Kenya Water Security and Climate Resilience Project
476
Kenya Water Security and Climate Resilience Project
-
Upload
khangminh22 -
Category
Documents
-
view
3 -
download
0
Transcript of Kenya Water Security and Climate Resilience Project
Kenya Water Security and Climate Resilience Project
Kenya Water Security and Climate Resilience Project
Kenya Water Security and Climate Resilience Project
Kenya Water Security and Climate Resilience Project
Final Lake Victoria North Basin Plan August 2020 i
Executive Summary E1. Background, context and objectives
The water resources of Kenya, a water-scarce country, are currently threatened on various fronts.
Addressing this, demands capacity for comprehensive water resources management and planning,
coupled with extensive investment in climate resilient water infrastructure.
In order to align the water sector in Kenya with Kenya’s 2010 Constitution, the 2016 Water Act was
promulgated in September 2016. The Act recognises that water related functions are a shared
responsibility between the National Government and the County Governments. To give effect to the
constitutional requirement for devolution of functions from National to County level, the Government of
Kenya has embarked on a wide-ranging water sector reform programme. The Act prioritises water user
categories, outlines an array of institutional shifts and established the new Water Resources Authority
(WRA) to protect, conserve, control and regulate the management and use of water resources through
supporting the Cabinet Secretary in the establishment and implementation of a National Water
Resource Management Strategy. The critical importance of proper water resources planning and
management is evident in relation to Kenya’s Big Four Agenda: Food security, Manufacturing,
Affordable universal health care and Affordable housing.
The Government of Kenya received financing from the World Bank toward the cost of implementing the
Kenya Water Security and Climate Resilience Project Phase 1 (KWSCRP-1), to be implemented
through the Ministry of Water, Sanitation and Irrigation. This Consultancy covers Sub-component 2.2
Strengthening Water Resource Management and Planning of the KWSCRP-1. The overall objective of
this Consultancy is to strengthen WRA’s capacity in terms of tools, skills and infrastructure to deliver on
its mandate for water resource management and regulation in the country. A key set of deliverables
under Sub-component 2.2 is the development of six Basin Plans for the six main river basins in Kenya.
This document constitutes the Integrated Water Resources Management and Development Basin Plan
for the Lake Victoria North (LVN) Basin. Integrated Water Resource Management (IWRM) considers
the environmental, social and economic aspects of a river basin, and ensures that these aspects are
integrated into an overall management strategy. It aims to achieve a sustainable balance between the
utilisation, development and protection of water resources.
The main objective of this Plan for the LVN Basin is to provide a clear pathway for the sustainable
utilisation and development of the water resources of the LVN Basin. The Plan provides a description
of the current state of the basin, establishes a shared vision for the future development of the basin and
identifies key strategic areas and actions for effective development and management of the basin’s
water resources. It draws information from relevant existing plans, sectoral perspectives and strategies,
incorporates comprehensive inputs from various stakeholders and presents updated information based
on analytical tools developed as part of this Consultancy.
In conjunction with stakeholders in the basin, a Vision for the sustainable development of the LVN Basin
was developed, which reads as follows:
Becoming a model basin in collaborative catchment management, protection, conservation and
control; equitably allocating good quality water for sustainable socio-economic development and
preservation of ecosystems by 2040.
Kenya Water Security and Climate Resilience Project
Final Lake Victoria North Basin Plan August 2020 ii
E2. Biophysical environment
The LVN Basin has an area of 18 500 km2 and is located at the western part of the country, with Mount
Elgon to the north, Uganda bordering to the west and Lake Victoria to the south-west. Although the LVN
Basin only covers 3.2% of the country’s total area, the catchment houses about 18% of the country’s
total population, resulting in this basin having the highest population density in the country. The major
towns in the Basin are Eldoret, Kakamega, Kitale, Bungoma, Webuye, Kapenguria, Busia, Siaya, Mbale
and Kapsabet.
The topography of the LVN Basin varies from 4 320 masl at Mount Elgon to 1 130 masl at Lake Victoria.
The Basin is divided into 38 sub-basins, 1AA to 1FG. The Nzoia River is the largest river in the basin
and drains 70% of the basin, followed by the Yala River which drains 18% of the basin. Both rivers drain
into Lake Victoria. The Sio River flows across the Ugandan border before draining into Lake Victoria.
The Nzoia River is a permanent river with seasonal variability and high flows during the two rainy
seasons, which frequently cause the river to burst its banks and cause flooding of the lower plains.
Surface water quality is degraded due to effluent discharges from major towns and urban areas,
factories in Eldoret as well as due to irrigation return flows in some areas.
The LVN Basin faces the north-eastern side of Lake Victoria, which is the largest freshwater lake in
Africa. The Lake is a shared water resource between Kenya, Tanzania, and Uganda. The major wetland
areas in the LVN Basin are Kingwal, Yala, Sergoit, Saiwa and Sio-Siteko. These systems are being
threatened by overexploitation of surface and groundwater resources, catchment degradation which
result in increased sediment loads, land use changes, encroachment and pollution.
The climate of the LVN Basin is primarily influenced by the topography of the basin, the intertropical
convergence zone (ITCZ), and the proximity to Lake Victoria. These factors contribute to the range and
variability in precipitation and temperature regimes. Average annual maximum day temperatures vary
from 18°C to 27°C across the basin, while the average annual minimum night temperatures vary from
4°C to 16°C. The central, northern, and southern parts of the basin receive higher rainfall, ranging from
a mean annual precipitation (MAP) of about 1 700 mm to 1 900 mm, while the MAP reduces to about
1 000 mm in the southwestern, and north-eastern parts of the basin. Rainfall occurs throughout the year
in the basin, however there are two periods of higher rainfall which occur during the year, namely the
long rains between March and May, and the short rains from October to November. The rainfall of the
basin varies depending on the location.
Under the influence of climate change there has been an increase in extreme climatic events in the
LVN Basin. The climate change analysis, undertaken by this Consultancy, showed a general increase
(between 4% and 5%) in mean annual rainfall across the basin by 2050. On average, the RCP 4.5
analysis predicted that the MAP across the LVN Basin would increase by 70 mm, from 1 536 mm to
1 606 mm, while day and night temperatures in the basin are expected to increase by up to 1.2°C and
1.4°C respectively by 2050. These projections are in line with current observed climate trends. The
variability of future climate within the basin will necessitate adaptive resilience to significantly different
scenarios within a season, inter-annually and by decadal. These challenges include increasing
temperature and evaporation rates, increasing intensity of extreme events, unpredictable and irregular
weather conditions, increased frequency of droughts, and a shift in seasons.
The LVN Basin is vulnerable to flood disasters, and the most vulnerable areas are Lower Yala, Lower
Sio and Lower Nzoia (specifically Budalangi). Flooding is currently controlled on the Nzoia and Yala
Rivers through the construction of dykes.
The LVN Basin forms part of the highest rainfall region in the country. The vegetation cover is mainly a
mosaic of forest and evergreen vegetation, with mountain forest vegetation in the highlands. The forests
in the basin comprise a critical part of the LVN hydrological ecosystem and have numerous economic,
social, cultural and ecological values, as they provide essential goods and services. Human
encroachment is threatening the forest reserves in the basin and there has been a significant loss of
vegetation cover.
Kenya Water Security and Climate Resilience Project
Final Lake Victoria North Basin Plan August 2020 iii
The Mount Elgon National Park is shared between the LVN Basin and the Rift Valley Basin. Other
protected areas are the Kakamega Forest and Chapkitale National Reserves, and the Mount Elgon,
Cherangani Hills and Mau Forest Complex water conservation forests.
Land use in the LVN Basin is dominated by agricultural use, with small urban and industrial areas.
However, many areas are characterised by unsustainable land use.
E3. Socio-economic environment
The total population of the LVN Basin is almost 8.55 million, which is equivalent to a population density
of 462 persons/km2. This is the highest population density of all six river basins in the country. Most of
the population in the LVN Basin live in rural settlements, with only 20% of the population located in
urban areas. The population of the LVN Basin is expected to increase due to high projected growth
rates, particularly for the urban sector.
The formal sector in the basin is made up of both public and private enterprises which have been legally
established or are listed with the registrar of companies. Most formal employment is in the urban
centres. The informal sector employs 43% of the labour force and covers all small-scale activities that
are semi-organised, unregulated and use basic technologies. The main economic activities in the basin
are agriculture and fishing. The LVN Basin’s location adjacent to Lake Victoria makes the production of
fish a strategic opportunity. The sources of livelihood vary across the basin, from fishing in the coastal
areas to subsistence agriculture and crop and livestock production in the pastoral and farming areas.
The country’s most food insecure areas do not fall within the LVN Basin. The basin is a relatively wet
area, with a low number of drought events and few poor-growing seasons. However, parts of the basin
do suffer from food insecurity. For the market-dependent households, especially in the rural areas, food
prices play a key role in food security.
At present, about 31% of the urban population in the basin receive piped water provided by Water
Service Providers, while 16% are dependent on unimproved water sources. The remaining 53% are
supplied from groundwater, which include protected and unimproved sources. In rural areas, 25% of
the population abstract water directly from rivers, ponds and lakes and 70% use groundwater. The rural
population in the basin also has a much lower percentage of piped water supply at only 5% compared
to the urban population at 31%.
Approximately 2% of the households in the LVN Basin are connected to a formal sewerage system, all
of which are in urban areas. On-site sanitation facilities like pit latrines and septic tanks are used by
94% of the population, while 4% of the population have no form of sanitation system and resort to
unsanitary waste disposal.
It has been estimated that approximately 80% of all communicable diseases in Kenya are water related.
It is anticipated that flooding risks would increase in the basin due to urbanisation and the effects of
climate change and that the increase in temperatures due to climate change would provide an
environment conducive for malaria vectors to thrive. Many of the counties within the LVN Basin
experience high rates of malaria.
E4. Key issues and challenges
The water resources of Kenya are currently threatened by many issues. These include catchment
degradation, pollution, inadequate monitoring networks, limited integrated basin planning and
management, water availability and supply issues, inadequate capacity (number of staff, skills,
equipment and finances), uneven spatial and temporal distribution of water resources, anthropogenic
encroachment on environmentally sensitive areas, inadequate flood and drought management and
various other issues. In addition to the above issues, the LVN Basin has location-specific challenges
and issues which, coupled with its unique basin characteristics, are an important consideration for
effective water resources management and planning at basin and sub-basin level.
Kenya Water Security and Climate Resilience Project
Final Lake Victoria North Basin Plan August 2020 iv
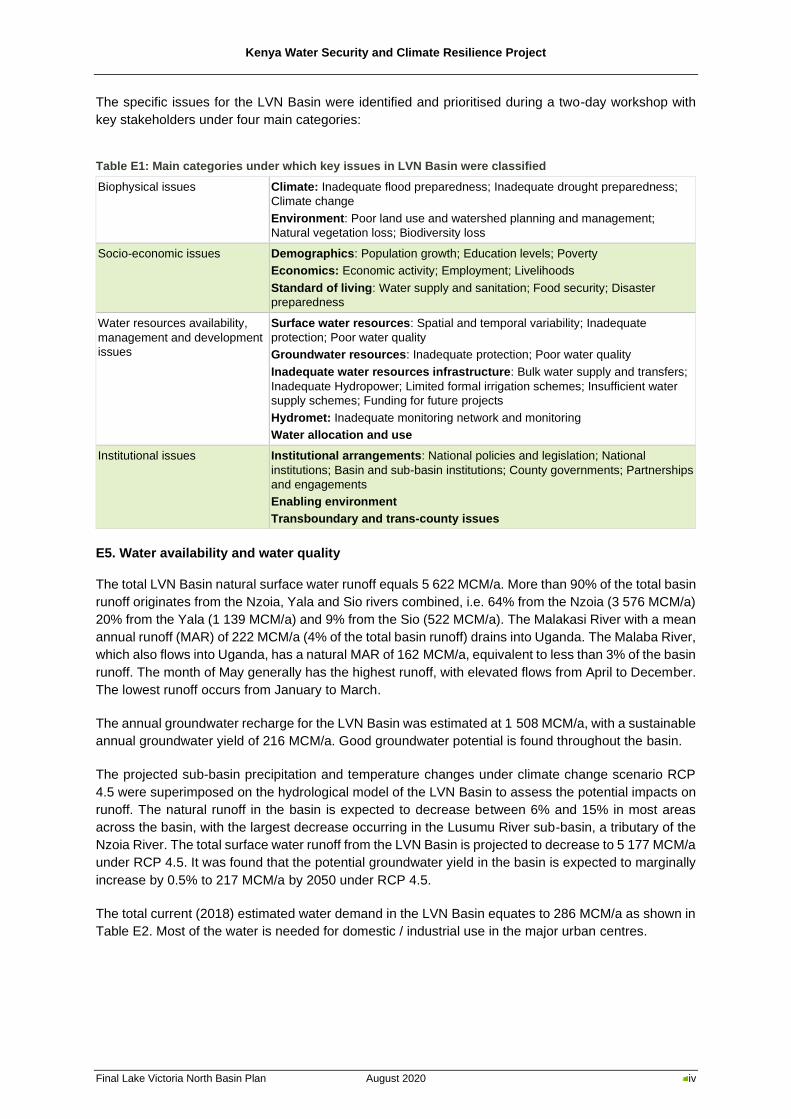
The specific issues for the LVN Basin were identified and prioritised during a two-day workshop with
key stakeholders under four main categories:
Table E1: Main categories under which key issues in LVN Basin were classified
Biophysical issues Climate: Inadequate flood preparedness; Inadequate drought preparedness;
Climate change
Environment: Poor land use and watershed planning and management;
Natural vegetation loss; Biodiversity loss
Socio-economic issues Demographics: Population growth; Education levels; Poverty
Economics: Economic activity; Employment; Livelihoods
Standard of living: Water supply and sanitation; Food security; Disaster
preparedness
Water resources availability,
management and development
issues
Surface water resources: Spatial and temporal variability; Inadequate
protection; Poor water quality
Groundwater resources: Inadequate protection; Poor water quality
Inadequate water resources infrastructure: Bulk water supply and transfers;
Inadequate Hydropower; Limited formal irrigation schemes; Insufficient water
supply schemes; Funding for future projects
Hydromet: Inadequate monitoring network and monitoring
Water allocation and use
Institutional issues Institutional arrangements: National policies and legislation; National
institutions; Basin and sub-basin institutions; County governments; Partnerships
and engagements
Enabling environment
Transboundary and trans-county issues
E5. Water availability and water quality
The total LVN Basin natural surface water runoff equals 5 622 MCM/a. More than 90% of the total basin
runoff originates from the Nzoia, Yala and Sio rivers combined, i.e. 64% from the Nzoia (3 576 MCM/a)
20% from the Yala (1 139 MCM/a) and 9% from the Sio (522 MCM/a). The Malakasi River with a mean
annual runoff (MAR) of 222 MCM/a (4% of the total basin runoff) drains into Uganda. The Malaba River,
which also flows into Uganda, has a natural MAR of 162 MCM/a, equivalent to less than 3% of the basin
runoff. The month of May generally has the highest runoff, with elevated flows from April to December.
The lowest runoff occurs from January to March.
The annual groundwater recharge for the LVN Basin was estimated at 1 508 MCM/a, with a sustainable
annual groundwater yield of 216 MCM/a. Good groundwater potential is found throughout the basin.
The projected sub-basin precipitation and temperature changes under climate change scenario RCP
4.5 were superimposed on the hydrological model of the LVN Basin to assess the potential impacts on
runoff. The natural runoff in the basin is expected to decrease between 6% and 15% in most areas
across the basin, with the largest decrease occurring in the Lusumu River sub-basin, a tributary of the
Nzoia River. The total surface water runoff from the LVN Basin is projected to decrease to 5 177 MCM/a
under RCP 4.5. It was found that the potential groundwater yield in the basin is expected to marginally
increase by 0.5% to 217 MCM/a by 2050 under RCP 4.5.
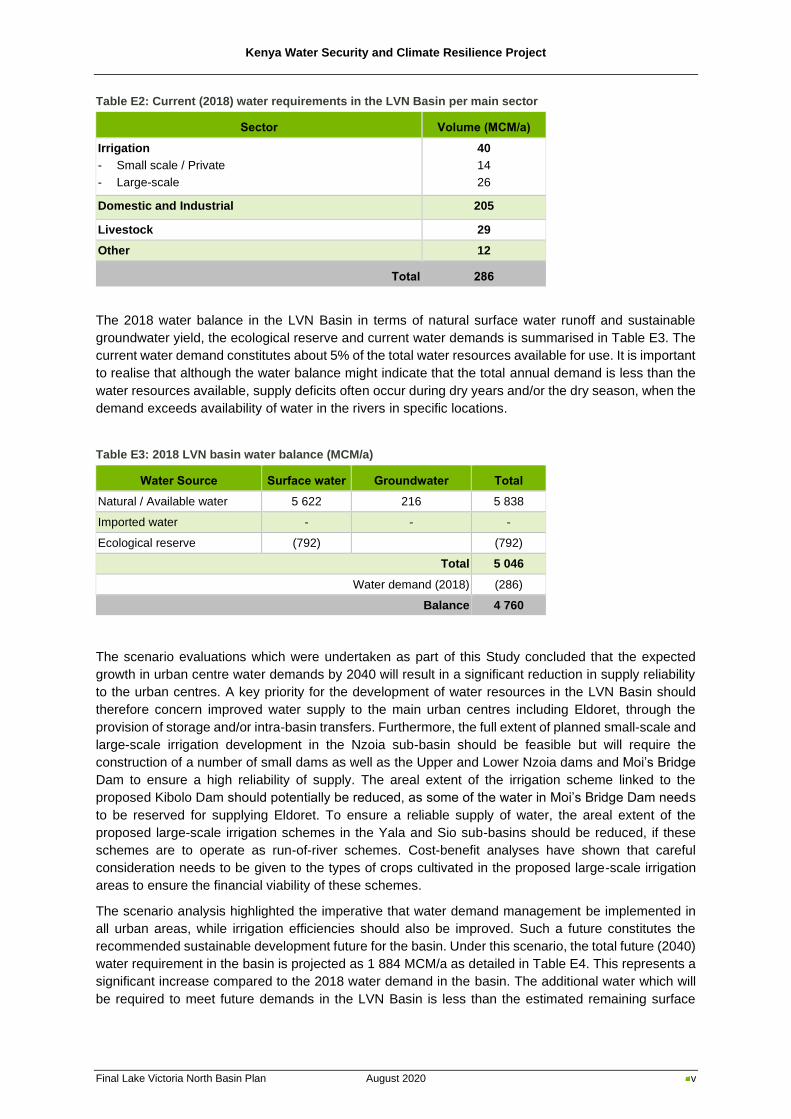
The total current (2018) estimated water demand in the LVN Basin equates to 286 MCM/a as shown in
Table E2. Most of the water is needed for domestic / industrial use in the major urban centres.
Kenya Water Security and Climate Resilience Project
Final Lake Victoria North Basin Plan August 2020 v
Table E2: Current (2018) water requirements in the LVN Basin per main sector
Sector Volume (MCM/a)
Irrigation
- Small scale / Private
- Large-scale
40
14
26
Domestic and Industrial 205
Livestock 29
Other 12
Total 286
The 2018 water balance in the LVN Basin in terms of natural surface water runoff and sustainable
groundwater yield, the ecological reserve and current water demands is summarised in Table E3. The
current water demand constitutes about 5% of the total water resources available for use. It is important
to realise that although the water balance might indicate that the total annual demand is less than the
water resources available, supply deficits often occur during dry years and/or the dry season, when the
demand exceeds availability of water in the rivers in specific locations.
Table E3: 2018 LVN basin water balance (MCM/a)
Water Source Surface water Groundwater Total
Natural / Available water 5 622 216 5 838
Imported water - - -
Ecological reserve (792) (792)
Total 5 046
Water demand (2018) (286)
Balance 4 760
The scenario evaluations which were undertaken as part of this Study concluded that the expected
growth in urban centre water demands by 2040 will result in a significant reduction in supply reliability
to the urban centres. A key priority for the development of water resources in the LVN Basin should
therefore concern improved water supply to the main urban centres including Eldoret, through the
provision of storage and/or intra-basin transfers. Furthermore, the full extent of planned small-scale and
large-scale irrigation development in the Nzoia sub-basin should be feasible but will require the
construction of a number of small dams as well as the Upper and Lower Nzoia dams and Moi’s Bridge
Dam to ensure a high reliability of supply. The areal extent of the irrigation scheme linked to the
proposed Kibolo Dam should potentially be reduced, as some of the water in Moi’s Bridge Dam needs
to be reserved for supplying Eldoret. To ensure a reliable supply of water, the areal extent of the
proposed large-scale irrigation schemes in the Yala and Sio sub-basins should be reduced, if these
schemes are to operate as run-of-river schemes. Cost-benefit analyses have shown that careful
consideration needs to be given to the types of crops cultivated in the proposed large-scale irrigation
areas to ensure the financial viability of these schemes.
The scenario analysis highlighted the imperative that water demand management be implemented in
all urban areas, while irrigation efficiencies should also be improved. Such a future constitutes the
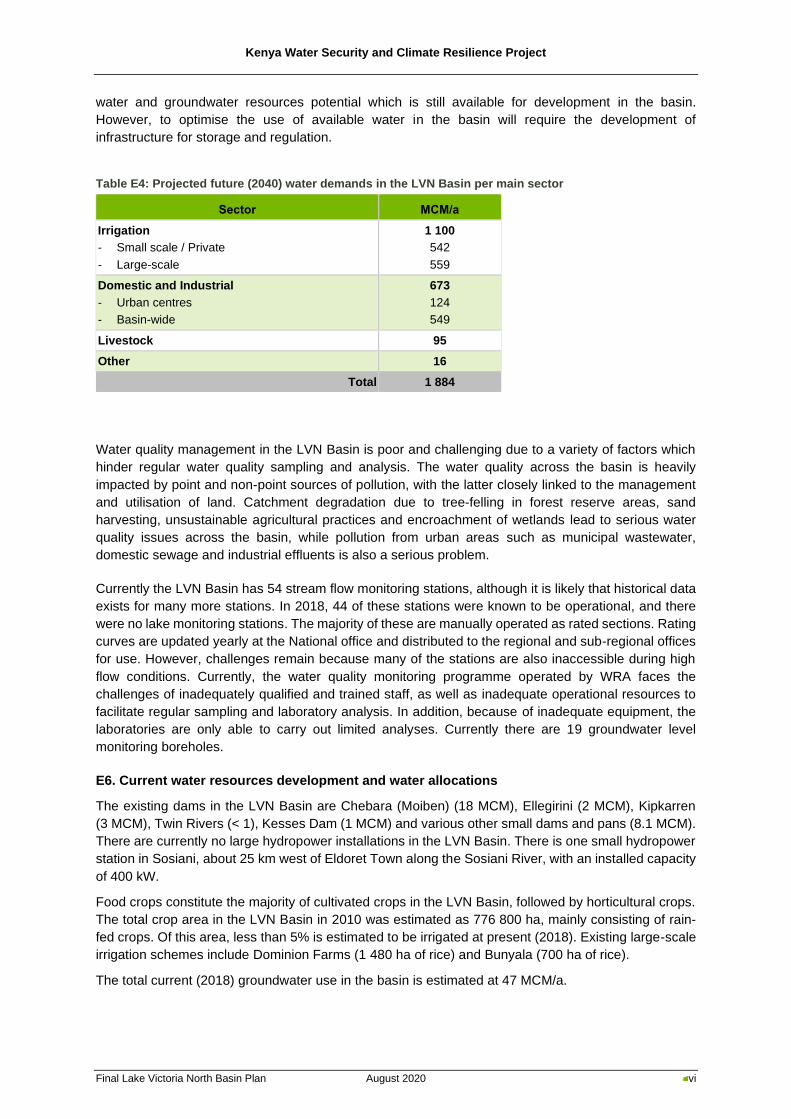
recommended sustainable development future for the basin. Under this scenario, the total future (2040)
water requirement in the basin is projected as 1 884 MCM/a as detailed in Table E4. This represents a
significant increase compared to the 2018 water demand in the basin. The additional water which will
be required to meet future demands in the LVN Basin is less than the estimated remaining surface
Kenya Water Security and Climate Resilience Project
Final Lake Victoria North Basin Plan August 2020 vi
water and groundwater resources potential which is still available for development in the basin.
However, to optimise the use of available water in the basin will require the development of
infrastructure for storage and regulation.
Table E4: Projected future (2040) water demands in the LVN Basin per main sector
Sector MCM/a
Irrigation
- Small scale / Private
- Large-scale
1 100
542
559
Domestic and Industrial
- Urban centres
- Basin-wide
673
124
549
Livestock 95
Other 16
Total 1 884
Water quality management in the LVN Basin is poor and challenging due to a variety of factors which
hinder regular water quality sampling and analysis. The water quality across the basin is heavily
impacted by point and non-point sources of pollution, with the latter closely linked to the management
and utilisation of land. Catchment degradation due to tree-felling in forest reserve areas, sand
harvesting, unsustainable agricultural practices and encroachment of wetlands lead to serious water
quality issues across the basin, while pollution from urban areas such as municipal wastewater,
domestic sewage and industrial effluents is also a serious problem.
Currently the LVN Basin has 54 stream flow monitoring stations, although it is likely that historical data
exists for many more stations. In 2018, 44 of these stations were known to be operational, and there
were no lake monitoring stations. The majority of these are manually operated as rated sections. Rating
curves are updated yearly at the National office and distributed to the regional and sub-regional offices
for use. However, challenges remain because many of the stations are also inaccessible during high
flow conditions. Currently, the water quality monitoring programme operated by WRA faces the
challenges of inadequately qualified and trained staff, as well as inadequate operational resources to
facilitate regular sampling and laboratory analysis. In addition, because of inadequate equipment, the
laboratories are only able to carry out limited analyses. Currently there are 19 groundwater level
monitoring boreholes.
E6. Current water resources development and water allocations
The existing dams in the LVN Basin are Chebara (Moiben) (18 MCM), Ellegirini (2 MCM), Kipkarren
(3 MCM), Twin Rivers (< 1), Kesses Dam (1 MCM) and various other small dams and pans (8.1 MCM).
There are currently no large hydropower installations in the LVN Basin. There is one small hydropower
station in Sosiani, about 25 km west of Eldoret Town along the Sosiani River, with an installed capacity
of 400 kW.
Food crops constitute the majority of cultivated crops in the LVN Basin, followed by horticultural crops.
The total crop area in the LVN Basin in 2010 was estimated as 776 800 ha, mainly consisting of rain-
fed crops. Of this area, less than 5% is estimated to be irrigated at present (2018). Existing large-scale
irrigation schemes include Dominion Farms (1 480 ha of rice) and Bunyala (700 ha of rice).
The total current (2018) groundwater use in the basin is estimated at 47 MCM/a.
Kenya Water Security and Climate Resilience Project
Final Lake Victoria North Basin Plan August 2020 vii
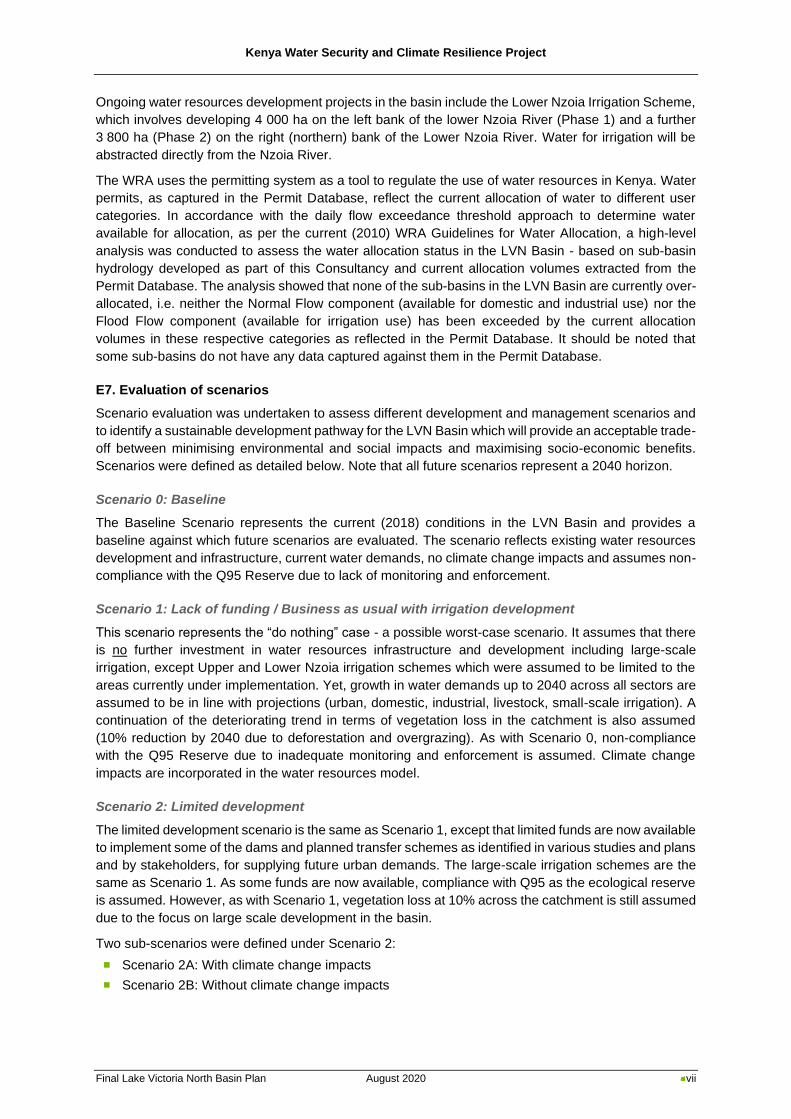
Ongoing water resources development projects in the basin include the Lower Nzoia Irrigation Scheme,
which involves developing 4 000 ha on the left bank of the lower Nzoia River (Phase 1) and a further
3 800 ha (Phase 2) on the right (northern) bank of the Lower Nzoia River. Water for irrigation will be
abstracted directly from the Nzoia River.
The WRA uses the permitting system as a tool to regulate the use of water resources in Kenya. Water
permits, as captured in the Permit Database, reflect the current allocation of water to different user
categories. In accordance with the daily flow exceedance threshold approach to determine water
available for allocation, as per the current (2010) WRA Guidelines for Water Allocation, a high-level
analysis was conducted to assess the water allocation status in the LVN Basin - based on sub-basin
hydrology developed as part of this Consultancy and current allocation volumes extracted from the
Permit Database. The analysis showed that none of the sub-basins in the LVN Basin are currently over-
allocated, i.e. neither the Normal Flow component (available for domestic and industrial use) nor the
Flood Flow component (available for irrigation use) has been exceeded by the current allocation
volumes in these respective categories as reflected in the Permit Database. It should be noted that
some sub-basins do not have any data captured against them in the Permit Database.
E7. Evaluation of scenarios
Scenario evaluation was undertaken to assess different development and management scenarios and
to identify a sustainable development pathway for the LVN Basin which will provide an acceptable trade-
off between minimising environmental and social impacts and maximising socio-economic benefits.
Scenarios were defined as detailed below. Note that all future scenarios represent a 2040 horizon.
Scenario 0: Baseline
The Baseline Scenario represents the current (2018) conditions in the LVN Basin and provides a
baseline against which future scenarios are evaluated. The scenario reflects existing water resources
development and infrastructure, current water demands, no climate change impacts and assumes non-
compliance with the Q95 Reserve due to lack of monitoring and enforcement.
Scenario 1: Lack of funding / Business as usual with irrigation development
This scenario represents the “do nothing” case - a possible worst-case scenario. It assumes that there
is no further investment in water resources infrastructure and development including large-scale
irrigation, except Upper and Lower Nzoia irrigation schemes which were assumed to be limited to the
areas currently under implementation. Yet, growth in water demands up to 2040 across all sectors are
assumed to be in line with projections (urban, domestic, industrial, livestock, small-scale irrigation). A
continuation of the deteriorating trend in terms of vegetation loss in the catchment is also assumed
(10% reduction by 2040 due to deforestation and overgrazing). As with Scenario 0, non-compliance
with the Q95 Reserve due to inadequate monitoring and enforcement is assumed. Climate change
impacts are incorporated in the water resources model.
Scenario 2: Limited development
The limited development scenario is the same as Scenario 1, except that limited funds are now available
to implement some of the dams and planned transfer schemes as identified in various studies and plans
and by stakeholders, for supplying future urban demands. The large-scale irrigation schemes are the
same as Scenario 1. As some funds are now available, compliance with Q95 as the ecological reserve
is assumed. However, as with Scenario 1, vegetation loss at 10% across the catchment is still assumed
due to the focus on large scale development in the basin.
Two sub-scenarios were defined under Scenario 2:
◼ Scenario 2A: With climate change impacts
◼ Scenario 2B: Without climate change impacts
Kenya Water Security and Climate Resilience Project
Final Lake Victoria North Basin Plan August 2020 viii
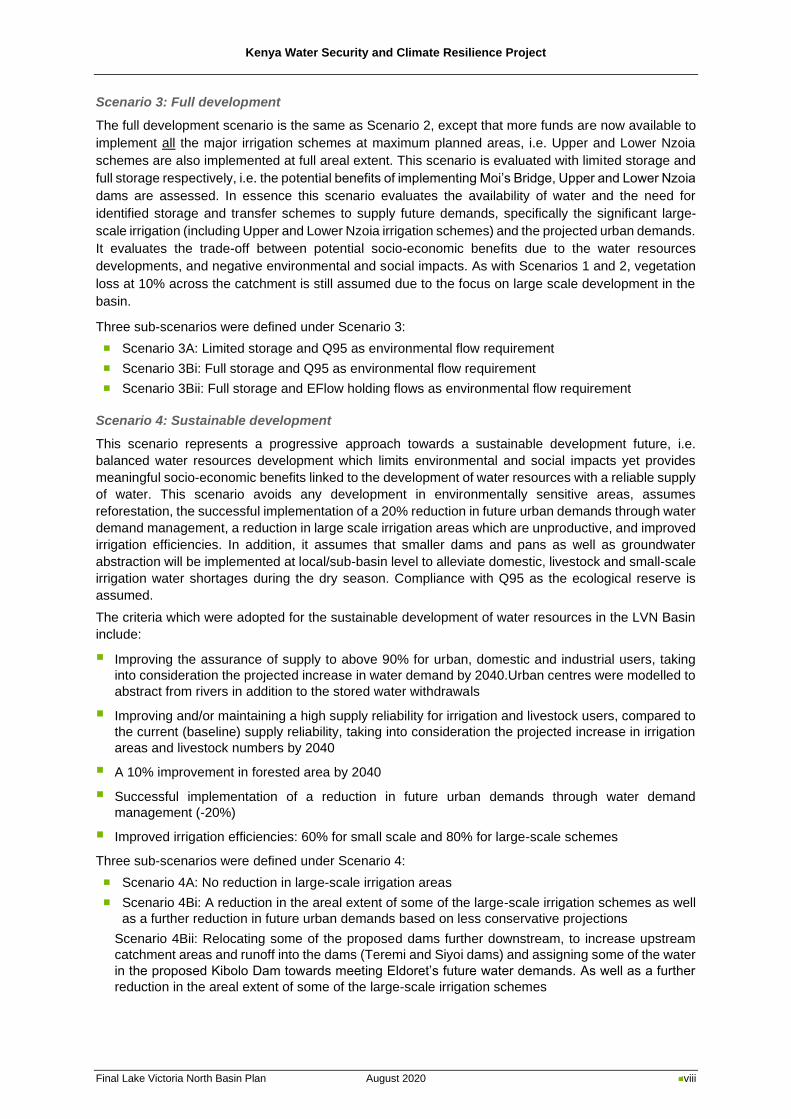
Scenario 3: Full development
The full development scenario is the same as Scenario 2, except that more funds are now available to
implement all the major irrigation schemes at maximum planned areas, i.e. Upper and Lower Nzoia
schemes are also implemented at full areal extent. This scenario is evaluated with limited storage and
full storage respectively, i.e. the potential benefits of implementing Moi’s Bridge, Upper and Lower Nzoia
dams are assessed. In essence this scenario evaluates the availability of water and the need for
identified storage and transfer schemes to supply future demands, specifically the significant large-
scale irrigation (including Upper and Lower Nzoia irrigation schemes) and the projected urban demands.
It evaluates the trade-off between potential socio-economic benefits due to the water resources
developments, and negative environmental and social impacts. As with Scenarios 1 and 2, vegetation
loss at 10% across the catchment is still assumed due to the focus on large scale development in the
basin.
Three sub-scenarios were defined under Scenario 3:
◼ Scenario 3A: Limited storage and Q95 as environmental flow requirement
◼ Scenario 3Bi: Full storage and Q95 as environmental flow requirement
◼ Scenario 3Bii: Full storage and EFlow holding flows as environmental flow requirement
Scenario 4: Sustainable development
This scenario represents a progressive approach towards a sustainable development future, i.e.
balanced water resources development which limits environmental and social impacts yet provides
meaningful socio-economic benefits linked to the development of water resources with a reliable supply
of water. This scenario avoids any development in environmentally sensitive areas, assumes
reforestation, the successful implementation of a 20% reduction in future urban demands through water
demand management, a reduction in large scale irrigation areas which are unproductive, and improved
irrigation efficiencies. In addition, it assumes that smaller dams and pans as well as groundwater
abstraction will be implemented at local/sub-basin level to alleviate domestic, livestock and small-scale
irrigation water shortages during the dry season. Compliance with Q95 as the ecological reserve is
assumed.
The criteria which were adopted for the sustainable development of water resources in the LVN Basin
include:
▪ Improving the assurance of supply to above 90% for urban, domestic and industrial users, taking
into consideration the projected increase in water demand by 2040.Urban centres were modelled to
abstract from rivers in addition to the stored water withdrawals
▪ Improving and/or maintaining a high supply reliability for irrigation and livestock users, compared to
the current (baseline) supply reliability, taking into consideration the projected increase in irrigation
areas and livestock numbers by 2040
▪ A 10% improvement in forested area by 2040
▪ Successful implementation of a reduction in future urban demands through water demand
management (-20%)
▪ Improved irrigation efficiencies: 60% for small scale and 80% for large-scale schemes
Three sub-scenarios were defined under Scenario 4:
◼ Scenario 4A: No reduction in large-scale irrigation areas
◼ Scenario 4Bi: A reduction in the areal extent of some of the large-scale irrigation schemes as well
as a further reduction in future urban demands based on less conservative projections
Scenario 4Bii: Relocating some of the proposed dams further downstream, to increase upstream
catchment areas and runoff into the dams (Teremi and Siyoi dams) and assigning some of the water
in the proposed Kibolo Dam towards meeting Eldoret’s future water demands. As well as a further
reduction in the areal extent of some of the large-scale irrigation schemes
Kenya Water Security and Climate Resilience Project
Final Lake Victoria North Basin Plan August 2020 ix
In order to provide a scientific-based, transparent and consistent approach towards the evaluation of
water resources development and management alternatives (scenarios) in the LVN Basin, analytical
tools were developed. These tools include: (a) tools which assess erosion risk and sediment yield; (b)
climate analysis tools which project changes in precipitation and temperature across the basin; (c) tools
which classify ecological river condition and estimate variable environmental flow requirements; (d)
water resources models, including a rainfall-runoff model, which simulate water availability and
demands and the movement of water through river networks and water infrastructure associated with
different levels of water resources development, and; (e) a macro-economic tool which, at a coarse
level, assesses the impacts of alternative water resources development scenarios in terms of macro-
economic sectors.
For the evaluation of scenarios, indicators were defined, categorised as environmental, social or
economic indicators, and quantified based on response functions. These functions quantify how
interventions affect the direction of change in environmental, social and economic performance, and
measure the magnitude of that change through defined relationships or linkages between water
resource driven processes (i.e. model outputs) and impacts or benefits. Typically, these response
functions are based on empirical relationships derived from observed data, on physically based
conceptual models which describe indicator responses in relation to physical parameters or on
statistical indices or relevant values extracted from output time series. In order to assess relative
impacts and benefits related to the defined water resources development scenarios, criteria, derived
from indicators, were used to compare and evaluate different combinations of scenarios using multi-
criteria analysis.
The evaluation of development and management scenarios provided useful information towards
informing the strategy for the sustainable development of water resources in the LVN Basin. The main
outcomes of the scenario evaluation with relevance to water resources development in the basin are
summarised below:
◼ Supply deficits for current urban and rural domestic demands as well as small scale irrigation
demands currently occur mainly due to shortfalls during the dry season.
◼ The expected growth in urban centre water demands by 2040 will result in a significant reduction
in supply reliability to the urban centres. A key priority for the development of water resources in
the LVN Basin should therefore concern improved water supply to the main urban centres including
Eldoret and Kakamega, through the provision of storage and/or intra-basin transfers.
◼ Interventions towards improving water availability and assurance of supply to urban users should
include a combination of new storage dams, new and/or upgrades to existing inter- and intra-basin
transfers, water demand management measures, conjunctive use depending on groundwater
availability and quality, as well as consideration of measures for rainwater harvesting.
◼ To improve current and future reliability of supply to towns and rural settlements outside of the
major urban centres, for livestock as well as for supply of small-scale irrigation which is projected
to increase significantly, new or additional storage (dams and pans), as well as local groundwater
development need to be promoted.
◼ The full extent of planned large-scale irrigation development in the Nzoia sub-basin (as per the
NWMP) appear to be feasible but will require the construction of the Upper and Lower Nzoia dams
to ensure a high reliability of supply.
◼ The areal extent of the irrigation scheme linked to the proposed Kibolo Dam should potentially be
reduced, as some of the water in Moi’s Bridge Dam needs to be reserved for supplying Eldoret.
◼ To ensure a reliable supply of water, the areal extent of the proposed large-scale irrigation schemes
in the Yala and Sio sub-basins should be reduced, if these schemes are to operate as run-of-river
schemes.
◼ Climate change is expected to result in increased rainfall and temperatures, however, the net
impact will be less water availability and increased irrigation demands. This highlights the
importance of providing storage and the need for water demand management.
Kenya Water Security and Climate Resilience Project
Final Lake Victoria North Basin Plan August 2020 x
◼ It is imperative that water demand management is implemented in all urban areas, while irrigation
efficiencies should also be improved.
◼ The availability of water for use within the basin will be severely impacted by the introduction of
variable minimum environmental flows as opposed to the current Q95 minimum constant flow.
Careful consideration should be given to resource classification and how this will impact water
resources availability.
E8. Proposed development pathway
The essence of the proposed water resources development plan for the LVN Basin, up to 2040, is to
address the expected growth in urban water demands, to ensure a reliable water availability for the
proposed large-scale irrigation development as well as the significant expansion of small-scale irrigation
in the basin, to improve existing and future water resources availability for smaller towns and basin-
wide domestic and livestock water demands and to unlock the significant potential for socio-economic
development through the construction of large, multi-purpose water resources development projects in
the basin. This will necessitate the construction of small-scale and large-scale storage and regulation
infrastructure, the expansion of existing and the development of new intra- and inter-basin transfers,
and increased groundwater abstraction. In addition; water demand management will be required for
both small and large-scale irrigation and for urban centres.
E9. Water resources development investment plan
Meeting the above objectives will require the following interventions:
◼ The existing transfer from Moiben Dam to Eldoret and Iten needs to be expanded, while a new dam
would have to be constructed on the Sosiani River or the Kipkarren River to supply Eldoret.
◼ To meet the future domestic and industrial demands of other urban areas (e.g. Kakamega,
Kapenguria, Moi’s bridge, Matunda, Lumakanda, Kimilili, Bungoma, Chwele, Yala, Siyaya, Mbale),
towns and rural areas as well as livestock and small-scale irrigation water demands within the
remainder of the LVN Basin, additional storage should be provided through the implementation of
already identified dams, the construction of additional dams and pans, and through the construction
of more boreholes, while more intra-basin transfers might also be required.
◼ The proposed Nandi Forest Multipurpose Dam Project needs to be implemented to make use of
the abundant water resources in the upper Yala River - to augment the future urban water supply
to Kisumu, to generate hydropower and to enable large-scale irrigation development along the
lower Oroba River in Lake Victoria South Basin. The dam would also be able to provide for the
expected increase in domestic and small-scale irrigation water demands in the middle and lower
Yala sub-basin, and possibly to augment the supply to Kakamega through an intra-basin transfer.
◼ The Lower and Upper Nzoia Dam projects, as well as Moi’s Bridge and Kibolo Dam should be
implemented to increase supply reliability to future large-scale irrigation development. An added
benefit of these projects relates to the generation of hydropower and flood control.
◼ Implementation and enforcement of environmental flows downstream of proposed dams and large-
scale irrigation schemes to maintain the ecological health of the rivers.
A phased project investment plan linked to the development of water resources infrastructure in the
LVN Basin is included as Table E5.
Kenya Water Security and Climate Resilience Project
Final Lake Victoria North Basin Plan August 2020 xi
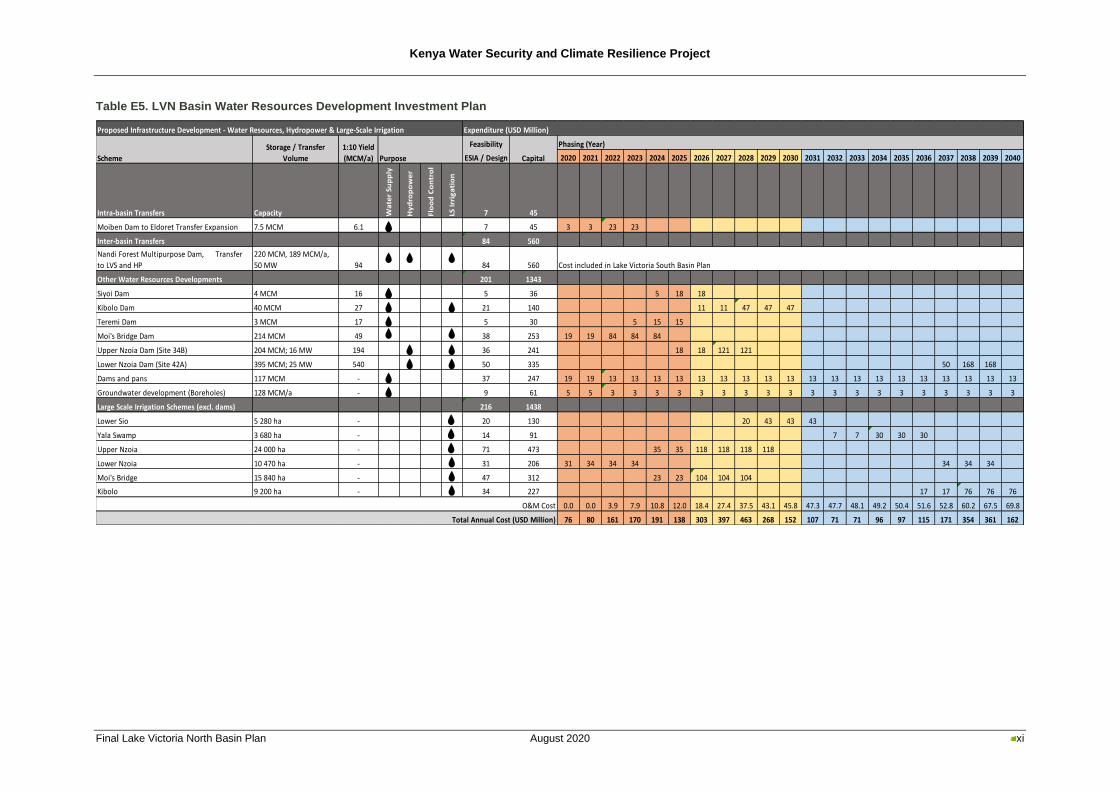
Table E5. LVN Basin Water Resources Development Investment Plan
Proposed Infrastructure Development - Water Resources, Hydropower & Large-Scale Irrigation
Feasibility
ESIA / Design 2020 2021 2022 2023 2024 2025 2026 2027 2028 2029 2030 2031 2032 2033 2034 2035 2036 2037 2038 2039 2040
Intra-basin Transfers Capacity Wa
ter
Sup
ply
Hy
dro
po
we
r
Flo
od
Co
ntr
ol
LS I
rrig
ati
on
7 45
Moiben Dam to Eldoret Transfer Expansion 7.5 MCM 6.1 7 45 3 3 23 23
Inter-basin Transfers 84 560
Nandi Forest Multipurpose Dam, Transfer
to LVS and HP
220 MCM, 189 MCM/a,
50 MW 94 84 560
Other Water Resources Developments 201 1343
Siyoi Dam 4 MCM 16 5 36 5 18 18
Kibolo Dam 40 MCM 27 21 140 11 11 47 47 47
Teremi Dam 3 MCM 17 5 30 5 15 15
Moi's Bridge Dam 214 MCM 49 38 253 19 19 84 84 84
Upper Nzoia Dam (Site 34B) 204 MCM; 16 MW 194 36 241 18 18 121 121
Lower Nzoia Dam (Site 42A) 395 MCM; 25 MW 540 50 335 50 168 168
Dams and pans 117 MCM - 37 247 19 19 13 13 13 13 13 13 13 13 13 13 13 13 13 13 13 13 13 13 13
Groundwater development (Boreholes) 128 MCM/a - 9 61 5 5 3 3 3 3 3 3 3 3 3 3 3 3 3 3 3 3 3 3 3
Large Scale Irrigation Schemes (excl. dams) 216 1438
Lower Sio 5 280 ha - 20 130 20 43 43 43
Yala Swamp 3 680 ha - 14 91 7 7 30 30 30
Upper Nzoia 24 000 ha - 71 473 35 35 118 118 118 118
Lower Nzoia 10 470 ha - 31 206 31 34 34 34 34 34 34
Moi's Bridge 15 840 ha - 47 312 23 23 104 104 104
Kibolo 9 200 ha - 34 227 17 17 76 76 76
0.0 0.0 3.9 7.9 10.8 12.0 18.4 27.4 37.5 43.1 45.8 47.3 47.7 48.1 49.2 50.4 51.6 52.8 60.2 67.5 69.8
76 80 161 170 191 138 303 397 463 268 152 107 71 71 96 97 115 171 354 361 162
Expenditure (USD Million)
Purpose
Total Annual Cost (USD Million)
O&M Cost
Capital
Phasing (Year)
Scheme
1:10 Yield
(MCM/a)
Storage / Transfer
Volume
Cost included in Lake Victoria South Basin Plan
Kenya Water Security and Climate Resilience Project
Final Lake Victoria North Basin Plan August 2020 xii
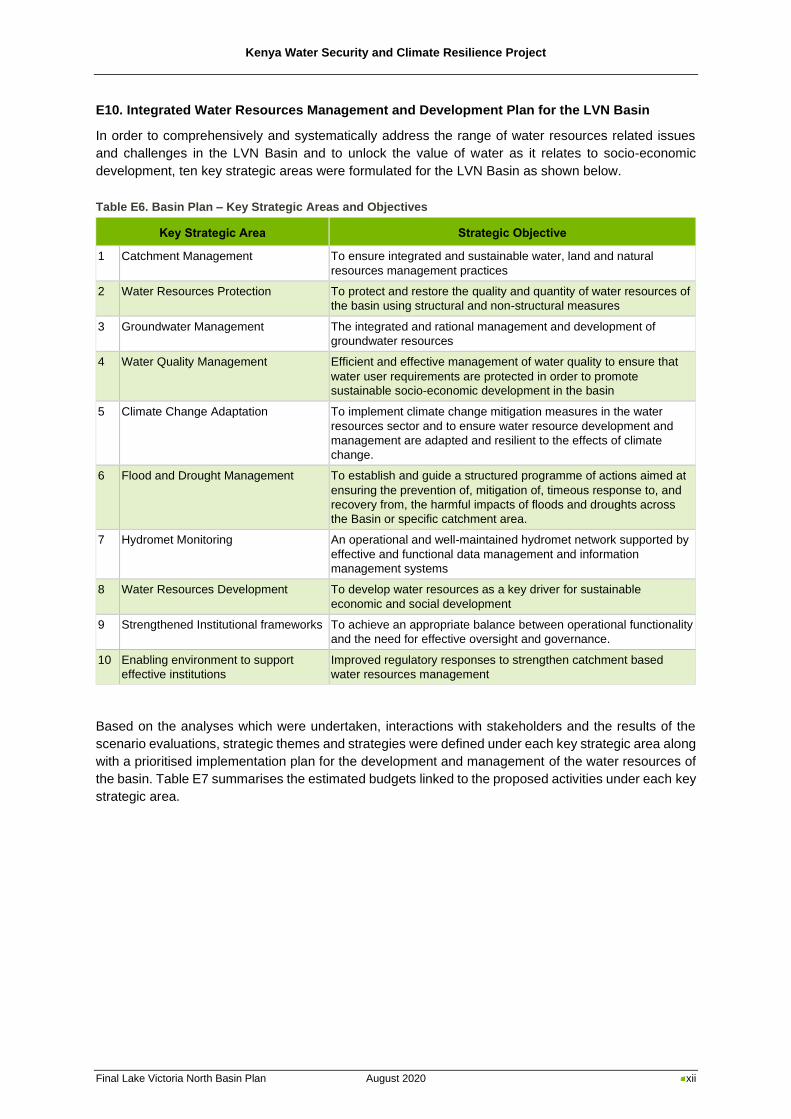
E10. Integrated Water Resources Management and Development Plan for the LVN Basin
In order to comprehensively and systematically address the range of water resources related issues
and challenges in the LVN Basin and to unlock the value of water as it relates to socio-economic
development, ten key strategic areas were formulated for the LVN Basin as shown below.
Table E6. Basin Plan – Key Strategic Areas and Objectives
Key Strategic Area Strategic Objective
1 Catchment Management To ensure integrated and sustainable water, land and natural
resources management practices
2 Water Resources Protection To protect and restore the quality and quantity of water resources of
the basin using structural and non-structural measures
3 Groundwater Management The integrated and rational management and development of
groundwater resources
4 Water Quality Management Efficient and effective management of water quality to ensure that
water user requirements are protected in order to promote
sustainable socio-economic development in the basin
5 Climate Change Adaptation To implement climate change mitigation measures in the water
resources sector and to ensure water resource development and
management are adapted and resilient to the effects of climate
change.
6 Flood and Drought Management To establish and guide a structured programme of actions aimed at
ensuring the prevention of, mitigation of, timeous response to, and
recovery from, the harmful impacts of floods and droughts across
the Basin or specific catchment area.
7 Hydromet Monitoring An operational and well-maintained hydromet network supported by
effective and functional data management and information
management systems
8 Water Resources Development To develop water resources as a key driver for sustainable
economic and social development
9 Strengthened Institutional frameworks To achieve an appropriate balance between operational functionality
and the need for effective oversight and governance.
10 Enabling environment to support
effective institutions
Improved regulatory responses to strengthen catchment based
water resources management
Based on the analyses which were undertaken, interactions with stakeholders and the results of the
scenario evaluations, strategic themes and strategies were defined under each key strategic area along
with a prioritised implementation plan for the development and management of the water resources of
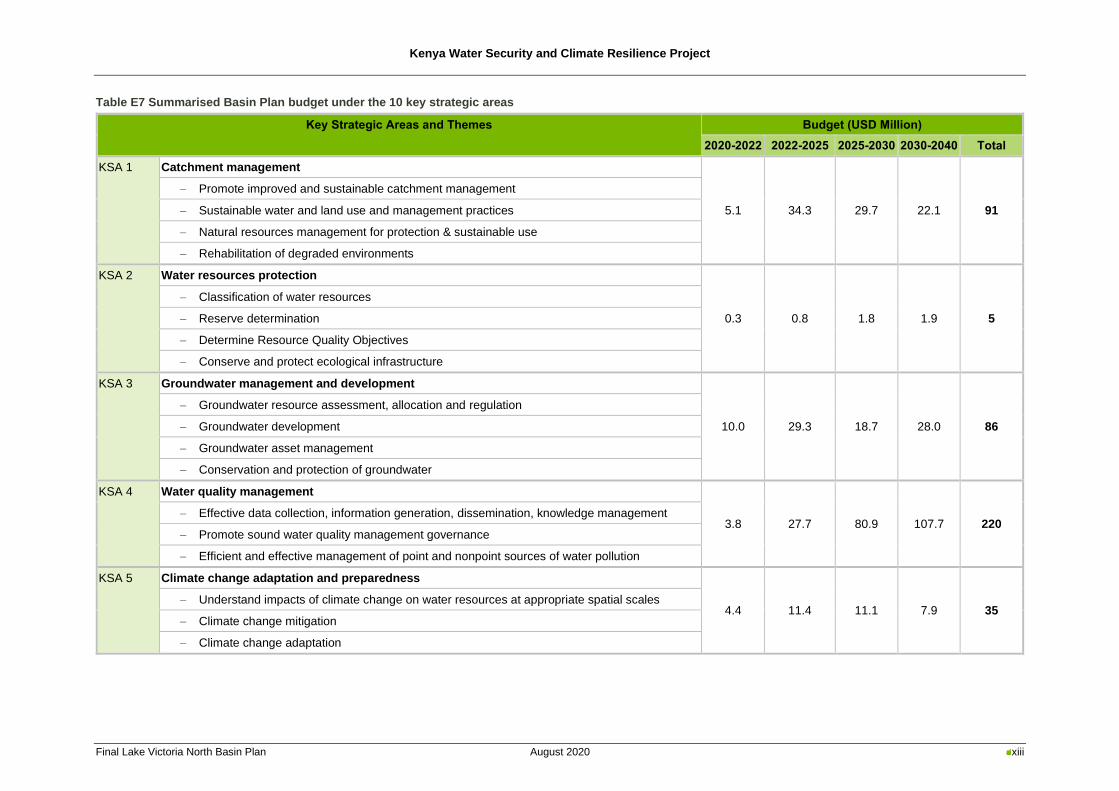
the basin. Table E7 summarises the estimated budgets linked to the proposed activities under each key
strategic area.
Kenya Water Security and Climate Resilience Project
Final Lake Victoria North Basin Plan August 2020 xiii
Table E7 Summarised Basin Plan budget under the 10 key strategic areas
Key Strategic Areas and Themes Budget (USD Million)
2020-2022 2022-2025 2025-2030 2030-2040 Total
KSA 1 Catchment management
5.1 34.3 29.7 22.1 91
− Promote improved and sustainable catchment management
− Sustainable water and land use and management practices
− Natural resources management for protection & sustainable use
− Rehabilitation of degraded environments
KSA 2 Water resources protection
0.3 0.8 1.8 1.9 5
− Classification of water resources
− Reserve determination
− Determine Resource Quality Objectives
− Conserve and protect ecological infrastructure
KSA 3 Groundwater management and development
10.0 29.3 18.7 28.0 86
− Groundwater resource assessment, allocation and regulation
− Groundwater development
− Groundwater asset management
− Conservation and protection of groundwater
KSA 4 Water quality management
3.8 27.7 80.9 107.7 220 − Effective data collection, information generation, dissemination, knowledge management
− Promote sound water quality management governance
− Efficient and effective management of point and nonpoint sources of water pollution
KSA 5 Climate change adaptation and preparedness
4.4 11.4 11.1 7.9 35 − Understand impacts of climate change on water resources at appropriate spatial scales
− Climate change mitigation
− Climate change adaptation
Kenya Water Security and Climate Resilience Project
Final Lake Victoria North Basin Plan August 2020 xiv
Key Strategic Areas and Themes Budget (USD Million)
2020-2022 2022-2025 2025-2030 2030-2040 Total
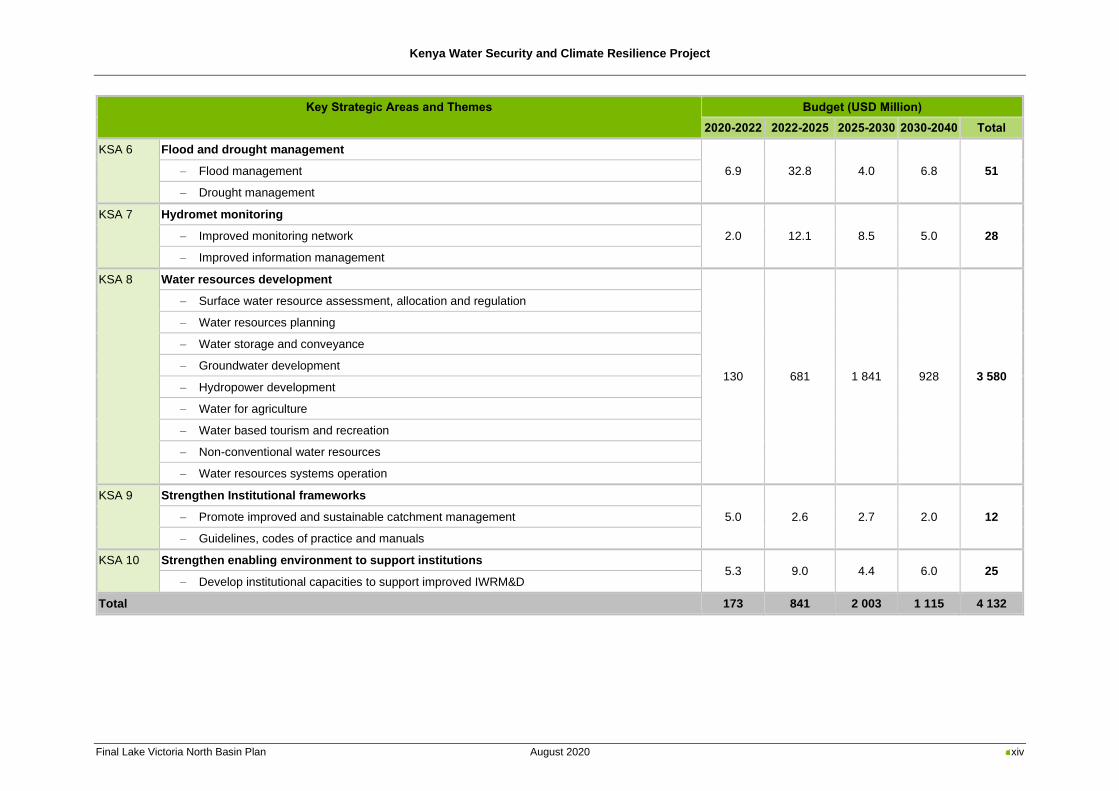
KSA 6 Flood and drought management
6.9 32.8 4.0 6.8 51 − Flood management
− Drought management
KSA 7 Hydromet monitoring
2.0 12.1 8.5 5.0 28 − Improved monitoring network
− Improved information management
KSA 8 Water resources development
130 681 1 841 928 3 580
− Surface water resource assessment, allocation and regulation
− Water resources planning
− Water storage and conveyance
− Groundwater development
− Hydropower development
− Water for agriculture
− Water based tourism and recreation
− Non-conventional water resources
− Water resources systems operation
KSA 9 Strengthen Institutional frameworks
5.0 2.6 2.7 2.0 12 − Promote improved and sustainable catchment management
− Guidelines, codes of practice and manuals
KSA 10 Strengthen enabling environment to support institutions 5.3 9.0 4.4 6.0 25
− Develop institutional capacities to support improved IWRM&D
Total 173 841 2 003 1 115 4 132
Kenya Water Security and Climate Resilience Project
Final Lake Victoria North Basin Plan August 2020 xv
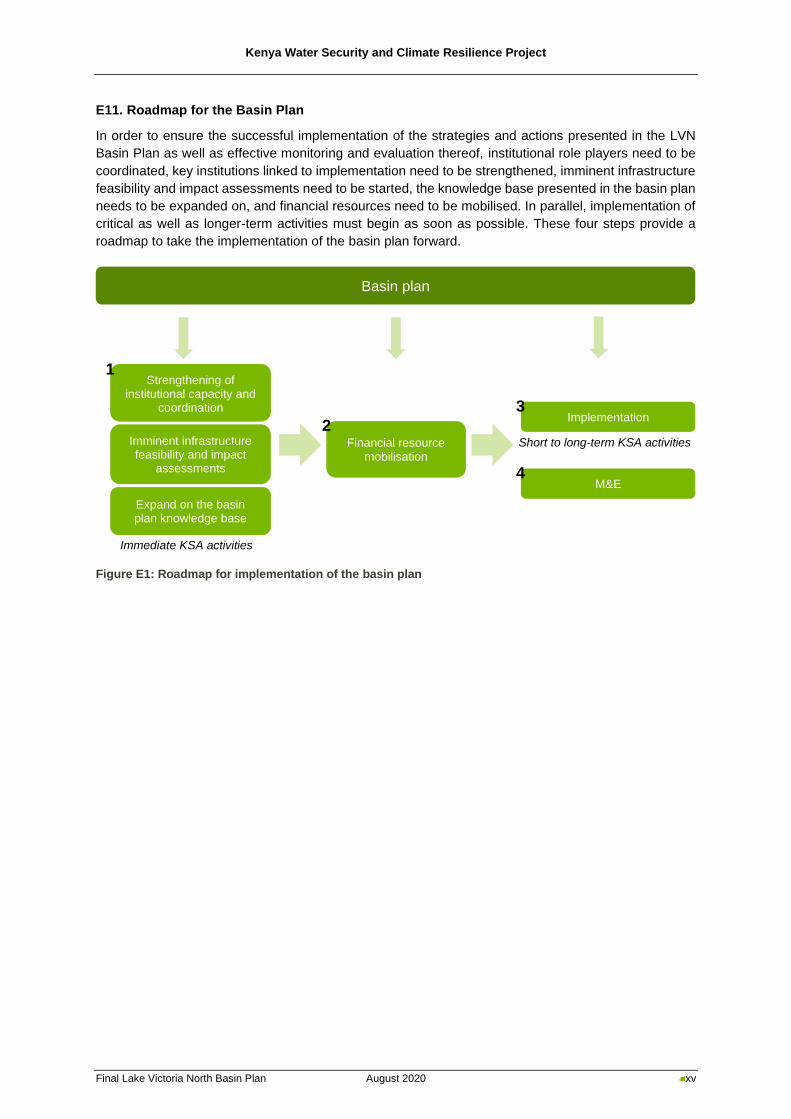
E11. Roadmap for the Basin Plan
In order to ensure the successful implementation of the strategies and actions presented in the LVN
Basin Plan as well as effective monitoring and evaluation thereof, institutional role players need to be
coordinated, key institutions linked to implementation need to be strengthened, imminent infrastructure
feasibility and impact assessments need to be started, the knowledge base presented in the basin plan
needs to be expanded on, and financial resources need to be mobilised. In parallel, implementation of
critical as well as longer-term activities must begin as soon as possible. These four steps provide a
roadmap to take the implementation of the basin plan forward.
Figure E1: Roadmap for implementation of the basin plan
Short to long-term KSA activities Imminent infrastructure feasibility and impact
assessments
Expand on the basin plan knowledge base
Strengthening of institutional capacity and
coordination
1
Implementation 3
Financial resource mobilisation
2
Basin plan
M&E 4
Immediate KSA activities
Kenya Water Security and Climate Resilience Project
Final Lake Victoria North Basin Plan August 2020 xvi
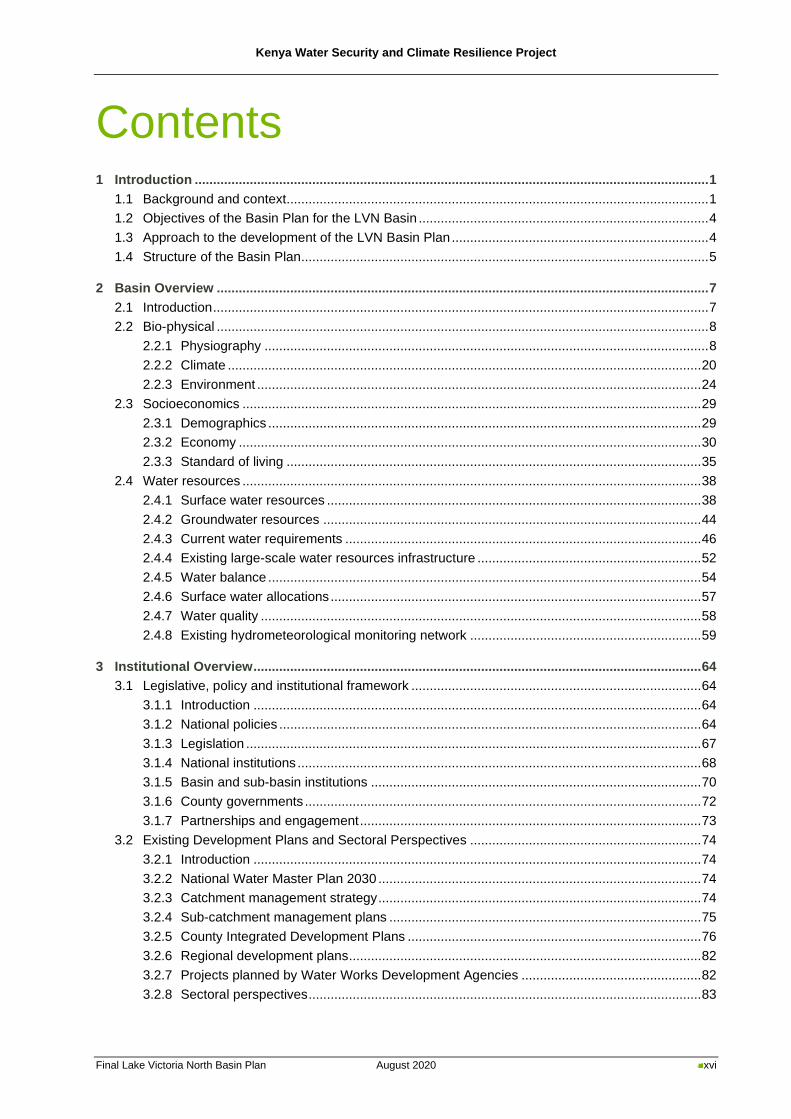
Contents 1 Introduction ............................................................................................................................................ 1
1.1 Background and context................................................................................................................... 1
1.2 Objectives of the Basin Plan for the LVN Basin ............................................................................... 4
1.3 Approach to the development of the LVN Basin Plan ...................................................................... 4
1.4 Structure of the Basin Plan............................................................................................................... 5
2 Basin Overview ...................................................................................................................................... 7
2.1 Introduction ....................................................................................................................................... 7
2.2 Bio-physical ...................................................................................................................................... 8
2.2.1 Physiography ......................................................................................................................... 8
2.2.2 Climate ................................................................................................................................. 20
2.2.3 Environment ......................................................................................................................... 24
2.3 Socioeconomics ............................................................................................................................. 29
2.3.1 Demographics ...................................................................................................................... 29
2.3.2 Economy .............................................................................................................................. 30
2.3.3 Standard of living ................................................................................................................. 35
2.4 Water resources ............................................................................................................................. 38
2.4.1 Surface water resources ...................................................................................................... 38
2.4.2 Groundwater resources ....................................................................................................... 44
2.4.3 Current water requirements ................................................................................................. 46
2.4.4 Existing large-scale water resources infrastructure ............................................................. 52
2.4.5 Water balance ...................................................................................................................... 54
2.4.6 Surface water allocations ..................................................................................................... 57
2.4.7 Water quality ........................................................................................................................ 58
2.4.8 Existing hydrometeorological monitoring network ............................................................... 59
3 Institutional Overview .......................................................................................................................... 64
3.1 Legislative, policy and institutional framework ............................................................................... 64
3.1.1 Introduction .......................................................................................................................... 64
3.1.2 National policies ................................................................................................................... 64
3.1.3 Legislation ............................................................................................................................ 67
3.1.4 National institutions .............................................................................................................. 68
3.1.5 Basin and sub-basin institutions .......................................................................................... 70
3.1.6 County governments ............................................................................................................ 72
3.1.7 Partnerships and engagement ............................................................................................. 73
3.2 Existing Development Plans and Sectoral Perspectives ............................................................... 74
3.2.1 Introduction .......................................................................................................................... 74
3.2.2 National Water Master Plan 2030 ........................................................................................ 74
3.2.3 Catchment management strategy ........................................................................................ 74
3.2.4 Sub-catchment management plans ..................................................................................... 75
3.2.5 County Integrated Development Plans ................................................................................ 76
3.2.6 Regional development plans ................................................................................................ 82
3.2.7 Projects planned by Water Works Development Agencies ................................................. 82
3.2.8 Sectoral perspectives ........................................................................................................... 83
Kenya Water Security and Climate Resilience Project
Final Lake Victoria North Basin Plan August 2020 xvii
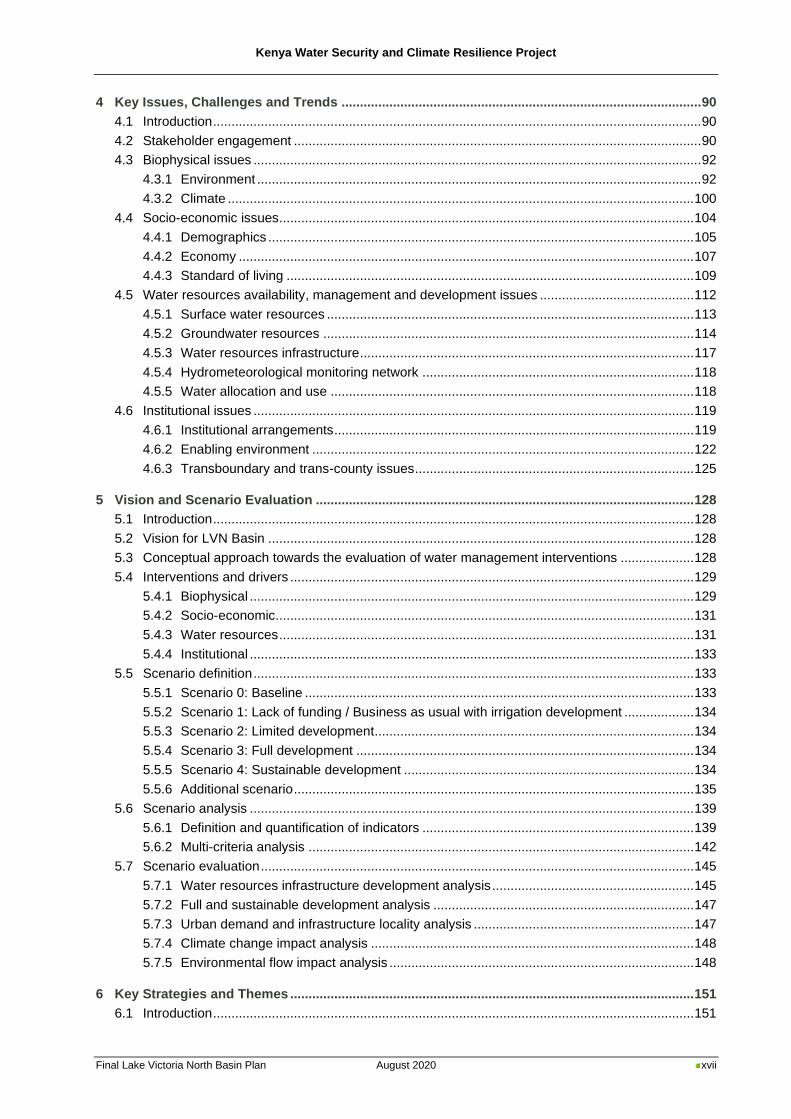
4 Key Issues, Challenges and Trends .................................................................................................. 90
4.1 Introduction ..................................................................................................................................... 90
4.2 Stakeholder engagement ............................................................................................................... 90
4.3 Biophysical issues .......................................................................................................................... 92
4.3.1 Environment ......................................................................................................................... 92
4.3.2 Climate ............................................................................................................................... 100
4.4 Socio-economic issues ................................................................................................................. 104
4.4.1 Demographics .................................................................................................................... 105
4.4.2 Economy ............................................................................................................................ 107
4.4.3 Standard of living ............................................................................................................... 109
4.5 Water resources availability, management and development issues .......................................... 112
4.5.1 Surface water resources .................................................................................................... 113
4.5.2 Groundwater resources ..................................................................................................... 114
4.5.3 Water resources infrastructure ........................................................................................... 117
4.5.4 Hydrometeorological monitoring network .......................................................................... 118
4.5.5 Water allocation and use ................................................................................................... 118
4.6 Institutional issues ........................................................................................................................ 119
4.6.1 Institutional arrangements .................................................................................................. 119
4.6.2 Enabling environment ........................................................................................................ 122
4.6.3 Transboundary and trans-county issues ............................................................................ 125
5 Vision and Scenario Evaluation ....................................................................................................... 128
5.1 Introduction ................................................................................................................................... 128
5.2 Vision for LVN Basin .................................................................................................................... 128
5.3 Conceptual approach towards the evaluation of water management interventions .................... 128
5.4 Interventions and drivers .............................................................................................................. 129
5.4.1 Biophysical ......................................................................................................................... 129
5.4.2 Socio-economic.................................................................................................................. 131
5.4.3 Water resources ................................................................................................................. 131
5.4.4 Institutional ......................................................................................................................... 133
5.5 Scenario definition ........................................................................................................................ 133
5.5.1 Scenario 0: Baseline .......................................................................................................... 133
5.5.2 Scenario 1: Lack of funding / Business as usual with irrigation development ................... 134
5.5.3 Scenario 2: Limited development....................................................................................... 134
5.5.4 Scenario 3: Full development ............................................................................................ 134
5.5.5 Scenario 4: Sustainable development ............................................................................... 134
5.5.6 Additional scenario ............................................................................................................. 135
5.6 Scenario analysis ......................................................................................................................... 139
5.6.1 Definition and quantification of indicators .......................................................................... 139
5.6.2 Multi-criteria analysis ......................................................................................................... 142
5.7 Scenario evaluation ...................................................................................................................... 145
5.7.1 Water resources infrastructure development analysis ....................................................... 145
5.7.2 Full and sustainable development analysis ....................................................................... 147
5.7.3 Urban demand and infrastructure locality analysis ............................................................ 147
5.7.4 Climate change impact analysis ........................................................................................ 148
5.7.5 Environmental flow impact analysis ................................................................................... 148
6 Key Strategies and Themes .............................................................................................................. 151
6.1 Introduction ................................................................................................................................... 151
Kenya Water Security and Climate Resilience Project
Final Lake Victoria North Basin Plan August 2020 xviii
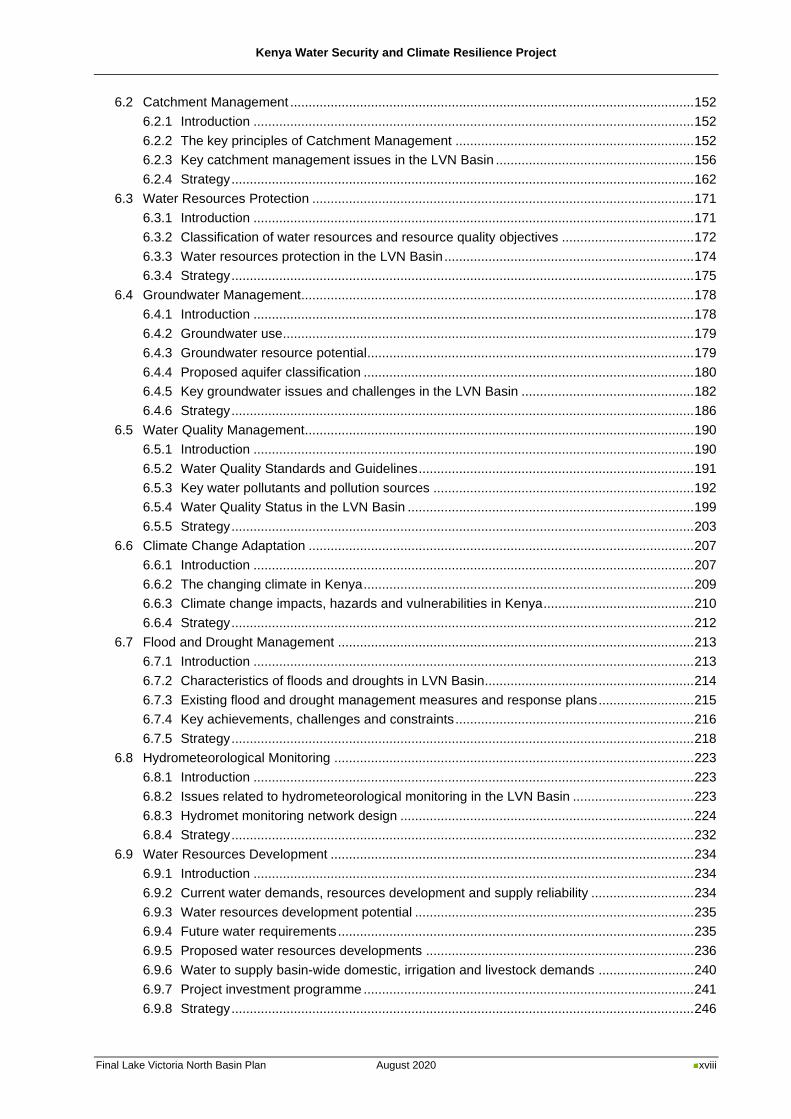
6.2 Catchment Management .............................................................................................................. 152
6.2.1 Introduction ........................................................................................................................ 152
6.2.2 The key principles of Catchment Management ................................................................. 152
6.2.3 Key catchment management issues in the LVN Basin ...................................................... 156
6.2.4 Strategy .............................................................................................................................. 162
6.3 Water Resources Protection ........................................................................................................ 171
6.3.1 Introduction ........................................................................................................................ 171
6.3.2 Classification of water resources and resource quality objectives .................................... 172
6.3.3 Water resources protection in the LVN Basin .................................................................... 174
6.3.4 Strategy .............................................................................................................................. 175
6.4 Groundwater Management........................................................................................................... 178
6.4.1 Introduction ........................................................................................................................ 178
6.4.2 Groundwater use................................................................................................................ 179
6.4.3 Groundwater resource potential......................................................................................... 179
6.4.4 Proposed aquifer classification .......................................................................................... 180
6.4.5 Key groundwater issues and challenges in the LVN Basin ............................................... 182
6.4.6 Strategy .............................................................................................................................. 186
6.5 Water Quality Management.......................................................................................................... 190
6.5.1 Introduction ........................................................................................................................ 190
6.5.2 Water Quality Standards and Guidelines ........................................................................... 191
6.5.3 Key water pollutants and pollution sources ....................................................................... 192
6.5.4 Water Quality Status in the LVN Basin .............................................................................. 199
6.5.5 Strategy .............................................................................................................................. 203
6.6 Climate Change Adaptation ......................................................................................................... 207
6.6.1 Introduction ........................................................................................................................ 207
6.6.2 The changing climate in Kenya .......................................................................................... 209
6.6.3 Climate change impacts, hazards and vulnerabilities in Kenya ......................................... 210
6.6.4 Strategy .............................................................................................................................. 212
6.7 Flood and Drought Management ................................................................................................. 213
6.7.1 Introduction ........................................................................................................................ 213
6.7.2 Characteristics of floods and droughts in LVN Basin......................................................... 214
6.7.3 Existing flood and drought management measures and response plans .......................... 215
6.7.4 Key achievements, challenges and constraints ................................................................. 216
6.7.5 Strategy .............................................................................................................................. 218
6.8 Hydrometeorological Monitoring .................................................................................................. 223
6.8.1 Introduction ........................................................................................................................ 223
6.8.2 Issues related to hydrometeorological monitoring in the LVN Basin ................................. 223
6.8.3 Hydromet monitoring network design ................................................................................ 224
6.8.4 Strategy .............................................................................................................................. 232
6.9 Water Resources Development ................................................................................................... 234
6.9.1 Introduction ........................................................................................................................ 234
6.9.2 Current water demands, resources development and supply reliability ............................ 234
6.9.3 Water resources development potential ............................................................................ 235
6.9.4 Future water requirements ................................................................................................. 235
6.9.5 Proposed water resources developments ......................................................................... 236
6.9.6 Water to supply basin-wide domestic, irrigation and livestock demands .......................... 240
6.9.7 Project investment programme .......................................................................................... 241
6.9.8 Strategy .............................................................................................................................. 246
Kenya Water Security and Climate Resilience Project
Final Lake Victoria North Basin Plan August 2020 xix
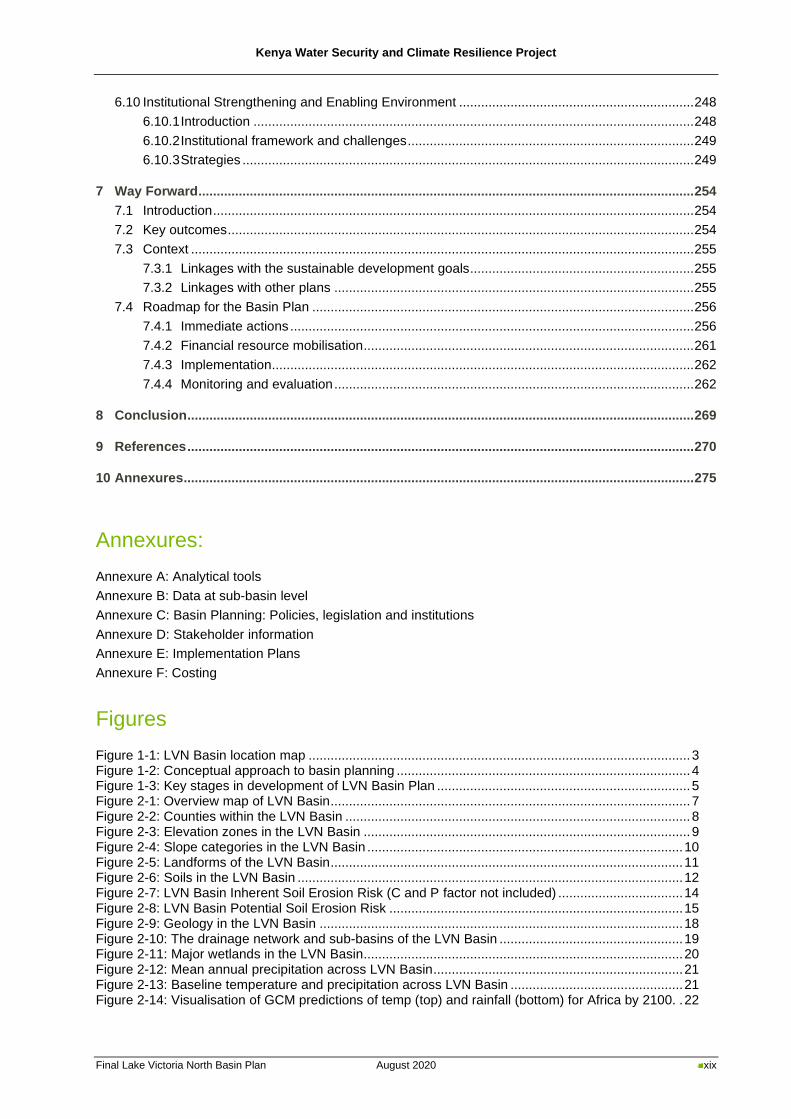
6.10 Institutional Strengthening and Enabling Environment ................................................................ 248
6.10.1 Introduction ........................................................................................................................ 248
6.10.2 Institutional framework and challenges .............................................................................. 249
6.10.3 Strategies ........................................................................................................................... 249
7 Way Forward ....................................................................................................................................... 254
7.1 Introduction ................................................................................................................................... 254
7.2 Key outcomes ............................................................................................................................... 254
7.3 Context ......................................................................................................................................... 255
7.3.1 Linkages with the sustainable development goals............................................................. 255
7.3.2 Linkages with other plans .................................................................................................. 255
7.4 Roadmap for the Basin Plan ........................................................................................................ 256
7.4.1 Immediate actions .............................................................................................................. 256
7.4.2 Financial resource mobilisation .......................................................................................... 261
7.4.3 Implementation................................................................................................................... 262
7.4.4 Monitoring and evaluation .................................................................................................. 262
8 Conclusion .......................................................................................................................................... 269
9 References .......................................................................................................................................... 270
10 Annexures ........................................................................................................................................... 275
Annexures:
Annexure A: Analytical tools
Annexure B: Data at sub-basin level
Annexure C: Basin Planning: Policies, legislation and institutions
Annexure D: Stakeholder information
Annexure E: Implementation Plans
Annexure F: Costing
Figures
Figure 1-1: LVN Basin location map ........................................................................................................ 3 Figure 1-2: Conceptual approach to basin planning ................................................................................ 4 Figure 1-3: Key stages in development of LVN Basin Plan ..................................................................... 5 Figure 2-1: Overview map of LVN Basin .................................................................................................. 7 Figure 2-2: Counties within the LVN Basin .............................................................................................. 8 Figure 2-3: Elevation zones in the LVN Basin ......................................................................................... 9 Figure 2-4: Slope categories in the LVN Basin ...................................................................................... 10 Figure 2-5: Landforms of the LVN Basin ................................................................................................ 11 Figure 2-6: Soils in the LVN Basin ......................................................................................................... 12 Figure 2-7: LVN Basin Inherent Soil Erosion Risk (C and P factor not included) .................................. 14 Figure 2-8: LVN Basin Potential Soil Erosion Risk ................................................................................ 15 Figure 2-9: Geology in the LVN Basin ................................................................................................... 18 Figure 2-10: The drainage network and sub-basins of the LVN Basin .................................................. 19 Figure 2-11: Major wetlands in the LVN Basin....................................................................................... 20 Figure 2-12: Mean annual precipitation across LVN Basin .................................................................... 21 Figure 2-13: Baseline temperature and precipitation across LVN Basin ............................................... 21 Figure 2-14: Visualisation of GCM predictions of temp (top) and rainfall (bottom) for Africa by 2100. . 22
Kenya Water Security and Climate Resilience Project
Final Lake Victoria North Basin Plan August 2020 xx
Figure 2-15: Projected Change in Mean Annual Precipitation in the LVN Basin by 2050 (RCP 4.5) .... 23 Figure 2-16: Project Tmax anomalies in the LVN Basin by 2050 (RCP 4.5) ......................................... 23 Figure 2-17: Vegetation cover in the LVN Basin .................................................................................... 24 Figure 2-18: Sitantunga antelope in the Saiwa Swamp National Park .................................................. 25 Figure 2-19: Protected areas across the LVN Basin ............................................................................. 27 Figure 2-20: LVN Basin land cover and use map .................................................................................. 28 Figure 2-21: Sustainability of current land use in the LVN Basin........................................................... 29 Figure 2-22: Natural mean annual runoff and seasonal flow patterns at key nodes in the Lake
Victoria Basin ................................................................................................................ 39 Figure 2-23: Flow seasonality Index per sub-basin ............................................................................... 40 Figure 2-24: Annual flow variability in the three main rivers in the LVN Basin ...................................... 41 Figure 2-25: Unit runoff per sub-basin ................................................................................................... 42 Figure 2-26: Runoff coefficient per sub-basin ........................................................................................ 43 Figure 2-27: Climate change impacts on natural runoff in the LVN Basin 2050 (RCP 4.5) ................... 44 Figure 2-28: Estimated annual groundwater recharge in the LVN Basin .............................................. 45 Figure 2-29: Estimated sustainable groundwater yield in the LVN Basin .............................................. 46 Figure 2-30: Rainfed and Irrigated crops in the LVN Basin (RCMRD Kenya Crop Mask, 2015) .......... 48 Figure 2-31: Present-day (2018) water requirements across the LVN Basin ........................................ 51 Figure 2-32: Water balance per sub-basin ............................................................................................. 55 Figure 2-33: Current-day water availability and use in the LVN Basin .................................................. 56 Figure 2-34: Water allocation status per sub-basin (2018) .................................................................... 58 Figure 2-35: Locations of operational stream flow gauging stations in the LVN Basin.......................... 61 Figure 2-36: Locations of operational meteorological stations in the LVN Basin .................................. 62 Figure 3-1: WRA Offices and sub-regions in the LVN Basin ................................................................. 71 Figure 4-1: Example of output from the workshop for the LVN Basin ................................................... 90 Figure 4-2: Frequency of identified key issues in the LVN Basin .......................................................... 91 Figure 4-3: Key issues framework ......................................................................................................... 91 Figure 4-4: Tree loss and tree gain for LVN Basin according to Global Forest Watch .......................... 95 Figure 4-5: Flooding from the Yala River in the LVN Basin (Ndonga, 2018) ....................................... 102 Figure 5-1: Scenario Evaluation (adapted from Kusek & Rist, 2004 and World Bank, 2008) ............. 128 Figure 5-2: Approach to scenario development and evaluation .......................................................... 130 Figure 6-1: Illustration of good (left) and poor (right) state of both land and water resources ............. 152 Figure 6-2: An example of the interconnected links of land degradation ............................................. 153 Figure 6-3: The interaction of different management strategies for Catchment Management ............ 154 Figure 6-4: Illustration of water and land use activities within a catchment ......................................... 155 Figure 6-5: Catchment management considerations in LVN Basin ..................................................... 163 Figure 6-6: The different levels of water resources protection in Kenya ............................................. 172 Figure 6-7: Water resources management cycle ................................................................................. 173 Figure 6-8: The seven steps to determine water resource classes and resource quality objectives .. 174 Figure 6-9: Total water resource, comprised of the Reserve and allocable resource (WRMA 2010) . 174 Figure 6-10: Water resources protection considerations in LVN Basin ............................................... 176 Figure 6-11: Proposed aquifer classification of the LVN Basin............................................................ 180 Figure 6-12: Water quality monitoring in LVN Basin -turbidity (a), TDS (b), PO4 (c) and NO3 (d) * ... 202 Figure 6-13: Flood management plan for LVN Basin .......................................................................... 219 Figure 6-14: Eldoret sub-region: Proposed flow and met monitoring network ..................................... 225 Figure 6-15: Kitale sub-region: Proposed flow and met monitoring network ....................................... 226 Figure 6-16: Siaya sub-region: Proposed flow and met monitoring network ....................................... 226 Figure 6-17:Eldoret sub-region: Proposed surface water quality monitoring points ............................ 228 Figure 6-18: Kitale sub-region: Proposed surface water quality monitoring points ............................. 229 Figure 6-19: Siaya sub-region: Proposed surface water quality monitoring points ............................. 229 Figure 6-20: Proposed developments, dams and transfer schemes in the LVN Basin ....................... 238 Figure 7-1: Integration of the SDGs into the LVN Basin Plan .............................................................. 255 Figure 7-2: Roadmap for implementation of the Basin Plan ................................................................ 256
Tables
Table 2-1: Description of main soil types found in the LVN Basin ......................................................... 11 Table 2-2: Soil Classification for the LVN Basin .................................................................................... 13 Table 2-3: Current classification of aquifers in the LVN Basin ............................................................... 17 Table 2-4: The important and protected areas in the LVN Basin ........................................................... 26
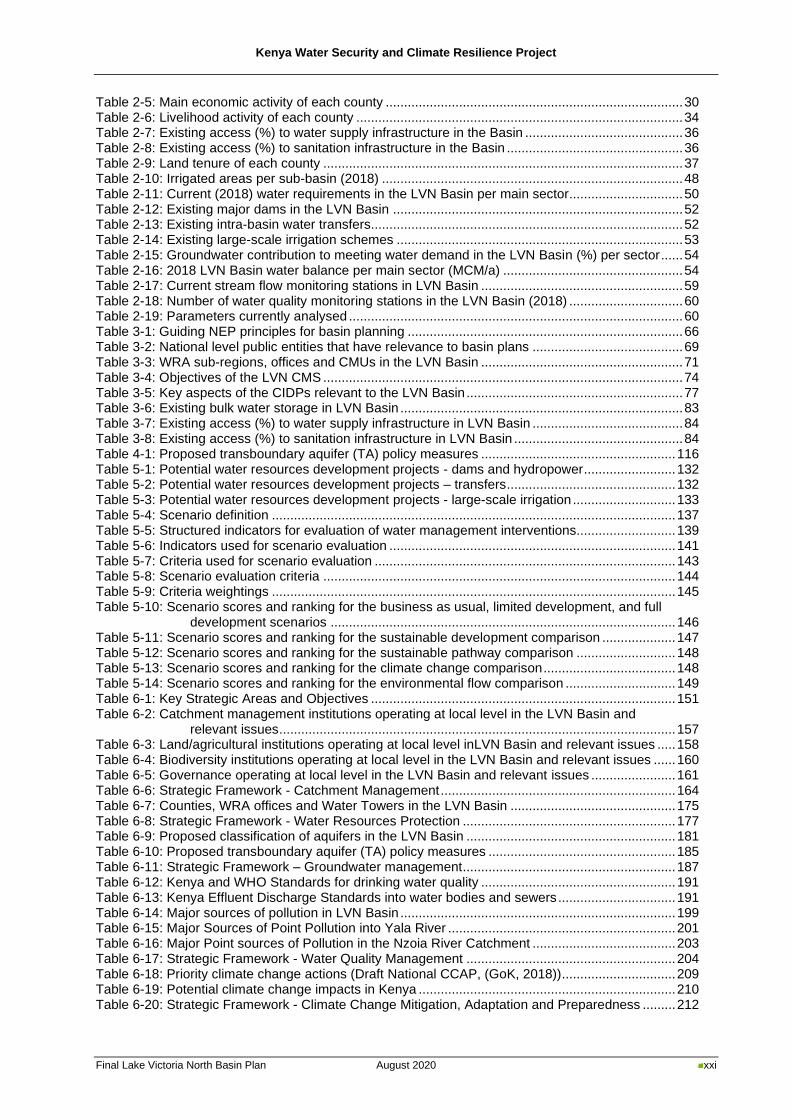
Kenya Water Security and Climate Resilience Project
Final Lake Victoria North Basin Plan August 2020 xxi
Table 2-5: Main economic activity of each county ................................................................................. 30 Table 2-6: Livelihood activity of each county ......................................................................................... 34 Table 2-7: Existing access (%) to water supply infrastructure in the Basin ........................................... 36 Table 2-8: Existing access (%) to sanitation infrastructure in the Basin ................................................ 36 Table 2-9: Land tenure of each county .................................................................................................. 37 Table 2-10: Irrigated areas per sub-basin (2018) .................................................................................. 48 Table 2-11: Current (2018) water requirements in the LVN Basin per main sector............................... 50 Table 2-12: Existing major dams in the LVN Basin ............................................................................... 52 Table 2-13: Existing intra-basin water transfers..................................................................................... 52 Table 2-14: Existing large-scale irrigation schemes .............................................................................. 53 Table 2-15: Groundwater contribution to meeting water demand in the LVN Basin (%) per sector ...... 54 Table 2-16: 2018 LVN Basin water balance per main sector (MCM/a) ................................................. 54 Table 2-17: Current stream flow monitoring stations in LVN Basin ....................................................... 59 Table 2-18: Number of water quality monitoring stations in the LVN Basin (2018) ............................... 60 Table 2-19: Parameters currently analysed ........................................................................................... 60 Table 3-1: Guiding NEP principles for basin planning ........................................................................... 66 Table 3-2: National level public entities that have relevance to basin plans ......................................... 69 Table 3-3: WRA sub-regions, offices and CMUs in the LVN Basin ....................................................... 71 Table 3-4: Objectives of the LVN CMS .................................................................................................. 74 Table 3-5: Key aspects of the CIDPs relevant to the LVN Basin ........................................................... 77 Table 3-6: Existing bulk water storage in LVN Basin ............................................................................. 83 Table 3-7: Existing access (%) to water supply infrastructure in LVN Basin ......................................... 84 Table 3-8: Existing access (%) to sanitation infrastructure in LVN Basin .............................................. 84 Table 4-1: Proposed transboundary aquifer (TA) policy measures ..................................................... 116 Table 5-1: Potential water resources development projects - dams and hydropower ......................... 132 Table 5-2: Potential water resources development projects – transfers .............................................. 132 Table 5-3: Potential water resources development projects - large-scale irrigation ............................ 133 Table 5-4: Scenario definition .............................................................................................................. 137 Table 5-5: Structured indicators for evaluation of water management interventions........................... 139 Table 5-6: Indicators used for scenario evaluation .............................................................................. 141 Table 5-7: Criteria used for scenario evaluation .................................................................................. 143 Table 5-8: Scenario evaluation criteria ................................................................................................ 144 Table 5-9: Criteria weightings .............................................................................................................. 145 Table 5-10: Scenario scores and ranking for the business as usual, limited development, and full
development scenarios .............................................................................................. 146 Table 5-11: Scenario scores and ranking for the sustainable development comparison .................... 147 Table 5-12: Scenario scores and ranking for the sustainable pathway comparison ........................... 148 Table 5-13: Scenario scores and ranking for the climate change comparison .................................... 148 Table 5-14: Scenario scores and ranking for the environmental flow comparison .............................. 149 Table 6-1: Key Strategic Areas and Objectives ................................................................................... 151 Table 6-2: Catchment management institutions operating at local level in the LVN Basin and
relevant issues ............................................................................................................ 157 Table 6-3: Land/agricultural institutions operating at local level inLVN Basin and relevant issues ..... 158 Table 6-4: Biodiversity institutions operating at local level in the LVN Basin and relevant issues ...... 160 Table 6-5: Governance operating at local level in the LVN Basin and relevant issues ....................... 161 Table 6-6: Strategic Framework - Catchment Management ................................................................ 164 Table 6-7: Counties, WRA offices and Water Towers in the LVN Basin ............................................. 175 Table 6-8: Strategic Framework - Water Resources Protection .......................................................... 177 Table 6-9: Proposed classification of aquifers in the LVN Basin ......................................................... 181 Table 6-10: Proposed transboundary aquifer (TA) policy measures ................................................... 185 Table 6-11: Strategic Framework – Groundwater management .......................................................... 187 Table 6-12: Kenya and WHO Standards for drinking water quality ..................................................... 191 Table 6-13: Kenya Effluent Discharge Standards into water bodies and sewers ................................ 191 Table 6-14: Major sources of pollution in LVN Basin ........................................................................... 199 Table 6-15: Major Sources of Point Pollution into Yala River .............................................................. 201 Table 6-16: Major Point sources of Pollution in the Nzoia River Catchment ....................................... 203 Table 6-17: Strategic Framework - Water Quality Management ......................................................... 204 Table 6-18: Priority climate change actions (Draft National CCAP, (GoK, 2018)) ............................... 209 Table 6-19: Potential climate change impacts in Kenya ...................................................................... 210 Table 6-20: Strategic Framework - Climate Change Mitigation, Adaptation and Preparedness ......... 212
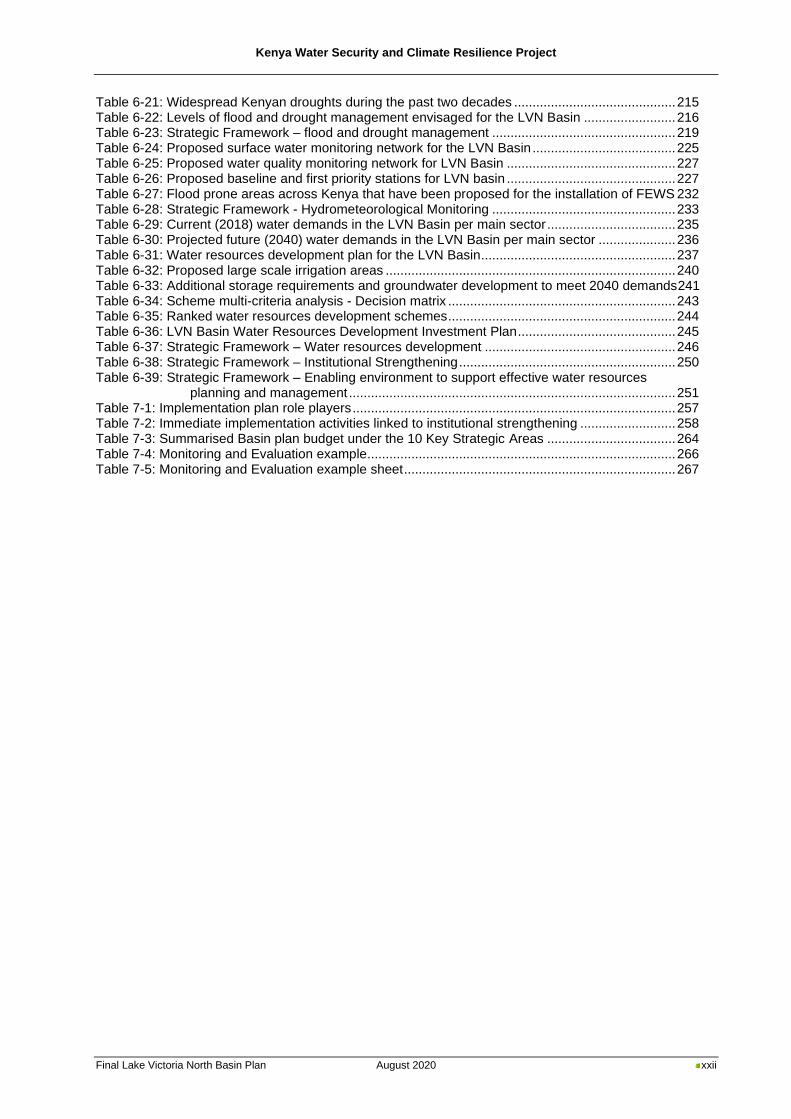
Kenya Water Security and Climate Resilience Project
Final Lake Victoria North Basin Plan August 2020 xxii
Table 6-21: Widespread Kenyan droughts during the past two decades ............................................ 215 Table 6-22: Levels of flood and drought management envisaged for the LVN Basin ......................... 216 Table 6-23: Strategic Framework – flood and drought management .................................................. 219 Table 6-24: Proposed surface water monitoring network for the LVN Basin ....................................... 225 Table 6-25: Proposed water quality monitoring network for LVN Basin .............................................. 227 Table 6-26: Proposed baseline and first priority stations for LVN basin .............................................. 227 Table 6-27: Flood prone areas across Kenya that have been proposed for the installation of FEWS 232 Table 6-28: Strategic Framework - Hydrometeorological Monitoring .................................................. 233 Table 6-29: Current (2018) water demands in the LVN Basin per main sector ................................... 235 Table 6-30: Projected future (2040) water demands in the LVN Basin per main sector ..................... 236 Table 6-31: Water resources development plan for the LVN Basin..................................................... 237 Table 6-32: Proposed large scale irrigation areas ............................................................................... 240 Table 6-33: Additional storage requirements and groundwater development to meet 2040 demands241 Table 6-34: Scheme multi-criteria analysis - Decision matrix .............................................................. 243 Table 6-35: Ranked water resources development schemes .............................................................. 244 Table 6-36: LVN Basin Water Resources Development Investment Plan ........................................... 245 Table 6-37: Strategic Framework – Water resources development .................................................... 246 Table 6-38: Strategic Framework – Institutional Strengthening ........................................................... 250 Table 6-39: Strategic Framework – Enabling environment to support effective water resources
planning and management ......................................................................................... 251 Table 7-1: Implementation plan role players ........................................................................................ 257 Table 7-2: Immediate implementation activities linked to institutional strengthening .......................... 258 Table 7-3: Summarised Basin plan budget under the 10 Key Strategic Areas ................................... 264 Table 7-4: Monitoring and Evaluation example.................................................................................... 266 Table 7-5: Monitoring and Evaluation example sheet .......................................................................... 267
Kenya Water Security and Climate Resilience Project
Final Lake Victoria North Basin Plan August 2020 xxiii
Abbreviations and Acronyms AGR Artificial groundwater recharge
AMP Aquifer Management Plan
ASAL Arid or Semi-Arid Land
ASDS Agricultural Sector Development Strategy
BOD Biochemical Oxygen Demand
BWRC Basin Water Resource Committee
CAAC Catchment Area Advisory Committee
CBA Cost-benefit analysis
CFA Community Forest Association
CGs County Governments
CIDP County Integrated Development Plan
CITES Convention on International Trade in Endangered Species of Wild Fauna & Flora
CMS Catchment Management Strategy
CMUs Catchment Management Units
COD Chemical Oxygen Demand
CORDEX Coordinated Regional Climate Downscaling Experiment
CRA Commission on Revenue Allocation
CRBC China Roads and Bridge Corporation
DCF Drought Contingency Fund
DEC District Environmental Committee
DEF Drought Emergency Fund
DEM Digital Elevation Model
DFID Department for International Development (United Kingdom)
DHI Danish Hydraulics Institute
DNAPL Dense non-aqueous phase liquid
DO Dissolved Oxygen
DSS Decision Support System
DWF Dry weather flow
EDC Endocrine disrupting chemical
EDE-CPF Ending Drought Emergencies Common Programme Framework
EEZ Exclusive Economic Zone
EIA Environmental Impact Assessment
EMCA Environmental Management and Coordination Act
ENR Environment and Natural Resource
ENSO El Niño–Southern Oscillation
EPC Export Promotion Council
EPV Export Production Village
EPZ Export Processing Zone
ERC Energy Regulatory Commission
ERS Economic Recovery Strategy
FAO Food and Agriculture Organization (agency of the United Nations)
FEWS Flood Early Warning System
FEWS NET Famine Early Warning Systems Network
Kenya Water Security and Climate Resilience Project
Final Lake Victoria North Basin Plan August 2020 xxiv
FMCF Forest Management and Conservation Fund
FRF Flood Response Forum
GCA Groundwater Conservation Area
GCM Global Climate Model
GDE Groundwater dependent ecosystem
GDP Gross Domestic Product
GIS Geographical Information System
GMP Groundwater Management Plan
GoK Government of Kenya
GW Groundwater
GWMATE Groundwater Management Advisory Team (2002-2011), supported by the World Bank group
HQ Headquarters
ICZM Integrated Coastal Zone Management
IDA International Development Association
IPCC Intergovernmental Panel on Climate Change
ISGEAG Improving Sustainable Groundwater Exploration with Amended Geophysics
IUCN International Union for Conservation of Nature
IWRM Integrated Water Resources Management
JICA Japan International Cooperation Agency
KCCAP Kenya Climate Change Adaptation Programme
KCDP Kenya Coastal Development Programme
KCSAS Kenya Climate Smart Agriculture Strategy
KEWI Kenya Water Institute
KFS Kenya Forest Service
KMD Kenya Meteorological Department
KNBS Kenya National Bureau of Statistics
KNCPC Kenya National Cleaner Production Centre
KSA Key Strategic Area
KWSCRP Kenya Water Security and Climate Resilience Project
KWT Kenya Wildlife Trust
KWS Kenya Wildlife Service
KWTA Kenya Water Towers Agency
LAPSSET Lamu Port-South Sudan-Ethiopia Transport
LIMS Laboratory Information Management System
LPG Liquefied Petroleum Gas
LSRWSS Large Scale Rural Water Supply Scheme
LVNWWDA Lake Victoria North Water Works Development Agency
MAE Mean Annual Evaporation
MAP Mean Annual Precipitation
masl Metres above sea level
MAR Mean Annual Runoff
MCM Million Cubic Metre
MEMR Ministry of Environment and Mineral Resources
M&E Monitoring and Evaluation
MoWI Ministry of Water and Irrigation
MoLPP Ministry of Lands and Physical Planning
Kenya Water Security and Climate Resilience Project
Final Lake Victoria North Basin Plan August 2020 xxv
MoLRRWD Ministry of Land Reclamation, Regional and Water Development
MoWD Ministry of Water Development
MTPs Medium Term Plans
MWSI Ministry of Water, Sanitation and Irrigation
NAP
NAS
National Adaptation Plan
Nairobi Aquifer Suite
NAWARD National Water Resources Database
NCCAP National Climate Change Adaptation Plan
NCCRS National Climate Change Response Strategy
NDEF National Drought Emergency Fund
NDMA National Drought Management Authority
NDMU National Disaster Management Unit
NDOC National Disaster Operations Centre
NEMA National Environment Management Authority
NEP National Environment Policy
NERA National Electrification and Renewable Energy Authority
NET National Environmental Tribunal
NGO Non-Governmental Organisation
NIA National Irrigation Authority
NLC National Land Commission
NMK National Museums of Kenya
NPEP National Petroleum and Energy Policy
NPS Nonpoint source
NRW Non-Revenue Water
NWC&PC National Water Conservation and Pipeline Corporation (now the National Water Harvesting
and Storage Authority)
NWHSA National Water Harvesting and Storage Authority
NWMP National Water Master Plan
NWQMS National Water Quality Management Strategy
OECD Organisation for Economic Co-operation and Development
O&M Operating and maintenance
PDB Permit Database
POPs Persistent organic pollutants
PPP Public Private Partnership
PV Photovoltaic
REA Rural Electrification Agency
RCP Representative Concentration Pathways
RO Regional Office
RQOs Resource Quality Objectives
RUSLE Revised Universal Soil Loss Equation
SANBI South African National Biodiversity Institute
SCMP Sub-Catchment Management Plan
SEA Strategic Environmental Assessment
SME Small and Medium Enterprise
SOPs Standard operating procedures
SRO Sub-Regional Office
SSWRS Small Scale Rural Water Supply Scheme
Kenya Water Security and Climate Resilience Project
Final Lake Victoria North Basin Plan August 2020 xxvi
TA Transboundary aquifer
TNC The Nature Conservancy
UPOPs Unintentionally Produced Persistent Organic Pollutants
USAID United States Agency for International Development
UWSS Urban Water Supply System
W/S Water Supply
WAP Water Allocation Plan
WASREB Water Services Regulatory Board
WASSIP Water Supply and Sanitation Improvement Project
WKCDD&FMP Western Kenya Community Driven Development and Flood Mitigation Project
WFP World Food Programme
Wp Watt peak
WRA Water Resources Authority
WRM Water resources management (also integrated WRM)
WRMA Water Resources Management Authority
WRUA Water Resource User Association
WSB Water Services Board
WSP Water Service Provider
WSSP Water Sector Strategic Plan
WSTF Water Sector Trust Fund
WT Water Tribunal
WWDA Water Works Development Agency
WWF World Wildlife Fund
Kenya Water Security and Climate Resilience Project
Final Lake Victoria North Basin Plan August 2020 aa
Kenya Water Security and Climate Resilience Project
Final Lake Victoria North Basin Plan August 2020 1
1 Introduction
1.1 Background and context
The water resources of Kenya, a water-scarce country, are currently threatened on various fronts.
Addressing this, demands capacity for comprehensive water resources management and planning,
coupled with extensive investment in climate resilient water infrastructure.
Under the guidance of the Economic Recovery Strategy, the Kenyan economy resumed a path of rapid
growth. The Strategy expired in 2007 and the updated long-term vision to guide development in Kenya
is the Kenya Vision 2030 (Government of Kenya, 2007a) The aim of this Vision for the water and
sanitation sector is “to ensure water and improved sanitation availability and access to all by 2030”
while aiming to transform Kenya into “a newly industrialising, middle income country providing a high
quality of life to all its citizens in a clean and secure environment”.
The critical importance of proper water resources planning and management is also evident in relation
to Kenya’s Big Four Agenda: Food security, Manufacturing, Affordable universal health care and
Affordable housing.
As set out in the Constitution of Kenya (2010), the national government is responsible for water
resources management through the Ministry of Water, Sanitation and Irrigation (MWSI) as the sector
leader taking responsibility for policy development. The constitution also introduced a decentralised
system of 47 county governments. To align the water sector with the Constitution of Kenya (2010), the
Water Act (No. 43 of 2016) was promulgated in September 2016. It recognises that water related
functions are a shared responsibility between the national government and the county governments
and that water resources are vested in and held by the national government in trust for the people of
Kenya. To give effect to the constitutional requirement for devolution of functions from national to county
level, the Government of Kenya has embarked on a wide-ranging water sector reform programme.
The Water Act prioritises water user categories, outlines an array of institutional shifts and established
the new Water Resources Authority (WRA) to protect, conserve, control and regulate the
management and use of water resources. WRA also supports the Cabinet Secretary in the
establishment of a National Water Resources Management Strategy. WRA responsibilities include the
formulation and enforcement of procedures and regulations, policy development, water abstraction
permitting and collecting of water use fees.
The Government of Kenya received financing from the World Bank toward the cost of implementing the
Kenya Water Security and Climate Resilience Project Phase 1 (KWSCRP-1), to be implemented
through the Ministry of Water, Sanitation and Irrigation. KWSCRP-1 is made up of two components,
namely:
◼ Component 1: Water Resources Development. This component supports climate resilience and
water security for economic growth by financing water investments and by building a longer-term
investment pipeline.
◼ Component 2: Effective Water Sector Institutions. This component aims to support the current
water sector institutions as well as the preparation, implementation and full function of the new and
proposed legal and institutional framework resulting from the alignments with the 2010 Constitution.
Ultimately, it aims for improved management and development of Kenya’s water resources for its
growth and development.
This Consultancy covers Sub-component 2.2 Strengthening Water Resources Management and
Planning of the KWSCRP-1. The overall objective of this Consultancy is to strengthen WRA’s capacity
in terms of tools, skills and infrastructure to deliver on its mandate for water resources management
and regulation in the country. Kenya’s water sector reforms, including WRA’s broadened mandate for
water resources management, planning and regulation, have introduced new functions that require new
capacities within WRA and its de-centralised structures. Existing capacities also need strengthening to
Kenya Water Security and Climate Resilience Project
Final Lake Victoria North Basin Plan August 2020 2
address water resources development and management issues in a knowledge-driven manner. The
scope of this Consultancy therefore aims to strengthen WRA’s capacity to deliver on core functions that
are new, have been expanded, or have in the past not been delivered on. A key set of deliverables
under Sub-component 2.2 is the development of one Basin Plan for each of the six main river basins in
Kenya as shown in Figure 1-1, namely Lake Victoria North, Lake Victoria South, Rift Valley, Athi, Tana
and Ewaso Ng’iro North. This document constitutes the Basin Plan for the Lake Victoria North (LVN)
Basin.
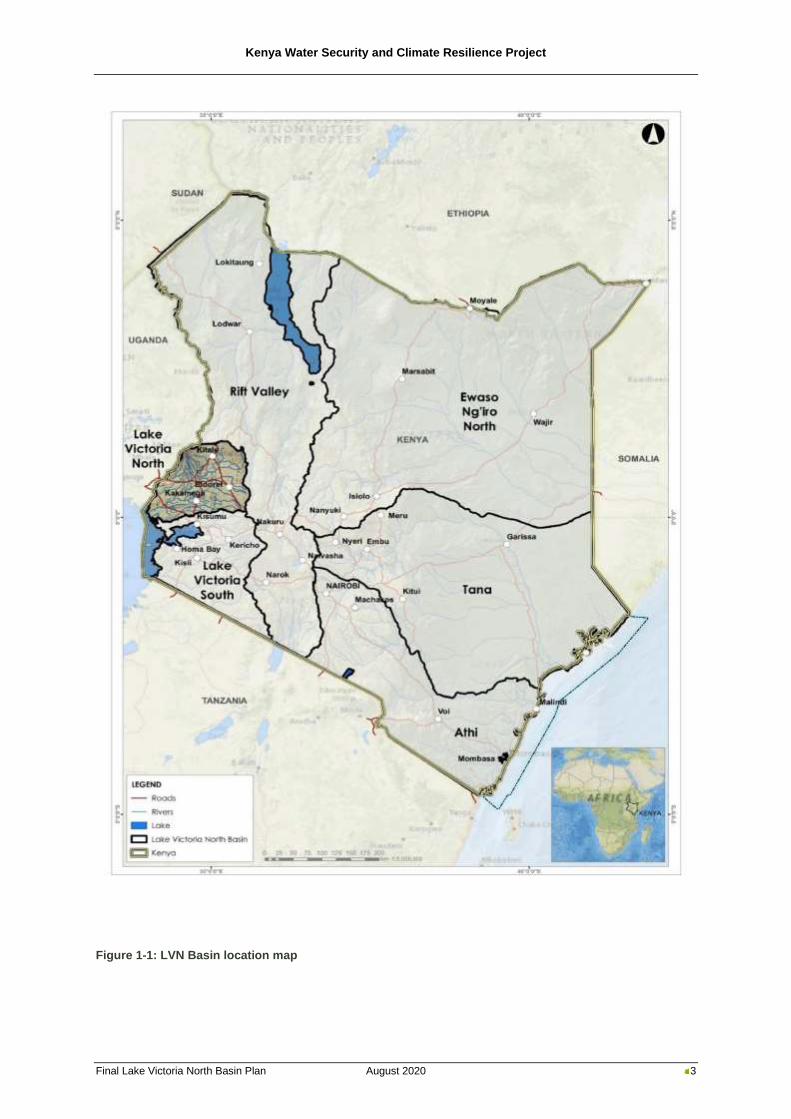
Kenya Water Security and Climate Resilience Project
Final Lake Victoria North Basin Plan August 2020 3
Figure 1-1: LVN Basin location map
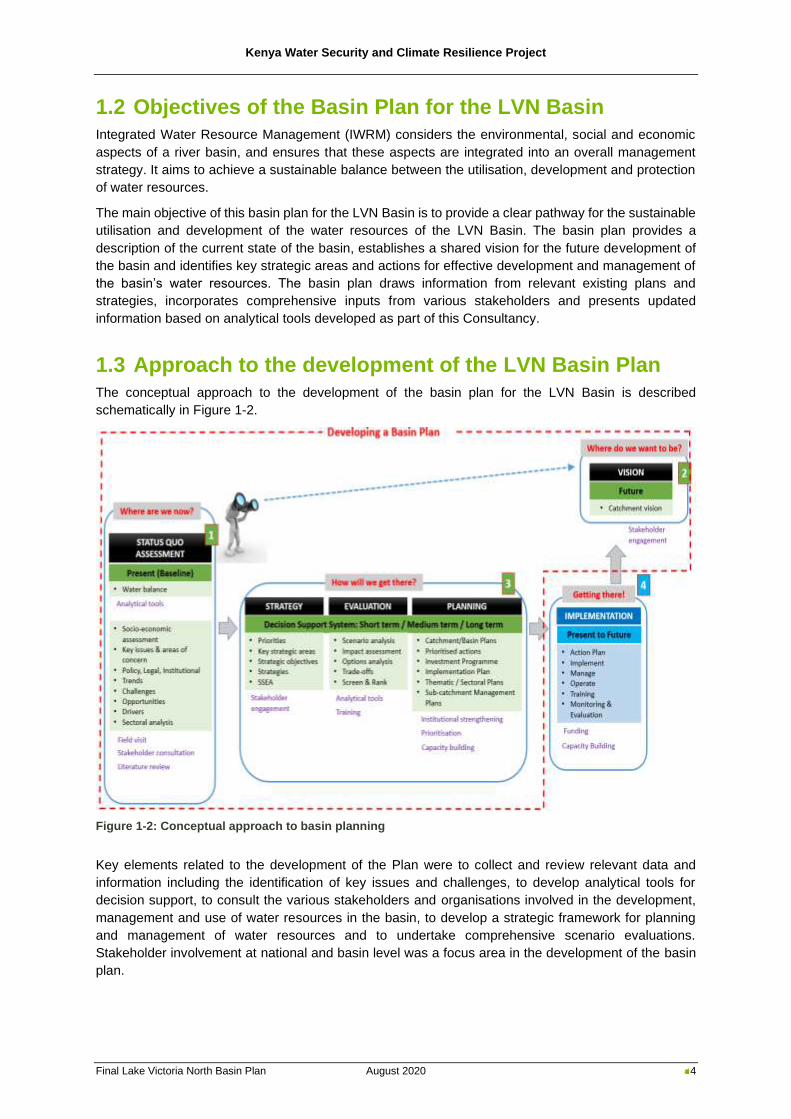
Kenya Water Security and Climate Resilience Project
Final Lake Victoria North Basin Plan August 2020 4
1.2 Objectives of the Basin Plan for the LVN Basin
Integrated Water Resource Management (IWRM) considers the environmental, social and economic
aspects of a river basin, and ensures that these aspects are integrated into an overall management
strategy. It aims to achieve a sustainable balance between the utilisation, development and protection
of water resources.
The main objective of this basin plan for the LVN Basin is to provide a clear pathway for the sustainable
utilisation and development of the water resources of the LVN Basin. The basin plan provides a
description of the current state of the basin, establishes a shared vision for the future development of
the basin and identifies key strategic areas and actions for effective development and management of
the basin’s water resources. The basin plan draws information from relevant existing plans and
strategies, incorporates comprehensive inputs from various stakeholders and presents updated
information based on analytical tools developed as part of this Consultancy.
1.3 Approach to the development of the LVN Basin Plan
The conceptual approach to the development of the basin plan for the LVN Basin is described
schematically in Figure 1-2.
Figure 1-2: Conceptual approach to basin planning
Key elements related to the development of the Plan were to collect and review relevant data and
information including the identification of key issues and challenges, to develop analytical tools for
decision support, to consult the various stakeholders and organisations involved in the development,
management and use of water resources in the basin, to develop a strategic framework for planning
and management of water resources and to undertake comprehensive scenario evaluations.
Stakeholder involvement at national and basin level was a focus area in the development of the basin
plan.
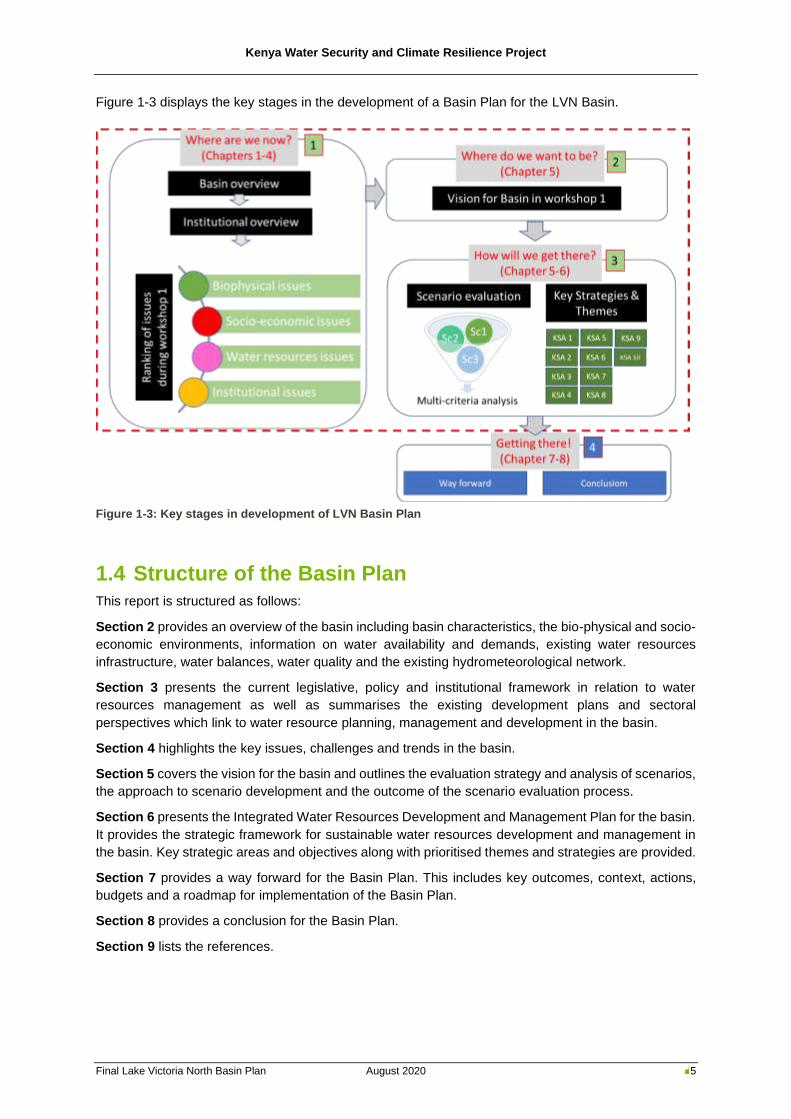
Kenya Water Security and Climate Resilience Project
Final Lake Victoria North Basin Plan August 2020 5
Figure 1-3 displays the key stages in the development of a Basin Plan for the LVN Basin.
Figure 1-3: Key stages in development of LVN Basin Plan
1.4 Structure of the Basin Plan
This report is structured as follows:
Section 2 provides an overview of the basin including basin characteristics, the bio-physical and socio-
economic environments, information on water availability and demands, existing water resources
infrastructure, water balances, water quality and the existing hydrometeorological network.
Section 3 presents the current legislative, policy and institutional framework in relation to water
resources management as well as summarises the existing development plans and sectoral
perspectives which link to water resource planning, management and development in the basin.
Section 4 highlights the key issues, challenges and trends in the basin.
Section 5 covers the vision for the basin and outlines the evaluation strategy and analysis of scenarios,
the approach to scenario development and the outcome of the scenario evaluation process.
Section 6 presents the Integrated Water Resources Development and Management Plan for the basin.
It provides the strategic framework for sustainable water resources development and management in
the basin. Key strategic areas and objectives along with prioritised themes and strategies are provided.
Section 7 provides a way forward for the Basin Plan. This includes key outcomes, context, actions,
budgets and a roadmap for implementation of the Basin Plan.
Section 8 provides a conclusion for the Basin Plan.
Section 9 lists the references.
Kenya Water Security and Climate Resilience Project
Final Lake Victoria North Basin Plan August 2020 6
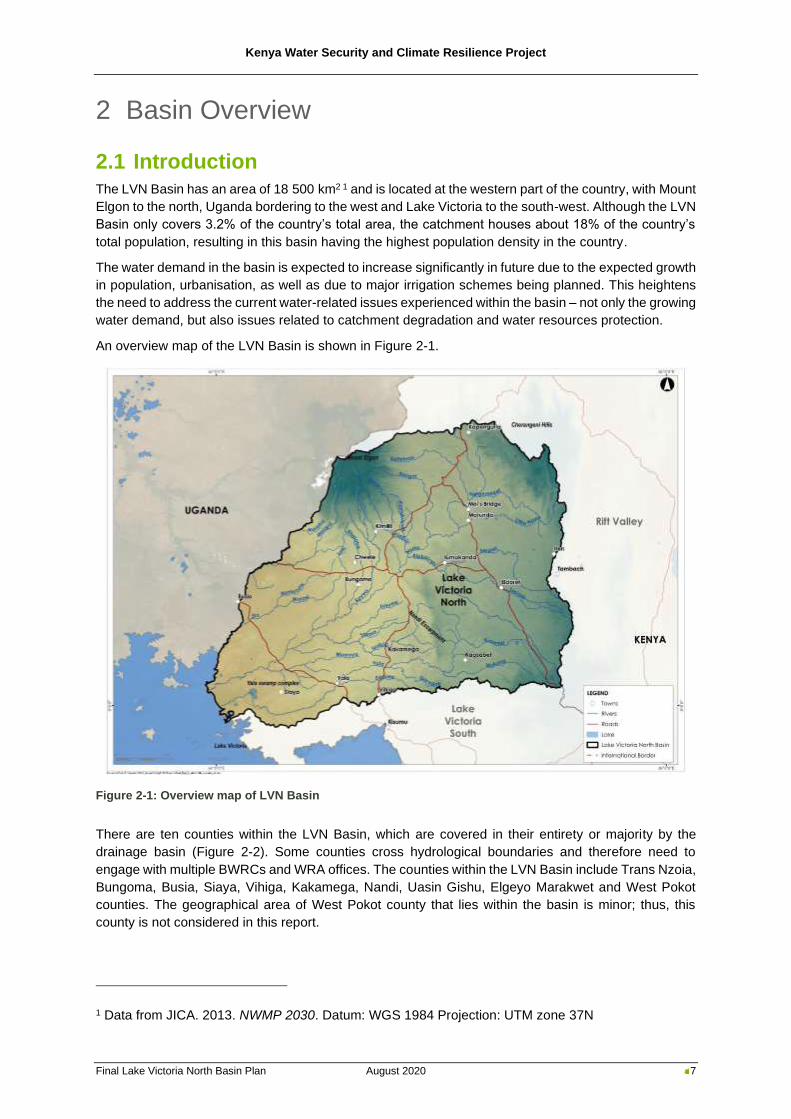
Kenya Water Security and Climate Resilience Project
Final Lake Victoria North Basin Plan August 2020 7
2 Basin Overview
2.1 Introduction
The LVN Basin has an area of 18 500 km2 1 and is located at the western part of the country, with Mount
Elgon to the north, Uganda bordering to the west and Lake Victoria to the south-west. Although the LVN
Basin only covers 3.2% of the country’s total area, the catchment houses about 18% of the country’s
total population, resulting in this basin having the highest population density in the country.
The water demand in the basin is expected to increase significantly in future due to the expected growth
in population, urbanisation, as well as due to major irrigation schemes being planned. This heightens
the need to address the current water-related issues experienced within the basin – not only the growing
water demand, but also issues related to catchment degradation and water resources protection.
An overview map of the LVN Basin is shown in Figure 2-1.
Figure 2-1: Overview map of LVN Basin
There are ten counties within the LVN Basin, which are covered in their entirety or majority by the
drainage basin (Figure 2-2). Some counties cross hydrological boundaries and therefore need to
engage with multiple BWRCs and WRA offices. The counties within the LVN Basin include Trans Nzoia,
Bungoma, Busia, Siaya, Vihiga, Kakamega, Nandi, Uasin Gishu, Elgeyo Marakwet and West Pokot
counties. The geographical area of West Pokot county that lies within the basin is minor; thus, this
county is not considered in this report.
1 Data from JICA. 2013. NWMP 2030. Datum: WGS 1984 Projection: UTM zone 37N
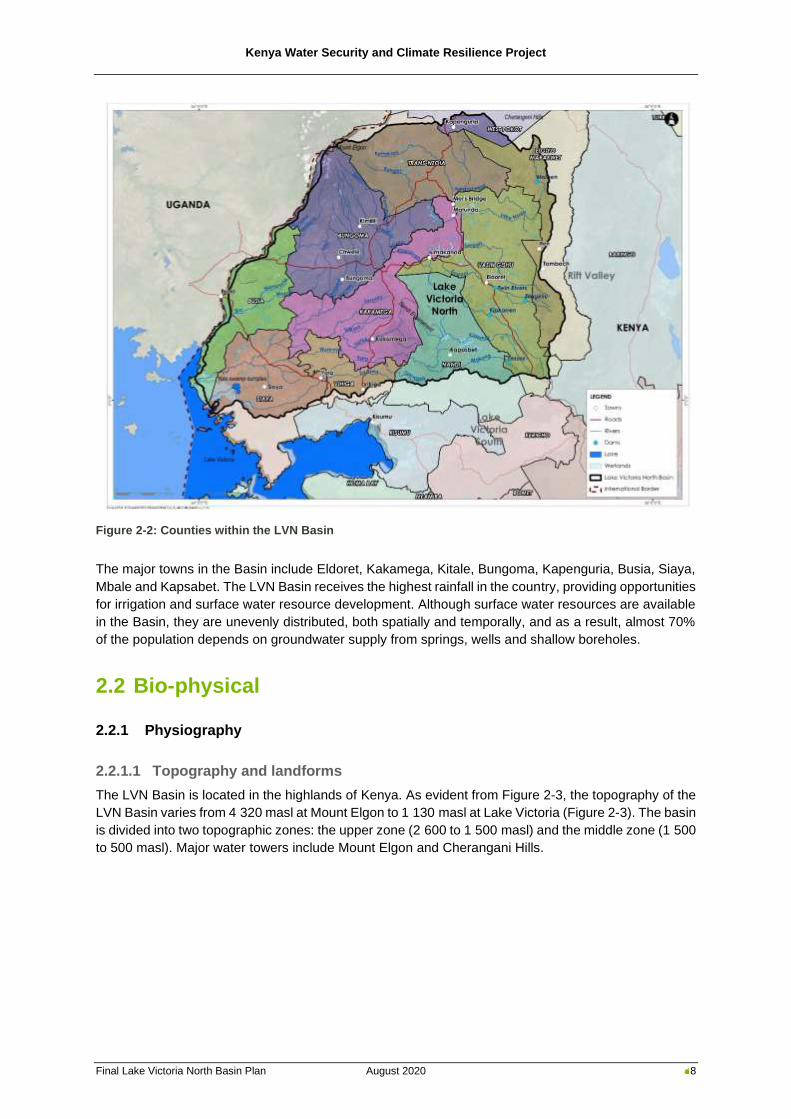
Kenya Water Security and Climate Resilience Project
Final Lake Victoria North Basin Plan August 2020 8
Figure 2-2: Counties within the LVN Basin
The major towns in the Basin include Eldoret, Kakamega, Kitale, Bungoma, Kapenguria, Busia, Siaya,
Mbale and Kapsabet. The LVN Basin receives the highest rainfall in the country, providing opportunities
for irrigation and surface water resource development. Although surface water resources are available
in the Basin, they are unevenly distributed, both spatially and temporally, and as a result, almost 70%
of the population depends on groundwater supply from springs, wells and shallow boreholes.
2.2 Bio-physical
2.2.1 Physiography
2.2.1.1 Topography and landforms
The LVN Basin is located in the highlands of Kenya. As evident from Figure 2-3, the topography of the
LVN Basin varies from 4 320 masl at Mount Elgon to 1 130 masl at Lake Victoria (Figure 2-3). The basin
is divided into two topographic zones: the upper zone (2 600 to 1 500 masl) and the middle zone (1 500
to 500 masl). Major water towers include Mount Elgon and Cherangani Hills.
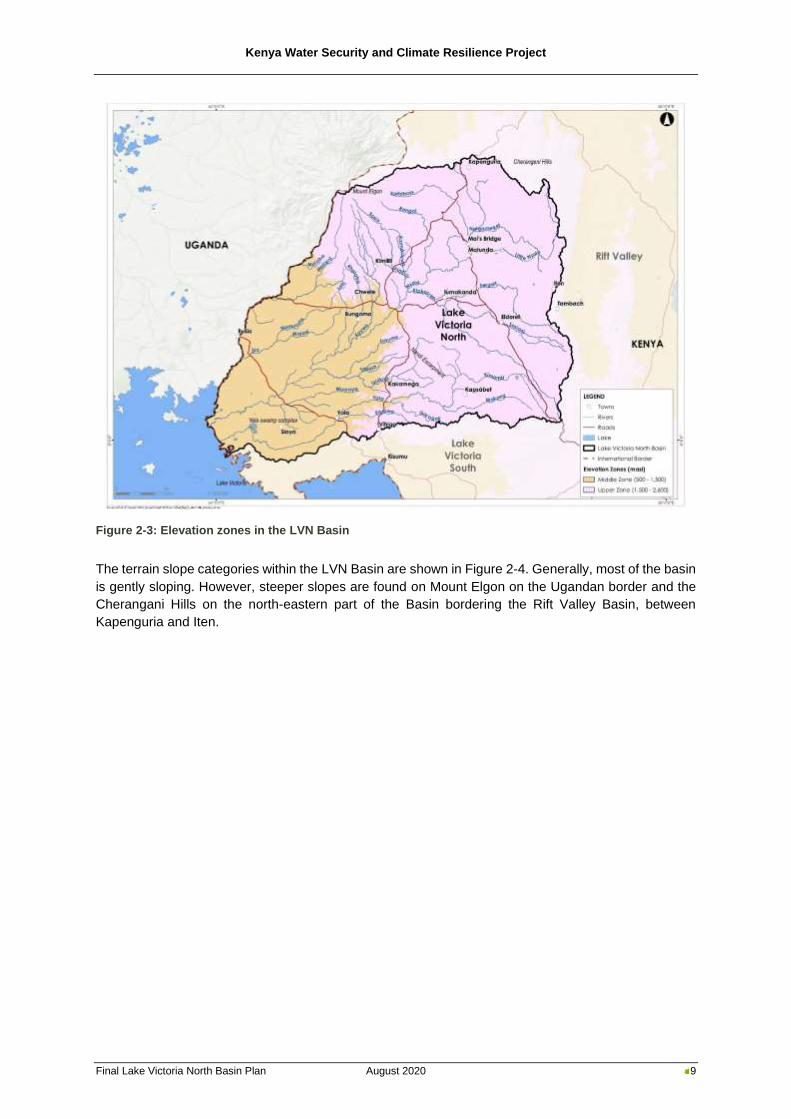
Kenya Water Security and Climate Resilience Project
Final Lake Victoria North Basin Plan August 2020 9
Figure 2-3: Elevation zones in the LVN Basin
The terrain slope categories within the LVN Basin are shown in Figure 2-4. Generally, most of the basin
is gently sloping. However, steeper slopes are found on Mount Elgon on the Ugandan border and the
Cherangani Hills on the north-eastern part of the Basin bordering the Rift Valley Basin, between
Kapenguria and Iten.
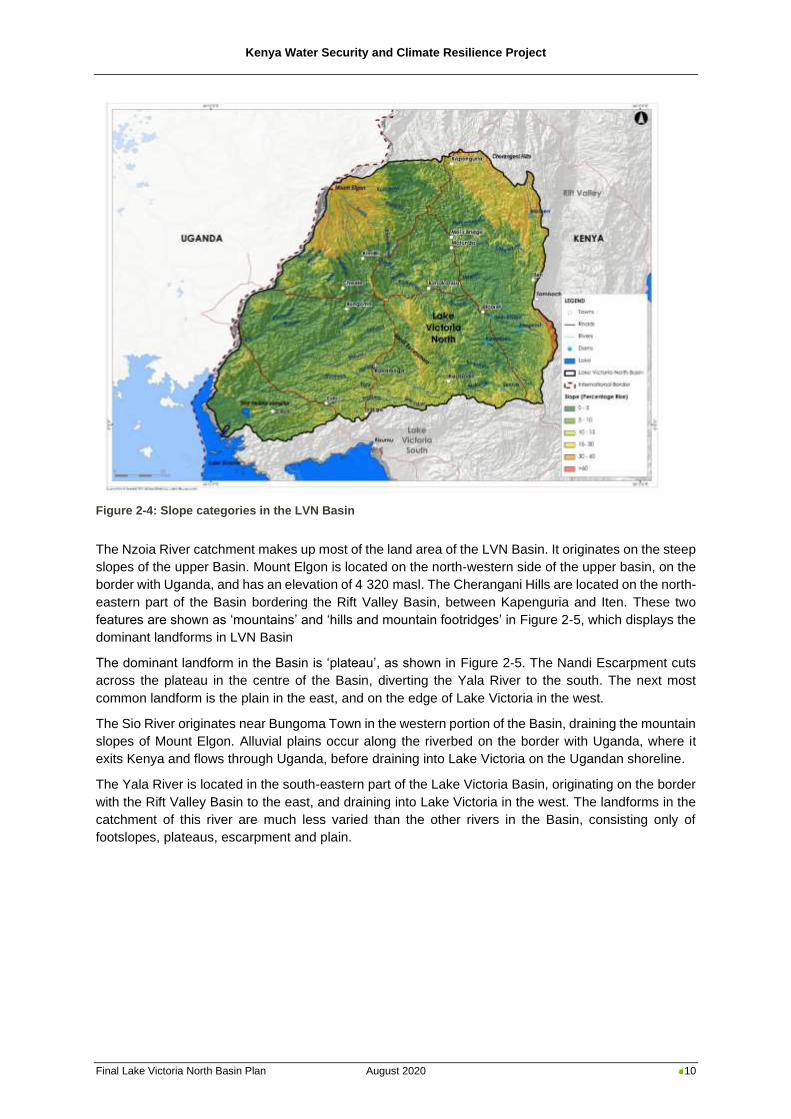
Kenya Water Security and Climate Resilience Project
Final Lake Victoria North Basin Plan August 2020 10
Figure 2-4: Slope categories in the LVN Basin
The Nzoia River catchment makes up most of the land area of the LVN Basin. It originates on the steep
slopes of the upper Basin. Mount Elgon is located on the north-western side of the upper basin, on the
border with Uganda, and has an elevation of 4 320 masl. The Cherangani Hills are located on the north-
eastern part of the Basin bordering the Rift Valley Basin, between Kapenguria and Iten. These two
features are shown as ‘mountains’ and ‘hills and mountain footridges’ in Figure 2-5, which displays the
dominant landforms in LVN Basin
The dominant landform in the Basin is ‘plateau’, as shown in Figure 2-5. The Nandi Escarpment cuts
across the plateau in the centre of the Basin, diverting the Yala River to the south. The next most
common landform is the plain in the east, and on the edge of Lake Victoria in the west.
The Sio River originates near Bungoma Town in the western portion of the Basin, draining the mountain
slopes of Mount Elgon. Alluvial plains occur along the riverbed on the border with Uganda, where it
exits Kenya and flows through Uganda, before draining into Lake Victoria on the Ugandan shoreline.
The Yala River is located in the south-eastern part of the Lake Victoria Basin, originating on the border
with the Rift Valley Basin to the east, and draining into Lake Victoria in the west. The landforms in the
catchment of this river are much less varied than the other rivers in the Basin, consisting only of
footslopes, plateaus, escarpment and plain.
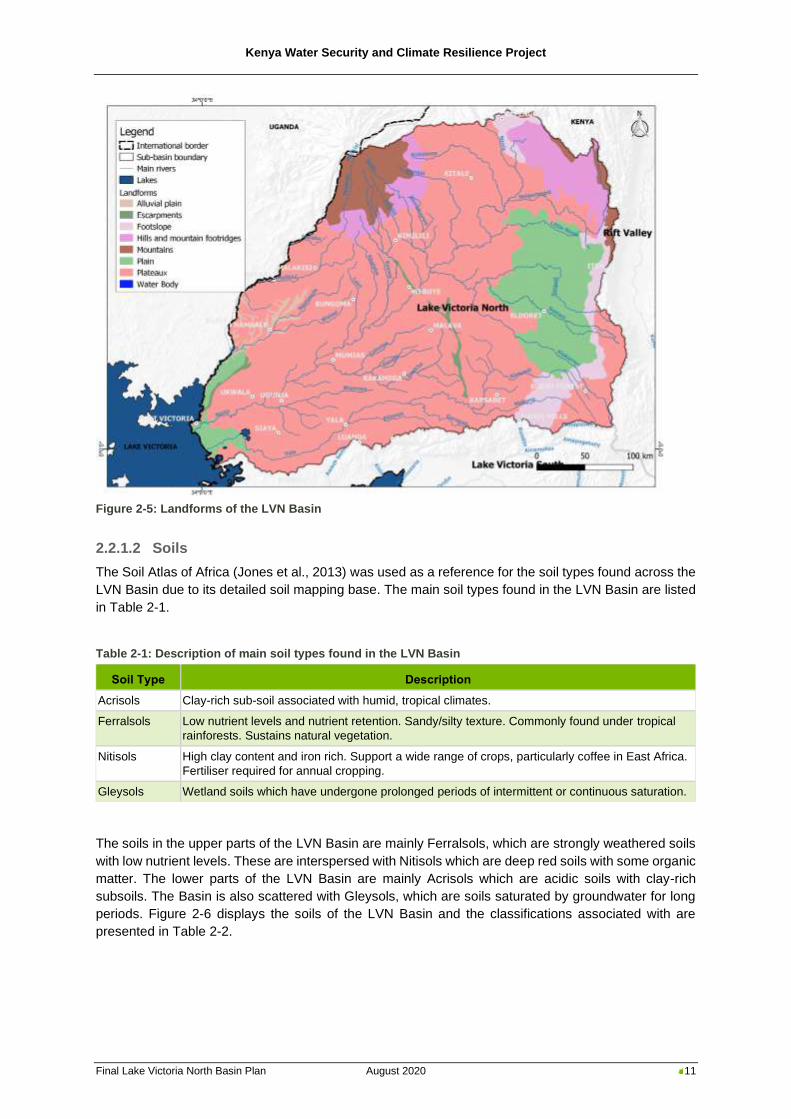
Kenya Water Security and Climate Resilience Project
Final Lake Victoria North Basin Plan August 2020 11
Figure 2-5: Landforms of the LVN Basin
2.2.1.2 Soils
The Soil Atlas of Africa (Jones et al., 2013) was used as a reference for the soil types found across the
LVN Basin due to its detailed soil mapping base. The main soil types found in the LVN Basin are listed
in Table 2-1.
Table 2-1: Description of main soil types found in the LVN Basin
Soil Type Description
Acrisols Clay-rich sub-soil associated with humid, tropical climates.
Ferralsols Low nutrient levels and nutrient retention. Sandy/silty texture. Commonly found under tropical
rainforests. Sustains natural vegetation.
Nitisols High clay content and iron rich. Support a wide range of crops, particularly coffee in East Africa.
Fertiliser required for annual cropping.
Gleysols Wetland soils which have undergone prolonged periods of intermittent or continuous saturation.
The soils in the upper parts of the LVN Basin are mainly Ferralsols, which are strongly weathered soils
with low nutrient levels. These are interspersed with Nitisols which are deep red soils with some organic
matter. The lower parts of the LVN Basin are mainly Acrisols which are acidic soils with clay-rich
subsoils. The Basin is also scattered with Gleysols, which are soils saturated by groundwater for long
periods. Figure 2-6 displays the soils of the LVN Basin and the classifications associated with are
presented in Table 2-2.
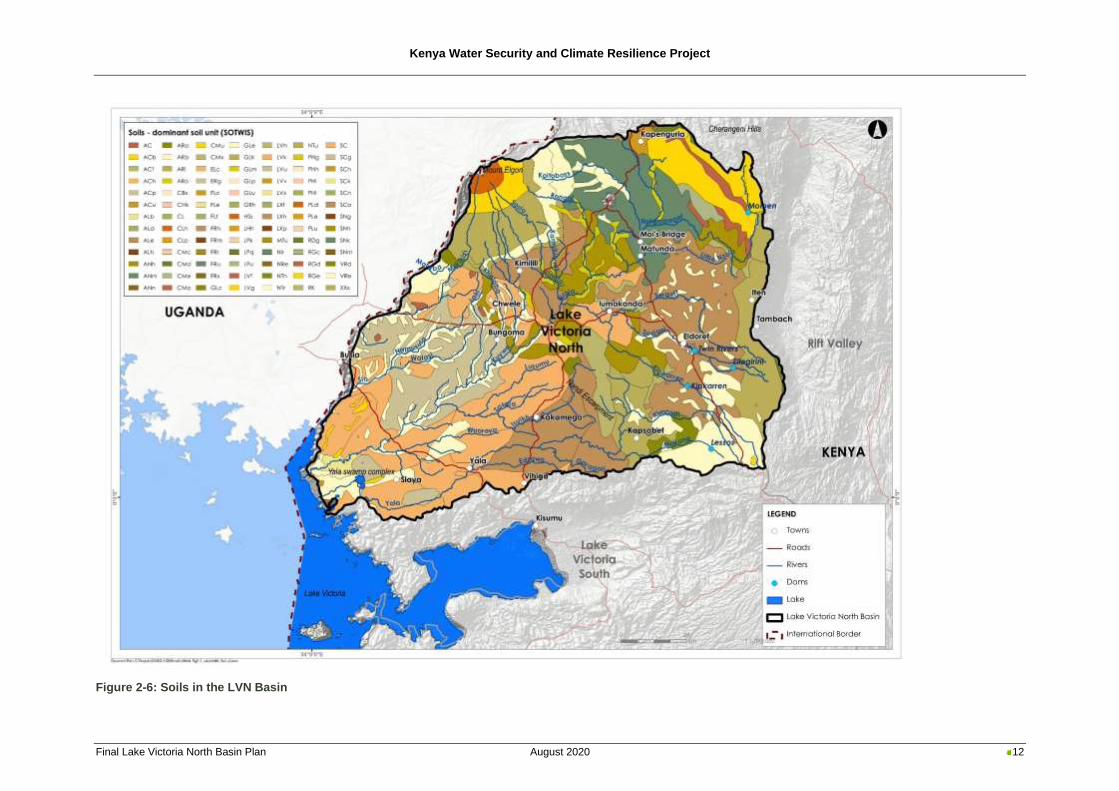
Kenya Water Security and Climate Resilience Project
Final Lake Victoria North Basin Plan August 2020 12
Figure 2-6: Soils in the LVN Basin
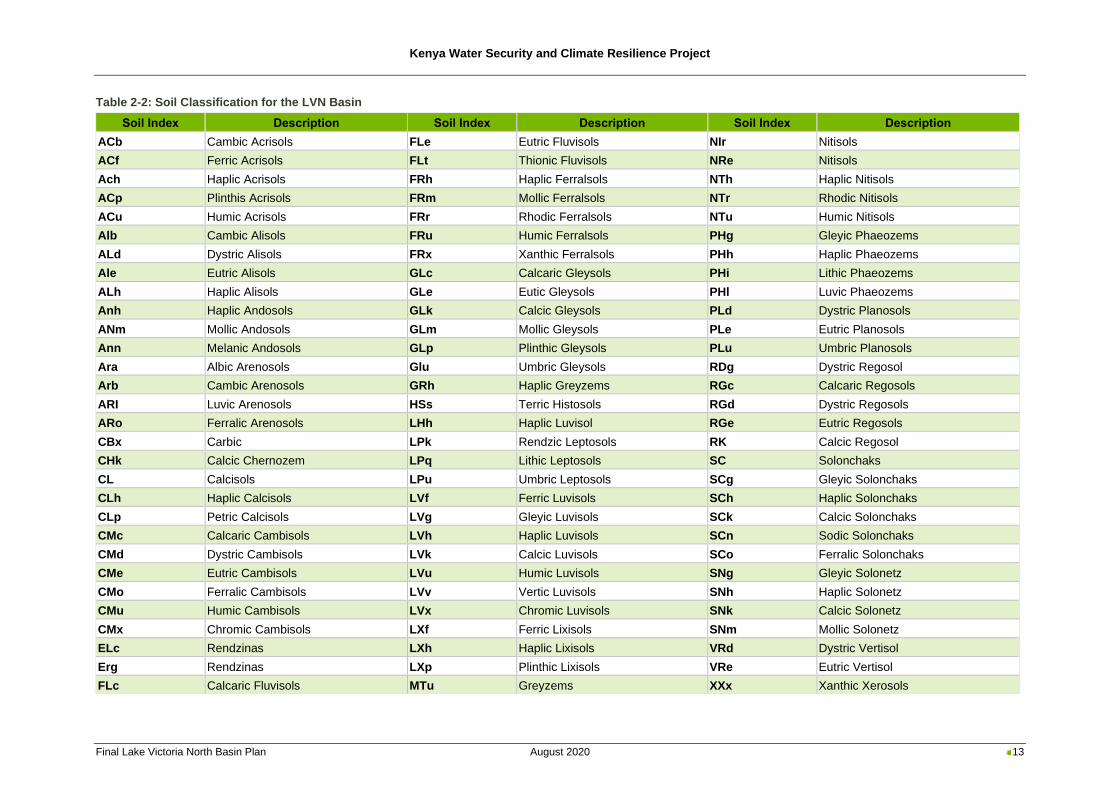
Kenya Water Security and Climate Resilience Project
Final Lake Victoria North Basin Plan August 2020 13
Table 2-2: Soil Classification for the LVN Basin
Soil Index Description Soil Index Description Soil Index Description
ACb Cambic Acrisols FLe Eutric Fluvisols NIr Nitisols
ACf Ferric Acrisols FLt Thionic Fluvisols NRe Nitisols
Ach Haplic Acrisols FRh Haplic Ferralsols NTh Haplic Nitisols
ACp Plinthis Acrisols FRm Mollic Ferralsols NTr Rhodic Nitisols
ACu Humic Acrisols FRr Rhodic Ferralsols NTu Humic Nitisols
Alb Cambic Alisols FRu Humic Ferralsols PHg Gleyic Phaeozems
ALd Dystric Alisols FRx Xanthic Ferralsols PHh Haplic Phaeozems
Ale Eutric Alisols GLc Calcaric Gleysols PHi Lithic Phaeozems
ALh Haplic Alisols GLe Eutic Gleysols PHl Luvic Phaeozems
Anh Haplic Andosols GLk Calcic Gleysols PLd Dystric Planosols
ANm Mollic Andosols GLm Mollic Gleysols PLe Eutric Planosols
Ann Melanic Andosols GLp Plinthic Gleysols PLu Umbric Planosols
Ara Albic Arenosols Glu Umbric Gleysols RDg Dystric Regosol
Arb Cambic Arenosols GRh Haplic Greyzems RGc Calcaric Regosols
ARI Luvic Arenosols HSs Terric Histosols RGd Dystric Regosols
ARo Ferralic Arenosols LHh Haplic Luvisol RGe Eutric Regosols
CBx Carbic LPk Rendzic Leptosols RK Calcic Regosol
CHk Calcic Chernozem LPq Lithic Leptosols SC Solonchaks
CL Calcisols LPu Umbric Leptosols SCg Gleyic Solonchaks
CLh Haplic Calcisols LVf Ferric Luvisols SCh Haplic Solonchaks
CLp Petric Calcisols LVg Gleyic Luvisols SCk Calcic Solonchaks
CMc Calcaric Cambisols LVh Haplic Luvisols SCn Sodic Solonchaks
CMd Dystric Cambisols LVk Calcic Luvisols SCo Ferralic Solonchaks
CMe Eutric Cambisols LVu Humic Luvisols SNg Gleyic Solonetz
CMo Ferralic Cambisols LVv Vertic Luvisols SNh Haplic Solonetz
CMu Humic Cambisols LVx Chromic Luvisols SNk Calcic Solonetz
CMx Chromic Cambisols LXf Ferric Lixisols SNm Mollic Solonetz
ELc Rendzinas LXh Haplic Lixisols VRd Dystric Vertisol
Erg Rendzinas LXp Plinthic Lixisols VRe Eutric Vertisol
FLc Calcaric Fluvisols MTu Greyzems XXx Xanthic Xerosols
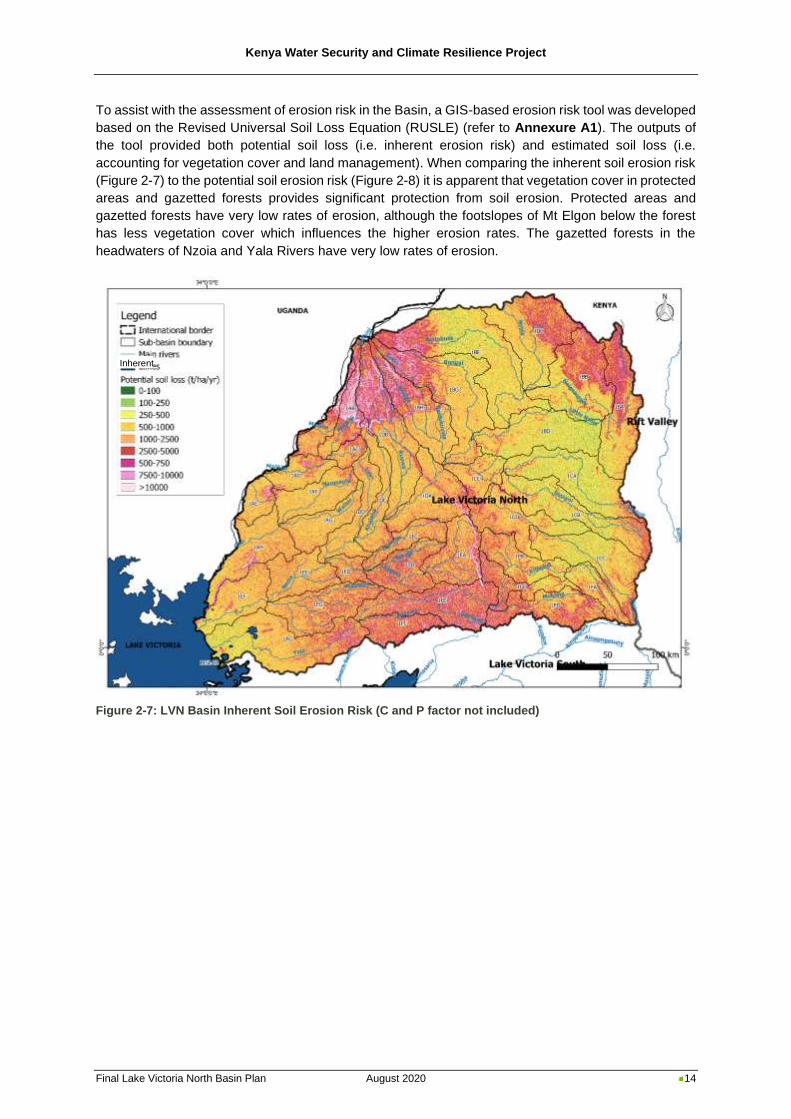
Kenya Water Security and Climate Resilience Project
Final Lake Victoria North Basin Plan August 2020 14
To assist with the assessment of erosion risk in the Basin, a GIS-based erosion risk tool was developed
based on the Revised Universal Soil Loss Equation (RUSLE) (refer to Annexure A1). The outputs of
the tool provided both potential soil loss (i.e. inherent erosion risk) and estimated soil loss (i.e.
accounting for vegetation cover and land management). When comparing the inherent soil erosion risk
(Figure 2-7) to the potential soil erosion risk (Figure 2-8) it is apparent that vegetation cover in protected
areas and gazetted forests provides significant protection from soil erosion. Protected areas and
gazetted forests have very low rates of erosion, although the footslopes of Mt Elgon below the forest
has less vegetation cover which influences the higher erosion rates. The gazetted forests in the
headwaters of Nzoia and Yala Rivers have very low rates of erosion.
Figure 2-7: LVN Basin Inherent Soil Erosion Risk (C and P factor not included)
Inherent
Inherent
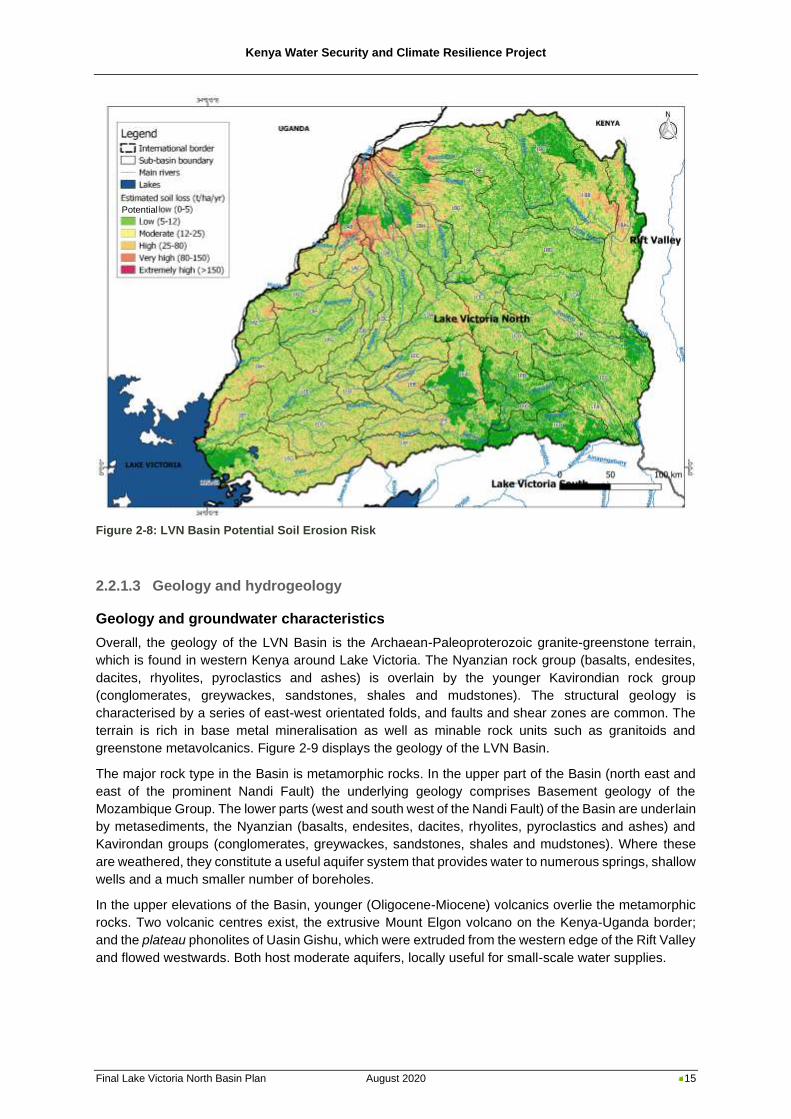
Kenya Water Security and Climate Resilience Project
Final Lake Victoria North Basin Plan August 2020 15
Figure 2-8: LVN Basin Potential Soil Erosion Risk
2.2.1.3 Geology and hydrogeology
Geology and groundwater characteristics
Overall, the geology of the LVN Basin is the Archaean-Paleoproterozoic granite-greenstone terrain,
which is found in western Kenya around Lake Victoria. The Nyanzian rock group (basalts, endesites,
dacites, rhyolites, pyroclastics and ashes) is overlain by the younger Kavirondian rock group
(conglomerates, greywackes, sandstones, shales and mudstones). The structural geology is
characterised by a series of east-west orientated folds, and faults and shear zones are common. The
terrain is rich in base metal mineralisation as well as minable rock units such as granitoids and
greenstone metavolcanics. Figure 2-9 displays the geology of the LVN Basin.
The major rock type in the Basin is metamorphic rocks. In the upper part of the Basin (north east and
east of the prominent Nandi Fault) the underlying geology comprises Basement geology of the
Mozambique Group. The lower parts (west and south west of the Nandi Fault) of the Basin are underlain
by metasediments, the Nyanzian (basalts, endesites, dacites, rhyolites, pyroclastics and ashes) and
Kavirondan groups (conglomerates, greywackes, sandstones, shales and mudstones). Where these
are weathered, they constitute a useful aquifer system that provides water to numerous springs, shallow
wells and a much smaller number of boreholes.
In the upper elevations of the Basin, younger (Oligocene-Miocene) volcanics overlie the metamorphic
rocks. Two volcanic centres exist, the extrusive Mount Elgon volcano on the Kenya-Uganda border;
and the plateau phonolites of Uasin Gishu, which were extruded from the western edge of the Rift Valley
and flowed westwards. Both host moderate aquifers, locally useful for small-scale water supplies.
Potential
Kenya Water Security and Climate Resilience Project
Final Lake Victoria North Basin Plan August 2020 16
In the Eldoret area well over 120 boreholes have been constructed in the Miocene plateau lavas. Flow
is westwards from the recharge zone underlying the western part of the Elgeyo Escarpment. Borehole
depths vary immensely. To the south and east where the lava thickness is greatest, considerable
borehole depth is required to encounter water. Beneath Eldoret itself, however, the depth to the
Basement rarely exceeds 130 m. The groundwater system is a multi-part aquifer, with water bearing
zones occurring in either Old Land Surfaces (OLS) between separate lava flows, in basal tuffs and grits,
or in the OLS at the top of the metamorphic Basement, or all three. Of the 119 boreholes reviewed,
30% reported multiple aquifer strikes. The aquifer system is confined; flow is predominately inter-
granular and because of this, test yields are low to moderate (between 0.1 and 13.6 m3/hr, with a mean
of 3.5 m3/hr) (The Nature Conservancy, 2019). There does not appear to have been significant depletion
in this aquifer; however, water quality is considered marginal at some locations (EC~3,000µS/cm).
Aquifers in the Mount Elgon area (in Trans Nzoia County) are variable in terms of yield, and boreholes
constructed in the Elgon volcanics are often of poor quality (EC>3,000µS/cm). Yields of seven
boreholes in volcanic material ranged from dry to 3.12 m3/hr. This contrasts with boreholes constructed
in metamorphic Basement (east and south east of the mountain) where yields from seven boreholes
ranged from 12 to 32 m3/hr, which is good by Kenyan Basement standards (Odida, 2015).
Siaya County is underlain by metamorphic rocks of volcanic and volcanoclastic origin. They are
intensively jointed, fractured and faulted and are covered by weathering material. The relatively high
annual rainfall in the more elevated parts of the County provides reliable and steady recharge into the
weathered layer. Groundwater levels typically vary between 5 and 15 mbgl. This makes groundwater
readily accessible via hand dug wells and shallow boreholes. Where major faults and fractures occur,
high-yielding deep boreholes can be constructed (DHV Consultants, 1988).
Boreholes in Navakholo (Kakamega County) have unusually high yields for the LVN Basin, 146 m3/day
(Lake Victoria North Water Services Board, 2011). Navakholo is located on Kavirondian rocks, which
accounts for the high yields.
Elsewhere in the Basin few aquifers have been described in published material that could be reviewed
as part of this consultancy.
WRMA Aquifer classification
The WRMA aquifer classification system (Water Resources Management Authority, 2007) is partly
demand-oriented and partly geo-political. As part of this consultancy, a new aquifer classification system
is proposed in section 6.4.36.4.4, and uses the same classes and status as is described below.
There are five classes in the WRMA aquifer classification system (Water Resources Management
Authority, 2007) as follows:
◼ Strategic aquifers: aquifers used to supply significant amounts/proportions of water to an area
where there are no alternatives, or where alternatives would take time and money to develop
◼ Major aquifers: high-yielding aquifers with good quality water
◼ Minor aquifers: moderate-yielding aquifers with variable water quality
◼ Poor aquifers: low-yielding aquifers with poor to reasonable quality water
◼ Special aquifers: aquifers or parts of aquifers designated ‘special aquifers' by the WRA
Each is further defined in terms of its status, i.e.:
◼ Satisfactory: no immediate stress, pressure or threat
◼ Alert: stress, pressure or threat identified or anticipated
◼ Alarm: water levels declining, water quality declining (stress, pressure or threat identified)
The Lake Victoria South Basin’s aquifers under the WRMA aquifer classification system are
summarised in Table 2-3.
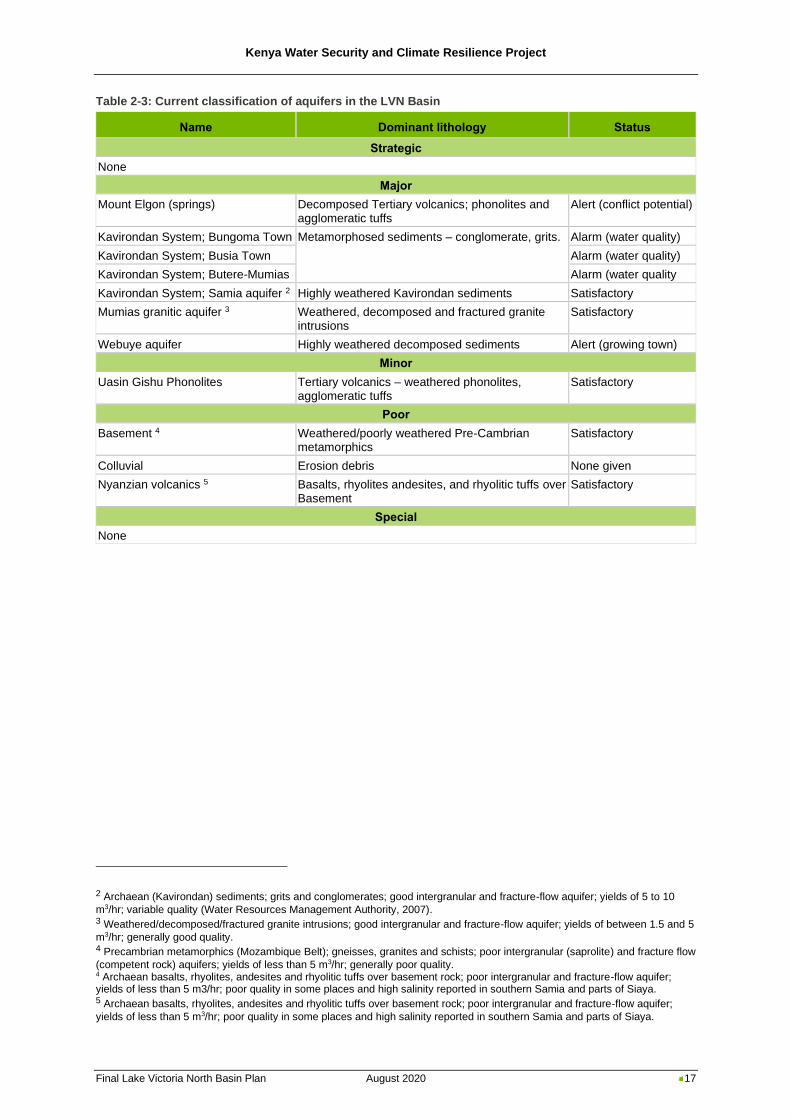
Kenya Water Security and Climate Resilience Project
Final Lake Victoria North Basin Plan August 2020 17
Table 2-3: Current classification of aquifers in the LVN Basin
Name Dominant lithology Status
Strategic
None
Major
Mount Elgon (springs) Decomposed Tertiary volcanics; phonolites and agglomeratic tuffs
Alert (conflict potential)
Kavirondan System; Bungoma Town Metamorphosed sediments – conglomerate, grits. Alarm (water quality)
Kavirondan System; Busia Town Alarm (water quality)
Kavirondan System; Butere-Mumias Alarm (water quality
Kavirondan System; Samia aquifer 2 Highly weathered Kavirondan sediments Satisfactory
Mumias granitic aquifer 3 Weathered, decomposed and fractured granite intrusions
Satisfactory
Webuye aquifer Highly weathered decomposed sediments Alert (growing town)
Minor
Uasin Gishu Phonolites Tertiary volcanics – weathered phonolites, agglomeratic tuffs
Satisfactory
Poor
Basement 4 Weathered/poorly weathered Pre-Cambrian metamorphics
Satisfactory
Colluvial Erosion debris None given
Nyanzian volcanics 5 Basalts, rhyolites andesites, and rhyolitic tuffs over Basement
Satisfactory
Special
None
2 Archaean (Kavirondan) sediments; grits and conglomerates; good intergranular and fracture-flow aquifer; yields of 5 to 10
m3/hr; variable quality (Water Resources Management Authority, 2007). 3 Weathered/decomposed/fractured granite intrusions; good intergranular and fracture-flow aquifer; yields of between 1.5 and 5
m3/hr; generally good quality. 4 Precambrian metamorphics (Mozambique Belt); gneisses, granites and schists; poor intergranular (saprolite) and fracture flow
(competent rock) aquifers; yields of less than 5 m3/hr; generally poor quality. 4 Archaean basalts, rhyolites, andesites and rhyolitic tuffs over basement rock; poor intergranular and fracture-flow aquifer; yields of less than 5 m3/hr; poor quality in some places and high salinity reported in southern Samia and parts of Siaya. 5 Archaean basalts, rhyolites, andesites and rhyolitic tuffs over basement rock; poor intergranular and fracture-flow aquifer;
yields of less than 5 m3/hr; poor quality in some places and high salinity reported in southern Samia and parts of Siaya.
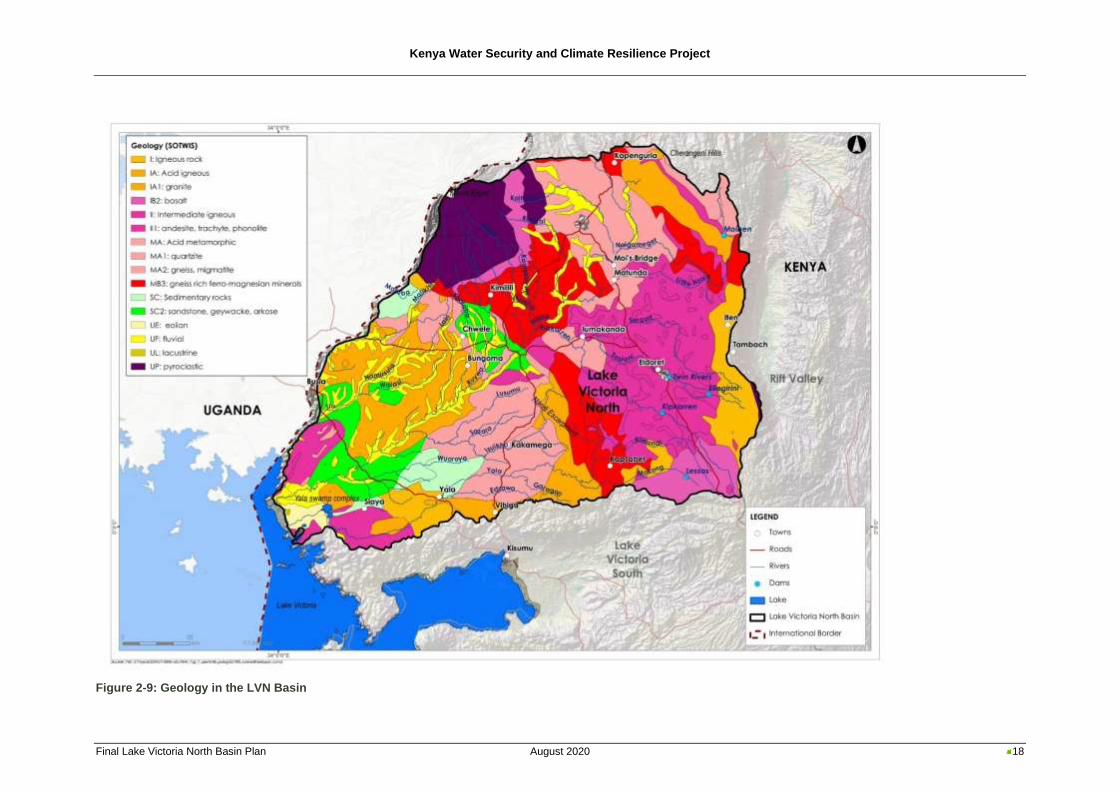
Kenya Water Security and Climate Resilience Project
Final Lake Victoria North Basin Plan August 2020 18
Figure 2-9: Geology in the LVN Basin
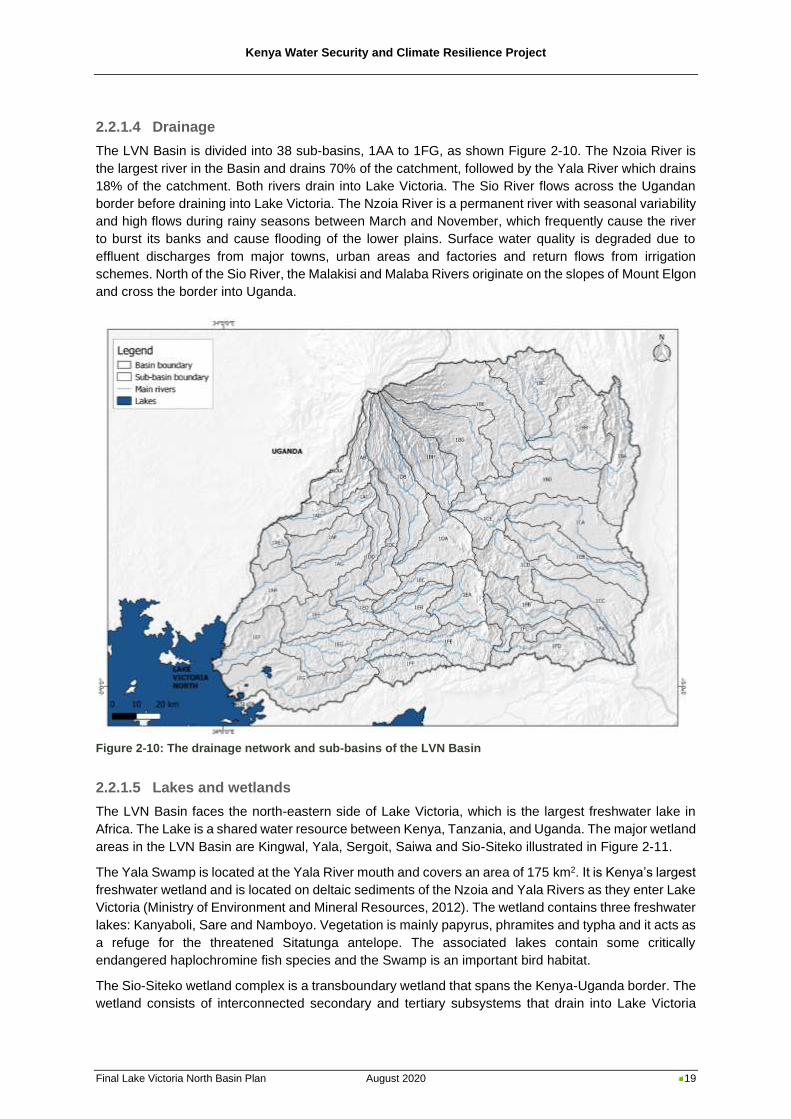
Kenya Water Security and Climate Resilience Project
Final Lake Victoria North Basin Plan August 2020 19
2.2.1.4 Drainage
The LVN Basin is divided into 38 sub-basins, 1AA to 1FG, as shown Figure 2-10. The Nzoia River is
the largest river in the Basin and drains 70% of the catchment, followed by the Yala River which drains
18% of the catchment. Both rivers drain into Lake Victoria. The Sio River flows across the Ugandan
border before draining into Lake Victoria. The Nzoia River is a permanent river with seasonal variability
and high flows during rainy seasons between March and November, which frequently cause the river
to burst its banks and cause flooding of the lower plains. Surface water quality is degraded due to
effluent discharges from major towns, urban areas and factories and return flows from irrigation
schemes. North of the Sio River, the Malakisi and Malaba Rivers originate on the slopes of Mount Elgon
and cross the border into Uganda.
Figure 2-10: The drainage network and sub-basins of the LVN Basin
2.2.1.5 Lakes and wetlands
The LVN Basin faces the north-eastern side of Lake Victoria, which is the largest freshwater lake in
Africa. The Lake is a shared water resource between Kenya, Tanzania, and Uganda. The major wetland
areas in the LVN Basin are Kingwal, Yala, Sergoit, Saiwa and Sio-Siteko illustrated in Figure 2-11.
The Yala Swamp is located at the Yala River mouth and covers an area of 175 km2. It is Kenya’s largest
freshwater wetland and is located on deltaic sediments of the Nzoia and Yala Rivers as they enter Lake
Victoria (Ministry of Environment and Mineral Resources, 2012). The wetland contains three freshwater
lakes: Kanyaboli, Sare and Namboyo. Vegetation is mainly papyrus, phramites and typha and it acts as
a refuge for the threatened Sitatunga antelope. The associated lakes contain some critically
endangered haplochromine fish species and the Swamp is an important bird habitat.
The Sio-Siteko wetland complex is a transboundary wetland that spans the Kenya-Uganda border. The
wetland consists of interconnected secondary and tertiary subsystems that drain into Lake Victoria
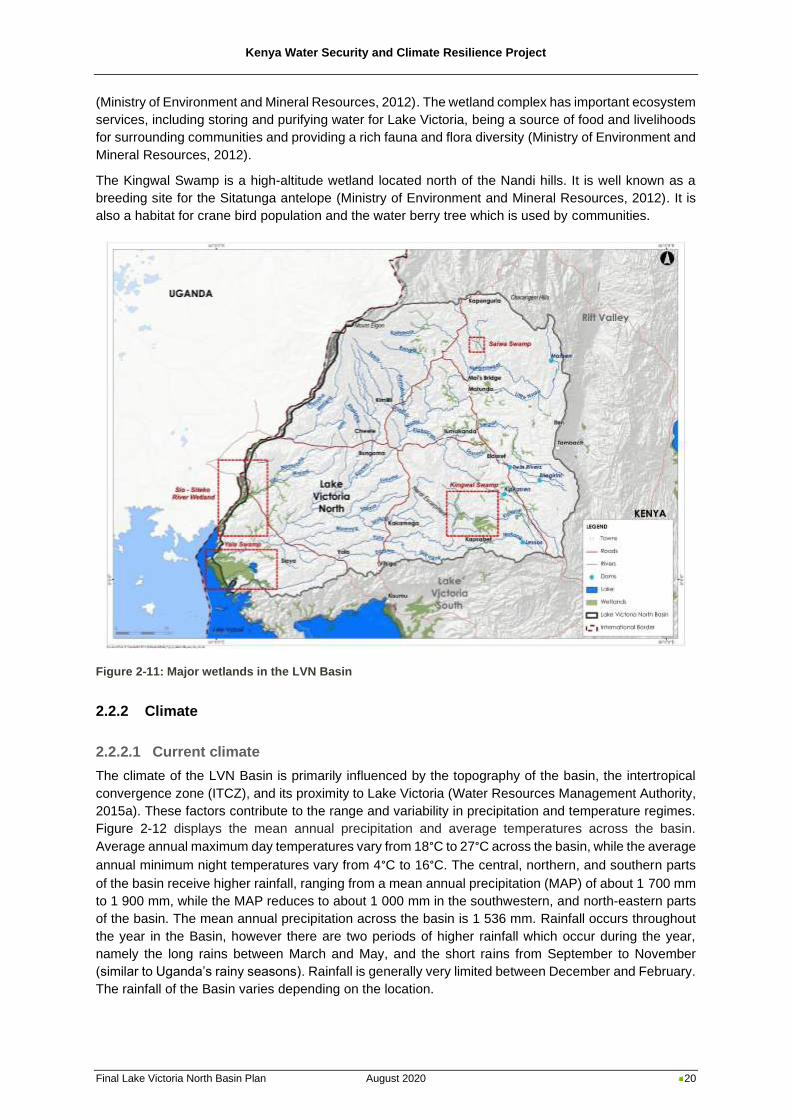
Kenya Water Security and Climate Resilience Project
Final Lake Victoria North Basin Plan August 2020 20
(Ministry of Environment and Mineral Resources, 2012). The wetland complex has important ecosystem
services, including storing and purifying water for Lake Victoria, being a source of food and livelihoods
for surrounding communities and providing a rich fauna and flora diversity (Ministry of Environment and
Mineral Resources, 2012).
The Kingwal Swamp is a high-altitude wetland located north of the Nandi hills. It is well known as a
breeding site for the Sitatunga antelope (Ministry of Environment and Mineral Resources, 2012). It is
also a habitat for crane bird population and the water berry tree which is used by communities.
Figure 2-11: Major wetlands in the LVN Basin
2.2.2 Climate
2.2.2.1 Current climate
The climate of the LVN Basin is primarily influenced by the topography of the basin, the intertropical
convergence zone (ITCZ), and its proximity to Lake Victoria (Water Resources Management Authority,
2015a). These factors contribute to the range and variability in precipitation and temperature regimes.
Figure 2-12 displays the mean annual precipitation and average temperatures across the basin.
Average annual maximum day temperatures vary from 18°C to 27°C across the basin, while the average
annual minimum night temperatures vary from 4°C to 16°C. The central, northern, and southern parts
of the basin receive higher rainfall, ranging from a mean annual precipitation (MAP) of about 1 700 mm
to 1 900 mm, while the MAP reduces to about 1 000 mm in the southwestern, and north-eastern parts
of the basin. The mean annual precipitation across the basin is 1 536 mm. Rainfall occurs throughout
the year in the Basin, however there are two periods of higher rainfall which occur during the year,
namely the long rains between March and May, and the short rains from September to November
(similar to Uganda’s rainy seasons). Rainfall is generally very limited between December and February.
The rainfall of the Basin varies depending on the location.
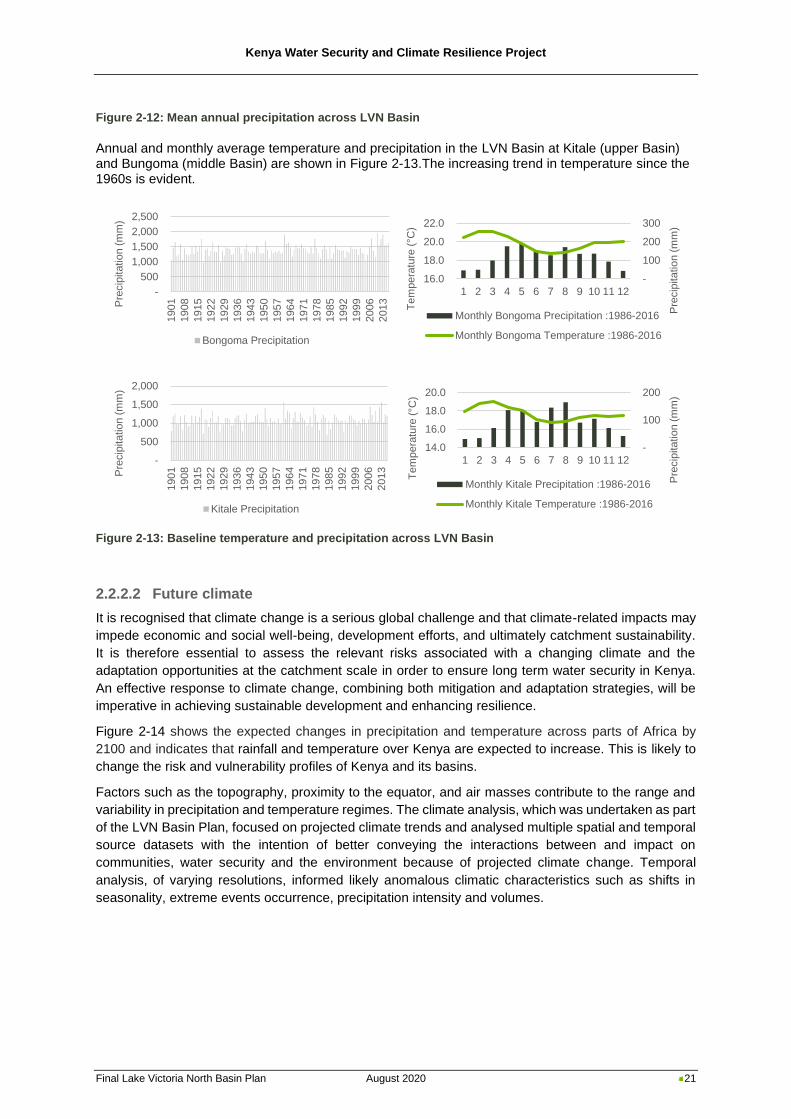
Kenya Water Security and Climate Resilience Project
Final Lake Victoria North Basin Plan August 2020 21
Figure 2-12: Mean annual precipitation across LVN Basin
Annual and monthly average temperature and precipitation in the LVN Basin at Kitale (upper Basin) and Bungoma (middle Basin) are shown in Figure 2-13.The increasing trend in temperature since the 1960s is evident.
Figure 2-13: Baseline temperature and precipitation across LVN Basin
2.2.2.2 Future climate
It is recognised that climate change is a serious global challenge and that climate-related impacts may
impede economic and social well-being, development efforts, and ultimately catchment sustainability.
It is therefore essential to assess the relevant risks associated with a changing climate and the
adaptation opportunities at the catchment scale in order to ensure long term water security in Kenya.
An effective response to climate change, combining both mitigation and adaptation strategies, will be
imperative in achieving sustainable development and enhancing resilience.
Figure 2-14 shows the expected changes in precipitation and temperature across parts of Africa by
2100 and indicates that rainfall and temperature over Kenya are expected to increase. This is likely to
change the risk and vulnerability profiles of Kenya and its basins.
Factors such as the topography, proximity to the equator, and air masses contribute to the range and
variability in precipitation and temperature regimes. The climate analysis, which was undertaken as part
of the LVN Basin Plan, focused on projected climate trends and analysed multiple spatial and temporal
source datasets with the intention of better conveying the interactions between and impact on
communities, water security and the environment because of projected climate change. Temporal
analysis, of varying resolutions, informed likely anomalous climatic characteristics such as shifts in
seasonality, extreme events occurrence, precipitation intensity and volumes.
-
500
1,000
1,500
2,000
2,500
1901
1908
1915
1922
1929
1936
1943
1950
1957
1964
1971
1978
1985
1992
1999
2006
2013Pre
cip
itatio
n (
mm
)
Bongoma Precipitation
-
100
200
300
16.0
18.0
20.0
22.0
1 2 3 4 5 6 7 8 9 10 11 12
Pre
cip
itatio
n (
mm
)
Te
mpera
ture
(°C
)
Monthly Bongoma Precipitation :1986-2016
Monthly Bongoma Temperature :1986-2016
-
100
200
14.0
16.0
18.0
20.0
1 2 3 4 5 6 7 8 9 10 11 12
Pre
cip
itatio
n (
mm
)
Te
mpera
ture
(°C
)
Monthly Kitale Precipitation :1986-2016
Monthly Kitale Temperature :1986-2016
-
500
1,000
1,500
2,000
1901
1908
1915
1922
1929
1936
1943
1950
1957
1964
1971
1978
1985
1992
1999
2006
2013Pre
cip
itatio
n (
mm
)
Kitale Precipitation
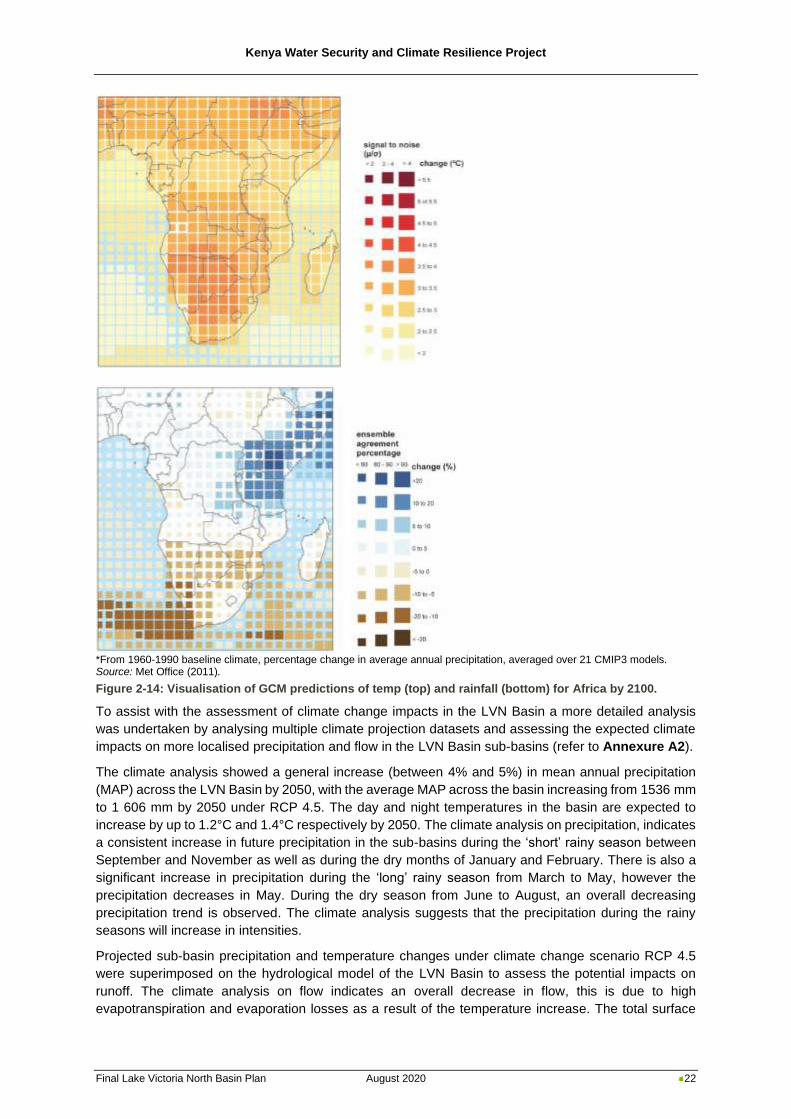
Kenya Water Security and Climate Resilience Project
Final Lake Victoria North Basin Plan August 2020 22
*From 1960-1990 baseline climate, percentage change in average annual precipitation, averaged over 21 CMIP3 models. Source: Met Office (2011).
Figure 2-14: Visualisation of GCM predictions of temp (top) and rainfall (bottom) for Africa by 2100.
To assist with the assessment of climate change impacts in the LVN Basin a more detailed analysis
was undertaken by analysing multiple climate projection datasets and assessing the expected climate
impacts on more localised precipitation and flow in the LVN Basin sub-basins (refer to Annexure A2).
The climate analysis showed a general increase (between 4% and 5%) in mean annual precipitation
(MAP) across the LVN Basin by 2050, with the average MAP across the basin increasing from 1536 mm
to 1 606 mm by 2050 under RCP 4.5. The day and night temperatures in the basin are expected to
increase by up to 1.2°C and 1.4°C respectively by 2050. The climate analysis on precipitation, indicates
a consistent increase in future precipitation in the sub-basins during the ‘short’ rainy season between
September and November as well as during the dry months of January and February. There is also a
significant increase in precipitation during the ‘long’ rainy season from March to May, however the
precipitation decreases in May. During the dry season from June to August, an overall decreasing
precipitation trend is observed. The climate analysis suggests that the precipitation during the rainy
seasons will increase in intensities.
Projected sub-basin precipitation and temperature changes under climate change scenario RCP 4.5
were superimposed on the hydrological model of the LVN Basin to assess the potential impacts on
runoff. The climate analysis on flow indicates an overall decrease in flow, this is due to high
evapotranspiration and evaporation losses as a result of the temperature increase. The total surface
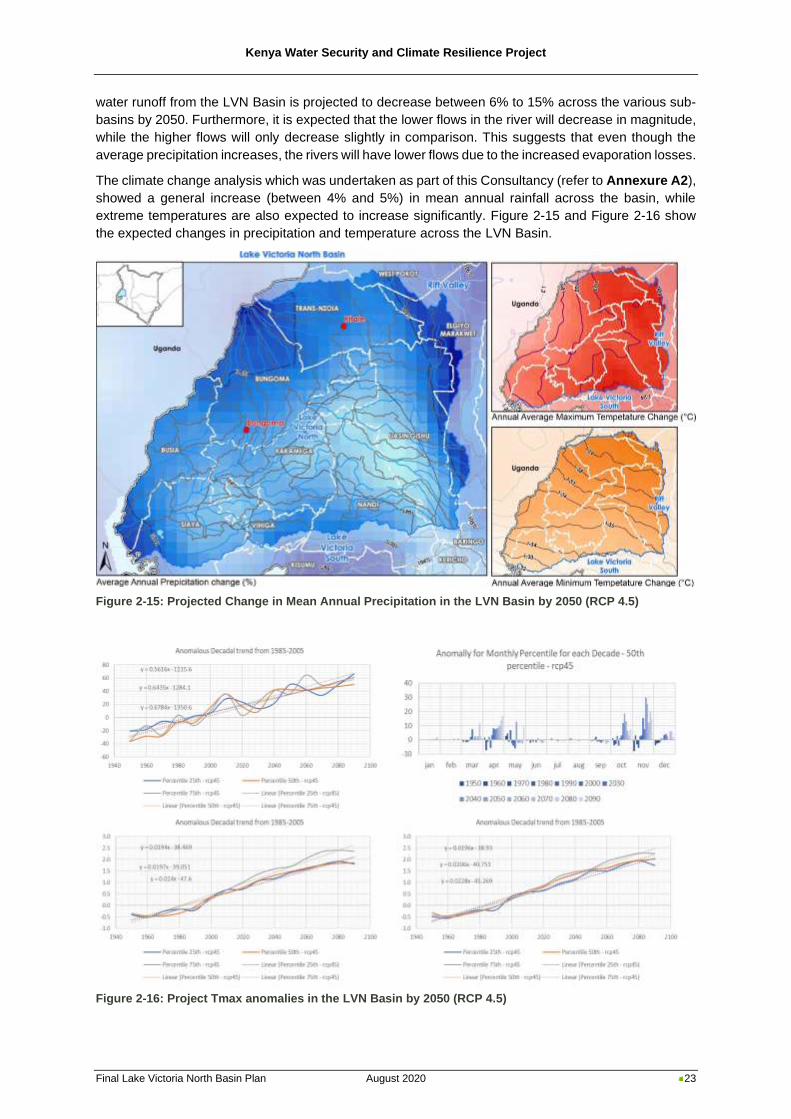
Kenya Water Security and Climate Resilience Project
Final Lake Victoria North Basin Plan August 2020 23
water runoff from the LVN Basin is projected to decrease between 6% to 15% across the various sub-
basins by 2050. Furthermore, it is expected that the lower flows in the river will decrease in magnitude,
while the higher flows will only decrease slightly in comparison. This suggests that even though the
average precipitation increases, the rivers will have lower flows due to the increased evaporation losses.
The climate change analysis which was undertaken as part of this Consultancy (refer to Annexure A2),
showed a general increase (between 4% and 5%) in mean annual rainfall across the basin, while
extreme temperatures are also expected to increase significantly. Figure 2-15 and Figure 2-16 show
the expected changes in precipitation and temperature across the LVN Basin.
Figure 2-15: Projected Change in Mean Annual Precipitation in the LVN Basin by 2050 (RCP 4.5)
Figure 2-16: Project Tmax anomalies in the LVN Basin by 2050 (RCP 4.5)
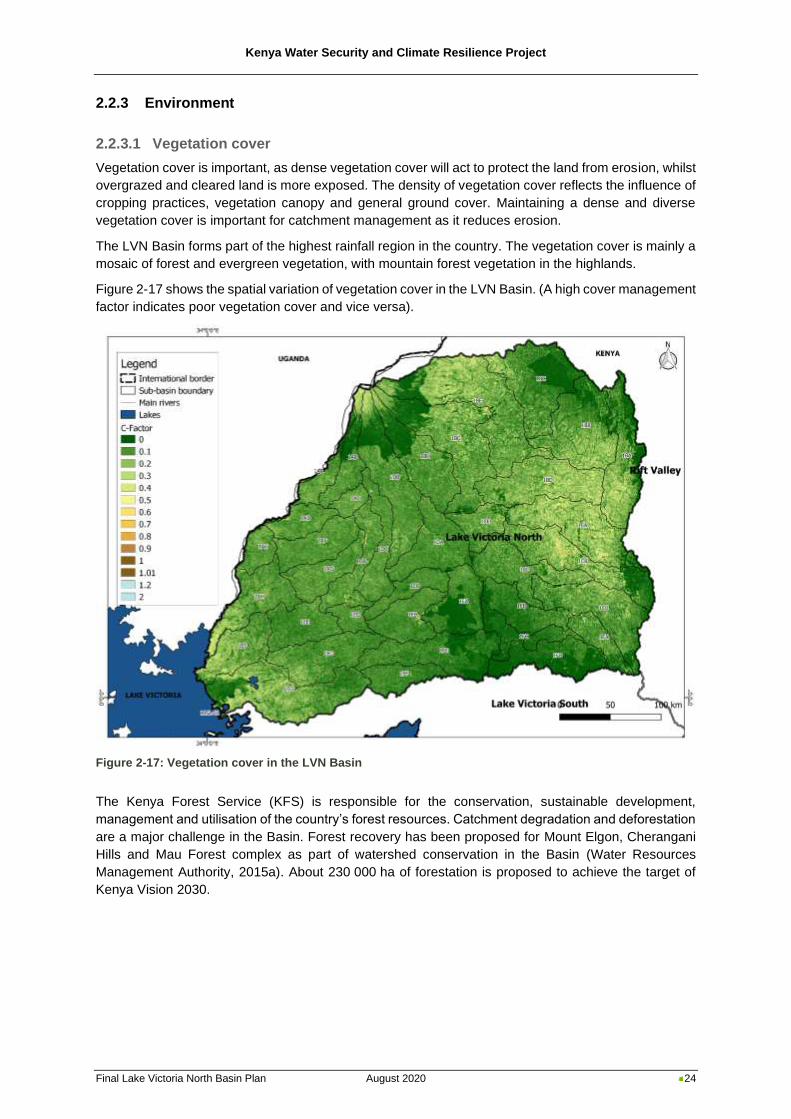
Kenya Water Security and Climate Resilience Project
Final Lake Victoria North Basin Plan August 2020 24
2.2.3 Environment
2.2.3.1 Vegetation cover
Vegetation cover is important, as dense vegetation cover will act to protect the land from erosion, whilst
overgrazed and cleared land is more exposed. The density of vegetation cover reflects the influence of
cropping practices, vegetation canopy and general ground cover. Maintaining a dense and diverse
vegetation cover is important for catchment management as it reduces erosion.
The LVN Basin forms part of the highest rainfall region in the country. The vegetation cover is mainly a
mosaic of forest and evergreen vegetation, with mountain forest vegetation in the highlands.
Figure 2-17 shows the spatial variation of vegetation cover in the LVN Basin. (A high cover management
factor indicates poor vegetation cover and vice versa).
Figure 2-17: Vegetation cover in the LVN Basin
The Kenya Forest Service (KFS) is responsible for the conservation, sustainable development,
management and utilisation of the country’s forest resources. Catchment degradation and deforestation
are a major challenge in the Basin. Forest recovery has been proposed for Mount Elgon, Cherangani
Hills and Mau Forest complex as part of watershed conservation in the Basin (Water Resources
Management Authority, 2015a). About 230 000 ha of forestation is proposed to achieve the target of
Kenya Vision 2030.
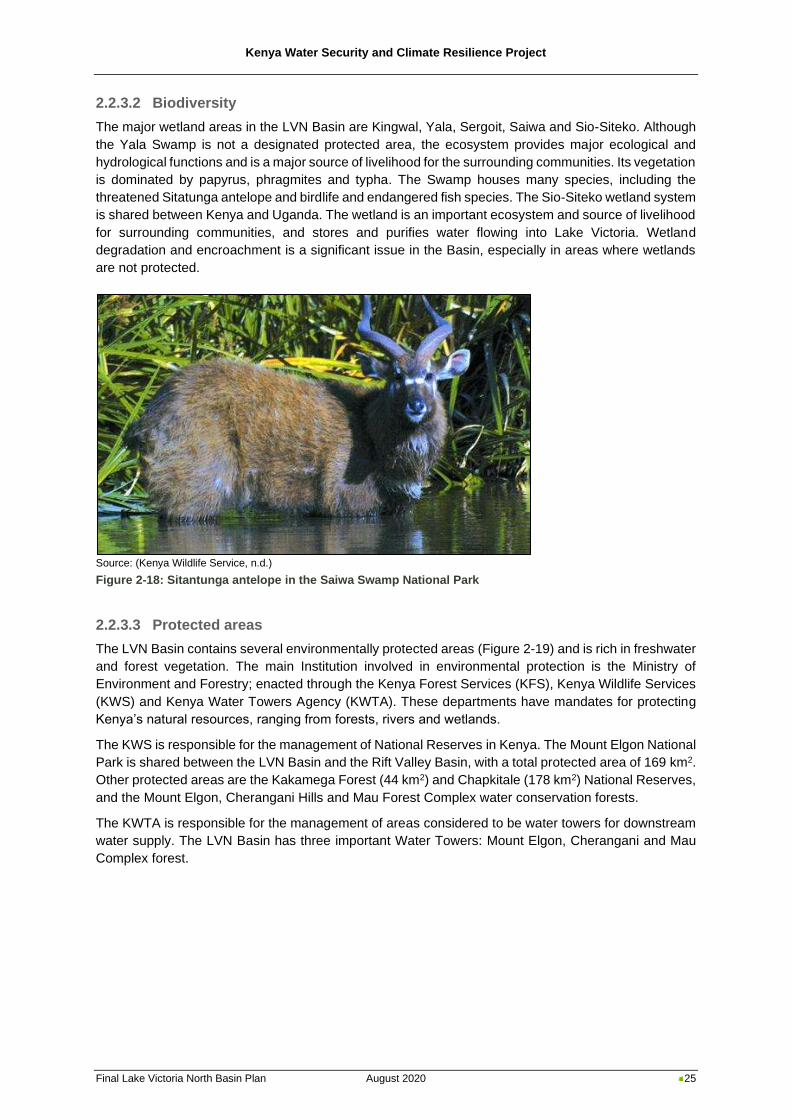
Kenya Water Security and Climate Resilience Project
Final Lake Victoria North Basin Plan August 2020 25
2.2.3.2 Biodiversity
The major wetland areas in the LVN Basin are Kingwal, Yala, Sergoit, Saiwa and Sio-Siteko. Although
the Yala Swamp is not a designated protected area, the ecosystem provides major ecological and
hydrological functions and is a major source of livelihood for the surrounding communities. Its vegetation
is dominated by papyrus, phragmites and typha. The Swamp houses many species, including the
threatened Sitatunga antelope and birdlife and endangered fish species. The Sio-Siteko wetland system
is shared between Kenya and Uganda. The wetland is an important ecosystem and source of livelihood
for surrounding communities, and stores and purifies water flowing into Lake Victoria. Wetland
degradation and encroachment is a significant issue in the Basin, especially in areas where wetlands
are not protected.
Source: (Kenya Wildlife Service, n.d.)
Figure 2-18: Sitantunga antelope in the Saiwa Swamp National Park
2.2.3.3 Protected areas
The LVN Basin contains several environmentally protected areas (Figure 2-19) and is rich in freshwater
and forest vegetation. The main Institution involved in environmental protection is the Ministry of
Environment and Forestry; enacted through the Kenya Forest Services (KFS), Kenya Wildlife Services
(KWS) and Kenya Water Towers Agency (KWTA). These departments have mandates for protecting
Kenya’s natural resources, ranging from forests, rivers and wetlands.
The KWS is responsible for the management of National Reserves in Kenya. The Mount Elgon National
Park is shared between the LVN Basin and the Rift Valley Basin, with a total protected area of 169 km2.
Other protected areas are the Kakamega Forest (44 km2) and Chapkitale (178 km2) National Reserves,
and the Mount Elgon, Cherangani Hills and Mau Forest Complex water conservation forests.
The KWTA is responsible for the management of areas considered to be water towers for downstream
water supply. The LVN Basin has three important Water Towers: Mount Elgon, Cherangani and Mau
Complex forest.
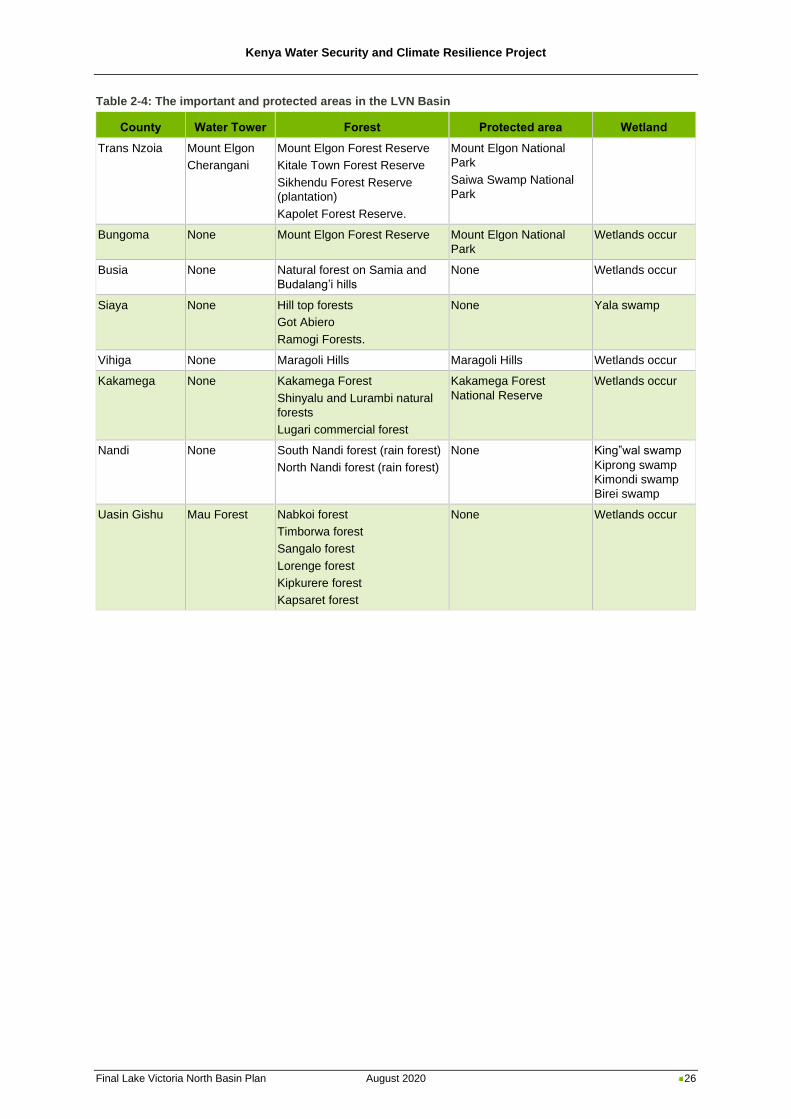
Kenya Water Security and Climate Resilience Project
Final Lake Victoria North Basin Plan August 2020 26
Table 2-4: The important and protected areas in the LVN Basin
County Water Tower Forest Protected area Wetland
Trans Nzoia Mount Elgon
Cherangani
Mount Elgon Forest Reserve
Kitale Town Forest Reserve
Sikhendu Forest Reserve
(plantation)
Kapolet Forest Reserve.
Mount Elgon National
Park
Saiwa Swamp National
Park
Bungoma None Mount Elgon Forest Reserve Mount Elgon National
Park
Wetlands occur
Busia None Natural forest on Samia and
Budalang’i hills
None Wetlands occur
Siaya None Hill top forests
Got Abiero
Ramogi Forests.
None Yala swamp
Vihiga None Maragoli Hills Maragoli Hills Wetlands occur
Kakamega None Kakamega Forest
Shinyalu and Lurambi natural
forests
Lugari commercial forest
Kakamega Forest
National Reserve
Wetlands occur
Nandi None South Nandi forest (rain forest)
North Nandi forest (rain forest)
None King‟wal swamp
Kiprong swamp
Kimondi swamp
Birei swamp
Uasin Gishu Mau Forest Nabkoi forest
Timborwa forest
Sangalo forest
Lorenge forest
Kipkurere forest
Kapsaret forest
None Wetlands occur
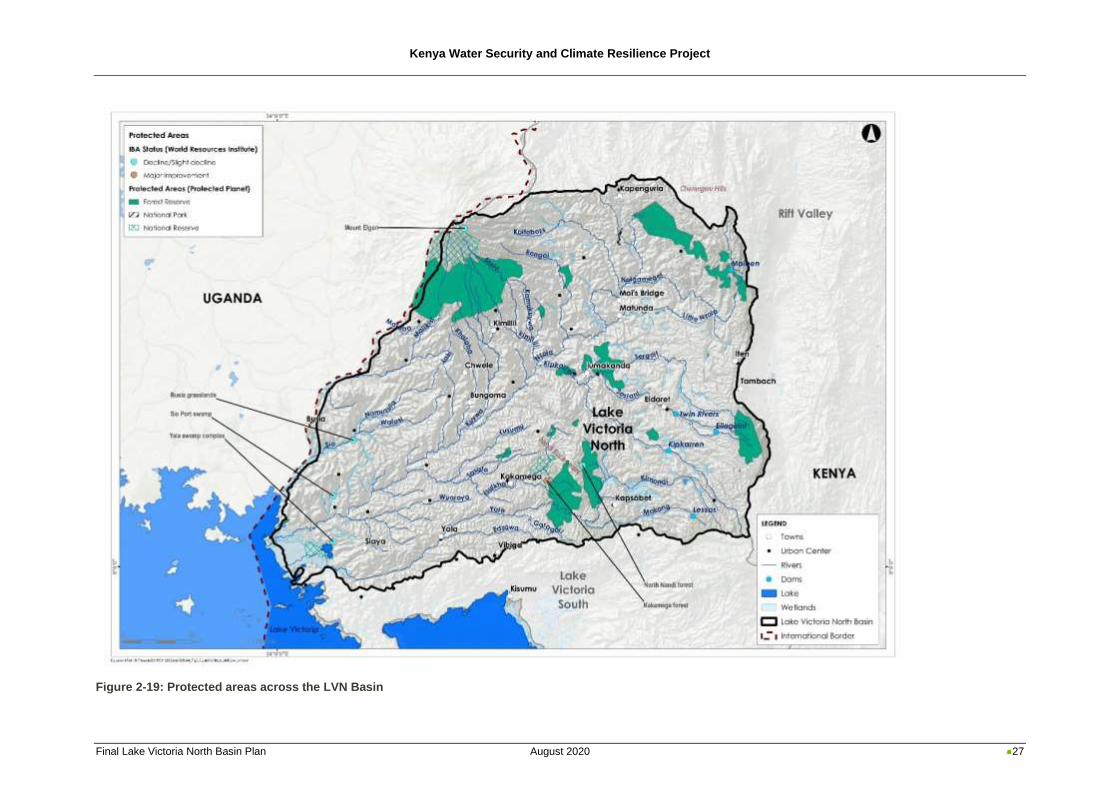
Kenya Water Security and Climate Resilience Project
Final Lake Victoria North Basin Plan August 2020 27
Figure 2-19: Protected areas across the LVN Basin
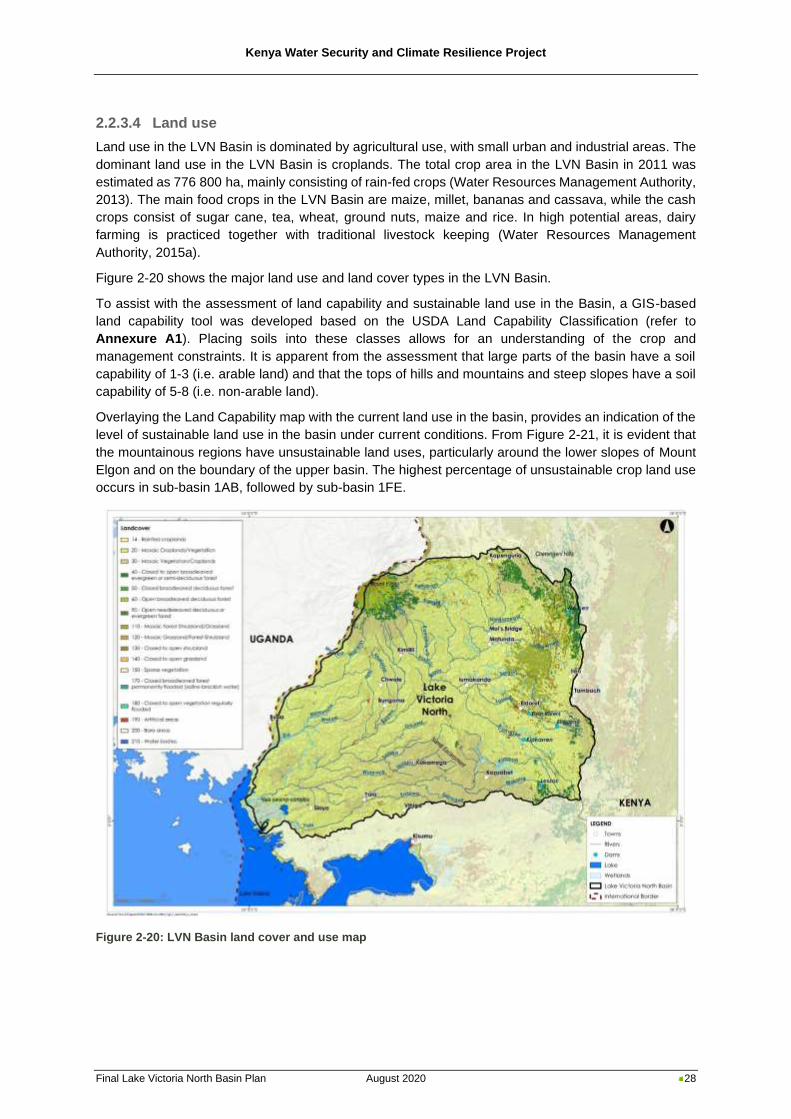
Kenya Water Security and Climate Resilience Project
Final Lake Victoria North Basin Plan August 2020 28
2.2.3.4 Land use
Land use in the LVN Basin is dominated by agricultural use, with small urban and industrial areas. The
dominant land use in the LVN Basin is croplands. The total crop area in the LVN Basin in 2011 was
estimated as 776 800 ha, mainly consisting of rain-fed crops (Water Resources Management Authority,
2013). The main food crops in the LVN Basin are maize, millet, bananas and cassava, while the cash
crops consist of sugar cane, tea, wheat, ground nuts, maize and rice. In high potential areas, dairy
farming is practiced together with traditional livestock keeping (Water Resources Management
Authority, 2015a).
Figure 2-20 shows the major land use and land cover types in the LVN Basin.
To assist with the assessment of land capability and sustainable land use in the Basin, a GIS-based
land capability tool was developed based on the USDA Land Capability Classification (refer to
Annexure A1). Placing soils into these classes allows for an understanding of the crop and
management constraints. It is apparent from the assessment that large parts of the basin have a soil
capability of 1-3 (i.e. arable land) and that the tops of hills and mountains and steep slopes have a soil
capability of 5-8 (i.e. non-arable land).
Overlaying the Land Capability map with the current land use in the basin, provides an indication of the
level of sustainable land use in the basin under current conditions. From Figure 2-21, it is evident that
the mountainous regions have unsustainable land uses, particularly around the lower slopes of Mount
Elgon and on the boundary of the upper basin. The highest percentage of unsustainable crop land use
occurs in sub-basin 1AB, followed by sub-basin 1FE.
Figure 2-20: LVN Basin land cover and use map
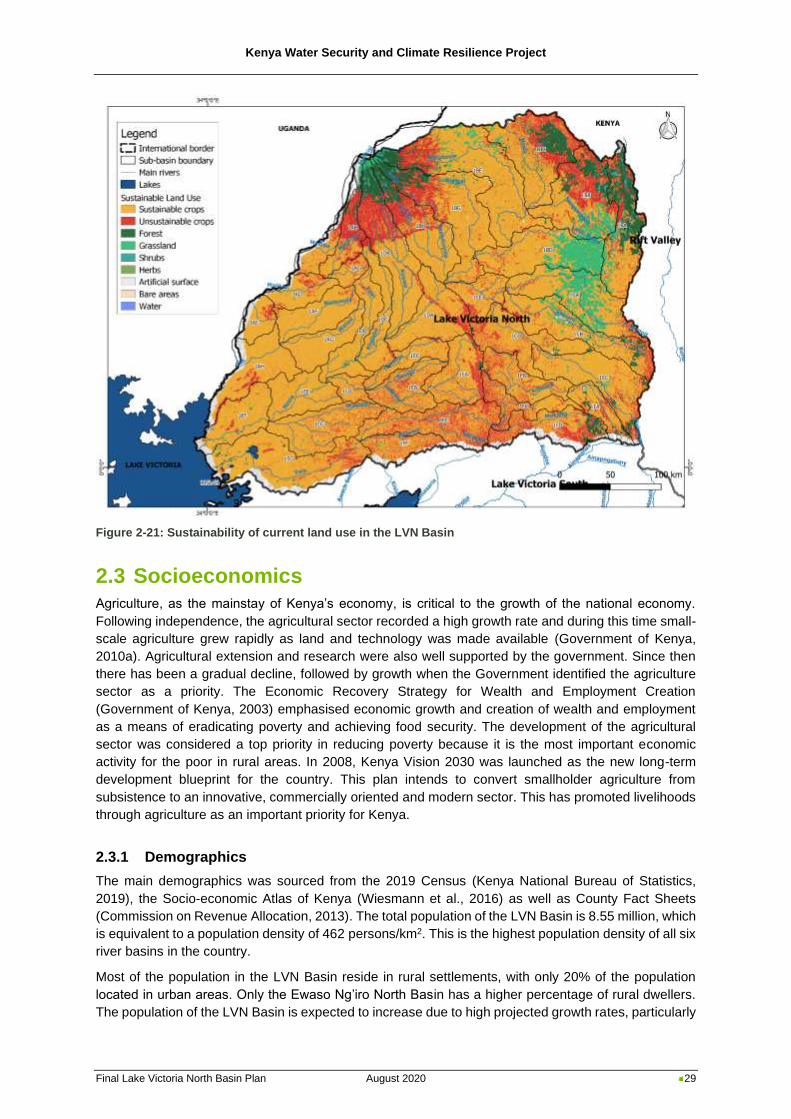
Kenya Water Security and Climate Resilience Project
Final Lake Victoria North Basin Plan August 2020 29
Figure 2-21: Sustainability of current land use in the LVN Basin
2.3 Socioeconomics
Agriculture, as the mainstay of Kenya’s economy, is critical to the growth of the national economy.
Following independence, the agricultural sector recorded a high growth rate and during this time small-
scale agriculture grew rapidly as land and technology was made available (Government of Kenya,
2010a). Agricultural extension and research were also well supported by the government. Since then
there has been a gradual decline, followed by growth when the Government identified the agriculture
sector as a priority. The Economic Recovery Strategy for Wealth and Employment Creation
(Government of Kenya, 2003) emphasised economic growth and creation of wealth and employment
as a means of eradicating poverty and achieving food security. The development of the agricultural
sector was considered a top priority in reducing poverty because it is the most important economic
activity for the poor in rural areas. In 2008, Kenya Vision 2030 was launched as the new long-term
development blueprint for the country. This plan intends to convert smallholder agriculture from
subsistence to an innovative, commercially oriented and modern sector. This has promoted livelihoods
through agriculture as an important priority for Kenya.
2.3.1 Demographics
The main demographics was sourced from the 2019 Census (Kenya National Bureau of Statistics,
2019), the Socio-economic Atlas of Kenya (Wiesmann et al., 2016) as well as County Fact Sheets
(Commission on Revenue Allocation, 2013). The total population of the LVN Basin is 8.55 million, which
is equivalent to a population density of 462 persons/km2. This is the highest population density of all six
river basins in the country.
Most of the population in the LVN Basin reside in rural settlements, with only 20% of the population
located in urban areas. Only the Ewaso Ng’iro North Basin has a higher percentage of rural dwellers.
The population of the LVN Basin is expected to increase due to high projected growth rates, particularly
Kenya Water Security and Climate Resilience Project
Final Lake Victoria North Basin Plan August 2020 30
for the urban sector. The projected population is based on Census 2009 (Kenya National Bureau of
Statistics, 2009) population data and United Nations population growth rates as estimated in the Kenya
Vision 2030. The total population is projected to be 12.36 million in 2030. The rural population is
projected to reduce from 5.43 million in 2010 to 4.65 million in 2030. The urban population is projected
to increase from 1.53 million to 7.71 million by 2030 (Water Resources Management Authority, 2013).
The education level index measures the average level of formal education reached by adults in a given
area. It is calculated by averaging together the highest education level reached by each individual in a
specific area. When calculating the index ranges from 0 (no formal education), 1.0 (completed primary
school), 2.0 (completed secondary school) and 3.0 (completed university degree). The education level
index in the LVN Basin is 1.0, which indicates that, on average, all adults have completed primary
school education and very few completed secondary school education. This is an average value,
individuals in a given area will differ. Enrolment at primary and secondary schools is highest in Bungoma
(119%, 63%), Vihaga (116%, 49%), Siaya (110%, 53%), and Kakamega (96%, 52%) counties. Busia
(80%, 20%) and Elgeyo Marakwet (80%, 76%) counties have lower levels of school enrolment. (This
information is not available for Nandi, Tranz-Nzoai, and Uasin Gishu counties).
2.3.2 Economy
2.3.2.1 Economic activity
The main economic activities in the Basin are agriculture and fishing. The LVN Basin’s location adjacent
to Lake Victoria makes the production of fish a strategic opportunity for the catchment. However, the
fisheries sub-sector has been declining since 2014, with the total fish output decreasing by 12% from
2015 to 2016. Lake Victoria continues to account for over 80% of the total freshwater fish production in
the country, however its output is decreasing partly due to the presence of water hyacinth and
unsustainable fishing practises.
Industrial activity in the Basin is limited to the processing of locally produced raw materials from
agriculture and fishing, for example: sugar and flour milling; paper, tobacco, coffee, dairy and chemical
production; and fish processing factories. Industries are in the urban areas of Eldoret (Uasin Gishu
County), Bungoma, Nzoia and Webuye (Bungoma County), Kakamega (Kakamega County), Kitale
(Trans Nzoia County), Busia (Busia County), Siaya (Siaya County).
Limited gold mining taking place in the Basin, with potential existing for mining of other minerals. Sand
mining and quarrying for building materials occurs throughout the Basin.
Tourism occurs at present, and there is significant potential for expansion of this sector in the Basin.
The LVN Basin includes ten counties, some of them only partly, as shown in Figure 2-2.The main
economic activities per county are described in Table 2-5:
Table 2-5: Main economic activity of each county
County Economic activity Reference
Bungoma This county falls wholly within the LVN basin. The main economic activity in
Bungoma County is agriculture. Approximately 201 655 ha of food crops are under
cultivation and 86 423 ha of cash crops. Most crops are rain-fed, but there are four
operational irrigation schemes in the county, located at: Kamusinga, Chebukui,
Kuywa and Stabicha.The beef and dairy industries are also growing in this county.
- The Kenya-Uganda railway which passes through the region has also
contributed significantly to the development of urban centres and retail
business. The main industries in the county are sugar milling and paper
production. Other industries are tobacco, coffee, dairy and chemical
production. These industries all rely on locally produced raw materials. The
main industrial centres are located in Nzoia and Webuye.
(County
Government of
Bungoma,
2018)
Kenya Water Security and Climate Resilience Project
Final Lake Victoria North Basin Plan August 2020 31
County Economic activity Reference
Busia This county falls wholly within the LVN Basin.
The main economic activities in Busia County are agriculture, fishing and trade.
- Agriculture (crop cultivation and livestock rearing) and fisheries provide for
65% of the county’s earnings, and most people in the county are employed
directly or indirectly in this sector. It is estimated that 63 126 ha is under food
crops (maize, beans, sweet potatoes, millet, cassava), and 11 948 ha is under
cash crops (cotton, tobacco and sugar cane) in the county. Irrigation schemes
in the county consist of small-scale irrigation schemes ranging between 70 and
200 ha in size, and large-scale schemes totalling 8 000 ha. The crops irrigated
include vegetables, melons, tomatoes, maize, sorghum and rice.
- Fishing in the lake region is one of the major economic activities in the county.
Approximately 5 000 families living on the lake shore rely directly on fishing for
their livelihood, and 3 000 families trade in lake resources. The estimated
value of fish traded in Busia county is Kshs. 1.2 billion annually. The main
commercial species caught are Tilapia, Omena and Nile Perch. Cage farming
of fish is being encouraged in the lake to help increase fish stocks.
- The county is the main point of entry between Kenya and Uganda, accounting
for the bulk of trade between the two countries. The towns of Busia and
Malaba benefit from the trade of livestock, agricultural products and
manufactured goods. Other urban areas in the county are Port Victoria,
Bumala, Nambale and Samia.
- The relatively large population provides a potentially large labour force which, if
utilised well, would allow the county to be a major contributor to Kenya’s
economy. There is not much industry in Busia county. There are two major
sugar factories, and smaller industries such as flour mills and fish processing
factories exist.
(County
Government of
Busia, 2018)
Kakamega This county falls wholly within the LVN Basin.
The major economic activity in Kakamega County is agriculture.
- Food crops cover 114 054 ha (mainly maize) and cash crops (mainly sugar
cane) cover 141 429 ha. The cultivation of tea is being promoted in Khwisero,
Ikolomani and Shanyalu sub-counties. Rice production is being promoted in
Matungu, Mumias and Buere sub-counties.
- Fish farming projects are being implemented by the County Government of
Kakamega, and the Department of Fisheries is implementing a fish Farming
Programme.
- The Kakamega Forest is a major tourist attraction, and opportunities exist for
development of tourist facilities to tap into this resource. This applies
particularly to avifauna, with international interest in at least 45 species of local
birds, including some threatened species.
- The county is home to a large sugar producing company, Mumias sugar. Other
minor industries are bakeries, small scale milk cold rooms and the fish factory
in Kakamega town. There are no industrial parks in the county, and it is
proposed that one is established in the town centre of Kakamega.
(County
Government of
Kakamega,
2017)
Trans Nzoia This county falls wholly within the LVN Basin
The leading economic activity in the Trans Nzoia County is agriculture, and it is
referred to as the “bread basket of Kenya” due to its large-scale maize farms. The
county is considered to be one of the most food secure in Kenya. There are about
157 068 ha under food crops, 2 590 ha under horticultural crops and 4 173 ha
under cash crops.
- The food crops include maize, beans, potatoes, millet, bananas and wheat,
while cash crops include sugar cane, coffee and tea. Horticultural crops grown
are tomatoes, cabbages, kale, avocados, oranges, mangoes, and export crops
like French beans, sugar snaps, snow peas, chillies and cut flowers.
- Other economic activities include dairy farming, horticulture, fishing and
commerce in the commercial hub of Kitale Town. The county hosts tourist
attractions such as the Mount Elgon National Park, Kitale Nature Conservancy
and Saiwa Swamp National Park.
(County
Government of
Trans Nzoia,
2018)
Kenya Water Security and Climate Resilience Project
Final Lake Victoria North Basin Plan August 2020 32
County Economic activity Reference
Uasin Gishu The majority of this county falls within the LVN Basin, with a very small portion of
the southern tip falling into the Lake Victoria South Basin. Uasin Gishu County
houses the large town of Eldoret.
- The economy is dominated by dairy farming and agriculture, the main crops
being maize and wheat. Bananas, macadamias, avocados and coffee were
introduced during the previous CIDP period to increase crop diversity in the
county. Approximately 41% of the population lives below the poverty line.
There is very little industry or mining in the county.
- Tourism is an important growth area for the county, and tourism products such
as the Chagaiya High Altitude Training camp, the Kesses dam tourist attraction
site, and the River Sosiani Nature Park were developed in the previous CIDP
period.
(County
Government of
Uasin Gishu,
2018)
Nandi Approximately 70% of this county falls within LVN Basin, with the remaining 30%
falling within the Lake Victoria South Basin.
- Agriculture is the main economic activity in Nandi County, and many
households keep cattle for both the production of beef and dairy products.
Food crops (maize, beans, finger millet, sorghum, sweet potatoes and
cassava) cover approximately 105 087 ha, while cash crops (tea, coffee and
sugar cane) account of 28 294 ha. An area of 250 ha is currently under
irrigation in the county, with a total potential of 2 500 ha. The Chemise Ward
irrigation scheme of 1 500 ha.
- Sports events such as golf tournaments and cross-country running
competitions regularly bring a number of visitors to the county. The county also
hosts both Kenyan and foreign athletes and cyclists who come to the region to
do high altitude training.
- The county has many tea processing factories, and a number of small
industries such as timber lumbering, coffee, milk, honey processing. There is
an initiative to establish a textile apparel unit in the county.
- There are currently no industrial parks in the County, but there is an initiative to
establish one in Chemase. The purpose would be to create employment,
improve agro-processing and value.
- A flagship water supply initiative is planned in Nandi County. The Keben water
project, is planned in partnership with the national government, and will provide
water to Nandi Hills and Kapsebet town and their environs.
(County
Government of
Nandi, 2018)
Siaya Approximately 70% of this county falls within LVN Basin, with the remaining 30%
falling within the Lake Victoria South Basin. The latest CIDP for this county is not
available, so this information is based on the previous CIDP covering the period
2013-2017.
In Siaya County, agriculture and fishing are the main economic activities, and
cattle and poultry are also kept. There are several fisheries in the county that
process fish from Lake Victoria. Main food crops include maize, sorghum, millet,
beans, cowpeas, cassava, sweet potatoes, groundnuts and finger millets, and
cover 150 300 ha.
- Cash crops include cotton, rice, sugar cane and groundnuts, and cover an
area of 2 500 ha. Vegetables and fruit are also grown. The reclamation of
450 ha of the Yala Swamp for rice production was a significant project that
increased the area under cash crops.
- There is very little industry in the county, with the only officially demarcated
industrial area being in Siaya town.
- The mining of gold has taken place in the county on a subsistence basis for
some time in Bondo, Siava, Rarieda, Ugunia and Gem sub-counties. Granite
and black sand are mined in the Yala valley and sand is harvested along the
beaches of the Nzoia River. There is potential to mine other minerals, precious
stones and rare earth elements such as fluorite.
- Some tourism is taking place, but there is still considerable growth potential for
tourism in the county.
(County
Government of
Siaya, 2018)
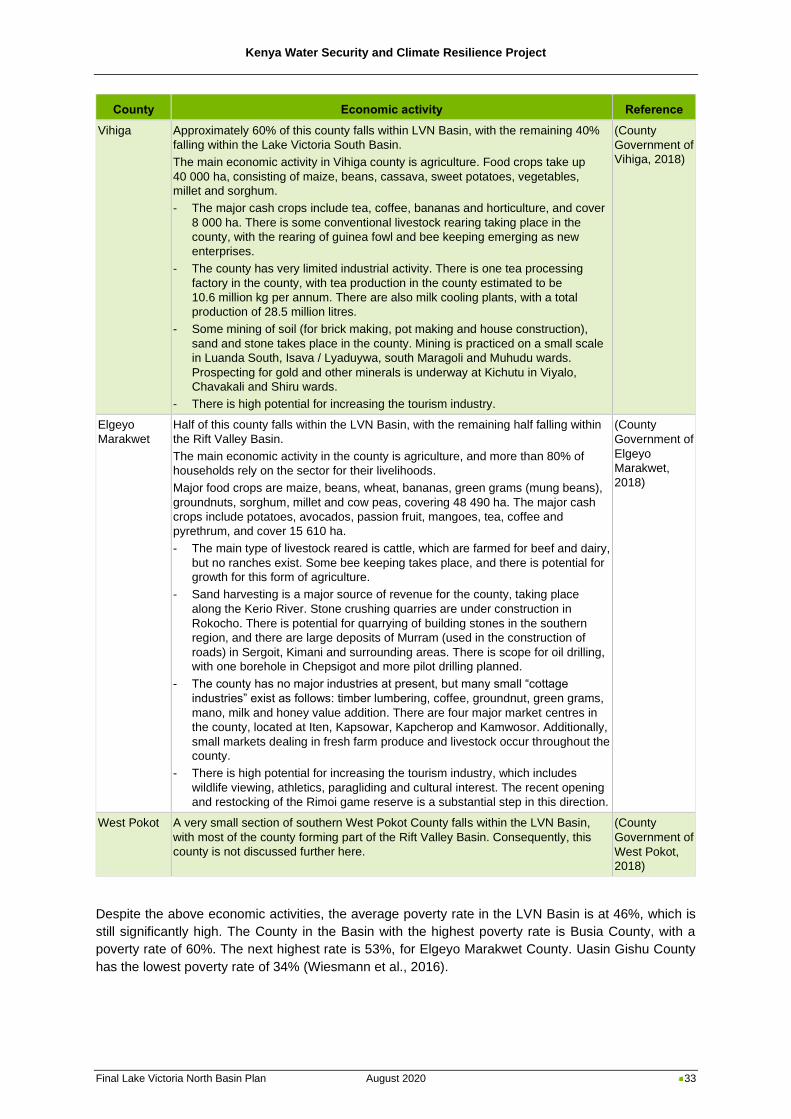
Kenya Water Security and Climate Resilience Project
Final Lake Victoria North Basin Plan August 2020 33
County Economic activity Reference
Vihiga Approximately 60% of this county falls within LVN Basin, with the remaining 40%
falling within the Lake Victoria South Basin.
The main economic activity in Vihiga county is agriculture. Food crops take up
40 000 ha, consisting of maize, beans, cassava, sweet potatoes, vegetables,
millet and sorghum.
- The major cash crops include tea, coffee, bananas and horticulture, and cover
8 000 ha. There is some conventional livestock rearing taking place in the
county, with the rearing of guinea fowl and bee keeping emerging as new
enterprises.
- The county has very limited industrial activity. There is one tea processing
factory in the county, with tea production in the county estimated to be
10.6 million kg per annum. There are also milk cooling plants, with a total
production of 28.5 million litres.
- Some mining of soil (for brick making, pot making and house construction),
sand and stone takes place in the county. Mining is practiced on a small scale
in Luanda South, Isava / Lyaduywa, south Maragoli and Muhudu wards.
Prospecting for gold and other minerals is underway at Kichutu in Viyalo,
Chavakali and Shiru wards.
- There is high potential for increasing the tourism industry.
(County
Government of
Vihiga, 2018)
Elgeyo
Marakwet
Half of this county falls within the LVN Basin, with the remaining half falling within
the Rift Valley Basin.
The main economic activity in the county is agriculture, and more than 80% of
households rely on the sector for their livelihoods.
Major food crops are maize, beans, wheat, bananas, green grams (mung beans),
groundnuts, sorghum, millet and cow peas, covering 48 490 ha. The major cash
crops include potatoes, avocados, passion fruit, mangoes, tea, coffee and
pyrethrum, and cover 15 610 ha.
- The main type of livestock reared is cattle, which are farmed for beef and dairy,
but no ranches exist. Some bee keeping takes place, and there is potential for
growth for this form of agriculture.
- Sand harvesting is a major source of revenue for the county, taking place
along the Kerio River. Stone crushing quarries are under construction in
Rokocho. There is potential for quarrying of building stones in the southern
region, and there are large deposits of Murram (used in the construction of
roads) in Sergoit, Kimani and surrounding areas. There is scope for oil drilling,
with one borehole in Chepsigot and more pilot drilling planned.
- The county has no major industries at present, but many small “cottage
industries” exist as follows: timber lumbering, coffee, groundnut, green grams,
mano, milk and honey value addition. There are four major market centres in
the county, located at Iten, Kapsowar, Kapcherop and Kamwosor. Additionally,
small markets dealing in fresh farm produce and livestock occur throughout the
county.
- There is high potential for increasing the tourism industry, which includes
wildlife viewing, athletics, paragliding and cultural interest. The recent opening
and restocking of the Rimoi game reserve is a substantial step in this direction.
(County
Government of
Elgeyo
Marakwet,
2018)
West Pokot A very small section of southern West Pokot County falls within the LVN Basin,
with most of the county forming part of the Rift Valley Basin. Consequently, this
county is not discussed further here.
(County
Government of
West Pokot,
2018)
Despite the above economic activities, the average poverty rate in the LVN Basin is at 46%, which is
still significantly high. The County in the Basin with the highest poverty rate is Busia County, with a
poverty rate of 60%. The next highest rate is 53%, for Elgeyo Marakwet County. Uasin Gishu County
has the lowest poverty rate of 34% (Wiesmann et al., 2016).
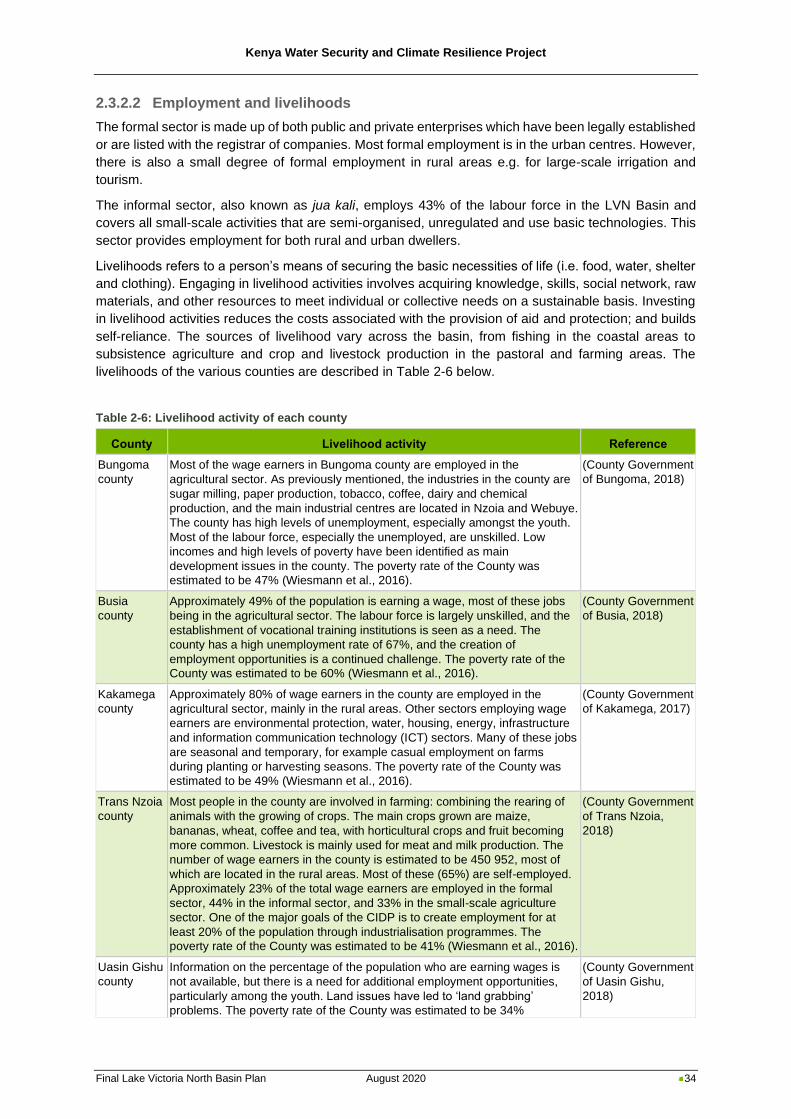
Kenya Water Security and Climate Resilience Project
Final Lake Victoria North Basin Plan August 2020 34
2.3.2.2 Employment and livelihoods
The formal sector is made up of both public and private enterprises which have been legally established
or are listed with the registrar of companies. Most formal employment is in the urban centres. However,
there is also a small degree of formal employment in rural areas e.g. for large-scale irrigation and
tourism.
The informal sector, also known as jua kali, employs 43% of the labour force in the LVN Basin and
covers all small-scale activities that are semi-organised, unregulated and use basic technologies. This
sector provides employment for both rural and urban dwellers.
Livelihoods refers to a person’s means of securing the basic necessities of life (i.e. food, water, shelter
and clothing). Engaging in livelihood activities involves acquiring knowledge, skills, social network, raw
materials, and other resources to meet individual or collective needs on a sustainable basis. Investing
in livelihood activities reduces the costs associated with the provision of aid and protection; and builds
self-reliance. The sources of livelihood vary across the basin, from fishing in the coastal areas to
subsistence agriculture and crop and livestock production in the pastoral and farming areas. The
livelihoods of the various counties are described in Table 2-6 below.
Table 2-6: Livelihood activity of each county
County Livelihood activity Reference
Bungoma
county
Most of the wage earners in Bungoma county are employed in the
agricultural sector. As previously mentioned, the industries in the county are
sugar milling, paper production, tobacco, coffee, dairy and chemical
production, and the main industrial centres are located in Nzoia and Webuye.
The county has high levels of unemployment, especially amongst the youth.
Most of the labour force, especially the unemployed, are unskilled. Low
incomes and high levels of poverty have been identified as main
development issues in the county. The poverty rate of the County was
estimated to be 47% (Wiesmann et al., 2016).
(County Government
of Bungoma, 2018)
Busia
county
Approximately 49% of the population is earning a wage, most of these jobs
being in the agricultural sector. The labour force is largely unskilled, and the
establishment of vocational training institutions is seen as a need. The
county has a high unemployment rate of 67%, and the creation of
employment opportunities is a continued challenge. The poverty rate of the
County was estimated to be 60% (Wiesmann et al., 2016).
(County Government
of Busia, 2018)
Kakamega
county
Approximately 80% of wage earners in the county are employed in the
agricultural sector, mainly in the rural areas. Other sectors employing wage
earners are environmental protection, water, housing, energy, infrastructure
and information communication technology (ICT) sectors. Many of these jobs
are seasonal and temporary, for example casual employment on farms
during planting or harvesting seasons. The poverty rate of the County was
estimated to be 49% (Wiesmann et al., 2016).
(County Government
of Kakamega, 2017)
Trans Nzoia
county
Most people in the county are involved in farming: combining the rearing of
animals with the growing of crops. The main crops grown are maize,
bananas, wheat, coffee and tea, with horticultural crops and fruit becoming
more common. Livestock is mainly used for meat and milk production. The
number of wage earners in the county is estimated to be 450 952, most of
which are located in the rural areas. Most of these (65%) are self-employed.
Approximately 23% of the total wage earners are employed in the formal
sector, 44% in the informal sector, and 33% in the small-scale agriculture
sector. One of the major goals of the CIDP is to create employment for at
least 20% of the population through industrialisation programmes. The
poverty rate of the County was estimated to be 41% (Wiesmann et al., 2016).
(County Government
of Trans Nzoia,
2018)
Uasin Gishu
county
Information on the percentage of the population who are earning wages is
not available, but there is a need for additional employment opportunities,
particularly among the youth. Land issues have led to ‘land grabbing’
problems. The poverty rate of the County was estimated to be 34%
(County Government
of Uasin Gishu,
2018)
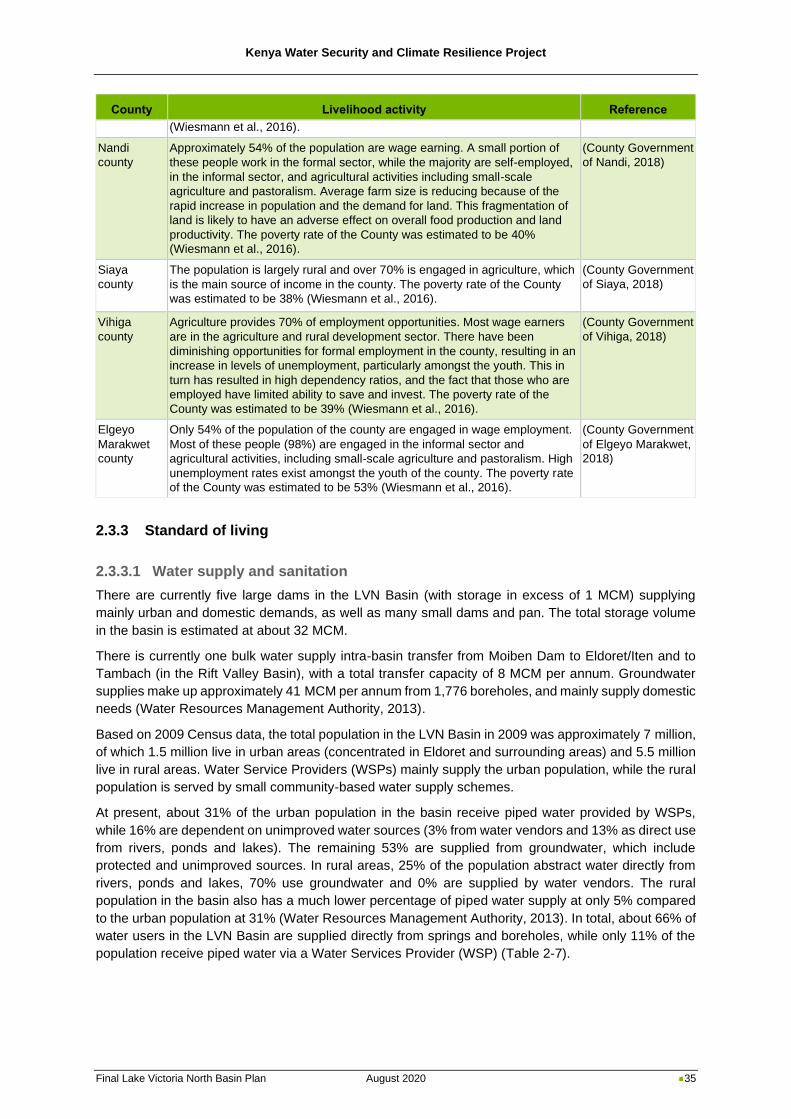
Kenya Water Security and Climate Resilience Project
Final Lake Victoria North Basin Plan August 2020 35
County Livelihood activity Reference
(Wiesmann et al., 2016).
Nandi
county
Approximately 54% of the population are wage earning. A small portion of
these people work in the formal sector, while the majority are self-employed,
in the informal sector, and agricultural activities including small-scale
agriculture and pastoralism. Average farm size is reducing because of the
rapid increase in population and the demand for land. This fragmentation of
land is likely to have an adverse effect on overall food production and land
productivity. The poverty rate of the County was estimated to be 40%
(Wiesmann et al., 2016).
(County Government
of Nandi, 2018)
Siaya
county
The population is largely rural and over 70% is engaged in agriculture, which
is the main source of income in the county. The poverty rate of the County
was estimated to be 38% (Wiesmann et al., 2016).
(County Government
of Siaya, 2018)
Vihiga
county
Agriculture provides 70% of employment opportunities. Most wage earners
are in the agriculture and rural development sector. There have been
diminishing opportunities for formal employment in the county, resulting in an
increase in levels of unemployment, particularly amongst the youth. This in
turn has resulted in high dependency ratios, and the fact that those who are
employed have limited ability to save and invest. The poverty rate of the
County was estimated to be 39% (Wiesmann et al., 2016).
(County Government
of Vihiga, 2018)
Elgeyo
Marakwet
county
Only 54% of the population of the county are engaged in wage employment.
Most of these people (98%) are engaged in the informal sector and
agricultural activities, including small-scale agriculture and pastoralism. High
unemployment rates exist amongst the youth of the county. The poverty rate
of the County was estimated to be 53% (Wiesmann et al., 2016).
(County Government
of Elgeyo Marakwet,
2018)
2.3.3 Standard of living
2.3.3.1 Water supply and sanitation
There are currently five large dams in the LVN Basin (with storage in excess of 1 MCM) supplying
mainly urban and domestic demands, as well as many small dams and pan. The total storage volume
in the basin is estimated at about 32 MCM.
There is currently one bulk water supply intra-basin transfer from Moiben Dam to Eldoret/Iten and to
Tambach (in the Rift Valley Basin), with a total transfer capacity of 8 MCM per annum. Groundwater
supplies make up approximately 41 MCM per annum from 1,776 boreholes, and mainly supply domestic
needs (Water Resources Management Authority, 2013).
Based on 2009 Census data, the total population in the LVN Basin in 2009 was approximately 7 million,
of which 1.5 million live in urban areas (concentrated in Eldoret and surrounding areas) and 5.5 million
live in rural areas. Water Service Providers (WSPs) mainly supply the urban population, while the rural
population is served by small community-based water supply schemes.
At present, about 31% of the urban population in the basin receive piped water provided by WSPs,
while 16% are dependent on unimproved water sources (3% from water vendors and 13% as direct use
from rivers, ponds and lakes). The remaining 53% are supplied from groundwater, which include
protected and unimproved sources. In rural areas, 25% of the population abstract water directly from
rivers, ponds and lakes, 70% use groundwater and 0% are supplied by water vendors. The rural
population in the basin also has a much lower percentage of piped water supply at only 5% compared
to the urban population at 31% (Water Resources Management Authority, 2013). In total, about 66% of
water users in the LVN Basin are supplied directly from springs and boreholes, while only 11% of the
population receive piped water via a Water Services Provider (WSP) (Table 2-7).
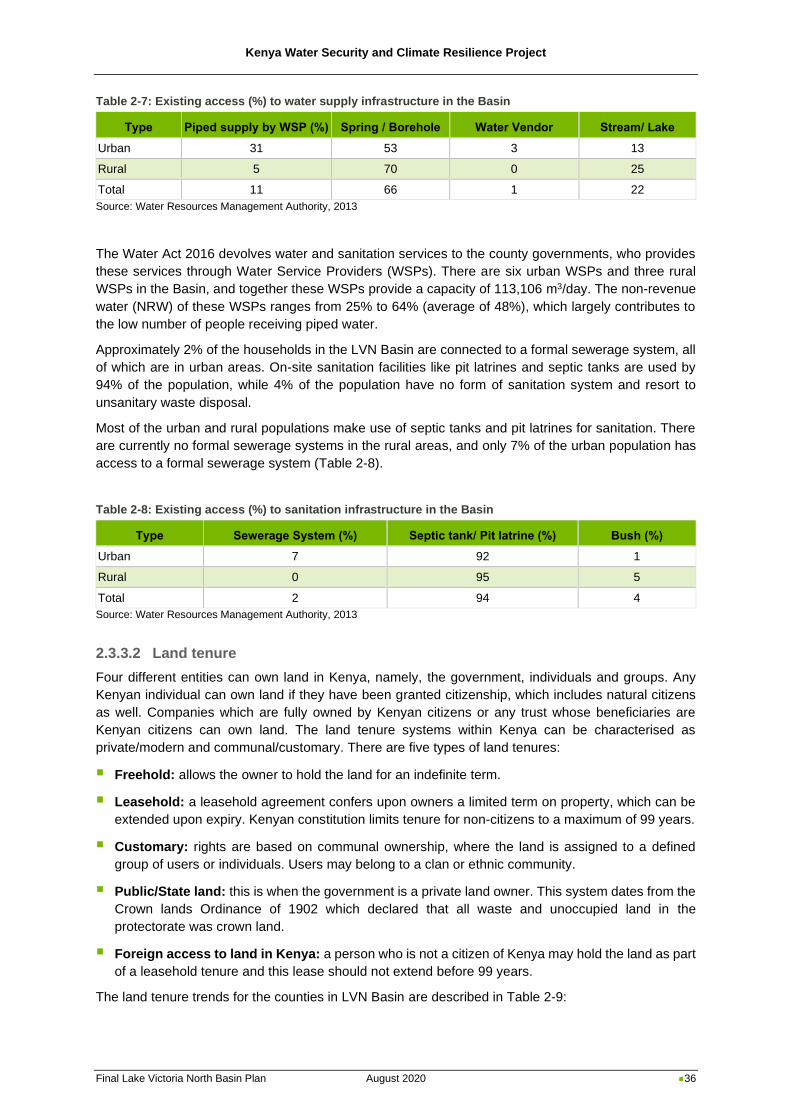
Kenya Water Security and Climate Resilience Project
Final Lake Victoria North Basin Plan August 2020 36
Table 2-7: Existing access (%) to water supply infrastructure in the Basin
Type Piped supply by WSP (%) Spring / Borehole Water Vendor Stream/ Lake
Urban 31 53 3 13
Rural 5 70 0 25
Total 11 66 1 22
Source: Water Resources Management Authority, 2013
The Water Act 2016 devolves water and sanitation services to the county governments, who provides
these services through Water Service Providers (WSPs). There are six urban WSPs and three rural
WSPs in the Basin, and together these WSPs provide a capacity of 113,106 m3/day. The non-revenue
water (NRW) of these WSPs ranges from 25% to 64% (average of 48%), which largely contributes to
the low number of people receiving piped water.
Approximately 2% of the households in the LVN Basin are connected to a formal sewerage system, all
of which are in urban areas. On-site sanitation facilities like pit latrines and septic tanks are used by
94% of the population, while 4% of the population have no form of sanitation system and resort to
unsanitary waste disposal.
Most of the urban and rural populations make use of septic tanks and pit latrines for sanitation. There
are currently no formal sewerage systems in the rural areas, and only 7% of the urban population has
access to a formal sewerage system (Table 2-8).
Table 2-8: Existing access (%) to sanitation infrastructure in the Basin
Type Sewerage System (%) Septic tank/ Pit latrine (%) Bush (%)
Urban 7 92 1
Rural 0 95 5
Total 2 94 4
Source: Water Resources Management Authority, 2013
2.3.3.2 Land tenure
Four different entities can own land in Kenya, namely, the government, individuals and groups. Any
Kenyan individual can own land if they have been granted citizenship, which includes natural citizens
as well. Companies which are fully owned by Kenyan citizens or any trust whose beneficiaries are
Kenyan citizens can own land. The land tenure systems within Kenya can be characterised as
private/modern and communal/customary. There are five types of land tenures:
▪ Freehold: allows the owner to hold the land for an indefinite term.
▪ Leasehold: a leasehold agreement confers upon owners a limited term on property, which can be
extended upon expiry. Kenyan constitution limits tenure for non-citizens to a maximum of 99 years.
▪ Customary: rights are based on communal ownership, where the land is assigned to a defined
group of users or individuals. Users may belong to a clan or ethnic community.
▪ Public/State land: this is when the government is a private land owner. This system dates from the
Crown lands Ordinance of 1902 which declared that all waste and unoccupied land in the
protectorate was crown land.
▪ Foreign access to land in Kenya: a person who is not a citizen of Kenya may hold the land as part
of a leasehold tenure and this lease should not extend before 99 years.
The land tenure trends for the counties in LVN Basin are described in Table 2-9:
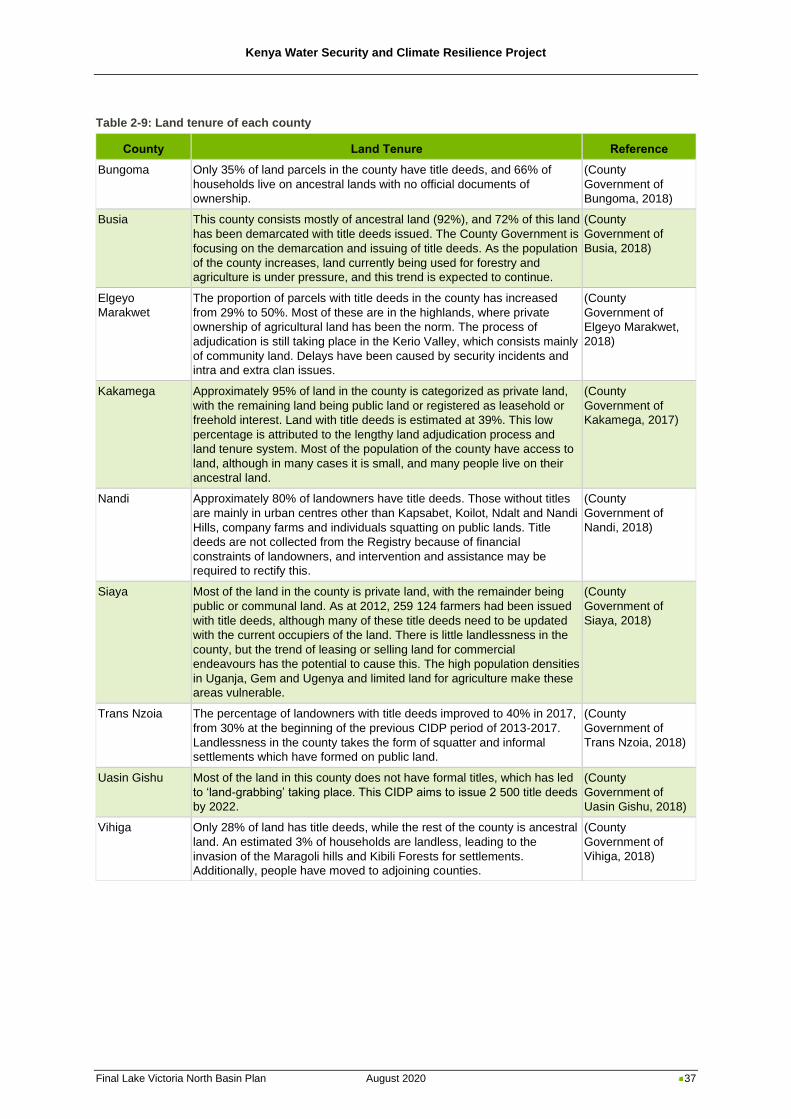
Kenya Water Security and Climate Resilience Project
Final Lake Victoria North Basin Plan August 2020 37
Table 2-9: Land tenure of each county
County Land Tenure Reference
Bungoma Only 35% of land parcels in the county have title deeds, and 66% of
households live on ancestral lands with no official documents of
ownership.
(County
Government of
Bungoma, 2018)
Busia This county consists mostly of ancestral land (92%), and 72% of this land
has been demarcated with title deeds issued. The County Government is
focusing on the demarcation and issuing of title deeds. As the population
of the county increases, land currently being used for forestry and
agriculture is under pressure, and this trend is expected to continue.
(County
Government of
Busia, 2018)
Elgeyo
Marakwet
The proportion of parcels with title deeds in the county has increased
from 29% to 50%. Most of these are in the highlands, where private
ownership of agricultural land has been the norm. The process of
adjudication is still taking place in the Kerio Valley, which consists mainly
of community land. Delays have been caused by security incidents and
intra and extra clan issues.
(County
Government of
Elgeyo Marakwet,
2018)
Kakamega Approximately 95% of land in the county is categorized as private land,
with the remaining land being public land or registered as leasehold or
freehold interest. Land with title deeds is estimated at 39%. This low
percentage is attributed to the lengthy land adjudication process and
land tenure system. Most of the population of the county have access to
land, although in many cases it is small, and many people live on their
ancestral land.
(County
Government of
Kakamega, 2017)
Nandi Approximately 80% of landowners have title deeds. Those without titles
are mainly in urban centres other than Kapsabet, Koilot, Ndalt and Nandi
Hills, company farms and individuals squatting on public lands. Title
deeds are not collected from the Registry because of financial
constraints of landowners, and intervention and assistance may be
required to rectify this.
(County
Government of
Nandi, 2018)
Siaya Most of the land in the county is private land, with the remainder being
public or communal land. As at 2012, 259 124 farmers had been issued
with title deeds, although many of these title deeds need to be updated
with the current occupiers of the land. There is little landlessness in the
county, but the trend of leasing or selling land for commercial
endeavours has the potential to cause this. The high population densities
in Uganja, Gem and Ugenya and limited land for agriculture make these
areas vulnerable.
(County
Government of
Siaya, 2018)
Trans Nzoia The percentage of landowners with title deeds improved to 40% in 2017,
from 30% at the beginning of the previous CIDP period of 2013-2017.
Landlessness in the county takes the form of squatter and informal
settlements which have formed on public land.
(County
Government of
Trans Nzoia, 2018)
Uasin Gishu Most of the land in this county does not have formal titles, which has led
to ‘land-grabbing’ taking place. This CIDP aims to issue 2 500 title deeds
by 2022.
(County
Government of
Uasin Gishu, 2018)
Vihiga Only 28% of land has title deeds, while the rest of the county is ancestral
land. An estimated 3% of households are landless, leading to the
invasion of the Maragoli hills and Kibili Forests for settlements.
Additionally, people have moved to adjoining counties.
(County
Government of
Vihiga, 2018)
Kenya Water Security and Climate Resilience Project
Final Lake Victoria North Basin Plan August 2020 38
2.4 Water resources
2.4.1 Surface water resources
2.4.1.1 Conceptual approach to surface water resources assessment
A surface water resources analysis for the LVN Basin was undertaken to quantify the available surface
water within the basin under natural conditions in both space and time (refer to Annexure A3). This
involved the development of a water resources systems model of the basin, including a rainfall-runoff
model. Based on the availability of historical rainfall data, a simulation period from 1960 to 2017 was
used for the model simulations, conducted at a daily time-step. MIKE HYDRO Basin, which incorporates
the NAM rainfall-runoff model, was used as the water resources systems model. The water resources
modelling task involved several sequential steps including the collection, review and quality control of
hydrometeorological data, model sub-catchment delineation, model calibration and validation, the
configuration of a system model, and hydrological assessment through water resources simulation.
Note: More details regarding the surface water resources assessment for the LVN Basin are provided
in “ISC Report C1-2: Lake Victoria North Surface Water Resources Assessment”.
2.4.1.2 Surface water resources potential
Figure 2-22 displays the simulated natural Mean Annual Runoff (MAR) at key locations across the LVN
Basin. From the Figure 2-22, the following observations can be made:
◼ The total basin natural runoff equals 5 622 MCM/a.
◼ More than 90% of the total basin runoff originates from the Nzoia, Yala and Sio rivers combined,
i.e. 64% from the Nzoia (3 576 MCM/a) 20% from the Yala (1 139 MCM/a) and 9% from the Sio
(522 MCM/a).
◼ The Malakasi River with a natural discharge of 222 MCM/a (4% of the total basin runoff) drains into
Uganda.
◼ The Malaba River, which also flows into Uganda, has a natural mean annual runoff of 162 MCM/a,
equivalent to less than 3% of the basin runoff.
◼ The month of May generally has the highest runoff, with elevated flows from April to December.
◼ The lowest runoff occurs from January to March.
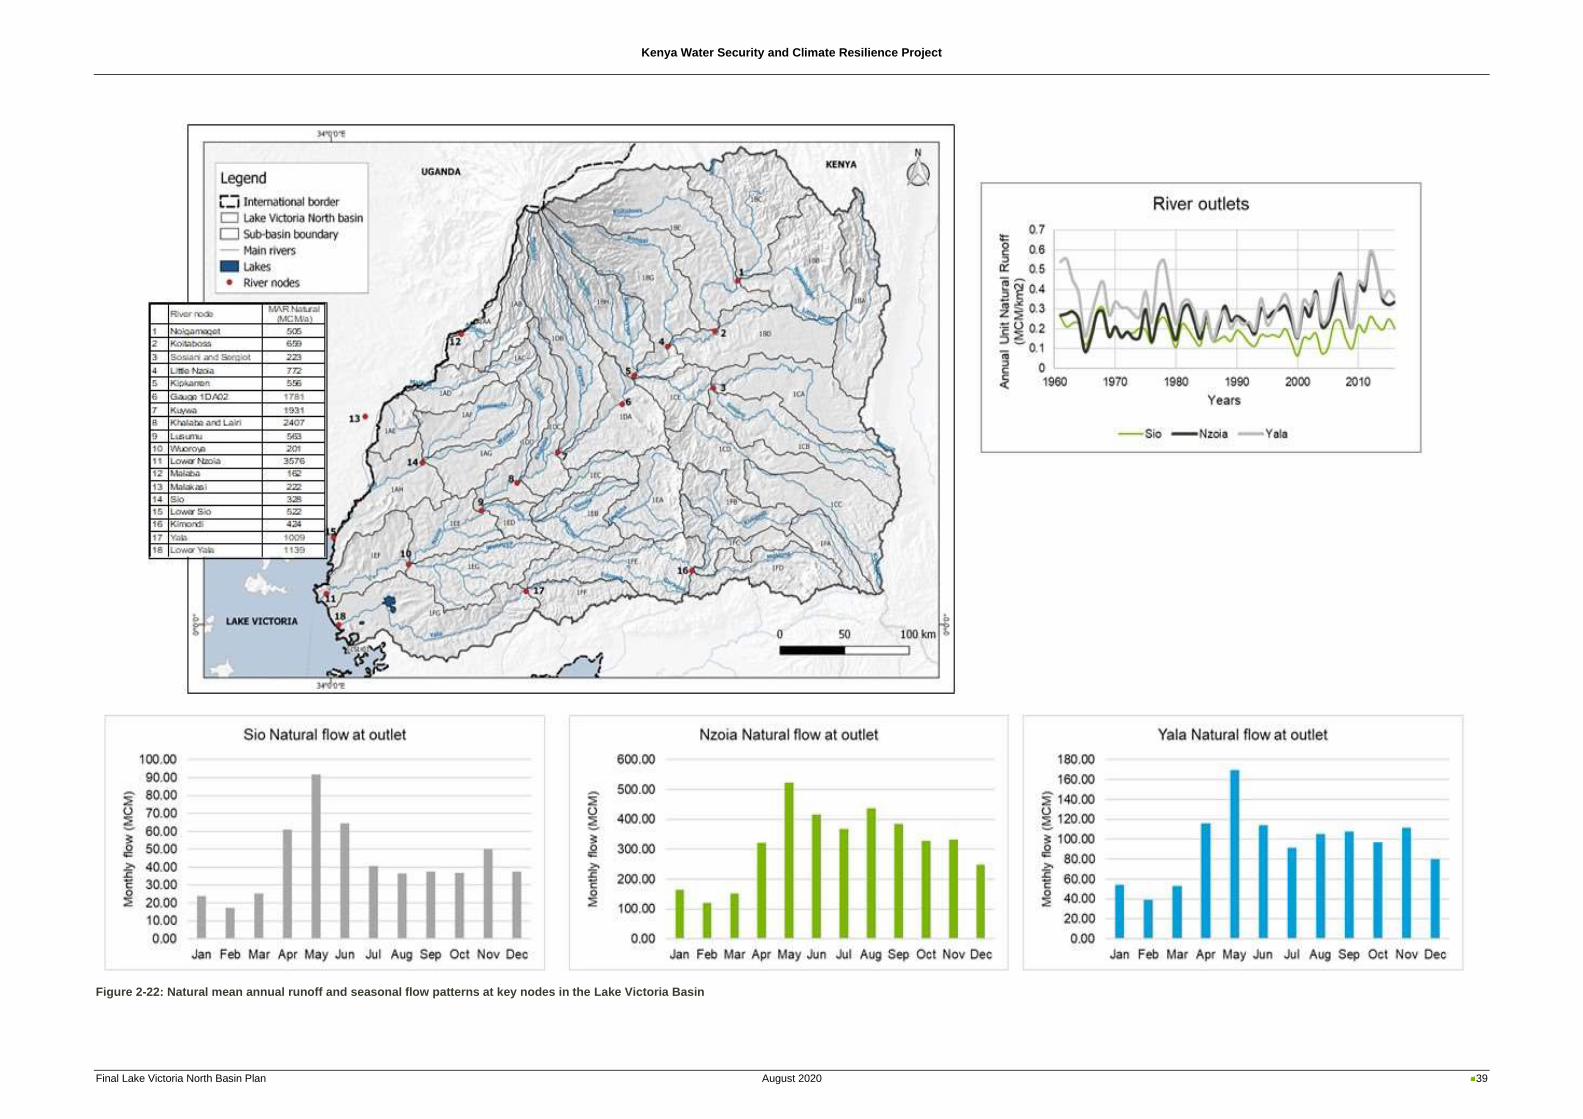
Kenya Water Security and Climate Resilience Project
Final Lake Victoria North Basin Plan August 2020 39
Figure 2-22: Natural mean annual runoff and seasonal flow patterns at key nodes in the Lake Victoria Basin
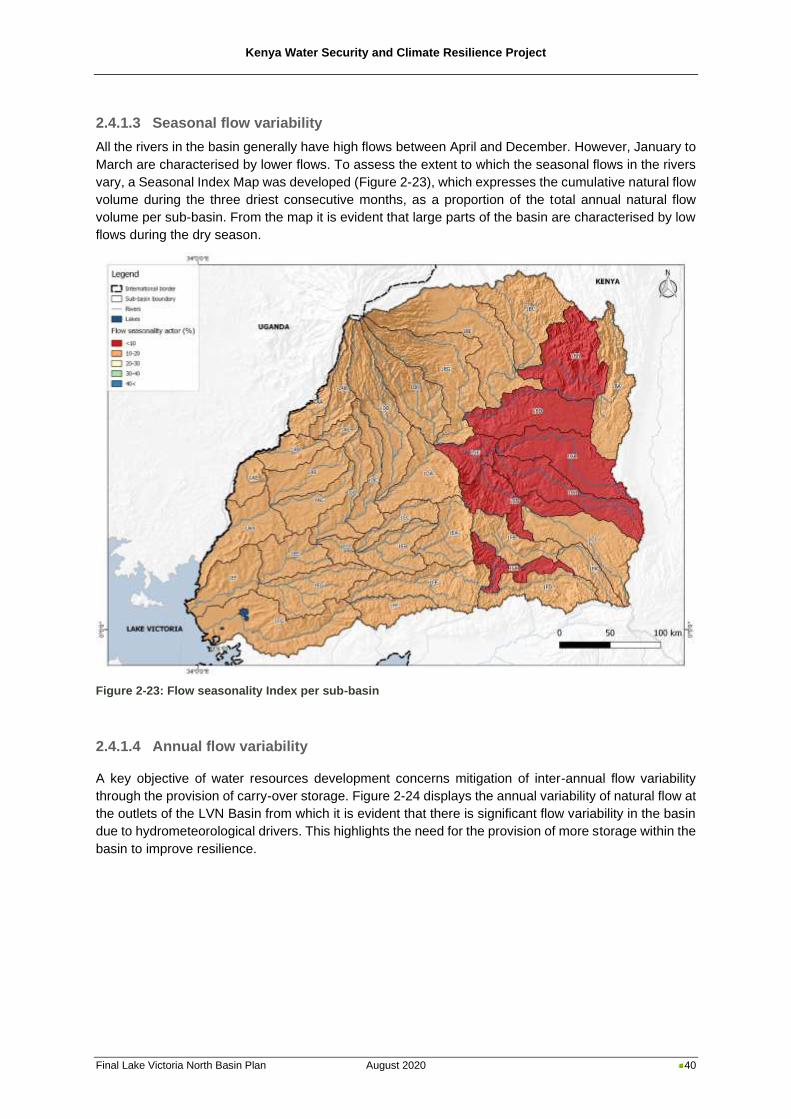
Kenya Water Security and Climate Resilience Project
Final Lake Victoria North Basin Plan August 2020 40
2.4.1.3 Seasonal flow variability
All the rivers in the basin generally have high flows between April and December. However, January to
March are characterised by lower flows. To assess the extent to which the seasonal flows in the rivers
vary, a Seasonal Index Map was developed (Figure 2-23), which expresses the cumulative natural flow
volume during the three driest consecutive months, as a proportion of the total annual natural flow
volume per sub-basin. From the map it is evident that large parts of the basin are characterised by low
flows during the dry season.
Figure 2-23: Flow seasonality Index per sub-basin
2.4.1.4 Annual flow variability
A key objective of water resources development concerns mitigation of inter-annual flow variability
through the provision of carry-over storage. Figure 2-24 displays the annual variability of natural flow at
the outlets of the LVN Basin from which it is evident that there is significant flow variability in the basin
due to hydrometeorological drivers. This highlights the need for the provision of more storage within the
basin to improve resilience.
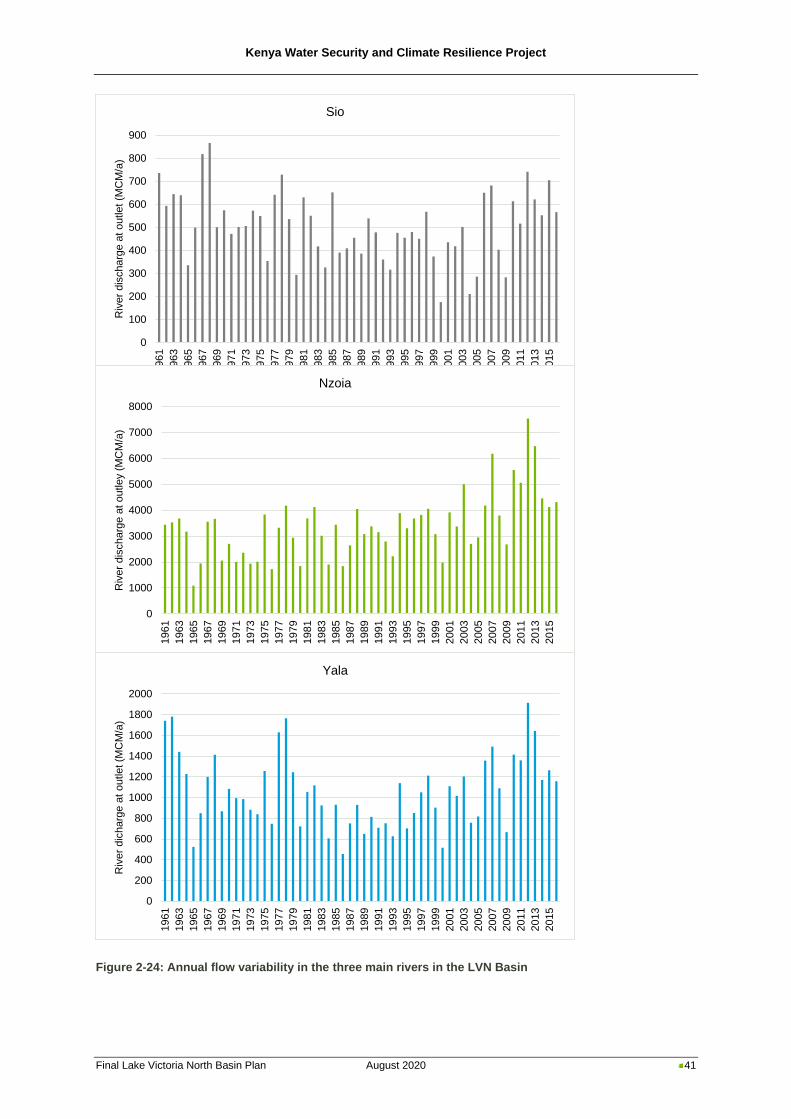
Kenya Water Security and Climate Resilience Project
Final Lake Victoria North Basin Plan August 2020 41
Figure 2-24: Annual flow variability in the three main rivers in the LVN Basin
0
100
200
300
400
500
600
700
800
900
1961
1963
1965
1967
1969
1971
1973
1975
1977
1979
1981
1983
1985
1987
1989
1991
1993
1995
1997
1999
2001
2003
2005
2007
2009
2011
2013
2015
Riv
er
dis
charg
e a
t outle
t (M
CM
/a)
Sio
0
1000
2000
3000
4000
5000
6000
7000
8000
1961
1963
1965
1967
1969
1971
1973
1975
1977
1979
1981
1983
1985
1987
1989
1991
1993
1995
1997
1999
2001
2003
2005
2007
2009
2011
2013
2015
Riv
er
dis
charg
e a
t outle
y (
MC
M/a
)
Nzoia
0
200
400
600
800
1000
1200
1400
1600
1800
2000
1961
1963
1965
1967
1969
1971
1973
1975
1977
1979
1981
1983
1985
1987
1989
1991
1993
1995
1997
1999
2001
2003
2005
2007
2009
2011
2013
2015
Riv
er
dic
harg
e a
t outle
t (M
CM
/a)
Yala
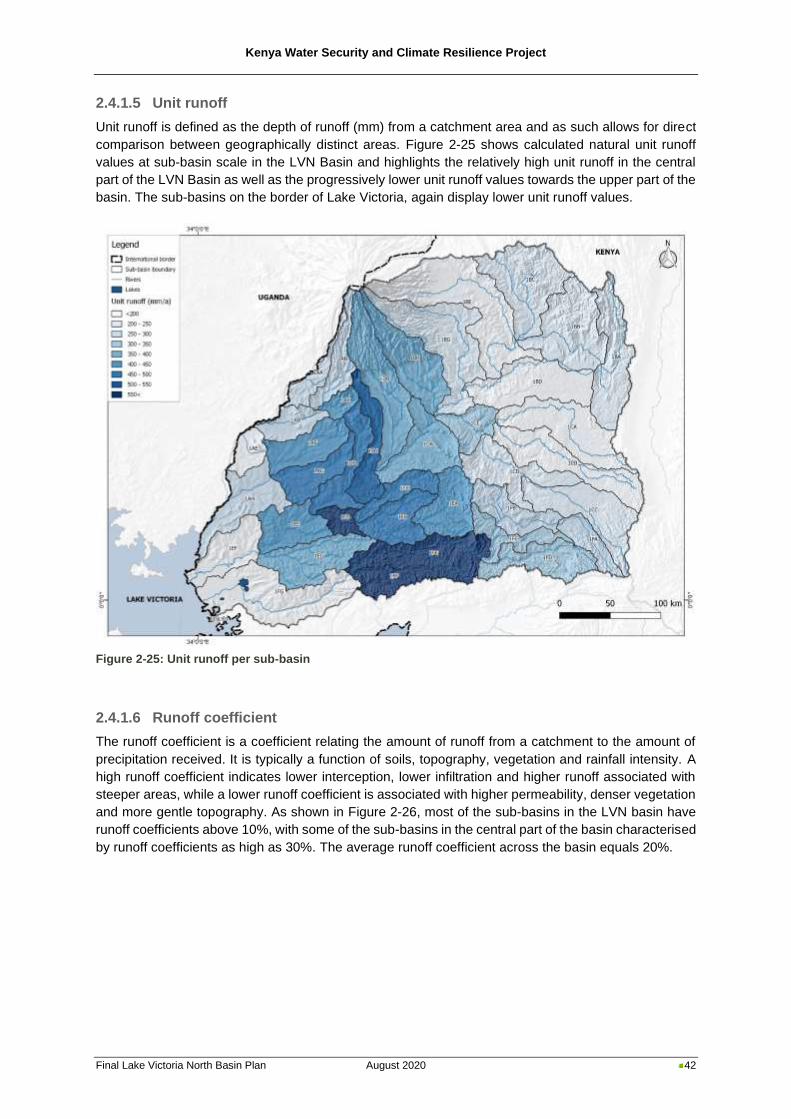
Kenya Water Security and Climate Resilience Project
Final Lake Victoria North Basin Plan August 2020 42
2.4.1.5 Unit runoff
Unit runoff is defined as the depth of runoff (mm) from a catchment area and as such allows for direct
comparison between geographically distinct areas. Figure 2-25 shows calculated natural unit runoff
values at sub-basin scale in the LVN Basin and highlights the relatively high unit runoff in the central
part of the LVN Basin as well as the progressively lower unit runoff values towards the upper part of the
basin. The sub-basins on the border of Lake Victoria, again display lower unit runoff values.
Figure 2-25: Unit runoff per sub-basin
2.4.1.6 Runoff coefficient
The runoff coefficient is a coefficient relating the amount of runoff from a catchment to the amount of
precipitation received. It is typically a function of soils, topography, vegetation and rainfall intensity. A
high runoff coefficient indicates lower interception, lower infiltration and higher runoff associated with
steeper areas, while a lower runoff coefficient is associated with higher permeability, denser vegetation
and more gentle topography. As shown in Figure 2-26, most of the sub-basins in the LVN basin have
runoff coefficients above 10%, with some of the sub-basins in the central part of the basin characterised
by runoff coefficients as high as 30%. The average runoff coefficient across the basin equals 20%.
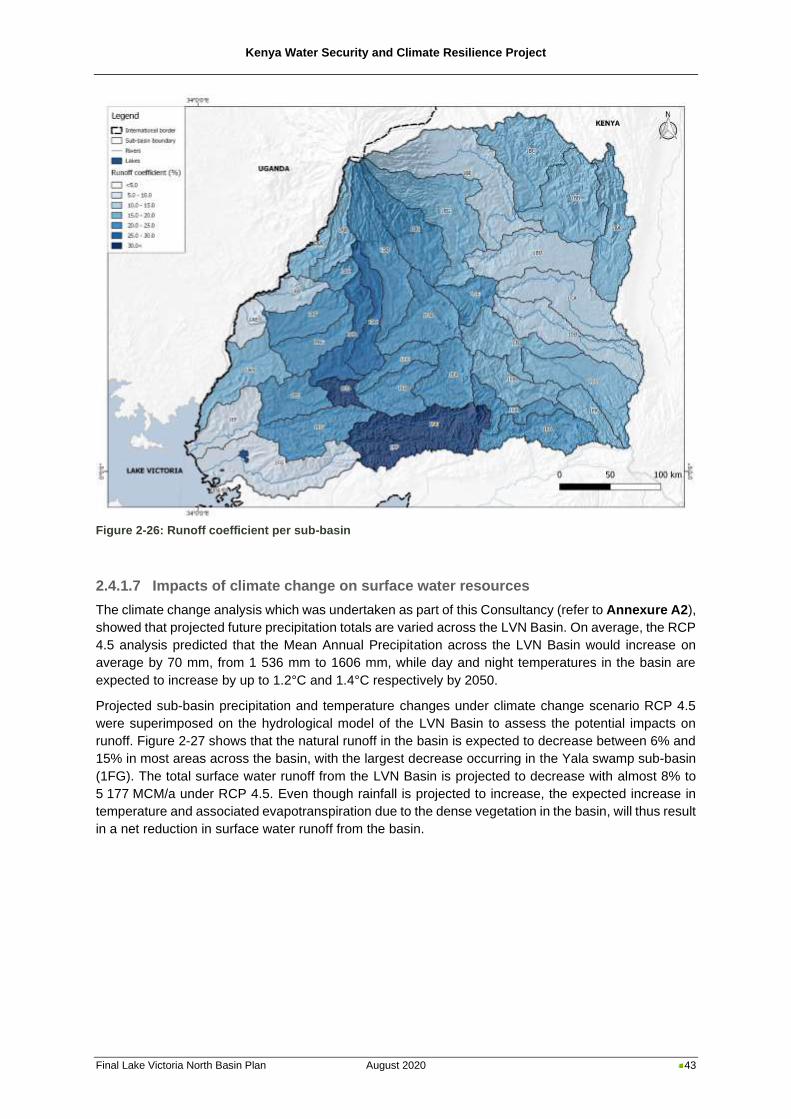
Kenya Water Security and Climate Resilience Project
Final Lake Victoria North Basin Plan August 2020 43
Figure 2-26: Runoff coefficient per sub-basin
2.4.1.7 Impacts of climate change on surface water resources
The climate change analysis which was undertaken as part of this Consultancy (refer to Annexure A2),
showed that projected future precipitation totals are varied across the LVN Basin. On average, the RCP
4.5 analysis predicted that the Mean Annual Precipitation across the LVN Basin would increase on
average by 70 mm, from 1 536 mm to 1606 mm, while day and night temperatures in the basin are
expected to increase by up to 1.2°C and 1.4°C respectively by 2050.
Projected sub-basin precipitation and temperature changes under climate change scenario RCP 4.5
were superimposed on the hydrological model of the LVN Basin to assess the potential impacts on
runoff. Figure 2-27 shows that the natural runoff in the basin is expected to decrease between 6% and
15% in most areas across the basin, with the largest decrease occurring in the Yala swamp sub-basin
(1FG). The total surface water runoff from the LVN Basin is projected to decrease with almost 8% to
5 177 MCM/a under RCP 4.5. Even though rainfall is projected to increase, the expected increase in
temperature and associated evapotranspiration due to the dense vegetation in the basin, will thus result
in a net reduction in surface water runoff from the basin.
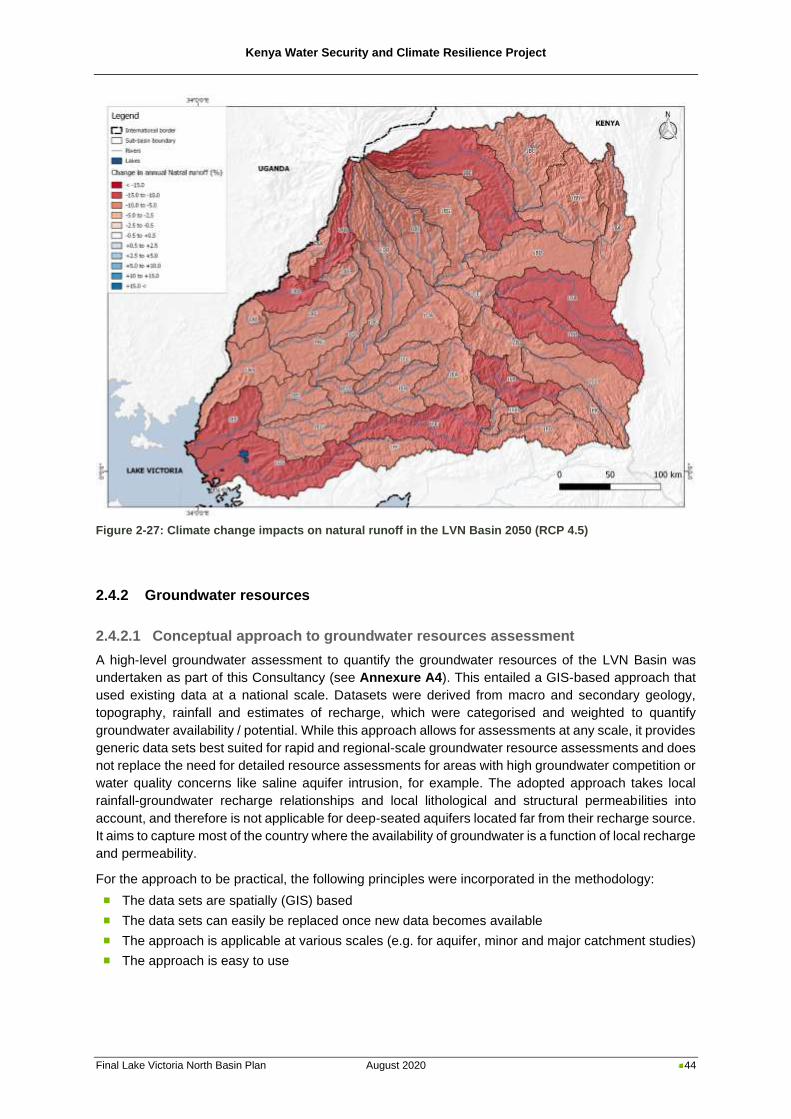
Kenya Water Security and Climate Resilience Project
Final Lake Victoria North Basin Plan August 2020 44
Figure 2-27: Climate change impacts on natural runoff in the LVN Basin 2050 (RCP 4.5)
2.4.2 Groundwater resources
2.4.2.1 Conceptual approach to groundwater resources assessment
A high-level groundwater assessment to quantify the groundwater resources of the LVN Basin was
undertaken as part of this Consultancy (see Annexure A4). This entailed a GIS-based approach that
used existing data at a national scale. Datasets were derived from macro and secondary geology,
topography, rainfall and estimates of recharge, which were categorised and weighted to quantify
groundwater availability / potential. While this approach allows for assessments at any scale, it provides
generic data sets best suited for rapid and regional-scale groundwater resource assessments and does
not replace the need for detailed resource assessments for areas with high groundwater competition or
water quality concerns like saline aquifer intrusion, for example. The adopted approach takes local
rainfall-groundwater recharge relationships and local lithological and structural permeabilities into
account, and therefore is not applicable for deep-seated aquifers located far from their recharge source.
It aims to capture most of the country where the availability of groundwater is a function of local recharge
and permeability.
For the approach to be practical, the following principles were incorporated in the methodology:
◼ The data sets are spatially (GIS) based
◼ The data sets can easily be replaced once new data becomes available
◼ The approach is applicable at various scales (e.g. for aquifer, minor and major catchment studies)
◼ The approach is easy to use
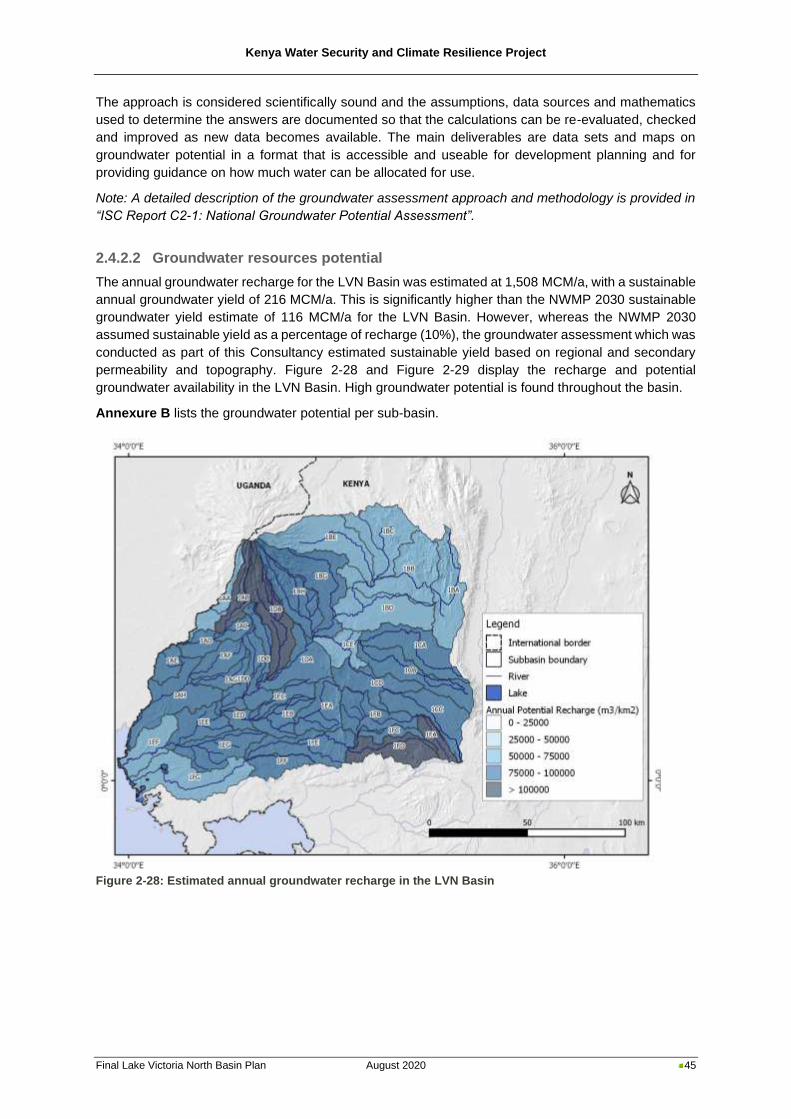
Kenya Water Security and Climate Resilience Project
Final Lake Victoria North Basin Plan August 2020 45
The approach is considered scientifically sound and the assumptions, data sources and mathematics
used to determine the answers are documented so that the calculations can be re-evaluated, checked
and improved as new data becomes available. The main deliverables are data sets and maps on
groundwater potential in a format that is accessible and useable for development planning and for
providing guidance on how much water can be allocated for use.
Note: A detailed description of the groundwater assessment approach and methodology is provided in
“ISC Report C2-1: National Groundwater Potential Assessment”.
2.4.2.2 Groundwater resources potential
The annual groundwater recharge for the LVN Basin was estimated at 1,508 MCM/a, with a sustainable
annual groundwater yield of 216 MCM/a. This is significantly higher than the NWMP 2030 sustainable
groundwater yield estimate of 116 MCM/a for the LVN Basin. However, whereas the NWMP 2030
assumed sustainable yield as a percentage of recharge (10%), the groundwater assessment which was
conducted as part of this Consultancy estimated sustainable yield based on regional and secondary
permeability and topography. Figure 2-28 and Figure 2-29 display the recharge and potential
groundwater availability in the LVN Basin. High groundwater potential is found throughout the basin.
Annexure B lists the groundwater potential per sub-basin.
Figure 2-28: Estimated annual groundwater recharge in the LVN Basin
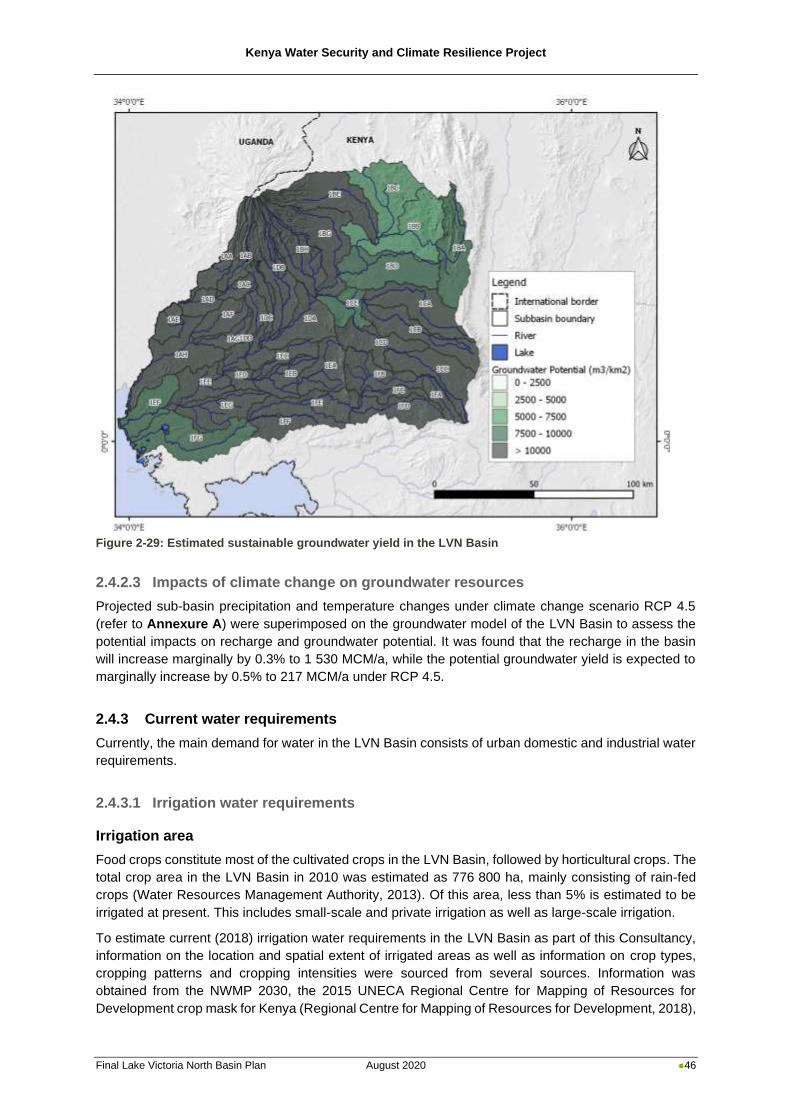
Kenya Water Security and Climate Resilience Project
Final Lake Victoria North Basin Plan August 2020 46
Figure 2-29: Estimated sustainable groundwater yield in the LVN Basin
2.4.2.3 Impacts of climate change on groundwater resources
Projected sub-basin precipitation and temperature changes under climate change scenario RCP 4.5
(refer to Annexure A) were superimposed on the groundwater model of the LVN Basin to assess the
potential impacts on recharge and groundwater potential. It was found that the recharge in the basin
will increase marginally by 0.3% to 1 530 MCM/a, while the potential groundwater yield is expected to
marginally increase by 0.5% to 217 MCM/a under RCP 4.5.
2.4.3 Current water requirements
Currently, the main demand for water in the LVN Basin consists of urban domestic and industrial water
requirements.
2.4.3.1 Irrigation water requirements
Irrigation area
Food crops constitute most of the cultivated crops in the LVN Basin, followed by horticultural crops. The
total crop area in the LVN Basin in 2010 was estimated as 776 800 ha, mainly consisting of rain-fed
crops (Water Resources Management Authority, 2013). Of this area, less than 5% is estimated to be
irrigated at present. This includes small-scale and private irrigation as well as large-scale irrigation.
To estimate current (2018) irrigation water requirements in the LVN Basin as part of this Consultancy,
information on the location and spatial extent of irrigated areas as well as information on crop types,
cropping patterns and cropping intensities were sourced from several sources. Information was
obtained from the NWMP 2030, the 2015 UNECA Regional Centre for Mapping of Resources for
Development crop mask for Kenya (Regional Centre for Mapping of Resources for Development, 2018),
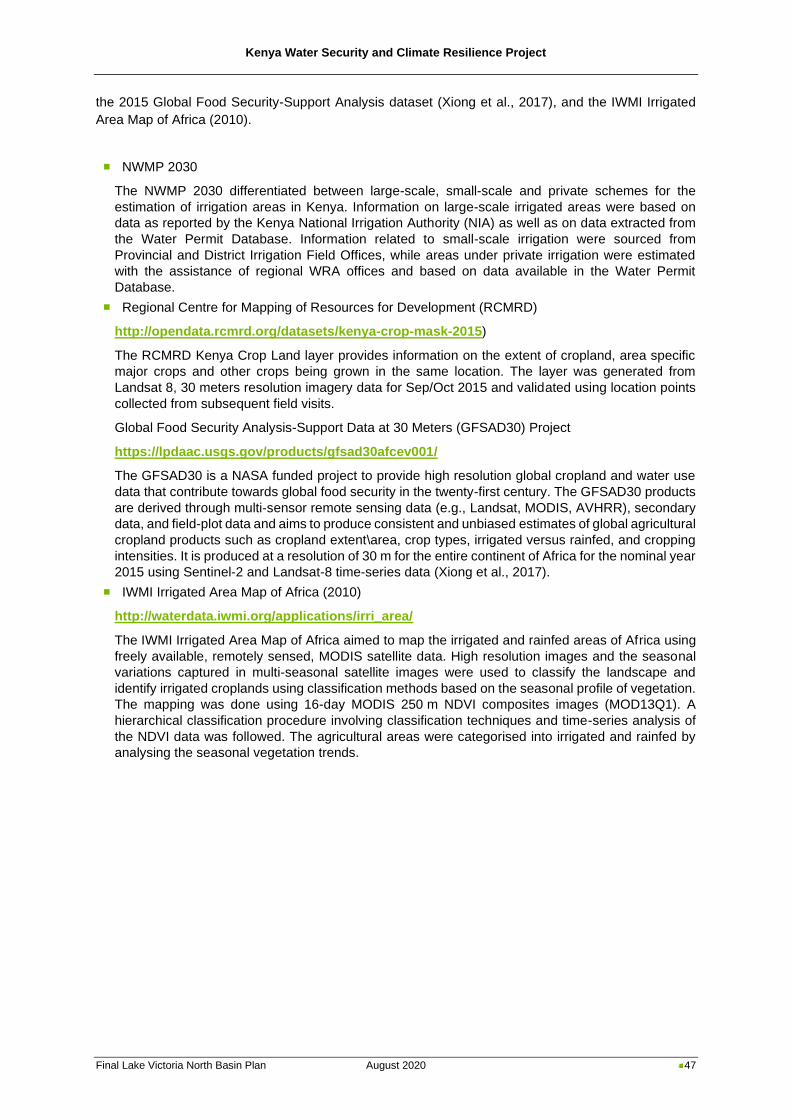
Kenya Water Security and Climate Resilience Project
Final Lake Victoria North Basin Plan August 2020 47
the 2015 Global Food Security-Support Analysis dataset (Xiong et al., 2017), and the IWMI Irrigated
Area Map of Africa (2010).
◼ NWMP 2030
The NWMP 2030 differentiated between large-scale, small-scale and private schemes for the
estimation of irrigation areas in Kenya. Information on large-scale irrigated areas were based on
data as reported by the Kenya National Irrigation Authority (NIA) as well as on data extracted from
the Water Permit Database. Information related to small-scale irrigation were sourced from
Provincial and District Irrigation Field Offices, while areas under private irrigation were estimated
with the assistance of regional WRA offices and based on data available in the Water Permit
Database.
◼ Regional Centre for Mapping of Resources for Development (RCMRD)
http://opendata.rcmrd.org/datasets/kenya-crop-mask-2015)
The RCMRD Kenya Crop Land layer provides information on the extent of cropland, area specific
major crops and other crops being grown in the same location. The layer was generated from
Landsat 8, 30 meters resolution imagery data for Sep/Oct 2015 and validated using location points
collected from subsequent field visits.
Global Food Security Analysis-Support Data at 30 Meters (GFSAD30) Project
https://lpdaac.usgs.gov/products/gfsad30afcev001/
The GFSAD30 is a NASA funded project to provide high resolution global cropland and water use
data that contribute towards global food security in the twenty-first century. The GFSAD30 products
are derived through multi-sensor remote sensing data (e.g., Landsat, MODIS, AVHRR), secondary
data, and field-plot data and aims to produce consistent and unbiased estimates of global agricultural
cropland products such as cropland extent\area, crop types, irrigated versus rainfed, and cropping
intensities. It is produced at a resolution of 30 m for the entire continent of Africa for the nominal year
2015 using Sentinel-2 and Landsat-8 time-series data (Xiong et al., 2017).
◼ IWMI Irrigated Area Map of Africa (2010)
http://waterdata.iwmi.org/applications/irri_area/
The IWMI Irrigated Area Map of Africa aimed to map the irrigated and rainfed areas of Africa using
freely available, remotely sensed, MODIS satellite data. High resolution images and the seasonal
variations captured in multi-seasonal satellite images were used to classify the landscape and
identify irrigated croplands using classification methods based on the seasonal profile of vegetation.
The mapping was done using 16-day MODIS 250 m NDVI composites images (MOD13Q1). A
hierarchical classification procedure involving classification techniques and time-series analysis of
the NDVI data was followed. The agricultural areas were categorised into irrigated and rainfed by
analysing the seasonal vegetation trends.
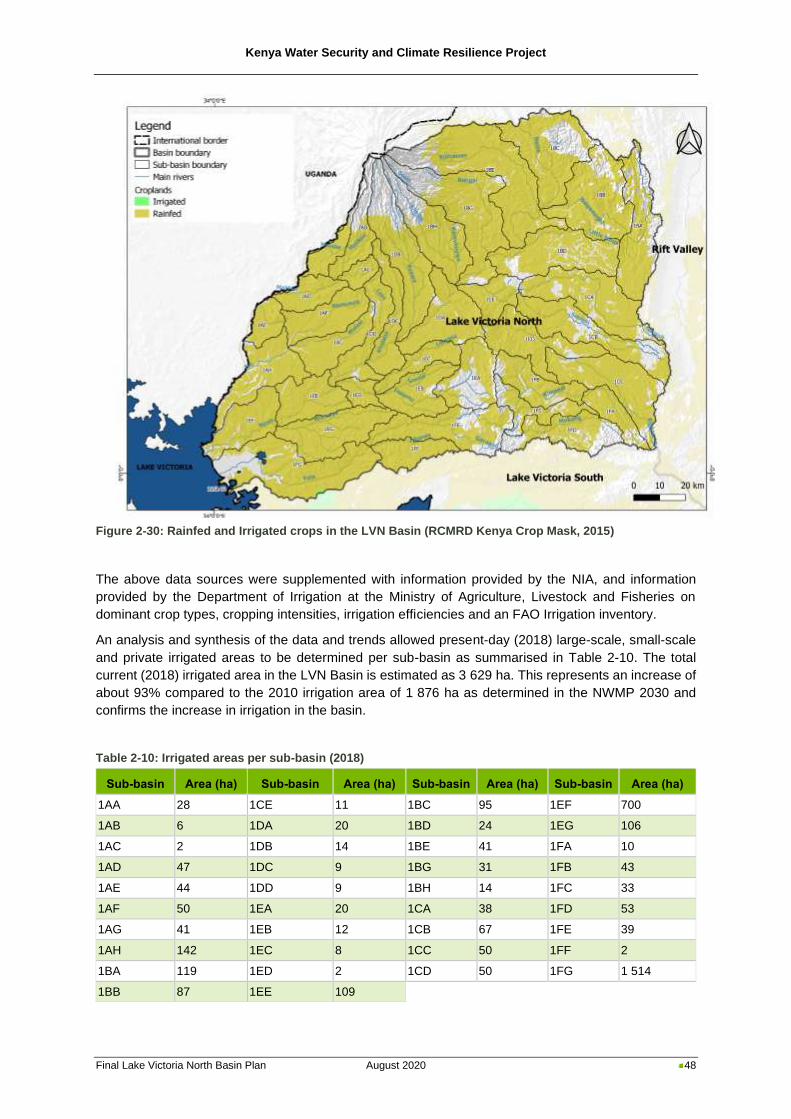
Kenya Water Security and Climate Resilience Project
Final Lake Victoria North Basin Plan August 2020 48
Figure 2-30: Rainfed and Irrigated crops in the LVN Basin (RCMRD Kenya Crop Mask, 2015)
The above data sources were supplemented with information provided by the NIA, and information
provided by the Department of Irrigation at the Ministry of Agriculture, Livestock and Fisheries on
dominant crop types, cropping intensities, irrigation efficiencies and an FAO Irrigation inventory.
An analysis and synthesis of the data and trends allowed present-day (2018) large-scale, small-scale
and private irrigated areas to be determined per sub-basin as summarised in Table 2-10. The total
current (2018) irrigated area in the LVN Basin is estimated as 3 629 ha. This represents an increase of
about 93% compared to the 2010 irrigation area of 1 876 ha as determined in the NWMP 2030 and
confirms the increase in irrigation in the basin.
Table 2-10: Irrigated areas per sub-basin (2018)
Sub-basin Area (ha) Sub-basin Area (ha) Sub-basin Area (ha) Sub-basin Area (ha)
1AA 28 1CE 11 1BC 95 1EF 700
1AB 6 1DA 20 1BD 24 1EG 106
1AC 2 1DB 14 1BE 41 1FA 10
1AD 47 1DC 9 1BG 31 1FB 43
1AE 44 1DD 9 1BH 14 1FC 33
1AF 50 1EA 20 1CA 38 1FD 53
1AG 41 1EB 12 1CB 67 1FE 39
1AH 142 1EC 8 1CC 50 1FF 2
1BA 119 1ED 2 1CD 50 1FG 1 514
1BB 87 1EE 109
Kenya Water Security and Climate Resilience Project
Final Lake Victoria North Basin Plan August 2020 49
Irrigation water demand
The standard crop coefficient (Kc) approach was used to estimate irrigation water requirements per
sub-basin. Kc values were obtained from the FAO Irrigation and Drainage Paper 56 (Allen et al., 1998),
using regional data where available. An effective rainfall factor of 0.6 was assumed, and an average
irrigation efficiency factor of 0.5 (Ministry of Agriculture, Livestock and Fisheries, personal
communication, February 2019). 200% cropping intensities were assumed for large scale irrigation
schemes as well as for small-scale horticulture, maize, rice and sorghum, while a 60% cropping intensity
was used for vegetables, beans, green grams and cow peas (Ministry of Agriculture, Livestock and
Fisheries, personal communication, February 2019).
The total current irrigation demand in the LVN Basin was calculated as 40 MCM/a and includes
26 MCM/a for large scale irrigation and 14 MCM/a for small-scale and private irrigation. It equates to
an average irrigation demand of 11 022 m3/ha per annum and is almost double the 2010 estimated
demand of 18 MCM/a for irrigation as per the NWMP 2030. This demand is predominantly supplied
from surface water, although groundwater provides some supply for small-scale irrigation.
2.4.3.2 Domestic and Industrial water requirements
For some of the urban centres in the basin, the latest water demand figures for domestic and industrial
use were obtained from recent development and master plans or similar studies. Water demands for
urban domestic and industrial as well as rural domestic use were also extracted per sub-basin from the
NWMP 2030 and from the WRA Permit Database and compared. Where the Permit Database values
were higher than the NWMP 2030 estimates extrapolated to 2018, the permit Database values were
used as representative of the current demand and vice versa. The total domestic and industrial water
demand in the basin was estimated at 205 MCM/a. This is slightly more than the NWMP 2030 estimate
(2010) of 175 MCM/a as should be expected.
2.4.3.3 Livestock water requirements
The livestock water demands in the LVN Basin, as per the WRA Permit Database, were compared to
that of the NWMP 2030 and found to be significantly less. Due to the livestock water demand in the
LVN Basin being almost negligible when compared to the urban-rural and irrigation demands, a
conservative approach was adopted for this Study by extrapolating the NWMP 2030 estimate to
29 MCM/a as the demand for 2018. Most of the livestock water demand is supplied from surface water.
2.4.3.4 Wildlife and fisheries
Water demands for fisheries and wildlife constitute less than 1% of water demand in the basin.
Consequently, the wildlife and fisheries water demand values as stated in the NWMP 2030 were
accepted as correct and extrapolated to a 2018 demand of 12 MCM/a.
2.4.3.5 Total water requirements
The total current water requirement (2018) in the LVN Basin equates to 286 MCM/a. Currently, the main
demand for water in the LVN Basin is constituted by domestic and industrial water requirements,
followed by irrigation and livestock as summarised in Table 2-11. Figure 2-31 shows the distribution of
current water demands across the LVN Basin. Current water requirements per sub-basin and main user
category in the Lake Victoria North Basin are summarised in Annexure B1.
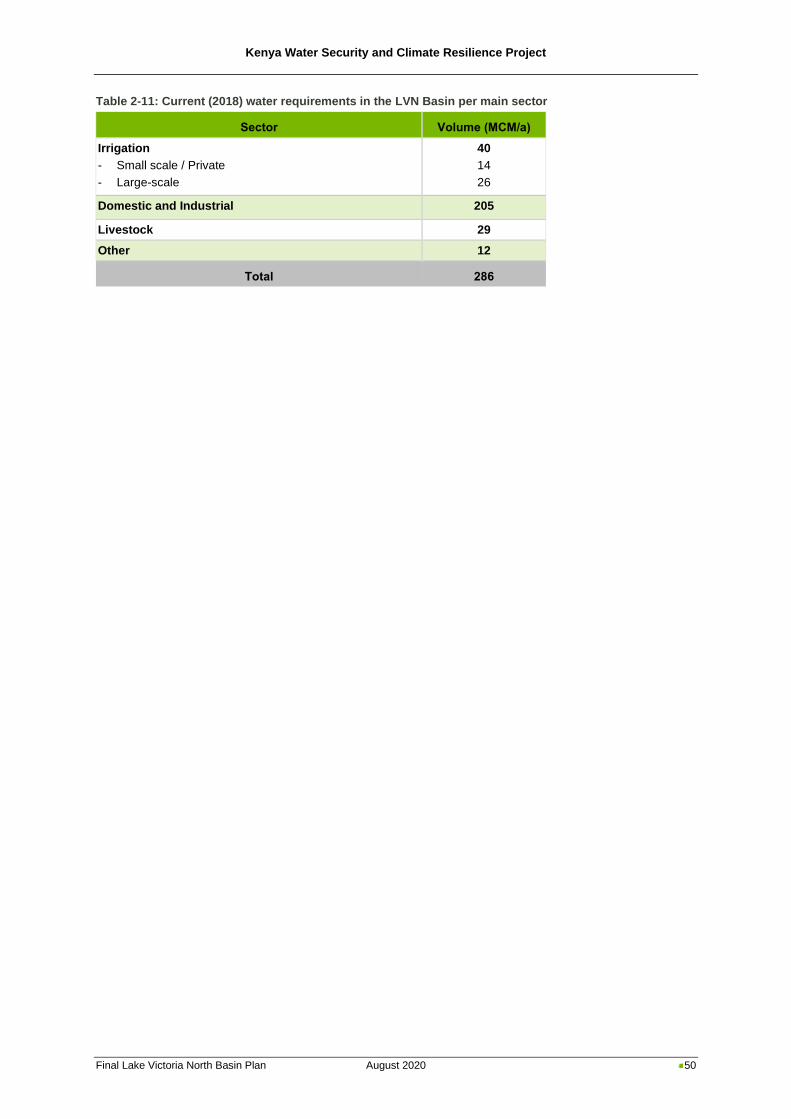
Kenya Water Security and Climate Resilience Project
Final Lake Victoria North Basin Plan August 2020 50
Table 2-11: Current (2018) water requirements in the LVN Basin per main sector
Sector Volume (MCM/a)
Irrigation
- Small scale / Private
- Large-scale
40
14
26
Domestic and Industrial 205
Livestock 29
Other 12
Total 286

Kenya Water Security and Climate Resilience Project
Final Lake Victoria North Basin Plan August 2020 51
Figure 2-31: Present-day (2018) water requirements across the LVN Basin
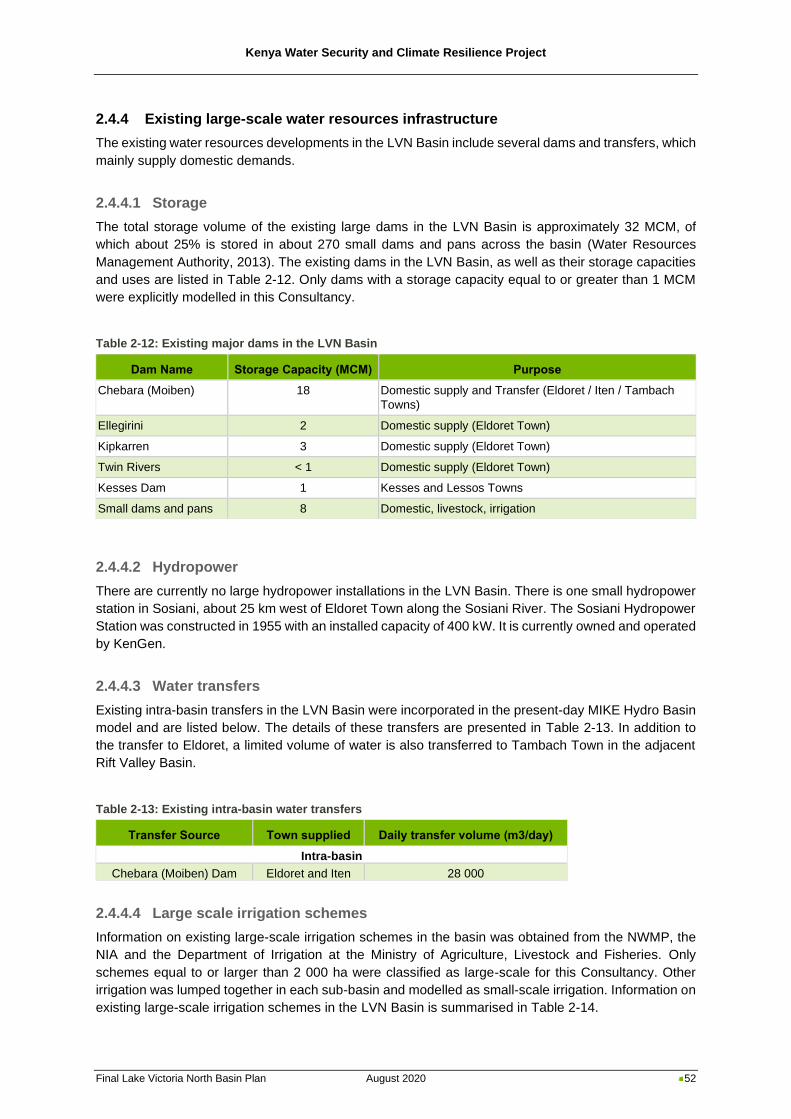
Kenya Water Security and Climate Resilience Project
Final Lake Victoria North Basin Plan August 2020 52
2.4.4 Existing large-scale water resources infrastructure
The existing water resources developments in the LVN Basin include several dams and transfers, which
mainly supply domestic demands.
2.4.4.1 Storage
The total storage volume of the existing large dams in the LVN Basin is approximately 32 MCM, of
which about 25% is stored in about 270 small dams and pans across the basin (Water Resources
Management Authority, 2013). The existing dams in the LVN Basin, as well as their storage capacities
and uses are listed in Table 2-12. Only dams with a storage capacity equal to or greater than 1 MCM
were explicitly modelled in this Consultancy.
Table 2-12: Existing major dams in the LVN Basin
Dam Name Storage Capacity (MCM) Purpose
Chebara (Moiben) 18 Domestic supply and Transfer (Eldoret / Iten / Tambach
Towns)
Ellegirini 2 Domestic supply (Eldoret Town)
Kipkarren 3 Domestic supply (Eldoret Town)
Twin Rivers < 1 Domestic supply (Eldoret Town)
Kesses Dam 1 Kesses and Lessos Towns
Small dams and pans 8 Domestic, livestock, irrigation
2.4.4.2 Hydropower
There are currently no large hydropower installations in the LVN Basin. There is one small hydropower
station in Sosiani, about 25 km west of Eldoret Town along the Sosiani River. The Sosiani Hydropower
Station was constructed in 1955 with an installed capacity of 400 kW. It is currently owned and operated
by KenGen.
2.4.4.3 Water transfers
Existing intra-basin transfers in the LVN Basin were incorporated in the present-day MIKE Hydro Basin
model and are listed below. The details of these transfers are presented in Table 2-13. In addition to
the transfer to Eldoret, a limited volume of water is also transferred to Tambach Town in the adjacent
Rift Valley Basin.
Table 2-13: Existing intra-basin water transfers
Transfer Source Town supplied Daily transfer volume (m3/day)
Intra-basin
Chebara (Moiben) Dam Eldoret and Iten 28 000
2.4.4.4 Large scale irrigation schemes
Information on existing large-scale irrigation schemes in the basin was obtained from the NWMP, the
NIA and the Department of Irrigation at the Ministry of Agriculture, Livestock and Fisheries. Only
schemes equal to or larger than 2 000 ha were classified as large-scale for this Consultancy. Other
irrigation was lumped together in each sub-basin and modelled as small-scale irrigation. Information on
existing large-scale irrigation schemes in the LVN Basin is summarised in Table 2-14.
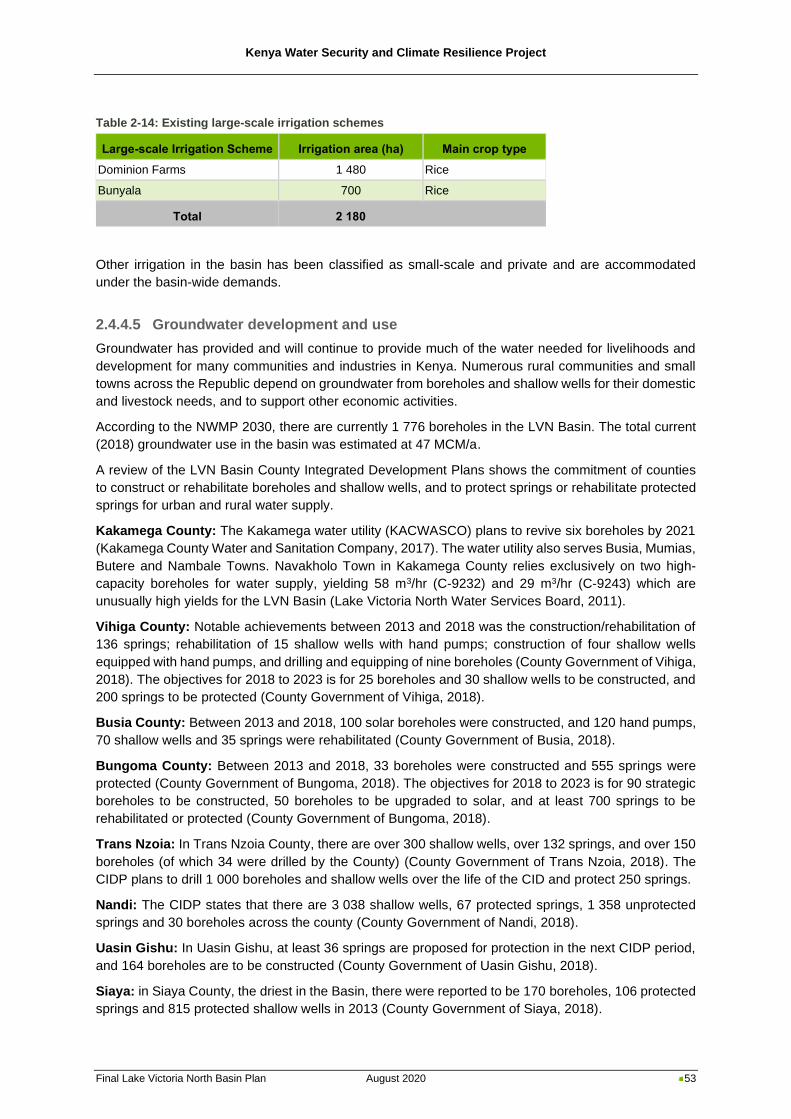
Kenya Water Security and Climate Resilience Project
Final Lake Victoria North Basin Plan August 2020 53
Table 2-14: Existing large-scale irrigation schemes
Large-scale Irrigation Scheme Irrigation area (ha) Main crop type
Dominion Farms 1 480 Rice
Bunyala 700 Rice
Total 2 180
Other irrigation in the basin has been classified as small-scale and private and are accommodated
under the basin-wide demands.
2.4.4.5 Groundwater development and use
Groundwater has provided and will continue to provide much of the water needed for livelihoods and
development for many communities and industries in Kenya. Numerous rural communities and small
towns across the Republic depend on groundwater from boreholes and shallow wells for their domestic
and livestock needs, and to support other economic activities.
According to the NWMP 2030, there are currently 1 776 boreholes in the LVN Basin. The total current
(2018) groundwater use in the basin was estimated at 47 MCM/a.
A review of the LVN Basin County Integrated Development Plans shows the commitment of counties
to construct or rehabilitate boreholes and shallow wells, and to protect springs or rehabilitate protected
springs for urban and rural water supply.
Kakamega County: The Kakamega water utility (KACWASCO) plans to revive six boreholes by 2021
(Kakamega County Water and Sanitation Company, 2017). The water utility also serves Busia, Mumias,
Butere and Nambale Towns. Navakholo Town in Kakamega County relies exclusively on two high-
capacity boreholes for water supply, yielding 58 m3/hr (C-9232) and 29 m3/hr (C-9243) which are
unusually high yields for the LVN Basin (Lake Victoria North Water Services Board, 2011).
Vihiga County: Notable achievements between 2013 and 2018 was the construction/rehabilitation of
136 springs; rehabilitation of 15 shallow wells with hand pumps; construction of four shallow wells
equipped with hand pumps, and drilling and equipping of nine boreholes (County Government of Vihiga,
2018). The objectives for 2018 to 2023 is for 25 boreholes and 30 shallow wells to be constructed, and
200 springs to be protected (County Government of Vihiga, 2018).
Busia County: Between 2013 and 2018, 100 solar boreholes were constructed, and 120 hand pumps,
70 shallow wells and 35 springs were rehabilitated (County Government of Busia, 2018).
Bungoma County: Between 2013 and 2018, 33 boreholes were constructed and 555 springs were
protected (County Government of Bungoma, 2018). The objectives for 2018 to 2023 is for 90 strategic
boreholes to be constructed, 50 boreholes to be upgraded to solar, and at least 700 springs to be
rehabilitated or protected (County Government of Bungoma, 2018).
Trans Nzoia: In Trans Nzoia County, there are over 300 shallow wells, over 132 springs, and over 150
boreholes (of which 34 were drilled by the County) (County Government of Trans Nzoia, 2018). The
CIDP plans to drill 1 000 boreholes and shallow wells over the life of the CID and protect 250 springs.
Nandi: The CIDP states that there are 3 038 shallow wells, 67 protected springs, 1 358 unprotected
springs and 30 boreholes across the county (County Government of Nandi, 2018).
Uasin Gishu: In Uasin Gishu, at least 36 springs are proposed for protection in the next CIDP period,
and 164 boreholes are to be constructed (County Government of Uasin Gishu, 2018).
Siaya: in Siaya County, the driest in the Basin, there were reported to be 170 boreholes, 106 protected
springs and 815 protected shallow wells in 2013 (County Government of Siaya, 2018).
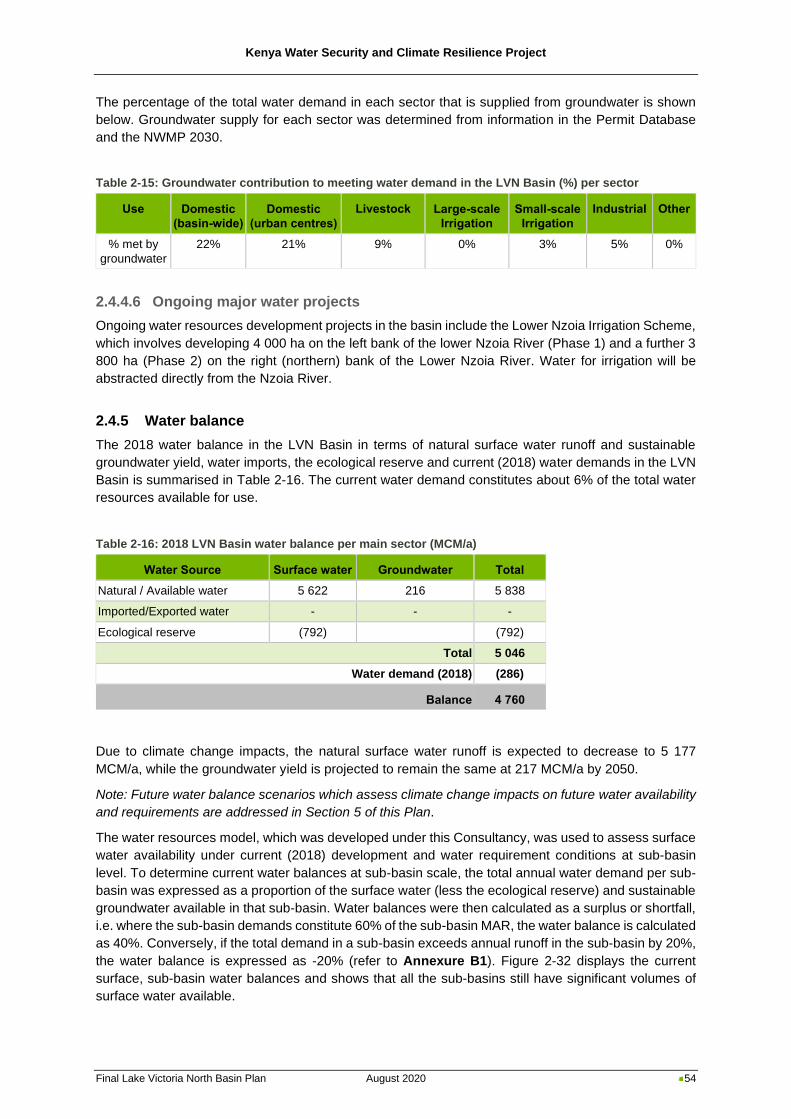
Kenya Water Security and Climate Resilience Project
Final Lake Victoria North Basin Plan August 2020 54
The percentage of the total water demand in each sector that is supplied from groundwater is shown
below. Groundwater supply for each sector was determined from information in the Permit Database
and the NWMP 2030.
Table 2-15: Groundwater contribution to meeting water demand in the LVN Basin (%) per sector
Use Domestic
(basin-wide)
Domestic
(urban centres)
Livestock Large-scale
Irrigation
Small-scale
Irrigation
Industrial Other
% met by
groundwater
22% 21% 9% 0% 3% 5% 0%
2.4.4.6 Ongoing major water projects
Ongoing water resources development projects in the basin include the Lower Nzoia Irrigation Scheme,
which involves developing 4 000 ha on the left bank of the lower Nzoia River (Phase 1) and a further 3
800 ha (Phase 2) on the right (northern) bank of the Lower Nzoia River. Water for irrigation will be
abstracted directly from the Nzoia River.
2.4.5 Water balance
The 2018 water balance in the LVN Basin in terms of natural surface water runoff and sustainable
groundwater yield, water imports, the ecological reserve and current (2018) water demands in the LVN
Basin is summarised in Table 2-16. The current water demand constitutes about 6% of the total water
resources available for use.
Table 2-16: 2018 LVN Basin water balance per main sector (MCM/a)
Water Source Surface water Groundwater Total
Natural / Available water 5 622 216 5 838
Imported/Exported water - - -
Ecological reserve (792) (792)
Total 5 046
Water demand (2018) (286)
Balance 4 760
Due to climate change impacts, the natural surface water runoff is expected to decrease to 5 177
MCM/a, while the groundwater yield is projected to remain the same at 217 MCM/a by 2050.
Note: Future water balance scenarios which assess climate change impacts on future water availability
and requirements are addressed in Section 5 of this Plan.
The water resources model, which was developed under this Consultancy, was used to assess surface
water availability under current (2018) development and water requirement conditions at sub-basin
level. To determine current water balances at sub-basin scale, the total annual water demand per sub-
basin was expressed as a proportion of the surface water (less the ecological reserve) and sustainable
groundwater available in that sub-basin. Water balances were then calculated as a surplus or shortfall,
i.e. where the sub-basin demands constitute 60% of the sub-basin MAR, the water balance is calculated
as 40%. Conversely, if the total demand in a sub-basin exceeds annual runoff in the sub-basin by 20%,
the water balance is expressed as -20% (refer to Annexure B1). Figure 2-32 displays the current
surface, sub-basin water balances and shows that all the sub-basins still have significant volumes of
surface water available.
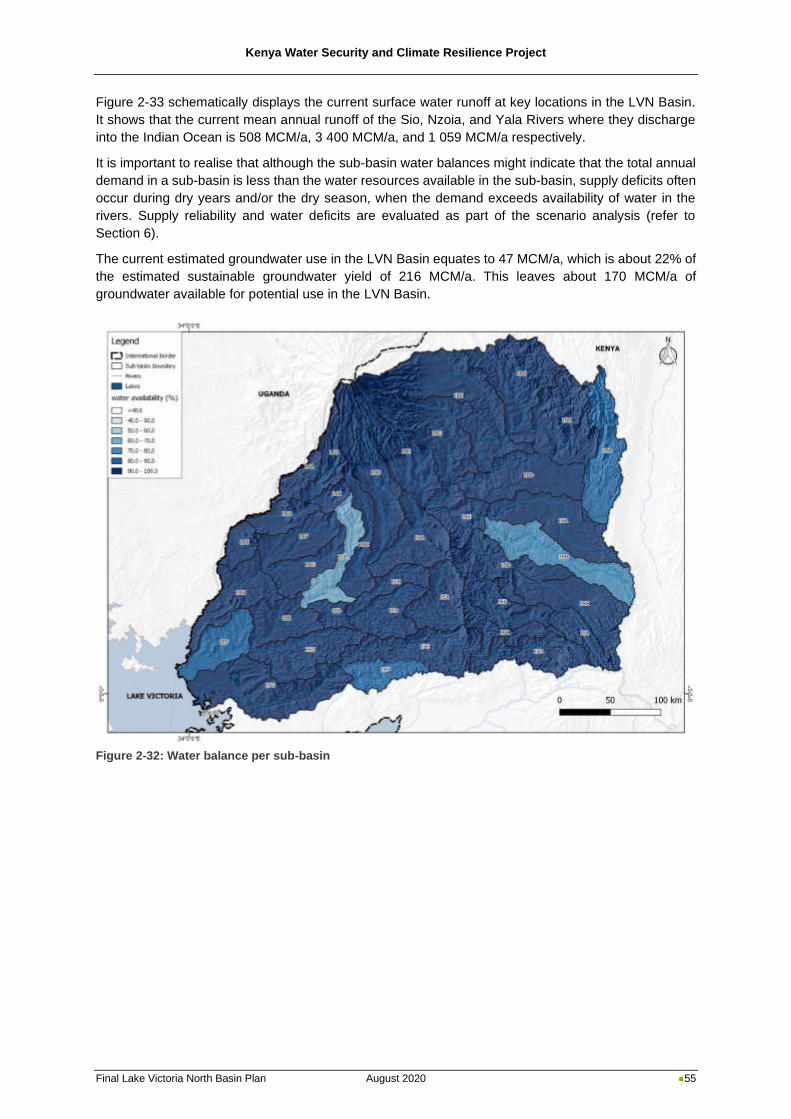
Kenya Water Security and Climate Resilience Project
Final Lake Victoria North Basin Plan August 2020 55
Figure 2-33 schematically displays the current surface water runoff at key locations in the LVN Basin.
It shows that the current mean annual runoff of the Sio, Nzoia, and Yala Rivers where they discharge
into the Indian Ocean is 508 MCM/a, 3 400 MCM/a, and 1 059 MCM/a respectively.
It is important to realise that although the sub-basin water balances might indicate that the total annual
demand in a sub-basin is less than the water resources available in the sub-basin, supply deficits often
occur during dry years and/or the dry season, when the demand exceeds availability of water in the
rivers. Supply reliability and water deficits are evaluated as part of the scenario analysis (refer to
Section 6).
The current estimated groundwater use in the LVN Basin equates to 47 MCM/a, which is about 22% of
the estimated sustainable groundwater yield of 216 MCM/a. This leaves about 170 MCM/a of
groundwater available for potential use in the LVN Basin.
Figure 2-32: Water balance per sub-basin
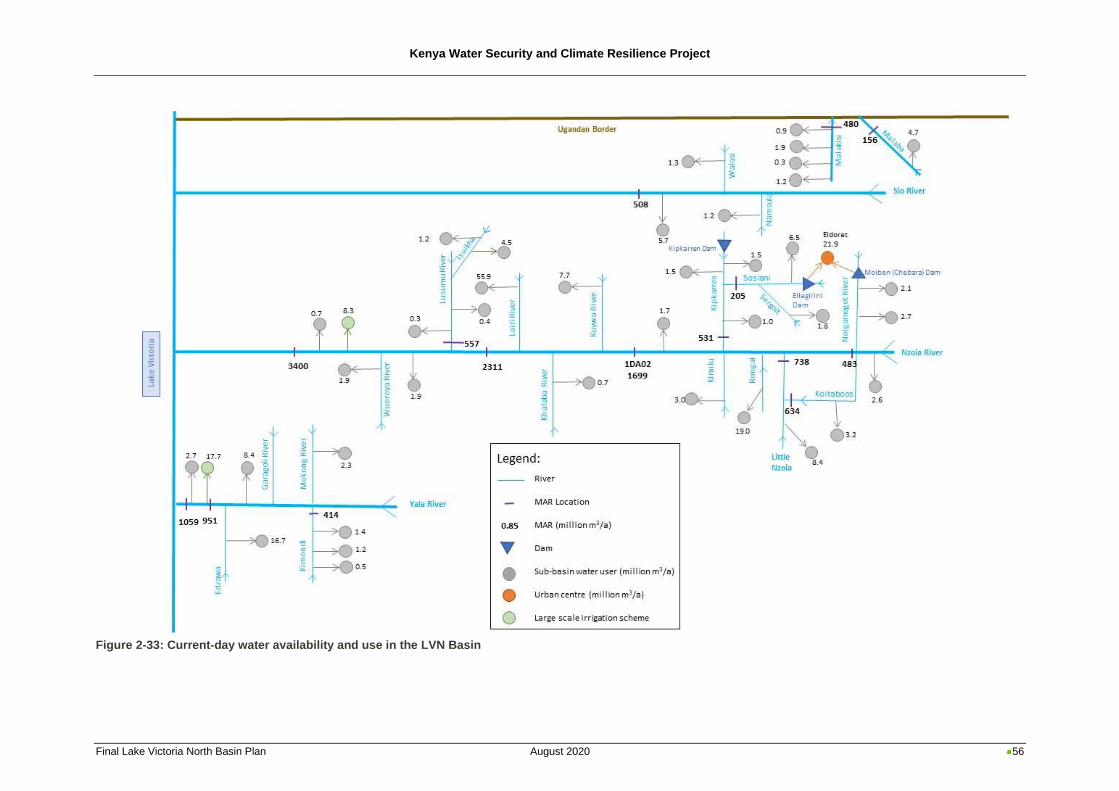
Kenya Water Security and Climate Resilience Project
Final Lake Victoria North Basin Plan August 2020 56
Figure 2-33: Current-day water availability and use in the LVN Basin
Kenya Water Security and Climate Resilience Project
Final Lake Victoria North Basin Plan August 2020 57
2.4.6 Surface water allocations
The WRA uses the permitting system as a tool to regulate the use of water resources in Kenya and
enhance equitable use of water resources. This water allocation is based on order of priority; reserve,
domestic, agricultural, and finally industrial. Water permits have a five-year validity period, with renewal
subject to the conditions attached for compliance. These permits, as captured in the Permit Database,
reflect the current allocation of water to different user categories. The volume of water which is available
for allocation in any catchment, is determined in accordance with the Guidelines for Water Allocation
(Water Resources Management Authority, 2010) superseded by Draft 2018 Water Allocation Guideline
(Water Resources Authority, 2019a). Essentially, the Guideline prescribes a flow/reliability approach
based on natural flow exceedance values, to estimate the volumes (Q) of water which are available for
allocation to domestic and irrigation users. It also specifies how the Reserve should be quantified:
Q < Q95 : Ecological reserve
Q95 < Q < Q80 : Normal flow (available for domestic and industrial use)
Q80 < Q : Flood flow (available for irrigation use)
This water allocation framework which is reflected in the water regulations aims to:
◼ safeguard at least a minimum ecological reserve (Q95) throughout the year
◼ safeguard dry season resource availability for domestic use by restricting allocation to the dry
season resource availability. The dry season flows (called normal flow) are typically less than the
Q80 flow
◼ allocate water for irrigation from flood flows (i.e. when flow exceeds Q80) which implies the need
for storage as irrigation demand occurs during the dry season when abstraction for irrigation is
restricted
In accordance with the guidelines, a high-level analysis was conducted, using the above daily flow
exceedance thresholds (m3/day), to assess the surface water allocation status in the LVN Basin - based
on sub-basin hydrology developed as part of this Consultancy and current allocation volumes extracted
from the Permit Database. It is important to note that this calculation approach did not consider the
availability of storage.
Figure 2-34 provides a comparison, per sub-basin, of the current permit allocations per user category
vs the water available for allocation in the LVN Basin. Sub-basins shown as “under-allocated”, mean
that either the Normal Flow component (available for domestic and industrial use) and/or the Flood Flow
component (available for irrigation use) has not been exceeded by the current allocation volumes in
these respective categories as reflected in the Permit Database. Sub-basins indicated with “no data”
represent sub-basins with no permit-based allocation records in the Permit Database.
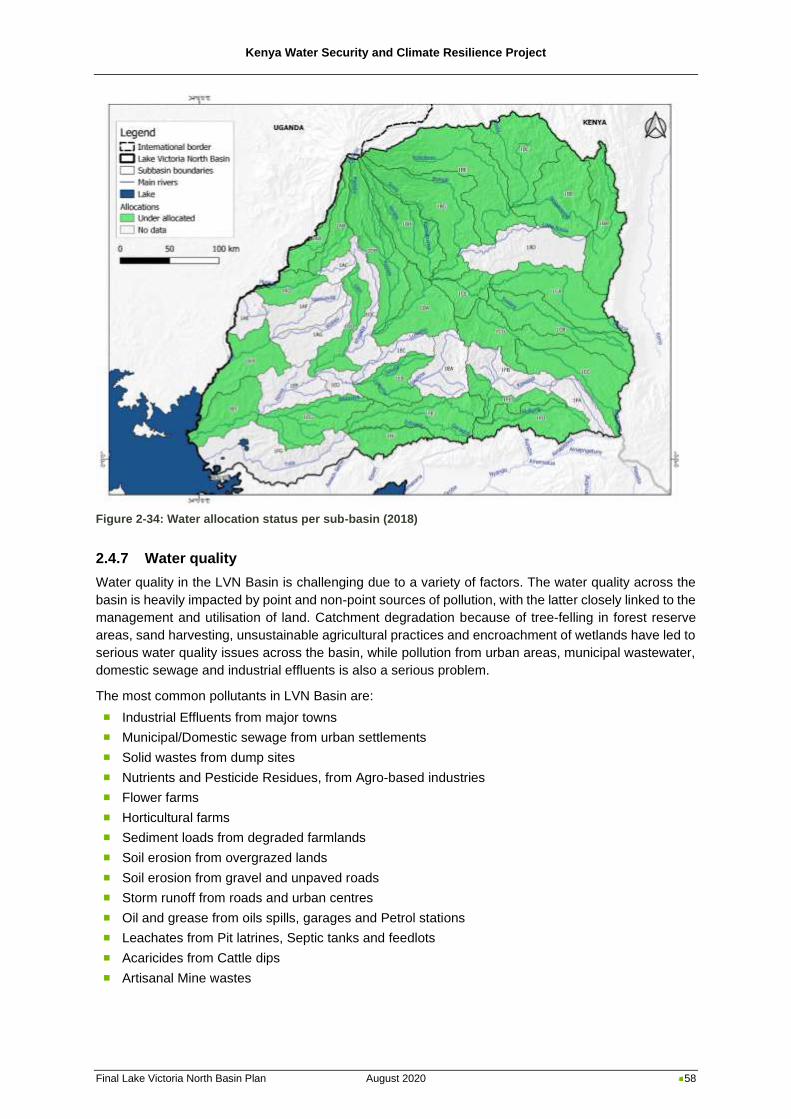
Kenya Water Security and Climate Resilience Project
Final Lake Victoria North Basin Plan August 2020 58
Figure 2-34: Water allocation status per sub-basin (2018)
2.4.7 Water quality
Water quality in the LVN Basin is challenging due to a variety of factors. The water quality across the
basin is heavily impacted by point and non-point sources of pollution, with the latter closely linked to the
management and utilisation of land. Catchment degradation because of tree-felling in forest reserve
areas, sand harvesting, unsustainable agricultural practices and encroachment of wetlands have led to
serious water quality issues across the basin, while pollution from urban areas, municipal wastewater,
domestic sewage and industrial effluents is also a serious problem.
The most common pollutants in LVN Basin are:
◼ Industrial Effluents from major towns
◼ Municipal/Domestic sewage from urban settlements
◼ Solid wastes from dump sites
◼ Nutrients and Pesticide Residues, from Agro-based industries
◼ Flower farms
◼ Horticultural farms
◼ Sediment loads from degraded farmlands
◼ Soil erosion from overgrazed lands
◼ Soil erosion from gravel and unpaved roads
◼ Storm runoff from roads and urban centres
◼ Oil and grease from oils spills, garages and Petrol stations
◼ Leachates from Pit latrines, Septic tanks and feedlots
◼ Acaricides from Cattle dips
◼ Artisanal Mine wastes
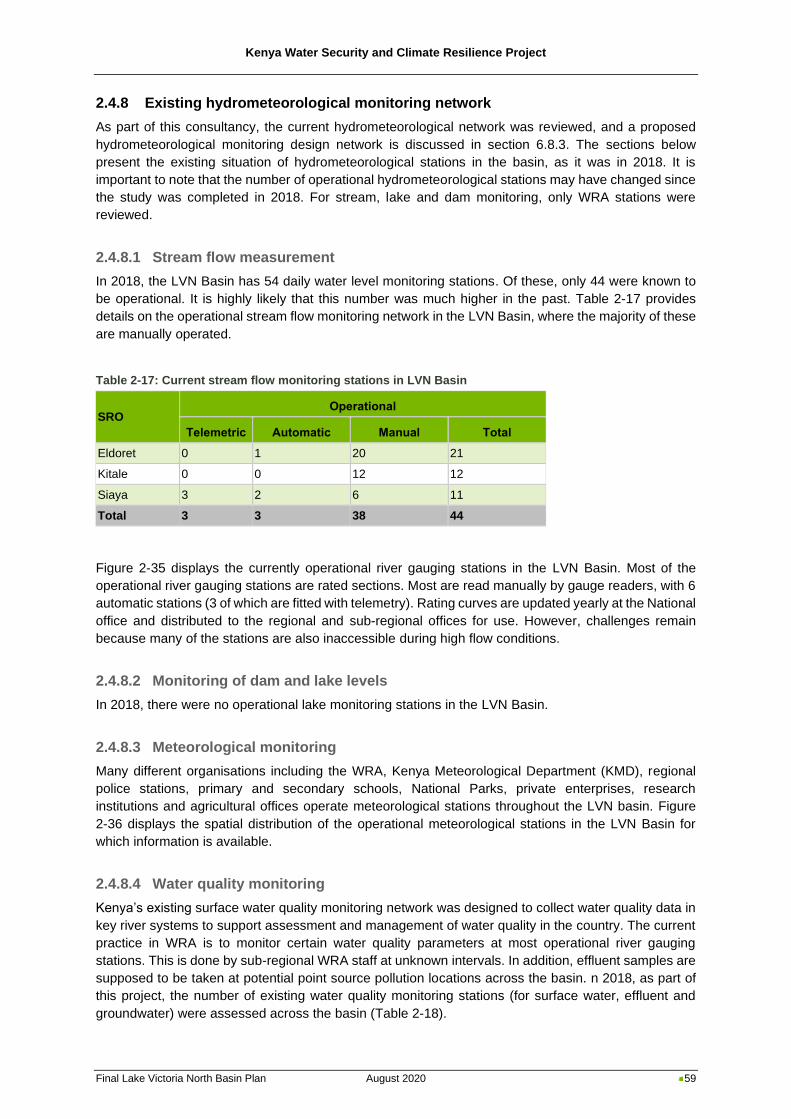
Kenya Water Security and Climate Resilience Project
Final Lake Victoria North Basin Plan August 2020 59
2.4.8 Existing hydrometeorological monitoring network
As part of this consultancy, the current hydrometeorological network was reviewed, and a proposed
hydrometeorological monitoring design network is discussed in section 6.8.3. The sections below
present the existing situation of hydrometeorological stations in the basin, as it was in 2018. It is
important to note that the number of operational hydrometeorological stations may have changed since
the study was completed in 2018. For stream, lake and dam monitoring, only WRA stations were
reviewed.
2.4.8.1 Stream flow measurement
In 2018, the LVN Basin has 54 daily water level monitoring stations. Of these, only 44 were known to
be operational. It is highly likely that this number was much higher in the past. Table 2-17 provides
details on the operational stream flow monitoring network in the LVN Basin, where the majority of these
are manually operated.
Table 2-17: Current stream flow monitoring stations in LVN Basin
SRO Operational
Telemetric Automatic Manual Total
Eldoret 0 1 20 21
Kitale 0 0 12 12
Siaya 3 2 6 11
Total 3 3 38 44
Figure 2-35 displays the currently operational river gauging stations in the LVN Basin. Most of the
operational river gauging stations are rated sections. Most are read manually by gauge readers, with 6
automatic stations (3 of which are fitted with telemetry). Rating curves are updated yearly at the National
office and distributed to the regional and sub-regional offices for use. However, challenges remain
because many of the stations are also inaccessible during high flow conditions.
2.4.8.2 Monitoring of dam and lake levels
In 2018, there were no operational lake monitoring stations in the LVN Basin.
2.4.8.3 Meteorological monitoring
Many different organisations including the WRA, Kenya Meteorological Department (KMD), regional
police stations, primary and secondary schools, National Parks, private enterprises, research
institutions and agricultural offices operate meteorological stations throughout the LVN basin. Figure
2-36 displays the spatial distribution of the operational meteorological stations in the LVN Basin for
which information is available.
2.4.8.4 Water quality monitoring
Kenya’s existing surface water quality monitoring network was designed to collect water quality data in
key river systems to support assessment and management of water quality in the country. The current
practice in WRA is to monitor certain water quality parameters at most operational river gauging
stations. This is done by sub-regional WRA staff at unknown intervals. In addition, effluent samples are
supposed to be taken at potential point source pollution locations across the basin. n 2018, as part of
this project, the number of existing water quality monitoring stations (for surface water, effluent and
groundwater) were assessed across the basin (Table 2-18).
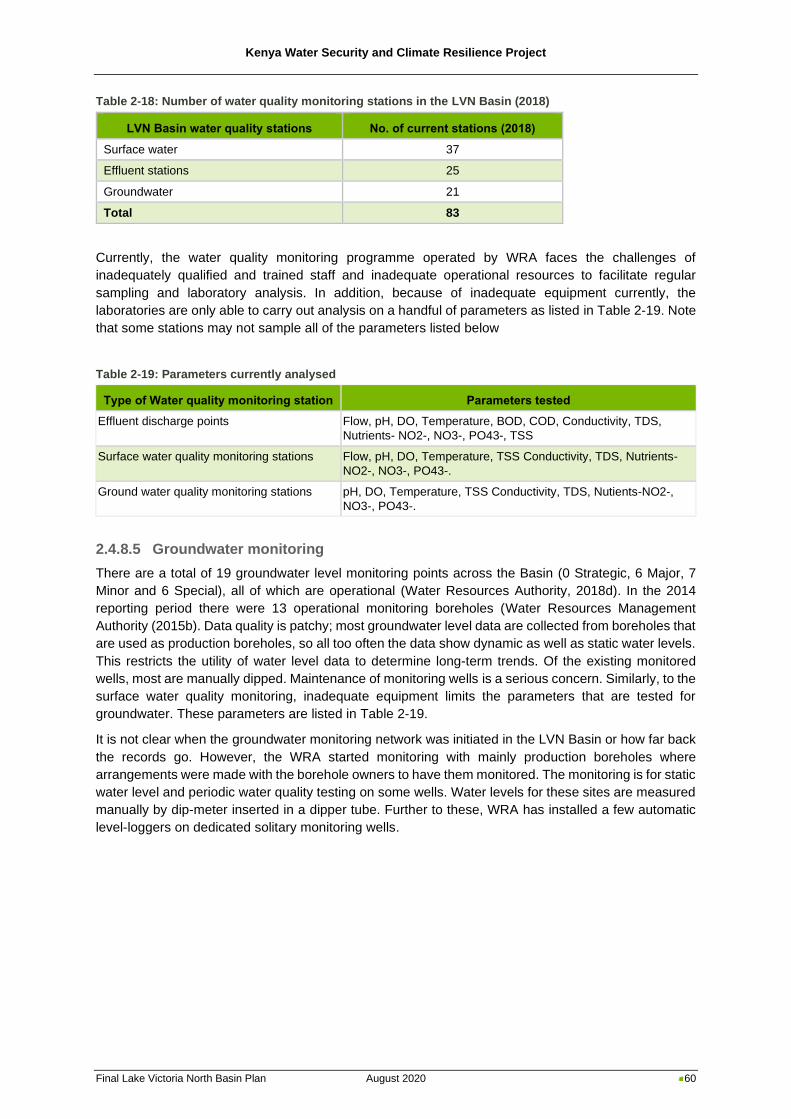
Kenya Water Security and Climate Resilience Project
Final Lake Victoria North Basin Plan August 2020 60
Table 2-18: Number of water quality monitoring stations in the LVN Basin (2018)
LVN Basin water quality stations No. of current stations (2018)
Surface water 37
Effluent stations 25
Groundwater 21
Total 83
Currently, the water quality monitoring programme operated by WRA faces the challenges of
inadequately qualified and trained staff and inadequate operational resources to facilitate regular
sampling and laboratory analysis. In addition, because of inadequate equipment currently, the
laboratories are only able to carry out analysis on a handful of parameters as listed in Table 2-19. Note
that some stations may not sample all of the parameters listed below
Table 2-19: Parameters currently analysed
Type of Water quality monitoring station Parameters tested
Effluent discharge points Flow, pH, DO, Temperature, BOD, COD, Conductivity, TDS,
Nutrients- NO2-, NO3-, PO43-, TSS
Surface water quality monitoring stations Flow, pH, DO, Temperature, TSS Conductivity, TDS, Nutrients-
NO2-, NO3-, PO43-.
Ground water quality monitoring stations pH, DO, Temperature, TSS Conductivity, TDS, Nutients-NO2-,
NO3-, PO43-.
2.4.8.5 Groundwater monitoring
There are a total of 19 groundwater level monitoring points across the Basin (0 Strategic, 6 Major, 7
Minor and 6 Special), all of which are operational (Water Resources Authority, 2018d). In the 2014
reporting period there were 13 operational monitoring boreholes (Water Resources Management
Authority (2015b). Data quality is patchy; most groundwater level data are collected from boreholes that
are used as production boreholes, so all too often the data show dynamic as well as static water levels.
This restricts the utility of water level data to determine long-term trends. Of the existing monitored
wells, most are manually dipped. Maintenance of monitoring wells is a serious concern. Similarly, to the
surface water quality monitoring, inadequate equipment limits the parameters that are tested for
groundwater. These parameters are listed in Table 2-19.
It is not clear when the groundwater monitoring network was initiated in the LVN Basin or how far back
the records go. However, the WRA started monitoring with mainly production boreholes where
arrangements were made with the borehole owners to have them monitored. The monitoring is for static
water level and periodic water quality testing on some wells. Water levels for these sites are measured
manually by dip-meter inserted in a dipper tube. Further to these, WRA has installed a few automatic
level-loggers on dedicated solitary monitoring wells.
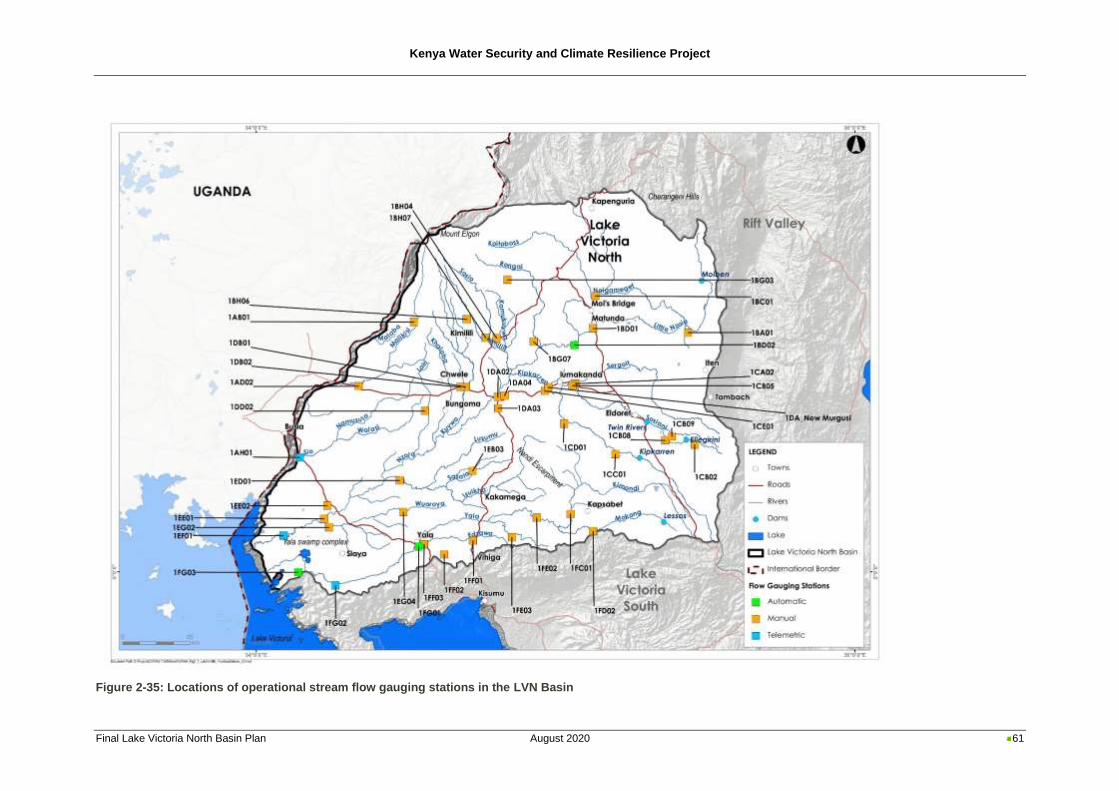
Kenya Water Security and Climate Resilience Project
Final Lake Victoria North Basin Plan August 2020 61
Figure 2-35: Locations of operational stream flow gauging stations in the LVN Basin
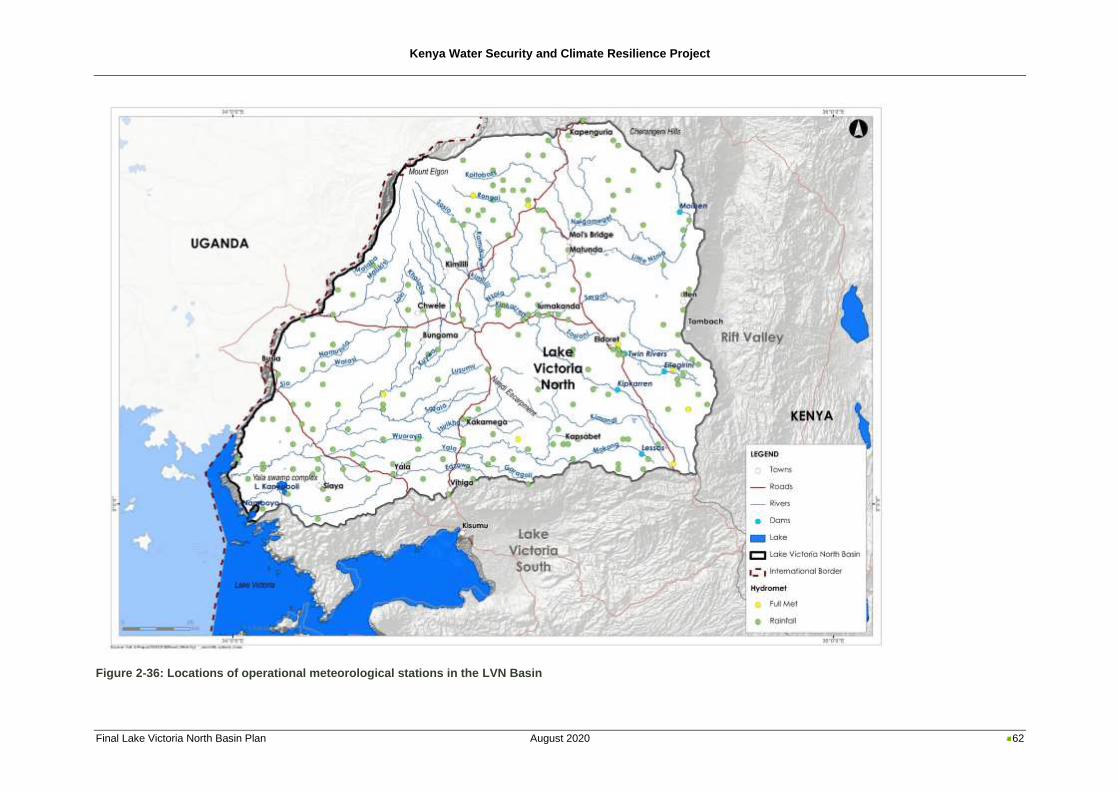
Kenya Water Security and Climate Resilience Project
Final Lake Victoria North Basin Plan August 2020 62
Figure 2-36: Locations of operational meteorological stations in the LVN Basin
Kenya Water Security and Climate Resilience Project
Final Lake Victoria North Basin Plan August 2020 63
Kenya Water Security and Climate Resilience Project
Final Lake Victoria North Basin Plan August 2020 64
3 Institutional Overview
3.1 Legislative, policy and institutional framework
3.1.1 Introduction
The Constitution of Kenya (2010) provides the basis for water resources management in the country
and recognises this through the right to a clean and healthy environment, through the management and
sustainable development of natural resources (which includes both surface and ground water), as well
as through the economic and social right “to clean and safe water of adequate quantities”. Importantly,
the State has the obligation to ensure that water is conserved, that development is managed to be
sustainable and to ensure that the benefits accrued are shared equitably. Whilst it is noted that the
utilisation of natural resources should be for the benefit of the people of Kenya, there is important
emphasis placed upon the needs of marginalised communities. The recognition of the link between
water and land is also of importance. This recognition provides the basis for improved integration in the
planning, management and sustainable development of natural resources. In this regard, institutional
arrangements from national to county level are imperative for leading efforts in socio-economic
development at national scale and for implementing national government policies on natural resource
and environmental conservation at a local scale.
Annexure C provides an overview of the legal, institutional and policy framework relating to
environmental and integrated water resources management.
3.1.2 National policies
3.1.2.1 Water
Worldwide, there is increased recognition of the importance of water in terms of socio-economic
development. This is increasingly emerging through the nexus discussions which acknowledge the
interfaces between water, food and energy, and, more recently the findings of the World Economic
Forum through their Global Risks Reports which repeatedly reflect water and climate related risks as
being the most significant to economic growth.
At national level in Kenya, this sentiment has been mirrored in the development of various forms of
national development plans. The Kenya Vision 2030, published in 2007, provides the national
development blueprint. It is structured around economic, social and political dimensions and notes the
important role of water in catalysing growth. National targets outlined in the Vision 2030 that have
implications for the water sector include:
◼ Water and sanitation – to ensure that improved water and sanitation are available and accessible
to all by 2030
◼ Agriculture – to increase the area under irrigation to 1.2 million ha by 2030 for increase of
agricultural production
◼ Environment – to be a nation that has a clean, secure and sustainable environment by 2030
◼ Energy – to generate more energy and increase efficiency in the energy sector
In addition to these strategic targets outlined above, many flagship projects were identified for unlocking
development related to water resources. These projects include rehabilitation and protection of Kenya’s
five major water towers (the Aberdares, Cherengany, Mau, Mount Kenya and Mount Elgon), and waste
management and pollution control.
The Kenya National Water Resources Management Strategy provides the overarching policy
framework for water resource management and development in Kenya, despite several successive
adjustments in the core water legislation. This consistency in policy intent has been critical in guiding
Kenya Water Security and Climate Resilience Project
Final Lake Victoria North Basin Plan August 2020 65
the water sector, with legislative amendments being progressively utilised to improve and strengthen
the way that policy is affected. At the time of its introduction, the ‘Sessional paper no. 1 of 1999 on
national policy on water resources management policy and development’ introduced key shifts in policy
such as the separation of functions (including water resource management, water service delivery,
policy, regulation, financing), the devolution of decision making to regional and local levels, the
commercialisation of water (i.e. water to be treated as an economic and social good) and stakeholder
participation through community and private sector participation.
The ‘Sessional paper no. 1 of 1999 on national policy on water resources management policy and
development’ provides specific policy objectives covering the core focus of water resources
management, water supply and sewerage development, institutional arrangement and financing of the
water sector, which include:
◼ Preserve, conserve and protect all available water resources and allocate it in a sustainable,
rational and economical way
◼ Supply of water of good quality and in sufficient quantities to meet the various water needs including
poverty alleviation, while ensuring safe disposal of wastewater and environmental protection
◼ Establish an efficient and effective institutional framework to achieve systematic development and
management of the water sector
◼ Develop a sound and sustainable financing system for effective water resources management,
water supply and sanitation development
3.1.2.2 Environment and natural resources
In conjunction with the ‘Sessional paper no. 1 of 1999 on national policy on water resources
management policy and development’ (Government of Kenya, 1999), the National Environment Policy
(NEP) (Government of Kenya, 2013a) provides an important framework in terms of improved river basin
management in that the NEP has the goal of ensuring a “better quality of life for present and future
generations through sustainable management and use of the environment and natural resources”. As
such, this framework policy has relevance to several differing sectors that are engaged in the
management of natural resources, including water resources. The objectives of this policy that have
relevance to the management of the LVN Basin include, amongst others:
◼ Provide a framework for an integrated approach to planning and sustainable management of
Kenya’s environment and natural resources
◼ Strengthen the legal and institutional framework for good governance, effective coordination and
management of the environment and natural resources
◼ Ensure sustainable management of the environment and natural resources, such as unique
terrestrial and aquatic ecosystems, for national economic growth and improved livelihoods
◼ Promote and support research and capacity development as well as use of innovative
environmental management tools such as incentives, disincentives, total economic valuation,
indicators of sustainable development
◼ Promote and enhance cooperation, collaboration, synergy, partnerships and participation in the
protection, conservation, sustainable management of the environment and natural resources
◼ Ensure inclusion of cross-cutting and emerging issues such as poverty reduction, gender, disability,
HIV&AIDS and other diseases in the management of the environment and natural resources.
Incorporated in the NEP are several important principles to take into consideration in undertaking
planning in the LVN Basin and these are presented below.
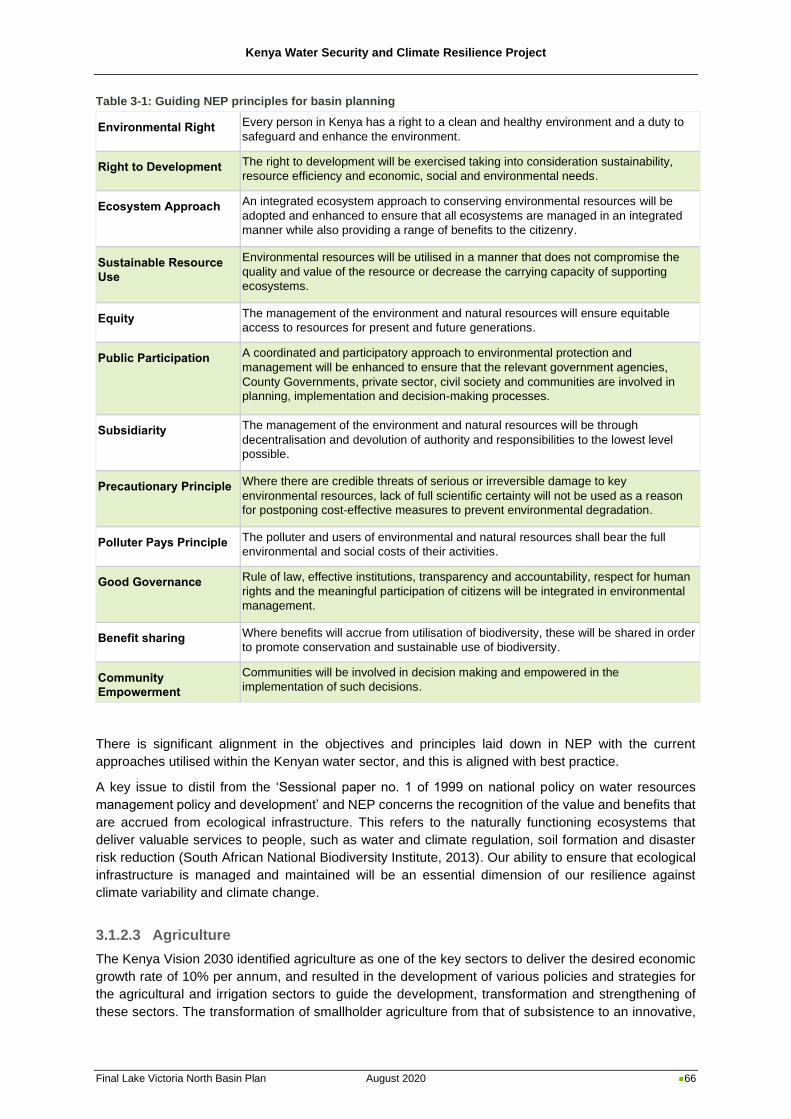
Kenya Water Security and Climate Resilience Project
Final Lake Victoria North Basin Plan August 2020 66
Table 3-1: Guiding NEP principles for basin planning
Environmental Right Every person in Kenya has a right to a clean and healthy environment and a duty to
safeguard and enhance the environment.
Right to Development The right to development will be exercised taking into consideration sustainability,
resource efficiency and economic, social and environmental needs.
Ecosystem Approach An integrated ecosystem approach to conserving environmental resources will be
adopted and enhanced to ensure that all ecosystems are managed in an integrated
manner while also providing a range of benefits to the citizenry.
Sustainable Resource
Use
Environmental resources will be utilised in a manner that does not compromise the
quality and value of the resource or decrease the carrying capacity of supporting
ecosystems.
Equity The management of the environment and natural resources will ensure equitable
access to resources for present and future generations.
Public Participation A coordinated and participatory approach to environmental protection and
management will be enhanced to ensure that the relevant government agencies,
County Governments, private sector, civil society and communities are involved in
planning, implementation and decision-making processes.
Subsidiarity The management of the environment and natural resources will be through
decentralisation and devolution of authority and responsibilities to the lowest level
possible.
Precautionary Principle Where there are credible threats of serious or irreversible damage to key
environmental resources, lack of full scientific certainty will not be used as a reason
for postponing cost-effective measures to prevent environmental degradation.
Polluter Pays Principle The polluter and users of environmental and natural resources shall bear the full
environmental and social costs of their activities.
Good Governance Rule of law, effective institutions, transparency and accountability, respect for human
rights and the meaningful participation of citizens will be integrated in environmental
management.
Benefit sharing Where benefits will accrue from utilisation of biodiversity, these will be shared in order
to promote conservation and sustainable use of biodiversity.
Community
Empowerment
Communities will be involved in decision making and empowered in the
implementation of such decisions.
There is significant alignment in the objectives and principles laid down in NEP with the current
approaches utilised within the Kenyan water sector, and this is aligned with best practice.
A key issue to distil from the ‘Sessional paper no. 1 of 1999 on national policy on water resources
management policy and development’ and NEP concerns the recognition of the value and benefits that
are accrued from ecological infrastructure. This refers to the naturally functioning ecosystems that
deliver valuable services to people, such as water and climate regulation, soil formation and disaster
risk reduction (South African National Biodiversity Institute, 2013). Our ability to ensure that ecological
infrastructure is managed and maintained will be an essential dimension of our resilience against
climate variability and climate change.
3.1.2.3 Agriculture
The Kenya Vision 2030 identified agriculture as one of the key sectors to deliver the desired economic
growth rate of 10% per annum, and resulted in the development of various policies and strategies for
the agricultural and irrigation sectors to guide the development, transformation and strengthening of
these sectors. The transformation of smallholder agriculture from that of subsistence to an innovative,
Kenya Water Security and Climate Resilience Project
Final Lake Victoria North Basin Plan August 2020 67
commercially oriented and modern agricultural sector has been identified as a fundamental component
for achieving agricultural growth. It is realised that this transformation will be achieved through
transforming key institutions in agriculture, livestock, forestry and wildlife to promote agricultural growth;
increasing productivity of crops, livestock and tree cover; introducing land-use policies for better use of
high- and medium-potential lands; developing more irrigable areas in Arid or Semi-Arid Lands (ASALs)
for both crops and livestock; improving market access for smallholders through better supply chain
management; and adding value to farm, livestock and forestry products before they reach local, regional
and international markets.
Increasing the productivity of agricultural water use in Kenya is a national priority given the country’s
low water endowment, growing population, and changing climate. Increasing productivity will also help
contribute to achieving one of the primary targets of the Big Four Agenda; food security. Expanding the
use of modern irrigation technology, such as drip and sprinkler systems, will be fundamental to
achieving water productivity because of the potential for such systems to increase yields relative to
water withdrawals. One of the key outputs of the NWMP 2030 was the identification of potential areas
for future irrigation expansion. All the proposed schemes will be supplied from surface water - either by
means of irrigation dams, multi-purpose dams or weirs. An Irrigation and Drainage Master Plan for
Kenya was prepared in 2009 (Government of Kenya, 2009), which identified the following interventions
to increase agricultural production: finalising and implementing the national irrigation policy and legal
framework; intensifying and expanding irrigation; improving rainwater harvesting and storage for
agriculture; rehabilitation and protecting water catchments; and implementing the irrigation flagship
projects.
3.1.2.4 Energy
The enactment of the 2010 Constitution generated transformative processes in the energy sector.
National government is tasked with the formulation of energy policy under the auspices of the Ministry
of Energy and Petroleum. The draft National Petroleum and Energy Policy (Government of Kenya,
2015) indicates that government will transform the Rural Electrification Agency (REA) into the National
Electrification and Renewable Energy Authority (NERA) to be the lead agency for development of
energy resources that includes both geothermal energy and hydropower. Hydropower provides a
significant portion of the energy mix, with the intention to further improve current systems whist
developing new opportunities.
3.1.3 Legislation
The water and environmental legislation in Kenya has developed over time and this has enabled
successive adjustments in order to improve the manner in which water (and other natural resources)
are managed and sustainably developed.
In March 2003 the GoK Water Act (Act No. 8 of 2002) came into effect. This Water Act provided the
legal framework to support the ‘Sessional paper no. 1 of 1999 on national policy on water resources
management policy and development’. Importantly, the Act provided for the establishment of new
institutions with clearly determined functions, with decentralised decision-making reflected in
autonomous regional water management institutions and Water Resource User Associations (WRUAs).
This provided a key step forward to enable more effective implementation of national policy.
The promulgation of the 2016 Water Act (Act No. 12 of 2016) was required to align with the 2010
Constitution as well as enabling amendments that were required to support the improved management
of water resources. The 2016 Water Act revises the institutional mandates of key water sector
institutions and sets out the role of counties in the water sector. It also defines a clear role for the WRA
in the regulation of water resources, which provides a potential strengthening in the way that water
resource development is regulated. Some ambiguities in the GoK 2016 Water Act that require resolution
in order to clarify institutional matters. The ambiguity is regarding the dual and conflicting mandate of
the BWRCs as an advisor to WRA on one hand and with executive powers for basin level water
resources management on the other hand. In reality, operationalisation of the BWRCs is impossible if
Kenya Water Security and Climate Resilience Project
Final Lake Victoria North Basin Plan August 2020 68
this ambiguity is not removed as it affects establishment of the committees and should be addressed
urgently. The MoWSI is leading a water sector transition process which will address such challenges
and assist institutions to give effect to policy and law.
The Environmental Management and Co-ordination Act (EMCA) (Act No.8 of 1999) was
promulgated in 1999 and provided Kenya’s first framework for environmental legislation. The EMCA
recognises the importance of improving the legal alignment and administration across the various
sectors that are engaged in the management and development of environmental resources. As it stands
there is a range of legislative instruments, across these various sectors, that face challenges in
alignment towards the aim of sustainable development as outlined in Vision 2030. The EMCA has
undergone a number of revisions over time to strengthen various elements of the law and in a sense,
these have also been largely focused upon improving the regulatory environment.
A range of legislative instruments underpins the development of agriculture in Kenya. Amongst these
is the Agriculture, Fisheries and Food Authority Act (Act No 13 of 2013) which provides for the
regulation and promotion of agriculture. This is supported through the establishment of the Agriculture,
Fisheries and Food Authority that is charged with, in consultation with County Governments,
administering the Crops Act (Act No 16 of 2013) and the Fisheries Act (Chapter 378 of 1989). The
drive to increase agricultural development will require ongoing development in irrigation capacity. As
such, a draft Irrigation Bill was developed in 2015 intended to repeal the Irrigation Act (Chapter 347 of
2013). This amendment bill has been enacted to the Irrigation Act (Act No 14 of 2019) for the
strengthening of irrigation regulations.
In terms of energy, the current legal framework is still informed by Sessional Paper No 4 on Energy
of 2004 (Ministry of Energy, 2004) and the Energy Act (Act No.6 of 2006). Sessional Paper 4 identified
the need to integrate energy and petroleum planning with national economic, social and environmental
policies, as energy and petroleum are critical inputs in the social economic progress of the economy.
The 2006 Energy Act assigns the responsibility for development of indicative national energy plans to
the Energy Regulatory Commission (ERC). In 2009, the ERC established a committee with
responsibility for preparation of the Least Cost Power Development Plan in the electricity sub sector.
The development of plans for the petroleum, coal and renewable energy subsectors, as well as for
integrated energy and petroleum are yet to be developed and are a critical part of supporting the socio-
economic development of Kenya.
3.1.4 National institutions
The 2010 Constitution provides for two tiers of Government with national government being broadly
responsible for policy development and regulation to ensure that policies are effectively implemented.
Some of the key functions, articulated in detail within the fourth schedule of the Constitution, relate to
socio-economic development and natural resources management and are critically important from a
basin planning perspective. These include, for example: the use of international waters and water
resources; national economic policy and planning; national statistics and data on population, the
economy and society generally; education; national public works; general principles of land planning
and the coordination of planning by the counties; protection of the environment and natural resources
with a view to establishing a durable and sustainable system of development, including, in particular -
fishing, hunting and gathering; protection of animals and wildlife; water protection, securing sufficient
residual water, hydraulic engineering and the safety of dams; and energy policy; disaster management;
agricultural policy; energy policy including electricity and gas reticulation and energy regulation;
capacity building and technical assistance to the counties; public investment; and tourism policy and
development.
In the aftermath of the 2017 national elections, the national government in Kenya has undergone some
changes in configuration to support a more effective and efficient Government. Whilst many Ministries
can be seen as enablers (e.g. Education, Justice etc), the key sector ministries from a basin planning
perspective include:
◼ Ministry of Water, Sanitation and Irrigation
◼ Ministry of Environment and Forestry
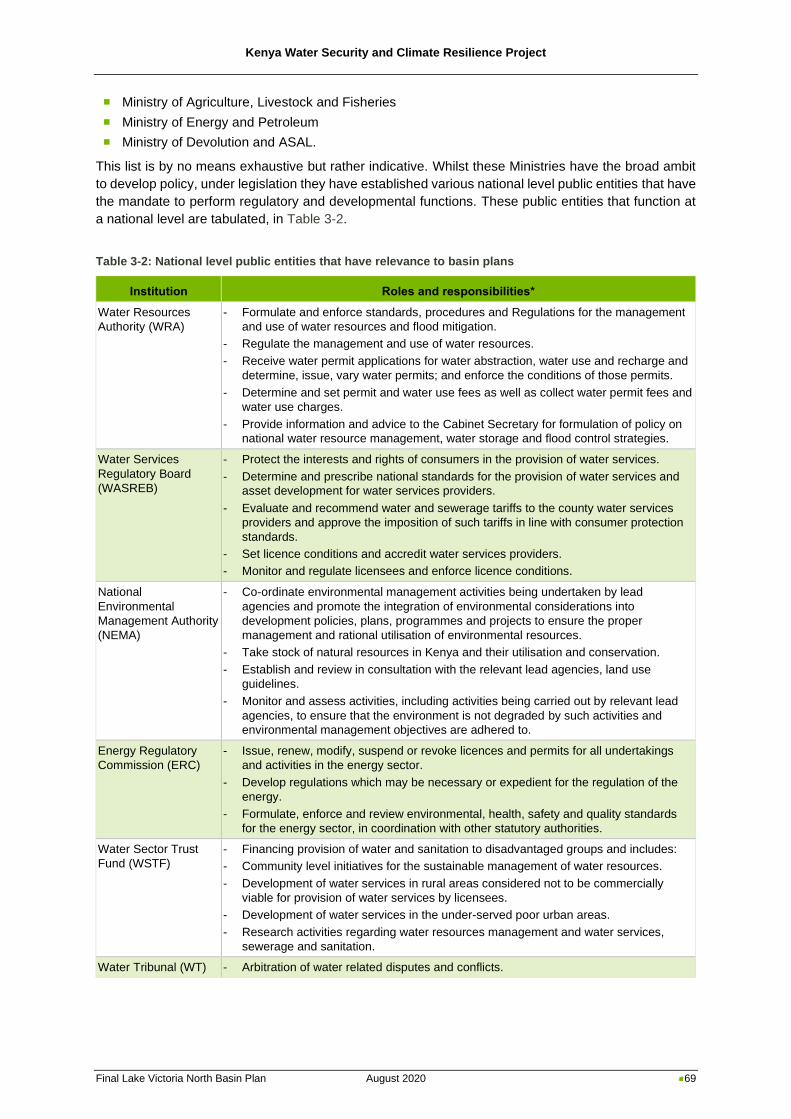
Kenya Water Security and Climate Resilience Project
Final Lake Victoria North Basin Plan August 2020 69
◼ Ministry of Agriculture, Livestock and Fisheries
◼ Ministry of Energy and Petroleum
◼ Ministry of Devolution and ASAL.
This list is by no means exhaustive but rather indicative. Whilst these Ministries have the broad ambit
to develop policy, under legislation they have established various national level public entities that have
the mandate to perform regulatory and developmental functions. These public entities that function at
a national level are tabulated, in Table 3-2.
Table 3-2: National level public entities that have relevance to basin plans
Institution Roles and responsibilities*
Water Resources
Authority (WRA)
- Formulate and enforce standards, procedures and Regulations for the management
and use of water resources and flood mitigation.
- Regulate the management and use of water resources.
- Receive water permit applications for water abstraction, water use and recharge and
determine, issue, vary water permits; and enforce the conditions of those permits.
- Determine and set permit and water use fees as well as collect water permit fees and
water use charges.
- Provide information and advice to the Cabinet Secretary for formulation of policy on
national water resource management, water storage and flood control strategies.
Water Services
Regulatory Board
(WASREB)
- Protect the interests and rights of consumers in the provision of water services.
- Determine and prescribe national standards for the provision of water services and
asset development for water services providers.
- Evaluate and recommend water and sewerage tariffs to the county water services
providers and approve the imposition of such tariffs in line with consumer protection
standards.
- Set licence conditions and accredit water services providers.
- Monitor and regulate licensees and enforce licence conditions.
National
Environmental
Management Authority
(NEMA)
- Co-ordinate environmental management activities being undertaken by lead
agencies and promote the integration of environmental considerations into
development policies, plans, programmes and projects to ensure the proper
management and rational utilisation of environmental resources.
- Take stock of natural resources in Kenya and their utilisation and conservation.
- Establish and review in consultation with the relevant lead agencies, land use
guidelines.
- Monitor and assess activities, including activities being carried out by relevant lead
agencies, to ensure that the environment is not degraded by such activities and
environmental management objectives are adhered to.
Energy Regulatory
Commission (ERC)
- Issue, renew, modify, suspend or revoke licences and permits for all undertakings
and activities in the energy sector.
- Develop regulations which may be necessary or expedient for the regulation of the
energy.
- Formulate, enforce and review environmental, health, safety and quality standards
for the energy sector, in coordination with other statutory authorities.
Water Sector Trust
Fund (WSTF)
- Financing provision of water and sanitation to disadvantaged groups and includes:
- Community level initiatives for the sustainable management of water resources.
- Development of water services in rural areas considered not to be commercially
viable for provision of water services by licensees.
- Development of water services in the under-served poor urban areas.
- Research activities regarding water resources management and water services,
sewerage and sanitation.
Water Tribunal (WT) - Arbitration of water related disputes and conflicts.
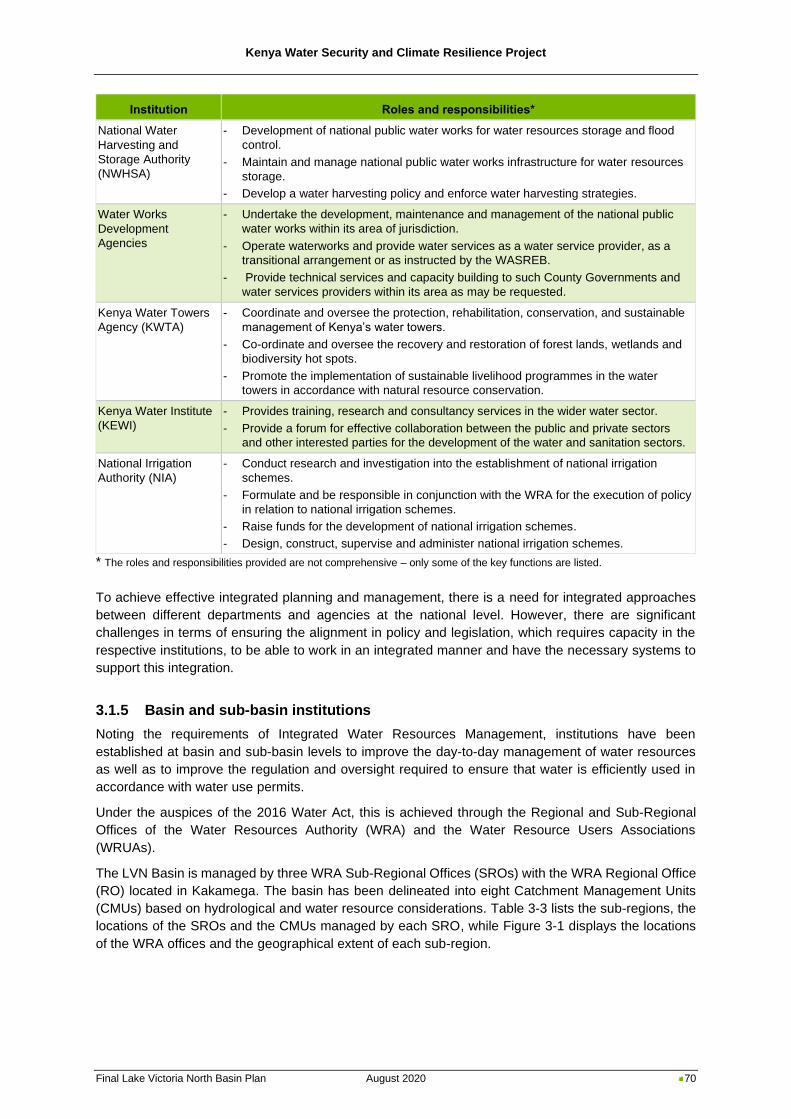
Kenya Water Security and Climate Resilience Project
Final Lake Victoria North Basin Plan August 2020 70
Institution Roles and responsibilities*
National Water
Harvesting and
Storage Authority
(NWHSA)
- Development of national public water works for water resources storage and flood
control.
- Maintain and manage national public water works infrastructure for water resources
storage.
- Develop a water harvesting policy and enforce water harvesting strategies.
Water Works
Development
Agencies
- Undertake the development, maintenance and management of the national public
water works within its area of jurisdiction.
- Operate waterworks and provide water services as a water service provider, as a
transitional arrangement or as instructed by the WASREB.
- Provide technical services and capacity building to such County Governments and
water services providers within its area as may be requested.
Kenya Water Towers
Agency (KWTA)
- Coordinate and oversee the protection, rehabilitation, conservation, and sustainable
management of Kenya’s water towers.
- Co-ordinate and oversee the recovery and restoration of forest lands, wetlands and
biodiversity hot spots.
- Promote the implementation of sustainable livelihood programmes in the water
towers in accordance with natural resource conservation.
Kenya Water Institute
(KEWI)
- Provides training, research and consultancy services in the wider water sector.
- Provide a forum for effective collaboration between the public and private sectors
and other interested parties for the development of the water and sanitation sectors.
National Irrigation
Authority (NIA)
- Conduct research and investigation into the establishment of national irrigation
schemes.
- Formulate and be responsible in conjunction with the WRA for the execution of policy
in relation to national irrigation schemes.
- Raise funds for the development of national irrigation schemes.
- Design, construct, supervise and administer national irrigation schemes.
* The roles and responsibilities provided are not comprehensive – only some of the key functions are listed.
To achieve effective integrated planning and management, there is a need for integrated approaches
between different departments and agencies at the national level. However, there are significant
challenges in terms of ensuring the alignment in policy and legislation, which requires capacity in the
respective institutions, to be able to work in an integrated manner and have the necessary systems to
support this integration.
3.1.5 Basin and sub-basin institutions
Noting the requirements of Integrated Water Resources Management, institutions have been
established at basin and sub-basin levels to improve the day-to-day management of water resources
as well as to improve the regulation and oversight required to ensure that water is efficiently used in
accordance with water use permits.
Under the auspices of the 2016 Water Act, this is achieved through the Regional and Sub-Regional
Offices of the Water Resources Authority (WRA) and the Water Resource Users Associations
(WRUAs).
The LVN Basin is managed by three WRA Sub-Regional Offices (SROs) with the WRA Regional Office
(RO) located in Kakamega. The basin has been delineated into eight Catchment Management Units
(CMUs) based on hydrological and water resource considerations. Table 3-3 lists the sub-regions, the
locations of the SROs and the CMUs managed by each SRO, while Figure 3-1 displays the locations
of the WRA offices and the geographical extent of each sub-region.
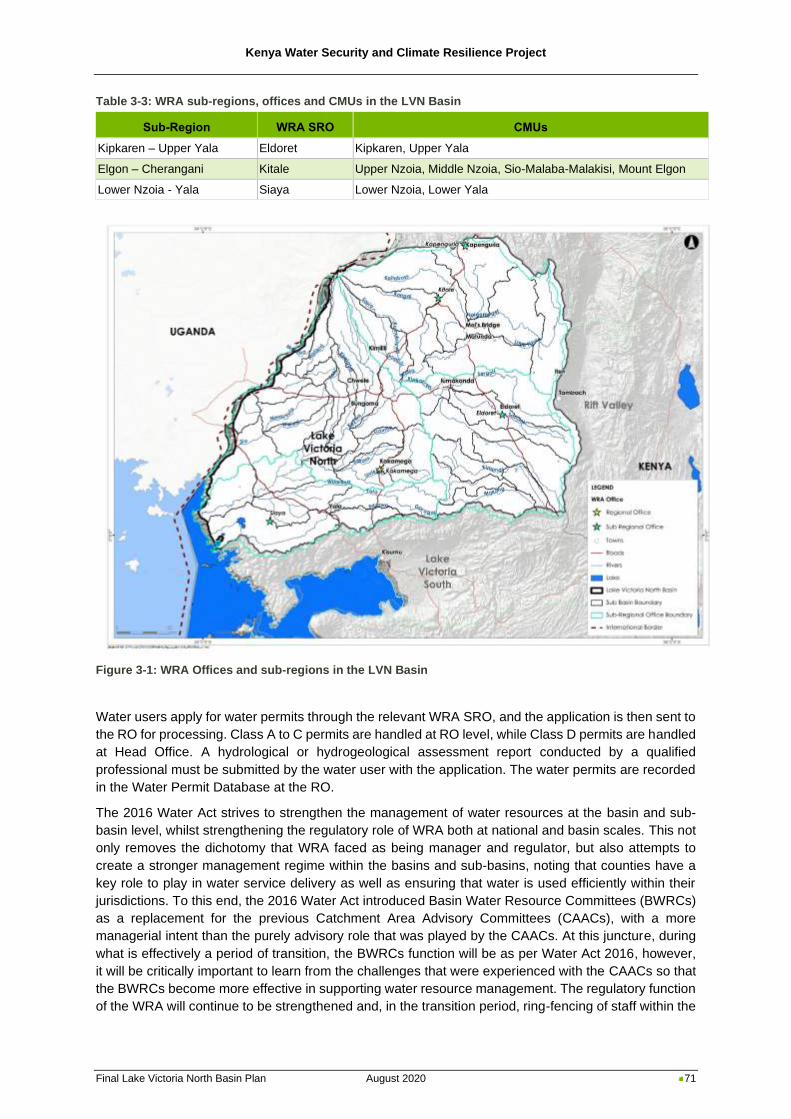
Kenya Water Security and Climate Resilience Project
Final Lake Victoria North Basin Plan August 2020 71
Table 3-3: WRA sub-regions, offices and CMUs in the LVN Basin
Sub-Region WRA SRO CMUs
Kipkaren – Upper Yala Eldoret Kipkaren, Upper Yala
Elgon – Cherangani Kitale Upper Nzoia, Middle Nzoia, Sio-Malaba-Malakisi, Mount Elgon
Lower Nzoia - Yala Siaya Lower Nzoia, Lower Yala
Figure 3-1: WRA Offices and sub-regions in the LVN Basin
Water users apply for water permits through the relevant WRA SRO, and the application is then sent to
the RO for processing. Class A to C permits are handled at RO level, while Class D permits are handled
at Head Office. A hydrological or hydrogeological assessment report conducted by a qualified
professional must be submitted by the water user with the application. The water permits are recorded
in the Water Permit Database at the RO.
The 2016 Water Act strives to strengthen the management of water resources at the basin and sub-
basin level, whilst strengthening the regulatory role of WRA both at national and basin scales. This not
only removes the dichotomy that WRA faced as being manager and regulator, but also attempts to
create a stronger management regime within the basins and sub-basins, noting that counties have a
key role to play in water service delivery as well as ensuring that water is used efficiently within their
jurisdictions. To this end, the 2016 Water Act introduced Basin Water Resource Committees (BWRCs)
as a replacement for the previous Catchment Area Advisory Committees (CAACs), with a more
managerial intent than the purely advisory role that was played by the CAACs. At this juncture, during
what is effectively a period of transition, the BWRCs function will be as per Water Act 2016, however,
it will be critically important to learn from the challenges that were experienced with the CAACs so that
the BWRCs become more effective in supporting water resource management. The regulatory function
of the WRA will continue to be strengthened and, in the transition period, ring-fencing of staff within the
Kenya Water Security and Climate Resilience Project
Final Lake Victoria North Basin Plan August 2020 72
Regional and Sub-Regional Offices will be essential to separate staff and functions that are managerial
in nature, and as such, supportive of the BWRCs. The BWRCs shall operate under the regulations
made by the Authority Water Act 4 (a) including the formulation of Basin Water Resources Strategies,
management of basins, advice to WRA and the facilitation of WRUA establishment.
At a more localised level, the establishment of the Water Resource User Associations (WRUAs) has
been essential in ensuring a focus on the operational management functions within a sub-basin. The
WRUAs are community-based, voluntary associations made up of water users and riparian owners
interested in proper management of their water resources and were established to enable the
collaborative management of water resources and to provide essential support in the resolution of
conflicts concerning the use of water resources. As provided for in the Water Act 2016 Section 29 (4),
BWRCs may contract WRUAs as agents to perform certain duties in water resource management. To
date, WRUAs have performed important local functions, but have faced an array of challenges that
have served to hinder their effectiveness. Many of these are enabling factors such as capacity in terms
of having sufficient skills and training, but also includes such issues as insufficient financial resources.
These challenges will require redress in order to support the implementation of this Basin Plan and
realise the local level capacitation that can unlock the localised socio-economic development required
to support Vision 2030. This is supported by the 2016 Water Act that provides in Section 29 (3) that
“basin area water resources management strategy shall facilitate the establishment and operation of
water resources user associations”.
3.1.6 County governments
The 2010 Constitution introduced a decentralised system, with 47 county governments and one national
government with specific functions accorded to the two levels. Guided by the overarching objectives
and principles of the county governments as set out in the Constitution, specific functions of counties
are provided in Schedule Four of the Constitution. County functions which are closely related to basin
planning include:
◼ Agriculture: crop and animal husbandry; plant and animal disease control; and fisheries
◼ County health services: refuse removal, refuse dumps and solid waste disposal
◼ County planning and development: statistics; land survey and mapping; boundaries and fencing;
housing; and electricity and gas reticulation and energy regulation
◼ Natural resources and conservation: Implementation of specific national government policies on
natural resources and environmental conservation: soil and water conservation; and forestry
◼ County public works and services: storm water management systems in built-up areas; and
water and sanitation services
◼ Firefighting services and disaster management
◼ Community participation: Ensuring and coordinating the participation of communities in
governance at the local level and assisting communities to develop the administrative capacity for
the effective exercise of the functions and powers and participation in governance at the local level
The county governments face considerable challenges as a relatively new level of government, and
these include capacity and financial resources. The latter is being assisted through the Division of
Revenue Act (No 1 of 2018) which will provide an “equitable share” of national revenue to the counties.
In addition, the Equalisation Fund, which targets specific counties and areas, typically in the arid areas,
where socio-economic indicators lag significantly behind the national average, will also support in
reducing the financial shortfalls. Recognising that the county governments will be required to give effect
to policy that is provided by national government across an array of sectors, they will face considerable
institutional challenges in working horizontally across these various sectors, endeavouring to ensure
effective integration whilst trying to ensure that there is effective vertical interaction with the various
Ministries and national public entities. The effective alignment in various planning instruments across
spatial scales and differing sectors will be critical for county governments to ensure the service delivery
mandate that they have been given.
Kenya Water Security and Climate Resilience Project
Final Lake Victoria North Basin Plan August 2020 73
3.1.7 Partnerships and engagement
3.1.7.1 Partnerships
Internationally there has been a growing recognition of the important role that the private sector and
civil society must play in the management of water resources. The importance of collective action is
being realised in that the available capacity and resources within Government are not sufficient to
ensure that common-pool resources such as water are sustainably managed.
In addition, partnerships and civil society engagement becomes more important as water resources
become increasingly utilised (through increasing abstractive water use and waste discharges) and
exposed to the associated risks. Therefore, whilst there is a need for the private sector and civil society
to engage in water resources management to manage their own risks, in so doing they provide critical
support to the wider water sector.
The nature of these partnerships will vary depending on their relationship with the water sector and the
various interfaces that these actors have. For example, the partnership between WRA and the Kenya
Meteorological Department (KMD) at national level is seen as critical in that KMD provide
meteorological and climatological services to the water sector. This is not only essential for the
hydrological modelling that assists in understanding the status of water resources, but also provides
important information in terms of flood and drought warnings. Another example is that with international
Non-Governmental Organisations (NGOs) such as World Wildlife Fund (WWF) and International Union
for Conservation of Nature (IUCN), amongst others. These provide useful capacity as well as enable
(and often fund) studies and research that sometimes serve to unlock challenges.
As the implementation of the LVN Basin Plan progresses, partnerships will be further developed to
realise the implementation of the basin plan. It will be important to map and bring together all the
partners into one big picture that is centrally monitored for the good of the entire basin.
3.1.7.2 Stakeholder Engagement
Legislation across the sectors emphasises the importance of stakeholder engagement. This provides a
means of not only bringing in diverse views and opinions that enrich solution development, but also
creates the sense of ownership for processes and products that can help to ensure better
implementation.
There is always room for improvement regarding stakeholder engagement and there is a sense that in
Kenya this is the case. The benefits that can be realised through catchment forum processes have not
always been maximised and ongoing work is needed to find more appropriate forum structures and
functional modalities that ensure that the maximum benefits from stakeholder engagement are ensured.
To date the forums have met annually and have not truly enabled the discussion required. The basin
planning process has not only in itself been a vehicle to improve engagement, but also provides a
cogent and pragmatic stakeholder engagement framework.
It emerged from consultations with the various levels of government at national, county and local levels
that one of the major challenges to effective engagement is the overlap of mandates of the various
national and county government agencies working in water resources management. The BWRCs will
provide a better engagement plan with county governments and will allow for better representation of
basin area stakeholders in matters relating to IWRM. This Consultancy has developed tools to better
equip the BWRCs to ensure they deliver on their mandate and to provide a systematic way of enhancing
their effectiveness (refer to Annexure A: Analytical Tools). This process however must involve adequate
stakeholder consultations including county governments and various actors in the basin who need to
be included in the planning for such engagement to work (refer to Annexure D).
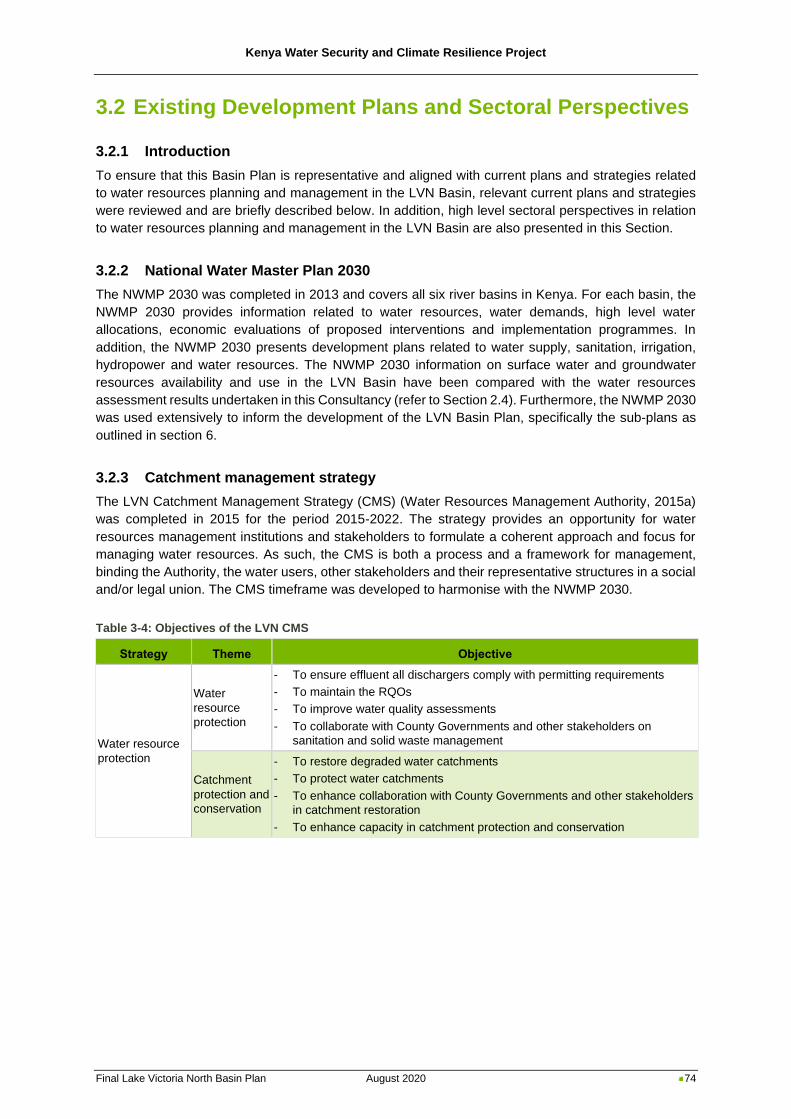
Kenya Water Security and Climate Resilience Project
Final Lake Victoria North Basin Plan August 2020 74
3.2 Existing Development Plans and Sectoral Perspectives
3.2.1 Introduction
To ensure that this Basin Plan is representative and aligned with current plans and strategies related
to water resources planning and management in the LVN Basin, relevant current plans and strategies
were reviewed and are briefly described below. In addition, high level sectoral perspectives in relation
to water resources planning and management in the LVN Basin are also presented in this Section.
3.2.2 National Water Master Plan 2030
The NWMP 2030 was completed in 2013 and covers all six river basins in Kenya. For each basin, the
NWMP 2030 provides information related to water resources, water demands, high level water
allocations, economic evaluations of proposed interventions and implementation programmes. In
addition, the NWMP 2030 presents development plans related to water supply, sanitation, irrigation,
hydropower and water resources. The NWMP 2030 information on surface water and groundwater
resources availability and use in the LVN Basin have been compared with the water resources
assessment results undertaken in this Consultancy (refer to Section 2.4). Furthermore, the NWMP 2030
was used extensively to inform the development of the LVN Basin Plan, specifically the sub-plans as
outlined in section 6.
3.2.3 Catchment management strategy
The LVN Catchment Management Strategy (CMS) (Water Resources Management Authority, 2015a)
was completed in 2015 for the period 2015-2022. The strategy provides an opportunity for water
resources management institutions and stakeholders to formulate a coherent approach and focus for
managing water resources. As such, the CMS is both a process and a framework for management,
binding the Authority, the water users, other stakeholders and their representative structures in a social
and/or legal union. The CMS timeframe was developed to harmonise with the NWMP 2030.
Table 3-4: Objectives of the LVN CMS
Strategy Theme Objective
Water resource
protection
Water
resource
protection
- To ensure effluent all dischargers comply with permitting requirements
- To maintain the RQOs
- To improve water quality assessments
- To collaborate with County Governments and other stakeholders on
sanitation and solid waste management
Catchment
protection and
conservation
- To restore degraded water catchments
- To protect water catchments
- To enhance collaboration with County Governments and other stakeholders
in catchment restoration
- To enhance capacity in catchment protection and conservation
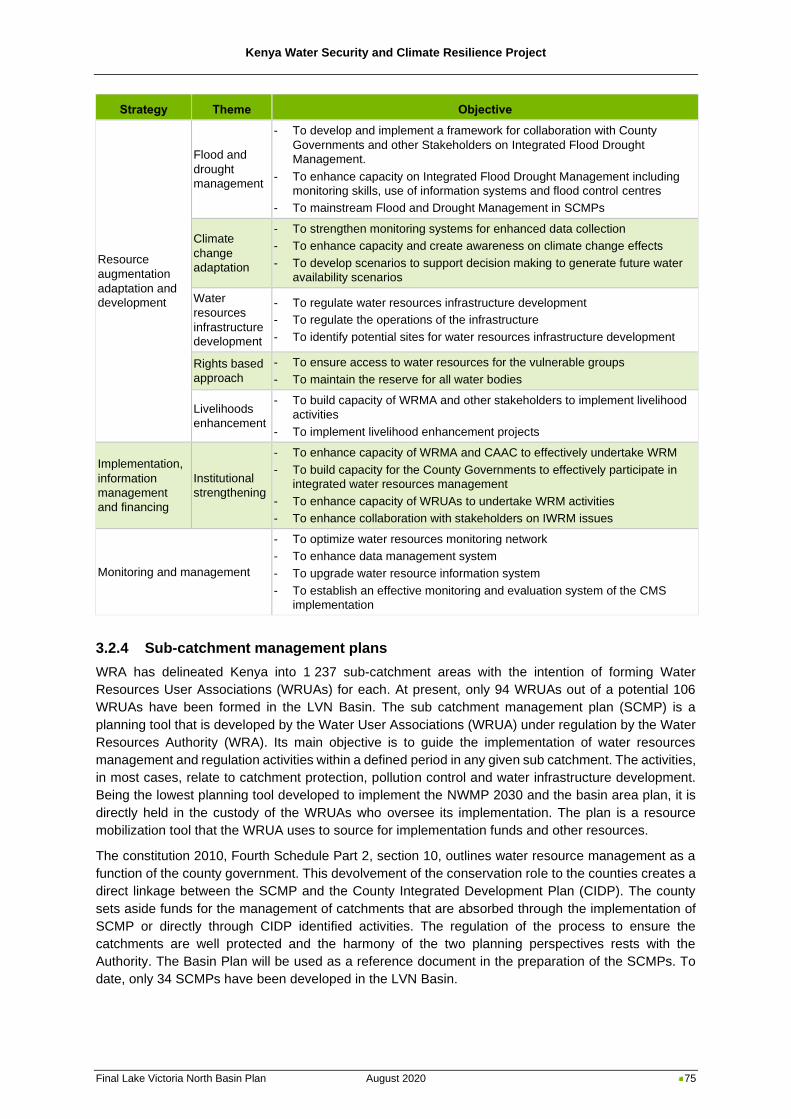
Kenya Water Security and Climate Resilience Project
Final Lake Victoria North Basin Plan August 2020 75
Strategy Theme Objective
Resource
augmentation
adaptation and
development
Flood and
drought
management
- To develop and implement a framework for collaboration with County
Governments and other Stakeholders on Integrated Flood Drought
Management.
- To enhance capacity on Integrated Flood Drought Management including
monitoring skills, use of information systems and flood control centres
- To mainstream Flood and Drought Management in SCMPs
Climate
change
adaptation
- To strengthen monitoring systems for enhanced data collection
- To enhance capacity and create awareness on climate change effects
- To develop scenarios to support decision making to generate future water
availability scenarios
Water
resources
infrastructure
development
- To regulate water resources infrastructure development
- To regulate the operations of the infrastructure
- To identify potential sites for water resources infrastructure development
Rights based
approach
- To ensure access to water resources for the vulnerable groups
- To maintain the reserve for all water bodies
Livelihoods
enhancement
- To build capacity of WRMA and other stakeholders to implement livelihood
activities
- To implement livelihood enhancement projects
Implementation,
information
management
and financing
Institutional
strengthening
- To enhance capacity of WRMA and CAAC to effectively undertake WRM
- To build capacity for the County Governments to effectively participate in
integrated water resources management
- To enhance capacity of WRUAs to undertake WRM activities
- To enhance collaboration with stakeholders on IWRM issues
Monitoring and management
- To optimize water resources monitoring network
- To enhance data management system
- To upgrade water resource information system
- To establish an effective monitoring and evaluation system of the CMS
implementation
3.2.4 Sub-catchment management plans
WRA has delineated Kenya into 1 237 sub-catchment areas with the intention of forming Water
Resources User Associations (WRUAs) for each. At present, only 94 WRUAs out of a potential 106
WRUAs have been formed in the LVN Basin. The sub catchment management plan (SCMP) is a
planning tool that is developed by the Water User Associations (WRUA) under regulation by the Water
Resources Authority (WRA). Its main objective is to guide the implementation of water resources
management and regulation activities within a defined period in any given sub catchment. The activities,
in most cases, relate to catchment protection, pollution control and water infrastructure development.
Being the lowest planning tool developed to implement the NWMP 2030 and the basin area plan, it is
directly held in the custody of the WRUAs who oversee its implementation. The plan is a resource
mobilization tool that the WRUA uses to source for implementation funds and other resources.
The constitution 2010, Fourth Schedule Part 2, section 10, outlines water resource management as a
function of the county government. This devolvement of the conservation role to the counties creates a
direct linkage between the SCMP and the County Integrated Development Plan (CIDP). The county
sets aside funds for the management of catchments that are absorbed through the implementation of
SCMP or directly through CIDP identified activities. The regulation of the process to ensure the
catchments are well protected and the harmony of the two planning perspectives rests with the
Authority. The Basin Plan will be used as a reference document in the preparation of the SCMPs. To
date, only 34 SCMPs have been developed in the LVN Basin.
Kenya Water Security and Climate Resilience Project
Final Lake Victoria North Basin Plan August 2020 76
3.2.5 County Integrated Development Plans
County Integrated Development Plans (CIDPs) are prepared every five years by counties as a road
map for development. The plan touches on all sectors devolved to county governments, providing a
plan towards improvement. Catchment protection and water and sanitation services are devolved
functions and therefore feature in all CIDPs. A review of the CIDPs showed that planned activities
related to water resources mainly revolve around rehabilitation of old pipe networks, extension of
distribution network, development of new water sources including boreholes and small dams/pans,
extension of sewer networks and expansion of sewer treatment plants. In some cases, large water
projects are planned in conjunction with the National Government.
The key aspects of each CIDP for the main counties situated in the LVN Basin are presented in
Table 3-5 (refer to Figure 2-2Figure 2-23 in Section 2.1. for a map of the counties).
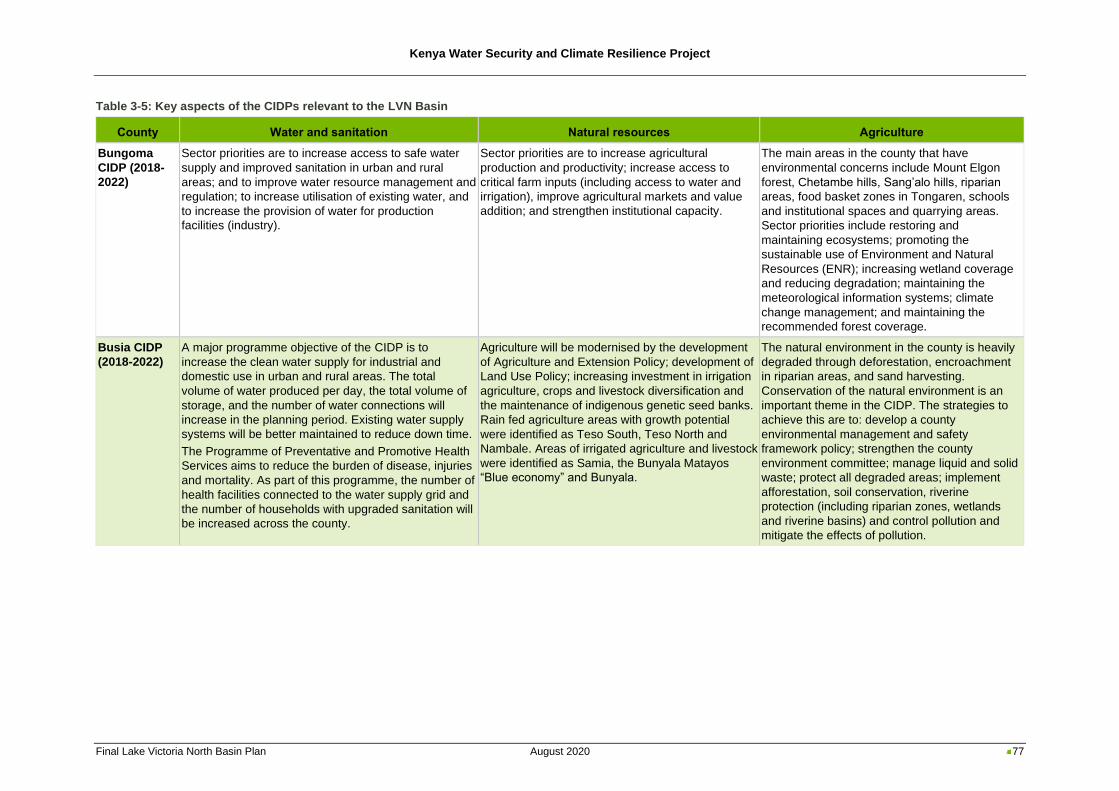
Kenya Water Security and Climate Resilience Project
Final Lake Victoria North Basin Plan August 2020 77
Table 3-5: Key aspects of the CIDPs relevant to the LVN Basin
County Water and sanitation Natural resources Agriculture
Bungoma
CIDP (2018-
2022)
Sector priorities are to increase access to safe water
supply and improved sanitation in urban and rural
areas; and to improve water resource management and
regulation; to increase utilisation of existing water, and
to increase the provision of water for production
facilities (industry).
Sector priorities are to increase agricultural
production and productivity; increase access to
critical farm inputs (including access to water and
irrigation), improve agricultural markets and value
addition; and strengthen institutional capacity.
The main areas in the county that have
environmental concerns include Mount Elgon
forest, Chetambe hills, Sang’alo hills, riparian
areas, food basket zones in Tongaren, schools
and institutional spaces and quarrying areas.
Sector priorities include restoring and
maintaining ecosystems; promoting the
sustainable use of Environment and Natural
Resources (ENR); increasing wetland coverage
and reducing degradation; maintaining the
meteorological information systems; climate
change management; and maintaining the
recommended forest coverage.
Busia CIDP
(2018-2022)
A major programme objective of the CIDP is to
increase the clean water supply for industrial and
domestic use in urban and rural areas. The total
volume of water produced per day, the total volume of
storage, and the number of water connections will
increase in the planning period. Existing water supply
systems will be better maintained to reduce down time.
The Programme of Preventative and Promotive Health
Services aims to reduce the burden of disease, injuries
and mortality. As part of this programme, the number of
health facilities connected to the water supply grid and
the number of households with upgraded sanitation will
be increased across the county.
Agriculture will be modernised by the development
of Agriculture and Extension Policy; development of
Land Use Policy; increasing investment in irrigation
agriculture, crops and livestock diversification and
the maintenance of indigenous genetic seed banks.
Rain fed agriculture areas with growth potential
were identified as Teso South, Teso North and
Nambale. Areas of irrigated agriculture and livestock
were identified as Samia, the Bunyala Matayos
“Blue economy” and Bunyala.
The natural environment in the county is heavily
degraded through deforestation, encroachment
in riparian areas, and sand harvesting.
Conservation of the natural environment is an
important theme in the CIDP. The strategies to
achieve this are to: develop a county
environmental management and safety
framework policy; strengthen the county
environment committee; manage liquid and solid
waste; protect all degraded areas; implement
afforestation, soil conservation, riverine
protection (including riparian zones, wetlands
and riverine basins) and control pollution and
mitigate the effects of pollution.
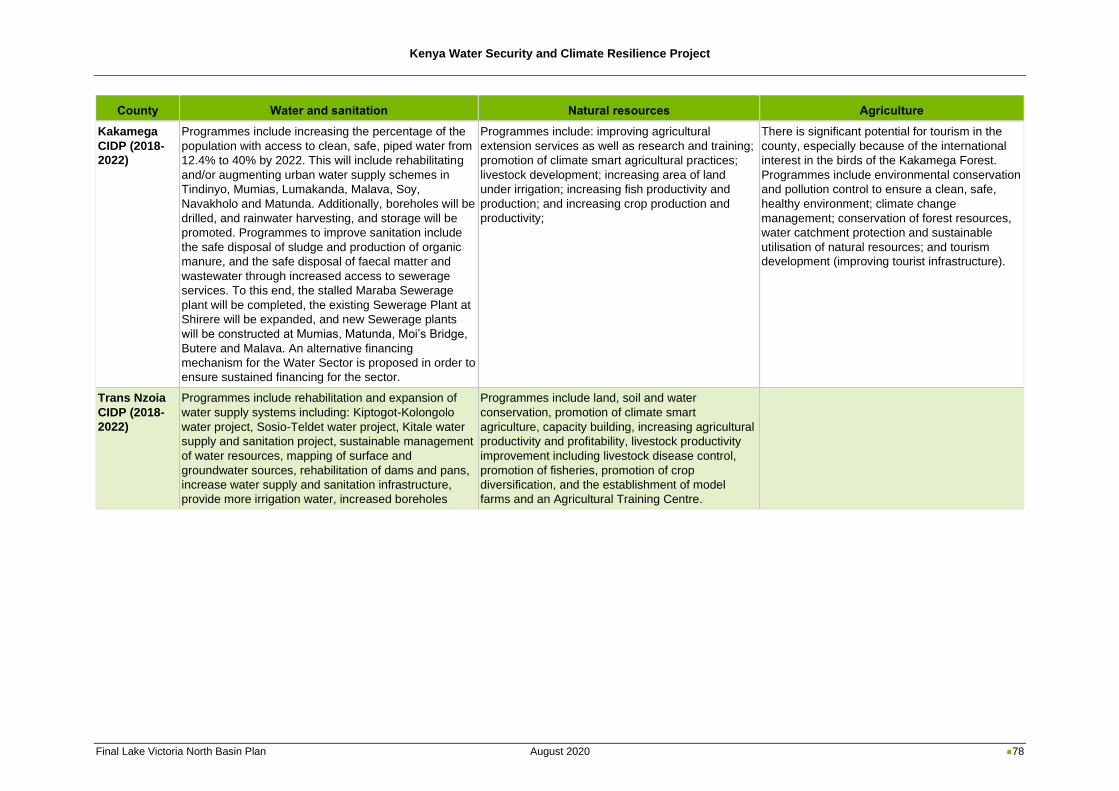
Kenya Water Security and Climate Resilience Project
Final Lake Victoria North Basin Plan August 2020 78
County Water and sanitation Natural resources Agriculture
Kakamega
CIDP (2018-
2022)
Programmes include increasing the percentage of the
population with access to clean, safe, piped water from
12.4% to 40% by 2022. This will include rehabilitating
and/or augmenting urban water supply schemes in
Tindinyo, Mumias, Lumakanda, Malava, Soy,
Navakholo and Matunda. Additionally, boreholes will be
drilled, and rainwater harvesting, and storage will be
promoted. Programmes to improve sanitation include
the safe disposal of sludge and production of organic
manure, and the safe disposal of faecal matter and
wastewater through increased access to sewerage
services. To this end, the stalled Maraba Sewerage
plant will be completed, the existing Sewerage Plant at
Shirere will be expanded, and new Sewerage plants
will be constructed at Mumias, Matunda, Moi’s Bridge,
Butere and Malava. An alternative financing
mechanism for the Water Sector is proposed in order to
ensure sustained financing for the sector.
Programmes include: improving agricultural
extension services as well as research and training;
promotion of climate smart agricultural practices;
livestock development; increasing area of land
under irrigation; increasing fish productivity and
production; and increasing crop production and
productivity;
There is significant potential for tourism in the
county, especially because of the international
interest in the birds of the Kakamega Forest.
Programmes include environmental conservation
and pollution control to ensure a clean, safe,
healthy environment; climate change
management; conservation of forest resources,
water catchment protection and sustainable
utilisation of natural resources; and tourism
development (improving tourist infrastructure).
Trans Nzoia
CIDP (2018-
2022)
Programmes include rehabilitation and expansion of
water supply systems including: Kiptogot-Kolongolo
water project, Sosio-Teldet water project, Kitale water
supply and sanitation project, sustainable management
of water resources, mapping of surface and
groundwater sources, rehabilitation of dams and pans,
increase water supply and sanitation infrastructure,
provide more irrigation water, increased boreholes
Programmes include land, soil and water
conservation, promotion of climate smart
agriculture, capacity building, increasing agricultural
productivity and profitability, livestock productivity
improvement including livestock disease control,
promotion of fisheries, promotion of crop
diversification, and the establishment of model
farms and an Agricultural Training Centre.
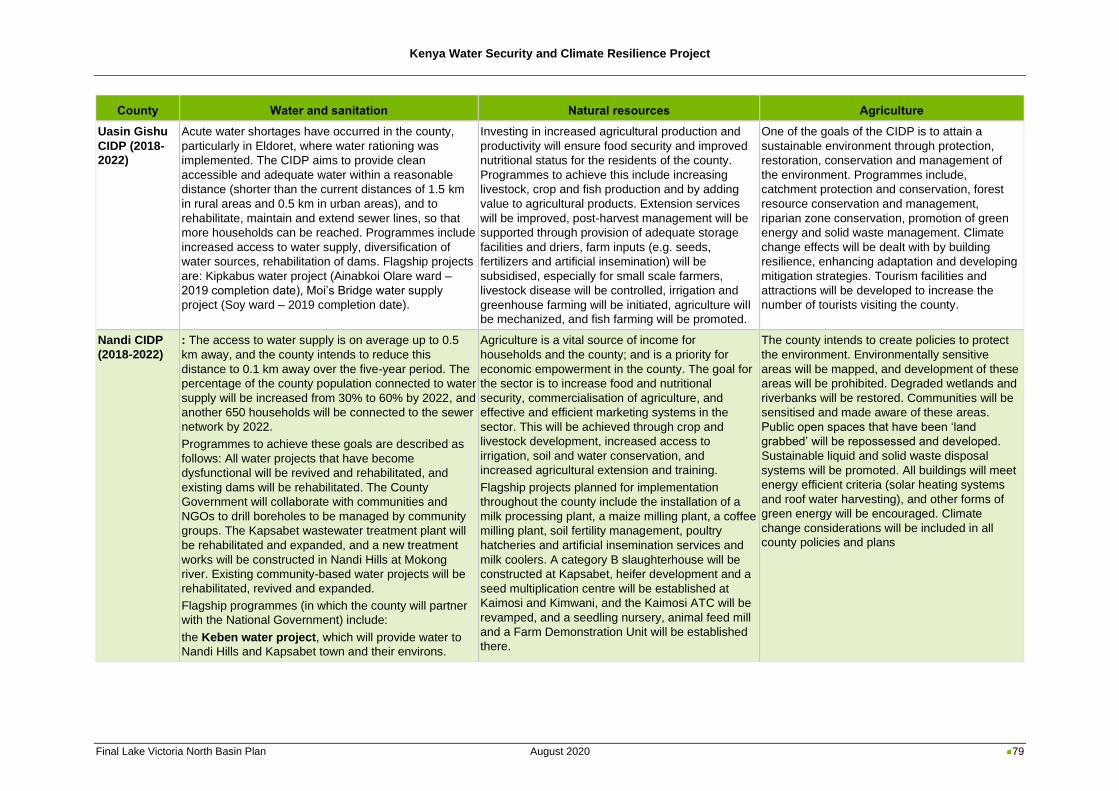
Kenya Water Security and Climate Resilience Project
Final Lake Victoria North Basin Plan August 2020 79
County Water and sanitation Natural resources Agriculture
Uasin Gishu
CIDP (2018-
2022)
Acute water shortages have occurred in the county,
particularly in Eldoret, where water rationing was
implemented. The CIDP aims to provide clean
accessible and adequate water within a reasonable
distance (shorter than the current distances of 1.5 km
in rural areas and 0.5 km in urban areas), and to
rehabilitate, maintain and extend sewer lines, so that
more households can be reached. Programmes include
increased access to water supply, diversification of
water sources, rehabilitation of dams. Flagship projects
are: Kipkabus water project (Ainabkoi Olare ward –
2019 completion date), Moi’s Bridge water supply
project (Soy ward – 2019 completion date).
Investing in increased agricultural production and
productivity will ensure food security and improved
nutritional status for the residents of the county.
Programmes to achieve this include increasing
livestock, crop and fish production and by adding
value to agricultural products. Extension services
will be improved, post-harvest management will be
supported through provision of adequate storage
facilities and driers, farm inputs (e.g. seeds,
fertilizers and artificial insemination) will be
subsidised, especially for small scale farmers,
livestock disease will be controlled, irrigation and
greenhouse farming will be initiated, agriculture will
be mechanized, and fish farming will be promoted.
One of the goals of the CIDP is to attain a
sustainable environment through protection,
restoration, conservation and management of
the environment. Programmes include,
catchment protection and conservation, forest
resource conservation and management,
riparian zone conservation, promotion of green
energy and solid waste management. Climate
change effects will be dealt with by building
resilience, enhancing adaptation and developing
mitigation strategies. Tourism facilities and
attractions will be developed to increase the
number of tourists visiting the county.
Nandi CIDP
(2018-2022)
: The access to water supply is on average up to 0.5
km away, and the county intends to reduce this
distance to 0.1 km away over the five-year period. The
percentage of the county population connected to water
supply will be increased from 30% to 60% by 2022, and
another 650 households will be connected to the sewer
network by 2022.
Programmes to achieve these goals are described as
follows: All water projects that have become
dysfunctional will be revived and rehabilitated, and
existing dams will be rehabilitated. The County
Government will collaborate with communities and
NGOs to drill boreholes to be managed by community
groups. The Kapsabet wastewater treatment plant will
be rehabilitated and expanded, and a new treatment
works will be constructed in Nandi Hills at Mokong
river. Existing community-based water projects will be
rehabilitated, revived and expanded.
Flagship programmes (in which the county will partner
with the National Government) include:
the Keben water project, which will provide water to
Nandi Hills and Kapsabet town and their environs.
Agriculture is a vital source of income for
households and the county; and is a priority for
economic empowerment in the county. The goal for
the sector is to increase food and nutritional
security, commercialisation of agriculture, and
effective and efficient marketing systems in the
sector. This will be achieved through crop and
livestock development, increased access to
irrigation, soil and water conservation, and
increased agricultural extension and training.
Flagship projects planned for implementation
throughout the county include the installation of a
milk processing plant, a maize milling plant, a coffee
milling plant, soil fertility management, poultry
hatcheries and artificial insemination services and
milk coolers. A category B slaughterhouse will be
constructed at Kapsabet, heifer development and a
seed multiplication centre will be established at
Kaimosi and Kimwani, and the Kaimosi ATC will be
revamped, and a seedling nursery, animal feed mill
and a Farm Demonstration Unit will be established
there.
The county intends to create policies to protect
the environment. Environmentally sensitive
areas will be mapped, and development of these
areas will be prohibited. Degraded wetlands and
riverbanks will be restored. Communities will be
sensitised and made aware of these areas.
Public open spaces that have been ‘land
grabbed’ will be repossessed and developed.
Sustainable liquid and solid waste disposal
systems will be promoted. All buildings will meet
energy efficient criteria (solar heating systems
and roof water harvesting), and other forms of
green energy will be encouraged. Climate
change considerations will be included in all
county policies and plans
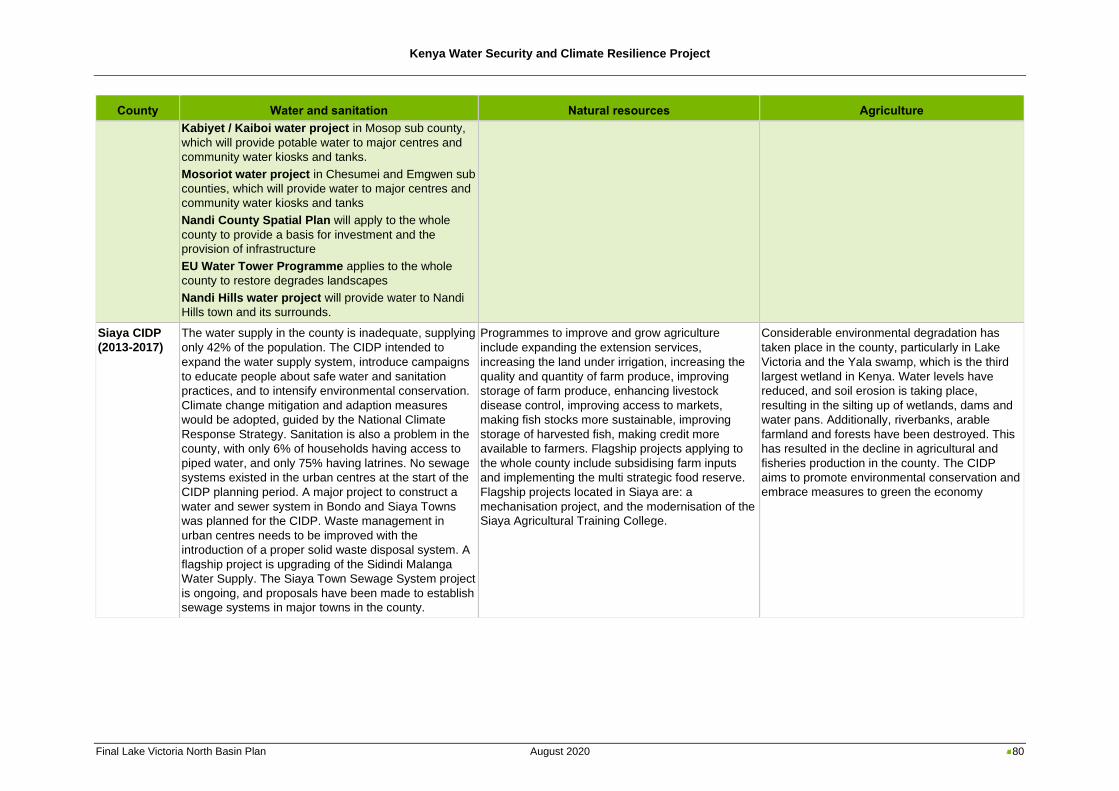
Kenya Water Security and Climate Resilience Project
Final Lake Victoria North Basin Plan August 2020 80
County Water and sanitation Natural resources Agriculture
Kabiyet / Kaiboi water project in Mosop sub county,
which will provide potable water to major centres and
community water kiosks and tanks.
Mosoriot water project in Chesumei and Emgwen sub
counties, which will provide water to major centres and
community water kiosks and tanks
Nandi County Spatial Plan will apply to the whole
county to provide a basis for investment and the
provision of infrastructure
EU Water Tower Programme applies to the whole
county to restore degrades landscapes
Nandi Hills water project will provide water to Nandi
Hills town and its surrounds.
Siaya CIDP
(2013-2017)
The water supply in the county is inadequate, supplying
only 42% of the population. The CIDP intended to
expand the water supply system, introduce campaigns
to educate people about safe water and sanitation
practices, and to intensify environmental conservation.
Climate change mitigation and adaption measures
would be adopted, guided by the National Climate
Response Strategy. Sanitation is also a problem in the
county, with only 6% of households having access to
piped water, and only 75% having latrines. No sewage
systems existed in the urban centres at the start of the
CIDP planning period. A major project to construct a
water and sewer system in Bondo and Siaya Towns
was planned for the CIDP. Waste management in
urban centres needs to be improved with the
introduction of a proper solid waste disposal system. A
flagship project is upgrading of the Sidindi Malanga
Water Supply. The Siaya Town Sewage System project
is ongoing, and proposals have been made to establish
sewage systems in major towns in the county.
Programmes to improve and grow agriculture
include expanding the extension services,
increasing the land under irrigation, increasing the
quality and quantity of farm produce, improving
storage of farm produce, enhancing livestock
disease control, improving access to markets,
making fish stocks more sustainable, improving
storage of harvested fish, making credit more
available to farmers. Flagship projects applying to
the whole county include subsidising farm inputs
and implementing the multi strategic food reserve.
Flagship projects located in Siaya are: a
mechanisation project, and the modernisation of the
Siaya Agricultural Training College.
Considerable environmental degradation has
taken place in the county, particularly in Lake
Victoria and the Yala swamp, which is the third
largest wetland in Kenya. Water levels have
reduced, and soil erosion is taking place,
resulting in the silting up of wetlands, dams and
water pans. Additionally, riverbanks, arable
farmland and forests have been destroyed. This
has resulted in the decline in agricultural and
fisheries production in the county. The CIDP
aims to promote environmental conservation and
embrace measures to green the economy
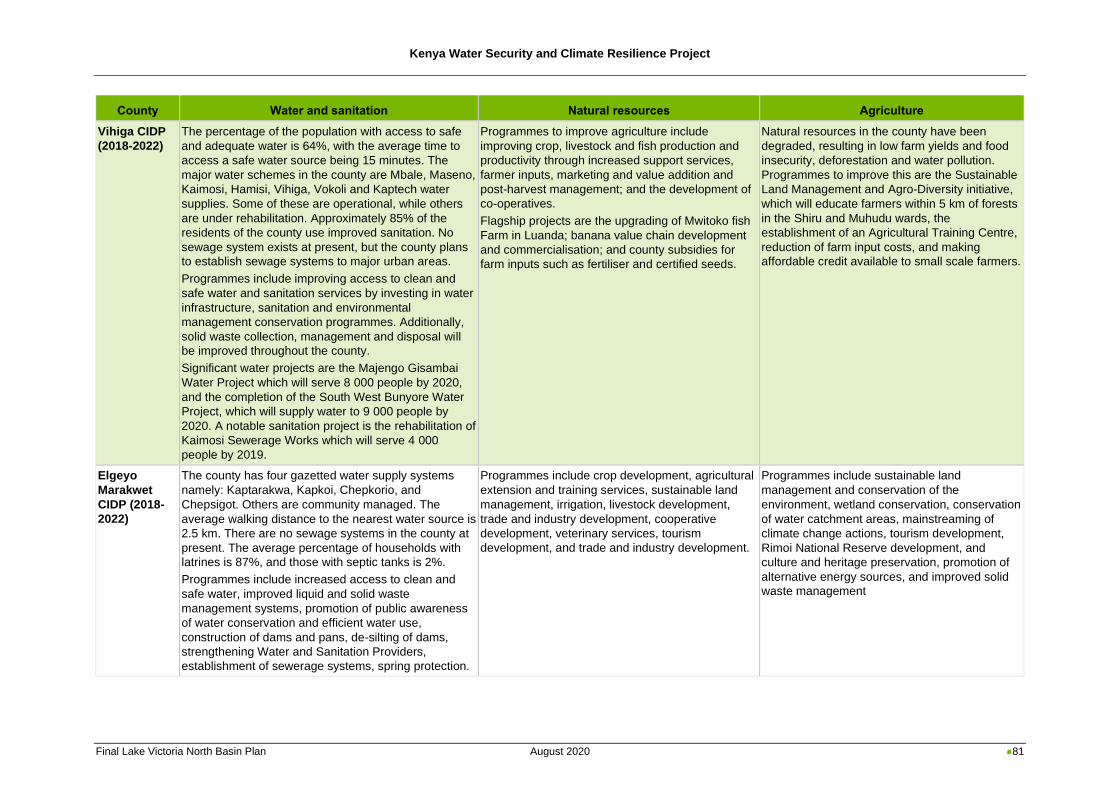
Kenya Water Security and Climate Resilience Project
Final Lake Victoria North Basin Plan August 2020 81
County Water and sanitation Natural resources Agriculture
Vihiga CIDP
(2018-2022)
The percentage of the population with access to safe
and adequate water is 64%, with the average time to
access a safe water source being 15 minutes. The
major water schemes in the county are Mbale, Maseno,
Kaimosi, Hamisi, Vihiga, Vokoli and Kaptech water
supplies. Some of these are operational, while others
are under rehabilitation. Approximately 85% of the
residents of the county use improved sanitation. No
sewage system exists at present, but the county plans
to establish sewage systems to major urban areas.
Programmes include improving access to clean and
safe water and sanitation services by investing in water
infrastructure, sanitation and environmental
management conservation programmes. Additionally,
solid waste collection, management and disposal will
be improved throughout the county.
Significant water projects are the Majengo Gisambai
Water Project which will serve 8 000 people by 2020,
and the completion of the South West Bunyore Water
Project, which will supply water to 9 000 people by
2020. A notable sanitation project is the rehabilitation of
Kaimosi Sewerage Works which will serve 4 000
people by 2019.
Programmes to improve agriculture include
improving crop, livestock and fish production and
productivity through increased support services,
farmer inputs, marketing and value addition and
post-harvest management; and the development of
co-operatives.
Flagship projects are the upgrading of Mwitoko fish
Farm in Luanda; banana value chain development
and commercialisation; and county subsidies for
farm inputs such as fertiliser and certified seeds.
Natural resources in the county have been
degraded, resulting in low farm yields and food
insecurity, deforestation and water pollution.
Programmes to improve this are the Sustainable
Land Management and Agro-Diversity initiative,
which will educate farmers within 5 km of forests
in the Shiru and Muhudu wards, the
establishment of an Agricultural Training Centre,
reduction of farm input costs, and making
affordable credit available to small scale farmers.
Elgeyo
Marakwet
CIDP (2018-
2022)
The county has four gazetted water supply systems
namely: Kaptarakwa, Kapkoi, Chepkorio, and
Chepsigot. Others are community managed. The
average walking distance to the nearest water source is
2.5 km. There are no sewage systems in the county at
present. The average percentage of households with
latrines is 87%, and those with septic tanks is 2%.
Programmes include increased access to clean and
safe water, improved liquid and solid waste
management systems, promotion of public awareness
of water conservation and efficient water use,
construction of dams and pans, de-silting of dams,
strengthening Water and Sanitation Providers,
establishment of sewerage systems, spring protection.
Programmes include crop development, agricultural
extension and training services, sustainable land
management, irrigation, livestock development,
trade and industry development, cooperative
development, veterinary services, tourism
development, and trade and industry development.
Programmes include sustainable land
management and conservation of the
environment, wetland conservation, conservation
of water catchment areas, mainstreaming of
climate change actions, tourism development,
Rimoi National Reserve development, and
culture and heritage preservation, promotion of
alternative energy sources, and improved solid
waste management
Kenya Water Security and Climate Resilience Project
Final Lake Victoria North Basin Plan August 2020 82
3.2.6 Regional development plans
District development plans were once a tool for implementing development at the district level in Kenya.
Currently, under the new dispensation, local development is done under county governments. Two
regional Development Authorities have jurisdiction over parts of the LVN Basin:
The Kerio Valley Development Authority is responsible for regional development in the Kerio Valley,
which falls mainly withing the Rift Valley Basin. It includes the town of Eldoret and a small portion of the
Elgeyo-Marakwet County in the north-eastern part of the LVN Basin. Since their main area of
responsibility falls within the Rift Valley Basin, it is not covered further in this report.
The Lake Basin Development Authority’s area of jurisdiction covers approximately 39 000 km2,
including the LVN and Lake Victoria South Basins. The mandate of the Lake Basin Development
Authority is to spearhead development, undertake overall integrated planning, co-ordination and
implementation of programs and projects in the basin. It was established in 1979 by an Act of Parliament
and falls under the Ministry of East African Community and Regional Development.
Three of the five water towers in the country fall within the area under the jurisdiction of the Lake Basin
Development Authority, namely: the Mau complex, Cherangany Hills and Mount Elgon. The rivers
feeding Lake Victoria originate from these water towers, and three of these fall within the Lake Victoria
Basin (Sio, Nzoia and Yala rivers). The Lake Basin Development Authority implements an integrated
land and water management system. They have partnered with County Governments, Youth and
Women’s groups to promote the commercialisation of tree seedlings production, bamboo
commercialisation and value addition as part of a wider programme for climate change mitigations
mainly in the catchment and riverine areas of the Basin. The Lake Development Authority plans to
produce 20 million seedlings, undertake catchment management and ecosystems studies as part of
these catchment restoration activities.
Two major projects taking place under the auspices of the Lake Basin Development Authority are the
Magwagwa and Nandi Multipurpose Dams, the latter falling within the LVN Basin. Capacity building and
technology transfer are also provided in the areas of agriculture and livestock development; dairy
development; apiculture development; coffee farming within the region, and aquaculture development.
3.2.7 Projects planned by Water Works Development Agencies
One Water Works Development Agency (WWDA) operates in the LVN Basin. The LVN Water Works
Development Agency (LVNWWDA) covers the following counties: Bungoma, Kakamega, Vihiga, Busia,
Uasin Gishu, Trans Nzoia and Nandi. Five Urban Water Service Providers have been appointed to
provide of water and sanitation services directly to the various urban areas within its coverage. The
Water Service Providers include:
◼ Eldoret Water and Sanitation Company: serving Eldoret town and its environs.
◼ Nzoia Water Services Company: serving the towns of Kitale, Webuye, Kimilili and Bungoma.
◼ Western Water Services Company: serving the towns of Kakamega, Busia, Mumias, Butere and
Nambale.
◼ Amatsi Water Services Company: serving Luanda, Majengo, Chavakali, Kaimosi, Maseno
University and Mbale.
◼ Kapsabet Nandi Water and Sanitation Company: serving Kapsabet town and its environs
The LVNWWDA has ongoing and proposed projects that vary from rehabilitation of water supply
schemes, extension of service lines, construction of storage tanks and drilling and equipping of
boreholes in all the counties, to major dam and water resource projects. Some of these projects are
listed below:
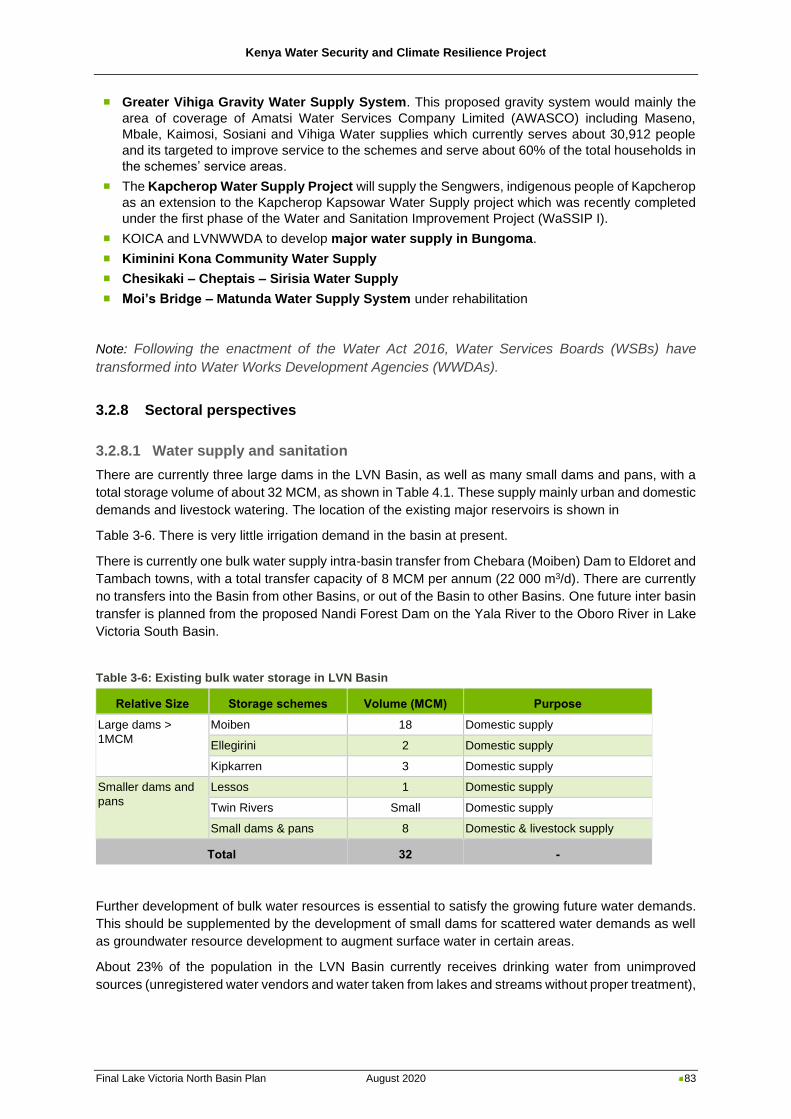
Kenya Water Security and Climate Resilience Project
Final Lake Victoria North Basin Plan August 2020 83
◼ Greater Vihiga Gravity Water Supply System. This proposed gravity system would mainly the
area of coverage of Amatsi Water Services Company Limited (AWASCO) including Maseno,
Mbale, Kaimosi, Sosiani and Vihiga Water supplies which currently serves about 30,912 people
and its targeted to improve service to the schemes and serve about 60% of the total households in
the schemes’ service areas.
◼ The Kapcherop Water Supply Project will supply the Sengwers, indigenous people of Kapcherop
as an extension to the Kapcherop Kapsowar Water Supply project which was recently completed
under the first phase of the Water and Sanitation Improvement Project (WaSSIP I).
◼ KOICA and LVNWWDA to develop major water supply in Bungoma.
◼ Kiminini Kona Community Water Supply
◼ Chesikaki – Cheptais – Sirisia Water Supply
◼ Moi’s Bridge – Matunda Water Supply System under rehabilitation
Note: Following the enactment of the Water Act 2016, Water Services Boards (WSBs) have
transformed into Water Works Development Agencies (WWDAs).
3.2.8 Sectoral perspectives
3.2.8.1 Water supply and sanitation
There are currently three large dams in the LVN Basin, as well as many small dams and pans, with a
total storage volume of about 32 MCM, as shown in Table 4.1. These supply mainly urban and domestic
demands and livestock watering. The location of the existing major reservoirs is shown in
Table 3-6. There is very little irrigation demand in the basin at present.
There is currently one bulk water supply intra-basin transfer from Chebara (Moiben) Dam to Eldoret and
Tambach towns, with a total transfer capacity of 8 MCM per annum (22 000 m3/d). There are currently
no transfers into the Basin from other Basins, or out of the Basin to other Basins. One future inter basin
transfer is planned from the proposed Nandi Forest Dam on the Yala River to the Oboro River in Lake
Victoria South Basin.
Table 3-6: Existing bulk water storage in LVN Basin
Relative Size Storage schemes Volume (MCM) Purpose
Large dams >
1MCM
Moiben 18 Domestic supply
Ellegirini 2 Domestic supply
Kipkarren 3 Domestic supply
Smaller dams and
pans
Lessos 1 Domestic supply
Twin Rivers Small Domestic supply
Small dams & pans 8 Domestic & livestock supply
Total 32 -
Further development of bulk water resources is essential to satisfy the growing future water demands.
This should be supplemented by the development of small dams for scattered water demands as well
as groundwater resource development to augment surface water in certain areas.
About 23% of the population in the LVN Basin currently receives drinking water from unimproved
sources (unregistered water vendors and water taken from lakes and streams without proper treatment),
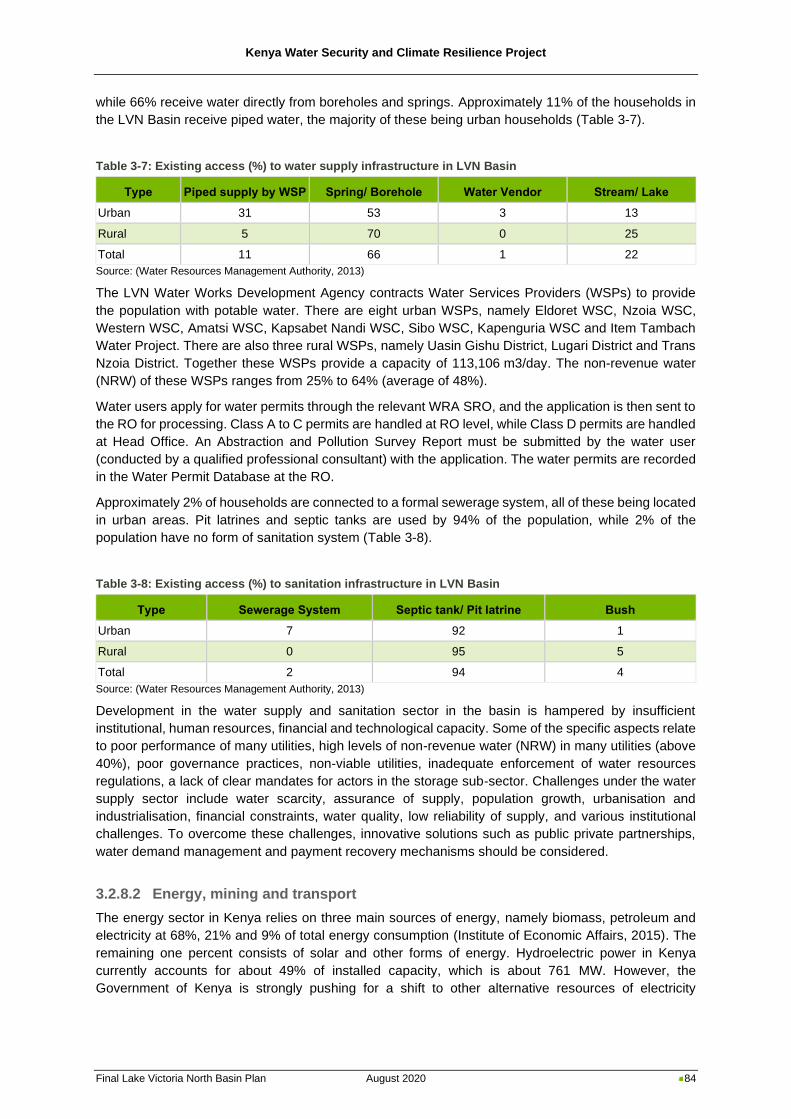
Kenya Water Security and Climate Resilience Project
Final Lake Victoria North Basin Plan August 2020 84
while 66% receive water directly from boreholes and springs. Approximately 11% of the households in
the LVN Basin receive piped water, the majority of these being urban households (Table 3-7).
Table 3-7: Existing access (%) to water supply infrastructure in LVN Basin
Type Piped supply by WSP Spring/ Borehole Water Vendor Stream/ Lake
Urban 31 53 3 13
Rural 5 70 0 25
Total 11 66 1 22
Source: (Water Resources Management Authority, 2013)
The LVN Water Works Development Agency contracts Water Services Providers (WSPs) to provide
the population with potable water. There are eight urban WSPs, namely Eldoret WSC, Nzoia WSC,
Western WSC, Amatsi WSC, Kapsabet Nandi WSC, Sibo WSC, Kapenguria WSC and Item Tambach
Water Project. There are also three rural WSPs, namely Uasin Gishu District, Lugari District and Trans
Nzoia District. Together these WSPs provide a capacity of 113,106 m3/day. The non-revenue water
(NRW) of these WSPs ranges from 25% to 64% (average of 48%).
Water users apply for water permits through the relevant WRA SRO, and the application is then sent to
the RO for processing. Class A to C permits are handled at RO level, while Class D permits are handled
at Head Office. An Abstraction and Pollution Survey Report must be submitted by the water user
(conducted by a qualified professional consultant) with the application. The water permits are recorded
in the Water Permit Database at the RO.
Approximately 2% of households are connected to a formal sewerage system, all of these being located
in urban areas. Pit latrines and septic tanks are used by 94% of the population, while 2% of the
population have no form of sanitation system (Table 3-8).
Table 3-8: Existing access (%) to sanitation infrastructure in LVN Basin
Type Sewerage System Septic tank/ Pit latrine Bush
Urban 7 92 1
Rural 0 95 5
Total 2 94 4
Source: (Water Resources Management Authority, 2013)
Development in the water supply and sanitation sector in the basin is hampered by insufficient
institutional, human resources, financial and technological capacity. Some of the specific aspects relate
to poor performance of many utilities, high levels of non-revenue water (NRW) in many utilities (above
40%), poor governance practices, non-viable utilities, inadequate enforcement of water resources
regulations, a lack of clear mandates for actors in the storage sub-sector. Challenges under the water
supply sector include water scarcity, assurance of supply, population growth, urbanisation and
industrialisation, financial constraints, water quality, low reliability of supply, and various institutional
challenges. To overcome these challenges, innovative solutions such as public private partnerships,
water demand management and payment recovery mechanisms should be considered.
3.2.8.2 Energy, mining and transport
The energy sector in Kenya relies on three main sources of energy, namely biomass, petroleum and
electricity at 68%, 21% and 9% of total energy consumption (Institute of Economic Affairs, 2015). The
remaining one percent consists of solar and other forms of energy. Hydroelectric power in Kenya
currently accounts for about 49% of installed capacity, which is about 761 MW. However, the
Government of Kenya is strongly pushing for a shift to other alternative resources of electricity
Kenya Water Security and Climate Resilience Project
Final Lake Victoria North Basin Plan August 2020 85
generation and by 2030 it is expected that hydro power will only account for 5% of total capacity at
1 039 MW.
The National Water Resource Management Strategy (Government of Kenya, 2006) acknowledges the
need to identify and prioritise energy-based needs as part of the planning and management aspects of
water resources management. Due to the increasing power demand in Kenya, there is a need to expand
the existing hydropower system, but also a need to diversify into other alternative but sustainable energy
forms based on life cycle least cost criteria to minimise stress on the water resources. The lack of
access to modern energy services for cooking and lighting is leading to the destruction of trees and
resultant catchment degradation in many parts of Kenya. This in turn impacts base flows along rivers
that provide the driving force for hydro power.
About 9% of the population in the LVN Basin has access to electricity. Paraffin is commonly used for
lighting in households without access to electricity, and about 95% of the population use biomass
(burning of firewood and charcoal) as a source of energy for cooking. There is one small hydropower
scheme in the catchment on the Sosiani River, with an installed capacity of 400 kW. Although
hydropower generation is currently low in the catchment, there is potential for future development of
hydropower dams on the Nzoia and Yala rivers.
Connection of users to the main electricity grid in the LVN is generally very poor except in large towns.
The rest of the basin has no access to modern energy services or employs off-grid energy systems like
solar, wind and hydro.
The LVN Basin will need to develop specific plans based on distributed generation and renewable
energy to expand energy access to many users in this region. Considering that a major section of the
Basin is not connected to the national grid, the opportunity for exploiting renewable energy is very
attractive. This would involve using mini-grid hydro, mini-grid wind, stand-alone diesel, stand-alone PV
or a hybrid combination of these technologies. The use of run of the river micro-hydro systems is also
a potential possibility.
◼ Limited gold mining taking place in the LVN Basin at the following locations:
− Kakamega County - Ikolomani goldmines
− Siaya County in Bondo, Siaya, Rarieda, Unguja and Gem sub-counties
− Nandi county - Chemase in Tinderet Sub-County
◼ There is potential to mine other minerals, precious stones and rare earth elements, for example
graphite (Cheang’any hills), asbestos, vermiculite and fluorite.
◼ Sand mining and quarrying for building materials such as granite, murram and ballast, occurs
throughout the Basin. Sand harvesting is common along riverbanks and areas with sandy soils,
such as the riverbanks of the Nzoia, Malakisi, Sirisia, Kundos, Kipkaren and Mokong Rivers.
◼ All these activities need to be regulated to ensure safe and sustainable practices.
◼ Prospecting for gold and other minerals is underway in Vihaga county at Kichutu in Viyalo,
Chavakali and Shiru wards. The CIDP recognises this potential for more mining activity in the
county, and intends to promote this by involving development partners to invest in modern mining
technology and establish mining plants
◼ Future water demands for the mining sector need to be accommodated in water resources
planning.
3.2.8.3 Agriculture
The Kenya Vision 2030 identified agriculture as one of the key sectors to deliver the annual economic
growth rate of 10% envisaged under the economic pillar. However, there are many issues and
challenges related to agriculture in Kenya linked to crop production, climate, water security, markets,
finance, trade, institutional setups, land management, soil management and environmental
sustainability. To achieve agricultural sector growth, transforming smallholder agriculture from
subsistence to an innovative, commercially oriented and modern agricultural sector is critical. This will
Kenya Water Security and Climate Resilience Project
Final Lake Victoria North Basin Plan August 2020 86
be supported by appropriate institutional reform in the agricultural sector. Agriculture is the most
important sector of the Kenyan economy and agricultural sector growth and development is therefore
crucial to Kenya’s overall economic and social development.
Only 17% of Kenya’s land area is suitable for rain-fed agriculture, with 83% of Kenya being ASAL. While
most of Kenya’s arable land is cultivated for crop production, a very small proportion is irrigated.
However, as the cropping and livestock production systems follow the annual rainfall patterns which
are highly variable and unreliable, it is well recognised that the country must embrace irrigation
development to remain competitive in the global and regional arena. Kenya has not fully developed her
irrigation potential. In 2010, about 142 000 ha was under irrigation, with a corresponding total irrigation
water demand of 1.6 BCM/a. Most of this is used for private and smallholder irrigation and mostly in the
Athi and Tana catchments. Most of the growth in irrigation in recent years is contributed by smallholder
and private sector schemes, while no substantial development was achieved in public schemes over
the last number of years. Although Kenya has ample land resources available, water resources for
irrigation are limited in most basins. Based on high-level water balance calculations undertaken for the
NWMP 2030, it was anticipated that water for future irrigation will have to be supplied mainly from
surface water, supplemented from groundwater and water harvesting sources and it is evident that
significant investments in large dams would be required for storage purposes. Increasing the
productivity of agricultural water use in Kenya is a national priority, given the country’s low water
endowment, growing population, and changing climate. Expanding the use of modern irrigation
technology, such as drip and sprinkler systems, will be fundamental to achieving water productivity
because of the potential for such systems to increase yields relative to water withdrawals.
The total livestock water requirement in Kenya in 2010 was estimated at 255 MCM/a in the NWMP 2030
and is mainly supplied from surface water. However, this is expected to almost double by 2030. Water
harvesting measures such as small dams and/or pans have been identified as the most feasible for
supplying this growth in demand, a large portion of which is expected to occur in the ASAL parts of
Kenya. In high-rainfall areas there is potential to develop the dairy, poultry and pig industries
(Government of Kenya, 2010a).
Freshwater fishing in Lake Victoria is the largest in Kenya and accounts for 78.7% of the total freshwater
fisheries production (Water Resources Management Authority, 2013). Aquaculture is an important
contributor to Kenya’s fisheries sector. Freshwater aquaculture development has grown remarkably,
making Kenya one of the fastest-growing major producers in Sub-Saharan Africa (Saunders et al.,
2017). Aquaculture production has risen since the late 1990s, with a focus on private, large-scale
aquaculture development. However, the aquaculture sector suffers basic challenges such as limited
knowledge and skills and inadequate supplies of quality feed and seed fish. Small-scale rural
enterprises produce mainly Tilapia at a subsistence level.
The LVN Basin is classified as humid land (Water Resources Management Authority, 2013). Water
demands for agriculture in the Basin include commercial farming (mainly horticulture, floriculture and
wheat farming), livestock keeping, small-holder subsistence farming and fisheries. These demands are
projected to increase due to population and economic activities. The total crop area in the Basin in 2011
was about 776 811 ha, mainly consisting of rain-fed crops, with only 1 876 ha of irrigated crops. This
irrigated area is made up of 19% large-scale, 71% small-scale and 10% private irrigation schemes
(Water Resources Management Authority, 2013).
Various Directorates under the Agriculture, Fisheries and Food Authority (AFFA) provide technical input
and advice to County Governments. The Authority also conducts farmers’ training programs aimed at
increasing their knowledge on production technologies and prospects for various types of crops, through
farmer training institutions. Conservation agriculture has been promoted as a sustainable alternative for
farmers to address the problem of declining soil fertility and provide the dual benefit of enhanced food
production and adaptation/resilience to changing climatic conditions (Agriculture and Food Authority,
2017). Aquaculture has been promoted as a food security intervention at the household level. Counties
are being encouraged to increase aquaculture in both marine and inland systems. Improved livestock
Kenya Water Security and Climate Resilience Project
Final Lake Victoria North Basin Plan August 2020 87
productivity has been promoted through improving animal breeds, improving feeds regulation,
developing pastures and forage and enhancing extension services. Cooperatives have not performed
adequately since State withdrawal from their day-to-day operations (Agriculture and Food Authority,
2017), therefore counties are encouraged to revitalise cooperatives and strengthen their capacities to
make them competitive.
3.2.8.4 Forestry, land use and catchment management
Poor land use planning and management have detrimental effects on the water resources of a basin.
Human encroachment of riparian land and forest areas, as well as unsustainable agricultural, pastoral
and livelihood activities that are incompatible with the capacity of the land are some of the major land
use issues in the LVN Basin. The valuation of the forests in the basin and its contribution to the national
economy is largely undocumented. Human encroachment, illegal logging, overgrazing, fires, pests and
diseases among others are threatening the forest reserves leading to a significant loss of vegetation
cover. In 2010, the total forest area in the LVN Basin was about 107,000 ha. However, according to
satellite imagery, the forested area had decreased by about 30% since 1990 (Water Resources
Management Authority, 2013). In recognition of the importance of forests for sustainable development,
the 2010 Constitution in Article 69 provides for the state to work towards increasing the country’s forest
cover to 10% of the land area of Kenya (The Constitution of Kenya, 2010). A total area of 230 000 ha
of forestation is proposed in the NWMP 2030 for LVN Basin up to 2030.
The National Environmental Management Authority (NEMA) has Environmental Committees who
provide technical support for environmental management and provide input to county integrated
development plans. The Kenya Water Towers Agency (KWTA) looks after Kenya’s water towers. The
Forest Management and Conservation division under the Kenya Forest Service (KFS) is charged with
the management and conservation of the natural forests in Kenya, of which most form water towers.
Strategic outputs involve increasing percentage cover through tree planting and gazetting new forests;
as well as improving livelihoods. The KFS Forest Farm and Dryland Forestry program provides technical
support to the Counties, advisory services for forest management, promoting biomass energy
development and utilization, promote dryland forest conservation and promote participatory forest
extension methodologies including farmer field schools.
In the LVN Basin, forest reserves largely cover the area surrounding the major water tower of the
catchment as well as groundwater recharge areas. These reserves include: Mount Elgon Park,
Cherangani Hills, and the Mau Forest Complex. Other forest reserves are the Kakamega and Nandi
forest reserves. The Kikuyu Escarpment, Chyulu Hills and Ngong Hills forest reserves are important
groundwater recharge areas in the catchment.
3.2.8.5 Biodiversity, protected areas and tourism
The LVN Basin contains important wildlife habitats and tourism/recreation assets. It includes one
national park namely, Mount Elgon National Park. Lake Victoria is a major tourist attraction, with many
people visiting the lake to fish, and to enjoy its natural beauty. Other tourist attractions are the
Kakamega Forest (renowned for the occurrence of the rare bird species, for example: The Great Blue
Turaco), Saiwa Game Reserve and the ‘Crying Stone’ located in Kakamega County. The LVN Basin
has developed infrastructure for tourism, including holiday resorts, camping areas and transport
infrastructure.
Aside from the Water Towers and gazetted forests, which are managed by KWTA and KFS respectively,
the Parks and Reserves division of the Kenya Wildlife Service (KWS) manages the National Parks,
National Reserves, and National Sanctuaries in the country. KWS is also involved in forest conservation
and water towers conservation as well as ratifying the RAMSAR convention. KWS exercises mandates
over the LVN Basin, not just in areas within parks and reserves, but also as the custodians of Kenya’s
biodiversity, a role they are committed to through the Nagoya Protocol of the Convention of Biological
Diversity. Kenya ratified the Protocol in May 2014, which obliges states to develop appropriate domestic
Kenya Water Security and Climate Resilience Project
Final Lake Victoria North Basin Plan August 2020 88
measures for effective management of biodiversity in relation to access to genetic resources, benefit-
sharing and compliance. Biodiversity in wetlands and sections of the river flowing through protected
areas also receive protection by KWS.
The main threats to protected areas in the LVN Basin are increased deforestation and loss of
biodiversity. This has been caused by both direct and indirect drivers. The main direct drivers to
increased forest degradation and deforestation leading to high biodiversity losses are illegal and legal
excision arising mainly from pressure for expansion of agricultural land, urban development and
settlements, unsustainable utilisation of forest resources, increasing dependence on wood energy for
lighting and domestic consumption especially firewood and charcoal, forest fires, overgrazing and
institutional failures. The weak institutions arise from weak governance structures and inadequate
capacity for law enforcement, and weak stakeholder participation in forest management and
governance. This is exacerbated by inadequate funding of the forestry sector from the exchequer, civil
and public sectors.
The LVN Basin ecosystems, as with most river basins in Kenya, do not have specific plans or strategies
that target biodiversity and ecosystem conservation. However, efforts made for natural resource
management, basin rehabilitation, and integrated water resource management in the basin result in
biodiversity conservation. The wetland ecosystems of the LVN Basin are environmentally sensitive
areas under threat from human encroachment. Lake Victoria is an international lake in the LVN Basin
which straddles the Kenya-Uganda border. The National Environment Management Authority (NEMA)
raised great concern for the degradation of wetlands in Kenya, and in 2011, NEMA enforced regulations
to improve and conserve these ecologically sensitive areas.
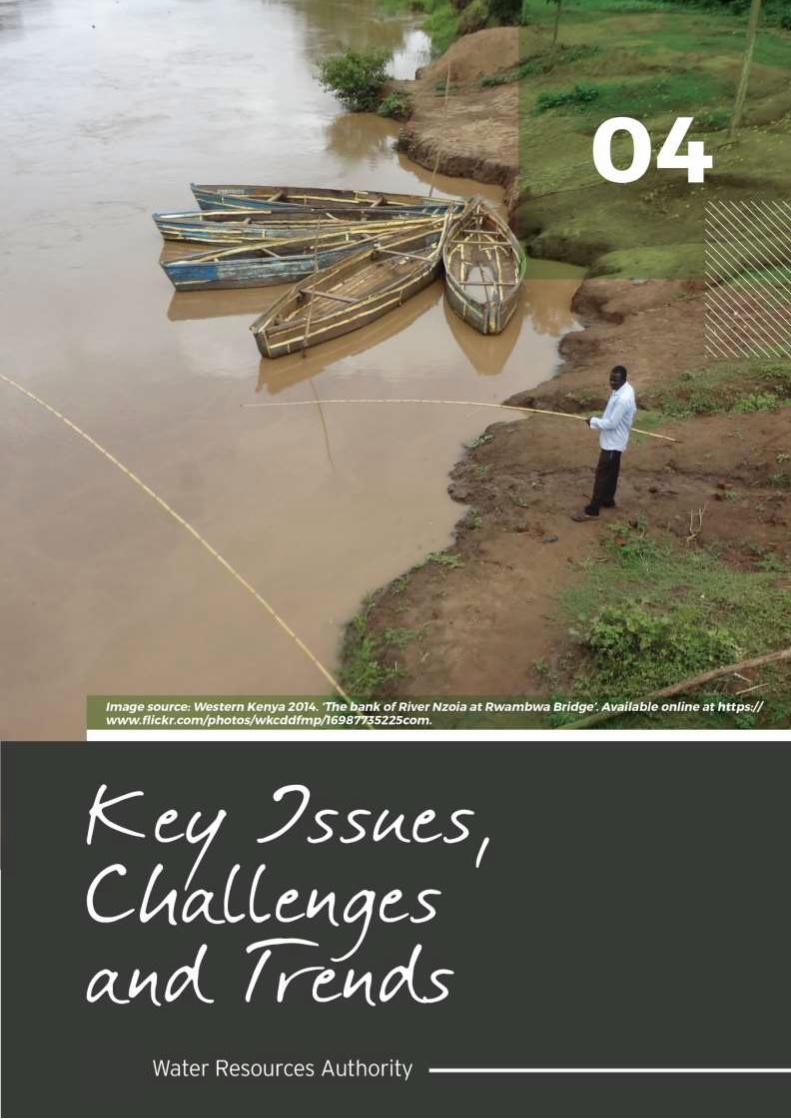
Kenya Water Security and Climate Resilience Project
Final Lake Victoria North Basin Plan August 2020 89
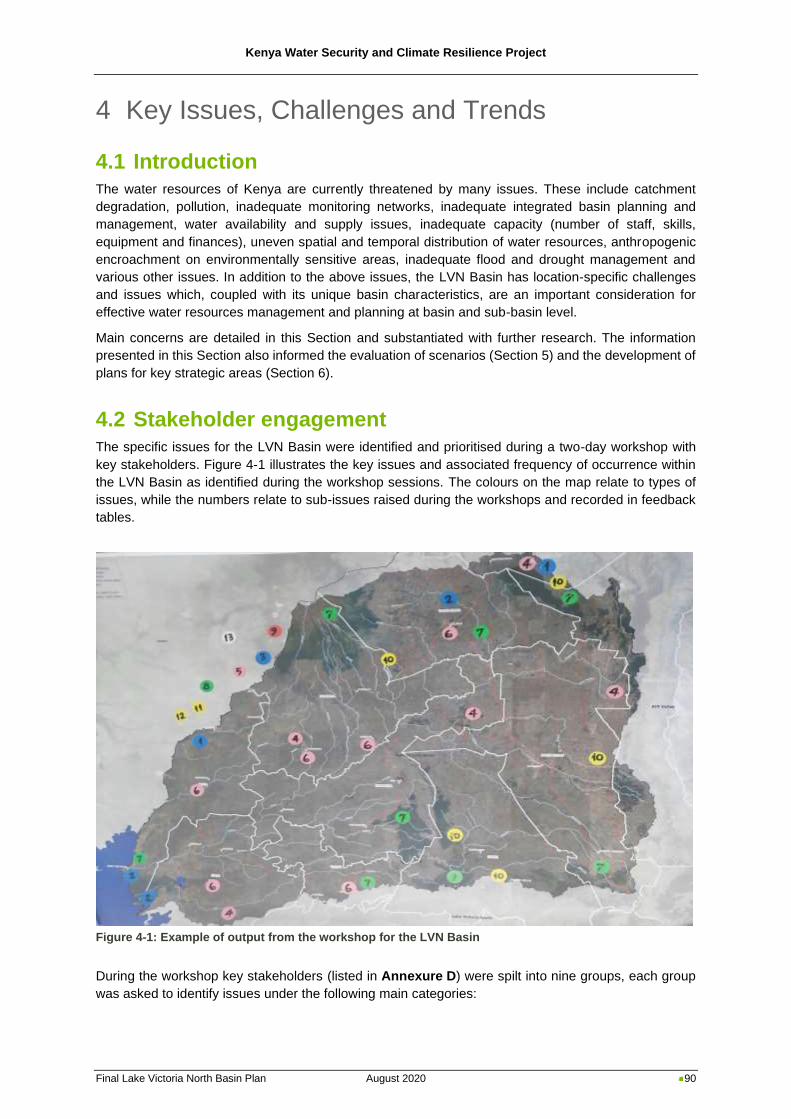
Kenya Water Security and Climate Resilience Project
Final Lake Victoria North Basin Plan August 2020 90
4 Key Issues, Challenges and Trends
4.1 Introduction
The water resources of Kenya are currently threatened by many issues. These include catchment
degradation, pollution, inadequate monitoring networks, inadequate integrated basin planning and
management, water availability and supply issues, inadequate capacity (number of staff, skills,
equipment and finances), uneven spatial and temporal distribution of water resources, anthropogenic
encroachment on environmentally sensitive areas, inadequate flood and drought management and
various other issues. In addition to the above issues, the LVN Basin has location-specific challenges
and issues which, coupled with its unique basin characteristics, are an important consideration for
effective water resources management and planning at basin and sub-basin level.
Main concerns are detailed in this Section and substantiated with further research. The information
presented in this Section also informed the evaluation of scenarios (Section 5) and the development of
plans for key strategic areas (Section 6).
4.2 Stakeholder engagement
The specific issues for the LVN Basin were identified and prioritised during a two-day workshop with
key stakeholders. Figure 4-1 illustrates the key issues and associated frequency of occurrence within
the LVN Basin as identified during the workshop sessions. The colours on the map relate to types of
issues, while the numbers relate to sub-issues raised during the workshops and recorded in feedback
tables.
Figure 4-1: Example of output from the workshop for the LVN Basin
During the workshop key stakeholders (listed in Annexure D) were spilt into nine groups, each group
was asked to identify issues under the following main categories:
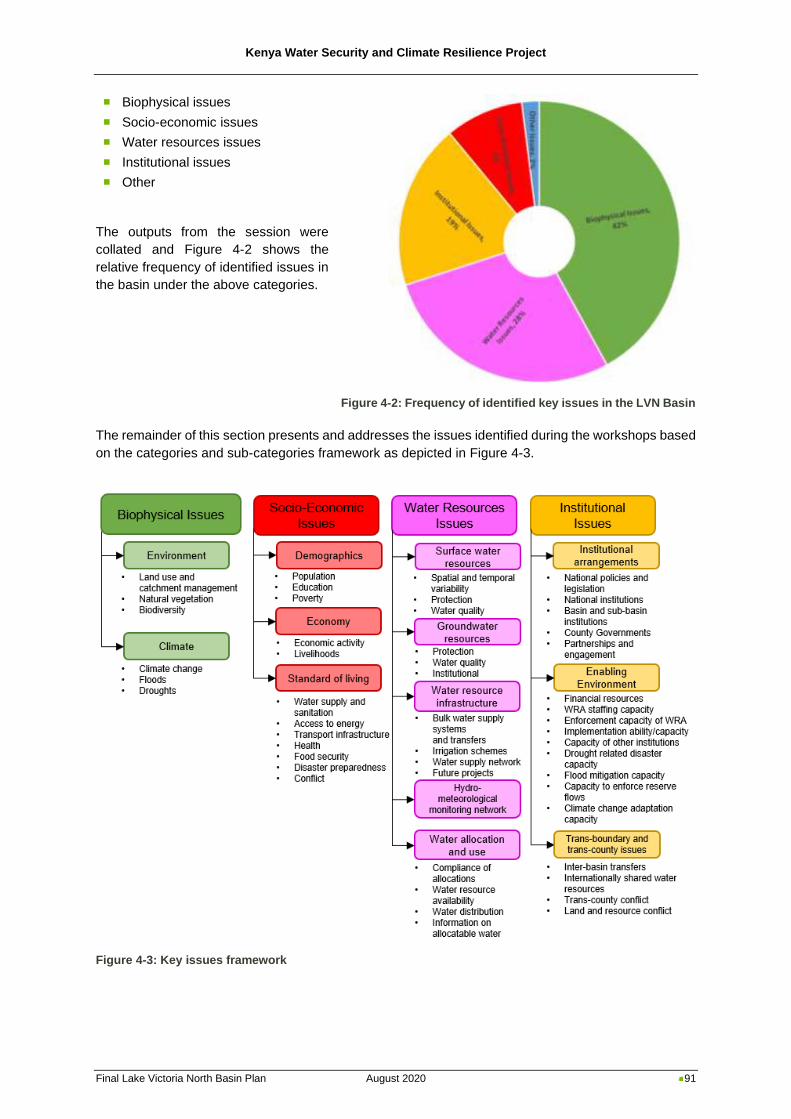
Kenya Water Security and Climate Resilience Project
Final Lake Victoria North Basin Plan August 2020 91
◼ Biophysical issues
◼ Socio-economic issues
◼ Water resources issues
◼ Institutional issues
◼ Other
The outputs from the session were
collated and Figure 4-2 shows the
relative frequency of identified issues in
the basin under the above categories.
The remainder of this section presents and addresses the issues identified during the workshops based
on the categories and sub-categories framework as depicted in Figure 4-3.
Figure 4-3: Key issues framework
Figure 4-2: Frequency of identified key issues in the LVN Basin
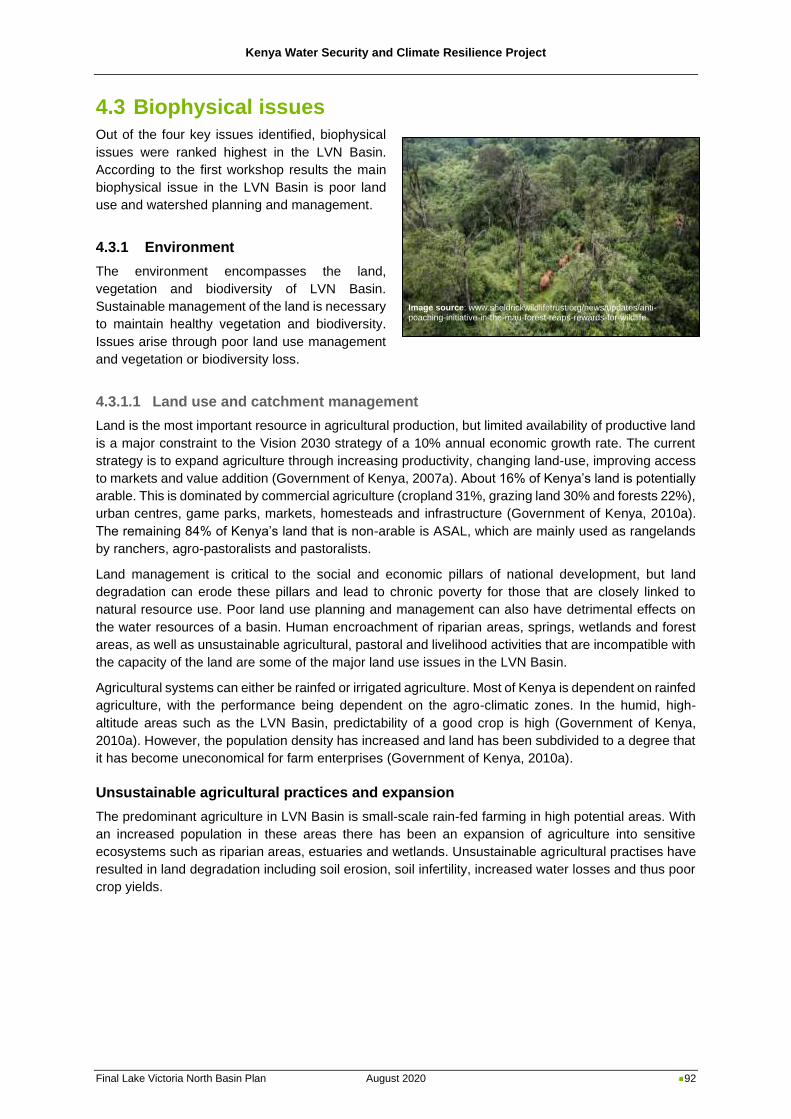
Kenya Water Security and Climate Resilience Project
Final Lake Victoria North Basin Plan August 2020 92
4.3 Biophysical issues
Out of the four key issues identified, biophysical
issues were ranked highest in the LVN Basin.
According to the first workshop results the main
biophysical issue in the LVN Basin is poor land
use and watershed planning and management.
4.3.1 Environment
The environment encompasses the land,
vegetation and biodiversity of LVN Basin.
Sustainable management of the land is necessary
to maintain healthy vegetation and biodiversity.
Issues arise through poor land use management
and vegetation or biodiversity loss.
4.3.1.1 Land use and catchment management
Land is the most important resource in agricultural production, but limited availability of productive land
is a major constraint to the Vision 2030 strategy of a 10% annual economic growth rate. The current
strategy is to expand agriculture through increasing productivity, changing land-use, improving access
to markets and value addition (Government of Kenya, 2007a). About 16% of Kenya’s land is potentially
arable. This is dominated by commercial agriculture (cropland 31%, grazing land 30% and forests 22%),
urban centres, game parks, markets, homesteads and infrastructure (Government of Kenya, 2010a).
The remaining 84% of Kenya’s land that is non-arable is ASAL, which are mainly used as rangelands
by ranchers, agro-pastoralists and pastoralists.
Land management is critical to the social and economic pillars of national development, but land
degradation can erode these pillars and lead to chronic poverty for those that are closely linked to
natural resource use. Poor land use planning and management can also have detrimental effects on
the water resources of a basin. Human encroachment of riparian areas, springs, wetlands and forest
areas, as well as unsustainable agricultural, pastoral and livelihood activities that are incompatible with
the capacity of the land are some of the major land use issues in the LVN Basin.
Agricultural systems can either be rainfed or irrigated agriculture. Most of Kenya is dependent on rainfed
agriculture, with the performance being dependent on the agro-climatic zones. In the humid, high-
altitude areas such as the LVN Basin, predictability of a good crop is high (Government of Kenya,
2010a). However, the population density has increased and land has been subdivided to a degree that
it has become uneconomical for farm enterprises (Government of Kenya, 2010a).
Unsustainable agricultural practices and expansion
The predominant agriculture in LVN Basin is small-scale rain-fed farming in high potential areas. With
an increased population in these areas there has been an expansion of agriculture into sensitive
ecosystems such as riparian areas, estuaries and wetlands. Unsustainable agricultural practises have
resulted in land degradation including soil erosion, soil infertility, increased water losses and thus poor
crop yields.
Image source: www.sheldrickwildlifetrust.org/news/updates/anti-poaching-initiative-in-the-mau-forest-reaps-rewards-for-wildlife
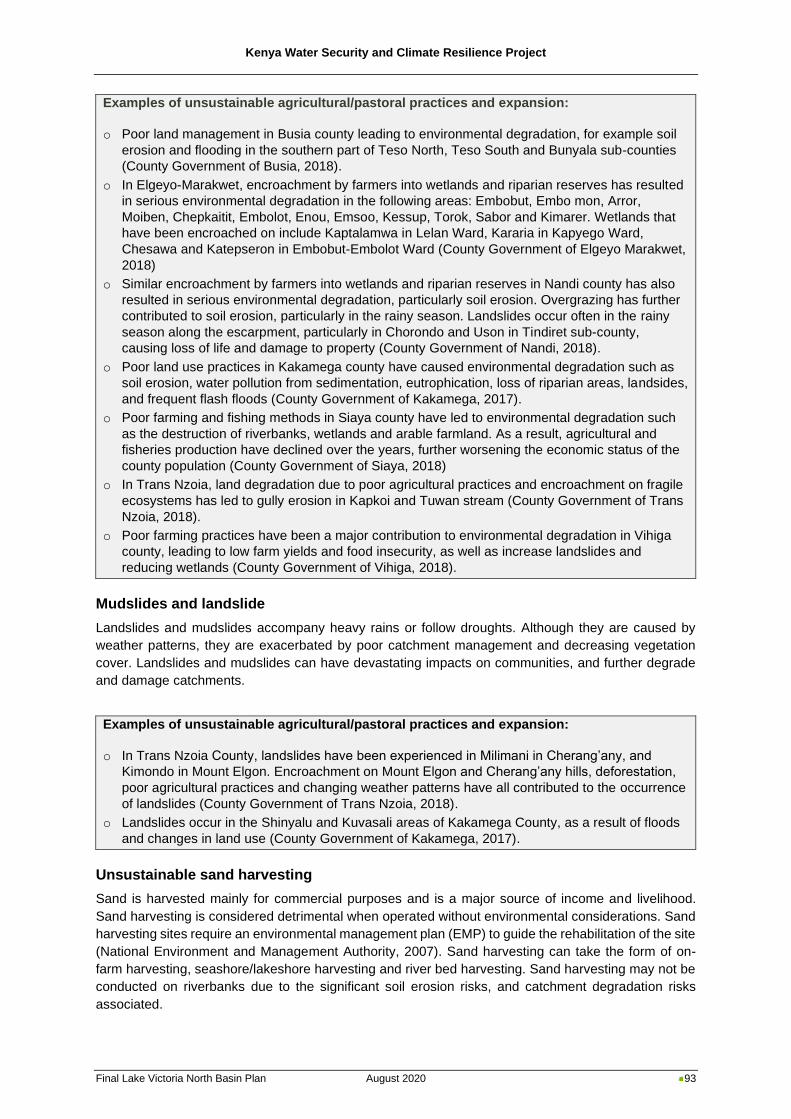
Kenya Water Security and Climate Resilience Project
Final Lake Victoria North Basin Plan August 2020 93
Examples of unsustainable agricultural/pastoral practices and expansion:
o Poor land management in Busia county leading to environmental degradation, for example soil
erosion and flooding in the southern part of Teso North, Teso South and Bunyala sub-counties
(County Government of Busia, 2018).
o In Elgeyo-Marakwet, encroachment by farmers into wetlands and riparian reserves has resulted
in serious environmental degradation in the following areas: Embobut, Embo mon, Arror,
Moiben, Chepkaitit, Embolot, Enou, Emsoo, Kessup, Torok, Sabor and Kimarer. Wetlands that
have been encroached on include Kaptalamwa in Lelan Ward, Kararia in Kapyego Ward,
Chesawa and Katepseron in Embobut-Embolot Ward (County Government of Elgeyo Marakwet,
2018)
o Similar encroachment by farmers into wetlands and riparian reserves in Nandi county has also
resulted in serious environmental degradation, particularly soil erosion. Overgrazing has further
contributed to soil erosion, particularly in the rainy season. Landslides occur often in the rainy
season along the escarpment, particularly in Chorondo and Uson in Tindiret sub-county,
causing loss of life and damage to property (County Government of Nandi, 2018).
o Poor land use practices in Kakamega county have caused environmental degradation such as
soil erosion, water pollution from sedimentation, eutrophication, loss of riparian areas, landsides,
and frequent flash floods (County Government of Kakamega, 2017).
o Poor farming and fishing methods in Siaya county have led to environmental degradation such
as the destruction of riverbanks, wetlands and arable farmland. As a result, agricultural and
fisheries production have declined over the years, further worsening the economic status of the
county population (County Government of Siaya, 2018)
o In Trans Nzoia, land degradation due to poor agricultural practices and encroachment on fragile
ecosystems has led to gully erosion in Kapkoi and Tuwan stream (County Government of Trans
Nzoia, 2018).
o Poor farming practices have been a major contribution to environmental degradation in Vihiga
county, leading to low farm yields and food insecurity, as well as increase landslides and
reducing wetlands (County Government of Vihiga, 2018).
Mudslides and landslide
Landslides and mudslides accompany heavy rains or follow droughts. Although they are caused by
weather patterns, they are exacerbated by poor catchment management and decreasing vegetation
cover. Landslides and mudslides can have devastating impacts on communities, and further degrade
and damage catchments.
Examples of unsustainable agricultural/pastoral practices and expansion:
o In Trans Nzoia County, landslides have been experienced in Milimani in Cherang’any, and
Kimondo in Mount Elgon. Encroachment on Mount Elgon and Cherang’any hills, deforestation,
poor agricultural practices and changing weather patterns have all contributed to the occurrence
of landslides (County Government of Trans Nzoia, 2018).
o Landslides occur in the Shinyalu and Kuvasali areas of Kakamega County, as a result of floods
and changes in land use (County Government of Kakamega, 2017).
Unsustainable sand harvesting
Sand is harvested mainly for commercial purposes and is a major source of income and livelihood.
Sand harvesting is considered detrimental when operated without environmental considerations. Sand
harvesting sites require an environmental management plan (EMP) to guide the rehabilitation of the site
(National Environment and Management Authority, 2007). Sand harvesting can take the form of on-
farm harvesting, seashore/lakeshore harvesting and river bed harvesting. Sand harvesting may not be
conducted on riverbanks due to the significant soil erosion risks, and catchment degradation risks
associated.
Kenya Water Security and Climate Resilience Project
Final Lake Victoria North Basin Plan August 2020 94
Example of unsustainable sand harvesting:
o Rivers with sand mining:
- Kerio River in Elgeyo Marakwet (County Government of Elgeyo Marakwet, 2018)
- Major Rivers in Kakamega county, including Yala, Isiukhu, Nzoia, Firatsi, Sasala and
Lusumu (County Government of Kakamega, 2017)
- Nzoia River in Trans Nzoia county (County Government of Trans Nzoia, 2018)
o Counties with sand mining issues:
- Sand harvesting occurs in Bungoma county. It is common along riverbanks and areas with
sandy soils such as Malakisi and Sirisaia (County Government of Bungoma, 2018).
- Sand harvesting along riverbanks occurs in Busia County (County Government of Busia,
2018).
- Sand harvesting, mainly for construction purposes, is undertaken in Kakamega county
(County Government of Kakamega, 2017).
- Sand harvesting in Nandi County usually occurs in Aldai and Tinderet sub-counties (County
Government of Nandi, 2018).
- Sand harvesting occurs in Trans Nzoia county in Machewa, Saboti, Keiyo and Chepchoina
wards (County Government of Trans Nzoia, 2018).
- Sand harvesting takes place in Vihiga county (County Government of Vihiga, 2018)
Unsustainable mining
Mining and collection of stones and other minerals is carried out and sold for commercial value and as
building materials. Quarry sites require an environmental management plan (EMP) to guide the
rehabilitation of the site, although small scale mines have not been adhering to this legislation. Small
scale mining has adverse environmental impacts due to the limited rehabilitation and planning
conducted. Quarrying involves the destruction of vegetation and fauna habitats, soil erosion, dust and
noise impacts. Many quarry sites are uncontrolled and have been located haphazardly without proper
planning. When quarry sites are located near a river they may lead to water pollution through oil or
petroleum spills, sedimentation and other waste products.
Example of unsustainable mining:
o Mining is one of the major contributors to environmental degradation in Vihaga county (County
Government of Vihiga, 2018)
o Gold mining has taken place in Nandi county at Chemase in Tinderet sub-county since 2009.
The company undertaking these mining operations has been accused of poor management of
the environment (County Government of Nandi, 2018)
o Gold mining is carried out in Rosterman in Lurambi, Ikolomani, Khwisero, Shinyalu and Butere
in Kakamega county. Negative effects result from these activities, for example: acid mine
drainage, air and noise pollution, collapse of mining pits, caving of overburden, and heavy
metals pollution (County Government of Kakamega, 2017).
o Poor mining techniques are used in Elgeyo Marakwet county (County Government of Elgeyo
Marakwet, 2018)
Land use change
Change in land use can have several effects, depending on the type of change that occurs.
Deforestation occurs when trees are cut down and cleared so that fields can be planted. Wetlands and
swamps are sometimes filled in or drained so that fields can be planted. Farmland can be turned to
settlements, which may increase surface runoff due to the change in land cover. Urban areas will
produce waste, which may increase pollution if not handled properly.
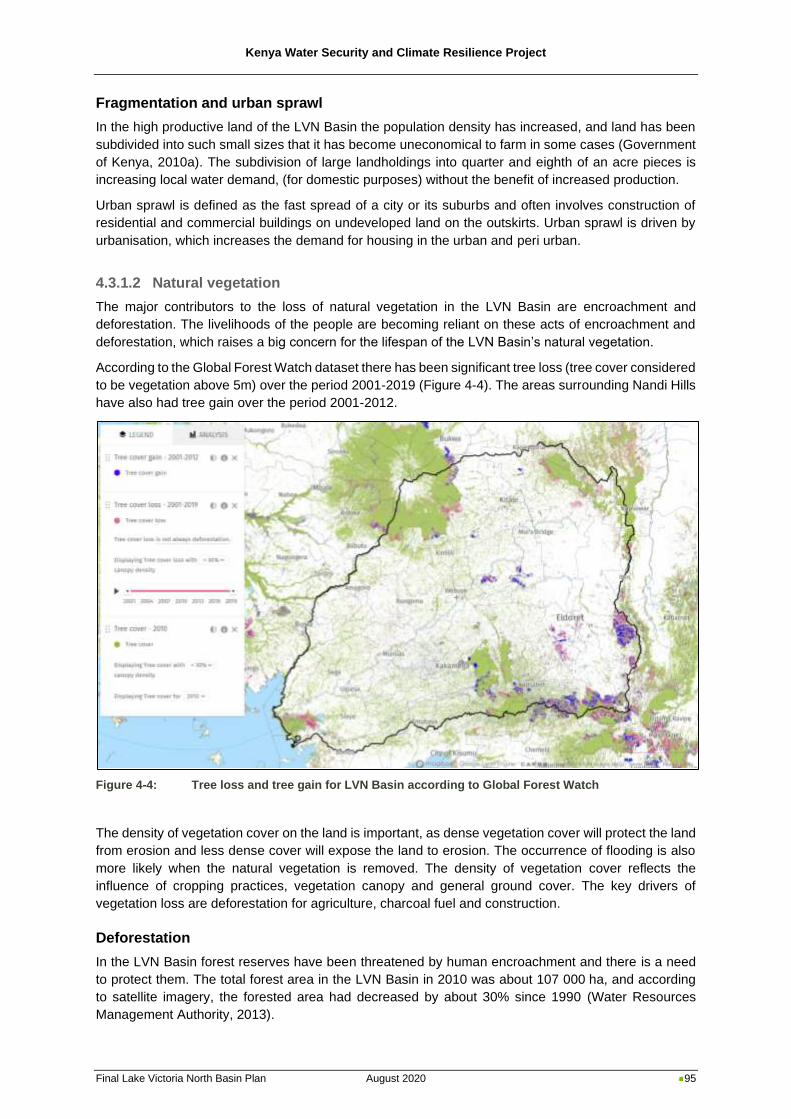
Kenya Water Security and Climate Resilience Project
Final Lake Victoria North Basin Plan August 2020 95
Fragmentation and urban sprawl
In the high productive land of the LVN Basin the population density has increased, and land has been
subdivided into such small sizes that it has become uneconomical to farm in some cases (Government
of Kenya, 2010a). The subdivision of large landholdings into quarter and eighth of an acre pieces is
increasing local water demand, (for domestic purposes) without the benefit of increased production.
Urban sprawl is defined as the fast spread of a city or its suburbs and often involves construction of
residential and commercial buildings on undeveloped land on the outskirts. Urban sprawl is driven by
urbanisation, which increases the demand for housing in the urban and peri urban.
4.3.1.2 Natural vegetation
The major contributors to the loss of natural vegetation in the LVN Basin are encroachment and
deforestation. The livelihoods of the people are becoming reliant on these acts of encroachment and
deforestation, which raises a big concern for the lifespan of the LVN Basin’s natural vegetation.
According to the Global Forest Watch dataset there has been significant tree loss (tree cover considered
to be vegetation above 5m) over the period 2001-2019 (Figure 4-4). The areas surrounding Nandi Hills
have also had tree gain over the period 2001-2012.
Figure 4-4: Tree loss and tree gain for LVN Basin according to Global Forest Watch
The density of vegetation cover on the land is important, as dense vegetation cover will protect the land
from erosion and less dense cover will expose the land to erosion. The occurrence of flooding is also
more likely when the natural vegetation is removed. The density of vegetation cover reflects the
influence of cropping practices, vegetation canopy and general ground cover. The key drivers of
vegetation loss are deforestation for agriculture, charcoal fuel and construction.
Deforestation
In the LVN Basin forest reserves have been threatened by human encroachment and there is a need
to protect them. The total forest area in the LVN Basin in 2010 was about 107 000 ha, and according
to satellite imagery, the forested area had decreased by about 30% since 1990 (Water Resources
Management Authority, 2013).
Kenya Water Security and Climate Resilience Project
Final Lake Victoria North Basin Plan August 2020 96
Increasing demand from urban markets drives deforestation for commercial purposes. New and
expanding settlements have also led to encroachment as communities use wood for firewood and
charcoal. Some communities fell the trees and use the logs and sticks to build their houses. Charcoal
burning has become a major economic activity and source of income and livelihood for the local
communities.
As an industry the forestry sector provides timber, poles and fuel wood. The demand for these products
has grown faster than supply, resulting in an increase in net imports (Kenya Forest Service, 2015).
Farmers are increasingly practicing agroforestry through the introduction of trees to meet their wood
requirements, increase productivity and livelihoods. The KFS plays a role in training farmers on tree
management, harvesting and management and county governments encourage agroforestry for
development.
Examples of forest conservation efforts:
o During the period 2013-2017, the Elgeyo-Marakwet county government planted 1 100 000 tree
seedlings in the Cheragany hills, escarpments and the Kerio Valley. Bamboo seedlings were
also planted in wetlands, springs and water catchment areas that include: Lelan Wetland,
Emsoo Dam Wetland, Kap Ali Spring in Iten Town, and Lolgarini dam in Kabiemit. The Elgeyo
Marakwet charcoal act, 2017 was introduced to regulate the production of charcoal and reduce
deforestation in the county. The latest CIDP includes plans to establish more tree nurseries
and continue tree planting efforts (County Government of Elgeyo Marakwet, 2018).
o Tree planting by institutions and individuals will be promoted by the Nandi county government
by establishing tree nurseries under a PPP arrangement (County Government of Nandi, 2018).
Examples of deforestation
o The high population in Bungoma county has led to encroachment on wetlands, riverbanks and
protected forests for farming and settlement purposes. This has resulted in poor quality and
quantity of water resources, increased intensity of flash floods, riverbank erosion and
sedimentation. Some water catchment and riparian areas that need conservation are Kongit,
Chesito, Kaptama, Kaptalelio, Chemoge Kaborom and Kaboywo. (County Government of
Bungoma, 2018)
o In Busia county, the natural environment is heavily degraded through deforestation especially
on the hills (County Government of Busia, 2018).
o Occupation of gazetted forest areas such as Embobut, Kipkabus and Chebara takes place in
Elgeyo-Marakwet county. This leads to deforestation, illegal logging charcoal burning and
forest fires along the escarpment and Kerio valley. The destruction of the water catchment
areas has led to reduced water flow and escalating resource based conflicts among the
downstream communities (County Government of Elgeyo Marakwet, 2018)
o Rivers in Kakamega county are drying up because of deforestation in the catchment areas.
Many of these trees are used to create charcoal and make bricks as people try to earn an
income and escape poverty (County Government of Kakamega, 2017).
o High levels of deforestation occur in Nandi county in the following areas: Nandi escarpment,
Legemet, Ndalat, Kabiyet and Tabolwa hills (County Government of Nandi, 2018)
o Deforestation has occurred in Uasin-Gishu county because people rely on trees for fuel
(County Government of Uasin Gishu, 2018).
o Trans Nzoia experiences high levels of deforestation. Landslides have occurred in Milimani in
Cherang’any and Kimondo in Mount Elgon due to a combination of deforestation, poor
agricultural practices, changing weather patterns, and encroachment for settlement and
cultivation (County Government of Trans Nzoia, 2018).
o Deforestation in Siaya county has led to the destruction of tree cover, resulting in a decline in
agricultural and fisheries production over the years (County Government of Siaya, 2018)
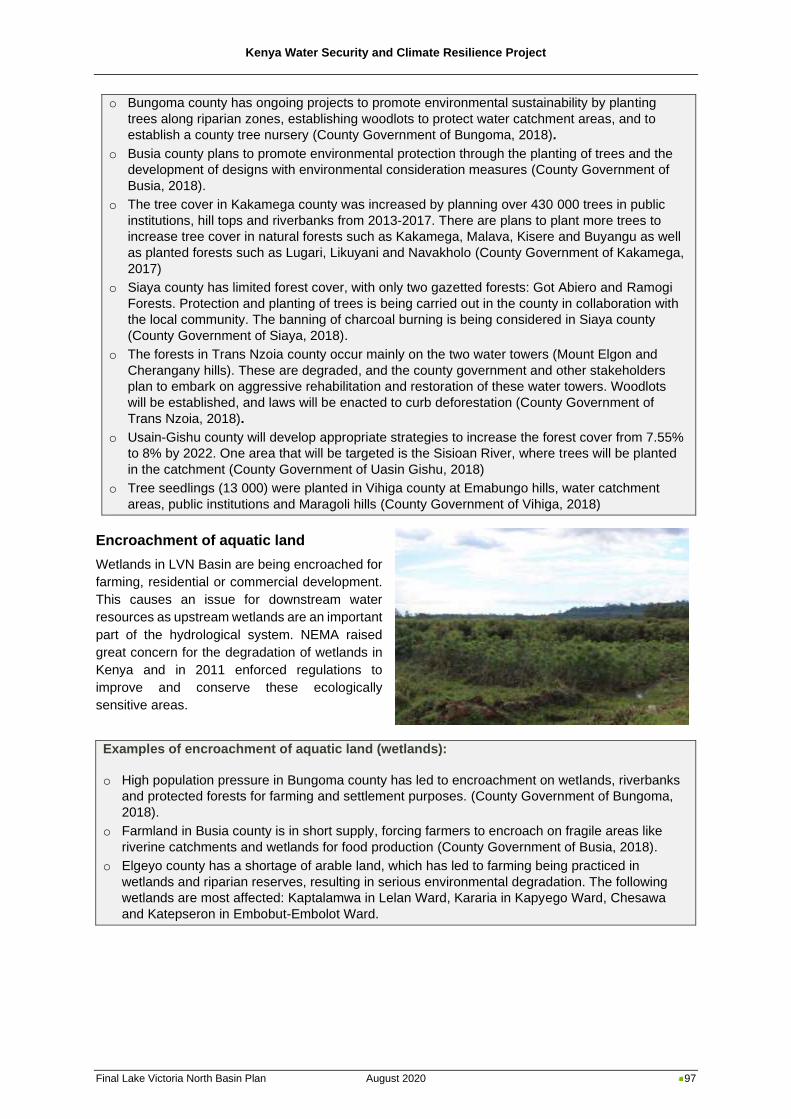
Kenya Water Security and Climate Resilience Project
Final Lake Victoria North Basin Plan August 2020 97
o Bungoma county has ongoing projects to promote environmental sustainability by planting
trees along riparian zones, establishing woodlots to protect water catchment areas, and to
establish a county tree nursery (County Government of Bungoma, 2018).
o Busia county plans to promote environmental protection through the planting of trees and the
development of designs with environmental consideration measures (County Government of
Busia, 2018).
o The tree cover in Kakamega county was increased by planning over 430 000 trees in public
institutions, hill tops and riverbanks from 2013-2017. There are plans to plant more trees to
increase tree cover in natural forests such as Kakamega, Malava, Kisere and Buyangu as well
as planted forests such as Lugari, Likuyani and Navakholo (County Government of Kakamega,
2017)
o Siaya county has limited forest cover, with only two gazetted forests: Got Abiero and Ramogi
Forests. Protection and planting of trees is being carried out in the county in collaboration with
the local community. The banning of charcoal burning is being considered in Siaya county
(County Government of Siaya, 2018).
o The forests in Trans Nzoia county occur mainly on the two water towers (Mount Elgon and
Cherangany hills). These are degraded, and the county government and other stakeholders
plan to embark on aggressive rehabilitation and restoration of these water towers. Woodlots
will be established, and laws will be enacted to curb deforestation (County Government of
Trans Nzoia, 2018).
o Usain-Gishu county will develop appropriate strategies to increase the forest cover from 7.55%
to 8% by 2022. One area that will be targeted is the Sisioan River, where trees will be planted
in the catchment (County Government of Uasin Gishu, 2018)
o Tree seedlings (13 000) were planted in Vihiga county at Emabungo hills, water catchment
areas, public institutions and Maragoli hills (County Government of Vihiga, 2018)
Encroachment of aquatic land
Wetlands in LVN Basin are being encroached for
farming, residential or commercial development.
This causes an issue for downstream water
resources as upstream wetlands are an important
part of the hydrological system. NEMA raised
great concern for the degradation of wetlands in
Kenya and in 2011 enforced regulations to
improve and conserve these ecologically
sensitive areas.
Examples of encroachment of aquatic land (wetlands):
o High population pressure in Bungoma county has led to encroachment on wetlands, riverbanks
and protected forests for farming and settlement purposes. (County Government of Bungoma,
2018).
o Farmland in Busia county is in short supply, forcing farmers to encroach on fragile areas like
riverine catchments and wetlands for food production (County Government of Busia, 2018).
o Elgeyo county has a shortage of arable land, which has led to farming being practiced in
wetlands and riparian reserves, resulting in serious environmental degradation. The following
wetlands are most affected: Kaptalamwa in Lelan Ward, Kararia in Kapyego Ward, Chesawa
and Katepseron in Embobut-Embolot Ward.
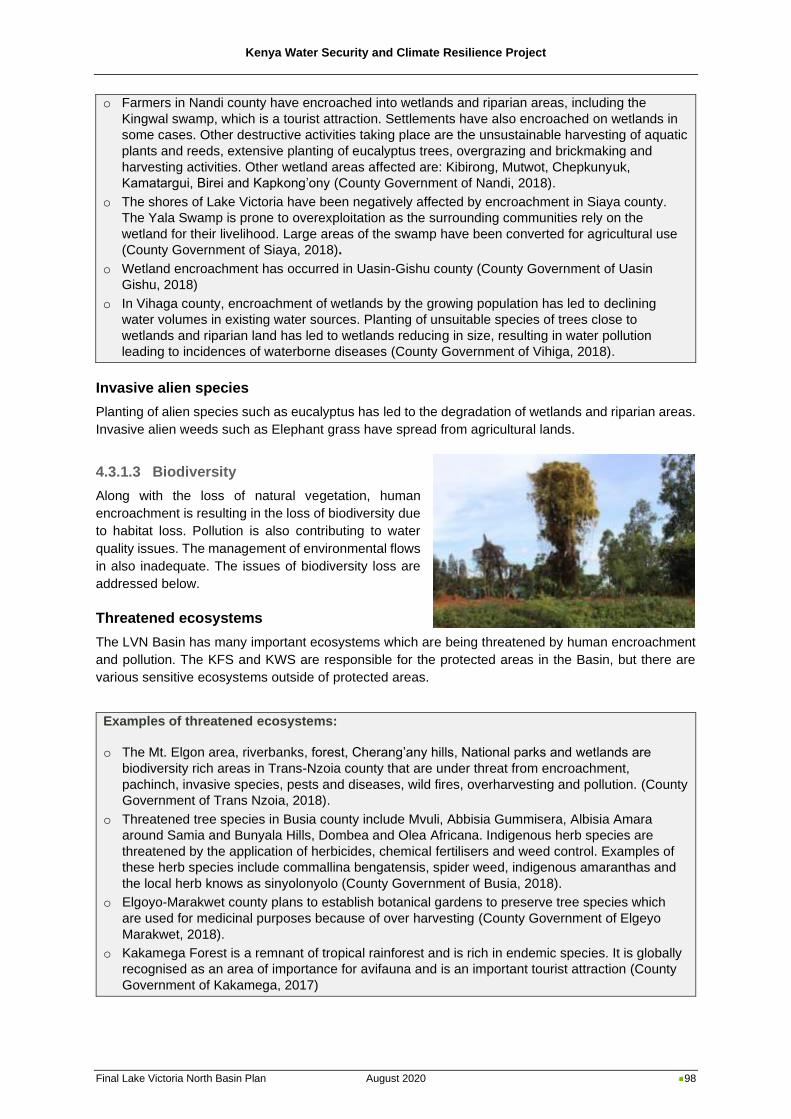
Kenya Water Security and Climate Resilience Project
Final Lake Victoria North Basin Plan August 2020 98
o Farmers in Nandi county have encroached into wetlands and riparian areas, including the
Kingwal swamp, which is a tourist attraction. Settlements have also encroached on wetlands in
some cases. Other destructive activities taking place are the unsustainable harvesting of aquatic
plants and reeds, extensive planting of eucalyptus trees, overgrazing and brickmaking and
harvesting activities. Other wetland areas affected are: Kibirong, Mutwot, Chepkunyuk,
Kamatargui, Birei and Kapkong’ony (County Government of Nandi, 2018).
o The shores of Lake Victoria have been negatively affected by encroachment in Siaya county.
The Yala Swamp is prone to overexploitation as the surrounding communities rely on the
wetland for their livelihood. Large areas of the swamp have been converted for agricultural use
(County Government of Siaya, 2018).
o Wetland encroachment has occurred in Uasin-Gishu county (County Government of Uasin
Gishu, 2018)
o In Vihaga county, encroachment of wetlands by the growing population has led to declining
water volumes in existing water sources. Planting of unsuitable species of trees close to
wetlands and riparian land has led to wetlands reducing in size, resulting in water pollution
leading to incidences of waterborne diseases (County Government of Vihiga, 2018).
Invasive alien species
Planting of alien species such as eucalyptus has led to the degradation of wetlands and riparian areas.
Invasive alien weeds such as Elephant grass have spread from agricultural lands.
4.3.1.3 Biodiversity
Along with the loss of natural vegetation, human
encroachment is resulting in the loss of biodiversity due
to habitat loss. Pollution is also contributing to water
quality issues. The management of environmental flows
in also inadequate. The issues of biodiversity loss are
addressed below.
Threatened ecosystems
The LVN Basin has many important ecosystems which are being threatened by human encroachment
and pollution. The KFS and KWS are responsible for the protected areas in the Basin, but there are
various sensitive ecosystems outside of protected areas.
Examples of threatened ecosystems:
o The Mt. Elgon area, riverbanks, forest, Cherang’any hills, National parks and wetlands are
biodiversity rich areas in Trans-Nzoia county that are under threat from encroachment,
pachinch, invasive species, pests and diseases, wild fires, overharvesting and pollution. (County
Government of Trans Nzoia, 2018).
o Threatened tree species in Busia county include Mvuli, Abbisia Gummisera, Albisia Amara
around Samia and Bunyala Hills, Dombea and Olea Africana. Indigenous herb species are
threatened by the application of herbicides, chemical fertilisers and weed control. Examples of
these herb species include commallina bengatensis, spider weed, indigenous amaranthas and
the local herb knows as sinyolonyolo (County Government of Busia, 2018).
o Elgoyo-Marakwet county plans to establish botanical gardens to preserve tree species which
are used for medicinal purposes because of over harvesting (County Government of Elgeyo
Marakwet, 2018).
o Kakamega Forest is a remnant of tropical rainforest and is rich in endemic species. It is globally
recognised as an area of importance for avifauna and is an important tourist attraction (County
Government of Kakamega, 2017)
Kenya Water Security and Climate Resilience Project
Final Lake Victoria North Basin Plan August 2020 99
o As mentioned previously, the Kingwal swamp in Nandi county is threatened by encroachment
and unsustainable harvesting (County Government of Nandi, 2018).
o The Lake Kanyaboli ecosystem is degraded and requires rehabilitation and conservation
(County Government of Siaya, 2018)
o The Saiwa Swamp ia a major tourist attraction in Trans-Nzoia County, and is home to the
Sitatunga, a swamp-swelling antelope. Saiwa National Park is a protected area, but still faces
the threats of deforestation, degradation and the clearing of bulrushes, and land encroachment
(County Government of Trans Nzoia, 2018).
Inadequate reserve flow requirements
Reserve flows are currently determined using the 95th percentile of the naturalised present daily flow
duration curve. This method, which is known as a hydrological index method, has many shortcomings
and should ideally be replaced with more comprehensive reserve determination methods which
promote variable environmental flow regimes. Although WRA are putting in efforts to monitor and
enforce the reserve, there are serious challenges in this regard.
Wildlife impacts
Infrastructure and irrigation schemes which impact wildlife migration routes or water supply will increase
human-wildlife conflict.
Examples of wildlife impacts:
o There has been human encroachment into wildlife habitat in Siaya county (County Government
of Siaya, 2018).
o The habitat of the Sitatunga antelope is threatened by the degradation of Saiwa swamp
through clearing of bulrushes and encroachment in Trans Nzoia county. This antelope is very
rare and is an important tourist attraction (County Government of Trans Nzoia, 2018).
o The Sitantunga antelope is also found in the Kingwal Swamp in Nandi county. The county
government plans to fence and protect the swamp in order to protect and conserve the species
and promote tourism (County Government of Nandi, 2018)
o Wildlife, especially large herds of elephant, in the Rimoi game reserve is the main tourist
attraction in Elgoyo-Marakwet county. The highly endangered pangolin occurs here (County
Government of Elgeyo Marakwet, 2018).
o Forty-five of the species on the list of birds occurring in Kenya are only found in the Kakamega
Forest, and nine of the species occur nowhere else in Kenya. Three species are threatened,
namely Turner’s Eremomela (Eremomela turneri), Grey Parrot (Psittacus erithacus erithacus)
and Chapin’ Flycatcher (Muscicapa lendu) (County Government of Kakamega, 2017).
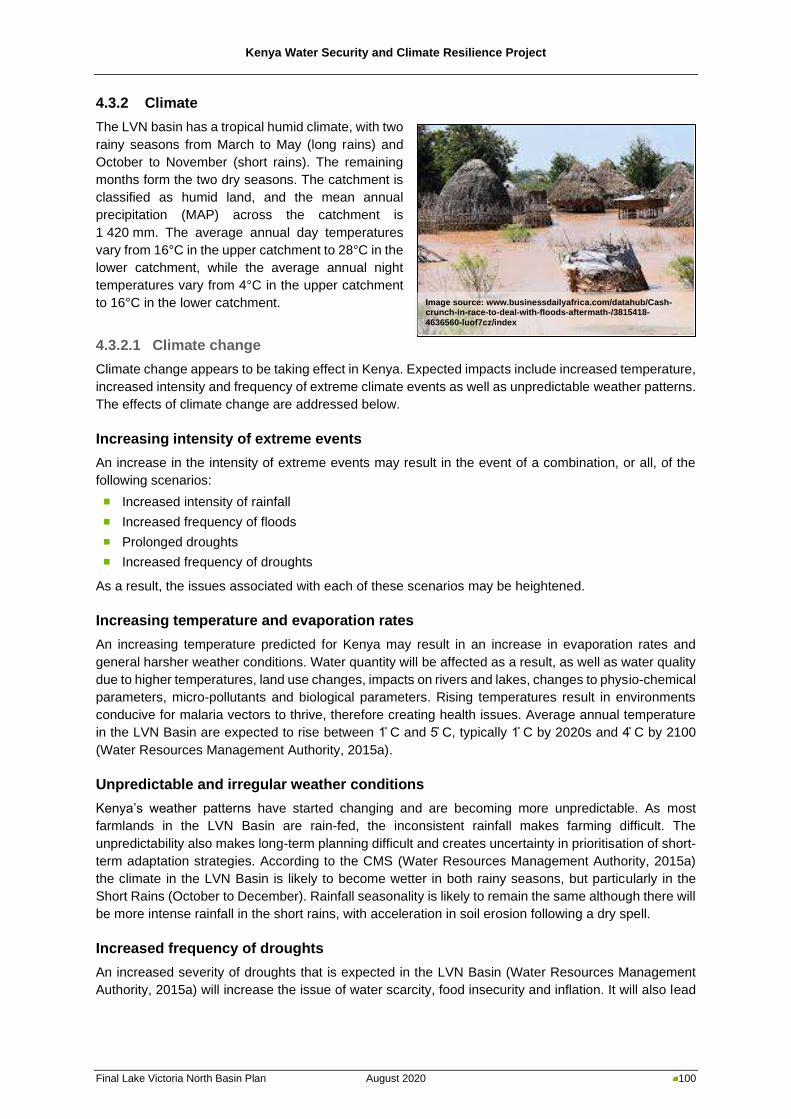
Kenya Water Security and Climate Resilience Project
Final Lake Victoria North Basin Plan August 2020 100
4.3.2 Climate
The LVN basin has a tropical humid climate, with two
rainy seasons from March to May (long rains) and
October to November (short rains). The remaining
months form the two dry seasons. The catchment is
classified as humid land, and the mean annual
precipitation (MAP) across the catchment is
1 420 mm. The average annual day temperatures
vary from 16°C in the upper catchment to 28°C in the
lower catchment, while the average annual night
temperatures vary from 4°C in the upper catchment
to 16°C in the lower catchment.
4.3.2.1 Climate change
Climate change appears to be taking effect in Kenya. Expected impacts include increased temperature,
increased intensity and frequency of extreme climate events as well as unpredictable weather patterns.
The effects of climate change are addressed below.
Increasing intensity of extreme events
An increase in the intensity of extreme events may result in the event of a combination, or all, of the
following scenarios:
◼ Increased intensity of rainfall
◼ Increased frequency of floods
◼ Prolonged droughts
◼ Increased frequency of droughts
As a result, the issues associated with each of these scenarios may be heightened.
Increasing temperature and evaporation rates
An increasing temperature predicted for Kenya may result in an increase in evaporation rates and
general harsher weather conditions. Water quantity will be affected as a result, as well as water quality
due to higher temperatures, land use changes, impacts on rivers and lakes, changes to physio-chemical
parameters, micro-pollutants and biological parameters. Rising temperatures result in environments
conducive for malaria vectors to thrive, therefore creating health issues. Average annual temperature
in the LVN Basin are expected to rise between 1̊ C and 5̊ C, typically 1̊ C by 2020s and 4̊ C by 2100
(Water Resources Management Authority, 2015a).
Unpredictable and irregular weather conditions
Kenya’s weather patterns have started changing and are becoming more unpredictable. As most
farmlands in the LVN Basin are rain-fed, the inconsistent rainfall makes farming difficult. The
unpredictability also makes long-term planning difficult and creates uncertainty in prioritisation of short-
term adaptation strategies. According to the CMS (Water Resources Management Authority, 2015a)
the climate in the LVN Basin is likely to become wetter in both rainy seasons, but particularly in the
Short Rains (October to December). Rainfall seasonality is likely to remain the same although there will
be more intense rainfall in the short rains, with acceleration in soil erosion following a dry spell.
Increased frequency of droughts
An increased severity of droughts that is expected in the LVN Basin (Water Resources Management
Authority, 2015a) will increase the issue of water scarcity, food insecurity and inflation. It will also lead
Image source: www.businessdailyafrica.com/datahub/Cash-crunch-in-race-to-deal-with-floods-aftermath-/3815418-
4636560-luof7cz/index
Kenya Water Security and Climate Resilience Project
Final Lake Victoria North Basin Plan August 2020 101
to increased malnutrition and loss of lives and an increase in the number of children dropping out of
school due to families migrating to better lands.
Examples of climate change impacts:
o Busia county has experienced flooding in the southern part of Teso North, Teso South and
Banyala sub-counties (County Government of Busia, 2018).
o Elgeyo Marakwet county has experienced a general reduction in water levels in all rivers and
water storage bodies in the county. Lake Kapnarok in the Kerio Valley has silted, and the lake
waters have significantly reduced. Reduced flows have been experienced over the years in all
rivers in the county, especially during the dry season from January to March (County
Government of Elgeyo Marakwet, 2018).
o Flooding has been experienced in Kakamega county due to climatic changes, leading to
displacement of people. Farming on the lowlands has been reduced due to regular destruction
of crops during heavy rains, further affecting the already low food production in the county
(County Government of Kakamega, 2017).
o Prolonged drought has been experienced in Trans-Nzoia county over the past few years,
affecting agricultural activities, livestock and water sources. Flooding has affected areas such
as Namanjalala every year (County Government of Trans Nzoia, 2018).
o Vihaga county has experienced climate change as varying high temperatures and erratic rainfall
patterns (County Government of Vihiga, 2018).
4.3.2.2 Floods
The LVN Basin is vulnerable to flood disasters, and the most vulnerable areas are Lower Yala, Lower
Sio and Lower Nzoia (specifically Budalangi). Flooding is currently controlled on the Nzoia and Yala
Rivers through the construction of dykes. Recent historical floods include:
◼ The collapse of dykes in Budalangi in November 2006, displacing over 10 000 people.
◼ Heavy rains in October to November 2008, causing the River Nzoia to overflow its banks.
The Western Kenya Community Driven Development and Flood Mitigation Project (WKCDD&FMP) has
been completed and is a key contributor to flood control and management in the LVN Basin. Their
planning includes the construction of flood control dams and dykes, the development of Flood Early
Warning Systems (FEWSs) and community-based disaster management systems.
Although the LVN Basin is not generally a drought-prone catchment, a recent Strategic Drought
Mitigation Study undertaken for the LVN Water Services Board (WSB) focused on drought tendencies
in the LVN, Lake Victoria South and the Rift Valley Basins. Some areas in the LVN Basin that experience
drought include the Lower Sio, Nzoia and Yala sub-basins. There are currently fewer agencies involved
in drought management compared to floods. Pre-emptive water use restrictions on the reservoirs
supplying the LVN Basin have not been implemented, resulting in water rationing being applied in
Eldoret in recent years (Ndanyi, 2017). There is also minimal enforcement of Reserve flows in the
catchment.
Some of the proposed flood and drought management plans include flood control by dams, dykes and
river improvement in the Nzoia River Basin; the operation of a FEWS in the Nzoia River Basin;
preparation of integrated flood management plans in the Nzoia and Yala River Basins; and the
implementation of Water Use Restriction Rules for reservoirs in the LVN Basin.
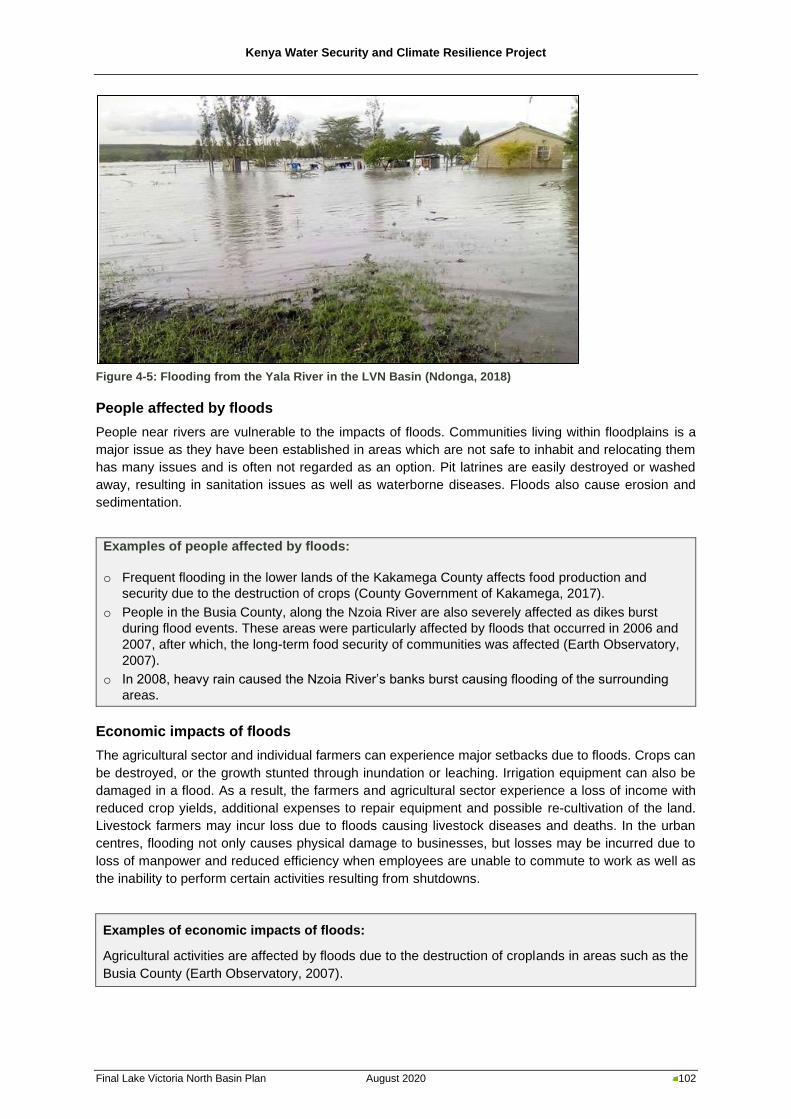
Kenya Water Security and Climate Resilience Project
Final Lake Victoria North Basin Plan August 2020 102
Figure 4-5: Flooding from the Yala River in the LVN Basin (Ndonga, 2018)
People affected by floods
People near rivers are vulnerable to the impacts of floods. Communities living within floodplains is a
major issue as they have been established in areas which are not safe to inhabit and relocating them
has many issues and is often not regarded as an option. Pit latrines are easily destroyed or washed
away, resulting in sanitation issues as well as waterborne diseases. Floods also cause erosion and
sedimentation.
Examples of people affected by floods:
o Frequent flooding in the lower lands of the Kakamega County affects food production and
security due to the destruction of crops (County Government of Kakamega, 2017).
o People in the Busia County, along the Nzoia River are also severely affected as dikes burst
during flood events. These areas were particularly affected by floods that occurred in 2006 and
2007, after which, the long-term food security of communities was affected (Earth Observatory,
2007).
o In 2008, heavy rain caused the Nzoia River’s banks burst causing flooding of the surrounding
areas.
Economic impacts of floods
The agricultural sector and individual farmers can experience major setbacks due to floods. Crops can
be destroyed, or the growth stunted through inundation or leaching. Irrigation equipment can also be
damaged in a flood. As a result, the farmers and agricultural sector experience a loss of income with
reduced crop yields, additional expenses to repair equipment and possible re-cultivation of the land.
Livestock farmers may incur loss due to floods causing livestock diseases and deaths. In the urban
centres, flooding not only causes physical damage to businesses, but losses may be incurred due to
loss of manpower and reduced efficiency when employees are unable to commute to work as well as
the inability to perform certain activities resulting from shutdowns.
Examples of economic impacts of floods:
Agricultural activities are affected by floods due to the destruction of croplands in areas such as the
Busia County (Earth Observatory, 2007).
Kenya Water Security and Climate Resilience Project
Final Lake Victoria North Basin Plan August 2020 103
Conflict
Communities that are vulnerable to flooding are generally those living on less secure pieces of land or
those who do not have the resources to build stronger houses. Displacement of communities causes
conflict as communities compete for more secure land.
Example of conflict caused by floods:
o Soil erosion caused by frequent flooding has reduced soil fertility in some areas of the
Kakamega County causing conflict over competition for natural resources (County Government
of Kakamega, 2017).
o Floods occurring in the Namanjalala area during the long rains have also caused conflict in the
past (County Government of Trans Nzoia, 2018).
Damage to infrastructure
Depending on the magnitude and frequency, floods have the potential to deteriorate, and cause major
damage to infrastructure. As a result, maintenance costs are often incurred (County Government of
Kakamega, 2017).
4.3.2.3 Droughts
Although droughts in the LVN Basin are not as severe as in other parts of the country, below-average
rainfall causes decreased agricultural production, deterioration of water quality, and lower lake levels.
Areas within the Basin that experience frequent droughts include Lower Sio, Nzoia and Yala (Water
Resources Management Authority, 2015a). Water use restriction levels are not clearly defined for the
existing dams in the Basin, which cause operational issues during times of drought. These needs to be
reframed. In addition, dam operating rules should be adhered to, and new ones should be developed
to mitigate the impacts of droughts and floods.
The main issues associated with droughts are described below.
People affected by droughts
People are affected by droughts directly through reduced water availability, and indirectly through
reduced crop yields and water quality issues. Droughts reduce surface water availability and may also
reduce recharge rates for groundwater. This is an issue in LVN Basin as a large portion of the population
are reliant on groundwater.
Droughts increase food insecurity due to poor crop growth or lower crop yields and a decrease in milk
production. As a result of lower crop yields, crop prices increase, which reduces the household
purchasing power. Water scarcity increases, which decreases water supply and the communities who
collect water from a water source may need to travel further.
Water quality deteriorates during droughts, which increases the number of health issues of the
population. The environment and living standards during a drought increase people’s susceptibility to
diseases.
Examples of damage to infrastructure caused by floods:
Floods have caused damage to irrigation infrastructure, critical infrastructure, and property in the
Busia District in the past, particularly during the 2006, and 2007 floods (Earth Observatory, 2007).
Kenya Water Security and Climate Resilience Project
Final Lake Victoria North Basin Plan August 2020 104
Example of people affected by droughts:
People have been displaced by frequent droughts in the Trans Nzoia County, and now there are
high poverty levels amongst the women who were displaced (County Government of Trans Nzoia,
2018)
Economic impacts of droughts
The agricultural and livestock sectors experience major losses due to droughts. Due to a large amount
of the farmlands in the LVN Basin being rain-fed agriculture, droughts result in low crop yields. Although
crop prices increase to counter the lower crop yields, the agricultural sector usually experiences a
reduction in sales.
The livestock sector experiences several issues because of droughts. The lack of water for cattle results
in decreased milk production. Water scarcity also contributes to livestock diseases and deaths. There
is concern that pastoralists and crop farmers may leave the agricultural sector in the hope of finding
new work opportunities in the urban centres.
Example of economic impacts of droughts:
Hydropower generation becomes less efficient during droughts due to limited water availability
(UNEP-DHI et al., 2016)
Conflict due to droughts
Droughts result in scarcity of water for both wildlife and people. This gives rise to conflicts between
various groups. Conflict arises between locals and pastoralists when the migration of the pastoralists’
livestock increases competition for available resources. The probability of humans encountering wildlife
also increases during droughts as both humans and animals are in search of food and water. Drought
is the cause of many trans-county conflicts as it worsens water scarcity.
Examples of conflict due to droughts:
Droughts in the dry season cause conflict along the boundary lines of Trans Nzoia and West Pokot
Counties due to cattle rustling, as well as crop and animal diseases (County Government of Trans
Nzoia, 2018)
4.4 Socio-economic issues
According to Workshop 1 the main socio-economic issues in LVN Basin were transboundary and trans-
county conflict and other socio-economic challenges.
Agriculture, as the mainstay of Kenya’s economy, is critical to the growth of the national economy.
Following independence, the agricultural sector recorded a high growth rate and during this time small-
scale agriculture grew rapidly as land and technology was made available (Government of Kenya,
2010a). Agricultural extension and research were also well supported by the government. Since then
there has been a gradual decline, followed by growth when the Government identified the agriculture
sector as a priority.
The Economic Recovery Strategy for Wealth and Employment Creation (Government of Kenya, 2003)
emphasised economic growth and creation of wealth and employment as a means of eradicating
poverty and achieving food security. The development of the agricultural sector was considered a top
priority in reducing poverty because it is the most important economic activity for the poor in rural areas.
In 2008, Kenya Vision 2030 was launched as the new long-term development blueprint for the country.
This plan intends to convert smallholder agriculture from subsistence to an innovative, commercially
Kenya Water Security and Climate Resilience Project
Final Lake Victoria North Basin Plan August 2020 105
oriented and modern sector. This has promoted livelihoods through agriculture as an important priority
for Kenya.
The LVN Basin is expected to exhibit high population growth as well as urbanisation. The main socio-
economic challenges in the basin are described below.
4.4.1 Demographics
The demographic challenges in the LVN Basin include an increasing population in certain areas, the
lack of education and the level of poverty.
4.4.1.1 Population
Increased population growth
The LVN Basin is expected to experience high population growth. This poses a challenge in terms of
managing and servicing the growing population, especially in the growing urban centres.
Urbanisation
Urbanisation is a trend in the LVN Basin resulting from rural poverty, land pressures, and lack of jobs
in rural areas (GEF et al., 2016). This means that there will be an increased need for water supply and
sanitation systems in urban areas. With an increase in paved areas, the amount of storm water runoff
will increase. Industrial areas increase along with the growth of an urban area, which will result in
increased industrial effluent.
Example of population growth and urbanisation issues:
The sewerage infrastructure in Eldoret is insufficient for the current population, which is a major
issue as the population is expected to increase.
4.4.1.2 Education
Inadequate education can affect water resources management in terms of information sharing with the
public as well as general understanding of water resources and the relevant laws and regulations put
in place to protect water resources. The education challenges are discussed further below.
Information sharing
Education and literacy levels impact the ability to share information with the community. This creates
challenges when the authorities are required to share information with the public, such as any changes
in regulations, water restrictions that are being implemented or even alternative methods of water
harvesting.
Inadequate understanding and awareness
There is an inadequate of understanding of catchment management and the protection of land and
water resources as people think it is normal to live or farm within riparian areas or floodplains. This has
resulted in catchment degradation. Improved education will give the opportunity for better
understanding of laws and regulations, and implementation and enforcement will also improve. There
is inadequate awareness and knowledge within communities on the impacts of climate change as well
as adaptation strategies, which can be implemented at household and community level, such as
reforestation and rainwater harvesting.
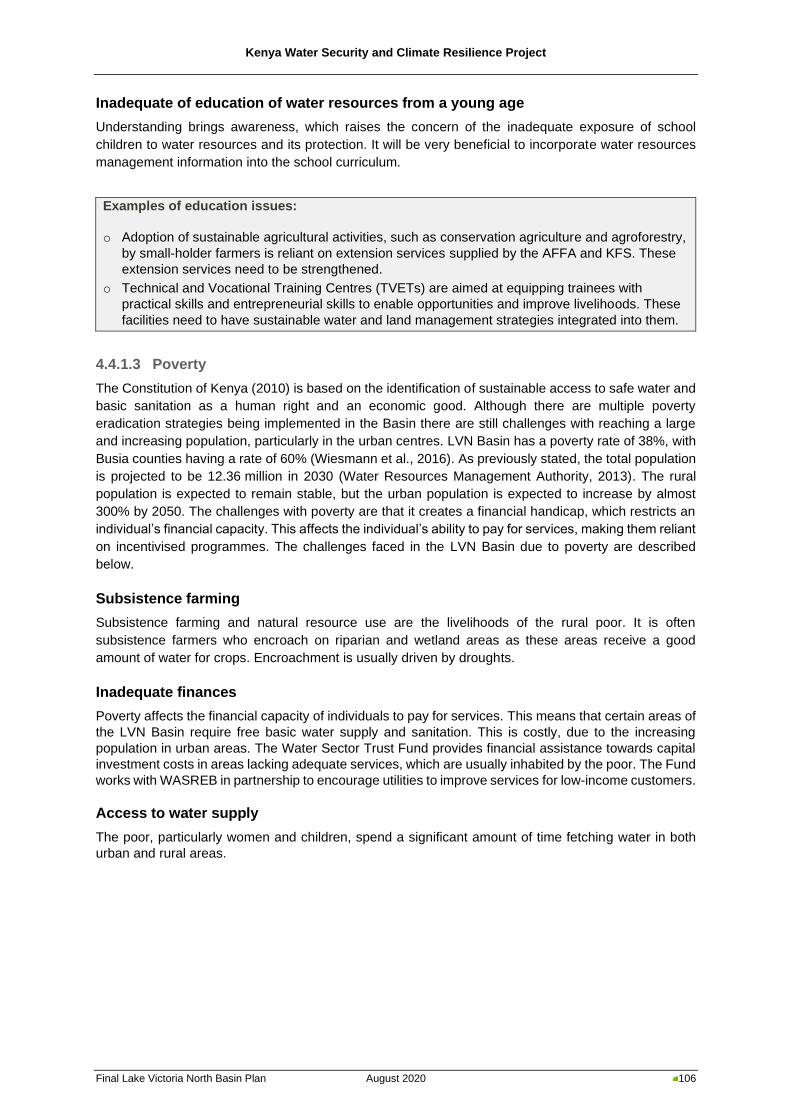
Kenya Water Security and Climate Resilience Project
Final Lake Victoria North Basin Plan August 2020 106
Inadequate of education of water resources from a young age
Understanding brings awareness, which raises the concern of the inadequate exposure of school
children to water resources and its protection. It will be very beneficial to incorporate water resources
management information into the school curriculum.
Examples of education issues:
o Adoption of sustainable agricultural activities, such as conservation agriculture and agroforestry,
by small-holder farmers is reliant on extension services supplied by the AFFA and KFS. These
extension services need to be strengthened.
o Technical and Vocational Training Centres (TVETs) are aimed at equipping trainees with
practical skills and entrepreneurial skills to enable opportunities and improve livelihoods. These
facilities need to have sustainable water and land management strategies integrated into them.
4.4.1.3 Poverty
The Constitution of Kenya (2010) is based on the identification of sustainable access to safe water and
basic sanitation as a human right and an economic good. Although there are multiple poverty
eradication strategies being implemented in the Basin there are still challenges with reaching a large
and increasing population, particularly in the urban centres. LVN Basin has a poverty rate of 38%, with
Busia counties having a rate of 60% (Wiesmann et al., 2016). As previously stated, the total population
is projected to be 12.36 million in 2030 (Water Resources Management Authority, 2013). The rural
population is expected to remain stable, but the urban population is expected to increase by almost
300% by 2050. The challenges with poverty are that it creates a financial handicap, which restricts an
individual’s financial capacity. This affects the individual’s ability to pay for services, making them reliant
on incentivised programmes. The challenges faced in the LVN Basin due to poverty are described
below.
Subsistence farming
Subsistence farming and natural resource use are the livelihoods of the rural poor. It is often
subsistence farmers who encroach on riparian and wetland areas as these areas receive a good
amount of water for crops. Encroachment is usually driven by droughts.
Inadequate finances
Poverty affects the financial capacity of individuals to pay for services. This means that certain areas of
the LVN Basin require free basic water supply and sanitation. This is costly, due to the increasing
population in urban areas. The Water Sector Trust Fund provides financial assistance towards capital
investment costs in areas lacking adequate services, which are usually inhabited by the poor. The Fund
works with WASREB in partnership to encourage utilities to improve services for low-income customers.
Access to water supply
The poor, particularly women and children, spend a significant amount of time fetching water in both
urban and rural areas.
Kenya Water Security and Climate Resilience Project
Final Lake Victoria North Basin Plan August 2020 107
4.4.2 Economy
As discussed above, agriculture is the mainstay of the
LVN Basin’s economy with trade forming another
important economic activity. Economic development
has a major influence on the development of water
resources. Water scarcity has a direct impact on rain-
fed and irrigated agriculture as well as livestock and an
indirect impact on food processing industries. The
economic activity occurring in the LVN Basin, discussed
below, will influence the planning for water resources.
4.4.2.1 Economic activity
Plans for new urban development
With the projected increase in urbanisation in LVN Basin it is important to provide for a growing
population in certain areas. Kenya has proposed various new city developments which require adequate
water supply and sanitation.
Examples of new urban developments:
o Construct a Tier 1 marketplace at Chepkube, Bungoma Town to provide a suitable working
environment for traders. Construct an industrial park along the Webuye-Malaba Road to promote
industrial development and employment creation (County Government of Bungoma, 2018).
o To promote investment, three industrial / business parks and six economic zones will be
established in Busia county (County Government of Busia, 2018)
o Elgoyo-Marakwet county plans to develop a cable car system and champion the adoption of
premium part initiatives to promote tourism. Incubation centres will be established in four
vocational training centres in Chesongoch, Chebara, Iten and Chepkorio. All CTCs will be
equipped with modern tools and equipment (County Government of Elgeyo Marakwet, 2018)
o Bukhungu Stadium in Kakamega will be upgraded to international standards. County Polytechnic
Centres of Excellence will be constructed to increase access to quality vocational education and
training. The Kakmega County Youth Service will create employment opportunities for youth and
economically empower them (County Government of Kakamega, 2017).
o Formal markets will be constructed in Kapsabet and Nandi hills. The Chemase Industrial Park
will be created (County Government of Nandi, 2018).
o Completion of the Trans Nzoia county Teaching and Referral Hospital, the rehabilitation of Kitale
county hospital, and the upgrading of all sub-county hospitals to Tier 3 (Cherang’any, Kapsara,
Kwanza, Endebess, Saboti, Maunda, Mount Elgon) (County Government of Trans Nzoia, 2018).
o Markets in numerous towns in Uasin Gishu county will be upgraded by the addition of modern
kiosks, perimeter walls or ablution facilities (County Government of Uasin Gishu, 2018)
o Market infrastructure will be developed in Sabatia, Emuhaya, Hamisi, Vihaga and Luanda
(County Government of Vihiga, 2018).
Plans for new transport infrastructure
There are several proposed projects across the basin which aim to improve the transport infrastructure
by upgrading roads and building new bridges and roads (according to various CIDPs). It is important to
account for these developments to ensure that the catchment is protected during construction and
operation of the new routes.
Examples of new transport infrastructure:
o A flagship project for 2018-2022 in Bongoma county is to use the Public Private Partnership
model to upgrade major county roads to bitumen standards (County Government of Bungoma,
2018).
Image source: www.businessdailyafrica.com/news/counties/Land-rates-up-five-times-for-Nandi-tea-firms/4003142-5031108-dgt0cs/index
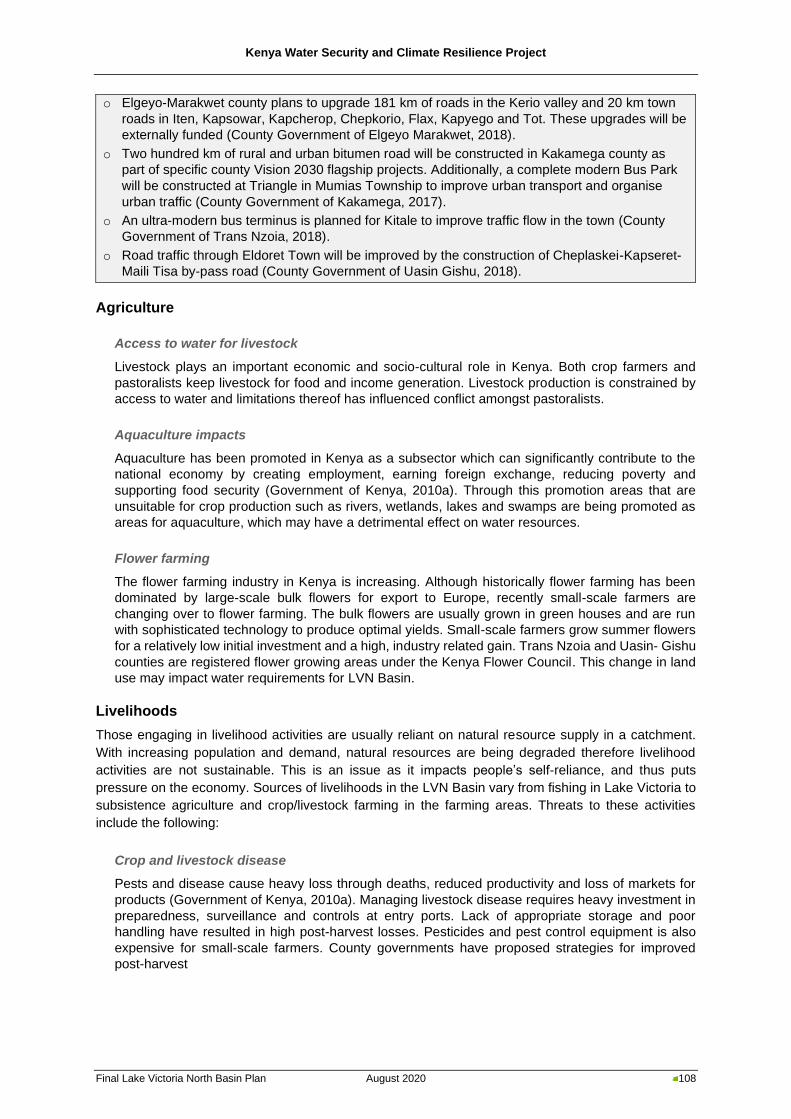
Kenya Water Security and Climate Resilience Project
Final Lake Victoria North Basin Plan August 2020 108
o Elgeyo-Marakwet county plans to upgrade 181 km of roads in the Kerio valley and 20 km town
roads in Iten, Kapsowar, Kapcherop, Chepkorio, Flax, Kapyego and Tot. These upgrades will be
externally funded (County Government of Elgeyo Marakwet, 2018).
o Two hundred km of rural and urban bitumen road will be constructed in Kakamega county as
part of specific county Vision 2030 flagship projects. Additionally, a complete modern Bus Park
will be constructed at Triangle in Mumias Township to improve urban transport and organise
urban traffic (County Government of Kakamega, 2017).
o An ultra-modern bus terminus is planned for Kitale to improve traffic flow in the town (County
Government of Trans Nzoia, 2018).
o Road traffic through Eldoret Town will be improved by the construction of Cheplaskei-Kapseret-
Maili Tisa by-pass road (County Government of Uasin Gishu, 2018).
Agriculture
Access to water for livestock
Livestock plays an important economic and socio-cultural role in Kenya. Both crop farmers and
pastoralists keep livestock for food and income generation. Livestock production is constrained by
access to water and limitations thereof has influenced conflict amongst pastoralists.
Aquaculture impacts
Aquaculture has been promoted in Kenya as a subsector which can significantly contribute to the
national economy by creating employment, earning foreign exchange, reducing poverty and
supporting food security (Government of Kenya, 2010a). Through this promotion areas that are
unsuitable for crop production such as rivers, wetlands, lakes and swamps are being promoted as
areas for aquaculture, which may have a detrimental effect on water resources.
Flower farming
The flower farming industry in Kenya is increasing. Although historically flower farming has been
dominated by large-scale bulk flowers for export to Europe, recently small-scale farmers are
changing over to flower farming. The bulk flowers are usually grown in green houses and are run
with sophisticated technology to produce optimal yields. Small-scale farmers grow summer flowers
for a relatively low initial investment and a high, industry related gain. Trans Nzoia and Uasin- Gishu
counties are registered flower growing areas under the Kenya Flower Council. This change in land
use may impact water requirements for LVN Basin.
Livelihoods
Those engaging in livelihood activities are usually reliant on natural resource supply in a catchment.
With increasing population and demand, natural resources are being degraded therefore livelihood
activities are not sustainable. This is an issue as it impacts people’s self-reliance, and thus puts
pressure on the economy. Sources of livelihoods in the LVN Basin vary from fishing in Lake Victoria to
subsistence agriculture and crop/livestock farming in the farming areas. Threats to these activities
include the following:
Crop and livestock disease
Pests and disease cause heavy loss through deaths, reduced productivity and loss of markets for
products (Government of Kenya, 2010a). Managing livestock disease requires heavy investment in
preparedness, surveillance and controls at entry ports. Lack of appropriate storage and poor
handling have resulted in high post-harvest losses. Pesticides and pest control equipment is also
expensive for small-scale farmers. County governments have proposed strategies for improved
post-harvest
Kenya Water Security and Climate Resilience Project
Final Lake Victoria North Basin Plan August 2020 109
4.4.3 Standard of living
The Constitution of Kenya (2010) is based on
the identification of sustainable access to
safe water and basic sanitation, as well as a
healthy environment as a human right. The
people in the LVN Basin face various
challenges in terms of their standard of living,
which have been categorised into water
supply and sanitation challenges, access to
energy, transport infrastructure, food
security and disaster preparedness. These
are discussed further below.
4.4.3.1 Water supply and sanitation
The greatest water security needs in Kenya are for household and agricultural use. A first step in
increasing access to potable water is recognising equal rights to water, regardless of ability to pay
(UNDP, 2011). The Water Act (2016) devolves water and sanitation services to county governments,
who provide services through WSPs. Achieving the goal of increasing access to potable water across
the Basin has the following challenges:
About 11% of the total population in the LVN Basin receive piped water provided by the WSPs, whilst
23% are dependent on unimproved sources (i.e. vendors and direct access) and the rest from
groundwater sources (Water Resources Management Authority, 2013).
Formal sewerage systems have been developed in limited parts of the LVN Basin, and most of the
population (92%) still makes use of septic tanks and pit latrines for sanitation purposes. There is an
uneven distribution of water in terms of urban and rural areas, with the former generally having better
access to water and sanitation facilities. However, water systems in the urban areas are often degraded
and/or inadequate. Water and sanitation issues in informal settlements are prevalent due to inadequate
access to safe water, improper drainage systems, and inadequate access roads and social amenities.
4.4.3.2 Access to energy
Access to electricity is an important factor in raising living standards. Electrification can reduce poverty
by increasing productivity, employment and time spent in school and reducing environmental
degradation (UNDP, 2011). Areas without access to electricity use inefficient fossil fuels as a substitute.
Over-exploitation of biomass can cause catchment degradation and requires a large amount of time for
fuel gathering. Green technologies are being promoted by Counties and the government has also
implemented tariff changes for green energy, but at the local scale communities are still engaging in
charcoal and wood burning.
Example of access to energy issues:
Most households in Bungoma, Busia, Elgeyo Marakwet, Kakamega, Nandi, Trans Nzoia and Vihiga
counties rely on paraffin for lighting and biofuels (wood, shrubs / grass, dung or charcoal) for
cooking.
4.4.3.3 Transport infrastructure
Inadequate transport infrastructure contributes to food insecurity and limits future opportunities for
development. Several roads in the LVN Basin become unusable during the rainy seasons as they
become muddy or submerged. Sectors or industries which rely on transport, are therefore limited in
their ability to travel to various parts of the basin during the year.
Image source: www.flickr.com/photos/usaidkenya/sets/72157653183130708/
Kenya Water Security and Climate Resilience Project
Final Lake Victoria North Basin Plan August 2020 110
4.4.3.4 Health
Approximately 80% of communicable diseases are water, sanitation and hygiene related (Wiesmann et
al., 2016). More than 90% of the water and sanitation related disease outbreaks occur in rural
households. Water quality issues are caused by industrial effluent, solid waste dumping, sanitation
issues, salinisation of groundwater, among others. Health issues are encountered when a person is
malnourished, which is a result of food insecurity. Floods often result in the contamination of boreholes,
raising concern for waterborne diseases.
Example of health issues:
The water-borne diseases of malaria and diarrhoea are among the main causes of death in the
following counties in the Basin: Bungoma, Elgeyo-Marakwet, Kakamega, Nandi, Siaya and Vihiga.
In Busia and Trans Nzoia counties, malaria is prevalent.
o Bungoma county (County Government of Bungoma, 2018)
- The top cases of morbidity are malaria, anaemia, pneumonia, diarrhoea and peptic ulcers.
o Busia county (County Government of Busia, 2018)
- The top cases for morbidity are malaria, road traffic accidents (RTA), respiratory diseases
and skin diseases.
o Elgeyo Marakwet county (County Government of Elgeyo Marakwet, 2018)
- The top cases for morbidity are respiratory infections, skin diseases, diarrhoea, pneumonia
and malaria.
o Kakamega county (County Government of Kakamega, 2017)
- The top cases for morbidity are malaria/fever, diarrhoea, stomach-ache, respiratory diseases
and flu.
o Nandi county (County Government of Nandi, 2018)
- The top cases for morbidity are respiratory tract infections, malaria, skin infections, diarrhoea
and pneumonia.
o Siaya county (County Government of Siaya, 2018)
- The top cases for morbidity are malaria, respiratory tract infections and diarrhoea.
o Trans Nzoia county (County Government of Trans Nzoia, 2018)
- The top cases for morbidity are malaria, respiratory tract infections, skin diseases, urinary
tract infection and pneumonia.
o Uasin Gishu county (County Government of Uasin Gishu, 2018)
- This information is not available.
o Vihiga county (County Government of Vihiga, 2018)
- The top cases for morbidity are malaria, HIV/AIDS related illness, respiratory infections,
diabetes, cancer, diarrhoea and skin diseases.
4.4.3.5 Food security
High population growth and low agricultural productivity in Kenya have led to agricultural production not
meeting consumption. Low production is linked to the reliance on rain-fed agriculture, limited access to
farming inputs, low uptake of new technology and influence of climate change. There are various levels
of food insecurity across the LVN Basin.
The country’s most food insecure areas do not fall within the LVN Basin. The Basin is a relatively wet
area, with a low number of drought events and few poor-growing seasons. However, parts of the Basin
do suffer from food insecurity. For the market-dependent households, especially in the rural areas, food
prices play a key role in food security. Markets in the high potential farming zones are fairly integrated
and within close proximity to buyers. In areas where crop production only takes place during the rainy
season, the seasonality of food supply necessitates the purchase of food from markets which are often
inaccessible and highly priced.
Kenya Water Security and Climate Resilience Project
Final Lake Victoria North Basin Plan August 2020 111
Food shortages are experienced in Busia and Siaya Counties due to lack of access to food supplies,
and poor nutritional diversity is also an issue in Busia County. Busia County is characterised by low
education levels, low livestock ownership, and a large reliance on agricultural labour. It has a Poverty
Gap of 60%, which is the highest in the Basin. Siaya County is characterised by small agricultural plots
and a high percentage of households headed by women or the elderly. Stunted growth due to
malnutrition of children under five years old is serious in Trans Nzoia, Uasin Gishu and Nandi Counties.
The percentage of households with poor/borderline food consumption is 5 to 10% in Bungoma,
Kakamega and Uasin Gishu Counties, 15 to 20% in Nandi, Siaya and Trans Nzoia Counties, and 20 to
25% in Busia County.
Food security in the counties is summarised according to basic nutrition levels of children. National
stunting level (height for age) is 26%, wasting (weight for height) at 4%, underweight 11%. The overall
Poverty Gap for Kenya as a country is 45% (Wiesmann et al., 2016).
Food insecurity is most prominent in Busia and Siaya Counties, mainly due to high levels of poverty
and very high unemployment rates, followed by Trans Nzoia, Uasin Gishu and Nandi Counties. Uasin
Gishu county is the main contributor to food security in Kenya and has the lowest poverty levels in the
Basin. The lack of irrigation systems and reliance on rain for crop production results in low crop yields
and leads to food insecurity. These are factors contributing to food insecurity, which are discussed
further below:
Example of food security issues:
o Bungoma county (County Government of Bungoma, 2018)
- Children under five years have stunting levels at 24%, wasting at 2% and underweight at 9%.
The Poverty Gap for this County is 47% (Wiesmann et al., 2016).
o Busia county (County Government of Busia, 2018)
- Children under five years have stunting levels at 27%, and 31% are malnourished. The Poverty
Gap for this County is 60% (Wiesmann et al., 2016).
o Elgeyo Marakwet county (County Government of Elgeyo Marakwet, 2018)
- Children under five have stunting levels at 30%, wasting at 4% and underweight at 13%.
Seasonal food insecurity is experienced by about 55% of the population because they rely on
rain-fed agricultural production combined with poor storage and distribution systems. The Poverty
Gap for this County is 53% (Wiesmann et al., 2016).
o Kakamega county (County Government of Kakamega, 2017)
- Stunting levels, wasting levels, and the percentage of children under five years who are
underweight were not reported. The Poverty Gap for this County is 49% (Wiesmann et al., 2016).
o Nandi county (County Government of Nandi, 2018)
- Children under five years have stunting levels at 30%, wasting at 4% and underweight at 11%.
The Poverty Gap for this County is 40% (Wiesmann et al., 2016).
o Siaya county (County Government of Siaya, 2018)
- Children under five have stunting levels at 23% and 13% are underweight. Wasting levels were
not reported. The Poverty Gap for this County is 38% (Wiesmann et al., 2016).
o Trans Nzoia county (County Government of Trans Nzoia, 2018)
- Children under five have stunting levels at 29.2%, wasting at 4.7% and underweight at 15.3%. As
mentioned in Section 2.3.3., this county is one of the most food secure in Kenya. The Poverty
Gap for this County is 41% (Wiesmann et al., 2016).
o Uasin Gishu county (County Government of Uasin Gishu, 2018)
- Stunting levels, wasting levels, and the percentage of children under five years who are
underweight were not reported. This county is the main contributor to food security in Kenya. The
Poverty Gap for this County is 34% (Wiesmann et al., 2016).
o Vihiga county (County Government of Vihiga, 2018)
- Children under five have stunting levels at 14.6%, wasting at 2.6% and underweight at 3.8%. The
Poverty Gap for this County is 39% (Wiesmann et al., 2016).
Kenya Water Security and Climate Resilience Project
Final Lake Victoria North Basin Plan August 2020 112
Rain-fed agriculture
There are no major irrigation schemes in the LVN Basin. While there are small-scale irrigation schemes,
a large portion of the agricultural land in the basin is rain-fed agriculture. Most crops in the LVN Basin
are rain fed. This means that many of the crops are rain-dependent, leaving the season’s productivity
up to chance. This contributes to the basin’s food insecurity. Droughts have a devastating impact on
the crop production.
Food price fluctuations
With the crops being vulnerable to the weather conditions, price fluctuations occur depending on the
crop yield for the season. When the crop production is low the price rises, while the price falls when the
crop yield is high.
High cost of living
Although food insecurity prevalence is higher in the rural areas, urbanised areas have many food-
insecure households, mainly due to the high cost of living, unhygienic and crowded living conditions, as
well as limited coping strategies (limited access to land and inter-generational support networks). Some
urban by-laws prohibit farming and livestock keeping, giving preference to development of residential
and commercial areas.
4.4.3.6 Disaster preparedness
In areas where natural resources are degraded or where no disaster planning has taken place,
communities are more vulnerable to the effects of the disasters. Fires can damage and destroy houses,
forests, crops and grazing land. Floods can cause personal danger to communities and can also wash
away good farming soil if there is no village-level emergency planning in place. Floods can cut off access
to clean water supply and contribute to the spread of illnesses such as cholera. In the LVN Basin there
is inadequate disaster response and disaster management protocols in place for communities. With the
effects of a disaster often being devastating, the inadequate preparedness for these disasters increases
and prolongs these effects as the relief work may be delayed in response to the disaster. As a result,
the people and the economy are affected more when there is inadequate preparedness to a disaster
event. The issues and challenges involved are discussed further below.
Susceptibility to impacts of disasters
There is currently inadequate capacity for community-based disaster management in the scarcely
populated areas. This is a major concern as certain communities are affected by seasonal floods and
droughts. The susceptibility of communities to a disaster affects the residents’ standard of living as their
houses could get destroyed and the community’s economy will dip. There is also an element of fear
involved when a community is aware that it is susceptible to the effects of a disaster, but there is no
plan in place for them to protect themselves or their community.
Dependence on charities/NGO’s
The Government does not have the funds for disaster relief and rehabilitation to the damages occurred.
The Government, and therefore the affected communities, are dependent on funds and aid from
charities and organisations.
4.5 Water resources availability, management and development issues
The middle LVN Basin has the most issues relating to inadequate infrastructure, while most water
quality issues were identified in the lower LVN Basin.
Kenya Water Security and Climate Resilience Project
Final Lake Victoria North Basin Plan August 2020 113
4.5.1 Surface water resources
The quantity of surface water in the LVN Basin is an issue as the resource is not efficiently protected
resulting in water shortages and inefficient water use. The quality of surface water is threatened by
various types of pollution. The main issues regarding surface water quantity and quality are described
below.
4.5.1.1 Spatial and temporal variability
The spatial variability of water resources in LVN Basin influences the availability of water supply. The
level of population pressure and water demand is also varied across the Basin.
Water security
The LVN Basin includes major towns such as Eldoret, Kitale and Kakamega and is the most densely
populated area in Kenya, with an average catchment population density of 379 persons per km2 (Water
Resources Management Authority, 2013). High water demand is expected in the future that will be led
by domestic and industrial water supply, as well as irrigation water uses.
Water supply access
Access to clean and safe water is the foundation of a community and due to the spatial variability of
water resources in the Basin, this varies greatly.
4.5.1.2 Protection
Poor management of Kenya’s limited water resources breaches the constitution and urgent measures
are required to reverse the trend. Water resource protection issues in LVN Basin are discussed below:
Inefficient water use
The non-revenue water (NRW) is high for several of the WSPs in the basin. The average water supply
amount per person is 230 L/person/day inclusive of NRW (Water Resources Management Authority,
2013). WSPs have enough capacity for the current service population, but the NRW rate is quite high
(Water Resources Management Authority, 2013). Five out of seven urban WSPs have records of more
than 50% of NRW.
Inadequate RQOs
There is currently limited Resource Quality Objectives (RQOs) for the water resources in the Lake
Victoria North Basin. The RQOs represent the desired status of the water resource, covering all aspects
of quantity, quality, timing and aquatic biota. Management decisions should be made such that the
condition of the resource is targeting the RQO. The degradation of the water resources in the Lake
Victoria North Basin due to pollution emanates, among many other things, from the lack of RQOs.
However, there are urgent plans to develop guidelines for the establishment of RQOs and River
Classification for all the Basins.
4.5.1.3 Water quality
Water quality in the LVN Basin is very poor due to various cases of pollution, including solid waste,
sewerage, industrial effluent and non-point sources such as chemicals from the agricultural sector.
Sedimentation and storm water runoff also decreases the quality of water. Socio-economic
development coupled with human settlements has led to deposition of garbage, industrial waste,
agrochemicals, heavy metal and other pollutants, to the detriment of ecosystems and extinction of
aquatic species. The contributors to the decrease in water quality in the LVN Basin are described below.
Kenya Water Security and Climate Resilience Project
Final Lake Victoria North Basin Plan August 2020 114
Dumping of solid waste
The dumping of solid waste contributes to surface water pollution. In the LVN Basin, rubbish can be
seen in and around rivers and lakes, specifically near informal settlements and in urban areas. There
is minimal rubbish removal companies and citizens are required to pay private companies to remove
their waste. As a result, rubbish is often seen on the sides of the roads in the urban areas. This solid
waste lands up in the storm water, which ends up in rivers and dams.
Sanitation
Many urban centres usually have unplanned slum areas, often with high population densities. Slums
lack sewer systems and on-site sanitation is used to dispose of faecal matter. These wastes often find
their way into nearby water courses and can contaminate shallow groundwater.
Inadequate sewerage treatment
Similar to the poor connections to proper sewerage systems, there is a lack of wastewater treatment
facilities, which makes efforts to alleviate water quality deterioration difficult to implement.
Non-point sources
Non-point sources of pollution include agricultural chemicals (fertilisers and pesticides), unmanaged
storm water, soil erosion, overgrazing and infrastructural developments.
Sedimentation
Sedimentation negatively affects the water quality of the rivers. Agricultural activities are a major
contributor to sediment loads in rivers. Also, stormwater from urban areas gets washed into rivers,
carrying the sediments from the roads and pavements. Deforestation is another major contributor to
increased sediment loads. Sediment loads are generally higher in the rainy seasons and lower in the
dry seasons. As a result of the sediment load, the water quality is reduced, which has impacted the
fisheries and tourism sector.
To monitor reservoir performance, some monitoring stations have been proposed immediately
upstream to monitor both stream flow and sediment loading.
4.5.2 Groundwater resources
Most of the water supply in LVN Basin comes from surface water sources, given its abundance of rainfall
and available surface water from Lake Victoria. It’s largest town, Eldoret, is only reliant on surface water.
However, groundwater does play a key role in small-scale water supply for private domestic use. While
groundwater provides 1% of the public water supply, it does provide 77% of the private domestic supply
in the basin. This could result in over-abstraction of groundwater in the basin. The quality of groundwater
is a major concern as the quality is often affected by inadequate sanitation systems. The main issues
regarding groundwater quantity and quality are described below.
4.5.2.1 Protection
Discussions about a policy for groundwater protection were initiated within the WRMA in 2006 (Water
Resources Management Authority, 2006); these were considered during the development of the
National Groundwater Policy (Ministry of Water and Irrigation, 2013).
The unsustainable use of groundwater (particularly groundwater pollution from anthropogenic activities)
is a concern for the LVN Basin. Groundwater issues have resulted from inadequate protection of
groundwater, which is discussed further below.
Kenya Water Security and Climate Resilience Project
Final Lake Victoria North Basin Plan August 2020 115
Groundwater protection programs
The National Water Quality Management Strategy (2012): in S. 2.7 (Ground Water Protection), the
NWQMS lays out the following “strategic responses”:
◼ Extraction of groundwater at sustainable rates to avoid seawater intrusion.
◼ Intensifying groundwater quality monitoring by sinking observation boreholes.
◼ Establishing a monitoring program for selected production wells to capture any changing trends.
◼ Requiring all borehole owners to have their water tested periodically as part of the water quality
monitoring programme.
◼ Maintain updated database of borehole data.
It recommended the “Development of Ground Water Protection programs” without defining or describing
them. This needs to be refined.
Groundwater recharge areas
No groundwater models of the LVN Basin have been developed, and there is often a poor level of
understanding of aquifers. There is a need to select Priority Aquifers for modelling, then prioritise these
and develop models; this inevitably requires the establishment of a water resources monitoring network
in advance of generating a model, which would involve any or all of the following:
◼ Climate
◼ Surface water flows
◼ GW levels
◼ GW abstraction
◼ Water quality (both surface and GW).
A time series of several years is ideally required for the baseline dataset which the model will use for
calibration; given the natural climate variability of much of the Basin, it is desirable that both drier and
wetter than ‘normal’ years are captured.
Groundwater contamination
The significance of small-scale water sources (e.g. hand pumped boreholes, shallow wells and springs)
in water supply in the LVN Basin, particularly rural water supply, is very clear on the ground. However,
this is difficult to capture as the water permit process is typically skewed to capture data from larger,
more significant water users.
It is apparent that reliance on these small-scale water resources and aquifers in the LVN basin is
increasing. However, high population (such as in the LVN Basin) is resulting in the aquifers supplying
these sources becoming contaminated by pit latrines and occasionally septic tanks. It is therefore
important to address local groundwater recharge zones.
Transboundary aquifers
The East African Community Protocol on Environment and Natural Resource Management (East
African Community, 2018) Article 13 (Management of Water Resources): “The Partner States shall
develop, harmonise and adopt common national policies, laws and programmes relating to the
management and sustainable use of water resources” is not yet ratified by Tanzania. The Draft National
Policy on Trans-Boundary Waters (Ministry of Water and Irrigation, 2009), provides limited guidance or
intent on transboundary GW resources. There is one transboundary aquifer in the LVN Basin, out of
eight across the country (Nijsten et al., 2018):
◼ Mount Elgon aquifer – Combination of trachytes and metamorphic Basement (ILEC et al., 2015);
total area 4 900 km2, shared with Uganda.
Kenya Water Security and Climate Resilience Project
Final Lake Victoria North Basin Plan August 2020 116
A transboundary aquifer policy needs to be developed; the National GW Policy (Ministry of Water and
Irrigation, 2013), lists the following activities required to improve transboundary GW management
(“Issue 9”):
Table 4-1: Proposed transboundary aquifer (TA) policy measures
Issue Objective Policy direction Activity Timeframe
Transboundary
aquifers not
well known,
characterised
nor managed
TAs well known,
characterised and
managed by
countries sharing
TAs
Implement
appropriate new
policies and
institutions to ensure
seamless
management of TAs
a) Identify and demarcate TAs;
b) Collect information;
c) Promote information sharing and
adopt international good practices;
d) Expand transboundary water
unit to Department
Short- to long-
term
There is also the National Land Use Policy (Ministry of Lands and Physical Planning, 2017), which
specifically describes measures to be adopted in relation to the definition and management of
transboundary groundwater resources.
4.5.2.2 Institutional
Regulations
There is poor planning and water allocation when it comes to considering surface water and
groundwater allocation. The two remain divided, and effectively treated as different water resources.
The recent Water Allocation Plan Guideline (Water Resources Authority, 2019a) should help to resolve
this, as it treats both resources in a given area in its approach to WAPs. There is confused NEMA and
WRA mandates with regards to wastewater management and licensing (both bodies seek ‘polluter
payments’ from water users/polluters). NEMA legislation (Act of 1999 and effluent regulations in the
Environmental Management and Co-ordination (Water Quality) Regulations, 2006) pre-date water
legislation (Water Act in 2002, and effluent regulations in the Water Resources Management
(Amendment) Rules). Communication of mandates between counties and the WRA are also uncertain,
with counties drilling boreholes without the benefit of WRA Authorisations and sometimes of poor
technical quality (installing mild steel casing/screen in low pH GW environments, for example).
Furthermore, potential conflict between national and county governments is likely, regarding the sharing
of natural resources benefits (cf. the Natural Resources (Benefit Sharing) Bill, 2014 and the Natural
Resources (Benefit Sharing) Bill, 2018). Both Bills specifically include water resources. Mandates
between different state actors are trans-sectoral.
Inadequate monitoring
Groundwater monitoring has improved significantly in the past decade, with a total of 19 operational
groundwater monitoring points across the Basin (Water Resources Authority, 2018d). In the 2014
reporting period (Water Resources Management Authority, 2016) there were 13 operational monitoring
boreholes. Data quality is, however, patchy - most groundwater level data are collected from boreholes
that are used as production boreholes. All too often, the data show dynamic as well as static water
levels. This restricts the utility of water level data to determine long-term trends.
Private sector or NGO players do operate their own monitoring networks, such as that operated by
Base Titanium Ltd in the South Coast (covering both water levels and water chemistry). Field water
quality data collection is also improving, with a broader range of measurements planned in order that
RQOs can be determined. Parameters planned cover the following: electrical conductivity, turbidity,
temperature, pH, total suspended solids, dissolved oxygen, total nitrogen and total phosphorus.
Abstraction monitoring is done on an ad hoc basis at best - groundwater users are required to submit
abstraction data monthly or quarterly as evidence to support their water charge payments, but these
Kenya Water Security and Climate Resilience Project
Final Lake Victoria North Basin Plan August 2020 117
are rarely checked in the field by the WRA. The capacity to improve abstraction monitoring will be
boosted by the adoption of formal guidelines for groundwater abstraction surveys, using
electromagnetic flow meters (Water Resources Authority, 2018c).
Unclassified groundwater applications in the PDB
The PDB of the WRA has had challenges, including numerous duplicate or out-of-date entries. When it
comes to water permit classification, a decision must be made whether dedicated monitoring boreholes
(or piezometers) require a Water Permit. Prior to 2014, applications to construct monitoring boreholes
were issued with Authorisations but not Water Permits; since 2014 there has apparently been no
requirement for either Authorisations or Permits for monitoring boreholes (diameters <4”/102mm).
Furthermore, clarity is also required whether true exploratory boreholes require a Water Permit after
completion, if they are not to be commissioned as production boreholes. Finally, the function and
application of the Form WRMA 0A3 (Notification Approval for Construction of Work and Use of Water)
needs clarification.
For Class A, the applicant will get an Approval. For Class B, C and D, the applicant is issued with a
Permit. For all Classes, the applicant is mandatorily required to obtain an Authorization.
4.5.3 Water resources infrastructure
The key issues regarding water resources infrastructure in the LVN Basin are described below.
4.5.3.1 Bulk water supply systems and transfers
The main issue of bulk water supply systems in the LVN Basin is inadequate storage for various uses.
There is also a concern that the current infrastructure will not meet the growing demands. The design
of dams and other infrastructure is important to maintain the capacity designed for. There has been
evidence that some dams as well other infrastructure is undersized for floods, which raises the question
of whether floods were considered during the design of the infrastructure.
4.5.3.2 Irrigation schemes
There are a few major irrigation schemes in LVN Basin, but most of the agriculture is rain-fed. The lack
of major irrigation schemes is a concern for the basin. There are proposed irrigation schemes, which
should help relieve the problem of food insecurity.
4.5.3.3 Water supply network
The water supply and sanitation systems suffer from various issues including losses due to leakages,
bursts and blockages, illegal connections, inefficient and wasteful water use and overflow of sewers.
4.5.3.4 Future projects
Inadequate capacity for infrastructure development
The WRA and the Water Works Department do not have sufficient capabilities and financial resources
for the regulatory, monitoring and technical aspects of water resource infrastructure development. The
high cost of assessment of potential dam sites inhibits the Water Works Department’s ability to support
the development of new reservoirs. There is also inadequate capacity at WRUA level to initiate the
development of storage infrastructure.
Kenya Water Security and Climate Resilience Project
Final Lake Victoria North Basin Plan August 2020 118
Lack of investments into infrastructure development
An article by Business Daily (Wafula, 2010), highlights the issue that potential investors in the water
sector are put off by Kenya’s regulatory framework. Investors are hesitant to invest in the high-risk water
sector of Kenya where there are no guaranteed payments from consumers.
Priority areas for groundwater resource development
There is currently a limited information regarding the groundwater potential across the LVN Basin, and
priority areas have not been identified for groundwater resource development.
4.5.4 Hydrometeorological monitoring network
The current monitoring network in the LVN Basin is inadequate, and the network is not being effectively
operated. Data management and sharing platforms are not well established, and there is inadequate
technical capacity coupled with an oversupply of work that requires data processing, analysis and
reporting, beyond the available time of the staff. There is also inadequate maintenance of the gauging
stations. Although the WRA continuously rehabilitates and expands the hydromet monitoring network,
issues such as ageing, vandalism and flood damage limit progress.
4.5.5 Water allocation and use
One of the key challenges across most of the LVN Basin is limited water resource availability. There is
intense competition for water resources and pressure on prioritisation of water use. This basin therefore
has the biggest challenge to ensure the equitable and sustainable allocation of water to domestic,
industrial and agricultural users, and has the opportunity to take the lead in water allocation planning.
Managing and enforcing water allocations and use is one of the major challenges in the basin, as
described below.
4.5.5.1 Compliance of allocations
Managing and enforcing water allocations and use is one of the major challenges in the basin, and
there is currently inadequate capacity and time in WRA to enforce compliance and to collect, record
and analyse water resource monitoring data. There is also inadequate monitoring of actual water use
for large water users and illegal abstractions taking place which are not monitored and removed.
4.5.5.2 Water resource availability
One of the key challenges across most of the LVN Basin is limited water resource availability. The
discrepancy in water availability verses water demand creates challenges in allocation of water.
Groundwater is used as a supplementary resource to surface water and is currently exploited without
adequate knowledge of groundwater potential.
4.5.5.3 Information on allocable water
There is currently inadequate information on surface and groundwater availability for the purpose of
water allocation management. Only limited estimates of allocable water are available.
4.5.5.4 Water allocation
The fair allocation of water resources is affected by the social standing in society.
Water is a necessity for all sectors, which, when the availability is low or restricted, can result in tension.
When one sector is favoured in terms of water supply above another, conflict arises. An example is the
Kenya Water Security and Climate Resilience Project
Final Lake Victoria North Basin Plan August 2020 119
domestic water supply to Eldoret is a higher priority than water supply to the people living in the
catchment area of the dam that supplies Eldoret.
4.6 Institutional issues
4.6.1 Institutional arrangements
Key institutional issues in the basin include inadequate capacity of the WRUAs, inadequate capacity
and knowledge of integrated water resource management in the County Governments, and inadequate
reporting framework to the public. During the workshop institutional issues were only identified in the
upper LVN.
4.6.1.1 National policies and legislation
Promulgation of the Constitution of Kenya 2010
Kenya’s new (2010) introduced the County Governments structure that was aimed at decentralising
some of the national functions to the 47 counties. The Water Act (2016) provides policy direction and
relegates catchment management and water supply services to County Governments.
Conflicting policies, regulations and mandates
Conflict exists in certain counties where either the County Government or Water Service Provider acts
in contention with the WRA mandates in order to increase income or to gain favour with the public. This
results in animosity towards the WRA.
Organisations such as NEMA and Kenya Wildlife Trust (KWT) have acts in place, which conflict with
WRA regulations. An example is NEMA’s physical planning act, which is not in alignment with WRA
regulations. A major issue is the mandates on wetlands and riparian lands. The Physical Planning Act,
and Agricultural/Land Acts, hold different definitions to the Water Act regulations as to what constitutes
riparian land. This has created mandate conflict on a national level and has also made it easy for people
to encroach on riparian land or for developers to bypass the law.
There is need to carry out a mapping and analysis of key institutions in the national and County
Governments, civil and private sectors and their overlapping mandates while identifying opportunities
of synergy. A detailed stakeholder analysis is to be undertaken at the beginning of the Strategic
Environmental Assessment (SEA) process. This will include a governance and institutional assessment
of the various institutions and how these are envisaged to change in the proposed basin plan. A range
of institutions and organisations are directly involved in forest management and conservation of forests
in the basin. Many of the forests in the basin forests are found on protected areas whose management
is vested in the KFS. There are also closed canopy forests gazetted as national parks and national
reserves managed by KWS. Moreover, a significant forest area is found in trust land and vested in the
respective County Governments.
Revenue collection and resource mobilisation challenges
Currently, the billing system is not integrated with the Permitting Data Base (PDB) thus lowering
revenue billed. Initial consultations by ISC indicate that there is need to explore innovative additional
revenue streams to increase revenue base such as: (a) Further developing a policy directive/caveat on
all future development projects to include a 10-15 % budget to be set aside for conservation of water
resources management activities. Such a policy caveat has been developed, and the percentages are
the only remaining bit under discussion with the MWSI; (b) Commercialise water testing labs through
accreditation; and (c) Establish a Water Payment for Ecosystem Services Scheme anchored on
‘beneficiary pays principle’. Revenue collection rates for WRA are low due to inadequate resources to
facilitate this process. However, since 2009 the Authority has recently incorporated electronic payment
Kenya Water Security and Climate Resilience Project
Final Lake Victoria North Basin Plan August 2020 120
services through Mpesa, a mobile money transfer platform that will significantly increase the revenue
collected because of the convenience it offers the water users. Also, there are on-going discussions on
acquiring an integrated system that will increase efficiency in the permitting and commercial processes
at WRA. Furthermore, there is on-going installation of automated telemetric consumer meters to
enhance revenue collection, while also minimising time for WRA staff to travel for meter readings.
Non-compliance to effluent discharge regulations
For the 2011/12 and 2013/14 period the WRA reported that in June 2013 the LVN had the lowest
number of registered major effluent dischargers at 15 (Water Resources Management Authority, 2016).
The major discharges complied with the Effluent Discharge Control Plan (EDCP) and were
subsequently issued with an effluent discharge permit. However, in June 2014 the 15 registered major
effluent dischargers had their ED permits cancelled. It is not clear whether the revocation of ED licenses
and discontinuation of effluent discharged into the lake was as a result of non-compliance.
4.6.1.2 National institutions
Uncoordinated institutional roles
The uncoordinated roles of the various organisations cause not only poor efficiency, but also conflict
between the organisations. WRA, KFS and KWT all have a catchment protection mandate, which
creates conflict when all three organisations have their set roles to fulfil. Similarly, there is conflict
between CFAs and WRUAs in terms of forest management, where the river sources are in the forest
which falls under the jurisdiction of the CFAs, while the WRA usually manages the sub catchment
outside the jurisdiction of CFAs. There are some initiatives that have brought WRUAs and CFAs
together on how to manage the river sub-basin as a system. The Centre for International Research on
Forest has been working in the Mount Elgon region, and has successfully brought together WRUAs and
CFAs to manage the Chebombai sub basin.
There is inadequate coordination between CGs and WRA. This makes it difficult for the WRUAs, whose
responsibility lies between that of the CGs and WRA, to implement sub-catchment based water
resources management interventions. Also, water resources management is a function that has
devolved to the CGs, while WRA performs regulation of the CG’s management of water resources.
4.6.1.3 Basin and sub-basin institutions
Dormant or potential WRUAs
There are currently (2019) 94 established WRUAs out of the potential 106 WRUAs, translating into 12
WRUAs that need to be established. However, there are disparities in levels of development and
maturity of the established WRUAs. Among the well-established WRUAs is the Kuywa Water
Resources Users Association (KUWRUA) with robust institutional structures and technical capacity in
comparison with other WRUAs in the region (Liambila, 2017). The institutional elements and technical
capacity for existing WRUAs and those that are yet to be established needs to be bolstered to improve
the operational capability of the institutions. Limited financial resources also affect the operational
excellence of WRUAs. This is also compounded by the fact that several of the WRUAs in the basin do
not have long term financial strategies or resource mobilisation plans as a result struggle to sustain
themselves (Openji, 2017).
The unclear role of the BWRCs
There are conflicting mandates for the BWRCs in the Water Act (2016) where they have both advisory
and management functions. ISC has an understanding that the BWRCs will remain advisory for the
foreseeable future with a long-term plan of making the BWRCs have an executive role. There is a need
to develop tools to support the operationalisation of the BWRCs, when they are finally established, and
Kenya Water Security and Climate Resilience Project
Final Lake Victoria North Basin Plan August 2020 121
to ring-fence WRA staff at the ROs who will provide both technical and secretariat services to the
BWRCs. The actual responsibility and how the BWRCs will work with WRA at the regional offices will
only be clear once the mandates are agreed upon.
Expansive area of jurisdiction
The total area of LVN Basin is 18 374 km2, corresponding to 3.2% of the country’s total land area (Water
Resources Management Authority, 2013). The regional office is in Kakamega with sub-regional offices
in Eldoret, Kitale and Siaya. LVN covers 8 counties namely Trans Nzoia, Kakamega, Bungoma, Siaya,
Vihiga, Nandi, Ursin Gishu and Busia. This is clearly a very expansive basin and WRA’s 4 offices in the
basin poses a challenge in terms of capacity to effectively serve all the 8 counties. Most stakeholders
have been voicing the need to have more representation of WRA in every County to increase WRA’s
effectiveness. This situation is further worsened by WRA’s inadequate human resources, financing,
vehicles, laboratory facilities and data.
Inadequate institutions in forestry sector
The inadequate institutions arise from weak governance structures and inadequate capacity for law
enforcement and weak stakeholder participation in forest management and governance. This is
exacerbated by inadequate funding of the forestry sector from the exchequer, civil and public sectors.
Since the enactment of the new Constitution in 2010, nationally and within the basin, the level of public
support to the conservation of forests has increased significantly but has not been matched by an equal
measure of resource allocation in all sectors. For example, the Forest Management and Conservation
Fund (FMCF) established in the established in the Forests Act 2005 and the Forest Conservation and
Management Act No.34 2016 to promote the development of forests, maintenance and conservation of
indigenous forests, the promotion of commercial forest plantation, provision of forest extension services,
the establishment of arboreta and botanical gardens, and a variety of other purposes outlined in Forest
Act is yet to be fully operationalised. Furthermore, there are conflicting institutional mandates as is
evident from the overlapping mandates, programmes, projects, and conflicting policies and legislation.
Overall, forest conservation has witnessed increased cases of political interference in the management
of forests, poor governance as well as inadequate and/or weak structural/institutional capacity for forest
law enforcement and governance.
4.6.1.4 County Governments
Governance issues
Water resources management decisions in Kenya are often influenced by political agendas, which are
not always aligned with scientific, engineering and resource realities. This creates unrealistic
expectations and often leads to frustration. Furthermore, there is sometimes a misconception that WRA
acts as a barrier to people’s desire to get access to water resources. This in return occasionally creates
animosity amongst community members towards WRA, which can negatively impact WRA’s activities
on the ground. Another instance of political opportunism involves politicians announcing unrestricted
access to water, which for example results in people drilling illegal boreholes.
County Governments have been actively pursuing ground water development with some counties
acquiring borehole drilling rigs to support their ground water development plans. Some of the boreholes
drilled have not followed formal registration with WRA posing a serious challenge to ground water
monitoring and revenue collection for WRA.
Limited coordination
Limited coordination and isolated planning by the various stakeholders operating in the counties is
prevalent. These practices are also reflected in the NWMP 2030. The Master plan proposes the
development of major dams in the upper reaches of the Nzoia River. The area has rich water and water
Kenya Water Security and Climate Resilience Project
Final Lake Victoria North Basin Plan August 2020 122
conservation forest such as Mount Elgon, Cherangany Hills and other gazetted forests. These dams
might have significant negative impact on water and forest conservation. The development of these
dams will likely occur at the expense of the forest despite Vision 2030 advocating for improved efforts
towards forest recovery and afforestation.
Additionally, isolated planning is another major challenge to water conservation. Since 2013, Kenya
has had a devolved system of governance and one of the components of this is the counties planning
their own land independently of each other. In the case of ‘moving resources’ like wildlife and water,
this has led to loss of coordination and poor resource use. There is need for policy action to ensure
integration of planning and decision making at all levels. Some counties have established environment
management committees and WRA is a member of some of these committees, such as West Pokot
and Elgeyo Marakwet where the County Environment Committees and WRA meet regularly. For the
other counties, WRA is not a member of the committees.
4.6.1.5 Partnerships and engagement
Limited partnerships
The partnerships operating in the basin predominately operate at a nation-wide level with key strategic
partners with seemingly less partnerships at a localised level. Limited partnerships at a localised level
is concerning since it is as this sphere where focused collective action can take place. Increased efforts
at improving coordination and formation of partnerships amongst sub-catchments stakeholders is
incremental going forward.
Limited coordination between stakeholders
Generally, there is currently a limited of coordination between the WRA, WRUAs, County Governments
and other stakeholders which leads to poor urban and rural planning and uncontrolled development
which has a negative impact on regulation of use and management of water resources.
One of the challenges facing WRA towards integrated river basin management has been limited
coordination amongst the various WRUAs working within a large basin. Some of the larger river basins
such as the Nzoia could have as many as 100 WRUAs operating within the same basin (Liambila,
2017). Thus, there is need for coordination of the activities that each of them carries out to ensure
synergy and harmonisation of initiatives. The LVN basin forum aimed at ensuring coordination amongst
WRUAs was set to be established in 2016 however there is no clear indication on the functionality and
effectiveness of the platform.
Low public awareness of WRA’s mandate
Generally, there is low public awareness of WRA in the LVN Basin. Some of the stakeholders in the
basin are unaware of WRA’s role in regulating the use and management of water resources. Those that
are aware of WRA’s mandate sometimes criticise the Authority of weak performance. Thus, there is
urgent need to create awareness and understanding of WRA mandate as a Regulator through activism
and engagement with other partners. This can be achieved by articulating WRA’s functions well,
demonstrating ways of measuring results achieved and packaging results in ways attractive to different
stakeholders in the basin. Improved enforcement of offenders is also another alternative that will enable
water users to realise the value addition of WRA’s services for the fees they remit to the Authority.
4.6.2 Enabling environment
4.6.2.1 Financial resources
WRA has insufficient funding, which results in a clear gap in financing, that in turn affects operational
activities which have a bearing on quality and quantity of outputs by the Authority. This has negatively
Kenya Water Security and Climate Resilience Project
Final Lake Victoria North Basin Plan August 2020 123
affected procurement of modern equipment, upgrading existing stations, improving monitoring
networks, increasing staffing capacity, training etc. However, although approved recurrent budgets over
the years has increased steadily, though with a small percentage and actual funds released for
operations have also improved over recent years in line with the available funding, the financing gap
has been significant with FY2016/17 having a financing gap of KES 819 million. Opportunities that exist
within the sector with regards to financing water and sewerage infrastructure include:
▪ Donor finance – there exist several international organisations that supports this sector. Projects like
KIWASH, WSUP are opportunities that can be explored in bridging the financing gap.
▪ Market finance – Commercial banks are currently supporting water utilities in expansion activities.
This initially happened under Output Based Aid and has supported several water utilities. The water
utility must demonstrate that it is commercially viable to benefit from the loan facility.
▪ Water Sector Trust Fund – The Water Sector Trust Fund targets to improve service in pro-poor
areas. The water utilities can take advantage of this facility to increase access to services in low
income areas where the population is limited by the ability to pay for connection to services.
▪ Public Private Partnership – The sector in recognition of the financing gap and the need to achieve
vision 2030 has embraced PPP arrangement.
Current funding includes WSTF financing for WRUAs as well as African Development Bank funding for
the Kenya towns sustainable water supply and sanitation programme through which WRA is being
facilitated in institutional strengthening and funding of WRUAs.
In addition, there are programmes by international banks that target the sector under special conditions
such as the Kenya Towns Sustainable Water and Sanitation Program being implemented by the African
Development Bank Group.
Some of the issues arising from inadequate financial resources are inadequate office space and
equipment, and inadequate vehicles and/or fuel.
Inadequate office space and equipment
The WRA does not own any office buildings and office structures. The current buildings and office
structures are owned by the Ministry of Water and Irrigation. Inadequate ownership of immovable assets
by the WRA attest to the fledgling phase the WRA is currently in, in addition inadequate ownership may
present challenges with the WRA identifying itself as an independent body.
The estimated value of the building and office structures in the LVN catchment is Ksh 78 000 000. This
figure is not disaggregated in terms of regional offices and sub regional offices as a result one cannot
determine whether more office space is required per sub office.
Data collection tools/equipment and infrastructure at gauging stations are often in need of maintenance,
repair or upgrade, e.g. survey equipment, meter readers, water quality monitoring equipment and
manual data collection tools. This is a major concern considering that there are internationally and
locally shared rivers and aquifers which require regular monitoring to ensure that water use activities
do not negatively impact on users downstream.
Inadequate vehicles and/or fuel
The basin has 6 vehicles with Kakamega with 2, Eldoret has 2 vehicles, Kitale and Siaya offices have
1 vehicle respectively. The cumulative value of the vehicles is Ksh 11 870 000. The basin does not have
sufficient vehicles to undertake functions. In the Water Resources Authority Establishment Report it
was recorded that each WRA Basin office requires 2 vehicles and drivers and each sub-regional office
requires a minimum of 3 vehicles. The sub regional offices are significantly under capacitated.
Kenya Water Security and Climate Resilience Project
Final Lake Victoria North Basin Plan August 2020 124
4.6.2.2 WRA staffing capacity
As of 2018, the LVN catchment had a cumulative staff complement of 70 people of which 34 are
deployed in the Kakamega RO, 17 are in the Siaya RO and 19 are in the Kita SRO. Although the current
figures do not provide disaggregation of technical staff, professional staff and administrative support,
there is a significant capacity gap in sub regional offices. The capacity gaps need to be addressed
through increased employment and training of staff. The shortage of staff at the sub-regional offices
affects the operational excellence of WRA at a localised level.
4.6.2.3 Enforcement capacity of WRA
At the end of the 2013/14 FY in June 2014 the LVN catchment recorded the lowest number of metered
abstractions (surface and groundwater) indicating a weakness in the compliance and enforcement
capacity of the WRA (Water Resources Management Authority, 2016). There is a need to increase
water meters to improve accountability of allocated water resources as well as improve compliance &
enforcement of water permit conditions on metered users.
4.6.2.4 Implementation ability/capacity
There is concern regarding the ability of the WRA to implement certain conditions of the Water Act in
the catchment as well as operationalise strategic plans. The WRA has lagged in regulating water users
and has been unsuccessful in performing critical water management functions due to inadequate
capacity and resource constraints. By June 2013 LVN catchment had the lowest performance, in
comparison to other basins, in implementing the catchment management strategy. The catchment had
the lowest proportion of permitted water use, lowest number of effluent dischargers complying with
EDCP, and a low proportion of operational water resource monitoring stations (Water Resources
Management Authority, 2016).
4.6.2.5 Capacity in WRA to deal with drought related disasters
Drought related disasters present challenges to equitable water allocation and have the potential to
increase the frequency conflict over water resources. LVN catchment has limited capacity to navigate
through drought periods. Out of the water related conflicts reported the WRA was able to resolve half
of those case, in addition the catchment was unable to carry out robust drought management measures
(Water Resources Management Authority, 2016). The capacity of the LVN catchment regarding drought
management needs to be strengthened through the establishment of appropriate structures that
develop drought response strategies. The WRA and the district Disaster Operations Centre (DOC)
under the Ministry of Special Programs need to coordinate to ensure the harmonisation of drought
response measures of the LVN catchment with that of the district office.
4.6.2.6 Capacity in WRA with regards to flood mitigation
Flooding events are a serious issue in the basin, concerningly is the relatively limited capacity of the
WRA to effectively manage flood events. The WRA only mainstreamed flood management in their
operations in June 2011. Since then several achievements have been made such as the mapping of
flood prone areas. Only three areas were identified in the LVN catchment namely Budalangi, Lower
Yala and Namanjalala. There is inadequate clarity regarding whether structural measures such as
building of evacuation centres and installation of flood warning systems have been developed around
the areas. Moreover, there is inadequate indication whether non-structural measures have been
implemented such as the inclusion of flood management in the catchment plan and sub catchment
plans of WRUAs. In 2013, the World Bank completed a study through the Water Partnership
Programme which identified the construction of large and medium sized reservoirs upstream the
upstream the catchment for flood management and water supply. There is no indication regarding the
uptake of the research recommendations by the Ministry of Water and Irrigation
Kenya Water Security and Climate Resilience Project
Final Lake Victoria North Basin Plan August 2020 125
4.6.2.7 Capacity to enforce reserve flows
In 2014 the LVN catchment had not developed a water allocation plan indicating constraints in
determining reserve flows. Subsequently the WRA is yet to enforce reserve flows adequately (Water
Resources Management Authority, 2016). There are capacity gaps in integrating the reserve and
planning for the reserve in the catchment. To overcome these challenges training of existing technical
staff is required in order to build technical competency in reserve determination. Furthermore, adequate
equipment to support reserve determination is required.
4.6.2.8 Capacity of WRA with regards to climate change adaptation strategies
Climate proofing the LVN basin is critical for the continued social and economic development of the
catchment. The current catchment management plans and sub-catchment plans do not explicitly
address climate change and do not elucidate on climate adaptation strategies. Revising the plans to
include specific actions for addressing climate risks in the basin is required. In addition, the institutional
capacity of the WRA in terms of appointing climate technical support and the allocation of resources
(finances) needs to be strengthened. The existing WRA staff complement does not constitute climate
experts. The capacity of the WRA in LVN to develop and implement climate change adaptation
strategies is relatively low in comparison to other basins where IFMP has been implemented. As a
result, greater support and increased allocation of resources (human and financial) is required in order
to improve the climate resiliency of the basin.
4.6.3 Transboundary and trans-county issues
LVN catchment has four transboundary rivers presenting a greater potential for multiple conflicts due
to the overly complex environment for managing water resources.
4.6.3.1 Inter-basin transfers
The LVN basin does not receive additional water supply from inter basin transfers nor does it augment
the supply of other basins through transfers.
4.6.3.2 Internationally shared water resources
The LVN basin’s major rivers flow into Lake Victoria and flow across borders. The Nzoia and Yala Rivers
flow into Lake Victoria which straddles Kenya, Uganda and Tanzania (Water Resources Management
Authority, 2013). The Sio, Lwakhakha, Malakisi and Malaba rivers flow across the border to Uganda
and ultimately flow into Lake Victoria. There are sporadic water use and water pollution related conflicts
between the Kenya-Uganda border, specifically Busia-Malaba border, and other Nile treaty countries.
Uganda has complained that there is water pollution from the Kenyan side on the Sio, Lwakhakha,
Malakisi and Malaba rivers.
The management of water in the LVN catchment is complex because all the catchment’s major rivers
discharge downstream to Lake Victoria. As a result, infrastructural development (i.e. dams) and
activities on the major rivers of the basin need to be carefully considered as they might negatively affect
the runoff to the Lake. This could potentially lead to conflict between the riparian states due to the
decreased discharge from the rivers into the lake.
To minimise water related conflicts and move towards the long-term sustainable water management of
Lake Victoria waters, the Lake Victoria Basin Commission (LVBC) was established in 1999 and
operationalised in 2004. Despite the presence of this institution conflicts in Lake Victoria persist.
According to Okumu (2010) over the past five years, there has been a serious dispute between Uganda
and her neighbours over the cause of a drop in the water level of the lake by 1.5 metres between 2004
and 2006 (Okumu, 2010). While Tanzania and Kenya have blamed Uganda for causing the decline by
over-draining the lake for hydroelectric production, Uganda has attributed the drop to climate change.
Kenya Water Security and Climate Resilience Project
Final Lake Victoria North Basin Plan August 2020 126
Uganda was also in July 2008 accused of entering into a secret agreement with Egypt to release more
water into the Nile to meet Egypt’s increasing needs (Okumu, 2010).
4.6.3.3 Trans-county conflict
There are reported cases of water related conflicts between West Pokot, Nandi Hills, Kiminini, and
Tindinyo areas. These cases are prominent during dry seasons when the resource is scarce. There
have been water pollution related conflicts between communities in Busia town in addition to riparian
land misuse. For Malaba town, there have been cases of illegal use of wetland and areas for agricultural
and commercial use contrary to the set-out regulations for conserving wetlands.
The Lake Basin Development Authority plans to build a dam inside the South Nandi Forest that will lead
to the clearing of 1 185 ha of closed canopy rainforest, including 10 million indigenous trees (Temper
et al., 2015). The dam will significantly drain the Yala Swamp, a wetland of international importance by
diverting 9% of waters of the Yala river to the adjacent Nyando river (Temper et al., 2015). The dam is
will support irrigation of 17 000 ha in the Nyanza sugar belt, the supply of drinking water to the
Vihiga/Sabatia, Hamisi, Nandi Central, Kisumu and Nyando districts (in the region of Lake Basin
District), flood control downstream of the dam, the development of fisheries in the area of the reservoir
and the tourist development of the region (Temper et al., 2015).
The Nandi county local communities are strongly opposed to the project because the proposed benefits
are not attractive enough; and for political reasons, where they feel they will bear the cost of the dam,
with benefits being reaped by the downstream community members and counties (Temper et al., 2015).
The Nandi county council has threatened to move to court to challenge the proposed project. Street
protest have been held by the affected community groups and interest groups (Temper et al., 2015).
The continuation of the project has potential to escalate levels of intra county tensions as well as inter
county tensions.
Land conflicts in Nandi county exist in Tindiret and Mosop where adjudication and issuing of title deeds
still needs to be done. Squatters were evicted by the government from Kipkurere forest, Nandi South
forest, Cengalo forest and other public land, resulting in Internally Displaced persons without land.
There is tension over land held by multinational companies who took over land previously annexed by
colonialists. Tensions across ethnic communities resulted in conflict in 1992, 1997 and 2007, and still
needs to be resolved (County Government of Nandi, 2018).
4.6.3.4 Land and resource conflict
The acquisition of land in the Yala swamps by the Dominion Group for the agricultural projects led to
turmoil and conflict with the community resulting in the Group’s exit 12 years earlier than the lease
period of 25 years (Kamadi, 2019). A set of events contributed to the conflict for one the community
was not consulted prior the land acquisition deal, secondly revenue generated from the initiatives were
not ploughed back to the community and lastly land grabs from the community member. However, the
Dominion Group would drive communities soon after the land grab (Kamadi, 2019).
Kenya Water Security and Climate Resilience Project
Final Lake Victoria North Basin Plan August 2020 127
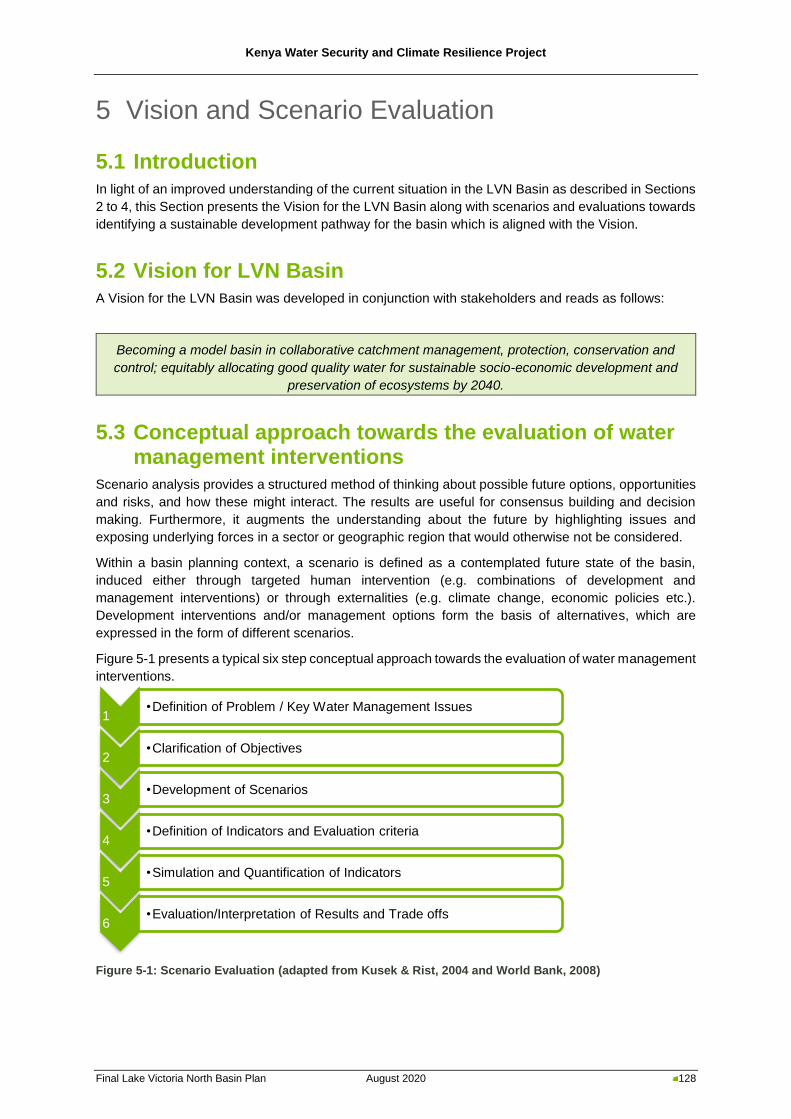
Kenya Water Security and Climate Resilience Project
Final Lake Victoria North Basin Plan August 2020 128
5 Vision and Scenario Evaluation
5.1 Introduction
In light of an improved understanding of the current situation in the LVN Basin as described in Sections
2 to 4, this Section presents the Vision for the LVN Basin along with scenarios and evaluations towards
identifying a sustainable development pathway for the basin which is aligned with the Vision.
5.2 Vision for LVN Basin
A Vision for the LVN Basin was developed in conjunction with stakeholders and reads as follows:
Becoming a model basin in collaborative catchment management, protection, conservation and
control; equitably allocating good quality water for sustainable socio-economic development and
preservation of ecosystems by 2040.
5.3 Conceptual approach towards the evaluation of water management interventions
Scenario analysis provides a structured method of thinking about possible future options, opportunities
and risks, and how these might interact. The results are useful for consensus building and decision
making. Furthermore, it augments the understanding about the future by highlighting issues and
exposing underlying forces in a sector or geographic region that would otherwise not be considered.
Within a basin planning context, a scenario is defined as a contemplated future state of the basin,
induced either through targeted human intervention (e.g. combinations of development and
management interventions) or through externalities (e.g. climate change, economic policies etc.).
Development interventions and/or management options form the basis of alternatives, which are
expressed in the form of different scenarios.
Figure 5-1 presents a typical six step conceptual approach towards the evaluation of water management
interventions.
Figure 5-1: Scenario Evaluation (adapted from Kusek & Rist, 2004 and World Bank, 2008)
1•Definition of Problem / Key Water Management Issues
2•Clarification of Objectives
3•Development of Scenarios
4•Definition of Indicators and Evaluation criteria
5•Simulation and Quantification of Indicators
6•Evaluation/Interpretation of Results and Trade offs
Kenya Water Security and Climate Resilience Project
Final Lake Victoria North Basin Plan August 2020 129
The key aim of the LVN Basin Plan was to provide a pathway towards a future which achieves a
sustainable balance between utilisation and development of water resources and the protection of the
natural environment, i.e. minimising negative environmental and social impacts and maximising socio-
economic benefits, taking into consideration the availability of water.
The approach adopted by this Study is illustrated schematically in Figure 5-2 below. The interventions
and drivers are the key variables which constitute scenarios. Each scenario produces a set of indicators
and scenarios are then compared through their indicators using multi-criteria analysis. Through
evaluation of the results, a sustainable development pathway was identified.
Evident from Figure 5-2 is the use of analytical tools at various key stages throughout the scenario
development and evaluation process. These tools included erosion models, climate change analysis
tools, surface water resources models, groundwater assessment tools, environmental flow assessment
tools and multi-criteria analysis tools. Detailed descriptions of the analytical tools are provided in
Annexure A.
5.4 Interventions and drivers
To build scenarios, several key interventions and drivers were identified and incorporated into the
scenario analysis in different combinations, constituting the key “building blocks” or variables of the
defined scenarios. These include climate change impacts on water availability and water use, land use
management, the anticipated growth in future water requirements, potential local water supply and
large-scale water resources developments, the degree of compliance with environmental flows and
possible institutional interventions. To align with the issues discussed in Section 4, the “building blocks”
for the scenarios were categorised into biophysical, socio-economic, water resources and institutional
interventions and drivers.
5.4.1 Biophysical
5.4.1.1 Land management
The erosion risk tool which was developed as part of this Study was used to quantify erosion risk and
potential sediment yields and loads in relation to changes in vegetation under different scenarios.
5.4.1.2 Climate change impacts
The impacts of climate change on future precipitation and temperature within the LVN Basin were
superimposed on the hydrological models of the basin representing different scenarios, to assess how
the change in climate translates into changes in surface water runoff, groundwater availability and crop
water requirements.
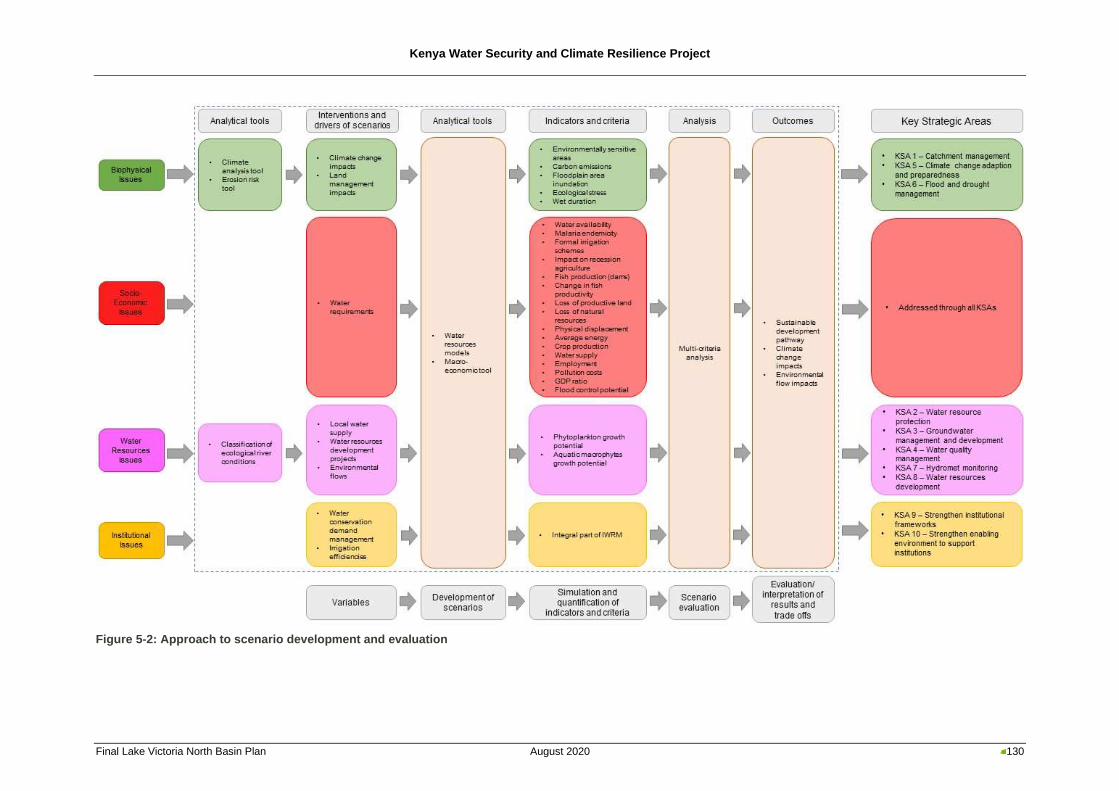
Kenya Water Security and Climate Resilience Project
Final Lake Victoria North Basin Plan August 2020 130
Figure 5-2: Approach to scenario development and evaluation
Kenya Water Security and Climate Resilience Project
Final Lake Victoria North Basin Plan August 2020 131
5.4.2 Socio-economic
5.4.2.1 Future water requirements
A key driver in the development of future scenarios in the LVN Basin relates to the expected growth in
future water requirements. To estimate future (2040) water requirements in the LVN Basin, the following
approach was used:
Irrigation water requirements
To estimate future (2040) small-scale irrigation areas in the LVN Basin, the baseline (2018) small-scale
irrigation area in each sub-basin was extrapolated linearly to 2040 based on the projected growth factor
in small-scale irrigation areas between 2010 and 2030 as presented in the NWMP.
The growth in large-scale irrigation area up to 2040 in the LVN Basin was based on the expected growth
in large-scale irrigation as per Table 5-3 – validated with the Department of Irrigation at the Ministry of
Agriculture, Livestock and Fisheries. Only schemes with proposed areas larger than 2000 ha were
considered as large-scale. Planned schemes with areas below 2000 ha were included in the small-
scale irrigation areas as determined per sub-basin.
To estimate future (2040) small-scale irrigation water requirements, crop types, crop patterns and
cropping intensities were assumed to be similar to current conditions. For planned large-scale schemes,
information on crop types was sourced from the NIA. Using the FAO 56 approach, future irrigation water
requirements could be estimated per sub-basin for different growth and irrigation efficiency scenarios.
Domestic and Industrial water requirements
For estimates of future domestic and industrial water demands in the major urban centres as well as
the smaller towns and rural areas in the LVN Basin, information per sub-basin was sourced from the
NWMP and CIDPs as relevant.
The NWMP estimated 2030 water demands based on expected population growth in urban and rural
areas, assumptions with regard to design water consumption rates, and future target levels of coverage
in terms of different water supply systems. Baseline (2018) demands were therefore extrapolated to
2040 demands, based on projected growth factors between 2010 and 2030 as presented in the NWMP.
Livestock and wildlife water requirements
Current estimated livestock and wildlife water demands in the LVN Basin were extrapolated to 2040
based on observed trends. Growth factors were calculated per sub-basin using data from the NWMP.
5.4.3 Water resources
5.4.3.1 Local water supply
As evident from Section 2.4, there are still surface water resources available in some sub-basins which
can be used to address current and future local supply deficits. However, utilising this water optimally
will require storage in dams and pans. Similarly, based on the groundwater analysis conducted as part
of this Study, groundwater resources are still available for allocation in some sub-basins.
The provision of additional surface water storage in dams and pans in conjunction with local
groundwater development to improve water availability to local domestic, industrial, small-scale
irrigation and livestock demands at sub-basin scale, was considered as part of the scenario
development. Required surface water storage and sustainable groundwater abstraction volumes were
estimated with the use of the water resources system model and groundwater assessment tool.
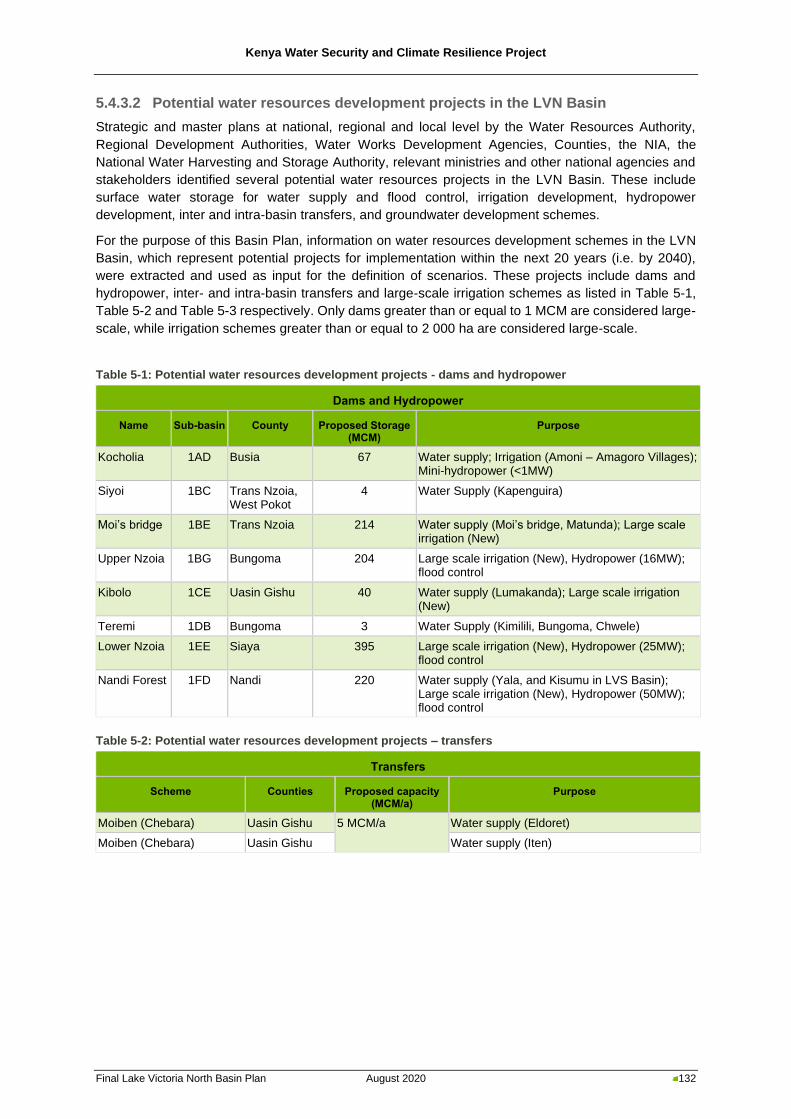
Kenya Water Security and Climate Resilience Project
Final Lake Victoria North Basin Plan August 2020 132
5.4.3.2 Potential water resources development projects in the LVN Basin
Strategic and master plans at national, regional and local level by the Water Resources Authority,
Regional Development Authorities, Water Works Development Agencies, Counties, the NIA, the
National Water Harvesting and Storage Authority, relevant ministries and other national agencies and
stakeholders identified several potential water resources projects in the LVN Basin. These include
surface water storage for water supply and flood control, irrigation development, hydropower
development, inter and intra-basin transfers, and groundwater development schemes.
For the purpose of this Basin Plan, information on water resources development schemes in the LVN
Basin, which represent potential projects for implementation within the next 20 years (i.e. by 2040),
were extracted and used as input for the definition of scenarios. These projects include dams and
hydropower, inter- and intra-basin transfers and large-scale irrigation schemes as listed in Table 5-1,
Table 5-2 and Table 5-3 respectively. Only dams greater than or equal to 1 MCM are considered large-
scale, while irrigation schemes greater than or equal to 2 000 ha are considered large-scale.
Table 5-1: Potential water resources development projects - dams and hydropower
Dams and Hydropower
Name Sub-basin County Proposed Storage (MCM)
Purpose
Kocholia 1AD Busia 67 Water supply; Irrigation (Amoni – Amagoro Villages); Mini-hydropower (<1MW)
Siyoi 1BC Trans Nzoia, West Pokot
4 Water Supply (Kapenguira)
Moi’s bridge 1BE Trans Nzoia 214 Water supply (Moi’s bridge, Matunda); Large scale irrigation (New)
Upper Nzoia 1BG Bungoma 204 Large scale irrigation (New), Hydropower (16MW); flood control
Kibolo 1CE Uasin Gishu 40 Water supply (Lumakanda); Large scale irrigation (New)
Teremi 1DB Bungoma 3 Water Supply (Kimilili, Bungoma, Chwele)
Lower Nzoia 1EE Siaya 395 Large scale irrigation (New), Hydropower (25MW); flood control
Nandi Forest 1FD Nandi 220 Water supply (Yala, and Kisumu in LVS Basin); Large scale irrigation (New), Hydropower (50MW); flood control
Table 5-2: Potential water resources development projects – transfers
Transfers
Scheme Counties Proposed capacity (MCM/a)
Purpose
Moiben (Chebara) Uasin Gishu 5 MCM/a Water supply (Eldoret)
Moiben (Chebara) Uasin Gishu Water supply (Iten)
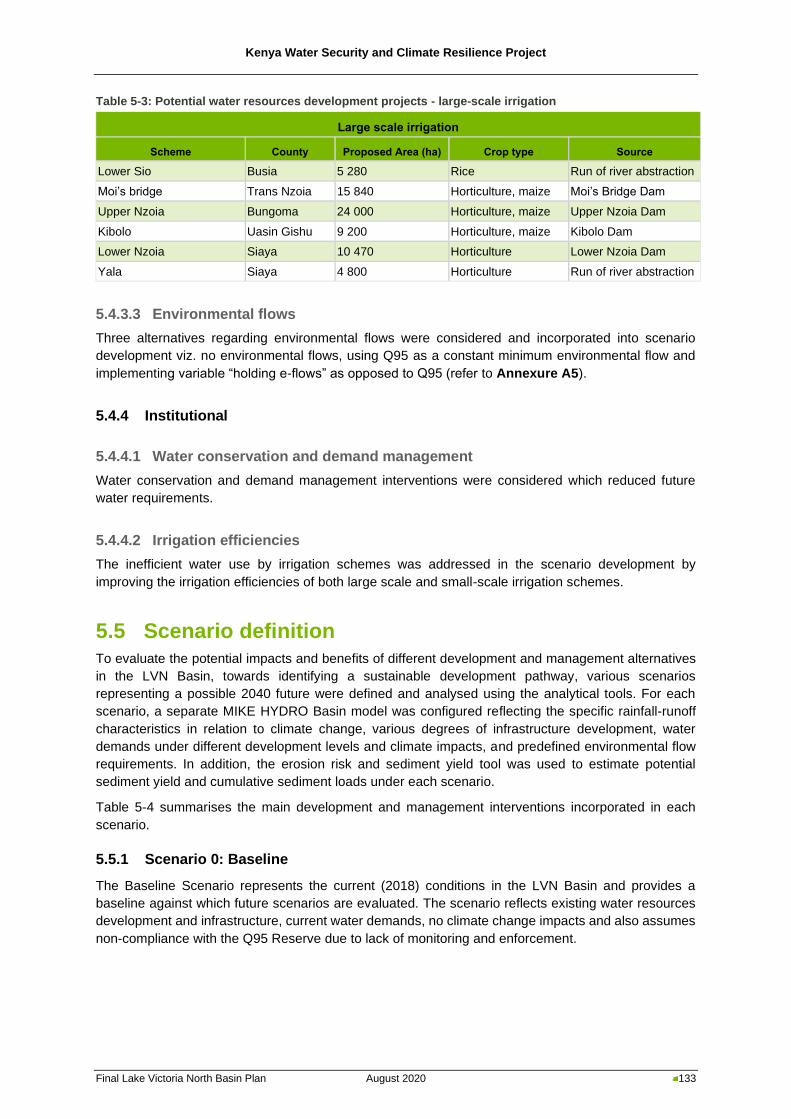
Kenya Water Security and Climate Resilience Project
Final Lake Victoria North Basin Plan August 2020 133
Table 5-3: Potential water resources development projects - large-scale irrigation
Large scale irrigation
Scheme County Proposed Area (ha) Crop type Source
Lower Sio Busia 5 280 Rice Run of river abstraction
Moi’s bridge Trans Nzoia 15 840 Horticulture, maize Moi’s Bridge Dam
Upper Nzoia Bungoma 24 000 Horticulture, maize Upper Nzoia Dam
Kibolo Uasin Gishu 9 200 Horticulture, maize Kibolo Dam
Lower Nzoia Siaya 10 470 Horticulture Lower Nzoia Dam
Yala Siaya 4 800 Horticulture Run of river abstraction
5.4.3.3 Environmental flows
Three alternatives regarding environmental flows were considered and incorporated into scenario
development viz. no environmental flows, using Q95 as a constant minimum environmental flow and
implementing variable “holding e-flows” as opposed to Q95 (refer to Annexure A5).
5.4.4 Institutional
5.4.4.1 Water conservation and demand management
Water conservation and demand management interventions were considered which reduced future
water requirements.
5.4.4.2 Irrigation efficiencies
The inefficient water use by irrigation schemes was addressed in the scenario development by
improving the irrigation efficiencies of both large scale and small-scale irrigation schemes.
5.5 Scenario definition
To evaluate the potential impacts and benefits of different development and management alternatives
in the LVN Basin, towards identifying a sustainable development pathway, various scenarios
representing a possible 2040 future were defined and analysed using the analytical tools. For each
scenario, a separate MIKE HYDRO Basin model was configured reflecting the specific rainfall-runoff
characteristics in relation to climate change, various degrees of infrastructure development, water
demands under different development levels and climate impacts, and predefined environmental flow
requirements. In addition, the erosion risk and sediment yield tool was used to estimate potential
sediment yield and cumulative sediment loads under each scenario.
Table 5-4 summarises the main development and management interventions incorporated in each
scenario.
5.5.1 Scenario 0: Baseline
The Baseline Scenario represents the current (2018) conditions in the LVN Basin and provides a
baseline against which future scenarios are evaluated. The scenario reflects existing water resources
development and infrastructure, current water demands, no climate change impacts and also assumes
non-compliance with the Q95 Reserve due to lack of monitoring and enforcement.
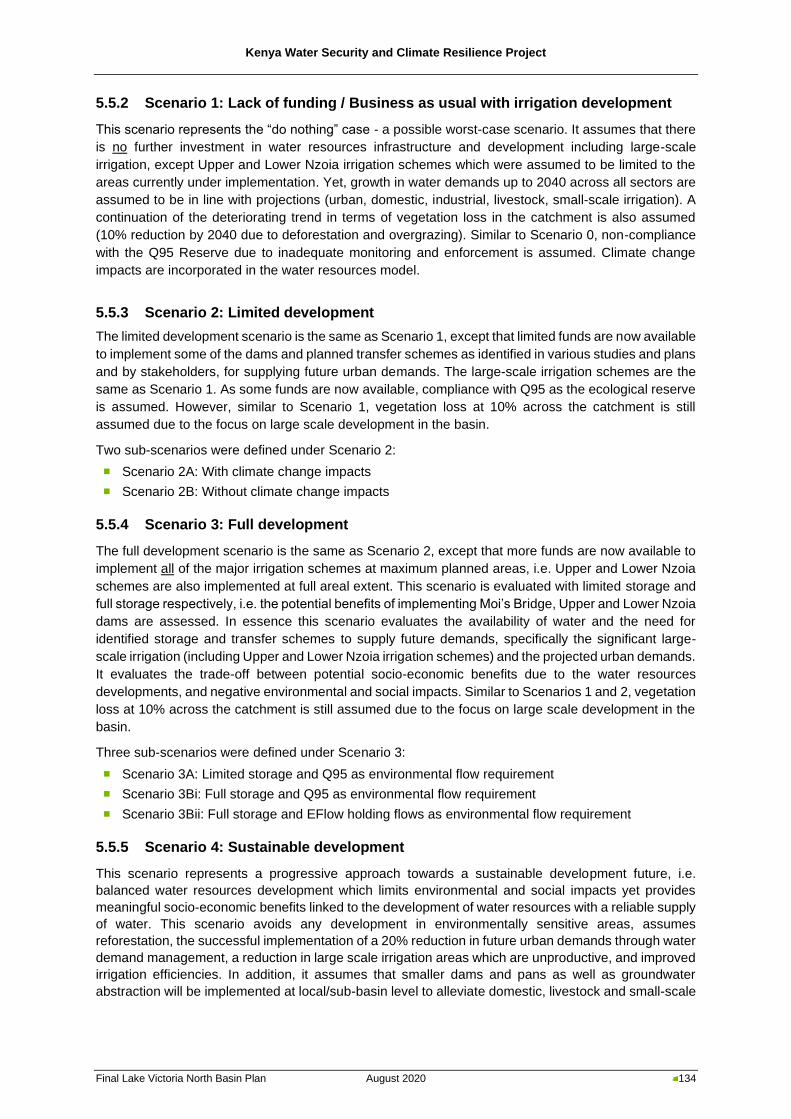
Kenya Water Security and Climate Resilience Project
Final Lake Victoria North Basin Plan August 2020 134
5.5.2 Scenario 1: Lack of funding / Business as usual with irrigation development
This scenario represents the “do nothing” case - a possible worst-case scenario. It assumes that there
is no further investment in water resources infrastructure and development including large-scale
irrigation, except Upper and Lower Nzoia irrigation schemes which were assumed to be limited to the
areas currently under implementation. Yet, growth in water demands up to 2040 across all sectors are
assumed to be in line with projections (urban, domestic, industrial, livestock, small-scale irrigation). A
continuation of the deteriorating trend in terms of vegetation loss in the catchment is also assumed
(10% reduction by 2040 due to deforestation and overgrazing). Similar to Scenario 0, non-compliance
with the Q95 Reserve due to inadequate monitoring and enforcement is assumed. Climate change
impacts are incorporated in the water resources model.
5.5.3 Scenario 2: Limited development
The limited development scenario is the same as Scenario 1, except that limited funds are now available
to implement some of the dams and planned transfer schemes as identified in various studies and plans
and by stakeholders, for supplying future urban demands. The large-scale irrigation schemes are the
same as Scenario 1. As some funds are now available, compliance with Q95 as the ecological reserve
is assumed. However, similar to Scenario 1, vegetation loss at 10% across the catchment is still
assumed due to the focus on large scale development in the basin.
Two sub-scenarios were defined under Scenario 2:
◼ Scenario 2A: With climate change impacts
◼ Scenario 2B: Without climate change impacts
5.5.4 Scenario 3: Full development
The full development scenario is the same as Scenario 2, except that more funds are now available to
implement all of the major irrigation schemes at maximum planned areas, i.e. Upper and Lower Nzoia
schemes are also implemented at full areal extent. This scenario is evaluated with limited storage and
full storage respectively, i.e. the potential benefits of implementing Moi’s Bridge, Upper and Lower Nzoia
dams are assessed. In essence this scenario evaluates the availability of water and the need for
identified storage and transfer schemes to supply future demands, specifically the significant large-
scale irrigation (including Upper and Lower Nzoia irrigation schemes) and the projected urban demands.
It evaluates the trade-off between potential socio-economic benefits due to the water resources
developments, and negative environmental and social impacts. Similar to Scenarios 1 and 2, vegetation
loss at 10% across the catchment is still assumed due to the focus on large scale development in the
basin.
Three sub-scenarios were defined under Scenario 3:
◼ Scenario 3A: Limited storage and Q95 as environmental flow requirement
◼ Scenario 3Bi: Full storage and Q95 as environmental flow requirement
◼ Scenario 3Bii: Full storage and EFlow holding flows as environmental flow requirement
5.5.5 Scenario 4: Sustainable development
This scenario represents a progressive approach towards a sustainable development future, i.e.
balanced water resources development which limits environmental and social impacts yet provides
meaningful socio-economic benefits linked to the development of water resources with a reliable supply
of water. This scenario avoids any development in environmentally sensitive areas, assumes
reforestation, the successful implementation of a 20% reduction in future urban demands through water
demand management, a reduction in large scale irrigation areas which are unproductive, and improved
irrigation efficiencies. In addition, it assumes that smaller dams and pans as well as groundwater
abstraction will be implemented at local/sub-basin level to alleviate domestic, livestock and small-scale
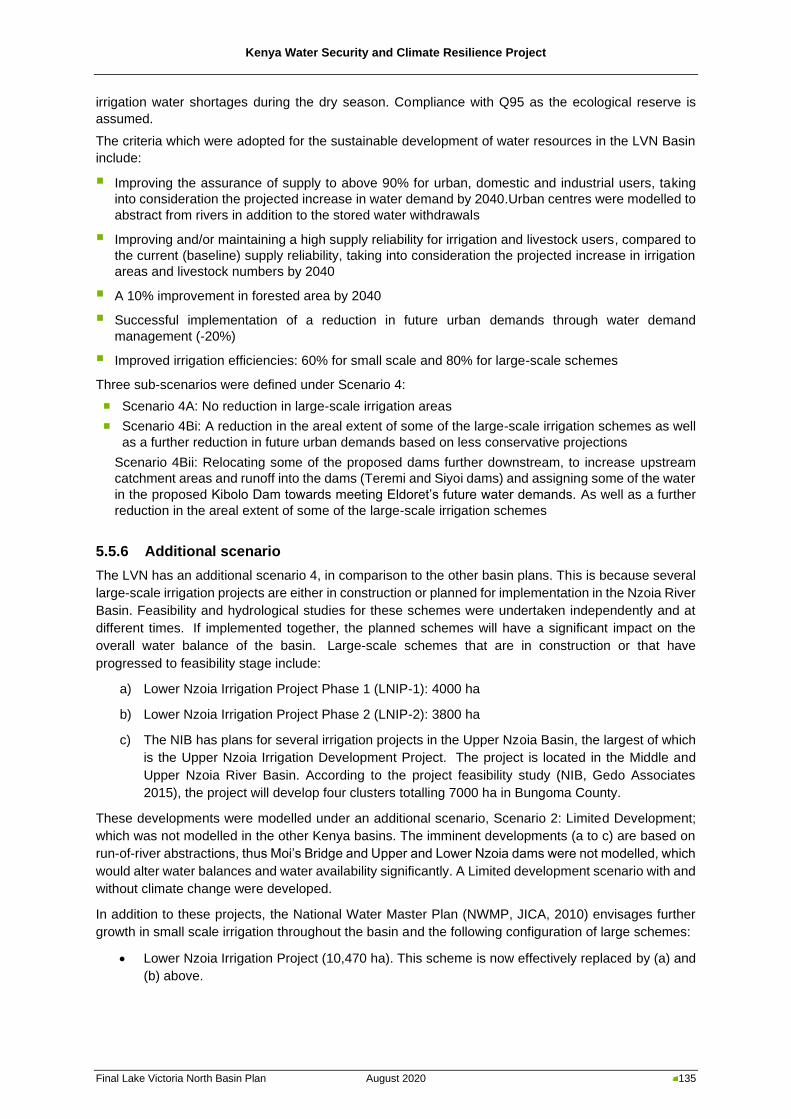
Kenya Water Security and Climate Resilience Project
Final Lake Victoria North Basin Plan August 2020 135
irrigation water shortages during the dry season. Compliance with Q95 as the ecological reserve is
assumed.
The criteria which were adopted for the sustainable development of water resources in the LVN Basin
include:
▪ Improving the assurance of supply to above 90% for urban, domestic and industrial users, taking
into consideration the projected increase in water demand by 2040.Urban centres were modelled to
abstract from rivers in addition to the stored water withdrawals
▪ Improving and/or maintaining a high supply reliability for irrigation and livestock users, compared to
the current (baseline) supply reliability, taking into consideration the projected increase in irrigation
areas and livestock numbers by 2040
▪ A 10% improvement in forested area by 2040
▪ Successful implementation of a reduction in future urban demands through water demand
management (-20%)
▪ Improved irrigation efficiencies: 60% for small scale and 80% for large-scale schemes
Three sub-scenarios were defined under Scenario 4:
◼ Scenario 4A: No reduction in large-scale irrigation areas
◼ Scenario 4Bi: A reduction in the areal extent of some of the large-scale irrigation schemes as well
as a further reduction in future urban demands based on less conservative projections
Scenario 4Bii: Relocating some of the proposed dams further downstream, to increase upstream
catchment areas and runoff into the dams (Teremi and Siyoi dams) and assigning some of the water
in the proposed Kibolo Dam towards meeting Eldoret’s future water demands. As well as a further
reduction in the areal extent of some of the large-scale irrigation schemes
5.5.6 Additional scenario
The LVN has an additional scenario 4, in comparison to the other basin plans. This is because several
large-scale irrigation projects are either in construction or planned for implementation in the Nzoia River
Basin. Feasibility and hydrological studies for these schemes were undertaken independently and at
different times. If implemented together, the planned schemes will have a significant impact on the
overall water balance of the basin. Large-scale schemes that are in construction or that have
progressed to feasibility stage include:
a) Lower Nzoia Irrigation Project Phase 1 (LNIP-1): 4000 ha
b) Lower Nzoia Irrigation Project Phase 2 (LNIP-2): 3800 ha
c) The NIB has plans for several irrigation projects in the Upper Nzoia Basin, the largest of which
is the Upper Nzoia Irrigation Development Project. The project is located in the Middle and
Upper Nzoia River Basin. According to the project feasibility study (NIB, Gedo Associates
2015), the project will develop four clusters totalling 7000 ha in Bungoma County.
These developments were modelled under an additional scenario, Scenario 2: Limited Development;
which was not modelled in the other Kenya basins. The imminent developments (a to c) are based on
run-of-river abstractions, thus Moi’s Bridge and Upper and Lower Nzoia dams were not modelled, which
would alter water balances and water availability significantly. A Limited development scenario with and
without climate change were developed.
In addition to these projects, the National Water Master Plan (NWMP, JICA, 2010) envisages further
growth in small scale irrigation throughout the basin and the following configuration of large schemes:
• Lower Nzoia Irrigation Project (10,470 ha). This scheme is now effectively replaced by (a) and
(b) above.
Kenya Water Security and Climate Resilience Project
Final Lake Victoria North Basin Plan August 2020 136
• Upper Nzoia Irrigation Project (24,000 ha). This is a variation of (c) above, but with a larger
area.
• Moi’s Bridge Dam Irrigation Project (19,800 ha)
• Kibolo Dam Irrigation Project (11,500 ha).
While the NWMP envisaged large scale irrigation development in the Nzoia Basin, the need for storage
to supply future demands in the dry season was recognized. Therefore, Scenario 3: Full development
had an additional scenario for limited storage i.e. without Moi’s Bridge and Upper and Lower Nzoia
dams; which differed from the other basin. And two scenarios with the proposed NWMP storage with
Q95 applied and with EFlow holding flows as opposed to Q95; similarly to the other basins.
Lastly, based on the supply shortages still evident in the sustainable development scenario 4Bi; and
additional sustainable development scenario was developed which allowed for increased catchment
areas for the proposed dams- namely Termei and Siyoi- and aligned all population growth rates to that
of the largest urban centre i.e. Eldoret.
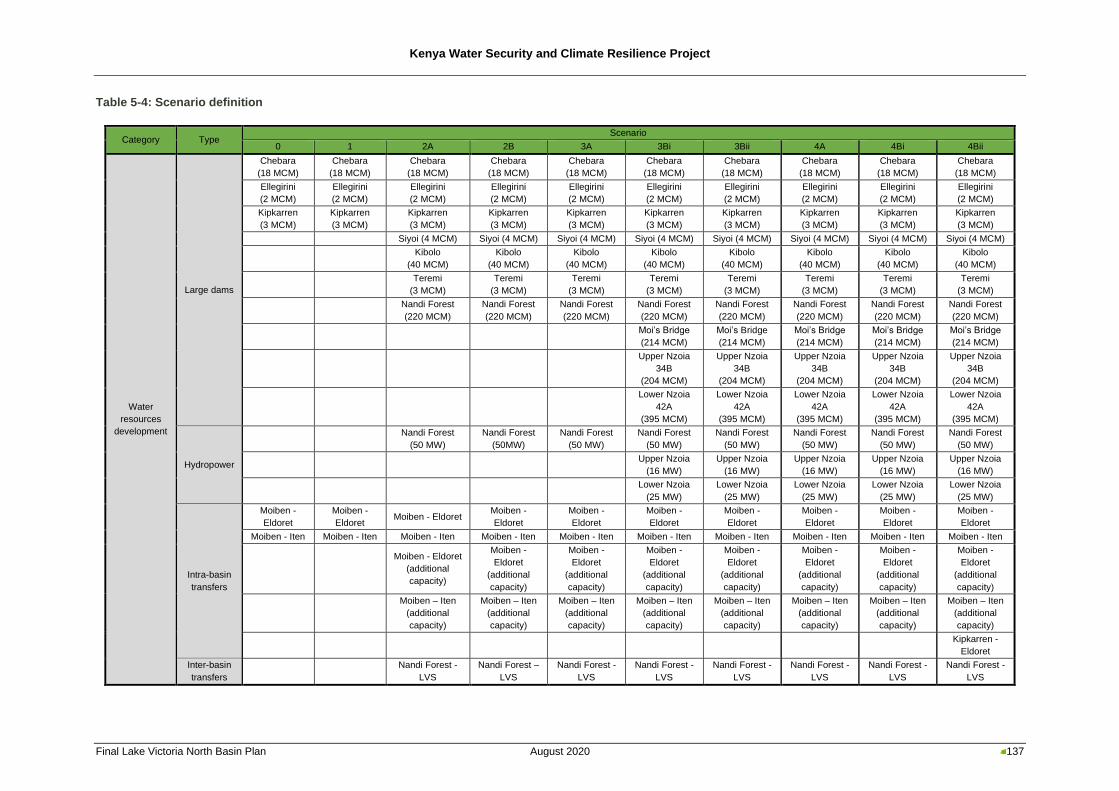
Kenya Water Security and Climate Resilience Project
Final Lake Victoria North Basin Plan August 2020 137
Table 5-4: Scenario definition
Category Type Scenario
0 1 2A 2B 3A 3Bi 3Bii 4A 4Bi 4Bii
Water
resources
development
Large dams
Chebara
(18 MCM)
Chebara
(18 MCM)
Chebara
(18 MCM)
Chebara
(18 MCM)
Chebara
(18 MCM)
Chebara
(18 MCM)
Chebara
(18 MCM)
Chebara
(18 MCM)
Chebara
(18 MCM)
Chebara
(18 MCM)
Ellegirini
(2 MCM)
Ellegirini
(2 MCM)
Ellegirini
(2 MCM)
Ellegirini
(2 MCM)
Ellegirini
(2 MCM)
Ellegirini
(2 MCM)
Ellegirini
(2 MCM)
Ellegirini
(2 MCM)
Ellegirini
(2 MCM)
Ellegirini
(2 MCM)
Kipkarren
(3 MCM)
Kipkarren
(3 MCM)
Kipkarren
(3 MCM)
Kipkarren
(3 MCM)
Kipkarren
(3 MCM)
Kipkarren
(3 MCM)
Kipkarren
(3 MCM)
Kipkarren
(3 MCM)
Kipkarren
(3 MCM)
Kipkarren
(3 MCM)
Siyoi (4 MCM) Siyoi (4 MCM) Siyoi (4 MCM) Siyoi (4 MCM) Siyoi (4 MCM) Siyoi (4 MCM) Siyoi (4 MCM) Siyoi (4 MCM)
Kibolo
(40 MCM)
Kibolo
(40 MCM)
Kibolo
(40 MCM)
Kibolo
(40 MCM)
Kibolo
(40 MCM)
Kibolo
(40 MCM)
Kibolo
(40 MCM)
Kibolo
(40 MCM)
Teremi
(3 MCM)
Teremi
(3 MCM)
Teremi
(3 MCM)
Teremi
(3 MCM)
Teremi
(3 MCM)
Teremi
(3 MCM)
Teremi
(3 MCM)
Teremi
(3 MCM)
Nandi Forest
(220 MCM)
Nandi Forest
(220 MCM)
Nandi Forest
(220 MCM)
Nandi Forest
(220 MCM)
Nandi Forest
(220 MCM)
Nandi Forest
(220 MCM)
Nandi Forest
(220 MCM)
Nandi Forest
(220 MCM)
Moi’s Bridge
(214 MCM)
Moi’s Bridge
(214 MCM)
Moi’s Bridge
(214 MCM)
Moi’s Bridge
(214 MCM)
Moi’s Bridge
(214 MCM)
Upper Nzoia
34B
(204 MCM)
Upper Nzoia
34B
(204 MCM)
Upper Nzoia
34B
(204 MCM)
Upper Nzoia
34B
(204 MCM)
Upper Nzoia
34B
(204 MCM)
Lower Nzoia
42A
(395 MCM)
Lower Nzoia
42A
(395 MCM)
Lower Nzoia
42A
(395 MCM)
Lower Nzoia
42A
(395 MCM)
Lower Nzoia
42A
(395 MCM)
Hydropower
Nandi Forest
(50 MW)
Nandi Forest
(50MW)
Nandi Forest
(50 MW)
Nandi Forest
(50 MW)
Nandi Forest
(50 MW)
Nandi Forest
(50 MW)
Nandi Forest
(50 MW)
Nandi Forest
(50 MW)
Upper Nzoia
(16 MW)
Upper Nzoia
(16 MW)
Upper Nzoia
(16 MW)
Upper Nzoia
(16 MW)
Upper Nzoia
(16 MW)
Lower Nzoia
(25 MW)
Lower Nzoia
(25 MW)
Lower Nzoia
(25 MW)
Lower Nzoia
(25 MW)
Lower Nzoia
(25 MW)
Intra-basin
transfers
Moiben -
Eldoret
Moiben -
Eldoret Moiben - Eldoret
Moiben -
Eldoret
Moiben -
Eldoret
Moiben -
Eldoret
Moiben -
Eldoret
Moiben -
Eldoret
Moiben -
Eldoret
Moiben -
Eldoret
Moiben - Iten Moiben - Iten Moiben - Iten Moiben - Iten Moiben - Iten Moiben - Iten Moiben - Iten Moiben - Iten Moiben - Iten Moiben - Iten
Moiben - Eldoret
(additional
capacity)
Moiben -
Eldoret
(additional
capacity)
Moiben -
Eldoret
(additional
capacity)
Moiben -
Eldoret
(additional
capacity)
Moiben -
Eldoret
(additional
capacity)
Moiben -
Eldoret
(additional
capacity)
Moiben -
Eldoret
(additional
capacity)
Moiben -
Eldoret
(additional
capacity)
Moiben – Iten
(additional
capacity)
Moiben – Iten
(additional
capacity)
Moiben – Iten
(additional
capacity)
Moiben – Iten
(additional
capacity)
Moiben – Iten
(additional
capacity)
Moiben – Iten
(additional
capacity)
Moiben – Iten
(additional
capacity)
Moiben – Iten
(additional
capacity)
Kipkarren -
Eldoret
Inter-basin
transfers
Nandi Forest -
LVS
Nandi Forest –
LVS
Nandi Forest -
LVS
Nandi Forest -
LVS
Nandi Forest -
LVS
Nandi Forest -
LVS
Nandi Forest -
LVS
Nandi Forest -
LVS
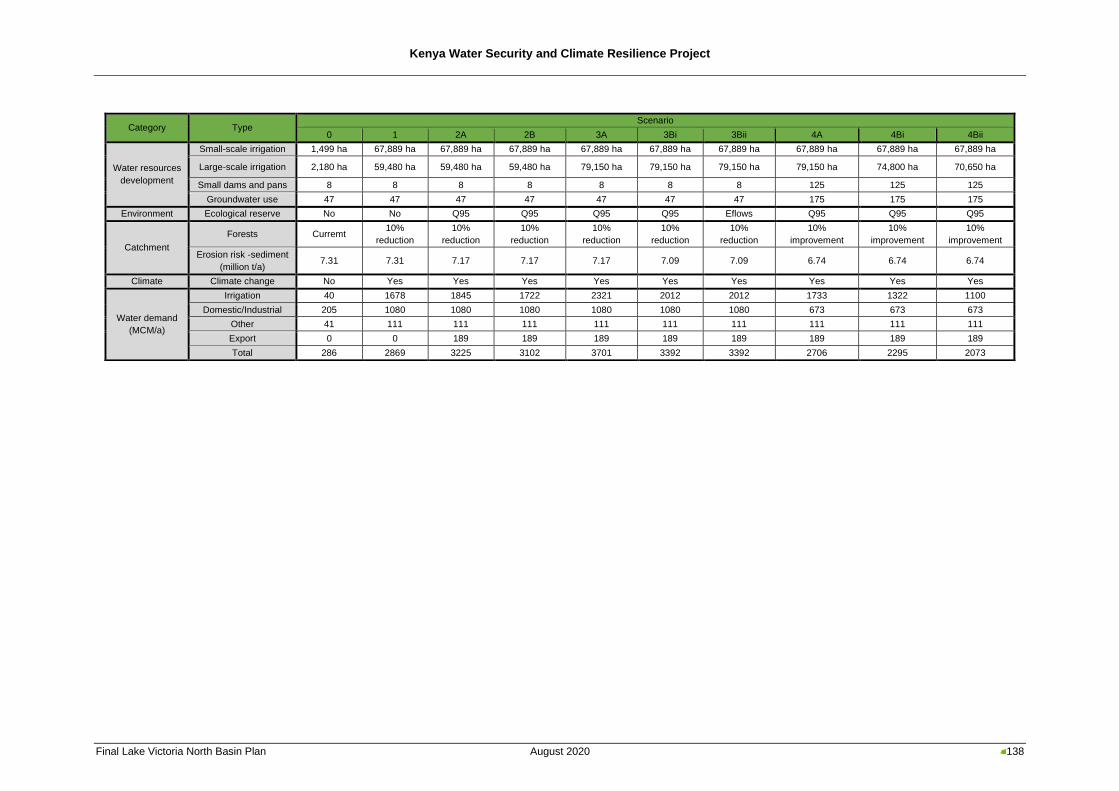
Kenya Water Security and Climate Resilience Project
Final Lake Victoria North Basin Plan August 2020 138
Category Type Scenario
0 1 2A 2B 3A 3Bi 3Bii 4A 4Bi 4Bii
Water resources
development
Small-scale irrigation 1,499 ha 67,889 ha 67,889 ha 67,889 ha 67,889 ha 67,889 ha 67,889 ha 67,889 ha 67,889 ha 67,889 ha
Large-scale irrigation 2,180 ha 59,480 ha 59,480 ha 59,480 ha 79,150 ha 79,150 ha 79,150 ha 79,150 ha 74,800 ha 70,650 ha
Small dams and pans 8 8 8 8 8 8 8 125 125 125
Groundwater use 47 47 47 47 47 47 47 175 175 175
Environment Ecological reserve No No Q95 Q95 Q95 Q95 Eflows Q95 Q95 Q95
Catchment
Forests Curremt 10%
reduction
10%
reduction
10%
reduction
10%
reduction
10%
reduction
10%
reduction
10%
improvement
10%
improvement
10%
improvement
Erosion risk -sediment
(million t/a) 7.31 7.31 7.17 7.17 7.17 7.09 7.09 6.74 6.74 6.74
Climate Climate change No Yes Yes Yes Yes Yes Yes Yes Yes Yes
Water demand
(MCM/a)
Irrigation 40 1678 1845 1722 2321 2012 2012 1733 1322 1100
Domestic/Industrial 205 1080 1080 1080 1080 1080 1080 673 673 673
Other 41 111 111 111 111 111 111 111 111 111
Export 0 0 189 189 189 189 189 189 189 189
Total 286 2869 3225 3102 3701 3392 3392 2706 2295 2073
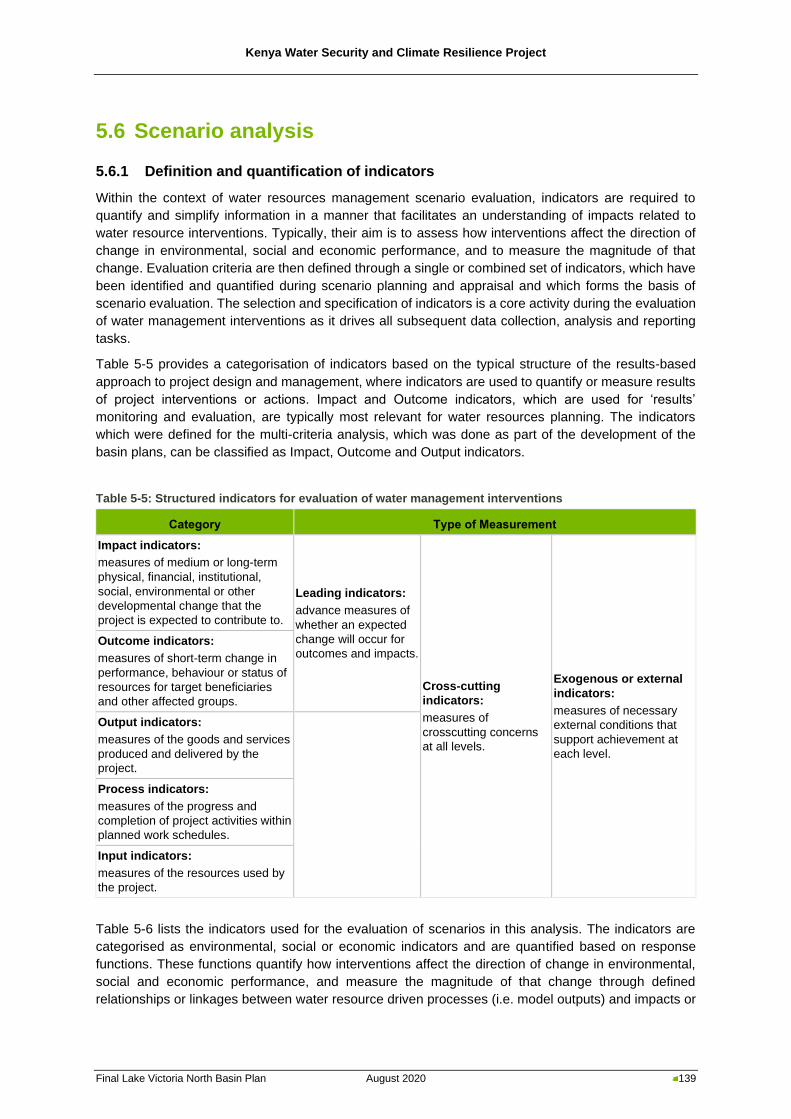
Kenya Water Security and Climate Resilience Project
Final Lake Victoria North Basin Plan August 2020 139
5.6 Scenario analysis
5.6.1 Definition and quantification of indicators
Within the context of water resources management scenario evaluation, indicators are required to
quantify and simplify information in a manner that facilitates an understanding of impacts related to
water resource interventions. Typically, their aim is to assess how interventions affect the direction of
change in environmental, social and economic performance, and to measure the magnitude of that
change. Evaluation criteria are then defined through a single or combined set of indicators, which have
been identified and quantified during scenario planning and appraisal and which forms the basis of
scenario evaluation. The selection and specification of indicators is a core activity during the evaluation
of water management interventions as it drives all subsequent data collection, analysis and reporting
tasks.
Table 5-5 provides a categorisation of indicators based on the typical structure of the results-based
approach to project design and management, where indicators are used to quantify or measure results
of project interventions or actions. Impact and Outcome indicators, which are used for ‘results’
monitoring and evaluation, are typically most relevant for water resources planning. The indicators
which were defined for the multi-criteria analysis, which was done as part of the development of the
basin plans, can be classified as Impact, Outcome and Output indicators.
Table 5-5: Structured indicators for evaluation of water management interventions
Category Type of Measurement
Impact indicators:
measures of medium or long-term
physical, financial, institutional,
social, environmental or other
developmental change that the
project is expected to contribute to.
Leading indicators:
advance measures of
whether an expected
change will occur for
outcomes and impacts.
Cross-cutting
indicators:
measures of
crosscutting concerns
at all levels.
Exogenous or external
indicators:
measures of necessary
external conditions that
support achievement at
each level.
Outcome indicators:
measures of short-term change in
performance, behaviour or status of
resources for target beneficiaries
and other affected groups.
Output indicators:
measures of the goods and services
produced and delivered by the
project.
Process indicators:
measures of the progress and
completion of project activities within
planned work schedules.
Input indicators:
measures of the resources used by
the project.
Table 5-6 lists the indicators used for the evaluation of scenarios in this analysis. The indicators are
categorised as environmental, social or economic indicators and are quantified based on response
functions. These functions quantify how interventions affect the direction of change in environmental,
social and economic performance, and measure the magnitude of that change through defined
relationships or linkages between water resource driven processes (i.e. model outputs) and impacts or
Kenya Water Security and Climate Resilience Project
Final Lake Victoria North Basin Plan August 2020 140
benefits. Typically, these response functions are based on empirical relationships derived from
observed data, physically based conceptual models which describe indicator responses in relation to
physical parameters or statistical indices or relevant values extracted from output time series.
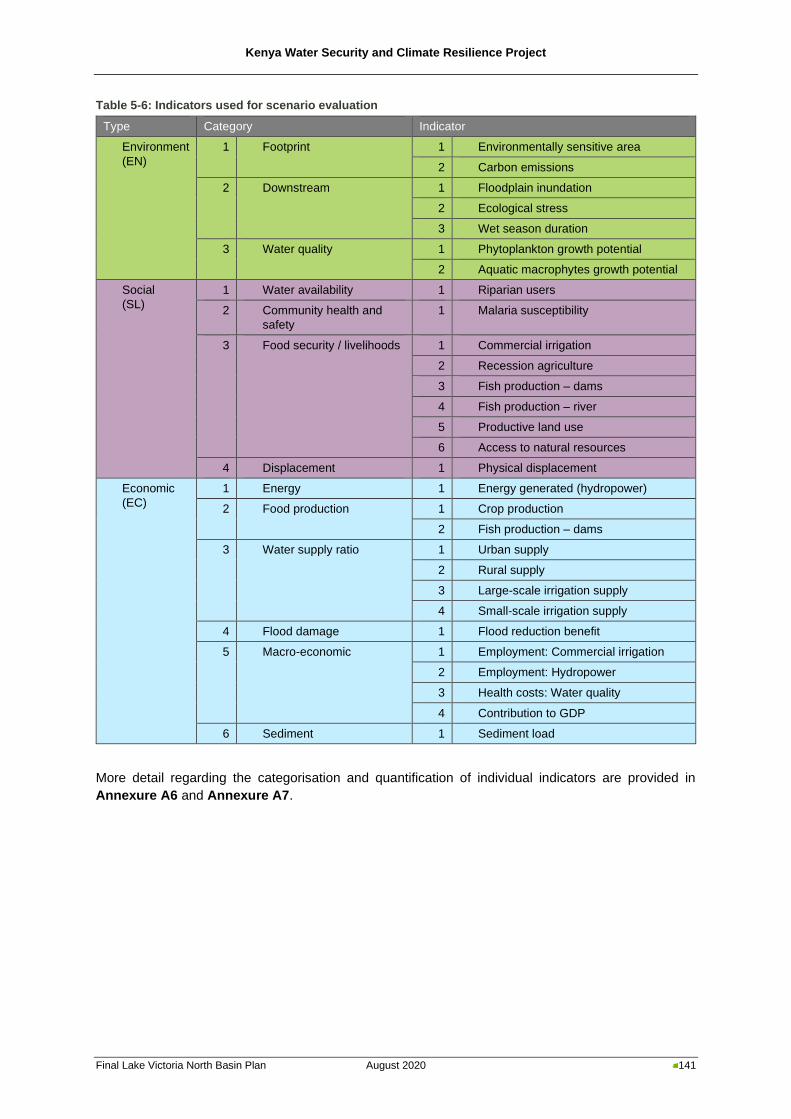
Kenya Water Security and Climate Resilience Project
Final Lake Victoria North Basin Plan August 2020 141
Table 5-6: Indicators used for scenario evaluation
Type Category Indicator
Environment
(EN)
1 Footprint 1 Environmentally sensitive area
2 Carbon emissions
2 Downstream 1 Floodplain inundation
2 Ecological stress
3 Wet season duration
3 Water quality 1 Phytoplankton growth potential
2 Aquatic macrophytes growth potential
Social
(SL)
1 Water availability 1 Riparian users
2 Community health and
safety
1 Malaria susceptibility
3 Food security / livelihoods 1 Commercial irrigation
2 Recession agriculture
3 Fish production – dams
4 Fish production – river
5 Productive land use
6 Access to natural resources
4 Displacement 1 Physical displacement
Economic
(EC)
1 Energy 1 Energy generated (hydropower)
2 Food production 1 Crop production
2 Fish production – dams
3 Water supply ratio 1 Urban supply
2 Rural supply
3 Large-scale irrigation supply
4 Small-scale irrigation supply
4 Flood damage 1 Flood reduction benefit
5 Macro-economic 1 Employment: Commercial irrigation
2 Employment: Hydropower
3 Health costs: Water quality
4 Contribution to GDP
6 Sediment 1 Sediment load
More detail regarding the categorisation and quantification of individual indicators are provided in
Annexure A6 and Annexure A7.
Kenya Water Security and Climate Resilience Project
Final Lake Victoria North Basin Plan August 2020 142
5.6.2 Multi-criteria analysis
To assess relative impacts and benefits related to the defined water resources development scenarios,
the indicator values at pre-determined locations within the basin for each scenario, were combined into
three criteria groups representing the three dimensions of sustainability viz. Environmental, Social and
Economic.
Table 5-7 describes how the criteria were determined from the indicators, which were then used to
compare and evaluate different combinations of scenarios using multi-criteria analysis.
Table 5-8 indicates the evaluation criteria as calculated for each scenario of the LVN Basin, with each
criterion ranked with a green (best) to orange (worst) colour scale.
By assigning weights to criteria categorised under the three dimensions of sustainability, it was possible
to assess the relative impacts and benefits of scenarios in relation to these three dimensions. Table 5-9
indicates the weightings used per sustainability dimension. The multi-criteria analysis was based on the
unit vector normalisation method, while ordinal ranking was used for weighting. In ordinal ranking, the
order of ranking assigned to criteria is important, while the absolute differences between criteria values
is not, due to it being disproportionate and/or difficult to quantify. The indicator analysis provides a wide
array of indicators, which cannot be assessed against each other; thus, ordinal ranking was the suitable
option.
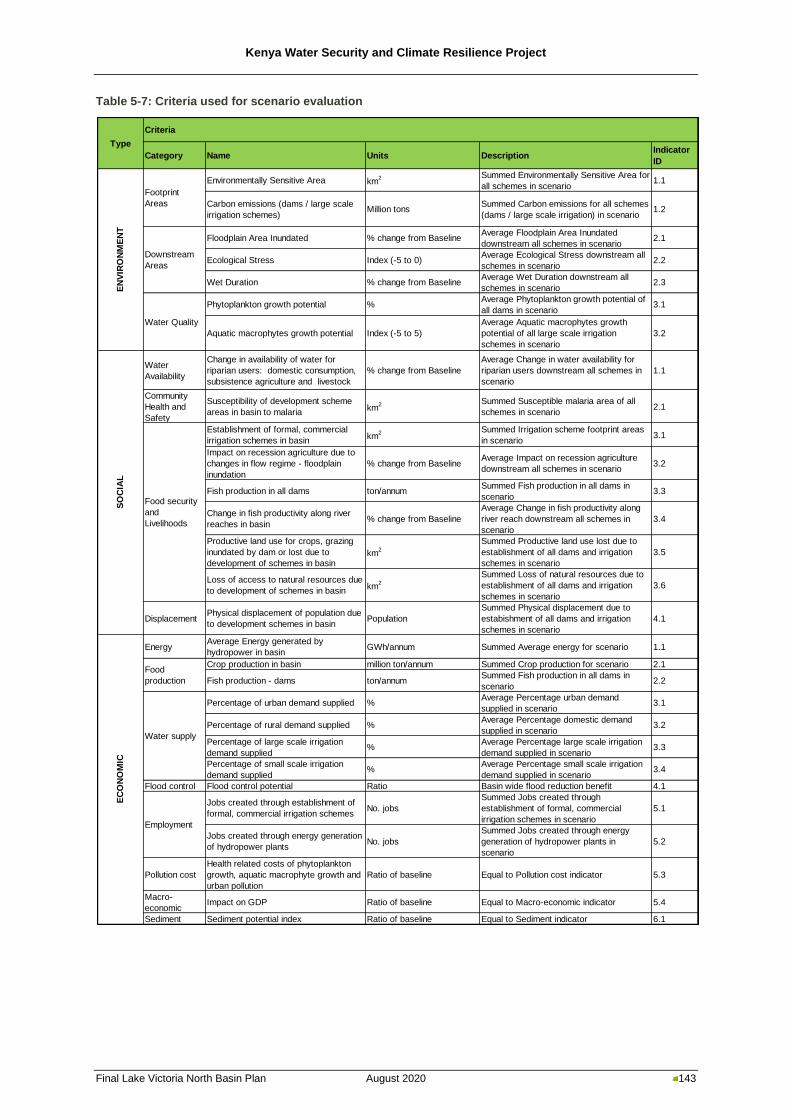
Kenya Water Security and Climate Resilience Project
Final Lake Victoria North Basin Plan August 2020 143
Table 5-7: Criteria used for scenario evaluation
Category Name Units DescriptionIndicator
ID
Environmentally Sensitive Area km2 Summed Environmentally Sensitive Area for
all schemes in scenario 1.1
Carbon emissions (dams / large scale
irrigation schemes)Million tons
Summed Carbon emissions for all schemes
(dams / large scale irrigation) in scenario1.2
Floodplain Area Inundated % change from BaselineAverage Floodplain Area Inundated
downstream all schemes in scenario2.1
Ecological Stress Index (-5 to 0)Average Ecological Stress downstream all
schemes in scenario2.2
Wet Duration % change from BaselineAverage Wet Duration downstream all
schemes in scenario2.3
Phytoplankton growth potential %Average Phytoplankton growth potential of
all dams in scenario3.1
Aquatic macrophytes growth potential Index (-5 to 5)
Average Aquatic macrophytes growth
potential of all large scale irrigation
schemes in scenario
3.2
Water
Availability
Change in availability of water for
riparian users: domestic consumption,
subsistence agriculture and livestock
% change from Baseline
Average Change in water availability for
riparian users downstream all schemes in
scenario
1.1
Community
Health and
Safety
Susceptibility of development scheme
areas in basin to malariakm
2 Summed Susceptible malaria area of all
schemes in scenario2.1
Establishment of formal, commercial
irrigation schemes in basinkm
2 Summed Irrigation scheme footprint areas
in scenario3.1
Impact on recession agriculture due to
changes in flow regime - floodplain
inundation
% change from BaselineAverage Impact on recession agriculture
downstream all schemes in scenario3.2
Fish production in all dams ton/annumSummed Fish production in all dams in
scenario3.3
Change in fish productivity along river
reaches in basin% change from Baseline
Average Change in fish productivity along
river reach downstream all schemes in
scenario
3.4
Productive land use for crops, grazing
inundated by dam or lost due to
development of schemes in basinkm
2
Summed Productive land use lost due to
establishment of all dams and irrigation
schemes in scenario
3.5
Loss of access to natural resources due
to development of schemes in basinkm
2
Summed Loss of natural resources due to
establishment of all dams and irrigation
schemes in scenario
3.6
DisplacementPhysical displacement of population due
to development schemes in basinPopulation
Summed Physical displacement due to
estabishment of all dams and irrigation
schemes in scenario
4.1
EnergyAverage Energy generated by
hydropower in basinGWh/annum Summed Average energy for scenario 1.1
Crop production in basin million ton/annum Summed Crop production for scenario 2.1
Fish production - dams ton/annumSummed Fish production in all dams in
scenario2.2
Percentage of urban demand supplied %Average Percentage urban demand
supplied in scenario3.1
Percentage of rural demand supplied %Average Percentage domestic demand
supplied in scenario3.2
Percentage of large scale irrigation
demand supplied%
Average Percentage large scale irrigation
demand supplied in scenario3.3
Percentage of small scale irrigation
demand supplied%
Average Percentage small scale irrigation
demand supplied in scenario3.4
Flood control Flood control potential Ratio Basin wide flood reduction benefit 4.1
Jobs created through establishment of
formal, commercial irrigation schemesNo. jobs
Summed Jobs created through
establishment of formal, commercial
irrigation schemes in scenario
5.1
Jobs created through energy generation
of hydropower plantsNo. jobs
Summed Jobs created through energy
generation of hydropower plants in
scenario
5.2
Pollution cost
Health related costs of phytoplankton
growth, aquatic macrophyte growth and
urban pollution
Ratio of baseline Equal to Pollution cost indicator 5.3
Macro-
economicImpact on GDP Ratio of baseline Equal to Macro-economic indicator 5.4
Sediment Sediment potential index Ratio of baseline Equal to Sediment indicator 6.1
SO
CIA
L
Food security
and
Livelihoods
Food
production
Water supply
Employment
EC
ON
OM
IC
Type
EN
VIR
ON
ME
NT
Footprint
Areas
Downstream
Areas
Water Quality
Criteria
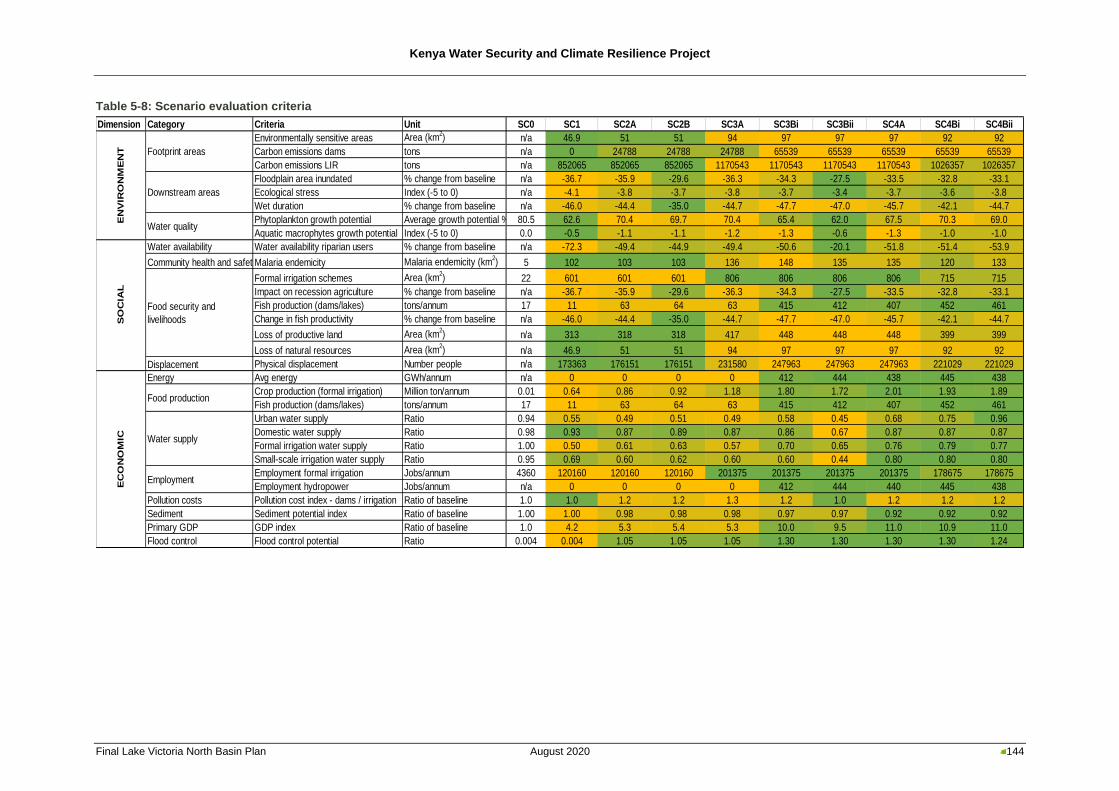
Kenya Water Security and Climate Resilience Project
Final Lake Victoria North Basin Plan August 2020 144
Table 5-8: Scenario evaluation criteria
Dimension Category Criteria Unit SC0 SC1 SC2A SC2B SC3A SC3Bi SC3Bii SC4A SC4Bi SC4Bii
Environmentally sensitive areas Area (km2) n/a 46.9 51 51 94 97 97 97 92 92
Carbon emissions dams tons n/a 0 24788 24788 24788 65539 65539 65539 65539 65539
Carbon emissions LIR tons n/a 852065 852065 852065 1170543 1170543 1170543 1170543 1026357 1026357
Floodplain area inundated % change from baseline n/a -36.7 -35.9 -29.6 -36.3 -34.3 -27.5 -33.5 -32.8 -33.1
Ecological stress Index (-5 to 0) n/a -4.1 -3.8 -3.7 -3.8 -3.7 -3.4 -3.7 -3.6 -3.8
Wet duration % change from baseline n/a -46.0 -44.4 -35.0 -44.7 -47.7 -47.0 -45.7 -42.1 -44.7
Phytoplankton growth potential Average growth potential % 80.5 62.6 70.4 69.7 70.4 65.4 62.0 67.5 70.3 69.0
Aquatic macrophytes growth potential Index (-5 to 0) 0.0 -0.5 -1.1 -1.1 -1.2 -1.3 -0.6 -1.3 -1.0 -1.0
Water availability Water availability riparian users % change from baseline n/a -72.3 -49.4 -44.9 -49.4 -50.6 -20.1 -51.8 -51.4 -53.9
Community health and safetyMalaria endemicity Malaria endemicity (km2) 5 102 103 103 136 148 135 135 120 133
Formal irrigation schemes Area (km2) 22 601 601 601 806 806 806 806 715 715
Impact on recession agriculture % change from baseline n/a -36.7 -35.9 -29.6 -36.3 -34.3 -27.5 -33.5 -32.8 -33.1
Fish production (dams/lakes) tons/annum 17 11 63 64 63 415 412 407 452 461
Change in fish productivity % change from baseline n/a -46.0 -44.4 -35.0 -44.7 -47.7 -47.0 -45.7 -42.1 -44.7
Loss of productive land Area (km2) n/a 313 318 318 417 448 448 448 399 399
Loss of natural resources Area (km2) n/a 46.9 51 51 94 97 97 97 92 92
Displacement Physical displacement Number people n/a 173363 176151 176151 231580 247963 247963 247963 221029 221029
Energy Avg energy GWh/annum n/a 0 0 0 0 412 444 438 445 438
Crop production (formal irrigation) Million ton/annum 0.01 0.64 0.86 0.92 1.18 1.80 1.72 2.01 1.93 1.89
Fish production (dams/lakes) tons/annum 17 11 63 64 63 415 412 407 452 461
Urban water supply Ratio 0.94 0.55 0.49 0.51 0.49 0.58 0.45 0.68 0.75 0.96
Domestic water supply Ratio 0.98 0.93 0.87 0.89 0.87 0.86 0.67 0.87 0.87 0.87
Formal irrigation water supply Ratio 1.00 0.50 0.61 0.63 0.57 0.70 0.65 0.76 0.79 0.77
Small-scale irrigation water supply Ratio 0.95 0.69 0.60 0.62 0.60 0.60 0.44 0.80 0.80 0.80
Employment formal irrigation Jobs/annum 4360 120160 120160 120160 201375 201375 201375 201375 178675 178675
Employment hydropower Jobs/annum n/a 0 0 0 0 412 444 440 445 438
Pollution costs Pollution cost index - dams / irrigation Ratio of baseline 1.0 1.0 1.2 1.2 1.3 1.2 1.0 1.2 1.2 1.2
Sediment Sediment potential index Ratio of baseline 1.00 1.00 0.98 0.98 0.98 0.97 0.97 0.92 0.92 0.92
Primary GDP GDP index Ratio of baseline 1.0 4.2 5.3 5.4 5.3 10.0 9.5 11.0 10.9 11.0
Flood control Flood control potential Ratio 0.004 0.004 1.05 1.05 1.05 1.30 1.30 1.30 1.30 1.24
EC
ON
OM
IC
Food production
Water supply
Employment
EN
VIR
ON
ME
NT Footprint areas
Downstream areas
Water quality
SO
CIA
L
Food security and
livelihoods
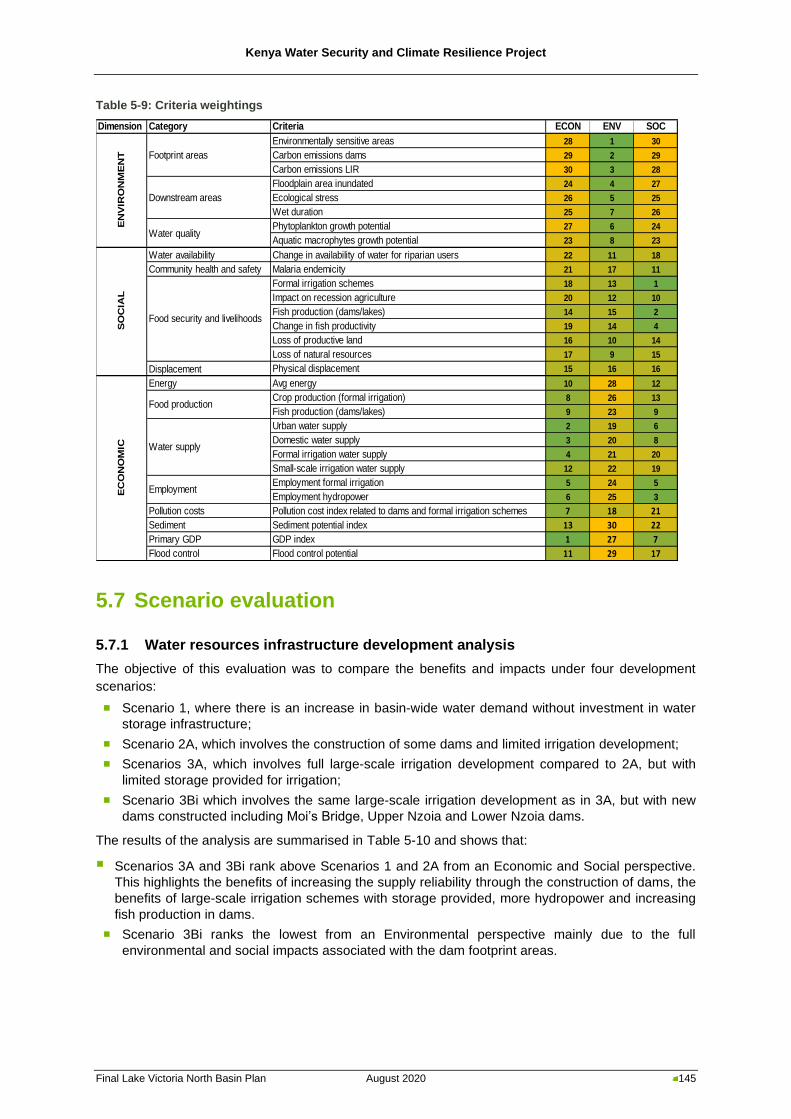
Kenya Water Security and Climate Resilience Project
Final Lake Victoria North Basin Plan August 2020 145
Table 5-9: Criteria weightings
5.7 Scenario evaluation
5.7.1 Water resources infrastructure development analysis
The objective of this evaluation was to compare the benefits and impacts under four development
scenarios:
◼ Scenario 1, where there is an increase in basin-wide water demand without investment in water
storage infrastructure;
◼ Scenario 2A, which involves the construction of some dams and limited irrigation development;
◼ Scenarios 3A, which involves full large-scale irrigation development compared to 2A, but with
limited storage provided for irrigation;
◼ Scenario 3Bi which involves the same large-scale irrigation development as in 3A, but with new
dams constructed including Moi’s Bridge, Upper Nzoia and Lower Nzoia dams.
The results of the analysis are summarised in Table 5-10 and shows that:
▪ Scenarios 3A and 3Bi rank above Scenarios 1 and 2A from an Economic and Social perspective.
This highlights the benefits of increasing the supply reliability through the construction of dams, the
benefits of large-scale irrigation schemes with storage provided, more hydropower and increasing
fish production in dams.
◼ Scenario 3Bi ranks the lowest from an Environmental perspective mainly due to the full
environmental and social impacts associated with the dam footprint areas.
Dimension Category Criteria ECON ENV SOC
Environmentally sensitive areas 28 1 30
Carbon emissions dams 29 2 29
Carbon emissions LIR 30 3 28
Floodplain area inundated 24 4 27
Ecological stress 26 5 25
Wet duration 25 7 26
Phytoplankton growth potential 27 6 24
Aquatic macrophytes growth potential 23 8 23
Water availability Change in availability of water for riparian users 22 11 18
Community health and safety Malaria endemicity 21 17 11
Formal irrigation schemes 18 13 1
Impact on recession agriculture 20 12 10
Fish production (dams/lakes) 14 15 2
Change in fish productivity 19 14 4
Loss of productive land 16 10 14
Loss of natural resources 17 9 15
Displacement Physical displacement 15 16 16
Energy Avg energy 10 28 12
Crop production (formal irrigation) 8 26 13
Fish production (dams/lakes) 9 23 9
Urban water supply 2 19 6
Domestic water supply 3 20 8
Formal irrigation water supply 4 21 20
Small-scale irrigation water supply 12 22 19
Employment formal irrigation 5 24 5
Employment hydropower 6 25 3
Pollution costs Pollution cost index related to dams and formal irrigation schemes 7 18 21
Sediment Sediment potential index 13 30 22
Primary GDP GDP index 1 27 7
Flood control Flood control potential 11 29 17
EC
ON
OM
IC
Food production
Water supply
Employment
EN
VIR
ON
ME
NT Footprint areas
Downstream areas
Water quality
SO
CIA
L
Food security and livelihoods
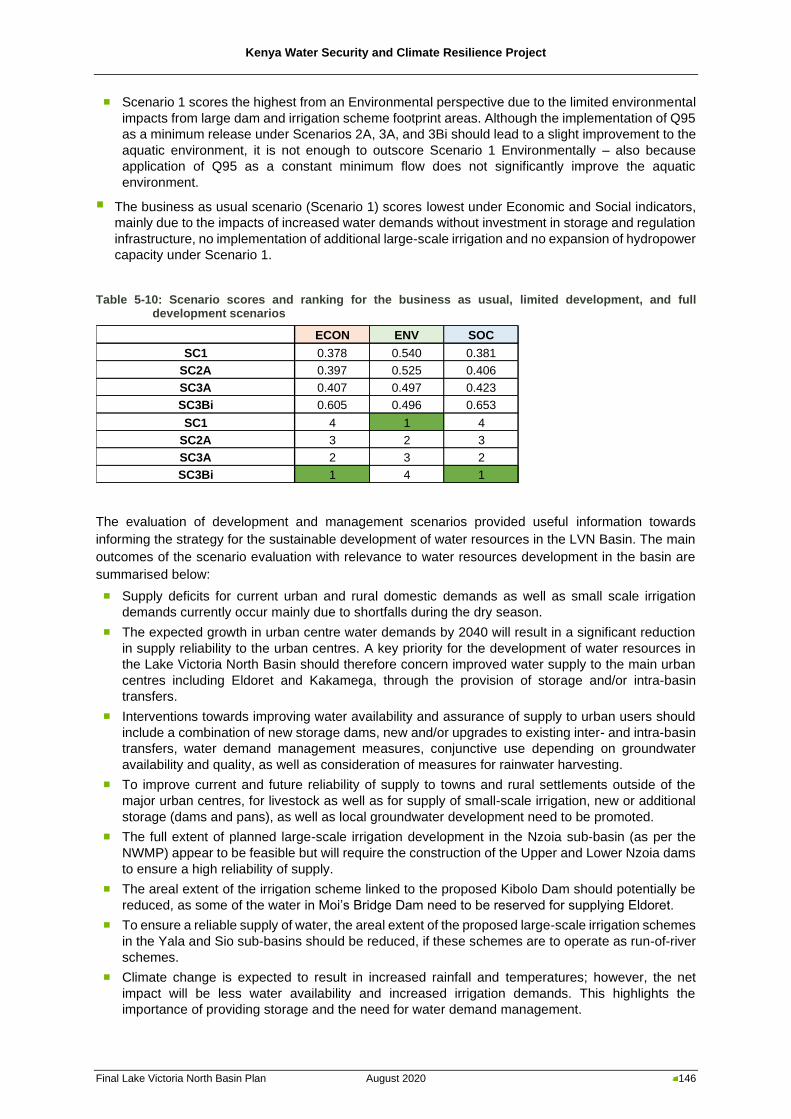
Kenya Water Security and Climate Resilience Project
Final Lake Victoria North Basin Plan August 2020 146
◼ Scenario 1 scores the highest from an Environmental perspective due to the limited environmental
impacts from large dam and irrigation scheme footprint areas. Although the implementation of Q95
as a minimum release under Scenarios 2A, 3A, and 3Bi should lead to a slight improvement to the
aquatic environment, it is not enough to outscore Scenario 1 Environmentally – also because
application of Q95 as a constant minimum flow does not significantly improve the aquatic
environment.
▪ The business as usual scenario (Scenario 1) scores lowest under Economic and Social indicators,
mainly due to the impacts of increased water demands without investment in storage and regulation
infrastructure, no implementation of additional large-scale irrigation and no expansion of hydropower
capacity under Scenario 1.
Table 5-10: Scenario scores and ranking for the business as usual, limited development, and full development scenarios
The evaluation of development and management scenarios provided useful information towards
informing the strategy for the sustainable development of water resources in the LVN Basin. The main
outcomes of the scenario evaluation with relevance to water resources development in the basin are
summarised below:
◼ Supply deficits for current urban and rural domestic demands as well as small scale irrigation
demands currently occur mainly due to shortfalls during the dry season.
◼ The expected growth in urban centre water demands by 2040 will result in a significant reduction
in supply reliability to the urban centres. A key priority for the development of water resources in
the Lake Victoria North Basin should therefore concern improved water supply to the main urban
centres including Eldoret and Kakamega, through the provision of storage and/or intra-basin
transfers.
◼ Interventions towards improving water availability and assurance of supply to urban users should
include a combination of new storage dams, new and/or upgrades to existing inter- and intra-basin
transfers, water demand management measures, conjunctive use depending on groundwater
availability and quality, as well as consideration of measures for rainwater harvesting.
◼ To improve current and future reliability of supply to towns and rural settlements outside of the
major urban centres, for livestock as well as for supply of small-scale irrigation, new or additional
storage (dams and pans), as well as local groundwater development need to be promoted.
◼ The full extent of planned large-scale irrigation development in the Nzoia sub-basin (as per the
NWMP) appear to be feasible but will require the construction of the Upper and Lower Nzoia dams
to ensure a high reliability of supply.
◼ The areal extent of the irrigation scheme linked to the proposed Kibolo Dam should potentially be
reduced, as some of the water in Moi’s Bridge Dam need to be reserved for supplying Eldoret.
◼ To ensure a reliable supply of water, the areal extent of the proposed large-scale irrigation schemes
in the Yala and Sio sub-basins should be reduced, if these schemes are to operate as run-of-river
schemes.
◼ Climate change is expected to result in increased rainfall and temperatures; however, the net
impact will be less water availability and increased irrigation demands. This highlights the
importance of providing storage and the need for water demand management.
ECON ENV SOC
SC1 0.378 0.540 0.381
SC2A 0.397 0.525 0.406
SC3A 0.407 0.497 0.423
SC3Bi 0.605 0.496 0.653
SC1 4 1 4
SC2A 3 2 3
SC3A 2 3 2
SC3Bi 1 4 1
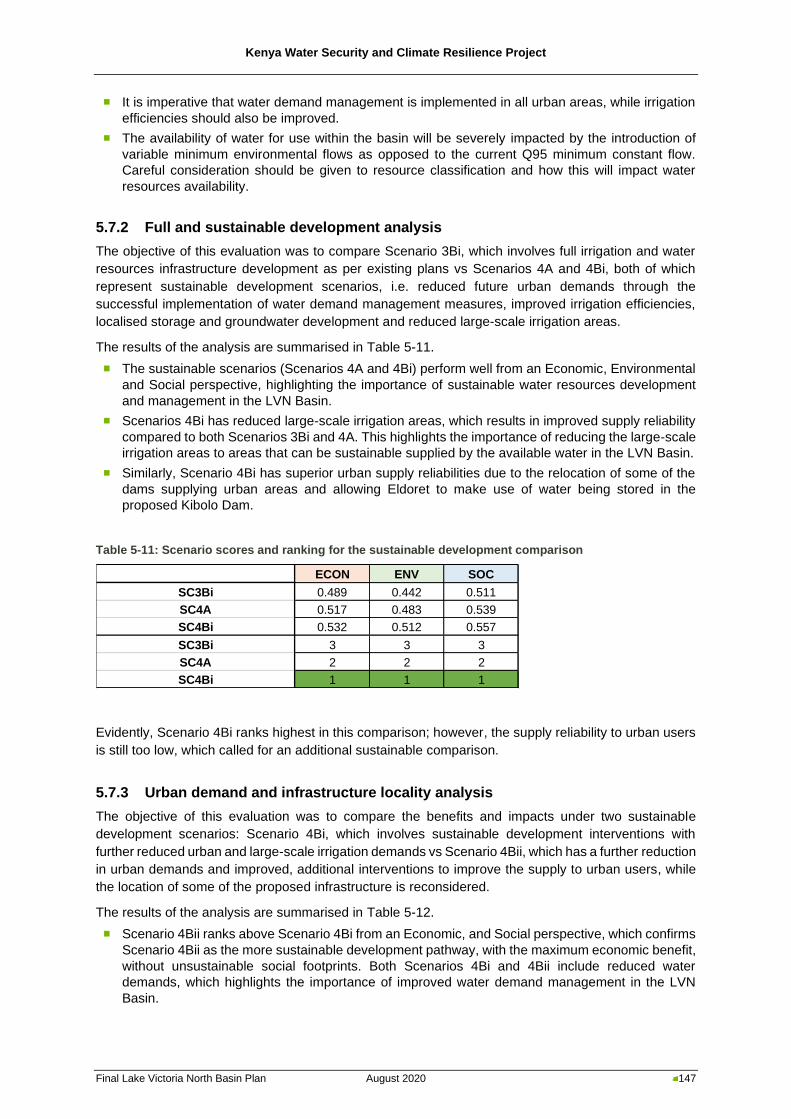
Kenya Water Security and Climate Resilience Project
Final Lake Victoria North Basin Plan August 2020 147
◼ It is imperative that water demand management is implemented in all urban areas, while irrigation
efficiencies should also be improved.
◼ The availability of water for use within the basin will be severely impacted by the introduction of
variable minimum environmental flows as opposed to the current Q95 minimum constant flow.
Careful consideration should be given to resource classification and how this will impact water
resources availability.
5.7.2 Full and sustainable development analysis
The objective of this evaluation was to compare Scenario 3Bi, which involves full irrigation and water
resources infrastructure development as per existing plans vs Scenarios 4A and 4Bi, both of which
represent sustainable development scenarios, i.e. reduced future urban demands through the
successful implementation of water demand management measures, improved irrigation efficiencies,
localised storage and groundwater development and reduced large-scale irrigation areas.
The results of the analysis are summarised in Table 5-11.
◼ The sustainable scenarios (Scenarios 4A and 4Bi) perform well from an Economic, Environmental
and Social perspective, highlighting the importance of sustainable water resources development
and management in the LVN Basin.
◼ Scenarios 4Bi has reduced large-scale irrigation areas, which results in improved supply reliability
compared to both Scenarios 3Bi and 4A. This highlights the importance of reducing the large-scale
irrigation areas to areas that can be sustainable supplied by the available water in the LVN Basin.
◼ Similarly, Scenario 4Bi has superior urban supply reliabilities due to the relocation of some of the
dams supplying urban areas and allowing Eldoret to make use of water being stored in the
proposed Kibolo Dam.
Table 5-11: Scenario scores and ranking for the sustainable development comparison
Evidently, Scenario 4Bi ranks highest in this comparison; however, the supply reliability to urban users
is still too low, which called for an additional sustainable comparison.
5.7.3 Urban demand and infrastructure locality analysis
The objective of this evaluation was to compare the benefits and impacts under two sustainable
development scenarios: Scenario 4Bi, which involves sustainable development interventions with
further reduced urban and large-scale irrigation demands vs Scenario 4Bii, which has a further reduction
in urban demands and improved, additional interventions to improve the supply to urban users, while
the location of some of the proposed infrastructure is reconsidered.
The results of the analysis are summarised in Table 5-12.
◼ Scenario 4Bii ranks above Scenario 4Bi from an Economic, and Social perspective, which confirms
Scenario 4Bii as the more sustainable development pathway, with the maximum economic benefit,
without unsustainable social footprints. Both Scenarios 4Bi and 4Bii include reduced water
demands, which highlights the importance of improved water demand management in the LVN
Basin.
ECON ENV SOC
SC3Bi 0.489 0.442 0.511
SC4A 0.517 0.483 0.539
SC4Bi 0.532 0.512 0.557
SC3Bi 3 3 3
SC4A 2 2 2
SC4Bi 1 1 1
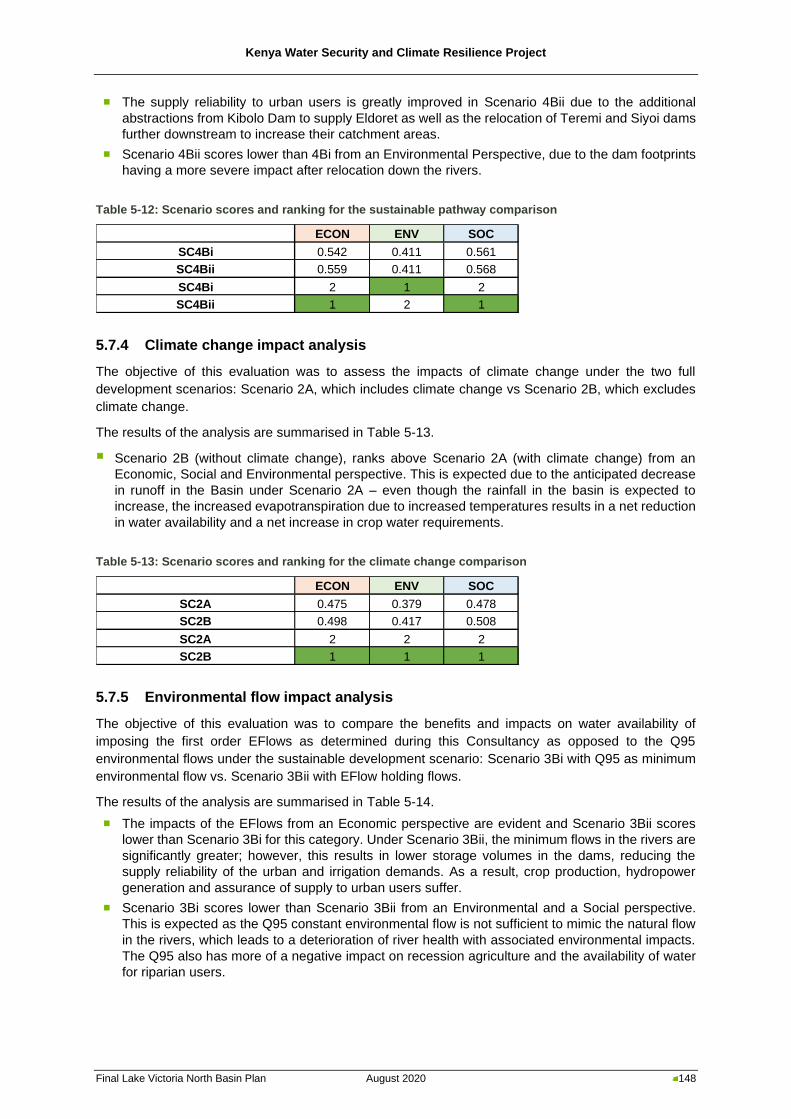
Kenya Water Security and Climate Resilience Project
Final Lake Victoria North Basin Plan August 2020 148
◼ The supply reliability to urban users is greatly improved in Scenario 4Bii due to the additional
abstractions from Kibolo Dam to supply Eldoret as well as the relocation of Teremi and Siyoi dams
further downstream to increase their catchment areas.
◼ Scenario 4Bii scores lower than 4Bi from an Environmental Perspective, due to the dam footprints
having a more severe impact after relocation down the rivers.
Table 5-12: Scenario scores and ranking for the sustainable pathway comparison
5.7.4 Climate change impact analysis
The objective of this evaluation was to assess the impacts of climate change under the two full
development scenarios: Scenario 2A, which includes climate change vs Scenario 2B, which excludes
climate change.
The results of the analysis are summarised in Table 5-13.
▪ Scenario 2B (without climate change), ranks above Scenario 2A (with climate change) from an
Economic, Social and Environmental perspective. This is expected due to the anticipated decrease
in runoff in the Basin under Scenario 2A – even though the rainfall in the basin is expected to
increase, the increased evapotranspiration due to increased temperatures results in a net reduction
in water availability and a net increase in crop water requirements.
Table 5-13: Scenario scores and ranking for the climate change comparison
5.7.5 Environmental flow impact analysis
The objective of this evaluation was to compare the benefits and impacts on water availability of
imposing the first order EFlows as determined during this Consultancy as opposed to the Q95
environmental flows under the sustainable development scenario: Scenario 3Bi with Q95 as minimum
environmental flow vs. Scenario 3Bii with EFlow holding flows.
The results of the analysis are summarised in Table 5-14.
◼ The impacts of the EFlows from an Economic perspective are evident and Scenario 3Bii scores
lower than Scenario 3Bi for this category. Under Scenario 3Bii, the minimum flows in the rivers are
significantly greater; however, this results in lower storage volumes in the dams, reducing the
supply reliability of the urban and irrigation demands. As a result, crop production, hydropower
generation and assurance of supply to urban users suffer.
◼ Scenario 3Bi scores lower than Scenario 3Bii from an Environmental and a Social perspective.
This is expected as the Q95 constant environmental flow is not sufficient to mimic the natural flow
in the rivers, which leads to a deterioration of river health with associated environmental impacts.
The Q95 also has more of a negative impact on recession agriculture and the availability of water
for riparian users.
ECON ENV SOC
SC4Bi 0.542 0.411 0.561
SC4Bii 0.559 0.411 0.568
SC4Bi 2 1 2
SC4Bii 1 2 1
ECON ENV SOC
SC2A 0.475 0.379 0.478
SC2B 0.498 0.417 0.508
SC2A 2 2 2
SC2B 1 1 1
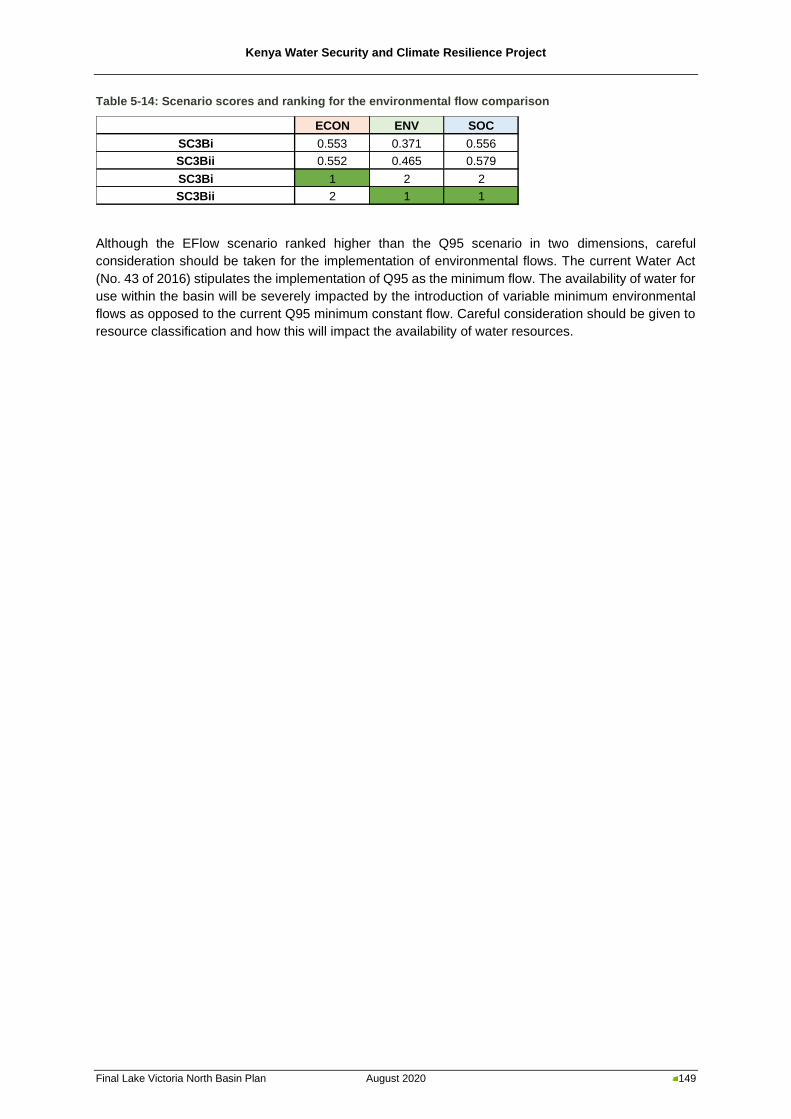
Kenya Water Security and Climate Resilience Project
Final Lake Victoria North Basin Plan August 2020 149
Table 5-14: Scenario scores and ranking for the environmental flow comparison
Although the EFlow scenario ranked higher than the Q95 scenario in two dimensions, careful
consideration should be taken for the implementation of environmental flows. The current Water Act
(No. 43 of 2016) stipulates the implementation of Q95 as the minimum flow. The availability of water for
use within the basin will be severely impacted by the introduction of variable minimum environmental
flows as opposed to the current Q95 minimum constant flow. Careful consideration should be given to
resource classification and how this will impact the availability of water resources.
ECON ENV SOC
SC3Bi 0.553 0.371 0.556
SC3Bii 0.552 0.465 0.579
SC3Bi 1 2 2
SC3Bii 2 1 1
Kenya Water Security and Climate Resilience Project
Final Lake Victoria North Basin Plan August 2020 150
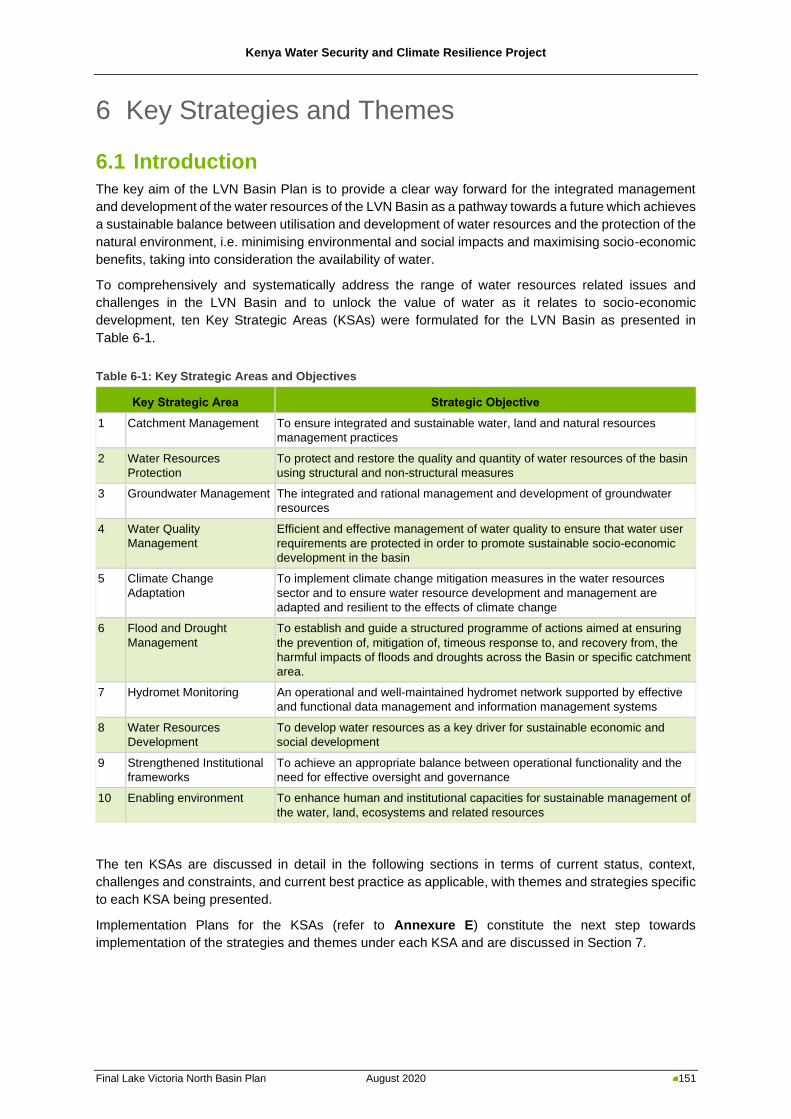
Kenya Water Security and Climate Resilience Project
Final Lake Victoria North Basin Plan August 2020 151
6 Key Strategies and Themes
6.1 Introduction
The key aim of the LVN Basin Plan is to provide a clear way forward for the integrated management
and development of the water resources of the LVN Basin as a pathway towards a future which achieves
a sustainable balance between utilisation and development of water resources and the protection of the
natural environment, i.e. minimising environmental and social impacts and maximising socio-economic
benefits, taking into consideration the availability of water.
To comprehensively and systematically address the range of water resources related issues and
challenges in the LVN Basin and to unlock the value of water as it relates to socio-economic
development, ten Key Strategic Areas (KSAs) were formulated for the LVN Basin as presented in
Table 6-1.
Table 6-1: Key Strategic Areas and Objectives
Key Strategic Area Strategic Objective
1 Catchment Management To ensure integrated and sustainable water, land and natural resources
management practices
2 Water Resources
Protection
To protect and restore the quality and quantity of water resources of the basin
using structural and non-structural measures
3 Groundwater Management The integrated and rational management and development of groundwater
resources
4 Water Quality
Management
Efficient and effective management of water quality to ensure that water user
requirements are protected in order to promote sustainable socio-economic
development in the basin
5 Climate Change
Adaptation
To implement climate change mitigation measures in the water resources
sector and to ensure water resource development and management are
adapted and resilient to the effects of climate change
6 Flood and Drought
Management
To establish and guide a structured programme of actions aimed at ensuring
the prevention of, mitigation of, timeous response to, and recovery from, the
harmful impacts of floods and droughts across the Basin or specific catchment
area.
7 Hydromet Monitoring An operational and well-maintained hydromet network supported by effective
and functional data management and information management systems
8 Water Resources
Development
To develop water resources as a key driver for sustainable economic and
social development
9 Strengthened Institutional
frameworks
To achieve an appropriate balance between operational functionality and the
need for effective oversight and governance
10 Enabling environment To enhance human and institutional capacities for sustainable management of
the water, land, ecosystems and related resources
The ten KSAs are discussed in detail in the following sections in terms of current status, context,
challenges and constraints, and current best practice as applicable, with themes and strategies specific
to each KSA being presented.
Implementation Plans for the KSAs (refer to Annexure E) constitute the next step towards
implementation of the strategies and themes under each KSA and are discussed in Section 7.
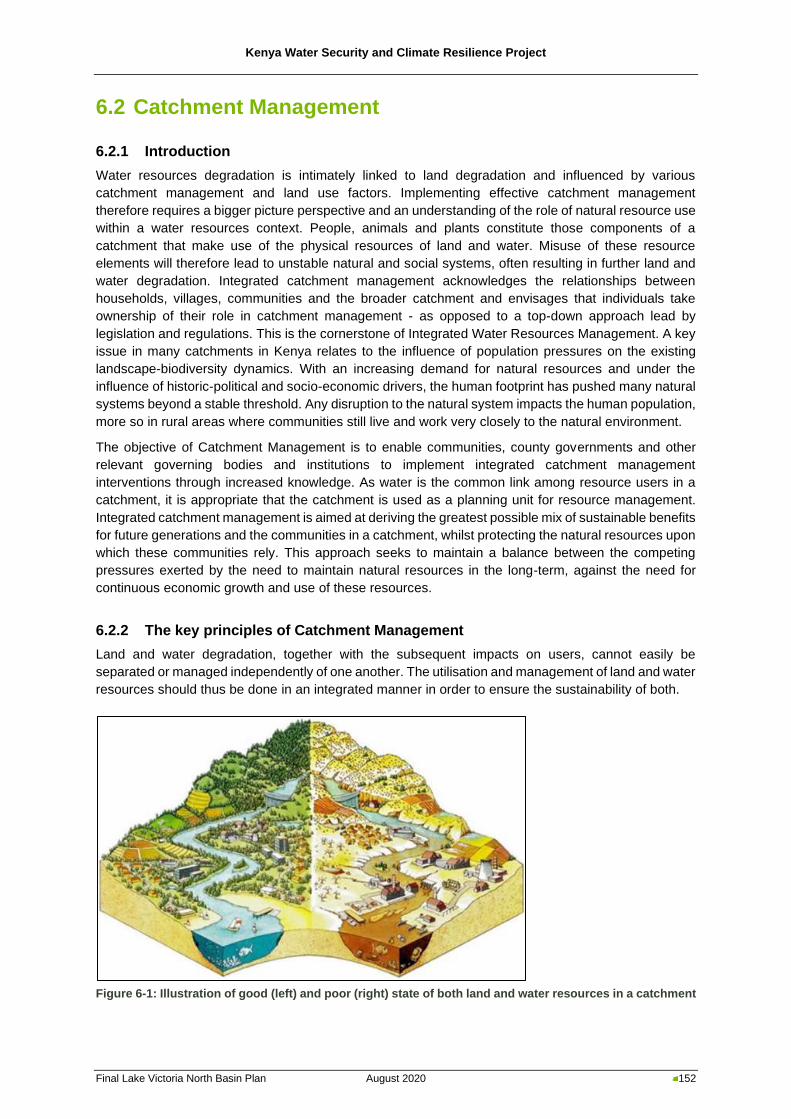
Kenya Water Security and Climate Resilience Project
Final Lake Victoria North Basin Plan August 2020 152
6.2 Catchment Management
6.2.1 Introduction
Water resources degradation is intimately linked to land degradation and influenced by various
catchment management and land use factors. Implementing effective catchment management
therefore requires a bigger picture perspective and an understanding of the role of natural resource use
within a water resources context. People, animals and plants constitute those components of a
catchment that make use of the physical resources of land and water. Misuse of these resource
elements will therefore lead to unstable natural and social systems, often resulting in further land and
water degradation. Integrated catchment management acknowledges the relationships between
households, villages, communities and the broader catchment and envisages that individuals take
ownership of their role in catchment management - as opposed to a top-down approach lead by
legislation and regulations. This is the cornerstone of Integrated Water Resources Management. A key
issue in many catchments in Kenya relates to the influence of population pressures on the existing
landscape-biodiversity dynamics. With an increasing demand for natural resources and under the
influence of historic-political and socio-economic drivers, the human footprint has pushed many natural
systems beyond a stable threshold. Any disruption to the natural system impacts the human population,
more so in rural areas where communities still live and work very closely to the natural environment.
The objective of Catchment Management is to enable communities, county governments and other
relevant governing bodies and institutions to implement integrated catchment management
interventions through increased knowledge. As water is the common link among resource users in a
catchment, it is appropriate that the catchment is used as a planning unit for resource management.
Integrated catchment management is aimed at deriving the greatest possible mix of sustainable benefits
for future generations and the communities in a catchment, whilst protecting the natural resources upon
which these communities rely. This approach seeks to maintain a balance between the competing
pressures exerted by the need to maintain natural resources in the long-term, against the need for
continuous economic growth and use of these resources.
6.2.2 The key principles of Catchment Management
Land and water degradation, together with the subsequent impacts on users, cannot easily be
separated or managed independently of one another. The utilisation and management of land and water
resources should thus be done in an integrated manner in order to ensure the sustainability of both.
Figure 6-1: Illustration of good (left) and poor (right) state of both land and water resources in a catchment
Kenya Water Security and Climate Resilience Project
Final Lake Victoria North Basin Plan August 2020 153
Land degradation is not just the physical degradation of the soil, but the disturbance of the biophysical
environment through human activity. This occurs through activities such as overgrazing, deforestation,
alien invasive infestation, poor solid waste management and other similar disruptive actions, and leads
to a disturbance of the natural system, which in some cases pushes a system beyond a critical
threshold. The impacts of land degradation are long-term and damaging to not only the biophysical
environment, but also the socio-economic environment of communities. A loss of soil fertility will lead
to low crop yields, which in turn lead to food shortages and reduced income generation, whilst increased
runoff due to exposed soil and soil erosion leads to gully erosion and sedimentation of water bodies,
leading to biodiversity threats and water resources depletion and degradation, and a reduced capacity
to use the water resource e.g. for irrigation or hydropower. In general, the impact that is readily felt in
rural communities is a reduced standard of living, which leads to chronic poverty.
Figure 6-2: An example of the interconnected links of land degradation
Soil degradation (the long-term decline on soil productivity) is exacerbated through the physical decline
in soil structure or through accelerated erosion via water and wind. Soil, termed sediment once eroded,
also becomes a significant non-point pollution source for water resources. Soil erosion and
sedimentation is one of the biggest problems facing mankind globally due to the serious environmental,
economic and social consequences, including loss of productive land, siltation of reservoirs, reduction
of water quality for human use and impacts on aquatic ecosystems.
The above implies that a co-ordinated and integrated approach and actions are required across all
scales of a catchment and through all levels of catchment management - from individual land users,
through local and regional structures to national level. Integrated Catchment Management addresses
soil, water, biodiversity and people issues at a catchment scale as shown in Figure 6-3.
Land unsuitable
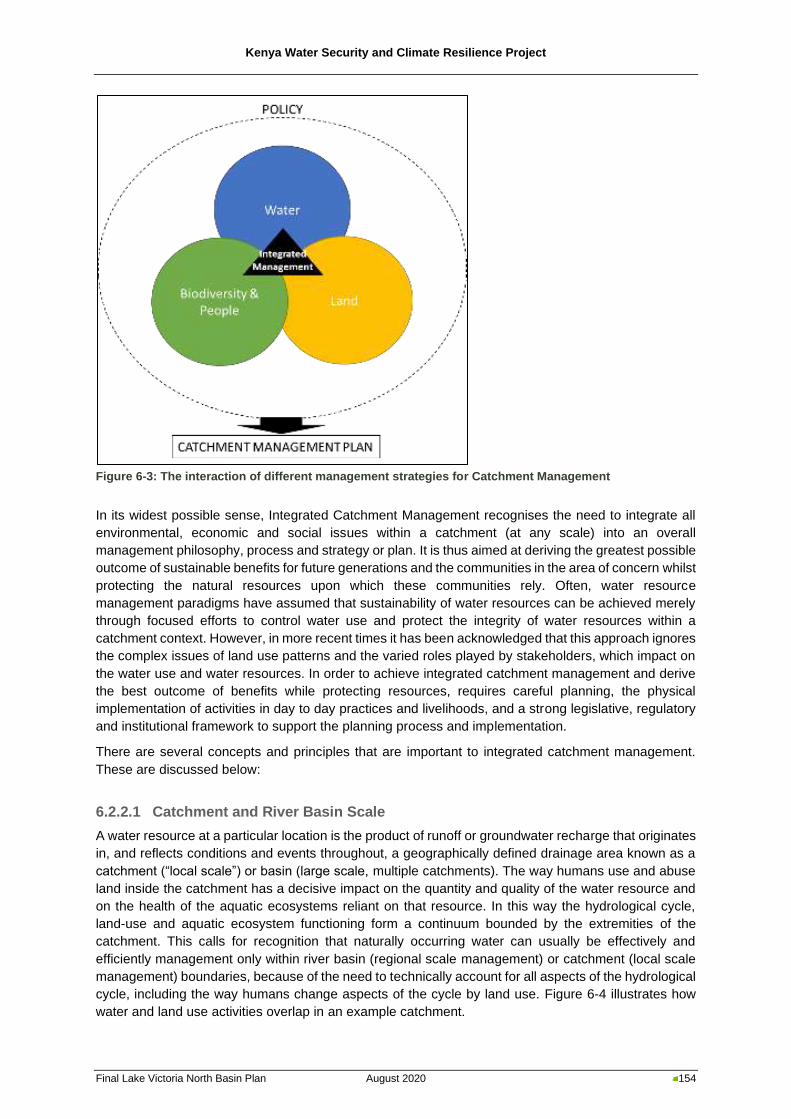
Kenya Water Security and Climate Resilience Project
Final Lake Victoria North Basin Plan August 2020 154
Figure 6-3: The interaction of different management strategies for Catchment Management
In its widest possible sense, Integrated Catchment Management recognises the need to integrate all
environmental, economic and social issues within a catchment (at any scale) into an overall
management philosophy, process and strategy or plan. It is thus aimed at deriving the greatest possible
outcome of sustainable benefits for future generations and the communities in the area of concern whilst
protecting the natural resources upon which these communities rely. Often, water resource
management paradigms have assumed that sustainability of water resources can be achieved merely
through focused efforts to control water use and protect the integrity of water resources within a
catchment context. However, in more recent times it has been acknowledged that this approach ignores
the complex issues of land use patterns and the varied roles played by stakeholders, which impact on
the water use and water resources. In order to achieve integrated catchment management and derive
the best outcome of benefits while protecting resources, requires careful planning, the physical
implementation of activities in day to day practices and livelihoods, and a strong legislative, regulatory
and institutional framework to support the planning process and implementation.
There are several concepts and principles that are important to integrated catchment management.
These are discussed below:
6.2.2.1 Catchment and River Basin Scale
A water resource at a particular location is the product of runoff or groundwater recharge that originates
in, and reflects conditions and events throughout, a geographically defined drainage area known as a
catchment (“local scale”) or basin (large scale, multiple catchments). The way humans use and abuse
land inside the catchment has a decisive impact on the quantity and quality of the water resource and
on the health of the aquatic ecosystems reliant on that resource. In this way the hydrological cycle,
land-use and aquatic ecosystem functioning form a continuum bounded by the extremities of the
catchment. This calls for recognition that naturally occurring water can usually be effectively and
efficiently management only within river basin (regional scale management) or catchment (local scale
management) boundaries, because of the need to technically account for all aspects of the hydrological
cycle, including the way humans change aspects of the cycle by land use. Figure 6-4 illustrates how
water and land use activities overlap in an example catchment.
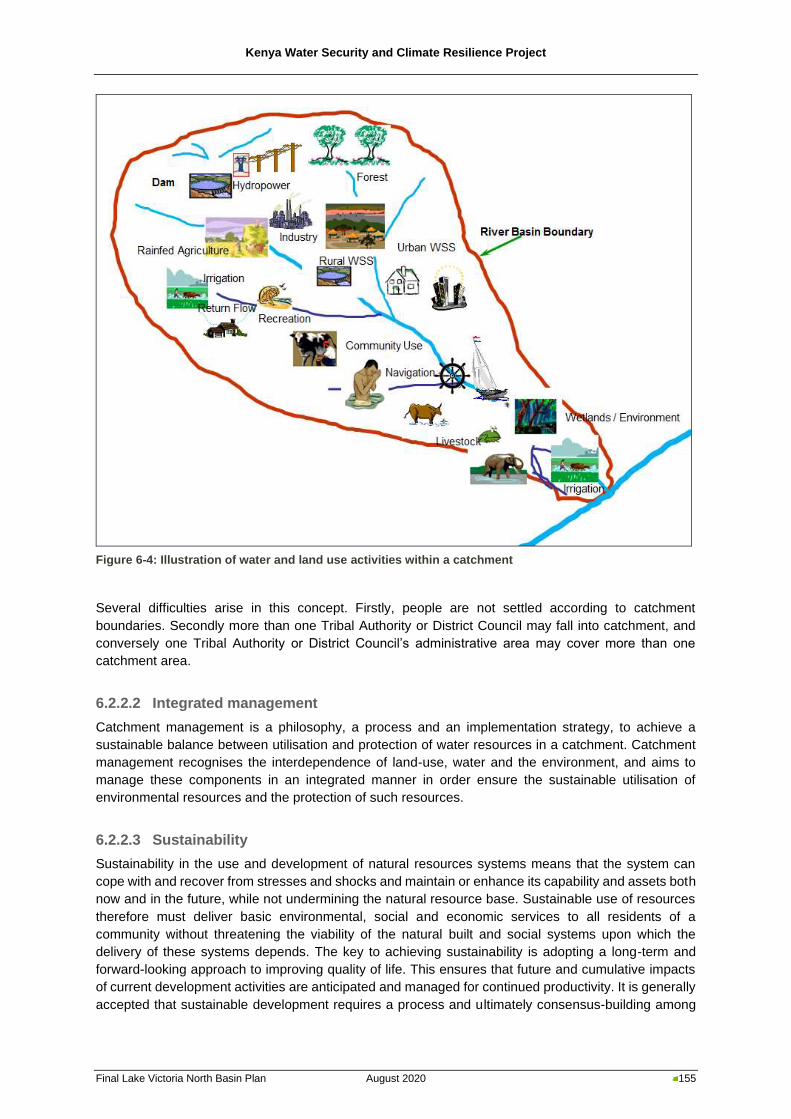
Kenya Water Security and Climate Resilience Project
Final Lake Victoria North Basin Plan August 2020 155
Figure 6-4: Illustration of water and land use activities within a catchment
Several difficulties arise in this concept. Firstly, people are not settled according to catchment
boundaries. Secondly more than one Tribal Authority or District Council may fall into catchment, and
conversely one Tribal Authority or District Council’s administrative area may cover more than one
catchment area.
6.2.2.2 Integrated management
Catchment management is a philosophy, a process and an implementation strategy, to achieve a
sustainable balance between utilisation and protection of water resources in a catchment. Catchment
management recognises the interdependence of land-use, water and the environment, and aims to
manage these components in an integrated manner in order ensure the sustainable utilisation of
environmental resources and the protection of such resources.
6.2.2.3 Sustainability
Sustainability in the use and development of natural resources systems means that the system can
cope with and recover from stresses and shocks and maintain or enhance its capability and assets both
now and in the future, while not undermining the natural resource base. Sustainable use of resources
therefore must deliver basic environmental, social and economic services to all residents of a
community without threatening the viability of the natural built and social systems upon which the
delivery of these systems depends. The key to achieving sustainability is adopting a long-term and
forward-looking approach to improving quality of life. This ensures that future and cumulative impacts
of current development activities are anticipated and managed for continued productivity. It is generally
accepted that sustainable development requires a process and ultimately consensus-building among
Kenya Water Security and Climate Resilience Project
Final Lake Victoria North Basin Plan August 2020 156
all stakeholders. This must be inclusive of all role-players, government institutions, stakeholders,
clients, non-governmental organisations and community-based organisations as partners who together
define the problems, design possible solutions, collaborate to implement them, obtain specific products,
and monitor and evaluate the outcome. In some cases, this has been incorporated into “water
stewardship” whereby water use is evaluated across the entire value chain and water users are willing
to be accountable to a larger group that is operating in a service and working to achieve a fundamental
change.
6.2.2.4 Reasonable utilisation
In order to ensure that natural resources are not depleted or ruined, development must be balanced
between economic and social benefits whilst also protecting the resource base that supports these.
People want access to more reliable domestic water supply, better sanitation, water for livestock and
irrigation, timber and fuel from forests and good soils for productive agriculture. Many of these activities,
singly and in combination, can result in adverse impacts on the catchment itself and on the natural
resource base of the catchment such as impacts on groundwater recharge, streamflow, flood flows and
soil erosion. Water for environmental services especially in wetlands and securing the biodiversity in
the plants and wildlife, are all very important to protect and improve the present access to water and
land resources. Reasonable utilisation of natural resources must be encouraged so that that
development and resource use do not waste or diminish the resource, as for example, discharge of
wastewater and pollutants into the catchment.
6.2.3 Key catchment management issues in the LVN Basin
There are always rules, formal/informal, which determine how people access resources and
opportunities (Levine & Pavanello, 2012). These rules, and the ways in which they are enforced,
constitute ‘institutions’. Institutions could relate to the institutions of the state or organised committees
following written constitutions, to informal rules of culture and locally accepted figures of authority.
Local-level catchment management strategies address issues that are locally relevant, but depending
on the mandate, also legislatively relevant.
Who is responsible for catchment management?
Integrated catchment management requires management of both land and water resources,
inclusive of different role players and institutions. Some of the institutions involved are as follows:
o Water resource-based: WRA/BWRC/WRUA
o Land/Agricultural based: AFFA/Extension officers/Pastoralists
o Environmental/Biodiversity based: NEMA/KWTA/KFS/KWS
o Governance based: County government
It is critical that these institutions are aware of each other to achieve sustainable management of
the Basin.
6.2.3.1 Water resource-based issues
The LVN Basin is managed by three WRA Sub-regional offices, which manage eight Catchment
Management Units (CMUs) based on hydrological, water resources and land use considerations. Some
of the WRA offices in the LVN Basin have jurisdiction over expansive areas. This, combined with the
issue of understaffing, makes it difficult to manage the entire area.
Basin Water Resource Committees (BWRCs) are responsible for management of the six main basins
in Kenya. However, conflicting mandates for the BWRCs have been identified in the Water Act 2016,
where BWRCs are assigned both advisory and management functions. Both scenarios cannot be
implemented at the same time without conflicts and thus only one scenario can work. This implies that
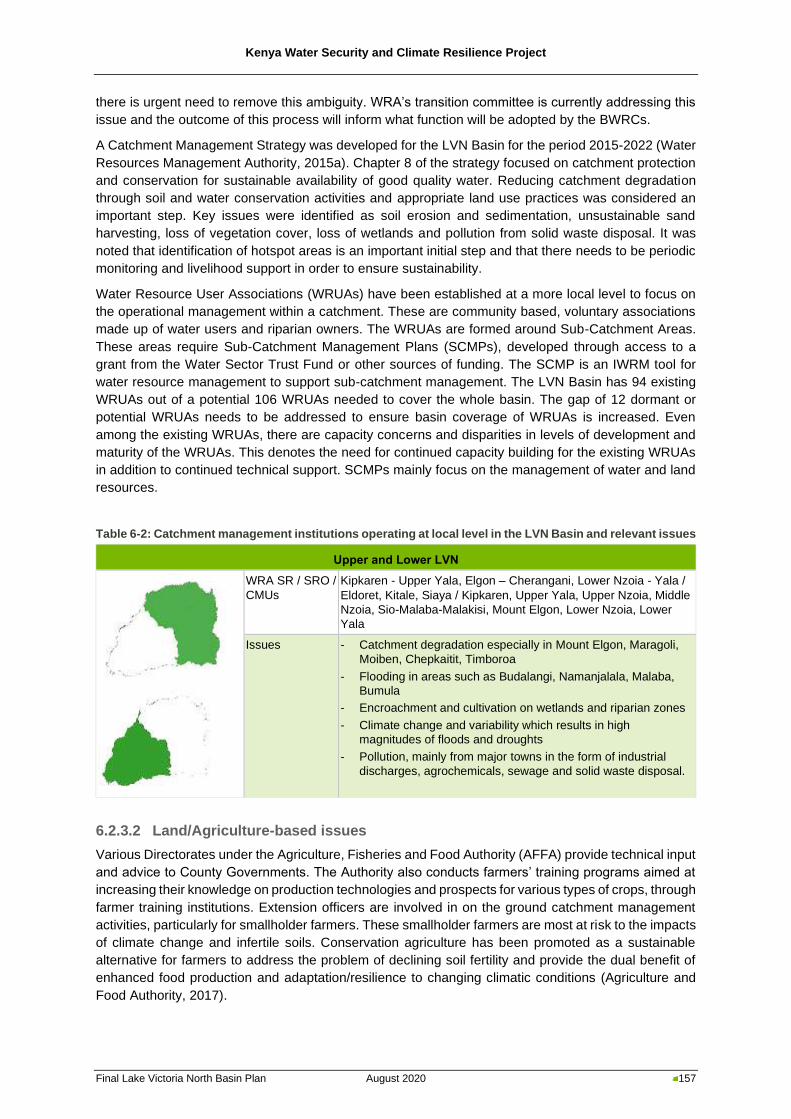
Kenya Water Security and Climate Resilience Project
Final Lake Victoria North Basin Plan August 2020 157
there is urgent need to remove this ambiguity. WRA’s transition committee is currently addressing this
issue and the outcome of this process will inform what function will be adopted by the BWRCs.
A Catchment Management Strategy was developed for the LVN Basin for the period 2015-2022 (Water
Resources Management Authority, 2015a). Chapter 8 of the strategy focused on catchment protection
and conservation for sustainable availability of good quality water. Reducing catchment degradation
through soil and water conservation activities and appropriate land use practices was considered an
important step. Key issues were identified as soil erosion and sedimentation, unsustainable sand
harvesting, loss of vegetation cover, loss of wetlands and pollution from solid waste disposal. It was
noted that identification of hotspot areas is an important initial step and that there needs to be periodic
monitoring and livelihood support in order to ensure sustainability.
Water Resource User Associations (WRUAs) have been established at a more local level to focus on
the operational management within a catchment. These are community based, voluntary associations
made up of water users and riparian owners. The WRUAs are formed around Sub-Catchment Areas.
These areas require Sub-Catchment Management Plans (SCMPs), developed through access to a
grant from the Water Sector Trust Fund or other sources of funding. The SCMP is an IWRM tool for
water resource management to support sub-catchment management. The LVN Basin has 94 existing
WRUAs out of a potential 106 WRUAs needed to cover the whole basin. The gap of 12 dormant or
potential WRUAs needs to be addressed to ensure basin coverage of WRUAs is increased. Even
among the existing WRUAs, there are capacity concerns and disparities in levels of development and
maturity of the WRUAs. This denotes the need for continued capacity building for the existing WRUAs
in addition to continued technical support. SCMPs mainly focus on the management of water and land
resources.
Table 6-2: Catchment management institutions operating at local level in the LVN Basin and relevant issues
Upper and Lower LVN
WRA SR / SRO /
CMUs
Kipkaren - Upper Yala, Elgon – Cherangani, Lower Nzoia - Yala /
Eldoret, Kitale, Siaya / Kipkaren, Upper Yala, Upper Nzoia, Middle
Nzoia, Sio-Malaba-Malakisi, Mount Elgon, Lower Nzoia, Lower
Yala
Issues - Catchment degradation especially in Mount Elgon, Maragoli,
Moiben, Chepkaitit, Timboroa
- Flooding in areas such as Budalangi, Namanjalala, Malaba,
Bumula
- Encroachment and cultivation on wetlands and riparian zones
- Climate change and variability which results in high
magnitudes of floods and droughts
- Pollution, mainly from major towns in the form of industrial
discharges, agrochemicals, sewage and solid waste disposal.
6.2.3.2 Land/Agriculture-based issues
Various Directorates under the Agriculture, Fisheries and Food Authority (AFFA) provide technical input
and advice to County Governments. The Authority also conducts farmers’ training programs aimed at
increasing their knowledge on production technologies and prospects for various types of crops, through
farmer training institutions. Extension officers are involved in on the ground catchment management
activities, particularly for smallholder farmers. These smallholder farmers are most at risk to the impacts
of climate change and infertile soils. Conservation agriculture has been promoted as a sustainable
alternative for farmers to address the problem of declining soil fertility and provide the dual benefit of
enhanced food production and adaptation/resilience to changing climatic conditions (Agriculture and
Food Authority, 2017).
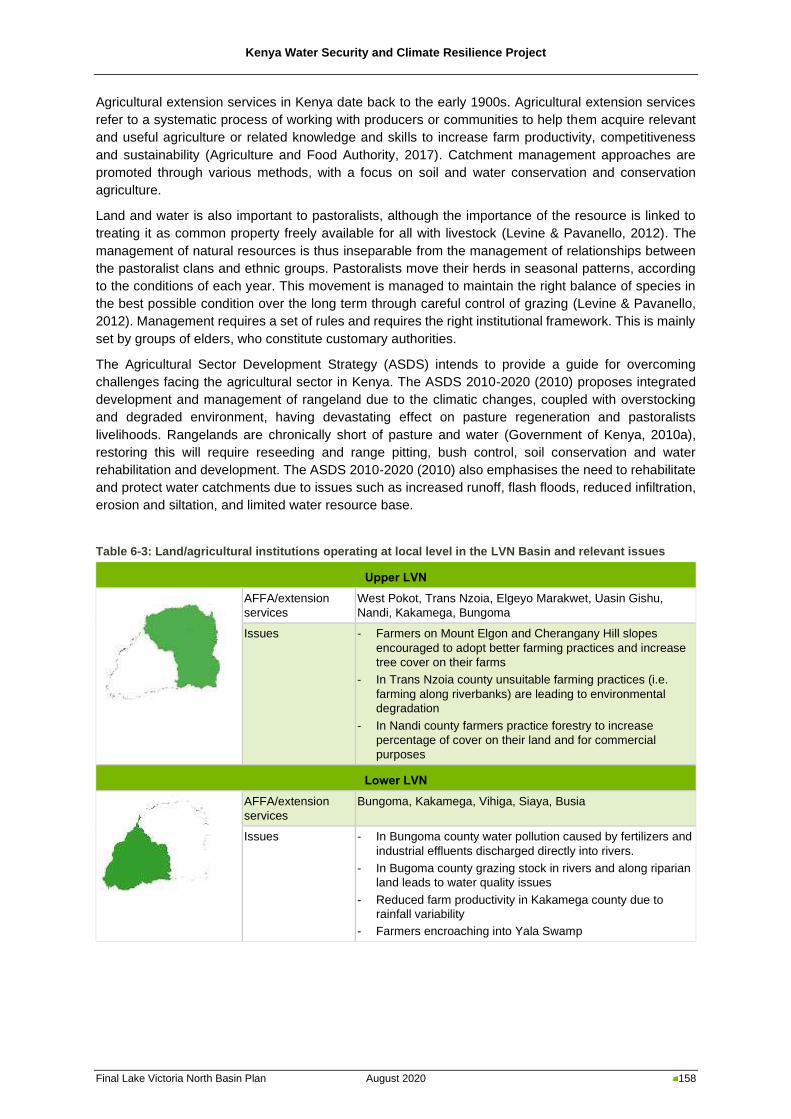
Kenya Water Security and Climate Resilience Project
Final Lake Victoria North Basin Plan August 2020 158
Agricultural extension services in Kenya date back to the early 1900s. Agricultural extension services
refer to a systematic process of working with producers or communities to help them acquire relevant
and useful agriculture or related knowledge and skills to increase farm productivity, competitiveness
and sustainability (Agriculture and Food Authority, 2017). Catchment management approaches are
promoted through various methods, with a focus on soil and water conservation and conservation
agriculture.
Land and water is also important to pastoralists, although the importance of the resource is linked to
treating it as common property freely available for all with livestock (Levine & Pavanello, 2012). The
management of natural resources is thus inseparable from the management of relationships between
the pastoralist clans and ethnic groups. Pastoralists move their herds in seasonal patterns, according
to the conditions of each year. This movement is managed to maintain the right balance of species in
the best possible condition over the long term through careful control of grazing (Levine & Pavanello,
2012). Management requires a set of rules and requires the right institutional framework. This is mainly
set by groups of elders, who constitute customary authorities.
The Agricultural Sector Development Strategy (ASDS) intends to provide a guide for overcoming
challenges facing the agricultural sector in Kenya. The ASDS 2010-2020 (2010) proposes integrated
development and management of rangeland due to the climatic changes, coupled with overstocking
and degraded environment, having devastating effect on pasture regeneration and pastoralists
livelihoods. Rangelands are chronically short of pasture and water (Government of Kenya, 2010a),
restoring this will require reseeding and range pitting, bush control, soil conservation and water
rehabilitation and development. The ASDS 2010-2020 (2010) also emphasises the need to rehabilitate
and protect water catchments due to issues such as increased runoff, flash floods, reduced infiltration,
erosion and siltation, and limited water resource base.
Table 6-3: Land/agricultural institutions operating at local level in the LVN Basin and relevant issues
Upper LVN
AFFA/extension
services
West Pokot, Trans Nzoia, Elgeyo Marakwet, Uasin Gishu,
Nandi, Kakamega, Bungoma
Issues
- Farmers on Mount Elgon and Cherangany Hill slopes
encouraged to adopt better farming practices and increase
tree cover on their farms
- In Trans Nzoia county unsuitable farming practices (i.e.
farming along riverbanks) are leading to environmental
degradation
- In Nandi county farmers practice forestry to increase
percentage of cover on their land and for commercial
purposes
Lower LVN
AFFA/extension
services
Bungoma, Kakamega, Vihiga, Siaya, Busia
Issues - In Bungoma county water pollution caused by fertilizers and
industrial effluents discharged directly into rivers.
- In Bugoma county grazing stock in rivers and along riparian
land leads to water quality issues
- Reduced farm productivity in Kakamega county due to
rainfall variability
- Farmers encroaching into Yala Swamp
Kenya Water Security and Climate Resilience Project
Final Lake Victoria North Basin Plan August 2020 159
6.2.3.3 Environmental/biodiversity-based issues
The National Environmental Management Authority (NEMA) has Environmental Committees who
provide technical support for environmental management and provide input to county integrated
development plans. The Kenya Water Towers Agency (KWTA) looks after Kenya’s water towers –
defined as “montane forests”, i.e. mountainous regions that are the sources of water. A water tower
collects and filters natural water including rain, dew and snow. It is the zone through which the rainwater
and snow seeps to eventually provide base flow to rivers, lakes and spring water and provides for
groundwater recharge. There are 18 gazetted, 24 non-gazetted, water towers in Kenya. In the LVN
Basin the gazetted water towers include Mount Elgon.
The Forest Management and Conservation division under the Kenya Forest Service (KFS) is charged
with the management and conservation of the natural forests in Kenya, of which most form water towers.
Strategic outputs involve increasing percentage cover through tree planting and gazetting new forests;
as well as improving livelihoods. The Division includes forest biodiversity conservation, participatory
forest management and fire management, natural forest management, licencing and eco-tourism.
The KFS Forest Farm and Dryland Forestry program provides technical support to the counties,
advisory services for forest management, promoting biomass energy development and utilization,
promote dryland forest conservation and promote participatory forest extension methodologies
including farmer field schools. Issues in the Forestry sector are weak institutions arising from weak
governance structures and inadequate capacity for law enforcement and weak stakeholder participation
in forest management and governance. This is exacerbated by inadequate funding of the forestry sector
from the exchequer, civil and public sectors. Since the enactment of the new Constitution in 2010,
nationally and within the basin, the level of public support to the conservation of forests has increased
significantly but has not been matched by an equal measure of resource allocation in all sectors. For
example, the Forest Management and Conservation Fund (FMCF) established in the Forests Act 2005
and the Forest Management and Conservation Act No.34 2016 to promote the development of forests,
maintenance and conservation of indigenous forests, the promotion of commercial forest plantation,
provision of forest extension services, the establishment of arboreta and botanical gardens, and a
variety of other purposes outlined in Forest Act is yet to be fully operationalised. Furthermore, there are
conflicting institutional mandates as is evident from the overlapping mandates, programmes, projects,
and conflicting policies and legislation. Overall, forest conservation has witnessed increased cases of
political interference in the management of forests, poor governance as well as inadequate and/or weak
structural/institutional capacity for forest law enforcement and governance.
The Parks and Reserves division of the Kenya Wildlife Service (KWS) manages the National Parks,
National Reserves, National Sanctuaries, Marine National Parks and Marine National Reserves in the
country. KWS is also involved in forest conservation and water towers conservation as well as ratifying
the RAMSAR convention. KWS exercises mandates over the LVN Basin, not just in areas within parks
and reserves, but also as the custodians of Kenya’s biodiversity, a role they are committed to through
the Nagoya Protocol of the Convention of Biological Diversity. Kenya ratified the Protocol in May 2014,
which obliges states to develop appropriate domestic measures for effective management of
biodiversity in relation to access to genetic resources, benefit-sharing and compliance. Biodiversity in
wetlands and sections of the river flowing through protected areas also receive protection by KWS.
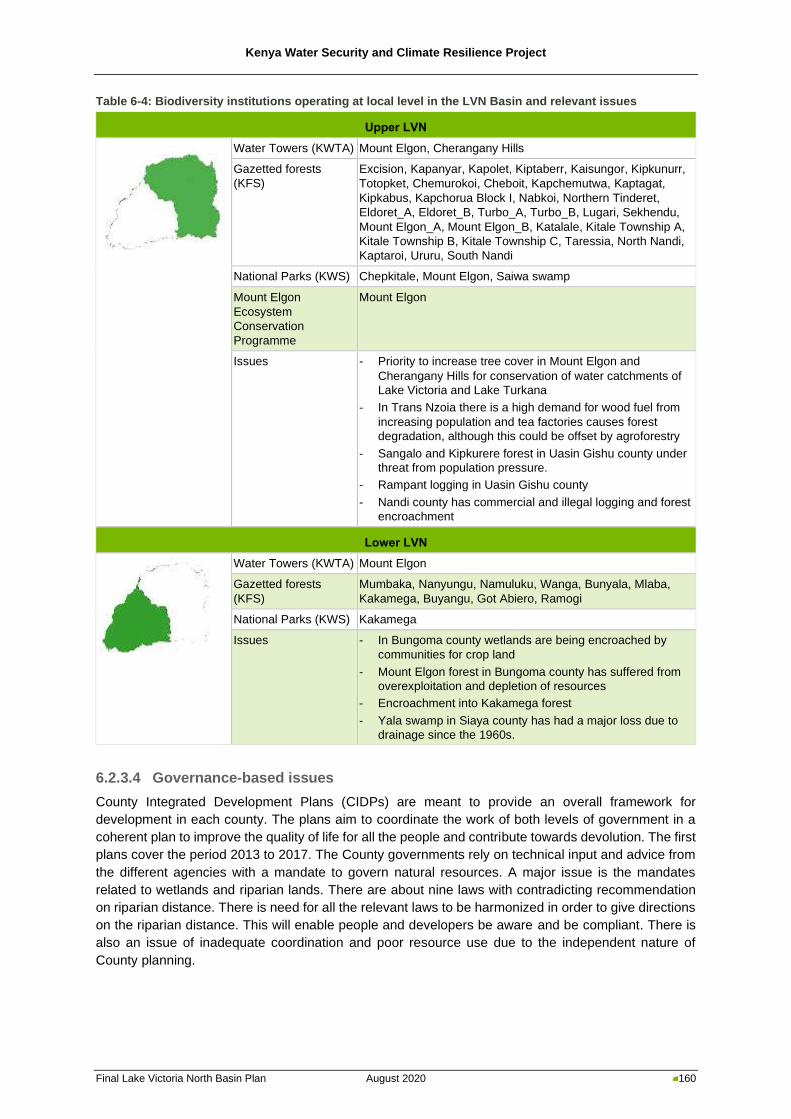
Kenya Water Security and Climate Resilience Project
Final Lake Victoria North Basin Plan August 2020 160
Table 6-4: Biodiversity institutions operating at local level in the LVN Basin and relevant issues
Upper LVN
Water Towers (KWTA) Mount Elgon, Cherangany Hills
Gazetted forests
(KFS)
Excision, Kapanyar, Kapolet, Kiptaberr, Kaisungor, Kipkunurr,
Totopket, Chemurokoi, Cheboit, Kapchemutwa, Kaptagat,
Kipkabus, Kapchorua Block I, Nabkoi, Northern Tinderet,
Eldoret_A, Eldoret_B, Turbo_A, Turbo_B, Lugari, Sekhendu,
Mount Elgon_A, Mount Elgon_B, Katalale, Kitale Township A,
Kitale Township B, Kitale Township C, Taressia, North Nandi,
Kaptaroi, Ururu, South Nandi
National Parks (KWS) Chepkitale, Mount Elgon, Saiwa swamp
Mount Elgon
Ecosystem
Conservation
Programme
Mount Elgon
Issues - Priority to increase tree cover in Mount Elgon and
Cherangany Hills for conservation of water catchments of
Lake Victoria and Lake Turkana
- In Trans Nzoia there is a high demand for wood fuel from
increasing population and tea factories causes forest
degradation, although this could be offset by agroforestry
- Sangalo and Kipkurere forest in Uasin Gishu county under
threat from population pressure.
- Rampant logging in Uasin Gishu county
- Nandi county has commercial and illegal logging and forest
encroachment
Lower LVN
Water Towers (KWTA) Mount Elgon
Gazetted forests
(KFS)
Mumbaka, Nanyungu, Namuluku, Wanga, Bunyala, Mlaba,
Kakamega, Buyangu, Got Abiero, Ramogi
National Parks (KWS) Kakamega
Issues - In Bungoma county wetlands are being encroached by
communities for crop land
- Mount Elgon forest in Bungoma county has suffered from
overexploitation and depletion of resources
- Encroachment into Kakamega forest
- Yala swamp in Siaya county has had a major loss due to
drainage since the 1960s.
6.2.3.4 Governance-based issues
County Integrated Development Plans (CIDPs) are meant to provide an overall framework for
development in each county. The plans aim to coordinate the work of both levels of government in a
coherent plan to improve the quality of life for all the people and contribute towards devolution. The first
plans cover the period 2013 to 2017. The County governments rely on technical input and advice from
the different agencies with a mandate to govern natural resources. A major issue is the mandates
related to wetlands and riparian lands. There are about nine laws with contradicting recommendation
on riparian distance. There is need for all the relevant laws to be harmonized in order to give directions
on the riparian distance. This will enable people and developers be aware and be compliant. There is
also an issue of inadequate coordination and poor resource use due to the independent nature of
County planning.
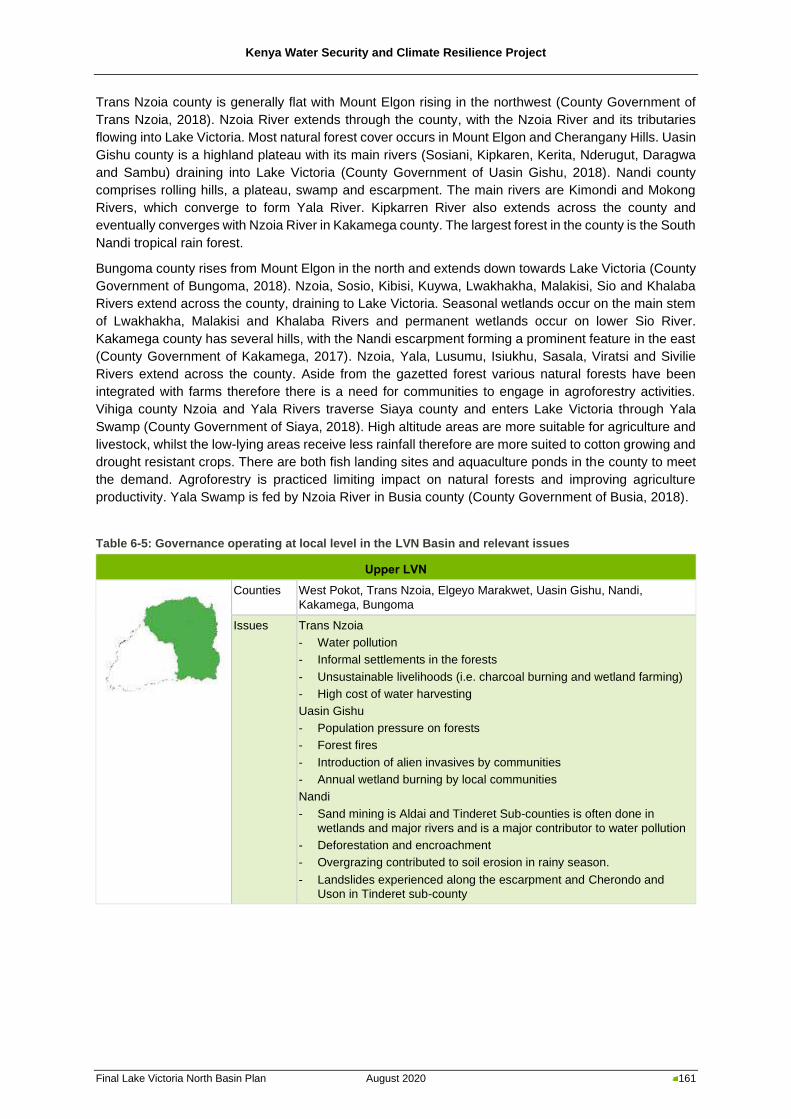
Kenya Water Security and Climate Resilience Project
Final Lake Victoria North Basin Plan August 2020 161
Trans Nzoia county is generally flat with Mount Elgon rising in the northwest (County Government of
Trans Nzoia, 2018). Nzoia River extends through the county, with the Nzoia River and its tributaries
flowing into Lake Victoria. Most natural forest cover occurs in Mount Elgon and Cherangany Hills. Uasin
Gishu county is a highland plateau with its main rivers (Sosiani, Kipkaren, Kerita, Nderugut, Daragwa
and Sambu) draining into Lake Victoria (County Government of Uasin Gishu, 2018). Nandi county
comprises rolling hills, a plateau, swamp and escarpment. The main rivers are Kimondi and Mokong
Rivers, which converge to form Yala River. Kipkarren River also extends across the county and
eventually converges with Nzoia River in Kakamega county. The largest forest in the county is the South
Nandi tropical rain forest.
Bungoma county rises from Mount Elgon in the north and extends down towards Lake Victoria (County
Government of Bungoma, 2018). Nzoia, Sosio, Kibisi, Kuywa, Lwakhakha, Malakisi, Sio and Khalaba
Rivers extend across the county, draining to Lake Victoria. Seasonal wetlands occur on the main stem
of Lwakhakha, Malakisi and Khalaba Rivers and permanent wetlands occur on lower Sio River.
Kakamega county has several hills, with the Nandi escarpment forming a prominent feature in the east
(County Government of Kakamega, 2017). Nzoia, Yala, Lusumu, Isiukhu, Sasala, Viratsi and Sivilie
Rivers extend across the county. Aside from the gazetted forest various natural forests have been
integrated with farms therefore there is a need for communities to engage in agroforestry activities.
Vihiga county Nzoia and Yala Rivers traverse Siaya county and enters Lake Victoria through Yala
Swamp (County Government of Siaya, 2018). High altitude areas are more suitable for agriculture and
livestock, whilst the low-lying areas receive less rainfall therefore are more suited to cotton growing and
drought resistant crops. There are both fish landing sites and aquaculture ponds in the county to meet
the demand. Agroforestry is practiced limiting impact on natural forests and improving agriculture
productivity. Yala Swamp is fed by Nzoia River in Busia county (County Government of Busia, 2018).
Table 6-5: Governance operating at local level in the LVN Basin and relevant issues
Upper LVN
Counties West Pokot, Trans Nzoia, Elgeyo Marakwet, Uasin Gishu, Nandi,
Kakamega, Bungoma
Issues Trans Nzoia
- Water pollution
- Informal settlements in the forests
- Unsustainable livelihoods (i.e. charcoal burning and wetland farming)
- High cost of water harvesting
Uasin Gishu
- Population pressure on forests
- Forest fires
- Introduction of alien invasives by communities
- Annual wetland burning by local communities
Nandi
- Sand mining is Aldai and Tinderet Sub-counties is often done in
wetlands and major rivers and is a major contributor to water pollution
- Deforestation and encroachment
- Overgrazing contributed to soil erosion in rainy season.
- Landslides experienced along the escarpment and Cherondo and
Uson in Tinderet sub-county
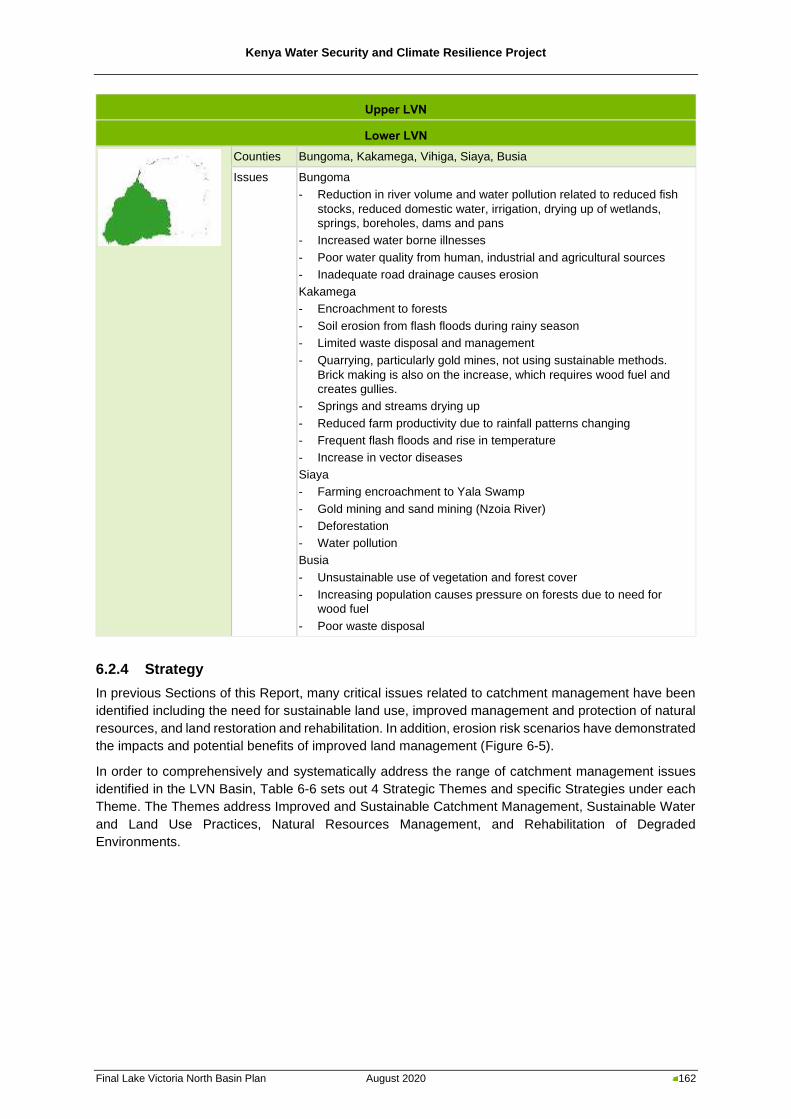
Kenya Water Security and Climate Resilience Project
Final Lake Victoria North Basin Plan August 2020 162
Upper LVN
Lower LVN
Counties Bungoma, Kakamega, Vihiga, Siaya, Busia
Issues Bungoma
- Reduction in river volume and water pollution related to reduced fish
stocks, reduced domestic water, irrigation, drying up of wetlands,
springs, boreholes, dams and pans
- Increased water borne illnesses
- Poor water quality from human, industrial and agricultural sources
- Inadequate road drainage causes erosion
Kakamega
- Encroachment to forests
- Soil erosion from flash floods during rainy season
- Limited waste disposal and management
- Quarrying, particularly gold mines, not using sustainable methods.
Brick making is also on the increase, which requires wood fuel and
creates gullies.
- Springs and streams drying up
- Reduced farm productivity due to rainfall patterns changing
- Frequent flash floods and rise in temperature
- Increase in vector diseases
Siaya
- Farming encroachment to Yala Swamp
- Gold mining and sand mining (Nzoia River)
- Deforestation
- Water pollution
Busia
- Unsustainable use of vegetation and forest cover
- Increasing population causes pressure on forests due to need for
wood fuel
- Poor waste disposal
6.2.4 Strategy
In previous Sections of this Report, many critical issues related to catchment management have been
identified including the need for sustainable land use, improved management and protection of natural
resources, and land restoration and rehabilitation. In addition, erosion risk scenarios have demonstrated
the impacts and potential benefits of improved land management (Figure 6-5).
In order to comprehensively and systematically address the range of catchment management issues
identified in the LVN Basin, Table 6-6 sets out 4 Strategic Themes and specific Strategies under each
Theme. The Themes address Improved and Sustainable Catchment Management, Sustainable Water
and Land Use Practices, Natural Resources Management, and Rehabilitation of Degraded
Environments.
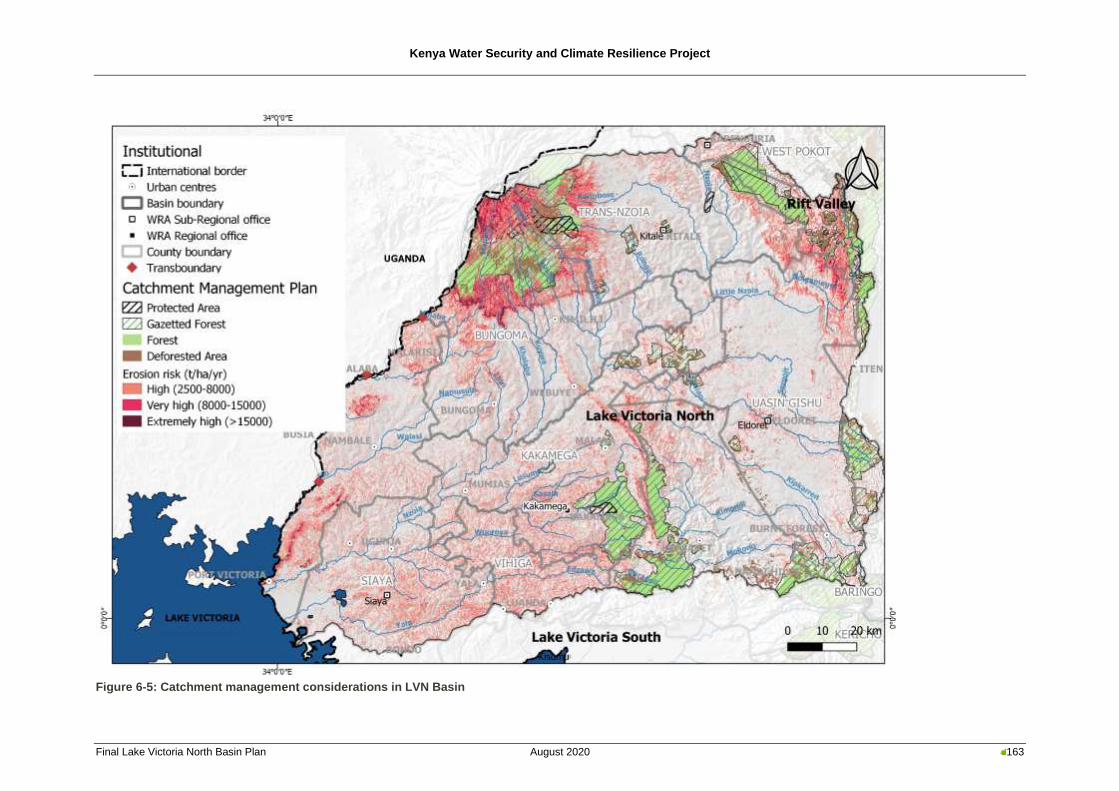
Kenya Water Security and Climate Resilience Project
Final Lake Victoria North Basin Plan August 2020 163
Figure 6-5: Catchment management considerations in LVN Basin
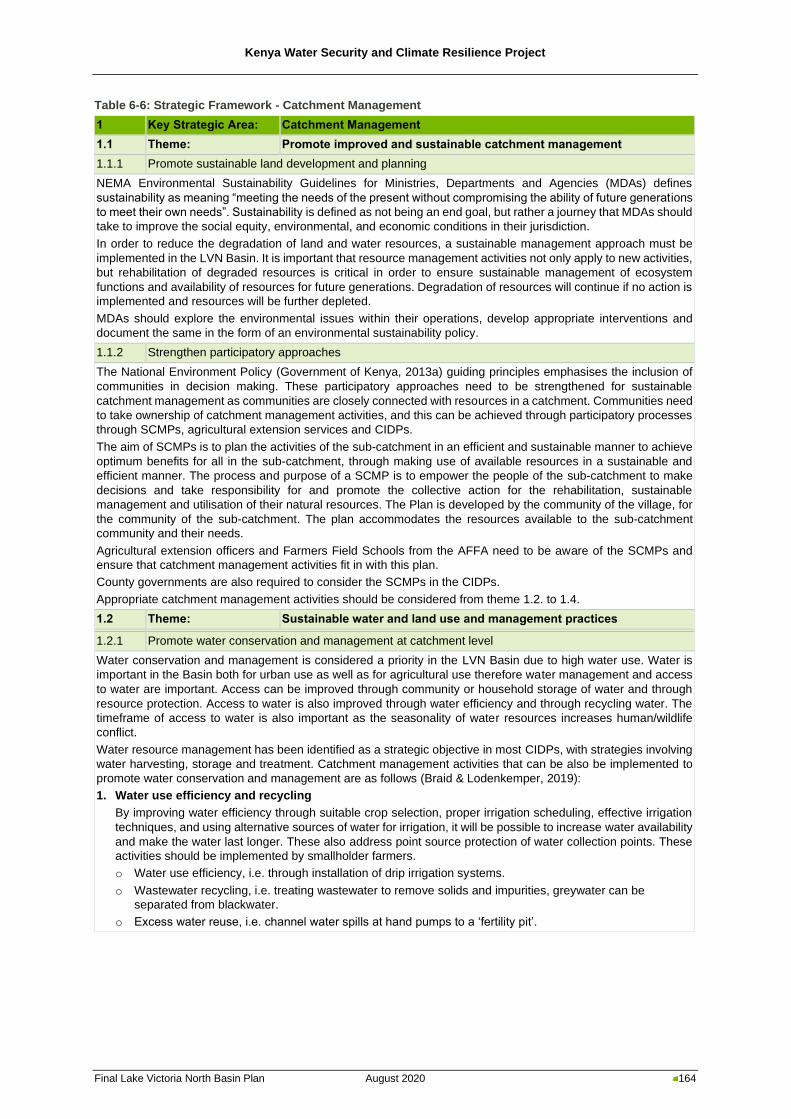
Kenya Water Security and Climate Resilience Project
Final Lake Victoria North Basin Plan August 2020 164
Table 6-6: Strategic Framework - Catchment Management
1 Key Strategic Area: Catchment Management
1.1 Theme: Promote improved and sustainable catchment management
1.1.1 Promote sustainable land development and planning
NEMA Environmental Sustainability Guidelines for Ministries, Departments and Agencies (MDAs) defines
sustainability as meaning “meeting the needs of the present without compromising the ability of future generations
to meet their own needs”. Sustainability is defined as not being an end goal, but rather a journey that MDAs should
take to improve the social equity, environmental, and economic conditions in their jurisdiction.
In order to reduce the degradation of land and water resources, a sustainable management approach must be
implemented in the LVN Basin. It is important that resource management activities not only apply to new activities,
but rehabilitation of degraded resources is critical in order to ensure sustainable management of ecosystem
functions and availability of resources for future generations. Degradation of resources will continue if no action is
implemented and resources will be further depleted.
MDAs should explore the environmental issues within their operations, develop appropriate interventions and
document the same in the form of an environmental sustainability policy.
1.1.2 Strengthen participatory approaches
The National Environment Policy (Government of Kenya, 2013a) guiding principles emphasises the inclusion of
communities in decision making. These participatory approaches need to be strengthened for sustainable
catchment management as communities are closely connected with resources in a catchment. Communities need
to take ownership of catchment management activities, and this can be achieved through participatory processes
through SCMPs, agricultural extension services and CIDPs.
The aim of SCMPs is to plan the activities of the sub-catchment in an efficient and sustainable manner to achieve
optimum benefits for all in the sub-catchment, through making use of available resources in a sustainable and
efficient manner. The process and purpose of a SCMP is to empower the people of the sub-catchment to make
decisions and take responsibility for and promote the collective action for the rehabilitation, sustainable
management and utilisation of their natural resources. The Plan is developed by the community of the village, for
the community of the sub-catchment. The plan accommodates the resources available to the sub-catchment
community and their needs.
Agricultural extension officers and Farmers Field Schools from the AFFA need to be aware of the SCMPs and
ensure that catchment management activities fit in with this plan.
County governments are also required to consider the SCMPs in the CIDPs.
Appropriate catchment management activities should be considered from theme 1.2. to 1.4.
1.2 Theme: Sustainable water and land use and management practices
1.2.1 Promote water conservation and management at catchment level
Water conservation and management is considered a priority in the LVN Basin due to high water use. Water is
important in the Basin both for urban use as well as for agricultural use therefore water management and access
to water are important. Access can be improved through community or household storage of water and through
resource protection. Access to water is also improved through water efficiency and through recycling water. The
timeframe of access to water is also important as the seasonality of water resources increases human/wildlife
conflict.
Water resource management has been identified as a strategic objective in most CIDPs, with strategies involving
water harvesting, storage and treatment. Catchment management activities that can be also be implemented to
promote water conservation and management are as follows (Braid & Lodenkemper, 2019):
1. Water use efficiency and recycling
By improving water efficiency through suitable crop selection, proper irrigation scheduling, effective irrigation
techniques, and using alternative sources of water for irrigation, it will be possible to increase water availability
and make the water last longer. These also address point source protection of water collection points. These
activities should be implemented by smallholder farmers.
o Water use efficiency, i.e. through installation of drip irrigation systems.
o Wastewater recycling, i.e. treating wastewater to remove solids and impurities, greywater can be
separated from blackwater.
o Excess water reuse, i.e. channel water spills at hand pumps to a ‘fertility pit’.
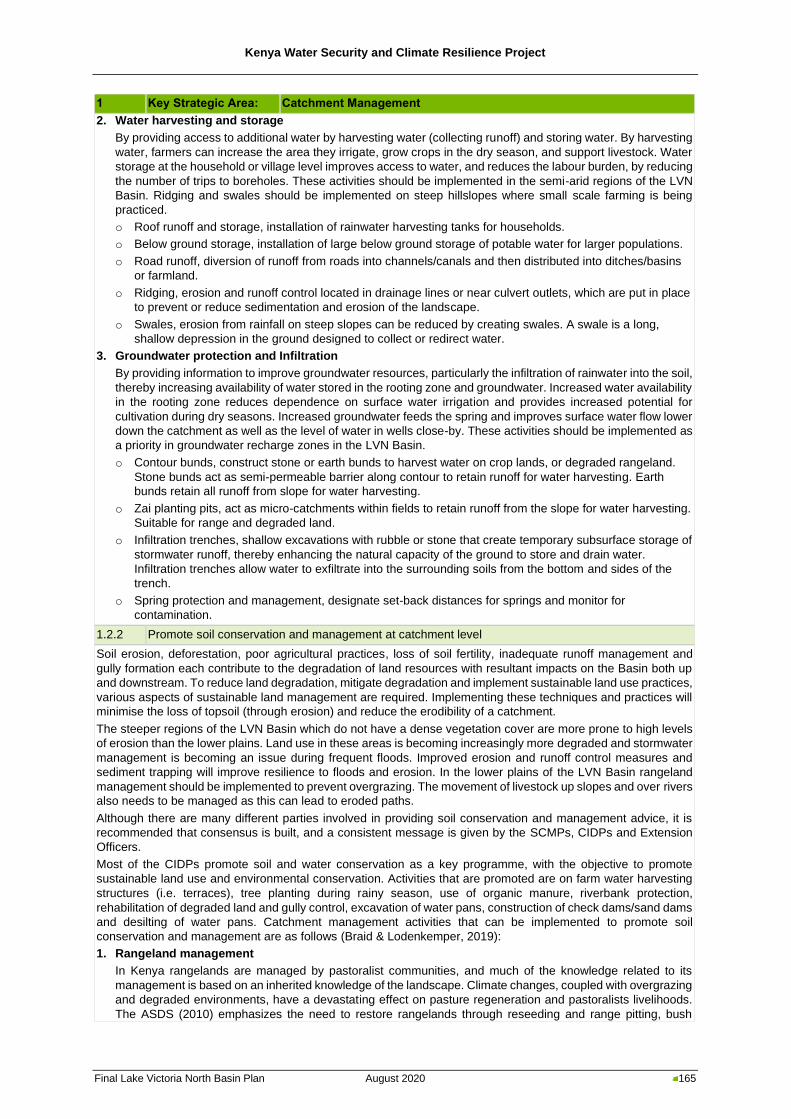
Kenya Water Security and Climate Resilience Project
Final Lake Victoria North Basin Plan August 2020 165
1 Key Strategic Area: Catchment Management
2. Water harvesting and storage
By providing access to additional water by harvesting water (collecting runoff) and storing water. By harvesting
water, farmers can increase the area they irrigate, grow crops in the dry season, and support livestock. Water
storage at the household or village level improves access to water, and reduces the labour burden, by reducing
the number of trips to boreholes. These activities should be implemented in the semi-arid regions of the LVN
Basin. Ridging and swales should be implemented on steep hillslopes where small scale farming is being
practiced.
o Roof runoff and storage, installation of rainwater harvesting tanks for households.
o Below ground storage, installation of large below ground storage of potable water for larger populations.
o Road runoff, diversion of runoff from roads into channels/canals and then distributed into ditches/basins
or farmland.
o Ridging, erosion and runoff control located in drainage lines or near culvert outlets, which are put in place
to prevent or reduce sedimentation and erosion of the landscape.
o Swales, erosion from rainfall on steep slopes can be reduced by creating swales. A swale is a long,
shallow depression in the ground designed to collect or redirect water.
3. Groundwater protection and Infiltration
By providing information to improve groundwater resources, particularly the infiltration of rainwater into the soil,
thereby increasing availability of water stored in the rooting zone and groundwater. Increased water availability
in the rooting zone reduces dependence on surface water irrigation and provides increased potential for
cultivation during dry seasons. Increased groundwater feeds the spring and improves surface water flow lower
down the catchment as well as the level of water in wells close-by. These activities should be implemented as
a priority in groundwater recharge zones in the LVN Basin.
o Contour bunds, construct stone or earth bunds to harvest water on crop lands, or degraded rangeland.
Stone bunds act as semi-permeable barrier along contour to retain runoff for water harvesting. Earth
bunds retain all runoff from slope for water harvesting.
o Zai planting pits, act as micro-catchments within fields to retain runoff from the slope for water harvesting.
Suitable for range and degraded land.
o Infiltration trenches, shallow excavations with rubble or stone that create temporary subsurface storage of
stormwater runoff, thereby enhancing the natural capacity of the ground to store and drain water.
Infiltration trenches allow water to exfiltrate into the surrounding soils from the bottom and sides of the
trench.
o Spring protection and management, designate set-back distances for springs and monitor for
contamination.
1.2.2 Promote soil conservation and management at catchment level
Soil erosion, deforestation, poor agricultural practices, loss of soil fertility, inadequate runoff management and
gully formation each contribute to the degradation of land resources with resultant impacts on the Basin both up
and downstream. To reduce land degradation, mitigate degradation and implement sustainable land use practices,
various aspects of sustainable land management are required. Implementing these techniques and practices will
minimise the loss of topsoil (through erosion) and reduce the erodibility of a catchment.
The steeper regions of the LVN Basin which do not have a dense vegetation cover are more prone to high levels
of erosion than the lower plains. Land use in these areas is becoming increasingly more degraded and stormwater
management is becoming an issue during frequent floods. Improved erosion and runoff control measures and
sediment trapping will improve resilience to floods and erosion. In the lower plains of the LVN Basin rangeland
management should be implemented to prevent overgrazing. The movement of livestock up slopes and over rivers
also needs to be managed as this can lead to eroded paths.
Although there are many different parties involved in providing soil conservation and management advice, it is
recommended that consensus is built, and a consistent message is given by the SCMPs, CIDPs and Extension
Officers.
Most of the CIDPs promote soil and water conservation as a key programme, with the objective to promote
sustainable land use and environmental conservation. Activities that are promoted are on farm water harvesting
structures (i.e. terraces), tree planting during rainy season, use of organic manure, riverbank protection,
rehabilitation of degraded land and gully control, excavation of water pans, construction of check dams/sand dams
and desilting of water pans. Catchment management activities that can be implemented to promote soil
conservation and management are as follows (Braid & Lodenkemper, 2019):
1. Rangeland management
In Kenya rangelands are managed by pastoralist communities, and much of the knowledge related to its
management is based on an inherited knowledge of the landscape. Climate changes, coupled with overgrazing
and degraded environments, have a devastating effect on pasture regeneration and pastoralists livelihoods.
The ASDS (2010) emphasizes the need to restore rangelands through reseeding and range pitting, bush
Kenya Water Security and Climate Resilience Project
Final Lake Victoria North Basin Plan August 2020 166
1 Key Strategic Area: Catchment Management
control, soil conservation and water resource development and management. The CIDPs also promote the
development of range and ranch resource management through training of herders, developing ranch plans,
constructing water pans and developing firebreaks. Access roads. Rangeland management is the practice of
deciding where to graze animals, how many animals to graze at one time, when to burn, how to harvest
firewood and thatch-grass, and other issues relevant to managing natural resources.
o Rotational resting of rangeland, overgrazed land leads to increased soil erosion and loss of soil nutrients.
Grazing lands should be rested to allow vegetation to recover and protect the soils while other areas are
being grazed in rotation. Pastoralism practices which allow for grazing areas to be rested should be
promoted.
o Prevention and rehabilitating overgrazing, where land has been overgrazed, it needs to be rehabilitated
to improve ecosystem function and goods and services provision.
o Grazing movement, moving animals around allows livestock owners to control where and when animals
graze. This allows much greater control over the feeding of the animals and the resting of different areas.
This is applicable to livestock owners who do not move over large areas, and who can practice block
grazing.
o Cattle paths up a slope, cattle paths on slopes can be a major source of erosion and can quickly become
large gullies. Reducing cattle paths up slopes requires a combination of rehabilitating existing paths and
using strategies to prevent future paths from forming.
2. Erosion and runoff control measures
Erosion and runoff control tools are structures or measures, located in drainage lines or near culvert outlets,
which are put in place to prevent or reduce sedimentation and erosion of the landscape caused by intensive
rainfall and direct runoff.
o Contour ridging, construct during dry season to allow time for re-aligning ridges. Height is usually 30-
40cm and interval between ridges varies according to slope gradient.
o Contour vegetation rows, vegetation barrier slows down and retains runoff and reduces erosion. Roots
increase resistance to rills and gullies.
3. Gully management and sediment trapping
Gullies may not be actively eroding in some cases but provide a channel for increased runoff and sediment
delivery. Prevention is better than rehabilitation.
o Gully prevention prevent gully development through sound land use, runoff control and reduction in flow
concentration. Raised footbaths and field boundaries should also be implemented.
o Gully reclamation (small), gullies can be reclaimed either to cultivate, or simply to prevent further loss of
soil and land.
o Stone check dams, large gully rehabilitation requires more complex interventions to prevent continued
erosion. Check dams can be implemented in a stepped approach for larger gullies to gradually trap
sediment and be reclaimed.
o Brushwood check dams, where stones are not available brushwood check dams may be used in some
cases.
o Vegetation barriers, silt traps reduce the loss of soil and the resulting sedimentation of rivers.
o Erosion management along roadsides, one of the areas most prone to erosion and gully formation is
along the side of roads, especially dirt roads. This affects the usability of these roads during the wet
season. Improved runoff management, such as mitre drains, along the roads will help mitigate this
problem.
4. Stream/riverbank management
A more manageable riverbank habitat is beneficial to wildlife and at the same time manages the riverine zone,
ensuring adequate river function through sediment control and water quality improvement.
o Riparian buffer zones, some of the most productive farming areas are on stream/ riverbanks because of
the fertile silt and ease of access to water. However, this practice results in the loss of important riparian
vegetation which amongst other things helps to clean the water, reduce flood flows, trap sediments,
provide food and is also an important habitat for biodiversity.
o River crossing for cattle, cattle can cause a lot of damage to riverbanks where they cross rivers. They
cause soil erosion, can drop dung and urine in rivers, which pollutes the water for people living
downstream of the cattle crossing. Well-designed cattle crossings can substantially improve the water
quality, as well as making it safer for animals and people to cross rivers.
o Earth berm, flooding is a natural phenomenon of rivers. For ease of access to water and highly fertile
soils, many villages are established near rivers. However, these are affected by floods. A berm/dyke is a
wall that runs parallel with the watercourse. Berms or dykes help reduce flood waters affecting villages –
they do not stop floods or prevent damage. They require prioritised maintenance.
Kenya Water Security and Climate Resilience Project
Final Lake Victoria North Basin Plan August 2020 167
1 Key Strategic Area: Catchment Management
o Gabion baskets, bank collapse along rivers and gullies contribute to catchment degradation. Gabion
baskets are rock filled structures to protect banks, reduce erosion and prevent bank collapse.
1.2.3 Promote conservation agriculture and improved farm management
One of the most important natural resources is the soil. Healthy and fertile soils produce good yields of crops;
whereas poor or degraded soils produce low and unreliable yields. Soil health is a function of rooting depth, nutrient
fertility, structure, organic matter content, below-ground biodiversity and water holding capacity – all of which are
related. Ensuring soils remain healthy and fertile requires a variety of management techniques including climate-
smart farming practices and nutrient management.
Most of the CIDPs promote soil fertility improvement and agroforestry but a more holistic approach would to
consider conservation agriculture and improved farm management as follows (Braid & Lodenkemper, 2019):
1. Climate-smart agriculture
Climate-smart agriculture practices contribute to improving the health of the soil by enhancing its physical,
chemical and biological properties. Good soil health will produce higher and more stable yields. These
techniques contribute to avoiding erosion and controlling rainfall runoff, by increasing infiltration of rainwater
and water holding properties and thereby improving soil moisture. Climate-smart agriculture covers the
principles and practices of conservation agriculture and Permaculture (natural farming). Nutrient management
focuses on soil fertility, which is of fundamental importance for agricultural production. These include compost
techniques and natural fertilizers.
o Conservation agriculture: Conservation agriculture combines profitable agricultural production with
environmental concerns and sustainability by conserving, improving, and using natural resources more
efficiently through integrated management of soil, water and biological resources. Conservation agriculture
contributes to food security and increases tolerance to changes in temperature and rainfall including
incidences of drought and flooding. Conservation agriculture combines three basic principles or ‘pillars’: (i)
minimum tillage, (ii) crop rotation and (iii) maintaining soil cover by crops or crop residues.
Conservation tillage: Minimum tillage is superficial loosening of the soil (5 cm), ripping of planting
rows with a ripper tine (chisel plough), or making permanent planting basins by hand, without
disturbing the soil between. Zero or no-tell is direct planting through a mulch layer using a special
planter or hand tool. Conservation tillage is any form of reduced tillage technique.
Crop rotation and intercropping: Mixing crops by either planting a different crop in each field every
season, or by planting a mixture of crops which complement each other can be beneficial. Rotating
crops regularly reduces the ability of each crop’s pests to become established in the soil through
minimising the available food and habitat for each pest. The variety of crops also increases
opportunities for a mixture of pest predators to survive.
Soil cover (mulching): Soil cover and mulches protect the soil from the heating and drying effects of
direct sunlight and the physical damage caused by heavy rain. They also reduce evaporation, and
moderate soil surface temperatures. Soil covers also slow surface runoff during rainstorms, reducing
erosion and increasing infiltration.
o Natural farming (small scale): Energy can be saved by laying out the farm and household cultivation/
farming beds and plots more efficiently.
2. Nutrient management
Soil fertility is of fundamental importance for agricultural production. Certain techniques maximize the efficiency
of nutrients and water use for better agricultural productivity. This improves and sustains soil quality for the
future. These include compost techniques and natural fertilizers.
o Compost: Compost helps return nutrients to the soil, reduces reliance on chemical fertilizers, increases
soil organic matter, maintains moisture and provides soil cover. Compost can be made household level
for cost-effective soil fertility improvement.
o Natural fertilizer: A balance of all essential soil nutrients is necessary for healthy plant growth. The
application of any one nutrient in a soil with multiple nutrient deficiencies will have limited impact on crop
growth.
o Micro dosing: Low-technology precision agriculture technique initially developed by ICRISAT. Small
doses of fertilizer applied in the right place has been found to lead to large benefits in yields for the
smallholder farmer.
o Weeding: A move from conventional farming (i.e. tilling the soil) to conservation farming can result in
increased number of weeds. An appropriate weeding strategy is required for successful conservation
farming. Weeds lower crops yields due to competition for water, nutrients, light and space.
o Agroforestry: Agroforestry is the intentional integration of trees within a cropping system for multiple
benefits. It is increasingly recognised as one way of dealing with the lack of space and infertile soils.
Kenya Water Security and Climate Resilience Project
Final Lake Victoria North Basin Plan August 2020 168
1 Key Strategic Area: Catchment Management
1.3 Theme: Natural resources management for the protection and sustainable use
of natural resources
1.3.1 Improved wetlands and lake management
According to the LVN Basin Catchment Management Strategy (2015) wetlands are under pressure from human
encroachment for settlement, expansion of crop production, urbanization, property development and livestock
grazing. These wetlands need protection from degradation and restoration of their functional capacities.
Although significant wetlands are protected from use (refer to KSA 2), in certain cases seasonal wetlands are
utilized by surrounding communities. It is important to not only conserve what is existing, but also improve the
farming practices and grazing in wetlands for more sustainable utilisation and reduced impacts (Braid &
Lodenkemper, 2019).
1. Wetland conservation
Refer to KSA 2
2. Sustainable utilization of wetlands
WRUAs should facilitate the integrated sustainable management of wetlands that require communities to not
only manage the wetlands through land use planning but also the surrounding catchments that sustain and
impact the wetlands.
Wetlands must be clearly zoned with a 50m buffer of protected natural vegetation to act as an infiltration zone
and blocker of sediments/runoff reaching the wetland. Cultivation in the wetland should be limited to small plots
or beds surrounded by natural vegetation closer to the edge of the wetland, with no development at the centre
of the wetland. This will limit erosion and gully formation. Erosion and increased sedimentation can be further
limited through managed grazing practices.
Correctly utilised drainage ditches will give crops space to grow, move water away to prevent waterlogging
(wet season), be well placed to limit erosion, not be dug too deep/have excessive drainage which would lower
the water table (dry season) and lead to gully development (flash flood event).
Organic compost improves water infiltration close to the roots of the crops. Water hungry plants such as sugar
cane and Eucalyptus that reduce the water supply should not be planted in wetlands. In the catchment,
agroforestry trees reduce sedimentation, improve infiltration, and stabilise and improve soil fertility. It also
reduces the removal of natural vegetation for fuel wood and building materials which is a problem.
Wetlands must be clearly zoned to ensure communities manage it sustainably.
The wetland centre must be clearly demarcated and natural vegetation must be protected to prevent erosion
Community wells should not be located in the centre of the wetland because they can become focal point for
gully formation. They should be placed closer to the edge of the wetlands.
1.3.2 Promote alternative/sustainable livelihoods
Communities rely on natural resources to live and earn an income. Over utilisation leads to the depletion of natural
resources. Natural resources need to be managed and utilised in a sustainable manner, to maximise the goods
and services received from them, while still maintaining their function and production capacity. Natural forests,
grasslands and wetlands are finite resources that must be managed sustainably; similarly alien vegetation can
provide useful resources but needs to be managed to prevent uncontrollable spread. Programmes that require
management are as follows:
- Alien vegetation woodlots for personal and commercial use
- Promotion of alien vegetation for agroforestry use
- Agroforestry tree nurseries
- Beekeeping
- Inland aquaculture
1.3.3 Improved solid waste management
To ensure that catchment management activities and resource protection activities can be implemented, it is
important that activities around the household, farm and village are also sustainable and of a high standard. These
include activities such as waste management. Waste management involves the generation, collection,
transportation, and disposal of garbage, sewage and other waste products. Responsible waste management is
the process of treating solid wastes and offers a variety of solutions for waste with the ultimate aim of changing
mind-sets to regard waste as a valuable resource rather than something that must be thrown away. The
government is constitutionally bound to provide sanitation services to all of its citizens, this includes the removal
and proper treatment of solid waste. In reality this is not being done in many parts of the country, particularly in
remote rural areas. Water resources nearby urban areas are particularly at risk, as evident in the CIDPs. It is
important to ensure that the mind-set of waste management extend to individuals and communities as it is
important for a clean and safe environment.
Kenya Water Security and Climate Resilience Project
Final Lake Victoria North Basin Plan August 2020 169
1 Key Strategic Area: Catchment Management
1. Household waste management
Household waste management reduces the potential for underground contamination of water by preventing
the infiltration of pollutants into the surrounding soil of illegal dump sites. Households should be encouraged
to reduce the production of unnecessary waste and dispose of what cannot be reused, recycles or
composted in a responsible way at a legal disposal site.
2. Village waste management
In communal rural areas, solid waste is left on open land or dumped on the roadside. Food scraps and plastic
present in dumped waste creates unpleasant odours and can contribute to the spread of diseases. Waste often
spreads from these sites into drains causing blockages leading to local flooding and results in various
undesirable health and environmental impacts. A village waste management program involves the community
in waste management.
3. Buy back centres
Many unemployed people earn some income collecting and selling recyclable goods on an informal basis.
Waste picking is therefore an important alternative for those who cannot find employment in the formal labour
market due to inadequate skills. Buy back centres play a crucial role in facilitating the recycling potential of
these informal sector participants. Buy back centres are depots where waste collectors can sell their recyclable
waste. The Buy back centres, in turn, sell these waste products to other larger Buy back centres or directly to
recycling companies. Formal recycling companies process the recyclable waste into a form that is readily
usable by a manufacturer or end-use market, where the recyclable waste is converted into materials or other
consumption products. Buy back centres are the link between formal and informal sector activities.
1.3.4 Improved forestry management
Forests are important to return moisture to the air through evapotranspiration, which then generates rain, as well
as to stabilise soils with their root systems; they can also be rich in terms of biodiversity as well as stores of carbon.
Sustainable management of forests both natural and plantation, for reforesting of areas where forests have been
removed including the selection of beneficial tree species.
The Vision 2030 requires the country to work towards achieving a forest cover of at least 10% of the land area to
ensure sustainable resource use, growth and employment creation. The National Forest Policy (Ministry of
Environment and Natural Resources, 2014) indicates that the sustainable management of forests includes:
- Indigenous forests
- Plantation forests
- Dryland forests
- Urban forests and roadside tree planting
- Farm forestry
To achieve the national forest cover target of 10% of land area, the major afforestation effort will have to be in
community and private lands. Dryland forests offer great potential for intensified afforestation but woody vegetation
in the arid and semi-arid areas are unique and require special attention. Most CIDPs promote reforestation through
agroforestry, and in some cases water catchment areas are being protected through the use of alien trees (i.e.
eucalyptus). Consideration needs to be made to the objective of these programmes as there could be significant
long-term challenges associated with planting trees with high water requirements in counties with limited water
supply.
1.3.5 Removal of alien invasive species
Community knowledge base on how to sustainably manage invasive and alien species should be strengthened.
This is because there is knowledge but not strong understanding on the general approaches to sustainably
manage invasive and alien plant species. The KFS and KWTA need to consider alien invasive vegetation
management as invasive alien plant species are a threat to water resources and water availability. By managing
them and preventing their further spread, these plants can also provide useful resources and alternatives to rapidly
depleting indigenous vegetation.
1. Controlling alien invasive vegetation
Invading alien plants use much more water than indigenous trees and plants – and through doing so they grow
faster. They prevent rainwater from reaching rivers and deprive people and ecosystems of much needed water.
Invasive alien plants can displace indigenous species and thereby reduce biodiversity. Invading alien plants
also increase fuel loads making the area vulnerable to devastating fires that destroy infrastructure and damage
soils. By damaging the soils, important indigenous seed banks are destroyed and may be eliminated from the
area.
Invasive alien plant control relies on four main methods - manual, mechanical, chemical and biological
control. Long-term success of any programme is best achieved through a combination of these. This is called
an integrated control approach.
Kenya Water Security and Climate Resilience Project
Final Lake Victoria North Basin Plan August 2020 170
1 Key Strategic Area: Catchment Management
o Removal of larger hardwood invading alien vegetation:
Ring barking
Strip barking
Hand pull
2. Utilising and controlling blue gum (eucalyptus) trees
Blue Gum trees, if left unmanaged, will invade and replace indigenous vegetation by monopolising the water
resources. Application of invasive species management should be done throughout the catchment, but a
particular focus should be given to areas closer to settlements, areas near smaller non-perennial rivers and
areas known to have an elevated fire risk
3. Utilising and controlling pine trees
Invasive plants such as pine trees use much more water than indigenous species. As such they prevent
rainwater from reaching rivers and deprive people and ecosystems of much needed water. Invasive alien plants
can displace indigenous species and thereby reduce biodiversity. Invading alien plants also increase fuel loads
enhancing the potential intensity of fires that destroy infrastructure and damage soils. However, as they are
fast growing trees, they are useful for afforestation projects, they must however be carefully managed in order
to prevent uncontrollable spread through the catchment.
4. Utilising and controlling Bamboo
There are many types of bamboo but in general they can be divided into either clumpers or runners. The
clumping species are non-invasive and can be used for building materials or stabilising soil erosion. Running
bamboo species can be become very invasive and must be controlled.
5. Utilising and controlling Prosopis species
Prosopis spp. also known as mesquite, is a dominant groundwater dependent invasive alien species found in
the arid and semi-arid areas. Hybridization between the dominant species, Prosopis velutina and Prosopis
glandulosa var. torreyana are very invasive.
6. Utilising and controlling water weed/hyacinth
Water hyacinth, Eichhornia crassipes (Mart.) Solms-Laubach (Pontederiaceae) is a perennial, herbaceous,
free-floating aquatic plant that is widely recognized as one of the world’s worst invasive weeds. Anyone
undertaking biological or chemical control methods should have proper training in the use of the
chemical/biological agents. Additionally, they must have a strategic plan in place over several years to ensure
that the process in successful and the system doesn’t relapse into an infestation state.
1.3.6 Improved fisheries management
Promote the sustainable development and management of fisheries in lakes, dams, wetlands and rivers.
1.3.7 Improved energy management
To ensure that catchment management activities and resource protection activities can be implemented, it is
important that activities around the household, farm and village are also sustainable and of a high standard. These
include activities such as energy management. Renewable sources of energy should be promoted to generate
electric power for use in the household, or community, as a replacement for the burning of wood or charcoal.
Most CIDPs promote “green energy” as an alternative fuel to wood and charcoal.
The following renewable sources could also be promoted for energy supply instead of burning wood or charcoal:
- Solar cooker
- Solar electrification
- Solar borehole pump
- Wind pump
- Micro hydropower
- Biogas digester
- Energy efficient stoves and ovens
- Heat retention cooker
- Solar turtle
1.3.8 Improved sand mine management
Develop policies for sand harvesting. Consider alternative sources of sand.
1.4 Theme: Rehabilitation of degraded environments
1.4.1 Rehabilitation and Restoration Plan
Develop a restoration and rehabilitation programme. Refer to 1.2.2.
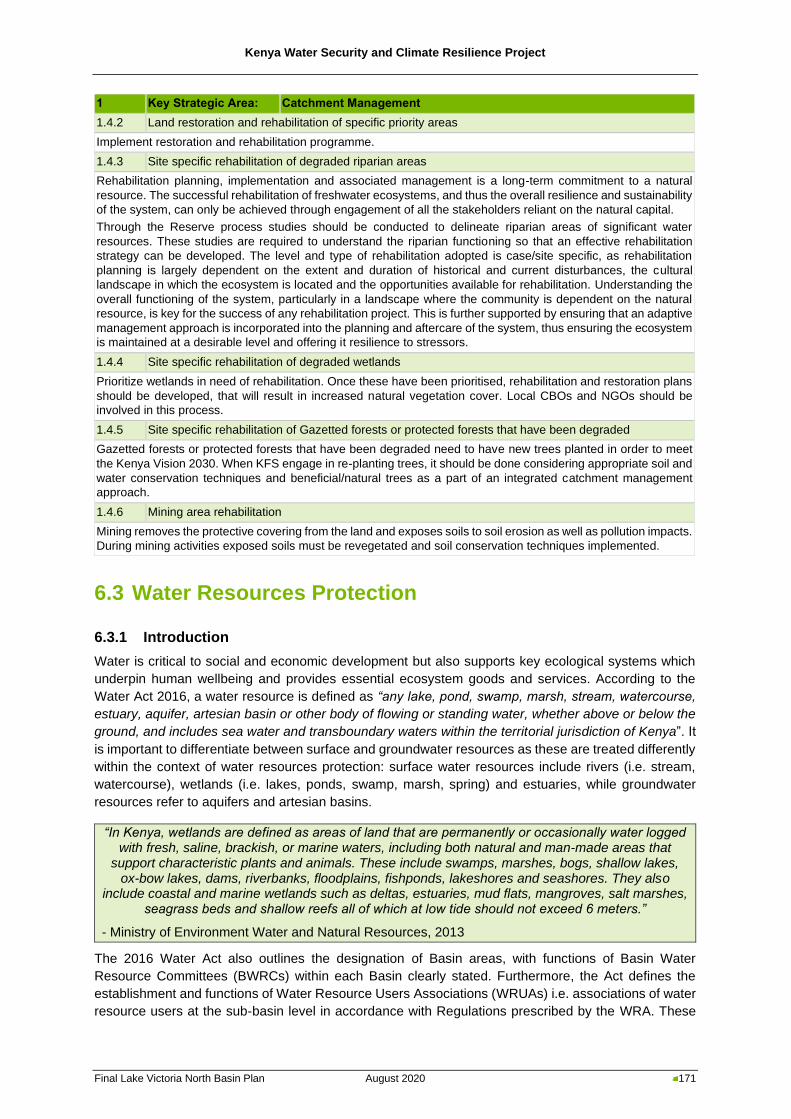
Kenya Water Security and Climate Resilience Project
Final Lake Victoria North Basin Plan August 2020 171
1 Key Strategic Area: Catchment Management
1.4.2 Land restoration and rehabilitation of specific priority areas
Implement restoration and rehabilitation programme.
1.4.3 Site specific rehabilitation of degraded riparian areas
Rehabilitation planning, implementation and associated management is a long-term commitment to a natural
resource. The successful rehabilitation of freshwater ecosystems, and thus the overall resilience and sustainability
of the system, can only be achieved through engagement of all the stakeholders reliant on the natural capital.
Through the Reserve process studies should be conducted to delineate riparian areas of significant water
resources. These studies are required to understand the riparian functioning so that an effective rehabilitation
strategy can be developed. The level and type of rehabilitation adopted is case/site specific, as rehabilitation
planning is largely dependent on the extent and duration of historical and current disturbances, the cultural
landscape in which the ecosystem is located and the opportunities available for rehabilitation. Understanding the
overall functioning of the system, particularly in a landscape where the community is dependent on the natural
resource, is key for the success of any rehabilitation project. This is further supported by ensuring that an adaptive
management approach is incorporated into the planning and aftercare of the system, thus ensuring the ecosystem
is maintained at a desirable level and offering it resilience to stressors.
1.4.4 Site specific rehabilitation of degraded wetlands
Prioritize wetlands in need of rehabilitation. Once these have been prioritised, rehabilitation and restoration plans
should be developed, that will result in increased natural vegetation cover. Local CBOs and NGOs should be
involved in this process.
1.4.5 Site specific rehabilitation of Gazetted forests or protected forests that have been degraded
Gazetted forests or protected forests that have been degraded need to have new trees planted in order to meet
the Kenya Vision 2030. When KFS engage in re-planting trees, it should be done considering appropriate soil and
water conservation techniques and beneficial/natural trees as a part of an integrated catchment management
approach.
1.4.6 Mining area rehabilitation
Mining removes the protective covering from the land and exposes soils to soil erosion as well as pollution impacts.
During mining activities exposed soils must be revegetated and soil conservation techniques implemented.
6.3 Water Resources Protection
6.3.1 Introduction
Water is critical to social and economic development but also supports key ecological systems which
underpin human wellbeing and provides essential ecosystem goods and services. According to the
Water Act 2016, a water resource is defined as “any lake, pond, swamp, marsh, stream, watercourse,
estuary, aquifer, artesian basin or other body of flowing or standing water, whether above or below the
ground, and includes sea water and transboundary waters within the territorial jurisdiction of Kenya”. It
is important to differentiate between surface and groundwater resources as these are treated differently
within the context of water resources protection: surface water resources include rivers (i.e. stream,
watercourse), wetlands (i.e. lakes, ponds, swamp, marsh, spring) and estuaries, while groundwater
resources refer to aquifers and artesian basins.
“In Kenya, wetlands are defined as areas of land that are permanently or occasionally water logged with fresh, saline, brackish, or marine waters, including both natural and man-made areas that
support characteristic plants and animals. These include swamps, marshes, bogs, shallow lakes, ox-bow lakes, dams, riverbanks, floodplains, fishponds, lakeshores and seashores. They also
include coastal and marine wetlands such as deltas, estuaries, mud flats, mangroves, salt marshes, seagrass beds and shallow reefs all of which at low tide should not exceed 6 meters.”
- Ministry of Environment Water and Natural Resources, 2013
The 2016 Water Act also outlines the designation of Basin areas, with functions of Basin Water
Resource Committees (BWRCs) within each Basin clearly stated. Furthermore, the Act defines the
establishment and functions of Water Resource Users Associations (WRUAs) i.e. associations of water
resource users at the sub-basin level in accordance with Regulations prescribed by the WRA. These
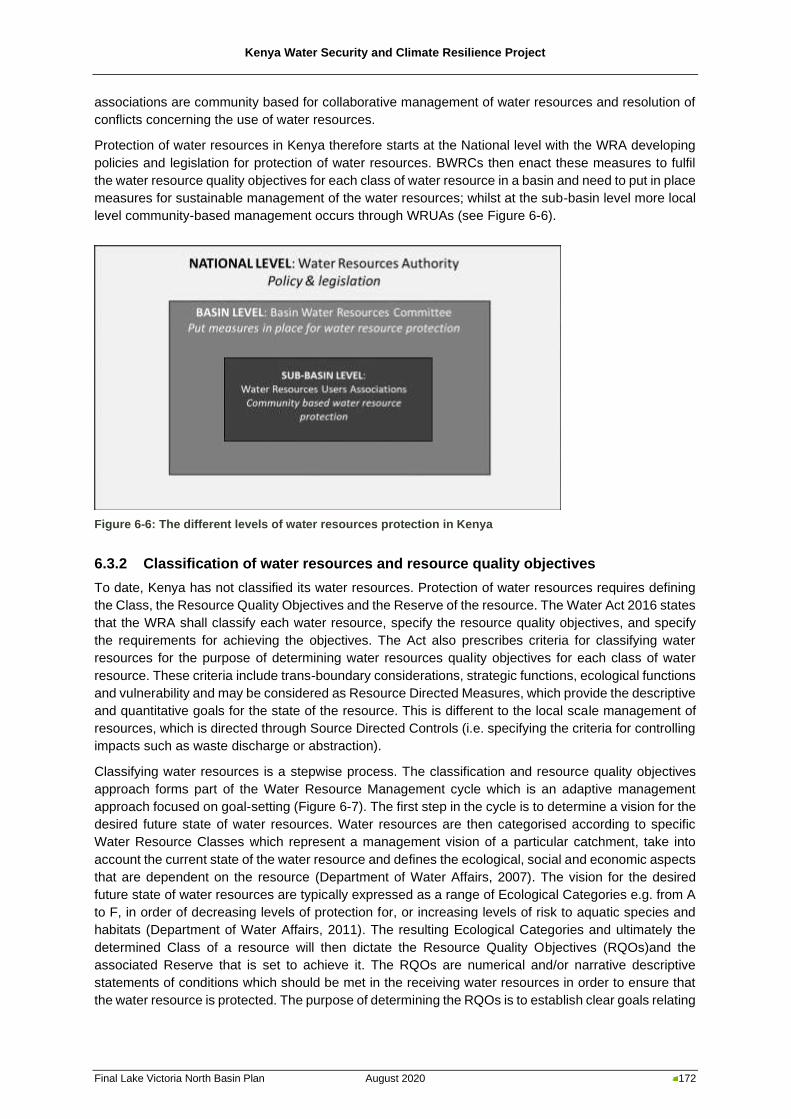
Kenya Water Security and Climate Resilience Project
Final Lake Victoria North Basin Plan August 2020 172
associations are community based for collaborative management of water resources and resolution of
conflicts concerning the use of water resources.
Protection of water resources in Kenya therefore starts at the National level with the WRA developing
policies and legislation for protection of water resources. BWRCs then enact these measures to fulfil
the water resource quality objectives for each class of water resource in a basin and need to put in place
measures for sustainable management of the water resources; whilst at the sub-basin level more local
level community-based management occurs through WRUAs (see Figure 6-6).
Figure 6-6: The different levels of water resources protection in Kenya
6.3.2 Classification of water resources and resource quality objectives
To date, Kenya has not classified its water resources. Protection of water resources requires defining
the Class, the Resource Quality Objectives and the Reserve of the resource. The Water Act 2016 states
that the WRA shall classify each water resource, specify the resource quality objectives, and specify
the requirements for achieving the objectives. The Act also prescribes criteria for classifying water
resources for the purpose of determining water resources quality objectives for each class of water
resource. These criteria include trans-boundary considerations, strategic functions, ecological functions
and vulnerability and may be considered as Resource Directed Measures, which provide the descriptive
and quantitative goals for the state of the resource. This is different to the local scale management of
resources, which is directed through Source Directed Controls (i.e. specifying the criteria for controlling
impacts such as waste discharge or abstraction).
Classifying water resources is a stepwise process. The classification and resource quality objectives
approach forms part of the Water Resource Management cycle which is an adaptive management
approach focused on goal-setting (Figure 6-7). The first step in the cycle is to determine a vision for the
desired future state of water resources. Water resources are then categorised according to specific
Water Resource Classes which represent a management vision of a particular catchment, take into
account the current state of the water resource and defines the ecological, social and economic aspects
that are dependent on the resource (Department of Water Affairs, 2007). The vision for the desired
future state of water resources are typically expressed as a range of Ecological Categories e.g. from A
to F, in order of decreasing levels of protection for, or increasing levels of risk to aquatic species and
habitats (Department of Water Affairs, 2011). The resulting Ecological Categories and ultimately the
determined Class of a resource will then dictate the Resource Quality Objectives (RQOs)and the
associated Reserve that is set to achieve it. The RQOs are numerical and/or narrative descriptive
statements of conditions which should be met in the receiving water resources in order to ensure that
the water resource is protected. The purpose of determining the RQOs is to establish clear goals relating
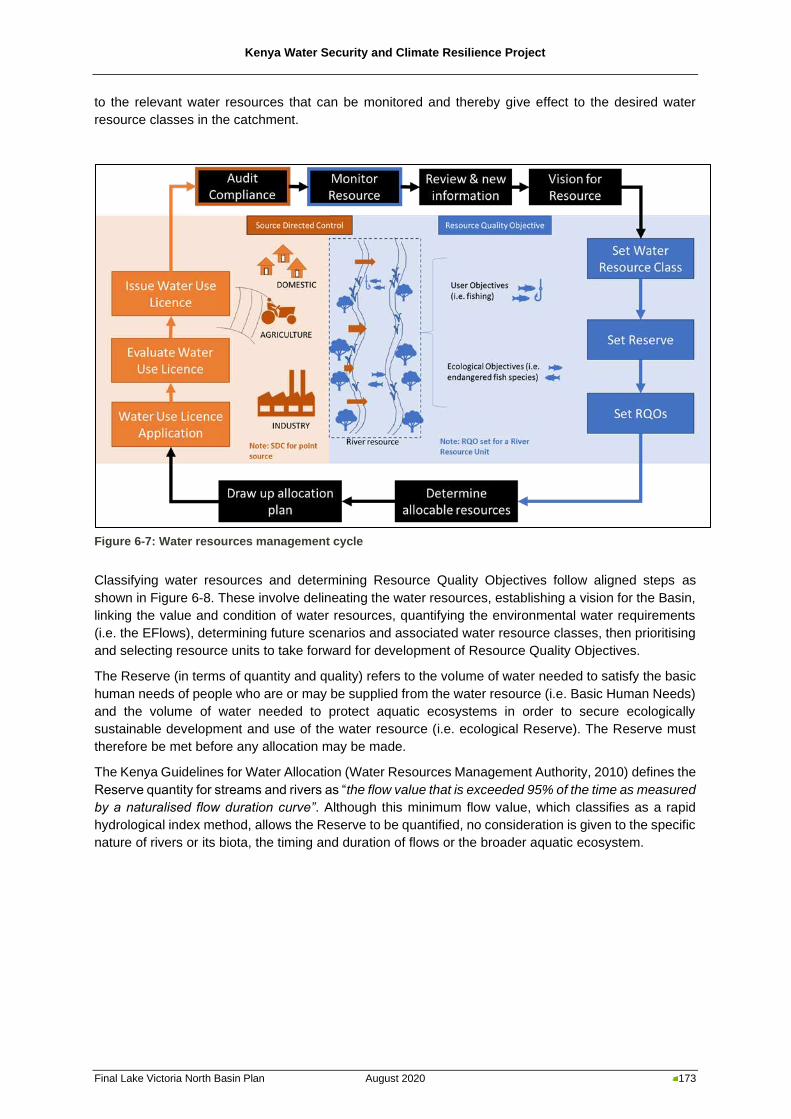
Kenya Water Security and Climate Resilience Project
Final Lake Victoria North Basin Plan August 2020 173
to the relevant water resources that can be monitored and thereby give effect to the desired water
resource classes in the catchment.
Figure 6-7: Water resources management cycle
Classifying water resources and determining Resource Quality Objectives follow aligned steps as
shown in Figure 6-8. These involve delineating the water resources, establishing a vision for the Basin,
linking the value and condition of water resources, quantifying the environmental water requirements
(i.e. the EFlows), determining future scenarios and associated water resource classes, then prioritising
and selecting resource units to take forward for development of Resource Quality Objectives.
The Reserve (in terms of quantity and quality) refers to the volume of water needed to satisfy the basic
human needs of people who are or may be supplied from the water resource (i.e. Basic Human Needs)
and the volume of water needed to protect aquatic ecosystems in order to secure ecologically
sustainable development and use of the water resource (i.e. ecological Reserve). The Reserve must
therefore be met before any allocation may be made.
The Kenya Guidelines for Water Allocation (Water Resources Management Authority, 2010) defines the
Reserve quantity for streams and rivers as “the flow value that is exceeded 95% of the time as measured
by a naturalised flow duration curve”. Although this minimum flow value, which classifies as a rapid
hydrological index method, allows the Reserve to be quantified, no consideration is given to the specific
nature of rivers or its biota, the timing and duration of flows or the broader aquatic ecosystem.
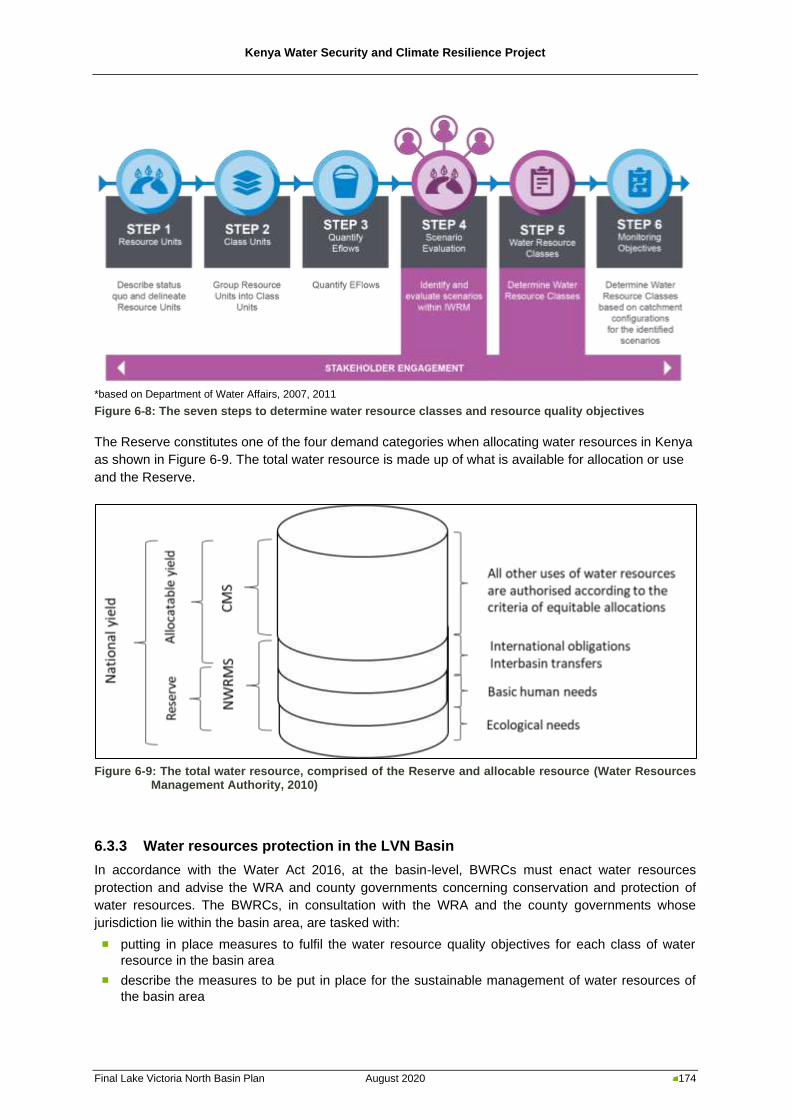
Kenya Water Security and Climate Resilience Project
Final Lake Victoria North Basin Plan August 2020 174
*based on Department of Water Affairs, 2007, 2011
Figure 6-8: The seven steps to determine water resource classes and resource quality objectives
The Reserve constitutes one of the four demand categories when allocating water resources in Kenya
as shown in Figure 6-9. The total water resource is made up of what is available for allocation or use
and the Reserve.
Figure 6-9: The total water resource, comprised of the Reserve and allocable resource (Water Resources Management Authority, 2010)
6.3.3 Water resources protection in the LVN Basin
In accordance with the Water Act 2016, at the basin-level, BWRCs must enact water resources
protection and advise the WRA and county governments concerning conservation and protection of
water resources. The BWRCs, in consultation with the WRA and the county governments whose
jurisdiction lie within the basin area, are tasked with:
◼ putting in place measures to fulfil the water resource quality objectives for each class of water
resource in the basin area
◼ describe the measures to be put in place for the sustainable management of water resources of
the basin area
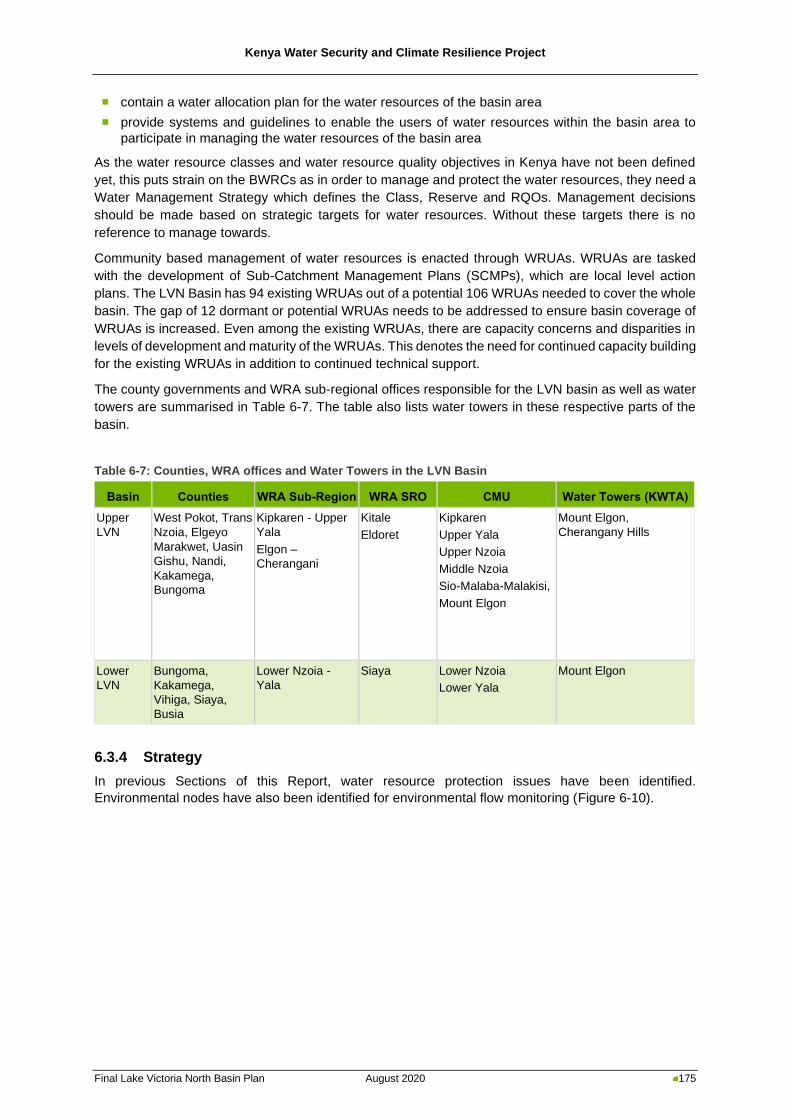
Kenya Water Security and Climate Resilience Project
Final Lake Victoria North Basin Plan August 2020 175
◼ contain a water allocation plan for the water resources of the basin area
◼ provide systems and guidelines to enable the users of water resources within the basin area to
participate in managing the water resources of the basin area
As the water resource classes and water resource quality objectives in Kenya have not been defined
yet, this puts strain on the BWRCs as in order to manage and protect the water resources, they need a
Water Management Strategy which defines the Class, Reserve and RQOs. Management decisions
should be made based on strategic targets for water resources. Without these targets there is no
reference to manage towards.
Community based management of water resources is enacted through WRUAs. WRUAs are tasked
with the development of Sub-Catchment Management Plans (SCMPs), which are local level action
plans. The LVN Basin has 94 existing WRUAs out of a potential 106 WRUAs needed to cover the whole
basin. The gap of 12 dormant or potential WRUAs needs to be addressed to ensure basin coverage of
WRUAs is increased. Even among the existing WRUAs, there are capacity concerns and disparities in
levels of development and maturity of the WRUAs. This denotes the need for continued capacity building
for the existing WRUAs in addition to continued technical support.
The county governments and WRA sub-regional offices responsible for the LVN basin as well as water
towers are summarised in Table 6-7. The table also lists water towers in these respective parts of the
basin.
Table 6-7: Counties, WRA offices and Water Towers in the LVN Basin
Basin Counties WRA Sub-Region WRA SRO CMU Water Towers (KWTA)
Upper
LVN
West Pokot, Trans
Nzoia, Elgeyo
Marakwet, Uasin
Gishu, Nandi,
Kakamega,
Bungoma
Kipkaren - Upper
Yala
Elgon –
Cherangani
Kitale
Eldoret
Kipkaren
Upper Yala
Upper Nzoia
Middle Nzoia
Sio-Malaba-Malakisi,
Mount Elgon
Mount Elgon,
Cherangany Hills
Lower
LVN
Bungoma,
Kakamega,
Vihiga, Siaya,
Busia
Lower Nzoia -
Yala
Siaya Lower Nzoia
Lower Yala
Mount Elgon
6.3.4 Strategy
In previous Sections of this Report, water resource protection issues have been identified.
Environmental nodes have also been identified for environmental flow monitoring (Figure 6-10).
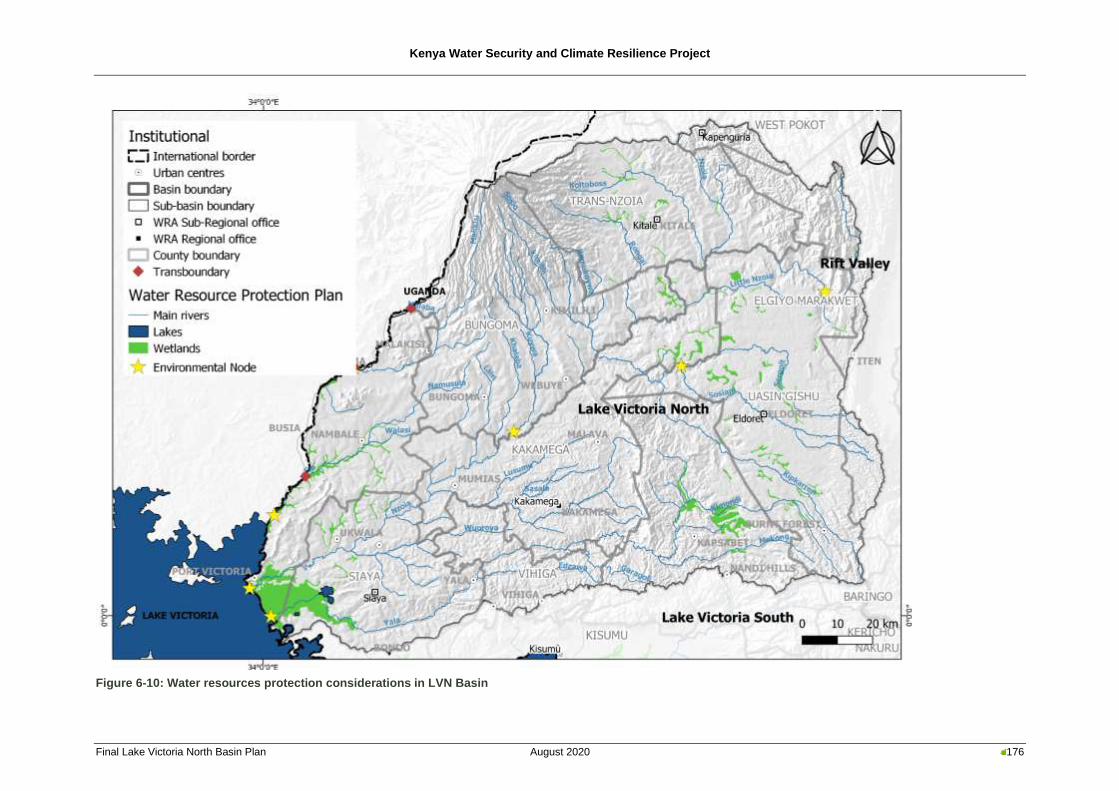
Kenya Water Security and Climate Resilience Project
Final Lake Victoria North Basin Plan August 2020 176
Figure 6-10: Water resources protection considerations in LVN Basin
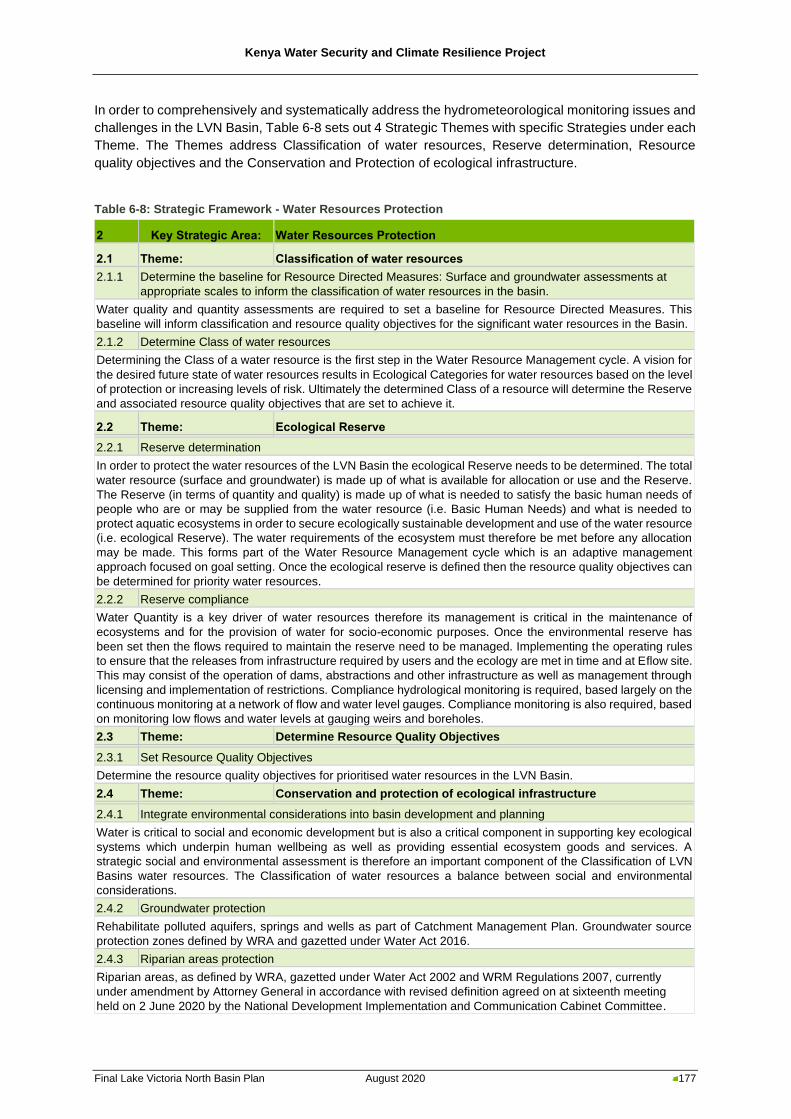
Kenya Water Security and Climate Resilience Project
Final Lake Victoria North Basin Plan August 2020 177
In order to comprehensively and systematically address the hydrometeorological monitoring issues and
challenges in the LVN Basin, Table 6-8 sets out 4 Strategic Themes with specific Strategies under each
Theme. The Themes address Classification of water resources, Reserve determination, Resource
quality objectives and the Conservation and Protection of ecological infrastructure.
Table 6-8: Strategic Framework - Water Resources Protection
2 Key Strategic Area: Water Resources Protection
2.1 Theme: Classification of water resources
2.1.1 Determine the baseline for Resource Directed Measures: Surface and groundwater assessments at
appropriate scales to inform the classification of water resources in the basin.
Water quality and quantity assessments are required to set a baseline for Resource Directed Measures. This
baseline will inform classification and resource quality objectives for the significant water resources in the Basin.
2.1.2 Determine Class of water resources
Determining the Class of a water resource is the first step in the Water Resource Management cycle. A vision for
the desired future state of water resources results in Ecological Categories for water resources based on the level
of protection or increasing levels of risk. Ultimately the determined Class of a resource will determine the Reserve
and associated resource quality objectives that are set to achieve it.
2.2 Theme: Ecological Reserve
2.2.1 Reserve determination
In order to protect the water resources of the LVN Basin the ecological Reserve needs to be determined. The total
water resource (surface and groundwater) is made up of what is available for allocation or use and the Reserve.
The Reserve (in terms of quantity and quality) is made up of what is needed to satisfy the basic human needs of
people who are or may be supplied from the water resource (i.e. Basic Human Needs) and what is needed to
protect aquatic ecosystems in order to secure ecologically sustainable development and use of the water resource
(i.e. ecological Reserve). The water requirements of the ecosystem must therefore be met before any allocation
may be made. This forms part of the Water Resource Management cycle which is an adaptive management
approach focused on goal setting. Once the ecological reserve is defined then the resource quality objectives can
be determined for priority water resources.
2.2.2 Reserve compliance
Water Quantity is a key driver of water resources therefore its management is critical in the maintenance of
ecosystems and for the provision of water for socio-economic purposes. Once the environmental reserve has
been set then the flows required to maintain the reserve need to be managed. Implementing the operating rules
to ensure that the releases from infrastructure required by users and the ecology are met in time and at Eflow site.
This may consist of the operation of dams, abstractions and other infrastructure as well as management through
licensing and implementation of restrictions. Compliance hydrological monitoring is required, based largely on the
continuous monitoring at a network of flow and water level gauges. Compliance monitoring is also required, based
on monitoring low flows and water levels at gauging weirs and boreholes.
2.3 Theme: Determine Resource Quality Objectives
2.3.1 Set Resource Quality Objectives
Determine the resource quality objectives for prioritised water resources in the LVN Basin.
2.4 Theme: Conservation and protection of ecological infrastructure
2.4.1 Integrate environmental considerations into basin development and planning
Water is critical to social and economic development but is also a critical component in supporting key ecological
systems which underpin human wellbeing as well as providing essential ecosystem goods and services. A
strategic social and environmental assessment is therefore an important component of the Classification of LVN
Basins water resources. The Classification of water resources a balance between social and environmental
considerations.
2.4.2 Groundwater protection
Rehabilitate polluted aquifers, springs and wells as part of Catchment Management Plan. Groundwater source
protection zones defined by WRA and gazetted under Water Act 2016.
2.4.3 Riparian areas protection
Riparian areas, as defined by WRA, gazetted under Water Act 2002 and WRM Regulations 2007, currently
under amendment by Attorney General in accordance with revised definition agreed on at sixteenth meeting
held on 2 June 2020 by the National Development Implementation and Communication Cabinet Committee.
Kenya Water Security and Climate Resilience Project
Final Lake Victoria North Basin Plan August 2020 178
2 Key Strategic Area: Water Resources Protection
2.4.4 Ecosystem services protection
Water is critical to social and economic development but is also a critical component in supporting key ecological
systems which underpin human wellbeing as well as providing essential ecosystem goods and services. In
particular, certain environmentally sensitive areas are reliant on the protection of water resources. Although
environmentally sensitive areas are defined by NEMA, this information should be provided to WRA during the
Classification of water resources in order for WRA to classify and protect according to the Water Act 2016.
6.4 Groundwater Management
6.4.1 Introduction
Many LVN Towns rely on groundwater to a certain degree, as described in the Office of the Auditor-
General’s report on the LVNWWDA (Office of the Auditor-General, 2016). While volumetric data is
sparse, reliance on groundwater is clearly of significance. Given the above, groundwater resources are
clearly very important in the LVN Basin, and particularly so for rural water supplies. The very nature of
these sources (particularly shallow wells and springs) mean that other than as part of county or NGO
development or rehabilitation programmes, they are seldom counted; abstraction from them is even
more rarely quantified. Few of them are likely to have Water Permits (the PDB captures the geology of
the groundwater source, but does not differentiate between boreholes, shallow wells or springs);
furthermore, groundwater sources other than boreholes exploited by motorised pumps are also rarely
captured by the PDB.
Spring flow and baseflow contribute significantly to maintaining streamflow, particularly during dry
seasons. Protecting springs is a simple, sensible and relatively cheap measure with potentially
significant health benefits (Kremer et al., 2011).
A groundwater management plan (GMP) is therefore necessary for the integrated and rational
management and development of groundwater resources. A GMP should capture and integrate basic
groundwater understanding, describe sustainable management measures and present an action plan
in a single document. The GMP must present both clear objectives and desired outcomes. The GMP
should describe the financial requirements needed to implement it, the time frame for its implementation
and the monitoring network necessary to monitor the resource across the plan’s lifetime. A GMP is not
a static instrument; as resources monitoring and data analysis takes place across the plan period,
improvements and even whole new aspects may need to be incorporated, as development occurs
across the resource. Finally, the plan must include a regular, planned stakeholder consultation
mechanism which provides feedback and an avenue for information dissemination by the WRA and
stakeholders.
Ultimately, a GMP must:
◼ Conserve the overall groundwater resource base and protect its quality; and
◼ Recognise and resolve local conflicts over resource allocation (abstraction or pollution) (Foster et
al., 2015).
Groundwater in Kenya is not currently managed in a coherent fashion (Mumma et al., 2011). A final
draft National Policy on Groundwater Resources Development and Management was published in 2013
(MoWI, 2013), but despite the best of intentions, groundwater remains poorly understood and poorly
managed. The policy document highlights several specific issues:
◼ The availability and vulnerability of groundwater resources in Kenya are poorly understood;
◼ The institutional arrangements for groundwater management in Kenya, including groundwater
management capacity and financing are weak;
◼ There is very limited integrated water resources management in Kenya, with groundwater and
surface water typically being treated as separate water resources; and
◼ There is very limited groundwater quality management in Kenya.
Kenya Water Security and Climate Resilience Project
Final Lake Victoria North Basin Plan August 2020 179
A groundwater management strategy is influenced by hydrogeological, socio-economic and political
factors, therefore both policy and strategy together inform a GMP. The GMP needs to be differentiated
from an Aquifer Management Plan as the GMP considers groundwater management from the Basin
perspective, while an Aquifer Management Plan is applied to a single aquifer unit.
6.4.2 Groundwater use
Because of the high and generally reliable rainfall in LVN Basin, much of the water used to meet formal
water supply demand comes from surface water sources. However, across the Basin groundwater has
long been used for urban and rural water supplies, particularly to meet private water demands (DHV
Consultants, 1988; Ministry of Foreign Affairs of Finland, 2009). While no towns or other major centres
rely heavily on groundwater, groundwater use is widespread across the Basin. According to the Kenya
National Water Master Plan (NWMP) 2030, there are 1 776 boreholes in the Basin; however, only 1 383
separate groundwater permit applicants are captured in the PDB.
In Busia County, groundwater makes up 68% of the drinking water (46% from boreholes and 22% from
springs) (County Government of Busia, 2018). In Trans Nzoia, the CIDP states that 52% of all the
households use springs, wells or boreholes. In every other category, groundwater constitutes a small
(sometimes vanishingly small) proportion of total water use. The preponderance of total surface water
use over groundwater use is striking; groundwater use constitutes just over 2% of total water use.
Navakholo (Kakamega County) relies exclusively on two high-capacity boreholes for water supply,
yielding 58 m3/hr (C-9232) and 29 m3/hr (C-9243); these are unusually high yields for the LVN Basin
(Lake Victoria North Water Services Board, 2011).
Limited conjunctive use is in place at present, other than in the following public water supply systems:
Butere, Nambale, Shitole, Mumias and Bungoma.
Kakamega uses four boreholes to supplement surface water resources; Busia uses eight boreholes,
Butere five (yielding three to eight m3/hr, for a total of 420 m3/d in 2011: Lake Victoria North Water
Services Board, 2011, Nambale (Busia County) five, Shitole (Bungoma County) uses three and Mumias
two. While volumetric data are sparse, reliance on groundwater is clearly of significance. In Bungoma
Town surface water from the Kuywa River (about 8 500 m3/d) is supplemented by six boreholes in the
Town, between them supplying about 500 m3/d (County Government of Bungoma, 2018; Ministry of
Lands and Physical Planning, 2017).
In 2016/17, Busia Town was supplied with an average of 2 770 m3/d (Water Services Regulatory Board,
2018). Busia water supply relies on the Sio river (design capacity 2 900 m3/d) and eight boreholes for
water supply; the latter can supply 1 080 m3/d, with yields ranging from three to 14 m3/hr (WSTF, ND).
In the Vihiga County In addition to surface water, the Sosiani and Vihiga schemes are served by
protected springs, providing 400 and 150 m3/d respectively; the Sosiani Scheme cannot be expanded
further, though there is some scope for expanding the Vihiga Scheme (Kanda et al., 2018).
In the commercial irrigated agricultural zone in the humid uplands of the LVN Basin, private sector
farmers may practice limited conjunctive use (particularly horticultural enterprises in the Eldoret area).
These users combine surface water abstraction, limited groundwater use and extensive rainwater
harvesting to maintain water supplies. This is likely to intensify as more and more pressure is placed on
limited land and water resources.
6.4.3 Groundwater resource potential
The annual groundwater recharge for the LVN Basin was estimated at 1,508 MCM/a, with a sustainable
annual groundwater yield of 216 MCM/a. This is significantly higher than the NWMP 2030 sustainable
groundwater yield estimate of 116 MCM/a for the LVN Basin. However, whereas the NWMP 2030
assumed sustainable yield as a percentage of recharge (10%), the groundwater assessment which was
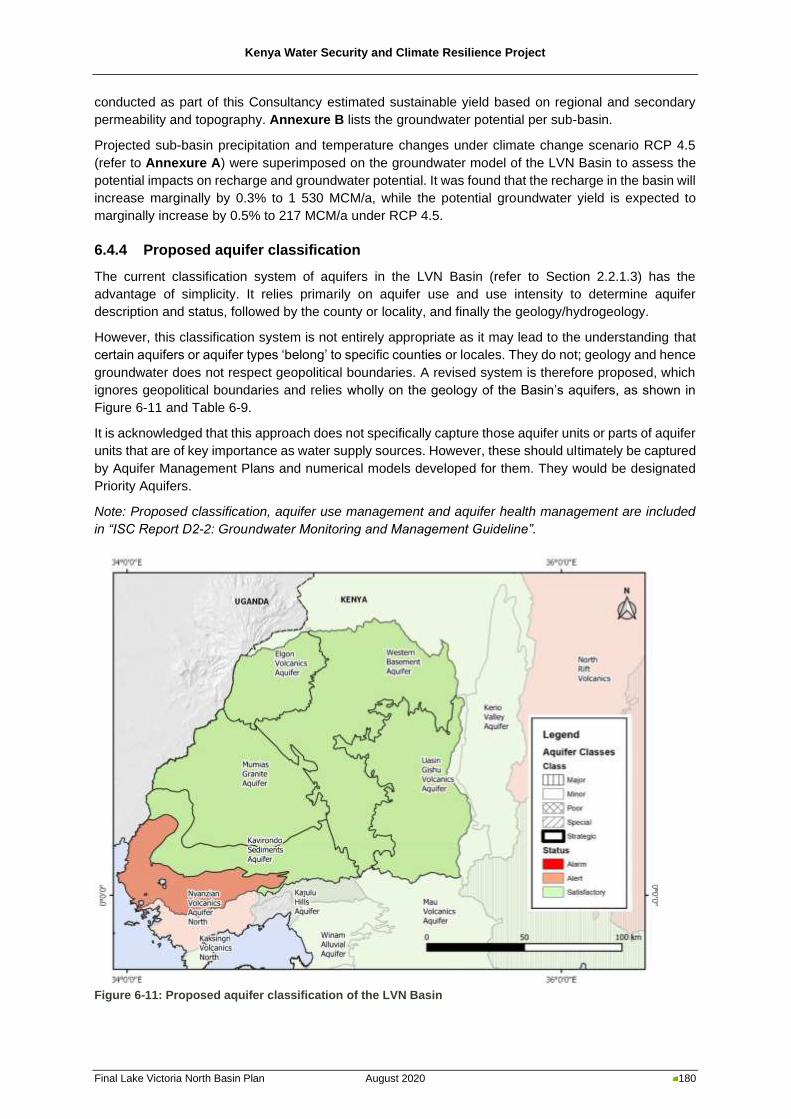
Kenya Water Security and Climate Resilience Project
Final Lake Victoria North Basin Plan August 2020 180
conducted as part of this Consultancy estimated sustainable yield based on regional and secondary
permeability and topography. Annexure B lists the groundwater potential per sub-basin.
Projected sub-basin precipitation and temperature changes under climate change scenario RCP 4.5
(refer to Annexure A) were superimposed on the groundwater model of the LVN Basin to assess the
potential impacts on recharge and groundwater potential. It was found that the recharge in the basin will
increase marginally by 0.3% to 1 530 MCM/a, while the potential groundwater yield is expected to
marginally increase by 0.5% to 217 MCM/a under RCP 4.5.
6.4.4 Proposed aquifer classification
The current classification system of aquifers in the LVN Basin (refer to Section 2.2.1.3) has the
advantage of simplicity. It relies primarily on aquifer use and use intensity to determine aquifer
description and status, followed by the county or locality, and finally the geology/hydrogeology.
However, this classification system is not entirely appropriate as it may lead to the understanding that
certain aquifers or aquifer types ‘belong’ to specific counties or locales. They do not; geology and hence
groundwater does not respect geopolitical boundaries. A revised system is therefore proposed, which
ignores geopolitical boundaries and relies wholly on the geology of the Basin’s aquifers, as shown in
Figure 6-11 and Table 6-9.
It is acknowledged that this approach does not specifically capture those aquifer units or parts of aquifer
units that are of key importance as water supply sources. However, these should ultimately be captured
by Aquifer Management Plans and numerical models developed for them. They would be designated
Priority Aquifers.
Note: Proposed classification, aquifer use management and aquifer health management are included
in “ISC Report D2-2: Groundwater Monitoring and Management Guideline”.
Figure 6-11: Proposed aquifer classification of the LVN Basin
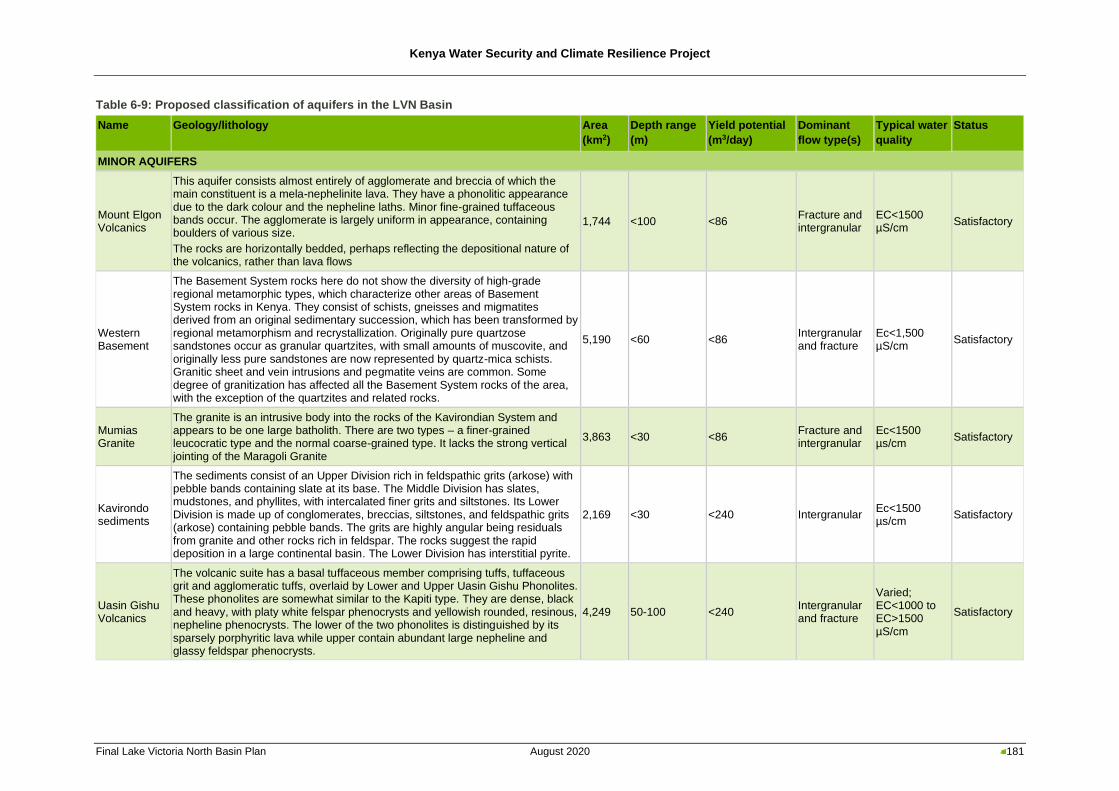
Kenya Water Security and Climate Resilience Project
Final Lake Victoria North Basin Plan August 2020 181
Table 6-9: Proposed classification of aquifers in the LVN Basin
Name Geology/lithology Area
(km2)
Depth range
(m)
Yield potential
(m3/day)
Dominant
flow type(s)
Typical water
quality
Status
MINOR AQUIFERS
Mount Elgon Volcanics
This aquifer consists almost entirely of agglomerate and breccia of which the main constituent is a mela-nephelinite lava. They have a phonolitic appearance due to the dark colour and the nepheline laths. Minor fine-grained tuffaceous bands occur. The agglomerate is largely uniform in appearance, containing boulders of various size.
The rocks are horizontally bedded, perhaps reflecting the depositional nature of the volcanics, rather than lava flows
1,744 <100 <86 Fracture and intergranular
EC<1500 µS/cm
Satisfactory
Western Basement
The Basement System rocks here do not show the diversity of high-grade regional metamorphic types, which characterize other areas of Basement System rocks in Kenya. They consist of schists, gneisses and migmatites derived from an original sedimentary succession, which has been transformed by regional metamorphism and recrystallization. Originally pure quartzose sandstones occur as granular quartzites, with small amounts of muscovite, and originally less pure sandstones are now represented by quartz-mica schists. Granitic sheet and vein intrusions and pegmatite veins are common. Some degree of granitization has affected all the Basement System rocks of the area, with the exception of the quartzites and related rocks.
5,190 <60 <86 Intergranular and fracture
Ec<1,500 µS/cm
Satisfactory
Mumias Granite
The granite is an intrusive body into the rocks of the Kavirondian System and appears to be one large batholith. There are two types – a finer-grained leucocratic type and the normal coarse-grained type. It lacks the strong vertical jointing of the Maragoli Granite
3,863 <30 <86 Fracture and intergranular
Ec<1500 µs/cm
Satisfactory
Kavirondo sediments
The sediments consist of an Upper Division rich in feldspathic grits (arkose) with pebble bands containing slate at its base. The Middle Division has slates, mudstones, and phyllites, with intercalated finer grits and siltstones. Its Lower Division is made up of conglomerates, breccias, siltstones, and feldspathic grits (arkose) containing pebble bands. The grits are highly angular being residuals from granite and other rocks rich in feldspar. The rocks suggest the rapid deposition in a large continental basin. The Lower Division has interstitial pyrite.
2,169 <30 <240 Intergranular Ec<1500 µs/cm
Satisfactory
Uasin Gishu Volcanics
The volcanic suite has a basal tuffaceous member comprising tuffs, tuffaceous grit and agglomeratic tuffs, overlaid by Lower and Upper Uasin Gishu Phonolites. These phonolites are somewhat similar to the Kapiti type. They are dense, black and heavy, with platy white felspar phenocrysts and yellowish rounded, resinous, nepheline phenocrysts. The lower of the two phonolites is distinguished by its sparsely porphyritic lava while upper contain abundant large nepheline and glassy feldspar phenocrysts.
4,249 50-100 <240 Intergranular and fracture
Varied; EC<1000 to EC>1500 µS/cm
Satisfactory
Kenya Water Security and Climate Resilience Project
Final Lake Victoria North Basin Plan August 2020 182
6.4.5 Key groundwater issues and challenges in the LVN Basin
6.4.5.1 Vulnerability
A review of groundwater vulnerability assessment in Kenya as a whole is given by Rendilicha et al.
(2018),and highlights how few vulnerability assessments have been carried out in Kenya. The risk of
pollution to deep groundwaters across Kenya is discussed in general terms in the National Groundwater
Quality Report (Water Resources Authority, 2019c).
The vulnerability of LVN Basin aquifers is largely unknown, as few studies have been carried out at the
appropriate level of detail; shallow groundwater pollution in Eldoret is discussed below.
The GMP must therefore address vulnerability and include measures to:
◼ Define vulnerable aquifers (through abstraction and groundwater quality surveys; and the review of
data);
◼ Delineate vulnerable aquifers (through GIS and mapping on the ground);
◼ Develop methods to protect vulnerable aquifers.
6.4.5.2 Water quality
Surface waters in the LVN Basin are quite frequently polluted, due to both industrial and municipal
wastewater discharge; this is described elsewhere in this report. Natural groundwater contaminants
include high TDS (total dissolved solids), fluoride, chloride, iron and manganese. These are distributed
in groundwaters across the LVN Basin, but basement groundwaters often contain groundwater with
elevated TDS.
Both the KEFINCO (Ministry of Foreign Affairs of Finland, 2009) and RWSS programmes (DHV
Consultants, 1988) relied heavily on boreholes fitted with handpumps; it soon became clear that iron
was a sufficiently serious contaminant that it led to the abandonment of a "relatively high percentage
(10-12%) of boreholes and wells not used for drinking because of the bitter taste of the water (probably
caused by a high manganese and/or iron concentration)" (verbatim, DHV Consultants, 1988). The
problem was serious enough that KEFINCO constructed iron removal plants (IRPs) and trained
communities to use them. KEFINCO also funded a University of Nairobi research project into iron
removal from groundwater (Muruiki, 1994).
An aspect of iron in groundwater relates to pH and the use of galvanised iron (GI) rising main and pump
parts. Groundwaters of pH <6.5 corrode GI pipe and fittings (Langenegger, 1994). This is particularly a
problem in parts of LVN. KEFINCO responded by constructing boreholes with uPVC rather than mild
steel (Ruotsalainen & Turunen, 1994). Similar problems were noted in the RUWASA Project in Uganda,
where Danida and the Uganda Government switched from using GI to stainless steel downhole
materials in pumps in response to corrosion and problem iron (Baumann, 1998).
Generally, the extent and significance of groundwater pollution in the LVN Basin is relatively unknown.
However, given high LVN Basin population densities and reported experiences in other Basins, shallow
groundwater pollution is likely to be more widespread than currently reported. Research conducted as
part of this consultancy indicate that the following localities have associated groundwater quality issues.
Kenya Water Security and Climate Resilience Project
Final Lake Victoria North Basin Plan August 2020 183
◼ A number of studies show that shallow groundwaters beneath informal settlements in Eldoret
contain measurable and significant concentrations of E. coli bacteria (the Kenya Standard is nil
colony counts in 250 mL of sample: Kenya Bureau of Standards, 2007). A study in Langas (Kiptum
& Nbambuki, 2012) found nitrate concentrations exceeding the Standard in 28 out of 60 dry and
wet season well samples (the Kenya Standard for nitrate is 50 mg/L). The highest nitrate
concentration was 157.5 mg/L (minimum 2.2, mean 50.9 mg/L). Phosphates were present at
significant concentrations, but not reaching the Standard (2 mg/L). Every sample reported
measurable concentrations of faecal coliforms (lowest reported 25 counts, volume unit not given;
highest – ‘too numerous to count’). This paper presented the results of a PMWIN groundwater
particle-tracking model which indicates that the minimum safe separation distance between a latrine
and a shallow well should be 48 m; in one plot, latrine and well were only 5.5 m apart. The
conclusion of this Study was that groundwater pollution is due to human waste leachate from pit
latrines. If reported nitrate values are anything to judge by, it is likely that other anthropogenic
contaminants are present – sodium and chloride, for example (AGROSS, 2001). Other studies have
confirmed these patterns (Muruka et al., 2012; Muyoma et al., 2017).
◼ Adika et al. (2018) reported excessive trace metals in Kakmega groundwaters (it is unclear whether
the sources were shallow wells or boreholes, as the terms are used interchangeably in this paper);
reported mercury concentrations ranged from 0.0025 to 0.061 mg/L (the Kenya Standard is 0.001
mg/L); arsenic ranged from 0.012 to 0.019 mg/L (the Standard is 0.01 mg/L). Cadmium was present
in two samples at 0.003 mg/L (which is equal to the Standard) and lead ranged from 0.001 to 0.006
mg/L (< Standard, which is 0.01 mg/L). Mercury concentrations are alarmingly high, arsenic
concentrations rather less so. The paper does not discuss possible sources in any but a generalised
fashion.
◼ Wambu et al. (2016) reported copper2+ and zinc2+ concentrations in a range of waters in the Siaya
County lakeside zone. In five boreholes, copper2+ concentrations ranged from 0.72 to 2.63 mg/L
and zinc2+ from 0.06 to 0.603 mg/L (Kenya Standards are 1 and 5 mg/L respectively). In four springs
copper ranged from 0.42 to 2.44 mg/L and zinc from 0.12 to 0.59 mg/L. The zinc standard was not
exceeded, but copper concentrations did exceed the Standard in one borehole and one spring
sample. The paper does not discuss possible sources of soluble copper.
◼ A research thesis by a student at Kenyatta University (Wekesa, 2015), describes significant heavy
metal contamination of shallow well waters in the Kuywa river basin (Bungoma County); excessive
concentrations of lead, copper and cadmium were reported.
◼ K’oreje et al. (2016) found pharmaceutical compounds in wastewaters, surface waters and
groundwaters in Kisumu (2016); and in wastewaters and surface waters in Nairobi (2012, 2016),
albeit at low concentrations. Similar GW pollution in the LVN Basin is likely, particularly in aquifers
beneath high density informal settlements. These are the only studies of their type carried out in
Kenya that we have reviewed; the study of pharmaceutical pollution in groundwaters is a
comparatively recent phenomenon even in developed countries, but the presence and persistence
of pharmaceutical products and other organic compounds in groundwaters has been widely
reported (see Lapworth et al. (2012) for examples and EPA Ireland (2015) for a broad review).
6.4.5.3 Other issues and challenges
Regulatory
Poor planning and water allocation when it comes to considering SW and groundwater allocation; the
two remain divided, and effectively treated as different water resources. The recent Water Allocation
Plan Guideline (Water Resources Authority, 2019a) should help to resolve this, as it treats both
resources in a given area in its approach to WAPs.
Unclear NEMA and WRA mandates with regards to wastewater management and licensing (both bodies
seek ‘polluter payments’ from water users/polluters). NEMA legislation (Act of 1999 and effluent
regulations in the Environmental Management and Co-ordination (Water Quality) Regulations, 2006),
pre-dates water legislation (Water Act in 2002, and effluent regulations in the Water Resources
Management (Amendment) Rules).
Kenya Water Security and Climate Resilience Project
Final Lake Victoria North Basin Plan August 2020 184
Communication of mandates between Counties and the WRA are also uncertain, with Counties in
particular drilling boreholes without the benefit of WRA Authorisations, and sometimes leading to poor
technical quality (installing mild steel casing/screen in low pH groundwater environments, for example).
Further potential conflict between national and county governments is likely, regarding the sharing of
natural resources benefits (cf. the Natural Resources (Benefit Sharing) Bill, 2014 and the Natural
Resources (Benefit Sharing) Bill, 2018). Both Bills specifically include water resources.
Inadequate monitoring
The LVN Basin has 19 groundwater monitoring points (0 Strategic, 6 Major, 7 Minor and 6 Special), all
of which are operational (Water Resources Authority, 2018d); in the 2014 reporting period (Water
Resources Management Authority, 2016) there were 13 operational monitoring boreholes. Broadly
however, the monitoring network needs to be expanded as a matter of some urgency. Data quality is
patchy, with most groundwater level data being collected from boreholes that are used as production
boreholes and too often show dynamic as well as static water levels. This restricts the use of water level
data to determine long-term trends.
Field water quality data collection is also improving, with a broader range of measurements planned in
order that resource-quality objectives (RQOs) can be determined. Parameters planned to be included
are temperature, electrical conductivity, total suspended solids, dissolved oxygen and pH (Water
Resources Management Authority, 2015a).
Abstraction monitoring is done on an ad hoc basis at best. Groundwater users are required to submit
abstraction data monthly or quarterly as evidence to support their water charge payments, but these
are rarely checked in the field by the WRA. The capacity to improve abstraction monitoring will be
boosted by the adoption of formal guidelines for groundwater abstraction surveys, using
electromagnetic flow meters (Water Resources Authority, 2018c).
Groundwater permit classifications
For water permit classification it is necessary to determine whether dedicated monitoring boreholes (or
piezometers) require a Water Permit. In cases where a monitoring borehole may be periodically used
to obtain small quantities of water for analysis (<<1m3), a Category A Permit should potentially be
issued. Prior to 2014, applications to construct monitoring boreholes were issued with Authorisations
but not Water Permits. Since 2014 there has apparently been no requirement for either Authorisations
or Permits for monitoring boreholes (diameters <4”/102mm). It is necessary to determine whether true
exploratory boreholes require a Water Permit after completion if they are not to be commissioned as
production boreholes. There is a need to clarify the role and application of the Form WRMA 0A3
(Notification Approval for Construction of Work and Use of Water).
For Class A, the applicant will get an Approval. For Class B, C and D, the applicant is issued with a
Permit. For all Classes, the applicant is mandatorily required to obtain an Authorization.
Outdated borehole inventory
Borehole data have been and are stored in several separate systems:
◼ The 1992 NWMP (Water Resources Management Authority, 1992) initiated the National Water
Resources Database (NAWARD), which remains a source of data - although it has not been
updated since 2005. In the period 2005-2010, the data collection role was taken up by the WRA,
and during the handover period, there was a measure of confusion as to which agency drilling
contractors should submit drilling data to (Ministry of Water and Irrigation, 2012).
◼ The WRA currently collects and stores borehole data in a combination of paper and digital formats,
with the long-term intention of digitising all records. The first attempt at digitising borehole data was
made in 2010 as part of the Nairobi Borehole Census. All borehole records that could be found
across a wide range of sources were digitised and established in a Microsoft Access database
system, protected by password access.
Kenya Water Security and Climate Resilience Project
Final Lake Victoria North Basin Plan August 2020 185
Completion of the digitisation exercise is essential. This should be digitally linked to/interfaced with the
PDB.
Over-abstraction in the LVN Basin
The presence of over-abstraction across the LVN Basin is not really known, although there are some
concerns (e.g. the Webuye aquifer).
Insufficient information on GW recharge and GW potential
There is a need to select Priority Aquifers for modelling (see Table 7-12 above), then prioritise these
and develop models. This inevitably requires the establishment of a water resources monitoring network
in advance of generating a model, which would involve climate, surface water flows, groundwater levels,
groundwater abstraction and water quality (both surface and groundwater). A time series of several
years is ideally required for the baseline dataset which the model will use for calibration; given the
natural climate variability of much of the Basin, it is desirable that both drier and wetter than ‘normal’
years are captured.
Transboundary aquifers
There is one transboundary aquifer in the LVN Basin:
◼ Mount Elgon aquifer. Area in Kenya covers 4 900 km2, shared with Uganda. Comprises a
combination of trachytes and metamorphic Basement (ILEC et al., 2015).
Nationally, the Draft National Policy on Trans-Boundary Waters (Ministry of Water and Irrigation, 2009),
provides limited guidance or intent on transboundary GW resources. The statement is brief, and cited
in full below (S. 5.1, para. 38):
“Consideration will also be given by the Government to the feasibility of declaring vulnerable
trans-boundary catchment areas as “protected areas” under the provisions of the Water Act,
2002. This allows the Minister to declare an area to be a protected area if special measures are
necessary for the protection of the area. A similar mechanism exists with respect to
groundwater, in which case the protected area is designated a “groundwater conservation
area.” This mechanism may be useful with respect to shared water resources such as Lake
Jipe or, in the case of groundwater, the Merti Aquifer, which are vulnerable to unsustainable
exploitation and, because of their trans-boundary character, lack effective frameworks for
sustainable management.”
A transboundary aquifer policy needs to be developed for Kenya.
The National GW Policy (Ministry of Water and Irrigation, 2013), lists the following activities required to
improve transboundary GW management (“Issue 9”).
Table 6-10: Proposed transboundary aquifer (TA) policy measures
Issue Objective Policy-direction Activity Timeframe
Transboundary
aquifers not well
known,
characterised nor
managed
TAs well known,
characterised and
managed by
countries sharing
TAs
Implement
appropriate new
policies and
institutions to ensure
seamless
management of TAs
a) Identify and demarcate TAs;
b) Collect information;
c) Promote information sharing
and adopt international good
practices;
d) Expand transboundary
water unit to Department
Short- to long-
term
Kenya Water Security and Climate Resilience Project
Final Lake Victoria North Basin Plan August 2020 186
Finally, the National Land Use Policy (Ministry of Lands and Physical Planning, 2017) specifically
describes measures to be adopted in relation to the definition and management of transboundary GW
resources.
Climate change
That climate change will affect Kenya is largely unquestioned. Numerous global climate models forecast
increasing temperatures, deeper dry seasons and more intense rainfall. The effects of both floods and
drought have been significant, adversely affecting gross domestic product (GDP). Adverse effects on
the water sector are well documented (Mogaka et al., 2005; Mwangi & Mutua, 2015).
Kenya has developed a climate change adaptation plan (Government of Kenya, 2016), which
“recognizes that climate change is a cross-cutting sustainable development issue with economic, social
and environmental impacts”. The Plan is underpinned by the Climate Change Act.
Groundwater is less affected by climate change than surface water, and as such it can contribute hugely
to ameliorating the short-term effects of climate change (also see conjunctive use). In the longer term,
the effects of climate change on the LVN Basin aquifers are uncertain, though as adduced above, an
increase in mean annual recharge is likely.
Poor technical quality of drilling
The National Groundwater Policy (Ministry of Water and Irrigation, 2013) acknowledges that the quality
of drilling in Kenya is poor - which is widely understood in the GW sector (S. 3.10 National and local
level Capacity Needs, p. 36 – 37). Despite a drilling contractor registration and regulation process, the
technical quality of borehole drilling in Kenya is poor and has declined perceptibly in the past two
decades; This needs to be reversed by appropriate application of the existing Codes of Practice (for
siting boreholes; for construction of boreholes; for supervision of borehole drilling and construction; and
for the conduct of pumping tests – see (Water Resources Authority, 2018c, 2018b, 2018a). Regulation
and registration is currently carried out by the parent Ministry, which does not monitor the quality of
drilling works. This creates confusion between the WRA and the Ministry, as it is the WRA who observe
the consequences of poor-quality drilling and are best positioned to report on and regulate it.
The technical capacity of the WRA in the supervision of borehole drilling needs to be improved, and the
number of groundwater staff available to monitor or supervise drilling activities need to be increased.
This is important not only to vet the private sector hydrogeologists who currently supervise drilling
operations (if they are supervised at all), but also to support the development of this capacity.
Boreholes drilled by County water ministries often do not comply with the WRM Rules (Government of
Kenya, 2007b) - either in drilling only after an Authorisation has been issued, failing to collect a water
sample for analysis, or failing to conduct proper pumping tests.
Enforcement of conditions of Authorisations to construct boreholes
Due to inadequate technical capacity and insufficient technical staff in the WRA, conditions attached to
Authorisations are not always observed. This is associated with the discussion above on borehole
drilling supervision capacity.
6.4.6 Strategy
In order to comprehensively and systematically address the groundwater issues and challenges in the
LVN Basin, Table 6-11 sets out 4 Strategic Themes with specific Strategies under each Theme. The
Themes address Groundwater Resources Assessment, Allocation and Regulation, Groundwater
Development, Groundwater Asset Management, and Conservation and Protection of Groundwater.
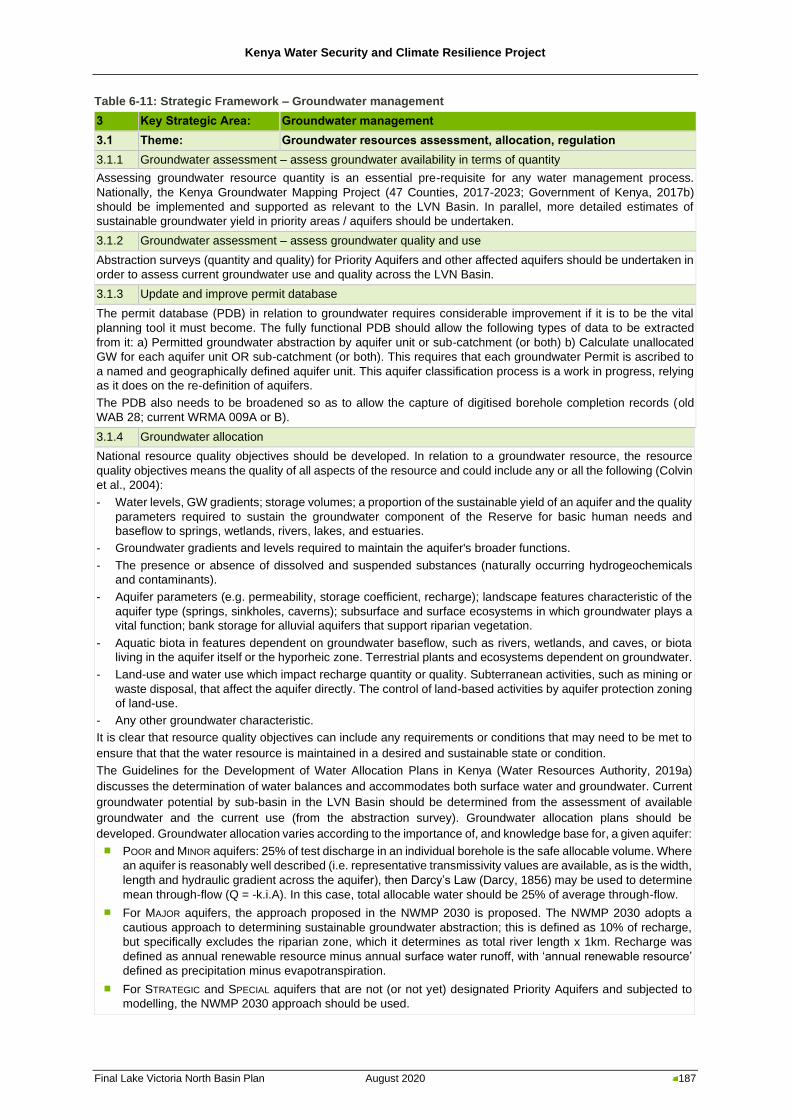
Kenya Water Security and Climate Resilience Project
Final Lake Victoria North Basin Plan August 2020 187
Table 6-11: Strategic Framework – Groundwater management
3 Key Strategic Area: Groundwater management
3.1 Theme: Groundwater resources assessment, allocation, regulation
3.1.1 Groundwater assessment – assess groundwater availability in terms of quantity
Assessing groundwater resource quantity is an essential pre-requisite for any water management process.
Nationally, the Kenya Groundwater Mapping Project (47 Counties, 2017-2023; Government of Kenya, 2017b)
should be implemented and supported as relevant to the LVN Basin. In parallel, more detailed estimates of
sustainable groundwater yield in priority areas / aquifers should be undertaken.
3.1.2 Groundwater assessment – assess groundwater quality and use
Abstraction surveys (quantity and quality) for Priority Aquifers and other affected aquifers should be undertaken in
order to assess current groundwater use and quality across the LVN Basin.
3.1.3 Update and improve permit database
The permit database (PDB) in relation to groundwater requires considerable improvement if it is to be the vital
planning tool it must become. The fully functional PDB should allow the following types of data to be extracted
from it: a) Permitted groundwater abstraction by aquifer unit or sub-catchment (or both) b) Calculate unallocated
GW for each aquifer unit OR sub-catchment (or both). This requires that each groundwater Permit is ascribed to
a named and geographically defined aquifer unit. This aquifer classification process is a work in progress, relying
as it does on the re-definition of aquifers.
The PDB also needs to be broadened so as to allow the capture of digitised borehole completion records (old
WAB 28; current WRMA 009A or B).
3.1.4 Groundwater allocation
National resource quality objectives should be developed. In relation to a groundwater resource, the resource
quality objectives means the quality of all aspects of the resource and could include any or all the following (Colvin
et al., 2004):
- Water levels, GW gradients; storage volumes; a proportion of the sustainable yield of an aquifer and the quality
parameters required to sustain the groundwater component of the Reserve for basic human needs and
baseflow to springs, wetlands, rivers, lakes, and estuaries.
- Groundwater gradients and levels required to maintain the aquifer's broader functions.
- The presence or absence of dissolved and suspended substances (naturally occurring hydrogeochemicals
and contaminants).
- Aquifer parameters (e.g. permeability, storage coefficient, recharge); landscape features characteristic of the
aquifer type (springs, sinkholes, caverns); subsurface and surface ecosystems in which groundwater plays a
vital function; bank storage for alluvial aquifers that support riparian vegetation.
- Aquatic biota in features dependent on groundwater baseflow, such as rivers, wetlands, and caves, or biota
living in the aquifer itself or the hyporheic zone. Terrestrial plants and ecosystems dependent on groundwater.
- Land-use and water use which impact recharge quantity or quality. Subterranean activities, such as mining or
waste disposal, that affect the aquifer directly. The control of land-based activities by aquifer protection zoning
of land-use.
- Any other groundwater characteristic.
It is clear that resource quality objectives can include any requirements or conditions that may need to be met to
ensure that that the water resource is maintained in a desired and sustainable state or condition.
The Guidelines for the Development of Water Allocation Plans in Kenya (Water Resources Authority, 2019a)
discusses the determination of water balances and accommodates both surface water and groundwater. Current
groundwater potential by sub-basin in the LVN Basin should be determined from the assessment of available
groundwater and the current use (from the abstraction survey). Groundwater allocation plans should be
developed. Groundwater allocation varies according to the importance of, and knowledge base for, a given aquifer:
◼ POOR and MINOR aquifers: 25% of test discharge in an individual borehole is the safe allocable volume. Where
an aquifer is reasonably well described (i.e. representative transmissivity values are available, as is the width,
length and hydraulic gradient across the aquifer), then Darcy’s Law (Darcy, 1856) may be used to determine
mean through-flow (Q = -k.i.A). In this case, total allocable water should be 25% of average through-flow.
◼ For MAJOR aquifers, the approach proposed in the NWMP 2030 is proposed. The NWMP 2030 adopts a
cautious approach to determining sustainable groundwater abstraction; this is defined as 10% of recharge,
but specifically excludes the riparian zone, which it determines as total river length x 1km. Recharge was
defined as annual renewable resource minus annual surface water runoff, with ‘annual renewable resource’
defined as precipitation minus evapotranspiration.
◼ For STRATEGIC and SPECIAL aquifers that are not (or not yet) designated Priority Aquifers and subjected to
modelling, the NWMP 2030 approach should be used.
Kenya Water Security and Climate Resilience Project
Final Lake Victoria North Basin Plan August 2020 188
3 Key Strategic Area: Groundwater management
◼ For Priority Aquifers that have been modelled, allocable GW is 10% of mean annual recharge. Mean annual
recharge should, wherever possible, consider both wet and dry years in order to recognise natural recharge
variability.
◼ The allocation of GW from aquifers that experience episodic recharge or are fossil aquifers remains
unresolved (e.g. the Merti aquifer; Blandenier, 2015). How they should be treated in Kenya requires further
debate and ultimately, a policy decision.
All of the above require the completion of the aquifer classification exercise.
3.2 Theme: Groundwater development
3.2.1 Aquifer recharge
Estimates of recharge per sub-basin in the LVN Basin were undertaken as part of this Consultancy. These are not
based on ground studies, geophysics, drilling or modelling; therefore, it is necessary to conduct a preliminary
assessment of recharge areas from existing data.
- Definition of Recharge Areas: At present, the accurate definition of the recharge areas for almost all aquifers
remains unclear, apart from the Miocene Uasin Gishu phonolites east of Eldoret described the recharge zone
(The Nature Conservancy, 2019). This makes it difficult to protect such areas, and recharge areas for Priority
Aquifers should therefore be defined.
- Protection of natural recharge: Land use planning and groundwater management are regarded as separate
functions of different arms of Government. This is a fundamental disconnect, meaning that land use plans
disregard how different land uses may affect both recharge and abstraction. The National Land Use Policy
(2017) provides an entry point to begin discussions between the water sector and other players. This requires
a high-level policy discussion to align land use planning and WRM actions that favour (or do not conflict with),
sensible groundwater resources management. Numerous legal instruments exist across numerous state and
county actors.
- Managed aquifer recharge: First mentioned in the 1999 Policy document (Government of Kenya, 1999) and
the Water Design Manual (Ministry of Water and Irrigation, 2005), Managed Aquifer Recharge is covered in
the WRM Rules (Government of Kenya, 2007b). Efforts were made to encourage managed aquifer recharge
by developing a Code of Practice that discussed methods and management approaches, and considered a
few instances of MAR potential in Kenya (Water Resources Authority, 2018c). It has been developed further
since (Water Resources Management Authority, 2015; A Njuguna, personal communication, December 2018),
but has yet to be published. A study of the potential for Managed Aquifer Recharge in Kenya, commissioned
by the National Water Conservation & Pipeline Corporation in 2006, provides a useful introduction to MAR and
describes several possible MAR schemes across the country.
- At a practical level, sand dams (masonry or concrete weirs across sand rivers which accumulate coarse sands
that act as a storage reservoir) also act as MAR structures (Borst & de Haas, 2006; Mutiso, 2003). These are
in widespread use in ASALs underlain by siliceous metamorphic Basement and have been in use for decades.
- Ad hoc Managed Aquifer Recharge: Ad hoc Managed Aquifer Recharge may occur in the LVN Basin but
has yet to be described.
- Managed Aquifer Recharge potential in the LVN Basin: Aquifers in the LVN Basin have not been assessed
for MAR potential. There is almost certainly scope for MAR across the LVN Basin, given the humid nature of
the Basin.
3.2.2 Local groundwater development: Reconciliation of water demands and groundwater availability and
implementation of groundwater schemes
Local groundwater development is largely ad hoc at present, and heavily under-written at the WWDA and County
level for rural water supply (boreholes, shallow wells and protected springs) to meet the water demands of small
rural centres, schools and other institutions. Areas of unexploited groundwater resources should be identified and
linked to small centre water demand estimates to determine if groundwater resources could meet these demands.
3.2.3 Large scale groundwater development: Reconciliation of water demands and groundwater availability
and implementation of groundwater schemes
Assess allocable groundwater potential close to major demand centers and determine if groundwater resources
could meet demands.
3.2.4 Conjunctive use: Reconciliation of water demands and groundwater availability
The existing extent of conjunctive use in the LVN Basin should be determined using the PDB and existing reports
and studies. Areas of unexploited groundwater resources should also be identified and linked to water demand
estimates to determine if groundwater resources could meet these demands as part of conjunctive use schemes.
3.3 Theme: Groundwater asset management
3.3.1 Develop asset inventory
Kenya Water Security and Climate Resilience Project
Final Lake Victoria North Basin Plan August 2020 189
3 Key Strategic Area: Groundwater management
An asset inventory should itemise all dedicated groundwater equipment in a readily accessible database. The
asset inventory shall be available to those staff that may need it, and particularly to staff who will plan and
coordinate activities or studies that require specific assets to support them. The inventory should include a list of
assets determined during a formal inspection and verification process, complete with supporting paperwork:
- Vehicles/heavy plant; at present, WRA GW does not own or operate its own vehicles or GW plant. There may
come a time when it will operate its own drilling rigs (to construct monitoring boreholes) or other dedicated
equipment
- Office infrastructure (dedicated GW computers and printers, laptops/notebooks, PDAs, licensed software,
storage facilities etc.)
- Laboratory infrastructure: it is not expected that GW sections would have laboratories tied exclusively to GW,
but laboratory facilities must be expanded to include the capacity to measure GW-specific parameters, e.g.
bromide, strontium and boron to determine extent/degree of seawater intrusion (to low ppm Limits of Detection,
better than 0.01 mg/L)
- Field equipment (geophysics equipment [surface and down-hole], GPS instruments, water chemistry meters
and associated equipment, dipmeters and sonic dippers, GW sampling equipment, electro-magnetic
flowmeters etc.)
- Static field equipment (monitoring boreholes, loggers/barometric loggers and telemetry [covering both
pressure/water level and field chemistry parameters such as temperature and electrical conductivity],
monitoring flowmeters owned by the WRA etc.)
- Mobile equipment that will be left in the field for the duration of a study (Automatic Weather Stations and
associated meteorological equipment, rainfall samplers, evaporation pans, portable weirs, time-series water
quality probes etc.)
1. An Asset Inventory database system should be developed:
- Each asset should be tagged with a unique number
- Each item and its tag number should be entered into the inventory database, together with all relevant details
(year purchased/acquired, office allocated to, office lent to, last service or maintenance period, next
recommended service/maintenance etc.). The database system must allow that major components (such as
a multi-parameter water quality probe), are linked to related spare parts (such as individual parameter probes
or calibration reagents).
- Where an item is available for rent to the public (such as geophysics equipment), the relevant details should
be included in the inventory database; this will include, but not necessarily limited to, the following:
o Rental cost (per day or per week, as relevant)
o Rental requirements (items rented must be insured by the renter and proof of insurance provided to the
WRA)
o Any other condition of rental
o Name, address and relevant details of the renter, and the anticipated duration of the rental period
3.3.2 Develop asset management plan
Asset management is necessary to ensure that assets are used for the correct purpose and contribute to meeting
the objectives of the WRA at National, basin and sub-basin levels. The asset management plan should ensure
that the location and status of all assets are known to relevant staff. An asset management plan should be
developed which must list all equipment and facilities that require refurbishing, along with a corresponding
programme and budget. This should involve appropriate consultation with basin and sub-basin offices:
- For each item, determine what refurbishment is required
- Draw up a priority list of the items to be refurbished, together with a deadline for its refurbishment
- Determine the cost and duration of the refurbishment process
- Draw up a Refurbishment Plan, containing the deadlines, costs and duration of refurbishment, and feed this
into the annual procurement planning process
- When refurbishment commences, ensure that the process is monitored, and funds spent on it are tracked
- After refurbishment, update the Asset Inventory to reflect change of status
- Amend Asset Management Plan as necessary
The asset management plan will ensure that all equipment is always fit for purpose, and that equipment
requiring servicing, maintenance or calibration is serviced, maintained or calibrated when it is required.
The Plan should also indicate:
- The value of each asset
- The need for spare parts, and what a practical spare parts/consumable inventory would be
- Maintenance frequency for all assets and the typical life cycle of the asset
Kenya Water Security and Climate Resilience Project
Final Lake Victoria North Basin Plan August 2020 190
3 Key Strategic Area: Groundwater management
- The frequencies of planned maintenance
- A calendar showing when each item must be released for maintenance;
- The type of maintenance required (some may be maintained in-house within the WRA; other items may
require maintenance by a dedicated supplier, or even sent overseas for maintenance).
- The maintenance cost, or anticipated cost
The asset management plan will feed into the annual procurement planning process.
3.4 Theme: Conservation and protection of groundwater
3.4.1 Groundwater source protection
GW vulnerability assessment: Once a National Policy for the Protection of Groundwater has been formulated and
put into place, follow Guidelines for Vulnerability Assessments and assess LVN Basin Groundwater Vulnerability
Groundwater conservation areas (GCAs): As above for GCAs; assess which LVN Basin aquifers or parts of
aquifers require formal protection; draw up Plans for the protection of Priority Aquifers or parts of Priority Aquifers.
Groundwater dependent ecosystems (GDEs): As above for GDEs; assess which LVN Basin aquifers contain
important GDEs; draw up Plans to protect important GDEs.
3.4.2 Rehabilitation of polluted aquifers, springs and wells
Where groundwater protections have failed, measures need to be taken to address polluted aquifers. Here
aquifers, springs and wells are lumped together as ‘aquifers’.
Define LVN Basin’s polluted aquifers: Use the Guidelines for Groundwater Quality Surveys in Kenya (WRA,
2019) to define the extent of polluted aquifers, and determine what pollutants are present. Follow guidance
presented in the NWQMS (MoWI, 2012).
For each polluted aquifer, determine the optimum and most cost-effective way to rehabilitate it. The
approach to be adopted will depend on the following:
- Whether the aquifer is confined or unconfined;
- The nature of the pollutant; e.g. dense non-aqueous phase liquids (DNAPLs) require a different treatment
approach – pump, treat, return - compared with an aquifer polluted with human wastewater – eliminate the
pollution source(s) followed by natural attenuation and remediation;
- Whether the source of the pollution is diffuse or from a point source;
- The affected aquifer area.
- Prioritise aquifers for rehabilitation and implement rehabilitation programmes.
6.5 Water Quality Management
6.5.1 Introduction
Water quality is the physical, chemical, biological and aesthetic properties of water that determine its
fitness for its intended use, and that are necessary for protecting the health of aquatic ecosystems.
Water quality management is the maintenance of the fitness for use of surface and groundwater
resources, on a sustainable basis, by achieving a balance between socio-economic development and
water resources protection. Fitness for use is an evaluation of how suitable water is for its intended
purpose (e.g. domestic, agricultural or industrial water supply) or for protecting the health of aquatic
ecosystems. The fitness for use evaluation is based on scientific evidence in the form of water quality
guidelines or standards for different water uses (e.g. drinking water standards). The business of water
quality management is the ongoing process of planning, development, implementation and
administration of Kenyan water quality management policies, the authorisation of water uses that impact
on water quality, and monitoring and auditing all these activities.
This section provides an introduction of the key water pollutants responsible for the deterioration of
water quality in the basin, the point and non-point sources associated with the pollutants, and overview
of the water quality status and threats in the basin, and a strategic framework for water quality
management in the basin.
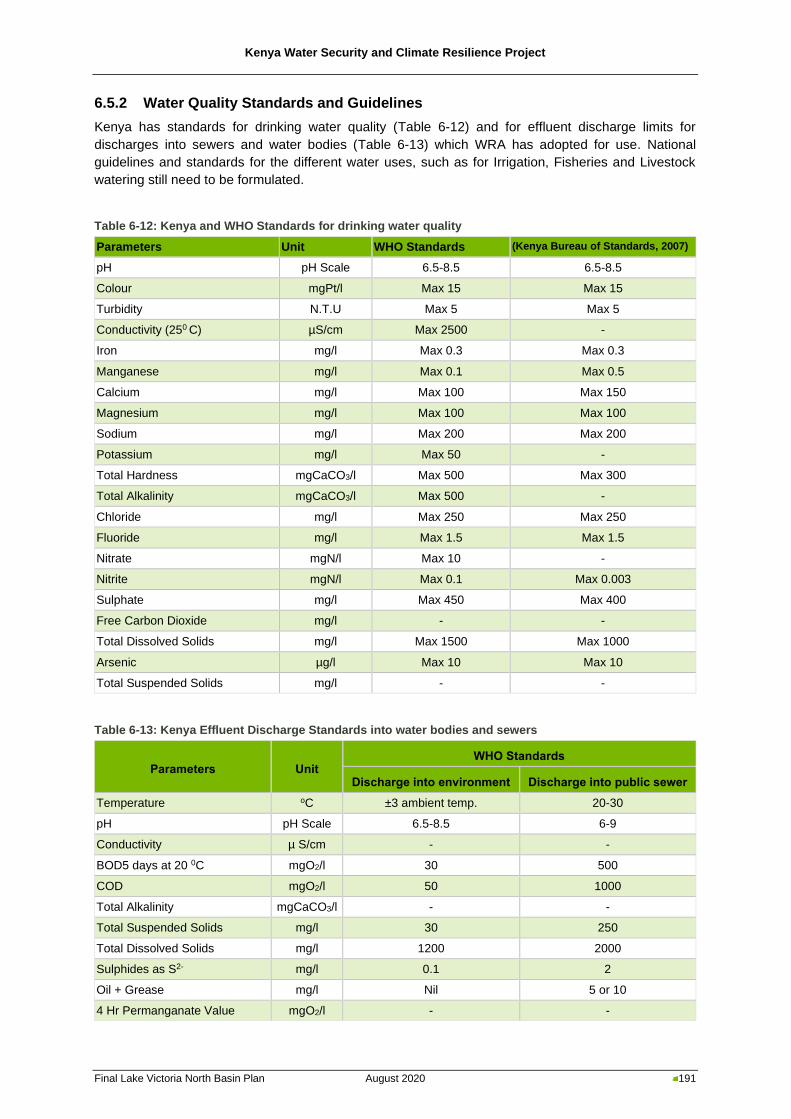
Kenya Water Security and Climate Resilience Project
Final Lake Victoria North Basin Plan August 2020 191
6.5.2 Water Quality Standards and Guidelines
Kenya has standards for drinking water quality (Table 6-12) and for effluent discharge limits for
discharges into sewers and water bodies (Table 6-13) which WRA has adopted for use. National
guidelines and standards for the different water uses, such as for Irrigation, Fisheries and Livestock
watering still need to be formulated.
Table 6-12: Kenya and WHO Standards for drinking water quality
Parameters Unit WHO Standards (Kenya Bureau of Standards, 2007)
pH pH Scale 6.5-8.5 6.5-8.5
Colour mgPt/l Max 15 Max 15
Turbidity N.T.U Max 5 Max 5
Conductivity (250 C) µS/cm Max 2500 -
Iron mg/l Max 0.3 Max 0.3
Manganese mg/l Max 0.1 Max 0.5
Calcium mg/l Max 100 Max 150
Magnesium mg/l Max 100 Max 100
Sodium mg/l Max 200 Max 200
Potassium mg/l Max 50 -
Total Hardness mgCaCO3/l Max 500 Max 300
Total Alkalinity mgCaCO3/l Max 500 -
Chloride mg/l Max 250 Max 250
Fluoride mg/l Max 1.5 Max 1.5
Nitrate mgN/l Max 10 -
Nitrite mgN/l Max 0.1 Max 0.003
Sulphate mg/l Max 450 Max 400
Free Carbon Dioxide mg/l - -
Total Dissolved Solids mg/l Max 1500 Max 1000
Arsenic µg/l Max 10 Max 10
Total Suspended Solids mg/l - -
Table 6-13: Kenya Effluent Discharge Standards into water bodies and sewers
Parameters Unit WHO Standards
Discharge into environment Discharge into public sewer
Temperature oC ±3 ambient temp. 20-30
pH pH Scale 6.5-8.5 6-9
Conductivity µ S/cm - -
BOD5 days at 20 0C mgO2/l 30 500
COD mgO2/l 50 1000
Total Alkalinity mgCaCO3/l - -
Total Suspended Solids mg/l 30 250
Total Dissolved Solids mg/l 1200 2000
Sulphides as S2- mg/l 0.1 2
Oil + Grease mg/l Nil 5 or 10
4 Hr Permanganate Value mgO2/l - -
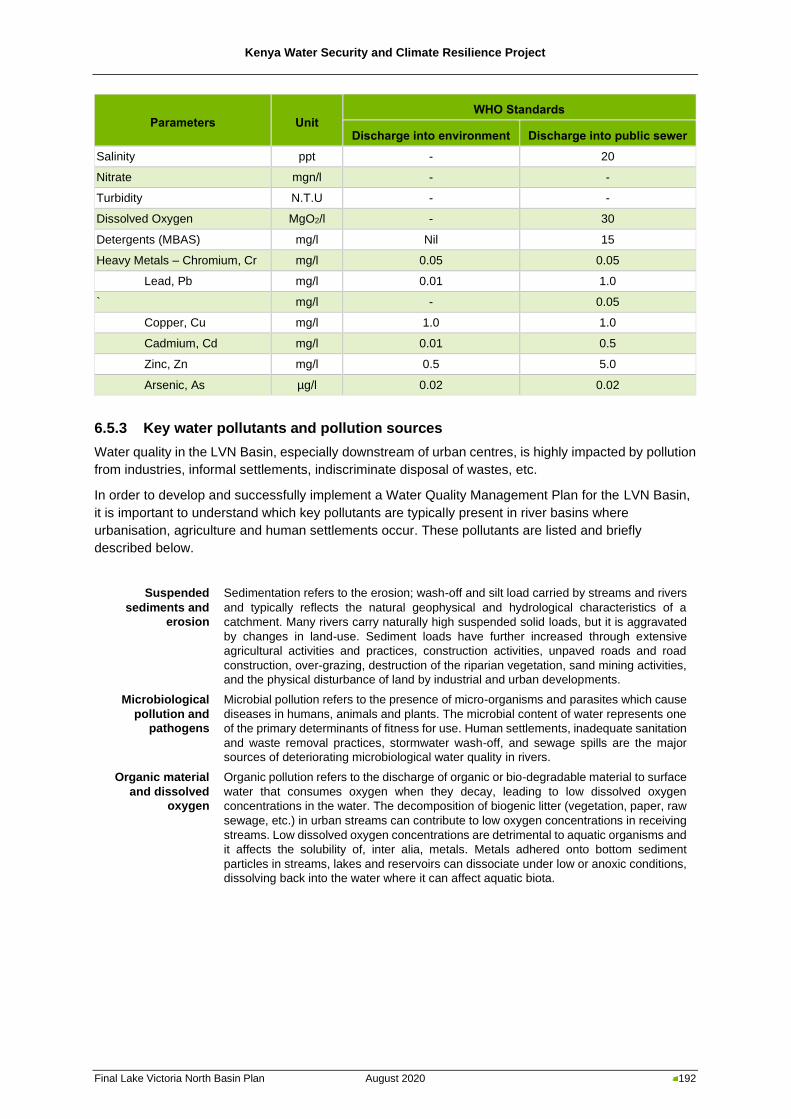
Kenya Water Security and Climate Resilience Project
Final Lake Victoria North Basin Plan August 2020 192
Parameters Unit WHO Standards
Discharge into environment Discharge into public sewer
Salinity ppt - 20
Nitrate mgn/l - -
Turbidity N.T.U - -
Dissolved Oxygen MgO2/l - 30
Detergents (MBAS) mg/l Nil 15
Heavy Metals – Chromium, Cr mg/l 0.05 0.05
Lead, Pb mg/l 0.01 1.0
` mg/l - 0.05
Copper, Cu mg/l 1.0 1.0
Cadmium, Cd mg/l 0.01 0.5
Zinc, Zn mg/l 0.5 5.0
Arsenic, As µg/l 0.02 0.02
6.5.3 Key water pollutants and pollution sources
Water quality in the LVN Basin, especially downstream of urban centres, is highly impacted by pollution
from industries, informal settlements, indiscriminate disposal of wastes, etc.
In order to develop and successfully implement a Water Quality Management Plan for the LVN Basin,
it is important to understand which key pollutants are typically present in river basins where
urbanisation, agriculture and human settlements occur. These pollutants are listed and briefly
described below.
Suspended
sediments and
erosion
Sedimentation refers to the erosion; wash-off and silt load carried by streams and rivers
and typically reflects the natural geophysical and hydrological characteristics of a
catchment. Many rivers carry naturally high suspended solid loads, but it is aggravated
by changes in land-use. Sediment loads have further increased through extensive
agricultural activities and practices, construction activities, unpaved roads and road
construction, over-grazing, destruction of the riparian vegetation, sand mining activities,
and the physical disturbance of land by industrial and urban developments.
Microbiological
pollution and
pathogens
Microbial pollution refers to the presence of micro-organisms and parasites which cause
diseases in humans, animals and plants. The microbial content of water represents one
of the primary determinants of fitness for use. Human settlements, inadequate sanitation
and waste removal practices, stormwater wash-off, and sewage spills are the major
sources of deteriorating microbiological water quality in rivers.
Organic material
and dissolved
oxygen
Organic pollution refers to the discharge of organic or bio-degradable material to surface
water that consumes oxygen when they decay, leading to low dissolved oxygen
concentrations in the water. The decomposition of biogenic litter (vegetation, paper, raw
sewage, etc.) in urban streams can contribute to low oxygen concentrations in receiving
streams. Low dissolved oxygen concentrations are detrimental to aquatic organisms and
it affects the solubility of, inter alia, metals. Metals adhered onto bottom sediment
particles in streams, lakes and reservoirs can dissociate under low or anoxic conditions,
dissolving back into the water where it can affect aquatic biota.
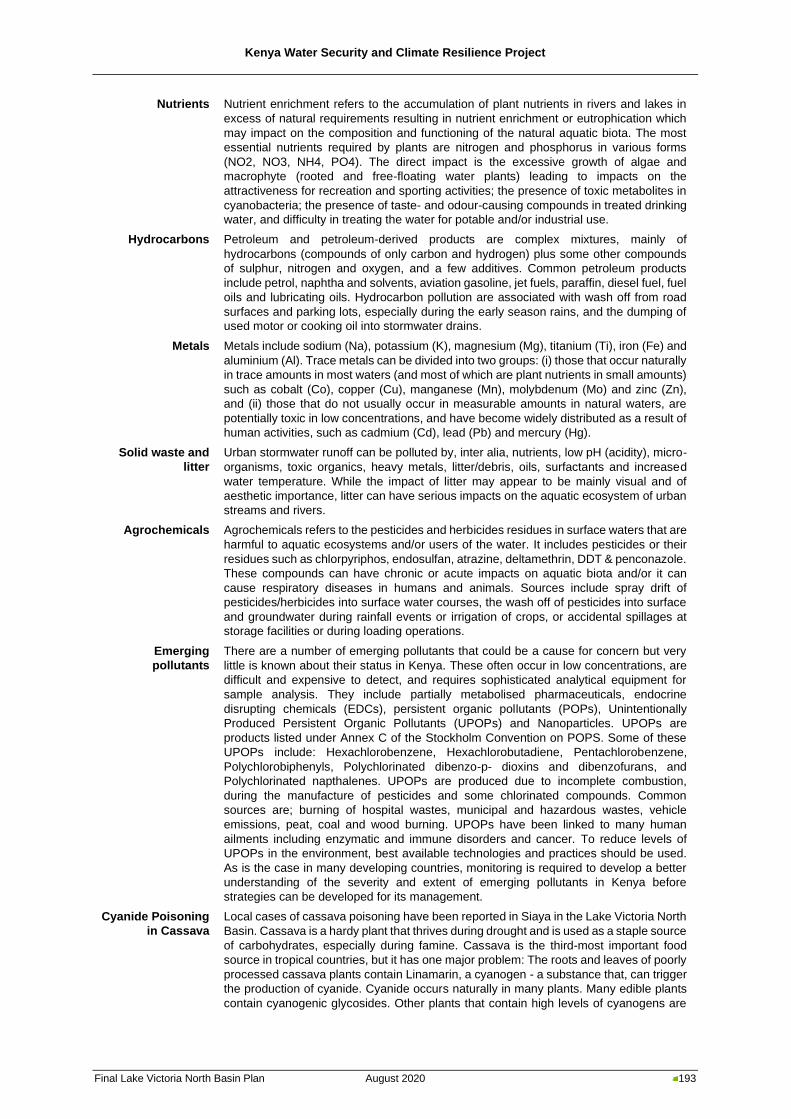
Kenya Water Security and Climate Resilience Project
Final Lake Victoria North Basin Plan August 2020 193
Nutrients Nutrient enrichment refers to the accumulation of plant nutrients in rivers and lakes in
excess of natural requirements resulting in nutrient enrichment or eutrophication which
may impact on the composition and functioning of the natural aquatic biota. The most
essential nutrients required by plants are nitrogen and phosphorus in various forms
(NO2, NO3, NH4, PO4). The direct impact is the excessive growth of algae and
macrophyte (rooted and free-floating water plants) leading to impacts on the
attractiveness for recreation and sporting activities; the presence of toxic metabolites in
cyanobacteria; the presence of taste- and odour-causing compounds in treated drinking
water, and difficulty in treating the water for potable and/or industrial use.
Hydrocarbons Petroleum and petroleum-derived products are complex mixtures, mainly of
hydrocarbons (compounds of only carbon and hydrogen) plus some other compounds
of sulphur, nitrogen and oxygen, and a few additives. Common petroleum products
include petrol, naphtha and solvents, aviation gasoline, jet fuels, paraffin, diesel fuel, fuel
oils and lubricating oils. Hydrocarbon pollution are associated with wash off from road
surfaces and parking lots, especially during the early season rains, and the dumping of
used motor or cooking oil into stormwater drains.
Metals Metals include sodium (Na), potassium (K), magnesium (Mg), titanium (Ti), iron (Fe) and
aluminium (Al). Trace metals can be divided into two groups: (i) those that occur naturally
in trace amounts in most waters (and most of which are plant nutrients in small amounts)
such as cobalt (Co), copper (Cu), manganese (Mn), molybdenum (Mo) and zinc (Zn),
and (ii) those that do not usually occur in measurable amounts in natural waters, are
potentially toxic in low concentrations, and have become widely distributed as a result of
human activities, such as cadmium (Cd), lead (Pb) and mercury (Hg).
Solid waste and
litter
Urban stormwater runoff can be polluted by, inter alia, nutrients, low pH (acidity), micro-
organisms, toxic organics, heavy metals, litter/debris, oils, surfactants and increased
water temperature. While the impact of litter may appear to be mainly visual and of
aesthetic importance, litter can have serious impacts on the aquatic ecosystem of urban
streams and rivers.
Agrochemicals Agrochemicals refers to the pesticides and herbicides residues in surface waters that are
harmful to aquatic ecosystems and/or users of the water. It includes pesticides or their
residues such as chlorpyriphos, endosulfan, atrazine, deltamethrin, DDT & penconazole.
These compounds can have chronic or acute impacts on aquatic biota and/or it can
cause respiratory diseases in humans and animals. Sources include spray drift of
pesticides/herbicides into surface water courses, the wash off of pesticides into surface
and groundwater during rainfall events or irrigation of crops, or accidental spillages at
storage facilities or during loading operations.
Emerging
pollutants
There are a number of emerging pollutants that could be a cause for concern but very
little is known about their status in Kenya. These often occur in low concentrations, are
difficult and expensive to detect, and requires sophisticated analytical equipment for
sample analysis. They include partially metabolised pharmaceuticals, endocrine
disrupting chemicals (EDCs), persistent organic pollutants (POPs), Unintentionally
Produced Persistent Organic Pollutants (UPOPs) and Nanoparticles. UPOPs are
products listed under Annex C of the Stockholm Convention on POPS. Some of these
UPOPs include: Hexachlorobenzene, Hexachlorobutadiene, Pentachlorobenzene,
Polychlorobiphenyls, Polychlorinated dibenzo-p- dioxins and dibenzofurans, and
Polychlorinated napthalenes. UPOPs are produced due to incomplete combustion,
during the manufacture of pesticides and some chlorinated compounds. Common
sources are; burning of hospital wastes, municipal and hazardous wastes, vehicle
emissions, peat, coal and wood burning. UPOPs have been linked to many human
ailments including enzymatic and immune disorders and cancer. To reduce levels of
UPOPs in the environment, best available technologies and practices should be used.
As is the case in many developing countries, monitoring is required to develop a better
understanding of the severity and extent of emerging pollutants in Kenya before
strategies can be developed for its management.
Cyanide Poisoning
in Cassava
Local cases of cassava poisoning have been reported in Siaya in the Lake Victoria North
Basin. Cassava is a hardy plant that thrives during drought and is used as a staple source
of carbohydrates, especially during famine. Cassava is the third-most important food
source in tropical countries, but it has one major problem: The roots and leaves of poorly
processed cassava plants contain Linamarin, a cyanogen - a substance that, can trigger
the production of cyanide. Cyanide occurs naturally in many plants. Many edible plants
contain cyanogenic glycosides. Other plants that contain high levels of cyanogens are
Kenya Water Security and Climate Resilience Project
Final Lake Victoria North Basin Plan August 2020 194
Sorghum (whole immature plant), bamboo shoots and Lima seeds (Nartey (1980); Honig
et al. (1983). Cassava roots however contain less linamarin level s than that found in
leaves. Linamarin is converted to cyanide when cassava is eaten raw or when poorly
cooked or processed. Long-term exposure of low doses of cyanide over time can lead to
health problems, hence the danger posed by cyanide poisoning for those who use
cassava as a staple carbohydrate source. Levels of cyanide in water sources are
generally low but depend on releases from upstream sources and discharges. Cyanide
is highly acute and toxic and should not be present in drinking water. The East African
Standard for Discharges of Effluent into water bodies gives the maximum permissible
level for cyanide as 0.05 mg/l. To avoid cassava poisoning, cassava roots, peels and
leaves should not be eaten raw as they contain two cyanogenic glucosides, linamarin
and lotaustralin. These are decomposed by linamarase, a naturally occurring enzyme in
cassava, liberating hydrogen cyanide (HCN), which is toxic. An effective way of removing
cyanogens from cassava leaves is by pounding or crushing and then boiling them in
water. Most of the cyanogenic glucosides are removed and cyanohydrins and free
cyanide are completely removed in this way. (Nambisan 1994).
Other proven methods of cyanide removal but with varying degrees of success include:
Drying in the sun; Drying in an oven; Steaming, baking and frying; Fermentation of
crushed cassava roots; Steam distillation of cassava pulp.
Sources of pollution are generally divided into two categories, namely point sources and nonpoint
sources.
◼ Point sources of pollution is one whose initial impact on a water resource is at a well-defined local
point (such as a pipe or canal). The US EPA describes point sources of pollution as any discernible,
confined and discrete conveyance, including but not limited to any pipe, ditch, channel, tunnel,
conduit, well, discrete fissure, container, rolling stock, concentrated animal feeding operation, or
vessel or other floating craft, from which pollutants are or may be discharged. Typical point sources
of pollution are listed below
Industrial point
sources
Effluent discharges from industries can have a significant impact on receiving water
bodies. These can include high concentrations of BOD/COD, nutrients, heavy metals,
acids, dyes, suspended solids, oils and grease, bacterial pathogens, chemicals, phenols,
etc.
Wastewater
treatment works
(WWTWs)
Wastewater treatment works (WWTWs) that discharge treated effluent into surface water
streams are important point sources of pollution if they do not meet effluent standards.
Domestic WWTWs are regarded as important sources of nutrients, organic matter
(BOD/COD), suspended solids, human pathogens, and depending on the demographics,
a source of partially metabolised pharmaceuticals and endocrine disrupting chemicals.
Mining and
quarrying
operations
Mines can be significant source of pollution and pollutants such as heavy metals,
suspended solids, salinity, sulphates, and acidification are associated with mining
activities. High suspended sediment loads, and increased turbidity are associated with
sand mining and washing operations.
Agricultural
processing plants
Agricultural processing plants such as coffee washing stations contribute significantly to
the organic loads in receiving rivers and streams. The same applied to dairies and milking
operations. Tea factories also produce wastewater that are rich in organic material. Fish
farms can also have a major impact on water quality as the outflow from ponds can be
high in BOD/COD, ammonium and nitrates from fish wastes and food residues.
Solid waste
dumps and
landfills
Solid waste dumps and landfills can also be regarded as point sources of pollution.
Pollutants in seepage/leachate from landfills include organic wastes from decomposing
organic wastes, heavy metals from corroding metallic objects and old batteries,
waterborne pathogens from discarded diapers and sewage sludge, acidic waters, hydro-
carbons and oils from used motor and cooking oils, etc.
− Mitigation measures: the following are some remedial measures to forestall pollution from point
sources:
▪ Treatment of industrial waste discharges at source, before discharge into receiving water bodies
Kenya Water Security and Climate Resilience Project
Final Lake Victoria North Basin Plan August 2020 195
▪ Ensuring that industrial waste discharges meet the stipulated Effluent Discharge Standards
before being discharged
▪ Regularly reviewing the performance and waste removal efficiency of WWT plants as well as
carrying out effective operation and maintenance procedures
▪ Preparing and implementing safe and sound mining and quarrying operation guidelines
▪ Ensuring that solid waste is sorted at source and safely transported to the dumpsites for final
sorting out and safe disposal
▪ Ensuring that the dumping site is selected after an EIA has been carried out on the site, and that
all urban centres have a dumping site for solid wastes
▪ Enhancing capacity to carry out timely water quality monitoring to identify polluters and take legal
action against them.
◼ Nonpoint sources (also called diffuse sources) of pollution whose initial impact on a water
resource occurs over a wide area or long river reach (such as un-channelled surface runoff from
agricultural land or stormwater and dry-weather runoff from a dense settlement). The US EPA
describes nonpoint source pollution resulting from land runoff, precipitation, atmospheric
deposition, drainage, seepage or hydrologic modification. Nonpoint source (NPS) pollution, unlike
pollution from industrial and sewage treatment plants, comes from many diffuse sources. NPS
pollution is caused by rainfall moving over and through the ground. As the runoff moves, it picks up
and carries away natural and human-made pollutants, finally depositing them into lakes, rivers,
wetlands, and ground waters.
Agricultural
nonpoint sources
Agriculture is a major nonpoint source of pollution. The following generic land use
categories can contribute to nonpoint source pollution, particularly sediments, nutrients,
and agrochemicals:
Livestock grazing can contribute to sediment yield through removal of the natural
vegetative cover (overgrazing), while nutrients and pathogens are associated with
livestock faecal matter. These impacts are aggravated and significant bank
destabilisation (habitat destruction) can occur where livestock are allowed direct access
to wetlands and rivers.
Croplands, vegetable gardens and flower growing tunnels are often a major rural source
of sediment, particularly if good land management practices are not adhered to. Wash-
off of nutrients from fertilizers and of agrochemicals (pesticides and herbicides) can also
have a significant impact, where these are applied. Croplands are particularly vulnerable
during the preparation of plots for planting and harvesting when the soil is disturbed.
Irrigation of crops can be a further source of nutrient (inorganic fertilizer), pesticides, and
pathogens if manure is used as fertilizer.
Confined animal facilities, such as livestock enclosures (zero grazing), piggeries, and
chicken farms, can contribute significant nutrient, organic matter (BOD) and pathogen
loads from faecal waste, especially during storm runoff directly to a stream or river. This
is the main concentrated agricultural source and may include dairies and piggeries.
Urban nonpoint
sources
High levels of non-point sources of contamination, particularly organic material
(BOD/COD), hydrocarbons, pathogens, and sediments are associated with formal urban
areas and industrial activities with the urban boundaries. Their general character and
impacts in Kenya are like those other developing countries, and are as follows:
Formal residential areas range from sparse small holdings on the outskirts of cities,
through suburban and high density multi-stories apartments in the urban centre (informal
settlements are dealt with below). They generally have some levels of waste
management services (onsite sanitation, solid waste removal, and storm water drains).
Residential areas cause increase storm runoff from impervious surfaces, with an
associated wash-off of sediment, nutrients, pathogens, organic matter, litter, heavy
metals, hydrocarbons and toxic substances. These impacts tend to increase with
population density and are aggravated in areas where the waste management services
are inappropriately used, overloaded or inadequately maintained. Increased streamflow
and encroachment into the riparian zone causes habitat destruction.
Kenya Water Security and Climate Resilience Project
Final Lake Victoria North Basin Plan August 2020 196
Commercial and light industrial areas are generally located near the urban core and have
similar water quality impacts to formal residential areas. Storm runoff increases with
impervious area and heavy metal loading tends to be higher, associated with greater
pedestrian and vehicle traffic. Pathogen and sediment wash-off can be similar or even
higher than in formal residential areas due to the higher density of people. Garages and
workshops are often a source of significant hydrocarbon pollution because there is no
used oil recycling in Kenya. Fresh produce markets are a significant source of organic
waste as peels and leaves from cleaning vegetables and fruit and vegetable cleaning
often end up in stormwater drains.
Heavier industrial areas are located both within and on the edge of urban centres, and
include the metal, food and beverage manufacturing, and agricultural product processing
industries. They are generally associated with increased storm runoff and wash-off of
heavy metals, toxic organics and nutrients, depending upon the processes and
management practices at the site. Other water quality impacts are similar to light
commercial areas.
Roads within and between urban centres are a major non-point source of heavy metals
and hydrocarbons. Sediment, nutrient, litter, pathogens and organic matter loads from
these roads are comparable to commercial and industrial areas. Unpaved and gravel
roads in urban areas can cause severe soil erosion, sediment wash-off, and dust
pollution.
Construction and urban development sites represent a significant source of sediment
loads in urban areas; often an order of magnitude higher than other urban land uses.
This also results in an increase in adsorbed contaminants, such as nutrients and heavy
metals. Concrete wash water generally has a high pH due to the cement in the wash
water.
Informal waste disposal sites represent a major concentrated source associated with
formal residential and industrial areas. Pollutants include solid waste and litter, nutrients,
organic matter, heavy metals, and toxic substances in surface wash-off or leachates form
the sites.
Informal
settlements
Informal settlements are a feature of many developing countries and include settlements
in and around the formal urban areas, but which consist of informal shack dwellings,
usually with no or limited waste management services. They include the low to medium
density (5 to 30 dwellings per hectare) informal areas on the periphery of urban centres,
as well as the very dense shack areas on marginal land within the urban centre. Water
quality impacts increase with density, and are largely associated with inadequate
services, namely pathogens and nutrients from the disposal of grey and black
wastewater, litter from solid waste disposal, organic matter and sediment from storm
water. These impacts are exacerbated, because these settlements are usually on the
most marginal urban land (e.g. poor stormwater drainage) or within the riparian zone of
urban rivers.
Artisanal & small-
scale mining
It is estimated artisanal and small-scale mining operations such gold and gemstone
mining provides employment to some 146 000 people compared to the large scale
mining that employs about 9 000 workers (PACT and Alliance for Responsible Mining
(ARM), 2018). A significant impact of artisanal and small-scale gold mining operations is
the misuse of mercury and the discharge of mercury-cyanide complexes used in the
extraction of gold, into aquatic systems. There are also substantial concerns related to
deforestation. For gemstone mining, unsanitary mining camp conditions and bacterial
pollution of scarce water sources is a major concern. All activities, including sand mining
activities, would increase the sediment loads to rivers during rainfall events.
Gravel roads and
erosion
Roads, and gravel roads can be a significant source of erosion and fine sediments. When
roads are constructed, they create an interference with the natural drainage systems and
collect water, channel it through culverts, increasing its volume and velocity, resulting in
accelerated erosion downstream of a bridge or culvert. One of the areas most prone to
erosion and gully formation is along the side of roads, especially gravel roads. Roads
also act as a source of oil pollution due to vehicle maintenance often conducted next to
a road.
− Mitigation measures: The following are some mitigation measures to forestall pollution form non-
point sources:
▪ Encourage the adoption and use of effective and sustainable crop and animal husbandry
practices
Kenya Water Security and Climate Resilience Project
Final Lake Victoria North Basin Plan August 2020 197
▪ Collection and treatment of storm water discharges from roads and farmlands, before discharge
into receiving water bodies
▪ Ensuring that storm water and farmland discharges meet the stipulated Effluent Discharge
Standards before being discharged into a receiving water body
▪ Encouraging the use of approved on-site sanitation facilities to contain faecal human wastes in
informal settlements
▪ Erecting sediment traps such as grass strips to trap sediment and eroded soil from gravel roads
▪ Controlling the amounts of chemicals used in artisanal mining and ensuring that the chemicals
do not find their way back into the river.
▪ Preparing and implementing safe and sound mining and quarrying operation guidelines
▪ Selection and designation of specific solid waste dump sites for every urban centre
▪ Ensuring that solid waste is sorted at source and safely transported to the dumpsites for final
sorting out and safe disposal
▪ Ensuring that the dumping sites are selected after an EIA has been carried out on the sites, and
that all urban centres have a dumping site for solid wastes
▪ Enhancing capacity to carry out timely water quality monitoring to characterize pollution levels in
water bodies.
6.5.3.1 Overview of heavy metals use and heavy metals pollution
The term “heavy metal’ refers to any metallic chemical element that has a relatively high density and is
toxic to humans at low concentrations. Examples of heavy metals include mercury (Hg), cadmium (Cd),
arsenic (As), chromium (Cr), Lead (Pb), Zinc (Zn), Nickel (Ni), Cobalt (Co), and Copper (Cu).
The heavy metals most commonly associated with poisoning of humans are lead, mercury, arsenic and
cadmium. Heavy metal poisoning may occur from industrial exposure, air or water pollution, foods,
medicines, improperly coated food containers, or the ingestion of lead-based paints. High levels of
heavy metals are toxic to soil, plants, aquatic life and humans.
Some of the common toxic heavy metals include arsenic, cadmium, lead, and mercury. Other than
polluted water, some foods, l may also contain heavy metals.
Anthropogenic sources contributing heavy metal contamination include automobile exhaust which
releases lead; smelting (arsenic, copper and zinc); insecticide (arsenic); and burning of fossil fuels which
release nickel, vanadium, mercury.
The most common heavy metal pollutants in water and soil are arsenic, cadmium, chromium, copper,
nickel, lead and mercury. Most common heavy metal pollution in freshwater comes from mining
companies, as they use acids to release heavy metals from ores.
Metalloids are elements (e.g. arsenic, antimony, or tin) whose properties are intermediate between
those of metals and solid non-metals or semiconductors.
Major sources of heavy metals in contaminated soils and water are:
▪ Fertilizers
▪ Pesticides
▪ Bio-solids/Sludge and Manures
▪ Wastewater
▪ Metal Mining and Milling Processes and Industrial Wastes
▪ Air-Borne Sources
Kenya Water Security and Climate Resilience Project
Final Lake Victoria North Basin Plan August 2020 198
It is therefore evident that heavy metals can easily be found as pollutants in industrial effluents being
discharged from many of Kenya’s major towns and urban centres. The main threats to human health
from heavy metals are associated with exposure to lead, cadmium, mercury and arsenic.
Heavy metals in water are determined in the Laboratory using Atomic Absorption Spectrophotometer
(AAS). Heavy metals are not routinely determined in water samples by most laboratories, as only few
Laboratories have installed and operate functional AASs. This means that in most cases there is no
regular assay for heavy metals in water and wastewater samples. This therefore makes it difficult to
describe how serious the problem of heavy metal pollution is in the country, because of lack of data.
However, in regions such as along Gucha- Migori River in LVS and River Yala in LVN, where it is known
that mercury is being used in artisanal mining, regular heavy metals monitoring should be initiated. This
will establish the levels of contamination in water, soil and fish, so that remedial action can be taken to
safeguard both humans and the environment from the effects of heavy metal pollution.
Since heavy metals are likely to find their way into water courses from the major sources listed above,
it is recommended that all Regional Laboratories procure AASs to be used for the analysis of heavy
metals in water samples in all the six drainage basins.
6.5.3.2 Measures to undertake for accidental oil product spillages (pipeline leakages,
trucks, petrol stations) and other pollutants to the Lake Victoria Basin waters
Under the LVEMP 1 – (1997-2003) a “Study on Toxic Chemicals and Oil Products Spill Contingency
Plan for Lake Victoria” was undertaken. Before that there was no such a plan. The plan was to be
adopted and implemented by the three EA countries that share Lake Victoria. The main purpose of such
a plan was to ensure that countries prepared a timely response in case there was any oil spillage or any
toxic pollutant spilled into the lake. The response could involve, local, national and regional actions
including industry, and other agencies in order to minimize the impact and damage that would be caused
by such a spillage. It appears that the provisions and recommendations of such a plan were never fully
adopted or implemented and there are now plans to prepare a new plan under the coordination of the
LVBC.
Although a draft Oil Spills Contingency Plan (The National Contingency Plan for Marine Spills from
Shipping and Offshore Installations, 2014) has been prepared for the port of Mombasa by the Kenya
Maritime Authority, it does not cover Lake Victoria waters.
In the event of an accidental oil spillage, the following is a summary of the measures to undertaken in
sequence, if such an oil spillage and other pollutants occurs in the Lake Victoria basin waters:
▪ Notification/Reporting of spillage (where, when, size)
▪ Assessing/Establishing nature and type of spillage (chemical/oil; properties)
▪ Establishing level of response required (availability and location of equipment such as booms,
pumps, boats and personnel)
▪ Setting up national response units/teams
▪ Activating national and regional response units
▪ Responses (local, national, regional, international)
▪ Sampling and analysis of samples (Environmental monitoring)
▪ Clean up of spillage
▪ Salvage/Termination of clean-up
▪ Protection of sensitive ecosystems
▪ Restoration of ecosystems
▪ Legal and economic aspects (Liability and compensation for pollution damages)
Kenya Water Security and Climate Resilience Project
Final Lake Victoria North Basin Plan August 2020 199
▪ Prosecution and reparation
It should be recalled that the sinking of the ship, MV Nyerere, off the Tanzania coast near Mwanza in
2018, was a wake-up call to the EA countries to put in place, locate and rescue plans and oil spill
contingency plans to deal with such emergencies. However, it is noted that the LVBC also has one
container of Oil Spill response equipment to handle small to medium oil and chemical spills that can be
safely handled by local oil terminal personnel - equipment stationed at Kisumu Port which can be used
in the event of oil pollution in the Lake. A major component in dealing with all the stages of reporting
spillage and the responses is effective communication, which should be coordinated preferably from a
central emergency response centre.
A toxic chemicals and oil spill contingency plan will need to be reviewed and revised preferably every
two years.
6.5.4 Water Quality Status in the LVN Basin
Water resources in the LVN Basin exhibits symptoms of deterioration due to rapid urbanisation,
inadequate sewerage infrastructure and wastewater treatment, increasing use of agrochemicals in the
horticulture and agricultural sectors, indiscriminate disposal of solid and liquid wastes, and destruction
of natural infrastructure. This deterioration in water quality has grave economic impacts because it
increases the cost of doing business as many enterprises are forced to treat water before being able to
use it in their industrial processes, the increased cost to municipalities and cities to treat water to drinking
water standards, reduced economic productivity and an increased number of days that are lost due to
water-related illnesses and/or poor crop yields, threats to human health and livelihoods where people
are exposed to poor water quality for domestic use, and it reduces the amount of water available for
use as more water must be retained in rivers to dilute pollution to acceptable standards.
The typical point and non-point sources of pollution in the LVN Basin are as follows:
◼ Point Sources:
− Domestic and industrial effluents from: Kitale, Eldoret, Kakamega, Busia, Bungoma, Webuye,
Siaya
− Oils and Grease: from garages in these towns
− Human wastes: from markets and urban centre and fish landing villages
− Sugar Mills: Nzoia, Mumias, Kibos, Butali,
◼ Non-Point sources:
− Environmental degradation especially catchment and wetlands destruction.
− Release of high nitrate and phosphate quantities into the environment due to poor application of
agricultural chemicals on tea, coffee, maize and sugarcane farms.
− Use of herbicides and acaricides on farms.
− Sedimentation from murram, feeder and animal truck roads.
− Soil erosion due to poor agricultural practices resulting in soil cover destruction or overgrazing.
Table 6-14 below identifies the actual sources of pollution within the LVN Basin:
Table 6-14: Major sources of pollution in LVN Basin
Basin Type of Pollution Sources of Pollution
Upper Yala Municipal wastes and untreated
sewage, including hospital and Towns of Kakamega, Khayega and Mbale
Kenya Water Security and Climate Resilience Project
Final Lake Victoria North Basin Plan August 2020 200
Basin Type of Pollution Sources of Pollution
laboratory wastes
Agro chemicals Coffee, Tea and sugar cane farms along the Yala sub-
catchments.
Mining wastes Gold mining along the mid-Yala river
Industrial waste discharges
including dyes and detergents Towns of Kakamega, Khayega and Mbale, Kipkaren
Soil erosion and sediment Evident on riparian reserves, and hill slopes and
unpaved roads in the smaller towns and rural areas
Oil drilling wastes None
UPOPs, including air pollution Towns of Kakamega, Khayega and Mbale
Solid wastes Towns of Kakamega, Khayega and Mbale and small
urban centres
Salinity None
Upper & Middle
Nzoia/Sio Malaba
Malakisi
Municipal wastes and untreated
sewage, including hospital and
laboratory wastes
Towns of Eldoret, Kitale, Kapsabet.
Agro chemicals Tea, coffee and sugar cane farms along the Nzoia, Sio
and Malaba Malakisi sub-catchments
Mining wastes Quarrying and Sand harvesting along the water courses
of Malakisi, Sirisia, Kundos, Kipkaren and Mokong
Industrial waste discharges,
including dyes and detergents Towns of Eldoret, Kitale, Kapenguria.
Soil erosion and sediment Evident on riparian reserves, and hill slopes and
unpaved roads in the smaller towns and rural areas
UPOPs, including air pollution
Open burning of pesticides and other organic
compounds in solid wastes in the major towns of
Eldoret, Kitale and Kapenguria
Solid wastes Towns of Eldoret, Kitale, Kapenguria. and other small
urban centres
Salinity None
Lower Nzoia and
Lower Yala
Municipal wastes and untreated
sewage, including hospital and
laboratory wastes
Towns of Siaya, Mumias
Agro chemicals Tea, coffee and sugar cane farms along the Nzoia and
Yala rivers
Mining wastes Gold mining in Siaya, Kakamega and Nandi Counties
and sand mining along the river Yala
Industrial waste discharges,
including dyes and detergents From towns of Siaya and Mumias
Soil erosion and sediment Encroachment on riparian reserves, and hill slopes and
unpaved roads in the smaller towns and rural areas
Solid wastes From towns of Siaya and Mumias and other urban
centres
UPOPs including air pollution
Open burning of pesticides and other organic
compounds in solid wastes in the towns of Siaya and
Mumias
Salinity Some Ground waters have slightly high salinity and
TDS along the shores of L. Victoria.
Kenya Water Security and Climate Resilience Project
Final Lake Victoria North Basin Plan August 2020 201
6.5.4.1 Surface water
Surface Waters in the LVN Basin have been divided into Upper Yala, Upper &Middle Nzoia / Sio Malaba
Malakisi and Lower Nzoiaand / Lower Yala.
Figure 6-12 shows the water quality characteristics of water bodies within the LVN Basin.
Upper Yala River System
Some of the rivers that drain and form the Upper Yala are the Kimondi, Kesses and Kipkaren. The
increase in population growth and the pressure exerted on land and water resources, has led to severe
land degradation and pollution of the rivers from anthropogenic activities and domestic effluent from
urban settlements. These rivers have also been polluted by effluent from agro-based industries such as
tea, coffee sugarcane and horticulture. Industrial effluents from towns also contribute to the pollution of
these rivers.
These rivers are brown and are laden with silt and sediment from the farms and contain nutrients from
the fertilizers used on the farms as well as pesticide residues. All these rivers show high levels of colour
and turbidity, bacterial contamination, diminished dissolved oxygen levels and moderately high levels
of BOD and COD. In their current state these rivers forming Upper Yala, which in the past few decades
were suitable for domestic purposes, are now unsuitable in their raw state.
Table 6-15: Major Sources of Point Pollution into Yala River
Item No. Name of Source Type of waste Receiving River System
1. Moi University Sewage treatment works Domestic sewage Kesses
2. Kapsabet Municipal sewage works Domestic sewage Mokong’
3. KCC- Kapsabet Milk processing Kesses
4. Bondo T. T. C. Sewage Works Domestic sewage Yala
Upper/Middle Nzoia and Sio and Malaba-Malakisi Rivers
Over 15 rivers drain and form the Upper and Middle Nzoia. The main tributaries include: Kuywa,
Koitobus, Ellegrin, Endoroto, Safu, Kimilili, Terem, Chwele, Isiukhu and Sosiani. To these we add the
Sio, and Malaba, Malakisi. Like in the case of the Upper Yala System, these rivers are also polluted by
anthropogenic activities. Severe land degradation and pollution of the rivers by domestic and industrial
effluent from urban settlements and effluent from agro-based industries such as tea, coffee, sugarcane,
and horticulture make these rivers appear turbid and coloured brown.
All these rivers show high levels of colour and turbidity, bacterial contamination, diminished dissolved
oxygen levels and moderately high concentrations of BOD and COD. In their current state these rivers
forming Upper and middle Nzoia and the Sio, Malaba- Malakisi, cannot be used directly for domestic
purposes without treatment to remove suspended material and disinfect the water.
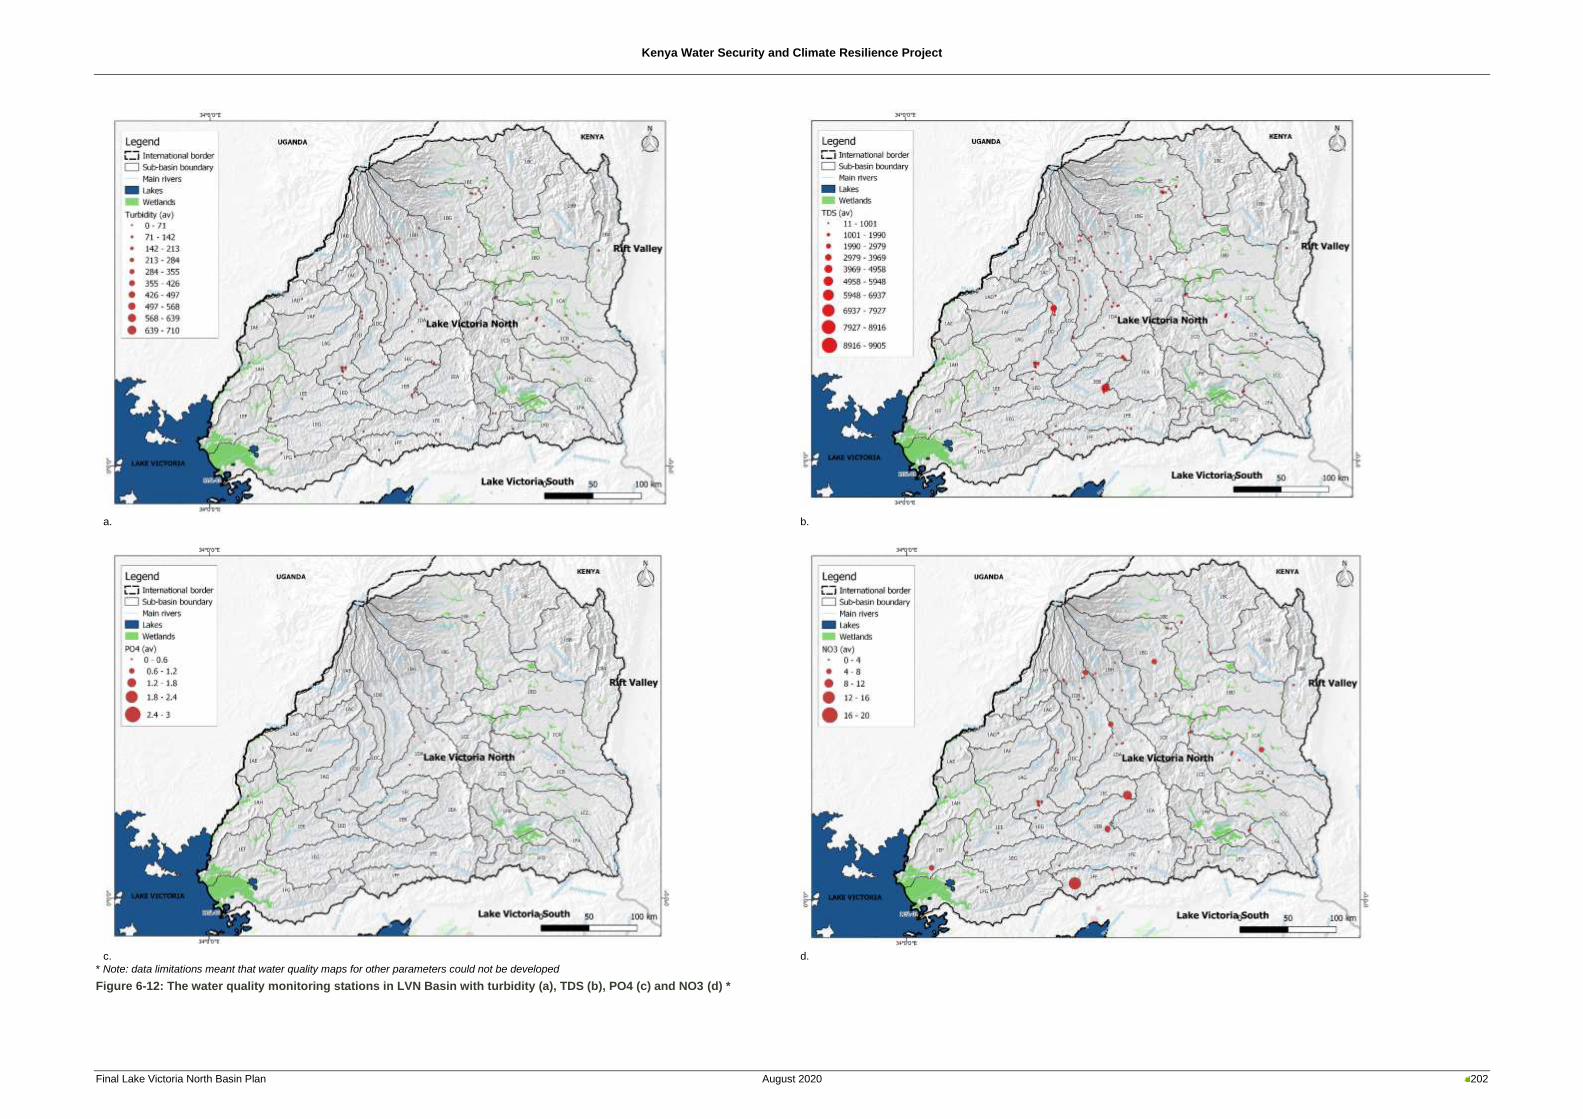
Kenya Water Security and Climate Resilience Project
Final Lake Victoria North Basin Plan August 2020 202
a. b.
c. d.
* Note: data limitations meant that water quality maps for other parameters could not be developed
Figure 6-12: The water quality monitoring stations in LVN Basin with turbidity (a), TDS (b), PO4 (c) and NO3 (d) *
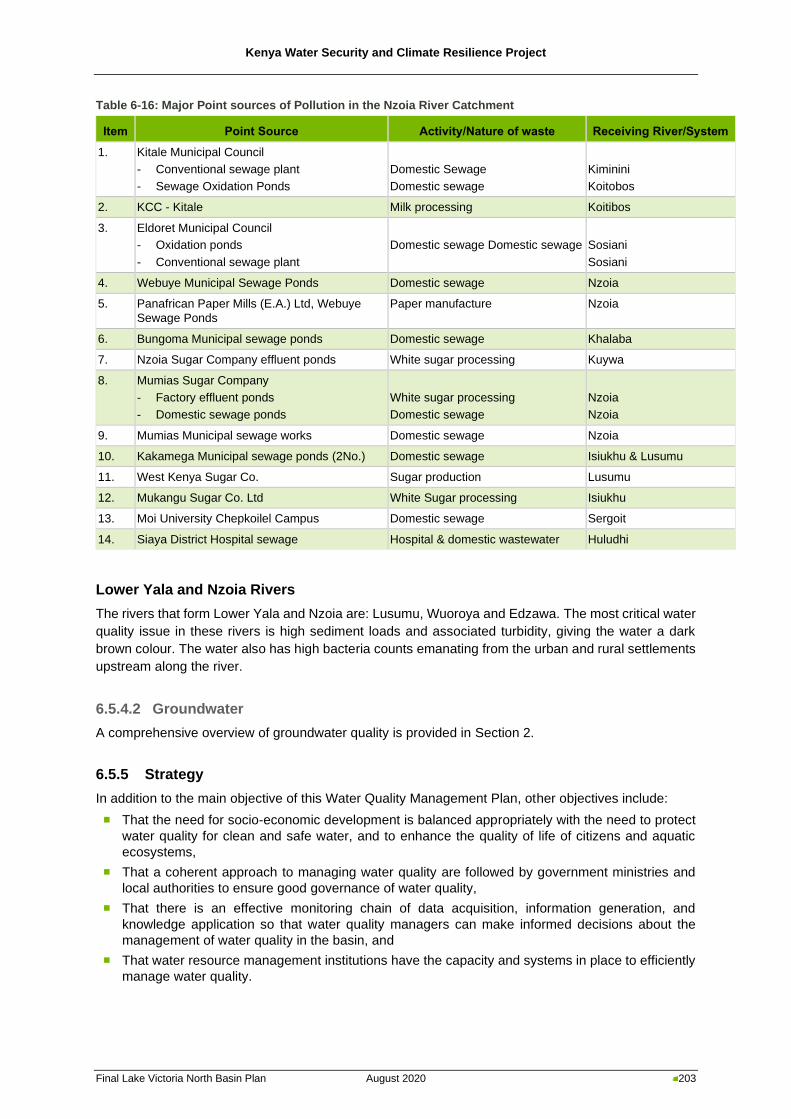
Kenya Water Security and Climate Resilience Project
Final Lake Victoria North Basin Plan August 2020 203
Table 6-16: Major Point sources of Pollution in the Nzoia River Catchment
Item Point Source Activity/Nature of waste Receiving River/System
1. Kitale Municipal Council
- Conventional sewage plant
- Sewage Oxidation Ponds
Domestic Sewage
Domestic sewage
Kiminini
Koitobos
2. KCC - Kitale Milk processing Koitibos
3. Eldoret Municipal Council
- Oxidation ponds
- Conventional sewage plant
Domestic sewage Domestic sewage
Sosiani
Sosiani
4. Webuye Municipal Sewage Ponds Domestic sewage Nzoia
5. Panafrican Paper Mills (E.A.) Ltd, Webuye
Sewage Ponds
Paper manufacture Nzoia
6. Bungoma Municipal sewage ponds Domestic sewage Khalaba
7. Nzoia Sugar Company effluent ponds White sugar processing Kuywa
8. Mumias Sugar Company
- Factory effluent ponds
- Domestic sewage ponds
White sugar processing
Domestic sewage
Nzoia
Nzoia
9. Mumias Municipal sewage works Domestic sewage Nzoia
10. Kakamega Municipal sewage ponds (2No.) Domestic sewage Isiukhu & Lusumu
11. West Kenya Sugar Co. Sugar production Lusumu
12. Mukangu Sugar Co. Ltd White Sugar processing Isiukhu
13. Moi University Chepkoilel Campus Domestic sewage Sergoit
14. Siaya District Hospital sewage Hospital & domestic wastewater Huludhi
Lower Yala and Nzoia Rivers
The rivers that form Lower Yala and Nzoia are: Lusumu, Wuoroya and Edzawa. The most critical water
quality issue in these rivers is high sediment loads and associated turbidity, giving the water a dark
brown colour. The water also has high bacteria counts emanating from the urban and rural settlements
upstream along the river.
6.5.4.2 Groundwater
A comprehensive overview of groundwater quality is provided in Section 2.
6.5.5 Strategy
In addition to the main objective of this Water Quality Management Plan, other objectives include:
◼ That the need for socio-economic development is balanced appropriately with the need to protect
water quality for clean and safe water, and to enhance the quality of life of citizens and aquatic
ecosystems,
◼ That a coherent approach to managing water quality are followed by government ministries and
local authorities to ensure good governance of water quality,
◼ That there is an effective monitoring chain of data acquisition, information generation, and
knowledge application so that water quality managers can make informed decisions about the
management of water quality in the basin, and
◼ That water resource management institutions have the capacity and systems in place to efficiently
manage water quality.
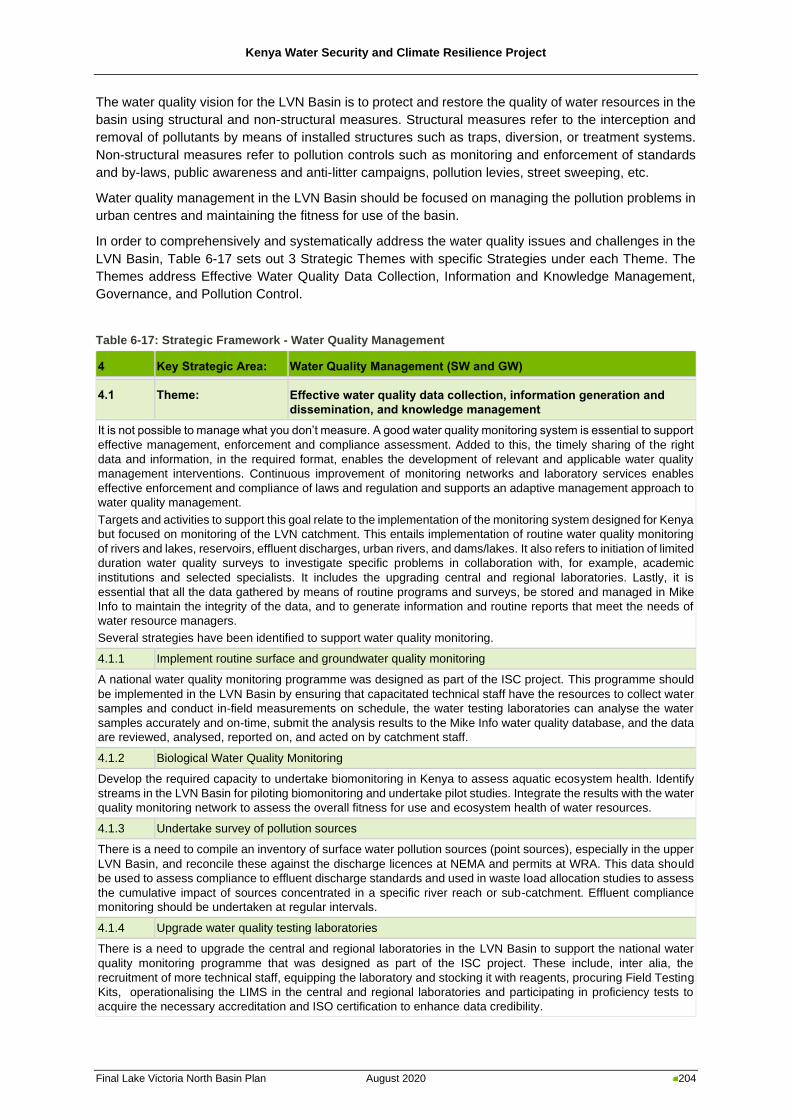
Kenya Water Security and Climate Resilience Project
Final Lake Victoria North Basin Plan August 2020 204
The water quality vision for the LVN Basin is to protect and restore the quality of water resources in the
basin using structural and non-structural measures. Structural measures refer to the interception and
removal of pollutants by means of installed structures such as traps, diversion, or treatment systems.
Non-structural measures refer to pollution controls such as monitoring and enforcement of standards
and by-laws, public awareness and anti-litter campaigns, pollution levies, street sweeping, etc.
Water quality management in the LVN Basin should be focused on managing the pollution problems in
urban centres and maintaining the fitness for use of the basin.
In order to comprehensively and systematically address the water quality issues and challenges in the
LVN Basin, Table 6-17 sets out 3 Strategic Themes with specific Strategies under each Theme. The
Themes address Effective Water Quality Data Collection, Information and Knowledge Management,
Governance, and Pollution Control.
Table 6-17: Strategic Framework - Water Quality Management
4 Key Strategic Area: Water Quality Management (SW and GW)
4.1 Theme: Effective water quality data collection, information generation and
dissemination, and knowledge management
It is not possible to manage what you don’t measure. A good water quality monitoring system is essential to support
effective management, enforcement and compliance assessment. Added to this, the timely sharing of the right
data and information, in the required format, enables the development of relevant and applicable water quality
management interventions. Continuous improvement of monitoring networks and laboratory services enables
effective enforcement and compliance of laws and regulation and supports an adaptive management approach to
water quality management.
Targets and activities to support this goal relate to the implementation of the monitoring system designed for Kenya
but focused on monitoring of the LVN catchment. This entails implementation of routine water quality monitoring
of rivers and lakes, reservoirs, effluent discharges, urban rivers, and dams/lakes. It also refers to initiation of limited
duration water quality surveys to investigate specific problems in collaboration with, for example, academic
institutions and selected specialists. It includes the upgrading central and regional laboratories. Lastly, it is
essential that all the data gathered by means of routine programs and surveys, be stored and managed in Mike
Info to maintain the integrity of the data, and to generate information and routine reports that meet the needs of
water resource managers.
Several strategies have been identified to support water quality monitoring.
4.1.1 Implement routine surface and groundwater quality monitoring
A national water quality monitoring programme was designed as part of the ISC project. This programme should
be implemented in the LVN Basin by ensuring that capacitated technical staff have the resources to collect water
samples and conduct in-field measurements on schedule, the water testing laboratories can analyse the water
samples accurately and on-time, submit the analysis results to the Mike Info water quality database, and the data
are reviewed, analysed, reported on, and acted on by catchment staff.
4.1.2 Biological Water Quality Monitoring
Develop the required capacity to undertake biomonitoring in Kenya to assess aquatic ecosystem health. Identify
streams in the LVN Basin for piloting biomonitoring and undertake pilot studies. Integrate the results with the water
quality monitoring network to assess the overall fitness for use and ecosystem health of water resources.
4.1.3 Undertake survey of pollution sources
There is a need to compile an inventory of surface water pollution sources (point sources), especially in the upper
LVN Basin, and reconcile these against the discharge licences at NEMA and permits at WRA. This data should
be used to assess compliance to effluent discharge standards and used in waste load allocation studies to assess
the cumulative impact of sources concentrated in a specific river reach or sub-catchment. Effluent compliance
monitoring should be undertaken at regular intervals.
4.1.4 Upgrade water quality testing laboratories
There is a need to upgrade the central and regional laboratories in the LVN Basin to support the national water
quality monitoring programme that was designed as part of the ISC project. These include, inter alia, the
recruitment of more technical staff, equipping the laboratory and stocking it with reagents, procuring Field Testing
Kits, operationalising the LIMS in the central and regional laboratories and participating in proficiency tests to
acquire the necessary accreditation and ISO certification to enhance data credibility.
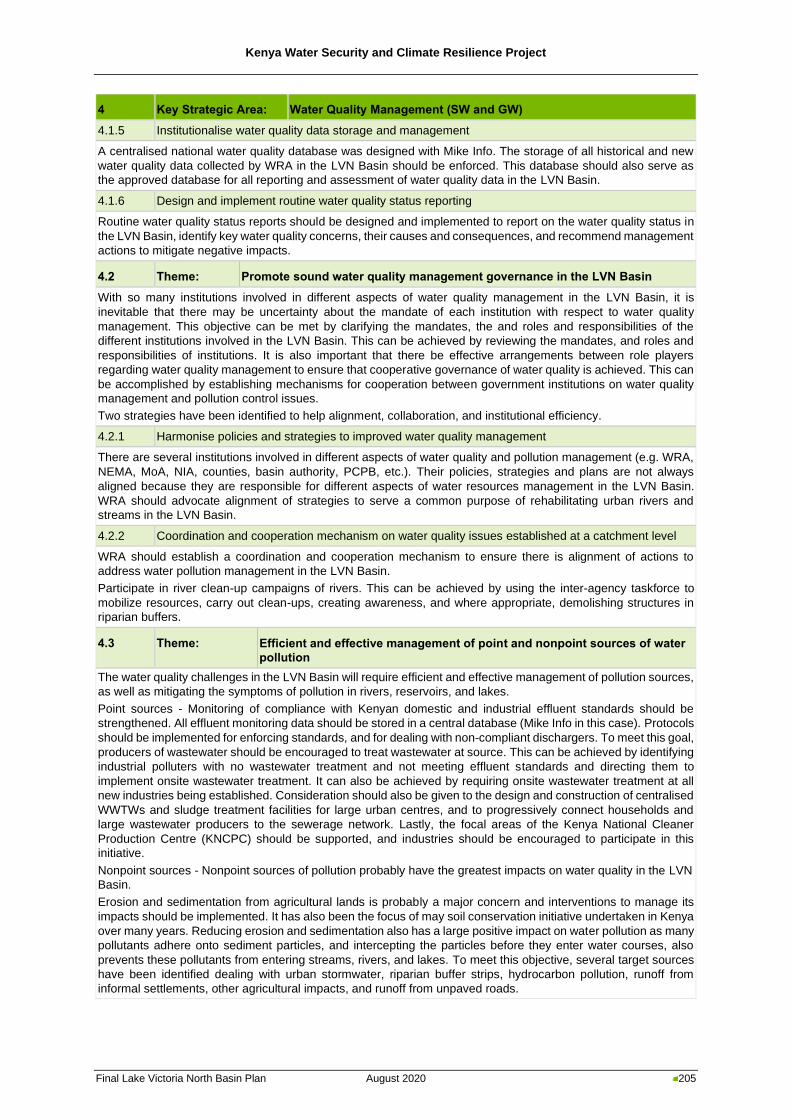
Kenya Water Security and Climate Resilience Project
Final Lake Victoria North Basin Plan August 2020 205
4 Key Strategic Area: Water Quality Management (SW and GW)
4.1.5 Institutionalise water quality data storage and management
A centralised national water quality database was designed with Mike Info. The storage of all historical and new
water quality data collected by WRA in the LVN Basin should be enforced. This database should also serve as
the approved database for all reporting and assessment of water quality data in the LVN Basin.
4.1.6 Design and implement routine water quality status reporting
Routine water quality status reports should be designed and implemented to report on the water quality status in
the LVN Basin, identify key water quality concerns, their causes and consequences, and recommend management
actions to mitigate negative impacts.
4.2 Theme: Promote sound water quality management governance in the LVN Basin
With so many institutions involved in different aspects of water quality management in the LVN Basin, it is
inevitable that there may be uncertainty about the mandate of each institution with respect to water quality
management. This objective can be met by clarifying the mandates, the and roles and responsibilities of the
different institutions involved in the LVN Basin. This can be achieved by reviewing the mandates, and roles and
responsibilities of institutions. It is also important that there be effective arrangements between role players
regarding water quality management to ensure that cooperative governance of water quality is achieved. This can
be accomplished by establishing mechanisms for cooperation between government institutions on water quality
management and pollution control issues.
Two strategies have been identified to help alignment, collaboration, and institutional efficiency.
4.2.1 Harmonise policies and strategies to improved water quality management
There are several institutions involved in different aspects of water quality and pollution management (e.g. WRA,
NEMA, MoA, NIA, counties, basin authority, PCPB, etc.). Their policies, strategies and plans are not always
aligned because they are responsible for different aspects of water resources management in the LVN Basin.
WRA should advocate alignment of strategies to serve a common purpose of rehabilitating urban rivers and
streams in the LVN Basin.
4.2.2 Coordination and cooperation mechanism on water quality issues established at a catchment level
WRA should establish a coordination and cooperation mechanism to ensure there is alignment of actions to
address water pollution management in the LVN Basin.
Participate in river clean-up campaigns of rivers. This can be achieved by using the inter-agency taskforce to
mobilize resources, carry out clean-ups, creating awareness, and where appropriate, demolishing structures in
riparian buffers.
4.3 Theme: Efficient and effective management of point and nonpoint sources of water
pollution
The water quality challenges in the LVN Basin will require efficient and effective management of pollution sources,
as well as mitigating the symptoms of pollution in rivers, reservoirs, and lakes.
Point sources - Monitoring of compliance with Kenyan domestic and industrial effluent standards should be
strengthened. All effluent monitoring data should be stored in a central database (Mike Info in this case). Protocols
should be implemented for enforcing standards, and for dealing with non-compliant dischargers. To meet this goal,
producers of wastewater should be encouraged to treat wastewater at source. This can be achieved by identifying
industrial polluters with no wastewater treatment and not meeting effluent standards and directing them to
implement onsite wastewater treatment. It can also be achieved by requiring onsite wastewater treatment at all
new industries being established. Consideration should also be given to the design and construction of centralised
WWTWs and sludge treatment facilities for large urban centres, and to progressively connect households and
large wastewater producers to the sewerage network. Lastly, the focal areas of the Kenya National Cleaner
Production Centre (KNCPC) should be supported, and industries should be encouraged to participate in this
initiative.
Nonpoint sources - Nonpoint sources of pollution probably have the greatest impacts on water quality in the LVN
Basin.
Erosion and sedimentation from agricultural lands is probably a major concern and interventions to manage its
impacts should be implemented. It has also been the focus of may soil conservation initiative undertaken in Kenya
over many years. Reducing erosion and sedimentation also has a large positive impact on water pollution as many
pollutants adhere onto sediment particles, and intercepting the particles before they enter water courses, also
prevents these pollutants from entering streams, rivers, and lakes. To meet this objective, several target sources
have been identified dealing with urban stormwater, riparian buffer strips, hydrocarbon pollution, runoff from
informal settlements, other agricultural impacts, and runoff from unpaved roads.
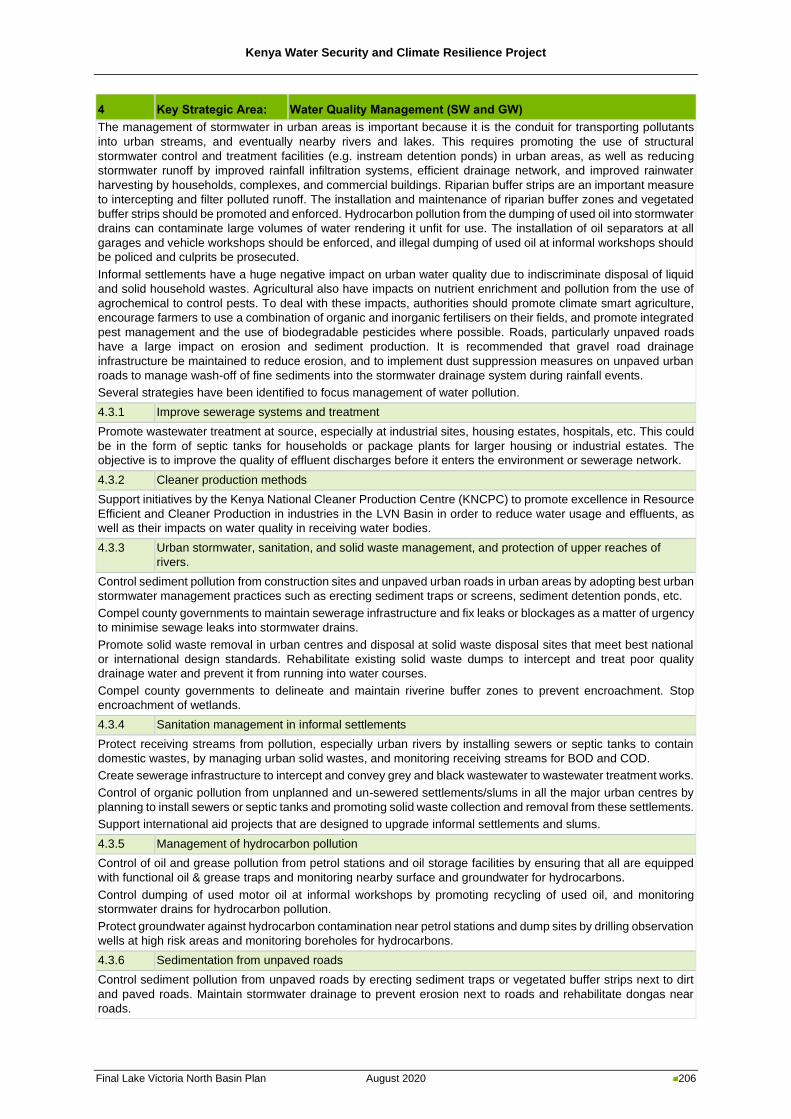
Kenya Water Security and Climate Resilience Project
Final Lake Victoria North Basin Plan August 2020 206
4 Key Strategic Area: Water Quality Management (SW and GW)
The management of stormwater in urban areas is important because it is the conduit for transporting pollutants
into urban streams, and eventually nearby rivers and lakes. This requires promoting the use of structural
stormwater control and treatment facilities (e.g. instream detention ponds) in urban areas, as well as reducing
stormwater runoff by improved rainfall infiltration systems, efficient drainage network, and improved rainwater
harvesting by households, complexes, and commercial buildings. Riparian buffer strips are an important measure
to intercepting and filter polluted runoff. The installation and maintenance of riparian buffer zones and vegetated
buffer strips should be promoted and enforced. Hydrocarbon pollution from the dumping of used oil into stormwater
drains can contaminate large volumes of water rendering it unfit for use. The installation of oil separators at all
garages and vehicle workshops should be enforced, and illegal dumping of used oil at informal workshops should
be policed and culprits be prosecuted.
Informal settlements have a huge negative impact on urban water quality due to indiscriminate disposal of liquid
and solid household wastes. Agricultural also have impacts on nutrient enrichment and pollution from the use of
agrochemical to control pests. To deal with these impacts, authorities should promote climate smart agriculture,
encourage farmers to use a combination of organic and inorganic fertilisers on their fields, and promote integrated
pest management and the use of biodegradable pesticides where possible. Roads, particularly unpaved roads
have a large impact on erosion and sediment production. It is recommended that gravel road drainage
infrastructure be maintained to reduce erosion, and to implement dust suppression measures on unpaved urban
roads to manage wash-off of fine sediments into the stormwater drainage system during rainfall events.
Several strategies have been identified to focus management of water pollution.
4.3.1 Improve sewerage systems and treatment
Promote wastewater treatment at source, especially at industrial sites, housing estates, hospitals, etc. This could
be in the form of septic tanks for households or package plants for larger housing or industrial estates. The
objective is to improve the quality of effluent discharges before it enters the environment or sewerage network.
4.3.2 Cleaner production methods
Support initiatives by the Kenya National Cleaner Production Centre (KNCPC) to promote excellence in Resource
Efficient and Cleaner Production in industries in the LVN Basin in order to reduce water usage and effluents, as
well as their impacts on water quality in receiving water bodies.
4.3.3 Urban stormwater, sanitation, and solid waste management, and protection of upper reaches of
rivers.
Control sediment pollution from construction sites and unpaved urban roads in urban areas by adopting best urban
stormwater management practices such as erecting sediment traps or screens, sediment detention ponds, etc.
Compel county governments to maintain sewerage infrastructure and fix leaks or blockages as a matter of urgency
to minimise sewage leaks into stormwater drains.
Promote solid waste removal in urban centres and disposal at solid waste disposal sites that meet best national
or international design standards. Rehabilitate existing solid waste dumps to intercept and treat poor quality
drainage water and prevent it from running into water courses.
Compel county governments to delineate and maintain riverine buffer zones to prevent encroachment. Stop
encroachment of wetlands.
4.3.4 Sanitation management in informal settlements
Protect receiving streams from pollution, especially urban rivers by installing sewers or septic tanks to contain
domestic wastes, by managing urban solid wastes, and monitoring receiving streams for BOD and COD.
Create sewerage infrastructure to intercept and convey grey and black wastewater to wastewater treatment works.
Control of organic pollution from unplanned and un-sewered settlements/slums in all the major urban centres by
planning to install sewers or septic tanks and promoting solid waste collection and removal from these settlements.
Support international aid projects that are designed to upgrade informal settlements and slums.
4.3.5 Management of hydrocarbon pollution
Control of oil and grease pollution from petrol stations and oil storage facilities by ensuring that all are equipped
with functional oil & grease traps and monitoring nearby surface and groundwater for hydrocarbons.
Control dumping of used motor oil at informal workshops by promoting recycling of used oil, and monitoring
stormwater drains for hydrocarbon pollution.
Protect groundwater against hydrocarbon contamination near petrol stations and dump sites by drilling observation
wells at high risk areas and monitoring boreholes for hydrocarbons.
4.3.6 Sedimentation from unpaved roads
Control sediment pollution from unpaved roads by erecting sediment traps or vegetated buffer strips next to dirt
and paved roads. Maintain stormwater drainage to prevent erosion next to roads and rehabilitate dongas near
roads.
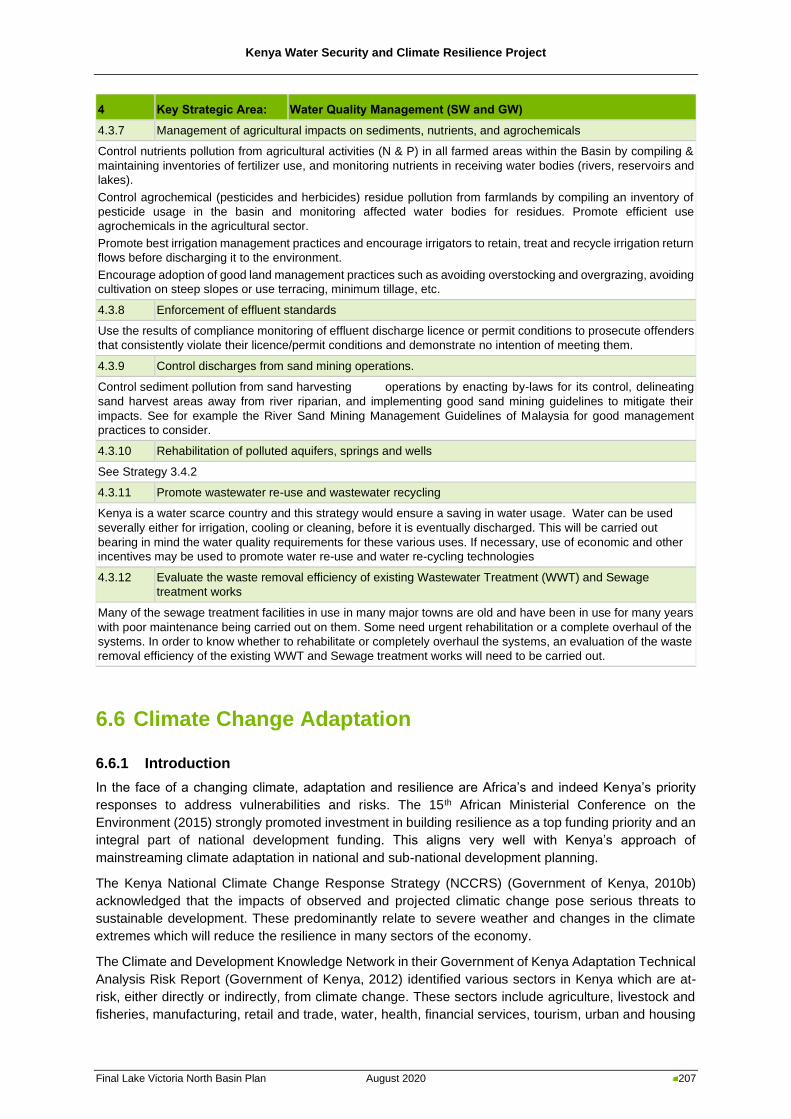
Kenya Water Security and Climate Resilience Project
Final Lake Victoria North Basin Plan August 2020 207
4 Key Strategic Area: Water Quality Management (SW and GW)
4.3.7 Management of agricultural impacts on sediments, nutrients, and agrochemicals
Control nutrients pollution from agricultural activities (N & P) in all farmed areas within the Basin by compiling &
maintaining inventories of fertilizer use, and monitoring nutrients in receiving water bodies (rivers, reservoirs and
lakes).
Control agrochemical (pesticides and herbicides) residue pollution from farmlands by compiling an inventory of
pesticide usage in the basin and monitoring affected water bodies for residues. Promote efficient use
agrochemicals in the agricultural sector.
Promote best irrigation management practices and encourage irrigators to retain, treat and recycle irrigation return
flows before discharging it to the environment.
Encourage adoption of good land management practices such as avoiding overstocking and overgrazing, avoiding
cultivation on steep slopes or use terracing, minimum tillage, etc.
4.3.8 Enforcement of effluent standards
Use the results of compliance monitoring of effluent discharge licence or permit conditions to prosecute offenders
that consistently violate their licence/permit conditions and demonstrate no intention of meeting them.
4.3.9 Control discharges from sand mining operations.
Control sediment pollution from sand harvesting operations by enacting by-laws for its control, delineating
sand harvest areas away from river riparian, and implementing good sand mining guidelines to mitigate their
impacts. See for example the River Sand Mining Management Guidelines of Malaysia for good management
practices to consider.
4.3.10 Rehabilitation of polluted aquifers, springs and wells
See Strategy 3.4.2
4.3.11 Promote wastewater re-use and wastewater recycling
Kenya is a water scarce country and this strategy would ensure a saving in water usage. Water can be used
severally either for irrigation, cooling or cleaning, before it is eventually discharged. This will be carried out
bearing in mind the water quality requirements for these various uses. If necessary, use of economic and other
incentives may be used to promote water re-use and water re-cycling technologies
4.3.12 Evaluate the waste removal efficiency of existing Wastewater Treatment (WWT) and Sewage
treatment works
Many of the sewage treatment facilities in use in many major towns are old and have been in use for many years
with poor maintenance being carried out on them. Some need urgent rehabilitation or a complete overhaul of the
systems. In order to know whether to rehabilitate or completely overhaul the systems, an evaluation of the waste
removal efficiency of the existing WWT and Sewage treatment works will need to be carried out.
6.6 Climate Change Adaptation
6.6.1 Introduction
In the face of a changing climate, adaptation and resilience are Africa’s and indeed Kenya’s priority
responses to address vulnerabilities and risks. The 15th African Ministerial Conference on the
Environment (2015) strongly promoted investment in building resilience as a top funding priority and an
integral part of national development funding. This aligns very well with Kenya’s approach of
mainstreaming climate adaptation in national and sub-national development planning.
The Kenya National Climate Change Response Strategy (NCCRS) (Government of Kenya, 2010b)
acknowledged that the impacts of observed and projected climatic change pose serious threats to
sustainable development. These predominantly relate to severe weather and changes in the climate
extremes which will reduce the resilience in many sectors of the economy.
The Climate and Development Knowledge Network in their Government of Kenya Adaptation Technical
Analysis Risk Report (Government of Kenya, 2012) identified various sectors in Kenya which are at-
risk, either directly or indirectly, from climate change. These sectors include agriculture, livestock and
fisheries, manufacturing, retail and trade, water, health, financial services, tourism, urban and housing
Kenya Water Security and Climate Resilience Project
Final Lake Victoria North Basin Plan August 2020 208
sectors, infrastructure, energy, transport, natural resources and environment, political and social
sectors.
The Climate Change Act 2016 aims to strengthen climate change governance coordination structures
and outlines the key climate change duties of public and non-state actors. It establishes a high-level
National Climate Change Council chaired by the President, a Climate Change Directorate as the lead
technical agency on climate change affairs, and a Climate Change Fund as a financing mechanism for
priority climate change actions/interventions. Climate desks/units have subsequently been established
in certain line ministries staffed by relevant climate change desk officers. The Act is to be applied across
all sectors of the economy, and by both the national and county governments. Mainstreaming of climate
change has to some extent been undertaken at the county government level, where some counties
have taken measures to include climate change in their County Integrated Development Plans (CIDPs)
and to develop relevant county legislation.
The National Climate Change Action Plan 2013 to 2017 (Government of Kenya, 2013b) sets out a vision
for a low carbon development pathway for Kenya and lists specific adaptation and mitigation actions for
each national planning sector to support this vision. One of the “big wins” identified in the draft National
Climate Change Action Plan 2018-2022 relates to “improved water resources management”.
The draft National Climate Change Action Plan 2018-2022 (Government of Kenya, 2018) builds on the
first Action Plan (2013-2017) and provides a framework for Kenya to deliver on its Nationally Determined
Contribution (NDC) under the Paris Agreement of the United Nations Framework Convention on Climate
Change. The draft National Climate Change Action Plan 2018-2022 guides the climate actions of the
national and county governments, the private sector, civil society and other actors as Kenya transitions
to a low carbon climate resilient development pathway. It identifies strategic areas where climate action
over the next five years is linked to Kenya’s Big Four Agenda, recognising that climate change is likely
to limit the achievement of these pillars. One of the “big wins” identified in the draft National Climate
Change Action Plan 2018-2022 relates to “improved water resources management”. Of relevance to
water resources management and planning is “Food and Nutrition Security” where food security may
be threatened through climate change-driven declines in agricultural productivity. The draft National
Climate Change Action Plan 2018-2022 also prioritises seven climate change actions (Table 6-18),
three of which (nos. 1 to 3) align very strongly with the planning and management of water resources.
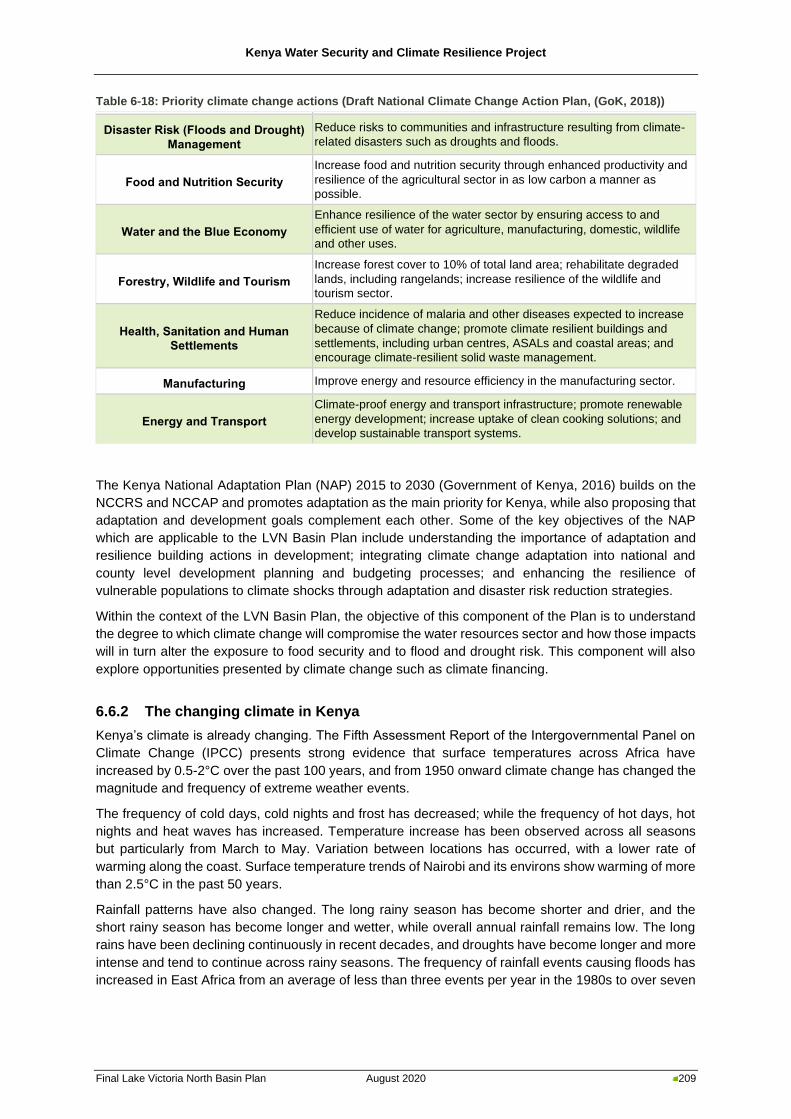
Kenya Water Security and Climate Resilience Project
Final Lake Victoria North Basin Plan August 2020 209
Table 6-18: Priority climate change actions (Draft National Climate Change Action Plan, (GoK, 2018))
Disaster Risk (Floods and Drought)
Management
Reduce risks to communities and infrastructure resulting from climate-
related disasters such as droughts and floods.
Food and Nutrition Security
Increase food and nutrition security through enhanced productivity and
resilience of the agricultural sector in as low carbon a manner as
possible.
Water and the Blue Economy
Enhance resilience of the water sector by ensuring access to and
efficient use of water for agriculture, manufacturing, domestic, wildlife
and other uses.
Forestry, Wildlife and Tourism
Increase forest cover to 10% of total land area; rehabilitate degraded
lands, including rangelands; increase resilience of the wildlife and
tourism sector.
Health, Sanitation and Human
Settlements
Reduce incidence of malaria and other diseases expected to increase
because of climate change; promote climate resilient buildings and
settlements, including urban centres, ASALs and coastal areas; and
encourage climate-resilient solid waste management.
Manufacturing Improve energy and resource efficiency in the manufacturing sector.
Energy and Transport
Climate-proof energy and transport infrastructure; promote renewable
energy development; increase uptake of clean cooking solutions; and
develop sustainable transport systems.
The Kenya National Adaptation Plan (NAP) 2015 to 2030 (Government of Kenya, 2016) builds on the
NCCRS and NCCAP and promotes adaptation as the main priority for Kenya, while also proposing that
adaptation and development goals complement each other. Some of the key objectives of the NAP
which are applicable to the LVN Basin Plan include understanding the importance of adaptation and
resilience building actions in development; integrating climate change adaptation into national and
county level development planning and budgeting processes; and enhancing the resilience of
vulnerable populations to climate shocks through adaptation and disaster risk reduction strategies.
Within the context of the LVN Basin Plan, the objective of this component of the Plan is to understand
the degree to which climate change will compromise the water resources sector and how those impacts
will in turn alter the exposure to food security and to flood and drought risk. This component will also
explore opportunities presented by climate change such as climate financing.
6.6.2 The changing climate in Kenya
Kenya’s climate is already changing. The Fifth Assessment Report of the Intergovernmental Panel on
Climate Change (IPCC) presents strong evidence that surface temperatures across Africa have
increased by 0.5-2°C over the past 100 years, and from 1950 onward climate change has changed the
magnitude and frequency of extreme weather events.
The frequency of cold days, cold nights and frost has decreased; while the frequency of hot days, hot
nights and heat waves has increased. Temperature increase has been observed across all seasons
but particularly from March to May. Variation between locations has occurred, with a lower rate of
warming along the coast. Surface temperature trends of Nairobi and its environs show warming of more
than 2.5°C in the past 50 years.
Rainfall patterns have also changed. The long rainy season has become shorter and drier, and the
short rainy season has become longer and wetter, while overall annual rainfall remains low. The long
rains have been declining continuously in recent decades, and droughts have become longer and more
intense and tend to continue across rainy seasons. The frequency of rainfall events causing floods has
increased in East Africa from an average of less than three events per year in the 1980s to over seven
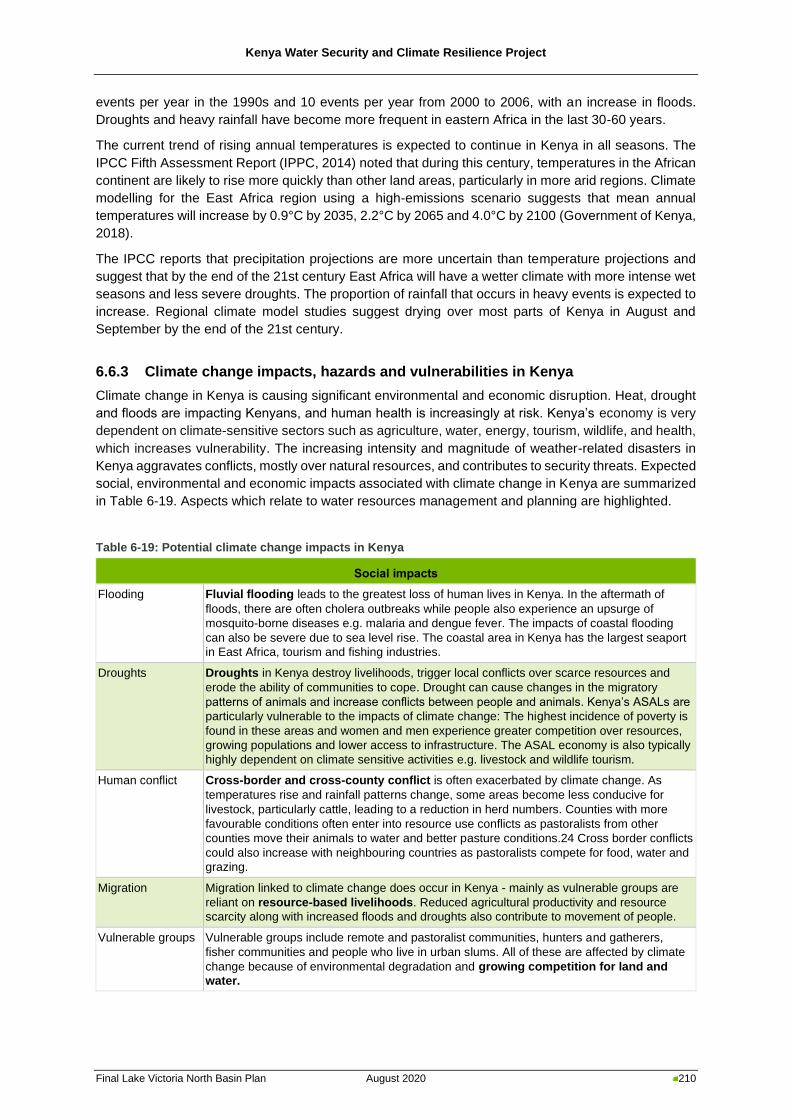
Kenya Water Security and Climate Resilience Project
Final Lake Victoria North Basin Plan August 2020 210
events per year in the 1990s and 10 events per year from 2000 to 2006, with an increase in floods.
Droughts and heavy rainfall have become more frequent in eastern Africa in the last 30-60 years.
The current trend of rising annual temperatures is expected to continue in Kenya in all seasons. The
IPCC Fifth Assessment Report (IPPC, 2014) noted that during this century, temperatures in the African
continent are likely to rise more quickly than other land areas, particularly in more arid regions. Climate
modelling for the East Africa region using a high-emissions scenario suggests that mean annual
temperatures will increase by 0.9°C by 2035, 2.2°C by 2065 and 4.0°C by 2100 (Government of Kenya,
2018).
The IPCC reports that precipitation projections are more uncertain than temperature projections and
suggest that by the end of the 21st century East Africa will have a wetter climate with more intense wet
seasons and less severe droughts. The proportion of rainfall that occurs in heavy events is expected to
increase. Regional climate model studies suggest drying over most parts of Kenya in August and
September by the end of the 21st century.
6.6.3 Climate change impacts, hazards and vulnerabilities in Kenya
Climate change in Kenya is causing significant environmental and economic disruption. Heat, drought
and floods are impacting Kenyans, and human health is increasingly at risk. Kenya’s economy is very
dependent on climate-sensitive sectors such as agriculture, water, energy, tourism, wildlife, and health,
which increases vulnerability. The increasing intensity and magnitude of weather-related disasters in
Kenya aggravates conflicts, mostly over natural resources, and contributes to security threats. Expected
social, environmental and economic impacts associated with climate change in Kenya are summarized
in Table 6-19. Aspects which relate to water resources management and planning are highlighted.
Table 6-19: Potential climate change impacts in Kenya
Social impacts
Flooding Fluvial flooding leads to the greatest loss of human lives in Kenya. In the aftermath of
floods, there are often cholera outbreaks while people also experience an upsurge of
mosquito-borne diseases e.g. malaria and dengue fever. The impacts of coastal flooding
can also be severe due to sea level rise. The coastal area in Kenya has the largest seaport
in East Africa, tourism and fishing industries.
Droughts Droughts in Kenya destroy livelihoods, trigger local conflicts over scarce resources and
erode the ability of communities to cope. Drought can cause changes in the migratory
patterns of animals and increase conflicts between people and animals. Kenya’s ASALs are
particularly vulnerable to the impacts of climate change: The highest incidence of poverty is
found in these areas and women and men experience greater competition over resources,
growing populations and lower access to infrastructure. The ASAL economy is also typically
highly dependent on climate sensitive activities e.g. livestock and wildlife tourism.
Human conflict Cross-border and cross-county conflict is often exacerbated by climate change. As
temperatures rise and rainfall patterns change, some areas become less conducive for
livestock, particularly cattle, leading to a reduction in herd numbers. Counties with more
favourable conditions often enter into resource use conflicts as pastoralists from other
counties move their animals to water and better pasture conditions.24 Cross border conflicts
could also increase with neighbouring countries as pastoralists compete for food, water and
grazing.
Migration Migration linked to climate change does occur in Kenya - mainly as vulnerable groups are
reliant on resource-based livelihoods. Reduced agricultural productivity and resource
scarcity along with increased floods and droughts also contribute to movement of people.
Vulnerable groups Vulnerable groups include remote and pastoralist communities, hunters and gatherers,
fisher communities and people who live in urban slums. All of these are affected by climate
change because of environmental degradation and growing competition for land and
water.
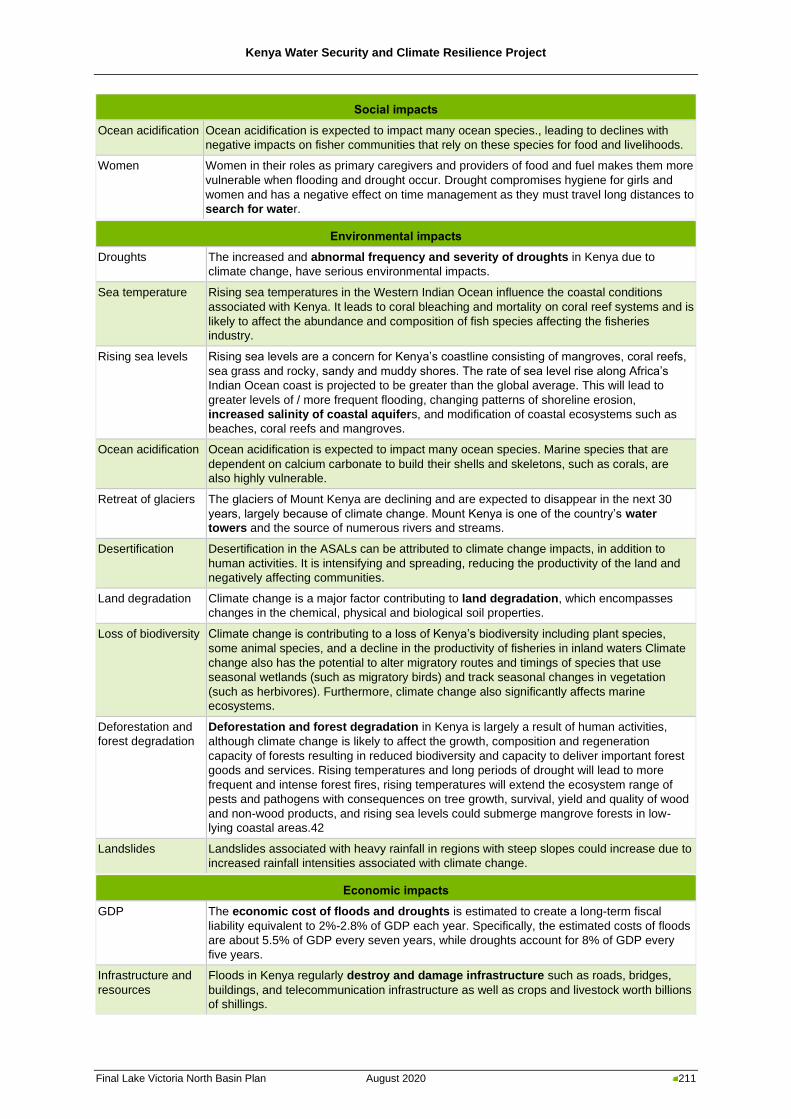
Kenya Water Security and Climate Resilience Project
Final Lake Victoria North Basin Plan August 2020 211
Social impacts
Ocean acidification Ocean acidification is expected to impact many ocean species., leading to declines with
negative impacts on fisher communities that rely on these species for food and livelihoods.
Women Women in their roles as primary caregivers and providers of food and fuel makes them more
vulnerable when flooding and drought occur. Drought compromises hygiene for girls and
women and has a negative effect on time management as they must travel long distances to
search for water.
Environmental impacts
Droughts The increased and abnormal frequency and severity of droughts in Kenya due to
climate change, have serious environmental impacts.
Sea temperature Rising sea temperatures in the Western Indian Ocean influence the coastal conditions
associated with Kenya. It leads to coral bleaching and mortality on coral reef systems and is
likely to affect the abundance and composition of fish species affecting the fisheries
industry.
Rising sea levels Rising sea levels are a concern for Kenya’s coastline consisting of mangroves, coral reefs,
sea grass and rocky, sandy and muddy shores. The rate of sea level rise along Africa’s
Indian Ocean coast is projected to be greater than the global average. This will lead to
greater levels of / more frequent flooding, changing patterns of shoreline erosion,
increased salinity of coastal aquifers, and modification of coastal ecosystems such as
beaches, coral reefs and mangroves.
Ocean acidification Ocean acidification is expected to impact many ocean species. Marine species that are
dependent on calcium carbonate to build their shells and skeletons, such as corals, are
also highly vulnerable.
Retreat of glaciers The glaciers of Mount Kenya are declining and are expected to disappear in the next 30
years, largely because of climate change. Mount Kenya is one of the country’s water
towers and the source of numerous rivers and streams.
Desertification Desertification in the ASALs can be attributed to climate change impacts, in addition to
human activities. It is intensifying and spreading, reducing the productivity of the land and
negatively affecting communities.
Land degradation Climate change is a major factor contributing to land degradation, which encompasses
changes in the chemical, physical and biological soil properties.
Loss of biodiversity Climate change is contributing to a loss of Kenya’s biodiversity including plant species,
some animal species, and a decline in the productivity of fisheries in inland waters Climate
change also has the potential to alter migratory routes and timings of species that use
seasonal wetlands (such as migratory birds) and track seasonal changes in vegetation
(such as herbivores). Furthermore, climate change also significantly affects marine
ecosystems.
Deforestation and
forest degradation
Deforestation and forest degradation in Kenya is largely a result of human activities,
although climate change is likely to affect the growth, composition and regeneration
capacity of forests resulting in reduced biodiversity and capacity to deliver important forest
goods and services. Rising temperatures and long periods of drought will lead to more
frequent and intense forest fires, rising temperatures will extend the ecosystem range of
pests and pathogens with consequences on tree growth, survival, yield and quality of wood
and non-wood products, and rising sea levels could submerge mangrove forests in low-
lying coastal areas.42
Landslides Landslides associated with heavy rainfall in regions with steep slopes could increase due to
increased rainfall intensities associated with climate change.
Economic impacts
GDP The economic cost of floods and droughts is estimated to create a long-term fiscal
liability equivalent to 2%-2.8% of GDP each year. Specifically, the estimated costs of floods
are about 5.5% of GDP every seven years, while droughts account for 8% of GDP every
five years.
Infrastructure and
resources
Floods in Kenya regularly destroy and damage infrastructure such as roads, bridges,
buildings, and telecommunication infrastructure as well as crops and livestock worth billions
of shillings.
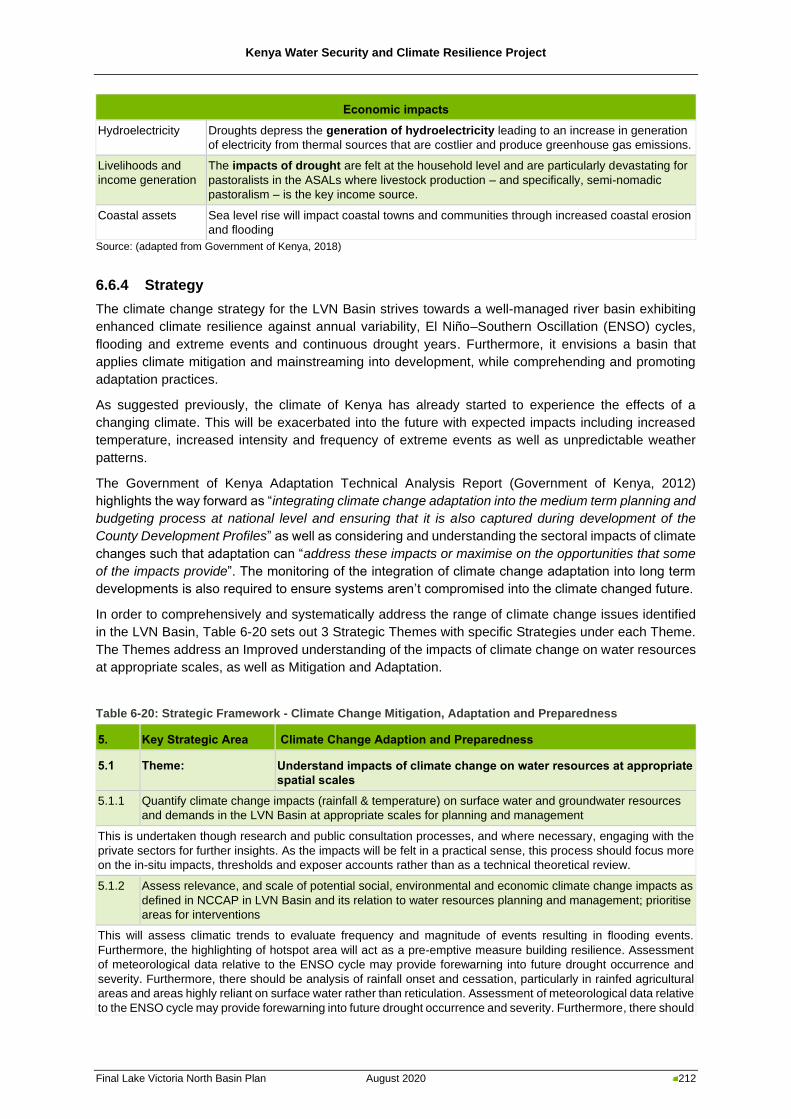
Kenya Water Security and Climate Resilience Project
Final Lake Victoria North Basin Plan August 2020 212
Economic impacts
Hydroelectricity Droughts depress the generation of hydroelectricity leading to an increase in generation
of electricity from thermal sources that are costlier and produce greenhouse gas emissions.
Livelihoods and
income generation
The impacts of drought are felt at the household level and are particularly devastating for
pastoralists in the ASALs where livestock production – and specifically, semi-nomadic
pastoralism – is the key income source.
Coastal assets Sea level rise will impact coastal towns and communities through increased coastal erosion
and flooding
Source: (adapted from Government of Kenya, 2018)
6.6.4 Strategy
The climate change strategy for the LVN Basin strives towards a well-managed river basin exhibiting
enhanced climate resilience against annual variability, El Niño–Southern Oscillation (ENSO) cycles,
flooding and extreme events and continuous drought years. Furthermore, it envisions a basin that
applies climate mitigation and mainstreaming into development, while comprehending and promoting
adaptation practices.
As suggested previously, the climate of Kenya has already started to experience the effects of a
changing climate. This will be exacerbated into the future with expected impacts including increased
temperature, increased intensity and frequency of extreme events as well as unpredictable weather
patterns.
The Government of Kenya Adaptation Technical Analysis Report (Government of Kenya, 2012)
highlights the way forward as “integrating climate change adaptation into the medium term planning and
budgeting process at national level and ensuring that it is also captured during development of the
County Development Profiles” as well as considering and understanding the sectoral impacts of climate
changes such that adaptation can “address these impacts or maximise on the opportunities that some
of the impacts provide”. The monitoring of the integration of climate change adaptation into long term
developments is also required to ensure systems aren’t compromised into the climate changed future.
In order to comprehensively and systematically address the range of climate change issues identified
in the LVN Basin, Table 6-20 sets out 3 Strategic Themes with specific Strategies under each Theme.
The Themes address an Improved understanding of the impacts of climate change on water resources
at appropriate scales, as well as Mitigation and Adaptation.
Table 6-20: Strategic Framework - Climate Change Mitigation, Adaptation and Preparedness
5. Key Strategic Area Climate Change Adaption and Preparedness
5.1 Theme: Understand impacts of climate change on water resources at appropriate
spatial scales
5.1.1 Quantify climate change impacts (rainfall & temperature) on surface water and groundwater resources
and demands in the LVN Basin at appropriate scales for planning and management
This is undertaken though research and public consultation processes, and where necessary, engaging with the
private sectors for further insights. As the impacts will be felt in a practical sense, this process should focus more
on the in-situ impacts, thresholds and exposer accounts rather than as a technical theoretical review.
5.1.2 Assess relevance, and scale of potential social, environmental and economic climate change impacts as
defined in NCCAP in LVN Basin and its relation to water resources planning and management; prioritise
areas for interventions
This will assess climatic trends to evaluate frequency and magnitude of events resulting in flooding events.
Furthermore, the highlighting of hotspot area will act as a pre-emptive measure building resilience. Assessment
of meteorological data relative to the ENSO cycle may provide forewarning into future drought occurrence and
severity. Furthermore, there should be analysis of rainfall onset and cessation, particularly in rainfed agricultural
areas and areas highly reliant on surface water rather than reticulation. Assessment of meteorological data relative
to the ENSO cycle may provide forewarning into future drought occurrence and severity. Furthermore, there should
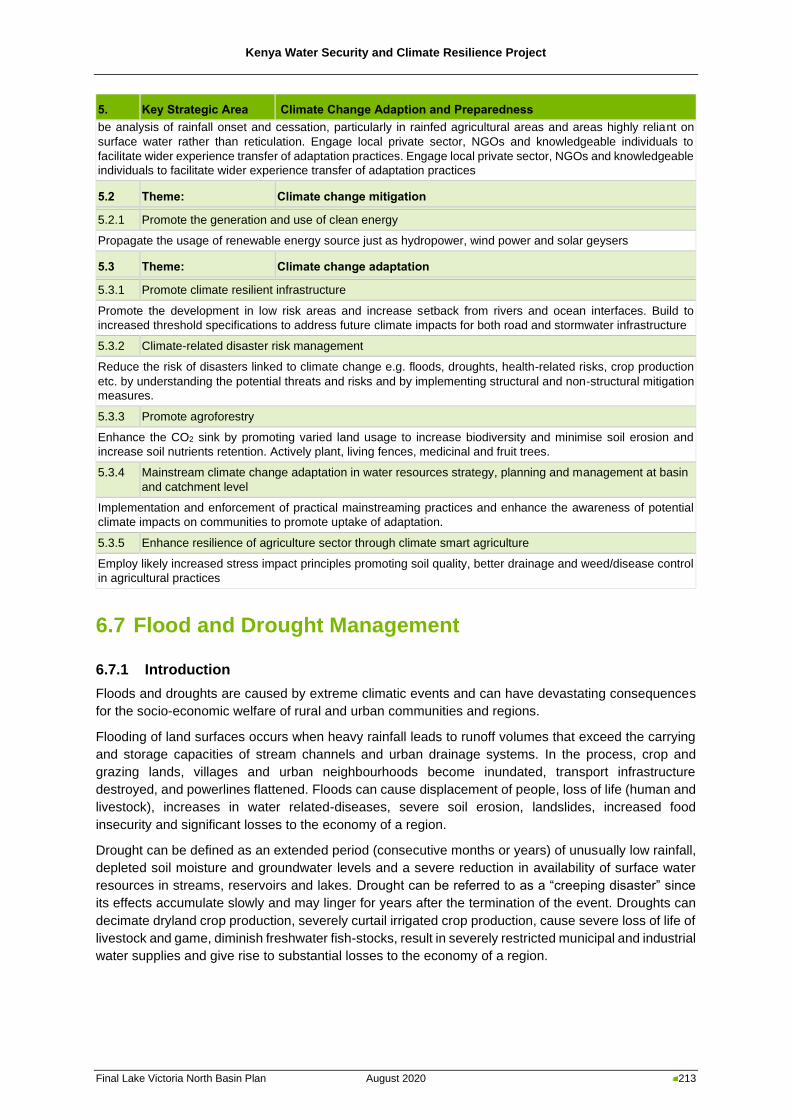
Kenya Water Security and Climate Resilience Project
Final Lake Victoria North Basin Plan August 2020 213
5. Key Strategic Area Climate Change Adaption and Preparedness
be analysis of rainfall onset and cessation, particularly in rainfed agricultural areas and areas highly reliant on
surface water rather than reticulation. Engage local private sector, NGOs and knowledgeable individuals to
facilitate wider experience transfer of adaptation practices. Engage local private sector, NGOs and knowledgeable
individuals to facilitate wider experience transfer of adaptation practices
5.2 Theme: Climate change mitigation
5.2.1 Promote the generation and use of clean energy
Propagate the usage of renewable energy source just as hydropower, wind power and solar geysers
5.3 Theme: Climate change adaptation
5.3.1 Promote climate resilient infrastructure
Promote the development in low risk areas and increase setback from rivers and ocean interfaces. Build to
increased threshold specifications to address future climate impacts for both road and stormwater infrastructure
5.3.2 Climate-related disaster risk management
Reduce the risk of disasters linked to climate change e.g. floods, droughts, health-related risks, crop production
etc. by understanding the potential threats and risks and by implementing structural and non-structural mitigation
measures.
5.3.3 Promote agroforestry
Enhance the CO2 sink by promoting varied land usage to increase biodiversity and minimise soil erosion and
increase soil nutrients retention. Actively plant, living fences, medicinal and fruit trees.
5.3.4 Mainstream climate change adaptation in water resources strategy, planning and management at basin
and catchment level
Implementation and enforcement of practical mainstreaming practices and enhance the awareness of potential
climate impacts on communities to promote uptake of adaptation.
5.3.5 Enhance resilience of agriculture sector through climate smart agriculture
Employ likely increased stress impact principles promoting soil quality, better drainage and weed/disease control
in agricultural practices
6.7 Flood and Drought Management
6.7.1 Introduction
Floods and droughts are caused by extreme climatic events and can have devastating consequences
for the socio-economic welfare of rural and urban communities and regions.
Flooding of land surfaces occurs when heavy rainfall leads to runoff volumes that exceed the carrying
and storage capacities of stream channels and urban drainage systems. In the process, crop and
grazing lands, villages and urban neighbourhoods become inundated, transport infrastructure
destroyed, and powerlines flattened. Floods can cause displacement of people, loss of life (human and
livestock), increases in water related-diseases, severe soil erosion, landslides, increased food
insecurity and significant losses to the economy of a region.
Drought can be defined as an extended period (consecutive months or years) of unusually low rainfall,
depleted soil moisture and groundwater levels and a severe reduction in availability of surface water
resources in streams, reservoirs and lakes. Drought can be referred to as a “creeping disaster” since
its effects accumulate slowly and may linger for years after the termination of the event. Droughts can
decimate dryland crop production, severely curtail irrigated crop production, cause severe loss of life of
livestock and game, diminish freshwater fish-stocks, result in severely restricted municipal and industrial
water supplies and give rise to substantial losses to the economy of a region.
Kenya Water Security and Climate Resilience Project
Final Lake Victoria North Basin Plan August 2020 214
It follows from the above that systematic preparedness planning for floods and droughts is an imperative
to ensure mitigation of and protection against the above negative consequences of extreme floods and
droughts.
The purpose of a Flood and Drought Management Plan is to establish and guide a structured
programme of actions aimed at ensuring the prevention of, mitigation of, timeous response to, and
recovery from, the harmful impacts of floods and droughts across a specific Basin or catchment area.
6.7.2 Characteristics of floods and droughts in LVN Basin
6.7.2.1 Frequency and extent of floods
The frequency and extent of significant floods in Kenya have increased during the past six decades
from about one flood period every four years, on average, to a near-annual event, as is illustrated by
the following details:
◼ Between 1961 and 1997/98, Kenya experienced eight individual years with widespread flooding
(Opere, 2013). The most devastating among these were the floods of 1997/98, the so-called El
Nino Flood, with 1.5 million people affected, 770 000 displaced, 2 000 human deaths, 2.3 million
livestock lost and 100 000 km roads and 13 major bridges destroyed (Gathura, 2015). The Siaya,
Busia, Uasin Gishu and Trans Nzoia counties were particularly severely impacted.
◼ During the period 1998-2012, widespread flooding and landslides across Kenya were absent for
only two of the years and during a number of these events Kitale and all the eastern counties in
the LVN Basin were impacted to varying degrees (Huho et al., 2016). In November 2006, in
Budalangi, the collapse of dykes led to flooding which displaced more than 10 000 people. In late
2008, the Nzoia River burst its banks at various locations and caused wide-spread displacements.
◼ Widespread flooding and occasional landslides during March–May 2013 displaced 140 000 people
and led to 96 deaths. Siaya and Vihiga counties in the LVN Basin were impacted (OCHA, 2013;
Reliefweb, 2013).
◼ Widespread flooding and occasional landslides during October-December 2015 affected 240 000
people, displaced 104 000 and caused 112 deaths across the impacted areas. LVN Basin counties
that were impacted were Busia, Siaya and Nandi (International Federation of Red Cross, 2016a).
◼ Widespread flooding and occasional landslides during April and May 2016 displaced 48 000 people
and caused 100 deaths. LVN Basin counties that were severely impacted were Busia and
Kakamega (International Federation of Red Cross, 2016b).
◼ During 2017, two different periods of significant flooding occurred in separate parts of Kenya -
during May in south-eastern Kenya and during November in northern Kenya. The LVN Basin was
not severely impacted (Davies, 2017).
◼ Widespread flooding and various landslides during March-May 2018 impacted more than 800 000
people across Kenya, including in LVN Basin counties, Siaya and Busia. About 300 000 people
were displaced and 186 people lost their lives across the country. More than 8 500 hectares of
crops were destroyed and some 20 000 livestock lost, while about 100 schools were flooded
(OCHA, 2018).
6.7.2.2 Flood-prone areas in LVN Basin
The chronic flood-prone areas in the LVN Basin are as follows (Government of Kenya, 2009; Water
Resources Management Authority, 2015a):
◼ Long-duration flooding (up to a month) in the Lower Nzoia River at Budalangi in Busia county
◼ Long-duration flooding (up to a month) in the Lower Nyala River and, particularly, Yala Swamp in
Siaya county
◼ Short-duration flooding (1 – 2 days) in the Lower Sio and Lower Malikisi Rivers, in Busia county
◼ Short-duration (1 – 2 hours) flash floods in the foothills of Mount Elgon in Bungoma county.
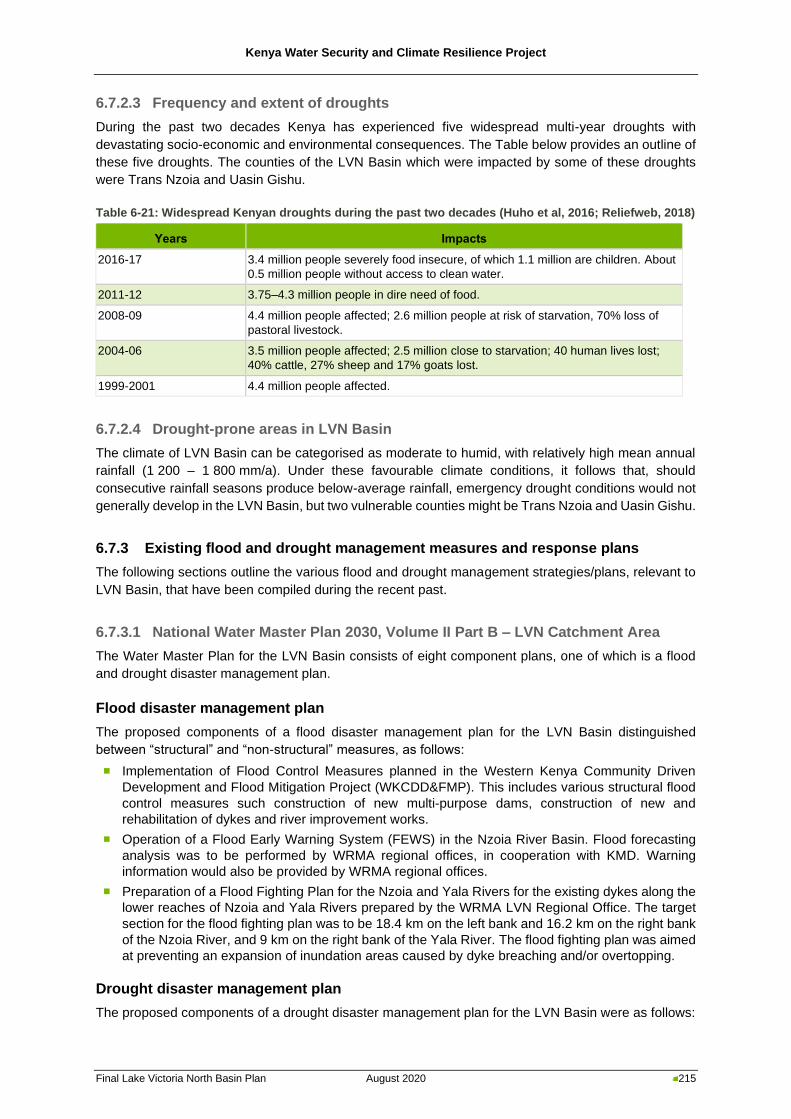
Kenya Water Security and Climate Resilience Project
Final Lake Victoria North Basin Plan August 2020 215
6.7.2.3 Frequency and extent of droughts
During the past two decades Kenya has experienced five widespread multi-year droughts with
devastating socio-economic and environmental consequences. The Table below provides an outline of
these five droughts. The counties of the LVN Basin which were impacted by some of these droughts
were Trans Nzoia and Uasin Gishu.
Table 6-21: Widespread Kenyan droughts during the past two decades (Huho et al, 2016; Reliefweb, 2018)
Years Impacts
2016-17 3.4 million people severely food insecure, of which 1.1 million are children. About
0.5 million people without access to clean water.
2011-12 3.75–4.3 million people in dire need of food.
2008-09 4.4 million people affected; 2.6 million people at risk of starvation, 70% loss of
pastoral livestock.
2004-06 3.5 million people affected; 2.5 million close to starvation; 40 human lives lost;
40% cattle, 27% sheep and 17% goats lost.
1999-2001 4.4 million people affected.
6.7.2.4 Drought-prone areas in LVN Basin
The climate of LVN Basin can be categorised as moderate to humid, with relatively high mean annual
rainfall (1 200 – 1 800 mm/a). Under these favourable climate conditions, it follows that, should
consecutive rainfall seasons produce below-average rainfall, emergency drought conditions would not
generally develop in the LVN Basin, but two vulnerable counties might be Trans Nzoia and Uasin Gishu.
6.7.3 Existing flood and drought management measures and response plans
The following sections outline the various flood and drought management strategies/plans, relevant to
LVN Basin, that have been compiled during the recent past.
6.7.3.1 National Water Master Plan 2030, Volume II Part B – LVN Catchment Area
The Water Master Plan for the LVN Basin consists of eight component plans, one of which is a flood
and drought disaster management plan.
Flood disaster management plan
The proposed components of a flood disaster management plan for the LVN Basin distinguished
between “structural” and “non-structural” measures, as follows:
◼ Implementation of Flood Control Measures planned in the Western Kenya Community Driven
Development and Flood Mitigation Project (WKCDD&FMP). This includes various structural flood
control measures such construction of new multi-purpose dams, construction of new and
rehabilitation of dykes and river improvement works.
◼ Operation of a Flood Early Warning System (FEWS) in the Nzoia River Basin. Flood forecasting
analysis was to be performed by WRMA regional offices, in cooperation with KMD. Warning
information would also be provided by WRMA regional offices.
◼ Preparation of a Flood Fighting Plan for the Nzoia and Yala Rivers for the existing dykes along the
lower reaches of Nzoia and Yala Rivers prepared by the WRMA LVN Regional Office. The target
section for the flood fighting plan was to be 18.4 km on the left bank and 16.2 km on the right bank
of the Nzoia River, and 9 km on the right bank of the Yala River. The flood fighting plan was aimed
at preventing an expansion of inundation areas caused by dyke breaching and/or overtopping.
Drought disaster management plan
The proposed components of a drought disaster management plan for the LVN Basin were as follows:
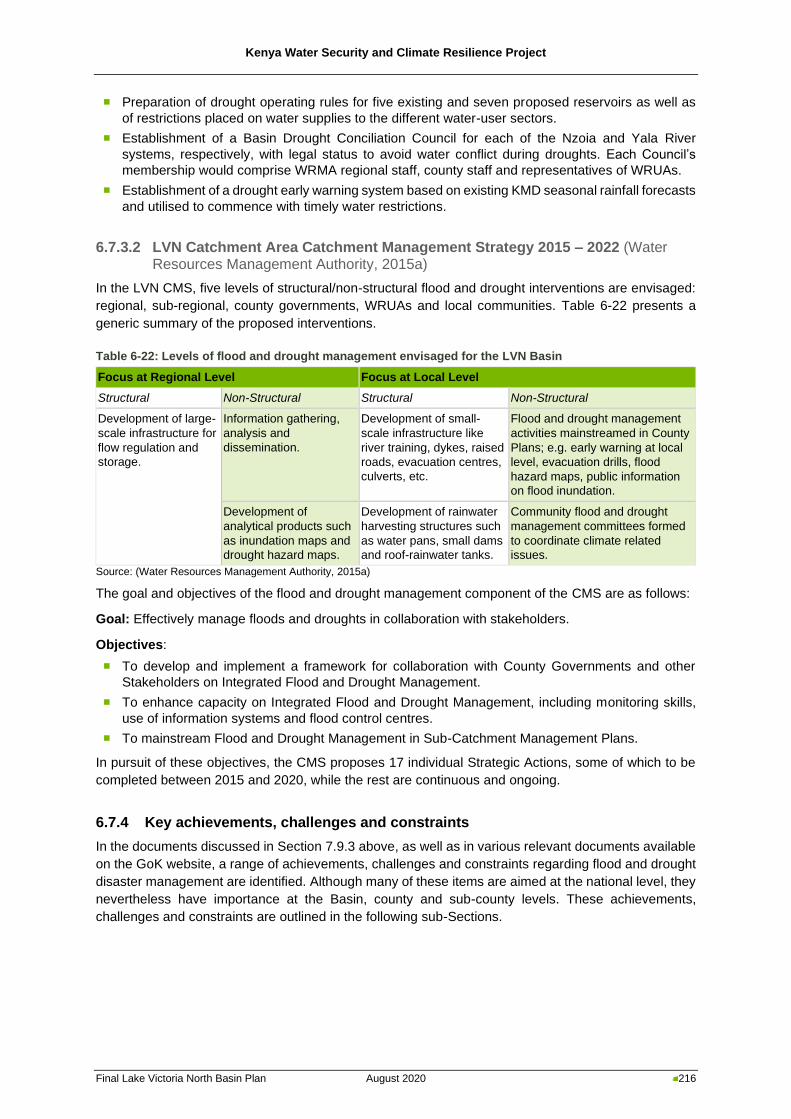
Kenya Water Security and Climate Resilience Project
Final Lake Victoria North Basin Plan August 2020 216
◼ Preparation of drought operating rules for five existing and seven proposed reservoirs as well as
of restrictions placed on water supplies to the different water-user sectors.
◼ Establishment of a Basin Drought Conciliation Council for each of the Nzoia and Yala River
systems, respectively, with legal status to avoid water conflict during droughts. Each Council’s
membership would comprise WRMA regional staff, county staff and representatives of WRUAs.
◼ Establishment of a drought early warning system based on existing KMD seasonal rainfall forecasts
and utilised to commence with timely water restrictions.
6.7.3.2 LVN Catchment Area Catchment Management Strategy 2015 – 2022 (Water Resources Management Authority, 2015a)
In the LVN CMS, five levels of structural/non-structural flood and drought interventions are envisaged:
regional, sub-regional, county governments, WRUAs and local communities. Table 6-22 presents a
generic summary of the proposed interventions.
Table 6-22: Levels of flood and drought management envisaged for the LVN Basin
Focus at Regional Level Focus at Local Level
Structural Non-Structural Structural Non-Structural
Development of large-
scale infrastructure for
flow regulation and
storage.
Information gathering,
analysis and
dissemination.
Development of small-
scale infrastructure like
river training, dykes, raised
roads, evacuation centres,
culverts, etc.
Flood and drought management
activities mainstreamed in County
Plans; e.g. early warning at local
level, evacuation drills, flood
hazard maps, public information
on flood inundation.
Development of
analytical products such
as inundation maps and
drought hazard maps.
Development of rainwater
harvesting structures such
as water pans, small dams
and roof-rainwater tanks.
Community flood and drought
management committees formed
to coordinate climate related
issues.
Source: (Water Resources Management Authority, 2015a)
The goal and objectives of the flood and drought management component of the CMS are as follows:
Goal: Effectively manage floods and droughts in collaboration with stakeholders.
Objectives:
◼ To develop and implement a framework for collaboration with County Governments and other
Stakeholders on Integrated Flood and Drought Management.
◼ To enhance capacity on Integrated Flood and Drought Management, including monitoring skills,
use of information systems and flood control centres.
◼ To mainstream Flood and Drought Management in Sub-Catchment Management Plans.
In pursuit of these objectives, the CMS proposes 17 individual Strategic Actions, some of which to be
completed between 2015 and 2020, while the rest are continuous and ongoing.
6.7.4 Key achievements, challenges and constraints
In the documents discussed in Section 7.9.3 above, as well as in various relevant documents available
on the GoK website, a range of achievements, challenges and constraints regarding flood and drought
disaster management are identified. Although many of these items are aimed at the national level, they
nevertheless have importance at the Basin, county and sub-county levels. These achievements,
challenges and constraints are outlined in the following sub-Sections.
Kenya Water Security and Climate Resilience Project
Final Lake Victoria North Basin Plan August 2020 217
6.7.4.1 Achievements
◼ Detailed dyke studies on the Lower Nzoia River which involved detailed assessment of the existing
structures, including geotechnical, geomorphology, hydraulic modelling, historical hydrological and
rainfall data etc., were successfully completed as part of the WKCDD&FMP (The World Bank,
2016). Important rehabilitation of some 20 km of the existing structures, as well as some 1.3 km of
river training to increase discharge capacity, have also been completed.
◼ The Flood Early Warning System for the Nzoia River as part of the WKCDD&FMP is innovative
and highly impactful, complete with real time flood prediction equipment, production and
dissemination of daily flood watch bulletins, and radio broadcasts in the local dialect (The World
Bank, 2016).
◼ Under the WKCDD&FMP, sediment loads in the Nzoia decreased from 180 tons/day in 2008 to
139 tons/day in 2016 as the results of micro-catchment protection activities by WRUAs and soil
and water conservation activities and establishment of soil conservation structures (The World
Bank, 2016).
◼ The National Hydrometeorological Network Design Project for the Republic of Kenya, currently
underway, has designed a provisional network of 28 meteorological and 53 surface water stations
(telemetric or automatic or manual) for LVN Basin.
◼ The National Drought Management Authority (NDMA) has been established and it exercises its
functions both at national level and Basin level, and, in collaboration with county governments, also
at county and community level. The Ending Drought Emergencies Common Programme
Framework (EDE-CPF) has been operationalised and is now in its 3rd Medium-Term Plan
(Government of Kenya, 2017a).
◼ The Cabinet approved the National Drought Emergency Fund (NDEF) Regulations in May 2018.
The Regulations guide the operations of the National Drought Emergency Fund which is to be
established for improving the effectiveness and efficiency of drought risk management systems in
Kenya as well as to provide a common basket of emergency funds for drought risk management.
The establishment of the NDEF reflects a wider Government policy shift towards drought risk
management rather than crisis management. NDMA has, since 2014, been piloting the use of a
dedicated Fund in drought risk management through the European Union-funded Drought
Contingency Fund (DCF). The DCF business process was successfully employed during the 2016-
2017 drought, thereby mitigating losses both of lives and livelihoods].
◼ During drought periods, the WRA LVN Regional Office institutes water use restrictions at the
catchment level, applied at the major dams for domestic water supply purposes, namely, Moiben,
Twin Rivers, Ellegirini, Kipkarren, Lessos.
◼ The Department of Agriculture has been rolling out a subsidised crop insurance policy to maize
farmers in various counties. Campaigns are ongoing by the Department to advise farmers to
construct water-harvesting structures on their farms in order to benefit from good rainfall periods.
6.7.4.2 Challenges
◼ Sourcing financing for the completion of the rehabilitation of flood protection dykes along the Lower
Nzoia and Lower Yala Rivers. The cost of this work was estimated at USD 54 million by the World
Bank (2016).
◼ Ongoing urbanisation leading to increased urban populations.
◼ Ongoing encroachment of communities in flood-prone zones for crop and livestock farming.
◼ Increasing upland deforestation and soil degradation which compounds river siltation and
subsequent flooding of riparian zones and floodplains.
◼ Expanding more widely the establishment of timely hydrometeorological data collection and
subsequent analysis necessary for setting up early warning systems.
◼ Adaptation required in the face of climate change impacts in the form of increased frequency of
floods and droughts.
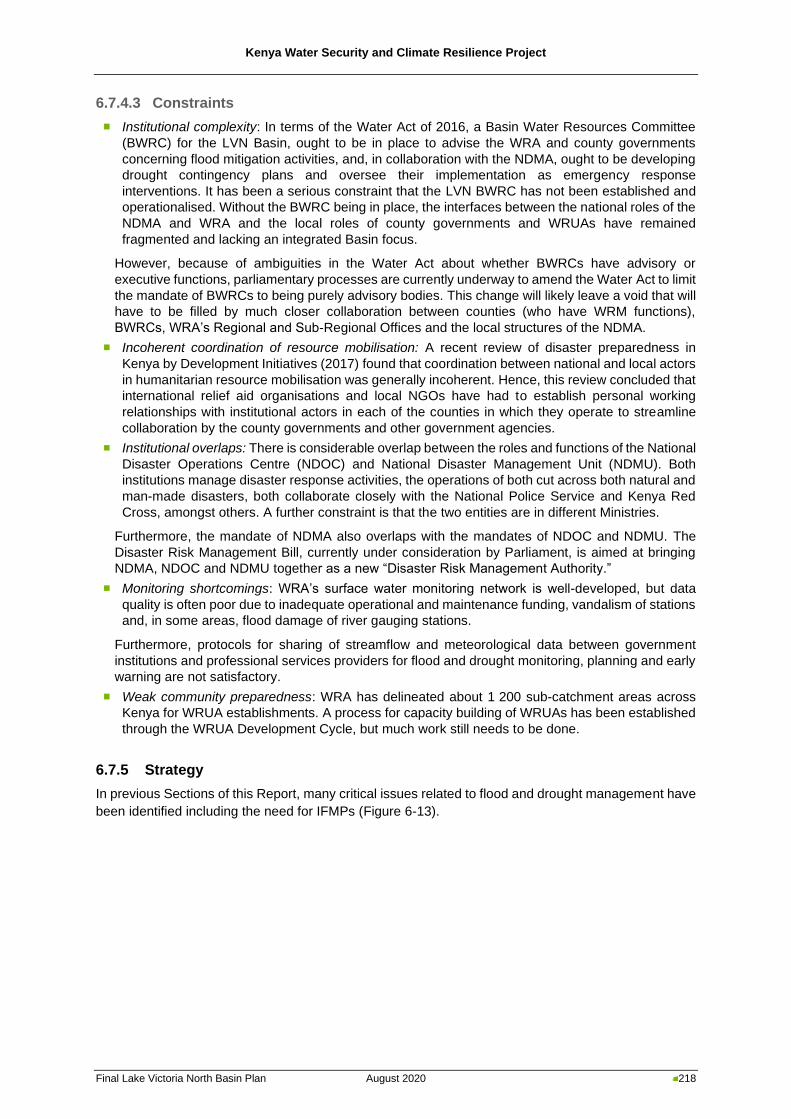
Kenya Water Security and Climate Resilience Project
Final Lake Victoria North Basin Plan August 2020 218
6.7.4.3 Constraints
◼ Institutional complexity: In terms of the Water Act of 2016, a Basin Water Resources Committee
(BWRC) for the LVN Basin, ought to be in place to advise the WRA and county governments
concerning flood mitigation activities, and, in collaboration with the NDMA, ought to be developing
drought contingency plans and oversee their implementation as emergency response
interventions. It has been a serious constraint that the LVN BWRC has not been established and
operationalised. Without the BWRC being in place, the interfaces between the national roles of the
NDMA and WRA and the local roles of county governments and WRUAs have remained
fragmented and lacking an integrated Basin focus.
However, because of ambiguities in the Water Act about whether BWRCs have advisory or
executive functions, parliamentary processes are currently underway to amend the Water Act to limit
the mandate of BWRCs to being purely advisory bodies. This change will likely leave a void that will
have to be filled by much closer collaboration between counties (who have WRM functions),
BWRCs, WRA’s Regional and Sub-Regional Offices and the local structures of the NDMA.
◼ Incoherent coordination of resource mobilisation: A recent review of disaster preparedness in
Kenya by Development Initiatives (2017) found that coordination between national and local actors
in humanitarian resource mobilisation was generally incoherent. Hence, this review concluded that
international relief aid organisations and local NGOs have had to establish personal working
relationships with institutional actors in each of the counties in which they operate to streamline
collaboration by the county governments and other government agencies.
◼ Institutional overlaps: There is considerable overlap between the roles and functions of the National
Disaster Operations Centre (NDOC) and National Disaster Management Unit (NDMU). Both
institutions manage disaster response activities, the operations of both cut across both natural and
man-made disasters, both collaborate closely with the National Police Service and Kenya Red
Cross, amongst others. A further constraint is that the two entities are in different Ministries.
Furthermore, the mandate of NDMA also overlaps with the mandates of NDOC and NDMU. The
Disaster Risk Management Bill, currently under consideration by Parliament, is aimed at bringing
NDMA, NDOC and NDMU together as a new “Disaster Risk Management Authority.”
◼ Monitoring shortcomings: WRA’s surface water monitoring network is well-developed, but data
quality is often poor due to inadequate operational and maintenance funding, vandalism of stations
and, in some areas, flood damage of river gauging stations.
Furthermore, protocols for sharing of streamflow and meteorological data between government
institutions and professional services providers for flood and drought monitoring, planning and early
warning are not satisfactory.
◼ Weak community preparedness: WRA has delineated about 1 200 sub-catchment areas across
Kenya for WRUA establishments. A process for capacity building of WRUAs has been established
through the WRUA Development Cycle, but much work still needs to be done.
6.7.5 Strategy
In previous Sections of this Report, many critical issues related to flood and drought management have
been identified including the need for IFMPs (Figure 6-13).
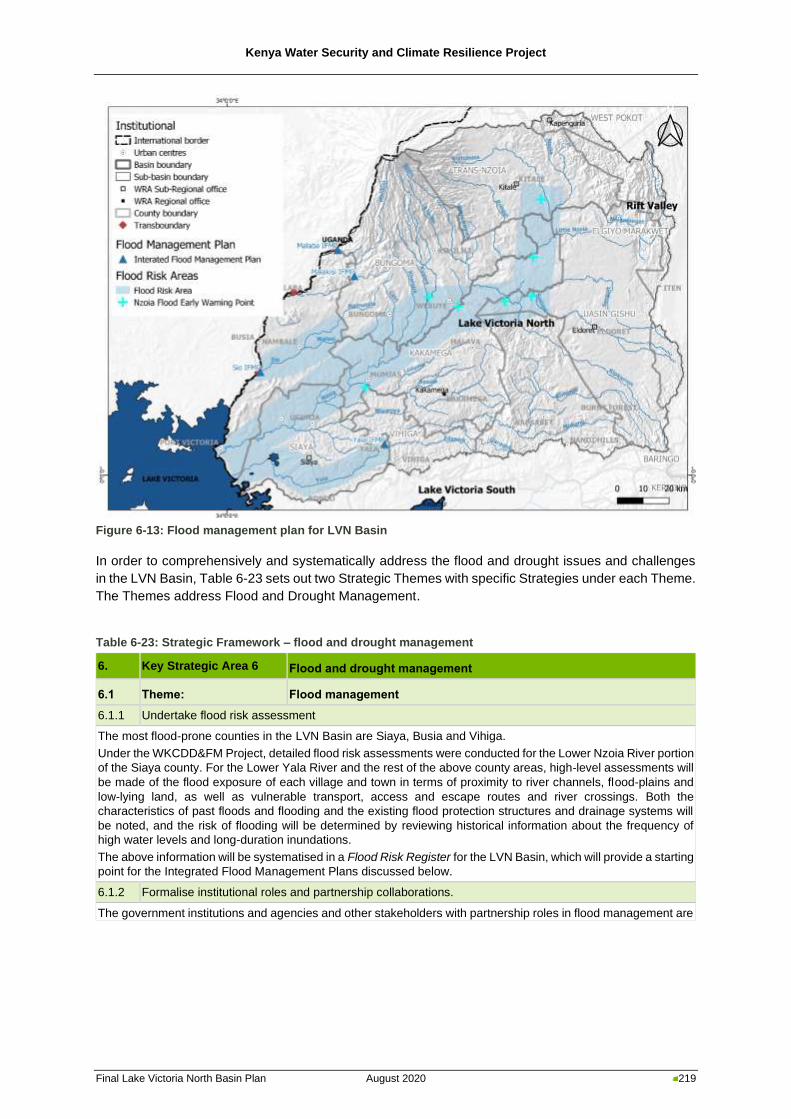
Kenya Water Security and Climate Resilience Project
Final Lake Victoria North Basin Plan August 2020 219
Figure 6-13: Flood management plan for LVN Basin
In order to comprehensively and systematically address the flood and drought issues and challenges
in the LVN Basin, Table 6-23 sets out two Strategic Themes with specific Strategies under each Theme.
The Themes address Flood and Drought Management.
Table 6-23: Strategic Framework – flood and drought management
6. Key Strategic Area 6 Flood and drought management
6.1 Theme: Flood management
6.1.1 Undertake flood risk assessment
The most flood-prone counties in the LVN Basin are Siaya, Busia and Vihiga.
Under the WKCDD&FM Project, detailed flood risk assessments were conducted for the Lower Nzoia River portion
of the Siaya county. For the Lower Yala River and the rest of the above county areas, high-level assessments will
be made of the flood exposure of each village and town in terms of proximity to river channels, flood-plains and
low-lying land, as well as vulnerable transport, access and escape routes and river crossings. Both the
characteristics of past floods and flooding and the existing flood protection structures and drainage systems will
be noted, and the risk of flooding will be determined by reviewing historical information about the frequency of
high water levels and long-duration inundations.
The above information will be systematised in a Flood Risk Register for the LVN Basin, which will provide a starting
point for the Integrated Flood Management Plans discussed below.
6.1.2 Formalise institutional roles and partnership collaborations.
The government institutions and agencies and other stakeholders with partnership roles in flood management are
Kenya Water Security and Climate Resilience Project
Final Lake Victoria North Basin Plan August 2020 220
6. Key Strategic Area 6 Flood and drought management
as follows6:
- KMD
- NDMU (including its County Coordinators)
- NDOC
- National WRA and Regional and Sub-Regional WRA Offices
- County Governments and County Disaster Risk Management Committees
- BWRCs
- WRUAs
- Village Disaster Risk Management Committees
- Various Ministries; particularly Departments dealing with Roads, Railways and Health
- Kenya Red Cross Service
- International Relief Aid Agencies
- NGOs
Formalising and aligning the roles of and proactive partnership collaborations among the above entities are crucial
to ensuring that the above objectives of the flood response protocol are achieved. To this end, it is proposed that
the LVN Basin Flood Response Forum (FRF) be established that integrates all flood-relevant resource
mobilisations and related interventions in the LVN Basin by the various collaboration partnerships listed above.
The LVN Basin FRF must operate under the auspices of the KMD and, to ensure continuity, it must be served by
a Secretariat. The Secretariat can be physically housed in the WRA Regional Office or in one of the WRA Sub-
Regional Offices. Furthermore, the activities of the LVN Basin FRF must be systematised through the development
of appropriate standard operating procedures (SOPs)7.
6.1.3 Develop flood response protocol
The flood response protocol: The flood response protocol follows a multi-stakeholder approach and comprises a
structured set of inter-connected institutional and partnership roles, focus areas and mechanisms to prepare for,
respond to and recover from a flood disaster. The components of the flood response protocol are as follows:
- Formalised institutional roles and partnership collaborations.
- A flood preparedness plan that is understood by both institutional actors and communities in flood-prone
zones.
- A key principle of the plan is that it is better to protect more people from the frequent smaller floods, than
fewer people from the rarer larger floods. Flood early warning systems should be used to warn communities
when larger floods may occur.
- SOPs that comprise sequential response actions: monitoring early warning alerts severity trigger
alerts pro-active resource mobilisations emergency interventions post-flood recovery
interventions.
Objectives of the flood response protocol:
- Minimise the impacts of flooding on the safety and quality of life of affected communities.
- Minimise environmental impacts.
- Accelerate recovery of prior homestead environments, livelihoods and transport routes of affected
communities.
6.1.4 Develop Integrated Flood Management Plans
An Integrated Flood Management Plan (IFMP) will be developed for each of the individual catchments in the Lake
Victoria North Basin, namely the Nzoia, Yala, Malaba, Malakisi, and Sio River catchments. The IFMPs will be
6 There are currently three bills seeking to establish a National Disaster Management Authority and a National
Disaster Management Fund. However, the three bills differ in content and structure e.g. proposed governance structure, membership and functions among other things. The mandates of NDMA, NDOC and NDMU overlap in various ways. The Disaster Risk Management Bill, currently under consideration by parliament, is aimed at bringing NDMA, NDOC and NDMU together as a new “Disaster Risk Management Authority.” The sponsors of the bills will have to sit and agree on how to collapse the three bills into one or alternatively, the first bill to pass through all the stages of development will be adopted and the rest will be nullified. 7 SOPs aim at: (1) Providing a list of major executive actions involved in responding to disasters and necessary
measures needed for preparedness, response and relief. (2). Indicating various actions that should be taken and by which actors within their sphere of responsibilities – linking up with their contingency plans. (3) Ensuring that all concerned actors and agencies know the precise actions required of them at each stage of the response and that all actions are closely and continuously coordinated (Development Initiatives, 2017).
Kenya Water Security and Climate Resilience Project
Final Lake Victoria North Basin Plan August 2020 221
6. Key Strategic Area 6 Flood and drought management
structured around the following topics:
- Overview of the natural conditions (topography, climate, soils, land-use, land-cover, hydrology) and the
socio-economic make-up of each catchment.
- Overview of the statutory, institutional and civil society stakeholder context of each catchment.
- Characteristics of floods and flooding in each catchment, namely identifying all flood-prone locations, flash
floods, long-duration overbank inundations, sediment dumping floods, etc.
- Overview of existing flood management/counter measures – both structural and non-structural.
- Analysis and costing of required flood management/counter measures at all flood-prone locations,
categorised as follows: prevention measures; protection measures; preparedness measures; flood early
warning systems; emergency response measures.
- Stakeholder participation in prioritising required flood management/counter measures at all flood-prone
locations.
- Proposed Implementation Schedules of flood management/counter measures at all flood-prone locations.
- Funding sources for the proposed flood management/counter measures.
6.1.5 Implement flood management measures
The above proposed Implementation Schedules for the five catchment IFMPs that cover the Lake Victoria North
Basin, will be reviewed by the Lake Victoria North Basin FRF and, through negotiation with representatives of
each of the affected stakeholder sectors and villages/communities, be re-prioritised according to both non-
structural and structural measures that cover all the short-term, medium-term and long-term flood
management/counter measures that are required across the Lake Victoria North Basin at all flood-prone locations.
The above re-prioritised non-structural and structural flood management/counter measures will encompass the
following: prevention measures; protection measures; preparedness measures; flood early warning systems;
emergency response measures. These measures will be focused on flood-prone river reaches and floodplains in
each of the six catchments in the Lake Victoria North River Basin. Wherever feasible, community-based flood
early warning and flood preparedness approaches will be followed.
The Lake Victoria North Basin FRF will provide a platform for coordinating the resourcing and for supervision of
the funding of the above re-prioritised non-structural and structural flood management/counter measures. In all
instances, labour-intensive approaches will be followed.
6.1.6 Capacity development
Capacity for flood management in the Lake Victoria North Basin will be assessed according to three categories,
namely, organisational alignment/collaboration, technical skills and community preparedness. The outcomes of
these assessments will inform the strategy for development of capacity in each of the three categories.
Organisational alignment/collaboration: The aim is to expand organisational capacity in the Lake Victoria North
Basin by aligning the flood response roles and responsibilities of the government institutions/agencies,
International Relief Aid Agencies, Kenya Red Cross, NGOs and other stakeholders with partnership roles in
flood management. The vehicle for this strategy will be the Lake Victoria North Basin Flood Response Forum
(FRF) to be introduced in Theme 6.2.1.
Institutional technical skills: The aim is to strategically expand institutional technical skills relevant to flood
response activities across three different sets of competencies, namely, (i) competence at translating Flood Early
Warning Bulletin information to support prioritisation of resource mobilisations for humanitarian interventions; (ii)
competence at logistical planning of required interventions followed by subsequent operationalisation; (iii)
competence at communicating technical and logistical information in multi-stakeholder environments.
Community preparedness: Community-based flood early warning drills as well as emergency evacuation drills will
be prioritised by the Secretariat of the Lake Victoria North Basin FRF. The resources and experience of the
NDMU/NDOC (or their successor institution) can make valuable contributions to developing community self-help
awareness in terms of flood management.
6.2 Theme: Drought management
6.2.1 Formalise institutional roles and partnership collaborations.
The government institutions and agencies and other stakeholders with partnership roles in drought management
Kenya Water Security and Climate Resilience Project
Final Lake Victoria North Basin Plan August 2020 222
6. Key Strategic Area 6 Flood and drought management
are as follows8:
- NDMA
- NDMU (including its County Coordinators)
- NDOC
- KMD
- National WRA and Regional and Sub-Regional WRA Offices
- County Governments and County Disaster Risk Management Committees
- BWRCs
- WRUAs
- Village Disaster Risk Management Committees
- Ministry of Agriculture, Livestock and Fisheries as well as Ministry of Health
- Kenya Red Cross Service
- International Relief Aid Agencies
- NGOs
Formalising and aligning the roles of and proactive partnership collaborations among the above entities are crucial
to ensuring that the above objectives of the drought response protocol are achieved.
6.2.2 Develop drought response protocol.
The drought response protocol: The drought response protocol follows a multi-stakeholder approach and
comprises a structured set of inter-connected institutional and partnership roles, focus areas and mechanisms to
prepare for, respond to and recover from a drought disaster. The components of the protocol are as follows:
- Formalised institutional roles and partnership collaborations.
- A drought preparedness plan that is understood by both institutional actors and communities in drought-
prone zones.
- SOPs that comprise sequential response actions: monitoring early warning alerts severity trigger
alerts pro-active resource mobilisations recovery interventions.
Objectives of the drought response protocol:
- Minimise the impact of water shortages on the quality of life of affected communities.
- Minimise environmental impacts.
- Ensure equitable allocation of water despite systematic restrictions of supply.
- Accelerate restoration of prior homestead environments and livelihoods of affected communities.
6.2.3 Improve drought preparedness.
The above LVN Basin Drought Response must address five primary drought response needs, i.e. drought
monitoring, drought early warning, drought severity assessment, mitigation interventions and recovery
interventions.
Currently, drought monitoring, drought early warning and severity assessment are conducted by the NDMA, who
issues regular Drought Early Warning Bulletins, with inputs from KMD, the above two Ministries and WRA Offices.
Regarding mitigation interventions and recovery interventions, NDMA oversees two coordinating bodies at the
national level that bring together various stakeholders in drought preparedness. These are the Kenya Food
Security Meeting and the Kenya Food Security Steering Group. At the county level, this is organised under County
Steering Groups.
The drought severity assessments of the national and county-level coordinating structures of the NDMA relevant
to the LVN Basin must be reviewed and deliberated by the collaboration partnership participants in the LVN Basin
Drought Response. In the case of an adverse severity assessment, the LVN Basin Drought Response participants
will have a common point of reference from which to launch and systematically coordinate their various drought-
relevant resource mobilisations and related interventions in the LVN Basin.
6.2.4 Strengthen existing drought early warning systems
8 There are currently three bills seeking to establish a National Disaster Management Authority and a National
Disaster Management Fund. However, the three bills differ in content and structure e.g. proposed governance structure, membership and functions among other things. The mandates of NDMA, NDOC and NDMU overlap in various ways. The Disaster Risk Management Bill, currently under consideration by parliament, is aimed at bringing NDMA, NDOC and NDMU together as a new “Disaster Risk Management Authority.” The sponsors of the bills will have to sit and agree on how to collapse the three bills into one or alternatively, the first bill to pass through all the stages of development will be adopted and the rest will be nullified.
Kenya Water Security and Climate Resilience Project
Final Lake Victoria North Basin Plan August 2020 223
6. Key Strategic Area 6 Flood and drought management
The NDMA currently issues regular Drought Early Warning Bulletins for ASAL counties. Bulletins must in future
also be issued for LVN counties that are more drought-prone than the rest, namely Trans Nzoia and Uasin Gishu.
SOP responses based on the Bulletins’ early warning findings and alerts must be an integrating force in the above
LVN Basin Drought Response. The sub-county scale of the Bulletins’ reporting ensures that such responses can
be spatially accurately focused. Furthermore, such informed responses will secure appropriate and timeous
resource mobilisations and humanitarian interventions across all the collaborating partnerships at county, sub-
county and local community scales across the above two drought-prone counties in the LVN Basin.
The Famine Early Warning Systems Network (FEWS NET), which produces monthly reports and maps detailing
current and projected food insecurity in several regions in the world, has a Regional Office in Kenya and FEWS
NET outputs will support the deliberations by the participants in the LVN Basin Drought Response.
6.2.4 Capacity development
Capacity for drought management in the LVN Basin will be assessed according to three categories, namely,
funding, organisational alignment and institutional technical skills. The outcomes of these assessments will inform
the strategy for development of capacity in each of the three categories.
Funding: The funding strategy is to secure a standing allocation from the recently-established National Drought
Emergency Fund (DEF) to the LVN Basin’s two drought-prone counties to ensure that finance for early drought
response will always be available when needed. This will avoid the hitherto time-consuming approach of
emergency budgetary re-allocations, which is also counter-productive, because it takes resources away from the
long-term development that should enhance resilience to drought.
Organisational alignment/collaboration: The strategy is to expand organisational capacity in the LVN Basin by
aligning the drought response roles and responsibilities of the government institutions/agencies, International
Relief Aid Agencies, Kenya Red Cross, NGOs and other stakeholders with partnership roles in drought
management. The vehicle for this strategy will be the LVN Basin Drought Response introduced in Sub-Section
7.2.1.
Institutional technical skills: The strategy is to strategically expand institutional technical skills relevant to drought
response activities across three different sets of competencies, namely, (i) competence at translating Drought
Early Warning Bulletin information to support prioritisation of resource mobilisations for humanitarian interventions;
(ii) competence at logistical planning of required interventions followed by subsequent operationalisation; (i ii)
competence at communicating technical and logistical information in multi-stakeholder environments.
6.8 Hydrometeorological Monitoring
6.8.1 Introduction
An operational and well-maintained hydrometeorological network is critical to support the WRA with its
key functions related to water resources planning, regulation and management in the LVN Basin. The
WRA is responsible for all aspects related to the monitoring (quantity and quality) of surface and
groundwater in Kenya, including the construction and maintenance of monitoring stations, related
equipment, data collection, transmission, capturing and storage, and dissemination.
6.8.2 Issues related to hydrometeorological monitoring in the LVN Basin
A brief overview of the existing hydrometeorological monitoring network in the LVN Basin is provided in
Section 2.4.8. The current network is inadequate, and the network is not being effectively operated.
Data management and sharing platforms are not well established, and there is inadequate technical
capacity for data processing, analysis and reporting. There is also inadequate maintenance of the
monitoring stations. Although the WRA continuously rehabilitates and expands the hydromet monitoring
network, issues such as ageing, vandalism and flood damage limit progress.
The majority of the operational river gauging stations in the LVN Basin are rated sections. Most are
read manually by gauge readers. It has been reported that manual measurements are often difficult
during high flow and flood events due to access challenges. Although procedures are in place to collect
discharge data, compliance is often hampered due to logistical, financial and capacity constraints.
Rating curves are updated yearly at the National office and distributed to the regional and subregional
offices for use. Flow measurement for checking and updating rating curves are typically done manually
Kenya Water Security and Climate Resilience Project
Final Lake Victoria North Basin Plan August 2020 224
with flow meters. However, local offices often lack the necessary equipment and even fuel to travel to
remote stations to conduct measurements. There is also minimal updated bathymetry data in all sub-
regions. Stage records that are collected manually are entered into a database at the subregional office
then sent to the regional office for recording. Headquarters receives a backup copy from the regional
office on a monthly basis. Little is known about the quality control process.
Many different organisations including the WRA, Kenya Meteorological Department (KMD), regional
police stations, primary and secondary schools, national parks, private enterprises, research institutions
and agricultural offices operate meteorological stations throughout the basin. Due to the expansive and
diverse set of owners and operators of meteorological stations throughout the Basin, little accurate
information is known about operational status, station types, parameters collected, operators, and even
confirmed coordinates of meteorological stations.
LVN Basin has the highest population density out of all the basins, and the threat of anthropogenic
pollution is particularly high, particularly in the urban centres. To address this problem, intensified
monitoring and enforcement of the water permit conditions and effluent discharge guidelines will be
required as a start. Currently, the water quality monitoring programme operated by WRA faces
challenges of inadequately qualified and trained staff and inadequate operational resources to facilitate
regular sampling and laboratory analysis. There is a Regional Water Testing Laboratory at Kakamega.
It is well equipped with basic laboratory equipment, and it is manned by three WQ&PCOs instead of an
optimal number of five. Currently it can analyse both physicochemical parameters but no pesticide
residues and heavy metals in samples. The Laboratory is also in a poor state and the floor, water sinks
and reagent cabinets need to be fixed. There is an urgent need for the upgrade of this laboratory.
Furthermore, the mandates and roles and responsibilities of the different institutions involved in water
quality management in the LVN Basin need to be resolved to ensure that cooperative governance of
water quality is achieved.
Groundwater monitoring in Kenya has improved significantly in the past decade. In the LVN Basin, there
is currently a total of 21 groundwater monitoring points: 8 Major, 9 Minor and 4 Poor. Data quality is,
however, patchy - most groundwater level data are collected from boreholes that are used as production
boreholes. All too often, the data show dynamic as well as static water levels. This restricts the utility of
water level data to determine long-term trends. Groundwater abstraction monitoring is done on an ad
hoc basis at best - groundwater users are required to submit abstraction data monthly or quarterly as
evidence to support their water charge payments, but these are rarely checked in the field by the WRA.
6.8.3 Hydromet monitoring network design
A key output from this Consultancy is the design of a hydrometeorological network for the LVN Basin.
Details on the design approach as well as the proposed network are provided in “ISC Report D1-1:
Hydromet Monitoring Network Design”.
The following sections provide a brief overview of the proposed network.
6.8.3.1 Stream flow monitoring
The approach towards designing a stream flow monitoring network for the LVN Basin entailed an
assessment of the existing and historical network in the LVN Basin against specific criteria. The result
is a surface water network design for the LVN Basin consisting of 47 stations. In addition to the
refurbishment of some of the manual stations, 14 stations will be upgraded from manual to automatic.
Only 1 new station (automatic) will be constructed. Telemetric and automatic stations will remain the
same. An additional 7 stations are being upgraded as part of the Nzoia FEWS project. All 7 stations are
currently operational.
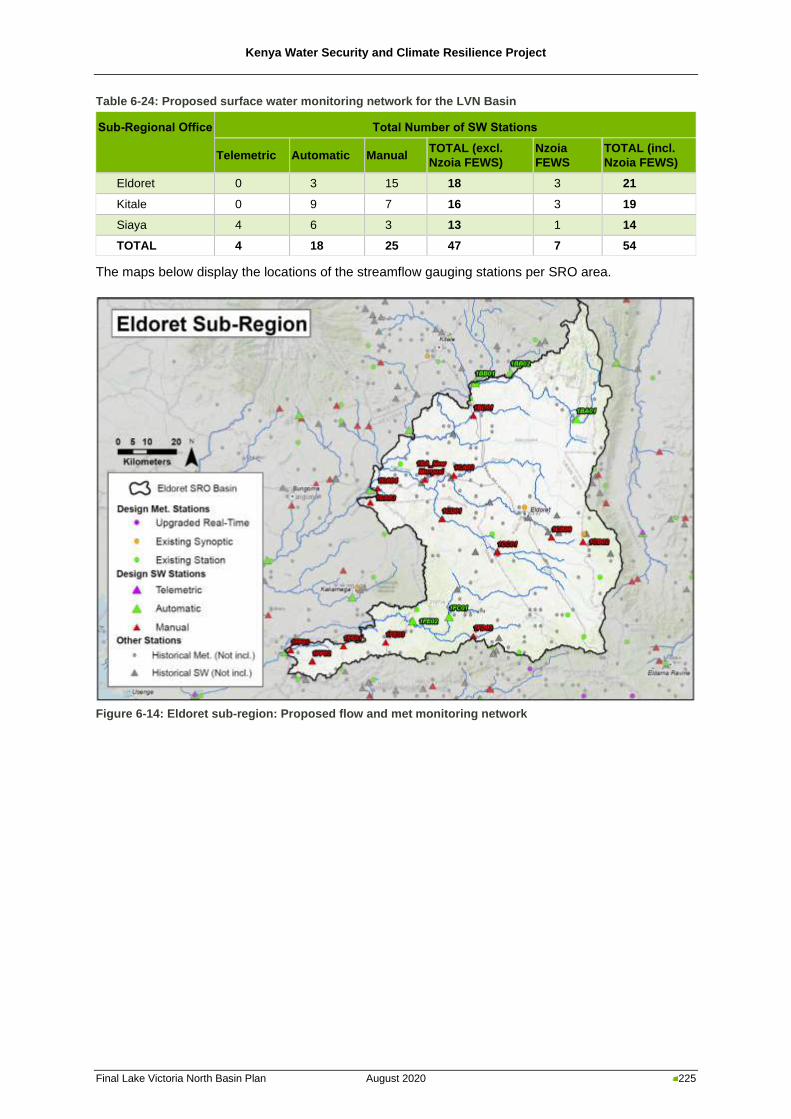
Kenya Water Security and Climate Resilience Project
Final Lake Victoria North Basin Plan August 2020 225
Table 6-24: Proposed surface water monitoring network for the LVN Basin
Sub-Regional Office Total Number of SW Stations
Telemetric Automatic Manual TOTAL (excl.
Nzoia FEWS)
Nzoia
FEWS
TOTAL (incl.
Nzoia FEWS)
Eldoret 0 3 15 18 3 21
Kitale 0 9 7 16 3 19
Siaya 4 6 3 13 1 14
TOTAL 4 18 25 47 7 54
The maps below display the locations of the streamflow gauging stations per SRO area.
Figure 6-14: Eldoret sub-region: Proposed flow and met monitoring network
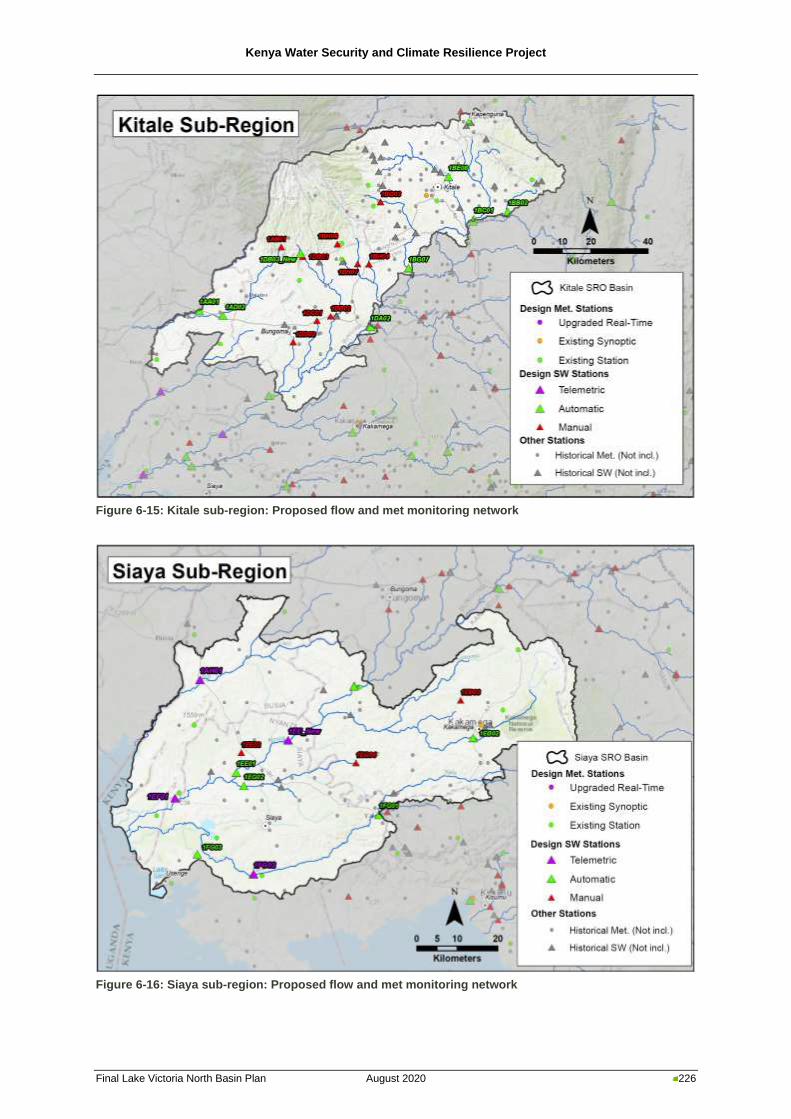
Kenya Water Security and Climate Resilience Project
Final Lake Victoria North Basin Plan August 2020 226
Figure 6-15: Kitale sub-region: Proposed flow and met monitoring network
Figure 6-16: Siaya sub-region: Proposed flow and met monitoring network
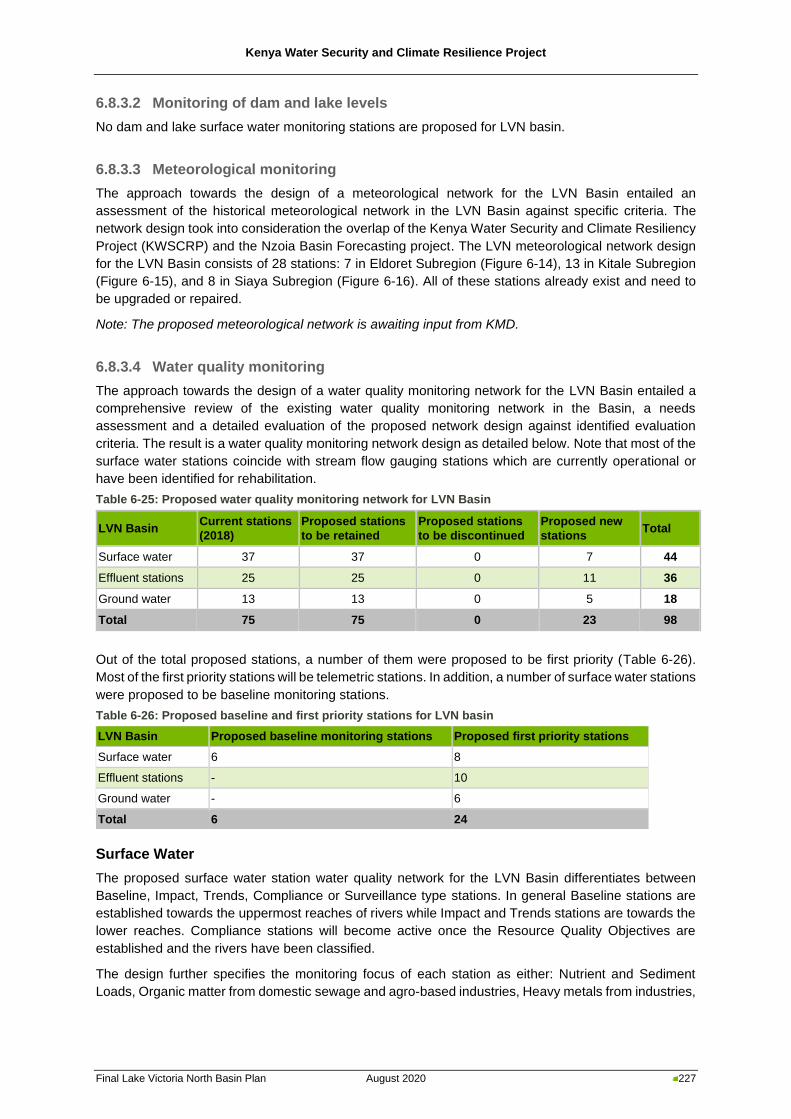
Kenya Water Security and Climate Resilience Project
Final Lake Victoria North Basin Plan August 2020 227
6.8.3.2 Monitoring of dam and lake levels
No dam and lake surface water monitoring stations are proposed for LVN basin.
6.8.3.3 Meteorological monitoring
The approach towards the design of a meteorological network for the LVN Basin entailed an
assessment of the historical meteorological network in the LVN Basin against specific criteria. The
network design took into consideration the overlap of the Kenya Water Security and Climate Resiliency
Project (KWSCRP) and the Nzoia Basin Forecasting project. The LVN meteorological network design
for the LVN Basin consists of 28 stations: 7 in Eldoret Subregion (Figure 6-14), 13 in Kitale Subregion
(Figure 6-15), and 8 in Siaya Subregion (Figure 6-16). All of these stations already exist and need to
be upgraded or repaired.
Note: The proposed meteorological network is awaiting input from KMD.
6.8.3.4 Water quality monitoring
The approach towards the design of a water quality monitoring network for the LVN Basin entailed a
comprehensive review of the existing water quality monitoring network in the Basin, a needs
assessment and a detailed evaluation of the proposed network design against identified evaluation
criteria. The result is a water quality monitoring network design as detailed below. Note that most of the
surface water stations coincide with stream flow gauging stations which are currently operational or
have been identified for rehabilitation.
Table 6-25: Proposed water quality monitoring network for LVN Basin
LVN Basin Current stations
(2018)
Proposed stations
to be retained
Proposed stations
to be discontinued
Proposed new
stations Total
Surface water 37 37 0 7 44
Effluent stations 25 25 0 11 36
Ground water 13 13 0 5 18
Total 75 75 0 23 98
Out of the total proposed stations, a number of them were proposed to be first priority (Table 6-26).
Most of the first priority stations will be telemetric stations. In addition, a number of surface water stations
were proposed to be baseline monitoring stations.
Table 6-26: Proposed baseline and first priority stations for LVN basin
LVN Basin Proposed baseline monitoring stations Proposed first priority stations
Surface water 6 8
Effluent stations - 10
Ground water - 6
Total 6 24
Surface Water
The proposed surface water station water quality network for the LVN Basin differentiates between
Baseline, Impact, Trends, Compliance or Surveillance type stations. In general Baseline stations are
established towards the uppermost reaches of rivers while Impact and Trends stations are towards the
lower reaches. Compliance stations will become active once the Resource Quality Objectives are
established and the rivers have been classified.
The design further specifies the monitoring focus of each station as either: Nutrient and Sediment
Loads, Organic matter from domestic sewage and agro-based industries, Heavy metals from industries,
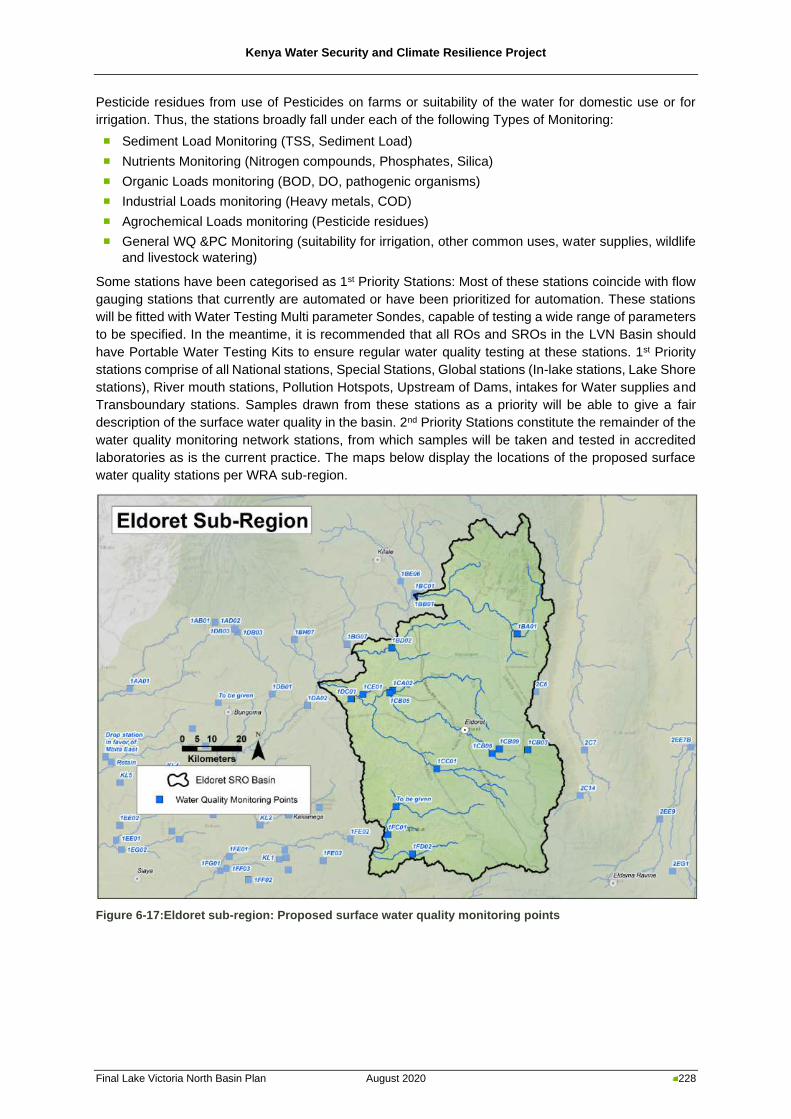
Kenya Water Security and Climate Resilience Project
Final Lake Victoria North Basin Plan August 2020 228
Pesticide residues from use of Pesticides on farms or suitability of the water for domestic use or for
irrigation. Thus, the stations broadly fall under each of the following Types of Monitoring:
◼ Sediment Load Monitoring (TSS, Sediment Load)
◼ Nutrients Monitoring (Nitrogen compounds, Phosphates, Silica)
◼ Organic Loads monitoring (BOD, DO, pathogenic organisms)
◼ Industrial Loads monitoring (Heavy metals, COD)
◼ Agrochemical Loads monitoring (Pesticide residues)
◼ General WQ &PC Monitoring (suitability for irrigation, other common uses, water supplies, wildlife
and livestock watering)
Some stations have been categorised as 1st Priority Stations: Most of these stations coincide with flow
gauging stations that currently are automated or have been prioritized for automation. These stations
will be fitted with Water Testing Multi parameter Sondes, capable of testing a wide range of parameters
to be specified. In the meantime, it is recommended that all ROs and SROs in the LVN Basin should
have Portable Water Testing Kits to ensure regular water quality testing at these stations. 1st Priority
stations comprise of all National stations, Special Stations, Global stations (In-lake stations, Lake Shore
stations), River mouth stations, Pollution Hotspots, Upstream of Dams, intakes for Water supplies and
Transboundary stations. Samples drawn from these stations as a priority will be able to give a fair
description of the surface water quality in the basin. 2nd Priority Stations constitute the remainder of the
water quality monitoring network stations, from which samples will be taken and tested in accredited
laboratories as is the current practice. The maps below display the locations of the proposed surface
water quality stations per WRA sub-region.
Figure 6-17:Eldoret sub-region: Proposed surface water quality monitoring points
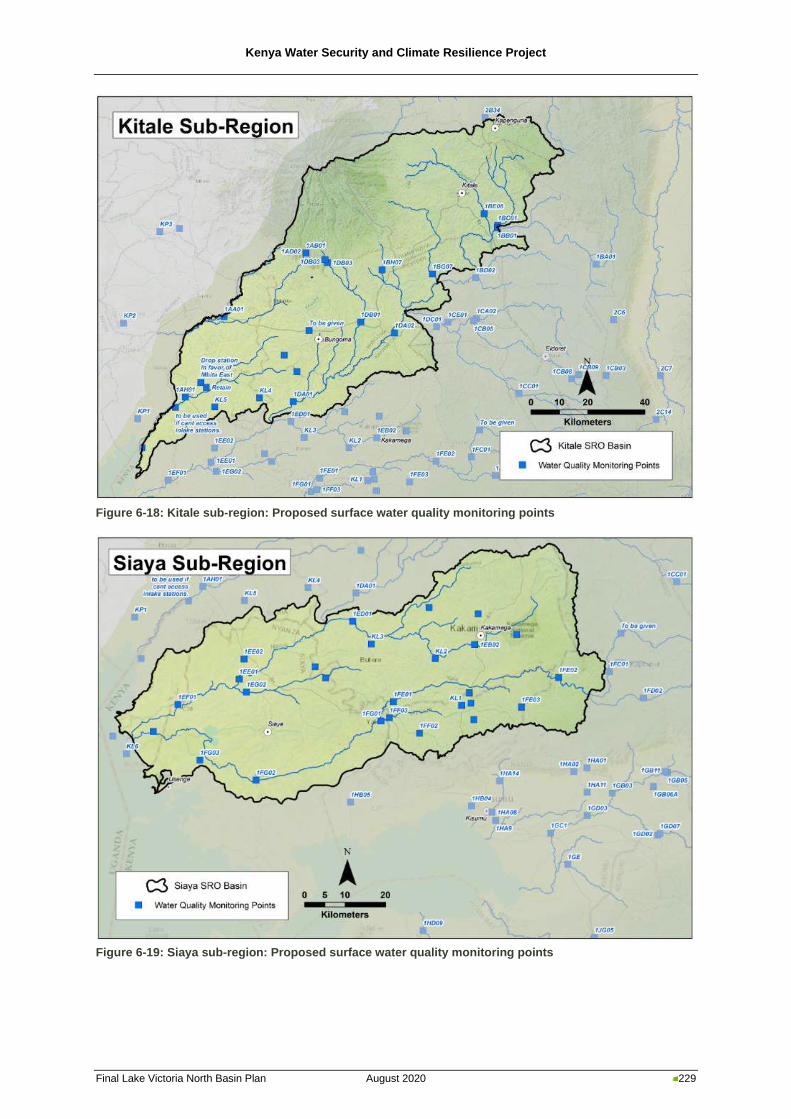
Kenya Water Security and Climate Resilience Project
Final Lake Victoria North Basin Plan August 2020 229
Figure 6-18: Kitale sub-region: Proposed surface water quality monitoring points
Figure 6-19: Siaya sub-region: Proposed surface water quality monitoring points
Kenya Water Security and Climate Resilience Project
Final Lake Victoria North Basin Plan August 2020 230
Effluent monitoring stations
Effluent monitoring stations should be located as close to discharge points as possible and monitoring
typically involves the sampling and analysis of samples collected from three related locations: the final
effluent, upstream of the receiving stream and immediately downstream of the discharge outfall. Where
these stations are known to be pollution hotspots, they have been designated as 1st Priority stations
based on the pollution threat level, pollution loads and based on past polluting history of the source.
Most of the sources within the LVN Basin which have been identified in the selection of Effluent
Monitoring stations are point sources of pollution. These may be broadly grouped into:
◼ Domestic Sewage outfalls from sewage works (from towns and cities)
◼ Industrial Effluent discharge from Factories (from towns and cities)
◼ Sugar Factories Effluent discharge
◼ Coffee Factories Effluent discharge
◼ Flower and Horticultural Farm discharges
◼ Sisal Waste discharges
◼ Dairies and Slaughterhouses
◼ Hospital waste discharges
In many small towns, where no sewerage systems exist, human waste is still handled by Septic Tanks
and Pit Latrines. When it rains and floods, many of the poorly constructed Septic tanks and Pit latrines
fill up and overflow and pollute nearby streams. These locations should also be monitored. The critical
parameters for domestic sewage are BOD and COD, while for Industrial effluent it is COD and Heavy
metals, and oil and grease among others depending on the source.
Note: Coordinates of Effluent Quality Monitoring stations will need to be validated.
Groundwater quality monitoring stations
Historically, and under the Ministry of Water, all legally authorized boreholes had borehole serial
numbers These were later changed, after the establishment of WRA, and each region kept its own
borehole records. It is also a requirement that each borehole shall have a Borehole Completion Report
as well as a Water Quality (WQ) Analysis Report, hereby referred to as the Baseline Water Quality
report. However, it has been observed that most boreholes being monitored do not have borehole IDs
and neither are the borehole completion reports available. It is recommended that this information be
looked for and documented for all boreholes. For boreholes that do not have Borehole Completion
Report or WQ Baseline Reports, it is proposed that the oldest WQ report on record be used as the
borehole WQ Baseline Report. If the boreholes do not have any WQ test report, then a sample should
be taken and analysed, and its report preserved as the borehole Baseline WQ report against which
other subsequent future analyses can be compared. Most borehole water samples can be easily
analysed as for routine water quality analysis using Basic equipment.
Groundwater quality characteristics vary regionally. Ideally GW will show low concentrations of
dissolved salts during the wet season and high concentrations during the dry season when recharge is
minimal. No major WQ changes are expected unless there is accidental pollution. Ideally monitoring
should be bi-annual instead of the recommended quarterly.
The Prioritization of GWQ monitoring stations was based on Aquifer type and classification. All the
aquifers within the basin are represented by at least one GWQ station and included in the 1st Priority
list. Another factor considered is the population served by a borehole. Most of the boreholes proposed
for WQ monitoring lack a complete set of coordinates. The few that had coordinates could also not be
validated. It is suggested that during the launch of the revised WQM Network, with the aim of collecting
the first set of samples for testing, the correct coordinates could be established as well as the validation
of any other information.
Kenya Water Security and Climate Resilience Project
Final Lake Victoria North Basin Plan August 2020 231
Sampling/Monitoring frequency
The frequency of sampling or monitoring will be dependent on the nature and type of sampling stations.
Generally, for groundwater sources, lakes and dams, which are not expected to undergo drastic WQ
changes over time, the sampling frequency can be bi-annual. For river stations and effluent stations,
whose water quality is constantly changing at short intervals, the recommended frequency of monitoring
can vary from daily to quarterly. In general, and for most stations a sampling frequency of quarterly has
been recommended, but this can be varied depending on the type of station and the circumstances
prevailing.
Water Quality Design Parameters
The parameters to be tested for at each monitoring station have been identified and may be described
as either Basic or Special parameters. Basic Parameters include pH, Colour, Turbidity, TSS,
Conductivity, TDS, Chloride, Temperature, Coliforms, DO, Fluoride, Ammonia, Total Nitrogen, Nitrates,
Nitrite, Total Phosphorus, Phosphates, Sulphates, Sodium, Potassium, Calcium, Manganese, Iron,
Magnesium. Special Parameters refer to pesticide residues, heavy metals, hydrocarbons, oil and
grease, sediment load, BOD and COD, and emerging special parameters such as organic micro-
pollutants e.g. pharmaceuticals, hormones and chemical substances used in products and households.
At some stations, critical or important parameters have been identified, which should be given priority
when testing. Such parameters would include Chromium downstream of a tannery; heavy metals
downstream of a metallurgical industry; pesticide residues and nutrients downstream of an intensive
farming area and BOD and COD downstream of a coffee de-pulping factory for example.
The selection of test parameters will typically be dictated by the data needs and issues in the river basin.
Because of inadequate equipment currently, laboratories in Kenya are only able to carry out tests for a
handful of parameters.
As a minimum requirement, all Regional Labs should be capable of analysing for all the basic
parameters and where not possible, special parameters can be tested for at the CWTL. The CWTL in
Nairobi should be elevated to a reference Laboratory to carry out advanced water quality analysis, and
should be manned by qualified, trained and experienced staff.
Water Quality Design Equipment
Once the design parameters have been identified, equipment for the analysis of the parameters need
to be selected for each station. These have been generally described as either basic or advanced
equipment. Basic equipment is used for routine water quality testing. Such equipment would include a
pH meter, conductivity meter and UV-Vis spectrophotometer among others. Advanced equipment
would include atomic absorption spectrophotometer and gas liquid chromatography and high-pressure
liquid chromatography for the analysis of special parameters.
Laboratory Equipment
The current level of instrumentation in water quality laboratories is poor. The CWTL and all other labs
need to be supported to procure basic water quality equipment and Field Water Test Kits, to be able to
carry out their mandate. In general, Lab equipment can be categorized into 3 categories:
◼ Field Water Test Kits: This mainly comprises of colorimeters and probes and versatile pocket
meters such as pH meters, turbidity and conductivity meters, or the innovative sondes/probes.
◼ Basic laboratory equipment: UV/Vis spectrophotometer, flame photometer, analytical balance, top-
pan balance, pH meter, conductivity meter, dissolved oxygen meter, water still, water bath, hot
plate, refrigerator, flame photometer, turbidimeter, desiccators, computers, printers, fuming hood,
titrators, ovens, water bath, centrifuges, incubators, rotary kilns, muffles, comparators, multi-probes
and many assorted items.
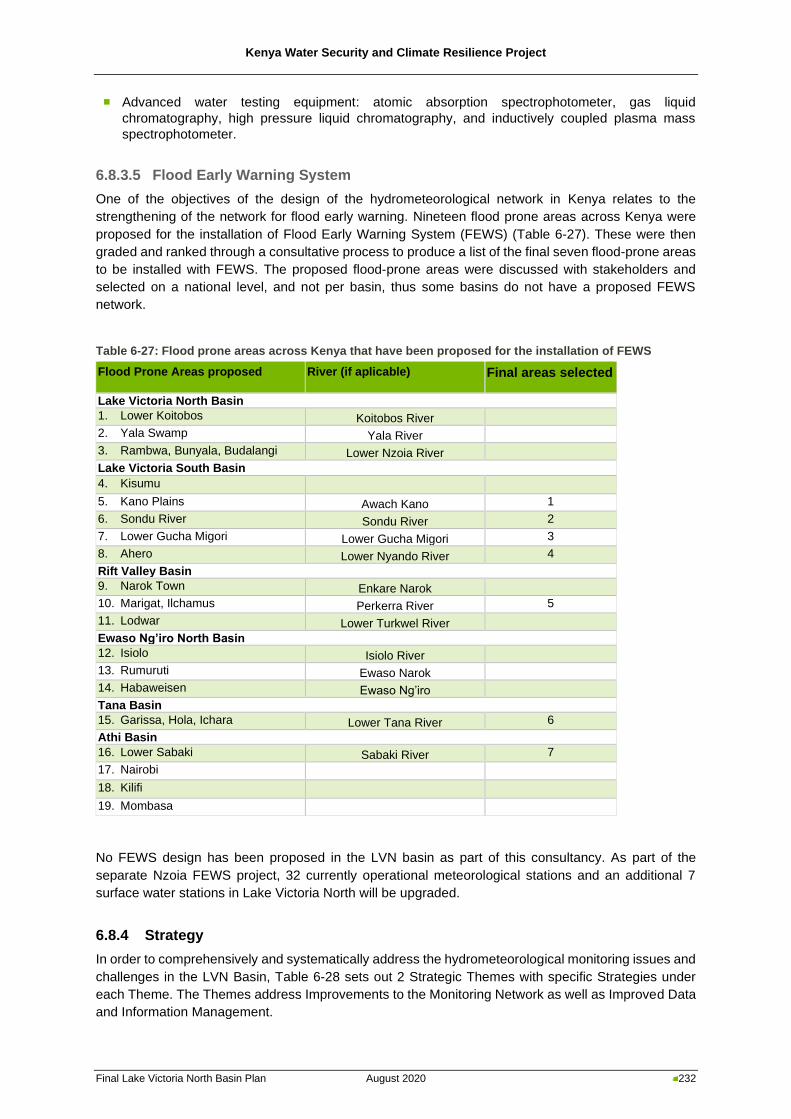
Kenya Water Security and Climate Resilience Project
Final Lake Victoria North Basin Plan August 2020 232
◼ Advanced water testing equipment: atomic absorption spectrophotometer, gas liquid
chromatography, high pressure liquid chromatography, and inductively coupled plasma mass
spectrophotometer.
6.8.3.5 Flood Early Warning System
One of the objectives of the design of the hydrometeorological network in Kenya relates to the
strengthening of the network for flood early warning. Nineteen flood prone areas across Kenya were
proposed for the installation of Flood Early Warning System (FEWS) (Table 6-27). These were then
graded and ranked through a consultative process to produce a list of the final seven flood-prone areas
to be installed with FEWS. The proposed flood-prone areas were discussed with stakeholders and
selected on a national level, and not per basin, thus some basins do not have a proposed FEWS
network.
Table 6-27: Flood prone areas across Kenya that have been proposed for the installation of FEWS
Flood Prone Areas proposed River (if aplicable) Final areas selected
Lake Victoria North Basin
1. Lower Koitobos Koitobos River
2. Yala Swamp Yala River
3. Rambwa, Bunyala, Budalangi Lower Nzoia River
Lake Victoria South Basin
4. Kisumu
5. Kano Plains Awach Kano 1
6. Sondu River Sondu River 2
7. Lower Gucha Migori Lower Gucha Migori 3
8. Ahero Lower Nyando River 4
Rift Valley Basin
9. Narok Town Enkare Narok
10. Marigat, Ilchamus Perkerra River 5
11. Lodwar Lower Turkwel River
Ewaso Ng’iro North Basin
12. Isiolo Isiolo River
13. Rumuruti Ewaso Narok
14. Habaweisen Ewaso Ng’iro
Tana Basin
15. Garissa, Hola, Ichara Lower Tana River 6
Athi Basin
16. Lower Sabaki Sabaki River 7
17. Nairobi
18. Kilifi
19. Mombasa
No FEWS design has been proposed in the LVN basin as part of this consultancy. As part of the
separate Nzoia FEWS project, 32 currently operational meteorological stations and an additional 7
surface water stations in Lake Victoria North will be upgraded.
6.8.4 Strategy
In order to comprehensively and systematically address the hydrometeorological monitoring issues and
challenges in the LVN Basin, Table 6-28 sets out 2 Strategic Themes with specific Strategies under
each Theme. The Themes address Improvements to the Monitoring Network as well as Improved Data
and Information Management.
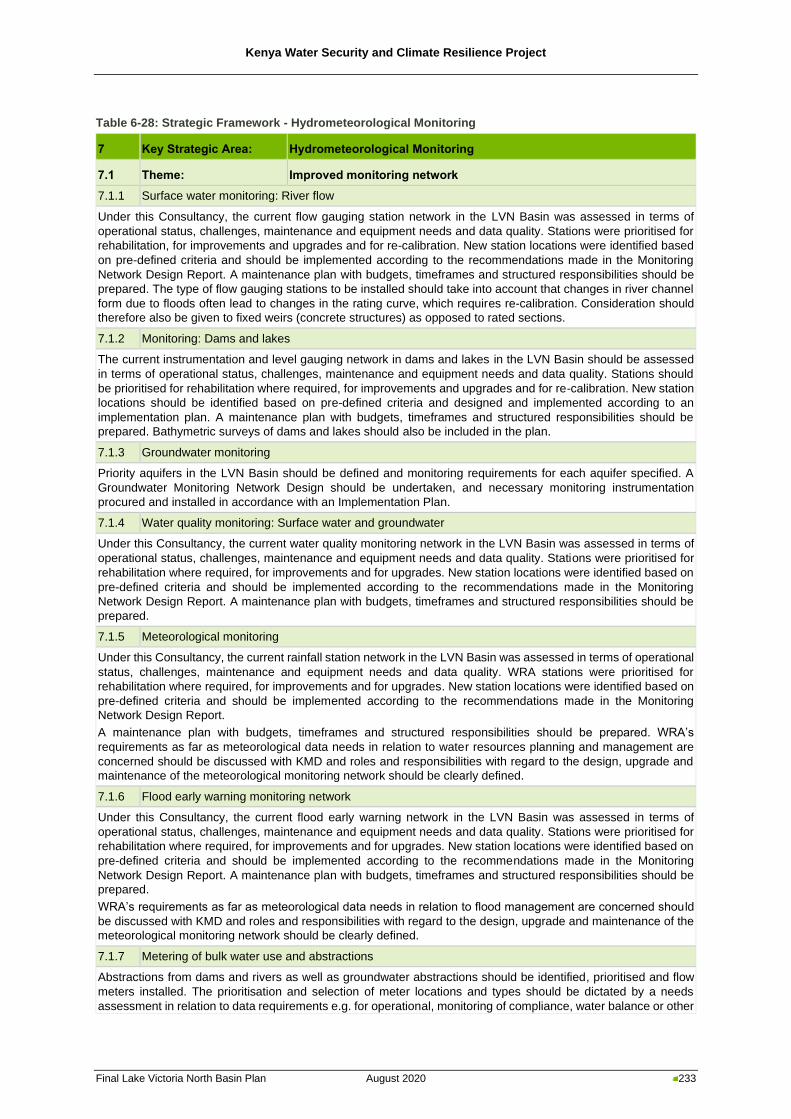
Kenya Water Security and Climate Resilience Project
Final Lake Victoria North Basin Plan August 2020 233
Table 6-28: Strategic Framework - Hydrometeorological Monitoring
7 Key Strategic Area: Hydrometeorological Monitoring
7.1 Theme: Improved monitoring network
7.1.1 Surface water monitoring: River flow
Under this Consultancy, the current flow gauging station network in the LVN Basin was assessed in terms of
operational status, challenges, maintenance and equipment needs and data quality. Stations were prioritised for
rehabilitation, for improvements and upgrades and for re-calibration. New station locations were identified based
on pre-defined criteria and should be implemented according to the recommendations made in the Monitoring
Network Design Report. A maintenance plan with budgets, timeframes and structured responsibilities should be
prepared. The type of flow gauging stations to be installed should take into account that changes in river channel
form due to floods often lead to changes in the rating curve, which requires re-calibration. Consideration should
therefore also be given to fixed weirs (concrete structures) as opposed to rated sections.
7.1.2 Monitoring: Dams and lakes
The current instrumentation and level gauging network in dams and lakes in the LVN Basin should be assessed
in terms of operational status, challenges, maintenance and equipment needs and data quality. Stations should
be prioritised for rehabilitation where required, for improvements and upgrades and for re-calibration. New station
locations should be identified based on pre-defined criteria and designed and implemented according to an
implementation plan. A maintenance plan with budgets, timeframes and structured responsibilities should be
prepared. Bathymetric surveys of dams and lakes should also be included in the plan.
7.1.3 Groundwater monitoring
Priority aquifers in the LVN Basin should be defined and monitoring requirements for each aquifer specified. A
Groundwater Monitoring Network Design should be undertaken, and necessary monitoring instrumentation
procured and installed in accordance with an Implementation Plan.
7.1.4 Water quality monitoring: Surface water and groundwater
Under this Consultancy, the current water quality monitoring network in the LVN Basin was assessed in terms of
operational status, challenges, maintenance and equipment needs and data quality. Stations were prioritised for
rehabilitation where required, for improvements and for upgrades. New station locations were identified based on
pre-defined criteria and should be implemented according to the recommendations made in the Monitoring
Network Design Report. A maintenance plan with budgets, timeframes and structured responsibilities should be
prepared.
7.1.5 Meteorological monitoring
Under this Consultancy, the current rainfall station network in the LVN Basin was assessed in terms of operational
status, challenges, maintenance and equipment needs and data quality. WRA stations were prioritised for
rehabilitation where required, for improvements and for upgrades. New station locations were identified based on
pre-defined criteria and should be implemented according to the recommendations made in the Monitoring
Network Design Report.
A maintenance plan with budgets, timeframes and structured responsibilities should be prepared. WRA’s
requirements as far as meteorological data needs in relation to water resources planning and management are
concerned should be discussed with KMD and roles and responsibilities with regard to the design, upgrade and
maintenance of the meteorological monitoring network should be clearly defined.
7.1.6 Flood early warning monitoring network
Under this Consultancy, the current flood early warning network in the LVN Basin was assessed in terms of
operational status, challenges, maintenance and equipment needs and data quality. Stations were prioritised for
rehabilitation where required, for improvements and for upgrades. New station locations were identified based on
pre-defined criteria and should be implemented according to the recommendations made in the Monitoring
Network Design Report. A maintenance plan with budgets, timeframes and structured responsibilities should be
prepared.
WRA’s requirements as far as meteorological data needs in relation to flood management are concerned shou ld
be discussed with KMD and roles and responsibilities with regard to the design, upgrade and maintenance of the
meteorological monitoring network should be clearly defined.
7.1.7 Metering of bulk water use and abstractions
Abstractions from dams and rivers as well as groundwater abstractions should be identified, prioritised and flow
meters installed. The prioritisation and selection of meter locations and types should be dictated by a needs
assessment in relation to data requirements e.g. for operational, monitoring of compliance, water balance or other
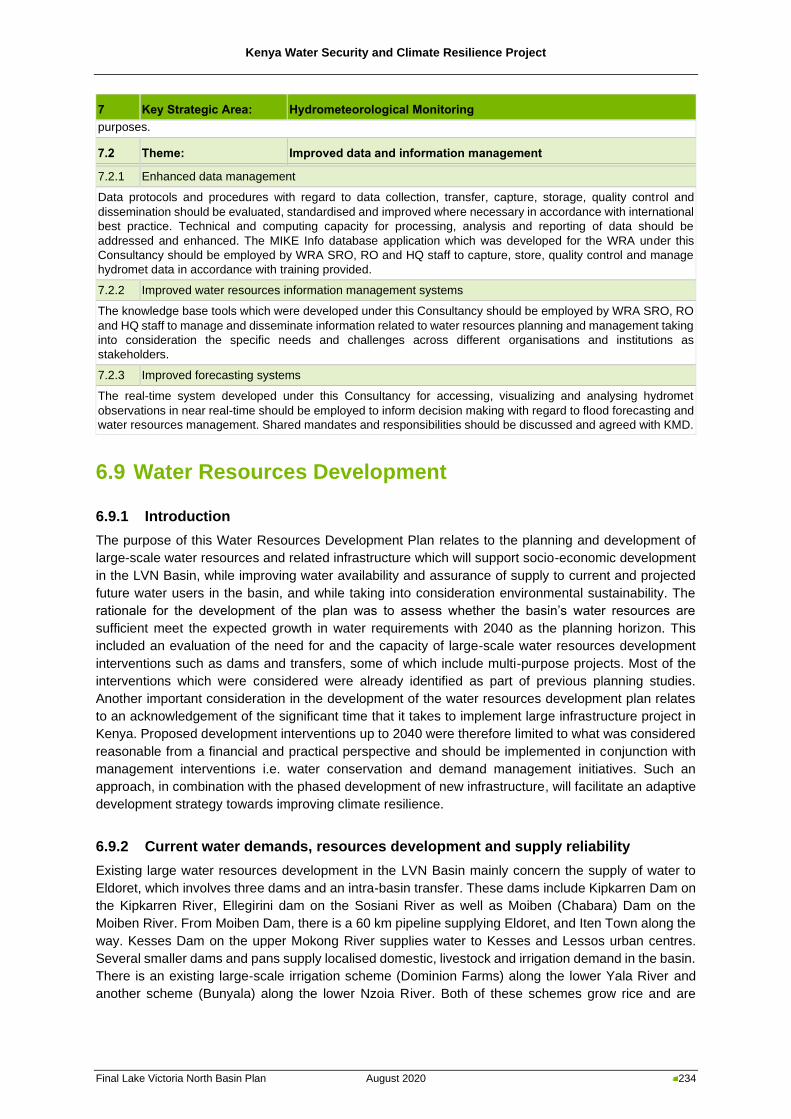
Kenya Water Security and Climate Resilience Project
Final Lake Victoria North Basin Plan August 2020 234
7 Key Strategic Area: Hydrometeorological Monitoring
purposes.
7.2 Theme: Improved data and information management
7.2.1 Enhanced data management
Data protocols and procedures with regard to data collection, transfer, capture, storage, quality control and
dissemination should be evaluated, standardised and improved where necessary in accordance with international
best practice. Technical and computing capacity for processing, analysis and reporting of data should be
addressed and enhanced. The MIKE Info database application which was developed for the WRA under this
Consultancy should be employed by WRA SRO, RO and HQ staff to capture, store, quality control and manage
hydromet data in accordance with training provided.
7.2.2 Improved water resources information management systems
The knowledge base tools which were developed under this Consultancy should be employed by WRA SRO, RO
and HQ staff to manage and disseminate information related to water resources planning and management taking
into consideration the specific needs and challenges across different organisations and institutions as
stakeholders.
7.2.3 Improved forecasting systems
The real-time system developed under this Consultancy for accessing, visualizing and analysing hydromet
observations in near real-time should be employed to inform decision making with regard to flood forecasting and
water resources management. Shared mandates and responsibilities should be discussed and agreed with KMD.
6.9 Water Resources Development
6.9.1 Introduction
The purpose of this Water Resources Development Plan relates to the planning and development of
large-scale water resources and related infrastructure which will support socio-economic development
in the LVN Basin, while improving water availability and assurance of supply to current and projected
future water users in the basin, and while taking into consideration environmental sustainability. The
rationale for the development of the plan was to assess whether the basin’s water resources are
sufficient meet the expected growth in water requirements with 2040 as the planning horizon. This
included an evaluation of the need for and the capacity of large-scale water resources development
interventions such as dams and transfers, some of which include multi-purpose projects. Most of the
interventions which were considered were already identified as part of previous planning studies.
Another important consideration in the development of the water resources development plan relates
to an acknowledgement of the significant time that it takes to implement large infrastructure project in
Kenya. Proposed development interventions up to 2040 were therefore limited to what was considered
reasonable from a financial and practical perspective and should be implemented in conjunction with
management interventions i.e. water conservation and demand management initiatives. Such an
approach, in combination with the phased development of new infrastructure, will facilitate an adaptive
development strategy towards improving climate resilience.
6.9.2 Current water demands, resources development and supply reliability
Existing large water resources development in the LVN Basin mainly concern the supply of water to
Eldoret, which involves three dams and an intra-basin transfer. These dams include Kipkarren Dam on
the Kipkarren River, Ellegirini dam on the Sosiani River as well as Moiben (Chabara) Dam on the
Moiben River. From Moiben Dam, there is a 60 km pipeline supplying Eldoret, and Iten Town along the
way. Kesses Dam on the upper Mokong River supplies water to Kesses and Lessos urban centres.
Several smaller dams and pans supply localised domestic, livestock and irrigation demand in the basin.
There is an existing large-scale irrigation scheme (Dominion Farms) along the lower Yala River and
another scheme (Bunyala) along the lower Nzoia River. Both of these schemes grow rice and are
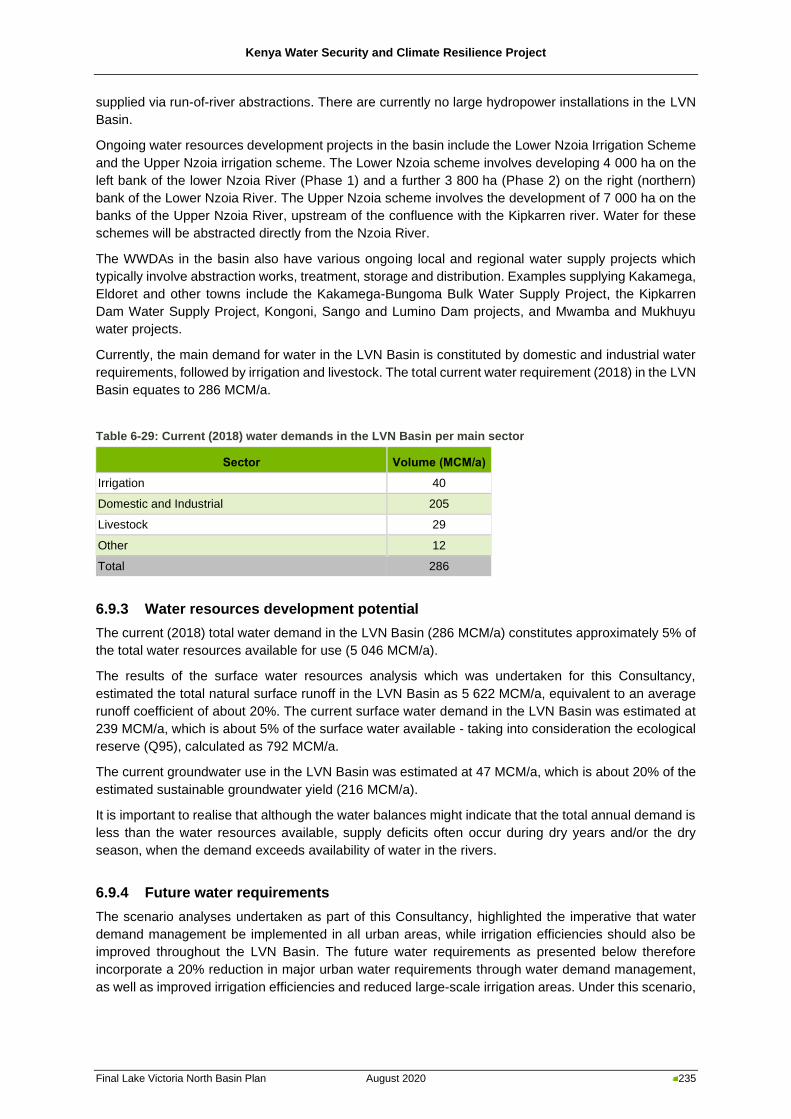
Kenya Water Security and Climate Resilience Project
Final Lake Victoria North Basin Plan August 2020 235
supplied via run-of-river abstractions. There are currently no large hydropower installations in the LVN
Basin.
Ongoing water resources development projects in the basin include the Lower Nzoia Irrigation Scheme
and the Upper Nzoia irrigation scheme. The Lower Nzoia scheme involves developing 4 000 ha on the
left bank of the lower Nzoia River (Phase 1) and a further 3 800 ha (Phase 2) on the right (northern)
bank of the Lower Nzoia River. The Upper Nzoia scheme involves the development of 7 000 ha on the
banks of the Upper Nzoia River, upstream of the confluence with the Kipkarren river. Water for these
schemes will be abstracted directly from the Nzoia River.
The WWDAs in the basin also have various ongoing local and regional water supply projects which
typically involve abstraction works, treatment, storage and distribution. Examples supplying Kakamega,
Eldoret and other towns include the Kakamega-Bungoma Bulk Water Supply Project, the Kipkarren
Dam Water Supply Project, Kongoni, Sango and Lumino Dam projects, and Mwamba and Mukhuyu
water projects.
Currently, the main demand for water in the LVN Basin is constituted by domestic and industrial water
requirements, followed by irrigation and livestock. The total current water requirement (2018) in the LVN
Basin equates to 286 MCM/a.
Table 6-29: Current (2018) water demands in the LVN Basin per main sector
Sector Volume (MCM/a)
Irrigation 40
Domestic and Industrial 205
Livestock 29
Other 12
Total 286
6.9.3 Water resources development potential
The current (2018) total water demand in the LVN Basin (286 MCM/a) constitutes approximately 5% of
the total water resources available for use (5 046 MCM/a).
The results of the surface water resources analysis which was undertaken for this Consultancy,
estimated the total natural surface runoff in the LVN Basin as 5 622 MCM/a, equivalent to an average
runoff coefficient of about 20%. The current surface water demand in the LVN Basin was estimated at
239 MCM/a, which is about 5% of the surface water available - taking into consideration the ecological
reserve (Q95), calculated as 792 MCM/a.
The current groundwater use in the LVN Basin was estimated at 47 MCM/a, which is about 20% of the
estimated sustainable groundwater yield (216 MCM/a).
It is important to realise that although the water balances might indicate that the total annual demand is
less than the water resources available, supply deficits often occur during dry years and/or the dry
season, when the demand exceeds availability of water in the rivers.
6.9.4 Future water requirements
The scenario analyses undertaken as part of this Consultancy, highlighted the imperative that water
demand management be implemented in all urban areas, while irrigation efficiencies should also be
improved throughout the LVN Basin. The future water requirements as presented below therefore
incorporate a 20% reduction in major urban water requirements through water demand management,
as well as improved irrigation efficiencies and reduced large-scale irrigation areas. Under this scenario,
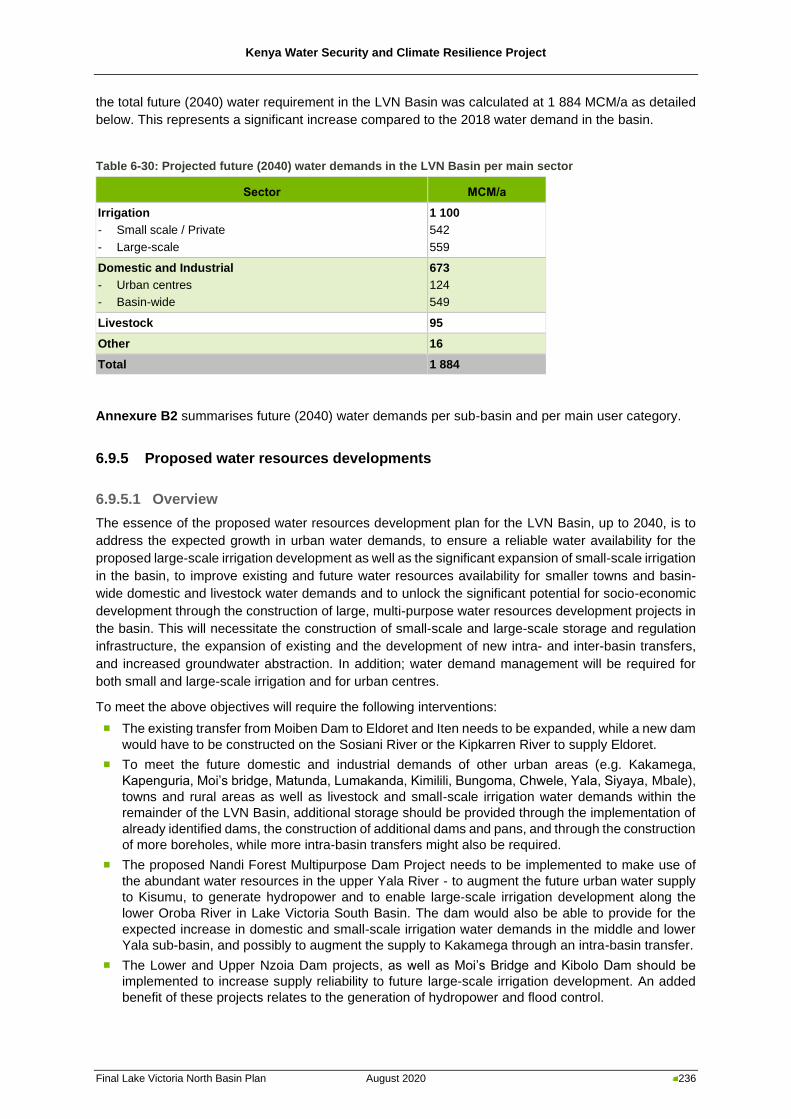
Kenya Water Security and Climate Resilience Project
Final Lake Victoria North Basin Plan August 2020 236
the total future (2040) water requirement in the LVN Basin was calculated at 1 884 MCM/a as detailed
below. This represents a significant increase compared to the 2018 water demand in the basin.
Table 6-30: Projected future (2040) water demands in the LVN Basin per main sector
Sector MCM/a
Irrigation
- Small scale / Private
- Large-scale
1 100
542
559
Domestic and Industrial
- Urban centres
- Basin-wide
673
124
549
Livestock 95
Other 16
Total 1 884
Annexure B2 summarises future (2040) water demands per sub-basin and per main user category.
6.9.5 Proposed water resources developments
6.9.5.1 Overview
The essence of the proposed water resources development plan for the LVN Basin, up to 2040, is to
address the expected growth in urban water demands, to ensure a reliable water availability for the
proposed large-scale irrigation development as well as the significant expansion of small-scale irrigation
in the basin, to improve existing and future water resources availability for smaller towns and basin-
wide domestic and livestock water demands and to unlock the significant potential for socio-economic
development through the construction of large, multi-purpose water resources development projects in
the basin. This will necessitate the construction of small-scale and large-scale storage and regulation
infrastructure, the expansion of existing and the development of new intra- and inter-basin transfers,
and increased groundwater abstraction. In addition; water demand management will be required for
both small and large-scale irrigation and for urban centres.
To meet the above objectives will require the following interventions:
◼ The existing transfer from Moiben Dam to Eldoret and Iten needs to be expanded, while a new dam
would have to be constructed on the Sosiani River or the Kipkarren River to supply Eldoret.
◼ To meet the future domestic and industrial demands of other urban areas (e.g. Kakamega,
Kapenguria, Moi’s bridge, Matunda, Lumakanda, Kimilili, Bungoma, Chwele, Yala, Siyaya, Mbale),
towns and rural areas as well as livestock and small-scale irrigation water demands within the
remainder of the LVN Basin, additional storage should be provided through the implementation of
already identified dams, the construction of additional dams and pans, and through the construction
of more boreholes, while more intra-basin transfers might also be required.
◼ The proposed Nandi Forest Multipurpose Dam Project needs to be implemented to make use of
the abundant water resources in the upper Yala River - to augment the future urban water supply
to Kisumu, to generate hydropower and to enable large-scale irrigation development along the
lower Oroba River in Lake Victoria South Basin. The dam would also be able to provide for the
expected increase in domestic and small-scale irrigation water demands in the middle and lower
Yala sub-basin, and possibly to augment the supply to Kakamega through an intra-basin transfer.
◼ The Lower and Upper Nzoia Dam projects, as well as Moi’s Bridge and Kibolo Dam should be
implemented to increase supply reliability to future large-scale irrigation development. An added
benefit of these projects relates to the generation of hydropower and flood control.
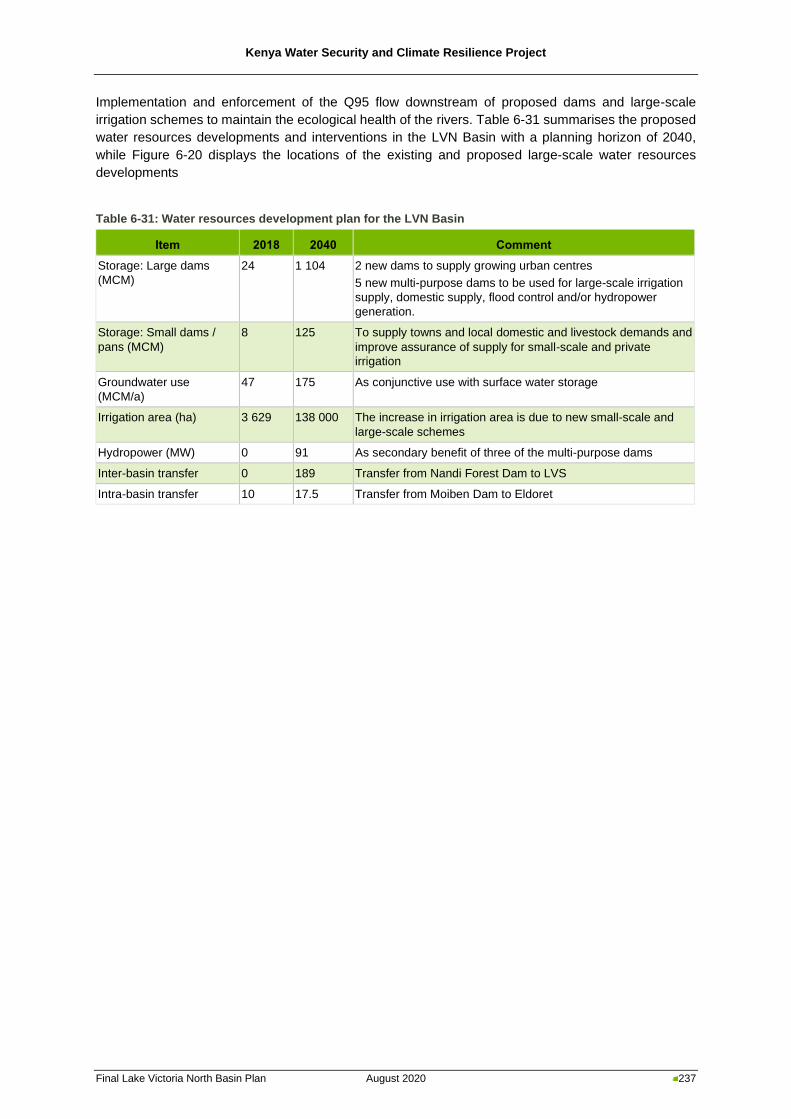
Kenya Water Security and Climate Resilience Project
Final Lake Victoria North Basin Plan August 2020 237
Implementation and enforcement of the Q95 flow downstream of proposed dams and large-scale
irrigation schemes to maintain the ecological health of the rivers. Table 6-31 summarises the proposed
water resources developments and interventions in the LVN Basin with a planning horizon of 2040,
while Figure 6-20 displays the locations of the existing and proposed large-scale water resources
developments
Table 6-31: Water resources development plan for the LVN Basin
Item 2018 2040 Comment
Storage: Large dams
(MCM)
24 1 104 2 new dams to supply growing urban centres
5 new multi-purpose dams to be used for large-scale irrigation
supply, domestic supply, flood control and/or hydropower
generation.
Storage: Small dams /
pans (MCM)
8 125 To supply towns and local domestic and livestock demands and
improve assurance of supply for small-scale and private
irrigation
Groundwater use
(MCM/a)
47 175 As conjunctive use with surface water storage
Irrigation area (ha) 3 629 138 000 The increase in irrigation area is due to new small-scale and
large-scale schemes
Hydropower (MW) 0 91 As secondary benefit of three of the multi-purpose dams
Inter-basin transfer 0 189 Transfer from Nandi Forest Dam to LVS
Intra-basin transfer 10 17.5 Transfer from Moiben Dam to Eldoret
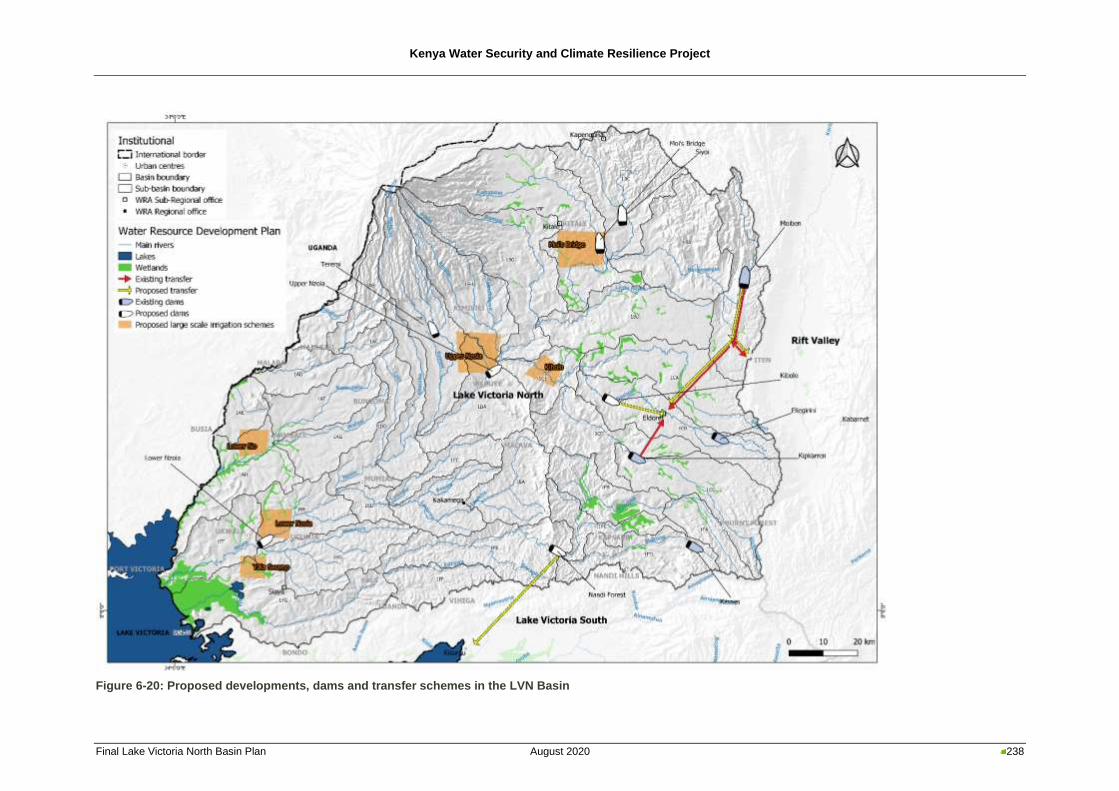
Kenya Water Security and Climate Resilience Project
Final Lake Victoria North Basin Plan August 2020 238
Figure 6-20: Proposed developments, dams and transfer schemes in the LVN Basin
Kenya Water Security and Climate Resilience Project
Final Lake Victoria North Basin Plan August 2020 239
6.9.5.2 Urban and town water supply
The current (2018) water demand of Eldoret (22 MCM/a) already exceeds the capacity of the existing
water supply system and the analysis undertaken as part of this Consultancy has confirmed that the
current annual assurance of supply is very low. This is not acceptable and is expected to deteriorate
even further in future as the demand increases - even with water demand management. The existing
schemes supplying water to Eldoret include Kipkarren, Ellegirini and Twin Rivers dams as well as a
transfer from Moiben (Chabara) Dam. The expected future water demand in Eldoret, based on expected
population growth, results in an estimated 2040 demand of 70 MCM/a (191 355 m3/day) under full
supply conditions. To achieve an acceptable reliability of supply to Eldoret in future, the transfer from
Moiben Dam needs to be expanded to 17.5 MCM/a, while an additional dam needs to be constructed
on either the Sosiani River or the Kipkarren River to further augment the supply to Eldoret by at least
20 MCM/a. Water could be transferred to Eldoret from the proposed Kibolo Dam on the lower Sosiani
River. In addition, it is imperative that water demand management measures to reduce demand in
Eldoret (aiming for a 20% reduction) are implemented as soon as possible.
In order to improve the existing assurance of supply and to meet the expected growth in water
requirements of some of the other major towns in the LVN Basin, additional dams and regional water
supply schemes will be required. These include Siyoi Dam (4 MCM) to supply Kapenguria and Teremi
Dam (3 MCM) to supply surrounding towns such as Kimilili. The proposed Moi’s Bridge Dam (214 MCM)
on the upper Nzoia River will be primarily used for irrigation. However, it will also be able to supply
surrounding towns e.g. Moi’s Bridge, Matunda and even Kitale with water. Similarly, the proposed Nandi
Forest Multipurpose Dam in the upper Yala Catchment will be able to augment the water supply to
towns such as Kapsabet, Vihiga and Yala. It could also serve as a potential source of water supply to
Kakamega in the adjacent Nzoia catchment.
6.9.5.3 Multipurpose Dam Projects
The proposed Nandi Forest Multipurpose Dam Project is a key project in the basin and entails a number
of components, viz. a 220 MCM storage dam at the confluence of the Remonde (Kimondi) and Sirua
(Mokong) Rivers in the Nandi Forest at an elevation of 1 800 masl, a 17.5 km tunnel which will divert
about 6.6 m3/s to Lake Victoria South Basin and a powerhouse at the foot of the Nayndo escarpment
with an installed hydropower capacity of 50 MW. The flow will eventually be discharged into the Oroba
River, from where the water will be abstracted for proposed irrigation of up to 16 500 ha in Miwani and
Chemelil. Other potential benefits include water supply to Kapsabet, towns along the middle and lower
Yala River e.g. Yala and Siaya and potentially to Kakamega in the adjacent Nzoia catchment as well
as to Kisumu and other towns in the Lake Victoria South Basin.
Similarly, the proposed Lower and Upper Nzoia dam projects are key to the development in the basin.
The Upper Nzoia Dam project is proposed on the Nzoia River upstream of the confluence with the
Kipkarren River. The dam has been proposed with a capacity of 204 MCM. The purpose of the dam is
primarily to irrigate the proposed Upper Nzoia irrigation scheme (24 000 ha); but owing to its large
storage volume will also be able to offer flood control measures for the sub-basins downstream as well
as generation of hydropower with a proposed installed capacity of 16 MW. The Lower Nzoia dam project
is proposed upstream of the Wuoroya River confluence. The dam has a proposed storage volume of
395 MCM. The purpose of the dam is primarily to irrigate the proposed Lower Nzoia irrigation scheme
(10 470 ha); but will also be able to offer flood control measures, especially given the proximity of flood
prone areas along the lower Nzoia River; as well as generation of hydropower with a proposed installed
capacity of 25 MW.
Under the sustainable scenario; both the Upper and Lower Nzoia Dam projects can supply the demand
for irrigation with an assurance of supply above 90%, as well as generation of hydropower to capacity.
Opportunities also exist to potentially develop transfer routes from these dams to supply towns in the
Nzoia catchment and even in neighbouring catchments.
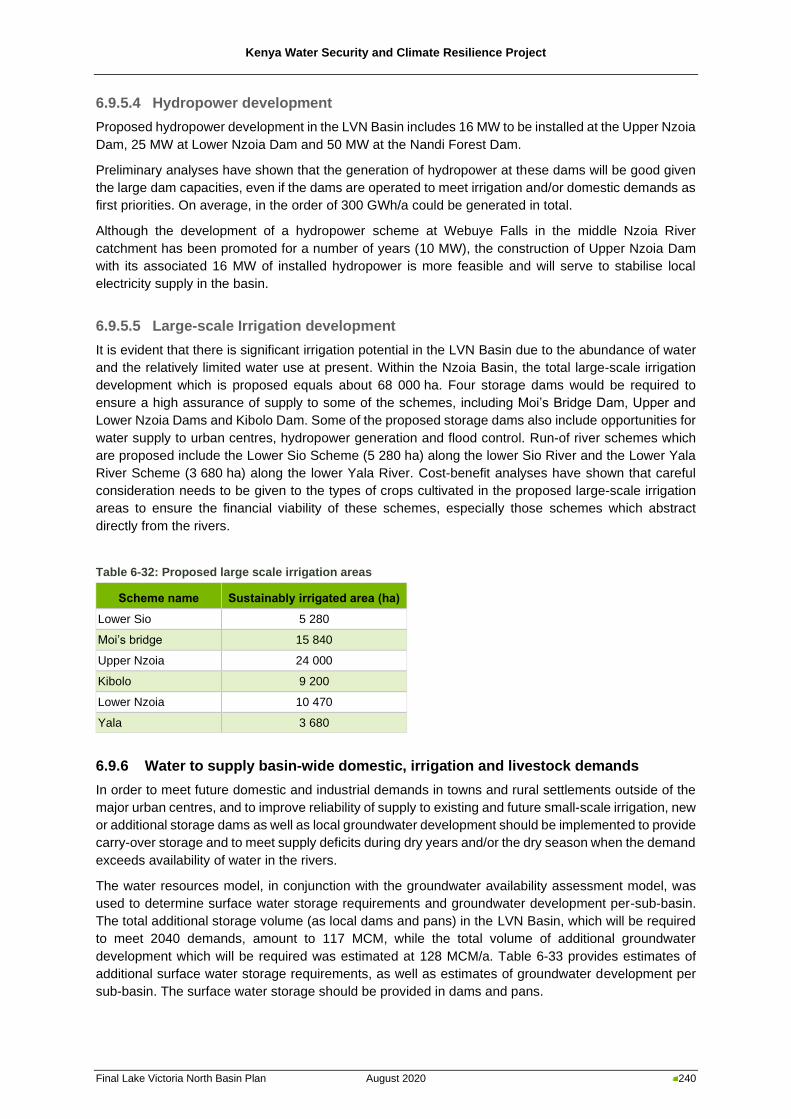
Kenya Water Security and Climate Resilience Project
Final Lake Victoria North Basin Plan August 2020 240
6.9.5.4 Hydropower development
Proposed hydropower development in the LVN Basin includes 16 MW to be installed at the Upper Nzoia
Dam, 25 MW at Lower Nzoia Dam and 50 MW at the Nandi Forest Dam.
Preliminary analyses have shown that the generation of hydropower at these dams will be good given
the large dam capacities, even if the dams are operated to meet irrigation and/or domestic demands as
first priorities. On average, in the order of 300 GWh/a could be generated in total.
Although the development of a hydropower scheme at Webuye Falls in the middle Nzoia River
catchment has been promoted for a number of years (10 MW), the construction of Upper Nzoia Dam
with its associated 16 MW of installed hydropower is more feasible and will serve to stabilise local
electricity supply in the basin.
6.9.5.5 Large-scale Irrigation development
It is evident that there is significant irrigation potential in the LVN Basin due to the abundance of water
and the relatively limited water use at present. Within the Nzoia Basin, the total large-scale irrigation
development which is proposed equals about 68 000 ha. Four storage dams would be required to
ensure a high assurance of supply to some of the schemes, including Moi’s Bridge Dam, Upper and
Lower Nzoia Dams and Kibolo Dam. Some of the proposed storage dams also include opportunities for
water supply to urban centres, hydropower generation and flood control. Run-of river schemes which
are proposed include the Lower Sio Scheme (5 280 ha) along the lower Sio River and the Lower Yala
River Scheme (3 680 ha) along the lower Yala River. Cost-benefit analyses have shown that careful
consideration needs to be given to the types of crops cultivated in the proposed large-scale irrigation
areas to ensure the financial viability of these schemes, especially those schemes which abstract
directly from the rivers.
Table 6-32: Proposed large scale irrigation areas
Scheme name Sustainably irrigated area (ha)
Lower Sio 5 280
Moi’s bridge 15 840
Upper Nzoia 24 000
Kibolo 9 200
Lower Nzoia 10 470
Yala 3 680
6.9.6 Water to supply basin-wide domestic, irrigation and livestock demands
In order to meet future domestic and industrial demands in towns and rural settlements outside of the
major urban centres, and to improve reliability of supply to existing and future small-scale irrigation, new
or additional storage dams as well as local groundwater development should be implemented to provide
carry-over storage and to meet supply deficits during dry years and/or the dry season when the demand
exceeds availability of water in the rivers.
The water resources model, in conjunction with the groundwater availability assessment model, was
used to determine surface water storage requirements and groundwater development per-sub-basin.
The total additional storage volume (as local dams and pans) in the LVN Basin, which will be required
to meet 2040 demands, amount to 117 MCM, while the total volume of additional groundwater
development which will be required was estimated at 128 MCM/a. Table 6-33 provides estimates of
additional surface water storage requirements, as well as estimates of groundwater development per
sub-basin. The surface water storage should be provided in dams and pans.
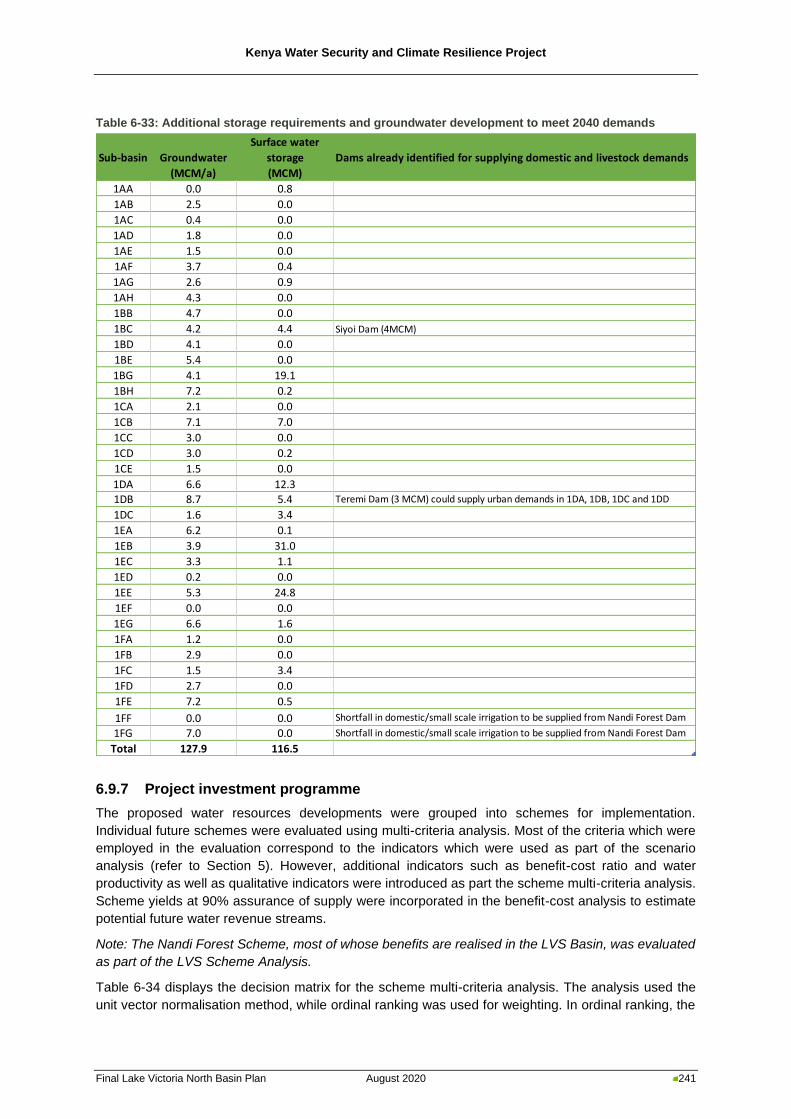
Kenya Water Security and Climate Resilience Project
Final Lake Victoria North Basin Plan August 2020 241
Table 6-33: Additional storage requirements and groundwater development to meet 2040 demands
6.9.7 Project investment programme
The proposed water resources developments were grouped into schemes for implementation.
Individual future schemes were evaluated using multi-criteria analysis. Most of the criteria which were
employed in the evaluation correspond to the indicators which were used as part of the scenario
analysis (refer to Section 5). However, additional indicators such as benefit-cost ratio and water
productivity as well as qualitative indicators were introduced as part the scheme multi-criteria analysis.
Scheme yields at 90% assurance of supply were incorporated in the benefit-cost analysis to estimate
potential future water revenue streams.
Note: The Nandi Forest Scheme, most of whose benefits are realised in the LVS Basin, was evaluated
as part of the LVS Scheme Analysis.
Table 6-34 displays the decision matrix for the scheme multi-criteria analysis. The analysis used the
unit vector normalisation method, while ordinal ranking was used for weighting. In ordinal ranking, the
Sub-basin Groundwater
Surface water
storage Dams already identified for supplying domestic and livestock demands
(MCM/a) (MCM)
1AA 0.0 0.8
1AB 2.5 0.0
1AC 0.4 0.0
1AD 1.8 0.0
1AE 1.5 0.0
1AF 3.7 0.4
1AG 2.6 0.9
1AH 4.3 0.0
1BB 4.7 0.0
1BC 4.2 4.4 Siyoi Dam (4MCM)
1BD 4.1 0.0
1BE 5.4 0.0
1BG 4.1 19.1
1BH 7.2 0.2
1CA 2.1 0.0
1CB 7.1 7.0
1CC 3.0 0.0
1CD 3.0 0.2
1CE 1.5 0.0
1DA 6.6 12.31DB 8.7 5.4 Teremi Dam (3 MCM) could supply urban demands in 1DA, 1DB, 1DC and 1DD
1DC 1.6 3.4
1EA 6.2 0.1
1EB 3.9 31.0
1EC 3.3 1.1
1ED 0.2 0.0
1EE 5.3 24.8
1EF 0.0 0.0
1EG 6.6 1.6
1FA 1.2 0.0
1FB 2.9 0.0
1FC 1.5 3.4
1FD 2.7 0.0
1FE 7.2 0.5
1FF 0.0 0.0 Shortfall in domestic/small scale irrigation to be supplied from Nandi Forest Dam
1FG 7.0 0.0 Shortfall in domestic/small scale irrigation to be supplied from Nandi Forest Dam
Total 127.9 116.5
Kenya Water Security and Climate Resilience Project
Final Lake Victoria North Basin Plan August 2020 242
order of ranking assigned to criteria is important, while the absolute differences between criteria values
is not, due to it being disproportionate and/or difficult to quantify. The indicator analysis provides a wide
array of indicators, which cannot be assessed against each other; thus, ordinal ranking was the suitable
option.
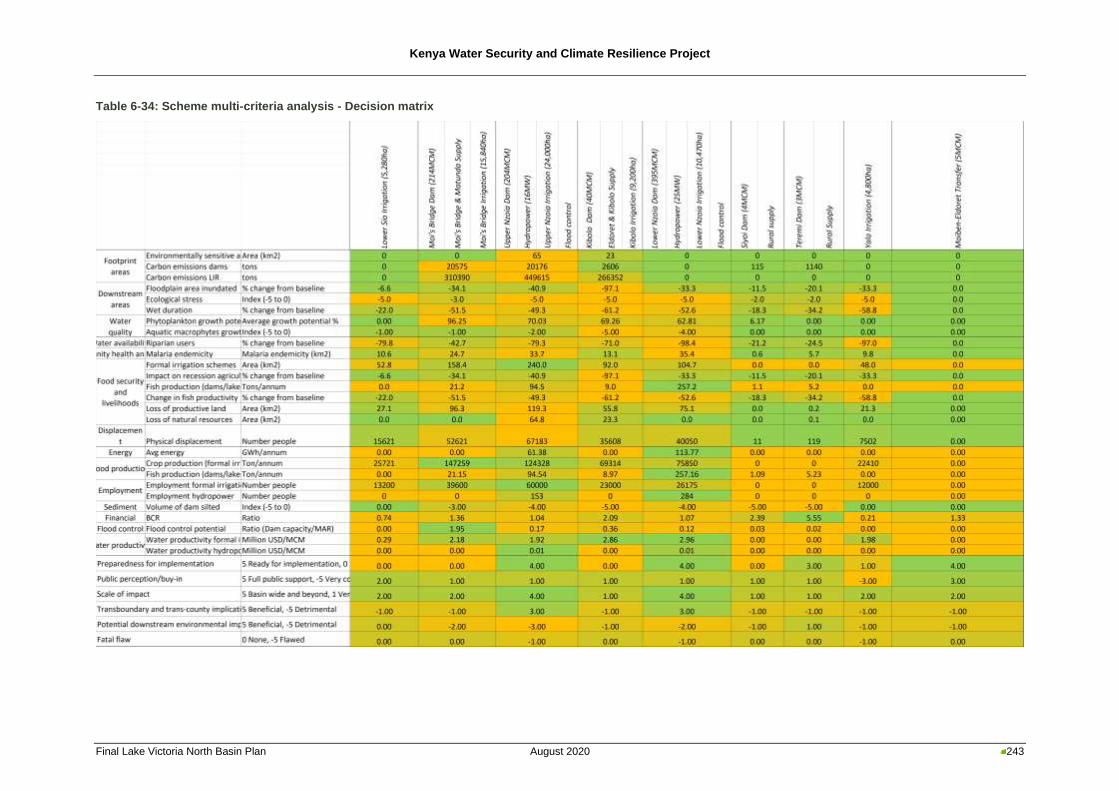
Kenya Water Security and Climate Resilience Project
Final Lake Victoria North Basin Plan August 2020 243
Table 6-34: Scheme multi-criteria analysis - Decision matrix
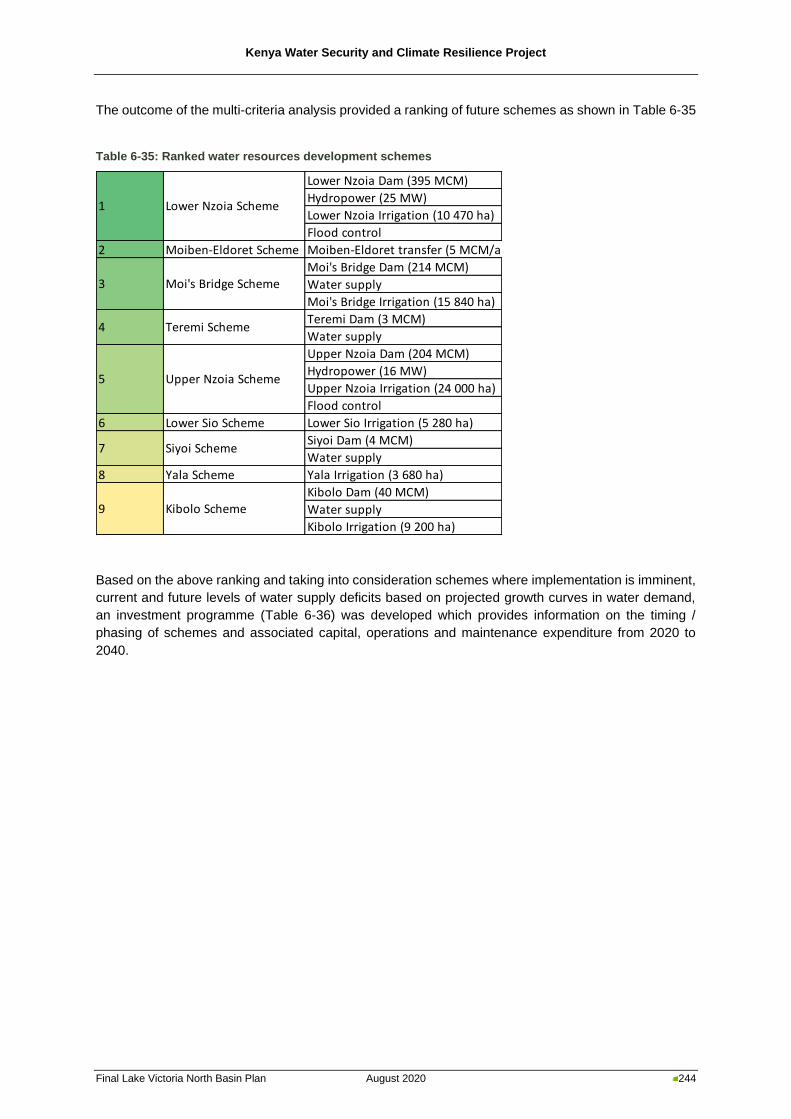
Kenya Water Security and Climate Resilience Project
Final Lake Victoria North Basin Plan August 2020 244
The outcome of the multi-criteria analysis provided a ranking of future schemes as shown in Table 6-35
Table 6-35: Ranked water resources development schemes
Based on the above ranking and taking into consideration schemes where implementation is imminent,
current and future levels of water supply deficits based on projected growth curves in water demand,
an investment programme (Table 6-36) was developed which provides information on the timing /
phasing of schemes and associated capital, operations and maintenance expenditure from 2020 to
2040.
Lower Nzoia Dam (395 MCM)
Hydropower (25 MW)
Lower Nzoia Irrigation (10 470 ha)
Flood control
2 Moiben-Eldoret Scheme Moiben-Eldoret transfer (5 MCM/a)
Moi's Bridge Dam (214 MCM)
Water supply
Moi's Bridge Irrigation (15 840 ha)
Teremi Dam (3 MCM)
Water supply
Upper Nzoia Dam (204 MCM)
Hydropower (16 MW)
Upper Nzoia Irrigation (24 000 ha)
Flood control
6 Lower Sio Scheme Lower Sio Irrigation (5 280 ha)
Siyoi Dam (4 MCM)
Water supply
8 Yala Scheme Yala Irrigation (3 680 ha)
Kibolo Dam (40 MCM)
Water supply
Kibolo Irrigation (9 200 ha)
9 Kibolo Scheme
1
3
4
5
7
Lower Nzoia Scheme
Moi's Bridge Scheme
Teremi Scheme
Upper Nzoia Scheme
Siyoi Scheme

Kenya Water Security and Climate Resilience Project
Final Lake Victoria North Basin Plan August 2020 245
Table 6-36: LVN Basin Water Resources Development Investment Plan
Proposed Infrastructure Development - Water Resources, Hydropower & Large-Scale Irrigation
Feasibility
ESIA / Design 2020 2021 2022 2023 2024 2025 2026 2027 2028 2029 2030 2031 2032 2033 2034 2035 2036 2037 2038 2039 2040
Intra-basin Transfers Capacity Wa
ter
Sup
ply
Hy
dro
po
we
r
Flo
od
Co
ntr
ol
LS I
rrig
ati
on
7 45
Moiben Dam to Eldoret Transfer Expansion 7.5 MCM 6.1 7 45 3 3 23 23
Inter-basin Transfers 84 560
Nandi Forest Multipurpose Dam, Transfer
to LVS and HP
220 MCM, 189 MCM/a,
50 MW 94 84 560
Other Water Resources Developments 201 1343
Siyoi Dam 4 MCM 16 5 36 5 18 18
Kibolo Dam 40 MCM 27 21 140 11 11 47 47 47
Teremi Dam 3 MCM 17 5 30 5 15 15
Moi's Bridge Dam 214 MCM 49 38 253 19 19 84 84 84
Upper Nzoia Dam (Site 34B) 204 MCM; 16 MW 194 36 241 18 18 121 121
Lower Nzoia Dam (Site 42A) 395 MCM; 25 MW 540 50 335 50 168 168
Dams and pans 117 MCM - 37 247 19 19 13 13 13 13 13 13 13 13 13 13 13 13 13 13 13 13 13 13 13
Groundwater development (Boreholes) 128 MCM/a - 9 61 5 5 3 3 3 3 3 3 3 3 3 3 3 3 3 3 3 3 3 3 3
Large Scale Irrigation Schemes (excl. dams) 216 1438
Lower Sio 5 280 ha - 20 130 20 43 43 43
Yala Swamp 3 680 ha - 14 91 7 7 30 30 30
Upper Nzoia 24 000 ha - 71 473 35 35 118 118 118 118
Lower Nzoia 10 470 ha - 31 206 31 34 34 34 34 34 34
Moi's Bridge 15 840 ha - 47 312 23 23 104 104 104
Kibolo 9 200 ha - 34 227 17 17 76 76 76
0.0 0.0 3.9 7.9 10.8 12.0 18.4 27.4 37.5 43.1 45.8 47.3 47.7 48.1 49.2 50.4 51.6 52.8 60.2 67.5 69.8
76 80 161 170 191 138 303 397 463 268 152 107 71 71 96 97 115 171 354 361 162
Expenditure (USD Million)
Purpose
Total Annual Cost (USD Million)
O&M Cost
Capital
Phasing (Year)
Scheme
1:10 Yield
(MCM/a)
Storage / Transfer
Volume
Cost included in Lake Victoria South Basin Plan
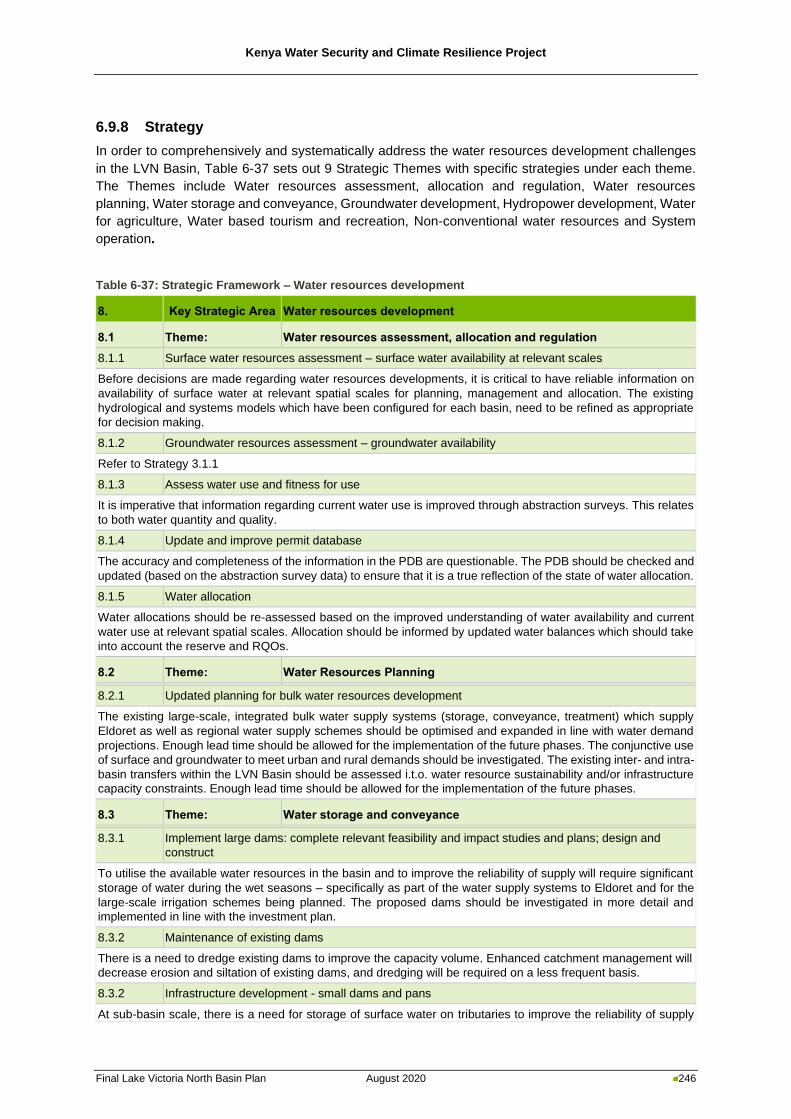
Kenya Water Security and Climate Resilience Project
Final Lake Victoria North Basin Plan August 2020 246
6.9.8 Strategy
In order to comprehensively and systematically address the water resources development challenges
in the LVN Basin, Table 6-37 sets out 9 Strategic Themes with specific strategies under each theme.
The Themes include Water resources assessment, allocation and regulation, Water resources
planning, Water storage and conveyance, Groundwater development, Hydropower development, Water
for agriculture, Water based tourism and recreation, Non-conventional water resources and System
operation.
Table 6-37: Strategic Framework – Water resources development
8. Key Strategic Area Water resources development
8.1 Theme: Water resources assessment, allocation and regulation
8.1.1 Surface water resources assessment – surface water availability at relevant scales
Before decisions are made regarding water resources developments, it is critical to have reliable information on
availability of surface water at relevant spatial scales for planning, management and allocation. The existing
hydrological and systems models which have been configured for each basin, need to be refined as appropriate
for decision making.
8.1.2 Groundwater resources assessment – groundwater availability
Refer to Strategy 3.1.1
8.1.3 Assess water use and fitness for use
It is imperative that information regarding current water use is improved through abstraction surveys. This relates
to both water quantity and quality.
8.1.4 Update and improve permit database
The accuracy and completeness of the information in the PDB are questionable. The PDB should be checked and
updated (based on the abstraction survey data) to ensure that it is a true reflection of the state of water allocation.
8.1.5 Water allocation
Water allocations should be re-assessed based on the improved understanding of water availability and current
water use at relevant spatial scales. Allocation should be informed by updated water balances which should take
into account the reserve and RQOs.
8.2 Theme: Water Resources Planning
8.2.1 Updated planning for bulk water resources development
The existing large-scale, integrated bulk water supply systems (storage, conveyance, treatment) which supply
Eldoret as well as regional water supply schemes should be optimised and expanded in line with water demand
projections. Enough lead time should be allowed for the implementation of the future phases. The conjunctive use
of surface and groundwater to meet urban and rural demands should be investigated. The existing inter- and intra-
basin transfers within the LVN Basin should be assessed i.t.o. water resource sustainability and/or infrastructure
capacity constraints. Enough lead time should be allowed for the implementation of the future phases.
8.3 Theme: Water storage and conveyance
8.3.1 Implement large dams: complete relevant feasibility and impact studies and plans; design and
construct
To utilise the available water resources in the basin and to improve the reliability of supply will require significant
storage of water during the wet seasons – specifically as part of the water supply systems to Eldoret and for the
large-scale irrigation schemes being planned. The proposed dams should be investigated in more detail and
implemented in line with the investment plan.
8.3.2 Maintenance of existing dams
There is a need to dredge existing dams to improve the capacity volume. Enhanced catchment management will
decrease erosion and siltation of existing dams, and dredging will be required on a less frequent basis.
8.3.2 Infrastructure development - small dams and pans
At sub-basin scale, there is a need for storage of surface water on tributaries to improve the reliability of supply
Kenya Water Security and Climate Resilience Project
Final Lake Victoria North Basin Plan August 2020 247
8. Key Strategic Area Water resources development
for local domestic, livestock and small-scale irrigation use. Studies should be initiated, and an infrastructure
development programme should be compiled to guide the phased implementation of storage at sub-basin scale
8.3.3 Provide other types of storage
Sand dams, artificial recharge and water harvesting should be investigated and implemented where feasible to
provide storage of water during the wet season for use during the dry season, especially in areas without reliable
river flows.
8.3.4 Upgrade existing / Construct new water transfers
The LVN Basin has limited inter and intra-basin transfers. Proposed expansion of these transfers should be
implemented timeously to ensure reliability of supply in line with future water demands.
8.4 Theme: Groundwater development
8.4.1 Develop groundwater resources
Implement under Strategic Theme 3.2
8.5 Theme: Hydropower development
8.5.1 Large scale hydropower development
Whereas the primary purpose of the proposed large dams in the LVN Basin, due to the high water demands in the
basin, will be urban supply and/or irrigation, the dams can also be used for hydropower generation. The possibility
of retrofitting existing large dams with hydroelectric power generation capabilities should also be investigated.
8.5.2 Small scale hydropower development
Hydropower is an important source of energy for economic and social development, on both a large and small
scale. For development, the potential for small-scale hydropower plants should be assessed across the basin.
8.6 Theme: Water for agriculture
8.6.1 Large scale irrigation development: Develop new / expand existing irrigation schemes. Limit to max
sustainable areas
Although some large-scale irrigation development can be accommodated in the LVN Basin, the extent of the
originally proposed developments should be scaled down in light of constraints associated with water availability
and assurance of supply.
8.6.2 Promote water conservation in irrigation
As part of the sustainable scenario proposed in this basin plan, increased irrigation efficiency and reduced water
demand for large-scale irrigation accounts largely for more sustainable water use. Water use efficiency can be
increased through the rehabilitation or improvement of irrigation technologies and techniques, and through the
use of smart metering.
8.6.3 Compile infrastructure development program for small scale irrigation. Develop new / expand
existing irrigation schemes
Small scale irrigation in the basin should be improved due to the significant socio-economic benefits associated
with this. Water supply should be improved and/or expanded by means of storage (small dams) and boreholes.
8.6.4 Aquaculture development
The new large dams to be developed within the basin will provide opportunities for aquaculture and this should
be promoted.
8.6.5 Improved water supply reliability at local scale through construction of small dams / pans and/or
development of local groundwater resources to provide carry-over storage during the dry season
Implement under Strategies 8.3.2 and 3.2.2
8.7 Theme: Water based tourism and recreation
8.7.1 Promote water-based tourism and recreation
Adventure tourism, leisure activities, recreational activities and resorts should be promoted in the vicinity of large
dams, especially at dams situated close to major cities.
8.8 Theme: Non-conventional water resources
8.8.1 Rainwater harvesting
Kenya Water Security and Climate Resilience Project
Final Lake Victoria North Basin Plan August 2020 248
8. Key Strategic Area Water resources development
Rainwater harvesting should be promoted in urban and rural areas. Especially in rural areas, harvested water can
be used for some domestic purposes and gardening.
8.8.3 Reuse
The feasibility of re-use as an alternative and/or integrated supply option to Eldoret should be evaluated as part
of a detailed feasibility study.
8.8.4 Water Conservation and Demand Management
WCDM should be implemented as an immediate option to reduce water demand in Eldoret.
8.9 Theme: Water resources systems operation
8.9.1 Optimise system operating rules
The operation of the bulk water systems supplying Eldoret should be integrated and optimised, taking into
consideration new dams and transfers.
8.9.2 Conduct Annual Operating Analyses (AOA) to decide need for and severity of restrictions for the
coming year based on current storage levels and anticipated demands
Annual operating analyses, taking into consideration the current storage state, projected water demands and
infrastructure constraints should be conducted for the bulk water supply systems in the LVN Basin to inform
decision with regard to curtailment of water use and the need for/phasing of new augmentation schemes.
6.10 Institutional Strengthening and Enabling Environment
6.10.1 Introduction
In effect, the key aspect of any institutional reform process is to find an appropriate balance between
operational functionality and the need for effective oversight and governance. Despite the various efforts
that have been targeted at improving the institutional framework in the LVN Basin, there remains
challenges that warrant dynamic and progressive approaches to address them. Thus, this Plan provides
the opportunity to integrate institutional reforms with the various elements of water resources
management and development, noting that these reforms are an important part of ensuring that this
Plan is implemented. Whilst, the various technical dimensions of this Plan are significant, it does need
to be highlighted that the ability of institutions to implement, oversee and review approaches accordingly
will determine the efficacy of the basin plan.
Noting the variability of the climate and the potential impacts of climate change, the ability of institutions
to manage adaptively will become increasingly important. In addition, given the high population density
of the LVN Basin, its importance in terms of Kenya’s socio-economic development cannot be
underestimated. This will require strengthened inter-governmental approaches and inter-sectoral
partnerships. These will be imperative noting the importance of the water-food-energy nexus, and will
need to not only ensure improved levels of inter-sectoral planning, but equally improved effectiveness
and efficiency from better implementation alignment as well as coordinated oversight. This is especially
important when one notes the ongoing capacity constraints that face most sectors.
Whilst there will be ongoing pressures to develop and use water resources to enable socio-economic
growth and development in the LVN Basin, the need to ensure that this takes place in a sustainable
manner will become increasingly imperative. The shifts towards strengthening the regulatory role of the
Water Resources Authority (WRA), aligned to the Water Act 2016, are important and will have an impact
on the institutional roles and responsibilities within the LVN Basin. Hence, the drive to enable better
coordinated resource development will be balanced by an improvement in the regulatory response by
WRA. This will mirror and support the drive at a national level to strengthen catchment-based water
resources management.
Kenya Water Security and Climate Resilience Project
Final Lake Victoria North Basin Plan August 2020 249
6.10.2 Institutional framework and challenges
The institutional framework in the LVN Basin is currently undergoing a transition in line with the water
sector reforms. At the basin level, WRA operates through the Regional Offices (ROs) and Sub-Regional
Offices (SROs) with respective offices spread across the Basin. These offices are facing various
challenges including inadequate human resources, inadequate office space and equipment, inadequate
vehicles and/or fuel, insufficient laboratory facilities, inefficient systems and tools, inadequate data and
insufficient financing - which is partly due to inefficient revenue collection systems. These require an
institution-wide approach to strengthen the regulatory role of WRA. In this regard, there is currently poor
compliance with permit conditions and a range of unlawful activities that are enabled through
inadequate enforcement.
At the same time, there is a need to improve the catchment-based management of water resources
within the LVN basin. This needs to take place through a range of approaches to address various
challenges. There is a need to transition from the Catchment Area Advisory Committees (CAACs) to
the Basin Water Resources Committees (BWRCs) as the representative basin area management entity.
The BWRCs are yet to be established, but in terms of operational functionality, the BWRCs have an
advisory role like their predecessor, the CAACs. The advisory nature of the CAACs was problematic in
the sense that there was often limited consideration of their inputs, leaving the CAACs as effectively
redundant. Noting the need to strengthen catchment-based management in the LVN Basin, there is a
dire need to put in place dynamic measures to prevent the BWRCs from running into similar challenges
as the CAACs and to ensure that the guidance provided by the BWRCs is considered and translated
into implementable actions wherever possible. WRA is currently exploring options that will ensure better
operational functionality of the BWRCs given the current setting.
Additionally, the Constitution of Kenya 2010 introduced the County Governments (CGs) into the water
resources management space with a mandate on catchment conservation in their respective
jurisdictions. There are teething challenges on how to better coordinate water resource management
efforts cohesively between WRA and the Counties. These challenges include inadequate awareness
of the CGs roles in catchment conservation and what this means for WRA in the overall regulation of
management and use of the resource. It is anticipated that the BWRCs will provide a platform to ensure
better coordination between WRA and the CGs, especially as the CGs are members of the BWRCs.
WRUAs are an important organ at the community level to ensure better water resources management.
There have been a few successes with some WRUAs in the LVN Basin, but predominantly there are
challenges with capacity of the WRUAs along with financing gaps for the WRUAs that affect their
sustainability.
Lastly, noting the importance of inter-sectoral approaches to support improved water resources
management and development, there is currently insufficient partnerships and stakeholder engagement
to foster these integrated approaches.
6.10.3 Strategies
The Institutional Strengthening Plan for the LVN Basin is aligned with the overall vision for the Basin
and focusses on becoming a model basin in collaborative catchment management, protection,
conservation and control; equitably allocating good quality water for sustainable socio-economic
development and preservation of ecosystems by 2040. The aim of the Plan is focused upon the
incremental strengthening of the institutional frameworks to enable improved water resource
governance within the LVN Basin. Noting the pressures upon the resource as well as the need to
support ongoing socio-economic development within the basin, the need to have institutions that have
clarity in roles and responsibilities, that have the capacity and systems to achieve their mandates, and
that are supported by sustainable financing frameworks, is imperative. This Plan is therefore focused
upon developing the institutional frameworks whilst supporting the enabling environment to underpin
and sustain the operational implementation of this institutional framework.
Kenya Water Security and Climate Resilience Project
Final Lake Victoria North Basin Plan August 2020 250
The two tables below set out Key Strategic Areas and Strategic Themes to achieve this objective and
provides specific strategies under each theme.
Table 6-38: Strategic Framework – Institutional Strengthening
9 Key Strategic Area: Strengthen the Institutional Frameworks
9.1 Theme: Promote improved and sustainable catchment management
9.1.1 Strengthen WRA’s regulatory role
The Water Act 2016, aligned to the Constitution of Kenya (2010), provides for the strengthening of the regulatory
functioning of the WRA. Towards this end there is a need to separate out the regulatory and management functions
of the Authority and provide different reporting lines for these differing functions. This will enable WRA to focus on its
regulatory functions and in the longer-term work towards the delegation of management and operational functions to
the BWRCs when they are established, the County Governments and WRUAs. Acknowledging that the process of
establishing the BWRCs may be lengthy, and the need to strengthen the institutional capacity of the Counties and
WRUAs will require time, there is need for WRA to establish interim modalities to bridge this gap and to ensure a
smooth transition. This will require an optimisation of the ROs and the SROs supported by a capacity building drive.
At the same time, there is a need for the ongoing improvement and strengthening of the regulatory approaches utilised
by the WRA. This will include several enabling factors but also requires a clarification of roles and responsibilities
across the entire institutional framework. This will include working with various sector stakeholders to support the
improved harmonisation of legislation and regulatory instruments across a range of sectors. This will need to
incorporate the development of operational modalities across institutions as well as across administrative and
hydrological boundaries.
9.1.2 Strengthen BWRCs
The BWRCs have more representation from different stakeholders in the basin and will thus enable improved
engagement across a wider range of stakeholders as well as inter-sectoral issues. There are lessons to be learned
from the former CAACs and these need to be translated into improved operational modalities for the BWRCs. These
lessons include ensuring adequate and sustainable financing, ensuring frequent and well-structured engagements of
the members of the BWRCs, WRA providing secretariat and technical assistance services, clear communication and
reporting channels between WRA and the BWRCs, modalities for WRA taking on board recommendations of BWRCs,
detailed guidelines on appointing members to the committees including qualifications, operationalisation guidelines,
prescribed remuneration for the committee members and continued training and capacity building for the members. In
addition, strengthening the BWRCs will include WRA providing secretariat services through the ROs and SROs. There
is need to provide appropriate channels for enabling recommendations made by the Committee to be taken on board
by WRA for further action. This will need to be supported by designated line functions within WRA that do not dilute
the WRAs regulatory authority. Training and capacity building will be an ongoing requirement for the BWRCs including
a thorough on-boarding upon establishment. This would include not only the more technical dimensions of water
resource management, but also a range of skills to enable sound governance.
9.1.3 Strengthen county governments engagements in WRM in the basin
The introduction of county governments into the management frameworks provides an opportunity for improved
management at local levels. The key role of county governments to support localised socio-economic development is
crucial and therefore there is a very important need to align planning instruments to ensure that the sustainable
development of water resources does underpin this developmental agenda. To date, engagements with the county
governments are unstructured, partly borne from a lack of clarity as to institutional mandates, roles and responsibilities.
WRA needs to clarify these roles and responsibilities and to introduce more structured strategic planning and
operational engagement. The BWRCs will provide a platform for structured engagements with the county governments,
at a governance and strategic level, however, there is need to explore more ways of engaging with the counties at the
basin and sub-basin level for day to day issues that may arise. Training and capacity building is required for the county
governments as well as awareness creation which can be achieved through a collaborative partnership approach with
the counties. In addition, the ongoing development of protocols for the sharing of information and knowledge exchange
need to be established to provide the necessary information required for decision making.
9.1.4 Strengthen WRUAs
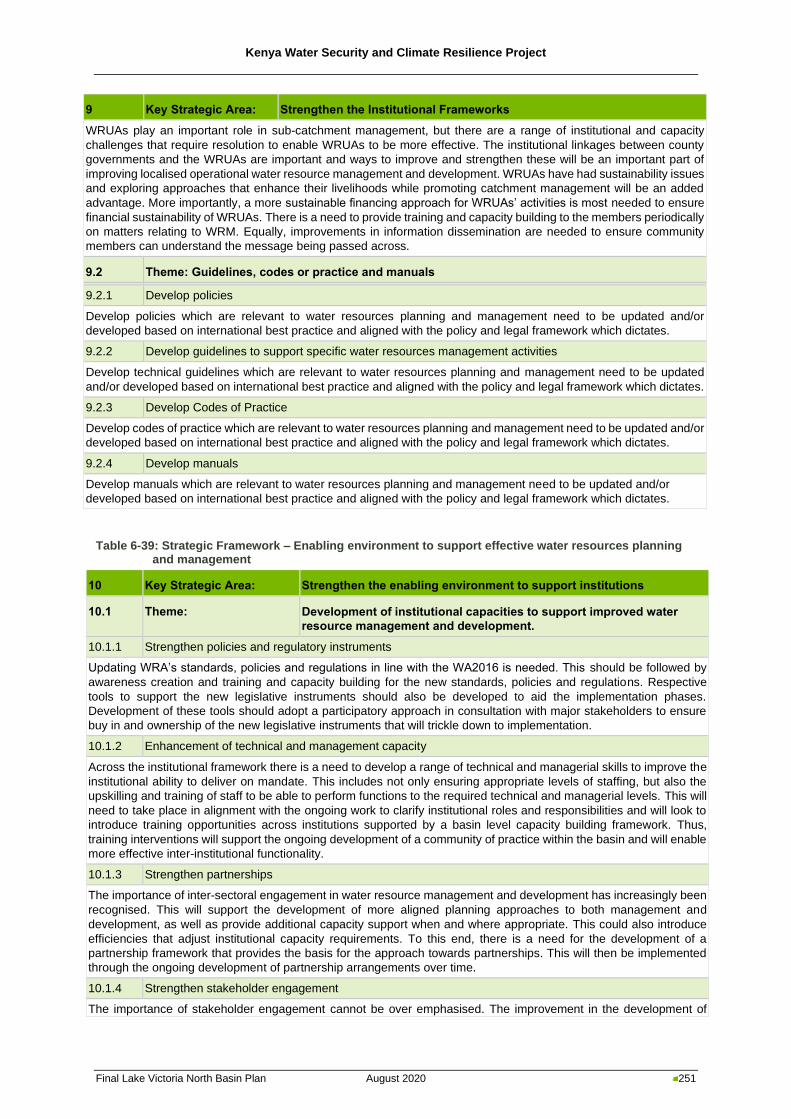
Kenya Water Security and Climate Resilience Project
Final Lake Victoria North Basin Plan August 2020 251
9 Key Strategic Area: Strengthen the Institutional Frameworks
WRUAs play an important role in sub-catchment management, but there are a range of institutional and capacity
challenges that require resolution to enable WRUAs to be more effective. The institutional linkages between county
governments and the WRUAs are important and ways to improve and strengthen these will be an important part of
improving localised operational water resource management and development. WRUAs have had sustainability issues
and exploring approaches that enhance their livelihoods while promoting catchment management will be an added
advantage. More importantly, a more sustainable financing approach for WRUAs’ activities is most needed to ensure
financial sustainability of WRUAs. There is a need to provide training and capacity building to the members periodically
on matters relating to WRM. Equally, improvements in information dissemination are needed to ensure community
members can understand the message being passed across.
9.2 Theme: Guidelines, codes or practice and manuals
9.2.1 Develop policies
Develop policies which are relevant to water resources planning and management need to be updated and/or
developed based on international best practice and aligned with the policy and legal framework which dictates.
9.2.2 Develop guidelines to support specific water resources management activities
Develop technical guidelines which are relevant to water resources planning and management need to be updated
and/or developed based on international best practice and aligned with the policy and legal framework which dictates.
9.2.3 Develop Codes of Practice
Develop codes of practice which are relevant to water resources planning and management need to be updated and/or
developed based on international best practice and aligned with the policy and legal framework which dictates.
9.2.4 Develop manuals
Develop manuals which are relevant to water resources planning and management need to be updated and/or
developed based on international best practice and aligned with the policy and legal framework which dictates.
Table 6-39: Strategic Framework – Enabling environment to support effective water resources planning and management
10 Key Strategic Area: Strengthen the enabling environment to support institutions
10.1 Theme: Development of institutional capacities to support improved water
resource management and development.
10.1.1 Strengthen policies and regulatory instruments
Updating WRA’s standards, policies and regulations in line with the WA2016 is needed. This should be followed by
awareness creation and training and capacity building for the new standards, policies and regulations. Respective
tools to support the new legislative instruments should also be developed to aid the implementation phases.
Development of these tools should adopt a participatory approach in consultation with major stakeholders to ensure
buy in and ownership of the new legislative instruments that will trickle down to implementation.
10.1.2 Enhancement of technical and management capacity
Across the institutional framework there is a need to develop a range of technical and managerial skills to improve the
institutional ability to deliver on mandate. This includes not only ensuring appropriate levels of staffing, but also the
upskilling and training of staff to be able to perform functions to the required technical and managerial levels. This will
need to take place in alignment with the ongoing work to clarify institutional roles and responsibilities and will look to
introduce training opportunities across institutions supported by a basin level capacity building framework. Thus,
training interventions will support the ongoing development of a community of practice within the basin and will enable
more effective inter-institutional functionality.
10.1.3 Strengthen partnerships
The importance of inter-sectoral engagement in water resource management and development has increasingly been
recognised. This will support the development of more aligned planning approaches to both management and
development, as well as provide additional capacity support when and where appropriate. This could also introduce
efficiencies that adjust institutional capacity requirements. To this end, there is a need for the development of a
partnership framework that provides the basis for the approach towards partnerships. This will then be implemented
through the ongoing development of partnership arrangements over time.
10.1.4 Strengthen stakeholder engagement
The importance of stakeholder engagement cannot be over emphasised. The improvement in the development of
Kenya Water Security and Climate Resilience Project
Final Lake Victoria North Basin Plan August 2020 252
10 Key Strategic Area: Strengthen the enabling environment to support institutions
water resource management and development solutions, the improvement in alignment of operational activities and
the development of a sense of ownership of the management regime all provide the basis for more robust and
sustainable management. There is a clear understanding that there is a need to improve upon the levels of stakeholder
engagement and this cuts across the various institutions that play a role in water resource management and
development. In this regard, the development of an agreed upon basin-wide framework for engagement is a key first
step, supported then by the implementation of this framework. A key element of this, will include improving the
functionality of the existing forum.
10.1.5 Improved research
Noting the impacts that climate variability and climate change will have upon the water resources of the LVN basin,
together with the need to support ongoing development, there will be an ongoing need to develop innovative solutions
to the ongoing challenges of water resource management and development. Research towards finding these
innovative approaches and technologies will become increasingly important. Developing the network of supporting
research institutions will be an important step together with providing the appropriate communication and engagement
channels that enables exchange of information. A key challenge has always been ensuring that the research agenda
is supportive of the challenges that the sector is experiencing, and so the need to ensure ongoing exchange is critical.
10.1.6 Innovative financing
Ensuring adequate financial resources to support integrated water resources management at the basin level is a
significant challenge evidenced by the financial hurdles for catchment-based institutions such as the WRA ROs and
SROs, the former CAACs and forums. Embracing innovative internal and external resource mobilisation strategies is
needed. This needs to factor in new entities in the sector such as the County Governments and other water sector
institutions. The private sector provides opportunities for innovative financing for water resources management and
should therefore be explored to complement the budget allocated for water resources management from the national
fiscus. Internal and external resource mobilisation strategies will be implemented concurrently because of the very
crucial role financing plays as a key enabler for IWRM implementation.
Kenya Water Security and Climate Resilience Project
Final Lake Victoria North Basin Plan August 2020 253
Kenya Water Security and Climate Resilience Project
Final Lake Victoria North Basin Plan August 2020 254
7 Way Forward
7.1 Introduction
This section establishes a link between the findings and outcomes of the basin planning process and
the effective implementation of the recommended strategies within the framework of IWRM. It provides
a high-level summary of the main outcomes of the basin planning process, contextualises the Basin
Plan and recommends specific interventions for implementation of the Plan.
It is imperative to note that monitoring and evaluation of the Basin Plan be done to ensure that
implementation is on track, to measure short and long-term impacts and to evaluate the impacts in order
to modify the plan or its implementation (if necessary). Monitoring and evaluation need to be guided by
an efficient, effective and sustainable M&E system. Formal monitoring results should be shared with
wider stakeholders and funders.
It is also important to remember that the Plan is a “living document”, which should accommodate
adjustments and/or updates. Ideally the Basin Plan should be reviewed and updated every five years.
7.2 Key outcomes
The main challenges associated with water resources development and management in the LVN Basin
relate to the assurance of supply for the planned developments and growth in the basin, and water
quality issues in some areas, which are exacerbated by various management and institutional
challenges. The rationale for the development of this Basin Plan was to assess whether the basin’s
water resources are sufficient to meet the expected growth in water requirements with 2040 as the
planning horizon. These water requirements refer not only to those in the LVN Basin but include the
volume of water to be transferred from the LVN Basin to the LVS Basin.
The essence of the proposed water resources development plan for the LVN Basin, up to 2040, is to
address the expected growth in urban water demands, to ensure a reliable water availability for the
proposed large-scale irrigation development in the basin, to improve existing and future water resources
availability for smaller towns and basin-wide domestic, livestock and small-scale irrigation water
demands and to unlock the significant potential for socio-economic development through the
construction of large, multi-purpose water resources development projects in the basin. This will
necessitate the construction of small-scale and large-scale storage and regulation infrastructure, the
expansion of existing and the development of new intra- and inter-basin transfers, and increased
groundwater abstraction. In addition, water demand management will be required for both small and
large-scale irrigation and for urban centres.
In order to comprehensively and systematically address the range of water resources related issues
and challenges in the LVN Basin and unlock the value of water as it relates to socio-economic
development, ten key strategic areas were formulated for the LVN Basin. Strategic themes and
strategies under each Key Strategic Area along with a prioritised implementation / action plan were
prepared. It is important to ensure that the implementation of the sub-plans, strategies, and actions
emanating from this Basin Plan are aligned with relevant legislative, policy and institutional principles
and guided by internationally accepted standards for good practice to attain the goals of social
acceptability, economic viability and technical sustainability.
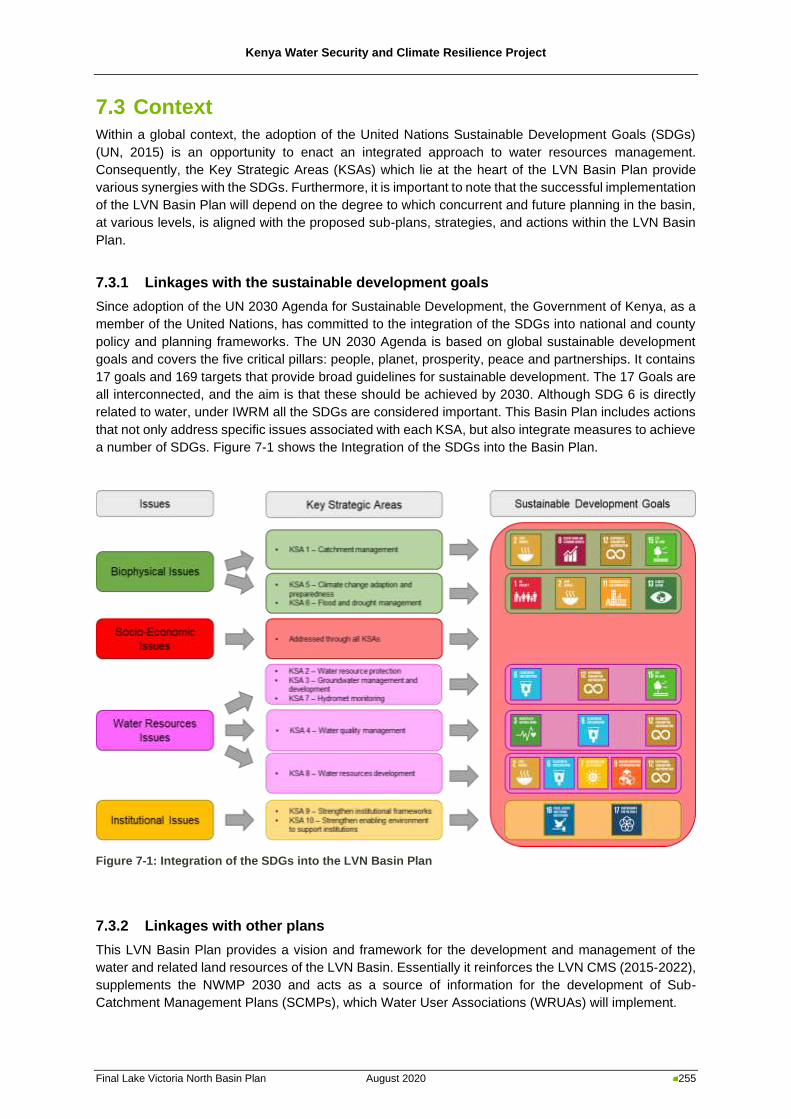
Kenya Water Security and Climate Resilience Project
Final Lake Victoria North Basin Plan August 2020 255
7.3 Context
Within a global context, the adoption of the United Nations Sustainable Development Goals (SDGs)
(UN, 2015) is an opportunity to enact an integrated approach to water resources management.
Consequently, the Key Strategic Areas (KSAs) which lie at the heart of the LVN Basin Plan provide
various synergies with the SDGs. Furthermore, it is important to note that the successful implementation
of the LVN Basin Plan will depend on the degree to which concurrent and future planning in the basin,
at various levels, is aligned with the proposed sub-plans, strategies, and actions within the LVN Basin
Plan.
7.3.1 Linkages with the sustainable development goals
Since adoption of the UN 2030 Agenda for Sustainable Development, the Government of Kenya, as a
member of the United Nations, has committed to the integration of the SDGs into national and county
policy and planning frameworks. The UN 2030 Agenda is based on global sustainable development
goals and covers the five critical pillars: people, planet, prosperity, peace and partnerships. It contains
17 goals and 169 targets that provide broad guidelines for sustainable development. The 17 Goals are
all interconnected, and the aim is that these should be achieved by 2030. Although SDG 6 is directly
related to water, under IWRM all the SDGs are considered important. This Basin Plan includes actions
that not only address specific issues associated with each KSA, but also integrate measures to achieve
a number of SDGs. Figure 7-1 shows the Integration of the SDGs into the Basin Plan.
Figure 7-1: Integration of the SDGs into the LVN Basin Plan
7.3.2 Linkages with other plans
This LVN Basin Plan provides a vision and framework for the development and management of the
water and related land resources of the LVN Basin. Essentially it reinforces the LVN CMS (2015-2022),
supplements the NWMP 2030 and acts as a source of information for the development of Sub-
Catchment Management Plans (SCMPs), which Water User Associations (WRUAs) will implement.
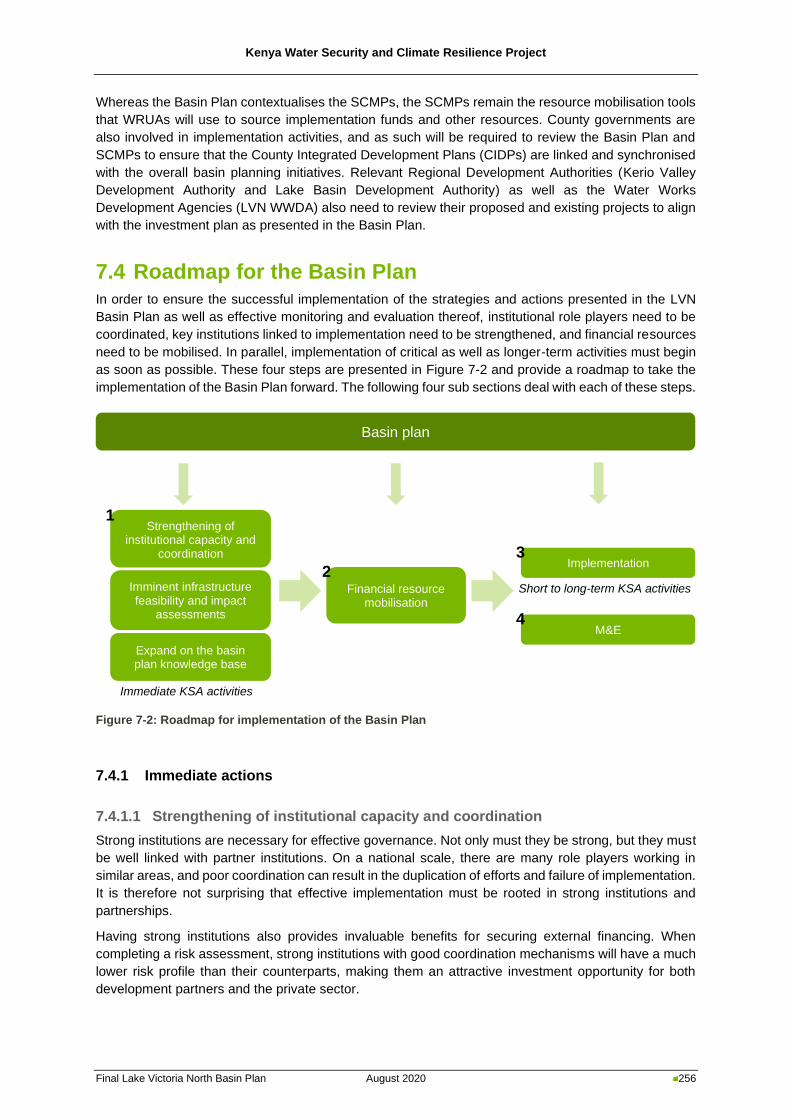
Kenya Water Security and Climate Resilience Project
Final Lake Victoria North Basin Plan August 2020 256
Whereas the Basin Plan contextualises the SCMPs, the SCMPs remain the resource mobilisation tools
that WRUAs will use to source implementation funds and other resources. County governments are
also involved in implementation activities, and as such will be required to review the Basin Plan and
SCMPs to ensure that the County Integrated Development Plans (CIDPs) are linked and synchronised
with the overall basin planning initiatives. Relevant Regional Development Authorities (Kerio Valley
Development Authority and Lake Basin Development Authority) as well as the Water Works
Development Agencies (LVN WWDA) also need to review their proposed and existing projects to align
with the investment plan as presented in the Basin Plan.
7.4 Roadmap for the Basin Plan
In order to ensure the successful implementation of the strategies and actions presented in the LVN
Basin Plan as well as effective monitoring and evaluation thereof, institutional role players need to be
coordinated, key institutions linked to implementation need to be strengthened, and financial resources
need to be mobilised. In parallel, implementation of critical as well as longer-term activities must begin
as soon as possible. These four steps are presented in Figure 7-2 and provide a roadmap to take the
implementation of the Basin Plan forward. The following four sub sections deal with each of these steps.
Figure 7-2: Roadmap for implementation of the Basin Plan
7.4.1 Immediate actions
7.4.1.1 Strengthening of institutional capacity and coordination
Strong institutions are necessary for effective governance. Not only must they be strong, but they must
be well linked with partner institutions. On a national scale, there are many role players working in
similar areas, and poor coordination can result in the duplication of efforts and failure of implementation.
It is therefore not surprising that effective implementation must be rooted in strong institutions and
partnerships.
Having strong institutions also provides invaluable benefits for securing external financing. When
completing a risk assessment, strong institutions with good coordination mechanisms will have a much
lower risk profile than their counterparts, making them an attractive investment opportunity for both
development partners and the private sector.
Short to long-term KSA activities Imminent infrastructure feasibility and impact
assessments
Expand on the basin plan knowledge base
Strengthening of institutional capacity and
coordination
1
Implementation 3
Financial resource mobilisation
2
Basin plan
M&E 4
Immediate KSA activities
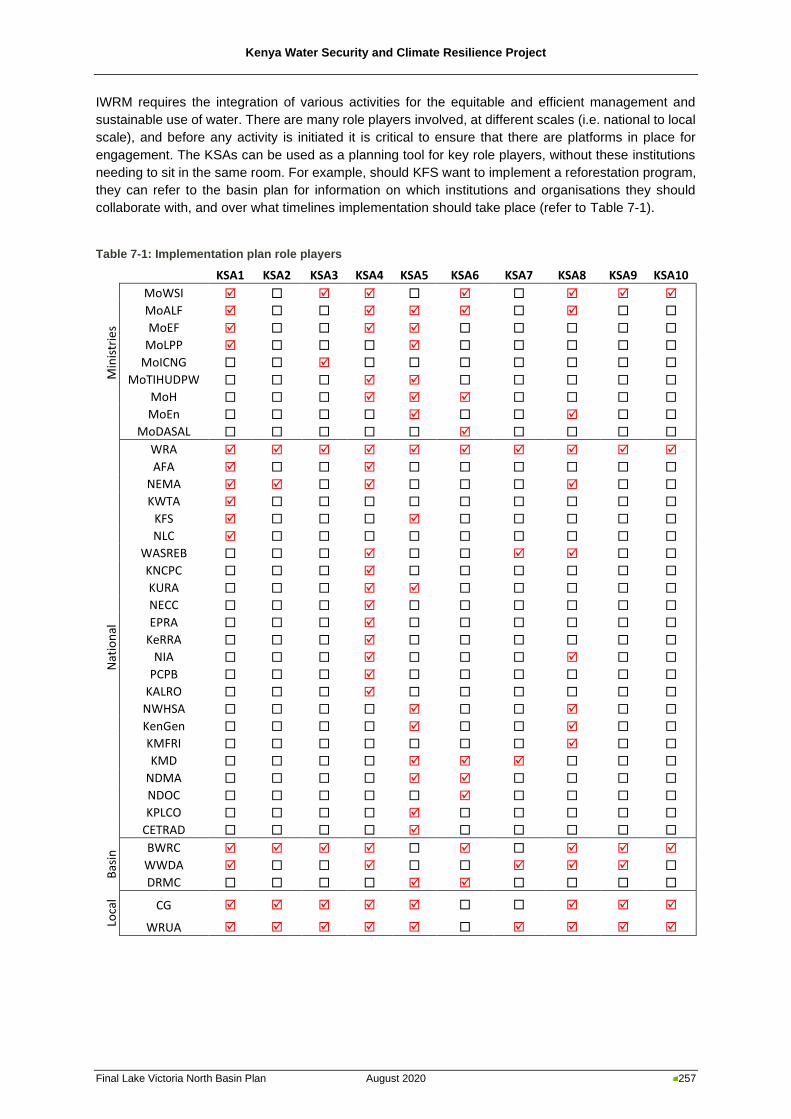
Kenya Water Security and Climate Resilience Project
Final Lake Victoria North Basin Plan August 2020 257
IWRM requires the integration of various activities for the equitable and efficient management and
sustainable use of water. There are many role players involved, at different scales (i.e. national to local
scale), and before any activity is initiated it is critical to ensure that there are platforms in place for
engagement. The KSAs can be used as a planning tool for key role players, without these institutions
needing to sit in the same room. For example, should KFS want to implement a reforestation program,
they can refer to the basin plan for information on which institutions and organisations they should
collaborate with, and over what timelines implementation should take place (refer to Table 7-1).
Table 7-1: Implementation plan role players
KSA1 KSA2 KSA3 KSA4 KSA5 KSA6 KSA7 KSA8 KSA9 KSA10
Min
istr
ies
MoWSI
MoALF
MoEF
MoLPP
MoICNG
MoTIHUDPW
MoH
MoEn
MoDASAL
WRA
Nat
ion
al
AFA
NEMA
KWTA
KFS
NLC
WASREB
KNCPC
KURA
NECC
EPRA
KeRRA
NIA
PCPB
KALRO
NWHSA
KenGen
KMFRI
KMD
NDMA
NDOC
KPLCO
CETRAD
Bas
in BWRC
WWDA
DRMC
Loca
l
CG
WRUA
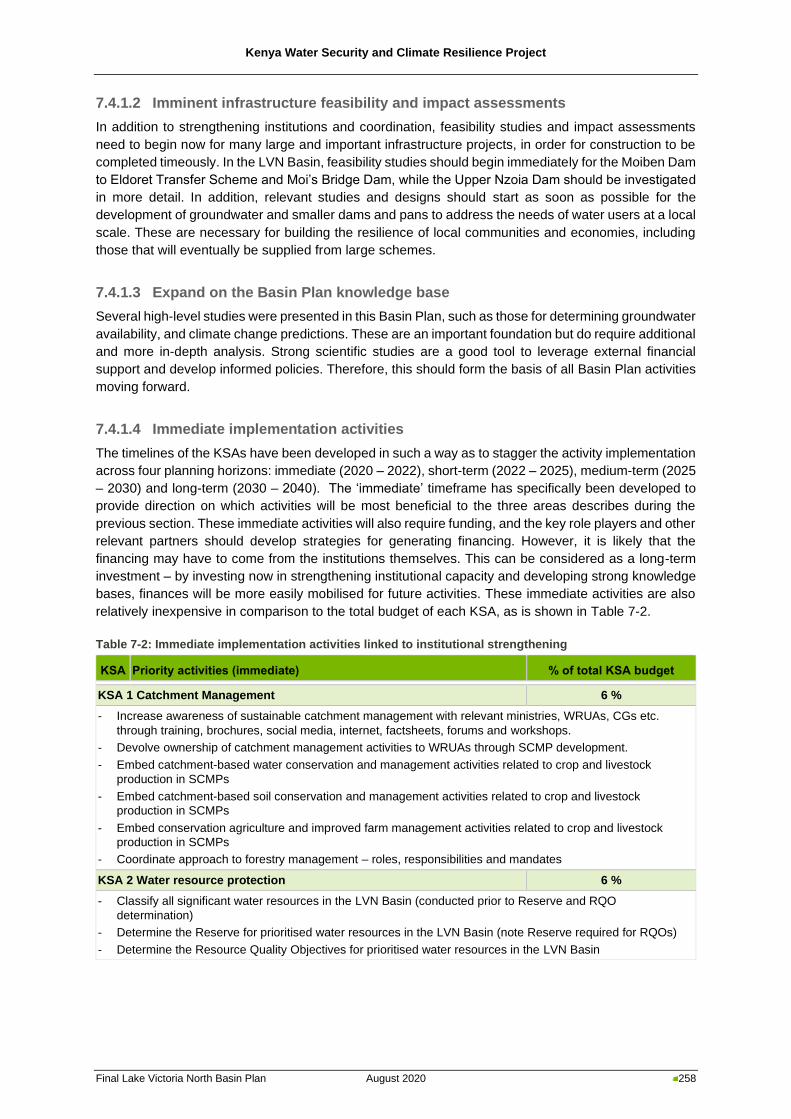
Kenya Water Security and Climate Resilience Project
Final Lake Victoria North Basin Plan August 2020 258
7.4.1.2 Imminent infrastructure feasibility and impact assessments
In addition to strengthening institutions and coordination, feasibility studies and impact assessments
need to begin now for many large and important infrastructure projects, in order for construction to be
completed timeously. In the LVN Basin, feasibility studies should begin immediately for the Moiben Dam
to Eldoret Transfer Scheme and Moi’s Bridge Dam, while the Upper Nzoia Dam should be investigated
in more detail. In addition, relevant studies and designs should start as soon as possible for the
development of groundwater and smaller dams and pans to address the needs of water users at a local
scale. These are necessary for building the resilience of local communities and economies, including
those that will eventually be supplied from large schemes.
7.4.1.3 Expand on the Basin Plan knowledge base
Several high-level studies were presented in this Basin Plan, such as those for determining groundwater
availability, and climate change predictions. These are an important foundation but do require additional
and more in-depth analysis. Strong scientific studies are a good tool to leverage external financial
support and develop informed policies. Therefore, this should form the basis of all Basin Plan activities
moving forward.
7.4.1.4 Immediate implementation activities
The timelines of the KSAs have been developed in such a way as to stagger the activity implementation
across four planning horizons: immediate (2020 – 2022), short-term (2022 – 2025), medium-term (2025
– 2030) and long-term (2030 – 2040). The ‘immediate’ timeframe has specifically been developed to
provide direction on which activities will be most beneficial to the three areas describes during the
previous section. These immediate activities will also require funding, and the key role players and other
relevant partners should develop strategies for generating financing. However, it is likely that the
financing may have to come from the institutions themselves. This can be considered as a long-term
investment – by investing now in strengthening institutional capacity and developing strong knowledge
bases, finances will be more easily mobilised for future activities. These immediate activities are also
relatively inexpensive in comparison to the total budget of each KSA, as is shown in Table 7-2.
Table 7-2: Immediate implementation activities linked to institutional strengthening
KSA Priority activities (immediate) % of total KSA budget
KSA 1 Catchment Management 6 %
- Increase awareness of sustainable catchment management with relevant ministries, WRUAs, CGs etc.
through training, brochures, social media, internet, factsheets, forums and workshops.
- Devolve ownership of catchment management activities to WRUAs through SCMP development.
- Embed catchment-based water conservation and management activities related to crop and livestock
production in SCMPs
- Embed catchment-based soil conservation and management activities related to crop and livestock
production in SCMPs
- Embed conservation agriculture and improved farm management activities related to crop and livestock
production in SCMPs
- Coordinate approach to forestry management – roles, responsibilities and mandates
KSA 2 Water resource protection 6 %
- Classify all significant water resources in the LVN Basin (conducted prior to Reserve and RQO
determination)
- Determine the Reserve for prioritised water resources in the LVN Basin (note Reserve required for RQOs)
- Determine the Resource Quality Objectives for prioritised water resources in the LVN Basin
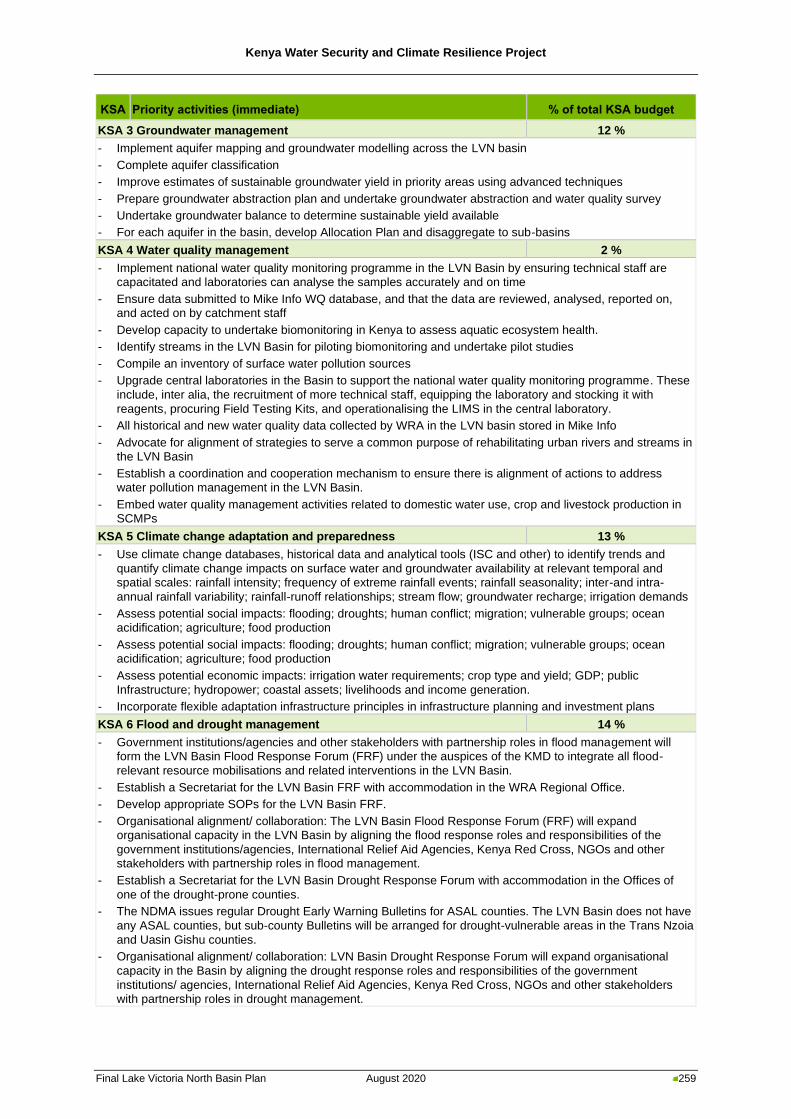
Kenya Water Security and Climate Resilience Project
Final Lake Victoria North Basin Plan August 2020 259
KSA Priority activities (immediate) % of total KSA budget
KSA 3 Groundwater management 12 %
- Implement aquifer mapping and groundwater modelling across the LVN basin
- Complete aquifer classification
- Improve estimates of sustainable groundwater yield in priority areas using advanced techniques
- Prepare groundwater abstraction plan and undertake groundwater abstraction and water quality survey
- Undertake groundwater balance to determine sustainable yield available
- For each aquifer in the basin, develop Allocation Plan and disaggregate to sub-basins
KSA 4 Water quality management 2 %
- Implement national water quality monitoring programme in the LVN Basin by ensuring technical staff are
capacitated and laboratories can analyse the samples accurately and on time
- Ensure data submitted to Mike Info WQ database, and that the data are reviewed, analysed, reported on,
and acted on by catchment staff
- Develop capacity to undertake biomonitoring in Kenya to assess aquatic ecosystem health.
- Identify streams in the LVN Basin for piloting biomonitoring and undertake pilot studies
- Compile an inventory of surface water pollution sources
- Upgrade central laboratories in the Basin to support the national water quality monitoring programme. These
include, inter alia, the recruitment of more technical staff, equipping the laboratory and stocking it with
reagents, procuring Field Testing Kits, and operationalising the LIMS in the central laboratory.
- All historical and new water quality data collected by WRA in the LVN basin stored in Mike Info
- Advocate for alignment of strategies to serve a common purpose of rehabilitating urban rivers and streams in
the LVN Basin
- Establish a coordination and cooperation mechanism to ensure there is alignment of actions to address
water pollution management in the LVN Basin.
- Embed water quality management activities related to domestic water use, crop and livestock production in
SCMPs
KSA 5 Climate change adaptation and preparedness 13 %
- Use climate change databases, historical data and analytical tools (ISC and other) to identify trends and
quantify climate change impacts on surface water and groundwater availability at relevant temporal and
spatial scales: rainfall intensity; frequency of extreme rainfall events; rainfall seasonality; inter-and intra-
annual rainfall variability; rainfall-runoff relationships; stream flow; groundwater recharge; irrigation demands
- Assess potential social impacts: flooding; droughts; human conflict; migration; vulnerable groups; ocean
acidification; agriculture; food production
- Assess potential social impacts: flooding; droughts; human conflict; migration; vulnerable groups; ocean
acidification; agriculture; food production
- Assess potential economic impacts: irrigation water requirements; crop type and yield; GDP; public
Infrastructure; hydropower; coastal assets; livelihoods and income generation.
- Incorporate flexible adaptation infrastructure principles in infrastructure planning and investment plans
KSA 6 Flood and drought management 14 %
- Government institutions/agencies and other stakeholders with partnership roles in flood management will
form the LVN Basin Flood Response Forum (FRF) under the auspices of the KMD to integrate all flood-
relevant resource mobilisations and related interventions in the LVN Basin.
- Establish a Secretariat for the LVN Basin FRF with accommodation in the WRA Regional Office.
- Develop appropriate SOPs for the LVN Basin FRF.
- Organisational alignment/ collaboration: The LVN Basin Flood Response Forum (FRF) will expand
organisational capacity in the LVN Basin by aligning the flood response roles and responsibilities of the
government institutions/agencies, International Relief Aid Agencies, Kenya Red Cross, NGOs and other
stakeholders with partnership roles in flood management.
- Establish a Secretariat for the LVN Basin Drought Response Forum with accommodation in the Offices of
one of the drought-prone counties.
- The NDMA issues regular Drought Early Warning Bulletins for ASAL counties. The LVN Basin does not have
any ASAL counties, but sub-county Bulletins will be arranged for drought-vulnerable areas in the Trans Nzoia
and Uasin Gishu counties.
- Organisational alignment/ collaboration: LVN Basin Drought Response Forum will expand organisational
capacity in the Basin by aligning the drought response roles and responsibilities of the government
institutions/ agencies, International Relief Aid Agencies, Kenya Red Cross, NGOs and other stakeholders
with partnership roles in drought management.
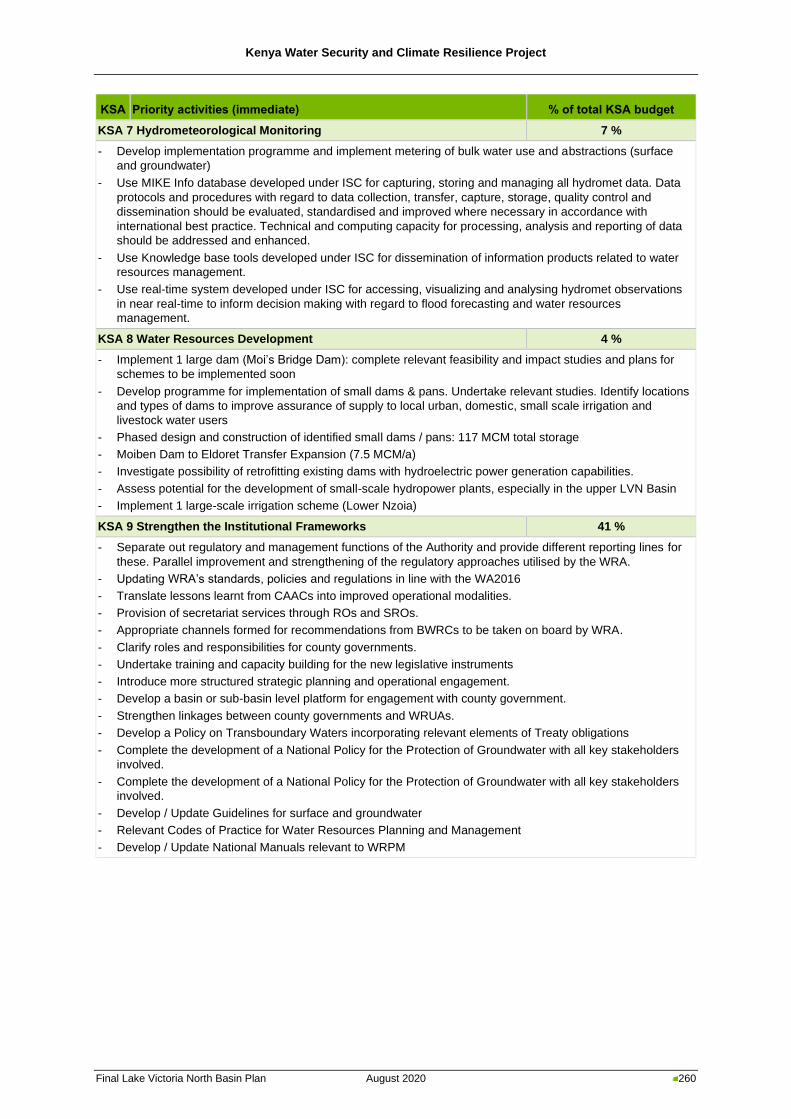
Kenya Water Security and Climate Resilience Project
Final Lake Victoria North Basin Plan August 2020 260
KSA Priority activities (immediate) % of total KSA budget
KSA 7 Hydrometeorological Monitoring 7 %
- Develop implementation programme and implement metering of bulk water use and abstractions (surface
and groundwater)
- Use MIKE Info database developed under ISC for capturing, storing and managing all hydromet data. Data
protocols and procedures with regard to data collection, transfer, capture, storage, quality control and
dissemination should be evaluated, standardised and improved where necessary in accordance with
international best practice. Technical and computing capacity for processing, analysis and reporting of data
should be addressed and enhanced.
- Use Knowledge base tools developed under ISC for dissemination of information products related to water
resources management.
- Use real-time system developed under ISC for accessing, visualizing and analysing hydromet observations
in near real-time to inform decision making with regard to flood forecasting and water resources
management.
KSA 8 Water Resources Development 4 %
- Implement 1 large dam (Moi’s Bridge Dam): complete relevant feasibility and impact studies and plans for
schemes to be implemented soon
- Develop programme for implementation of small dams & pans. Undertake relevant studies. Identify locations
and types of dams to improve assurance of supply to local urban, domestic, small scale irrigation and
livestock water users
- Phased design and construction of identified small dams / pans: 117 MCM total storage
- Moiben Dam to Eldoret Transfer Expansion (7.5 MCM/a)
- Investigate possibility of retrofitting existing dams with hydroelectric power generation capabilities.
- Assess potential for the development of small-scale hydropower plants, especially in the upper LVN Basin
- Implement 1 large-scale irrigation scheme (Lower Nzoia)
KSA 9 Strengthen the Institutional Frameworks 41 %
- Separate out regulatory and management functions of the Authority and provide different reporting lines for
these. Parallel improvement and strengthening of the regulatory approaches utilised by the WRA.
- Updating WRA’s standards, policies and regulations in line with the WA2016
- Translate lessons learnt from CAACs into improved operational modalities.
- Provision of secretariat services through ROs and SROs.
- Appropriate channels formed for recommendations from BWRCs to be taken on board by WRA.
- Clarify roles and responsibilities for county governments.
- Undertake training and capacity building for the new legislative instruments
- Introduce more structured strategic planning and operational engagement.
- Develop a basin or sub-basin level platform for engagement with county government.
- Strengthen linkages between county governments and WRUAs.
- Develop a Policy on Transboundary Waters incorporating relevant elements of Treaty obligations
- Complete the development of a National Policy for the Protection of Groundwater with all key stakeholders
involved.
- Complete the development of a National Policy for the Protection of Groundwater with all key stakeholders
involved.
- Develop / Update Guidelines for surface and groundwater
- Relevant Codes of Practice for Water Resources Planning and Management
- Develop / Update National Manuals relevant to WRPM
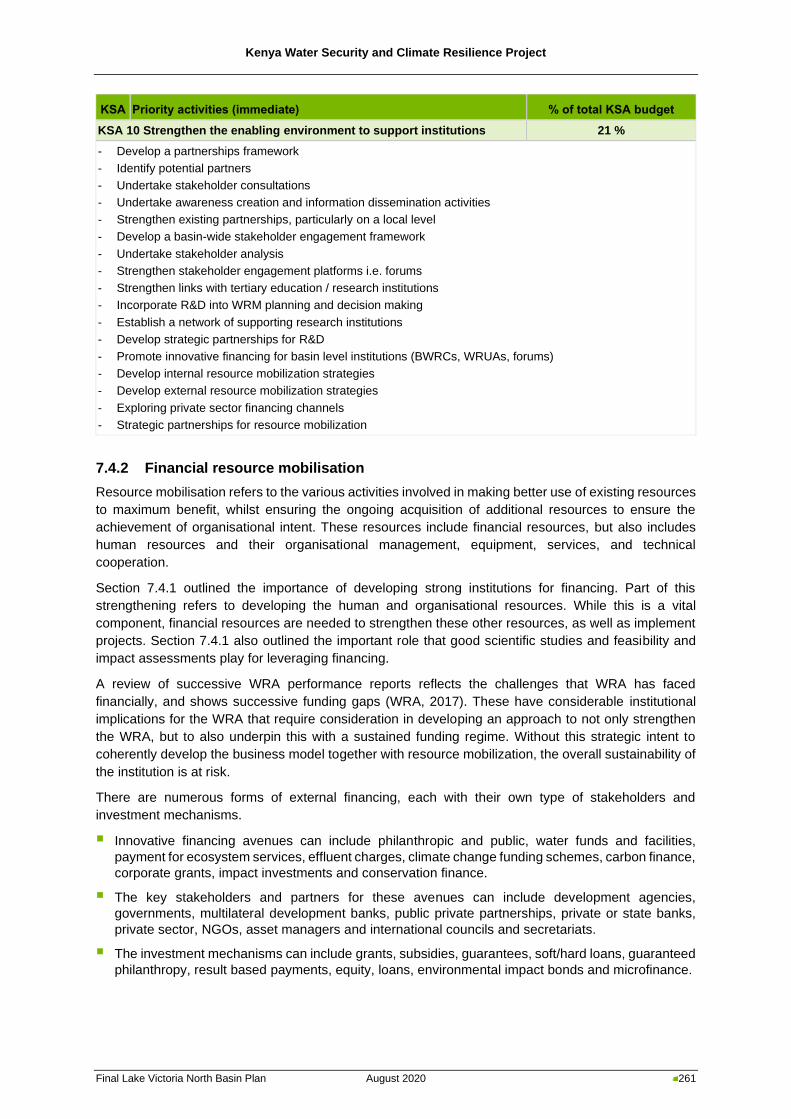
Kenya Water Security and Climate Resilience Project
Final Lake Victoria North Basin Plan August 2020 261
KSA Priority activities (immediate) % of total KSA budget
KSA 10 Strengthen the enabling environment to support institutions 21 %
- Develop a partnerships framework
- Identify potential partners
- Undertake stakeholder consultations
- Undertake awareness creation and information dissemination activities
- Strengthen existing partnerships, particularly on a local level
- Develop a basin-wide stakeholder engagement framework
- Undertake stakeholder analysis
- Strengthen stakeholder engagement platforms i.e. forums
- Strengthen links with tertiary education / research institutions
- Incorporate R&D into WRM planning and decision making
- Establish a network of supporting research institutions
- Develop strategic partnerships for R&D
- Promote innovative financing for basin level institutions (BWRCs, WRUAs, forums)
- Develop internal resource mobilization strategies
- Develop external resource mobilization strategies
- Exploring private sector financing channels
- Strategic partnerships for resource mobilization
7.4.2 Financial resource mobilisation
Resource mobilisation refers to the various activities involved in making better use of existing resources
to maximum benefit, whilst ensuring the ongoing acquisition of additional resources to ensure the
achievement of organisational intent. These resources include financial resources, but also includes
human resources and their organisational management, equipment, services, and technical
cooperation.
Section 7.4.1 outlined the importance of developing strong institutions for financing. Part of this
strengthening refers to developing the human and organisational resources. While this is a vital
component, financial resources are needed to strengthen these other resources, as well as implement
projects. Section 7.4.1 also outlined the important role that good scientific studies and feasibility and
impact assessments play for leveraging financing.
A review of successive WRA performance reports reflects the challenges that WRA has faced
financially, and shows successive funding gaps (WRA, 2017). These have considerable institutional
implications for the WRA that require consideration in developing an approach to not only strengthen
the WRA, but to also underpin this with a sustained funding regime. Without this strategic intent to
coherently develop the business model together with resource mobilization, the overall sustainability of
the institution is at risk.
There are numerous forms of external financing, each with their own type of stakeholders and
investment mechanisms.
▪ Innovative financing avenues can include philanthropic and public, water funds and facilities,
payment for ecosystem services, effluent charges, climate change funding schemes, carbon finance,
corporate grants, impact investments and conservation finance.
▪ The key stakeholders and partners for these avenues can include development agencies,
governments, multilateral development banks, public private partnerships, private or state banks,
private sector, NGOs, asset managers and international councils and secretariats.
▪ The investment mechanisms can include grants, subsidies, guarantees, soft/hard loans, guaranteed
philanthropy, result based payments, equity, loans, environmental impact bonds and microfinance.
Kenya Water Security and Climate Resilience Project
Final Lake Victoria North Basin Plan August 2020 262
It is important to note that different KSA activities will require different levels of partnership and will
therefore have to tap into different financing avenue. Using the resource mobilization strategy as a
base, it will be necessary for the WRA or the key implementing agency (as outlined in the KSA) to
develop a resource mobilization and financier engagement strategy that is applicable to each specific
activity.
7.4.3 Implementation
Having initiated the coordinated strengthening of institutional capacity as well as resource mobilisation
as immediate critical actions (discussed in Section 7.4.2), other activities in each KSA should be
considered for implementation. These activities are typically costlier and have a longer implementation
horizon. They also often deal with more physical interventions, and therefore require a stronger local
presence and engagement.
An Implementation Plan for each KSA for the LVN Basin is presented in Annexure E, which provides
a clear intent and prioritised plan of action. The implementation plan is set up considering
implementation:
▪ theme priority (i.e. critical, very important, important)
▪ activities (i.e. implementation actions)
▪ indicators to measure outcomes of activities (refer to Section 7.4.4)
▪ implementation horizon (i.e. immediate (1-2yr), short (2-5yr), medium (6-10yr) or long (11-20yr)
term)
▪ responsibility for activity (i.e. at the basin scale, national scale, local scale and key stakeholders)
▪ estimated budgets for implementation of individual activities are provided (summarised in Table 7-3)
with possible funding sources per activity identified
▪ corresponding CMS Strategic Actions are linked to each activity as applicable
7.4.4 Monitoring and evaluation
Monitoring and evaluation (M&E) is essential to ensure that plan implementation is on track, to measure
short and long-term impacts and to evaluate the impacts in order to modify the plan or its implementation
(if necessary) (Global Water Partnership, 2006). M&E systems can be costly and often require
significant human, data and financial resources. However, the cost of no M&E may be considerably
higher when Basin Plan implementation is inefficient and ineffective. It is therefore necessary to develop
an efficient, effective and sustainable M&E system, which can be implemented within existing or
planned for resources and line functions. Interpreting and acting on the data is as important as data
collection.
It is extremely important that the KSAs are monitored and evaluated on a regular basis. How often, and
when, monitoring is carried out will be dictated by what is being measured (i.e. environmental
improvements will have different timescales to budget expenditure). M&E will also provide an indication
of where delays or diversions are being experienced. Monitoring also provides an evidence base to
show funders that their money is being used effectively, to identify where more funding is required to
tackle new issues or try new actions where stubborn problems remain. Formal monitoring results are
often shared with wider stakeholders and funders, whilst informal monitoring will be restricted to those
managing the process.
Lastly, and most importantly, the KSAs and Plans are “living documents” and should not stay static, as
circumstances are not static. M&E allows for timely adjustments and/or updates. Ideally the Basin Plan
should be reviewed and updated every five years – using the results of monitoring to identify what can
and cannot be achieved when revising the plan.
Kenya Water Security and Climate Resilience Project
Final Lake Victoria North Basin Plan August 2020 263
7.4.4.1 Monitoring framework
Key components of a monitoring and evaluation (M&E) include the selection of M&E indicators and
ensuring feedback of the results into the decision-making and implementation processes. In simple
terms, M&E is necessary to ensure that implementation of the Basin Plan takes place with the intended
results and impacts. A proper M&E system, whose results are shared among stakeholders, also fosters
accountability and transparency, and is likely to generate broad-based support for the plan
implementation. It is essential that there is full consistency between the goals, objectives, strategies,
activities and the chosen indicators. The M&E should focus on the implementation issues (are activities
implemented according to planning) and the results (e.g. is water used more efficiently?). M&E will aid
the successful implementation of the Basin Plan by ensuring that targets and goals set out in the Basin
Plan are achieved and that problems regarding implementation are detected early and addressed. Good
targets and indicators, stakeholder participation in monitoring process as well as good feedback
mechanisms are essential for effective M&E.
7.4.4.2 Targets and indicators
Monitoring of the LVN Basin Plan and achievements should be done based on the Implementation Plan
(Annexure E) and should be guided by the specific result-based targets/indicators described in the
Implementation Plan. This will include M&E of progress in terms of implementation programmes and
actual against planned expenditure, among others. For individual projects/programmes, more detailed
stepwise M&E indicators could be identified for each projects/programme so that progress can be
adequately tracked and evaluated. The evaluation will be based on the monitoring results and possible
additional data collected and will provide feedback into the decision-making process which could lead
to adjustments in the plan and its implementation.
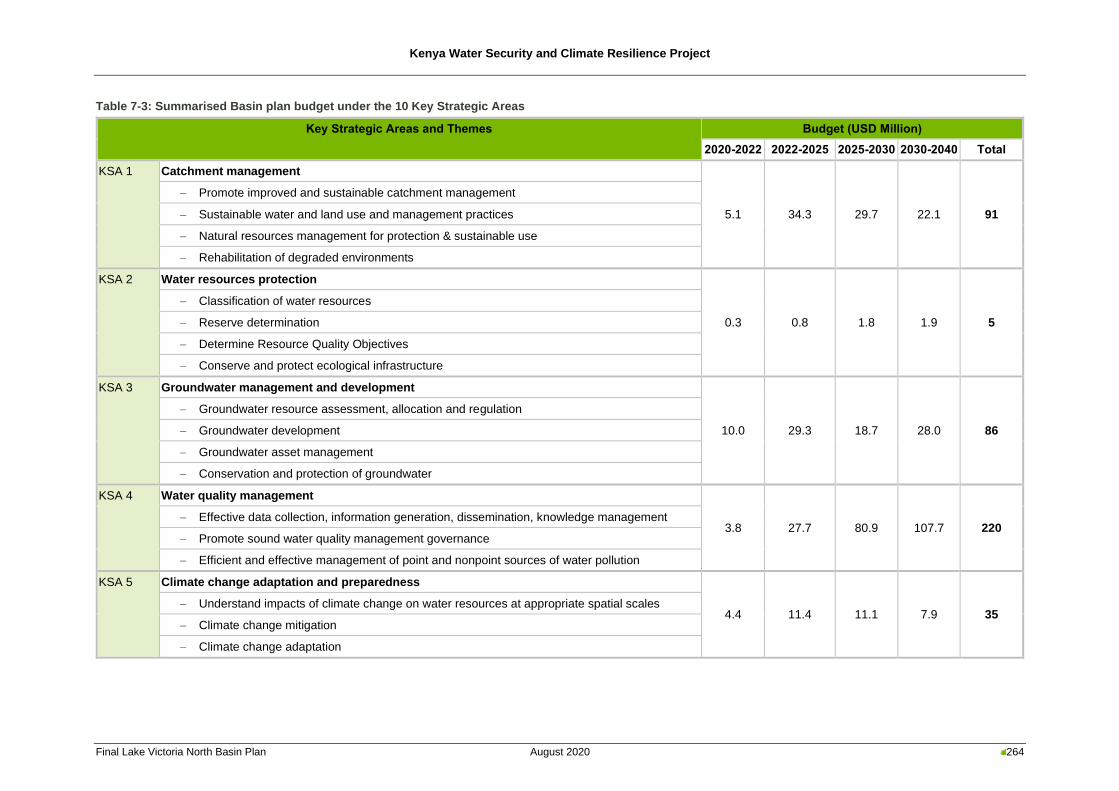
Kenya Water Security and Climate Resilience Project
Final Lake Victoria North Basin Plan August 2020 264
Table 7-3: Summarised Basin plan budget under the 10 Key Strategic Areas
Key Strategic Areas and Themes Budget (USD Million)
2020-2022 2022-2025 2025-2030 2030-2040 Total
KSA 1 Catchment management
5.1 34.3 29.7 22.1 91
− Promote improved and sustainable catchment management
− Sustainable water and land use and management practices
− Natural resources management for protection & sustainable use
− Rehabilitation of degraded environments
KSA 2 Water resources protection
0.3 0.8 1.8 1.9 5
− Classification of water resources
− Reserve determination
− Determine Resource Quality Objectives
− Conserve and protect ecological infrastructure
KSA 3 Groundwater management and development
10.0 29.3 18.7 28.0 86
− Groundwater resource assessment, allocation and regulation
− Groundwater development
− Groundwater asset management
− Conservation and protection of groundwater
KSA 4 Water quality management
3.8 27.7 80.9 107.7 220 − Effective data collection, information generation, dissemination, knowledge management
− Promote sound water quality management governance
− Efficient and effective management of point and nonpoint sources of water pollution
KSA 5 Climate change adaptation and preparedness
4.4 11.4 11.1 7.9 35 − Understand impacts of climate change on water resources at appropriate spatial scales
− Climate change mitigation
− Climate change adaptation
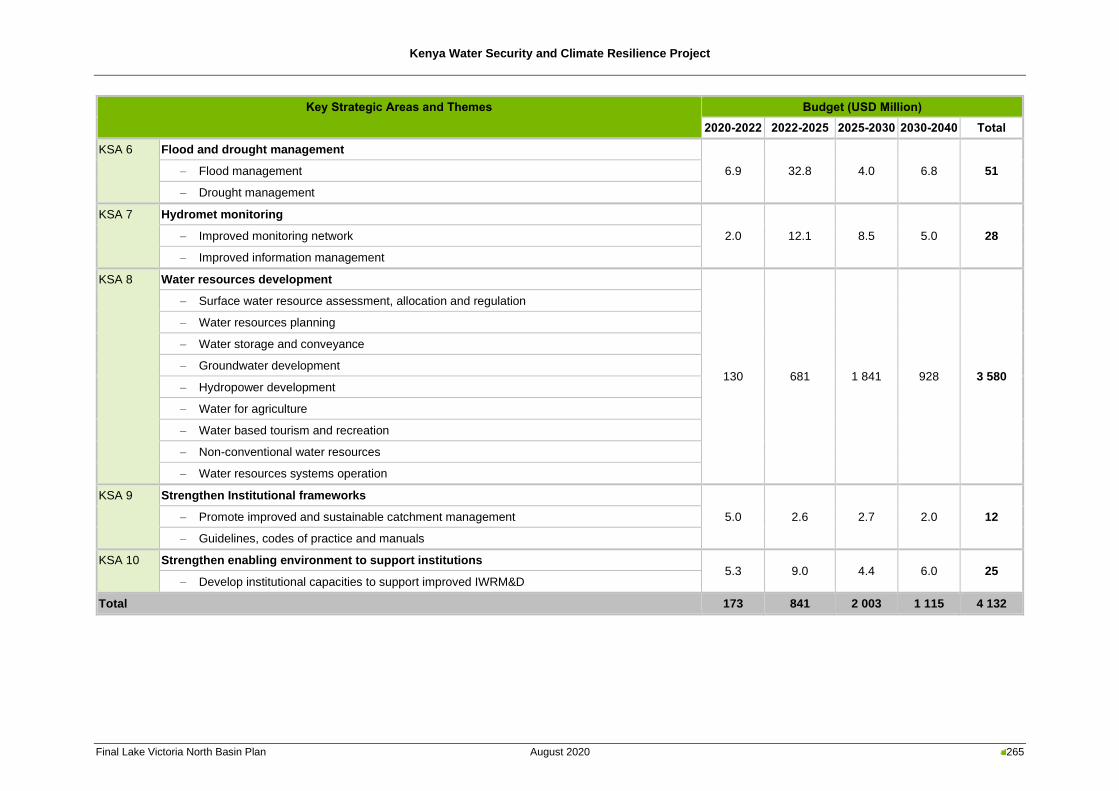
Kenya Water Security and Climate Resilience Project
Final Lake Victoria North Basin Plan August 2020 265
Key Strategic Areas and Themes Budget (USD Million)
2020-2022 2022-2025 2025-2030 2030-2040 Total
KSA 6 Flood and drought management
6.9 32.8 4.0 6.8 51 − Flood management
− Drought management
KSA 7 Hydromet monitoring
2.0 12.1 8.5 5.0 28 − Improved monitoring network
− Improved information management
KSA 8 Water resources development
130 681 1 841 928 3 580
− Surface water resource assessment, allocation and regulation
− Water resources planning
− Water storage and conveyance
− Groundwater development
− Hydropower development
− Water for agriculture
− Water based tourism and recreation
− Non-conventional water resources
− Water resources systems operation
KSA 9 Strengthen Institutional frameworks
5.0 2.6 2.7 2.0 12 − Promote improved and sustainable catchment management
− Guidelines, codes of practice and manuals
KSA 10 Strengthen enabling environment to support institutions 5.3 9.0 4.4 6.0 25
− Develop institutional capacities to support improved IWRM&D
Total 173 841 2 003 1 115 4 132
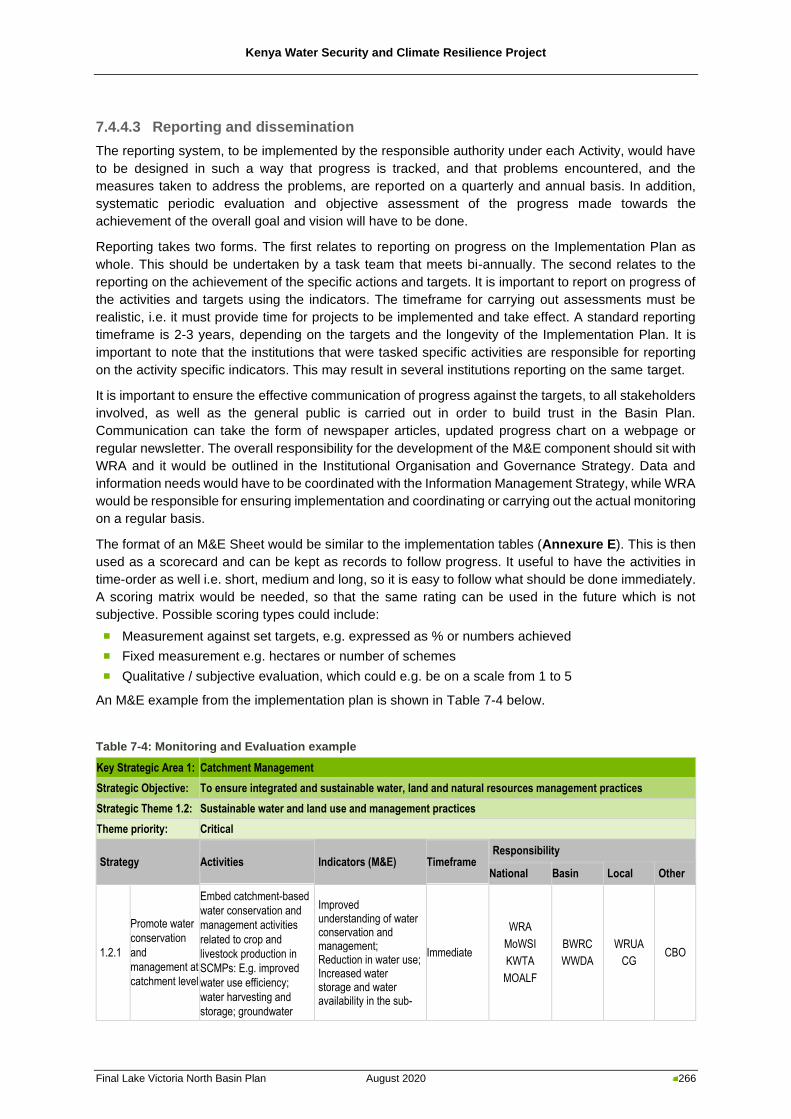
Kenya Water Security and Climate Resilience Project
Final Lake Victoria North Basin Plan August 2020 266
7.4.4.3 Reporting and dissemination
The reporting system, to be implemented by the responsible authority under each Activity, would have
to be designed in such a way that progress is tracked, and that problems encountered, and the
measures taken to address the problems, are reported on a quarterly and annual basis. In addition,
systematic periodic evaluation and objective assessment of the progress made towards the
achievement of the overall goal and vision will have to be done.
Reporting takes two forms. The first relates to reporting on progress on the Implementation Plan as
whole. This should be undertaken by a task team that meets bi-annually. The second relates to the
reporting on the achievement of the specific actions and targets. It is important to report on progress of
the activities and targets using the indicators. The timeframe for carrying out assessments must be
realistic, i.e. it must provide time for projects to be implemented and take effect. A standard reporting
timeframe is 2-3 years, depending on the targets and the longevity of the Implementation Plan. It is
important to note that the institutions that were tasked specific activities are responsible for reporting
on the activity specific indicators. This may result in several institutions reporting on the same target.
It is important to ensure the effective communication of progress against the targets, to all stakeholders
involved, as well as the general public is carried out in order to build trust in the Basin Plan.
Communication can take the form of newspaper articles, updated progress chart on a webpage or
regular newsletter. The overall responsibility for the development of the M&E component should sit with
WRA and it would be outlined in the Institutional Organisation and Governance Strategy. Data and
information needs would have to be coordinated with the Information Management Strategy, while WRA
would be responsible for ensuring implementation and coordinating or carrying out the actual monitoring
on a regular basis.
The format of an M&E Sheet would be similar to the implementation tables (Annexure E). This is then
used as a scorecard and can be kept as records to follow progress. It useful to have the activities in
time-order as well i.e. short, medium and long, so it is easy to follow what should be done immediately.
A scoring matrix would be needed, so that the same rating can be used in the future which is not
subjective. Possible scoring types could include:
◼ Measurement against set targets, e.g. expressed as % or numbers achieved
◼ Fixed measurement e.g. hectares or number of schemes
◼ Qualitative / subjective evaluation, which could e.g. be on a scale from 1 to 5
An M&E example from the implementation plan is shown in Table 7-4 below.
Table 7-4: Monitoring and Evaluation example
Key Strategic Area 1: Catchment Management
Strategic Objective: To ensure integrated and sustainable water, land and natural resources management practices
Strategic Theme 1.2: Sustainable water and land use and management practices
Theme priority: Critical
Strategy Activities Indicators (M&E) Timeframe Responsibility
National Basin Local Other
1.2.1
Promote water
conservation
and
management at
catchment level
Embed catchment-based
water conservation and
management activities
related to crop and
livestock production in
SCMPs: E.g. improved
water use efficiency;
water harvesting and
storage; groundwater
Improved understanding of water conservation and management; Reduction in water use; Increased water storage and water availability in the sub-
Immediate
WRA
MoWSI
KWTA
MOALF
BWRC
WWDA
WRUA
CG CBO
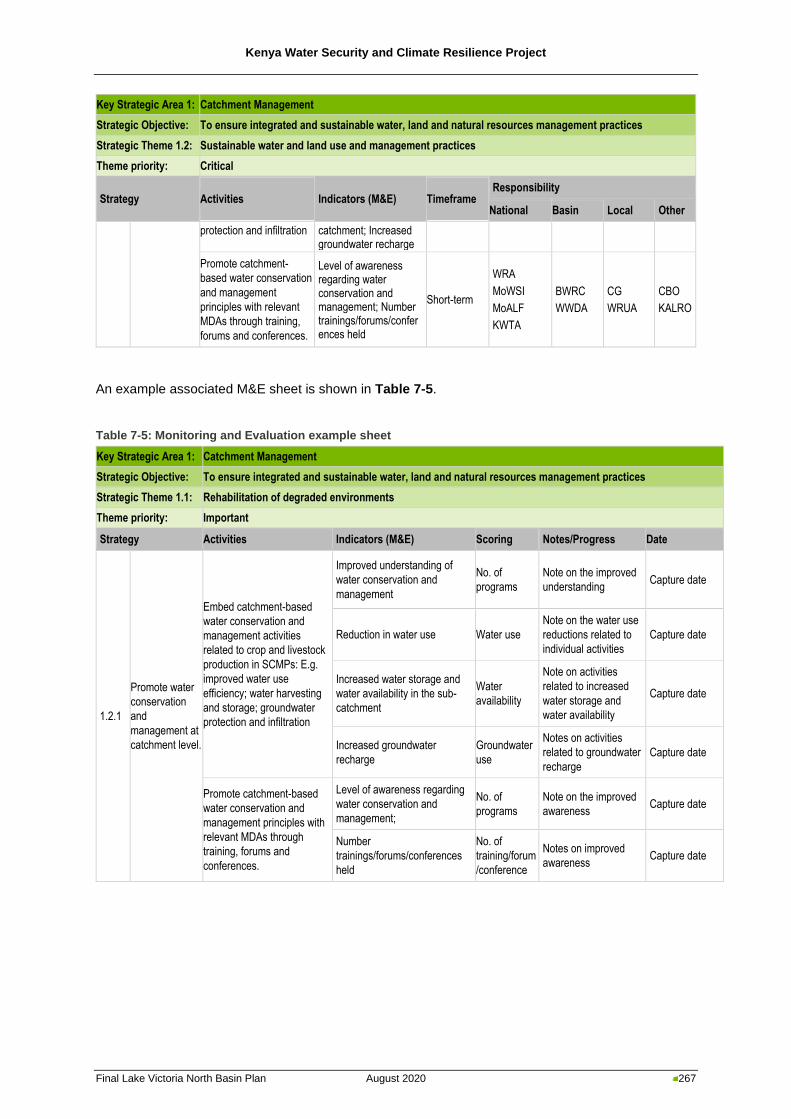
Kenya Water Security and Climate Resilience Project
Final Lake Victoria North Basin Plan August 2020 267
Key Strategic Area 1: Catchment Management
Strategic Objective: To ensure integrated and sustainable water, land and natural resources management practices
Strategic Theme 1.2: Sustainable water and land use and management practices
Theme priority: Critical
Strategy Activities Indicators (M&E) Timeframe Responsibility
National Basin Local Other
protection and infiltration catchment; Increased groundwater recharge
Promote catchment-
based water conservation
and management
principles with relevant
MDAs through training,
forums and conferences.
Level of awareness regarding water conservation and management; Number trainings/forums/conferences held
Short-term
WRA
MoWSI
MoALF
KWTA
BWRC
WWDA
CG
WRUA
CBO
KALRO
An example associated M&E sheet is shown in Table 7-5.
Table 7-5: Monitoring and Evaluation example sheet
Key Strategic Area 1: Catchment Management
Strategic Objective: To ensure integrated and sustainable water, land and natural resources management practices
Strategic Theme 1.1: Rehabilitation of degraded environments
Theme priority: Important
Strategy Activities Indicators (M&E) Scoring Notes/Progress Date
1.2.1
Promote water
conservation
and
management at
catchment level.
Embed catchment-based
water conservation and
management activities
related to crop and livestock
production in SCMPs: E.g.
improved water use
efficiency; water harvesting
and storage; groundwater
protection and infiltration
Improved understanding of
water conservation and
management
No. of
programs
Note on the improved
understanding Capture date
Reduction in water use Water use
Note on the water use
reductions related to
individual activities
Capture date
Increased water storage and
water availability in the sub-
catchment
Water
availability
Note on activities
related to increased
water storage and
water availability
Capture date
Increased groundwater
recharge
Groundwater
use
Notes on activities
related to groundwater
recharge
Capture date
Promote catchment-based
water conservation and
management principles with
relevant MDAs through
training, forums and
conferences.
Level of awareness regarding
water conservation and
management;
No. of
programs
Note on the improved
awareness Capture date
Number
trainings/forums/conferences
held
No. of
training/forum
/conference
Notes on improved
awareness Capture date
Kenya Water Security and Climate Resilience Project
Final Lake Victoria North Basin Plan August 2020 268
Kenya Water Security and Climate Resilience Project
Final Lake Victoria North Basin Plan August 2020 269
8 Conclusion
Integrated Water Resources Management is based on the equitable and efficient management and
sustainable use of water. It recognises that water is an integral part of the ecosystem, a natural
resource, and a social and economic good, whose quantity and quality determine the nature of its
utilisation (Global Water Partnership, 2006)(Global Water Partnership, 2006). This emphasises the
importance of an integrated approach towards water resources planning, development and
management – focusing on an enabling environment, institutional framework and setting up the
management instruments required by institutions to understand mandates, roles and responsibilities to
effectively and seamlessly do their job.
The LVN Basin Plan provides a status quo of the current water resources management situation and a
plan for future management. There is no correct administrative model to ensure successful
implementation. However, the principles of IWRM allow for selecting, adjusting and applying a mix of
tools for a given situation and agreeing on milestones and timeframes critical for success.
This Basin Plan is a key deliverable towards the overall objective of the KWSCRP namely to strengthen
WRA’s capacity in terms of tools, skills and infrastructure to deliver on its mandate for water resources
regulation in the country. It constitutes an Integrated Water Resources Management and Development
Plan for the LVN Basin, which considers the environmental, social and economic aspects of the river
basin, addresses the key issues and challenges, and ensures that these aspects are integrated into an
overall management strategy. It aims to achieve a sustainable balance between the utilisation,
development and protection of water resources and provides a clear pathway for the sustainable
utilisation and development of the water resources of the LVN Basin.
Kenya Water Security and Climate Resilience Project
Final Lake Victoria North Basin Plan August 2020 270
9 References
Adika, C., Kibet, J., Kiprop, A., & Munyendo, W. (2018). The assessment of bore-hole water quality of Kakamega County, Kenya. Applied Water Science, 8. https://doi.org/10.1007/s13201-018-0688-8
Agriculture and Food Authority. (2017). 2017/18 – 2021/22 Strategic Plan. AGROSS. (2001). Guidelines for Assessing the Risk to Groundwater from On-Site Sanitation -
Commissioned Report CR/01/142. Allen, R. G., Pereira, L. S., Raes, D., & Smith, M. (1998). Crop evapotranspiration — guidelines for
computing crop water requirements. FAO Irrigation and drainage paper 56. Baumann, E. (1998). Handpump Technology Input to the Joint Review of the Rural Water Supply and
Sanitation Eastern Uganda Project- RUWASA Phase IIA. Rural Water Supply Network. Blandenier, L. (2015). Recharge Quantification and Continental Freshwater Lens Dynamics in Arid
Regions: Application to the Merti Aquifer (Eastern Kenya). University of Neuchâtel, Switzerland. Borst, L., & de Haas, S. A. (2006). Hydrology of Sand Storage Dams: A case study in the Kiindu
Catchment, Kitui District, Kenya. Vrije Universiteit Amsterdam. Braid, S. G., & Lodenkemper, L. K. (2019). Catchment Management Guidelines and Training Report
No K5/2508. Colvin, C., Cave, L., & Saayman, I. (2004). A Functional Approach to Setting Resource Quality
Objectives for Groundwater Report No. 1235/1/04. Commission on Revenue Allocation. (2013). Kenya County Fact Sheets. County Government of Bungoma. (2018). County Integrated Development Plan 2018-2022. County Government of Busia. (2018). County Integrated Development Plan 2018-2022. County Government of Elgeyo Marakwet. (2018). County Integrated Development Plan (CIDP) 2018-
2022. County Government of Kakamega. (2017). Kakamega County Integrated Development 2018-2022. County Government of Nandi. (2018). County Integrated Development Plan 2018-2023. County Government of Siaya. (2018). County Integrated Development Plan 2018-2022. County Government of Trans Nzoia. (2018). Trans Nzoia County Integrated Development Plan 2018-
2022. County Government of Uasin Gishu. (2018). County Integrated Development Plan 2018-2022. County Government of Vihiga. (2018). County Integrated Development Plan 2018-2022. County Government of West Pokot. (2018). County Integrated Development Plan 2018-2022. Darcy, H. (1856). Les Fontaines Publiques de la Ville de Dijon (The Public Fountains of the City of
Dijon). Davies, R. (2017). Kenya – Deadly Floods in Mombasa After 235mm of Rain, Thousands Displaced in
Taveta. Flood List. http://floodlist.com/africa/kenya-mombasa-may-2017 Department of Water Affairs. (2007). Development of the water resource classification system:
overview and 7-step classification procedure. Department of Water Affairs. (2011). Procedures to develop and implement Resource Quality
Objectives. Development Initiatives. (2017). Assessment of Kenya’s preparedness to disasters caused by natural
hazards: floods, drought and disease outbreak. DHV Consultants. (1988). Rural Domestic Water Resources Assessment: Siaya District. Earth Observatory. (2007). Floods Raise Water Levels on Lake Victoria. NASA Earth Observatory.
https://earthobservatory.nasa.gov/images/7341/floods-raise-water-levels-on-lake-victoria East African Community. (2018). Protocol on Environment and Natural Resources Management.
https://www.eac.int/environment/natural-resources-management/protocol-on-environment-and-natural-resource-management. Arusha, August 2018
Foster, S. S. D., Evans, R., & Escolero, O. (2015). The groundwater management plan: in praise of a neglected ‘tool of our trade.’ Hydrogeology Journal, 23(5), 847–850.
Gathura, G. (2015, September 20). Scientists warn El Nino to be worse than 1997/98. The Standard. https://www.standardmedia.co.ke/article/2000176966/scientists-warn-el-nino-to-be-worse-than-1997-98
GEF, UNEP, DHI, & International Water Association. (2016). Flood and Drought Management Tools - Lake Victoria Basin.
Global Water Partnership. (2006). Policy Brief 4: How IWRM Will Contribute to Achieving the MDGs. The Fisheries Act, Pub. L. No. Cap. 378 of 1989 (1989). Government of Kenya. (1999). Sessional Paper No. 1 of 1999 on National Policy on Water Resources
Kenya Water Security and Climate Resilience Project
Final Lake Victoria North Basin Plan August 2020 271
Management and Development. The Environmental Management and Co-ordination Act, Pub. L. No. Cap. 387 (1999). The Water Act, Pub. L. No. Cap. 372 (2002). Government of Kenya. (2003). Economic Recovery Strategy for Wealth and Employment Creation
2003-2007. The Forests Act, Pub. L. No. Cap. 385 (2005). Environmental Management and Co-ordination (Water Quality) Regulations, (2006). The Energy Act, Pub. L. No. Cap. 314 (2006). Government of Kenya. (2006). The National Water Resources Management Strategy. Government of Kenya. (2007a). Kenya Vision 2030. Government of Kenya. (2007b). The Water Resources Management Rules. Government of Kenya. (2009). Interim Report on Irrigation and Drainage Master Plan, 2009. Government of Kenya. (2010a). Agricultural Sector Development Strategy 2010-2020. The Constitution of Kenya, (2010). Government of Kenya. (2010b). The National Climate Change Response Strategy. Government of Kenya. (2012). Government of Kenya Adaptation Technical Analysis Report. The Water Resources Management (Amendment) Rules, (2012). Government of Kenya. (2013a). National Environment Policy. Ministry of Environment, Water and
Natural Resources. www.environment.go.ke The Agriculture, Fisheries and Food Authority Act, Pub. L. No. 13 of 2013 (2013). The Crops Act, Pub. L. No. 16 of 2013 (2013). The Irrigation Act, (2013). Government of Kenya. (2013b). The National Climate Change Action Plan 2013-2017. The Natural Resources (Benefit Sharing) Bill, 587 (2014) (testimony of Government of Kenya). Government of Kenya. (2015). National Energy and Petroleum Policy - Final Draft. Government of
Kenya. Government of Kenya. (2016). Kenya National Adaptation Plan 2015-2030. The Climate Change Act, Pub. L. No. 43 of 2016 (2016). The Forest Conservation and Management Act, Pub. L. No. 34 of 2016 (2016). The Water Act, Pub. L. No. 43 of 2016 (2016). Government of Kenya. (2017a). Ending Drought Emergencies in Kenya - Progress Report. Government of Kenya. (2017b). Sector Plan for Environment, Water and Sanitation 2018-2022 (Draft
of 13th of June 2017). The Division of Revenue Act, Pub. L. No. 1 of 2018 (2018). Government of Kenya. (2018). The National Climate Change Action Plan 2018-2022. The Natural Resources (Benefit Sharing) Bill, 561 (2018) (testimony of Government of Kenya). The Irrigation Act, Pub. L. No. 14 of 2019 (2019). The National Disaster Management Authority Bill, 75 (2019) (testimony of Government of Kenya). Huho, J. M., Mashara, J. N., & Musyimi, P. K. (2016). Profiling Disaster in Kenya and their Causes.
Academic Research International, 7(1), 290–305. ILEC, UNEP-DHI, UNESCO-IHP, UNESCO-IOC, & UNEP. (2015). Water System Information Sheets:
Eastern & Southern Africa. Institute of Economic Affairs. (2015). Situational Analysis of Energy Industry, Policy and Strategy for
Kenya. International Federation of Red Cross. (2016a). Emergency Plan of Action (EPoA) Kenya: Floods - 4
January 2016. International Federation of Red Cross. (2016b). Emergency Plan of Action Final Report Kenya /
Floods. IPPC. (2014). Climate Change 2014: Impacts, Adaptation, and Vulnerability - Part A: Global and
Sectoral Aspects. Cambridge University Press. Jones, A., Breuning-Madsen, H., Brossard, M., Dampha, A., Deckers, J., Dewitte, O., Gallali, T.,
Hallett, S., Jones, R., Kilasara, M., Le Roux, P., Micheli, E., Montanarella, L., Spaargaren, O., Lamourdia, T., Van Ranst, E., Yemefack, M., & Zougmore, R. (2013). Soil Atlas of Africa.
K’oreje, K. O., Vergeynst, L., Ombaka, D., De Wispelaere, P., Okoth, M., Van Langenhove, H., & Demeestere, K. (2016). Occurrence patterns of pharmaceutical residues in wastewater, surface water and groundwater of Nairobi and Kisumu city, Kenya. Chemosphere, 149, 238–244. https://doi.org/https://doi.org/10.1016/j.chemosphere.2016.01.095
Kakamega County Water and Sanitation Company. (2017). Kakamega County Water and Sanitation Company Limited (KACWASCO) - Strategic Plan 2017-2022.
Kamadi, G. (2019). Yala Swamp Saga: Broken Promises and Idle Land. ScienceAfrica.
Kenya Water Security and Climate Resilience Project
Final Lake Victoria North Basin Plan August 2020 272
https://scienceafrica.co.ke/yala-swamp-saga-broken-promises-and-idle-land/ Kanda, E., James, O., Lutta, V., & Ong’or, B. (2018). Challenges Facing Small and Medium Water
Service Providers in Kenya: A Case of Amatsi Water Services Company, Vihiga County. Journal of the Civil Engineering Forum, 4, 19. https://doi.org/10.22146/jcef.29263
Kenya Bureau of Standards. (2007). Drinking Water – Specification, Part 1: The Requirements for Drinking Water (KS 459-1:2007).
Kenya Forest Service. (2015). Strategic Plan 2014-2017. Kenya National Bureau of Statistics. (2009). The 2009 Kenya Population and Housing Census. Kenya National Bureau of Statistics. (2019). 2019 Kenya Population and Housing Census Volume I:
Population by County and Sub-County. https://www.knbs.or.ke/?wpdmpro=2019-kenya-population-and-housing-census-volume-i-population-by-county-and-sub-county
Kenya Wildlife Service. (n.d.). Sanctuary of the Sitatunga antelope. Retrieved March 17, 2020, from http://www.kws.go.ke/content/saiwa-swamp-national-park
Kiptum, C. K., & Nbambuki, J. M. (2012). Well water contamination by pit latrines: a case study of Langas. International Journal of Water Resources and Environment, 4(2), 35–43. https://doi.org/10.5897/IJWREE11.084
Kremer, M., Leino, J., Miguel, E., & Zwane, A. P. (2011). Spring Cleaning: Rural Water Impacts, Valuation, and Property Rights Institutions. The Quarterly Journal of Economics, 126(1), 145–205. https://doi.org/10.1093/qje/qjq010
Kusek, J. Z., & Rist, R. C. (2004). A Handbook for Development Practitioners: Ten Steps to a Results-Based Monitoring and Evaluation System.
Lake Victoria North Water Services Board. (2011). Rehabilitation and Augmentation of Butere, Musanda and Navakholo Water Supply Systems. Environmental Impact Assessment (EIA) and Environmental Management Plan (EMP).
Langenegger, O. (1994). Groundwater quality and handpump corrosion in West Africa - Water and sanitation program report (No. 8). http://documents.worldbank.org/curated/en/998791468325792705/Groundwater-quality-and-handpump-corrosion-in-West-Africa
Lapworth, D. J., Baran, N., Stuart, M. E., & Ward, R. S. (2012). Emerging organic contaminants in groundwater: A review of sources, fate and occurrence. Environmental Pollution, 163, 287–303. https://doi.org/10.1016/J.ENVPOL.2011.12.034
Levine, S., & Pavanello, S. (2012). Rules of the Range - Natural resources management in Kenya-Ethiopia border areas: HPG Policy Brief 45.
Liambila, D. W. (2017). Assessing the Roles of Water Resources Users Associations in line with the Principles of Integrated River Basin Management: Case Study of the Kuywa Water Resources Users Association. International Journal of Science and Research, 6(6), 303–332.
Met Office. (2011). Climate: Observations, projections and impacts - Kenya. Ministry of Energy. (2004). Sessional Paper No.4 of 2004 on Energy. Ministry of Environment and Mineral Resources. (2012). Masterplan for the Conservation and
Sustainable Management of Water Catchment Areas in Kenya. Ministry of Environment and Natural Resources. (2014). The Forest Policy. Ministry of Foreign Affairs of Finland. (2009). Finnish Aid in Western Kenya; Impact and Lessons
Learned. Ministry of Lands and Physical Planning. (2017). Sessional Paper No. 1 of 2017 on National Land
Use Policy. Ministry of Water and Irrigation. (2005). Practice Manual for Water Supply Services in Kenya. Ministry of Water and Irrigation. (2009). Draft National Policy on Trans-Boundary Waters. Ministry of Water and Irrigation. (2012). National Water Quality Management Strategy (NWQMS)
(2012 – 2016). Ministry of Water and Irrigation. (2013). The National Policy Groundwater Resources Development
and Management - Final Draft. Mogaka, H., Gichere, S., Davis, R., & Hirji, R. (2005). Climate Variability and Water Resources
Degradation in Kenya. Improving Water Resources Development and Management (Working Paper No. 69).
Mumma, A., Lane, M., Kairu, E., Tuinhof, A., & Hirji, R. (2011). Kenya Groundwater Governance Case Study. In Water Papers (Vol. 71726). http://documents.worldbank.org/curated/en/2011/06/16583819/kenya-groundwater-governance-case-study
Muruiki, J. G. (1994). Evaluation of performance of iron removal plants for groundwater treatment in Western Kenya. University of Nairobi.
Kenya Water Security and Climate Resilience Project
Final Lake Victoria North Basin Plan August 2020 273
Muruka, C., Fagbamigbe, A., Muruka, A., Njuguna, J., Otieno, D., Onyando, J., Wanjiku, Z., & Onyango, Z. (2012). The Relationship between Bacteriological Quality of Dug-Wells & Pit Latrine Siting in an Unplanned Peri-Urban Settlement: A Case Study of Langas – Eldoret Municipality, Western Kenya. Public Health Research, 2. https://doi.org/10.5923/j.phr.20120202.06
Mutiso, S. (2003). The significance of sub-surface water storage in Kenya. In A. Tuinhof & J. P. Heederik (Eds.), Management of aquifer recharge and subsurface storage: making better use of our largest reservoir (Internatio). Utrecht: Netherlands National Committee for the IAH.
Muyoma, P., Tsingalia, H., Makatiani, J., & Maithya, J. (2017). Evaluation of Sustainable Use of Underground Water in Peri-Urban Centers of Eldoret Municipality in Kenya. Journal of Global Ecology and Environment, 6(2): 49-5, 49–59.
Mwangi, K., & Mutua, F. (2015). Modeling Kenya’s Vulnerability to Climate Change – A Multifactor Approach. International Journal of Science and Research, 3(9).
National Environment and Management Authority. (2007). National Sand Harvesting Guidelines 2007. Ndanyi, M. (2017, December 27). Water shortage hits Eldoret, Trans Nzoia goes for steady supply.
The Star. https://www.the-star.co.ke/news/2017-12-27-water-shortage-hits-eldoret-trans-nzoia-goes-for-steady-supply/
Ndonga, S. (2018, May 16). Police Say River Yala Levels Have Subsided. Capital News. https://www.capitalfm.co.ke/news/2018/05/police-say-river-yala-levels-subsided/
Nijsten, G.-J., Christelis, G., Villholth, K. G., Braune, E., & Gaye, C. B. (2018). Transboundary aquifers of Africa: Review of the current state of knowledge and progress towards sustainable development and management. Journal of Hydrology: Regional Studies, 20, 21–34. https://doi.org/10.1016/J.EJRH.2018.03.004
OCHA. (2013). Eastern Africa: Floods Update (as of 17 May 2013). OCHA. (2018). Flash Update #6 - Floods in Kenya. Odida, O. J. (2015). Aquifer Geometry and Structural Controls on Groundwater Potential in Mount
Elgon Aquifer, Trans-Nzoia County, Kenya. University of Nairobi. Office of the Auditor-General. (2016). Report of the Auditor-General on the Financial Statements of
Water and Sanitation Service Improvement Project-Component No.3 (IDA Grant 5130-KE) for the Year Ended 30 June 2016.
Okumu, W. (2010). Resources and border disputes in Eastern Africa. Journal of Eastern African Studies, 4(2), 279–297. https://doi.org/10.1080/17531055.2010.487338
Openji, O. (2017). Effectiveness of the Implementation of Sub-Catchment Management Plan using the CDC process: A case study of the Awacho Kano Water Resource Association. University of Nairobi.
Opere, A. (2013). Chapter 21 - Floods in Kenya. In P. Paron, D. O. Olago, & C. T. Omuto (Eds.), Kenya: A Natural Outlook (Vol. 16, pp. 315–330). Elsevier. https://doi.org/https://doi.org/10.1016/B978-0-444-59559-1.00021-9
Regional Centre for Mapping of Resources for Development. (2018). Mapping for Sustainable Development. https://www.rcmrd.org/
Reliefweb. (2013). Kenya: Floods - March 2013. https://reliefweb.int/disaster/fl-2013-000038-ken Rendilicha, H. G., Home, P. G., & Raude, J. M. (2018). A review of groundwater vulnerability
assessment in Kenya. Acque Sotterranee - Italian Journal of Groundwater, 7, 7–13. https://doi.org/10.7343/as-2018-328
Ruotsalainen, A., & Turunen, P. (1994). Assessment of water resources and implementation of rural water supplies in western Kenya. Future Groundwater Resources at Risk (Proceedings of the Helsinki Conference), 519–525.
Saunders, J., Menezes, A., Aguilar-Manjarrez, J., & Matere, J. (2017). Atlas of aquaculture potential in coastal Kenya.
South African National Biodiversity Institute. (2013). “Ecological Infrastructure: Nature Delivering Services”, Fact Sheet Produced by SANBI’s Grassland Programme and the CSIR’s ProEcoServ Project.
Temper, L., del Bene, D., & Martinez-Alier, J. (2015). Mapping the frontiers and front lines of global environmental justice: the EJAtlas. Journal of Political Ecology, 22, 255–278.
The Nature Conservancy. (2019). Eldoret Water Fund - Pre-feasibility Study Final Report. The World Bank. (2008). Toolkit for monitoring and evaluation of agricultural water management
projects. The World Bank. (2016). Kenya - Western Kenya Community Driven Development and Flood
Mitigation Project. http://documents.worldbank.org/curated/en/706421481552765649/Kenya-Western-Kenya-Community-Driven-Development-and-Flood-Mitigation-Project
UN. (2015). Sustainable Development Goals. Sustainable Development Goals Knowledge Platform.
Kenya Water Security and Climate Resilience Project
Final Lake Victoria North Basin Plan August 2020 274
https://sustainabledevelopment.un.org/sdgs UNDP. (2011). Human Development Report 2011 - Sustainability and Equity: A Better Future for All. UNEP-DHI, UNESCO-IOC, & UNEP. (2016). Water System Information Sheets: Eastern & Southern
Africa. In L. Talaue-McManus (Ed.), Transboundary Waters: A Global Compendium, Volume 6-Annex G. UNEP.
Wafula, P. (2010, July 16). Lack of investment in water sector leaves Kenyan towns parched. Business Daily. https://www.businessdailyafrica.com/news/539546-958756-pssc71/index.html
Wambu, E. W., Omwoyo, W. N., & Akenga, T. (2016). Excessive Copper(II) and Zinc(II) Levels in Drinkable Water Sources in Areas Along the Lake Victoria Shorelines in Siaya County, Kenya. Bulletin of Environmental Contamination and Toxicology, 96(1), 96–101. https://doi.org/10.1007/s00128-015-1690-6
Water Resources Authority. (2018a). Code of Practice for Supervision of Borehole Construction and Pumping Tests.
Water Resources Authority. (2018b). Code of Practice for the Pumping Test of Boreholes. Water Resources Authority. (2018c). Code of Practice for the Siting of Boreholes. Water Resources Authority. (2018d). Water Resources Situation Report, July 2017 to June 2018. Water Resources Authority. (2019a). Guidelines for the Development of Water Allocation Plans in
Kenya (Draft). Water Resources Authority. (2019b). Hydromet Monitoring Network Design IR2 VOLUME 7A. Water Resources Authority. (2019c). National Groundwater Potential Report IR2 VOLUME 4A. Water Resources Management Authority. (1992). The Study on the National Water Master Plan. Water Resources Management Authority. (2006). Groundwater Protection – Proposal for a National
Policy. Water Resources Management Authority. (2007). Guidelines for Artificial Groundwater Recharge
(Draft). Water Resources Management Authority. (2010). Preliminary Water Allocation Plan of the Nairobi
Aquifer Suite, and Long Term Water Resources Management Strategy. Water Resources Management Authority. (2013). The National Water Master Plan 2030. Water Resources Management Authority. (2015a). Lake Victoria North Catchment Area Catchment
Management Strategy (CMS) (2015-2022). Water Resources Management Authority. (2015b). Lake Victoria South Catchment Area Catchment
Management Strategy (CMS) (2015-2022). Water Resources Management Authority. (2016). National Water Resources Situation Report for
FY2015/2016. Water Services Regulatory Board. (2018). Impact Report Issue No. 11/2019 - A Performance Review
of Kenya’s Water Services Sector - 2017/18. Wekesa, P. W. (2015). Analysis of Selected Heavy Metals in water from River Kuywa and Adjacent
Wells in Bungoma Central Sub-County, Kenya. Kenyatta University. Wiesmann, U., Kiteme, B., & Mwangi, Z. (2016). Socio-Economic Atlas of Kenya: Depicting the
National Population Census by County and Sub-Location. Xiong, J., Thenkabail, P. S., Tilton, J. C., Gumma, M. K., Teluguntla, P., Congalton, R. G., Yadav, K.,
Dungan, J., Oliphant, A. J., Poehnelt, J., Smith, C., & Massey, R. (2017). NASA Making Earth System Data Records for Use in Research Environments (MEaSUREs) Global Food Security-support Analysis Data (GFSAD) @ 30-m Africa: Cropland Extent Product (GFSAD30AFCE). In NASA EOSDIS Land Processes DAAC. https://doi.org/10.5067/MEaSUREs/GFSAD/GFSAD30AFCE.001
Kenya Water Security and Climate Resilience Project
Final Lake Victoria North Basin Plan August 2020 275
10 Annexures
Kenya Water Security and Climate Resilience Project
Final Lake Victoria North Basin Plan August 2020
Annexure A: Analytical tools
Kenya Water Security and Climate Resilience Project
Final Lake Victoria North Basin Plan August 2020
Annexure B: Data at sub-basin level
Kenya Water Security and Climate Resilience Project
Final Lake Victoria North Basin Plan August 2020
Annexure C: Basin Planning: Policies, legislation and institutions
Kenya Water Security and Climate Resilience Project
Final Lake Victoria North Basin Plan August 2020
Annexure D: Stakeholder information
Kenya Water Security and Climate Resilience Project
Final Lake Victoria North Basin Plan August 2020
Annexure E: Implementation Plans

Kenya Water Security and Climate Resilience Project
Final Lake Victoria North Basin Plan August 2020
Annexure F: Costing
Aurecon offices are located in:
Angola, Australia, Botswana, China,
Ghana, Hong Kong, Indonesia, Kenya,
Lesotho, Macau, Mozambique,
Namibia, New Zealand, Nigeria,
Philippines, Qatar, Singapore, South Africa,
Swaziland, Tanzania, Thailand, Uganda,
United Arab Emirates, Vietnam.
Document prepared by Aurecon AMEI Limited Registration No: C087142-C1/GBL (MAU)
Ebéne House 3rd Floor
33 Cybercity
Ebéne
Mauritius
T F E W
+27 21 526 9400 +27 21 526 9500 [email protected] aurecongroup.com
A1: Erosion risk and land use capability
Erosion risk in the LVN Basin was determined by using the Revised Universal Soil Loss Equation
(RUSLE) model (Renard, Foster, Weesies, & Porter, 1991). The RUSLE model is used widely to predict
long-term rates of inter-rill and rill erosion from field or farm size units subject to different management
practices. RUSLE is a lumped model which assumes spatially homogeneous hillslopes. A raster-based
GIS soil erosion risk assessment tool for the LVN Basin was developed, which calculates the mean
annual gross soil erosion at a cell level as the product of six factors:
A = Ri × Ki × Li × Si × Ci × Pi (1)
where:
subscript i = ith cell
Ai = the average annual soil loss per unit area within the cell (t·ha-1·a-1)
Ri = rainfall-runoff erosivity factor (MJ·mm·ha-1·h-1·a-1)
Ki = the soil erodibility factor (t·h·MJ-1·mm-1)
Li = the slope length factor
Si = the slope steepness factor
Ci = the cover management factor
Pi = the conservation support practice factor
Input data for each erosion factor in the RUSLE model were collected from various sources as
presented in Table A1-1.
Modelling the sediment production potential is based on the relatively constant factors associated with
topography and soils. These factors are unlikely to change significantly over the short-term as they
relate to the geomorphology of the Basin. Rainfall is dependent on climatic factors, therefore is
inherently variable. The management factors (i.e. crop and practice) are more variable, as they are
dependent on the conservation management measures and seasonal rainfall. A wider study in Kenya
(Dunne, 1979) indicated that land use was a dominant control of sediment yield, although runoff and
topography were also recognised as important. It was also determined that yield from agricultural land
and grazed land was significantly greater than from forested basins, with variability in cultivated land.
Rainfall erosivity
One of the key drivers of erosion is rainfall erosivity. Although rainfall itself will not necessarily result in
high levels of erosion, intense prolonged rainfall will act to increase soil erosion rates. Rainfall erosivity
has a high impact on soil erosion as it provides the energy required to detach soil particles. As shown
in Figure A1-1, rainfall erosivity is very high in the middle LVN Basin, with lower values in the upper
Basin and at the basin outlet into Lake Victoria. Most wetlands occur in these lower rainfall erosivity
zones. This is indicative of a zone of deposition, where wetlands provide important flood attenuation
services.
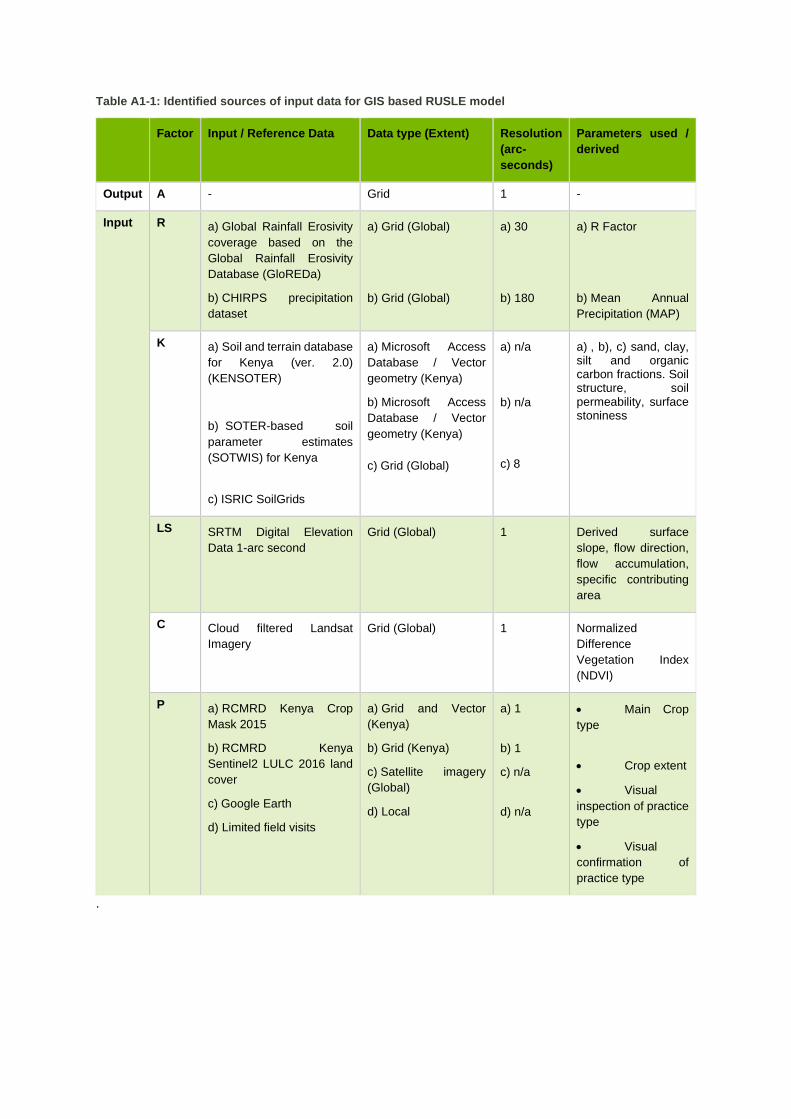
Table A1-1: Identified sources of input data for GIS based RUSLE model
Factor Input / Reference Data Data type (Extent) Resolution
(arc-
seconds)
Parameters used /
derived
Output A - Grid 1 -
Input R a) Global Rainfall Erosivity
coverage based on the
Global Rainfall Erosivity
Database (GloREDa)
b) CHIRPS precipitation
dataset
a) Grid (Global)
b) Grid (Global)
a) 30
b) 180
a) R Factor
b) Mean Annual
Precipitation (MAP)
K a) Soil and terrain database
for Kenya (ver. 2.0)
(KENSOTER)
b) SOTER-based soil
parameter estimates
(SOTWIS) for Kenya
c) ISRIC SoilGrids
a) Microsoft Access
Database / Vector
geometry (Kenya)
b) Microsoft Access
Database / Vector
geometry (Kenya)
c) Grid (Global)
a) n/a
b) n/a
c) 8
a) , b), c) sand, clay, silt and organic carbon fractions. Soil structure, soil permeability, surface stoniness
LS SRTM Digital Elevation
Data 1-arc second
Grid (Global) 1 Derived surface
slope, flow direction,
flow accumulation,
specific contributing
area
C Cloud filtered Landsat
Imagery
Grid (Global) 1 Normalized
Difference
Vegetation Index
(NDVI)
P a) RCMRD Kenya Crop
Mask 2015
b) RCMRD Kenya
Sentinel2 LULC 2016 land
cover
c) Google Earth
d) Limited field visits
a) Grid and Vector
(Kenya)
b) Grid (Kenya)
c) Satellite imagery
(Global)
d) Local
a) 1
b) 1
c) n/a
d) n/a
• Main Crop
type
• Crop extent
• Visual
inspection of practice
type
• Visual
confirmation of
practice type
.
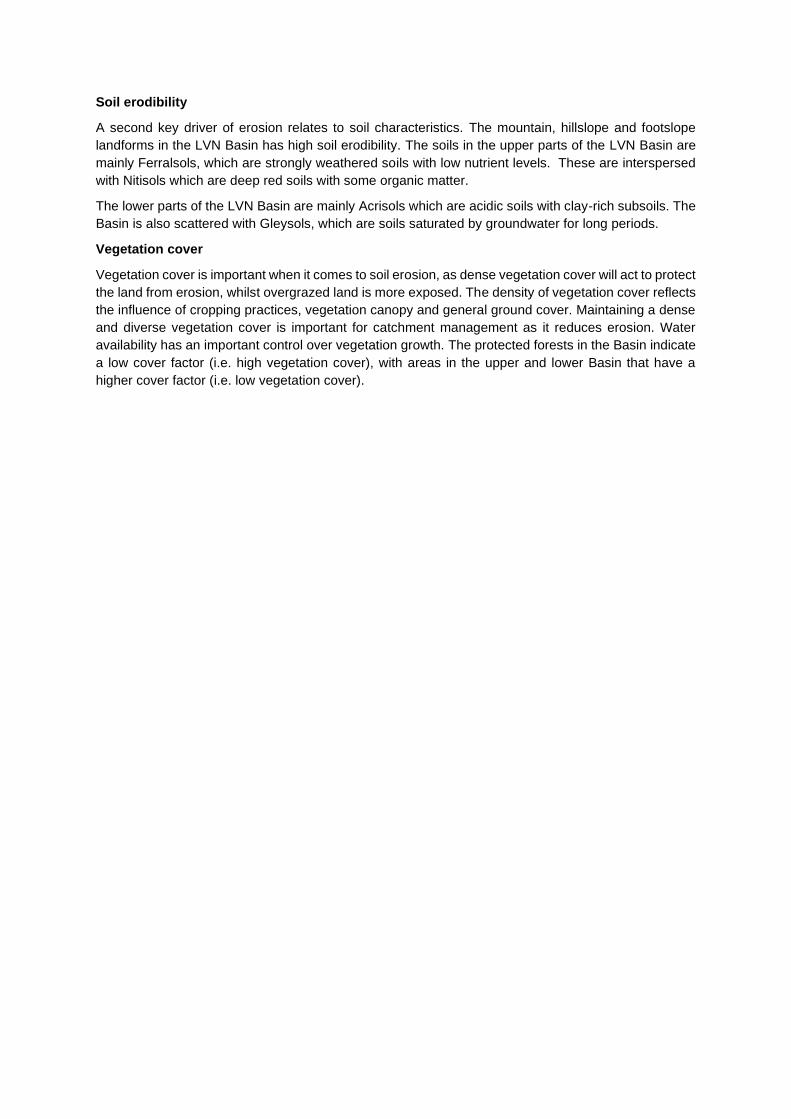
Soil erodibility
A second key driver of erosion relates to soil characteristics. The mountain, hillslope and footslope
landforms in the LVN Basin has high soil erodibility. The soils in the upper parts of the LVN Basin are
mainly Ferralsols, which are strongly weathered soils with low nutrient levels. These are interspersed
with Nitisols which are deep red soils with some organic matter.
The lower parts of the LVN Basin are mainly Acrisols which are acidic soils with clay-rich subsoils. The
Basin is also scattered with Gleysols, which are soils saturated by groundwater for long periods.
Vegetation cover
Vegetation cover is important when it comes to soil erosion, as dense vegetation cover will act to protect
the land from erosion, whilst overgrazed land is more exposed. The density of vegetation cover reflects
the influence of cropping practices, vegetation canopy and general ground cover. Maintaining a dense
and diverse vegetation cover is important for catchment management as it reduces erosion. Water
availability has an important control over vegetation growth. The protected forests in the Basin indicate
a low cover factor (i.e. high vegetation cover), with areas in the upper and lower Basin that have a
higher cover factor (i.e. low vegetation cover).
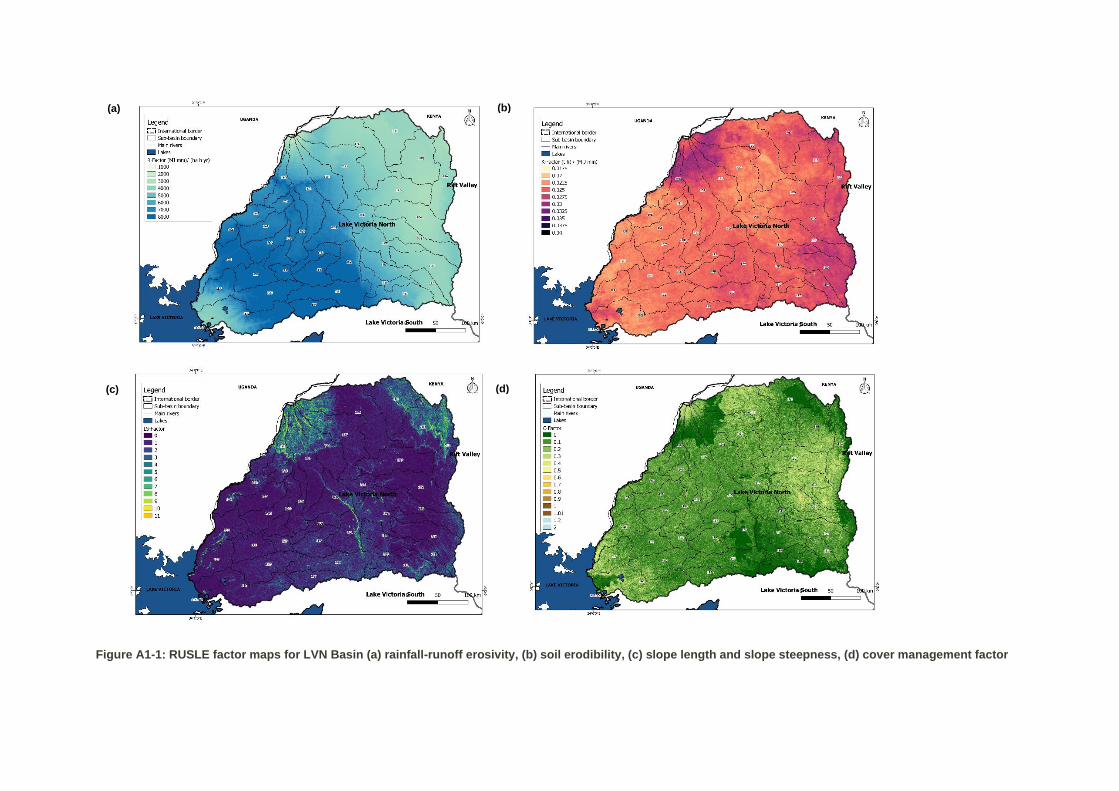
Figure A1-1: RUSLE factor maps for LVN Basin (a) rainfall-runoff erosivity, (b) soil erodibility, (c) slope length and slope steepness, (d) cover management factor
(b) (a)
(c) (d)
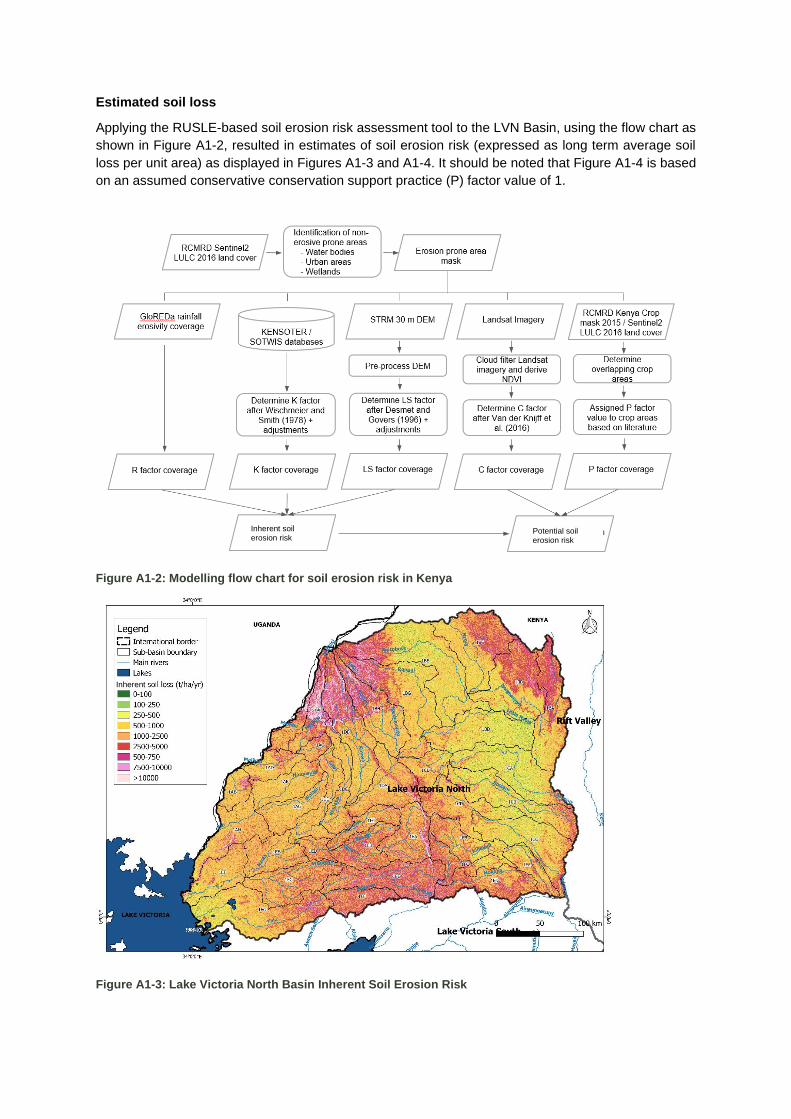
Estimated soil loss
Applying the RUSLE-based soil erosion risk assessment tool to the LVN Basin, using the flow chart as
shown in Figure A1-2, resulted in estimates of soil erosion risk (expressed as long term average soil
loss per unit area) as displayed in Figures A1-3 and A1-4. It should be noted that Figure A1-4 is based
on an assumed conservative conservation support practice (P) factor value of 1.
Figure A1-2: Modelling flow chart for soil erosion risk in Kenya
Figure A1-3: Lake Victoria North Basin Inherent Soil Erosion Risk
Inherent
Inherent soil erosion risk
Potential soil erosion risk
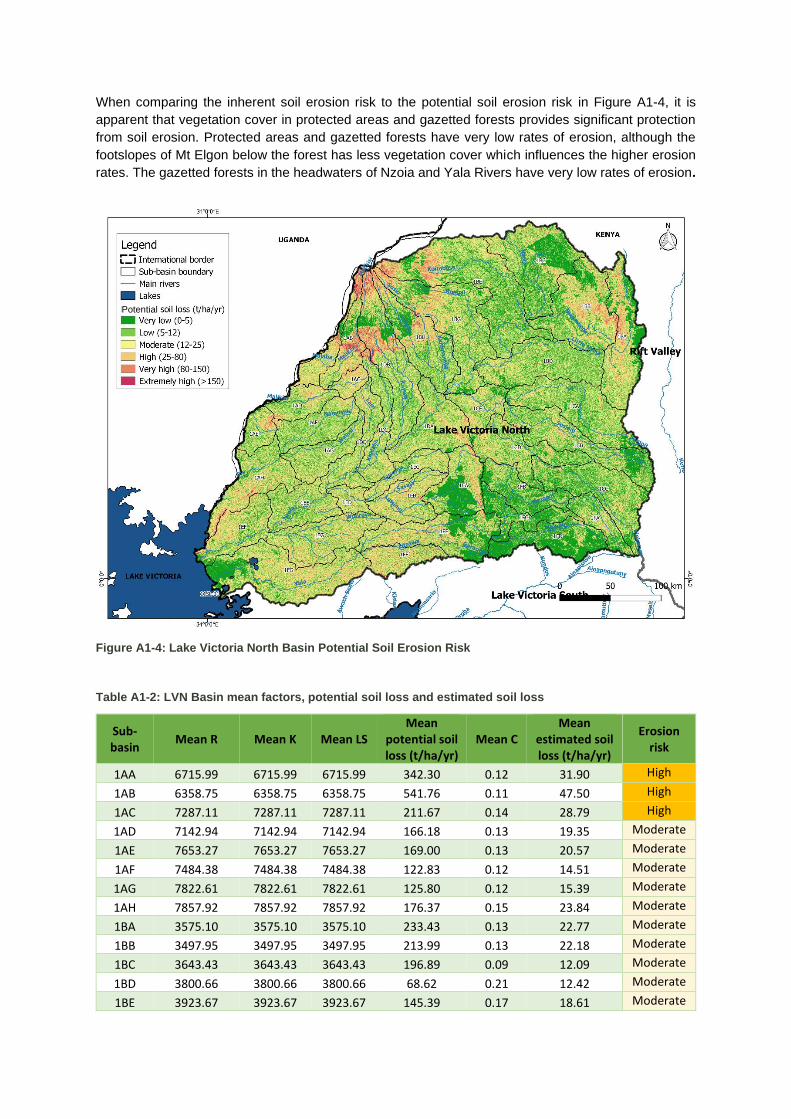
When comparing the inherent soil erosion risk to the potential soil erosion risk in Figure A1-4, it is
apparent that vegetation cover in protected areas and gazetted forests provides significant protection
from soil erosion. Protected areas and gazetted forests have very low rates of erosion, although the
footslopes of Mt Elgon below the forest has less vegetation cover which influences the higher erosion
rates. The gazetted forests in the headwaters of Nzoia and Yala Rivers have very low rates of erosion.
Figure A1-4: Lake Victoria North Basin Potential Soil Erosion Risk
Table A1-2: LVN Basin mean factors, potential soil loss and estimated soil loss
Sub-basin
Mean R Mean K Mean LS Mean
potential soil loss (t/ha/yr)
Mean C Mean
estimated soil loss (t/ha/yr)
Erosion risk
1AA 6715.99 6715.99 6715.99 342.30 0.12 31.90 High
1AB 6358.75 6358.75 6358.75 541.76 0.11 47.50 High
1AC 7287.11 7287.11 7287.11 211.67 0.14 28.79 High
1AD 7142.94 7142.94 7142.94 166.18 0.13 19.35 Moderate
1AE 7653.27 7653.27 7653.27 169.00 0.13 20.57 Moderate
1AF 7484.38 7484.38 7484.38 122.83 0.12 14.51 Moderate
1AG 7822.61 7822.61 7822.61 125.80 0.12 15.39 Moderate
1AH 7857.92 7857.92 7857.92 176.37 0.15 23.84 Moderate
1BA 3575.10 3575.10 3575.10 233.43 0.13 22.77 Moderate
1BB 3497.95 3497.95 3497.95 213.99 0.13 22.18 Moderate
1BC 3643.43 3643.43 3643.43 196.89 0.09 12.09 Moderate
1BD 3800.66 3800.66 3800.66 68.62 0.21 12.42 Moderate
1BE 3923.67 3923.67 3923.67 145.39 0.17 18.61 Moderate
Potential
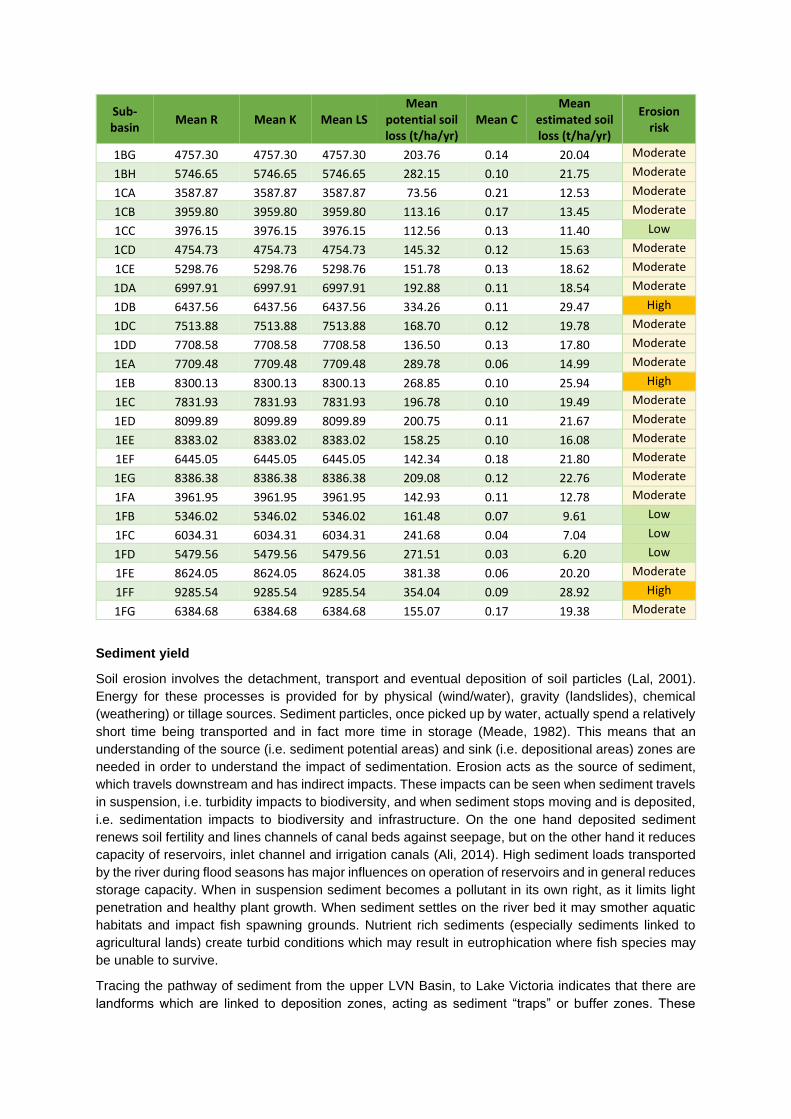
Sub-basin
Mean R Mean K Mean LS Mean
potential soil loss (t/ha/yr)
Mean C Mean
estimated soil loss (t/ha/yr)
Erosion risk
1BG 4757.30 4757.30 4757.30 203.76 0.14 20.04 Moderate
1BH 5746.65 5746.65 5746.65 282.15 0.10 21.75 Moderate
1CA 3587.87 3587.87 3587.87 73.56 0.21 12.53 Moderate
1CB 3959.80 3959.80 3959.80 113.16 0.17 13.45 Moderate
1CC 3976.15 3976.15 3976.15 112.56 0.13 11.40 Low
1CD 4754.73 4754.73 4754.73 145.32 0.12 15.63 Moderate
1CE 5298.76 5298.76 5298.76 151.78 0.13 18.62 Moderate
1DA 6997.91 6997.91 6997.91 192.88 0.11 18.54 Moderate
1DB 6437.56 6437.56 6437.56 334.26 0.11 29.47 High
1DC 7513.88 7513.88 7513.88 168.70 0.12 19.78 Moderate
1DD 7708.58 7708.58 7708.58 136.50 0.13 17.80 Moderate
1EA 7709.48 7709.48 7709.48 289.78 0.06 14.99 Moderate
1EB 8300.13 8300.13 8300.13 268.85 0.10 25.94 High
1EC 7831.93 7831.93 7831.93 196.78 0.10 19.49 Moderate
1ED 8099.89 8099.89 8099.89 200.75 0.11 21.67 Moderate
1EE 8383.02 8383.02 8383.02 158.25 0.10 16.08 Moderate
1EF 6445.05 6445.05 6445.05 142.34 0.18 21.80 Moderate
1EG 8386.38 8386.38 8386.38 209.08 0.12 22.76 Moderate
1FA 3961.95 3961.95 3961.95 142.93 0.11 12.78 Moderate
1FB 5346.02 5346.02 5346.02 161.48 0.07 9.61 Low
1FC 6034.31 6034.31 6034.31 241.68 0.04 7.04 Low
1FD 5479.56 5479.56 5479.56 271.51 0.03 6.20 Low
1FE 8624.05 8624.05 8624.05 381.38 0.06 20.20 Moderate
1FF 9285.54 9285.54 9285.54 354.04 0.09 28.92 High
1FG 6384.68 6384.68 6384.68 155.07 0.17 19.38 Moderate
Sediment yield
Soil erosion involves the detachment, transport and eventual deposition of soil particles (Lal, 2001).
Energy for these processes is provided for by physical (wind/water), gravity (landslides), chemical
(weathering) or tillage sources. Sediment particles, once picked up by water, actually spend a relatively
short time being transported and in fact more time in storage (Meade, 1982). This means that an
understanding of the source (i.e. sediment potential areas) and sink (i.e. depositional areas) zones are
needed in order to understand the impact of sedimentation. Erosion acts as the source of sediment,
which travels downstream and has indirect impacts. These impacts can be seen when sediment travels
in suspension, i.e. turbidity impacts to biodiversity, and when sediment stops moving and is deposited,
i.e. sedimentation impacts to biodiversity and infrastructure. On the one hand deposited sediment
renews soil fertility and lines channels of canal beds against seepage, but on the other hand it reduces
capacity of reservoirs, inlet channel and irrigation canals (Ali, 2014). High sediment loads transported
by the river during flood seasons has major influences on operation of reservoirs and in general reduces
storage capacity. When in suspension sediment becomes a pollutant in its own right, as it limits light
penetration and healthy plant growth. When sediment settles on the river bed it may smother aquatic
habitats and impact fish spawning grounds. Nutrient rich sediments (especially sediments linked to
agricultural lands) create turbid conditions which may result in eutrophication where fish species may
be unable to survive.
Tracing the pathway of sediment from the upper LVN Basin, to Lake Victoria indicates that there are
landforms which are linked to deposition zones, acting as sediment “traps” or buffer zones. These
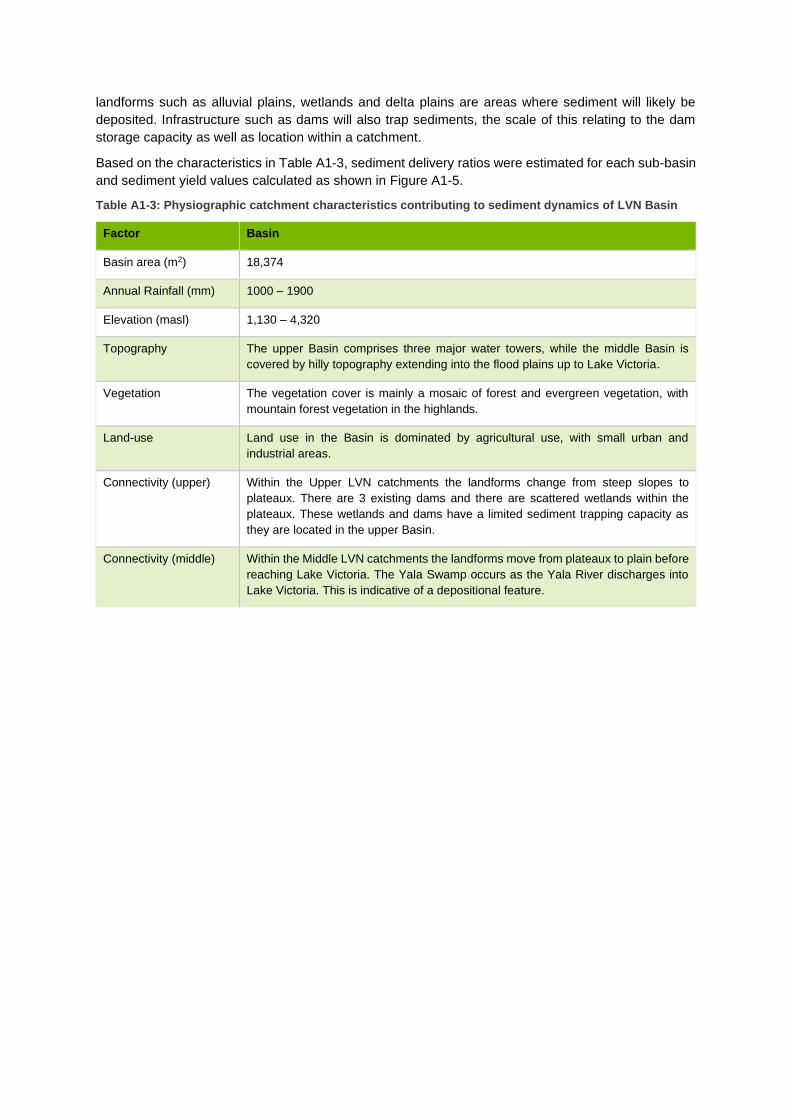
landforms such as alluvial plains, wetlands and delta plains are areas where sediment will likely be
deposited. Infrastructure such as dams will also trap sediments, the scale of this relating to the dam
storage capacity as well as location within a catchment.
Based on the characteristics in Table A1-3, sediment delivery ratios were estimated for each sub-basin
and sediment yield values calculated as shown in Figure A1-5.
Table A1-3: Physiographic catchment characteristics contributing to sediment dynamics of LVN Basin
Factor Basin
Basin area (m2) 18,374
Annual Rainfall (mm) 1000 – 1900
Elevation (masl) 1,130 – 4,320
Topography The upper Basin comprises three major water towers, while the middle Basin is
covered by hilly topography extending into the flood plains up to Lake Victoria.
Vegetation The vegetation cover is mainly a mosaic of forest and evergreen vegetation, with
mountain forest vegetation in the highlands.
Land-use Land use in the Basin is dominated by agricultural use, with small urban and
industrial areas.
Connectivity (upper) Within the Upper LVN catchments the landforms change from steep slopes to
plateaux. There are 3 existing dams and there are scattered wetlands within the
plateaux. These wetlands and dams have a limited sediment trapping capacity as
they are located in the upper Basin.
Connectivity (middle) Within the Middle LVN catchments the landforms move from plateaux to plain before
reaching Lake Victoria. The Yala Swamp occurs as the Yala River discharges into
Lake Victoria. This is indicative of a depositional feature.
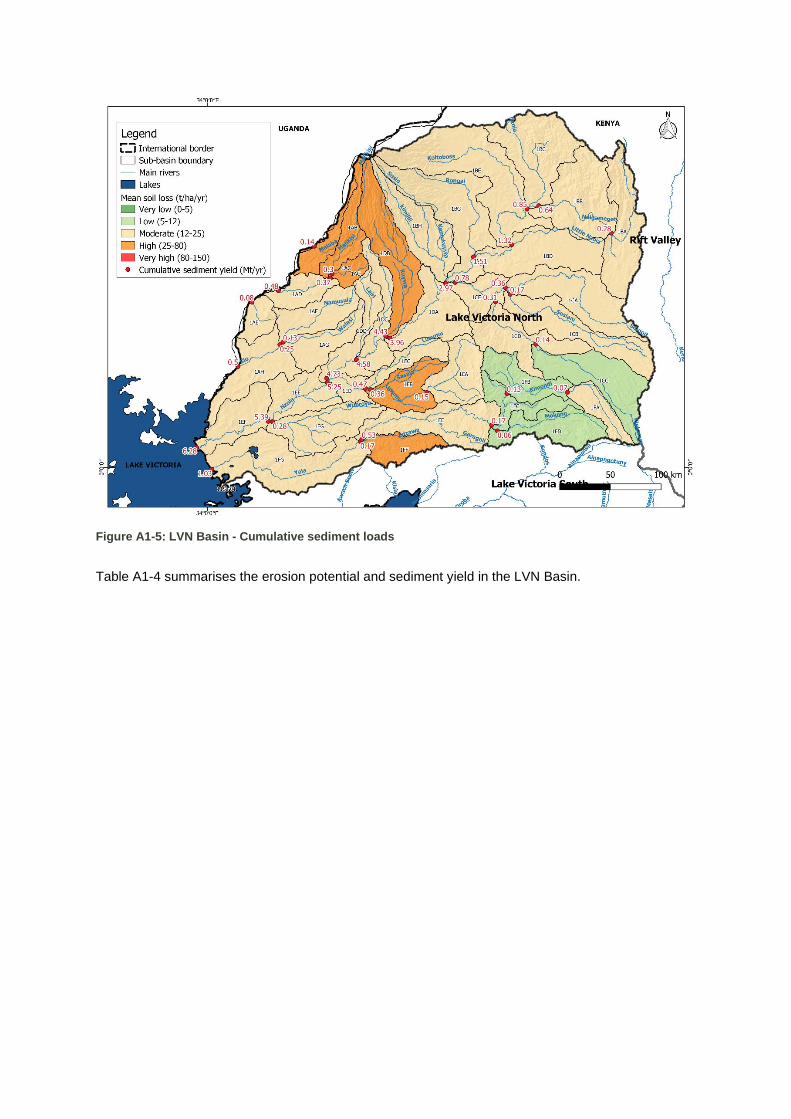
Figure A1-5: LVN Basin - Cumulative sediment loads
Table A1-4 summarises the erosion potential and sediment yield in the LVN Basin.
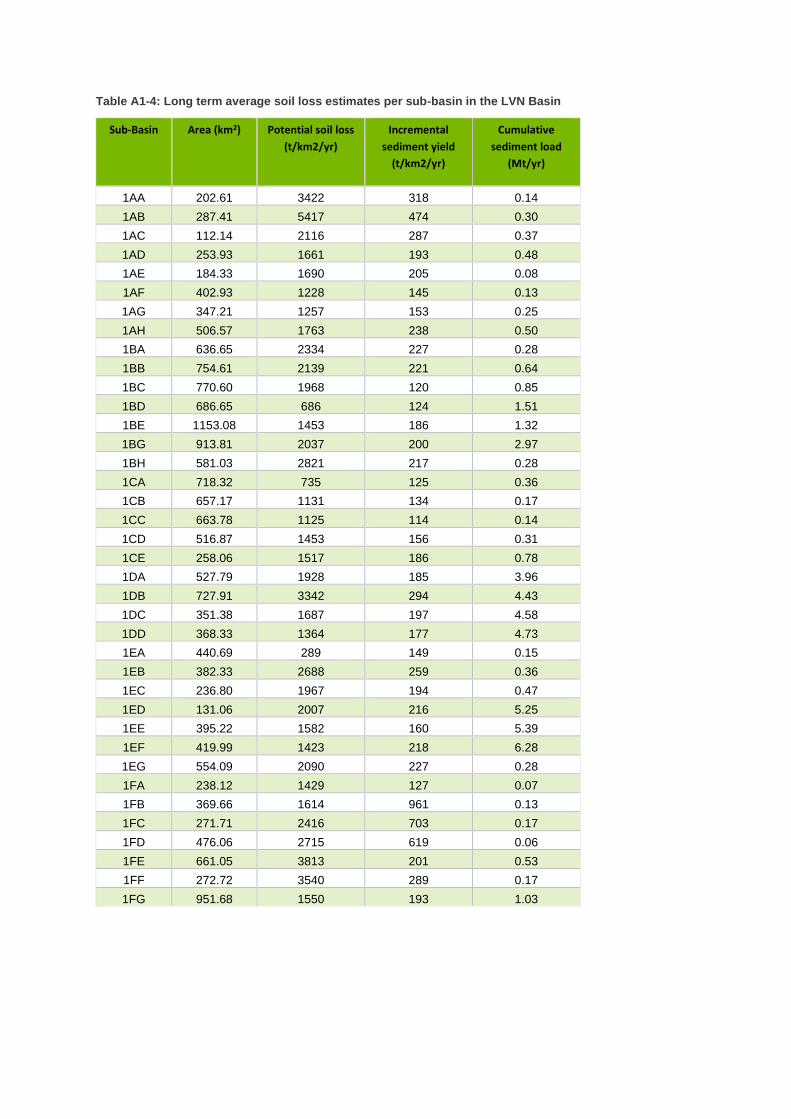
Table A1-4: Long term average soil loss estimates per sub-basin in the LVN Basin
Sub-Basin Area (km2) Potential soil loss
(t/km2/yr)
Incremental
sediment yield
(t/km2/yr)
Cumulative
sediment load
(Mt/yr)
1AA 202.61 3422 318 0.14
1AB 287.41 5417 474 0.30
1AC 112.14 2116 287 0.37
1AD 253.93 1661 193 0.48
1AE 184.33 1690 205 0.08
1AF 402.93 1228 145 0.13
1AG 347.21 1257 153 0.25
1AH 506.57 1763 238 0.50
1BA 636.65 2334 227 0.28
1BB 754.61 2139 221 0.64
1BC 770.60 1968 120 0.85
1BD 686.65 686 124 1.51
1BE 1153.08 1453 186 1.32
1BG 913.81 2037 200 2.97
1BH 581.03 2821 217 0.28
1CA 718.32 735 125 0.36
1CB 657.17 1131 134 0.17
1CC 663.78 1125 114 0.14
1CD 516.87 1453 156 0.31
1CE 258.06 1517 186 0.78
1DA 527.79 1928 185 3.96
1DB 727.91 3342 294 4.43
1DC 351.38 1687 197 4.58
1DD 368.33 1364 177 4.73
1EA 440.69 289 149 0.15
1EB 382.33 2688 259 0.36
1EC 236.80 1967 194 0.47
1ED 131.06 2007 216 5.25
1EE 395.22 1582 160 5.39
1EF 419.99 1423 218 6.28
1EG 554.09 2090 227 0.28
1FA 238.12 1429 127 0.07
1FB 369.66 1614 961 0.13
1FC 271.71 2416 703 0.17
1FD 476.06 2715 619 0.06
1FE 661.05 3813 201 0.53
1FF 272.72 3540 289 0.17
1FG 951.68 1550 193 1.03
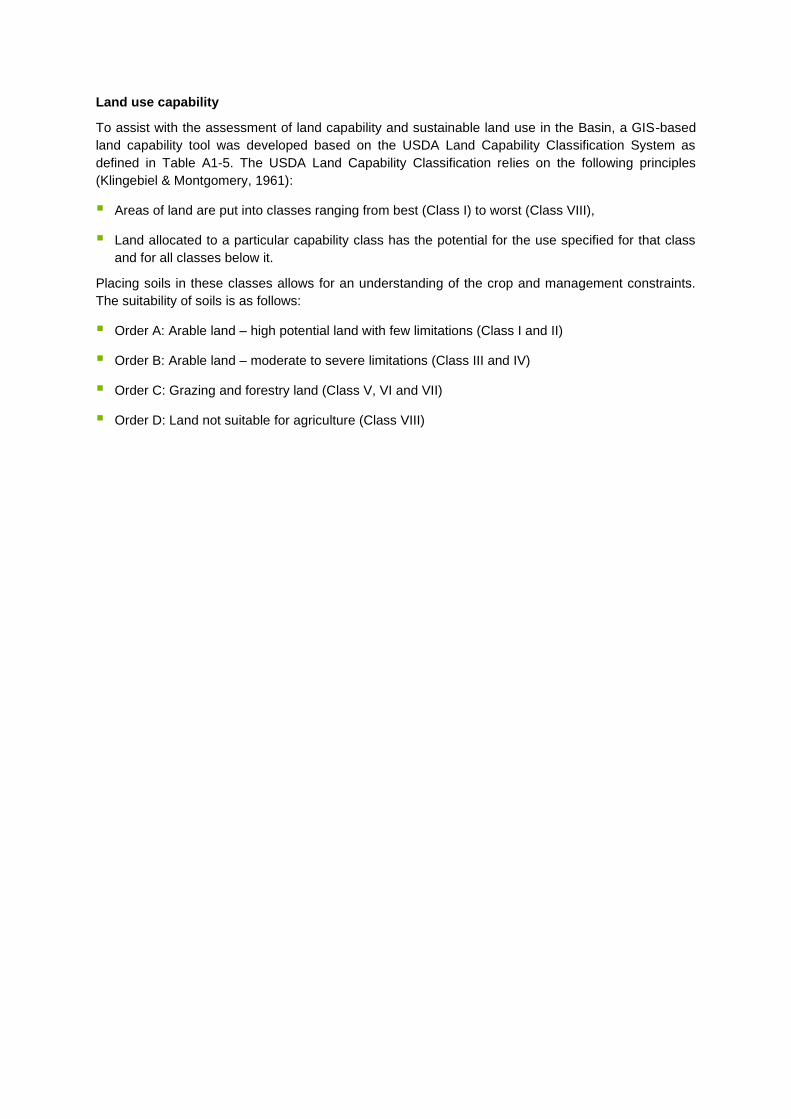
Land use capability
To assist with the assessment of land capability and sustainable land use in the Basin, a GIS-based
land capability tool was developed based on the USDA Land Capability Classification System as
defined in Table A1-5. The USDA Land Capability Classification relies on the following principles
(Klingebiel & Montgomery, 1961):
▪ Areas of land are put into classes ranging from best (Class I) to worst (Class VIII),
▪ Land allocated to a particular capability class has the potential for the use specified for that class
and for all classes below it.
Placing soils in these classes allows for an understanding of the crop and management constraints.
The suitability of soils is as follows:
▪ Order A: Arable land – high potential land with few limitations (Class I and II)
▪ Order B: Arable land – moderate to severe limitations (Class III and IV)
▪ Order C: Grazing and forestry land (Class V, VI and VII)
▪ Order D: Land not suitable for agriculture (Class VIII)
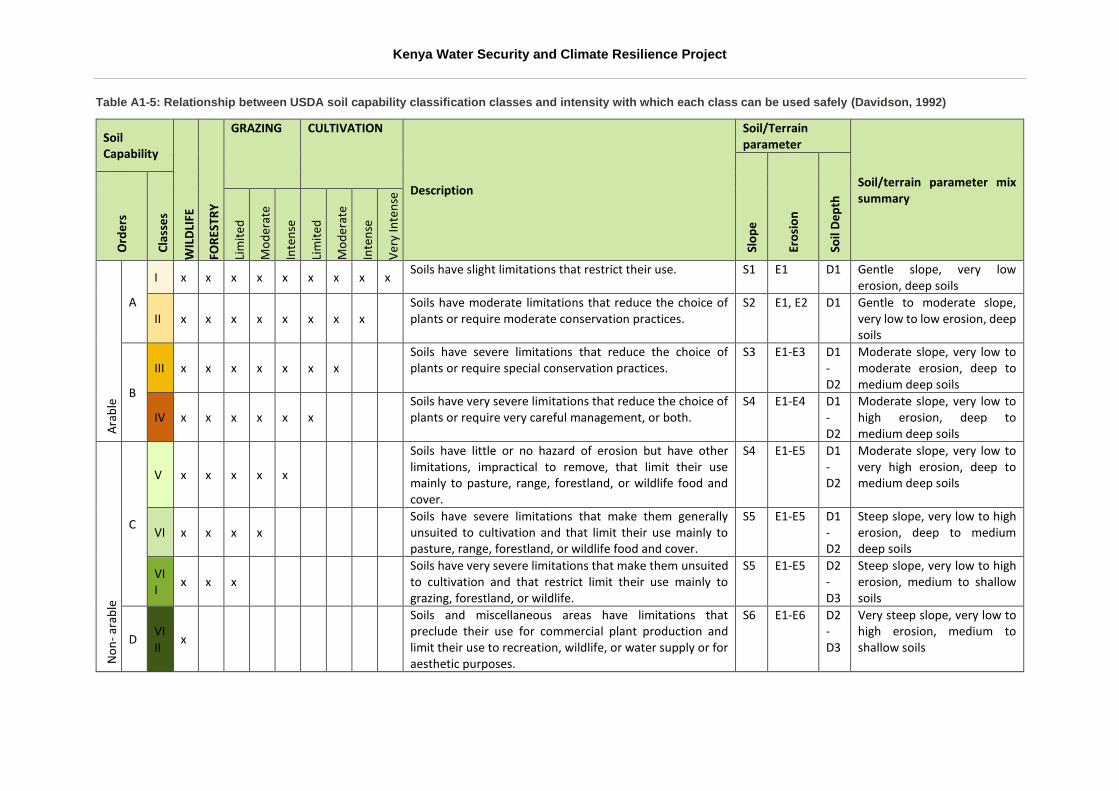
Kenya Water Security and Climate Resilience Project
Table A1-5: Relationship between USDA soil capability classification classes and intensity with which each class can be used safely (Davidson, 1992)
Soil Capability
WIL
DLI
FE
FOR
ESTR
Y
GRAZING CULTIVATION
Description
Soil/Terrain parameter
Soil/terrain parameter mix summary
Slo
pe
Ero
sio
n
Soil
De
pth
Ord
ers
Cla
sse
s
Lim
ited
Mo
der
ate
Inte
nse
Lim
ited
Mo
der
ate
Inte
nse
Ver
y In
ten
se
Ara
ble
A
I x x x x x x x x x Soils have slight limitations that restrict their use. S1 E1 D1 Gentle slope, very low
erosion, deep soils
II x x x x x x x x Soils have moderate limitations that reduce the choice of plants or require moderate conservation practices.
S2 E1, E2 D1 Gentle to moderate slope, very low to low erosion, deep soils
B
III x x x x x x x Soils have severe limitations that reduce the choice of plants or require special conservation practices.
S3 E1-E3 D1-D2
Moderate slope, very low to moderate erosion, deep to medium deep soils
IV x x x x x x Soils have very severe limitations that reduce the choice of plants or require very careful management, or both.
S4 E1-E4 D1-D2
Moderate slope, very low to high erosion, deep to medium deep soils
No
n-
arab
le
C
V x x x x x
Soils have little or no hazard of erosion but have other limitations, impractical to remove, that limit their use mainly to pasture, range, forestland, or wildlife food and cover.
S4 E1-E5 D1-D2
Moderate slope, very low to very high erosion, deep to medium deep soils
VI x x x x Soils have severe limitations that make them generally unsuited to cultivation and that limit their use mainly to pasture, range, forestland, or wildlife food and cover.
S5 E1-E5 D1-D2
Steep slope, very low to high erosion, deep to medium deep soils
VII
x x x Soils have very severe limitations that make them unsuited to cultivation and that restrict limit their use mainly to grazing, forestland, or wildlife.
S5 E1-E5 D2-D3
Steep slope, very low to high erosion, medium to shallow soils
D VIII
x
Soils and miscellaneous areas have limitations that preclude their use for commercial plant production and limit their use to recreation, wildlife, or water supply or for aesthetic purposes.
S6 E1-E6 D2-D3
Very steep slope, very low to high erosion, medium to shallow soils
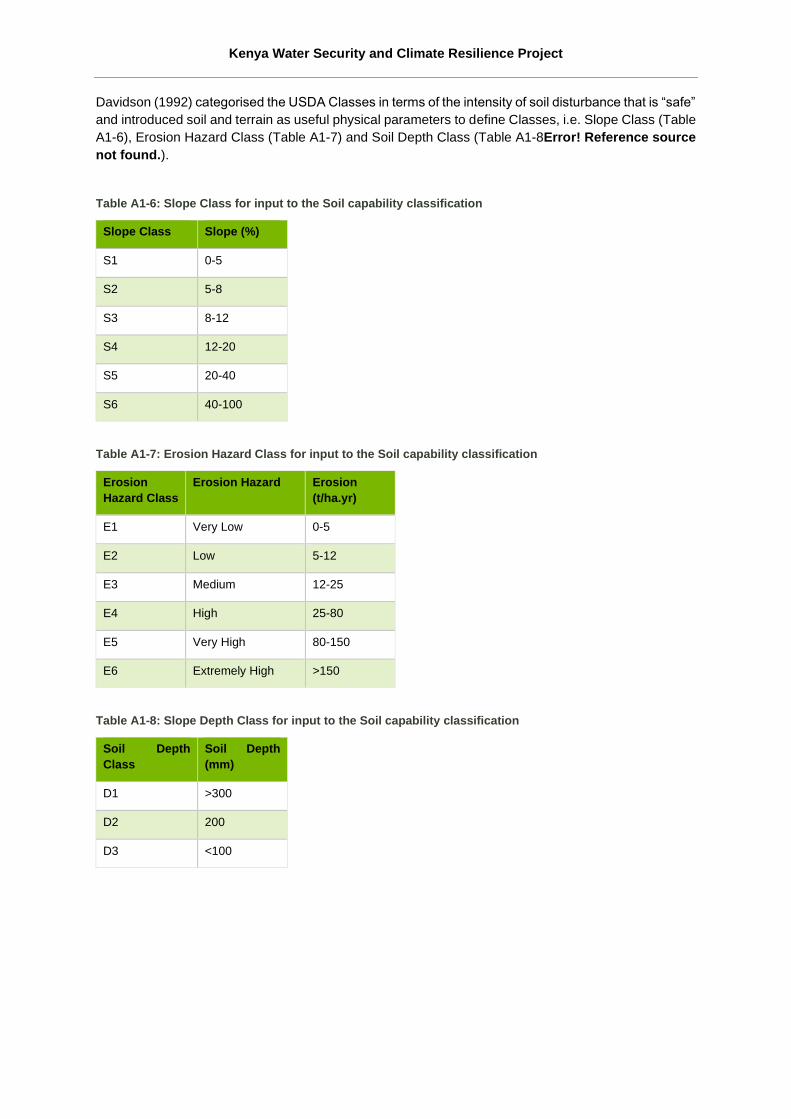
Kenya Water Security and Climate Resilience Project
Davidson (1992) categorised the USDA Classes in terms of the intensity of soil disturbance that is “safe”
and introduced soil and terrain as useful physical parameters to define Classes, i.e. Slope Class (Table
A1-6), Erosion Hazard Class (Table A1-7) and Soil Depth Class (Table A1-8Error! Reference source
not found.).
Table A1-6: Slope Class for input to the Soil capability classification
Slope Class Slope (%)
S1 0-5
S2 5-8
S3 8-12
S4 12-20
S5 20-40
S6 40-100
Table A1-7: Erosion Hazard Class for input to the Soil capability classification
Erosion
Hazard Class
Erosion Hazard Erosion
(t/ha.yr)
E1 Very Low 0-5
E2 Low 5-12
E3 Medium 12-25
E4 High 25-80
E5 Very High 80-150
E6 Extremely High >150
Table A1-8: Slope Depth Class for input to the Soil capability classification
Soil Depth
Class
Soil Depth
(mm)
D1 >300
D2 200
D3 <100
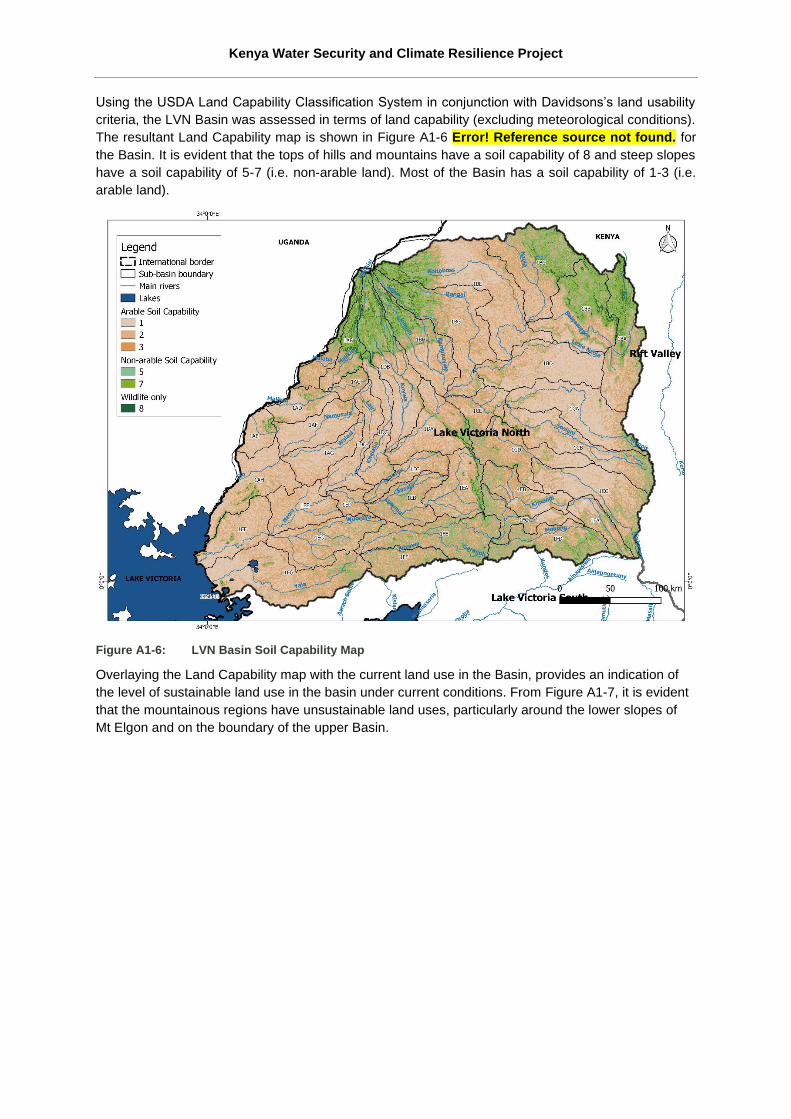
Kenya Water Security and Climate Resilience Project
Using the USDA Land Capability Classification System in conjunction with Davidsons’s land usability
criteria, the LVN Basin was assessed in terms of land capability (excluding meteorological conditions).
The resultant Land Capability map is shown in Figure A1-6 Error! Reference source not found. for
the Basin. It is evident that the tops of hills and mountains have a soil capability of 8 and steep slopes
have a soil capability of 5-7 (i.e. non-arable land). Most of the Basin has a soil capability of 1-3 (i.e.
arable land).
Figure A1-6: LVN Basin Soil Capability Map
Overlaying the Land Capability map with the current land use in the Basin, provides an indication of
the level of sustainable land use in the basin under current conditions. From Figure A1-7, it is evident
that the mountainous regions have unsustainable land uses, particularly around the lower slopes of
Mt Elgon and on the boundary of the upper Basin.
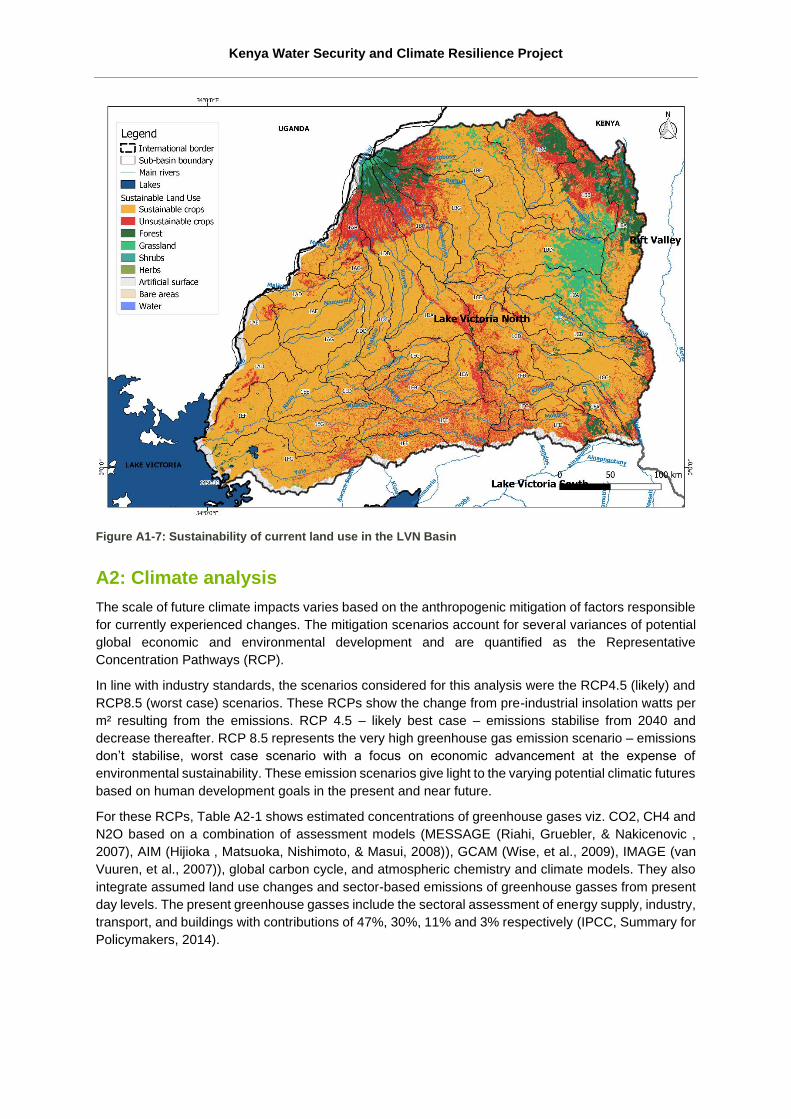
Kenya Water Security and Climate Resilience Project
Figure A1-7: Sustainability of current land use in the LVN Basin
A2: Climate analysis
The scale of future climate impacts varies based on the anthropogenic mitigation of factors responsible
for currently experienced changes. The mitigation scenarios account for several variances of potential
global economic and environmental development and are quantified as the Representative
Concentration Pathways (RCP).
In line with industry standards, the scenarios considered for this analysis were the RCP4.5 (likely) and
RCP8.5 (worst case) scenarios. These RCPs show the change from pre-industrial insolation watts per
m² resulting from the emissions. RCP 4.5 – likely best case – emissions stabilise from 2040 and
decrease thereafter. RCP 8.5 represents the very high greenhouse gas emission scenario – emissions
don’t stabilise, worst case scenario with a focus on economic advancement at the expense of
environmental sustainability. These emission scenarios give light to the varying potential climatic futures
based on human development goals in the present and near future.
For these RCPs, Table A2-1 shows estimated concentrations of greenhouse gases viz. CO2, CH4 and
N2O based on a combination of assessment models (MESSAGE (Riahi, Gruebler, & Nakicenovic ,
2007), AIM (Hijioka , Matsuoka, Nishimoto, & Masui, 2008)), GCAM (Wise, et al., 2009), IMAGE (van
Vuuren, et al., 2007)), global carbon cycle, and atmospheric chemistry and climate models. They also
integrate assumed land use changes and sector-based emissions of greenhouse gasses from present
day levels. The present greenhouse gasses include the sectoral assessment of energy supply, industry,
transport, and buildings with contributions of 47%, 30%, 11% and 3% respectively (IPCC, Summary for
Policymakers, 2014).
Kenya Water Security and Climate Resilience Project
Table A2-1: Representative Concentration Pathways
CO2 (ppm) CH4 and N2O
(ppm)
Resulting radiative
forcing (W.m-2)
Scenario
RCP 4.5 538 92 4.5 Best case - Medium scenario
RCP 8.5 936 377 8.5 Worst case
The greenhouse gas concentrations under different RCPs are used as input for the coupled model
ensembles of the IPCC Assessment Report Five (IPCC, Climate Change 2014: Impacts, Adaptation,
and Vulnerability. Part A: Global and Sectoral Aspects, 2014) (AR).
Using climate projection data requires the acknowledgement of various uncertainties. The IPCC
projections rely on forty different GCMs with different accuracies forecasting to the varying RCP
scenarios. These RCPs are themselves estimates of potential future thermal forcings, as informed by
adherence to emission policies and potential future technologies. The downscaling of the IPCC data
required robust constraining parameters to present a more accurate local projection. In areas where
observational data is limited, these constraining parameters have increased uncertainty. Results
obtained, and recommendations made based on these data should be used as a guideline to
adapt/mitigate to a potential future climate rather than a definitive one. This is particularly prevalent
when noting the significant disparity even in the current variability of rainfall regimes. This is influenced
by things like topography, wind, vegetation and even ocean currents. Beyond that, a further layer of
complexity is added with looking at rainfall intensity, diurnal and seasonal onsets before accounting for
short and long-term influences such as the diurnal, seasonal, inter annual cycles, the ENSO cycles as
well as decadal changes. When projecting precipitation changes into a semi unknown future these
uncertainties are further exacerbated. The projection parameters are therefore presented in terms of a
probability of changes highlighting the most likely range of precipitation experienced in the future. The
probabilities also allow for the possibility of more extreme anomalous occurrence of events in both
directions i.e. probability of more extreme rainfall days as well as less extreme rainfall days.
Factors such as the topography, proximity to the equator, and air masses contribute to the range and
variability in precipitation and temperature regimes. The climate analysis which was undertaken as part
of the Ewaso Ngiro North Basin, focused on projected climate trends and analysed multiple spatial and
temporal source datasets with the intention of better conveying the interactions between and impact on
communities, water security and the environment as a result of projected climate change. Temporal
analysis, of varying resolutions, informed likely anomalous climatic characteristics such as shifts in
seasonality, extreme events occurrence, precipitation intensity and volumes.
Data to be used in climate analysis need to be of sufficient duration and resolution to account for the
cycles of natural meteorological variability as well as any climate change signal embedded in the data.
While there is currently a dearth of climate change data of sufficient length and integrity for trend
analysis available, SIMCLIM (CLIMSystems, 2005) and CORDEX (Gutowski et al, 2016) data were
used to inform the analysis of climate change impacts as part of the development of this Basin Plan.
SimCLIM data is downscaled to 5km resolution from the IPCC AR5 climate models. It presents the
monthly projection from 1996 to 2100 through selected models or a model ensemble, with different
environmental sensitivities. SimCLIM is native to ESRI ArcGIS 10.3 and provides the basis for all spatial
climate analysis and long-term trends.
CORDEX (A Coordinated Regional Climate Downscaling Experiment) data is downscaled to 45km
resolution and has a daily temporal scale to 2100. The high temporal resolution of this data gives an
indication of intra-seasonal meteorological characteristics. High resolution data has several advantages
over the large scale GCMs, chief among them the increased spatial and temporal resolution. Having
spatial higher resolution provides greater local context between areas of interest, while daily scale
temporal scales allow for analysis such as extreme events or accumulation anomalies that is not
Kenya Water Security and Climate Resilience Project
possible in monthly data. The CORDEX experiments seeks to downscale the GCMs utilised in the IPCC
AR5 analysis.
The GCM models listed in Table A2-2 were utilised for downscaling in this analysis.
Table A2-2: GCM model input
Model Institute
CCCma-CanESM2 Canadian Centre for Climate Modelling and Analysis
CNRM-CERFACS-
CNRM-CM5
Météo-France / Centre National de Recherches Météorologiques
CSIRO-QCCCE-
CSIRO-Mk3-6-0
Commonwealth Scientific and Industrial Research Organization& Queensland Climate
Change Centre of Excellence
ICHEC-EC-EARTH Irish Centre for High-End Computing & -Earth consortium
IPSL-IPSL-CM5A-MR Institut Pierre Simon Laplace
IROC-MIROC5 Model for Interdisciplinary Research on Climate
MOHC-HadGEM2-ES Met Office Hadley Centre
MPI-M-MPI-ESM-LR Max-Planck-Institut für Meteorologie
NCC-NorESM1-M Norwegian Climate Centre & Norwegian Earth System Model 1
NOAA-GFDL-GFDL-
ESM2M
National Oceanic and Atmospheric Administration & Earth System Model - Geophysical
Fluid Dynamics Laboratory
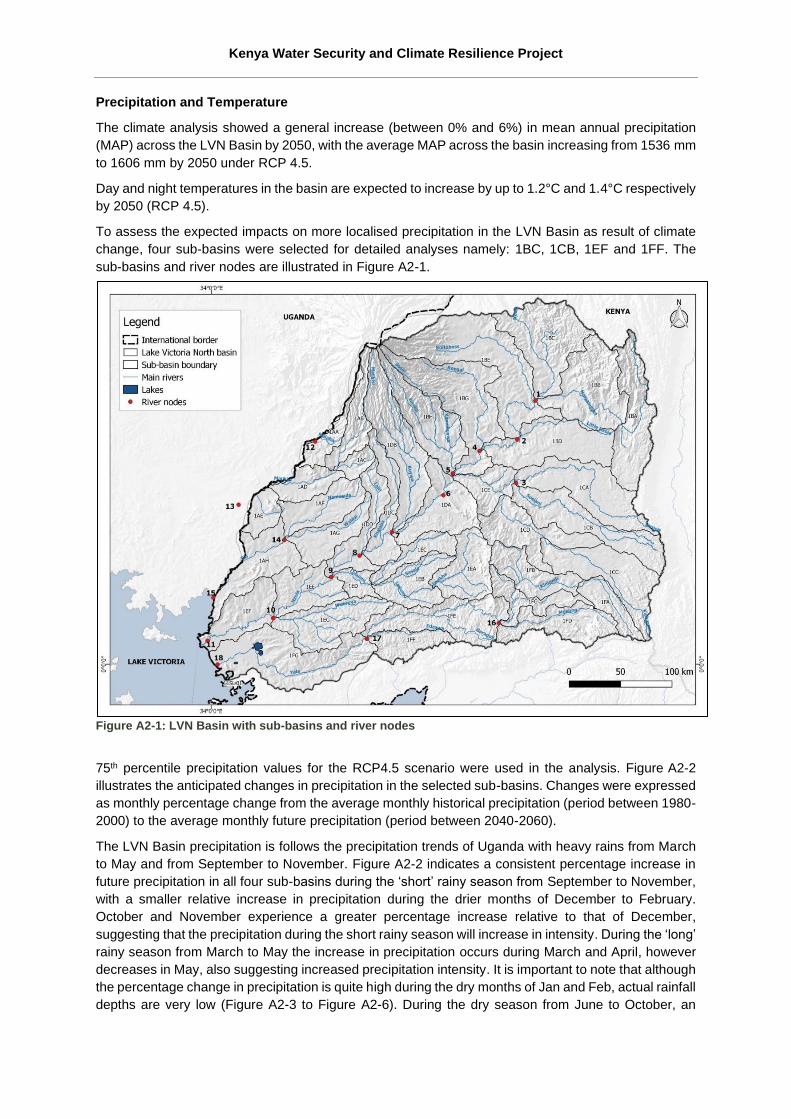
Kenya Water Security and Climate Resilience Project
Precipitation and Temperature
The climate analysis showed a general increase (between 0% and 6%) in mean annual precipitation
(MAP) across the LVN Basin by 2050, with the average MAP across the basin increasing from 1536 mm
to 1606 mm by 2050 under RCP 4.5.
Day and night temperatures in the basin are expected to increase by up to 1.2°C and 1.4°C respectively
by 2050 (RCP 4.5).
To assess the expected impacts on more localised precipitation in the LVN Basin as result of climate
change, four sub-basins were selected for detailed analyses namely: 1BC, 1CB, 1EF and 1FF. The
sub-basins and river nodes are illustrated in Figure A2-1.
Figure A2-1: LVN Basin with sub-basins and river nodes
75th percentile precipitation values for the RCP4.5 scenario were used in the analysis. Figure A2-2
illustrates the anticipated changes in precipitation in the selected sub-basins. Changes were expressed
as monthly percentage change from the average monthly historical precipitation (period between 1980-
2000) to the average monthly future precipitation (period between 2040-2060).
The LVN Basin precipitation is follows the precipitation trends of Uganda with heavy rains from March
to May and from September to November. Figure A2-2 indicates a consistent percentage increase in
future precipitation in all four sub-basins during the ‘short’ rainy season from September to November,
with a smaller relative increase in precipitation during the drier months of December to February.
October and November experience a greater percentage increase relative to that of December,
suggesting that the precipitation during the short rainy season will increase in intensity. During the ‘long’
rainy season from March to May the increase in precipitation occurs during March and April, however
decreases in May, also suggesting increased precipitation intensity. It is important to note that although
the percentage change in precipitation is quite high during the dry months of Jan and Feb, actual rainfall
depths are very low (Figure A2-3 to Figure A2-6). During the dry season from June to October, an
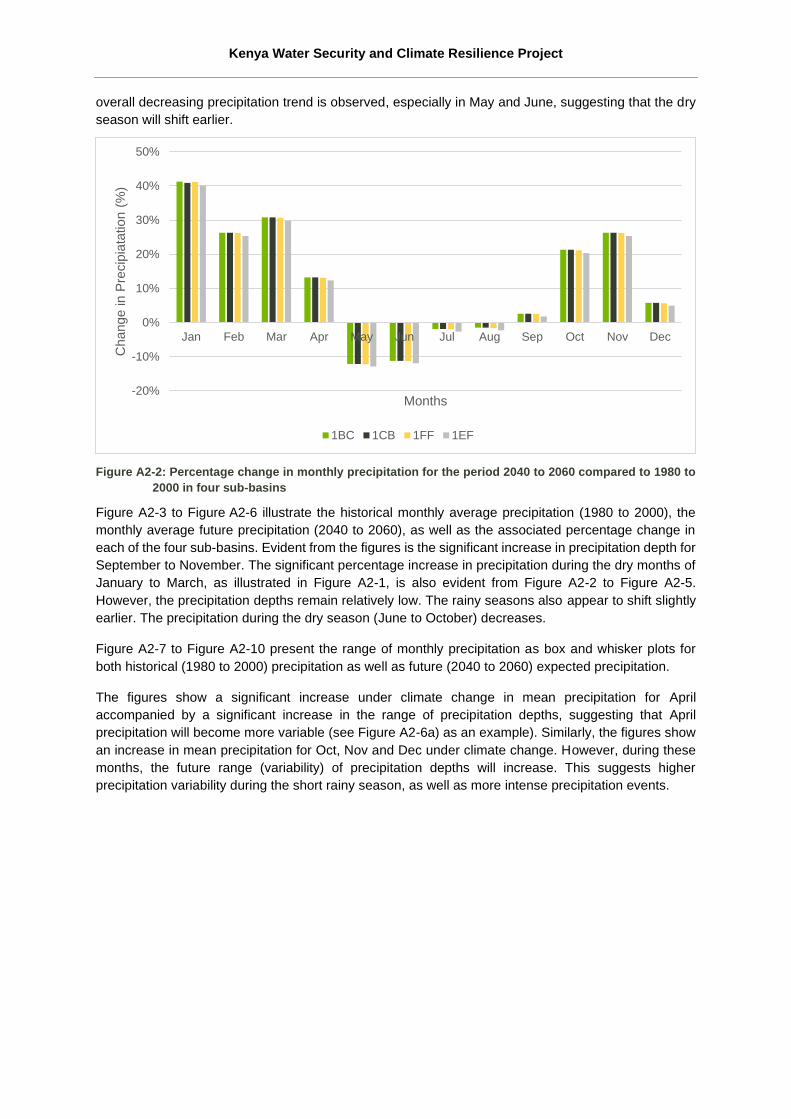
Kenya Water Security and Climate Resilience Project
overall decreasing precipitation trend is observed, especially in May and June, suggesting that the dry
season will shift earlier.
Figure A2-2: Percentage change in monthly precipitation for the period 2040 to 2060 compared to 1980 to
2000 in four sub-basins
Figure A2-3 to Figure A2-6 illustrate the historical monthly average precipitation (1980 to 2000), the
monthly average future precipitation (2040 to 2060), as well as the associated percentage change in
each of the four sub-basins. Evident from the figures is the significant increase in precipitation depth for
September to November. The significant percentage increase in precipitation during the dry months of
January to March, as illustrated in Figure A2-1, is also evident from Figure A2-2 to Figure A2-5.
However, the precipitation depths remain relatively low. The rainy seasons also appear to shift slightly
earlier. The precipitation during the dry season (June to October) decreases.
Figure A2-7 to Figure A2-10 present the range of monthly precipitation as box and whisker plots for
both historical (1980 to 2000) precipitation as well as future (2040 to 2060) expected precipitation.
The figures show a significant increase under climate change in mean precipitation for April
accompanied by a significant increase in the range of precipitation depths, suggesting that April
precipitation will become more variable (see Figure A2-6a) as an example). Similarly, the figures show
an increase in mean precipitation for Oct, Nov and Dec under climate change. However, during these
months, the future range (variability) of precipitation depths will increase. This suggests higher
precipitation variability during the short rainy season, as well as more intense precipitation events.
-20%
-10%
0%
10%
20%
30%
40%
50%
Jan Feb Mar Apr May Jun Jul Aug Sep Oct Nov Dec
Change in P
recip
iata
tion (
%)
Months
1BC 1CB 1FF 1EF
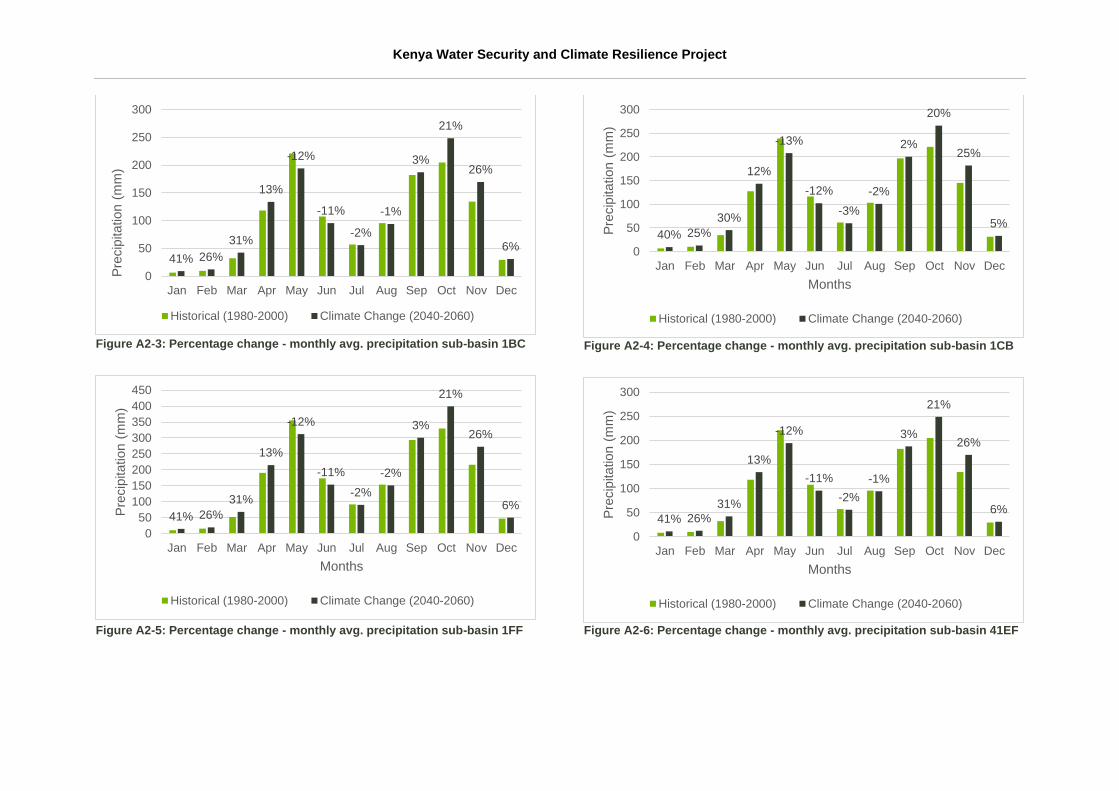
Kenya Water Security and Climate Resilience Project
Figure A2-3: Percentage change - monthly avg. precipitation sub-basin 1BC
Figure A2-5: Percentage change - monthly avg. precipitation sub-basin 1FF
Figure A2-4: Percentage change - monthly avg. precipitation sub-basin 1CB
Figure A2-6: Percentage change - monthly avg. precipitation sub-basin 41EF
41% 26%
31%
13%
-12%
-11%
-2%
-1%
3%
21%
26%
6%
0
50
100
150
200
250
300
Jan Feb Mar Apr May Jun Jul Aug Sep Oct Nov Dec
Pre
cip
itation (
mm
)
Historical (1980-2000) Climate Change (2040-2060)
41% 26%
31%
13%
-12%
-11%
-2%
-2%
3%
21%
26%
6%
0
50
100
150
200
250
300
350
400
450
Jan Feb Mar Apr May Jun Jul Aug Sep Oct Nov Dec
Pre
cip
itation (
mm
)
Months
Historical (1980-2000) Climate Change (2040-2060)
40% 25%
30%
12%
-13%
-12%
-3%
-2%
2%
20%
25%
5%
0
50
100
150
200
250
300
Jan Feb Mar Apr May Jun Jul Aug Sep Oct Nov Dec
Pre
cip
itation (
mm
)
Months
Historical (1980-2000) Climate Change (2040-2060)
41% 26%
31%
13%
-12%
-11%
-2%
-1%
3%
21%
26%
6%
0
50
100
150
200
250
300
Jan Feb Mar Apr May Jun Jul Aug Sep Oct Nov Dec
Pre
cip
itation (
mm
)
Months
Historical (1980-2000) Climate Change (2040-2060)
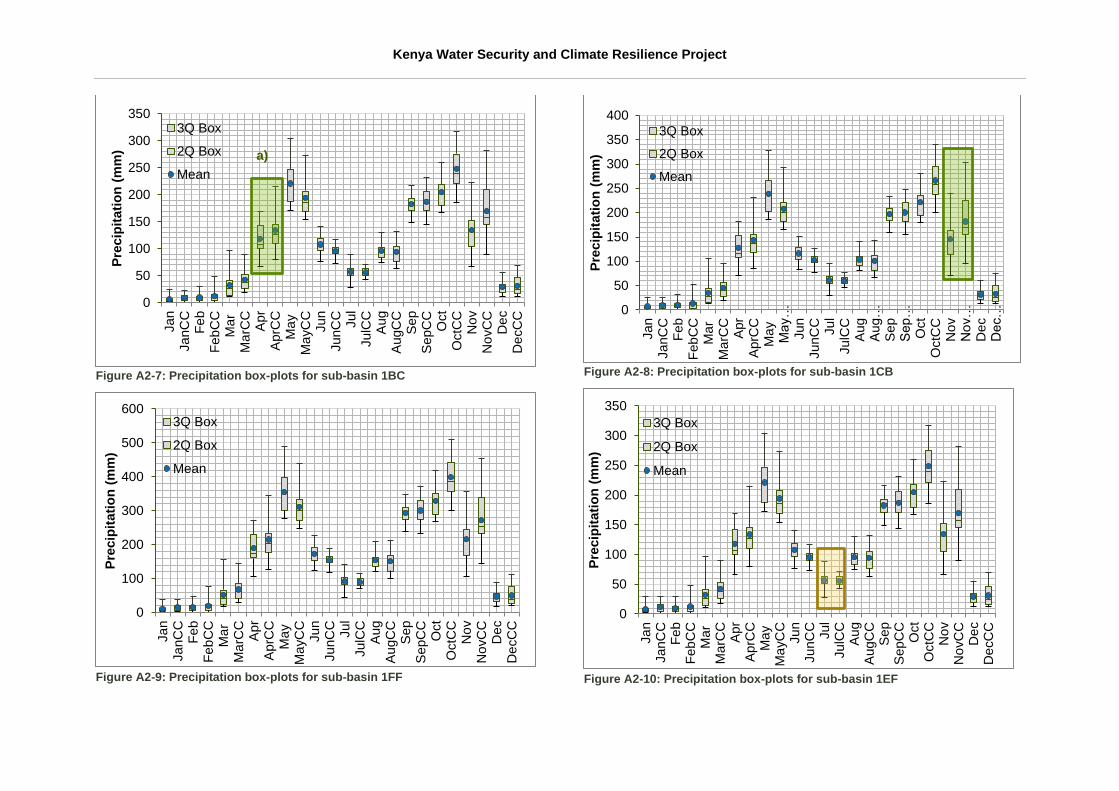
Kenya Water Security and Climate Resilience Project
Figure A2-7: Precipitation box-plots for sub-basin 1BC
Figure A2-9: Precipitation box-plots for sub-basin 1FF
Figure A2-8: Precipitation box-plots for sub-basin 1CB
Figure A2-10: Precipitation box-plots for sub-basin 1EF
0
50
100
150
200
250
300
350
Jan
JanC
CF
eb
Feb
CC
Ma
rM
arC
CA
pr
AprC
CM
ay
Ma
yC
CJun
JunC
CJul
JulC
CA
ug
AugC
CS
ep
SepC
CO
ct
OctC
CN
ov
No
vC
CD
ec
De
cC
C
Pre
cip
itati
on
(m
m)
3Q Box
2Q Box
Mean
0
100
200
300
400
500
600
Jan
JanC
CF
eb
Feb
CC
Ma
rM
arC
CA
pr
AprC
CM
ay
Ma
yC
CJun
JunC
CJul
JulC
CA
ug
AugC
CS
ep
SepC
CO
ct
OctC
CN
ov
No
vC
CD
ec
De
cC
C
Pre
cip
itati
on
(m
m)
3Q Box
2Q Box
Mean
0
50
100
150
200
250
300
350
400
Jan
JanC
CF
eb
Feb
CC
Ma
rM
arC
CA
pr
AprC
CM
ay
Ma
y…
Jun
JunC
CJul
JulC
CA
ug
Aug…
Sep
Sep…
Oct
OctC
CN
ov
No
v…
De
cD
ec…
Pre
cip
itati
on
(m
m)
3Q Box
2Q Box
Mean
0
50
100
150
200
250
300
350
Jan
JanC
CF
eb
Feb
CC
Ma
rM
arC
CA
pr
AprC
CM
ay
Ma
yC
CJun
JunC
CJul
JulC
CA
ug
AugC
CS
ep
SepC
CO
ct
OctC
CN
ov
No
vC
CD
ec
De
cC
C
Pre
cip
itati
on
(m
m)
3Q Box
2Q Box
Mean
a)
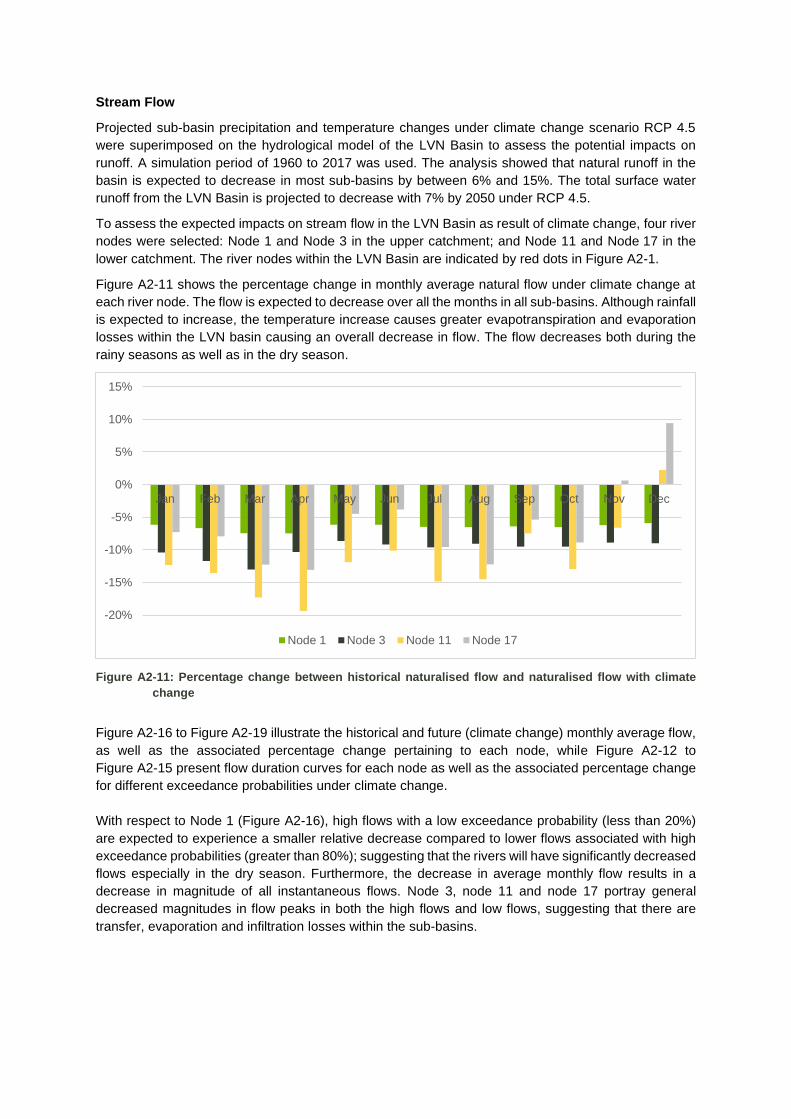
Stream Flow
Projected sub-basin precipitation and temperature changes under climate change scenario RCP 4.5
were superimposed on the hydrological model of the LVN Basin to assess the potential impacts on
runoff. A simulation period of 1960 to 2017 was used. The analysis showed that natural runoff in the
basin is expected to decrease in most sub-basins by between 6% and 15%. The total surface water
runoff from the LVN Basin is projected to decrease with 7% by 2050 under RCP 4.5.
To assess the expected impacts on stream flow in the LVN Basin as result of climate change, four river
nodes were selected: Node 1 and Node 3 in the upper catchment; and Node 11 and Node 17 in the
lower catchment. The river nodes within the LVN Basin are indicated by red dots in Figure A2-1.
Figure A2-11 shows the percentage change in monthly average natural flow under climate change at
each river node. The flow is expected to decrease over all the months in all sub-basins. Although rainfall
is expected to increase, the temperature increase causes greater evapotranspiration and evaporation
losses within the LVN basin causing an overall decrease in flow. The flow decreases both during the
rainy seasons as well as in the dry season.
Figure A2-11: Percentage change between historical naturalised flow and naturalised flow with climate
change
Figure A2-16 to Figure A2-19 illustrate the historical and future (climate change) monthly average flow,
as well as the associated percentage change pertaining to each node, while Figure A2-12 to
Figure A2-15 present flow duration curves for each node as well as the associated percentage change
for different exceedance probabilities under climate change.
With respect to Node 1 (Figure A2-16), high flows with a low exceedance probability (less than 20%)
are expected to experience a smaller relative decrease compared to lower flows associated with high
exceedance probabilities (greater than 80%); suggesting that the rivers will have significantly decreased
flows especially in the dry season. Furthermore, the decrease in average monthly flow results in a
decrease in magnitude of all instantaneous flows. Node 3, node 11 and node 17 portray general
decreased magnitudes in flow peaks in both the high flows and low flows, suggesting that there are
transfer, evaporation and infiltration losses within the sub-basins.
-20%
-15%
-10%
-5%
0%
5%
10%
15%
Jan Feb Mar Apr May Jun Jul Aug Sep Oct Nov Dec
Node 1 Node 3 Node 11 Node 17
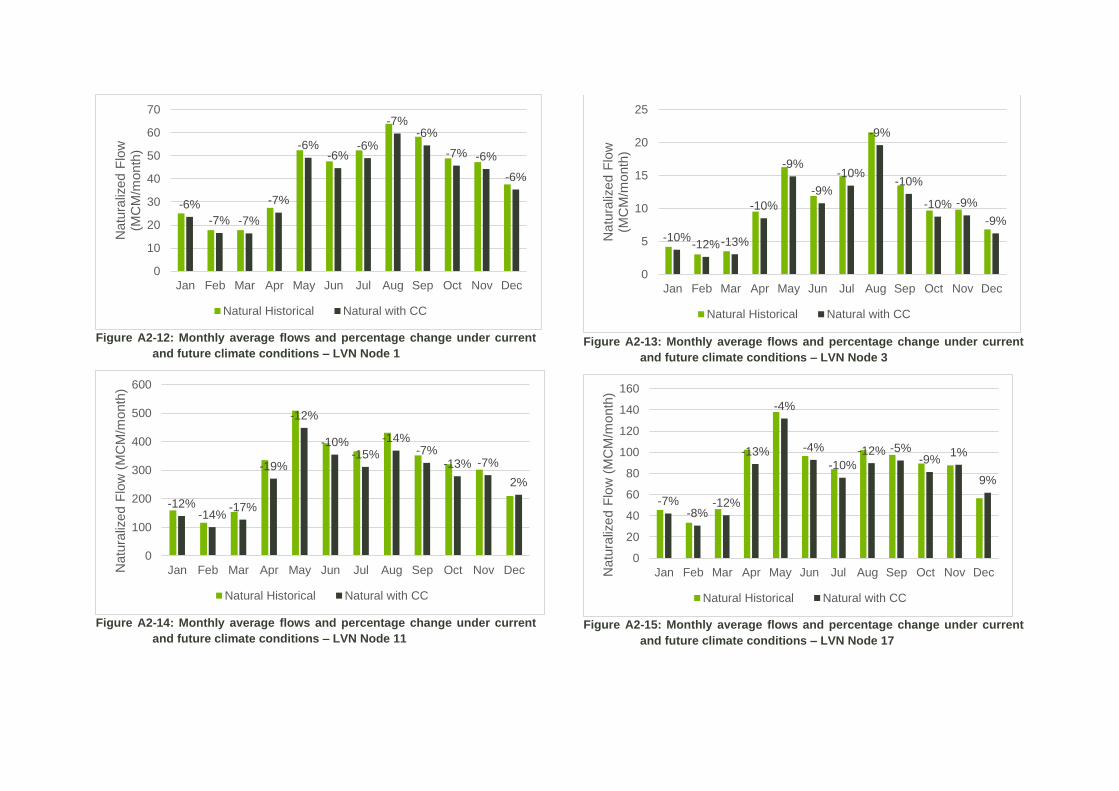
Figure A2-12: Monthly average flows and percentage change under current
and future climate conditions – LVN Node 1
Figure A2-14: Monthly average flows and percentage change under current
and future climate conditions – LVN Node 11
Figure A2-13: Monthly average flows and percentage change under current
and future climate conditions – LVN Node 3
Figure A2-15: Monthly average flows and percentage change under current
and future climate conditions – LVN Node 17
-6%
-7% -7%
-7%
-6%-6%
-6%
-7%-6%
-7% -6%
-6%
0
10
20
30
40
50
60
70
Jan Feb Mar Apr May Jun Jul Aug Sep Oct Nov Dec
Natu
raliz
ed F
low
(M
CM
/month
)
Natural Historical Natural with CC
-12%-14%
-17%
-19%
-12%
-10%-15%
-14%-7%
-13% -7%
2%
0
100
200
300
400
500
600
Jan Feb Mar Apr May Jun Jul Aug Sep Oct Nov DecNatu
raliz
ed F
low
(M
CM
/month
)
Natural Historical Natural with CC
-10%-12%-13%
-10%
-9%
-9%
-10%
-9%
-10%
-10% -9%
-9%
0
5
10
15
20
25
Jan Feb Mar Apr May Jun Jul Aug Sep Oct Nov Dec
Natu
raliz
ed F
low
(M
CM
/month
)
Natural Historical Natural with CC
-7%-8%
-12%
-13%
-4%
-4%
-10%
-12% -5%-9%
1%
9%
0
20
40
60
80
100
120
140
160
Jan Feb Mar Apr May Jun Jul Aug Sep Oct Nov DecNatu
raliz
ed F
low
(M
CM
/month
)Natural Historical Natural with CC
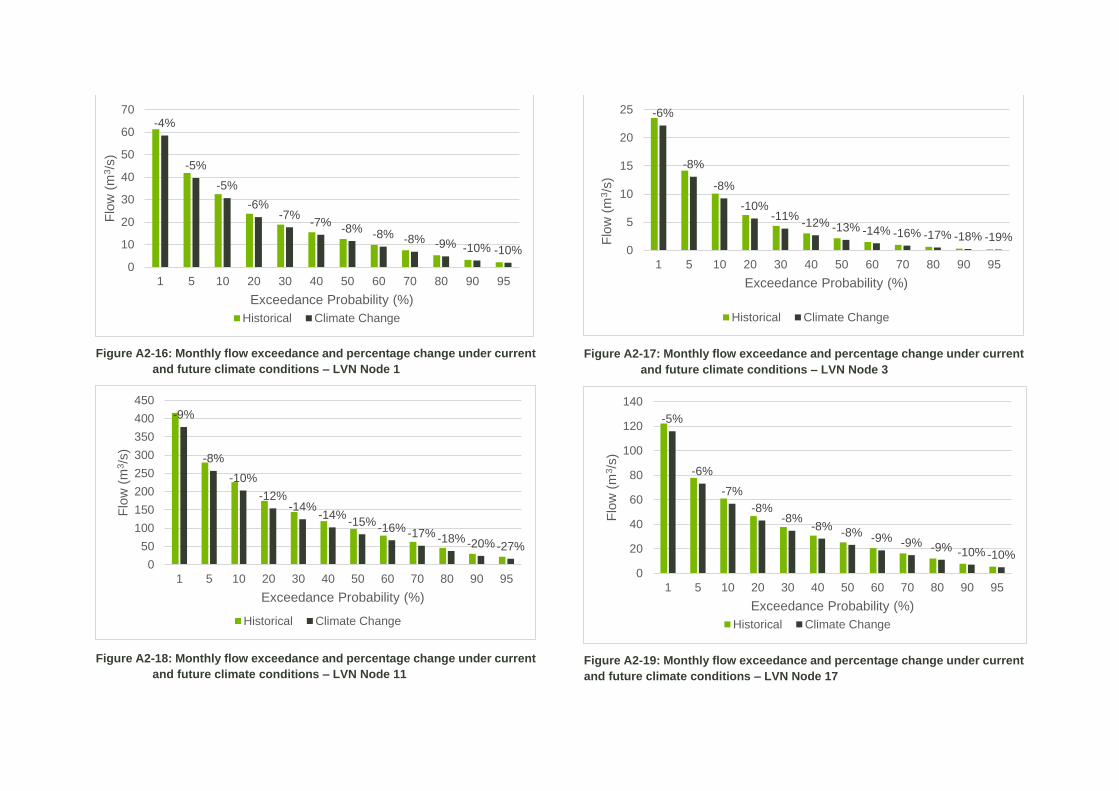
Figure A2-16: Monthly flow exceedance and percentage change under current
and future climate conditions – LVN Node 1
Figure A2-18: Monthly flow exceedance and percentage change under current
and future climate conditions – LVN Node 11
Figure A2-17: Monthly flow exceedance and percentage change under current
and future climate conditions – LVN Node 3
Figure A2-19: Monthly flow exceedance and percentage change under current
and future climate conditions – LVN Node 17
-4%
-5%
-5%
-6%-7%
-7%-8% -8% -8% -9% -10% -10%
0
10
20
30
40
50
60
70
1 5 10 20 30 40 50 60 70 80 90 95
Flo
w (
m3/s
)
Exceedance Probability (%)
Historical Climate Change
-9%
-8%
-10%
-12%-14%
-14%-15%
-16% -17% -18% -20% -27%
0
50
100
150
200
250
300
350
400
450
1 5 10 20 30 40 50 60 70 80 90 95
Flo
w (
m3/s
)
Exceedance Probability (%)
Historical Climate Change
-6%
-8%
-8%
-10%-11%
-12% -13% -14% -16% -17% -18% -19%0
5
10
15
20
25
1 5 10 20 30 40 50 60 70 80 90 95
Flo
w (
m3/s
)
Exceedance Probability (%)
Historical Climate Change
-5%
-6%
-7%
-8%-8%
-8%-8% -9% -9% -9% -10% -10%
0
20
40
60
80
100
120
140
1 5 10 20 30 40 50 60 70 80 90 95
Flo
w (
m3/s
)Exceedance Probability (%)
Historical Climate Change
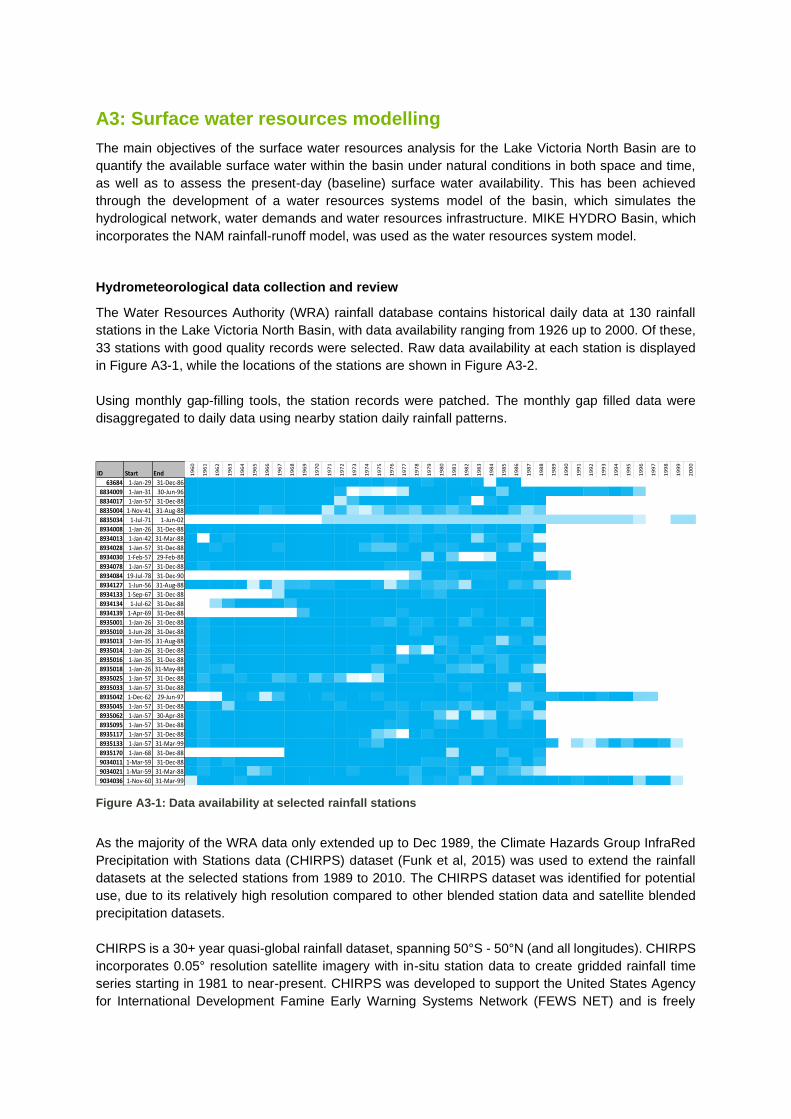
A3: Surface water resources modelling
The main objectives of the surface water resources analysis for the Lake Victoria North Basin are to
quantify the available surface water within the basin under natural conditions in both space and time,
as well as to assess the present-day (baseline) surface water availability. This has been achieved
through the development of a water resources systems model of the basin, which simulates the
hydrological network, water demands and water resources infrastructure. MIKE HYDRO Basin, which
incorporates the NAM rainfall-runoff model, was used as the water resources system model.
Hydrometeorological data collection and review
The Water Resources Authority (WRA) rainfall database contains historical daily data at 130 rainfall
stations in the Lake Victoria North Basin, with data availability ranging from 1926 up to 2000. Of these,
33 stations with good quality records were selected. Raw data availability at each station is displayed
in Figure A3-1, while the locations of the stations are shown in Figure A3-2.
Using monthly gap-filling tools, the station records were patched. The monthly gap filled data were
disaggregated to daily data using nearby station daily rainfall patterns.
Figure A3-1: Data availability at selected rainfall stations
As the majority of the WRA data only extended up to Dec 1989, the Climate Hazards Group InfraRed
Precipitation with Stations data (CHIRPS) dataset (Funk et al, 2015) was used to extend the rainfall
datasets at the selected stations from 1989 to 2010. The CHIRPS dataset was identified for potential
use, due to its relatively high resolution compared to other blended station data and satellite blended
precipitation datasets.
CHIRPS is a 30+ year quasi-global rainfall dataset, spanning 50°S - 50°N (and all longitudes). CHIRPS
incorporates 0.05° resolution satellite imagery with in-situ station data to create gridded rainfall time
series starting in 1981 to near-present. CHIRPS was developed to support the United States Agency
for International Development Famine Early Warning Systems Network (FEWS NET) and is freely
ID Start End 19
60
19
61
19
62
19
63
19
64
19
65
19
66
19
67
19
68
19
69
19
70
19
71
19
72
19
73
19
74
19
75
19
76
19
77
19
78
19
79
19
80
19
81
19
82
19
83
19
84
19
85
19
86
19
87
19
88
19
89
19
90
19
91
19
92
19
93
19
94
19
95
19
96
19
97
19
98
19
99
20
00
63684 1-Jan-29 31-Dec-86
8834009 1-Jan-31 30-Jun-96
8834017 1-Jan-57 31-Dec-88
8835004 1-Nov-41 31-Aug-88
8835034 1-Jul-71 1-Jun-02
8934008 1-Jan-26 31-Dec-88
8934013 1-Jan-42 31-Mar-88
8934028 1-Jan-57 31-Dec-88
8934030 1-Feb-57 29-Feb-88
8934078 1-Jan-57 31-Dec-88
8934084 19-Jul-78 31-Dec-90
8934127 1-Jun-56 31-Aug-88
8934133 1-Sep-67 31-Dec-88
8934134 1-Jul-62 31-Dec-88
8934139 1-Apr-69 31-Dec-88
8935001 1-Jan-26 31-Dec-88
8935010 1-Jun-28 31-Dec-88
8935013 1-Jan-35 31-Aug-88
8935014 1-Jan-26 31-Dec-88
8935016 1-Jan-35 31-Dec-88
8935018 1-Jan-26 31-May-88
8935025 1-Jan-57 31-Dec-88
8935033 1-Jan-57 31-Dec-88
8935042 1-Dec-62 29-Jun-97
8935045 1-Jan-57 31-Dec-88
8935062 1-Jan-57 30-Apr-88
8935095 1-Jan-57 31-Dec-88
8935117 1-Jan-57 31-Dec-88
8935133 1-Jan-57 31-Mar-99
8935170 1-Jan-68 31-Dec-88
9034011 1-Mar-59 31-Dec-88
9034021 1-Mar-59 31-Mar-88
9034036 1-Nov-60 31-Mar-99

available. CHIRPS data been used in studies to quantify the hydrologic impacts of decreasing
precipitation and rising air temperatures in the Greater Horn of Africa, as well as support effective
hydrologic forecasts and trend analyses in south-eastern Ethiopia (Funk, et al., 2015). CHIRPS daily
precipitation data (Jan 1989 - Jan 2017) were extracted for multiple 0.05° grid cells corresponding to
selected rainfall stations locations. The extracted CHIRPS records were used to extend the gap-filled
observed rainfall records providing point rainfall time series for the period from Jan 1960 to Jan 2017.
Due to the relatively few rainfall stations in the Lake Victoria North Basin, as well as the limited
availability of high elevation and near recent observed precipitation data, a Mean Annual Precipitation
(MAP) surface for the basin was generated using the CHIRPS rainfall dataset (see Figure A3-3).
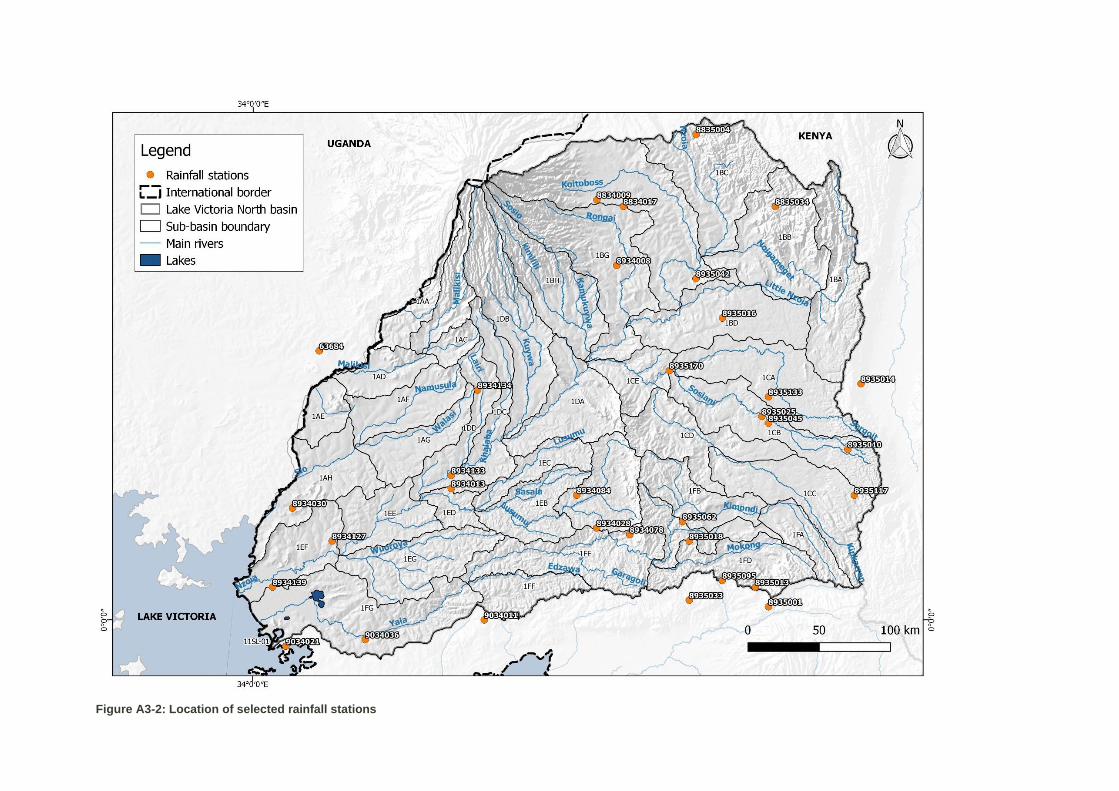
Figure A3-2: Location of selected rainfall stations
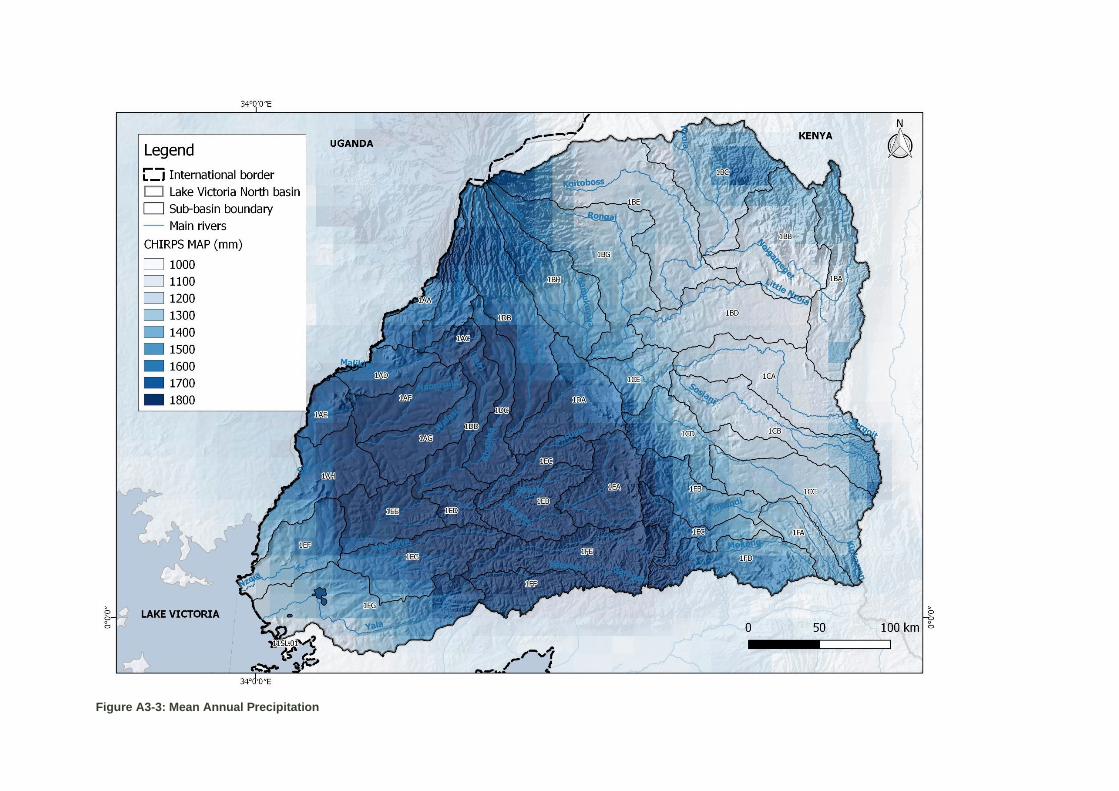
Figure A3-3: Mean Annual Precipitation
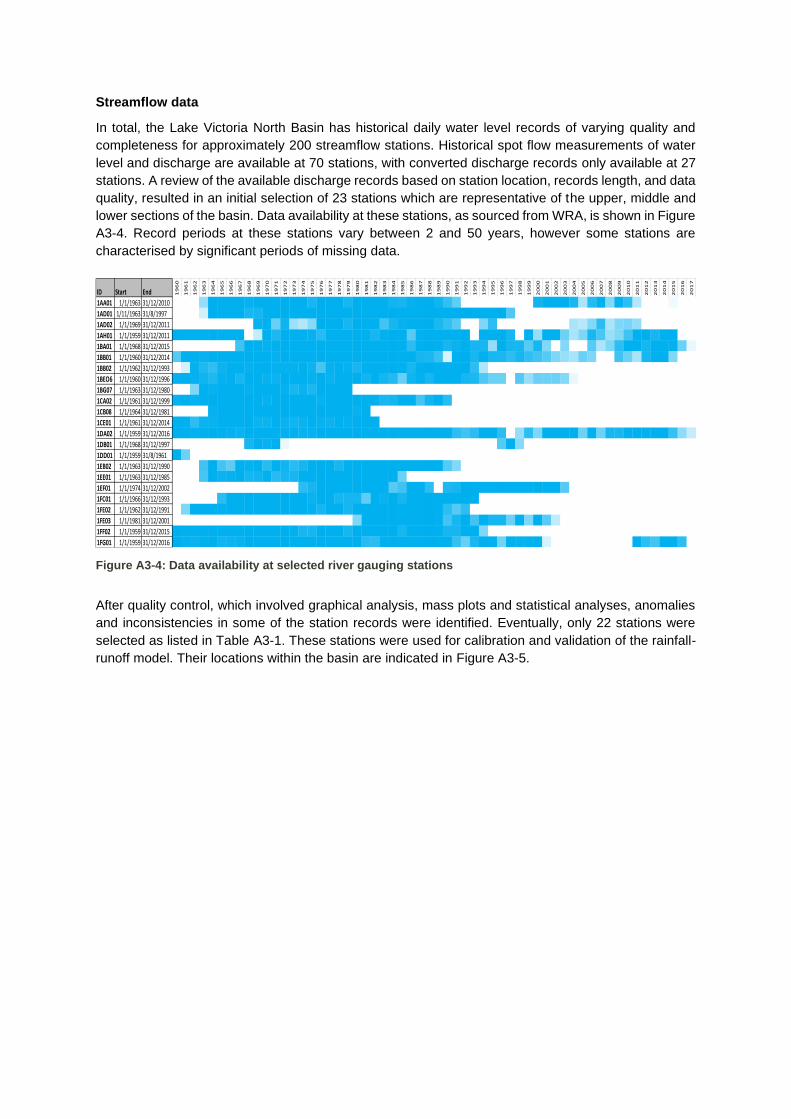
Streamflow data
In total, the Lake Victoria North Basin has historical daily water level records of varying quality and
completeness for approximately 200 streamflow stations. Historical spot flow measurements of water
level and discharge are available at 70 stations, with converted discharge records only available at 27
stations. A review of the available discharge records based on station location, records length, and data
quality, resulted in an initial selection of 23 stations which are representative of the upper, middle and
lower sections of the basin. Data availability at these stations, as sourced from WRA, is shown in Figure
A3-4. Record periods at these stations vary between 2 and 50 years, however some stations are
characterised by significant periods of missing data.
Figure A3-4: Data availability at selected river gauging stations
After quality control, which involved graphical analysis, mass plots and statistical analyses, anomalies
and inconsistencies in some of the station records were identified. Eventually, only 22 stations were
selected as listed in Table A3-1. These stations were used for calibration and validation of the rainfall-
runoff model. Their locations within the basin are indicated in Figure A3-5.
ID Start End 19
60
19
61
19
62
19
63
19
64
19
65
19
66
19
67
19
68
19
69
19
70
19
71
19
72
19
73
19
74
19
75
19
76
19
77
19
78
19
79
19
80
19
81
19
82
19
83
19
84
19
85
19
86
19
87
19
88
19
89
19
90
19
91
19
92
19
93
19
94
19
95
19
96
19
97
19
98
19
99
20
00
20
01
20
02
20
03
20
04
20
05
20
06
20
07
20
08
20
09
20
10
20
11
20
12
20
13
20
14
20
15
20
16
20
17
1AA01 1/1/1963 31/12/2010
1AD01 1/11/1963 31/8/1997
1AD02 1/1/1969 31/12/2011
1AH01 1/1/1959 31/12/2011
1BA01 1/1/1968 31/12/2015
1BB01 1/1/1960 31/12/2014
1BB02 1/1/1962 31/12/1993
1BEO6 1/1/1960 31/12/1996
1BG07 1/1/1963 31/12/1980
1CA02 1/1/1961 31/12/1999
1CB08 1/1/1964 31/12/1981
1CE01 1/1/1961 31/12/2014
1DA02 1/1/1959 31/12/2016
1DB01 1/1/1968 31/12/1997
1DD01 1/1/1959 31/8/1961
1EB02 1/1/1963 31/12/1990
1EE01 1/1/1963 31/12/1985
1EF01 1/1/1974 31/12/2002
1FC01 1/1/1966 31/12/1993
1FE02 1/1/1962 31/12/1991
1FE03 1/1/1981 31/12/2001
1FF02 1/1/1959 31/12/2015
1FG01 1/1/1959 31/12/2016
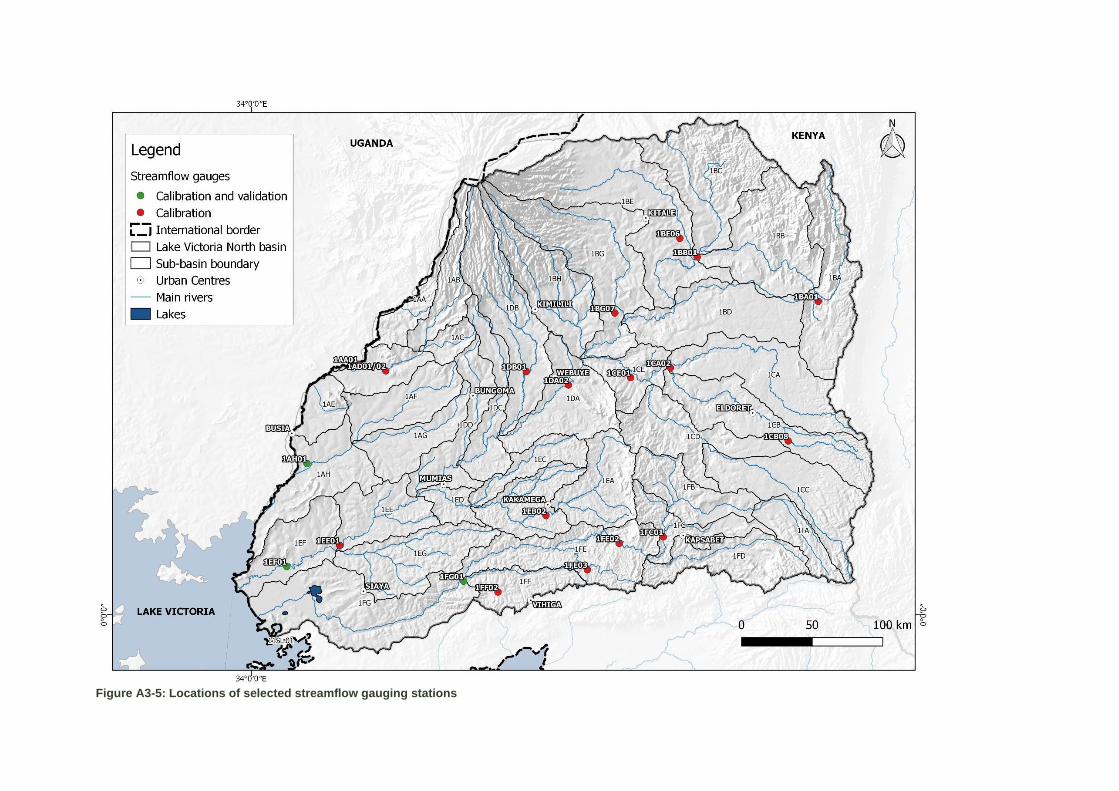
Figure A3-5: Locations of selected streamflow gauging stations
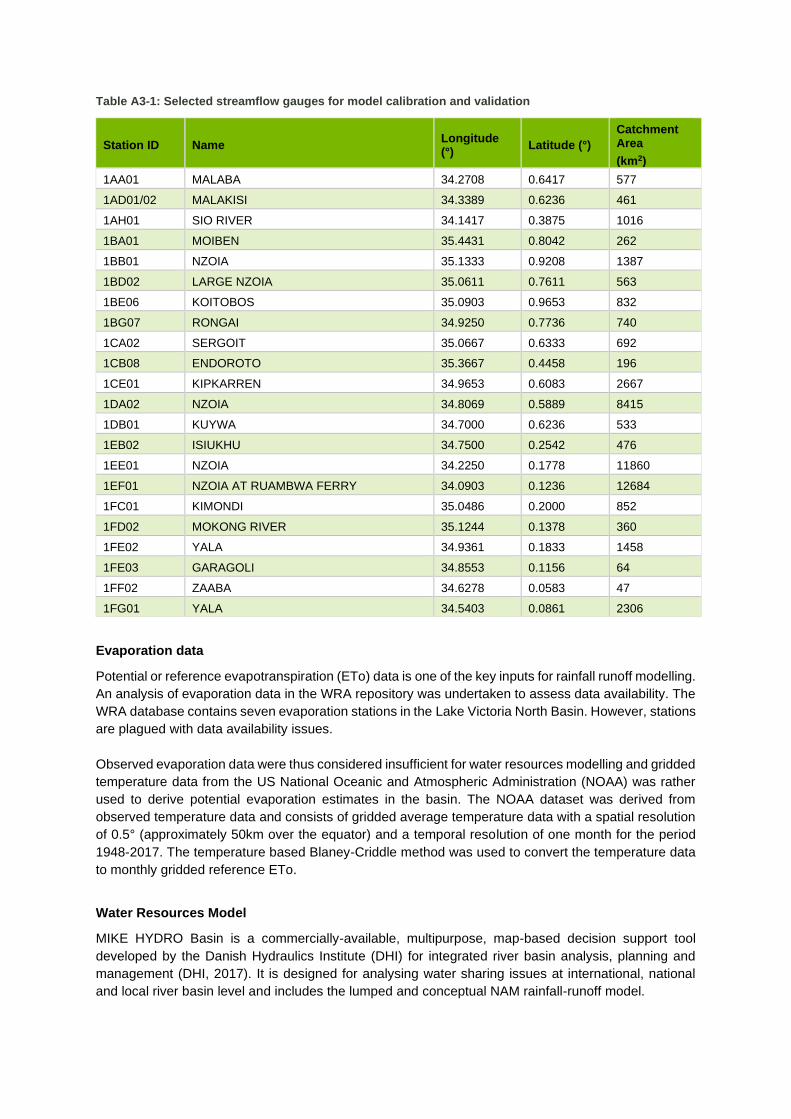
Table A3-1: Selected streamflow gauges for model calibration and validation
Station ID Name Longitude (°)
Latitude (°)
Catchment Area
(km2)
1AA01 MALABA 34.2708 0.6417 577
1AD01/02 MALAKISI 34.3389 0.6236 461
1AH01 SIO RIVER 34.1417 0.3875 1016
1BA01 MOIBEN 35.4431 0.8042 262
1BB01 NZOIA 35.1333 0.9208 1387
1BD02 LARGE NZOIA 35.0611 0.7611 563
1BE06 KOITOBOS 35.0903 0.9653 832
1BG07 RONGAI 34.9250 0.7736 740
1CA02 SERGOIT 35.0667 0.6333 692
1CB08 ENDOROTO 35.3667 0.4458 196
1CE01 KIPKARREN 34.9653 0.6083 2667
1DA02 NZOIA 34.8069 0.5889 8415
1DB01 KUYWA 34.7000 0.6236 533
1EB02 ISIUKHU 34.7500 0.2542 476
1EE01 NZOIA 34.2250 0.1778 11860
1EF01 NZOIA AT RUAMBWA FERRY 34.0903 0.1236 12684
1FC01 KIMONDI 35.0486 0.2000 852
1FD02 MOKONG RIVER 35.1244 0.1378 360
1FE02 YALA 34.9361 0.1833 1458
1FE03 GARAGOLI 34.8553 0.1156 64
1FF02 ZAABA 34.6278 0.0583 47
1FG01 YALA 34.5403 0.0861 2306
Evaporation data
Potential or reference evapotranspiration (ETo) data is one of the key inputs for rainfall runoff modelling.
An analysis of evaporation data in the WRA repository was undertaken to assess data availability. The
WRA database contains seven evaporation stations in the Lake Victoria North Basin. However, stations
are plagued with data availability issues.
Observed evaporation data were thus considered insufficient for water resources modelling and gridded
temperature data from the US National Oceanic and Atmospheric Administration (NOAA) was rather
used to derive potential evaporation estimates in the basin. The NOAA dataset was derived from
observed temperature data and consists of gridded average temperature data with a spatial resolution
of 0.5° (approximately 50km over the equator) and a temporal resolution of one month for the period
1948-2017. The temperature based Blaney-Criddle method was used to convert the temperature data
to monthly gridded reference ETo.
Water Resources Model
MIKE HYDRO Basin is a commercially-available, multipurpose, map-based decision support tool
developed by the Danish Hydraulics Institute (DHI) for integrated river basin analysis, planning and
management (DHI, 2017). It is designed for analysing water sharing issues at international, national
and local river basin level and includes the lumped and conceptual NAM rainfall-runoff model.
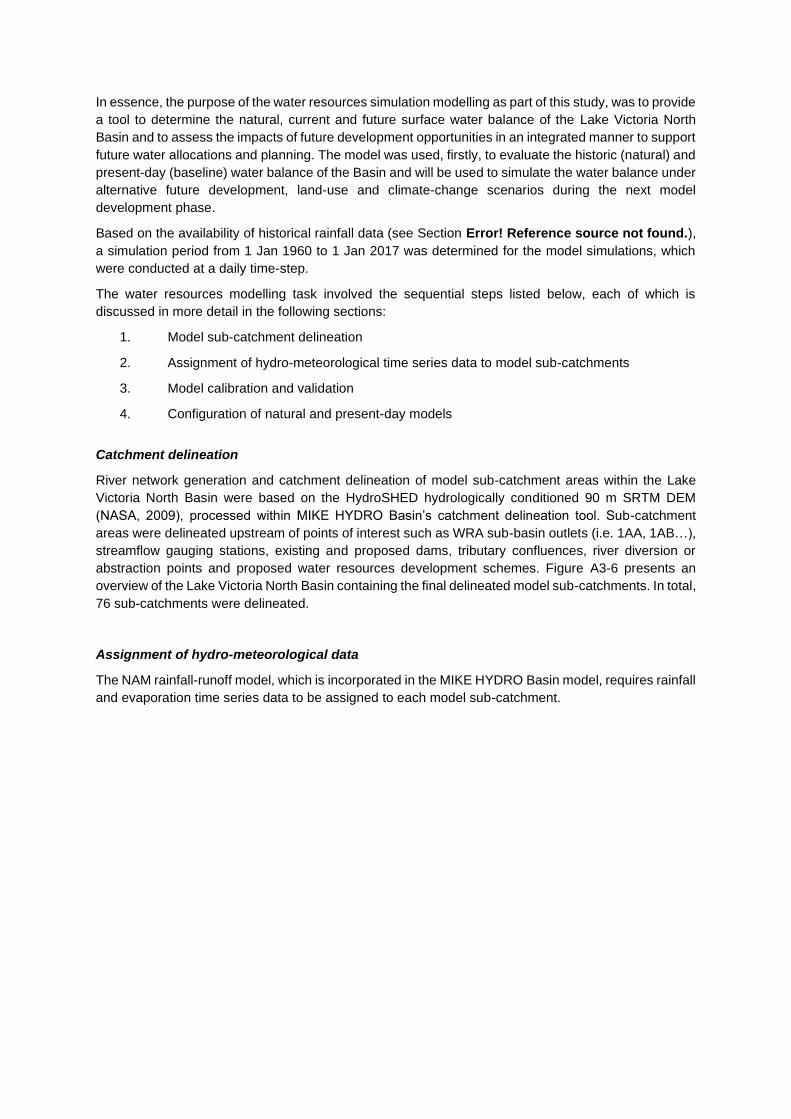
In essence, the purpose of the water resources simulation modelling as part of this study, was to provide
a tool to determine the natural, current and future surface water balance of the Lake Victoria North
Basin and to assess the impacts of future development opportunities in an integrated manner to support
future water allocations and planning. The model was used, firstly, to evaluate the historic (natural) and
present-day (baseline) water balance of the Basin and will be used to simulate the water balance under
alternative future development, land-use and climate-change scenarios during the next model
development phase.
Based on the availability of historical rainfall data (see Section Error! Reference source not found.),
a simulation period from 1 Jan 1960 to 1 Jan 2017 was determined for the model simulations, which
were conducted at a daily time-step.
The water resources modelling task involved the sequential steps listed below, each of which is
discussed in more detail in the following sections:
1. Model sub-catchment delineation
2. Assignment of hydro-meteorological time series data to model sub-catchments
3. Model calibration and validation
4. Configuration of natural and present-day models
Catchment delineation
River network generation and catchment delineation of model sub-catchment areas within the Lake
Victoria North Basin were based on the HydroSHED hydrologically conditioned 90 m SRTM DEM
(NASA, 2009), processed within MIKE HYDRO Basin’s catchment delineation tool. Sub-catchment
areas were delineated upstream of points of interest such as WRA sub-basin outlets (i.e. 1AA, 1AB…),
streamflow gauging stations, existing and proposed dams, tributary confluences, river diversion or
abstraction points and proposed water resources development schemes. Figure A3-6 presents an
overview of the Lake Victoria North Basin containing the final delineated model sub-catchments. In total,
76 sub-catchments were delineated.
Assignment of hydro-meteorological data
The NAM rainfall-runoff model, which is incorporated in the MIKE HYDRO Basin model, requires rainfall
and evaporation time series data to be assigned to each model sub-catchment.
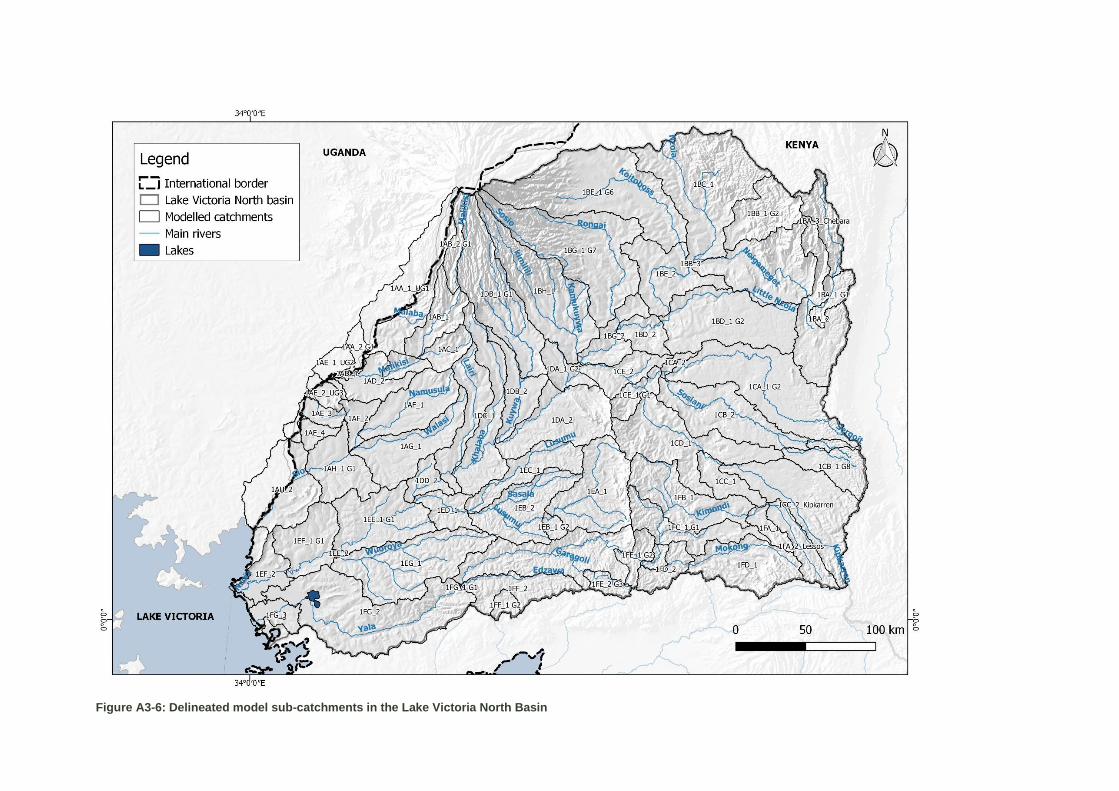
Figure A3-6: Delineated model sub-catchments in the Lake Victoria North Basin

The point rainfall data at the 33 rainfall stations across the Basin (see Section 2.1) were converted from
units of millimetres per day to % MAP per day for the simulation period (1960 – 2017). Point rainfall
time series were then converted to catchment (areal) rainfall time series with the use of Thiessen
Polygons, resulting in a single, daily % MAP file for each modelled sub-catchment. The conversion of
rainfall units from % MAP back to mm, was achieved though multiplication with the sub-catchment
MAPs extracted from the CHIRPS-based MAP coverage.
Based on the constructed ETo surface for the Lake Victoria North Basin as discussed in Section 0,
areal averaged monthly ETo values for each model sub-catchment were calculated and assigned. An
example of calculated daily ETo values at locations in the upper, middle and lower regions of each of
the main rivers of are shown below shown in Figure A3-7.
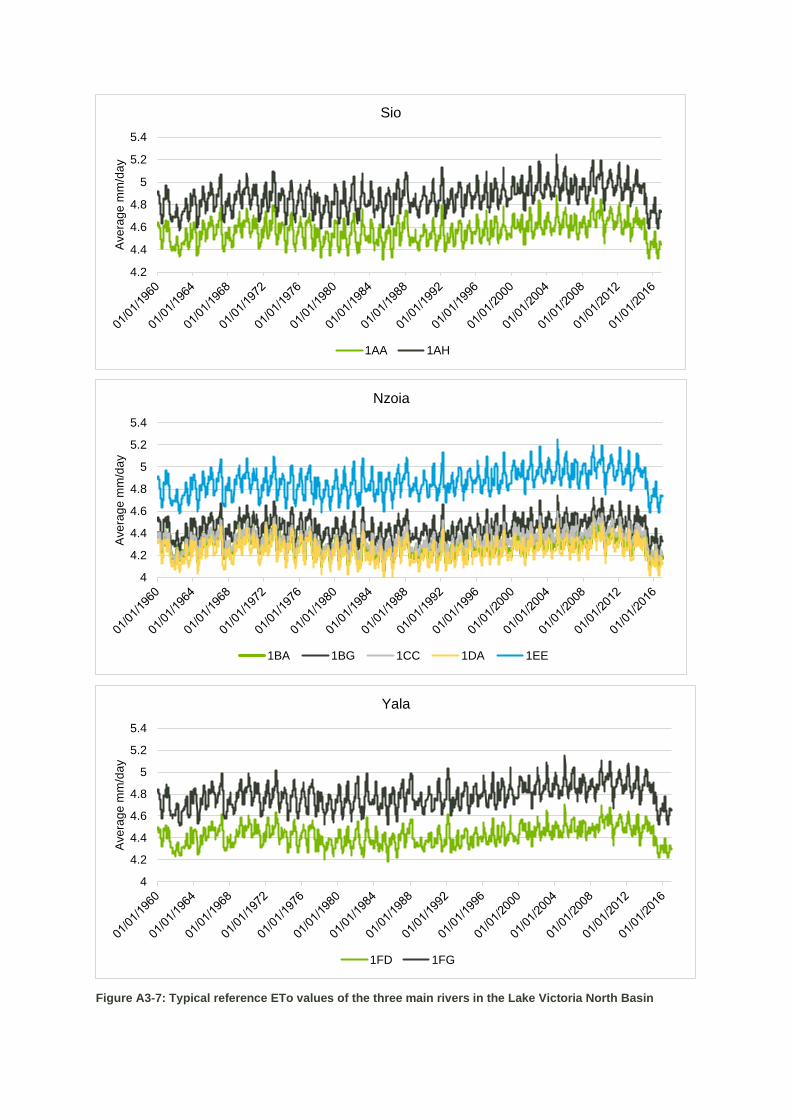
Figure A3-7: Typical reference ETo values of the three main rivers in the Lake Victoria North Basin
4.2
4.4
4.6
4.8
5
5.2
5.4
Ave
rag
e m
m/d
ay
Sio
1AA 1AH
4
4.2
4.4
4.6
4.8
5
5.2
5.4
Ave
rag
e m
m/d
ay
Nzoia
1BA 1BG 1CC 1DA 1EE
4
4.2
4.4
4.6
4.8
5
5.2
5.4
Ave
rag
e m
m/d
ay
Yala
1FD 1FG
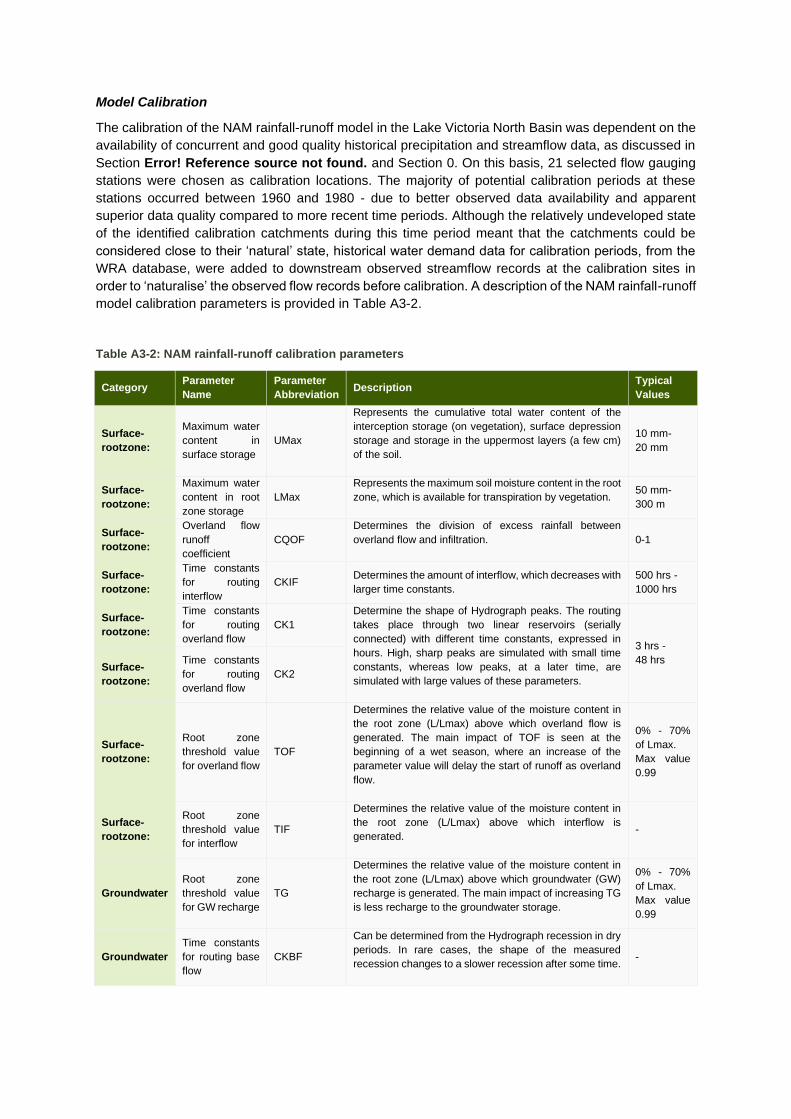
Model Calibration
The calibration of the NAM rainfall-runoff model in the Lake Victoria North Basin was dependent on the
availability of concurrent and good quality historical precipitation and streamflow data, as discussed in
Section Error! Reference source not found. and Section 0. On this basis, 21 selected flow gauging
stations were chosen as calibration locations. The majority of potential calibration periods at these
stations occurred between 1960 and 1980 - due to better observed data availability and apparent
superior data quality compared to more recent time periods. Although the relatively undeveloped state
of the identified calibration catchments during this time period meant that the catchments could be
considered close to their ‘natural’ state, historical water demand data for calibration periods, from the
WRA database, were added to downstream observed streamflow records at the calibration sites in
order to ‘naturalise’ the observed flow records before calibration. A description of the NAM rainfall-runoff
model calibration parameters is provided in Table A3-2.
Table A3-2: NAM rainfall-runoff calibration parameters
Category Parameter
Name
Parameter
Abbreviation Description
Typical
Values
Surface-
rootzone:
Maximum water
content in
surface storage
UMax
Represents the cumulative total water content of the
interception storage (on vegetation), surface depression
storage and storage in the uppermost layers (a few cm)
of the soil.
10 mm-
20 mm
Surface-
rootzone:
Maximum water
content in root
zone storage
LMax
Represents the maximum soil moisture content in the root
zone, which is available for transpiration by vegetation.
50 mm-
300 m
Surface-
rootzone:
Overland flow
runoff
coefficient
CQOF
Determines the division of excess rainfall between
overland flow and infiltration.
0-1
Surface-
rootzone:
Time constants
for routing
interflow
CKIF Determines the amount of interflow, which decreases with
larger time constants.
500 hrs -
1000 hrs
Surface-
rootzone:
Time constants
for routing
overland flow
CK1
Determine the shape of Hydrograph peaks. The routing
takes place through two linear reservoirs (serially
connected) with different time constants, expressed in
hours. High, sharp peaks are simulated with small time
constants, whereas low peaks, at a later time, are
simulated with large values of these parameters.
3 hrs -
48 hrs Surface-
rootzone:
Time constants
for routing
overland flow
CK2
Surface-
rootzone:
Root zone
threshold value
for overland flow
TOF
Determines the relative value of the moisture content in
the root zone (L/Lmax) above which overland flow is
generated. The main impact of TOF is seen at the
beginning of a wet season, where an increase of the
parameter value will delay the start of runoff as overland
flow.
0% - 70%
of Lmax.
Max value
0.99
Surface-
rootzone:
Root zone
threshold value
for interflow
TIF
Determines the relative value of the moisture content in
the root zone (L/Lmax) above which interflow is
generated.
-
Groundwater
Root zone
threshold value
for GW recharge
TG
Determines the relative value of the moisture content in
the root zone (L/Lmax) above which groundwater (GW)
recharge is generated. The main impact of increasing TG
is less recharge to the groundwater storage.
0% - 70%
of Lmax.
Max value
0.99
Groundwater
Time constants
for routing base
flow
CKBF
Can be determined from the Hydrograph recession in dry
periods. In rare cases, the shape of the measured
recession changes to a slower recession after some time.
-
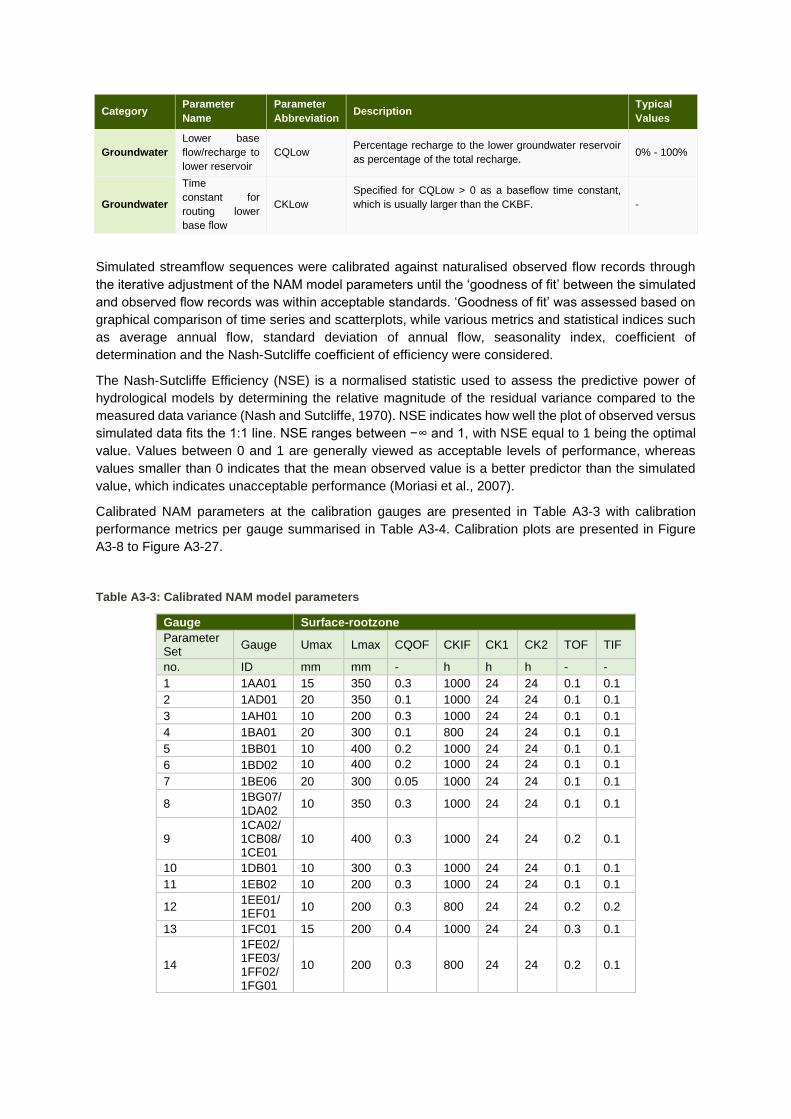
Category Parameter
Name
Parameter
Abbreviation Description
Typical
Values
Groundwater
Lower base
flow/recharge to
lower reservoir
CQLow Percentage recharge to the lower groundwater reservoir
as percentage of the total recharge. 0% - 100%
Groundwater
Time
constant for
routing lower
base flow
CKLow
Specified for CQLow > 0 as a baseflow time constant,
which is usually larger than the CKBF.
-
Simulated streamflow sequences were calibrated against naturalised observed flow records through
the iterative adjustment of the NAM model parameters until the ‘goodness of fit’ between the simulated
and observed flow records was within acceptable standards. ‘Goodness of fit’ was assessed based on
graphical comparison of time series and scatterplots, while various metrics and statistical indices such
as average annual flow, standard deviation of annual flow, seasonality index, coefficient of
determination and the Nash-Sutcliffe coefficient of efficiency were considered.
The Nash-Sutcliffe Efficiency (NSE) is a normalised statistic used to assess the predictive power of
hydrological models by determining the relative magnitude of the residual variance compared to the
measured data variance (Nash and Sutcliffe, 1970). NSE indicates how well the plot of observed versus
simulated data fits the 1:1 line. NSE ranges between −∞ and 1, with NSE equal to 1 being the optimal
value. Values between 0 and 1 are generally viewed as acceptable levels of performance, whereas
values smaller than 0 indicates that the mean observed value is a better predictor than the simulated
value, which indicates unacceptable performance (Moriasi et al., 2007).
Calibrated NAM parameters at the calibration gauges are presented in Table A3-3 with calibration
performance metrics per gauge summarised in Table A3-4. Calibration plots are presented in Figure
A3-8 to Figure A3-27.
Table A3-3: Calibrated NAM model parameters
Gauge Surface-rootzone
Parameter Set
Gauge Umax Lmax CQOF CKIF CK1 CK2 TOF TIF
no. ID mm mm - h h h - -
1 1AA01 15 350 0.3 1000 24 24 0.1 0.1
2 1AD01 20 350 0.1 1000 24 24 0.1 0.1
3 1AH01 10 200 0.3 1000 24 24 0.1 0.1
4 1BA01 20 300 0.1 800 24 24 0.1 0.1
5 1BB01 10 400 0.2 1000 24 24 0.1 0.1
6 1BD02 10 400 0.2 1000 24 24 0.1 0.1
7 1BE06 20 300 0.05 1000 24 24 0.1 0.1
8 1BG07/ 1DA02
10 350 0.3 1000 24 24 0.1 0.1
9 1CA02/ 1CB08/ 1CE01
10 400 0.3 1000 24 24 0.2 0.1
10 1DB01 10 300 0.3 1000 24 24 0.1 0.1
11 1EB02 10 200 0.3 1000 24 24 0.1 0.1
12 1EE01/1EF01
10 200 0.3 800 24 24 0.2 0.2
13 1FC01 15 200 0.4 1000 24 24 0.3 0.1
14
1FE02/ 1FE03/ 1FF02/ 1FG01
10 200 0.3 800 24 24 0.2 0.1
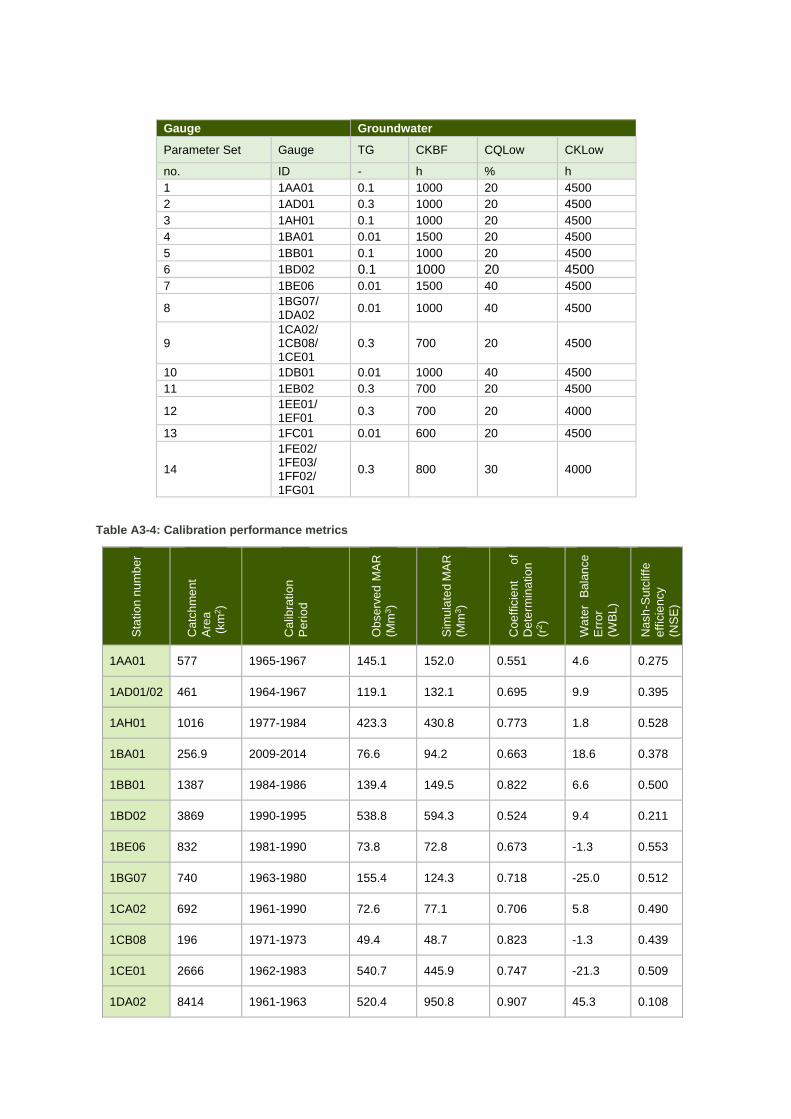
Gauge Groundwater
Parameter Set Gauge TG CKBF CQLow CKLow
no. ID - h % h
1 1AA01 0.1 1000 20 4500
2 1AD01 0.3 1000 20 4500
3 1AH01 0.1 1000 20 4500
4 1BA01 0.01 1500 20 4500
5 1BB01 0.1 1000 20 4500
6 1BD02 0.1 1000 20 4500
7 1BE06 0.01 1500 40 4500
8 1BG07/ 1DA02
0.01 1000 40 4500
9 1CA02/ 1CB08/ 1CE01
0.3 700 20 4500
10 1DB01 0.01 1000 40 4500
11 1EB02 0.3 700 20 4500
12 1EE01/ 1EF01
0.3 700 20 4000
13 1FC01 0.01 600 20 4500
14
1FE02/ 1FE03/ 1FF02/ 1FG01
0.3 800 30 4000
Table A3-4: Calibration performance metrics
Sta
tio
n n
um
be
r
Catc
hm
en
t
Are
a
(km
2)
Calib
ratio
n
Pe
rio
d
Ob
se
rve
d M
AR
(Mm
3)
Sim
ula
ted M
AR
(Mm
3)
Coe
ffic
ient
of
Dete
rmin
atio
n
(r2)
Wa
ter
Ba
lan
ce
Err
or
(WB
L)
Nash
-Su
tclif
fe
eff
icie
ncy
(NS
E)
1AA01 577 1965-1967 145.1 152.0 0.551 4.6 0.275
1AD01/02 461 1964-1967 119.1 132.1 0.695 9.9 0.395
1AH01 1016 1977-1984 423.3 430.8 0.773 1.8 0.528
1BA01 256.9 2009-2014 76.6 94.2 0.663 18.6 0.378
1BB01 1387 1984-1986 139.4 149.5 0.822 6.6 0.500
1BD02 3869 1990-1995 538.8 594.3 0.524 9.4 0.211
1BE06 832 1981-1990 73.8 72.8 0.673 -1.3 0.553
1BG07 740 1963-1980 155.4 124.3 0.718 -25.0 0.512
1CA02 692 1961-1990 72.6 77.1 0.706 5.8 0.490
1CB08 196 1971-1973 49.4 48.7 0.823 -1.3 0.439
1CE01 2666 1962-1983 540.7 445.9 0.747 -21.3 0.509
1DA02 8414 1961-1963 520.4 950.8 0.907 45.3 0.108
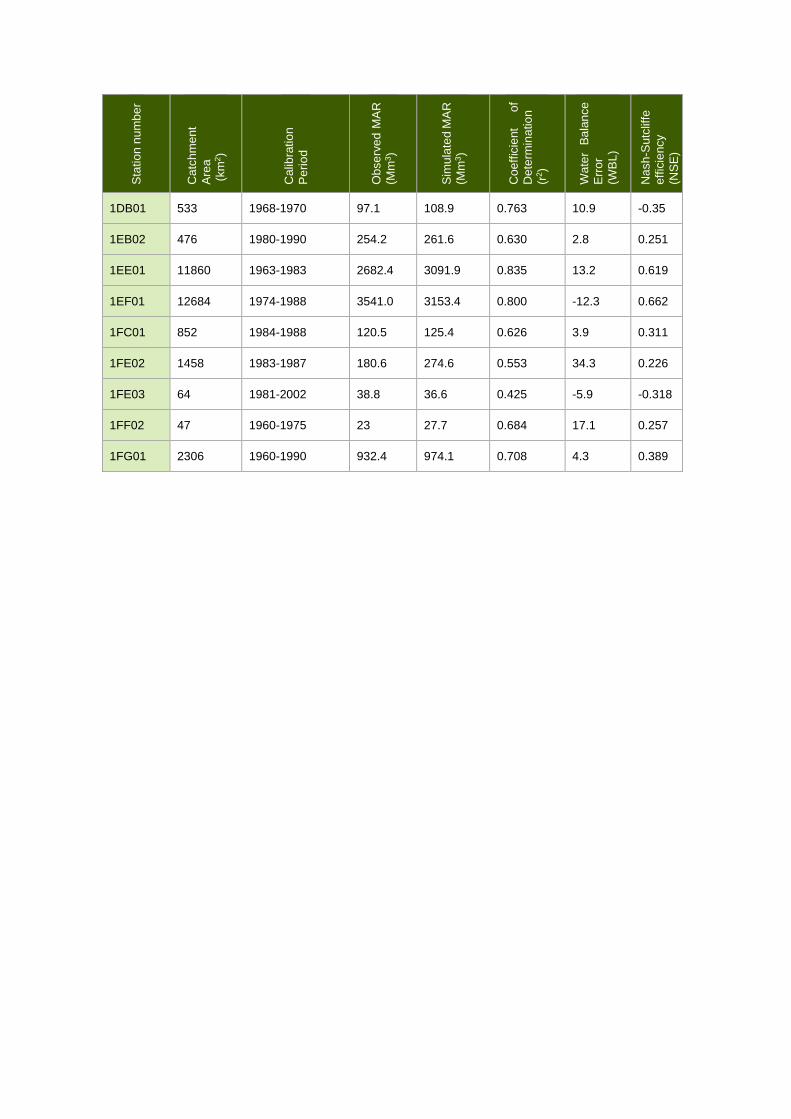
Sta
tio
n n
um
be
r
Ca
tch
me
nt
Are
a
(km
2)
Ca
libra
tio
n
Pe
rio
d
Ob
se
rve
d M
AR
(Mm
3)
Sim
ula
ted M
AR
(Mm
3)
Co
eff
icie
nt
of
De
term
ina
tio
n
(r2)
Wa
ter
Ba
lan
ce
Err
or
(WB
L)
Na
sh
-Su
tclif
fe
eff
icie
ncy
(NS
E)
1DB01 533 1968-1970 97.1 108.9 0.763 10.9 -0.35
1EB02 476 1980-1990 254.2 261.6 0.630 2.8 0.251
1EE01 11860 1963-1983 2682.4 3091.9 0.835 13.2 0.619
1EF01 12684 1974-1988 3541.0 3153.4 0.800 -12.3 0.662
1FC01 852 1984-1988 120.5 125.4 0.626 3.9 0.311
1FE02 1458 1983-1987 180.6 274.6 0.553 34.3 0.226
1FE03 64 1981-2002 38.8 36.6 0.425 -5.9 -0.318
1FF02 47 1960-1975 23 27.7 0.684 17.1 0.257
1FG01 2306 1960-1990 932.4 974.1 0.708 4.3 0.389
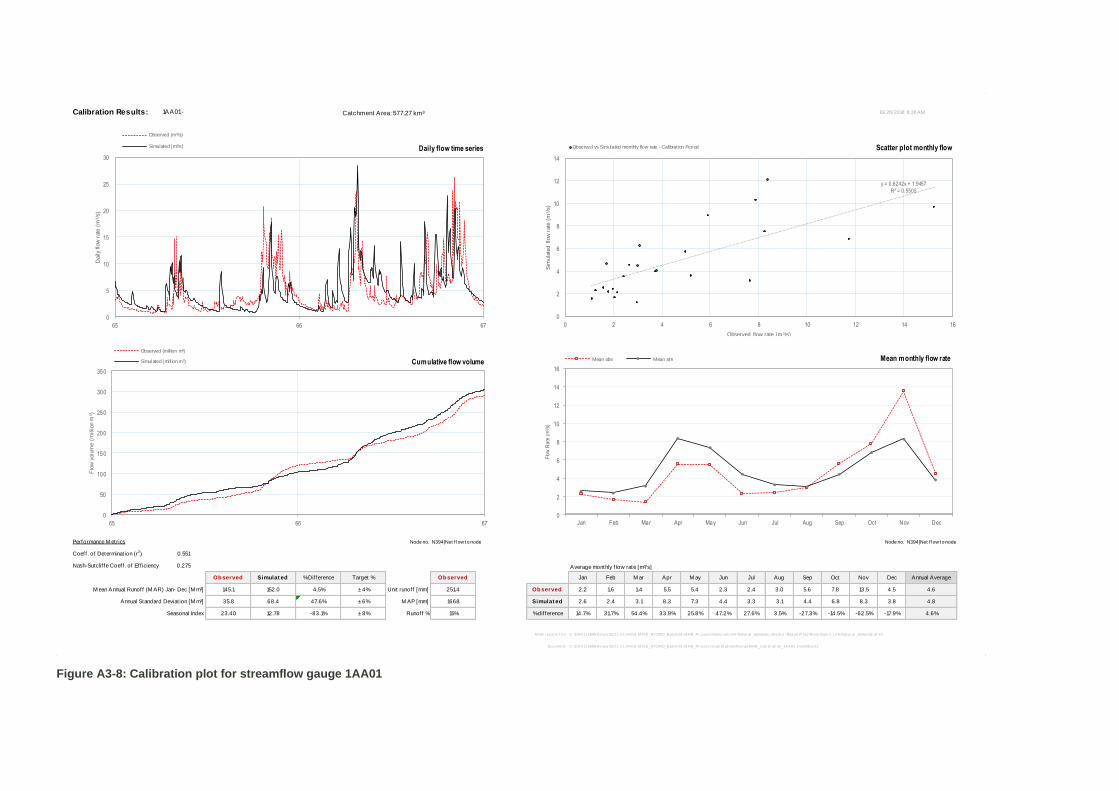
Figure A3-8: Calibration plot for streamflow gauge 1AA01
Calibration Results: 1AA01 - Catchment Area: 577.27 km³ 10/ 26/ 2018 8:36 AM
Performance M etrics Node no. N394|Net f low t o node Node no. N394|Net f low t o node
Coeff . of Determinat ion (r2) 0.551
Nash-Sutclif fe Coeff . of Eff iciency 0.275 Average monthly f low rate [m³/s]
Observed Simulat ed % Dif ference Target % Observed Jan Feb M ar Apr M ay Jun Jul Aug Sep Oct Nov Dec Annual Average
M ean Annual Runoff (M AR) Jan- Dec [M m³] 145.1 152.0 4.5% ± 4% Unit runoff [mm] 251.4 Observed 2.2 1.6 1.4 5.5 5.4 2.3 2.4 3.0 5.6 7.8 13.5 4.5 4.6
Annual Standard Deviat ion [M m³] 35.8 68.4 47.6% ± 6% M AP [mm] 1668 Simulat ed 2.6 2.4 3.1 8.3 7.3 4.4 3.3 3.1 4.4 6.8 8.3 3.8 4.8
Seasonal Index 23.40 12.78 -83.1% ± 8% Runoff % 15% % dif ference 14.7% 31.7% 54.4% 33.9% 25.8% 47.2% 27.6% 3.5% -27.3% -14.5% -62.5% -17.9% 4.6%
M HB r esul ts f i l e:
Document :
C: \DHI \113699 Kenya ISC\1.1-LVN\01-M IKE_HYDRO_Basi n\01-M HB_Pr oj ects\Natur al \LVN-Natur al _demands.mhydr o - Resul t Fi l es\Ri ver Basi n_LVN Natur al _demands.df s0
C: \DHI \113699 Kenya ISC\1.1-LVN\01-M IKE_HYDRO_Basi n\01-M HB_Pr oj ects\Cal i br at i on\Nzoi a\ [M HB_Cal i br at i on_1AA01.xl sm]Sheet1
0
5
10
15
20
25
30
65 66 67
Daily flo
w r
ate
(m
3/s
)
Observed (m³/s)
Simulated (m³/s)
0
50
100
150
200
250
300
350
65 66 67
Flo
w v
olu
me (
million m
3)
Observed (million m³)
Simulated (million m³)
y = 0.6242x + 1.9457
R² = 0.5505
0
2
4
6
8
10
12
14
0 2 4 6 8 10 12 14 16
Sim
ula
ted flow
rate
(m
3/s
)
Observed flow rate (m3/s)
Observed vs Simulated monthly flow rate - Calibration Period
0
2
4
6
8
10
12
14
16
Jan Feb Mar Apr May Jun Jul Aug Sep Oct Nov Dec
Flo
w R
ate
(m
3 /s)
Mean obs Mean sim
Scatter plot monthly flow
Mean monthly flow rateCumulative flow volume
Daily flow time series
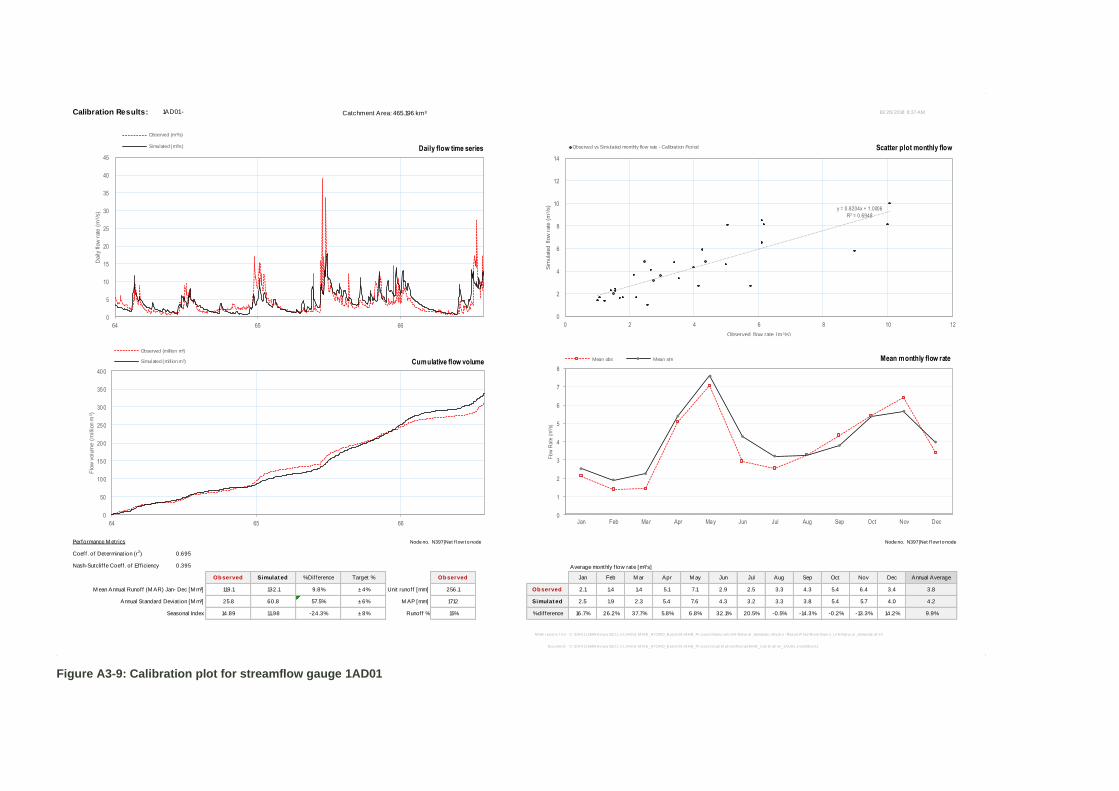
Figure A3-9: Calibration plot for streamflow gauge 1AD01
Calibration Results: 1AD01 - Catchment Area: 465.196 km³ 10/ 26/ 2018 8:37 AM
Performance M etrics Node no. N397|Net f low t o node Node no. N397|Net f low t o node
Coeff . of Determinat ion (r2) 0.695
Nash-Sutclif fe Coeff . of Eff iciency 0.395 Average monthly f low rate [m³/s]
Observed Simulat ed % Dif ference Target % Observed Jan Feb M ar Apr M ay Jun Jul Aug Sep Oct Nov Dec Annual Average
M ean Annual Runoff (M AR) Jan- Dec [M m³] 119.1 132.1 9.8% ± 4% Unit runoff [mm] 256.1 Observed 2.1 1.4 1.4 5.1 7.1 2.9 2.5 3.3 4.3 5.4 6.4 3.4 3.8
Annual Standard Deviat ion [M m³] 25.8 60.8 57.5% ± 6% M AP [mm] 1712 Simulat ed 2.5 1.9 2.3 5.4 7.6 4.3 3.2 3.3 3.8 5.4 5.7 4.0 4.2
Seasonal Index 14.89 11.98 -24.3% ± 8% Runoff % 15% % dif ference 16.7% 26.2% 37.7% 5.8% 6.8% 32.1% 20.5% -0.5% -14.3% -0.2% -13.3% 14.2% 9.9%
M HB r esul ts f i l e:
Document :
C: \DHI \113699 Kenya ISC\1.1-LVN\01-M IKE_HYDRO_Basi n\01-M HB_Pr oj ects\Natur al \LVN-Natur al _demands.mhydr o - Resul t Fi l es\Ri ver Basi n_LVN Natur al _demands.df s0
C: \DHI \113699 Kenya ISC\1.1-LVN\01-M IKE_HYDRO_Basi n\01-M HB_Pr oj ects\Cal i br at i on\Nzoi a\ [M HB_Cal i br at i on_1AD01.xl sm]Sheet1
0
5
10
15
20
25
30
35
40
45
64 65 66
Daily flo
w r
ate
(m
3/s
)
Observed (m³/s)
Simulated (m³/s)
0
50
100
150
200
250
300
350
400
64 65 66
Flo
w v
olu
me (
million m
3)
Observed (million m³)
Simulated (million m³)
y = 0.8204x + 1.0006
R² = 0.6948
0
2
4
6
8
10
12
14
0 2 4 6 8 10 12
Sim
ula
ted flow
rate
(m
3/s
)
Observed flow rate (m3/s)
Observed vs Simulated monthly flow rate - Calibration Period
0
1
2
3
4
5
6
7
8
Jan Feb Mar Apr May Jun Jul Aug Sep Oct Nov Dec
Flo
w R
ate
(m
3 /s)
Mean obs Mean sim
Scatter plot monthly flow
Mean monthly flow rateCumulative flow volume
Daily flow time series
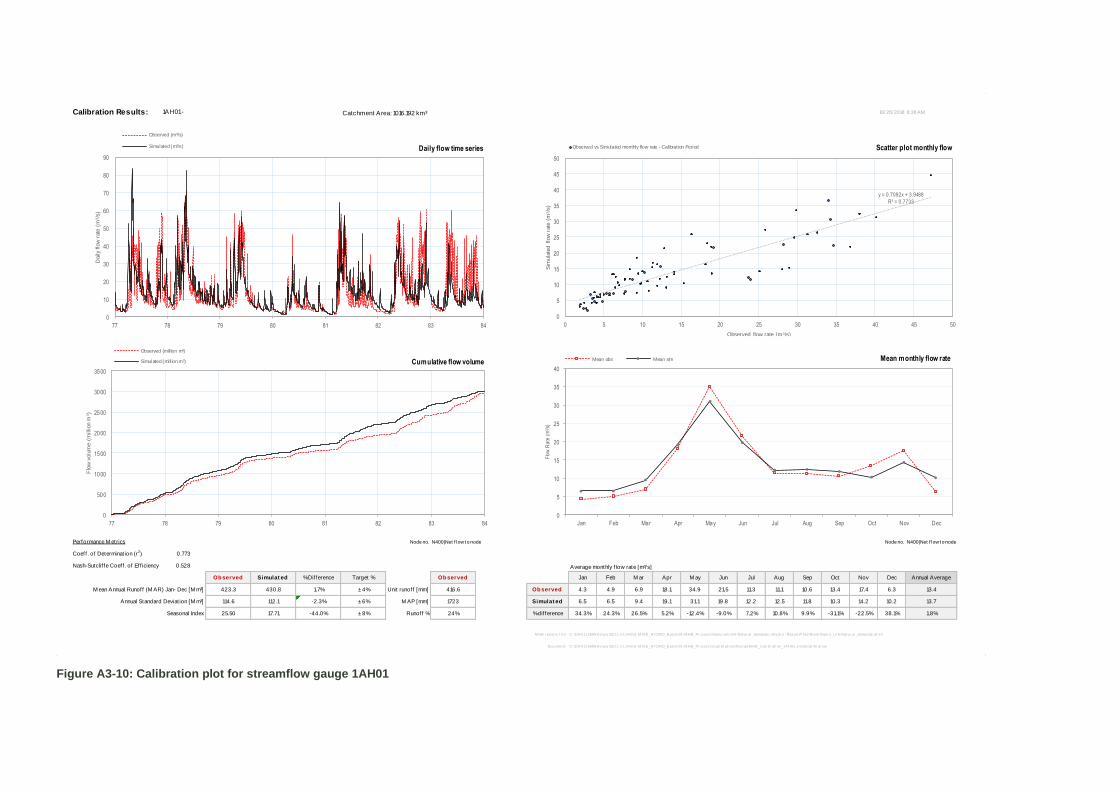
Figure A3-10: Calibration plot for streamflow gauge 1AH01
Calibration Results: 1AH01 - Catchment Area: 1016.192 km³ 10/ 26/ 2018 8:38 AM
Performance M etrics Node no. N400|Net f low t o node Node no. N400|Net f low t o node
Coeff . of Determinat ion (r2) 0.773
Nash-Sutclif fe Coeff . of Eff iciency 0.528 Average monthly f low rate [m³/s]
Observed Simulat ed % Dif ference Target % Observed Jan Feb M ar Apr M ay Jun Jul Aug Sep Oct Nov Dec Annual Average
M ean Annual Runoff (M AR) Jan- Dec [M m³] 423.3 430.8 1.7% ± 4% Unit runoff [mm] 416.6 Observed 4.3 4.9 6.9 18.1 34.9 21.5 11.3 11.1 10.6 13.4 17.4 6.3 13.4
Annual Standard Deviat ion [M m³] 114.6 112.1 -2.3% ± 6% M AP [mm] 1723 Simulat ed 6.5 6.5 9.4 19.1 31.1 19.8 12.2 12.5 11.8 10.3 14.2 10.2 13.7
Seasonal Index 25.50 17.71 -44.0% ± 8% Runoff % 24% % dif ference 34.3% 24.3% 26.5% 5.2% -12.4% -9.0% 7.2% 10.8% 9.9% -31.1% -22.5% 38.1% 1.8%
M HB r esul ts f i l e:
Document :
C: \DHI \113699 Kenya ISC\1.1-LVN\01-M IKE_HYDRO_Basi n\01-M HB_Pr oj ects\Natur al \LVN-Natur al _demands.mhydr o - Resul t Fi l es\Ri ver Basi n_LVN Natur al _demands.df s0
C: \DHI \113699 Kenya ISC\1.1-LVN\01-M IKE_HYDRO_Basi n\01-M HB_Pr oj ects\Cal i br at i on\Nzoi a\ [M HB_Cal i br at i on_1AH01.xl sm]Cal i br at i on
0
10
20
30
40
50
60
70
80
90
77 78 79 80 81 82 83 84
Daily flo
w r
ate
(m
3/s
)
Observed (m³/s)
Simulated (m³/s)
0
500
1000
1500
2000
2500
3000
3500
77 78 79 80 81 82 83 84
Flo
w v
olu
me (
million m
3)
Observed (million m³)
Simulated (million m³)
y = 0.7092x + 3.9488
R² = 0.7733
0
5
10
15
20
25
30
35
40
45
50
0 5 10 15 20 25 30 35 40 45 50
Sim
ula
ted flow
rate
(m
3/s
)
Observed flow rate (m3/s)
Observed vs Simulated monthly flow rate - Calibration Period
0
5
10
15
20
25
30
35
40
Jan Feb Mar Apr May Jun Jul Aug Sep Oct Nov Dec
Flo
w R
ate
(m
3 /s)
Mean obs Mean sim
Scatter plot monthly flow
Mean monthly flow rateCumulative flow volume
Daily flow time series
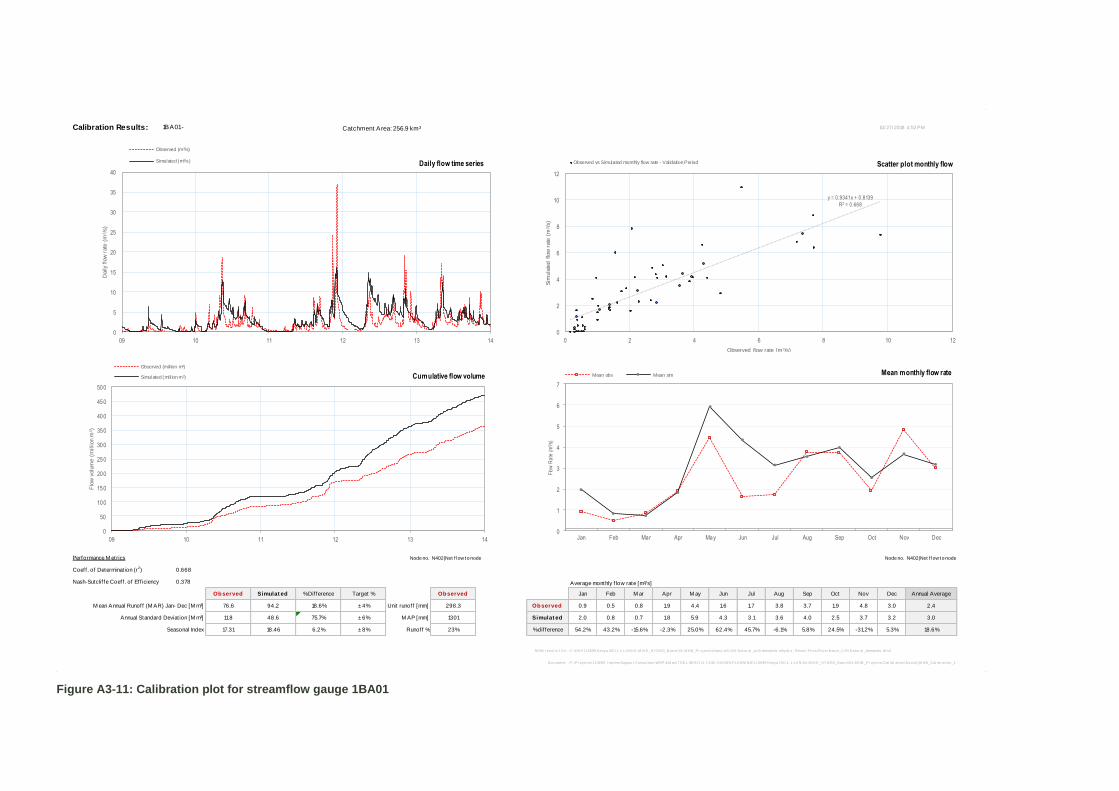
Figure A3-11: Calibration plot for streamflow gauge 1BA01
Calibration Results: 1BA01 - Catchment Area: 256.9 km³ 10/ 27/ 2018 4:52 PM
Performance M etrics Node no. N402|Net f low t o node Node no. N402|Net f low t o node
Coeff . of Determinat ion (r2) 0.668
Nash-Sutclif fe Coeff . of Eff iciency 0.378 Average monthly f low rate [m³/s]
Observed Simulat ed % Dif ference Target % Observed Jan Feb M ar Apr M ay Jun Jul Aug Sep Oct Nov Dec Annual Average
M ean Annual Runoff (M AR) Jan- Dec [M m³] 76.6 94.2 18.6% ± 4% Unit runoff [mm] 298.3 Observed 0.9 0.5 0.8 1.9 4.4 1.6 1.7 3.8 3.7 1.9 4.8 3.0 2.4
Annual Standard Deviat ion [M m³] 11.8 48.6 75.7% ± 6% M AP [mm] 1301 Simulat ed 2.0 0.8 0.7 1.8 5.9 4.3 3.1 3.6 4.0 2.5 3.7 3.2 3.0
Seasonal Index 17.31 18.46 6.2% ± 8% Runoff % 23% % dif ference 54.2% 43.2% -15.6% -2.3% 25.0% 62.4% 45.7% -6.1% 5.8% 24.5% -31.2% 5.3% 18.6%
M HB r esul ts f i l e:
Document :
C: \DHI \113699 Kenya ISC\1.1-LVN\01-M IKE_HYDRO_Basi n\01-M HB_Pr oj ects\Natur al \LVN-Natur al _wi th demands.mhydr o - Resul t Fi l es\Ri ver Basi n_LVN Natur al _demands.df s0
P : \P r oj ects\113699 Impl em Suppor t Consul tant WRP & M an\7 DEL SERV\11 T ASK 2 BASIN PLANNING\113699 Kenya ISC\1.1-LVN\01-M IKE_HYDRO_Basi n\01-M HB_Pr oj ects\Cal i br at i on\Nzoi a\ [M HB_Cal i br at i on_1BA01.xl sm]Val i dat i on
0
5
10
15
20
25
30
35
40
09 10 11 12 13 14
Daily flo
w r
ate
(m
3/s
)
Observed (m³/s)
Simulated (m³/s)
0
50
100
150
200
250
300
350
400
450
500
09 10 11 12 13 14
Flo
w v
olu
me (
million m
3)
Observed (million m³)
Simulated (million m³)
y = 0.9341x + 0.8139
R² = 0.668
0
2
4
6
8
10
12
0 2 4 6 8 10 12
Sim
ula
ted flow
rate
(m
3/s
)
Observed flow rate (m3/s)
Observed vs Simulated monthly flow rate - Validation Period
0
1
2
3
4
5
6
7
Jan Feb Mar Apr May Jun Jul Aug Sep Oct Nov Dec
Flo
w R
ate
(m
3 /s)
Mean obs Mean sim
Scatter plot monthly flow
Mean monthly flow rateCumulative flow volume
Daily flow time series
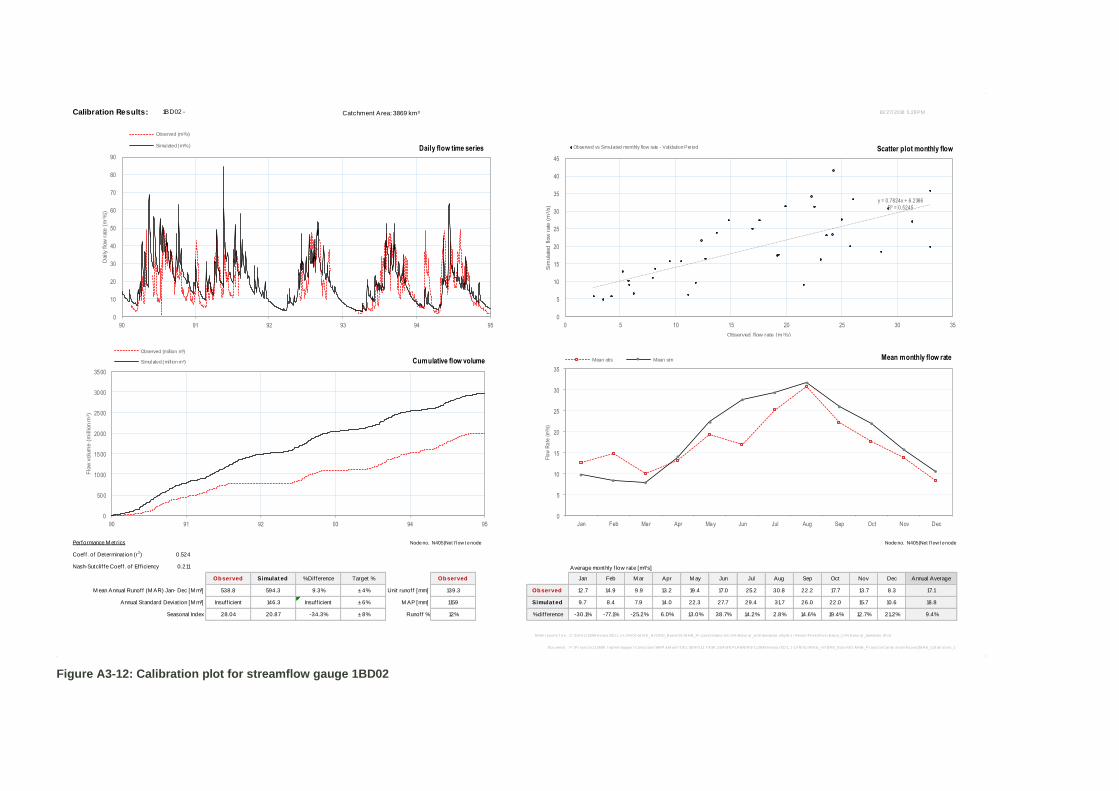
Figure A3-12: Calibration plot for streamflow gauge 1BD02
Calibration Results: 1BD02 - Catchment Area: 3869 km³ 10/ 27/ 2018 5:28 PM
Performance M etrics Node no. N405|Net f low t o node Node no. N405|Net f low t o node
Coeff . of Determinat ion (r2) 0.524
Nash-Sutclif fe Coeff . of Eff iciency 0.211 Average monthly f low rate [m³/s]
Observed Simulat ed % Dif ference Target % Observed Jan Feb M ar Apr M ay Jun Jul Aug Sep Oct Nov Dec Annual Average
M ean Annual Runoff (M AR) Jan- Dec [M m³] 538.8 594.3 9.3% ± 4% Unit runoff [mm] 139.3 Observed 12.7 14.9 9.9 13.2 19.4 17.0 25.2 30.8 22.2 17.7 13.7 8.3 17.1
Annual Standard Deviat ion [M m³] Insuff icient 146.3 Insuff icient ± 6% M AP [mm] 1159 Simulat ed 9.7 8.4 7.9 14.0 22.3 27.7 29.4 31.7 26.0 22.0 15.7 10.6 18.8
Seasonal Index 28.04 20.87 -34.3% ± 8% Runoff % 12% % dif ference -30.1% -77.1% -25.2% 6.0% 13.0% 38.7% 14.2% 2.8% 14.6% 19.4% 12.7% 21.2% 9.4%
M HB r esul ts f i l e:
Document :
C: \DHI \113699 Kenya ISC\1.1-LVN\01-M IKE_HYDRO_Basi n\01-M HB_Pr oj ects\Natur al \LVN-Natur al _wi th demands.mhydr o - Resul t Fi l es\Ri ver Basi n_LVN Natur al _demands.df s0
P : \P r oj ects\113699 Impl em Suppor t Consul tant WRP & M an\7 DEL SERV\11 T ASK 2 BASIN PLANNING\113699 Kenya ISC\1.1-LVN\01-M IKE_HYDRO_Basi n\01-M HB_Pr oj ects\Cal i br at i on\Nzoi a\ [M HB_Cal i br at i on_1BD02.xl sm]Val i dat i on
0
10
20
30
40
50
60
70
80
90
90 91 92 93 94 95
Daily flo
w r
ate
(m
3/s
)
Observed (m³/s)
Simulated (m³/s)
0
500
1000
1500
2000
2500
3000
3500
90 91 92 93 94 95
Flo
w v
olu
me (
million m
3)
Observed (million m³)
Simulated (million m³)
y = 0.7824x + 6.2386
R² = 0.5245
0
5
10
15
20
25
30
35
40
45
0 5 10 15 20 25 30 35
Sim
ula
ted flow
rate
(m
3/s
)
Observed flow rate (m3/s)
Observed vs Simulated monthly flow rate - Validation Period
0
5
10
15
20
25
30
35
Jan Feb Mar Apr May Jun Jul Aug Sep Oct Nov Dec
Flo
w R
ate
(m
3 /s)
Mean obs Mean sim
Scatter plot monthly flow
Mean monthly flow rateCumulative flow volume
Daily flow time series
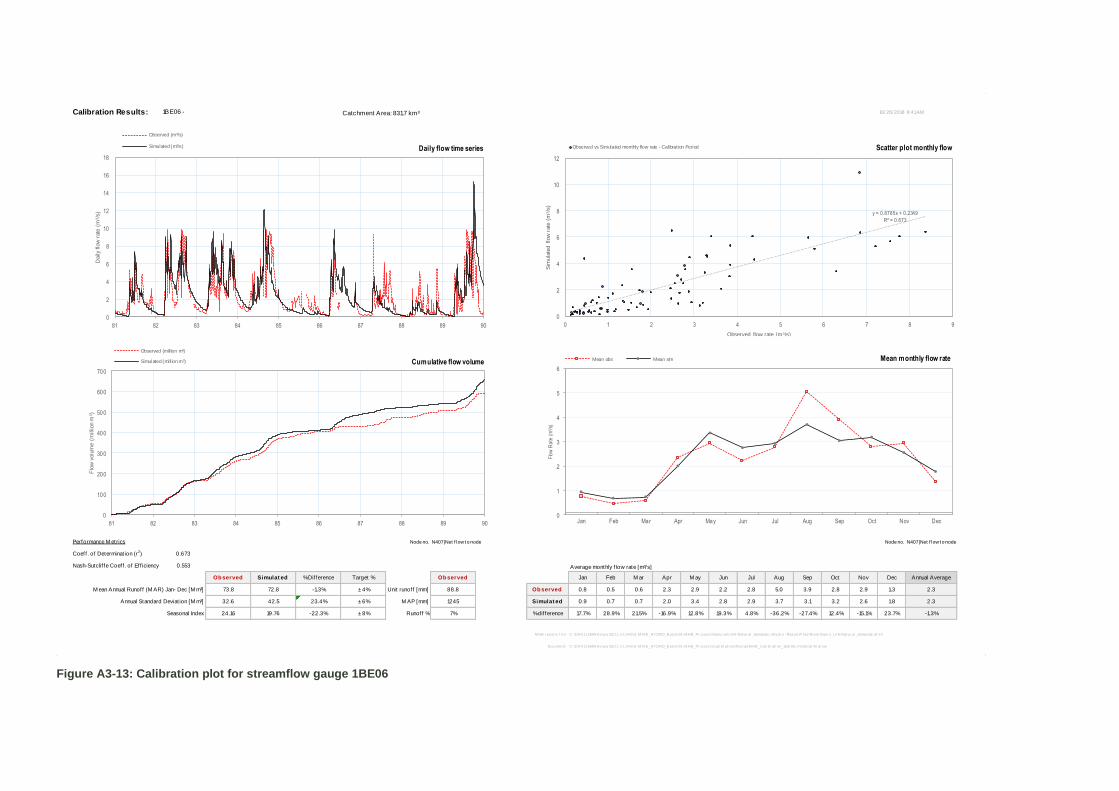
Figure A3-13: Calibration plot for streamflow gauge 1BE06
Calibration Results: 1BE06 - Catchment Area: 831.7 km³ 10/ 26/ 2018 8:41 AM
Performance M etrics Node no. N407|Net f low t o node Node no. N407|Net f low t o node
Coeff . of Determinat ion (r2) 0.673
Nash-Sutclif fe Coeff . of Eff iciency 0.553 Average monthly f low rate [m³/s]
Observed Simulat ed % Dif ference Target % Observed Jan Feb M ar Apr M ay Jun Jul Aug Sep Oct Nov Dec Annual Average
M ean Annual Runoff (M AR) Jan- Dec [M m³] 73.8 72.8 -1.3% ± 4% Unit runoff [mm] 88.8 Observed 0.8 0.5 0.6 2.3 2.9 2.2 2.8 5.0 3.9 2.8 2.9 1.3 2.3
Annual Standard Deviat ion [M m³] 32.6 42.5 23.4% ± 6% M AP [mm] 1245 Simulat ed 0.9 0.7 0.7 2.0 3.4 2.8 2.9 3.7 3.1 3.2 2.6 1.8 2.3
Seasonal Index 24.16 19.76 -22.3% ± 8% Runoff % 7% % dif ference 17.7% 28.9% 21.5% -16.9% 12.8% 19.3% 4.8% -36.2% -27.4% 12.4% -15.1% 23.7% -1.3%
M HB r esul ts f i l e:
Document :
C: \DHI \113699 Kenya ISC\1.1-LVN\01-M IKE_HYDRO_Basi n\01-M HB_Pr oj ects\Natur al \LVN-Natur al _demands.mhydr o - Resul t Fi l es\Ri ver Basi n_LVN Natur al _demands.df s0
C: \DHI \113699 Kenya ISC\1.1-LVN\01-M IKE_HYDRO_Basi n\01-M HB_Pr oj ects\Cal i br at i on\Nzoi a\ [M HB_Cal i br at i on_1BE06.xl sm]Cal i br at i on
0
2
4
6
8
10
12
14
16
18
81 82 83 84 85 86 87 88 89 90
Daily flo
w r
ate
(m
3/s
)
Observed (m³/s)
Simulated (m³/s)
0
100
200
300
400
500
600
700
81 82 83 84 85 86 87 88 89 90
Flo
w v
olu
me (
million m
3)
Observed (million m³)
Simulated (million m³)
y = 0.8785x + 0.2349
R² = 0.673
0
2
4
6
8
10
12
0 1 2 3 4 5 6 7 8 9
Sim
ula
ted flow
rate
(m
3/s
)
Observed flow rate (m3/s)
Observed vs Simulated monthly flow rate - Calibration Period
0
1
2
3
4
5
6
Jan Feb Mar Apr May Jun Jul Aug Sep Oct Nov Dec
Flo
w R
ate
(m
3 /s)
Mean obs Mean sim
Scatter plot monthly flow
Mean monthly flow rateCumulative flow volume
Daily flow time series
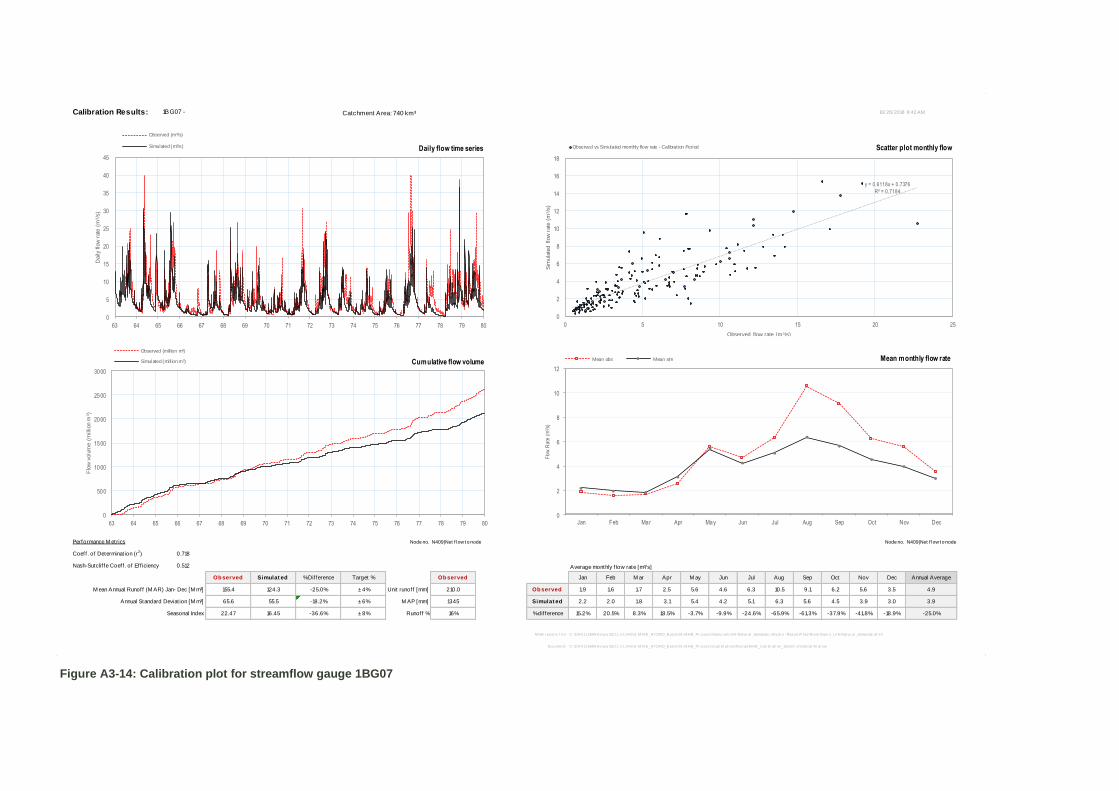
Figure A3-14: Calibration plot for streamflow gauge 1BG07
Calibration Results: 1BG07 - Catchment Area: 740 km³ 10/ 26/ 2018 8:42 AM
Performance M etrics Node no. N409|Net f low t o node Node no. N409|Net f low t o node
Coeff . of Determinat ion (r2) 0.718
Nash-Sutclif fe Coeff . of Eff iciency 0.512 Average monthly f low rate [m³/s]
Observed Simulat ed % Dif ference Target % Observed Jan Feb M ar Apr M ay Jun Jul Aug Sep Oct Nov Dec Annual Average
M ean Annual Runoff (M AR) Jan- Dec [M m³] 155.4 124.3 -25.0% ± 4% Unit runoff [mm] 210.0 Observed 1.9 1.6 1.7 2.5 5.6 4.6 6.3 10.5 9.1 6.2 5.6 3.5 4.9
Annual Standard Deviat ion [M m³] 65.6 55.5 -18.2% ± 6% M AP [mm] 1345 Simulat ed 2.2 2.0 1.8 3.1 5.4 4.2 5.1 6.3 5.6 4.5 3.9 3.0 3.9
Seasonal Index 22.47 16.45 -36.6% ± 8% Runoff % 16% % dif ference 15.2% 20.5% 8.3% 18.5% -3.7% -9.9% -24.6% -65.9% -61.3% -37.9% -41.8% -18.9% -25.0%
M HB r esul ts f i l e:
Document :
C: \DHI \113699 Kenya ISC\1.1-LVN\01-M IKE_HYDRO_Basi n\01-M HB_Pr oj ects\Natur al \LVN-Natur al _demands.mhydr o - Resul t Fi l es\Ri ver Basi n_LVN Natur al _demands.df s0
C: \DHI \113699 Kenya ISC\1.1-LVN\01-M IKE_HYDRO_Basi n\01-M HB_Pr oj ects\Cal i br at i on\Nzoi a\ [M HB_Cal i br at i on_1BG07.xl sm]Cal i br at i on
0
5
10
15
20
25
30
35
40
45
63 64 65 66 67 68 69 70 71 72 73 74 75 76 77 78 79 80
Daily flo
w r
ate
(m
3/s
)
Observed (m³/s)
Simulated (m³/s)
0
500
1000
1500
2000
2500
3000
63 64 65 66 67 68 69 70 71 72 73 74 75 76 77 78 79 80
Flo
w v
olu
me (
million m
3)
Observed (million m³)
Simulated (million m³)
y = 0.6118x + 0.7376
R² = 0.7184
0
2
4
6
8
10
12
14
16
18
0 5 10 15 20 25
Sim
ula
ted flow
rate
(m
3/s
)
Observed flow rate (m3/s)
Observed vs Simulated monthly flow rate - Calibration Period
0
2
4
6
8
10
12
Jan Feb Mar Apr May Jun Jul Aug Sep Oct Nov Dec
Flo
w R
ate
(m
3 /s)
Mean obs Mean sim
Scatter plot monthly flow
Mean monthly flow rateCumulative flow volume
Daily flow time series
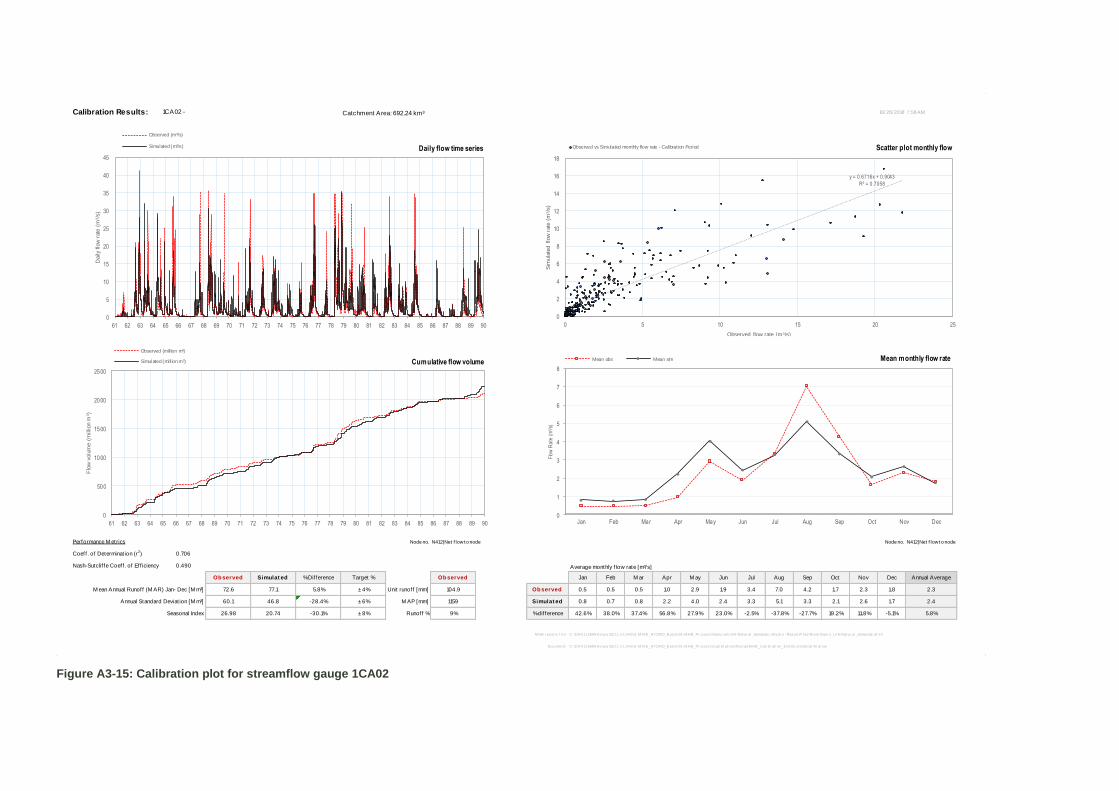
Figure A3-15: Calibration plot for streamflow gauge 1CA02
Calibration Results: 1CA02 - Catchment Area: 692.24 km³ 10/ 26/ 2018 7:58 AM
Performance M etrics Node no. N412|Net f low t o node Node no. N412|Net f low t o node
Coeff . of Determinat ion (r2) 0.706
Nash-Sutclif fe Coeff . of Eff iciency 0.490 Average monthly f low rate [m³/s]
Observed Simulat ed % Dif ference Target % Observed Jan Feb M ar Apr M ay Jun Jul Aug Sep Oct Nov Dec Annual Average
M ean Annual Runoff (M AR) Jan- Dec [M m³] 72.6 77.1 5.8% ± 4% Unit runoff [mm] 104.9 Observed 0.5 0.5 0.5 1.0 2.9 1.9 3.4 7.0 4.2 1.7 2.3 1.8 2.3
Annual Standard Deviat ion [M m³] 60.1 46.8 -28.4% ± 6% M AP [mm] 1159 Simulat ed 0.8 0.7 0.8 2.2 4.0 2.4 3.3 5.1 3.3 2.1 2.6 1.7 2.4
Seasonal Index 26.98 20.74 -30.1% ± 8% Runoff % 9% % dif ference 42.6% 38.0% 37.4% 56.8% 27.9% 23.0% -2.5% -37.8% -27.7% 19.2% 11.8% -5.1% 5.8%
M HB r esul ts f i l e:
Document :
C: \DHI \113699 Kenya ISC\1.1-LVN\01-M IKE_HYDRO_Basi n\01-M HB_Pr oj ects\Natur al \LVN-Natur al _demands.mhydr o - Resul t Fi l es\Ri ver Basi n_LVN Natur al _demands.df s0
C: \DHI \113699 Kenya ISC\1.1-LVN\01-M IKE_HYDRO_Basi n\01-M HB_Pr oj ects\Cal i br at i on\Nzoi a\ [M HB_Cal i br at i on_1CA02.xl sm]Cal i br at i on
0
5
10
15
20
25
30
35
40
45
61 62 63 64 65 66 67 68 69 70 71 72 73 74 75 76 77 78 79 80 81 82 83 84 85 86 87 88 89 90
Daily flo
w r
ate
(m
3/s
)
Observed (m³/s)
Simulated (m³/s)
0
500
1000
1500
2000
2500
61 62 63 64 65 66 67 68 69 70 71 72 73 74 75 76 77 78 79 80 81 82 83 84 85 86 87 88 89 90
Flo
w v
olu
me (
million m
3)
Observed (million m³)
Simulated (million m³)
y = 0.6716x + 0.9043
R² = 0.7058
0
2
4
6
8
10
12
14
16
18
0 5 10 15 20 25
Sim
ula
ted flow
rate
(m
3/s
)
Observed flow rate (m3/s)
Observed vs Simulated monthly flow rate - Calibration Period
0
1
2
3
4
5
6
7
8
Jan Feb Mar Apr May Jun Jul Aug Sep Oct Nov Dec
Flo
w R
ate
(m
3 /s)
Mean obs Mean sim
Scatter plot monthly flow
Mean monthly flow rateCumulative flow volume
Daily flow time series
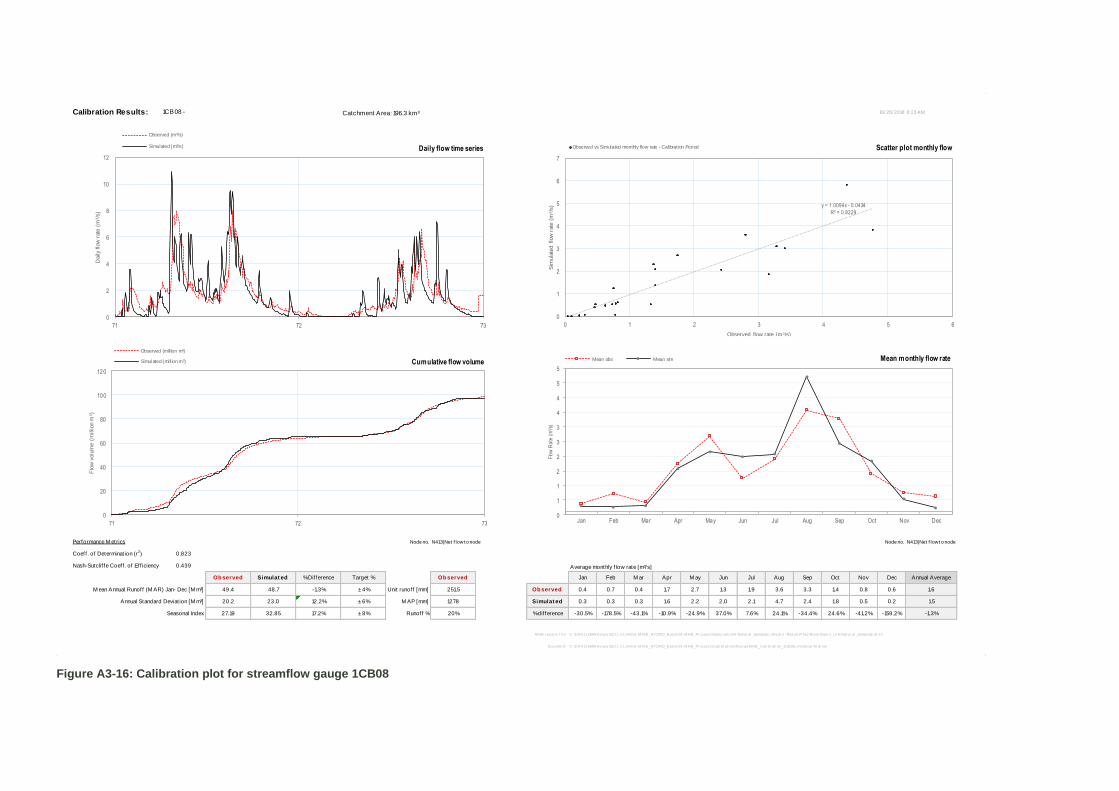
Figure A3-16: Calibration plot for streamflow gauge 1CB08
Calibration Results: 1CB08 - Catchment Area: 196.3 km³ 10/ 26/ 2018 8:23 AM
Performance M etrics Node no. N413|Net f low t o node Node no. N413|Net f low t o node
Coeff . of Determinat ion (r2) 0.823
Nash-Sutclif fe Coeff . of Eff iciency 0.439 Average monthly f low rate [m³/s]
Observed Simulat ed % Dif ference Target % Observed Jan Feb M ar Apr M ay Jun Jul Aug Sep Oct Nov Dec Annual Average
M ean Annual Runoff (M AR) Jan- Dec [M m³] 49.4 48.7 -1.3% ± 4% Unit runoff [mm] 251.5 Observed 0.4 0.7 0.4 1.7 2.7 1.3 1.9 3.6 3.3 1.4 0.8 0.6 1.6
Annual Standard Deviat ion [M m³] 20.2 23.0 12.2% ± 6% M AP [mm] 1278 Simulat ed 0.3 0.3 0.3 1.6 2.2 2.0 2.1 4.7 2.4 1.8 0.5 0.2 1.5
Seasonal Index 27.19 32.85 17.2% ± 8% Runoff % 20% % dif ference -30.5% -178.5% -43.1% -10.9% -24.9% 37.0% 7.6% 24.1% -34.4% 24.6% -41.2% -159.2% -1.3%
M HB r esul ts f i l e:
Document :
C: \DHI \113699 Kenya ISC\1.1-LVN\01-M IKE_HYDRO_Basi n\01-M HB_Pr oj ects\Natur al \LVN-Natur al _demands.mhydr o - Resul t Fi l es\Ri ver Basi n_LVN Natur al _demands.df s0
C: \DHI \113699 Kenya ISC\1.1-LVN\01-M IKE_HYDRO_Basi n\01-M HB_Pr oj ects\Cal i br at i on\Nzoi a\ [M HB_Cal i br at i on_1CB08.xl sm]Cal i br at i on
0
2
4
6
8
10
12
71 72 73
Daily flo
w r
ate
(m
3/s
)
Observed (m³/s)
Simulated (m³/s)
0
20
40
60
80
100
120
71 72 73
Flo
w v
olu
me (
million m
3)
Observed (million m³)
Simulated (million m³)
y = 1.0094x - 0.0434
R² = 0.8229
0
1
2
3
4
5
6
7
0 1 2 3 4 5 6
Sim
ula
ted flow
rate
(m
3/s
)
Observed flow rate (m3/s)
Observed vs Simulated monthly flow rate - Calibration Period
0
1
1
2
2
3
3
4
4
5
5
Jan Feb Mar Apr May Jun Jul Aug Sep Oct Nov Dec
Flo
w R
ate
(m
3 /s)
Mean obs Mean sim
Scatter plot monthly flow
Mean monthly flow rateCumulative flow volume
Daily flow time series

Figure A3-17: Calibration plot for streamflow gauge 1CE01
Calibration Results: 1CB08 - Catchment Area: 196.3 km³ 10/ 26/ 2018 8:23 AM
Performance M etrics Node no. N413|Net f low t o node Node no. N413|Net f low t o node
Coeff . of Determinat ion (r2) 0.823
Nash-Sutclif fe Coeff . of Eff iciency 0.439 Average monthly f low rate [m³/s]
Observed Simulat ed % Dif ference Target % Observed Jan Feb M ar Apr M ay Jun Jul Aug Sep Oct Nov Dec Annual Average
M ean Annual Runoff (M AR) Jan- Dec [M m³] 49.4 48.7 -1.3% ± 4% Unit runoff [mm] 251.5 Observed 0.4 0.7 0.4 1.7 2.7 1.3 1.9 3.6 3.3 1.4 0.8 0.6 1.6
Annual Standard Deviat ion [M m³] 20.2 23.0 12.2% ± 6% M AP [mm] 1278 Simulat ed 0.3 0.3 0.3 1.6 2.2 2.0 2.1 4.7 2.4 1.8 0.5 0.2 1.5
Seasonal Index 27.19 32.85 17.2% ± 8% Runoff % 20% % dif ference -30.5% -178.5% -43.1% -10.9% -24.9% 37.0% 7.6% 24.1% -34.4% 24.6% -41.2% -159.2% -1.3%
M HB r esul ts f i l e:
Document :
C: \DHI \113699 Kenya ISC\1.1-LVN\01-M IKE_HYDRO_Basi n\01-M HB_Pr oj ects\Natur al \LVN-Natur al _demands.mhydr o - Resul t Fi l es\Ri ver Basi n_LVN Natur al _demands.df s0
C: \DHI \113699 Kenya ISC\1.1-LVN\01-M IKE_HYDRO_Basi n\01-M HB_Pr oj ects\Cal i br at i on\Nzoi a\ [M HB_Cal i br at i on_1CB08.xl sm]Cal i br at i on
0
2
4
6
8
10
12
71 72 73
Daily flo
w r
ate
(m
3/s
)
Observed (m³/s)
Simulated (m³/s)
0
20
40
60
80
100
120
71 72 73
Flo
w v
olu
me (
million m
3)
Observed (million m³)
Simulated (million m³)
y = 1.0094x - 0.0434
R² = 0.8229
0
1
2
3
4
5
6
7
0 1 2 3 4 5 6
Sim
ula
ted flow
rate
(m
3/s
)
Observed flow rate (m3/s)
Observed vs Simulated monthly flow rate - Calibration Period
0
1
1
2
2
3
3
4
4
5
5
Jan Feb Mar Apr May Jun Jul Aug Sep Oct Nov Dec
Flo
w R
ate
(m
3 /s)
Mean obs Mean sim
Scatter plot monthly flow
Mean monthly flow rateCumulative flow volume
Daily flow time series
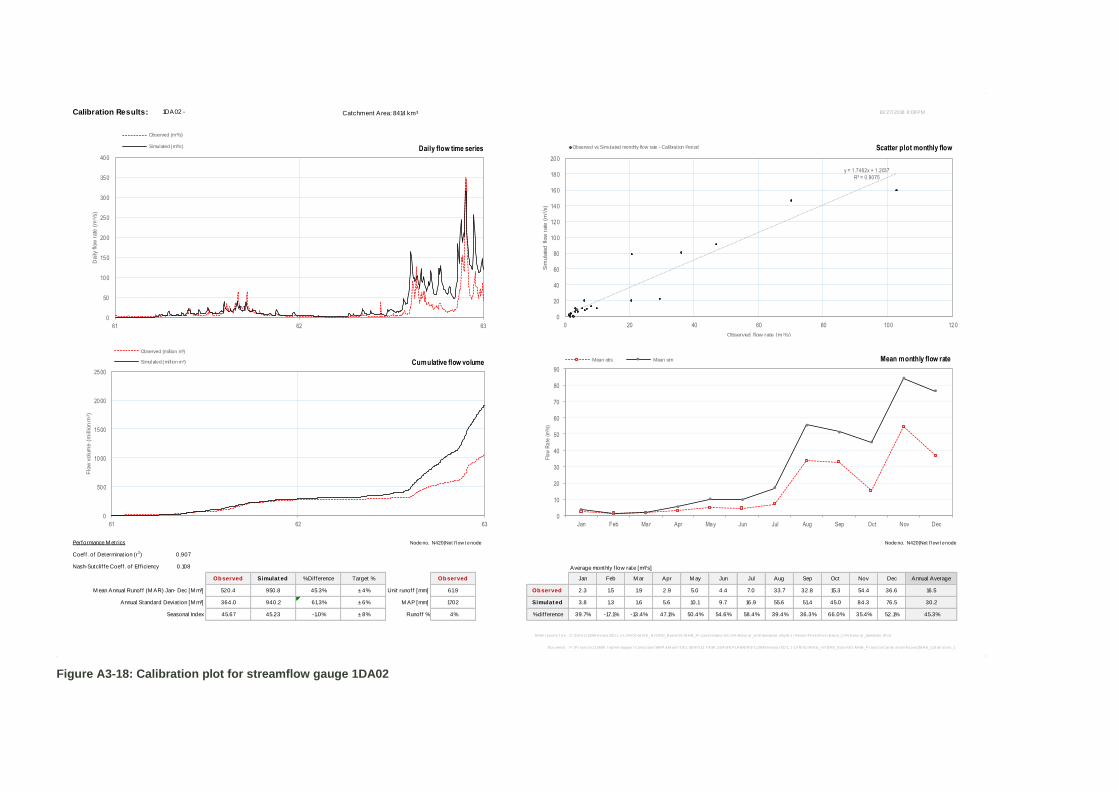
Figure A3-18: Calibration plot for streamflow gauge 1DA02
Calibration Results: 1DA02 - Catchment Area: 8414 km³ 10/ 27/ 2018 8:08 PM
Performance M etrics Node no. N420|Net f low t o node Node no. N420|Net f low t o node
Coeff . of Determinat ion (r2) 0.907
Nash-Sutclif fe Coeff . of Eff iciency 0.108 Average monthly f low rate [m³/s]
Observed Simulat ed % Dif ference Target % Observed Jan Feb M ar Apr M ay Jun Jul Aug Sep Oct Nov Dec Annual Average
M ean Annual Runoff (M AR) Jan- Dec [M m³] 520.4 950.8 45.3% ± 4% Unit runoff [mm] 61.9 Observed 2.3 1.5 1.9 2.9 5.0 4.4 7.0 33.7 32.8 15.3 54.4 36.6 16.5
Annual Standard Deviat ion [M m³] 364.0 940.2 61.3% ± 6% M AP [mm] 1702 Simulat ed 3.8 1.3 1.6 5.6 10.1 9.7 16.9 55.6 51.4 45.0 84.3 76.5 30.2
Seasonal Index 45.67 45.23 -1.0% ± 8% Runoff % 4% % dif ference 39.7% -17.1% -13.4% 47.1% 50.4% 54.6% 58.4% 39.4% 36.3% 66.0% 35.4% 52.1% 45.3%
M HB r esul ts f i l e:
Document :
C: \DHI \113699 Kenya ISC\1.1-LVN\01-M IKE_HYDRO_Basi n\01-M HB_Pr oj ects\Natur al \LVN-Natur al _wi th demands.mhydr o - Resul t Fi l es\Ri ver Basi n_LVN Natur al _demands.df s0
P : \P r oj ects\113699 Impl em Suppor t Consul tant WRP & M an\7 DEL SERV\11 T ASK 2 BASIN PLANNING\113699 Kenya ISC\1.1-LVN\01-M IKE_HYDRO_Basi n\01-M HB_Pr oj ects\Cal i br at i on\Nzoi a\ [M HB_Cal i br at i on_1DA02.xl sm]Cal i br at i on
0
50
100
150
200
250
300
350
400
61 62 63
Daily flo
w r
ate
(m
3/s
)
Observed (m³/s)
Simulated (m³/s)
0
500
1000
1500
2000
2500
61 62 63
Flo
w v
olu
me (
million m
3)
Observed (million m³)
Simulated (million m³)
y = 1.7462x + 1.2037
R² = 0.9075
0
20
40
60
80
100
120
140
160
180
200
0 20 40 60 80 100 120
Sim
ula
ted flow
rate
(m
3/s
)
Observed flow rate (m3/s)
Observed vs Simulated monthly flow rate - Calibration Period
0
10
20
30
40
50
60
70
80
90
Jan Feb Mar Apr May Jun Jul Aug Sep Oct Nov Dec
Flo
w R
ate
(m
3 /s)
Mean obs Mean sim
Scatter plot monthly flow
Mean monthly flow rateCumulative flow volume
Daily flow time series
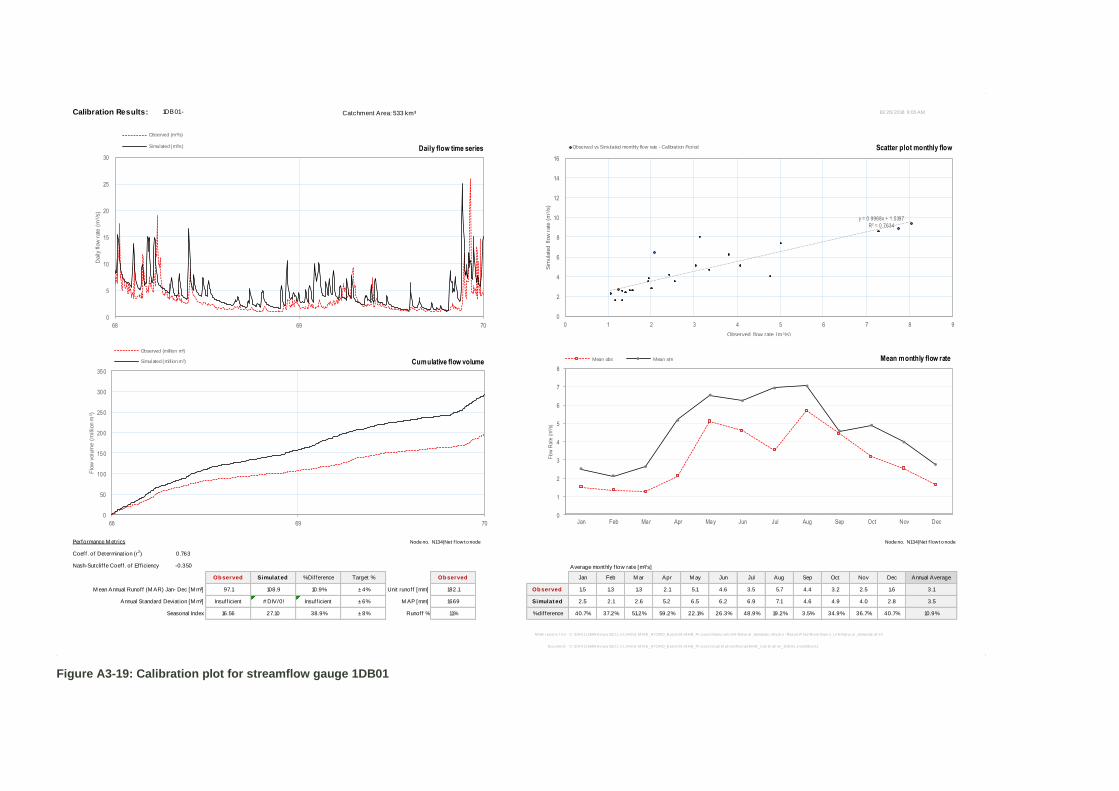
Figure A3-19: Calibration plot for streamflow gauge 1DB01
Calibration Results: 1DB01 - Catchment Area: 533 km³ 10/ 26/ 2018 9:05 AM
Performance M etrics Node no. N134|Net f low t o node Node no. N134|Net f low t o node
Coeff . of Determinat ion (r2) 0.763
Nash-Sutclif fe Coeff . of Eff iciency -0.350 Average monthly f low rate [m³/s]
Observed Simulat ed % Dif ference Target % Observed Jan Feb M ar Apr M ay Jun Jul Aug Sep Oct Nov Dec Annual Average
M ean Annual Runoff (M AR) Jan- Dec [M m³] 97.1 108.9 10.9% ± 4% Unit runoff [mm] 182.1 Observed 1.5 1.3 1.3 2.1 5.1 4.6 3.5 5.7 4.4 3.2 2.5 1.6 3.1
Annual Standard Deviat ion [M m³] Insuff icient # DIV/0! Insuff icient ± 6% M AP [mm] 1669 Simulat ed 2.5 2.1 2.6 5.2 6.5 6.2 6.9 7.1 4.6 4.9 4.0 2.8 3.5
Seasonal Index 16.56 27.10 38.9% ± 8% Runoff % 11% % dif ference 40.7% 37.2% 51.2% 59.2% 22.1% 26.3% 48.9% 19.2% 3.5% 34.9% 36.7% 40.7% 10.9%
M HB r esul ts f i l e:
Document :
C: \DHI \113699 Kenya ISC\1.1-LVN\01-M IKE_HYDRO_Basi n\01-M HB_Pr oj ects\Natur al \LVN-Natur al _demands.mhydr o - Resul t Fi l es\Ri ver Basi n_LVN Natur al _demands.df s0
C: \DHI \113699 Kenya ISC\1.1-LVN\01-M IKE_HYDRO_Basi n\01-M HB_Pr oj ects\Cal i br at i on\Nzoi a\ [M HB_Cal i br at i on_1DB01.xl sm]Sheet1
0
5
10
15
20
25
30
68 69 70
Daily flo
w r
ate
(m
3/s
)
Observed (m³/s)
Simulated (m³/s)
0
50
100
150
200
250
300
350
68 69 70
Flo
w v
olu
me (
million m
3)
Observed (million m³)
Simulated (million m³)
y = 0.9968x + 1.5397
R² = 0.7634
0
2
4
6
8
10
12
14
16
0 1 2 3 4 5 6 7 8 9
Sim
ula
ted flow
rate
(m
3/s
)
Observed flow rate (m3/s)
Observed vs Simulated monthly flow rate - Calibration Period
0
1
2
3
4
5
6
7
8
Jan Feb Mar Apr May Jun Jul Aug Sep Oct Nov Dec
Flo
w R
ate
(m
3 /s)
Mean obs Mean sim
Scatter plot monthly flow
Mean monthly flow rateCumulative flow volume
Daily flow time series

Figure A3-20: Calibration plot for streamflow gauge 1EB02
Calibration Results: 1EB02 - Catchment Area: 475.9 km³ 10/ 26/ 2018 9:09 AM
Performance M etrics Node no. N427|Net f low t o node Node no. N427|Net f low t o node
Coeff . of Determinat ion (r2) 0.630
Nash-Sutclif fe Coeff . of Eff iciency 0.251 Average monthly f low rate [m³/s]
Observed Simulat ed % Dif ference Target % Observed Jan Feb M ar Apr M ay Jun Jul Aug Sep Oct Nov Dec Annual Average
M ean Annual Runoff (M AR) Jan- Dec [M m³] 254.2 261.6 2.8% ± 4% Unit runoff [mm] 534.2 Observed 4.0 2.5 4.0 8.0 11.5 9.7 9.4 13.9 12.0 8.1 8.4 5.1 8.1
Annual Standard Deviat ion [M m³] 123.7 83.9 -47.4% ± 6% M AP [mm] 2005 Simulat ed 2.7 2.1 3.7 10.5 13.7 10.7 8.6 11.6 11.3 9.3 8.2 4.8 8.3
Seasonal Index 18.00 19.71 8.6% ± 8% Runoff % 27% % dif ference -45.7% -17.8% -6.4% 23.6% 16.0% 9.1% -9.2% -20.0% -5.8% 13.5% -2.7% -6.5% 2.8%
M HB r esul ts f i l e:
Document :
C: \DHI \113699 Kenya ISC\1.1-LVN\01-M IKE_HYDRO_Basi n\01-M HB_Pr oj ects\Natur al \LVN-Natur al _demands.mhydr o - Resul t Fi l es\Ri ver Basi n_LVN Natur al _demands.df s0
C: \DHI \113699 Kenya ISC\1.1-LVN\01-M IKE_HYDRO_Basi n\01-M HB_Pr oj ects\Cal i br at i on\Nzoi a\ [M HB_Cal i br at i on_1EB02.xl sm]Val i dat i on
0
10
20
30
40
50
60
80 81 82 83 84 85 86 87 88 89 90
Daily flo
w r
ate
(m
3/s
)
Observed (m³/s)
Simulated (m³/s)
0
500
1000
1500
2000
2500
3000
80 81 82 83 84 85 86 87 88 89 90
Flo
w v
olu
me (
million m
3)
Observed (million m³)
Simulated (million m³)
y = 0.7393x + 1.6468
R² = 0.6301
0
5
10
15
20
25
30
0 5 10 15 20 25 30 35
Sim
ula
ted flow
rate
(m
3/s
)
Observed flow rate (m3/s)
Observed vs Simulated monthly flow rate - Validation Period
0
2
4
6
8
10
12
14
16
Jan Feb Mar Apr May Jun Jul Aug Sep Oct Nov Dec
Flo
w R
ate
(m
3 /s)
Mean obs Mean sim
Scatter plot monthly flow
Mean monthly flow rateCumulative flow volume
Daily flow time series
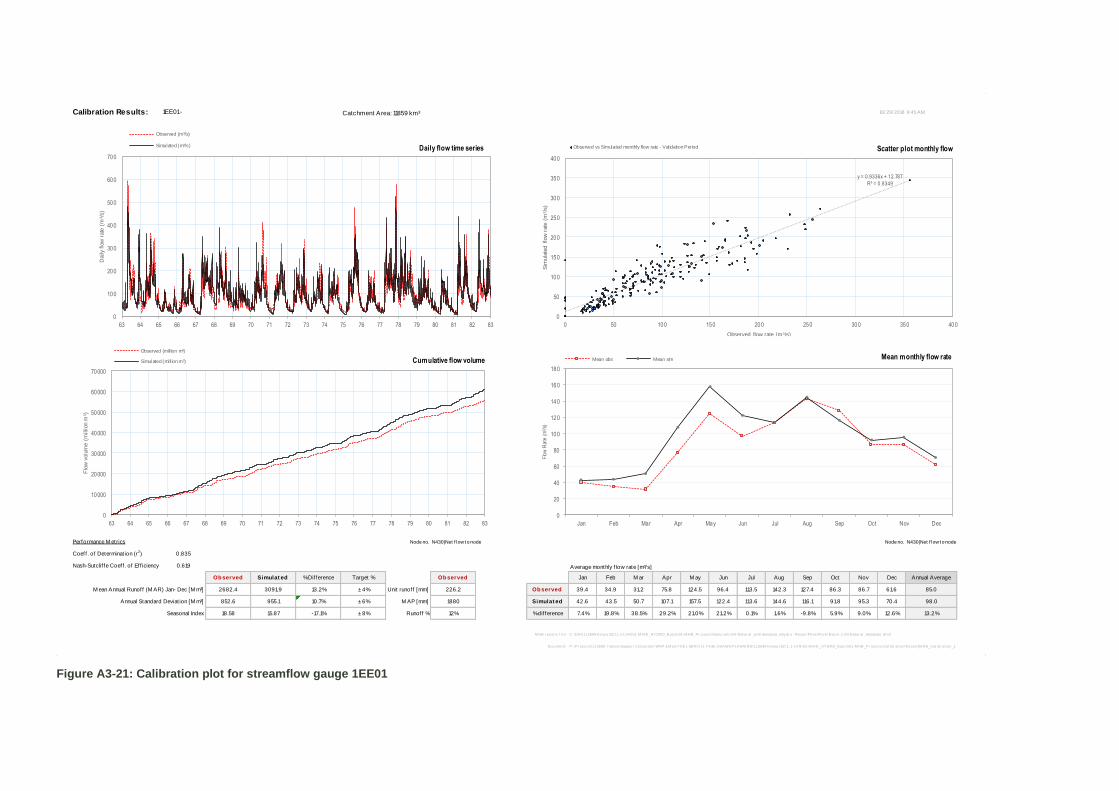
Figure A3-21: Calibration plot for streamflow gauge 1EE01
Calibration Results: 1EE01 - Catchment Area: 11859 km³ 10/ 29/ 2018 9:45 AM
Performance M etrics Node no. N430|Net f low t o node Node no. N430|Net f low t o node
Coeff . of Determinat ion (r2) 0.835
Nash-Sutclif fe Coeff . of Eff iciency 0.619 Average monthly f low rate [m³/s]
Observed Simulat ed % Dif ference Target % Observed Jan Feb M ar Apr M ay Jun Jul Aug Sep Oct Nov Dec Annual Average
M ean Annual Runoff (M AR) Jan- Dec [M m³] 2682.4 3091.9 13.2% ± 4% Unit runoff [mm] 226.2 Observed 39.4 34.9 31.2 75.8 124.5 96.4 113.5 142.3 127.4 86.3 86.7 61.6 85.0
Annual Standard Deviat ion [M m³] 852.6 955.1 10.7% ± 6% M AP [mm] 1880 Simulat ed 42.6 43.5 50.7 107.1 157.5 122.4 113.6 144.6 116.1 91.8 95.3 70.4 98.0
Seasonal Index 18.58 15.87 -17.1% ± 8% Runoff % 12% % dif ference 7.4% 19.8% 38.5% 29.2% 21.0% 21.2% 0.1% 1.6% -9.8% 5.9% 9.0% 12.6% 13.2%
M HB r esul ts f i l e:
Document :
C: \DHI \113699 Kenya ISC\1.1-LVN\01-M IKE_HYDRO_Basi n\01-M HB_Pr oj ects\Natur al \LVN-Natur al _wi th demands.mhydr o - Resul t Fi l es\Ri ver Basi n_LVN Natur al _demands.df s0
P : \P r oj ects\113699 Impl em Suppor t Consul tant WRP & M an\7 DEL SERV\11 T ASK 2 BASIN PLANNING\113699 Kenya ISC\1.1-LVN\01-M IKE_HYDRO_Basi n\01-M HB_Pr oj ects\Cal i br at i on\Nzoi a\ [M HB_Cal i br at i on_1EE01.xl sm]Val i dat i on
0
100
200
300
400
500
600
700
63 64 65 66 67 68 69 70 71 72 73 74 75 76 77 78 79 80 81 82 83
Daily flo
w r
ate
(m
3/s
)
Observed (m³/s)
Simulated (m³/s)
0
10000
20000
30000
40000
50000
60000
70000
63 64 65 66 67 68 69 70 71 72 73 74 75 76 77 78 79 80 81 82 83
Flo
w v
olu
me (
million m
3)
Observed (million m³)
Simulated (million m³)
y = 0.9336x + 12.787
R² = 0.8349
0
50
100
150
200
250
300
350
400
0 50 100 150 200 250 300 350 400
Sim
ula
ted flow
rate
(m
3/s
)
Observed flow rate (m3/s)
Observed vs Simulated monthly flow rate - Validation Period
0
20
40
60
80
100
120
140
160
180
Jan Feb Mar Apr May Jun Jul Aug Sep Oct Nov Dec
Flo
w R
ate
(m
3 /s)
Mean obs Mean sim
Scatter plot monthly flow
Mean monthly flow rateCumulative flow volume
Daily flow time series
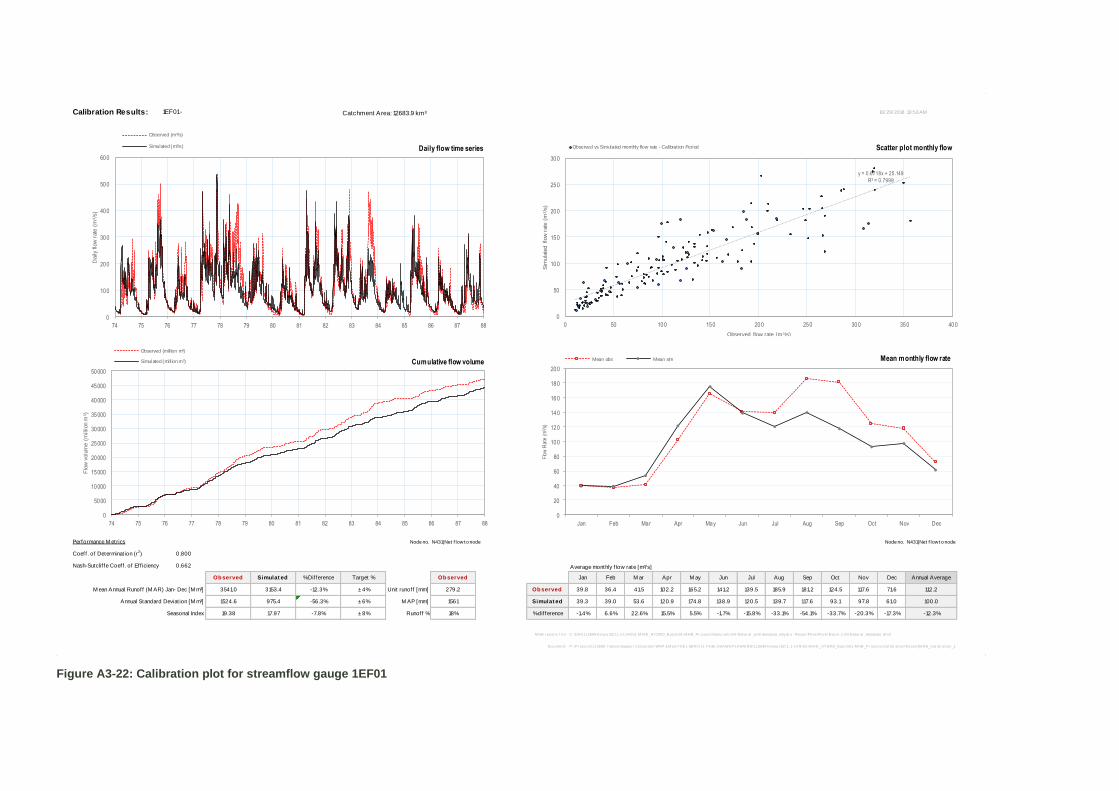
Figure A3-22: Calibration plot for streamflow gauge 1EF01
Calibration Results: 1EF01 - Catchment Area: 12683.9 km³ 10/ 29/ 2018 10:53 AM
Performance M etrics Node no. N431|Net f low t o node Node no. N431|Net f low t o node
Coeff . of Determinat ion (r2) 0.800
Nash-Sutclif fe Coeff . of Eff iciency 0.662 Average monthly f low rate [m³/s]
Observed Simulat ed % Dif ference Target % Observed Jan Feb M ar Apr M ay Jun Jul Aug Sep Oct Nov Dec Annual Average
M ean Annual Runoff (M AR) Jan- Dec [M m³] 3541.0 3153.4 -12.3% ± 4% Unit runoff [mm] 279.2 Observed 39.8 36.4 41.5 102.2 165.2 141.2 139.5 185.9 181.2 124.5 117.6 71.6 112.2
Annual Standard Deviat ion [M m³] 1524.6 975.4 -56.3% ± 6% M AP [mm] 1561 Simulat ed 39.3 39.0 53.6 120.9 174.8 138.9 120.5 139.7 117.6 93.1 97.8 61.0 100.0
Seasonal Index 19.38 17.97 -7.8% ± 8% Runoff % 18% % dif ference -1.4% 6.6% 22.6% 15.5% 5.5% -1.7% -15.8% -33.1% -54.1% -33.7% -20.3% -17.3% -12.3%
M HB r esul ts f i l e:
Document :
C: \DHI \113699 Kenya ISC\1.1-LVN\01-M IKE_HYDRO_Basi n\01-M HB_Pr oj ects\Natur al \LVN-Natur al _wi th demands.mhydr o - Resul t Fi l es\Ri ver Basi n_LVN Natur al _demands.df s0
P : \P r oj ects\113699 Impl em Suppor t Consul tant WRP & M an\7 DEL SERV\11 T ASK 2 BASIN PLANNING\113699 Kenya ISC\1.1-LVN\01-M IKE_HYDRO_Basi n\01-M HB_Pr oj ects\Cal i br at i on\Nzoi a\ [M HB_Cal i br at i on_1EF01.xl sm]Val i dat i on
0
100
200
300
400
500
600
74 75 76 77 78 79 80 81 82 83 84 85 86 87 88
Daily flo
w r
ate
(m
3/s
)
Observed (m³/s)
Simulated (m³/s)
0
5000
10000
15000
20000
25000
30000
35000
40000
45000
50000
74 75 76 77 78 79 80 81 82 83 84 85 86 87 88
Flo
w v
olu
me (
million m
3)
Observed (million m³)
Simulated (million m³)
y = 0.6718x + 25.149
R² = 0.7999
0
50
100
150
200
250
300
0 50 100 150 200 250 300 350 400
Sim
ula
ted flow
rate
(m
3/s
)
Observed flow rate (m3/s)
Observed vs Simulated monthly flow rate - Calibration Period
0
20
40
60
80
100
120
140
160
180
200
Jan Feb Mar Apr May Jun Jul Aug Sep Oct Nov Dec
Flo
w R
ate
(m
3 /s)
Mean obs Mean sim
Scatter plot monthly flow
Mean monthly flow rateCumulative flow volume
Daily flow time series
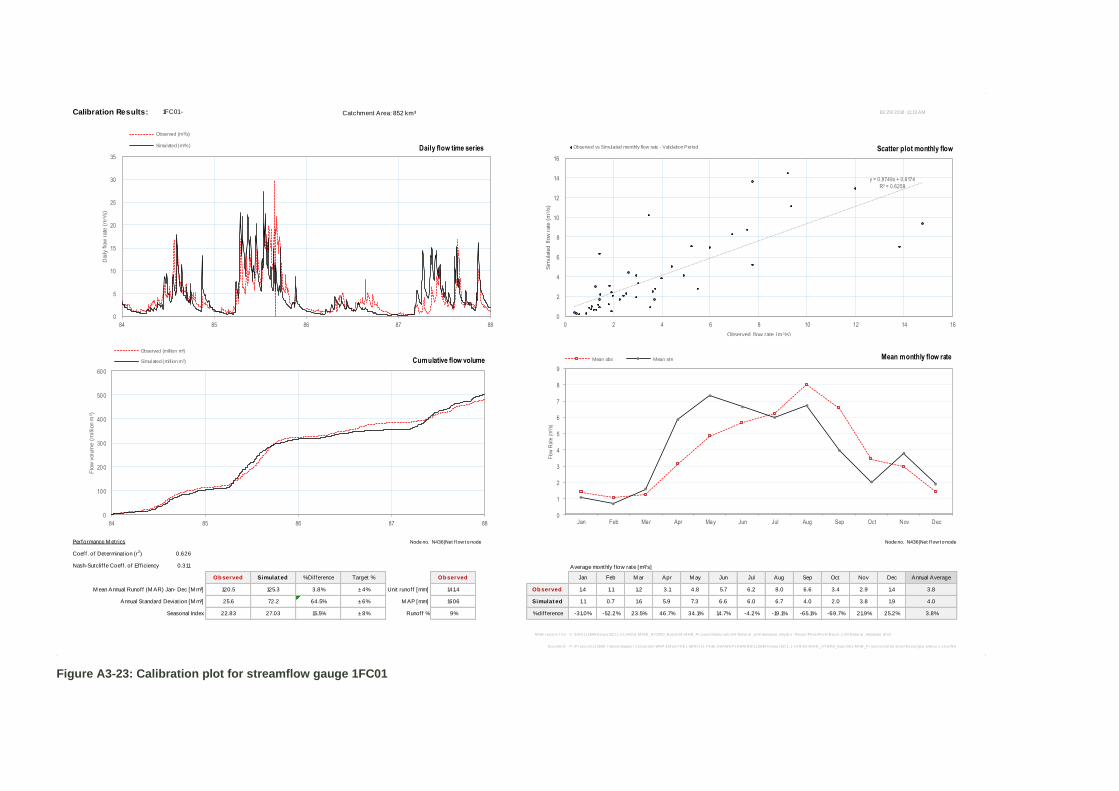
Figure A3-23: Calibration plot for streamflow gauge 1FC01
Calibration Results: 1FC01 - Catchment Area: 852 km³ 10/ 29/ 2018 11:13 AM
Performance M etrics Node no. N436|Net f low t o node Node no. N436|Net f low t o node
Coeff . of Determinat ion (r2) 0.626
Nash-Sutclif fe Coeff . of Eff iciency 0.311 Average monthly f low rate [m³/s]
Observed Simulat ed % Dif ference Target % Observed Jan Feb M ar Apr M ay Jun Jul Aug Sep Oct Nov Dec Annual Average
M ean Annual Runoff (M AR) Jan- Dec [M m³] 120.5 125.3 3.8% ± 4% Unit runoff [mm] 141.4 Observed 1.4 1.1 1.2 3.1 4.8 5.7 6.2 8.0 6.6 3.4 2.9 1.4 3.8
Annual Standard Deviat ion [M m³] 25.6 72.2 64.5% ± 6% M AP [mm] 1606 Simulat ed 1.1 0.7 1.6 5.9 7.3 6.6 6.0 6.7 4.0 2.0 3.8 1.9 4.0
Seasonal Index 22.83 27.03 15.5% ± 8% Runoff % 9% % dif ference -31.0% -52.2% 23.5% 46.7% 34.1% 14.7% -4.2% -19.1% -65.1% -69.7% 21.9% 25.2% 3.8%
M HB r esul ts f i l e:
Document :
C: \DHI \113699 Kenya ISC\1.1-LVN\01-M IKE_HYDRO_Basi n\01-M HB_Pr oj ects\Natur al \LVN-Natur al _wi th demands.mhydr o - Resul t Fi l es\Ri ver Basi n_LVN Natur al _demands.df s0
P : \P r oj ects\113699 Impl em Suppor t Consul tant WRP & M an\7 DEL SERV\11 T ASK 2 BASIN PLANNING\113699 Kenya ISC\1.1-LVN\01-M IKE_HYDRO_Basi n\01-M HB_Pr oj ects\Cal i br at i on\Nzoi a\ [par ameter s.x l sx]NODES
0
5
10
15
20
25
30
35
84 85 86 87 88
Daily flo
w r
ate
(m
3/s
)
Observed (m³/s)
Simulated (m³/s)
0
100
200
300
400
500
600
84 85 86 87 88
Flo
w v
olu
me (
million m
3)
Observed (million m³)
Simulated (million m³)
y = 0.8749x + 0.6174
R² = 0.6259
0
2
4
6
8
10
12
14
16
0 2 4 6 8 10 12 14 16
Sim
ula
ted flow
rate
(m
3/s
)
Observed flow rate (m3/s)
Observed vs Simulated monthly flow rate - Validation Period
0
1
2
3
4
5
6
7
8
9
Jan Feb Mar Apr May Jun Jul Aug Sep Oct Nov Dec
Flo
w R
ate
(m
3 /s)
Mean obs Mean sim
Scatter plot monthly flow
Mean monthly flow rateCumulative flow volume
Daily flow time series
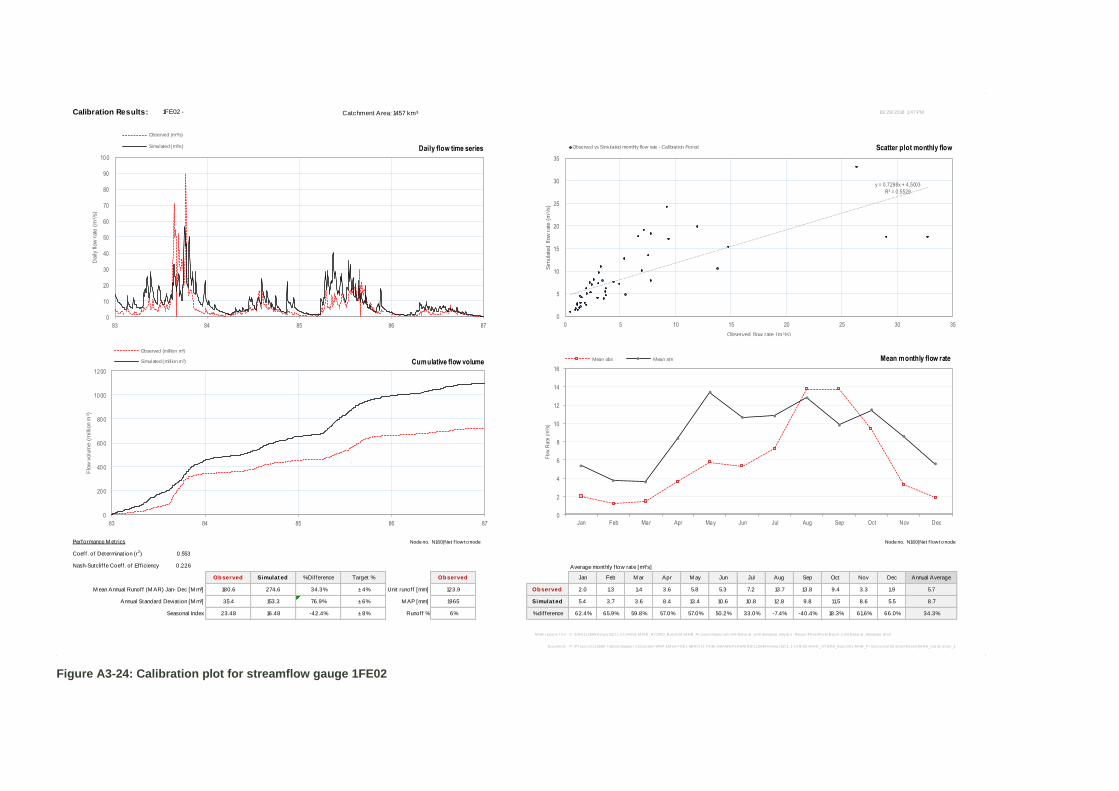
Figure A3-24: Calibration plot for streamflow gauge 1FE02
Calibration Results: 1FE02 - Catchment Area: 1457 km³ 10/ 29/ 2018 1:47 PM
Performance M etrics Node no. N160|Net f low t o node Node no. N160|Net f low t o node
Coeff . of Determinat ion (r2) 0.553
Nash-Sutclif fe Coeff . of Eff iciency 0.226 Average monthly f low rate [m³/s]
Observed Simulat ed % Dif ference Target % Observed Jan Feb M ar Apr M ay Jun Jul Aug Sep Oct Nov Dec Annual Average
M ean Annual Runoff (M AR) Jan- Dec [M m³] 180.6 274.6 34.3% ± 4% Unit runoff [mm] 123.9 Observed 2.0 1.3 1.4 3.6 5.8 5.3 7.2 13.7 13.8 9.4 3.3 1.9 5.7
Annual Standard Deviat ion [M m³] 35.4 153.3 76.9% ± 6% M AP [mm] 1965 Simulat ed 5.4 3.7 3.6 8.4 13.4 10.6 10.8 12.8 9.8 11.5 8.6 5.5 8.7
Seasonal Index 23.48 16.48 -42.4% ± 8% Runoff % 6% % dif ference 62.4% 65.9% 59.8% 57.0% 57.0% 50.2% 33.0% -7.4% -40.4% 18.3% 61.6% 66.0% 34.3%
M HB r esul ts f i l e:
Document :
C: \DHI \113699 Kenya ISC\1.1-LVN\01-M IKE_HYDRO_Basi n\01-M HB_Pr oj ects\Natur al \LVN-Natur al _wi th demands.mhydr o - Resul t Fi l es\Ri ver Basi n_LVN Natur al _demands.df s0
P : \P r oj ects\113699 Impl em Suppor t Consul tant WRP & M an\7 DEL SERV\11 T ASK 2 BASIN PLANNING\113699 Kenya ISC\1.1-LVN\01-M IKE_HYDRO_Basi n\01-M HB_Pr oj ects\Cal i br at i on\Nzoi a\ [M HB_Cal i br at i on_1FE02 - NO LESSOS.xl sm]Cal i br at i on
0
10
20
30
40
50
60
70
80
90
100
83 84 85 86 87
Daily flo
w r
ate
(m
3/s
)
Observed (m³/s)
Simulated (m³/s)
0
200
400
600
800
1000
1200
83 84 85 86 87
Flo
w v
olu
me (
million m
3)
Observed (million m³)
Simulated (million m³)
y = 0.7298x + 4.5003
R² = 0.5529
0
5
10
15
20
25
30
35
0 5 10 15 20 25 30 35
Sim
ula
ted flow
rate
(m
3/s
)
Observed flow rate (m3/s)
Observed vs Simulated monthly flow rate - Calibration Period
0
2
4
6
8
10
12
14
16
Jan Feb Mar Apr May Jun Jul Aug Sep Oct Nov Dec
Flo
w R
ate
(m
3 /s)
Mean obs Mean sim
Scatter plot monthly flow
Mean monthly flow rateCumulative flow volume
Daily flow time series
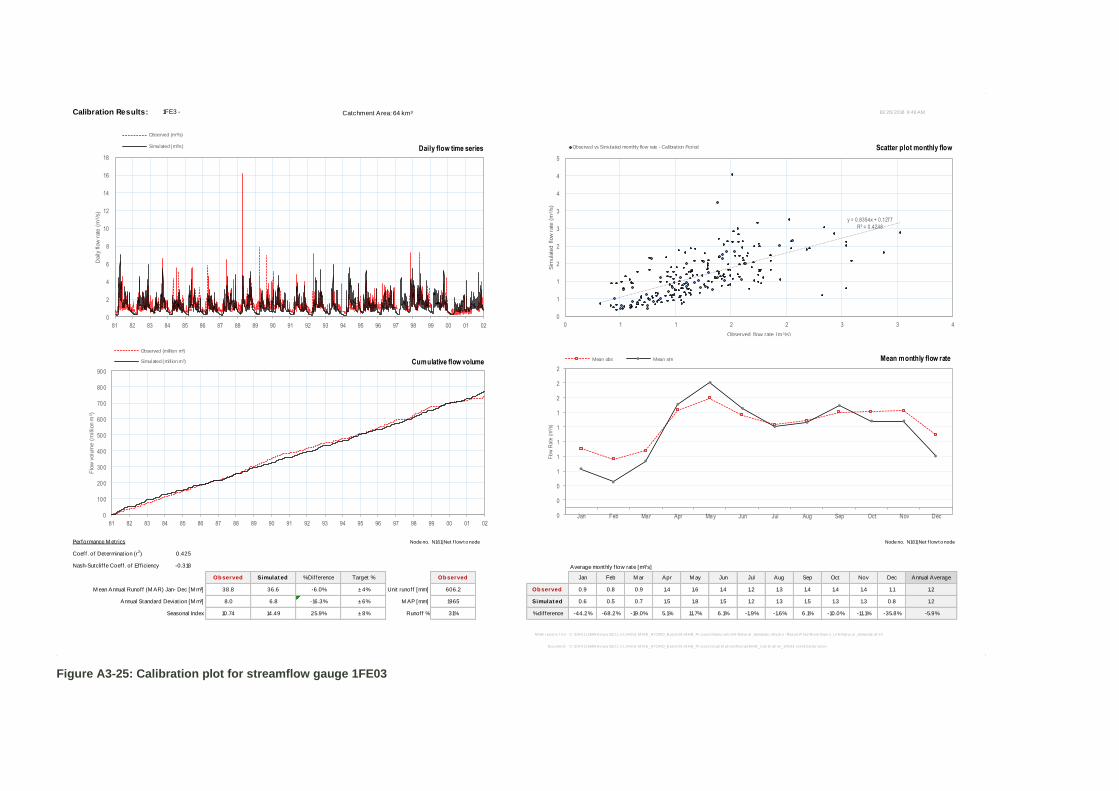
Figure A3-25: Calibration plot for streamflow gauge 1FE03
Calibration Results: 1FE3 - Catchment Area: 64 km³ 10/ 26/ 2018 9:46 AM
Performance M etrics Node no. N161|Net f low t o node Node no. N161|Net f low t o node
Coeff . of Determinat ion (r2) 0.425
Nash-Sutclif fe Coeff . of Eff iciency -0.318 Average monthly f low rate [m³/s]
Observed Simulat ed % Dif ference Target % Observed Jan Feb M ar Apr M ay Jun Jul Aug Sep Oct Nov Dec Annual Average
M ean Annual Runoff (M AR) Jan- Dec [M m³] 38.8 36.6 -6.0% ± 4% Unit runoff [mm] 606.2 Observed 0.9 0.8 0.9 1.4 1.6 1.4 1.2 1.3 1.4 1.4 1.4 1.1 1.2
Annual Standard Deviat ion [M m³] 8.0 6.8 -16.3% ± 6% M AP [mm] 1965 Simulat ed 0.6 0.5 0.7 1.5 1.8 1.5 1.2 1.3 1.5 1.3 1.3 0.8 1.2
Seasonal Index 10.74 14.49 25.9% ± 8% Runoff % 31% % dif ference -44.2% -68.2% -19.0% 5.1% 11.7% 6.1% -1.9% -1.6% 6.1% -10.0% -11.1% -35.8% -5.9%
M HB r esul ts f i l e:
Document :
C: \DHI \113699 Kenya ISC\1.1-LVN\01-M IKE_HYDRO_Basi n\01-M HB_Pr oj ects\Natur al \LVN-Natur al _demands.mhydr o - Resul t Fi l es\Ri ver Basi n_LVN Natur al _demands.df s0
C: \DHI \113699 Kenya ISC\1.1-LVN\01-M IKE_HYDRO_Basi n\01-M HB_Pr oj ects\Cal i br at i on\Nzoi a\ [M HB_Cal i br at i on_1FE03.xl sm]Cal i br at i on
0
2
4
6
8
10
12
14
16
18
81 82 83 84 85 86 87 88 89 90 91 92 93 94 95 96 97 98 99 00 01 02
Daily flo
w r
ate
(m
3/s
)
Observed (m³/s)
Simulated (m³/s)
0
100
200
300
400
500
600
700
800
900
81 82 83 84 85 86 87 88 89 90 91 92 93 94 95 96 97 98 99 00 01 02
Flo
w v
olu
me (
million m
3)
Observed (million m³)
Simulated (million m³)
y = 0.8354x + 0.1277
R² = 0.4248
0
1
1
2
2
3
3
4
4
5
0 1 1 2 2 3 3 4
Sim
ula
ted flow
rate
(m
3/s
)
Observed flow rate (m3/s)
Observed vs Simulated monthly flow rate - Calibration Period
0
0
0
1
1
1
1
1
2
2
2
Jan Feb Mar Apr May Jun Jul Aug Sep Oct Nov Dec
Flo
w R
ate
(m
3 /s)
Mean obs Mean sim
Scatter plot monthly flow
Mean monthly flow rateCumulative flow volume
Daily flow time series
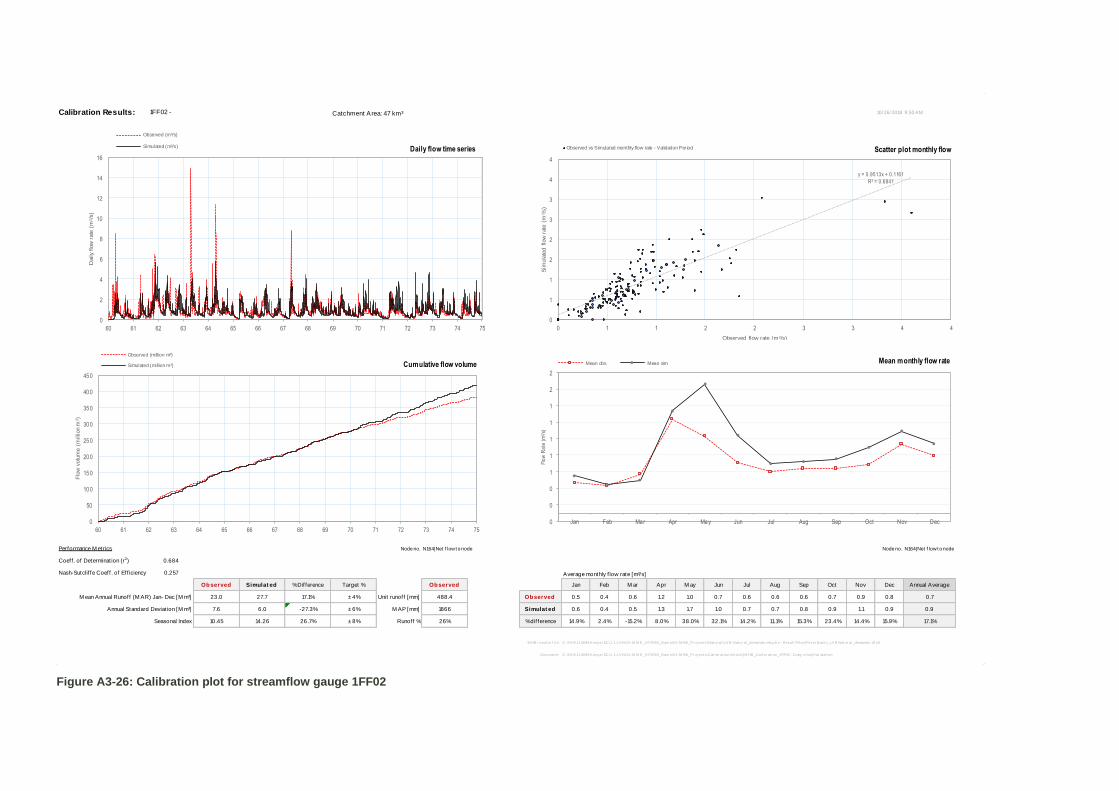
Figure A3-26: Calibration plot for streamflow gauge 1FF02
Calibration Results: 1FF02 - Catchment Area: 47 km³ 10/ 26/ 2018 9:50 AM
Performance M etrics Node no. N164|Net f low t o node Node no. N164|Net f low t o node
Coeff . of Determinat ion (r2) 0.684
Nash-Sutclif fe Coeff . of Eff iciency 0.257 Average monthly f low rate [m³/s]
Observed Simulat ed % Dif ference Target % Observed Jan Feb M ar Apr M ay Jun Jul Aug Sep Oct Nov Dec Annual Average
M ean Annual Runoff (M AR) Jan- Dec [M m³] 23.0 27.7 17.1% ± 4% Unit runoff [mm] 488.4 Observed 0.5 0.4 0.6 1.2 1.0 0.7 0.6 0.6 0.6 0.7 0.9 0.8 0.7
Annual Standard Deviat ion [M m³] 7.6 6.0 -27.3% ± 6% M AP [mm] 1866 Simulat ed 0.6 0.4 0.5 1.3 1.7 1.0 0.7 0.7 0.8 0.9 1.1 0.9 0.9
Seasonal Index 10.45 14.26 26.7% ± 8% Runoff % 26% % dif ference 14.9% 2.4% -15.2% 8.0% 38.0% 32.1% 14.2% 11.1% 15.3% 23.4% 14.4% 15.9% 17.1%
M HB r esul ts f i l e:
Document :
C: \DHI \113699 Kenya ISC\1.1-LVN\01-M IKE_HYDRO_Basi n\01-M HB_Pr oj ects\Natur al \LVN-Natur al _demands.mhydr o - Resul t Fi l es\Ri ver Basi n_LVN Natur al _demands.df s0
C: \DHI \113699 Kenya ISC\1.1-LVN\01-M IKE_HYDRO_Basi n\01-M HB_Pr oj ects\Cal i br at i on\Nzoi a\ [M HB_Cal i br at i on_1FF02 - Copy.xl sm]Val i dat i on
0
2
4
6
8
10
12
14
16
60 61 62 63 64 65 66 67 68 69 70 71 72 73 74 75
Daily flo
w r
ate
(m
3/s
)
Observed (m³/s)
Simulated (m³/s)
0
50
100
150
200
250
300
350
400
450
60 61 62 63 64 65 66 67 68 69 70 71 72 73 74 75
Flo
w v
olu
me (
million m
3)
Observed (million m³)
Simulated (million m³)
y = 0.9513x + 0.1161
R² = 0.6841
0
1
1
2
2
3
3
4
4
0 1 1 2 2 3 3 4 4
Sim
ula
ted flow
rate
(m
3/s
)
Observed flow rate (m3/s)
Observed vs Simulated monthly flow rate - Validation Period
0
0
0
1
1
1
1
1
2
2
Jan Feb Mar Apr May Jun Jul Aug Sep Oct Nov Dec
Flo
w R
ate
(m
3 /s)
Mean obs Mean sim
Scatter plot monthly flow
Mean monthly flow rateCumulative flow volume
Daily flow time series
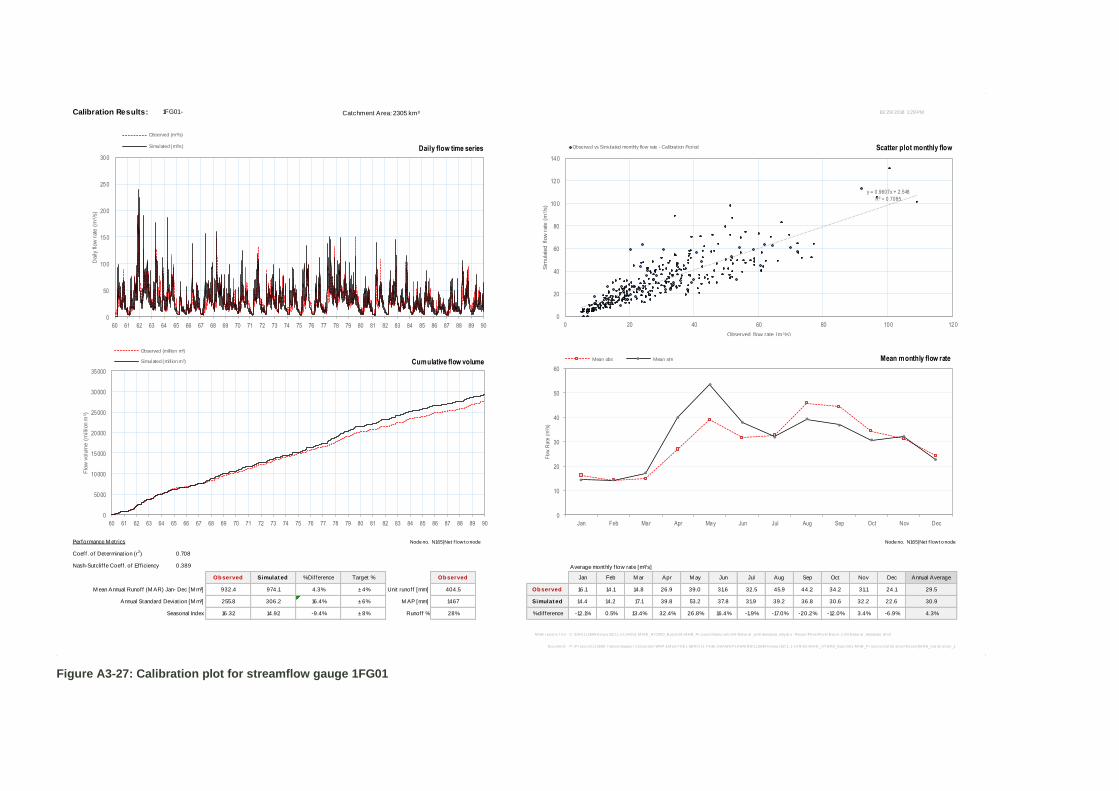
Figure A3-27: Calibration plot for streamflow gauge 1FG01
Calibration Results: 1FG01 - Catchment Area: 2305 km³ 10/ 29/ 2018 1:29 PM
Performance M etrics Node no. N165|Net f low t o node Node no. N165|Net f low t o node
Coeff . of Determinat ion (r2) 0.708
Nash-Sutclif fe Coeff . of Eff iciency 0.389 Average monthly f low rate [m³/s]
Observed Simulat ed % Dif ference Target % Observed Jan Feb M ar Apr M ay Jun Jul Aug Sep Oct Nov Dec Annual Average
M ean Annual Runoff (M AR) Jan- Dec [M m³] 932.4 974.1 4.3% ± 4% Unit runoff [mm] 404.5 Observed 16.1 14.1 14.8 26.9 39.0 31.6 32.5 45.9 44.2 34.2 31.1 24.1 29.5
Annual Standard Deviat ion [M m³] 255.8 306.2 16.4% ± 6% M AP [mm] 1467 Simulat ed 14.4 14.2 17.1 39.8 53.2 37.8 31.9 39.2 36.8 30.6 32.2 22.6 30.9
Seasonal Index 16.32 14.92 -9.4% ± 8% Runoff % 28% % dif ference -12.1% 0.5% 13.4% 32.4% 26.8% 16.4% -1.9% -17.0% -20.2% -12.0% 3.4% -6.9% 4.3%
M HB r esul ts f i l e:
Document :
C: \DHI \113699 Kenya ISC\1.1-LVN\01-M IKE_HYDRO_Basi n\01-M HB_Pr oj ects\Natur al \LVN-Natur al _wi th demands.mhydr o - Resul t Fi l es\Ri ver Basi n_LVN Natur al _demands.df s0
P : \P r oj ects\113699 Impl em Suppor t Consul tant WRP & M an\7 DEL SERV\11 T ASK 2 BASIN PLANNING\113699 Kenya ISC\1.1-LVN\01-M IKE_HYDRO_Basi n\01-M HB_Pr oj ects\Cal i br at i on\Nzoi a\ [M HB_Cal i br at i on_1FG01 NO LESSOS.xl sm]Val i dat i on
0
50
100
150
200
250
300
60 61 62 63 64 65 66 67 68 69 70 71 72 73 74 75 76 77 78 79 80 81 82 83 84 85 86 87 88 89 90
Daily flo
w r
ate
(m
3/s
)
Observed (m³/s)
Simulated (m³/s)
0
5000
10000
15000
20000
25000
30000
35000
60 61 62 63 64 65 66 67 68 69 70 71 72 73 74 75 76 77 78 79 80 81 82 83 84 85 86 87 88 89 90
Flo
w v
olu
me (
million m
3)
Observed (million m³)
Simulated (million m³)
y = 0.9607x + 2.548
R² = 0.7085
0
20
40
60
80
100
120
140
0 20 40 60 80 100 120
Sim
ula
ted flow
rate
(m
3/s
)
Observed flow rate (m3/s)
Observed vs Simulated monthly flow rate - Calibration Period
0
10
20
30
40
50
60
Jan Feb Mar Apr May Jun Jul Aug Sep Oct Nov Dec
Flo
w R
ate
(m
3 /s)
Mean obs Mean sim
Scatter plot monthly flow
Mean monthly flow rateCumulative flow volume
Daily flow time series
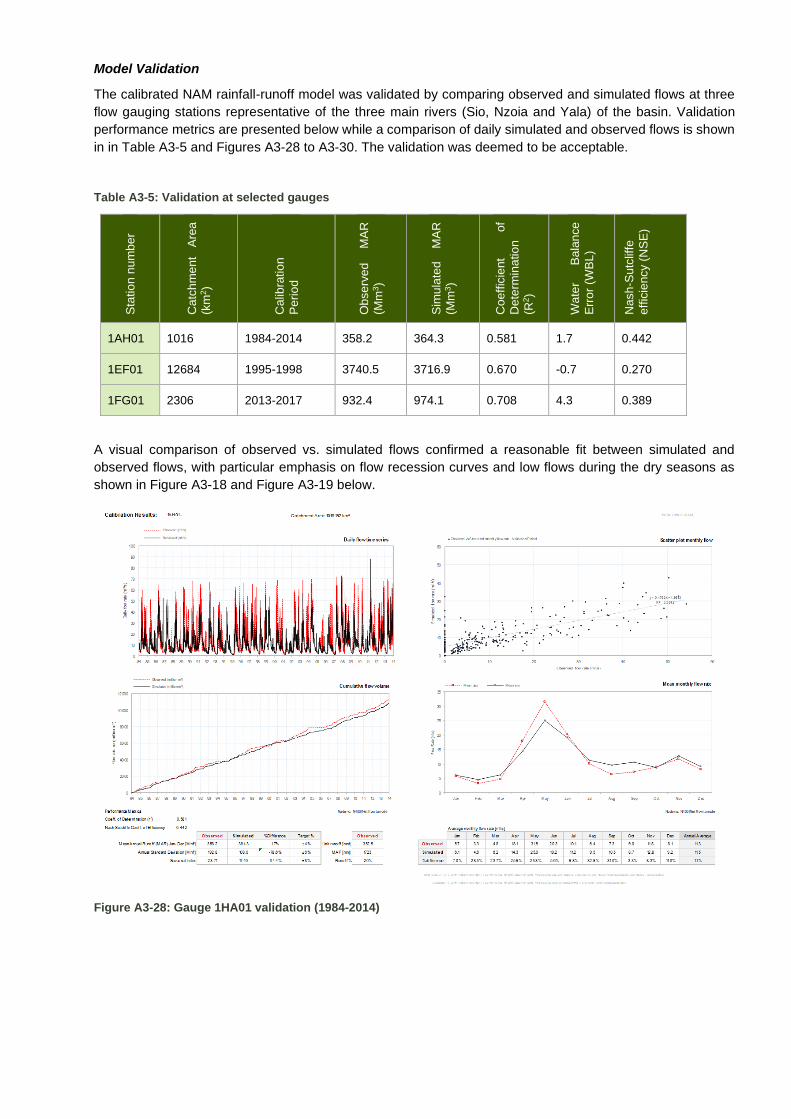
Model Validation
The calibrated NAM rainfall-runoff model was validated by comparing observed and simulated flows at three
flow gauging stations representative of the three main rivers (Sio, Nzoia and Yala) of the basin. Validation
performance metrics are presented below while a comparison of daily simulated and observed flows is shown
in in Table A3-5 and Figures A3-28 to A3-30. The validation was deemed to be acceptable.
Table A3-5: Validation at selected gauges
Sta
tio
n n
um
be
r
Ca
tch
me
nt
Are
a
(km
2)
Ca
libra
tio
n
Pe
rio
d
Ob
se
rve
d
MA
R
(Mm
3)
Sim
ula
ted
M
AR
(Mm
3)
Co
eff
icie
nt
of
De
term
ina
tio
n
(R2)
Wa
ter
Ba
lan
ce
Err
or
(WB
L)
Na
sh
-Su
tclif
fe
eff
icie
ncy (
NS
E)
1AH01 1016 1984-2014 358.2 364.3 0.581 1.7 0.442
1EF01 12684 1995-1998 3740.5 3716.9 0.670 -0.7 0.270
1FG01 2306 2013-2017 932.4 974.1 0.708 4.3 0.389
A visual comparison of observed vs. simulated flows confirmed a reasonable fit between simulated and
observed flows, with particular emphasis on flow recession curves and low flows during the dry seasons as
shown in Figure A3-18 and Figure A3-19 below.
Figure A3-28: Gauge 1HA01 validation (1984-2014)
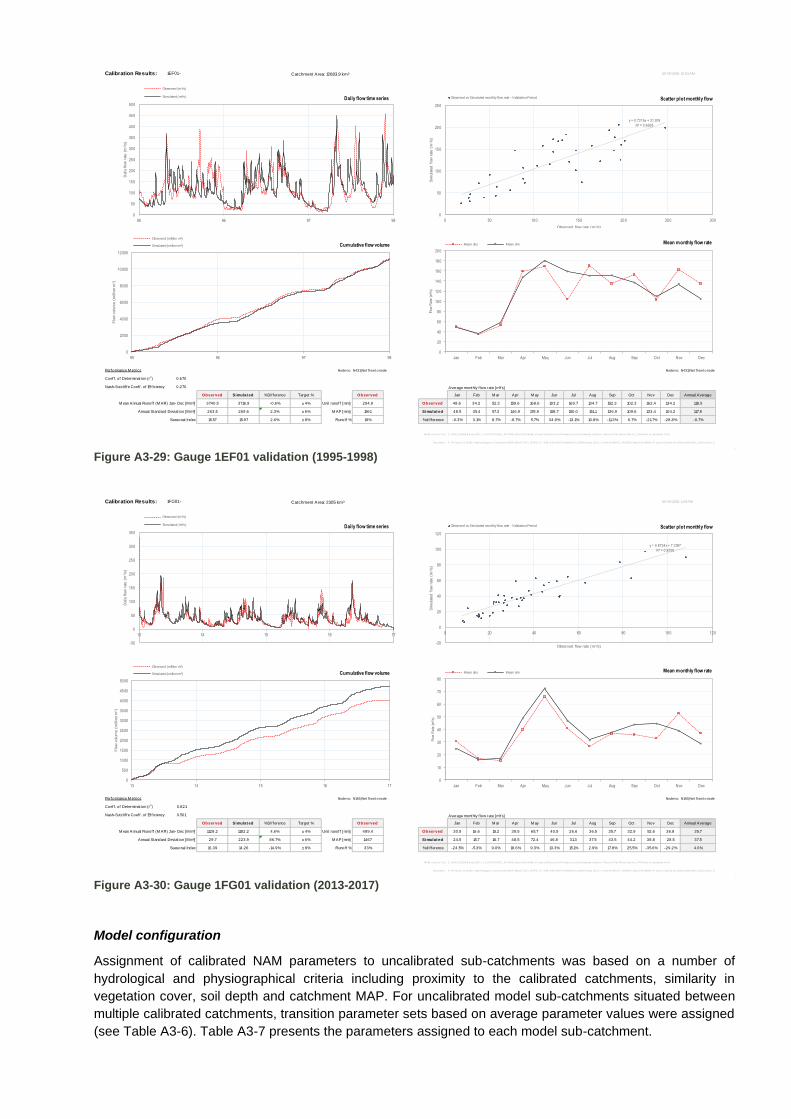
Figure A3-29: Gauge 1EF01 validation (1995-1998)
Figure A3-30: Gauge 1FG01 validation (2013-2017)
Model configuration
Assignment of calibrated NAM parameters to uncalibrated sub-catchments was based on a number of
hydrological and physiographical criteria including proximity to the calibrated catchments, similarity in
vegetation cover, soil depth and catchment MAP. For uncalibrated model sub-catchments situated between
multiple calibrated catchments, transition parameter sets based on average parameter values were assigned
(see Table A3-6). Table A3-7 presents the parameters assigned to each model sub-catchment.
Calibration Results: 1EF01 - Catchment Area: 12683.9 km³ 10/ 29/ 2018 10:53 AM
Performance M etrics Node no. N431|Net f low t o node Node no. N431|Net f low t o node
Coeff . of Determinat ion (r2) 0.670
Nash-Sutclif fe Coeff . of Eff iciency 0.270 Average monthly f low rate [m³/s]
Observed Simulat ed % Dif ference Target % Observed Jan Feb M ar Apr M ay Jun Jul Aug Sep Oct Nov Dec Annual Average
M ean Annual Runoff (M AR) Jan- Dec [M m³] 3740.5 3716.9 -0.6% ± 4% Unit runoff [mm] 294.9 Observed 48.6 34.2 52.3 159.6 168.6 103.2 169.7 134.7 152.3 102.3 162.4 134.2 118.5
Annual Standard Deviat ion [M m³] 263.5 269.6 2.3% ± 6% M AP [mm] 1561 Simulat ed 48.5 35.4 57.3 146.9 178.9 158.7 150.0 151.1 136.9 109.6 133.4 104.2 117.8
Seasonal Index 15.57 15.97 2.6% ± 8% Runoff % 19% % dif ference -0.3% 3.1% 8.7% -8.7% 5.7% 34.9% -13.1% 10.8% -11.3% 6.7% -21.7% -28.8% -0.7%
M HB r esul ts f i l e:
Document :
C: \DHI \113699 Kenya ISC\1.1-LVN\01-M IKE_HYDRO_Basi n\01-M HB_Pr oj ects\Natur al \LVN-Natur al _wi th demands.mhydr o - Resul t Fi l es\Ri ver Basi n_LVN Natur al _demands.df s0
P : \P r oj ects\113699 Impl em Suppor t Consul tant WRP & M an\7 DEL SERV\11 T ASK 2 BASIN PLANNING\113699 Kenya ISC\1.1-LVN\01-M IKE_HYDRO_Basi n\01-M HB_Pr oj ects\Cal i br at i on\Nzoi a\ [M HB_Cal i br at i on_1EF01.xl sm]Val i dat i on
0
50
100
150
200
250
300
350
400
450
500
95 96 97 98
Daily flo
w r
ate
(m
3/s
)
Observed (m³/s)
Simulated (m³/s)
0
2000
4000
6000
8000
10000
12000
95 96 97 98
Flo
w v
olu
me (
million m
3)
Observed (million m³)
Simulated (million m³)
y = 0.7216x + 31.919
R² = 0.6695
0
50
100
150
200
250
0 50 100 150 200 250 300
Sim
ula
ted flow
rate
(m
3/s
)
Observed flow rate (m3/s)
Observed vs Simulated monthly flow rate - Validation Period
0
20
40
60
80
100
120
140
160
180
200
Jan Feb Mar Apr May Jun Jul Aug Sep Oct Nov Dec
Flo
w R
ate
(m
3 /s)
Mean obs Mean sim
Scatter plot monthly flow
Mean monthly flow rateCumulative flow volume
Daily flow time series
Calibration Results: 1FG01 - Catchment Area: 2305 km³ 10/ 29/ 2018 1:29 PM
Performance M etrics Node no. N165|Net f low t o node Node no. N165|Net f low t o node
Coeff . of Determinat ion (r2) 0.821
Nash-Sutclif fe Coeff . of Eff iciency 0.501 Average monthly f low rate [m³/s]
Observed Simulat ed % Dif ference Target % Observed Jan Feb M ar Apr M ay Jun Jul Aug Sep Oct Nov Dec Annual Average
M ean Annual Runoff (M AR) Jan- Dec [M m³] 1128.2 1182.2 4.6% ± 4% Unit runoff [mm] 489.4 Observed 30.5 16.6 15.2 39.5 65.7 40.5 26.6 36.5 35.7 32.9 52.6 36.8 35.7
Annual Standard Deviat ion [M m³] 29.7 223.9 86.7% ± 6% M AP [mm] 1467 Simulat ed 24.5 15.7 16.7 48.5 72.4 46.8 31.3 37.5 43.5 44.2 38.8 28.5 37.5
Seasonal Index 16.39 14.26 -14.9% ± 8% Runoff % 33% % dif ference -24.5% -5.3% 9.0% 18.6% 9.3% 13.3% 15.1% 2.9% 17.8% 25.5% -35.6% -29.2% 4.6%
M HB r esul ts f i l e:
Document :
C: \DHI \113699 Kenya ISC\1.1-LVN\01-M IKE_HYDRO_Basi n\01-M HB_Pr oj ects\Natur al \LVN-Natur al _wi th demands.mhydr o - Resul t Fi l es\Ri ver Basi n_LVN Natur al _demands.df s0
P : \P r oj ects\113699 Impl em Suppor t Consul tant WRP & M an\7 DEL SERV\11 T ASK 2 BASIN PLANNING\113699 Kenya ISC\1.1-LVN\01-M IKE_HYDRO_Basi n\01-M HB_Pr oj ects\Cal i br at i on\Nzoi a\ [M HB_Cal i br at i on_1FG01 NO LESSOS.xl sm]Val i dat i on
-50
0
50
100
150
200
250
300
350
13 14 15 16 17
Daily flo
w r
ate
(m
3/s
)
Observed (m³/s)
Simulated (m³/s)
0
500
1000
1500
2000
2500
3000
3500
4000
4500
5000
13 14 15 16 17
Flo
w v
olu
me (
million m
3)
Observed (million m³)
Simulated (million m³)
y = 0.8734x + 7.2297
R² = 0.8206
-20
0
20
40
60
80
100
120
0 20 40 60 80 100 120
Sim
ula
ted flow
rate
(m
3/s
)
Observed flow rate (m3/s)
Observed vs Simulated monthly flow rate - Validation Period
0
10
20
30
40
50
60
70
80
Jan Feb Mar Apr May Jun Jul Aug Sep Oct Nov Dec
Flo
w R
ate
(m
3 /s)
Mean obs Mean sim
Scatter plot monthly flow
Mean monthly flow rateCumulative flow volume
Daily flow time series
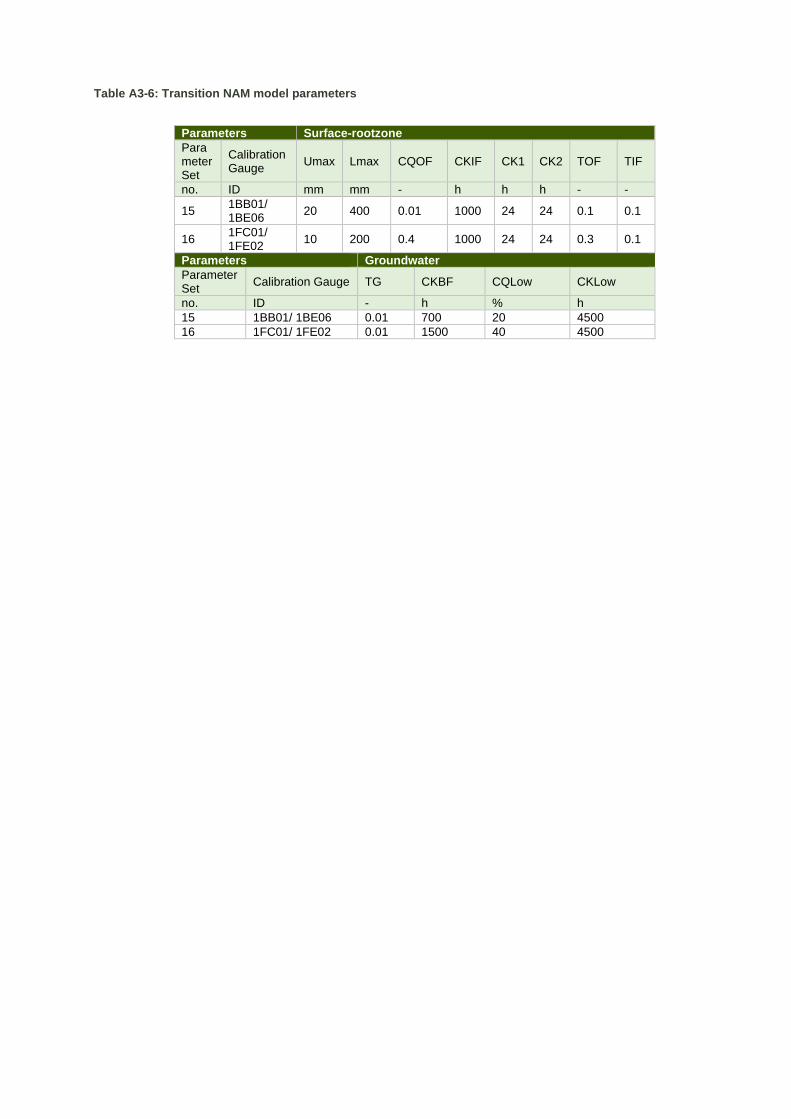
Table A3-6: Transition NAM model parameters
Parameters Surface-rootzone
Parameter Set
Calibration Gauge
Umax Lmax CQOF CKIF CK1 CK2 TOF TIF
no. ID mm mm - h h h - -
15 1BB01/ 1BE06
20 400 0.01 1000 24 24 0.1 0.1
16 1FC01/ 1FE02
10 200 0.4 1000 24 24 0.3 0.1
Parameters Groundwater
Parameter Set
Calibration Gauge TG CKBF CQLow CKLow
no. ID - h % h
15 1BB01/ 1BE06 0.01 700 20 4500
16 1FC01/ 1FE02 0.01 1500 40 4500
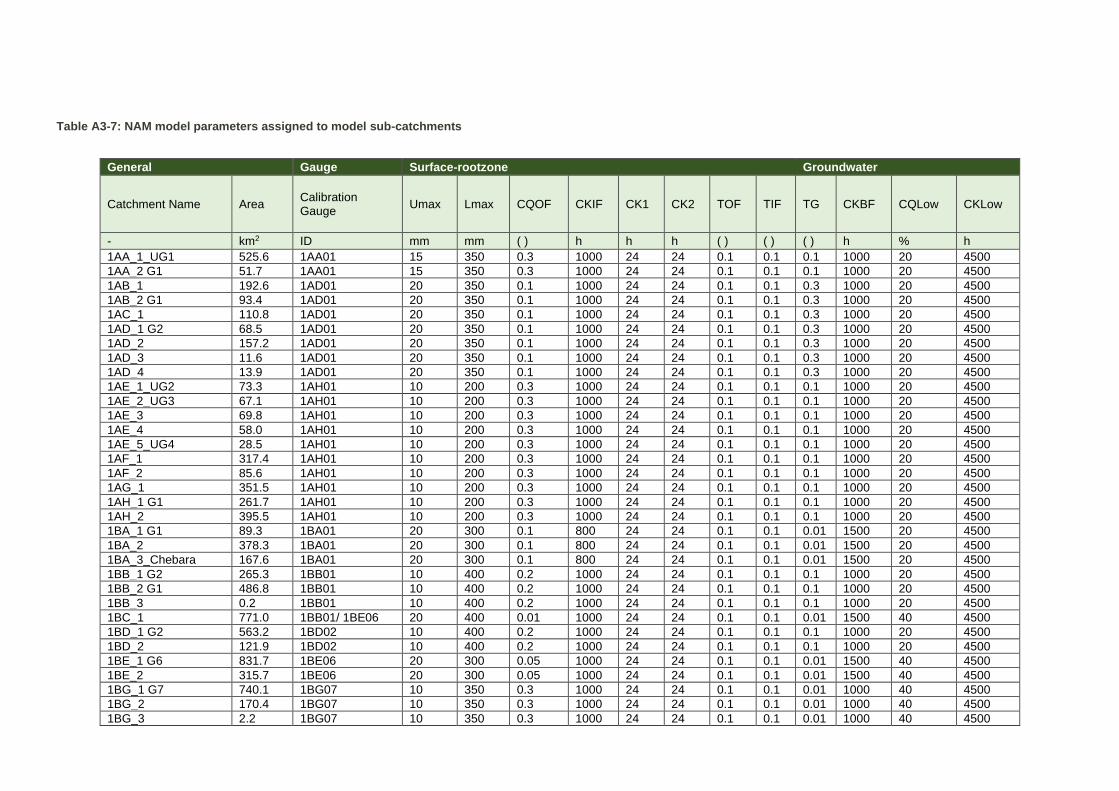
Table A3-7: NAM model parameters assigned to model sub-catchments
General Gauge Surface-rootzone Groundwater
Catchment Name Area Calibration Gauge
Umax Lmax CQOF CKIF CK1 CK2 TOF TIF TG CKBF CQLow CKLow
- km2 ID mm mm ( ) h h h ( ) ( ) ( ) h % h
1AA_1_UG1 525.6 1AA01 15 350 0.3 1000 24 24 0.1 0.1 0.1 1000 20 4500
1AA_2 G1 51.7 1AA01 15 350 0.3 1000 24 24 0.1 0.1 0.1 1000 20 4500
1AB_1 192.6 1AD01 20 350 0.1 1000 24 24 0.1 0.1 0.3 1000 20 4500
1AB_2 G1 93.4 1AD01 20 350 0.1 1000 24 24 0.1 0.1 0.3 1000 20 4500
1AC_1 110.8 1AD01 20 350 0.1 1000 24 24 0.1 0.1 0.3 1000 20 4500
1AD_1 G2 68.5 1AD01 20 350 0.1 1000 24 24 0.1 0.1 0.3 1000 20 4500
1AD_2 157.2 1AD01 20 350 0.1 1000 24 24 0.1 0.1 0.3 1000 20 4500
1AD_3 11.6 1AD01 20 350 0.1 1000 24 24 0.1 0.1 0.3 1000 20 4500
1AD_4 13.9 1AD01 20 350 0.1 1000 24 24 0.1 0.1 0.3 1000 20 4500
1AE_1_UG2 73.3 1AH01 10 200 0.3 1000 24 24 0.1 0.1 0.1 1000 20 4500
1AE_2_UG3 67.1 1AH01 10 200 0.3 1000 24 24 0.1 0.1 0.1 1000 20 4500
1AE_3 69.8 1AH01 10 200 0.3 1000 24 24 0.1 0.1 0.1 1000 20 4500
1AE_4 58.0 1AH01 10 200 0.3 1000 24 24 0.1 0.1 0.1 1000 20 4500
1AE_5_UG4 28.5 1AH01 10 200 0.3 1000 24 24 0.1 0.1 0.1 1000 20 4500
1AF_1 317.4 1AH01 10 200 0.3 1000 24 24 0.1 0.1 0.1 1000 20 4500
1AF_2 85.6 1AH01 10 200 0.3 1000 24 24 0.1 0.1 0.1 1000 20 4500
1AG_1 351.5 1AH01 10 200 0.3 1000 24 24 0.1 0.1 0.1 1000 20 4500
1AH_1 G1 261.7 1AH01 10 200 0.3 1000 24 24 0.1 0.1 0.1 1000 20 4500
1AH_2 395.5 1AH01 10 200 0.3 1000 24 24 0.1 0.1 0.1 1000 20 4500
1BA_1 G1 89.3 1BA01 20 300 0.1 800 24 24 0.1 0.1 0.01 1500 20 4500
1BA_2 378.3 1BA01 20 300 0.1 800 24 24 0.1 0.1 0.01 1500 20 4500
1BA_3_Chebara 167.6 1BA01 20 300 0.1 800 24 24 0.1 0.1 0.01 1500 20 4500
1BB_1 G2 265.3 1BB01 10 400 0.2 1000 24 24 0.1 0.1 0.1 1000 20 4500
1BB_2 G1 486.8 1BB01 10 400 0.2 1000 24 24 0.1 0.1 0.1 1000 20 4500
1BB_3 0.2 1BB01 10 400 0.2 1000 24 24 0.1 0.1 0.1 1000 20 4500
1BC_1 771.0 1BB01/ 1BE06 20 400 0.01 1000 24 24 0.1 0.1 0.01 1500 40 4500
1BD_1 G2 563.2 1BD02 10 400 0.2 1000 24 24 0.1 0.1 0.1 1000 20 4500
1BD_2 121.9 1BD02 10 400 0.2 1000 24 24 0.1 0.1 0.1 1000 20 4500
1BE_1 G6 831.7 1BE06 20 300 0.05 1000 24 24 0.1 0.1 0.01 1500 40 4500
1BE_2 315.7 1BE06 20 300 0.05 1000 24 24 0.1 0.1 0.01 1500 40 4500
1BG_1 G7 740.1 1BG07 10 350 0.3 1000 24 24 0.1 0.1 0.01 1000 40 4500
1BG_2 170.4 1BG07 10 350 0.3 1000 24 24 0.1 0.1 0.01 1000 40 4500
1BG_3 2.2 1BG07 10 350 0.3 1000 24 24 0.1 0.1 0.01 1000 40 4500
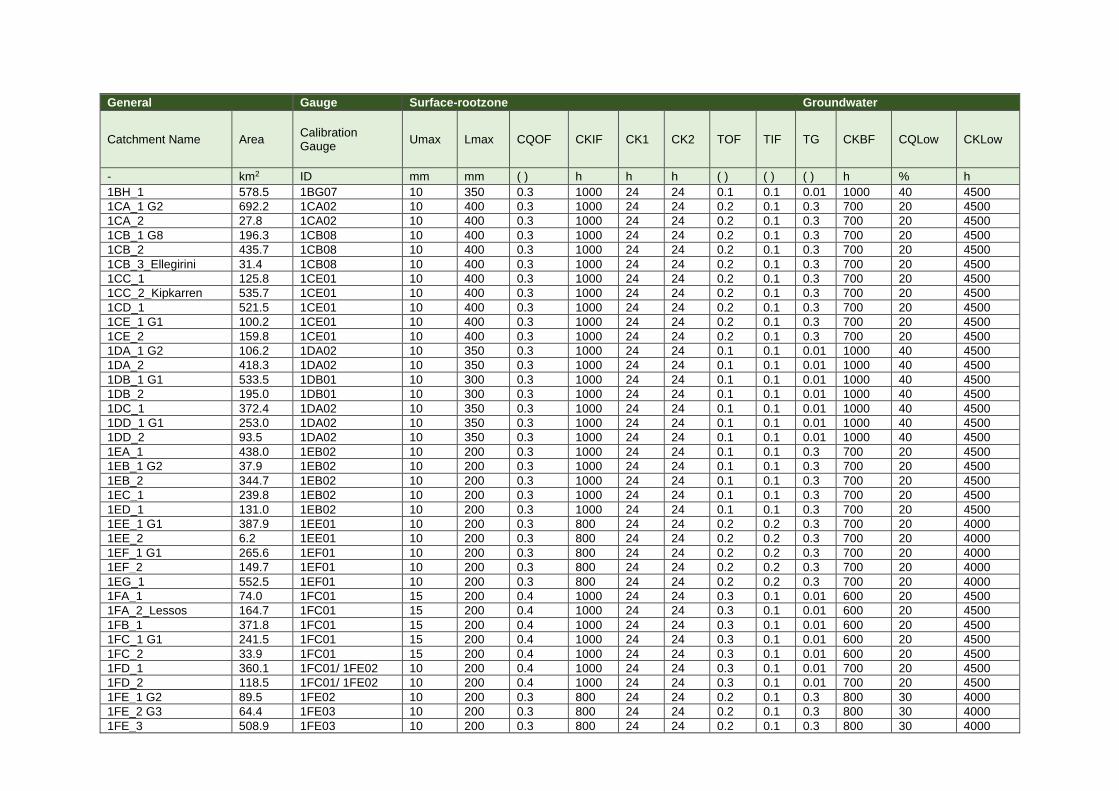
General Gauge Surface-rootzone Groundwater
Catchment Name Area Calibration Gauge
Umax Lmax CQOF CKIF CK1 CK2 TOF TIF TG CKBF CQLow CKLow
- km2 ID mm mm ( ) h h h ( ) ( ) ( ) h % h
1BH_1 578.5 1BG07 10 350 0.3 1000 24 24 0.1 0.1 0.01 1000 40 4500
1CA_1 G2 692.2 1CA02 10 400 0.3 1000 24 24 0.2 0.1 0.3 700 20 4500
1CA_2 27.8 1CA02 10 400 0.3 1000 24 24 0.2 0.1 0.3 700 20 4500
1CB_1 G8 196.3 1CB08 10 400 0.3 1000 24 24 0.2 0.1 0.3 700 20 4500
1CB_2 435.7 1CB08 10 400 0.3 1000 24 24 0.2 0.1 0.3 700 20 4500
1CB_3_Ellegirini 31.4 1CB08 10 400 0.3 1000 24 24 0.2 0.1 0.3 700 20 4500
1CC_1 125.8 1CE01 10 400 0.3 1000 24 24 0.2 0.1 0.3 700 20 4500
1CC_2_Kipkarren 535.7 1CE01 10 400 0.3 1000 24 24 0.2 0.1 0.3 700 20 4500
1CD_1 521.5 1CE01 10 400 0.3 1000 24 24 0.2 0.1 0.3 700 20 4500
1CE_1 G1 100.2 1CE01 10 400 0.3 1000 24 24 0.2 0.1 0.3 700 20 4500
1CE_2 159.8 1CE01 10 400 0.3 1000 24 24 0.2 0.1 0.3 700 20 4500
1DA_1 G2 106.2 1DA02 10 350 0.3 1000 24 24 0.1 0.1 0.01 1000 40 4500
1DA_2 418.3 1DA02 10 350 0.3 1000 24 24 0.1 0.1 0.01 1000 40 4500
1DB_1 G1 533.5 1DB01 10 300 0.3 1000 24 24 0.1 0.1 0.01 1000 40 4500
1DB_2 195.0 1DB01 10 300 0.3 1000 24 24 0.1 0.1 0.01 1000 40 4500
1DC_1 372.4 1DA02 10 350 0.3 1000 24 24 0.1 0.1 0.01 1000 40 4500
1DD_1 G1 253.0 1DA02 10 350 0.3 1000 24 24 0.1 0.1 0.01 1000 40 4500
1DD_2 93.5 1DA02 10 350 0.3 1000 24 24 0.1 0.1 0.01 1000 40 4500
1EA_1 438.0 1EB02 10 200 0.3 1000 24 24 0.1 0.1 0.3 700 20 4500
1EB_1 G2 37.9 1EB02 10 200 0.3 1000 24 24 0.1 0.1 0.3 700 20 4500
1EB_2 344.7 1EB02 10 200 0.3 1000 24 24 0.1 0.1 0.3 700 20 4500
1EC_1 239.8 1EB02 10 200 0.3 1000 24 24 0.1 0.1 0.3 700 20 4500
1ED_1 131.0 1EB02 10 200 0.3 1000 24 24 0.1 0.1 0.3 700 20 4500
1EE_1 G1 387.9 1EE01 10 200 0.3 800 24 24 0.2 0.2 0.3 700 20 4000
1EE_2 6.2 1EE01 10 200 0.3 800 24 24 0.2 0.2 0.3 700 20 4000
1EF_1 G1 265.6 1EF01 10 200 0.3 800 24 24 0.2 0.2 0.3 700 20 4000
1EF_2 149.7 1EF01 10 200 0.3 800 24 24 0.2 0.2 0.3 700 20 4000
1EG_1 552.5 1EF01 10 200 0.3 800 24 24 0.2 0.2 0.3 700 20 4000
1FA_1 74.0 1FC01 15 200 0.4 1000 24 24 0.3 0.1 0.01 600 20 4500
1FA_2_Lessos 164.7 1FC01 15 200 0.4 1000 24 24 0.3 0.1 0.01 600 20 4500
1FB_1 371.8 1FC01 15 200 0.4 1000 24 24 0.3 0.1 0.01 600 20 4500
1FC_1 G1 241.5 1FC01 15 200 0.4 1000 24 24 0.3 0.1 0.01 600 20 4500
1FC_2 33.9 1FC01 15 200 0.4 1000 24 24 0.3 0.1 0.01 600 20 4500
1FD_1 360.1 1FC01/ 1FE02 10 200 0.4 1000 24 24 0.3 0.1 0.01 700 20 4500
1FD_2 118.5 1FC01/ 1FE02 10 200 0.4 1000 24 24 0.3 0.1 0.01 700 20 4500
1FE_1 G2 89.5 1FE02 10 200 0.3 800 24 24 0.2 0.1 0.3 800 30 4000
1FE_2 G3 64.4 1FE03 10 200 0.3 800 24 24 0.2 0.1 0.3 800 30 4000
1FE_3 508.9 1FE03 10 200 0.3 800 24 24 0.2 0.1 0.3 800 30 4000
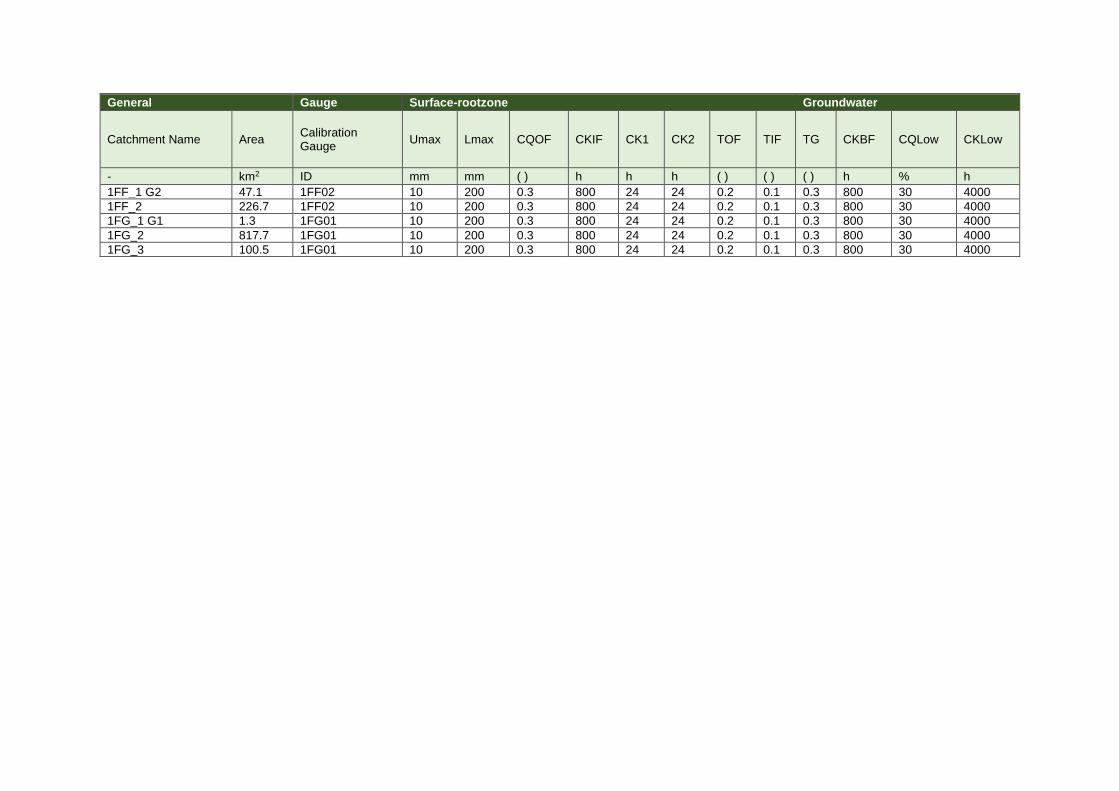
General Gauge Surface-rootzone Groundwater
Catchment Name Area Calibration Gauge
Umax Lmax CQOF CKIF CK1 CK2 TOF TIF TG CKBF CQLow CKLow
- km2 ID mm mm ( ) h h h ( ) ( ) ( ) h % h
1FF_1 G2 47.1 1FF02 10 200 0.3 800 24 24 0.2 0.1 0.3 800 30 4000
1FF_2 226.7 1FF02 10 200 0.3 800 24 24 0.2 0.1 0.3 800 30 4000
1FG_1 G1 1.3 1FG01 10 200 0.3 800 24 24 0.2 0.1 0.3 800 30 4000
1FG_2 817.7 1FG01 10 200 0.3 800 24 24 0.2 0.1 0.3 800 30 4000
1FG_3 100.5 1FG01 10 200 0.3 800 24 24 0.2 0.1 0.3 800 30 4000
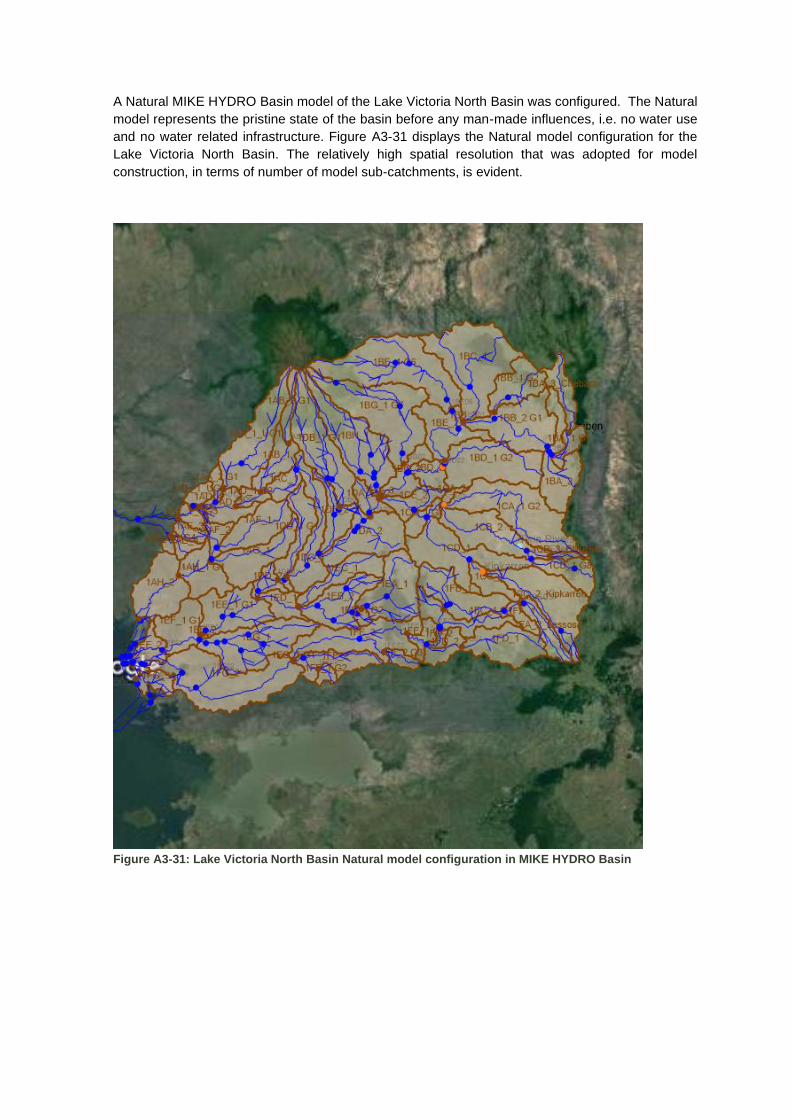
A Natural MIKE HYDRO Basin model of the Lake Victoria North Basin was configured. The Natural
model represents the pristine state of the basin before any man-made influences, i.e. no water use
and no water related infrastructure. Figure A3-31 displays the Natural model configuration for the
Lake Victoria North Basin. The relatively high spatial resolution that was adopted for model
construction, in terms of number of model sub-catchments, is evident.
Figure A3-31: Lake Victoria North Basin Natural model configuration in MIKE HYDRO Basin
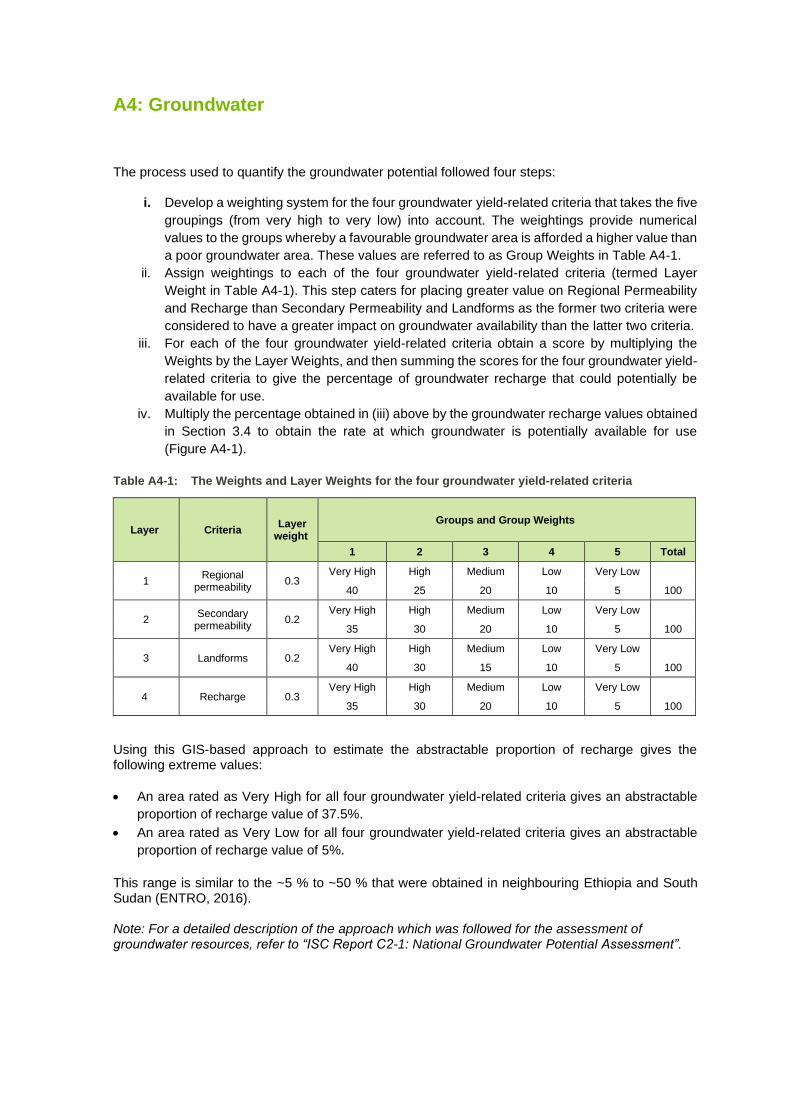
A4: Groundwater
The process used to quantify the groundwater potential followed four steps:
i. Develop a weighting system for the four groundwater yield-related criteria that takes the five
groupings (from very high to very low) into account. The weightings provide numerical
values to the groups whereby a favourable groundwater area is afforded a higher value than
a poor groundwater area. These values are referred to as Group Weights in Table A4-1.
ii. Assign weightings to each of the four groundwater yield-related criteria (termed Layer
Weight in Table A4-1). This step caters for placing greater value on Regional Permeability
and Recharge than Secondary Permeability and Landforms as the former two criteria were
considered to have a greater impact on groundwater availability than the latter two criteria.
iii. For each of the four groundwater yield-related criteria obtain a score by multiplying the
Weights by the Layer Weights, and then summing the scores for the four groundwater yield-
related criteria to give the percentage of groundwater recharge that could potentially be
available for use.
iv. Multiply the percentage obtained in (iii) above by the groundwater recharge values obtained
in Section 3.4 to obtain the rate at which groundwater is potentially available for use
(Figure A4-1).
Table A4-1: The Weights and Layer Weights for the four groundwater yield-related criteria
Layer Criteria Layer
weight
Groups and Group Weights
1 2 3 4 5 Total
1 Regional
permeability 0.3
Very High High Medium Low Very Low
40 25 20 10 5 100
2 Secondary
permeability 0.2
Very High High Medium Low Very Low
35 30 20 10 5 100
3 Landforms 0.2 Very High High Medium Low Very Low
40 30 15 10 5 100
4 Recharge 0.3 Very High High Medium Low Very Low
35 30 20 10 5 100
Using this GIS-based approach to estimate the abstractable proportion of recharge gives the following extreme values:
• An area rated as Very High for all four groundwater yield-related criteria gives an abstractable
proportion of recharge value of 37.5%.
• An area rated as Very Low for all four groundwater yield-related criteria gives an abstractable
proportion of recharge value of 5%.
This range is similar to the ~5 % to ~50 % that were obtained in neighbouring Ethiopia and South Sudan (ENTRO, 2016). Note: For a detailed description of the approach which was followed for the assessment of groundwater resources, refer to “ISC Report C2-1: National Groundwater Potential Assessment”.
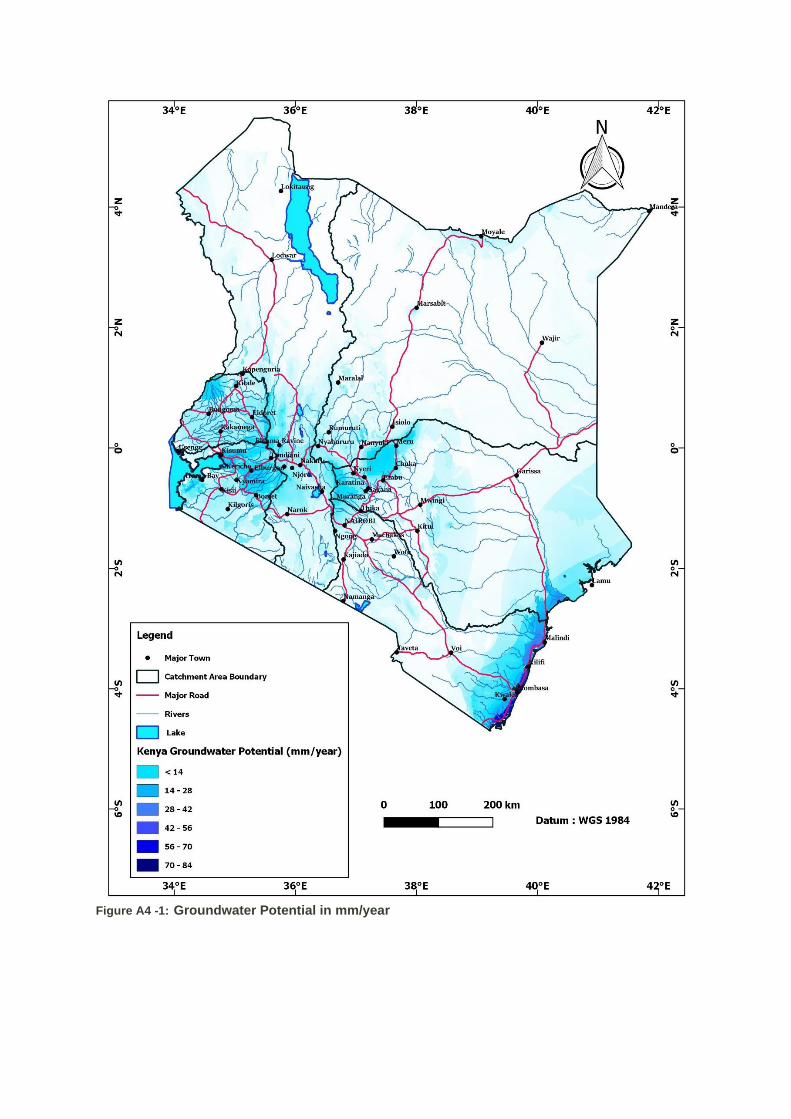
Figure A4 -1: Groundwater Potential in mm/year
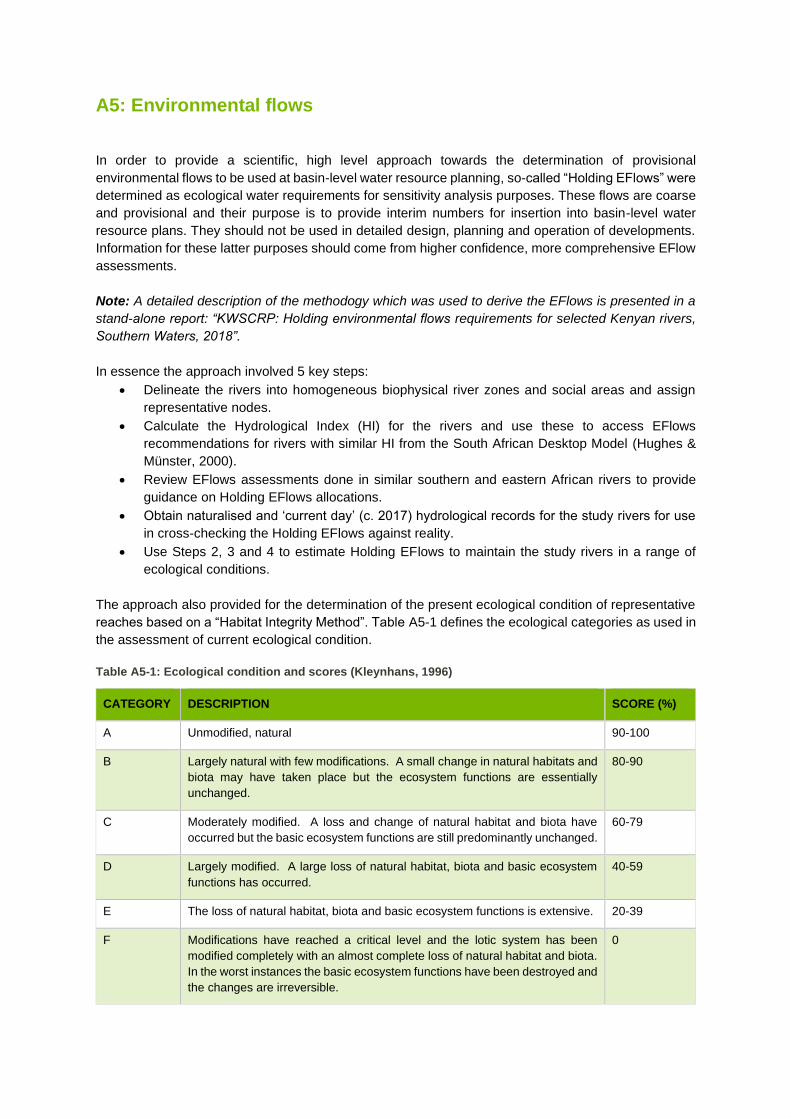
A5: Environmental flows
In order to provide a scientific, high level approach towards the determination of provisional
environmental flows to be used at basin-level water resource planning, so-called “Holding EFlows” were
determined as ecological water requirements for sensitivity analysis purposes. These flows are coarse
and provisional and their purpose is to provide interim numbers for insertion into basin-level water
resource plans. They should not be used in detailed design, planning and operation of developments.
Information for these latter purposes should come from higher confidence, more comprehensive EFlow
assessments.
Note: A detailed description of the methodogy which was used to derive the EFlows is presented in a
stand-alone report: “KWSCRP: Holding environmental flows requirements for selected Kenyan rivers,
Southern Waters, 2018”.
In essence the approach involved 5 key steps:
• Delineate the rivers into homogeneous biophysical river zones and social areas and assign
representative nodes.
• Calculate the Hydrological Index (HI) for the rivers and use these to access EFlows
recommendations for rivers with similar HI from the South African Desktop Model (Hughes &
Münster, 2000).
• Review EFlows assessments done in similar southern and eastern African rivers to provide
guidance on Holding EFlows allocations.
• Obtain naturalised and ‘current day’ (c. 2017) hydrological records for the study rivers for use
in cross-checking the Holding EFlows against reality.
• Use Steps 2, 3 and 4 to estimate Holding EFlows to maintain the study rivers in a range of
ecological conditions.
The approach also provided for the determination of the present ecological condition of representative
reaches based on a “Habitat Integrity Method”. Table A5-1 defines the ecological categories as used in
the assessment of current ecological condition.
Table A5-1: Ecological condition and scores (Kleynhans, 1996)
CATEGORY DESCRIPTION SCORE (%)
A Unmodified, natural 90-100
B Largely natural with few modifications. A small change in natural habitats and
biota may have taken place but the ecosystem functions are essentially
unchanged.
80-90
C Moderately modified. A loss and change of natural habitat and biota have
occurred but the basic ecosystem functions are still predominantly unchanged.
60-79
D Largely modified. A large loss of natural habitat, biota and basic ecosystem
functions has occurred.
40-59
E The loss of natural habitat, biota and basic ecosystem functions is extensive. 20-39
F Modifications have reached a critical level and the lotic system has been
modified completely with an almost complete loss of natural habitat and biota.
In the worst instances the basic ecosystem functions have been destroyed and
the changes are irreversible.
0
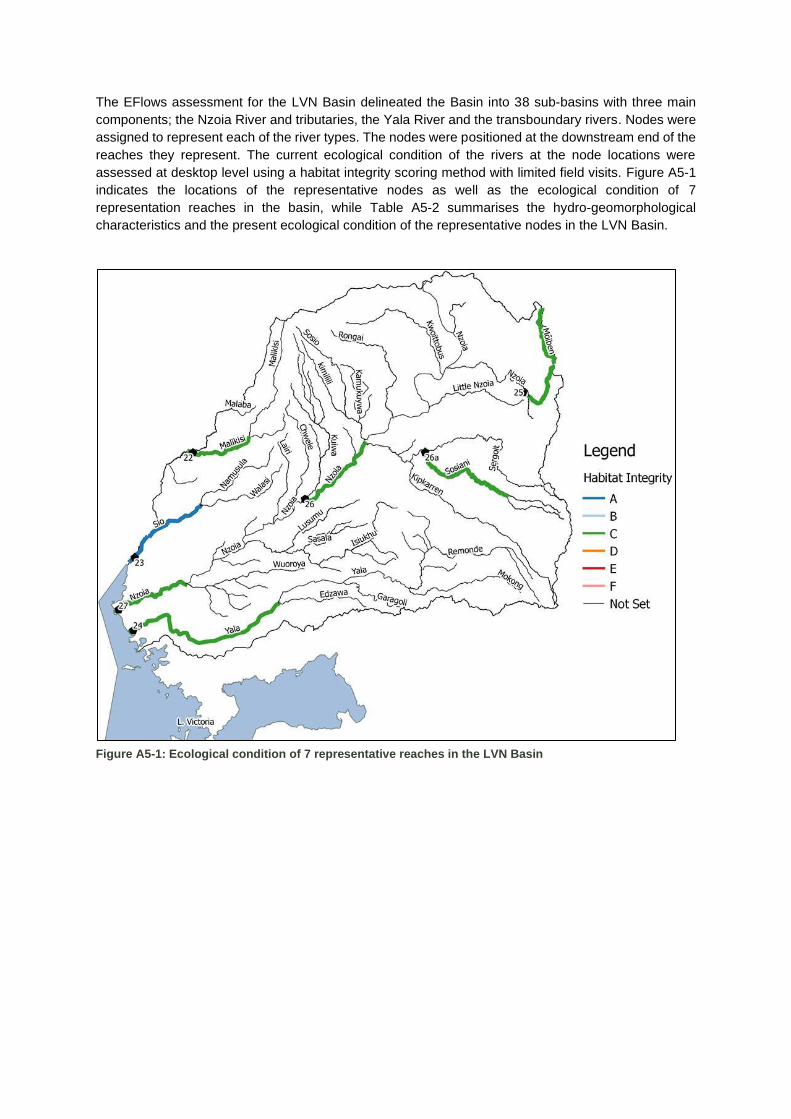
The EFlows assessment for the LVN Basin delineated the Basin into 38 sub-basins with three main
components; the Nzoia River and tributaries, the Yala River and the transboundary rivers. Nodes were
assigned to represent each of the river types. The nodes were positioned at the downstream end of the
reaches they represent. The current ecological condition of the rivers at the node locations were
assessed at desktop level using a habitat integrity scoring method with limited field visits. Figure A5-1
indicates the locations of the representative nodes as well as the ecological condition of 7
representation reaches in the basin, while Table A5-2 summarises the hydro-geomorphological
characteristics and the present ecological condition of the representative nodes in the LVN Basin.
Figure A5-1: Ecological condition of 7 representative reaches in the LVN Basin
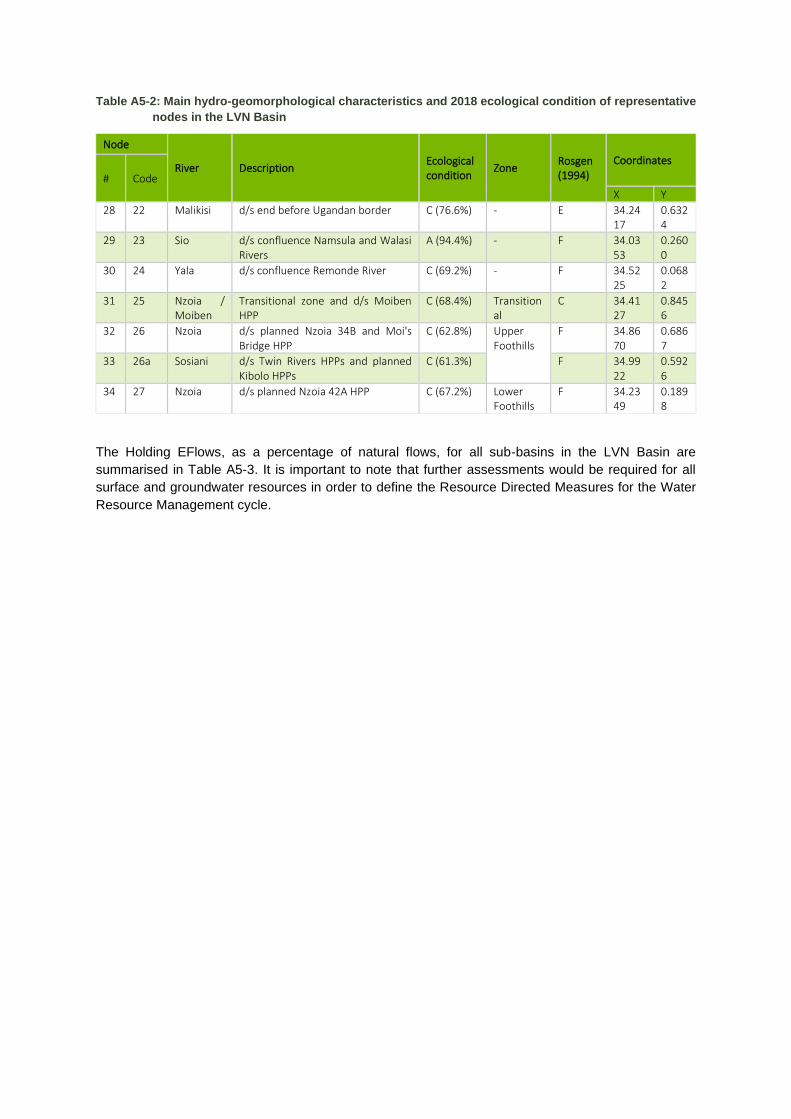
Table A5-2: Main hydro-geomorphological characteristics and 2018 ecological condition of representative
nodes in the LVN Basin
Node
River Description Ecological condition
Zone Rosgen (1994)
Coordinates
# Code
X Y
28 22 Malikisi d/s end before Ugandan border C (76.6%) - E 34.2417
0.6324
29 23 Sio d/s confluence Namsula and Walasi Rivers
A (94.4%) - F 34.0353
0.2600
30 24 Yala d/s confluence Remonde River C (69.2%) - F 34.5225
0.0682
31 25 Nzoia / Moiben
Transitional zone and d/s Moiben HPP
C (68.4%) Transitional
C 34.4127
0.8456
32 26 Nzoia d/s planned Nzoia 34B and Moi's Bridge HPP
C (62.8%) Upper Foothills
F 34.8670
0.6867
33 26a Sosiani d/s Twin Rivers HPPs and planned Kibolo HPPs
C (61.3%) F 34.9922
0.5926
34 27 Nzoia d/s planned Nzoia 42A HPP C (67.2%) Lower Foothills
F 34.2349
0.1898
The Holding EFlows, as a percentage of natural flows, for all sub-basins in the LVN Basin are
summarised in Table A5-3. It is important to note that further assessments would be required for all
surface and groundwater resources in order to define the Resource Directed Measures for the Water
Resource Management cycle.
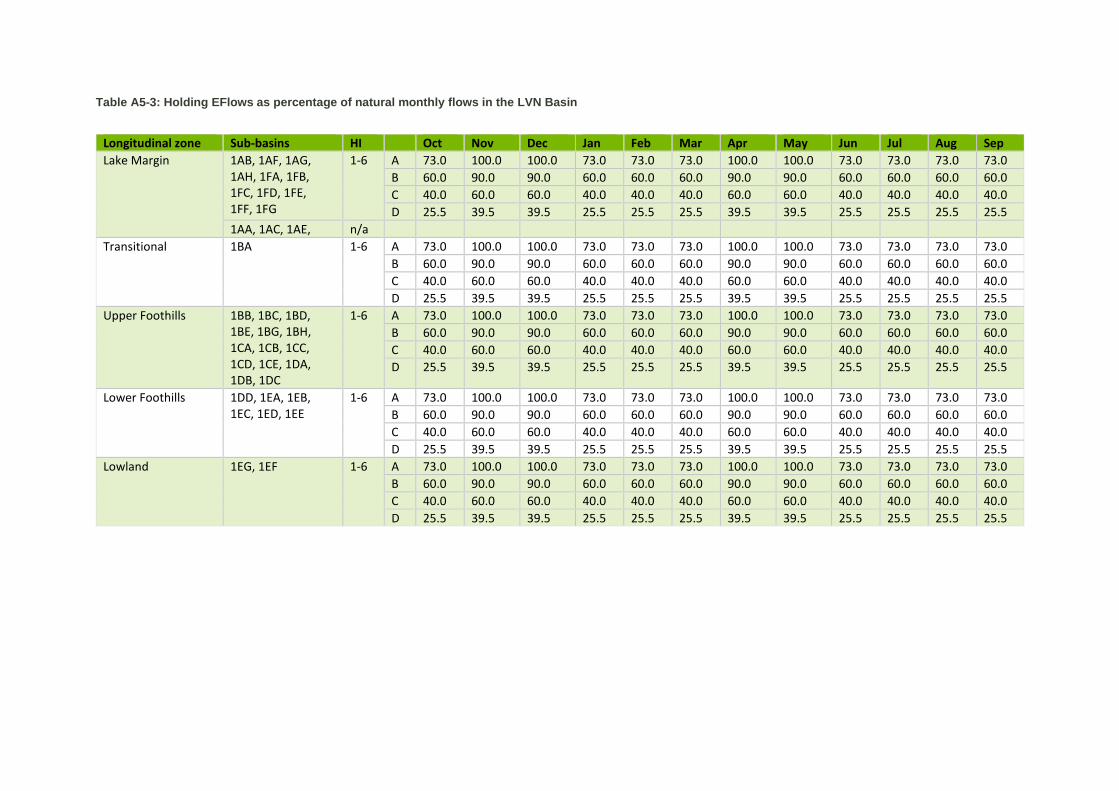
Table A5-3: Holding EFlows as percentage of natural monthly flows in the LVN Basin
Longitudinal zone Sub-basins HI
Oct Nov Dec Jan Feb Mar Apr May Jun Jul Aug Sep
Lake Margin 1AB, 1AF, 1AG, 1AH, 1FA, 1FB, 1FC, 1FD, 1FE, 1FF, 1FG
1-6 A 73.0 100.0 100.0 73.0 73.0 73.0 100.0 100.0 73.0 73.0 73.0 73.0
B 60.0 90.0 90.0 60.0 60.0 60.0 90.0 90.0 60.0 60.0 60.0 60.0
C 40.0 60.0 60.0 40.0 40.0 40.0 60.0 60.0 40.0 40.0 40.0 40.0
D 25.5 39.5 39.5 25.5 25.5 25.5 39.5 39.5 25.5 25.5 25.5 25.5
1AA, 1AC, 1AE, n/a
Transitional 1BA 1-6 A 73.0 100.0 100.0 73.0 73.0 73.0 100.0 100.0 73.0 73.0 73.0 73.0
B 60.0 90.0 90.0 60.0 60.0 60.0 90.0 90.0 60.0 60.0 60.0 60.0
C 40.0 60.0 60.0 40.0 40.0 40.0 60.0 60.0 40.0 40.0 40.0 40.0
D 25.5 39.5 39.5 25.5 25.5 25.5 39.5 39.5 25.5 25.5 25.5 25.5
Upper Foothills 1BB, 1BC, 1BD, 1BE, 1BG, 1BH, 1CA, 1CB, 1CC, 1CD, 1CE, 1DA, 1DB, 1DC
1-6 A 73.0 100.0 100.0 73.0 73.0 73.0 100.0 100.0 73.0 73.0 73.0 73.0
B 60.0 90.0 90.0 60.0 60.0 60.0 90.0 90.0 60.0 60.0 60.0 60.0
C 40.0 60.0 60.0 40.0 40.0 40.0 60.0 60.0 40.0 40.0 40.0 40.0
D 25.5 39.5 39.5 25.5 25.5 25.5 39.5 39.5 25.5 25.5 25.5 25.5
Lower Foothills 1DD, 1EA, 1EB, 1EC, 1ED, 1EE
1-6 A 73.0 100.0 100.0 73.0 73.0 73.0 100.0 100.0 73.0 73.0 73.0 73.0
B 60.0 90.0 90.0 60.0 60.0 60.0 90.0 90.0 60.0 60.0 60.0 60.0
C 40.0 60.0 60.0 40.0 40.0 40.0 60.0 60.0 40.0 40.0 40.0 40.0
D 25.5 39.5 39.5 25.5 25.5 25.5 39.5 39.5 25.5 25.5 25.5 25.5
Lowland 1EG, 1EF 1-6 A 73.0 100.0 100.0 73.0 73.0 73.0 100.0 100.0 73.0 73.0 73.0 73.0
B 60.0 90.0 90.0 60.0 60.0 60.0 90.0 90.0 60.0 60.0 60.0 60.0
C 40.0 60.0 60.0 40.0 40.0 40.0 60.0 60.0 40.0 40.0 40.0 40.0
D 25.5 39.5 39.5 25.5 25.5 25.5 39.5 39.5 25.5 25.5 25.5 25.5
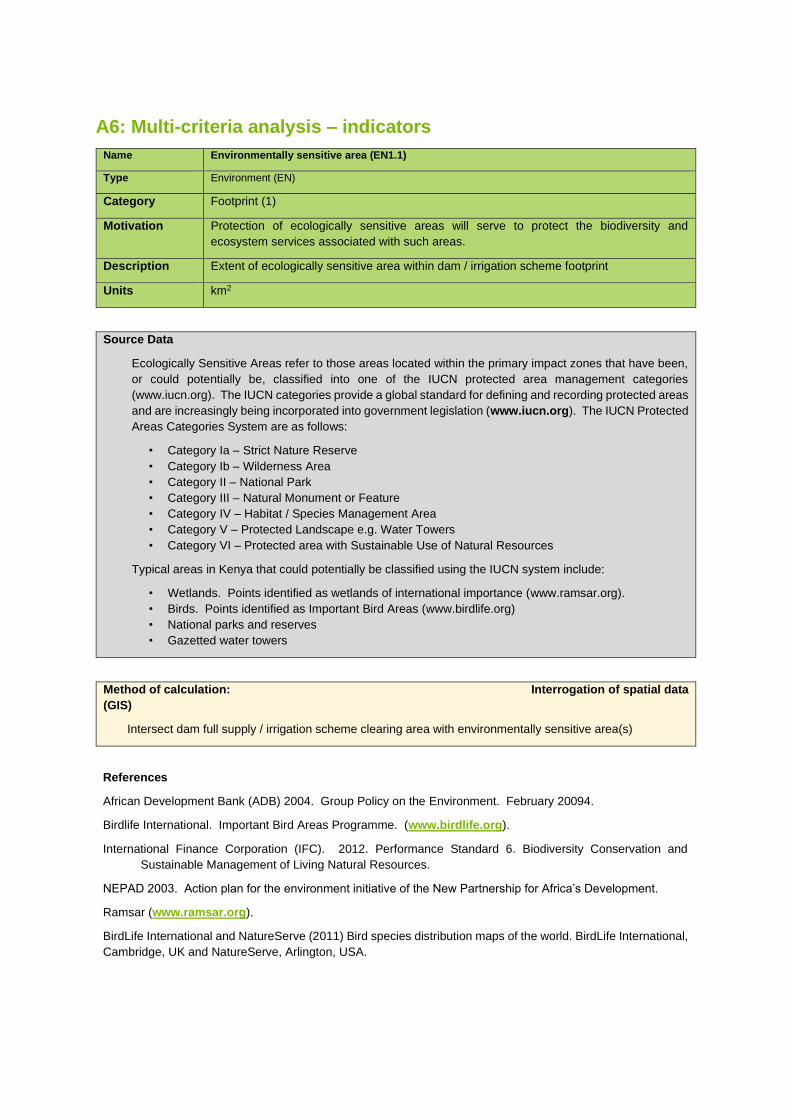
A6: Multi-criteria analysis – indicators
Name Environmentally sensitive area (EN1.1)
Type Environment (EN)
Category Footprint (1)
Motivation Protection of ecologically sensitive areas will serve to protect the biodiversity and
ecosystem services associated with such areas.
Description Extent of ecologically sensitive area within dam / irrigation scheme footprint
Units km2
Source Data
Ecologically Sensitive Areas refer to those areas located within the primary impact zones that have been,
or could potentially be, classified into one of the IUCN protected area management categories
(www.iucn.org). The IUCN categories provide a global standard for defining and recording protected areas
and are increasingly being incorporated into government legislation (www.iucn.org). The IUCN Protected
Areas Categories System are as follows:
• Category Ia – Strict Nature Reserve
• Category Ib – Wilderness Area
• Category II – National Park
• Category III – Natural Monument or Feature
• Category IV – Habitat / Species Management Area
• Category V – Protected Landscape e.g. Water Towers
• Category VI – Protected area with Sustainable Use of Natural Resources
Typical areas in Kenya that could potentially be classified using the IUCN system include:
• Wetlands. Points identified as wetlands of international importance (www.ramsar.org).
• Birds. Points identified as Important Bird Areas (www.birdlife.org)
• National parks and reserves
• Gazetted water towers
Method of calculation: Interrogation of spatial data
(GIS)
Intersect dam full supply / irrigation scheme clearing area with environmentally sensitive area(s)
References
African Development Bank (ADB) 2004. Group Policy on the Environment. February 20094.
Birdlife International. Important Bird Areas Programme. (www.birdlife.org).
International Finance Corporation (IFC). 2012. Performance Standard 6. Biodiversity Conservation and
Sustainable Management of Living Natural Resources.
NEPAD 2003. Action plan for the environment initiative of the New Partnership for Africa’s Development.
Ramsar (www.ramsar.org).
BirdLife International and NatureServe (2011) Bird species distribution maps of the world. BirdLife International,
Cambridge, UK and NatureServe, Arlington, USA.
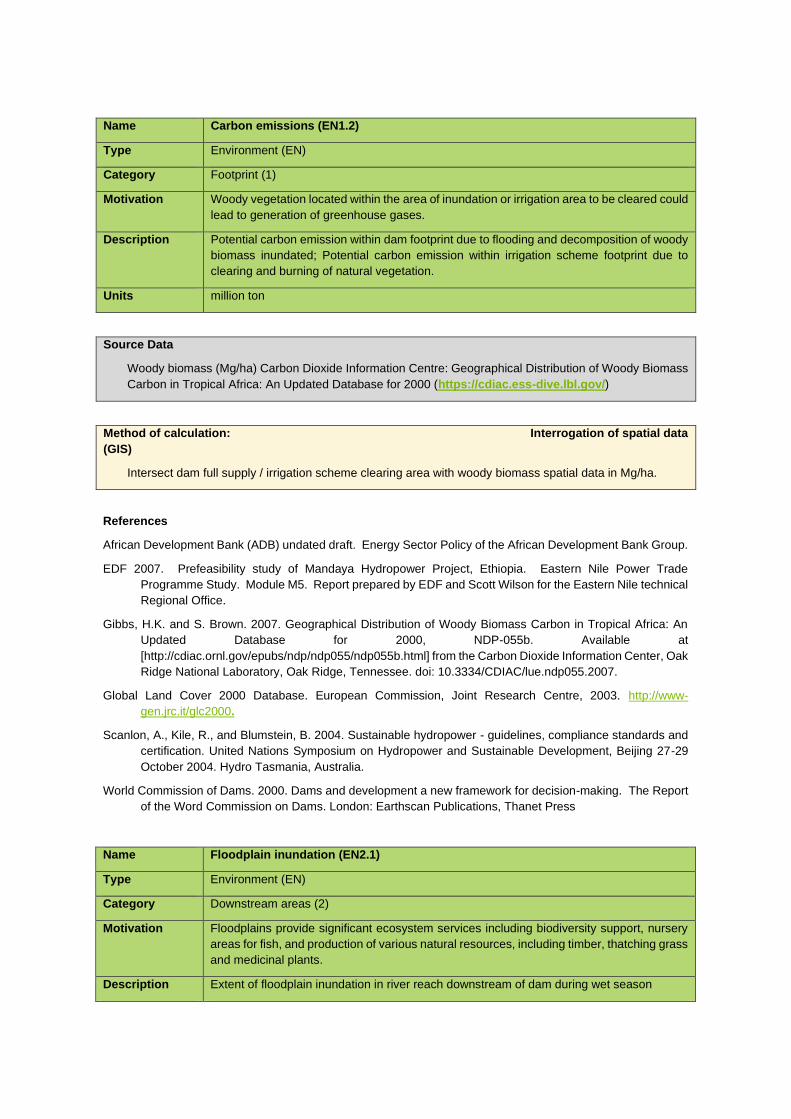
Name Carbon emissions (EN1.2)
Type Environment (EN)
Category Footprint (1)
Motivation Woody vegetation located within the area of inundation or irrigation area to be cleared could
lead to generation of greenhouse gases.
Description Potential carbon emission within dam footprint due to flooding and decomposition of woody
biomass inundated; Potential carbon emission within irrigation scheme footprint due to
clearing and burning of natural vegetation.
Units million ton
Source Data
Woody biomass (Mg/ha) Carbon Dioxide Information Centre: Geographical Distribution of Woody Biomass
Carbon in Tropical Africa: An Updated Database for 2000 (https://cdiac.ess-dive.lbl.gov/)
Method of calculation: Interrogation of spatial data
(GIS)
Intersect dam full supply / irrigation scheme clearing area with woody biomass spatial data in Mg/ha.
References
African Development Bank (ADB) undated draft. Energy Sector Policy of the African Development Bank Group.
EDF 2007. Prefeasibility study of Mandaya Hydropower Project, Ethiopia. Eastern Nile Power Trade
Programme Study. Module M5. Report prepared by EDF and Scott Wilson for the Eastern Nile technical
Regional Office.
Gibbs, H.K. and S. Brown. 2007. Geographical Distribution of Woody Biomass Carbon in Tropical Africa: An
Updated Database for 2000, NDP-055b. Available at
[http://cdiac.ornl.gov/epubs/ndp/ndp055/ndp055b.html] from the Carbon Dioxide Information Center, Oak
Ridge National Laboratory, Oak Ridge, Tennessee. doi: 10.3334/CDIAC/lue.ndp055.2007.
Global Land Cover 2000 Database. European Commission, Joint Research Centre, 2003. http://www-
gen.jrc.it/glc2000.
Scanlon, A., Kile, R., and Blumstein, B. 2004. Sustainable hydropower - guidelines, compliance standards and
certification. United Nations Symposium on Hydropower and Sustainable Development, Beijing 27-29
October 2004. Hydro Tasmania, Australia.
World Commission of Dams. 2000. Dams and development a new framework for decision-making. The Report
of the Word Commission on Dams. London: Earthscan Publications, Thanet Press
Name Floodplain inundation (EN2.1)
Type Environment (EN)
Category Downstream areas (2)
Motivation Floodplains provide significant ecosystem services including biodiversity support, nursery
areas for fish, and production of various natural resources, including timber, thatching grass
and medicinal plants.
Description Extent of floodplain inundation in river reach downstream of dam during wet season
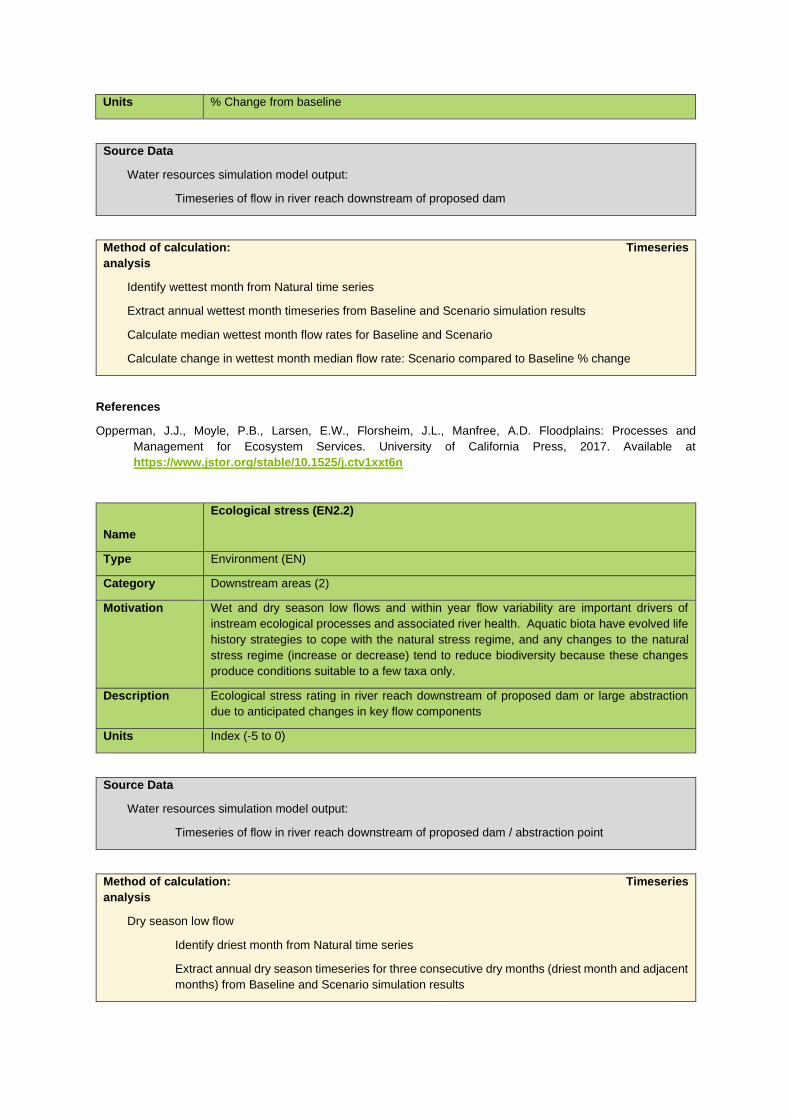
Units % Change from baseline
Source Data
Water resources simulation model output:
Timeseries of flow in river reach downstream of proposed dam
Method of calculation: Timeseries
analysis
Identify wettest month from Natural time series
Extract annual wettest month timeseries from Baseline and Scenario simulation results
Calculate median wettest month flow rates for Baseline and Scenario
Calculate change in wettest month median flow rate: Scenario compared to Baseline % change
References
Opperman, J.J., Moyle, P.B., Larsen, E.W., Florsheim, J.L., Manfree, A.D. Floodplains: Processes and
Management for Ecosystem Services. University of California Press, 2017. Available at
https://www.jstor.org/stable/10.1525/j.ctv1xxt6n
Name
Ecological stress (EN2.2)
Type Environment (EN)
Category Downstream areas (2)
Motivation Wet and dry season low flows and within year flow variability are important drivers of
instream ecological processes and associated river health. Aquatic biota have evolved life
history strategies to cope with the natural stress regime, and any changes to the natural
stress regime (increase or decrease) tend to reduce biodiversity because these changes
produce conditions suitable to a few taxa only.
Description Ecological stress rating in river reach downstream of proposed dam or large abstraction
due to anticipated changes in key flow components
Units Index (-5 to 0)
Source Data
Water resources simulation model output:
Timeseries of flow in river reach downstream of proposed dam / abstraction point
Method of calculation: Timeseries
analysis
Dry season low flow
Identify driest month from Natural time series
Extract annual dry season timeseries for three consecutive dry months (driest month and adjacent
months) from Baseline and Scenario simulation results
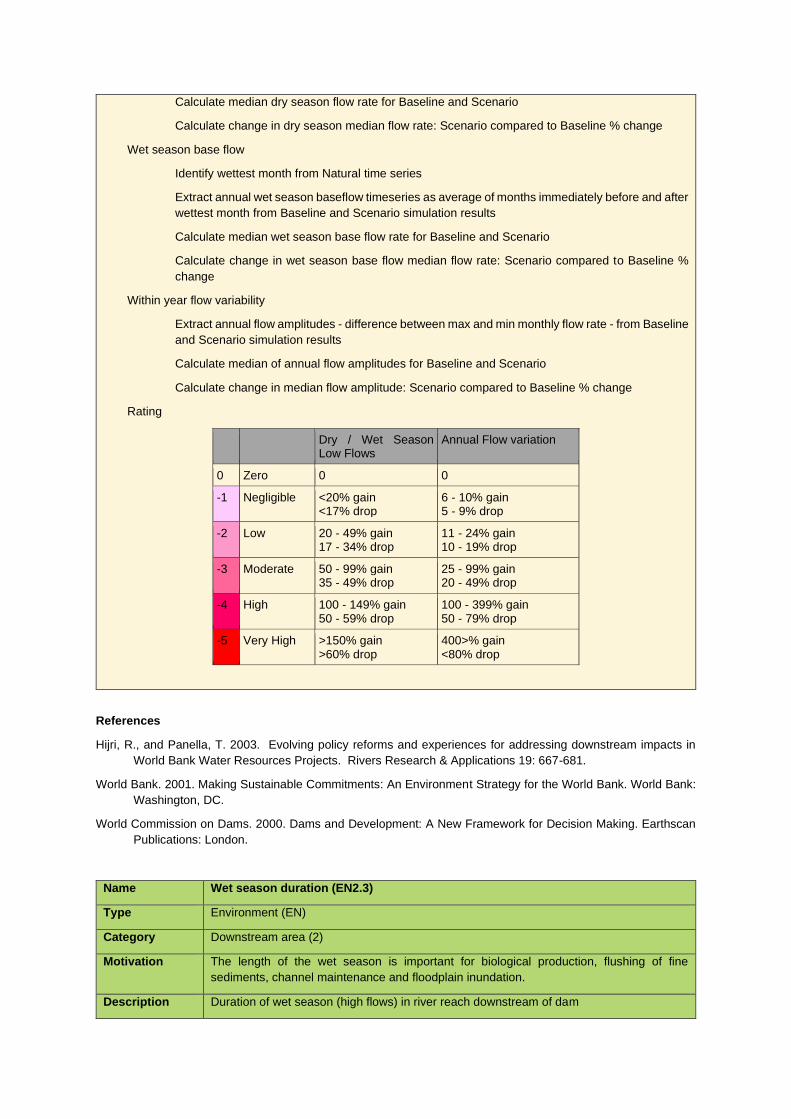
Calculate median dry season flow rate for Baseline and Scenario
Calculate change in dry season median flow rate: Scenario compared to Baseline % change
Wet season base flow
Identify wettest month from Natural time series
Extract annual wet season baseflow timeseries as average of months immediately before and after
wettest month from Baseline and Scenario simulation results
Calculate median wet season base flow rate for Baseline and Scenario
Calculate change in wet season base flow median flow rate: Scenario compared to Baseline %
change
Within year flow variability
Extract annual flow amplitudes - difference between max and min monthly flow rate - from Baseline
and Scenario simulation results
Calculate median of annual flow amplitudes for Baseline and Scenario
Calculate change in median flow amplitude: Scenario compared to Baseline % change
Rating
Dry / Wet Season Low Flows
Annual Flow variation
0 Zero 0 0
-1 Negligible <20% gain <17% drop
6 - 10% gain 5 - 9% drop
-2 Low 20 - 49% gain 17 - 34% drop
11 - 24% gain 10 - 19% drop
-3 Moderate 50 - 99% gain 35 - 49% drop
25 - 99% gain 20 - 49% drop
-4 High 100 - 149% gain 50 - 59% drop
100 - 399% gain 50 - 79% drop
-5 Very High >150% gain >60% drop
400>% gain <80% drop
ass
References
Hijri, R., and Panella, T. 2003. Evolving policy reforms and experiences for addressing downstream impacts in
World Bank Water Resources Projects. Rivers Research & Applications 19: 667-681.
World Bank. 2001. Making Sustainable Commitments: An Environment Strategy for the World Bank. World Bank:
Washington, DC.
World Commission on Dams. 2000. Dams and Development: A New Framework for Decision Making. Earthscan
Publications: London.
Name Wet season duration (EN2.3)
Type Environment (EN)
Category Downstream area (2)
Motivation The length of the wet season is important for biological production, flushing of fine
sediments, channel maintenance and floodplain inundation.
Description Duration of wet season (high flows) in river reach downstream of dam
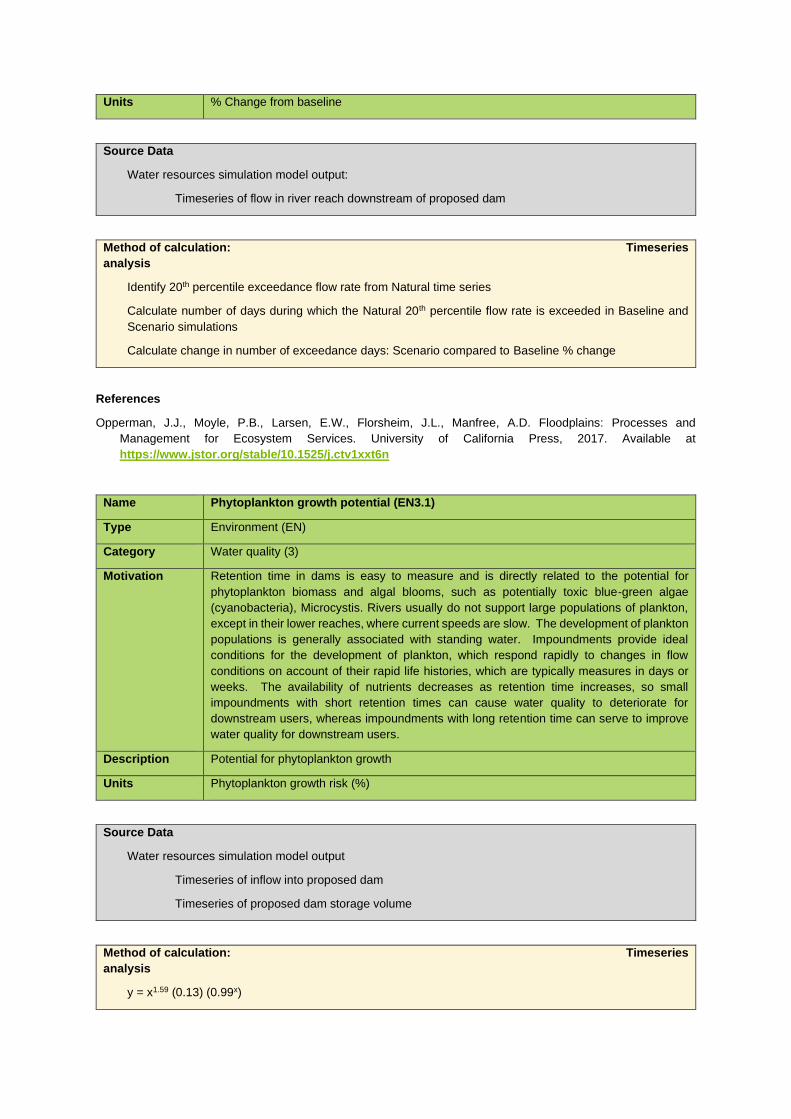
Units % Change from baseline
Source Data
Water resources simulation model output:
Timeseries of flow in river reach downstream of proposed dam
Method of calculation: Timeseries
analysis
Identify 20th percentile exceedance flow rate from Natural time series
Calculate number of days during which the Natural 20th percentile flow rate is exceeded in Baseline and
Scenario simulations
Calculate change in number of exceedance days: Scenario compared to Baseline % change
References
Opperman, J.J., Moyle, P.B., Larsen, E.W., Florsheim, J.L., Manfree, A.D. Floodplains: Processes and
Management for Ecosystem Services. University of California Press, 2017. Available at
https://www.jstor.org/stable/10.1525/j.ctv1xxt6n
Name Phytoplankton growth potential (EN3.1)
Type Environment (EN)
Category Water quality (3)
Motivation Retention time in dams is easy to measure and is directly related to the potential for
phytoplankton biomass and algal blooms, such as potentially toxic blue-green algae
(cyanobacteria), Microcystis. Rivers usually do not support large populations of plankton,
except in their lower reaches, where current speeds are slow. The development of plankton
populations is generally associated with standing water. Impoundments provide ideal
conditions for the development of plankton, which respond rapidly to changes in flow
conditions on account of their rapid life histories, which are typically measures in days or
weeks. The availability of nutrients decreases as retention time increases, so small
impoundments with short retention times can cause water quality to deteriorate for
downstream users, whereas impoundments with long retention time can serve to improve
water quality for downstream users.
Description Potential for phytoplankton growth
Units Phytoplankton growth risk (%)
Source Data
Water resources simulation model output
Timeseries of inflow into proposed dam
Timeseries of proposed dam storage volume
Method of calculation: Timeseries
analysis
y = x1.59 (0.13) (0.99x)
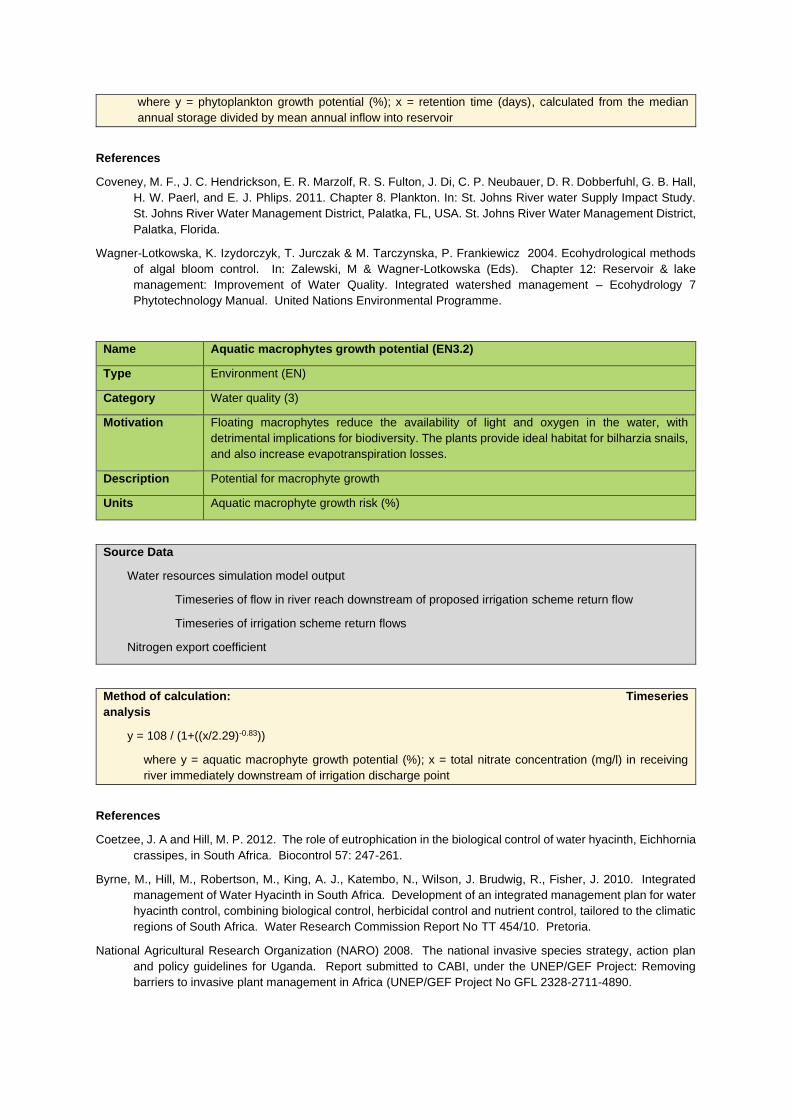
where y = phytoplankton growth potential (%); x = retention time (days), calculated from the median
annual storage divided by mean annual inflow into reservoir
References
Coveney, M. F., J. C. Hendrickson, E. R. Marzolf, R. S. Fulton, J. Di, C. P. Neubauer, D. R. Dobberfuhl, G. B. Hall,
H. W. Paerl, and E. J. Phlips. 2011. Chapter 8. Plankton. In: St. Johns River water Supply Impact Study.
St. Johns River Water Management District, Palatka, FL, USA. St. Johns River Water Management District,
Palatka, Florida.
Wagner-Lotkowska, K. Izydorczyk, T. Jurczak & M. Tarczynska, P. Frankiewicz 2004. Ecohydrological methods
of algal bloom control. In: Zalewski, M & Wagner-Lotkowska (Eds). Chapter 12: Reservoir & lake
management: Improvement of Water Quality. Integrated watershed management – Ecohydrology 7
Phytotechnology Manual. United Nations Environmental Programme.
Name Aquatic macrophytes growth potential (EN3.2)
Type Environment (EN)
Category Water quality (3)
Motivation Floating macrophytes reduce the availability of light and oxygen in the water, with
detrimental implications for biodiversity. The plants provide ideal habitat for bilharzia snails,
and also increase evapotranspiration losses.
Description Potential for macrophyte growth
Units Aquatic macrophyte growth risk (%)
Source Data
Water resources simulation model output
Timeseries of flow in river reach downstream of proposed irrigation scheme return flow
Timeseries of irrigation scheme return flows
Nitrogen export coefficient
Method of calculation: Timeseries
analysis
y = 108 / (1+((x/2.29)-0.83))
where y = aquatic macrophyte growth potential (%); x = total nitrate concentration (mg/l) in receiving
river immediately downstream of irrigation discharge point
References
Coetzee, J. A and Hill, M. P. 2012. The role of eutrophication in the biological control of water hyacinth, Eichhornia
crassipes, in South Africa. Biocontrol 57: 247-261.
Byrne, M., Hill, M., Robertson, M., King, A. J., Katembo, N., Wilson, J. Brudwig, R., Fisher, J. 2010. Integrated
management of Water Hyacinth in South Africa. Development of an integrated management plan for water
hyacinth control, combining biological control, herbicidal control and nutrient control, tailored to the climatic
regions of South Africa. Water Research Commission Report No TT 454/10. Pretoria.
National Agricultural Research Organization (NARO) 2008. The national invasive species strategy, action plan
and policy guidelines for Uganda. Report submitted to CABI, under the UNEP/GEF Project: Removing
barriers to invasive plant management in Africa (UNEP/GEF Project No GFL 2328-2711-4890.
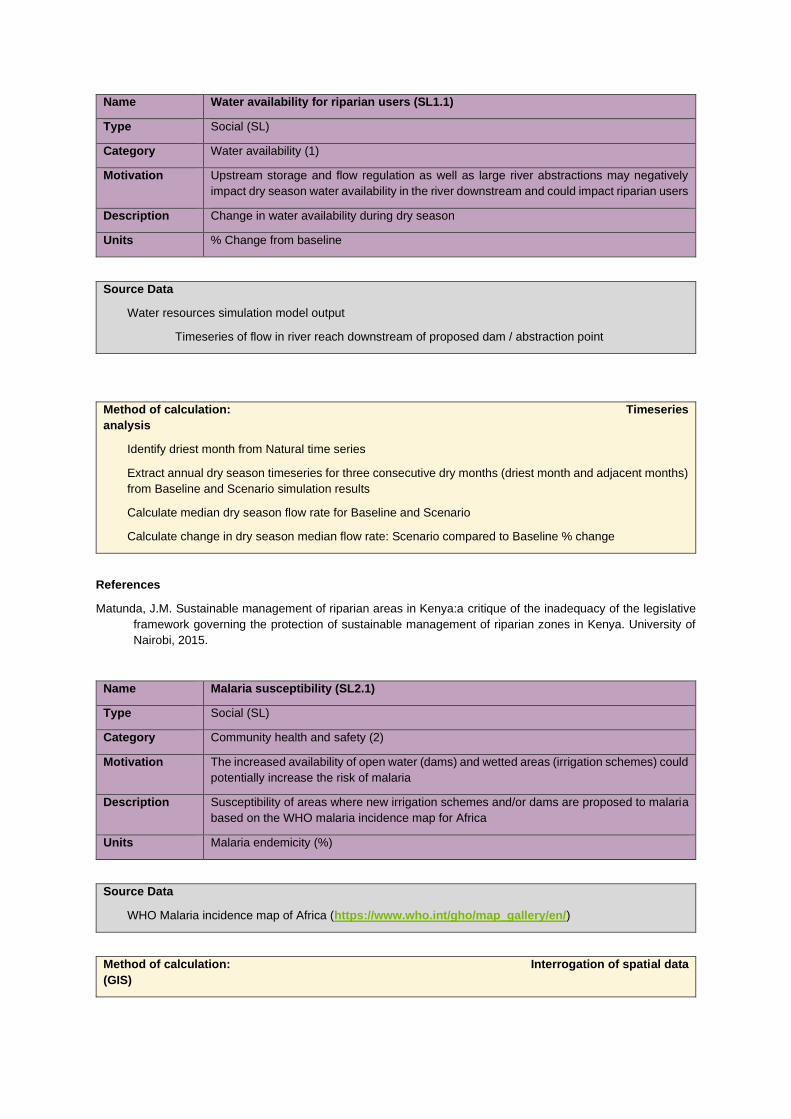
Name Water availability for riparian users (SL1.1)
Type Social (SL)
Category Water availability (1)
Motivation Upstream storage and flow regulation as well as large river abstractions may negatively
impact dry season water availability in the river downstream and could impact riparian users
Description Change in water availability during dry season
Units % Change from baseline
Source Data
Water resources simulation model output
Timeseries of flow in river reach downstream of proposed dam / abstraction point
Method of calculation: Timeseries
analysis
Identify driest month from Natural time series
Extract annual dry season timeseries for three consecutive dry months (driest month and adjacent months)
from Baseline and Scenario simulation results
Calculate median dry season flow rate for Baseline and Scenario
Calculate change in dry season median flow rate: Scenario compared to Baseline % change
References
Matunda, J.M. Sustainable management of riparian areas in Kenya:a critique of the inadequacy of the legislative
framework governing the protection of sustainable management of riparian zones in Kenya. University of
Nairobi, 2015.
Name Malaria susceptibility (SL2.1)
Type Social (SL)
Category Community health and safety (2)
Motivation The increased availability of open water (dams) and wetted areas (irrigation schemes) could
potentially increase the risk of malaria
Description Susceptibility of areas where new irrigation schemes and/or dams are proposed to malaria
based on the WHO malaria incidence map for Africa
Units Malaria endemicity (%)
Source Data
WHO Malaria incidence map of Africa (https://www.who.int/gho/map_gallery/en/)
Method of calculation: Interrogation of spatial data
(GIS)

Intersect dam full supply / irrigation scheme clearing area with WHO Malaria prevalence map and calculate
average % malaria endemicity in footprint area(s)
References
Kibret, S., Lautze, J., McCartney, M., Nhamo, L., Yan, G. 2019. Malaria around large dams in Africa: effect of
environmental and transmission endemicity factors. Malaria Journal 18, Article number 303 (2019)
World Health Organisation: Global Health Observatory Data. Available at https://www.who.int/data/gho
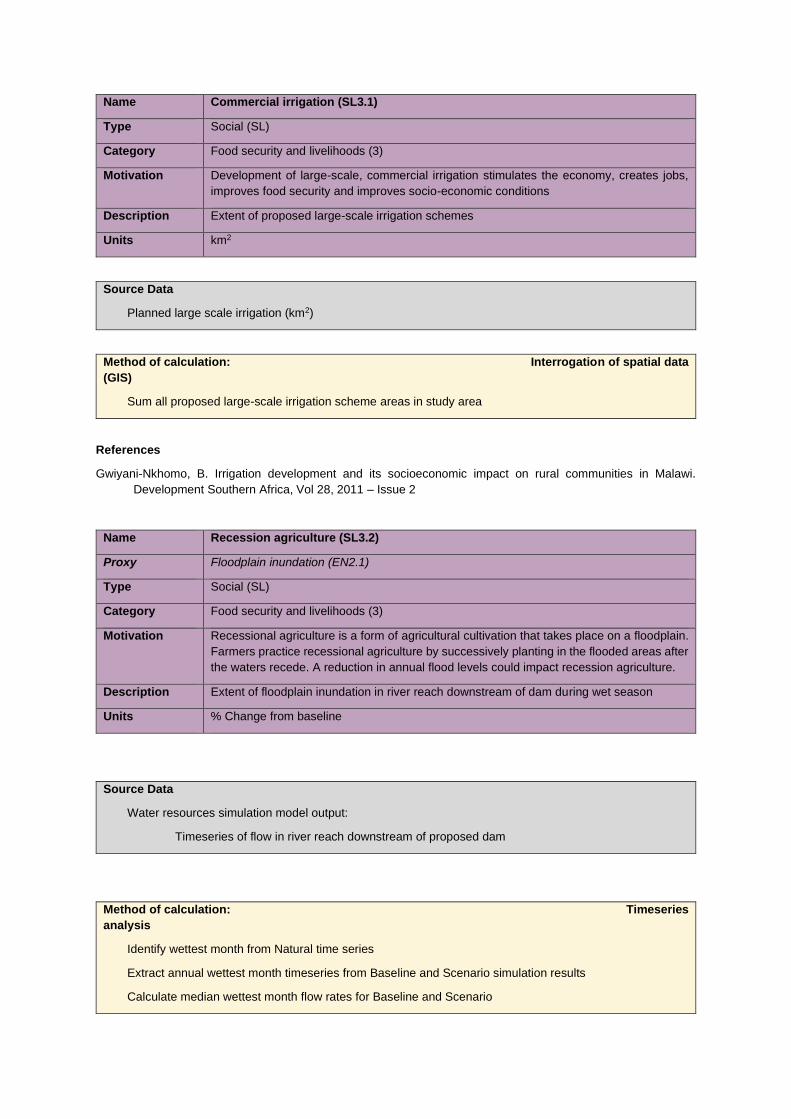
Name Commercial irrigation (SL3.1)
Type Social (SL)
Category Food security and livelihoods (3)
Motivation Development of large-scale, commercial irrigation stimulates the economy, creates jobs,
improves food security and improves socio-economic conditions
Description Extent of proposed large-scale irrigation schemes
Units km2
Source Data
Planned large scale irrigation (km2)
Method of calculation: Interrogation of spatial data
(GIS)
Sum all proposed large-scale irrigation scheme areas in study area
References
Gwiyani-Nkhomo, B. Irrigation development and its socioeconomic impact on rural communities in Malawi.
Development Southern Africa, Vol 28, 2011 – Issue 2
Name Recession agriculture (SL3.2)
Proxy Floodplain inundation (EN2.1)
Type Social (SL)
Category Food security and livelihoods (3)
Motivation Recessional agriculture is a form of agricultural cultivation that takes place on a floodplain.
Farmers practice recessional agriculture by successively planting in the flooded areas after
the waters recede. A reduction in annual flood levels could impact recession agriculture.
Description Extent of floodplain inundation in river reach downstream of dam during wet season
Units % Change from baseline
Source Data
Water resources simulation model output:
Timeseries of flow in river reach downstream of proposed dam
Method of calculation: Timeseries
analysis
Identify wettest month from Natural time series
Extract annual wettest month timeseries from Baseline and Scenario simulation results
Calculate median wettest month flow rates for Baseline and Scenario
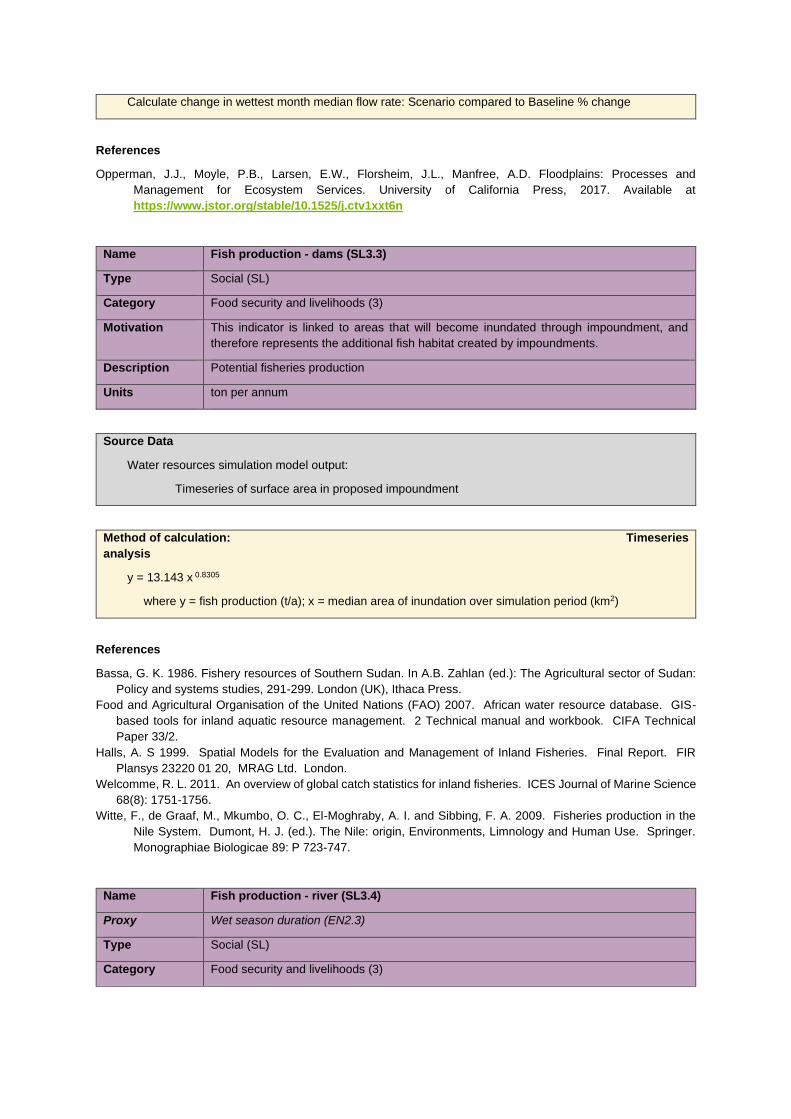
Calculate change in wettest month median flow rate: Scenario compared to Baseline % change
References
Opperman, J.J., Moyle, P.B., Larsen, E.W., Florsheim, J.L., Manfree, A.D. Floodplains: Processes and
Management for Ecosystem Services. University of California Press, 2017. Available at
https://www.jstor.org/stable/10.1525/j.ctv1xxt6n
Name Fish production - dams (SL3.3)
Type Social (SL)
Category Food security and livelihoods (3)
Motivation This indicator is linked to areas that will become inundated through impoundment, and
therefore represents the additional fish habitat created by impoundments.
Description Potential fisheries production
Units ton per annum
Source Data
Water resources simulation model output:
Timeseries of surface area in proposed impoundment
Method of calculation: Timeseries
analysis
y = 13.143 x 0.8305
where y = fish production (t/a); x = median area of inundation over simulation period (km2)
References
Bassa, G. K. 1986. Fishery resources of Southern Sudan. In A.B. Zahlan (ed.): The Agricultural sector of Sudan:
Policy and systems studies, 291-299. London (UK), Ithaca Press.
Food and Agricultural Organisation of the United Nations (FAO) 2007. African water resource database. GIS-
based tools for inland aquatic resource management. 2 Technical manual and workbook. CIFA Technical
Paper 33/2.
Halls, A. S 1999. Spatial Models for the Evaluation and Management of Inland Fisheries. Final Report. FIR
Plansys 23220 01 20, MRAG Ltd. London.
Welcomme, R. L. 2011. An overview of global catch statistics for inland fisheries. ICES Journal of Marine Science
68(8): 1751-1756.
Witte, F., de Graaf, M., Mkumbo, O. C., El-Moghraby, A. I. and Sibbing, F. A. 2009. Fisheries production in the
Nile System. Dumont, H. J. (ed.). The Nile: origin, Environments, Limnology and Human Use. Springer.
Monographiae Biologicae 89: P 723-747.
Name Fish production - river (SL3.4)
Proxy Wet season duration (EN2.3)
Type Social (SL)
Category Food security and livelihoods (3)
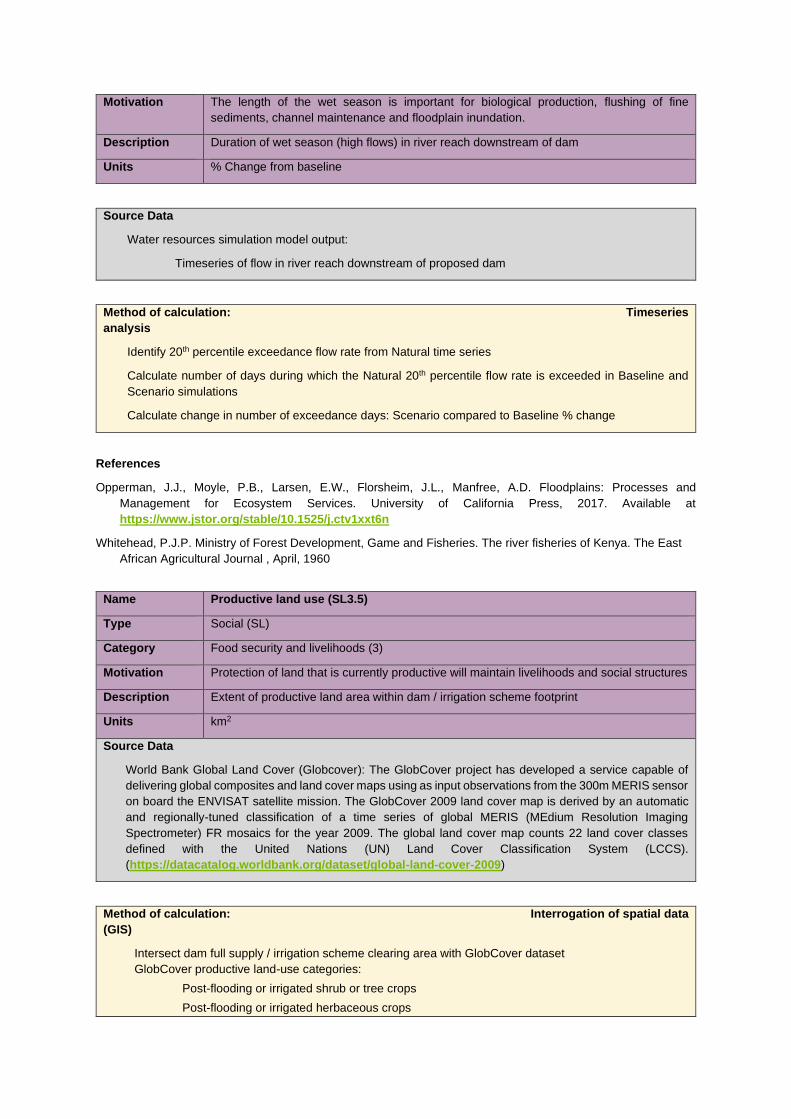
Motivation The length of the wet season is important for biological production, flushing of fine
sediments, channel maintenance and floodplain inundation.
Description Duration of wet season (high flows) in river reach downstream of dam
Units % Change from baseline
Source Data
Water resources simulation model output:
Timeseries of flow in river reach downstream of proposed dam
Method of calculation: Timeseries
analysis
Identify 20th percentile exceedance flow rate from Natural time series
Calculate number of days during which the Natural 20th percentile flow rate is exceeded in Baseline and
Scenario simulations
Calculate change in number of exceedance days: Scenario compared to Baseline % change
References
Opperman, J.J., Moyle, P.B., Larsen, E.W., Florsheim, J.L., Manfree, A.D. Floodplains: Processes and
Management for Ecosystem Services. University of California Press, 2017. Available at
https://www.jstor.org/stable/10.1525/j.ctv1xxt6n
Whitehead, P.J.P. Ministry of Forest Development, Game and Fisheries. The river fisheries of Kenya. The East
African Agricultural Journal , April, 1960
Name Productive land use (SL3.5)
Type Social (SL)
Category Food security and livelihoods (3)
Motivation Protection of land that is currently productive will maintain livelihoods and social structures
Description Extent of productive land area within dam / irrigation scheme footprint
Units km2
Source Data
World Bank Global Land Cover (Globcover): The GlobCover project has developed a service capable of
delivering global composites and land cover maps using as input observations from the 300m MERIS sensor
on board the ENVISAT satellite mission. The GlobCover 2009 land cover map is derived by an automatic
and regionally-tuned classification of a time series of global MERIS (MEdium Resolution Imaging
Spectrometer) FR mosaics for the year 2009. The global land cover map counts 22 land cover classes
defined with the United Nations (UN) Land Cover Classification System (LCCS).
(https://datacatalog.worldbank.org/dataset/global-land-cover-2009)
Method of calculation: Interrogation of spatial data
(GIS)
Intersect dam full supply / irrigation scheme clearing area with GlobCover dataset
GlobCover productive land-use categories:
Post-flooding or irrigated shrub or tree crops
Post-flooding or irrigated herbaceous crops
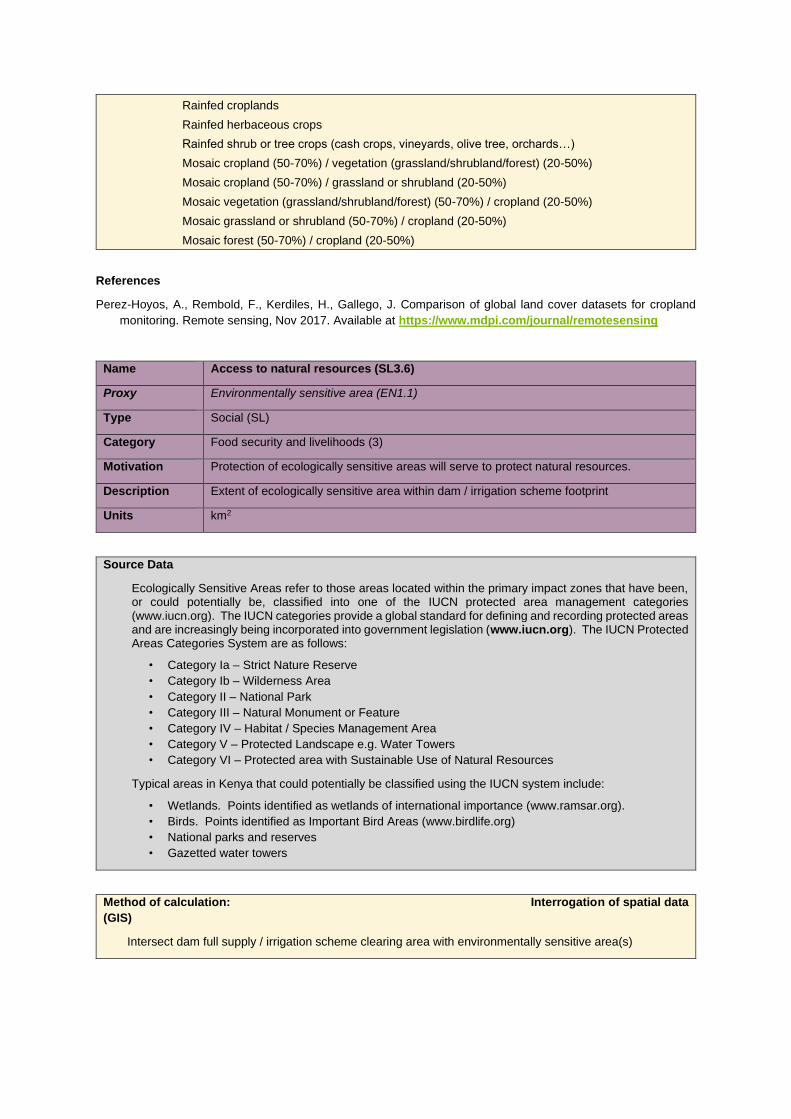
Rainfed croplands
Rainfed herbaceous crops
Rainfed shrub or tree crops (cash crops, vineyards, olive tree, orchards…)
Mosaic cropland (50-70%) / vegetation (grassland/shrubland/forest) (20-50%)
Mosaic cropland (50-70%) / grassland or shrubland (20-50%)
Mosaic vegetation (grassland/shrubland/forest) (50-70%) / cropland (20-50%)
Mosaic grassland or shrubland (50-70%) / cropland (20-50%)
Mosaic forest (50-70%) / cropland (20-50%)
References
Perez-Hoyos, A., Rembold, F., Kerdiles, H., Gallego, J. Comparison of global land cover datasets for cropland
monitoring. Remote sensing, Nov 2017. Available at https://www.mdpi.com/journal/remotesensing
Name Access to natural resources (SL3.6)
Proxy Environmentally sensitive area (EN1.1)
Type Social (SL)
Category Food security and livelihoods (3)
Motivation Protection of ecologically sensitive areas will serve to protect natural resources.
Description Extent of ecologically sensitive area within dam / irrigation scheme footprint
Units km2
Source Data
Ecologically Sensitive Areas refer to those areas located within the primary impact zones that have been, or could potentially be, classified into one of the IUCN protected area management categories (www.iucn.org). The IUCN categories provide a global standard for defining and recording protected areas and are increasingly being incorporated into government legislation (www.iucn.org). The IUCN Protected Areas Categories System are as follows:
• Category Ia – Strict Nature Reserve
• Category Ib – Wilderness Area
• Category II – National Park
• Category III – Natural Monument or Feature
• Category IV – Habitat / Species Management Area
• Category V – Protected Landscape e.g. Water Towers
• Category VI – Protected area with Sustainable Use of Natural Resources
Typical areas in Kenya that could potentially be classified using the IUCN system include:
• Wetlands. Points identified as wetlands of international importance (www.ramsar.org).
• Birds. Points identified as Important Bird Areas (www.birdlife.org)
• National parks and reserves
• Gazetted water towers
Method of calculation: Interrogation of spatial data
(GIS)
Intersect dam full supply / irrigation scheme clearing area with environmentally sensitive area(s)
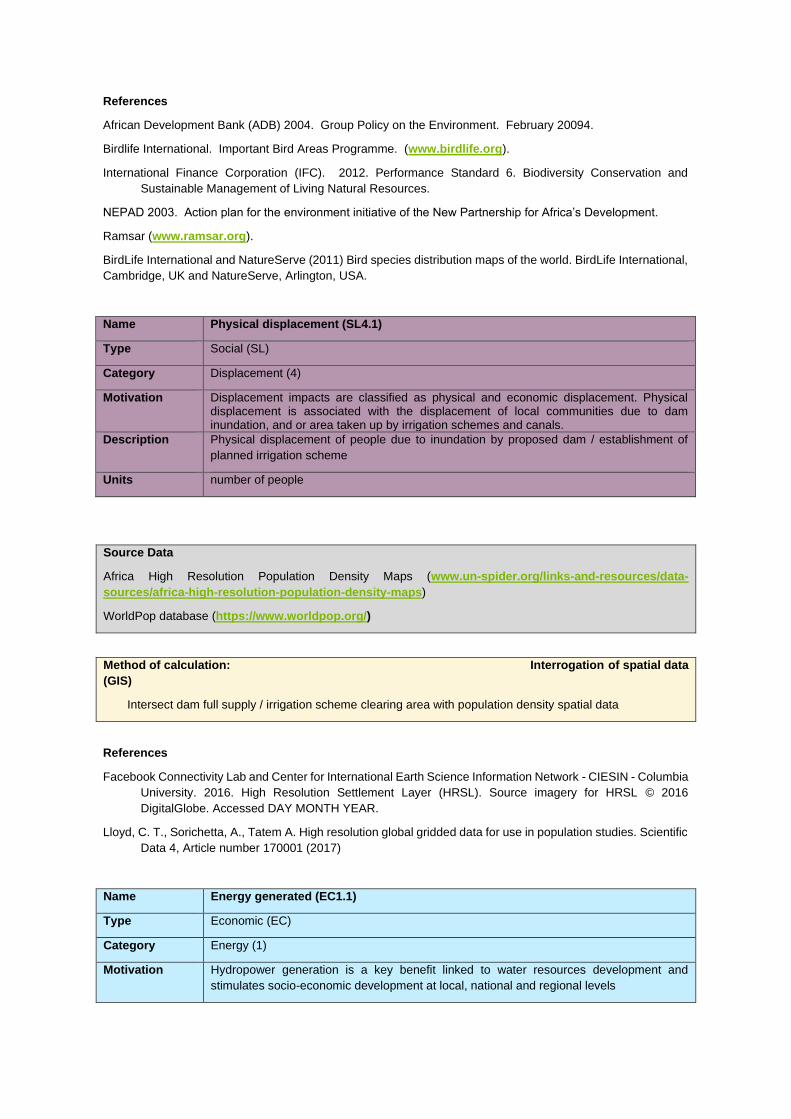
References
African Development Bank (ADB) 2004. Group Policy on the Environment. February 20094.
Birdlife International. Important Bird Areas Programme. (www.birdlife.org).
International Finance Corporation (IFC). 2012. Performance Standard 6. Biodiversity Conservation and
Sustainable Management of Living Natural Resources.
NEPAD 2003. Action plan for the environment initiative of the New Partnership for Africa’s Development.
Ramsar (www.ramsar.org).
BirdLife International and NatureServe (2011) Bird species distribution maps of the world. BirdLife International,
Cambridge, UK and NatureServe, Arlington, USA.
Name Physical displacement (SL4.1)
Type Social (SL)
Category Displacement (4)
Motivation Displacement impacts are classified as physical and economic displacement. Physical displacement is associated with the displacement of local communities due to dam inundation, and or area taken up by irrigation schemes and canals.
Description Physical displacement of people due to inundation by proposed dam / establishment of
planned irrigation scheme
Units number of people
Source Data
Africa High Resolution Population Density Maps (www.un-spider.org/links-and-resources/data-
sources/africa-high-resolution-population-density-maps)
WorldPop database (https://www.worldpop.org/)
Method of calculation: Interrogation of spatial data
(GIS)
Intersect dam full supply / irrigation scheme clearing area with population density spatial data
References
Facebook Connectivity Lab and Center for International Earth Science Information Network - CIESIN - Columbia
University. 2016. High Resolution Settlement Layer (HRSL). Source imagery for HRSL © 2016
DigitalGlobe. Accessed DAY MONTH YEAR.
Lloyd, C. T., Sorichetta, A., Tatem A. High resolution global gridded data for use in population studies. Scientific
Data 4, Article number 170001 (2017)
Name Energy generated (EC1.1)
Type Economic (EC)
Category Energy (1)
Motivation Hydropower generation is a key benefit linked to water resources development and
stimulates socio-economic development at local, national and regional levels
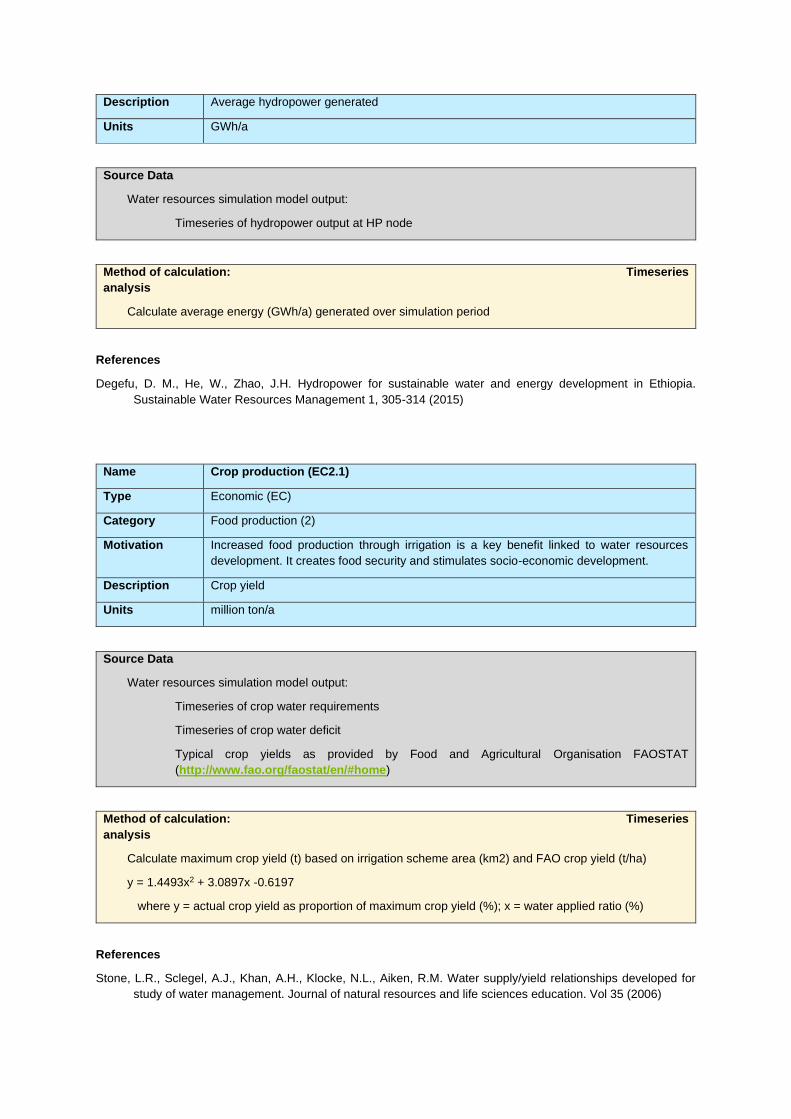
Description Average hydropower generated
Units GWh/a
Source Data
Water resources simulation model output:
Timeseries of hydropower output at HP node
Method of calculation: Timeseries
analysis
Calculate average energy (GWh/a) generated over simulation period
References
Degefu, D. M., He, W., Zhao, J.H. Hydropower for sustainable water and energy development in Ethiopia.
Sustainable Water Resources Management 1, 305-314 (2015)
Name Crop production (EC2.1)
Type Economic (EC)
Category Food production (2)
Motivation Increased food production through irrigation is a key benefit linked to water resources
development. It creates food security and stimulates socio-economic development.
Description Crop yield
Units million ton/a
Source Data
Water resources simulation model output:
Timeseries of crop water requirements
Timeseries of crop water deficit
Typical crop yields as provided by Food and Agricultural Organisation FAOSTAT
(http://www.fao.org/faostat/en/#home)
Method of calculation: Timeseries
analysis
Calculate maximum crop yield (t) based on irrigation scheme area (km2) and FAO crop yield (t/ha)
y = 1.4493x2 + 3.0897x -0.6197
where y = actual crop yield as proportion of maximum crop yield (%); x = water applied ratio (%)
References
Stone, L.R., Sclegel, A.J., Khan, A.H., Klocke, N.L., Aiken, R.M. Water supply/yield relationships developed for
study of water management. Journal of natural resources and life sciences education. Vol 35 (2006)
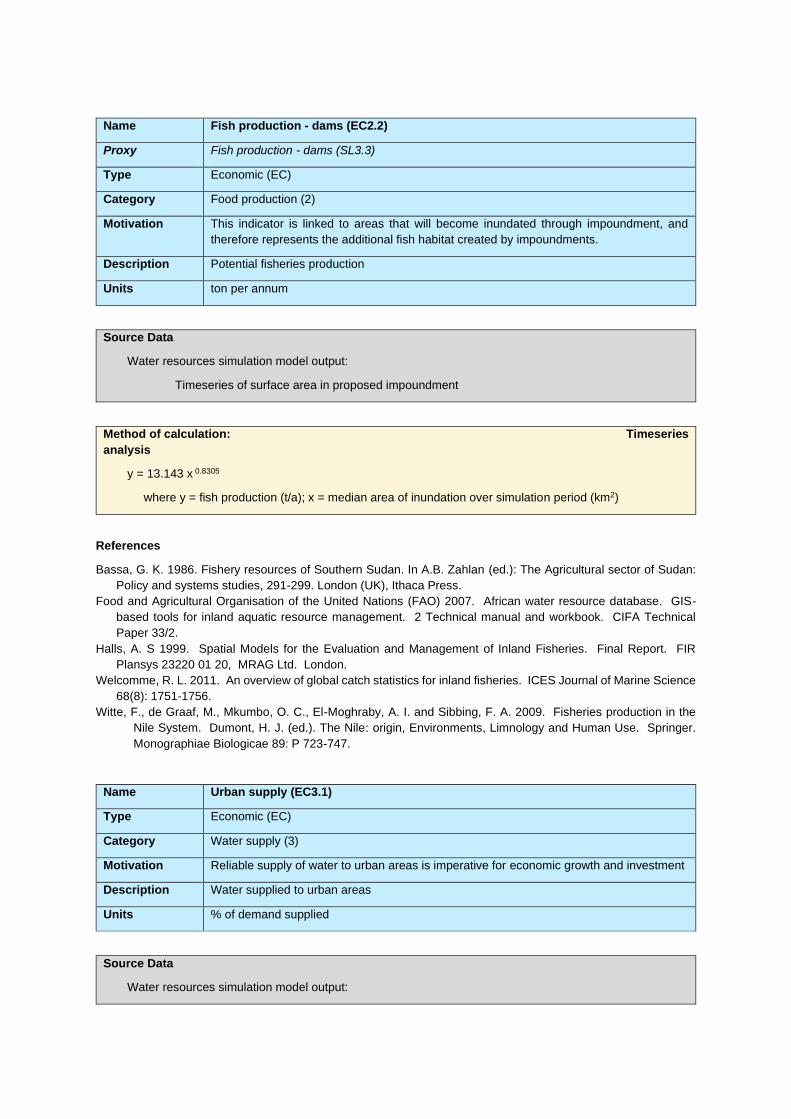
Name Fish production - dams (EC2.2)
Proxy Fish production - dams (SL3.3)
Type Economic (EC)
Category Food production (2)
Motivation This indicator is linked to areas that will become inundated through impoundment, and
therefore represents the additional fish habitat created by impoundments.
Description Potential fisheries production
Units ton per annum
Source Data
Water resources simulation model output:
Timeseries of surface area in proposed impoundment
Method of calculation: Timeseries
analysis
y = 13.143 x 0.8305
where y = fish production (t/a); x = median area of inundation over simulation period (km2)
References
Bassa, G. K. 1986. Fishery resources of Southern Sudan. In A.B. Zahlan (ed.): The Agricultural sector of Sudan:
Policy and systems studies, 291-299. London (UK), Ithaca Press.
Food and Agricultural Organisation of the United Nations (FAO) 2007. African water resource database. GIS-
based tools for inland aquatic resource management. 2 Technical manual and workbook. CIFA Technical
Paper 33/2.
Halls, A. S 1999. Spatial Models for the Evaluation and Management of Inland Fisheries. Final Report. FIR
Plansys 23220 01 20, MRAG Ltd. London.
Welcomme, R. L. 2011. An overview of global catch statistics for inland fisheries. ICES Journal of Marine Science
68(8): 1751-1756.
Witte, F., de Graaf, M., Mkumbo, O. C., El-Moghraby, A. I. and Sibbing, F. A. 2009. Fisheries production in the
Nile System. Dumont, H. J. (ed.). The Nile: origin, Environments, Limnology and Human Use. Springer.
Monographiae Biologicae 89: P 723-747.
Name Urban supply (EC3.1)
Type Economic (EC)
Category Water supply (3)
Motivation Reliable supply of water to urban areas is imperative for economic growth and investment
Description Water supplied to urban areas
Units % of demand supplied
Source Data
Water resources simulation model output:
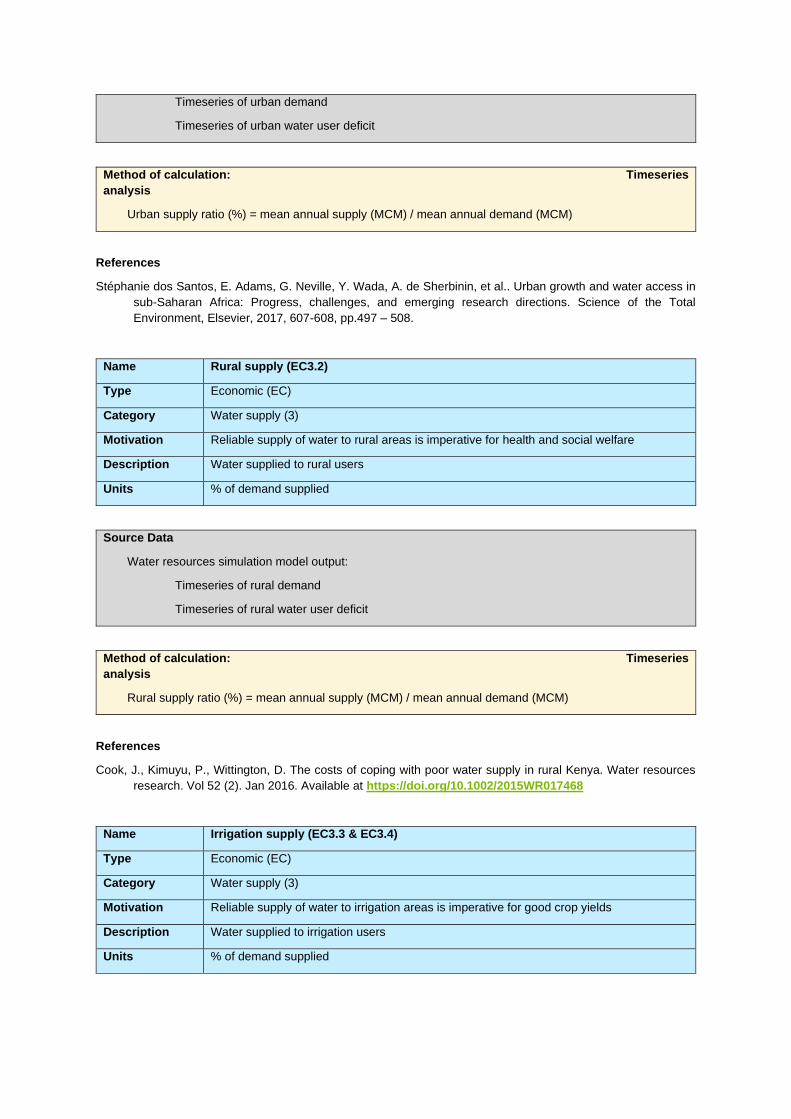
Timeseries of urban demand
Timeseries of urban water user deficit
Method of calculation: Timeseries
analysis
Urban supply ratio (%) = mean annual supply (MCM) / mean annual demand (MCM)
References
Stéphanie dos Santos, E. Adams, G. Neville, Y. Wada, A. de Sherbinin, et al.. Urban growth and water access in
sub-Saharan Africa: Progress, challenges, and emerging research directions. Science of the Total
Environment, Elsevier, 2017, 607-608, pp.497 – 508.
Name Rural supply (EC3.2)
Type Economic (EC)
Category Water supply (3)
Motivation Reliable supply of water to rural areas is imperative for health and social welfare
Description Water supplied to rural users
Units % of demand supplied
Source Data
Water resources simulation model output:
Timeseries of rural demand
Timeseries of rural water user deficit
Method of calculation: Timeseries
analysis
Rural supply ratio (%) = mean annual supply (MCM) / mean annual demand (MCM)
References
Cook, J., Kimuyu, P., Wittington, D. The costs of coping with poor water supply in rural Kenya. Water resources
research. Vol 52 (2). Jan 2016. Available at https://doi.org/10.1002/2015WR017468
Name Irrigation supply (EC3.3 & EC3.4)
Type Economic (EC)
Category Water supply (3)
Motivation Reliable supply of water to irrigation areas is imperative for good crop yields
Description Water supplied to irrigation users
Units % of demand supplied
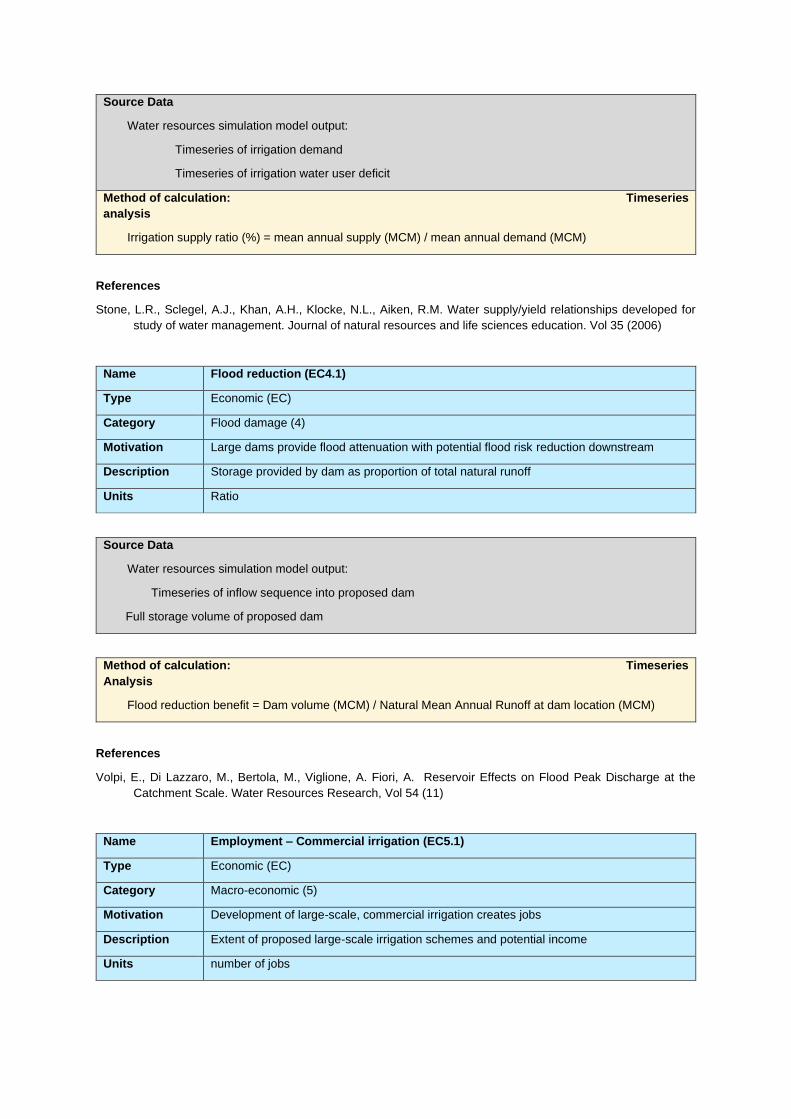
Source Data
Water resources simulation model output:
Timeseries of irrigation demand
Timeseries of irrigation water user deficit
Method of calculation: Timeseries
analysis
Irrigation supply ratio (%) = mean annual supply (MCM) / mean annual demand (MCM)
References
Stone, L.R., Sclegel, A.J., Khan, A.H., Klocke, N.L., Aiken, R.M. Water supply/yield relationships developed for
study of water management. Journal of natural resources and life sciences education. Vol 35 (2006)
Name Flood reduction (EC4.1)
Type Economic (EC)
Category Flood damage (4)
Motivation Large dams provide flood attenuation with potential flood risk reduction downstream
Description Storage provided by dam as proportion of total natural runoff
Units Ratio
Source Data
Water resources simulation model output:
Timeseries of inflow sequence into proposed dam
Full storage volume of proposed dam
Method of calculation: Timeseries
Analysis
Flood reduction benefit = Dam volume (MCM) / Natural Mean Annual Runoff at dam location (MCM)
References
Volpi, E., Di Lazzaro, M., Bertola, M., Viglione, A. Fiori, A. Reservoir Effects on Flood Peak Discharge at the
Catchment Scale. Water Resources Research, Vol 54 (11)
Name Employment – Commercial irrigation (EC5.1)
Type Economic (EC)
Category Macro-economic (5)
Motivation Development of large-scale, commercial irrigation creates jobs
Description Extent of proposed large-scale irrigation schemes and potential income
Units number of jobs
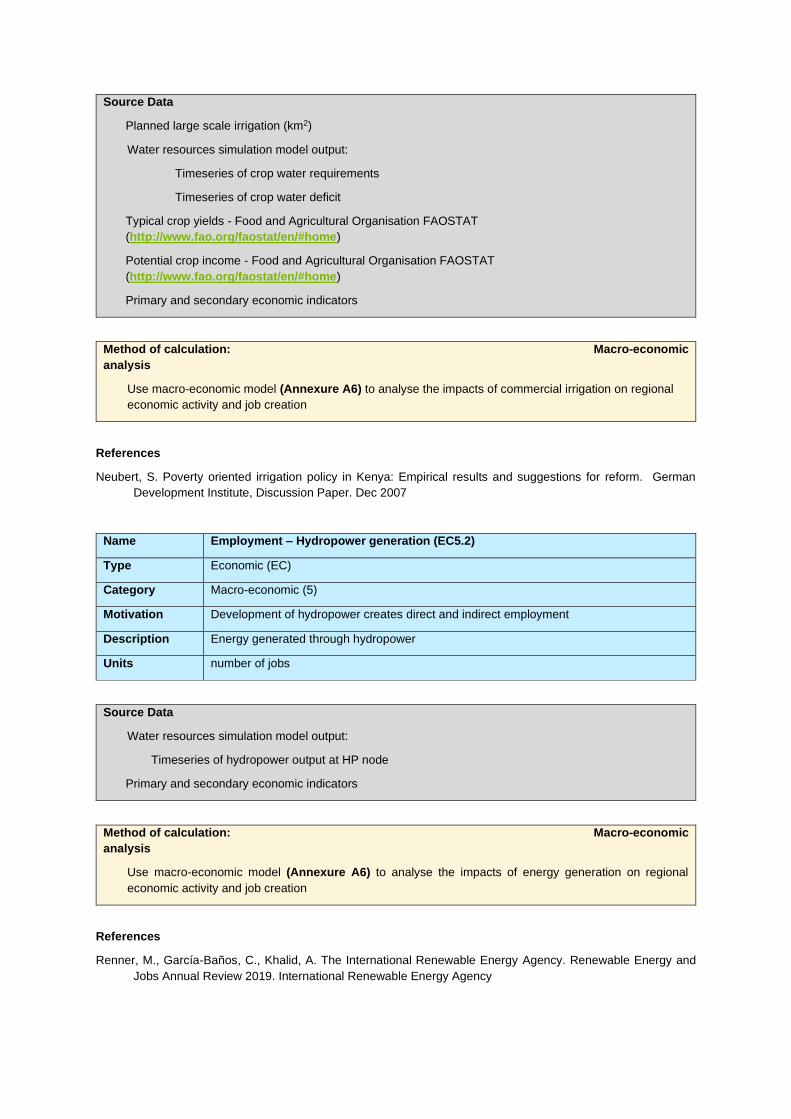
Source Data
Planned large scale irrigation (km2)
Water resources simulation model output:
Timeseries of crop water requirements
Timeseries of crop water deficit
Typical crop yields - Food and Agricultural Organisation FAOSTAT
(http://www.fao.org/faostat/en/#home)
Potential crop income - Food and Agricultural Organisation FAOSTAT
(http://www.fao.org/faostat/en/#home)
Primary and secondary economic indicators
Method of calculation: Macro-economic
analysis
Use macro-economic model (Annexure A6) to analyse the impacts of commercial irrigation on regional
economic activity and job creation
References
Neubert, S. Poverty oriented irrigation policy in Kenya: Empirical results and suggestions for reform. German
Development Institute, Discussion Paper. Dec 2007
Name Employment – Hydropower generation (EC5.2)
Type Economic (EC)
Category Macro-economic (5)
Motivation Development of hydropower creates direct and indirect employment
Description Energy generated through hydropower
Units number of jobs
Source Data
Water resources simulation model output:
Timeseries of hydropower output at HP node
Primary and secondary economic indicators
Method of calculation: Macro-economic
analysis
Use macro-economic model (Annexure A6) to analyse the impacts of energy generation on regional
economic activity and job creation
References
Renner, M., García-Baños, C., Khalid, A. The International Renewable Energy Agency. Renewable Energy and
Jobs Annual Review 2019. International Renewable Energy Agency
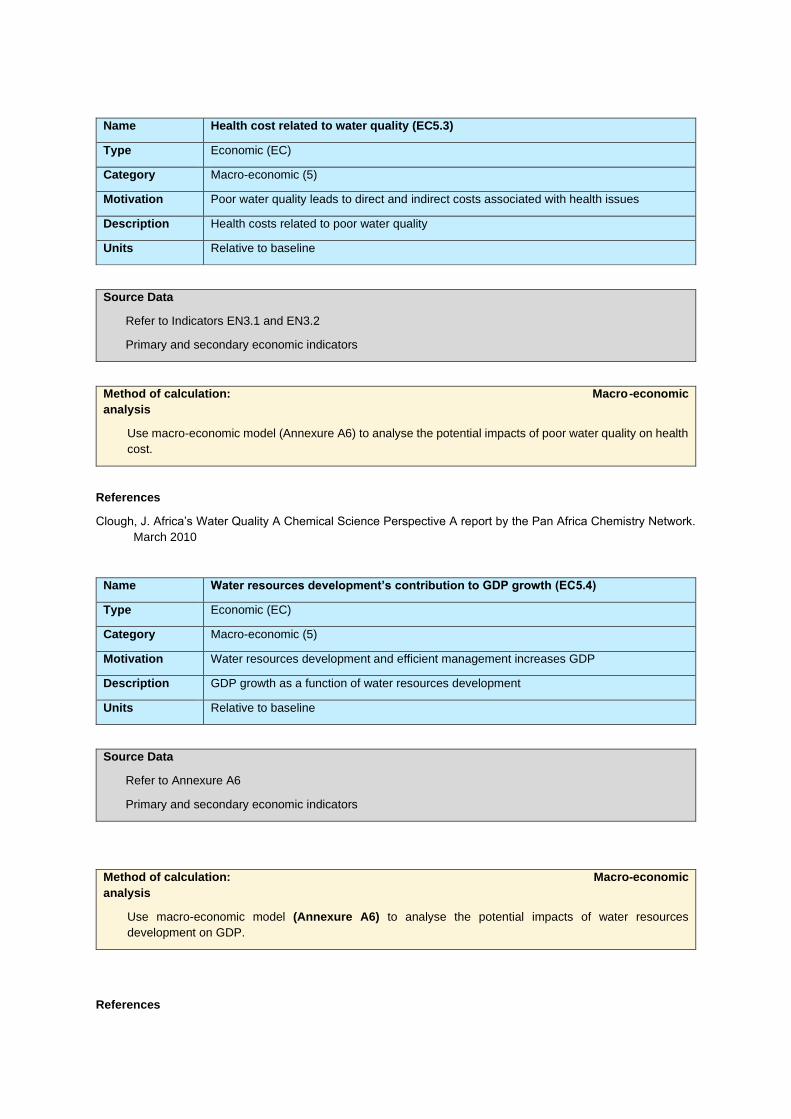
Name Health cost related to water quality (EC5.3)
Type Economic (EC)
Category Macro-economic (5)
Motivation Poor water quality leads to direct and indirect costs associated with health issues
Description Health costs related to poor water quality
Units Relative to baseline
Source Data
Refer to Indicators EN3.1 and EN3.2
Primary and secondary economic indicators
Method of calculation: Macro-economic
analysis
Use macro-economic model (Annexure A6) to analyse the potential impacts of poor water quality on health
cost.
References
Clough, J. Africa’s Water Quality A Chemical Science Perspective A report by the Pan Africa Chemistry Network.
March 2010
Name Water resources development’s contribution to GDP growth (EC5.4)
Type Economic (EC)
Category Macro-economic (5)
Motivation Water resources development and efficient management increases GDP
Description GDP growth as a function of water resources development
Units Relative to baseline
Source Data
Refer to Annexure A6
Primary and secondary economic indicators
Method of calculation: Macro-economic
analysis
Use macro-economic model (Annexure A6) to analyse the potential impacts of water resources
development on GDP.
References
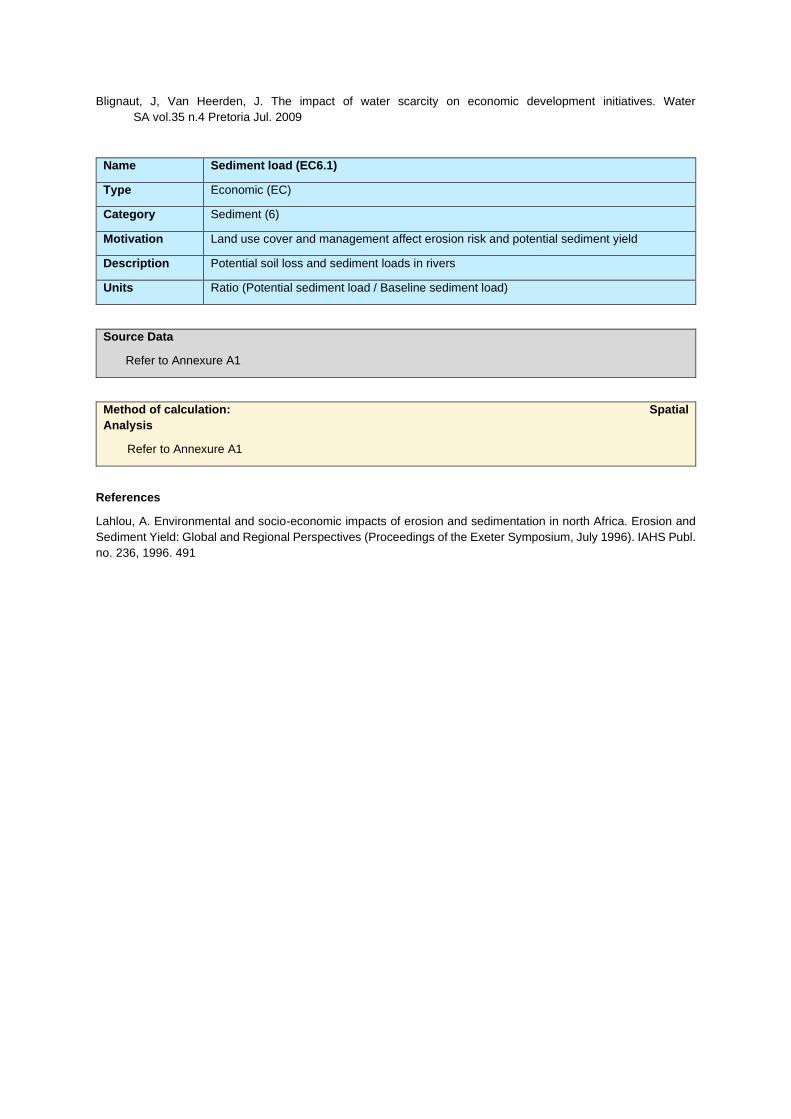
Blignaut, J, Van Heerden, J. The impact of water scarcity on economic development initiatives. Water
SA vol.35 n.4 Pretoria Jul. 2009
Name Sediment load (EC6.1)
Type Economic (EC)
Category Sediment (6)
Motivation Land use cover and management affect erosion risk and potential sediment yield
Description Potential soil loss and sediment loads in rivers
Units Ratio (Potential sediment load / Baseline sediment load)
Source Data
Refer to Annexure A1
Method of calculation: Spatial
Analysis
Refer to Annexure A1
References
Lahlou, A. Environmental and socio-economic impacts of erosion and sedimentation in north Africa. Erosion and
Sediment Yield: Global and Regional Perspectives (Proceedings of the Exeter Symposium, July 1996). IAHS Publ.
no. 236, 1996. 491
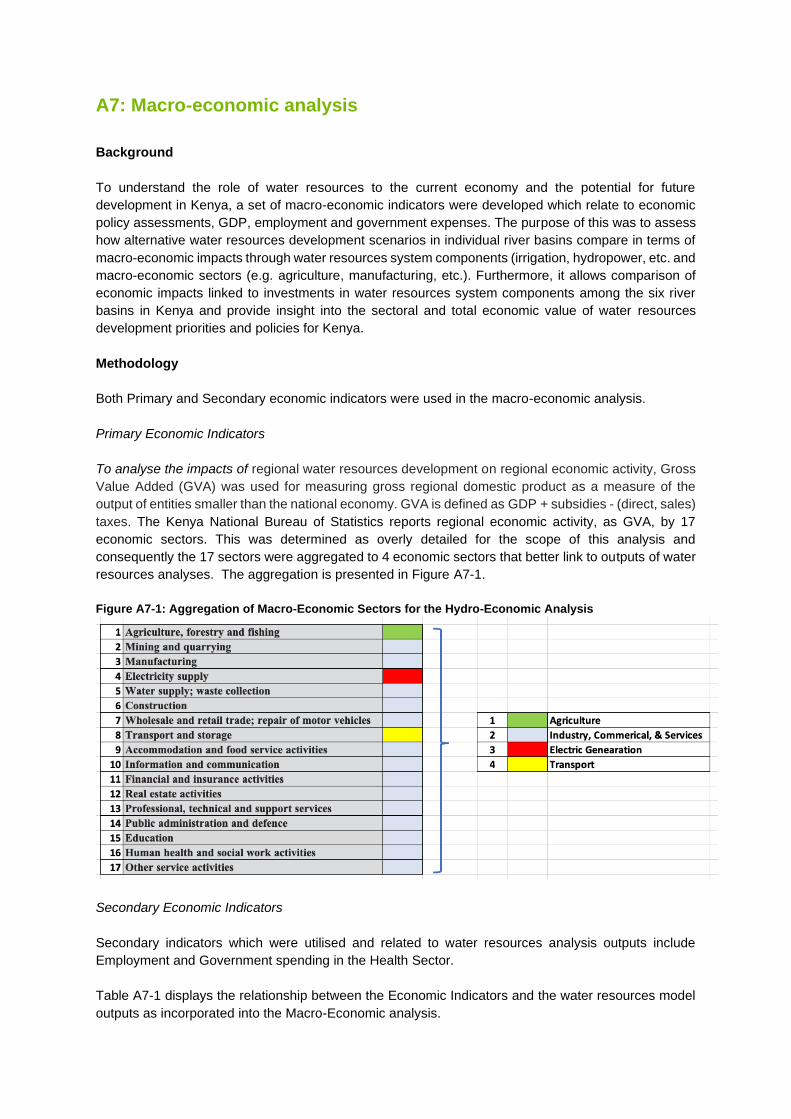
A7: Macro-economic analysis
Background
To understand the role of water resources to the current economy and the potential for future
development in Kenya, a set of macro-economic indicators were developed which relate to economic
policy assessments, GDP, employment and government expenses. The purpose of this was to assess
how alternative water resources development scenarios in individual river basins compare in terms of
macro-economic impacts through water resources system components (irrigation, hydropower, etc. and
macro-economic sectors (e.g. agriculture, manufacturing, etc.). Furthermore, it allows comparison of
economic impacts linked to investments in water resources system components among the six river
basins in Kenya and provide insight into the sectoral and total economic value of water resources
development priorities and policies for Kenya.
Methodology
Both Primary and Secondary economic indicators were used in the macro-economic analysis.
Primary Economic Indicators
To analyse the impacts of regional water resources development on regional economic activity, Gross
Value Added (GVA) was used for measuring gross regional domestic product as a measure of the
output of entities smaller than the national economy. GVA is defined as GDP + subsidies - (direct, sales)
taxes. The Kenya National Bureau of Statistics reports regional economic activity, as GVA, by 17
economic sectors. This was determined as overly detailed for the scope of this analysis and
consequently the 17 sectors were aggregated to 4 economic sectors that better link to outputs of water
resources analyses. The aggregation is presented in Figure A7-1.
Figure A7-1: Aggregation of Macro-Economic Sectors for the Hydro-Economic Analysis
Secondary Economic Indicators
Secondary indicators which were utilised and related to water resources analysis outputs include
Employment and Government spending in the Health Sector.
Table A7-1 displays the relationship between the Economic Indicators and the water resources model
outputs as incorporated into the Macro-Economic analysis.
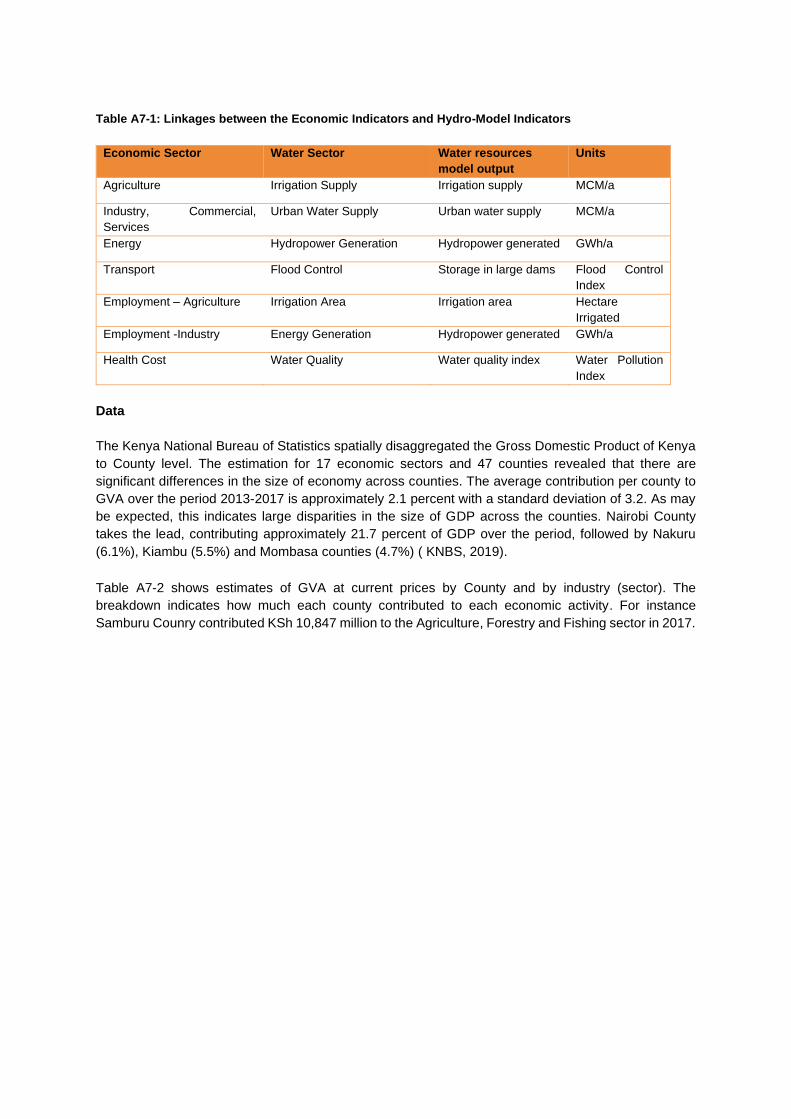
Table A7-1: Linkages between the Economic Indicators and Hydro-Model Indicators
Economic Sector Water Sector Water resources
model output
Units
Agriculture Irrigation Supply Irrigation supply MCM/a
Industry, Commercial,
Services
Urban Water Supply Urban water supply MCM/a
Energy Hydropower Generation Hydropower generated GWh/a
Transport Flood Control Storage in large dams Flood Control
Index
Employment – Agriculture Irrigation Area Irrigation area Hectare
Irrigated
Employment -Industry Energy Generation Hydropower generated GWh/a
Health Cost Water Quality Water quality index Water Pollution
Index
Data
The Kenya National Bureau of Statistics spatially disaggregated the Gross Domestic Product of Kenya
to County level. The estimation for 17 economic sectors and 47 counties revealed that there are
significant differences in the size of economy across counties. The average contribution per county to
GVA over the period 2013-2017 is approximately 2.1 percent with a standard deviation of 3.2. As may
be expected, this indicates large disparities in the size of GDP across the counties. Nairobi County
takes the lead, contributing approximately 21.7 percent of GDP over the period, followed by Nakuru
(6.1%), Kiambu (5.5%) and Mombasa counties (4.7%) ( KNBS, 2019).
Table A7-2 shows estimates of GVA at current prices by County and by industry (sector). The
breakdown indicates how much each county contributed to each economic activity. For instance
Samburu Counry contributed KSh 10,847 million to the Agriculture, Forestry and Fishing sector in 2017.
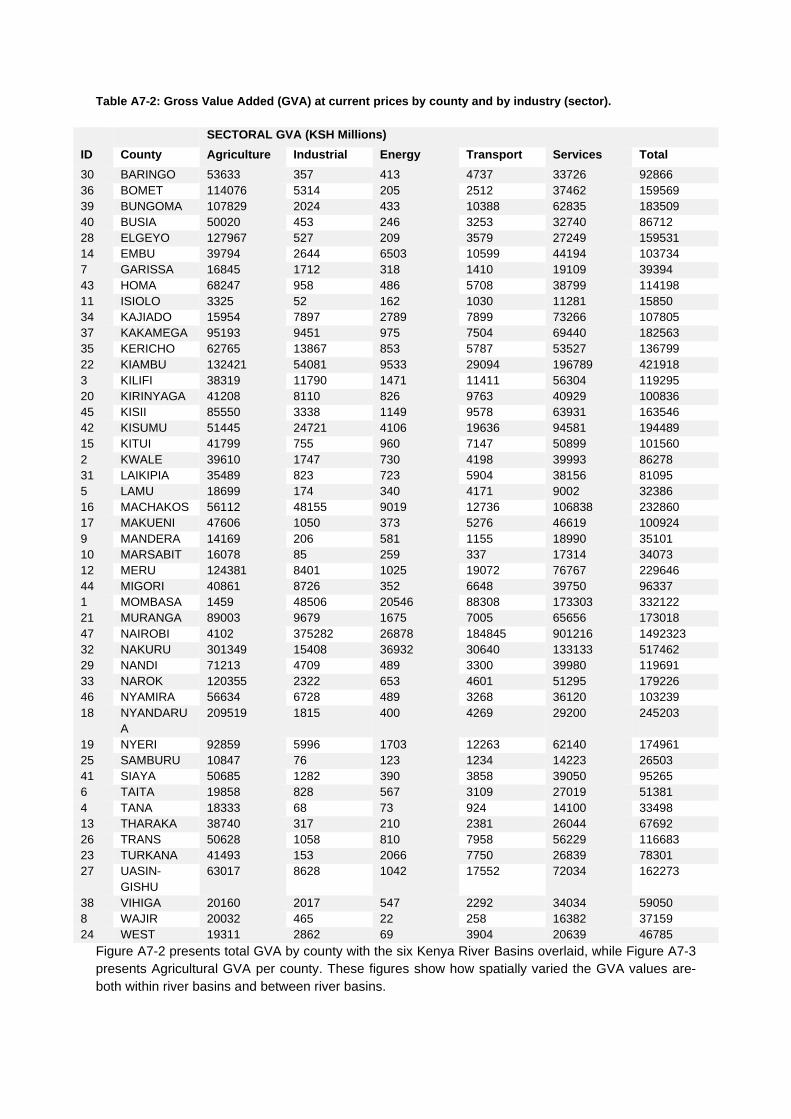
Table A7-2: Gross Value Added (GVA) at current prices by county and by industry (sector).
SECTORAL GVA (KSH Millions)
ID County Agriculture Industrial Energy Transport Services Total
30 BARINGO 53633 357 413 4737 33726 92866
36 BOMET 114076 5314 205 2512 37462 159569
39 BUNGOMA 107829 2024 433 10388 62835 183509
40 BUSIA 50020 453 246 3253 32740 86712
28 ELGEYO 127967 527 209 3579 27249 159531
14 EMBU 39794 2644 6503 10599 44194 103734
7 GARISSA 16845 1712 318 1410 19109 39394
43 HOMA 68247 958 486 5708 38799 114198
11 ISIOLO 3325 52 162 1030 11281 15850
34 KAJIADO 15954 7897 2789 7899 73266 107805
37 KAKAMEGA 95193 9451 975 7504 69440 182563
35 KERICHO 62765 13867 853 5787 53527 136799
22 KIAMBU 132421 54081 9533 29094 196789 421918
3 KILIFI 38319 11790 1471 11411 56304 119295
20 KIRINYAGA 41208 8110 826 9763 40929 100836
45 KISII 85550 3338 1149 9578 63931 163546
42 KISUMU 51445 24721 4106 19636 94581 194489
15 KITUI 41799 755 960 7147 50899 101560
2 KWALE 39610 1747 730 4198 39993 86278
31 LAIKIPIA 35489 823 723 5904 38156 81095
5 LAMU 18699 174 340 4171 9002 32386
16 MACHAKOS 56112 48155 9019 12736 106838 232860
17 MAKUENI 47606 1050 373 5276 46619 100924
9 MANDERA 14169 206 581 1155 18990 35101
10 MARSABIT 16078 85 259 337 17314 34073
12 MERU 124381 8401 1025 19072 76767 229646
44 MIGORI 40861 8726 352 6648 39750 96337
1 MOMBASA 1459 48506 20546 88308 173303 332122
21 MURANGA 89003 9679 1675 7005 65656 173018
47 NAIROBI 4102 375282 26878 184845 901216 1492323
32 NAKURU 301349 15408 36932 30640 133133 517462
29 NANDI 71213 4709 489 3300 39980 119691
33 NAROK 120355 2322 653 4601 51295 179226
46 NYAMIRA 56634 6728 489 3268 36120 103239
18 NYANDARU
A
209519 1815 400 4269 29200 245203
19 NYERI 92859 5996 1703 12263 62140 174961
25 SAMBURU 10847 76 123 1234 14223 26503
41 SIAYA 50685 1282 390 3858 39050 95265
6 TAITA 19858 828 567 3109 27019 51381
4 TANA 18333 68 73 924 14100 33498
13 THARAKA 38740 317 210 2381 26044 67692
26 TRANS 50628 1058 810 7958 56229 116683
23 TURKANA 41493 153 2066 7750 26839 78301
27 UASIN-
GISHU
63017 8628 1042 17552 72034 162273
38 VIHIGA 20160 2017 547 2292 34034 59050
8 WAJIR 20032 465 22 258 16382 37159
24 WEST 19311 2862 69 3904 20639 46785
Figure A7-2 presents total GVA by county with the six Kenya River Basins overlaid, while Figure A7-3
presents Agricultural GVA per county. These figures show how spatially varied the GVA values are-
both within river basins and between river basins.
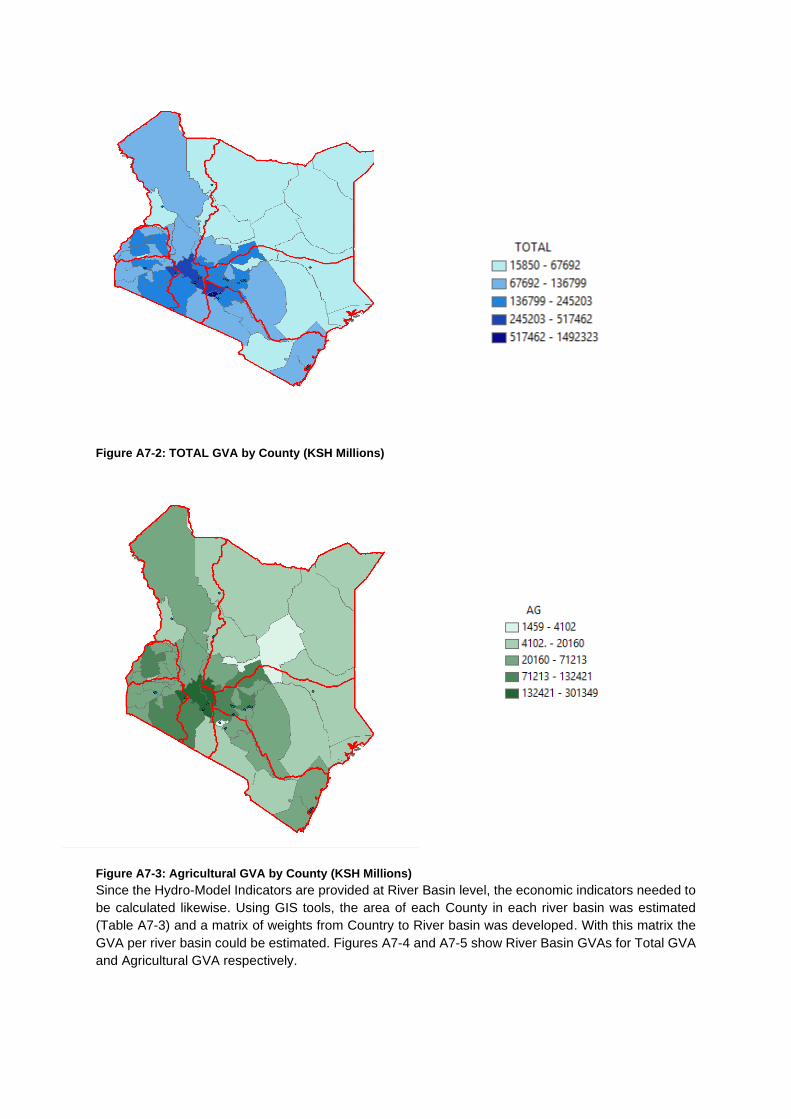
Figure A7-2: TOTAL GVA by County (KSH Millions)
Figure A7-3: Agricultural GVA by County (KSH Millions)
Since the Hydro-Model Indicators are provided at River Basin level, the economic indicators needed to
be calculated likewise. Using GIS tools, the area of each County in each river basin was estimated
(Table A7-3) and a matrix of weights from Country to River basin was developed. With this matrix the
GVA per river basin could be estimated. Figures A7-4 and A7-5 show River Basin GVAs for Total GVA
and Agricultural GVA respectively.
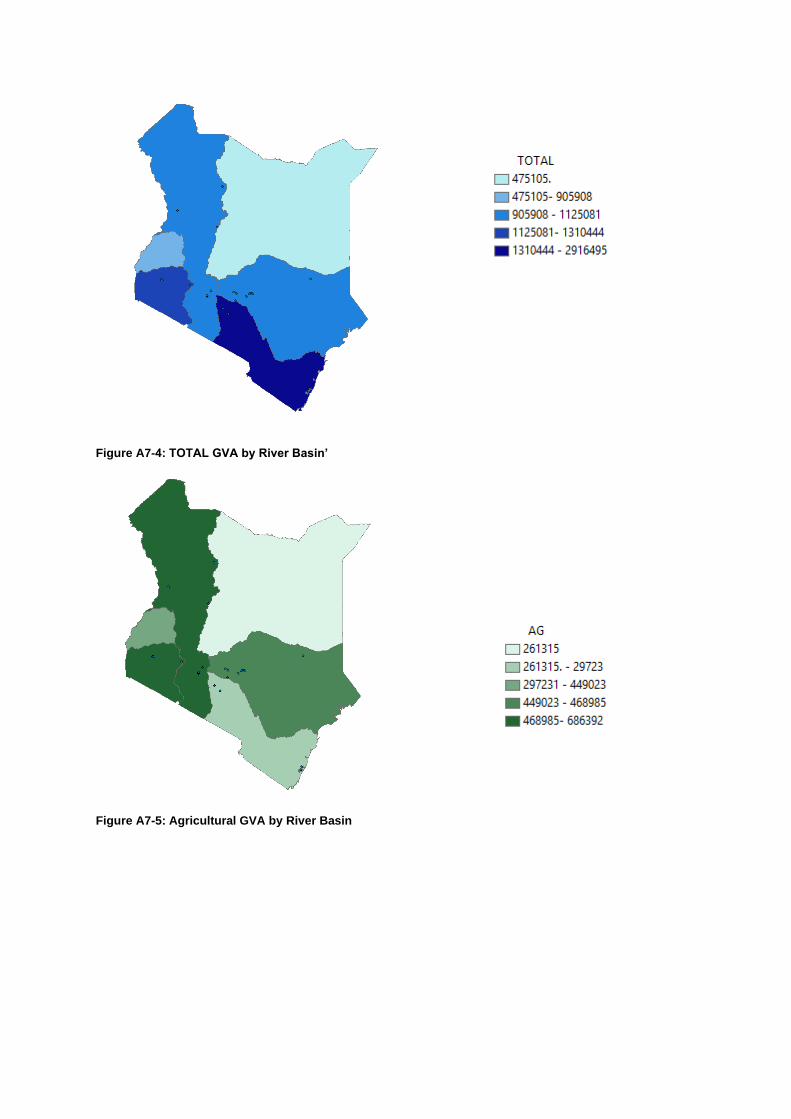
Figure A7-4: TOTAL GVA by River Basin’
Figure A7-5: Agricultural GVA by River Basin
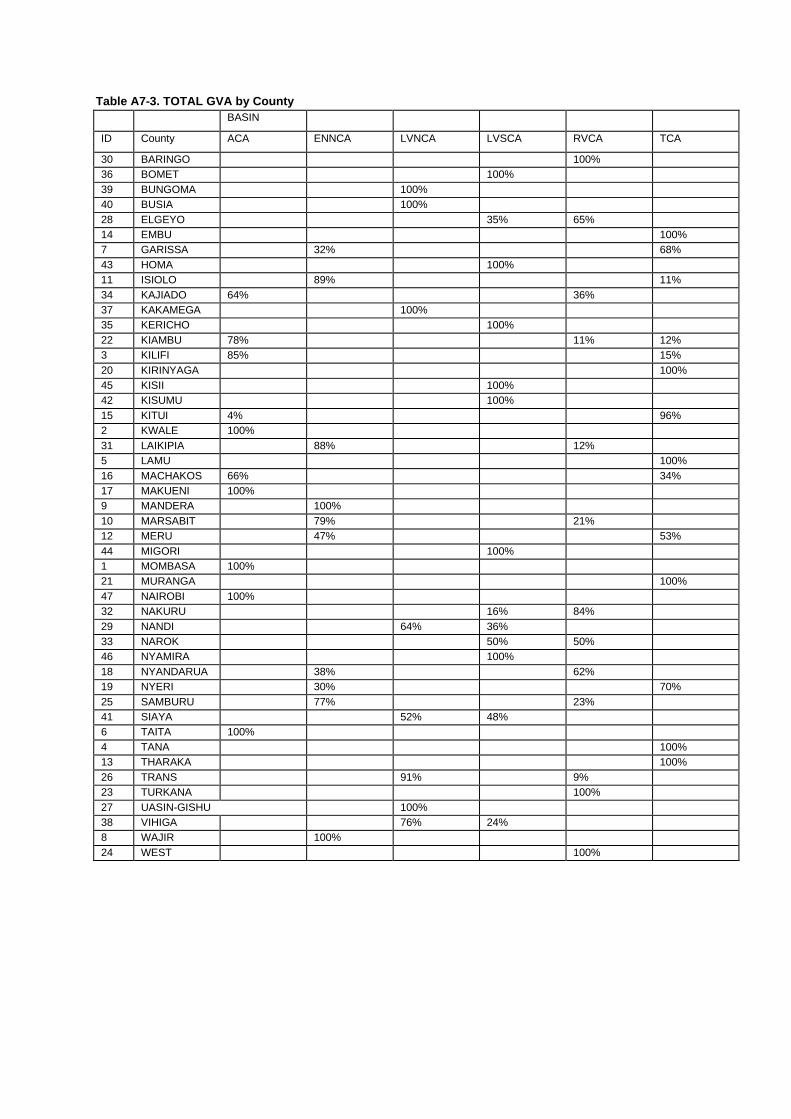
Table A7-3. TOTAL GVA by County
BASIN
ID County ACA ENNCA LVNCA LVSCA RVCA TCA
30 BARINGO 100%
36 BOMET 100%
39 BUNGOMA 100%
40 BUSIA 100%
28 ELGEYO 35% 65%
14 EMBU 100%
7 GARISSA 32% 68%
43 HOMA 100%
11 ISIOLO 89% 11%
34 KAJIADO 64% 36%
37 KAKAMEGA 100%
35 KERICHO 100%
22 KIAMBU 78% 11% 12%
3 KILIFI 85% 15%
20 KIRINYAGA 100%
45 KISII 100%
42 KISUMU 100%
15 KITUI 4% 96%
2 KWALE 100%
31 LAIKIPIA 88% 12%
5 LAMU 100%
16 MACHAKOS 66% 34%
17 MAKUENI 100%
9 MANDERA 100%
10 MARSABIT 79% 21%
12 MERU 47% 53%
44 MIGORI 100%
1 MOMBASA 100%
21 MURANGA 100%
47 NAIROBI 100%
32 NAKURU 16% 84%
29 NANDI 64% 36%
33 NAROK 50% 50%
46 NYAMIRA 100%
18 NYANDARUA 38% 62%
19 NYERI 30% 70%
25 SAMBURU 77% 23%
41 SIAYA 52% 48%
6 TAITA 100%
4 TANA 100%
13 THARAKA 100%
26 TRANS 91% 9%
23 TURKANA 100%
27 UASIN-GISHU 100%
38 VIHIGA 76% 24%
8 WAJIR 100%
24 WEST 100%
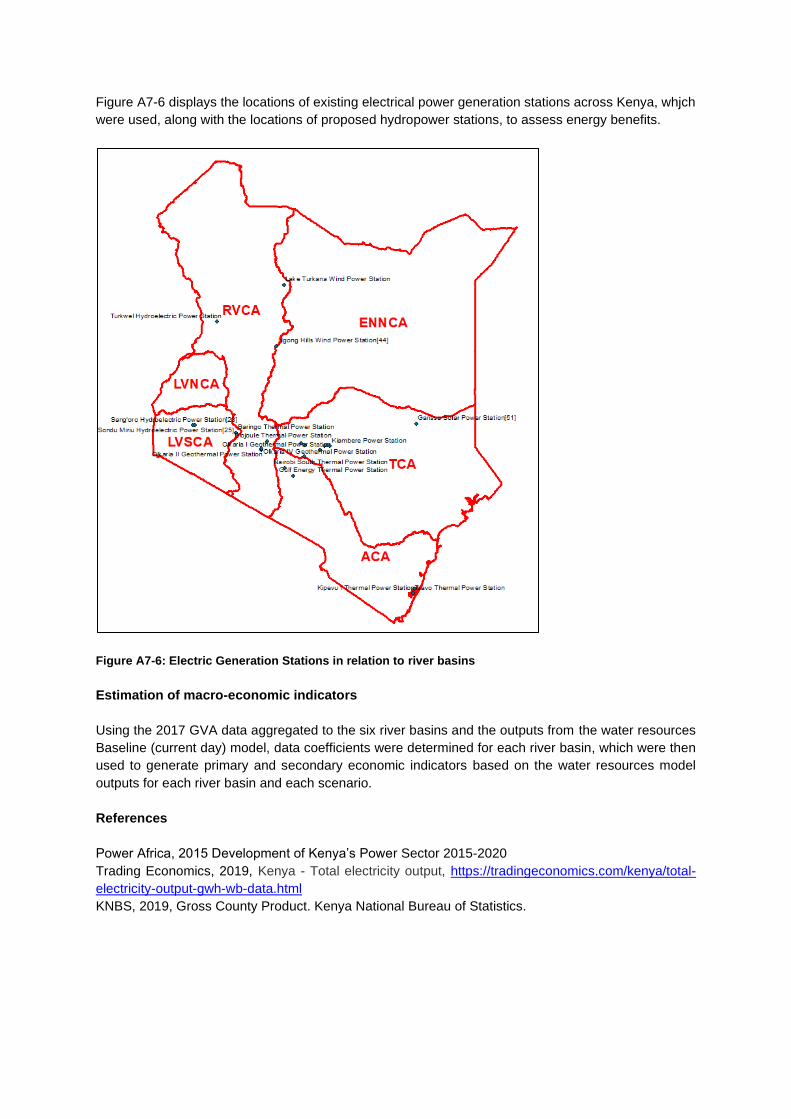
Figure A7-6 displays the locations of existing electrical power generation stations across Kenya, whjch
were used, along with the locations of proposed hydropower stations, to assess energy benefits.
Figure A7-6: Electric Generation Stations in relation to river basins
Estimation of macro-economic indicators
Using the 2017 GVA data aggregated to the six river basins and the outputs from the water resources
Baseline (current day) model, data coefficients were determined for each river basin, which were then
used to generate primary and secondary economic indicators based on the water resources model
outputs for each river basin and each scenario.
References
Power Africa, 2015 Development of Kenya’s Power Sector 2015-2020 Trading Economics, 2019, Kenya - Total electricity output, https://tradingeconomics.com/kenya/total-
electricity-output-gwh-wb-data.html KNBS, 2019, Gross County Product. Kenya National Bureau of Statistics.
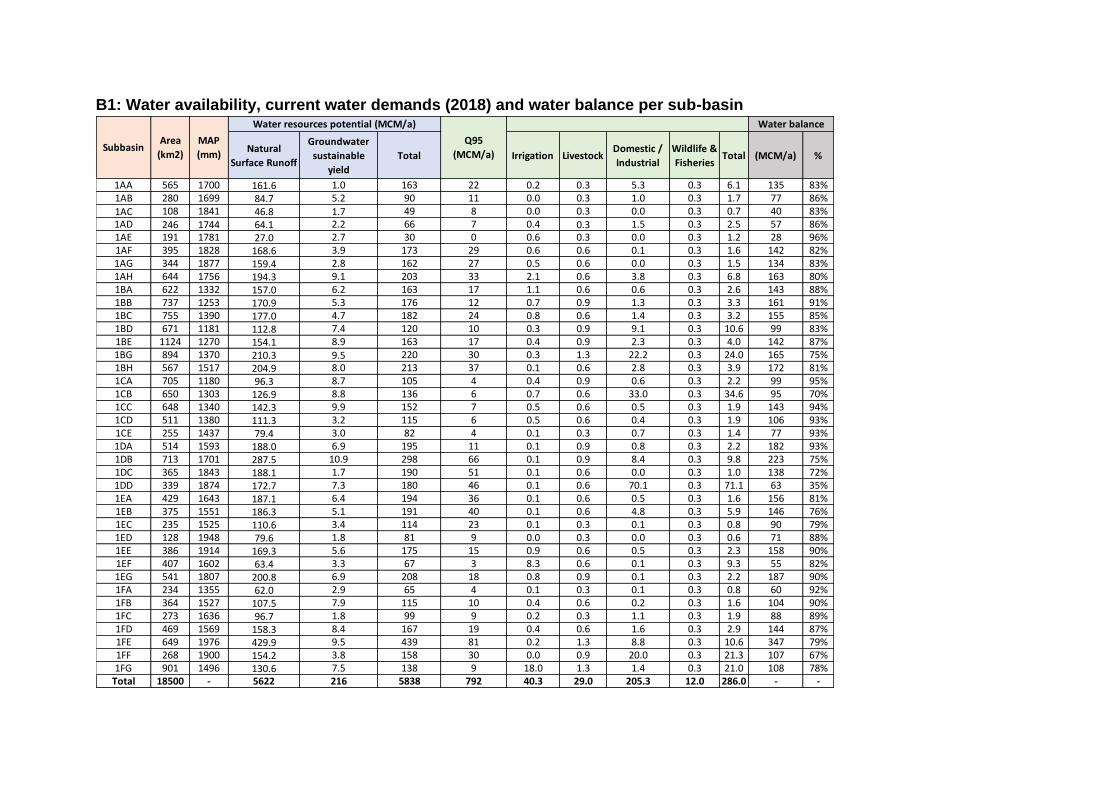
B1: Water availability, current water demands (2018) and water balance per sub-basin
Natural
Surface Runoff
Groundwater
sustainable
yield
Total Irrigation LivestockDomestic /
Industrial
Wildlife &
FisheriesTotal (MCM/a) %
1AA 565 1700 161.6 1.0 163 22 0.2 0.3 5.3 0.3 6.1 135 83%1AB 280 1699 84.7 5.2 90 11 0.0 0.3 1.0 0.3 1.7 77 86%
1AC 108 1841 46.8 1.7 49 8 0.0 0.3 0.0 0.3 0.7 40 83%1AD 246 1744 64.1 2.2 66 7 0.4 0.3 1.5 0.3 2.5 57 86%1AE 191 1781 27.0 2.7 30 0 0.6 0.3 0.0 0.3 1.2 28 96%1AF 395 1828 168.6 3.9 173 29 0.6 0.6 0.1 0.3 1.6 142 82%1AG 344 1877 159.4 2.8 162 27 0.5 0.6 0.0 0.3 1.5 134 83%1AH 644 1756 194.3 9.1 203 33 2.1 0.6 3.8 0.3 6.8 163 80%1BA 622 1332 157.0 6.2 163 17 1.1 0.6 0.6 0.3 2.6 143 88%1BB 737 1253 170.9 5.3 176 12 0.7 0.9 1.3 0.3 3.3 161 91%1BC 755 1390 177.0 4.7 182 24 0.8 0.6 1.4 0.3 3.2 155 85%1BD 671 1181 112.8 7.4 120 10 0.3 0.9 9.1 0.3 10.6 99 83%1BE 1124 1270 154.1 8.9 163 17 0.4 0.9 2.3 0.3 4.0 142 87%1BG 894 1370 210.3 9.5 220 30 0.3 1.3 22.2 0.3 24.0 165 75%1BH 567 1517 204.9 8.0 213 37 0.1 0.6 2.8 0.3 3.9 172 81%1CA 705 1180 96.3 8.7 105 4 0.4 0.9 0.6 0.3 2.2 99 95%1CB 650 1303 126.9 8.8 136 6 0.7 0.6 33.0 0.3 34.6 95 70%1CC 648 1340 142.3 9.9 152 7 0.5 0.6 0.5 0.3 1.9 143 94%1CD 511 1380 111.3 3.2 115 6 0.5 0.6 0.4 0.3 1.9 106 93%1CE 255 1437 79.4 3.0 82 4 0.1 0.3 0.7 0.3 1.4 77 93%1DA 514 1593 188.0 6.9 195 11 0.1 0.9 0.8 0.3 2.2 182 93%1DB 713 1701 287.5 10.9 298 66 0.1 0.9 8.4 0.3 9.8 223 75%1DC 365 1843 188.1 1.7 190 51 0.1 0.6 0.0 0.3 1.0 138 72%1DD 339 1874 172.7 7.3 180 46 0.1 0.6 70.1 0.3 71.1 63 35%1EA 429 1643 187.1 6.4 194 36 0.1 0.6 0.5 0.3 1.6 156 81%1EB 375 1551 186.3 5.1 191 40 0.1 0.6 4.8 0.3 5.9 146 76%1EC 235 1525 110.6 3.4 114 23 0.1 0.3 0.1 0.3 0.8 90 79%1ED 128 1948 79.6 1.8 81 9 0.0 0.3 0.0 0.3 0.6 71 88%1EE 386 1914 169.3 5.6 175 15 0.9 0.6 0.5 0.3 2.3 158 90%1EF 407 1602 63.4 3.3 67 3 8.3 0.6 0.1 0.3 9.3 55 82%1EG 541 1807 200.8 6.9 208 18 0.8 0.9 0.1 0.3 2.2 187 90%1FA 234 1355 62.0 2.9 65 4 0.1 0.3 0.1 0.3 0.8 60 92%1FB 364 1527 107.5 7.9 115 10 0.4 0.6 0.2 0.3 1.6 104 90%1FC 273 1636 96.7 1.8 99 9 0.2 0.3 1.1 0.3 1.9 88 89%1FD 469 1569 158.3 8.4 167 19 0.4 0.6 1.6 0.3 2.9 144 87%1FE 649 1976 429.9 9.5 439 81 0.2 1.3 8.8 0.3 10.6 347 79%1FF 268 1900 154.2 3.8 158 30 0.0 0.9 20.0 0.3 21.3 107 67%1FG 901 1496 130.6 7.5 138 9 18.0 1.3 1.4 0.3 21.0 108 78%
Total 18500 - 5622 216 5838 792 40.3 29.0 205.3 12.0 286.0 - -
Water balance
SubbasinArea
(km2)
MAP
(mm)
Water resources potential (MCM/a)
Q95
(MCM/a)
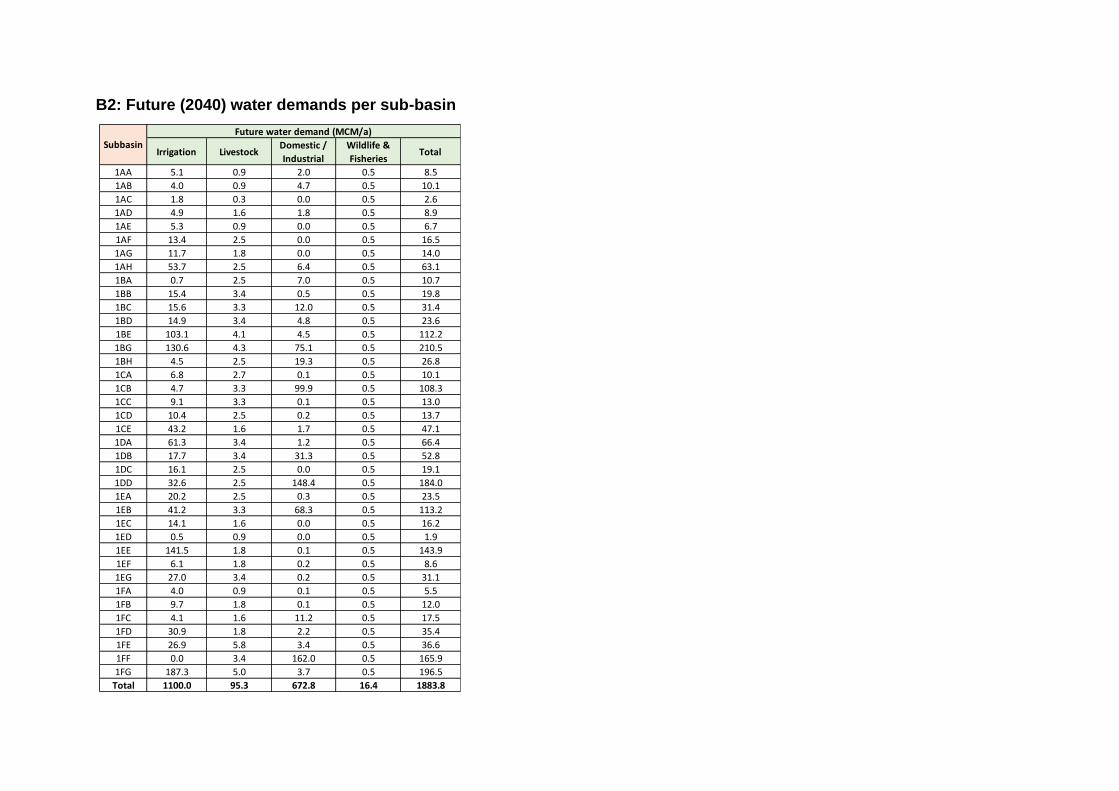
B2: Future (2040) water demands per sub-basin
Irrigation LivestockDomestic /
Industrial
Wildlife &
FisheriesTotal
1AA 5.1 0.9 2.0 0.5 8.5
1AB 4.0 0.9 4.7 0.5 10.1
1AC 1.8 0.3 0.0 0.5 2.6
1AD 4.9 1.6 1.8 0.5 8.9
1AE 5.3 0.9 0.0 0.5 6.7
1AF 13.4 2.5 0.0 0.5 16.5
1AG 11.7 1.8 0.0 0.5 14.0
1AH 53.7 2.5 6.4 0.5 63.1
1BA 0.7 2.5 7.0 0.5 10.7
1BB 15.4 3.4 0.5 0.5 19.8
1BC 15.6 3.3 12.0 0.5 31.4
1BD 14.9 3.4 4.8 0.5 23.6
1BE 103.1 4.1 4.5 0.5 112.2
1BG 130.6 4.3 75.1 0.5 210.5
1BH 4.5 2.5 19.3 0.5 26.8
1CA 6.8 2.7 0.1 0.5 10.1
1CB 4.7 3.3 99.9 0.5 108.3
1CC 9.1 3.3 0.1 0.5 13.0
1CD 10.4 2.5 0.2 0.5 13.7
1CE 43.2 1.6 1.7 0.5 47.1
1DA 61.3 3.4 1.2 0.5 66.4
1DB 17.7 3.4 31.3 0.5 52.8
1DC 16.1 2.5 0.0 0.5 19.1
1DD 32.6 2.5 148.4 0.5 184.0
1EA 20.2 2.5 0.3 0.5 23.5
1EB 41.2 3.3 68.3 0.5 113.2
1EC 14.1 1.6 0.0 0.5 16.2
1ED 0.5 0.9 0.0 0.5 1.9
1EE 141.5 1.8 0.1 0.5 143.9
1EF 6.1 1.8 0.2 0.5 8.6
1EG 27.0 3.4 0.2 0.5 31.1
1FA 4.0 0.9 0.1 0.5 5.5
1FB 9.7 1.8 0.1 0.5 12.0
1FC 4.1 1.6 11.2 0.5 17.5
1FD 30.9 1.8 2.2 0.5 35.4
1FE 26.9 5.8 3.4 0.5 36.6
1FF 0.0 3.4 162.0 0.5 165.9
1FG 187.3 5.0 3.7 0.5 196.5
Total 1100.0 95.3 672.8 16.4 1883.8
Subbasin
Future water demand (MCM/a)
C1. Environmental management
Framework
To ensure quality of attention to environmental and social factors that affect the sustainable utilisation
of water and allied resources in the LVN Basin, the legislative, policy and institutional framework for
environmental management should govern the development, and implementation of the strategies,
sub-plans and actions emanating from this LVN Basin Plan. This framework needs to be understood if
the LVN Basin Plan is to attain the goals of social acceptability, economic viability and technical
sustainability in line with internationally accepted standards for good practice.
▪ The Constitution of Kenya, 2010: is the supreme law in the Country providing the broad framework
regulating all existence and development aspects of interest to the people of Kenya, and along which
all national and sectoral legislative documents are drawn. Chapter V is entirely dedicated to land
and environment, and a number of environmental principles feature in various parts. The
Constitution embodies social and economic rights of an environmental character, such as the right
to water, food and shelter, the right of every person to a clean and healthy environment, and the
right to have the environment protected for the benefit of present and future generations through
legislative measures.
▪ The National Environment Policy, 2012: provides a holistic framework to guide the management
of the environment and natural resources in Kenya. It further ensures that the linkage between the
environment and poverty reduction is integrated in all government processes and institutions to
facilitate and realize sustainable development at all levels in the context of green economy
enhancing social inclusion, improving human welfare and creating opportunities for employment and
maintaining the healthy functioning of ecosystem.
▪ The Environmental Management and Coordination Act, 1999 (as amended 2015) Cap 387
(EMCA): is the framework law on the environment in Kenya. The EMCA was enacted to provide an
appropriate legal and institutional framework for the management of the environment in Kenya. The
Act was amended in May 2015 and took effect on 17 June 2015.
The Act aims to improve the legal and administrative coordination of the diverse sectoral
initiatives in the field of environment in order to enhance the national capacity for its effective
management. In addition, the Act seeks to align the 77 sector specific legislations pertaining to
the environment in a manner designed to ensure greater protection of the environment. This is in
line with national objectives and sustainable development goals enunciated in the Agenda 21 of
the Earth Summit held in Rio de Janeiro in 1992. The ultimate objective is to provide a framework
for integrating environmental considerations into the country’s overall economic and social
development. In terms of environmental management, the EMCA provides a comprehensive legal
and institutional framework for the handling of all environmental issues in Kenya and covers all
sectoral laws.
EMCA does not repeal the sectoral legislation but seeks to coordinate the activities of the various
institutions tasked to regulate the various sectors. These institutions are referred to as Lead
Agencies in EMCA.
The EMCA is supported by several subsidiary Regulations such as Solid Waste Management
Regulations (2006), Environmental Management and Coordination (Water Quality) Regulations
(2006) and Emissions Regulations (2007), as well as other pertinent International Environmental
Regulations.
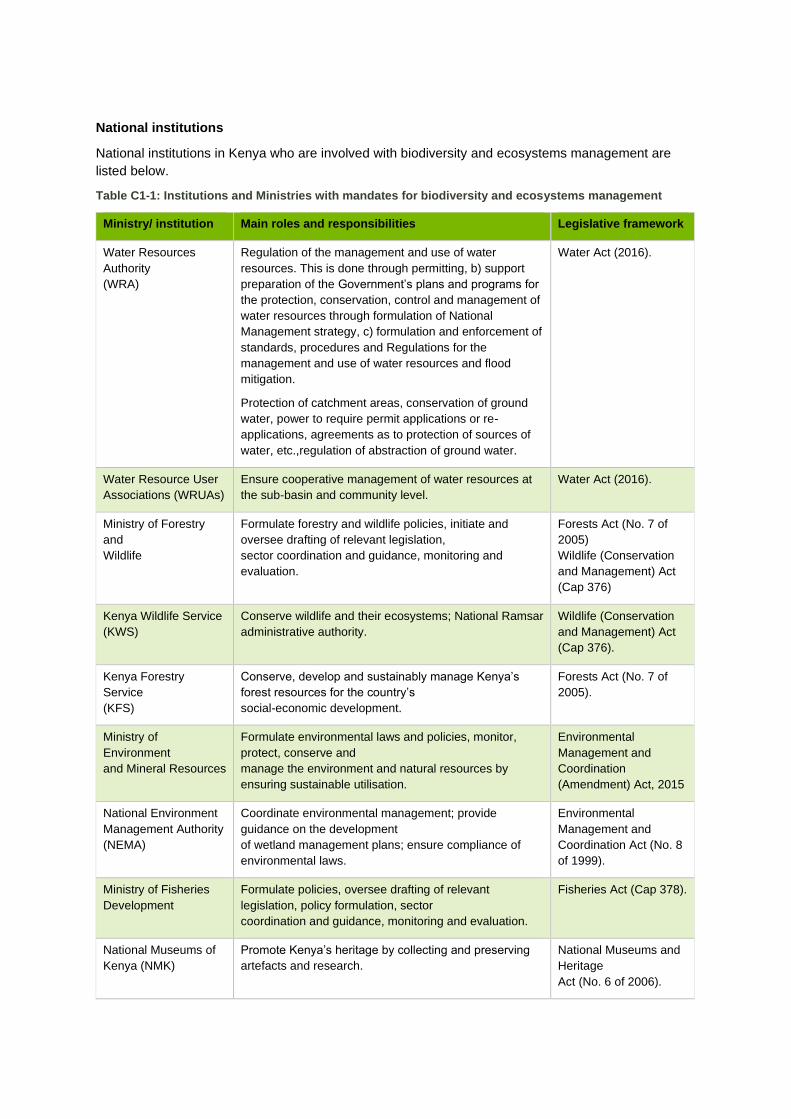
National institutions
National institutions in Kenya who are involved with biodiversity and ecosystems management are
listed below.
Table C1-1: Institutions and Ministries with mandates for biodiversity and ecosystems management
Ministry/ institution Main roles and responsibilities Legislative framework
Water Resources
Authority
(WRA)
Regulation of the management and use of water
resources. This is done through permitting, b) support
preparation of the Government’s plans and programs for
the protection, conservation, control and management of
water resources through formulation of National
Management strategy, c) formulation and enforcement of
standards, procedures and Regulations for the
management and use of water resources and flood
mitigation.
Protection of catchment areas, conservation of ground
water, power to require permit applications or re-
applications, agreements as to protection of sources of
water, etc.,regulation of abstraction of ground water.
Water Act (2016).
Water Resource User
Associations (WRUAs)
Ensure cooperative management of water resources at
the sub-basin and community level.
Water Act (2016).
Ministry of Forestry
and
Wildlife
Formulate forestry and wildlife policies, initiate and
oversee drafting of relevant legislation,
sector coordination and guidance, monitoring and
evaluation.
Forests Act (No. 7 of
2005)
Wildlife (Conservation
and Management) Act
(Cap 376)
Kenya Wildlife Service
(KWS)
Conserve wildlife and their ecosystems; National Ramsar
administrative authority.
Wildlife (Conservation
and Management) Act
(Cap 376).
Kenya Forestry
Service
(KFS)
Conserve, develop and sustainably manage Kenya’s
forest resources for the country’s
social-economic development.
Forests Act (No. 7 of
2005).
Ministry of
Environment
and Mineral Resources
Formulate environmental laws and policies, monitor,
protect, conserve and
manage the environment and natural resources by
ensuring sustainable utilisation.
Environmental
Management and
Coordination
(Amendment) Act, 2015
National Environment
Management Authority
(NEMA)
Coordinate environmental management; provide
guidance on the development
of wetland management plans; ensure compliance of
environmental laws.
Environmental
Management and
Coordination Act (No. 8
of 1999).
Ministry of Fisheries
Development
Formulate policies, oversee drafting of relevant
legislation, policy formulation, sector
coordination and guidance, monitoring and evaluation.
Fisheries Act (Cap 378).
National Museums of
Kenya (NMK)
Promote Kenya’s heritage by collecting and preserving
artefacts and research.
National Museums and
Heritage
Act (No. 6 of 2006).
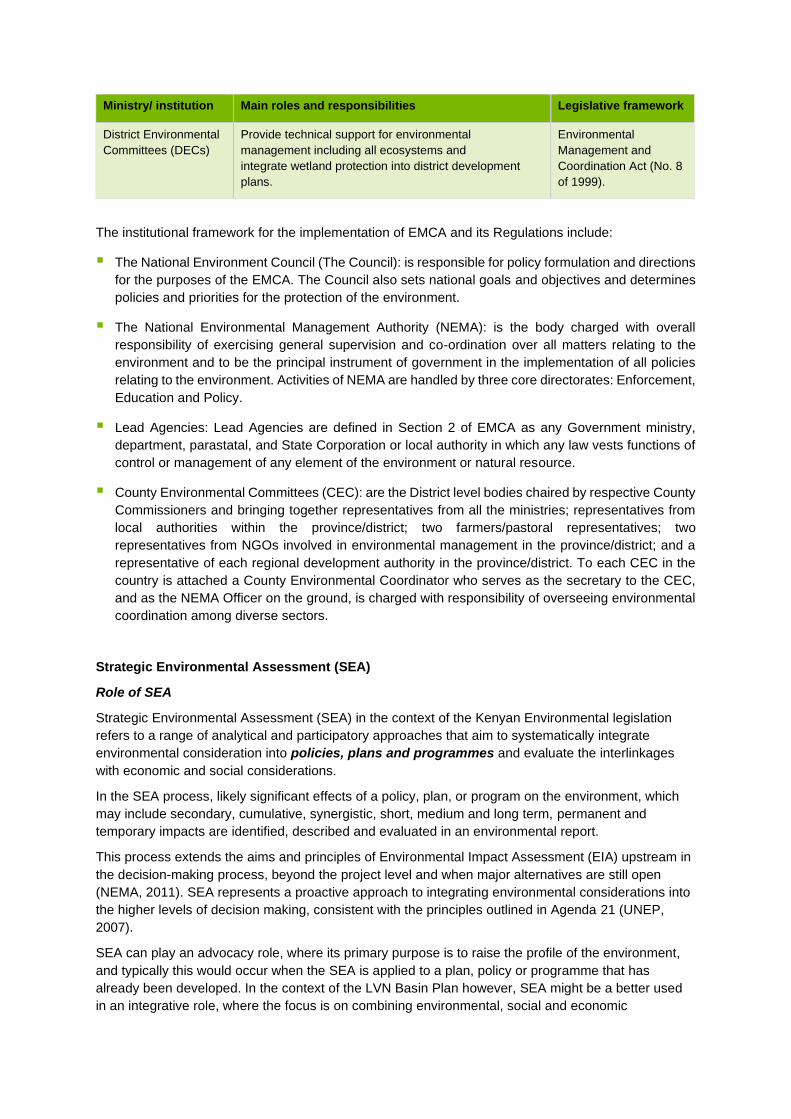
Ministry/ institution Main roles and responsibilities Legislative framework
District Environmental
Committees (DECs)
Provide technical support for environmental
management including all ecosystems and
integrate wetland protection into district development
plans.
Environmental
Management and
Coordination Act (No. 8
of 1999).
The institutional framework for the implementation of EMCA and its Regulations include:
▪ The National Environment Council (The Council): is responsible for policy formulation and directions
for the purposes of the EMCA. The Council also sets national goals and objectives and determines
policies and priorities for the protection of the environment.
▪ The National Environmental Management Authority (NEMA): is the body charged with overall
responsibility of exercising general supervision and co-ordination over all matters relating to the
environment and to be the principal instrument of government in the implementation of all policies
relating to the environment. Activities of NEMA are handled by three core directorates: Enforcement,
Education and Policy.
▪ Lead Agencies: Lead Agencies are defined in Section 2 of EMCA as any Government ministry,
department, parastatal, and State Corporation or local authority in which any law vests functions of
control or management of any element of the environment or natural resource.
▪ County Environmental Committees (CEC): are the District level bodies chaired by respective County
Commissioners and bringing together representatives from all the ministries; representatives from
local authorities within the province/district; two farmers/pastoral representatives; two
representatives from NGOs involved in environmental management in the province/district; and a
representative of each regional development authority in the province/district. To each CEC in the
country is attached a County Environmental Coordinator who serves as the secretary to the CEC,
and as the NEMA Officer on the ground, is charged with responsibility of overseeing environmental
coordination among diverse sectors.
Strategic Environmental Assessment (SEA)
Role of SEA
Strategic Environmental Assessment (SEA) in the context of the Kenyan Environmental legislation
refers to a range of analytical and participatory approaches that aim to systematically integrate
environmental consideration into policies, plans and programmes and evaluate the interlinkages
with economic and social considerations.
In the SEA process, likely significant effects of a policy, plan, or program on the environment, which
may include secondary, cumulative, synergistic, short, medium and long term, permanent and
temporary impacts are identified, described and evaluated in an environmental report.
This process extends the aims and principles of Environmental Impact Assessment (EIA) upstream in
the decision-making process, beyond the project level and when major alternatives are still open
(NEMA, 2011). SEA represents a proactive approach to integrating environmental considerations into
the higher levels of decision making, consistent with the principles outlined in Agenda 21 (UNEP,
2007).
SEA can play an advocacy role, where its primary purpose is to raise the profile of the environment,
and typically this would occur when the SEA is applied to a plan, policy or programme that has
already been developed. In the context of the LVN Basin Plan however, SEA might be a better used
in an integrative role, where the focus is on combining environmental, social and economic
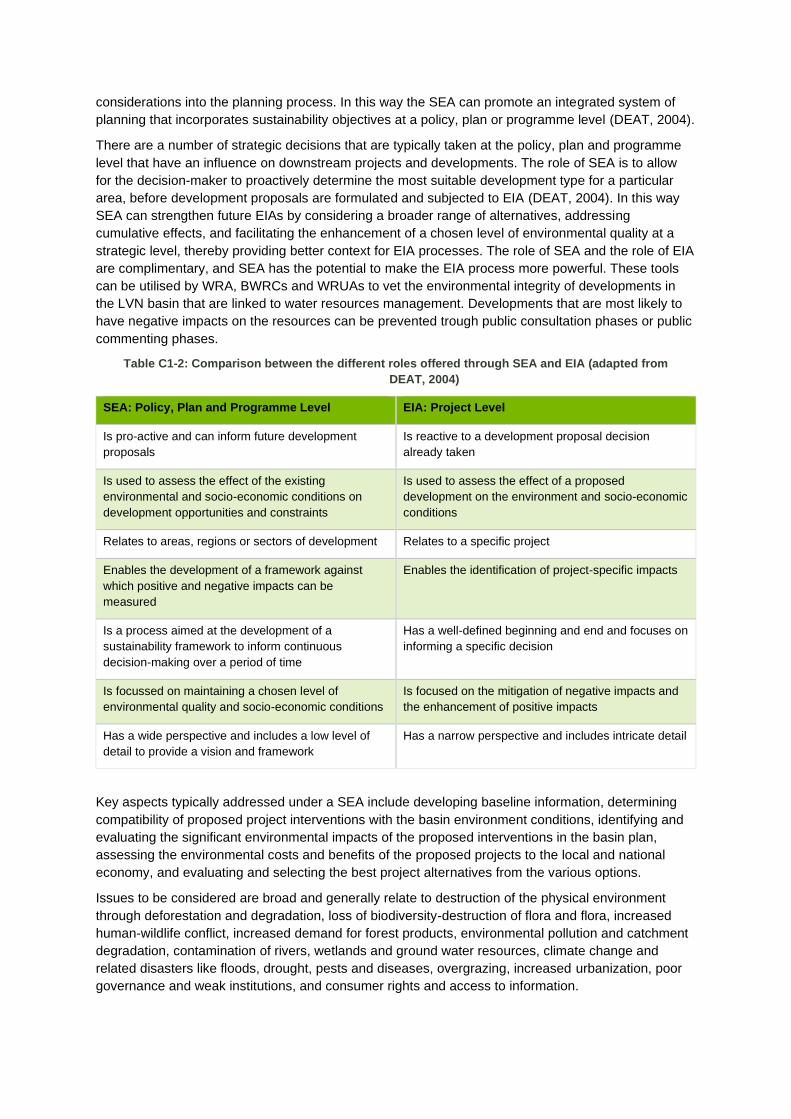
considerations into the planning process. In this way the SEA can promote an integrated system of
planning that incorporates sustainability objectives at a policy, plan or programme level (DEAT, 2004).
There are a number of strategic decisions that are typically taken at the policy, plan and programme
level that have an influence on downstream projects and developments. The role of SEA is to allow
for the decision-maker to proactively determine the most suitable development type for a particular
area, before development proposals are formulated and subjected to EIA (DEAT, 2004). In this way
SEA can strengthen future EIAs by considering a broader range of alternatives, addressing
cumulative effects, and facilitating the enhancement of a chosen level of environmental quality at a
strategic level, thereby providing better context for EIA processes. The role of SEA and the role of EIA
are complimentary, and SEA has the potential to make the EIA process more powerful. These tools
can be utilised by WRA, BWRCs and WRUAs to vet the environmental integrity of developments in
the LVN basin that are linked to water resources management. Developments that are most likely to
have negative impacts on the resources can be prevented trough public consultation phases or public
commenting phases.
Table C1-2: Comparison between the different roles offered through SEA and EIA (adapted from
DEAT, 2004)
SEA: Policy, Plan and Programme Level EIA: Project Level
Is pro-active and can inform future development
proposals
Is reactive to a development proposal decision
already taken
Is used to assess the effect of the existing
environmental and socio-economic conditions on
development opportunities and constraints
Is used to assess the effect of a proposed
development on the environment and socio-economic
conditions
Relates to areas, regions or sectors of development Relates to a specific project
Enables the development of a framework against
which positive and negative impacts can be
measured
Enables the identification of project-specific impacts
Is a process aimed at the development of a
sustainability framework to inform continuous
decision-making over a period of time
Has a well-defined beginning and end and focuses on
informing a specific decision
Is focussed on maintaining a chosen level of
environmental quality and socio-economic conditions
Is focused on the mitigation of negative impacts and
the enhancement of positive impacts
Has a wide perspective and includes a low level of
detail to provide a vision and framework
Has a narrow perspective and includes intricate detail
Key aspects typically addressed under a SEA include developing baseline information, determining
compatibility of proposed project interventions with the basin environment conditions, identifying and
evaluating the significant environmental impacts of the proposed interventions in the basin plan,
assessing the environmental costs and benefits of the proposed projects to the local and national
economy, and evaluating and selecting the best project alternatives from the various options.
Issues to be considered are broad and generally relate to destruction of the physical environment
through deforestation and degradation, loss of biodiversity-destruction of flora and flora, increased
human-wildlife conflict, increased demand for forest products, environmental pollution and catchment
degradation, contamination of rivers, wetlands and ground water resources, climate change and
related disasters like floods, drought, pests and diseases, overgrazing, increased urbanization, poor
governance and weak institutions, and consumer rights and access to information.
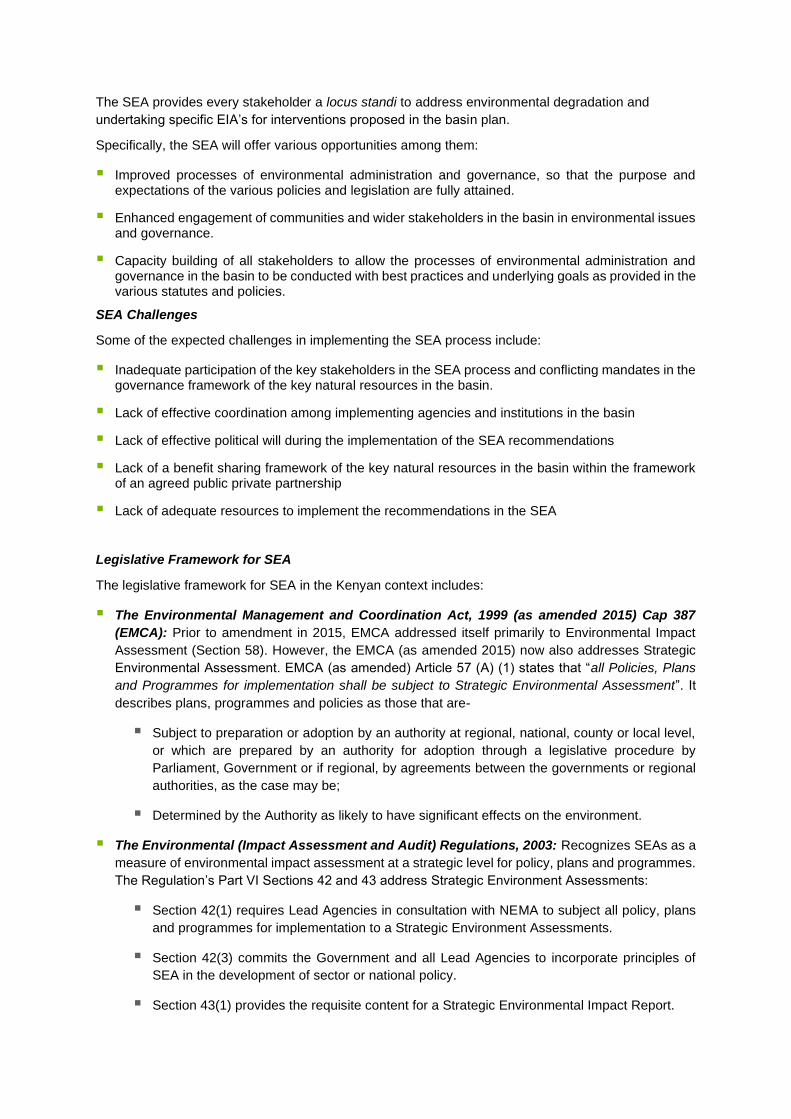
The SEA provides every stakeholder a locus standi to address environmental degradation and
undertaking specific EIA’s for interventions proposed in the basin plan.
Specifically, the SEA will offer various opportunities among them:
▪ Improved processes of environmental administration and governance, so that the purpose and expectations of the various policies and legislation are fully attained.
▪ Enhanced engagement of communities and wider stakeholders in the basin in environmental issues and governance.
▪ Capacity building of all stakeholders to allow the processes of environmental administration and governance in the basin to be conducted with best practices and underlying goals as provided in the various statutes and policies.
SEA Challenges
Some of the expected challenges in implementing the SEA process include:
▪ Inadequate participation of the key stakeholders in the SEA process and conflicting mandates in the governance framework of the key natural resources in the basin.
▪ Lack of effective coordination among implementing agencies and institutions in the basin
▪ Lack of effective political will during the implementation of the SEA recommendations
▪ Lack of a benefit sharing framework of the key natural resources in the basin within the framework of an agreed public private partnership
▪ Lack of adequate resources to implement the recommendations in the SEA
Legislative Framework for SEA
The legislative framework for SEA in the Kenyan context includes:
▪ The Environmental Management and Coordination Act, 1999 (as amended 2015) Cap 387
(EMCA): Prior to amendment in 2015, EMCA addressed itself primarily to Environmental Impact
Assessment (Section 58). However, the EMCA (as amended 2015) now also addresses Strategic
Environmental Assessment. EMCA (as amended) Article 57 (A) (1) states that “all Policies, Plans
and Programmes for implementation shall be subject to Strategic Environmental Assessment”. It
describes plans, programmes and policies as those that are-
▪ Subject to preparation or adoption by an authority at regional, national, county or local level,
or which are prepared by an authority for adoption through a legislative procedure by
Parliament, Government or if regional, by agreements between the governments or regional
authorities, as the case may be;
▪ Determined by the Authority as likely to have significant effects on the environment.
▪ The Environmental (Impact Assessment and Audit) Regulations, 2003: Recognizes SEAs as a
measure of environmental impact assessment at a strategic level for policy, plans and programmes.
The Regulation’s Part VI Sections 42 and 43 address Strategic Environment Assessments:
▪ Section 42(1) requires Lead Agencies in consultation with NEMA to subject all policy, plans
and programmes for implementation to a Strategic Environment Assessments.
▪ Section 42(3) commits the Government and all Lead Agencies to incorporate principles of
SEA in the development of sector or national policy.
▪ Section 43(1) provides the requisite content for a Strategic Environmental Impact Report.
▪ Section 43(2) requests certain information within the policy, plan or programme.
▪ Section 43(3) commits the Government and all Lead Agencies to incorporate principles of
SEA in the development of sector or national or regional policy.
▪ National Guidelines for Strategic Environmental Assessment in Kenya, (NEMA, Revised
2011): Increasingly, NEMA was faced with the challenges of the inadequacy of EIA to deal with
cumulative, synergistic, secondary and long-term impacts. These impacts are better addressed if
policies, plans and programmes are subjected to an SEA process. Consequently, NEMA formulated
the National SEA guideline to give an understanding on the of the general principles, basic steps of
SEA application, the tools and techniques to be adopted, the final output of the SEA process and
enhance the practice of SEA in Kenya.
▪ Draft Environmental (Strategic Assessment, Integrated Impact Assessment and Audit)
Regulations, 2018: NEMA has recently prepared draft Regulations, and as these are intended to
repeal the Environmental (Impact Assessment and Audit) Regulations, 2003, their content will likely
be of consequence to the LVN Basin Plan and its sub-plans. The overall objective of the Draft
Environmental Regulations (2018) is to align processes with the EMCA following its amendment in
2015. The regulations also seek to address emerging issues such as environmental and social
safeguard procedures; and Climate Change. Part VI 41(1) to 50(3) details the requirements for SEA.
Process of SEA
The SEA process described follows those set out in the Draft Environmental Regulations (2018).
These regulations have undergone public consultation: stakeholder forums were held in March 2018,
and a national validation workshop was held in Nairobi on 4th April 2018. It is therefore anticipated that
these regulations will be enacted imminently.
The Draft Environmental Regulations (2018) (Section 41(1)) require that NEMA in consultation with
county governments, Lead Agencies, institutions and private entities subject all proposals for policies,
plans or programmes to an SEA, and describe the objectives of such a study in Section 42(2). The
following legislated steps required for an SEA are described in Sections 42(1) to 50(3):
▪ Step 1 - Screening:
▪ Step 1.1 – Programme Brief: The policy, plan or programme brief is to be submitted to NEMA for screening.
▪ Step 1.2 – NEMA Review: NEMA will undertake a screening process and determine the need for an SEA. If an SEA is required, then NEMA will request a scoping study with the objective of defining the geographical and thematic scope of the assessment, and Step 2 is then applicable.
▪ Step 2 – Scoping:
▪ Step 2.1 – Scoping Study: A licensed lead environmental expert/firm is to be appointed to undertake the scoping study.
▪ Step 2.2 – Public Consultation: Consultation with the relevant government authorities, agencies and public is to be undertaken to obtain comment. The first of two mandatory public meetings is to be held in the Scoping stage.
▪ Step 2.3 - Scoping Report: The licensed lead environmental expert/firm is to prepare and submit a Scoping Report to NEMA. The mandatory content of the Scoping Report is provided in Section 41(4).
▪ Step 3 – Scoping Report Review:
▪ Step 3.1 – NEMA Review: NEMA are to review the adequacy of the Scoping Report, and either approve it (thereby instructing the commencement of the SEA); or request additional information. Once the Scoping report is approved, then Step 4 is applicable.
▪ Step 4 – SEA:
▪ Step 4.1 – SEA Study: The team of experts will undertake the SEA, and the mandatory process of conducting an SEA is described in Section 44(3)
▪ Step 4.2 – Public Consultation: Consultation with the relevant government authorities, agencies and public is to continue to be undertaken to obtain comment. The second of two mandatory public meetings is to be held in the SEA stage.
▪ Step 4.3 – SEA Report: A draft SEA Report is to be prepared and submitted to NEMA. The mandatory content of the SEA Report is provided in Section 44(2).
▪ Step 5 – Draft SEA Report Review:
▪ Step 5.1 – NEMA Review: NEMA are to review the adequacy of the Draft SEA Report, once approved, Step 5.2 is applicable.
▪ Step 5.2 – Organs of State: NEMA is to dispatch copies of the Draft SEA Report to the relevant County Government, Lead Agencies and stakeholders for comment within a stipulated timeframe.
▪ Step 5.3 – General Public: NEMA are to provide notice of the availability of the draft report for comment and make it available for comment to the general public (as per specific public consultation steps described in Sections 46(2)(3)(4) and (5)) for a stipulated timeframe.
▪ Step 5.4 – NEMA Review: Upon closure of the comment period, NEMA are to review the draft SEA Report and make comments on their review that are to be sent to the SEA team for inclusion in the draft SEA Report (a Technical Advisory Committee may be appointed by NEMA to undertake a detailed review, in which case their comments are also to be included in the draft SEA Report)
▪ Step 6 – Revised SEA Report:
▪ Step 6.1 – Update Draft SEA: The draft SEA is to be revised to incorporate all comments and a Revised SEA Report is to be submitted to NEMA.
▪ Step 6.2 – Validation Workshop: Upon verification of the revised report, the SEA team in consultation with NEMA is to hold a validation workshop with the public and stakeholders, and the report is to be updated accordingly as the “Final” version.
▪ Step 7 – Final SEA Report:
▪ Step 7.1 – Final Submission: The Final SEA Report is to be submitted to NEMA together with the requisite forms as per Section 48.
▪ Step 7.2 – Record of Decision: NEMA are to determine a Record of Decision within the requisite timeframes, and if this is an approval then NEMA are to include written conditions which are to be accepted by the proponent before implementing the plan or programme. If this is a rejection, then NEMA are to provide reasons for this.
▪ Step 8 – Monitoring & Evaluation:
▪ Step 8.1 – Annual Reports: The proponent is to undertake monitoring and evaluation of the policy, plan or programme, and submit annual report to NEMA.
▪ Step 8.2 – NEMA Evaluation: NEMA is to undertake a formal evaluation of the monitoring results within three years.
SEA in the context of the LVN Basin Plan
The SEA for the LVN Basin will in general conduct a detailed project life cycle analysis to identify
known and/or foreseeable impacts, which can be positive or negative, and to develop mitigation and
management measures to ensure sustainability of the projects identified under the Basin Plan.
The main recommendations for the LVN Basin Plan in terms of the legislated requirements for SEA
are:
1. In the context of the LVN Basin Plan and its sub-plans, SEAs should be instituted as a set of core
assessment activities that are integrated into all phases of the planning processes, rather than as
separate procedures. This integrated assessment approach should evolve gradually and retain
flexibility, initially through simple technical assessments and moving towards more sophisticated,
open processes as the plans become more focused and concrete. The SEAs should be a
continuous process that also addresses institutional and governance considerations at different
tiers of decision-making.
2. A Programme Brief (as per Step 1 of the SEA Process described above) for the LVN Basin Plan
should be prepared and submitted to NEMA, who can determine whether an SEA is required for
the entire plan, or whether SEA’s might be better applied to sub-plans and their resulting plans and
programmes when more information is available, and when a defined stakeholder group can be
determined.
3. The World Bank (2005) suggests that to better influence policies, plans or programmes, the SEA
process should move towards a continuous process that also addresses institutional and
governance considerations. It is recommended that the SEA activities that are immediately applied
to the LVN Basin planning process include a detailed stakeholder analysis:
▪ There is a need to carry out a mapping and analysis of key institutions in the National and County Governments, civil and private sectors and their overlapping mandates while identifying opportunities for synergy. A detailed stakeholder analysis that is undertaken early on can offer great value to the LVN Basin planning process and can include a governance and institutional assessment to determine how these currently operate and are envisaged to change in the basin. Specifically, integrating SEA activities early on into the basin planning can offer various opportunities:
▪ Improved processes of environmental administration and governance, so that the purpose and expectations of the various policies and legislation are fully attained.
▪ Enhanced engagement of communities and wider stakeholders in the basin in environmental issues and governance.
▪ Capacity building of all stakeholders to allow the processes of environmental administration and governance in the basin to be conducted with best practices and underlying goals as provided in the various statutes and policies.
4. Environmental problems are typically complex, uncertain, and occur at various scales affecting
multiple people at different levels. In many cases, the problems are also caused by people. This
therefore demands transparent decision-making and buy-in that considers the views of people
interested in or affected by a given project. Stakeholder engagement is therefore increasingly
embedded into environmental management.
According to the SEA guidelines, the Kenyan government asks three relatively simple questions
of a proposed plan:
▪ Has there been effective co-operation between the SEA team and those responsible for developing the PPP?
▪ Was there effective public involvement?
▪ Was there effort to involve less powerful stakeholders in the consultation?
As detailed in the Inception and Interim Reports for the LVN Basin Plan, stakeholder consultation
is deeply embedded into this process across Tasks 2 (Basin Planning) and 4 (Stakeholder
Consultation). The focus of the stakeholder engagement included in these phases is to learn
from the local ecological knowledge with existing catchment management practices; and to
provide an enabling environment for implementation of the plans.
It is important to note that should the relevant plans go through an SEA and/or EIA process, the
relevant stakeholder engagement guidelines must be followed, unless otherwise agreed upon
with the NEMA. Such requirements would include making the SEA and/ or EIA reports available
to the public for comment and provide opportunity to engage through public meetings. As has
already been considered in Tasks 2 and 4, efforts to engage with vulnerable stakeholders must
be specifically considered, considering alternative approaches where necessary.
As part of the decision-making process, the NEMA uses the submitted copies of the SEAs/ EIAs
to distribute to the necessary commenting authorities. This provides another opportunity for the
public to review and comment on the proposal before the NEMA provides an authorisation.
During this time, it is important to consider the SEA and EIA regulations, and appoint a specific
SEA expert to undertake this exercise.
Environmental Impact Assessment (EIA)
Role of EIA
An EIA in the context of the Kenyan Environmental Legislation refers to a systematic examination that
is conducted to determine whether a programme, activity or project will have any adverse impacts
on the environment.
The main purpose of an EIA is to determine and evaluate the environmental implications of
development and to inform decision-making at a project level. An EIA process focuses on the positive
and negative environmental and social impacts of a specific development project once it has been
designed, and proposes measures to mitigate the negative impacts, while maximising the positive
ones (DEAT, 2004). The EIA process is seen as a tool to facilitate informed decision-making on
sustainable development in Kenya.
The EIA process integrates environmental considerations into all stages of the planning and
development process of a project and requires post-impact monitoring and management. Principles
for good environmental assessment practice, includes (DEAT, 2002):
▪ Focus on the main issues.
▪ Involve the appropriate persons and groups.
▪ Link information to decisions about the project.
▪ Present clear options for mitigation for impacts and for sound environmental management.
▪ Provide information to decision-makers in a useful form.
Legislative Framework for EIA
The legislative framework for EIA in Kenya is set out below:
▪ The Environmental Management and Coordination Act, 1999 (as amended 2015) (EMCA):
The Act provides a number of mechanisms to protect the environment one of which is
environmental impact assessment. Project activities that are subject to an EIA process are set out
in the Second Schedule of the EMCA. Sections 58 – 67, deal with the EIA process. All EIA’s need
to be undertaken by a NEMA registered and licensed EIA/EA expert.
▪ The Environmental (Impact Assessment and Audit) Regulations, 2003: Recognises EIA as a
means to determine whether a programme, activity or project will have an adverse impact on the
environment.
▪ Part I Section 4(1) prohibits anyone from implementing a project that is likely to have a
negative environmental impact, or for which an EIA is required under the Act or Regulations,
unless an EIA has been concluded and approved.
▪ Part II Sections 7 – 10 set out the requirements and process for Project Report; and NEMA
will either issue a license if satisfied that the project will not have significant environmental
impact or that the report discloses sufficient mitigation measures OR will request an EIA if the
project will have a significant environmental impact or that the report discloses insufficient
mitigation measures.
▪ Part III Sections 11 - 17 set out the requirements and process for Environmental Impact
Assessment Study.
▪ Draft Environmental (Strategic Assessment, Integrated Impact Assessment and Audit)
Regulations, 2018: Refers to Integrated EIA rather than EIA, although by definition this is deemed
to be the same thing. The Regulation’s requirements for an Integrated EIA differ from the previous
2003 Regulations in that the anticipated potential risks of a project or activity will dictate whether a
simpler process termed a Project Report is necessary, or whether a full Integrated EIA is necessary.
▪ Part I Section 4(1) prohibits anyone from implementing a project that is likely to have a
negative environmental impact, or for which an EIA is required under the Act or Regulations,
unless an Integrated EIA has been concluded and approved.
▪ Part III sets out the requirements for a Project Report.
▪ Part IV sets out the requirements for an Integrated EIA.
Process of EIA
The EIA processes described below follows those set out in the Draft Environmental Regulations
(2018). Depending on the potential risk (low, medium or high) of a project activity, the proponent will
either submit a Project Report or an EIA Study Report to the Authority:
▪ Part III 10 (1) require anyone undertaking a project listed as low or medium risk of the Second
Schedule of the Act, to prepare a Project Report (low to medium risk projects and activities).
▪ Part IV 15(1) requires that an Integrated EIA study be undertaken for all high-risk projects tabulated
in the Second Schedule of the Act (high risk projects and activities).
The following legislated steps required for a Project Report are described in Sections 10(1) to 14(4):
▪ Step 1 – Project Report Preparation:
▪ Step 1.1 - Describe Project: The Project Report is to include content as required in Section
10(1)(a) to (o), which in summary includes project information, location and activities
proposed, potential environmental; economic and socio-cultural impacts and possible
mitigation options, accident and health and safety action plans, public participation issues, a
climate change vulnerability assessment and an environmental management plan.
▪ Step 1.2 – Public Consultation: Consultation with the public including at least one public
meeting. The aim of the meeting would be to explain the project and it’s social, economic and
environmental impacts, and collate all oral or written comments on the proposed project and
attach the evidence of such public participation in the Project Report through signed
attendance register, minutes and photographs.
▪ Step 1.3 – Project Report Preparation: The licensed lead environmental expert/firm is to
prepare a Project Report to NEMA.
▪ Step 1.4 – Form 9 Application: an application for an environmental impact assessment license
is to be submitted to NEMA and the appointed agent in the County.
▪ Step 2 – Project Report Review:
▪ Step 2.1– Organs of State: NEMA is to dispatch copies of the Project Report to the relevant
County Government, Lead Agencies and stakeholders for comment within a stipulated
timeframe.
▪ Step 3 – Project Report Determination:
▪ Step 3.1 – Decision: NEMA are to issue a license if the project will have no significant impact
on the environment, or that the project report discloses sufficient mitigation measures. If this
is a rejection then NEMA are to provide reasons for this and are to advise on suitable
alternatives (in which case Step 3.2 is applicable).
▪ Step 3.2 – Appeal: The proponent may appeal the decision within the stipulated timeframes.
The following legislated steps required for an Integrated EIA are described in Sections 15(1) to 31(2):
▪ Step 1 – Scoping:
▪ Step 1.1 – Scoping Report: A scoping study is to be undertaken as per Section 15(3) and a
Scoping Report of a content as described in Section 15(4) is to be prepared.
▪ Step 1.2 - Terms of Reference: A ToR for the Integrated EIA is to be prepared.
▪ Step 1.3 – Public Notification: Notification of the project intentions to the public is to be
undertaken in accordance with Section 20(1).
▪ Step 2 – Scoping Report Review:
▪ Step 2.1 – Submit to NEMA: The Scoping Report and ToR is to be submitted to NEMA for
approval. Upon approval, Step 2.1 is applicable.
▪ Step 2.1 – Appoint Team: A competent team of licensed environmental assessment experts
are to be appointed to undertake the Integrated EIA.
▪ Step 3 – Integrated EIA:
▪ Step 3.1 – Integrated EIA study: An Integrated EIA study is to be undertaken as per Section
19(a) to (d), and an Integrated EIA Report of a content as described in Section 21(1)(a) to (q)
is to be prepared and submitted to NEMA.
▪ Step 4 – Integrated EIA Review:
▪ Step 4.1 – Organs of State: NEMA is to dispatch copies of the report to the relevant Lead
Agencies for comment within a stipulated timeframe.
▪ Step 4.2 – General Public: NEMA are to provide notice of the availability of the report for
comment and make it available for comment to the general public (as per specific public
consultation steps described in Sections 24(1)(3) and (4) for a stipulated timeframe.
▪ Step 4.3 – Public Hearing: Upon receipt of written comment, NEMA may hold a public hearing
as per Section 25 (1) to (7).
▪ Step 5 – License:
Step 5.1 – Record of Decision: NEMA are to determine a Record of Decision within the requisite
timeframes, and if this is an approval then NEMA are to issue a license and include written conditions
which are to be accepted by the proponent before implementing the project. If this is a rejection, then
NEMA are to provide reasons for this.
C2. Catchment Management
C2.1. Legal and institutional environment
C2.1.1. National level
• At a National level natural resource use provides employment and income. Within the Lake
Victoria North Basin small scale irrigation and pastoralism make up the majority of employment
opportunities.
• The key ministries in Kenya responsible for enacting policies related to catchment management
are the Ministry of Water and Sanitation, Ministry of Agriculture and Irrigation; and Ministry of
Environment and Forestry.
• National policies and legislation feed into the local-level catchment management, where
projects are implemented on the ground. It is therefore important to understand the underlying
policies driving these projects as in most cases similar strategies are being implemented by
different institutions.
• The National Environmental Management Agency (NEMA) is responsible for coordinating
environmental management; providing guidance on the development of environmental
management plans and ensure compliance of environmental laws. The Kenya Water Towers
Agency (KWTA) is responsible for management of Kenya’s water towers. Kenya Forest Service
(KFS) has a mandate to conserve, develop and sustainably manage Kenya’s forest resources
for the country’s socio-economic development. Kenya Wildlife Service (KWS) has a mandate
to conserve and manage wildlife in Kenya, and to enforce related laws and regulations. KWS
is also the RAMSAR Administrative Authority.
C2.1.2. Basin and sub-basin level
• County governments’ Integrated Development Plans (IDPs) are meant to provide an overall
framework for development in each county. The plans aim to coordinate the work of both
levels of government in a coherent plan to improve the quality of life for all the people and
contribute towards devolution. The first plans cover the period 2013 to 2017, the second plans
over 2018 to 2022.
• The County governments rely on technical input and advice from the different agencies with a
mandate to govern natural resources. A major issue is the mandates related to wetlands and
riparian lands.
C2.1.3. National plans and policies
• The Kenya Vision 2030 (2008) set targets such as improved water and sanitation, increased
agricultural production, a clean environment and more energy production by 2030. All of these
cross-cutting targets impact catchment management.
• The Kenya National Policy on Water Resource Management and Development
(NPWRMD, 1999) provides specific policy objectives including protection of water resources,
supply of water while ensuring safe disposal of wastewater and environmental protection.
• In accordance with the Kenya Vision 2030 goal that agricultural production increase by 10% by
2019, various agriculture policies and strategies have been developed to guide this
development (SEE IRR SECT ANAL). Transformation of smallholder, subsistence agriculture
to modern agriculture was identified as a fundamental component, as was increased irrigation.
An Irrigation and Drainage Master Plan was prepared in 2009 (MWI, 2009). This was followed
by the National Water Master Plan (JICA, 2013) which evaluated irrigation potential against
availability of water. Other ongoing national projects involve improving rainwater harvesting and
storage for agriculture; rehabilitation and protecting water catchments; and implementing the
irrigation flagship projects.
• The National Environment Policy (NEP, 2013) provides the goal of a better quality of life for
present and future generations through sustainable management and use of natural resources.
Guiding principles include an ecosystem approach to management, sustainable resource use
as well as inclusion of communities in decision making.
• The 2010 Constitution in Article 69 recognises the importance of forests for sustainable
development, the provides for the state to work towards increasing the country’s forest cover
to 10% of the land area of Kenya. The Constitution provides for two tiers of Government with
the national government being responsible for policy development and regulation. The second
tier of governance are 47 geographical units of devolved government, known as counties. Lake
Victoria North Basin has nine counties, although some counties cross hydrological boundaries.
These counties may be involved in various functions which are closely linked to catchment
management.
• The Water Act (2016) gives the Water Resources Authority (WRA) a clear role in the regulation
of water resources. However, there are some ambiguities in the Water Act that require
resolution.
• The Agriculture, Fisheries and Food Authority Act (Act No 13 of 2013) provides for the
regulation and promotion of agriculture. This is supported through the establishment of the
Agriculture, Fisheries and Food Authority (AFFA) that is charged with, in consultation with
County Governments, administering the Crops Act (Act No 16 of 2013) and the Fisheries Act
(CAP 378 of 1989).
• Directorates of the Agriculture, Fisheries and Food Agency (AFFA) include coffee; nuts and oil;
fibre; horticultural crops; food crops; sugar; tea; pyrethrum and other industrial crops. The drive
to increase agricultural development will require ongoing development in irrigation capacity. As
such, a draft Irrigation Bill was developed in 2015 intended to repeal the Irrigation Act (CAP
347 of 2013). This amendment bill has yet to be enacted and provides for the establishment of
a National Irrigation Development Service and strengthening of irrigation regulations.
• The Environmental Management and Coordination Act (EMCA, 1999) provided Kenya’s
first framework for environmental legislation. The EMCA recognises the importance of
improving the legal alignment and administration across the various sectors that are engaged
in the management and development of environmental resources.
• The Forest Conservation and Management Act (2016) mandates the Directorate of Natural
Resources-Forest Conservation to formulating forest policies, initiating and overseeing drafting
of relevant legislation, sector coordination and guidance, monitoring and evaluation.
• The Wildlife Conservation and Management Act (2013) mandates the Directorate of Natural
Resources-Wildlife Conservation in formulating wildlife policies, initiating and overseeing
drafting of relevant legislation, sector coordination and guidance, monitoring and evaluation.
C3. Water resources protection
C3.1. Legal and institutional environment
C3.1.1. National level
• The mandate for protecting water resources in Kenya falls on the Water Resources Authority
(WRA) (the Authority) through Part III of the Water Act of 2016 under the “Regulation of the
Management and Use of Water Resources”. A specific aspect which is addressed in the Act
relates to the Authority “prescribing criteria for classifying water resources for the purpose of
determining Water Resources Quality Objectives for each Class of Water Resource”.
Classifying and determining Water Resource Quality Objectives provide a series of measures
to achieve protection while at the same time acknowledging the important role of water
resources in supporting social and economic development. Further to the above, where the
Authority considers a water resource vulnerable, special measures may be published in a
Gazette to declare the catchment area a Protected Area. The Authority may then impose
requirements or regulations and prohibit activities to ensure the protection of the area and water
resources. The same is considered for the conservation of groundwater for public interest.
• The National Environmental Management Authority (NEMA) is responsible for coordination
of environmental management, and the Kenya Water Towers Agency (KWTA) for
coordination of the protection, rehabilitation, conservation, and sustainable management of
Kenya’s water towers, wetlands and biodiversity hotspots. Environmental Committees provide
technical support for environmental management and provide input to provincial/district
development plans.
C3.1.2. Basin and sub-basin level
• The 2016 Water Act outlines the designation of Basin areas, with functions of Basin Water
Resource Committees (BWRCs) within each Basin clearly stated. Furthermore, the Act
defines the establishment and functions of Water Resource Users Associations (WRUAs)
i.e. associations of water resource users at the sub-basin level in accordance with Regulations
prescribed by the Authority. These associations are community based for collaborative
management of water resources and resolution of conflicts concerning the use of water
resources.
• Protection of water resources in Kenya therefore starts at the National level with the WRA
developing policies and legislation for protection of water resources. BWRCs then enact these
measures to fulfil the water resource quality objectives for each class of water resource in a
basin and need to put in place measures for sustainable management of the water resources;
whilst at the sub-basin level more local level community-based management occurs through
WRUAs.
C3.1.3. National plans and policies
• The Kenya Vision 2030 (2008) set targets such for a clean environment by 2030.
• The Kenya National Policy on Water Resource Management and Development
(NPWRMD, 1999) provides specific policy objectives including protection of water resources.
• In the Water Act (2016), the specific functions of the WRA which relate to water resources
protection include:
o formulate and enforce standards, procedures, and regulations for the management and use of water resources
o regulate the management and use of water resources
o receive water permit applications for water abstraction, water use and recharge and determine, issue and vary water permits; and enforce the conditions of those permits
o In addition, the WRA has the power to:
o collect, analyse and disseminate information on water resources
o monitor compliance by water users with the conditions of permits and the requirements of the Act
o issue permits for inter-basin water transfer
o delegate regulatory functions to the Basin Water Resource Committees
• Part V of the Environmental Management and Coordination Act (EMCA, 1999) focuses on the protection and conservation of the environment. According to the Act, certain activities in relation to a river, lake or wetland require an environmental impact assessment. The Minister may also declare a lake shore, wetland, coastal zone or river bank to be a protected area and impose restrictions to protect them. The Minister may issue general and specific orders, regulations or standards for the management of a lake shore, wetland, coastal zone or river bank. Although it is acknowledged that environmental issues cut across different sectors, the Act emphasises the principles and provides guidance for improved environmental management.
• Other areas of relevance to water resources protection in Kenya, which are regulated by various government departments, include: protection of traditional interests of local communities customarily resident within or around a lake shore, wetland, coastal zone or river bank or forests defined as protected; protection of hill tops, hill sides, mountain areas and forests for sustainable utilisation and protection of water catchment areas; protection of forests on private land; conservation of biological resources in situ (related to buffer zones near protected areas and alien invasive species management); protection of environmentally significant areas; and protection of the coastal zone
• Consistency across the Water Act (2016) and the EMCA (1999) in relation to water resources protection is important to allow for a coordinated approach. In the Water Act (2016), as has been defined above, water resources have a wide-ranging definition ranging from surface water to groundwater resources; whilst the EMCA (1999) focuses on the surface water resources (river, lake, wetland, coastal zone) as well as the upper catchment areas. Although this is an institutional issue, it impacts the protection and management strategies for water resources.
C4. Groundwater management
C4.1. Legal and institutional environment
C4.1.1. National plans and policies
• The Water Act (2016) defines protection of groundwater under Section 22/23 and groundwater
use is managed through Section 47 and 104.
• The National Land Use Policy (2017) considers surface and underground water bodies.
• Part VIII (Conservation Orders, Easements and Incentives, Wildlife Conservation Orders and
Easements), S. 65 (4) of the Wildlife Conservation and Management Act (2013) which
states, inter alia, “a wildlife conservation order or easement may be created so as to” (d),
“preserve the quality and flow of water in a dam, lake, river or aquifer”.
• The Draft National Policy Groundwater Resources Development and Management (2013)
highlights a number of specific issues:
o The availability and vulnerability of groundwater resources in Kenya are poorly
understood;
o The institutional arrangements for groundwater management in Kenya, including
groundwater management capacity and financing are weak;
o There is very limited integrated water resources management in Kenya, with
groundwater and surface water typically being treated as separate water resources;
and
o There is very limited groundwater quality management in Kenya.
• Section 23 of the Agriculture, Fisheries and Food Authority Act (2013) relates to land
preservation guidelines, on preservation of soil.
• Section 5.3 (Required Policy and Legal Reforms) of the National Water Harvesting and
Storage Management Policy (2010), recommended the formulation of a Policy on Ground
Water Protection
• Section 5.1 of the Draft National Policy on Trans-Boundary Waters (2009) relates to
sustainable management and equitable utilization of trans-boundary water resources (para. 38:
provision for “groundwater conservation areas” with respect to transboundary waters)
• Part XI of the Water Resources Management Rules (2007) relates to Protected Areas and
Groundwater Conservation Areas.
• Section 25 of the National Museums and Heritage Act (2006) relates to the declaration of
monuments.
• Section 2.1.2 of a Sessional Paper No. 1 of 1999 on National Policy on Water Resources
Management and Development indicates “In addition, groundwater conservation zones need
to be identified to avoid depletion of this resource”.
• Part V of the Environmental Management and Co-ordination Act (1999) relates to the
Protection and Conservation of the Environment, inter alia.
• Masterplan for the Conservation and Sustainable Management of Water Catchment
Areas in Kenya (MEMR, 2012)
• Kenya Water Towers Status Report; Saving our Future & Heritage, A Call To Action
(KWTA, 2015).
C5. Climate change adaptation
C5.1. Legal and institutional environment
C5.1.1. National level
• The Kenya Agricultural and Livestock Research organisation have a National Strategy on Genetic Resources within the context of climate change (2016-2021)
• The Ministry of Agriculture and Irrigation, Ministry of Transport, Infrastructure, Housing and Urban Development have a Blue Economy Strategy (2017)
• The National Treasury Ministry of Interior and Coordination have Kenya’s Disaster Risk Financing Strategy (2018-2022) and National Disaster Risk Management Policy (2017)
• The National Drought Management Authority have a National Drought Management Authority Act (No 4 of 2016), Ending Drought Emergencies Strategy and Public Finance Management (National Drought Emergency Fund) Regulations, 2018.
• The Ministry of Energy has an Energy Bill (2017) – Part 3, section 43; Part 4, section 74 (i); and Part 9 address climate change-related issues.
• The Ministry of Environment and Forestry has an Environmental Management and Coordination Act, 1999 (Cap. 387), Green Economy Strategy and Implementation Plan (GESIP 2016-2030) and Kenya Strategic Investment Framework on Sustainable Land Management (2017-2027).
• The Kenya Forest Services and Ministry of Environment and Forestry have a National Forest Programme (2017) – chapter on climate change and REDD + Readiness Plan and analysis (2013-2017)
• The Ministry of Health has a Health Act (No 21 of 2017) – section on environmental health and climate change (Part VII, sections 68 and 69)
• The Ministry of Transport, Infrastructure, Housing and Urban Development has a Kenya Building Research Centre: Strategic Plan, 2017/18-2021/22
• The Ministry of Lands and Physical Planning has a National Spatial Plan (2015-2045)
• The Ministry of Transport, Infrastructure, Housing and Urban Development has an Action Plan to reduce CO2 Emissions from Aviation (2015), Executive Order: The Nairobi Metropolitan Area Transport Authority (2017), Kenya National Aviation Action Plan for International Civil Aviation Organisation (ICAO) and Mitigation plan for International Maritime Organisation (IMO) (2017)
• The Ministry of Water and Sanitation Water Act (No 43 of 2016) – establishes National Water Harvesting and Storage Authority, Draft Water Harvesting and Storage Policy (2018) Basin and sub-basin level
C5.1.2. Basin and Sub-basin level
• The Kenya Vision 2030 – the country’s development blueprint – recognised climate change
as a risk that could slow the country’s development. Climate change actions were identified
in the Second Medium Term Plan (MTP) (2013-2017). The Third Medium Term Plan (2018-
2022) recognised climate change as a crosscutting thematic area and mainstreamed climate
change actions in sector plans.
• The County Governments have a key delivery role in implementing the Climate Change Act,
2016, having jurisdiction, as set out in the Fourth Schedule (Part 2) of the Constitution, over
sectors relevant for climate change such as agriculture, soil and water conservation, forestry,
water and sanitation, and health. Article 203(2) of the Constitution requires that County
governments be allocated a minimum of 15% of national revenue received annually, but the
allocation often surpasses the minimum thus giving County governments considerable scope
to influence climate change investments.
C5.1.3. National plans and policies
• East African Climate Change Master Plan (EACCCMP, 2011-2031) provide a long-term
vision and a basis for Partner States to operationalise a comprehensive framework for
adapting to and mitigating climate change, in line with the EAC Protocol on Environment and
Natural Resources Management and with international climate change agreements.
• East African Community Climate Change Policy and Strategy (2010) was developed by
the East African Community (EAC) Secretariat. This document guides partner countries
with the preparation and implementation of collective measures to address climate change in
the region.
• The East African Community Climate Change Policy and Strategy (2010) was developed
by the East African Community (EAC) Secretariat. This document guides partner countries
with the preparation and implementation of collective measures to address climate change in
the region.
• The African Union Agenda 2063 commits to climate change action to prioritise adaptation. It
calls on member countries to implement the Programme on Climate Action in Africa, including
climate resilience in agriculture.
• The African Forest Landscape Restoration Initiative (AFR100) aims to bring 100 million
hectares of land in Africa into restoration by 2030.
• The Constitution of Kenya (2010) demands sustainable development and provides for the
right to a clean and healthy environment through legislative and other measures.
• National Climate Change Response Strategy (2010) is Kenya’s National Climate Change
Response Strategy was the first national policy document on climate change. It aimed to
advance the integration of climate change adaptation and mitigation into all government
planning, budgeting and development objectives.
• Kenya’s National Climate Change Action Plan, 2013-2017 was a five-year plan that aimed
to further Kenya’s development goals in a low carbon climate resilient manner. The plan set
out adaptation, mitigation and enabling actions.
• Kenya’s National Adaptation Plan 2015-2030 was submitted to the UNFCCC in 2017. The
NAP provides a climate hazard and vulnerability assessment and sets out priority adaptation
actions in the 21 planning sectors in MTP II.
• Kenya’s Nationally Determined Contribution (NDC) (2016) under the Paris Agreement of
the UNFCCC includes mitigation and adaptation contributions. In regard to adaptation,
“Kenya will ensure enhanced resilience to climate change towards the attainment of Vision
2030 by mainstreaming climate change into the Medium Term Plans (MTPs) and
implementing adaptation actions”. The mitigation contribution “seeks to abate its GHG
emissions by 30% by 2030 relative to the BAU scenario of 143 MtCO2-eq.” Achievement of
the NDS is subject to international support in the form of finance, investment, technology
development and transfer and capacity development.
• The Climate Change Act (No 11 of 2016) is the first comprehensive legal framework for
climate change governance for Kenya. The objective of the Act is to “Enhance climate
change resilience and low carbon development for sustainable development of Kenya.” The
Act establishes the National Climate Change Council (Section 5), Climate Change Directorate
(Section 0), and Climate Change Fund (Section 25).
• The objectives of the Kenya Climate Smart Agriculture Strategy (KCSAS) are to adapt to
climate change and build resilience of agricultural systems while minimising greenhouse gas
emissions. The actions will lead to enhanced food and nutritional security and improved
livelihoods.
• The Climate Risk Management Framework (2017) for Kenya integrates disaster risk
reduction, climate change adaptation, and sustainable development so that they are pursued
as mutually supportive rather than stand-alone goals. It promotes an integrated climate risk
management approach as a central part of policy and planning at National and County levels.
• The National Climate Change Framework Policy (2018) aims to ensure the integration of
climate change considerations into planning, budgeting, implementation and decision-making
at the National and County levels and across all sectors.
• The National Climate Finance Policy (2018) promotes the establishment of legal,
institutional and reporting frameworks to access and manage climate finance. The goal of the
policy is to further Kenya’s national development goals through enhanced mobilisation of
climate finance that contributes to low carbon climate resilient development goals.
• The Government of Kenya Big Four Agenda (2018-2022) establishes priorities areas for
2018 to 2022 of ensuring food security, affordable housing, increased manufacturing and
affordable healthcare. Sector plans and budgets are to be aligned to the Big Four priorities.
• The Climate Change Act, 2016 is Key legislation guiding Kenya’s climate change response,
setting the legal basis for mainstreaming climate change considerations and actions into
sector functions. The Act seeks to provide the “framework for enhanced response to climate
change and to provide for mechanisms and measures to achieve low carbon climate
development”. The Act promotes a mainstreaming approach which includes integrating
climate change in all sectors and at all levels. The Act applies to all sectors of the economy
and at national and county levels. Specific objectives of the Act, that relate to water resources
planning and development, include:
o mainstream climate change responses into development planning, decision making and implementation;
o build resilience and enhance adaptive capacity to the impacts of climate change; o formulate programmes and plans to enhance the resilience and adaptive capacity of
human and ecological systems to the impacts of climate change o mainstream and reinforce climate change disaster risk reduction into strategies and
actions of public and private entities; o mainstream the principle of sustainable development into the planning for and
decision making on climate change response; and o integrate climate change into the exercise of power and functions of all levels of
governance, and to enhance cooperative climate change governance between the national government and county governments.
• The Constitution of Kenya advances gender equality, stating in Chapter 4, the Bill of Rights
that “women have the right to equal opportunities in political, economic and cultural spheres,”
and in order to achieve that equality, requires that government to put in place and implement
affirmative actions that deliver equity for women. This commitment to gender equality and
implementation of gender equity is taken up in section 7(6) of the Climate Change Act, 2016
that requires the President to ensure compliance with the two thirds gender principle when
appointing members to the National Climate Change Council. Further, section 8(2)(c) of the
Climate Change Act, 2016 obligates the Cabinet Secretary responsible for climate change
affairs to formulate and implement a national gender and intergenerational responsive public
education and awareness strategy.
C6. Flood and drought management
C6.1. Legislative and institutional environment
C6.1.1. National level
• The Constitution of Kenya (2010) requires the National Government to perform a wide range of
water resource management functions. Relevant here is Section 24: Disaster management – The
National Government will institute integrated flood and drought management plans to address
water related disasters such as floods, droughts and landslides.
• The Water Act (No. 43 of 2016) provides a statutory foundation for flood and drought management
plans. The Water Act aims “to provide for the regulation, management and development of water
resources, water and sewerage services”. Section 12 of the Act establishes a national Water
Resources Authority (WRA) whose functions are “to formulate and enforce standards, procedures
and regulations for the management and use of water resources and flood mitigation”. The WRA
must also “provide information and advice to the Cabinet Secretary for formulation of policy on
national water resource management, water storage and flood control strategies”.
• Section 32 of the Act establishes a national Water Storage Authority (WSA) whose functions and
powers are “to undertake on behalf of the national government, the development of national public
water works for water resources storage and flood control; collect and provide information for the
formulation by the Cabinet Secretary of the national water resources storage and flood control
strategies”. The WSA must also “undertake on behalf of the national government strategic water
emergency interventions during drought; and advise the Cabinet Secretary on any matter
concerning national public water works for water storage and flood control”.
• The National Drought Management Authority (NDMA) Act (No.4 of 2016) provides an important
statutory foundation for drought management plans. The NDMA is an agency of the Government
of Kenya under the Ministry of Planning and Devolution, mandated “to establish mechanisms which
ensure that drought does not result in emergencies and that the impacts of climate change are
sufficiently mitigated”. The NDMA exercises its functions both at national level and Basin level, and
in collaboration with county governments, also at county and community level. However, the
NDMA’s primary focus is on the 23 drought-prone counties, known as the ASAL (Arid and Semi-
Arid Lands) counties.
• The National Disaster Operations Centre (NDOC) is responsible for coordinating all disaster
response operations in the country – and was leading the country's El Niño flood response in
2015. It does this through partnering with other actors such as the police and the Kenya Red Cross.
NDOC was established in 1997, following the El Niño floods, within the Ministry of Interior. Besides
response, NDOC also plays a preparedness role by managing the country's disaster loss database.
It has also led disaster drills for man-made disasters.
• The National Disaster Management Unit (NDMU) was established in 2013 as an effective and
competent disaster management unit with an established command structure, budget and Standard
Operating Procedures (SOPs) based on best practices. The NDMU, together with stakeholders,
formulated the National Emergency / Disaster Plan and SOPs which were signed off in 2014. The
Plan and SOPs recognizes the existence of other National and contingency plans. The National
Plan and SOPs is anchored in the medium-term Phase Two of Vision 2030 in that it promotes
safety, security and protecting Kenyan assets from adverse impacts of hazards and disasters.
• The mandates of the NDMA, NDOC and NDMU clearly overlap. The Disaster Risk Management
Bill, currently under consideration, is aimed at bringing NDMA, NDOC and NDMU together as a
new “Disaster Risk Management Authority”.
• The Kenya Meteorological Department (KMD) of the Ministry of Environment and Mineral
Resources issues regular short-term and seasonal rainfall forecasts for the whole country which
form part of the structure of Kenya’s drought preparedness.
C6.1.2. Basin and Sub-Basin level
• Section 27 of the Water Act specifies establishment of Basin Water Resources Committees
responsible for the management of the water resources within a particular Basin area, with various
powers and functions, among which is to advise the Water Resources Authority and county
governments concerning flood mitigation activities. Each county government in a Basin has one
representative on the Basin Water Resources Committee, which, in collaboration with the NDMA,
must develop drought contingency plans for the ASAL counties and oversee their
implementation as emergency response interventions. (It should be noted that at the time of writing
the Basin Water Resources Committee for the Lake Victoria North Basin has not been established.)
• Section 29 of the Water Act specifies establishment of Water Resource Users Associations
(WRUAs) at the sub-basin level as community-based associations for collaborative management
of water resources and resolution of conflicts concerning the use of water resources. The Basin
Water Resources Committees may contract WRUAs as agents to perform certain duties in water
resource management.
• The NDMA issues regular drought early warning bulletins on a county basis which cover various
bio-physical indicators, as well as a range of socio-economic impact indicators.
C6.1.3. National plans and policies
• The Water Resources Management Authority (WRMA) Strategic Plan for 2012 – 2017 (WRMA,
2013) specifies six strategic objectives for the WRMA covering the five financial years 2012/13 to
2016/17. Each strategic objective is served by various underlying strategies. Under strategic
objective 5, “To heighten the national development agenda on water resources”, two of the
underlying strategies are “Develop integrated River Basin flood management plans” and
“Develop and implement programs to strengthen communities’ preparedness/adaptation to
impacts of climate change.”
• Under the National Water Master Plan 2030 (known as NWMP 2030), developed as part of the
above Strategic Plan, five development plans and three management plans were developed for
each of six Basin areas that cover the whole of Kenya (WRMA, 2013). A flood and drought
management plan featured among the latter three plans.
• The Ending Drought Emergencies Common Programme Framework (EDE-CPF) (NDMA, 2017)
has three components: drought risk and vulnerability reduction, drought early warning and early
response, and institutional capacity for drought and climate resilience and comprises six sets of
interrelated action plans for ensuring ongoing drought preparedness. The EDE-CPF is currently
being operationalised through its 3rd Medium-Term Plan 2018-2022 and is mainly focused on the
ASAL counties (NDMA, 2017).
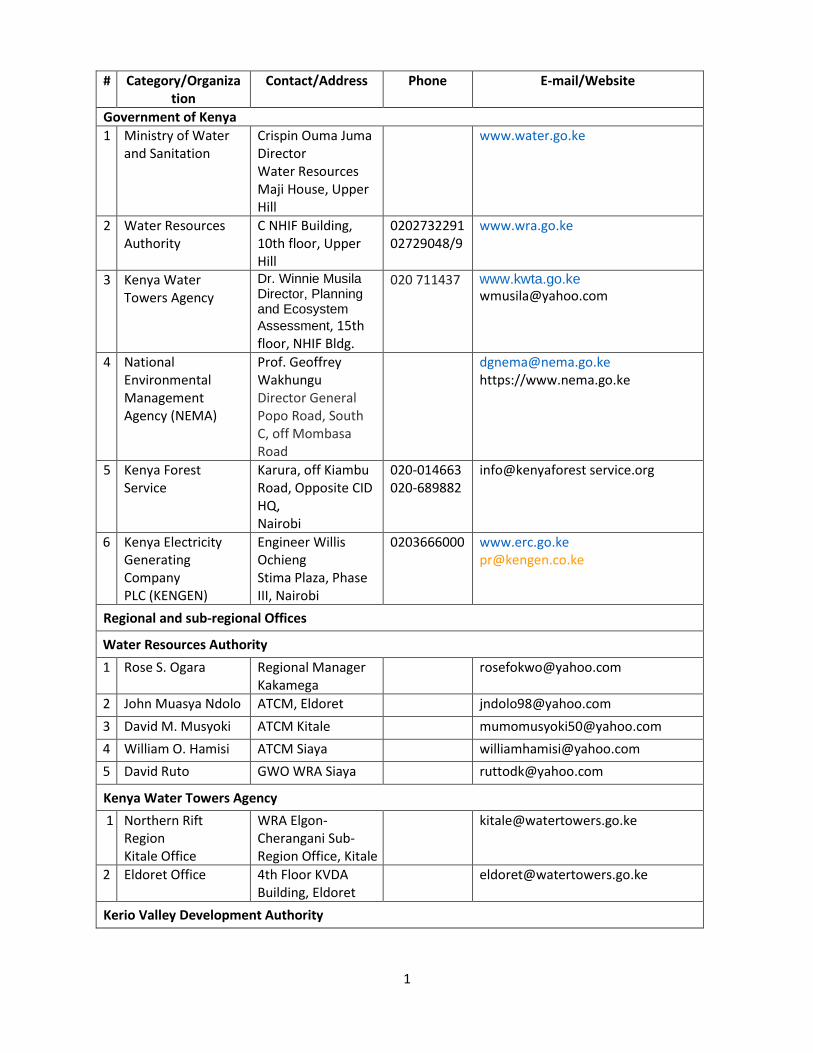
1
# Category/Organization
Contact/Address Phone E-mail/Website
Government of Kenya
1 Ministry of Water and Sanitation
Crispin Ouma Juma Director Water Resources Maji House, Upper Hill
www.water.go.ke
2 Water Resources Authority
C NHIF Building, 10th floor, Upper Hill
0202732291 02729048/9
www.wra.go.ke
3 Kenya Water Towers Agency
Dr. Winnie Musila Director, Planning and Ecosystem
Assessment, 15th floor, NHIF Bldg.
020 711437 www.kwta.go.ke [email protected]
4 National Environmental Management Agency (NEMA)
Prof. Geoffrey Wakhungu Director General Popo Road, South C, off Mombasa Road
[email protected] https://www.nema.go.ke
5 Kenya Forest Service
Karura, off Kiambu Road, Opposite CID HQ, Nairobi
020-014663 020-689882
info@kenyaforest service.org
6 Kenya Electricity Generating Company PLC (KENGEN)
Engineer Willis Ochieng Stima Plaza, Phase III, Nairobi
0203666000 www.erc.go.ke [email protected]
Regional and sub-regional Offices
Water Resources Authority
1 Rose S. Ogara Regional Manager Kakamega
2 John Muasya Ndolo ATCM, Eldoret [email protected]
3 David M. Musyoki ATCM Kitale [email protected]
4 William O. Hamisi ATCM Siaya [email protected]
5 David Ruto GWO WRA Siaya [email protected]
Kenya Water Towers Agency
1 Northern Rift Region Kitale Office
WRA Elgon-Cherangani Sub-Region Office, Kitale
2 Eldoret Office 4th Floor KVDA Building, Eldoret
Kerio Valley Development Authority
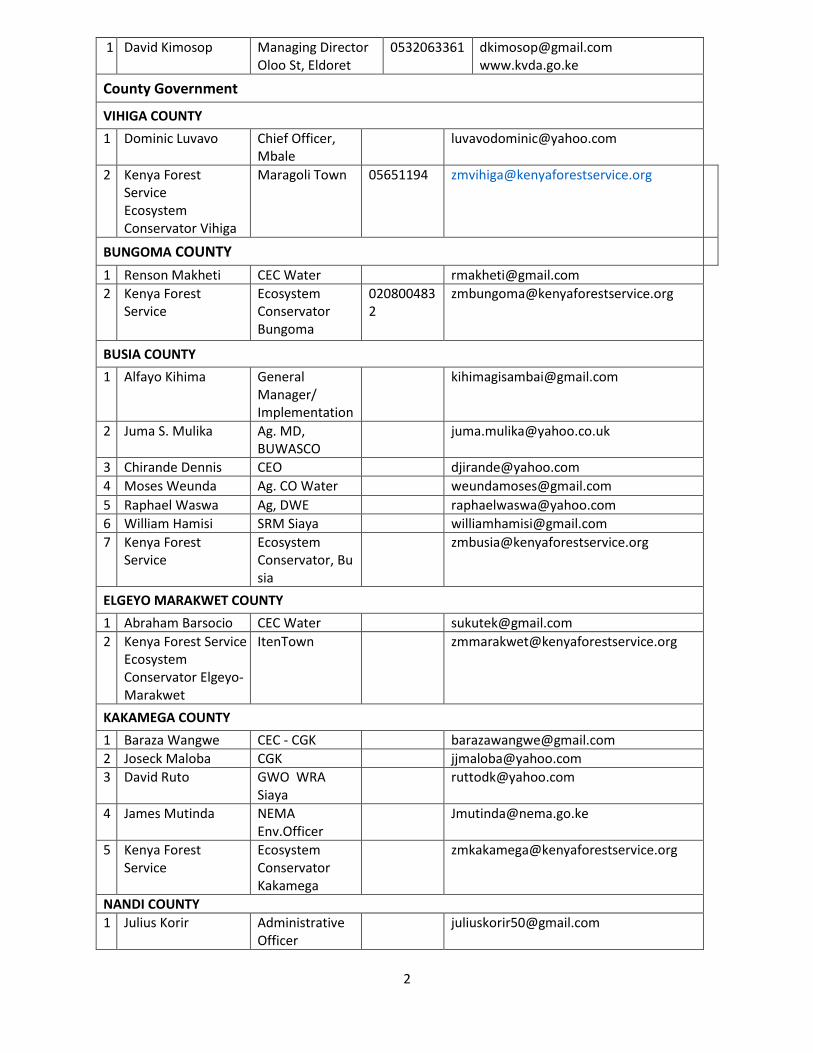
2
1 David Kimosop Managing Director Oloo St, Eldoret
0532063361 [email protected] www.kvda.go.ke
County Government
VIHIGA COUNTY
1 Dominic Luvavo Chief Officer, Mbale
2 Kenya Forest Service Ecosystem Conservator Vihiga
Maragoli Town
05651194
BUNGOMA COUNTY
1 Renson Makheti CEC Water [email protected]
2 Kenya Forest Service
Ecosystem Conservator Bungoma
0208004832
BUSIA COUNTY
1 Alfayo Kihima General Manager/ Implementation
2 Juma S. Mulika Ag. MD, BUWASCO
3 Chirande Dennis CEO [email protected]
4 Moses Weunda Ag. CO Water [email protected]
5 Raphael Waswa Ag, DWE [email protected]
6 William Hamisi SRM Siaya [email protected]
7 Kenya Forest Service
Ecosystem Conservator, Busia
ELGEYO MARAKWET COUNTY
1 Abraham Barsocio CEC Water [email protected]
2 Kenya Forest Service Ecosystem Conservator Elgeyo-Marakwet
ItenTown
KAKAMEGA COUNTY
1 Baraza Wangwe CEC - CGK [email protected]
2 Joseck Maloba CGK [email protected]
3 David Ruto GWO WRA Siaya
4 James Mutinda NEMA Env.Officer
5 Kenya Forest Service
Ecosystem Conservator Kakamega
NANDI COUNTY
1 Julius Korir Administrative Officer
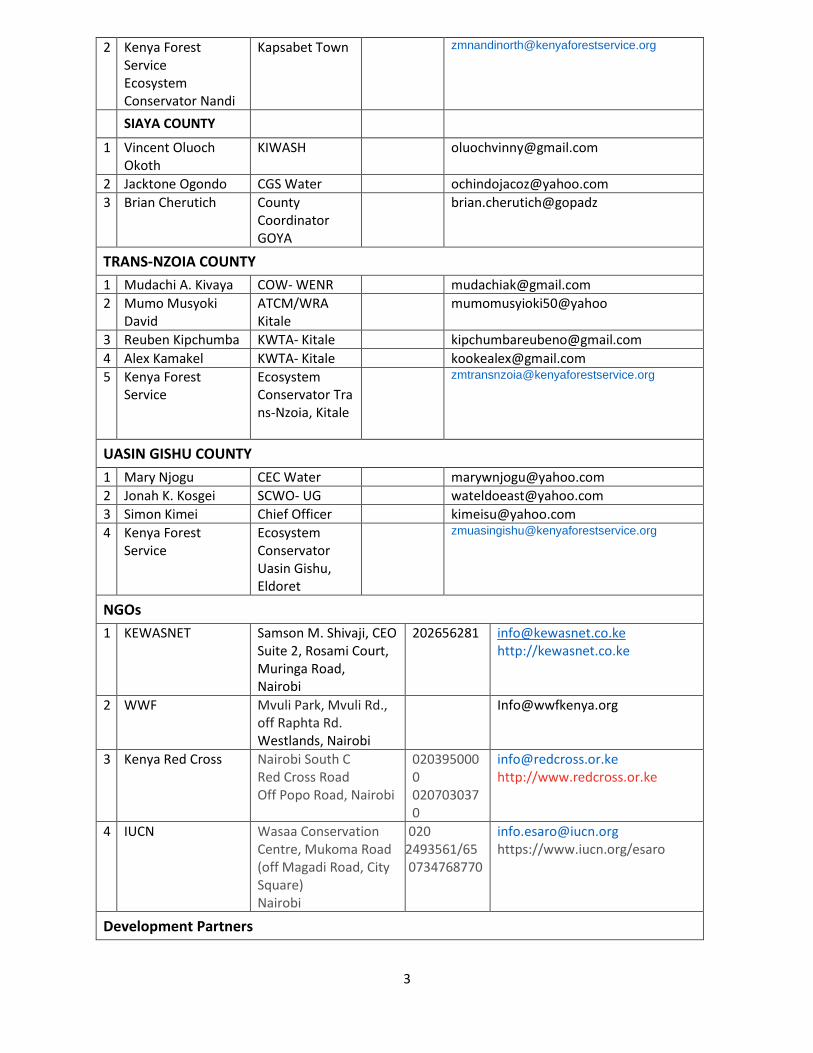
3
2 Kenya Forest Service Ecosystem Conservator Nandi
Kapsabet Town
SIAYA COUNTY
1 Vincent Oluoch Okoth
KIWASH [email protected]
2 Jacktone Ogondo CGS Water [email protected]
3 Brian Cherutich County Coordinator GOYA
brian.cherutich@gopadz
TRANS-NZOIA COUNTY
1 Mudachi A. Kivaya COW- WENR [email protected]
2 Mumo Musyoki David
ATCM/WRA Kitale
mumomusyioki50@yahoo
3 Reuben Kipchumba KWTA- Kitale [email protected]
4 Alex Kamakel KWTA- Kitale [email protected]
5 Kenya Forest Service
Ecosystem Conservator Trans-Nzoia, Kitale
UASIN GISHU COUNTY
1 Mary Njogu CEC Water [email protected]
2 Jonah K. Kosgei SCWO- UG [email protected]
3 Simon Kimei Chief Officer [email protected]
4 Kenya Forest Service
Ecosystem Conservator Uasin Gishu, Eldoret
NGOs
1 KEWASNET
Samson M. Shivaji, CEO Suite 2, Rosami Court, Muringa Road, Nairobi
202656281 [email protected] http://kewasnet.co.ke
2 WWF Mvuli Park, Mvuli Rd., off Raphta Rd. Westlands, Nairobi
3 Kenya Red Cross Nairobi South C Red Cross Road Off Popo Road, Nairobi
0203950000 0207030370
[email protected] http://www.redcross.or.ke
4 IUCN Wasaa Conservation Centre, Mukoma Road (off Magadi Road, City Square) Nairobi
020 2493561/65 0734768770
[email protected] https://www.iucn.org/esaro
Development Partners
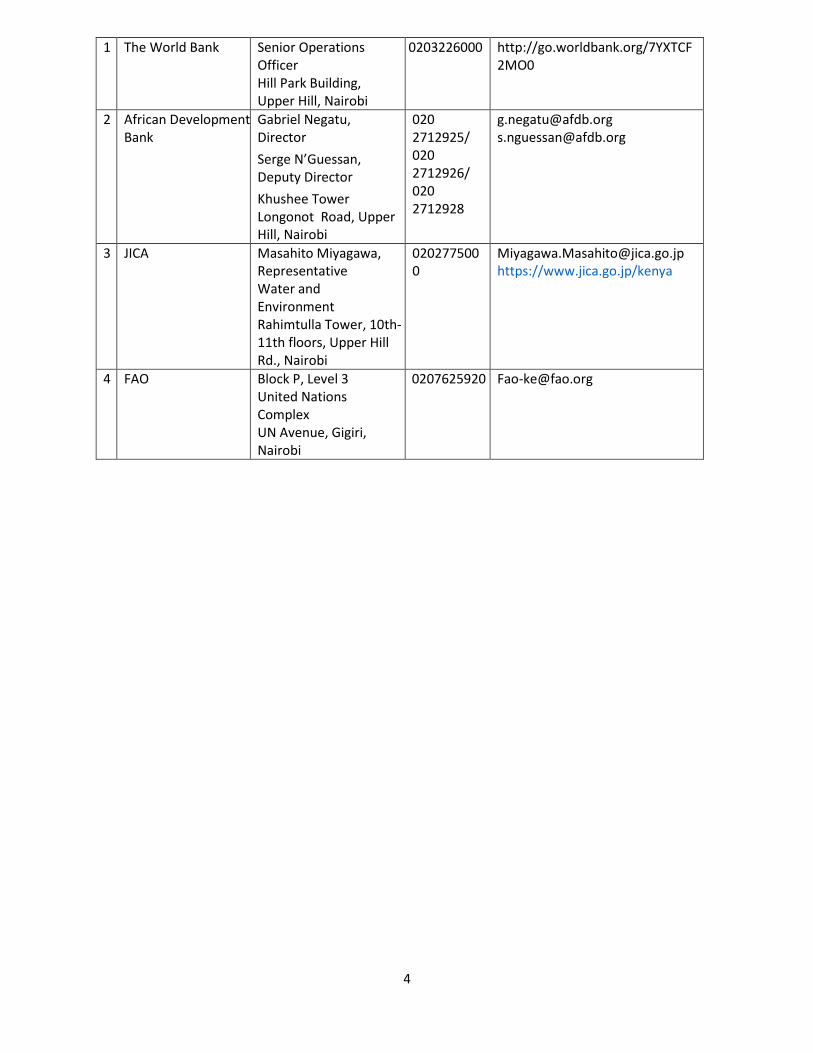
4
1 The World Bank Senior Operations Officer Hill Park Building, Upper Hill, Nairobi
0203226000 http://go.worldbank.org/7YXTCF2MO0
2 African Development Bank
Gabriel Negatu, Director
Serge N’Guessan, Deputy Director
Khushee Tower Longonot Road, Upper Hill, Nairobi
020 2712925/ 020 2712926/ 020 2712928
[email protected] [email protected]
3 JICA Masahito Miyagawa, Representative Water and Environment Rahimtulla Tower, 10th-11th floors, Upper Hill Rd., Nairobi
0202775000
[email protected] https://www.jica.go.jp/kenya
4 FAO Block P, Level 3 United Nations Complex UN Avenue, Gigiri, Nairobi
0207625920 [email protected]
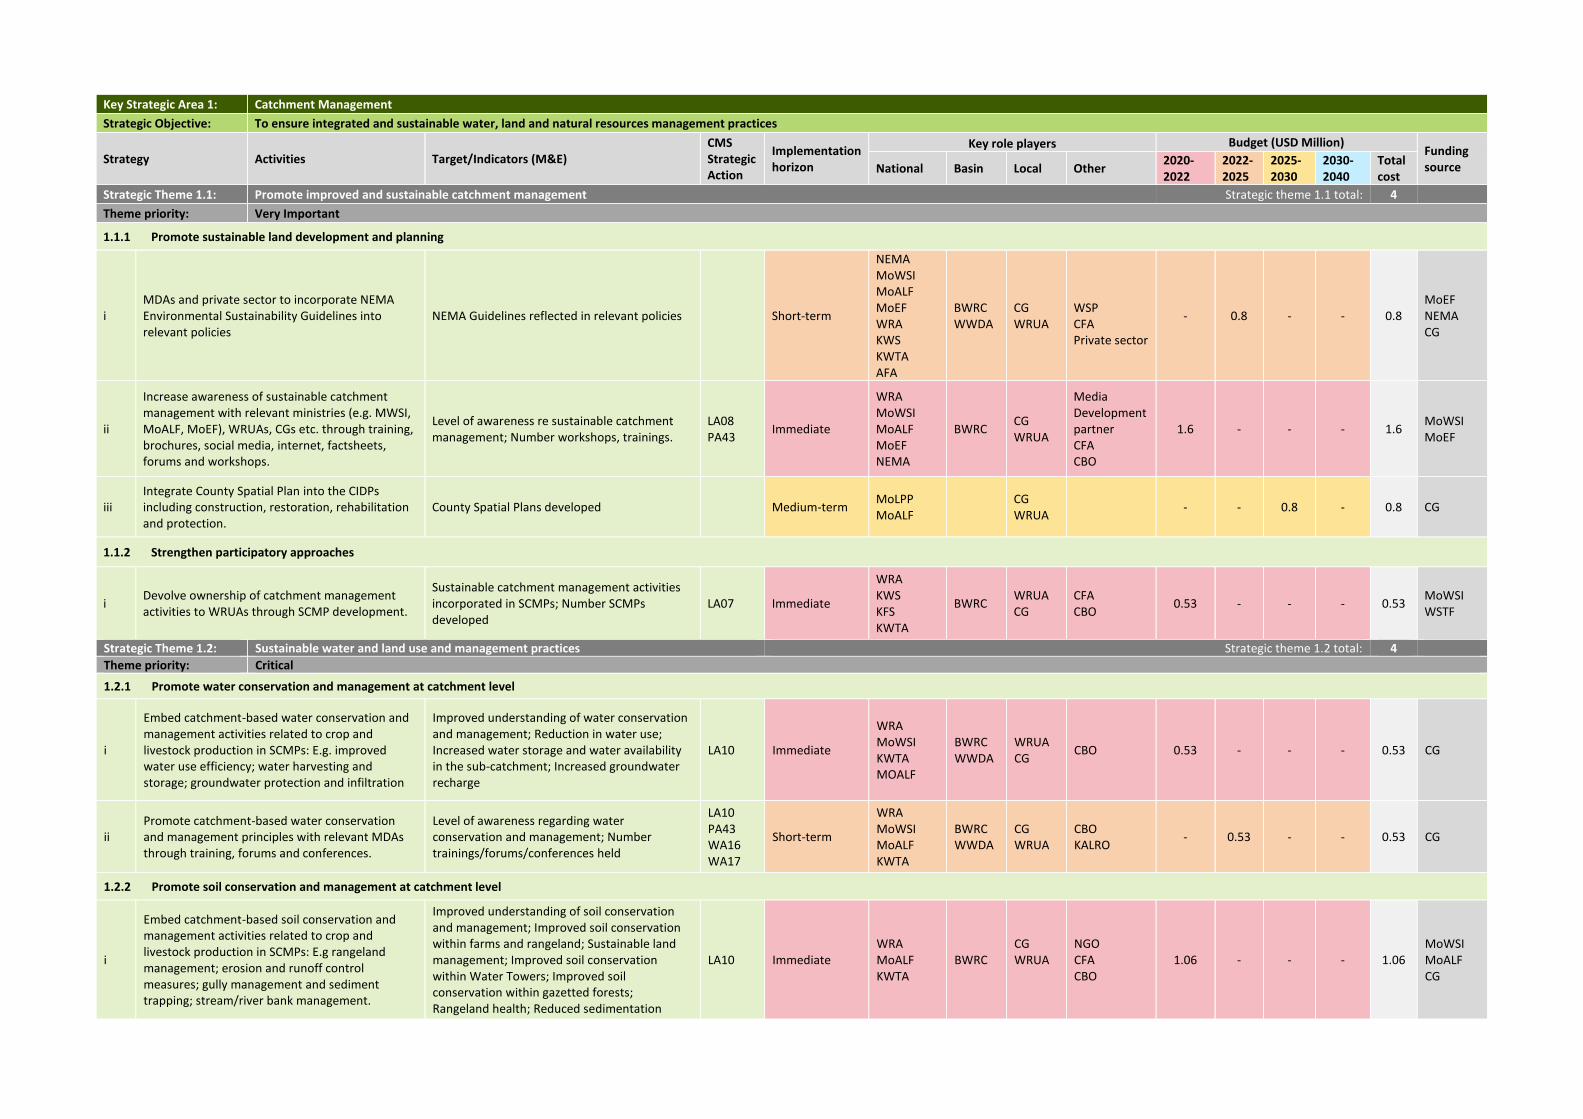
Key Strategic Area 1: Catchment Management
Strategic Objective: To ensure integrated and sustainable water, land and natural resources management practices
Strategy Activities Target/Indicators (M&E) CMS Strategic Action
Implementation horizon
Key role players Budget (USD Million) Funding source National Basin Local Other
2020-2022
2022-2025
2025-2030
2030-2040
Total cost
Strategic Theme 1.1: Promote improved and sustainable catchment management Strategic theme 1.1 total: 4
Theme priority: Very Important
1.1.1 Promote sustainable land development and planning
i MDAs and private sector to incorporate NEMA Environmental Sustainability Guidelines into relevant policies
NEMA Guidelines reflected in relevant policies Short-term
NEMA MoWSI MoALF MoEF WRA KWS KWTA AFA
BWRC WWDA
CG WRUA
WSP CFA Private sector
- 0.8 - - 0.8 MoEF NEMA CG
ii
Increase awareness of sustainable catchment management with relevant ministries (e.g. MWSI, MoALF, MoEF), WRUAs, CGs etc. through training, brochures, social media, internet, factsheets, forums and workshops.
Level of awareness re sustainable catchment management; Number workshops, trainings.
LA08 PA43
Immediate
WRA MoWSI MoALF MoEF NEMA
BWRC CG WRUA
Media Development partner CFA CBO
1.6 - - - 1.6 MoWSI MoEF
iii Integrate County Spatial Plan into the CIDPs including construction, restoration, rehabilitation and protection.
County Spatial Plans developed Medium-term MoLPP MoALF
CG WRUA
- - 0.8 - 0.8 CG
1.1.2 Strengthen participatory approaches
i Devolve ownership of catchment management activities to WRUAs through SCMP development.
Sustainable catchment management activities incorporated in SCMPs; Number SCMPs developed
LA07 Immediate
WRA KWS KFS KWTA
BWRC WRUA CG
CFA CBO
0.53 - - - 0.53 MoWSI WSTF
Strategic Theme 1.2: Sustainable water and land use and management practices Strategic theme 1.2 total: 4
Theme priority: Critical
1.2.1 Promote water conservation and management at catchment level
i
Embed catchment-based water conservation and management activities related to crop and livestock production in SCMPs: E.g. improved water use efficiency; water harvesting and storage; groundwater protection and infiltration
Improved understanding of water conservation and management; Reduction in water use; Increased water storage and water availability in the sub-catchment; Increased groundwater recharge
LA10 Immediate
WRA MoWSI KWTA MOALF
BWRC WWDA
WRUA CG
CBO 0.53 - - - 0.53 CG
ii Promote catchment-based water conservation and management principles with relevant MDAs through training, forums and conferences.
Level of awareness regarding water conservation and management; Number trainings/forums/conferences held
LA10 PA43 WA16 WA17
Short-term
WRA MoWSI MoALF KWTA
BWRC WWDA
CG WRUA
CBO KALRO
- 0.53 - - 0.53 CG
1.2.2 Promote soil conservation and management at catchment level
i
Embed catchment-based soil conservation and management activities related to crop and livestock production in SCMPs: E.g rangeland management; erosion and runoff control measures; gully management and sediment trapping; stream/river bank management.
Improved understanding of soil conservation and management; Improved soil conservation within farms and rangeland; Sustainable land management; Improved soil conservation within Water Towers; Improved soil conservation within gazetted forests; Rangeland health; Reduced sedimentation
LA10 Immediate WRA MoALF KWTA
BWRC
CG WRUA
NGO CFA CBO
1.06 - - - 1.06 MoWSI MoALF CG
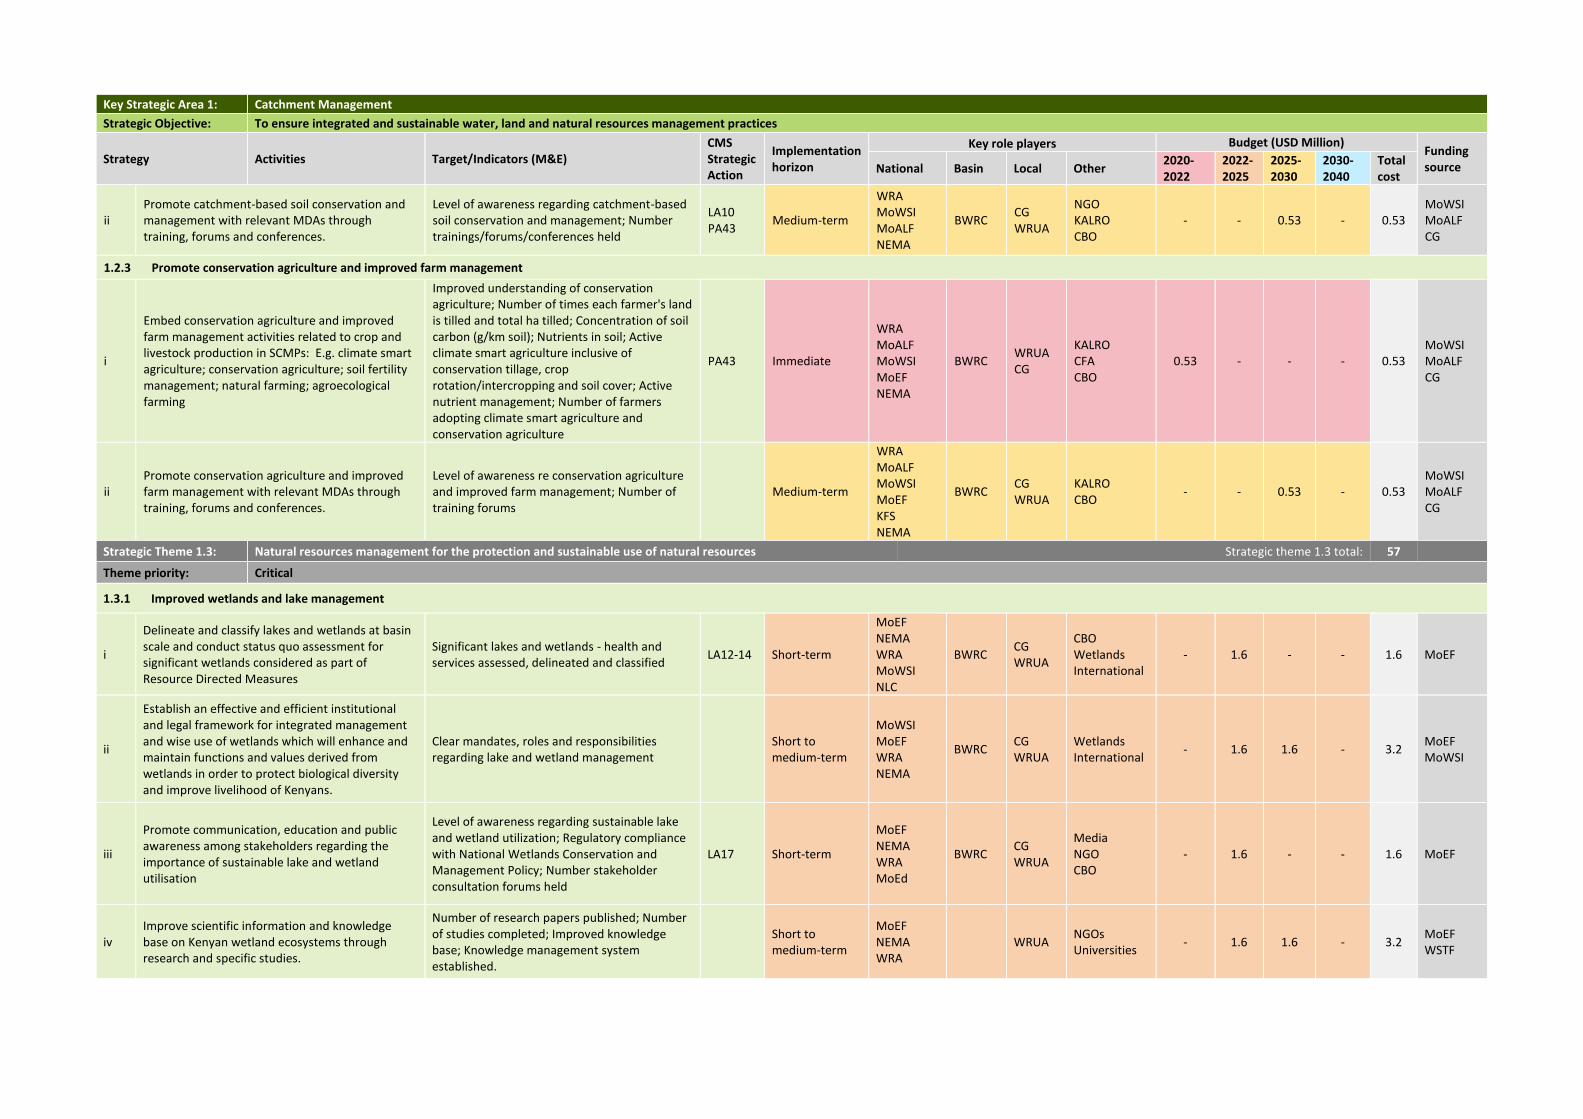
Key Strategic Area 1: Catchment Management
Strategic Objective: To ensure integrated and sustainable water, land and natural resources management practices
Strategy Activities Target/Indicators (M&E) CMS Strategic Action
Implementation horizon
Key role players Budget (USD Million) Funding source National Basin Local Other
2020-2022
2022-2025
2025-2030
2030-2040
Total cost
ii Promote catchment-based soil conservation and management with relevant MDAs through training, forums and conferences.
Level of awareness regarding catchment-based soil conservation and management; Number trainings/forums/conferences held
LA10 PA43
Medium-term
WRA MoWSI MoALF NEMA
BWRC CG WRUA
NGO KALRO CBO
- - 0.53 - 0.53 MoWSI MoALF CG
1.2.3 Promote conservation agriculture and improved farm management
i
Embed conservation agriculture and improved farm management activities related to crop and livestock production in SCMPs: E.g. climate smart agriculture; conservation agriculture; soil fertility management; natural farming; agroecological farming
Improved understanding of conservation agriculture; Number of times each farmer's land is tilled and total ha tilled; Concentration of soil carbon (g/km soil); Nutrients in soil; Active climate smart agriculture inclusive of conservation tillage, crop rotation/intercropping and soil cover; Active nutrient management; Number of farmers adopting climate smart agriculture and conservation agriculture
PA43 Immediate
WRA MoALF MoWSI MoEF NEMA
BWRC WRUA CG
KALRO CFA CBO
0.53 - - - 0.53 MoWSI MoALF CG
ii Promote conservation agriculture and improved farm management with relevant MDAs through training, forums and conferences.
Level of awareness re conservation agriculture and improved farm management; Number of training forums
Medium-term
WRA MoALF MoWSI MoEF KFS NEMA
BWRC CG WRUA
KALRO CBO
- - 0.53 - 0.53 MoWSI MoALF CG
Strategic Theme 1.3: Natural resources management for the protection and sustainable use of natural resources Strategic theme 1.3 total: 57
Theme priority: Critical
1.3.1 Improved wetlands and lake management
i
Delineate and classify lakes and wetlands at basin scale and conduct status quo assessment for significant wetlands considered as part of Resource Directed Measures
Significant lakes and wetlands - health and services assessed, delineated and classified
LA12-14 Short-term
MoEF NEMA WRA MoWSI NLC
BWRC CG WRUA
CBO Wetlands International
- 1.6 - - 1.6 MoEF
ii
Establish an effective and efficient institutional and legal framework for integrated management and wise use of wetlands which will enhance and maintain functions and values derived from wetlands in order to protect biological diversity and improve livelihood of Kenyans.
Clear mandates, roles and responsibilities regarding lake and wetland management
Short to medium-term
MoWSI MoEF WRA NEMA
BWRC CG WRUA
Wetlands International
- 1.6 1.6 - 3.2 MoEF MoWSI
iii
Promote communication, education and public awareness among stakeholders regarding the importance of sustainable lake and wetland utilisation
Level of awareness regarding sustainable lake and wetland utilization; Regulatory compliance with National Wetlands Conservation and Management Policy; Number stakeholder consultation forums held
LA17 Short-term
MoEF NEMA WRA MoEd
BWRC CG WRUA
Media NGO CBO
- 1.6 - - 1.6 MoEF
iv Improve scientific information and knowledge base on Kenyan wetland ecosystems through research and specific studies.
Number of research papers published; Number of studies completed; Improved knowledge base; Knowledge management system established.
Short to medium-term
MoEF NEMA WRA
WRUA NGOs Universities
- 1.6 1.6 - 3.2 MoEF WSTF
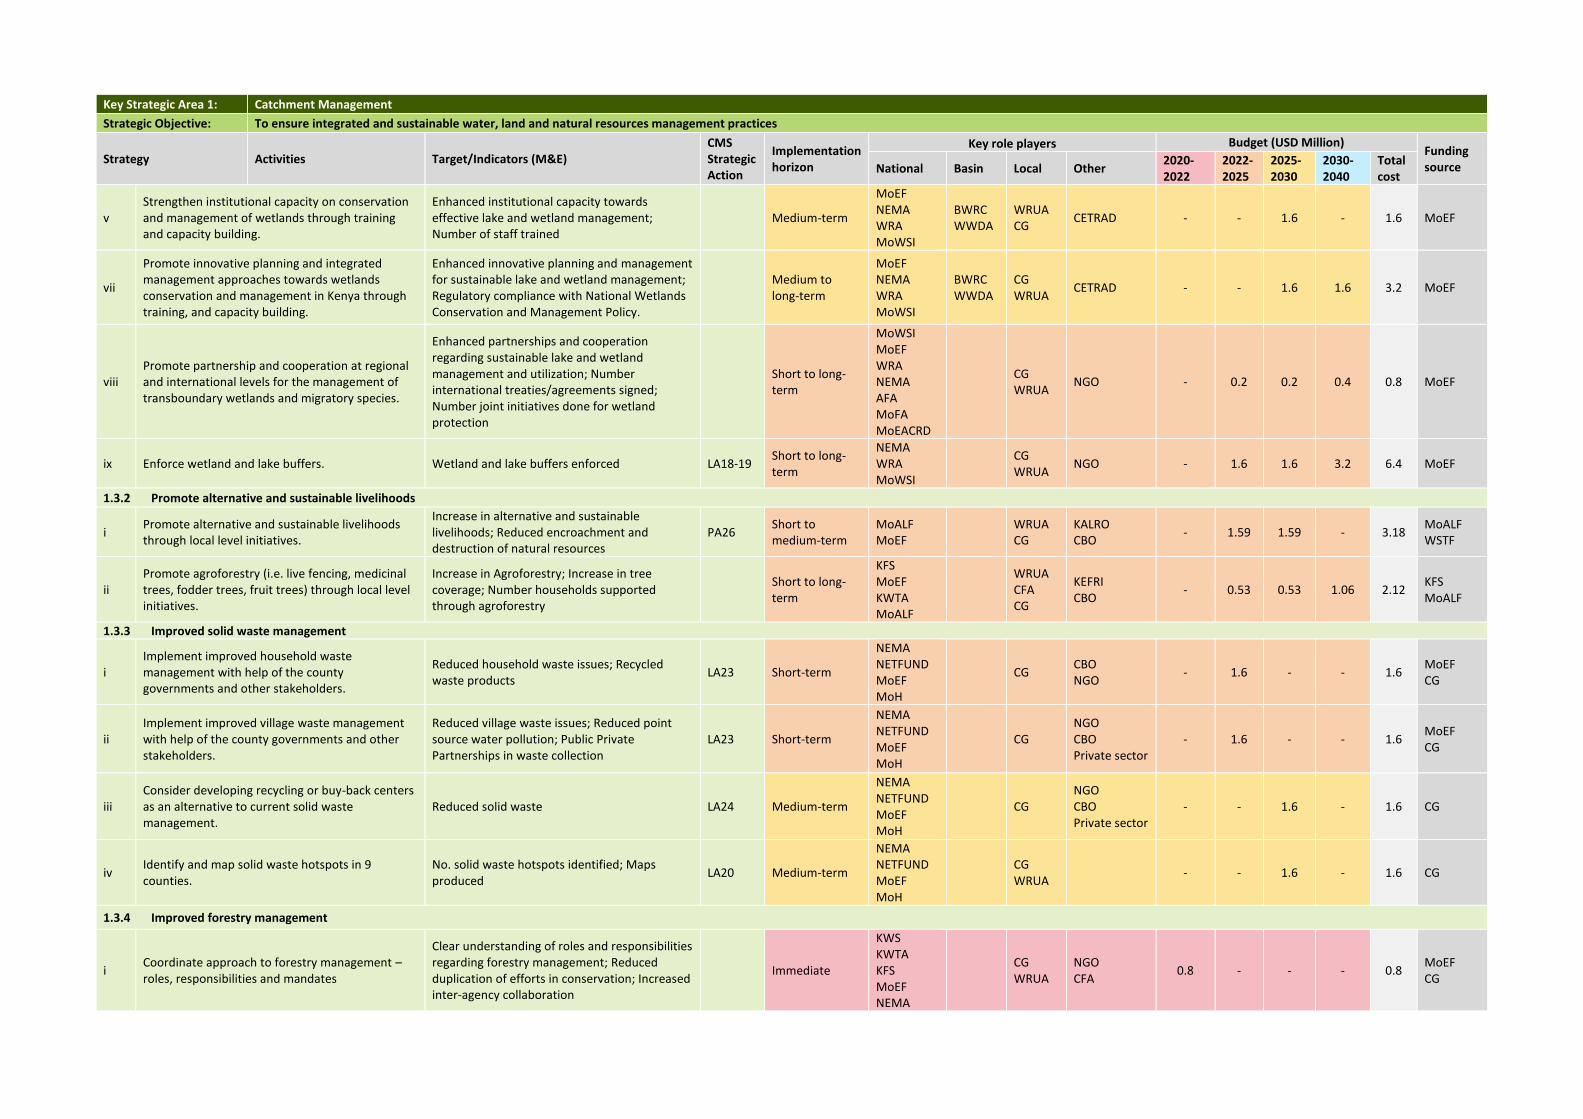
Key Strategic Area 1: Catchment Management
Strategic Objective: To ensure integrated and sustainable water, land and natural resources management practices
Strategy Activities Target/Indicators (M&E) CMS Strategic Action
Implementation horizon
Key role players Budget (USD Million) Funding source National Basin Local Other
2020-2022
2022-2025
2025-2030
2030-2040
Total cost
v Strengthen institutional capacity on conservation and management of wetlands through training and capacity building.
Enhanced institutional capacity towards effective lake and wetland management; Number of staff trained
Medium-term
MoEF NEMA WRA MoWSI
BWRC WWDA
WRUA CG
CETRAD - - 1.6 - 1.6 MoEF
vii
Promote innovative planning and integrated management approaches towards wetlands conservation and management in Kenya through training, and capacity building.
Enhanced innovative planning and management for sustainable lake and wetland management; Regulatory compliance with National Wetlands Conservation and Management Policy.
Medium to long-term
MoEF NEMA WRA MoWSI
BWRC WWDA
CG WRUA
CETRAD - - 1.6 1.6 3.2 MoEF
viii Promote partnership and cooperation at regional and international levels for the management of transboundary wetlands and migratory species.
Enhanced partnerships and cooperation regarding sustainable lake and wetland management and utilization; Number international treaties/agreements signed; Number joint initiatives done for wetland protection
Short to long-term
MoWSI MoEF WRA NEMA AFA MoFA MoEACRD
CG WRUA
NGO - 0.2 0.2 0.4 0.8 MoEF
ix Enforce wetland and lake buffers. Wetland and lake buffers enforced LA18-19 Short to long-term
NEMA WRA MoWSI
CG WRUA
NGO - 1.6 1.6 3.2 6.4 MoEF
1.3.2 Promote alternative and sustainable livelihoods
i Promote alternative and sustainable livelihoods through local level initiatives.
Increase in alternative and sustainable livelihoods; Reduced encroachment and destruction of natural resources
PA26 Short to medium-term
MoALF MoEF
WRUA CG
KALRO CBO
- 1.59 1.59 - 3.18 MoALF WSTF
ii Promote agroforestry (i.e. live fencing, medicinal trees, fodder trees, fruit trees) through local level initiatives.
Increase in Agroforestry; Increase in tree coverage; Number households supported through agroforestry
Short to long-term
KFS MoEF KWTA MoALF
WRUA CFA CG
KEFRI CBO
- 0.53 0.53 1.06 2.12 KFS MoALF
1.3.3 Improved solid waste management
i Implement improved household waste management with help of the county governments and other stakeholders.
Reduced household waste issues; Recycled waste products
LA23 Short-term
NEMA NETFUND MoEF MoH
CG CBO NGO
- 1.6 - - 1.6 MoEF CG
ii Implement improved village waste management with help of the county governments and other stakeholders.
Reduced village waste issues; Reduced point source water pollution; Public Private Partnerships in waste collection
LA23 Short-term
NEMA NETFUND MoEF MoH
CG NGO CBO Private sector
- 1.6 - - 1.6 MoEF CG
iii Consider developing recycling or buy-back centers as an alternative to current solid waste management.
Reduced solid waste LA24 Medium-term
NEMA NETFUND MoEF MoH
CG
NGO CBO Private sector
- - 1.6 - 1.6 CG
iv Identify and map solid waste hotspots in 9 counties.
No. solid waste hotspots identified; Maps produced
LA20 Medium-term
NEMA NETFUND MoEF MoH
CG WRUA
- - 1.6 - 1.6 CG
1.3.4 Improved forestry management
i Coordinate approach to forestry management – roles, responsibilities and mandates
Clear understanding of roles and responsibilities regarding forestry management; Reduced duplication of efforts in conservation; Increased inter-agency collaboration
Immediate
KWS KWTA KFS MoEF NEMA
CG WRUA
NGO CFA
0.8 - - - 0.8 MoEF CG
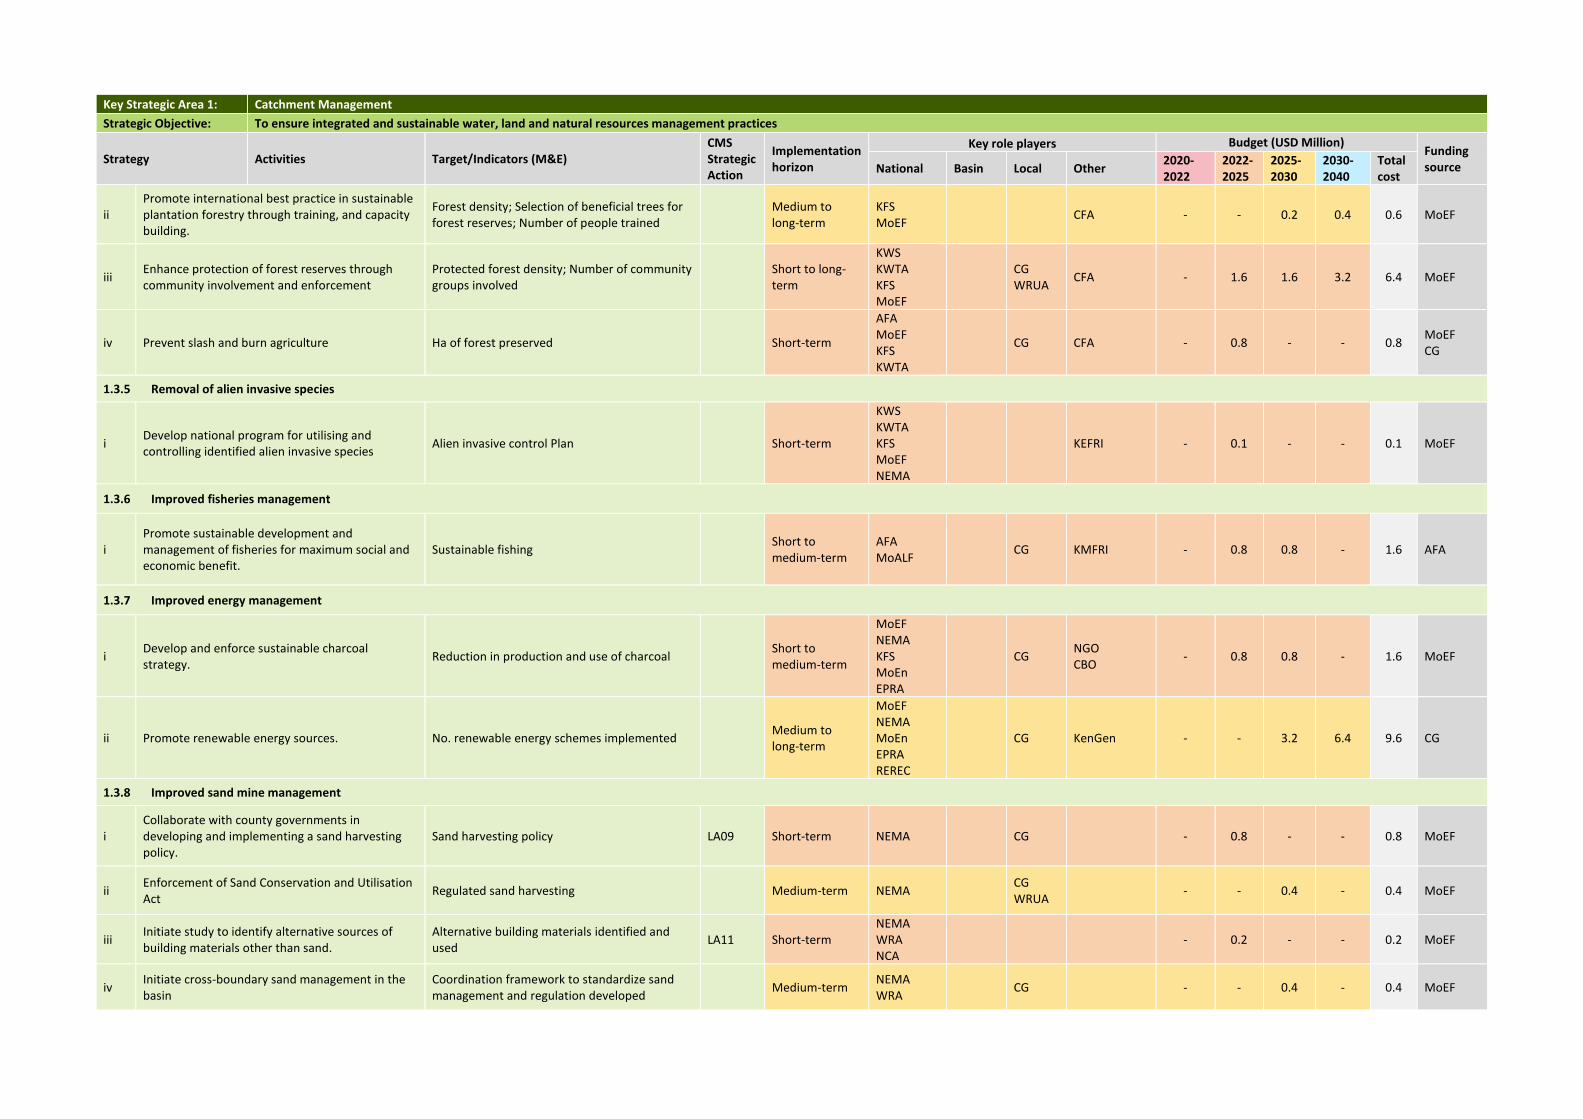
Key Strategic Area 1: Catchment Management
Strategic Objective: To ensure integrated and sustainable water, land and natural resources management practices
Strategy Activities Target/Indicators (M&E) CMS Strategic Action
Implementation horizon
Key role players Budget (USD Million) Funding source National Basin Local Other
2020-2022
2022-2025
2025-2030
2030-2040
Total cost
ii Promote international best practice in sustainable plantation forestry through training, and capacity building.
Forest density; Selection of beneficial trees for forest reserves; Number of people trained
Medium to long-term
KFS MoEF
CFA - - 0.2 0.4 0.6 MoEF
iii Enhance protection of forest reserves through community involvement and enforcement
Protected forest density; Number of community groups involved
Short to long-term
KWS KWTA KFS MoEF
CG WRUA
CFA - 1.6 1.6 3.2 6.4 MoEF
iv Prevent slash and burn agriculture Ha of forest preserved Short-term
AFA MoEF KFS KWTA
CG CFA - 0.8 - - 0.8 MoEF CG
1.3.5 Removal of alien invasive species
i Develop national program for utilising and controlling identified alien invasive species
Alien invasive control Plan Short-term
KWS KWTA KFS MoEF NEMA
KEFRI - 0.1 - - 0.1 MoEF
1.3.6 Improved fisheries management
i Promote sustainable development and management of fisheries for maximum social and economic benefit.
Sustainable fishing Short to medium-term
AFA MoALF
CG KMFRI - 0.8 0.8 - 1.6 AFA
1.3.7 Improved energy management
i Develop and enforce sustainable charcoal strategy.
Reduction in production and use of charcoal Short to medium-term
MoEF NEMA KFS MoEn EPRA
CG NGO CBO
- 0.8 0.8 - 1.6 MoEF
ii Promote renewable energy sources. No. renewable energy schemes implemented Medium to long-term
MoEF NEMA MoEn EPRA REREC
CG KenGen - - 3.2 6.4 9.6 CG
1.3.8 Improved sand mine management
i Collaborate with county governments in developing and implementing a sand harvesting policy.
Sand harvesting policy LA09 Short-term NEMA CG - 0.8 - - 0.8 MoEF
ii Enforcement of Sand Conservation and Utilisation Act
Regulated sand harvesting Medium-term NEMA CG WRUA
- - 0.4 - 0.4 MoEF
iii Initiate study to identify alternative sources of building materials other than sand.
Alternative building materials identified and used
LA11 Short-term NEMA WRA NCA
- 0.2 - - 0.2 MoEF
iv Initiate cross-boundary sand management in the basin
Coordination framework to standardize sand management and regulation developed
Medium-term NEMA WRA
CG - - 0.4 - 0.4 MoEF
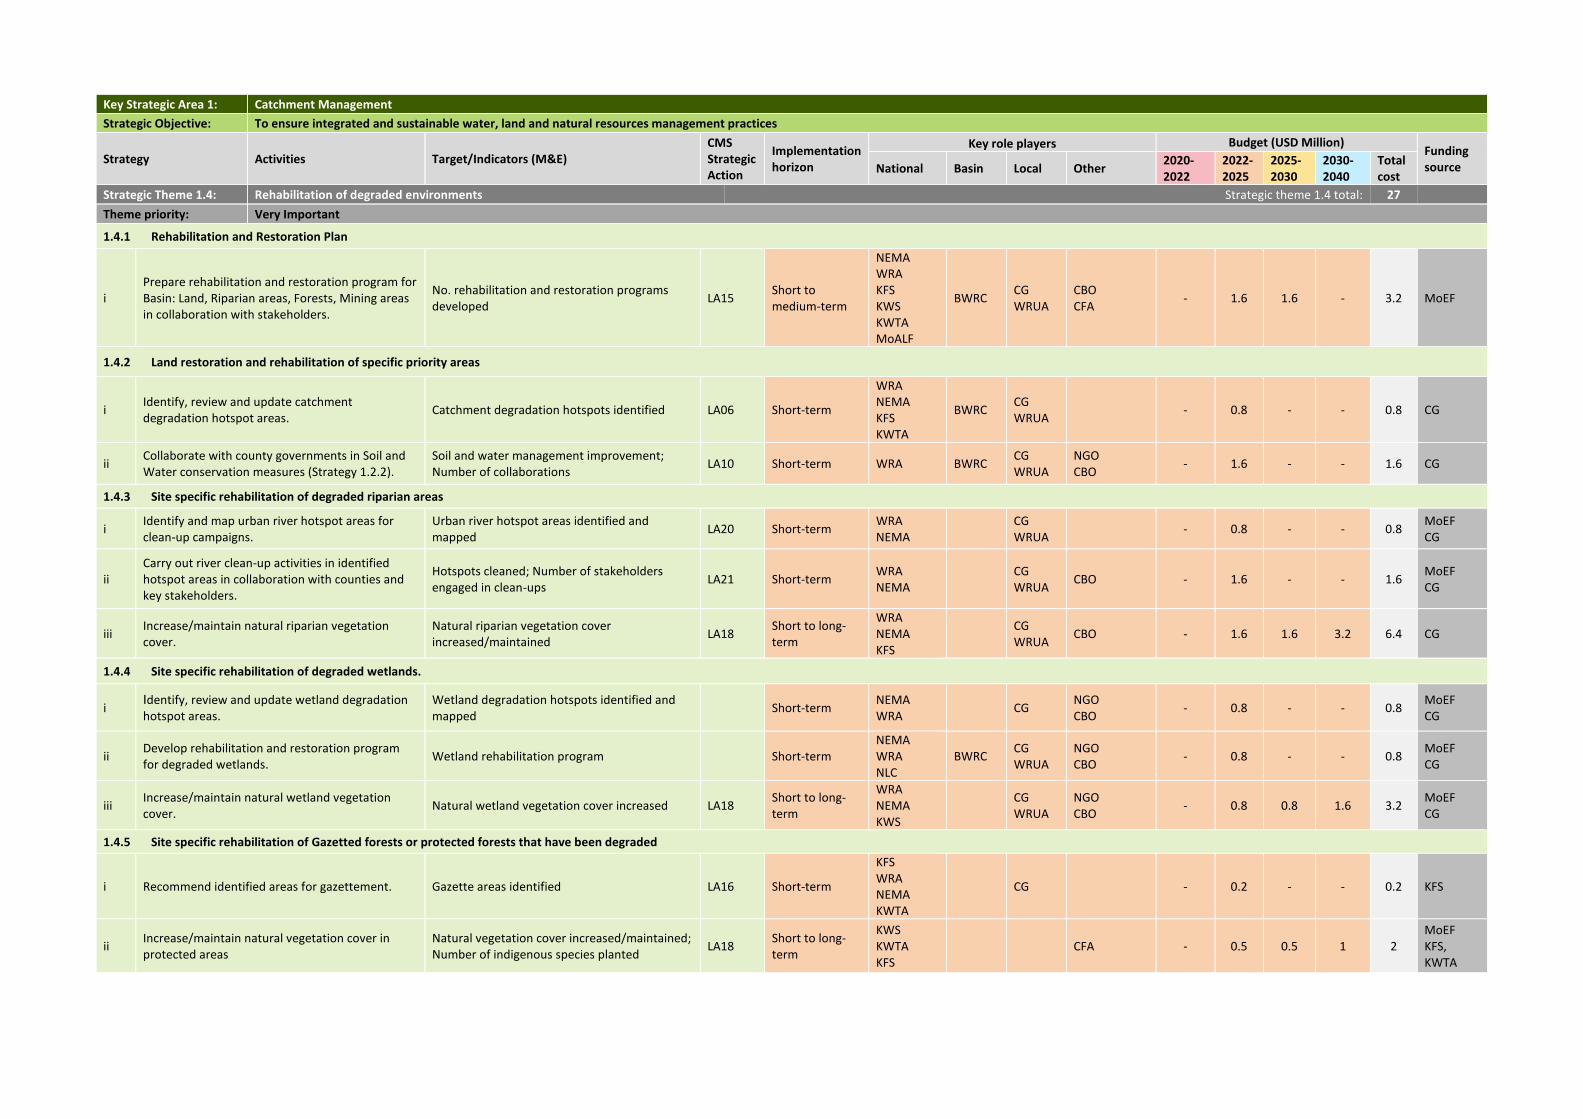
Key Strategic Area 1: Catchment Management
Strategic Objective: To ensure integrated and sustainable water, land and natural resources management practices
Strategy Activities Target/Indicators (M&E) CMS Strategic Action
Implementation horizon
Key role players Budget (USD Million) Funding source National Basin Local Other
2020-2022
2022-2025
2025-2030
2030-2040
Total cost
Strategic Theme 1.4: Rehabilitation of degraded environments Strategic theme 1.4 total: 27
Theme priority: Very Important
1.4.1 Rehabilitation and Restoration Plan
i Prepare rehabilitation and restoration program for Basin: Land, Riparian areas, Forests, Mining areas in collaboration with stakeholders.
No. rehabilitation and restoration programs developed
LA15 Short to medium-term
NEMA WRA KFS KWS KWTA MoALF
BWRC CG WRUA
CBO CFA
- 1.6 1.6 - 3.2 MoEF
1.4.2 Land restoration and rehabilitation of specific priority areas
i Identify, review and update catchment degradation hotspot areas.
Catchment degradation hotspots identified LA06 Short-term
WRA NEMA KFS KWTA
BWRC CG WRUA
- 0.8 - - 0.8 CG
ii Collaborate with county governments in Soil and Water conservation measures (Strategy 1.2.2).
Soil and water management improvement; Number of collaborations
LA10 Short-term WRA BWRC CG WRUA
NGO CBO
- 1.6 - - 1.6 CG
1.4.3 Site specific rehabilitation of degraded riparian areas
i Identify and map urban river hotspot areas for clean-up campaigns.
Urban river hotspot areas identified and mapped
LA20 Short-term WRA NEMA
CG WRUA
- 0.8 - - 0.8 MoEF CG
ii Carry out river clean-up activities in identified hotspot areas in collaboration with counties and key stakeholders.
Hotspots cleaned; Number of stakeholders engaged in clean-ups
LA21 Short-term WRA NEMA
CG WRUA
CBO - 1.6 - - 1.6 MoEF CG
iii Increase/maintain natural riparian vegetation cover.
Natural riparian vegetation cover increased/maintained
LA18 Short to long-term
WRA NEMA KFS
CG WRUA
CBO - 1.6 1.6 3.2 6.4 CG
1.4.4 Site specific rehabilitation of degraded wetlands.
i Identify, review and update wetland degradation hotspot areas.
Wetland degradation hotspots identified and mapped
Short-term NEMA WRA
CG NGO CBO
- 0.8 - - 0.8 MoEF CG
ii Develop rehabilitation and restoration program for degraded wetlands.
Wetland rehabilitation program Short-term NEMA WRA NLC
BWRC CG WRUA
NGO CBO
- 0.8 - - 0.8 MoEF CG
iii Increase/maintain natural wetland vegetation cover.
Natural wetland vegetation cover increased LA18 Short to long-term
WRA NEMA KWS
CG WRUA
NGO CBO
- 0.8 0.8 1.6 3.2 MoEF CG
1.4.5 Site specific rehabilitation of Gazetted forests or protected forests that have been degraded
i Recommend identified areas for gazettement. Gazette areas identified LA16 Short-term
KFS WRA NEMA KWTA
CG - 0.2 - - 0.2 KFS
ii Increase/maintain natural vegetation cover in protected areas
Natural vegetation cover increased/maintained; Number of indigenous species planted
LA18 Short to long-term
KWS KWTA KFS
CFA - 0.5 0.5 1 2 MoEF KFS, KWTA
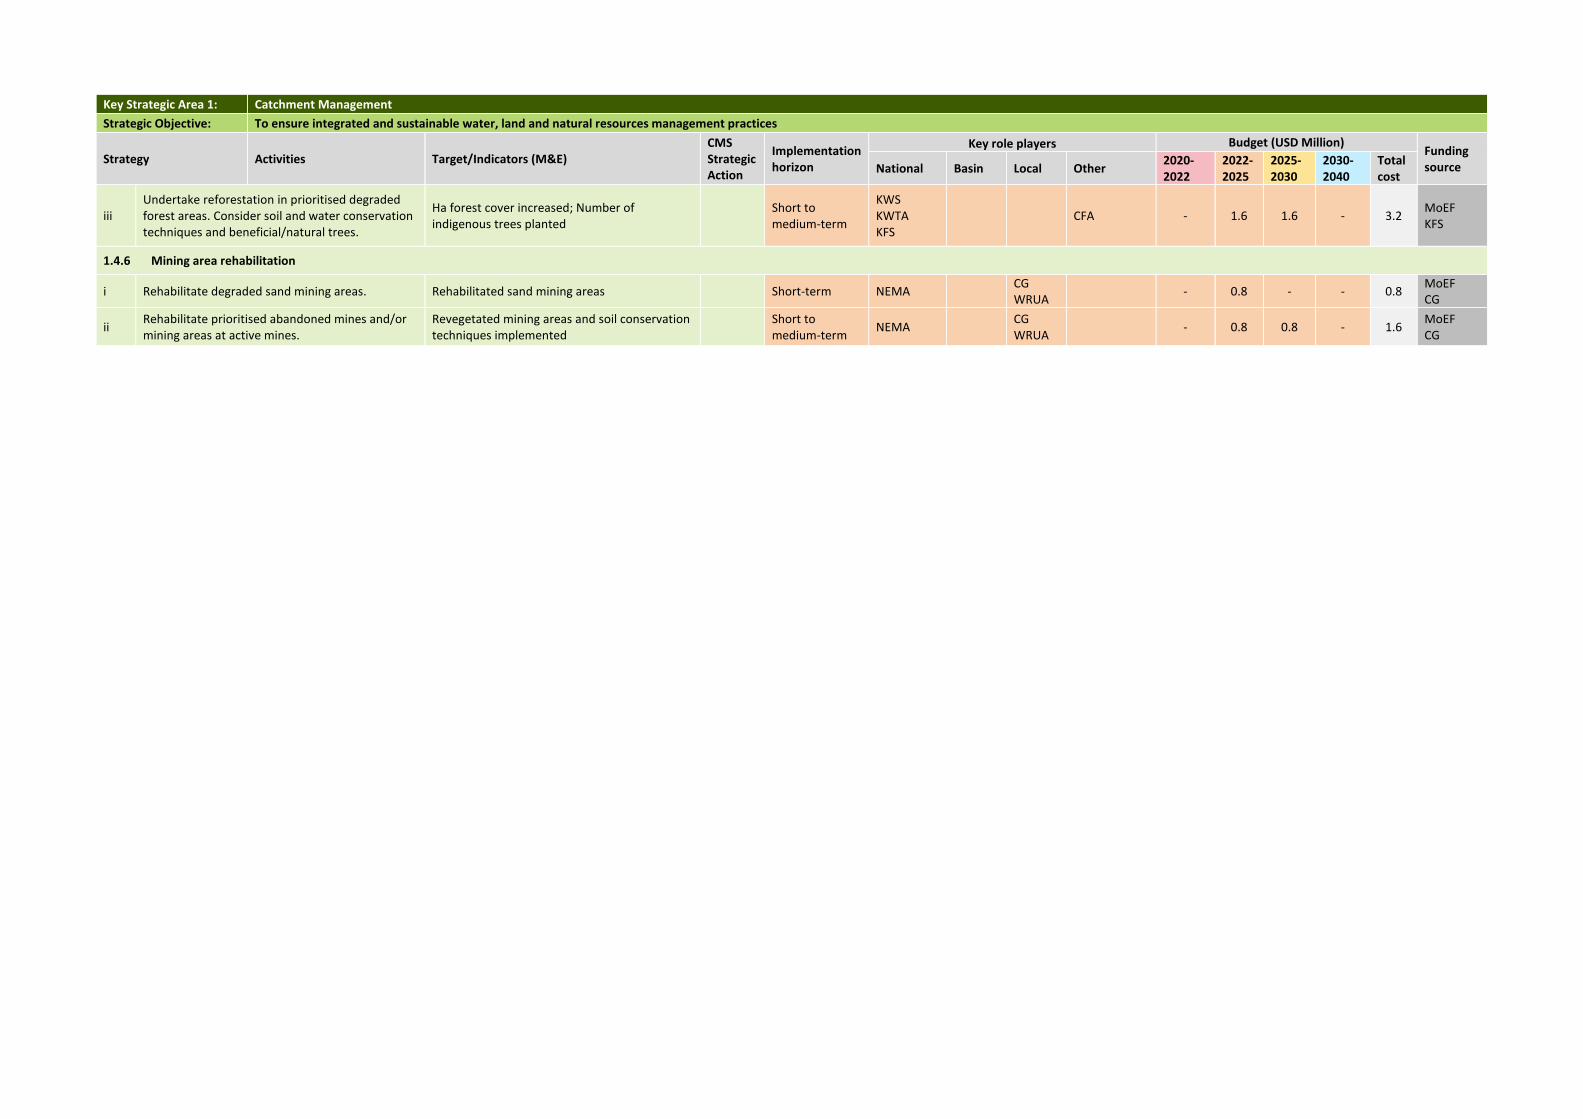
Key Strategic Area 1: Catchment Management
Strategic Objective: To ensure integrated and sustainable water, land and natural resources management practices
Strategy Activities Target/Indicators (M&E) CMS Strategic Action
Implementation horizon
Key role players Budget (USD Million) Funding source National Basin Local Other
2020-2022
2022-2025
2025-2030
2030-2040
Total cost
iii Undertake reforestation in prioritised degraded forest areas. Consider soil and water conservation techniques and beneficial/natural trees.
Ha forest cover increased; Number of indigenous trees planted
Short to medium-term
KWS KWTA KFS
CFA - 1.6 1.6 - 3.2 MoEF KFS
1.4.6 Mining area rehabilitation
i Rehabilitate degraded sand mining areas. Rehabilitated sand mining areas Short-term NEMA CG WRUA
- 0.8 - - 0.8 MoEF CG
ii Rehabilitate prioritised abandoned mines and/or mining areas at active mines.
Revegetated mining areas and soil conservation techniques implemented
Short to medium-term
NEMA CG WRUA
- 0.8 0.8 - 1.6 MoEF CG
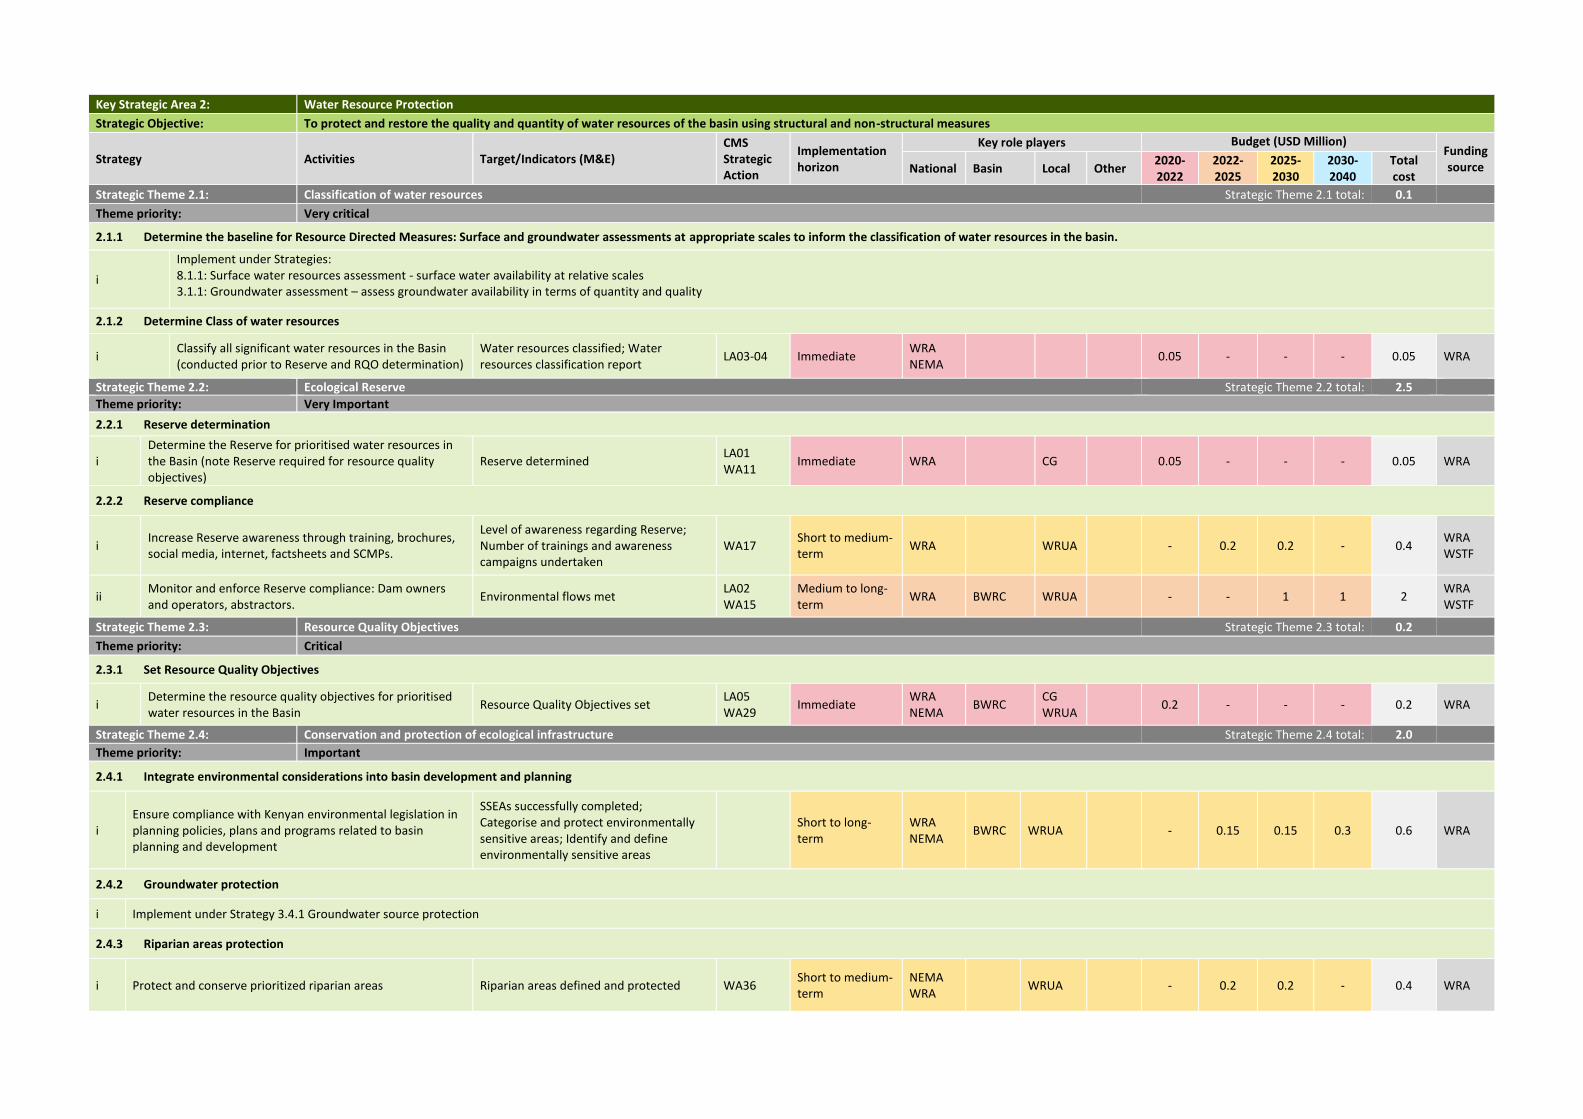
Key Strategic Area 2: Water Resource Protection
Strategic Objective: To protect and restore the quality and quantity of water resources of the basin using structural and non-structural measures
Strategy Activities Target/Indicators (M&E) CMS Strategic Action
Implementation horizon
Key role players Budget (USD Million) Funding source National Basin Local Other
2020-2022
2022- 2025
2025-2030
2030- 2040
Total cost
Strategic Theme 2.1: Classification of water resources Strategic Theme 2.1 total: 0.1
Theme priority: Very critical
2.1.1 Determine the baseline for Resource Directed Measures: Surface and groundwater assessments at appropriate scales to inform the classification of water resources in the basin.
i
Implement under Strategies: 8.1.1: Surface water resources assessment - surface water availability at relative scales 3.1.1: Groundwater assessment – assess groundwater availability in terms of quantity and quality
2.1.2 Determine Class of water resources
i Classify all significant water resources in the Basin (conducted prior to Reserve and RQO determination)
Water resources classified; Water resources classification report
LA03-04 Immediate WRA NEMA
0.05 - - - 0.05 WRA
Strategic Theme 2.2: Ecological Reserve Strategic Theme 2.2 total: 2.5
Theme priority: Very Important
2.2.1 Reserve determination
i Determine the Reserve for prioritised water resources in the Basin (note Reserve required for resource quality objectives)
Reserve determined LA01 WA11
Immediate WRA CG 0.05 - - - 0.05 WRA
2.2.2 Reserve compliance
i Increase Reserve awareness through training, brochures, social media, internet, factsheets and SCMPs.
Level of awareness regarding Reserve; Number of trainings and awareness campaigns undertaken
WA17 Short to medium-term
WRA WRUA - 0.2 0.2 - 0.4 WRA WSTF
ii Monitor and enforce Reserve compliance: Dam owners and operators, abstractors.
Environmental flows met LA02 WA15
Medium to long-term
WRA BWRC WRUA - - 1 1 2 WRA WSTF
Strategic Theme 2.3: Resource Quality Objectives Strategic Theme 2.3 total: 0.2
Theme priority: Critical
2.3.1 Set Resource Quality Objectives
i Determine the resource quality objectives for prioritised water resources in the Basin
Resource Quality Objectives set LA05 WA29
Immediate WRA NEMA
BWRC CG WRUA
0.2 - - - 0.2 WRA
Strategic Theme 2.4: Conservation and protection of ecological infrastructure Strategic Theme 2.4 total: 2.0
Theme priority: Important
2.4.1 Integrate environmental considerations into basin development and planning
i Ensure compliance with Kenyan environmental legislation in planning policies, plans and programs related to basin planning and development
SSEAs successfully completed; Categorise and protect environmentally sensitive areas; Identify and define environmentally sensitive areas
Short to long-term
WRA NEMA
BWRC WRUA - 0.15 0.15 0.3 0.6 WRA
2.4.2 Groundwater protection
i Implement under Strategy 3.4.1 Groundwater source protection
2.4.3 Riparian areas protection
i Protect and conserve prioritized riparian areas Riparian areas defined and protected WA36 Short to medium-term
NEMA WRA
WRUA - 0.2 0.2 - 0.4 WRA
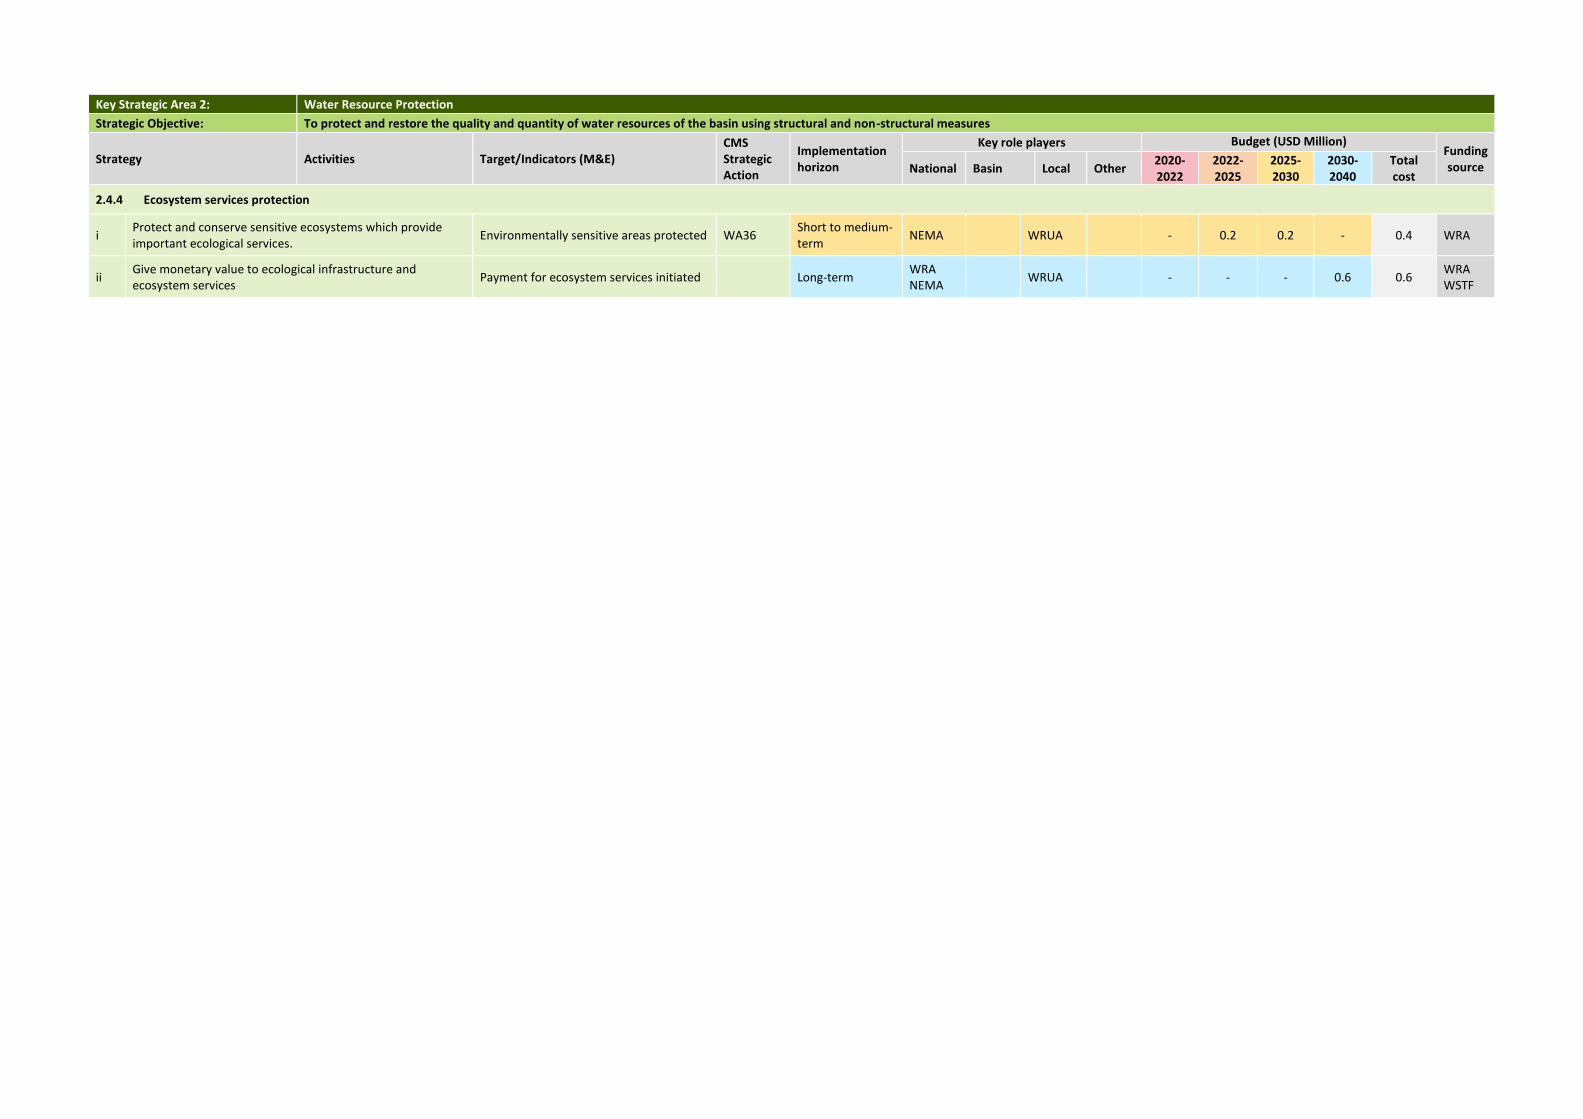
Key Strategic Area 2: Water Resource Protection
Strategic Objective: To protect and restore the quality and quantity of water resources of the basin using structural and non-structural measures
Strategy Activities Target/Indicators (M&E) CMS Strategic Action
Implementation horizon
Key role players Budget (USD Million) Funding source National Basin Local Other
2020-2022
2022- 2025
2025-2030
2030- 2040
Total cost
2.4.4 Ecosystem services protection
i Protect and conserve sensitive ecosystems which provide important ecological services.
Environmentally sensitive areas protected WA36 Short to medium-term
NEMA WRUA - 0.2 0.2 - 0.4 WRA
ii Give monetary value to ecological infrastructure and ecosystem services
Payment for ecosystem services initiated Long-term WRA NEMA
WRUA - - - 0.6 0.6 WRA WSTF
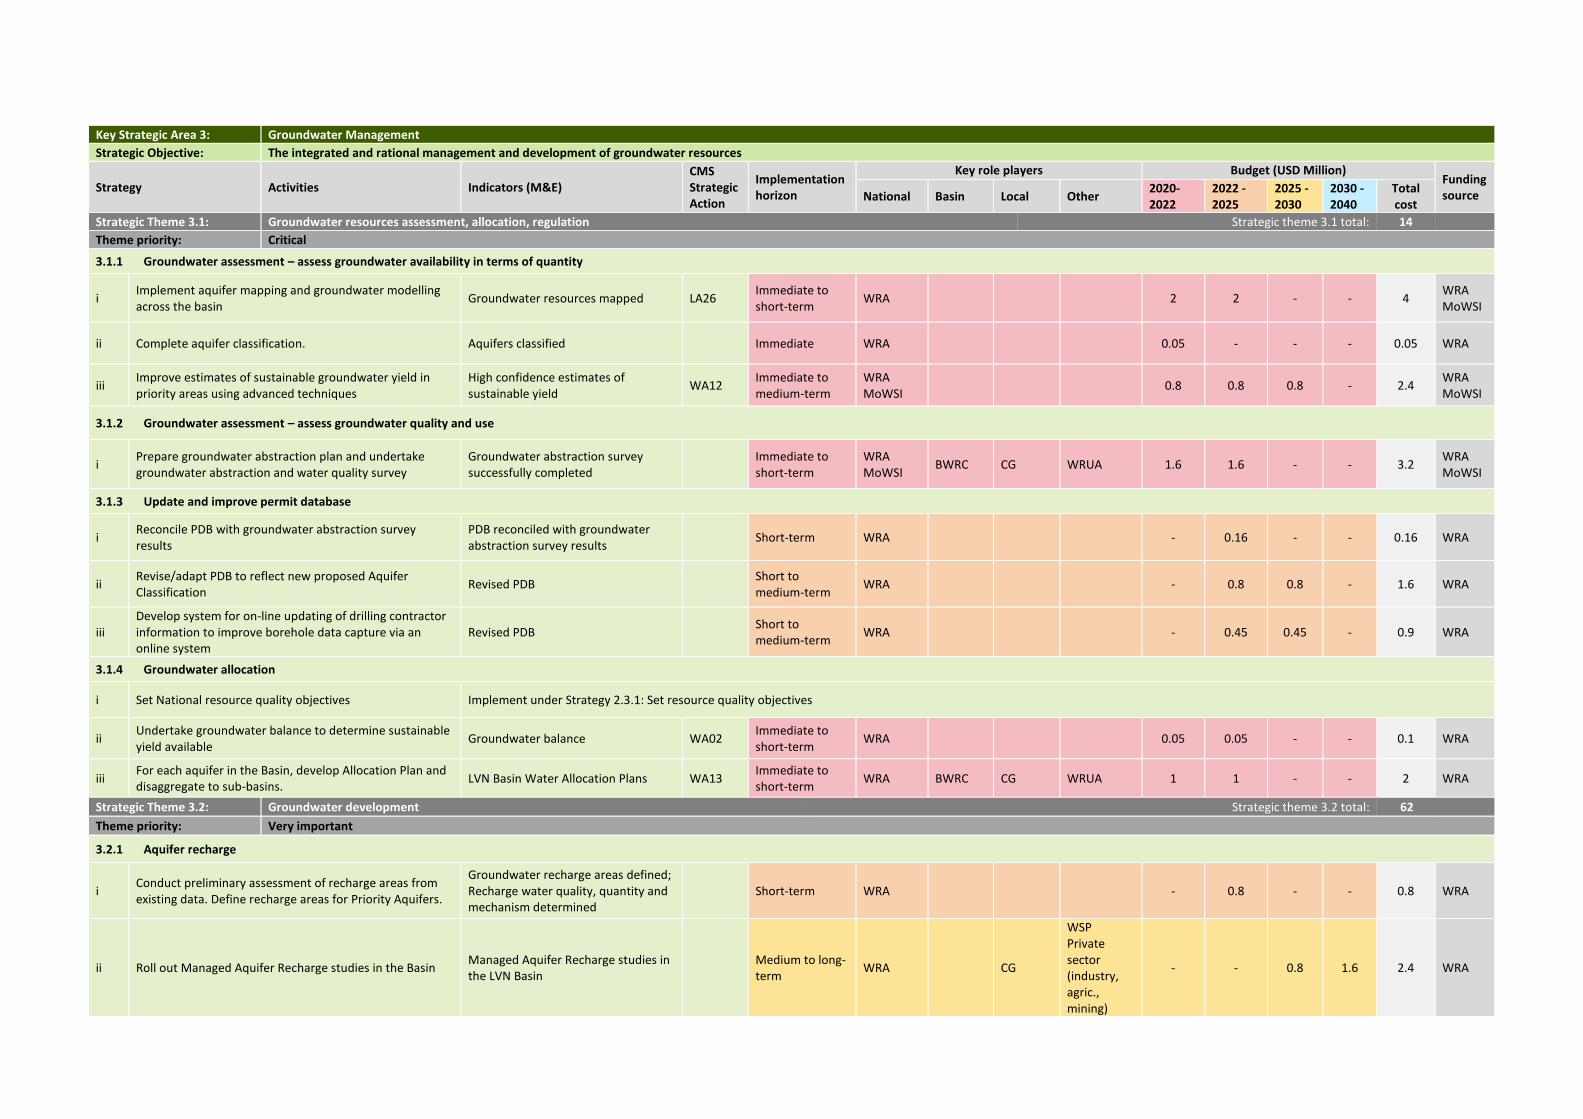
Key Strategic Area 3: Groundwater Management
Strategic Objective: The integrated and rational management and development of groundwater resources
Strategy Activities Indicators (M&E) CMS Strategic Action
Implementation horizon
Key role players Budget (USD Million) Funding source National Basin Local Other
2020-2022
2022 - 2025
2025 - 2030
2030 - 2040
Total cost
Strategic Theme 3.1: Groundwater resources assessment, allocation, regulation Strategic theme 3.1 total: 14
Theme priority: Critical
3.1.1 Groundwater assessment – assess groundwater availability in terms of quantity
i Implement aquifer mapping and groundwater modelling across the basin
Groundwater resources mapped LA26 Immediate to short-term
WRA 2 2 - - 4 WRA MoWSI
ii Complete aquifer classification. Aquifers classified Immediate WRA 0.05 - - - 0.05 WRA
iii Improve estimates of sustainable groundwater yield in priority areas using advanced techniques
High confidence estimates of sustainable yield
WA12 Immediate to medium-term
WRA MoWSI
0.8 0.8 0.8 - 2.4 WRA MoWSI
3.1.2 Groundwater assessment – assess groundwater quality and use
i Prepare groundwater abstraction plan and undertake groundwater abstraction and water quality survey
Groundwater abstraction survey successfully completed
Immediate to short-term
WRA MoWSI
BWRC CG WRUA 1.6 1.6 - - 3.2 WRA MoWSI
3.1.3 Update and improve permit database
i Reconcile PDB with groundwater abstraction survey results
PDB reconciled with groundwater abstraction survey results
Short-term WRA - 0.16 - - 0.16 WRA
ii Revise/adapt PDB to reflect new proposed Aquifer Classification
Revised PDB
Short to medium-term
WRA - 0.8 0.8 - 1.6 WRA
iii Develop system for on-line updating of drilling contractor information to improve borehole data capture via an online system
Revised PDB Short to medium-term
WRA - 0.45 0.45 - 0.9 WRA
3.1.4 Groundwater allocation
i Set National resource quality objectives Implement under Strategy 2.3.1: Set resource quality objectives
ii Undertake groundwater balance to determine sustainable yield available
Groundwater balance WA02 Immediate to short-term
WRA 0.05 0.05 - - 0.1 WRA
iii For each aquifer in the Basin, develop Allocation Plan and disaggregate to sub-basins.
LVN Basin Water Allocation Plans WA13 Immediate to short-term
WRA BWRC CG WRUA 1 1 - - 2 WRA
Strategic Theme 3.2: Groundwater development Strategic theme 3.2 total: 62
Theme priority: Very important
3.2.1 Aquifer recharge
i Conduct preliminary assessment of recharge areas from existing data. Define recharge areas for Priority Aquifers.
Groundwater recharge areas defined; Recharge water quality, quantity and mechanism determined
Short-term WRA - 0.8 - - 0.8 WRA
ii Roll out Managed Aquifer Recharge studies in the Basin Managed Aquifer Recharge studies in the LVN Basin
Medium to long-term
WRA CG
WSP Private sector (industry, agric., mining)
- - 0.8 1.6 2.4 WRA
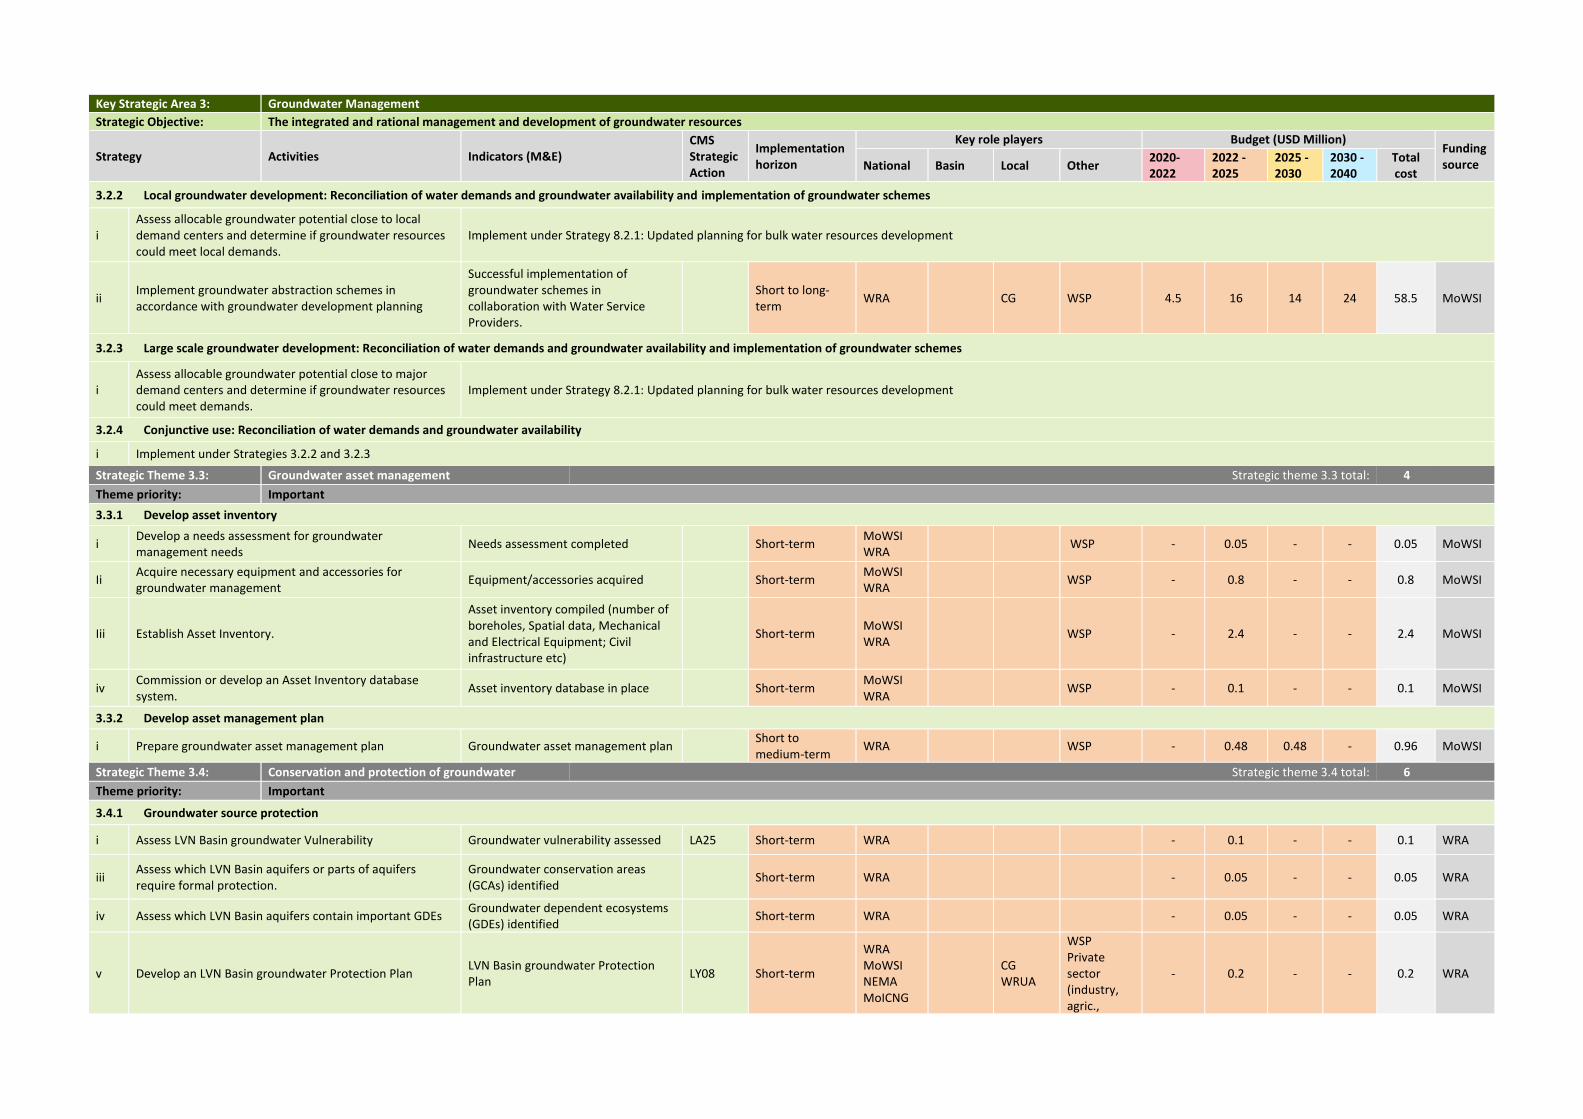
Key Strategic Area 3: Groundwater Management
Strategic Objective: The integrated and rational management and development of groundwater resources
Strategy Activities Indicators (M&E) CMS Strategic Action
Implementation horizon
Key role players Budget (USD Million) Funding source National Basin Local Other
2020-2022
2022 - 2025
2025 - 2030
2030 - 2040
Total cost
3.2.2 Local groundwater development: Reconciliation of water demands and groundwater availability and implementation of groundwater schemes
i Assess allocable groundwater potential close to local demand centers and determine if groundwater resources could meet local demands.
Implement under Strategy 8.2.1: Updated planning for bulk water resources development
ii Implement groundwater abstraction schemes in accordance with groundwater development planning
Successful implementation of groundwater schemes in collaboration with Water Service Providers.
Short to long-term
WRA CG WSP 4.5 16 14 24 58.5 MoWSI
3.2.3 Large scale groundwater development: Reconciliation of water demands and groundwater availability and implementation of groundwater schemes
i Assess allocable groundwater potential close to major demand centers and determine if groundwater resources could meet demands.
Implement under Strategy 8.2.1: Updated planning for bulk water resources development
3.2.4 Conjunctive use: Reconciliation of water demands and groundwater availability
i Implement under Strategies 3.2.2 and 3.2.3
Strategic Theme 3.3: Groundwater asset management Strategic theme 3.3 total: 4
Theme priority: Important
3.3.1 Develop asset inventory
i Develop a needs assessment for groundwater management needs
Needs assessment completed Short-term MoWSI WRA
WSP - 0.05 - - 0.05 MoWSI
Ii Acquire necessary equipment and accessories for groundwater management
Equipment/accessories acquired Short-term MoWSI WRA
WSP - 0.8 - - 0.8 MoWSI
Iii Establish Asset Inventory.
Asset inventory compiled (number of boreholes, Spatial data, Mechanical and Electrical Equipment; Civil infrastructure etc)
Short-term MoWSI WRA
WSP - 2.4 - - 2.4 MoWSI
iv Commission or develop an Asset Inventory database system.
Asset inventory database in place
Short-term MoWSI WRA
WSP - 0.1 - - 0.1 MoWSI
3.3.2 Develop asset management plan
i Prepare groundwater asset management plan Groundwater asset management plan Short to
medium-term WRA WSP - 0.48 0.48 - 0.96 MoWSI
Strategic Theme 3.4: Conservation and protection of groundwater Strategic theme 3.4 total: 6
Theme priority: Important
3.4.1 Groundwater source protection
i Assess LVN Basin groundwater Vulnerability Groundwater vulnerability assessed LA25 Short-term WRA - 0.1 - - 0.1 WRA
iii Assess which LVN Basin aquifers or parts of aquifers require formal protection.
Groundwater conservation areas (GCAs) identified
Short-term WRA - 0.05 - - 0.05 WRA
iv Assess which LVN Basin aquifers contain important GDEs Groundwater dependent ecosystems (GDEs) identified
Short-term WRA - 0.05 - - 0.05 WRA
v Develop an LVN Basin groundwater Protection Plan LVN Basin groundwater Protection Plan
LY08 Short-term
WRA MoWSI NEMA MoICNG
CG WRUA
WSP Private sector (industry, agric.,
- 0.2 - - 0.2 WRA
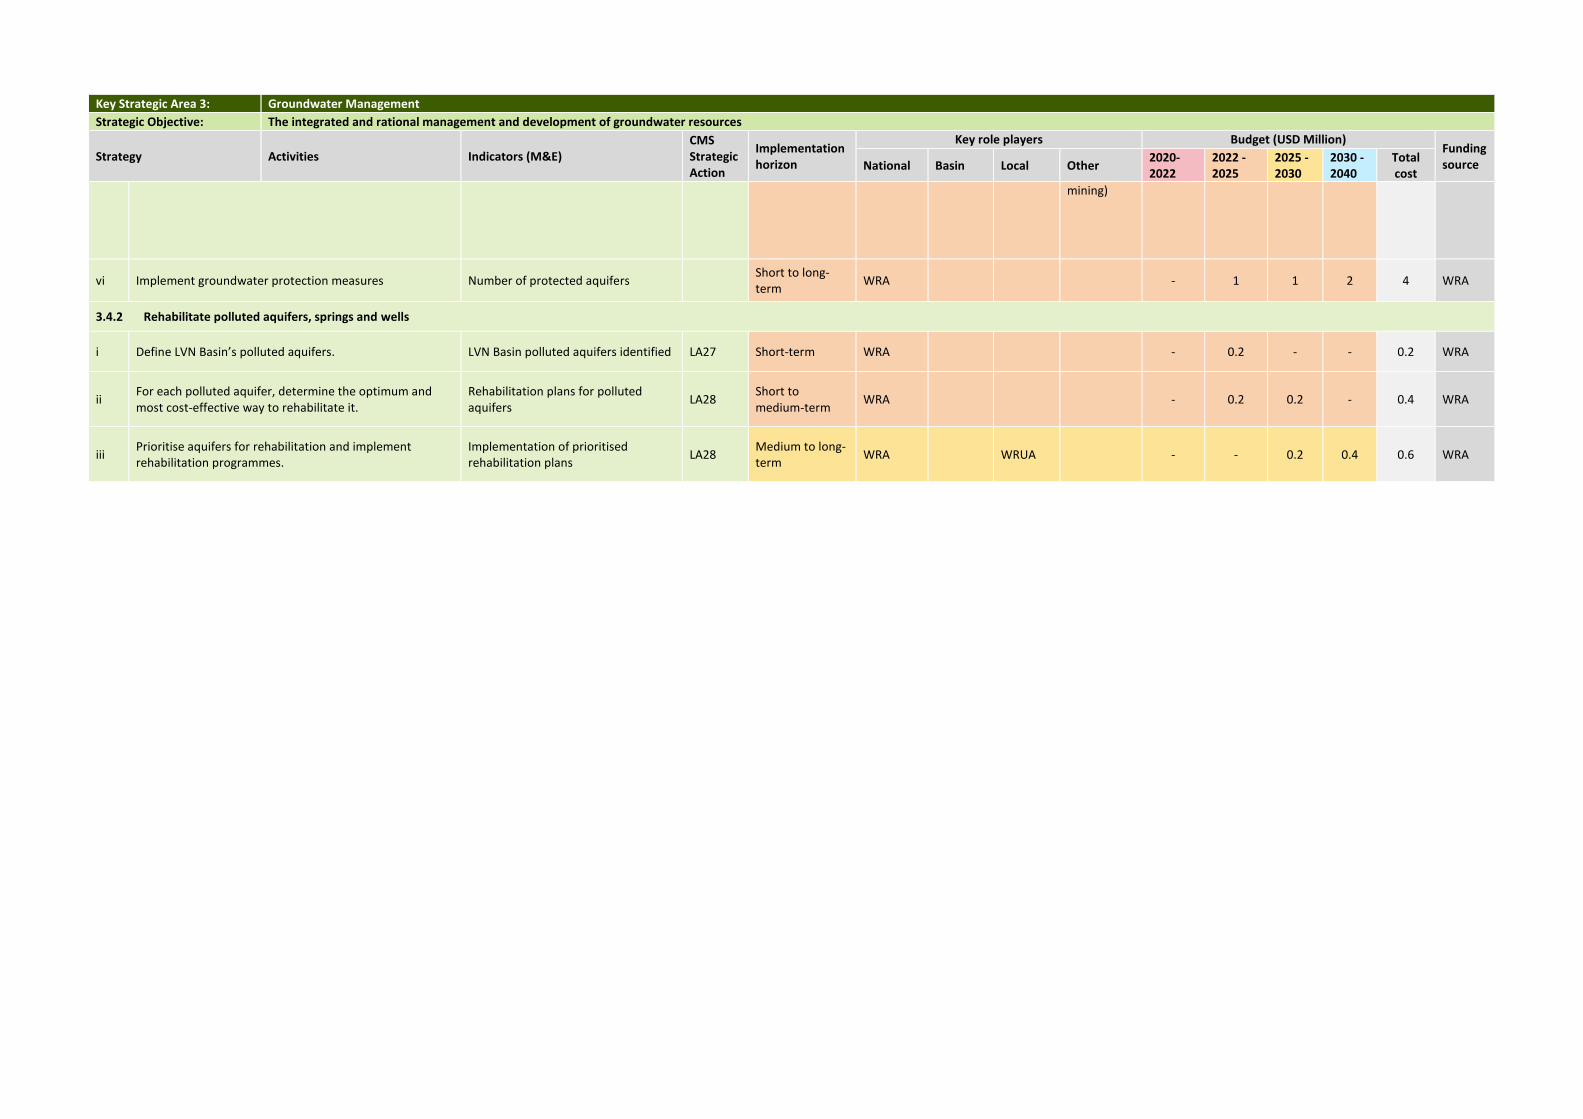
Key Strategic Area 3: Groundwater Management
Strategic Objective: The integrated and rational management and development of groundwater resources
Strategy Activities Indicators (M&E) CMS Strategic Action
Implementation horizon
Key role players Budget (USD Million) Funding source National Basin Local Other
2020-2022
2022 - 2025
2025 - 2030
2030 - 2040
Total cost
mining)
vi Implement groundwater protection measures Number of protected aquifers Short to long-term
WRA - 1 1 2 4 WRA
3.4.2 Rehabilitate polluted aquifers, springs and wells
i Define LVN Basin’s polluted aquifers. LVN Basin polluted aquifers identified LA27 Short-term WRA - 0.2 - - 0.2 WRA
ii For each polluted aquifer, determine the optimum and most cost-effective way to rehabilitate it.
Rehabilitation plans for polluted aquifers
LA28 Short to medium-term
WRA - 0.2 0.2 - 0.4 WRA
iii Prioritise aquifers for rehabilitation and implement rehabilitation programmes.
Implementation of prioritised rehabilitation plans
LA28 Medium to long-term
WRA WRUA - - 0.2 0.4 0.6 WRA
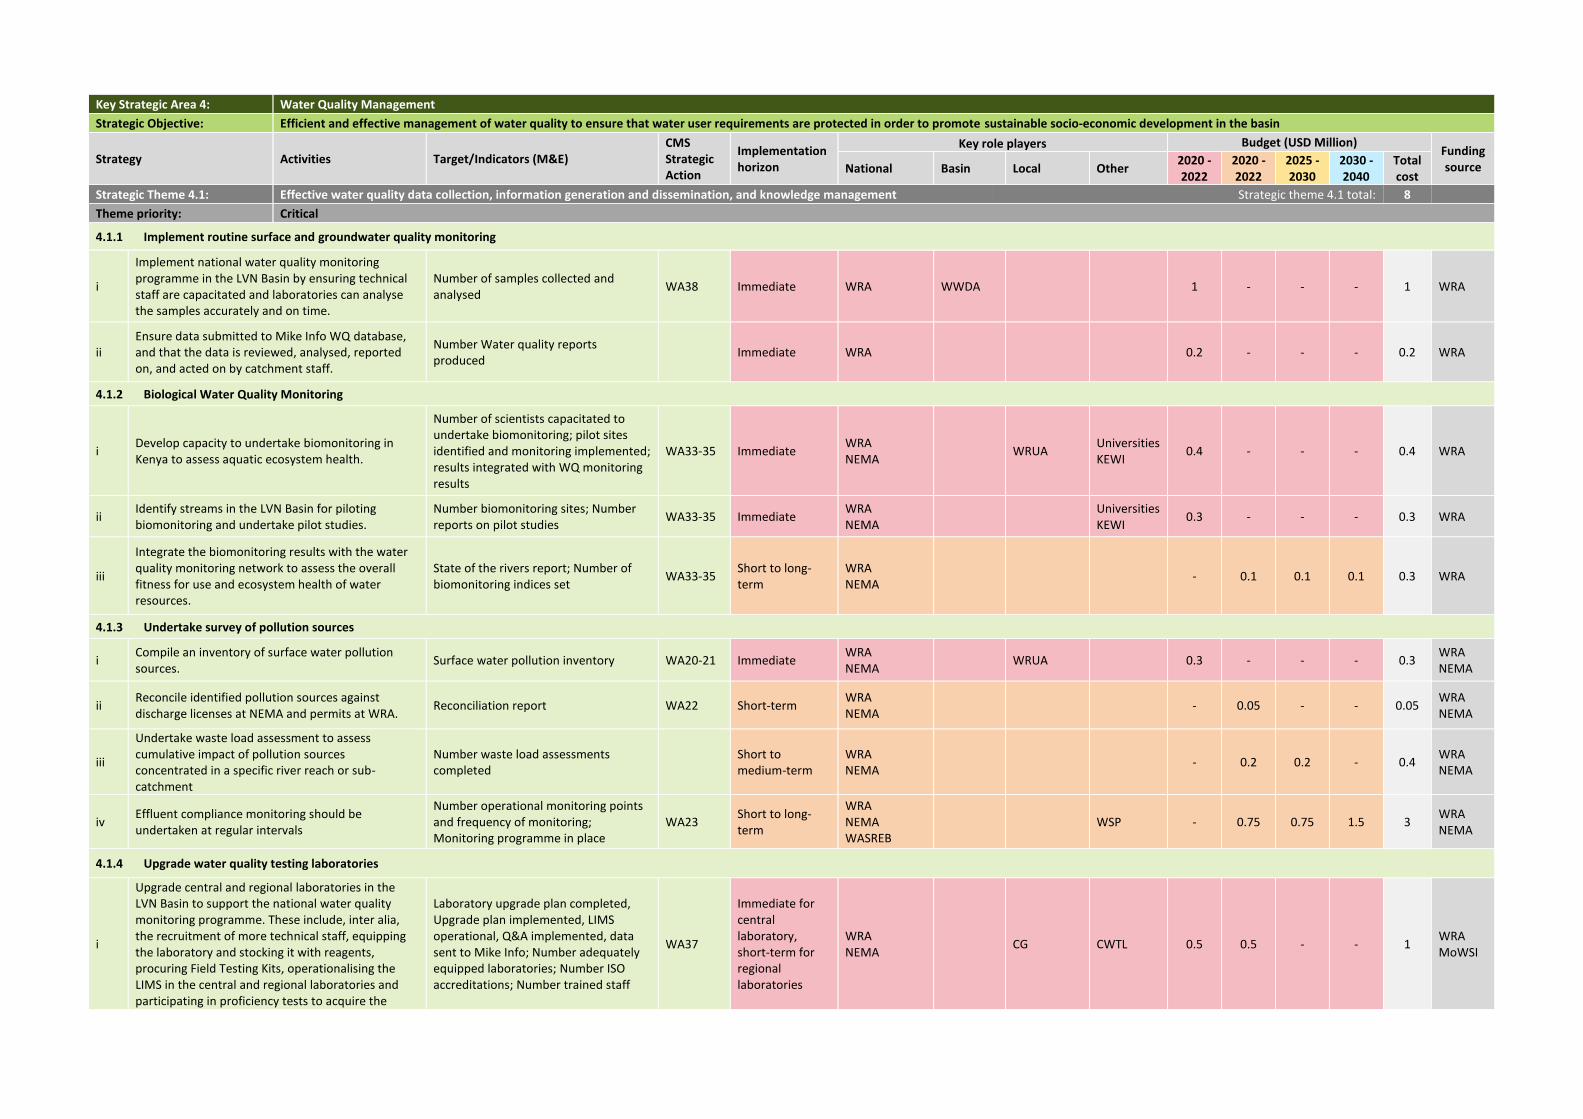
Key Strategic Area 4: Water Quality Management
Strategic Objective: Efficient and effective management of water quality to ensure that water user requirements are protected in order to promote sustainable socio-economic development in the basin
Strategy Activities Target/Indicators (M&E) CMS Strategic Action
Implementation horizon
Key role players Budget (USD Million) Funding source National Basin Local Other
2020 -2022
2020 - 2022
2025 - 2030
2030 - 2040
Total cost
Strategic Theme 4.1: Effective water quality data collection, information generation and dissemination, and knowledge management Strategic theme 4.1 total: 8
Theme priority: Critical
4.1.1 Implement routine surface and groundwater quality monitoring
i
Implement national water quality monitoring programme in the LVN Basin by ensuring technical staff are capacitated and laboratories can analyse the samples accurately and on time.
Number of samples collected and analysed
WA38 Immediate WRA WWDA 1 - - - 1 WRA
ii Ensure data submitted to Mike Info WQ database, and that the data is reviewed, analysed, reported on, and acted on by catchment staff.
Number Water quality reports produced
Immediate WRA 0.2 - - - 0.2 WRA
4.1.2 Biological Water Quality Monitoring
i Develop capacity to undertake biomonitoring in Kenya to assess aquatic ecosystem health.
Number of scientists capacitated to undertake biomonitoring; pilot sites identified and monitoring implemented; results integrated with WQ monitoring results
WA33-35 Immediate WRA NEMA
WRUA Universities KEWI
0.4 - - - 0.4 WRA
ii Identify streams in the LVN Basin for piloting biomonitoring and undertake pilot studies.
Number biomonitoring sites; Number reports on pilot studies
WA33-35 Immediate WRA NEMA
Universities KEWI
0.3 - - - 0.3 WRA
iii
Integrate the biomonitoring results with the water quality monitoring network to assess the overall fitness for use and ecosystem health of water resources.
State of the rivers report; Number of biomonitoring indices set
WA33-35 Short to long-term
WRA NEMA
- 0.1 0.1 0.1 0.3 WRA
4.1.3 Undertake survey of pollution sources
i Compile an inventory of surface water pollution sources.
Surface water pollution inventory WA20-21 Immediate WRA NEMA
WRUA 0.3 - - - 0.3 WRA NEMA
ii Reconcile identified pollution sources against discharge licenses at NEMA and permits at WRA.
Reconciliation report WA22 Short-term WRA NEMA
- 0.05 - - 0.05 WRA NEMA
iii
Undertake waste load assessment to assess cumulative impact of pollution sources concentrated in a specific river reach or sub-catchment
Number waste load assessments completed
Short to medium-term
WRA NEMA
- 0.2 0.2 - 0.4 WRA NEMA
iv Effluent compliance monitoring should be undertaken at regular intervals
Number operational monitoring points and frequency of monitoring; Monitoring programme in place
WA23 Short to long-term
WRA NEMA WASREB
WSP - 0.75 0.75 1.5 3 WRA NEMA
4.1.4 Upgrade water quality testing laboratories
i
Upgrade central and regional laboratories in the LVN Basin to support the national water quality monitoring programme. These include, inter alia, the recruitment of more technical staff, equipping the laboratory and stocking it with reagents, procuring Field Testing Kits, operationalising the LIMS in the central and regional laboratories and participating in proficiency tests to acquire the
Laboratory upgrade plan completed, Upgrade plan implemented, LIMS operational, Q&A implemented, data sent to Mike Info; Number adequately equipped laboratories; Number ISO accreditations; Number trained staff
WA37
Immediate for central laboratory, short-term for regional laboratories
WRA NEMA
CG CWTL 0.5 0.5 - - 1 WRA MoWSI
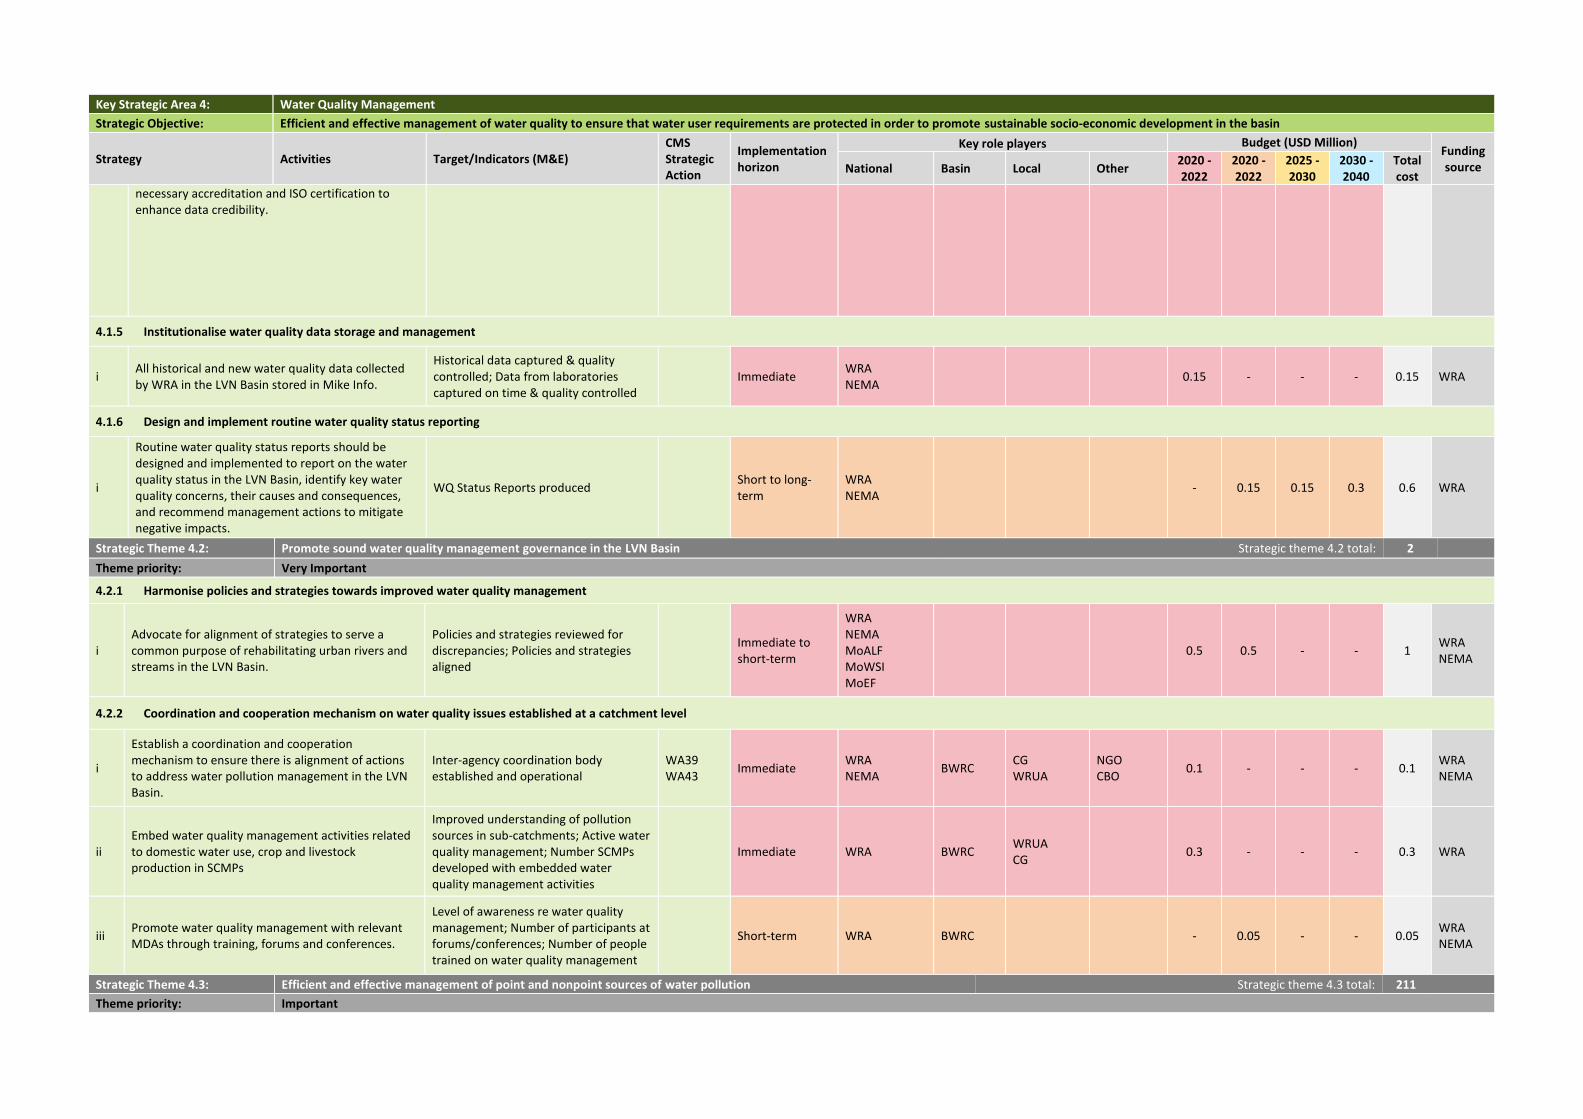
Key Strategic Area 4: Water Quality Management
Strategic Objective: Efficient and effective management of water quality to ensure that water user requirements are protected in order to promote sustainable socio-economic development in the basin
Strategy Activities Target/Indicators (M&E) CMS Strategic Action
Implementation horizon
Key role players Budget (USD Million) Funding source National Basin Local Other
2020 -2022
2020 - 2022
2025 - 2030
2030 - 2040
Total cost
necessary accreditation and ISO certification to enhance data credibility.
4.1.5 Institutionalise water quality data storage and management
i All historical and new water quality data collected by WRA in the LVN Basin stored in Mike Info.
Historical data captured & quality controlled; Data from laboratories captured on time & quality controlled
Immediate WRA NEMA
0.15 - - - 0.15 WRA
4.1.6 Design and implement routine water quality status reporting
i
Routine water quality status reports should be designed and implemented to report on the water quality status in the LVN Basin, identify key water quality concerns, their causes and consequences, and recommend management actions to mitigate negative impacts.
WQ Status Reports produced
Short to long-term
WRA NEMA
- 0.15 0.15 0.3 0.6 WRA
Strategic Theme 4.2: Promote sound water quality management governance in the LVN Basin Strategic theme 4.2 total: 2
Theme priority: Very Important
4.2.1 Harmonise policies and strategies towards improved water quality management
i Advocate for alignment of strategies to serve a common purpose of rehabilitating urban rivers and streams in the LVN Basin.
Policies and strategies reviewed for discrepancies; Policies and strategies aligned
Immediate to short-term
WRA NEMA MoALF MoWSI MoEF
0.5 0.5 - - 1 WRA NEMA
4.2.2 Coordination and cooperation mechanism on water quality issues established at a catchment level
i
Establish a coordination and cooperation mechanism to ensure there is alignment of actions to address water pollution management in the LVN Basin.
Inter-agency coordination body established and operational
WA39 WA43
Immediate WRA NEMA
BWRC CG WRUA
NGO CBO
0.1 - - - 0.1 WRA NEMA
ii Embed water quality management activities related to domestic water use, crop and livestock production in SCMPs
Improved understanding of pollution sources in sub-catchments; Active water quality management; Number SCMPs developed with embedded water quality management activities
Immediate WRA BWRC WRUA CG
0.3 - - - 0.3 WRA
iii Promote water quality management with relevant MDAs through training, forums and conferences.
Level of awareness re water quality management; Number of participants at forums/conferences; Number of people trained on water quality management
Short-term WRA BWRC - 0.05 - - 0.05 WRA NEMA
Strategic Theme 4.3: Efficient and effective management of point and nonpoint sources of water pollution Strategic theme 4.3 total: 211
Theme priority: Important
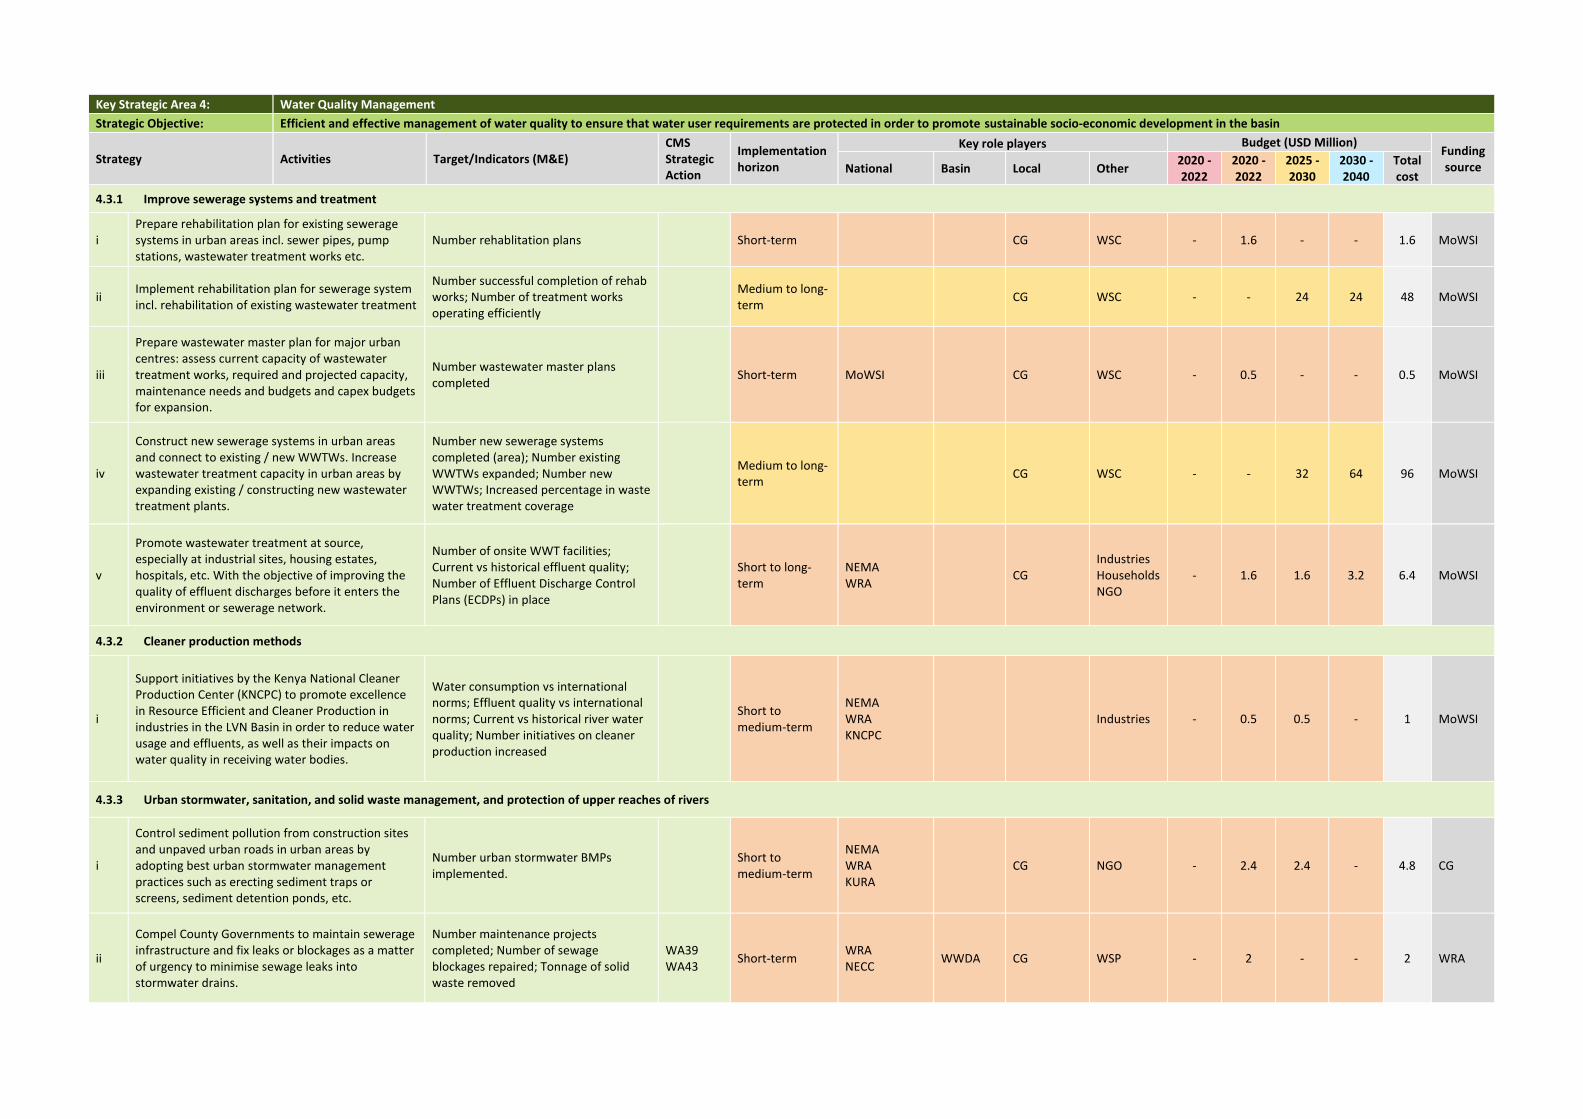
Key Strategic Area 4: Water Quality Management
Strategic Objective: Efficient and effective management of water quality to ensure that water user requirements are protected in order to promote sustainable socio-economic development in the basin
Strategy Activities Target/Indicators (M&E) CMS Strategic Action
Implementation horizon
Key role players Budget (USD Million) Funding source National Basin Local Other
2020 -2022
2020 - 2022
2025 - 2030
2030 - 2040
Total cost
4.3.1 Improve sewerage systems and treatment
i Prepare rehabilitation plan for existing sewerage systems in urban areas incl. sewer pipes, pump stations, wastewater treatment works etc.
Number rehablitation plans
Short-term CG WSC - 1.6 - - 1.6 MoWSI
ii Implement rehabilitation plan for sewerage system incl. rehabilitation of existing wastewater treatment
Number successful completion of rehab works; Number of treatment works operating efficiently
Medium to long-term
CG WSC - - 24 24 48 MoWSI
iii
Prepare wastewater master plan for major urban centres: assess current capacity of wastewater treatment works, required and projected capacity, maintenance needs and budgets and capex budgets for expansion.
Number wastewater master plans completed
Short-term MoWSI CG WSC - 0.5 - - 0.5 MoWSI
iv
Construct new sewerage systems in urban areas and connect to existing / new WWTWs. Increase wastewater treatment capacity in urban areas by expanding existing / constructing new wastewater treatment plants.
Number new sewerage systems completed (area); Number existing WWTWs expanded; Number new WWTWs; Increased percentage in waste water treatment coverage
Medium to long-term
CG WSC - - 32 64 96 MoWSI
v
Promote wastewater treatment at source, especially at industrial sites, housing estates, hospitals, etc. With the objective of improving the quality of effluent discharges before it enters the environment or sewerage network.
Number of onsite WWT facilities; Current vs historical effluent quality; Number of Effluent Discharge Control Plans (ECDPs) in place
Short to long-term
NEMA WRA
CG Industries Households NGO
- 1.6 1.6 3.2 6.4 MoWSI
4.3.2 Cleaner production methods
i
Support initiatives by the Kenya National Cleaner Production Center (KNCPC) to promote excellence in Resource Efficient and Cleaner Production in industries in the LVN Basin in order to reduce water usage and effluents, as well as their impacts on water quality in receiving water bodies.
Water consumption vs international norms; Effluent quality vs international norms; Current vs historical river water quality; Number initiatives on cleaner production increased
Short to medium-term
NEMA WRA KNCPC
Industries - 0.5 0.5 - 1 MoWSI
4.3.3 Urban stormwater, sanitation, and solid waste management, and protection of upper reaches of rivers
i
Control sediment pollution from construction sites and unpaved urban roads in urban areas by adopting best urban stormwater management practices such as erecting sediment traps or screens, sediment detention ponds, etc.
Number urban stormwater BMPs implemented.
Short to medium-term
NEMA WRA KURA
CG NGO - 2.4 2.4 - 4.8 CG
ii
Compel County Governments to maintain sewerage infrastructure and fix leaks or blockages as a matter of urgency to minimise sewage leaks into stormwater drains.
Number maintenance projects completed; Number of sewage blockages repaired; Tonnage of solid waste removed
WA39 WA43
Short-term WRA NECC
WWDA CG WSP - 2 - - 2 WRA
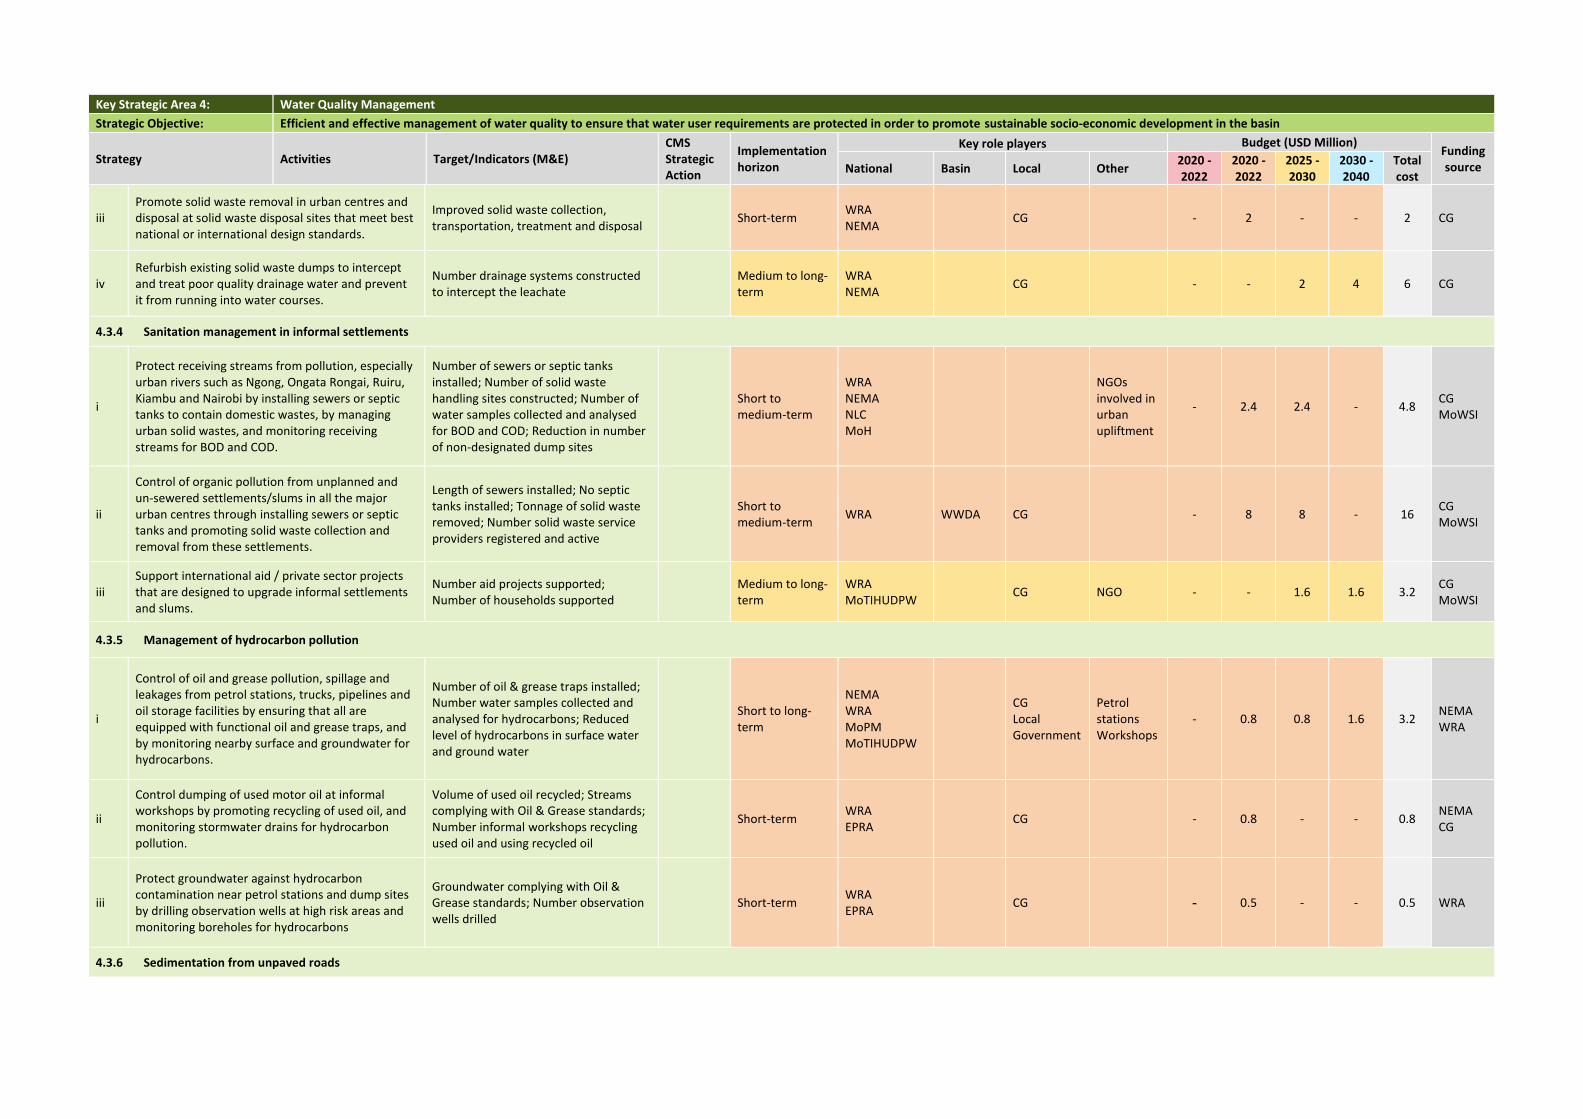
Key Strategic Area 4: Water Quality Management
Strategic Objective: Efficient and effective management of water quality to ensure that water user requirements are protected in order to promote sustainable socio-economic development in the basin
Strategy Activities Target/Indicators (M&E) CMS Strategic Action
Implementation horizon
Key role players Budget (USD Million) Funding source National Basin Local Other
2020 -2022
2020 - 2022
2025 - 2030
2030 - 2040
Total cost
iii Promote solid waste removal in urban centres and disposal at solid waste disposal sites that meet best national or international design standards.
Improved solid waste collection, transportation, treatment and disposal
Short-term WRA NEMA
CG - 2 - - 2 CG
iv Refurbish existing solid waste dumps to intercept and treat poor quality drainage water and prevent it from running into water courses.
Number drainage systems constructed to intercept the leachate
Medium to long-term
WRA NEMA
CG - - 2 4 6 CG
4.3.4 Sanitation management in informal settlements
i
Protect receiving streams from pollution, especially urban rivers such as Ngong, Ongata Rongai, Ruiru, Kiambu and Nairobi by installing sewers or septic tanks to contain domestic wastes, by managing urban solid wastes, and monitoring receiving streams for BOD and COD.
Number of sewers or septic tanks installed; Number of solid waste handling sites constructed; Number of water samples collected and analysed for BOD and COD; Reduction in number of non-designated dump sites
Short to medium-term
WRA NEMA NLC MoH
NGOs involved in urban upliftment
- 2.4 2.4 - 4.8 CG MoWSI
ii
Control of organic pollution from unplanned and un-sewered settlements/slums in all the major urban centres through installing sewers or septic tanks and promoting solid waste collection and removal from these settlements.
Length of sewers installed; No septic tanks installed; Tonnage of solid waste removed; Number solid waste service providers registered and active
Short to medium-term
WRA WWDA CG
- 8 8 - 16 CG MoWSI
iii Support international aid / private sector projects that are designed to upgrade informal settlements and slums.
Number aid projects supported; Number of households supported
Medium to long-term
WRA MoTIHUDPW
CG NGO - - 1.6 1.6 3.2 CG MoWSI
4.3.5 Management of hydrocarbon pollution
i
Control of oil and grease pollution, spillage and leakages from petrol stations, trucks, pipelines and oil storage facilities by ensuring that all are equipped with functional oil and grease traps, and by monitoring nearby surface and groundwater for hydrocarbons.
Number of oil & grease traps installed; Number water samples collected and analysed for hydrocarbons; Reduced level of hydrocarbons in surface water and ground water
Short to long-term
NEMA WRA MoPM MoTIHUDPW
CG Local Government
Petrol stations Workshops
- 0.8 0.8 1.6 3.2 NEMA WRA
ii
Control dumping of used motor oil at informal workshops by promoting recycling of used oil, and monitoring stormwater drains for hydrocarbon pollution.
Volume of used oil recycled; Streams complying with Oil & Grease standards; Number informal workshops recycling used oil and using recycled oil
Short-term WRA EPRA
CG
- 0.8 - - 0.8 NEMA CG
iii
Protect groundwater against hydrocarbon contamination near petrol stations and dump sites by drilling observation wells at high risk areas and monitoring boreholes for hydrocarbons
Groundwater complying with Oil & Grease standards; Number observation wells drilled
Short-term WRA EPRA
CG
- 0.5 - - 0.5 WRA
4.3.6 Sedimentation from unpaved roads
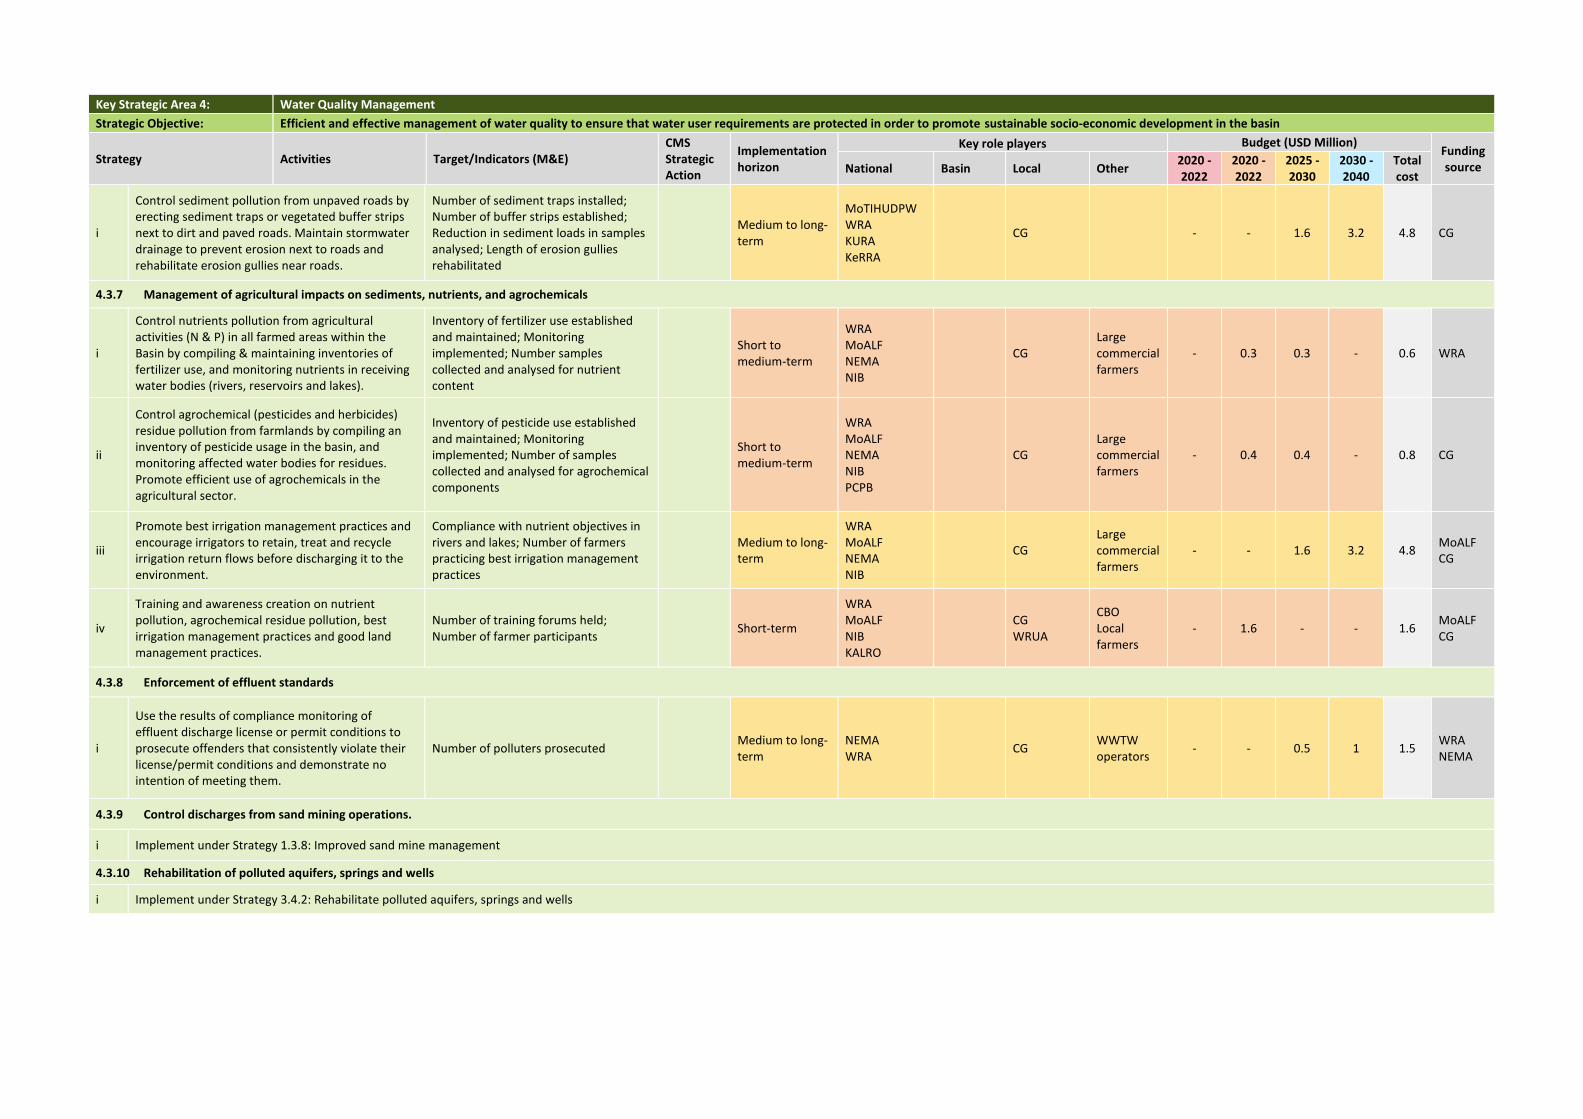
Key Strategic Area 4: Water Quality Management
Strategic Objective: Efficient and effective management of water quality to ensure that water user requirements are protected in order to promote sustainable socio-economic development in the basin
Strategy Activities Target/Indicators (M&E) CMS Strategic Action
Implementation horizon
Key role players Budget (USD Million) Funding source National Basin Local Other
2020 -2022
2020 - 2022
2025 - 2030
2030 - 2040
Total cost
i
Control sediment pollution from unpaved roads by erecting sediment traps or vegetated buffer strips next to dirt and paved roads. Maintain stormwater drainage to prevent erosion next to roads and rehabilitate erosion gullies near roads.
Number of sediment traps installed; Number of buffer strips established; Reduction in sediment loads in samples analysed; Length of erosion gullies rehabilitated
Medium to long-term
MoTIHUDPW WRA KURA KeRRA
CG
- - 1.6 3.2 4.8 CG
4.3.7 Management of agricultural impacts on sediments, nutrients, and agrochemicals
i
Control nutrients pollution from agricultural activities (N & P) in all farmed areas within the Basin by compiling & maintaining inventories of fertilizer use, and monitoring nutrients in receiving water bodies (rivers, reservoirs and lakes).
Inventory of fertilizer use established and maintained; Monitoring implemented; Number samples collected and analysed for nutrient content
Short to medium-term
WRA MoALF NEMA NIB
CG Large commercial farmers
- 0.3 0.3 - 0.6 WRA
ii
Control agrochemical (pesticides and herbicides) residue pollution from farmlands by compiling an inventory of pesticide usage in the basin, and monitoring affected water bodies for residues. Promote efficient use of agrochemicals in the agricultural sector.
Inventory of pesticide use established and maintained; Monitoring implemented; Number of samples collected and analysed for agrochemical components
Short to medium-term
WRA MoALF NEMA NIB PCPB
CG Large commercial farmers
- 0.4 0.4 - 0.8 CG
iii
Promote best irrigation management practices and encourage irrigators to retain, treat and recycle irrigation return flows before discharging it to the environment.
Compliance with nutrient objectives in rivers and lakes; Number of farmers practicing best irrigation management practices
Medium to long-term
WRA MoALF NEMA NIB
CG Large commercial farmers
- - 1.6 3.2 4.8 MoALF CG
iv
Training and awareness creation on nutrient pollution, agrochemical residue pollution, best irrigation management practices and good land management practices.
Number of training forums held; Number of farmer participants
Short-term
WRA MoALF NIB KALRO
CG WRUA
CBO Local farmers
- 1.6 - - 1.6 MoALF CG
4.3.8 Enforcement of effluent standards
i
Use the results of compliance monitoring of effluent discharge license or permit conditions to prosecute offenders that consistently violate their license/permit conditions and demonstrate no intention of meeting them.
Number of polluters prosecuted Medium to long-term
NEMA WRA
CG WWTW operators
- - 0.5 1 1.5 WRA NEMA
4.3.9 Control discharges from sand mining operations.
i Implement under Strategy 1.3.8: Improved sand mine management
4.3.10 Rehabilitation of polluted aquifers, springs and wells
i Implement under Strategy 3.4.2: Rehabilitate polluted aquifers, springs and wells
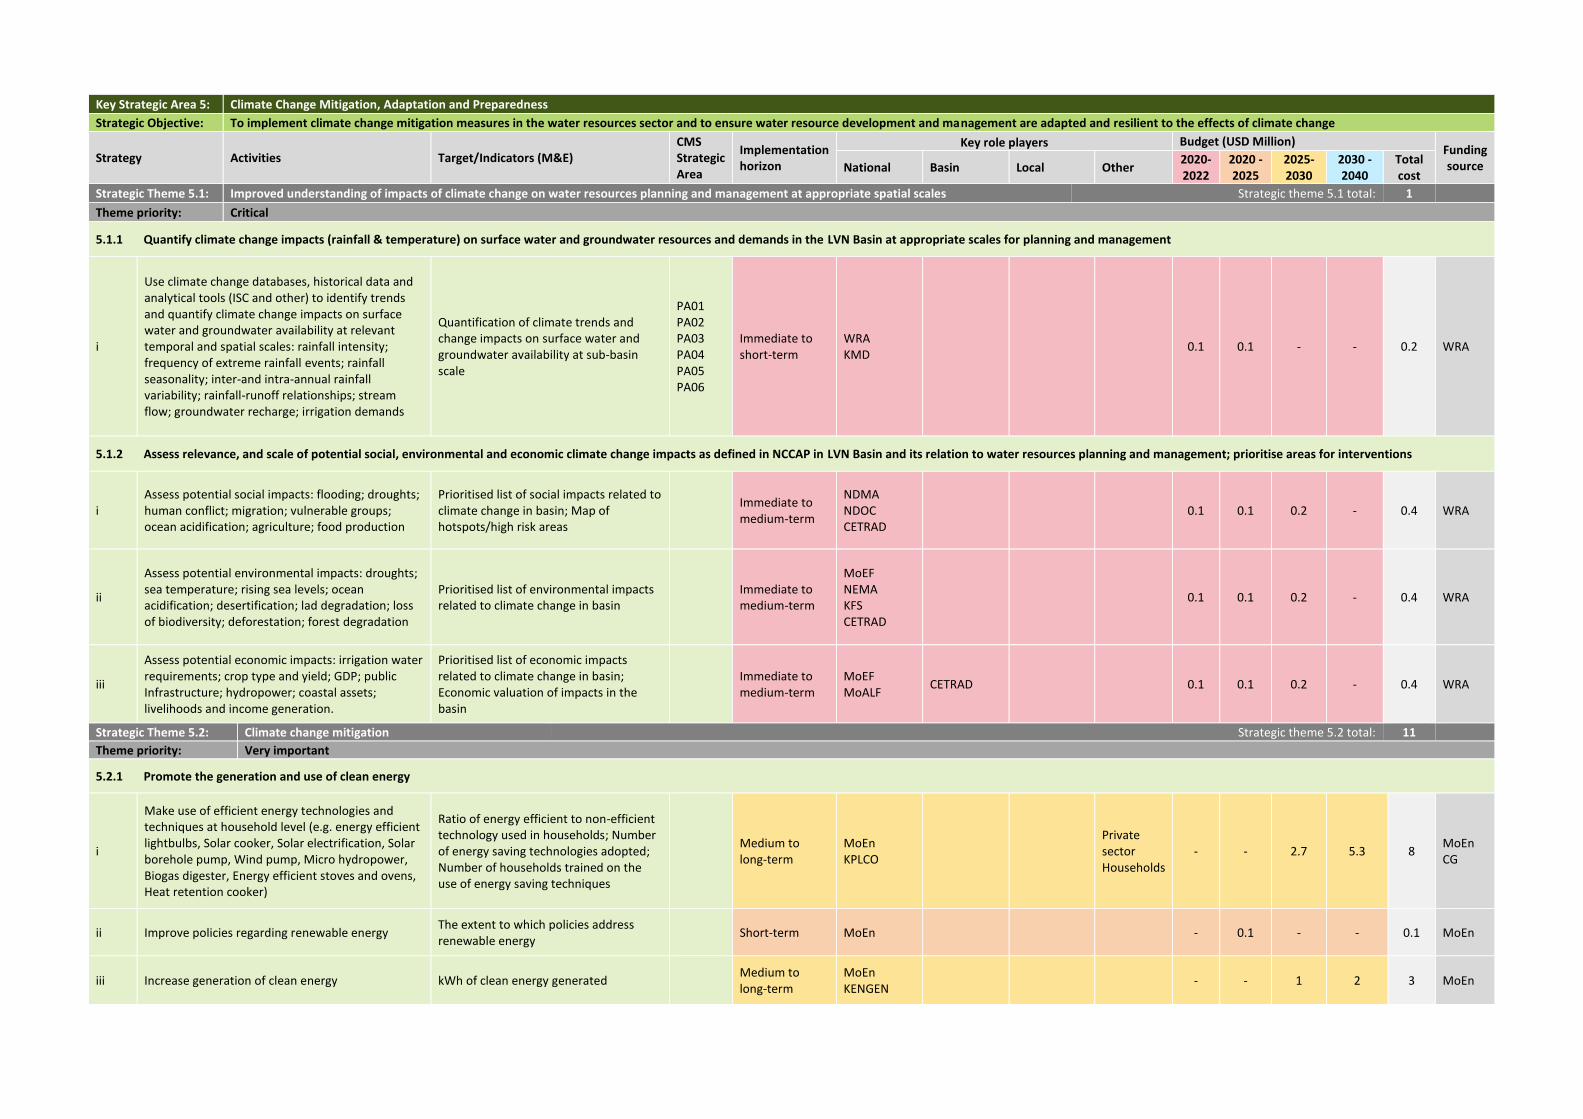
Key Strategic Area 5: Climate Change Mitigation, Adaptation and Preparedness
Strategic Objective: To implement climate change mitigation measures in the water resources sector and to ensure water resource development and management are adapted and resilient to the effects of climate change
Strategy Activities Target/Indicators (M&E) CMS Strategic Area
Implementation horizon
Key role players Budget (USD Million) Funding source National Basin Local Other
2020-2022
2020 - 2025
2025- 2030
2030 - 2040
Total cost
Strategic Theme 5.1: Improved understanding of impacts of climate change on water resources planning and management at appropriate spatial scales Strategic theme 5.1 total: 1
Theme priority: Critical
5.1.1 Quantify climate change impacts (rainfall & temperature) on surface water and groundwater resources and demands in the LVN Basin at appropriate scales for planning and management
i
Use climate change databases, historical data and analytical tools (ISC and other) to identify trends and quantify climate change impacts on surface water and groundwater availability at relevant temporal and spatial scales: rainfall intensity; frequency of extreme rainfall events; rainfall seasonality; inter-and intra-annual rainfall variability; rainfall-runoff relationships; stream flow; groundwater recharge; irrigation demands
Quantification of climate trends and change impacts on surface water and groundwater availability at sub-basin scale
PA01 PA02 PA03 PA04 PA05 PA06
Immediate to short-term
WRA KMD
0.1 0.1 - - 0.2 WRA
5.1.2 Assess relevance, and scale of potential social, environmental and economic climate change impacts as defined in NCCAP in LVN Basin and its relation to water resources planning and management; prioritise areas for interventions
i Assess potential social impacts: flooding; droughts; human conflict; migration; vulnerable groups; ocean acidification; agriculture; food production
Prioritised list of social impacts related to climate change in basin; Map of hotspots/high risk areas
Immediate to medium-term
NDMA NDOC CETRAD
0.1 0.1 0.2 - 0.4 WRA
ii
Assess potential environmental impacts: droughts; sea temperature; rising sea levels; ocean acidification; desertification; lad degradation; loss of biodiversity; deforestation; forest degradation
Prioritised list of environmental impacts related to climate change in basin
Immediate to medium-term
MoEF NEMA KFS CETRAD
0.1 0.1 0.2 - 0.4 WRA
iii
Assess potential economic impacts: irrigation water requirements; crop type and yield; GDP; public Infrastructure; hydropower; coastal assets; livelihoods and income generation.
Prioritised list of economic impacts related to climate change in basin; Economic valuation of impacts in the basin
Immediate to medium-term
MoEF MoALF
CETRAD 0.1 0.1 0.2 - 0.4 WRA
Strategic Theme 5.2: Climate change mitigation Strategic theme 5.2 total: 11
Theme priority: Very important
5.2.1 Promote the generation and use of clean energy
i
Make use of efficient energy technologies and techniques at household level (e.g. energy efficient lightbulbs, Solar cooker, Solar electrification, Solar borehole pump, Wind pump, Micro hydropower, Biogas digester, Energy efficient stoves and ovens, Heat retention cooker)
Ratio of energy efficient to non-efficient technology used in households; Number of energy saving technologies adopted; Number of households trained on the use of energy saving techniques
Medium to long-term
MoEn KPLCO
Private sector Households
- - 2.7 5.3 8 MoEn CG
ii Improve policies regarding renewable energy The extent to which policies address renewable energy
Short-term MoEn - 0.1 - - 0.1 MoEn
iii Increase generation of clean energy kWh of clean energy generated
Medium to long-term
MoEn KENGEN
- - 1 2 3 MoEn
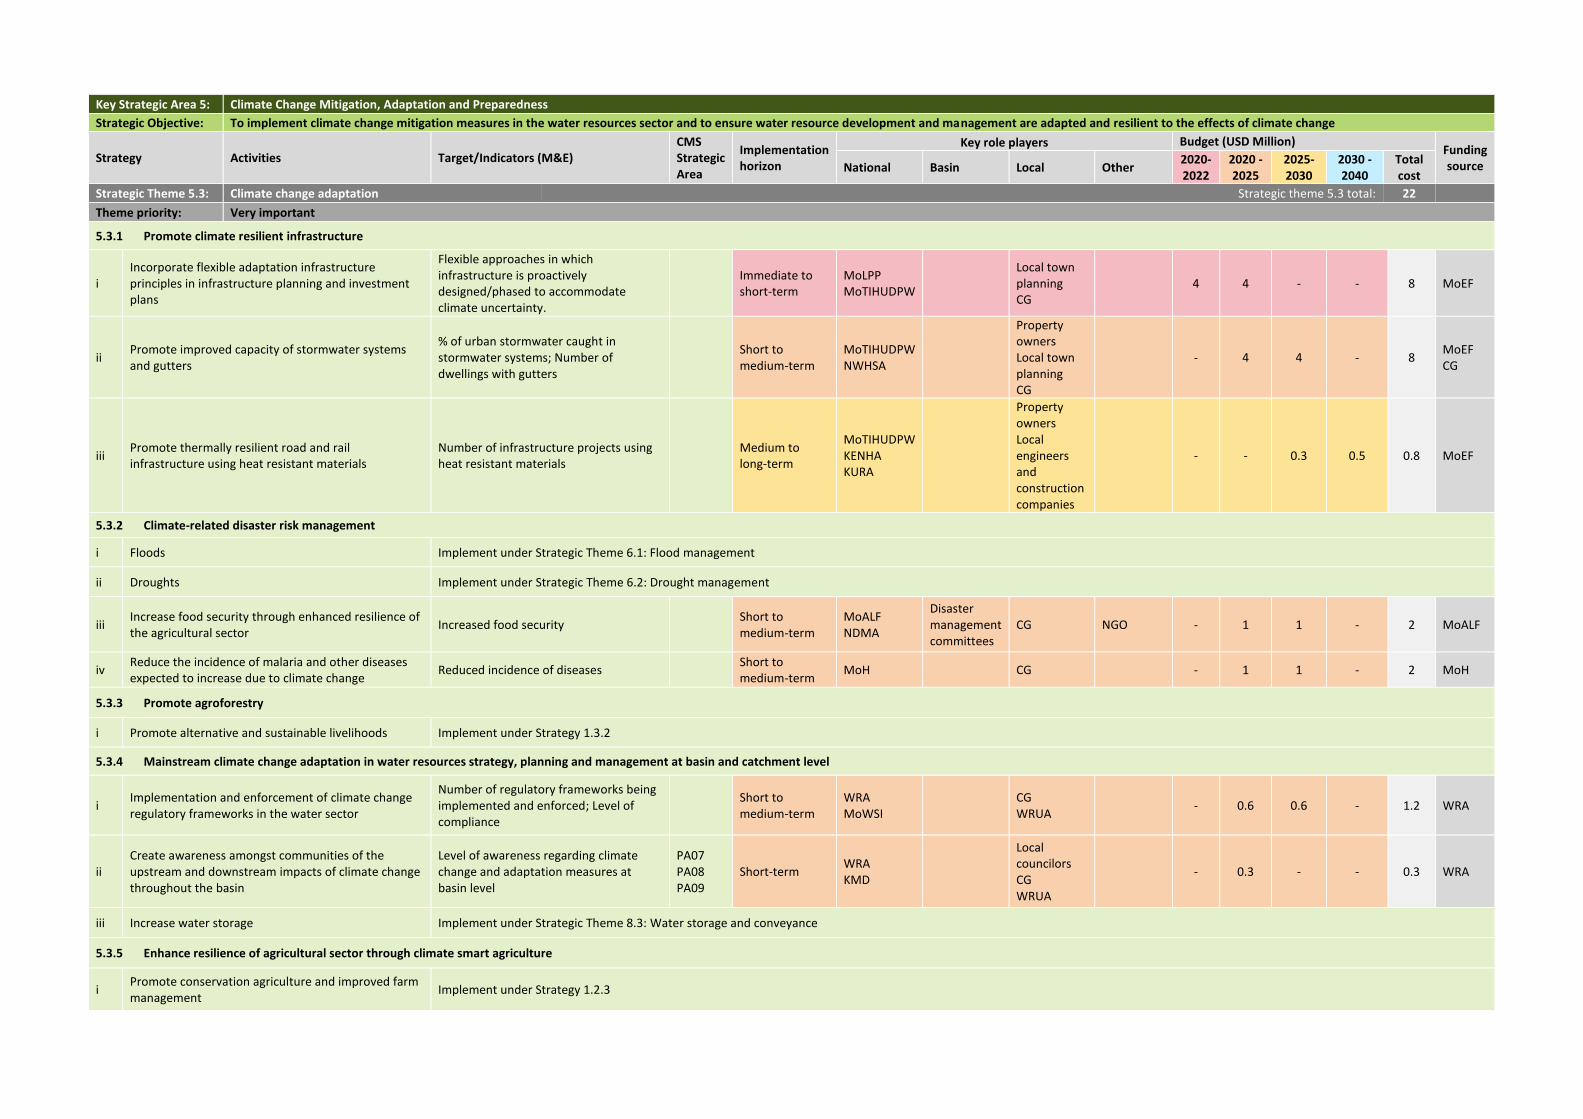
Key Strategic Area 5: Climate Change Mitigation, Adaptation and Preparedness
Strategic Objective: To implement climate change mitigation measures in the water resources sector and to ensure water resource development and management are adapted and resilient to the effects of climate change
Strategy Activities Target/Indicators (M&E) CMS Strategic Area
Implementation horizon
Key role players Budget (USD Million) Funding source National Basin Local Other
2020-2022
2020 - 2025
2025- 2030
2030 - 2040
Total cost
Strategic Theme 5.3: Climate change adaptation Strategic theme 5.3 total: 22
Theme priority: Very important
5.3.1 Promote climate resilient infrastructure
i Incorporate flexible adaptation infrastructure principles in infrastructure planning and investment plans
Flexible approaches in which infrastructure is proactively designed/phased to accommodate climate uncertainty.
Immediate to short-term
MoLPP MoTIHUDPW
Local town planning CG
4 4 - - 8 MoEF
ii Promote improved capacity of stormwater systems and gutters
% of urban stormwater caught in stormwater systems; Number of dwellings with gutters
Short to medium-term
MoTIHUDPW NWHSA
Property owners Local town planning CG
- 4 4 - 8 MoEF CG
iii Promote thermally resilient road and rail infrastructure using heat resistant materials
Number of infrastructure projects using heat resistant materials
Medium to long-term
MoTIHUDPW KENHA KURA
Property owners Local engineers and construction companies
- - 0.3 0.5 0.8 MoEF
5.3.2 Climate-related disaster risk management
i Floods Implement under Strategic Theme 6.1: Flood management
ii Droughts Implement under Strategic Theme 6.2: Drought management
iii Increase food security through enhanced resilience of the agricultural sector
Increased food security Short to medium-term
MoALF NDMA
Disaster management committees
CG NGO - 1 1 - 2 MoALF
iv Reduce the incidence of malaria and other diseases expected to increase due to climate change
Reduced incidence of diseases Short to medium-term
MoH CG - 1 1 - 2 MoH
5.3.3 Promote agroforestry
i Promote alternative and sustainable livelihoods Implement under Strategy 1.3.2
5.3.4 Mainstream climate change adaptation in water resources strategy, planning and management at basin and catchment level
i Implementation and enforcement of climate change regulatory frameworks in the water sector
Number of regulatory frameworks being implemented and enforced; Level of compliance
Short to medium-term
WRA MoWSI
CG WRUA
- 0.6 0.6 - 1.2 WRA
ii Create awareness amongst communities of the upstream and downstream impacts of climate change throughout the basin
Level of awareness regarding climate change and adaptation measures at basin level
PA07 PA08 PA09
Short-term WRA KMD
Local councilors CG WRUA
- 0.3 - - 0.3 WRA
iii Increase water storage Implement under Strategic Theme 8.3: Water storage and conveyance
5.3.5 Enhance resilience of agricultural sector through climate smart agriculture
i Promote conservation agriculture and improved farm management
Implement under Strategy 1.2.3
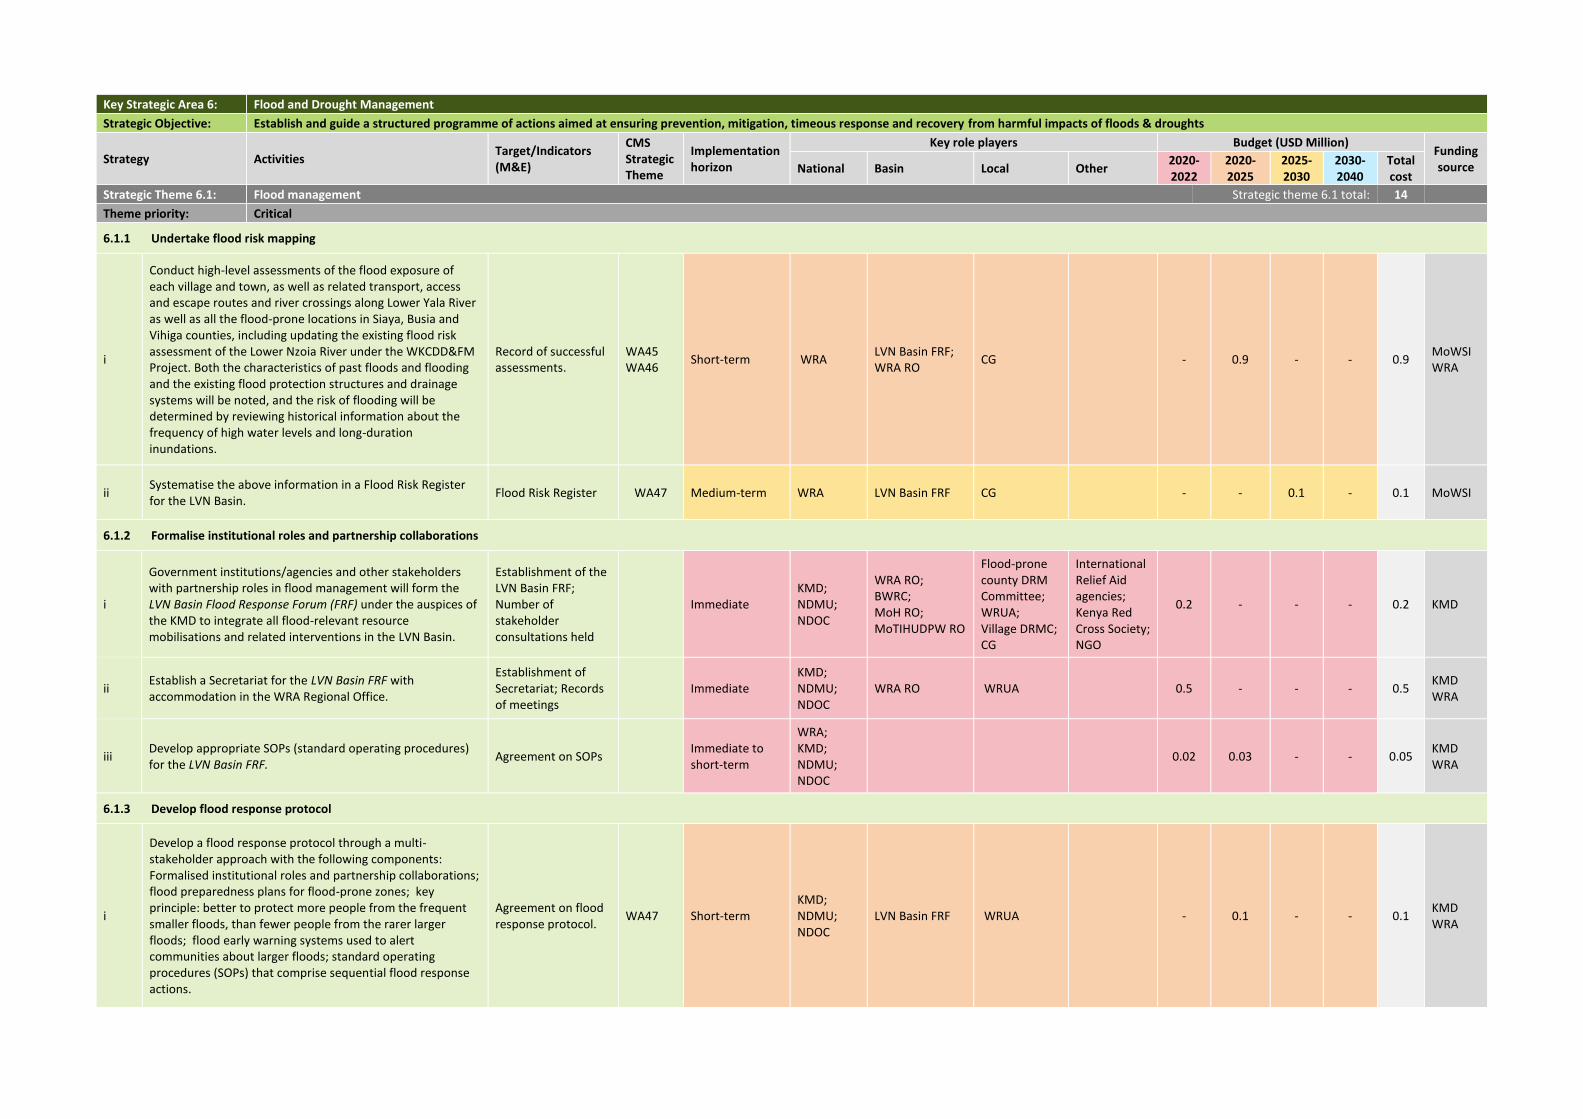
Key Strategic Area 6: Flood and Drought Management
Strategic Objective: Establish and guide a structured programme of actions aimed at ensuring prevention, mitigation, timeous response and recovery from harmful impacts of floods & droughts
Strategy Activities Target/Indicators (M&E)
CMS Strategic Theme
Implementation horizon
Key role players Budget (USD Million) Funding source National Basin Local Other
2020-2022
2020- 2025
2025- 2030
2030- 2040
Total cost
Strategic Theme 6.1: Flood management Strategic theme 6.1 total: 14
Theme priority: Critical
6.1.1 Undertake flood risk mapping
i
Conduct high-level assessments of the flood exposure of each village and town, as well as related transport, access and escape routes and river crossings along Lower Yala River as well as all the flood-prone locations in Siaya, Busia and Vihiga counties, including updating the existing flood risk assessment of the Lower Nzoia River under the WKCDD&FM Project. Both the characteristics of past floods and flooding and the existing flood protection structures and drainage systems will be noted, and the risk of flooding will be determined by reviewing historical information about the frequency of high water levels and long-duration inundations.
Record of successful assessments.
WA45 WA46
Short-term WRA LVN Basin FRF; WRA RO
CG - 0.9 - - 0.9 MoWSI WRA
ii Systematise the above information in a Flood Risk Register for the LVN Basin.
Flood Risk Register WA47 Medium-term WRA LVN Basin FRF CG - - 0.1 - 0.1 MoWSI
6.1.2 Formalise institutional roles and partnership collaborations
i
Government institutions/agencies and other stakeholders with partnership roles in flood management will form the LVN Basin Flood Response Forum (FRF) under the auspices of the KMD to integrate all flood-relevant resource mobilisations and related interventions in the LVN Basin.
Establishment of the LVN Basin FRF; Number of stakeholder consultations held
Immediate KMD; NDMU; NDOC
WRA RO; BWRC; MoH RO; MoTIHUDPW RO
Flood-prone county DRM Committee; WRUA; Village DRMC; CG
International Relief Aid agencies; Kenya Red Cross Society; NGO
0.2 - - - 0.2 KMD
ii Establish a Secretariat for the LVN Basin FRF with accommodation in the WRA Regional Office.
Establishment of Secretariat; Records of meetings
Immediate KMD; NDMU; NDOC
WRA RO WRUA 0.5 - - - 0.5 KMD WRA
iii Develop appropriate SOPs (standard operating procedures) for the LVN Basin FRF.
Agreement on SOPs
Immediate to short-term
WRA; KMD; NDMU; NDOC
0.02 0.03 - - 0.05 KMD WRA
6.1.3 Develop flood response protocol
i
Develop a flood response protocol through a multi-stakeholder approach with the following components: Formalised institutional roles and partnership collaborations; flood preparedness plans for flood-prone zones; key principle: better to protect more people from the frequent smaller floods, than fewer people from the rarer larger floods; flood early warning systems used to alert communities about larger floods; standard operating procedures (SOPs) that comprise sequential flood response actions.
Agreement on flood response protocol.
WA47 Short-term KMD; NDMU; NDOC
LVN Basin FRF WRUA - 0.1 - - 0.1 KMD WRA
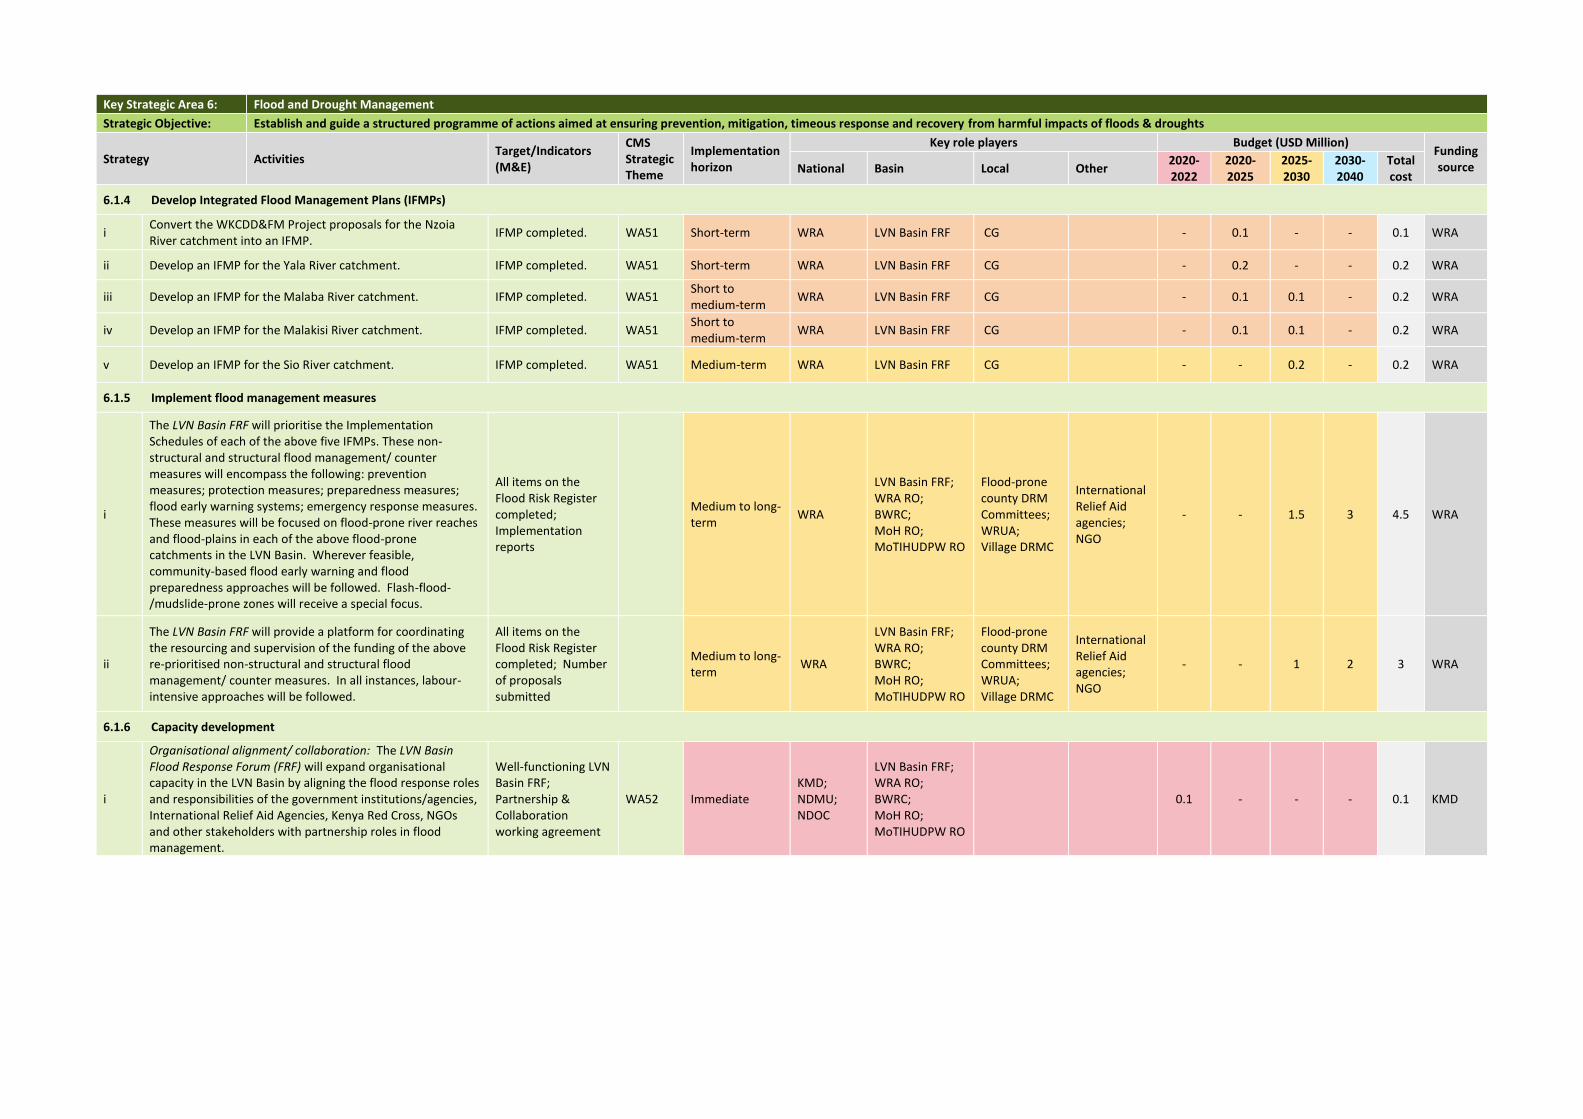
Key Strategic Area 6: Flood and Drought Management
Strategic Objective: Establish and guide a structured programme of actions aimed at ensuring prevention, mitigation, timeous response and recovery from harmful impacts of floods & droughts
Strategy Activities Target/Indicators (M&E)
CMS Strategic Theme
Implementation horizon
Key role players Budget (USD Million) Funding source National Basin Local Other
2020-2022
2020- 2025
2025- 2030
2030- 2040
Total cost
6.1.4 Develop Integrated Flood Management Plans (IFMPs)
i Convert the WKCDD&FM Project proposals for the Nzoia River catchment into an IFMP.
IFMP completed. WA51 Short-term WRA LVN Basin FRF CG - 0.1 - - 0.1 WRA
ii Develop an IFMP for the Yala River catchment. IFMP completed. WA51 Short-term WRA LVN Basin FRF CG - 0.2 - - 0.2 WRA
iii Develop an IFMP for the Malaba River catchment. IFMP completed. WA51 Short to medium-term
WRA LVN Basin FRF CG - 0.1 0.1 - 0.2 WRA
iv Develop an IFMP for the Malakisi River catchment. IFMP completed. WA51 Short to medium-term
WRA LVN Basin FRF CG - 0.1 0.1 - 0.2 WRA
v Develop an IFMP for the Sio River catchment. IFMP completed. WA51 Medium-term WRA LVN Basin FRF CG - - 0.2 - 0.2 WRA
6.1.5 Implement flood management measures
i
The LVN Basin FRF will prioritise the Implementation Schedules of each of the above five IFMPs. These non-structural and structural flood management/ counter measures will encompass the following: prevention measures; protection measures; preparedness measures; flood early warning systems; emergency response measures. These measures will be focused on flood-prone river reaches and flood-plains in each of the above flood-prone catchments in the LVN Basin. Wherever feasible, community-based flood early warning and flood preparedness approaches will be followed. Flash-flood-/mudslide-prone zones will receive a special focus.
All items on the Flood Risk Register completed; Implementation reports
Medium to long-term
WRA
LVN Basin FRF; WRA RO; BWRC; MoH RO; MoTIHUDPW RO
Flood-prone county DRM Committees; WRUA; Village DRMC
International Relief Aid agencies; NGO
- - 1.5 3 4.5 WRA
ii
The LVN Basin FRF will provide a platform for coordinating the resourcing and supervision of the funding of the above re-prioritised non-structural and structural flood management/ counter measures. In all instances, labour-intensive approaches will be followed.
All items on the Flood Risk Register completed; Number of proposals submitted
Medium to long-term
WRA
LVN Basin FRF; WRA RO; BWRC; MoH RO; MoTIHUDPW RO
Flood-prone county DRM Committees; WRUA; Village DRMC
International Relief Aid agencies; NGO
- - 1 2 3 WRA
6.1.6 Capacity development
i
Organisational alignment/ collaboration: The LVN Basin Flood Response Forum (FRF) will expand organisational capacity in the LVN Basin by aligning the flood response roles and responsibilities of the government institutions/agencies, International Relief Aid Agencies, Kenya Red Cross, NGOs and other stakeholders with partnership roles in flood management.
Well-functioning LVN Basin FRF; Partnership & Collaboration working agreement
WA52 Immediate KMD; NDMU; NDOC
LVN Basin FRF; WRA RO; BWRC; MoH RO; MoTIHUDPW RO
0.1 - - - 0.1 KMD
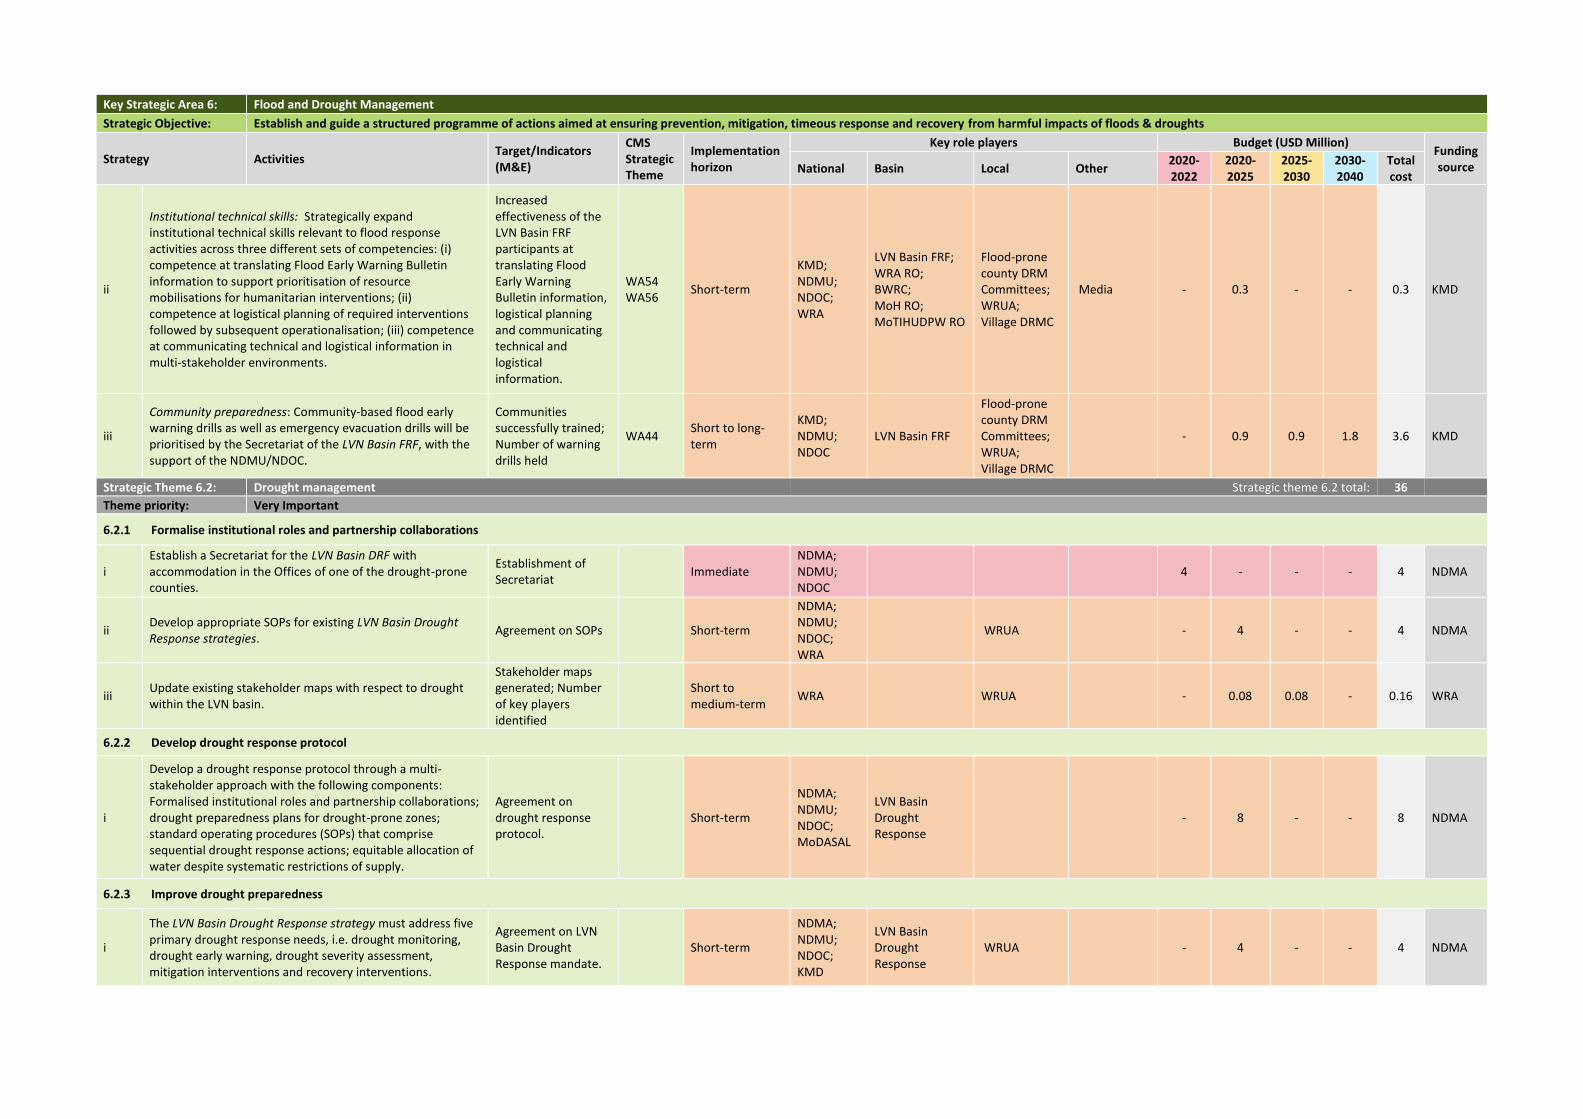
Key Strategic Area 6: Flood and Drought Management
Strategic Objective: Establish and guide a structured programme of actions aimed at ensuring prevention, mitigation, timeous response and recovery from harmful impacts of floods & droughts
Strategy Activities Target/Indicators (M&E)
CMS Strategic Theme
Implementation horizon
Key role players Budget (USD Million) Funding source National Basin Local Other
2020-2022
2020- 2025
2025- 2030
2030- 2040
Total cost
ii
Institutional technical skills: Strategically expand institutional technical skills relevant to flood response activities across three different sets of competencies: (i) competence at translating Flood Early Warning Bulletin information to support prioritisation of resource mobilisations for humanitarian interventions; (ii) competence at logistical planning of required interventions followed by subsequent operationalisation; (iii) competence at communicating technical and logistical information in multi-stakeholder environments.
Increased effectiveness of the LVN Basin FRF participants at translating Flood Early Warning Bulletin information, logistical planning and communicating technical and logistical information.
WA54 WA56
Short-term
KMD; NDMU; NDOC; WRA
LVN Basin FRF; WRA RO; BWRC; MoH RO; MoTIHUDPW RO
Flood-prone county DRM Committees; WRUA; Village DRMC
Media - 0.3 - - 0.3 KMD
iii
Community preparedness: Community-based flood early warning drills as well as emergency evacuation drills will be prioritised by the Secretariat of the LVN Basin FRF, with the support of the NDMU/NDOC.
Communities successfully trained; Number of warning drills held
WA44 Short to long-term
KMD; NDMU; NDOC
LVN Basin FRF
Flood-prone county DRM Committees; WRUA; Village DRMC
- 0.9 0.9 1.8 3.6 KMD
Strategic Theme 6.2: Drought management Strategic theme 6.2 total: 36
Theme priority: Very Important
6.2.1 Formalise institutional roles and partnership collaborations
i Establish a Secretariat for the LVN Basin DRF with accommodation in the Offices of one of the drought-prone counties.
Establishment of Secretariat
Immediate NDMA; NDMU; NDOC
4 - - - 4 NDMA
ii Develop appropriate SOPs for existing LVN Basin Drought Response strategies.
Agreement on SOPs
Short-term
NDMA; NDMU; NDOC; WRA
WRUA - 4 - - 4 NDMA
iii Update existing stakeholder maps with respect to drought within the LVN basin.
Stakeholder maps generated; Number of key players identified
Short to medium-term
WRA WRUA - 0.08 0.08 - 0.16 WRA
6.2.2 Develop drought response protocol
i
Develop a drought response protocol through a multi-stakeholder approach with the following components: Formalised institutional roles and partnership collaborations; drought preparedness plans for drought-prone zones; standard operating procedures (SOPs) that comprise sequential drought response actions; equitable allocation of water despite systematic restrictions of supply.
Agreement on drought response protocol.
Short-term
NDMA; NDMU; NDOC; MoDASAL
LVN Basin Drought Response
- 8 - - 8 NDMA
6.2.3 Improve drought preparedness
i
The LVN Basin Drought Response strategy must address five primary drought response needs, i.e. drought monitoring, drought early warning, drought severity assessment, mitigation interventions and recovery interventions.
Agreement on LVN Basin Drought Response mandate.
Short-term
NDMA; NDMU; NDOC; KMD
LVN Basin Drought Response
WRUA - 4 - - 4 NDMA
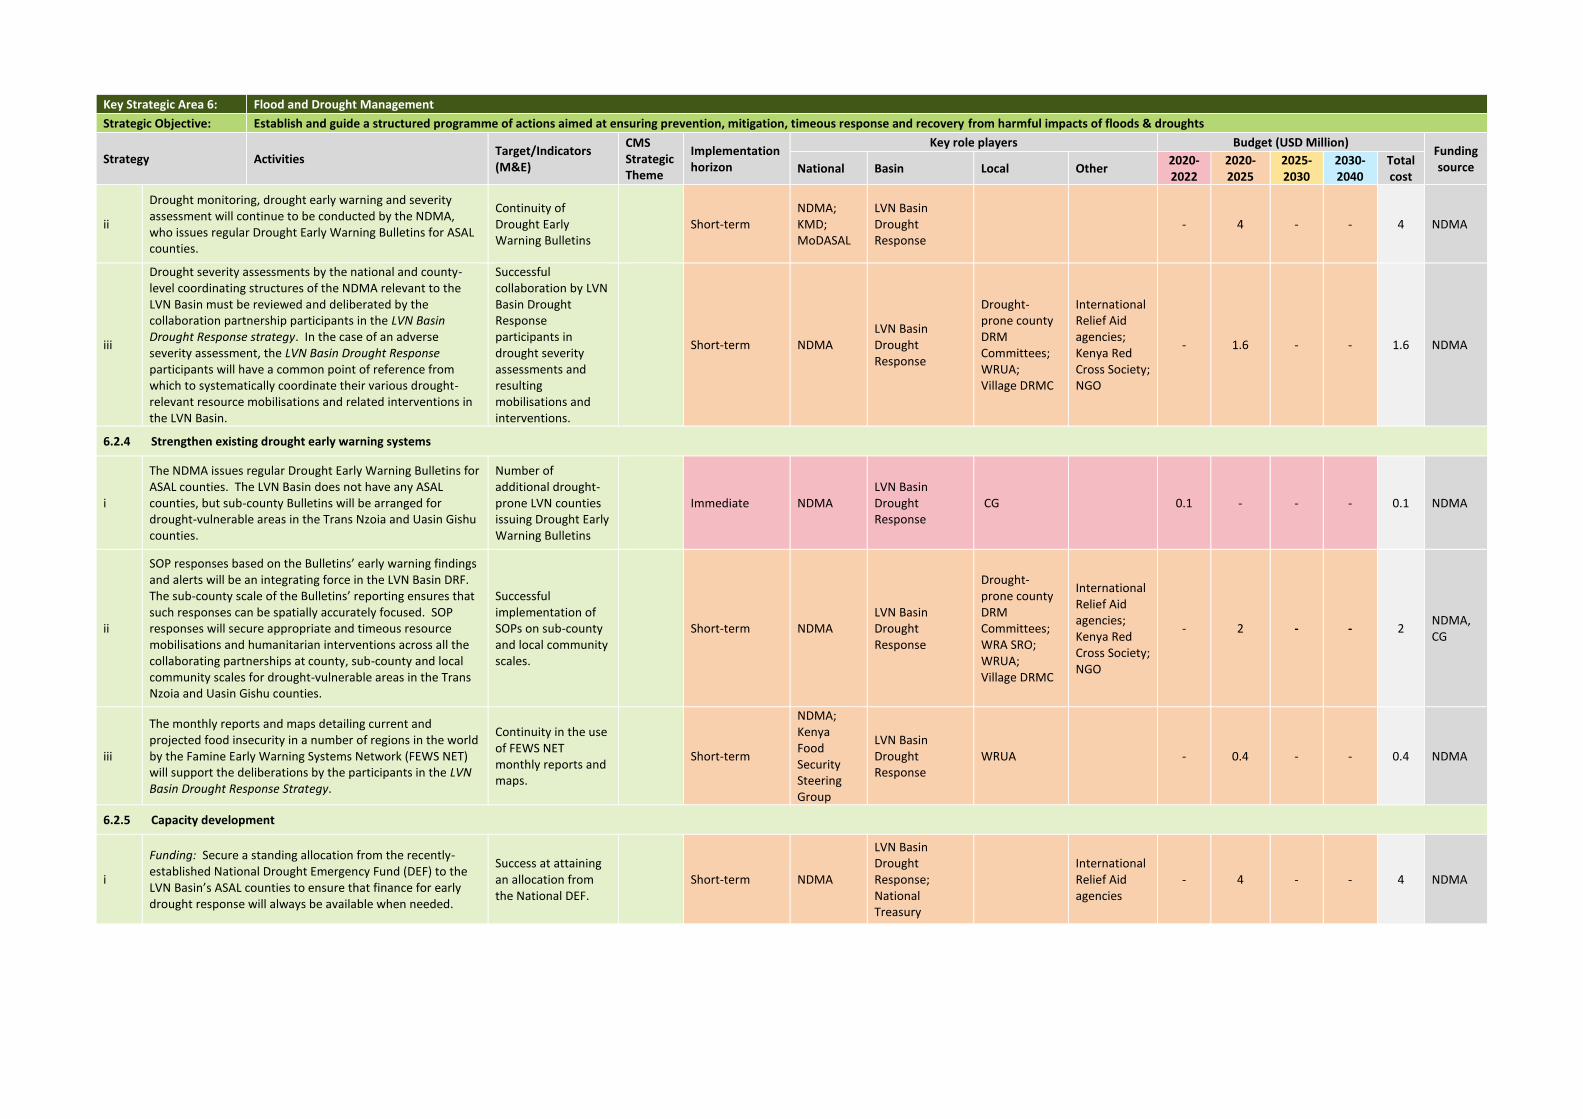
Key Strategic Area 6: Flood and Drought Management
Strategic Objective: Establish and guide a structured programme of actions aimed at ensuring prevention, mitigation, timeous response and recovery from harmful impacts of floods & droughts
Strategy Activities Target/Indicators (M&E)
CMS Strategic Theme
Implementation horizon
Key role players Budget (USD Million) Funding source National Basin Local Other
2020-2022
2020- 2025
2025- 2030
2030- 2040
Total cost
ii
Drought monitoring, drought early warning and severity assessment will continue to be conducted by the NDMA, who issues regular Drought Early Warning Bulletins for ASAL counties.
Continuity of Drought Early Warning Bulletins
Short-term NDMA; KMD; MoDASAL
LVN Basin Drought Response
- 4 - - 4 NDMA
iii
Drought severity assessments by the national and county-level coordinating structures of the NDMA relevant to the LVN Basin must be reviewed and deliberated by the collaboration partnership participants in the LVN Basin Drought Response strategy. In the case of an adverse severity assessment, the LVN Basin Drought Response participants will have a common point of reference from which to systematically coordinate their various drought-relevant resource mobilisations and related interventions in the LVN Basin.
Successful collaboration by LVN Basin Drought Response participants in drought severity assessments and resulting mobilisations and interventions.
Short-term NDMA LVN Basin Drought Response
Drought-prone county DRM Committees; WRUA; Village DRMC
International Relief Aid agencies; Kenya Red Cross Society; NGO
- 1.6 - - 1.6 NDMA
6.2.4 Strengthen existing drought early warning systems
i
The NDMA issues regular Drought Early Warning Bulletins for ASAL counties. The LVN Basin does not have any ASAL counties, but sub-county Bulletins will be arranged for drought-vulnerable areas in the Trans Nzoia and Uasin Gishu counties.
Number of additional drought-prone LVN counties issuing Drought Early Warning Bulletins
Immediate NDMA LVN Basin Drought Response
CG 0.1 - - - 0.1 NDMA
ii
SOP responses based on the Bulletins’ early warning findings and alerts will be an integrating force in the LVN Basin DRF. The sub-county scale of the Bulletins’ reporting ensures that such responses can be spatially accurately focused. SOP responses will secure appropriate and timeous resource mobilisations and humanitarian interventions across all the collaborating partnerships at county, sub-county and local community scales for drought-vulnerable areas in the Trans Nzoia and Uasin Gishu counties.
Successful implementation of SOPs on sub-county and local community scales.
Short-term NDMA LVN Basin Drought Response
Drought-prone county DRM Committees; WRA SRO; WRUA; Village DRMC
International Relief Aid agencies; Kenya Red Cross Society; NGO
- 2 - - 2 NDMA, CG
iii
The monthly reports and maps detailing current and projected food insecurity in a number of regions in the world by the Famine Early Warning Systems Network (FEWS NET) will support the deliberations by the participants in the LVN Basin Drought Response Strategy.
Continuity in the use of FEWS NET monthly reports and maps.
Short-term
NDMA; Kenya Food Security Steering Group
LVN Basin Drought Response
WRUA - 0.4 - - 0.4 NDMA
6.2.5 Capacity development
i
Funding: Secure a standing allocation from the recently-established National Drought Emergency Fund (DEF) to the LVN Basin’s ASAL counties to ensure that finance for early drought response will always be available when needed.
Success at attaining an allocation from the National DEF.
Short-term NDMA
LVN Basin Drought Response; National Treasury
International Relief Aid agencies
- 4 - - 4 NDMA
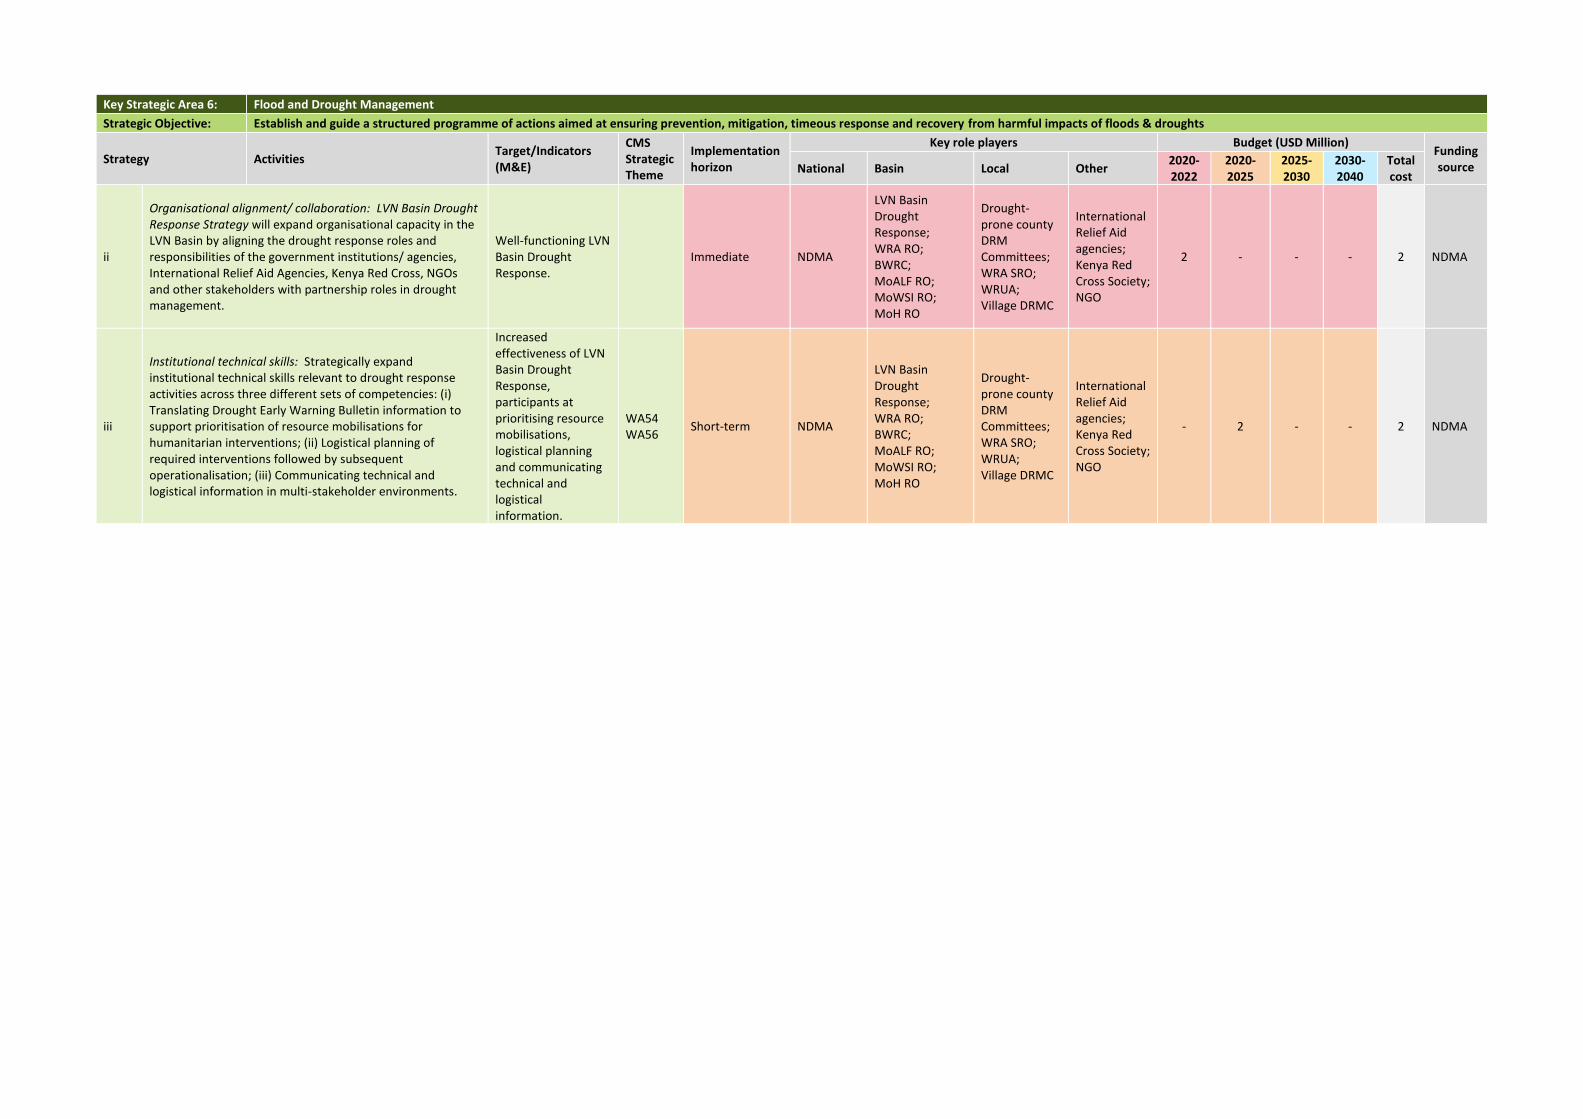
Key Strategic Area 6: Flood and Drought Management
Strategic Objective: Establish and guide a structured programme of actions aimed at ensuring prevention, mitigation, timeous response and recovery from harmful impacts of floods & droughts
Strategy Activities Target/Indicators (M&E)
CMS Strategic Theme
Implementation horizon
Key role players Budget (USD Million) Funding source National Basin Local Other
2020-2022
2020- 2025
2025- 2030
2030- 2040
Total cost
ii
Organisational alignment/ collaboration: LVN Basin Drought Response Strategy will expand organisational capacity in the LVN Basin by aligning the drought response roles and responsibilities of the government institutions/ agencies, International Relief Aid Agencies, Kenya Red Cross, NGOs and other stakeholders with partnership roles in drought management.
Well-functioning LVN Basin Drought Response.
Immediate NDMA
LVN Basin Drought Response; WRA RO; BWRC; MoALF RO; MoWSI RO; MoH RO
Drought-prone county DRM Committees; WRA SRO; WRUA; Village DRMC
International Relief Aid agencies; Kenya Red Cross Society; NGO
2 - - - 2 NDMA
iii
Institutional technical skills: Strategically expand institutional technical skills relevant to drought response activities across three different sets of competencies: (i) Translating Drought Early Warning Bulletin information to support prioritisation of resource mobilisations for humanitarian interventions; (ii) Logistical planning of required interventions followed by subsequent operationalisation; (iii) Communicating technical and logistical information in multi-stakeholder environments.
Increased effectiveness of LVN Basin Drought Response, participants at prioritising resource mobilisations, logistical planning and communicating technical and logistical information.
WA54 WA56
Short-term NDMA
LVN Basin Drought Response; WRA RO; BWRC; MoALF RO; MoWSI RO; MoH RO
Drought-prone county DRM Committees; WRA SRO; WRUA; Village DRMC
International Relief Aid agencies; Kenya Red Cross Society; NGO
- 2 - - 2 NDMA
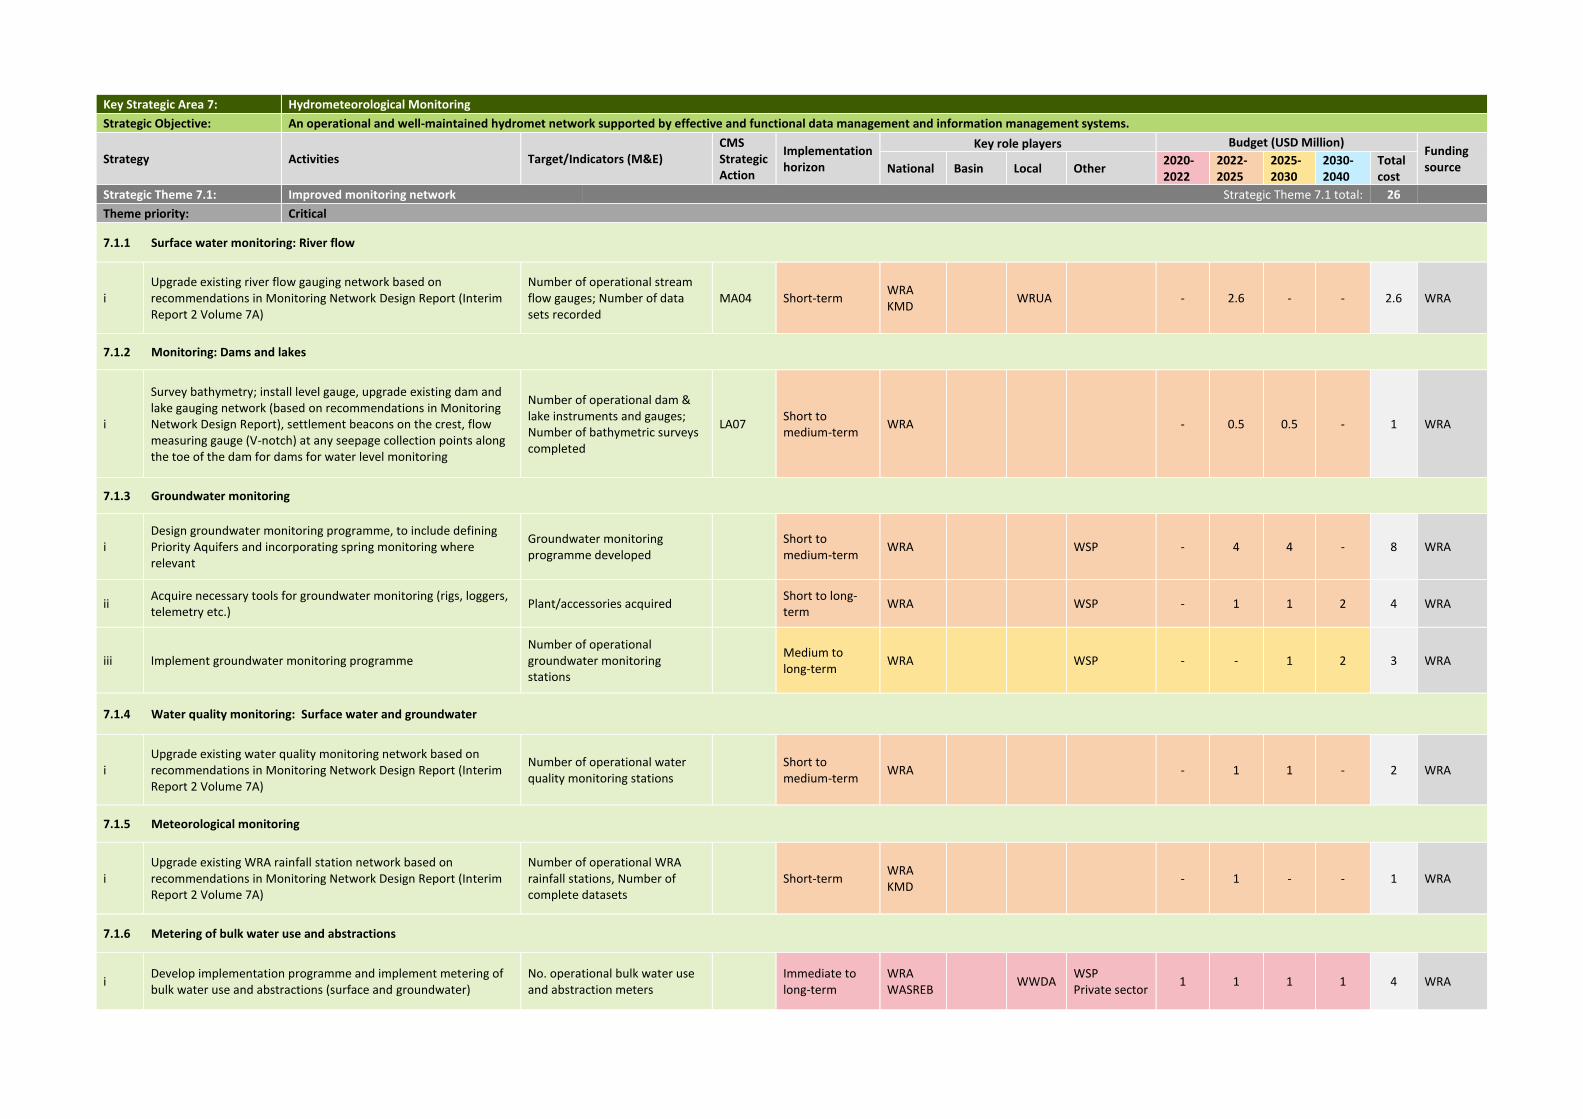
Key Strategic Area 7: Hydrometeorological Monitoring
Strategic Objective: An operational and well-maintained hydromet network supported by effective and functional data management and information management systems.
Strategy Activities Target/Indicators (M&E) CMS Strategic Action
Implementation horizon
Key role players Budget (USD Million) Funding source National Basin Local Other
2020-2022
2022-2025
2025-2030
2030-2040
Total cost
Strategic Theme 7.1: Improved monitoring network Strategic Theme 7.1 total: 26
Theme priority: Critical
7.1.1 Surface water monitoring: River flow
i Upgrade existing river flow gauging network based on recommendations in Monitoring Network Design Report (Interim Report 2 Volume 7A)
Number of operational stream flow gauges; Number of data sets recorded
MA04 Short-term WRA KMD
WRUA - 2.6 - - 2.6 WRA
7.1.2 Monitoring: Dams and lakes
i
Survey bathymetry; install level gauge, upgrade existing dam and lake gauging network (based on recommendations in Monitoring Network Design Report), settlement beacons on the crest, flow measuring gauge (V-notch) at any seepage collection points along the toe of the dam for dams for water level monitoring
Number of operational dam & lake instruments and gauges; Number of bathymetric surveys completed
LA07 Short to medium-term
WRA - 0.5 0.5 - 1 WRA
7.1.3 Groundwater monitoring
i Design groundwater monitoring programme, to include defining Priority Aquifers and incorporating spring monitoring where relevant
Groundwater monitoring programme developed
Short to medium-term
WRA WSP - 4 4 - 8 WRA
ii Acquire necessary tools for groundwater monitoring (rigs, loggers, telemetry etc.)
Plant/accessories acquired Short to long-term
WRA WSP - 1 1 2 4 WRA
iii Implement groundwater monitoring programme Number of operational groundwater monitoring stations
Medium to long-term
WRA WSP - - 1 2 3 WRA
7.1.4 Water quality monitoring: Surface water and groundwater
i Upgrade existing water quality monitoring network based on recommendations in Monitoring Network Design Report (Interim Report 2 Volume 7A)
Number of operational water quality monitoring stations
Short to medium-term
WRA - 1 1 - 2 WRA
7.1.5 Meteorological monitoring
i Upgrade existing WRA rainfall station network based on recommendations in Monitoring Network Design Report (Interim Report 2 Volume 7A)
Number of operational WRA rainfall stations, Number of complete datasets
Short-term WRA KMD
- 1 - - 1 WRA
7.1.6 Metering of bulk water use and abstractions
i Develop implementation programme and implement metering of bulk water use and abstractions (surface and groundwater)
No. operational bulk water use and abstraction meters
Immediate to long-term
WRA WASREB
WWDA WSP Private sector
1 1 1 1 4 WRA
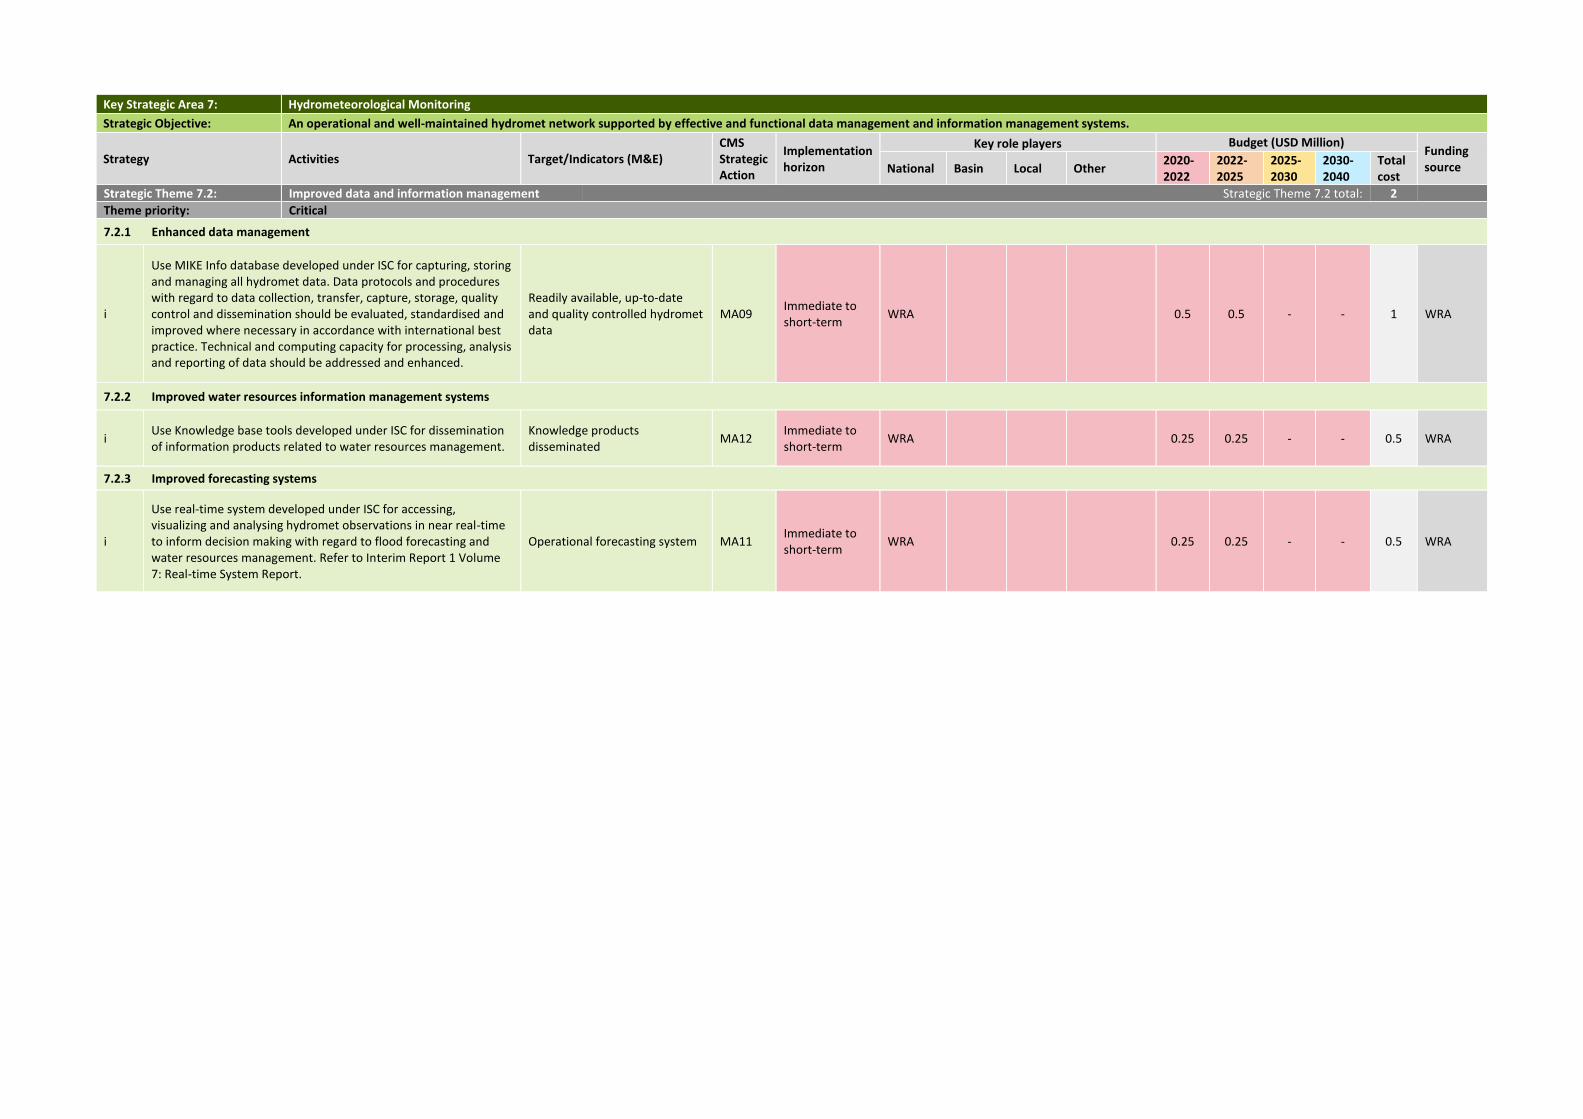
Key Strategic Area 7: Hydrometeorological Monitoring
Strategic Objective: An operational and well-maintained hydromet network supported by effective and functional data management and information management systems.
Strategy Activities Target/Indicators (M&E) CMS Strategic Action
Implementation horizon
Key role players Budget (USD Million) Funding source National Basin Local Other
2020-2022
2022-2025
2025-2030
2030-2040
Total cost
Strategic Theme 7.2: Improved data and information management Strategic Theme 7.2 total: 2
Theme priority: Critical
7.2.1 Enhanced data management
i
Use MIKE Info database developed under ISC for capturing, storing and managing all hydromet data. Data protocols and procedures with regard to data collection, transfer, capture, storage, quality control and dissemination should be evaluated, standardised and improved where necessary in accordance with international best practice. Technical and computing capacity for processing, analysis and reporting of data should be addressed and enhanced.
Readily available, up-to-date and quality controlled hydromet data
MA09 Immediate to short-term
WRA 0.5 0.5 - - 1 WRA
7.2.2 Improved water resources information management systems
i Use Knowledge base tools developed under ISC for dissemination of information products related to water resources management.
Knowledge products disseminated
MA12 Immediate to short-term
WRA 0.25 0.25 - - 0.5 WRA
7.2.3 Improved forecasting systems
i
Use real-time system developed under ISC for accessing, visualizing and analysing hydromet observations in near real-time to inform decision making with regard to flood forecasting and water resources management. Refer to Interim Report 1 Volume 7: Real-time System Report.
Operational forecasting system MA11 Immediate to short-term
WRA 0.25 0.25 - - 0.5 WRA
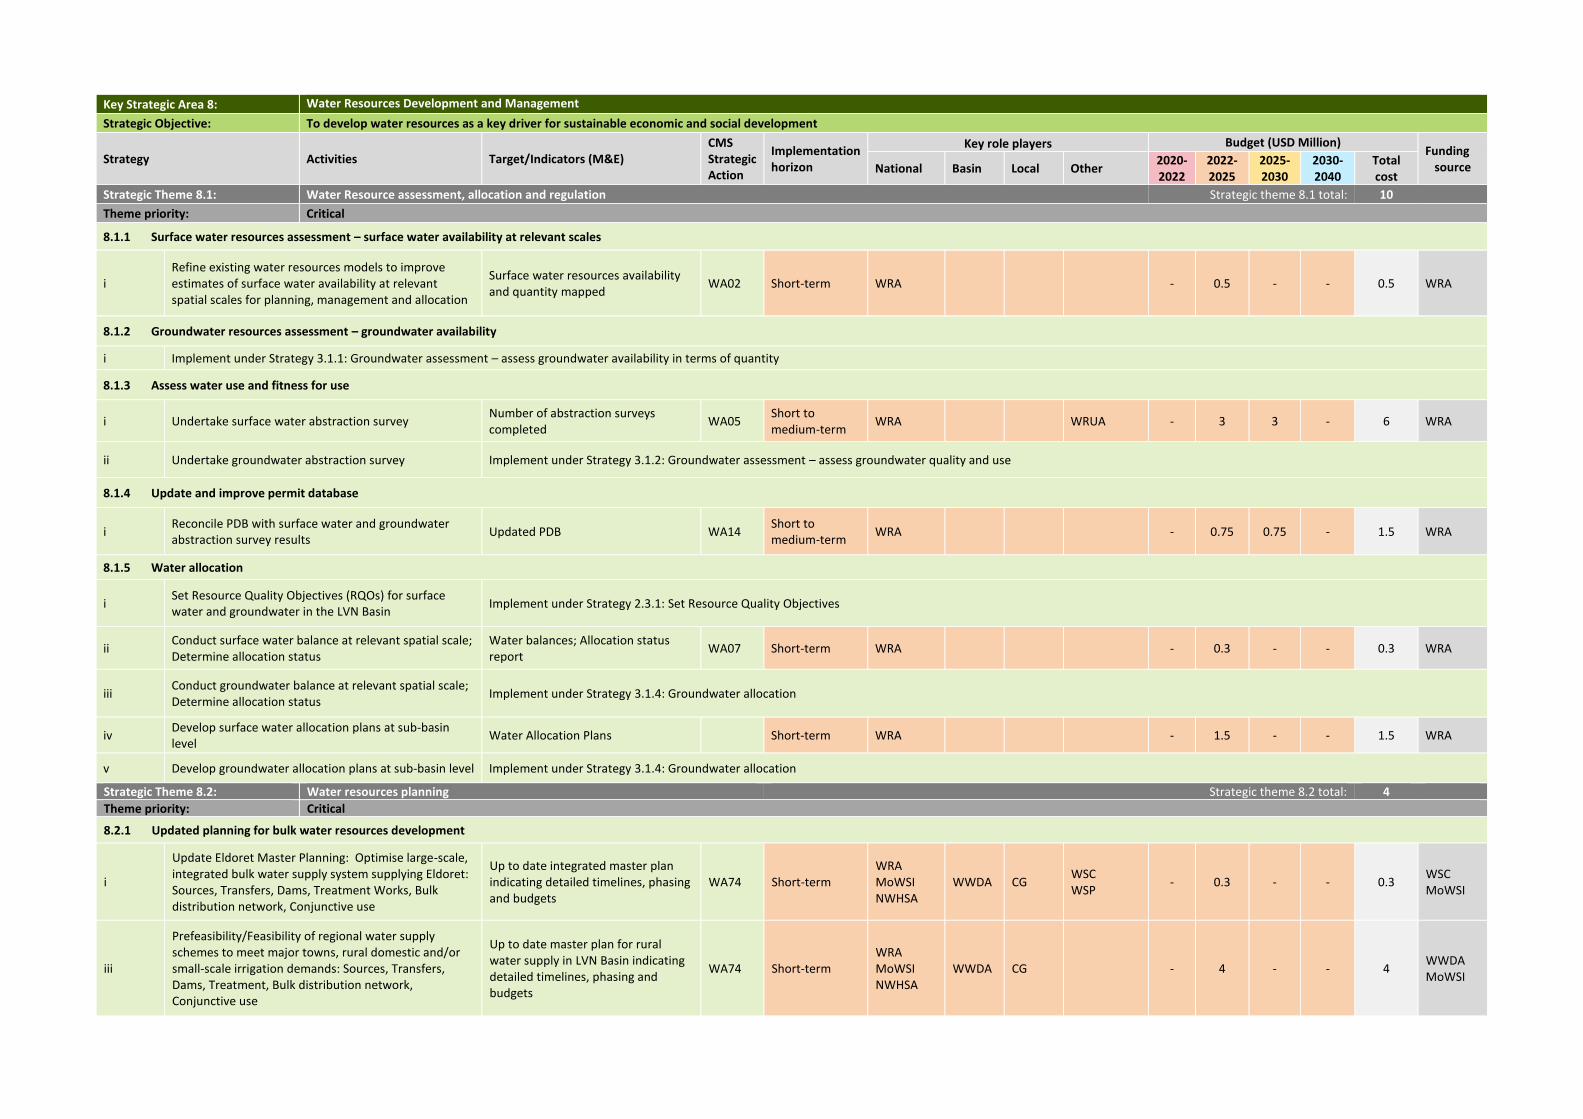
Key Strategic Area 8: Water Resources Development and Management
Strategic Objective: To develop water resources as a key driver for sustainable economic and social development
Strategy Activities Target/Indicators (M&E) CMS Strategic Action
Implementation horizon
Key role players Budget (USD Million) Funding
source National Basin Local Other 2020-2022
2022-2025
2025-2030
2030-2040
Total cost
Strategic Theme 8.1: Water Resource assessment, allocation and regulation Strategic theme 8.1 total: 10
Theme priority: Critical
8.1.1 Surface water resources assessment – surface water availability at relevant scales
i Refine existing water resources models to improve estimates of surface water availability at relevant spatial scales for planning, management and allocation
Surface water resources availability and quantity mapped
WA02 Short-term WRA - 0.5 - - 0.5 WRA
8.1.2 Groundwater resources assessment – groundwater availability
i Implement under Strategy 3.1.1: Groundwater assessment – assess groundwater availability in terms of quantity
8.1.3 Assess water use and fitness for use
i Undertake surface water abstraction survey Number of abstraction surveys completed
WA05 Short to medium-term
WRA WRUA - 3 3 - 6 WRA
ii Undertake groundwater abstraction survey Implement under Strategy 3.1.2: Groundwater assessment – assess groundwater quality and use
8.1.4 Update and improve permit database
i Reconcile PDB with surface water and groundwater abstraction survey results
Updated PDB WA14 Short to medium-term
WRA - 0.75 0.75 - 1.5 WRA
8.1.5 Water allocation
i Set Resource Quality Objectives (RQOs) for surface water and groundwater in the LVN Basin
Implement under Strategy 2.3.1: Set Resource Quality Objectives
ii Conduct surface water balance at relevant spatial scale; Determine allocation status
Water balances; Allocation status report
WA07 Short-term WRA - 0.3 - - 0.3 WRA
iii Conduct groundwater balance at relevant spatial scale; Determine allocation status
Implement under Strategy 3.1.4: Groundwater allocation
iv Develop surface water allocation plans at sub-basin level
Water Allocation Plans Short-term WRA - 1.5 - - 1.5 WRA
v Develop groundwater allocation plans at sub-basin level Implement under Strategy 3.1.4: Groundwater allocation
Strategic Theme 8.2: Water resources planning Strategic theme 8.2 total: 4
Theme priority: Critical
8.2.1 Updated planning for bulk water resources development
i
Update Eldoret Master Planning: Optimise large-scale, integrated bulk water supply system supplying Eldoret: Sources, Transfers, Dams, Treatment Works, Bulk distribution network, Conjunctive use
Up to date integrated master plan indicating detailed timelines, phasing and budgets
WA74 Short-term WRA MoWSI NWHSA
WWDA CG WSC WSP
- 0.3 - - 0.3 WSC MoWSI
iii
Prefeasibility/Feasibility of regional water supply schemes to meet major towns, rural domestic and/or small-scale irrigation demands: Sources, Transfers, Dams, Treatment, Bulk distribution network, Conjunctive use
Up to date master plan for rural water supply in LVN Basin indicating detailed timelines, phasing and budgets
WA74 Short-term WRA MoWSI NWHSA
WWDA CG - 4 - - 4 WWDA MoWSI
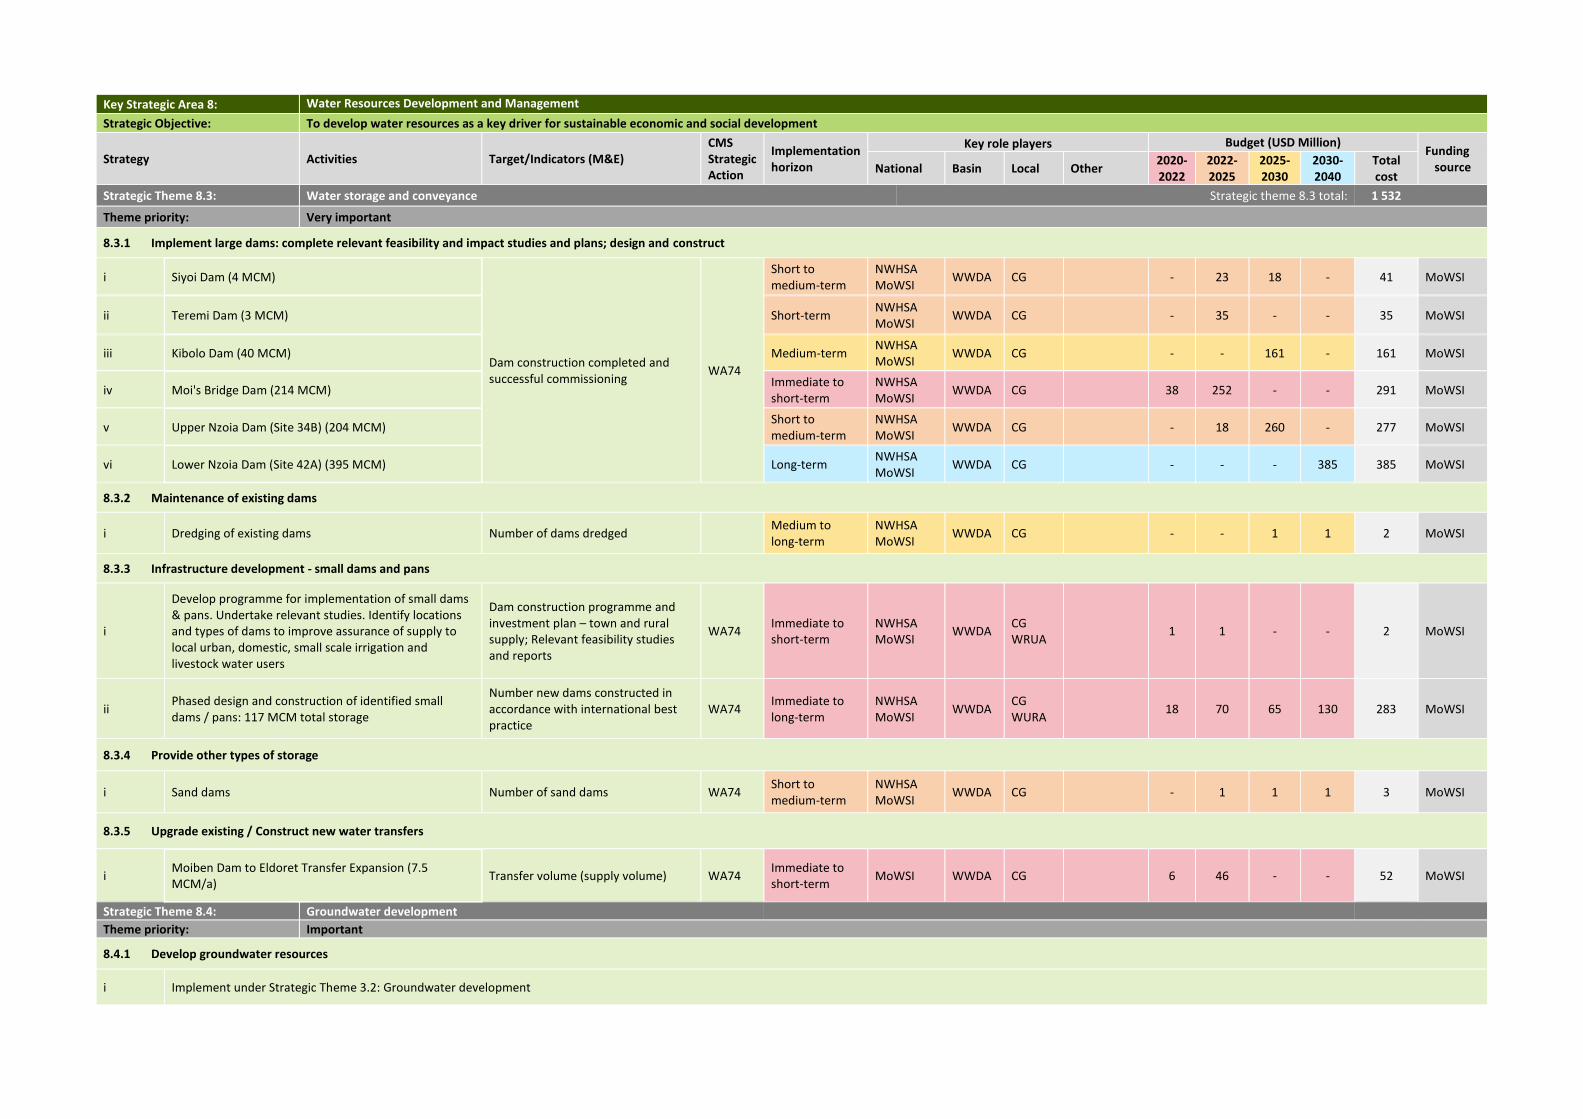
Key Strategic Area 8: Water Resources Development and Management
Strategic Objective: To develop water resources as a key driver for sustainable economic and social development
Strategy Activities Target/Indicators (M&E) CMS Strategic Action
Implementation horizon
Key role players Budget (USD Million) Funding
source National Basin Local Other 2020-2022
2022-2025
2025-2030
2030-2040
Total cost
Strategic Theme 8.3: Water storage and conveyance Strategic theme 8.3 total: 1 532
Theme priority: Very important
8.3.1 Implement large dams: complete relevant feasibility and impact studies and plans; design and construct
i Siyoi Dam (4 MCM)
Dam construction completed and successful commissioning
WA74
Short to medium-term
NWHSA MoWSI
WWDA CG - 23 18 - 41 MoWSI
ii Teremi Dam (3 MCM) Short-term NWHSA MoWSI
WWDA CG - 35 - - 35 MoWSI
iii Kibolo Dam (40 MCM) Medium-term NWHSA MoWSI
WWDA CG - - 161 - 161 MoWSI
iv Moi's Bridge Dam (214 MCM) Immediate to short-term
NWHSA MoWSI
WWDA CG 38 252 - - 291 MoWSI
v Upper Nzoia Dam (Site 34B) (204 MCM) Short to medium-term
NWHSA MoWSI
WWDA CG - 18 260 - 277 MoWSI
vi Lower Nzoia Dam (Site 42A) (395 MCM) Long-term NWHSA MoWSI
WWDA CG - - - 385 385 MoWSI
8.3.2 Maintenance of existing dams
i Dredging of existing dams Number of dams dredged Medium to long-term
NWHSA MoWSI
WWDA CG - - 1 1 2 MoWSI
8.3.3 Infrastructure development - small dams and pans
i
Develop programme for implementation of small dams & pans. Undertake relevant studies. Identify locations and types of dams to improve assurance of supply to local urban, domestic, small scale irrigation and livestock water users
Dam construction programme and investment plan – town and rural supply; Relevant feasibility studies and reports
WA74 Immediate to short-term
NWHSA MoWSI
WWDA CG WRUA
1 1 - - 2 MoWSI
ii Phased design and construction of identified small dams / pans: 117 MCM total storage
Number new dams constructed in accordance with international best practice
WA74 Immediate to long-term
NWHSA MoWSI
WWDA CG WURA
18 70 65 130 283 MoWSI
8.3.4 Provide other types of storage
i Sand dams Number of sand dams WA74 Short to medium-term
NWHSA MoWSI
WWDA CG - 1 1 1 3 MoWSI
8.3.5 Upgrade existing / Construct new water transfers
i Moiben Dam to Eldoret Transfer Expansion (7.5 MCM/a)
Transfer volume (supply volume) WA74 Immediate to short-term
MoWSI WWDA CG 6 46 - - 52 MoWSI
Strategic Theme 8.4: Groundwater development
Theme priority: Important
8.4.1 Develop groundwater resources
i Implement under Strategic Theme 3.2: Groundwater development
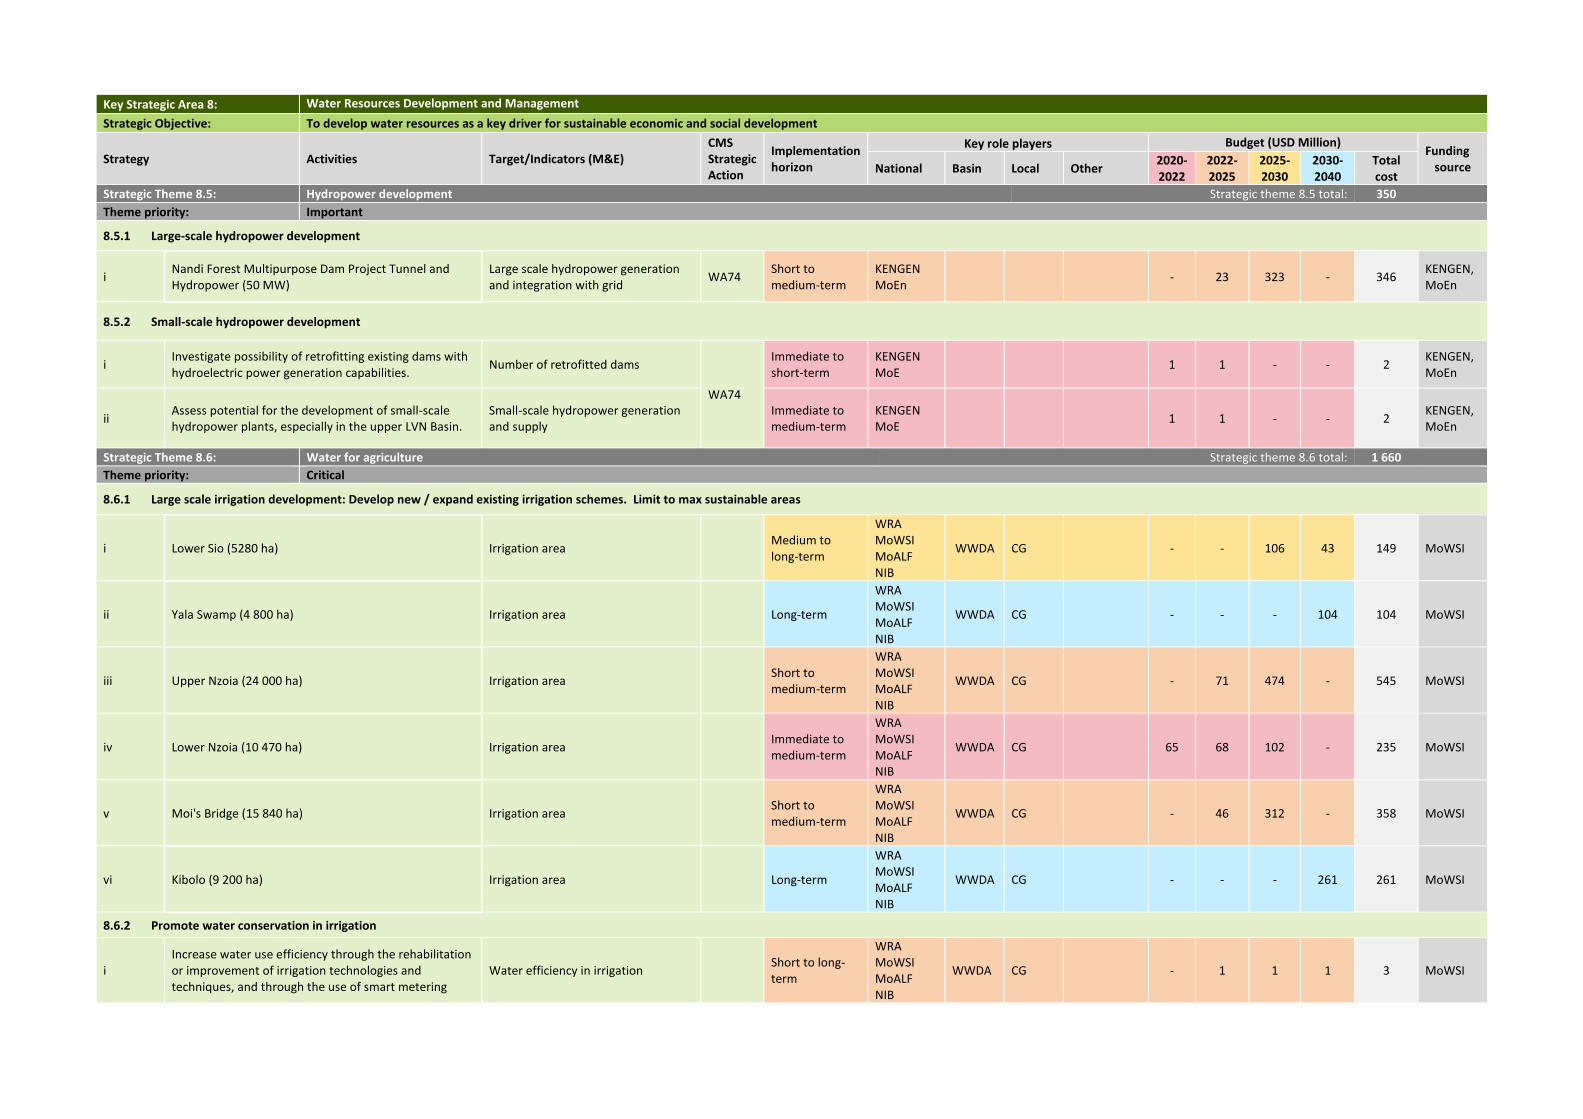
Key Strategic Area 8: Water Resources Development and Management
Strategic Objective: To develop water resources as a key driver for sustainable economic and social development
Strategy Activities Target/Indicators (M&E) CMS Strategic Action
Implementation horizon
Key role players Budget (USD Million) Funding
source National Basin Local Other 2020-2022
2022-2025
2025-2030
2030-2040
Total cost
Strategic Theme 8.5: Hydropower development Strategic theme 8.5 total: 350
Theme priority: Important
8.5.1 Large-scale hydropower development
i Nandi Forest Multipurpose Dam Project Tunnel and Hydropower (50 MW)
Large scale hydropower generation and integration with grid
WA74 Short to medium-term
KENGEN MoEn
- 23 323 - 346 KENGEN, MoEn
8.5.2 Small-scale hydropower development
i Investigate possibility of retrofitting existing dams with hydroelectric power generation capabilities.
Number of retrofitted dams
WA74
Immediate to short-term
KENGEN MoE
1 1 - - 2 KENGEN, MoEn
ii Assess potential for the development of small-scale hydropower plants, especially in the upper LVN Basin.
Small-scale hydropower generation and supply
Immediate to medium-term
KENGEN MoE
1 1 - - 2 KENGEN, MoEn
Strategic Theme 8.6: Water for agriculture Strategic theme 8.6 total: 1 660
Theme priority: Critical
8.6.1 Large scale irrigation development: Develop new / expand existing irrigation schemes. Limit to max sustainable areas
i Lower Sio (5280 ha) Irrigation area Medium to long-term
WRA MoWSI MoALF NIB
WWDA CG - - 106 43 149 MoWSI
ii Yala Swamp (4 800 ha) Irrigation area Long-term
WRA MoWSI MoALF NIB
WWDA CG - - - 104 104 MoWSI
iii Upper Nzoia (24 000 ha) Irrigation area Short to medium-term
WRA MoWSI MoALF NIB
WWDA CG - 71 474 - 545 MoWSI
iv Lower Nzoia (10 470 ha) Irrigation area Immediate to medium-term
WRA MoWSI MoALF NIB
WWDA CG 65 68 102 - 235 MoWSI
v Moi's Bridge (15 840 ha) Irrigation area Short to medium-term
WRA MoWSI MoALF NIB
WWDA CG - 46 312 - 358 MoWSI
vi Kibolo (9 200 ha) Irrigation area Long-term
WRA MoWSI MoALF NIB
WWDA CG - - - 261 261 MoWSI
8.6.2 Promote water conservation in irrigation
i Increase water use efficiency through the rehabilitation or improvement of irrigation technologies and techniques, and through the use of smart metering
Water efficiency in irrigation Short to long-term
WRA MoWSI MoALF NIB
WWDA CG - 1 1 1 3 MoWSI
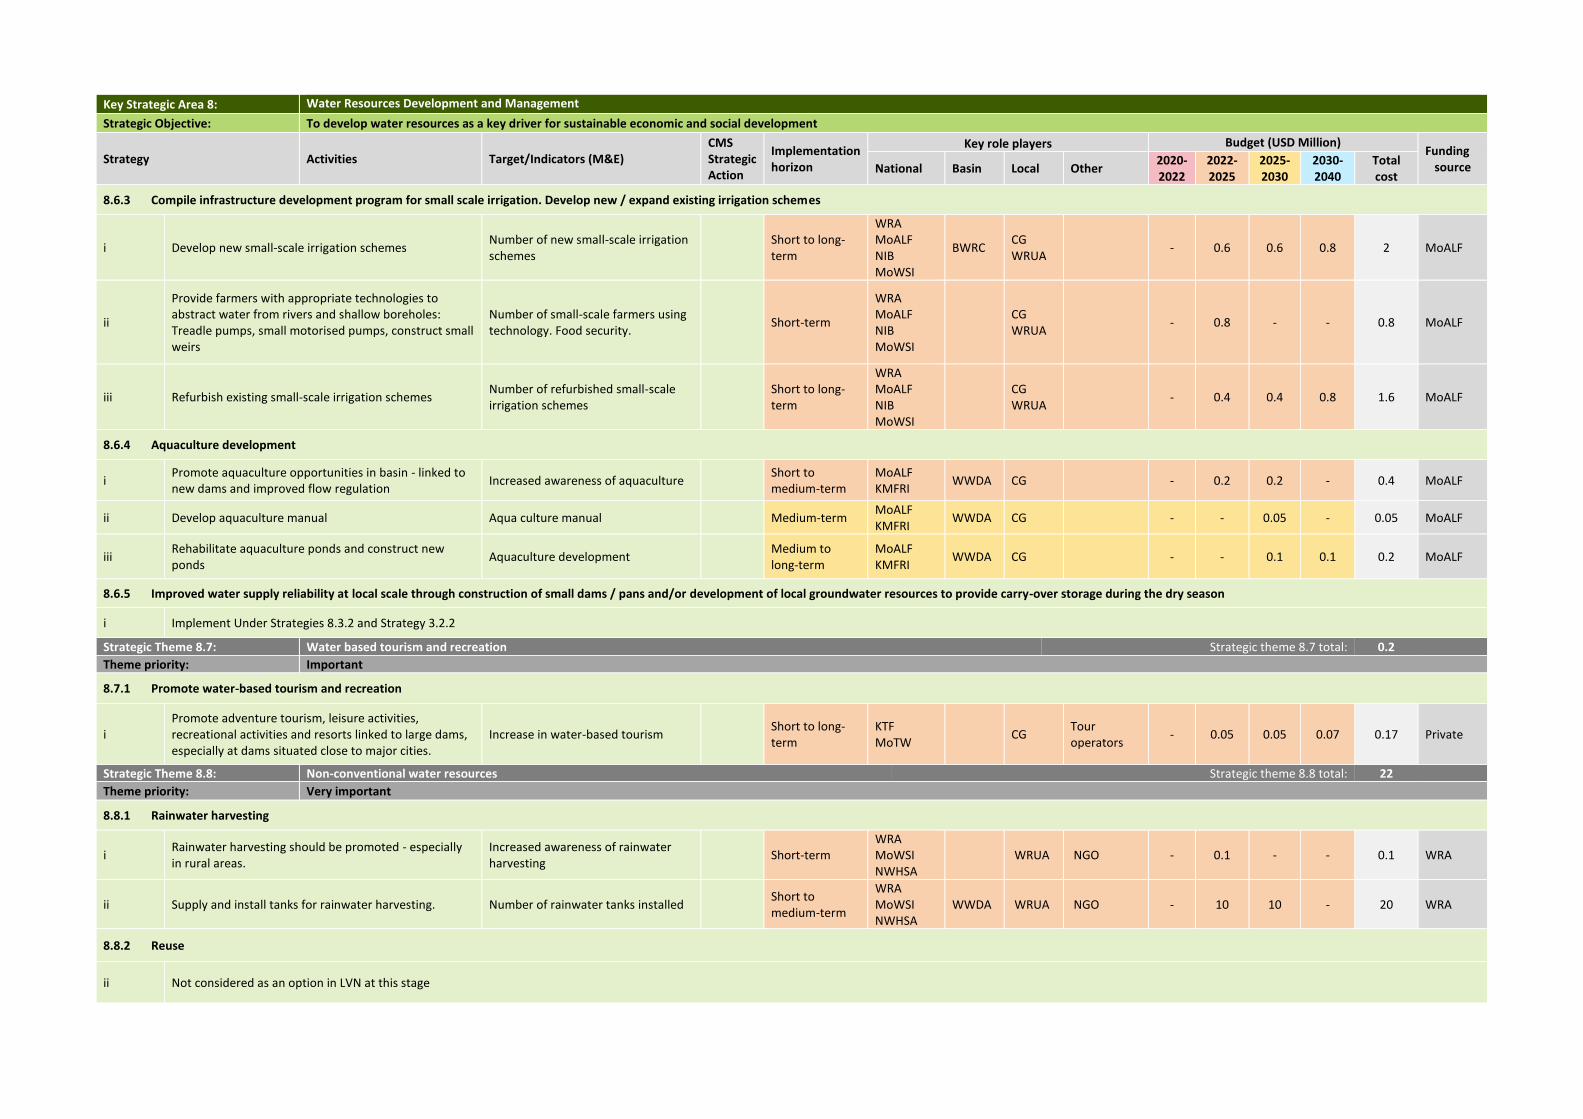
Key Strategic Area 8: Water Resources Development and Management
Strategic Objective: To develop water resources as a key driver for sustainable economic and social development
Strategy Activities Target/Indicators (M&E) CMS Strategic Action
Implementation horizon
Key role players Budget (USD Million) Funding
source National Basin Local Other 2020-2022
2022-2025
2025-2030
2030-2040
Total cost
8.6.3 Compile infrastructure development program for small scale irrigation. Develop new / expand existing irrigation schemes
i Develop new small-scale irrigation schemes Number of new small-scale irrigation schemes
Short to long-term
WRA MoALF NIB MoWSI
BWRC CG WRUA
- 0.6 0.6 0.8 2 MoALF
ii
Provide farmers with appropriate technologies to abstract water from rivers and shallow boreholes: Treadle pumps, small motorised pumps, construct small weirs
Number of small-scale farmers using technology. Food security.
Short-term
WRA MoALF NIB MoWSI
CG WRUA
- 0.8 - - 0.8 MoALF
iii Refurbish existing small-scale irrigation schemes Number of refurbished small-scale irrigation schemes
Short to long-term
WRA MoALF NIB MoWSI
CG WRUA
- 0.4 0.4 0.8 1.6 MoALF
8.6.4 Aquaculture development
i Promote aquaculture opportunities in basin - linked to new dams and improved flow regulation
Increased awareness of aquaculture Short to medium-term
MoALF KMFRI
WWDA CG - 0.2 0.2 - 0.4 MoALF
ii Develop aquaculture manual Aqua culture manual Medium-term MoALF KMFRI
WWDA CG - - 0.05 - 0.05 MoALF
iii Rehabilitate aquaculture ponds and construct new ponds
Aquaculture development Medium to long-term
MoALF KMFRI
WWDA CG - - 0.1 0.1 0.2 MoALF
8.6.5 Improved water supply reliability at local scale through construction of small dams / pans and/or development of local groundwater resources to provide carry-over storage during the dry season
i Implement Under Strategies 8.3.2 and Strategy 3.2.2
Strategic Theme 8.7: Water based tourism and recreation Strategic theme 8.7 total: 0.2
Theme priority: Important
8.7.1 Promote water-based tourism and recreation
i Promote adventure tourism, leisure activities, recreational activities and resorts linked to large dams, especially at dams situated close to major cities.
Increase in water-based tourism Short to long-term
KTF MoTW
CG Tour operators
- 0.05 0.05 0.07 0.17 Private
Strategic Theme 8.8: Non-conventional water resources Strategic theme 8.8 total: 22
Theme priority: Very important
8.8.1 Rainwater harvesting
i Rainwater harvesting should be promoted - especially in rural areas.
Increased awareness of rainwater harvesting
Short-term WRA MoWSI NWHSA
WRUA NGO - 0.1 - - 0.1 WRA
ii Supply and install tanks for rainwater harvesting. Number of rainwater tanks installed Short to medium-term
WRA MoWSI NWHSA
WWDA WRUA NGO - 10 10 - 20 WRA
8.8.2 Reuse
ii Not considered as an option in LVN at this stage
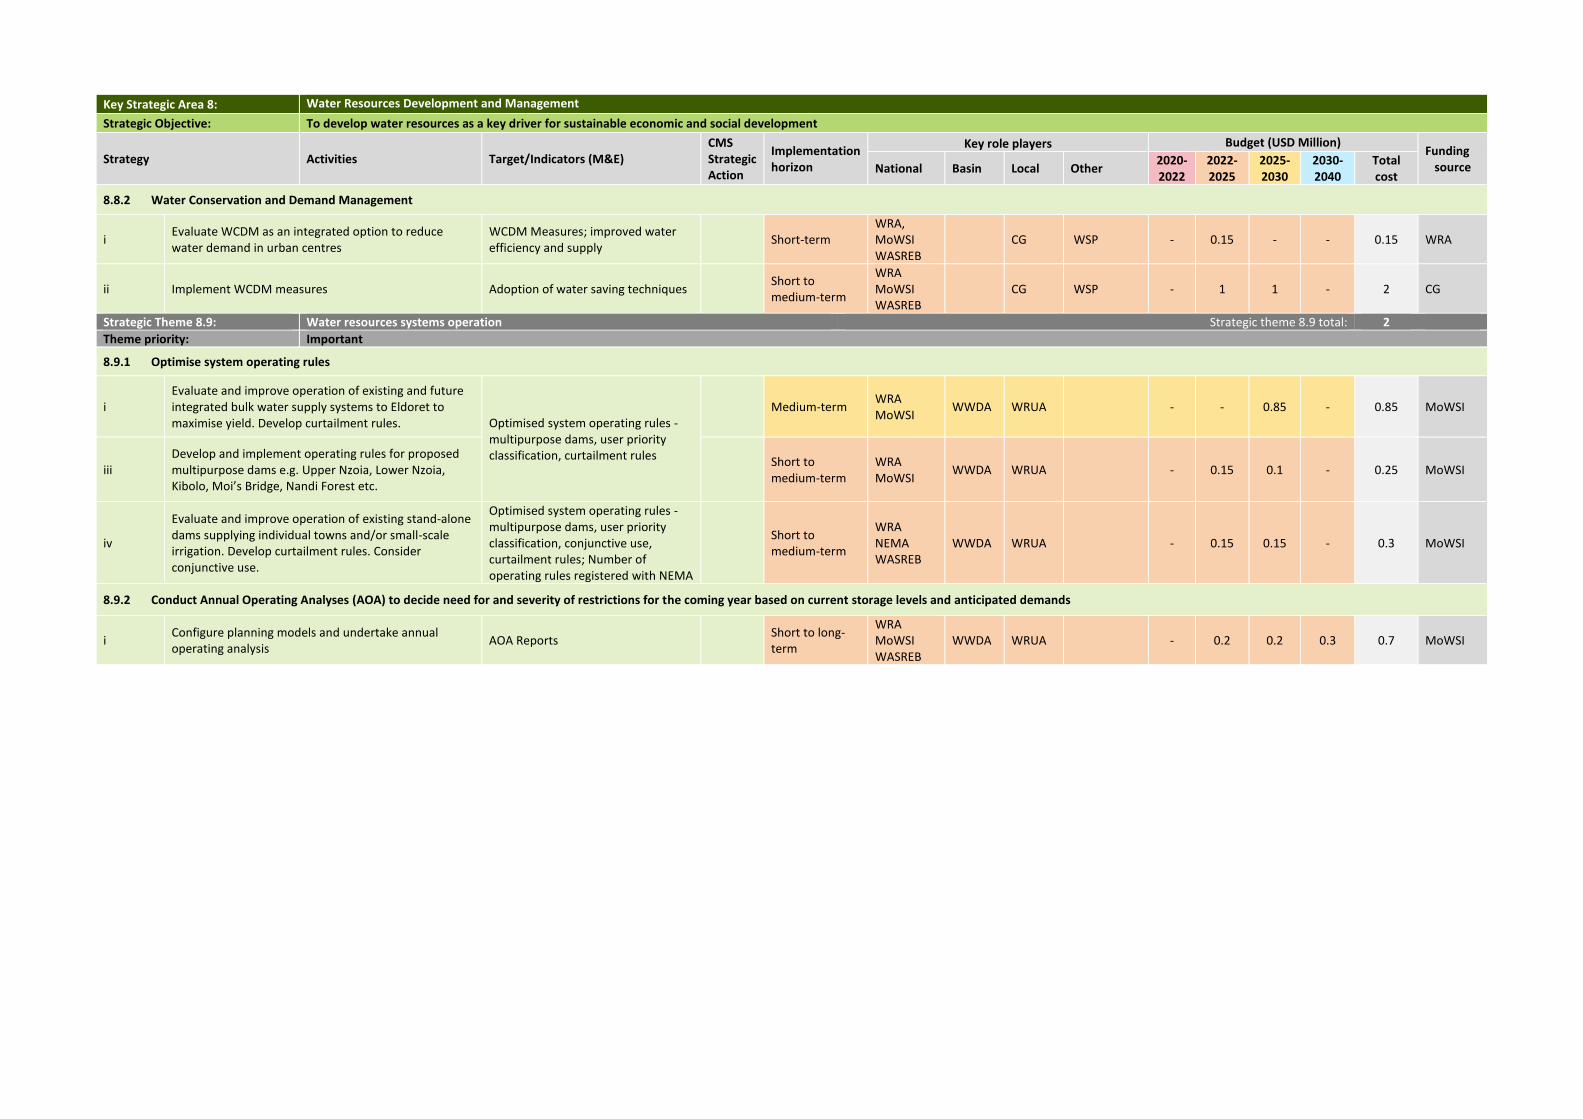
Key Strategic Area 8: Water Resources Development and Management
Strategic Objective: To develop water resources as a key driver for sustainable economic and social development
Strategy Activities Target/Indicators (M&E) CMS Strategic Action
Implementation horizon
Key role players Budget (USD Million) Funding
source National Basin Local Other 2020-2022
2022-2025
2025-2030
2030-2040
Total cost
8.8.2 Water Conservation and Demand Management
i Evaluate WCDM as an integrated option to reduce water demand in urban centres
WCDM Measures; improved water efficiency and supply
Short-term WRA, MoWSI WASREB
CG WSP - 0.15 - - 0.15 WRA
ii Implement WCDM measures Adoption of water saving techniques Short to medium-term
WRA MoWSI WASREB
CG WSP - 1 1 - 2 CG
Strategic Theme 8.9: Water resources systems operation Strategic theme 8.9 total: 2
Theme priority: Important
8.9.1 Optimise system operating rules
i Evaluate and improve operation of existing and future integrated bulk water supply systems to Eldoret to maximise yield. Develop curtailment rules. Optimised system operating rules -
multipurpose dams, user priority classification, curtailment rules
Medium-term WRA MoWSI
WWDA WRUA - - 0.85 - 0.85 MoWSI
iii Develop and implement operating rules for proposed multipurpose dams e.g. Upper Nzoia, Lower Nzoia, Kibolo, Moi’s Bridge, Nandi Forest etc.
Short to medium-term
WRA MoWSI
WWDA WRUA - 0.15 0.1 - 0.25 MoWSI
iv
Evaluate and improve operation of existing stand-alone dams supplying individual towns and/or small-scale irrigation. Develop curtailment rules. Consider conjunctive use.
Optimised system operating rules - multipurpose dams, user priority classification, conjunctive use, curtailment rules; Number of operating rules registered with NEMA
Short to medium-term
WRA NEMA WASREB
WWDA WRUA - 0.15 0.15 - 0.3 MoWSI
8.9.2 Conduct Annual Operating Analyses (AOA) to decide need for and severity of restrictions for the coming year based on current storage levels and anticipated demands
i Configure planning models and undertake annual operating analysis
AOA Reports Short to long-term
WRA MoWSI WASREB
WWDA WRUA - 0.2 0.2 0.3 0.7 MoWSI
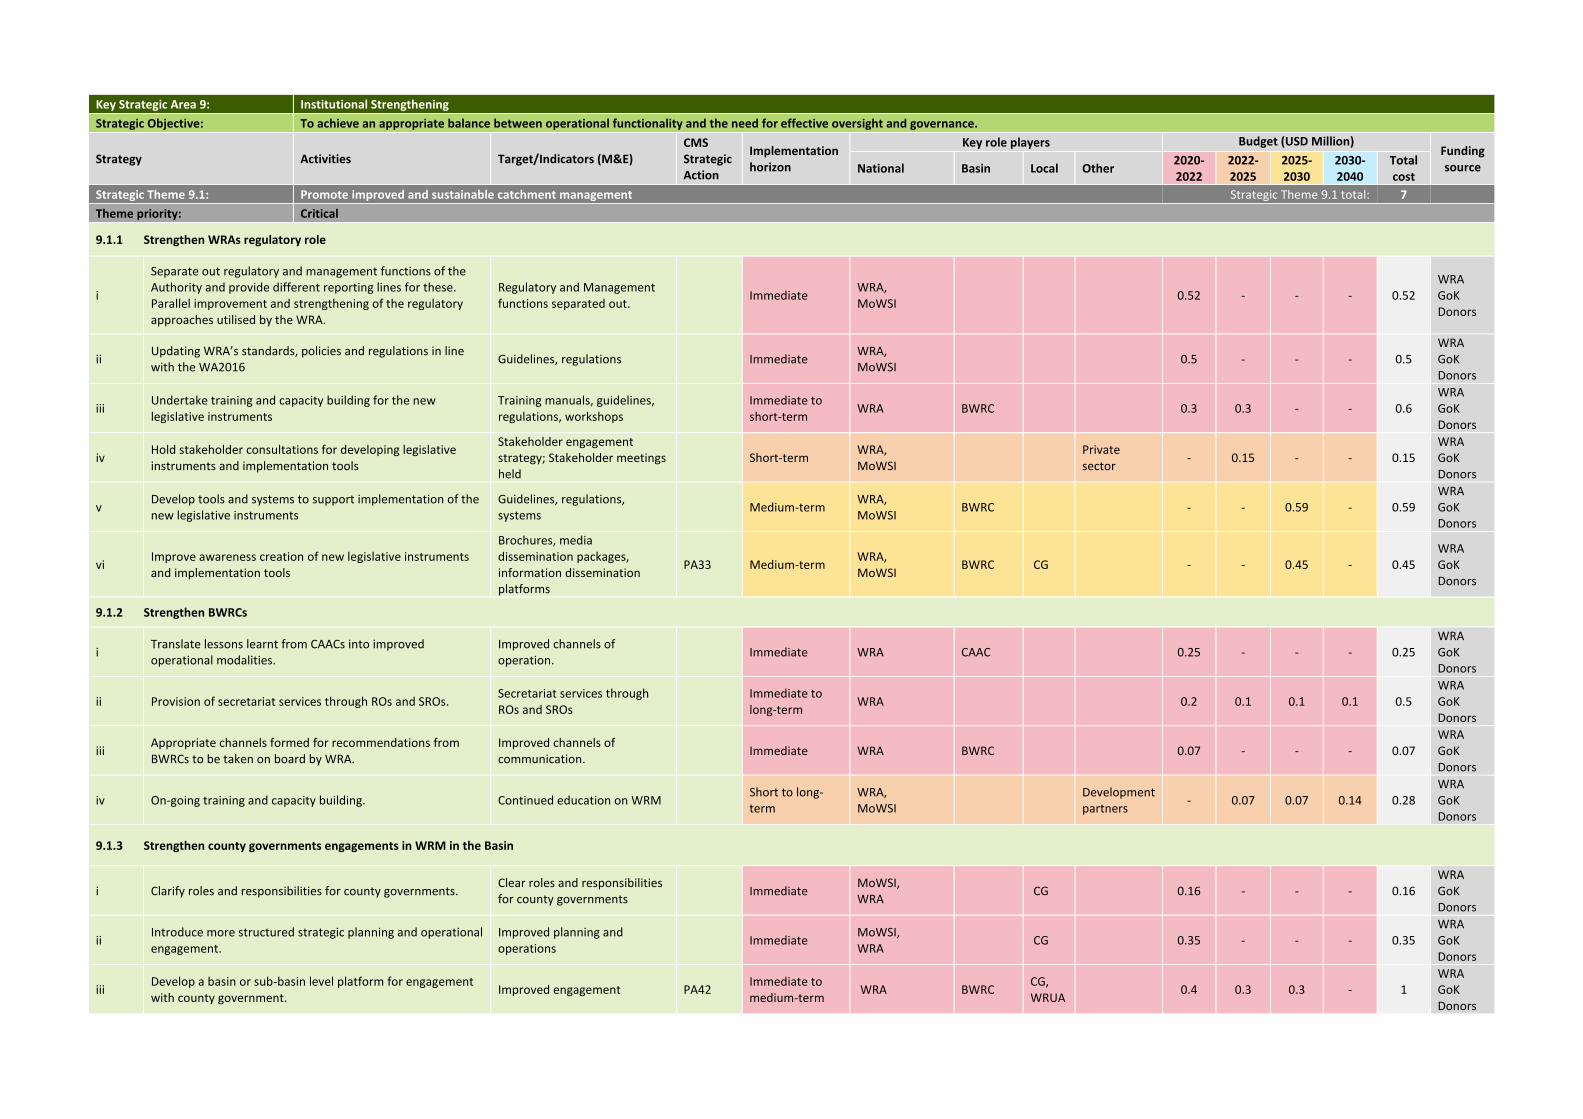
Key Strategic Area 9: Institutional Strengthening
Strategic Objective: To achieve an appropriate balance between operational functionality and the need for effective oversight and governance.
Strategy Activities Target/Indicators (M&E) CMS Strategic Action
Implementation horizon
Key role players Budget (USD Million) Funding source National Basin Local Other
2020-2022
2022- 2025
2025-2030
2030- 2040
Total cost
Strategic Theme 9.1: Promote improved and sustainable catchment management Strategic Theme 9.1 total: 7
Theme priority: Critical
9.1.1 Strengthen WRAs regulatory role
i
Separate out regulatory and management functions of the Authority and provide different reporting lines for these. Parallel improvement and strengthening of the regulatory approaches utilised by the WRA.
Regulatory and Management functions separated out.
Immediate WRA, MoWSI
0.52 - - - 0.52 WRA GoK Donors
ii Updating WRA’s standards, policies and regulations in line with the WA2016
Guidelines, regulations Immediate WRA, MoWSI
0.5 - - - 0.5 WRA GoK Donors
iii Undertake training and capacity building for the new legislative instruments
Training manuals, guidelines, regulations, workshops
Immediate to short-term
WRA BWRC 0.3 0.3 - - 0.6 WRA GoK Donors
iv Hold stakeholder consultations for developing legislative instruments and implementation tools
Stakeholder engagement strategy; Stakeholder meetings held
Short-term WRA, MoWSI
Private sector
- 0.15 - - 0.15 WRA GoK Donors
v Develop tools and systems to support implementation of the new legislative instruments
Guidelines, regulations, systems
Medium-term WRA, MoWSI
BWRC - - 0.59 - 0.59 WRA GoK Donors
vi Improve awareness creation of new legislative instruments and implementation tools
Brochures, media dissemination packages, information dissemination platforms
PA33 Medium-term WRA, MoWSI
BWRC CG - - 0.45 - 0.45 WRA GoK Donors
9.1.2 Strengthen BWRCs
i Translate lessons learnt from CAACs into improved operational modalities.
Improved channels of operation.
Immediate WRA CAAC 0.25 - - - 0.25 WRA GoK Donors
ii Provision of secretariat services through ROs and SROs. Secretariat services through ROs and SROs
Immediate to long-term
WRA 0.2 0.1 0.1 0.1 0.5 WRA GoK Donors
iii Appropriate channels formed for recommendations from BWRCs to be taken on board by WRA.
Improved channels of communication.
Immediate WRA BWRC 0.07 - - - 0.07 WRA GoK Donors
iv On-going training and capacity building. Continued education on WRM Short to long-term
WRA, MoWSI
Development partners
- 0.07 0.07 0.14 0.28 WRA GoK Donors
9.1.3 Strengthen county governments engagements in WRM in the Basin
i Clarify roles and responsibilities for county governments. Clear roles and responsibilities for county governments
Immediate MoWSI, WRA
CG 0.16 - - - 0.16 WRA GoK Donors
ii Introduce more structured strategic planning and operational engagement.
Improved planning and operations
Immediate MoWSI, WRA
CG 0.35 - - - 0.35 WRA GoK Donors
iii Develop a basin or sub-basin level platform for engagement with county government.
Improved engagement PA42 Immediate to medium-term
WRA BWRC CG, WRUA
0.4 0.3 0.3 - 1 WRA GoK Donors
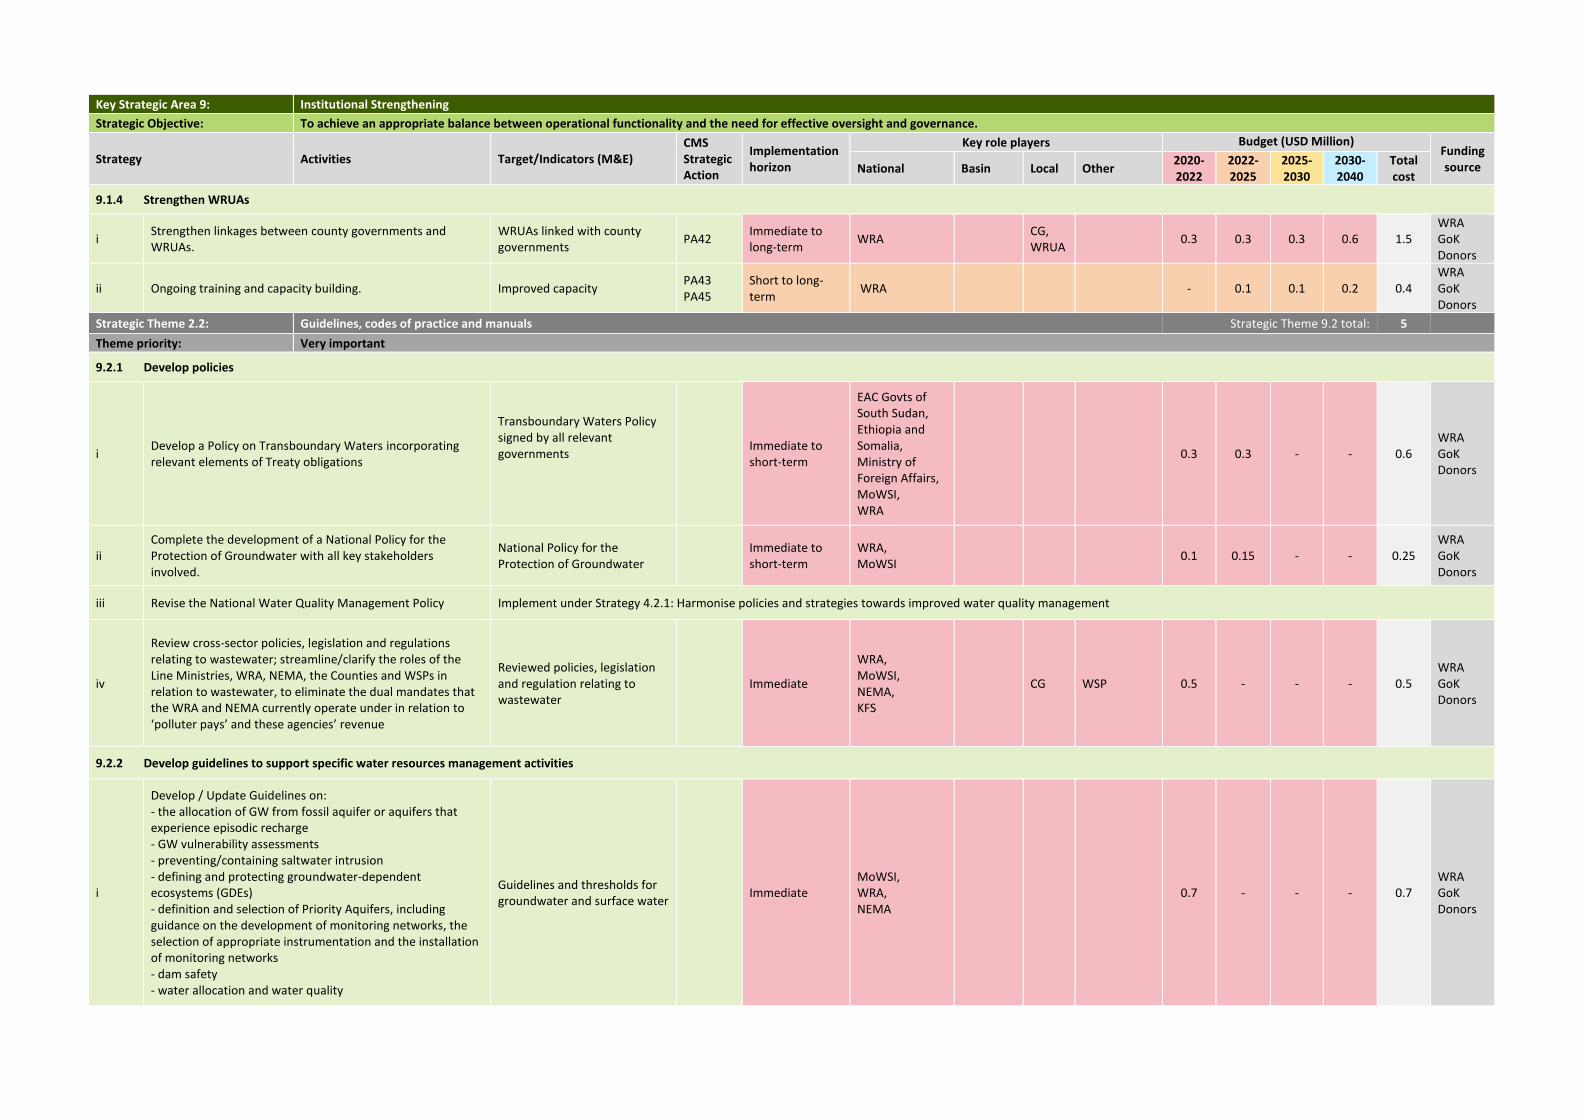
Key Strategic Area 9: Institutional Strengthening
Strategic Objective: To achieve an appropriate balance between operational functionality and the need for effective oversight and governance.
Strategy Activities Target/Indicators (M&E) CMS Strategic Action
Implementation horizon
Key role players Budget (USD Million) Funding source National Basin Local Other
2020-2022
2022- 2025
2025-2030
2030- 2040
Total cost
9.1.4 Strengthen WRUAs
i Strengthen linkages between county governments and WRUAs.
WRUAs linked with county governments
PA42 Immediate to long-term
WRA CG, WRUA
0.3 0.3 0.3 0.6 1.5 WRA GoK Donors
ii Ongoing training and capacity building. Improved capacity PA43 PA45
Short to long-term
WRA - 0.1 0.1 0.2 0.4 WRA GoK Donors
Strategic Theme 2.2: Guidelines, codes of practice and manuals Strategic Theme 9.2 total: 5
Theme priority: Very important
9.2.1 Develop policies
i Develop a Policy on Transboundary Waters incorporating relevant elements of Treaty obligations
Transboundary Waters Policy signed by all relevant governments
Immediate to short-term
EAC Govts of South Sudan, Ethiopia and Somalia, Ministry of Foreign Affairs, MoWSI, WRA
0.3 0.3 - - 0.6 WRA GoK Donors
ii Complete the development of a National Policy for the Protection of Groundwater with all key stakeholders involved.
National Policy for the Protection of Groundwater
Immediate to short-term
WRA, MoWSI
0.1 0.15 - - 0.25 WRA GoK Donors
iii Revise the National Water Quality Management Policy Implement under Strategy 4.2.1: Harmonise policies and strategies towards improved water quality management
iv
Review cross-sector policies, legislation and regulations relating to wastewater; streamline/clarify the roles of the Line Ministries, WRA, NEMA, the Counties and WSPs in relation to wastewater, to eliminate the dual mandates that the WRA and NEMA currently operate under in relation to ‘polluter pays’ and these agencies’ revenue
Reviewed policies, legislation and regulation relating to wastewater
Immediate
WRA, MoWSI, NEMA, KFS
CG WSP 0.5 - - - 0.5 WRA GoK Donors
9.2.2 Develop guidelines to support specific water resources management activities
i
Develop / Update Guidelines on: - the allocation of GW from fossil aquifer or aquifers that experience episodic recharge - GW vulnerability assessments - preventing/containing saltwater intrusion - defining and protecting groundwater-dependent ecosystems (GDEs) - definition and selection of Priority Aquifers, including guidance on the development of monitoring networks, the selection of appropriate instrumentation and the installation of monitoring networks - dam safety - water allocation and water quality
Guidelines and thresholds for groundwater and surface water
Immediate MoWSI, WRA, NEMA
0.7 - - - 0.7 WRA GoK Donors
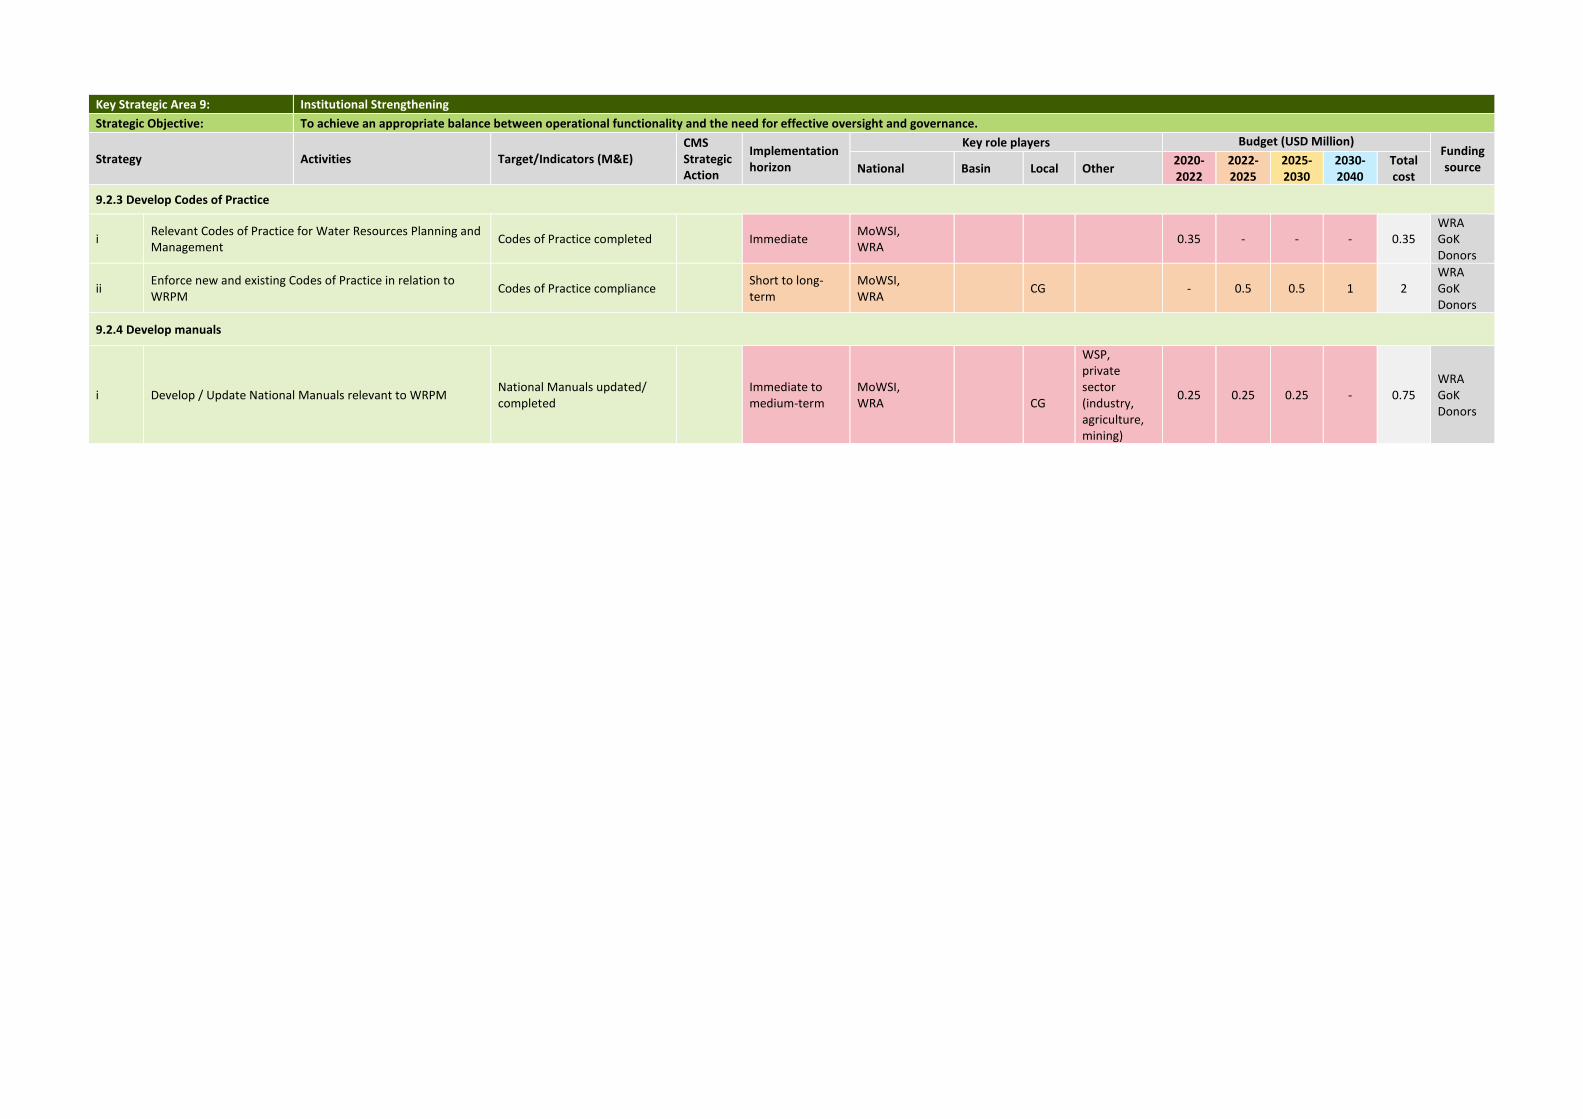
Key Strategic Area 9: Institutional Strengthening
Strategic Objective: To achieve an appropriate balance between operational functionality and the need for effective oversight and governance.
Strategy Activities Target/Indicators (M&E) CMS Strategic Action
Implementation horizon
Key role players Budget (USD Million) Funding source National Basin Local Other
2020-2022
2022- 2025
2025-2030
2030- 2040
Total cost
9.2.3 Develop Codes of Practice
i Relevant Codes of Practice for Water Resources Planning and Management
Codes of Practice completed Immediate MoWSI, WRA
0.35 - - - 0.35 WRA GoK Donors
ii Enforce new and existing Codes of Practice in relation to WRPM
Codes of Practice compliance Short to long-term
MoWSI, WRA
CG - 0.5 0.5 1 2 WRA GoK Donors
9.2.4 Develop manuals
i Develop / Update National Manuals relevant to WRPM National Manuals updated/ completed
Immediate to medium-term
MoWSI, WRA
CG
WSP, private sector (industry, agriculture, mining)
0.25 0.25 0.25 - 0.75 WRA GoK Donors
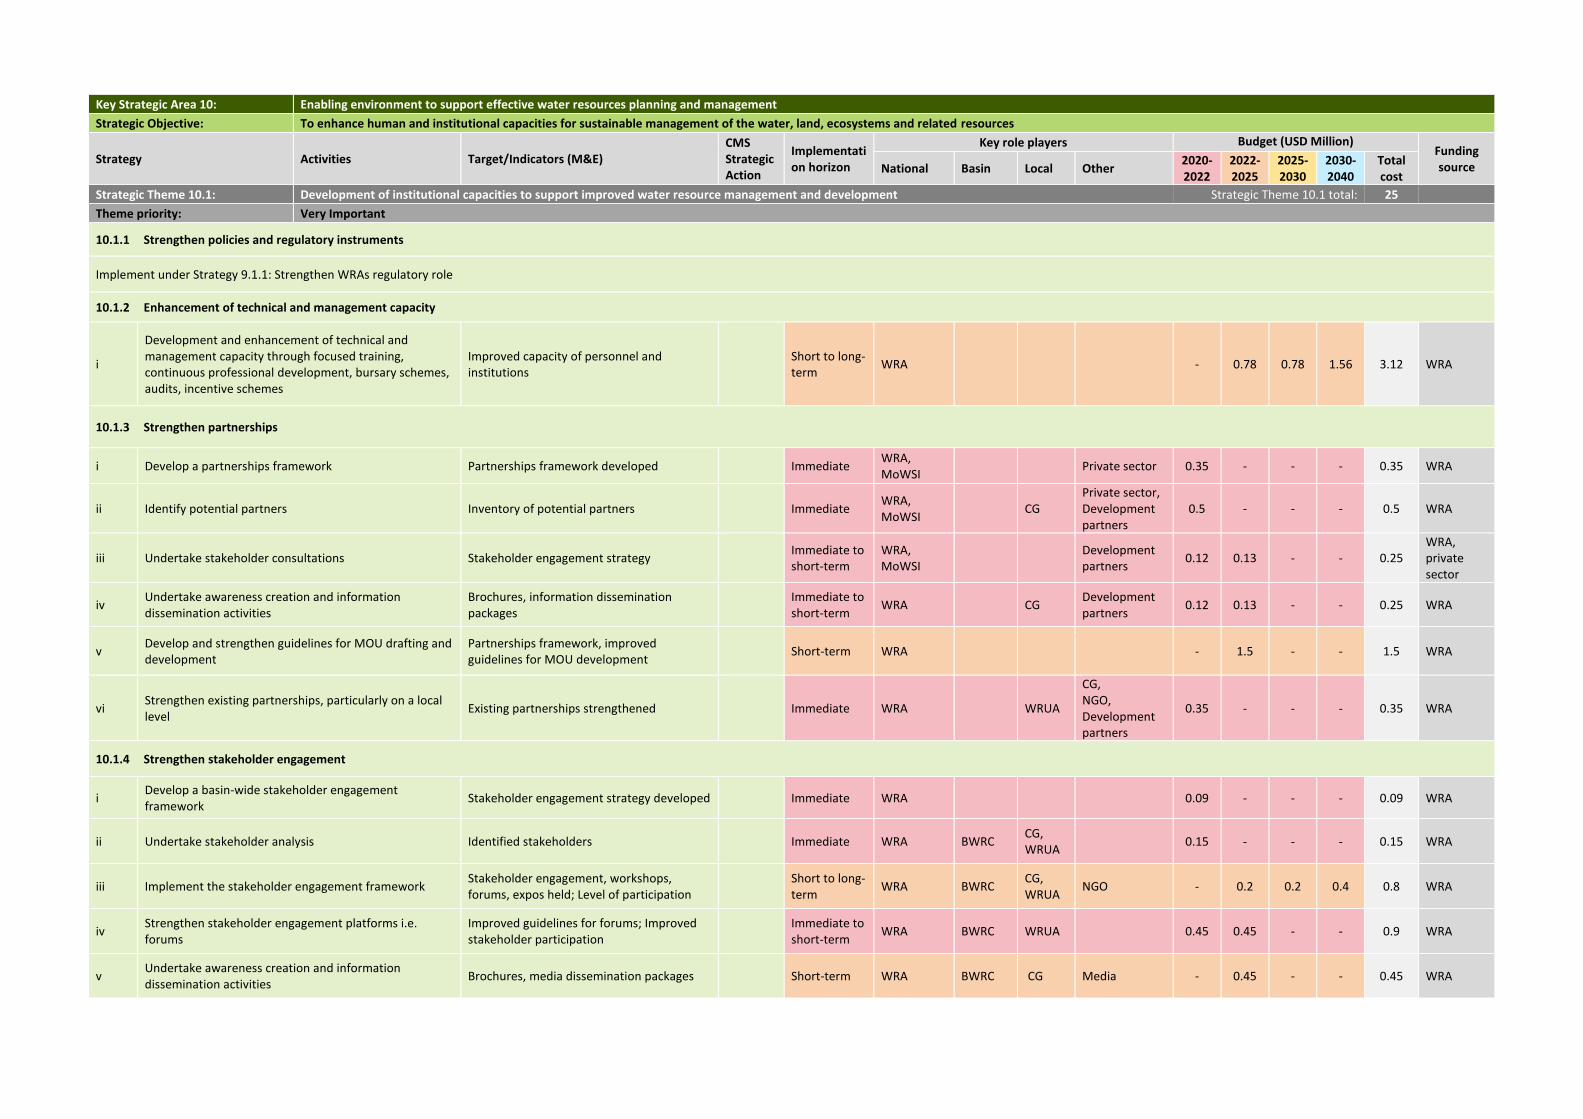
Key Strategic Area 10: Enabling environment to support effective water resources planning and management
Strategic Objective: To enhance human and institutional capacities for sustainable management of the water, land, ecosystems and related resources
Strategy Activities Target/Indicators (M&E) CMS Strategic Action
Implementation horizon
Key role players Budget (USD Million) Funding source National Basin Local Other
2020-2022
2022- 2025
2025-2030
2030- 2040
Total cost
Strategic Theme 10.1: Development of institutional capacities to support improved water resource management and development Strategic Theme 10.1 total: 25
Theme priority: Very Important
10.1.1 Strengthen policies and regulatory instruments
Implement under Strategy 9.1.1: Strengthen WRAs regulatory role
10.1.2 Enhancement of technical and management capacity
i
Development and enhancement of technical and management capacity through focused training, continuous professional development, bursary schemes, audits, incentive schemes
Improved capacity of personnel and institutions
Short to long-term
WRA - 0.78 0.78 1.56 3.12 WRA
10.1.3 Strengthen partnerships
i Develop a partnerships framework Partnerships framework developed
Immediate WRA, MoWSI
Private sector 0.35 - - - 0.35 WRA
ii Identify potential partners Inventory of potential partners
Immediate WRA, MoWSI
CG Private sector, Development partners
0.5 - - - 0.5 WRA
iii Undertake stakeholder consultations Stakeholder engagement strategy
Immediate to short-term
WRA, MoWSI
Development partners
0.12 0.13 - - 0.25 WRA, private sector
iv Undertake awareness creation and information dissemination activities
Brochures, information dissemination packages
Immediate to short-term
WRA CG Development partners
0.12 0.13 - - 0.25 WRA
v Develop and strengthen guidelines for MOU drafting and development
Partnerships framework, improved guidelines for MOU development
Short-term WRA - 1.5 - - 1.5 WRA
vi Strengthen existing partnerships, particularly on a local level
Existing partnerships strengthened
Immediate WRA WRUA
CG, NGO, Development partners
0.35 - - - 0.35 WRA
10.1.4 Strengthen stakeholder engagement
i Develop a basin-wide stakeholder engagement framework
Stakeholder engagement strategy developed
Immediate WRA 0.09 - - - 0.09 WRA
ii Undertake stakeholder analysis Identified stakeholders
Immediate WRA BWRC CG, WRUA
0.15 - - - 0.15 WRA
iii Implement the stakeholder engagement framework Stakeholder engagement, workshops, forums, expos held; Level of participation
Short to long-term
WRA BWRC CG, WRUA
NGO - 0.2 0.2 0.4 0.8 WRA
iv Strengthen stakeholder engagement platforms i.e. forums
Improved guidelines for forums; Improved stakeholder participation
Immediate to short-term
WRA BWRC WRUA 0.45 0.45 - - 0.9 WRA
v Undertake awareness creation and information dissemination activities
Brochures, media dissemination packages
Short-term WRA BWRC CG Media - 0.45 - - 0.45 WRA
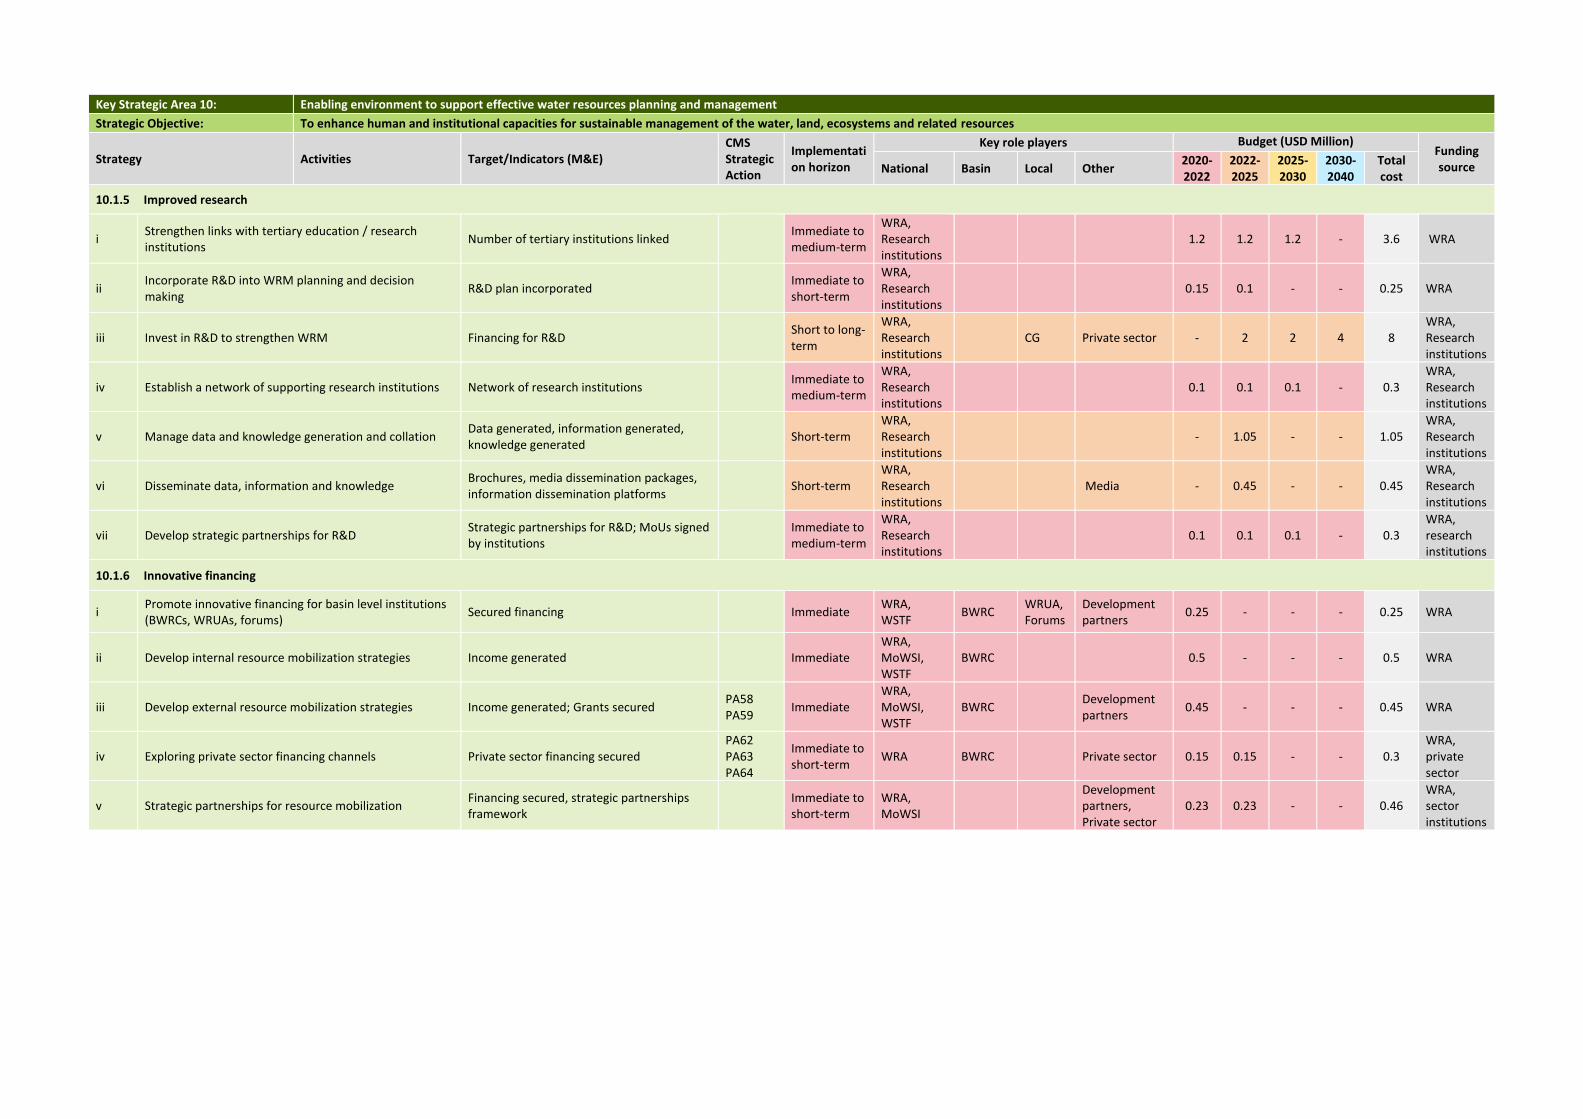
Key Strategic Area 10: Enabling environment to support effective water resources planning and management
Strategic Objective: To enhance human and institutional capacities for sustainable management of the water, land, ecosystems and related resources
Strategy Activities Target/Indicators (M&E) CMS Strategic Action
Implementation horizon
Key role players Budget (USD Million) Funding source National Basin Local Other
2020-2022
2022- 2025
2025-2030
2030- 2040
Total cost
10.1.5 Improved research
i Strengthen links with tertiary education / research institutions
Number of tertiary institutions linked
Immediate to medium-term
WRA, Research institutions
1.2 1.2 1.2 - 3.6 WRA
ii Incorporate R&D into WRM planning and decision making
R&D plan incorporated
Immediate to short-term
WRA, Research institutions
0.15 0.1 - - 0.25 WRA
iii Invest in R&D to strengthen WRM Financing for R&D
Short to long-term
WRA, Research institutions
CG Private sector - 2 2 4 8 WRA, Research institutions
iv Establish a network of supporting research institutions Network of research institutions
Immediate to medium-term
WRA, Research institutions
0.1 0.1 0.1 - 0.3 WRA, Research institutions
v Manage data and knowledge generation and collation Data generated, information generated, knowledge generated
Short-term
WRA, Research institutions
- 1.05 - - 1.05 WRA, Research institutions
vi Disseminate data, information and knowledge Brochures, media dissemination packages, information dissemination platforms
Short-term
WRA, Research institutions
Media - 0.45 - - 0.45 WRA, Research institutions
vii Develop strategic partnerships for R&D Strategic partnerships for R&D; MoUs signed by institutions
Immediate to medium-term
WRA, Research institutions
0.1 0.1 0.1 - 0.3 WRA, research institutions
10.1.6 Innovative financing
i Promote innovative financing for basin level institutions (BWRCs, WRUAs, forums)
Secured financing Immediate WRA, WSTF
BWRC WRUA, Forums
Development partners
0.25 - - - 0.25 WRA
ii Develop internal resource mobilization strategies Income generated Immediate WRA, MoWSI, WSTF
BWRC 0.5 - - - 0.5 WRA
iii Develop external resource mobilization strategies Income generated; Grants secured PA58 PA59
Immediate WRA, MoWSI, WSTF
BWRC Development partners
0.45 - - - 0.45 WRA
iv Exploring private sector financing channels Private sector financing secured PA62 PA63 PA64
Immediate to short-term
WRA BWRC Private sector 0.15 0.15 - - 0.3 WRA, private sector
v Strategic partnerships for resource mobilization Financing secured, strategic partnerships framework
Immediate to short-term
WRA, MoWSI
Development partners, Private sector
0.23 0.23 - - 0.46 WRA, sector institutions
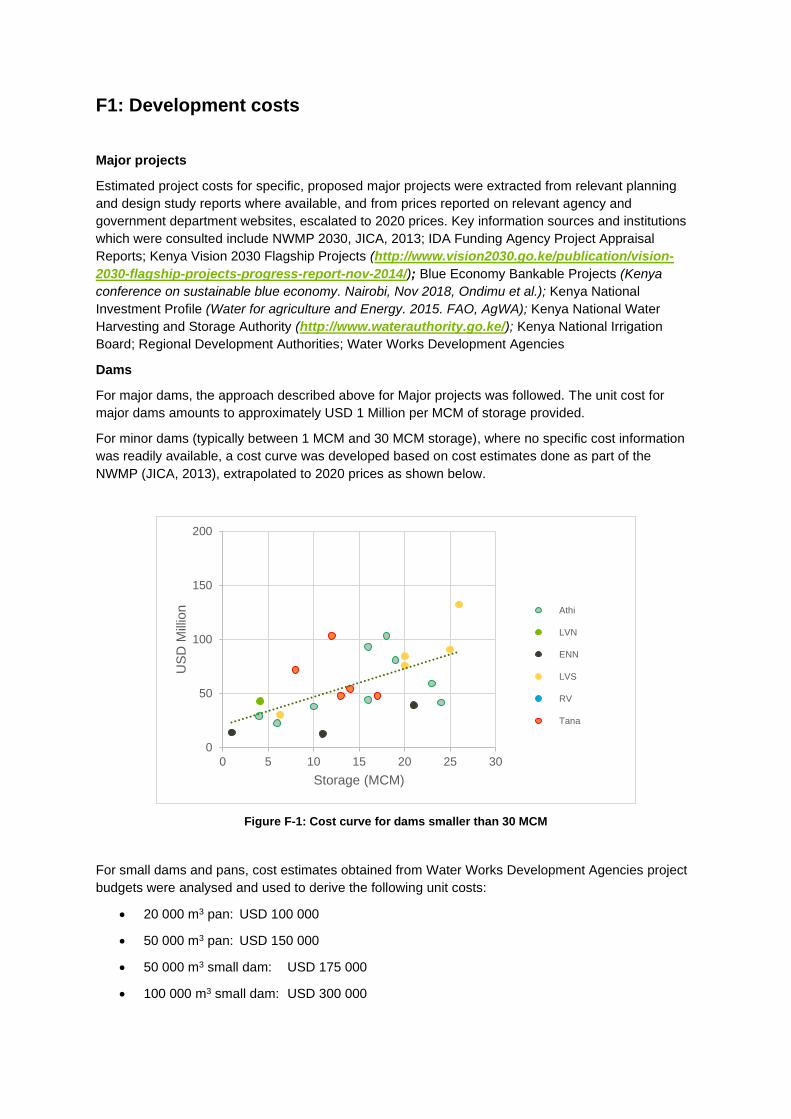
F1: Development costs
Major projects
Estimated project costs for specific, proposed major projects were extracted from relevant planning
and design study reports where available, and from prices reported on relevant agency and
government department websites, escalated to 2020 prices. Key information sources and institutions
which were consulted include NWMP 2030, JICA, 2013; IDA Funding Agency Project Appraisal
Reports; Kenya Vision 2030 Flagship Projects (http://www.vision2030.go.ke/publication/vision-
2030-flagship-projects-progress-report-nov-2014/); Blue Economy Bankable Projects (Kenya
conference on sustainable blue economy. Nairobi, Nov 2018, Ondimu et al.); Kenya National
Investment Profile (Water for agriculture and Energy. 2015. FAO, AgWA); Kenya National Water
Harvesting and Storage Authority (http://www.waterauthority.go.ke/); Kenya National Irrigation
Board; Regional Development Authorities; Water Works Development Agencies
Dams
For major dams, the approach described above for Major projects was followed. The unit cost for
major dams amounts to approximately USD 1 Million per MCM of storage provided.
For minor dams (typically between 1 MCM and 30 MCM storage), where no specific cost information
was readily available, a cost curve was developed based on cost estimates done as part of the
NWMP (JICA, 2013), extrapolated to 2020 prices as shown below.
Figure F-1: Cost curve for dams smaller than 30 MCM
For small dams and pans, cost estimates obtained from Water Works Development Agencies project
budgets were analysed and used to derive the following unit costs:
• 20 000 m3 pan: USD 100 000
• 50 000 m3 pan: USD 150 000
• 50 000 m3 small dam: USD 175 000
• 100 000 m3 small dam: USD 300 000
0
50
100
150
200
0 5 10 15 20 25 30
US
D M
illio
n
Storage (MCM)
Athi
LVN
ENN
LVS
RV
Tana
Linear ( )
Irrigation
For large irrigation projects, the approach described above for Major projects was followed.
For schemes where no specific cost information was readily available, the following unit costs
(complete) for large-scale and small-scale irrigation were derived:
• Large-scale irrigation: USD 19 700 /ha
• Small-scale irrigation: USD 9 500 /ha
The unit costs were based on information provided in the following sources: NWMP 2030 (JICA,
2013); FAO Investment Centre Technical Paper 5, Irrigation: Africa South of Sahara. Rome 1986;
Kenya National Irrigation Board; IWMI Research Report 109. Costs and performance of irrigation
projects: A comparison of Sub-Saharan Africa and other developing regions. (Inocencio et al, 2007)
Hydropower
For many of the planned major hydropower projects, the cost of the hydropower installation was
included with the development cost of the dam.
Otherwise, a unit installation cost of USD 200 000 per MW installed was used based on international
rates (https://www.hydro.org/)
Boreholes
For large groundwater development projects, the approach described above for Major projects was
followed.
For individual boreholes, a cost of USD 20 000 per borehole was used based on typical costs in
Kenya. This includes drilling and equipping of borehole with independent power supply. An average
yield of 4.4 m3/h per borehole was assumed (https://constructionreviewonline.com/2018/03/water-
borehole-services-kenya/)
Bulk Water Transfers
For bulk water transfer projects, the approach described above for Major projects was followed.
Where no specific information was available, tunnels were costed at a unit cost of USD 50 million/km.
Hydromet network
Costs associated with the procurement, installation and commissioning of monitoring stations and
hydromet equipment were based on information and typical unit costs provided by WRA offices and/or
suppliers.
Cost Benefit Analysis (2020)
• Electricity price: 0.15 USD million/GWh.
(https://www.globalpetrolprices.com/Kenya/electricity_prices/)
• Water supply price - urban: 2.9 USD/m3; Water supply price - rural: 1.65 USD/m3. (Gulyani, S
et al. Water for the urban poor: Water markets, Household demand and Service preferences
in Kenya. Water supply and sanitation sector board discussion paper series. Paper No. 5. Jan
2005)
• Irrigation: Unit crop yields and producer prices
(http://www.fao.org/countryprofiles/index/en/?iso3=KEN); Kenya Horticulture Validated
Report 2015 – 2016. AFA – Horticultural Crops Directorate (Avg. County values)
• Operation and Maintenance: Dams and hydropower - 2.5% of capital cost per annum;
Irrigation- 0.5% of capital cost per annum.
• Discount rate: 10%
F2: Management costs
A stepwise approach for estimating costs associated with the implementation of management actions
was followed:
i. Decide on the appropriate implementing agency at national, basin, county or local scale,
based on defined mandates in relation to specific KSA activities. Implementing agencies
include national government, sub-regional offices, county governments and WRUAs.
ii. The type of implementing agency defines the number of offices/units per Basin in the budget
estimation calculation. In the case of a site- specific activity, such as the development of
IFMPs, the number of sites was used to estimate the budget.
iii. Allocate budget over four time frames based on personal experience, professional
consultation fees, management cost estimates as per NWMP 2030 and reference to local
information. Timeframes are 2020-2022 (2 years), 2022-2025 (3 years), 2025-2030 (5 years)
and 2030-2040 (10 years).
iv. Timeframes indicate which activities should be completed immediately (2022) or in the short
(2025), medium (2030) or long-term (2040), as well as the duration of this implementation.
F3: General
• Upfront costs - Planning/Feasibility, Environmental Assessment, Design: 15% of capital cost
• Infrastructure replacement costs were not considered
• Annual inflation rate: 5%
• Exchange rate: 1 USD = 100 KES
• Desalination and water re-use plants were not costed as part of this Plan. Rather, the Plan
recommended that the construction of such plants as alternatives to conventional surface
water and groundwater resources development projects, be investigated in more detail for
possible implementation in the next planning horizon.