Keeyask Generation Project - Province of Manitoba
381
Responses to Request for Additional Information from TAC & Public Reviewers, Round 2 Keeyask Generation Project Environmental Impact Statement April 2013
-
Upload
khangminh22 -
Category
Documents
-
view
0 -
download
0
Transcript of Keeyask Generation Project - Province of Manitoba

Responses to Request for Additional Information from TAC & Public Reviewers, Round 2
Keeyask Generation Project Environmental Impact Statement
April 2013
P~,n’
KEE\ASKHydropower Limited Partnership
20120426
Environmental Assessment & Licensing BranchManitoba Conservation and Water StewardshipSuite 160 123 Main StreetWinnipeg, MB R3C 1A5
Attention: Ms. Tracey Braun
Dear Tracey:
Re: RESPONSES TO SECOND ROUND OF SUPPLEMENTAL INFORMATION REQUESTS
REGARDING THE KEEYASK GENERATION PROJECT
The Keeyask Hydropower Limited Partnership submitted the Keeyask Generation ProjectEnvironmental Impact Statement on July 6, 2012. On November 19, 2012, the Partnershipprovided a formal response to Requests for Additional Information from Manitoba Conservationand Water Stewardship, which had considered comments received from Manitoba governmentdepartments, the federal review team and the public.
Subsequent to the November filing of the Partnership’s Responses to Requests for AdditionalInformation from TAC and Public, Round], Manitoba Conservation and Water Stewardshipcoordinated a review of these responses with provincial government departments. The CanadianEnvironmental Assessment Agency coordinated a similar review with the federal review teamand, on November 21, 2012, also invited the public to comment on the potential environmentaleffects of the Keeyask Generation Project (the Project) and the proposed measures to prevent ormitigate those effects as described in the Environmental Effects Summary document. From thesereviews, the Canadian Environmental Assessment Agency provided the Partnership withsubsequent Requests for Additional Information on December 28, 2012 and ManitobaConservation and Water Stewardship provided additional requests on January 29 and 30, 2013.In accordance with the Canada-Manitoba Agreement on Environmental AssessmentCoordination, Manitoba
Keeyask Hydropower Limited Partnership360 Portage Avenue, P0 Box 815, Stn. Main, Winnipeg, MB R3C 2P4
Page 2 of 2
Conservation and Water Stewardship continues to coordinate the process for ensuring theinformation requested is organized and provided back to federal and provincial reviewers.
The Partnership is pleased to respond to this second round of requests. Our responses arecontained in the attached hinder titled Responses to Requests for Additional Information fromTAC and Public Reviewers, Round 2. Please note that responses to the following requests are stillbeing finalized and will be provided as soon as they are available:
• TAC Public Rd 2 CEAA-0009, regarding the assessment of effects of potential accidentsand malfunctions.
• TAC Public Rd 2 CEAA-0014, regarding the use of the Keeyask area by other Aboriginalgroups, namely the Metis, Pimicikimak Cree Nation/Cross Lake First Nation andShamattawa First Nation.
• TAC Public Rd 2 CEAA-O0l 5, regarding the capacity of renewable resources andreceived from CEAA on April 19, 2012.
• TAC Public Rd 2 EC-0026, EC-0027 and EC-003 1, regarding clearing and blastingduring the breeding bird period.
Should you have any questions or require additional assistance, please feel free to contact VickyCole at 204 360-4621.
Yours truly,
5900345 Manitoba Ltd.as general partner of theKeeyask Hydropower Limited Partnership
K.R.F. Adams, P. EngPresident
KRFAJEnclosure
c: Ms. Shauna SigurdsonMr. Dan McNaughton
Page 2 of 2

Requests for Additional Information - Federal Reviewers
Preamble TAC Rd 2 Follow-up/New Question
(e.g. provide applicable background/rationale for providing the comment)
5 CEAAMap Figure
FolioSection 4.0
Map 4-10
Terrestrial
Biophysical Environmental Mitigation Areas Map - A potential high quality wetland area identified on the map will be fragmented by the south access road development. The road location has the potential to impact the wetland mitigation.
Please provide a rationale for developing the wetland mitigation in an area that is also identified for the development of proposed south access road corridor.
Given that the road will be located through the wetland area, what measures will be in put place to create a suitable buffer area between the road and the wetlands? Please describe the mitigation measures that will be employed to protect the new 'potential high quality wetland' from impacts due to the presence of or operation and maintenance of the proposed road and water control structures, including erosion and sedimentation from the road surface.
see TAC Rd 2 CEAA-0005
9 CEAA R-EIS Gdlines Section 4.78 N/AProject
Description
Assessment of Accidents and Malfunctions - There is no assessment of the effects of accidents and malfunctions as required in the EIS Guidelines. There is little discussion on contingency and emergency response procedures developed in the event of an accident or malfunction. The EIS does not include a list of emergency response plans to be developed and implemented over the life of the project.
Please provide this information.
Proponent has identified a number of potential accidents and malfunctions; however, the assessment of the potential adverse environmental effects resulting from these occurrences has not been adequately described. As stated in the EIS guidelines, the potential consequences of accidents and malfunctions including the environmental effects, must be considered and described in the EIS documentation. The proponent must consider the significance of the potential environmental effects as a result of accidents and malfunctions using the significance criteria described in section 9.4 of the Guidelines (magnitude; geographic extent; timing, duration and frequency; reversibility; ecological and social context; level of confidence and probability; and existence of environmental standards, guidelines or objectives for assessing the impact).
TO BE FILED AT A LATER DATE
10 CEAA R-EIS Gdlines
Section 6.2.3.2.5 Section
6.2.3.4.8
N/APhysical
Environment
EIS Guidelines required the proponent to provide the present mercury and methylmercury data and analysis in soil. The is very little detail provided.
Please provide this information.
Proponent indicated that total mercury, along with other metals and nutrients, were analysed in soil samples from the flooded area; however, the EIS indicates that the report documenting this work has not been completed. Please provide the data and analysis to support the assessment.
see TAC Rd 2 CEAA-0010
Proponent Response
Canadian Environmental Assessment Agency
Page Topic TAC Rd 1 QuestionComment Number
DepartmentVolume / Document
Section
1

Requests for Additional Information - Federal Reviewers
Preamble TAC Rd 2 Follow-up/New Question
(e.g. provide applicable background/rationale for providing the comment)
Proponent Response
Page Topic TAC Rd 1 QuestionComment Number
DepartmentVolume / Document
Section
The Proponent response reiterates efforts to involve Aboriginal communities via the Public Involvement Program (PIP) and summarizes efforts to explore the interests of members of the Manitoba Metis Federation (MMF), Cross Lake First Nation (Pimicikamak Cree Nation) and Shamattawa First Nation.
The Proponent response does not provide information for the environmental assessment with respect to the current use of lands and resources for traditional purposes by Aboriginal persons other than those who are members of KCN communities. While the effects to the use of those lands for traditional purposes could be similar for all Aboriginal persons, the mitigations for effects to traditional use for non-KCN Aboriginal persons are not identified. Current mitigation strategies for this effect only apply to KCN partner Aboriginal groups because mitigation is tied directly to the Adverse Effects Agreements negotiated with the KCN communities. The Proponent response notes that if effects to other users are identified, "appropriate mitigation strategies will be considered."
The EIS Guidelines (s. 8.3.4 Land and Resource Use) require the Proponent to provide information on current and proposed use of land and resources by each Aboriginal group (not just the KCN partners) "based on information provided by the Aboriginal groups or, if Aboriginal groups do not provide this information, on available information from other sources...". The proponent has described the ongoing process to collect accurate information from the other Aboriginal groups. While this information may more accurately inform ongoing effects identification and mitigation strategies, in its absence, the Proponent is required to: (a) provide a description of current and proposed use of resources for affected non-KCN Aboriginal groups based on available information from other sources, if not provided by the Aboriginal group; (b) assess the effects (if any) on those uses; (c) identify mitigation and residual effects (if any) for non-KCN Aboriginal groups.
TO BE FILED AT A LATER DATE
14 CEAA SE SV
We require further information to confirm the extent of use (or lack of use) for traditional purposes by Aboriginal persons of the resources likely to be affected by the project. If further information is collected indicating resource use by Aboriginal persons not party to the Adverse Effects Agreements, assess these effects and describe measures that will be undertaken to mitigate effects to current use of lands and resources by Aboriginal persons not party to the Adverse Effects Agreements off-setting programs.
Part 2: Resource Use Section 1.2.2
1-7Socio-
Economy
CEAA requires consideration of environmental effects, including the effects of changes to the environment on the current use of lands and resources for traditional purposes by aboriginal persons. The EIS notes that the effects on domestic resource use are predicted for KCN communities only, and therefore the primary mitigation involves the effective implementation of the Adverse Effects Agreement offsetting programs (see as an example p 1-27, s. 1.2.4.1.1 Domestic Fishing Construction Phase Effects and Mitigation) which apply only to the KCN communities and members. Use in the Local Study Area by other Aboriginal groups has not been identified through the Public Involvement Program; however, the EIS also acknowledges that this information may be outstanding, in that there are ongoing discussions with the MMF and CLFN/PCN regarding how the resources are used by those communities. Further, notes from the PIP meeting with Shamattawa indicate that this community believes that their treaty rights may be impacted, implying effects to resource use. Finally, the proponent acknowledges that contact with some potentially affected Aboriginal groups has not been completed. The extent of hunting and fishing by Aboriginal groups or persons other than the KCN communities or members is not identified 'to date.'
2

Requests for Additional Information - Federal Reviewers
Preamble TAC Rd 2 Follow-up/New Question
(e.g. provide applicable background/rationale for providing the comment)
Proponent Response
Page Topic TAC Rd 1 QuestionComment Number
DepartmentVolume / Document
Section
1 DFO AE SV Section
3.3.2.3.1 3-15
Aquatic Environment
"Biological components of the aquatic habitat were based on the period during which field studies conducted in the area, generally between 1997 and 2006. This period included both high and low flows, and therefore would indicate interannual variability related to flows."
Detailed background reports to support statements regarding interannaul variability have not been provided in the EIS. These should be made available for review.
Requested reports not provided.see TAC Rd 2
DFO-0001
2 DFO AE SV Section 3.3.1Section 3.3.2
3-11 3-12
Aquatic Environment
"No analysis of trends in aquatic habitat was conducted, since the water regime was established in 1977 and has been operated within set bounds since that time."
However, has aquatic habitat and changes in fish stocks changed since 1977, despite apparent constancy in water regime? Moreover, habitat changes were not actually assessed to support this claim. Can the existing environment be adequately portrayed if not assessed/sampled? This also does not account for natural changes in habitat with flow events outside of regulation. For example, a flow/ice event approximately 10 years ago changed the flow patterns at Gull Rapids, creating a new channel that flows northeast to Stephens Lake. Please consider the entire period of record for analyses.
No additional information provided.see TAC Rd 2
DFO-0002
3 DFO AE SV Map 3A-3 N/AAquatic
Environment"Substrate composition could not be determined immediately upstream, within, or downstream of rapid sections due to safety concerns. "
Please define "immediately". Substrate composition be should be confirmed in the dewatered areas in Gull Rapids prior to any construction. Resolution should be similar to that already conducted in the vicinity of Gull Rapids. This information is crucial for proper accounting of habitat destruction in the rapids.
Physical area "immediately" downstream of Gull Rapids is not defined.
see TAC Rd 2 DFO-0003
Department of Fisheries and Oceans
3

Requests for Additional Information - Federal Reviewers
Preamble TAC Rd 2 Follow-up/New Question
(e.g. provide applicable background/rationale for providing the comment)
Proponent Response
Page Topic TAC Rd 1 QuestionComment Number
DepartmentVolume / Document
Section
4 DFO AE SV Section
3.3.2.3.1 3-15
Aquatic Environment
"For the purposes of predicting habitat conditions in the post-Project environment and quantifying areal changes in habitat area between the pre and post-Project environments, conditions at 95th percentile flow (pre-Project) and full supply level (FSL) in the reservoir post-Project were used. "
This analysis is incomplete. While the 95th percentile accommodates the majority of flows, changes in fish habitat at lower flows are not shown and may be more crucial. Moreover, the 95th percentile flow will be relatively uncommon. The 50th percentile would represent a more normal flow condition and changes in this habitat are not presented. Please provide the results of this analysis which includes the 5th and 50th percentile flows.
Results of percentile flows not provided. As further clarification to the proponent, request pertains to the period of record.
see TAC Rd 2 DFO-0004
5 DFO AE SV Section
3.4.2.3.1N/A
Aquatic Environment
"intermittently-exposed zone"Uncertain as to whether the "intermittently-exposed zone" is in the forebay, below the GS or both. There is no mention or study of the effects of water control on dewatering and re-watering areas below the GS and whether habitat losses and fish fills will occur as a result of this.
Please confirm whether the "intermittently-exposed zone" is in the forebay, below the GS or both. Please also provide an analysis of the effects of water control on dewatering and re-watering areas below the GS and whether habitat losses and fish fills will occur as a result of this.
Requested information not provided.see TAC Rd 2
DFO-0005
7 DFO AE SV Appendix 3A N/AAquatic
EnvironmentDepth Zones Section
In reviewing methods for aquatic habitat assessment in Appendix 3A, while the bathymetric surveying was very detailed, the validation of sonar data does not appear to be structured and repeated such that there is statistical confidence in the results obtained. There in no description of a comparison between the results expected and results observed and therefore the fidelity of the observations. Can the proponent present this sensitivity analysis or point the reviewer to the report which document this? Alternatively, can a study be proposed to test repeatability of bathymetric data collection (test areas beyond the survey area could be tested in the upcoming field season)?
Question may not have been clear. Was direct substrate sampling conducted for each point of sonar data? If not, for areas modelled or extrapolated, how was "modelled" substrate confirmed. Areas of high habitat value are important, but its unclear how this would be known a priori (that is, before sampling)?
see TAC Rd 2 DFO-0007
4
Requests for Additional Information - Federal Reviewers
Preamble TAC Rd 2 Follow-up/New Question
(e.g. provide applicable background/rationale for providing the comment)
Proponent Response
Page Topic TAC Rd 1 QuestionComment Number
DepartmentVolume / Document
Section
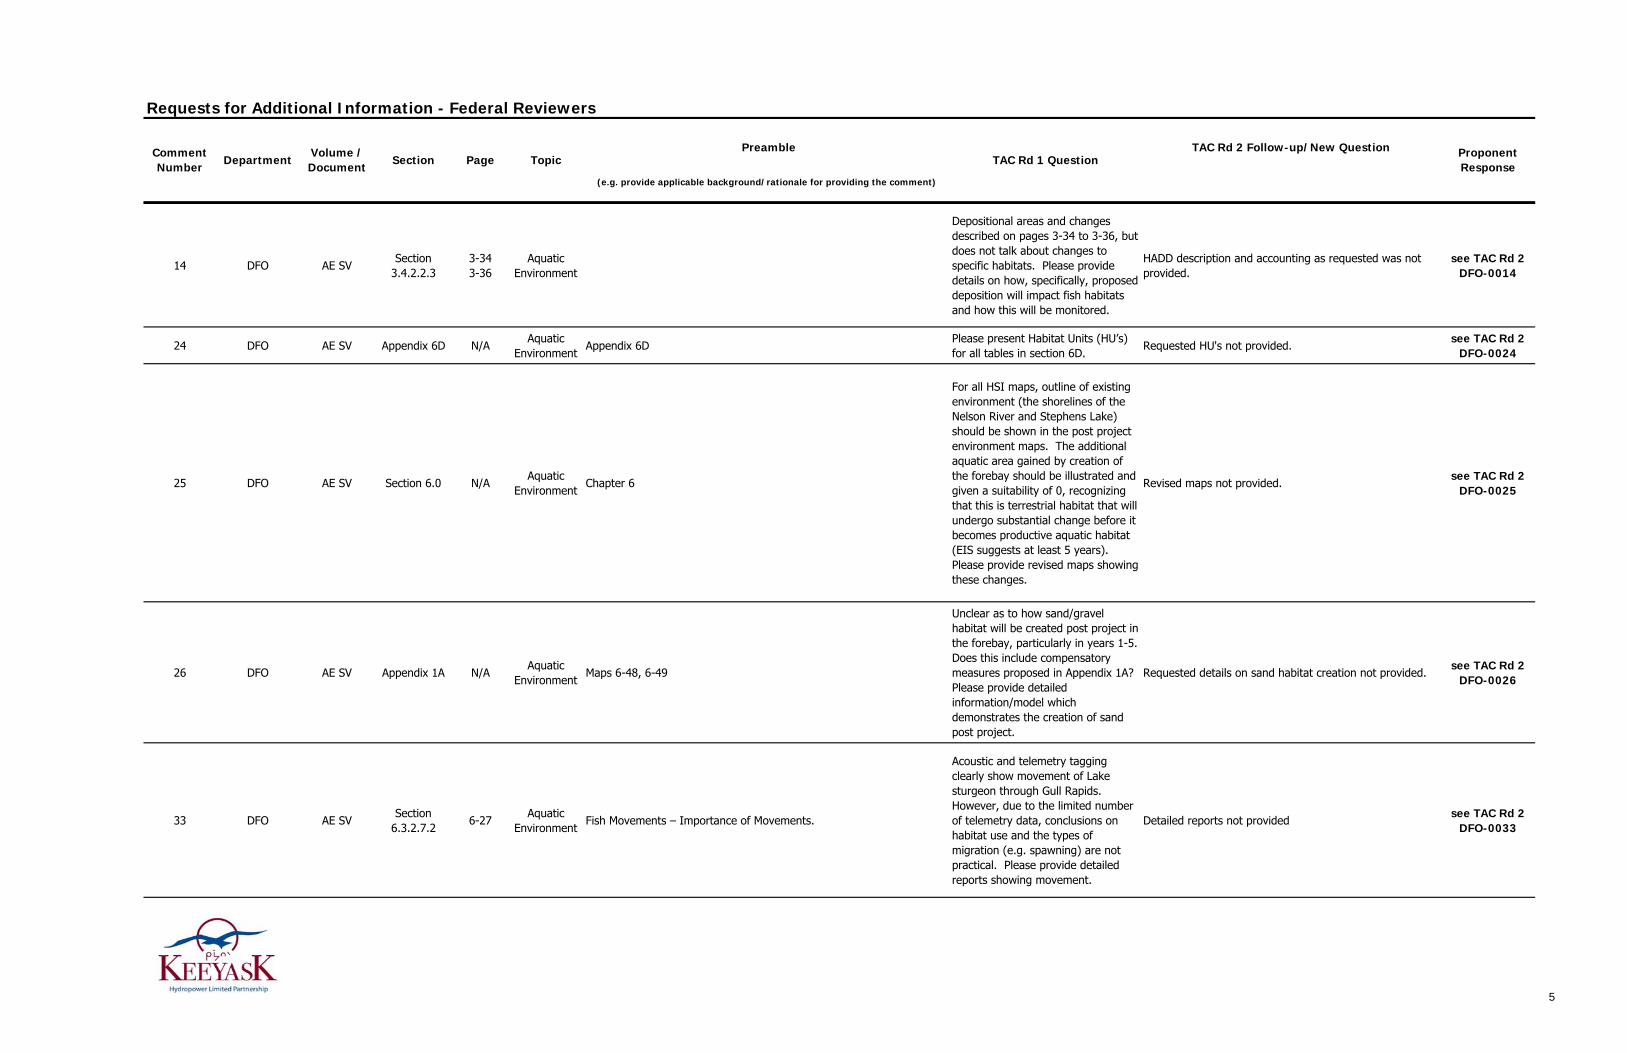
14 DFO AE SV Section
3.4.2.2.33-343-36
Aquatic Environment
Depositional areas and changes described on pages 3-34 to 3-36, but does not talk about changes to specific habitats. Please provide details on how, specifically, proposed deposition will impact fish habitats and how this will be monitored.
HADD description and accounting as requested was not provided.
see TAC Rd 2 DFO-0014
24 DFO AE SV Appendix 6D N/AAquatic
EnvironmentAppendix 6D
Please present Habitat Units (HU’s) for all tables in section 6D.
Requested HU's not provided.see TAC Rd 2
DFO-0024
25 DFO AE SV Section 6.0 N/AAquatic
EnvironmentChapter 6
For all HSI maps, outline of existing environment (the shorelines of the Nelson River and Stephens Lake) should be shown in the post project environment maps. The additional aquatic area gained by creation of the forebay should be illustrated and given a suitability of 0, recognizing that this is terrestrial habitat that will undergo substantial change before it becomes productive aquatic habitat (EIS suggests at least 5 years). Please provide revised maps showing these changes.
Revised maps not provided.see TAC Rd 2
DFO-0025
26 DFO AE SV Appendix 1A N/AAquatic
EnvironmentMaps 6-48, 6-49
Unclear as to how sand/gravel habitat will be created post project in the forebay, particularly in years 1-5. Does this include compensatory measures proposed in Appendix 1A? Please provide detailed information/model which demonstrates the creation of sand post project.
Requested details on sand habitat creation not provided.see TAC Rd 2
DFO-0026
33 DFO AE SV Section
6.3.2.7.26-27
Aquatic Environment
Fish Movements – Importance of Movements.
Acoustic and telemetry tagging clearly show movement of Lake sturgeon through Gull Rapids. However, due to the limited number of telemetry data, conclusions on habitat use and the types of migration (e.g. spawning) are not practical. Please provide detailed reports showing movement.
Detailed reports not providedsee TAC Rd 2
DFO-0033
5
Requests for Additional Information - Federal Reviewers
Preamble TAC Rd 2 Follow-up/New Question
(e.g. provide applicable background/rationale for providing the comment)
Proponent Response
Page Topic TAC Rd 1 QuestionComment Number
DepartmentVolume / Document
Section
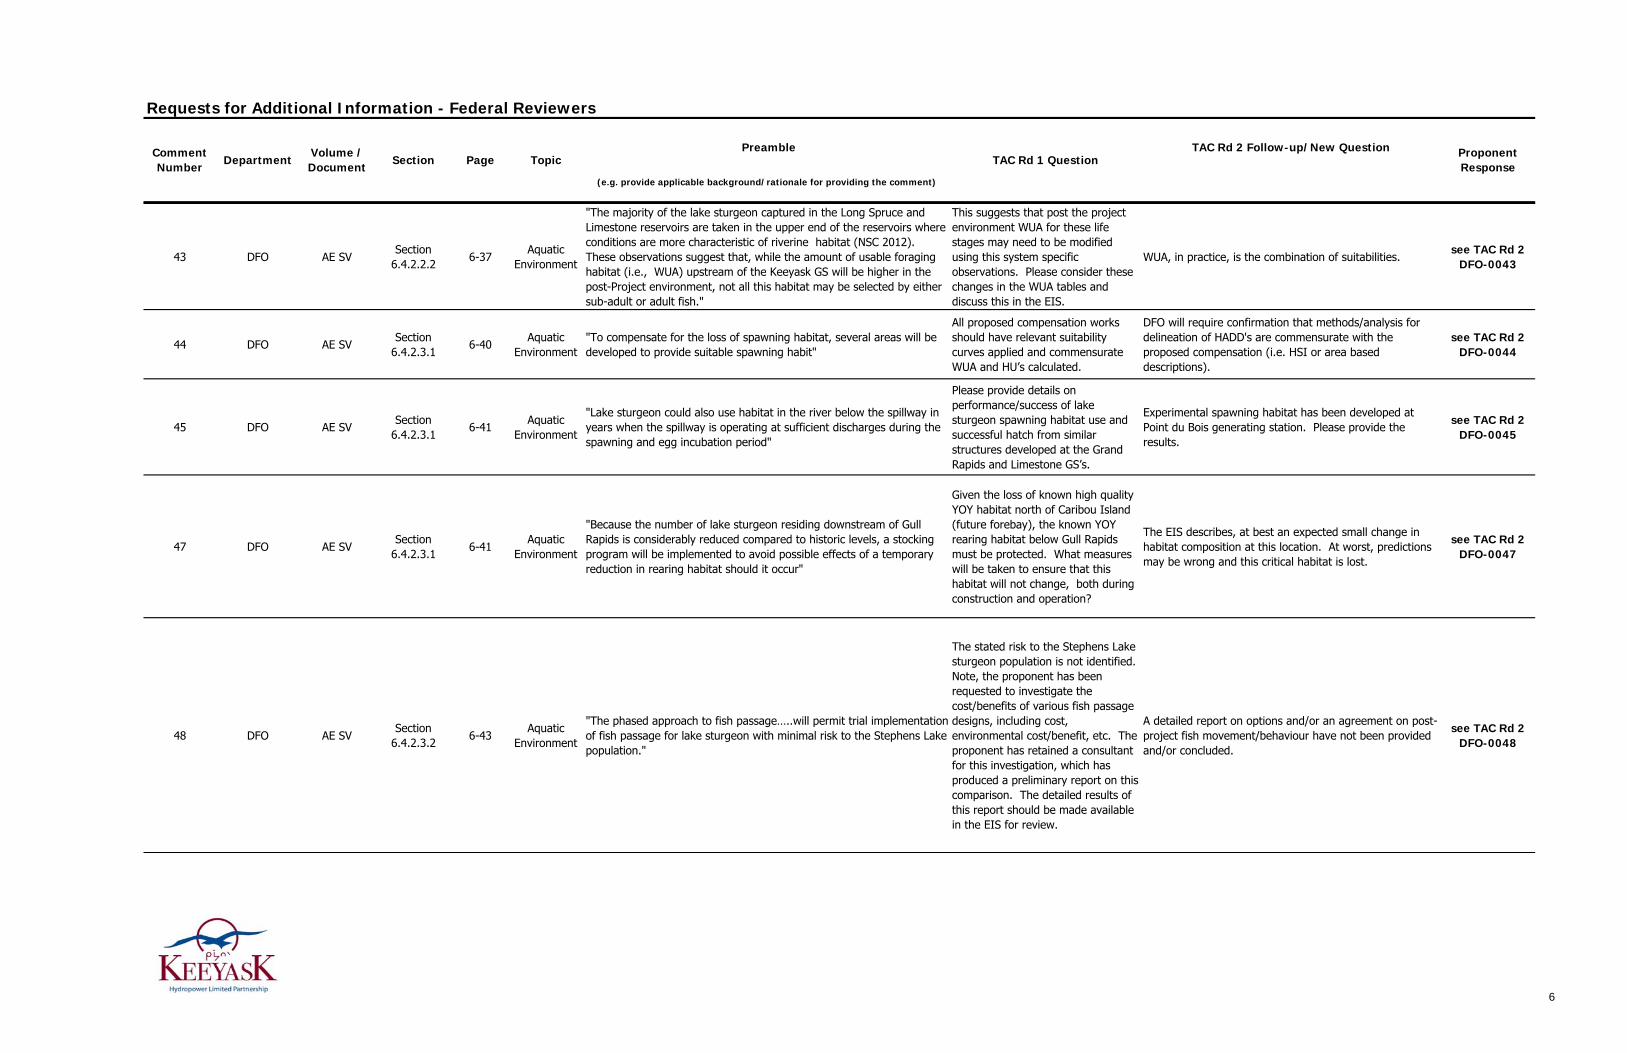
43 DFO AE SV Section
6.4.2.2.2 6-37
Aquatic Environment
"The majority of the lake sturgeon captured in the Long Spruce and Limestone reservoirs are taken in the upper end of the reservoirs where conditions are more characteristic of riverine habitat (NSC 2012). These observations suggest that, while the amount of usable foraging habitat (i.e., WUA) upstream of the Keeyask GS will be higher in the post-Project environment, not all this habitat may be selected by either sub-adult or adult fish."
This suggests that post the project environment WUA for these life stages may need to be modified using this system specific observations. Please consider these changes in the WUA tables and discuss this in the EIS.
WUA, in practice, is the combination of suitabilities.see TAC Rd 2
DFO-0043
44 DFO AE SV Section
6.4.2.3.1 6-40
Aquatic Environment
"To compensate for the loss of spawning habitat, several areas will be developed to provide suitable spawning habit"
All proposed compensation works should have relevant suitability curves applied and commensurate WUA and HU’s calculated.
DFO will require confirmation that methods/analysis for delineation of HADD's are commensurate with the proposed compensation (i.e. HSI or area based descriptions).
see TAC Rd 2 DFO-0044
45 DFO AE SV Section
6.4.2.3.1 6-41
Aquatic Environment
"Lake sturgeon could also use habitat in the river below the spillway in years when the spillway is operating at sufficient discharges during the spawning and egg incubation period"
Please provide details on performance/success of lake sturgeon spawning habitat use and successful hatch from similar structures developed at the Grand Rapids and Limestone GS’s.
Experimental spawning habitat has been developed at Point du Bois generating station. Please provide the results.
see TAC Rd 2 DFO-0045
47 DFO AE SV Section
6.4.2.3.1 6-41
Aquatic Environment
"Because the number of lake sturgeon residing downstream of Gull Rapids is considerably reduced compared to historic levels, a stocking program will be implemented to avoid possible effects of a temporary reduction in rearing habitat should it occur"
Given the loss of known high quality YOY habitat north of Caribou Island (future forebay), the known YOY rearing habitat below Gull Rapids must be protected. What measures will be taken to ensure that this habitat will not change, both during construction and operation?
The EIS describes, at best an expected small change in habitat composition at this location. At worst, predictions may be wrong and this critical habitat is lost.
see TAC Rd 2 DFO-0047
48 DFO AE SV Section
6.4.2.3.2 6-43
Aquatic Environment
"The phased approach to fish passage…..will permit trial implementation of fish passage for lake sturgeon with minimal risk to the Stephens Lake population."
The stated risk to the Stephens Lake sturgeon population is not identified. Note, the proponent has been requested to investigate the cost/benefits of various fish passage designs, including cost, environmental cost/benefit, etc. The proponent has retained a consultant for this investigation, which has produced a preliminary report on this comparison. The detailed results of this report should be made available in the EIS for review.
A detailed report on options and/or an agreement on post-project fish movement/behaviour have not been provided and/or concluded.
see TAC Rd 2 DFO-0048
6

Requests for Additional Information - Federal Reviewers
Preamble TAC Rd 2 Follow-up/New Question
(e.g. provide applicable background/rationale for providing the comment)
Proponent Response
Page Topic TAC Rd 1 QuestionComment Number
DepartmentVolume / Document
Section
49 DFO AE SV Section
6.4.2.3.2 6-43
Aquatic Environment
"The phased approach to fish passage…..will permit trial implementation of fish passage for lake sturgeon with minimal risk to the Stephens Lake population."
Trap and truck was identified as the fish passage option for Keeyask, this method has traditionally been used at high head dams and information behind the rational for the selection of this option would be helpful. What criteria will be used to determine if and when trap and truck should be implemented?
While DFO has been provided a summary report on November 29th, 2012, this report has not (to DFO's knowledge) been made available to the federal review team or the public. Moreover, release of the full report on fish passage options at Keeyask would be ideal.
see TAC Rd 2 DFO-0049
51 DFO AE SV Section
6.4.2.3.2 6-43
Aquatic Environment
"There is no information available on turbine mortality rates for sturgeon. "
Mortality rate for sturgeon should be based on: 1) known mortality for species of a similar size (e.g. pike) for both spillway and turbine and 2) the number of individuals passing the turbines can be calculated based on fish passage studies (e.g. Missi Falls) and a commensurate relative abundance estimates.
Unclear as to why northern pike cannot be used as a surrogate for lake sturgeon - please clarify. Are mortality rates available for white sturgeon for comparable turbine designs?
see TAC Rd 2 DFO-0051
54 DFO AE SV Appendix 6B.1 6B-1Aquatic
EnvironmentAppendix 6B Field Data Collection and Analysis
Details on mark recapture information is lacking in terms of annual movements. Raw data used for population estimates should be made available.
Proponent plan still in production and not available for review.
see TAC Rd 2 DFO-0054
55 DFO PD SV Section 3.10.2 3-32Project
DescriptionManagement Plans to be Developed
All cited management plans should be provided as part of the EIS submission.
Proponent plans still in production and not available for review.
see TAC Rd 2 DFO-0055
57 DFO R-EIS Gdlines Section 4.3.3 4-14Physical
EnvironmentConstruction Mitigation - DFO notes that timing for the majority of in-stream work is scheduled between July 16 to September 15
Please provide detailed contingency plans for construction techniques proposed should a request to extend construction beyond proposed dates occur. DFO would appreciate the opportunity to review contingency plans in advance to ensure appropriate decisions with a timely response can be provided.
Pre-emptive planning and design required for exemption to time restrictions
see TAC Rd 2 DFO-0057
7
Requests for Additional Information - Federal Reviewers
Preamble TAC Rd 2 Follow-up/New Question
(e.g. provide applicable background/rationale for providing the comment)
Proponent Response
Page Topic TAC Rd 1 QuestionComment Number
DepartmentVolume / Document
Section
58 DFO R-EIS Gdlines Section 8.0 N/APhysical
EnvironmentMonitoring
DFO notes that there are no monitoring plans submitted within the EIS. We look forward to reviewing the following management and monitoring plans (as proposed to be developed in chapter 8 of the EIS):o Sediment Management Plano Fish Habitat Compensation Plano Waterways Management Plano Aquatic Effects Monitoring Plano Physical Environment Monitoring Plan
See DFO-0055see TAC Rd 2
DFO-0058
59 DFO R-EIS Gdlines Section 8.0 N/APhysical
EnvironmentMonitoring
How will peat deposition be monitored? And assumptions in the EIS verified? (ex. Estimate only 1% of peat will be transported downstream)
Proponent plan still in production and not available for review.
see TAC Rd 2 DFO-0059
60 DFO PE SVAppendix 7CAppendix 7D
N/APhysical
EnvironmentMonitoring
Please provide a detailed map of baseline sedimentation sampling sites and proposed monitoring sites? Ideally, future monitoring sites should be located near the baseline sampling sites for accurate comparisons.
Proponent plan still in production and not available for review.
see TAC Rd 2 DFO-0060
61 DFO PE SV Appendix 7B N/APhysical
EnvironmentBed Load
Between 2005-2007, approximately 350 bedload samples were collected, but this yielded few measurable samples (Appendix 7B). The EIS reports an estimated an average bedload of 4 g/m/s. How reasonable is this estimate given the insufficient samples to estimate the annual bedload discharge? What method(s) will be used to monitor bedload?
Proponent plan still in production and not available for review.
see TAC Rd 2 DFO-0061
65 DFO PE SVSection 7.2.5.1
Appendix 7A.2.2
7-11 7A-25
Physical Environment
Sedimentation - TSS
Assumption that 70% of all fine particles will remain in suspension past Kettle GS. How can they determine this? Has this been modelled? How will the model/assumptions be tested?
Proponent plan still in production and not available for review.
see TAC Rd 2 DFO-0065
8

Requests for Additional Information - Federal Reviewers
Preamble TAC Rd 2 Follow-up/New Question
(e.g. provide applicable background/rationale for providing the comment)
Proponent Response
Page Topic TAC Rd 1 QuestionComment Number
DepartmentVolume / Document
Section
66 DFO R-EIS Gdlines Section 8.0 N/APhysical
EnvironmentSedimentation - TSS
Suggest that discrete data loggers (TSS) are better than continuous collection data loggers. Discrete loggers should be verified using point sampling to verify data loggers especially in the first year. The use of discrete data loggers for existing environment and post project post project environment. The continuous data loggers are too variable and subject to error due to bio-fouling.
Would the proponent please extract those parts of any sediment management plan (their answer states that it will be provide in the first quarter of 2013) that provides additional information pertinent to the question? Proponent plan still in production and not available for review.
see TAC Rd 2 DFO-0066
67 DFO R-EIS Gdlines Section 8.0 N/APhysical
EnvironmentSedimentation - TSS
EIS proposes to have the first post project monitoring station 1km downstream of the construction site in the “fully mixed zone”. The location of the first monitoring station downstream of Keeyask construction site is too far away to assess impacts and effectiveness of mitigation. It is recommended that a turbidity/TSS monitoring site be placed at the construction site.
Would the proponent please extract those parts of any sediment management plan (their answer states that it will be provide in the first quarter of 2013) that provides additional information pertinent to the question? Proponent plan still in production and not available for review.
see TAC Rd 2 DFO-0067
68 DFO R-EIS Gdlines Section 8.0 N/APhysical
EnvironmentSedimentation - TSS
Can the Proponent provide an analysis showing that its monitoring will have a high degree of confidence, or the power, to detect TSS above the action threshold?
Would the proponent please re-state their answer to the question rather than refer to another response? Proponent plan still in production and not available for review.
see TAC Rd 2 DFO-0068
69 DFO AE SV Section
2.5.2.2.52-66 to 2-68
Physical Environment
Sedimentation - TSS
The Proponent appears not to discuss effects of TSS specific to the individual VEC fish species. The Proponent’s impact assessment appears to rely primarily on lethal TSS concentration effects. Can the Proponent provide an expanded discussion of sub-lethal or chronic impact risk assessment for anticipated TSS changes?
Would the proponent please extract those parts of the EIS referred to and re-phrase them in a manner that provides a more detailed answer to the question?
see TAC Rd 2 DFO-0069
9

Requests for Additional Information - Federal Reviewers
Preamble TAC Rd 2 Follow-up/New Question
(e.g. provide applicable background/rationale for providing the comment)
Proponent Response
Page Topic TAC Rd 1 QuestionComment Number
DepartmentVolume / Document
Section
70 DFO PE SV Section 4.0 N/APhysical
EnvironmentSedimentation - TSS
Existing environment sedimentation models based on low, med and high flows (2059, 3032 and 4,327 cms). Do these relate to percentile flows? Post-project sedimentation modelling simulated under 50th percentile for year 1, 5, 15 and 30 years after impoundment, and under 5th and 95th percentile flow for 1 and 5 years after impoundment. Why different flow regimes for different time periods? The post-project sedimentation environment was also simulated under the 50th and 95th percentile flows using the eroded shore mineral volumes as estimated, considering peaking mode of operation for the time frames of 1 and 5 years after impoundment. Proposed monitoring to valid models?
Proponent plan still in production and not available for review.
see TAC Rd 2 DFO-0070
71 DFO PE SV Appendix 7A N/APhysical
EnvironmentPeatland Erosion.
Did not look at peat downstream of the generating station, claiming that peat would not go past the GS (only 1% would get past the GS – is this reasonable?). What monitoring is proposed to confirm this?
Would the proponent please extract those parts of the EIS referred to that provide an assessment of the risk to fish, fisheries, and fish habitat of peat deposition from peat passing through the GS?
see TAC Rd 2 DFO-0071
72 DFOPE SV and AE
SVSection 7.4.2.3Section 3.4.2.2
7-35Physical
EnvironmentPeatland Erosion.
Visual distribution (maps) of peatland deposition not presented in the EIS. How will peat deposition impact on known/suspected areas of fish habitat in the future forebay?
Would the proponent please provide a GIS or similar analysis of peatland deposition in fish habitat in the future forebay? Would the proponent please provide an analysis, including a table of areas, of impact, given a biologically significant risk threshold, of impact area?
see TAC Rd 2 DFO-0072
10

Requests for Additional Information - Federal Reviewers
Preamble TAC Rd 2 Follow-up/New Question
(e.g. provide applicable background/rationale for providing the comment)
Proponent Response
Page Topic TAC Rd 1 QuestionComment Number
DepartmentVolume / Document
Section
73 DFO R-EIS Gdlines Section 6.3.8 6-215Physical
Environment
Deposition - EIS states deposition loads will not change post project – about 3cm/year, based on about 30cm of sediment deposited in ten years since Kettle GS was built. “Based on extensive modelling (using Stephens Lake) and field verification”, the majority of mineral sediments resulting from shoreline erosion are predicted to deposit in near shore areas…after year 1, rates predicted at 0-3 cm/y. Offshore = 0-1 cm/y after year 1. The south nearshore areas in gull lake predicted to experience highest deposition rate of 4-6 cm/y for year 1 under baseloaded conditions.
Do not provide sedimentation rates based on a range of flows. No detail on sampling conducted to establish baseline other than at Kettle GS. How will the sedimentation model be tested for accuracy? What monitoring will be conducted to validate model assumptions?
Would the proponent now provide details from documents not provided with the EIS that were to follow (e.g., physical environment monitoring plan for second quarter 2013) that answer this question? Can the proponent provide information on thresholds for risk of sediment deposition (e.g., are 1-4 cm sediment thickness of concern or some other thickness)? Can the proponent carry out a GIS, or other, risk based assessment that delineates areas of pre-project sediment types of biological interest compared with post-project critical deposition thicknesses? Can the proponent provide a table of total areas by impact zone (e.g., upstream and downstream) of area affected by biologically significant deposition? Proponent plan still in production and not available for review.
see TAC Rd 2 DFO-0073
74 DFO PE SVAppendix 7A.1.1.3
7A-6Physical
EnvironmentSedimentation
Given the variation in sedimentation rates over time and the challenges in estimating sedimentation level, does the sedimentation analysis include a sensitivity analysis to reflect possible ranges in sedimentation and the effects on fish and fish habitat both upstream and downstream?
Sensitivity analysis not provided.see TAC Rd 2
DFO-0074
75 DFO PE SV Section 7.4.1 N/APhysical
Environment
The EIS notes “Placement and removal of cofferdams/groins during Stage II Diversion will occur over three years (2017, 2018, and 2019) during the open water seasons. Most of these activities are predicted to result in increases in TSS of less than 5 mg/L above background, which would be within the…CCME guidelines for the protection of aquatic life. The exceptions include placement of the South Dam Rock Fill Groin, which is predicted to result in TSS increases of up to 15 mg/L above background, with increases of greater than 5 mg/L for a period of approximately 10 days in early September 2017. An increase in TSS of 7 mg/L for a period one month is also predicted during removal of the Tailrace Summer Level Cofferdam in September/October 2019.
The Proponent predicts several instances of average TSS increases greater than the CCME guideline for longer term impacts (e.g., inputs lasting between 24 h and 30 d should not exceed 5 mg/L above background). Are there additional opportunities, both reasonable and practical, to further prevent and mitigate sediment releases such that the guidelines can be met? For example, if a given TSS exceedance is in part due to shoreline erosion, would pre-emptive shoreline stabilization be an option?
Proponent plan still in production and not available for review.
see TAC Rd 2 DFO-0075
11
Requests for Additional Information - Federal Reviewers
Preamble TAC Rd 2 Follow-up/New Question
(e.g. provide applicable background/rationale for providing the comment)
Proponent Response
Page Topic TAC Rd 1 QuestionComment Number
DepartmentVolume / Document
Section
76 DFO PE SV Appendix 7A N/APhysical
Environment
The EIS notes “Prediction of the post-impoundment…environment upstream…was carried out by…numerical modelling…Depth-average mineral suspended sediment concentrations were estimated for average (50th percentile) flow for prediction periods of 1 year, 5 years, 15 years and 30 years after impoundment. Sediment concentrations were also predicted for low (5th percentile) and high (95th percentile flow conditions for…1 year and 5 years after…impoundment. While outside the zone of hydraulic influence, a qualitative assessment was carried out for…sedimentation…in Stephens Lake…”
Can the Proponent provide some explanation, or direct reviewers to its location, of why TSS modeling at selected flow percentiles, e.g., 50th percentile or 5th and 95th percentile, or other model settings, provide good estimates of likely effects on the aquatic environment?
Can the proponent clarify why a median is used for the first, fifth, fifteenth, and thirtieth years while 5th, 50th, and 95th percentiles are only estimated for one and five years after impoundment? Proponent plan still in production and not available for review.
see TAC Rd 2 DFO-0076
77 DFO AE SV Section
2.5.2.2.5 2-66 to 2-68
Physical Environment
The EIS notes “Placement and removal of cofferdams/groins during Stage II Diversion will occur over three years (2017, 2018, and 2019) during the open water seasons. Most of these activities are predicted to result in increases in TSS of less than 5 mg/L above background, which would be within the…CCME guidelines for the protection of aquatic life. The exceptions include placement of the South Dam Rock Fill Groin, which is predicted to result in TSS increases of up to 15 mg/L above background, with increases of greater than 5 mg/L for a period of approximately 10 days in early September 2017. An increase in TSS of 7 mg/L for a period one month is also predicted during removal of the Tailrace Summer Level Cofferdam in September/October 2019…”
If increases in TSS exceeding the CCME guidelines appear to be unavoidable, can the Proponent provide additional discussion and rationale (or direct reviewers to the location of that information in the EIS) for why the exceedances, in the Nelson River at Keeyask case, are not likely significant adverse environmental effects. For example, can the Proponent indicate that an exceedance of 7 mg/L TSS above background for 30 days in September/October is not likely to be in the sublethal or lethal severity of effect range for fish, fish eggs or larvae, benthic macroinvertebrates, or other aquatic organisms. In addition, can the Proponent say that the exceedance when added to the expected background range for that time of year is within the anticipated natural range of TSS in the Nelson River at the Project site, and in one case downstream to the estuary, at that time of year?
Would the proponent please provide an expanded discussion of the type and extent of expected sub-lethal effects, extracting information as necessary from the EIS sections referred to?
see TAC Rd 2 DFO-0077
12
Requests for Additional Information - Federal Reviewers
Preamble TAC Rd 2 Follow-up/New Question
(e.g. provide applicable background/rationale for providing the comment)
Proponent Response
Page Topic TAC Rd 1 QuestionComment Number
DepartmentVolume / Document
Section
78 DFO PE SV Appendix 7E N/APhysical
Environment
The EIS notes “data collected in the open water periods of 2005 to 2007 indicates…suspended sediment concentration generally lies within the range of 5 mg/L to 30 mg/L…from Clark Lake to Gull Rapids…sediment concentrations can vary within their normal range at a given location in a given day…variations…over a short period…can be due to many reasons, including local turbulences in the waterbody, changes in the meteorological environment, and local bank erosion processes…suspended sediment concentrations…in the open water period…2001 to 2004…show similar ranges (2 mg/L to 30 mg/L with an average of 12 mg/L)…A report prepared by Lake Winnipeg, Churchill and Nelson Rivers Study Board in 1975…documents a suspended sediment concentration range of 6 mg/L to 25 mg/L with an average of 15 mg/L based on…measurements in 1972 and 1973. Field studies…on the Burntwood and…Lower Nelson River reach also show a concentration range of 5 mg/L to30 mg/L (Acres…2004…2007b, KGS Acres 2008b…KGS Acres 2008c)…Suspended sediment concentration measurements during…winter…(January to April), of 2008 and 2009 reveal that sediment concentration variations in the winter period are larger than the open water period. A limited data set collected at monitoring locations in Gull Lake show a concentration range of 3 mg/L to 84 mg/L, with an average of 14.6 mg/L…”
The Proponent provides some ranges, point estimates, and expected durations of TSS changes. Would it be possible to provide, or direct reviewers to where this information is in the EIS, sample sizes and standard deviations for estimates? Where intervals that are not ranges, would it be possible to specify the level of confidence? E.g., are they 95% confidence intervals for a mean?
Would the proponent please provide a description of the extent to which the historic TSS information can be expected to represent seasonal and year-to-year variation in TSS? Would the proponent please propose one or more composite sample sizes, averages and standard deviations as background criteria for expected TSS during construction for determining the power of its proposed monitoring program?
see TAC Rd 2 DFO-0078
80 DFO AE SV Appendix 2A
2.5.2.2.5 4.2.4.2
N/APhysical
Environment
The EIS says “Mineral TSS would generally remain within the chronic Manitoba PAL water quality objective and the CCME PAL guideline (a change of less than or equal to 5 mg/L relative to background, where background TSS is less than or equal to 25 mg/L). The exceptions would occur in the immediate reservoir (reach 9) and reach 8 (the area north of Caribou Island) under high flow conditions, where decreases may be larger than the Manitoba water quality objective…”
When discussing TSS decreases the Proponent refers to TSS guidelines as being for changes. In fact, the guidelines talk about increases only – not changes in general – so that they do not really apply to decreases in TSS. Can the Proponent explain in more detail its criteria for discussing changes?
Proponent’s answer asks reader to re-read sections of the EIS. Would the proponent please extract the appropriate information from the EIS or provide additional information to answer the question?
see TAC Rd 2 DFO-0080
13
Requests for Additional Information - Federal Reviewers
Preamble TAC Rd 2 Follow-up/New Question
(e.g. provide applicable background/rationale for providing the comment)
Proponent Response
Page Topic TAC Rd 1 QuestionComment Number
DepartmentVolume / Document
Section
83 DFO PE SV Section 7.4.1 7-22Physical
Environment
"Water Quality: Project Effects, Mitigation, and Monitoring…Construction Period…Total Suspended Solids, Turbidity, and Water Clarity…” p 2-40 ff “Cofferdam Placement and Removal…during Stage I and II Diversions have the potential to increase TSS in the Nelson River…results…presented in detail in the PE SV, section 7.4.1…Predicted increases in TSS refer to the fully mixed condition, approximately 1 km downstream of Gull Rapids…”
The Proponent notes that it has modeled TSS downstream at 1km from the construction area in the fully mixed zone. Will the Proponent be able to monitor TSS closer to the construction areas? What sort of area might be affected by construction TSS increases greater than those predicted upstream of the fully mixed zone. What are the, at source, sediment loading TSS concentrations likely to be, how extensive might they be in area, and what might their durations be?
Would the proponent please re-iterate information provided for a previous question so that the reader does not have to refer to another response? The answer refers to information not provided with the EIS. Please use information from documents developed after the EIS to provide an answer to the question. Would the proponent please describe the extent and nature of plumes exceeding effect thresholds and evaluate them for potential lethal and sub-lethal risks?
see TAC Rd 2 DFO-0083
84 DFO R-EIS Gdlines Section 8.0 N/APhysical
Environment
Information does not appear to be present in the EIS but is required to determine if monitoring can adequately determine potential problems and appropriate actions taken to mitigate unexpected events.
Can the Proponent provide an analysis showing that its monitoring will have sufficient power with high confidence, to detect TSS above the action threshold (regulatory guideline)? For example, how likely is it that the Proponent can detect environmental changes that result in elevated TSS that exceed critical effect sizes such as 5 mg/L above background? Will the number of samples collected during monitoring be sufficient to correctly conclude, with a confidence of say 95% [i.e., a high confidence], that there is a difference of, say, 5 mg/L or more above background?
Proponent plan still in production and not available for review.
see TAC Rd 2 DFO-0084
14
Requests for Additional Information - Federal Reviewers
Preamble TAC Rd 2 Follow-up/New Question
(e.g. provide applicable background/rationale for providing the comment)
Proponent Response
Page Topic TAC Rd 1 QuestionComment Number
DepartmentVolume / Document
Section
The EIS, in the aquatic effects supporting document section 2 on water and sediment quality, notes: “There are few studies that have reported the acute or chronic toxicity of TSS to fish species represented in the Aquatic Environment Study Area. Lawrence and Scherer (1974) reported that the 96-hour lethal concentration (LC50) for lake whitefish (Coregonus clupeaformis) was 16,613 mg/L. McKinnon and Hnytka (1988) found relatively high increases in TSS (instantaneous maximum = 3,524 mg/L and 1-day average concentration = 524 mg/L) caused by winter pipeline construction did not have any direct effect (no downstream emigration and no mortalities) on the fish community of Hodgson Creek, NT. This study is notable as four of the fish species found in Hodgson Creek - northern pike (Esox lucius), lake chub (Couesius plumbeus), longnose sucker (Catostomus catostomus), and burbot(Lota lota) - are also found in the Aquatic Environment Study Area. As indicated in Section 5.4.2, northern pike may spawn in the nearshore areas of the Keeyask reservoir, even during the initial years of operation. Therefore, early life history stages of northern pike may be exposed to elevated concentrations of TSS for several years post-impoundment. No information on the acute or chronic toxicity of TSS to northern pike eggs or larvae could be located. Information for early life history stages of other species represented in the Aquatic Environment Study Area is also sparse and many of the available studies do not differentiate between the effects of suspended particulate materials and sediment deposition. However, the available scientific literature indicates a potential for reduced hatching success in salmonids exposed to elevated TSS concentrations on the order oftwo months or more, at concentrations ranging from 6.6–157 mg/L (Table 2-17).
In addition, northern pike eggs would also be exposed to the combined effects of sedimentation and elevated TSS. Therefore, should northern pike spawn in the nearshore, flooded areas of the reservoir in the initial years of operation where organic TSS will be notably elevated, reduced hatching success of northern pike eggs is likely. Conversely, elevated TSS and turbidity can provide benefits to some fish species and life history stages. Reduced water clarity can reduce the risk of predation by visual predators, which in turn can enhance survival of juvenile fish (e.g., Sweka and Hartman 2003) and may favour planktivorous fish…”
see TAC Rd 2 DFO-0085
85 DFO AE SV Section
2.5.2.2.52-64
Physical Environment
The Proponent discusses effects of TSS specific to the individual VEC fish species. However, much of the Proponent’s impact assessment appears to rely primarily on general and lethal TSS concentration effects. Can the Proponent provide an expanded discussion of sub-lethal or chronic impact severity of effect risk assessment for anticipated TSS changes?
In the absence of specific lethal and sub-lethal data for various species and life-stages, would the proponent provide some hypothetical modelling for evaluation of sub-lethal risks?
15

Requests for Additional Information - Federal Reviewers
Preamble TAC Rd 2 Follow-up/New Question
(e.g. provide applicable background/rationale for providing the comment)
Proponent Response
Page Topic TAC Rd 1 QuestionComment Number
DepartmentVolume / Document
Section
86 DFO AE SV N/A N/AAquatic
Environment
“Keeyask Generation Project Environmental Impact Statement Supporting Volume Aquatic Environment June 2012” (disc 2), p1A-2ff… Restricted activity timing windows…DFO…In northern Manitoba, no in-water or shoreline work is allowed during the 15 April – 30 June, 15 May – 15 July, and 1 September -15 May periods where spring, summer, and fall spawning fish respectively are present, except under site- or project-specific review and with…implementation of protective measures…Based on data from Keeyask field investigations…proposed area-specific timing windows for restricted in-water construction activities are…15 May – 15 July for spring and summer spawning fish and 15 September – 15 May for fall spawning fish…scheduling of construction activities that require working in water have been developed and modified to the extent practicable to avoid or minimize the potential for disturbance to fish in the Keeyask area during spawning, and egg an fry development periods…Adjustments to scheduling…to restrict construction and removal of structures to times of …year when sensitive life stages of fish are least likely to be present are summarized in Table 1A-2…” A summary listing shows these are mostly for cofferdam construction and removal “To the extent possible, work in water has been scheduled to avoid interaction with fish and fish habitat during the spring and fall spawning periods…When avoidance of both spring and fall spawning periods was not possible due to critical construction sequences, avoidance of spring spawning periods was given priority over avoidance of the fall spawning period…Additional mitigation of potential disturbances to fish and fish habitat will be gained by constructing each cofferdam in a sequence that minimizes the exposure of readily-transported fines to flowing water…”
A key mitigation is timing of in-water activity to avoid impacts on VEC fish species. Can the Proponent describe its contingency plans for unavoidable changes in scheduling. E.g., if a TSS episode exceeding the CCME guidelines is relatively benign for adult whitefish migration to spawning areas, is the same episode when delayed due to schedule changes similarly benign for incubating whitefish eggs? What sort of information would be available to rapidly assess the potential risk of a schedule change? What criteria would the Proponent use to trade-off costs to the project and costs to a VEC fish species?
The proponent’s answer refers to action plans yet to be developed. Would the proponent provide details of action plans for unanticipated scheduling changes that are protective of fish, fisheries, and fish habitat?
see TAC Rd 2 DFO-0086
87 DFO R-EIS Gdlines Section 8.0 N/APhysical
EnvironmentPrevious daily TSS sediment monitoring at the Wuskwatim GS construction site had frequent problems with bio-fouling of sensors.
Can the Proponent provide additional information on its anticipated TSS monitoring showing that problems with previous monitoring, e.g., bio-fouling of sensors, has been anticipated and solved?
Can the proponent provide additional information on its anticipated TSS monitoring showing that problems with previous monitoring , e.g., bio-fouling of sensors, has been anticipated and solved? Proponent notes that the SMP to be provided “in the first quarter of 2013…” provides details. DFO notes that a draft, referred to as an informal draft was received on October 17, 2012 noting that a formal version would follow after discussion with regulators. Would the proponent provide details, specific to the biofouling risk, from the proposed SMP to answer the EIS question? Awaiting receipt of In-stream Construction Sediment Management Plan (SMP).
see TAC Rd 2 DFO-0087
16
Requests for Additional Information - Federal Reviewers
Preamble TAC Rd 2 Follow-up/New Question
(e.g. provide applicable background/rationale for providing the comment)
Proponent Response
Page Topic TAC Rd 1 QuestionComment Number
DepartmentVolume / Document
Section
93 DFO AE SV Appendix 1A,
Part 2N/A
Aquatic Environment
Appendix 1A - Part2Should the original population be decimated, how will the population within the Gull Reach be maintained?
Proponent’s answer asks reader to re-read sections of the EIS. Would the proponent please extract the appropriate information from the EIS or provide additional information to answer the question?
see TAC Rd 2 DFO-0093
94 DFO AE SV Appendix 1A,
Part 2N/A
Aquatic Environment
Appendix 1A - Part2
The recruitment model/unexploited scenario mimics the Wisconsin guideline. There is acknowledgement that these numbers may be too low given the guideline was developed based on rivers smaller that the Nelson. How will final numbers be derived?
This contradicts statements in proponent response provided in DF0-0052, "CPUE was not used to estimate population size" and DFO-0017 "CPUE was not used in statistical analysis"
see TAC Rd 2 DFO-0094
98 DFO AE SV Appendix 1A,
Part 2N/A
Aquatic Environment
Appendix 1A - Part2
Given predications of accumulated sedimentation/peat accumulation and subsequent influences in water chemistry (including decreasing oxygen and increasing mercury levels) is stocking the forebay with sturgeon a rational option?
DFO is interested in knowing more detail about the amount of change in the reservoir. The Proponent’s answer talks about the post-project but does not compare it to the pre-project. Would the proponent please provide a pre- versus post-project comparison? "Stocking lake sturgeon into the Keeyask Reservoir is a rational option to recover populations" Please provide publications in support for this conclusion, given mercury in fish tissue significantly elevate post project.
see TAC Rd 2 DFO-0098
100 DFO AE SV Appendix 1A,
Part 2N/A
Aquatic Environment
Appendix 1A - Part2
Given the challenges of detecting changes in sturgeon (growth, age, etc) over the short term, how will success/failure be determined?
To date, sample sizes for lake sturgeon in the study area has been challenging due to population size. Will sample sizes be sufficient to detect statistical change in life history parameters post project?
see TAC Rd 2 DFO-0100
103 DFO PD SV Section 6.7 6-13Aquatic
Environment
The EIS indicates 90 % survival for fish up to 500mm. Can this be further broken down into species, sex, maturity and length for the VEC fish species within the Keeyask Study area. An analysis/graphs of survival rates and injury rates should be provided.
A failure of the Franke analysis is the lack of size and age specific mortality rates, which are crucial for assessing impacts to populations and predicting change.
see TAC Rd 2 DFO-0103
17

Requests for Additional Information - Federal Reviewers
Preamble TAC Rd 2 Follow-up/New Question
(e.g. provide applicable background/rationale for providing the comment)
Proponent Response
Page Topic TAC Rd 1 QuestionComment Number
DepartmentVolume / Document
Section
104 DFO PD SV Section 6.7 6-13Aquatic
Environment
Several recommendations to minimize mortality that can be incorporated into hydro facilities include: using trashracks with reduced bar spacing while preventing further impingement, using temporary overlays with the existing trashracks to reduce clear spacing during migration periods, use of partial depth curtain wall over existing trash rack, installation of an inclined or skewed bar rack system upstream of the intake, barrier or stop nets set upstream in the forebay, and use of partial depth guide walls or an angled louver system upstream of the intakes coupled with a bypass system. Will the powerhouse be designed to incorporate some of these features if monitoring indicates that fish mortality is higher than predicted? Additional biological data and studies will be required post construction to better assess the requirements and potential mitigation for both potential downstream passage and protection. Also, these studies should determine the overall number of fish expected to pass through the turbines.
DFO should be provided with an operating regime and an estimate of mortality under various flow/seasonal conditions. Mortality rates for fish over 500mm required.
see TAC Rd 2 DFO-0104
105 DFO PD SV Section 6.7 6-13Aquatic
Environment
Survival rates can be maximized for entrained fish if operation of the turbines is at maximum efficiency. How will Keeyask be operated to minimize mortality?
Elaboration required. Could turbine operation mitigate impacts to fish during critical life stages (e.g. -Y-O-Y drift)?
see TAC Rd 2 DFO-0105
106 DFO PD SV Section 6.7 6-13Aquatic
Environment
What are acceptable mortality rates based on the fish community and population in the Keeyask study area?
Information on acceptable mortality rates not provided (e.g. literature).
see TAC Rd 2 DFO-0106
107 DFO PD SV Section 6.7 6-13Aquatic
Environment
A detailed monitoring plan should be developed to assess mortality of fish passing through the station and spillway. How will this impact the fish community?
See DFO-0015see TAC Rd 2
DFO-0107
18

Requests for Additional Information - Federal Reviewers
Preamble TAC Rd 2 Follow-up/New Question
(e.g. provide applicable background/rationale for providing the comment)
Proponent Response
Page Topic TAC Rd 1 QuestionComment Number
DepartmentVolume / Document
Section
7 EC AE SV 2Section 2.0, Table 2-11
2-135Aquatic
Environment
Table 2-11 outlines that water treatment plant backwash will be treated if required, such that TSS will be less then 25 mg/L prior to discharge to the receiving environment.
EC requests the Proponent provide a full characterization of discharges to ensure they are not deleterious; noting that TSS should not be the only discharge parameter to be assessed against water quality objectives.
The Proponent does not clarify which other discharge parameter will be considered as part of the treated back wash water quality objectives.
EC requests that the Proponent provide a detailed characterisation of the anticipated backwash water quality, including other parameters of potential concern, aside from TSS.
see TAC Rd 2 EC-0007
18 ECR-EIS
GuidelinesSection 6.5 6-362
Terrestrial Environment
The Proponent has not included a discussion or impact assessment regarding these risks associated with lighting and collision; could find no reference to these in the EIS.
EC requests that the Proponent provide information regarding any design and mitigation measures that have been incorporated to minimize the adverse effects of lighting. EC also requests further information regarding the communication tower, and any other features planned for the project site that may create a specific collision hazard for migratory birds, as well as on the proponent’s proposed mitigation measures to minimize the risk of collisions.
EC requests that the Proponent clarify what lighting will be used for the powerhouse building and communication tower. EC also has a particular interest in project effects on migratory birds and requests the opportunity to review the monitoring reports.
In order to minimize the risk of avian collisions and fatalities, EC recommends that any lighting used on the communications tower at night be limited to white (preferable) or red flashing LED or strobe lights, and be the minimum in number, intensity, and frequency of flashes required for aircraft safety. EC also recommends that Manitoba Hydro avoid the use of floodlights and other intense light sources at the base of the tower, or on the powerhouse building, especially those left on all night.
With respect to any necessary security lighting on ground facilities (including buildings) and equipment, EC recommends that this lighting is as minimal as possible, and be down-shielded to keep light within the boundaries of the site. Consideration could also be given to turning these lights off at night during migration, and during bad weather.
Finally, EC recommends that the proponent regularly monitor and document the level of avian mortality that occurs near the communications tower.
see TAC Rd 2 EC-0018
Environment Canada
19
Requests for Additional Information - Federal Reviewers
Preamble TAC Rd 2 Follow-up/New Question
(e.g. provide applicable background/rationale for providing the comment)
Proponent Response
Page Topic TAC Rd 1 QuestionComment Number
DepartmentVolume / Document
Section
As the proponent has indicated in their response, details about the mitigation measures to offset the loss of gull and tern nesting habitat at Gull Rapids and areas upstream are limited at this time.
EC requests the opportunity to review detailed plans (complete with design, placement, development, and implementation information for each proposed mitigation measure) as they are developed.
With respect to the Artificial Nesting Platforms, EC recommends that the developed plan 1) address the recommendations in the studies cited, and their implementation for this project; and 2) include plans to maintain the rafts and make any necessary repairs to the platforms prior to each breeding season. To the extent possible, EC recommends constructing platforms such that the total available area for nesting waterbirds is equivalent to the area of the natural islands that will be lost, such that equivalent breeding populations might be maintained.With respect to the Nesting Island (or Peninsula) Enhancements downstream, EC recommends that the developed plan address the expected variability of the water level below the Generation Station, and provide the rationale behind enhancing nesting sites downstream if the variation in water level will be greater than which would occur naturally during the breeding season. Terns and other waterbirds often nest at sites that are only a few inches to a couple of feet above water and frequent changes to the water level during the breeding season may render this mitigation option futile.
EC also recommends that the plan address the feasibility of fencing off portions of land to limit predator access, and describe any plans to monitor and maintain the fencing. Colonial nesting birds have an innate preference for sites that mammalian predators cannot access and it would be preferential to work with islands. Moreover, maintaining the fencing and ensuring that it did not become a hazard to breeding colonial species or other wildlife would require frequent monitoring and maintenance throughout the year.With respect to the proponent's response regarding the development of Artificial Nesting Islands, EC questions how monitoring annually during the first 3 years of operations will confirm the necessity and feasibility of these nesting islands. More specifically, EC is unsure how the construction could take place prior to filling the reservoir considering monitoring will only occur after operation has commenced. EC requests clarification.
see TAC Rd 2 EC-0019
EC requests that the Proponent provide additional information regarding each mitigation measure (i.e., for artificial nesting platforms, island enhancements, or development of artificial islands), including information regarding the design, placement, development and implementation of each measure. EC also requests that the Proponent identify the decision-making process by and situations in which they would choose to a) deploy an artificial nesting platform, b) enhance an existing island, c) develop an artificial island, or d) implement a combination of these measures.
In this section the Proponent has proposed the following mitigation in response to the loss of gull and tern breeding habitat: “Deployment of artificial gull and tern nesting platforms (e.g., reef rafts), breeding habitat enhancements to existing islands (e.g., predator fencing or placement of suitable surface substrate), and/or development of an artificial island, or a combination of these measures, will be implemented to off-set the loss of gull and tern nesting habitat at Gull Rapids and areas upstream.”
Terrestrial Environment
19 ECR-EIS
GuidelinesSection
6.5.7.7.36-362
20

Requests for Additional Information - Federal Reviewers
Preamble TAC Rd 2 Follow-up/New Question
(e.g. provide applicable background/rationale for providing the comment)
Proponent Response
Page Topic TAC Rd 1 QuestionComment Number
DepartmentVolume / Document
Section
In this section the proponent indicates that clearing will be undertaken outside of “the sensitive breeding period (April 1-July 31)” to the extent practicable to minimize disturbance to breeding birds. The proponent also proposes to retain 100m vegetated buffers “wherever practicable” around lakes, wetlands and creeks located adjacent to infrastructure sites to minimize loss of nesting habitat and limit noise-related disturbance to migratory birds (p. 6-341, 6-343).
EC's mandate includes the protection of migratory birds and their habitat.
EC reminds the proponent of the federal Migratory Birds Convention Act (MBCA) which protects migratory birds and their eggs and nests. Section 5(1) of the Regulations prohibits the hunting of a migratory bird except under authority of a permit. “Hunt” means chase, pursue, worry, follow after or on the trail of, lie in wait for, or attempt in any manner to capture, kill, injure or harass a migratory bird, whether or not the migratory bird is captured, killed or injured. Section 6 of the regulations prohibits the disturbance, destruction, or taking of a nest, egg or nest shelter of a migratory bird. Possession of a migratory bird, nest or egg without lawful excuse is also prohibited. Section 5.1 of the MBCA prohibits the deposition of substances harmful to migratory birds in waters or areas frequented by migratory birds, or in a place from which the substance may enter such waters or such an area. EC's website on Incidental Take (http://www.ecgc.ca/paom-itmb/default.asp?lang=En&n=FA4AC736-1 ) contains additional information as well as a link to the MBCA and Regulations.
EC provides the following recommendations as general guidelines for industry to protect the great majority of migratory birds while realizing the practicalities of development activities on the landscape. However the onus remains with the proponent to comply with the legislation.
•To minimize disturbance to breeding migratory birds in the Boreal ecozones of Manitoba, in areas where migratory birds may be nesting, EC recommends that habitat destruction activities (e.g. vegetation clearing and management, initial flooding, reclamation, etc.) for project areas greater than 50 hectares (such as this project) avoid at minimum the period between April 1 and August 31, to minimize population level effects to breeding birds.•If limited habitat destruction (e.g. vegetation clearing and management, reclamation, etc.) must proceed during the migratory bird breeding season (despite EC’s recommendations for avoidance), the area to be cleared/destroyed should not exceed one hectare in size, as the effectiveness of finding nests is compromised in forested habitats. The lands to be cleared/destroyed should be surveyed for active nests by an avian biologist or naturalist with experience with migratory birds and migratory bird behaviours indicative of nesting (e.g. carrying fecal sacs, nesting material or food, aggressive territorial behaviour, or distraction behaviour, etc.) within 7 days of destruction/clearing. Nest surveys should follow widely-accepted protocols and be thorough and defensible. Some nest search protocols may require a permit, therefore the proponent is advised to contact the regional permitting officer John Dunlop, at [email protected] or at (306) 975-4090). Any nests found should be protected with a species appropriate buffer until the young have fledged and left the area.
•If an individual has a priori knowledge of an active nest, at any time during the year, it must be protected with a suitable species-appropriate buffer until the young have fledged. •Wetlands attractive to breeding migratory birds (e.g. those containing water) should not be cleared/destroyed at minimum between April 1 and August 31. Canada geese and Mallards may nest early and broods of waterfowl and waterbird species are dependent upon wetlands throughout August and beyond.
EC requests that the Proponent confirm that they will include the month of August in the habitat and wetland
clearing/destruction avoidance period and to confirm that no greater than one hectare in size will be
cleared/destroyed if limited habitat destruction must proceed during the migratory bird breeding season.
EC also requests that the Proponent discuss their plans in regards to active nest surveys should limited habitat
destruction proceed and their plans should an active nest be found in the habitat destruction area.
TO BE FILED AT A LATER DATE
26 ECR-EIS
Guidelines
6.5 Effects and Mitigation Terrestrial
Environment and 6.5.7
Birds
6-343, 6-349 and 6-
351
Terrestrial Environment
21

Requests for Additional Information - Federal Reviewers
Preamble TAC Rd 2 Follow-up/New Question
(e.g. provide applicable background/rationale for providing the comment)
Proponent Response
Page Topic TAC Rd 1 QuestionComment Number
DepartmentVolume / Document
Section
27 ECR-EIS
Guidelines
6.5 Effects and Mitigation Terrestrial
Environment and 6.5.7
Birds
6-361Terrestrial
Environment
With respect to blasting, the proponent indicates that “over the course of construction, if there is overlap of scheduled construction activities that could affect the breeding colonies at Gull Rapids with the bird breeding period (April 1-July 31), measures will also be taken to avoid or minimize disturbance to active nesting colonies to the extent possible” (p. 6-361).
Regarding blasting, EC recommends that the Proponent implement an appropriate blasting guideline for the protection of migratory birds (e.g., buffer zone, scheduling) and design a monitoring program that allows for detection of potential adverse effects and implementation of timely adaptive management actions. EC recommends that the proponent avoid commencing blasting between April 1 and August 31, and within 1600m of active nesting colonies at any time during the year. Where local landscape features lessen blasting impacts, this distance may be reduced, to a minimum of 1000m.
EC requests that the Proponent:• confirm that blasting will be avoided between April 1st and August 31st and will not be within 1600m of active nesting colonies, or within 1000m where local landscape features will lessen blasting effects, at any time during the year;• discuss any blasting guidelines that will be developed to protect migratory birds; and• confirm if a monitoring program will be in place that allows for the detection of potential adverse effects on migratory birds.
TO BE FILED AT A LATER DATE
28 ECR-EIS
Guidelines
6.2.3 Existing Environment and Future
Trends, 6.2.3.4
Terrestrial Environment and 6.2.3.4.3
Terrestrial Plants
6-102Terrestrial
Environment
Invasive species spread readily along disturbance corridors and once established are virtually impossible to eradicate. This section mentions that “field studies detected all of the 19 invasive plants known to occur in the Regional Study Area”.
The construction and operation of the project may provide additional opportunities for invasive species to establish and spread (through dispersal of weed seeds on equipment and vehicles, or in reclamation materials brought to the site, etc.), disrupting native plant communities.
EC acknowledges the proponent’s commitment on page 3-34 of TE SV to 1) clean construction equipment and machinery recently used more than 150km from the project area prior to transport to the project area regularly; 2) use seed mixtures containing only native species and/or non-invasive introduced plant species; 3) implement containment, eradication and/or control programs if monitoring identifies problems with invasive plants; and 4) educate contractors about the importance of cleaning their vehicles, equipment and footwear before traveling to the area.
In addition to the proponent’s commitments above, EC recommends that all vehicles and equipment are cleaned prior to entering the project areas. EC also recommends that any areas containing noxious weeds be clearly marked, so that equipment operators can easily recognize when passing through weed infested areas, and so that the spread of species from these areas can be monitored. EC further recommends that equipment and vehicles are thoroughly cleaned after passing through any such area in order to avoid transporting seed to other areas.
EC requests that the Proponent discuss:• if all vehicles and equipment will be cleaned prior to entering the project areas;• if areas containing noxious weeds will be clearly marked, so that equipment operators can easily recognize when passing through weed infested areas; • if vehicles and equipment will be cleaned after passing through areas containing noxious weeds; and• if seed mixtures to be used contain only native species and/or non-invasive introduced plant species.
see TAC Rd 2 EC-0028
22
Requests for Additional Information - Federal Reviewers
Preamble TAC Rd 2 Follow-up/New Question
(e.g. provide applicable background/rationale for providing the comment)
Proponent Response
Page Topic TAC Rd 1 QuestionComment Number
DepartmentVolume / Document
Section
29 ECR-EIS
Guidelines
6.5.3 Terrestrial
Ecosystems and Habitat, and 6.5.3.2 Ecosystem Diversity
6-318 to 6-320
Terrestrial Environment
This section notes on page 6-318 that a “rehabilitation plan will be developed that gives preference to rehabilitating the most affected priority habitat types using approaches that “go with nature” and on page 6-319 that “the rehabilitation plan developed and initiated during construction will extend into the operation phase, and continue until all necessary rehabilitation is completed.” Lastly, on page 6-320 of this section it mentions that “Monitoring will include confirming that…rehabilitation to native broad habitat types was successful at locations identified in the rehabilitation plan”.
EC recommends that any disturbed areas that will not be flooded are restored, and are restored as quickly as possible once they are no longer in use. EC recommends that disturbed areas are restored to mimic native vegetation communities in the surrounding area, and to provide similar habitat to pre-construction conditions. EC also recommends that the restoration materials be of local provenance, and be certified and inspected to be free of both invasive and noxious weed materials. Finally, EC recommends long-term monitoring and adaptive management to ensure restoration.
EC requests that the Proponent:• confirm that disturbed areas that are no longer in use will be restored as quickly as possible;• confirm that disturbed areas will be restored to mimic native vegetation communities in the surrounding area, and provide similar habitat to pre-construction conditions; • discuss whether the restoration materials will be of local provenance, and be certified and inspected to be free of both invasive and noxious weed materials; and• discuss any long-term monitoring and adaptive management plans to ensure restoration.
see TAC Rd 2 EC-0029
23
Requests for Additional Information - Federal Reviewers
Preamble TAC Rd 2 Follow-up/New Question
(e.g. provide applicable background/rationale for providing the comment)
Proponent Response
Page Topic TAC Rd 1 QuestionComment Number
DepartmentVolume / Document
Section
These sections outline the following:1) project construction is predicted to affect up to 7765 ha of wetlands, including 9-12 ha of off-system marsh (p. 6-325); 2) mitigation to replace Nelson river wetlands is not proposed (p. 6-325); and3) “globally, nationally and/or provincially significant wetlands are not affected” (p. 6-327).Proposed mitigation includes: 1) “measures to protect against erosion, siltation and hydrological alteration will be implemented in utilized construction areas that are within 50 m of any off-system marsh that is outside of the Project Footprint” (p. 6-325) ; and 2) “12 ha of the off-system marsh wetland type will be developed within or near the local Study Area” (p. 6-326; p. 6-327). Wetlands provide important habitat for both migratory birds and Species at Risk. EC promotes the maintenance of the functions and values derived from wetlands throughout Canada, enhancement and rehabilitation of wetlands in areas where continuing loss or degradation of wetlands have reached critical levels, no net loss of wetland functions for federal lands and waters, recognition of wetland functions in resource planning and economic decisions, and utilization of wetlands in a manner that enhances prospects for their sustained and productive use by future generations.
EC recommends that the proponent take all reasonable measures to avoid wetlands, where feasible, irrespective of whether they are wet or dry, and that buffers or setbacks originate from the one in one hundred year high water mark. One hundred metre setbacks should be utilized from the edge of the proposed development or associated feature (e.g., access route) where feasible. EC acknowledges that the proponent will develop 12 ha of off-system marsh habitat within or near the study area to compensate for the loss of 9-12 ha of off-system marsh. EC refers the Proponent to 'The Federal Policy on Wetland Conservation' which promotes the wise use of wetlands and elevates concerns for wetland conservation to a national level. EC recommends that the Proponent review this document to provide further guidance on reducing impacts to wetlands.
30 ECR-EIS
Guidelines
6.5.3 Terrestrial
Ecosystems and Habitat, and 6.5.3.4
Wetland Function
Terrestrial Environment
6-325 to 6-327
EC requests that the Proponent confirm the use of appropriate setbacks from wetlands and discuss, for those wetlands where avoidance is not possible, what mitigation and compensation measures will be implemented. I79+I79
see TAC Rd 2 EC-0030
24

Requests for Additional Information - Federal Reviewers
Preamble TAC Rd 2 Follow-up/New Question
(e.g. provide applicable background/rationale for providing the comment)
Proponent Response
Page Topic TAC Rd 1 QuestionComment Number
DepartmentVolume / Document
Section
31 ECR-EIS
Guidelines
Table 6-10 SARA and
MESA-Listed Species at Risk
That May Occur within
the Bird Regional Study
Area
6-117Terrestrial
Environment
The EIS lists the Common Nighthawk, Olive-sided Flycatcher, Rusty Blackbird, Short-eared Owl, Peregrine Falcon, and Wolverine as species that have been identified in the project area. In addition Northern Leopard Frog, Yellow Rail, Red Knot, Horned Grebe, and Little Brown Myotis also have the potential to occur within the project area.
The federal Species at Risk Act (SARA) is directed towards preventing wildlife species from becoming extinct or lost from the wild, helping in the recovery of species that are at risk as a result of human activities, and promoting stewardship. The Act prohibits the killing, harming or harassing of listed species; the damage and destruction of their residences; and the destruction of critical habitat.
EC recommends that an Environmental Monitor, knowledgeable in the identification of all species at risk that may occur in the project area, is present on site during project construction activities.
In the event that species at risk are expected or encountered, the primary mitigation measure should be avoidance. EC refers the proponent to the Petroleum Industry Activity Guidelines for Wildlife Species at Risk in the Prairie and Northern Region (attached). This document includes species-specific timing restrictions, setback distances and best management practices. Please note the following amendments not reflected in the document:
•Common nighthawk May 1 to August 31 200m•Horned Grebe April 1 to August 31 100m from the high water mark of the wetland or waterbody containing the nest•Olive-sided flycatcher May 1 to August 31 300m•Rusty Blackbird May 1 to July 31 300m
EC requests that the Proponent confirm whether they intend to have an environmental monitor on site during construction activities and the setbacks and timing restrictions that will be used to avoid the nests of species at risk in the project area.
TO BE FILED AT A LATER DATE
25
Requests for Additional Information - Federal Reviewers
Preamble TAC Rd 2 Follow-up/New Question
(e.g. provide applicable background/rationale for providing the comment)
Proponent Response
Page Topic TAC Rd 1 QuestionComment Number
DepartmentVolume / Document
Section
The EIS describes three groupings of caribou for the Regional Study area: 1) barren-ground caribou from the Qamanirjuaq herd; 2) coastal caribou from the Cape-Churchill and Pen Islands herds; and 3) "summer resident caribou" (which "could be coastal caribou, [boreal] woodland caribou, or a mixture of both"; p. 6-130).
There are 6 geographically distinct populations of the forest-dwelling Woodland Caribou in Canada: Northern Mountain population, Southern Mountain population, Boreal population, Forest-Tundra population, Atlantic Gaspesie population, and the insular Newfoundland population. With the exception of the barren-ground caribou, EC considers the caribou in the project area to be part of the “forest-tundra“ population, which are not SARA-listed and have not been assessed.
EC notes that the project will result in the permanent loss of some primary calving and rearing complexes ("clusters of islands in lakes or islands of black spruce surrounded by expansive wetlands or treeless areas (peatland complexes)" (p. 6-131)) for the summer resident caribou (p. 6-367, 6-372), as well as 6825 ha of physical winter habitat for the Qamanirjuaq, Cape-Churchill and Pen Island herds (p. 6-366). Additionally, sensory disturbances associated with construction and operation are expected to result in additional loss of effective habitat (p. 6-367, p. 6-372), and increased access to the project area could increase mortality due to predation (p. 6-368, 6-372).
EC encourages the proponent to consult with Manitoba Conservation to identify any plans to manage undisturbed caribou habitat in the project area.
EC acknowledges the proponent plans to implement mitigation measures including;•minimizing blasting from May 15 to June 30 (p. 6-370); •implementing an access management plan, including locked gates at the north and south dykes from May 15 to June 30, as well as during other sensitive times determined through monitoring (p.6-371); •rehabilitating temporarily cleared and excavated materials placement areas to native habitat; •blocking and revegetating project-related cutlines and trails within 100m of the project footprint (p. 6-374); and •long term monitoring of caribou and predators in the project area (p. 8-23, 8-26).
In addition to these measures, EC recommends the reduction of sight lines along the access trails, and the continual restoration of project-related cleared areas, cutlines, trails, etc. as they are no longer in use. EC also recommends that the proponent consider additional mitigation measures (e.g., mitigation of noise, light, smells, vibrations; reduction of vehicle speeds, etc.) to minimize harassment of caribou in the project area, particularly from late winter to late spring and early summer, as this will be a stressful period for all of the caribou in the project area.
see TAC Rd 2 EC-0032a
32a ECR-EIS
Guidelines
6.2.3 Existing Environment and Future
Trends, 6.2.3.4
Terrestrial Environment and 6.2.3.4.7
Mammals
6-127 and 6-130
Terrestrial Environment
EC requests that the Proponent discuss any plans to implement additional mitigation measures (e.g. mitigation
of noise, light, smells, vibrations, reduction of vehicle speeds, etc.) to minimize harassment of caribou in the project area, particularly from late winter to late spring
and early summer.
EC requests that the Proponent discuss any plans to reduce sight lines along access trails and discuss
restoration plans for project-related cleared areas, temporary transmission right of ways, trails, etc.
EC also requests the Proponent discuss their plans to consult with the province.
26
Requests for Additional Information - Federal Reviewers
Preamble TAC Rd 2 Follow-up/New Question
(e.g. provide applicable background/rationale for providing the comment)
Proponent Response
Page Topic TAC Rd 1 QuestionComment Number
DepartmentVolume / Document
Section
32b ECR-EIS
Guidelines
6.2.3 Existing Environment and Future
Trends, 6.2.3.4
Terrestrial Environment and 6.2.3.4.7
Mammals
Terrestrial Environment
In addition to the previous comments provided by EC regarding caribou in the project area, EC notes that the southwest corner of the Regional Study Area overlaps with parts of two ranges of boreal woodland caribou as delineated in the Final Recovery Strategy: Wapisu (MB8) and Manitoba North (MB9). While it does not appear that the project will have any direct effects on these herds, there is potential for indirect effects on these SARA-listed species. The effects analysis in the EIS appears to focus on project effects on the non-SARA-listed caribou (the migratory ecotype of woodland caribou and the barren ground caribou), and predominantly on caribou in the local study area. The EIS report states the following regarding the potential impact on boreal caribou: “Because changes to intactness will be negligible, effects on caribou will likely be negligible. The Project will not contribute to measurable changes in caribou intactness of the RSA.” (p. 6-370) It is not clear from the information provided however, what indirect effects on boreal woodland caribou may occur (e.g., sensory disturbances, loss of habitat, habitat degradation, increased access, indirect mortality, etc.), or the nature of cumulative impacts on boreal woodland caribou when considered with all other foreseeable projects in the area. Additionally it is unclear how the proponent has determined effects for boreal woodland caribou specifically, to be “negligible”.
EC suggests that the proponent provide clarification on the above points. EC also encourages the Canadian Environmental Assessment Agency to discuss the potential for indirect effects on boreal woodland caribou with both the proponent and provincial caribou experts.
see TAC Rd 2 EC-0032b
33 ECR-EIS
Guidelines
Chapter 8.0 Monitoring
and Follow-upN/A
Monitoring and Follow-
Up
EC notes the proponent’s plans to implement monitoring and follow-up plans regarding the effects of the project on colonial waterbirds, species at risk, caribou, wetlands, invasive plants, and ecosystem diversity, and the success of planned mitigation measures for each.
EC has a particular interest in project effects on migratory birds and species at risk, the development of wetlands, the progress of reclamation with native species in the project area, and the success in preventing the incursion of invasive species.
EC requests confirmation from the Proponent that the monitoring reports collected will be shared with EC.
see TAC Rd 2 EC-0033
27
Requests for Additional Information - Federal Reviewers
Preamble TAC Rd 2 Follow-up/New Question
(e.g. provide applicable background/rationale for providing the comment)
Proponent Response
Page Topic TAC Rd 1 QuestionComment Number
DepartmentVolume / Document
Section
2 HCSE SV and
TE SV
Appendix 5CSection 5.4.2.3
Table 7-1
5C-15-2147-53
Socio-Economy
Mercury and human health – proposed mitigation measures: Based on the results of the HHRA, fish consumption recommendations were developed. HC agrees with the need for such recommendations and in general, would also concur with the recommendations themselves.
However, HC notes that with respect to recommendations of “unrestricted eating” for all fish with less than 0.2 ppm mercury, the current edition of the Guidelines for the Consumption of Recreationally Angled Fish in Manitoba (2007) recommends that women of childbearing age and children under 12 years, limit their consumption of fish with less than 0.2 ppm mercury to 8 meals per month.
The HHRA recommends that fish consumption advisories be communicated to local First Nations and communities. Also, based on fish monitoring data, additional human health risk assessments will be undertaken every 5 years after peak mercury levels have been reached to determine if consumption advisories need to be changed.
HC advises adopting Manitoba’s guidelines recommendation limiting consumption for women of childbearing age and children under 12 years with respect to fish with less than 0.2 ppm mercury to provide added protection of health for these sensitive receptors.
HC would consider this approach reasonable but would advise that if monitoring results show that mercury levels in fish are higher than the predicted maximum levels in the HHRA, prior to reaching their actual maximum levels, fish consumption advisories should be re-visited to ensure that they remain protective of human health.
HC has previously submitted a response to the CEA Agency in its letter of December 28, 2012.
HC disagrees with the HHRA conclusion of supporting unrestricted eating of fish with elevated Hazard Quotients (eg. HQ of 14 for whitefish from Gull and Stephens Lakes). HC welcomes further discussions on mercury levels in fish and the use of provisional Tolerable Daily Intakes (pTDI) of 0.47 micrograms (μg) methyl mercury (MeHg) per kilogram of body weight per day (kg-bw/day) for adults, and 0.2 μg MeHg per kg-bw/day 0.2 ug/kg bw/day for women of childbearing age in human health risk assessments.
HC advises the risk communication plan be separate from the HHRA and included within a risk management plan as mitigation for this project. HC welcomes further discussion and is available to review the risk management plan upon request.
see TAC Rd 2 HC-0002
3 HC SE SV Section 5.3.35-104 to 5-120
Socio-Economy
Mercury and human health: The EIS indicates that communication products to address adverse health impacts will be developed.
It should be noted that the determination and implementation of risk management strategies for country foods in the project area fall under the responsibilities of provincial and/or municipal authorities.
However, HC considers accurate communication strategies a very important tool in the reduction of risk to Aboriginal health with regards to country foods. HC would be willing to review proposed risk management approaches and communication products to provide its opinion.
HC has reviewed the communication products provided, and some preliminary comments are provided in the attached table (Formative Review of Risk Comm Products). HC would be pleased to meet with the proponent to undertake a more thorough discussion of the communication products, upon request.
HC advises that the focus of the communication products be on the protection of the most sensitive receptors first (i.e. pregnant women and women of child-bearing age, and children).
HC is available to review communication products that are developed for the post-impoundment scenario, upon request.
see TAC Rd 2 HC-0003
Health Canada
28
Requests for Additional Information - Federal Reviewers
Preamble TAC Rd 2 Follow-up/New Question
(e.g. provide applicable background/rationale for providing the comment)
Proponent Response
Page Topic TAC Rd 1 QuestionComment Number
DepartmentVolume / Document
Section
7 HC AE SV 2 Section 7.2.4 7-16
Project Effects, Mitigation and Monitoring: HC understands that the proponent has proposed to monitor mercury in fish tissue on an annual basis until maximum concentrations are reached, and every 3 years thereafter until concentrations are stable. HC does not have any objections to this approach; however, the EIS does not provided a clear determinant of what constitutes “maximum concentration” and “stable”. Mercury levels in fish are expected to steadily increase over a number of years, reach a maximum, and decline steadily thereafter but may fluctuate slightly over the course of this time. The number of years in which a decrease in mercury levels is observed to conclude that a maximum concentration has been reached, does not appear to have been determined.
The EIS includes an outline of monitoring planned for the mercury in fish tissue. However, the detailed monitoring program that will be provided in the Aquatic Effects Monitoring Plan (AEMP) is not yet provided and is related to regulatory licensing with DFO and Manitoba Conservation.
HC advises that the proponent provide a clear determinant in the EIS of what will constitute a “maximum concentration” and “stable” condition at which point fish tissue monitoring will be reduced to a frequency of every third year.
When the AEMP is available for review, HC is able to provide advice regarding potential effects and review of additional HHRAs to ensure fish consumption advisories remain protective of human health.
HC is satisfied with the explanation of “maximum concentration” and “stable” for post-project monitoring of mercury concentrations in fish.
Draft Aquatic Effects Monitoring PlanHC was provided with a copy of the draft Aquatic Effects Monitoring Plan on October 29, 2012. HC has the following comments:
Section 6.1.2.1.3 ParametersIn the core monitoring of lake sturgeon, methyl mercury is not listed as a parameter that will be measured. Because draft risk communication products advise consuming lake sturgeon, please confirm that methyl mercury is included in the monitoring plan.
Section 7.0 Mercury in Fish FleshIn Section 7.2 Monitoring During Operation,HC advises that lake sturgeon be added to the large-bodied fish species that will sampled for mercury concentrations. HC advises that all fish species that will be consumed be included in the monitoring plan (including lake sturgeon, cisco, rainbow smelt, lake trout, etc.).
HC is available to review results of the AEMP, upon request.
see TAC Rd 2 HC-0007
29
Requests for Additional Information - Federal Reviewers
Preamble TAC Rd 2 Follow-up/New Question
(e.g. provide applicable background/rationale for providing the comment)
Proponent Response
Page Topic TAC Rd 1 QuestionComment Number
DepartmentVolume / Document
Section
5 NRCan R-EIS GdlinesSection
6.2.3.2.96-50
Physical Environment
The proponent discusses baseline groundwater quality based on reference to the literature. They also mention that on-site groundwater analyses confirm this and discuss elevated zinc concentrations. However, there is no information provided with respect to on-site sampling. It is unclear how many on-site samples were collected and what parameters they were analyzed for. The analytical results are not presented. The absence of this information makes it impossible to assess if baseline conditions of groundwater quality have been adequately determined.
Provide the location of on-site groundwater monitoring well sampling sites. Provide information on the frequency of groundwater sampling from these sites. Provide information on sampling and laboratory methodologies, including a discussion of quality assurance and quality control. Present the analytical results of all field-derived and laboratory analyses. Provide a direct comparison, by means of a table, of groundwater quality determined from on-site measurements versus groundwater quality gleaned from the literature. It is recommended the following physical and chemical parameters be tested for in groundwater: alkalinity, temperature, pH, Eh, electrical conductivity (EC), major ions, nutrients, minor and trace constituents, and metals (including methyl mercury).
The proponent mentions that two groundwater sampling trips were conducted- one for the camp well investigation and one for the groundwater investigation. Are the results presented in the Keeyask Response to IR's just for the groundwater investigation? Please clarify. If camp well data has not been presented, please do so. Also, on Map 8.2-2 of the Physical Environment Supporting Volume Groundwater, there are 5 other wells (G-0556, G-5086, G-0561, 03-042, 03-045). Please clarify if these wells were sampled and provide any data for these wells.
see TAC Rd 2 NRCan-0005
Natural Resources Canada
30
Requests for Additional Information - Federal Reviewers
Preamble TAC Rd 2 Follow-up/New Question
(e.g. provide applicable background/rationale for providing the comment)
Proponent Response
Page Topic TAC Rd 1 QuestionComment Number
DepartmentVolume / Document
Section
16 NRCan PE SV Section 5.3.2.1 5-6Physical
Environment
The nature of underlying bedrock (and overlying materials) is an important component, even in projects such as Keeyask where it provides not only the solid ground on which the Generating Station rests but also it may contain trace elements that may affect groundwater and surface water quality.
The proponent has not provided the information requested in relation to a detailed description of the regional and local bedrock that includes information such as: local fracture/joint density, orientation, etc. NRCan requests that this information be provided.
see TAC Rd 2 NRCan-0016
17 NRCan R-EIS Gdlines Section
4.3.3.1 Section 4.6.3
4-154-34
Reservoir Preparation
The proponent indicates that standing woody material, including dead and living trees and shrubs 1.5 m tall or taller, as well as fallen trees will be removed from the areas to be flooded. Reservoir clearing addresses boating safety issues and aesthetic issues and is also intended to reduce the production of methylmercury in the future reservoir.
The reduction of methylmercury production would be more effective if reservoir clearing included the removal of labile organic materials such as shrub foliage. Labile organic matter from flooded foliage is one of the main factors favouring the algal bloom that occurs in the first years after impoundment, and this in turn favours the methylation of mercury and its uptake in the reservoir foodweb. NRCan recommends consider whether this strategy could be applied for the Keeyask project.
The proponent states that the production of MeHg is predominantly associated with the decomposition of peat and other organic soils and that the decomposition of shrub foliage is not expected to reduce significantly the mobilization of MeHg in the reservoir foodweb. The EIS however, contains no information on the nature (labile/non labile) of organic matter in soils (including peat) or vegetation of the region. The terrains that will be flooded consist of a mosaic of vegetation and soil cover that have not been characterized with respect to their MeHg mobilization potential. Characterize the variable nature and concentration of C and Hg in vegetation and soils.
see TAC Rd 2 NRCan-0017
31
Requests for Additional Information - Federal Reviewers
Preamble TAC Rd 2 Follow-up/New Question
(e.g. provide applicable background/rationale for providing the comment)
Proponent Response
Page Topic TAC Rd 1 QuestionComment Number
DepartmentVolume / Document
Section
18 NRCan R-EIS Gdlines Section 6.4.76-288 to 6-291
Mercury mitigation in
aquatic environments
The proponent expects a significant increase of mercury concentrations in large piscivorous species, such as walleye and northern pike and to a lesser extent in lake whitefish. This increase is expected to peak within 3 to 5 years after flooding and to decrease gradually in the following 25 to 30 years. Peak concentrations on the order of 0.8 to 1.4 ppm (Table 6-18), well above the 0.5 ppm guideline for commercial marketing, are expected for walleye and northern pike. Given the amplitude of the mercury residual effect, monitoring of Hg concentrations in fish muscle tissue will take place until concentrations return to long-term stable levels.
The main measures proposed to mitigate the mercury issue in reservoir biota are (1) the clearing of trees and large shrubs prior to flooding and (2) the monitoring of Hg concentrations in large fish and (3) the ensuing publication of consumption advisories. In an effort to reduce as much as possible the increase of mercury concentrations, NRCan recommends that the proponent consider extending the reservoir clearing activities to areas expected to be affected by peatland disintegration (cf. section 6.3.7), one possible effect of which may be is to stretch beyond 30 years the period of strong mercury contamination in the Keeyask reservoir. This consideration should be discussed with relevant federal departments (e.g. Environment Canada) and provincial ministries.
In the proponent's view the model has the ability to fully integrate all the factors that lead to MeHg contamination and that there is no need to characterize the organic C and Hg burden of the vegetation and soils in terrains that will be flooded by the reservoir. It is NRCan's view that fish MeHg concentrations in some boreal reservoirs, such as Gouin or Baskatong, have yet to return to acceptable levels after more than 80 years of impoundment. The proponent should consider all measures that may help to mitigate the expected Hg increase in the reservoir foodweb, especially in view of the continued 'breakdown of shorelines' some 30 years after impoundment.
see TAC Rd 2 NRCan-0018
32
Requests for Additional Information - Federal Reviewers
Preamble TAC Rd 2 Follow-up/New Question
(e.g. provide applicable background/rationale for providing the comment)
Proponent Response
Page Topic TAC Rd 1 QuestionComment Number
DepartmentVolume / Document
Section
19 NRCan AE SV Section 7.07-1 to 7-75
Mercury in fish
This section presents a well documented and fairly comprehensive account of the mercury issue in boreal hydroelectric reservoirs, and more specifically in the Keeyask reservoir and nearby water bodies. It presents in a single document much of the information which is otherwise scattered in various other EIS documents.
However, this document presents no information on the variability of Hg concentrations in soils (particularly in organic horizons) that will be affected by reservoir flooding, whether immediately following impoundment or much later as a result of peatland disintegration. In NRCan's view this information, and its links with vegetation cover and wildfire history, are critical in the development of strategies to reduce the remobilization of mercury and to reduce methylation rates in flooded terrain. Moreover, the EIS documents contain no information on forest fire history, as had been requested in the Guidelines (section 8.1.3). NRCan recommends that this information be included in the EIS.
As stated by the proponent, the magnitude and timing of the Hg responses are not only related to mercury concentrations in soils and vegetation but also to factors such as controls on methylation, availability of MeHg to the food web or trophic transfer to the food web. For these reasons, NRCan proposes that the proponent characterize the variable nature and concentration of C and Hg in vegetation and soils. As the proponent recognizes, the algal bloom that follows flooding plays a key, perhaps determining, role in transferring MeHg to the reservoir food web and thus must be attenuated as much as possible by the removal of labile organic matter prior to flooding. It is NRCan's understanding that the proponent has not utilized information on soil mercury content, as this data was not included in the EIS. Without quality information on both Hg and C characteristics in flooded terrains, there are no grounds to compare or assess MeHg predictions in the future reservoir. The region that will be flooded has combined terrain characteristics (thick peaty soils, permafrost) that have yet to be fully assessed in the context of potential Hg contamination. NRCan suggests that the proponent carry out a characterization study in this rather unique terrain and discuss results and mitigation measures (as appropriate) with federal departments and provincial ministries.
see TAC Rd 2 NRCan-0019a and NRCan-
0019b
1Aboriginal
and/or public comments
R-EIS Guidelines
Section 4.8 Decommissioning 4-54
Decomissioning of
permanent facilities
Although the EIS notes that any future decomissioning will be conducted according to the legislation, standards, and agreements in place at the time, it does not provide a conceptual discussion of decommissioning of permanent facilities as required by the EIS Guidelines.
Provide a conceptual discussion on how decommissioning may occur for permanent facilities.
see TAC Rd 2 Aboriginal
and/or Public Comments-
0001
Aboriginal and/or Public Comments
33
Requests for Additional Information - Federal Reviewers
Preamble TAC Rd 2 Follow-up/New Question
(e.g. provide applicable background/rationale for providing the comment)
Proponent Response
Page Topic TAC Rd 1 QuestionComment Number
DepartmentVolume / Document
Section
2aAboriginal
and/or public comments
R-EIS Guidelines
6.2 Existing Environment;
6.4 Effects and mitigation Aquatic
Environment
6-238Reservoir
comparisons
(a) Since Stephens Lake reservoir fluctuates within a 3 m range, whereas Keeyask reservoir fluctuates within a 1 m range and according to a peaking operation pattern, explain how the resulting differences in physical factors would influence future riparian habitat development in the Keeyask reservoir.
see TAC Rd 2 Aboriginal
and/or Public Comments-
0002a
2bAboriginal
and/or public comments
R-EIS Guidelines
6.2 Existing Environment;
6.4 Effects and mitigation Aquatic
Environment
6-238Reservoir
comparisons
(b) Since the lower Churchill projects are not yet developed, and existing reservoirs in the Churchill Falls projects have widely-varying characteristics, clarify what data from the Churchill River System reservoirs were used to assess proposed effects for the Keeyask project.
see TAC Rd 2 Aboriginal
and/or Public Comments-
0002b
3aAboriginal
and/or public comments
R-EIS Guidelines
7.0 Cumulative Effects
Assessment
Sturgeon mitigation
(a) Describe the design, implementation and results of experimental habitat enhancement that has occurred in Stephens Lake reservoir.
see TAC Rd 2 Aboriginal
and/or Public Comments-
0003a
3bAboriginal
and/or public comments
AE SV 1Section 1A.3.1.6
p. 1A-11Sturgeon mitigation
(b) Provide information about the implementation and results of stocking programs in the upper Nelson River, including any trial programs (as recommended by the draft Keeyask Lake Sturgeon Stocking Strategy) or existing programs implemented by the Nelson River Sturgeon Co-Management Board.
see TAC Rd 2 Aboriginal
and/or Public Comments-
0003b
3cAboriginal
and/or public comments
R-EIS Guidelines
Section 1A.3.1.6
p. 1A-11Sturgeon mitigation
(c ) To assist in understanding how stocking programs recommended as mitigation might be implemented within existing management frameworks, describe the functioning of the Nelson River Sturgeon Co-Management Board.
see TAC Rd 2 Aboriginal
and/or Public Comments-
0003c
3d Aboriginal and/or public comments
R-EIS Guidelines
Section 1A.3.1.6
p. 1A-11 Sturgeon mitigation (d) Describe other mitigation measures that could be considered
as part of an adaptive management regime if the proposed mitigation measures are inadequate.
see TAC Rd 2 Aboriginal
and/or Public Comments-
0003d
Given the long-term decline of Lake Sturgeon populations, the further fragmentation of the river system, and the importance of the success of stocking and/or habitat enhancement as mitigation for the predicted effects of another hydroelectric dam on the Nelson River to lake Sturgeon, the uncertainties related to the effectiveness of the strategy should be clearly represented and evaluated. Uncertainties include success of spawining habitat enhancement measures (e.g. to be implemented at Brithday Rapids "if practicable and feasible." (p.1A-11)), and long-term effectiveness of trap/catch & transport upstream passage. There are also uncertainties related to predicted effects (e.g. effects to fish of downstream passage through turbines). Given the importance that the EIS places on the stocking strategy (while acknowledging the KCN's reduced confidence in its adequacy to mitigate for disturbance to, and loss of, habitat), results from any existing or experimental programs should be described. Further, other measures that may be required should the proposed mitigation measures fail or prove inadequate should be described and analysed with respect to feasibility and practicality.
The EIS notes that the proposed Keeyask reservoir is compared to other reservoirs for predicting and assessing effects. In particular, the EIS refers to Stephens Lake reservoir and to the "lower Churchill reservoir in Newfoundland and Labrador."
34
Requests for Additional Information - Provincial & Public Reviewers
Context / Preamble
(e.g. provide applicable background/rationale for providing the comment)
1 MCWS-EAB R-EIS Gdlines Section 7.0 N/ACumulative
Effects Assessment
Please provide the map required pursuant to Section 9.8 of the federal EIS guidelines showing all the past, present and future projects that were considered in the cumulative effects assessment.
see MCWS-EAB-0001
1 MCWS-FB AE SV N/A N/AAquatic
Environment
Please provide additional information regarding aquatic invasive species (AIS), with specific reference to Spiny Waterflea, Zebra Mussels and Rainbow Smelt. In particular, demonstrate how the proponent will: 1) identify the impact of AIS on the native fish community given that these specific AIS are better adapted to lacustrine and reservoir habitats and 2) distinguish the potential impact of these AIS on both the existing and post project aquatic environment apart from the impact of the Project itself. The the impacts may be synergistic, but if that is expected to be the case, then the proponent is requested to explain how the project and the effects of AIS are expected to interact. Finally, please include a discussion of best management practices to be implemented both during project construction and, during ongoing operation to negate the spread and / or mitigate the impact of aquatic invasive species.
see MCWS-FB-0001
2 MCWS-FB R-EIS Gdlines N/A N/APlease provide additional information on how the Partnership will monitor and mitigate impacts resulting from the offset lake fishing program.
see MCWS-FB-0002
1 MB-Health R-EIS Gdlines N/A N/APlease provide additional information on how the offset lake fishing program will be evaluated to ensure that it is working as it is intended.
see MB-Health-0001
2 MB-Health R-EIS Gdlines N/A N/A
Flooding due to extreme weather has been a concern in Manitoba and has caused damage to homes in some locations. Are there any risks of ice jams or extreme flooding as a result of unusual weather patterns as it relates to the Development?
see MB-Health-0002
Section
Manitoba Health
Page Topic Specific Department Comment / Request for Additional Information:Proponent Response
Manitoba Conservation and Water Stewardship - Fisheries Branch
Comment Number
DepartmentVolume / Document
Manitoba Conservation and Water Stewardship - Environmental Approvals Branch
1

Requests for Additional Information - Provincial & Public Reviewers
Context / Preamble
(e.g. provide applicable background/rationale for providing the comment)
Section Page Topic Specific Department Comment / Request for Additional Information:Proponent Response
Comment Number
DepartmentVolume / Document
12 MCWS-LB R-EIS Gdlines N/A N/A
The NE Wildlife Branch was not aware that a caribou access program was going to be implemented with TCN. If this is happening, will the branch have any input or say on this? Initially it doesn't make sense as the Caribou aren't always in the area of the Keeyask access road or Generation Station. How is there enough of a disturbance that would require an annual fly out hunting program? Locals aren't guaranteed caribou every year if they haven't migrated through the area, why would guaranteed hunting via an access program be allowed? Please provide additional comment.
see MCWS-LB-0012
13 MCWS-LB R-EIS Gdlines N/A N/AMCWS-LB-0004: Lines 55-60. This paragraph seems to refer to an offsetting program specifically for caribou domestic harvest. Is this what it means or is it referencing offsetting programs in general
see MCWS-LB-0013
1 PCN N/A N/A
The Stephens Lake reservoir is used as a comparison with the proposed Keeyask reservoir in terms of factors such as the development of new riparian habitats in future. This reservoir fluctuates within a 3m range, whereas the Keeyask reservoir would fluctuate within a 1m range and according to a peaking operation pattern. Please explain the differences in these reservoirs and how these physical factors would be expected to influence future habitat development.
see PCN-0001
2 PCN R-EIS Gdlines N/A 6-238
Reservoir Comparisons: This section describes approaches used in the technical assessment. It mentions that magnitude and spatial and temporal extent of effects were determined through several methods, one of which is comparing data from other reservoirs. It mentions the “lower Churchill River reservoir in Newfoundland and Labrador”. There are no reservoirs on the lower Churchill River in Labrador. In the Churchill River system there are the Smallwood and Ossokmanuan reservoirs and two forebays associated with the Churchill Falls project in the upper reaches of the basin. These reservoirs all have widely differing characteristics. The lower Churchill projects are not yet developed. What data were used in this assessment?
see PCN-0002
Manitoba Conservation and Water Stewardship - Lands Branch
Pimicikamak Cree Nation
2

Page 1 of 1
ACRONYMS
Submitter Name Full Name
Aboriginal and/or Public Comments
CEAA Canadian Environmental Assessment Agency
DFO Department of Fisheries and Oceans
EC Environment Canada
HC Health Canada
MB Health Manitoba Health
MCWS-EAB Manitoba Conservation and Water Stewardship - Environmental Approvals Branch
MCWS-FB Manitoba Conservation and Water Stewardship - Fisheries Branch
MCWS-LB Manitoba Conservation and Water Stewardship - Lands Branch
MCWS-WB Manitoba Conservation and Water Stewardship - Wildlife Branch
NRCan Natural Resources Canada
PCN Pimicikamak Cree Nation

TAC Public Rd 2 Aboriginal and/or public comments-0002a
Page 1 of 2
REFERENCE: Volume: Response to EIS Guidelines; Section: 4.8 1
Decommissioning; p. 4-54 2
TAC Public Rd 2 Aboriginal and/or public comments-0001 3
PREAMBLE: 4 Although the EIS notes that any future decomissioning will be conducted according to 5 the legislation, standards, and agreements in place at the time, it does not provide a 6 conceptual discussion of decommissioning of permanent facilities as required by the EIS 7 Guidelines. 8
QUESTION: 9 Provide a conceptual discussion on how decommissioning may occur for permanent 10 facilities. 11
RESPONSE: 12 Should there ever be a decision to discontinue production of electricity at the Project, 13 the TCN 1992 NFA Implementation Agreement, signed by Canada, Manitoba, Manitoba 14 Hydro and TCN, establishes the fundamental parameters for future water regimes. 15 According to article 2.9 (the Maintenance of the Water Regime): 16
“If, in the future, the Project is no longer utilized for the production of hydro-17 electric power, then Hydro covenants and agrees to continue to operate and 18 maintain all such works, structures and improvements, within its legal authority 19 and control, as may be necessary to avoid, to the extent reasonably possible, 20 deviations from the Post Project Water Regime.” 21
In this context, the word Project “…means and includes all Existing Development and all 22 past, present and future hydroelectric development or redevelopment on the Churchill, 23 Burntwood, and Nelson River Systems, and shall include all development or 24 redevelopment of the Lake Winnipeg Regulation System north of the 53rd parallel, and 25 shall also include the operation thereof by Hydro.” 26
Post Project Water Regime means “…the levels and flows, including the fluctuation and 27 timing thereof, with respect to the Project Influenced Waterways (excepting the Aiken 28 River) as such levels and flows occur within the Resource Area and have been observed 29 since September 1, 1977 to the Date of this Agreement, or based thereon are 30 reasonably anticipated to occur in the future…” 31
As such, in order to meet the requirements of the TCN 1992 NFA Implementation 32 Agreement, the permanent facilities would need to be maintained to avoid deviations in 33

TAC Public Rd 2 Aboriginal and/or public comments-0002a
Page 2 of 2
the post project water regime. Even if electric production were discontinued, effects to 34 the environment would be very limited, if any were to occur at all. 35
TAC Public Rd 2 Aboriginal and/or public comments-0002a
Page 1 of 4
REFERENCE: Volume: Response to EIS Guidelines; Section: 6.2 1
Existing Environment; 6.4 Effects and Mitigation Aquatic 2
Environment; p. 6-238 3
TAC Public Rd 2 Aboriginal and/or public comments-0002a 4
PREAMBLE: 5 The EIS notes that the proposed Keeyask reservoir is compared to other reservoirs for 6 predicting and assessing effects. In particular, the EIS refers to Stephens Lake reservoir 7 and to the "lower Churchill reservoir in Newfoundland and Labrador." 8
QUESTION: 9 Since Stephens Lake reservoir fluctuates within a 3 m range, whereas Keeyask reservoir 10 fluctuates within a 1 m range and according to a peaking operation pattern, explain how 11 the resulting differences in physical factors would influence future riparian habitat 12 development in the Keeyask reservoir. 13
RESPONSE: 14 This same question was also raised by Pimicikimak Cree Nation (PCN) and a response is 15 provided as TAC Public Rd 2 PCN-0001. For convenience, this response is also provided 16 below. 17
PCN-0001 RESPONSE: 18 Generalizations about the relative importance of physical factors and how they are 19 expected to influence future Keeyask reservoir shore zone habitat development are 20 based on six northern Manitoba proxy areas for flooding and/or water regulation, some 21 northern Quebec reservoirs and the scientific literature. More than one northern 22 Manitoba proxy area is used because no single one represents ecological conditions 23 identical to Keeyask and to provide replication for any findings. 24
The six proxy areas used for the shore zone habitat effects assessment are the Kelsey 25 reservoir, Stephens Lake (i.e., Kettle reservoir), Long Spruce reservoir, Wuskwatim Lake 26 (post-CRD and prior to Wuskwatim GS), Notigi reservoir (TE SV Map 2-2) and the 27 Keeyask reach of the Nelson River (post CRD and prior to Keeyask Generating Station 28 development). The Stephens Lake proxy area is immediately downstream of the 29 proposed Keeyask reservoir, is the most ecologically comparable proxy area and has the 30 best historical time series of large scale aerial photography. 31
The Keeyask reservoir and four of the proxy areas are located in peatland dominated 32 areas. Relief ranges from low to high (Keeyask is low). The normal water level range (i.e., 33

TAC Public Rd 2 Aboriginal and/or public comments-0002a
Page 2 of 4
the difference between the 5th and 95th percentiles for daily water elevations) during the 34 open water season at the proxy areas is as follows: 0.8 m at Kelsey, 1.2 m at 35 Wuskwatim, 1.5 m at Notigi, 0.8 m at Long Spruce, 2.0 m at Stephens and 2.3 m at 36 Keeyask. Three of the proxy areas have normal water level ranges similar to the Keeyask 37 project, which is 1.0 m, while the remaining three proxy areas have increasingly higher 38 ranges. 39
The proxy areas indicate that relief and the proportion of reservoir area that is peatland 40 are expected to be the most important physical factors for shore zone habitat 41 development in the Keeyask reservoir. Reservoir flooding in peatland dominated areas 42 essentially converts existing riparian peatlands and a high proportion of inland 43 peatlands to reservoir riparian peatlands because the new shoreline forms in these 44 peatlands. These peatlands already have established wetland vegetation that is adapted 45 to the new conditions and can persist over the long-term. Relief is important because 46 flooded areas that are generally flatter tend to have more of the wetter peatland types, 47 which already have vegetation that is similar to what develops along reservoir 48 shorelines. 49
Water regime is another important factor for shore zone habitat development because 50 it influences the proportion of the shore zone that can support wetland vegetation. The 51 length of time that various water depths persist determines the width of the shoreline 52 wetland band that can potentially support vegetation. That is, the normal range of 53 growing season water depths rather than the entire water level fluctuation range 54 determines the potential width of the shore zone. For ease of relating this to 55 information in the Physical Environment Supporting Volume, the normal range of 56 growing season water depths is approximated by the difference between the 5th and 57 95th percentiles for daily water elevations during the open water season ( for Stephens 58 Lake the normal water level range is 2 m rather than 3 m; see the Terrestrial 59 Environment Supporting Volume Section 2.3.2.2 for details on how the normal range of 60 growing season water depths are calculated for shore zone habitat). The proportion of 61 this shoreline wetland zone that is actually vegetated is influenced by water level 62 variability, the seasonality of extended high and low water levels, wave energy, current, 63 substrate type, water chemistry, turbidity, substrate freezing during winter drawdowns, 64 ice scouring and ice-related substrate compression. 65
Prior to 2005 there was a relatively small amount of shoreline wetland vegetation in the 66 Keeyask reach, and the vegetation that was there was less diverse than that found in 67 off-system waterbodies and in the Stephens proxy area (the proxy area with a 68 comparable number of ground transects). Of the total available shoreline wetland area 69 determined for the Keeyask reach based on water depth durations, only approximately 70 10% to 15% of the area with suitable water depths actually supported wetland 71

TAC Public Rd 2 Aboriginal and/or public comments-0002a
Page 3 of 4
vegetation. Emergent vegetation on the littoral to middle beach sub-zones (i.e., what 72 people generally think of as marsh) accounted for very little of that 10% to 15%. That is, 73 most of the area that could be vegetated based on water depth is not vegetated. This 74 was attributed to the high degree of water level variability and the effects of winter 75 drawdowns. 76
The Project would affect a small amount of existing shoreline wetland vegetation 77 relative to what is expected to develop during Project operation. Very high water levels 78 and river flows from 2005 to 2011 have virtually eliminated beach and littoral 79 vegetation, and also removed some shoreline tall shrub habitat in the Keeyask reach. 80 Even using pre-2005 conditions as the baseline, the total area removed by the Project is 81 small relative to the total available area there in 2005 based on suitable depths. 82
The six proxy areas support the overall EIS prediction that shoreline wetlands removed 83 or altered by the Project will be replaced by wetlands that develop along the reservoir 84 shoreline during the operation phase. Most of the shoreline wetland vegetation in the 85 existing Nelson River reservoir proxy areas was shrub and/or low vegetation on sunken 86 peat that predominantly originated from riparian and inland peatlands that became 87 reservoir shoreline after flooding and reservoir expansion. Because the Keeyask 88 reservoir occurs in similar conditions to the other Nelson River reservoirs (the majority 89 of the flooded area is peatlands), the Keeyask reservoir shoreline is expected to support 90 more shoreline wetland per kilometer of shoreline than the Keeyask reach presently 91 does. The overall EIS prediction may be met on this basis alone even before considering 92 that the reservoir shoreline at Year 30 is predicted to be almost 20% longer than the 93 existing shoreline. 94
Incremental to the above factors, reduced water level variability in winter should reduce 95 exposed substrate freezing, ice scouring and ice-related bottom compression, which is 96 expected to facilitate more widespread emergent vegetation development. Reduced 97 water level variability during the growing season is expected to provide emergent plants 98 sufficient time to establish over a larger percentage of the area where water depths are 99 suitable. 100
An additional important contributor to total vegetated shoreline wetland area will be 101 the peat islands that are now virtually absent in the Keeyask reach but are expected to 102 be common in the Keeyask reservoir (peat islands are still present in the reservoir proxy 103 areas after more than 35 years). Floating peat islands will develop through peatland 104 disintegration processes. The proxy areas have shown that emergent vegetation 105 develops on the sunken fringes of the peat islands much like it does on the fringes of 106 off-system riparian peatlands. 107
TAC Public Rd 2 Aboriginal and/or public comments-0002a
Page 4 of 4
In summary, when comparing post-Project with existing conditions, at least an 108 equivalent amount of vegetated shoreline wetland is expected to develop because: 109
• the total area to replace is relatively small (especially the emergent vegetation 110 component of this total); 111
• vegetated riparian peatland will already be established along much of the shoreline; 112
• a higher percentage of the shore zone area with water depths suitable for emergent 113 vegetation will become vegetated because the water level fluctuation regime will be 114 more favorable than it is currently and winter drawdowns will be eliminated; 115
• the reservoir will contain peat islands, a feature not presently found in the Keeyask 116 reach of the Nelson River, which are expected to be a substantial long-term 117 contributor to emergent vegetation; and, 118
• a longer shoreline will be available for shoreline wetland development. 119
Additionally, the proxy areas indicate that it is likely that the Keeyask reservoir will have 120 higher vegetation diversity than currently exists in the Keeyask reach. 121

TAC Public Rd 2 Aboriginal and/or public comments-0002b
Page 1 of 2
REFERENCE: Volume: Response to EIS Guidelines; Section: 6.2 1
Existing Environment; 6.4 Effects and mitigation Aquatic 2
Environment; P. 6-238 3
TAC Public Rd 2 Aboriginal and_or public comments-0002b 4
PREAMBLE: 5 The EIS notes that the proposed Keeyask reservoir is compared to other reservoirs for 6 predicting and assessing effects. In particular, the EIS refers to Stephens Lake reservoir 7 and to the "lower Churchill reservoir in Newfoundland and Labrador." 8
QUESTION: 9 Since the lower Churchill projects are not yet developed, and existing reservoirs in the 10 Churchill Falls projects have widely-varying characteristics, clarify what data from the 11 Churchill River System reservoirs were used to assess proposed effects for the Keeyask 12 project. 13
RESPONSE: 14 This same question was also raised by Pimicikamak Cree Nation (PCN) and a response is 15 provided as TAC Public Rd 2 PCN-0002. For convenience, this response is also provided 16 below. 17
PCN-0002 RESPONSE: 18 The reviewer is correct that there is currently no reservoir on the lower Churchill River 19 in Labrador. In amalgamating text from several sections of the Aquatic Environment 20 Supporting Volume, references to data and models used to predict effects to the lower 21 Churchill River were inadvertently included in the list of existing reservoirs. We 22 apologize for any confusion this may have caused. 23
The data sources to describe the existing environment and the methods used to conduct 24 the effects assessment are described in detail in the Aquatic Environment Supporting 25 Volume. The effects assessment was based on a combination of comparison of pre- and 26 post-Project conditions, models, and comparison to other similar systems. It is assumed 27 that the above-stated question is referring specifically to reservoirs or similar systems 28 that were used to assist in determining effects of the Keeyask Project. These are as 29 follows: 30
• Manitoba: Stephens Lake, Long Spruce Forebay, Limestone Forebay, impounded 31 river upstream of the Kelsey Generating Station, Southern Indian Lake, Notigi Lake, 32 other lakes along the Churchill River Diversion route, the impoundment upstream of 33

TAC Public Rd 2 Aboriginal and/or public comments-0002b
Page 2 of 2
the lower Churchill River weir, Winnipeg River below the Slave Falls generating 34 station and between the Slave Falls and the Pointe du Bois generating stations. 35
• Québec : Opinaca Reservoir, Robert-Bourassa Reservoir, Desaulniers Reservoir, 36 Caniapiscau Reservoir, and La Grande Complex, among others. 37
In addition, the assessment referenced general information obtained from studies of 38 impoundments in Scandinavia and other areas of Canada and the United States. 39
40

TAC Public Rd 2 Aboriginal and/or public comments-0003a
Page 1 of 16
REFERENCE: Volume: Response to EIS Guidelines; Section: 7.0 1
Cumulative Effects Assessment; p. N/A 2
TAC Public Rd 2 Aboriginal and/or public comments-0003a 3
PREAMBLE: 4 Given the long-term decline of Lake Sturgeon populations, the further fragmentation of 5 the river system, and the importance of the success of stocking and/or habitat 6 enhancement as mitigation for the predicted effects of another hydroelectric dam on 7 the Nelson River to Lake Sturgeon, the uncertainties related to the effectiveness of the 8 strategy should be clearly represented and evaluated. Uncertainties include success of 9 spawining habitat enhancement measures (e.g. to be implemented at Brithday Rapids 10 "if practicable and feasible." (p.1A-11)), and long-term effectiveness of trap/catch & 11 transport upstream passage. There are also uncertainties related to predicted effects 12 (e.g. effects to fish of downstream passage through turbines). Given the importance 13 that the EIS places on the stocking strategy (while acknowledging the KCN's reduced 14 confidence in its adequacy to mitigate for disturbance to, and loss of, habitat), results 15 from any existing or experimental programs should be described. Further, other 16 measures that may be required should the proposed mitigation measures fail or prove 17 inadequate should be described and analysed with respect to feasibility and practicality. 18
QUESTION: 19 (a) Describe the design, implementation and results of experimental habitat 20 enhancement that has occurred in Stephens Lake reservoir. 21
RESPONSE: 22 No experimental habitat enhancement has occurred to date in Stephens Lake because 23 Gull Rapids currently provides habitat for any spawning sturgeon that may be present in 24 Stephens Lake. 25
TAC Public Rd 2 DFO-0045 provides a description of spawning habitat creation in other 26 reservoirs, and has been copied below for convenience. Similarly, TAC Public Rd 2 DFO-27 0098 provides a discussion of successful lake sturgeon stocking programs and is also 28 copied below. 29 30
TAC Public Rd 2 Aboriginal and/or public comments-0003a
Page 2 of 16
DFO-0098 RESPONSE: 31 The reviewers comments appear to comprise four questions: 32
1. Will the reservoir be suitable for Lake Sturgeon given predictions of accumulated 33 sedimentation/peat accumulation and subsequent influences on water chemistry 34 (including decreasing oxygen)? 35
2. Will mercury levels (presumably in fish) affect the suitability of the reservoir for Lake 36 Sturgeon? 37
3. Will the Proponent provide more detail about changes in the reservoir (pre- versus 38 post-Project comparison)? 39
4. Will the proponent provide publications that support stocking in the reservoir given 40 mercury in fish tissue significantly elevate post-Project? 41
Each of these is answered in turn. 42
1. Will the reservoir be suitable for Lake Sturgeon given predictions of accumulated 43 sedimentation/peat accumulation and subsequent influences on water chemistry 44 (including decreasing oxygen)? 45
Most effects to water quality (e.g., dissolved oxygen depletion) will be restricted to the 46 newly flooded terrestrial habitat that is currently not aquatic habitat. Over time, flooded 47 terrestrial habitat will evolve to become suitable for subadult and adult Lake Sturgeon. 48 Sediment deposition will affect flooded terrestrial habitat and much of existing aquatic 49 habitat in Gull Lake. However, habitat will be available for spawning and for foraging by 50 subadult and adult sturgeon in riverine sections of the river, even in the first years post-51 impoundment. Monitoring and mitigation measures have been identified to address 52 uncertainties with respect to the availability of rearing habit for young-of-the-year 53 sturgeon. The following are quoted from the AE SV Section 6.4.2.2.2: 54
Changes to water quality are not expected to affect the suitability of spawning 55 habitat in the riverine portion of the reservoir where lake sturgeon spawn as the 56 analysis of sediment transport indicates that total suspended solids levels will 57 decline post-impoundment and no consequential effects to other water quality 58 parameters are expected (Section 2). 59
The existing environment HSI model for lake sturgeon rearing habitat show the 60 reach between Clark Lake and Gull Rapids as having a WUA of between 199 and 61 220 ha (Section 6.3.2.3.1). However, almost all high quality habitat (HSI greater 62 than or equal to 0.5; 54–64 ha) is located in the downstream portion of Gull Lake 63 on the north side of Caribou Island, where YOY lake sturgeon were captured 64 during environmental studies. The post-Project HSI model predicts a total rearing 65 habitat WUA of between 445 and 637 ha. However, the amount of high quality 66 rearing habitat for the reservoir is predicted to be lower (WUA=16–19 ha; Map 67

TAC Public Rd 2 Aboriginal and/or public comments-0003a
Page 3 of 16
6-47 to Map 6-49; Appendix 6D). Furthermore, YOY access to the high quality 68 habitat also is expected to be reduced given the increased area of the reservoir 69 and the loss of moderate currents on which larvae currently rely to transport 70 them to favourable rearing habitat in the lower end of Gull Lake. Because of this, 71 it is uncertain whether the post-Project rearing habitat will be accessible to 72 drifting larval sturgeon. 73
During the initial years post-impoundment, conditions over the newly flooded 74 terrestrial habitat would not be optimal for lake sturgeon, which appear to 75 favour deeper, more riverine, mineral substrate environments in the Nelson River 76 (Section 6.3.2.3.1)…. Lake sturgeon will continue to be able to use habitat in the 77 former mainstem and Gull Lake that are not expected to experience the changes 78 in water quality (Section 2.5.2.2) that are predicted for flooded shallow water 79 lentic habitats (decreased dissolved oxygen, flooded terrestrial organics and 80 episodic increases in suspended sediments). Over time, as the substratum 81 evolves, lake sturgeon could begin to use flooded portions of the reservoir as 82 conditions become suitable. 83
2. Will mercury levels (presumably in fish) affect the suitability of the reservoir for 84 Lake Sturgeon? 85
Current (2002-2006) mean mercury concentrations in the body musculature of Lake 86 Sturgeon captured from Gull Lake have been measured at approximately 0.2 ppm in 87 adult fish (i.e., exceeding 1000 mm fork length) and, based on a single fish captured in 88 2006, may be considerably lower in juveniles (Table 1; also see AE SV 2012, Appendix 89 7A). Data on sturgeon mercury content are limited for Manitoba. Two recent samples of 90 relatively small fish from the Winnipeg River and for a large range of fish sizes from the 91 Churchill River indicate that mercury concentrations in juvenile (<700 mm fork length) 92 Lake Sturgeon are less than 0.1 ppm, approximately 0.2 ppm for fish of up to 1000 mm 93 length, and some of the larger individuals may reach concentrations of up to 0.7 ppm 94 (Table 1). A similar relationship between mercury concentration and fish length has 95 been shown for Lake Sturgeon from the Ottawa River (Haxton and Findlay 2008). 96 Therefore, current mercury concentrations in Lake Sturgeon from Gull Lake seem to be 97 quite typical for Manitoba and the species in general. 98
The models applied in the Keeyask EIS to estimate maximum mean mercury 99 concentrations in Lake Whitefish, Northern Pike, and Walleye for the future Keeyask 100 forebay (and for Stephens Lake) do not include Lake Sturgeon and quantitative 101 predictions were not attempted for this species. In trying to attempt such predictions, 102 several factors have to be considered, particularly: 103

TAC Public Rd 2 Aboriginal and/or public comments-0003a
Page 4 of 16
• The trophic position of sturgeon from the time of stocking as 0+ or 1+ fish until 104 reaching approximately 1000 mm fork length (a mean [i.e., “standard”] length at 105 which meaningful comparisons of mercury levels between locations and among 106 years for the same location can be made) will be similar to that of adult (i.e., 107 benthivorous) whitefish and certainly lower than that of adult (i.e., piscivorous) pike 108 and Walleye. The same applies to wild sturgeon in the Keeyask reservoir. 109
• Based on the preferred habitat of juvenile Lake Sturgeon, deeper water over mainly 110 mineral sediments, the general conditions for mercury methylation and the 111 availability of methylmercury (MeHg) and its bioaccumulation up the food chain will 112 be less so than in most other areas of the reservoir. Spatial variation in fish mercury 113 concentrations due to heterogeneity in MeHg availability are well documented 114 (Chumchal et al. 2008; Schetagne et al. 2003; Cizdziel et al. 2002). 115
Based on the predicted increases in mercury concentrations for the Keeyask forebay 116 (0.2 ppm in whitefish, approximately 1.0 ppm in pike and Walleye, AE SV 2012) and 117 taking into account the ecological parameters that will affect the dynamics of mercury 118 bioaccumulation in Lake Sturgeon after the impoundment of the Keeyask forebay, a 119 maximum mean concentration of 0.30 ppm for fish of approximately 1000 mm fork 120 length seems realistic. This estimate applies to fish that use Gull Lake as a habitat and 121 will continue to forage in the area during and after impoundment. Fish stocked in year 2 122 or later after the start of operations will grow in an environment of successively 123 declining efficiency of MeHg bioaccumulation and likely will not reach the maximum 124 mean concentration of 0.3 ppm. Also because of the relative long time it will take 125 stocked sturgeon to attain a length of 1000 mm, maximum mercury concentrations may 126 not be measured in the population after 4-8 years as for the other three large-bodied 127 fish species (see above), but a few years later. Similar to the other three species, the 128 maximum concentrations may last no longer than 1-2 years and a period of up to 30 129 years may be expected for mercury levels to return to pre-Project concentrations. 130
Mean muscle mercury concentrations of 0.3 ppm, particularly if transient, will in all 131 likelihood not affect the success of sturgeon stocking. To our knowledge no studies exist 132 on the effects of mercury on Lake Sturgeon. However, there have been many recent 133 publications of the effects of dietary MeHg and mercury tissue concentration on the 134 physiology and behavior of fish, including other sturgeon species (Lee et al. 2011; 135 Gharaei et al. 2011, 2008, Webb et al. 2008). These studies indicate lowest observed 136 adverse effect levels of dietary MeHg for growth and mortality of juvenile Beluga (Huso 137 huso) of 1.97 and 4.05 ppm, respectively (Gharaei et al. 2011, 2008) and of juvenile 138 Green Sturgeon (Acipenser medirostris) and White Sturgeon (A. transmontanus) of 9.73 139 and 24.3 ppm, respectively (Lee et al. 2011; also see summary in Depew et al. 2012). 140 Reviews by Sandheinrich and Wiener (2011) and Depew et al. (2012) have summarized 141 recent advances in our knowledge regarding toxicological effects of environmentally 142
TAC Public Rd 2 Aboriginal and/or public comments-0003a
Page 5 of 16
relevant concentrations of mercury in freshwater fish. In trying to establish a ‘tissue 143 residue guideline’ concentration above which there is the potential for mercury induced 144 effects to fish, Sandheinrich and Wiener (2011) reported that impairment of 145 biochemical processes, damage to cells and tissues, and reduced reproduction have 146 been observed at MeHg concentrations of about 0.5-1.2 ppm mercury in axial muscle. 147 Such concentrations are well above the predicted mean maximum concentration for 148 Lake Sturgeon in the future Keeyask forebay, although some of the largest, oldest 149 individuals may reach the lower range of these mercury levels, as has been observed for 150 existing populations in Gull Lake, the mouth of the Nelson River, and the Churchill River 151 (Table 1). 152
To assess the health risk of elevated muscle mercury concentrations on sturgeon 153 populations in the future Keeyask forebay (and the Keeyask Study Area in general) it 154 must also be considered that many adult fish inhabiting natural freshwaters in the 155 midwestern and eastern United States and the eastern half of Canada exceed muscle 156 concentrations of 1.0 ppm wet weight (Kamman et al. 2005; Schetagne and Verdon 157 1999a). Moreover, mean muscle mercury concentrations of adult Northern Pike (Esox 158 lucius) and Walleye (Sander vitreus), but also Lake Trout (Salvelinus namaycush) and 159 burbot (Lota lota) are known to exceed 2.0 ppm in newly created reservoirs in Québec 160 and Manitoba (Therrien and Schetagne 2008; Bodaly et al. 2007; Schetagne and Verdon 161 1999b), and may reach 4.0 ppm in pike (Schetagne and Verdon 1999b). Despite the 162 obvious potential (based on the threshold concentrations proposed by Sandheinrich and 163 Wiener 2011) for compromised health of these fish populations due to elevated body 164 mercury concentrations, clear evidence for associated population level effects on wild 165 fish is lacking. For example, based on catch-per-unit-effort data, which provide 166 approximate estimates of fish abundance, pike and Walleye populations have not been 167 substantially reduced in any of the well-studied lakes/reservoirs on the CRD route and 168 the lower Nelson River in Manitoba (e.g., AE SV 2012) or reservoirs on the La Grande 169 Rivière in Québec (Schetagne et al. 2003; Roger Schetagene, Hydro Québec, pers. 170 comm., July 2011). These findings do not necessarily indicate an absence of mercury 171 effects on fish populations, but if such effects exist they have not been severe enough to 172 be detected by the sampling and analytical methods applied in these studies. Mercury 173 effects may also be confounded by the multitude of ecological variables that structure 174 fish populations, such as the abundance of prey and predators, parasite loads, fishing 175 pressure, and habitat alterations, and that are likely affected by the physical, chemical, 176 and biological changes in the course of reservoir creation and succession. 177
For all these reason, the expected relatively minor increase in muscle mercury 178 concentrations of Lake Sturgeon in the future Keeyask forebay does not pose a threat to 179 the health of individuals and is not expected to affect the potential benefits of a 180

TAC Public Rd 2 Aboriginal and/or public comments-0003a
Page 6 of 16
stocking program to the recovery and long-term viability of the population in the 181 Keeyask Study Area. 182
Table 1. Mean arithmetic (± standard error, SE, range) mercury concentration 183 (ppm) and mean fork length (range) of Lake Sturgeon sampled from Manitoba 184 waterbodies in 1970-2012. R= River; Lt CR= Little Churchill River; GrF= Great Falls 185 reservoir; PdB= Pointe du Bois; TP= near The Pas. Mean concentrations with 186 superscripted letters are from commercial samples and raw data are not available. 187
Waterbody Year n Arithmetic SE Range Length (mm) n
Gull Lake 2006 1 0.039 - - 646 1
2004 10 0.207 0.060 0.04 - 0.67 1158.81 (1035 - 1286) 10
2002 3 0.166 0.033 0.10 - 0.20 1162.5 (1050 - 1275) 2 Nelson R, lower 2011 3 0.141 0.016 0.14 - 0.21 693.7 (654 - 715) 3
2010 1 0.178 - - 690 1
2008 5 0.125 0.019 0.08 - 0.19 621.2 (537 - 736) 5
2003 7 0.185 0.028 0.13 - 0.34 841.4 (725 - 1200) 7
1970 a 4 0.11 - 0.09 - 0.13 - -
Nelson R, mouth 1982 5 0.220 0.096 0.10 - 0.60 - 0 Fox River 1979 3 0.263 0.050 0.19 - 0.36 - 2 0 Hayes River 2011 1 0.213 - - 771 1
2010 1 0.194 - - 6649 1
2009 2 0.098 0.033 0.07 - 0.13 550.5 (543 - 558) 2 Stephens Lake 2008 1 0.099 - - 587 1
Split Lake 1970 b 1 0.014 - - - - Churchill R, at Lt CR 2010 32 0.156 0.023 0.03 - 0.65 797.6 (221 - 1334) 32 Playgreen Lake 1970 c 7 0.18 0.07 0.49 - 0
Duck to Sipiwesk lakes 1970 d 1 0.08 - - - 0
Cross L (Eves Falls) 1970 e 1 0.11 - - - 0
Mud Lake 1972 f 1 0.12 - - - 0 Burntwood R, 2011 1 0.041 - - 562 1 Winnipeg R, GrF 2011 3 0.058 0.010 0.08 - 0.11 561.3 (442 - 770) 3
Winnipeg R, PdB 2008 21 0.081 0.005 0.03 - 0.14 582.8 (443 - 682) 21
2007 4 0.064 0.009 0.04 - 0.08 511.5 (270 - 613) 4 Saskatchewan R, TP 1990 1 0.08 - - 884 1
1970 g 2 0.29 - 0.21 - 0.37 - 0
TAC Public Rd 2 Aboriginal and/or public comments-0003a
Page 7 of 16
1 Calculated based on relationship between fork length and total length for 68 Lake Sturgeon from 188 Manitoba waters 189 2 range of weights: 1022 - 2247 g 190 a Derksen 1978a (p.25), b (p.52), 1979 (p.30); undesignated location 191 b Derksen 1978b (p.51), 1979 (p.30) 192 c Derksen 1978a (p.24), b (p.49), 1979 (p.29) 193 d Derksen 1979 (p.30) 194 e Derksen 1978a (p.24), b (p.50), 1979 (p.29) 195 f Derksen 1978b (p.51) 196 g Derksen 1978b (p.42), 1979 (p.24) 197 198 3. Will the Proponent provide more detail about changes in the reservoir (pre- versus 199 post-Project comparison)? 200
The following provides a description of habitat available to Lake Sturgeon pre- and post-201 Project (AE SV Section 6.4.2.2.2 p. 6-35 to 6-36). 202
6.4.2.2.2 Habitat 203
Spawning Habitat 204
Environmental studies indicate that Birthday Rapids is an important spawning 205 location for lake sturgeon in the reach of the Nelson River between Clark Lake 206 and Gull Rapids. Alternative spawning habitat may be available in Long Rapids 207 immediately downstream of Clark Lake (Section 6.3.2.3). Physical conditions in 208 the Long Rapids area appear to meet depth, velocity, and substrate criteria for 209 sturgeon spawning habitat. Evidence of sturgeon spawning activity at Long 210 Rapids was documented during two of the four environmental studies conducted 211 between Clark Lake and Birthday Rapids from 2001–2010. In some cases, lake 212 sturgeon may only move upstream as far as the first set of rapids that provides 213 suitable conditions for spawning, even if suitable habitat is also available further 214 upstream (Section 6.3.2.3.1). Lake sturgeon in the Nelson River between Clark 215 Lake and Gull Rapids do not appear to use Gull Rapids for spawning; therefore, 216 the loss of Gull Rapids is not expected to affect spawning sturgeon between 217 Clark Lake and the Keeyask GS. 218
The existing environment HSI model for lake sturgeon spawning habitat 219 indicates that there is a WUA of between 9 and 12 ha from Clark Lake to Gull 220 Rapids (Section 6.3.2.3.1). Birthday Rapids and Long Rapids and areas 221 immediately downstream of them account for all of this area. Existing spawning 222 habitat between Clark Lake and Birthday Rapids is not expected to be affected 223 by the Project as flooding is not expected to extend that far upstream. However, 224 increased water levels at Birthday Rapids due to impoundment may reduce the 225 suitability of habitat in the rapids for spawning lake sturgeon; the post-Project 226
TAC Public Rd 2 Aboriginal and/or public comments-0003a
Page 8 of 16
HSI model suggests that these rapids will no longer be suitable for spawning due 227 to the associated loss of white water (Map 6-44 to Map 6-46; Appendix 6D). Loss 228 of spawning habitat due to flooding has been observed at the rapids on the 229 Nelson River above the Kettle GS (FLCN 2008 Draft). However, some locations 230 where increased water depth has resulted in the loss of white water but 231 maintained appropriate velocity and substrate conditions have continued to 232 support spawning lake sturgeon. For example, sturgeon appear to have 233 continued to spawn in the Nelson River above the Kelsey GS following 234 impoundment (Macdonald pers. comm. 2009). Therefore, it is possible that lake 235 sturgeon will continue to use Birthday Rapids as a spawning area. Post-236 impoundment monitoring of spawning activity in this reach will be conducted to 237 determine spawning success and, should monitoring indicate poor or no 238 spawning success, contingency works to create suitable spawning habitat will be 239 implemented. Contingency measures for the loss of Birthday Rapids as a 240 spawning site are discussed further in Appendix 1A. 241
Changes to water quality are not expected to affect the suitability of spawning 242 habitat in the riverine portion of the reservoir where lake sturgeon spawn as the 243 analysis of sediment transport indicates that total suspended solids levels will 244 decline post-impoundment and no consequential effects to other water quality 245 parameters are expected (Section 2). 246
The current extent of predation on lake sturgeon eggs at their spawning grounds 247 in the study area is not known. Predation by both lake sturgeon and other 248 species is a source of mortality for lake sturgeon eggs in other systems 249 (Appendix 6A). While the Project is predicted to change the composition of the 250 fish community between Clark Lake and the Keeyask GS (Section 5), this change 251 (increase in piscivorous fish species) is not expected to result in an increase in 252 predation on lake sturgeon eggs. 253
Rearing Habitat (YOY) 254
Different life history stages of sturgeon appear to have different requirements 255 for foraging habitat, with younger fish having more specific habitat needs than 256 older fish (Appendix 6A). In the Nelson River between Clark Lake and Gull Rapids, 257 YOY lake sturgeon were captured in deep, low velocity water over a mostly sand 258 substrate in the downstream portion of Gull Lake on the north side of Caribou 259 Island during environmental studies (Section 6.3.2.3.1). The existing environment 260 HSI model for lake sturgeon rearing habitat show the reach between Clark Lake 261 and Gull Rapids as having a WUA of between 199 and 220 ha (Section 6.3.2.3.1). 262 However, almost all high quality habitat (HSI greater than or equal to 0.5; 54–64 263 ha) is located in the downstream portion of Gull Lake on the north side of 264
TAC Public Rd 2 Aboriginal and/or public comments-0003a
Page 9 of 16
Caribou Island, where YOY lake sturgeon were captured during environmental 265 studies. The post-Project HSI model predicts a total rearing habitat WUA of 266 between 445 and 637 ha. However, the amount of high quality rearing habitat 267 for the reservoir is predicted to be lower (WUA=16–19 ha; Map 6-47 to Map 6-268 49; Appendix 6D). Furthermore, YOY access to the high quality habitat also is 269 expected to be reduced given the increased area of the reservoir and the loss of 270 moderate currents on which larvae currently rely to transport them to 271 favourable rearing habitat in the lower end of Gull Lake. Because of this, it is 272 uncertain whether the post-Project rearing habitat will be accessible to drifting 273 larval sturgeon. Post-Project monitoring will be conducted to determine YOY 274 distribution and abundance and, if necessary, contingency works to create sandy 275 habitat suitable for YOY rearing in the reservoir would be implemented; 276 contingency measures are discussed further in Appendix 1A. 277
Foraging Habitat (Sub-adult and Adult) 278
During the initial years post-impoundment, conditions over the newly flooded 279 terrestrial habitat would not be optimal for lake sturgeon, which appear to 280 favour deeper, more riverine, mineral substrate environments in the Nelson River 281 (Section 6.3.2.3.1). Both sub-adult and adult lake sturgeon were captured or 282 relocated via telemetry between Birthday Rapids and Gull Rapids, but were 283 mainly found in Gull Lake (Section 6.3.2.3.1). In Gull Lake, sub-adults occupied a 284 narrower range of conditions, favouring deep, low to moderate velocity areas. 285 Adult sturgeon were also observed in the reach between Clark Lake and Birthday 286 Rapids. 287
Lake sturgeon will continue to be able to use habitat in the former mainstem 288 and Gull Lake that are not expected to experience the changes in water quality 289 (Section 2.5.2.2) that are predicted for flooded shallow water lentic habitats 290 (decreased dissolved oxygen, flooded terrestrial organics and episodic increases 291 in suspended sediments). Over time, as the substratum evolves, lake sturgeon 292 could begin to use flooded portions of the reservoir as conditions become 293 suitable. 294
The long-term use of the reservoir by sub-adult and adult sturgeon was modeled 295 separately. The post-Project HSI models predict a net gain of approximately 296 600–750 ha (WUA) of foraging habitat for sub-adults and a net gain of 297 approximately 3,000–3,150 ha for adults (Map 6-50 to Map 6-55; Appendix 6D). 298
Currently, there appears to be a sufficient food supply for lake sturgeon between 299 the outlet of Clark Lake and Gull Rapids (Section 6.3.2.3.1). Overall, benthic 300 invertebrate abundance is expected to increase between Clark Lake and the 301

TAC Public Rd 2 Aboriginal and/or public comments-0003a
Page 10 of 16
Keeyask GS in both the short-term and long-term (Table 4-34), suggesting there 302 will be an adequate food supply for both sub-adult and adult lake sturgeon post-303 Project. 304
The majority of the lake sturgeon captured in the Long Spruce and Limestone 305 reservoirs are taken in the upper end of the reservoirs where conditions are more 306 characteristic of riverine habitat (NSC 2012). These observations suggest that, 307 while the amount of usable foraging habitat (i.e., WUA) upstream of the 308 Keeyask GS will be higher in the post-Project environment, not all this habitat 309 may be selected by either sub-adult or adult fish. 310
Overwintering Habitat 311
Localized reductions in dissolved oxygen in nearshore zones may reduce the 312 quality of habitat in off-current areas during winter, particularly in the first year 313 post-impoundment (Section 2.5.2.2). However, these reductions are expected to 314 have a limited effect on lake sturgeon overwintering habitat as ample well-315 oxygenated deep-water habitat will be available during winter. 316
4. Will the Proponent provide publications that support stocking in the reservoir given 317 mercury in fish tissue significantly elevate post-Project? 318
As discussed above, mercury concentrations in Lake Sturgeon are not expected to 319 increase significantly post-Project. 320
Stocking Lake Sturgeon into the Keeyask Reservoir is the only realistic option to recover 321 populations as stocks are already at very low levels. Lake Sturgeon stocking has been 322 attempted in several North American rivers, especially in tributaries of the Great Lakes; 323 however, monitoring or evaluation of the stocking programs are often not published in 324 the primary literature. Below is a short summary of selected relevant Lake Sturgeon 325 stocking initiatives that have occurred in North America. Additional examples of Lake 326 Sturgeon stocking plans can be found in Smith 2009 and in the Keeyask Lake Sturgeon 327 stocking strategy. 328
In the past 30 years, stocking has commonly been used to rehabilitate Lake Sturgeon 329 populations. Culture and rearing can now be conducted with relative certainty in both 330 hatchery and stream-side rearing facilities, and many programs have successfully 331 released young fish into the wild. Survival and growth of stocked Lake Sturgeon has 332 been demonstrated in many locations. However, it has been noted that stocking 333 initiatives “have not been adequately evaluated and many programs rely on 334 intermittent, short-term, or anecdotal indicators of program success” (Smith 2009). 335 Until recently, due at least in part to lengthy generation times, stocking initiatives have 336 been conducted based on the assumption that stocked Lake Sturgeon which survive to 337

TAC Public Rd 2 Aboriginal and/or public comments-0003a
Page 11 of 16
maturity will successfully reproduce and contribute to subsequent generations. 338 However, in 2011, Lake Sturgeon stocked into the St. Louis River successfully spawned 339 approximately 30 years following their initial reintroduction (R. Bruch, Wisconsin DNR, 340 pers. comm.) This finding is significant, since re-establishment of self-sustaining 341 populations (as opposed to put-and-take fisheries) is the ultimate goal of most Lake 342 Sturgeon recovery strategies. 343
While the vast majority of Lake Sturgeon stocking initiatives have occurred in Great 344 Lakes systems which are markedly different environments from the Nelson River, there 345 are some relevant proximal examples. In Western Canada, Lake Sturgeon stocking has 346 been conducted in the Assiniboine, Nelson, Winnipeg, and Saskatchewan rivers. Lake 347 Sturgeon stocking has also been conducted in the Minnesota portion of the Red River, 348 which subsequently flows through Manitoba. 349
The Assiniboine River was stocked with over 12,000 fingerlings and 4,000 fry between 350 1996 to 2008. Although a formal study has never been conducted to assess the success 351 of the stocking effort, Lake Sturgeon captures are frequently reported by anglers (B. 352 Bruederlin, Manitoba Fisheries Branch, pers. comm.). At present, most of the Lake 353 Sturgeon being captured are larger than 43 inches, with the largest measuring 60 inches. 354 A study is now required to determine if stocked fish will begin to reproduce naturally. 355
The Minnesota Department of Natural Resources started a 20 year plan to restore Lake 356 Sturgeon populations and has been releasing Lake Sturgeon from the Rainy River into 357 the Red River drainage (Minnesota DNR 2002; Aadland et al. 2005). The 2002-2022 plan 358 is to release 600,000 fry and 34,000 fingerlings per year at various locations throughout 359 the Red River drainage in Minnesota. Anecdotal evidence (angler recaptures) suggests 360 that Lake Sturgeon encounters in the Red River in Canada are increasing (Cleator et al. 361 2010). 362
Lake Sturgeon stocking in the Nelson River was conducted intermittently from 1994 to 363 2011 by the Nelson River Sturgeon Board and Manitoba Fisheries Branch. Spawn 364 collection typically occurred at the Landing River tributary, located 30 km upstream of 365 the Kelsey GS. Prior to 2011, male and female Lake Sturgeon were held in streamside 366 tanks until they were ripe and running (water temperature influenced). Attempts were 367 then made to collect eggs and milt from these fish. Because success was sporadic using 368 these methods, Ovaprim was adopted for spawn taking operations in 2011. Fertilized 369 eggs were transported to the Grand Rapids Hatchery for rearing during each year in 370 which spawn collection was successful. Lake Sturgeon fingerlings (age 0) and some 371 yearlings (age 1) were stocked back into various locations of the upper Nelson River. 372 Until recently, success of Nelson River stocking efforts has remained largely unknown. In 373 fall 2012, a Lake Sturgeon inventory was conducted in the Sea Falls – Sugar Falls reach, 374 which had been stocked with large quantities of both fingerling (age 0, n = 20,885) and 375

TAC Public Rd 2 Aboriginal and/or public comments-0003a
Page 12 of 16
yearling (age 1, n = 1,107) Lake Sturgeon from 1994 – 2011. A total of 91 individual Lake 376 Sturgeon (90 juvenile, 1 adult) were captured and 67 (74%) of these had Passive 377 Integrated Transponder (PIT) tags, signifying that they were stocked as age 1 (McDougall 378 and Pisiak 2012). Given the relative proportions of PIT tagged fish in the catch and 379 considering only those fish from the 2006 – 2011 cohorts reasoned to be susceptible to 380 the gillnets deployed, relative recruitment success was conservatively estimated to be 381 17.4 times greater for Lake Sturgeon stocked as age 1 versus those stocked as age 0 382 (which were stocked in far greater numbers). Furthermore, based on atypical growth 383 chronologies observed when examining ageing structures of the captured fish (missing 384 or weak first annuli, attributed to unnatural overwinter hatchery thermal regimes), the 385 authors suggested that as many as 95.5% of the fish aged may actually have been 386 stocked as age 1 (and perhaps that PIT tag loss or malfunction occurred, or that tags 387 were somehow missed during field scanning). Based on this observation, relative 388 recruitment success might actually have been 128 times as great for age 1 compared to 389 age 0 stocked fish. In addition to survival, it was noted that age 1 stocked fish from the 390 2007 cohort were considerably larger than those identified as age 0 stocked fish from 391 the same cohort based on growth chronologies, and therefore the head-start afforded 392 by overwinter hatchery growth might well translate into age 1 stocked fish reaching 393 maturity faster or being more fecund upon reaching maturity (since they are larger for a 394 given age) than their age 0 stocked counterparts. It was concluded that stocking 395 initiatives should strongly consider rearing Lake Sturgeon to age 1 prior to release in 396 order to increase survival. 397
Lake Sturgeon (primarily fingerlings) were stocked in the Winnipeg River most years 398 from 1996 – 2010. In 2008 and 2009, Ovaprim was used to induce ripe Lake Sturgeon to 399 release gametes. Research investigating the physiological effects (as well as survival and 400 post-release movement patterns) of Ovaprim injected adults began in 2011, and it is 401 expected that results will be available shortly. Research also suggests that survival of 402 stocked yearlings (age 1) may far exceed survival of fingerlings (age 0) in the Slave Falls 403 to Seven Sisters reach of the river, although data analysis is ongoing (C. Klassen, 404 University of Manitoba, pers. comm.). With those exceptions, Winnipeg River stocking 405 was conducted to supplement recruitment. As natural recruitment has now been 406 ascertained in all impoundments on the Manitoba side of the Winnipeg River, stocking 407 Winnipeg River populations does not appear to be necessary to rehabilitate these 408 populations. However, stocking is still being considered for the Lamprey Falls – 409 Manitoba/Ontario border stretch of river conditional on the presence of quality habitat 410 and very few fish, both of which have not been adequately assessed (K. Kansas, 411 Manitoba Fisheries Branch, pers. comm.). 412
Lake Sturgeon were stocked into the Saskatchewan River during 1999 and 2000, as well 413 as from 2003 – 2007. Spawning adults were captured from downstream of the EB 414

TAC Public Rd 2 Aboriginal and/or public comments-0003a
Page 13 of 16
Campbell or Nipawin dams by Saskatchewan Environment staff. Ovaprim was used 415 during each year. Fertilized eggs were reared in the Grand Rapids Hatchery or Fort 416 Qu’Appelle hatchery. While considerable numbers of Lake Sturgeon have been stocked 417 into the Saskatchewan River as either fry or fingerlings, the success of the Lake Sturgeon 418 program remains unknown. 419
DFO-0045 RESPONSE: 420 The proposed spawning shoal at Keeyask was designed based on characteristics of 421 successful structures. Constructed spawning shoals that have been reported in the 422 primary literature include two locations in Quebec, one below the Des Prairie GS 423 (Dumont et al. 2011) and the other in the St. Lawrence River (Johnson et al. 2006) and 424 one in the Detroit River (Roseman et al. 2011). All three are reported to have been 425 successful at improving Lake Sturgeon spawning success. 426
The results of Manitoba Hydro’s tests of constructed spawning shoals at the Pointe du 427 Bois Generating Station on the Winnipeg River are summarized below. It should be 428 noted that the shoals at Pointe due Bois are not a test of the proposed design for the 429 Keeyask Generating Station because the velocity, depth and substrate conditions in the 430 tailraces of the two generating stations are very different. The tests of the constructed 431 shoals at Pointe du Bois were designed to provide an understanding of factors that 432 attract sturgeon to spawn on specific micro-habitats. However, as discussed in the 433 conclusion of this response, some of the information obtained from these tests has 434 been applied to improve the design of the Keeyask spawning shoal. 435
Lake Sturgeon spawning shoals were constructed at four areas below the Pointe du Bois 437 Generating Station, one in 2009 and three in 2010 (Murray and MacDonell 2010, 2012; 438 North/South Consultants Inc., 2011). The intent was to test shoals in various locations to 439 obtain a better understanding the factors influencing selection of spawning locations by 440 Lake Sturgeon. 441
Pointe du Bois Generating Station Lake Sturgeon Spawning Shoals 436
The Pointe du Bois Generating Station is a 100-year-old facility, spanning 150 m of the 442 Winnipeg River with 16 turbine units and a spillway over a natural rock shelf with 97 443 spillway/sluiceway bays. Due to the age of the station, turbines are often off for 444 maintenance and therefore operation cannot be predicted in advance. In 2009, an area 445 downstream of Unit 16 was selected to test construction of a spawning shoal because 446 velocities and depths were within the known ranges used by sturgeon but the existing 447 substrate lacked flow diversity and the interstitial spaces needed for egg incubation. 448
Three additional shoals were constructed in 2010 based on the results of the previous 449 year’s monitoring program. The locations selected for construction were spread out 450 across the face of the generating station to test a variety of flow conditions. The 451

TAC Public Rd 2 Aboriginal and/or public comments-0003a
Page 14 of 16
location below Unit 13 was adjacent to Unit 12 where there was some evidence of 452 spawning in 2007 and 2008. The location below Unit 5 was in proximity to units 2-4 453 where there was evidence of spawning from 2007 to 2009. The location below Unit 1 454 was selected because it was immediately downstream of the highest water velocities 455 recorded in the vicinity of the Pointe du Bois powerhouse (~1.8-2.6 m/s). 456
Shoals were constructed by lowering boulders and cobble from a barge and divers then 457 positioned the material on the bottom according to predetermined specifications. The 458 shoals were constructed of coarse cobbles with four large boulders 1-1.5 m in diameter 459 placed in a v-formation at the upstream end. The shoals were expected to provide the 460 necessary cover, turbulence and flow diversity for spawning, and interstitial spaces for 461 egg incubation. 462
Shoals have been monitored via two methods each subsequent spring to determine if: 463 (i) adult sturgeon are orienting to the shoals; and and (ii) spawning is occurring on or 464 near the shoals. A Dual-frequency Identification Sonar (DIDSON) acoustic camera 465 (manufactured by Sound Metrics Corporation, WA) was used during the peak spawning 466 period each spring to observe the abundance and behaviour of fish on the constructed 467 shoals. Egg collection mats were deployed throughout the tailrace and spillway areas 468 with some specifically targeting the experimental shoals to determine where egg 469 deposition was occurring. 470
The Unit 16 spawning shoal was the only shoal present during the 2009 spring spawning 471 season. Very few Lake Sturgeon were observed on or near the shoal and no eggs were 472 collected in its vicinity. Monitoring in 2010, 2011 and 2012 also showed no Lake 473 Sturgeon utilization of the Unit 16 shoal. However, it should be noted that in 2012 the 474 entire west side of the Pointe du Bois GS from Unit 11 on to Unit 16 was not in 475 operation; therefore, Lake Sturgeon were not expected to spawn in the vicinity as they 476 do not spawn in the absence of direct flow. 477
The Unit 13 spawning shoal has been subject to unit outages and has not had direct flow 478 across it during the spawning season since construction. As may be expected, no Lake 479 Sturgeon spawning has been detected on the shoal to 2012. 480
Monitoring of the spawning shoal constructed below Unit 5 was hampered in 2010 and 481 2011 due to difficulties associated with operating the DIDSON camera in the turbulent 482 flow and accurately placing egg mats. However, egg mats located within 10 m of the 483 shoal in both years had the highest frequency of egg captures of any of the shoals. In 484 total, 1285 eggs were collected in 2010 and 1863 eggs were collected in 2011, 600 of 485 which were on egg mats within 5 m of the shoal. In 2012 Unit 5 was not in operation, 486 which allowed the monitoring crews to more safely access the Unit 5 spawning shoal. 487 The DIDSON camera recorded large congregations of adult Lake Sturgeon both on and 488
TAC Public Rd 2 Aboriginal and/or public comments-0003a
Page 15 of 16
adjacent to the spawning shoal with the greatest numbers being observed downstream 489 of units 4 and 5. Up to 50 individuals were observed congregating in the area at a time 490 and multiple instances of small groups forming around larger individuals, presumably 491 females, were observed. Potential spawning behavior was noted among these groups, 492 including smaller Lake Sturgeon holding until a larger sturgeon arrived, which was then 493 followed by tails being thrashed against the larger individuals for several seconds. A 494 total of six egg mats were located on the Unit 5 shoal in 2012 resulting in 88 eggs 495 collected with an additional 222 eggs collected within 5 m and 827 within 10 m of the 496 shoal. 497
Monitoring at the Unit 1 spawning shoal was limited throughout the monitoring period 498 due to its location along the edge of the highest velocity areas within the tailrace. The 499 shoal was also placed slightly further away from the dam than the other shoals due to a 500 larger channel present immediately below the station at Unit 1 to accommodate the 501 larger turbine at this location. No egg mats were located directly on the shoal in either 502 2010 or 2011, and only one was located on the shoal in 2012, which resulted in no eggs. 503 Despite this, egg mats located within 10 m of the shoal each year have indicated that 504 spawning is occurring in close proximity to the shoal. In 2010, 1128 eggs were collected 505 from 37 egg mat stations, in 2011, 112 eggs were collected from 16 stations, and in 506 2012 35 eggs were collected from 13 stations. No evidence of Lake Sturgeon spawning 507 was observed using the DIDSON camera on the Unit 1 shoal from 2010 to 2012; 508 however, Lake Sturgeon were observed in both 2010 and 2011 lined up on and near the 509 spawning shoal prior to the peak spawning period. When peak spawning occurred, the 510 Lake Sturgeon appeared to vacate the area below Unit 1 and move further into the 511 tailrace area as increases in Lake Sturgeon numbers were noted at several other 512 locations in the tailrace at this time. In 2012 this movement was not observed; however, 513 this may be due to monitoring commencing closer to the peak spawning time when the 514 Lake Sturgeon may have already moved further into the tailrace area. 515
In summary, the egg mat and DIDSON monitoring data suggests that successful 516 spawning occurred on and near the Unit 5 spawning shoal from 2010 to 2012. The egg 517 mat data also suggests that some spawning likely occurred near the Unit 1 shoal. There 518 is no evidence that either the Unit 13 or Unit 16 spawning shoals have had any success 519 to date. The lack of flow due to unit outages has undoubtedly affected the success of 520 these areas for attracting spawning Lake Sturgeon. 521
Overall, the data suggest that constructed shoals should be built close to the origin of 523 flow and near maximum available water velocities, but still within the sustainable 524 swimming speeds for Lake Sturgeon. The shoals also need to provide flow diversity and 525 nearby staging areas that allow sturgeon to congregate before moving into optimal 526
Conclusion 522

TAC Public Rd 2 Aboriginal and/or public comments-0003a
Page 16 of 16
habitats for egg deposition. These features have been incorporated into the design of 527 the spawning structure proposed for downstream of the Keeyask generating station. 528
Data reports listed below are provided on the enclosed CD entitled “Technical Reports 529 Referenced in TAC and Public Review, Round 2.” 530

TAC Public Rd 2 Aboriginal and/or public comments-0003b
Page 1 of 2
REFERENCE: Volume: Aquatic Environment Supporting Volume; 1
Section: Section 1A.3.1.6; p. 1A-11 2
TAC Public Rd 2 Aboriginal and/or public comments-0003b 3
PREAMBLE: 4 Given the long-term decline of Lake Sturgeon populations, the further fragmentation of 5 the river system, and the importance of the success of stocking and/or habitat 6 enhancement as mitigation for the predicted effects of another hydroelectric dam on 7 the Nelson River to lake Sturgeon, the uncertainties related to the effectiveness of the 8 strategy should be clearly represented and evaluated. Uncertainties include success of 9 spawining habitat enhancement measures (e.g. to be implemented at Brithday Rapids 10 "if practicable and feasible." (p.1A-11)), and long-term effectiveness of trap/catch & 11 transport upstream passage. There are also uncertainties related to predicted effects 12 (e.g. effects to fish of downstream passage through turbines). Given the importance 13 that the EIS places on the stocking strategy (while acknowledging the KCN's reduced 14 confidence in its adequacy to mitigate for disturbance to, and loss of, habitat), results 15 from any existing or experimental programs should be described. Further, other 16 measures that may be required should the proposed mitigation measures fail or prove 17 inadequate should be described and analysed with respect to feasibility and practicality. 18
QUESTION: 19 Provide information about the implementation and results of stocking programs in the 20 upper Nelson River, including any trial programs (as recommended by the draft Keeyask 21 Lake Sturgeon Stocking Strategy) or existing programs implemented by the Nelson River 22 Sturgeon Co-Management Board. 23
RESPONSE: 24 The Nelson River Sturgeon Board initiated a lake sturgeon stocking program in the upper 25 Nelson River in 1994. Since that time they have operated a spawn camp each spring to 26 collect eggs from wild adults at the Landing River and transported them to Grand Rapids 27 Hatchery for rearing. Between 1994 and 2012, over 80,000 sturgeon fingerlings (3-4 28 months old) and yearlings have been stocked in a total of five (5) different locations in 29 the upper Nelson River (Sea Falls, Jenpeg, Cross Lake, Duck Rapids, Landing River). Since 30 that time, anecdotal reports of small sturgeon being caught by local fishers in some of 31 these areas have been increasing. To begin to formally investigate the success of 32 stocking, the Nelson River Sturgeon Board and Manitoba Hydro conducted a sturgeon 33 inventory study between Sea Falls and Sugar Falls in 2012. The majority of nets set for 34 small sturgeon were successful and captured a total of 90 juvenile-size sturgeon. 35

TAC Public Rd 2 Aboriginal and/or public comments-0003b
Page 2 of 2
Seventy-four percent of the juvenile sturgeon that were captured contained tags that 36 confirmed they had been stocked as yearlings from Grand Rapids Hatchery. Only 37 sturgeon stocked as yearlings were tagged on release since fingerlings were too small. A 38 full report of the 2012 sturgeon inventory at Sea Falls is included on the enclosed CD 39 “Technical Reports Referenced in TAC and Public Reviews, Round 2”. 40

TAC Public Rd 2 Aboriginal and/or public comments-0003c
Page 1 of 2
REFERENCE: Volume: Aquatic Environment Supporting Volume; 1
Section: Section 1A.3.1.6; p. 1A-11 2
TAC Public Rd 2 Aboriginal and/or public comments-0003c 3
PREAMBLE: 4 Given the long-term decline of Lake Sturgeon populations, the further fragmentation of 5 the river system, and the importance of the success of stocking and/or habitat 6 enhancement as mitigation for the predicted effects of another hydroelectric dam on 7 the Nelson River to lake Sturgeon, the uncertainties related to the effectiveness of the 8 strategy should be clearly represented and evaluated. Uncertainties include success of 9 spawining habitat enhancement measures (e.g. to be implemented at Brithday Rapids 10 "if practicable and feasible." (p.1A-11)), and long-term effectiveness of trap/catch & 11 transport upstream passage. There are also uncertainties related to predicted effects 12 (e.g. effects to fish of downstream passage through turbines). Given the importance 13 that the EIS places on the stocking strategy (while acknowledging the KCN's reduced 14 confidence in its adequacy to mitigate for disturbance to, and loss of, habitat), results 15 from any existing or experimental programs should be described. Further, other 16 measures that may be required should the proposed mitigation measures fail or prove 17 inadequate should be described and analysed with respect to feasibility and practicality. 18
QUESTION: 19 To assist in understanding how stocking programs recommended as mitigation might be 20 implemented within existing management frameworks, describe the functioning of the 21 Nelson River Sturgeon Co-Management Board. 22
RESPONSE: 23 The Nelson River Sturgeon Board is a multi-stakeholder board consisting of 24 communities, First Nations, regulators and industry. It operates with a small amount of 25 base funding from Manitoba and Manitoba Hydro which it uses to leverage additional 26 funding from sources such as federal stewardship programs. It conducts basic field 27 studies to assess stock status and habitat condition on which management decisions can 28 be based. Conservation efforts include educational programs and specific 29 recommendations for voluntary harvest reduction. Stock enhancement measures 30 consist of annual collection of sturgeon eggs from the spawning run of fish in the Nelson 31 River near the confluence with the Landing River. Eggs are shipped to Grand Rapids 32 Hatchery for incubation and rearing. Summer and fall incubation also occurs at the 33 NRSB seasonal rearing facility at Jenpeg. Fingerlings or yearlings are stocked in fall to 34

TAC Public Rd 2 Aboriginal and/or public comments-0003c
Page 2 of 2
areas of the Nelson River, such as Sea Falls, Jenpeg and Duck Rapids, where stocks are 35
severely depleted. 36

TAC Public Rd 2 Aboriginal and/or public comments-0003d
Page 1 of 4
REFERENCE: Volume: Aquatic Environment Supporting Volume; 1
Section: Section 1A.3.1.6; p. p. 1A-11 2
TAC Public Rd 2 Aboriginal and/or public comments-0003d 3
PREAMBLE: 4 Given the long-term decline of Lake Sturgeon populations, the further fragmentation of 5 the river system, and the importance of the success of stocking and/or habitat 6 enhancement as mitigation for the predicted effects of another hydroelectric dam on 7 the Nelson River to lake Sturgeon, the uncertainties related to the effectiveness of the 8 strategy should be clearly represented and evaluated. Uncertainties include success of 9 spawning habitat enhancement measures (e.g. to be implemented at Birthday Rapids "if 10 practicable and feasible." (p.1A-11)), and long-term effectiveness of trap/catch & 11 transport upstream passage. There are also uncertainties related to predicted effects 12 (e.g. effects to fish of downstream passage through turbines). Given the importance 13 that the EIS places on the stocking strategy (while acknowledging the KCN's reduced 14 confidence in its adequacy to mitigate for disturbance to, and loss of, habitat), results 15 from any existing or experimental programs should be described. Further, other 16 measures that may be required should the proposed mitigation measures fail or prove 17 inadequate should be described and analysed with respect to feasibility and practicality. 18
QUESTION: 19 Describe other mitigation measures that could be considered as part of an adaptive 20 management regime if the proposed mitigation measures are inadequate. 21
RESPONSE: 22 Adaptive management can be defined as a process used to continually improve 23 management policies and practices through learning from the outcomes of previously 24 employed policies and practices. One element of adaptive management is consideration 25 of the success and failure for management practices at other locations with similar 26 mitigation needs. Responses to TAC Public Rd 2 Aboriginal and/or public comments 27 0003a and 0003b provide information related to the successful application of planned 28 mitigation and compensation measures elsewhere. Additional discussion is provided in 29 conjunction with plans for mitigation measures in the AE SV Appendix 1A. 30
Two essential elements required for the successful implementation of adaptive 31 management are: (i) an effective monitoring program to identify the response of the 32 environmental component of interest to the established management practices; and, (ii) 33 required expertise and commitment to identify changes to existing management 34 practices, if required. 35
TAC Public Rd 2 Aboriginal and/or public comments-0003d
Page 2 of 4
With respect to lake sturgeon and the Keeyask Project, post-Project monitoring will be 36 used to identify factors limiting the lake sturgeon population, and to provide 37 information on the effectiveness of compensation works and mitigation measures 38 designed to address effects of the Project. The monitoring program is being developed 39 in consultation with and will be reviewed by biologists from Manitoba Conservation and 40 Water Stewardship and Fisheries and Oceans Canada. A draft of the Aquatic Effects 41 Monitoring Plan will be formally filed with regulators and available to the public in the 42 second quarter of 2013. The plan will provide reference to baseline conditions and 43 identify action points at which a review of, and potential modifications to, mitigation 44 and compensation measures will be required. If monitoring indicates that mitigation is 45 not working as planned, or that other unanticipated factors related to the Project are 46 adversely affecting the population, then existing mitigation measures will be modified, 47 or alternative measures will be implemented, until the long-term goal of self-sustaining 48 lake sturgeon populations is reached (this is discussed in the AE SV Section 6.4.4). 49
In order to “describe other mitigation measures that could be considered under an 50 adaptive management regime” for lake sturgeon, it is important to first identify the 51 potential limiting factor in each specific circumstance. While all potential adaptive 52 mitigation measures cannot be described at this time, two scenarios are provided as 53 examples below: (1) lake sturgeon do not spawn in the vicinity of Birthday Rapids; and 54 (2) lake sturgeon stocked into Stephens Lake do not survive. 55
Spawning Habitat at Birthday Rapids 56 The following text is quoted from the AE SV Section 6.4.2.2.2, p. 6-35 to 6-36. 57
“Environmental studies indicate that Birthday Rapids is an important spawning 58 location for lake sturgeon in the reach of the Nelson River between Clark Lake 59 and Gull Rapids. Alternative spawning habitat may be available in Long Rapids 60 immediately downstream of Clark Lake (Section 6.3.2.3)… 61
The existing environment HSI model for lake sturgeon spawning habitat 62 indicates that there is a WUA of between 9 and 12 ha from Clark Lake to Gull 63 Rapids (Section 6.3.2.3.1)… However, increased water levels at Birthday Rapids 64 due to impoundment may reduce the suitability of habitat in the rapids for 65 spawning lake sturgeon; the post-Project HSI model suggests that these rapids 66 will no longer be suitable for spawning due to the associated loss of white 67 water(Map 6-44 to Map 6-46; Appendix 6D). Loss of spawning habitat due to 68 flooding has been observed at the rapids on the Nelson River above the Kettle GS 69 (FLCN 2008 Draft). However, some locations where increased water depth has 70 resulted in the loss of white water but maintained appropriate velocity and 71 substrate conditions have continued to support spawning lake sturgeon. For 72 example, sturgeon appear to have continued to spawn in the Nelson River above 73

TAC Public Rd 2 Aboriginal and/or public comments-0003d
Page 3 of 4
the Kelsey GS following impoundment (Macdonald pers. comm. 2009). 74 Therefore, it is possible that lake sturgeon will continue to use Birthday Rapids 75 as a spawning area. Post-impoundment monitoring of spawning activity in this 76 reach will be conducted to determine spawning success and, should monitoring 77 indicate poor or no spawning success, contingency works to create suitable 78 spawning habitat will be implemented. Contingency measures for the loss of 79 Birthday Rapids as a spawning site are discussed further in Appendix 1A.” 80
If monitoring indicates that sturgeon are not observed at Birthday Rapids, then detailed 81 plans will be developed to construct spawning habitat as described in AE SV Appendix 82 1A p. 1A-10 to 1A-11: 83
“Monitoring will be implemented to determine the success of lake sturgeon 84 spawning in the reach of the Nelson River between Long Rapids and Birthday 85 Rapids. Should monitoring indicate poor or no spawning success, contingency 86 works to create suitable spawning habitat for the maintenance of lake sturgeon 87 in the reservoir would be implemented. One option currently being considered is 88 the addition of large boulders/structures at locations slightly upstream of the 89 current spawning site at Birthday Rapids to create white water to attract 90 spawning fish. Placement of large boulders in this area would be difficult during 91 the construction phase due to lack of access. However, access would be 92 improved during the operation period. The design would be such that the 93 structures could not be removed by ice. 94
Sturgeon behavior in response to these structures would be monitored and 95 modifications implemented if and as required.” 96
In terms of the lake sturgeon stocking program, the stocking strategy outlined in AE SV 97 Appendix 1A Part 2 describes a variety of contingency measures that could be applied if 98 required, including the following scenarios: 99
1. Insufficient spawn is collected at initial target locations due to inadequate 100 numbers of adult fish. Other locations would be assessed as potential sites of 101 spawn collection, in consultation with MCWS and DFO. Considerations would 102 include genetic similarities and differences among the donor and recipient 103 populations; the number of sturgeon available for span collection at the target 104 locations; and the suitability of the site for spawn collection (e.g., access, ease of 105 capture of lake sturgeon). 106
2. Monitoring indicates that survival of stocked fish released as fingerlings is very 107 low. If survival of stocked fingerling lake sturgeon is poor, then potential 108 adaptive management measures include: 109
TAC Public Rd 2 Aboriginal and/or public comments-0003d
Page 4 of 4
a. review rearing and handling procedures to determine if fish are in good 110 condition when released and modify procedures as appropriate; 111
b. stock out a higher proportion of fish as yearlings rather than fingerlings, 112 if the issue appears related to age of fish stocked; 113
c. select other locations/microhabitats to stock the fish if poor survival 114 appears linked to a particular area; and 115
d. investigate site-specific conditions to determine if habitat modification 116 is warranted. 117
3. Monitoring indicates that though numbers of young sturgeon are high, the 118 condition is poor. The potential for overstocking would be investigated and, if 119 this is an issue, the number of sturgeon stocked would be reduced. 120
The above examples illustrate that in adaptive management, the appropriate response 121 is closely linked to an analysis of monitoring results to determine the exact nature of the 122 problem. In each case, an iterative response may be required, with additional 123 monitoring indicating whether further modifications to a mitigation measure may be 124 necessary. 125

TAC Public Rd 2 CEAA-0005
Page 1 of 3
REFERENCE: Volume: Map & Figure Folio; Section: 4.0 Project 1
Description; Map 4-10 2
TAC Public Rd 2 CEAA-0005 3
ORIGINAL PREAMBLE AND QUESTION: 4 Biophysical Environmental Mitigation Areas Map - A potential high quality wetland area 5 identified on the map will be fragmented by the south access road development. The 6 road location has the potential to impact the wetland mitigation. 7
Please provide a rationale for developing the wetland mitigation in an area that is also 8 identified for the development of proposed south access road corridor. 9
FOLLOW-UP QUESTION: 10 Given that the road will be located through the wetland area, what measures will be in 11 put place to create a suitable buffer area between the road and the wetlands? Please 12 describe the mitigation measures that will be employed to protect the new 'potential 13 high quality wetland' from impacts due to the presence of or operation and 14 maintenance of the proposed road and water control structures, including erosion and 15 sedimentation from the road surface. 16
RESPONSE: 17 Construction of the South Access Road (SAR) will take place prior to construction of the 18 new wetland mitigation measure and will be used to facilitate construction of the 19 wetland mitigation area. 20
One of the primary concerns raised in the question was potential effects to the wetland 21 mitigation area from erosion and sedimentation. Construction of the SAR will follow 22 procedures described in the Keeyask Generation Project South Access Road Construction 23 Environmental Protection Plan (EnvPP). This is currently in draft form, but will include a 24 sediment and erosion control plan to be implemented in conjunction with road 25 construction. 26
Much of the area traversed by the SAR is comprised of peat and, as such, construction 27 techniques for the SAR will be the same as those used in other areas where there is 28 peat. Figure 1 illustrates the typical road construction to be undertaken at this location. 29 It will involve placing geotextile over top of the existing peat and constructing an 30 earthfill berm (i.e., a flat pad) comprised of composite material (sand/gravel) on top of 31 the geotextile. The final road will be constructed on top of a berm, which will extend 32 approximately two meters wider on either side of the final road. The road will be 33 constructed using the same composite materials as used in the berm. The berm will trap 34
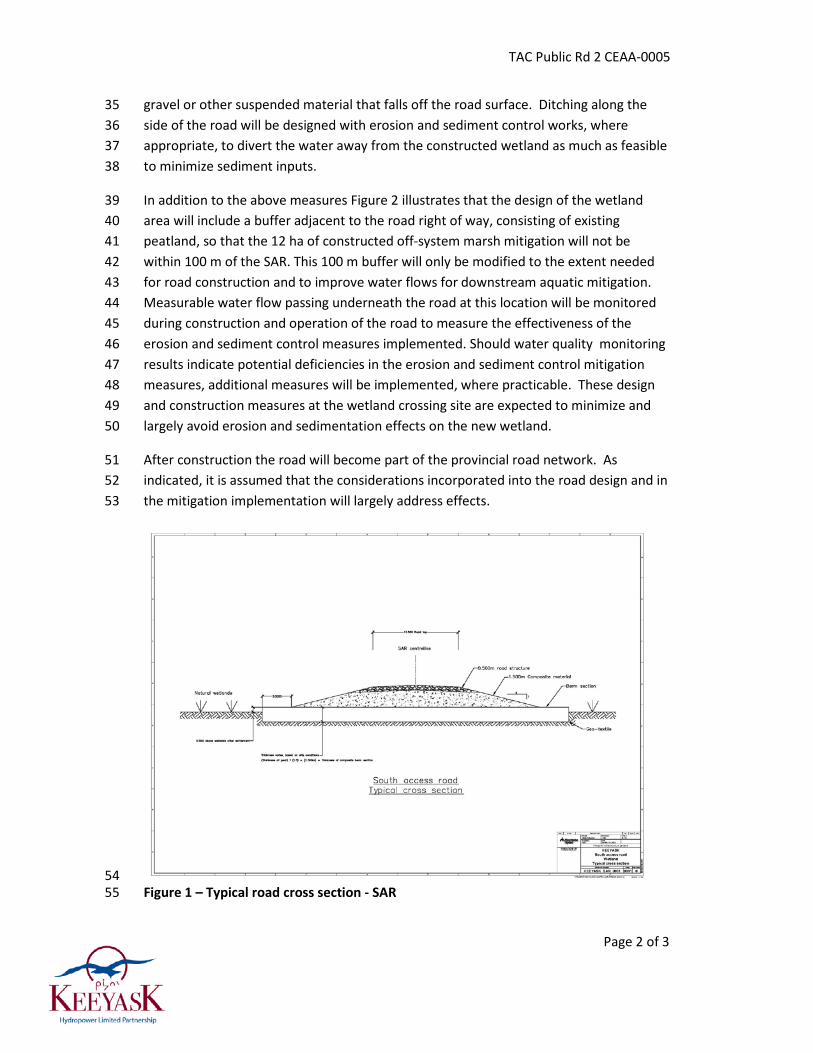
TAC Public Rd 2 CEAA-0005
Page 2 of 3
gravel or other suspended material that falls off the road surface. Ditching along the 35 side of the road will be designed with erosion and sediment control works, where 36 appropriate, to divert the water away from the constructed wetland as much as feasible 37 to minimize sediment inputs. 38
In addition to the above measures Figure 2 illustrates that the design of the wetland 39 area will include a buffer adjacent to the road right of way, consisting of existing 40 peatland, so that the 12 ha of constructed off-system marsh mitigation will not be 41 within 100 m of the SAR. This 100 m buffer will only be modified to the extent needed 42 for road construction and to improve water flows for downstream aquatic mitigation. 43 Measurable water flow passing underneath the road at this location will be monitored 44 during construction and operation of the road to measure the effectiveness of the 45 erosion and sediment control measures implemented. Should water quality monitoring 46 results indicate potential deficiencies in the erosion and sediment control mitigation 47 measures, additional measures will be implemented, where practicable. These design 48 and construction measures at the wetland crossing site are expected to minimize and 49 largely avoid erosion and sedimentation effects on the new wetland. 50
After construction the road will become part of the provincial road network. As 51 indicated, it is assumed that the considerations incorporated into the road design and in 52 the mitigation implementation will largely address effects. 53
54 Figure 1 – Typical road cross section - SAR 55
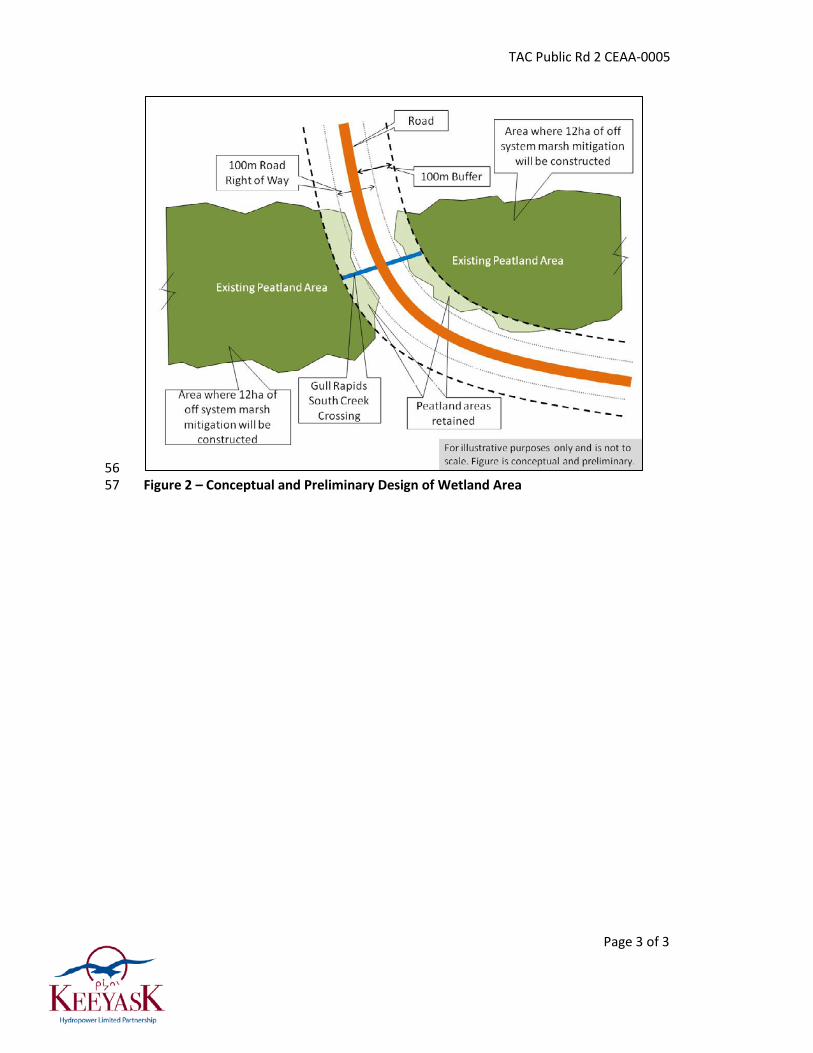
TAC Public Rd 2 CEAA-0005
Page 3 of 3
56 Figure 2 – Conceptual and Preliminary Design of Wetland Area57

TAC Public Rd 2 CEAA-0010
Page 1 of 5
REFERENCE: Volume: Response to EIS Guidelines; Section: 1
6.2.3.2.5 Physiography and 6.2.3.4.8 Mercury in Wildlife; p. N/A 2
TAC Public Rd 2 CEAA-0010 3
ORIGINAL PREAMBLE AND QUESTION: 4 EIS Guidelines required the proponent to provide the present mercury and 5 methylmercury data and analysis in soil. There is very little detail provided. 6
Please provide this information. 7
FOLLOW-UP QUESTION: 8 Proponent indicated that total mercury, along with other metals and nutrients, were 9 analysed in soil samples from the flooded area; however, the EIS indicates that the 10 report documenting this work has not been completed. Please provide the data and 11 analysis to support the assessment. 12
RESPONSE: 13 Peat samples were collected at 49 representative locations during 2003 in the Keeyask 14 project area, predominantly in the proposed reservoir area (Map 1) to characterize the 15 chemical properties of flooded peat. Two volumetric peat samples were collected at 16 each location, one at the surface and the second starting at 20 cm below the surface. 17 Peat samples were air-dried in the field camp to the extent feasible and then shipped to 18 the office laboratory where they were dried at approximately 35° C. 19
Samples were sent to an accredited lab for chemical analysis, where they were oven-20
dried at 60°C prior to analysis to ensure consistent moisture content. Element 21 concentrations except for mercury were determined using inductively coupled atomic 22 emission spectroscopy following EPA Method 6010B. Mercury was determined using by 23 cold-vapor atomic absorption following APHA Method 3112B. Quality control during 24 analyses was monitored by the use of duplicate samples, blanks, and standard reference 25 materials. 26
Samples were sent in two batches. The 35 samples in the first batch (or approximately 27 22% of the total number analyzed) were retested to determine arsenic and selenium 28 concentrations using graphite furnace atomic absorption spectrophotometry, a more 29 costly technique with much lower detection limits for these elements. Retesting 30 evaluated whether using the optical ICP and EPA 3052 digestion method created a 31

TAC Public Rd 2 CEAA-0010
Page 2 of 5
serious limitation. The graphite furnace detection limits for arsenic and selenium were 32
0.3 µg/g and 0.2 µg/g, respectively. All retested samples had arsenic concentrations less 33
than 2.1 µg/g (including 13 below the lower detection limit) and selenium 34
concentrations less than 0.6 µg/g (including 25 below the lower detection limit). On this 35 basis it was decided that the additional cost of analyzing all samples using a method 36 with a lower detection limit was not justified. 37
Table 1 below provides element detection limits (µg/g), percentage of samples with 38 non-detects, and mean concentrations and standard errors of the mean for each 39 element by soil layer (the DL/2 substitution method was used for non-detect values). Of 40 the 22 elements, 20 had less than 10% non-detects. Mean concentrations by soil layer 41
differed significantly (α=1%) for at least one soil layer when compared with the others 42 for 22 of the 27 elements that had less than 50% non-detects. Elements whose 43 concentrations did not vary significantly with soil layer and had less than 50% non-44 detects included manganese, phosphorus, potassium, tin and zinc. 45

TAC Public Rd 2 CEAA-0010
Page 3 of 5
Table 1: Element detection limits (µg/g), percentage of samples with non-detects, mean and standard error of element concentrations (µg/g) 1 measured in peat samples (DL/2 substituted for non-detects) 2
Element DL % Non-detects
Surface Of Om Oh
Mean S.E of Mean Mean S.E of Mean Mean S.E of Mean Mean S.E of Mean
Aluminum 1 0 2,769 716 757 181 7,014 2,607 11,787 4,299
Antimony 2 94 1.08 0.08 1.09 0.09 1.21 0.21 1.58 0.40
Arsenic 4 87 2.43 0.24 2.52 0.29 2.57 0.33 2.63 0.46
Barium 0.05 0 33.4 6.2 22.7 2.9 87.8 18.9 143.8 20.8
Beryllium 0.05 57 0.07 0.02 0.03 0.00 0.25 0.08 0.41 0.10
Bismuth 2 94 1.00 0.00 1.00 0.00 1.53 0.25 1.25 0.25
Cadmium 0.05 7 0.41 0.05 0.15 0.02 0.32 0.03 0.53 0.07
Calcium 1 0 8,642 2,678 9,131 1,678 21,408 4,187 23,823 4,683
Chromium 0.1 1 2.32 0.72 1.20 0.21 11.45 3.84 17.33 5.10
Cobalt 0.1 15 0.49 0.13 0.85 0.35 2.66 0.63 4.29 0.82
Copper 0.1 0 3.82 0.50 2.42 0.34 9.65 1.64 16.40 2.02
Iron 0.2 0 1,340 406 937 178 5,171 1,485 8,987 2,740
Lead 1 43 8.02 0.80 2.69 0.68 1.88 0.74 2.00 0.95
Lithium 0.6 63 1.00 0.44 0.44 0.08 5.42 2.08 9.12 3.45
Magnesium 1 0 1,046 149 1,679 210 2,725 511 4,297 983
Manganese 0.05 0 83.0 11.7 181.8 61.8 165.9 46.7 151.4 39.2
Mercury 0.01 1 0.15 0.01 0.09 0.01 0.09 0.01 0.11 0.01
Molybdenum 1 84 0.50 0.00 0.57 0.07 1.27 0.19 0.67 0.13
Nickel 0.2 1 3.14 0.52 1.73 0.20 5.94 1.43 11.69 2.37
Phosphorus 5 0 548 42 471 41 510 54 531 67
Potassium 100 9 1,563 471 917 107 895 332 2,434 1,533
Selenium 10 100 5.00 0.00 5.00 0.00 5.00 0.00 5.00 0.00
Silicon 5 9 1,430 907 805 655 890 421 2,609 1,324
Silver 0.2 66 0.15 0.02 0.11 0.01 0.54 0.14 0.91 0.18

TAC Public Rd 2 CEAA-0010
Page 4 of 5
Element DL % Non-detects
Surface Of Om Oh
Mean S.E of Mean Mean S.E of Mean Mean S.E of Mean Mean S.E of Mean
Sodium 5 0 329 57 329 36 1,028 321 1,481 360
Strontium 0.5 0 14 2 22 3 63 8 80 9
Sulfur 100 0 893 56 887 143 2,314 287 2,213 292
Thorium 0.5 3 0.50 0.08 0.45 0.09 2.13 0.51 3.81 0.85
Tin 1 0 1.23 0.22 1.32 0.25 1.44 0.29 1.34 0.34
Titanium 0.4 0 60.35 16.02 24.01 5.26 260.35 83.45 422.47 109.50
Uranium 6 1 4.55 0.33 5.00 0.45 12.22 1.89 24.11 4.94
Vanadium 0.1 0 3.00 0.84 1.26 0.25 13.28 4.10 21.47 5.58
Zinc 0.1 0 18.39 1.76 16.07 1.63 16.48 4.40 25.26 11.38
Zirconium 0.5 0 2.31 0.66 1.55 0.29 13.05 3.37 22.46 3.84
N 26 23 19 12
Notes: DL=detection limit; Of=fibric organic layer; Om=mesic organic layer; Oh=humic organic layer; S.E.=standard error.

TAC Public Rd 2 CEAA-0010
Page 5 of 5
1 Map 1: Peat chemistry sample locations [DRAFT2

TAC Public Rd 2 DFO-0001
Page 1 of 8
REFERENCE: Volume: Aquatic Environment Supporting Volume; 1
Section: 3.3.2.3.1 Description of the Mainstem; Page No.: 3-15 2
TAC Public Rd 2 DFO-0001 3
ORIGINAL PREAMBLE AND QUESTION: 4 "Biological components of the aquatic habitat were based on the period during which 5 field studies were conducted in the area, generally between 1997 and 2006. This period 6 included both high and low flows, and therefore would indicate inter-annual variability 7 related to flows." 8
Detailed background reports have not been provided in the EIS. These should be made 9 available for review. 10
QUESTION: 11 Requested reports not provided. 12
RESPONSE: 13 By “biological components of aquatic habitat” it is understood that the reviewer is 14 referring to aquatic macrophytes. A description of changes in macrophyte distribution in 15 relation to inter-annual variations in flow is provided in Aquatic Environment Supporting 16 Volume Section 3.3.2.3.1 and is reproduced below. Also see data reports 01-06, 02-10, 17 03-16, 04-17, 17 06-08. These reports are included on the enclosed CD “Technical 18 Reports Referenced in TAC and Public Reviews, Round 2.” 19
AE SV Section 3.3.2.3.1 p. 3-15 to 3-20 20
“Immediately below Clark Lake, is Long Rapids which is about 3 km long, and is relatively 21 shallow, fast flowing and turbulent, with some areas of white water habitat. Between 22 Clark Lake and Birthday Rapids there is an approximate 4 m drop in water level, 23 velocities are typically more than 1.5 m/s within this reach, and standing waves are 24 common (PE SV, Section 4.3.1). Depths range from less than 4 m in the Long Rapids area 25 to more than 15 m just upstream of Birthday Rapids. The substrate and shoreline 26 features of this section of the river are largely bedrock and boulder/cobble. 27 Downstream of Long Rapids the river widens to about 600 m, deepens, and velocity 28 decreases. 29
Birthday Rapids, situated approximately 10 km downstream of Clark Lake, is a 300 m 30 wide constriction in the Nelson River that is characterized by a fairly steep gradient 31 (drop of approximately 1.8–2.0 m) with high velocities (greater than 1.5 m/s), (PE SV, 32 Section 4.3.1) white water habitat, and boulder/cobble/bedrock substrate. Below 33
TAC Public Rd 2 DFO-0001
Page 2 of 8
Birthday Rapids the next 15 km of the Nelson River is a relatively uniform approximately 34 600 m wide channel with medium to high water velocities and relatively consistent 35 depths of less than 8.0 m (PE SV, Section 4.3.1). River substrates here are primarily 36 bedrock in shallow water, boulder and cobble in the thalweg, with some fine sediment 37 in areas with reduced velocity in shallow water. There are a few large bays with reduced 38 water velocity, which in some years will support aquatic macrophytes. 39
Gull Lake features a diversity of aquatic habitats, including lotic and lentic 40 environments. Gull Lake is generally a very wide channel with several islands and bays 41 (PE SV, Section 4.3.1). Depths along the main body of the lake are more than 7 m, with 42 some areas approaching 20 m in depth. Depths around the islands and in the bays are 43 substantially shallower (less than 3 m). Due to the width and depth of Gull Lake, 44 velocities are typically less than 0.5 m/s. Under 50th and 95th percentile flows, velocities 45 in the 46 0.5–1.5 m/s range become increasingly more abundant in Gull Lake, particularly in the 47 main river channel(s) (PE SV, Map 4.3-5). At the downstream end of Gull Lake, the 48 Nelson River splits around Caribou Island. The north channel is generally wider, 49 shallower, and longer than the south channel. As a result, approximately 75% of the 50 river discharge is conveyed by the south channel (PE SV, Section 4.3.1). Both channels 51 are characterized by moderate velocities (0.5–1.5 m/s). Lake substrates are 52 predominantly cobble and boulder in on-current areas, with soft substrates in off-53 current areas. Aquatic vegetation is primarily restricted to lower velocity areas that are 54 off the major river channel. The presence of macrophytes and their location may vary 55 from year to year depending on water levels. 56
Gull Rapids is the largest set of rapids in the Keeyask area with a drop of approximately 57 11 m across its approximately 2 km length (PE SV, Section 4.3.1). There are several 58 islands and channels located in Gull Rapids. Gull Rapids is a dynamic environment, with 59 new channels being cut periodically due to the erosive forces of the existing ice and 60 water processes occurring in the area (PE SV, Section 4.3.1). Most of the flow (75% to 61 85%) passes through the south channel of Gull Rapids, with little to no flow being 62 conveyed by the north channel during low Nelson River discharge (PE SV, Section 4.3.1). 63 All channels include rapid and turbulent flows featuring the highest velocities (greater 64 than 1.5 m/s) found within the Keeyask area. The substrate and shoreline of Gull Rapids 65 are composed of bedrock and boulders. 66
Just below Gull Rapids, the Nelson River enters Stephens Lake. Stephens Lake was 67 formed in 1971 by the creation of the Kettle GS. Between Gull Rapids and Stephens 68 Lake, there is an approximately 6.0 km- long reach of the Nelson River that, although 69 affected by the Kettle reservoir, remains a lotic environment with moderate water 70 velocity. A breach in the north and south bank of the Nelson River below Gull Rapids 71

TAC Public Rd 2 DFO-0001
Page 3 of 8
occurred during winter 2000/2001, when the ice dam that forms each year in the area 72 was particularly massive (PE SV, Appendix 4A). The north breach has since developed 73 into a well-formed channel that connects via “Pond 13” to O’Neil Bay in Stephens Lake. 74
A detailed description of habitat in the Keeyask area based on specific variables is 75 provided below. 76
Habitat Variables 77
Habitat variables discussed in the following sections are characterized under 95th 78 percentile flow open water conditions. Effects under variable flows and ice conditions 79 are discussed under “Environmental Variation”. 80
Water depth in the Keeyask area is deepest in the primary thalweg and tends to become 81 deeper in the downstream direction. Depths as shallow as 2.5 m occur between Clark 82 Lake and Birthday Rapids. Depth attains a maximum of 16 m in Gull Lake (Map 3-6). 83 Most of the main channel of the river has depths in the range of 8–12 m. 84
Most of the Nelson River habitat within the Keeyask area is deep (i.e., more than 3 m), 85 with shallow habitat in the main channel being limited to two areas: 1) the reach of river 86 between Clark Lake and Birthday Rapids; and 2) Gull Rapids (Map 3-7). Shallow habitat is 87 abundant in bays in the Gull Lake area. Areas that are backwatered during high flow 88 events are limited to inlets or the upper extent of shallow bays fed by tributaries. The 89 IEZ of the Nelson River is described later in this section. 90
Lotic water masses are defined as having a depth average velocity of 0.2 m/s or greater. 91 A lotic water mass is continuous throughout the thalweg of the Keeyask area, despite 92 having apparent riverine and lacustrine sections. Lentic water masses are limited to 93 narrow bays or areas where the river is notably wider than the thalweg. 94
Velocities in the riverine portion upstream of Gull Lake are predominantly moderate or 95 high (Map 3-8). Velocities are lower in Gull Lake but moderate velocity habitat 96 (0.5−1.5 m/s) is found throughout the lake (Map 3-8). 97
White water habitat exists in several riverine locations upstream of Gull Lake. White 98 water habitat is formed in a rapid, when a river's gradient increases enough to disturb 99 its laminar flow and create turbulence. Sites with white water may have sudden drops in 100 riverbed level and may be associated with eddies where reverse flows occur. The 101 presence of white water suggests the diversity of hydraulic habitat over a small area is 102 relatively high and so provides important fish habitat during spawning or for refugia or 103 feeding. 104

TAC Public Rd 2 DFO-0001
Page 4 of 8
The location of rapids with white water habitat does not change with different inflows, 105 although at some locations white water occurs only under lower flow conditions. Under 106 an inflow of 3,102 m3/s (just above the 50th percentile condition), white water was 107 observed at various locations in the Keeyask area (Map 3-9 to Map 3-13). White water 108 habitat is well developed mainly in two localized areas occupying part of the river 109 channel between Clark Lake and Birthday Rapids. This area is known as Long Rapids 110 (Map 3-9). Within Reach 4, white water at Birthday Rapids spans the full width of the 111 Nelson River (about 275 m) (Map 3-10). White water is present on both sides of the 112 island downstream of Birthday Rapids, but is better developed under lower flows. In the 113 north channel, white water habitat is localized in two areas: 1) the north side of the 114 island; and 2) just downstream along the north bank of the Nelson River. The white 115 water on the south side of the island spans most of the width of the south channel 116 (~200 m wide). Water movements in reaches 5–8 are turbulent in several areas but no 117 white water is developed. White water in Reach 9A and 9B, Gull Rapids, is frequent in 118 the north channel (Map 3-11), middle channel (Map 3-12), and south channel (Map 3-119 13). 120
The substrate distribution upstream of Gull Rapids corresponds closely to the pattern of 121 flows and water depth. This is most notable when lentic and lotic areas are compared; 122 habitats along the edge of the river in lentic habitat typically are depositional (i.e., soft 123 bottomed; silt/clay), whereas the areas of lotic habitat are erosion or transport 124 environments (i.e., hard bottomed; boulder to gravel). 125
Areas that are deep and lotic are found within the thalweg and are dominated by hard 126 bottomed materials (i.e., mainly boulder/cobble/gravel) (Map 3-14). Generally, the 127 largest materials line the riverbed in reaches 2A–5. In Reach 6, the flows disperse 128 enough to enable cobble to form a stable bottom. Some lotic habitat in this reach has a 129 stable bottom formed of gravel, as shown downstream of Seebeesis Creek along the 130 south shore (Map 3-14), providing evidence of dampened velocity gradient in the lower 131 part of Reach 6. Decreases in thalweg velocity are evident again farther downstream 132 where the secondary channel that flows around the north side of Caribou Island allows 133 sand to form a stable bottom. Sand is not abundant in Deep habitat, and has only been 134 located in this channel. Velocity in this area is not fast enough to create a net movement 135 of sand away from the area but is sufficient to transport silt/clay downstream. 136 Observations of near bottom velocity in these two areas averaged 0.26 m/s, with a 137 corresponding depth averaged velocity of 0.48 m/s with water depths in the range of 8–138 11 m (Appendix 3A). 139
Areas of shallow and lentic habitat are present along the edge of the river in the form of 140 depositional bays (i.e., mostly silt/clay). Organic materials are found mostly in the lower 141
TAC Public Rd 2 DFO-0001
Page 5 of 8
reaches of the tributaries where backwater effects from the Nelson River occur during 142 times of higher flows (Map 3-14). 143
Below Gull Rapids, the riverbed shows that a size gradient of materials occurs in the first 144 6 km as velocity drops. Flows are sufficient to maintain the bed processes of erosion and 145 transport for more than 5 km, as evident by substrates of sand or greater material size 146 (Map 3-15). A small eroded channel exists about 2 km downstream of Gull Rapids on the 147 south bank. The substrate of the channel was mainly clay but it should be noted that 148 changes in flow among seasons over time may create changing hydraulic conditions and 149 the long term character of the substrate may change. About 3.5 km downstream of Gull 150 Rapids, gravel starts to dominate the flooded thalweg which then grades to gravel/sand 151 and then to sand over the next two kilometres. The zone of homogenous silt deposition 152 in the flooded thalweg starts about 5.5 km below Gull Rapids at depths of about 17–153 20 m. 154
The position of the silt boundary in the flooded thalweg of the river as it enters 155 Stephens Lake appears to be formed by relatively high magnitude flows. Low inflows, 156 i.e., 5th or 50th percentile, form lentic habitat about 1.2–2.2 km up river of the 157 depositional boundary and this standing water overlies erosion and transport substrate 158 habitat. In comparison, flows above the 50th percentile maintain lotic habitat over the 159 gravel and sand substrates that extend to depths of 17–20 m, where the onset of silt 160 deposition begins. Homogeneous silt deposition dominates the bottom of the flooded 161 thalweg down river of the silt boundary even in lotic habitat during relatively high 162 inflows, due to increased water depth/lack of channel confinement. 163
The lentic habitat in the river channel downstream of Gull Rapids on the north bank of 164 Reach 11 is not depositional as was observed consistently in lentic habitat up river of 165 Gull Rapids. This is an apparent response to the winter hydrodynamics resulting from 166 the hanging ice dams (PE SV 4.3.2.5), which may create a seasonal shift in the position of 167 the lentic/lotic boundary. 168

TAC Public Rd 2 DFO-0001
Page 6 of 8
The distribution of macrophytes (Map 3-16) above Gull Rapids corresponds closely with 169
the distribution of standing or low water velocity, shallow water, and silt/clay substrate. 170
Most of these habitat variables co-occur in low slope areas, including the relatively large 171
bays in the Gull Lake area, but small plant beds are also found in portions of the Nelson 172
River mainstem. In the first 4 km below Gull Rapids, the availability of potential habitat 173
is limited and macrophytes are sparse. 174
Environmental Variation 175
Variation in flows, within and among years, determines the amount and type of aquatic 176 habitat available to biota. A comparison of annual and seasonal flows is provided in the 177 PE SV, Section 4.3.1. 178
Open water season inflows during the period when the majority of environmental 179 assessment studies were conducted (2000−2006) varied to near the full range expected 180 in the Nelson River (Figure 3-2, further described in PE SV, Section 4). The maximum 181 hourly discharge during this period was observed in the fall of 2005, when flow was 182 about 6,590 m3/s, or about 1.2 times the 95th percentile flow of 5,266 m3/s. The lowest 183 discharge occurred in the fall of 2003 when flow was 1,372 m3/s, or about 0.73 times 184 lower than the 5th percentile of 1,882 m3/s. Most years had flows for extended periods 185 in the range of 3,000–4,000 m3/s; i.e., higher than the 50th percentile (2,866 m3/s). The 186 following discussion compares aquatic habitat at 95th and 5th percentile inflows, and also 187 describes other changes that have occurred as a result of variation in open water flows. 188
Upstream of Gull Rapids, difference in average water depth for the reaches ranged from 189 0.6 to 1.7 m at 5th and 95th percentile flows. The average depth of the IEZ in reaches 2–8 190 (upstream of Gull Rapids) ranges from 1.2–2.1 m. Water depth in many areas of Gull 191 Rapids is uncertain (PE SV, Appendix 4A) preventing calculation of the IEZ. Water level 192 variation in reaches downstream of Gull Rapids is primarily controlled by operation of 193 the Kettle GS. 194
During the open water season, changes in depth over short time periods are small: for 195 example, the typical 1-day water level variation on Gull Lake is 0.01 m, while the 7-day 196 variation was 0.07 m (PE SV, Section 4.3.1). 197
Variations in flow result in changes in velocity magnitude and pattern in the river. 198 Differences in velocity between the 5th (Map 3-17) and 95th percentile inflows above 199 Gull Rapids are smallest in the riverine reaches, in particular at rapids, and are largest in 200 the lacustrine reaches (Map 3-18). Maximum velocities within each reach are typically 201 found in rapids or narrows; the 5th percentile maxima are 87% (4.4 m/s) of the 95th 202 percentile flows (5.1 m/s), and are very similar. Away from the rapids, the average 203 riverine velocity also remains similar between low and high flows; the average 5th 204
TAC Public Rd 2 DFO-0001
Page 7 of 8
percentile flow rate is 1.0 m/s, and this is 75% of the 1.36 m/s average of the 95th 205 percentile. In the lacustrine reaches, the average 5th percentile velocity is 0.21 m/s; this 206 is 65% of the 0.33 m/s modelled for the 95th percentile flow. These data show that the 207 riverine sections do not slow notably over a wide range in flows, but the area of faster 208 water near each narrows does decrease. In the lacustrine reaches, the decrease in 209 velocity between the 95th and the 5th percentile inflows is largest suggesting that 210 changes of flow are more likely to have an effect on the type and distribution of 211 substrate in Gull Lake, for example. 212
The discussion of aquatic habitat above was based on open water conditions, which is 213 an important period to determine the distribution of aquatic biota and includes most 214 biologically significant periods, such as spawning. However, ice scour in shallow areas 215 can disrupt littoral biota and formation of ice dams or thick ice cover can make areas 216 unsuitable for overwintering fish. As described in PE SV, Section 4.3.1.4, the formation 217 of ice is complex and varies considerably between years. Constrictions in the river due 218 to formation of ice results in higher overall water elevation in some sections than during 219 the open water season and the distribution of velocity may be substantially different 220 from the open water season. In particular, nearshore velocity can be high in riverine 221 reaches. 222
Macrophytes 223
The presence or absence of rooted macrophytes depends on the availability of suitable 224 wetted habitat, and the ability of plants to occupy that habitat. Changes in water level 225 for a prolonged period during the growing season result in shifts in the location of 226 macrophyte beds as plants respond to the changes in the availability of suitable habitat. 227 When river levels remain low, some of the potential habitat higher on the bank is not 228 wetted (i.e., not suitable) and the elevation to which light can penetrate will also be 229 lower (Figure 3-3). In the Nelson River, the zone of suitable habitat fluctuates up and 230 down the bank within the zone of potential habitat as water levels change; as such, the 231 suitable habitat will always be smaller than the potential habitat, and more closely 232 linked to the recent water regime. 233
Constraint criteria were used to define the area of habitat with potential for macrophyte 234 growth, and calculate the proportion of occupied habitat. The constraint criteria were 235 limited to observations made during 2001, 2003, and 2006 in reaches 5–8. The 236 constraint criteria were: 1) 95th percentile inflow water surface; 2) silt/clay substrata; 3) 237 standing or low water velocity (depth averaged) (i.e., less than0.5 m/s); and 4) water 238 depths less than 3 m at a 5th percentile inflow (to account for light penetration at low 239 water). The constraint criteria accounted for 94–99.7% of the macrophyte data 240 observed each year. 241
TAC Public Rd 2 DFO-0001
Page 8 of 8
Macrophyte stands observed in any one year tended to occupy the same general areas 242 in the other years (Map 3-16), but notable differences in the depth of plant beds, their 243 size, and number was evident between years. Water levels varied within and among 244 years but in general they were high in 2001 and 2006 and were low in 2003 (Figure 3-2). 245 The average depth of the plant beds in 2003 (1.9 m), when compared using depths 246 relative to the 95th percentile, was notably greater than that of 2001 and 2006 (1.2 m, 247 0.72 m) (Figure 3-4A). After the 2003 depths were adjusted to account for low water 248 using the 5th percentile inflow instead, the average depth (0.95 m) appears similar to the 249 other years (Figure 3-4B) with a grand mean depth of 1.09 m and a standard deviation 250 of 0.68 m. These data show that plants in the Keeyask area have adapted to 251 considerable interannual variation of water levels. 252
Low water years appear to have fewer but larger macrophyte stands when compared to 253 high water years (Table 3-3). Although 2001 and 2006 were both years of high water 254 and both had relatively small average stand sizes, the total area occupied by plants in 255 2001 was about 2.5 times that observed in 2006 (Table 3-3). In 2005, water levels in the 256 Keeyask area were also high for most of the open water season (Figure 3-2) and this 257 may have also contributed to the distribution observed at higher elevations in 2006. 258 Review of the water regime data for the early part of the growing season suggests that 259 the relatively lower water levels in 2001, i.e., nearer to the 50th percentile inflow, may 260 have provided better conditions (i.e., somewhat similar to 2003) than in 2006 when 261 water levels remained relatively high throughout the growing season. 262
The total area that macrophytes occupied in reaches 5–8 during the three years of study 263 was 788 hectares (ha) (164 ha of overlapping plants was surveyed among years). 264 Therefore, over the years of study, rooted macrophytes occupied 624 ha of the 1,168 ha 265 (i.e., 53.4%) of the total potential habitat available (Table 3-4). In any one year, plants 266 occupied 13.6–37.7% of the suitable habitat, or 12.5% to 30.7% of the potential habitat, 267 that was available over the years. On average, the area of plants found in reaches 2B-9A 268 is 208 ha. 269
In summary, low water levels provide better overall conditions for plant growth in the 270 Keeyask area as the soft textured substrate in the extensive flats of the bays becomes 271 sufficiently shallow to be suitable; this appears to result in fewer but much larger 272 macrophyte beds. At high water, many of these areas do not to support plant growth. 273 Instead, the plant beds are visible at higher elevations (which correspond with sloped 274 parts of the channel) as relatively narrow bands that are oriented parallel to shore. The 275 effect of intra and inter-annual variation of the water regime on macrophyte 276 distribution is large. The ability of plants to occupy suitable habitat ranged from 13.6–277 37.7%; the range was slightly smaller when potential habitat was considered. “ 278

TAC Public Rd 2 DFO-0002
Page 1 of 6
REFERENCE: Volume: Aquatic Environment Supporting Volume; 1
Section: 3.3.1 Pre-1997 Conditions and 3.3.2 Current Conditions 2
(Post-1996); p. 3-11 and 3-12 3
TAC Public Rd 2 DFO-0002 4
ORIGINAL PREAMBLE AND QUESTION: 5 "No analysis of trends in aquatic habitat was conducted, since the water regime was 6 established in 1977 and has been operated within set bounds since that time." 7 However, has aquatic habitat and changes in fish stocks changed since 1977, despite 8 apparent constancy in water regime? Moreover, habitat changes were not actually 9 assessed to support this claim. Can the existing environment be adequately portrayed if 10 not assessed/sampled? This also does not account for natural changes in habitat with 11 flow events outside of regulation. For example, a flow/ice event approximately 10 years 12 ago changed the flow patterns at Gull Rapids, creating a new channel that flows 13 northeast to Stephens Lake. Please consider the entire period of record for analysis. 14
FOLLOW-UP QUESTION: 15 No additional information provided. 16
RESPONSE: 17 As discussed in the response to TAC Public Rd 1 DFO 002 and further at a TAC Review 18 meeting on February 14, 2013, among KHLP, DFO and MCWS, there is little historic 19 habitat information for the reach of the Nelson River that will become the future 20 Keeyask reservoir. Available aquatic habitat information is summarized in AE SV Section 21 3.3.1 and 3.3.2 and reproduced below. Relevant information is also found in Section 4.3 22 of the Physical Environment Supporting Volume 23
“Impoundment of the Kettle GS reservoir in 1970 resulted in a backwater effect 25 at Gull Rapids that typically ranges from 141.1 m ASL in winter to 139.2 m ASL in 26 summer (Split Lake Cree - Manitoba Hydro Joint Study Group 1996b). CRD 27 increased the average flow through the reach by 246 m3/s, an increase of 28 approximately 8%, and water levels increased marginally. LWR reversed the 29 seasonal pattern of flow such that average flows are more similar during the 30 summer and winter, with winter flows averaging about 194 m3/s more than 31 summer flows. Prior to regulation, average summer flows had been 892 m3/s 32 higher than winter flows. In the post-project period, there is now a greater range 33 in water fluctuations”. 34
Aquatic Environment Supporting Volume, 3.3.1.2 Keeyask Area 24

TAC Public Rd 2 DFO-0002
Page 2 of 6
“Crowe (1973) estimated the surface area of the Nelson River between lower 36 Gull Rapids and the Kettle dam prior to construction of the Kettle GS at 101.5 37 km2. The impoundment of the Kettle GS reservoir resulted in the formation of 38 Stephens Lake by flooding the existing river and lakes. Stephens Lake attained 39 the full supply water level of the reservoir for the first time in 1971 when the 40 water level immediately upstream of the GS increased by approximately 31.5 m 41 (Split Lake Cree - Manitoba Hydro Joint Study Group 1996b). The reservoir 42 surface area increased by about 263 km2, or about 3.6 times that of surface area 43 found within the extent of the reservoir before flooding (Cherepak 1990). In 44 1989, Cherepak (1990) reported that the post-CRD/LWR water surface area of 45 Stephens Lake was 364.7 km2 and the mean and maximum depths of the lake 46 were 7.6 and 35 m, respectively. Changes in the shape of the shoreline in 47 Stephens Lake during the period 1971–1997 are apparent from topographic 48 mapping or aerial photography due to erosion of mineral soils and/or 49 degradation or movement of organic soils within the reservoir. The changes in 50 the shape, extent, and number of islands apparent in topographic maps are 51 most notable in shallow bays. 52
3.3.1.3 Stephens Lake Area 35
Operation of the Kettle GS can noticeably affect short-term water levels on 53 Stephens Lake. It is typically drawn down over a week, and has been drawn 54 down by as much as 2.4 m in a one-month period (Split Lake Cree - Manitoba 55 Hydro Joint Study Group 1996b). Although LWR resulted in a reversal of seasonal 56 flows and water levels, these effects are not discernable due to the operation of 57 the Kettle GS. Prior to regulation, average water levels were typically 0.9 m 58 higher in summer compared to winter, whereas the reservoir is now operated 59 such that winter levels are approximately 0.4 m higher than summer levels. CRD 60 resulted in an increase of flows such that the average flow out of Stephens Lake 61 has increased by 227 m3/s.” 62
“Apart from the effect of inter-annual variations in flow, aquatic habitat has 64 been relatively stable over the recent past, given that analyses of the water 65 regime and sedimentation (Section 6.2.3.2.6 and Section 6.2.3.2.8) do not 66 identify any pronounced trends. However, the formation of large ice dams at 67 Gull Rapids has created and would continue to create new channels, due to 68 water level staging and redirection of flows, and may cause changes to the river 69 bottom such as the movement of substrate (e.g., boulders) (Section 6.2.3.2.8). 70 The potential effects of climate change were considered separately as described 71 in Section 6.4.9.” 72
3.3.3 Current Trends/Future Conditions 63
TAC Public Rd 2 DFO-0002
Page 3 of 6
With respect to the statement by the reviewer “habitat changes were not assessed to 73 support this claim”, as noted above, habitat changes would arise from changes to water 74 flows and/or erosion/sedimentation. As discussed in the Physical Environment 75 Supporting Volume and quoted below, these have varied but not displayed a consistent 76 trend (upwards or downwards) since 1977. 77
“The environmental setting has been influenced by past hydroelectric 79 development in northern Manitoba. In 1970, Manitoba Hydro was granted a 80 license to regulate Lake Winnipeg. As described in the Project Description 81 Supporting Volume, the license stipulates conditions under which Manitoba 82 Hydro is allowed to adjust the outflows as required for power production 83 purposes along the Nelson River. This allows Manitoba Hydro to store water in 84 Lake Winnipeg during periods of high water supply, typically during spring and 85 summer, and release this water during higher power demand periods such as fall 86 and winter. LWR has resulted in a shift in seasonal patterns of lake outflows, 87 which results in a winter flow increase on the Lower Nelson River and an 88 associated summer flow decrease. 89
PE SV Section 4.3 78
In 1977, the CRD was constructed, diverting water from the Churchill River into 90 the Burntwood River and eventually into Split Lake. The amount of water 91 diverted into Split Lake fluctuates monthly and annually between 400 m3/s and 92 1,000 m3/s. This augmented flow has increased the level of Split Lake by up to 93 0.8 m. The exact magnitude of the water level depends on the outflow at the 94 Notigi control structure and varies throughout the year. 95
The estimated Post-project flow conditions are within the range of flows 96 experienced on the study area portion of the Nelson River prior to LWR and CRD. 97
The combined effects of CRD and LWR somewhat offset each other with respect 98 to Split Lake outflows and the flows in the reach of the Nelson River affected by 99 the Keeyask Project. In the unregulated state, the highest lower Nelson River 100 flows typically occurred in mid-summer and reduced to the lowest flows in mid-101 winter. With LWR and CRD, the lower Nelson River flows are still typically 102 highest in mid-summer, lower in late summer and then rising in winter, due to 103 increased power demand but the Post-project flows during the winter and open 104 water periods are much closer together. Historical water levels on Split Lake 105 were higher in summer than winter, whereas post-CRD and LWR, the winter 106 levels are an average of about 0.6 m higher than summer. Water levels at the 107 downstream end of Gull Rapids were affected by the backwater effects of the 108 Kettle GS reservoir (Stephens Lake) and the water levels throughout the reach 109
TAC Public Rd 2 DFO-0002
Page 4 of 6
were also affected by the increased flows resulting from LWR and CRD. It is 110 important to note that the net combined effect of LWR and CRD can vary as the 111 net effect is largely a function of the inflow conditions and the values above 112 were estimated from limited data available for pre-CRD and pre-LWR conditions. 113
Little information is available to estimate the exact change in water levels 114 throughout the Clark Lake to Gull Rapids reach.” 115
In addition to the flows, the following discussion on trends within the water regime 116 highlights that many parameters are relatively insensitive to changes in inflow. 117
“It is expected that without the development of the Project, and assuming that 119 climatic and watershed conditions remain as they currently are, that the open 120 water regime for the study reach of the Nelson River would continue to be the 121 same in the future as that described earlier for the environmental setting. 122
PE SV Section 4.3.2 Open Water Conditions/Trends 118
As indicated in the Approach and Methodology Section (Section 4.2), the river 123 flows for the historical period of 1977 to 2006 are very similar to the river flows 124 that are used to represent the future long term flow record. Based on this 125 characteristic of the inflows and the relatively low sensitivity of water regime 126 characteristics to flow variations, it is reasonable to assume that the water 127 regime characteristics presented in the environmental setting would represent 128 the water regime characteristics for the future environment without the Project 129 in place. 130
While the general hydraulic conditions in the study area are expected to be the 131 same in the future, the magnitude and duration of water levels, variations, and 132 other water regime characteristics are dictated by the frequency and duration of 133 different river flows. Also, the hydrologic characteristics of the study area and 134 the distribution of river flows are expected to vary from year to year and the 135 resulting 5th, 50th, and 95th percentile water regime parameters may be slightly 136 different, but the general hydraulic characteristics of the study area would 137 remain the same without the Project in place. For example, the 50th percentile 138 water level on Gull Lake for the environmental setting would be the same as the 139 50th percentile water level on Gull Lake for the future environment without the 140 Project in place.” 141
The same constancy was recorded for the other key physical parameter affecting 142 aquatic habitat, erosion and resulting sedimentation. 143
PE SV Section 6.3 144

TAC Public Rd 2 DFO-0002
Page 5 of 6
“The environmental setting has been influenced by past hydroelectric 145 development in northern Manitoba, particularly the LWR and CRD. The Water 146 Regime section of the PE SV describes the nature of the changes. Of particular 147 note to shoreline erosion, it is estimated that Post-project flows and water levels 148 in the study area portion of the Nelson River are within the range of conditions 149 experienced prior to LWR and CRD. Due to LWR and CRD, mean water levels in 150 the study area portion of the Nelson River during the winter and open water 151 seasons have generally increased and mean winter water levels have become 152 higher than mean open water levels. The net combined effect of LWR and CRD 153 can vary as the net effect is largely a function of the inflow conditions to the 154 reach and limited data exist for pre-LWR and pre-CRD conditions. 155
Existing information regarding shoreline peatlands and peatland disintegration 156 in the Gull reach was not previously available. Photo-interpretation of historical 157 air photos indicated that measureable peat bank recession did not occur 158 between 1962 and 2005 except at one localized area where an ice dam diverted 159 river flow and carved a channel through an island in the river. The high degree of 160 water level variability prior to and after water regulation may have maintained 161 peat bank position in shore segments where peatland disintegration was the 162 dominant bank formation and recession process. 163
Little information is available regarding mineral erosion rates in the Keeyask 164 Project study area prior to LWR and CRD and, as a result, little is known about 165 changes in mineral shoreline erosion rates following implementation of those 166 projects. 167
Kellerhals (1987) and the Federal Ecological Monitoring Program Summary 168 Report (1992) report that erosion to date in the post-LWR and CRD environment 169 has been much lower than originally predicted. Moreover, the focus of those 170 studies was on shoreline reaches upstream of Split Lake where changes to flow 171 and water levels were likely greater than in reaches downstream of Split Lake. 172 Therefore, it seems probable that effects on erosion rates downstream of Split 173 Lake would have been less than in upstream reaches. 174
As discussed later in this section, studies conducted for Keeyask (i.e., Shoreline 175 Erosion section of the PE SV) indicate that shore zone materials and slope 176 geometry in the Keeyask study area are such that one would not expect large 177 changes in erosion rates to have resulted from water level and flow changes 178 caused by LWR and CRD. Much of the riverine reach between Clark Lake and 179 Birthday Rapids is bedrock controlled, while the remaining river reach and gently 180 sloping shores in Gull Lake have experienced low erosion rates in the existing 181 environment, with the exception of a few localized shoreline segments. 182

TAC Public Rd 2 DFO-0002
Page 6 of 6
Therefore, even if LWR and CRD had an effect on erosion rates, the magnitude of 183 that effect must have been small, at most, judging by erosion rates in the 184 existing environment. 185
In order to incorporate whatever effect LWR and CRD may have had on erosion 186 rates in the study area, the existing mineral erosion environment has been based 187 on post-1986 erosion rates as determined from historical air photos and 188 surveyed transects.” 189
“Mineral banks on the existing Nelson River shoreline consist mainly of low to 191 moderately high (0 m to 3 m) steep banks that have formed in coarse-textured 192 clay till and glaciofluvial (sand and gravel) sediments and, in places, fine-193 textured clay and silt sediment which were deposited in glacial Lake Agassiz. 194 Gently sloping beaches and nearshore slopes extend out into the lake from the 195 toe of steep shoreline banks. In places mineral shorelines consist of non-erodible 196 river-washed bedrock, and in other places very gently sloping non-eroding 197 mineral slopes that are overlain by thin peat and vegetated to just above the 198 normal high-water elevation. Many of the banks along the Nelson River are ice 199 scoured for a short distance above the normal open water elevation, and in 200 places ice has shoved coarse gravel, cobbles and boulders onto the shore, 201 effectively protecting these shorelines from erosion. Overall, mineral erosion 202 rates in the study area are relatively low under existing conditions as compared 203 to other lakes and rivers in northern Manitoba.”204
6.3.1.1.2 Mineral Shorelines 190

TAC Public Rd 2 DFO-0003
Page 1 of 2
REFERENCE: Volume: Aquatic Environment Supporting Volume; 1
Section: Map 3A-3 Substratum Data Collection Index Map; p. N/A 2
TAC Public Rd 2 DFO-0003 3
ORIGINAL PREAMBLE AND QUESTION: 4 "Substrate composition could not be determined immediately upstream, within, or 5 downstream of rapid sections due to safety concerns." 6
Please define "immediately". Substrate composition be should be confirmed in the 7 dewatered areas in Gull Rapids prior to any construction. Resolution should be similar to 8 that already conducted in the vicinity of Gull Rapids. This information is crucial for 9 proper accounting of habitat destruction in the rapids. 10
FOLLOW-UP QUESTION: 11 Physical area "immediately" downstream of Gull Rapids is not defined. 12
RESPONSE: 13 The November 2012 response noted, “Mapping of bottom types extended to 14 approximately 330 m upstream of Gull Rapids and 330 m downstream of Gull Rapids”; 15 i.e., 330 m downstream of Gull Rapids is considered “immediately” downstream of Gull 16 Rapids. Map 3A-3 in the Aquatic Environment Supporting Volume shows the location of 17 transects and other methods of data collection. A copy of this map is attached. 18

TAC Public Rd 2 DFO-0003
Page 2 of 2

TAC Public Rd 2 DFO-0004
Page 1 of 3
REFERENCE: Volume: Aquatic Environment Supporting Volume; 1
Section: 3.3.2.3.1 Description of Mainstream; p. 3-15 2
TAC Public Rd 2 DFO-0004 3
ORIGINAL PREAMBLE AND QUESTION: 4 "For the purposes of predicting habitat conditions in the post-Project environment and 5 quantifying areal changes in habitat area between the pre and post-Project 6 environments, conditions at 95th percentile flow (pre-Project) and full supply level (FSL) 7 in the reservoir post-Project were used. " 8
This analysis is incomplete. While the 95th percentile accommodates the majority of 9 flows, changes in fish habitat at lower flows are not shown and may be more crucial. 10 Moreover, the 95th percentile flow will be relatively uncommon. The 50th percentile 11 would represent a more normal flow condition and changes in this habitat are not 12 presented. Please provide the results of this analysis which includes the 5th and 50th 13 percentile flows. 14
FOLLOW-UP QUESTION: 15 Results of percentile flows not provided. As further clarification to the proponent, 16 request pertains to the period of record. 17
RESPONSE: 18 During a technical meeting held on February 14, 2013, among KHLP, CEAA, DFO and 19 MCWS, DFO clarified that modelling results would be required for the full range of flows 20 if the model was to be used to calculate the Harmful Alteration, Disruption, and 21 Destruction (HADD) of habitat for Authorization under the Fisheries Act. DFO indicated 22 a concern that not determining model results at the full range of flows could under-23 estimate the effects to habitat and consequently, the fish community. The proponent 24 clarified that the model was one of several approaches used to assess the net effect to 25 fish of the changes in habitat as a result of impoundment; other approaches included 26 assessment of changes to specific habitats used in the existing environment and their 27 condition post-impoundment, and effects to the fish community observed in similar 28 systems. Taken together, this three-pronged approach provides additional certainty in 29 conclusions presented in the Aquatic Environment Supporting Volume. 30
With respect to the use of a fish model based on habitat availability calculated at 95th 31 percentile flows, the proponent clarified at the technical meeting that the intent of the 32 model was to determine the relative amount of foraging habitat in the post versus pre-33 Project environments and as the 95th percentile provides the most available habitat in 34 the pre-Project environment, this is an appropriate basis for comparison in a “worst 35

TAC Public Rd 2 DFO-0004
Page 2 of 3
case” scenario. In addition, the amount of habitat available in the reservoir only varies 36 slightly between flows, since the water level in the majority of the reservoir is regulated 37 to be between 158 to 159 m Above Sea Level (ASL). Finally, as described in the response 38 to Round 1 DFO-0004 and repeated below, for the reader’s convenience, the range of 39 flows (5th, 50th and 95th) were described for depth and velocity and for other aquatic 40 habitat parameters that are affected by flow (e.g., aquatic plants). 41
The response to Round 1 is repeated below. 42
RESPONSE: 43 The 95th percentile approach describes the total area of habitat that is available except 44 under very high magnitude but low frequency events. The median condition would 45 leave about half of the habitat undescribed, which is undesirable when assessing the 46 loss/alteration of habitat. Post-project, water levels on the reservoir will be constrained 47 within a one metre range. Inflows will affect water levels in the upper, riverine section 48 of the reservoir where there is relatively little change in wetted area with changes in 49 flow. Therefore, 95th percentile inflows provide a realistic description of habitat 50 available Post-project. The appropriate basis of comparison in the existing environment 51 would then also be the 95th percentile inflow. 52
It is recognized that the availability of certain types of habitat vary with inflow in both 53 the existing and Post-project environments. Variation with flow in the existing 54 environment is described in Aquatic Environment Supporting Volume, Section 3.3.2.3.1. 55 The existing environment habitat data demonstrate that small changes in lentic and lotic 56 habitat occur over wide ranges of inflow. River stage affects habitat availability most in 57 lentic habitat where bed slope is low. This effect was covered in the section on 58 macrophyte habitat availability which addressed river stage directly using observational 59 data collected over nearly the full range of inflow (see Aquatic Environment Supporting 60 Volume, Section 3.3.2.3.1. 61
In the Post-project environment, effects of inflow on habitat were described where 62 relevant (see for example discussion of substrate composition in the reservoir, Aquatic 63 Environment Supporting Volume 3.4.2.2.3). In general, inflows have the greatest effect 64 on habitat downstream of the generating station as it affects operation of the 65 generating station (e.g., spilling vs. not spilling). This is discussed in Aquatic Environment 66 Supporting Volume Section 3.4.2.3.1. With respect to the statement, “The 50th 67 percentile would represent a more normal flow condition”, there is typically a wide 68 range of inflow in the system and flows are not normally distributed (see Physical 69 Environment Supporting Volume Figure 4.3.3), so the 50th percentile is not likely to 70 repeat as often as may be expected. Further, and as shown in Aquatic Environment 71 Supporting Volume Figure 3-2, the 50th percentile occurred only during three years 72

TAC Public Rd 2 DFO-0004
Page 3 of 3
during 2000 - 2006. Even when it did occur, this state occurred for short a duration 73 (week) amidst a longer trend of change. 74
Sampling programs for habitat and biota were distributed over a wide range in flow. In 75 the Aquatic Environment Supporting Volume, the variation in specific aspects of habitat 76 with flow was described in order to set the context for the 95th percentile comparisons. 77 Fifth percentile inflows were described in addition to 95th for the IEZ/depth (Aquatic 78 Environment Supporting Volume Table 3-8) before and after the project. Other 79 descriptions of variations due to inflow included: the change in area of flooded creek 80 habitat due to the range of IEZ (i.e. 5th – 95th variation) (Aquatic Environment 81 Supporting Volume Table 3-9); velocity (Aquatic Environment Supporting Volume Map 82 3-18); and effect of IEZ on plants (Aquatic Environment Supporting Volume Figure 3-4). 83 Models of deposition were built over a wide range of discharge (Aquatic Environment 84 Supporting Volume Table 3B-2) and tested for relative importance of variables at 5th 85 and 95th percentile flows (Aquatic Environment Supporting Volume able 3B-3, 3B-4, and 86 3B-5). The differences between the predicted depositional boundaries at 5th and 95th 87 percentiles are shown for lotic habitat in Aquatic Environment Supporting Volume Map 88 3B-3. These analyses provide information on habitat availability under different flow 89 conditions in both the existing and post-Project environments; however, as discussed at 90 the beginning of this response, it is felt that comparisons of habitat areas at the 95th 91 percentile inflows provide an appropriate overall summary of changes in habitat area. 92
At the technical meeting on February 14, DFO indicated that in order to calculate the 93 HADD there is currently uncertainty regarding the amount of habitat lost versus the 94 amount in the existing environment, and the current outputs of the fish habitat model 95 used in the EIS do not appear to fully address this issue given that modeling is limited to 96 95th percentile flows. In addition, DFO noted uncertainty with the use of catch-per-unit-97 effort results in establishing the relative use by fish of different types of habitat for 98 foraging. DFO indicated that further analyses may be required for the HADD calculations 99 and the current model may not be sufficient. Further discussions will be undertaken as 100 part of the Fisheries Act approvals but additional analysis for the range of flow 101 conditions using the model has not been undertaken pending the results of these 102 discussions.103
TAC Public Rd 2 DFO-0005
Page 1 of 2
REFERENCE: Volume: Aquatic Environment Supporting Volume; 1
Section: 3.4.2.3.1 Aquatic Habitat at Impoundment; p. N/A 2
TAC Public Rd 2 DFO-0005 3
ORIGINAL PREAMBLE AND QUESTION: 4 "intermittently-exposed zone" . Uncertain as to whether the "intermittently-exposed 5 zone" is in the forebay, below the GS or both. There is no mention or study of the 6 effects of water control on dewatering and re-watering areas below the GS and whether 7 habitat losses and fish kills will occur as a result of this. 8
Please confirm whether the "intermittently-exposed zone" is in the forebay, below the 9 GS or both. Please also provide an analysis of the effects of water control on dewatering 10 and re-watering areas below the GS and whether habitat losses and fish kills will occur 11 as a result of this. 12
FOLLOW-UP QUESTION: 13 Requested information not provided. 14
RESPONSE: 15 The round 1 response was clarified by discussions at a February 14, 2013, technical 16 review meeting with regulators and no further information is required. Specifically, it 17 was re-iterated that the intermittently exposed zone refers to the area wetted at high 18 flows (95th percentile) and exposed at low flows (5th percentile). Downstream of the 19 generating station, the area where water levels are affected by cycling of the turbines at 20 the generating station is backwatered by Stephens Lake, and the small changes in water 21 levels caused by operation of the station lie within the larger range of water level 22 variations on Stephens Lake. Fish stranding is not expected as a result of water level 23 fluctuations in the tailrace due to cycling at the station. Potential fish stranding after 24 spillway operation is being mitigated through the provision of channels to connect 25 isolated pools to Stephens Lake. 26
The round 1 response is provided below. 27
The “intermittently exposed zone” (IEZ) is both in the forebay (reservoir) and 28 below the generating station. It is the area that is wetted at high flows (95th 29 percentile) and dewatered at low flows (5th percentile). The effects of water 30 controls on dewatering and re-watering areas below the generating station are 31 discussed in Aquatic Environment Supporting Volume Section 3.4.2.3.1. As 32 discussed in this section, the tailrace is backwatered by Stephens Lake and small 33 water level fluctuations caused by cycling of turbines at the generating station 34
TAC Public Rd 2 DFO-0005
Page 2 of 2
occur within the larger range of water level variations caused by regulation of 35 Stephens Lake by the Kettle Generating Station. The area downstream of the 36 spillway would be watered and dewatered depending on spillway operation. 37
Effects of water level fluctuations on fish downstream of the generating station 38 are discussed in Aquatic Environment Supporting Volume Section 5.4.2.3. Fish 39 stranding is not expected as a result of water level fluctuations in the tailrace 40 due to cycling at the station. Potential fish stranding after spillway operation is 41 being mitigated through the provision of channels to connect isolated pools to 42 Stephens Lake.43

TA Public Rd 2 DFO-0007
Page 1 of 6
REFERENCE: Volume: Aquatic Environment Supporting Volume; 1
Section: Appendix 3A Aquatic Habitat Methods; p. N/A 2
TAC Public Rd 2 DFO-0007 3
ORIGINAL PREAMBLE AND QUESTION: 4 Depth Zones Section 5
In reviewing methods for aquatic habitat assessment in Appendix 3A, while the 6 bathymetric surveying was very detailed, the validation of sonar data does not appear 7 to be structured and repeated such that there is statistical confidence in the results 8 obtained. There is no description of a comparison between the results expected and 9 results observed and therefore the fidelity of the observations. Can the proponent 10 present this sensitivity analysis or point the reviewer to the report which document 11 this? Alternatively, can a study be proposed to test repeatability of bathymetric data 12 collection (test areas beyond the survey area could be tested in the upcoming field 13 season)? 14
FOLLOW-UP QUESTION: 15 Question may not have been clear. Was direct substrate sampling conducted for each 16 point of sonar data? If not, for areas modelled or extrapolated, how was "modelled" 17 substrate confirmed. Areas of high habitat value are important, but its unclear how this 18 would be known a priori (that is, before sampling)? 19
RESPONSE: 20 At a technical review meeting on February 14, 2013, among KHLP, DFO and MCWS, 21 reviewers indicated an interest in maps showing the location of sonar transects and 22 points where physical samples to verify bottom type were collected. These maps are 23 provided in the AE SV maps 3A-1 to 3A-4 and copies are attached to this response. 24
The following information is provided to clarify the approach to sampling and 25 determination of bottom substrate type. 26
The primary means for riverbed classification was direct sampling of the bottom and 27 sonar was used as a secondary means. Surveys were iterative such that the results of 28 previous surveys directed additional efforts to locations where more precision was 29 needed (e.g., where substrate type changed). 30
Synoptic or preliminary surveys sometimes use a small amount of validation data to 31 classify the associated sonar data, suggesting that extrapolation is large and analysis 32 such as described by the reviewer is needed to confirm that the predicted bottom type 33
TA Public Rd 2 DFO-0007
Page 2 of 6
is the same as observed. In the surveys conducted for the Keeyask project, sonar 34 transects were used to confirm that heterogeneity between locations where the bottom 35 was directly sampled was limited. If heterogeneity in acoustic returns was observed in 36 areas of particular interest, direct sampling of the bottom type was used to improve 37 certainty of the specific bottom type. 38
Areas of very fast flows, like that upstream of Gull Lake and immediately below Gull 39 Rapids have fewer sampling sites but the bottom type in such areas still are fairly well 40 known; only relatively large material, like boulder/cobble or bedrock, can remain stable 41 under such high water velocities. Transitions to materials more fine than cobble, such as 42 gravel or sand, were identified in more detail with samples retrieved from the bottom. 43
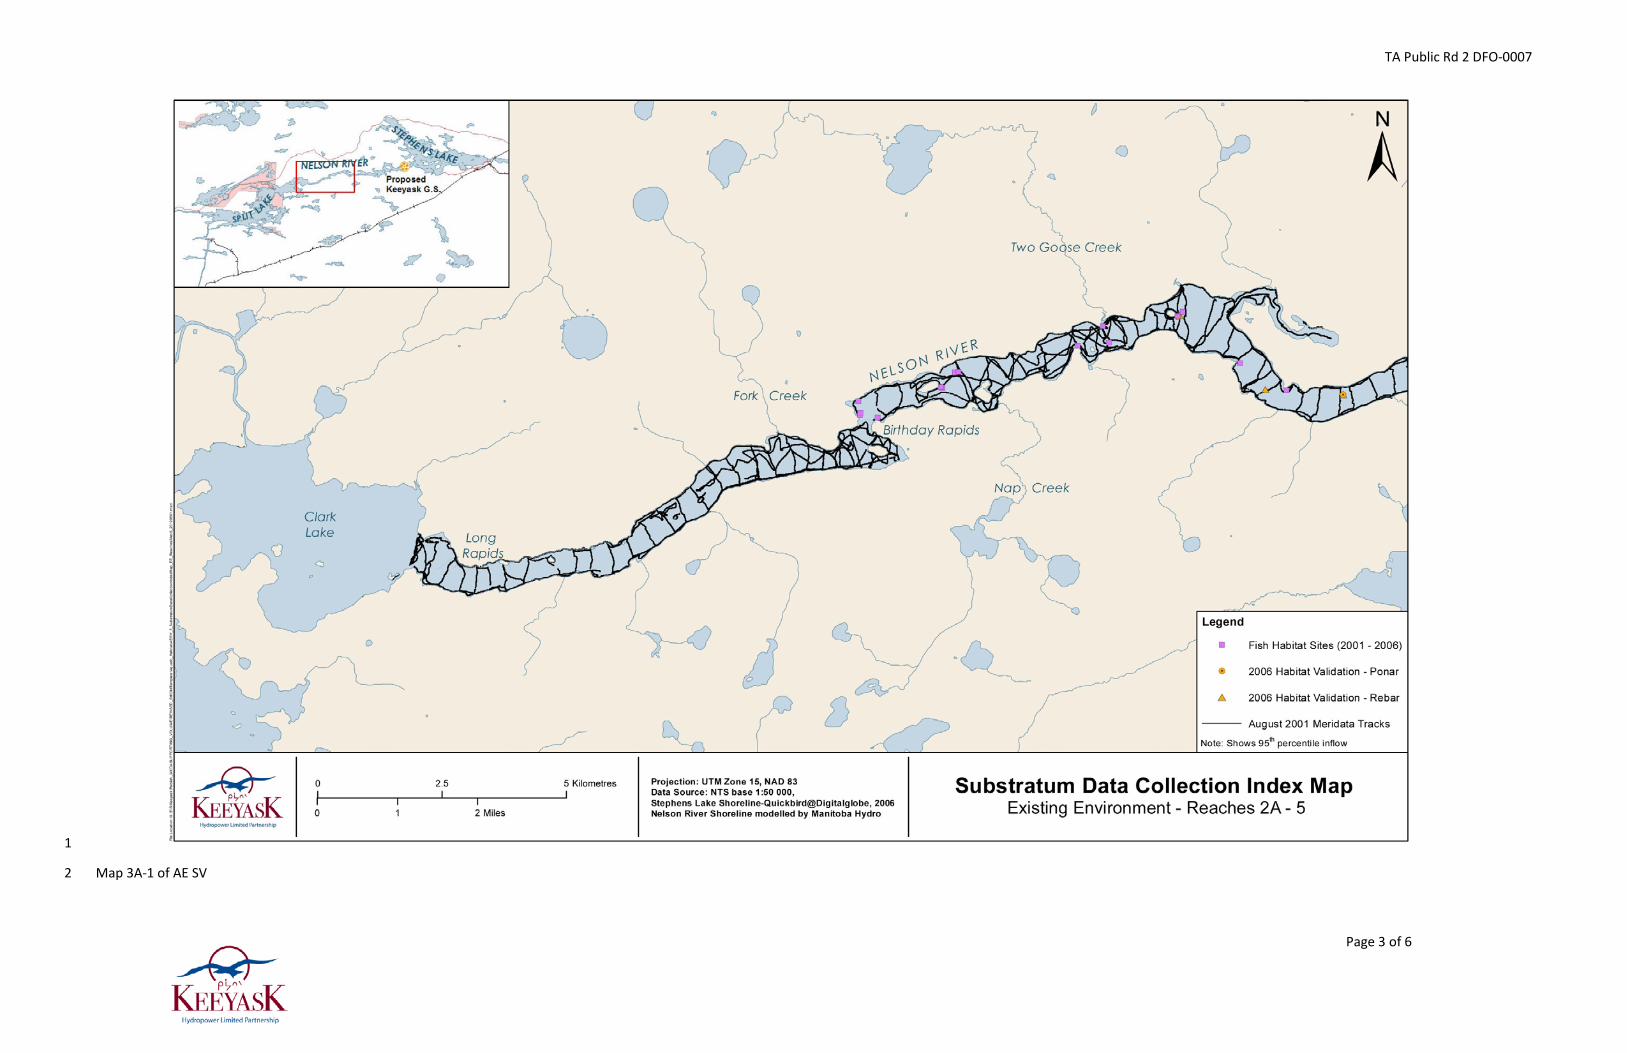
TA Public Rd 2 DFO-0007
Page 3 of 6
1
Map 3A-1 of AE SV 2
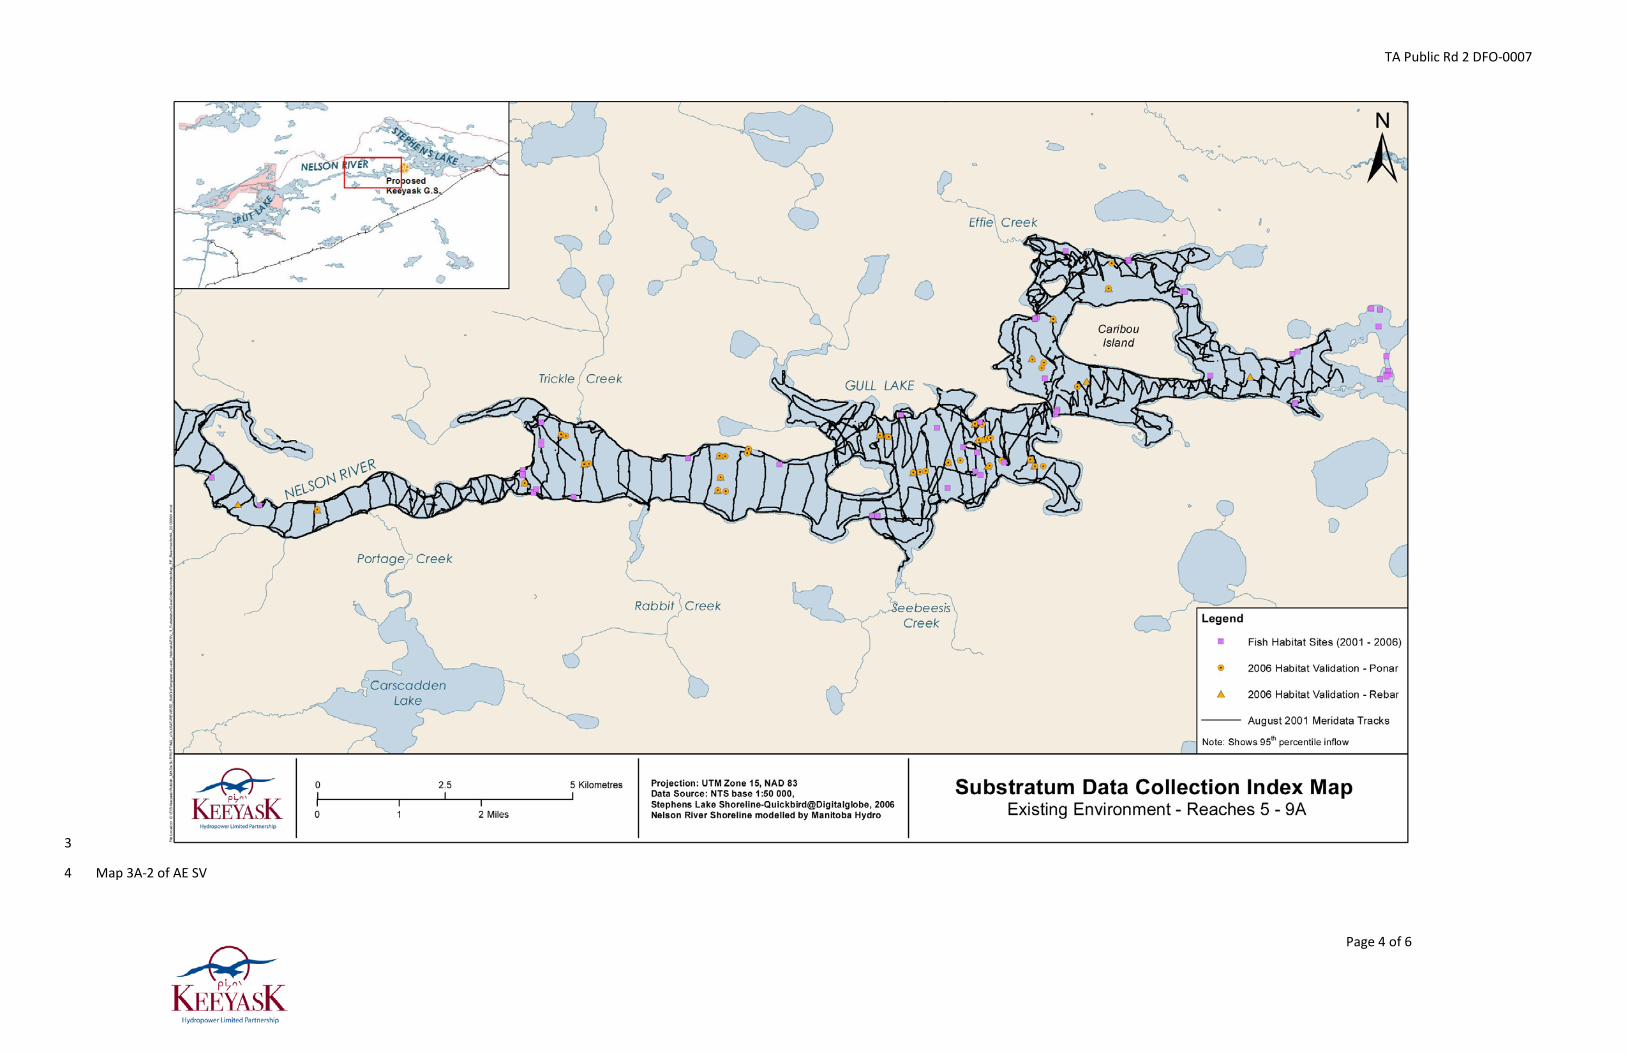
TA Public Rd 2 DFO-0007
Page 4 of 6
3
Map 3A-2 of AE SV 4

TA Public Rd 2 DFO-0007
Page 5 of 6
5
Map 3A-3 of AE SV 6

TA Public Rd 2 DFO-0007
Page 6 of 6
7
Map 3A-4 of AE SV8

TAC Public Rd 2 DFO-0014
Page 1 of 12
REFERENCE: Volume: Aquatic Environment Supporting Volume; 1
Section: 3.4.2.2.3 Aquatic Habitat at Year 30; p. 3-34 to 3-36 2
TAC Public Rd 2 DFO-0014 3
ORIGINAL QUESTION AND PREAMBLE: 4 Depositional areas and changes described on pages 3-34 to 3-36, but does not talk 5 about changes to specific habitats. Please provide details on how, specifically, proposed 6 deposition will impact fish habitats and how this will be monitored. 7
FOLLOW-UP QUESTION: 8 HADD description and accounting as requested was not provided. 9
RESPONSE: 10 TAC Public Rd 1 DFO-0014 initially requested information on how deposition would 11 change fish habitats and how this impact would be monitored. The response provided a 12 brief summary of changes as a result of deposition and referenced sections of the 13 Aquatic Environment Supporting Volume where effects of this habitat change to specific 14 fish life history functions were assessed. In this second round of Requests for Additional 15 Information, the reviewer indicates, “HADD description and accounting as requested not 16 provided”. 17
During discussions at a technical review meeting on February 14, 2013, among KHLP, 18 CEAA, DFO and MCWS, the following points were raised: 19
1. An accounting of the area of pre and post-Project habitat types (which include 20 substrate) are provided in Appendix 3D of the Aquatic Environment Supporting 21 Volume. This appendix includes the flooded terrestrial area as part of the post-22 Project habitat. 23
2. A description of substrate changes from pre- to post-Project is provided in 24 Aquatic Environment Supporting Volume, Section 3.4.2.2.3. This description 25 includes the flooded terrestrial areas. Text, tables and figures illustrating 26 changes in substrate considering the pre-existing aquatic habitat alone are 27 provided below. 28
3. Existing aquatic habitat in the Nelson River mainstem is not expected to be 29 subject to peat deposition. The Physical Environment Supporting Volume (PE 30 SV) Section 7.4.2.3, p. 7-35 provides an analysis of peat sedimentation upstream 31 of the Project. Specifically with respect to organic sediment deposition: 32

TAC Public Rd 2 DFO-0014
Page 2 of 12
7.4.2.3.3 Organic Sediment Deposition 33
“Most of the organic sediments are expected to accumulate in the bays of origin. 34 The process of accumulation will occur in different forms including deposition. 35 The magnitude of deposition will vary depending upon the amount of peat 36 disintegrated from the shoreline and the location of the bays. The bays in the 37 south side of the reservoir will experience relatively higher deposition than those 38 in the north side. It is unlikely that there will be any appreciable amount of 39 organic sediment deposition in the mainstem waterbody outside of the bays.” 40
Aquatic Substrate Change due to the Keeyask Project 41
Substrate changes expected due to the Keeyask Project at Year 30 are described in 42 Section 3.4.2.2.3 of the Aquatic Environment Supporting Volume, relative to the Existing 43 Environment 95th percentile inflow. This text complements that section and extends the 44 detail of description of substrate changes. 45
Changes to specific substrate types for the full reservoir area are summarized, and then 46 again for each of three areas within the hydraulic zone of influence where the type and 47 magnitude of change are notably different: 1) the riverine reach extending to Gull Lake; 48 2) lower reservoir (including Gull Lake), and 3) the area downstream of Gull 49 Rapids/Principal Structures. The effect of classification precision on change is also 50 considered given that prediction (post-project) is seldom possible at the same resolution 51 as observation (existing environment). 52
Changes of substrate by area are provided for the entire reservoir (Table 1), the riverine 53 reaches (Table 2), and the lower reservoir (including Gull Lake) (Table 3). Changes 54 downstream of the proposed Keeyask dam are discussed in the text. 55
At Year 30, the Keeyask reservoir will have an estimated area of 9973.5 ha, or an 57 increase of about 5149.4 relative to the existing environment at a 95th percentile inflow 58 (PE SV). Silt is expected to be present as a relatively homogenous surficial layer over an 59 area of about 5280.5 ha, or 52.9% of the total reservoir (Table 1) (Aquatic Environment 60 Supporting Volume, Map 3.34 and Map 1, attached). Most of the silt deposition 61 upstream of the dam will be found in Reaches 6 – 9a. Silt deposition is expected to 62 change slightly more than half of the substrate area present today (54.3% of 2806.7 ha). 63 Silt deposits will notably decrease the area of several existing substrate types that are 64 relatively abundant in the existing environment: 1) silt/clay located mainly in large lentic 65 bays (92.5% of 1268 ha); 2) gravel/cobble/boulder found in the main channel of present 66 day Gull Lake (75.4% of 1198.9 ha); 3) cobble/boulder, which forms most of the main 67
Overview of Substrate Changes in the Keeyask Reservoir at Year 30 Post-impoundment 56

TAC Public Rd 2 DFO-0014
Page 3 of 12
channel except at Gull Lake and Gull Rapids (18.3% of 1782.3 ha); and 4) 68 cobble/boulder/bedrock, which composes most of the substrate in Gull Rapids (74.6% of 69 256.5 ha). 70
Other lotic bottom types, such as gravel and sand, are relatively fine and are not 71 common in the existing environment. When present, sand and gravel was found most 72 often in shallow water along the banks, except for a few relatively large patches that are 73 found in the lower reservoir where water velocities in lotic areas are relatively slow. 74 Sand habitat totals about 177.5 ha with the single largest patch of about 1 ha in size 75 found in the secondary channel north of Caribou Island (Map 1). After the Project, 78.4% 76 of the total area of sand will change to silt over time. Most of the homogenous gravel 77 substrate (92.6% of 19.6 ha) will be covered by silt after the Project, including the 78 largest known patch (0.16 ha) located on the bottom of the main channel in deep water 79 of Gull Lake. 80
In the flooded area, about 442.4 ha of fine organic deposition will become the main 81 substrate type at the ends of bays over flooded peatlands fed by tributaries (Aquatic 82 Environment Supporting Volume, Map 3.34 and Map 1). This will be a new habitat but 83 will total only about 5.4% of the total reservoir area. There is expected to be about 84 273.8 ha of peat nearshore area (i.e., at depths less than that of silt sediment in shallow 85 water). Peat substrates are expected occupy about 297.2 ha (2.9 %) of the reservoir 86 area. When found in the main reservoir they will be mainly where deep peat deposits 87 are found today. Peat nearshore substrates will be composed of inundated fibrous peat, 88 as well as areas of partially decomposed peat after the fibrous surface layer has 89 resurfaced (PE SV Section 6.4.2.1). In most other exposed areas of the reservoir, the 90 processes of wave action and water level variation will remove the thin organic 91 overburden. Most shorelines of the lower reservoir (reaches 6 – 9a) that erode into the 92 sloped topography of today will erode through the thin peat and/or mineral soils, and 93 create a clay nearshore area (1427 ha; 14.3%), with some localized deposits of 94 aggregate lag when available. The clay-based nearshore areas in the main reservoir and 95 the deposits of fine organic deposition at the ends of bays will form most of the rooted 96 macrophyte habitat in the reservoir (Aquatic Environment Supporting Volume Section 3, 97 3.4.2.2.3). Areas of inundated peat, either at exposed or sheltered sites, will not 98 contribute to potential macrophyte habitat. Some of the islands flooded in Gull Rapids 99 may not be depositional sites due to sufficient water velocity and/or slope, and so will 100 likely have the character of inundated mineral soils (137 ha or 1.38% of reservoir area). 101
In Year 30, most of the substrate in the main channel of the riverine reaches (Long 103 Rapids to entrance to Gull Lake) is expected to remain similar to today (Map 2, 104
Substrate Changes in the Riverine Reaches of the Keeyask Reservoir at Year 30 102
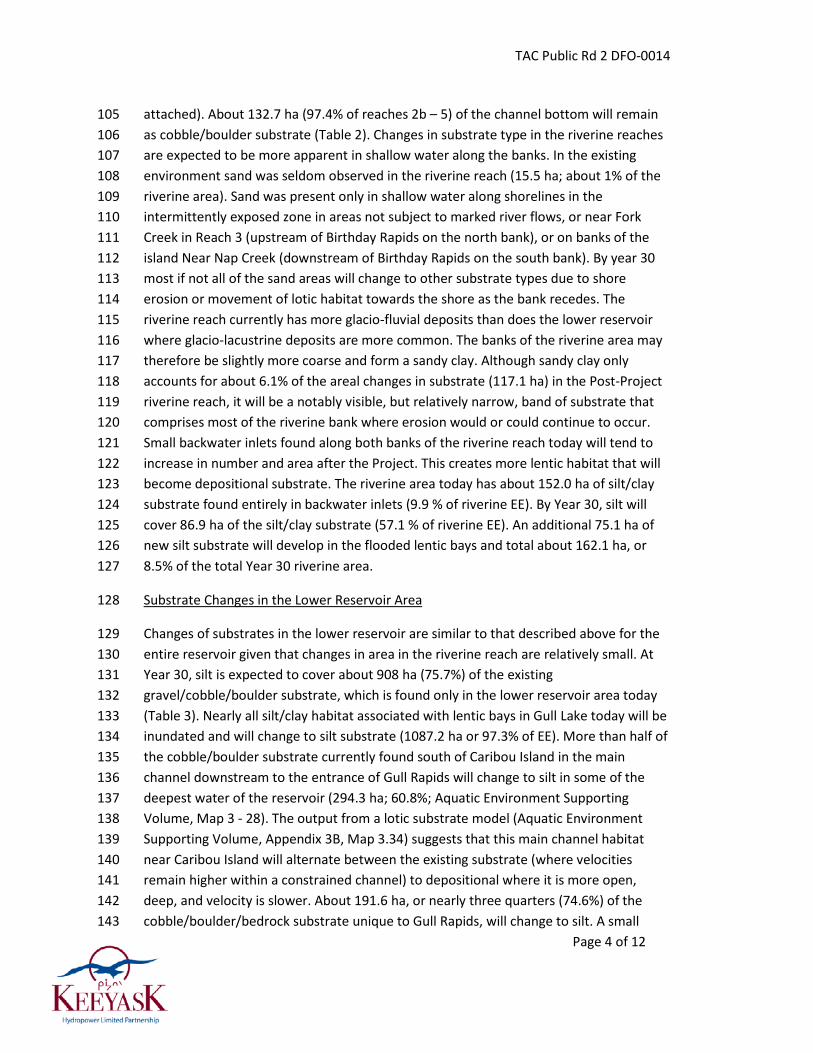
TAC Public Rd 2 DFO-0014
Page 4 of 12
attached). About 132.7 ha (97.4% of reaches 2b – 5) of the channel bottom will remain 105 as cobble/boulder substrate (Table 2). Changes in substrate type in the riverine reaches 106 are expected to be more apparent in shallow water along the banks. In the existing 107 environment sand was seldom observed in the riverine reach (15.5 ha; about 1% of the 108 riverine area). Sand was present only in shallow water along shorelines in the 109 intermittently exposed zone in areas not subject to marked river flows, or near Fork 110 Creek in Reach 3 (upstream of Birthday Rapids on the north bank), or on banks of the 111 island Near Nap Creek (downstream of Birthday Rapids on the south bank). By year 30 112 most if not all of the sand areas will change to other substrate types due to shore 113 erosion or movement of lotic habitat towards the shore as the bank recedes. The 114 riverine reach currently has more glacio-fluvial deposits than does the lower reservoir 115 where glacio-lacustrine deposits are more common. The banks of the riverine area may 116 therefore be slightly more coarse and form a sandy clay. Although sandy clay only 117 accounts for about 6.1% of the areal changes in substrate (117.1 ha) in the Post-Project 118 riverine reach, it will be a notably visible, but relatively narrow, band of substrate that 119 comprises most of the riverine bank where erosion would or could continue to occur. 120 Small backwater inlets found along both banks of the riverine reach today will tend to 121 increase in number and area after the Project. This creates more lentic habitat that will 122 become depositional substrate. The riverine area today has about 152.0 ha of silt/clay 123 substrate found entirely in backwater inlets (9.9 % of riverine EE). By Year 30, silt will 124 cover 86.9 ha of the silt/clay substrate (57.1 % of riverine EE). An additional 75.1 ha of 125 new silt substrate will develop in the flooded lentic bays and total about 162.1 ha, or 126 8.5% of the total Year 30 riverine area. 127
Changes of substrates in the lower reservoir are similar to that described above for the 129 entire reservoir given that changes in area in the riverine reach are relatively small. At 130 Year 30, silt is expected to cover about 908 ha (75.7%) of the existing 131 gravel/cobble/boulder substrate, which is found only in the lower reservoir area today 132 (Table 3). Nearly all silt/clay habitat associated with lentic bays in Gull Lake today will be 133 inundated and will change to silt substrate (1087.2 ha or 97.3% of EE). More than half of 134 the cobble/boulder substrate currently found south of Caribou Island in the main 135 channel downstream to the entrance of Gull Rapids will change to silt in some of the 136 deepest water of the reservoir (294.3 ha; 60.8%; Aquatic Environment Supporting 137 Volume, Map 3 - 28). The output from a lotic substrate model (Aquatic Environment 138 Supporting Volume, Appendix 3B, Map 3.34) suggests that this main channel habitat 139 near Caribou Island will alternate between the existing substrate (where velocities 140 remain higher within a constrained channel) to depositional where it is more open, 141 deep, and velocity is slower. About 191.6 ha, or nearly three quarters (74.6%) of the 142 cobble/boulder/bedrock substrate unique to Gull Rapids, will change to silt. A small 143
Substrate Changes in the Lower Reservoir Area 128

TAC Public Rd 2 DFO-0014
Page 5 of 12
amount of the remaining cobble/boulder/bedrock habitat in this area will be excavated 144 bedrock at the powerhouse intake channel. Silt will cover all (17.9 ha.) of the known 145 large gravel bed area in reach 6 of Gull Lake, and about 81.9% (132.7 ha) of the existing 146 sand substrate in reaches 6 – 9a. 147
As described above for the entire reservoir area, the substrates that are either new or 148 that increase in area markedly within the flooded area due to the Project, are: 1) clay; 2) 149 flooded terrestrial soil; 3) peat; and 4) fine organic deposition. Clay, which will be 150 common sloped substrate in the nearshore zone after removal of thin peat and/or 151 mineral soil erosion, will increase in area by about 110 times (1376.2 ha increase, or 152 17.1% of lower reservoir). The flooded terrestrial soils that persist in some of the 153 flooded islands will be only total about 1.7% of the lower reservoir area. Peat nearshore 154 substrate will occupy about 3.4% of the lower reservoir area. The deposition of fine 155 organic material that will develop at the end of bays, where peatlands were abundant 156 before the Project, will be a notable and new habitat in the reservoir, but will only 157 occupy about 5.4% of the Year 30 lower reservoir area. 158
Sediment deposition may occur along the north bank within 3 km downstream of the GS 160 (Map 3). Deposition is expected in this area due to: 1) a shift in the path of flow which 161 will increase the area of lentic habitat over that which occurs in the open water season 162 today (Aquatic Environment Supporting Volume Map 3.31); and 2) this lentic habitat will 163 persist all year due to the loss of the ice dam and associated flow dynamics in winter (PE 164 SV Section 4). The area of anticipated sedimentation is approximately 55.1 ha, all of 165 which covers cobble/boulder habitat in the existing environment. 166
Downstream of the Keeyask Generating Station 159
Changes of substrate type apparent in Tables 1 – 3 include those that are expected to 168 occur and be readily observable, as described above, as well as those that result due to 169 comparisons made between observation and prediction. For the latter, Table 1 shows 170 that about 290.9 ha of gravel/cobble/boulder bottom type present in Gull Lake today 171 will change to cobble/boulder after the Project. This is an apparent change that shows 172 the difference of detail between observation and prediction. After the Project the areas 173 of non-depositional bottom type will continue to exhibit the substrate type present 174 today (i.e., hard bottom). These non-depositional areas after the Project are expected to 175 be in relatively fast flowing areas, as they are today. Such sites do not have a lot of 176 gravel today and therefore would not be expected to have this substrate in the future 177 with the Project. For example, Gull Lake was sampled most often as a cobble/boulder 178 substrate, but gravel was sometimes present downstream of bottom undulation, or was 179 more available where current slowed over large areas. After the Project, these gravel 180
Modelling Precision 167

TAC Public Rd 2 DFO-0014
Page 6 of 12
areas are expected to become depositional substrate due to the fact that these areas 181 are relatively slow lotic habitat today. Although there is the potential that some small 182 areas of gravel present now could remain after the Project (e.g., Table 1; 1.45 ha), this is 183 not likely. These gravel sites tend to be small and found along shorelines where lotic 184 habitat will form, or velocity will notably increase as the channel widens in the future 185 with the Project. Consequently, it is expected that most often a cobble/boulder bottom 186 type will form where gravel is present today and deposition is not predicted. 187 Cobble/boulder is the dominant bottom type of the main channel today in most flowing 188 water areas (i.e., where the parent bedrock geology does not control material 189 availability). This is expected to continue to be the case after the Project. 190
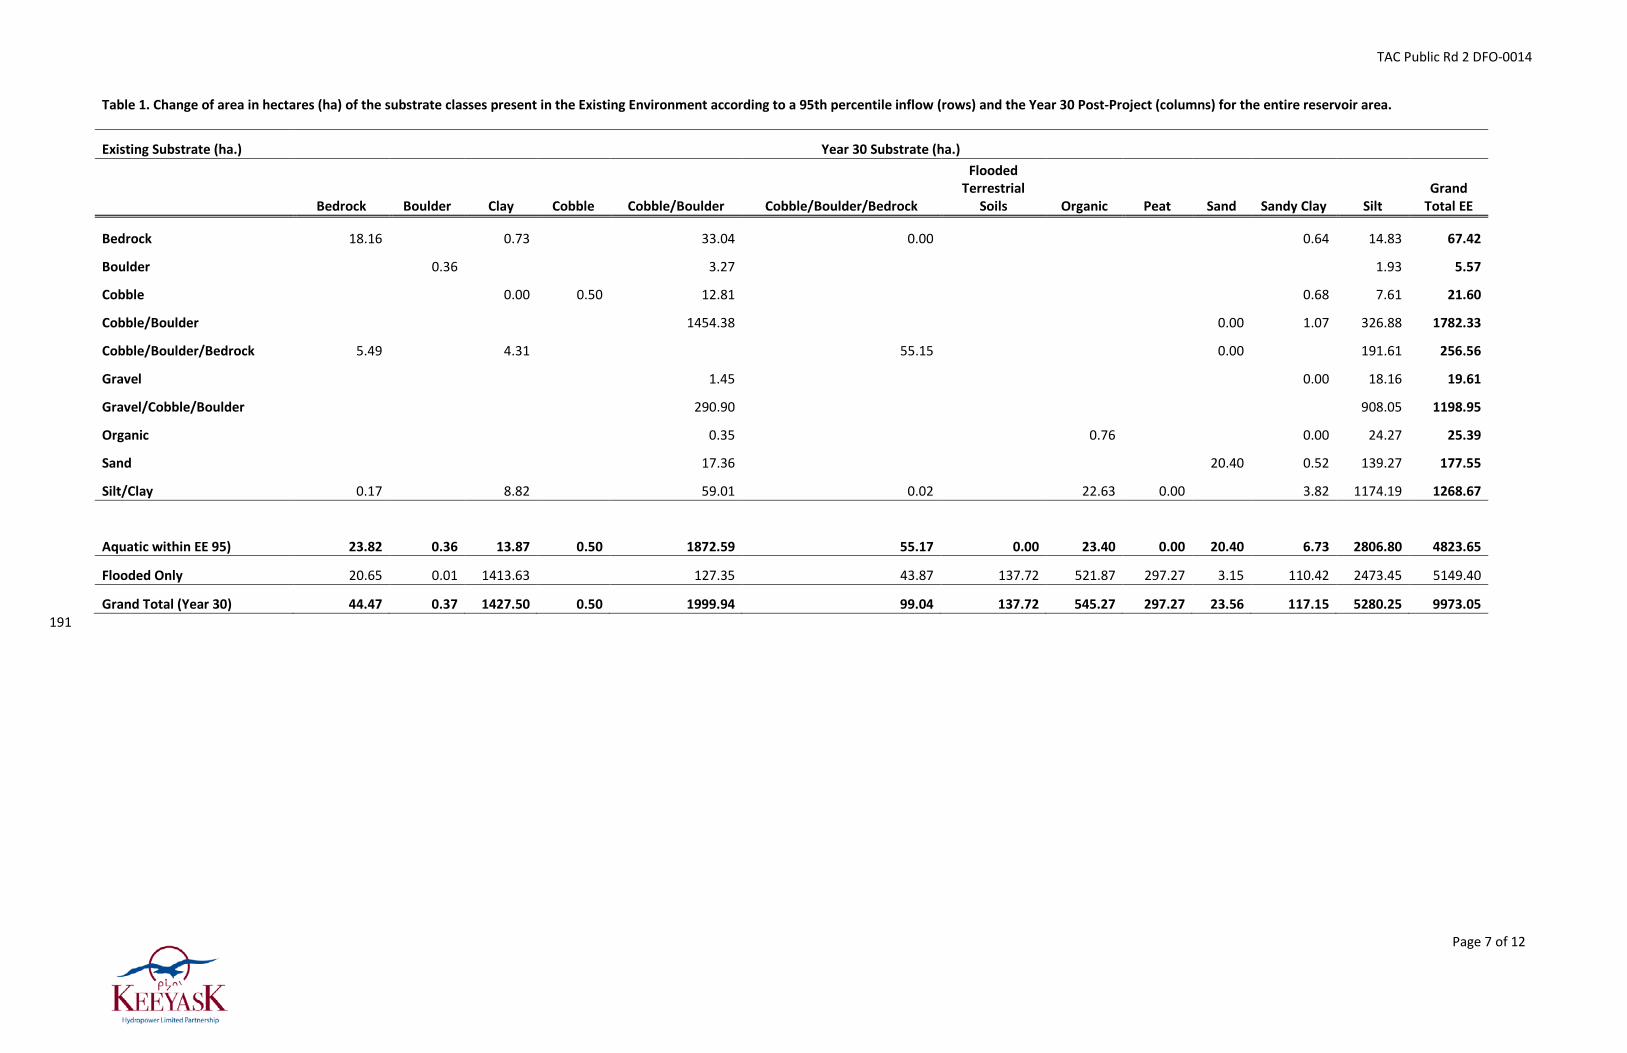
TAC Public Rd 2 DFO-0014
Page 7 of 12
Table 1. Change of area in hectares (ha) of the substrate classes present in the Existing Environment according to a 95th percentile inflow (rows) and the Year 30 Post-Project (columns) for the entire reservoir area.
Existing Substrate (ha.) Year 30 Substrate (ha.)
Bedrock Boulder Clay Cobble Cobble/Boulder Cobble/Boulder/Bedrock
Flooded Terrestrial
Soils Organic Peat Sand Sandy Clay Silt Grand
Total EE
Bedrock 18.16
0.73
33.04 0.00
0.64 14.83 67.42
Boulder
0.36
3.27
1.93 5.57
Cobble
0.00 0.50 12.81
0.68 7.61 21.60
Cobble/Boulder
1454.38
0.00 1.07 326.88 1782.33
Cobble/Boulder/Bedrock 5.49
4.31
55.15
0.00
191.61 256.56
Gravel
1.45
0.00 18.16 19.61
Gravel/Cobble/Boulder
290.90
908.05 1198.95
Organic
0.35
0.76
0.00 24.27 25.39
Sand
17.36
20.40 0.52 139.27 177.55
Silt/Clay 0.17
8.82
59.01 0.02
22.63 0.00
3.82 1174.19 1268.67
Aquatic within EE 95) 23.82 0.36 13.87 0.50 1872.59 55.17 0.00 23.40 0.00 20.40 6.73 2806.80 4823.65
Flooded Only 20.65 0.01 1413.63
127.35 43.87 137.72 521.87 297.27 3.15 110.42 2473.45 5149.40
Grand Total (Year 30) 44.47 0.37 1427.50 0.50 1999.94 99.04 137.72 545.27 297.27 23.56 117.15 5280.25 9973.05 191
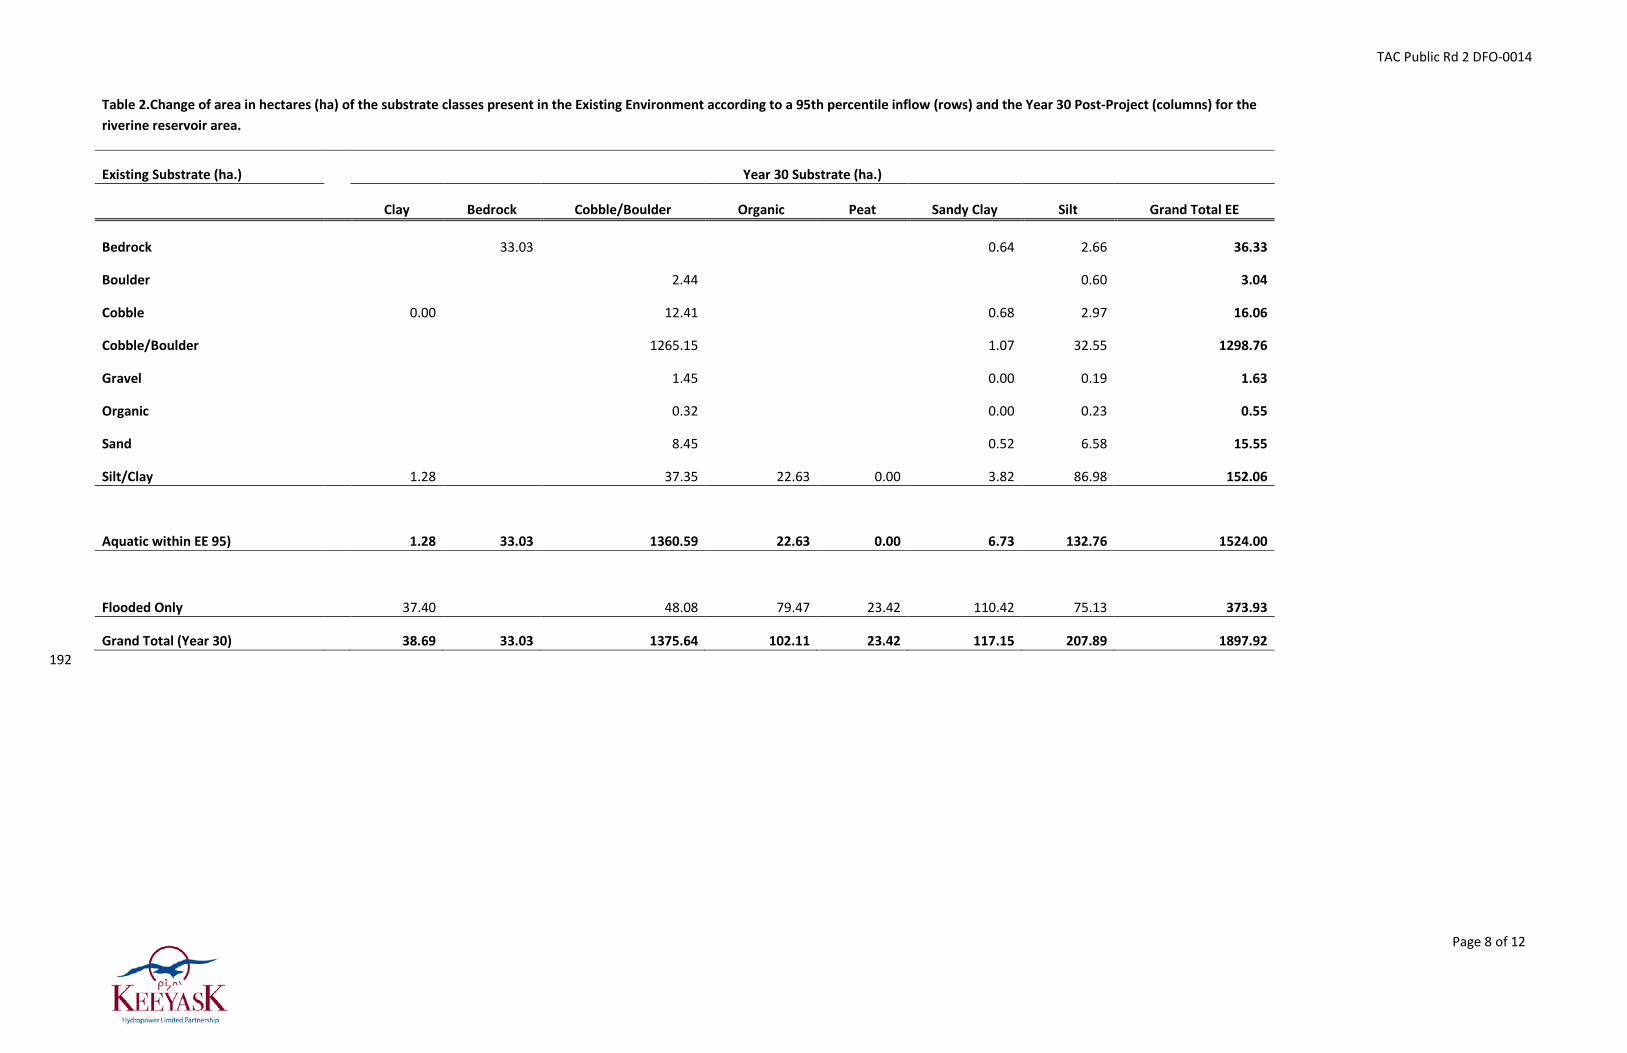
TAC Public Rd 2 DFO-0014
Page 8 of 12
Table 2.Change of area in hectares (ha) of the substrate classes present in the Existing Environment according to a 95th percentile inflow (rows) and the Year 30 Post-Project (columns) for the riverine reservoir area.
Existing Substrate (ha.) Year 30 Substrate (ha.)
Clay Bedrock Cobble/Boulder Organic Peat Sandy Clay Silt Grand Total EE
Bedrock
33.03
0.64 2.66 36.33
Boulder
2.44
0.60 3.04
Cobble
0.00
12.41
0.68 2.97 16.06
Cobble/Boulder
1265.15
1.07 32.55 1298.76
Gravel
1.45
0.00 0.19 1.63
Organic
0.32
0.00 0.23 0.55
Sand
8.45
0.52 6.58 15.55
Silt/Clay
1.28
37.35 22.63 0.00 3.82 86.98 152.06
Aquatic within EE 95) 1.28 33.03 1360.59 22.63 0.00 6.73 132.76 1524.00
Flooded Only 37.40 48.08 79.47 23.42 110.42 75.13 373.93
Grand Total (Year 30) 38.69 33.03 1375.64 102.11 23.42 117.15 207.89 1897.92 192
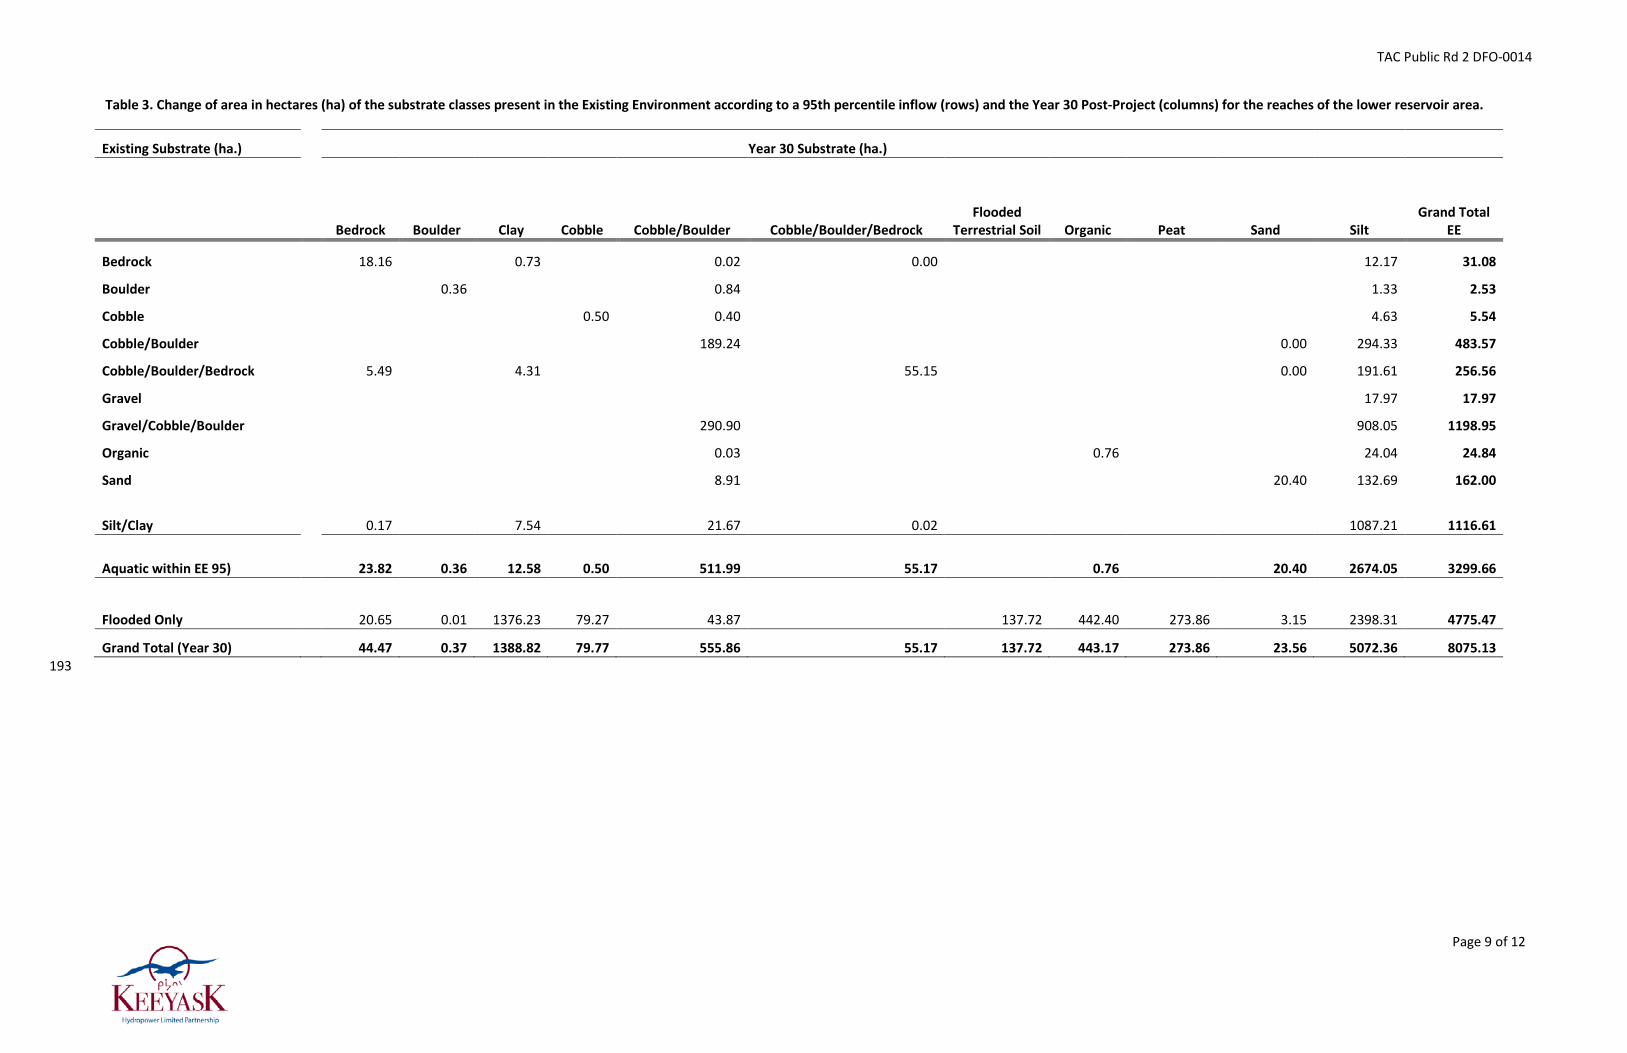
TAC Public Rd 2 DFO-0014
Page 9 of 12
Table 3. Change of area in hectares (ha) of the substrate classes present in the Existing Environment according to a 95th percentile inflow (rows) and the Year 30 Post-Project (columns) for the reaches of the lower reservoir area.
Existing Substrate (ha.)
Year 30 Substrate (ha.)
Bedrock Boulder Clay Cobble Cobble/Boulder Cobble/Boulder/Bedrock Flooded
Terrestrial Soil Organic Peat Sand Silt Grand Total
EE
Bedrock
18.16
0.73
0.02 0.00
12.17 31.08
Boulder
0.36
0.84
1.33 2.53
Cobble
0.50 0.40
4.63 5.54
Cobble/Boulder
189.24
0.00 294.33 483.57
Cobble/Boulder/Bedrock
5.49
4.31
55.15
0.00 191.61 256.56
Gravel
17.97 17.97
Gravel/Cobble/Boulder
290.90
908.05 1198.95
Organic
0.03
0.76
24.04 24.84
Sand
8.91
20.40 132.69 162.00
Silt/Clay
0.17
7.54
21.67 0.02
1087.21 1116.61
Aquatic within EE 95) 23.82 0.36 12.58 0.50 511.99 55.17 0.76 20.40 2674.05 3299.66
Flooded Only
20.65 0.01 1376.23 79.27 43.87
137.72 442.40 273.86 3.15 2398.31 4775.47
Grand Total (Year 30) 44.47 0.37 1388.82 79.77 555.86 55.17 137.72 443.17 273.86 23.56 5072.36 8075.13 193
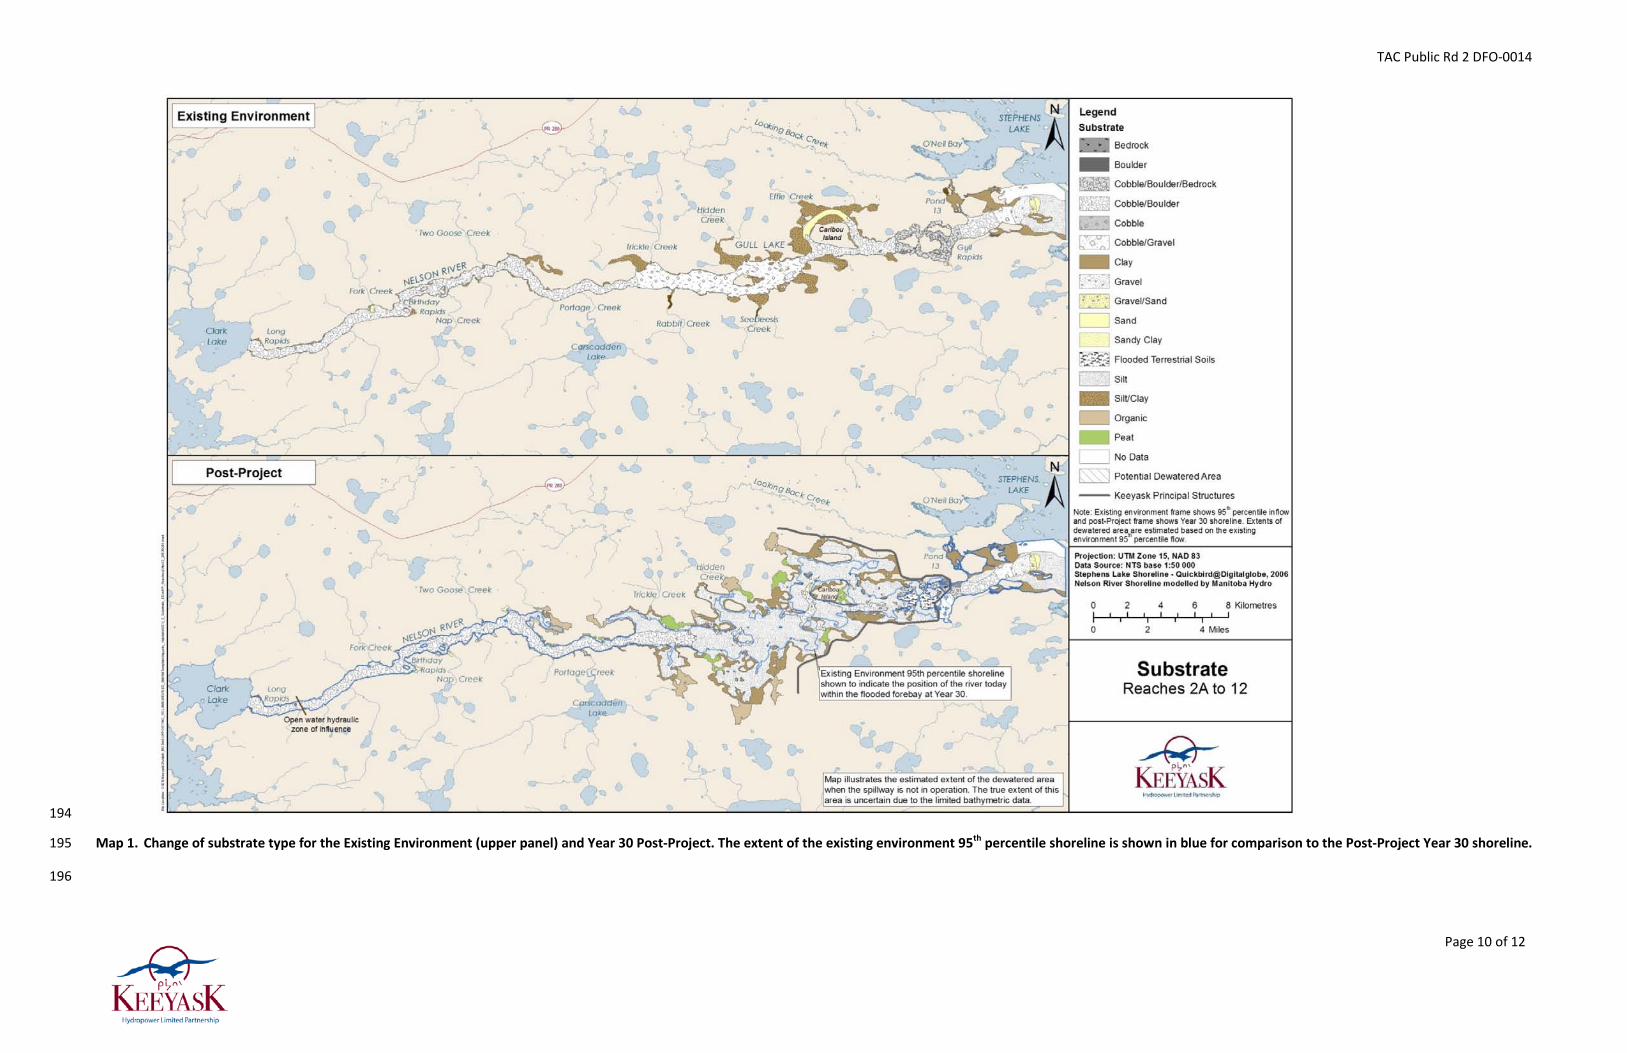
TAC Public Rd 2 DFO-0014
Page 10 of 12
194
Map 1. Change of substrate type for the Existing Environment (upper panel) and Year 30 Post-Project. The extent of the existing environment 95th percentile shoreline is shown in blue for comparison to the Post-Project Year 30 shoreline. 195
196

TAC Public Rd 2 DFO-0014
Page 11 of 12
197
Map 2. Change of substrate type for the Existing Environment (upper panel) and Year 30 Post- Project for the riverine reaches. The hydraulic zone of influence is shown in the lower panel for the Post-Project. 198
199

TAC Public Rd 2 DFO-0014
Page 12 of 12
200
Map 3. Post-Project substrate immediately downstream of the generating station.201

TAC Public Rd 2 DFO-0024
Page 1 of 13
REFERENCE: Volume: Aquatic Environment Supporting Volume; 1
Section: Appendix 6D Lake Sturgeon Habitat Suitability Index 2
Modelling Results; p. N/A 3
TAC Public Rd 2 DFO-0024 4
ORIGINAL PREAMBLE AND QUESTION: 5 Appendix 6D 6
Please present Habitat Units (HU’s) for all tables in section 6D. 7
FOLLOW-UP QUESTION: 8 Requested HU's not provided. 9
RESPONSE: 10 As discussed at a technical review meeting among KHLP, DFO and MCWS on February 11 14, 2013, and in the response TAC Public Rd 1 DFO-0024, habitat units and weighted 12 useable area are computationally the same measure. 13
Weighted Usable Areas (WUA) of Lake Sturgeon habitat are presented as follows: 14
• Lake Sturgeon spawning habitat in Tables 1-3 (Tables 6D-4, 6D-6 and 6D-8 in the AE 15 SV) 16
• Young-of-the-year habitat in Tables 4-6 (Tables 6D-10, 6D-12 and 6D-14 in the AE 17 SV) 18
• Sub-adult Lake Sturgeon habitat in Tables 7-9 (Tables 6D-16, 6D-18 and 6D-20 in the 19 AE SV) 20
• Adult Lake Sturgeon foraging habitat in Tables 10-12 (Tables 6D-22, 6D-24 and 6D-21 26 in the AE SV). 22
The following tables come from Appendix 6D of the Aquatic Environment Supporting 23 Volume (AE SV) of the Keeyask Generation Project Environmental Impact Statement. 24

TAC Public Rd 2 DFO-0024
Page 2 of 13
Table 1: Lake Sturgeon 5th percentile spawning weighted usable areas (WUAs; in hectares), by habitat suitability index (HSI) and reach in the existing and Year 30 post-Project environments from Clark Lake to downstream of Gull Rapids and the proposed Keeyask Generating Station (GS)
Existing Environment
HSI Suitability
Classification
Upstream
Birthday Rapids Downstream
Birthday Rapids Gull Lake
Upstream Total
Gull Rapids Downstream of
Gull Rapids
Downstream Total
Overall Total
Reach1 2A
Reach 2B
Reach 3
Reach 4
Reach 5
Reach 6
Reach 7
Reach 8
Reach 9A
Reach 9B
Reach 11
Reach 12
WUA 0.001 – <0.25 Low 2.5 1.1 0.0 2.5 0.0 0.0 0.0 0.0 6.1 3.0 5.9 0.0 0.0 8.9 15.0
WUA 0.25 – <0.5 Moderate 1.2 0.4 0.0 1.2 0.0 0.0 0.0 0.0 2.8 0.9 4.4 0.0 0.0 5.3 8.0
WUA 0.5 – <0.75 High 0.9 0.2 0.0 0.9 0.0 0.0 0.0 0.0 1.9 0.9 2.7 0.0 0.0 3.5 5.4
WUA 0.75 – 1 Very High 0.4 0.1 0.0 0.4 0.0 0.0 0.0 0.0 1.0 0.1 0.2 0.0 0.0 0.3 1.3
Total WUA (0.001–1) 5.0 1.7 0.0 5.0 0.0 0.0 0.0 0.0 11.8 4.8 13.2 0.0 0.0 18.0 29.8
Year 30 Post-Project Environment
HSI Suitability
Classification
Upstream
Birthday Rapids Downstream
Birthday Rapids Keeyask GS Reservoir
Upstream Total
Downstream of Keeyask GS
Downstream Total
Overall Total
Reach 2A
Reach 2B
Reach 3
Reach 4
Reach 5
Reach 6
Reach 7
Reach 8
Reach 9A
Reach 9B
Reach 11
Reach 12
WUA 0.001 – <0.25 Low 2.5 1.2 0.0 0.0 0.0 0.0 0.0 0.0 0.0 3.7 2.0 0.0 0.0 2.0 5.7
WUA 0.25 – <0.5 Moderate 1.3 0.7 0.0 0.0 0.0 0.0 0.0 0.0 0.0 2.0 0.4 0.0 0.0 0.4 2.4
WUA 0.5 – <0.75 High 0.8 0.4 0.0 0.0 0.0 0.0 0.0 0.0 0.0 1.2 0.1 0.0 0.0 0.1 1.3
WUA 0.75 – 1 Very High 0.5 0.3 0.0 0.0 0.0 0.0 0.0 0.0 0.0 0.7 0.0 0.0 0.0 0.0 0.7
Total WUA (0.001–1) 5.1 2.6 0.0 0.0 0.0 0.0 0.0 0.0 0.0 7.6 2.5 0.0 0.0 2.5 10.1
1. Location of reaches outlined in Map 6D-1.
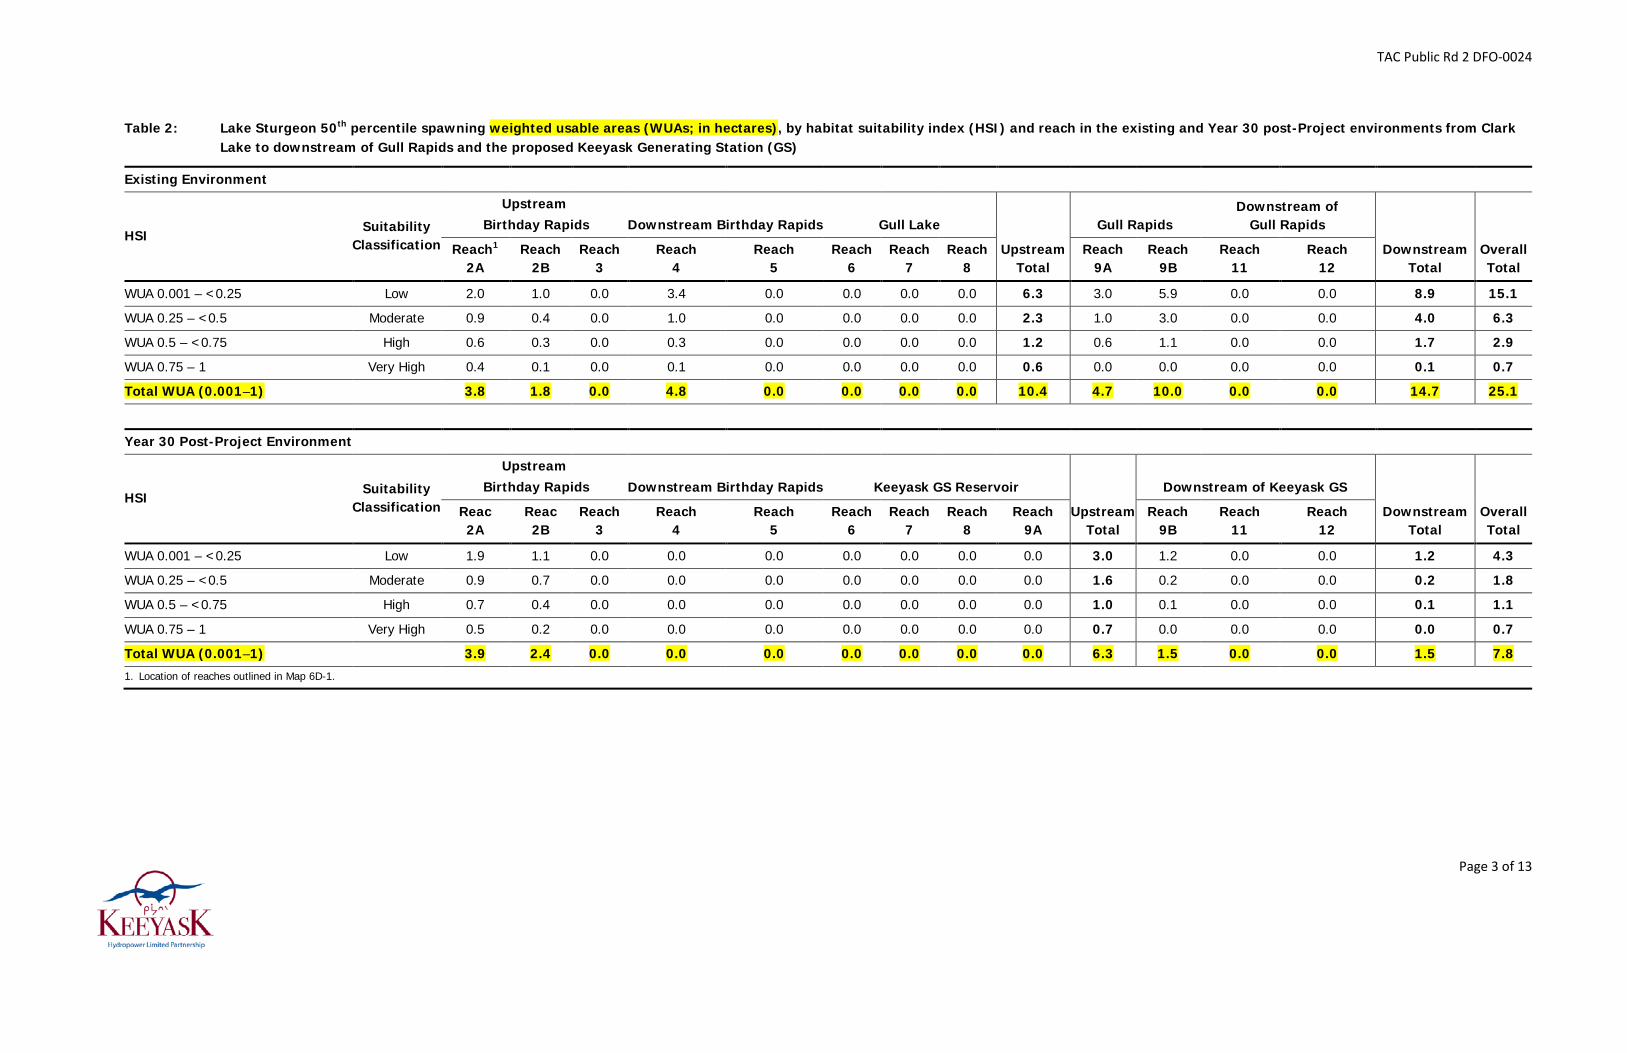
TAC Public Rd 2 DFO-0024
Page 3 of 13
Table 2: Lake Sturgeon 50th percentile spawning weighted usable areas (WUAs; in hectares), by habitat suitability index (HSI) and reach in the existing and Year 30 post-Project environments from Clark Lake to downstream of Gull Rapids and the proposed Keeyask Generating Station (GS)
Existing Environment
HSI Suitability
Classification
Upstream
Birthday Rapids Downstream Birthday Rapids Gull Lake
Upstream Total
Gull Rapids Downstream of
Gull Rapids
Downstream Total
Overall Total
Reach1 2A
Reach 2B
Reach 3
Reach 4
Reach 5
Reach 6
Reach 7
Reach 8
Reach 9A
Reach 9B
Reach 11
Reach 12
WUA 0.001 – <0.25 Low 2.0 1.0 0.0 3.4 0.0 0.0 0.0 0.0 6.3 3.0 5.9 0.0 0.0 8.9 15.1
WUA 0.25 – <0.5 Moderate 0.9 0.4 0.0 1.0 0.0 0.0 0.0 0.0 2.3 1.0 3.0 0.0 0.0 4.0 6.3
WUA 0.5 – <0.75 High 0.6 0.3 0.0 0.3 0.0 0.0 0.0 0.0 1.2 0.6 1.1 0.0 0.0 1.7 2.9
WUA 0.75 – 1 Very High 0.4 0.1 0.0 0.1 0.0 0.0 0.0 0.0 0.6 0.0 0.0 0.0 0.0 0.1 0.7
Total WUA (0.001–1) 3.8 1.8 0.0 4.8 0.0 0.0 0.0 0.0 10.4 4.7 10.0 0.0 0.0 14.7 25.1
Year 30 Post-Project Environment
HSI Suitability
Classification
Upstream
Birthday Rapids Downstream Birthday Rapids Keeyask GS Reservoir
Upstream Total
Downstream of Keeyask GS
Downstream Total
Overall Total
Reac 2A
Reac 2B
Reach 3
Reach 4
Reach 5
Reach 6
Reach 7
Reach 8
Reach 9A
Reach 9B
Reach 11
Reach 12
WUA 0.001 – <0.25 Low 1.9 1.1 0.0 0.0 0.0 0.0 0.0 0.0 0.0 3.0 1.2 0.0 0.0 1.2 4.3
WUA 0.25 – <0.5 Moderate 0.9 0.7 0.0 0.0 0.0 0.0 0.0 0.0 0.0 1.6 0.2 0.0 0.0 0.2 1.8
WUA 0.5 – <0.75 High 0.7 0.4 0.0 0.0 0.0 0.0 0.0 0.0 0.0 1.0 0.1 0.0 0.0 0.1 1.1
WUA 0.75 – 1 Very High 0.5 0.2 0.0 0.0 0.0 0.0 0.0 0.0 0.0 0.7 0.0 0.0 0.0 0.0 0.7
Total WUA (0.001–1) 3.9 2.4 0.0 0.0 0.0 0.0 0.0 0.0 0.0 6.3 1.5 0.0 0.0 1.5 7.8
1. Location of reaches outlined in Map 6D-1.

TAC Public Rd 2 DFO-0024
Page 4 of 13
Table 3: Lake Sturgeon 95th percentile spawning weighted usable areas (WUAs; in hectares), by habitat suitability index (HSI) and reach in the existing and Year 30 post-Project environments from Clark Lake to downstream of Gull Rapids and the proposed Keeyask Generating Station (GS)
Existing Environment
HSI Suitability
Classification
Upstream
Birthday Rapids Downstream Birthday Rapids Gull Lake
Upstream Total
Gull Rapids Downstream of Gull Rapids
Downstream Total
Overall Total
Reach1 2A
Reach 2B
Reach 3
Reach 4
Reach 5
Reach 6
Reach 7
Reach 8
Reach 9A
Reach 9B
Reach 11
Reach 12
WUA 0.001 – <0.25 Low 1.3 0.8 0.0 3.2 0.0 0.0 0.0 0.0 5.3 3.6 4.6 0.0 0.0 8.2 13.4
WUA 0.25 – <0.5 Moderate 0.7 0.6 0.0 1.0 0.0 0.0 0.0 0.0 2.3 1.1 3.0 0.0 0.0 4.1 6.4
WUA 0.5 – <0.75 High 0.5 0.3 0.0 0.4 0.0 0.0 0.0 0.0 1.2 0.4 0.7 0.0 0.0 1.1 2.3
WUA 0.75 – 1 Very High 0.2 0.1 0.0 0.1 0.0 0.0 0.0 0.0 0.4 0.0 0.0 0.0 0.0 0.0 0.5
Total WUA (0.001–1) 2.7 1.8 0.0 4.7 0.0 0.0 0.0 0.0 9.2 5.1 8.3 0.0 0.0 13.4 22.6
Year 30 Post-Project Environment
HSI Suitability
Classification
Upstream
Birthday Rapids Downstream Birthday Rapids Keeyask GS Reservoir
Upstream Total
Downstream of Keeyask GS
Downstream Total
Overall Total
Reach 2A
Reach 2B
Reach 3
Reach 4
Reach 5
Reach 6
Reach 7
Reach 8
Reach 9A
Reach 9B
Reach 11
Reach 12
WUA 0.001 – <0.25 Low 1.3 0.8 0.0 0.0 0.0 0.0 0.0 0.0 0.0 2.1 2.6 0.0 0.0 2.6 4.7
WUA 0.25 – <0.5 Moderate 0.7 0.8 0.0 0.0 0.0 0.0 0.0 0.0 0.0 1.5 2.0 0.0 0.0 2.0 3.4
WUA 0.5 – <0.75 High 0.5 0.5 0.0 0.0 0.0 0.0 0.0 0.0 0.0 1.1 1.0 0.0 0.0 1.0 2.1
WUA 0.75 – 1 Very High 0.3 0.4 0.0 0.0 0.0 0.0 0.0 0.0 0.0 0.7 0.1 0.0 0.0 0.1 0.7
Total WUA (0.001–1) 2.8 2.6 0.0 0.0 0.0 0.0 0.0 0.0 0.0 5.3 5.6 0.0 0.0 5.6 11.0
1. Location of reaches outlined in Map 6D-1.

TAC Public Rd 2 DFO-0024
Page 5 of 13
Table 4: Young-of-the-year Lake sturgeon 5th percentile foraging (rearing) weighted usable areas (WUAs; in hectares), by habitat suitability index (HSI) and reach in the existing and Year 30 post-Project Senvironments from Clark Lake to Gull Rapids and the proposed Keeyask Generating Station (GS)
Existing Environment
HSI Suitability
Classification
Upstream
Birthday Rapids Downstream Birthday Rapids Gull Lake
Upstream Total
Gull Rapids Downstream of Gull Rapids
Downstream Total
Overall Total
Reach1 2A
Reach 2B
Reach 3
Reach 4
Reach 5
Reach 6
Reach 7
Reach 8
Reach 9A
Reach 9B
Reach 11
Reach 12
WUA 0.001 – <0.25 Low 0.5 0.4 5.0 1.3 6.8 90.7 26.9 5.4 137.0 0.0 1.5 30.4 28.4 60.3 197.4
WUA 0.25 – <0.5 Moderate 0.0 0.0 0.6 0.0 0.0 3.4 0.5 9.1 13.6 0.0 0.0 4.7 5.3 9.9 23.5
WUA 0.5 – <0.75 High 0.0 0.0 0.3 0.0 0.0 0.1 0.2 24.3 24.9 0.0 0.0 0.0 12.8 12.8 37.7
WUA 0.75 – 1 Very High 0.0 0.0 1.1 0.0 0.0 0.0 0.0 30.8 31.9 0.0 0.0 0.0 1.2 1.2 33.2
Total WUA (0.001–1) 0.5 0.4 7.0 1.3 6.8 94.3 27.7 69.6 207.5 0.0 1.5 35.0 47.7 84.3 291.8
Year 30 Post-Project Environment
HSI Suitability
Classification
Upstream
Birthday Rapids Downstream Birthday Rapids Keeyask GS Reservoir
Upstream Total
Downstream of Keeyask GS
Downstream Total
Overall Total
Reach 2A
Reach 2B
Reach 3
Reach 4
Reach 5
Reach 6
Reach 7
Reach 8
Reach 9A
Reach 9B
Reach 11
Reach 12
WUA 0.001 – <0.25 Low 0.5 0.7 9.2 12.6 62.0 182.8 86.0 31.1 32.3 417.3 1.5 31.2 30.7 63.4 480.8
WUA 0.25 – <0.5 Moderate 0.0 0.0 0.0 0.0 0.2 2.2 8.3 0.3 0.7 11.8 0.0 6.5 8.4 14.8 26.6
WUA 0.5 – <0.75 High 0.0 0.0 0.0 0.0 0.0 0.0 2.3 1.9 0.1 4.3 0.0 0.0 10.7 10.7 15.0
WUA 0.75 – 1 Very High 0.0 0.0 0.0 0.0 0.0 0.0 1.6 9.6 0.5 11.7 0.0 0.0 5.7 5.7 17.3
Total WUA (0.001–1) 0.5 0.7 9.2 12.6 62.3 185.0 98.2 42.9 33.6 445.0 1.5 37.6 55.5 94.7 539.7
1. Location of reaches outlined in Map 6D-1.

TAC Public Rd 2 DFO-0024
Page 6 of 13
Table 5: Young-of-the-year Lake Sturgeon 50th percentile foraging (rearing) weighted usable areas (WUAs; in hectares), by habitat suitability index (HSI) and reach in the existing and Year 30 post-Project environments from Clark Lake to Gull Rapids and the proposed Keeyask Generating Station (GS)
Existing Environment
HSI Suitability
Classification
Upstream
Birthday Rapids Downstream Birthday Rapids Gull Lake
Upstream Total
Gull Rapids Downstream of Gull Rapids
Downstream Total
Overall Total
Reach1 2A
Reach 2B
Reach 3
Reach 4
Reach 5
Reach 6
Reach 7
Reach 8
Reach 9A
Reach 9B
Reach 11
Reach 12
WUA 0.001 – <0.25 Low 0.5 0.5 4.4 2.0 7.0 93.9 25.2 9.5 142.8 0.1 1.3 29.6 33.5 64.5 207.3
WUA 0.25 – <0.5 Moderate 0.0 0.0 0.7 0.0 0.0 3.8 0.5 8.4 13.4 0.0 0.0 8.8 14.5 23.2 36.6
WUA 0.5 – <0.75 High 0.0 0.0 0.5 0.0 0.0 0.2 0.3 22.2 23.1 0.0 0.0 0.0 5.2 5.2 28.4
WUA 0.75 – 1 Very High 0.0 0.0 0.5 0.0 0.0 0.1 0.1 40.3 40.9 0.0 0.0 0.0 37.5 37.5 78.4
Total WUA (0.001–1) 0.6 0.5 5.9 2.0 7.0 97.9 26.1 80.3 220.3 0.1 1.3 38.4 90.7 130.4 350.7
Year 30 Post-Project Environment
HSI Suitability
Classification
Upstream
Birthday Rapids Downstream Birthday Rapids Keeyask GS Reservoir
Upstream Total
Downstream of Keeyask GS
Downstream Total
Overall Total
Reach 2A
Reach 2B
Reach 3
Reach 4
Reach 5
Reach 6
Reach 7
Reach 8
Reach 9A
Reach 9B
Reach 11
Reach 12
WUA 0.001 – <0.25 Low 0.5 0.6 5.9 8.5 41.4 163.0 84.7 45.1 24.6 374.3 1.3 28.9 35.8 66.0 440.3
WUA 0.25 – <0.5 Moderate 0.0 0.0 0.0 0.0 0.4 90.8 37.9 3.9 22.2 155.2 0.0 9.0 16.3 25.2 180.5
WUA 0.5 – <0.75 High 0.0 0.0 0.0 0.0 0.0 0.0 2.5 0.3 0.0 2.8 0.0 0.0 5.1 5.1 7.8
WUA 0.75 – 1 Very High 0.0 0.0 0.0 0.0 0.0 0.0 2.4 12.9 0.6 15.9 0.0 0.0 36.7 36.7 52.6
Total WUA (0.001–1) 0.5 0.6 5.9 8.5 41.8 253.9 127.4 62.2 47.4 548.2 1.3 37.8 93.8 133.0 681.2
1. Location of reaches outlined in Map 6D-1.

TAC Public Rd 2 DFO-0024
Page 7 of 13
Table 6: Young-of-the-year Lake Sturgeon 95th percentile foraging (rearing) weighted usable areas (WUAs; in hectares), by habitat suitability index (HSI) and reach in the existing and Year 30 post-Project environments from Clark Lake to Gull Rapids and the proposed Keeyask Generating Station (GS)
Existing Environment
HSI Suitability
Classification
Upstream
Birthday Rapids Downstream Birthday Rapids Gull Lake
Upstream Total
Gull Rapids Downstream of Gull Rapids Downstream
Total Overall Total Reach1
2A Reach
2B Reach
3 Reach
4 Reach
5 Reach
6 Reach
7 Reach
8 Reach
9A Reach
9B Reach
11 Reach
12
WUA 0.001 – <0.25 Low 0.5 0.5 3.1 2.5 8.1 77.0 21.5 17.6 130.9 0.2 1.2 26.8 32.3 60.5 191.4
WUA 0.25 – <0.5 Moderate 0.1 0.0 1.9 0.0 0.0 2.2 0.5 9.2 13.8 0.0 0.0 6.8 39.7 46.5 60.3
WUA 0.5 – <0.75 High 0.0 0.0 0.7 0.0 0.0 0.5 0.0 11.9 13.1 0.0 0.0 0.0 0.0 0.0 13.2
WUA 0.75 – 1 Very High 0.0 0.0 0.0 0.0 0.0 0.1 0.0 40.8 40.9 0.0 0.0 0.0 50.1 50.1 91.0
Total WUA (0.001–1)
0.6 0.5 5.7 2.5 8.1 79.8 22.0 79.5 198.8 0.2 1.2 33.6 122.1 157.1 355.9
Year 30 Post-Project Environment
HSI Suitability
Classification
Upstream
Birthday Rapids Downstream Birthday Rapids Keeyask GS Reservoir
Upstream Total
Downstream of Keeyask GS Downstream
Total Overall Total Reach
2A Reach
2B Reach
3 Reach
4 Reach
5 Reach
6 Reach
7 Reach
8 Reach
9A Reach
9B Reach
11 Reach
12
WUA 0.001 – <0.25 Low 0.5 0.6 4.5 6.6 25.3 132.8 87.2 48.3 22.7 328.3 1.2 27.9 39.3 68.4 396.6
WUA 0.25 – <0.5 Moderate 0.1 0.0 0.0 0.0 0.7 172.5 56.4 24.6 35.5 289.8 0.0 8.8 34.1 42.9 332.7
WUA 0.5 – <0.75 High 0.0 0.0 0.0 0.0 0.0 0.0 2.4 0.3 0.0 2.7 0.0 0.0 0.3 0.3 2.9
WUA 0.75 – 1 Very High 0.0 0.0 0.0 0.0 0.0 0.0 2.5 13.1 0.6 16.2 0.0 0.0 49.6 49.6 65.8
Total WUA (0.001–1)
0.6 0.6 4.5 6.6 26.0 305.3 148.5 86.2 58.8 636.9 1.2 36.7 123.3 161.2 798.1
1. Location of reaches outlined in Map 6D-1.
TAC Public Rd 2 DFO-0024
Page 8 of 13
Table 7: Sub-adult Lake Sturgeon 5th percentile foraging weighted usable areas (WUAs; in hectares), by habitat suitability index (HSI) and reach in the existing and Year 30 post-Project environments from Clark Lake to Gull Rapids and the proposed Keeyask Generating Station (GS)
Existing Environment
HSI Suitability
Classification
Upstream
Birthday Rapids Downstream Birthday Rapids Gull Lake
Upstream Total
Gull Rapids Downstream of Gull Rapids
Downstream Total
Overall Total
Reach1 2A
Reach 2B
Reach 3
Reach 4
Reach 5
Reach 6
Reach 7
Reach 8
Reach 9A
Reach 9B
Reach 11
Reach 12
WUA 0.001 – <0.25 Low 3.2 6.6 13.6 15.2 45.5 58.8 29.1 10.0 181.9 5.9 8.5 24.9 4.8 44.2 226.1
WUA 0.25 – <0.5 Moderate 0.0 0.6 20.1 0.9 16.9 77.4 57.2 9.0 182.2 0.0 5.9 46.2 127.7 179.8 362.0
WUA 0.5 – <0.75 High 0.0 0.0 0.2 0.0 0.1 46.6 1.4 10.9 59.3 0.0 0.0 53.5 34.9 88.4 147.6
WUA 0.75 – 1 Very High 0.0 0.0 1.8 0.0 0.1 517.7 0.1 46.2 565.9 0.0 0.0 32.9 61.0 93.9 659.8
Total WUA (0.001–1) 3.2 7.2 35.7 16.1 62.7 700.6 87.7 76.1 989.3 5.9 14.5 157.5 228.4 406.3 1395.6
Year 30 Post-Project Environment
HSI Suitability
Classification
Upstream
Birthday Rapids Downstream Birthday Rapids Keeyask GS Reservoir
Upstream Total
Downstream of Keeyask GS
Downstream Total
Overall Total
Reach 2A
Reach 2B
Reach 3
Reach 4
Reach 5
Reach 6
Reach 7
Reach 8
Reach 9A
Reach 9B
Reach 11
Reach 12
WUA 0.001 – <0.25 Low 3.1 9.4 14.2 19.6 32.0 125.7 54.0 38.7 94.7 391.5 6.4 18.3 4.8 29.5 421.0
WUA 0.25 – <0.5 Moderate 0.0 2.3 29.6 44.5 165.0 587.2 240.7 139.6 94.7 1303.6 5.2 69.5 134.2 208.9 1512.5
WUA 0.5 – <0.75 High 0.0 0.0 0.0 0.0 0.0 0.0 1.9 0.1 0.1 2.0 0.0 47.4 23.1 70.5 72.6
WUA 0.75 – 1 Very High 0.0 0.0 0.0 0.0 0.0 0.0 4.3 12.3 0.6 17.2 0.0 35.8 70.9 106.7 123.9
Total WUA (0.001–1) 3.1 11.7 43.8 64.1 197.0 712.9 300.8 190.8 190.1 1714.4 11.6 171.0 233.0 415.6 2130.0
1. Location of reaches outlined in Map 6D-1.

TAC Public Rd 2 DFO-0024
Page 9 of 13
Table 8: Sub-adult Lake Sturgeon 50th percentile foraging weighted usable areas (WUAs; in hectares), by habitat suitability index (HSI) and reach in the existing and Year 30 post-Project environments from Clark Lake to Gull Rapids and the proposed Keeyask Generating Station (GS)
Existing Environment
HSI Suitability
Classification
Upstream
Birthday Rapids Downstream Birthday Rapids Gull Lake
Upstream Total
Gull Rapids Downstream of Gull Rapids
Downstream Total
Overall Total
Reach1 2A
Reach 2B
Reach 3
Reach 4
Reach 5
Reach 6
Reach 7
Reach 8
Reach 9A
Reach 9B
Reach 11
Reach 12
WUA 0.001 – <0.25 Low 3.0 8.2 15.0 19.4 53.2 55.2 31.2 14.7 199.9 7.2 8.9 23.7 4.8 44.7 244.6
WUA 0.25 – <0.5 Moderate 0.0 0.7 23.9 0.7 17.8 81.7 65.7 7.9 198.5 0.0 3.7 46.6 139.7 189.9 388.4
WUA 0.5 – <0.75 High 0.0 0.0 0.1 0.0 0.1 73.5 1.7 9.7 85.1 0.0 0.0 58.6 10.8 69.4 154.6
WUA 0.75 – 1 Very High 0.0 0.0 2.1 0.0 0.1 590.0 0.2 59.2 651.5 0.0 0.0 39.7 105.0 144.7 796.2
Total WUA (0.001–1) 3.0 8.9 41.1 20.2 71.2 800.5 98.8 91.4 1135.0 7.2 12.6 168.6 260.3 448.7 1583.8
Year 30 Post-Project Environment
HSI Suitability
Classification
Upstream
Birthday Rapids Downstream Birthday Rapids Keeyask GS Reservoir
Upstream Total
Downstream of Keeyask GS
Downstream Total
Overall Total
Reach 2A
Reach 2B
Reach 3
Reach 4
Reach 5
Reach 6
Reach 7
Reach 8
Reach 9A
Reach 9B
Reach 11
Reach 12
WUA 0.001 – <0.25 Low 2.7 12.5 20.4 38.4 45.5 132.0 55.8 38.5 46.3 392.0 6.7 16.9 4.8 28.4 420.4
WUA 0.25 – <0.5 Moderate 0.0 0.3 25.8 19.5 148.3 370.8 167.2 132.6 47.1 911.6 3.6 71.6 146.8 222.0 1133.5
WUA 0.5 – <0.75 High 0.0 0.0 0.0 0.0 0.4 329.8 121.9 43.8 68.0 563.9 0.0 50.2 4.2 54.4 618.3
WUA 0.75 – 1 Very High 0.0 0.0 0.0 0.0 0.0 0.0 5.4 13.7 0.6 19.8 0.0 40.5 105.3 145.8 165.6
Total WUA (0.001–1) 2.7 12.8 46.1 57.9 194.2 832.6 350.2 228.7 162.0 1887.2 10.3 179.3 261.0 450.6 2337.8
1. Location of reaches outlined in Map 6D-1.
TAC Public Rd 2 DFO-0024
Page 10 of 13
Table 9: Sub-adult Lake Sturgeon 95th percentile foraging weighted usable areas (WUAs; in hectares), by habitat suitability index (HSI) and reach in the existing and Year 30 post-Project environments from Clark Lake to Gull Rapids and the proposed Keeyask Generating Station (GS)
Existing Environment
HSI Suitability
Classification
Upstream
Birthday Rapids Downstream Birthday Rapids Gull Lake
Upstream Total
Gull Rapids Downstream of Gull Rapids
Downstream Total
Overall Total
Reach1 2A
Reach 2B
Reach 3
Reach 4
Reach 5
Reach 6
Reach 7
Reach 8
Reach 9A
Reach 9B
Reach 11
Reach 12
WUA 0.001 – <0.25 Low 2.6 9.8 20.4 21.0 57.1 53.1 42.9 19.5 226.5 8.3 6.9 23.9 4.9 44.0 270.5
WUA 0.25 – <0.5 Moderate 0.0 0.1 20.0 1.6 17.1 78.6 64.1 8.3 189.8 0.0 2.6 41.2 141.9 185.6 375.4
WUA 0.5 – <0.75 High 0.0 0.0 0.8 0.0 0.2 81.4 1.7 8.2 92.2 0.0 0.0 63.1 21.2 84.3 176.5
WUA 0.75 – 1 Very High 0.0 0.0 2.0 0.0 0.1 699.8 0.3 72.4 774.7 0.0 0.0 46.1 118.4 164.5 939.2
Total WUA (0.001–1) 2.6 9.9 43.2 22.6 74.4 912.9 109.0 108.5 1283.1 8.3 9.5 174.3 286.4 478.4 1761.5
Year 30 Post-Project Environment
HSI Suitability
Classification
Upstream
Birthday Rapids Downstream Birthday Rapids Keeyask GS Reservoir
Upstream Total
Downstream of Keeyask GS
Downstream Total
Overall Total
Reach 2A
Reach 2B
Reach 3
Reach 4
Reach 5
Reach 6
Reach 7
Reach 8
Reach 9A
Reach 9B
Reach 11
Reach 12
WUA 0.001 – <0.25 Low 2.7 12.5 20.4 38.4 45.5 132.0 55.8 38.5 47.1 392.8 6.3 17.1 4.8 28.3 421.1
WUA 0.25 – <0.5 Moderate 0.0 0.3 25.8 19.5 148.3 370.8 167.2 132.6 47.1 911.6 3.3 72.6 150.2 226.1 1137.7
WUA 0.5 – <0.75 High 0.0 0.0 0.0 0.0 0.4 329.8 121.9 43.8 68.0 563.9 0.0 54.0 13.7 67.7 631.5
WUA 0.75 – 1 Very High 0.0 0.0 0.0 0.0 0.0 0.0 5.4 13.7 0.6 19.8 0.0 42.1 115.2 157.3 177.1
Total WUA (0.001–1) 2.7 12.8 46.1 57.9 194.2 832.6 350.2 228.7 162.8 1888.0 9.7 185.9 283.9 479.4 2367.4
1. Location of reaches outlined in Map 6D-1.
TAC Public Rd 2 DFO-0024
Page 11 of 13
Table 10: Adult Lake Sturgeon 5th percentile foraging weighted usable areas (WUAs; in hectares), by habitat suitability index (HSI) and reach in the existing and Year 30 post-Project environments from Clark Lake to Gull Rapids and the proposed Keeyask Generating Station (GS)
Existing Environment
HSI Suitability
Classification
Upstream
Birthday Rapids Downstream Birthday Rapids Gull Lake
Upstream Total
Gull Rapids Downstream of Gull Rapids
Downstream Total
Overall Total
Reach1 2A
Reach 2B
Reach 3
Reach 4
Reach 5
Reach 6
Reach 7
Reach 8
Reach 9A
Reach 9B
Reach 11
Reach 12
WUA 0.001 – <0.25 Low 5.5 3.5 1.1 3.7 4.1 10.7 3.5 6.8 38.9 5.6 2.2 0.5 0.3 8.6 47.6
WUA 0.25 – <0.5 Moderate 15.2 15.9 8.3 17.1 27.5 60.2 29.6 27.2 201.0 16.5 7.9 26.2 7.1 57.6 258.6
WUA 0.5 – <0.75 High 18.2 34.1 26.0 57.6 109.3 84.0 28.6 23.2 381.1 24.8 18.9 164.8 409.4 617.9 999.0
WUA 0.75 – 1 Very High 15.7 35.1 165.1 74.8 317.9 1049.2 432.1 131.0 2220.8 59.4 83.3 199.9 75.2 417.9 2638.7
Total WUA (0.001–1) 54.6 88.6 200.5 153.2 458.8 1204.1 493.8 188.2 2841.9 106.3 112.3 391.4 492.0 1102.0 3943.8
Year 30 Post-Project Environment
HSI Suitability
Classification
Upstream
Birthday Rapids Downstream Birthday Rapids Keeyask GS Reservoir
Upstream Total
Downstream of Keeyask GS
Downstream Total
Overall Total
Reach 2A
Reach 2B
Reach 3
Reach 4
Reach 5
Reach 6
Reach 7
Reach 8
Reach 9A
Reach 9B
Reach 11
Reach 12
WUA 0.001 – <0.25 Low 5.1 2.5 0.7 0.6 4.1 31.0 3.2 10.4 24.0 81.6 0.1 0.7 0.3 1.1 82.7
WUA 0.25 – <0.5 Moderate 15.1 9.9 4.2 2.7 24.0 323.1 61.9 123.1 24.0 588.0 1.9 25.2 6.9 34.1 622.1
WUA 0.5 – <0.75 High 17.6 27.9 16.7 19.1 95.6 1057.7 376.7 341.8 155.0 2108.1 15.4 158.0 415.2 588.6 2696.7
WUA 0.75 – 1 Very High 16.1 76.9 208.5 267.4 617.0 901.1 520.8 108.7 390.6 3107.2 49.0 212.1 86.3 347.4 3454.5
Total WUA (0.001–1) 53.9 117.2 230.2 289.8 740.7 2312.9 962.6 584.0 593.6 5884.9 66.4 395.9 508.8 971.1 6856.0
1. Location of reaches outlined in Map 6D-1.

TAC Public Rd 2 DFO-0024
Page 12 of 13
Table 11: Adult Lake Sturgeon 50th percentile foraging weighted usable areas (WUAs; in hectares), by habitat suitability index (HSI) and reach in the existing and Year 30 post-Project environments from Clark Lake to Gull Rapids and the proposed Keeyask Generating Station (GS)
Existing Environment
HSI Suitability
Classification
Upstream
Birthday Rapids Downstream Birthday Rapids Gull Lake
Upstream Total
Gull Rapids Downstream of Gull Rapids
Downstream Total
Overall Total
Reach1 2A
Reach 2B
Reach 3
Reach 4
Reach 5
Reach 6
Reach 7
Reach 8
Reach 9A
Reach 9B
Reach 11
Reach 12
WUA 0.001 – <0.25 Low 4.8 3.8 1.0 3.7 6.8 20.9 7.5 8.0 56.6 4.0 2.7 0.5 0.2 7.5 64.0
WUA 0.25 – <0.5 Moderate 12.7 14.0 8.1 22.6 45.1 84.8 21.0 30.1 238.4 15.1 8.4 23.2 6.2 52.9 291.3
WUA 0.5 – <0.75 High 14.1 30.4 25.6 58.4 115.3 90.4 50.9 60.2 445.2 27.9 23.0 151.2 332.3 534.4 979.6
WUA 0.75 – 1 Very High 14.9 39.8 175.8 82.7 283.9 1164.6 465.0 160.4 2387.0 72.5 61.2 240.2 213.4 587.4 2974.4
Total WUA (0.001–1) 46.6 88.1 210.5 167.4 451.0 1360.7 544.3 258.7 3127.2 119.5 95.4 415.1 552.2 1182.1 4309.3
Year 30 Post-Project Environment
HSI Suitability
Classification
Upstream
Birthday Rapids Downstream Birthday Rapids Keeyask GS Reservoir
Upstream Total
Downstream of Keeyask GS
Downstream Total
Overall Total
Reach 2A
Reach 2B
Reach 3
Reach 4
Reach 5
Reach 6
Reach 7
Reach 8
Reach 9A
Reach 9B
Reach 11
Reach 12
WUA 0.001 – <0.25 Low 4.9 2.3 0.7 0.7 4.3 30.3 3.0 10.3 22.2 78.6 0.1 0.6 0.2 1.0 79.6
WUA 0.25 – <0.5 Moderate 12.5 10.0 4.3 4.2 25.2 309.6 49.9 122.4 22.2 560.4 5.2 23.5 5.8 34.5 594.9
WUA 0.5 – <0.75 High 14.4 35.0 24.8 23.6 82.0 925.5 312.2 260.7 114.8 1793.1 20.0 152.1 335.0 507.1 2300.2
WUA 0.75 – 1 Very High 15.6 59.6 200.1 253.2 640.3 1206.8 675.2 225.7 479.4 3755.7 33.5 236.2 219.0 488.6 4244.3
Total WUA (0.001–1) 47.3 106.9 229.9 281.8 751.8 2472.2 1040.3 619.1 638.6 6187.8 58.8 412.3 560.0 1031.1 7219.0
1. Location of reaches outlined in Map 6D-1.

TAC Public Rd 2 DFO-0024
Page 13 of 13
Table 12: Adult Lake Sturgeon 95th percentile foraging habitat areas and weighted usable areas (WUAs; in hectares), by habitat suitability index (HSI) and reach in the existing and Year 30 post-Project environments from Clark Lake to Gull Rapids and the proposed Keeyask Generating Station (GS)
Existing Environment
HSI Suitability
Classification
Upstream
Birthday Rapids Downstream Birthday Rapids Gull Lake
Upstream Total
Gull Rapids Downstream of Gull Rapids
Downstream Total
Overall Total
Reach1 2A
Reach 2B
Reach 3
Reach 4
Reach 5
Reach 6
Reach 7
Reach 8
Reach 9A
Reach 9B
Reach 11
Reach 12
WUA 0.001 – <0.25 Low 3.8 3.6 1.3 5.5 15.1 10.9 2.0 2.1 44.3 3.8 3.6 0.6 0.2 8.2 52.5
WUA 0.25 – <0.5 Moderate 8.4 16.4 11.0 30.1 61.7 96.2 26.4 23.9 274.1 15.5 8.7 22.3 5.3 51.8 325.9
WUA 0.5 – <0.75 High 9.7 27.9 25.1 36.9 93.0 124.1 62.2 51.3 430.3 33.4 14.1 137.4 230.5 415.4 845.7
WUA 0.75 – 1 Very High 13.9 30.5 168.1 89.8 245.2 1258.6 489.5 247.5 2543.1 72.2 50.0 267.3 381.1 770.6 3313.7
Total WUA (0.001–1) 35.8 78.4 205.5 162.3 415.0 1489.8 580.0 324.8 3291.7 124.9 76.4 427.6 617.1 1246.0 4537.7
Year 30 Post-Project Environment
HSI Suitability
Classification
Upstream
Birthday Rapids Downstream Birthday Rapids Keeyask GS Reservoir
Upstream Total
Downstream of Keeyask GS
Downstream Total
Overall Total
Reach 2A
Reach 2B
Reach 3
Reach 4
Reach 5
Reach 6
Reach 7
Reach 8
Reach 9A
Reach 9B
Reach 11
Reach 12
WUA 0.001 – <0.25 Low 3.7 2.4 1.2 1.7 8.4 29.0 2.7 9.9 20.2 79.3 1.8 0.6 0.2 2.6 81.9
WUA 0.25 – <0.5 Moderate 8.9 16.1 9.2 10.6 31.5 292.6 40.6 120.8 20.2 550.6 5.5 21.9 5.0 32.3 582.9
WUA 0.5 – <0.75 High 10.0 31.0 26.2 48.4 102.5 851.4 243.7 209.6 79.3 1602.1 8.9 136.4 242.0 387.2 1989.4
WUA 0.75 – 1 Very High 14.6 40.7 183.2 186.3 586.1 1469.0 832.0 333.4 551.3 4196.5 42.1 266.8 368.8 677.7 4874.2
Total WUA (0.001–1) 37.1 90.2 219.7 247.1 728.6 2642.0 1119.0 673.8 671.0 6428.6 58.3 425.6 616.0 1099.9 7528.5
1. Location of reaches outlined in Map 6D-1.

TAC Public Rd 2 DFO-0025
Page 1 of 3
REFERENCE: Volume: Aquatic Environment Supporting Volume; 1
Section: 6.0 Lake Sturgeon; p. N/A 2
TAC Public Rd 2 DFO-0025 3
ORIGINAL QUESTION AND PREAMBLE: 4 Chapter 6 5
For all HSI maps, outline of existing environment (the shorelines of the Nelson River and 6 Stephens Lake) should be shown in the post project environment maps. The additional 7 aquatic area gained by creation of the forebay should be illustrated and given a 8 suitability of 0, recognizing that this is terrestrial habitat that will undergo substantial 9 change before it becomes productive aquatic habitat (EIS suggests at least 5 years). 10 Please provide revised maps showing these changes. 11
FOLLOW-UP QUESTION: 12 Revised maps not provided. 13
RESPONSE: 14 The original Partnership response to TAC Public Rd 1 DFO-0025 indicated that the HSI 15 analysis is based on long-term (30 year) habitat conditions in the reservoir. At that time, 16 flooded habitat with suitable substrate, depth and velocity is expected to provide 17 foraging habitat to sub-adult and adult Lake Sturgeon based on the suitability criteria 18 used for the HSI analysis. 19
DFO indicated in this second round of Requests for Additional Information that the 20 requested maps were not provided. Subsequent discussions at a technical review 21 meeting on February 14, 2013 among KHLP, CEAA, DFO and MCWS indicated that the 22 issue was the determination of the Harmful Alteration, Disruption and Destruction 23 (HADD) of habitat and that this determination needed to include the initial years post-24 impoundment when the flooded habitat is still evolving. It is understood that habitat for 25 certain life history stages (i.e., spawning and young-of-the-year rearing) is negatively 26 affected. The effect of habitat changes associated with reservoir creation on sub-adult 27 and adult Lake Sturgeon is more complex since habitat in certain areas will become 28 more productive (e.g., based on the suitability indices provided in AE SV Appendix 6D, 29 where velocities decrease to the 0.2-1.0 m/s range from greater than 1 m/s suitability 30 increases, but deposition of silt may decrease the suitability of existing sand or gravel 31 areas for sub-adult Lake Sturgeon). Based on the suitability indices for these life stages 32 provided in AE SV, p. 6-Appendix 6D, the overall amount of suitable habitat for these life 33 stages will increase post-Project. The degree to which Lake Sturgeon will use flooded 34

TAC Public Rd 2 DFO-0025
Page 2 of 3
terrestrial habitat immediately after flooding is unknown so a conservative approach 35 was taken in the AE SV Section 6.4.2.2.2, p. 6-36): 36
During the initial years post-impoundment, conditions over the newly flooded 37 terrestrial habitat would not be optimal for lake sturgeon, which appear to 38 favour deeper, more riverine, mineral substrate environments in the Nelson River 39 (Section 6.3.2.3.1). Both sub-adult and adult lake sturgeon were captured or 40 relocated via telemetry between Birthday Rapids and Gull Rapids, but were 41 mainly found in Gull Lake (Section 6.3.2.3.1). In Gull Lake, sub-adults occupied a 42 narrower range of conditions, favouring deep, low to moderate velocity areas. 43 Adult sturgeon were also observed in the reach between Clark Lake and Birthday 44 Rapids. 45
Lake sturgeon will continue to be able to use habitat in the former mainstem 46 and Gull Lake that are not expected to experience the changes in water quality 47 (Section 2.5.2.2) that are predicted for flooded shallow water lentic habitats 48 (decreased dissolved oxygen, flooded terrestrial organics and episodic increases 49 in suspended sediments). Over time, as the substratum evolves, lake sturgeon 50 could begin to use flooded portions of the reservoir as conditions become 51 suitable. 52
The long-term use of the reservoir by sub-adult and adult sturgeon was modeled 53 separately. The post-Project HSI models predict a net gain of approximately 54 600–750 ha (WUA) of foraging habitat for sub-adults and a net gain of 55 approximately 3,000–3,150 ha for adults (Map 6-50 to Map 6-55; Appendix 6D). 56
The AE SV Section 6.4.2.2.3, p. 6-37 also considered potential effects of emigration of 57 Lake Sturgeon in response to rapids habitat changes at impoundment: 58
Studies conducted to date have recorded incidental movements of lake sturgeon 59 through Birthday Rapids and Gull Rapids (Section 6.3.2.7). Lower velocities and 60 increased depth at Birthday Rapids may facilitate passage of lake sturgeon 61 upstream through the rapids. It is possible that sturgeon will emigrate upstream 62 or downstream away from the reservoir in response to habitat changes resulting 63 from impoundment. Upstream emigration of other fish species was observed in 64 the Desaulniers River, Québec (Boucher 1982), and downstream emigration was 65 documented for lake sturgeon moving out of the Limestone reservoir within the 66 first five years after impoundment (NSC 2012). Over time, some lake sturgeon 67 that move upstream may return downstream to the reservoir. Although fish that 68 permanently leave Gull Lake will not be replaced with the same age classes, 69 conservation stocking will be used to maintain the total number of lake sturgeon 70 in the reservoir. Details of the stocking program are provided in Appendix 1A. 71

TAC Public Rd 2 DFO-0025
Page 3 of 3
At the technical meeting on February 14, 2013, the Proponent was asked to develop a 72 brief summary of Lake Sturgeon habitat changes for DFO’s consideration. This summary 73 is provided below. 74
Summary of Lake Sturgeon Habitat Changes from Keeyask Generation Project 75 Development 76
The Keeyask Generation Project will result in the destruction of 128 ha of habitat used 77 by lake sturgeon due to construction and operation of the Keeyask Generating Station 78 and the effects on reservoir and downstream flow regime modification as detailed 79 below: 80
• Destruction of 128 ha of habitat in Gull Rapids that will be permanently lost due 81 to the footprint of the principle structures of the generating station, 82 construction of intake and tailrace channels, and dewatering of the south 83 channel of Gull Rapids. Areas within Gull Rapids provide spawning habitat for 84 Lake Sturgeon resident in Stephens Lake. 85
• Reduction in the suitability of habitat along the north bank of the Nelson River 86 for sub-adult Lake Sturgeon due to velocity reduction and siltation. 87
• Alteration of fish habitat in the Nelson River between Long Rapids and Stephens 88 Lake, an area of approximately 4,500 ha of river and lake habitat. Negative 89 effects of this habitat alteration include: 90 o A potential short term emigration of sub-adult and adult Lake Sturgeon 91
in response to the rapid habitat change. Sturgeon are expected to 92 return to the area over time. 93
o A potential decrease in the suitability of spawning habitat at Birthday 94 Rapids. 95
o A loss of access to young-of-the-year rearing habitat north of Caribou 96 Island in Gull Lake. 97
o A decrease in suitability of some currently preferred areas of habitat for 98 sub-adult Lake Sturgeon due to reduction in velocity to less than 0.2 m/s 99 and siltation. 100
Positive or neutral effects of this alteration include: 101
• Conversion of high velocity (>1 m/s) habitat to habitat with a velocity of 0.2-1.0 102 m/s. 103
• Creation, in the long term, of an additional 4,800 ha of habitat from the flooded 104 terrestrial area. Given that velocity is mainly less than 0.2 m/s, it is not high 105 value habitat but has some value as foraging habitat for adult Lake Sturgeon.106
TAC Public Rd 2 DFO-0026
Page 1 of 17
REFERENCE: Volume: Aquatic Environment Supporting Volume; 1
Section: Appendix 1A Aquatic Mitigation and Compensation 2
Measures: Evaluation of Alternatives and Rationale for Selected 3
Measures; p. N/A 4
TAC Public Rd 2 DFO-0026 5
ORIGINAL PREAMBLE AND QUESTION: 6 Maps 6-48, 6-49 7
Unclear as to how sand/gravel habitat will be created post project in the forebay, 8 particularly in years 1-5. Does this include compensatory measures proposed in 9 Appendix 1A? Please provide detailed information/model which demonstrates the 10 creation of sand post project. 11
FOLLOW-UP QUESTION: 12 Requested details on sand habitat creation not provided. 13
RESPONSE: 14 Impoundment of the Gull Lake area to create the forebay of the Keeyask Generating 15 Station will flood a diverse variety of aquatic habitats. An existing area where Young-Of-16 Year Habitat (YOYH) sturgeon have been located has been identified north of Caribou 17 Island, as shown in Figure 1. This document describes a phased approach for the 18 development of the YOYH. 19
Sand Blanket Criteria 20 Using the information provided by North/South and a preliminary estimate of where the 21 velocity drops below 0.5 m/s in the central channel, the approximate area that would be 22 suitable for sand blanket deposition is shown on Figure 2. It should be noted that the 23 selection of the preferred location for the construction of the sand blanket was not 24 based on an area where young-of-year sturgeon have been located under current 25 conditions, but rather on conditions that will exist once the Keeyask Generating station 26 is operational. The preferred location was instead based on the most likely area in the 27 post-impoundment setting where YOY lake sturgeon that emerge from upstream 28 spawning locations in the reach from Birthday Rapids to Long Rapids would settle to the 29 bottom of the river channel. The area was selected based on water velocity 30 characteristics following impoundment. 31
The preferred location for the sand blanket is an approximately 400 m wide by 2 km 32 long section (total area of 800,000 m2) in the central channel, as shown in Figure 2. The 33

TAC Public Rd 2 DFO-0026
Page 2 of 17
sand blanket would consist of dirty sand, ideally containing some silt, covering the 34 existing cobbles by 5 cm. 35
An average cobble size of 7.5 inches, or 19 cm, would require a blanket depth of 36 approximately 24 cm. Since the presence of cobbles and boulders will not require a 37 continuous sand thickness of 24 cm, an approximate thickness of 20 cm has been used 38 to estimate a volume of sand required for 160,000 m3. Some boulders and cobbles may 39 not be covered by this thickness of sand and will provide cover for the fish. The outline 40 of the proposed sand blanket is shown in Figure 2. 41
Phased Approach for Sand Blanket Development 42
Phase I Sand Placement 43 If monitoring indicates that sand placement is necessary, then the placement of a sand 44 blanket as a Phase I pilot program would provide an area of sand habitat covering a 45 200,000 m2 area. This area represents approximately one-half of the existing high 46 suitability area. The preliminary location of the Phase I sand blanket that is shown in 47 Figure 2 may be refined based on observations made during the initial monitoring 48 program prior to Phase I sand placement. 49
Intermediate Monitoring Program 50 The success of the Phase I pilot placement will be monitored over one or more years to 51 assess the need for and location of the next phase of sand placement. 52
Phase II Sand Placement 53 Based on the observations made during the intermediate monitoring program, the 54 Phase II sand placement would be implemented. The preliminary location of the Phase II 55 sand blanket is shown on Figure 2; however, the location of the sand blanket would be 56 refined based on observations made during the intermediate monitoring program. The 57 Phase II sand blanket may be an extension of the Phase I sand blanket or a separate site, 58 depending on the observations made during the intermediate monitoring program. 59
Construction Methodology 60
Sand Blanket Material Sources 61 The two material sources were reviewed to ensure that each could provide a sufficient 62 quantity of clean sand for this project. Two locations have been identified as potential 63 source of sand: 64
• Option 1 sources material from Deposit G-1. 65
• Option 2 sources material from Deposit B-1. 66
Options 1 and 2 can be seen on Figure 1. Deposit B-1 can be seen in detail in Figure 3. 67
TAC Public Rd 2 DFO-0026
Page 3 of 17
Sand Placement Methods 68 Sand placement on river bottoms and lakebeds has been used to cover contaminated 69 material deposited in the water bodies. The sand placement methods used for these 70 projects can also be used for the placement of sand blanket material in the Nelson River. 71 The appendix at the end of this document provides figures that illustrate some of these 72 placement methods. 73
Surface release from a barge, dredge or pipeline would result in more TSS generation 74 than the placement of material from a barge using a sand spreader or tremie 75 equipment. The sand spreader and tremie placement methods are described below. 76
A sand spreader system can be used to place material on the bottom of a river. Sand is 77 transported to the placement area on a barge. Water is added to the sand to create a 78 slurry, which is pumped through a submerged pipe to the river bottom. A winch and 79 anchor system is used to move the submerged pipe to direct the placement of the sand 80 slurry. This gives a more accurate sand placement and less TSS generation than dumping 81 material from the surface of the river. In the same way, tremie equipment mounted on 82 a barge can be used to place material on the bottom of a river. When the barge is in the 83 placement area, the sand is moved to a hopper using a small front-end loader or 84 conveyor belt. The hopper feeds the sand into a large-diameter pipe mounted on the 85 side of the barge. The pipe extends vertically from the hopper to just above the river 86 bottom, isolating the sand from the upper water column. An anchor and winch system, 87 tugboat guidance or cable and winch system can be used to move the barge over the 88 sand blanket area. This method also results in more accurate sand placement and less 89 TSS generation than dumping material from the surface of the river. A conceptual 90 drawing of a tremie composed of a retractable nested plastic chute attached to the side 91 of a barge is shown in the appendix. Photos of a retractable plastic chute with a hopper 92 loading system are also shown in the appendix. Either the sand spreader or tremie 93 methods would be suitable for the placement of sand blanket material. 94
Excavation and Transportation of Sand Material 95 This is a significant construction operation in which 80,000 m3 of sand is to be placed on 96 the river bottom over two areas of 200,000 m2 each. It is assumed that approximately 97 one metre of clay would be stripped from Deposit B-1 to access the poorly graded 98 gravelly sand. Stripping of clay and overburden would not be required at Deposit G-1, as 99 the sand would have already been exposed during the development of the Keeyask GS. 100 Some processing is required to isolate the material between 1.0 mm and 2.0 mm in 101 diameter. The material would be transported by truck from the deposit areas to the 102 river, and then transported to the sand blanket placement area by a tug towing a barge. 103 Depending on the source of material for this project a barge loading area would be 104
TAC Public Rd 2 DFO-0026
Page 4 of 17
constructed at the North Dyke or near Deposit B-1 if Deposit B-1 was selected as the 105 source for the material. 106
These loading areas would be removed at the end of the project. 107
The proposed barge loading areas and barge routes are shown in Figures 1 and 2. Use of 108 Deposit B-1 would require construction of a winter road prior to the Phase I sand 109 blanket placement in order to allow access for equipment to clear and prepare the 110 deposit sites. This will ensure that the full summer construction season can be utilized 111 for the construction of YOYH. 112
Five barge sections would be connected to be used for transportation of the sand 113 blanket material. An example of interconnected barge segments and a tug is shown in 114 the Appendix. One tug will be able to move the interconnected barge. 115
The sand blanket areas shown in Figure 2 would be revised based on observations from 116 the initial monitoring program. GPS technology would be used during sand placement, 117 and placement would be verified using a dive team. The marine staff would consist of 118 one tug operator and one small front-end loader operator to move the material into the 119 hopper. Three truck operators and two loader operators with one foreman comprise a 120 total staff of eight. Two divers would also be required for the diving program. 121
A fuel depot would be included at the site of the granular source. 122
Scheduling Of Work 123 This operation would require about 5 weeks each for Phase I and Phase II, with 60 hour 124 work weeks using Deposit B-1 as a source. Alternatively, the operation would require 125 about 10 weeks each for Phase I and Phase II using Deposit G-1 as a source. Placement 126 of the Phase I sand blanket would begin following a three-year initial monitoring 127 program after impoundment. An intermediate monitoring program would monitor the 128 success of the Phase I sand blanket for a minimum of one year. The Phase II sand 129 blanket placement would begin following this monitoring program. 130
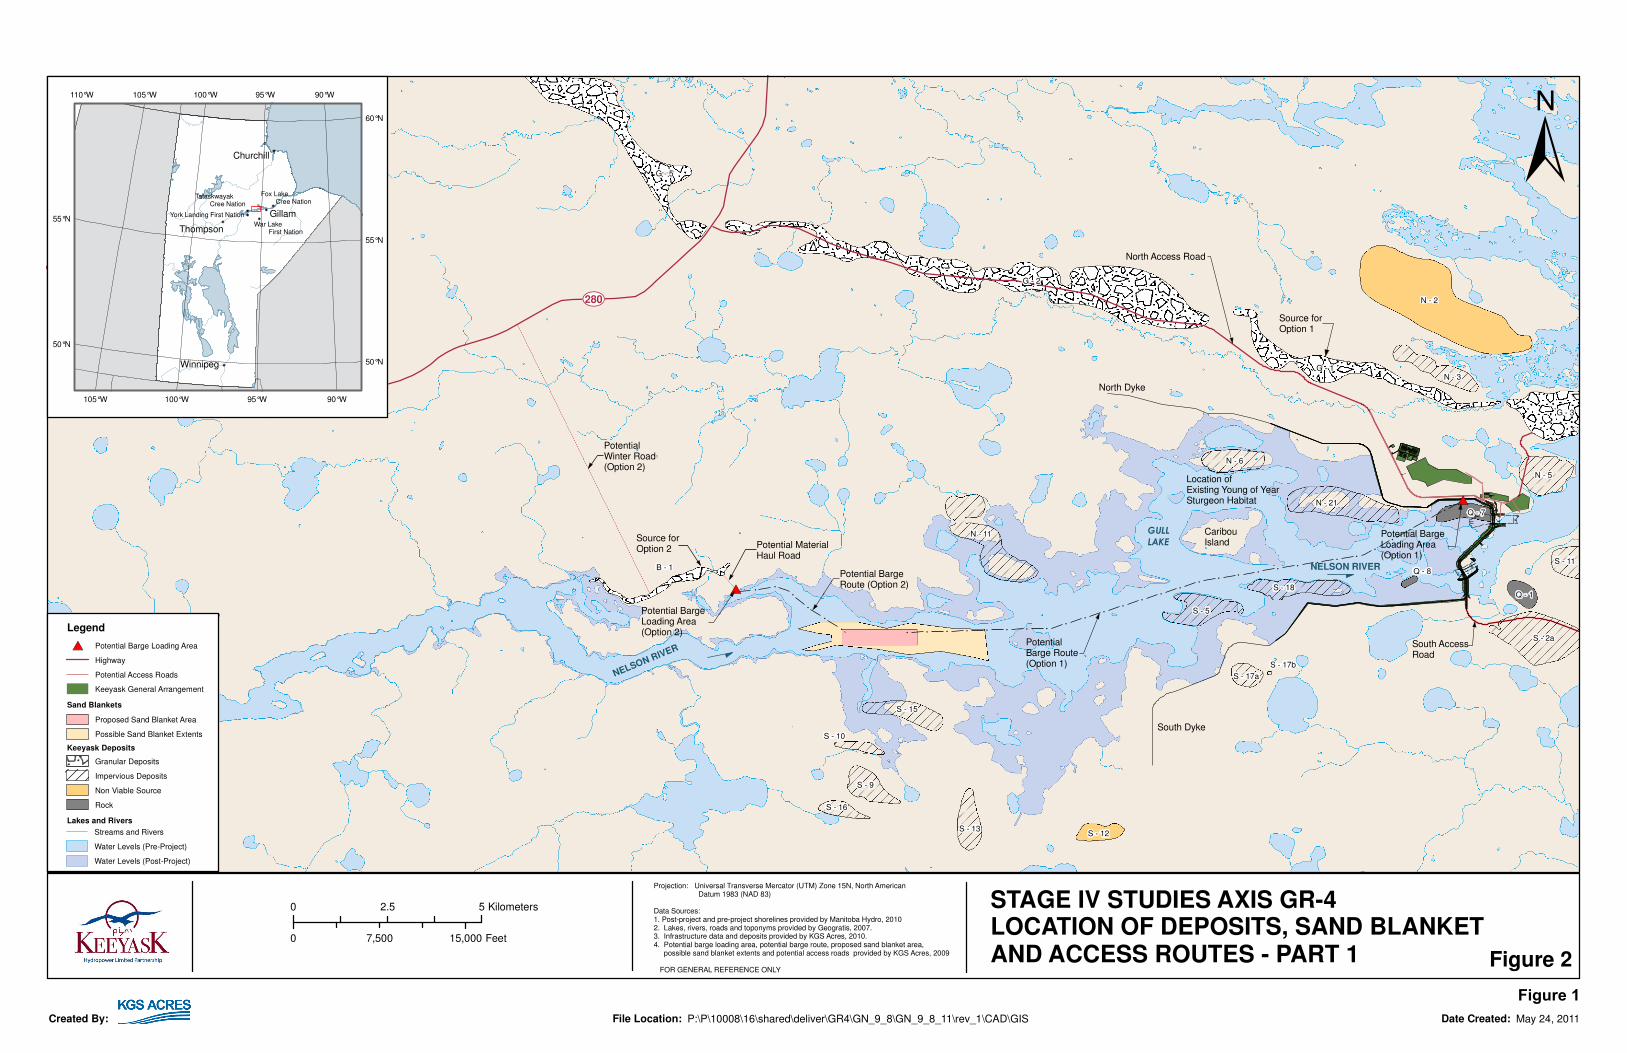
!
!
!
!
!
!
!
!
!
!
!
!
!
!
!
!
!
!
!
!
!
!
!
!
!
!
!
!
!
!!!!!!!!
#*
#*
N - 6
S - 18
G - 3
GULL
LAKE
NELSON RIVER
South Dyke
North Dyke
��280
Source forOption 2
PotentialWinter Road(Option 2)
Potential MaterialHaul Road
Potential BargeLoading Area(Option 2)
Potential BargeRoute (Option 2)
PotentialBarge Route(Option 1)
Potential BargeLoading Area(Option 1)
South AccessRoad
North Access Road
NELSON RIVER
Source forOption 1
CaribouIsland
Location of Existing Young of Year Sturgeon Habitat
S - 11
G - 2
N - 2
G - 5
G - 1
S - 2a
N - 11
N - 21
S
N - 5
S - 5
S - 9
Q - 7
S - 12
N - 3
S - 15
S - 13
B - 1
Q - 1
S - 16
S - 17a
S - 10
Q - 8
S - 17b
±Q
Q
Q
Q
Q
Q
Q
Q
Tataskwayak Cree Nation
York Landing First Nation
Thompson
Gillam
Winnipeg
War Lake First Nation
Fox Lake Cree Nation
Churchill
90°W
90°W
95°W
95°W
100°W
100°W
105°W
105°W110°W
60°N
55°N
55°N
50°N
50°N
Projection: Universal Transverse Mercator (UTM) Zone 15N, North American Datum 1983 (NAD 83)
Data Sources:1. Post-project and pre-project shorelines provided by Manitoba Hydro, 20102. Lakes, rivers, roads and toponyms provided by Geogratis, 2007.3. Infrastructure data and deposits provided by KGS Acres, 2010.4. Potential barge loading area, potential barge route, proposed sand blanket area, possible sand blanket extents and potential access roads provided by KGS Acres, 2009
FOR GENERAL REFERENCE ONLY
STAGE IV STUDIES AXIS GR-4LOCATION OF DEPOSITS, SAND BLANKETAND ACCESS ROUTES - PART 1 Figure 2
Legend
#* Potential Barge Loading Area
Highway
Potential Access Roads
Keeyask General Arrangement
Streams and Rivers
Water Levels (Pre-Project)
Water Levels (Post-Project)
Lakes and Rivers
Keeyask Deposits
Granular Deposits
Impervious Deposits
Non Viable Source
Rock
Sand Blankets
Proposed Sand Blanket Area
Possible Sand Blanket Extents
0 52.5 Kilometers
0 15,0007,500 Feet
Created By: File Location: P:\P\10008\16\shared\deliver\GR4\GN_9_8\GN_9_8_11\rev_1\CAD\GIS Date Created: May 24, 2011
Figure 1

!
!
!
!
!
!
!
!
!
!
!
!
!
!
!
!
!
!
!
!
!
!
!
!
!
!
!
!
!
!
!
!
!
!
!
!
!!!!!!!!!!!!!!!!!!!!!!!!!!
Potential BargeRoute (Option 2)
Proposed Phase ISand Blanket
Proposed Phase IISand Blanket
Potential BargeRoute (Option 1)
±
Projection: Universal Transverse Mercator (UTM) Zone 15N, North American Datum 1983 (NAD 83)Data Sources:1. Lakes, rivers, roads and toponyms provided by Geogratis, 2007.2. Infrastructure data and deposits provided by KGS Acres, 2010.3. Minimum permissible material data, potential barge route and proposed sand blanket area provided by KGS Acres, 20114. Water levels (pre-project) and water levels (post-project) provided by MB Hydro 20105. Habitat suitability index areas provided by North South Consultants, 2011
FOR GENERAL REFERENCE ONLY
STAGE IV STUDIES AXIS GR-4LOCATION OF SAND BLANKETSAND ACCESS ROUTES - PART 2 Figure 4
0 1,000500 Meters
0 3,0001,500 Feet
Created By: File Location: P:\P\10008\16\shared\deliver\GR4\GN_9_8\GN_9_8_11\rev_1\CAD\GIS Date Created: May 17, 2011
Legend
! ! Potential Barge Route
Proposed Sand Blanket Areas
Streams and Rivers
Water Levels (Post-Project)
Water Levels (Pre-Project)
Lakes and Rivers
Minimum Permissible Material to be placedin Post-Impoundment
Very Fine Gravel (2.0 mm - 4.0 mm)
Very Coarse Sand (1.0 mm - 2.0 mm)
Coarse Sand (0.250 mm - 1.0 mm)
Fine Sand (0.125 mm - 0.25 mm)
Finer Material (< 0.125 mm)
Habitat Suitability Index
Optimal Sand Area
0.75 - 1.00 Suitability
Figure 2

!
!
!
!
!
!
#*
B-1
PotentialWinter Road
Potential BargeLoading Area
Potential MaterialHaul Road
166
164
162
174
158
156
176
154
178
168
15
8
164
168
172
162
174
168
164
172
174
154
164
178
164
172
166164
168
172
178
162
168
162
162
162
164
166
166
16
2
164
164
154
164
172
174
162
174
164
176
170
160
170
160
160
160
160
170
160
16
0
160
16
0
160
170
170
160160
170
160
±
Legend
#* Potential Barge Loading Area
! ! Potential Barge Route
Potential Access Roads
Streams and Rivers
Deposit B-1
Proposed Limits of Excavation
Water Levels (Post-Project)
Projection: Universal Transverse Mercator (UTM) Zone 15N, North American Datum 1983 (NAD 83)
Data Sources:1. 1. Post-project and pre-project shorelines provided by Manitoba Hydro, 20102. Lakes, rivers, roads and toponyms provided by Geogratis, 2007.3. Deposits provided by KGS Acres, 2010.4. Potential barge loading area, potential barge route and potential access roads provided by KGS Acres, 2009
FOR GENERAL REFERENCE ONLY
STAGE IV STUDIES AXIS GR-4PROPOSED LIMITS OF EXCAVATIONFOR DEPOSIT B-1 (OPTION 2) - PART 1 Figure 3
0 1,000500 Meters
0 3,0001,500 Feet
Created By: File Location: P:\P\10008\16\shared\deliver\GR4\GN_9_8\GN_9_8_11\rev_1\CAD\GIS Date Created: May 09, 2011
Figure 3

Appendix

P:\P\10008\16\shared\deliver\GR4\GN_9_8\GN_9_8_11\rev_1\Appendix_B.doc
Photo 1: Typical Dump Scow Barge
Photo 2: Transportation of Barge by Truck
+
Source:
Stark, Joseph P. (Great Lakes Shipyard). Message to David Ranta (KGS ACRES) [Email]. “Truckable Workboat and Barges”. November 19, 2009 2:28 PM.

P:\P\10008\16\shared\deliver\GR4\GN_9_8\GN_9_8_11\rev_1\Appendix_B.doc
Photo 3: Typical Tugboat

Plate 1 Keeyask GS, Stage IV Studies – Axis GR-4 Sand Placement Methods
1 ..... : _8 _o(4~ Spr.-d!"II wIttI f>II»Ilne .nd 8affle Plate or Iklx
•
Submel'{lftl Dlt'fIrItt _ Pipeline
\ c
•
7
.~
7
Sind apowtde, B ... ge

CU
STO
ME
RPR
OJE
CT
DR
AW
N B
YR
EV
A
SU
PE
RC
HU
TE
.CO
M
This
doc
umen
t con
tain
s co
nfid
entia
l, pr
ivile
ged
or p
ropr
ieta
ry in
form
atio
n an
d is
to b
e vi
ewed
by
the
Sup
erch
ute
desi
gnat
ed re
cipi
ent o
nly.
Uni
nten
ded
reci
pien
ts a
re p
rohi
bite
d fro
m m
akin
g an
y us
e of
this
doc
umen
t. S
uper
chut
e Fa
ctor
y P
hone
: 1-8
00-3
63-2
488.
Lorin
Spe
vack
, B
.Eng
.M
arch
17,
201
1
Nes
ting
Chu
te fo
r San
dG
reat
Lak
es T
owin
g
Nes
ting
Chu
te fo
r San
d Bar
ge
Alu
min
um S
uppo
rt Fr
ame
• Int
egra
ted
win
ch &
funn
el
B
DE
TAIL
B
A
DE
TAIL
A
Dua
l Dru
m W
inch
Ste
el L
iftin
g C
olla
r• C
ount
erac
ts b
uoya
ncy
of p
last
ic c
hute

Photo 1
Keeyask GS, Stage IV Studies – Axis GR-4
Example of Retractable Plastic Chute with Hopper
Photo 2
Keeyask GS, Stage IV Studies – Axis GR-4
Example of Hopper on Retractable Plastic Chute

Truckable workboats that pay for themselves. Again. Again. And again.
Workboats and Barges Built for a Lifetime.
Not Just a Job.
We will work closely with you to design the perfect workboat solution to match your specific application. Or, maybe one of our standard models will meet your needs. These tough workboats can be delivered in single or twin-screw models, on time anywhere you need them.
If you want a quality workboat or barge that will withstand the test of time, in a tough working environment, put your trust in Great Lakes Shipyard. Whether it's a simple or a complex design, our experienced engineers, construction team
and ABS welders will deliver your vessel on time – at a competitive price.
Models 251 - Single Screw Truckable Work Boat
252 - Twin Screw Truckable Work Boat
Dimensions 25'11" x 10'0" x 4'6" single screw, Up to 300HP, approximately 20,000lbs
25'6" x 13'2" x 5'6" twin screw, Up to 600HP, approximately 25,000lbs
Construction Deck and hull all 1/4"A36 through-out. All seams welded continuously. Bottom, sides and deck framed with 3" x 3" x 1/4" angle on 20" centers. 2 transverse frames of 4" x 5.4" channel installed 7'6" from bow and stern.
Pilot house House is 4'0" x 4'0" x 7'0" and is constructed of 3/16" plate. All windows are of high quality aluminum construc-tion, horizontal sliding type.
Power Train Workboat engines, gears, and shafting to be selected by buyer from multiple manufacturers.
Custom Equipped Buyer to select multiple available op-tions such as generators, electronics, custom pilot houses, coatings, deck equipment and much more.
WorkboaT SPECifiCaTionS
HandySizeWorkboatz-Bargez_sheet.indd 1 11/20/08 12:02:24 PM

Truckable barges built for tough working environments.We can design and build your floating equipment at a competitive price. And, we will deliver it anywhere, on time. Whether you require a deck barge, hopper barge, or a custom designed work platform, our design engineers and experienced construction crews will build the highest quality equipment you can buy, that will stand the test of time.
Great Lakes Shipyard has a long history of new construction, marine fabrication and vessel repair, serving the needs of government and commercial marine industry.Talk to one or our marine professionals today about your floating equipment requirements. Floating docks, tanks, ferries, pontoons, modules, and much more. Our engineers will personally work with you to design, build and equip a truckable unit to fit your working environment. Then, we will deliver it anywhere in the world - on time and on budget.
High-quality marine fabrication, delivered on time, at a competitive price.
breakwall Deck barge naval Work Platform rail barge
1-800-321-3663thegreatlakesgroup.com
For sales and chartering information
bargE SPECifiCaTionS
Standard Sizes Widths 8', 10', or 12'.
Lengths 30', 40', or 50'.
Available as single rake, double rake or box-end units. Custom sizes and designs to meet special requirements are also available.
Plating 1/4" A36 plate throughout
Longitudinal Bottom and sides 3" x 3" x 1/4" angle, framing 20" maximum spacing
Deck 3" x 4" x 1/4" angle, 20" maxi-mum spacing. Transcers frames are 5" x 8# channels box framed with 3" x 3" x 1/4" angle verticals, frames on 5'0" centers.
Pin Connections 3 – 2-1/2" 1045 steel pins with 3/4" x 6" retainer plates, which mate to pocketed pin bosses of 1-1/2" steel plate. The pin bosses are nested inside notched 8" x 20.0# ship channel and welded continuous inside and out.
Lifting Eyes 4 balanced lifting lugs or D-rings per barge, welded continuous and integral to the frames and pinning system.
naval Work Platform
HandySizeWorkboatz-Bargez_sheet.indd 2 11/20/08 12:02:40 PM
HandySize Barge%~
~®GREATLAKES SHIPYARD® THE GREAT LAKES GROUPsM

TAC Public Rd 2 DFO-0033
Page 1 of 1
REFERENCE: Volume: Aquatic Environment Supporting Volume; 1
Section: 6.3.2.7.2 Movements Through Large Rapids; p. 6-27 2
TAC Public Rd 2 DFO-0033 3
ORIGINAL QUESTION AND PREAMBLE: 4 Fish Movements – Importance of Movements. 5
Acoustic and telemetry tagging clearly show movement of lake sturgeon through Gull 6 Rapids. However, due to the limited number of telemetry data, conclusions on habitat 7 use and the types of migration (e.g. spawning) are not practical. Please provide detailed 8 reports showing movement. 9
FOLLOW-UP QUESTION: 10 Detailed reports not provided. 11
RESPONSE: 12 Results of lake sturgeon movement studies reported in the EIS are discussed in data 13 reports 01-14; 02-19; 03-08; 04-05. These reports are provided on the enclosed CD 14 “Technical Reports Referenced in TAC and Public Review, Round 2.” The Aquatic Effects 15 Monitoring Plan (AEMP) describes additional fish movement studies that are being 16 undertaken prior to construction (studies initiated in 2011). A preliminary version of the 17 AEMP was informally provided to DFO and MCWS in fall 2012 for review and 18 consideration; a draft of the AEMP will be formally submitted to regulators during the 19 second quarter of 2013. 20

TAC Public Rd 2 DFO-0043
Page 1 of 1
REFERENCE: Volume: Aquatic Environment Supporting Volume; 1
Section: 6.4.2.2.2. Habitat; p. 6-37 2
TAC Public Rd 2 DFO-0043 3
ORIGINAL PREAMBLE AND QUESTION: 4 "The majority of the lake sturgeon captured in the Long Spruce and Limestone 5 reservoirs are taken in the upper end of the reservoirs where conditions are more 6 characteristic of riverine habitat (NSC 2012). These observations suggest that, while the 7 amount of usable foraging habitat (i.e., WUA) upstream of the Keeyask GS will be higher 8 in the post-project environment, not all this habitat may be selected by either sub-adult 9 or adult fish." 10
This suggests that post the project environment WUA for these life stages may need to 11 be modified using this system specific observations. Please consider these changes in 12 the WUA tables and discuss this in the EIS. 13
FOLLOW-UP QUESTION: 14 WUA, in practice, is the combination of suitabilities. 15
RESPONSE: 16 The original response to TAC Public Rd 1 DFO-0043 was discussed and at a technical 17 review meeting on February 14, 2013, among KHLP, CEAA, DFO and MCWS. 18
It was clarified that in referring to the combination of "suitabilities” that DFO was 19 referring to the product of the suitability values for each of the parameters considered 20 in the HSI (i.e., depth, velocity, and substrate). This method of calculation was used in 21 the HSI analysis.22
TAC Public Rd 2 DFO-0044
Page 1 of 1
REFERENCE: Volume: Aquatic Environment Supporting Volume; 1
Section: 6.4.2.3.1 Habitat; p. 6-40 2
TAC Public Rd 2 DFO-0044 3
ORIGINAL PREAMBLE AND QUESTION: 4 "To compensate for the loss of spawning habitat, several areas will be developed to 5 provide suitable spawning habit" 6
All proposed compensation works should have relevant suitability curves applied and 7 commensurate WUA and HU’s calculated. 8
FOLLOW-UP QUESTION: 9 DFO will require confirmation that methods/analysis for delineation of HADD's are 10 commensurate with the proposed compensation (i.e. HSI or area based descriptions). 11
RESPONSE: 12 The Partnership recognizes that DFO and the Partnership are continuing to discuss the 13 approach to determination of the HADD. The Partnership confirms that 14 methods/analysis for delineation of the HADD will be commensurate with the proposed 15 compensation.16

TAC Public Rd 2 DFO-0045
Page 1 of 5
REFERENCE: Volume: Aquatic Environment Supporting Volume; 1
Section: 6.4.2.3.1 Habitat; p. 6-41 2
TAC Public Rd 2 DFO-0045 3
ORIGINAL PREAMBLE AND QUESTION: 4 "Lake sturgeon could also use habitat in the river below the spillway in years when the 5 spillway is operating at sufficient discharges during the spawning and egg incubation 6 period". 7
Please provide details on performance/success of lake sturgeon spawning habitat use 8 and successful hatch from similar structures developed at the Grand Rapids and 9 Limestone GS’s. 10
FOLLOW-UP QUESTION: 11 Experimental spawning habitat has been developed at Pointe du Bois generating 12 station. Please provide the results. 13
RESPONSE: 14 The proposed spawning shoal at Keeyask was designed based on characteristics of 15 successful structures. Constructed spawning shoals that have been reported in the 16 primary literature include two locations in Quebec, one below the Des Prairie GS 17 (Dumont et al. 2011) and the other in the St. Lawrence River (Johnson et al. 2006) and 18 one in the Detroit River (Roseman et al. 2011). All three are reported to have been 19 successful at improving Lake Sturgeon spawning success. 20
The results of Manitoba Hydro’s tests of constructed spawning shoals at the Pointe du 21 Bois Generating Station on the Winnipeg River are summarized below. It should be 22 noted that the shoals at Pointe due Bois are not a test of the proposed design for the 23 Keeyask Generating Station because the velocity, depth and substrate conditions in the 24 tailraces of the two generating stations are very different. The tests of the constructed 25 shoals at Pointe du Bois were designed to provide an understanding of factors that 26 attract sturgeon to spawn on specific micro-habitats. However, as discussed in the 27 conclusion of this response, some of the information obtained from these tests has 28 been applied to improve the design of the Keeyask spawning shoal. 29
Lake Sturgeon spawning shoals were constructed at four areas below the Pointe du Bois 31 Generating Station, one in 2009 and three in 2010 (Murray and MacDonell 2010, 2012; 32 North/South Consultants Inc., 2011). The intent was to test shoals in various locations to 33
Pointe du Bois Generating Station Lake Sturgeon Spawning Shoals 30

TAC Public Rd 2 DFO-0045
Page 2 of 5
obtain a better understanding the factors influencing selection of spawning locations by 34 Lake Sturgeon. 35
The Pointe du Bois Generating Station is a 100-year-old facility, spanning 150 m of the 36 Winnipeg River with 16 turbine units and a spillway over a natural rock shelf with 97 37 spillway/sluiceway bays. Due to the age of the station, turbines are often off for 38 maintenance and therefore operation cannot be predicted in advance. In 2009, an area 39 downstream of Unit 16 was selected to test construction of a spawning shoal because 40 velocities and depths were within the known ranges used by sturgeon but the existing 41 substrate lacked flow diversity and the interstitial spaces needed for egg incubation. 42
Three additional shoals were constructed in 2010 based on the results of the previous 43 year’s monitoring program. The locations selected for construction were spread out 44 across the face of the generating station to test a variety of flow conditions. The 45 location below Unit 13 was adjacent to Unit 12 where there was some evidence of 46 spawning in 2007 and 2008. The location below Unit 5 was in proximity to units 2-4 47 where there was evidence of spawning from 2007 to 2009. The location below Unit 1 48 was selected because it was immediately downstream of the highest water velocities 49 recorded in the vicinity of the Pointe du Bois powerhouse (~1.8-2.6 m/s). 50
Shoals were constructed by lowering boulders and cobble from a barge and divers then 51 positioned the material on the bottom according to predetermined specifications. The 52 shoals were constructed of coarse cobbles with four large boulders 1-1.5 m in diameter 53 placed in a v-formation at the upstream end. The shoals were expected to provide the 54 necessary cover, turbulence and flow diversity for spawning, and interstitial spaces for 55 egg incubation. 56
Shoals have been monitored via two methods each subsequent spring to determine if: 57 (i) adult sturgeon are orienting to the shoals; and and (ii) spawning is occurring on or 58 near the shoals. A Dual-frequency Identification Sonar (DIDSON) acoustic camera 59 (manufactured by Sound Metrics Corporation, WA) was used during the peak spawning 60 period each spring to observe the abundance and behaviour of fish on the constructed 61 shoals. Egg collection mats were deployed throughout the tailrace and spillway areas 62 with some specifically targeting the experimental shoals to determine where egg 63 deposition was occurring. 64
The Unit 16 spawning shoal was the only shoal present during the 2009 spring spawning 65 season. Very few Lake Sturgeon were observed on or near the shoal and no eggs were 66 collected in its vicinity. Monitoring in 2010, 2011 and 2012 also showed no Lake 67 Sturgeon utilization of the Unit 16 shoal. However, it should be noted that in 2012 the 68 entire west side of the Pointe du Bois GS from Unit 11 on to Unit 16 was not in 69
TAC Public Rd 2 DFO-0045
Page 3 of 5
operation; therefore, Lake Sturgeon were not expected to spawn in the vicinity as they 70 do not spawn in the absence of direct flow. 71
The Unit 13 spawning shoal has been subject to unit outages and has not had direct flow 72 across it during the spawning season since construction. As may be expected, no Lake 73 Sturgeon spawning has been detected on the shoal to 2012. 74
Monitoring of the spawning shoal constructed below Unit 5 was hampered in 2010 and 75 2011 due to difficulties associated with operating the DIDSON camera in the turbulent 76 flow and accurately placing egg mats. However, egg mats located within 10 m of the 77 shoal in both years had the highest frequency of egg captures of any of the shoals. In 78 total, 1285 eggs were collected in 2010 and 1863 eggs were collected in 2011, 600 of 79 which were on egg mats within 5 m of the shoal. In 2012 Unit 5 was not in operation, 80 which allowed the monitoring crews to more safely access the Unit 5 spawning shoal. 81 The DIDSON camera recorded large congregations of adult Lake Sturgeon both on and 82 adjacent to the spawning shoal with the greatest numbers being observed downstream 83 of units 4 and 5. Up to 50 individuals were observed congregating in the area at a time 84 and multiple instances of small groups forming around larger individuals, presumably 85 females, were observed. Potential spawning behavior was noted among these groups, 86 including smaller Lake Sturgeon holding until a larger sturgeon arrived, which was then 87 followed by tails being thrashed against the larger individuals for several seconds. A 88 total of six egg mats were located on the Unit 5 shoal in 2012 resulting in 88 eggs 89 collected with an additional 222 eggs collected within 5 m and 827 within 10 m of the 90 shoal. 91
Monitoring at the Unit 1 spawning shoal was limited throughout the monitoring period 92 due to its location along the edge of the highest velocity areas within the tailrace. The 93 shoal was also placed slightly further away from the dam than the other shoals due to a 94 larger channel present immediately below the station at Unit 1 to accommodate the 95 larger turbine at this location. No egg mats were located directly on the shoal in either 96 2010 or 2011, and only one was located on the shoal in 2012, which resulted in no eggs. 97 Despite this, egg mats located within 10 m of the shoal each year have indicated that 98 spawning is occurring in close proximity to the shoal. In 2010, 1128 eggs were collected 99 from 37 egg mat stations, in 2011, 112 eggs were collected from 16 stations, and in 100 2012 35 eggs were collected from 13 stations. No evidence of Lake Sturgeon spawning 101 was observed using the DIDSON camera on the Unit 1 shoal from 2010 to 2012; 102 however, Lake Sturgeon were observed in both 2010 and 2011 lined up on and near the 103 spawning shoal prior to the peak spawning period. When peak spawning occurred, the 104 Lake Sturgeon appeared to vacate the area below Unit 1 and move further into the 105 tailrace area as increases in Lake Sturgeon numbers were noted at several other 106 locations in the tailrace at this time. In 2012 this movement was not observed; however, 107

TAC Public Rd 2 DFO-0045
Page 4 of 5
this may be due to monitoring commencing closer to the peak spawning time when the 108 Lake Sturgeon may have already moved further into the tailrace area. 109
In summary, the egg mat and DIDSON monitoring data suggests that successful 110 spawning occurred on and near the Unit 5 spawning shoal from 2010 to 2012. The egg 111 mat data also suggests that some spawning likely occurred near the Unit 1 shoal. There 112 is no evidence that either the Unit 13 or Unit 16 spawning shoals have had any success 113 to date. The lack of flow due to unit outages has undoubtedly affected the success of 114 these areas for attracting spawning Lake Sturgeon. 115
Overall, the data suggest that constructed shoals should be built close to the origin of 117 flow and near maximum available water velocities, but still within the sustainable 118 swimming speeds for Lake Sturgeon. The shoals also need to provide flow diversity and 119 nearby staging areas that allow sturgeon to congregate before moving into optimal 120 habitats for egg deposition. These features have been incorporated into the design of 121 the spawning structure proposed for downstream of the Keeyask generating station. 122
Conclusion 116
Data reports listed below are provided on the enclosed CD entitled “Technical Reports 123 Referenced in TAC and Public Review, Round 2.” 124
REFERENCES 125
Murray, L., and D.S. MacDonell. 2010. Lake Sturgeon Spawning Habitat Enhancement 126 Project. A report prepared for Manitoba Hydro by North/South Consultants Inc. 127 #5900.01 09-01. 11 pp. 128
North/South Consultants Inc. 2011. Construction of Shoals to Enhance Lake Sturgeon 129 Spawning Habitat in the Winnipeg River at Pointe du Bois: 2010 Monitoring 130 Program. A report prepared for Manitoba Hydro by North/South Consultants 131 Inc. #5900 10-01. 33 pp. 132
Murray, L., and D. MacDonell. 2012. Construction of Shoals to Enhance Lake Sturgeon 133 Spawning Habitat in the Winnipeg River at Pointe du Bois: 2011 Monitoring 134 Program. A report prepared for Manitoba Hydro by North/South Consultants 135 Inc. #5914 11-05. 24 pp. 136
LITERATURE CITED 137
Johnson, J.H., S.R. LaPan, R.M. Klindt, and A. Schiavone. 2006. Lake sturgeon spawning 138 on artificial habitat in the St Lawrence River. Journal of Applied Ichthyology 22: 139 465-470 pp. 140
Dumont, P., J. D’Amours, S. Thibodeau, N. Dubuc, R. Verdon, S. Garceau, P. Bilodeau, Y. 141 Mailhot, and R. Fortin. 2011. Effects of the development of a newly created 142

TAC Public Rd 2 DFO-0045
Page 5 of 5
spawning ground in the Des Prairies River (Quebec, Canada) on the reproductive 143 success of lake sturgeon (Acipenser fulvescens). Journal of Applied Ichthyology 144 27: 394-404 pp. 145
Roseman, E.F., B. Manny, J. Boase, M. Child, G. Kennedy, J. Craig, K. Soper, and R. 146 Drouin. 2011. Lake sturgeon response to a spawning reef constructed in the 147 Detroit River. Journal of Applied Ichthyology 27 (Suppl. 2): 66-76. 148
TAC Public Rd 2 DFO-0047
Page 1 of 2
REFERENCE: Volume: Aquatic Environment Supporting Volume; 1
Section: 6.4.2.3.1 Habitat; p. 6-41 2
TAC Public Rd 2 DFO-0047 3
ORIGINAL PREAMBLE AND QUESTION: 4 "Because the number of lake sturgeon residing downstream of Gull Rapids is 5 considerably reduced compared to historic levels, a stocking program will be 6 implemented to avoid possible effects of a temporary reduction in rearing habitat 7 should it occur". 8
Given the loss of known high quality YOY habitat north of Caribou Island (future 9 forebay), the known YOY rearing habitat below Gull Rapids must be protected. What 10 measures will be taken to ensure that this habitat will not change, both during 11 construction and operation? 12
FOLLOW-UP QUESTION: 13 The EIS describes, at best an expected small change in habitat composition at this 14 location. At worst, predictions may be wrong and this critical habitat is lost. 15
RESPONSE: 16 In response to the original question, the Partnership noted, “Based on the 17 sedimentation analysis, there will be no long-term change in substrate composition of 18 the YOY habitat downstream of Gull Rapids. Monitoring will determine whether this 19 prediction is correct.” 20
At the technical review meeting among KHLP, CEAA, DFO and MCWS on February 15, 21 2013, the Partnership provided clarification as to the basis for concluding that the sand 22 habitat downstream of the generating station at the entrance to Stephens Lake would 23 not be lost. Key points included: 24
• A map showing the post-Project minus existing environment velocities 25 demonstrates virtually no change in velocity in the area of sand habitat in 26 Stephens Lake downstream of the generating station. Since the pre and post 27 Project changes in hydraulic conditions for a given rate of flow are expected to 28 be minimal in the area of the sand habitat, the change in deposition regime is 29 also expected to be minimal in the area of the sand habitat. 30
• Similar to existing conditions, silts are expected to deposit in this area during 31 lower flow conditions and are expected to remobilize and wash away 32

TAC Public Rd 2 DFO-0047
Page 2 of 2
downstream during higher flows. There would be insufficient time for the silts 33 to consolidate thus allowing the silts to remobilize. 34
• There may be slight shifts in the boundary of the sand area in Stephens Lake as 35 flows change, which is also expected under existing conditions. 36
• Mitigation measures during construction are designed to minimize the addition 37 of sediment to the river. 38
• During operation, when the station is operating in a peaking mode, there will be 39 high flows during the day and lower flows at night. Potential silt accumulation 40 that would occur during the night is expected to be washed away during day. 41
During discussion at the February 15, 2013, technical review meeting, DFO asked that 42 the proponent consider adaptive management measures in the case of unanticipated 43 loss of the sand habitat. The creation of YOY habitat through the placement of sand, as 44 has been described for the reservoir in the response to TAC Public Rd 2 DFO-0026, could 45 be conducted in Stephens Lake. If the results of monitoring indicate that the sand 46 habitat downstream of Gull Rapids is lost as a result of the Project, more sand could be 47 put into Stephens Lake in an area with suitable velocities to provide habitat for YOY 48 sturgeon. While this contingency plan is in place, the proponent expects that this 49 measure will not be required.50
TAC Public Rd 2 DFO-0048
Page 1 of 1
REFERENCE: Volume: Aquatic Environment Supporting Volume; 1
Section: 6.4.2.3.2 Movements; p. 6-43 2
TAC Public Rd 2 DFO-0048 3
ORIGINAL PREAMBLE AND QUESTION: 4 "The phased approach to fish passage…will permit trial implementation of fish passage 5 for lake sturgeon with minimal risk to the Stephens Lake population." 6
The stated risk to the Stephens Lake sturgeon population is not identified. Note, the 7 proponent has been requested to investigate the cost/benefits of various fish passage 8 designs, including cost, environmental cost/benefit, etc. The proponent has retained a 9 consultant for this investigation, which has produced a preliminary report on this 10 comparison. The detailed results of this report should be made available in the EIS for 11 review. 12
FOLLOW-UP QUESTION: 13 A detailed report on options and/or an agreement on post-project fish 14 movement/behaviour have not been provided and/or concluded. 15
RESPONSE: 16
Note that the following response to DFO-0048 is the same as the response to DFO-0049. 17
As clarified at a technical review meeting among KHLP, CEAA, DFO and MCWS on 18 February 14, 2013, all relevant information on fish passage options has been provided to 19 DFO and MCWS in the report entitled “Keeyask Fish Passage Identification of Design 20 Concepts Report, November 29th, 2012“; this report is provided on the enclosed CD 21 entitled “Technical Reports Referenced in TAC and Public Review, Round 2.” 22
The scope of this report is based on a number of meetings and discussions that have 23 occurred with DFO and MCWS since March 2012. Part of these discussions involved an 24 understanding not to select a single fish passage option until the results of post-25 construction monitoring on fish movements and behavior in the immediate vicinity of 26 the Project are available. 27
Like the fish passage report, a preliminary Aquatic Effects Monitoring Plan (AEMP) was 28 provided to DFO and MCWS in fall 2012. This document provides a description of 29 planned fish movement studies, including studies that are being initiated during the pre-30 construction phase of monitoring. A draft of the AEMP will be submitted to regulators 31 in the second quarter of 2013.32

TAC Public Rd 2 DFO-0049
Page 1 of 1
REFERENCE: Volume: Aquatic Environment Supporting Volume; 1
Section: 6.4.2.3.2 Movements; p. 6-43 2
TAC Public Rd 2 DFO-0049 3
ORIGINAL PREAMBLE AND QUESTION: 4 "The phased approach to fish passage…will permit trial implementation of fish passage 5 for lake sturgeon with minimal risk to the Stephens Lake population." 6
Trap and truck was identified as the fish passage option for Keeyask, this method has 7 traditionally been used at high head dams and information behind the rationale for the 8 selection of this option is required. What criteria will be used to determine if and when 9 trap and truck should be implemented? 10
FOLLOW-UP QUESTION: 11 While DFO has been provided a summary report on November 29th, 2012, this report 12 has not (to DFO's knowledge) been made available to the federal review team or the 13 public. Moreover, release of the full report on fish passage options at Keeyask would be 14 ideal. 15
RESPONSE: 16 Note that the following response to DFO-0049 is the same as the response for DFO-17 0048. 18
As clarified at a technical review meeting among KHLP, CEAA, DFO and MCWS on 19 February 14, 2013, all relevant information on fish passage options has been provided to 20 DFO and MCWS in the report entitled “Keeyask Fish Passage Identification of Design 21 Concepts Report, November 29th, 2012“; this report is provided on the enclosed CD 22 entitled “Technical Reports Referenced in TAC and Public Review, Round 2.” 23
The scope of this report is based on a number of meetings and discussions that have 24 occurred with DFO and MCWS since March 2012. Part of these discussions involved an 25 understanding not to select a single fish passage option until the results of post-26 construction monitoring on fish movements and behavior in the immediate vicinity of 27 the Project are available. Like the fish passage report, a preliminary Aquatic Effects 28 Monitoring Plan (AEMP) was provided to DFO and MCWS in fall 2012. This document 29 provides a description of planned fish movement studies, including studies that are 30 being initiated during the pre-construction phase of monitoring. A draft of the AEMP 31 will be submitted to regulators in the second quarter of 2013.32

TAC Public Rd 2 DFO-0051
Page 1 of 5
REFERENCE: Volume: Aquatic Environment Supporting Volume; 1
Section: 6.4.2.3.2 Movements; p. 6-43 2
TAC Public Rd 2 DFO-0051 3
ORIGINAL PREAMBLE AND QUESTION: 4 "There is no information available on turbine mortality rates for sturgeon." 5
Mortality rate for sturgeon should be based on: 1) known mortality for species of a 6 similar size (e.g. pike) for both spillway and turbine and 2) the number of individuals 7 passing the turbines can be calculated based on fish passage studies (e.g. Missi Falls) 8 and a commensurate relative abundance estimates. Please provide detailed reports 9 which describe this. 10
FOLLOW-UP QUESTION: 11 Unclear as to why northern pike cannot be used as a surrogate for lake sturgeon - please 12 clarify. Are mortality rates available for white sturgeon for comparable turbine designs? 13
RESPONSE: 14 By way clarification, the November 2012 response to TAC Public Rd 1 DFO-0051 did not 15 indicate that turbine mortality rates for large Northern Pike could not be used as a 16 surrogate for Lake Sturgeon. Rather, it was stated that mortality rates for large Northern 17 Pike measured at the Kelsey Generating Station cannot be directly used to predict 18 mortality rates at the proposed Keeyask Generating Station as the turbines planned for 19 the Keeyask Generating Station incorporate several features that would reduce 20 mortality. The text from TAC Public Rd 1 DFO-051 (November 2012) stated: 21
“While using a species of similar size is one approach in the absence of other 22 data, the turbines at Kelsey are not similar to the turbines that will be used at 23 Keeyask; the Keeyask turbines incorporate several features that are expected to 24 improve survival over the kind tested at Kelsey (see DFO -0102). Therefore, using 25 results from the turbine mortality studies at the Kelsey Generation Station to 26 directly predict lake sturgeon mortality through turbines at Keeyask, is not 27 advisable.” 28
The response to TAC Public Rd 1 DFO-0051 then provided a table summarizing mortality 29 rates for a variety of turbines for larger fish (including the Northern Pike at the Kelsey 30 Generating Station). As noted in this response, “Survival estimates range from 65-93% 31 and tend to be greater for turbines with a larger diameter and slower rotational speed. 32 As described in DFO-0102, the turbines at the Keeyask Generating Station will have a 33 larger diameter (8.35 m) and slower rotational speed (75 rpm) than any of the 34
TAC Public Rd 2 DFO-0051
Page 2 of 5
generating stations listed in the attached table; these properties are expected to reduce 35 the incidence of fish injury and mortality.” 36
DFO requested any information available for turbine effects to White Sturgeon. To our 37 knowledge no field study on White Sturgeon (or any other sturgeon species) turbine 38 mortality exist for a full-sized hydroelectric generating station (literature search and 39 discussions with specialists in the field of turbine effects on January 28, 2013). The only 40 data that address the topic come from a recent Alden Research Laboratories laboratory 41 study using a pilot scale size Alden/Concepts NREC turbine (approximate diameter of 1 42 m; Amaral and Sullivan, unpublished). These authors experimentally passed several 43 hundred juvenile (mean length of 103 mm) White Sturgeon through the turbine and 44 compared outcomes to results from Alewife (Alosa pseudoharengus; 75.5 mm) and 45 Coho Salmon (Oncorhynchus kisutch; 102 mm). White Sturgeon had higher “immediate” 46 (98.3%) and “total” (97.0%) survival than Alewife and Coho Salmon (~95.5% immediate, 47 ~93.5% total survival). Also, (non-lethal) injury rates of White Sturgeon (~7%) were 48 lower than those of the two other species (15% and 10%, respectively). 49
As discussed at a technical review meeting among KHLP, DFO and MCWS on February 50 15, 2013, and further at a similar meeting on February 22, 2013, an analysis of the 51 potential effect of increased mortality rates on the Lake Sturgeon population based on a 52 population model is provided in TAC Public Rd 2 DFO-0106 (for ease of reference, this 53 response is also copied below). Although precise measures of turbine mortality are not 54 available for adult Lake Sturgeon, this analysis provides insight into potential effects of 55 increased losses from the population. 56
DFO-0106 RESPONSE: 57 The initial question posed by TAC Public Rd 1 DFO-0106 requested acceptable mortality 58 rates for turbine passage based on the fish community and population in the Keeyask 59 study area. The proponent noted, with reference to specific sections of the AE SV, that 60 mortality of fish during passage past the turbines and spillway would reduce the number 61 of fish entering Stephens Lake. Given the relative size of Gull and Stephens lakes, 62 emigration of juvenile and adult fish from Gull Lake to Stephens Lake is not thought to 63 provide a major input to the Stephens Lake population and no material impact of 64 turbine/spillway mortality to the fish community is expected. Construction of the 65 Keeyask Generating Station will also reduce the drift of larval fish from Gull to Stephens 66 lakes. The input of larval Lake Sturgeon from upstream of Gull Rapids may be the source 67 of young Lake Sturgeon in Stephens Lake, given the extremely low numbers of spawning 68 fish observed in the last decade; however, this reduction in larval drift is due to the 69 presence of the reservoir and would not be affected by the turbines. 70
The follow-up question by DFO notes that information on acceptable mortality rates 71 was not provided. In subsequent discussions (technical review meeting on 15 February, 72

TAC Public Rd 2 DFO-0051
Page 3 of 5
2013 among KHLP, CEAA, DFO and MCWS), the Partnership noted that no literature 73 values of “acceptable” turbine mortality rates could be located, though considerations 74 of effects to fish were included in the turbine design at Keeyask. It was noted that, even 75 at stations that do not use modern turbines with features to reduce effects to fish, there 76 is no clear evidence that fish numbers are declining through a series of reservoirs (e.g., 77 Winnipeg River system has eight generating stations; lower Nelson River has three 78 generating stations). DFO noted that a particular concern is with a rare species such as 79 Lake Sturgeon, where the mortality of even a few individuals is of concern. At the 15 80 February, 2013 meeting, it was suggested that examining the effect of increasing 81 mortality rates on Lake Sturgeon using a population model could assist in assessing the 82 potential effects of increased turbine mortality. This analysis was presented at a follow-83 up meeting on February 22, 2013 meeting and is documented below. 84
MORTALITY ANALYSIS USING POPULATION MODEL FOR LAKE STURGEON 85
It should be noted that although this assessment does not deal specifically with turbine 86 mortality or decreased immigration, it does address the permanent loss of individual 87 Lake Sturgeon from the population through decreased survival. The following 88 assumptions are made: 89
1. The current Jolly-Seber model for the Gull Lake population is definitive for other 90 exploited populations (i.e., Stephens Lake) (Nelson and Barth 2012); and 91
2. That the parameters as modeled from Program MARK (White and Burnham 92 1999) are normally and independently distributed. 93
The Burnham Jolly-Seber model estimates new entrants into the population indirectly 94 by modeling the rate of population growth (λ) between each interval where population 95 growth is the net effect of survival and recruitment (White and Burnham 1999) . 96
λi = Ni+1/Ni 97
The formulations for these versions of the Jolly-Seber were developed by Burnham 98 (1991) and Pradel (1996). The key difference between the two parameterizations is that 99 the Pradel-λ approach is conditional upon animals being seen during the study, while 100 the Burnham Jolly-Seber formulation is not. Therefore, the Burnham Jolly-Seber 101 formulation also includes a parameter for the population size at the start of the 102 experiment. This enables the estimation of the population size at each subsequent time 103 point. 104
Table 1. Model output for the best model based on Akaike’s Information Criterion 105 selection in Program MARK (Akaike 1973). 106
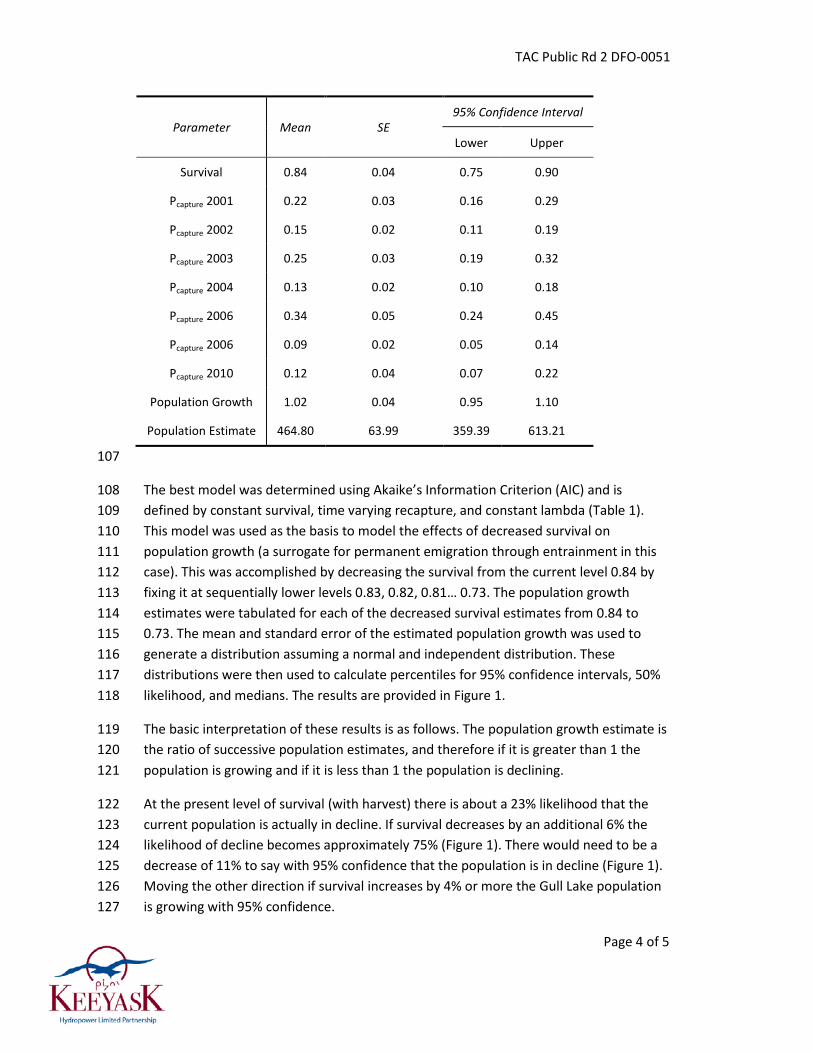
TAC Public Rd 2 DFO-0051
Page 4 of 5
Parameter Mean SE 95% Confidence Interval
Lower Upper
Survival 0.84 0.04 0.75 0.90
Pcapture 2001 0.22 0.03 0.16 0.29
Pcapture 2002 0.15 0.02 0.11 0.19
Pcapture 2003 0.25 0.03 0.19 0.32
Pcapture 2004 0.13 0.02 0.10 0.18
Pcapture 2006 0.34 0.05 0.24 0.45
Pcapture 2006 0.09 0.02 0.05 0.14
Pcapture 2010 0.12 0.04 0.07 0.22
Population Growth 1.02 0.04 0.95 1.10
Population Estimate 464.80 63.99 359.39 613.21
107
The best model was determined using Akaike’s Information Criterion (AIC) and is 108 defined by constant survival, time varying recapture, and constant lambda (Table 1). 109 This model was used as the basis to model the effects of decreased survival on 110 population growth (a surrogate for permanent emigration through entrainment in this 111 case). This was accomplished by decreasing the survival from the current level 0.84 by 112 fixing it at sequentially lower levels 0.83, 0.82, 0.81… 0.73. The population growth 113 estimates were tabulated for each of the decreased survival estimates from 0.84 to 114 0.73. The mean and standard error of the estimated population growth was used to 115 generate a distribution assuming a normal and independent distribution. These 116 distributions were then used to calculate percentiles for 95% confidence intervals, 50% 117 likelihood, and medians. The results are provided in Figure 1. 118
The basic interpretation of these results is as follows. The population growth estimate is 119 the ratio of successive population estimates, and therefore if it is greater than 1 the 120 population is growing and if it is less than 1 the population is declining. 121
At the present level of survival (with harvest) there is about a 23% likelihood that the 122 current population is actually in decline. If survival decreases by an additional 6% the 123 likelihood of decline becomes approximately 75% (Figure 1). There would need to be a 124 decrease of 11% to say with 95% confidence that the population is in decline (Figure 1). 125 Moving the other direction if survival increases by 4% or more the Gull Lake population 126 is growing with 95% confidence. 127

TAC Public Rd 2 DFO-0051
Page 5 of 5
It should be noted that decline in this sense means only that successive population 128 estimates are lower; there is no implication of significance statistical or otherwise. This 129 should be considered a preliminary assessment of effects. Based on the literature 130 minimum viable population size estimates vary between 80-1800 (Schueller and Hayes 131 2011) and between 413 and 2500 for adult spawning females (Velez-Espino and Koops 132 2008). The current estimate for Gull Lake is 465 (this particular model) which is in the 133 range for what the Schueller and Hayes (2011) model determines as a minimum viable 134 population size (see paper for model specifics). The best way to foster increases in 135 population survival and ultimately growth, is to increase the survival for critical life 136 stages which are most sensitive to elasticity (Gross et al. 2002). For Lake Sturgeon this 137 means increasing the survival from egg to yearly; in other words, if population growth is 138 a goal then stocking of yearlings is the fastest and most efficient way to overcome the 139 low population levels for Lake Sturgeon. 140

TAC Public Rd 2 DFO-0054
Page 1 of 1
REFERENCE: Volume: Aquatic Environment Supporting Volume; 1
Section: Appendix 6B.1 Field Data Collection and Analysis; p. 6B-1 2
TAC Public Rd 2 DFO-0054 3
ORIGINAL PREAMBLE AND QUESTION: 4 Appendix 6B Field Data Collection and Analysis 5
Details on mark recapture information are lacking in terms of annual movements. Raw 6 data used for population estimates should be made available. 7
FOLLOW-UP QUESTION: 8 Proponent plan still in production and not available for review. 9
RESPONSE: 10 The report is provided on the enclosed CD entitled “Technical Reports Referenced in 11 TAC and Public Review, Round 2.” 12
Nelson, P.A., and C.C. Barth. 2012. Lake Sturgeon population estimates in the Keeyask 13 Study Area: 1995-2011. Keeyask Project Environmental Studies Program Report # 11-02.14

TAC Public Rd 2 DFO-0055
Page 1 of 1
REFERENCE: Volume: Project Description Supporting Volume; 1
Section: 3.10.2 Management Plans to be Developed; p. 3-32 2
TAC Public Rd 2 DFO-0055 3
ORIGINAL PREAMBLE AND QUESTION: 4 Management Plans to be Developed. 5
All cited management plans should be provided as part of the EIS submission. 6
FOLLOW-UP QUESTION: 7 Proponent plans still in production and not available for review. 8
RESPONSE: 9 The original response to TAC Public Rd 1 DFO-0055 noted that, while the EIS Guidelines 10 do not require the management plans, the Partnership will provide preliminary versions 11 of the management plans to regulators in the first quarter of 2013. Preliminary versions 12 of the monitoring plans will be provided in the second quarter of 2013. 13
Preliminary drafts of the Aquatic Effects Monitoring Plan, the In-stream Construction 14 Sediment Management Plan and the Fish Habitat Compensation Plan were provided to 15 DFO in the fall of 2012 for their review and comment before these preliminary versions 16 are formally filed. 17
1

TAC Public Rd 2 DFO-0057
Page 1 of 3
REFERENCE: Volume: Response to EIS Guidelines; Section: Section: 1
4.3.3 Environmental Mitigation/Compensation; p. 4-14 2
TAC Public Rd 2 DFO-0057 3
ORIGINAL PREAMBLE AND QUESTION: 4 Construction Mitigation - DFO notes that timing for the majority of in-stream work is 5 scheduled between July 16 to September 15. 6
Please provide detailed contingency plans for construction techniques proposed should 7 a request to extend construction beyond proposed dates occur. DFO would appreciate 8 the opportunity to review contingency plans in advance to ensure appropriate decisions 9 with a timely response can be provided. 10
FOLLOW-UP QUESTION: 11 Pre-emptive planning and design required for exemption to time restrictions. 12
RESPONSE: 13 This question is addressed in the response to TAC Public Rd 2 DFO-0086. For ease of 14 review, this response is copied below. 15
DFO-0086 RESPONSE: 16 This response is similar to the response to TAC Public Rd 2 DFO-0057 and DFO-75. 17
The primary tool in reducing the environmental effects of construction is mitigation 18 through construction methods, timing and/or locations, all of which has been integrated 19 into project planning. The secondary tool has been compensation and follow-up, 20 through replacement of predicted losses or harmful alterations and a commitment to 21 monitor effectiveness of compensation measures and modify, if necessary. The question 22 recognizes that there is uncertainty in the planning of construction activities, and 23 unavoidable changes that can occur must be efficiently managed – ideally in a proactive 24 manner, so that contingency options are developed and agreed to prior to the need to 25 apply them. 26
In developing detailed construction schedules, considerable effort has been made to 27 mitigate effects as much as possible by avoiding sensitive timing windows. However, it is 28 recognized that there is potential for the need to undertake in-stream construction 29 during restricted periods (i.e., fall/winter to protect lake whitefish and spring/early 30 summer to protect species such as lake sturgeon/walleye/northern pike) in spawning 31 habitat (Gull Rapids). This has the potential to introduce sediments to these areas 32

TAC Public Rd 2 DFO-0057
Page 2 of 3
during sensitive times. It is also recognized that adaptive management measures need 33 to be in place to deal with this potential. 34
The Keeyask Generation Project In-stream Construction Sediment Management Plan 35 (SMP) documents the adaptive management measures to be taken during construction 36 should sediment monitoring trigger a need for them. A draft of this plan was provided 37 to DFO in October 2012, and will be filed with regulators in the second quarter of 2013. 38 A key tool in the plan is monitoring and communication. Section 4.0 of the SMP outlines 39 the communication protocol for construction site staff and environmental regulators. 40
Once the general civil contractor is retained and throughout the construction process, 41 construction schedules will be monitored on a regular basis and any potential changes 42 that may encroach upon sensitive timing windows or predetermined and/or agreed to 43 timing restrictions will be communicated to the appropriate regulatory authorities to 44 discuss proposed changes and to confirm acceptance prior to implementation where 45 practicable. 46
The SMP also describes the actions planned and potential measures to manage the 47 release of sediments during in-stream construction activities. Considerable effort has 48 already gone into developing in-stream construction methods to minimize impacts as 49 much as practical. Substantial changes in construction techniques and mitigation 50 measures to reduce sediment inputs as a result of changes to the schedule are therefore 51 not anticipated. One caveat to this may involve innovative construction techniques that 52 the general civil contractor may bring once they are selected 53
Section 4.0 of the SMP outlines the adaptive action plans for increases in suspended 54 sediment levels above thresholds set out in the plan. Section 4.3 outlines the 55 management plan for commissioning the spillway and powerhouse. 56
Section 2.4 of the SMP lists the primary mitigation measures for each of the potential 57 sources of sediment for the anticipated in-stream construction activities. Section 2.5 58 lists the secondary mitigation techniques that have been established to address the 59 uncertainty in the predictions of shoreline erosion and impacts to TSS due to in-stream 60 construction activities. It is noted that the estimated impacts to TSS due to construction 61 activities are conservative, which minimizes the likelihood of exceeding the thresholds 62 set out in the SMP for TSS increases above background levels. 63
Appendix A of the SMP lists the various mitigation techniques that could be 64 implemented to address potential sediment problems for the following in-stream 65 construction activities: 66
• Placement of rock fill and rip rap; 67
• Placement of transition fill; 68

TAC Public Rd 2 DFO-0057
Page 3 of 3
• Placement of impervious fill; 69
• Dewatering cofferdams; 70
• Rock excavation and removal of rock fill; 71
• Removal of transition and impervious fill; 72
• First flow through spillway; 73
• First flow through powerhouse; and 74
• Shoreline erosion upstream of cofferdams. 75
Figure 5 in the SMP shows the predicted concentration of TSS for each in-stream 76 activity. It should be noted that these predicted concentrations should not increase if 77 the activity is shifted to other times of the year. The same action plans and mitigation 78 techniques described in the SMP and summarized in the previous response to this 79 question would be applied to protect fish, fisheries and fish habitat. As indicated above, 80 this includes timely communication with DFO and MCWS, applying one or more of the 81 secondary measures described in Section 2.5 and Appendix A of the SMP, and discussing 82 results and the need for follow up with the regulators, as described in the previous 83 response.84

TAC Public Rd 2 DFO-0058
Page 1 of 1
REFERENCE: Volume: Response to EIS Guidelines; Section: 8.0 1
Monitoring & Follow-up; p. N/A 2
TAC Public Rd 2 DFO-0058 3
ORIGINAL PREAMBLE AND QUESTION: 4 Monitoring 5
DFO notes that there are no monitoring plans submitted within the EIS. We look 6 forward to reviewing the following management and monitoring plans (as proposed to 7 be developed in chapter 8 of the EIS): o Sediment Management Plan o Fish Habitat 8 Compensation Plan o Waterways Management Plan o Aquatic Effects Monitoring Plan o 9 Physical Environment Monitoring Plan 10
FOLLOW-UP QUESTION: 11 See DFO-0055 12
RESPONSE: 13 The original response to TAC Public Rd DFO-0055 noted that, while the EIS Guidelines do 14 not require the management plans, the Partnership will provide preliminary versions of 15 the management plans to regulators in the first quarter of 2013. Preliminary versions of 16 the monitoring plans will be provided in the second quarter of 2013. 17
Preliminary drafts of the Aquatic Effects Monitoring Plan, the In-stream Construction 18 Sediment Management Plan and the Fish Habitat Compensation Plan were provided to 19 DFO in the fall of 2012 for their review and comment before these preliminary versions 20 are formally filed. 21
TAC Public Rd 2 DFO-0059
Page 1 of 1
REFERENCE: Volume: Response to EIS Guidelines; Section: 8.0 1
Monitoring & Follow-up; p. N/A 2
TAC Public Rd 2 DFO-0059 3
ORIGINAL PREAMBLE AND QUESTION: 4 Monitoring 5
How will peat deposition be monitored? And assumptions in the EIS verified? (ex. 6 Estimate only 1% of peat will be transported downstream) 7
FOLLOW-UP QUESTION: 8 Proponent plan still in production and not available for review. 9
RESPONSE: 10 A description of proposed monitoring and follow-up activities, as required by the 11 Guidelines, is provided in Chapter 8 of the Response to the EIS Guidelines. Table 8-1 12 indicates that monitoring will be performed with respect to: water and ice regimes; 13 shoreline erosion and peat breakdown; sedimentation; and greenhouse gas. Table 8-2 14 indicates that physical environment monitoring will be performed in support of other 15 monitoring programs for the following: woody debris; dissolved oxygen and water 16 temperature; and total dissolved gas. 17
The preliminary Physical Environment Monitoring Plan will contain additional details. As 18 noted in original response to TAC Public Rd 1 CEAA-0011, while the Guidelines do not 19 require the Physical Environment Monitoring Plan, the Partnership will provide a 20 preliminary version of the plan to regulators in the second quarter of 2013. 21

TAC Public Rd 2 DFO-0060
Page 1 of 1
REFERENCE: Volume: Physical Environment Supporting Volume; 1
Section: Appendix 7C Field Maps (Open Water) and 7D Monitoring 2
Locations (Winter); p. N/A 3
TAC Public Rd 2 DFO-0060 4
ORIGINAL PREAMBLE AND QUESTION: 5 Monitoring 6
Please provide a detailed map of baseline sedimentation sampling sites and proposed 7 monitoring sites? Ideally, future monitoring sites should be located near the baseline 8 sampling sites for accurate comparisons. 9
FOLLOW-UP QUESTION: 10 Proponent plan still in production and not available for review. 11
RESPONSE: 12 A description of proposed monitoring and follow-up activities, as required by the 13 Guidelines, is provided in Chapter 8 of the Response to the EIS Guidelines. Table 8-1 14 indicates that monitoring will be performed with respect to: water and ice regimes; 15 shoreline erosion and peat breakdown; sedimentation; and greenhouse gas. Table 8-2 16 indicates that physical environment monitoring will be performed in support of other 17 monitoring programs for the following: woody debris; dissolved oxygen and water 18 temperature; and total dissolved gas. 19
The preliminary Physical Environment Monitoring Plan will contain additional details. As 20 noted in original response to TAC Public Rd 1 CEAA-0011, while the Guidelines do not 21 require the Physical Environment Monitoring Plan, the Partnership will provide a 22 preliminary version of the plan to regulators in the second quarter of 2013. 23
TAC Public Rd 2 DFO-0061
Page 1 of 1
REFERENCE: Volume: Physical Environment Supporting Volume; 1
Section: Appendix 7B Detailed Description of the Environmental 2
Setting for Mineral Sedimentation; p. N/A 3
TAC Public Rd 2 DFO-0061 4
ORIGINAL PREAMBLE AND QUESTION: 5 Bed Load 6
Between 2005-2007, approximately 350 bedload samples were collected, but this 7 yielded few measurable samples (Appendix 7B). The EIS reports an estimated an 8 average bedload of 4 g/m/s. How reasonable is this estimate given the insufficient 9 samples to estimate the annual bedload discharge? What method(s) will be used to 10 monitor bedload? 11
FOLLOW-UP QUESTION: 12 Proponent plan still in production and not available for review. 13
RESPONSE: 14 A description of proposed monitoring and follow-up activities, as required by the 15 Guidelines, is provided in Chapter 8 of the Response to the EIS Guidelines. Table 8-1 16 indicates that monitoring will be performed with respect to: water and ice regimes; 17 shoreline erosion and peat breakdown; sedimentation; and greenhouse gas. Table 8-2 18 indicates that physical environment monitoring will be performed in support of other 19 monitoring programs for the following: woody debris; dissolved oxygen and water 20 temperature; and total dissolved gas. 21
The preliminary Physical Environment Monitoring Plan will contain additional details. As 22 noted in original response to TAC Public Rd 1 CEAA-0011, while the Guidelines do not 23 require the Physical Environment Monitoring Plan, the Partnership will provide a 24 preliminary version of the plan to regulators in the second quarter of 2013. 25
TAC Public Rd 2 DFO-0065
Page 1 of 1
REFERENCE: Volume: Physical Environment Supporting Volume; 1
Section: 7.2.5.1 Mineral Sedimentation and Appendix 7A.2.2 2
Stephens Lake Sedimentation During Construction Model; p. 7-11 3
and 7A-25 4
TAC Public Rd 2 DFO-0065 5
ORIGINAL PREAMBLE AND QUESTION: 6 Sedimentation – TSS 7
Assumption that 70% of all fine particles will remain in suspension past Kettle GS. How 8 can they determine this? Has this been modelled? How will the model/assumptions be 9 tested? 10
FOLLOW-UP QUESTION: 11 Proponent plan still in production and not available for review. 12
RESPONSE: 13 A description of proposed monitoring and follow-up activities, as required by the 14 Guidelines, is provided in Chapter 8 of the Response to the EIS Guidelines. Table 8-1 15 indicates that monitoring will be performed with respect to: water and ice regimes; 16 shoreline erosion and peat breakdown; sedimentation; and greenhouse gas. Table 8-2 17 indicates that physical environment monitoring will be performed in support of other 18 monitoring programs for the following: woody debris; dissolved oxygen and water 19 temperature; and total dissolved gas. 20
The preliminary Physical Environment Monitoring Plan will contain additional details. As 21 noted in original response to TAC Public Rd 1 CEAA-0011, while the Guidelines do not 22 require the Physical Environment Monitoring Plan, the Partnership will provide a 23 preliminary version of the plan to regulators in the second quarter of 2013. 24

TAC Public Rd 2 DFO-0066
Page 1 of 2
REFERENCE: Volume: Response to EIS Guidelines; Section: 8.0 1
Monitoring & Follow-up; p. N/A 2
TAC Public Rd 2 DFO-0066 3
ORIGINAL PREAMBLE AND QUESTION: 4 Sedimentation – TSS 5
Suggest that discrete data loggers (TSS) are better than continuous collection data 6 loggers. Discrete loggers should be verified using point sampling to verify data loggers 7 especially in the first year. The use of discrete data loggers for existing environment and 8 post project post project environment. The continuous data loggers are too variable and 9 subject to error due to bio-fouling. 10
FOLLOW-UP QUESTION: 11 Would the proponent please extract those parts of any sediment management plan 12 (their answer states that it will be provide in the first quarter of 2013) that provides 13 additional information pertinent to the question? Proponent plan still in production and 14 not available for review. 15
RESPONSE: 16 The Partnership provided a preliminary draft of the Sediment Management Plan for In-17 stream Construction to regulators on October 17, 2012 and a revised draft will be 18 provided during the 2nd quarter of 2013. 19
With respect to the issue of biofouling, Section 3.4.1 of the draft SMP states: 20
“The YSI turbidity loggers that will be used for the Project are equipped with self-21 cleaning sensors with integrated wipers to remove biofouling and maintain high 22 data accuracy. However, the loggers will be visited every two weeks to maintain 23 and clean the monitoring system (and free them of algae and vegetation debris) 24 to avoid erratic spikes in data.” 25
At the request of the regulators, Section 3.4.1 will be revised to include additional 26 maintenance and manual sampling to determine if there are problems with loggers such 27 as biofouling. 28
Further, with regards to discrete sampling, Section 3.4 of the draft SMP states: 29
“In-situ turbidity logger data will be supplemented through manual monitoring 30 of turbidity using handheld loggers and collecting water samples. At each 31

TAC Public Rd 2 DFO-0066
Page 2 of 2
location, water samples will also be collected for analysis of TSS to confirm or 32 improve the Tu-TSS relationship. Manual sampling will consist of the collection 33 of turbidity measurements and water sampling at near surface, mid-depth, and 34 near-bottom depths in the water column along a river cross section in the 35 vicinity of the turbidity loggers (SMP sites).” 36
The draft SMP thus provides for maintenance and data checks to ensure that the in-situ 37 loggers are accurately measuring and reporting in-stream turbidity.38

TAC Public Rd 2 DFO-0067
Page 1 of 2
REFERENCE: Volume: Response to EIS Guidelines; Section: 8.0 1
Monitoring & Follow-up; p. N/A 2
TAC Public Rd 2 DFO-0067 3
ORIGINAL PREAMBLE AND QUESTION: 4 Sedimentation – TSS 5
EIS proposes to have the first post project monitoring station 1km downstream of the 6 construction site in the “fully mixed zone”. The location of the first monitoring station 7 downstream of Keeyask construction site is too far away to assess impacts and 8 effectiveness of mitigation. It is recommended that a turbidity/TSS monitoring site be 9 placed at the construction site. 10
FOLLOW-UP QUESTION: 11 Would the proponent please extract those parts of any sediment management plan 12 (their answer states that it will be provide in the first quarter of 2013) that provides 13 additional information pertinent to the question? Proponent plan still in production and 14 not available for review. 15
RESPONSE: 16 The Partnership provided a preliminary draft of the Sediment Management Plan for In-17 stream Construction to regulators on October 17, 2012 and a revised draft will be 18 provided during the 2nd quarter of 2013. 19
Section 3.3 of the SMP notes the following with respect to the location of the first 20 downstream monitoring site (SMP-2): 21
”SMP-2 will be located approximately 1.5 km downstream of all in-stream 22 sediment sources from the Project and is a near-field location within the mixing 23 zone prior to fully mixed conditions. Loggers will be installed at two sites (SMP-24 2L and SMP-2R) located evenly across the channel width to monitor for sediment 25 plumes that may be located closer to one shoreline. [Drafting Note: Based on 26 discussions with regulators, the text describing the location of SMP-2 will be 27 revised to more accurately indicate that the distance between in-stream 28 construction activity and SMP-2 depends upon the structure being constructed. 29 The following revision is proposed: ‘SMP-2 will be located approximately 1.5 km 30 downstream of the powerhouse structure, or approximately 0.7 km to 3 km 31 downstream of sediment sources from the Project due to in-stream construction 32 depending on which structure is being constructed. This is a near-field location 33
TAC Public Rd 2 DFO-0067
Page 2 of 2
within the mixing zone prior to fully mixed conditions. Loggers will be installed 34 at two sites (SMP-2L and SMP-2R) located evenly across the channel width to 35 monitor for sediment plumes that may be located closer to one shoreline.’]” 36
As noted in the response to the original information request, based on the experience of 37 field staff who conducted baseline monitoring studies, moving the SMP-2 monitoring 38 site further upstream is problematic due to potentially high water velocities, possible 39 presence of large standing waves and large waves that can develop due to high winds 40 on Stephens Lake. While it may be possible to navigate further upstream, conditions can 41 present unacceptable safety hazards for equipment and people that need to work in a 42 stationary position for lengthy periods of time.43
1

TAC Public Rd 2 DFO-0068
Page 1 of 5
REFERENCE: Volume: Response to EIS Guidelines; Section: 8.0 1
Monitoring & Follow-Up; p. N/A 2
TAC Public Rd 2 DFO-0068 3
ORIGINAL PREAMBLE AND QUESTION: 4 Sedimentation – TSS 5
Can the Proponent provide an analysis showing that its monitoring will have a high 6 degree of confidence, or the power, to detect TSS above the action threshold? 7
FOLLOW-UP QUESTION: 8 Would the proponent please re-state their answer to the question rather than refer to 9 another response? Proponent plan still in production and not available for review. 10
RESPONSE: 11 The original response to DFO-0068 pointed the reader to the response for DFO-0084, 12 which reads: 13
“The In-stream Construction Sediment Management Plan (SMP) will utilize 14 continuous, real time turbidity measurements as a proxy for total suspended 15 solids (TSS) concentrations, which cannot be measured in real time. Turbidity 16 readings will be converted to TSS concentration based on a regression equation 17 relating turbidity to TSS. The regression equation was developed based on 18 turbidity and TSS data collected in the study area between Clark Lake and the 19 entrance to Stephens Lake in open water periods from 2007-2009. The regional 20 regression equation was tested on an independent data set not used to develop 21 the relationship and calculated average TSS was within 1.2 mg/L of measured 22 average TSS. The SMP will be used to measure change in TSS between a 23 monitoring site upstream and a site downstream. It will, therefore, be an 24 assessment of relative difference between the TSS at monitoring sites upstream 25 and downstream of the in-stream construction activities. Note that the 26 relationship will be revised if necessary during construction. Revision would be 27 based on TSS test results for water quality samples obtained during routine 28 maintenance of the SMP loggers. Maintenance will occur approximately every 2 29 weeks. Overall, it is expected that the regional turbidity-TSS relationship will be 30 able to reliably indicate if TSS increases due to construction exceed SMP action 31 thresholds. 32

TAC Public Rd 2 DFO-0068
Page 2 of 5
CEAA-0011 provides information about the Partnership’s environmental 33 protection program, including the In-stream Construction Sediment 34 Management Plan. The Partnership intends to provide a preliminary version of 35 that report to regulators in the first quarter of 2013.” 36
The Partnership provided a preliminary draft of the Sediment Management Plan for In-37 stream Construction (SMP) to regulators on October 17, 2012 and a revised draft is 38 being filed with regulators at the end of April 2013. 39
The response to TAC Public Rd 2 DFO-0078 provides additional discussion pertaining to 40 the detection of TSS increases above action thresholds specified in the SMP. The 41 response to that question is copied below. 42
DFO-0078 RESPONSE: 43 The proponent understands that the question is asking for a statistical characterization 44 of the historic total suspended solids (TSS) data to be used as a background criterion 45 against which observed TSS during construction would be compared. Based on this 46 understanding, the question suggests that TSS levels obtained from monitoring for the 47 Sediment Management Plan for In-Stream Construction (SMP) would be compared with 48 baseline data to determine if TSS increases due to in-stream construction exceed action 49 levels specified in the SMP. The proponent notes that the SMP uses real time 50 monitoring of ambient in-stream conditions to measure changes in TSS in the river as in-51 stream work is taking place. The monitoring is not based upon the measurement of 52 changes relative to conditions observed in the pre-Project baseline studies. 53
Implementation of the SMP will involve identifying changes in TSS between a reference 54 monitoring site (SMP-1) just upstream of in-stream construction, a site (SMP-2) in the 55 mixing zone just downstream of in-stream construction, and a site (SMP-3) in a fully 56 mixed zone further downstream. The monitoring is designed to detect if an in-stream 57 construction activity causes an increase in ambient TSS between SMP-1 and SMP-2 that 58 exceeds specified action levels. The SMP (Sec. 4) describes actions to be taken to reduce 59 the effects of in-stream construction if it causes TSS to increase by 200 mg/L or more in 60 a 15-minute averaging period or 25 mg/L or more in four consecutive 15-minute 61 averaging periods. The action levels at SMP-2 are set so that increases due to 62 construction can be addressed in sufficient time to take action to attempt to maintain 63 the 24-hour average increases at SMP-3 (relative to SMP-1) below 25 mg/L as well as the 64 areas downstream of SMP-3. 65
The SMP will use automated probes to continuously measure ambient turbidity levels in 66 the river in real time as in-stream work is occurring, and will continuously transmit the 67 data to an on-site environmental office. Turbidity values will be converted to TSS 68 concentrations using a linear regression relationship between turbidity and TSS based 69
TAC Public Rd 2 DFO-0068
Page 3 of 5
on data collected during baseline environmental monitoring studies. During in-stream 70 work, samples of water at the monitoring stations will be periodically collected and 71 analyzed for TSS to confirm or adjust the turbidity-TSS relationship, as required. It is 72 anticipated that each probe will measure and transmit several dozen turbidity 73 measurements every hour and hundreds of measurements per day. 74
Because the SMP is based on real-time monitoring, the background TSS at SMP-1 and 75 the TSS at SMP-2 and SMP-3 will vary in real-time as ambient conditions change. Thus 76 the calculation of TSS changes and determination of whether or not action levels are 77 exceeded is based on ambient conditions while in-stream work is taking place. The SMP 78 monitoring does not measure TSS changes relative to fixed background criteria (e.g., 79 seasonal or annual) based on data from pre-Project environmental studies. 80
Although the SMP is based on ambient TSS conditions rather than a comparison with 81 pre-Project monitoring data, an a-priori power analysis was performed to determine the 82 number of samples required to detect changes equal to the specified action levels (i.e., 83 the effect size to be detected). The analysis assumes that the standard deviation of TSS 84 from the baseline data used to develop the turbidity-TSS relationship (see Figure 1 85 below) are representative of the standard deviations of the SMP measurements over 86 the 15-minute and 1-hour averaging periods at SMP-2 and the 24-hour averaging period 87 at SMP-3. The power analysis employed methods described in the documents Metal 88 Mining Technical Guidance for Environmental Effects Monitoring (Environment Canada, 89 2012, Ottawa) and Guidance Document on Collection and Preparation of Sediments for 90 Physicochemical Characterization and Biological Testing (Environment Canada, 91 Environmental Protection Series Report, EPS 1/RM/29, 1994, Ottawa). Assuming 5% 92 significance coefficients (α = β =0.05; power=1- β=95%), approximately four 93 measurements are required to detect effect sizes of 25 mg/L and 200 mg/L, while 94 approximately 40 samples would be required for an effect size of 5 mg/L. Based on the 95 anticipated sampling frequency, a sufficient number of measurements will be obtained 96 to detect TSS changes equal to the action levels over the specified averaging periods 97 with a high level of power. 98
As noted above, TSS at the SMP monitoring sites will be calculated using a linear 99 regression relationship between turbidity and TSS (SMP, Sec. 3.2). In order for 100 calculated TSS differences between the upstream reference site (SMP-1) and the 101 downstream sites (SMP-2, SMP-3) to be considered statistically significant, the sum of 102 the confidence intervals for the TSS estimates at SMP-1 and SMP-2 or SMP-3 must be 103 less than the effect sizes to be measured. Based on the 95th percentile confidence 104 intervals for the linear regression (Figure 1) and assuming typical TSS concentrations of 105 about 5 mg/L to 30 mg/L at the reference site (SMP-1), TSS differences of 200 mg/L 106

TAC Public Rd 2 DFO-0068
Page 4 of 5
between SMP-1 and SMP-2 or 25 mg/L between SMP-1 and SMP-2 or SMP-3 would be 107 considered statistically significant. 108
109 Figure 1: TSS-Turbidity Relationship for the Nelson River at Keeyask 110
Two locations will be monitored at each SMP monitoring site, with the locations spaced 111 evenly across the river (i.e., left and right side of channel). Pre-project TSS monitoring 112 across transects at sampling sites K-S-06 (location of SMP-1) and K-S-07 (just upstream 113 of SMP-2) found that TSS typically had a small variation across the river width. From 114 eight sets of TSS transect data at K-S-06 (five sample points across the river) from 2005-115 2007, the average standard deviation of TSS across the river was 1.4 mg/L. At K-S-07 the 116 average standard deviation from seven sets of transect data was 1.2 mg/L. On average, 117 the standard deviations were less than 10% of the average TSS concentration across the 118 transects. Due to the low variation in TSS across the river width, sampling at two 119 locations at each SMP site is expected to reasonably represent average conditions at 120 each site for the purposes of the SMP monitoring program. Because site SMP-2 is in the 121 mixing zone downstream of in-stream construction, the variability in TSS across the river 122 will likely be greater than observed in the existing environment if in-stream work causes 123 an increase in TSS at SMP-2. Based on discussions with regulators (March 25, 2013; 124 Canadian Environmental Assessment Agency; Fisheries and Oceans; Environment 125 Canada), methods are being developed to confirm that site SMP-2 is able to detect 126 changes in TSS concentrations due to in-stream construction activities. A potential 127 method that is being explored is to augment the ambient measurements from the in-128
0
10
20
30
40
50
60
0 10 20 30 40 50 60
TSS
(mg/
L)
Turbidity (NTU)
Measured Data
95% Confidence Interval
Linear Regression

TAC Public Rd 2 DFO-0068
Page 5 of 5
situ data loggers with additional manual readings. Potential revisions to the proposed 129 SMP monitoring will be the subject of additional discussions with the regulators. 130
1
TAC Public Rd 2 DFO-0069
Page 1 of 7
REFERENCE: Volume: Aquatic Environment Supporting Volume; 1
Section: 2.5.2.2.5 Total Suspended Solids/Turbidity; p. 2-66 to 2-2
68 3
TAC Public Rd 2 DFO-0069 4
ORIGINAL PREAMBLE AND QUESTION: 5 Sedimentation – TSS 6
The Proponent appears not to discuss effects of TSS specific to the individual VEC fish 7 species. The Proponent’s impact assessment appears to rely primarily on lethal TSS 8 concentration effects. Can the Proponent provide an expanded discussion of sub-lethal 9 or chronic impact risk assessment for anticipated TSS changes? 10
FOLLOW-UP QUESTION: 11 Would the proponent please extract those parts of the EIS referred to and re-phrase 12 them in a manner that provides a more detailed answer to the question? 13
RESPONSE: 14 The following text has been taken from the AESV in response to this request. To 15 highlight the sections of text that provide a more detailed answer to the question as per 16 the reviewer’s request, some sections have been bolded: 17
“Changes in TSS may affect primary producers (through changes in the 18 characteristics and penetration of light), fish, and invertebrates. Fish and 19 invertebrates may be directly or indirectly affected by changes in TSS. Direct 20 effects to fish and invertebrates are generally considered in terms of increases 21 in TSS and may include behavioural alterations, reduced growth or condition, 22 physiological stress, and in the most severe instances mortality. Indirect effects 23 include changes in the food web (e.g., reductions in primary production due to 24 reduced water clarity, reduced abundance of benthic invertebrates due to 25 increased TSS and/or sedimentation causing reductions in the abundance of fish 26 diet items), which are considered in Section 4. Potential effects of changes in 27 TSS on water clarity are discussed in the “Water Clarity” section below. 28
Increases in TSS within the order of tens to hundreds of mg/L are generally 29 associated with sub-lethal effects to fish such as behavioural alterations, 30 reduced growth or condition, and physiological stress (e.g., DFO 2000). Acute 31 toxicities are generally reported for concentrations ranging from the hundreds 32 to hundreds of thousands of mg/L (DFO 2000; Robertson et al. 2006). Therefore, 33

TAC Public Rd 2 DFO-0069
Page 2 of 7
the predicted maximum increases in organic TSS in the flooded, lentic areas of 34 the reservoir in Year 1 could result in sub-lethal effects to fish, but estimated 35 concentrations are well below acute toxicity levels. Sub-lethal effects may 36 include alterations in behaviour, such as feeding and predation, growth, and 37 condition. 38
Increases in organic TSS are predicted to decrease rapidly after initial full 39 impoundment. As described in the PE SV, Section 7, maximum concentrations of 40 organic TSS in the peat transport zones are predicted to range from less than 1 41 to 4 mg/L in Year 2 and by less than 1 to 1 mg/L by Year 5. Therefore, it is 42 expected that increases in TSS would remain within the chronic Manitoba PAL 43 water quality objective and CCME PAL guideline (5 mg/L change from 44 background) by Year 2 of operation. 45
There are few studies that have reported the acute or chronic toxicity of TSS 46 to fish species represented in the Aquatic Environment Study Area. Lawrence 47 and Scherer (1974) reported that the 96-hour lethal concentration (LC50) for 48 lake whitefish (Coregonus clupeaformis) was 16,613 mg/L. McKinnon and 49 Hnytka (1988) found relatively high increases in TSS (instantaneous maximum = 50 3,524 mg/L and 1-day average concentration = 524 mg/L) caused by winter 51 pipeline construction did not have any direct effect (no downstream emigration 52 and no mortalities) on the fish community of Hodgson Creek, NT. This study is 53 notable as four of the fish species found in Hodgson Creek - northern pike (Esox 54 lucius), lake chub (Couesius plumbeus), longnose sucker (Catostomus 55 catostomus), and burbot (Lota lota) - are also found in the Aquatic Environment 56 Study Area. 57
As indicated in Section 5.4.2, northern pike may spawn in the nearshore areas 58 of the Keeyask reservoir, even during the initial years of operation. Therefore, 59 early life history stages of northern pike may be exposed to elevated 60 concentrations of TSS for several years post-impoundment. No information on 61 the acute or chronic toxicity of TSS to northern pike eggs or larvae could be 62 located. Information for early life history stages of other species represented 63 in the Aquatic Environment Study Area is also sparse and many of the 64 available studies do not differentiate between the effects of suspended 65 particulate materials and sediment deposition. However, the available 66 scientific literature indicates a potential for reduced hatching success in 67 salmonids exposed to elevated TSS concentrations on the order of two months 68 or more, at concentrations ranging from 6.6–157 mg/L (Table 2-17). In 69 addition, northern pike eggs would also be exposed to the combined effects of 70 sedimentation and elevated TSS. Therefore, should northern pike spawn in the 71

TAC Public Rd 2 DFO-0069
Page 3 of 7
nearshore, flooded areas of the reservoir in the initial years of operation 72 where organic TSS will be notably elevated, reduced hatching success of 73 northern pike eggs is likely. 74
Conversely, elevated TSS and turbidity can provide benefits to some fish species 75 and life history stages. Reduced water clarity can reduce the risk of predation by 76 visual predators, which in turn can enhance survival of juvenile fish (e.g., Sweka 77 and Hartman 2003) and may favour planktivorous fish (De Robertis et al. 2003). 78 Alternatively, increased TSS and turbidity may be detrimental to visual 79 predators (De Robertis et al. 2003). Therefore, nearshore areas may favour 80 some fish species and/or life history stages during the initial years of operation 81 when TSS is notably elevated.” 82
As per discussions during a February 15, 2013, technical review meeting among KHLP, 83 DFO and MCWS, a model was used to analyze the severity of effects of predicted low 84 level increases in TSS and is discussed in the response to TAC Public Rd 2 DFO-0085. The 85 effects of sediment deposition on fish habitat are discussed in TAC Public Rd 2 DFO-86 0073. For convenience, they are copied below. 87
DFO-0073 RESPONSE: 88 A description of proposed monitoring and follow-up activities, as required by the 89 Guidelines, is provided in Chapter 8 of the Response to the EIS Guidelines. The 90 preliminary Physical Environment Monitoring Plan will contain additional details. As 91 noted in original response to TAC Public Rd 1 CEAA-0011, while the Guidelines do not 92 require the Physical Environment Monitoring Plan, the Partnership will provide a 93 preliminary version of the plan to regulators in the second quarter of 2013. 94
With respect to information on thresholds for risk of sediment deposition, the aquatic 95 habitat assessment assumed that all areas in the reservoir where fine sediment (i.e., silt) 96 would be deposited over sand, gravel, or coarser substrate would, in the long term, be 97 classified as fine sediment. Therefore, there is no “threshold for risk of sediment 98 deposition”; it was recognized that even very small amounts of annual deposition (e.g., 99 0.5 cm) over several decades would result in the accumulation of substantial amounts of 100 silt. 101
Effects of sediment (i.e., silt) deposition on aquatic habitat in the reservoir in the long 102 term (i.e., after 30 years of impoundment) were assessed based on whether or not 103 sediment (i.e., silt) deposition was predicted(AESV Appendix 3B). The presence or 104 absence of sediment deposition was used to determine whether a qualitative change of 105 substrate type would occur. Studies of Stephens Lake showed that sites of net 106 deposition, despite varying sediment deposition rates, develop a homogenous silt 107 surficial layer within 30 years of impoundment. This silt layer completely covered the 108

TAC Public Rd 2 DFO-0069
Page 4 of 7
underlying materials, although the depth of silt varied depending on location (see AESV 109 Appendix 3B, photo 3B-2). Therefore, the rate of sediment deposition is not the primary 110 determinant of substrate availability three decades after impoundment. Instead, the 111 approach to determine the long term type of substrate was to identify the boundaries of 112 sites of net deposition (for methods see AE SV Appendix 3B). 113
Downstream of the generating station, the change in flow distribution in the river within 114 3 km of the generating station will create shoreline areas with minimal flow, where silt 115 is expected to accumulate over rock in the long term (see AE SV Map 3-34). Further 116 downriver (including at the area of the present day sand lens in Stephens Lake), the 117 velocity post-Project will essentially be the same as today so deposited materials would 118 be redistributed over time as they are today (PE SV Section 7.4.2.2.4). Superimposition 119 of like materials would not change the habitat type (e.g., sand deposited on the sand 120 lens will not change the habitat classification). It should be noted that sediment 121 deposition and re- suspension occurs in the existing environment and will continue post-122 Project. 123
The description of sedimentation downstream of the generating station in PE SV Section 124 7.4.2.2.4 is reproduced below: 125
“7.4.2.2.4 Mineral Sediment Deposition 126
As discussed earlier in this section, some of the relatively coarser sediment 127 material would be deposited in the Keeyask reservoir. Absence of relatively 128 coarser material in the flow in the Post-project environment downstream of 129 Keeyask GS would likely cause reduction in deposition currently observed in the 130 existing environment in Stephens Lake, particularly near the upstream end of the 131 lake. It is expected that Project impact on the mineral deposition would be 132 limited to a reach of approximately 10 km to 12 km from the Gull Rapids. 133
As discussed earlier in Section 7.4.1.1, a young of year habitat area for Lake 134 Sturgeon currently exists downstream of Gull Rapids near a sand and 135 gravel/sand bed. Two-dimensional modelling was used to assess the spatial 136 distribution of the potential for suspended material to be deposited near the 137 young of yeah habitat area under Post-project conditions. The modelling results 138 indicate that it is unlikely that silt will deposit near the young of year habitat 139 under on-peak flows, such as all seven powerhouse units. 140
Under off-peak flows, such as one Powerhouse unit, there is a higher potential 141 for silt deposition near the young of year habitat area compared to the existing 142 environment. However, due to the relatively short duration of off-peak flows, the 143 amount of silt deposition would be very small and will likely be eroded from the 144
TAC Public Rd 2 DFO-0069
Page 5 of 7
bed under on-peak flows. Map 7.4-26 illustrates the potential for sediment 145 deposition as well as the existing substrate immediately downstream of the 146 Keeyask GS under all seven Powerhouse units operating at best gate flow. A 147 detailed description of this two-dimensional modeling can be found in Appendix 148 7A.” 149
Maps and tables providing the areas of different types of substrate in the existing and 150 post-Project environment are provided in the response to TAC Public Rd 2 DFO-0014. 151 These are reproduced below for your convenience. 152
DFO-0085 RESPONSE: 153 Predicted effects of altered total suspended solids (TSS) on aquatic life in the Keeyask 154 area are discussed in the Aquatic Environment Supporting Volume (AE SV) and provided 155 in the response to TAC Public Rd 2 DFO-0069. As noted in the AE SV, we are not aware 156 of studies assessing the effect of low level increases of TSS on fish species in the Keeyask 157 area. In the absence of data, the reviewer requested hypothetical modeling for 158 evaluation of sub-lethal risks; we are only aware of the Severity of Ill Effects model (SEV) 159 developed by Newcombe and Jensen (1996) for this purpose. However, as discussed 160 below, this model is not able to accurately predict the effects of low levels of TSS on 161 aquatic life. Nevertheless, the requested assessment was conducted and is provided 162 below. 163
Manitoba water quality objectives (MWS 2011) and CCME water quality guidelines 164 (1999; updated to 2013) for TSS for the protection of aquatic life are based on the 165 British Columbia Ministry of the Environment Lands and Parks (BCMELP) guidelines, 166 derived using the severity of ill effects model originally developed by Newcombe and 167 Jensen (1996) and modified by Caux et al. (1997). Specifically, the BCMELP criteria were 168 developed based on the Newcombe and Jensen (1996) SEV Model for adult salmonids 169 (Model 2); this group was determined to elicit the largest response to a given increase in 170 TSS concentration over a set duration (i.e., this group was identified as the most 171 sensitive based on the various models developed). Consideration of exposure duration 172 as well as background conditions in the natural environment were incorporated into the 173 criteria. 174
As noted in the AESV, the MWQSOG/CCME PAL guideline is predicted to be exceeded in 175 the fully mixed Lower Nelson River during three events: 176
• Exposure Scenario 1: maximum predicted increase of 7 mg/L for approximately six 177 days during placement of the Spillway and Central Dam cofferdams in July 2015; 178
• Exposure Scenario 2: an increase in TSS of 7 mg/L for a period of one month during 179 removal of the Tailrace Summer Level Cofferdam in September 2019; and 180
TAC Public Rd 2 DFO-0069
Page 6 of 7
• Exposure Scenario 3: maximum predicted increase of 15 mg/L for 10 days (actual 181 concentrations are predicted to peak at 15 mg/L above background and to decrease 182 over this 10 day period) during placement of the South Dam Rock Fill Groin in early 183 September 2017. 184
TSS currently ranges between 5 and 30 mg/L, averaging 14 mg/L in the Gull Lake area. 185 Using the existing background TSS conditions, effects of increases in TSS identified 186 above on fish were examined using the Newcombe and Jensen (1996), as modified by 187 Caux et al. (1997), Severity of Ill Effects Model for adult salmonids (Model 2) and non-188 salmonid freshwater fish (Model 6). 189
SEV scores for adult salmonids are presented in Figure 1 and Table 1 for a range of 191 scenarios applicable to the Keeyask Project. As the SEV models generate scores based 192 on absolute TSS concentrations rather than effects related to relative increases, it is 193 relevant to compare scores for the exposure scenarios indicated above to the scores 194 based on background TSS concentrations. All three exposure scenarios cause an 195 increase in the SEV scores of one or less, and most scenarios cause changes of less than 196 0.5. The largest change in SEV score is predicted to occur under the minimum TSS 197 background condition (5 mg/L); as discussed below, the SEV model is limited in its ability 198 to predict effects of low concentrations of TSS, in particular due to the lack of empirical 199 data on which the model was constructed. All SEV scores are below the paralethal/lethal 200 threshold (SEV = 9) and the highest SEV rankings are unchanged from background 201 conditions under each of the three scenarios (Table 1). 202
Effects on Salmonids 190
SEV scores for adult freshwater non-salmonids are presented in Figure 2 and Table 2 for 204 a range of scenarios applicable to the Keeyask Project. SEV scores for exposure 205 scenarios 1 and 3 are below the paralethal/lethal threshold (SEV = 9; Table 2). However, 206 SEV scores exceed 9 for scenario 2 – including purely background TSS conditions (i.e., 207 without Project-induced increases in TSS). It is also worth noting that this model predicts 208 that concentrations of TSS of 5 mg/L (the minimum measured in the Keeyask area), 209 would prove lethal to non-salmonids in less than one month (Figure 3). A concentration 210 of near zero (0.1 mg/L) is predicted to be lethal by the SEV model in less than 2 months. 211 This observation illustrates one of the key limitations of this model; the model is not 212 reliable for predicting effects associated with low concentrations of TSS. For the 213 purposes of assessing potential effects associated with the Keeyask Project, it is the 214 relative difference between the SEV scores with and without the Project that is of 215 relevance. All three exposure scenarios cause an increase in the SEV scores of less than 216 0.5, and most scenarios cause changes of less than 0.2. 217
Effects on Adult Freshwater Non-Salmonids 203

TAC Public Rd 2 DFO-0069
Page 7 of 7
For additional context, Figure 3 presents SEV model results for a TSS concentration of 219 120 mg/L – the mean concentration measured in the Assiniboine River at Headingley. 220 Mean concentrations in the Red River are of a similar magnitude (132 mg/L at the south 221 gate of the floodway and 124 mg/L at Selkirk). These averages are an order of 222 magnitude higher than the predicted TSS concentrations for the Keeyask Project. Over a 223 365 day period, this average concentration (120 mg/L) is predicted to cause SEV 224 rankings of 10 and 12 for salmonids and non-salmonids, respectively. These scores fall 225 into the categories of “0-20% mortality, increased predation, moderate to severe 226 habitat degradation” and “40-60% mortality”, respectively. 227
Context 218
The SEV model developed by Newcombe and Jensen (1996) has been criticized for its 229 inherent inability to accurately predict effects of low levels of TSS to aquatic life, as 230 these conditions were not captured within the database used to construct the model 231 (e.g., Birtwell et al. 2003, Anderson et al. 1996). Therefore, the utility or accuracy of the 232 model to predict risks to fish associated with small increases in TSS is limited. 233
Conclusions 228
Notwithstanding the limitations of the SEV model to predict effects of small increases in 234 TSS on fish, the SEV model indicated that scores increased by less than one, and 235 generally less than 0.2, for the various potential exposure scenarios examined. 236
Collectively, these results indicate effects of the predicted increases in TSS on salmonids 237 and non-salmonids during construction would be small and potentially indistinguishable 238 from existing conditions. 239

TAC Public Rd 2 DFO-0070
Page 1 of 1
REFERENCE: Volume: Physical Environment Supporting Volume; 1
Section: 4.0 Surface Water and Ice Regimes; p. N/A 2
TAC Public Rd 2 DFO-0070 3
ORIGINAL PREAMBLE AND QUESTION: 4 Sedimentation – TSS 5
Existing environment sedimentation models based on low, med and high flows (2059, 6 3032 and 4,327 cms). Do these relate to percentile flows? Post-project sedimentation 7 modelling simulated under 50th percentile for year 1, 5, 15 and 30 years after 8 impoundment, and under 5th and 95th percentile flow for 1 and 5 years after 9 impoundment. Why different flow regimes for different time periods? The post-project 10 sedimentation environment was also simulated under the 50th and 95th percentile 11 flows using the eroded shore mineral volumes as estimated, considering peaking mode 12 of operation for the time frames of 1 and 5 years after impoundment. Proposed 13 monitoring to valid models? 14
FOLLOW-UP QUESTION: 15 Proponent plan still in production and not available for review. 16
RESPONSE: 17 A description of proposed monitoring and follow-up activities, as required by the 18 Guidelines, is provided in Chapter 8 of the Response to the EIS Guidelines. Table 8-1 19 indicates that monitoring will be performed with respect to: water and ice regimes; 20 shoreline erosion and peat breakdown; sedimentation; and greenhouse gas. Table 8-2 21 indicates that physical environment monitoring will be performed in support of other 22 monitoring programs for the following: woody debris; dissolved oxygen and water 23 temperature; and total dissolved gas. 24
The preliminary Physical Environment Monitoring Plan will contain additional details. As 25 noted in original response to TAC Public Rd 1 CEAA-0011, while the Guidelines do not 26 require the Physical Environment Monitoring Plan, the Partnership will provide a 27 preliminary version of the plan to regulators in the second quarter of 2013. 28
29

TAC Public Rd 2 DFO-0071
Page 1 of 15
REFERENCE: Volume: Physical Environment Supporting Volume; 1
Section: Appendix 7A, Model Descriptions; p. N/A 2
TAC Public Rd 2 DFO-0071 3
ORIGINAL PREAMBLE AND QUESTION: 4 Peatland erosion. 5
Did not look at peat downstream of the generating station, claiming that peat would not 6 go past the GS (only 1% would get past the GS – is this reasonable?). What monitoring is 7 proposed to confirm this? 8
FOLLOW-UP QUESTION: 9 Would the proponent please extract those parts of the EIS referred to that provide an 10 assessment of the risk to fish, fisheries, and fish habitat of peat deposition from peat 11 passing through the GS? 12
RESPONSE: 13 AE SV 2.5.2.3.5 notes: “Changes in organic carbon are not expected to be detectable 14 along the mainstem of the river upstream of Stephens Lake and concentrations flowing 15 into Stephens Lake would therefore remain similar to existing conditions.“ The effects of 16 increased organic TSS concentrations on fish and fish habitat in Stephens Lake were not 17 assessed based on the assessment results that there would be no measureable 18 increases in organic TSS leaving the reservoir. The following text is quoted for the 19 assessment of effects to mineral and organic totals suspended sediments in the 20 reservoir (AE SV Section 2.5.2.2.5). Sections pertaining directly to organic TSS in the 21 main flow of the river are provided in bold. 22
“Total suspended sediments (TSS) and turbidity may be affected by erosion of 23 mineral or organic shoreline materials in combination with changes in the 24 hydraulic regime that affect sediment transport and deposition. TSS is defined 25 here as organic and inorganic materials that are retained on a standard-sized 26 filter (typically 1.5 micrometre [μm]). Predicted changes in TSS during the 27 Project operation period were generated separately for mineral bank erosion 28 (i.e., “mineral TSS”) and disintegration of peat (i.e., “organic TSS”) and are 29 presented in the PE SV, Section 7. The following is intended to provide a brief 30 summary and integration of these predictions and describe how these changes 31 may affect water quality and aquatic biota. Mineral TSS predictions were based 32 on the modeling reaches and shallow/deep areas indicated in Map 2 23 and 33 organic TSS predictions were based on peat transport zones as shown in Map 2 34

TAC Public Rd 2 DFO-0071
Page 2 of 15
22. Peat transport zones 4, 5 and 7–13 (note: there is no zone 6) are composed 35 entirely of lentic habitat, whereas peat transport zones 1–3 contain both lotic 36 and lentic habitat and are deeper (i.e., composed largely of deep habitat; see 37 Section 3.4.2.2). Additionally, peat transport zones 7–13 are composed mostly 38 of flooded habitat (see Section 3.4.2.2). 39
Predicted effects of the Project on the spatial distribution of mineral and organic 40 TSS are somewhat different. In general, effects of the Project on organic TSS 41 are expected to dominate in the flooded, nearshore areas, whereas Project-42 related effects on mineral TSS would be greatest in the lotic areas (i.e., 43 mainstem). The following provides a brief overview of these predicted changes. 44 Detailed descriptions of the effects of the Project on organic and mineral TSS 45 are presented in the PE SV, Section 7. 46
As described in the PE SV, Section 7, mineral TSS is generally predicted to 47 decrease in the shallow and deep areas of the reservoir with the Project, most 48 notably under high flows (95th percentile), although small increases (1–4 mg/L) 49 are projected in some areas under some conditions (i.e., different flows and 50 years of operation). The predicted changes in mineral TSS are also relatively 51 similar for the peaking and base loaded modes of operation for median and high 52 flows. In general, the predicted decreases (or occasionally increases) in mineral 53 TSS are less than 5 mg/L under low, median, and high flows in shallow and deep 54 areas for Years 1 and 5 of operation. The major exception would occur under 55 high flows in reaches 7 and 8 (at the downstream end of present day Gull Lake) 56 and most notably reach 9 (the reservoir immediately upstream of the GS) where 57 larger decreases (up to 14 mg/L below background) are expected. 58
Mineral TSS would generally remain within the chronic Manitoba PAL water 59 quality objective and the CCME PAL guideline (a change of less than or equal to 60 5 mg/L relative to background, where background TSS is less than or equal to 25 61 mg/L). The exceptions would occur in the immediate reservoir (reach 9) and 62 reach 8 (the area north of Caribou Island) under high flow conditions, where 63 decreases may be larger than the Manitoba water quality objective. 64
As described in the PE SV, Section 7, although mineral TSS will generally decline 65 in nearshore areas with the Project despite the increase in mineral erosion, 66 episodic resuspension of fine particles may occur in the nearshore areas of the 67 reservoir. Therefore, mineral TSS concentrations may increase during high wind 68 events. Similarly, episodic erosion events may lead to episodic increases in TSS 69 in the nearshore environment. 70
TAC Public Rd 2 DFO-0071
Page 3 of 15
Changes in mineral TSS beyond Year 5 were predicted for the base loaded 71 operation scenario under median flows only. Mineral TSS is predicted to be 72 similar to or lower in Years 15 and 30 relative to earlier years of operation, 73 under median flows in the deeper, lotic areas of reaches 6–9 (i.e., the central 74 areas of the reservoir). An equilibrium is predicted by Year 15. . Although 75 modelling was not conducted for time frames beyond Year 5 for the high flow 76 condition, it is expected that the magnitude of changes in TSS for the long-term 77 period would be similar to those predicted for Year 5 (i.e., up to 7-14 mg/L near 78 the GS). Therefore, the long-term effects on TSS (i.e., decreases) are expected to 79 be within the Manitoba PAL objective more than 50% of the time and the 80 largest decreases predicted under high flow conditions would occur in the areas 81 closest to the GS. 82
As described in the PE SV, Section 7, effects of the Project on organic TSS are 83 not expected to be detectable along the main flow of the reservoir (i.e., in 84 lotic areas) but would result in detectable increases in the nearshore, lentic 85 areas in Year 1 of operation. In addition, organic TSS concentrations will vary 86 across the lentic areas of the reservoir due to spatial differences regarding 87 peatland disintegration, local bathymetry, and the water regime. For the 88 purposes of quantitatively estimating the effects of this pathway on TSS, it was 89 assumed that organic TSS would be introduced evenly over the open water 90 period and that some accumulation (i.e., TSS carry-over between days) may 91 occur due to longer water residence times in the peat transport zones (i.e., 92 “average conditions”). Modeling predictions presented in the PE SV (Section 93 7.4.2.3) represent the maximum predicted increases within each peat transport 94 zone. Overall, the largest increases in organic TSS would occur in peat transport 95 zones 7–9, 11, and 12, which are flooded, lentic areas. 96
Organic TSS is predicted to remain within the Manitoba PAL water quality 97 objective and the CCME PAL guideline (i.e., less than or equal to 5 mg/L 98 change from background) in peat transport zones 1–3 (which includes the 99 main flow of the Nelson River, including the area immediately adjacent to the 100 GS) in Year 1 where flow and mixing are high. In addition, the predicted 101 decreases in mineral TSS in these areas will likely offset any increases in 102 organic TSS. 103
The upper range of predicted increases are above the Manitoba PAL water 104 quality objective and the CCME PAL guideline in peat transport zones 7–9, 11, 105 and 12 (i.e., maximum predicted increases ranging from 8–21 mg/L). Increases 106 in organic TSS are predicted to remain within the Manitoba PAL objective and 107

TAC Public Rd 2 DFO-0071
Page 4 of 15
the CCME PAL guideline in the remaining areas (peat transport zones 5, 10, and 108 13). 109
As peatland disintegration will decrease notably after Year 1, increases in 110 organic TSS will decline rapidly thereafter. The increases in organic TSS in the 111 flooded bay areas would also be somewhat offset by predicted decreases in 112 mineral TSS. However, changes in mineral TSS are expected to be small (less 113 than 5 mg/L) relative to the predicted increases in organic TSS for some of the 114 flooded backbays. 115
It should be noted that like mineral erosion, peatland disintegration will likely 116 not occur in a uniform manner over the open water season and statistically rare 117 events could occur in which larger quantities of peat and mineral soils are 118 introduced to the water column. In addition, resuspension of settled organic TSS 119 may also occur in the nearshore areas during high wind events. On that basis, it 120 is likely that short-term increases in organic TSS that exceed the short-term 121 Manitoba PAL water quality objective and CCME PAL guideline (increase of 25 122 mg/L above background) may periodically occur in some nearshore areas.” 123
At a February 15, 2013, technical review meeting among KHLP, DFO and MCWS, DFO 124 indicated concerns with the effect of sediment deposition on substrate type. The 125 response to TAC Public Rd 2 DFO-0014 provides substrate conditions in the existing and 126 post-Project environments. For ease of reference, this response is copied below. 127
DFO-0014 RESPONSE: 128 TAC Public Rd 1 DFO-0014 initially requested information on how deposition would 129 change fish habitats and how this impact would be monitored. The response provided a 130 brief summary of changes as a result of deposition and referenced sections of the 131 Aquatic Environment Supporting Volume where effects of this habitat change to specific 132 fish life history functions were assessed. In this second round of Requests for Additional 133 Information, the reviewer indicates, “HADD description and accounting as requested not 134 provided”. 135
During discussions at a technical review meeting on February 14, 2013, among KHLP, 136 CEAA, DFO and MCWS, the following points were raised: 137
1. An accounting of the area of pre and post-Project habitat types (which include 138 substrate) are provided in Appendix 3D of the Aquatic Environment Supporting 139 Volume. This appendix includes the flooded terrestrial area as part of the post-140 Project habitat. 141
TAC Public Rd 2 DFO-0071
Page 5 of 15
2. A description of substrate changes from pre- to post-Project is provided in 142 Aquatic Environment Supporting Volume, Section 3.4.2.2.3. This description 143 includes the flooded terrestrial areas. Text, tables and figures illustrating 144 changes in substrate considering the pre-existing aquatic habitat alone are 145 provided below. 146
3. Existing aquatic habitat in the Nelson River mainstem is not expected to be 147 subject to peat deposition. The Physical Environment Supporting Volume (PE 148 SV) Section 7.4.2.3, p. 7-35 provides an analysis of peat sedimentation upstream 149 of the Project. Specifically with respect to organic sediment deposition: 150
7.4.2.3.3 Organic Sediment Deposition 151
“Most of the organic sediments are expected to accumulate in the bays of origin. 152 The process of accumulation will occur in different forms including deposition. 153 The magnitude of deposition will vary depending upon the amount of peat 154 disintegrated from the shoreline and the location of the bays. The bays in the 155 south side of the reservoir will experience relatively higher deposition than those 156 in the north side. It is unlikely that there will be any appreciable amount of 157 organic sediment deposition in the mainstem waterbody outside of the bays.” 158
Aquatic Substrate Change due to the Keeyask Project 159
Substrate changes expected due to the Keeyask Project at Year 30 are described in 160 Section 3.4.2.2.3 of the Aquatic Environment Supporting Volume, relative to the Existing 161 Environment 95th percentile inflow. This text complements that section and extends the 162 detail of description of substrate changes. 163
Changes to specific substrate types for the full reservoir area are summarized, and then 164 again for each of three areas within the hydraulic zone of influence where the type and 165 magnitude of change are notably different: 1) the riverine reach extending to Gull Lake; 166 2) lower reservoir (including Gull Lake), and 3) the area downstream of Gull 167 Rapids/Principal Structures. The effect of classification precision on change is also 168 considered given that prediction (post-project) is seldom possible at the same resolution 169 as observation (existing environment). 170
Changes of substrate by area are provided for the entire reservoir (Table 1), the riverine 171 reaches (Table 2), and the lower reservoir (including Gull Lake) (Table 3). Changes 172 downstream of the proposed Keeyask dam are discussed in the text. 173
174

TAC Public Rd 2 DFO-0071
Page 6 of 15
Overview of Substrate Changes in the Keeyask Reservoir at Year 30 Post-impoundment 175
At Year 30, the Keeyask reservoir will have an estimated area of 9973.5 ha, or an 176 increase of about 5149.4 relative to the existing environment at a 95th percentile inflow 177 (PE SV). Silt is expected to be present as a relatively homogenous surficial layer over an 178 area of about 5280.5 ha, or 52.9% of the total reservoir (Table 1) (Aquatic Environment 179 Supporting Volume, Map 3.34 and Map 1, attached). Most of the silt deposition 180 upstream of the dam will be found in Reaches 6 – 9a. Silt deposition is expected to 181 change slightly more than half of the substrate area present today (54.3% of 2806.7 ha). 182 Silt deposits will notably decrease the area of several existing substrate types that are 183 relatively abundant in the existing environment: 1) silt/clay located mainly in large lentic 184 bays (92.5% of 1268 ha); 2) gravel/cobble/boulder found in the main channel of present 185 day Gull Lake (75.4% of 1198.9 ha); 3) cobble/boulder, which forms most of the main 186 channel except at Gull Lake and Gull Rapids (18.3% of 1782.3 ha); and 4) 187 cobble/boulder/bedrock, which composes most of the substrate in Gull Rapids (74.6% of 188 256.5 ha). 189
Other lotic bottom types, such as gravel and sand, are relatively fine and are not 190 common in the existing environment. When present, sand and gravel was found most 191 often in shallow water along the banks, except for a few relatively large patches that are 192 found in the lower reservoir where water velocities in lotic areas are relatively slow. 193 Sand habitat totals about 177.5 ha with the single largest patch of about 1 ha in size 194 found in the secondary channel north of Caribou Island (Map 1). After the Project, 78.4% 195 of the total area of sand will change to silt over time. Most of the homogenous gravel 196 substrate (92.6% of 19.6 ha) will be covered by silt after the Project, including the 197 largest known patch (0.16 ha) located on the bottom of the main channel in deep water 198 of Gull Lake. 199
In the flooded area, about 442.4 ha of fine organic deposition will become the main 200 substrate type at the ends of bays over flooded peatlands fed by tributaries (Aquatic 201 Environment Supporting Volume, Map 3.34 and Map 1). This will be a new habitat but 202 will total only about 5.4% of the total reservoir area. There is expected to be about 203 273.8 ha of peat nearshore area (i.e., at depths less than that of silt sediment in shallow 204 water). Peat substrates are expected occupy about 297.2 ha (2.9 %) of the reservoir 205 area. When found in the main reservoir they will be mainly where deep peat deposits 206 are found today. Peat nearshore substrates will be composed of inundated fibrous peat, 207 as well as areas of partially decomposed peat after the fibrous surface layer has 208 resurfaced (PE SV Section 6.4.2.1). In most other exposed areas of the reservoir, the 209 processes of wave action and water level variation will remove the thin organic 210 overburden. Most shorelines of the lower reservoir (reaches 6 – 9a) that erode into the 211 sloped topography of today will erode through the thin peat and/or mineral soils, and 212
TAC Public Rd 2 DFO-0071
Page 7 of 15
create a clay nearshore area (1427 ha; 14.3%), with some localized deposits of 213 aggregate lag when available. The clay-based nearshore areas in the main reservoir and 214 the deposits of fine organic deposition at the ends of bays will form most of the rooted 215 macrophyte habitat in the reservoir (Aquatic Environment Supporting Volume Section 3, 216 3.4.2.2.3). Areas of inundated peat, either at exposed or sheltered sites, will not 217 contribute to potential macrophyte habitat. Some of the islands flooded in Gull Rapids 218 may not be depositional sites due to sufficient water velocity and/or slope, and so will 219 likely have the character of inundated mineral soils (137 ha or 1.38% of reservoir area). 220
Substrate Changes in the Riverine Reaches of the Keeyask Reservoir at Year 30 221
In Year 30, most of the substrate in the main channel of the riverine reaches (Long 222 Rapids to entrance to Gull Lake) is expected to remain similar to today (Map 2, 223 attached). About 132.7 ha (97.4% of reaches 2b – 5) of the channel bottom will remain 224 as cobble/boulder substrate (Table 2). Changes in substrate type in the riverine reaches 225 are expected to be more apparent in shallow water along the banks. In the existing 226 environment sand was seldom observed in the riverine reach (15.5 ha; about 1% of the 227 riverine area). Sand was present only in shallow water along shorelines in the 228 intermittently exposed zone in areas not subject to marked river flows, or near Fork 229 Creek in Reach 3 (upstream of Birthday Rapids on the north bank), or on banks of the 230 island Near Nap Creek (downstream of Birthday Rapids on the south bank). By year 30 231 most if not all of the sand areas will change to other substrate types due to shore 232 erosion or movement of lotic habitat towards the shore as the bank recedes. The 233 riverine reach currently has more glacio-fluvial deposits than does the lower reservoir 234 where glacio-lacustrine deposits are more common. The banks of the riverine area may 235 therefore be slightly more coarse and form a sandy clay. Although sandy clay only 236 accounts for about 6.1% of the areal changes in substrate (117.1 ha) in the Post-Project 237 riverine reach, it will be a notably visible, but relatively narrow, band of substrate that 238 comprises most of the riverine bank where erosion would or could continue to occur. 239 Small backwater inlets found along both banks of the riverine reach today will tend to 240 increase in number and area after the Project. This creates more lentic habitat that will 241 become depositional substrate. The riverine area today has about 152.0 ha of silt/clay 242 substrate found entirely in backwater inlets (9.9 % of riverine EE). By Year 30, silt will 243 cover 86.9 ha of the silt/clay substrate (57.1 % of riverine EE). An additional 75.1 ha of 244 new silt substrate will develop in the flooded lentic bays and total about 162.1 ha, or 245 8.5% of the total Year 30 riverine area. 246
Substrate Changes in the Lower Reservoir Area 247
Changes of substrates in the lower reservoir are similar to that described above for the 248 entire reservoir given that changes in area in the riverine reach are relatively small. At 249
TAC Public Rd 2 DFO-0071
Page 8 of 15
Year 30, silt is expected to cover about 908 ha (75.7%) of the existing 250 gravel/cobble/boulder substrate, which is found only in the lower reservoir area today 251 (Table 3). Nearly all silt/clay habitat associated with lentic bays in Gull Lake today will be 252 inundated and will change to silt substrate (1087.2 ha or 97.3% of EE). More than half of 253 the cobble/boulder substrate currently found south of Caribou Island in the main 254 channel downstream to the entrance of Gull Rapids will change to silt in some of the 255 deepest water of the reservoir (294.3 ha; 60.8%; Aquatic Environment Supporting 256 Volume, Map 3 - 28). The output from a lotic substrate model (Aquatic Environment 257 Supporting Volume, Appendix 3B, Map 3.34) suggests that this main channel habitat 258 near Caribou Island will alternate between the existing substrate (where velocities 259 remain higher within a constrained channel) to depositional where it is more open, 260 deep, and velocity is slower. About 191.6 ha, or nearly three quarters (74.6%) of the 261 cobble/boulder/bedrock substrate unique to Gull Rapids, will change to silt. A small 262 amount of the remaining cobble/boulder/bedrock habitat in this area will be excavated 263 bedrock at the powerhouse intake channel. Silt will cover all (17.9 ha.) of the known 264 large gravel bed area in reach 6 of Gull Lake, and about 81.9% (132.7 ha) of the existing 265 sand substrate in reaches 6 – 9a. 266
As described above for the entire reservoir area, the substrates that are either new or 267 that increase in area markedly within the flooded area due to the Project, are: 1) clay; 2) 268 flooded terrestrial soil; 3) peat; and 4) fine organic deposition. Clay, which will be 269 common sloped substrate in the nearshore zone after removal of thin peat and/or 270 mineral soil erosion, will increase in area by about 110 times (1376.2 ha increase, or 271 17.1% of lower reservoir). The flooded terrestrial soils that persist in some of the 272 flooded islands will be only total about 1.7% of the lower reservoir area. Peat nearshore 273 substrate will occupy about 3.4% of the lower reservoir area. The deposition of fine 274 organic material that will develop at the end of bays, where peatlands were abundant 275 before the Project, will be a notable and new habitat in the reservoir, but will only 276 occupy about 5.4% of the Year 30 lower reservoir area. 277
Downstream of the Keeyask Generating Station 278
Sediment deposition may occur along the north bank within 3 km downstream of the GS 279 (Map 3). Deposition is expected in this area due to: 1) a shift in the path of flow which 280 will increase the area of lentic habitat over that which occurs in the open water season 281 today (Aquatic Environment Supporting Volume Map 3.31); and 2) this lentic habitat will 282 persist all year due to the loss of the ice dam and associated flow dynamics in winter (PE 283 SV Section 4). The area of anticipated sedimentation is approximately 55.1 ha, all of 284 which covers cobble/boulder habitat in the existing environment. 285

TAC Public Rd 2 DFO-0071
Page 9 of 15
Modelling Precision 286
Changes of substrate type apparent in Tables 1 – 3 include those that are expected to 287 occur and be readily observable, as described above, as well as those that result due to 288 comparisons made between observation and prediction. For the latter, Table 1 shows 289 that about 290.9 ha of gravel/cobble/boulder bottom type present in Gull Lake today 290 will change to cobble/boulder after the Project. This is an apparent change that shows 291 the difference of detail between observation and prediction. After the Project the areas 292 of non-depositional bottom type will continue to exhibit the substrate type present 293 today (i.e., hard bottom). These non-depositional areas after the Project are expected to 294 be in relatively fast flowing areas, as they are today. Such sites do not have a lot of 295 gravel today and therefore would not be expected to have this substrate in the future 296 with the Project. For example, Gull Lake was sampled most often as a cobble/boulder 297 substrate, but gravel was sometimes present downstream of bottom undulation, or was 298 more available where current slowed over large areas. After the Project, these gravel 299 areas are expected to become depositional substrate due to the fact that these areas 300 are relatively slow lotic habitat today. Although there is the potential that some small 301 areas of gravel present now could remain after the Project (e.g., Table 1; 1.45 ha), this is 302 not likely. These gravel sites tend to be small and found along shorelines where lotic 303 habitat will form, or velocity will notably increase as the channel widens in the future 304 with the Project. Consequently, it is expected that most often a cobble/boulder bottom 305 type will form where gravel is present today and deposition is not predicted. 306 Cobble/boulder is the dominant bottom type of the main channel today in most flowing 307 water areas (i.e., where the parent bedrock geology does not control material 308 availability). This is expected to continue to be the case after the Project. 309

TAC Public Rd 2 DFO-0071
Page 10 of 15
Table 1. Change of area in hectares (ha) of the substrate classes present in the Existing Environment according to a 95th percentile inflow (rows) and the Year 30 Post-Project (columns) for the entire reservoir area.
Existing Substrate (ha.) Year 30 Substrate (ha.)
Bedrock Boulder Clay Cobble Cobble/Boulder Cobble/Boulder/Bedrock
Flooded Terrestrial
Soils Organic Peat Sand Sandy Clay Silt Grand
Total EE
Bedrock 18.16
0.73
33.04 0.00
0.64 14.83 67.42
Boulder
0.36
3.27
1.93 5.57
Cobble
0.00 0.50 12.81
0.68 7.61 21.60
Cobble/Boulder
1454.38
0.00 1.07 326.88 1782.33
Cobble/Boulder/Bedrock 5.49
4.31
55.15
0.00
191.61 256.56
Gravel
1.45
0.00 18.16 19.61
Gravel/Cobble/Boulder
290.90
908.05 1198.95
Organic
0.35
0.76
0.00 24.27 25.39
Sand
17.36
20.40 0.52 139.27 177.55
Silt/Clay 0.17
8.82
59.01 0.02
22.63 0.00
3.82 1174.19 1268.67
Aquatic within EE 95) 23.82 0.36 13.87 0.50 1872.59 55.17 0.00 23.40 0.00 20.40 6.73 2806.80 4823.65
Flooded Only 20.65 0.01 1413.63
127.35 43.87 137.72 521.87 297.27 3.15 110.42 2473.45 5149.40
Grand Total (Year 30) 44.47 0.37 1427.50 0.50 1999.94 99.04 137.72 545.27 297.27 23.56 117.15 5280.25 9973.05 310

TAC Public Rd 2 DFO-0071
Page 11 of 15
Table 2.Change of area in hectares (ha) of the substrate classes present in the Existing Environment according to a 95th percentile inflow (rows) and the Year 30 Post-Project (columns) for the riverine reservoir area.
Existing Substrate (ha.) Year 30 Substrate (ha.)
Clay Bedrock Cobble/Boulder Organic Peat Sandy Clay Silt Grand Total EE
Bedrock
33.03
0.64 2.66 36.33
Boulder
2.44
0.60 3.04
Cobble
0.00
12.41
0.68 2.97 16.06
Cobble/Boulder
1265.15
1.07 32.55 1298.76
Gravel
1.45
0.00 0.19 1.63
Organic
0.32
0.00 0.23 0.55
Sand
8.45
0.52 6.58 15.55
Silt/Clay
1.28
37.35 22.63 0.00 3.82 86.98 152.06
Aquatic within EE 95) 1.28 33.03 1360.59 22.63 0.00 6.73 132.76 1524.00
Flooded Only 37.40 48.08 79.47 23.42 110.42 75.13 373.93
Grand Total (Year 30) 38.69 33.03 1375.64 102.11 23.42 117.15 207.89 1897.92 311

TAC Public Rd 2 DFO-0071
Page 12 of 15
Table 3. Change of area in hectares (ha) of the substrate classes present in the Existing Environment according to a 95th percentile inflow (rows) and the Year 30 Post-Project (columns) for the reaches of the lower reservoir area.
Existing Substrate (ha.)
Year 30 Substrate (ha.)
Bedrock Boulder Clay Cobble Cobble/Boulder Cobble/Boulder/Bedrock Flooded
Terrestrial Soil Organic Peat Sand Silt Grand Total
EE
Bedrock
18.16
0.73
0.02 0.00
12.17 31.08
Boulder
0.36
0.84
1.33 2.53
Cobble
0.50 0.40
4.63 5.54
Cobble/Boulder
189.24
0.00 294.33 483.57
Cobble/Boulder/Bedrock
5.49
4.31
55.15
0.00 191.61 256.56
Gravel
17.97 17.97
Gravel/Cobble/Boulder
290.90
908.05 1198.95
Organic
0.03
0.76
24.04 24.84
Sand
8.91
20.40 132.69 162.00
Silt/Clay
0.17
7.54
21.67 0.02
1087.21 1116.61
Aquatic within EE 95) 23.82 0.36 12.58 0.50 511.99 55.17 0.76 20.40 2674.05 3299.66
Flooded Only
20.65 0.01 1376.23 79.27 43.87
137.72 442.40 273.86 3.15 2398.31 4775.47
Grand Total (Year 30) 44.47 0.37 1388.82 79.77 555.86 55.17 137.72 443.17 273.86 23.56 5072.36 8075.13 312

TAC Public Rd 2 DFO-0071
Page 13 of 15
313
Map 1. Change of substrate type for the Existing Environment (upper panel) and Year 30 Post-Project. The extent of the existing environment 95th percentile shoreline is shown in blue for comparison to the Post-Project 314 Year 30 shoreline. 315
316

TAC Public Rd 2 DFO-0071
Page 14 of 15
317
Map 2. Change of substrate type for the Existing Environment (upper panel) and Year 30 Post- Project for the riverine reaches. The hydraulic zone of influence is shown in the lower panel for the Post-Project. 318
319
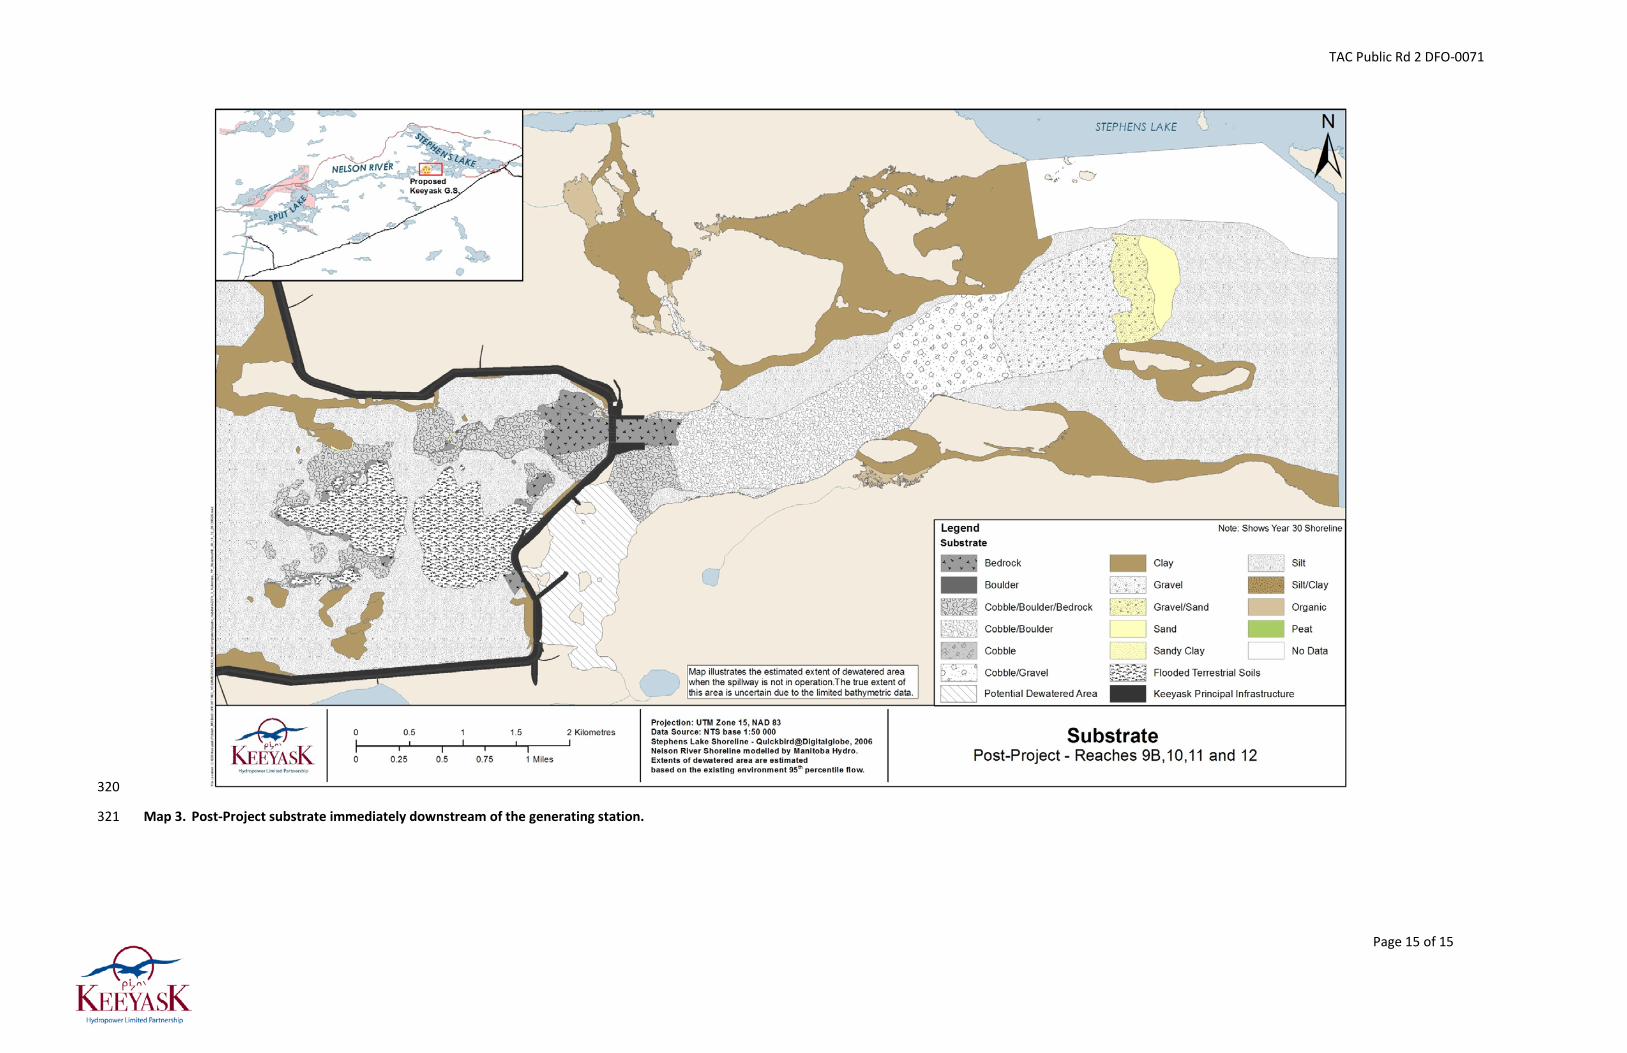
TAC Public Rd 2 DFO-0071
Page 15 of 15
320
Map 3. Post-Project substrate immediately downstream of the generating station. 321

TAC Public Rd 2 DFO-0072
Page 1 of 8
REFERENCE: Volume: Physical Environment Supporting Volume; 1
Section: 7.4.2.3 Peat Sedimentation - Upstream of Projects; p. 7-35 2
Volume: Aquatic Environment Supporting Volume; Section: 3.4.2.2 3
Outlet of Clark Lake to the Keeyask Generating Station; p. N/A 4
TAC Public Rd 2 DFO-0072 5
ORIGINAL PREAMBLE AND QUESTION: 6 Peatland Erosion. 7
Visual distribution (maps) of peatland deposition not presented in the EIS. How will peat 8 deposition impact on known/suspected areas of fish habitat in the future forebay? 9
FOLLOW-UP QUESTION: 10 Would the proponent please provide a GIS or similar analysis of peatland deposition in 11 fish habitat in the future forebay? Would the proponent please provide an analysis, 12 including a table of areas, of impact, given a biologically significant risk threshold, of 13 impact area? 14
RESPONSE: 15 Deposition of fine organic material is not expected to impact existing aquatic habitat 16 because, as discussed in TAC Round 1 DFO-0072, the majority of peat released from 17 flooded terrestrial areas will settle in the bay of origin (i.e., over flooded terrestrial 18 habitat). The substrate in the flooded terrestrial area will initially consist largely of 19 organic matter; however, in the long term silt is expected to deposit over the peat (see 20 TAC Round 1 DFO-0072). Organic material is expected to be present in the long term in 21 certain areas of flooded terrestrial habitat, as discussed below. 22
Sites for the deposition of fine organic material are shown in AE SV Map 3 – 34. The 23 model used to predict deposition of this fine organic material is provided in AE SV Map 24 3B - 4. Deposits of fine organic material are only expected to occur in the long term 25 (more than 30 years) in flooded areas at the terminal ends of small and flooded 26 peatland bays. This is consistent with observed conditions in Stephens Lake, where 30 27 years or more after impoundment, there is no evidence of fine organic deposition in 28 areas of the reservoir other than at the terminal ends of small tributaries. 29
The formation of organic deposits has been described in the AESV for Year 30 (i.e., 30 30 years post-impoundment) on page 3-35, Year 1 on page 3 – 37, Year 5 on page 3-38, and 31 Year 15 on page 3-39. (The relevant sections of the AE SV are provided below for 32 convenience.) TAC Public Rd 2 DFO-0014 provides maps and areas of pre- and post-33 Project substrate type. 34

TAC Public Rd 2 DFO-0072
Page 2 of 8
AE SV Pages 3-34 to 3-39 35
Section 3.4.2.2.3 Aquatic Habitat at Year 30 36 At Year 30, reservoir expansion will have increased the reservoir area to about 99.8 km2, 37 an increase of 7–8 km2 due to mineral bank erosion and shore peat breakdown (PE SV, 38 Section 6.4.2.1, see Map 6.4-6 and Map 6.4-7). Shoreline erosion, peatland resurfacing 39 and transport, and sedimentation processes will remain active in some areas, but are at 40 rates that are much slower than in the first 15 years of the reservoirs history (PE SV, 41 Section 6.4.2.1). The physical environment modelling studies and the aquatic 42 environment observations on Stephens Lake collectively suggest that the exposed 43 nearshore areas of a reservoir in the study area at Year 30 will be mostly mineral, 44 whereas sheltered bays retain more of their pre-flood peatland characteristics. Less 45 wave energy is available in flooded bays, and when compared to the main basin of the 46 reservoir, the slope of bays is minimal and the peat deposits tend to be larger and 47 deeper. The inherent character of peatland bays infers that they are less able to shift to 48 a mineral nearshore area over time. For the Keeyask reservoir, the physical environment 49 studies estimate that mineral-based shorelines are expected to increase from 28% to 50 69% of the total shoreline length over 30 years. This transition from mainly peat-based 51 substrates, which do not support rooted plants, to nearshore slopes that develop from 52 mineral soils due to erosion and resurfacing of peat is important as it helps develop 53 potential macrophyte habitat over time. Water velocities and water depths at Year 30 54 will essentially be the same as following the initial FSL, with the exception of changes in 55 very shallow water due to shoreline recession, peatland resurfacing, and development 56 of nearshore slopes that will slightly increase the amount of lentic habitat around the 57 perimeter of the reservoir. 58
The results of substrate modelling for the Keeyask reservoir at Year 30 are provided in 59 Appendix 3B. The pattern of substrate deposition in the reservoir is similar when 95th 60 and 5th percentile inflow scenarios are compared, although some differences are 61 apparent. The 95th percentile inflow model results suggest that the silt sediment 62 boundary would occur up to about 1 km farther downstream in Reach 6, at the entrance 63 to present day Gull Lake, when compared to the 5th percentile inflows. A few small areas 64 that are depositional under 95th percentile inflows will not be under 5th percentile flows. 65 These non-depositional sites under low flows tend to be shallow where flows would be 66 constrained, such as near the boundary of reaches 6 and 7 at narrows found between 67 islands, and in shallow areas within present day Gull Rapids. 68
Soil erosion studies indicate the river banks will erode (PE SV, Section 6.3.1.2.2), 69 including the riverine reaches 4 and 5 below Birthday Rapids. The altered state of the 70 banks is expected to be sandy/clay given the deposits are mainly glacial till, with local 71 occurrences of glaciofluvial or glaciolacustrine sediments. Nearshore sedimentation 72 studies suggest however that the mineral sediments eroded from these banks will not 73
TAC Public Rd 2 DFO-0072
Page 3 of 8
be transported downriver, so deposition of gravel and sand at the entrance to Gull Lake 74 is not expected (PE SV, Section 7). The PE studies of the existing environment 75 demonstrated limited bed load movement from upstream (PE SV 7.3.1.2); this is 76 expected to continue in the future with the Project; 77
The combined results of the terrestrial soil studies (TE SV, Section 2.3.4.2), peatland and 78 mineral erosion studies (PE SV, Section 5 and Section 6), sedimentation studies (PE SV, 79 Section 7) and the reservoir habitat models (Map 3-34 and Appendices 3B and 3C) 80 suggest: 81
• The bottom of the thalweg in the riverine section (reaches 2B–5) of the reservoir is 82
expected to remain free of silt. The thalweg of reaches 2B–5 expected to maintain a 83
bed composition similar to that of the existing environment; 84
• Most of the lower reservoir (reaches 6–9A) will become depositional with silt 85
sediments, except for some of the main thalweg areas where velocity, depth, 86
exposure, and slope are sufficient to keep the substrate silt-free with a substrate 87
composition similar to today; 88
• Shallow water substrate type depends strongly on the pre-flood soils (Appendix 3C). 89
In open areas of the reservoir, clay substrata forms from pre-flood mineral soils or 90
from thin peat veneers overlying mineral deposits, often in glaciolacustrine 91
deposits. The substrate in other shallow habitat is inundated fibrous or humic peat 92
where pre-flood peatlands are large and relatively deep; 93
• Deposits of fine organic material will accumulate in lentic habitat at the ends of bays 94
fed by local peatland streams in reaches 5–7(Appendix 3C); and 95
• Potential macrophyte habitat may develop in many nearshore areas of the 96
reservoir. Areas of thin peat, which is a common soil type within the bounds of the 97
future reservoir (PE SV 5.3.3.2), will resurface or erode and expose mineral-based 98
soils (Appendix 3C). Once relatively stable, nearshore processes (i.e., waves and 99
water level variation) will wash the clay and aggregate lag and keep some or the 100
entire photic zone on the nearshore slope silt free. Potential macrophyte habitat 101
may even develop at the ends of sheltered bays where peat accumulation was 102
relatively thick, after peat has floated away and local water masses prevent silt from 103
the main reservoir to deposit (Appendix 3C). 104
The availability of potential and suitable macrophyte habitat in the proposed reservoir 105 (reaches 2B–9A) varies by mode of operation. Under a base loaded mode of operation 106 scenario, when the Keeyask GS operates at 159 m ASL continuously, the amount of 107 habitat that is suitable is equal to the potential (i.e., all potential habitat is permanently 108 wetted). Conversely, under a peaking mode of operation, the area of suitable habitat is 109

TAC Public Rd 2 DFO-0072
Page 4 of 8
expected to be less than the potential due to dewatering from daily and weekly draw 110 down. 111
For the Base loaded mode of operation at the 95th percentile and 159 m ASL reservoir 112 stage, the area of potential macrophyte habitat in the reservoir is estimated to be 113 1,878.1 ha (Map 3-35), or 1.6 times more than the 1,197 ha of potential macrophyte 114 habitat present in reaches 2A–9A in the existing environment. For the peaking mode of 115 operation, the area of suitable macrophyte habitat (i.e., assuming half of the post-116 Project IEZ is suitable), is 1,396 ha or about 26% less than the Base loaded mode of 117 operation. The suitable macrophyte habitat of the peaking mode of operation is about 118 1.2 times more than exists in the same area under present day conditions. 119
The actual area occupied by plants in the reservoir may range widely in space and time, 120 given that Keeyask environmental studies have shown the area of potential habitat 121 actually occupied varied from a low of 11.5% at Stephens Lake (regulated reservoir) to a 122 maximum of 31% in the unregulated river/lake environment of the Keeyask area (Table 123 3-4). At present, it remains uncertain if the range of habitat occupied by macrophytes 124 arises from intrinsic differences between habitats in a reservoir and large river, or if the 125 area occupied by macrophytes is attributable to incomplete colonization of the potential 126 habitat available in Stephens Lake. In addition, the Stephens Lake reservoir experienced 127 high water conditions during the Keeyask environmental studies, which may suggest 128 plants could have been depth (i.e., light) limited and so had lower areas of occupation. 129 Consequently, as a highly conservative approach, it was assumed that 10% of the 130 potential habitat at Year 30 would be occupied by rooted macrophytes. Estimates 131 suggest that the area occupied by rooted macrophytes at Year 30 is 187.8 ha under Base 132 loaded mode of operation or 139.6 ha for peaking. When compared to the average area 133 occupied in reaches 2B–9A (i.e., 208 ha) in the existing environment, this equates to a 134 loss of 10.7% under a Base loaded scenario or 48.9% under peaking. 135
1.1.1.1.1 Evolution of the Reservoir - Year 1 to Year 15 136
The physical processes responsible for the development and maintenance of aquatic 137 habitat in the Keeyask area after the Project are expected to slow to levels at or near 138 those expected without the Project before or by Year 15 (PE SV, Section 6.4.2, Section 139 6.4.4, and Section 7.4.2). These studies suggest: 1) that rates of shoreline erosion are 140 expected to stabilize at rates similar to those of the existing environment by about Year 141 15; 2) like the rate of shoreline erosion, the rates of mineral deposition will be greatest 142 at Year 1 and generally decrease thereafter; and 3) the peatland disintegration models 143 suggest that most of the flooded peatland dynamics, which are unique to the post-144 Project, have occurred by Year 15. 145

TAC Public Rd 2 DFO-0072
Page 5 of 8
When compared to the Peaking Mode of operation, the Base loaded scenario generates 146 a slightly higher rate of mineral erosion, and rate of mineral deposition (PE SV, Section 147 6.4.2.1 and Section 7.4.2.1). The mode of operation is not expected to change the 148 amount of peat resurfacing or rate of disintegration, or movement of floating peat (PE 149 SV, Section 6.4.2.1). 150
The results of total suspended solids, dissolved oxygen, and organic sediment models by 151 the physical environment studies are described in Section 2 of this volume and in the PE 152 SV, Section 7 and Section 9. A detailed examination of the differences between Base 153 loaded and Peaking operations is provided in the PE SV, Section 4.4.2.2. 154
1.1.1.1.2 Development of Reservoir Habitat 155
The Keeyask environmental studies suggest that the reservoir habitat may begin to 156 approach a more stable state by Year 15 given that the physical processes that force the 157 composition and distribution of habitat (including water depth and velocity regimes 158 established at initial FSL) have slowed appreciably. Accordingly, the main habitat 159 patterns that are well established at Year 30 are expected to be evident by Year 15. 160 Although erosion, transport, and deposition are expected to continue in the reservoir 161 after Year 15, the rates of change within the habitats established are expected to be 162 relatively low and/or episodic over smaller areas. In all but the highly exposed areas 163 such small increments of change are not expected to alter the type of reservoir habitat 164 developed by Year 15 but more heterogeneity would be evident (i.e., arising from 165 remnants of flooded terrestrial and shore erosion) than in Year 30. Further, the ability of 166 the reservoir to form habitat boundaries (i.e., those that define the edges of habitat 167 types like rock, sand, or silt) is in part dependent on the available hydraulic energy. As 168 such, substrate habitat boundaries that form in Deep Water due to the pattern of 169 lentic/lotic habitat are more likely to be evident earlier in the reservoir than shallow 170 habitat, which, due to erosion, is relatively unstable for longer periods of time. Deep 171 Water habitat boundaries, such as the superimposition of silt on the existing riverbed, 172 could probably be observed by Year 5. In Shallow and Lentic habitat, the habitat 173 boundaries that form in back bays would be at a slower rate than those that form in the 174 main body of the reservoir where wave energy is higher, but could stabilize earlier than 175 highly exposed sites. 176
Year 1 177
As described in detail in the PE SV, the physical changes from the state at initial FSL are 178 mainly: 1) the ongoing peat resurfacing and transport, 2) mineral and peat erosion, 3) 179 mineral sediment deposition in shallow water and silt sediment begins to deposit in 180 many areas of the lower reservoir. 181

TAC Public Rd 2 DFO-0072
Page 6 of 8
One year after flooding the reservoir substrate is expected to be heterogeneous and 182 composed of flooded terrestrial habitat, flooded aquatic habitat, and early signs of 183 newly formed substrate that will eventually be predominant at Year 30. The area of 184 flooded terrestrial habitat (i.e., where substrate is still the same as at initial FSL) is 185 expected to decrease relative to initial FSL; many areas of the lower reservoir will be 186 heterogeneous and composed of pre-flood and post-flood materials. The distribution of 187 post-flood materials is expected to be discontinuous and under-developed due to the 188 limited time the reservoir has had to segregate water masses, move materials that have 189 been mobilized since flooding, and the available bottom types. Floating peat islands will 190 be readily apparent and mobile on the surface of the reservoir (PE SV, Appendix 6D). 191 Differences in the rate of peatland and mineral shore erosion around the perimeter of 192 the reservoir (PE SV, Section 6.4.2.1) suggest differences in the rate of reservoir habitat 193 evolution may be apparent. The shallow flooded terrestrial areas in the south Shallow 194 Water area of Reach 6 are expected to have the highest rates of shore erosion and 195 deposition at Year 1 (PE SV, Section 7.4.2.1). 196
The post-Project distribution of aquatic habitat types within each water elevation zone 197 (MOL=158 m ASL, FSL=159 m ASL, and the IEZ) that are expected to develop by Year 1 198 are shown in Appendix 3D (Table 3D-1). These predicted habitat distributions were used 199 in the lower trophic level and fish community assessments (Section 4 to Section 6). 200
Local tributaries that enter at the ends of bays will have pooled tea-colour peatland 201 water at the end of the bays; the visible contrast to that of the turbid water of the main 202 reservoir will remain a long-term characteristic of the reservoir (Appendix 3B). The 203 location where the peatland water mass meets the more turbid water of the reservoir 204 will influence the long-term position of organic and silt habitat boundaries evident at 205 Year 30 (Appendix 3B). The flooded terrestrial bays will have markedly different water 206 quality characteristics and are expected to show large seasonal changes in oxygen 207 (Section 2). 208
Year 5 209
At Year 5, the area of substrate comprised of post-flood materials is expected to 210 increase while the area of flooded terrestrial habitat will decrease. Sedimentation 211 analyses indicate erosion and sedimentation processes in the reservoir remain active at 212 five years post-flooding (PE SV, Section 6.4.2.1 and Section 7.4.2.1). Sedimentation 213 analysis indicates rates of sediment deposition of 0−1 cm/year in offshore areas (PE SV, 214 Section 7.4.4). Mineral sediment, primarily in the form of silt, is expected to cover much 215 of the flooded aquatic habitat and flooded terrestrial habitat, except where water 216 velocity, surface wave energy, or slope of the substrate is sufficient to prevent 217 deposition (Appendix 3B). 218
TAC Public Rd 2 DFO-0072
Page 7 of 8
Erosion of thin peatlands in exposed areas of shallow water of the lower reservoir is 219 expected to expose the underlying mineral soils (PE SV, Section 6.4.2.1). Aquatic studies 220 of Stephens Lake also show that, over time, a clay-based substrate will form from pre-221 flood topography that is mineral or thin peat from which potential macrophyte habitat 222 will begin to develop (Appendix 3B). Occupation of the potential plant habitat by rooted 223 macrophytes could occur but would probably be infrequent and, in general, not a widely 224 visible aspect of the reservoir. According to the results of erosion and sedimentation 225 studies (PE SV, Section 6.4.2.1), the habitat adjacent to the southern shoreline area of 226 Reach 7 and in Reach 9 would likely be the most unstable Shallow habitat in the 227 reservoir. 228
Ends of back bays fed by peatland streams will lack silt sediment originating from the 229 turbid waters of the main reservoir (Appendix 3B) and will resemble flooded terrestrial 230 habitat. Peat resurfacing and transport away from the bays appears to be slower when 231 compared to the main body of the reservoir (Larter 2010). At Year 5 peat is likely to be a 232 readily visible characteristic of back bays in the reservoir; floating and mobile peat is 233 estimated to be greatest at Year 5 (PE SV, Appendix 6D). The greatest accumulation of 234 floating peat is expected in the southern bays of the lower reservoir (PE SV, Section 235 7.4.4). Some of this mobile peat could anchor on shores and superimpose existing 236 reservoir habitat. This would constitute a small and short-term loss of habitat that is not 237 expected to influence biota. 238
The boundaries of post-flood substrate materials in deep water, (i.e., substrates of silt 239 and other harder bottom types) could evident by Year 5 in lentic habitat given that silt 240 sedimentation is the dominant open-water process but, as described in later time steps, 241 is discontinuous in the Lotic areas of the lower reservoir. 242
The post-Project distribution of aquatic habitat types within each water elevation zone 243 (MOL=158 m ASL, FSL=159 m ASL, and the IEZ) that are expected to develop by Year 5 244 are shown in Appendix 3D (Table 3D-1). These predicted habitat distributions were used 245 in the lower trophic level and fish community assessments (Section 4 to Section 6). 246
Year 15 247
The main habitat patterns that are evident and well established at Year 30 (described in 248 previous section) are expected to be present at Year 15. When compared to the 249 reservoir habitat at Years 1 and 5, relatively stable shallow water habitats will have 250 developed given that peatland disintegration, mineral erosion and mineral 251 sedimentation processes are expected to have slowed markedly (PE SV, Section 6.4.2.1 252 and Section 7.4.2.1). It is anticipated that the areas of post-flood substrate materials at 253 Year 15 would be somewhat less than at Year 30 as some heterogeneity would persist 254

TAC Public Rd 2 DFO-0072
Page 8 of 8
given that some remnant flooded terrestrial habitat would remain but the segregation 255 of distinct reservoir habitats (Appendix 3B) would be recognizable. 256
Some of the potential macrophyte habitat available at Year 30 would be present at Year 257 15 but heterogeneity would be expected due to remnants of flooded terrestrial habitat 258 and occasional changes in quality of some of that habitat due to ongoing erosion. A 259 predominantly clay-based substrate with some aggregate lag will begin to be widely 260 available in the lower reservoir in Shallow Water within the zone of wave action 261 (Appendix 3B); this is expected to form the primary habitat for the rooted macrophyte 262 Potamogeton richardsonii. Some of the potential macrophyte habitat found at the ends 263 of back bays also will have developed. By Year 15, much of the fibrous surface layers of 264 the resurfaced peat will have resurfaced and transported away (PE SV, Section 7) which 265 creates and enables fine organic deposition to form (Appendix 3B). The ends of 266 sheltered bays with fine organic deposition are expected to form some of the habitat for 267 the rooted macrophyte Myriophyllum sibiricum. 268
The Deep Water habitat patterns of silt deposition are expected to be quite similar to 269 modelled estimates of Year 30 (described in previous section). Unlike the development 270 of Shallow Habitat, which in most areas of the reservoir responds mainly to the 271 intermittent effects wave action and water level cycling, the Deep Water habitat will 272 arise from water depth and velocity regimes that will have acted continuously since 273 initial FSL. Silt deposits, which will sediment at rates from 0–1 cm/year (PE SV 7.4.2.1) 274 will form a continuous surface where deposition is expected at Year 30 (described in 275 previous section), but at Year 15 the deposits will be thinner (PE SV 7.4.2.1). In reaches 276 2A–5 the velocity of the thalweg will be sufficient to maintain the bottom type observed 277 in the studies of the existing environment. A substrate material size gradient is not 278 expected where riverine flows leave Reach 5 and enter Reach 6 upstream of the zone of 279 deep water silt deposition based on sediment transport analysis that suggest negligible 280 amounts of sand and gravel material will be transported from the flooded banks 281 upstream in the flooded riverine reaches (PE SV, Section 7). This is unlike the material 282 size gradient that appears to have formed 4–5 km below Gull Rapids after Kettle GS was 283 built (see Map 3-14). The area of the confluence of reaches 5 and 6 will be monitored 284 after the Project to determine if sand and gravel transport and deposit in this area. 285
The post-Project distribution of aquatic habitat types within each water elevation zone 286 (MOL=158 m ASL, FSL=159 m ASL, and the IEZ) that are expected to develop by Year 15 287 are shown in Appendix 3D (Table 3D-1). These predicted habitat distributions were used 288 in the lower trophic level and fish community assessments (Section 4 to Section 6). 289
TAC Public Rd 2 DFO-0073
Page 1 of 9
REFERENCE: Volume: Response to EIS Guidelines; Section: 6.3.8 1
Sedimentation; p. 6-215 2
TAC Public Rd 2 DFO-0073 3
ORIGINAL PREAMBLE AND QUESTION: 4 Deposition - EIS states deposition loads will not change post project – about 3cm/year, 5 based on about 30 cm of sediment deposited in ten years since Kettle GS was built. 6 “Based on extensive modelling (using Stephens Lake) and field verification”, the majority 7 of mineral sediments resulting from shoreline erosion are predicted to deposit in near 8 shore areas…after year 1, rates predicted at 0-3 cm/y. Offshore = 0-1 cm/y after year 1. 9 The south nearshore areas in Gull Lake predicted to experience highest deposition rate 10 of 4-6 cm/y for year 1 under baseloaded conditions. 11
Do not provide sedimentation rates based on a range of flows. No detail on sampling 12 conducted to establish baseline other than at Kettle GS. How will the sedimentation 13 model be tested for accuracy? What monitoring will be conducted to validate model 14 assumptions? 15
FOLLOW-UP QUESTION: 16 Would the proponent now provide details from documents not provided with the EIS 17 that were to follow (e.g., physical environment monitoring plan for second quarter 18 2013) that answer this question? Can the proponent provide information on thresholds 19 for risk of sediment deposition (e.g., are 1-4 cm sediment thickness of concern or some 20 other thickness)? Can the proponent carry out a GIS, or other, risk based assessment 21 that delineates areas of pre-project sediment types of biological interest compared with 22 post-project critical deposition thicknesses? Can the proponent provide a table of total 23 areas by impact zone (e.g., upstream and downstream) of area affected by biologically 24 significant deposition? Proponent plan still in production and not available for review. 25
RESPONSE: 26 A description of proposed monitoring and follow-up activities, as required by the 27 Guidelines, is provided in Chapter 8 of the Response to the EIS Guidelines. The 28 preliminary Physical Environment Monitoring Plan will contain additional details. As 29 noted in original response to TAC Public Rd 1 CEAA-0011, while the Guidelines do not 30 require the Physical Environment Monitoring Plan, the Partnership will provide a 31 preliminary version of the plan to regulators in the second quarter of 2013. 32

TAC Public Rd 2 DFO-0073
Page 2 of 9
With respect to information on thresholds for risk of sediment deposition, the aquatic 33 habitat assessment assumed that all areas in the reservoir where fine sediment (i.e., silt) 34 would be deposited over sand, gravel, or coarser substrate would, in the long term, be 35 classified as fine sediment. Therefore, there is no “threshold for risk of sediment 36 deposition”; it was recognized that even very small amounts of annual deposition (e.g., 37 0.5 cm) over several decades would result in the accumulation of substantial amounts of 38 silt. 39
Effects of sediment (i.e., silt) deposition on aquatic habitat in the reservoir in the long 40 term (i.e., after 30 years of impoundment) were assessed based on whether or not 41 sediment (i.e., silt) deposition was predicted(AESV Appendix 3B). The presence or 42 absence of sediment deposition was used to determine whether a qualitative change of 43 substrate type would occur. Studies of Stephens Lake showed that sites of net 44 deposition, despite varying sediment deposition rates, develop a homogenous silt 45 surficial layer within 30 years of impoundment. This silt layer completely covered the 46 underlying materials, although the depth of silt varied depending on location (see AESV 47 Appendix 3B, photo 3B-2). Therefore, the rate of sediment deposition is not the primary 48 determinant of substrate availability three decades after impoundment. Instead, the 49 approach to determine the long term type of substrate was to identify the boundaries of 50 sites of net deposition (for methods see AE SV Appendix 3B). 51
Downstream of the generating station, the change in flow distribution in the river within 52 3 km of the generating station will create shoreline areas with minimal flow, where silt 53 is expected to accumulate over rock in the long term (see AE SV Map 3-34). Further 54 downriver (including at the area of the present day sand lens in Stephens Lake), the 55 velocity post-Project will essentially be the same as today so deposited materials would 56 be redistributed over time as they are today (PE SV Section 7.4.2.2.4). Superimposition 57 of like materials would not change the habitat type (e.g., sand deposited on the sand 58 lens will not change the habitat classification). It should be noted that sediment 59 deposition and re- suspension occurs in the existing environment and will continue post-60 Project. 61
The description of sedimentation downstream of the generating station in PE SV Section 62 7.4.2.2.4 is reproduced below: 63
“7.4.2.2.4 Mineral Sediment Deposition 64
As discussed earlier in this section, some of the relatively coarser sediment 65 material would be deposited in the Keeyask reservoir. Absence of relatively 66 coarser material in the flow in the Post-project environment downstream of 67

TAC Public Rd 2 DFO-0073
Page 3 of 9
Keeyask GS would likely cause reduction in deposition currently observed in the 68 existing environment in Stephens Lake, particularly near the upstream end of the 69 lake. It is expected that Project impact on the mineral deposition would be 70 limited to a reach of approximately 10 km to 12 km from the Gull Rapids. 71
As discussed earlier in Section 7.4.1.1, a young of year habitat area for Lake 72 Sturgeon currently exists downstream of Gull Rapids near a sand and 73 gravel/sand bed. Two-dimensional modelling was used to assess the spatial 74 distribution of the potential for suspended material to be deposited near the 75 young of yeah habitat area under Post-project conditions. The modelling results 76 indicate that it is unlikely that silt will deposit near the young of year habitat 77 under on-peak flows, such as all seven powerhouse units. 78
Under off-peak flows, such as one Powerhouse unit, there is a higher potential 79 for silt deposition near the young of year habitat area compared to the existing 80 environment. However, due to the relatively short duration of off-peak flows, the 81 amount of silt deposition would be very small and will likely be eroded from the 82 bed under on-peak flows. Map 7.4-26 illustrates the potential for sediment 83 deposition as well as the existing substrate immediately downstream of the 84 Keeyask GS under all seven Powerhouse units operating at best gate flow. A 85 detailed description of this two-dimensional modeling can be found in Appendix 86 7A.” 87
Maps and tables providing the areas of different types of substrate in the existing and 88 post-Project environment are provided in the response to TAC Public Rd 2 DFO-0014. 89 These are reproduced below for your convenience.90

TAC Public Rd 2 DFO-0073
Page 4 of 9
Table 1. Change of area in hectares (ha) of the substrate classes present in the Existing Environment according to a 95th percentile inflow (rows) and the Year 30 Post-Project (columns) for the entire reservoir area.
Existing Substrate (ha.) Year 30 Substrate (ha.)
Bedrock Boulder Clay Cobble Cobble/Boulder Cobble/Boulder/Bedrock
Flooded Terrestrial
Soils Organic Peat Sand Sandy Clay Silt Grand
Total EE
Bedrock 18.16
0.73
33.04 0.00
0.64 14.83 67.42
Boulder
0.36
3.27
1.93 5.57
Cobble
0.00 0.50 12.81
0.68 7.61 21.60
Cobble/Boulder
1454.38
0.00 1.07 326.88 1782.33
Cobble/Boulder/Bedrock 5.49
4.31
55.15
0.00
191.61 256.56
Gravel
1.45
0.00 18.16 19.61
Gravel/Cobble/Boulder
290.90
908.05 1198.95
Organic
0.35
0.76
0.00 24.27 25.39
Sand
17.36
20.40 0.52 139.27 177.55
Silt/Clay 0.17
8.82
59.01 0.02
22.63 0.00
3.82 1174.19 1268.67
Aquatic within EE 95) 23.82 0.36 13.87 0.50 1872.59 55.17 0.00 23.40 0.00 20.40 6.73 2806.80 4823.65
Flooded Only 20.65 0.01 1413.63
127.35 43.87 137.72 521.87 297.27 3.15 110.42 2473.45 5149.40
Grand Total (Year 30) 44.47 0.37 1427.50 0.50 1999.94 99.04 137.72 545.27 297.27 23.56 117.15 5280.25 9973.05 91
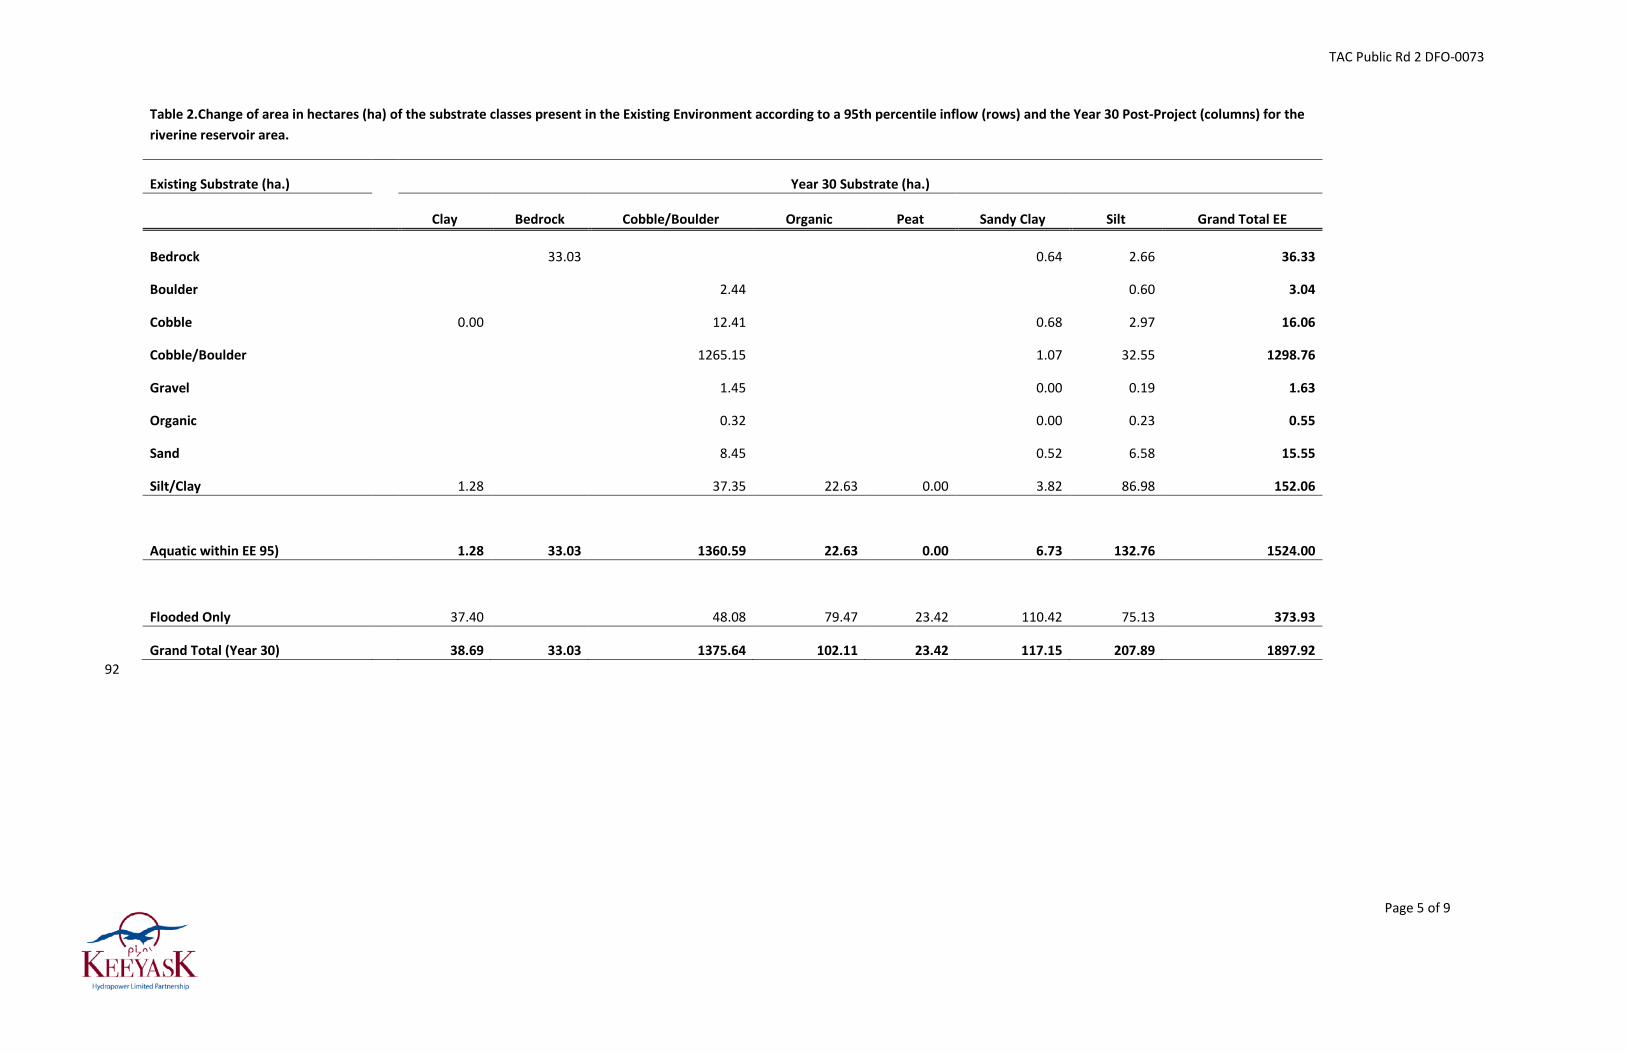
TAC Public Rd 2 DFO-0073
Page 5 of 9
Table 2.Change of area in hectares (ha) of the substrate classes present in the Existing Environment according to a 95th percentile inflow (rows) and the Year 30 Post-Project (columns) for the riverine reservoir area.
Existing Substrate (ha.) Year 30 Substrate (ha.)
Clay Bedrock Cobble/Boulder Organic Peat Sandy Clay Silt Grand Total EE
Bedrock
33.03
0.64 2.66 36.33
Boulder
2.44
0.60 3.04
Cobble
0.00
12.41
0.68 2.97 16.06
Cobble/Boulder
1265.15
1.07 32.55 1298.76
Gravel
1.45
0.00 0.19 1.63
Organic
0.32
0.00 0.23 0.55
Sand
8.45
0.52 6.58 15.55
Silt/Clay
1.28
37.35 22.63 0.00 3.82 86.98 152.06
Aquatic within EE 95) 1.28 33.03 1360.59 22.63 0.00 6.73 132.76 1524.00
Flooded Only 37.40 48.08 79.47 23.42 110.42 75.13 373.93
Grand Total (Year 30) 38.69 33.03 1375.64 102.11 23.42 117.15 207.89 1897.92 92

TAC Public Rd 2 DFO-0073
Page 6 of 9
Table 3. Change of area in hectares (ha) of the substrate classes present in the Existing Environment according to a 95th percentile inflow (rows) and the Year 30 Post-Project (columns) for the reaches of the lower reservoir area.
Existing Substrate (ha.)
Year 30 Substrate (ha.)
Bedrock Boulder Clay Cobble Cobble/Boulder Cobble/Boulder/Bedrock Flooded
Terrestrial Soil Organic Peat Sand Silt Grand Total
EE
Bedrock
18.16
0.73
0.02 0.00
12.17 31.08
Boulder
0.36
0.84
1.33 2.53
Cobble
0.50 0.40
4.63 5.54
Cobble/Boulder
189.24
0.00 294.33 483.57
Cobble/Boulder/Bedrock
5.49
4.31
55.15
0.00 191.61 256.56
Gravel
17.97 17.97
Gravel/Cobble/Boulder
290.90
908.05 1198.95
Organic
0.03
0.76
24.04 24.84
Sand
8.91
20.40 132.69 162.00
Silt/Clay
0.17
7.54
21.67 0.02
1087.21 1116.61
Aquatic within EE 95) 23.82 0.36 12.58 0.50 511.99 55.17 0.76 20.40 2674.05 3299.66
Flooded Only
20.65 0.01 1376.23 79.27 43.87
137.72 442.40 273.86 3.15 2398.31 4775.47
Grand Total (Year 30) 44.47 0.37 1388.82 79.77 555.86 55.17 137.72 443.17 273.86 23.56 5072.36 8075.13 93

TAC Public Rd 2 DFO-0073
Page 7 of 9
94
Map 1. Change of substrate type for the Existing Environment (upper panel) and Year 30 Post-Project. The extent of the existing environment 95th percentile shoreline is shown in blue for comparison to the Post-Project 95 Year 30 shoreline. 96
97

TAC Public Rd 2 DFO-0073
Page 8 of 9
98
Map 2. Change of substrate type for the Existing Environment (upper panel) and Year 30 Post- Project for the riverine reaches. The hydraulic zone of influence is shown in the lower panel for the Post-Project. 99
100

TAC Public Rd 2 DFO-0073
Page 9 of 9
101
Map 3. Post-Project substrate immediately downstream of the generating station.102

TAC Public Rd 2 DFO-0074
Page 1 of 5
REFERENCE: Volume: Physical Environment Supporting Volume; 1
Section: Appendix 7A.1.1.3 Post-Project Nearshore Sedimentation 2
Model; p. 7A-6 3
TAC Public Rd 2 DFO-0074 4
ORIGINAL PREAMBLE AND QUESTION: 5 Sedimentation 6
Given the variation in sedimentation rates over time and the challenges in estimating 7 sedimentation level, does the sedimentation analysis include a sensitivity analysis to 8 reflect possible ranges in sedimentation and the effects on fish and fish habitat both 9 upstream and downstream? 10
FOLLOW-UP QUESTION: 11 Sensitivity analysis not provided. 12
RESPONSE: 13 Analysis of nearshore mineral sedimentation upstream of the Keeyask Generating 14 Station produced estimates of sediment deposition rates based on different loading 15 conditions: 16
• Sediment loadings due to shoreline erosion were those resulting from operating 17 100% of the time in either a base loaded or a peaking mode of operation over the 18 prediction periods (PE SV Sec. 6.4.2.1.3). The Keeyask Response to EIS Guidelines 19 (Section 4.7.1 [appended to end of response]) describes the modes of operation. A 20 peaking mode of operation produces less erosion, and thus less sediment than a 21 base loaded mode of operation (Response to EIS Guidelines, Sec. 6.3.7.2). It is 22 expected that the generating station will not operate 100% of the time in one mode 23 or the other. Based on historic flow records, it could operate in peaking mode up to 24 88% of the time, although it could operate 27% of the time or more in a base loaded 25 mode (PE SV Sec. 4.4.2.2.1, 4.4.2.2.2). Assuming erosion volumes due to 100% 26 operation in one mode or the other gives a wider range of sediment input than 27 would actually be expected since actual operation will be a mix of peaking and base 28 loaded modes of operation. 29
• Using the estimated sediment loadings, the Post-project sedimentation 30 environment was simulated under low, medium and high (5th, 50th, 95th percentile) 31 open water flow conditions for different time frames of 1 year, 5 years, 15 years and 32 30 years after impoundment. 33

TAC Public Rd 2 DFO-0074
Page 2 of 5
• Nearshore sedimentation modeling tested different cases where 50% to 80% of the 34 eroded material was deposited within the nearshore area. The range of material 35 deposited in the nearshore was based on a conceptual model of nearshore 36 sedimentation, which tested the sensitivity of deposition based on injecting a 37 sediment load at distances of 10 m to 50 m offshore (PE SV, Sec. 7A.1.1.3). 38
Sedimentation rates reported as ranges in the Response to EIS Guidelines (e.g., 1-2 39 cm/yr) encompass the likely range of sedimentation rates during operation, particularly 40 because the predictions of sediment loads assume either 100% peaking or 100% base 41 loaded operation when in fact the operation (and thus the loading) will be somewhere 42 in between these two extremes. Deposition rates are not sensitive to flow because 43 nearshore water velocities in the post-Project environment would be low and of similar 44 magnitude regardless of flow. 45
Potential downstream sedimentation was also considered in the physical environment 46 studies. Analyses that were performed to estimate sediment loads and downstream 47 deposition during construction included the following (see Appendix 7A of the Physical 48 Environment Supporting Volume (PE SV) for model descriptions): 49
• Estimation of potential changes in suspended sediment transported downstream for 50 low, median and high flow conditions (i.e., 5th, 50th and 95th percentile flows) due 51 to in-stream construction and removal of dams and cofferdams. Results reported in 52 the Keeyask response to EIS Guidelines (Sec. 7.4.1; Figure 7.4-1) are for a low flow 53 condition, which results in the largest potential increase in suspended sediment due 54 to in-stream placement and removal of construction materials. 55
• Erosion of upstream shorelines resulting from water level increases along shorelines 56 in the Gull Rapids area due to cofferdam construction in the river. The analysis 57 considered erosion potential using four different sediment transport equations for 58 two high flow conditions (i.e., 95th percentile and 1:20 year flood flows). Lower 59 flows were not assessed because high flows produce the largest effects. 60 Additionally, the analysis assumed an infinite amount of shoreline material would 61 be available to be eroded from the shorelines, even though the actual amount of 62 material available may be limited. The assessment of shoreline erosion during 63 construction is therefore considered to produce estimates of potential Project 64 effects that are higher than what is expected to occur. 65
• A sediment transport model was developed to analyse the transport of eroded 66 materials through Stephens Lake, from just downstream of the Project to the Kettle 67 Generating Station. Various model scenarios were assessed using input that 68 considered multiple sediment gradations, several different flow conditions and two 69 different sediment transport equations. The analyses found that the resulting 70

TAC Public Rd 2 DFO-0074
Page 3 of 5
deposition within Stephens Lake is not very sensitive to the variables. The amount 71 of downstream sedimentation resulting from construction was estimated and 72 reported in PE SV (Map 7.4-1). 73
• Additional modeling was completed to identify sediment deposition potential in the 74 area downstream of the Project (i.e., about 5-6 km downstream) to assess sediment 75 deposition potential near a known fish habitat area. Sediment deposition potential 76 was analyzed for both the construction and operation periods for a range of flow 77 and operating conditions. The modeling only assessed the potential for sediment 78 deposition and did not include predictions of sediment deposition rates. 79
The downstream sedimentation analyses considered the sensitivity of estimated Project 80 effects by considering a range of flow and sediment input conditions using several 81 different erosion and sediment transport formulations. Results presented in the PE SV 82 (Sec. 7.4.1) likely overestimate Project effects because the values reported are based on 83 the high estimates of the Project effects rather than average effects. 84
The follow-up question for DFO-0073 also enquired about the risks of sedimentation 85 with respect to fish and fish habitat. The relevant portion of the response to the follow-86 up question for DFO-0073 is copied below. 87
DFO-0073 RESPONSE: 88 Effects of sediment (i.e., silt) deposition on aquatic habitat in the reservoir in the long 89 term (i.e., after 30 years of impoundment) were assessed based on whether or not 90 sediment (i.e., silt) deposition was predicted(AESV Appendix 3B). The presence or 91 absence of sediment deposition was used to determine whether a qualitative change of 92 substrate type would occur. Studies of Stephens Lake showed that sites of net 93 deposition, despite varying sediment deposition rates, develop a homogenous silt 94 surficial layer within 30 years of impoundment. This silt layer completely covered the 95 underlying materials, although the depth of silt varied depending on location (see AESV 96 Appendix 3B, photo 3B-2). Therefore, the rate of sediment deposition is not the primary 97 determinant of substrate availability three decades after impoundment. Instead, the 98 approach to determine the long term type of substrate was to identify the boundaries of 99 sites of net deposition (for methods see AE SV Appendix 3B). 100
Downstream of the generating station, the change in flow distribution in the river within 101 3 km of the generating station will create shoreline areas with minimal flow, where silt 102 is expected to accumulate over rock in the long term (see AE SV Map 3-34). Further 103 downriver (including at the area of the present day sand lens in Stephens Lake), the 104 velocity post-Project will essentially be the same as today so deposited materials would 105 be redistributed over time as they are today (PE SV Section 7.4.2.2.4). Superimposition 106 of like materials would not change the habitat type (e.g., sand deposited on the sand 107

TAC Public Rd 2 DFO-0074
Page 4 of 5
lens will not change the habitat classification). It should be noted that sediment 108 deposition and re- suspension occurs in the existing environment and will continue post-109 Project. 110
The description of sedimentation downstream of the generating station in PE SV Section 111 7.4.2.2.4 is reproduced below: 112
“7.4.2.2.4 Mineral Sediment Deposition 113
As discussed earlier in this section, some of the relatively coarser sediment 114 material would be deposited in the Keeyask reservoir. Absence of relatively 115 coarser material in the flow in the Post-project environment downstream of 116 Keeyask GS would likely cause reduction in deposition currently observed in the 117 existing environment in Stephens Lake, particularly near the upstream end of the 118 lake. It is expected that Project impact on the mineral deposition would be 119 limited to a reach of approximately 10 km to 12 km from the Gull Rapids. 120
As discussed earlier in Section 7.4.1.1, a young of year habitat area for Lake 121 Sturgeon currently exists downstream of Gull Rapids near a sand and 122 gravel/sand bed. Two-dimensional modelling was used to assess the spatial 123 distribution of the potential for suspended material to be deposited near the 124 young of yeah habitat area under Post-project conditions. The modelling results 125 indicate that it is unlikely that silt will deposit near the young of year habitat 126 under on-peak flows, such as all seven powerhouse units. 127
Under off-peak flows, such as one Powerhouse unit, there is a higher potential 128 for silt deposition near the young of year habitat area compared to the existing 129 environment. However, due to the relatively short duration of off-peak flows, the 130 amount of silt deposition would be very small and will likely be eroded from the 131 bed under on-peak flows. Map 7.4-26 illustrates the potential for sediment 132 deposition as well as the existing substrate immediately downstream of the 133 Keeyask GS under all seven Powerhouse units operating at best gate flow. A 134 detailed description of this two-dimensional modeling can be found in Appendix 135 7A.” 136
Copy of Text from Keeyask Response to EIS Guidelines, Section 4.7.1: 137
4.7.1 MODES OF OPERATION 138
The Project will operate as a modified peaking plant, meaning that it will operate either 139 in a peaking mode or a base-loaded mode. The extent by which the Project will be 140 operated in a base-loaded mode or a peaking mode will be determined by the flows in 141

TAC Public Rd 2 DFO-0074
Page 5 of 5
the Nelson River and the requirements of the Manitoba Hydro integrated power system 142 to meet the power demands at that time. 143
There may be occasions when the Project will be required to operate in a special or 144 emergency mode of operation. Special conditions include load rejection (units tripping 145 off due to mechanical, transmission or other problems), flood management, or 146 meteorological events. Emergency conditions include a risk of imminent failure of one of 147 the dams or dykes or when the flow passing through the station needs to be halted 148 temporarily. 149
When the Project operates in a peaking mode, water stored in the reservoir will be used 150 to augment Nelson River inflows so that maximum power can be generated during the 151 weekday on-peak periods to coincide with peak power demand. At night, when demand 152 for power is lower, flow through the station will be reduced to store water in the 153 reservoir for use the following day, resulting in an overnight increase in the reservoir 154 level. During weekends, flows through the station will be reduced to fill the reservoir to 155 the FSL by the following Monday morning. The reservoir may fluctuate up to 1.0 m in 156 one day between the FSL and the MOL during a peaking mode of operation. When the 157 Project operates in a base-loaded mode, the reservoir will remain relatively stable at or 158 near the FSL and the outflow from the station will be approximately equal to the inflow. 159 The volume of water available in the reservoir for a peak mode of operation is 81.4 160 million m3 when the reservoir is at its full supply level. During the first 30 years of 161 operation the reservoir is predicted to expand by 7-8 km2 due to the erosion of mineral 162 shoreline and peatland disintegration. Reservoir storage would increase to 84.9 – 85.4 163 million m3. Based on historic flow records since the LWR and CRD have been in 164 operation, the Project could operate in a peaking mode up to about 88% of the time. 165
There will be two potential constraints on the mode of operation to mitigate 166 environmental effects. The first potential constraint would be a minimum plant 167 discharge equal to two units at best gate setting and five units closed during the lake 168 sturgeon spring-spawning period to ensure sufficient water velocities exist in the 169 sturgeon spawning areas to be constructed downstream of the powerhouse. The results 170 of monitoring will be used to assess if this constraint is required or if the spawning shoal 171 requires modification. The second constraint would be applied if monitoring shows that 172 lake sturgeon eggs are deposited downstream of the spillway during its operation and 173 requires that the spillway discharge be maintained at levels sufficient to permit egg 174 hatch and survival of larval fish until they emerge and drift from the site (see Section 175 6.4.6.2.2). 176
The surface water and ice regimes during operation are described in Section 6.3. The 177 existing environment and post-Project environment shorelines (at FSL) and water 178 surface profiles for open water conditions are shown in Map 4-3.179

TAC Public Rd 2 DFO-0075
Page 1 of 1
REFERENCE: Volume: Physical Environment Supporting Volume; 1
Section: 7.4.1 Construction Period; p. N/A 2
TAC Public Rd 2 DFO-0075 3
ORIGINAL PREAMBLE AND QUESTION: 4 The EIS notes “Placement and removal of cofferdams/groins during Stage II Diversion 5 will occur over three years (2017, 2018, and 2019) during the open water seasons. Most 6 of these activities are predicted to result in increases in TSS of less than 5 mg/L above 7 background, which would be within the…CCME guidelines for the protection of aquatic 8 life. The exceptions include placement of the South Dam Rock Fill Groin, which is 9 predicted to result in TSS increases of up to 15 mg/L above background, with increases 10 of greater than 5 mg/L for a period of approximately 10 days in early September 2017. 11 An increase in TSS of 7 mg/L for a period one month is also predicted during removal of 12 the Tailrace Summer Level Cofferdam in September/October 2019. 13
The Proponent predicts several instances of average TSS increases greater than the 14 CCME guideline for longer term impacts (e.g., inputs lasting between 24 h and 30 d 15 should not exceed 5 mg/L above background). Are there additional opportunities, both 16 reasonable and practical, to further prevent and mitigate sediment releases such that 17 the guidelines can be met? For example, if a given TSS exceedance is in part due to 18 shoreline erosion, would pre-emptive shoreline stabilization be an option? 19
FOLLOW-UP QUESTION: 20 Proponent plan still in production and not available for review. 21
RESPONSE: 22 While it is recognized that it is not possible to prevent sediment releases so that TSS 23 concentrations meet the CCME guidelines at all times and at all locations, reasonable 24 and practical methods to reduce sediment inputs are described in the In-stream 25 Construction Sediment Management Plan (SMP). Monitoring conducted as part of the 26 Physical Environment Monitoring Plan (PEMP) and the Aquatic Effects Monitoring Plan 27 (AEMP) will be used to confirm the predicted effects of sediment releases on the 28 environment. 29
The Partnership provided a preliminary draft of the Keeyask Generation Project 30 Sediment Management Plan for In-Stream Construction to regulators on October 17, 31 2012 and a revised draft will be provided during the 2nd quarter of 2013. Preliminary 32 drafts of the PEMP and AEMP will be provided during the 2nd quarter of 2013.33

TAC Public Rd 2 DFO-0076
Page 1 of 1
REFERENCE: Volume: Physical Environment Supporting Volume; 1
Section: 7.2.1. 2
TAC Public Rd 2 DFO-0076 3
ORIGINAL PREAMBLE AND QUESTION: 4 The EIS notes “Prediction of the post-impoundment…environment upstream…was 5 carried out by…numerical modeling…Depth-average mineral suspended sediment 6 concentrations were estimated for average (50th percentile) flow for prediction periods 7 of 1 year, 5 years, 15 years and 30 years after impoundment. Sediment concentrations 8 were also predicted for low (5th percentile) and high (95th percentile flow conditions 9 for…1 year and 5 years after…impoundment. While outside the zone of hydraulic 10 influence, a qualitative assessment was carried out for…sedimentation…in Stephens 11 Lake…” 12
Can the Proponent provide some explanation, or direct reviewers to its location, of why 13 TSS modeling at selected flow percentiles, e.g., 50th percentile or 5th and 95th 14 percentile, or other model settings, provide good estimates of likely effects on the 15 aquatic environment? 16
FOLLOW-UP QUESTION: 17 Can the proponent clarify why a median is used for the first, fifth, fifteenth, and thirtieth 18 years while 5th, 50th, and 95th percentiles are only estimated for one and five years 19 after impoundment? Proponent plan still in production and not available for review. 20
RESPONSE: 21 This follow -up question is similar to the original question asked in TAC Public Rd 1 DFO-22 0070. The second paragraph of the response to TAC Public Rd 1 DFO-0070 addresses 23 why total suspended sediment concentrations were not modelled at 5th and 95th 24 percentile flows beyond year 5: 25
“Based on the 50th percentile results, most of the changes in total suspended 26 solids concentrations are predicted to occur between years 1 and 5. Similar 27 trends were predicted for the 5th and 95th percentile flow scenarios. No 28 modeling was carried out for 15 and 30 years for the low and high flow 29 conditions because the results are expected to be similar to the 50th percentile.” 30
It should be noted that 50 percentile and median flows refer to the same flow. 31

TAC Public Rd 2 DFO-0077
Page 1 of 5
REFERENCE: Volume: Aquatic Environment Supporting Volume; 1
Section: 2.5.2.2.5 Total Suspended Solids/Turbidity; p. 2-66 to 2-2
68 3
TAC Public Rd 2 DFO-0077 4
ORIGINAL PREAMBLE AND QUESTION: 5 The EIS notes “Placement and removal of cofferdams/groins during Stage II Diversion 6 will occur over three years (2017, 2018, and 2019) during the open water seasons. Most 7 of these activities are predicted to result in increases in TSS of less than 5 mg/L above 8 background, which would be within the…CCME guidelines for the protection of aquatic 9 life. The exceptions include placement of the South Dam Rock Fill Groin, which is 10 predicted to result in TSS increases of up to 15 mg/L above background, with increases 11 of greater than 5 mg/L for a period of approximately 10 days in early September 2017. 12 An increase in TSS of 7 mg/L for a period one month is also predicted during removal of 13 the Tailrace Summer Level Cofferdam in September/October 2019…” 14
If increases in TSS exceeding the CCME guidelines appear to be unavoidable, can the 15 Proponent provide additional discussion and rationale (or direct reviewers to the 16 location of that information in the EIS) for why the exceedences, in the Nelson River at 17 Keeyask case, are not likely significant adverse environmental effects. For example, can 18 the Proponent indicate that an exceedance of 7 mg/L TSS above background for 30 days 19 in September/October is not likely to be in the sub-lethal or lethal severity of effect 20 range for fish, fish eggs or larvae, benthic macroinvertebrates, or other aquatic 21 organisms. In addition, can the Proponent say that the exceedance when added to the 22 expected background range for that time of year is within the anticipated natural range 23 of TSS in the Nelson River at the Project site, and in one case downstream to the 24 estuary, at that time of year? 25
FOLLOW-UP QUESTION: 26 Would the proponent please provide an expanded discussion of the type and extent of 27 expected sub-lethal effects, extracting information as necessary from the EIS sections 28 referred to? 29
RESPONSE: 30 As described in AE SV Section 2.5.2.2.5, p. 2-66 to 2-68, increases in TSS within the order 31 of tens to hundreds of mg/L are generally associated with sub-lethal effects to fish such 32 as behavioural alterations, reduced growth or condition, and physiological stress (e.g., 33 DFO 2000). Acute toxicities are generally reported for concentrations ranging from the 34 hundreds to hundreds of thousands of mg/L (DFO 2000; Robertson et al. 2006). The 35

TAC Public Rd 2 DFO-0077
Page 2 of 5
available scientific literature indicates a potential for reduced hatching success in 36 salmonids exposed to elevated TSS concentrations on the order of two months or more, 37 at concentrations ranging from 6.6–157 mg/L (Table 2-17). 38
Based on the available scientific literature, the predicted increases in TSS may result in 39 sublethal effects to fish, but would not be in the lethal severity of effect range. Sublethal 40 effects of increases in TSS on fish may include behavioural alterations (e.g. avoidance of 41 sediment plumes), reduced growth or condition, and physiological stress. Indirect 42 effects include changes in the food web (e.g., reductions in primary production due to 43 reduced water clarity, reduced abundance of benthic invertebrates due to increased TSS 44 and/or sedimentation causing reductions in the abundance of fish diet items), which are 45 considered in Section 4. 46
As noted in the response provided to the original information request, the predicted 47 increases in TSS during Project construction are expected to remain within the existing 48 range of TSS in the area (i.e., 5-30 mg/L). Notably higher concentrations of TSS occur in 49 other river systems which support similar or even more diverse fish species 50 assemblages. For example, the mean TSS concentrations measured by Manitoba 51 Conservation and Water Stewardship over the period of 1997-2006 in the Assiniboine 52 River at Headingley (120 mg/l), the Red River at the south gate of the floodway 53 (132mg/L), and the Red River at Selkirk (124 mg/L) are an order of magnitude higher 54 than the predicted TSS concentrations for the Keeyask Project. 55
Based on discussions at a technical review meeting on February 15, 2013, among KHLP, 56 DFO and MCWS, sublethal effects were examined using the model described in the 57 response to TAC Public Rd 2 DFO-0085. For ease of reference, this response is copied 58 below. 59
60
DFO-0085 RESPONSE: 61 Predicted effects of altered total suspended solids (TSS) on aquatic life in the Keeyask 62 area are discussed in the Aquatic Environment Supporting Volume (AE SV) and provided 63 in the response to TAC Public Rd 2 DFO-0069. As noted in the AE SV, we are not aware 64 of studies assessing the effect of low level increases of TSS on fish species in the Keeyask 65 area. In the absence of data, the reviewer requested hypothetical modeling for 66 evaluation of sub-lethal risks; we are only aware of the Severity of Ill Effects model (SEV) 67 developed by Newcombe and Jensen (1996) for this purpose. However, as discussed 68 below, this model is not able to accurately predict the effects of low levels of TSS on 69 aquatic life. Nevertheless, the requested assessment was conducted and is provided 70 below. 71

TAC Public Rd 2 DFO-0077
Page 3 of 5
Manitoba water quality objectives (MWS 2011) and CCME water quality guidelines 72 (1999; updated to 2013) for TSS for the protection of aquatic life are based on the 73 British Columbia Ministry of the Environment Lands and Parks (BCMELP) guidelines, 74 derived using the severity of ill effects model originally developed by Newcombe and 75 Jensen (1996) and modified by Caux et al. (1997). Specifically, the BCMELP criteria were 76 developed based on the Newcombe and Jensen (1996) SEV Model for adult salmonids 77 (Model 2); this group was determined to elicit the largest response to a given increase in 78 TSS concentration over a set duration (i.e., this group was identified as the most 79 sensitive based on the various models developed). Consideration of exposure duration 80 as well as background conditions in the natural environment were incorporated into the 81 criteria. 82
As noted in the AESV, the MWQSOG/CCME PAL guideline is predicted to be exceeded in 83 the fully mixed Lower Nelson River during three events: 84
• Exposure Scenario 1: maximum predicted increase of 7 mg/L for approximately six 85 days during placement of the Spillway and Central Dam cofferdams in July 2015; 86
• Exposure Scenario 2: an increase in TSS of 7 mg/L for a period of one month during 87 removal of the Tailrace Summer Level Cofferdam in September 2019; and 88
• Exposure Scenario 3: maximum predicted increase of 15 mg/L for 10 days (actual 89 concentrations are predicted to peak at 15 mg/L above background and to decrease 90 over this 10 day period) during placement of the South Dam Rock Fill Groin in early 91 September 2017. 92
TSS currently ranges between 5 and 30 mg/L, averaging 14 mg/L in the Gull Lake area. 93 Using the existing background TSS conditions, effects of increases in TSS identified 94 above on fish were examined using the Newcombe and Jensen (1996), as modified by 95 Caux et al. (1997), Severity of Ill Effects Model for adult salmonids (Model 2) and non-96 salmonid freshwater fish (Model 6). 97
Effects on Salmonids 98
SEV scores for adult salmonids are presented in Figure 1 and Table 1 for a range of 99 scenarios applicable to the Keeyask Project. As the SEV models generate scores based 100 on absolute TSS concentrations rather than effects related to relative increases, it is 101 relevant to compare scores for the exposure scenarios indicated above to the scores 102 based on background TSS concentrations. All three exposure scenarios cause an 103 increase in the SEV scores of one or less, and most scenarios cause changes of less than 104 0.5. The largest change in SEV score is predicted to occur under the minimum TSS 105 background condition (5 mg/L); as discussed below, the SEV model is limited in its ability 106 to predict effects of low concentrations of TSS, in particular due to the lack of empirical 107 data on which the model was constructed. All SEV scores are below the paralethal/lethal 108

TAC Public Rd 2 DFO-0077
Page 4 of 5
threshold (SEV = 9) and the highest SEV rankings are unchanged from background 109 conditions under each of the three scenarios (Table 1). 110
Effects on Adult Freshwater Non-Salmonids 111
SEV scores for adult freshwater non-salmonids are presented in Figure 2 and Table 2 for 112 a range of scenarios applicable to the Keeyask Project. SEV scores for exposure 113 scenarios 1 and 3 are below the paralethal/lethal threshold (SEV = 9; Table 2). However, 114 SEV scores exceed 9 for scenario 2 – including purely background TSS conditions (i.e., 115 without Project-induced increases in TSS). It is also worth noting that this model predicts 116 that concentrations of TSS of 5 mg/L (the minimum measured in the Keeyask area), 117 would prove lethal to non-salmonids in less than one month (Figure 3). A concentration 118 of near zero (0.1 mg/L) is predicted to be lethal by the SEV model in less than 2 months. 119 This observation illustrates one of the key limitations of this model; the model is not 120 reliable for predicting effects associated with low concentrations of TSS. For the 121 purposes of assessing potential effects associated with the Keeyask Project, it is the 122 relative difference between the SEV scores with and without the Project that is of 123 relevance. All three exposure scenarios cause an increase in the SEV scores of less than 124 0.5, and most scenarios cause changes of less than 0.2. 125
Context 126
For additional context, Figure 3 presents SEV model results for a TSS concentration of 127 120 mg/L – the mean concentration measured in the Assiniboine River at Headingley. 128 Mean concentrations in the Red River are of a similar magnitude (132 mg/L at the south 129 gate of the floodway and 124 mg/L at Selkirk). These averages are an order of 130 magnitude higher than the predicted TSS concentrations for the Keeyask Project. Over a 131 365 day period, this average concentration (120 mg/L) is predicted to cause SEV 132 rankings of 10 and 12 for salmonids and non-salmonids, respectively. These scores fall 133 into the categories of “0-20% mortality, increased predation, moderate to severe 134 habitat degradation” and “40-60% mortality”, respectively. 135
Conclusions 136
The SEV model developed by Newcombe and Jensen (1996) has been criticized for its 137 inherent inability to accurately predict effects of low levels of TSS to aquatic life, as 138 these conditions were not captured within the database used to construct the model 139 (e.g., Birtwell et al. 2003, Anderson et al. 1996). Therefore, the utility or accuracy of the 140 model to predict risks to fish associated with small increases in TSS is limited. 141
Notwithstanding the limitations of the SEV model to predict effects of small increases in 142 TSS on fish, the SEV model indicated that scores increased by less than one, and 143 generally less than 0.2, for the various potential exposure scenarios examined. 144

TAC Public Rd 2 DFO-0077
Page 5 of 5
Collectively, these results indicate effects of the predicted increases in TSS on salmonids 145 and non-salmonids during construction would be small and potentially indistinguishable 146 from existing conditions. 147

TAC Public Rd 2 DFO-0078
Page 1 of 4
REFERENCE: Volume: Physical Environment Supporting Volume; 1
Section: Appendix 7E Sedimentation Field Data 2004 to 2007; p. 2
N/A 3
TAC Public Rd 2 DFO-0078 4
ORIGINAL PREAMBLE AND QUESTION: 5 The EIS notes “data collected in the open water periods of 2005 to 2007 6 indicates…suspended sediment concentration generally lies within the range of 5 mg/L 7 to 30 mg/L…from Clark Lake to Gull Rapids…sediment concentrations can vary within 8 their normal range at a given location in a given day…variations…over a short 9 period…can be due to many reasons, including local turbulences in the waterbody, 10 changes in the meteorological environment, and local bank erosion 11 processes…suspended sediment concentrations…in the open water period…2001 to 12 2004…show similar ranges (2 mg/L to 30 mg/L with an average of 12 mg/L)…A report 13 prepared by Lake Winnipeg, Churchill and Nelson Rivers Study Board in 14 1975…documents a suspended sediment concentration range of 6 mg/L to 25 mg/L with 15 an average of 15 mg/L based on…measurements in 1972 and 1973. Field studies…on the 16 Burntwood and…Lower Nelson River reach also show a concentration range of 5 mg/L 17 to30 mg/L (Acres…2004…2007b, KGS Acres 2008b…KGS Acres 2008c)…Suspended 18 sediment concentration measurements during…winter…(January to April), of 2008 and 19 2009 reveal that sediment concentration variations in the winter period are larger than 20 the open water period. A limited data set collected at monitoring locations in Gull Lake 21 show a concentration range of 3 mg/L to 84 mg/L, with an average of 14.6 mg/L…” 22
The Proponent provides some ranges, point estimates, and expected durations of TSS 23 changes. Would it be possible to provide, or direct reviewers to where this information 24 is in the EIS, sample sizes and standard deviations for estimates? Where intervals that 25 are not ranges, would it be possible to specify the level of confidence? E.g., are they 26 95% confidence intervals for a mean? 27
FOLLOW-UP QUESTION: 28 Would the proponent please provide a description of the extent to which the historic 29 TSS information can be expected to represent seasonal and year-to-year variation in 30 TSS? Would the proponent please propose one or more composite sample sizes, 31 averages and standard deviations as background criteria for expected TSS during 32 construction for determining the power of its proposed monitoring program? 33
RESPONSE: 34 The proponent understands that the question is asking for a statistical characterization 35

TAC Public Rd 2 DFO-0078
Page 2 of 4
of the historic total suspended solids (TSS) data to be used as a background criterion 36 against which observed TSS during construction would be compared. Based on this 37 understanding, the question suggests that TSS levels obtained from monitoring for the 38 Sediment Management Plan for In-Stream Construction (SMP) would be compared with 39 baseline data to determine if TSS increases due to in-stream construction exceed action 40 levels specified in the SMP. The proponent notes that the SMP uses real time 41 monitoring of ambient in-stream conditions to measure changes in TSS in the river as in-42 stream work is taking place. The monitoring is not based upon the measurement of 43 changes relative to conditions observed in the pre-Project baseline studies. 44
Implementation of the SMP will involve identifying changes in TSS between a reference 45 monitoring site (SMP-1) just upstream of in-stream construction, a site (SMP-2) in the 46 mixing zone just downstream of in-stream construction, and a site (SMP-3) in a fully 47 mixed zone further downstream. The monitoring is designed to detect if an in-stream 48 construction activity causes an increase in ambient TSS between SMP-1 and SMP-2 that 49 exceeds specified action levels. The SMP (Sec. 4) describes actions to be taken to reduce 50 the effects of in-stream construction if it causes TSS to increase by 200 mg/L or more in 51 a 15-minute averaging period or 25 mg/L or more in four consecutive 15-minute 52 averaging periods. The action levels at SMP-2 are set so that increases due to 53 construction can be addressed in sufficient time to take action to attempt to maintain 54 the 24-hour average increases at SMP-3 (relative to SMP-1) below 25 mg/L as well as the 55 areas downstream of SMP-3. 56
The SMP will use automated probes to continuously measure ambient turbidity levels in 57 the river in real time as in-stream work is occurring, and will continuously transmit the 58 data to an on-site environmental office. Turbidity values will be converted to TSS 59 concentrations using a linear regression relationship between turbidity and TSS based 60 on data collected during baseline environmental monitoring studies. During in-stream 61 work, samples of water at the monitoring stations will be periodically collected and 62 analyzed for TSS to confirm or adjust the turbidity-TSS relationship, as required. It is 63 anticipated that each probe will measure and transmit several dozen turbidity 64 measurements every hour and hundreds of measurements per day. 65
Because the SMP is based on real-time monitoring, the background TSS at SMP-1 and 66 the TSS at SMP-2 and SMP-3 will vary in real-time as ambient conditions change. Thus 67 the calculation of TSS changes and determination of whether or not action levels are 68 exceeded is based on ambient conditions while in-stream work is taking place. The SMP 69 monitoring does not measure TSS changes relative to fixed background criteria (e.g., 70 seasonal or annual) based on data from pre-Project environmental studies. 71
Although the SMP is based on ambient TSS conditions rather than a comparison with 72 pre-Project monitoring data, an a-priori power analysis was performed to determine the 73
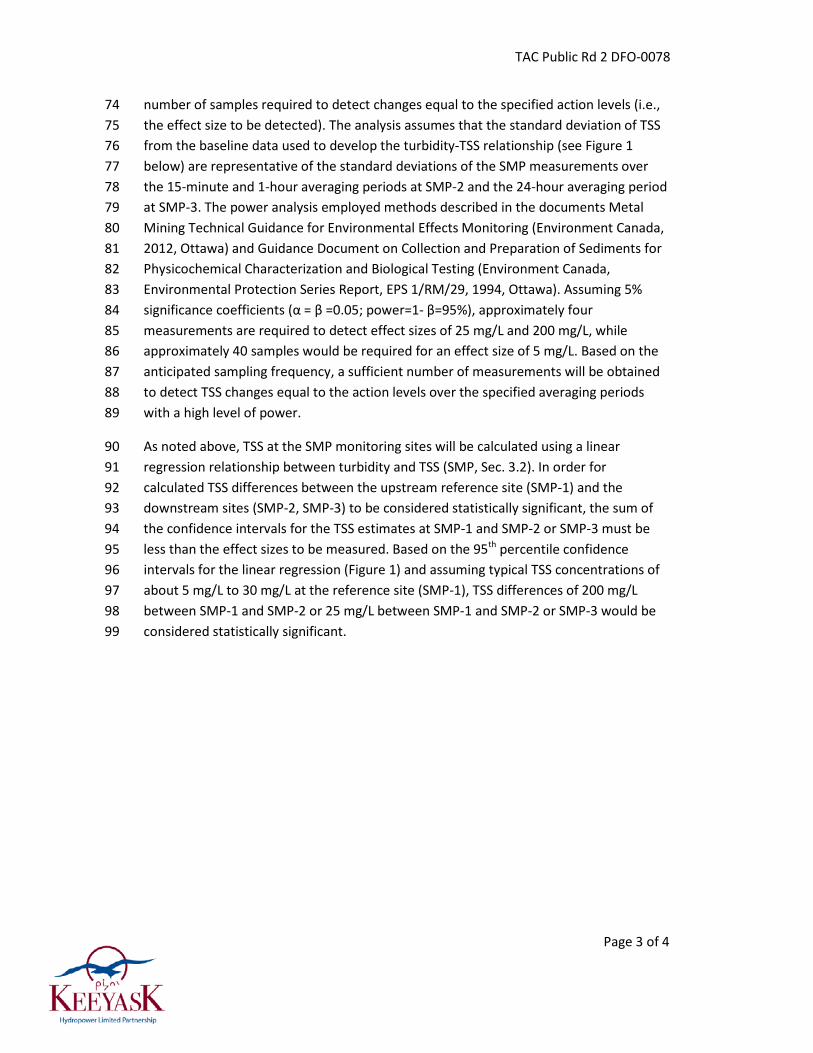
TAC Public Rd 2 DFO-0078
Page 3 of 4
number of samples required to detect changes equal to the specified action levels (i.e., 74 the effect size to be detected). The analysis assumes that the standard deviation of TSS 75 from the baseline data used to develop the turbidity-TSS relationship (see Figure 1 76 below) are representative of the standard deviations of the SMP measurements over 77 the 15-minute and 1-hour averaging periods at SMP-2 and the 24-hour averaging period 78 at SMP-3. The power analysis employed methods described in the documents Metal 79 Mining Technical Guidance for Environmental Effects Monitoring (Environment Canada, 80 2012, Ottawa) and Guidance Document on Collection and Preparation of Sediments for 81 Physicochemical Characterization and Biological Testing (Environment Canada, 82 Environmental Protection Series Report, EPS 1/RM/29, 1994, Ottawa). Assuming 5% 83 significance coefficients (α = β =0.05; power=1- β=95%), approximately four 84 measurements are required to detect effect sizes of 25 mg/L and 200 mg/L, while 85 approximately 40 samples would be required for an effect size of 5 mg/L. Based on the 86 anticipated sampling frequency, a sufficient number of measurements will be obtained 87 to detect TSS changes equal to the action levels over the specified averaging periods 88 with a high level of power. 89
As noted above, TSS at the SMP monitoring sites will be calculated using a linear 90 regression relationship between turbidity and TSS (SMP, Sec. 3.2). In order for 91 calculated TSS differences between the upstream reference site (SMP-1) and the 92 downstream sites (SMP-2, SMP-3) to be considered statistically significant, the sum of 93 the confidence intervals for the TSS estimates at SMP-1 and SMP-2 or SMP-3 must be 94 less than the effect sizes to be measured. Based on the 95th percentile confidence 95 intervals for the linear regression (Figure 1) and assuming typical TSS concentrations of 96 about 5 mg/L to 30 mg/L at the reference site (SMP-1), TSS differences of 200 mg/L 97 between SMP-1 and SMP-2 or 25 mg/L between SMP-1 and SMP-2 or SMP-3 would be 98 considered statistically significant. 99
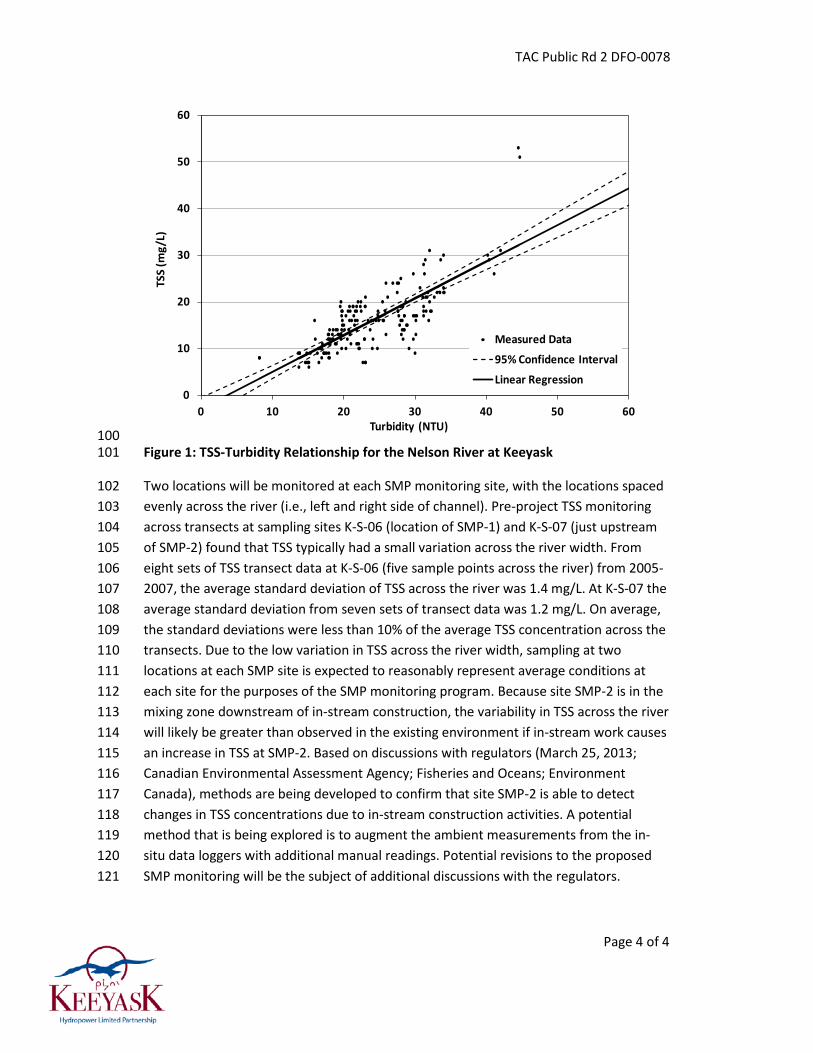
TAC Public Rd 2 DFO-0078
Page 4 of 4
100 Figure 1: TSS-Turbidity Relationship for the Nelson River at Keeyask 101
Two locations will be monitored at each SMP monitoring site, with the locations spaced 102 evenly across the river (i.e., left and right side of channel). Pre-project TSS monitoring 103 across transects at sampling sites K-S-06 (location of SMP-1) and K-S-07 (just upstream 104 of SMP-2) found that TSS typically had a small variation across the river width. From 105 eight sets of TSS transect data at K-S-06 (five sample points across the river) from 2005-106 2007, the average standard deviation of TSS across the river was 1.4 mg/L. At K-S-07 the 107 average standard deviation from seven sets of transect data was 1.2 mg/L. On average, 108 the standard deviations were less than 10% of the average TSS concentration across the 109 transects. Due to the low variation in TSS across the river width, sampling at two 110 locations at each SMP site is expected to reasonably represent average conditions at 111 each site for the purposes of the SMP monitoring program. Because site SMP-2 is in the 112 mixing zone downstream of in-stream construction, the variability in TSS across the river 113 will likely be greater than observed in the existing environment if in-stream work causes 114 an increase in TSS at SMP-2. Based on discussions with regulators (March 25, 2013; 115 Canadian Environmental Assessment Agency; Fisheries and Oceans; Environment 116 Canada), methods are being developed to confirm that site SMP-2 is able to detect 117 changes in TSS concentrations due to in-stream construction activities. A potential 118 method that is being explored is to augment the ambient measurements from the in-119 situ data loggers with additional manual readings. Potential revisions to the proposed 120 SMP monitoring will be the subject of additional discussions with the regulators.121
0
10
20
30
40
50
60
0 10 20 30 40 50 60
TSS
(mg/
L)
Turbidity (NTU)
Measured Data
95% Confidence Interval
Linear Regression

TAC Public Rd 2 DFO-0080
Page 1 of 2
REFERENCE: Volume: Aquatic Environment Supporting Volume; 1
Section: Appendix 2A Background Information on Selected Water 2
Quality Parameters, 2.5.2.2.5 Total Suspended Solids/Turbidity, 3
and 4.2.4.2 Operation Period; p. N/A 4
TAC Public Rd 2 DFO-0080 5
ORIGINAL PREAMBLE AND QUESTION: 6 The EIS says “Mineral TSS would generally remain within the chronic Manitoba PAL 7 water quality objective and the CCME PAL guideline (a change of less than or equal to 5 8 mg/L relative to background, where background TSS is less than or equal to 25 mg/L). 9 The exceptions would occur in the immediate reservoir (reach 9) and reach 8 (the area 10 north of Caribou Island) under high flow conditions, where decreases may be larger than 11 the Manitoba water quality objective…” 12
When discussing TSS decreases the Proponent refers to TSS guidelines as being for 13 changes. In fact, the guidelines talk about increases only – not changes in general – so 14 that they do not really apply to decreases in TSS. Can the Proponent explain in more 15 detail its criteria for discussing changes? 16
FOLLOW-UP QUESTION: 17 Proponent’s answer asks reader to re-read sections of the EIS. Would the proponent 18 please extract the appropriate information from the EIS or provide additional 19 information to answer the question? 20
RESPONSE: 21 The Manitoba water quality objective (MWQSOG) for TSS for the protection of aquatic 22 life (PAL) refers to a change in TSS and therefore applies to both increases and 23 decreases in TSS. The AESV compared predicted changes (both increases and decreases 24 in TSS) to the MWQSOG. This comparison indicated that under high flows in reaches 7 25 and 8 (at the downstream end of present day Gull Lake) and most notably reach 9 (the 26 reservoir immediately upstream of the GS) TSS may decrease by more than the 27 MWQSOG for PAL. It is also noted in the AESV (p. 2-70), that these decreases in TSS will 28 in turn increase water clarity. 29
As discussed in Section 4.2.4.2.2, the increase in clarity and other changes in the 30 mainstem of the Nelson River within the Keeyask reservoir are not expected to affect 31 phytoplankton growth due to the extremely short residence time: 32
“However, detectable changes in mean phytoplankton biomass along the 33 mainstem are not expected as increased water residence time will remain too 34
TAC Public Rd 2 DFO-0080
Page 2 of 2
short to permit a measureable increase in phytoplankton biomass… The lack of 35 detectable effects may be attributed to high water flushing rates through the 36 mainstem portion of the reservoir (i.e., post-Project water residence time will be 37 in the order of 15-30 hours, depending on flows, Section 3.4.2.2).” 38
There is a potential for increased clarity in Stephens Lake to have a small effect on 39 phytoplankton, as described in Section 4.2.4.2.3: 40
“Downstream effects on water quality are not expected to be substantive as the 41 conditions of the reservoir outflow will not be considerably different from 42 current conditions (Section 2.5.2.3). The major exception is a predicted decrease 43 in TSS at the outflow of the GS. Furthermore, TSS is expected to decrease further 44 as water moves through Stephens Lake and this area of reduced TSS would likely 45 extend approximately 10–12 km downstream of the GS. This improvement in 46 water clarity is expected to result in a long-term, small increase in phytoplankton 47 biomass in the affected portion of Stephens Lake (Figure 4-6). The absence of a 48 marked increase in phytoplankton biomass is likely due to the relatively short 49 water residence time within the portion of Stephens Lake along the main flow of 50 the Nelson River, which, although longer than the unimpounded river, is still too 51 short to allow substantial growth of phytoplankton.”52

TAC Public Rd 2 DFO-0083
Page 1 of 8
REFERENCE: Volume: Physical Environment Supporting Volume; 1
Section: 7.4.1 Project Effects, Mitigation & Monitoring, 2
Construction Period; p. 7-22 3
TAC Public Rd 2 DFO-0083 4
ORIGINAL PREAMBLE AND QUESTION: 5 "Water Quality: Project Effects, Mitigation, and Monitoring…Construction Period…Total 6 Suspended Solids, Turbidity, and Water Clarity…” p 2-40 “Cofferdam Placement and 7 Removal…during Stage I and II Diversions have the potential to increase TSS in the 8 Nelson River…results…presented in detail in the PE SV, section 7.4.1…Predicted 9 increases in TSS refer to the fully mixed condition, approximately 1 km downstream of 10 Gull Rapids…” 11
The Proponent notes that it has modeled TSS downstream at 1km from the construction 12 area in the fully mixed zone. Will the Proponent be able to monitor TSS closer to the 13 construction areas? What sort of area might be affected by construction TSS increases 14 greater than those predicted upstream of the fully mixed zone. What are the, at source, 15 sediment loading TSS concentrations likely to be, how extensive might they be in area, 16 and what might their durations be? 17
FOLLOW-UP QUESTION: 18 Would the proponent please re-iterate information provided for a previous question so 19 that the reader does not have to refer to another response? The answer refers to 20 information not provided with the EIS. Please use information from documents 21 developed after the EIS to provide an answer to the question. Would the proponent 22 please describe the extent and nature of plumes exceeding effect thresholds and 23 evaluate them for potential lethal and sub-lethal risks? 24
RESPONSE: 25 The response to TAC Public Rd 1 DFO-0083 pointed to the response for TAC Public Rd 1 26 DFO-0067, which states: 27
“During the construction phase of Project, the first downstream monitoring site 28 (SMP-2) for the Sediment Management Plan for In-stream Construction (SMP) is 29 proposed to be located approximately 1.5 km downstream of all in-stream 30 sediment sources from the Project. Moving this location closer to the 31 construction site is problematic due to high water velocities and turbulent flow 32 conditions in the area just downstream of Gull Rapids. Based on experience from 33 baseline monitoring programs, these conditions can result in significant safety 34 hazards for people and equipment.” 35

TAC Public Rd 2 DFO-0083
Page 2 of 8
The Partnership provided a preliminary draft of the Sediment Management Plan for In-36 stream Construction to regulators on October 17, 2012 and a revised draft will be 37 provided during the 2nd quarter of 2013. 38
Areas where total suspended solids (TSS) will be higher than in the fully mixed zone will 39 be localized and will depend upon where the sediment originates and how the plume 40 disperses between the source and the fully mixed zone. Sediments entering the Nelson 41 River during in-stream work will primarily come from two sources: shoreline erosion and 42 in-stream placement/removal of construction materials. As the plumes generated at the 43 source disperse downstream and across the river, the TSS concentration will reduce. 44 Passage of flow through the spillway and powerhouse for the first time will also result in 45 downstream TSS increases. 46
During Stage I river diversion, the river’s flow will be diverted through the south channel 47 of Gull Rapids, resulting in the erosion of susceptible shorelines because of increased 48 flow velocities. Shorelines along the south channel that are most likely to erode extend 49 over a distance of about 1.5 km (shown in Map 6.4-1 of the PE SV which is attached to 50 this response). Due to the high flow velocity in the south channel and shoreline 51 geometry (relatively mild sloped banks), the transverse spread of the plume across the 52 river would not be large: likely remaining within tens of metres of shore, but mixing 53 completely with the main flow once it passes through Gull Rapids. Such plumes moving 54 along the shoreline have been observed in the existing environment (as shown in Photo 55 7.3-1 below of the PE SV). 56
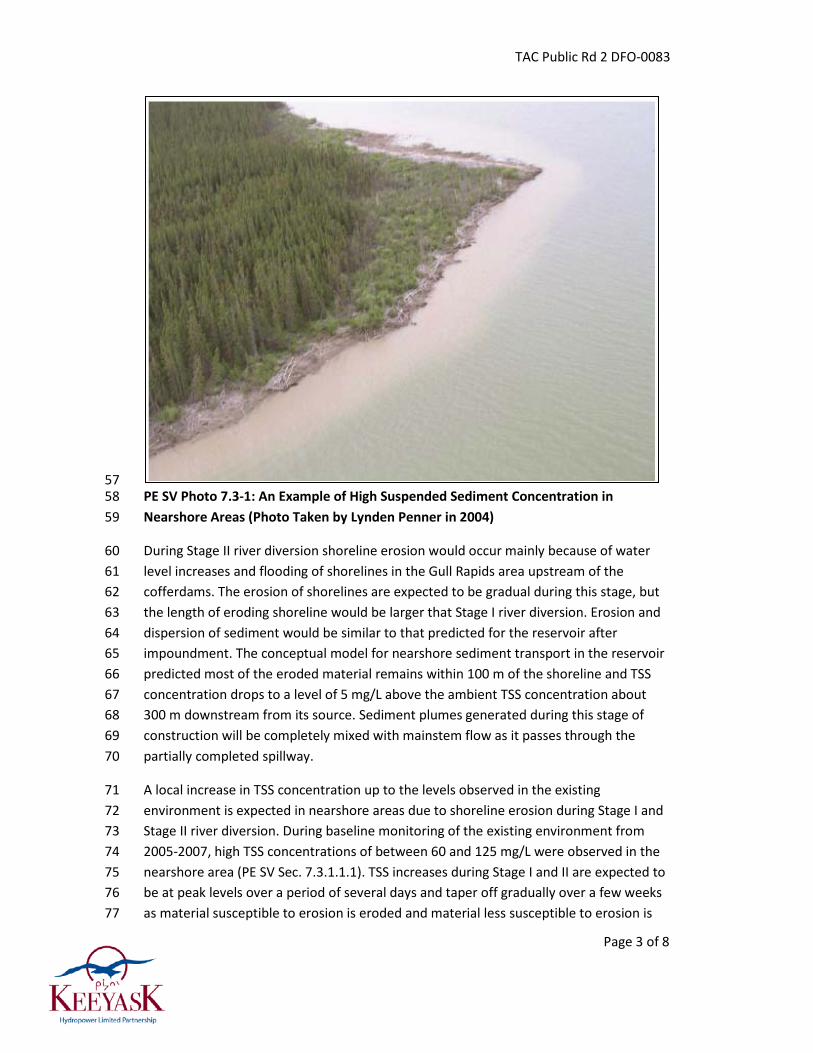
TAC Public Rd 2 DFO-0083
Page 3 of 8
57 PE SV Photo 7.3-1: An Example of High Suspended Sediment Concentration in 58 Nearshore Areas (Photo Taken by Lynden Penner in 2004) 59
During Stage II river diversion shoreline erosion would occur mainly because of water 60 level increases and flooding of shorelines in the Gull Rapids area upstream of the 61 cofferdams. The erosion of shorelines are expected to be gradual during this stage, but 62 the length of eroding shoreline would be larger that Stage I river diversion. Erosion and 63 dispersion of sediment would be similar to that predicted for the reservoir after 64 impoundment. The conceptual model for nearshore sediment transport in the reservoir 65 predicted most of the eroded material remains within 100 m of the shoreline and TSS 66 concentration drops to a level of 5 mg/L above the ambient TSS concentration about 67 300 m downstream from its source. Sediment plumes generated during this stage of 68 construction will be completely mixed with mainstem flow as it passes through the 69 partially completed spillway. 70
A local increase in TSS concentration up to the levels observed in the existing 71 environment is expected in nearshore areas due to shoreline erosion during Stage I and 72 Stage II river diversion. During baseline monitoring of the existing environment from 73 2005-2007, high TSS concentrations of between 60 and 125 mg/L were observed in the 74 nearshore area (PE SV Sec. 7.3.1.1.1). TSS increases during Stage I and II are expected to 75 be at peak levels over a period of several days and taper off gradually over a few weeks 76 as material susceptible to erosion is eroded and material less susceptible to erosion is 77

TAC Public Rd 2 DFO-0083
Page 4 of 8
exposed (as shown in PE SV, Sec. 7, Figure 7.4-1 – an updated version of the figure was 78 provided in the SMP and is provided at the end of this response). 79
At-source daily average TSS increases were estimated for in-stream construction and 80 removal of dams and cofferdams. The analysis estimated suspended sediment 81 concentrations at the source and for fully mixed conditions, and did not provide 82 estimates of spatial dispersion downstream of the source. Therefore, the spatial extent 83 of plumes was estimated based on an assumption of linear dispersion over a mixing 84 distance of about 1.5 km. At source increases of more than 5 mg/L ranged from about 6 85 mg/L to 19 mg/L for durations of 2 to 33 days for all construction activities except for 86 the Tailrace Summer Level Cofferdam. For even the highest value in this range, 87 dispersion is estimated to reduce the TSS increase to less than 5 mg/L above 88 background within about 50 m downstream, and about half the source concentration 89 over approximately half that distance. The affected areas are less than 0.1 ha. During 90 construction of the Tailrace Summer Level Cofferdam, a daily average sediment 91 concentration up to 43 mg/L is expected for 20 days at the source. This is estimated to 92 disperse to less than a 5 mg/L increase within about 100 m of the tailrace summer level 93 cofferdam over an area of less than about 0.4 ha. However, the increase is expected to 94 be localized between two rock groins forming the cofferdam and would not be exposed 95 to the main river flow. 96
The removal of the Tailrace Summer Level cofferdam is expected to locally increase daily 97 average sediment concentration between 35 and 70 mg/L above background, with the 98 highest concentrations in an area within 50 m from the cofferdam. This results from 99 removal of the impervious material sealing the outside of the cofferdam. The sediment 100 would be predominantly clay and silt and, based on linear dispersion as noted above, it 101 is estimated to disperse to less than a daily average 25 mg/L increase within about 300 102 m downstream of the cofferdam over an area of less than about 4 ha. In the fully mixed 103 zone, the increase in sediment concentration would be up to 7 mg/L because of this 104 activity. The duration of the removal activity was conservatively assumed as 25 days in 105 the construction schedule but the actual number of days with a TSS increase of 7 mg/L is 106 expected to be between 5 and 10 days depending on the flow conditions and removal 107 methods. The sedimentation analysis conservatively assumed an increase of 7 mg/L 108 over the 25-day duration of the removal activity (see PE SV, Fig. 7.4-1; also see copy of 109 revised figure (Fig. 5) from the draft SMP at end of this response). This conservative 110 increase was used in the aquatic assessment (e.g., see AE SV: Sec. 2.5.1.1.3 on water 111 quality; Sec 4.2.4.1.2 for phytoplankton and corresponding sections for other lower 112 trophic topics; Sec. 5.4.1.2.6 for fish community). 113
The estimated TSS increases noted above are for low flow conditions (i.e., 5th percentile 114 flows). At median (50th percentile) and high (95th percentile) flows the estimated 115
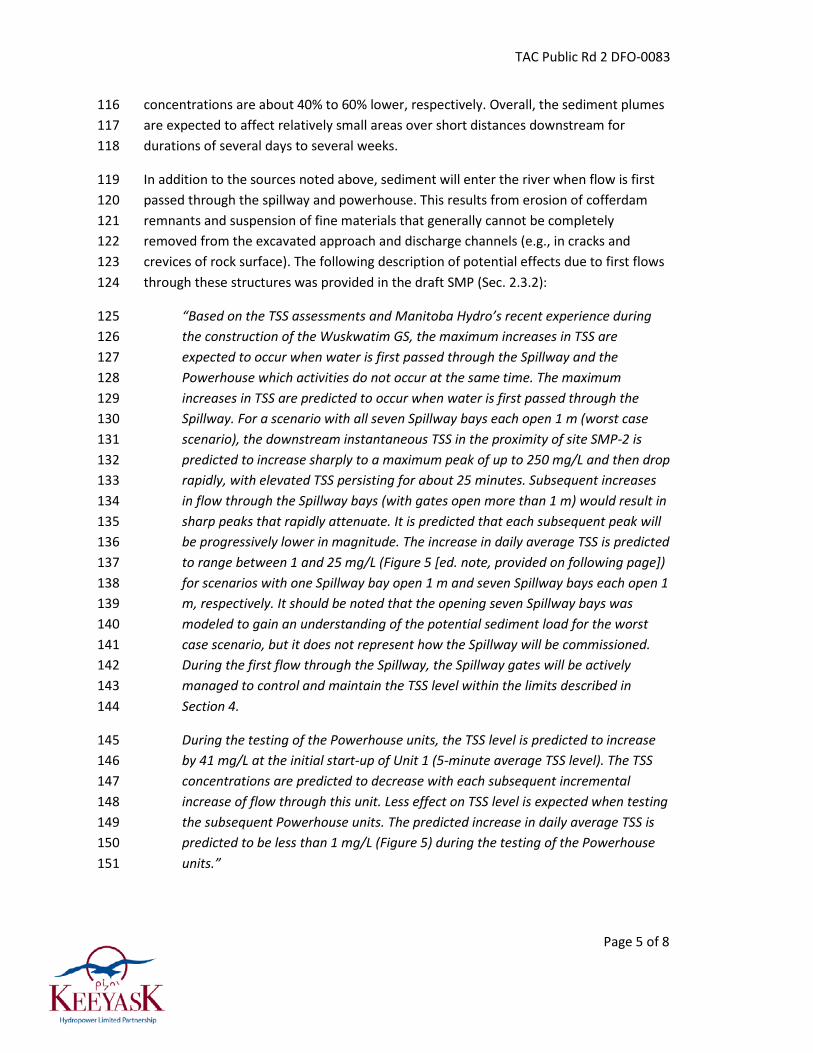
TAC Public Rd 2 DFO-0083
Page 5 of 8
concentrations are about 40% to 60% lower, respectively. Overall, the sediment plumes 116 are expected to affect relatively small areas over short distances downstream for 117 durations of several days to several weeks. 118
In addition to the sources noted above, sediment will enter the river when flow is first 119 passed through the spillway and powerhouse. This results from erosion of cofferdam 120 remnants and suspension of fine materials that generally cannot be completely 121 removed from the excavated approach and discharge channels (e.g., in cracks and 122 crevices of rock surface). The following description of potential effects due to first flows 123 through these structures was provided in the draft SMP (Sec. 2.3.2): 124
“Based on the TSS assessments and Manitoba Hydro’s recent experience during 125 the construction of the Wuskwatim GS, the maximum increases in TSS are 126 expected to occur when water is first passed through the Spillway and the 127 Powerhouse which activities do not occur at the same time. The maximum 128 increases in TSS are predicted to occur when water is first passed through the 129 Spillway. For a scenario with all seven Spillway bays each open 1 m (worst case 130 scenario), the downstream instantaneous TSS in the proximity of site SMP-2 is 131 predicted to increase sharply to a maximum peak of up to 250 mg/L and then drop 132 rapidly, with elevated TSS persisting for about 25 minutes. Subsequent increases 133 in flow through the Spillway bays (with gates open more than 1 m) would result in 134 sharp peaks that rapidly attenuate. It is predicted that each subsequent peak will 135 be progressively lower in magnitude. The increase in daily average TSS is predicted 136 to range between 1 and 25 mg/L (Figure 5 [ed. note, provided on following page]) 137 for scenarios with one Spillway bay open 1 m and seven Spillway bays each open 1 138 m, respectively. It should be noted that the opening seven Spillway bays was 139 modeled to gain an understanding of the potential sediment load for the worst 140 case scenario, but it does not represent how the Spillway will be commissioned. 141 During the first flow through the Spillway, the Spillway gates will be actively 142 managed to control and maintain the TSS level within the limits described in 143 Section 4. 144
During the testing of the Powerhouse units, the TSS level is predicted to increase 145 by 41 mg/L at the initial start-up of Unit 1 (5-minute average TSS level). The TSS 146 concentrations are predicted to decrease with each subsequent incremental 147 increase of flow through this unit. Less effect on TSS level is expected when testing 148 the subsequent Powerhouse units. The predicted increase in daily average TSS is 149 predicted to be less than 1 mg/L (Figure 5) during the testing of the Powerhouse 150 units.” 151

TAC Public Rd 2 DFO-0083
Page 6 of 8
The follow up request regarding information on potential lethal or sub-lethal effects is 152 similar to the follow up questions for DFO—0069, DFO-0077 and DFO-0085. The 153 response to the follow up question for DFO-0077 states: 154
DFO-0077 RESPONSE: 155 As described in AE SV Section 2.5.2.2.5, p. 2-66 to 2-68, increases in TSS within the order 156 of tens to hundreds of mg/L are generally associated with sub-lethal effects to fish such 157 as behavioural alterations, reduced growth or condition, and physiological stress (e.g., 158 DFO 2000). Acute toxicities are generally reported for concentrations ranging from the 159 hundreds to hundreds of thousands of mg/L (DFO 2000; Robertson et al. 2006). The 160 available scientific literature indicates a potential for reduced hatching success in 161 salmonids exposed to elevated TSS concentrations on the order of two months or more, 162 at concentrations ranging from 6.6–157 mg/L (Table 2-17). 163
Based on the available scientific literature, the predicted increases in TSS may result in 164 sublethal effects to fish, but would not be in the lethal severity of effect range. Sublethal 165 effects of increases in TSS on fish may include behavioural alterations (e.g. avoidance of 166 sediment plumes), reduced growth or condition, and physiological stress. Indirect 167 effects include changes in the food web (e.g., reductions in primary production due to 168 reduced water clarity, reduced abundance of benthic invertebrates due to increased TSS 169 and/or sedimentation causing reductions in the abundance of fish diet items), which are 170 considered in Section 4. 171
As noted in the response provided to the original information request, the predicted 172 increases in TSS during Project construction are expected to remain within the existing 173 range of TSS in the area (i.e., 5-30 mg/L). Notably higher concentrations of TSS occur in 174 other river systems which support similar or even more diverse fish species 175 assemblages. For example, the mean TSS concentrations measured by Manitoba 176 Conservation and Water Stewardship over the period of 1997-2006 in the Assiniboine 177 River at Headingley (120 mg/l), the Red River at the south gate of the floodway 178 (132mg/L), and the Red River at Selkirk (124 mg/L) are an order of magnitude higher 179 than the predicted TSS concentrations for the Keeyask Project. 180
Based on discussions at a technical review meeting on February 15, 2013, among KHLP, 181 DFO and MCWS, sublethal effects were examined using the model described in the 182 response to TAC Public Rd 2 DFO-0085. For ease of reference, this response is copied 183 below. 184

TAC Public Rd 2 DFO-0083
Page 7 of 8
Figure 5 from the Sediment Management Plan for In-stream Construction - 24-hour average TSS concentration predicted in the proximity of 1 site SMP-2 (mixing zone) during construction of Keeyask GS2
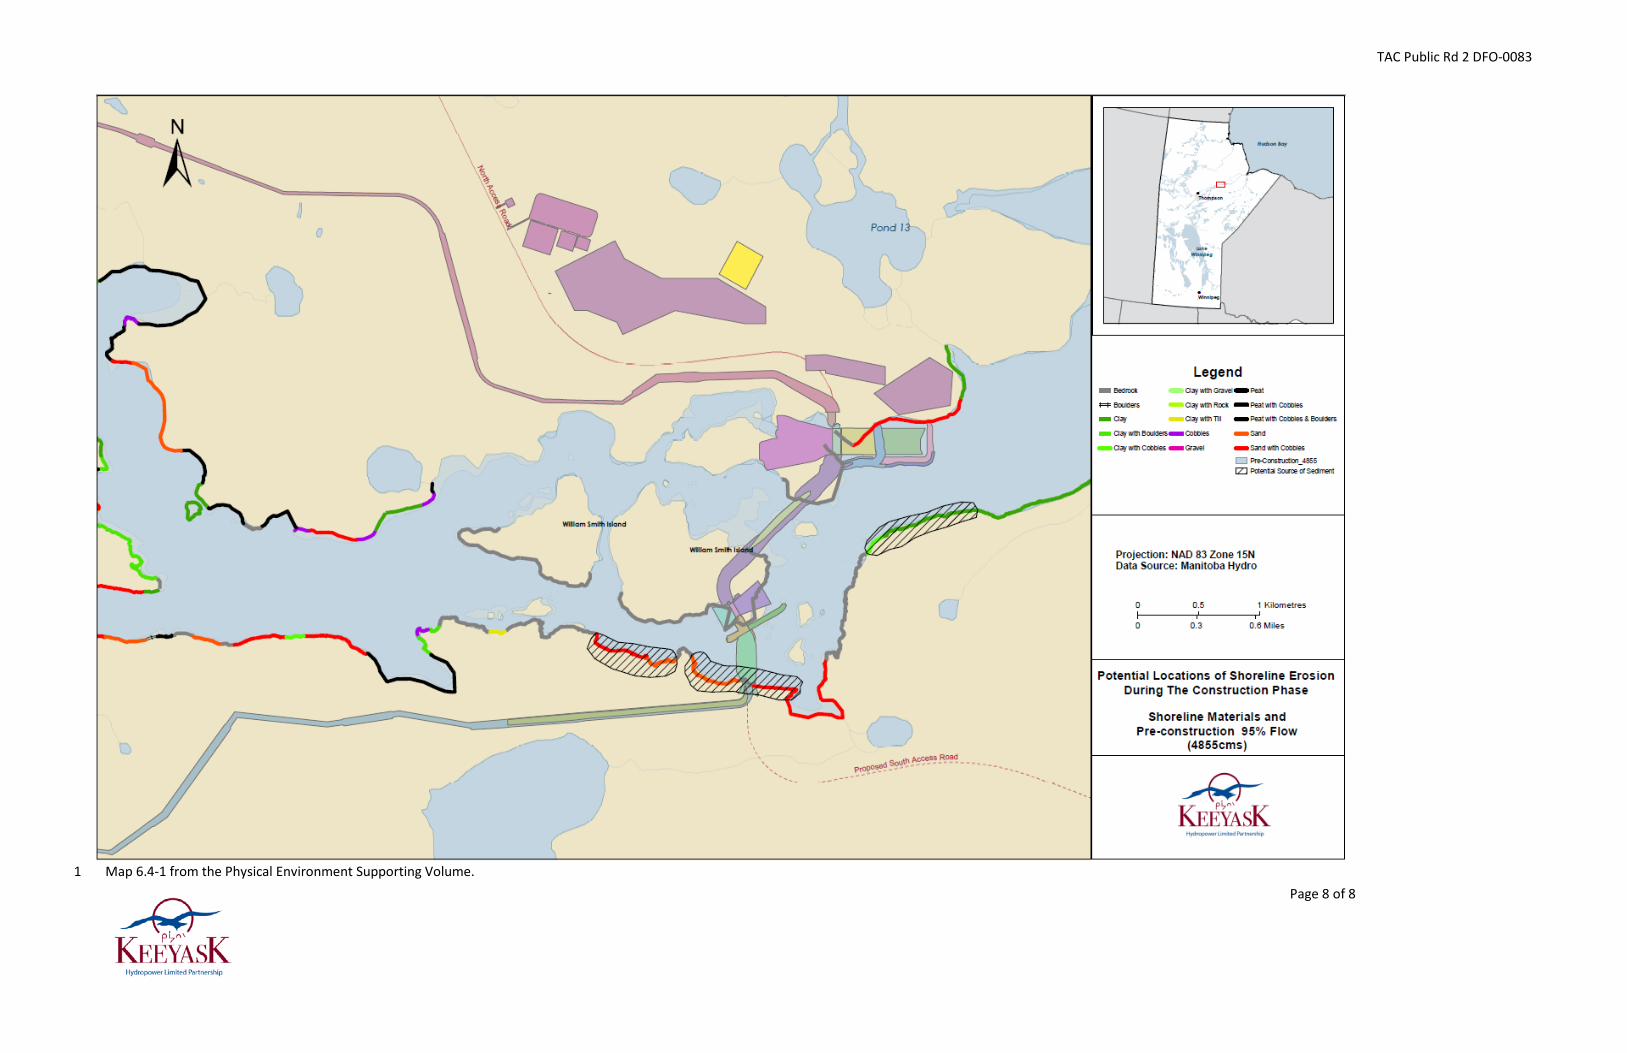
TAC Public Rd 2 DFO-0083
Page 8 of 8
Map 6.4-1 from the Physical Environment Supporting Volume. 1

TAC Public Rd 2 DFO-0084
Page 1 of 4
REFERENCE: Volume: Response to EIS Guidelines; Section: 8.0 1
Monitoring & Follow-up; p. N/A 2
TAC Public Rd 2 DFO-0084 3
ORIGINAL PREAMBLE AND QUESTION: 4 Information does not appear to be present in the EIS but is required to determine if 5 monitoring can adequately determine potential problems and appropriate actions taken 6 to mitigate unexpected events. 7
Can the Proponent provide an analysis showing that its monitoring will have sufficient 8 power with high confidence, to detect TSS above the action threshold (regulatory 9 guideline)? For example, how likely is it that the Proponent can detect environmental 10 changes that result in elevated TSS that exceed critical effect sizes such as 5 mg/L above 11 background? Will the number of samples collected during monitoring be sufficient to 12 correctly conclude, with a confidence of say 95% [i.e., a high confidence], that there is a 13 difference of, say, 5 mg/L or more above background? 14
FOLLOW-UP QUESTION: 15 Proponent plan still in production and not available for review. 16
RESPONSE: 17 The Partnership provided a preliminary draft of the Sediment Management Plan for In-18 stream Construction to regulators on October 17 2012, through the TAC review process. 19 As noted in the original response to TAC Public Rd 1 DFO-0084, preliminary monitoring 20 plans, although not required as part of the EIS Guidelines, will be filed with regulators in 21 the second quarter of 2013. 22
The response to DFO-0078 provides discussion pertaining to the detection on of 23 specified effect thresholds (i.e., changes in TSS due to in-stream construction) through 24 the monitoring proposed in the SMP. For ease of reference the response to DFO-0078 is 25 copied below. 26
DFO-0078 RESPONSE: 27 The proponent understands that the question is asking for a statistical characterization 28 of the historic total suspended solids (TSS) data to be used as a background criterion 29 against which observed TSS during construction would be compared. Based on this 30 understanding, the question suggests that TSS levels obtained from monitoring for the 31 Sediment Management Plan for In-Stream Construction (SMP) would be compared with 32 baseline data to determine if TSS increases due to in-stream construction exceed action 33 levels specified in the SMP. The proponent notes that the SMP uses real time 34

TAC Public Rd 2 DFO-0084
Page 2 of 4
monitoring of ambient in-stream conditions to measure changes in TSS in the river as in-35 stream work is taking place. The monitoring is not based upon the measurement of 36 changes relative to conditions observed in the pre-Project baseline studies. 37
Implementation of the SMP will involve identifying changes in TSS between a reference 38 monitoring site (SMP-1) just upstream of in-stream construction, a site (SMP-2) in the 39 mixing zone just downstream of in-stream construction, and a site (SMP-3) in a fully 40 mixed zone further downstream. The monitoring is designed to detect if an in-stream 41 construction activity causes an increase in ambient TSS between SMP-1 and SMP-2 that 42 exceeds specified action levels. The SMP (Sec. 4) describes actions to be taken to reduce 43 the effects of in-stream construction if it causes TSS to increase by 200 mg/L or more in 44 a 15-minute averaging period or 25 mg/L or more in four consecutive 15-minute 45 averaging periods. The action levels at SMP-2 are set so that increases due to 46 construction can be addressed in sufficient time to take action to attempt to maintain 47 the 24-hour average increases at SMP-3 (relative to SMP-1) below 25 mg/L as well as the 48 areas downstream of SMP-3. 49
The SMP will use automated probes to continuously measure ambient turbidity levels in 50 the river in real time as in-stream work is occurring, and will continuously transmit the 51 data to an on-site environmental office. Turbidity values will be converted to TSS 52 concentrations using a linear regression relationship between turbidity and TSS based 53 on data collected during baseline environmental monitoring studies. During in-stream 54 work, samples of water at the monitoring stations will be periodically collected and 55 analyzed for TSS to confirm or adjust the turbidity-TSS relationship, as required. It is 56 anticipated that each probe will measure and transmit several dozen turbidity 57 measurements every hour and hundreds of measurements per day. 58
Because the SMP is based on real-time monitoring, the background TSS at SMP-1 and 59 the TSS at SMP-2 and SMP-3 will vary in real-time as ambient conditions change. Thus 60 the calculation of TSS changes and determination of whether or not action levels are 61 exceeded is based on ambient conditions while in-stream work is taking place. The SMP 62 monitoring does not measure TSS changes relative to fixed background criteria (e.g., 63 seasonal or annual) based on data from pre-Project environmental studies. 64
Although the SMP is based on ambient TSS conditions rather than a comparison with 65 pre-Project monitoring data, an a-priori power analysis was performed to determine the 66 number of samples required to detect changes equal to the specified action levels (i.e., 67 the effect size to be detected). The analysis assumes that the standard deviation of TSS 68 from the baseline data used to develop the turbidity-TSS relationship (see Figure 1 69 below) are representative of the standard deviations of the SMP measurements over 70 the 15-minute and 1-hour averaging periods at SMP-2 and the 24-hour averaging period 71 at SMP-3. The power analysis employed methods described in the documents Metal 72

TAC Public Rd 2 DFO-0084
Page 3 of 4
Mining Technical Guidance for Environmental Effects Monitoring (Environment Canada, 73 2012, Ottawa) and Guidance Document on Collection and Preparation of Sediments for 74 Physicochemical Characterization and Biological Testing (Environment Canada, 75 Environmental Protection Series Report, EPS 1/RM/29, 1994, Ottawa). Assuming 5% 76 significance coefficients (α = β =0.05; power=1- β=95%), approximately four 77 measurements are required to detect effect sizes of 25 mg/L and 200 mg/L, while 78 approximately 40 samples would be required for an effect size of 5 mg/L. Based on the 79 anticipated sampling frequency, a sufficient number of measurements will be obtained 80 to detect TSS changes equal to the action levels over the specified averaging periods 81 with a high level of power. 82
As noted above, TSS at the SMP monitoring sites will be calculated using a linear 83 regression relationship between turbidity and TSS (SMP, Sec. 3.2). In order for 84 calculated TSS differences between the upstream reference site (SMP-1) and the 85 downstream sites (SMP-2, SMP-3) to be considered statistically significant, the sum of 86 the confidence intervals for the TSS estimates at SMP-1 and SMP-2 or SMP-3 must be 87 less than the effect sizes to be measured. Based on the 95th percentile confidence 88 intervals for the linear regression (Figure 1) and assuming typical TSS concentrations of 89 about 5 mg/L to 30 mg/L at the reference site (SMP-1), TSS differences of 200 mg/L 90 between SMP-1 and SMP-2 or 25 mg/L between SMP-1 and SMP-2 or SMP-3 would be 91 considered statistically significant. 92
93 Figure 1: TSS-Turbidity Relationship for the Nelson River at Keeyask 94
0
10
20
30
40
50
60
0 10 20 30 40 50 60
TSS
(mg/
L)
Turbidity (NTU)
Measured Data
95% Confidence Interval
Linear Regression
TAC Public Rd 2 DFO-0084
Page 4 of 4
Two locations will be monitored at each SMP monitoring site, with the locations spaced 95 evenly across the river (i.e., left and right side of channel). Pre-project TSS monitoring 96 across transects at sampling sites K-S-06 (location of SMP-1) and K-S-07 (just upstream 97 of SMP-2) found that TSS typically had a small variation across the river width. From 98 eight sets of TSS transect data at K-S-06 (five sample points across the river) from 2005-99 2007, the average standard deviation of TSS across the river was 1.4 mg/L. At K-S-07 the 100 average standard deviation from seven sets of transect data was 1.2 mg/L. On average, 101 the standard deviations were less than 10% of the average TSS concentration across the 102 transects. Due to the low variation in TSS across the river width, sampling at two 103 locations at each SMP site is expected to reasonably represent average conditions at 104 each site for the purposes of the SMP monitoring program. Because site SMP-2 is in the 105 mixing zone downstream of in-stream construction, the variability in TSS across the river 106 will likely be greater than observed in the existing environment if in-stream work causes 107 an increase in TSS at SMP-2. Based on discussions with regulators (March 25, 2013; 108 Canadian Environmental Assessment Agency; Fisheries and Oceans; Environment 109 Canada), methods are being developed to confirm that site SMP-2 is able to detect 110 changes in TSS concentrations due to in-stream construction activities. A potential 111 method that is being explored is to augment the ambient measurements from the in-112 situ data loggers with additional manual readings. Potential revisions to the proposed 113 SMP monitoring will be the subject of additional discussions with the regulators.114
TAC Public Rd 2 DFO-0085
Page 1 of 12
REFERENCE: Volume: Aquatic Environment Supporting Volume; 1
Section: 2.5.2.2.5 Total Suspended Solids/Turbidity; p. 2-64 2
TAC Public Rd 2 DFO-0085 3
ORIGINAL PREAMBLE AND QUESTION: 4 The EIS, in the aquatic effects supporting document section 2 on water and sediment 5 quality, notes: “There are few studies that have reported the acute or chronic toxicity of 6 TSS to fish species represented in the Aquatic Environment Study Area. Lawrence and 7 Scherer (1974) reported that the 96-hour lethal concentration (LC50) for lake whitefish 8 (Coregonus clupeaformis) was 16,613 mg/L. McKinnon and Hnytka (1988) found 9 relatively high increases in TSS (instantaneous maximum = 3,524 mg/L and 1-day 10 average concentration = 524 mg/L) caused by winter pipeline construction did not have 11 any direct effect (no downstream emigration and no mortalities) on the fish community 12 of Hodgson Creek, NT. This study is notable as four of the fish species found in Hodgson 13 Creek - northern pike (Esox lucius), lake chub (Couesius plumbeus), longnose sucker 14 (Catostomus catostomus), and burbot (Lota lota) - are also found in the Aquatic 15 Environment Study Area. As indicated in Section 5.4.2, northern pike may spawn in the 16 nearshore areas of the Keeyask reservoir, even during the initial years of operation. 17 Therefore, early life history stages of northern pike may be exposed to elevated 18 concentrations of TSS for several years post-impoundment. No information on the acute 19 or chronic toxicity of TSS to northern pike eggs or larvae could be located. Information 20 for early life history stages of other species represented in the Aquatic Environment 21 Study Area is also sparse and many of the available studies do not differentiate between 22 the effects of suspended particulate materials and sediment deposition. However, the 23 available scientific literature indicates a potential for reduced hatching success in 24 salmonids exposed to elevated TSS concentrations on the order of two months or more, 25 at concentrations ranging from 6.6–157 mg/L (Table 2-17). In addition, northern pike 26 eggs would also be exposed to the combined effects of sedimentation and elevated TSS. 27 Therefore, should northern pike spawn in the nearshore, flooded areas of the reservoir 28 in the initial years of operation where organic TSS will be notably elevated, reduced 29 hatching success of northern pike eggs is likely. Conversely, elevated TSS and turbidity 30 can provide benefits to some fish species and life history stages. Reduced water clarity 31 can reduce the risk of predation by visual predators, which in turn can enhance survival 32 of juvenile fish (e.g., Sweka and Hartman 2003) and may favour planktivorous fish…” 33

TAC Public Rd 2 DFO-0085
Page 2 of 12
The Proponent discusses effects of TSS specific to the individual VEC fish species. 34 However, much of the Proponent’s impact assessment appears to rely primarily on 35 general and lethal TSS concentration effects. Can the Proponent provide an expanded 36 discussion of sub-lethal or chronic impact severity of effect risk assessment for 37 anticipated TSS changes? 38
FOLLOW-UP QUESTION: 39 In the absence of specific lethal and sub-lethal data for various species and life-stages, 40 would the proponent provide some hypothetical modelling for evaluation of sub-lethal 41 risks? 42
RESPONSE: 43 Predicted effects of altered total suspended solids (TSS) on aquatic life in the Keeyask 44 area are discussed in the Aquatic Environment Supporting Volume (AE SV) and provided 45 in the response to TAC Public Rd 2 DFO-0069. As noted in the AE SV, we are not aware 46 of studies assessing the effect of low level increases of TSS on fish species in the Keeyask 47 area. In the absence of data, the reviewer requested hypothetical modeling for 48 evaluation of sub-lethal risks; we are only aware of the Severity of Ill Effects model (SEV) 49 developed by Newcombe and Jensen (1996) for this purpose. However, as discussed 50 below, this model is not able to accurately predict the effects of low levels of TSS on 51 aquatic life. Nevertheless, the requested assessment was conducted and is provided 52 below. 53
Manitoba water quality objectives (MWS 2011) and CCME water quality guidelines 54 (1999; updated to 2013) for TSS for the protection of aquatic life are based on the 55 British Columbia Ministry of the Environment Lands and Parks (BCMELP) guidelines, 56 derived using the severity of ill effects model originally developed by Newcombe and 57 Jensen (1996) and modified by Caux et al. (1997). Specifically, the BCMELP criteria were 58 developed based on the Newcombe and Jensen (1996) SEV Model for adult salmonids 59 (Model 2); this group was determined to elicit the largest response to a given increase in 60 TSS concentration over a set duration (i.e., this group was identified as the most 61 sensitive based on the various models developed). Consideration of exposure duration 62 as well as background conditions in the natural environment were incorporated into the 63 criteria. 64
As noted in the AESV, the MWQSOG/CCME PAL guideline is predicted to be exceeded in 65 the fully mixed Lower Nelson River during three events: 66

TAC Public Rd 2 DFO-0085
Page 3 of 12
• Exposure Scenario 1: maximum predicted increase of 7 mg/L for approximately six 67 days during placement of the Spillway and Central Dam cofferdams in July 2015; 68
• Exposure Scenario 2: an increase in TSS of 7 mg/L for a period of one month during 69 removal of the Tailrace Summer Level Cofferdam in September 2019; and 70
• Exposure Scenario 3: maximum predicted increase of 15 mg/L for 10 days (actual 71 concentrations are predicted to peak at 15 mg/L above background and to decrease 72 over this 10 day period) during placement of the South Dam Rock Fill Groin in early 73 September 2017. 74
TSS currently ranges between 5 and 30 mg/L, averaging 14 mg/L in the Gull Lake area. 75 Using the existing background TSS conditions, effects of increases in TSS identified 76 above on fish were examined using the Newcombe and Jensen (1996), as modified by 77 Caux et al. (1997), Severity of Ill Effects Model for adult salmonids (Model 2) and non-78 salmonid freshwater fish (Model 6). 79
Effects on Salmonids 80
SEV scores for adult salmonids are presented in Figure 1 and Table 1 for a range of 81 scenarios applicable to the Keeyask Project. As the SEV models generate scores based 82 on absolute TSS concentrations rather than effects related to relative increases, it is 83 relevant to compare scores for the exposure scenarios indicated above to the scores 84 based on background TSS concentrations. All three exposure scenarios cause an 85 increase in the SEV scores of one or less, and most scenarios cause changes of less than 86 0.5. The largest change in SEV score is predicted to occur under the minimum TSS 87 background condition (5 mg/L); as discussed below, the SEV model is limited in its ability 88 to predict effects of low concentrations of TSS, in particular due to the lack of empirical 89 data on which the model was constructed. All SEV scores are below the paralethal/lethal 90 threshold (SEV = 9) and the highest SEV rankings are unchanged from background 91 conditions under each of the three scenarios (Table 1). 92
Effects on Adult Freshwater Non-Salmonids 93
SEV scores for adult freshwater non-salmonids are presented in Figure 2 and Table 2 for 94 a range of scenarios applicable to the Keeyask Project. SEV scores for exposure 95 scenarios 1 and 3 are below the paralethal/lethal threshold (SEV = 9; Table 2). However, 96 SEV scores exceed 9 for scenario 2 – including purely background TSS conditions (i.e., 97 without Project-induced increases in TSS). It is also worth noting that this model predicts 98 that concentrations of TSS of 5 mg/L (the minimum measured in the Keeyask area), 99 would prove lethal to non-salmonids in less than one month (Figure 3). A concentration 100 of near zero (0.1 mg/L) is predicted to be lethal by the SEV model in less than 2 months. 101

TAC Public Rd 2 DFO-0085
Page 4 of 12
This observation illustrates one of the key limitations of this model; the model is not 102 reliable for predicting effects associated with low concentrations of TSS. For the 103 purposes of assessing potential effects associated with the Keeyask Project, it is the 104 relative difference between the SEV scores with and without the Project that is of 105 relevance. All three exposure scenarios cause an increase in the SEV scores of less than 106 0.5, and most scenarios cause changes of less than 0.2. 107
Context 108
For additional context, Figure 3 presents SEV model results for a TSS concentration of 109 120 mg/L – the mean concentration measured in the Assiniboine River at Headingley. 110 Mean concentrations in the Red River are of a similar magnitude (132 mg/L at the south 111 gate of the floodway and 124 mg/L at Selkirk). These averages are an order of 112 magnitude higher than the predicted TSS concentrations for the Keeyask Project. Over a 113 365 day period, this average concentration (120 mg/L) is predicted to cause SEV 114 rankings of 10 and 12 for salmonids and non-salmonids, respectively. These scores fall 115 into the categories of “0-20% mortality, increased predation, moderate to severe 116 habitat degradation” and “40-60% mortality”, respectively. 117
Conclusions 118
The SEV model developed by Newcombe and Jensen (1996) has been criticized for its 119 inherent inability to accurately predict effects of low levels of TSS to aquatic life, as 120 these conditions were not captured within the database used to construct the model 121 (e.g., Birtwell et al. 2003, Anderson et al. 1996). Therefore, the utility or accuracy of the 122 model to predict risks to fish associated with small increases in TSS is limited. 123
Notwithstanding the limitations of the SEV model to predict effects of small increases in 124 TSS on fish, the SEV model indicated that scores increased by less than one, and 125 generally less than 0.2, for the various potential exposure scenarios examined. 126
Collectively, these results indicate effects of the predicted increases in TSS on salmonids 127 and non-salmonids during construction would be small and potentially indistinguishable 128 from existing conditions. 129
Literature Cited 130
Anderson, P. G., B.R. Taylor, and G.C. Balch. 1996. Quantifying the effects of sediment 131 release on fish and their habitats. Can. Manuscr. Rep. Fish. Aquat. Sci. No. 2346. 132

TAC Public Rd 2 DFO-0085
Page 5 of 12
Birtwell, I. K., J.S. Korstrom, P.M.F. Walton, C.J. Whitfield, and D.M. Janz. 2003. An 133 examination of the growth, behaviour, and biochemical responses of juvenile coho 134 salmon (Oncorhyncus kisutch) at the Capilano Salmon Hatchery, North Vancouver, BC, in 135 relation to changes in water quality and food between November 2001 and May 2002. 136 Can. Tech. Rep. Fish. Aquat. Sci. No. 2499. 137
Caux, P.-Y., D.R.J. Moore, and D. MacDonald. 1997. Ambient water quality guidelines 138 (criteria) for turbidity, suspended and benthic sediments. BC Environment. 139
Newcombe, C.P., and J.O.T. Jensen. 1996. Channel suspended sediment and fisheries: a 140 synthesis for quantitative assessment of risk and impact. N. Amer. J. Fish. Manage. 16: 141 693-727. 142

TAC Public Rd 2 DFO-0085
Page 6 of 12
0
1
2
3
4
5
6
7
8
9
10
11
12
13
14
0 100 200 300 400 500 600 700 800
Seve
rity
of I
ll Ef
fect
Ran
king
Exposure Duration (hours)
1 mg/L
5 mg/L
12 mg/L
14 mg/L
21 mg/L
30 mg/L
32 mg/L
75 mg/L
120 mg/L
150 mg/L
250 mg/L
500 mg/L
1000 mg/L
Sublethal
Paralethal/Lethal
0
1
2
3
4
5
6
7
8
9
10
11
12
13
14
0 100 200 300 400 500 600 700 800
Seve
rity
of I
ll Ef
fect
Ran
king
Exposure Duration (hours)
1 mg/L
5 mg/L
14 mg/L
20 mg/L
29 mg/L
40 mg/L
75 mg/L
120 mg/L
150 mg/L
250 mg/L
500 mg/L
1000 mg/L
Sublethal
Paralethal/Lethal
(A) 1
2
3
4
5
6
7
8
9
10
11
12
(B) 13
14
15
16
17
18
19
20
21
22
23
24
Figure 1. Severity of Ill Effects scores for adult salmonids (Model 2) for a range of TSS 25 concentrations and exposure durations. Shaded boxes represent scores derived for 26 increases of: (A) 7 mg/L above background for 6 and 30 days; and (B) 15 mg/L above 27 background for 10 days, where background ranges from 5 to 30 mg/L. 28
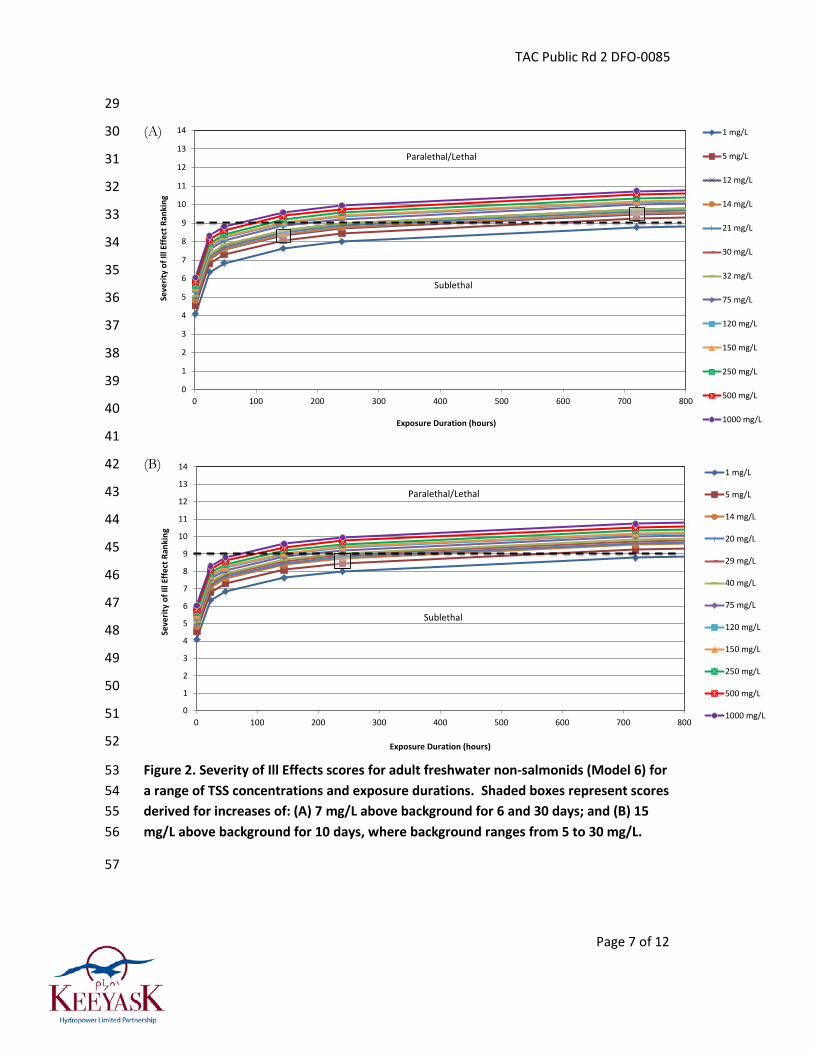
TAC Public Rd 2 DFO-0085
Page 7 of 12
0
1
2
3
4
5
6
7
8
9
10
11
12
13
14
0 100 200 300 400 500 600 700 800
Seve
rity
of I
ll Ef
fect
Ran
king
Exposure Duration (hours)
1 mg/L
5 mg/L
12 mg/L
14 mg/L
21 mg/L
30 mg/L
32 mg/L
75 mg/L
120 mg/L
150 mg/L
250 mg/L
500 mg/L
1000 mg/L
Sublethal
Paralethal/Lethal
0
1
2
3
4
5
6
7
8
9
10
11
12
13
14
0 100 200 300 400 500 600 700 800
Seve
rity
of I
ll Ef
fect
Ran
king
Exposure Duration (hours)
1 mg/L
5 mg/L
14 mg/L
20 mg/L
29 mg/L
40 mg/L
75 mg/L
120 mg/L
150 mg/L
250 mg/L
500 mg/L
1000 mg/L
Sublethal
Paralethal/Lethal
29
(A) 30
31
32
33
34
35
36
37
38
39
40
41
(B) 42
43
44
45
46
47
48
49
50
51
52
Figure 2. Severity of Ill Effects scores for adult freshwater non-salmonids (Model 6) for 53 a range of TSS concentrations and exposure durations. Shaded boxes represent scores 54 derived for increases of: (A) 7 mg/L above background for 6 and 30 days; and (B) 15 55 mg/L above background for 10 days, where background ranges from 5 to 30 mg/L. 56
57

TAC Public Rd 2 DFO-0085
Page 8 of 12
58
Figure 3. Severity of Ill Effects scores for adult freshwater non-salmonids (Model 6) for 59 a range of TSS concentrations and exposure durations, including the range for the 60 Keeyask Area (5-30 mg/L), the mean for the Assiniboine River (120 mg/L), and a 61 concentration near to 0 mg/L. 62
0
1
2
3
4
5
6
7
8
9
10
11
12
13
14
0 1000 2000 3000 4000 5000 6000 7000 8000 9000 10000
Seve
rity
of I
ll Ef
fect
Ran
king
Exposure Duration (hours)
0.1 mg/L
1 mg/L
5 mg/L
14 mg/L
30 mg/L
120 mg/L
Sublethal
Paralethal/Lethal
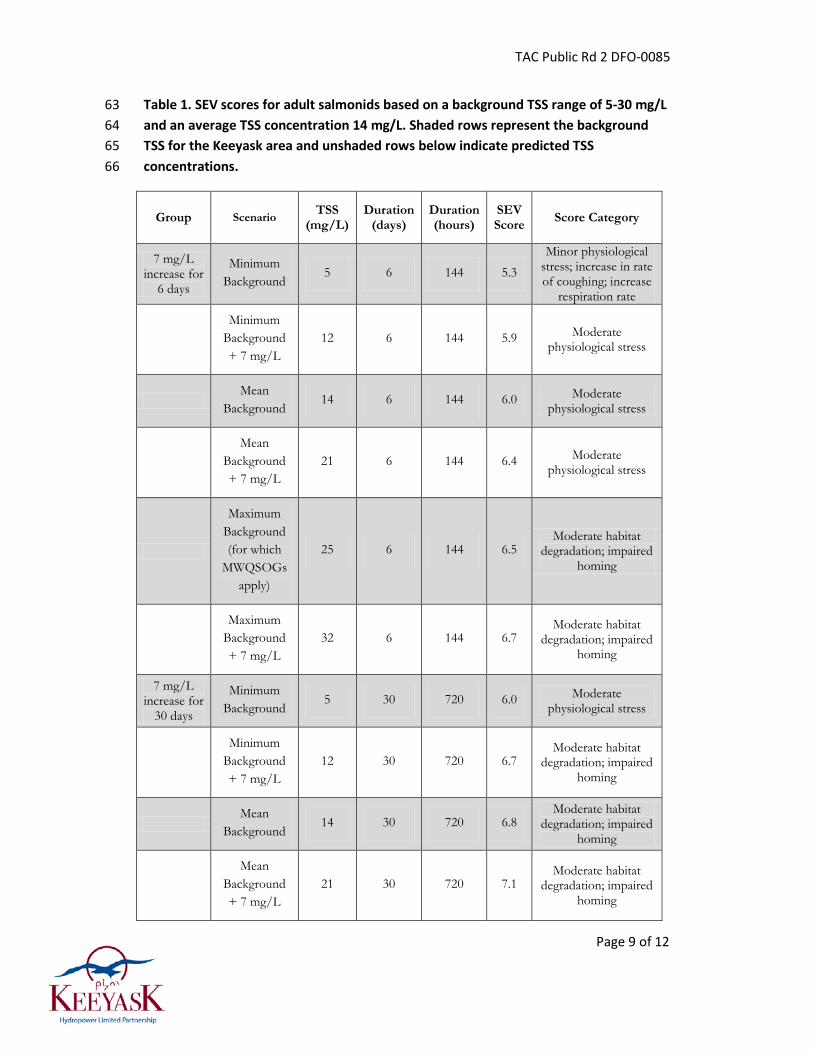
TAC Public Rd 2 DFO-0085
Page 9 of 12
Table 1. SEV scores for adult salmonids based on a background TSS range of 5-30 mg/L 63 and an average TSS concentration 14 mg/L. Shaded rows represent the background 64 TSS for the Keeyask area and unshaded rows below indicate predicted TSS 65 concentrations. 66
Group Scenario TSS (mg/L)
Duration (days)
Duration (hours)
SEV Score Score Category
7 mg/L increase for
6 days
Minimum Background
5 6 144 5.3
Minor physiological stress; increase in rate of coughing; increase
respiration rate
Minimum
Background + 7 mg/L
12 6 144 5.9 Moderate physiological stress
Mean
Background 14 6 144 6.0 Moderate
physiological stress
Mean
Background + 7 mg/L
21 6 144 6.4 Moderate physiological stress
Maximum Background (for which
MWQSOGs apply)
25 6 144 6.5 Moderate habitat
degradation; impaired homing
Maximum
Background + 7 mg/L
32 6 144 6.7 Moderate habitat
degradation; impaired homing
7 mg/L increase for
30 days
Minimum Background
5 30 720 6.0 Moderate physiological stress
Minimum
Background + 7 mg/L
12 30 720 6.7 Moderate habitat
degradation; impaired homing
Mean
Background 14 30 720 6.8
Moderate habitat degradation; impaired
homing
Mean
Background + 7 mg/L
21 30 720 7.1 Moderate habitat
degradation; impaired homing

TAC Public Rd 2 DFO-0085
Page 10 of 12
Group Scenario TSS (mg/L)
Duration (days)
Duration (hours)
SEV Score Score Category
Maximum Background (for which
MWQSOGs apply)
25 30 720 7.3 Moderate habitat
degradation; impaired homing
Maximum
Background + 7 mg/L
32 30 720 7.4 Moderate habitat
degradation; impaired homing
15 mg/L Increase
for 10 days
Minimum Background
5 10 240 5.5 Moderate physiological stress
Minimum
Background + 15 mg/L
20 10 240 6.6 Moderate habitat
degradation; impaired homing
Mean
Background 14 10 240 6.3 Moderate
physiological stress
Mean
Background + 15 mg/L
29 10 240 6.8 Moderate habitat
degradation; impaired homing
Maximum Background (for which
MWQSOGs apply)
25 10 240 6.7 Moderate habitat
degradation; impaired homing
Maximum
Background + 15 mg/L
40 10 240 7.1 Moderate habitat
degradation; impaired homing
67
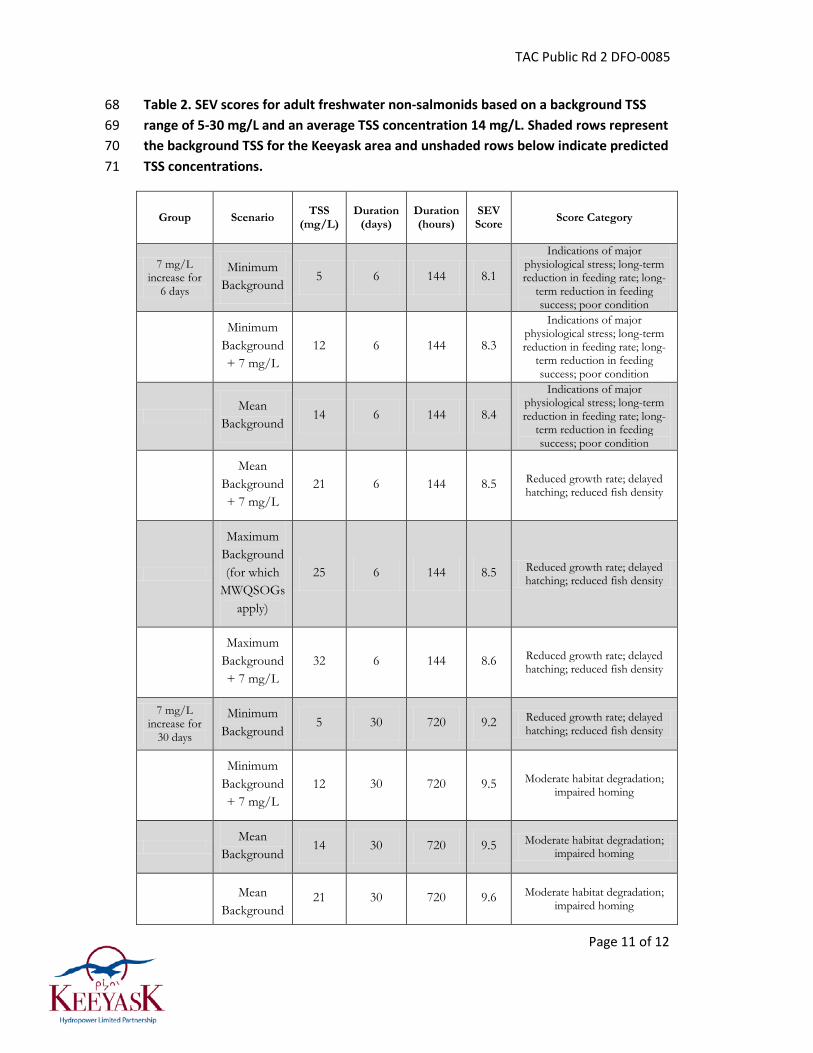
TAC Public Rd 2 DFO-0085
Page 11 of 12
Table 2. SEV scores for adult freshwater non-salmonids based on a background TSS 68 range of 5-30 mg/L and an average TSS concentration 14 mg/L. Shaded rows represent 69 the background TSS for the Keeyask area and unshaded rows below indicate predicted 70 TSS concentrations. 71
Group Scenario TSS (mg/L)
Duration (days)
Duration (hours)
SEV Score Score Category
7 mg/L increase for
6 days
Minimum Background
5 6 144 8.1
Indications of major physiological stress; long-term reduction in feeding rate; long-
term reduction in feeding success; poor condition
Minimum Background + 7 mg/L
12 6 144 8.3
Indications of major physiological stress; long-term reduction in feeding rate; long-
term reduction in feeding success; poor condition
Mean
Background 14 6 144 8.4
Indications of major physiological stress; long-term reduction in feeding rate; long-
term reduction in feeding success; poor condition
Mean Background + 7 mg/L
21 6 144 8.5 Reduced growth rate; delayed hatching; reduced fish density
Maximum Background (for which
MWQSOGs apply)
25 6 144 8.5 Reduced growth rate; delayed hatching; reduced fish density
Maximum Background + 7 mg/L
32 6 144 8.6 Reduced growth rate; delayed hatching; reduced fish density
7 mg/L increase for
30 days
Minimum Background
5 30 720 9.2 Reduced growth rate; delayed hatching; reduced fish density
Minimum Background + 7 mg/L
12 30 720 9.5 Moderate habitat degradation; impaired homing
Mean
Background 14 30 720 9.5 Moderate habitat degradation;
impaired homing
Mean Background
21 30 720 9.6 Moderate habitat degradation; impaired homing
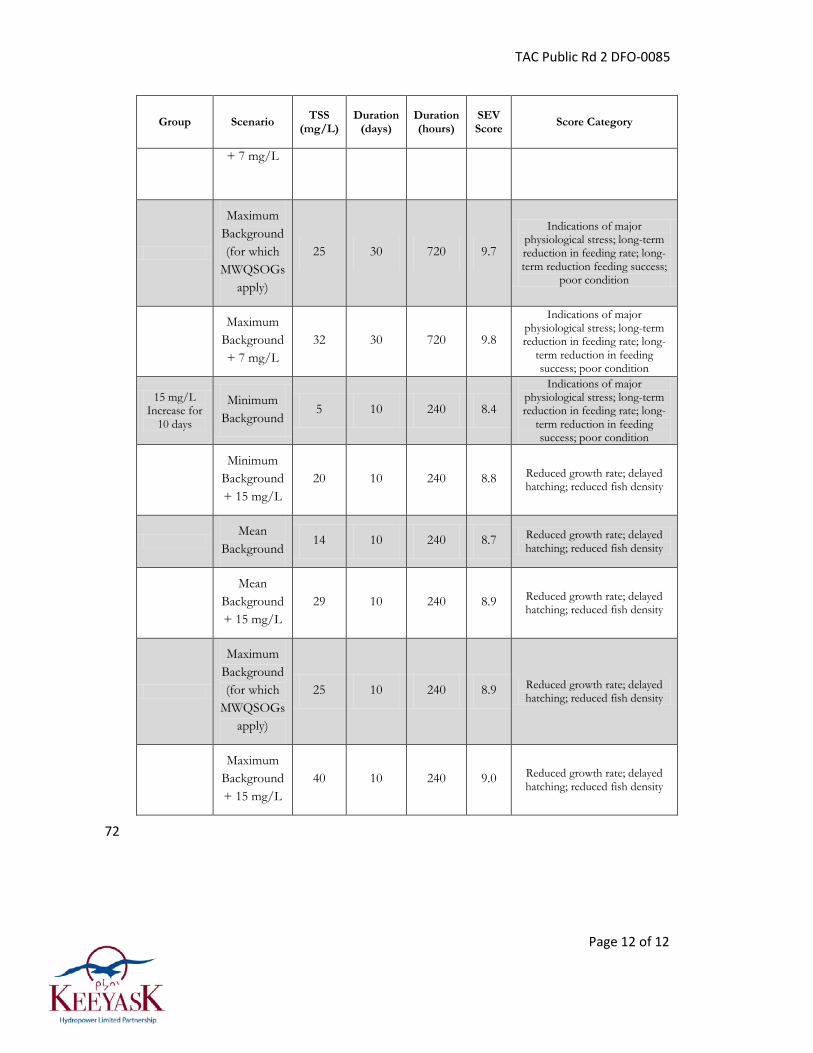
TAC Public Rd 2 DFO-0085
Page 12 of 12
Group Scenario TSS (mg/L)
Duration (days)
Duration (hours)
SEV Score Score Category
+ 7 mg/L
Maximum Background (for which
MWQSOGs apply)
25 30 720 9.7
Indications of major physiological stress; long-term reduction in feeding rate; long-term reduction feeding success;
poor condition
Maximum Background + 7 mg/L
32 30 720 9.8
Indications of major physiological stress; long-term reduction in feeding rate; long-
term reduction in feeding success; poor condition
15 mg/L Increase for
10 days
Minimum Background
5 10 240 8.4
Indications of major physiological stress; long-term reduction in feeding rate; long-
term reduction in feeding success; poor condition
Minimum Background + 15 mg/L
20 10 240 8.8 Reduced growth rate; delayed hatching; reduced fish density
Mean
Background 14 10 240 8.7 Reduced growth rate; delayed
hatching; reduced fish density
Mean Background + 15 mg/L
29 10 240 8.9 Reduced growth rate; delayed hatching; reduced fish density
Maximum Background (for which
MWQSOGs apply)
25 10 240 8.9 Reduced growth rate; delayed hatching; reduced fish density
Maximum Background + 15 mg/L
40 10 240 9.0 Reduced growth rate; delayed hatching; reduced fish density
72
TAC Public Rd 2 DFO-0086
Page 1 of 4
REFERENCE: Volume: Aquatic Environment Supporting Volume; 1
Section: 1A.2.1 Structures in Water - Construction Scheduling; p. 2
N/A 3
TAC Public Rd 2 DFO-0086 4
ORIGINAL PREAMBLE AND QUESTION: 5 “Keeyask Generation Project Environmental Impact Statement Supporting Volume 6 Aquatic Environment June 2012” (disc 2), p1A-2ff… Restricted activity timing 7 windows…DFO…In northern Manitoba, no in-water or shoreline work is allowed during 8 the 15 April – 30 June, 15 May – 15 July, and 1 September -15 May periods where 9 spring, summer, and fall spawning fish respectively are present, except under site- or 10 project-specific review and with…implementation of protective measures…Based on 11 data from Keeyask field investigations…proposed area-specific timing windows for 12 restricted in-water construction activities are…15 May – 15 July for spring and summer 13 spawning fish and 15 September – 15 May for fall spawning fish…scheduling of 14 construction activities that require working in water have been developed and modified 15 to the extent practicable to avoid or minimize the potential for disturbance to fish in the 16 Keeyask area during spawning, and egg an fry development periods…Adjustments to 17 scheduling…to restrict construction and removal of structures to times of …year when 18 sensitive life stages of fish are least likely to be present are summarized in Table 1A-2…” 19 A summary listing shows these are mostly for cofferdam construction and removal “To 20 the extent possible, work in water has been scheduled to avoid interaction with fish and 21 fish habitat during the spring and fall spawning periods…When avoidance of both spring 22 and fall spawning periods was not possible due to critical construction sequences, 23 avoidance of spring spawning periods was given priority over avoidance of the fall 24 spawning period…Additional mitigation of potential disturbances to fish and fish habitat 25 will be gained by constructing each cofferdam in a sequence that minimizes the 26 exposure of readily-transported fines to flowing water…” 27
A key mitigation is timing of in-water activity to avoid impacts on VEC fish species. Can 28 the Proponent describe its contingency plans for unavoidable changes in scheduling. 29 e.g., if a TSS episode exceeding the CCME guidelines is relatively benign for adult 30 whitefish migration to spawning areas, is the same episode when delayed due to 31 schedule changes similarly benign for incubating whitefish eggs? b) What sort of 32 information would be available to rapidly assess the potential risk of a schedule change? 33 c) What criteria would the Proponent use to trade-off costs to the project and costs to a 34 Valued Environmental Component (VEC) fish species? 35

TAC Public Rd 2 DFO-0086
Page 2 of 4
FOLLOW-UP QUESTION: 36 The proponent’s answer refers to action plans yet to be developed. Would the 37 proponent provide details of action plans for unanticipated scheduling changes that are 38 protective of fish, fisheries, and fish habitat? 39
RESPONSE: 40 This response is similar to the response to TAC Public Rd 2 DFO-0057 and DFO-75. 41
The primary tool in reducing the environmental effects of construction is mitigation 42 through construction methods, timing and/or locations, all of which has been integrated 43 into project planning. The secondary tool has been compensation and follow-up, 44 through replacement of predicted losses or harmful alterations and a commitment to 45 monitor effectiveness of compensation measures and modify, if necessary. The question 46 recognizes that there is uncertainty in the planning of construction activities, and 47 unavoidable changes that can occur must be efficiently managed – ideally in a proactive 48 manner, so that contingency options are developed and agreed to prior to the need to 49 apply them. 50
In developing detailed construction schedules, considerable effort has been made to 51 mitigate effects as much as possible by avoiding sensitive timing windows. However, it is 52 recognized that there is potential for the need to undertake in-stream construction 53 during restricted periods (i.e., fall/winter to protect lake whitefish and spring/early 54 summer to protect species such as lake sturgeon/walleye/northern pike) in spawning 55 habitat (Gull Rapids). This has the potential to introduce sediments to these areas 56 during sensitive times. It is also recognized that adaptive management measures need 57 to be in place to deal with this potential. 58
The Keeyask Generation Project In-stream Construction Sediment Management Plan 59 (SMP) documents the adaptive management measures to be taken during construction 60 should sediment monitoring trigger a need for them. A draft of this plan was provided 61 to DFO in October 2012, and will be filed with regulators in the second quarter of 2013. 62 A key tool in the plan is monitoring and communication. Section 4.0 of the SMP outlines 63 the communication protocol for construction site staff and environmental regulators. 64
Once the general civil contractor is retained and throughout the construction process, 65 construction schedules will be monitored on a regular basis and any potential changes 66 that may encroach upon sensitive timing windows or predetermined and/or agreed to 67 timing restrictions will be communicated to the appropriate regulatory authorities to 68 discuss proposed changes and to confirm acceptance prior to implementation where 69 practicable. 70
TAC Public Rd 2 DFO-0086
Page 3 of 4
The SMP also describes the actions planned and potential measures to manage the 71 release of sediments during in-stream construction activities. Considerable effort has 72 already gone into developing in-stream construction methods to minimize impacts as 73 much as practical. Substantial changes in construction techniques and mitigation 74 measures to reduce sediment inputs as a result of changes to the schedule are therefore 75 not anticipated. One caveat to this may involve innovative construction techniques that 76 the general civil contractor may bring once they are selected 77
Section 4.0 of the SMP outlines the adaptive action plans for increases in suspended 78 sediment levels above thresholds set out in the plan. Section 4.3 outlines the 79 management plan for commissioning the spillway and powerhouse. 80
Section 2.4 of the SMP lists the primary mitigation measures for each of the potential 81 sources of sediment for the anticipated in-stream construction activities. Section 2.5 82 lists the secondary mitigation techniques that have been established to address the 83 uncertainty in the predictions of shoreline erosion and impacts to TSS due to in-stream 84 construction activities. It is noted that the estimated impacts to TSS due to construction 85 activities are conservative, which minimizes the likelihood of exceeding the thresholds 86 set out in the SMP for TSS increases above background levels. 87
Appendix A of the SMP lists the various mitigation techniques that could be 88 implemented to address potential sediment problems for the following in-stream 89 construction activities: 90
• Placement of rock fill and rip rap; 91
• Placement of transition fill; 92
• Placement of impervious fill; 93
• Dewatering cofferdams; 94
• Rock excavation and removal of rock fill; 95
• Removal of transition and impervious fill; 96
• First flow through spillway; 97
• First flow through powerhouse; and 98
• Shoreline erosion upstream of cofferdams. 99
Figure 5 in the SMP shows the predicted concentration of TSS for each in-stream 100 activity. It should be noted that these predicted concentrations should not increase if 101 the activity is shifted to other times of the year. The same action plans and mitigation 102 techniques described in the SMP and summarized in the previous response to this 103 question would be applied to protect fish, fisheries and fish habitat. As indicated above, 104 this includes timely communication with DFO and MCWS, applying one or more of the 105 secondary measures described in Section 2.5 and Appendix A of the SMP, and discussing 106

TAC Public Rd 2 DFO-0086
Page 4 of 4
results and the need for follow up with the regulators, as described in the previous 107 response. 108
TAC Public Rd 2 DFO-0087
Page 1 of 1
REFERENCE: Volume: Response to EIS Guidelines; Section: 8.0 1
Monitoring & Follow-up; p. N/A 2
TAC Public Rd 2 DFO-0087 3
ORIGINAL PREAMBLE AND QUESTION: 4 Previous daily TSS sediment monitoring at the Wuskwatim GS construction site had 5 frequent problems with bio-fouling of sensors. 6
Can the Proponent provide additional information on its anticipated TSS monitoring 7 showing that problems with previous monitoring, e.g., bio-fouling of sensors, has been 8 anticipated and solved? 9
FOLLOW-UP QUESTION: 10 Can the proponent provide additional information on its anticipated TSS monitoring 11 showing that problems with previous monitoring , e.g., bio-fouling of sensors, has been 12 anticipated and solved? Proponent notes that the SMP to be provided “in the first 13 quarter of 2013…” provides details. DFO notes that a draft, referred to as an informal 14 draft was received on October 17, 2012 noting that a formal version would follow after 15 discussion with regulators. Would the proponent provide details, specific to the 16 biofouling risk, from the proposed SMP to answer the EIS question? Awaiting receipt of 17 In-stream Construction Sediment Management Plan (SMP). 18
RESPONSE: 19
Section 3.4.1 of the September 2012 draft In-Stream Construction Sediment 20 Management Plan (provided to DFO, as noted, on October 17, 2012) indicates that 21 biofouling will be addressed as follows: 22
“The YSI turbidity loggers that will be used for the Project are equipped with self-23 cleaning sensors with integrated wipers to remove biofouling and maintain high 24 data accuracty. However, the loggers will be visited every two weeks to maintain 25 and clean the monitoring system (and free them of algae and vegetation debris) 26 to avoid erratic spikes in data.” 27
In addition to the routine maintenance visits, the on-site environmental officers will be 28 routinely checking the monitoring data. At the request of the regulators, Section 3.4.1 29 of the SMP will be revised to include additional maintenance and manual sampling to 30 determine if there are problems with loggers such as biofouling. 31

TAC Public Rd 2 DFO-0093
Page 1 of 3
REFERENCE: Volume: Aquatic Environment Supporting Volume; 1
Section: Appendix 1A, Part 2 Keeyask Lake Sturgeon Stocking 2
Strategy; p. N/A 3
TAC Public Rd 2 DFO-0093 4
ORIGINAL PREAMBLE AND QUESTION: 5 Appendix 1A - Part 2 6
Should the original population be decimated, how will the population within the Gull 7 Reach be maintained? 8
FOLLOW-UP QUESTION: 9 Proponent’s answer asks reader to re-read sections of the EIS. Would the proponent 10 please extract the appropriate information from the EIS or provide additional 11 information to answer the question? 12
RESPONSE: 13 The Aquatic Environment Supporting Volume describes a two-pronged approach to 14 maintaining a Lake Sturgeon population in the Keeyask (Gull) reach of the Nelson River, 15 firstly by addressing habitat losses through the creation of habitat in the reservoir, and 16 secondly, by supplementing the existing population and replacing potential losses 17 through emigration at impoundment, by a long term stocking program. Within the 18 reservoir, the two primary habitat measures are: 19
• Monitoring to determine whether Lake Sturgeon continue to spawn at Birthday 20 Rapids and, if not, placement of large structures along the shorelines to create 21 turbulent flow to attract spawning fish; and 22
• Monitoring of potential YOY habitat in the Keeyask reservoir and, if monitoring 23 shows that juvenile recruitment is not successful, implementation of a program to 24 create suitable habitat. 25
Stocking of Lake Sturgeon is a key point and is described as follows (AE SV Section 26 6.4.2.4, pages 6-46 to 6-47): 27
“Finally, implementation of a stocking program in the Kelsey to Kettle GS reach of the 28 Nelson River. As discussed in Section 6.3.1, lake sturgeon were historically abundant in 29 much of the lower Nelson River, but numbers have declined to the extent that they are 30 currently assessed as endangered by COSEWIC and are being considered for listing under 31 SARA. Given that construction of the Project will alter existing lake sturgeon habitat, and 32 the uncertainties with respect to their use of constructed or altered habitats, it is 33

TAC Public Rd 2 DFO-0093
Page 2 of 3
proposed that stocking be used to support and enhance lake sturgeon populations within 34 the Clark Lake to Stephens Lake reach of the Nelson River. Stocking would commence 35 with the start of construction to compensate for the loss of natural recruitment that is 36 expected to occur until compensatory spawning habitat has been provided. The stocking 37 plan would include the introduction of fall fingerlings (three to four months old) and 38 spring yearlings. 39
In addition, lake sturgeon will be stocked at off-site locations that currently provide 40 habitat to support all life history functions where the current small populations are 41 limiting the potential for recovery. To date, candidate sites have been identified in the 42 upper Split Lake area, in the Nelson River below the Kelsey GS, the Grass River, and the 43 Burntwood River below First Rapids (Map 1 1). A detailed description of the stocking 44 program is provided in Appendix 1A. Principal points are provided below: 45
• The stocking program will address effects of the Project, but be conducted in 46 coordination with other regional recovery plans; 47
• The plan will be long-term, with a commitment by the Partnership to construct a 48 hatchery and/or other facilities in northern Manitoba to provide the necessary 49 infrastructure; 50
• Brood stock from the Nelson River will be selected based on genetic considerations, 51 including numbers of individuals and genetic similarity to the target area; 52
• The program will be conducted in consideration of the need to maintain genetic 53 diversity; and 54
• Target numbers and ages of fish stocked at each location will be determined based 55 on the size and age structure of the existing population, the ability of the habitat to 56 support additional fish, and recommended stocking rates and population targets 57 developed elsewhere (e.g., DFO 2010; Wisconsin stocking guidelines). 58
Stocking of lake sturgeon is one of the most effective means of recovering this species 59 where adequate habitat is available (see Appendix 1A for details). Examples of successful 60 conservation stocking programs include: 61 • The St. Louis River, a tributary of Lake Superior, where sturgeon were stocked from 62
1983 to 2000. Populations have increased in western Lake Superior and recently 63 stocked sturgeon have been observed using historical spawning grounds on the St. 64 Louis River; 65
• Red River of the North, a tributary of Lake Winnipeg, where a 20-year stocking plan 66 has released fingerlings and fry across tributaries in Minnesota and lake sturgeon 67 have been observed in the Red River to Lake Winnipeg; and 68
• Oneida Lake, New York, where lake sturgeon exhibited very high growth rates. 69
Lake sturgeon have also been stocked into the Saskatchewan, Assiniboine and upper 70 Nelson rivers in Manitoba.” 71
TAC Public Rd 2 DFO-0093
Page 3 of 3
If in referring to the depleted state of the Lake Sturgeon population, the reviewer was 72 concerned that insufficient sturgeon would be available to support a stocking program, 73 the Lake Sturgeon Stocking Strategy identified (AE SV Appendix 1A Part 2 – Page 17) 74 states: 75
“With respect to the third consideration listed above, the collection of spawn is 76 feasible (see Section 3.1) from each subpopulation. Therefore, given the 77 uncertainties surrounding genetic mixing of stocks, the initial stocking plan 78 would likely attempt to maintain the existing genetic structure and collect 79 spawn from the same subpopulations as will be stocked. However, given 80 uncertainties and difficulties associated with spawn collection, a second 81 contingency strategy may be required. If the number of spawning fish is too 82 small to support the above approach, then spawn will be collected at sites that 83 are genetically the most similar to proposed stocking locations”. 84
As discussed at a February 15, 2013 technical review meeting among KHLP, DFO and 85 MCWS and during follow-up discussions on February 22, genetic analyses currently 86 being conducted will provide the basis for more effectively assessing differences in 87 genetic structure among areas. These results will be provided to MCWS and DFO when 88 available and be used to assist in identifying alternate sources of spawn, if required. 89
TAC Public Rd 2 DFO-0094
Page 1 of 1
REFERENCE: Volume: Aquatic Environment Supporting Volume; 1
Section: Appendix 1A, Part 2 Keeyask Lake Sturgeon Stocking 2
Strategy; p. N/A 3
TAC Public Rd 2 DFO-0094 4
ORIGINAL PREAMBLE AND QUESTION: 5 Appendix 1A - Part 2 6
The recruitment model/unexploited scenario mimics the Wisconsin guideline. There is 7 acknowledgement that these numbers may be too low given the guideline was 8 developed based on rivers smaller than the Nelson. How will final numbers be derived? 9
FOLLOW-UP QUESTION: 10 This contradicts statements in proponent response provided in DF0-0052, "CPUE was 11 not used to estimate population size" and DFO-0017 "CPUE was not used in statistical 12 analysis" 13
RESPONSE: 14 At the technical meeting on February 15, 2013, held among DFO, MCWS, and KHLP, DFO 15 reviewed the follow-up question and indicated that it was a misunderstanding and 16 should be disregarded. No further information was required for DFO-0094. 17
TAC Public Rd 2 DFO-0098
Page 1 of 15
REFERENCE: Volume: Aquatic Environment Supporting Volume; 1
Section: Appendix 1A, Part 2 Keeyask Lake Sturgeon Stocking 2
Strategy; p. N/A 3
TAC Public Rd 2 DFO-0098 4
ORIGINAL PREAMBLE AND QUESTION: 5 Appendix 1A - Part 2 6
Given predictions of accumulated sedimentation/peat accumulation and subsequent 7 influences in water chemistry (including decreasing oxygen and increasing mercury 8 levels) is stocking the forebay with sturgeon a rational option? 9
FOLLOW-UP QUESTION: 10 DFO is interested in knowing more detail about the amount of change in the reservoir. 11 The Proponent’s answer talks about the post-project but does not compare it to the pre-12 project. Would the proponent please provide a pre- versus post-project comparison? 13 "Stocking lake sturgeon into the Keeyask Reservoir is a rational option to recover 14 populations" Please provide publications in support for this conclusion, given mercury in 15 fish tissue significantly elevate post project. 16
RESPONSE: 17 The reviewers comments appear to comprise four questions: 18
5. Will the reservoir be suitable for Lake Sturgeon given predictions of accumulated 19 sedimentation/peat accumulation and subsequent influences on water chemistry 20 (including decreasing oxygen)? 21
6. Will mercury levels (presumably in fish) affect the suitability of the reservoir for Lake 22 Sturgeon? 23
7. Will the Proponent provide more detail about changes in the reservoir (pre- versus 24 post-Project comparison)? 25
8. Will the proponent provide publications that support stocking in the reservoir given 26 mercury in fish tissue significantly elevate post-Project? 27
Each of these is answered in turn. 28
29
TAC Public Rd 2 DFO-0098
Page 2 of 15
1. Will the reservoir be suitable for Lake Sturgeon given predictions of accumulated 30 sedimentation/peat accumulation and subsequent influences on water chemistry 31 (including decreasing oxygen)? 32
Most effects to water quality (e.g., dissolved oxygen depletion) will be restricted to the 33 newly flooded terrestrial habitat that is currently not aquatic habitat. Over time, flooded 34 terrestrial habitat will evolve to become suitable for subadult and adult Lake Sturgeon. 35 Sediment deposition will affect flooded terrestrial habitat and much of existing aquatic 36 habitat in Gull Lake. However, habitat will be available for spawning and for foraging by 37 subadult and adult sturgeon in riverine sections of the river, even in the first years post-38 impoundment. Monitoring and mitigation measures have been identified to address 39 uncertainties with respect to the availability of rearing habit for young-of-the-year 40 sturgeon. The following are quoted from the AE SV Section 6.4.2.2.2: 41
Changes to water quality are not expected to affect the suitability of spawning 42 habitat in the riverine portion of the reservoir where lake sturgeon spawn as the 43 analysis of sediment transport indicates that total suspended solids levels will 44 decline post-impoundment and no consequential effects to other water quality 45 parameters are expected (Section 2). 46
The existing environment HSI model for lake sturgeon rearing habitat show the 47 reach between Clark Lake and Gull Rapids as having a WUA of between 199 and 48 220 ha (Section 6.3.2.3.1). However, almost all high quality habitat (HSI greater 49 than or equal to 0.5; 54–64 ha) is located in the downstream portion of Gull Lake 50 on the north side of Caribou Island, where YOY lake sturgeon were captured 51 during environmental studies. The post-Project HSI model predicts a total rearing 52 habitat WUA of between 445 and 637 ha. However, the amount of high quality 53 rearing habitat for the reservoir is predicted to be lower (WUA=16–19 ha; Map 54 6-47 to Map 6-49; Appendix 6D). Furthermore, YOY access to the high quality 55 habitat also is expected to be reduced given the increased area of the reservoir 56 and the loss of moderate currents on which larvae currently rely to transport 57 them to favourable rearing habitat in the lower end of Gull Lake. Because of this, 58 it is uncertain whether the post-Project rearing habitat will be accessible to 59 drifting larval sturgeon. 60
During the initial years post-impoundment, conditions over the newly flooded 61 terrestrial habitat would not be optimal for lake sturgeon, which appear to 62 favour deeper, more riverine, mineral substrate environments in the Nelson River 63 (Section 6.3.2.3.1)…. Lake sturgeon will continue to be able to use habitat in the 64 former mainstem and Gull Lake that are not expected to experience the changes 65 in water quality (Section 2.5.2.2) that are predicted for flooded shallow water 66 lentic habitats (decreased dissolved oxygen, flooded terrestrial organics and 67

TAC Public Rd 2 DFO-0098
Page 3 of 15
episodic increases in suspended sediments). Over time, as the substratum 68 evolves, lake sturgeon could begin to use flooded portions of the reservoir as 69 conditions become suitable. 70
2. Will mercury levels (presumably in fish) affect the suitability of the reservoir for 71 Lake Sturgeon? 72
Current (2002-2006) mean mercury concentrations in the body musculature of Lake 73 Sturgeon captured from Gull Lake have been measured at approximately 0.2 ppm in 74 adult fish (i.e., exceeding 1000 mm fork length) and, based on a single fish captured in 75 2006, may be considerably lower in juveniles (Table 1; also see AE SV 2012, Appendix 76 7A). Data on sturgeon mercury content are limited for Manitoba. Two recent samples of 77 relatively small fish from the Winnipeg River and for a large range of fish sizes from the 78 Churchill River indicate that mercury concentrations in juvenile (<700 mm fork length) 79 Lake Sturgeon are less than 0.1 ppm, approximately 0.2 ppm for fish of up to 1000 mm 80 length, and some of the larger individuals may reach concentrations of up to 0.7 ppm 81 (Table 1). A similar relationship between mercury concentration and fish length has 82 been shown for Lake Sturgeon from the Ottawa River (Haxton and Findlay 2008). 83 Therefore, current mercury concentrations in Lake Sturgeon from Gull Lake seem to be 84 quite typical for Manitoba and the species in general. 85
The models applied in the Keeyask EIS to estimate maximum mean mercury 86 concentrations in Lake Whitefish, Northern Pike, and Walleye for the future Keeyask 87 forebay (and for Stephens Lake) do not include Lake Sturgeon and quantitative 88 predictions were not attempted for this species. In trying to attempt such predictions, 89 several factors have to be considered, particularly: 90
• The trophic position of sturgeon from the time of stocking as 0+ or 1+ fish until 91 reaching approximately 1000 mm fork length (a mean [i.e., “standard”] length at 92 which meaningful comparisons of mercury levels between locations and among 93 years for the same location can be made) will be similar to that of adult (i.e., 94 benthivorous) whitefish and certainly lower than that of adult (i.e., piscivorous) pike 95 and Walleye. The same applies to wild sturgeon in the Keeyask reservoir. 96
• Based on the preferred habitat of juvenile Lake Sturgeon, deeper water over mainly 97 mineral sediments, the general conditions for mercury methylation and the 98 availability of methylmercury (MeHg) and its bioaccumulation up the food chain will 99 be less so than in most other areas of the reservoir. Spatial variation in fish mercury 100 concentrations due to heterogeneity in MeHg availability are well documented 101 (Chumchal et al. 2008; Schetagne et al. 2003; Cizdziel et al. 2002). 102
Based on the predicted increases in mercury concentrations for the Keeyask forebay 103 (0.2 ppm in whitefish, approximately 1.0 ppm in pike and Walleye, AE SV 2012) and 104

TAC Public Rd 2 DFO-0098
Page 4 of 15
taking into account the ecological parameters that will affect the dynamics of mercury 105 bioaccumulation in Lake Sturgeon after the impoundment of the Keeyask forebay, a 106 maximum mean concentration of 0.30 ppm for fish of approximately 1000 mm fork 107 length seems realistic. This estimate applies to fish that use Gull Lake as a habitat and 108 will continue to forage in the area during and after impoundment. Fish stocked in year 2 109 or later after the start of operations will grow in an environment of successively 110 declining efficiency of MeHg bioaccumulation and likely will not reach the maximum 111 mean concentration of 0.3 ppm. Also because of the relative long time it will take 112 stocked sturgeon to attain a length of 1000 mm, maximum mercury concentrations may 113 not be measured in the population after 4-8 years as for the other three large-bodied 114 fish species (see above), but a few years later. Similar to the other three species, the 115 maximum concentrations may last no longer than 1-2 years and a period of up to 30 116 years may be expected for mercury levels to return to pre-Project concentrations. 117
Mean muscle mercury concentrations of 0.3 ppm, particularly if transient, will in all 118 likelihood not affect the success of sturgeon stocking. To our knowledge no studies exist 119 on the effects of mercury on Lake Sturgeon. However, there have been many recent 120 publications of the effects of dietary MeHg and mercury tissue concentration on the 121 physiology and behavior of fish, including other sturgeon species (Lee et al. 2011; 122 Gharaei et al. 2011, 2008, Webb et al. 2008). These studies indicate lowest observed 123 adverse effect levels of dietary MeHg for growth and mortality of juvenile Beluga (Huso 124 huso) of 1.97 and 4.05 ppm, respectively (Gharaei et al. 2011, 2008) and of juvenile 125 Green Sturgeon (Acipenser medirostris) and White Sturgeon (A. transmontanus) of 9.73 126 and 24.3 ppm, respectively (Lee et al. 2011; also see summary in Depew et al. 2012). 127 Reviews by Sandheinrich and Wiener (2011) and Depew et al. (2012) have summarized 128 recent advances in our knowledge regarding toxicological effects of environmentally 129 relevant concentrations of mercury in freshwater fish. In trying to establish a ‘tissue 130 residue guideline’ concentration above which there is the potential for mercury induced 131 effects to fish, Sandheinrich and Wiener (2011) reported that impairment of 132 biochemical processes, damage to cells and tissues, and reduced reproduction have 133 been observed at MeHg concentrations of about 0.5-1.2 ppm mercury in axial muscle. 134 Such concentrations are well above the predicted mean maximum concentration for 135 Lake Sturgeon in the future Keeyask forebay, although some of the largest, oldest 136 individuals may reach the lower range of these mercury levels, as has been observed for 137 existing populations in Gull Lake, the mouth of the Nelson River, and the Churchill River 138 (Table 1). 139
To assess the health risk of elevated muscle mercury concentrations on sturgeon 140 populations in the future Keeyask forebay (and the Keeyask Study Area in general) it 141 must also be considered that many adult fish inhabiting natural freshwaters in the 142 midwestern and eastern United States and the eastern half of Canada exceed muscle 143
TAC Public Rd 2 DFO-0098
Page 5 of 15
concentrations of 1.0 ppm wet weight (Kamman et al. 2005; Schetagne and Verdon 144 1999a). Moreover, mean muscle mercury concentrations of adult Northern Pike (Esox 145 lucius) and Walleye (Sander vitreus), but also Lake Trout (Salvelinus namaycush) and 146 burbot (Lota lota) are known to exceed 2.0 ppm in newly created reservoirs in Québec 147 and Manitoba (Therrien and Schetagne 2008; Bodaly et al. 2007; Schetagne and Verdon 148 1999b), and may reach 4.0 ppm in pike (Schetagne and Verdon 1999b). Despite the 149 obvious potential (based on the threshold concentrations proposed by Sandheinrich and 150 Wiener 2011) for compromised health of these fish populations due to elevated body 151 mercury concentrations, clear evidence for associated population level effects on wild 152 fish is lacking. For example, based on catch-per-unit-effort data, which provide 153 approximate estimates of fish abundance, pike and Walleye populations have not been 154 substantially reduced in any of the well-studied lakes/reservoirs on the CRD route and 155 the lower Nelson River in Manitoba (e.g., AE SV 2012) or reservoirs on the La Grande 156 Rivière in Québec (Schetagne et al. 2003; Roger Schetagene, Hydro Québec, pers. 157 comm., July 2011). These findings do not necessarily indicate an absence of mercury 158 effects on fish populations, but if such effects exist they have not been severe enough to 159 be detected by the sampling and analytical methods applied in these studies. Mercury 160 effects may also be confounded by the multitude of ecological variables that structure 161 fish populations, such as the abundance of prey and predators, parasite loads, fishing 162 pressure, and habitat alterations, and that are likely affected by the physical, chemical, 163 and biological changes in the course of reservoir creation and succession. 164
For all these reason, the expected relatively minor increase in muscle mercury 165 concentrations of Lake Sturgeon in the future Keeyask forebay does not pose a threat to 166 the health of individuals and is not expected to affect the potential benefits of a 167 stocking program to the recovery and long-term viability of the population in the 168 Keeyask Study Area. 169
Table 1. Mean arithmetic (± standard error, SE, range) mercury concentration 170 (ppm) and mean fork length (range) of Lake Sturgeon sampled from Manitoba 171 waterbodies in 1970-2012. R= River; Lt CR= Little Churchill River; GrF= Great Falls 172 reservoir; PdB= Pointe du Bois; TP= near The Pas. Mean concentrations with 173 superscripted letters are from commercial samples and raw data are not available. 174

TAC Public Rd 2 DFO-0098
Page 6 of 15
Waterbody Year n Arithmetic SE Range Length (mm) n
Gull Lake 2006 1 0.039 - - 646 1
2004 10 0.207 0.060 0.04 - 0.67 1158.81 (1035 - 1286) 10
2002 3 0.166 0.033 0.10 - 0.20 1162.5 (1050 - 1275) 2 Nelson R, lower 2011 3 0.141 0.016 0.14 - 0.21 693.7 (654 - 715) 3
2010 1 0.178 - - 690 1
2008 5 0.125 0.019 0.08 - 0.19 621.2 (537 - 736) 5
2003 7 0.185 0.028 0.13 - 0.34 841.4 (725 - 1200) 7
1970 a 4 0.11 - 0.09 - 0.13 - -
Nelson R, mouth 1982 5 0.220 0.096 0.10 - 0.60 - 0 Fox River 1979 3 0.263 0.050 0.19 - 0.36 - 2 0 Hayes River 2011 1 0.213 - - 771 1
2010 1 0.194 - - 6649 1
2009 2 0.098 0.033 0.07 - 0.13 550.5 (543 - 558) 2 Stephens Lake 2008 1 0.099 - - 587 1
Split Lake 1970 b 1 0.014 - - - - Churchill R, at Lt CR 2010 32 0.156 0.023 0.03 - 0.65 797.6 (221 - 1334) 32 Playgreen Lake 1970 c 7 0.18 0.07 0.49 - 0
Duck to Sipiwesk lakes 1970 d 1 0.08 - - - 0
Cross L (Eves Falls) 1970 e 1 0.11 - - - 0
Mud Lake 1972 f 1 0.12 - - - 0 Burntwood R, 2011 1 0.041 - - 562 1 Winnipeg R, GrF 2011 3 0.058 0.010 0.08 - 0.11 561.3 (442 - 770) 3
Winnipeg R, PdB 2008 21 0.081 0.005 0.03 - 0.14 582.8 (443 - 682) 21
2007 4 0.064 0.009 0.04 - 0.08 511.5 (270 - 613) 4 Saskatchewan R, TP 1990 1 0.08 - - 884 1
1970 g 2 0.29 - 0.21 - 0.37 - 0 1 Calculated based on relationship between fork length and total length for 68 Lake Sturgeon from 175
Manitoba waters 176 2 range of weights: 1022 - 2247 g 177 a Derksen 1978a (p.25), b (p.52), 1979 (p.30); undesignated location 178 b Derksen 1978b (p.51), 1979 (p.30) 179 c Derksen 1978a (p.24), b (p.49), 1979 (p.29) 180 d Derksen 1979 (p.30) 181 e Derksen 1978a (p.24), b (p.50), 1979 (p.29) 182 f Derksen 1978b (p.51) 183 g Derksen 1978b (p.42), 1979 (p.24) 184

TAC Public Rd 2 DFO-0098
Page 7 of 15
3. Will the Proponent provide more detail about changes in the reservoir (pre- versus 185 post-Project comparison)? 186
The following provides a description of habitat available to Lake Sturgeon pre- and post-187 Project (AE SV Section 6.4.2.2.2 p. 6-35 to 6-36). 188
6.4.2.2.2 Habitat 189
Spawning Habitat 190
Environmental studies indicate that Birthday Rapids is an important spawning 191 location for lake sturgeon in the reach of the Nelson River between Clark Lake 192 and Gull Rapids. Alternative spawning habitat may be available in Long Rapids 193 immediately downstream of Clark Lake (Section 6.3.2.3). Physical conditions in 194 the Long Rapids area appear to meet depth, velocity, and substrate criteria for 195 sturgeon spawning habitat. Evidence of sturgeon spawning activity at Long 196 Rapids was documented during two of the four environmental studies conducted 197 between Clark Lake and Birthday Rapids from 2001–2010. In some cases, lake 198 sturgeon may only move upstream as far as the first set of rapids that provides 199 suitable conditions for spawning, even if suitable habitat is also available further 200 upstream (Section 6.3.2.3.1). Lake sturgeon in the Nelson River between Clark 201 Lake and Gull Rapids do not appear to use Gull Rapids for spawning; therefore, 202 the loss of Gull Rapids is not expected to affect spawning sturgeon between 203 Clark Lake and the Keeyask GS. 204
The existing environment HSI model for lake sturgeon spawning habitat 205 indicates that there is a WUA of between 9 and 12 ha from Clark Lake to Gull 206 Rapids (Section 6.3.2.3.1). Birthday Rapids and Long Rapids and areas 207 immediately downstream of them account for all of this area. Existing spawning 208 habitat between Clark Lake and Birthday Rapids is not expected to be affected 209 by the Project as flooding is not expected to extend that far upstream. However, 210 increased water levels at Birthday Rapids due to impoundment may reduce the 211 suitability of habitat in the rapids for spawning lake sturgeon; the post-Project 212 HSI model suggests that these rapids will no longer be suitable for spawning due 213 to the associated loss of white water (Map 6-44 to Map 6-46; Appendix 6D). Loss 214 of spawning habitat due to flooding has been observed at the rapids on the 215 Nelson River above the Kettle GS (FLCN 2008 Draft). However, some locations 216 where increased water depth has resulted in the loss of white water but 217 maintained appropriate velocity and substrate conditions have continued to 218 support spawning lake sturgeon. For example, sturgeon appear to have 219 continued to spawn in the Nelson River above the Kelsey GS following 220 impoundment (Macdonald pers. comm. 2009). Therefore, it is possible that lake 221

TAC Public Rd 2 DFO-0098
Page 8 of 15
sturgeon will continue to use Birthday Rapids as a spawning area. Post-222 impoundment monitoring of spawning activity in this reach will be conducted to 223 determine spawning success and, should monitoring indicate poor or no 224 spawning success, contingency works to create suitable spawning habitat will be 225 implemented. Contingency measures for the loss of Birthday Rapids as a 226 spawning site are discussed further in Appendix 1A. 227
Changes to water quality are not expected to affect the suitability of spawning 228 habitat in the riverine portion of the reservoir where lake sturgeon spawn as the 229 analysis of sediment transport indicates that total suspended solids levels will 230 decline post-impoundment and no consequential effects to other water quality 231 parameters are expected (Section 2). 232
The current extent of predation on lake sturgeon eggs at their spawning grounds 233 in the study area is not known. Predation by both lake sturgeon and other 234 species is a source of mortality for lake sturgeon eggs in other systems 235 (Appendix 6A). While the Project is predicted to change the composition of the 236 fish community between Clark Lake and the Keeyask GS (Section 5), this change 237 (increase in piscivorous fish species) is not expected to result in an increase in 238 predation on lake sturgeon eggs. 239
Rearing Habitat (YOY) 240
Different life history stages of sturgeon appear to have different requirements 241 for foraging habitat, with younger fish having more specific habitat needs than 242 older fish (Appendix 6A). In the Nelson River between Clark Lake and Gull Rapids, 243 YOY lake sturgeon were captured in deep, low velocity water over a mostly sand 244 substrate in the downstream portion of Gull Lake on the north side of Caribou 245 Island during environmental studies (Section 6.3.2.3.1). The existing environment 246 HSI model for lake sturgeon rearing habitat show the reach between Clark Lake 247 and Gull Rapids as having a WUA of between 199 and 220 ha (Section 6.3.2.3.1). 248 However, almost all high quality habitat (HSI greater than or equal to 0.5; 54–64 249 ha) is located in the downstream portion of Gull Lake on the north side of 250 Caribou Island, where YOY lake sturgeon were captured during environmental 251 studies. The post-Project HSI model predicts a total rearing habitat WUA of 252 between 445 and 637 ha. However, the amount of high quality rearing habitat 253 for the reservoir is predicted to be lower (WUA=16–19 ha; Map 6-47 to Map 6-254 49; Appendix 6D). Furthermore, YOY access to the high quality habitat also is 255 expected to be reduced given the increased area of the reservoir and the loss of 256 moderate currents on which larvae currently rely to transport them to 257 favourable rearing habitat in the lower end of Gull Lake. Because of this, it is 258 uncertain whether the post-Project rearing habitat will be accessible to drifting 259
TAC Public Rd 2 DFO-0098
Page 9 of 15
larval sturgeon. Post-Project monitoring will be conducted to determine YOY 260 distribution and abundance and, if necessary, contingency works to create sandy 261 habitat suitable for YOY rearing in the reservoir would be implemented; 262 contingency measures are discussed further in Appendix 1A. 263
Foraging Habitat (Sub-adult and Adult) 264
During the initial years post-impoundment, conditions over the newly flooded 265 terrestrial habitat would not be optimal for lake sturgeon, which appear to 266 favour deeper, more riverine, mineral substrate environments in the Nelson River 267 (Section 6.3.2.3.1). Both sub-adult and adult lake sturgeon were captured or 268 relocated via telemetry between Birthday Rapids and Gull Rapids, but were 269 mainly found in Gull Lake (Section 6.3.2.3.1). In Gull Lake, sub-adults occupied a 270 narrower range of conditions, favouring deep, low to moderate velocity areas. 271 Adult sturgeon were also observed in the reach between Clark Lake and Birthday 272 Rapids. 273
Lake sturgeon will continue to be able to use habitat in the former mainstem 274 and Gull Lake that are not expected to experience the changes in water quality 275 (Section 2.5.2.2) that are predicted for flooded shallow water lentic habitats 276 (decreased dissolved oxygen, flooded terrestrial organics and episodic increases 277 in suspended sediments). Over time, as the substratum evolves, lake sturgeon 278 could begin to use flooded portions of the reservoir as conditions become 279 suitable. 280
The long-term use of the reservoir by sub-adult and adult sturgeon was modeled 281 separately. The post-Project HSI models predict a net gain of approximately 282 600–750 ha (WUA) of foraging habitat for sub-adults and a net gain of 283 approximately 3,000–3,150 ha for adults (Map 6-50 to Map 6-55; Appendix 6D). 284
Currently, there appears to be a sufficient food supply for lake sturgeon between 285 the outlet of Clark Lake and Gull Rapids (Section 6.3.2.3.1). Overall, benthic 286 invertebrate abundance is expected to increase between Clark Lake and the 287 Keeyask GS in both the short-term and long-term (Table 4-34), suggesting there 288 will be an adequate food supply for both sub-adult and adult lake sturgeon post-289 Project. 290
The majority of the lake sturgeon captured in the Long Spruce and Limestone 291 reservoirs are taken in the upper end of the reservoirs where conditions are more 292 characteristic of riverine habitat (NSC 2012). These observations suggest that, 293 while the amount of usable foraging habitat (i.e., WUA) upstream of the 294
TAC Public Rd 2 DFO-0098
Page 10 of 15
Keeyask GS will be higher in the post-Project environment, not all this habitat 295 may be selected by either sub-adult or adult fish. 296
Overwintering Habitat 297
Localized reductions in dissolved oxygen in nearshore zones may reduce the 298 quality of habitat in off-current areas during winter, particularly in the first year 299 post-impoundment (Section 2.5.2.2). However, these reductions are expected to 300 have a limited effect on lake sturgeon overwintering habitat as ample well-301 oxygenated deep-water habitat will be available during winter. 302
4. Will the Proponent provide publications that support stocking in the reservoir given 303 mercury in fish tissue significantly elevate post-Project? 304
As discussed above, mercury concentrations in Lake Sturgeon are not expected to 305 increase significantly post-Project. 306
Stocking Lake Sturgeon into the Keeyask Reservoir is the only realistic option to recover 307 populations as stocks are already at very low levels. Lake Sturgeon stocking has been 308 attempted in several North American rivers, especially in tributaries of the Great Lakes; 309 however, monitoring or evaluation of the stocking programs are often not published in 310 the primary literature. Below is a short summary of selected relevant Lake Sturgeon 311 stocking initiatives that have occurred in North America. Additional examples of Lake 312 Sturgeon stocking plans can be found in Smith 2009 and in the Keeyask Lake Sturgeon 313 stocking strategy. 314
In the past 30 years, stocking has commonly been used to rehabilitate Lake Sturgeon 315 populations. Culture and rearing can now be conducted with relative certainty in both 316 hatchery and stream-side rearing facilities, and many programs have successfully 317 released young fish into the wild. Survival and growth of stocked Lake Sturgeon has 318 been demonstrated in many locations. However, it has been noted that stocking 319 initiatives “have not been adequately evaluated and many programs rely on 320 intermittent, short-term, or anecdotal indicators of program success” (Smith 2009). 321 Until recently, due at least in part to lengthy generation times, stocking initiatives have 322 been conducted based on the assumption that stocked Lake Sturgeon which survive to 323 maturity will successfully reproduce and contribute to subsequent generations. 324 However, in 2011, Lake Sturgeon stocked into the St. Louis River successfully spawned 325 approximately 30 years following their initial reintroduction (R. Bruch, Wisconsin DNR, 326 pers. comm.) This finding is significant, since re-establishment of self-sustaining 327 populations (as opposed to put-and-take fisheries) is the ultimate goal of most Lake 328 Sturgeon recovery strategies. 329

TAC Public Rd 2 DFO-0098
Page 11 of 15
While the vast majority of Lake Sturgeon stocking initiatives have occurred in Great 330 Lakes systems which are markedly different environments from the Nelson River, there 331 are some relevant proximal examples. In Western Canada, Lake Sturgeon stocking has 332 been conducted in the Assiniboine, Nelson, Winnipeg, and Saskatchewan rivers. Lake 333 Sturgeon stocking has also been conducted in the Minnesota portion of the Red River, 334 which subsequently flows through Manitoba. 335
The Assiniboine River was stocked with over 12,000 fingerlings and 4,000 fry between 336 1996 to 2008. Although a formal study has never been conducted to assess the success 337 of the stocking effort, Lake Sturgeon captures are frequently reported by anglers (B. 338 Bruederlin, Manitoba Fisheries Branch, pers. comm.). At present, most of the Lake 339 Sturgeon being captured are larger than 43 inches, with the largest measuring 60 inches. 340 A study is now required to determine if stocked fish will begin to reproduce naturally. 341
The Minnesota Department of Natural Resources started a 20 year plan to restore Lake 342 Sturgeon populations and has been releasing Lake Sturgeon from the Rainy River into 343 the Red River drainage (Minnesota DNR 2002; Aadland et al. 2005). The 2002-2022 plan 344 is to release 600,000 fry and 34,000 fingerlings per year at various locations throughout 345 the Red River drainage in Minnesota. Anecdotal evidence (angler recaptures) suggests 346 that Lake Sturgeon encounters in the Red River in Canada are increasing (Cleator et al. 347 2010). 348
Lake Sturgeon stocking in the Nelson River was conducted intermittently from 1994 to 349 2011 by the Nelson River Sturgeon Board and Manitoba Fisheries Branch. Spawn 350 collection typically occurred at the Landing River tributary, located 30 km upstream of 351 the Kelsey GS. Prior to 2011, male and female Lake Sturgeon were held in streamside 352 tanks until they were ripe and running (water temperature influenced). Attempts were 353 then made to collect eggs and milt from these fish. Because success was sporadic using 354 these methods, Ovaprim was adopted for spawn taking operations in 2011. Fertilized 355 eggs were transported to the Grand Rapids Hatchery for rearing during each year in 356 which spawn collection was successful. Lake Sturgeon fingerlings (age 0) and some 357 yearlings (age 1) were stocked back into various locations of the upper Nelson River. 358 Until recently, success of Nelson River stocking efforts has remained largely unknown. In 359 fall 2012, a Lake Sturgeon inventory was conducted in the Sea Falls – Sugar Falls reach, 360 which had been stocked with large quantities of both fingerling (age 0, n = 20,885) and 361 yearling (age 1, n = 1,107) Lake Sturgeon from 1994 – 2011. A total of 91 individual Lake 362 Sturgeon (90 juvenile, 1 adult) were captured and 67 (74%) of these had Passive 363 Integrated Transponder (PIT) tags, signifying that they were stocked as age 1 (McDougall 364 and Pisiak 2012). Given the relative proportions of PIT tagged fish in the catch and 365 considering only those fish from the 2006 – 2011 cohorts reasoned to be susceptible to 366 the gillnets deployed, relative recruitment success was conservatively estimated to be 367

TAC Public Rd 2 DFO-0098
Page 12 of 15
17.4 times greater for Lake Sturgeon stocked as age 1 versus those stocked as age 0 368 (which were stocked in far greater numbers). Furthermore, based on atypical growth 369 chronologies observed when examining ageing structures of the captured fish (missing 370 or weak first annuli, attributed to unnatural overwinter hatchery thermal regimes), the 371 authors suggested that as many as 95.5% of the fish aged may actually have been 372 stocked as age 1 (and perhaps that PIT tag loss or malfunction occurred, or that tags 373 were somehow missed during field scanning). Based on this observation, relative 374 recruitment success might actually have been 128 times as great for age 1 compared to 375 age 0 stocked fish. In addition to survival, it was noted that age 1 stocked fish from the 376 2007 cohort were considerably larger than those identified as age 0 stocked fish from 377 the same cohort based on growth chronologies, and therefore the head-start afforded 378 by overwinter hatchery growth might well translate into age 1 stocked fish reaching 379 maturity faster or being more fecund upon reaching maturity (since they are larger for a 380 given age) than their age 0 stocked counterparts. It was concluded that stocking 381 initiatives should strongly consider rearing Lake Sturgeon to age 1 prior to release in 382 order to increase survival. 383
Lake Sturgeon (primarily fingerlings) were stocked in the Winnipeg River most years 384 from 1996 – 2010. In 2008 and 2009, Ovaprim was used to induce ripe Lake Sturgeon to 385 release gametes. Research investigating the physiological effects (as well as survival and 386 post-release movement patterns) of Ovaprim injected adults began in 2011, and it is 387 expected that results will be available shortly. Research also suggests that survival of 388 stocked yearlings (age 1) may far exceed survival of fingerlings (age 0) in the Slave Falls 389 to Seven Sisters reach of the river, although data analysis is ongoing (C. Klassen, 390 University of Manitoba, pers. comm.). With those exceptions, Winnipeg River stocking 391 was conducted to supplement recruitment. As natural recruitment has now been 392 ascertained in all impoundments on the Manitoba side of the Winnipeg River, stocking 393 Winnipeg River populations does not appear to be necessary to rehabilitate these 394 populations. However, stocking is still being considered for the Lamprey Falls – 395 Manitoba/Ontario border stretch of river conditional on the presence of quality habitat 396 and very few fish, both of which have not been adequately assessed (K. Kansas, 397 Manitoba Fisheries Branch, pers. comm.). 398
Lake Sturgeon were stocked into the Saskatchewan River during 1999 and 2000, as well 399 as from 2003 – 2007. Spawning adults were captured from downstream of the EB 400 Campbell or Nipawin dams by Saskatchewan Environment staff. Ovaprim was used 401 during each year. Fertilized eggs were reared in the Grand Rapids Hatchery or Fort 402 Qu’Appelle hatchery. While considerable numbers of Lake Sturgeon have been stocked 403 into the Saskatchewan River as either fry or fingerlings, the success of the Lake Sturgeon 404 program remains unknown. 405

TAC Public Rd 2 DFO-0098
Page 13 of 15
LITERATURE CITED 406 Aadland, L.P., T.M. Koel, W.G. Franzin, K.W. Stewart, and P. Nelson. 2005. Changes in 407 fish assemblage structure of the Red River of the North. Pages 293-321 in Historical 408 Changes in Large River Fish Assemblages of the Americas. J. N. Rhine, R.M. Hughes, and 409 B. Calamusso, editors. Am. Fish. Soc. Symp. 45, Bethesda, Maryland. 410
Bodaly, R. A., W.A. Jansen, A.R. Majewski, R.J.P. Fudge, N.E. Strange, A.J. Derksen, and 411 D.J. Green. 2007. Postimpoundment time course of increased mercury concentrations 412 in fish in hydroelectric reservoirs of northern Manitoba, Canada. Arch. Environ. Contam. 413 Toxicol. 53: 379-389. 414
Chumchal, M.M., R.W. Drenner, B. Fry, K.D. Hambright, and L.W. Newland. 2008. 415 Habitat specific differences in mercury concentration in a top predator from a shallow 416 lake. Trans. Amer. Fish. Soc. 137: 195-208. 417
Cizdziel, J.V., T.A. Hinners, J.E. Pollard, E.M. Heithmar, and C.L. Cross. 2002. Mercury 418 concentrations in fish from Lake Mead, USA, related to fish size, condition, trophic level, 419 location, and consumption risk. Arch. Environ. Contam. Toxicol. 43: 309-317. 420
Cleator, H., K.A. Martin, T.C. Pratt, B. Bruederlin, M. Erickson, J. Hunt, D. Kroeker, D. 421 Leroux, L. Skitt and D. Watkinson. 2010. Information relevant to a recovery potential 422 assessment of Lake Sturgeon: Red-Assiniboine rivers – Lake Winnipeg populations 423 (DU4). DFO Canadian Science Advisory Secretariat Document 2010/083. vi + 38 p. 424
Depew, D.C., N. Basu, N.M. Burgess, L.M. Campbell, E. W. Devlin, P.E. Drevnick, C.R. 425 Hammerschmidt, C.A. Murphy, M.B. Sandheinrich, and J.G. Wiener. 2012. Toxicity of 426 dietary methylmercury to fish: Derivations of ecologically meaningful threshold 427 concentrations. Environmental Toxicology and Chemistry 31: 1536 -547. 428
Derksen, A.J. 1978a. A report on the preliminary testing of mercury contamination in 429 fishes from the Hudson Bay drainage system connected with Manitoba. Manitoba 430 Departments of Northern Affairs, Renewable Resources and Transportation Services MS 431 Report No. 78-70; 40 p. 432
Derksen, A.J. 1978b. A review of possible natural sources of mercury contamination in 433 Manitoba waters. Manitoba Departments of Northern Affairs, Renewable Resources 434 and Transportation Services MS Report No.78-71: 71 pp. 435
Derksen, A.J. 1979. A summary report of mercury contamination in fishes from 436 Manitoba waters to March, 1971. Manitoba Department of Mines, Natural Resources 437 and Environment MS Report No. 79-55: iii + 43 pp. 438
TAC Public Rd 2 DFO-0098
Page 14 of 15
Gharaei A., M. Ghaffari, S. Keyvanshokooh, R. Akrami. 2011. Changes in metabolic 439 enzymes, cortisol and glucose concentrations of Beluga (Huso huso) exposed to dietary 440 methylmercury. Fish Physiol Biochem 37: 485-493. 441
Gharaei A., A. Esmaili-Sari, V. Jafari-shamoshaki, M. Ghaffari. 2008. Beluga (Huso huso) 442 bioenergetics under dietary methylmercury. Fish Phyiol Biochem 34: 473-482. 443
Haxton, T.J., and C.S. Findlay. 2008. Variation in Lake Sturgeon (Acipenser fulvescens) 444 abundance and growth among river reaches in a large regulated river. Can. J. Fish. 445 Aquat. Sci. 65: 645-657. 446
Kamman, N.C., N.M. Burgess, C.T. Driscoll, H.A. Simonin, W. Goodale, J. Linehan, R. 447 Estabrook, M. Hutcheson, A. Major, A.M. Scheuhammer, and D.A. Scruton. 2005. 448 Mercury in freshwater fish of northeast North America A geographic perspective based 449 on fish tissue monitoring databases. Ecotoxicology 14: 163-180. 450
Lee, J.-W., N.D. Riu, S. Lee, S.C. Bai, G. Moniello, S.S.O. Hung. 2011. Effects of dietary 451 methylmercury on growth performance and tissue burden in juvenile Green (Acipenser 452 medirostris) and White Sturgeon (A. transmontanus). Aquat Toxicol 105: 227-234. 453
McDougall, C.A. and D.J. Pisiak. 2012. Results of a Lake Sturgeon inventory conducted in 454 the Sea Falls to Sugar Falls reach of the Nelson River – Fall, 2012. A draft Lake Sturgeon 455 Stewardship and Enhancement Program Report prepared for Manitoba Hydro by 456 North/South Consultants Inc., Winnipeg, Manitoba. 47pp. #5918.12-03. 457
Minnesota Department of Natural Resources. 2002. Restoration of extirpated Lake 458 Sturgeon (Acipenser fulvescens) in the Red River of the North watershed. Final 459 environmental assessment for fish passage in the Red River of the North Basin, 460 Minnesota: Appendix G. Retrieved online on 12 Dec 2012. 461
Sandheinrich, M.B., and J.G. Wiener. 2011. Methylmercury in freshwater fish Recent 462 advances in assessing toxicity in environmentally relevant exposures. In: "Environmental 463 Contaminants in Biota", Beyer, W.N. and Meador, J.P., eds., CRC Press, Boca Raton, FL. 464 pp. 169-190. 465
Schetagne, R., J. Therrien, and R. Lalumiere. 2003. Environmental monitoring at the La 466 Grande complex. Evolution of fish mercury levels. Summary report 1978 2000. Direction 467 Barrages et Environnement, Hydro Québec Production and Groupe conseil GENIVAR 468 Inc., 185 p. and appendix. 469
Schetagne, R., and R. Verdon. 1999a. Mercury in fish of natural lakes of Québec. In: 470 "Mercury in the Biochemical Cycle", Lucotte, M., Schetagne, R., Thérien, N., Langlois, C., 471 and Tremblay, A., eds., Springer, Berlin. pp. 115-130. 472

TAC Public Rd 2 DFO-0098
Page 15 of 15
Schetagne, R., and R. Verdon. 1999b. Post impoundment evolution of fish mercury 473 levels at the La Grande complex, Québec, Canada (from 1978 to 1996). In: "Mercury in 474 the Biogoechemical Cycle", Lucotte, M., Schetagne, R., Thérien, N., Langlois, C., and 475 Tremblay, A., eds., Springer, Berlin. pp. 235-258. 476
Smith, A. L. 2009. Lake Sturgeon (Acipenser fulvescens) stocking in North America. Fish 477 and Wildlife Branch. Ontario Ministry of Natural Resources. Peterborough, Ontario. 17 p 478 + appendices. 479
Webb, M.A.H., G.W. Feist, M.S. Fitzpatrick, E.P. Foster, C.B. Schreck, M. Plumlee, C. 480 Wong, and D.T. Gundersen 2006. Mercury concentrations in gonad, liver, and muscle of 481 White Sturgeon Acipenser transmontanus in the lower Columbia River. Arch. Environ. 482 Contam. Toxicol. 50: 443-451.483

TAC Public Rd 2 DFO-0100
Page 1 of 1
REFERENCE: Volume: Aquatic Environment Supporting Volume; 1
Section: Appendix 1A, Part 2 Keeyask Lake Sturgeon Stocking 2
Strategy; p. N/A 3
TAC Public Rd 2 DFO-0100 4
ORIGINAL PREAMBLE AND QUESTION: 5 Appendix 1A - Part 2 6
Given the challenges of detecting changes in sturgeon (growth, age, etc.) over the short 7 term, how will success/failure be determined? 8
FOLLOW-UP QUESTION: 9 To date, sample sizes for lake sturgeon in the study area has been challenging due to 10 population size. Will sample sizes be sufficient to detect statistical change in life history 11 parameters post project? 12
RESPONSE: 13 Detecting change in life history parameters such as fecundity, interbreeding intervals 14 (for females), and life expectancy post-Project will be difficult because information on 15 these life history parameters does not exist pre-Project. 16
Detecting change in life history parameters such as growth, spawning intervals (males), 17 size at first maturity and mortality/survival should be possible if similar data sets are 18 collected post-Project as exist today. 19
Determining success/failure will be subjective. For example, it is possible that Lake 20 Sturgeon growth in the Keeyask reservoir will be more rapid in the post-Project 21 environment. Is this considered success? 22
In addition to parameters already set out in the AEMP, discussions with DFO and MCWS 23 may identify additional metrics to include as measures of stocking program success.24

TAC Public Rd 2 DFO-0103
Page 1 of 6
REFERENCE: Volume: Project Description Supporting Volume; 1
Section: 6.7 Powerhouse; p. 6-13 2
TAC Public Rd 2 DFO-0103 3
ORIGINAL QUESTION: 4 The EIS indicates 90% survival for fish up to 500mm. Can this be further broken down 5 into species, sex, maturity and length for the VEC fish species within the Keeyask Study 6 area. An analysis/graphs of survival rates and injury rates should be provided. 7
FOLLOW-UP QUESTION: 8 A failure of the Franke analysis is the lack of size and age specific mortality rates, which 9 are crucial for assessing impacts to populations and predicting change. 10
RESPONSE: 11 As discussed at a TAC review meeting among KHLP, DFO and MCWS on February 14, 12 2013, the Partnership is not aware of relevant information related to turbine mortality 13 beyond what is presented in the EIS and IRs. An analysis of the potential effects of 14 increased mortality rates on the Lake Sturgeon population based on a population model 15 is provided in the response to TAC Public Rd 2 DFO-0106. For ease of reference, this 16 response is also copied below. Although precise measures of turbine mortality are not 17 available for adult Lake Sturgeon, this analysis provides insight into potential effects of 18 increased losses from the population. 19
DFO-0106 RESPONSE: 20 The initial question posed by TAC Public Rd 1 DFO-0106 requested acceptable mortality 21 rates for turbine passage based on the fish community and population in the Keeyask 22 study area. The proponent noted, with reference to specific sections of the AE SV, that 23 mortality of fish during passage past the turbines and spillway would reduce the number 24 of fish entering Stephens Lake. Given the relative size of Gull and Stephens lakes, 25 emigration of juvenile and adult fish from Gull Lake to Stephens Lake is not thought to 26 provide a major input to the Stephens Lake population and no material impact of 27 turbine/spillway mortality to the fish community is expected. Construction of the 28 Keeyask Generating Station will also reduce the drift of larval fish from Gull to Stephens 29 lakes. The input of larval Lake Sturgeon from upstream of Gull Rapids may be the source 30 of young Lake Sturgeon in Stephens Lake, given the extremely low numbers of spawning 31 fish observed in the last decade; however, this reduction in larval drift is due to the 32 presence of the reservoir and would not be affected by the turbines. 33
The follow-up question by DFO notes that information on acceptable mortality rates 34 was not provided. In subsequent discussions (technical review meeting on 15 February, 35

TAC Public Rd 2 DFO-0103
Page 2 of 6
2013 among KHLP, CEAA, DFO and MCWS), the Partnership noted that no literature 36 values of “acceptable” turbine mortality rates could be located, though considerations 37 of effects to fish were included in the turbine design at Keeyask. It was noted that, even 38 at stations that do not use modern turbines with features to reduce effects to fish, there 39 is no clear evidence that fish numbers are declining through a series of reservoirs (e.g., 40 Winnipeg River system has eight generating stations; lower Nelson River has three 41 generating stations). DFO noted that a particular concern is with a rare species such as 42 Lake Sturgeon, where the mortality of even a few individuals is of concern. At the 15 43 February, 2013 meeting, it was suggested that examining the effect of increasing 44 mortality rates on Lake Sturgeon using a population model could assist in assessing the 45 potential effects of increased turbine mortality. This analysis was presented at a follow-46 up meeting on February 22, 2013 meeting and is documented below. 47
MORTALITY ANALYSIS USING POPULATION MODEL FOR LAKE STURGEON 48
It should be noted that although this assessment does not deal specifically with turbine 49 mortality or decreased immigration, it does address the permanent loss of individual 50 Lake Sturgeon from the population through decreased survival. The following 51 assumptions are made: 52
3. The current Jolly-Seber model for the Gull Lake population is definitive for other 53 exploited populations (i.e., Stephens Lake) (Nelson and Barth 2012); and 54
4. That the parameters as modeled from Program MARK (White and Burnham 55 1999) are normally and independently distributed. 56
The Burnham Jolly-Seber model estimates new entrants into the population indirectly 57 by modeling the rate of population growth (λ) between each interval where population 58 growth is the net effect of survival and recruitment (White and Burnham 1999) . 59
λi = Ni+1/Ni 60
The formulations for these versions of the Jolly-Seber were developed by Burnham 61 (1991) and Pradel (1996). The key difference between the two parameterizations is that 62 the Pradel-λ approach is conditional upon animals being seen during the study, while 63 the Burnham Jolly-Seber formulation is not. Therefore, the Burnham Jolly-Seber 64 formulation also includes a parameter for the population size at the start of the 65 experiment. This enables the estimation of the population size at each subsequent time 66 point. 67
68
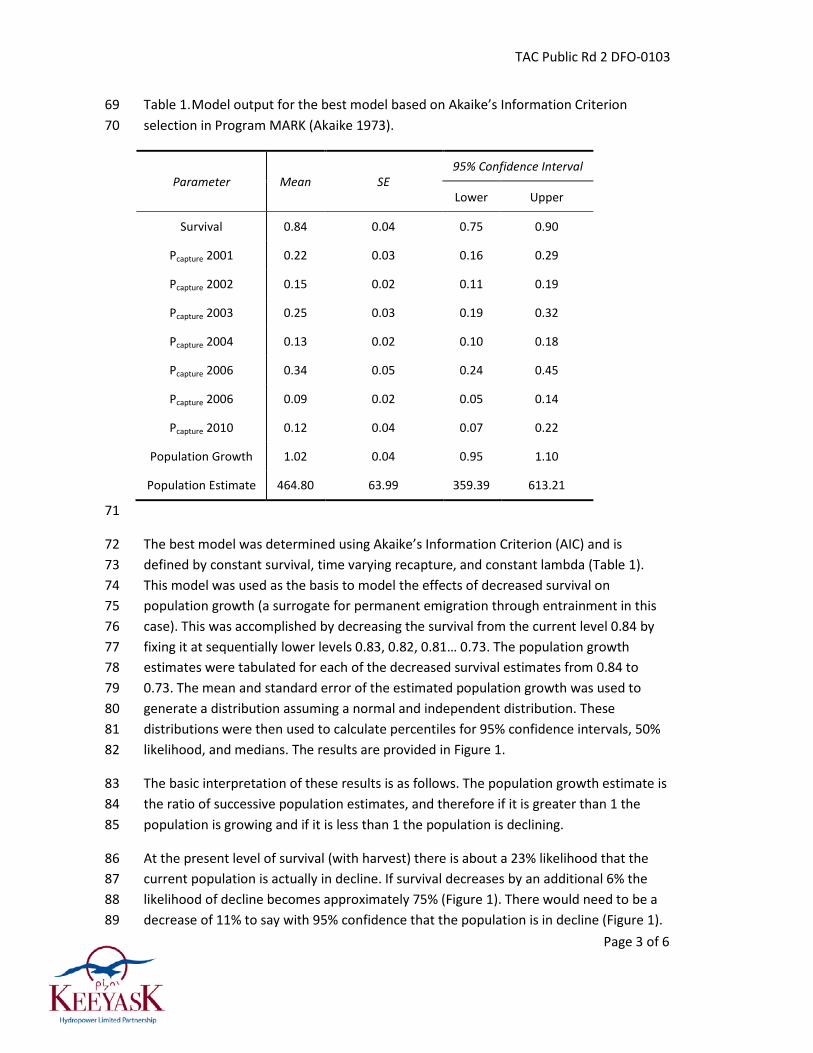
TAC Public Rd 2 DFO-0103
Page 3 of 6
Table 1. Model output for the best model based on Akaike’s Information Criterion 69 selection in Program MARK (Akaike 1973). 70
Parameter Mean SE 95% Confidence Interval
Lower Upper
Survival 0.84 0.04 0.75 0.90
Pcapture 2001 0.22 0.03 0.16 0.29
Pcapture 2002 0.15 0.02 0.11 0.19
Pcapture 2003 0.25 0.03 0.19 0.32
Pcapture 2004 0.13 0.02 0.10 0.18
Pcapture 2006 0.34 0.05 0.24 0.45
Pcapture 2006 0.09 0.02 0.05 0.14
Pcapture 2010 0.12 0.04 0.07 0.22
Population Growth 1.02 0.04 0.95 1.10
Population Estimate 464.80 63.99 359.39 613.21
71
The best model was determined using Akaike’s Information Criterion (AIC) and is 72 defined by constant survival, time varying recapture, and constant lambda (Table 1). 73 This model was used as the basis to model the effects of decreased survival on 74 population growth (a surrogate for permanent emigration through entrainment in this 75 case). This was accomplished by decreasing the survival from the current level 0.84 by 76 fixing it at sequentially lower levels 0.83, 0.82, 0.81… 0.73. The population growth 77 estimates were tabulated for each of the decreased survival estimates from 0.84 to 78 0.73. The mean and standard error of the estimated population growth was used to 79 generate a distribution assuming a normal and independent distribution. These 80 distributions were then used to calculate percentiles for 95% confidence intervals, 50% 81 likelihood, and medians. The results are provided in Figure 1. 82
The basic interpretation of these results is as follows. The population growth estimate is 83 the ratio of successive population estimates, and therefore if it is greater than 1 the 84 population is growing and if it is less than 1 the population is declining. 85
At the present level of survival (with harvest) there is about a 23% likelihood that the 86 current population is actually in decline. If survival decreases by an additional 6% the 87 likelihood of decline becomes approximately 75% (Figure 1). There would need to be a 88 decrease of 11% to say with 95% confidence that the population is in decline (Figure 1). 89

TAC Public Rd 2 DFO-0103
Page 4 of 6
Moving the other direction if survival increases by 4% or more the Gull Lake population 90 is growing with 95% confidence. 91
It should be noted that decline in this sense means only that successive population 92 estimates are lower; there is no implication of significance statistical or otherwise. This 93 should be considered a preliminary assessment of effects. Based on the literature 94 minimum viable population size estimates vary between 80-1800 (Schueller and Hayes 95 2011) and between 413 and 2500 for adult spawning females (Velez-Espino and Koops 96 2008). The current estimate for Gull Lake is 465 (this particular model) which is in the 97 range for what the Schueller and Hayes (2011) model determines as a minimum viable 98 population size (see paper for model specifics). The best way to foster increases in 99 population survival and ultimately growth, is to increase the survival for critical life 100 stages which are most sensitive to elasticity (Gross et al. 2002). For Lake Sturgeon this 101 means increasing the survival from egg to yearly; in other words, if population growth is 102 a goal then stocking of yearlings is the fastest and most efficient way to overcome the 103 low population levels for Lake Sturgeon. 104
Akaike, H. 1973. Information theory and an extension of the maximum likelihood 105 principle. In B. N. Petrov and F. Csaki (Eds.), Second international symposium on 106 information theory (pp. 267_281). Budapest: Academiai Kiado. 107
Burnham, K. P. 1991. On a unified theory for release-resampling of animal populations. 108 In Proceedings of 1990 Taipei Symposium in Statistics, M. T. Chao and P. E. Cheng (eds), 109 11-36. Institute of Statistical Science, Academia Sinica: Taipei, Taiwan. 110
Gross, M.R., J. Repka, C.T. Robertson, D.H. Secor, and W. Van Winkle. 2002. Sturgeon 111 Conservation: Insights from elasticity analysis. American Fisherie4s Society Symposium 112 28: 13-30. 113
Nelson, P.A. and C.C. Barth. 2012. LAKE STURGEON POPULATION ESTIMATES IN THE 114 KEEYASK STUDY AREA: 1995 – 2011. A report prepared for Manitoba Hydro by 115 North/South Consultants Inc. Report 11-02 36p. 116
Pradel, R. 1996. Utilization of capture-mark-recapture for the study of recruitment and 117 population growth rate. Biometrics 52, 703-709. 118
Schueller, A.M. and D.B. Hayes. 2011. Minimum viable population size for Lake Sturgeon 119 (Acipenser fulvescens) using an individual-based model of demographics and genetics. 120 Canadian Journal of Fisheries and Aquatic Sciences 68: 62-73. 121
Velez-Espino, L.A. and M.A. Koops. 2008. Recovery potential assessment for Lake 122 Sturgeon (Acipenser fulvescens) in Canadian designatable units. Canadian Science 123 Advisory Secretariat Research Document 2008/007. 35p. 124

TAC Public Rd 2 DFO-0103
Page 5 of 6
White, G.C. and K.P. Burnham. 1999. Program MARK: survival estimation from 125 populations of marked animals. Bird Study 46 Supplement: 120-138. 126

TAC Public Rd 2 DFO-0103
Page 6 of 6
1
Figure 1. Relationship between survival and population growth based on the Burnham Jolly Seber model for Gull Lake Lake 2 Sturgeon population. Data were collected between 2001 and 2010.3
0.80
0.85
0.90
0.95
1.00
1.05
1.10
1.15
1.20
0.7 0.72 0.74 0.76 0.78 0.8 0.82 0.84 0.86 0.88 0.9
Popu
latio
n G
row
th λ
Survival Φ
Relationship of Population Growth with Survival
Median 50% Likelihood 95% Confidence Interval
A drop of 0.06 in survivalchanges the probability of population decline from
~23% to 75%
A drop of 0.11 in Survival changes the probability of decline to 95%
95% probabilitypopulationis growing
Current statusof Gull Lake
Lake Sturgeon Population
Gro
wth
Dec
line

TAC Public Rd 2 DFO-0104
Page 1 of 1
REFERENCE: Volume: Project Description Supporting Volume; 1
Section: 6.7 Powerhouse; p. 6-13 2
TAC Public Rd 2 DFO-0104 3
ORIGINAL QUESTION: 4 Several recommendations to minimize mortality that can be incorporated into hydro 5 facilities include: using trashracks with reduced bar spacing while preventing further 6 impingement, using temporary overlays with the existing trashracks to reduce clear 7 spacing during migration periods, use of partial depth curtain wall over existing trash 8 rack, installation of an inclined or skewed bar rack system upstream of the intake, 9 barrier or stop nets set upstream in the forebay, and use of partial depth guide walls or 10 an angled louver system upstream of the intakes coupled with a bypass system. Will the 11 powerhouse be designed to incorporate some of these features if monitoring indicates 12 that fish mortality is higher than predicted? Additional biological data and studies will be 13 required post construction to better assess the requirements and potential mitigation 14 for both potential downstream passage and protection. Also, these studies should 15 determine the overall number of fish expected to pass through the turbines. 16
FOLLOW-UP QUESTION: 17 DFO should be provided with an operating regime and an estimate of mortality under 18 various flow/seasonal conditions. Mortality rates for fish over 500mm required. 19
RESPONSE: 20 As discussed at a technical review meeting among KHLP, CEAA, DFO and MCWS on 21 February 15, 2013, limited information is available on the effects of turbine passage on 22 fish populations, and it was agreed that additional information will be collected during 23 post-Project monitoring as described in the Aquatic Effects Monitoring Plan (AEMP). 24
At DFO’s request, an analysis was conducted to assess potential effects to the 25 population of a varying mortality rate. Please see DFO-0106.26

TAC Public Rd 2 DFO-0105
Page 1 of 1
REFERENCE: Volume: Project Description Supporting Volume; 1
Section: 6.7 Powerhouse; p. 6-13 2
TAC Public Rd 2 DFO-0105 3
ORIGINAL QUESTION: 4 Survival rates can be maximized for entrained fish if operation of the turbines is at 5 maximum efficiency. How will Keeyask be operated to minimize mortality? 6
FOLLOW-UP QUESTION: 7 Elaboration required. Could turbine operation mitigate impacts to fish during critical life 8 stages (e.g. -Y-O-Y drift)? 9
RESPONSE: 10 The Partnership understand that the question relates to the effects of turbine passage 11 on larval drift and young-of-the-year fish; in particular, that these life stages might be 12 more sensitive to negative effects of pressure changes during passage through turbines. 13 As discussed in the AE SV (p. 5-61), the amount of larval drift and movement of young 14 fish is expected to be reduced due to the presence of the reservoir, which will tend to 15 trap fish that are hatched upstream. 16
The Partnership notes that changes in turbine operation (with respect to maximum 17 efficiency) only minimally affect pressure changes during passage past turbines; relevant 18 pressure changes occur if fish are in deep water upstream of the station (i.e., entrained 19 from deeper than 10 m) and released at the surface downstream of the station and also 20 due to the acceleration of water within the turbine (Cada 2001; Brown et al. 2009). 21
REFERENCES: 22 Brown, R. S., T. J. Carlson, A. E. Welch, J. R. Stephenson, and C. S. Abernethy. 2009. 23 Assessment of barotrauma from rapid decompression of depth-acclimated juvenile 24 chinook salmon bearing radiotelemetry transmitters. Trans. Amer. Fish. Soc. 138:1285-25 1301. 26
Cada, G. F. 2001. The development of advanced hydroelectric turbines to improve fish 27 passage survival. Fisheries 26 :14-23.28
TAC Public Rd 2 DFO-0106
Page 1 of 6
REFERENCE: Volume: Project Description Supporting Volume; 1
Section: 6.7 Powerhouse; p. 6-13 2
TAC Public Rd 2 DFO-0106 3
ORIGINAL QUESTION: 4 What are acceptable mortality rates based on the fish community and population in the 5 Keeyask study area? 6
FOLLOW-UP QUESTION: 7 Information on acceptable mortality rates not provided (e.g. literature). 8
RESPONSE: 9 The initial question posed by TAC Public Rd 1 DFO-0106 requested acceptable mortality 10 rates for turbine passage based on the fish community and population in the Keeyask 11 study area. The proponent noted, with reference to specific sections of the AE SV, that 12 mortality of fish during passage past the turbines and spillway would reduce the number 13 of fish entering Stephens Lake. Given the relative size of Gull and Stephens lakes, 14 emigration of juvenile and adult fish from Gull Lake to Stephens Lake is not thought to 15 provide a major input to the Stephens Lake population and no material impact of 16 turbine/spillway mortality to the fish community is expected. Construction of the 17 Keeyask Generating Station will also reduce the drift of larval fish from Gull to Stephens 18 lakes. The input of larval Lake Sturgeon from upstream of Gull Rapids may be the source 19 of young Lake Sturgeon in Stephens Lake, given the extremely low numbers of spawning 20 fish observed in the last decade; however, this reduction in larval drift is due to the 21 presence of the reservoir and would not be affected by the turbines. 22
The follow-up question by DFO notes that information on acceptable mortality rates 23 was not provided. In subsequent discussions (technical review meeting on 15 February, 24 2013 among KHLP, CEAA, DFO and MCWS), the Partnership noted that no literature 25 values of “acceptable” turbine mortality rates could be located, though considerations 26 of effects to fish were included in the turbine design at Keeyask. It was noted that, even 27 at stations that do not use modern turbines with features to reduce effects to fish, there 28 is no clear evidence that fish numbers are declining through a series of reservoirs (e.g., 29 Winnipeg River system has eight generating stations; lower Nelson River has three 30 generating stations). DFO noted that a particular concern is with a rare species such as 31 Lake Sturgeon, where the mortality of even a few individuals is of concern. At the 15 32 February, 2013 meeting, it was suggested that examining the effect of increasing 33 mortality rates on Lake Sturgeon using a population model could assist in assessing the 34
TAC Public Rd 2 DFO-0106
Page 2 of 6
potential effects of increased turbine mortality. This analysis was presented at a follow-35 up meeting on February 22, 2013 meeting and is documented below. 36
MORTALITY ANALYSIS USING POPULATION MODEL FOR LAKE STURGEON 37
It should be noted that although this assessment does not deal specifically with turbine 38 mortality or decreased immigration, it does address the permanent loss of individual 39 Lake Sturgeon from the population through decreased survival. The following 40 assumptions are made: 41
1. The current Jolly-Seber model for the Gull Lake population is definitive for other 42 exploited populations (i.e., Stephens Lake) (Nelson and Barth 2012); and 43
2. That the parameters as modeled from Program MARK (White and Burnham 44 1999) are normally and independently distributed. 45
The Burnham Jolly-Seber model estimates new entrants into the population indirectly 46 by modeling the rate of population growth (λ) between each interval where population 47 growth is the net effect of survival and recruitment (White and Burnham 1999) . 48
λi = Ni+1/Ni 49
The formulations for these versions of the Jolly-Seber were developed by Burnham 50 (1991) and Pradel (1996). The key difference between the two parameterizations is that 51 the Pradel-λ approach is conditional upon animals being seen during the study, while 52 the Burnham Jolly-Seber formulation is not. Therefore, the Burnham Jolly-Seber 53 formulation also includes a parameter for the population size at the start of the 54 experiment. This enables the estimation of the population size at each subsequent time 55 point. 56
57

TAC Public Rd 2 DFO-0106
Page 3 of 6
Table 1. Model output for the best model based on Akaike’s Information Criterion 58 selection in Program MARK (Akaike 1973). 59
Parameter Mean SE 95% Confidence Interval
Lower Upper
Survival 0.84 0.04 0.75 0.90
Pcapture 2001 0.22 0.03 0.16 0.29
Pcapture 2002 0.15 0.02 0.11 0.19
Pcapture 2003 0.25 0.03 0.19 0.32
Pcapture 2004 0.13 0.02 0.10 0.18
Pcapture 2006 0.34 0.05 0.24 0.45
Pcapture 2006 0.09 0.02 0.05 0.14
Pcapture 2010 0.12 0.04 0.07 0.22
Population Growth 1.02 0.04 0.95 1.10
Population Estimate 464.80 63.99 359.39 613.21
60
The best model was determined using Akaike’s Information Criterion (AIC) and is 61 defined by constant survival, time varying recapture, and constant lambda (Table 1). 62 This model was used as the basis to model the effects of decreased survival on 63 population growth (a surrogate for permanent emigration through entrainment in this 64 case). This was accomplished by decreasing the survival from the current level 0.84 by 65 fixing it at sequentially lower levels 0.83, 0.82, 0.81… 0.73. The population growth 66 estimates were tabulated for each of the decreased survival estimates from 0.84 to 67 0.73. The mean and standard error of the estimated population growth was used to 68 generate a distribution assuming a normal and independent distribution. These 69 distributions were then used to calculate percentiles for 95% confidence intervals, 50% 70 likelihood, and medians. The results are provided in Figure 1. 71
The basic interpretation of these results is as follows. The population growth estimate is 72 the ratio of successive population estimates, and therefore if it is greater than 1 the 73 population is growing and if it is less than 1 the population is declining. 74
At the present level of survival (with harvest) there is about a 23% likelihood that the 75 current population is actually in decline. If survival decreases by an additional 6% the 76 likelihood of decline becomes approximately 75% (Figure 1). There would need to be a 77 decrease of 11% to say with 95% confidence that the population is in decline (Figure 1). 78

TAC Public Rd 2 DFO-0106
Page 4 of 6
Moving the other direction if survival increases by 4% or more the Gull Lake population 79 is growing with 95% confidence. 80
It should be noted that decline in this sense means only that successive population 81 estimates are lower; there is no implication of significance statistical or otherwise. This 82 should be considered a preliminary assessment of effects. Based on the literature 83 minimum viable population size estimates vary between 80-1800 (Schueller and Hayes 84 2011) and between 413 and 2500 for adult spawning females (Velez-Espino and Koops 85 2008). The current estimate for Gull Lake is 465 (this particular model) which is in the 86 range for what the Schueller and Hayes (2011) model determines as a minimum viable 87 population size (see paper for model specifics). The best way to foster increases in 88 population survival and ultimately growth, is to increase the survival for critical life 89 stages which are most sensitive to elasticity (Gross et al. 2002). For Lake Sturgeon this 90 means increasing the survival from egg to yearly; in other words, if population growth is 91 a goal then stocking of yearlings is the fastest and most efficient way to overcome the 92 low population levels for Lake Sturgeon. 93
Akaike, H. 1973. Information theory and an extension of the maximum likelihood 94 principle. In B. N. Petrov and F. Csaki (Eds.), Second international symposium on 95 information theory (pp. 267_281). Budapest: Academiai Kiado. 96
Burnham, K. P. 1991. On a unified theory for release-resampling of animal populations. 97 In Proceedings of 1990 Taipei Symposium in Statistics, M. T. Chao and P. E. Cheng (eds), 98 11-36. Institute of Statistical Science, Academia Sinica: Taipei, Taiwan. 99
Gross, M.R., J. Repka, C.T. Robertson, D.H. Secor, and W. Van Winkle. 2002. Sturgeon 100 Conservation: Insights from elasticity analysis. American Fisherie4s Society Symposium 101 28: 13-30. 102
Nelson, P.A. and C.C. Barth. 2012. LAKE STURGEON POPULATION ESTIMATES IN THE 103 KEEYASK STUDY AREA: 1995 – 2011. A report prepared for Manitoba Hydro by 104 North/South Consultants Inc. Report 11-02 36p. 105
Pradel, R. 1996. Utilization of capture-mark-recapture for the study of recruitment and 106 population growth rate. Biometrics 52, 703-709. 107
Schueller, A.M. and D.B. Hayes. 2011. Minimum viable population size for Lake Sturgeon 108 (Acipenser fulvescens) using an individual-based model of demographics and genetics. 109 Canadian Journal of Fisheries and Aquatic Sciences 68: 62-73. 110
Velez-Espino, L.A. and M.A. Koops. 2008. Recovery potential assessment for Lake 111 Sturgeon (Acipenser fulvescens) in Canadian designatable units. Canadian Science 112 Advisory Secretariat Research Document 2008/007. 35p. 113

TAC Public Rd 2 DFO-0106
Page 5 of 6
White, G.C. and K.P. Burnham. 1999. Program MARK: survival estimation from 114 populations of marked animals. Bird Study 46 Supplement: 120-138. 115

TAC Public Rd 2 DFO-0106
Page 6 of 6
1
Figure 1. Relationship between survival and population growth based on the Burnham Jolly Seber model for Gull Lake Lake Sturgeon 2 population. Data were collected between 2001 and 2010.3
0.80
0.85
0.90
0.95
1.00
1.05
1.10
1.15
1.20
0.7 0.72 0.74 0.76 0.78 0.8 0.82 0.84 0.86 0.88 0.9
Popu
latio
n G
row
th λ
Survival Φ
Relationship of Population Growth with Survival
Median 50% Likelihood 95% Confidence Interval
A drop of 0.06 in survivalchanges the probability of population decline from
~23% to 75%
A drop of 0.11 in Survival changes the probability of decline to 95%
95% probabilitypopulationis growing
Current statusof Gull Lake
Lake Sturgeon Population
Gro
wth
Dec
line

TAC Public Rd 2 DFO-0107
Page 1 of 1
REFERENCE: Volume: Project Description Supporting Volume; 1
Section: 6.7 Powerhouse; p. 6-13 2
TAC Public Rd 2 DFO-0107 3
ORIGINAL QUESTION: 4 A detailed monitoring plan should be developed to assess mortality of fish passing 5 through the station and spillway. How will this impact the fish community? 6
FOLLOW-UP QUESTION: 7 See DFO-0015 8
RESPONSE: 9 The Aquatic Effects Monitoring Plan (AEMP) is a detailed monitoring plan which includes 10 assessment of mortality of fish passaing through the station and spillway. The follow-up 11 question to this IR states, “See DFO-0015.” The response to DFO-0015 states, “The 12 Proponent response addresses the information request.”. Therefore, the Partnership 13 assumes that there is no further information required for this IR. This was confirmed 14 during the technical review meeting among DFO, CEAA, MCWS and KHLP on February 15 15, 2013. 16
TAC Public Rd 2 EC-0007
Page 1 of 2
REFERENCE: Volume: Aquatic Environment Supporting Volume; 1
Section: 2.0 Water and Sediment Quality, Table 2-11 Construction-2
related activities, potential effects to water quality, and proposed 3
mitigation measures; p. 2-135 4
TAC Public Rd 2 EC-0007 5
ORIGINAL PREAMBLE AND QUESTION: 6 Table 2-11 outlines that water treatment plant backwash will be treated if required, 7 such that TSS will be less than 25 mg/L prior to discharge to the receiving environment. 8
EC requests the Proponent provide a full characterization of discharges to ensure they 9 are not deleterious; noting that TSS should not be the only discharge parameter to be 10 assessed against water quality objectives. 11
FOLLOW-UP QUESTION: 12 The Proponent does not clarify which other discharge parameter will be considered as 13 part of the treated back wash water quality objectives. EC requests that the Proponent 14 provide a detailed characterisation of the anticipated backwash water quality, including 15 other parameters of potential concern, aside from TSS. 16
RESPONSE: 17 Plans for the water treatment plant backwash have changed from that described in the 18 Keeyask Generation Project – Project Description Supporting Volume. Based on the 19 current Stage 5 design plan, backwash from the main camp water treatment plant will 20 be sent to the main camp sewage treatment plant. Wastewater effluent criteria to be 21 achieved prior to its disposal to the environment are provided in Schedule B to 22 (Manitoba) Environment Act Licence No. 2952 R, which states that wastewater effluent 23 will not be discharged from the sewage treatment plant to the receiving environment 24 unless: 25
• The five day carbonaceous biochemical oxygen demand (CBOD5) is less than 25 26 mg/L; 27
• The fecal coliform content, as indicated by the Most Probable Number (MPN) index, 28 is less than 200 per 100mL of effluent; 29
• The total coliform content, as indicated by the MPN index, is less than 1500 per 30 100mL of effluent; 31
• The total suspended solids (TSS) concentration in the effluent is less than 25 mg/L; 32
• The concentration of unionized ammonia is less than 1.25 mg/L, expressed as 33 nitrogen (N), at 15oC ± 1oC; and 34

TAC Public Rd 2 EC-0007
Page 2 of 2
• The total residual chlorine concentration of the effluent is less than 0.02 mg/L, as 35 determined by the monthly average. 36
It should be noted that the sewage treatment plant effluent will be disinfected using 37 ultraviolet light and not chlorine, so there will be no residual chlorine in the effluent. 38
These criteria meet those listed in the new Wastewater Systems Effluent Regulations 39 under the federal Fisheries Act.40

TAC Public Rd 2 EC-0018
Page 1 of 2
REFERENCE: Volume: Response to EIS Guidelines; Section: 6.5 1
Effects and Mitigation Terrestrial Environment; 6.5.7 Birds; p. 6-2
362 3
TAC Public Rd 2 EC-0018 4
ORIGINAL PREAMBLE AND QUESTION: 5 The Proponent has not included a discussion or impact assessment regarding these risks 6 associated with lighting and collision; could find no reference to these in the EIS. 7
EC requests that the Proponent provide information regarding any design and mitigation 8 measures that have been incorporated to minimize the adverse effects of lighting. EC 9 also requests further information regarding the communication tower, and any other 10 features planned for the project site that may create a specific collision hazard for 11 migratory birds, as well as on the proponent’s proposed mitigation measures to 12 minimize the risk of collisions. 13
FOLLOW-UP QUESTION: 14 EC requests that the Proponent clarify what lighting will be used for the powerhouse 15 building and communication tower. EC also has a particular interest in project effects on 16 migratory birds and requests the opportunity to review the monitoring reports. In order 17 to minimize the risk of avian collisions and fatalities, EC recommends that any lighting 18 used on the communications tower at night be limited to white (preferable) or red 19 flashing LED or strobe lights, and be the minimum in number, intensity, and frequency 20 of flashes required for aircraft safety. EC also recommends that Manitoba Hydro avoid 21 the use of floodlights and other intense light sources at the base of the tower, or on the 22 powerhouse building, especially those left on all night. With respect to any necessary 23 security lighting on ground facilities (including buildings) and equipment, EC 24 recommends that this lighting is as minimal as possible, and be down-shielded to keep 25 light within the boundaries of the site. Consideration could also be given to turning 26 these lights off at night during migration, and during bad weather. Finally, EC 27 recommends that the proponent regularly monitor and document the level of avian 28 mortality that occurs near the communications tower. 29
RESPONSE: 30 Manitoba Hydro is currently reviewing the applicable regulations regarding the lighting 31 of the communication tower as part of the detailed design. In developing the final 32 design, careful consideration will be given to important issues like migratory birds and 33 public safety. A challenge will be that certain regulations developed for public safety 34 may preclude the adoption of some of the EC recommendation regarding migratory 35

TAC Public Rd 2 EC-0018
Page 2 of 2
birds. For example, Canadian Aviation Regulations (CARs) 12-1, Standard 621 – 36 Obstruction Marking and Lighting specifically states that “two or more steady burning 37 lights” are to be used at the top of a tower. Manitoba Hydro, on behalf of the 38 Partnership, will provide EC with lighting design information regarding the generating 39 station and ancillary buildings/structures as it becomes available and will commit to 40 working with EC to protect migratory birds as much as feasible. 41
The EC recommendation for selection of fixtures will be adopted, where feasible. Note 42 that lighting used on the generating station and ancillary facilities will be limited to 43 those fixtures required for safety, security and operation requirements of the 44 generating station. These lights cannot be turned off at night, as they are needed for 45 performing inspections, monitoring plant equipment and, most importantly, to allow for 46 proper egress at the plant in times of emergency. For similar safety reasons, turning 47 these lights off for extended periods, such as during inclement weather or during 48 migration, is not practicable. 49
The Partnership has committed to undertake project monitoring of bird collisions, 50 including at the communication tower, during the project construction phase to 51 determine whether there are any impacts on migratory birds. Based on the results of 52 monitoring, mitigation measures may be implemented to reduce collision effects on 53 birds. Further details will be provided in the Terrestrial Effects Monitoring Plan; the 54 Partnership will provide a preliminary version of the plan to regulators in the second 55 quarter of 2013. 56
Reports will be generated annually, documenting the monitoring programs and results. 57 These reports will be provided to Manitoba Conservation and Water Stewardship and 58 posted publicly on the Partnership’s Web site at www.keeyask.com.59
TAC Public Rd 2 EC-0019
Page 1 of 5
REFERENCE: Volume: Response to EIS Guidelines; Section: 1
6.5.7.7.3 Colonial Waterbirds; p. 6-362 2
TAC Public Rd 2 EC-0019 3
PREAMBLE: 4 In this section the Proponent has proposed the following mitigation in response to the 5 loss of gull and tern breeding habitat: “Deployment of artificial gull and tern nesting 6 platforms (e.g., reef rafts), breeding habitat enhancements to existing islands (e.g., 7 predator fencing or placement of suitable surface substrate), and/or development of an 8 artificial island, or a combination of these measures, will be implemented to off-set the 9 loss of gull and tern nesting habitat at Gull Rapids and areas upstream.” EC requests that 10 the Proponent provide additional information regarding each mitigation measure (i.e., 11 for artificial nesting platforms, island enhancements, or development of artificial 12 islands), including information regarding the design, placement, development and 13 implementation of each measure. EC also requests that the Proponent identify the 14 decision-making process by and situations in which they would choose to a) deploy an 15 artificial nesting platform, b) enhance an existing island, c) develop an artificial island, or 16 d) implement a combination of these measures. Annually during the first three years of 17 operation or until mitigation measures are deemed to be successful. 18
QUESTION: 19 As the proponent has indicated in their response, details about the mitigation measures 20 to offset the loss of gull and tern nesting habitat at Gull Rapids and areas upstream are 21 limited at this time. EC requests the opportunity to review detailed plans (complete with 22 design, placement, development, and implementation information for each proposed 23 mitigation measure) as they are developed. With respect to the Artificial Nesting 24 Platforms, EC recommends that the developed plan 1) address the recommendations in 25 the studies cited, and their implementation for this project; and 2) include plans to 26 maintain the rafts and make any necessary repairs to the platforms prior to each 27 breeding season. To the extent possible, EC recommends constructing platforms such 28 that the total available area for nesting waterbirds is equivalent to the area of the 29 natural islands that will be lost, such that equivalent breeding populations might be 30 maintained. With respect to the Nesting Island (or Peninsula) Enhancements 31 downstream, EC recommends that the developed plan address the expected variability 32 of the water level below the Generation Station, and provide the rationale behind 33 enhancing nesting sites downstream if the variation in water level will be greater than 34 which would occur naturally during the breeding season. Terns and other waterbirds 35 often nest at sites that are only a few inches to a couple of feet above water and 36 frequent changes to the water level during the breeding season may render this 37

TAC Public Rd 2 EC-0019
Page 2 of 5
mitigation option futile. EC also recommends that the plan address the feasibility of 38 fencing off portions of land to limit predator access, and describe any plans to monitor 39 and maintain the fencing. Colonial nesting birds have an innate preference for sites that 40 mammalian predators cannot access and it would be preferential to work with islands. 41 Moreover, maintaining the fencing and ensuring that it did not become a hazard to 42 breeding colonial species or other wildlife would require frequent monitoring and 43 maintenance throughout the year. With respect to the proponent's response regarding 44 the development of Artificial Nesting Islands, EC questions how monitoring annually 45 during the first 3 years of operations will confirm the necessity and feasibility of these 46 nesting islands. More specifically, EC is unsure how the construction could take place 47 prior to filling the reservoir considering monitoring will only occur after operation has 48 commenced. EC requests that the proponent provide clarification. 49
RESPONSE: 50 With respect to the proponent's response regarding the development of Artificial 51 Nesting Islands, EC questions how monitoring annually during the first 3 years of 52 operations will confirm the necessity and feasibility of these nesting islands. More 53 specifically, EC is unsure how the construction could take place prior to filling the 54 reservoir considering monitoring will only occur after operation has commenced. EC 55 requests that the proponent provide clarification. 56
To clarify, the monitoring activities in the first three years of operation are intended to 57 confirm success (rather than feasibility) of the proposed mitigation measures. 58
The Environmental Impact Statement (EIS) currently outlines an approach to mitigate 59 for the potential loss of habitat used by terns and gulls for nesting (see Keeyask 60 Hydropower Limited Partnership 2012, Terrestrial Environment Supporting Volume, 61 Section 6.4.2.3). The Partnership is currently in the process of determining the exact 62 design specifications and site locations for the various mitigation measures, which will 63 be documented in the Terrestrial Mitigation Implementation Plan. This Plan will include 64 detailed design, placement, development, and implementation information for the gull 65 and tern-nest habitat creation and /or enhancement. The Partnership agrees to share 66 this Plan with Environment Canada. 67
The preliminary development of this plan has considered existing literature and 68 information regarding the design and utilization of the various mitigation alternatives. 69
Artificial nesting platforms 70 Artificial nesting platforms are being proposed for the Keeyask Generation Project to 71 enhance common tern nesting. The floating nesting platforms are proposed to address 72 uncertainty regarding the formation of suitable tern nesting structures after the 73 construction of the generating station. In most jurisdictions, the nesting platforms are 74

TAC Public Rd 2 EC-0019
Page 3 of 5
left in the water year-round. It is currently anticipated that ice conditions at Keeyask will 75 not allow this to be done in most reaches of the Nelson River. During the initial years of 76 operation, the intent is to mobilize the platform(s) in a few key locations; if a platform is 77 not used to the capacity expected of common terns, then alternative locations will be 78 used in subsequent years. In most cases, these sites will be back-bay areas near shallow 79 waters where common terns typically forage. Some of these locations may potentially 80 be suitable sites where the floating platforms can be retained year-round. However, the 81 current planning is to remove the platforms in the fall and replace them in the spring 82 immediately prior to terns returning to the Keeyask reservoir area. 83
Key factors that will be considered with respect to the deployment of tern nesting 84 platforms include the following: 85
• time of year – platforms to be placed soon before the return of common terns to 86 breeding sites in the Keeyask area; 87
• location – ideally situate platforms within areas of low flow, such as back bays, that 88 are close (within 5 km) of prime foraging areas; and 89
• use by other species – there may potentially be an issue if gulls out-compete terns 90 for nesting sites on the platforms and terns are demonstrated to not have adequate 91 alternative nesting habitat in the area during Project operation. 92
The timing of deployment of the tern nesting platforms is a critical step in their success 93 for attracting and retaining breeding terns. As ring-billed gulls return to their nesting 94 grounds earlier than common terns, gulls will potentially occupy the nesting platforms if 95 they are available. By delaying the deployment of the platforms until immediately 96 (within about 1 week) of the return of common terns, the intent is that majority of the 97 local breeding gull population will have already completed their courtship rituals, 98 selected nesting sites, and begun laying and incubating eggs. To encourage the use of 99 nesting platforms by terns, a few tern decoys will be deployed on each platform; this 100 will provide a social cue that would facilitate the attraction of terns to the structures 101 during the courtship/pre-nesting period after their return to the Keeyask area in the 102 spring. Any maintenance that is required will be done when the rafts are removed from 103 the water in the fall. 104
The proposed plan for tern nesting is consistent with EC’s recommendation to construct 105 platforms, such that equivalent breeding populations might be maintained in the area. 106 The plan to have two nesting platforms should more than compensate for any lost tern 107 nesting areas, and from a habitat perspective, allow maintenance of the local tern 108 population. The number of terns observed nesting in the Gull Rapids and Gull Lake 109 reaches of the Nelson River between 2001 and 2010 ranged between 20 and 50 nesting 110 pairs. As the nesting platforms are intended for common terns, which occur in relatively 111 low numbers in the potentially affected areas, two platforms (which could support 112

TAC Public Rd 2 EC-0019
Page 4 of 5
approximately 60 nesting pairs) will be sufficient and adequately compensate for any 113 potential loss of nesting areas. However, another factor that may be influencing the 114 number of nesting terns in the Gull Rapids to Gull Lake reach of the Nelson River is that 115 ring-billed gulls may be displacing terns from the best sites on nest reefs in Gull Rapids 116 area. Ring-billed gulls have been shown, through the field investigations, to have 117 displaced common terns from their former nesting colony near Birthday Rapids – this is 118 a trend that has been seen in a variety of locations in North America, e.g., the Great 119 Lakes area. 120
A monitoring program outlined in the Terrestrial effects Monitoring Plan will help to 121 determine whether the platforms are being utilized as planned and whether there are 122 additional measures that are required to enhance their use by terns. The results of this 123 monitoring will be considered in relation to the results of monitoring conducted along 124 the Nelson River (from Gull Rapids to Clark Lake) to assure that an appropriate 125 management approach is taken and sufficient nesting structures are available. 126
Enhancement of Areas below the Generating Station 127 There will be areas below the Generating Station which will not be overtopped by large 128 spillway events. There are existing islands which will be well above the water level as 129 well as lower rocky areas that will be more like the existing reefs. The areas to be 130 enhanced to facilitate waterbird nesting will be identified based on potential water 131 levels below the generating station and terrestrial areas not typically affected by high 132 water levels during the breeding season. 133
The use of an island to enhance for nesting is preferable to using a peninsula and 134 isolating it from the shore with fencing. This is partly due to the level of uncertainty 135 regarding the size, structure and location of any suitable waterbird nesting structures 136 that will exist in the area below the generating station after impoundment; as such, use 137 of a peninsula is being considered as one of the alternatives. If the peninsula is utilized, 138 the condition of the predator fencing will need to be maintained by the Partnership. 139
Artificial Nesting Island 140 The EIS and subsequent processes to define action plans have considered a suite of 141 potential mitigation options that include the development of an artificial island in 142 addition to enhancement of structures that would be present during the operational 143 period of Keeyask. 144
The preferred time to build an artificial island is prior to filling the reservoir and this is 145 the current plan if such an island is built. At present, two potential sites have been 146 identified as a possible location for constructing the artificial island prior to filling the 147 reservoir. Both sites are in the Keeyask reservoir within 2.5 km of the generating station. 148

TAC Public Rd 2 EC-0019
Page 5 of 5
Manitoba Hydro has previously built a successful artificial nesting island to support 149 breeding bird species in the Lower Churchill River. The development of an island was 150 proposed as part of the Lower Churchill River Water Level Enhancement Project to 151 compensate for the potential loss of an island used primarily by arctic terns (Manitoba 152 Hydro 1997). Monitoring revealed that the Churchill River artificial island was utilized for 153 nesting by gulls, common terns and waterfowl. A similar design is being considered as a 154 starting point, although the design will need to be stronger to counter ice processes 155 along the Nelson River; this will necessitate, for example, some stronger armoring for 156 the sides of the island. 157
Literature Cited 158 Keeyask Hydropower Limited Partnership. 2012. Keeyask Generation Project 159 environmental impact statement: Terrestrial environment supporting volume. 160
Manitoba Hydro. 1997. Lower Churchill River Water Level Enhancement Weir Project, 161 Environmental Impact Statement, Manitoba Hydro. 162
TAC Public Rd 2 EC-0028
Page 1 of 3
REFERENCE: Volume: Response to EIS Guidelines; Section: 6.2.3 1
Existing Environment and Future Trends, 6.2.3.4 Terrestrial 2
Environment and 6.2.3.4.3 Terrestrial Plants; p. 6.102 3
TAC Public Rd 2 EC-0028 4
PREAMBLE: 5 Invasive species spread readily along disturbance corridors and once established are 6 virtually impossible to eradicate. This section mentions that “field studies detected all of 7 the 19 invasive plants known to occur in the Regional Study Area”. The construction and 8 operation of the project may provide additional opportunities for invasive species to 9 establish and spread (through dispersal of weed seeds on equipment and vehicles, or in 10 reclamation materials brought to the site, etc.), disrupting native plant communities. EC 11 acknowledges the proponent’s commitment on page 3-34 of TE SV to 1) clean 12 construction equipment and machinery recently used more than 150km from the 13 project area prior to transport to the project area regularly; 2) use seed mixtures 14 containing only native species and/or non-invasive introduced plant species; 3) 15 implement containment, eradication and/or control programs if monitoring identifies 16 problems with invasive plants; and 4) educate contractors about the importance of 17 cleaning their vehicles, equipment and footwear before traveling to the area. In addition 18 to the proponent’s commitments above, EC recommends that all vehicles and 19 equipment are cleaned prior to entering the project areas. EC also recommends that any 20 areas containing noxious weeds be clearly marked, so that equipment operators can 21 easily recognize when passing through weed infested areas, and so that the spread of 22 species from these areas can be monitored. EC further recommends that equipment 23 and vehicles are thoroughly cleaned after passing through any such area in order to 24 avoid transporting seed to other areas. 25
QUESTION: 26 EC requests that the Proponent discuss: 27
• if all vehicles and equipment will be cleaned prior to entering the project areas; 28 • if areas containing noxious weeds will be clearly marked, so that equipment 29
operators can easily recognize when passing through weed infested areas; 30 • if vehicles and equipment will be cleaned after passing through areas containing 31
noxious weeds; and 32
• if seed mixtures to be used contain only native species and/or non-invasive 33 introduced plant species. 34

TAC Public Rd 2 EC-0028
Page 2 of 3
RESPONSE: 35
There have been a number of previous developments and activities in the Project area 36 that provide insight in terms of distribution of invasive plants. These include the 37 development and operation of Kettle and Long Spruce generating stations, Radisson and 38 Henday converter stations, the Town of Gillam, PR 280, a fiber optic line alongside PR 39 280, over ten years of Project-related engineering and EA studies in the proposed 40 Project area and the activities of area residents and visitors over many years. Even with 41 this level of activity, all of the observed invasive plant patches were confined to human 42 disturbed areas. Field studies did not find any evidence that invasive plant species were 43 spreading into nearby native plant communities, likely due to the harsh climate, high 44 prevalence of surface peat, established ground cover and other factors. The risk that the 45 Project will spread invasive plant species into native plant communities appears to be 46 low given past trends and the Project mitigation measures. To verify this, and to be in a 47 position to respond quickly should any unexpected outbreaks occur, invasive plant 48 distributions in the Project area will be monitored and colonizations that could become 49 outbreaks will be eradicated where practicable and controlled elsewhere. Additionally, 50 areas cleared during construction but not required for operation will be rehabilitated to 51 native habitat types, which will eliminate colonization sites for invasive plants. 52 If all vehicles and equipment will be cleaned prior to entering the project areas 53
As stated in the Response to the EIS Guidelines, construction equipment and machinery 54 used more than 150 km away from the Project site will be cleaned prior to working on 55 site. Other vehicles (i.e., personal cars and trucks) will not be required to be cleaned 56 prior to arriving onsite. As part of the Environmental Protection Plans for the Project, 57 contractors will be educated about the importance of supporting measures to limit the 58 introduction and spreading of invasive plants. 59
If areas containing noxious weeds will be clearly marked, so that equipment operators 60 can easily recognize when passing through weed infested areas 61
Areas where there are patches of noxious weeds will be flagged for avoidance if they are 62 not contained in active construction areas. Concurrently, control and eradication 63 measures will be implemented in the event that noxious weeds patches develop during 64 construction. Monitoring and control programs will focus on the early detection of and 65 rapid response to noxious weeds. If vehicles and equipment will be cleaned after passing 66 through areas containing noxious weeds 67
Marking and avoiding noxious weed patches should eliminate the need to wash 68 vehicles and equipment. 69

TAC Public Rd 2 EC-0028
Page 3 of 3
If seed mixtures to be used contain only native species and/or non-invasive introduced 70 plant species 71
Seed mixtures used for revegetation will only contain native species and/or non-invasive 72 introduced plant species. 73

TAC Public Rd 2 EC-0029
Page 1 of 3
REFERENCE: Volume: Response to EIS Guidelines; Section: 6.5.3 1
Terrestrial Ecosystems and Habitat, and 6.5.3.2 Ecosystem 2
Diversity; p. 6-318 to 6-320 3
TAC Public Rd 2 EC-0029 4
PREAMBLE: 5 This section notes on page 6-318 that a “rehabilitation plan will be developed that gives 6 preference to rehabilitating the most affected priority habitat types using approaches 7 that “go with nature” and on page 6-319 that “the rehabilitation plan developed and 8 initiated during construction will extend into the operation phase, and continue until all 9 necessary rehabilitation is completed.” Lastly, on page 6-320 of this section it mentions 10 that “Monitoring will include confirming that…rehabilitation to native broad habitat 11 types was successful at locations identified in the rehabilitation plan”. EC recommends 12 that any disturbed areas that will not be flooded are restored, and are restored as 13 quickly as possible once they are no longer in use. EC recommends that disturbed areas 14 are restored to mimic native vegetation communities in the surrounding area, and to 15 provide similar habitat to pre-construction conditions. EC also recommends that the 16 restoration materials be of local provenance, and be certified and inspected to be free 17 of both invasive and noxious weed materials. Finally, EC recommends long-term 18 monitoring and adaptive management to ensure restoration. 19
QUESTION: 20 EC requests that the Proponent: 21
• confirm that disturbed areas that are no longer in use will be restored as quickly as 22 possible; 23
• confirm that disturbed areas will be restored to mimic native vegetation 24 communities in the surrounding area, and provide similar habitat to pre-25 construction conditions; 26
• discuss whether the restoration materials will be of local provenance, and be 27 certified and inspected to be free of both invasive and noxious weed materials; and 28
• discuss any long-term monitoring and adaptive management plans to ensure 29 restoration. 30
31

TAC Public Rd 2 EC-0029
Page 2 of 3
RESPONSE: 32
Confirm that disturbed areas that are no longer in use will be restored as quickly as 33 possible 34 Cleared and disturbed areas not required for Project operation will be rehabilitated as 35 quickly as is practicable. 36
Confirm that disturbed areas will be restored to mimic native vegetation communities in 37 the surrounding area, and provide similar habitat to pre-construction conditions 38
The target habitat types (combinations of vegetation type and ecosite type) for areas 39 not required for Project operation will be the native habitat types appropriate for the 40 post-construction conditions. In some locations, the target habitat type will be the same 41 one that was there prior to clearing or disturbance. In other locations, it will not be 42 feasible to rehabilitate the area to the pre-construction habitat type. For example, it 43 would be very difficult to regenerate an aspen forest in a borrow area where the clay 44 overburden was removed leaving coarse granular material. Another example is that a 45 jack pine woodland could not be recreated in the portion of a granular borrow area 46 where excavation has removed material to a depth where a pond forms. A marsh or 47 other wetland type will be the appropriate target habitat type in these locations. In 48 locations where construction has dramatically altered site conditions, the target habitat 49 type will be a native habitat type that is appropriate for the post-construction site 50 conditions giving preference to the most affected priority habitat types. 51
Discuss whether the restoration materials will be of local provenance, and be certified 52 and inspected to be free of both invasive and noxious weed materials 53
Tree and tall shrub propagules will be of local provenance. Most other propagules will 54 also likely be of local provenance since the majority will come from stockpiled materials 55 that are later spread. Fast-growing non-native grasses and forbs may be used in some 56 locations to meet temporary needs such as controlling erosion on steeper banks in 57 borrow areas. For these situations, the non-native species will eventually be displaced 58 with native plant species appropriate for the site conditions. This staged approach 59 maintains flexibility to use the most effective techniques to achieve the rehabilitation 60 objectives. 61
Seed mixtures obtained from commercial suppliers will meet the requirements of the 62 Canada Seeds Act for Certified Canada #1 seed for certified cultivars or Canada Common 63 #1 for common cultivars. Commercial seed suppliers will provide seed analysis 64 certificates verifying that the number of noxious seeds will not exceed the following 65 limits per 25 grams for species listed by the Weed Seeds Order: 0 prohibited noxious 66 weeds, 0 primary noxious weeds, 1 secondary noxious weeds, 25 total noxious weeds. 67
TAC Public Rd 2 EC-0029
Page 3 of 3
Commercial seed suppliers will provide seed analysis certificates verifying that the seed 68 mixture does not contain sweet clover or alfalfa seeds. 69
Discuss any long-term monitoring and adaptive management plans to ensure restoration 70
Monitoring will include confirming that rehabilitation to native broad habitat types is 71 successful. Vegetation and soils data will be collected in the rehabilitated areas to assess 72 degree of native habitat recovery. Additional or alternative rehabilitation will be applied 73 to the extent practicable in areas not meeting rehabilitation targets. 74

TAC Public Rd 2 EC-0030
Page 1 of 4
REFERENCE: Volume: Response to EIS Guidelines; Section: 6.5.3 1
Terrestrial Ecosystems and Habitat, and 6.5.3.4 Wetland Function; 2
p. 6-325 to 6-327 3
TAC Public Rd 2 EC-0030 4
PREAMBLE: 5 These sections outline the following: 1) project construction is predicted to affect up to 6 7765 ha of wetlands, including 9-12 ha of off-system marsh (p. 6-325); 2) mitigation to 7 replace Nelson river wetlands is not proposed (p. 6-325); and 3) “globally, nationally 8 and/or provincially significant wetlands are not affected” (p. 6-327). Proposed 9 mitigation includes: 1) “measures to protect against erosion, siltation and hydrological 10 alteration will be implemented in utilized construction areas that are within 50 m of any 11 off-system marsh that is outside of the Project Footprint” (p. 6-325) ; and 2) “12 ha of 12 the off-system marsh wetland type will be developed within or near the local Study 13 Area” (p. 6-326; p. 6-327). Wetlands provide important habitat for both migratory birds 14 and Species at Risk. EC promotes the maintenance of the functions and values derived 15 from wetlands throughout Canada, enhancement and rehabilitation of wetlands in areas 16 where continuing loss or degradation of wetlands have reached critical levels, no net 17 loss of wetland functions for federal lands and waters, recognition of wetland functions 18 in resource planning and economic decisions, and utilization of wetlands in a manner 19 that enhances prospects for their sustained and productive use by future generations. 20 EC recommends that the proponent take all reasonable measures to avoid wetlands, 21 where feasible, irrespective of whether they are wet or dry, and that buffers or setbacks 22 originate from the one in one hundred year high water mark. One hundred metre 23 setbacks should be utilized from the edge of the proposed development or associated 24 feature (e.g., access route) where feasible. EC acknowledges that the proponent will 25 develop 12 ha of off-system marsh habitat within or near the study area to compensate 26 for the loss of 9-12 ha of off-system marsh. EC refers the Proponent to 'The Federal 27 Policy on Wetland Conservation' which promotes the wise use of wetlands and elevates 28 concerns for wetland conservation to a national level. EC recommends that the 29 Proponent review this document to provide further guidance on reducing impacts to 30 wetlands. 31
QUESTION: 32 EC requests that the Proponent confirm the use of appropriate setbacks from wetlands 33 and discuss, for those wetlands where avoidance is not possible, what mitigation and 34 compensation measures will be implemented. 35
TAC Public Rd 2 EC-0030
Page 2 of 4
RESPONSE: 36
Approximately 90% of the Regional Study Area land area is covered by wetlands 37 (Terrestrial Environment Supporting Volume Section 2.8.3.2.1 p. 2-167 ), with the 38 majority of these wetlands being naturally functioning (Nelson River shoreline wetlands 39 being the main exception; Response to EIS Guidelines Section 6.5.3.4.1 p. 6-327; 40 Terrestrial Environment Supporting Volume Section 2.8.3.2.1 p. 2-167 ). The vast 41 majority of the potentially affected wetlands are inland bogs, which have relatively low 42 overall ratings for their contributions to various wetland functions (Response to EIS 43 Guidelines Section 6.5.3.4.1 p. 6-327; Terrestrial Environment Supporting Volume 44 Section 2.8.4.1.1 p. 2-181 ). While some of the wetland types in the study area provide 45 habitat suited for species at risk, such as olive-sided flycatcher and rusty blackbirds, very 46 little of the potentially affected wetlands are productive breeding habitat for most 47 migratory birds. 48
Given the very high proportion of natural wetland area, few land-based projects of any 49 type could proceed in the Project region if the project was designed to provide a 100 m 50 setback on all wetlands. The Project focus was on minimizing effects on wetlands to the 51 extent practicable. It is anticipated that some degree of wetland area loss can be 52 absorbed without adversely affecting wetland function in regions where wetlands are 53 abundant and remain in a relatively pristine condition (Terrestrial Environment 54 Supporting Volume 2.8.1.1). In these situations, the emphases are on reducing the total 55 area of wetland loss and minimizing effects on the particularly important wetland types. 56 Particularly important wetland types are those types that make relatively high 57 contributions to many wetland functions and/or are regionally rare. Given the high 58 prevalence of peatlands in the region and the absence of swamp in the Project zone of 59 influence, off-system marsh was evaluated as being the only particularly important 60 wetland type. 61
In this context, the Project minimized effects on wetlands using a three-stage approach 62 consisting of avoidance, minimization and then compensation. In some cases, avoidance 63 or minimization of wetland effects was indirectly achieved by a general objective to 64 reduce terrestrial flooding. In other cases, minimizing effects on wetlands and avoiding 65 specific wetland types were among the criteria used to search for the best balance 66 between minimizing a variety of potential adverse effects and maximizing potential 67 positive effects. The following summarizes how the Project planning process addressed 68 wetland avoidance, minimization and compensation. 69
Wetlands were avoided at various stages of Project planning. During the initial planning 70 stages, selecting the low-head option considerably reduced the amount of terrestrial 71 flooding, which in turn considerably reduced wetland loss since bog and fen wetlands 72

TAC Public Rd 2 EC-0030
Page 3 of 4
cover about 90% of the land area. Further reductions in wetland flooding were achieved 73 when Axis GR-4 was selected (Project Description Supporting Volume p. 6-10). 74
Selecting a 1 m reservoir operating range further reduced shore zone wetland effects 75 compared with a larger operating range. The high degree of water level variability 76 associated with reservoir operation would considerably limit the amount of emergent 77 wetland vegetation that can develop along the reservoir shoreline. A 1 m operating 78 range is expected to reduce the width of the sparsely vegetated shoreline band when 79 compared with a larger operating range. 80
Alternative dyke arrangements were evaluated with relevant considerations for 81 wetlands including minimizing flooding and minimizing effects on creek crossings and 82 local drainage patterns (Project Description Supporting Volume p. 6-17, 6-18). 83
Of the three south access road alternative routes, the south alternative was in part 84 selected because it avoids the most sensitive wetland types, minimizes the number of 85 waterway crossings and minimizes total affected wetland area. 86
Effects on wetlands were avoided and otherwise minimized in several ways during the 87 evaluation and refinement of alternative excavated material placement areas. The initial 88 inventory of 50 excavated material placement areas was reduced to 35 following a 89 preliminary review and ranking by the project team, which included consideration of 90 wetland effects. Some excavated material placement areas were located to promote 91 marsh development in the future reservoir. Excavated material placement areas were 92 situated in environmentally degraded areas wherever practicable. 93
The terrestrial, aquatic, socio-economic, engineering and construction teams worked 94 collaboratively to refine the Project Footprint so as to find the best balance between 95 minimizing potential adverse effects and maximizing potential positive effects. Two of 96 the criteria were to avoid the most sensitive wetland types, and where avoidance was 97 not practicable, minimize effects on these wetland types. As a result, some boundaries 98 for the proposed Project Footprint were modified to further reduce adverse effects on 99 wetlands. 100
By this stage of the Project design process, sufficient wetland area had been avoided 101 and wetland effects minimized that it is expected that substantial effects will be 102 eliminated for all wetland types except for off-system marsh (the only particularly 103 important wetland type in the Project region). 104
Compensation for the predicted 9 to 12 ha of off-system marsh loss and alteration 105 includes 100% replacement through 12 ha of wetland enhancement. Additional 106 mitigation to avoid potential effects on off-system marshes outside of the permanent 107 Project Footprint includes implementing measures to protect against erosion, siltation 108

TAC Public Rd 2 EC-0030
Page 4 of 4
and hydrological alteration in utilized construction areas that are within 100 m of any 109 off-system marsh that is outside of the permanent Project Footprint. 110
Setbacks from all wetlands are not feasible because most of the Project Footprint 111 borders on wetlands (the vast majority of the region is bog and fen wetland). The 112 Project planning process described above has already eliminated area effects on some 113 wetland types and reduced residual cumulative effects on all remaining types to 114 between 2% and 7% of the wetland area that existed prior to industrial development. 115 Additionally, most of the potentially affected wetlands are inland wetlands that are not 116 adjacent to a body of water. On this basis, setbacks will only be applied for off-system 117 marsh wetlands. Setbacks for off-system marsh wetlands outside of the permanent 118 Project Footprint will be increased to the 100 m recommended by Environment Canada 119 except at approximately 12 locations along borrow areas, excavated material placement 120 areas, the dykes and near two dyke drainage ditches. As noted above, measures to 121 protect against erosion, siltation and hydrological alteration during construction will be 122 implemented at these locations. Of the 12 locations where a 100 m buffer is not 123 currently possible mitigation may include; use of a slightly smaller buffer, or a physical 124 barrier such as clean fill and rock or a silt fence. 125
Several other mitigation measures will reduce Project effects on wetlands. Terrestrial 126 rehabilitation will regenerate areas not required for Project operation to native habitat 127 types, some of which are wetland types. Additionally, the rehabilitation plan may 128 prescribe wetland creation for some excavated material placement areas in depressions 129 (locations will not be known until construction determines which excavated material 130 placement area locations are actually used). 131

TAC Public Rd 2 EC-0032a
Page 1 of 3
REFERENCE: Volume: Response to EIS Guidelines; Section: 6.2.3 1
Existing Environment and Future Trends, 6.2.3.4 Terrestrial 2
Environment and 6.2.3.4.7 Mammals; p. 6-127 and 6-130 3
TAC Public Rd 2 EC-0032a 4
PREAMBLE: 5 The EIS describes three groupings of caribou for the Regional Study area: 1) barren-6 ground caribou from the Qamanirjuaq herd; 2) coastal caribou from the Cape-Churchill 7 and Pen Islands herds; and 3) "summer resident caribou" (which "could be coastal 8 caribou, [boreal] woodland caribou, or a mixture of both"; p. 6-130). There are 6 9 geographically distinct populations of the forest-dwelling Woodland Caribou in Canada: 10 Northern Mountain population, Southern Mountain population, Boreal population, 11 Forest-Tundra population, Atlantic Gaspesie population, and the insular Newfoundland 12 population. With the exception of the barren-ground caribou, EC considers the caribou 13 in the project area to be part of the “forest-tundra“ population, which are not SARA-14 listed and have not been assessed. EC notes that the project will result in the permanent 15 loss of some primary calving and rearing complexes ("clusters of islands in lakes or 16 islands of black spruce surrounded by expansive wetlands or treeless areas (peatland 17 complexes)" (p. 6-131)) for the summer resident caribou (p. 6-367, 6-372), as well as 18 6825 ha of physical winter habitat for the Qamanirjuaq, Cape-Churchill and Pen Island 19 herds (p. 6-366). Additionally, sensory disturbances associated with construction and 20 operation are expected to result in additional loss of effective habitat (p. 6-367, p. 6-21 372), and increased access to the project area could increase mortality due to predation 22 (p. 6-368, 6-372). EC encourages the proponent to consult with Manitoba Conservation 23 to identify any plans to manage undisturbed caribou habitat in the project area. EC 24 acknowledges the proponent plans to implement mitigation measures including; 25
• minimizing blasting from May 15 to June 30 (p. 6-370); 26
• implementing an access management plan, including locked gates at the north and 27 south dykes from May 15 to June 30, as well as during other sensitive times 28 determined through monitoring (p.6-371); 29
• rehabilitating temporarily cleared and excavated materials placement areas to 30 native habitat; 31
• blocking and revegetating project-related cutlines and trails within 100m of the 32 project footprint (p. 6-374); and 33
• long term monitoring of caribou and predators in the project area (p. 8-23, 8-26). 34
In addition to these measures, EC recommends the reduction of sight lines along the 35 access trails, and the continual restoration of project-related cleared areas, cutlines, 36

TAC Public Rd 2 EC-0032a
Page 2 of 3
trails, etc. as they are no longer in use. EC also recommends that the proponent 37 consider additional mitigation measures (e.g., mitigation of noise, light, smells, 38 vibrations; reduction of vehicle speeds, etc.) to minimize harassment of caribou in the 39 project area, particularly from late winter to late spring and early summer, as this will be 40 a stressful period for all of the caribou in the project area. 41
QUESTION: 42 EC requests that the Proponent discuss any plans to implement additional mitigation 43 measures (e.g. mitigation of noise, light, smells, vibrations, reduction of vehicle speeds, 44 etc.) to minimize harassment of caribou in the project area, particularly from late winter 45 to late spring and early summer. EC requests that the Proponent discuss any plans to 46 reduce sight lines along access trails and discuss restoration plans for project-related 47 cleared areas, temporary transmission right of ways, trails, etc. EC also requests the 48 Proponent discuss their plans to consult with the province. 49
RESPONSE: 50 Plans to implement additional mitigation measures (e.g. mitigation of noise, light, 51 smells, vibrations, reduction of vehicle speeds: 52
Mitigation measures to minimize disturbance of caribou in the project area are 53 discussed in the Terrestrial Environment Supporting Volume (Section 7.4.6.2) and 54 Response to EIS Guidelines (Section 6.5.8.1). In addition to the mitigation measures 55 stated in the preamble, caribou advisory signs will be placed on access roads to 56 emphasize the need for safety for migrating caribou and other wildlife. 57
Speed limits will be based on design criteria engineered to safely operate machinery and 58 vehicles on temporary winter trails during construction. Minimizing the use of this trail 59 by the public during construction via an Access Management Plan is expected to reduce 60 traffic noise and exhaust during construction. As part of the Environmental Protection 61 Plan, workers will be educated concerning the harassment of wildlife. The Keeyask 62 Generation Project will create sensory disturbances (e.g., noise, light, smells, and 63 vibrations) during construction and operation that result in a loss of effective habitat for 64 caribou. Potential disturbances are limited to areas near those lands identified for the 65 Project. Sensory disturbance during construction will result in less than a 1% loss of 66 winter and calving and rearing habitats in the Regional Study Area, and will not affect 67 long-distance movments of migratory caribou (Response to EIS Guidelines ,6-366, 6-68 368). Sensory disturbances are anticipated to be considerably less during operation 69 compared to construction. As a result, there are no plans to implement additional 70 mitigation measures. 71
Plans to reduce sight lines along access trails: 72

TAC Public Rd 2 EC-0032a
Page 3 of 3
Best management guidelines (Government of Alberta 2011) recommend that in forested 73 areas, line-of-sight should be limited to 200 metres on non-roadway, cross-country 74 linear features. The Project does not include any cross-country access trails (all trails are 75 within or near other Project Footprint components). In the event that additional access 76 trails are identified during construction, any cross-country access trails through forested 77 areas will be designed to either be less than 200 m long or cleared in a manner such that 78 sight lines are no greater than 200m. Access trails will be blocked when they are no 79 longer needed for construction (see next paragraph). Additionally, it is anticipated that 80 vegetation regeneration will generally be adequate to reduce sight lines on access trails. 81 A study conducted in the Project region found that approximately 35% of trails and 82 cutlines previously created for a variety of purposes had regenerated to the degree that 83 they likely no longer functioned as travel corridors within 10 years of clearing 84 (Terrestrial Environment Supporting Volume Section 2.4.3.2.1). 85
Discuss restoration plans for project-related cleared areas, temporary transmission right 86 of ways, trails, etc.: 87
As described in the response to TAC Public Rd 2 EC-0029, cleared areas (including new 88 trails) will be rehabilitated to native habitat types as quickly as is practicable after it is 89 determined they are not required for Project operation. Except for existing resource-use 90 trails (Response to EIS Guidelines Section 6.5.3.1.1), Project-related trails will be blocked 91 where they intersect the Project Footprint and the portions of these features within 100 92 m of the Project Footprint will be revegetated. The success of the revegetation efforts 93 will be monitored and additional efforts will be applied to areas not meeting objectives. 94
Plans to consult with the province: 95
Manitoba Hydro consults regularly with the Province concerning caribou and is an active 96 partner participating on regional caribou committees and resource management 97 boards. Manitoba Conservation and Water Stewardship has also participated in several 98 meetings of the Keeyask Generation Project Mammals Working Group (Response to EIS 99 Guidelines Section 4.5.2.2 ) to discuss various caribou issues. 100
The Partnership will be providing environmental protection plans, monitoring plans and 101 management plans to the Province for review and approval. These plans include 102 mitigation measures for protection of wildlife. The results of these programs will be 103 reported on annually and provided to Manitoba Conservation and Water Stewardship 104 and placed on the Partnership’s Web site at www.keeyask.com. 105
LITERATURE CITED: 106 Government of Alberta. 2011. Best management guidelines; Enhanced approval 107 process. Published by the Government of Alberta. 30pp. 108

TAC Public Rd 2 EC-0032b
Page 1 of 4
REFERENCE: Volume: Response to EIS Guidelines; Section: 1
6.5.8.1.1 Construction Effects and Mitigation; p. 6-370 2
TAC Public Rd 2 EC-0032b 3
PREAMBLE: 4 In addition to the previous comments provided by EC regarding caribou in the project 5 area, EC notes that the southwest corner of the Regional Study Area overlaps with parts 6 of two ranges of boreal woodland caribou as delineated in the Final Recovery Strategy: 7 Wapisu (MB8) and Manitoba North (MB9). While it does not appear that the project will 8 have any direct effects on these herds, there is potential for indirect effects on these 9 SARA-listed species. The effects analysis in the EIS appears to focus on project effects on 10 the non-SARA-listed caribou (the migratory ecotype of woodland caribou and the barren 11 ground caribou), and predominantly on caribou in the local study area. The EIS report 12 states the following regarding the potential impact on boreal caribou: “Because changes 13 to intactness will be negligible, effects on caribou will likely be negligible. The Project 14 will not contribute to measurable changes in caribou intactness of the RSA.” (p. 6-370) It 15 is not clear from the information provided however, what indirect effects on boreal 16 woodland caribou may occur (e.g., sensory disturbances, loss of habitat, habitat 17 degradation, increased access, indirect mortality, etc.), or the nature of cumulative 18 impacts on boreal woodland caribou when considered with all other foreseeable 19 projects in the area. Additionally it is unclear how the proponent has determined effects 20 for boreal woodland caribou specifically, to be “negligible”. 21
QUESTION: 22 EC suggests that the proponent provide clarification on the above points. EC also 23 encourages the Canadian Environmental Assessment Agency to discuss the potential for 24 indirect effects on boreal woodland caribou with both the proponent and provincial 25 caribou experts. 26
RESPONSE: 27 The current range of boreal woodland caribou extends into the southwest corner of the 28 Regional Study Area (Study Zone 6, Map 6-28) near Thompson, as described in Section 29 7.3.6.3.3 of the Terrestrial Environment Supporting Volume and Section 6.2.3.4.7 of the 30 Response to EIS Guidelines (see Map 6-38 for caribou ranges). The range of SARA-listed 31 boreal woodland caribou does not extend to the Local Study Area (Study Zone 4, Map 6-32 28), where the direct and most of the indirect Project impacts are expected to occur. No 33 effects on boreal woodland caribou were assessed directly, as the northernmost portion 34 of their ranges is located about 100 km from Gull Lake. 35

TAC Public Rd 2 EC-0032b
Page 2 of 4
The effects assessment described potential Project effects on barren-ground caribou 36 from the Qamanirjuaq herd, coastal caribou from the Pen Islands and Cape Churchill 37 herds, and the small group of summer resident caribou that remain in the Keeyask 38 region year-round. The herd association of the summer residents is unclear, and it was 39 stated that this group could be coastal caribou, boreal woodland caribou, or a mixture 40 of both. For the purposes of the assessment of potential Project effects, the group of 41 summer resident caribou was treated as an independent population that uses a smaller 42 range than the migratory groups and is more likely to use calving and rearing habitat 43 that occurs within the Keeyask region (Section 7.3.6.3.3 of the Terrestrial Environment 44 Supporting Volume and Section 6.2.3.4.7 of the Response to EIS Guidelines). Effects of 45 changes to intactness on these three groups of caribou (barren-ground, coastal, and 46 summer resident), none of which are listed by SARA, were determined to be negligible 47 based on benchmarks established for boreal woodland caribou (Section 7.2.6.2 of the 48 Terrestrial Environment Supporting Volume), which were based in part on 49 recommendations by Environment Canada (2012) 1
Environment Canada (2012) indicates that the population of the Wapisu (MB8 ) range is 52 estimated at 110-125 individuals, the population trend is stable, and the population is 53 likely self-sustaining. The population estimate for the Manitoba North (MB9) range is 54 not available, the population trend is not available, and the population is as likely as not 55 self-sustaining (Environment Canada 2012). If the change in habitat intactness were 56 assessed for these two ranges of boreal woodland caribou, which overlap a portion of 57 the Regional Study Area, the measureable effect would be none or negligible for the 58 same reasons as for other types of caribou. For example, as defined by Environment 59 Canada, the total habitat disturbance reflecting the loss of functional habitat for the 60 Wapisu range is currently at 24%, and the undisturbed habitat is greater than 65% of 61 this range. For the Manitoba North range, the current total range disturbance is 28%, 62 and the undisturbed habitat is greater than 65% of this range. Neither of these two 63 ranges are expected to change as a result of the Project. 64
. Other benchmarks used to describe 50 Project effects for all caribou included predation and linear feature density. 51
A small decrease in linear feature density, from 0.45 km/km² to 0.44 km/km², is 65 anticipated in the Intactness Regional Study Area (Zone 5) as a result of the Project, of 66 which a small portion overlaps boreal woodland caribou range (Section 6.5.3.3.1 of the 67 Response to EIS Guidelines). Because there will be no increase in linear feature density 68 as a result of the Project, there will be no effect on the portions of Wapisu and 69 Manitoba North ranges that overlap the Regional Study Area. The Project will have 70
1 Environment Canada. 2012. Recovery strategy for the woodland caribou (Rangifer tarandus caribou), Boreal population, in Canada. Species at Risk Act Recovery Strategy Series. Environment Canada, Ottawa, ON. Xi + 138 pp.
TAC Public Rd 2 EC-0032b
Page 3 of 4
localized core area effects for other caribou in and near the Keeyask segment of the 71 Nelson River (Section 6.5.3.3.1 of the Response to EIS Guidelines), which is well beyond 72 the recognized range of boreal woodland caribou. 73
Considering project linkage pathways, and the spatial separation between boreal 74 woodland caribou range and the Local Study Area, reasonably foreseeable indirect 75 effects on boreal woodland caribou could be related to increased traffic on the portions 76 of PR 391 and PR 280 that overlap both the Regional Study Area and boreal woodland 77 caribou range. Potential effects would be limited mainly to the construction period. 78 Increased traffic will temporarily increase sensory disturbance and reduce effective 79 habitat for boreal woodland caribou. However, the nearest boreal woodland caribou 80 core use area identified in Section 3.13 of the Bipole III Transmission Project Caribou 81 Technical Report (2011)2
Boreal woodland caribou distribution in this area is influenced by the existing roads and 85 other development near the City of Thompson. The Project is expected to increase 86 traffic on Road Section 1 between 1% and 6% from 2014 to 2021 (Section 5.4.1.5.2 of 87 the Socio-Economic Environment, Resource Use and Heritage Resources Supporting 88 Volume). Effects of increased traffic will be limited to individuals whose home ranges 89 overlap Road Section 1. These individuals may reduce their use of habitat or may 90 increase their movement rates near the road (Leblond et al. 2013)
does not overlap the portion of PR 391 from Thompson to PR 82 280 referred to as Road Section 1 in the Socio-Economic Environment, Resource Use and 83 Heritage Resources Supporting Volume. 84
3
The risk of caribou-vehicle collisions could also increase with increased traffic volume; 96 however, collisions with vehicles are not considered an important threat to boreal 97 woodland caribou (Environment Canada 2012). Caribou-vehicle collisions are rare in 98 Manitoba. While three or four areas on PTH 60 near The Pas have been identified as 99 locations for caribou-vehicle collisions, most of the people interviewed for Environment 100 Canada’s Aboriginal Traditional Knowledge report on boreal caribou had not heard of 101
. However, 91 considering the incrementally small increase in traffic that is already located on an 92 existing highway, any further loss of habitat effectiveness, or behavioral responses such 93 as increased rates of movement (Leblond et al. 2013) are still expected to be minimal, 94 and likely not measureable with such a small increase in traffic. 95
2 Joro Consultants Inc. 2011. Bipole III Transmission Project Caribou Technical Report. Prepared for Manitoba Hydro November 2011. 205 pp.
3 Leblond, M., Dussault, C., and Ouellet, J.-P. 2013. Avoidance of roads by large herbivores and its relation to disturbance intensity. Journal of Zoology 289: 32-40.

TAC Public Rd 2 EC-0032b
Page 4 of 4
such incidents (Boreal Caribou Aboriginal Traditional Knowledge Reports 2010-2011).4 102 From 2007 to 2010, no caribou injured by vehicles were dispatched by Manitoba 103 Conservation in the Gillam area (L. Meyers pers. comm.)5
Other indirect Project effects on boreal woodland caribou could include habitat loss, 110 habitat degradation, and access-related mortality due to hunting and predation. These 111 effects on caribou are discussed in Section 7.4.6.2 of the Terrestrial Environment 112 Supporting Volume and Section 6.5.8.1 of the Response to EIS Guidelines. No Project-113 related habitat loss or fragmentation will affect Wapisu or Manitoba North range 114 (Section 2.4.4.1.1 of the Terrestrial Environment Supporting Volume). Because access 115 (i.e., new roads, trails or highway upgrades) will not increase in these two ranges as a 116 result of the Project, neither will caribou harvest and predation. 117
. To date, no collisions have 104 been reported during construction of the Wuskwatim Generating Station, and of 217 105 reported collisions with wildlife in the Thompson area from 2008 to 2012, two were 106 reported with caribou (Manitoba Public Insurance unpubl. data). Collision data are 107 limited by what claimants reported (i.e., species may not have been specified in each 108 case) and are affected by people’s ability to correctly identify wildlife species.. 109
Manitoba Hydro, on behalf of the Partnership, is willing to meet with the CEAA, EC and 118 the provincial caribou experts to discuss the potential for indirect effects on boreal 119 woodland caribou. As described in TAC Public Rd 2 EC-0032, Manitoba Hydro consults 120 regularly with the Province concerning caribou, and is an active partner participating on 121 regional caribou committees and resource management boards. 122
4 Boreal Caribou Aboriginal Traditional Knowledge (ATK) Reports. 2010-2011. Compiled June 2011. Ottawa: Environment Canada.
5 Meyers, Lisa. 2010. District Supervisor, Gillam District, Manitoba Conservation, Gillam, Manitoba. Email correspondence with Andrea Ambrose, Wildlife Resource Consulting Services MB Inc. August 26, 2010.

TAC Public Rd 2 EC-0033
Page 1 of 1
REFERENCE: Volume: Response to EIS Guidelines; Section: Chapter 1
8.0 Monitoring and Follow-up; p. N/A 2
TAC Public Rd 2 EC-0033 3
PREAMBLE: 4 EC notes the proponent’s plans to implement monitoring and follow-up plans regarding 5 the effects of the project on colonial waterbirds, species at risk, caribou, wetlands, 6 invasive plants, and ecosystem diversity, and the success of planned mitigation 7 measures for each. EC has a particular interest in project effects on migratory birds and 8 species at risk, the development of wetlands, the progress of reclamation with native 9 species in the project area, and the success in preventing the incursion of invasive 10 species. 11
QUESTION: 12 EC requests confirmation from the Proponent that the monitoring reports collected will 13 be shared with EC. 14
RESPONSE: 15 Reports will be provided annually to Manitoba Conservation and Water Stewardship, 16 and placed on the Keeyask Hydropower Limited Partnership’s website: 17 http://keeyask.com/. 18

TAC Public Rd 2 HC-0002
Page 1 of 2
REFERENCE: Volume: Socio-Economic Supporting Volume; Section: 1
Appendix 5C: Human Health Risk Assessment; 5.4.2.3 Mercury & 2
Human Health; Aquatic Environment Supporting Volume; Section: 3
Table 7-1; p. SE SV 5C-1 and 5-214 to 5-224; AE SV 7-53 4
TAC Public Rd 2 HC-0002 5
PREAMBLE: 6 Mercury and human health – proposed mitigation measures: Based on the results of the 7 HHRA, fish consumption recommendations were developed. HC agrees with the need 8 for such recommendations and in general, would also concur with the 9 recommendations themselves. However, HC notes that with respect to 10 recommendations of “unrestricted eating” for all fish with less than 0.2 ppm mercury, 11 the current edition of the Guidelines for Consumption of Recreationally Angled Fish in 12 Manitoba (2007) recommends that women of childbearing age and children under 12 13 years, limit their consumption of fish with less than 0.2 ppm mercury to 8 meals per 14 month. The HHRA recommends that fish consumption advisories be communicated to 15 local First Nations and communities. Also, based on fish monitoring data, additional 16 human health risk assessments be undertaken every 5 years after peak mercury levels 17 have been reached to determine if consumption advisories need to be changed. HC 18 advises adopting Manitoba’s guidelines recommendation limiting consumption for 19 women of childbearing age and children under 12 years with respect to fish with less 20 than 0.2 ppm mercury to provide added protection of health for these sensitive 21 receptors. HC would consider this approach reasonable but would advise that if 22 monitoring results show that mercury levels in fish are higher than the predicted 23 maximum levels in the HHRA, prior to reaching their actual maximum levels, fish 24 consumption advisories should be re-visited to ensure that they remain protective of 25 human health. 26
QUESTION: 27 HC has previously submitted a response to the CEA Agency in its letter of December 28, 28 2012. HC disagrees with the HHRA conclusion of supporting unrestricted eating of fish 29 with elevated Hazard Quotients (eg. HQ of 14 for whitefish from Gull and Stephens 30 Lakes). HC welcomes further discussions on mercury levels in fish and the use of 31 provisional Tolerable Daily Intakes (pTDI) of 0.47 micrograms (μg) methyl mercury 32 (MeHg) per kilogram of body weight per day (kg-bw/day) for adults, and 0.2 μg MeHg 33 per kg-bw/day 0.2 ug/kg bw/day for women of childbearing age in human health risk 34 assessments. HC advises the risk communication plan be separate from the HHRA and 35

TAC Public Rd 2 HC-0002
Page 2 of 2
included within a risk management plan as mitigation for this project. HC welcomes 36 further discussion and is available to review the risk management plan upon request. 37
RESPONSE: 38 As requested by Health Canada, the Partnership has revised the HHRA as follows: 39
• Removed recommendations; 40
• Removed consumption guidance. 41
As requested by Health Canada, the Partnership is also preparing a separate Risk 42 Management Plan that includes recommendations and consumption guidance. In 43 preparing this Plan, the Partnership will continue to work with Manitoba Health and 44 Health Canada so that the Plan is culturally appropriate, protective of human health and 45 promotes a healthy fish diet. 46
We assume that the notation in the question of a Hazard Quotient of 14 for whitefish on 47 Gull and Stephens lakes is a typographical error. The Partnership notes that the highest 48 Hazard Quotients for whitefish from Gull and Stephens lakes, as set out in the HHRA, 49 were for women of childbearing age; these were 1.0 and 1.4 for Gull Lake and Stephens 50 Lake, respectively, under pre-project conditions and 2.7 and 2.1, respectively, under 51 post-impoundment conditions.52
TAC Public Rd 2 HC-0003
Page 1 of 2
REFERENCE: Volume: Socio-Economic Supporting Volume; Section: 1
5.3.3 Mercury and Human Health; p. 5-104 to 5-120 2
TAC Public Rd 2 HC-0003 3
PREAMBLE: 4 Mercury and human health: The EIS indicates that communication products to address 5 adverse health impacts will be developed. It should be noted that the determination 6 and implementation of risk management strategies for country foods in the project area 7 fall under the responsibilities of provincial and/or municipal authorities. However, HC 8 considers accurate communication strategies a very important tool in the reduction of 9 risk to Aboriginal health with regards to country foods. HC would be willing to review 10 proposed risk management approaches and communication products to provide its 11 opinion. 12
QUESTION: 13 HC has reviewed the communication products provided, and some preliminary 14 comments are provided in the attached table (Formative Review of Risk Comm 15 Products). HC would be pleased to meet with the proponent to undertake a more 16 thorough discussion of the communication products, upon request. HC advises that the 17 focus of the communication products be on the protection of the most sensitive 18 receptors first (i.e. pregnant women and women of child-bearing age, and children). HC 19 is available to review communication products that are developed for the post-20 impoundment scenario, upon request. 21
RESPONSE: 22 The Partnership appreciates the opportunity to discuss the communication products 23 with Health Canada, along with Manitoba Health. At a March 2013 technical meeting 24 among Health Canada, Manitoba Health, Manitoba Conservation and Water 25 Stewardship, Department of Fisheries and Oceans and the Partnership, there was 26 agreement to a process in which this discussion would continue to occur. 27
Manitoba Health indicated a willingness to prepare initial communication materials 28 regarding mercury and human health under present conditions. They also indicated that 29 they would look at how best to prepare further communication materials regarding 30 mercury and health for the Keeyask area under present conditions, including continued 31 consultation with the Partnership (e.g., a communication working group was noted as a 32 potential option to discuss the evolution of communication products). 33

TAC Public Rd 2 HC-0003
Page 2 of 2
The Partnership agrees that the communication products should focus on the protection 34 of the most sensitive receptors first (i.e., women of child-bearing age and children). 35
The Partnership appreciates the opportunity to review communication products for the 36 post-impoundment scenario with Health Canada, when they are developed closer to the 37 beginning of the operations phase.38

TAC Public Rd 2 HC-0007
Page 1 of 2
REFERENCE: Volume: Aquatic Environment Supporting Volume; 1
Section: 7.2.4 Project Effects: Mitigation and Monitoring; p. 7-16 2
TAC Public Rd 2 HC-0007 3
PREAMBLE: 4 Project Effects, Mitigation and Monitoring: HC understands that the proponent has 5 proposed to monitor mercury in fish tissue on an annual basis until maximum 6 concentrations are reached, and every 3 years thereafter until concentrations are 7 stable. HC does not have any objections to this approach; however, the EIS does not 8 provided a clear determinant of what constitutes “maximum concentration” and 9 “stable”. Mercury levels in fish are expected to steadily increase over a number of years, 10 reach a maximum, and decline steadily thereafter but may fluctuate slightly over the 11 course of this time. The number of years in which a decrease in mercury levels is 12 observed to conclude that a maximum concentration has been reached, does not 13 appear to have been determined. The EIS includes an outline of monitoring planned for 14 the mercury in fish tissue. However, the detailed monitoring program that will be 15 provided in the Aquatic Effects Monitoring Plan (AEMP) is not yet provided and is 16 related to regulatory licensing with DFO and Manitoba Conservation. HC advises that 17 the proponent provide a clear determinant in the EIS of what will constitute a 18 “maximum concentration” and “stable” condition at which point fish tissue monitoring 19 will be reduced to a frequency of every third year. When the AEMP is available for 20 review, HC is able to provide advice regarding potential effects and review of additional 21 HHRAs to ensure fish consumption advisories remain protective of human health. 22
QUESTION: 23 HC is satisfied with the explanation of “maximum concentration” and “stable” for post-24 project monitoring of mercury concentrations in fish. Draft Aquatic Effects Monitoring 25 Plan HC was provided with a copy of the draft Aquatic Effects Monitoring Plan on 26 October 29, 2012. HC has the following comments: Section 6.1.2.1.3 Parameters In the 27 core monitoring of lake sturgeon, methyl mercury is not listed as a parameter that will 28 be measured. Because draft risk communication products advise consuming lake 29 sturgeon, please confirm that methyl mercury is included in the monitoring plan. 30 Section 7.0 Mercury in Fish Flesh In Section 7.2 Monitoring During Operation, HC advises 31 that lake sturgeon be added to the large-bodied fish species that will sampled for 32 mercury concentrations. HC advises that all fish species that will be consumed be 33 included in the monitoring plan (including lake sturgeon, cisco, rainbow smelt, lake 34 trout, etc.). HC is available to review results of the AEMP, upon request. 35
TAC Public Rd 2 HC-0007
Page 2 of 2
RESPONSE: 36 As discussed in AE SV Section 2.4.2.3.4, “At present, this reach is subject to domestic 37 fishing but the number of sturgeon taken is not known. New road construction will 38 increase access opportunities for domestic harvesters and thereby potentially increase 39 lake sturgeon harvest. A lake sturgeon conservation awareness program for the Project 40 will be developed in consultation with local domestic resource users and MCWS to 41 highlight the sensitivity of populations in the Keeyask reservoir and immediately 42 downstream.” 43
Local resource users will be encouraged to not consume lake sturgeon from these 44 waters post-Project due to conservation concerns with lake sturgeon populations during 45 the first decades after impoundment. As such, there are no plans to measure 46 methylmercury concentrations in lake sturgeon from the Keeyask reservoir or Stephens 47 Lake post-impoundment. 48
HC also recommends that all species that will be consumed be included in the 49 monitoring plan. The current AEMP proposes to sample mercury from three large-50 bodied species, two piscivors (northern pike and walleye) at the top of the aquatic food 51 chain, and one omnivore (lake whitefish). In the relatively simple aquatic food chains of 52 northern Manitoba waterbodies, whitefish are approximately one trophic level 53 removed (i.e., lower) than pike and walleye and represent a levels representative of 54 several other large-bodies fish species in the area (e.g., sucker species, freshwater drum, 55 cisco). 56
In addition of being good representatives of the trophic levels (and thus, potential for 57 mercury bioaccumulaton) occupied by most large-bodied fish species in the Study Area, 58 Pike, Walleye, and whitefish also combine to represent the majority of the total fish 59 intake (and thus, potential for mercury exposure) of local First Nation members. This 60 statement is not based on exact catch statistics and formal consumption surveys (which 61 largely do not exist) but on experience in working and living with First Nation members, 62 including conversations about food preferences. Lake trout (a species mentioned by HC) 63 only occurs in a few remote lakes and is not consumed by First Nation members in 64 meaningful numbers. Rainbow smelt (another species mentioned by HC) is a recent 65 invader in the Keeyask ecosystem. Although abundant, it has no history as a food fish in 66 the area and is also not consumed in relevant numbers. 67
Worldwide, in Canada, and historically and currently in Manitoba, federal and provincial 68 fish mercury monitoring programs have not and do not monitor every fish species, but 69 concentrate on those species that are important in terms of human consumption and 70 exposure, and that are suitable surrogates of species which mercury content is not 71 directly measured. 72

TAC Public Rd 2 MB-Health-0001
Page 1 of 2
REFERENCE: Volume: Response to EIS Guidelines; Section: N/A; p. 1
N/A 2
TAC Public Rd 2 MB-Health-0001 3
QUESTION: 4 Please provide additional information on how the offset lake fishing program will be 5 evaluated to ensure that it is working as it is intended. 6
RESPONSE: 7 The Keeyask Adverse Effects Agreements with Tataskweyak Cree Nation, War Lake First 8 Nation and York Factory First Nation include provision for a program to address the 9 potential for increased mercury concentrations in fish by replacing the domestic supply 10 of fish currently taken from on-system lakes and rivers that have the potential to be 11 affected by Keeyask. The Keeyask Adverse Effects Agreement with Fox Lake Cree Nation 12 includes provision for an Alternative Resource Use Program, which may be used to 13 harvest fish species in alternate resource areas within the Fox Lake Resource 14 Management Area. These and other offsetting programs are designed to address effects 15 on KCNs members’ Treaty and Aboriginal rights resulting from the construction and 16 operation of the Keeyask Project. 17
Each of the Keeyask Cree Nations is responsible for implementing the relevant programs 18 for their community and for identifying possible off-system lakes to provide this 19 replacement fish supply. Thus far, Tataskweyak Cree Nation and War Lake First Nation 20 are the only communities who have outlined specific details for their respective 21 programs. These details are included in the adverse effects agreements with these 22 communities. 23
Ongoing success of these programs will be determined based on: 24
• Each community’s ability to continue to provide a replacement fish supply from off-25 system lakes until such time as mercury levels return to pre-project conditions in the 26 Keeyask forebay. 27
• The use of the program by community members – i.e., are community members 28 interested in and eating the supplied fish from offsystem lakes. 29
As noted in the response to TAC Public Rd 2 MCWS-Fisheries-0002, to assist in selecting 30 lakes for the programs to be operated by Tataskweyak and War Lake, the Partnership 31 undertook fish community assessments between 2004 and 2006 on 13 lakes in the Split 32 Lake Resource Management Area. The study documented the relative abundance of fish 33 species in each lake, biological data (age and size) of the fish, and mercury levels. The 34

TAC Public Rd 2 MB-Health-0001
Page 2 of 2
study also estimated the maximum sustainable yield in each lake. Based on this 35 information, TCN and War Lake selected seven and two lakes, respectively, to be 36 harvested for their offset fishing programs. As new or different lakes are identified by 37 the Keeyask Cree Nations for the purposes of these programs for which no fisheries data 38 are available, additional sampling and analysis will be undertaken by the Partnership at 39 that time. 40
TCN and War Lake are currently developing community-controlled Fish Harvest 41 Sustainability Plans. These plans are being developed through a process of consultation 42 with Members, provincial fisheries managers, the Partnership, and some members of 43 the Split Lake Resource Management Board (SLRMB). The plans will be provided to the 44 SLRMB to contribute to fulfilling requirements of Article 5.6.2 of the 1992 45 Implementation Agreement which states that the Board will develop and recommend 46 resource management plans for the Resource Management Area. The Partnership 47 intends to file the Plans in the second quarter of 2013. 48
The Fish Harvest Sustainability Plans will provide program managers in each community 49 with the information needed to guide, regulate and monitor fishing activities on 50 program lakes so that long-term community objectives will be met. Fishing pressure will 51 be adjusted according to monitoring results to ensure that harvest levels remain 52 sustainable. Monitoring details are provided in each Plan, and follow accepted fisheries 53 management practices. Among this monitoring, it is anticipated that monitoring of 54 mercury levels in the catch associated with these programs will be undertaken by the 55 Partnership on an as needed basis so that the programs can be adjusted if needed. As 56 part of ongoing program implementation, large pike and pickerel captured during fishing 57 operations will also be released due to anticipated high mercury levels. 58
Overall, the Tataskweyak Cree Nation Healthy Food Fish Program is to provide annually 59 up to one hundred thirty seven thousand (137,000) pounds (sixty two thousand one 60 hundred forty two (62,142) kilograms) round weight of fish from identified lakes in the 61 Split Lake Resource Management Area. The War Lake First Nation Community Fish 62 Program is similar in nature but much smaller in magnitude. The amount of fish to be 63 harvested through these programs was determined based on providing all on-reserve 64 members (at the time of negotiation) with an average of one pound of fish (headless 65 dressed) per week. As part of implementing these programs, the communities will track 66 the program uptake by community members. 67
In addition to the offset fishing programs provided for in the Adverse Effects 68 Agreements, the Partnership is also undertaking efforts to develop and distribute 69 communication products outlining safe fish consumption. Draft versions of these 70 communication products have been developed and will be reviewed and finalized in 71 consultation with Manitoba Health and Health Canada. 72

TAC Public Rd 2 MB-Health-0002
Page 1 of 2
REFERENCE: Volume: Response to EIS Guidelines; Section: Section 1
4.3.1.3; p. N/A 2
TAC Public Rd 2 MB-Health-0002 3
QUESTION: 4 Flooding due to extreme weather has been a concern in Manitoba and has caused 5 damage to homes in some locations. Are there any risks of ice jams or extreme flooding 6 as a result of unusual weather patterns as it relates to the Development? 7
RESPONSE: 8 The Keeyask GS will be designed to safely pass the Probable Maximum Flood (PMF). The 9 PMF is a statistically rare event (less frequent than a 1:10,000 year event) and is 10 considered the largest potential flood that could occur at this location in the river. The 11 estimated PMF at this location on the Nelson River is approximately double the flow 12 experienced during the summer of 2005, the highest daily average flow on record. 13 Water levels on Split Lake and areas further upstream as well as water levels on 14 Stephens Lake and areas further downstream would not be impacted by the Keeyask GS 15 during floods on the Nelson River including the PMF. 16
Based on many years of observing ice formation on the Nelson River, ice jams that cause 17 flooding do not currently occur upstream of Gull Rapids. A hanging ice dam that 18 normally forms downstream of Gull Rapids has caused localized over land flooding and 19 erosion during some years. The risk of ice induced effects during the construction phase 20 will be largely mitigated by the installation of an ice boom upstream of the project site. 21 This will facilitate the development of a stable ice cover on Gull Lake early in the winter 22 season and will greatly reduce the size of the hanging ice dam that presently forms 23 downstream of Gull Rapids at the inlet to Stephens Lake. Upstream of Gull Lake, the ice 24 front is expected to progress in the upstream direction in a manner similar to the 25 existing environment ice processes that occurs in this reach (see Response to Physical 26 Environment Supporting Volume Section 4.3.1.3 for a detailed description). These ice 27 formation processes are relatively insensitive to the specific weather patterns of each 28 winter; warmer and colder winters will serve to increase or decrease the rate at which 29 they occur but the magnitude of effects will be similar. This is true even for extreme 30 weather patterns that may occur throughout the winter. 31
During the operation period, the Keeyask GS will eliminate the hanging ice dam that 32 presently forms at the inlet to Stephens Lake. This will result in a smooth ice cover 33 beginning about 800 m downstream of the tailrace. The Keeyask reservoir will form a 34 smooth ice cover early in the winter season and the ice front will progress upstream in a 35 manner similar to the existing environment ice processes that occur in this reach. Again, 36

TAC Public Rd 2 MB-Health-0002
Page 2 of 2
these ice formation processes are relatively insensitive to the specific weather patterns 37 of each winter; warmer and colder winters will increase or decrease the rate at which 38 they occur but the magnitude of effects will be similar. This is true even for extreme 39 weather patterns that may occur throughout the winter.40

TAC Public Rd 2 MCWS‐EAB‐0001
Page 1 of 3
REFERENCE: Volume: Response to EIS Guidelines; Section: 7.0; 1
Page No.: n/a 2
TAC Public Rd 2 MCWSEAB0001 3
PREAMBLE: 4
5
QUESTION: 6
Please provide the map required pursuant to Section 9.8 of the federal EIS guidelines 7
showing all the past, present and future projects that were considered in the cumulative 8
effects assessment. 9
RESPONSE: 10
Please find attached a consolidated Keeyask Generation Project Cumulative Effects Map. 11
This map includes the content of the eight maps (7A‐1 to 7A‐8) that were located in 12
Appendix 7A of the Keeyask Generation Project Response to EIS Guidelines with the 13
following updates and additions. 14
The most recent information available for the following projects has been used: 15
1. Keeyask Generation Project – updated South Access Road approach into Gillam. 16
2. Keeyask Infrastructure Project (KIP) – project footprint has been updated to 17
reflect access and clearing required to drill water wells for the main camp, use 18
of additional borrow sources along the North Access Road (NAR), use of 19
additional borrow from G5 and use of a rock outcrop at kilometer 11, along the 20
NAR. All of the aforementioned alterations to the KIP project footprint have 21
been approved by Manitoba Conservation and Water Stewardship. 22
3. Keeyask Transmission Project – final routing of the line is now known and is 23
shown rather than the three alternative routes considered (A, B, C, displayed in 24
Maps 7A‐7 and 7A‐8). 25
The following information that was provided in text form in the Keeyask Generation 26
Project Response to EIS Guidelines Appendix 7A has been converted to graphical form: 27
1. Mining Activities ‐ the following information has been mapped: 28
a. The location of Vale near Thompson, Manitoba (see Inset Map A); 29
b. Mining claims north of Split Lake (see Inset Map A); and 30
c. Exploration license on the north shore of Stephens Lake (Inset Maps A and 31
B). 32
33

TAC Public Rd 2 MCWS‐EAB‐0001
Page 2 of 3
2. Commercial Fishing – the following information has been mapped: 34
a. The location of active commercial fisheries (Split, Assean and Stephens 35
lakes, Inset Map A); and 36
b. Sipiwesk Lake (location of former commercial lake sturgeon fishing). 37
38
3. Commercial Forestry – the following information has been mapped: 39
a. Forest Management License #2 (Provincial and Inset Map A); 40
b. The Nelson River Forest Section (Provincial and Inset Map A); and 41
c. Forest Management Units 85, 87 and 89 (Provincial and Inset Map A). 42
43
4. Kelsey re‐runnering ‐ The location of the Kelsey Generating Station has been 44
mapped (Inset Map A). Further details can be found on this project in Appendix 45
7A of the Response to EIS Guidelines, page 7A‐10. 46
47
5. Gillam Redevelopment and Expansion Program ‐ The location of Gillam has been 48
mapped (Inset Map B). Further details can be found on this project in Appendix 49
7A of the Response to EIS Guidelines, page 7A‐13. 50
Additional information available for the Bipole III Transmission Project is displayed 51
including the following components: 52
1. Keewatinoow Converter Station (Provincial and Inset Maps A and C); 53
2. Keewatinoow Ground Electrode Site (Inset Map C); 54
3. Keewatinoow Ground Electrode Line (Inset Map C); 55
4. AC collector line from Long Spruce Generating Station to Henday Converter 56
Station(Inset Map B); 57
5. Five AC 230Kv collector lines from Henday Converter Station to the 58
Keewatinoow Converter Station (Inset Map C); 59
6. Construction power line from Henday Converter Station to the construction 60
camp site (Inset Map C); 61
7. Start‐up and main construction camp sites (Inset Map C) ); and 62
8. Potential borrow and excavated material placement areas (Inset Map C). 63

GULL LAKE
Ferris Bay
Kettle Lake
ANGLING
LAKE
NELSON RIVER
Birthday Rapids
Little Kettle Lake
North
Angling
Lakes
Lower Limestone
Rapids
STEPHENSLAKE
Little LimestoneLake
ANGLING
RIVER
NORTH
ANGL IN
G
RIVER
LIMESTONE
RIVER
SundanceCree k
Twe lve
Mile Creek
S k y Pilot
Creek
Brooks
Cree
k
KETTLE
RIVER
LIM
ESTONE
RIVER
BUTN
AURIVER
SOUTHMO SWAKOT RIVER
NORTHMOSWAKOT
RIVER
LookingBack
Creek
BUTNAU LAKE
WASKAMAWRIVER
NELSO
N RIVE
R
Gillam
AC Collector Linesto Keewatinoow C.S.
Keeyask TransmissionSwitching Station
HWY # 290
ConawapaAccessRoad
HWY # 280
Existing AC Collector Lines
LongSpruce
G.S.
LimestoneG.S.
KettleG.S.
HendayConverterStation
RadissonConverterStation
ProposedKeeyaskG.S.
ProposedConawapaG.S.
Proposed SouthAccess Road
PR 280
SipiweskLake
Landing Lake
WuskwatimLake
Partridge Crop Lake
Oxford Lake
Bear Lake
Utik Lake
Gods Lake
Knee Lake
EdmundLake
KistiganLake
Stephens Lake
NELSON RIVER
WaskaiowakaLakeBaldock
Lake
GauerLake
NorthernIndianLake
Southern Indian
Lake
PaintLake
NELSO
NRIV
ER
Bu r ntwood
Rive r
Split Lake
Haye
sRiv
er
Oxford Lake
Settin
g La
ke
KeewatinoowConverter Station
ProposedKeeyask G.S.
ProposedKeewatinoowConverter Station
PlannedConawapaG.S.
Fox Lake Cree NationA Kwis KiMahka Reserve
TataskweyakCree Nation
Split Lake
York FactoryFirst NationYork Landing(Kawechiwasik)
Fox LakeCree NationFox Lake (Bird)
War LakeFirst NationIlfordKelsey
G.S.
PR 280Bipole III Final Preferred Route
500-kV TL Bipoles 1 & 2
138-kV TL KN36
138-k
V TL R
C60
138-kVTL KN36
PR 280 Upgrade
Locationof Vale
DATA SOURCE:
DATE CREATED:
CREATED BY:
VERSION NO:
REVISION DATE:
QA/QC:
COORDINATE SYSTEM:
CEDAR
LAKE
HUDSON
BAY
LAKE WINNIPEGOSI S
LAKE WINNIPEG
LAKEMANITOBA
N E LSON
RIVER
Keewatinoow C.S.
Riel C.S.
ConawapaG.S.Keeyask
G.S.
Brandon
Churchill
FlinFlon
Steinbach
The Pas
Thompson
Winnipeg
UTM NAD 1983 Z15N
0 50 100 Miles
0 60 120 Kilometres
Crea
ted B
y: bb
ench
arski
- B S
ize La
ndsc
ape B
TB - D
EC 20
11Fil
e Loc
ation
: \\ge
odata
\ware
hous
e\Ware
hous
e_Gr
oups
\Powe
r_Sup
ply\P
rojec
ts\Ke
eyas
k\Map
s\EIS
\IRs\C
umula
tiveE
ffects
\Core
_CEA
_EFF
ECTS
_EIS
_Com
bined
_v17
_FIN
AL.m
xd
Keeyask Generation ProjectCumulative Effects
Manitoba Hydro; Government of Manitoba; Government of Canada
Manitoba Hydro - Hydro Power Planning - GIS & Special Studies
1.0 XXX/YYY/ZZZ
23-APR-13 19-MAR-13
Overall LegendGenerating Station (Existing)Generating Station (Planned)
Converter Station (Existing)
Converter Station (Planned)
HighwayAccess RoadProposed Access RoadRail (Active)Rail (Abandoned)
Transmission Line (Existing)Transmission Line (Proposed)First Nation ReserveExisting Water LevelInitial Flooded Area (159 m)
LegendVale Industries LocationCommercial Fishing LakePR 280 Upgrade SegmentBipole III Final Preferred RouteMining Claims - North of Split LakeMineral Exploration LicenseTransmission Line (Proposed)Nelson River Forest SectionForest Management Unit: 85, 87, 89Forest Management License 2 - Tolko Industries
LegendHistoric Commercial Fishing (Sipiwesk Lake)
Jenpeg Control StructureMissi Control StructureNotigi Control Structure
Transmission Line (Planned)Bipole III - Final Preferred Route
Transmission Line (Existing)+/- 500 kV HVDC Line230 kV Line138 kV Line115 kV Line
Altered WaterwaysBy Churchill River Diversion (CRD)By Churchill Reduced FlowBy Lake Winnipeg Regulation (LWR)By Both CRD and LWRResource Management Area (Split Lake)Nelson River Forest SectionForest Management Unit: 85, 87, 89Forest Management License 2 - Tolko Industries
A
Inset Map A
Inset Map B Bipole III HVdc Line
To Henday C.S.
ConawapaAccessRoad
Construction Power Line
KeewatinoowGround Electrode Site
Start-UpCamp
Potential Borrow Area
KeewatinoowConverter Station
Potential ExcavatedMaterial Placement Area
Main ConstructionCamp
Construction Power Station
AC 230Kv C
ollector
Lines
Keew
atinoow
Ground
Electro
de Lin
e
AC 230Kv C
ollector
PlannedConawapaG.S.
LegendKeeyask Infrastructure Project - Local Study AreaKeeyask Infrastructure Project - Available for Use
Keeyask Transmission ProjectTransmission Line (Proposed)Transmission Switching Station (Proposed)
B
Inset Map C
C

TAC Public Rd 2 MCWS-Fisheries-0001
Page 1 of 6
REFERENCE: Volume: Aquatic Environment Supporting Volume; 1
Section: 3.4.2.2, 4.4.4.2.2 & 5.3.2.7 p. N/A 2
TAC Public Rd 2 MCWS-Fisheries-0001 3
QUESTION: 4 Please provide additional information regarding aquatic invasive species (AIS), with 5 specific reference to Spiny Waterflea, Zebra Mussels and Rainbow Smelt. In particular, 6 demonstrate how the proponent will: 1) identify the impact of AIS on the native fish 7 community given that these specific AIS are better adapted to lacustrine and reservoir 8 habitats and 2) distinguish the potential impact of these AIS on both the existing and 9 post project aquatic environment apart from the impact of the Project itself. The 10 impacts may be synergistic, but if that is expected to be the case, then the proponent is 11 requested to explain how the project and the effects of AIS are expected to interact. 12 Finally, please include a discussion of best management practices to be implemented 13 both during project construction and, during ongoing operation to negate the spread 14 and / or mitigate the impact of aquatic invasive species. 15
RESPONSE: 16 The discussion below separately addresses the spiny water flea, zebra mussel and 17 rainbow smelt in terms of their current status in Manitoba and the Project area, and 18 potential impacts on the native fish community in the Project area under existing and 19 post-Project conditions. Management measures are discussed at the end of this 20 submission. 21
Spiny Water Flea 22
The spiny water flea (Bythorephes longimanus Leydig) is a large cladoceran that is native 23 to northern Europe and Asia. This species has become established in all of the Great 24 Lakes where it is thought to have been introduced from ship ballast water (Sprules et al. 25 1990; Berg et al. 2002). The first occurrence of the spiny water flea in Manitoba waters 26 was recorded in a larval lake sturgeon drift trap sample collected from the Winnipeg 27 River (Gill 2011). The spiny water flea was also recorded in 2012 at nearshore sites in 28 Playgreen Lake (upper Nelson River) sampled under Manitoba/Manitoba Hydro’s 29 Coordinated Aquatic Monitoring Program (CAMP). To date, this species has not been 30 documented in the Keeyask Project area; however, given its presence in the upper 31 Nelson River it is likely that it will spread downstream, though whether it will thrive in 32 the Nelson River is not known. 33
The spiny water flea is a temperate, freshwater adapted species and is typically found in 34 large, deep clear lakes with relatively low summer bottom temperatures where it 35

TAC Public Rd 2 MCWS-Fisheries-0001
Page 2 of 6
associates with other zooplankton in the upper water column (Berg and Garton 1988; 36 MacIssac et al. 2000). The species reproduces rapidly and is not readily consumed by 37 smaller-sized predators due to its spiny tail. As a result, it can quickly dominate the 38 communities of waterbodies into which it is introduced. The introduction of the spiny 39 water flea has been associated with changes in the native zooplankton community 40 (USEPA 2008), declines in fish species abundance as a result of competition for food 41 with planktivorous larval fish (Berg and Garton 1988; Evans 1988; Vanderploeg et al. 42 1993), and the fouling of fishing gear resulting from tail spines hooking on fishing lines 43 (EC and MWS 2011). 44
As discussed above, the spiny water flea has not been recorded in the Project area, and 45 the record from the upper Nelson River occurred after the Keeyask environmental 46 impact statement (EIS) was prepared. For this reason, neither the potential effects of 47 the Project on this species, nor potential effects of this invasive species on the native 48 fish community were discussed in the EIS. The following outlines effects of reservoir 49 creation on the zooplankton community, as described in the Aquatic Environment 50 Supporting Volume (AE SV) Section 4.4.4.2.2, and it is anticipated that these would be 51 similar for the spiny water flea. 52
“Typically, predominantly riverine environments do not support an abundant 53 zooplankton community. In many impoundments, zooplankton density rises in 54 response to increases in the concentration of fine, particulate organic matter, 55 water retention time, and phytoplankton biomass (Henriques 1987). Evidence 56 from other northern Manitoba reservoirs also indicates a small increase in 57 zooplankton abundance because of conversion of river to reservoir habitat (NSC 58 2012). However, only small increases in mean zooplankton abundance along the 59 mainstem are expected in the Keeyask reservoir as increased water residence 60 time will remain too short to permit a measurable increase in abundance; 61 although total abundance (‘standing stock’) would increase with the predicted 62 increase in reservoir volume (approximate doubling in comparison to the existing 63 environment) (Section 3.4.2.2). Community composition should remain 64 comparable to the current condition, with a community dominated by small 65 cladocerans (e.g., Bosmina spp.) and cyclopoid copepods. The lack of detectable 66 effects may be attributed to high water flushing rates through the mainstem 67 portion of the reservoir (i.e., post-Project water residence time will be in the 68 order of 15 to 30 hours, depending on flow; Section 3.4.2.2), and subsequently, 69 the low accumulation of zooplankton in the reservoir. Short retention times are 70 often associated with high turbulence (turbidity), a mixed waterbody, and a lack 71 of thermal stratification. Zooplankton require a minimum retention time to allow 72 development. If rates of water movement through a reservoir exceed a few 73 millimetres per second, little plankton will develop (Hynes 1970). 74
TAC Public Rd 2 MCWS-Fisheries-0001
Page 3 of 6
Off-current areas could experience small to moderate increases in zooplankton 75 abundance as water residence time in bays is estimated to be substantially 76 longer than in the mainstem and could be up to one month long (Section 77 3.4.2.2). Post-impoundment conditions may favour bacteria over phytoplankton 78 (Paterson et al. 1997). The addition of large amounts of newly flooded terrestrial 79 organic matter may stimulate bacterial activity (increase the flow of carbon to 80 higher trophic levels through the detrital pathway) and increase bacterial 81 biomass in the medium term (5–10 years post-impoundment) instead of 82 phytoplankton. An increase in bacterial biomass could provide a post-flooding 83 food resource for zooplankton leading to an increase in zooplankton density and 84 a shift in community composition to larger daphnids (more effective grazers on 85 bacteria). Additionally, refugia for zooplankton from planktivorous fish 86 predation (e.g., rainbow smelt) may be created over flooded peat by low oxygen 87 conditions (Paterson et al. 1997).” 88
The effect of the spiny water flea on the fish community cannot be determined since it 89 is not known how abundant it will ultimately become in the Nelson River, nor how 90 native species will interact with it. Distinguishing the effects of this species versus the 91 Project on the fish community would also present a challenge; however, several sources 92 of information will assist in this endeavor: 93
1. A monitoring program for B. longimanus has been included in the Aquatic Effects 94 Monitoring Program (AEMP). This program will indicate whether the species is 95 present and, if so, whether its abundance is changing. A temporal record of this 96 species’ arrival and proliferation will assist in determining related effects to the fish 97 community; 98
2. The CAMP does not sample zooplankton; however, it does collect data on the fish 99 community in a wide range of waterbodies in northern Manitoba and both fish and 100 benthic invertebrate collection methods provide anecdotal records of the presence 101 of spiny water flea. As discussed in the AEMP for the Keeyask Project, CAMP 102 waterbodies provide valuable context for interpreting changes observed in the 103 Keeyask area, particularly to distinguish Project effects from other agents of change 104 (e.g., climate change, invasive species). 105
Zebra Mussels 106
Zebra mussels (Dreissena polymorpha) are native to eastern Europe and western Asia 107 and were first found in North America in the late 1980s. They are thought to have been 108 introduced in discharged freshwater ballasts from ocean-going ships. Although zebra 109 mussels are not currently in Manitoba, established colonies of zebra mussel were 110 reported in the Lake Winnipeg watershed in 2009 (EC and MWS 2011). The distribution 111 of zebra mussels is thought to be controlled by temperature and calcium concentration 112

TAC Public Rd 2 MCWS-Fisheries-0001
Page 4 of 6
in the water. The potential detrimental effects of zebra mussels include accumulation 113 on structures; reduction of recreation potential of beach areas due to the accumulation 114 of sharp shells and foul odors from decaying, dead mussels; reduction in species of algae 115 and zooplankton; and a decrease in native mussel populations. 116
The EIS for the Keeyask Project did not assess the effects of zebra mussel on the native 117 fish community, or the effects of the Project on this species, given that it has not been 118 recorded in Manitoba. Manitoba Hydro initiated a three part zebra mussel program in 119 the 1990s that includes monitoring, mitigation, and contingency planning. If this 120 program indicates that zebra mussel have entered Manitoba’s southern rivers and 121 subsequently the upper Nelson River, the monitoring program and mitigation measures 122 would be reviewed to determine whether any modifications are required. 123
Rainbow Smelt 124
Rainbow smelt (Osmerus mordax) are a small-bodied pelagic fish with a circumpolar 125 distribution. They first became introduced into the Great Lakes in the early 1900s and 126 their distribution continues to expand in North American lakes, both as a result of 127 human introductions and natural dispersal (Rooney and Paterson 2009). The potential 128 effects of the introduction of rainbow smelt are described in Section 5.3.1 of the AE SV: 129
“Rainbow smelt were first reported in Split Lake and Stephens Lake in 1996 130 (Remnant et al. 1997). The colonization of waterbodies by rainbow smelt is 131 generally considered to be an unfavourable occurrence. Rainbow smelt are an 132 aggressive invading species that can alter the composition and abundance of 133 native species, such as lake whitefish, cisco, and emerald shiner, residing in the 134 waterbodies they invade. It is believed that rainbow smelt compete with these 135 species for space and food and prey on their larvae (Franzin et al. 1994). 136 Additionally, the consumption of rainbow smelt by predatory species such as 137 walleye and northern pike may lead to an increase in mercury concentrations in 138 these predators (Evans and Loftus 1987). Consumption of rainbow smelt has also 139 been linked to a condition called “belly burn” in commercial catches of walleye. 140 Belly burn is generally thought to occur by the release of enzymes found in 141 rainbow smelt that break down the flesh of walleye stomachs. This condition can 142 negatively affect a commercial fishery by decreasing the amount of time to 143 process fish and by depreciating the value of fish stock that has not been 144 processed fast enough (Freshwater Fish Marketing Corporation [FFMC] 2003).” 145
The effects of rainbow smelt on the existing environment are described in Section 146 5.3.2.7 of the AE SV: 147

TAC Public Rd 2 MCWS-Fisheries-0001
Page 5 of 6
“In addition to habitat-related changed caused by hydroelectric development 148 (i.e., CRD/LWR, Kettle GS, Kelsey GS), fish populations in the study area have 149 more recently been affected by the introduction of rainbow smelt. Rainbow 150 smelt were first detected in Split and Stephens lakes in 1996 and currently 151 account for up to 40% of the catch at Split Lake in small mesh gill nets and up to 152 12% of the catch in Stephens Lake. In addition to changing species composition, 153 rainbow smelt are also affecting the diet of predatory species in these lakes. At 154 present, rainbow smelt occur in up to 60% of the stomachs of predatory fish 155 captured in standard gangs in Split Lake, and up to 30% of the piscivores 156 captured in Stephens Lake. 157
Due to the amount of time that fish populations require to adapt to habitat 158 changes, combined with the ongoing effects of rainbow smelt introduction, it is 159 expected that the fish populations in the study area are still evolving.” 160
It is expected that in the absence of the Project, rainbow smelt would continue to 161 increase in the Keeyask area and would contribute to an increase in the overall forage 162 fish production. It will be impossible to differentiate the effects of rainbow smelt and 163 the Project on the aquatic environment since these impacts will co-occur. The regional 164 abundance of rainbow smelt will be monitored as part of the Comprehensive Aquatic 165 Monitoring Program conducted by Manitoba and Manitoba Hydro. As discussed above, 166 CAMP waterbodies provide valuable context for interpreting changes observed in the 167 Keeyask area, particularly to distinguish Project effects from other agents of change. 168
Management Measures for Aquatic Invasive Species 169
The final Environmental Protection Plans for the Keeyask Project will incorporate 170 measures that will be developed with guidance from the Province, which is currently 171 developing a provincial Aquatic Invasive Species program to manage the spread of 172 invasive species. 173
LITERATURE CITED: 174 Berg, D.J., D.W. Garton, H.J. MacIsaac, V.E. Panov, and I.V. Telesh. 2002. Changes in 175 genetic structure of North American Bythotrephes populations following invasion from 176 Lake Ladoga, Russia. Freshwater Biology 47:275-282. 177
Berg, D.J., and D.W. Garton. 1988. Seasonal abundance of the exotic predatory 178 cladoceran, Bythotrephes cederstroemi, in western Lake Erie. Journal of Great Lakes 179 Research 14(4):479-488. 180
Environment Canada and Manitoba Water Stewardship (EC and MWS). 2011. State of 181 Lake Winnipeg: 1999 to 2007. June, 2011. 209 p. 182

TAC Public Rd 2 MCWS-Fisheries-0001
Page 6 of 6
Evans, M.S. 1988. Bythotrephes cederstroemi: its new appearance in Lake Michigan. 183 Journal of Great Lakes Research 14(2):234-240. 184
Gill, G.J. 2011. Spiny water flea (Bythotrephes longimanus Leydig) in the Winnipeg River: 185 first record of the aquatic invasive species in Manitoba. Report prepared by North/South 186 Consultants Inc. Publication # 5819.09-04, 6 pp. 187
MacIsacc, H.J., H.A.M Ketelaars, I.A. Grigorovich, C.W. Ramcharan, and N.D. Yan. 2000. 188 Modelling Bythotrephes longimanus invasions in the Great Lakes basins based on its 189 European distribution. Arch. Hydrobiol. 149: 1-23. 190
Rooney, R.C. and M.J. Paterson. 2009. Ecosystem effects of Rainbow Smelt (Osmerus 191 mordax) invasions in inland lakes: A literature review. Canadian Technical Report of 192 Fisheries and Aquatic Sciences 2845: 33 pp. 193
Sprules, W.G., H.P. Riessen, and E.H. Jin. 1990. Dynamics of the Bythotrephes invasion of 194 the St. Lawrence Great Lakes. Journal of Great Lakes Research 16: 346-351. 195
U.S. Environmental Protection Agency (USEPA). 2008. Predicting future introductions of 196 nonindigenous species to the Great Lakes. National Center for Environmental 197 Assessment, Washington, DC; EPA/600/R-08/066F. 198
Vanderploeg, H.A., J.R. Liebig, and M. Omair. 1993. Bythotrephes predation on Great 199 Lakes zooplankton measured by an in situ method: implications for zooplankton 200 community structure. Archiv für Hydrobiologie 127:1-8. 201

TAC Public Rd 2 MCWS-Fisheries-0002
Page 1 of 2
REFERENCE: Volume: Response to EIS Guidelines; Section: N/A; p. 1
N/A 2
TAC Public Rd 2 MCWS-Fisheries-0002 3
QUESTION: 4 Please provide additional information on how the Partnership will monitor and mitigate 5 impacts resulting from the offset lake fishing program. 6
RESPONSE: 7 The Keeyask Adverse Effects Agreements with Tataskweyak Cree Nation, War Lake First 8 Nation and York Factory First Nation include provision for a program to address the 9 potential for increased mercury concentrations in fish by replacing the domestic supply 10 of fish currently taken from on-system lakes and rivers that have the potential to be 11 affected by Keeyask. The Keeyask Adverse Effects Agreement with Fox Lake Cree Nation 12 includes provision for an Alternative Resource Use Program, which may be used to 13 harvest fish species in alternate resource areas within the Fox Lake Resource 14 Management Area. These and other offsetting programs are designed to address effects 15 on KCNs members’ Treaty and Aboriginal rights resulting from the construction and 16 operation of the Keeyask Project. 17
Each of the KCNs is responsible for implementing the relevant programs for their 18 community and for identifying possible off-system lakes to provide this replacement fish 19 supply. To assist in selecting lakes for the program, and in light of the potential for more 20 intensive fish harvests, the Partnership undertook fish community assessments between 21 2004 and 2006 on 13 lakes in the Split Lake Resource Management Area. The study 22 documented the relative abundance of fish species in each lake, biological data (age and 23 size) of the fish, and mercury levels. The study also estimated the maximum sustainable 24 yield in each lake. Based on this information, TCN and War Lake selected five and two 25 lakes, respectively, to be harvested for their offset fishing programs - the only 26 communities thus far to identify offset lakes for this purpose. As new or different lakes 27 are identified by the Keeyask Cree Nations for the purposes of these programs for which 28 no fisheries data are available, analysis will be undertaken in consultation with the Split 29 Lake Resource Management Board (SLRMB). 30
TCN and War Lake are currently developing community-controlled Fish Harvest 31 Sustainability Plans. These plans are being developed through a process of consultation 32 with Members, provincial fisheries managers, the Partnership, and the SLRMB. The 33 plans will be provided to the SLRMB to contribute to fulfilling requirements of Article 34

TAC Public Rd 2 MCWS-Fisheries-0002
Page 2 of 2
5.6.2 of the 1992 Implementation Agreement which states that the Board will develop 35 and recommend resource management plans for the Resource Management Area. 36
The Fish Harvest Sustainability Plans will provide program managers in each community 37 with information needed to implement, regulate and monitor fishing activities on 38 program lakes so that long-term community objectives will be met. Fishing pressure will 39 be adjusted according to monitoring results to ensure that harvest levels remain 40 sustainable. Monitoring details are provided in each Plan, and follow accepted fisheries 41 management practices. It is anticipated that monitoring of mercury levels in the catch 42 associated with these programs will be undertaken. 43
Monitoring will be undertaken to determine whether any reductions in trophy fish are 44 seen and to determine the need for any adaptive management measures. 45
The commercial lodges and outfitters operating in the Split Lake Resource Management 46 Area operate under licences issued by the Province of Manitoba. These licences are 47 subject to Treaty and Aboriginal rights. In the past, resolution of concerns has been 48 mutually resolved by the responsible parties involved and it is anticipated this will 49 continue into the future. 50
The KCNs’ adverse effects agreements also require each KCN to coordinate its activities 51 with its respective Resource Management Board. Each KCN is to seek input from the 52 respective Board and to provide annual program reports respecting the management 53 and administration of the Offsetting Programs that involve resource management, 54 resource harvesting and resource use activities. The Boards are comprised of 55 representatives from the respective KCNs, Manitoba and, in some cases, Manitoba 56 Hydro.57

TAC Public Rd 2 MCWS-LB-0012
Page 1 of 2
REFERENCE: Volume: Response to EIS Guidelines; Section: N/A; p. 1
N/A 2
TAC Public Rd 2 MCWS-LB-0012 3
QUESTION: 4 The NE Wildlife Branch was not aware that a caribou access program was going to be 5 implemented with TCN. If this is happening, will the branch have any input or say on 6 this? Initially it doesn't make sense as the Caribou aren't always in the area of the 7 Keeyask access road or Generation Station. How is there enough of a disturbance that 8 would require an annual fly out hunting program? Locals aren't guaranteed caribou 9 every year if they haven't migrated through the area, why would guaranteed hunting via 10 an access program be allowed? Please provide additional comment. 11
RESPONSE: 12 Under TCN’s Adverse Effects Agreement, a number of offsetting programs are 13 established to provide appropriate replacements, substitutions or opportunities to 14 offset unavoidable Keeyask adverse effects on practices, customs and traditions integral 15 to the distinctive cultural identity; i.e. to address effects of the Project on Treaty and 16 Aboriginal rights. 17
For example, among its Offsetting Programs, Tataskweyak Cree Nation (TCN) has an 18 Access Program through which Members are provided up to 52,000 miles of air charters 19 per year and other services to enable them to travel to areas in the Split Lake Resource 20 Management Area not affected by the Keeyask Generation Project. 21
The Access Program does not specifically target caribou – they are, however, hunted 22 opportunistically. Access Program reports from 2005 to date indicate that a total of four 23 (4) caribou have been harvested under the TCN spring and fall Access Programs. With 24 the Access Programs occurring in the spring and fall, very few caribou are harvested 25 because, typically, they are much more abundant and accessible during the winter 26 season. The Spring Access program tends to target waterfowl and the fall program tends 27 to target moose. 28
As part of its Adverse Effects Agreement, TCN is to coordinate its activities with the Split 29 Lake Resource Management Board. TCN is to seek input from the board and to provide 30 annual program reports respecting the management and administration of the 31 offsetting programs that involve resource management, resource harvesting and 32 resource use activities. 33

TAC Public Rd 2 MCWS-LB-0012
Page 2 of 2
Community harvest levels for the CNP will be gathered as part of the reporting process 34 outlined for the Access Program under the Adverse Effects Agreement. This information 35 will be available to Tataskweyak and War Lake representatives on the SLRMB and will be 36 shared as appropriate.37

TAC Public Rd 2 MCWS-LB-0013
Page 1 of 1
REFERENCE: Volume: N/A; Section: N/A; p. N/A 1
TAC Public Rd 2 MCWS-LB-0013 2
QUESTION: 3 MCWS-LB-0004: Lines 55-60. This paragraph seems to refer to an offsetting program 4 specifically for caribou domestic harvest. Is this what it means or is it referencing 5 offsetting programs in general 6
RESPONSE: 7 We apologize for the confusion. The paragraph is referring to the offsetting programs in 8 general. 9
For further clarification: The TCN Access Program does not specifically target caribou – 10 they are, however, hunted opportunistically. Access Program reports from 2005 to date 11 indicate that a total of four (4) caribou have been harvested under the TCN spring and 12 fall Access Programs. With the Access Programs occurring in the spring and fall, very few 13 caribou are harvested because, typically, they are much more abundant and accessible 14 during the winter season. The spring Access Program tends to target waterfowl and the 15 fall program tends to target moose. 16

TAC Public Rd 2 NRCan-0005
Page 1 of 5
REFERENCE: Volume: Response to EIS Guidelines; Section: Section 1
6.2.3.2.9; p. p. 6-50 2
TAC Public Rd 2 NRCan-0005 3
ORIGINAL PREAMBLE AND QUESTION: 4 The proponent discusses baseline groundwater quality based on reference to the 5 literature. They also mention that on-site groundwater analyses confirm this and discuss 6 elevated zinc concentrations. However, there is no information provided with respect to 7 on-site sampling. It is unclear how many on-site samples were collected and what 8 parameters they were analyzed for. The analytical results are not presented. The 9 absence of this information makes it impossible to assess if baseline conditions of 10 groundwater quality have been adequately determined. 11
Provide the location of on-site groundwater monitoring well sampling sites. Provide 12 information on the frequency of groundwater sampling from these sites. Provide 13 information on sampling and laboratory methodologies, including a discussion of quality 14 assurance and quality control. Present the analytical results of all field-derived and 15 laboratory analyses. Provide a direct comparison, by means of a table, of groundwater 16 quality determined from on-site measurements versus groundwater quality gleaned 17 from the literature. It is recommended the following physical and chemical parameters 18 be tested for in groundwater: alkalinity, temperature, pH, Eh, electrical conductivity 19 (EC), major ions, nutrients, minor and trace constituents, and metals (including methyl 20 mercury)." 21
FOLLOW-UP QUESTION: 22 The proponent mentions that two groundwater sampling trips were conducted- one for 23 the camp well investigation and one for the groundwater investigation. Are the results 24 presented in the Keeyask Response to IR's just for the groundwater investigation? 25 Please clarify. If camp well data has not been presented, please do so. Also, on Map 8.2-26 2 of the Physical Environment Supporting Volume Groundwater, there are 5 other wells 27 (G-0556, G-5086, G-0561, 03-042, 03-045). Please clarify if these wells were sampled 28 and provide any data for these wells. 29
RESPONSE: 30 Water quality results presented in the initial response to NRCAN-0005 were for the 31 groundwater investigation. Groundwater well G-0556 was also tested but results from 32 this well indicated that a solution was previously added to the well to prevent it from 33 freezing. Based on the water quality test results the solution was likely saline. 34 Preventing the well from freezing was necessary at this site because the well was 35 originally drilled to install a piezometer that would function year round. Because a 36

TAC Public Rd 2 NRCan-0005
Page 2 of 5
solution was added to prevent the well from freezing the results of the water quality 37 test at this site could not be used to represent groundwater quality. 38
The camp well investigation took place in 2008 to consider potential supply rates and 39 water quality. A test well (PW1) was drilled approximately 2.5 km due north of the 40 proposed Keeyask camp, north of Looking Back Creek in granular deposit G1 (see Figure 41 1 below for approximate location). Four observation wells (OW1, OW2, OW3, OW4) 42 were also drilled in deposit G1 near PW1 to observe drawdown and recharge during the 43 pump test. Water samples from these wells were also tested for water quality. Two 44 wells (OW1, OW2) were located immediately adjacent to PW1, one (OW1) was about 45 25 m to the west and another (OW4) was about 100 m east. All of the wells were 46 located outside of the groundwater study area. Current plans for the Keeyask Project 47 call for potable water to be drawn from two wells in deposit G1 for the camp water 48 supply (PD SV, Sec. 3.3.1.1). During operation, potable water will be drawn from the 49 reservoir (PD SV, Sec. 4.6.7). The following tables summarize the results of water quality 50 tests from these wells. Four water samples from PW1, including a duplicate, and one 51 sample from each from the OW wells were tested for general water quality (Table 2). 52 Two water quality samples from PW1, including a duplicate, were tested for dissolved 53 metals concentrations (Table 3). 54
Figure 1: Approximate location of camp well investigation (displayed on 55 portion of PE SV Map 8.2-2) 56
57
approximate location of camp well investigation

TAC Public Rd 2 NRCan-0005
Page 3 of 5
Table 2 (Page 1 of 2): 2008 Phase 1 Camp Well Installation & Pumping Well Test Program, General Water Quality. 1
2

TAC Public Rd 2 NRCan-0005
Page 4 of 5
Table 2 (Page 2 of 2): 2008 Phase 1 Camp Well Installation & Pumping Well Test Program, General Water Quality. 3
4

TAC Public Rd 2 NRCan-0005
Page 5 of 5
Table 3: 2008 Phase 1 Camp Well Installation & Pumping Well Test Program, Metals in Groundwater.5

TAC Public Rd 2 NRCan-0016
Page 1 of 3
REFERENCE: Volume: Physical Environment Supporting Volume; 1
Section: Section 5.3.2.1; p. 5-5 to 5-6 2
TAC Public Rd 2 NRCan-0016 3
PREAMBLE: 4 The nature of underlying bedrock (and overlying materials) is an important component, 5 even in projects such as Keeyask where it provides not only the solid ground on which 6 the Generating Station rests but also it may contain trace elements that may affect 7 groundwater and surface water quality. The Precambrian bedrock is described as 8 consisting of greywacke gneisses, granite gneisses and granites. What are greywacke 9 gneisses? Please provide a more detailed description of regional and local bedrock that 10 includes information such as: local fracture/joint density, orientation, etc. 11
QUESTION: 12 The proponent has not provided the information requested in relation to a detailed 13 description of the regional and local bedrock that includes information such as: local 14 fracture/joint density, orientation, etc. NRCan requests that this information be 15 provided. 16
RESPONSE: 17 Addition information about the geologic conditions in the Keeyask study area is 18 provided in the following seven reports which were provided to Natural Resources 19 Canada on March 25, 2013. 20
Keeyask Stage IV Engineering Design Memoranda 21
• GN-4.3.24 Rev 0 - Open File Report OF2006-32, Bedrock Geology of the Gull Rapids 22 Area, Manitoba (part of NTS 54D6) by C.O. Bohm, M.S. Bowerman and M.W. 23 Downey (2006) 24
The document aims to: 25
o provide part of a new framework for the geology of the northern margin of 26 the Superior Province in Manitoba; 27
o improve the understanding of an economically important but insufficiently 28 studied area between the exposed portions of the Thompson Nickel and Fox 29 River belts; and 30
o provide Manitoba Hydro with detailed geological information necessary for 31 the bedrock assessment of the Keeyask hydroelectric dam site. 32

TAC Public Rd 2 NRCan-0016
Page 2 of 3
• GN-1.5.4 Rev0 - Bedrock Geology – Review of Bedrock Conditions in the 33 Powerhouse Area by KGS/Acres (2009) 34
This memorandum discusses the preliminary results of the 2003 powerhouse 35 investigations and the overall interpretation of the findings of all the investigations 36 undertaken within this area. This review includes the following results: 37
o general bedrock lithology 38 o core losses/recovery 39 o Rock Quality Designation (RQD) and rock mass characteristics 40 o Water Pressure Testing (WPT) 41 o dominant joint orientation trends 42 o Rock Mass Rating (RMR) and Geological Strength Index (GSI). 43
• GN-1.5.5 Rev0 - Bedrock Geology – Review of Bedrock Conditions in the Spillway 44 Area by KGS/Acres (2009) 45
This memorandum discusses the preliminary results of the 2003 spillway investigations 46 and the overall interpretation of the findings of all the investigations undertaken within 47 this area. This review includes the following results: 48
o general bedrock lithology 49 o core losses/recovery 50 o Rock Quality Designation (RQD) and rock mass characteristics 51 o Water Pressure Testing (WPT) 52 o dominant joint orientation trends 53
o Rock Mass Rating (RMR) and Geological Strength Index (GSI) 54
Manitoba Geological Survey Reports 55
• GS-13 Bedrock mapping in the Gull Rapids area, northern Manitoba (NTS 56 54D6) by C.O. Böhm, M.S. Bowerman1 and M.W. Downey (2006). 57
In the summer of 2003, the Manitoba Geological Survey, in collaboration with the 58 Universities of Alberta and Waterloo, started a three-year integrated bedrock-mapping 59 program with the aim of documenting the geology in great detail, to unravel the nature 60 and age of the rocks and to resolve the timing and kinematics of structures at Gull 61 Rapids. Mapping at 1:1000 scale, undertaken this summer, identified an Archean 62 amphibolite-facies supracrustal assemblage consisting of amphibolite (metabasalt) and 63 Fe-rich metagreywacke, with interlayered banded oxide-, sulphide- and silicate-facies 64 iron formation 65
TAC Public Rd 2 NRCan-0016
Page 3 of 3
• GS-15 Split Lake Block revisited: new geological constraints from the Birthday to 66 Gull rapids corridor of the lower Nelson River (NTS 54D5 and 6) by R.P. Hartlaub, 67 L.M. Heaman, C.O. Böhm and M.T. Corkery (2003). 68
This report presents the preliminary results from a two-week field study of the Birthday 69 to Gull rapids section of the lower Nelson River and marks the beginning of a new 70 multiyear project to examine the age and tectonic setting of crustal domains along the 71 northwest margin of the Superior Province. 72
• GS-08 Structural geology of the Mystery-Apussigamasi lakes area, Manitoba (parts 73 of NTS 63P13 and 14) by Y.D. Kuiper1, C.O. Böhm and S. Lin (2005) 74
This report summarizes new structural data for the Mystery-Apussigamasi lakes area. A 75 major shear zone, trending ~030°, was found along Mystery Lake. It shows east-76 southeast-side-up sinistral movement and it crosscuts folds in the hostrocks to the east 77 and west. A minor northwest-side-up dextral shear/fault zone exists along the 78 northeastern part of Apussigamasi Lake and the southwestern part of the Burntwood 79 River 80
• GS-07 Northwestern Superior craton margin, Manitoba: an overview of Archean 81 and Proterozoic episodes of crustal growth, erosion and orogenesis (parts of NTS 82 54D and 64A) by R.P. Hartlaub1, C.O. Böhm, L.M. Heaman, and A. Simonetti 83 (2005). 84
This paper presents a summary of results from three years of mapping and 85 geochronology along the northwestern Superior Boundary Zone between 86 Paleoproterozoic rocks of the Trans-Hudson Orogen and Archean rocks of the Superior 87 craton. 88

TAC Public Rd 2 NRCan-0017
Page 1 of 2
REFERENCE: Volume: Response to EIS Guidelines; Section: Section 1
4.3.3.1 and 4.6.3; p. 4-34 2
TAC Public Rd 2 NRCan-0017 3
ORIGINAL PREAMBLE AND QUESTION: 4 The proponent indicates that standing woody material, including dead and living trees 5 and shrubs 1.5 m tall or taller, as well as fallen trees will be removed from the areas to 6 be flooded. Reservoir clearing addresses boating safety issues and aesthetic issues and 7 is also intended to reduce the production of methylmercury in the future reservoir. 8
The reduction of methylmercury production would be more effective if reservoir 9 clearing included the removal of labile organic materials such as shrub foliage. Labile 10 organic matter from flooded foliage is one of the main factors favouring the algal bloom 11 that occurs in the first years after impoundment, and this in turn favours the 12 methylation of mercury and its uptake in the reservoir foodweb. NRCan recommends 13 consider whether this strategy could be applied for the Keeyask project." 14
FOLLOW-UP QUESTION: 15 The proponent states that the production of MeHg is predominantly associated with the 16 decomposition of peat and other organic soils and that the decomposition of shrub 17 foliage is not expected to reduce significantly the mobilization of MeHg in the reservoir 18 foodweb. The EIS however, contains no information on the nature (labile/non labile) of 19 organic matter in soils (including peat) or vegetation of the region. The terrains that will 20 be flooded consist of a mosaic of vegetation and soil cover that have not been 21 characterized with respect to their MeHg mobilization potential. Characterize the 22 variable nature and concentration of C and Hg in vegetation and soils. 23
RESPONSE: 24 The predictions of future fish mercury concentrations in the Keeyask reservoir do not 25 rely on detailed information on all environmental compartments that potentially affect 26 the supply of methylmercury at the base of the food chain (including concentrations of 27 organic carbon and mercury in soil and vegetation of the flooded area) and the rate of 28 its bioaccumulation in the aquatic ecosystem. Instead, post-Project maximum fish 29 mercury concentrations were estimated from two empirical models relating the 30 percentage of flooded terrain to fish mercury content. One model (Johnston et al., 31 1991) is based on data from many reservoirs located in the same general geographical 32 area as the future Keeyask reservoir, i.e., areas with a similar mosaic of vegetation and 33 soil cover. The other model uses an existing reservoir (Stephens Lake) located within a 34 few kilometers downstream of the future Keeyask reservoir as a proxy for Keeyask. 35

TAC Public Rd 2 NRCan-0017
Page 2 of 2
These two models integrate the physical, chemical, and biological conditions that affect 36 the dynamics of mercury and its bioaccumulation in fish. Information on the quality 37 (e.g., labile/non labile) of organic matter in soils or vegetation will not improve the 38 quality of or add certainty to the model predictions and therefore, this information was 39 not collected. 40
REFERENCES: 41 Johnston, T.A., Bodaly, R.A., and Mathias, J.A. 1991. Predicting fish mercury levels from 42
physical characteristics of boreal reservoirs. Canadian Journal of Fisheries and 43 Aquatic Sciences. 48: 1468–1475.44

TAC Public Rd 2 NRCan-0018
Page 1 of 3
REFERENCE: Volume: KCN Evaluation Reports; Section: Section 1
6.4.7; p. 6-288 - 6-291 2
TAC Public Rd 2 NRCan-0018 3
ORIGINAL PREAMBLE AND QUESTION: 4 The proponent expects a significant increase of mercury concentrations in large 5 piscivorous species, such as walleye and northern pike and to a lesser extent in lake 6 whitefish. This increase is expected to peak within 3 to 5 years after flooding and to 7 decrease gradually in the following 25 to 30 years. Peak concentrations on the order of 8 0.8 to 1.4 ppm (Table 6-18), well above the 0.5 ppm guideline for commercial marketing, 9 are expected for walleye and northern pike. Given the amplitude of the mercury 10 residual effect, monitoring of Hg concentrations in fish muscle tissue will take place until 11 concentrations return to long-term stable levels. 12
The main measures proposed to mitigate the mercury issue in reservoir biota are (1) the 13 clearing of trees and large shrubs prior to flooding and (2) the monitoring of Hg 14 concentrations in large fish and (3) the ensuing publication of consumption advisories. 15 In an effort to reduce as much as possible the increase of mercury concentrations, 16 NRCan recommends that the proponent consider extending the reservoir clearing 17 activities to areas expected to be affected by peatland disintegration (cf. section 6.3.7), 18 one possible effect of which may be is to stretch beyond 30 years the period of strong 19 mercury contamination in the Keeyask reservoir. This consideration should be discussed 20 with relevant federal departments (e.g. Environment Canada) and provincial ministries. 21
FOLLOW-UP QUESTION: 22 In the proponent's view the model has the ability to fully integrate all the factors that 23 lead to MeHg contamination and that there is no need to characterize the organic C and 24 Hg burden of the vegetation and soils in terrains that will be flooded by the reservoir. It 25 is NRCan's view that fish MeHg concentrations in some boreal reservoirs, such as Gouin 26 or Baskatong, have yet to return to acceptable levels after more than 80 years of 27 impoundment. The proponent should consider all measures that may help to mitigate 28 the expected Hg increase in the reservoir foodweb, especially in view of the continued 29 'breakdown of shorelines' some 30 years after impoundment. 30
RESPONSE: 31
The overwhelming consensus in the scientific literature indicates that mercury 32 concentrations in fish from boreal reservoirs return to pre-Project or background levels 33 between 15 and 30 years after initial impoundment (Schetagne et al. 2003; Bodaly et al. 34 2007). The exact timeline of the return depends mainly on the fish species (piscivors 35

TAC Public Rd 2 NRCan-0018
Page 2 of 3
longer) and, to a lesser degree, on the magnitude of flooding (longer with high 36 proportion of flooded land), and the stability of the new reservoir shoreline (longer with 37 continuous erosion of organic soils). NRCan provides two examples of Québec 38 reservoirs, Gouin and Baskatong, for which the return times appear to be longer. 39 However, this notion is based on a single measurement taken 59 (Baskatong) and 67 40 years (Gouin) after reservoir formation, when mercury concentrations in Northern Pike 41 were at approximately 1.2 ppm (Schetagne et al. 2003 and pers. comm). Considering the 42 uncertainty of a single measurement in the face of considerable temporal variability in 43 mean mercury concentrations, and the fact that the range of concentrations in Pike 44 from natural lakes in the general area is 0.33-1.8 ppm (Schetagne et al. 2003), it is 45 questionable if Pike from the Gouin and Baskatong reservoirs represent valid examples 46 of extended return times of fish mercury. 47
Based primarily on empirical evidence from a number of reservoirs in the 48 physiographical region of the Keeyask reservoir, and taking into account the potential 49 effects of continuous but decreasing shoreline erosion on fish mercury concentrations, 50 the estimated 30 year return time for fish for the Keeyask reservoir must be considered 51 conservative (i.e., an over, rather than an under,estimate). Measures that potentially 52 shorten the time period needed for fish mercury concentrations to return to 53 background levels, such as the removal of organic soils and vegetation in the flooded 54 zone, may not be feasible and have little effect in an area dominated by peatlands which 55 are partly floating and inaccessible. Importantly, such measures bear a considerable risk 56 of actually increasing fish mercury concentrations. It has been shown that the 57 disturbance of the soil organic layer and the removal of vegetation can dramatically 58 increase methylmercury concentrations in runoff (Munthe and Hultberg 2004) and has 59 been linked to elevated mercury levels in fish (Bishop et al. 2009, Porvari et al. 2009). 60
LITERATURE CITED: 61 Bishop, K. Allan,C., Bringmark, L.,Garcia, E., Johansson, K., Munthe, J., Nilsson, M., 62
Porvari, P., and Meili, M. 2009. Forestry’s contribution to Hg bioaccumulation in 63 freshwaters: assessment of the available evidence. Abstract, 9th ICMGP. 7-12 June, 64 2009, Guiyang, China. 65
Bodaly, R.A., Jansen, W.A., Majewski, A.R., Fudge, R.J.P.,Strange, N.E., Derksen, A.J., and 66 Green, D.J. 2007. Post-impoundment time course of increased mercury 67 concentrations in fish in hydroelectric reservoirs of northern Manitoba, Canada. 68 Archives of Environmental Contamination and Toxicology 53: 379-389 pp. 69
Munthe, J., and Hultberg, H. 2004. Mercury and methylmercury in runoff from a 70 forested catchment concentrations, fluxes, and their response to manipulations. 71 Water, Air, and Soil Pollution: Focus 4: 607–618 pp. 72

TAC Public Rd 2 NRCan-0018
Page 3 of 3
Porvari, P., Verta, M., and Linjama, J. 2009. Forestry practices cause long-term and 73 highly elevated mercury and methylmercury output from boreal forest catchments. 74 Abstract, 9th ICMGP, 7-12 June, 2009, Guiyang, China.75
TAC Public Rd 2 NRCan-0019a and NRCan-0019b
Page 1 of 3
REFERENCE: Volume: Aquatic Environment Supporting Volume; 1
Section: Section 7.0 / Fish quality p. 7-1 to 7-75 2
TAC Public Rd 2 NRCan-0019a and NRCan-0019b 3
ORIGINAL PREAMBLE AND QUESTION: 4 This section presents a well documented and fairly comprehensive account of the 5 mercury issue in boreal hydroelectric reservoirs, and more specifically in the Keeyask 6 reservoir and nearby water bodies. It presents in a single document much of the 7 information which is otherwise scattered in various other EIS documents. 8
However, this document presents no information on the variability of Hg concentrations 9 in soils (particularly in organic horizons) that will be affected by reservoir flooding, 10 whether immediately following impoundment or much later as a result of peatland 11 disintegration. In NRCan's view this information, and its links with vegetation cover and 12 wildfire history, are critical in the development of strategies to reduce the 13 remobilization of mercury and to reduce methylation rates in flooded terrain. Moreover, 14 the EIS documents contain no information on forest fire history, as had been requested 15 in the Guidelines (section 8.1.3). NRCan recommends that this information be included 16 in the EIS. 17
FOLLOW-UP QUESTION: 18 As stated by the proponent, the magnitude and timing of the Hg responses are not only 19 related to mercury concentrations in soils and vegetation but also to factors such as 20 controls on methylation, availability of MeHg to the food web or trophic transfer to the 21 food web. For these reasons, NRCan proposes that the proponent characterize the 22 variable nature and concentration of C and Hg in vegetation and soils. As the proponent 23 recognizes, the algal bloom that follows flooding plays a key, perhaps determining, role 24 in transferring MeHg to the reservoir food web and thus must be attenuated as much as 25 possible by the removal of labile organic matter prior to flooding. It is NRCan's 26 understanding that the proponent has not utilized information on soil mercury content, 27 as this data was not included in the EIS. Without quality information on both Hg and C 28 characteristics in flooded terrains, there are no grounds to compare or assess MeHg 29 predictions in the future reservoir. The region that will be flooded has combined terrain 30 characteristics (thick peaty soils, permafrost) that have yet to be fully assessed in the 31 context of potential Hg contamination. NRCan suggests that the proponent carry out a 32 characterization study in this rather unique terrain and discuss results and mitigation 33 measures (as appropriate) with federal departments and provincial ministries. 34

TAC Public Rd 2 NRCan-0019a and NRCan-0019b
Page 2 of 3
RESPONSE: 35
As outlined in the original response to NRCan-0019a and the additional response to TAC 36 Public Rd 2, NRCan-0017, the predictions of future fish mercury concentrations in the 37 Keeyask reservoir were not based on a detailed mechanistic model that includes all or 38 most environmental compartments that potentially affect fish mercury concentrations 39 in reservoirs. Instead, post-Project fish mercury concentrations were estimated from 40 two empirical models that predict mercury content of reservoir fish based on its 41 relationship to the percentage of flooded terrain. Both models use reservoirs located in 42 the same general geographical area as the future Keeyask reservoir and feature similar 43 vegetation and soil cover and generally integrate the physical, chemical and biological 44 conditions that affect mercury bioaccumulation in fish. One of the models (Johnston et 45 al. 1991) has been published in peer-reviewed literature. This publication included 46 model tests by “hind casting” fish mercury concentrations from boreal reservoirs in 47 several Canadian regions. Although considerable differences existed between predicted 48 and observed concentrations for reservoirs from other regions, they closely agreed with 49 the test data from other northern Manitoba reservoirs. The second model was 50 developed based on measured mercury concentrations in Stephens Lake, a reservoir 51 developed immediately downstream of the Keeyask Generating Station in similar 52 terrain. Thus, detailed information on soil mercury concentrations (which are not known 53 to be related to post-flooding concentrations in fish) and the quality of organic matter in 54 soils or vegetation are not prerequisites for valid estimates of post-Project fish mercury 55 concentrations. 56
In their request for additional Information NRCan suggests that the proponents 57 recognize “the algal bloom that follows flooding to play a key, perhaps determining, role 58 in transferring MeHg to the reservoir food web”. NRCan further concludes that the algal 59 bloom “must be attenuated as much as possible by the removal of labile organic matter 60 prior to flooding”. The partnership did not make such a claim regarding the role of algal 61 blooms for mercury bioaccumulation at higher trophic levels. Conversely, the 62 concentration of methylmercury per cell decreases during algal blooms (i.e., bloom 63 dilution) and reduces mercury accumulation in zooplankton grazers (Pickhardt et al. 64 2002). At least for the reasons outlined by NRCan, the removal of labile organic matter 65 does not pose a promising mitigation method for elevated fish mercury concentrations 66 after reservoir creation. 67
The usefulness of mitigation measures based on the removal of soil and vegetation are 68 discussed in the additional response to TAC Public Rd 2 NRCan-0018. For the reader’s 69 convenience, that response is provided below. 70
NRCan-0018 RESPONSE: 71
TAC Public Rd 2 NRCan-0019a and NRCan-0019b
Page 3 of 3
The overwhelming consensus in the scientific literature indicates that mercury 72 concentrations in fish from boreal reservoirs return to pre-Project or background levels 73 between 15 and 30 years after initial impoundment (Schetagne et al. 2003; Bodaly et al. 74 2007). The exact timeline of the return depends mainly on the fish species (piscivors 75 longer) and, to a lesser degree, on the magnitude of flooding (longer with high 76 proportion of flooded land), and the stability of the new reservoir shoreline (longer with 77 continuous erosion of organic soils). NRCan provides two examples of Québec 78 reservoirs, Gouin and Baskatong, for which the return times appear to be longer. 79 However, this notion is based on a single measurement taken 59 (Baskatong) and 67 80 years (Gouin) after reservoir formation, when mercury concentrations in Northern Pike 81 were at approximately 1.2 ppm (Schetagne et al. 2003 and pers. comm). Considering the 82 uncertainty of a single measurement in the face of considerable temporal variability in 83 mean mercury concentrations, and the fact that the range of concentrations in Pike 84 from natural lakes in the general area is 0.33-1.8 ppm (Schetagne et al. 2003), it is 85 questionable if Pike from the Gouin and Baskatong reservoirs represent valid examples 86 of extended return times of fish mercury. 87
Based primarily on empirical evidence from a number of reservoirs in the 88 physiographical region of the Keeyask reservoir, and taking into account the potential 89 effects of continuous but decreasing shoreline erosion on fish mercury concentrations, 90 the estimated 30 year return time for fish for the Keeyask reservoir must be considered 91 conservative (i.e., an over, rather than an under,estimate). Measures that potentially 92 shorten the time period needed for fish mercury concentrations to return to 93 background levels, such as the removal of organic soils and vegetation in the flooded 94 zone, may not be feasible and have little effect in an area dominated by peatlands which 95 are partly floating and inaccessible. Importantly, such measures bear a considerable risk 96 of actually increasing fish mercury concentrations. It has been shown that the 97 disturbance of the soil organic layer and the removal of vegetation can dramatically 98 increase methylmercury concentrations in runoff (Munthe and Hultberg 2004) and has 99 been linked to elevated mercury levels in fish (Bishop et al. 2009, Porvari et al. 2009). 100
LITERATURE CITED: 101 Johnston, T.A., Bodaly, R.A., and Mathias, J.A. 1991. Predicting fish mercury levels from 102 physical characteristics of boreal reservoirs. Canadian Journal of Fisheries and Aquatic 103 Sciences. 48: 1468–1475. 104
Pickhardt, P.C., C.L. Folt, C.Y. Chen, B. Klaue, and J.D. Blum. 2002. Algal blooms reduce 105 the uptake of toxic methylmercury in freshwater food webs. PNAS 99(7): 4419-4423.106
TAC Public Rd 2 PCN-0001
Page 1 of 4
REFERENCE: Volume: N/A; Section: N/A; p. N/A 1
TAC Public Rd 2 PCN-0001 2
QUESTION: 3 The Stephens Lake reservoir is used as a comparison with the proposed Keeyask 4 reservoir in terms of factors such as the development of new riparian habitats in future. 5 This reservoir fluctuates within a 3m range, whereas the Keeyask reservoir would 6 fluctuate within a 1m range and according to a peaking operation pattern. Please 7 explain the differences in these reservoirs and how these physical factors would be 8 expected to influence future habitat development. 9
RESPONSE: 10 Generalizations about the relative importance of physical factors and how they are 11 expected to influence future Keeyask reservoir shore zone habitat development are 12 based on six northern Manitoba proxy areas for flooding and/or water regulation, some 13 northern Quebec reservoirs and the scientific literature. More than one northern 14 Manitoba proxy area is used because no single one represents ecological conditions 15 identical to Keeyask and to provide replication for any findings. 16
The six proxy areas used for the shore zone habitat effects assessment are the Kelsey 17 reservoir, Stephens Lake (i.e., Kettle reservoir), Long Spruce reservoir, Wuskwatim Lake 18 (post-CRD and prior to Wuskwatim GS), Notigi reservoir (TE SV Map 2-2) and the 19 Keeyask reach of the Nelson River (post CRD and prior to Keeyask Generating Station 20 development). The Stephens Lake proxy area is immediately downstream of the 21 proposed Keeyask reservoir, is the most ecologically comparable proxy area and has the 22 best historical time series of large scale aerial photography. 23
The Keeyask reservoir and four of the proxy areas are located in peatland dominated 24 areas. Relief ranges from low to high (Keeyask is low). The normal water level range (i.e., 25 the difference between the 5th and 95th percentiles for daily water elevations) during the 26 open water season at the proxy areas is as follows: 0.8 m at Kelsey, 1.2 m at 27 Wuskwatim, 1.5 m at Notigi, 0.8 m at Long Spruce, 2.0 m at Stephens and 2.3 m at 28 Keeyask. Three of the proxy areas have normal water level ranges similar to the Keeyask 29 project, which is 1.0 m, while the remaining three proxy areas have increasingly higher 30 ranges. 31
The proxy areas indicate that relief and the proportion of reservoir area that is peatland 32 are expected to be the most important physical factors for shore zone habitat 33 development in the Keeyask reservoir. Reservoir flooding in peatland dominated areas 34 essentially converts existing riparian peatlands and a high proportion of inland 35

TAC Public Rd 2 PCN-0001
Page 2 of 4
peatlands to reservoir riparian peatlands because the new shoreline forms in these 36 peatlands. These peatlands already have established wetland vegetation that is adapted 37 to the new conditions and can persist over the long-term. Relief is important because 38 flooded areas that are generally flatter tend to have more of the wetter peatland types, 39 which already have vegetation that is similar to what develops along reservoir 40 shorelines. 41
Water regime is another important factor for shore zone habitat development because 42 it influences the proportion of the shore zone that can support wetland vegetation. The 43 length of time that various water depths persist determines the width of the shoreline 44 wetland band that can potentially support vegetation. That is, the normal range of 45 growing season water depths rather than the entire water level fluctuation range 46 determines the potential width of the shore zone. For ease of relating this to 47 information in the Physical Environment Supporting Volume, the normal range of 48 growing season water depths is approximated by the difference between the 5th and 49 95th percentiles for daily water elevations during the open water season ( for Stephens 50 Lake the normal water level range is 2 m rather than 3 m; see the Terrestrial 51 Environment Supporting Volume Section 2.3.2.2 for details on how the normal range of 52 growing season water depths are calculated for shore zone habitat). The proportion of 53 this shoreline wetland zone that is actually vegetated is influenced by water level 54 variability, the seasonality of extended high and low water levels, wave energy, current, 55 substrate type, water chemistry, turbidity, substrate freezing during winter drawdowns, 56 ice scouring and ice-related substrate compression. 57
Prior to 2005 there was a relatively small amount of shoreline wetland vegetation in the 58 Keeyask reach, and the vegetation that was there was less diverse than that found in 59 off-system waterbodies and in the Stephens proxy area (the proxy area with a 60 comparable number of ground transects). Of the total available shoreline wetland area 61 determined for the Keeyask reach based on water depth durations, only approximately 62 10% to 15% of the area with suitable water depths actually supported wetland 63 vegetation. Emergent vegetation on the littoral to middle beach sub-zones (i.e., what 64 people generally think of as marsh) accounted for very little of that 10% to 15%. That is, 65 most of the area that could be vegetated based on water depth is not vegetated. This 66 was attributed to the high degree of water level variability and the effects of winter 67 drawdowns. 68
The Project would affect a small amount of existing shoreline wetland vegetation 69 relative to what is expected to develop during Project operation. Very high water levels 70 and river flows from 2005 to 2011 have virtually eliminated beach and littoral 71 vegetation, and also removed some shoreline tall shrub habitat in the Keeyask reach. 72

TAC Public Rd 2 PCN-0001
Page 3 of 4
Even using pre-2005 conditions as the baseline, the total area removed by the Project is 73 small relative to the total available area there in 2005 based on suitable depths. 74
The six proxy areas support the overall EIS prediction that shoreline wetlands removed 75 or altered by the Project will be replaced by wetlands that develop along the reservoir 76 shoreline during the operation phase. Most of the shoreline wetland vegetation in the 77 existing Nelson River reservoir proxy areas was shrub and/or low vegetation on sunken 78 peat that predominantly originated from riparian and inland peatlands that became 79 reservoir shoreline after flooding and reservoir expansion. Because the Keeyask 80 reservoir occurs in similar conditions to the other Nelson River reservoirs (the majority 81 of the flooded area is peatlands), the Keeyask reservoir shoreline is expected to support 82 more shoreline wetland per kilometer of shoreline than the Keeyask reach presently 83 does. The overall EIS prediction may be met on this basis alone even before considering 84 that the reservoir shoreline at Year 30 is predicted to be almost 20% longer than the 85 existing shoreline. 86
Incremental to the above factors, reduced water level variability in winter should reduce 87 exposed substrate freezing, ice scouring and ice-related bottom compression, which is 88 expected to facilitate more widespread emergent vegetation development. Reduced 89 water level variability during the growing season is expected to provide emergent plants 90 sufficient time to establish over a larger percentage of the area where water depths are 91 suitable. 92
An additional important contributor to total vegetated shoreline wetland area will be 93 the peat islands that are now virtually absent in the Keeyask reach but are expected to 94 be common in the Keeyask reservoir (peat islands are still present in the reservoir proxy 95 areas after more than 35 years). Floating peat islands will develop through peatland 96 disintegration processes. The proxy areas have shown that emergent vegetation 97 develops on the sunken fringes of the peat islands much like it does on the fringes of 98 off-system riparian peatlands. 99
In summary, when comparing post-Project with existing conditions, at least an 100 equivalent amount of vegetated shoreline wetland is expected to develop because: 101
• the total area to replace is relatively small (especially the emergent vegetation 102 component of this total); 103
• vegetated riparian peatland will already be established along much of the shoreline; 104
• a higher percentage of the shore zone area with water depths suitable for emergent 105 vegetation will become vegetated because the water level fluctuation regime will be 106 more favorable than it is currently and winter drawdowns will be eliminated; 107

TAC Public Rd 2 PCN-0001
Page 4 of 4
• the reservoir will contain peat islands, a feature not presently found in the Keeyask 108 reach of the Nelson River, which are expected to be a substantial long-term 109 contributor to emergent vegetation; and, 110
• a longer shoreline will be available for shoreline wetland development. 111
Additionally, the proxy areas indicate that it is likely that the Keeyask reservoir will have 112 higher vegetation diversity than currently exists in the Keeyask reach. 113

TAC Public Rd 2 PCN-0002
Page 1 of 2
REFERENCE: Volume: Response to EIS Guidelines; Section: 6.4 1
Effects and Mitigation Aquatic Environment; p. 6-238 2
TAC Public Rd 2 PCN-0002 3
QUESTION: 4 Reservoir Comparisons: This section describes approaches used in the technical 5 assessment. It mentions that magnitude and spatial and temporal extent of effects were 6 determined through several methods, one of which is comparing data from other 7 reservoirs. It mentions the “lower Churchill River reservoir in Newfoundland and 8 Labrador”. There are no reservoirs on the lower Churchill River in Labrador. In the 9 Churchill River system there are the Smallwood and Ossokmanuan reservoirs and two 10 forebays associated with the Churchill Falls project in the upper reaches of the basin. 11 These reservoirs all have widely differing characteristics. The lower Churchill projects 12 are not yet developed. What data were used in this assessment? 13
RESPONSE: 14 The reviewer is correct that there is currently no reservoir on the lower Churchill River 15 in Labrador. In amalgamating text from several sections of the Aquatic Environment 16 Supporting Volume, references to data and models used to predict effects to the lower 17 Churchill River were inadvertently included in the list of existing reservoirs. We 18 apologize for any confusion this may have caused. 19
The data sources to describe the existing environment and the methods used to conduct 20 the effects assessment are described in detail in the Aquatic Environment Supporting 21 Volume. The effects assessment was based on a combination of comparison of pre- and 22 post-Project conditions, models, and comparison to other similar systems. It is assumed 23 that the above-stated question is referring specifically to reservoirs or similar systems 24 that were used to assist in determining effects of the Keeyask Project. These are as 25 follows: 26
• Manitoba: Stephens Lake, Long Spruce Forebay, Limestone Forebay, impounded 27 river upstream of the Kelsey Generating Station, Southern Indian Lake, Notigi Lake, 28 other lakes along the Churchill River Diversion route, the impoundment upstream of 29 the lower Churchill River weir, Winnipeg River below the Slave Falls generating 30 station and between the Slave Falls and the Pointe du Bois generating stations. 31
• Québec : Opinaca Reservoir, Robert-Bourassa Reservoir, Desaulniers Reservoir, 32 Caniapiscau Reservoir, and La Grande Complex, among others. 33

TAC Public Rd 2 PCN-0002
Page 2 of 2
In addition, the assessment referenced general information obtained from studies of 34 impoundments in Scandinavia and other areas of Canada and the United States. 35