1967-68 - National Institute of Educational Planning and ...
Upload
khangminh22Category
view
0download
0
K C O N O M IC SIJRVKV"n 1999 - 2000
< ^ o v i : r n m k n t o f o k i s s a
E C O N O M IC S U R V E Y1999 - 2000
NIEPA DO
D10786
O IR FX rrO R A T E O F E C O N O M IC S A N D S T A T IS T IC S , i l .A N N I N G A N D C O -O R D IN A T IO N D E P A R T M E N T
G O V E R N M E N T O F O R IS S A

€
.mHAHl .
Phnnrv:l7-fi, Sfi #.. '.*w Delh
..,:')r;. U'J ■
.• l. ' AHU!\ * '' <'i fcidu<'«tu:>n .!
'iu iiiiitfition.o tudo M*f|>
CONTENTS
Chaptfti Subject Page
I !o F( ounmic PiT filB !/! I/ IJ
MdfipcrvA/tu ari(H rnpiovfrieiit 2/!-^ 2/OB
nfistinip! I xpenditure 3 /1 “ 3/00
I Aurir-ultufe 4 /1 - 4/21
'i f <!re;4ts and i:nv/ii()nmnn1 5/1- 5/11
0 i'lshf riHS 6/1 6/OM
f 'Xiunial Resoiircet. 7/1 7/0/
3 S ’d 'erty Aileviatior* 8/1 8/12
) Indiisfry 9/1 9/22
i(i Mineral RBSDurreH 10/1-10/12
I I Power 11/1 11/11
12 1 ransport and Communication 12/1-12/13
13 Financial Institutions 13/1 13/12
14 Education 14/1 14/14
15 Health Family Welfare, Sanitation and Social Welfare 15/1 15/15
16 F’ rices and Public Distribution 16/1 16/10
1 / Science and Technology 17/1 ' 17/05
18 E xport Promotion 18/1 1B/08
19, Development of Women 19/1 19/12
?(). Welfare of Scheduled Castes, Scheduled Trihes, SfCiallv and Edu< a1ior»ally Backward ClasBef. and rvyiinoritins
and Prosi*ects
♦ ♦ ♦

ANNEXURE
SI No Subject Page
SOCIO ECONOMIC PROFILE
Sb( httwise f ’lan Outlay/ rxperiditure in Orissa ANX
Strite s ( )wn Revenue, interest paid and Capital
l^epaynienl nt 14 MajOf Stales f199ft~96 A/C') ANX
-Hf\) Net Statf? Oonie^itir; Produ( t (NSDP S late lnr:r)nie)
c f ( 'riss. i at r acto! ( ost
TAs per old rr»ettiorlolngy w itl i base I9B0 81) ANX
3(B; Net Statr Domestic, Product (NSDP State Income)
of Ori^isa al Factor Cost
(As per new methodology with t)ase 1993 94) ANX Ah
4(A) Broad Sector wise Net State Domestic Product of
Orissa at Factor Cost at Current Prices
(% per old mettiodology witti base 1980-81)
4(B) Broad Sector wise Net State Domestic Product of
CVissa al Factor Cost at Current Prices
(As per new methodology with base 1993 94) ANX - h/1
5(A) Broad Sectorwise Net State Domestic Product of Orissa
i\[ t actoi Cost at 1980-81 Prices.
(As per old methodology with base 1980 81) ANX - f>
5(B) Broad Sectorwise Net State Domestic FVoduct of Orissa
at I acto! Cost at 1993-94 Pric =
(As per new methodology with be’ '♦93-94) ANX - 6/1
! H(A) ( , M a lt; I f *r(iduci al pHctur ’ -nsi !)y KkicI
of F tunfjmjG Activily f/\s |»er old inethodnlnyy wiHi ba .e HjBij I ^
(Perf enlaye nhufujf* over the previous year) m ;
i)(B) (iross i>late Doineslic l^roduct at Faclor CJost ()y Kind
of Eronomic Aniivity (As per new methodology with bdsu 19 )3 iA |
{F^f'rrentage ctianyo over the jtrevious ytiar)
1 7(A) Net National Product (National Income) at f at tor Cost
from 1990 91 to 1996-97
(As per old methodology with base 1980-81) A 'J' ;
1 , (B) Net National Product (National Income) at T actor Cost
from 1993 94 to 1998^99
(As pei new methodology with base 1980 81) AN ^
1 H Percaplta Net State Domestic Product at Constant
(1980-81) Prices 1992 93 to 1997-98 (As on 10,03 98
State Series) ANx 9
1.9 Percapita Net State Domestic Product at Current Prices,
199? 93 to 1997-98 (As on 10.03,98 State Series) AN x 10
MANPOWER AND EMPLOYMENT
2 1 Growth of Population in Orissa and India since 1901 AN < 1
2 2 Ijistfictwise I 'opulation of Orissa with Male and I eiririle
f^nr;H Bnd UrbrU! Scheduled c aste and Scheduled fiibe
biHrikiip hs (')ei VMM Census 'i2
ntd ,
2 5 1 )i i-u |ta lional C iassitlcatio ti (»f Maisi W iuktHK MaiginHi
V\/(H kHis and li»ta! Workers act onJidg to 1991 Chhsuh ANX 13
2 i SiHievi/iSB Pupulatinn w illi Ijrhan hreaku(> /Ku n iiliru j
in f i AMx \4
f luMibHi of LiMpkjyiiieiii diHi t iiipkiyHieiU
‘ seiskers In fho live Register acc orrling lo AcadRnm
UiJHlificaHon ANX
AGRICULTURE
4 1 L HiKi lltilisetHjn Maltern in Onssa. ANX 1 1
42 Cfopping P.itlerii of Prinnjpal Crops in Orissa ANX 18
43 Production of different Crops in Orissa from
1992-93 to 1998-99 (P) ANX - 20
44 Yieki Rate of Principal Crops in Orissa. ANX 21
4 3 Districtwise Area and Production of Autumn, Winter
and Summer Rice during 1998-99 (P) ANX - 22
4 ) Districtwise Consumption of Fertiliser for the year 1998-99 (P) ANX 23
4 Districtwise Estimates of Area, Yield Rate and Production
of HYV paddy for 1998-99 (P)
4 J Districtwise Estimates of Area under different categories
of Operational Holdings in Orissa during 1990-91
ANX- 2B
9 I Msltif IwisR FstiniHtes of Niirnbor of difforHnl CiitegDriBS
i)l Operaliotial Holdings in Oriss;} rjunncj 19904)1
FOREST AND 1 NVIRONMENT
( jislrir twisH Classification o f ! otesf Am.i in Orissn,
cl , on 199B 99 (I M
> 7 I orest Area DivortBri to Non horest use in Orissa, ANX ~ iO
3 f orest Aren I )ivortfc3d to Non f-orest ush in OrissH
(SHClorwise as rm 1997) AN> VI
FISHERIES
U.1 i )ist!u:t\;vise Ouantity and Value (if F ish P iodiu ed in Odssa ANX 3;
ANIMA! RESOURCES
/ 1 I )istr!r.twisf* Nunit)er of Veterinary Institutions and
I Personnel in Orissa as on 31 sf March 1999 (P)
/ / I )istnctwis(? I ivo .Stof'k Pf)|)ulation in Orissa as on 01 09 9S A!JX i*
RURAL DEVEI OPMENT
I ii'.IfM tiA/isfj I rnj)li!yniRnt Oenorafion under ) R Y
tor 199H 99
8 P fotjiess uridei PciHioiTiii; Petiatsilitatu)n ot
Bonded I itsoui. a NX X?'
i* 'iHitd }
8 3 AchicvturienI unde! Auli poveilvPruyfainnies ANX - 39
INrUISTRY
y 1 Nutntiei of F^egistered F actories, Value of Outpul aruf ValiiBAdded tiy Maiuifactiire in Organised Sector in Orissa ANX 41
M :/ f ’rodiictrv/e Capilal Net Value Added t)V ManiilactiiieAnd luinibHr nf peisons employed In Oiganised InduslnesHi OrissM if] the year 1997 98 (P) Af JX 43
!» J I Jislriciwise (I Individe(J) Ar hlovement of Orissa .Stater inani lal Cor()oration ANK 49
9 4 Distrirtwise details of Small Scale Industries in Orissa ANX fiO
9 5 Districtwise (Undivided) F^rogress of Handloom Industriesif! Orissa (Oo operative and Oorporate Sector) ANX 51
9 6 Districtwise Number of Cottage Industries set up in OrissaWith Investment and Employment Generation during1996-97to 1998-^99 ANX 52
9 7 Performance of Industrial Development CorporationotOnssa Ltd. ANX - 63
9 8 Statewise information of Annual Survey of Industries1997-98 (P) ANX - 54
TRANSPORT
17’ 1 Districtwise I ength of different Types of Roads
in Odssa as on 31.03.1999 (P) ANX ~ 55
1 ' f M lrlC!.yvise! fiK jll'M if Rnll\A/.iv f -iifl* «n« j s IhM I*
I ’ njiwav HlaMni'iP in )nsn,-t .»'> nn ^ j u i i QM9 (F-*i -N "
i ' nnffMBlll i alHnnrM*'; of IVI* >ln| ./fUiM ! m l in M* /':M> 'J!
F fNAN C IA l, iN S 'n n iT IO N B
1 i 1 PnK^iess o f (yij o |)e ia tive M ovoine iU hi < )nssa, AN>\ - S9
1 Vir MHrnbBrshij). W citking C rip ila l and AH^/^dice *if Agncnltnm l
]h il Noi\ A g iic tillun t! rodii c ,s npfu.slivn : »oi leties in < nissa AN?' fits
F n ilC A T IO N
1 1 1 Num ber o f E d iica tinna l InslitutKHis in G<issa ANK 6 1
I I N iin ibP ' ot je a i'h o fs m I ’ riruaiY 'U lu>ol'. M iddle fic fum ls
hi; jii .<nd ( ieneral ? :o!leqes AN 6?
Nnrriber n ideMi:, if * F'Hirrsa* y »(. hcjui; f/|iddln S iJioofs,
Hi' jh Snl'ioAis -ind f ^eneral f-oHecjes. ANX 63
I I I AI TH, rA W I lY W E IJ 'A R F . S A N IfA r iO N AWr? SO C IA I W ttF A R E
NfnrUlHi <.:t t )0 Vs f M i m» ! I r'1ni !|f... ij in
■ dS U!i > i U.i l!nKi AN'- '->
?^rH N< AN H l f - : l iN O I .o u ' i r
I ■ ? f :<■ -/fifriHni S >1 M f H H ihh : t nHi Ijy
i“ ‘ -M ^dprnei'i >Cjf H y A N '\
EXPORT PROMOTION
10 1 Itemwise Value of Exports from Orissa ANX - 66
SOCIO-ECONOMIC INDICATORS
21 1 Districtwlse Socio-Economic Indicators of Orissa ANX - 69
21.2 Statewise Socio-economic Indicators. ANX - 72
♦ ♦ ♦
CHAPTIR 1
80CI0-IC0N0MIC PROFILE
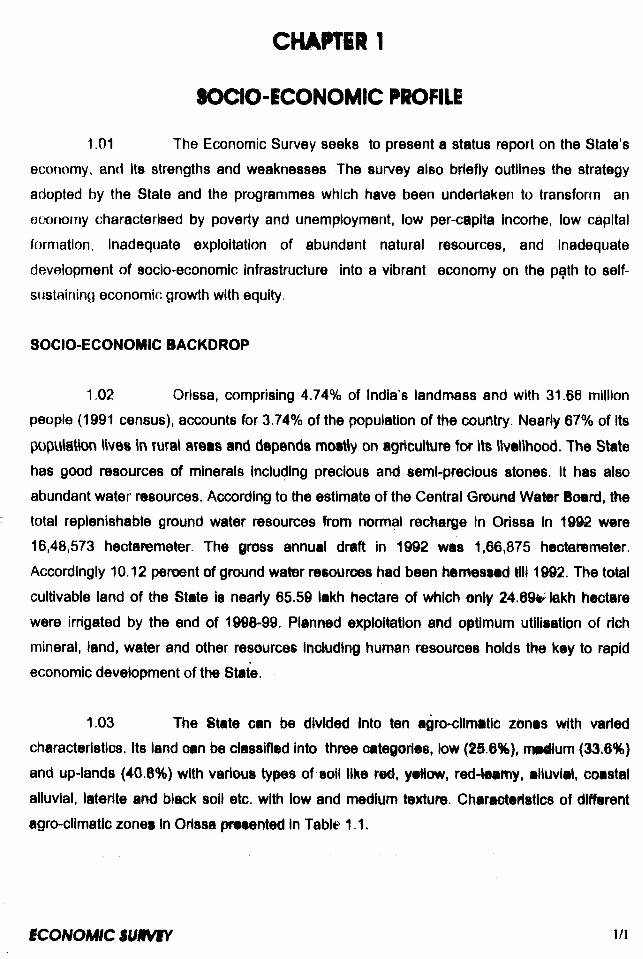
1.01 The Economic Survey seeks to present a status report on the State’s
economy, and its strengths and weaknesses The survey also briefly outlines the strategy
adopted by the State and the programmes which have been undertaken to transfonn an
etx)norny characterised by poverty and unemployment, tow per-capita indortie, low capital
formation, inadequate exploitation of abundant natural resources, and Inadequate
development of socio-economic infrastructure Into a vibrant economy on the path to self-
sustaining economic growth with equity.
SOCIO-ECONOMIC BACKDROP
1.02 Orissa, comprising 4.74% of India’s landmass and with 31.66 million
people (1991 census), accounts for 3,74% of the population of the country. Nearly 67% of Its
pcipulation ttves in rural areas and depends mostly on agriculture for Its livelihood. The State
has good resources of minerals Including precious and seml-preclous stones. It has also
abundant water resources. According to the estimate of the Central Ground Water Soard, the
total replenishable ground water resources from nomnal recharge In Orissa In 1 9 ^ were
16,48,573 heolaremeter. The gross annual drift in 1992 wes 1,66,875 hectaremeter.
Accordingly 10.12 peroent of ground water reeouroes had been hemessed till 1992. The total
cultivable land of the State Is nearly 65.59 lakh hectare of which only 24.69^ teikh hectare
were irrigated by the end of 1998-99. Planned exploitation and optimum utilisation of rich
mineral, land, water and other resources Including human resources holds the key to rapid
economic development of the State.
1.03 The State can be divided Into ten agro-cllmatic zones with varied
characteristics. Its land oan be classified into three oategories, low (t§.6%), nwium (33.6%)
and up-lands (40.8%) with various types of §oll like red, yeHow, red-leamy, alluvial, coastal
alluvial, laterite and black soil etc. with low and medium texture. Characteristics of different
agro-climatic zones In Orissa presented In Table 11.
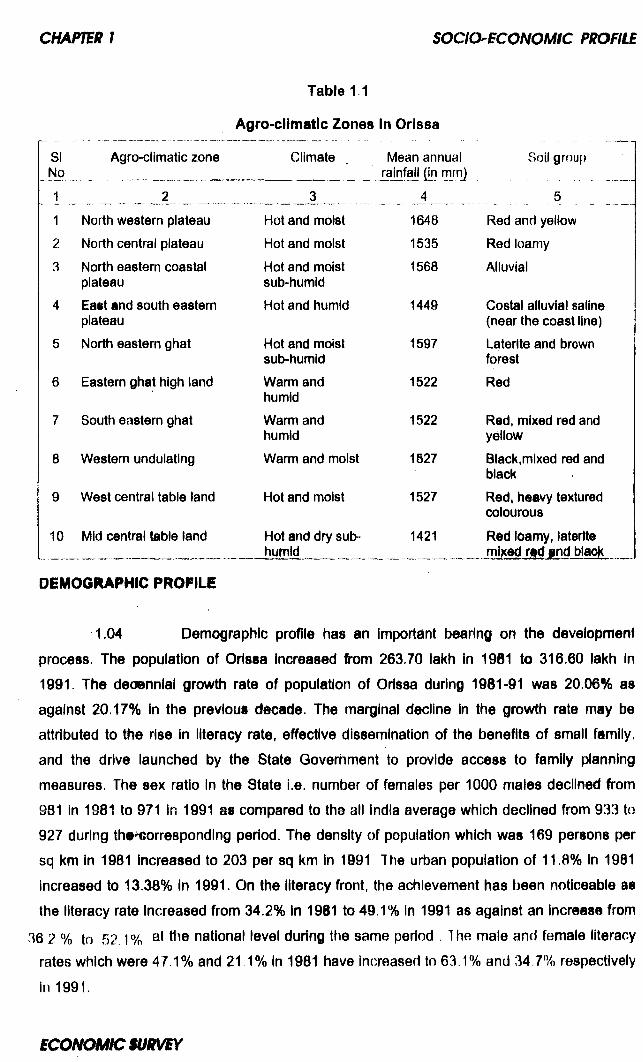
Table 11
Agro-climatic Zones in Orissa
SINo
Agro-climatic zone Climate
1 __________ 2______1 North western plateau2 North central plateau3 North eastern coastal
plateau4 East and south eastern
plateau5 North eastern ghat
6 Eastern ghat high land
7 South eastern ghat
8 Western undulating
9 West central table land
10 Mid central table land
Hot and moistHot and moistHot and moist sub-humidHot and humid
Hot and moist sub-humidWarm and humidWarm and humidWarm and moist
Hot and moist
Hot and dry sub- humid
Mean annual rainfall (in mm]
.....4 ..._
164815351568
1449
1597
1522
1522
1527
1527
1421
Soil group
Red and yellow
Red loamy
Alluvial
Costal alluvial saline (near the coast line)Laterite and brown forestRed
Red, mixed red and yellowBlack,mixed red and blackRed, heavy textured colourousRed loamy, laterite mixed rtd ind blaoK
DEM06HAPHIC PROFILE
1.04 Demographic profile has an important bearing on the development
process. The population of Orissa Increased from 263.70 lakh in 1981 to 316.60 lakh in
1991. The deoennlal growth rate of population of Orissa during 1981-91 was 20.06% as
against 20.17% In the previous decade. The marginal decline In the growth rate may be
attributed to the rise in literacy rate, effective dissemination of the benefits of small family,
and the drive launched by the State Goverhment to provide access to family planning
measures. The sex ratio in the State i.e. number of females per 1000 males declined from
981 in 1981 to 971 In 1991 as compared to the all India average which declined from 933 to
927 during th#^orresponding period. The density of population which was 169 persons per
sq km in 1981 Increased to 203 per sq km In 1991 The urban population of 11.8% In 1981
increased to 13.38% in 1991. On the literacy front, the achievement has been noticeable as
the literacy rate Increased from 34.2% In 1981 to 49.1% in 1991 as against an Increase from
36 2 % to 52.1% ttie national level during the same period The male and female literacy
rates which were 47.1% and 21 1% in 1981 have increased to 63.1% and 34 7% respectively
in 1991.
E C O N O M K : S U R V E Y
s o c io - ic o fH m c M K m a
1.06 Scheduled castes and scheduled tribes, as per the 1991 Census,
ienstltuta 16J0% and 22.21% respectively of the total population of the State. The
ieh®duled areas cover nearly 45% of the total geographical area. The literacy rate of
scheduled caste and scheduled tribe populations was 36.78% aryd 22.31% respectively
according to 1991 census.
EMPLOYMENT SITUATION
1.06 With the increase in population and consequent addition to the labour
force, the supply of labour continues to outstrip demand resulting in accentuation of the
problems of unemployment and under-employment. The occupational classification as per
1991 census data shows that the total workers in the State account for 118.83 lakh
constituting 37.53% of the total population of the State. Out of the total number of workers,
main workers accounted for 87.33%. The main workers comprised of cultivators (44 31%),
agricultural labourers (28.68%), household workers (3.13%) and other workers (23.88%).
1.07 The unemployment situation is a major problem for the State. It has
been estimated that the total backlog of unemployment at the beginning of 1998-99 was of
the order of 8.79 lakh. The employment generation during 1998-99 and 1999-2000 is
estimated at 3.06 lakh and 3.43 lakh respectively. Keeping in view the backlog of
unemployment at the beginning of 1998-99, the average annual addition to the labour force
at the rate of 2.62 lakh, and the employment generation during 1998-99 and 1999-2000, the
levels of un-employment at the end of 1998-99 and 1999-2000 are expected to be around
8.36 i«ikh and 7.55 lakh respectively. To tackle the problem of un-employment, the wage
employment and self-employment programmes that were Implementated during the Eighth
Plan would continue during the Ninth Plan with special emphasis on generation of
employment opportunities in the secondary sector.
1.08 As per the Live Register maintained by employment exchanges, at the
«nd of 1998, the number of educated unemployed in the State was 7.60 lakh which comes to
n % of the total number of applicants which was 10.00 lakh. The number of registrations
mide in employment exchanges during 1998 was 209,036 and vacancies notified were
'§$74 . Out of the notified vacancies, pifKierrtent was made In respect of 4,369 constituting
54.11 % of the vacancies notified.
m m m m iu iM Y 1/3
STATE INCOME
1.09 The Gross State Domestic Product (G8DP) of Orissa increased from
Rs 18,612.73 crore in 1993-94 to Rs.23,417.98 crore in 1998-99 at 1993-94 prices, showing
a compound annual growth rate of 4.70 percent over the period. The per capita income of
Orissa in 1998-99 has been estimated at Rs.5,648 at 1993-94 prices.
1 10 The (3SDP increased from Rs.22,358.34 crore at 1993-94 prices in
1997-98 (provisional estimates) to Rs.23,417 98 crore (quick estimate) in 1998-99 The
increase in GSDP in 1998-99 over the corresponding figure for 1997-98 is mainly
attributable to the increase in SDP of Manufacturing and Tertiary sector during 1998-99 .
AGRICULTURE
1,11 Agriculture continues to be the main-stay of the State’s economy with
contribution of about 30% to NSDP during 1998»99. Taking into account the high contribution
of this sector to the Slate's income and the large percentage of people dependent of this
sector, the State Government have formulated the Agriculture Policy 1996 with the main
objectives of doubling the production of food grains and oilseeds by the end of the Ninth
Plan, to generate employment opportunities, and to adopt agriculture as the main route for
eradication of poverty. The Agricultural Policy 1996 is expected to provide the much needed
boost to this sector for all-round development of the agricultural sector. Agriculture has been
given the status of an industry under the new Agricultural Policy.
112 According to Agricultural Census conducted by the Board of Revenue,
there were 39.48 lakh operational holdings in Orissa in 1990-91 of which small and marginal
holdings accounted for 79.88% while the remaining 20.12% came under the category of
semi-medium, medium and large holdings. As much as 46.66% of the total operated area
was owned by small and marginal farmers and the remaining 53.34% by the sejni-medium,
medium and large farmers.
T13 A bumper harvest of 72.3 lakh tonne of food grains was recorded
during 1991-92. The foodgrain production during 1992 93 was 59.6 lakh tonne which was
17.56% less than the production during 1991-92 However, during the three succeeding
years, the level of production of foodgrains rec.overed In 1993-94. the foudyrain production
E C O N O M I C S iim /B Y > ’
I S O a O ’ iC O N O M fC fHtOflLB
72.2 lakh tonne which was juat below the level of production In 1991 92. In 1994 95,
l||iiiU88 of unfavourable weather conditions, production of foodgrains declined to 69.0 lakh
tonne. Th® production of foodgraln^ further declined to 67.8 lakh tonne In 1995-96 and to a
rtpord low 40.1 lakh tonne In 1996-97. During 1997-98 and 1998-99 the production was 66,1
tikh tonne and 57.9 lakh tonnes respectively The production of pulses and oilseeds in the
State during 1998-99 was 2.5 lakh tonne and 1.7 lakh tonne respectively. The contribution of
Orissa to the foodgrain basket of the country which was 3.61% In 1994-95 declined to 2.97%
in 1998-99 Paddy was the major cereal crop in the State with coverage of about 74.4% of
the total gross cropped area under principal crops in 1998-99 followed by pulses (11.8%) and
oil seeds (6 4%) Similarly the area under fibre crops and cash crops accounted for 12%
and 3.0% respectively of the gross cropped area under principal crops
1 14 Due to increase in population, the State’s percapita availtjility of
cultivated land which was 0.39 hectare in 1950-51 declined to 0.18 hectare in 1998-99 and
percapita foodgrain production declined from 230 44 kg to 162.23 kg per annum during the
same period The average yield rate of rice in Orissa was 9.93 quintal per hectare which was
much below the national average of 10 8 quintal per hectare during 1996-97. However, the
average yield rate of rice in Orissa increased to 12.12 quintal per hectare in 1998-99
Consumption of fertiliser in the State was 36.2 kg per hectare during 1998-99 in comparision
to 30.5 kg per hectare during 1996-97
IRRIGATION
1.15 In the absence of adequate Irrigation facilities, agriculture has to
depend on monsoon. As a result of the erratic behaviour of the moonson, agricultural
production fluctuates widely from year to year. The net Irrigation potential created by the end
of 1998-99 from all sources was 24.69 lakh hectare which is 41.85% of the total Irrigable
area of the State. Out of 24.69 lakh hectare of Irrigated area, 11.42 lakh hectare of land are
irrigated through major and medium irrigation projects, 4.39 lakh heotare through minor
(flow), 3.32 lakh hectare through minor (lift), and 5.55 lakh hectare through other sources
which include private tanks, p6nds, du^wplls, water harvesting structures and the like.
FISHERIES
1.16 With a coast line of 480 km and- a continental shelf area of 24,000 sq
km, Orissa offers excellent scope for marine fish production. The inland fishery resources of the State Include fresh water area of 7.06 lakh hectare and brackish water area of 4>18 lakh
iC O N O M m W tM iY 1/5
hectare The State has thus vast scope for development of fish industry The total fish
production In the State was 2.84 lakh tonne In 1998-99 of which the marine fish accounted
for 43.74%, brackish water fish 5.24% and fresh water fish 51.02%. Export of fish to otier
States and countries during 1998-99 was estimated at 0.86 lakh tonne. The total Wlh
production in the State was 1.59 lakh tonne in 1990-91 which increased to 2.84 lakh tonne in
1998-99. The percapita consumption of fish in the State has decreased from 8.60 kg in1997-98^0 8.23 kg In 1998-99.
FOREST
117 The forest area in the State during 1998-99 was 58,135 sq km, whichconstitutes 37.3% of the total geographical area of the State, as against 59,963 sq km in
1981. Therefore, the main thrust In the forestry sector Is on afforestation of waste lands and
restoration of degraded forests. Besides, conservation of forests is being ensured by
intensifying protective measures and enlisting people’s involvement In checking Illegal feHing
and removal of trees. During 1998-99, plantations and reforestation programmes have been
carried out over 16,991 hectare of area as against 17,960 hectare during 1997-98.. th e
revenue receipts from forest produce were Rs.86.81 crore during 1998-99 as against Rs.73.11 crore In the previous year.
ANIMAL RESOURCES
1.18 Animal resources sector plays an Important roie In providing andsupplementing income of rural households. The total livestock population In the State was
250»20 lakh as per livestock census of 1995 of which cattle population accounted for 147 66
lakh, buffaloes 16.62 lakh, goats 54.12 lakh, sheep 18.65 lakh, pigs 5.72 lakh and other iivestdck 7.53 lakh. The total milk production in the St6te in 1998-99 was 8.33 lakh tonne, wiih per-caplta availability of 64 gm. per day. The production of milk during 1998-99 was
24.33% higher than the production of 6.70 lakh tonne in 1997c98. Egg production in 1998-99
was 9402.50 lakh showing an Increase of 13.93% over the production level of 8252 80 lakh
during 1997-98. Meat production In 1998-99 was 35 thousand tonne In comparison to 48
thousand tonne in 1997-98. There were 54l Veterinary Hospitals and dispensaries, and
2939 Livestock Aid Centres In the State by the end of 1998-99. During 1998-99, 113 64 lakh
animals were treated against diseases and 17 10 lakh castrations were done The number of Milk Producer’s Cooperative Societies In the State was 1055 at the end of 1998-99 with
procurement of 72.72 MT milk per day on an average during 1998-99
fCONOMfCSUfVfV

m m w ’ i o a o s c o tm m : n m m
E ^C A T IO N
1.19 iduoation serves as the base for development of human mourcts.
V ^ i i the overall literacy rate in 1951 was 15.8%, it was only 4.5% among ^males. The
overall literacy rate in Orissa has increased to 49.1% and that for females to 34.7% as per
1991 census. The literacy rates of scheduled caste and scheduled tribe populations were
comparatively low at 36.8% and 22.3% respectively as per the 1991 census. A major factor
responsible for low educational level among females and persons belonging to scheduled
castes and scheduled tribes is the high drop-out rate at primary level especially in tribal and
inaccessible areas
1.20 By the end of 1998-99, there were 42,104 primary schools In the
formal stream with enrolment of 40.80 lalih students and 1.11 lakh teachers. In the non
formal stream there were 23,448 educational institutions with enrolment of 5.86 lakh students
and 23,448 teachers. By the end of 1998-99, the number of upper primary schools in formal
stream was 11,510 with enrolment of 13.88 lakh students and 0.39 lakh teachers. In the non-
formal stream, there were 896 Institutions at the upper primary level with/enrolment of 0.22
lakh students and 1,792 teachtrs. During \h© sime pwkid, ^,072 /ilgh schools were
functioning in the State vwth about 0.51 lakh teachers and enrolment of 10.31 lakh students.
1.21 The State has 7 unlversi^s and 1034 general coNeQes with 5.15
students and 17,4(K) teaohers. In t^e field of teohntcat fducitlsn, ^ Stett jiia t
significant progress. By the e ^ of 1998>9i, ttiere were 20 infineertng CotUirM
capacity of 4.000 s^ctonls antf J5 E r^eertfig Sc^oota/PolytechnliaB w l^ Intike oapao^ of
3,800 students. Thme vmm §6 Induttrtal TrBlning b#h undiiir devmment m6
private management, with intake capacity ©f 1,978 students. In tt e field of mecMcal aelwiee,,
the State has thi«e Meiloal Celleges, one Denial Collegii, ^ Pfiarmacy C o^fe , fNr
Ayurvedic Colleges, six Homoeopathic Colleges and ene NureingxCiitaie.
POW iR
1.22 During 199t-i9, 3^t#’e share In ^statled eapaoMy in the State sinler
was 1691 .§2 MW (hydro 1271.92 MW and thermal 420 MW) agalrtst wWch power was
available to the extent of 698.87 MW. In addition to this, 401.92 MW of power was received
from Central sector projects towards State share and 115:94 MW of power was purchaeid
from captive power plants installed in the State by different industries Tfius, from all sources,
1206.73 MW power was available against the estimated demand of 1.234 MW Out of 46,969
villages in the State, 34,442 villages including 10.459 tribal villages and 3,/^84 schedtfj^
caste villages have been electrified by the end of 1998-99.
1.23 Flower sector reforms and restructuring have been implemented for promoting efficiency in the system Consequently, Orissa State Electricity Board has been
dissolved and generation, transmission and distribution systems have been entrusted to
Orissa Hydro Power Corporation (hydro generation). Orissa Power Generation Corporation
(thermal generation), Grid Corporation of Orissa (transmission), and four distribution
companies. An independent Regulatory Authority has been established to administer, regulate and monitor various aspects relating to generation, transmission and distribution of power.
HEALTH SiRVICES
1.24 The National Health Policy alms at providing universal health car# ind
access to medical services, covering preventive, promotive and curativa aspects, to al) sections of the society. By the end of 1998-99, there were 180 Hospitals, 157 Community
Health Centres, 164 Public Health Centres (PHCs), 1167 PHCs (New) and 14 Mobile Health
Units in the State providing curative health services Apart from 14 established mobile health
units in the State 80 more mobile health units are also operating in KBK districts with
assistance from Government of India of which 44 in tribal and 36 in non~trlbal areas. In
addition to these Institutions there were 5 Ayurvedic Hospitals, 519 Ayurvedic Dispensaries, 9 Unani dispensaries, 4 Homoeopathic Hospitais and 460 Homoeopathic Dispensaries
Health care and population control are the two main objectives of the Ninth Plan. The Family
Welfare Programme is being Implemented by the State Government with the objective of motivating eligible couples to adopt spacing and terminal methods and ensuring child
survival through universal Immurllsatlon. The number of persons covered under the Family
Welfare Programme increased from 104.8 lai h in 1994-95 to 138 0 lakh In 1998-99
registering an increase of 31.68% over these years. The death rate per thousand has been
brought down from 21.6 in 1951 to 111 in 1998 and the infant mortality rate has been
reduced from 188 to 98 per thousand during the same period
MINERALS
1 25 The State Is endowed with vast mineral deposits lii<e coal, iron-ore.
manganese ore, bauxite, chromite etc According to All India Mineral Resources Estimates,
the mineral deposits of Orissa in respect of chromite, bauxite, iron ore were atx)ut 98 4%,
E c o N o m :s u 0 V iY 1/8
U N M l l i f |« n i l lilK '(dN H M h 1 li iH m i|mimmii fif iwni®. oi iF wp wiBiitjUiyii n|Ag|j||i . ny| |& j|ll||i| iyigl iiiil Avyd
■Bpipi l^^Bpl l . ywBHJHI WIPR wWBf WWP IiSRf IW frflWPHPW
'HI fl^mn 'i llPPw iPilfW I Vffll. fff vPHwlHpl'l wr wWi SPIMW Wwll WPw«wIllM 'tifiMIIIMI flbt f t H M mI IHMA fliMiMMBMilnH I IwfWiw IHIi*iWiFW#liW WrIW w» iTfw VI^Hni wf fHlifWllWI wW mWP 5BfWBrwHI tBWilffPfWBtll llkli WM"'lMMlllfc4ll6till6i "''ttMliw 4 4 IttMi' liwHMfe liii jiHit At 'NMi lilMl'ttt "MNMKWTw ' nRP T f I SR t . InPffiyWl w *1 ! WI* RWb mPHI . wfl Tp *
Cit l l WHUIHI I IBWHI W H « N M N i I I M l.lll .W m m M l |« n i l N l.U R i.M m m in 1MI7-H gnn M jM hti.IWi WrWWPw • wRPfflTOP ™ I . l l f^ *
IPnSNPifPT
1.M Witti vMt iMnwit rtMursM, MkphIwkw of m matpnato trMeomftirMito |mww iNMKIon, m tOM hn « i HnmmM pnmmIM tor MliMMMMIten. Larga IrMlHtftMi Mw MMMKtt tMH nwM, MMwiM AlumlnMm Oaffipiny (NAt.09), NHNtn OMrg* 0»<mmi LIfl., PNmKMap AnnhMMi, iM iM tMMd pawir fMHiM at TMefwr, Kwiltw iM tanhiitMM Mva Immhi *«t ut> In tfw M M dtMtig ifliMwii mm MfMMi. M pfWMim, Wm tmm aiaMMt twMly liHtuMNH NMntton and invaaMant OUfoMHon Ud. (IPIOOI.),i|ki|||aji[ j l itmdtus l n u m m rteiiatiMMi iaiit**^P^BrWP* ■»»wP flffJIIl^P II wwFpiRVWPFt fc>W* ffl#|MWlW| wn^wtf-^WJKfl^ 1pll|i0^p(P |'-f> |P vJli|||!|P lfN lfIf
-IMM in Hm .Wfw WTI' ■vWNP' -BWiWBP*
ty l i t aM of 1lil<M>, OMaaa twd lia (atya and inadlum MdOsMaa vittt m 0Na.ia4i.M « m and an fi»»wiaw iMMWai far 1^,111 immmm. m tha a M ^ tia f-tt, m-taMtdl JiteMllllitfkV'g|||Mi jk4|| g| ' ' j||jjy|ylt ||k S y t i l ^ liHttt vj|| ^ || |||.* W*1 V» mm'm wWlfl IwT PW tPPR |spiiPPnlWW VBC l«rP
1M 7 4n TaectnWan af ma Mpananaa or amall ataHi «nf vtlMga «id aatwga Mtftiitito«i aw rti M M aaan m«da to m M m inalMlaMl aMNUwusW auptMti irtMWon ta vfiaua IwcaNw* a»id wwnatalawt, «w t»lWWIIn| <Wa m m . tBHMW, » .t7 >
MUM aodia inMMMM vKm a i iwwmnni'n ( Hi. 1.H3.0I •« » •« « « apaNMhfl in ttoW ita liM>#ii«al(HMqinmt t6 M i MIH fWWW. iMMIa^liA In Uite' liUttliA iilfc'tMMiifr-' i ^ ii rtffiliil t t'fci’ 'iik IHli lifffiiiIff WW'-vfpVi ffWn #Ti tn iP ilfm if il |#i IHIilW^ww P H F1 w nw ^ w i^ m m w -W ip^Bjff^PfH TO iR fP iiP
nariiitti
1 .M AtiMr(nalaUMtaMfflaMit>rmanr^<Mmmaaiena<iiallMlafsr«Na
staita, Wa iMrsaKitaia af papuMton Maw (ha iwyarly tlr« «nmHI.7S in wral ««aa ana 41.14 in uMNHi IMMHI M iiw3«l4. iavaMl anM-pa«wty «id waga an^Mi ant programmai m
( » J ■ . ":. :., • ; ■, ■, ■ . . . . V • ^ • . . ■ •. •. •, ■ ■. •. ■ • , ; j

bilng in th# itate since 1980-61 to create income generating assets anH
011 daily i^ ap lia la for identified beneficiaries of target groups so as to enaMa
tham to 6r®§a trta povarty (Ina. Since Its inception till the end of 1998-99, 31.6 i lakh famllNia
Hava NWI aailabd uniNir Intagrated Rural Development Programma (IR0P) ih
Invaitmant of R|. 1 ,020.# erara. Training of Rural Youth for Self Empioymawl Pfogwimilf^
(TFIY®iM)> wWoh if a ai^partlng component of IRDP, has played an imprWWH m k #»
imparting tracing to ryrat yeuths In the age group of 18-36 years to ana^li tHam t i tika iip
salf amploymant and wage ampioyment activities by utilising tha iftlifi acquM thoUQH
training. Undar tnii scHama, i.41 lakh rural youths have been trained and 1.81 lakh Hava
bstn f^abiiitaiad by tha #nd of 1998^99 with an expenditure of Pla.51.72 cmw. Uniar
Davelopmant of Woman and Children in Rural Areas (DWCRA), another sub-tehama ©f
IRDP. gmupa of 1S ^ 20 rural woman ara being assisted to in^maaa thair famliy
through Ini^m# gatlaratH^ ao^vitlas. A total of 12,799 gnm ps eoveiPHi|| 1dSi1NMI waman
bc^oiarlaa hava baan ^ a d by tha and of I9 ii*8e . Durin ^ m * m . l8fl.INI laliti
mani^ya of amplaymiim Mi am ganaratad undar the Jawahar R o i^ r H^jana a
Q«nrt Pf amra. U f ^ r Indim Awaa Yojana (lAY), 50.871 low fiisal Hmaiai «wwa
oanalryalad at a uaat af Ra,[email protected] crcNPa during 1988-99. itnpioymani Aaauratm Sohtma
( lA i) waa InM lu ia ii pH ^ ing assured amploymant up to 100 4a$^ in ^ lain
agrtmiiliiral aaaaan. Dyrlni W S-99. 340.14 lakh mandays ^ ampfaymifrt wara g a m ^ iii
undar tha aohama.
1 .29 Saverral walfare programmes ara being ImplamanliMi in tha tlata wHiohin@iuda a a i^ up of woman a tralnfng centres, provision of shaft Noma# far v im m ,
r#ia^ilMiMvt aaivloaa watfMm in dlatrasa, provision of old a p THailttirg»y in tha ita la has inoraased from 4.5% in 1951 to 34.7% In fW I. pr^rlf«n
of i aman total amjilayaaa in tha organised sector has inc^raitad 1mm 1.77% In 1990 la
11.48%^% inoraaia tha number of women in public sen icas, df tha vatain^ii W #ia State (Savarnmant Dapiirtmants in Group B, Group C and Group D sar¥te0i/piall to ba § I|^
up by dlraat racrullwant hava been reserved for women candidates. Ourlng 116140. t76 woman In dtitmai ware rehabilitated with an expenditure of [email protected] lakh. Undar Stats #ld A|a f>antion iahama 2.97 lakh women beneficiaries were covered d u ^ 1 9 91 ^ . Slmilariy undar NaWanrt ^ ^twtllon Scheme 1.47 lakh women ware banaf ttd. Urtdar HV\«)flA praQranifWa, fnianelal aaalalanea amounting to Rs.407 94 lakh has baan providad ta 2M7 DWiHA graUiWi bana tin® I4i921 women during 1998 99
1)4, , flIilM lft
lAMIfel ite |iyi j|y|||'j|j UM|M MAflkMlftfi jUttlll UMIMIII AJM HW pg|y|tf|g|||HII PKIWSWsWRiwHiP wljjlMP
i l l ^ irf »w m (|w«am «HM «f tttt IM M Hh im n m i IN'HjMRREPPgpPwPSF ■ wl" Wwi iWPIPWPlw - ' I H I . PPIwi liwlnRf 1|fw»* 1 fW IPi * IP
i M l i a m t O l f l.A M lM 'tw M M lw iH M M B flflllM ittM a illM r llll ^ l i l o im ut. 1‘erlil ttiHiMiA M^i at Mitt wytiyi u ^mintVlPniMHI I im illlTiii wwi VI IIHPIH Pf wW VpHEHPIJf ffWI inrffmtfrPil WmtHmnw HfWI wWmlmffmHmf
MwPHwHfw IRflw UWfwW WIS Wffi HP mVw IPpwli irlwflw IWWNB* WflilTWWrTwnli 1® IWfff|p ffWitff IfWB IfWi^iibtell^iiilyikilM #t# ^ iiiMiiiiiitfi'iiiiiit i<i ibm tiMi i rtiiifctfMtf-tfiiii jMIrnWinviflPNifl OT ■SlwPly. irw l BHHB isv V v n tm V fli HI w filfrlm VM %Q in il yPVWwppfllPm Of InlN Ip
imfttiTitiWttliiiii iif^ lifiiiii'Miiiifi^A ~' HjByit iMfeMft jJfeiUUi
iigal aid, nrtuiyNaiian at vtoHralMMl tT i and SC«, MxMlne iMtilMM, MMtbHnHMnt of tfMdal amitfdymwit aiiaMnpa. iwamMMn In w n p ^ ^
l.n 11wTfttHMtut^ni^|HaaehiiwaMaptiidiniMf>HHinanawOitfltifciiitiitiH ®#HilKi lilh#tf ISftlMi' HttP H%A' JMiiiti flMniii k litMowTf]pm^Mil f WIIi W« w l# il III p IP W ^Ri r^RHWHIwfli w w in ilfl|| w P I I f f O w IfW
i|||| |j lil jkpiiMtti' MlilMI r W n 8wlP^“ IWn w W m ^m m m l# M IIip M fW ll F IP II iil WIIBW n W n W f fpPFiviflf fPPiipRwfWlliP® w
®WWrlPffiiO PnW ' RP wSTf WfiP IP^P0 pPWlWBpWP ®IP WHP
1.11 -m ifr m m m m >
'PttI lH'-l^lf' 4 tflMHI 4 | ||||ll|k .M| llll ' r l• f p# f f • 1 f |PWWI|WHP w*1b,
'■ tw w ^W WfW ‘ ^Pl.**iwlWRW^^PPnil' ■ I^W l ‘Pilli!P.WPPp«w iWpB
Wwl^wlP w. iWi pWj 1 , 8lWR|WpWP%i|F Hm ■-f WI JItiiikiiK finiiiiiil tkn Sti 'H iyiKM ' %lii IhiiMMfei t lifciV ^ fw WBHfiPBMif DVHIP C^MnP* * nw ^W fiiW it dW * TwPOfHiBMI ^WtWPm ’v®Bn|WW5 ^ f
a iiii'* mm m < im im m m m m mm wnm m -w m M fiW w n mi itm m i D mMiHitfllitt lliyi i|||g| ||| g|M 'i 'HULHI IKI H MUUK ttl'flflkiilyBil
o n (W iiB r» » » tw r< ltt H W m » i r n m m m m m ^ . im M < « « n itlM N fe .i m « »iH INhi ^ Mitt IHHm sk IkyliMi d bi
u m il W t.<ti,« a t p i r i i wwwi# w m m ii iw t t i l i W , (M iiii»tM w«RiM faM M «iid. wwfT V^PIR fw^lwmP^PIj^piP^IIIff WwnP PWpWP WwlW' -Ifiif ^pWW HHPpWPPBPBW fH^WPffiiPP filHWWWPP jffi TwPPP*
*1itof1w l ffPPP WWP 'fwPlwPiiWWP wpPTfP P PPW M^Pf Iwti PWPII WWWPPirf* FlPP*fP wl Wf P Wwnrfl PPwiPflPWI PwH- PIWBi .MMMl ^ ltiH'IlMiMl i UlL AP MlA iHittt' ^^^ilillltttf ittyAmiAwWnf? WWwPfwlW
' i/lJ
& ¥ m i 1 io ao sco N O M ic m m
IXTMNAU.V t m & PWMI0T8 (EAPt)
1.11 tlltB avails extamai aMlttanoa In tha form of AMMhiM CwiM.AhNMWhw (ACM (kr MIANlwntation of lictamally Aidad Prq|«^ (lA m ) If) thi SiMt
Wl WflfW Sank, UnitBd Nations intamaMmal OhMrant IrraNgwwy Pumt (UMIOIP), in n i^ t of dlffarant countrlai auoh aa 9«tMKiy, PwUTWrji, IWtatrlMMi, IHWiM, Mwway, U.K. etc. have extandad fInanoM MMHMIM m WlWtMWWiBfP' fwT wyBHwri W' il*
1.i4 Pwrlfi tM Ninth Ran, It haa baan wivti«|M to liM M a fto.4.M4<|4In tf)e Stata, out of tha total Mita miM)» at fli. 11,000
mm. H Hi iwipaitw l IMK in wmmnt of Rt.a.saejs crwa of ASA w i ba mMi iwaiMMa teAddiMonai CantiWAatMMinaa |e thtM M af P I.IS IJ4
« w t Wi IIM 4 M I «W t Hava baan raaaivad d u ^ tht m u*' M IM I WM IM D il' wi im iw iy.' N r 9»yim iKMhaooo a previaion of Ma.1141.11 m m hn-Hw m m m tiM , imiar M Nl PWm Hbr UMOtMan of 10 Extamaiiy Aldad P f t ^ In tM P llik tt p # N M » i i l i i m w il S iR im M m ttm ai IB m tuna of (U .iW .1 1 « « t « i ba raatly ii
\fm i m«BOI>, lawn ^ tm>»rtani lAPt prMwifly un#r im p liiM iilliM ^ ^iWWP iWI wtNWfII "PWw MPOWr rVVfDffnS Pf(^#(R, Un99ll fiWWWi wyMlm UtPrWOpnipni prppjiwi
vmm l iMWw Otwm ilateii Pmim and onaw Btaii H^Hmy
1.M Al praaant 36 public saotor aiHarpdaia nmMNad undar thaOonpinlaa Ael» enuM undar Special Acta of tha staM latfaliluia am fMnrtlaniflt I" BMIa. igM Mvaumant in (haaa PSle m tha form of ahara oafriM «|mt lam laan wi» of tha DflMr af Na.1,aM.I1 srora and Re.3,3i8.oe orore of whieh ttia Hat* OawmtmNiV* aMra waa Ra.ia0|.00 arera an« Ni.1,aoi .70 cror© reipsctlvaly at on S1.».M . DtHln|| 1MMM. 14 P M i hava mada prafit amounting to a total of R i.i,12.11 orera. An amount af lta.130.00 eMra hia baan raallaed by the Government fram tha P tfa tawarda advaneaaandrmii ifciriirnM-iPfc# tfil i iiifllfc jlt ijAwii 41USS».ilQ r9 Wn|F*tWpfW I IfIwP Wtf>
1 .M th i itovtmment is according top pH©% m PWW iiteWliIn of lilt @hangid industrial scenario in the odumry. Tht ilt^ln@|y# finericiil restructuring, creation of 8o@iii iifity nil ^ ra^ndimi
m m m m m r tm
M m P M i.
’Ihmftl Mt IMMMIHyiMi (UUUk*HP 7 . jPHP ^ nPlwlF • ^Wf Hp pfp p
4 ft9 'A ' 1 1 ftR HMA iiiHh ll j||tt ii ^ ii-' 'i itt|I»™f * ipPIWPrw' l pPNIIilW wppi i. * i|ppi Wi wf fWW iP! i Pfltlttlbii iM Aflrift ilHtti ajyuyjl'-' 'HbHttil J|y^yy[ |||||tfyi rf Jj i ly ||g||||mi|l|j HjHyiyil l ^wrwHWfnWRIi Irliflffi ffUPBMI SRWRl wPI mRlnSf
i^liiyiiiM n iiiiiM h i -fltouiriiiWi Ifc itiiiitiitiiti ttb-iii ■ ' -■ : i i t i i iiii l i i iw ii 4'H .gyi^ #.H. #Htt||l| f l l i i l i l i t i i iOf nwTf®fjF yniFipiffii liiyipiiiii r wn iifiw fwiiffHif pn Mvnppm if prm !■» twwp* UNRigiifnim tht m$t iMm m dHWel A MM of jMi tNiintn ivm .Mtf. 19.111 •nUitM MM! wm^Mtliiiiiitiaii 4ib Immam k»e4 HJI &4M Itikiy|u|y|UK litoiiiiiMittfiifi AtUu MtMfj V MM MM4- Im m iiiiaiili i■ •V m im ra l W T ii iV * IPWin wnllj f w i l i a rm llv irV m i r V n W H l iy p u m u f W iw i f i y B i W i frw liw w i p w ^ jr .
'tel ^ iliji ln ^ ii 'MflWfllttiiWll if l i |M i Irt 0iwm iwmn I IVUipi IP W W|W8 w W l i UPim Ilf91 i« wHIfi Www pWfWwrW wlflFBIPWB
tt%tei>t i> tfAMiiiMA ti^'A MUtJttAil tih iuilill#^ llrilwiitfltoiMlMlife i>iii*t 'Itytti^wiM. M'WitIF^pwnWB* wr^PPI IPI wP wUnMl^^ll W W i ippHPPtl Ihf |PW^HB lffl»IMWriWf|iffw' ‘PlWr ■ WlWHilH i||W '' wfWI' pfi'f-HPi
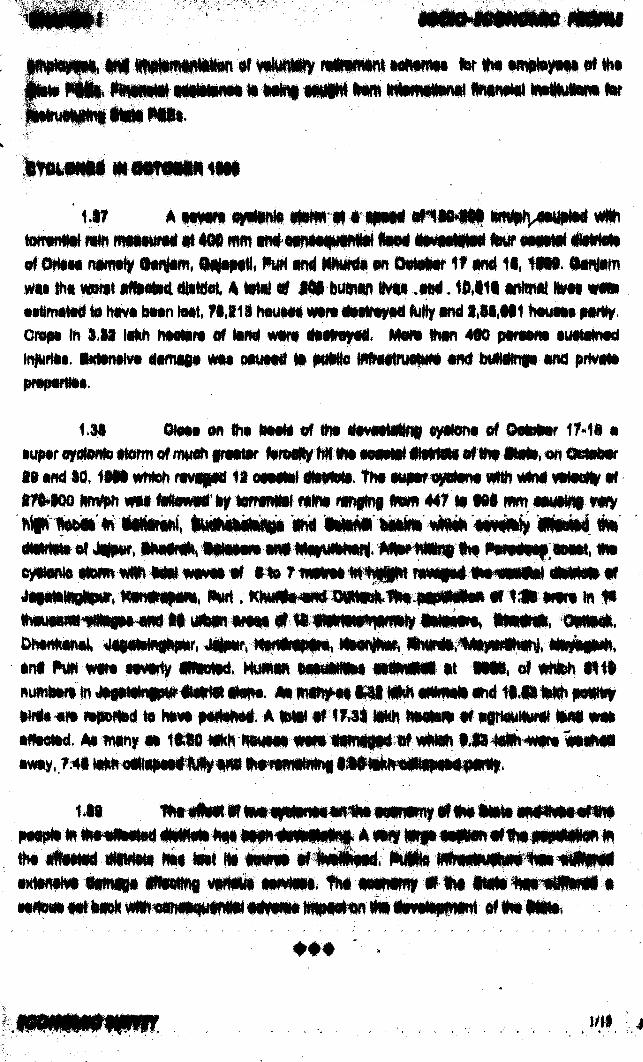
l.a i @Mm on ttw ImmM ef #w MvatMMi « Meft« of Soietor 17>18 aWm wT (B^Smifw llWfTii w mfflSwl pfWiRP fwiliwrly nil WT# ViMPIIIH wWFHPHI ww WW WWOTi WI IpBPPiPlpr
mW (BfW will iWPP WrWCfi r*Vi|pPrH f Jf mWHWW MHillWIIP* I ffW iW^Pi^"^pWwiwI WWlff WmMi IPWiPBS ”
ifM O Q N m ^ ««■ M Im m I'iv Mn«MM film nm ftni l iM 441 Ut t e l wm m o w y«ry
T
wf IMIIUMIR| w If' P B ^ I P t i iW!NIIIWII|P lPiPliPpll HWP
owMwwu i n p i »iia i i u ib tB iiitw i> 'W i i» ii iW 'p w t» » w w i fc. 'Oim m k ,b r f I wPI| Wi I *TSPiCTlWTPiP|wTPI| 1 ^ i |Wi PPl ®Ri•tM hw ww* MNIrly IMnM. MmMM t im iliMi -mlliwtll' (t m i , of «Mfe» n i lnumlwn InhWto «fO NHHHiiel to HlWt fWlllWl. A lew « ffJ I MH NMMM tf «9MiIIM« mm ww
tnmi II .iMMh 4IMUI - Wbui^ii .ft iWi
f i'lPW. In m IPPWPW in llPPPI' ll|MwPHFPNr BFlFlnPP- PIPPPrPPPrtHf -wn vK9' PHPI hp '•PPWPSPWIWHff ''TwP
ffiw milPmPIPP wHWfllWP fflMi WWW WH wwH IpP w? ' WPfWWSNlWP. P IiPPIIWB' WiBnlPliBBipRBW ' WPP» BWWRRIWP'>'3j|i|H|lljy l ^ |jjjjjykl|4v. ^ l l ^ ^y|pj ^ lgl|jjjjt' . i
WIIPrHPIVp wPtw fV wtfHiwm Ifll^PilPI WPRWiWi* t HI HBWfwWy 1^ wm UWRIp ^^iPriPl^wWi 'ipiwnwiiftMti<»iiMi«iii<itiiWit)i i l i MwiiflptKw i t * w i li >jHi n> eftfitiliii
»/»!
S » • -
liyyyL
|y|A | tt|||y||gg| m|| j| |y|y|||y|y|
/ '
8.01 AmnHoNrtion ef iwviily imt rt<(u««an in unwr liqmiirrt cnftUmM t« twiMile qIi m iv ii ttw pMiMrni pKKMm. In wtor to MWwt (MM iwin HMNriM if tmirieiriMHit t M «wiii pwflwwwi i havt MMHt m m n M ^ #w mm im iurban «nuii particularly tor acotiomleMy Mekvwrd and aoolatly vulnantila targat 0f«u^. The proMam Df unamjrtoyiMnr tH MUcMftafl patMha; t*H0 fw taitllf MM wflpft>y>ninriif Qovemment and aaml Osvammant offleaa, puMe aactor unteMaWnea, flntortas, buatnaai aatabMhnwnM ate. la partlai rly aouta THa Ejfhth Plah almad at IKMaMnt AMii li •mploymanl by *w and of the Ninfti Plan, Hsiwvar, tfta pMWarn af t^h lavala of unamploymant eoiWmwa (o parvlat. Buring t9M 4^ only 0.8% 01 tNa tabow foflca wai amployad In tha eifanlaad aacitsr.
. 2 02 TNa poputatten tha Stala, aaswing to m» 1M4 oWiaua, «Mia |^ U 0Jakh. Nanrly 87% of ttw total p^HMUim IMaa In rtfral fMMa and tlw rama)ntr){i 11% onntMa« u owm p fip m u n m iM t t iM m 4 W ^ d i liiW'JtiV m M iA
iniM Im n i. Tiw frawM i«ta {MHMMIieh # W .M II tn tw tta ia tM tMeaMIwijF ' ppPRpi . WMw*' - PrpWWifl IrIPPIp
<ao.i7%). tha iMnaity of papuNNot) aMch v»|a ifB |N» at) Km in wawmwi to iO l paraq Mn M im . to M il IM N iia i ir iM i» a |H»apttWMlmyaan. TM tn i i«lo vM «v«raifl1 (immM f « tW I iM b iM lM lI ,<iaHHi» » tW IR fU l.'ItkkA IfHliiiTiii ‘i H i & j l . ' kitk' ittk «dMHk 'HA iNhI n0 HwrPiijr' fWW 11 ipiy® IW»w ™ Ww- wBUi * pjPt Sw . WP*T/o
and M J l t w a f f l i ip a iw i9 « m e i* r i .1 % m ep«<liw*n t e t .
3.01 A i p » Via H f f iw ia iM ,^ p p p i B - |i» » |»H i i i ’» i W pfMWIton
wrwa Of iOW'Wi. fr¥m H •! WWPff Wwi llf^wlW'-pppwBIRwP^W
■nwo 1 |VlP^|<, wWfn* w^HWW 1|||PIISnAfWilMtt #k|fe <i|l "jilt, juilMitePwlmWP Wf IfllH pi
lind In uNMn m m 1t1 . lWWti|WW»i<lBH u to f i% M .
ww^BTi ip WFVHfV T^Pf 9MP9 W^Prri 4^RliilM!iPw
<, <L .
m i / m t M A N K m n A N D itm x m m n
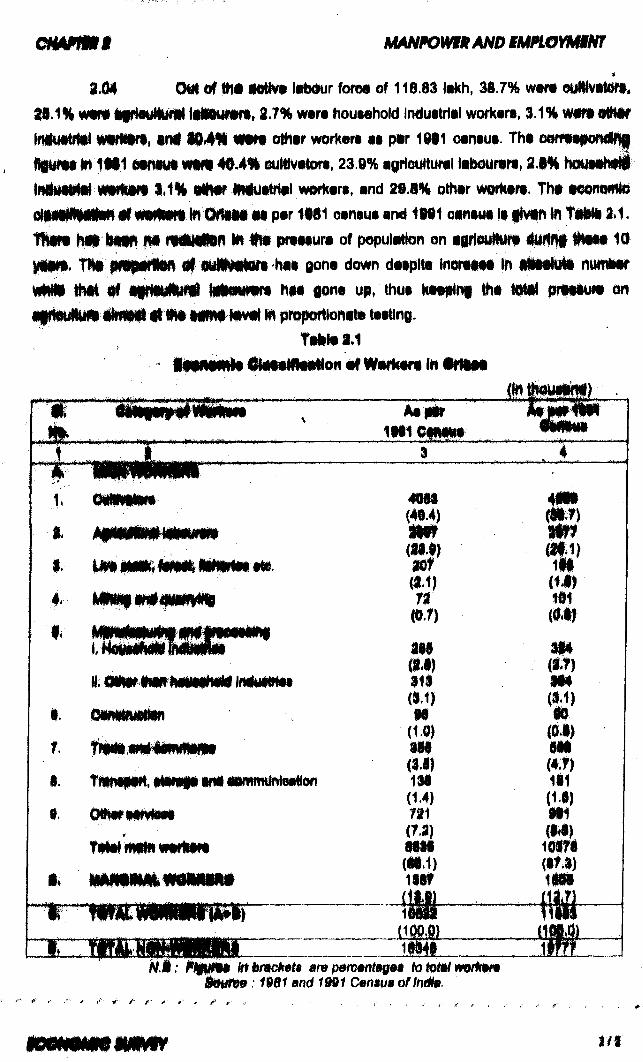
i M OM of th« Mlhw lalMur fores of 11 B.83 lakh, 38.7% ww« ouWvMW.i.7% Wire household industrtii work«ri, 3.1% WMi oM f
ir il iViW oINtr worHdn is p»r 1911 othiUi. Tht f^ltMit M IM I ewwM mm 40.4% euWvatora. 23.9% anrieultural labourara, t V ^ hoMUhiril
waiteM 3.1% a#Mr iMuMlai werkan, and 29.8% othar wortian. Tht •eonantai oHlllH»Hi W «f «NmIm m OHiM • • par 1M1 oaniua and 1M1 oanaut Is gvdn In T tM 3.1. H IM M l IhmM) IW tMNMnn m iw praMura of pepulatton on agilauHura AlrtfW 1Nm« 10 yCMt. TIM p w p ttin of BMllMrton ha* e°na down dnplta InoraM* In MMHuM nunMr WNM thM of afrHMllimi tabowwa hw gona up, thua KM|rin| ttM ieMt pr«tM«« on ifrHMlMN MWM ft i l t MfM Mvtl W projWftlonata taitlng.
r«Ma8.1 - I m w wii Clm w u r tiow I f W w h tft m <»>Mt
w t____ ____ ______
" L .'''“I M W li l l M r
1. tm m m - « > i « M i(49.4) (H n
«. if (wi liiw ii>m i«w t m t l / f f(UM) m > n
f. w f m(i-n ( i «
«, is w iw i» « w » in i n i« i» .f ) m
I . N e w W i S i * W H I mm {i> n
(*.1) (8.1)H fiMi'w* iiiiwflPIRpii fft \ Iw Wt'
(1.0) (0.1)<# ' if iiUMi MiAiliiiiiMilHiillte ititit Mitff § WWW
(3.1) mli iiuMihii I'iiiMiiii i iitii iHiiliHiifciit liiii'iiiiii 4 liii 4114B" I i P p P r l ^ p p iBnWI Bwt»H**lfflwWPwfT H I
(1.4) (l.i)I. o m w m m t 731 mi
. (r.a) (M )IMatHNMlVMHltN MM 10178
(•1.1) (8t.i)«: kuiMUIial, HMHWUI 1IM iiM l
.... - , - ■ I IT , . ..—-Ill--i-ii Ml...■I- ■III ^^ 1
i i m a --------------- ' » ...............mNM: InbmckBii am p9m#rif«00i fotot»fm0mm
Bm ifm : 19B1 and f SUf Census oflnetk.
it i iy S A tE i iM iEW ILS^M W tlEWWWW f lFflWiR|ffi lPlP-.^'|f|.p|f^ f
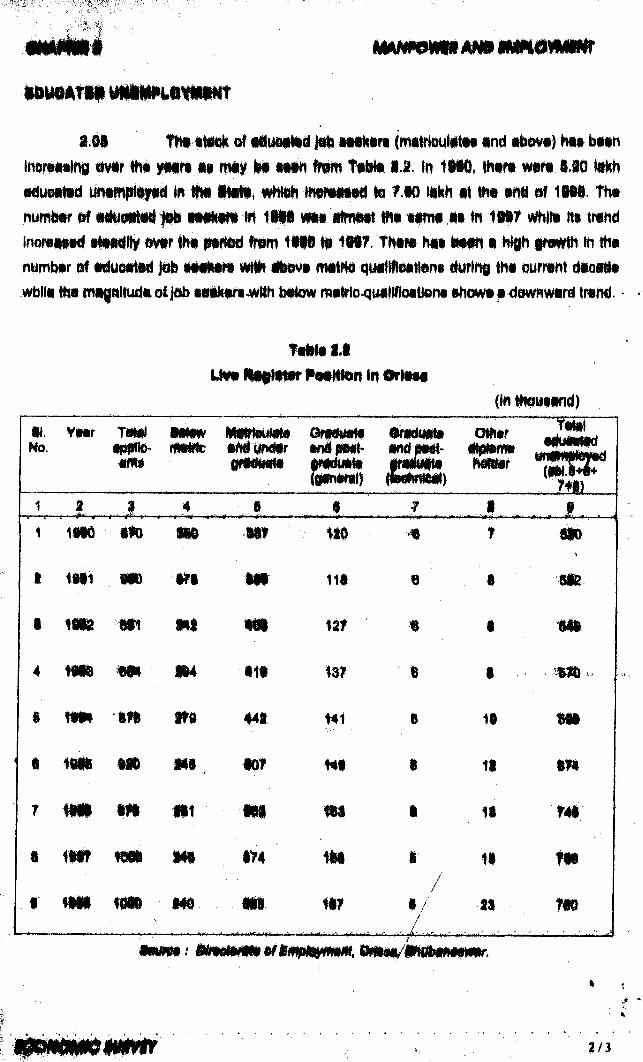
SOI TN iMnk of MuaMad ji^ MMwra (tra«rloulftM and abovs) Nat iHMn inoniMltig tivar (ha ytnri aa may Im laan ftam Talrta i.3. In IMO. thaw wara IJO lakh adueaiad unampHiyad In ^ iHrt*, #Meh lnei««MMl to 7 JO lakh at tha anti oflMW. Tha numbar of aitUMiad lob liM aw in ilM «wia afrnaat iha lama aa in 1M7 «#)lia ni trahd inoreaaad ataadNy evar tha parted frem 1N6 ta IH T. Thaw haa Imhri a i oMrth in tHa numbar of aduoatad job aaakara wHh Mova matho qualWeatlena during tha curmni daoada AWblla tha (nugoltuda otjob aaMiaruMtth baiow malHo-quallfloaUana ahowa a<levynward twnd.
falN aM U«B nwHMr PMKton In OrlNa
(Inihouaand)
SI.No.
¥ i i r r mifip tic -
«n is
tO M ^IfUflFIC
M i^ le u lito• ^ O N i r0 m m
O f t m min ip M M f-i r i i l u f t i i(3 0 i« f il}
0 T icK ttl9im ^ ifN il-
iiB w in ® w /
m m
h m § t
’W ” ■
ifnPflWllnfwOi m i ^
f m1 i 1 4 ® i i . , 1 . . .
1 IM O m m m W I m\
1 m i m m m H i • m
1 m m m %2f 1 m
4 w m m m i i i m t 1
1 w m m m 441 H i 8 11 m
• 4fiitigW pp m m , ' m 141 1 t i m
t m m m t .- M l m f i l m
• w p p m P 4 m 1 11 m
• m i m . m . . H i . . . m/
• / m m
c H A fm t m N P o w u A m tm o m iN T
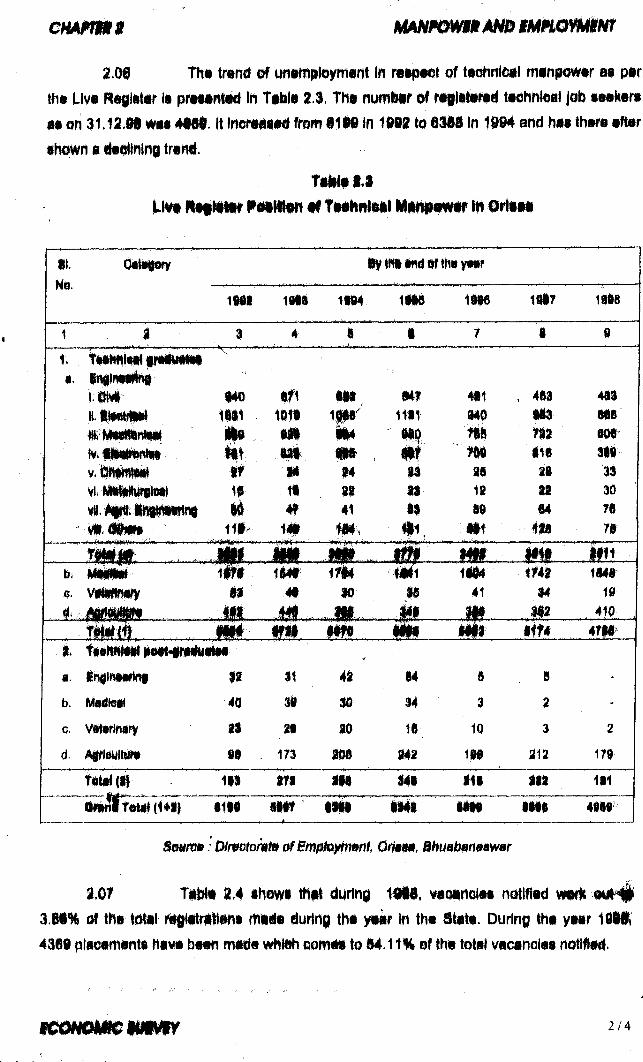
2.0# TN trma of unwnpteymiim In Wiptel of tcwhniMi minpowtr m ptr th« Livt Rsglatar It pramnM In Tabla !.3. THt numMr of rafftitanM taeHMeai Job laakara n on 31.13.M wat 4N |. it InenHiaatf fmm U N In 1888 to 6368 In 1884 and hat thara aflar fhown a daellning trand.
T a k lo lJI H iilitttiU M 'Y ttA ii'iilM ill -M iiirt'ii iit in i- f l l iptjlVip W» I wWFlf^Wpf i N f f i f f "liFF l*w w
iK Ciit«sorym .
m i 1013 1194 1SI6 1t§6 111? 199B
1 1 1 4 S 1 7 a 9'1 1Ts#hlil#el awMiUiMiiii!• ivHFiTiiifw HI miipivmi. ingiraiiil^
i.d t# 140 111, i l f , 411 411li iiifitM|plwlwl*ilPF* 1111 1011 1p8 1111 940 913 816tft.M lM rM ^ . m m ' m 722 606fVviinNintiii l i t m m m 116 319V. m l i 14 33 m la 33Vi. MtNur^leil If 11 31 I I 11 I I $0VH. in|i«> iMifpWfing 4f 41 H 19 «4 76
iii« t# m- A1, ^1 m 76
m m . V ..... ............................ ..m l . - l i l . ..". . . m .... \ . M .b. MmWM l lf l IM t ir«4 M il 4«4 iU l 1«*c. VfMMry I I 4* w ae 41 34 ID
- M _____M ____ JU2-4f9§
9 En0lH9«nn| n 31 4a 94 S S
b. 4(1 Si m 94 $ 2 ’
G. Vit«rNi9 I I m m 16 10 3 2
d. 90 . 173 206 042 1«S 12 179
111 171 i l l $41 111 I I I 111
i i i ...M i ~ im i i i i 4 t ir
§m m : Ohmtokm Or m, Ohmlmnmwar
m T iltw u ih@wi tH fi dyrtrii i m , v id tn iiit m m 4 w m
%M% tfti n if iit r ilif ii m iila M tip th i fim In thu a tiltt. Dyring th i y tir Id lft 431® planiffiifits Higm bt«n m ill# mmm to 14.11% ®f lh» totiii vieanclii notWiwl.
s c o N m m m m tf
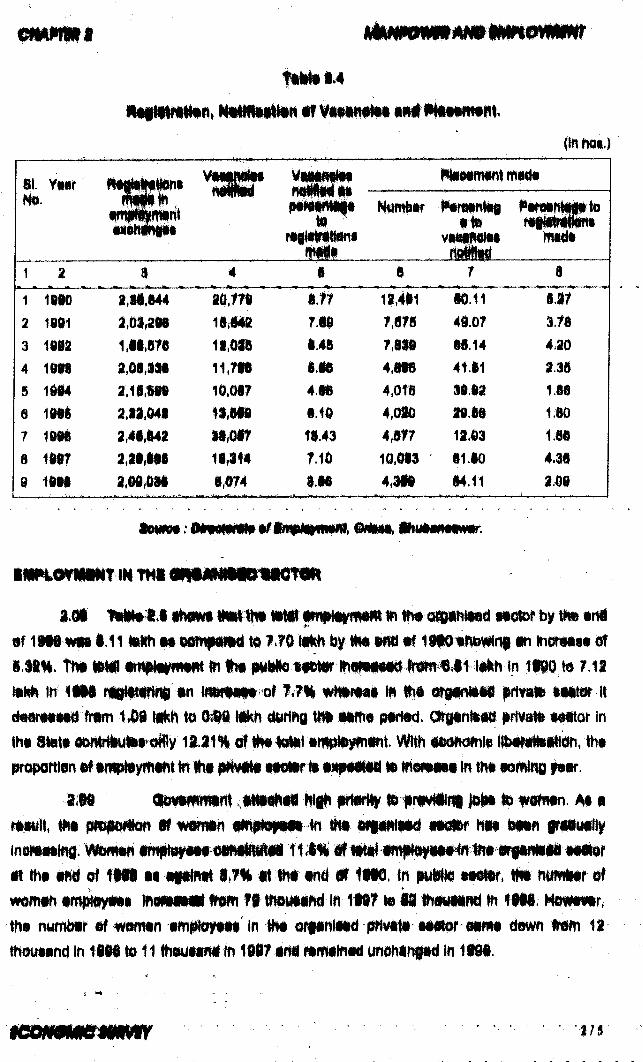
SI Vitr No mIPPW ip
pvrpvntl ll NfHindii toi l i r^proWmS
vai«m»tit m i^..i l M W________________
8
2 1»913 m i4 1&IS
9 i m
t.ii,i44im ,m1,11.876
mm 1.17rm
2.11,041m u i
z m m
11.036i i , mlo.oirnmUM m11^14
m4Mt.10fi.43r.io
12.401rmfsm4m4,om4.0104mr10.0134,m
•0.11 4i*07 tS.14 4t.l1 36ia
10 J«
aijo14,11
1.1?3.714.20l.liI9d1i80i n4.112.00
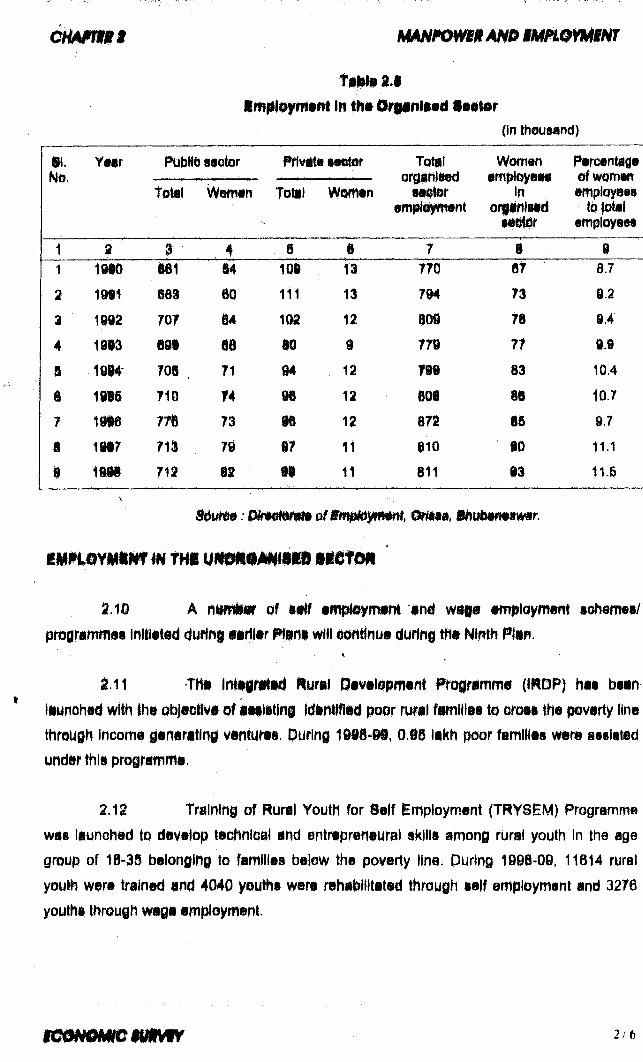
of ^wmrnm 1.11 tekh t« oomfMmd to ?.?0 tikh by »mi tf m inar as*8.lMl%. Hn IIM0 frf fm ^blio tm m immma lilh in il90 td 71 |
in IM riokiMHi in immm 7J% lh« $m\m \\fmm iM l(ith to OM mt\ (luring m i m m ptntd. C^gin^id irivaM nmot in
thi Steti oomHlNtit 0% 11.21% of in ^ y m M . With l iNtisiMon. |h«propoftiiin if impHiymi t t t i iHNMi mmr §wpmmn ti in m is i in thi doming f$m.
M M O l^ f fm n l m p m M m ^ w ^ n . At nriMitl, m piopi^n if iMMin <n ^ mfimmdi mmr hti btin ffiMiiNiHyin@4« i i ^ . ^ i m 11J % I f i i^ ^ ^ N iy iN M ^ i t M r
if tii ind of trai i i ifilDil S.7% it #ii tnd if liiO. In piul fo si^r, tfii nutfitoir at wimin inr }teyt»t 1mm H thiiMind in t i l l ^ M tt fili. MMiif.tN niimbir if omt\ imployiit in M nrfinM si^ r OiWi ilswn fm 11 tHiyiind In liM to 11 thcujiirMi In 1917 ini rin^tnii ^ihinp^ in tiii.
'-i;j
c m m t i mNm^SHANB tMnOYMiNT
TiiiiN iajIn O rg iiiltv ii io»lidr
(in thousanct)
i i .N©.
Yi«r PubHo sector Wivita ieetsr
t i t i ) W®rfiin to til Womtn
Totalorganised
seetor»m^i^iw«nt
Womenimptoyees
iftorganisiid
Percentage of women employees
to total employees
1 19§0 @61 14 109 13 rro 67 8.7
a 19t1 881 80 111 13 794 73 9.2
1 n m TO? 14 lOi 11 801 78 9.4
4 1113 891 88 80 g r n 77 9.§
§ 1iS4 ?0l , r i 94 ia 199 83 10.4
i 1995 m 14 m i i 808 88 10.7
7 1916 r n ?3 m 11 i n 88 9.7
& m r r i i 7$ m 11 810 90 11.1
1 19S9 n t 81 M 11 811 91 11J
w TMi i ie f M
t , l i A of • iff imp^yrtwrn »nil w tp tflfffldymtm s<tism©i/
programmes Inltiittd durtni sirliir Plarii wlH eont{nu« durinf NtfitH ^fin.i ■
1.11 Thi iniiiniaN i Plumi Pivelopment rro0fimm« ( m O P ) h it beinliynehsd with th» objactiv# of iiilit lr t | IcJinlfflid poor rural fim illis t® orota the poverty line through ihcomt fiftira ting venturis pyring 0.05 lakh poor famlMes mm assistedundirthlipfoiramme.
2.12 Tralnini of Rural Youth for 8e|f imployment (TRYSiM) Programme vvis launehed to develop teohfiM and entrepreneural akllls among rural youth in the age group of 1840 belonging to families below the poverty line During 1998-00, 11614 rural youth were trained and 4040 youths were rehitWltatad through self employment and 32T6 youths through \/^ a employment.
e wWllrlmWFFw iPlfirlrWf 2/ 6
1.13 DurinQ Id t M i , i aum of H i.1 l i1 l . i l NiMti H it Im n i ip it tor
pmvfilini wm itlth mwi iyi «tf w ip imp(<iymiiiit untfir iliV
1.14 WfHi Mlniitiri # « i|ir ¥ imii p ^ ¥ ) whWN m $ liwrwHt# In 1114-i§ m m il#m vl£ilrfg ttiiw liy m fil to u r iirv p tt^ i ynyth. iu r l r i 1li« *^M ,a ii tm tu m
of 6.S53 00 liNh wm fm 8 383 b«ntfleiiH«i uf whilsh i mm nf Rt.424.00 m hha^bisn dialiMri®! to t6ft b#ftiffeliclis. Thi eOibu«i«nintelurl0g liaT^ii w it «a.4,831,00 iakh for 7,0i4 bsndfleiaHes.
2.15 Uhiir OWORA urrng II3T ip#ups conilitlng of34,121 wom»n Wifi formtd at a m&i of fli.407.i4 (akh to criata aupplamantary amployment oppo frltlas for rural wtrrwn.
iMi»LO¥MiNT a iN t M t io N DUftiNQ f §11^1 m w f f i l « | ^ 0
IM 11^ btiDktei of u n a m ^^tn l ir\ the Itata al tha afms aitim i^d m i.7 i Mikh of tHjidur fbrca m tl a baaia of rtv^aH ^an sij ndiHira ^ r 1917* 86. Tf«s axpaiW p fitr ili(^ W\ llta ItiMa chiH^ lis a - il ani Idi&S^O iibata# on ^ aaitoral invaatfwawt-art rfeiymam ete^pad/lixad by Na«onal Caimcti of Apptiii icimmics Haa^ffrh m 19?3> r4 aiid on the aaaum^ dr Mat tHo magtMtudaof ampi@ mdm ginaraiad ^rm igi stata ^ a ^ i to tue emf ymantganaritii r iu p tnvaatrviam ay Cantral OD^ mrrvenl, tHrough fnvaalmant In the pftvata saot&r and tHfrciugh trtvettamant in F u iic a e ^ r UntiM^altinss takan to|a^ar. V^h a provlsten of tiata P\m »»witr^nt of F^,1,3f3.5S irom iu rir^ 1910^9 ais Stota Niw (^t lay ef ^i.1,?1|.ilS ernri fST tlii^ l^ O , afi l wam fortaratlDn dttrtwg 1S98-9I and 191©- 2i00 l« asMinttai at %M laKh and 1:43 lakh taapac^ah . Kaafiine Hi viaw tha liaiN<lag of unampksynwnt ot 8 79 lakh at tHe basiirNf g t»f 1« i|-i9 and avarafa armi i addWon t© #i@ labour foro® at a rato of 2.11 lakh, tNa tevel of unampteyff snt ^t tha and df 19»8*99 a»d Ii8 9 -i0 ii Ml axpaetid to m awwfid 8.88 lakh aftd ffiB lakh raapaetlfa^; Sac iir* irtia astlmatas fm amploymant fahamtton during t i l l - # and 1999-2080 ara Ihdleaiad In TaWa 2.8. .................................. .................................. . . . .
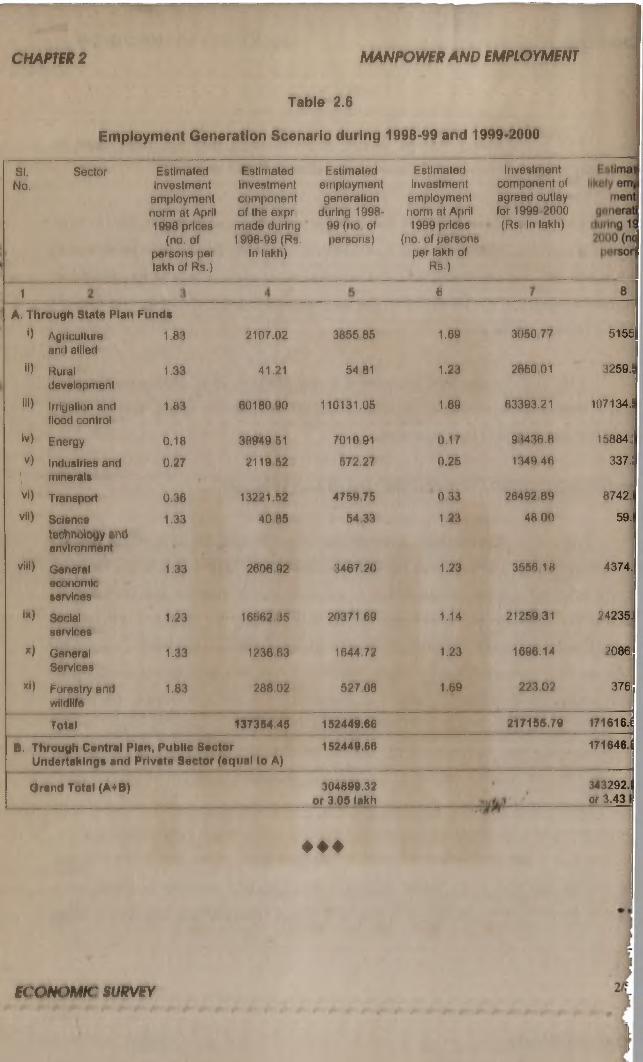
Table 2.6
Employment Generation Scenario during 1998-99 and 1999-2000
SI.No.
Sector Estimated Estimated Estimated Estimated Investment Investment investment employnient investment component of
employment component generation employment agreed outlaynorm at April oftheexpr during 1998- norm at April for 1999 20001998 prices nnade during 99 (no of 1999 prices (Rs In lakh)
(no. of 1998-99 (Rs. persofts) (no. of persons pefsons per In lakh) per lakh oflakh of Rs.) Rs.)
1 6
A. Through State Plan Funds
B. Through CvntrtI Plan, Public 8«ctorUndertakings and Private Sector (equal to A)
152449.66
Orand Total (A^B) 304B99.32 or 3.05 lakh
♦ ♦ ♦
i) Agriculture and allied
1.83 2107.02 3855 85 1.69 3050 77 5155
ii) Ruraldevelopment
1.33 41.21 54 81 1.23 2650 01 3259.
iii) Irrigation and flood control
1.83 60180,90 110131.05 1 69 63393,21 107134.
iv) Energy 0.18 38949.51 701091 0.17 93436.8 15884.1
V)iI
Industries and minerals
0.27 2119 52 572.27 0.25 1349 46 337.1
Vi) Transport 0.36 13221.52 4759 75 0.33 26492 89 8742J
vii) Science technology tndertvlronment
1.33 4085 54.33 1.23 48.00 59J
viii) Generaleconomicservices
1.33 2606 92 3467 20 1.23 3556 18 4374.
ix) Socialservices
1.23 16f)62 35 20371.69 1.14 2125931 24235.
X) GeneralServices
1.33 1236 63 1644 72 1.23 1696.14 2086,
xi) Forestry and wildlife
1.83 288 02 527 08 1.69 223.02 376i
Total 137364 45 152449.66 217155.79 171616.1
171646,
343292 or 3.43
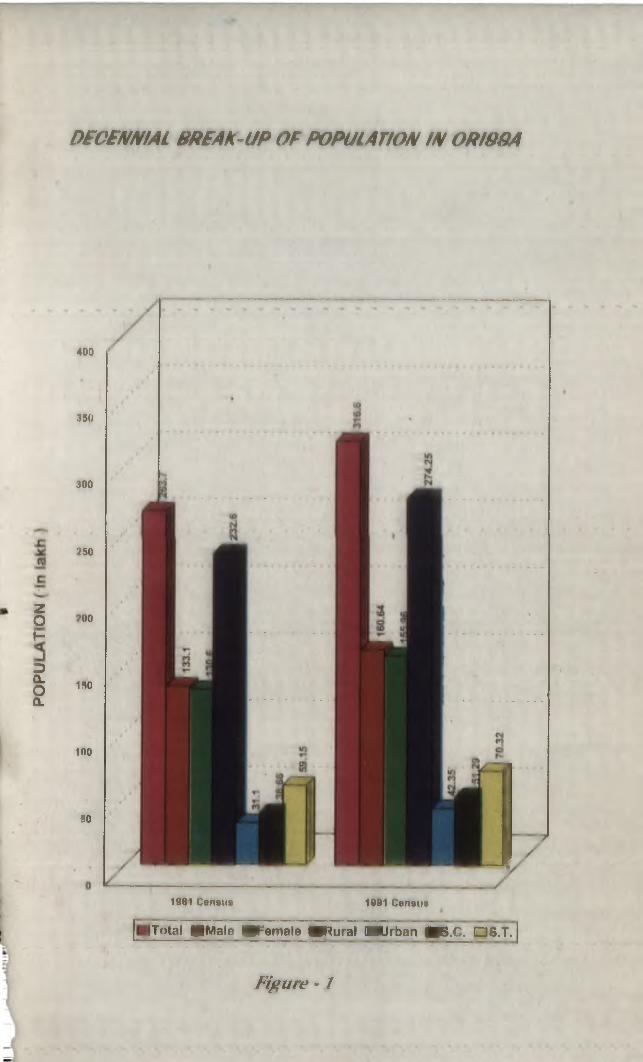
DECENNIAL BREAK-UP OF POPULATION IN ORI98A
zO»-
DQ.OQ.
400
350
300
250
200
150
100
1981 Census 1991 Census
ITotal PMale fe m a le SRural OHUrban 0 8 .0 . QS.T.
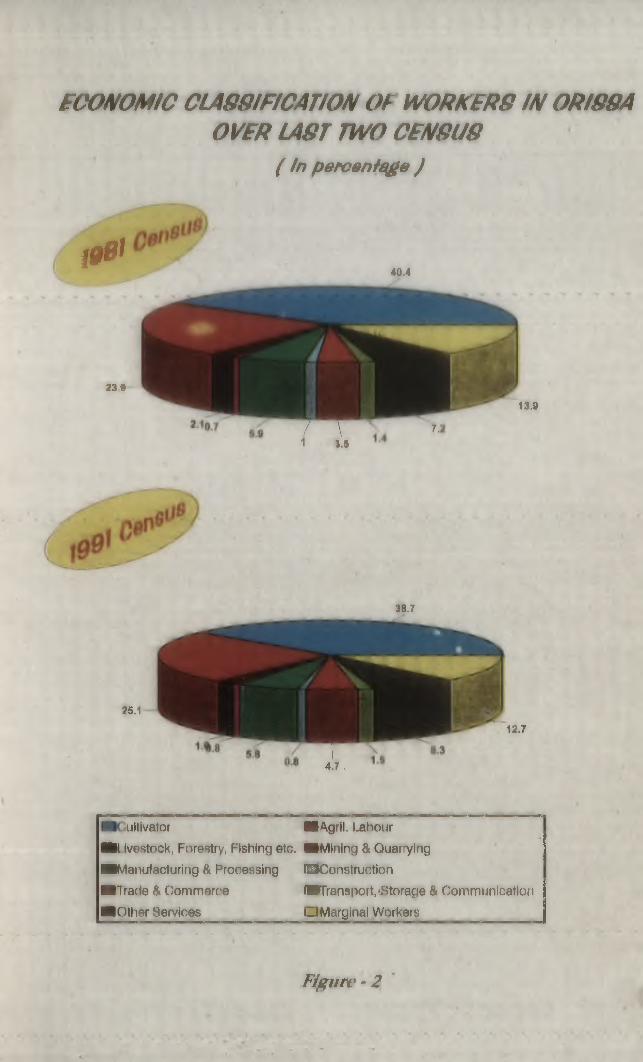
E C O N O M IC C L A 8 Q IF IC A T I0 N O F W 0 R K B R 8 IN 0 R I8 9 A
O V E R L A 8 T T W O C E N S U S
( In peroenf ge J
i 0 0 f
239
40.4
/ \ 7.1 3.S
13.9
25.1
38.7
4.7,
12.7
ultivator ■Agril. labour■ I ivestock, Forestry, Fishing etc. ■Mining & Quarrying ■Manufacturing & Processing IMConstruction ■Trade & Commfirne ■Transport,‘Storage & Communication■Other Services lUMarginai Workers
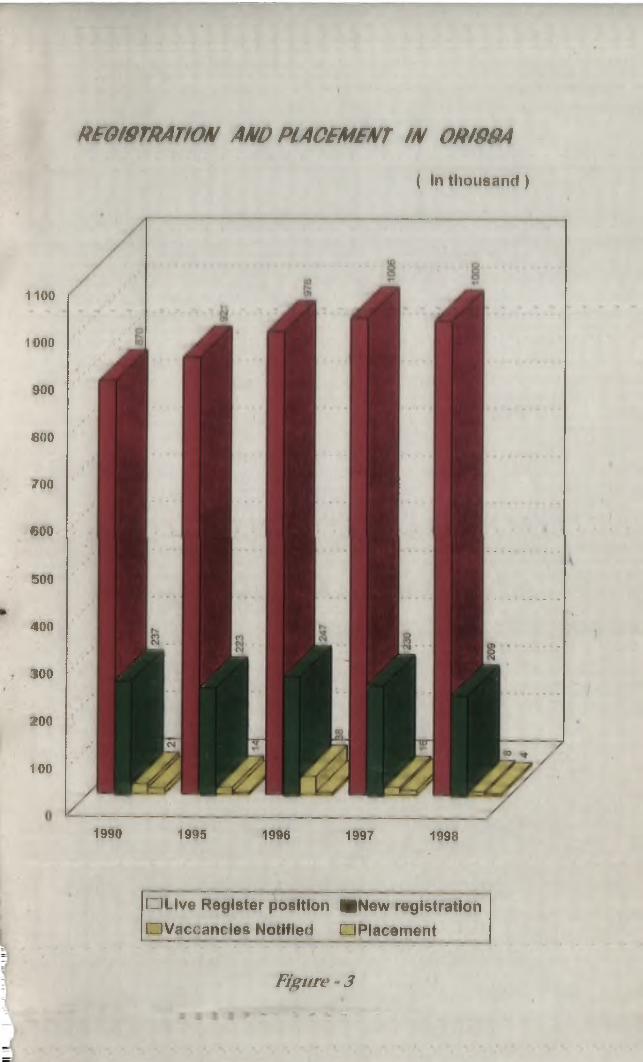
REOI9TRATION AND PL ACEMeNT IN 0R IB8A
( In thousand )
1100
1000
900
600
700
600
500
400
300
200
100
1995 1996 1997 1998
O LIve Register position S N ew registration O Vaccancies Notified OPiacem ent
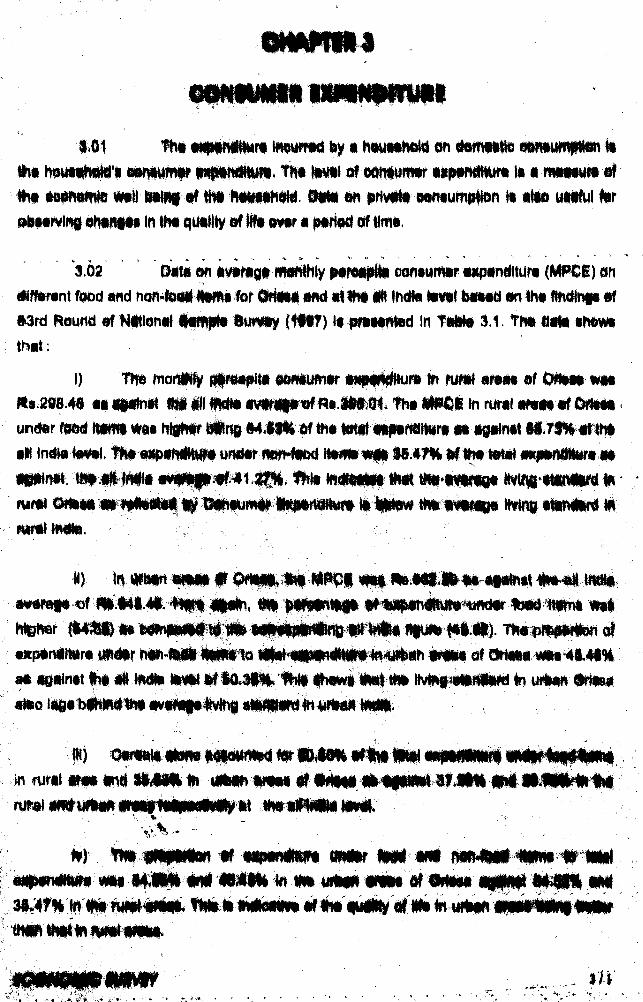
a.OI Th« MiMHHMuni HwufflKl by • tiouwhokil en ttomMtle eeiwumiRlM ItttliM iiiiitilit i f t i t y i i i Jiiiiiyiiiiiiiiii# ittiiiiiiiiiiittii \M M ii§"'W}w IwlfViPfWiiw 00fpWffTW P^WfrwiWflP* In" IHWii W wHifnUiffWf illipiinpiflffw IP ■ irWBwM™ w
ttw towwMto m il MWf if ttw MwHrti«tei. mm on pHvM» ewwump^ H Mm u«M im obMrvIng ohnnsM In tNt qwlHy sf IHii am ■ jatiled of tlnrw.
‘3.62 OflM en awmg* iMtHhly ptreipili ooniuitwr axpandttum (MPCi) an AfAirant fsod and non-MM A M I for OrNMt and at Hit i l jndta tawil bnad on ttit tlndin|« sard Naund sf NWonal M tfta Bun«y (1HT) !• pNHWntad In TaMa 3.1. TMtOMi ihewi that:
I) THe morMy fUraapita somurm Mppdliura m nmH amt» of OMiaa waa Kt.29B.48 aa HMnM m #H ttHMa avM |ir«f f)a.iM>Si tha MP6I In rural aMM of &nm under food ittmi wa« higfw bllne MJSK of tna total fnptnitiMra aa agomtt M.73% ar«i» all India IwHil. tta undsr mm>Mod Monta wm $ 6 .4 T % M tM tatal ORpanMiira aaMpmat. (Il» 4 i M li a v m ilW ia flg t. Ihht ttM Nvttl-MiNllN <Rfwfs O fii* i|f w w fl*# IN w iw *w » liitow » » im » e iM«w
«) M Wtiin M il will' tnm^-<of m'.|4l.4l. DtMntMP #lufon<ilMiMiHMKHir fMM-'MRni «al
anpentNiira uMir IHW-NtWllilM'la lMaHMP«m|IMWi«HM%#) imm of OHau at waintt ft* « Htdt« MM WlH).3«l|, fhMl fh«M« IM tNk Hv«H|<ailMMM 4n uitafl 8HaM aHio l«eal3|Nni«w «v«M|»4vttt| sttflMMIn uMmM MW.
in rural iNt HtSMk «i MMn IMNW # M m *«pW M-afJ|«l'iMI M M NM MfilPpif WPPBI§»
' ImV Im|^ iM . ng|fw:f ■ ' f I P i wPHP ■''!»' MHPi-'iMkM ii Ml '1ft Mik gjgjg ^ jgnymi luiNMMiL i^ ii, : PtsiPiPPP (ffpp fif IRf PSRP SHF WnBRPd _HPHH.
96*4f%’ln'«# im ikm m fM ii lyiaMiw Wiw'tiuliiy '«lim tn wi<>wi'ipil'» iiiii 'l i llii
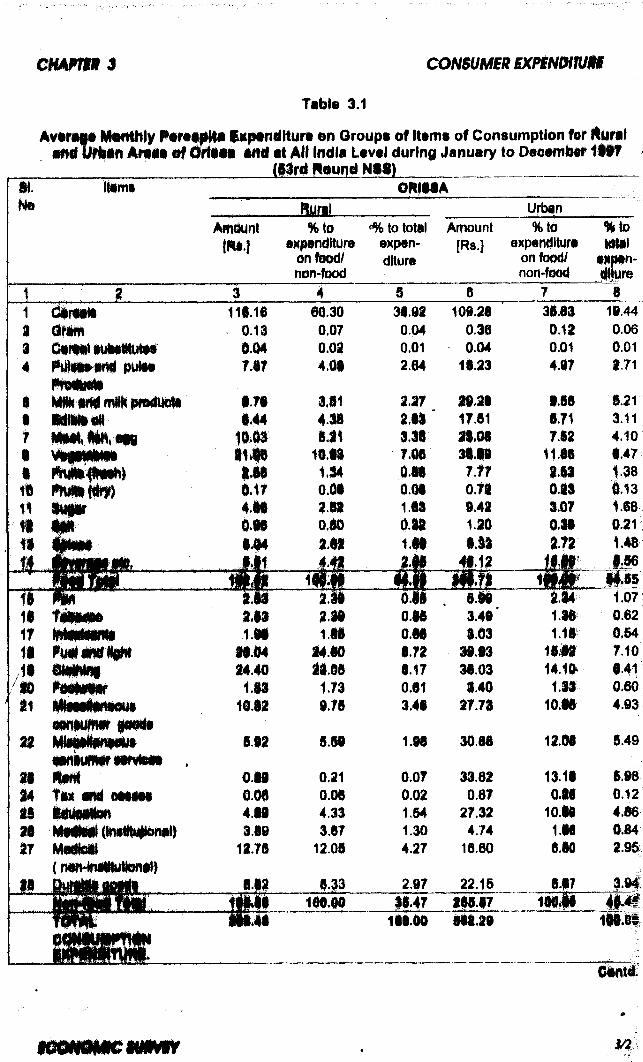
AvArig* Montlily N re i|lll« ixpa iid llu rt en Groups of Items of Consumption for ■fUlUHMn A rv ii of O ili^ i tftll ilt Att India Level during January to Decemlif
__________________________ (gird tlQund NSS)____________________
Kuraim r
m UrbinAmount
tRi.I%to
•xfiert iture an f00d/ non-food
^ to totil expenditure
Amount[Ra.]
%io ©xpendltitre
on food/ non-food
M . .. J. ............. i 4 § 6 7 11 diri9ti 11919 60 30 39.92 109.29 36.63 112 arim 0.13 0.07 0.04 0.36 0.12 13 « wflWi* wwWIf9IiVmF* 0.04 0.02 0.01 0.04 0.01 I4 pulM
WwlHfll®7J7 4.09 2.64 19.23 4.97 1
9 Mtfk mvM ftiMk nmdliitttllWffWi Hwpl IffWW 9.79 3.81 2J7 19.19 9.56 i9 MBMaN 9.44 4 .^ 2,91 17.61 6.71 :7 10.03 IJ1 i J i 29.09 7.129 ^f||9 l9 ltit : 10.91 i m 39.10 11.96 (9 m 134 m 7.77 2.63Ifi P n m m ) 0.17 0 09 O.M 0.72 0.23 (11 m m 4.19 262 1.91 9.42 3.07
m ' m 0.50 0 .^ 1.20 0.39 <11 9.04 2 .^ im 9 33 2.72
f lI I rim m
1111 m m §mPPw PH i Mtnimltiifiiirin t te* ■ HWwPiiflPf fwePwiP
111WrffWljifPi ' PPf'fipWPpfW
I I *lmt34 Tm MM OMMW' as UiMMfan<aH lUiMiiii tHii.tiail
17 m m i
121.
B.m
o mm4.ma.i9
ii.TS
a i l
S.S8
12.05
j y i
1.98
0.070.021.541.304.27
2.97
i . n3.40 1.03
39.9339.033.40
17.73
30.66
33.620.67
27.324.74
22.16
wmm 1147 111.17
199.90 991.29
a m
13.19m
10.19 1.96 6.90
6.971 9 0 lf
i t Ig lW i/2
NoAll India
Items
C ereals t^ratn( f'fonl suhstitiitoK fMilses iirid psilse
Amount(Rs]
986.48
0,86U.2b
14.81
Rural% to
expenditure on food/ non foc|d
m ...37.28
0 37 1111 ().3B
% to total expen diture
I f21 890 22
0 003.75
Amourit[l^s ]
12 8f) 77
1 12 0 3H
18 21
Urban
~ % to " expenditure)
on food/ non-food
132 6 /8 0 35 (1.12
'K, to totfjl
e )endi iurH14
13.29 0.1 /l.i.Ob
V [5/
‘ Milk ari3 tnilh piridiict‘ 39 3 1 10.94 9 9') 6? rh 19 55 M 7 'h t- f.iit)le uil If) 9H 0.89 4 01. 23 60 7 3/ .3 651 M^^a! ti"4i, _gu 1 ( 79 !) OB 2 98 19 58 i. 1 1 3 05[■ Vr‘gHtaf'10 . 21 10 !l.10 5 34 30 50 5.52 .1 7 ^ij Fiuils {fie^4i) 20 /.24 1 32 11 40 55 1 7/Vi Fiuit:-; (dry ) 1 4S O.6.' 0 37 2 71 0 8'- <» 4 /1 i Sugar 10 7 ) -1.63 2 Jy 12 47 3 89 1 951: Salt 0 7H (K34 0 20 1 02 0 35 (1 1(i1:> Spices 8 6;) 3,73 2 19 10 44 3 25 1 6.'14 Bevofaye r tc 14 59 (i 29 3 69 40 31 12 5<< 5 24
Food Total 231 99 100.00 58 73 320 26 'idooo 49 6216 Pan 1 96 1.20 049 2 76 0 85 0.4216 robatX(‘ 6 53 4.00 1.65 6 25 1 g:- 0 9717 Sntt)xicants 3 19 1 90 0 81 2 98 0 92 0 4rW Fuel and liqhl 28 30 1/30 7 16 45 i)8 14 05 / OB19 CInthiny 27 60 16 93 6 99 57 H2 1 1 55 5 8320 i-oiDtwear 4 59 2 82 1 16 6 41 1 9; 1 0(s21 Miscellaneous
■ consumer good-18 83 11 56 A l l 36 "4 n 30 5 69
22 MiHcellaneoub oonsiimer set vir es
18 7? 11 40 4 J 4 h0-(i5 !5 5/ 7 35
23 Rrnt 1 22 0 75 0.31 :-8 8 77 4 5'24 Ta< and cesses 0 49 0 30 0 12 3.35 1 18 0 Cm ^25 Education 11 73 7 19 2,97 38 57 ! 1 80 5 9726 Medical (institutional) 6 23 3 82 1.58 12 n 3 82 1 9?27 Medical
(nf,n4nstitutional)16 30 10 00 4 13 20 58 6 13 3 19
28 Durable goods 17 34 1064 4,39 32,33 9 94 5 5 iNon-food Total 16302 100 00 4127 325 19 100 00 50 3HrOTAL 395 01 100.00 645 45 100 00CONSUMPTIONEXPENDITURE
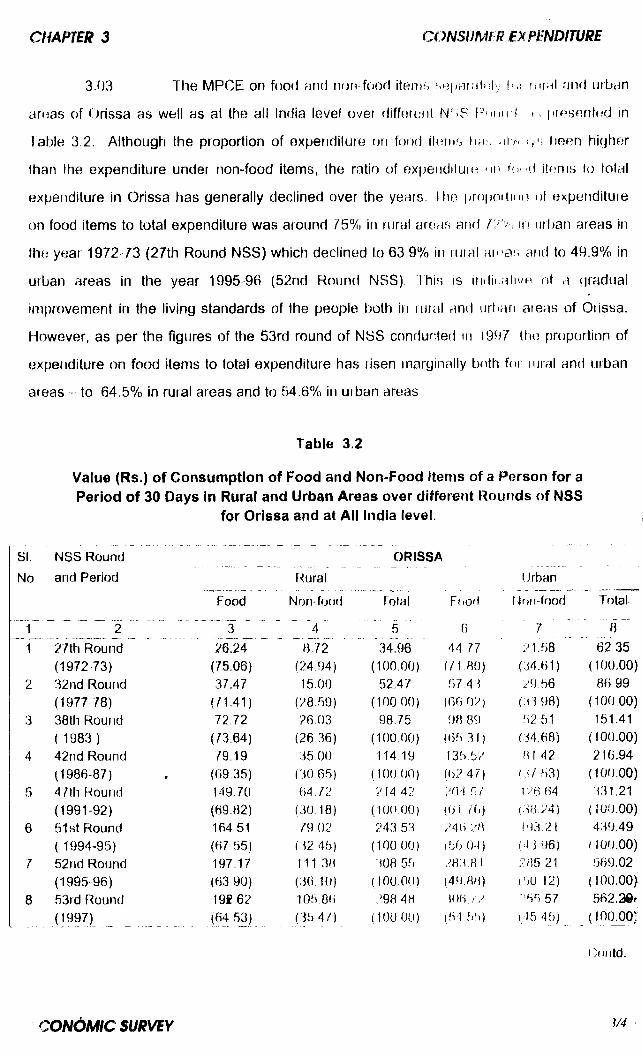
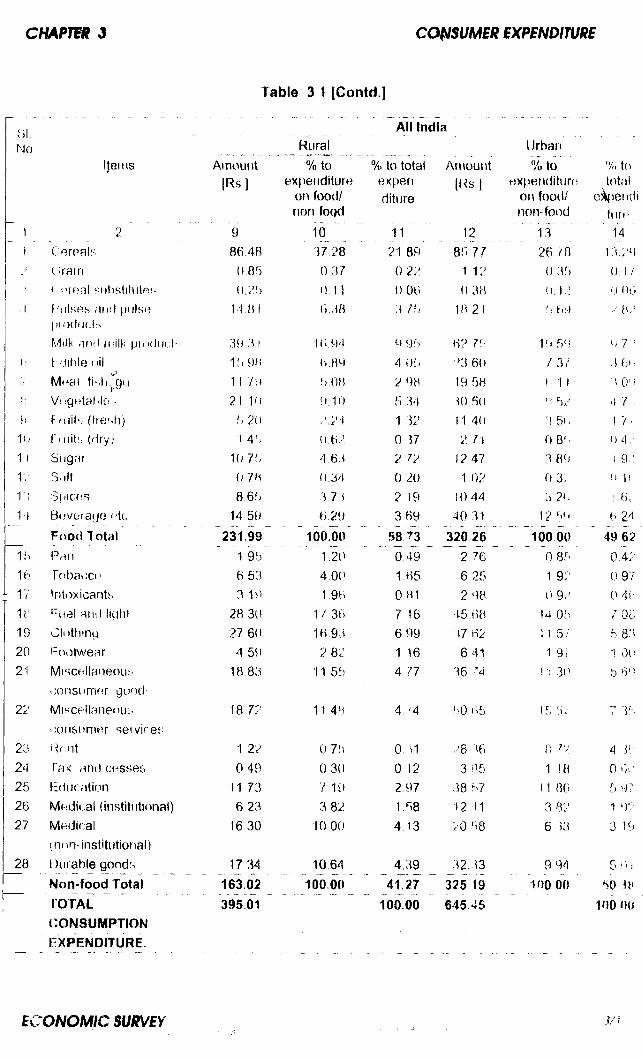
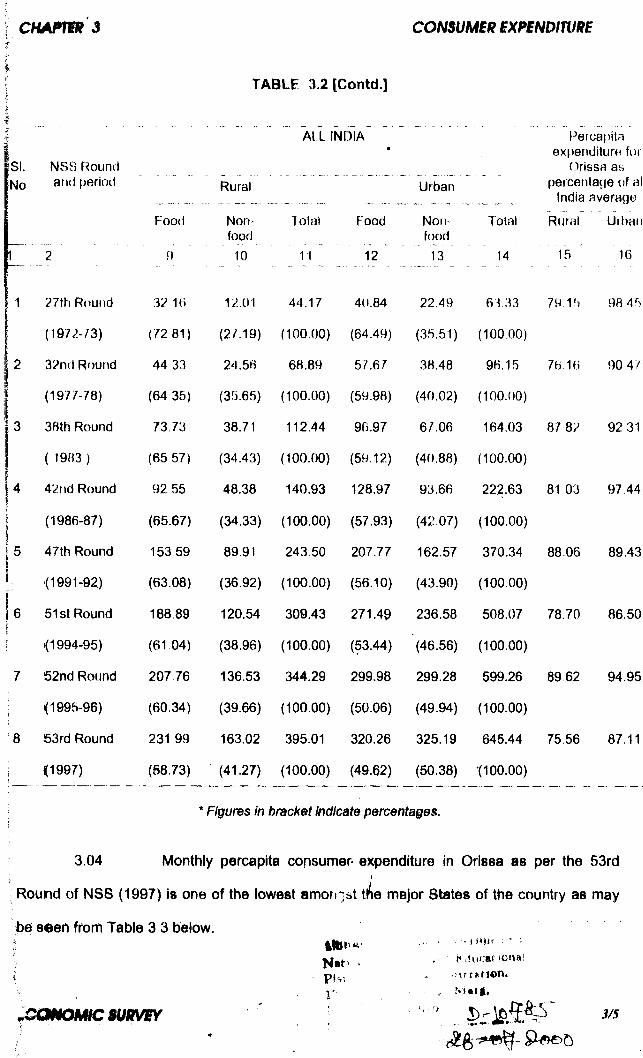
3-03 The MPCE on food and non-food items sepanitnly 1*? liinil and urban
amas of Orissa as well as at tfie all India level over difforent N?tS F uim I i . prpsentf^d in
Table 3.2. Although the proportion of expenditure on food iteiiiG tin , .il/nv/-, been higher
than Ihe expenditure under non-food items, the ratio of expendilutn np. rcH fd itnnis to lotal
expenditure in Orissa has generally declined over the years I ho propnitKHi of expenditure
on food items to total expenditure was around 75% in rural arods and in urban areas in
the year 1972-73 (27th Round NSS) which declined to 63 9% in rutal a ifas and to 49.9% in
urban areas in the year 1995 -96 (52nd Round NSS) This is indii alive of a gradual
improvement in the living standards of the people both in rural and urban areas of Oiissa.
However, as per the figures of the 53rd round of NSS conducted in 1997 Ihe proportion of
expenditure on food items to total expenditure has risen marginally both for iiiral and urban
areas - to 64.5% in rural areas and to 54.6% in urban areas
Table 3.2
Value (Rs.) of Consumption of Food and Non-Food Items of a Person for a Period of 30 Days In Rural and Urban Areas over different Rounds of NSS
for Orissa and at All India level.
SI. NSS Round ORISSA
No and Period F^ural Urban
Food Non- food Total Food Non-food Total
" l ” 2 ... ........... I ‘ ~ ' 4 ' 5 6 8
1 27th Round 26.24 '34 i)6 44 77 2138 ~ 62 35(1972 73) (75,06) (24 94) (100.00) (71 80) (34,61) (100.00)
2 32nd Round 37.47 15.00 52,47 5743 29.56 86,99(1977 78) (71,41) (28,59) (10000) (66 (]'/) (33 98) (100.00)
3 38th Round 72 72 26,03 98.75 98 89 52 51 151.41(1983 ) (73,64) (26,36) (100.00) (6fi 31) (34 68) (100.00)
4 42nd Round 79.19 35 00 114.19 135.5? M1 42 216.94(1986-87) (69.35) (3065) (100 00) (62 4 /) (3 / ',3 ) (100.00)
5 47tli Fecund 149 70 6472 214 42 ?04 n / 136 64 331,21(1991-92) (69.82) (30,18) (100 00) (01 n i) (38 24) (100.00)
6 51st Round 164 51 7902 243 53 ?4H 1H3 21 439.49( 1994-95) (67 55) ( 32 45) (100 00) ('3(j 04) (43 96) (100.00)
7 52nd Round 197.17 111 3H 308 55 283.8 1 285 21 569.02(1995 96) (63 90) (36 10) (10000) (40,88) (-.O 12) (100.00)
8 53rd f^ound 19f 62 105 8H ;>98 48 30H7.> 57 562.29*(1997) (64 53) (35 4 /) (100 00) (51 .“iih) (15 45) (100.00;
Odiltd.
CONdMIC SUBVBY 3/4
SI.No
NSS Round and period
Food
9
TABLE 3.2[Contd.]
ALL INDIA
Rural
Nonfood10
Urban
Total
11
Food Norh food
12 13
Total
14
Percapita expenditure foi
Orissa as percentage of al
India average
Rural Urt)an
15 16
1 27th Rnufid
(1972-73)
2 3?nd Round
(1977-78)
3 38th Round
( 19«3 )
4 42nd Round
(1986-87)
5 47th Round
: <1991-92)
6 51st Round
<1994-95)
7 52nd Round
<1996-96)
8 63rd Round
C1997)
32 16
(72 81)
44 33
(64 35)
73 73
(65 57)
92 55
(65.67)
153,59
(63.08)
188-89
(61.04)
207 76
(60.34)
231,99
(58.73)
12.01
(27.19)
24.56
(35.65)
38.71
(34.43)
48.38
(34.33)
89.91
(36.92)
120.54
(38.96)
136.53
(39.66)
163.02
(41.27)
44.17
( 100.00)
68.89
( 100.00)
112.44
( 100.00)
140.93
(100.00)
243.50
(100.00)
309.43
(100.00)
344.29
(100.00)
395.01
(100.00)
40.84
(64.49)
57.67
(59.98)
96.97
(59.12)
128.97
(57.93)
207.77
(56.10)
271.49
(53.44)
299.98
(50.06)
320.26
(49.62)
22.49
(35.51)
38.48
(40.02)
67.06
(40.88)
93.66
(42.07)
162.57
(43.90)
236.58
(46.56)
299.28
(49.94)
325.19
(50.38)
63.33 79 1h 98 45
( 100.00 )
96.15 76.16 90 47
( 100.00 )
164.03 87 8?
( 100.00 )
222.63 81 03
(100.00)
370.34 88.06
( 100.00)
508.07 7870
(100.00)
599.26 8962
(100.00)
645.44 75.56
•(100.00)
* Figures in bracket Indicate percentages.
92 31
97.44
89.43
86.50
94.95
87.11
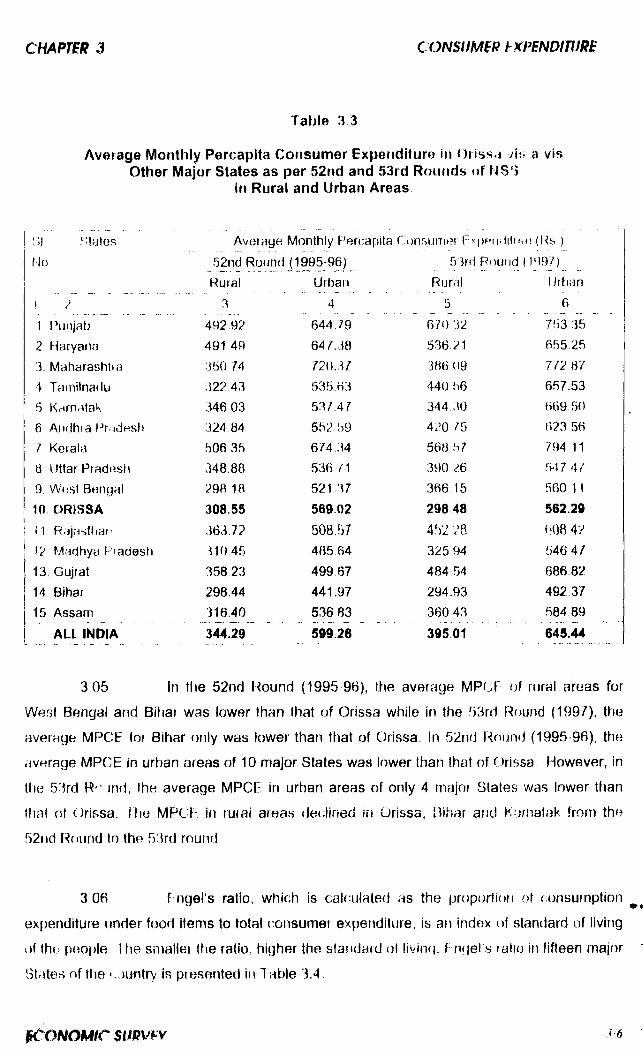
3.04 Monthly percapita consumer- expenditure In Orissa as per the 53rd
Round of NSS (1997) is one of the lowest amongst tl e major States of the country as may
be 86en from Table 3 3 below.! /. i i ^ducar ioual srrftHOn.
jv U li ,
^ c m o n M c s u i m r j / 5
Average Monthly Percapita Consumer Expenditure in f)rissa a vis Other Major States as per 52nd and 63rd Rounds of HS'5
in Rural and Urban Areas
.‘Uates Average Monthly Percapita Ctjnsunier hxpeiiilituif} (Rs )
No 52nd Round (1995-96) 53rd Round (1997)
Rurai Urban Rural I irban
i 3 4 5 6
1 Punjal) 492 92 644.79 670,32 753 35
2 Haryana 491 49 647.38 536.21 655-25
3. Maharashtia 350 M 720.37 386 09 7 /2 8 7
4 Tainiinadu 322,43 535.63 440 f)6 657.53
5 Karnatak 346.03 5 3 /4 7 344.30 669.50
6 Arulh?a f^nidesh 324 84 552 h9 420 75 623 56
7 Kerala 506 35 674.34 568 57 794 11
8 Uttar Pradesii 348.88 536./ I 390 26 547 47
9 W<5St Bengal 298 18 52E37 366 15 560 1 1
10 ORISSA 308.55 569 02 29848 562.2911 f?ajastltar! 363,72 508.57 452 28 tH)642
12 Madhya Pradesh 31045 485 64 32594 546 47
13. Gujrat 358.23 49967 484 54 68682
14 Bihar 298.44 441.97 294.93 492,37
15 Assam 316.40 53683 360 43 584 89
ALL INDIA 344.29 599 26 39501 645,44
31)5 in the 52nd Round (1995 96), the average MPCE of rural areas for
West Bengal and Bihar was lower than that of Orissa while in the 53rd Round (1997), the
average MPCE for Bihar only was lower than that of Orissa. In 52nd l-iound (1995*96), the
average MPCE In urban areas of 10 major States was lower than that of Orissa. However, in
the 53rd R ' nid, the average MPCE in urban areas of only 4 major Slates was lower than
that of Orissa. Ilie MPCE in rurai areas declined in Orissa, Bihar ar.d Karnalak from the
52nd Round to the 53rd round
3 06 Engel's ratio, which is calnulate<l as the proportion of consumption
expenditure under food items to total consumer expenditure, is an index of standard of living
t)f the people I he smaller tfie ratio, higher the standard of livin<}. Engel's latio in fifteen major
Stiites of tlie f . juntry is piesented in Table 3.4
ih to N o m c $im v¥v 16
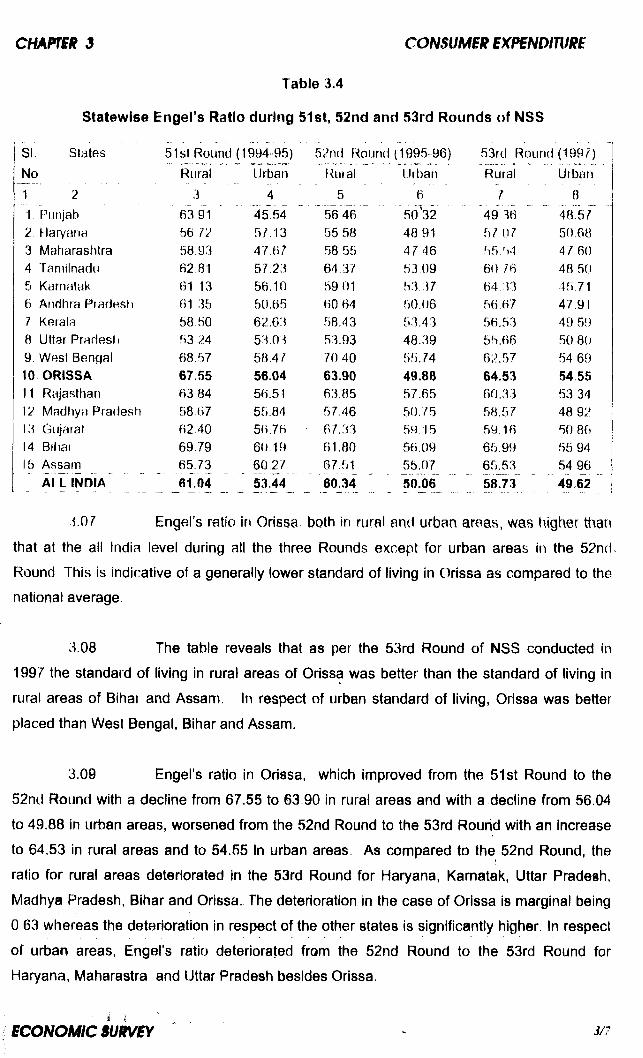
Table 3.4
Statewise Engel’s Ratio during 51st, 52nd and 53rd Rounds of NSS
SI, States 51st Round (1994-95) 52nd Round (1996-96) 53rd Round (1997)
No Rural Urban f^ural Urt)an Rural Uiban
I 2 3 4 5 6 7 81. Punjab ’ 63 91 ' 4^54 .. * 5646 50'32 49 3B2. Haryana 5672 57.13 55 58 48 91 57 U7 50 683 Maharashtra 58 93 47,67 58 55 47 46 55.54 47 604 Tanillnadu 62 81 5^23 64 37 53,09 60 76 48 505 Karnatak 61 13 56.10 59 01 53 37 64 33 45 716 Andhra Pradesh 61 35 50.65 60,64 50.06 56,67 47.917 Kerala 58 50 62.63 58.43 53.43 56.53 49 598 Uttar Pradesh 53 24 53.03 53,93 48.39 55.66 50 809 West Bengal 68.57 58.4/ 70 40 55.74 62.57 54 6910 ORISSA 67.55 56.04 63.90 49.88 64.53 54 55I I Rajasthan 63 84 56.51 63.85 57.65 60.33 53 3412 Madhya Pradesh 58,67 55.84 57.46 50.75 58.57 48 9213 Gujarat 62 40 56.76 67,33 59,15 59.16 50 8614 Bihar 69.79 60.19 61.80 56.09 65.99 55 94
60,27 67.51 55 07_ _ 65 53 54 96AILINDIA r I S®:?® 58.73 49 62
3.07 Engel’s ratio in Orissa, both in rural and urban areas, was higher than
that at the all India level during all the three Rounds except for urban areas in the 52nd
Round This is indicative of a generally lower standard of living in Orissa as compared to the
national average
3.08 The table reveals that as per the 53rd Round of NSS conducted in
1997 the standard of living in rural areas of Orissa was better than the standard of living in
rural areas of Bihar and Assam. In respect of urban standard of living, Orissa was better
placed than West Bengal, Bihar and Assam.
3.09 Engel’s ratio in Orissa, which improved from the 51st Round to the
52nd Round with a decline from 67.55 to 63 90 in rural areas and with a decline from 56.04
to 49.88 in urban areas, worsened from the 52nd Round to the 53rd Round with an Increase
to 64.53 in rural areas and to 54.55 In urban areas As compared to the 52nd Round, the
ratio for rural areas deteriorated in the 53rd Round for Haryana, Karnatak, Uttar Pradesh,
Madhya Pradesh, Bihar and Orissa. The deterioration in the case of Orissa is marginal being
0 63 whereas the deterioration in respect of the other states is significantly higher. In respect
of urban areas, Engel’s ratio deteriorated from the 52nd Round to the 53rd Round for
Haryana, Maharastra and Uttar Pradesh besides Orissa.
ECONOMIC 8URVSY 3/7
i lO Engers ratio for rural areas (ieterioiated from the 51 st Round fo tfie
')3rd Roiinrl for Haryana from h6 72 fo 6 / 07, for Karoalak from 0). 13 lo (54 33 aiid for Uttar
Rra(iesti from 53.24 to 55 66 while it improved for Ofissa from H7 5f> to h4 '>3 regi.sfeiiny an
ifnprovement of 3.02 points. This irnprovetnent was higher than that registered by Tamilriadu,
ketia, Madhya Pradesli and Assam Engel’s ratio for urban areas deleiioiated over the
period for Punjab from 45 54 to 48.57 while it improved foi Orissa from 56 04 to 54 55
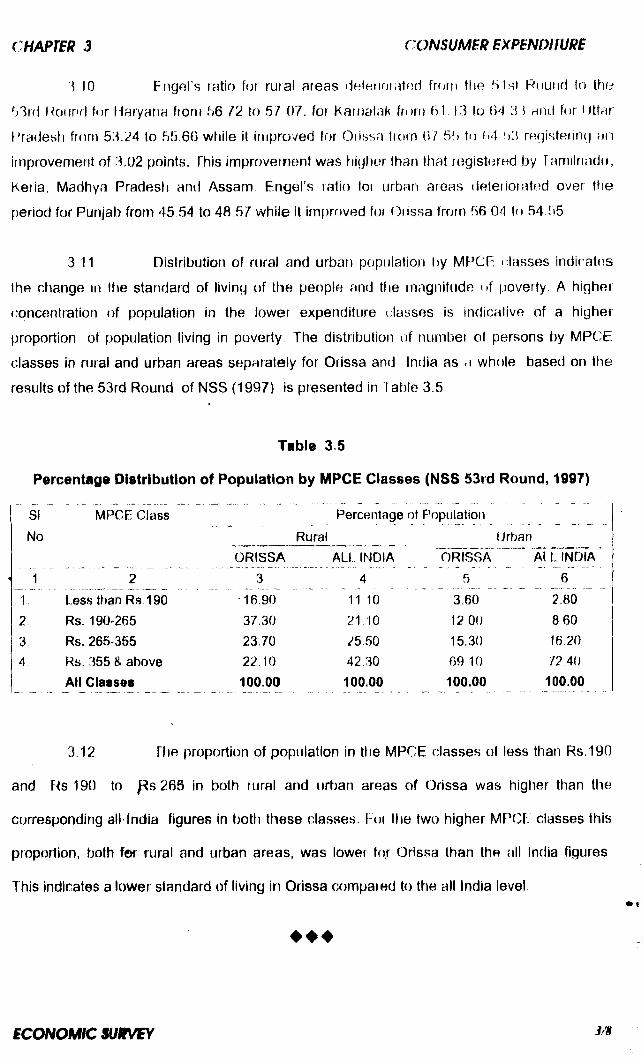
3 11 Distribution of rural and urban populatiorj by MF^CF classes indic.ates
the ctiange in tfie standard of living of Ifie people and the magnitude of poverty A higher
ooncentration of population in the lower expenditure classes is indicative of a higher
proportion of population living in poverty The distribution of number of persons by MPCE
classes in rural and urban areas separately for Orissa and India as a whole based on ttie
results of the 53rd Round of NSS (1997) is prevSented in 1 able 3.5.
Table 3.5
Percentage Distribution of Population by IViPCE Classes (NSS 53rd Round, 1997)
SI MPCE Class Percentage of PopulationNo Rural Urban
ORISSA ALL INDIA ORISSA AiUNrSlA1 2 3 4 5 6
1. Less than Rs 190 ’ 16.90 11 10 3,60 2.802 Rs. 190-265 37.30 21 10 12 00 8603, Rs. 265-355 23J0 25 50 15.30 16 204 Rs. 355 & above 22,10 42.30 69 10 /2.40
All Classes 100.00 100.00 100.00 100.00
3.12 The proportion of population in the MPCE classes of less than Rs.190
and Rs 190 to p s 265 in both rural and urban areas of Orissa was higtier than the
corresponding allTndia figures in both these classes, f-or tlie two higher MPCE classes this
proportion, both fe>r rural and urban areas, was lower for Orissa than the all India figures
This indicates a lower standard of living in Orissa compared to the all India level
♦ ♦ ♦
SCONOMiC 8Um/iY

CHAPTER 4
AGRICULTURE
4 01 The Agriculture sector has a vital place in ttie economy of the State While
Agriculture and Animal Husljandry contributed 28.68 percent of the Net State Domestic Product
of the State in 1997 9B, the Agriculture alone provide direct and indirect employment to around
64 pefcent of the total work force of the State as per the 1991 Census
4.02 Agriculture in Orissa continues to be characterised by low productivity
Tht: majdi factors contributing to low productivity are predominance of traditional agricultural
piacti( es, ina<iequato capital formation and low investment, inadequate irrigation facilities, and
uneconomic size of holdings Nearly 63% of the cultivable land is rainfed anci exposed to ttie
vagaries of monsoon The percapita availability of cultivated land whicfi was 0 39 hectare in
1950-'i1 has declined to 0,18 hectare in 1998-99. The State has around 31.54 lakh small and
mafgitial farmers accounting for 79.88% of the total operational holdings These farmers do not
have tfie means to make appropriate investment in agriculture due to poverty IVIoreovef, modern
technology in agriciiltural operations is yet to reach most of the cultivators.
4.03 Agriculture is a complex and multi-dimensional enterprise. Its
development depends on various factors like agro-climatic conditions, technology, inputs,
system of land holdings, and other socio-economic factors. During the Seventh Plan, several
new programmes like Integrated Cereals and Oil Seeds Programme, National Pulses
Development Programme and Special vlute Development Programme were launched under
Centrally Sponsored Plan and Central Plan These programmes continued during the Eighth
Plan period with the objective of improving the level of production and productivity Priority was
laid on location specific crop planning, increasing productivity, expansion of area under cash
crops like pulses, oil seeds, sugarcanes and fibres, increasing cropping Intensity, popularising
use of bio-fertilisers and bio-agents in pest management, improving marketing of agricultural
produce, and popularisation of use of modern agricultural implements and farm machinery.
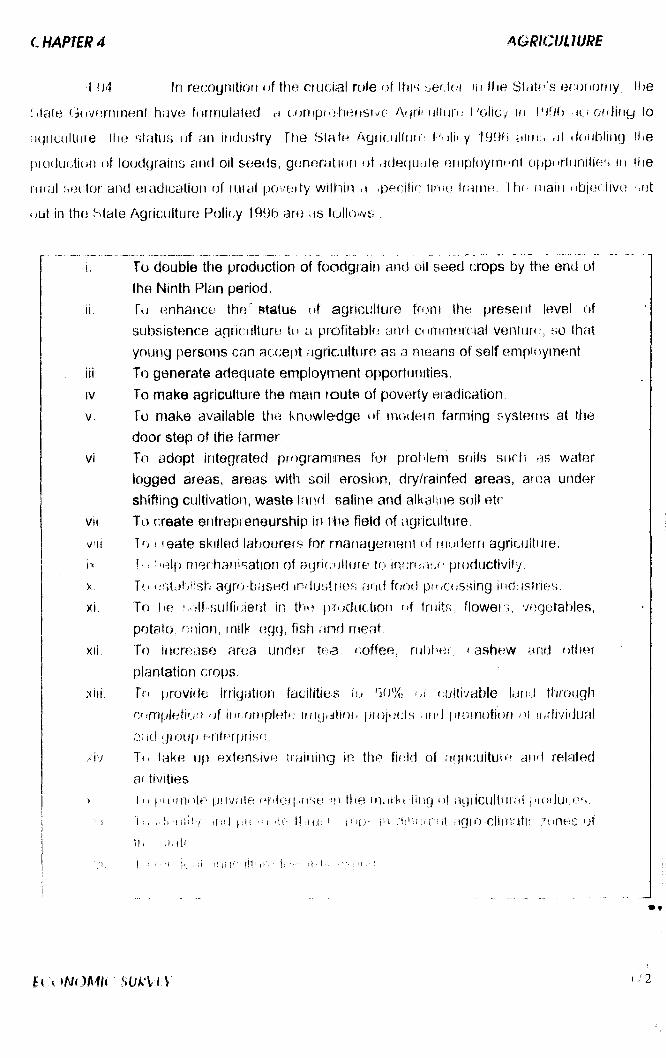
} {j4 In recoyriilion of the c ruc ia l ro le )f this secloi in life S tfitn ’s econon iy fiie
‘ .tale (:)C)Vf:rnfnHn( have forfnu la ted h cc jrnp iehefts ive A(jri< uH(im I'o lic y ifi i'iOh o fd in g lo
;iy iic i) llu re the status o f an industry ft ie S la tn AgiicuHnrf- Poli* y I99f) aims a( .lo iib ling the
p iodut tiun of loodyra ins and oil seeds, gone ra tion f)t adecjuale o !iip loytn t;n l opportnnilif^s m (he
rural secloi and eradication of tural povedy w ilh if i -pecilic Iiido Iraine. Ihf* luain objeclivu set
out in the S tale Agricu lture Poli(;y 1996 are as (o llow s
1. To double the production of foodgrain and oil seed crops by ttie end ofthe Ninth Plan period.
ii To enhance the' statue of aghculture from the present level of subsistence agriculture to a ptofitable and coiiirnerc.ial venture, so that young persons can acce[)t agriculture as a means of self empioyrnent
iii To generate adequate employnnent opportunities.iv To make agriculture the main route of poverty eradication,V. To make available tfie knowledge of modern farming systems at the
door step of the farmervi To adopt integrated programfrnes for prolslem soils sucli ris water
logged areas, areas with soil erosion, dry/rainfed areas, area under shifting cultivation, waste land saline and alkaline soil etc
vii To create entrepreneurship in t‘he field of agriculturevyj f leate skilled iatiourers for rnanayement of rrKjdern agriculture.ix IM selp mechanisation of agriculture to innrrianf^ productivityX, To cstabHsh agro-based indusincs and food processing indfistries.xi. To }ic ’ .elf-sufficient in the production of truits, floweis, vegetables,
potato, r-snion, milk egg, fish and meatxii To increase area under tea. coffee, rut)t>er cashew and ottier
plantation crops,xiii. Tri provirie irrigation facilities t(j G0% >,i cultivable land through
cr*mpletion *)f in? ornplet#: iidgation projects and promotion of i/idividual and group Hntf'rf)risc
xiv, Tf; lake up extensive iraining in the field of agritnjiture and related at tivities
> ; t o i'ltimote pnvaie orUerpuse ttie inarkntiiig of agticultural jModu!;es.mil thiU: r, \‘ny, ii) {iincieni agio-climatic; zones of
tii .Mts.'II ! ' '•■!'! M H Si |f ■' ill' H': ■ I; ij - i i U .1 i
C M p m 4 A m n K M itmi
PMDUCTION OF F00D0RAIN8
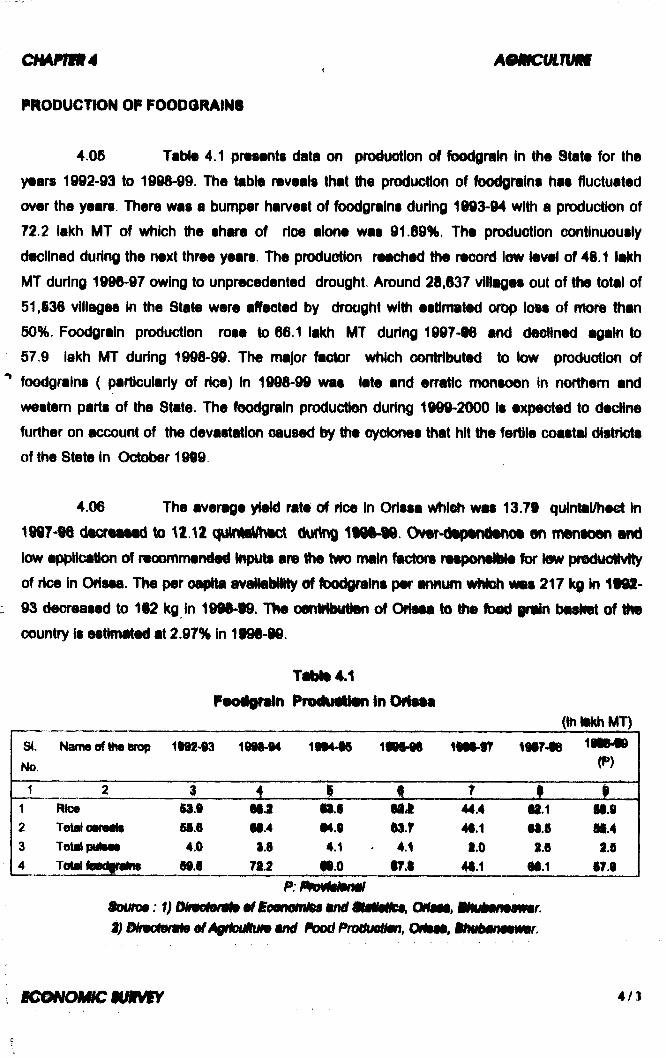
4.00 TabI* 4.1 pmants data on produotion of foodgrafn in the State for the
years 1992-93 to 1998-99. The table reveals that the production of foodgnins has fluctuated
over the years. There was a bumper harvest of foodgrains during 1993-94 with a production of
72.2 lakh MT of which the share of rice alone was 91.69%. The production continuously
declined during the next three years. The production reached the record low level of 48.1 lakh
MT during 1996-97 owing to unprecedented drought. Around 28,637 villages out of the total of
51,136 villages In the State were affected by drought with estimated crop loss of more ttian
50%. Foodgrain productkin rose to 66.1 lakh MT during 1997-M and decHned again to
57.9 lakh MT during 1998-99. The major factor whk:h contributed to low production of
foodgrains ( particularly of rice) In 1998-99 was late and erra^c monsoon In northern and
westem parts of the State. The foodgrain producton during 1999-2000 Is expected to decHne
further on account of the devastetion caused by the cyck>nes that hit the fertile coastal districts
oftheStetein October 1999
4.06 The average yield rate of rice in Orissa whieh was 13.79 qulr^i/heot In
1997^6 ctecreaied to 12.12 during O ver-d^in itr^o i on mtnaoen am)low appMcaMon of reoommended (npute are ttie two main factors neeponeibte for tnw pnsduc^h^ of rice in Odsea. The per oaplte avaNoliiNly fDodgralns per mrnim wN i^ w«s 217 kg in 18@8- 93 decreased to 162 kg in 1 9 ^ 9 9 . Hie oetili^yHen of OHaea te tfie fbdd grain basliet of m t country is esttomfted at 2.97% in 1998-99.
Tibte4.1 Footfgralti Pro^uiMn In Oi<laia
(inlMchMT)SI.No.
Name of the erqp 1l9i-93 1d9S-94 1994-iS i m m 888-97 im m l i iB ^(?»)
1 2 3 ...... i ...... ........1 , • 7 1 11 Rtea ^.9 SI.2 H.0 UM 44.4 ^.12 Tetalotrssit 5S.6 is.4 •4.8 83.7 48.1 88.S 88.43 Total pulBW 4.0 9.8 4.1 . 4.1 1.0 1.0 2.64 1 Owl ra9Q|piiin9 si.s 71.2 ii.o •7J 48.1 88.1 87.8
9mmm: 1) m r n o l & f m o f Q U m , i) IMreoteiate mid Pood PnMUmUmi, OrtM . Bfmbmmmr.
K m io n m m m m 4/3
RICE
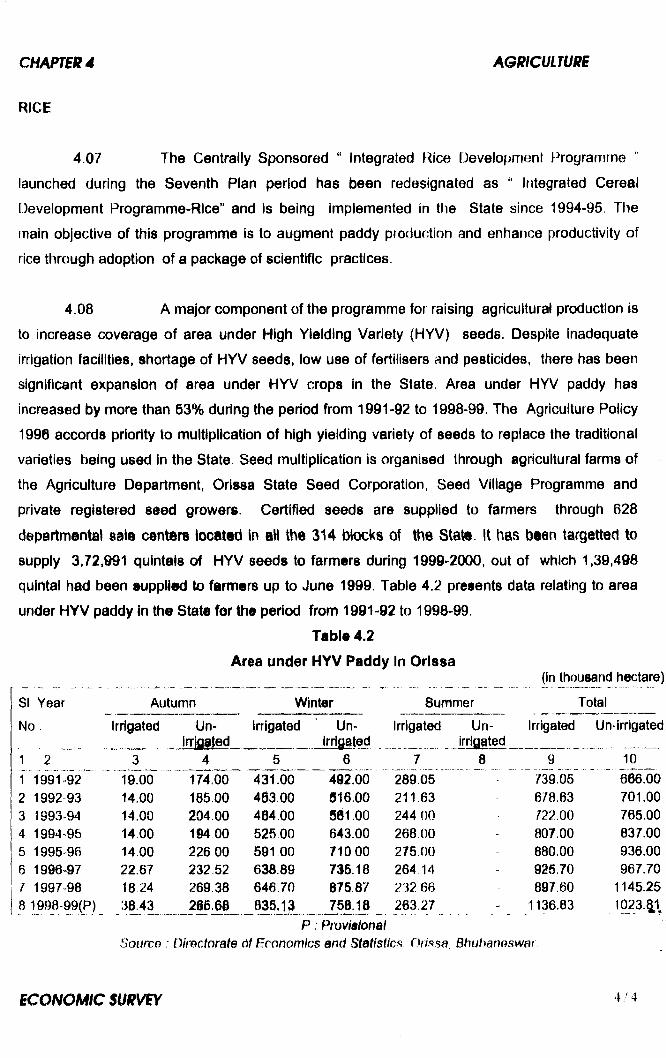
4.07 The Centrally Sponsored “ Integrated Rice Development Programme
launched during the Seventh Plan period has been redesignated as " Integrated Cereal
Development Programme-Rlce” and is being implemented in the State since 1994-95= The
main objective of this programme is to augment paddy production and enhance productivity of
rice through adoption of a package of scientific practices.
4.08 A major component of the programme for raising agricultural production is
to increase coverage of area under High Yielding Variety (HYV) seeds. Despite inadequate
irrigation facilities, shortage of HYV seeds, low use of fertilisers and pesticides, there has been
significant expansion of area under HYV crops in the State. Area under HYV paddy has
increased by more than 63% during the period from 1991-92 to 1998-99. The Agriculture Policy
1996 accords priority to multiplication of high yielding variety of seeds to replace the traditional
varieties being used in the State, Seed multiplication is organised through agricultural farms of
the Agriculture Department, Orissa State Seed Corporation, Seed Village Programme and
private registered seed growers. Certified seeds are supplied to farmers through 628
departm®ntal said centers iocated in ali the 314 blocks of the State. It has been targetted to
supply 3,72,991 quintals of HYV seeds to farmers during 1999-2000, out of which 1,39,498
quintal had been suppttad to farmers up to June 1999. Table 4.2 presents data relating to area
under HYV paddy in th® State for the period from 1991-92 to 1998-99.
Table 4.2
Area under HYV Paddy In Orissa
SI Year Autumn Winter Summer
(in thousand hectare)
Total
No. Irrigated Un-Irripated
Irrigated Un»Irrigated
Irrigated Unirrigated
Irrigated Un-irrigated
1 2 3 4 5 6 7 8 9 10f 1991-92 19.00 174.00 431.00 492.00 289~05 ' 739J06 666.002 1992 93 14=00 185.00 463,00 516.00 211.63 678.63 701.003 1993-94 14.00 204.00 464.00 501.00 244 00 ^22.00 765.004 1994 95 14.00 104 00 525 00 643.00 268,00 - 807.00 837.005 1995 96 14,00 226,00 591 00 710.00 275.00 ~ 880.00 936.006 1990-97 22.67 232.52 638.89 735.18 264 14 - 925.70 967.707 1997-98 18.24 26938 646.70 876.87 23266 897.60 1145.258 1998-99(P) 38.43 266.68 835.13 758.18 263.27 - 1136.83 1023.§ \
P : PmviaionalSource : Directorate 6f Economics and Statistics OrisBa Bhuhanoswar
c H A p m ^ d A m m c u L n m
PULSES
4.09 The total area under pulses accounted for about 13.19% (7.05 lakh
hectare) of the area under foodgralns and contributed about 3.96% (2 45 lakh MT) of total
foodgrain production of the State during 1998-99. As against the total demand of 12 lakh MT of
pulses in the State, only about 2.37 lakh MT has been produced on an average in a year during
the preceeding 3 years. In order to increase production of pulses, It is proposed to increase
the coverage of area under pulses and to raise prodtjctivity through the adoption of dry farming
technology, adoption of mixed and inter-cropping system, use of quality seeds, use of
phosphatic fertilisers, and need based plant protection measures. It has been targetted to
produce 13.42 lakh MT of pulses in the State during 1999-2000
OIL SEEDS
4 10 Groundnut, sesamum, mustard and niger are the main oil seed crops in
the State. Sun-flower cultivation has also been introduced in western Orissa Emphasis is laid
on production of certified seeds, supply of input kits, subsidised sale of quality seeds, plant
protection chemicals, plant protection equipments, and farm Implements under the Centrally
Sponsored Plan scheme “ OU Seeds ProducUon Programme" (OPP). The coverage under oil
seeds in 1998-99 was 3.84 lakh hectare with production of 1.77 lakh MT as against coverage of
4.23 lakh hectare and production of 2.00 lakh MT during 1997-98. Out of the total area under oil
seed crops during 1998-99, niger was cultivated in 44% followed by groundnut in 22%. The
oilseed production in the State contributed only 0.83% to the total production of oilseeds in the
country during 1998-99.
COMMERCIAL CROPS
4.11 Commercial crops like sugarcane, jute, mesta, cotton, soyabean,
groundnut, potato, chilly, onion etc. are being given more attention. Paddy and other foodgralns
will be encouraged only in land which is suitable for their cultivation. In low rainfed areas of
Kalahandi, Koraput, Bolangir, Nowrangpur and Rayagada, cotton cultivation has been
encouraged. In the coastal districts, river bed potato cultivation is being promoted by using
certified potato seeds and other Improved planting malerials. Sugarcane cultivation has been
accepted by farmers In the State because It is a high value commercial crop. Steps are being
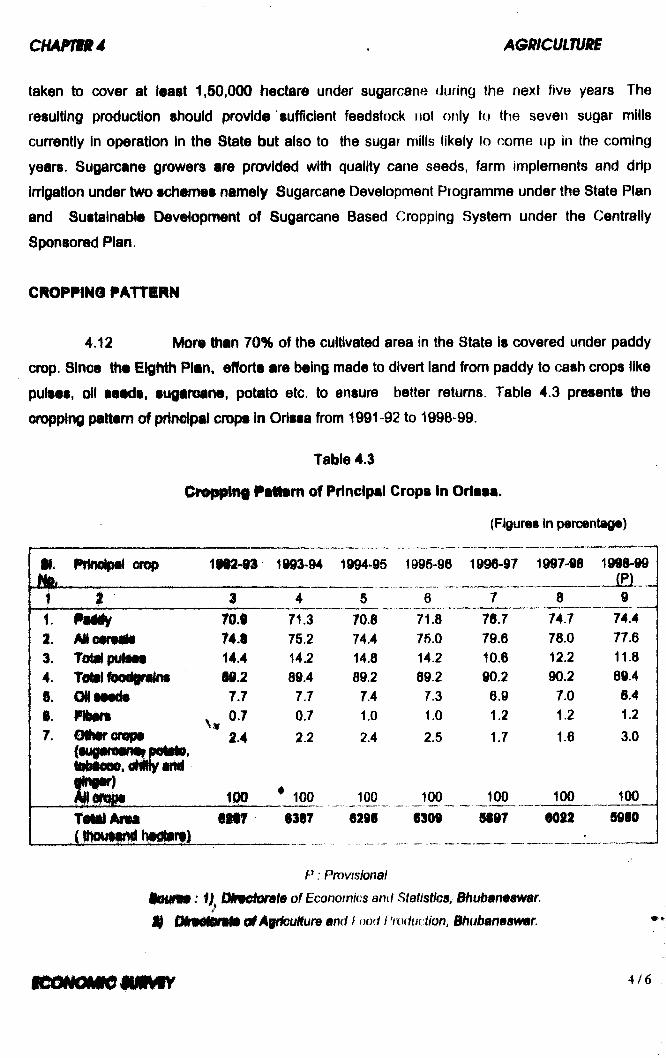
taken to cover at least 1,50,000 hectare under sugarcane during the next five years The
resulting production should provide sufficient feedstock not only to the seven sugar mills
currently In operation in the State but also to the sugar mills likely (o come up in ttie coming
years. Sugarcane growers are provided with quality cane seeds, farm Implements and drip
Irrigation under two schemes namely Sugarcane Development Programme under the State Plan
and Sustainable Development of Sugarcane Based Cropping System under the Centrally
Sponsored Plan.
cnopwtm PATTIRN
4.12 More than 70% of the cultivated area in the State is covered under paddy
crop. Since the iighlh Plan, efforts are being made to divert land from paddy to cash crops like
pulses, oil seeds, sugaroane, potato etc. to ensure better returns. Table 4.3 presents the
®t)pplno pittem of prlnelpal crops In Orissa from 1991 92 to 1998-99.
Table 4.3
Paltern of Principal Crops In Orissa.
(Figures in percentage)
m,M
tlNriee nn>tfn 1Si2-i3 1^3-94 1994-95 1995-96 1996-97 1997-98 1996-99(P)_a 1 4 5 a 7 8 91. P t i t t ru j 71.3 70.8 71.8 76.7 74.7 74.4t eiwes s T4J 75.2 74.4 75.0 79.6 78.0 77.63. Terturt pulses 14.4 14.2 14.8 14.2 10.6 12.2 11.84. Tent ^ .2 89.4 89.2 89.2 90.2 90.2 89.4S. CM seeds 7.7 7.7 74 7.3 6.9 7.0 6.4t. mm V. 0.7 1.0 1.0 1.2 1.2 1.2r.
idhini# WWWWBWwPf iPrWijf ipFipl
2.4 2.2 2.4 2.5 1.7 1.6 3.0
emger)100 • 100 JOO^ J 0 0 _ 100 100 100
TetalAma ( thousw^
0387 6296 6309 SS97 6082 5980
P : Provisional
1 D fm ^orate of Economics and Statistics, Bhuban»8WBr.
$ o f AstiouHurB and f ood Production, Bhubanaawar.
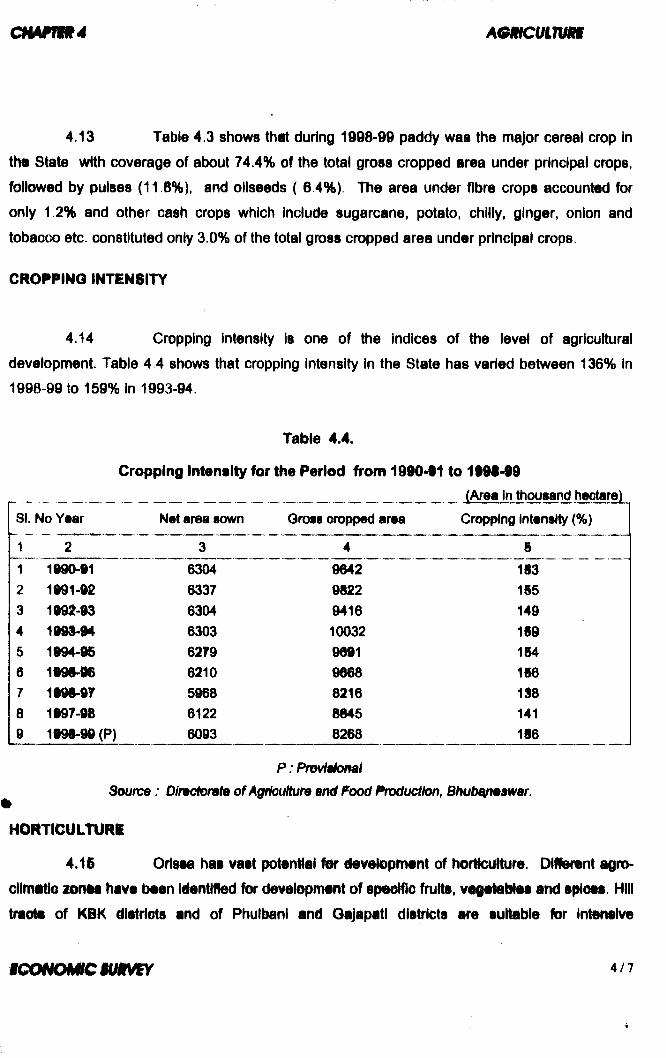
c m m t d A B m c u iim
4.13 Table 4.3 shows that during 1998-99 paddy was the major cereal crop In
tho State with coverage of about 74.4% of the total gross cropped area under principal crops,
foHowed by pulses (11.8%), and oilseeds ( 6.4%). The area under fibre crops accounted for
only 1.2% and other cash crops which include sugarcane, potato, chilly, ginger, onion and
tobacco etc. constituted only 3.0% of the total gross cropped area under principal crops.
CROPPING INTiNSITY
4.14 Cropping intensity is one of the indices of the level of agricultural
development. Table 4 4 shows that cropping intensity in the State has varied between 136% in
1998-99 to 159% in 1993-94.
Table 4.4.
Cropping Intonsity for the Period from 1990<^1 to 199S-99
SI. No Year Net area sown Orots cropped area Cropping Intensity (%)
1 2 3 4 61 1990-91 6304 9642 1S32 1991-92 6337 9822 1S53 1992-93 6304 9416 1494 19^94 6303 10032 1995 1994-% 6279 9691 1646 199S-96 6210 9668 1967 1999-97 5968 8216 1388 1997-96 6122 8645 1419 1999-99 (P) 6093 8268 1S6
P : PmvMonal^ Source: D/motomfe of Agricutture ami Food Production, Bhutmp^swar.
HORTICULTURi
4.IS Ortsea has vast potenliai f ir development of horMculture. Diflerent agro-
cllmtttio lonta have been Identlfted for development of epeetfic fruits. vegetatHes and splois. Hill
triole of K iK dietrlots and of Phulbanl and Gajapatl districts are suHable for intontlve
B c o m im m i m 4/7
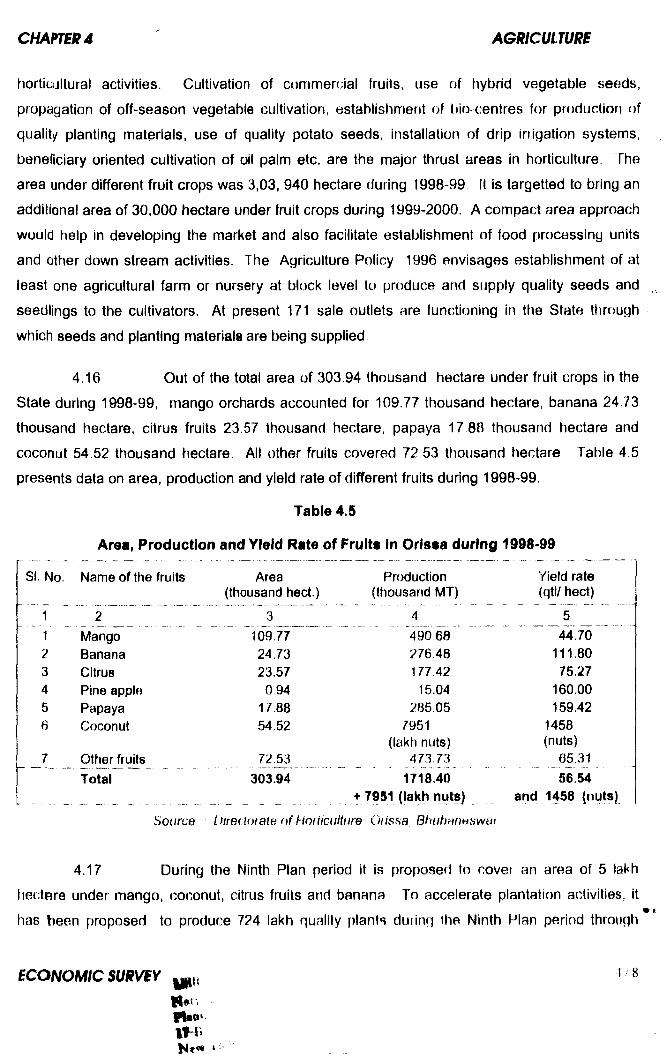
horticultural activities. Cultivation of commercial fruits, use of hybrid vegetable seeds,
propagation of off-season vegetable cultivation, establishment of bio centres for production of
quality planting matprials, use of quality potato seeds, installation of drip irrigation systems,
beneficiary oriented cultivation of oil palm etc. are the major thrust areas in horticulture. The
area under different fruit crops was 3,03, 940 hectare during 1998-99 It is targetted to bring an
additionaf area of 30,000 hectare under fruit crops during 1999-2000. A compact area approach
would help in developing the market and also facilitate establishment of food processing units
and other down stream activities. The Agriculture Policy 1996 envisages establishment of at
least one agricultural farm or nursery at block level to produce and supply quality seeds and
seedlings to the cultivators. At present 171 sale outlets are functioning in the State through
which seeds and planting materials are being supplied,
4.16 Out of the total area of 303.94 thousand hectare under fruit crops in the
State during 1998-99, mango orchards accounted for 109.77 thousand hectare, banana 24.73
thousand hectare, citrus fruits 23.57 thousand hectare, papaya 17 88 thousand hectare and
coconut 54 52 thousand hectare. All other fruits covered 72 53 thousand hectare Table 4 5
presents data on area, production and yield rate of different fruits during 1998-99.
Table 4.5
Area, Production and Yield Rate of Fruits in Orissa during 1998*99
SI. No. Name of the fruits Area Production Yield rate(thousand hect.) (thousand MT) (qtl/ hect)
1 2 „ „ J __________ _____ _______ 5______1 " Mango l0 9 7 7 ~490^^ 44.702 Banana 24,73 276.48 111.803 Citrus 23.57 177.42 75.274 Pineapple 0.94 15.04 160.005 Papaya 17.88 285.05 159.426 Coconut 54.52 7951 1458
(lakh nuts) (nuts) 7__Otheijruits_____ 72.53 _J55.^
Total 303.94 1718.40 56.54+ 7951 (lakh nutsj and 1458 (nuts)
Source Directorate o f Horticulture, Giissa: Bhubarmswai
4.17 During the Ninth Plan period it is proposed to cover an area of 5 lakh
hectare under mango, coconut, citrus fruits and banana To accelerate plantation activities, it
has been proposed to produr.’e 724 lakh quality f)lants during the Ninth Plan period through
I departmental production farms located at block level and through private nurseries During
1998'99, 28 30 lakh quality plants have been produced and supplied to farmers Potato and
onion development is being given importance and use of quality seeds has been promoted
i During 1998-'99, potato and onion were grown over an area of 15,150 hectare and 45,750
hectare respectively in the State A total of 22,500 quintal of quality potato seeds and 200 quintal
of onion seeds were supplied to farmers.
4.18 Oil palm plantations and use of drip irrigation system are being given
priority during the Ninth Plan. During 1998-09, cultivation of oil palm was taken up in an area of
1,382 hectare as against 1,327 hectare in 1997-98. Drip irrigation facilities were provided over
an area of 2,050 hectare under fruit crops during 1098-99 It has been targeted to bring an
additional area of 1,500 hectare under drip irrigation during 1999-2000.
LAND REFORMS
4.19 Land reforms continue to be an integral part of the overall strategy of
poverty alleviation Land reform measure Include abolition of intermediary rights, tenancy
I reforms such as regutatton of rent, provision of security of tenure to tenants, distribution of
I ceiling surplus land to the land less agricultural labourers and small land holders, consolidation
: of land holdings, and updating and maintenance of land records.;
4.20 The basic Directive of land celling laws is to acquire ceiling surplus land
and to distribute it among landless persons. By the end of 1998-99, 1,61,314.21 acre of ceiling
surplus land has been distributed among 1,42,971 landless persons as against 1,60,822.64
acres distributed to 1,41,922 persons by the end of the previous year.
4.21 Consolidation of holdings includes preparation, correction, and updating of
land records and amalgamation of small and scattered holdings In a rational manner with a view
to ensuring better land management and optimum utilisation bf limited water resources. During
1998-99, consolidation work was completed in 326 vfllages and was taken up in 3S0 new
villages. During the year, an area of 0.63 lakh hectare was cdhsolidated. By the end of 1998-
99, operations for consolidation of holdings had been completed in 7244 villages covering an
area of 10.83 lakh hectare.
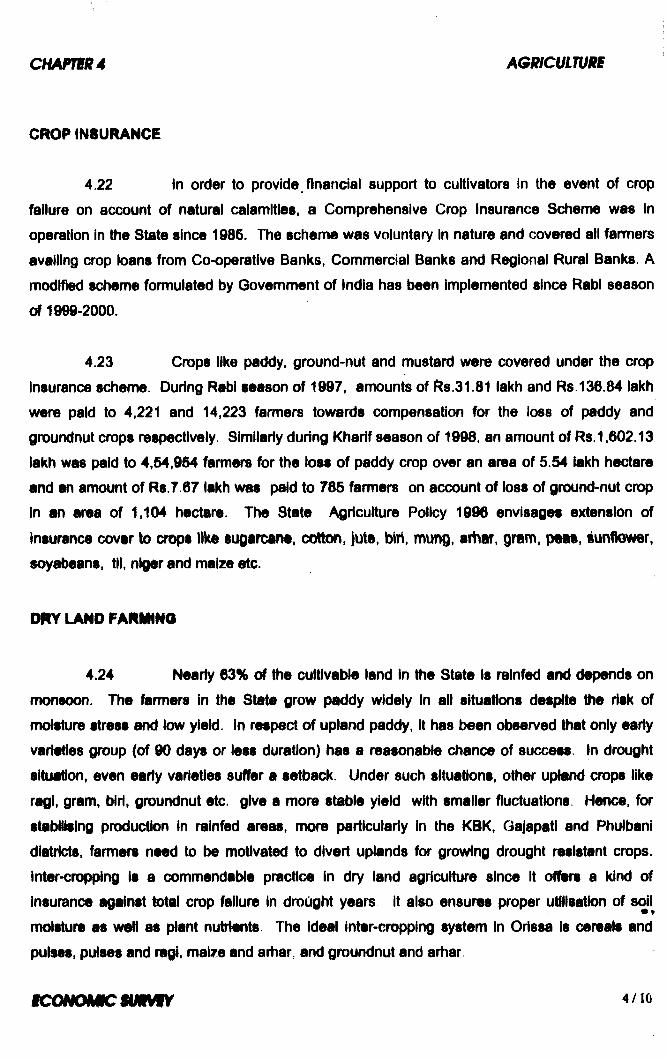
CROP INSURANCE
4.22 In order to provide financial support to cultivators In the event of crop
failure on account of natural calannltles, a Comprehensive Crop insurance Scheme was In
operation In the State since 1985. The scheme was voluntary in nature and covered all farmers
availing crop loans from Co-operative Banks, Commercial Banks and Regional Rural Banks. A
nrK)dlfied scheme formulated by Government of India has been implemented since RabI season
of 1999-2000.
4.23 Crops like paddy, ground-nut and mustard were covered under the crop
insurance scheme. During Rabi season of 1997, amounts of Rs.31.81 lakh and R8.136.B4 lakh
were paid to 4,221 and 14,223 farmers towards compensation for the loss of paddy and
groundnut crops respectively. Similarly during Kharif season of 1998, an amount of Rs. 1,602.13
lakh was paid to 4,54,954 farmers for the loss of paddy crop over an area of 5.54 iakh hectare
and an amount of Rs.7.67 lakh was paid to 785 farmers on account of loss of ground-nut crop
in an area of 1,104 hectare. The State Agriculture Policy 1996 envisages extension of
insurance cover to crops Itke sugarcane, cotton, juts, mung, art ar, gram, p m , sunfto¥ er, soyabeans, til. niger and maize etc.
DRY LAND FARIHNa
4.24 Nearly 63% of the cultivable land In the State is ralnfed and depends on
monsoon. The farmers In the State grow paddy widely in all situations despite the risk of
moisture stress and low yield, in respect of upland paddy, it has been observed that only early
varieties group (of 90 days or less duration) has a reasonable chance of success. In drought
situation, even early varieties suffer a setback. Under such situations, other upland crops like
ragi, gram, bid, groundnut etc. give a more stable yield with smaller fluctuations. Hence, for
stabilising productk>n in rainfed areas, more particularly in the KBK, Qajapati and Phuibani
diatricts, fanners need to be motivated to divert uplands for growing drought resistant crops.
Inter-cropping is a commendable practice in dry land agriculture since It offers a kind of
insurance against total crop failure in drought years it also ensures proper utlll8atk)n of s l
moisture as well as plant nutrients The Ideal inter-cropping system In Orissa is cereals and
pulses, pulses and ragi, maiie and arhar, and groundnut and arhar
tco N o im cm m m
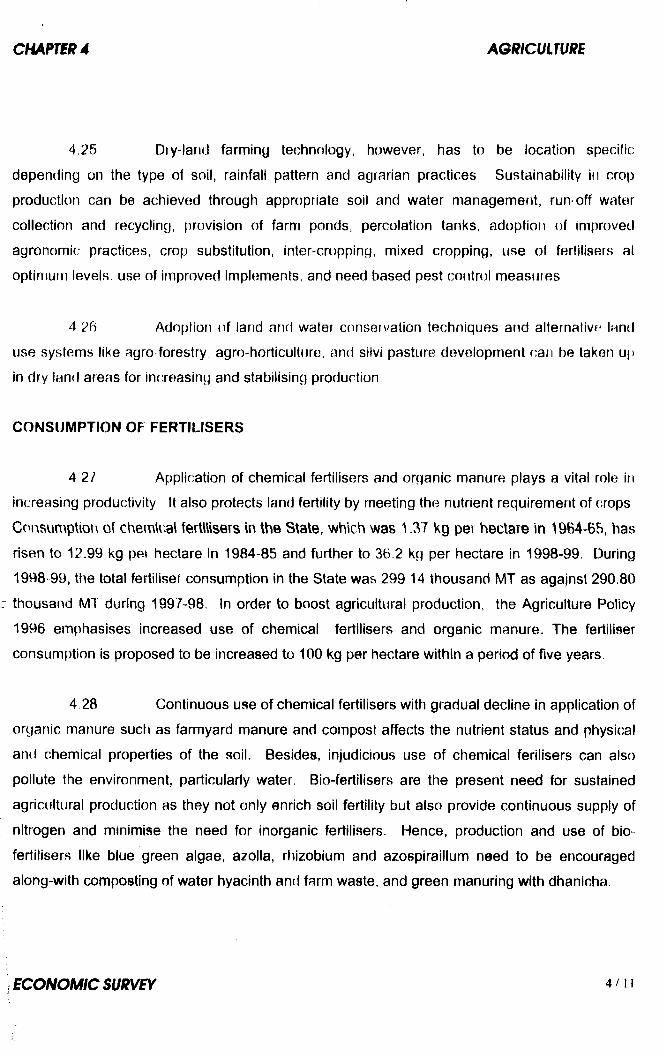
4.25 Dry-land farming technology, however, has to be location specific
depending on the type of soil, rainfall pattern and agrarian practices Sustainability in crop
production can be achieved through appropriate soil and water management, run off water
collection and recycling, provision of farm ponds, percolation tanks, adoption of Improved
agronomic practices, crop substitution, inter-cropping, mixed cropping, use of fertilisers at
optimum levels, use of improved implements, and need based pest cofitrol measures
4 2fi Adoption of land and water conservation techniques and alternative land
use systems like agro forestry, agro-horticulture, and silvi pasture development can be taken u[i
in dry land areas for increasing and stabilising production
CONSUMPTION OF FERTILISERS
4 27 Application of chemical fertilisers and organic manure plays a vital role in
increasing productivity It also protects land fertility by meeting the nutrient requirement of crops
Consumption ot chemkal fertl\is»rs in the State, which was 1.37 Kg per hectare in 1964-65, has
risen to 12.99 kg per hectare in 1984-85 and further to 36,2 kg per hectare in 1998-99. During
1998-99, the total fertiliser consumption in the State was 299 14 thousand MT as agajnst 290.80
thousand MT during 1997-98. In order to boost agricultural production, the Agriculture Policy
1996 emphasises increased use of chemical fertilisers and organic manure. The fertiliser
consumption is proposed to be increased to 100 kg per hectare within a period of five years
4 28 Continuous use of chemical fertilisers with gradual decline in application of
organic manure such as farmyard manure and compost affects the nutrient status and physical
and chemical properties of the soil. Besides, injudicious use of chemical ferilisers can also
pollute the environment, particulady water. Bio-fertilisers are the present need for sustained
agricultural production as they not only enrich soil fertility but also provide continuous supply of
nitrogen and minimise the need for inorganic fertilisers. Hence, production and use of bio-
fertilisers like blue green algae, azolla, rhizobium and azospiraillum need to be encouraged
along-with composting of water hyacinth and farm waste, and green manuring with dhanicha.
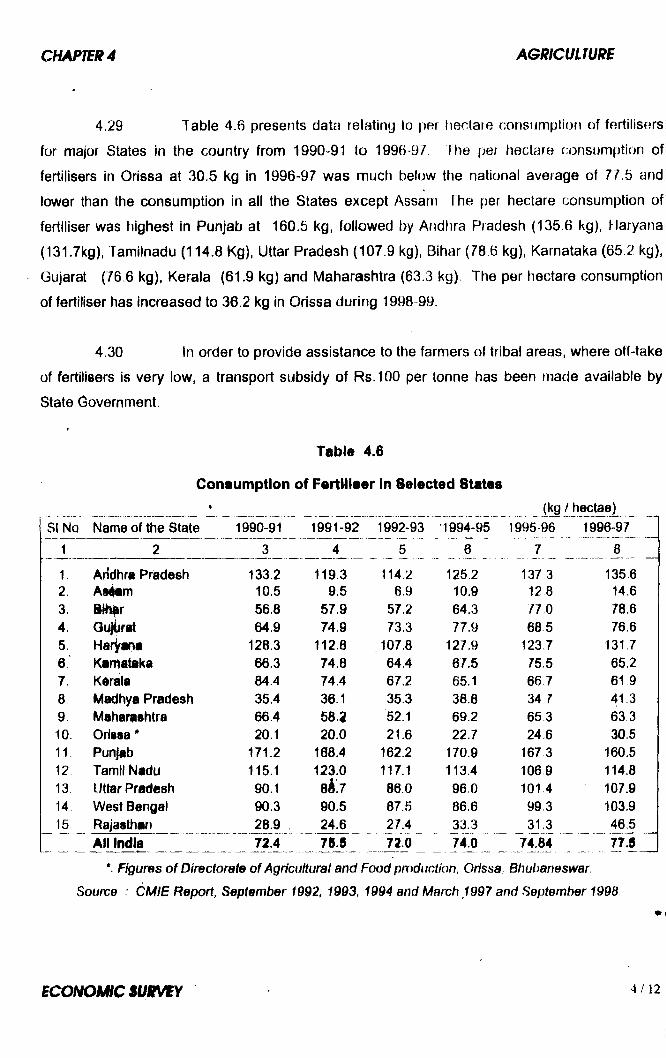
4.29 Table 4.6 presents data relating to per liectare consjjmption of fertilisers
for major States in the country from 1990-91 to 1996-9^ I he per hectare consumption of
fertilisers in Orissa at 30.5 kg in 1996-97 was much below the national average of 77.5 and
lower than the consumption in all the States except Assam fhe per hectare consumption of
fertiliser was highest in Punjab at 160.6 kg, followed by Andlira Pradesh (135 6 kg), Haryana
(131.7kg), Tamilnadu (114.8 Kg), Uttar Pradesh (107.9 kg), Bihar (78.6 kg), Karnataka (65.2 kg),
Gujarat (76.6 kg). Kerala (61.9 kg) and Maharashtra (63.3 kg) The per hectare consumption
of fertiliser has Increased to 36.2 kg in Orissa during 1998 99.
4.30 In order to provide assistance to the farmers of tribal areas, where off-take
of fertilisers is very low, a transport subsidy of Rs.lOO per tonne has been made available by
State Government.
Table 4.6
Consumption of Fertiliser in Selected States(kg / hectae)
5l No Nam© of the State 1990-91 1991-92 1992-93 1994-95 1995 96 1996-971 2 3 5 6 7 8
1. Aridhra Pradesh 133,2 119.3 114.2 125.2 137 3 135 62 Astern 10.5 9.5 6.9 10.9 12 8 14,63. Blh|ir 56.8 57.9 57.2 64.3 77,0 78.64. Gujarat 64,9 74.9 73.3 77.9 68 5 76.65. Haryana 120.3 112.8 .107.8 127.9 123.7 131,76. Karnataka 66.3 74.8 64.4 67.5 75.5 65.27. Kerala 84.4 74.4 67.2 65.1 66.7 61 98 Madhya Pradesh 35.4 36.1 35.3 38.8 34 7 41.39. Maharashtra 66.4 58.2 52.1 69.2 653 63.310. Orissa * 20.1 20.0 21.6 22.7 24 6 30.511 Punjab 171.2 168.4 162.2 170.9 167 3 160.512 Tamil Nadu 115.1 123.0 117.1 113.4 106 9 114.813. Uttar Pradesh 90.1 84.7 86.0 96.0 101 4 107.914. West Bengal 90.3 90.5 87.6 86.6 99 3 103.916 Rajasthan 28.9 24.6 27.4 33.3 31.3 46.5
All India 72.4 78.5 TJTO 74LO 74.84 77.5
Figures of Directorate of Agricultural and Food production, Orissa. Bhubaneswar.
Source : CMIE Report, September 1992, 1993, 1994 and March 1997 and September 1998

PEST CONTROL
4 31 As high yielding varieties of crops are susceptible to pests and diseases,
plant protection measures are essential for sustaining aghcultural production However,
excessive use of pesticides may be hazardous to human health. As a result, Integrated pest
management technology has been given a major thrust during the Ninth Plan period in order to
achieve effective pest control on one hand and to curb its possible adverse effects on
environment on the other This technology inter-alla envisages encouraging the use of
biological pest (control measures, identifying the most poisonous/toxic pesticides and putting a
ban on their use, and restricting the use of pesticides in a sustainable manner. During 1998-99,
870 50 MT of pesticides/insecticides were consumed in the State as against 916.66 M l during
the previous year with a decline of 5.03%
AGRICULTURAL MARKETING
4.32 The Orissa State Marketing Federation has been functioning as the apex
organisation of 55 Regional Co-operative Marketing Societies distributed all over the State At
present there are 33 rice mills and 16 oil milts managed by RCMSs, which am processing paddy
and oil seeds procured from cultivators. The Orissa State Tribal Development Co-operative
Corporation and Orissa State Oil Seeds Growers’ Federation are also functioning as apex
marketing institutions. The 223 LAMPS functioning in the TSP area provide a package of
services at a single contact point. One Jute Marketing Co-operative Society, one Coconut
Growers’ Marketing Co-operative Society, eighteen Cashew-nut Marketing Co-operative«
Societies, three Betel Marketing Co-operative Societies, three Forest Marketing Co-operative
Societies, 28 Fruit and Vegetable Co-operative Societies and eight Cotton Co-operative
Societies are functioning for assisting the growers in marketing their products.
4.33 It is proposed to restructure the existing Regulated Market Committees so
as to adopt the pattern of Mandi system In operation in Maharashtra, Punjab, Tamil Nadu,
Karnataka and Andhra Pradesh. The Orissa State Agricultural Marketing Board will have to
educate the growers and develop market yards for the purpose. Storage and other marketing
facilities are also proposed to be provided by the Regulated Market Committees.
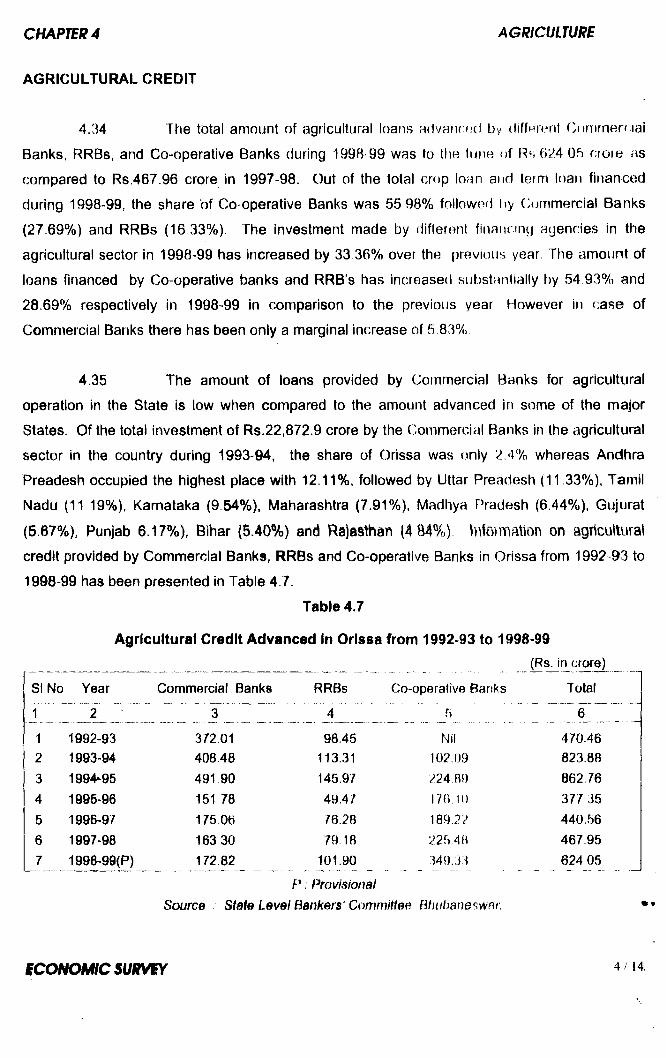
AGRICULTURAL CREDIT
4.34 The total amount of agricultural loans advancecl by (iiffwrynl CunirnHrf;iai
Banks, RRBs, and Co-operative Banks during 1998 99 was to the tune o f Rs 624 05 croie as
compared to Rs.467.96 crore in 1997-98. Out of the total crop loan and term loan financed
during 1998-99, the share “of Co-operative Banks was 55 98% follownd Ijy Commercial Banks
(27.69%) and RRBs (16 33%). The investment made by different finannng agencies in the
agricultural sector in 1998-99 has increased by 33.36% over the previous year The amount of
loans financed by Co-operative banks and RRB’s has increased sul)stanllally t>y 54 93% and
28.69% respectively in 1998^99 in comparison to the previous year However in case of
Commercial Banks there has been only a marginal increase of 6 83%
4.35 The amount of loans provided by Commercial Banks for agricultural
operation in the State is low when compared to the amount advanced in some of the major
States. Of the total investment of Rs.22,872.9 crore by the Commercial Banks in the agricultural
sector in the country during 1993-94, the share of Orissa was only 2A% whereas Andhra
Preadesh occupied the highest place with 12.11%, followed by Uttar Preadesh (11 33%), Tamil
Nadu (11.19%), Karnataka (9.54%), Maharashtra (7.91%), Madhya Pradesh (6.44%), Gujurat
(5.67%), Punjab 6.17%), Bihar (5.40%) and Ra)a§than (4 84%). IntDymation on agricultural
credit provided by Commercial Banks, RRBs and Co-operative Banks in Orissa from 1992 93 to
1998-99 has been presented in Table 47.
Table 4.7
Agricultural Credit Advanced in Orissa from 1992-93 to 1996-99
___________________ ___________________ _ _
SI No Year Commercial Banks RRBs Co operative Banks Total
1 2 3
1 1992-93 372.01 98.45 Nil 470.462 1993-94 408.48 113.31 102.09 823.883 1994-95 491.90 145.97 224 89 862764 1995-96 151 78 49.47 176.10 377,355 1996-97 175.06 76,28 189 22 440.566 1997-98 163 30 79.18 225.48 467.957 1996-99(P) 172.82 101.90 349.33 624 05
P : ProvisionalSource . StatB Level Bankers^ Committee Bhubaneswnr.
scoNOMic $ummY 4 / 14
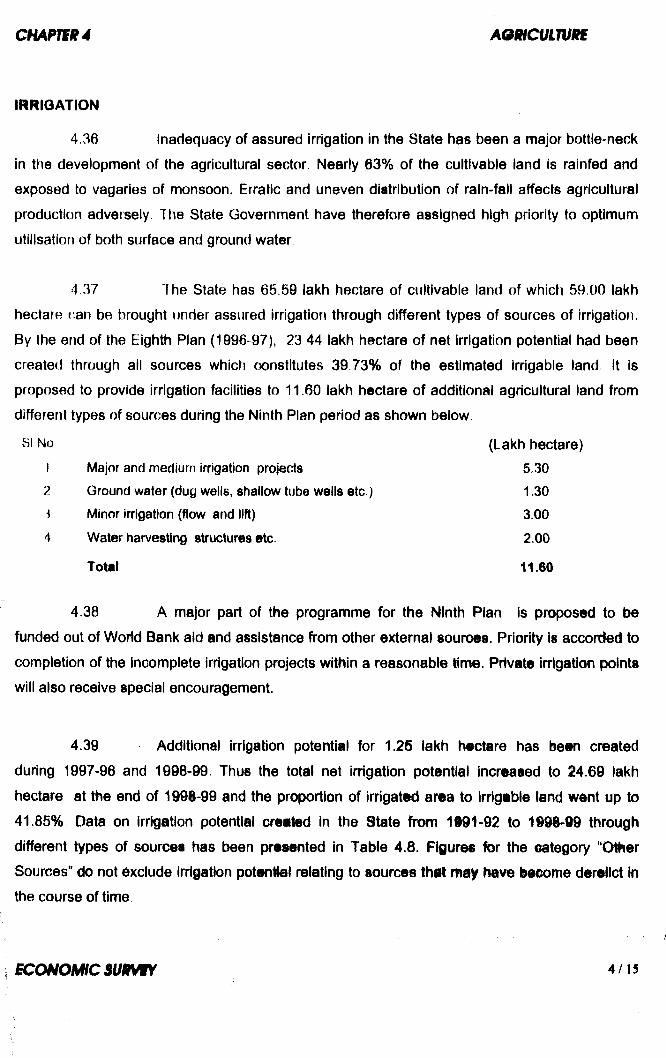
IRRIGATION
4.36 Inadequacy of assured irrigation in the State has been a major bottle-neck
in the development of the agricultural sector. Nearly 63% of the cultivable land is rainfed and
exposed to vagaries of monsoon. Erratic and uneven distribution of raln-fall affects agricultural
production adversely The State Government have therefore assigned high priority to optimum
utilisation of both surface and ground water.
4 37 The State has 65.59 lakh hectare of cultivable land of which 59.00 lakh
hectare can be brought under assured irrigation through different types of sources of irrigation.
By the end of the Eighth Plan (1996-97), 23 44 lakh hectare of net irrigation potential had been
created through all sources which (X)nstltutes 39.73% of the estimated Irrigable land It is
proposed to provide irrigation facilities to 11.60 lakh hectare of additional agricultural land from
different types of sources during the Ninth Plan period as shown below
Bl No (Lakh hectare)1 Major and medium irrigation projects 5.302 Ground water (dug wells, shallow tube wells etc.) 1,303 Minor irrigation (flow and lift) 3.004 Water harvesting structures etc. 2.00
Total 11.60
4.38 A major part of the programme for the Ninth Plan Is proposed to be
funded out of World Bank aid and assistance from other external sources. Priority is accorded to
completion of the Incomplete Irrigation projects within a reasonable ttme. Private irrigation points
will also receive special encouragement.
4.39 Additional irrigation potential for 1.25 lakh hectare has been created
during 1997-96 and 1998-99. Thus the total net irrigation potential increased to 24.69 lakh
hectare at the end of 1998-99 and the proportion of irrigated area to irrigable land went up to
41.85% Data on Irrigation potential created in the State from 1»91-92 to 1S98-i9 through
different types of sources has been presented in Table 4.8. Figure for the category “O^er
Sources” do not exclude Irrlgatbn potenHal relating to sources th il m&f Nave Hecome dereilct in
the course of time
B C O N o m c s u m m 4 / 1 5
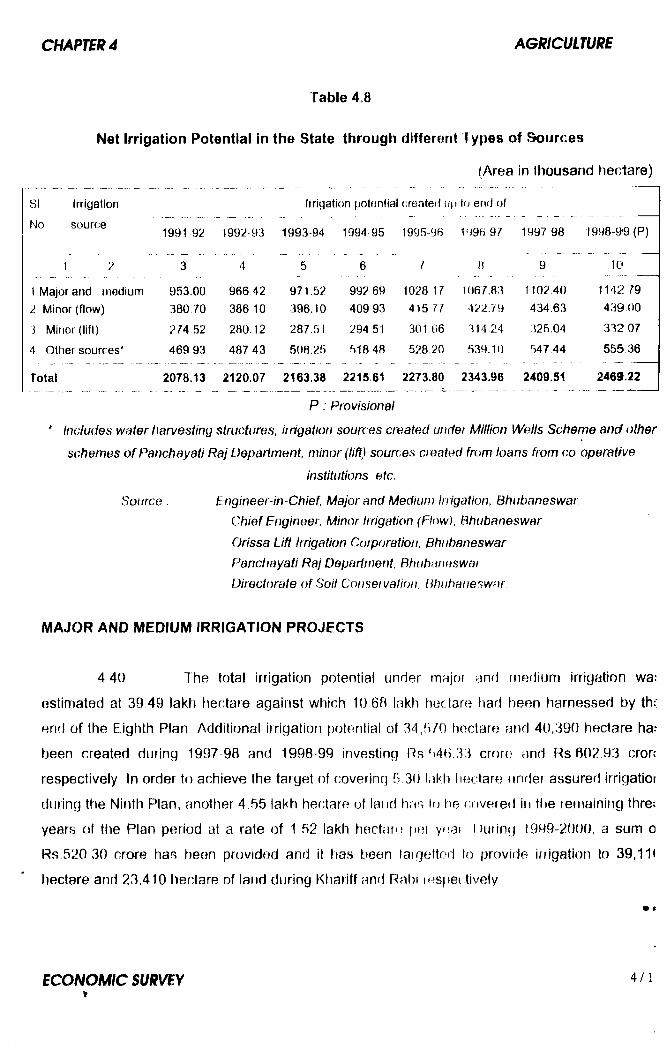
Table 4.8
Net Irrigation Potential In the State through different Types of Sources
(Area in thousand hectare)
SI Irrigation Irrigation potential created ii() to end of
No source1991 92 1992-93 1993 94 1994 95 1995-96 1’ )96 9? 1997 98 l998-9'9 (P)
1 2 3 4 5 6 I H 9 10
1 Major and medium 953,00 966 42 971.52 992 69 1028 17 1067.83 1102 40 1142,79
2 Minor (flow) 380 70 386 10 396.10 409 93 415 71 422.79 434.63 439 00
3 Minor (lift) 274 52 280.12 287.51 294 51 301,06 314 24 325,04 332 07
4 Other sources* 469 93 487 43 508.25 51848 528 20 539.10 547,44 555 36
Total 2078.13 2120.07 2163.38 2215.61 2273.80 2343.96 2409.51 2469.22
P : Provisional
* Includes water harvesting structures, irrigation sources created under Million Wells Scheme and other
schemes o f Panchayati Raj Department, minor (lift) sources created from loans from co operative
institutions etc.
Source . Engineer~in Chief, Major and Medium Irrigation, Bhubaneswar
Chief Engineer Minor Irrigation (Flow), Bhubaneswar
Orissa Lift Irrigation Corporation, Bhubaneswar
Panchayati Raj Department, Bhubaneswar
Directorate of Soil Conservation, Bhubaneswar
MAJOR AND MEDIUM IRRIGATION PROJECTS
4 40 The total irrigation potential under major dnrl fnedium irrigation wa:
estimated at 39.49 lakh hectare against which 10 6fi lakh hectare had been harnessed t)y th:
end of the Eighth Plan Additional irrigation potential of 3 4 ,5 /0 hectare and 40,390 hectare ha.
tjeen created during 1997-98 and 1998-99 investing Rs !)40.33 crore and Rs 602 93 cror:
respectively In order to achieve the target of covering 5 30 l.ikh liectare under assured irrigatioi
during the Ninth Plan, another 4 55 lakh hectare of land has lo he covered in the remaining thre;
years of the Plan period at a rate of 1.52 lakh hectare pet yrjat During 1999-2000, a sum o
Rs 520 30 crore has t)een provided and it has been laigetted to provide irrigation to 39,1H
hectare and 23.410 hectare of land during Khariff and Rabi n^sfiet lively

«4.41 Irrigation potential for 11 43 lakh hectare of land has been created by end
of 1998-99 through major and medium irrigation projects. However, in some of these projects,
water does not reach the tail end of ayacut area due to lack of maintenance and other defects
In order to tackle this problem, it has been decided to organise Water User’s Associations (Pani
Panchayats) with the involvement of NQOs. These Water User’s Associations will distribute
water, collect water taxes, maintain water channels, and ensure supply of water through outlets
In the first phase, on an experimental basis. Aunli, Darjang, Ghudahada and Rushikulya
Irrigation Projects have been taken up for this activity
MINOR IRRIGATION (FLOW)
4 42 By the end of 1998-99, the total number of minor irrigation projects in the
State was 4,764 of which 2,652 were fully functioning, 793 were partly derelict, 1,161 were
completely derelict and 158 were ongoing projects During 1998-99, additional irrigation facilities
for 4,378 hectare in Kharif and 549 hectare in Rabi were created as against the target of 6,884
hectare in Kharif and 1,185 hectare in Rabi. Thus, net irrigation potential of 4.39 lakh hectare
has been created by the end of 1998-99 in comparison to 3.79 lakh hectare at the end of 1990-
91 rBgisteririQ an increase of 14.17% over a period of nme years. The potential created through
minor irrigation (flow) constitutes 17.78% of the total net irrigation potential created in the State
through different types of sources. During 1999-2000, it is proposed to create additional
irrigation potential to the extent of 6,698 hectare in Kharif and 1,323 hectare in Rabi respectively.
MINOR IRRIGATION (LIFT)
4.43 Orissa Lift Irrigation Corporation (OLIC) Is in-charge of implementation of
ground water development schemes in the State. Individual farmers also make some investment
at their level to provide Irrigation to their agricultural fields. The irrigation potential targeted under
minor irrigation (lift) is 8.87 lakh hectare, against which irrigation facilities to the extent of 3.25
lakh hectare in Kharif and 1.95 likh hectare In Rabi season had been provided by the end of
1997-98 with energisation of 14,932 lift Irrigation points. During 1998-99, 307 pew lift irrigation
points were energised with creation of irrigation potential of 7,038 hectare In kharif and 4,223
hectare in Rabi. During 1999-2000, it has been targeted to establish 600 new lift Irrigation points
with creation of additional irrigation potential of 11,900 hectare in Kharif and 7,140 hectare in
Rabi respectively. A total of 127 lift Irrigation points have been handed over to WUAs during
1998-99, and another 1,000 are likely to be handed over by the end of 1999-2000.
IRRIGATION IN KBK DISTRICTS
4.44 The KBK districts namely Korapul, Malkanglri, Rayagada, Nawarangapur,
Bolangir. Sonepur, Kalahandi and Nuapada are cfironic ally Hffected by drought due lo low and
erratic rainfall. By the end of the Eightti Plan, the total iiriyation potential created in Ihese
districts was 3.64 lakh hectare constituting 14 34% of the total irrigation potential created in the
State During 199^98 and 1998-99, additional irrigation potential for 49,493 hectare has been
created The Annual F lan 1999-2000 envisages creation ot additional irrigation potential of
14,240 hectare with an outlay of Rs.212.96 crore throiigh ongoing and new irrigation projects
such as Upper Indrabati. Upper Kolab, Potteru, I owet Indra, l.ower Suktel etc
SOIL CONSERVATION
s4 45 Soil Conservation activities are taken up on water-shed basis An
integrated Watershed Development Project aided t)y the World Bank, Itido Danish
Comprehensive Watershed Development Project National Watershed Development Project in
Rainfed Areas, and River Valley Scheme under Central ?,ectors are important schemes for soil
conservation being implemented in the State Tlie primary ubjec;tives of the programmes are to
prevent land degradation, promote and balance the e( oBystem enhanc e capacity to retain
moisture, and increase the fertility and productivity f)f the soil f'eople's participatiofi is built in
into the programmes at all stages, from planning to execution Women are also involved in a
number of activities.
4 46 The total degraded land in tlie Sinte is 61 21 lakh liectare which works out
to 39 35% of the total geographical area of ttie Stiite lip to the end of 199B 99, It 59 lakh
liectare of larid has been trealed with differeni dnli e fobioii fnoasufos Cumulatively till the end
of 1998 99, 9,326 water harvesting structures have Ixco c tinstructed and irrigatioti potential of
0.83 lakh hectare (Kharif) has been created II has been targeted to lake up anti erosion
measures in an area of 10 95 lakh hectare during (he Nintti Plan |)eriod of which the target for
1999-2000 is 1 51 lakh hectare.
C H A m R d A m n c u L ty m
DRIP IRRIGATION
4.47 In racent years Oovemment have ^een laying emphasis on In tta lla ^ of
drip irrigation systems for development of crop husbandry In agriculture and hoftlculti^e Upto
1994-95, Government of India used to provide 50% subsWy with a maximum amount of
Rs.50,000 for establishment of drip irr jatlim systems in farmers' orchards.The remaining 60% of
cost was to be borne by the beneficiary After 1994-95, tWs 50% subsidy Is being shared at tie
rate of 45% and 5% by Centre and the State respectively During 1990-99, 840 drip Irrtgaton
sets have been supplied to Interested farmers at subsidised rates as against 2,02i In 1997-®8
and It is targetted to supply another 600 sets during 1999-2000
AGRICULTURAL PROMOTION’AWD INViSTMENT CORPORATION LTD (APICOL)
4 48 APICOL was estaibMshed In 1@9® as a wholly owned Government
corporation with the objective of jwDmotlng agro-based and food processing Industries
particularly in rural areas Up to th« end of 1997-98, the Corporation has promoted 27 agro
based and food processing InduelrtM wWh an Investment of Rs. 23 72 crore. Theee units have
created employment potential for 200 persons. During APICOL hw promoted 121
industrial units with an expendMimi of Ri.S.iS crore with the potential of genemting enfiployment
for 1210 persons. The CorporaHen alio aets as an agent for impienr^nting various in cen ^
schemes provided by Qovemment. By the end of 1908-99, It has released R«. 10.97 crore as
subsidy in favour of 8,453 ei fMile l)«n«iol«rte8. APICOL alse erganises training pro@r»mmet,
seminars, workshops, and awareneM pirogrammes.
AGRICULTURAL CENSUS
4.49 The AgrlcuMufvl C^ntui 1990-91 shows that there were 39.48 lakh
operational holdings in the State In eomfMirlton. k> 35.86 lakh as per the 1985-86 census
registering an increase of 10 09% ovw ■ p«rted of ftve years The total area of the operaMonal
holdings which was 52 61 lakh hee lM In 1§8§>96 has mari^nally Increased to 52.96 tekh
hectare in 1990-91. The average size hoki^s which was 1 47 hectare in 198S-86 hm
decreased to 1.34 hectare in 1i90-i1. The dietrlbution of number of operational holdtngs Into
different size classes and the area in each dM s is presented In Table 4.9.
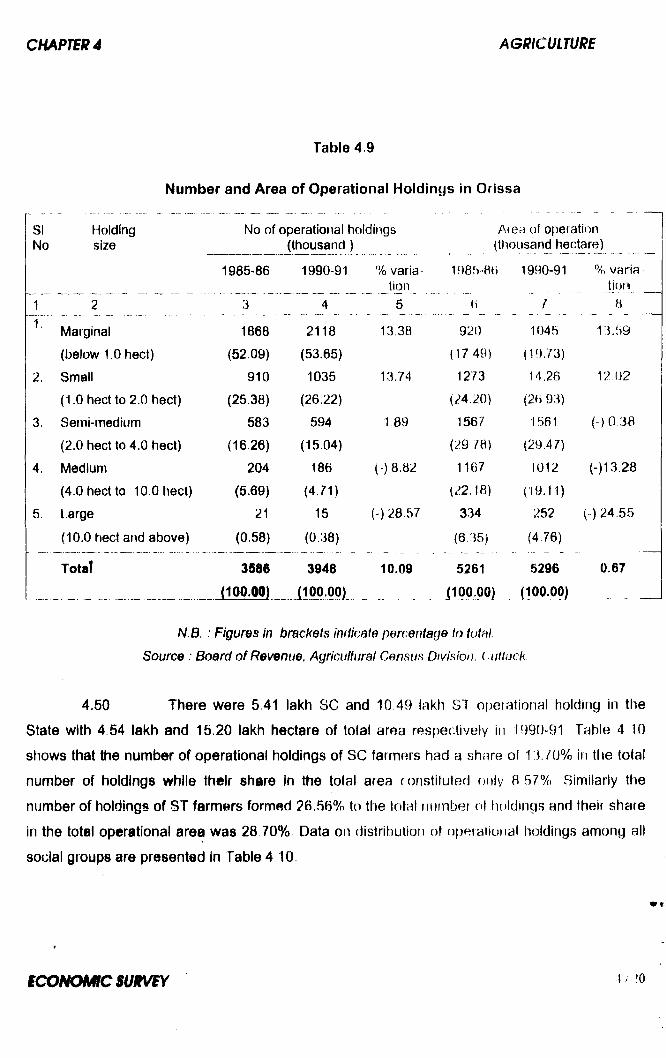
Number and Area of Operational Holdings In Orissa
SINo
Holdingsize
No of operational holditigs (thousand )
Aiea of operation (Ihousand hectare)
1985-86
3
1990-91
41. Marginal 1868 2118
(below 1.0 hect) (52,09) (53.65)2. Small 910 1035
(1.0 hect to 2.0 hect) (25,38) (26.22)
3. Serni-medlum 583 694
(2.0 hect to 4.0 hect) (16.26) (15.04)
4. Medium 204 186
(4.0 hect to lO.Otiect) (6.69) (4.71)5. Large 21 15
(10.0 hect and above) (0.58) (0.38)
Total 3586 3948(100.00) __(100.00)
% varia lion 5
13.38
13.74
1 89
(•) 8.B2
(-) 28 57
10.09
1985-8H 1990-91 % variatioR
6 1 8
920 1045 13.59(1749) (19.73)1273 14.26 12 U2
(24,20) (26.93)1567 1561 (-)0 38
(29 78) (29.4 7)1167 1012 (-)13.28
(22,18) (19.11)334 252 (-) 24.55
(6.35) (4.76)
5261 §296 0.67
iloopoi (lOQ-Op)
N.B. : Figures In brackets indicate percentage to total.
Source : Board of Revenue, Agricultural Census Division, ( -uttnck.
4.50 There were 5,41 lakh SC and 10 49 lakh ST o|)etational holding in the
State with 4.54 lakh and 15.20 lakh hectare of total area respectively in 1990-91 Table 4 10
shows that the number of operational holdings of SC farmers had a share of 13 /0% in tlie total
number of holdings while their share In the total area constituted only 8 57% Similarly the
number of holdings of ST farmers formed 26.56% to the total number ol tiuldings and their share
in the total operational area was 28.70% Data oti distribution of nperallunal holdings among all
social groups are presented in Table 4 10
i c o m m c s u i m Y \ / JO
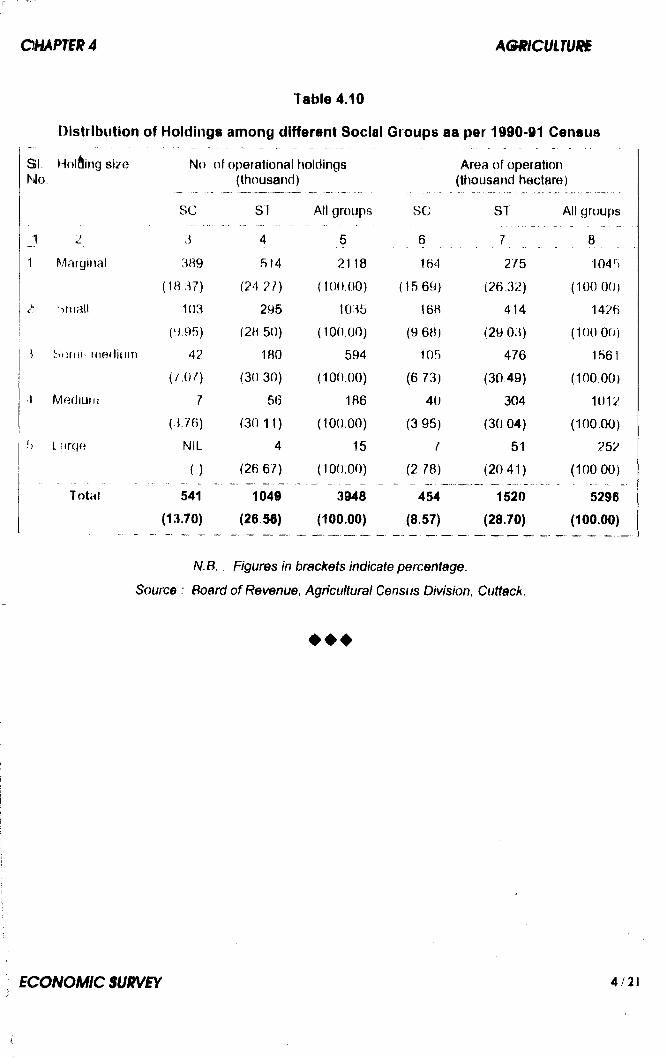
Distribution of Hoidings among different Social Groups aa per 1990-91 Census
SI. Holding size No,
J ^1 Marginal
2' ''.niall
SoriiH inefJiiitn
4 Mediuif!
b L firrie
Total
No of operational holdings (thousand)
SC
3389
(18 37) 103
(9.95) 42
(7.07)
1
(3.76)NIL
(■)
541(13.70)
ST
4514
(24 27)
295 (28 50)
180 (30 30)
56(30 11)
4(2667)
1049 (26 56)
All groups
5
2118( 100.00 )
1035( 100.00 )
594( 100.00)
186( 100.00 )
15( 100.00)
3946(100.00)
SC
6
164
(15 69) 168
(9 68) 105
(6 73) 40
(395) 1
(2 78)
454(8.57)
Area of operation (tfiousand hectare)
ST
7275
(26 32) 414
(29 03) 476
(3049) 304
(30 04) 51
(20 41)
1520(28.70)
All groups
8
1045 (100 00)
1426 (100 00 )
1561 ( 100.00 )
1012
(100 00)
252 (100 00)
5296(100.00)
H.B. : Figures in brackets indicate percentage.
Source Board of Revenue, Agricultural Census Division, Cuttack.
♦ ♦ ♦
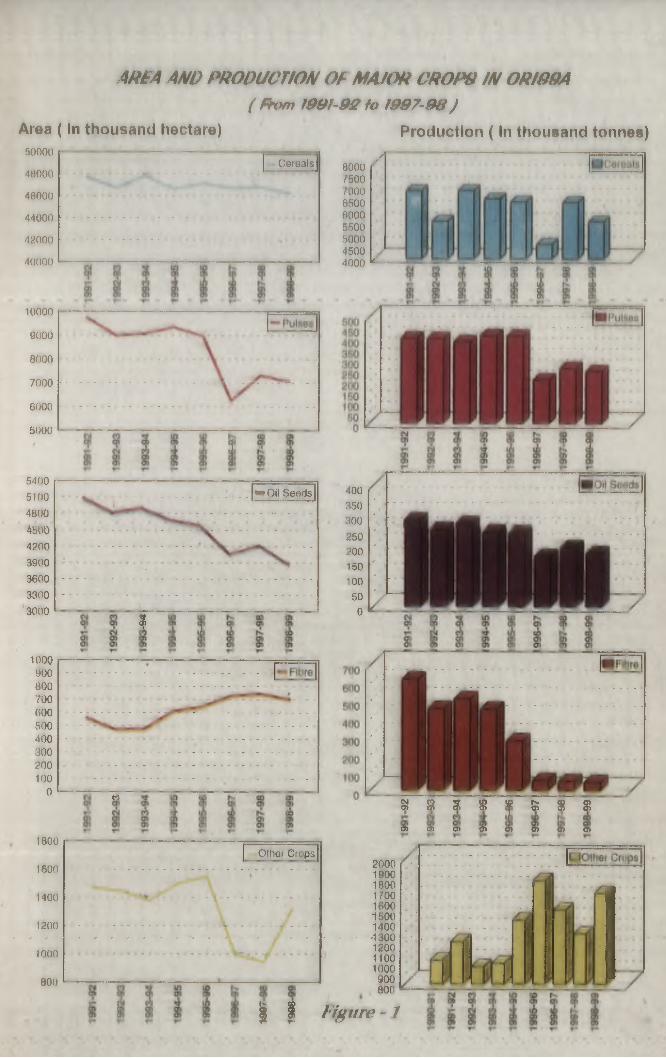
ARfA AW PRODUCTION OF MAJOR CROR& IN ORI99A ( Phm W 9h92 fo W97’ 9 e )
Production ( In thousand tonnes)Area ( In thousand hectare)50000
4H000
46000
44000
42000
40000
10000
9000
8000
7000
6000
5000
CetealJ/ ”
8000/5007000650060005500500045004000 i _
5400510048004bl)0420039003600330030( 0
1O O 0900800700600500400300200100
0
••O il Seeds 400350
............................- . - ------
300250200150100500
?
n
1800
1600
1400
1200
1000
Other Crops
£ J f 2 S r s C ! C f ^ ® 9 >w> cn Oy CD O) m O)o> cn o) 0) o) o) CD o)
2000190018001700160015001400'1300120011001000900800
I I H gure - /
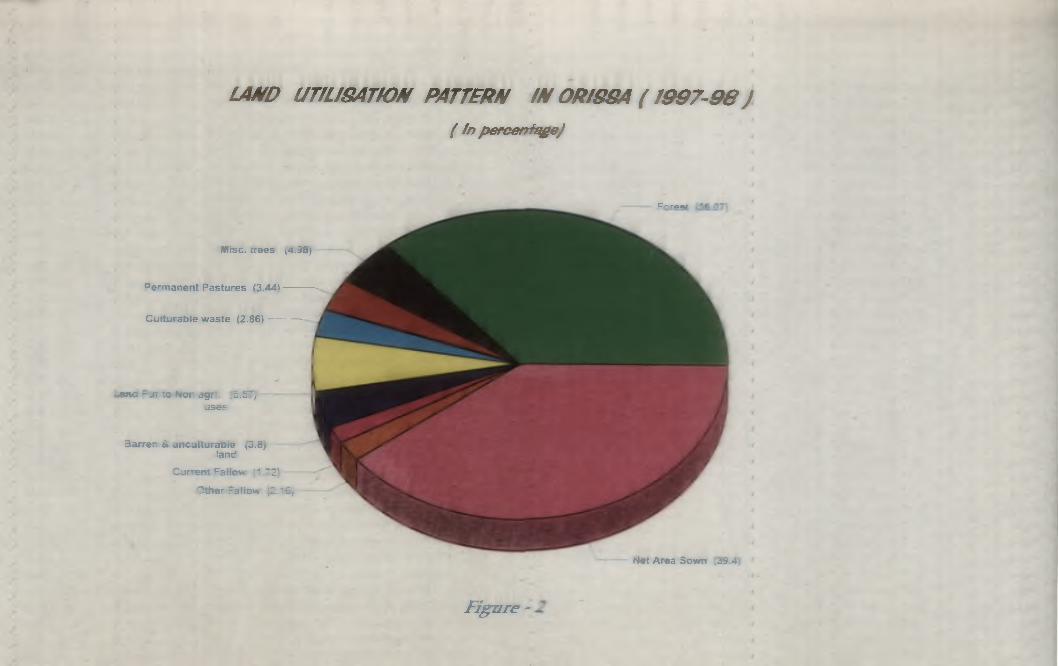
LAMP UTILI8ATIOM PATTERN W ORI8SA (1997-98j( In p e rce n f^e j
jC r- .ra ^ , '! t
Wise, trees (4.38)
Permanent Pastures (3-44)
Cufturable waste (2.86)
^ a n a - jt zo No t a g r . *5.5^/ uses
5 a rr« n & u n c u itu ra o te v3.8;iand
Current '^ailow ^ ‘ 2’
Other FaiiovK ;2 "i 5)
N«t Area Sown ;o9 4
F ig u re -
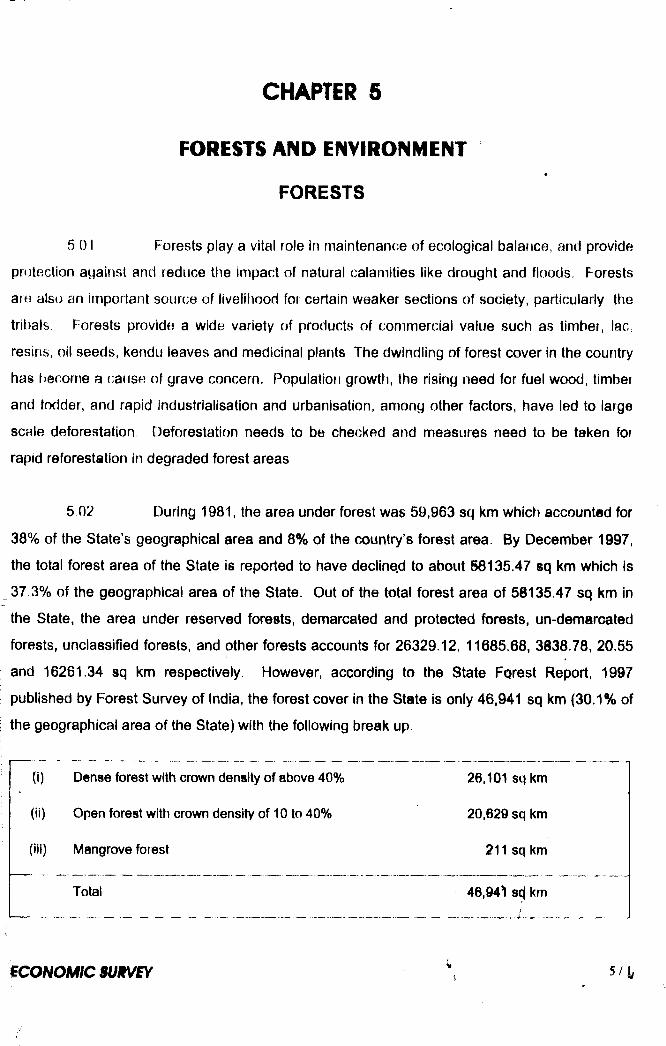
CHAPTER 5
FORESTS AND ENVIRONMENT
FORESTS
5 01 Forests play a vital role In maintenance of ecological balance, and provide
protection against and reduce the impact of natural calamities like drought and floods. Forests
are also an important source of livelihood for certain weaker sections of society, particulady the
trit)als. Forests provide a wide variety of products of commercial value such as timber, lac,
resins, oil seeds, kendu leaves and medicinal plants. The dwindling of forest cover in the country
has become a cause of grave concern. Population growtti, the rising need for fuel wood, timber
and fo(ider, and rapid industrialisation and urbanisation, among other factors, have led to large
scale deforestation Deforestation needs to be checked and measures need to be taken for
rapid reforestation in degraded forest areas
5 02 During 1981, the area under forest was 59,963 sq km which accounted for
38% of the State’s geographical area and 8% of the country’s forest area. By December 1997,
the total forest area of the State is reported to have decline,d to about 58135.47 sq km which is
37.3% of the geographical area of the State. Out of the total forest area of 58135.47 sq km in
the State, the area under reserved forests, demarcated and protected forests, un-demarcated
forests, unclassified forests, and other forests accounts for 26329.12, 11685.68, 3838.78, 20.55
and 16261.34 sq km respectively. However, according to the State Forest Report, 1997
published by Forest Survey of India, the forest cover in the State is only 46,941 sq km (30.1% of
; the geographical area of the State) with the following break up.
(i) Dense forest with crown density of above 40% 26,101 sq km
(ii) Open forest with crown density of 10 to 40% 20,629 sq km
(iii) Mangrove forest 211sqkm
Total 46,94’! scj km
I he forest area i)f the StHte is unevenly flistrihuled T he coastal districts where
population density is high have a coniparatively smaller areas utider forests
5 03 The National Forest I ’olicy, 1952 envisagiid a forest cover in the
aggregate of at least one third of total geographical art^a, with 60% coverage in the liilly tracts
and 20% in the plains. Against this, the State has 37% of its geographical area under forest as
compared to 23% at the national level
5 04 The main thrust in the forestry sector is afforestation of waste forest land
and restoration of degraded forests Besides, conservation of forests has to be ensured by
intensifying protective measures and enlisting people’s involvement in checking illegal felling
anfJ removal of trees Improvement of forest management has also become a necessity1
FOREST PLANTATION
5.05 Forestry sector has a vast potential for creating additional employment
opportunities for economically backward groups such as tribals and women In order to prevent
the fast depletion of forest resources and to preserve ecological balance, f)lantatioh programmes
have been undertaken in degraded ftjrests and waste lands umfer various State and Central
Plan schemes, fhe main objective and strategy of forest planning is “development without
destruction'
5 06 During 199H-99, plantation work under Block FMantation and RetrablHtatlon
!jf iJegrodod f orests Programmes has been carried out over 16990 /2 hectare of urea as
against 17959 83 liectare during 1997 9H In addition, tlie total nrrmt^er of seedlings distributed :
lo the farmers during 1998 99 was 8.67 lakh Achievement irndei forest plantation programmes ;!
in *Jrissa from 1992-93 to 1998-99 is pr esented in Table 5 1
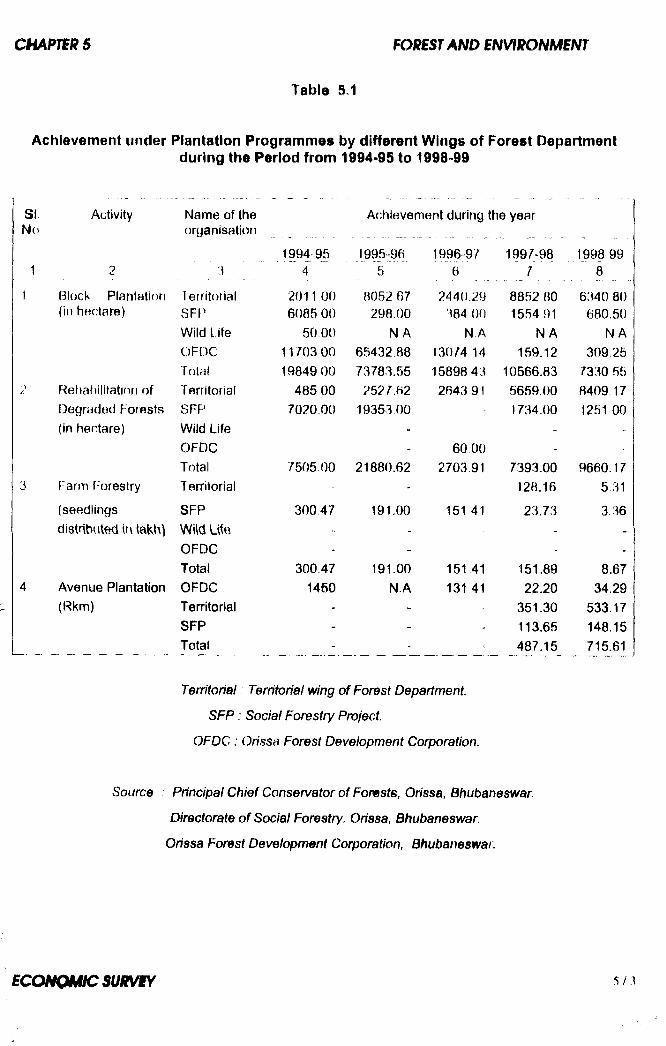
Achievement under Plantation Programmes by different Wings of Forest Departmentduring the Period from 1994-95 to 1998-99
Sl- Activity Nam e of the Achievement during the yearHo organisation .... . ... ............ .... . _ _ __________ - .. . .
1994 95 1995-96 1996-97 1997-98 1998 991 2 3 ...4 ....^5 ..... 6 7 [ 8
1 Blocl< Plantation Territorial 201 1 00 8052 67 2440.29 8852 80 6340 80(in hectare) SFP 6085 00 298.00 384 00 1554 91 680 50
Wild Life 50 00 N A N.A N A N AOFDC 11703 00 65432 88 13074 14 159.12 309,25Total 19849 00 73783.55 15898 43 10566.83 7330 55
2 F^ehai)ilitatinn of Territorial 485 00 2527.62 2643 91 5659.00 8409 17Degraded Forests SFP 7020.00 193v53,00 - 1734.00 1251 00(in hectare) Wild Life - - -
OFDC - 60 00 - -
Total 7505 00 21880.62 2703 91 7393.00 9660 173 f arm f-orestry Territorial - 128.16 5 31
(seedlings SFP 30047 191.00 151 41 23.73 3 36distnbiited ir\ Wild Lite - - - -
OFDC - - -
Total 300.47 191.00 151.41 151.89 8.674 Avenue Plantation OFDC 1450 N.A 131 41 22.20 34.29
(Rkm) Territorial - - 351.30 533.17SFP - - - 113.65 148.15Total - - - 487.15 715.61
Territorial Territorial wing of Forest Department.
SFP. Social Forestry Project.
OFDC : Orissa Forest Development Corporation.
Source Principal Chief Conservator of Forests, Orissa, Bhubaneswar.
DirectoratB of Social Forestry, Orissa, Bhubaneswar.
Orissa Forest Development Corporation, Bhubaneswar.
CITY FOREST AND GREENING OF THE STATE CAPITAL
5.07 This scheme was introduced in the vState during tfie Eiijhih Plan period.
The objective of the scheme is to develop the Bharatpur Reserve Forest in thn |)eriptiery of
Bhubaneswar City and to take up avenue plantation and plantation in ( ornpacl patches of
vacant land in Bhubaneswar A sum of Rs=22.60 lakh has been spent under tliis scheme during
1990-99 for raising plantation on 155 hectare of land and for maintenance of old plantations
REQUIREMENT OF FOREST PRODUCTS
5.08 It is estimated that the total requirement of fuel wood, bamtipo and timber
in Orissa by the year 2001 will be 141.28 lakh MT, 4.34 lakh MT and 367 lakh cum against
which the present production is only 1.35 lakh MT, 2.5 lakh MT and 0.18 lakh cum respectively,
thus making Orissa a zone of critical scarcity in these products.
FUEL WOOD AND FODDER PROJECT
5.09 This is a Centrally Sponsored Plan scheme with a funding pattern ih the
ratio of 50:50 between the Centre and the State Orissa Forest Development Corporation
(OFDC) is implementing this scheme. The main objective of the scheme is to augment
production of fuel wood and fodder with the involvement of local people by associating them in
planning, implementation and management. The scheme is now operating in 15 districts of the
State. The outlay for the Ninth Plan under the scheme is Rs=600.00 lakh During 1998-99,
plantations were raised over 4050 hectare of land with an expenditure of F s 160 ^0 lakh
KENDU LEAF
6.10 Kendu leaf Is one of the most important minor forest products and is used
for manufacture of bidis. The State produces about 16% of the total kendu leaf pmduction in the
country. Kendu leaf trade was nationi^fed in 1973 with a view to ensuring fait prices to the
pluckers and enhancing Government revenue The revenue from Kendu loaf trade has
increased stedily from Rs.2 92 crore during 1972 to Rs 63.50 crore durinr} 1998-99 The
purcfiase price has been enhanced from 13 paise for 20 leaves in 1998 to 15 paiso for 20 leaves
in 1999 and to 16 paise for the same number of leaves in 2000 to benefit pluckers
SOCIAL FORESTRY
5.11 A Social Forestry Project was implefnented in the State over a period of
13 years from 1983-84 to 1995'96 with the assistance of Swedish International Development
Authoiity (SIDA) The project aimed at creating forest resources with the active involvement of
the local community primarily to meet their needs of fuel wood, fodder, small timber and minor
forest produce, Aftei 1995-96, activities undei the project have been funded from the State Plan
resources. From its inception upto 1998-99, plantations have been raised over 109.89 lakh
hectare. In addition, 0 63 lakh hectare of degraded forest has been reforested During this
period, 24.49 crore of seedlings have been distributed
5.12 An agreerTient between Government of Sweden and Government of India
has been signed to implement a project for Capacity Building for Participatory and Sustainable
fVlanagement of Degraded Forest in the State. The project is to be implemented in two stages.
Stage I was launched in December 1997 and continued upto May 31 1999. Under Stage I,
contact has been («td!)iished with 15706 village level organisations and loresl area protected by
them has been ascert.iined and mapped by holding 13928 direct interface meetings Degraded
forest over 10660 hectare has been surveyed, demarcated and handed over for protection and
natural re-generation to Village Samrakhyan Samltis, A total of 968 forest personnel have been
trained, and 139 foiest personnel and 1514 villagers have been taken for exposure visits to
successful JFM areas A total of 2370 persons have been trained under experience sharing and
learning workshops and 3041 women have been trained for undertaking income generating
activities. A sum of Rs.1 28 crore has been spent under Stage I of the project. A project report
for Stage II has been submitted to SIDA.
5 13 A scheme namely “Sworna Jayanti Kunja" has been launched aiming at
distribution of seedlings free of cost at the rate of 50 seedlings to every village of the State
Government of India have provided an amount of Rs.46.99 lakh for the Scheme during 1997-98.
During 1998-99, 3.36 lakh seedlings were distributed and about 6700 villages were benefitted
under the scheme
FOREST PROTECTION
5 14 As a first step to involve people iti forest proterlioii, a Resolution was
issued [)y Government of Orissa on 1 8 1988 As per tfiis Resolution, village level organisations
called Forest Protection Committees (FPCs) were foimed for protection of reserve forest Area
adjoining the villages was assigned to thiese committees and in return villayeis were granted
certain concessions to meet their bona-fide requirement of fire-wood and small timt)er t his
Resolution was amended in 1990 and protected forest area was also tirought under ttiis scheme
of protection of forest t)y adjoining communities In 1993 it was felt that the earlier scheme has
not made the desired impact in re-generating degraded forests. In 1993 a new scheme of Joint
Forest Management involving formation of Vana Samrakhyana Samitis (VSSs) was initiated
under which Forest Department and villagers of adjoining villages were envisaged to t)e equal
partners in the protection and regeneration of degraded forests Under this scheme usufructoury
benefits were granted to VSSs Also, under the Slf3A assisted Social Forestry Project a number
of village level organisations called Village Forest CommiU86s(VFCs) iornied. At present
different types of village level organisations namely FPCs, VFCs, VSSs, and some unregistered
groups are engaged in protection of forests. On an average a village level organisation protects
50 to 200 hectare of forest.
5 15 Forest Protection Squads including police personnel and CF^PF are also
engaged in keeping vigil over vulnerable forest areas through out the year
FOREST REVENUE
5.16 Forest is an important source of non tax revenue for thf? State
Government Year-wise collectton of revenue from 1994-95 to 1998 99 is juesented in Table
5 2. The table shows tliat forest revenue has been increasing steadily after 1996 96
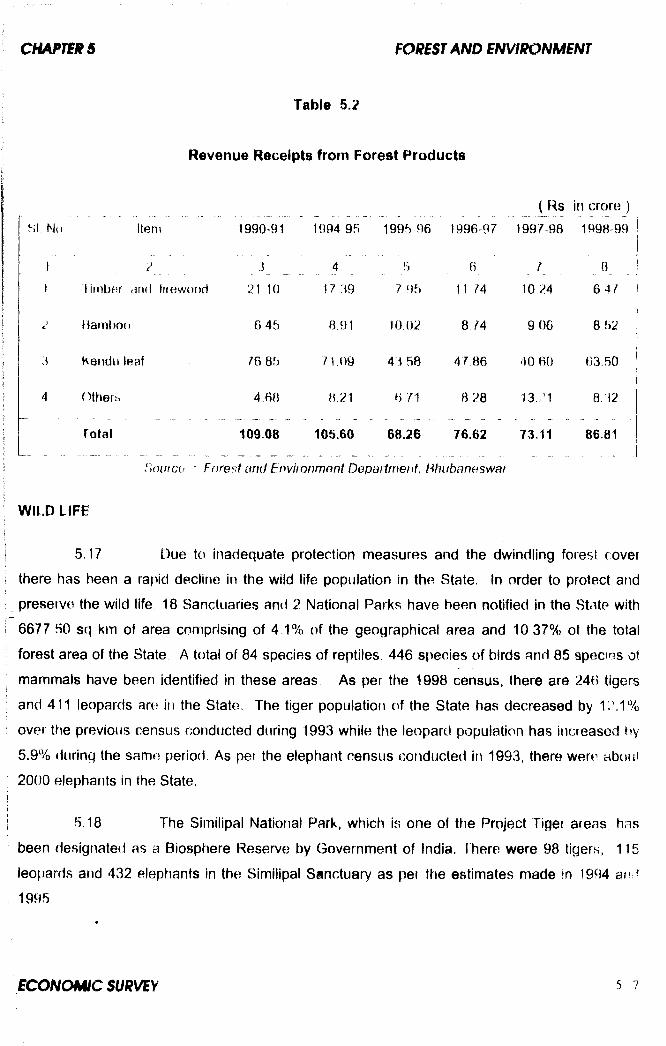
Revenue Receipts from Forest Products
( Rs in croreSI N(i lleni 1990’91 1994 95 1995 96 1996-97 1997 98 1998-9
1
1
...........
Timber and firewood 21 10
4
17 :i9 7 95
6
11 74
r
10 24
8
6 47
1i
'J' Bamboo 6 45 8 91 10.02 874 9 06 8 52
6 Kendii leaf 76 85 71.09 43,58 47 86 40 60 63 50
\
(A Others 4 60 H.21 f) 71 8 28 1 3 .’ 1 8,32
f-I Total 109 08 105.60 68.26 76.62 73.11 86.81
Souicb : Forest and Enviionmont Department, Bhubaneswa/
WILD LIFE
5J7 Due to inadequate protection measures and the dwindling forest coverii there has been a rapid decline in the wild life population in the State. In order to protect andiI preserve the wild life, 18 Sanctuaries and 2 National Parks have been notified in the State with
i 6677 60 sq km of area comprising of 4 1% of the geographical area and 10 37% ot the total
forest area of the State A total of 84 species of reptiles, 446 species of birds and 85 species of
, mammals have been identified in these areas As per the 1998 census, there are 246 tigers
I and 411 leopards are in the State, The tiger population of the State has decreased by 12.1%
; over the previous census conducted during 1993 while the leopard population has increased hy
I 5.9% during the same period. As per the elephant census conducted in 1993, there were abou?
i 2000 elephants in the State.
I 5.18 The Similipal National Park, which is one of the Project Tiger areas has
; been designated as a Biosphere Reserve by Government of India, f here were 98 tigers, 115
leopards and 432 elephants in the Similipal Sanctuary as per the estimates made in 1994 an j1995,
5.19 TJie Bhitar Kanika Wild Life Sanctuary comprises of 6/ 2 sti km, out f)f
which the National Park area is 367 sq km. The sanctuary is the largest nesting ground In the
world of Olive Ridley sea turtles. Every year about 2 to 6 lakh large turtles come to the
Gahiramatha beach for nesting and lay about 5 to 6 crore eggs.
5.20 The Chilika (Nalabana) Wild Life Sanctuary was started in December’
1987 over an area of 15 53 sq km. It is an ideal habitat for migratory birds and also for the
endangered irrawady dolphin It attracts 94 species of migratory birds from far off countries.
5.21 Chandaka-Dampara Sanctuary with 175.79 sq km of area was set up in
December 1982 As per the census conducted in 1996, there were 70 elephants in this reserve
forest Tiger, leopard, sambar and spotted deer are also found in this sanctuary. An outlay of
Rs. 180.00 lakh has been proposed for development of the Sanctuary during the Ninth Plan. A
sum of Rs.37.47 lakh was spent during 1998-99.
5.22 The Nandan Kanan Zoological Park, established in 1960, houses 604
amlmals of 52 species, 425 birds of 66 species and 114 reptiles of 14 species. A White Tiger
Safari, a Lion Safari, an Aquarium, a Toy Train and an Aerial f^opeway are some of the
attractions of this Zoo. During 1998-99 10.61 lakh visitors visited the Zoo and a revenue of
Rs.63.21 lakh was collected against 12.48 lakh visitors and revenue of f^s.55 8? lakfi collected
during 1997-98.
5.23 The Eco-Tourism scheme was introduced in 1995-96 to provide transport
and accommodation facilities for tourists in Sanctuaries and National Parks In the first phase
Similipal, Chilika, Bhitar Kanika and Nandan Kanan have been taken up An outlay of Rs 155.00
lakh has been proposed for the scheme in the Ninth Plan. A sum of Rs.18,17 lakh hias been
spent during 1998 99.
ECOLOGY AND ENVIRONMENT
5.24 The Environment Wing of the Forest and Environment Department has
the following objectives.
i To act as the nodal agency for environmental management and conservation.
ii Implementation of Pollution Control Acts and Rules
ill Environmental impact assesment of development projects and industries.
iv Eco management and protection of natural living resources and endangered
eco systems including land, waste land, grass land and mangroves
V Eco restoration, development, protection and maintenance of selected nature
reserves/locations.
vi Promotion of environmental awareness and environmental education.
vii Promotion of research, education and training on environmental conservation
and protection
viii Overall coordination of activities for conservation and management of Chilka
and Ansupa lakes.
ORISSA ENVIRONMENT PROQRAMMi (O IP)
5.25 Orissa Environment Programme (OEP) was launched in April 1992 with
the assistance of the Norwegian Government for a period of five years but was subsequently
extended upto March 2000. The total committed amount for the project is about Rs.18.0 crore.
The progress of different projects/programmes under O iP is as follows :
1 A project for strengthening of Orissa Pottution Control ioard has been complatad.
2 F ive projects were taken up for management of fly asli Threci of these projects have
t)een completed
3 A study of pollutlori proljlems due to hexavalent chrorniurn in ctiroino ore mining and
processing and its treatment has been completed A pilot water treatment plant has
t>een set up at the South Kallapani mine site at Sukirida
4 A processing plant with treatment capacity of 100 tonne miinicipal garbage per day
t)as been set up In Puri town A training programme on promotinc) awarness among
t itizens for proper disposal of garbage has been completed
b Projects for preparation of an Environment Management Plan for Angul-Talcher
area, for raising awareness of polliition related issues in Angul and Dhenkanal
distncts, for preparation of an impact study on crops, vegetation, domestic animals
and liurnan beings in Angul-Talcher area, and for conducting a remote sensing
study on monitoring and mitigation of envirotunorUal pollution in Anyul- l Hli.tier area
tiave t)een completed. Projects for preparation of a feasibility report on desiltatlon of
Nandira Jhor riverbed at Angul and for provision of piped water supply to eleven
fluoride affected villages In Angul district are in progress
6 A stream pollution atlas for Angul-Talcher area has been prepared Preparation of a
zoning atlas for siting of Industries in un divided Dhenkanal, Balasor?*. Gatijam and
Koraput districts is in progress
ENVIRONMENT EDUCATION AND AWARENESS PROMOTION
6 26 The State Government have taken up a number of educational and
awareness promotion prografnfTies for environmental protection and (xjnservoiion rh/rty District
Environment Societies, one for each district, have t>een constituted unrter tffe Ctiairmanship of
District Collectors with official and non offjrial fnernbers. the GovernniHf)! have Instituted
“I’ rakrutl MItra’ and Prakruti Bandhu awards to vt)lutitary organisations/
villages/lnsfltutlorm/lndlvlduals foi outstanding contribulion in the field of environment
conservathn, Upto the end of 1998-99 '9 / Piaknjti Mitra” <iwards and UM Prakiuti Bandhu” :
awcirds have been conferred ( he State Government is also (;o ordinatlng the implementation ot
National EnvironrTiental Awareness Campaign in the State for the last 5 years Duhng 199B-99,
grants-in-ald amounting Rs 19 1/ lakh have been sanctioned in favour of 352 organisations
under this programme
NAtrONAl RIVER CONSERVATION PLAN.
5 27 Under National F iver Conservation Plan. Cuttack, Talnher, Pharmasala
and Chandabali townships have t)een identified to avail suppoit for treatment of effluent water
and its discharge to Mahanadi, Kathajodi, Brahmani and Baitarani respectively to control the
pollulioti load ot these rivers. Both Government of India and the State Government have
provided Rs 12.43 lakh eacti for this work In the first phase a detailed project report for
Mnhanndi. Kathajodi and Cuttack has been sent to Government of India for approval
CONSERVATION AND MANAGEMENT OF THE COASTAL AREA
5 28 The Central Government has constituted an Orissa Coastal Zone
Management Authority in November 1998 under the provisions of the Environment (Protection)
Act 1986 under the Chairmanship of Secretary, Forest and Environment. The main functions of
the Authority are to deal with environmental Issues relating to Coastal Regulation Zone (CRZ)
referred to it by the State Government or the Central Government or the National Coastal Zone
Management Authority, to identify ecologically sensitive areas In the CRZ and coastal areas
highly vulnerable to erosion/degradation and to formulate area-specific management plans for
such identified areas, and to identify economically important stretches In the CRZ and to prspare
Integrated Coastal Zone Management Plans for these.
CONSERVATION OF ANSHUPA LAKE
5.29 Chlllka Development Authority has been declared as the nodal agency for
integrated devleopment and conservation of Anshupa lake. A master plan for Anshupa lake is
being prepared by the State Government for exploring possibilities of securing assistance from
Central Government and other foreign donor agencies for Its restoration arwl conservation.
STATE POLLUTION CONTROL BOARD (SPCB)
5.30 State Pollution Control Board (SF^CB) was constituted in 1983. Apart from
its head office and central laboratory at Bhubaneswar, it has seven regional offices at Cuttack,
Sambalpur, Berhampur, Balasore, Anugul, Rourkela and Rayagada. Ihe primary task of the
Board is to ensure optimal and sustainable utilisation of natural and human resources and to
control and prevent pollution from industries and urban local bodies For conttol of pollution, the
Board issues consent with conditions for operation of newly established industries During
1998-99, the Board has issued 93 consents to establish and 401 consents to operate various
industries.
5.31 The Board monitors the quality of the water of the rivers Mahanadi,
BrahmanI, Baitarani and Rusikulya. It also monitors the quality of the water of various ponds
ancfs wells in Bhubaneswar and in villages around the NALCO smelter in Angul. Apart from
water, the Board monitors the quality of ambient air of industrial areas and townships in the
State. It has monitored 1620 water samples and 3424 air samples during 1998-99.I
5.32 The Board has established a Public Awareness and Assistance Cell
(PAAC) through which it disseminates useful information to the public and interested parties. An :
Environmental Qrievance Cell has also been created for ledressal of etwirot^ment related '
complaints received from the public. Out of 259 complaints received, action fias been taken in
respect of 202 in 1998-99.
CHILIKA DEVELOPMENT AUTHROITY
5.33 The Chllika Development Authority was established in November 1992 as
an autonomous body to attend to the various problems of the lake and to ensure its conservation
and alround development. The lake Is facing a number of problems such as siltation, shifting of
Chllika mouth, loss of salinity, extensive weed growth, depletion of fishery resources etc
5 34 The Tenth Finance Commission has provided financial assistance of
Rs.27.0 crore for 1994-2000 for Integrated development of Chilika lake Out of this amount, a
sum of Rs.20 25 crore t)een utilised by the end of March 1999 F ollowing activities are being i
undertaken for the development of Chilika lake j
i) As per recommendation of an expert committee a lead channel measuring
2700 meter in length. 100 meter in width and 2 5 meter In depth has been
dredged.
ii) Programmes have been undertaken for habitat improvement of Nalabana bird
sanctuary through Wild-life Wing of Forest Development Department at a cost
of Rs 45 lakh.
ill) Orissa Renewable Energy Development Agency (OREDA) has developed a
patent for generation of bio-gas using weeds of Chilika and has been
promoting the setting up of these units in the peripheries of the lake with a
view to mitigate the problem of weed growth
iv) To tackle the problem of slltation of Chilika lake, a number of soil conservation
measures In catchment area are under implementation. A sum of Rs 1.96
crore has been released to the Soil Conservation Department for the purpose.
V) During 1998-99, a sum of Rs O 13 crore was rtteastd for removal of
unauthorised gherries. Steps have been Initiated for establishment of an
awareness promotion centre at Satapada.
REGIONAL PLANT RiSOURCES CENTRE
6.35 The Regional Plant Resources Centre has been functioning since March,
1986 as an autonomous body to introduce, conserve, propagate and upgrade plants of non-
agricultural importance in the State During 1998-99, 400 cuitlvars of rose, 20 varieties of
chrysanthemeum and several species of wild plants and garden ornamentals were introduced
by the Centre About 1440 species of tropical and sub-tropical trees have been studied and a
book entitled “Trees of the World" has been brought out during 1998-99. A total of 72 new
cultivars of cacti have been developed by the Centre and a booklet entitled “New Cactus
Cultivars" has been published during 1998-99. During 1998 and 1999 the Centre has published
54 research papers
♦ ♦ ♦
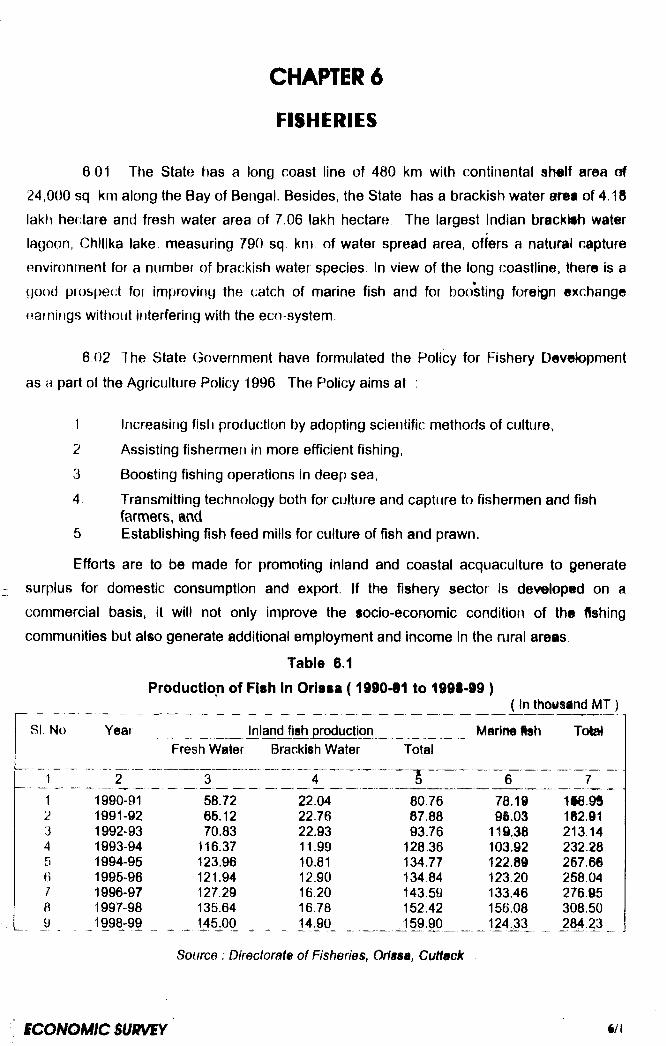
CHAPTER 6
FISHERIES
6 01 The State has a long coast line of 480 km with continental 8h«lf area of24,000 sq km along the Bay of Bengal. Besides, the State has a brackish water area of 4.18
lakh hectare and fresh water area of 7.06 lakh hectare The largest Indian brackish water lagoon, Chllika lake, measuring 790 sq km. of water spread area, offers a natural capture
environment for a number of brackish water species In view of the long coastline, there is a
good prospect for improving the catch of marine fish and for boo'sting foreign exchange
eainifigs without interfering with the eco-system,
6.02 The State Government have formulated the Policy for Fishery Devetopment
as a part of the Agriculture Policy 1996 The Policy aims at :
1 Increasing fish production by adopting scientific methods of culture,
2 Assisting fishermen in more efficient fishing,
3 Boosting fishing operations in deep sea,
4 Transmitting technology both for culture and capture to fishermen and fishfarmers, and
5 Establishing fish feed mills for culture of fish and prawn.
Efforts are to be made for promoting inland and coastal acquaculture to generatesurplus for domestic consumption and export. If the fishery sector is developed on a
commercial basis, it will not only improve the socio-economic condition of the fishing
communities but also generate additional employment and income In the rural areas
Table 6.1Production of Fish in Orissa (1990-81 to 1998-99 )
{ In thousand MT)
1. No Yeai Inland fish production Marine fteh TotelFresh Water Brackish Water Total
~’l 2 ______3____ 4 6___
1 1990-91 58.72 22.04 80.76 78.19 186.992 1991-92 66.12 22.76 87.88 9i.03 182.913 1992-93 70.83 22.93 93.76 119,38 213 144 1993-94 116.37 11.99 128.36 103.92 232285 1994-95 123.96 10.81 134,77 122.89 257.666 1995-96 121.94 12.90 134 84 123.20 258.047 1996-97 127.29 16.20 143.59 133.46 276.958 1997-98 135.64 16.78 152.42 156.08 308.509 1998-99 145.00 14.90 159.90 124.33 284.23
Source : Directorate of Fisheries, Orissa, Cuttack
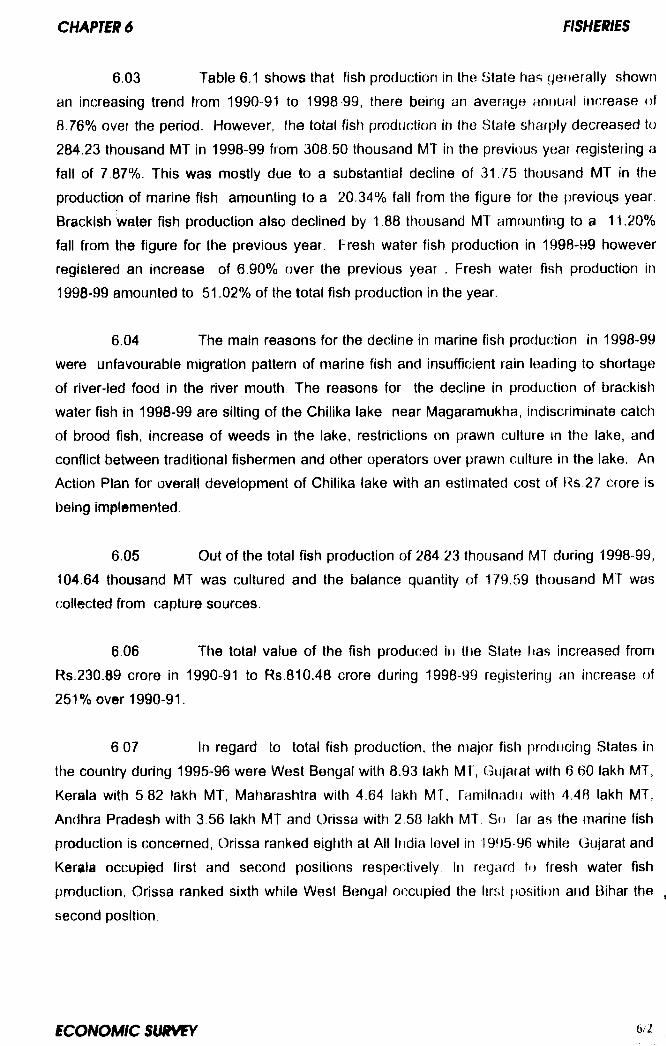
6.03 Table 6.1 shows that fish production in the State has generally shown
an increasing trend from 1990-91 to 1996 99, there being an average annual Iticrease ot 8.76% over the period. However, the total fish production in the State sharply decreased to284.23 thousand MT in 1998-99 from 308.50 thousand MT in the previous year registering a
fall of 7 87%. This was mostly due to a substantial decline of 31.75 thousand MT in the
production of marine fish amounting to a 20.34% fall from the figure for the previous year. Brackish Water fish production also declined by 1.88 thousand MT ariiounting to a 11.20%
fall from the figure for the previous year. Fresh water fish production in 1998-99 however registered an increase of 6.90% over the previous year . Fresh water fish production in
1998-99 amounted to 51.02% of the total fish production in the year.
6.04 The main reasons for the decline in rTiarine fish production in 1998-99
were unfavourable migration pattern of marine fish and insufficient rain leading to shortage
of river-led food in the river mouth. The reasons for the decline in production of brackish
water fish in 1998-99 are silting of the Chilika lake near Magaramukha. indiscriminate catch
of brood fish, increase of weeds in the lake, restrictions on prawn culture in the lake, and
conflict between traditional fishermen and other operators over prawn culture in the lake. An
Action Plan for overall development of Chilika lake with an estirriated cost of Rs 27 crore is
being implemented.
6.06 Out of the total fish production of 284.23 thousand MT during 1998-99, 104.64 thousand MT was cultured and the balance quantity of 179.59 thousand MT was
collected from capture sources.
6.06 The total value of the fish produced in the State tias increased from
Rs.230.89 crore in 1990-91 to Rs.810.48 crore during 1998-99 registering an increase of 251% over 1990-91.
6.07 In regard to total fish production, the major fish producing States in
the country during 1995-96 were West Bengal with 8.93 lakh Mf, (Bujarat with 6.60 lakh MT, Kerala with 5 82 lakh MT, Maharashtra with 4.64 lakh MT, Tamilnadu with 4.48 lakh MT, Andhra Pradesh with 3.56 lakh MT and Orissa with 2 58 lakh MT So far as the marine fish
production is concerned, Ohssa ranked eigtith at All Iridia level in 1995 96 while Gujarat and
Kerala occupied first and second positions respectively. In regard to fresh water fish
production, Orissa ranked sixth while West Bengal occupied the first position and Bihar the ,
second position
C H A F m s m H ffm s
6.08 The per capita annual consumptipn of flsh in the State has decreased
fronn 8 60 kg In 1997 98 to 8.23 kg In 1998-99. This was much less than the per capita
consumption in States like Assam, Tripura, West Bengal, Arunachal Pradesh and Union
Territories like Goa, Lakshadeep, Pondlchery and Andaman and NIcobar Islands. Similarly in
Soutli Asia, the per capita annual consumption of fish in Bangaladesh, Maldives and Sri Lanka is higher than in India. In 1992, while the per capita consumption of fish in India was3.7 ky, it was 7.3 kg in Bangaladesh, 33.1 kg in Maldives and 14.6 kg in Sri Lanka. In order to raise the per capita annual consumption of fish in Orissa to 11 kg which is the
recommended per capita level of requirement of fish, it is targeted to increase the production
from the present level of 284,23 thousand MT to 387 thousand MT by the end of the Ninth
Plan.
6.09 The year wise disposition of fish is given in Table 6,2 Out of the total production of 284 23 thousand MT during 1998 99, about 81% was marketed in raw form, 12% kept for sun drying, 5% for deep freezing and 2% for salting. The quantum of disposition
of fish under each item was less than that in the previous year due to 7.87% fall in the total fish production in the State.
Table 6.2
Disposition of Fish Produced in Orissa
( In thousand MT)
SI No Year Marketed in raw fonri
Freezing Drying Salting Total
~ 1 ....”'2 ^ 3 4 5 6 7” f 1990-91 126.6 5 9 22.4 4.0 158.9
2 1991-92 146.2 5,6 26.5 4.6 162.93 1992-93 168.6 7.2 32.0 5.4 213.24 1993-94 192.3 6.8 38.6 4.5 232.35 1994-95 210.4 9.3 32.8 5.2 257.76 1995-96 209.4 10 7 32.6 5.3 258.07 1996-97 222.6 13.2 35.4 5.8 277.08 1997-98 246.2 15.2 40.4 6.7 308.59 1998-99 230.8 14.2 33.8 5.4 284.2
Source Directorate of Fisheries, Orissa, CuttackINLAND FISHERIiS
6.10 The Inland fisheries can be classified broadly into two categories i.e. (I)
fresh water fisheries, and (II) brackish water fisheries. The fresh water fisheries resources
comprise of 1,14,822 hectare of small and big tanks and ponds. 2,56,000 hectare of small,
medium and major reservoirs, 1,80,000 hectare of fresh water lakes, swamps, jheels and
1,55,400 hectare of rivers and canals. Similarly, the brackish water area comprises of 79,000
hectare of Chilika lake 2,97,850 hectare of estuaries, 32,587 hectare of brackish water tanks,
and 8,100 hectare of back waters
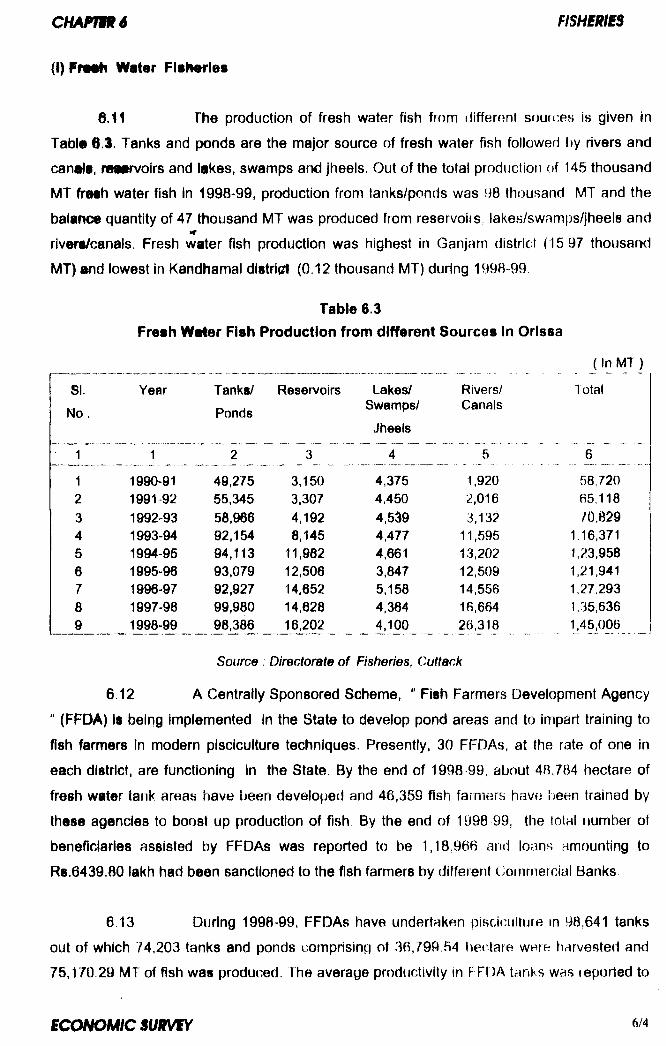
(I) Water Fisheries
6,11 The production of fresh water fish from different sources is given in
Tabis fi.3. Tanks and ponds are the major source of fresh water fish followed by rivers and
canaft, rettrvoirs and lakes, swamps and jheels. Out of the total production of 146 thousand
MT fri»h water fish In 1998-99, production from tanks/ponds was 98 thousand MT and the
balance quantity of 47 thousand MT was produced from reservoirs, lakes/swamps/jheels and
rivers/canals. Fresh water fish production was highest in Ganjam district (15 97 thousarnl
MT) and lowest in Kandhamal district (0.12 thousand MT) during 1998-99
Table 6.3Fresh Water Fish Production from different Sources In Orissa
{ In MT )
SI. Year Tanks/ Reservoirs Lakes/ Rivers/ TotalNo. Ponds Swamps/ Canals
Jheels
1 1 2 3 ” 4 ~~ 5 6
1 1990-91 49,275 3,150 4.375 1,920 58,7202 1991 92 55,345 3,307 4,450 2,016 65,1183 1992 93 50,966 4,192 4,539 3,132 /0.8294 1993-94 92,154 8,145 4,477 11,595 1,16,3715 1994-96 94,113 11,982 4,661 13,202 1,23,9586 1995-96 93,079 12,506 3,847 12,509 1,21,9417 1996-97 92,927 14,652 5,158 14,556 1,27,2938 1997-98 99,980 14,628 4,364 16,664 1,35,6369 1998-99 98,386 16,202 4,100 26,318 1,45,006
Source : Directorate of Fisheries, Cuttack
6.12 A Centrally Sponsored Scheme, " Fish Farmers Development Agency
" (FFDA) Is being implemented In the State to develop pond areas and to impart training to
fish farmers In modern pisciculture techniques. Presently, 30 FFDAs, at the rate of one In
each district, are functioning In the State. By the end of 1998 99, about 48,784 hectare of
fresh water tank areas have been developed and 46,359 fish farmers have i)een trained by
these agencies to boost up production of fish By the end of 1998 99, the total number of
beneficiaries assisted by FFDAs was reported to be 1,18,966 and loans amounting to
Rs.6439.80 lakh had been sanctioned to the fish farmers by different Commercial Banks.
6.13 During 1998-99, FFDAs have undertaken piBcic ultuie in 98,641 tanks
out of which 74,203 tanks and ponds cotTiprlsinq of 36,799 54 hectare werft harvested and
75,170 29 MT of fish was produced. The average productivity in FFDA tanks was reported to
c m p m 6 r m m im
be 2,043 kg per hectare in 1998-99 as compared to 2,200 kg per hectare in 1997-98 The
decrease in per hectare productivity was due to delayed harvesting in scwne tanks. There is a
target to develop 3,500 hectare of tank areas and impart training to 2,400 fishermen and fish
farmers during 1999-2000 by FFDAs.
6 14 The total reservoir resources available in Orissa were 256.00 thousandhectare out of which 197.20 thousand hectare were suitable for pl»olculture. In order to
increase fresh water fish production, 66 reservoirs constituting 147.81 thousand hectare of water area have been transferred to the Fisheries Department. Out of tt^ese, piscicutture has
been taken up in 54 reservoirs comprising of 24.92 thousand hectare of water area with
financial assistance from the World Bank. During 1998-99, 52 85 lakh fingerllngs were
stocked in different reservoirs and 1,861.63 MT fish worth Rs.204 78 lakh was produced
creating employment for 3,442 persons under the ‘ Special Programme for Reservoirs ” funded by the World Bank.
6.15 A project for development of fisheries, with World Bank assistance of FIs. 10B.55 crore, has been launched in the State from the year 1992-93. The project period
was initially for 5 years but was subsequently extended up to the end of December 1999.
The pro)ec\ envisages development of 863 hectare of brackish water area and 28.364
hectare of reservoir resources of the State to produce 1,900 MT of shrimps and 2,891 MT of fish at the end of the project period.
6.16 Fresh Water Prawn Culture Programme which has been launched
since 1991-92, is widely accepted by the fish farmers of the State. Demand for prawn from
botti within and outside the State Is high and the activity generates good profits for the
farmers. During 1998-99, fresh water prawn culture was undertaken In an area of 713.82
hectare, where 62.11 lakh prawn seeds were stocked against the target of 100.00 lakh.
(II) Brackish Water Fisheries
6.17 Brackish Water Fisheries Development Agencies have been set up in
seven coastal districts of the State which look after various aspects of brackish water fish
farming with special emphasis on prawn culture. The total brackish water area of the State is
about 4,17, 537 hectare of which the Brackish Water Fisheries Development Agencies have
identified 32,587 hectare as suitable for prawn culture These agencies have developed
12,468 43 hectare for prawn culture by the end of 1998-99 since th®lf Irvceptlon out of which
907 hectare have been leased out on long term basis. During 1998*89, brackish water prawn
culture was undertaken In an area of 10,245,26 hectare and 6,286.27 MT brackish water

prawn were produced. Up to the end of March 1999, since the inception of tl)e programme, about 8,956 fish farmers had been benefited and 3,805 farmers had tmen trained in modern
shrimp culture techniques. Up to the end of March 1999, since the inception of the
programme, loans amounting to Rs. 11.38 crore had been released by different financing
banks to the beneficiaries and an amount of Rs.2.25 crore had been released as subsidy
For 1999-2000, a target to develop 700 hectare of brackish water area and to train 210
beneficiaries has been set.
6.18 During 1998-99, about 3,330 lakh brackish water prawn seeds were
supplied to the prawn farmers of the State. There are nine brackish water prawn hatcheries
in the State of which the only departmental hatchery at Chandrabhaga produced 53.83 lakh
of shrimp seeds valued at Rs.21.67 lakh which were sold to the farmers. For 1999-2000, there is a target for production of 250 lakh shrimp seeds in Chandrabhaga hatchery.
6.19 Chlllka lake is the main source of brackish water fish with average
water spread area of 790 sq. km and Island area of 223 sq. km. There are 128 fishermen
villages with 12,363 families of whom 27,200 active fishermen depend on Chilika lake for their livelihood. There are 83 Primary Co-operative Societies with 18,972 members in these
vHlagtt. Th«r® art 12 itmlinQ In which about 1,702 M I of fish/shrimps and 9 M l ot crab were landed in 1998-99 against 4,273 MT and 24 MT during 1990-91. The reasons for the decline of fish, prawn and crab landing from Chlllka are silting of the mouth of the lake, Indiscriminate catch of brood fish and Juveniles, and increase of weeds in the lake
Measures have been initiated to restore the ecosystem of the lake. The brackish water fish/shrimp production from different sources In the State is given below :
Table 6.4Brackish Water Flah/Shrimp Production from different Sources in Orisaa
(in MT)
Si. No Year Chilika lake Brackish water shrimp Estuaries Total production1 2 3 4 51 1990-91 4,273 2,564 15,20? 22,0382 1991-92 4,558 3,715 14,494 22,7663 1992-93 4,158 3,992 74,783 22,9334 1993-94 3,485 4,344 4,156 11,9855 1994-9S 1,415 4,668 4,729 10,8126 199596 1,269 6,957 4,676 12,9027 1996-97 1,633 6,627 7,943 16,2038 1997-98 1,652 4,873 10,257 16,7829 1998-99 1,702 6,256 6,940 14,898
Source Directorate of Fisheries Orissa
MARINi F iSHlR liS
6.20 As mentioned earlier, the State has a coastline of 480 km with a
continental shelf area of about 24,000 §q. km which comprises about 6% of the coastline and
4.7% of the continental shelf area of the country. Among the seven coastal districts, Puri
district has the longest coastline of 155 km and Bhadrak district has the shortest of 50 km
From the off-shore and on-shore waters, 124.33 thousand MT of fish was caught during
1998-99 Prawn, hilsa pnd porpfret are the important species among the marine fish.
6.21 During the current year small fish landing centres at Tantiapal and
Kliandiapatna in Kendrapara district, Bahabalpur in Balasore district. Bandar in
Jagatsinghpur district, Baliapatpur/Bhusandpur in Khurda district and Sorada in Ganjam
district are under construction There is a proposal for undertaking the next phase of
construction work at the harbours at Dhamara, Chudamani and Chandipur Administrative
approval from Government of India has been received for construction of fish landing centres
at Kirtania and Talasari in Balasore district, Penthakata in Puri district, and at Gopalpur-on
sea in Ganjam district.
GENERAL
6.22 Contribution of the fisheries soctor to the Gross Domestic Product of
the State at constant prices has shown a steady growth from 1990-91 to 1997-98. In 1990-
91 the value added to the QSDP from the fisheries sector was Rs.101.49 crore at constant
(1980-81) prices which increased to Rs217.17 crore at constant(1980-81) prices in 1997-98.
The contribution of the fisheries sector to GSDP increased from 2.1 % In 1990-91 to 3.2 % in
1997-98. Considering the vastness of the water area available, the contribution of the
fisheries sector to G8DP Is much below the potentiality of the sector.
6.23 In view of the importance of the fisheries sector In the State economy,
the Plan investment for development of fisheries increased form a meagre amount of Rs.0.29
crore during the First Plan to Rs.51.03 crore during the Eighth Plan period. During 1998-99
an investment of Rs.11.38 crore has been made The State Plan outlay for 1999-2000 for the
fisheries sector has been kept at R8.17.90 crore. In addition, Rs.1.00 crore and 4.15 crore
have been provided under Centrally Sponsored Plan and Central Plan respectively.
6.24 Both fresh water and brackish water prawn culture tiave assunned
considerable importance on account of their profitability and as sources of foreign exchange
earnings. The State Government have decided to set up new fresti water prawn hatcheries
in the next five years with World Bank assistance. In the meantime private entrepreneurs
have set up prawn seed hatcheries in Puri and Ganjam districts to cater to the needs of prawn farmers. There is a shrimp hatchery at Chadrabhaga in Puri district and another at Gopalpur in Ganajm district under the Marine Products Export Development Agency
(MPEDA) The Fisheries Department also has a fresh water prawn hatchery at Paradeep in
Jagatsinghpur district.
6.25 In order to meet the growing demand of quality fish seed in the State, greater emphasis has been given to production of quality fish seed in departmental hatcheries and the hatcheries of Orissa Pisciculture Development Corporation. During
1998-99, about 2,617 lakh quality fries have been produced and sold to pisciculturists for stocking in their tanks.
EXPORT AND IMPORT OF FISH
6.26 The export offish from the State increased from 65 71 thousand MT in
1990-91 to 100.43 thousand MT in 1997-98 but it decreased to 85.96 thousand MT in 1998-99
Out of 85.96 thousand MT fish exported during 1998-99, marine fish constituted 68,38
thousand MT, fresh water fish 10.88 thousand MT, and brackish water fish 6 70 thousand
MT. In proportionate terms the respective share was 79.5 %, 12,6% and 7,8% . The total marine products exports from the State in 1997-98 amounted to 21,5% of the total marine
products exports of India.
6.27 During 1998-99, about 9,411 MT of marine products valued at Rs.275.33 crore were exported to countries like Japan, China, USA, UAE, Indonesia and
Hongkong. Among marine products of Orissa, frozen shrimp accounts for a major share of 7,252 MT valued at Rs.257.46 crore. The other products exported are frozen scampy, frozen
pomfret, frozen ribbon fish, frozen sheer fish, frozen eel fish and dry fish
6.28 During 1998-99, about 43,530 Ml of fresh water fish was imported
through private trade channels from the neighbouring State of Andhra Pradesti The import of fresh water fish from neighbouring States has been showing an increasing trend due to
high demand for fresh water fish in tlie State and low cost of imported fish The import of fresh water fish Increased from 40 25 thousand MT in 1997-98 to 4 1.53 thousand MT in
1998-99
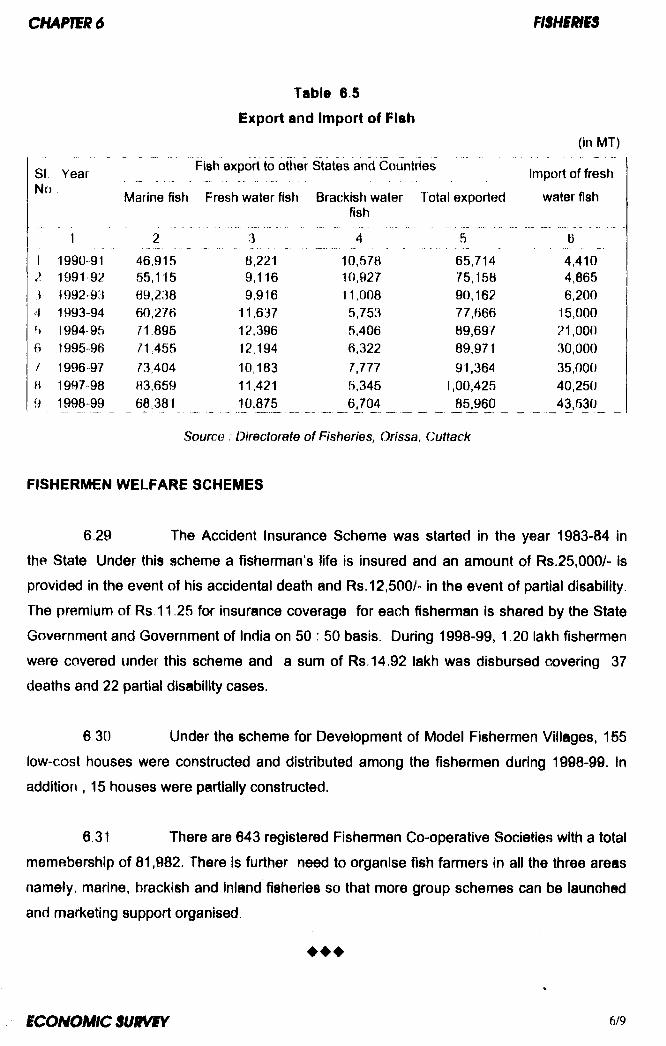
SI Year No
Table 6.5
Export and Import of Fish
Fish export to other States and Countries
Marine fish Fresh water fish Brackish water Total exported
(in MT)
Import of fresh
water fishfish
1 2 3 4 5 61 1990 91 46,915 8,221 10,578 65,714 4,4102 1991 92 55,115 9,116 10,927 75,158 4,865} 1992 93 69,238 9,916 11,008 90,162 6,200
4 1993-94 60,276 11,637 5,753 77,666 15,000») 1994 95 /1,895 12,396 5,406 89,697 21,0006 1995 96 n.455 12,194 6,322 89,971 30,000/ 1996 97 73,404 10,183 7,777 91,364 35,000H 1997-98 83,659 11,421 5,345 1,00,425 40,2509 1998 99 68,381 10,875 6,704 85,960 43,530
Source : Directorate of Fisheries, Orissa, Cuttack
FISHERMEN WELFARE SCHEMES
6.29 The Accident Insurance Scheme was started in the year 1983-84 in
the State Under this scheme a fisherman's life is insured and an amount of Rs.25,000/- is
provided in the event of his accidental death and Rs.12,500/- in the event of partial disability.
The premium of Rs 11 25 for Insurance coverage for each fisherman is shared by the State
Government and Government of India on 50 : 50 basis. During 1998-99, 1.20 lakh fishermen
were covered under this scheme and a sum of Rs. 14.92 lakh was disbursed covering 37
deaths and 22 partial disability cases.
6 30 Under the scheme for Development of Model Fishermen Villages, 155
low-cost houses were constructed and distributed among the fishermen during 1998-99. In
addition , 15 houses were partially constructed.
6 31 There are 643 registered Fishermen Co-operative Societies with a total
memebership of 81,982. There Is further need to organise fish farmers in all the three areas
namely, marine, brackish and Inland fisheries so that more group schemes can be launched
and marketing support organised.
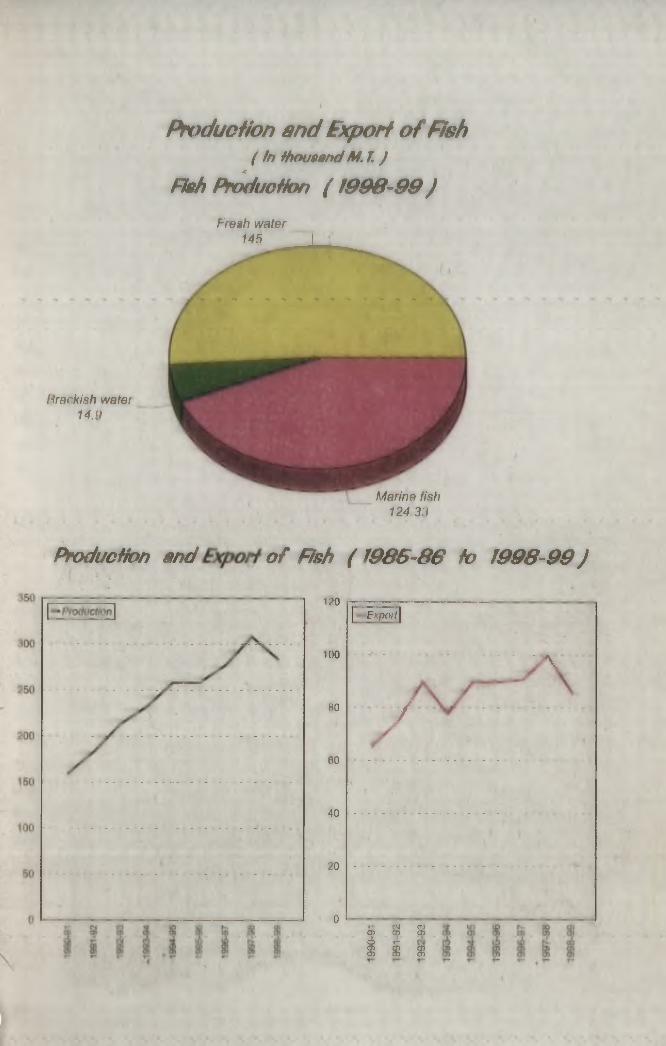
Production a n d E xport o f Fish( tn thousand M .l J
RehPr^uoHon (1 9 9 6 -9 9 )
Hracklsh watet14.9
Freah water 145 ^
Marine fish 124 33
ProducHon and o f Fish (1 9 6 6 -8 6 fo 1996-99J
120
100
80
60
40
20
Expoii
/
\
CM rj0) 0) 0)^ 5 o0) 0) 0)
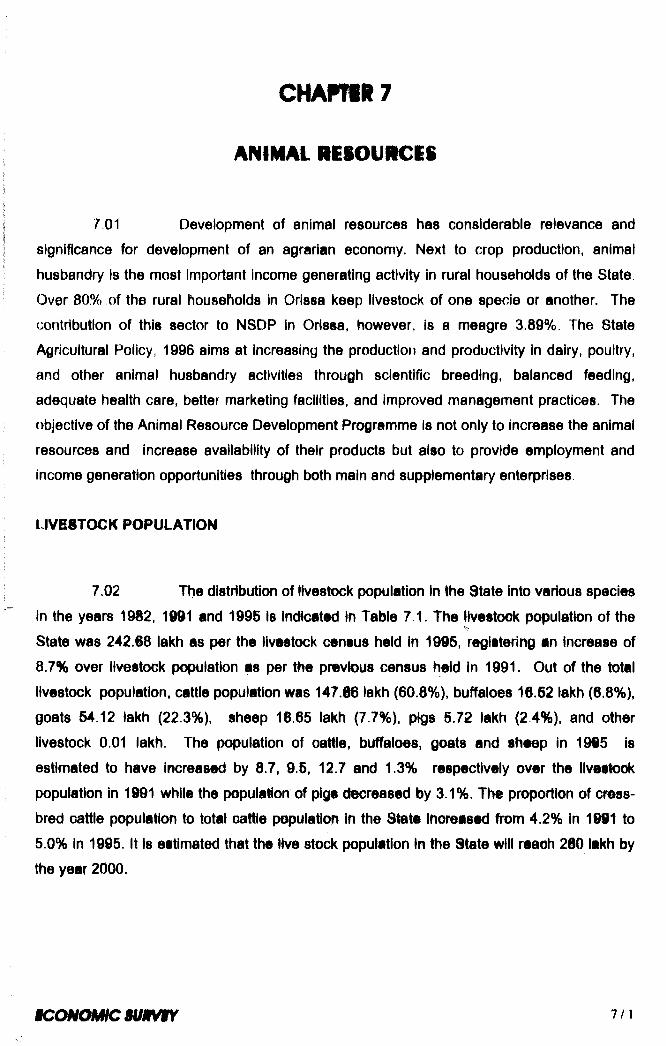
C H A P n R 7
ANIMAL RitOURCiS
7.01 Development of animal resources has considerable relevance and
significance for development of an agrarian economy. Next to crop production, animal
husbandry is the most important income generating activity in rural households of the State.
Over 80% of the rural households In Orissa keep livestock of one specie or another. The
contdbutlon of this sector to N8DP in Orissa, however, is a meagre 3.89%. The State
Agricultural Policy, 1996 aims at increasing the productioti and productivity In dairy, poultry,
and other animal husbandry activities through scientific breeding, balanced feeding,
adequate health care, better marketing facilities, and improved management practices. The
objective of the Animal Resource Development Programme Is not only to increase the animal
resources and increase availability of their products but also to provide employment and
Income generation opportunities through both main and supplementary enterprises
LIVESTOCK POPULATION
7.02 The distribution of Hvestock population In the State Into various speciesin the years 1982, 1991 and 1995 Is Indicated in Table 7.1. The livestock population of the State was 242.§8 lakh as per the livestock census held in 1995, registering an Increase of 8.7% over livestock population as per the previous census held in 1991. Out of the total livestock population, cattle population was 147.86 lakh (60.8%), buffaloes 16.52 lakh (6.8%), goats 54.12 lakh (22.3%), sheep 18.65 lakh (7.7%), pigs 5.72 lakh (2.4%), and other livestock 0.01 lakh. The population of oatlle, buffaloes, goats and sheep in 1995 is estimated to have increased by 8.7, 9.5, 12.7 and 1.3% respectively over the llveslook population in 1991 while the population of pigs decreased by 3.1%. The proportion of cress- bred cattle population to total cattle population in the State Inoreased from 4.2% in 1991 to 5.0% In 1995. It Is estimated that the Hve stock population In the State will reach 280 lakh by the year 2000.
K c o N ( m c $ im m 7/1
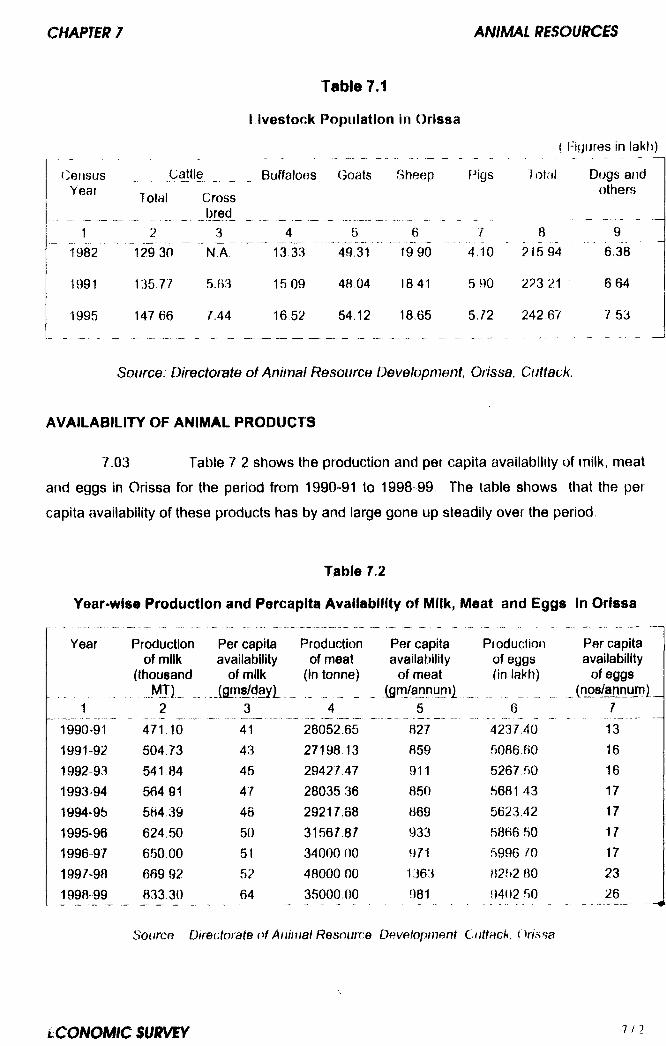
(^efisusYear
11982
1991
1995
I ivestock Population in Orissa
Cattle Buffaloes Goats SheepTotal Cross
_ _______ bred_ ____ ___________2 _______ ^
12^ 30 N~a 7 ~
( Figures in lakti)
f igs Total Dogs and others
135 77
147 66
5.63
7A4
41 3 X3 ^
549 31
619 90
74 10
8215 94
9 6 318
15 09 48 04 1841 5 90 223 21 6 64
16.52 54.12 18.65 572 242.67 7.53
Source: Directorate o f Animal Resource Development, Orissa, Cuttack.
AVAILABILITY OF ANIMAL PRODUCTS
7.03 Table 7 2 shows the production and per capita availability of rnilk, meat
and eggs in Orissa for the period from 1990-91 to 1998 99 The table shows that the per
capita availability of these products has by and large gone up steadily over the pehod.
Table 7.2
Year-wise Production and Percaplta Availability of Milk, Meat and Eggs in Orissa
Year Production Per capita Production Per capita Production Per capitaof milk availability of meat availability of eggs availability
(thousand of milk (in tonne) of meat (in lakh) of eggsM JL (grns/day)^ (grri/annurri| (nos/annum)
1 2 3 4 5 6 71990 91 471.10 41 26052.65 827 4237,40 131991-92 504 73 43 27198 13 859 5086.60 161992 93 541 84 45 29427 47 911 5267 50 161993 94 564 91 47 28035 36 850 5681 43 171994-95 584.39 48 2S217.B8 869 5623.42 171995^96 624,50 50 31567.87 933 5866 50 171996-97 650 00 51 34000 00 971 599670 171997-98 669 92 52 48000 00 1363 B252 80 231998 99 833 30 64 35000,00 981 9402 50 26
SoLircB Directorate of Animal Resource Developnwnt Cuttack. Orissa
ANIMAL HEALTH CARE
7.04 Provision of adequate health care is a prerequisite for increasing the
production potentiality of livestock. The spread of veterinary services in the State has
resulted in the control of some communicable diseases and improvement in animal health
By the end of 1998-99, the State had built up a network of 541 Veterinary
Hospitals/Dispensaries with 67v3 Veterinary Doctors, 3321 Livestock Inspectors and
I echnlcians, 2939 liVegtoCk Aid Centres (LACs), 3 Clinical Investigation Laboratories, 3
Disease Research Centres, one Animal Disease Research Institute at Phulnakhara in
Cuttack district, and two Biological Product Institutes (one at Bhubaneswar and the other at
Berliarnpur) to provide curative and preventive health services. Duhng 1998-99, 113 64 lakh
animals were protected against various diseases and 17,10 lakh castrations were performed
7.05 In order to provide better health care to the animal population, it is
proposed to open at least one I ivestock Aid Centre in every Gram Panchayat in the State in
a phased manner. The number of Livestock Aid Centres is proposed to be increased to
5263 by the end of 2009
7.06 It was targeted to treat 4 00 lakh animals against parasitic worm
diseases and to organise 35,000 infertility camps during 1998-99, against which 3.72 lakh
animals have been dewormed and 13, 261 infertility camps have been organised. Besides,
103.73 lakh doses of different vaccines were produced in the State during 1998-99. About
90.95 lakh animals were vaccinated during the year. It has been programmed to deworm 5.0
lakh animals, organise 40,000 Infertility camps, and produce 200 lakh doses of different
vaccines during 1999-2000.
CATTLE AND BUFFALO DEVELOPMiNT
7 07 According to the livestock census held in 1995, the cattle and buffalo
population was 164.18 lakh which constituted 67.7% of the tota< livestock population of the
State. Out of this, the number of adult female animals was 48,14 lakh and of milch animals
20.99 lakh which constitute 29.3% and 12.8“o of the total cattle and buffalo population.
Among the milch animals only 8.5% belong to cross bred/improvad varieties.
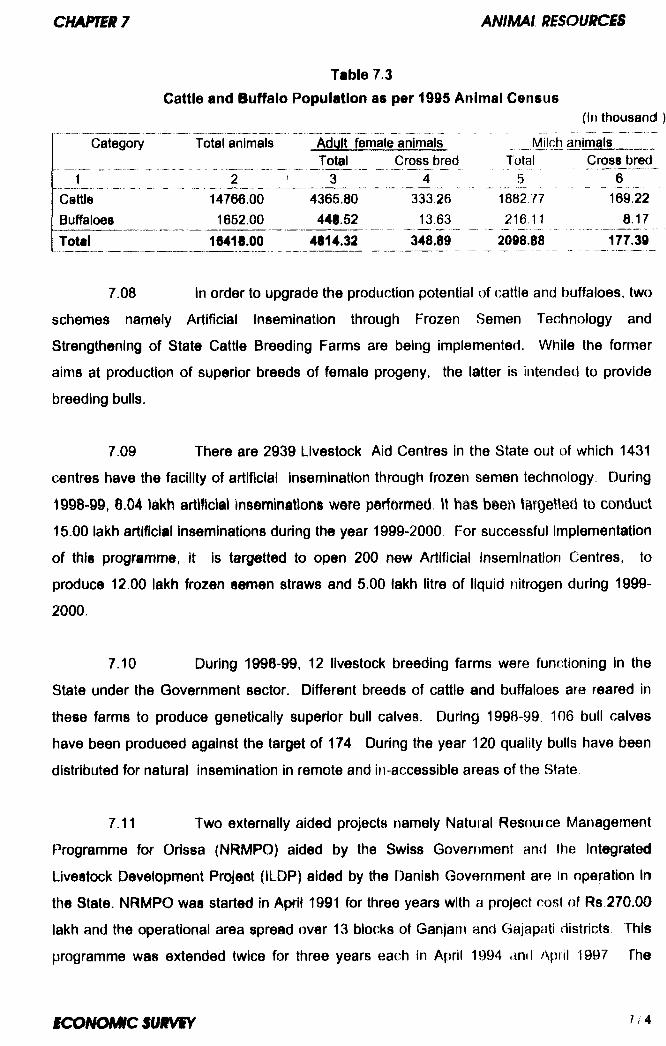
Table 7.3Cattle and Buffalo Population as per 1995 Animal Census
Category Total animals Adult female animals_______ _ _ _ _ _ _ ___T o ta l__
" 'a t t 7 'r 3" 4 _j jCattle 14766.00 4365.80 33326Buffaloes 1652.00 448.52 13.63
(In thousand )
Milch animalsTotal Cross bred
’ ..5......... . 61882 77 169.22216,11 8.17
2098.88 177.39Total 16418.00 4814.32 348.89
7.08 In order to upgrade the production potential of cattle and buffaloes, two
schemes namely Artificial Insemination through Frozen Semen Technology and
Strengthening of State Cattle Breeding Farms are being implemented. While the former
aims at production of superior breeds of female progeny, the latter is intended to provide
breeding bulls.
7.09 There are 2939 Livestock Aid Centres in the State out of which 1431
centres have the facility of artificial insemination through frozen semen technology. During
1998-99, 6.04 lakh artificial inseminations were performed 11 has b©en targetted to conduct
15.00 lakh artificial inseminations during the year 1999-2000 For successful implementation
of this programme, it is targetted to open 200 new Artificial Insemination Centres, to
produce 12.00 lakh frozen semen straws and 5.00 lakh litre of liquid nitrogen during 1999-
2000.
7.10 During 1998-99, 12 livestock breeding farms were functioning in the
State under the Government sector. Different breeds of cattle and buffaloes are reared in
these farms to produce genetically superior bull calves. During 1998-99, 106 bull calves
have been produced against the target of 174 During the year 120 quality bulls have been
distributed for natural insemination in remote and in-accessible areas of the State
7.11 Two externally aided projects namely Natural Resource Management
Programme for Orissa (NRMPO) aided by the Swiss Government anti Ihe Integrated
Livestock Development Project (ILDP) aided by the Danish Government are in operation In
the State. NRMPO was started in April 1991 for three years with a project cost of Rs 270.00
lakh and the operational area spread over 13 blocks of Ganjarri and Gajapati districts This
programme was extended twice for three years each in April 1994 .ind April 1997 The
C M P m 7 A N I M A L m O U I f C i S
project costs of the 2nd and 3rd phase are Rs.845.58 lakh and Rs.330 40 lakh respectively.
The third phase of the project Is In operation In Cuttack and Puri districts. The objective of
NRMPO Is to Improve the productivity of farm households mainly through livestock and diary
activities. ILDP was started in April 1993 with a project cost of Rs.969.66 lakh In four blocks
namely Jaipur, Koraput, Kundra and Laxmlpur of Koraput district The initial project period
of five years has been extended till the end of March 2002. The objective of the project Is to
improve the living standard of the poorer (mostly tribal) rural population through adoption of
improved fodder and animal husbandry practices-
7.12 The Orissa State Cooperative Milk Producers Federation Ltd
(OMFED) came into being on 01 10,1980 for Implementation of the Operation Flood
Programme At present, It functions with 5 dairy plants with a capacity of 135,000 litre per
day and 12 milk chilling plants with a capacity of 70,300 litre per day functioning within the
Operation Flood areas. Besides these plants four new plants with capacity of 18,000 litre per
day are under construction
7 13 Four dairy projects for women benefldarits are under Implacmnlation
in the undivided districts of Cuttack, Puri, Dhenkanal and Sambalpur with full assistance from
Government of India. About 40,000 rural women will be benefitted by these projects.
7 14 An Integrated Dairy Development Project, designed for hilly and
backward areas, is being implemented in 14 non-Operatlon Flood districts of the State with
the aim of increasing milk production and generating self-amployment. Infrastructure has
been built up for collecting about 3,000 litres of milk per day with potentiality of generating
income of about Rs.2.40 lakh to the milk producers.
7 15 During 1998-99, the 1055 Milk Producers’ Co-operative Societies
functioning in the State procured 72723 kg milk per day on an average. The total milk
production in the State during 1998-99 was 833.30 thousand MT against the target of 745
thousand MT The per capita per day availability of milk during 1997-98 was 52 gm which
increased to 64 gm during 1998-99. This figure is however below the per capita per day
requirement recommended by the Indian Council of Medical Research (ICMR) and also the
per capita per day availability at the all India level which are 210 gm and 203 gm
respectively. The yield of milk per adult milch animal is still very low at about 298 gm per
day. This low yield is due to the poor availability of hybrid/improved animals in the State.
Awareness and infrastructure for rearing cross bred/hybrid animals is lacking in the private
sector However, by introduction of frozen semen technology and ombryo transfer
technology, tfie population of cross t)red cattle has increased over the years and production
of milk has also gone up considerably. Indeed milk production during 1998-99 has exceeded
the target of M5 thousand MT by 88.3 thousand MT. The possibility of leasing
Government’s Livestock Breeding Farms to private entrepreneurs with a view to ensuring
full utilisation of available infrastructure is under consideration
FEED AND FODDER DEVELOPMENT
7 16 Green fodder is essential not only for raising production of milk, meat
and eggs but also for reducing the cost of rearing and keeping the animal fiealthy. This
underlines the need for pasture development programmes Farmers having milch cows are
being encouraged to take up fodder cultivation in their own land Fodder seeds are being
supplied to farmers at subsidised rate under the fodder minlkit programme. During 1998-99,
254.43 qtl of fodder seeds were produced and 9286 minikits were distributed against the
target of 6600. During 1999-2000, it is targetted to produce 200 qtl of fodder seeds, to train
4000 farmers, and to distribute 4000 fodder seed minikits to ensure expansion of fodder
production in the State
SMALL ANIMAL DEVELOPMENT
7 17 There is a good potential for development of sheep, goat and pigggery
resources in the State The State Agricultural F olicy provides incentives to farmers for
production of small animals and birds.
7 18 During 1998-99, 744 sheep, 388 goats, 298 pigs and 304 rabbits were
reared in the departmental farms against the target of 1300 sheep, 1250 goats, 480 pigs and
300 rabbits There are four farms each for sheep, goats and pigs and two farms for rabbits.
Besides, during 1998-99, 300 rams, 600 bucks and 125 boats were produced under tfie
National Rarn anti Buck Production Programme and supplied to enterprising farmers for
improvement of the local flocks. During 1999 2000, it is targetted to piodure 200 rams, 200
bucks, and 100 boars under this programme Efforts are l)eing made for introduction of goat
semen technology in ttie State for production of heavy weight goats to increase the yield of
meat It is also proposed to invigorate the [»ig breeding programme t)y importing boars form
foreign countries
POULTRY DEVELOPMENT
7 19 Poultry development In Orissa has made significant progress over tfie
years The total poultry population of the State as per the 1995 animal census was 160,08
lakh The demand for poultry meat and egg has been increasing over the years. There is
vast scope for generation of employment in poultry farming. The egg production in the State
dutirig 1998 99 was 940 25 million and the per capita availability was 26 eggs per annum,
against 30 eggs at the all India level The State has 11 departmental poultry and duck
l)reediny farrTis to supply day old chicks to farmers In order to increase egg production it is
propose}(i to rear F hode Island Red, Kaling Brown, and Commercial Parentline poultry birds
III defiarlmenlal farms There are about 110 large organised commercial poultry farms in
orissc), mostly in semi-urban areas. Leasing out of departmental farms to private
entref)reneurs is also under consideration
7.20 Orissa State Poultry Producers’ Cooperative Marketing Federation
(Of *OI Ff£D) is the apex organisation for marketing poultry products of the 72 Poultry
Producers’ Cooperative Societies affiliated to it OPOLOFED has four zonal offices at
Bhubaneswar, Angul, Berhampur and Cuttack It owns two feed mixing plants. There are
two hatcheries one at Bhubaneswar (with production capacity of 36,000 chicks per month)
and another at Similiguda (with production capacity of 50,000 chicks per month). OPOLFED
assists Poultry Producers’ Cooperative Societies by providing inputs like day old chicks, pre-
mixed poultry feed at subsidised rate, technical guidance, and health care. It also
implements self employment programmes for the educated unemployed youth. During 1998
99, OPOLFED has sold 34.64 lakh eggs, 6184 chicks, 11161 kg of birds, and 265.33 qtl ot
feed.
♦ ♦ ♦
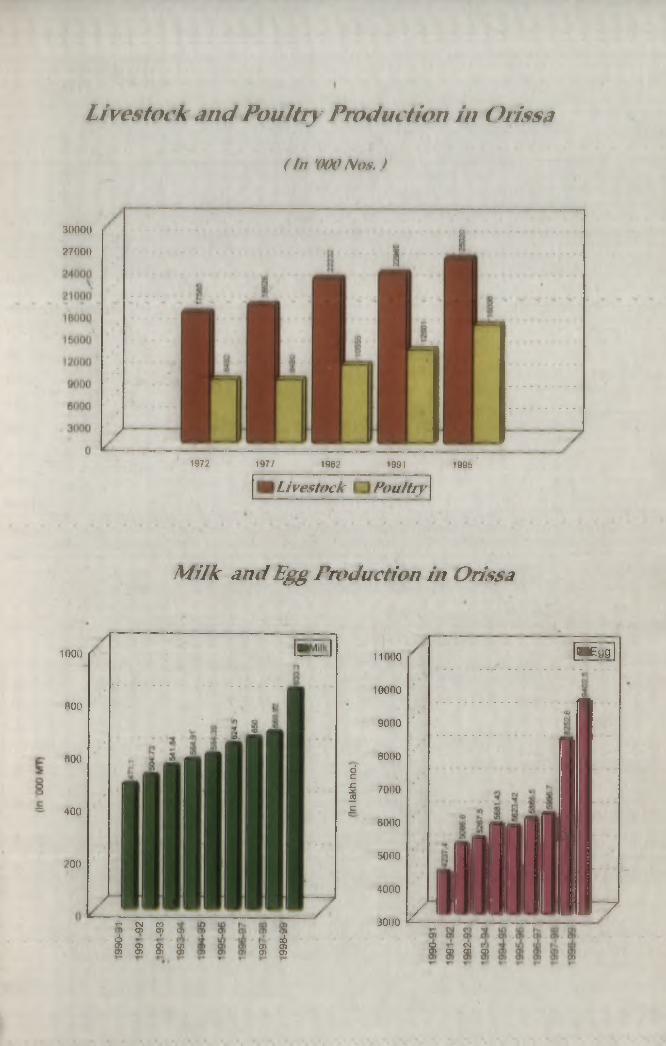
Livestock a n d Poultry^ P ro d u ctio n in O rissa
(In '(H)0 Nos. )
3UOOO
27000
1972 1977 1982 1991 1995
\ Livestock Poultry'
M ilk am i Egg Froduction in Orissa
1000
flOO
flOO
~ 400
200
T- CM COcn Op cJ)I s a s
yjio6at Oi O) O)
11000
10000
9000
8000dcx:1
7000c
6000
5000
4000
3000 z
■Egg
«J
Z
Q ^d) cn Cl) g>
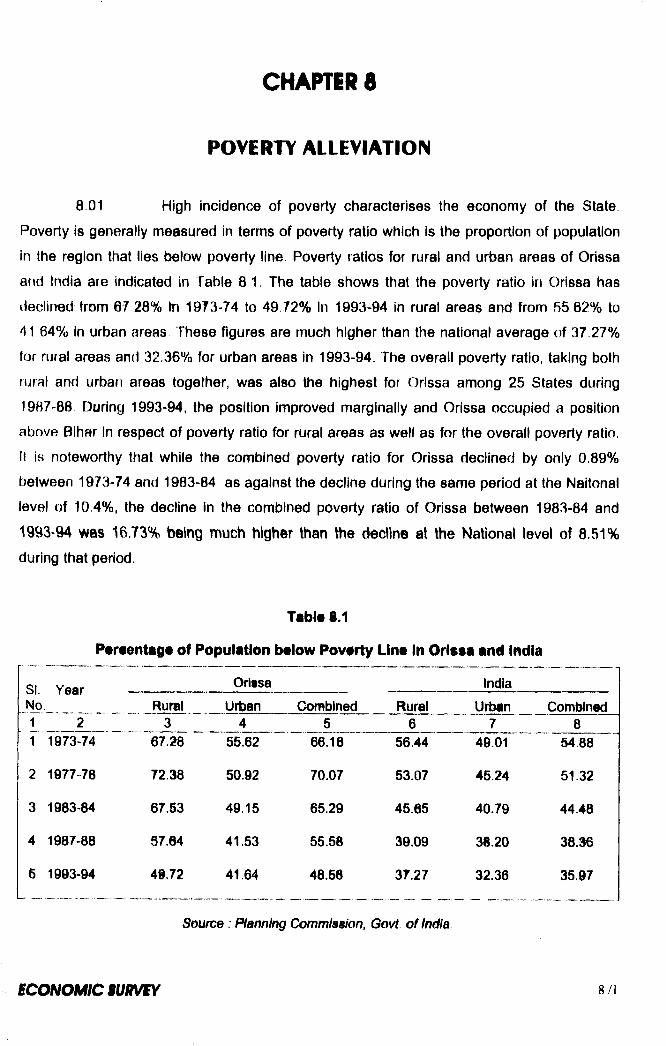
CHAPTER 8
POVERTY ALLEVIATION
8.01 High incidence of poverty characterises the economy of the State
Poverty is generally measured in terms of poverty ratio which is the proportion of population
in the region that lies below poverty line. Poverty ratios for rural and urban areas of Orissa
and India are indicated in Table 8 1. The table shows that the poverty ratio in Orissa has
declined from 67 28% In 1973-74 to 49 72% In 1993-94 in rural areas and from 55 62% to
41 64% in urban areas These figures are much higher than the national average of 37.27%
for rural areas and 32.36% for urban areas in 1993-94. The overall poverty ratio, taking both
rural and urban areas together, was also the highest for Orissa among 25 States during
1987-88 During 1993-94, the position improved marginally and Orissa occupied a position
above Bihar In respect of poverty ratio for rural areas as well as for the overall poverty ratio.
It is noteworthy that while the combined poverty ratio for Orissa declined by only 0.89%
between 1973-74 and 1983-84 as against the decline during the same period at the Naitonal
level of 10 4%, the decline in the combined poverty ratio of Orissa between 1983-84 and
1993-94 was 16.73% being much higher than the decline at the National level of 8.51%
during that period.
Table 8.1
Pereentage of Population below Poverty Line In Orissa anH India
Si Year Orissa IndiaNo Rural Urban Oorr btned Rural Urban Combined1 2 3 4 5 6 7 81 1973-74 67.28 55.62 66.18 56.44 49.01 54.88
2 1977-78 72.38 50.92 70.07 53.07 45.24 51.32
3 1983-84 67.53 49.15 65.29 45.65 40.79 44.48
4 1987-88 57.64 41.53 55.58 39.09 38.20 38.36
6 1993-94 4i.72 41.64 48.56 37.27 32.36 35.97
Source; Planning Commission, Govt of India.
B.U2 Of llie total population below the poverty line, a sizable section
belongs to scheduled castes, scheduled tribes and other weaker sections of society The
problem of unemployment, underemployment and poor working and living conditions among
these sections of society needs to be tackled in order to raise their standard of living Since
the benefits of economic growth have not reached the lower strata of society to the desired
extent there is need for continued direct State intervention for eradication of poverty. As
such, programmes for self-employment and supplementary wage employment and other
anti poverty programmes started eadier have been continued during tlie Ninth Plan period
INTEGRATED RURAL DEVELOPMENT PROGRAMME (IRDP)
8.03 The IRD Programme, which is being operated in the State from the
year 1979-80, is a centrally sponsored anti poverty programme designed for amelioration of
rural poverty. The objective undedying the programme is to enable identified rural poor
families to cross the poverty line through provision of financial assistance, in the form of bank
credit and Government subsidies, for acquisition of productive assets The target group
consists ot small and marginal farmers, agricultural and non-agrlGultufal labourers, rural
artisans and freed t)onded labourers having annual income of less than Rs. 11,000/- per
family. As per IRDP norms atleast 50% of the beneficiaries should be SC and ST, 40%
women and 3% physically handicapped, Tfie subsidy is 50% of the cost of the scheme for
SC and ST beneficiaries and handicapped persons, 33.5 % for marginal farmers, agricultural
labourers and rural artisans, and 25% for small farmers With effect from april, 1999 this
programme has been merged in to a new scheme called Swarnajayanti Gram Swarojagar
Yojana (SGSY) with a funding ratio of 75 ; 25 between the Centre and the State
8.04 During the Seventh Plan period (1985-90), 10.98 lakh families were
assisted under IRDP with an investment of Rs 303 73 crore In 1990-91 and 1991 92,
assistance was provided to 2 61 lakh families with an investment of F s 134 31 crore During
ttie Eighth Plan perif)d (1992-97), 6,05 lakh families were covered with an investment of
Rs,608.59 crore under this programme. It has been targetted to cover 3 75 lakh families
during the Ninth Plan period by Investing about Rs 150.00 crore in providing subsidy. During
1998-99, Government of India have released Rs 37.11 crore under the programme against
which the State Government have released Rs 30 13 crore A total of 94671 families have
been covered during 1998-99 with loan and subsidy comp^nHnts of Rs 1?7 93 crore and
Rs 60 24 crore respectively The total investment untier IRf )f * wan Ks 153.04 crore
benefiting 75,348 families during 1997 98
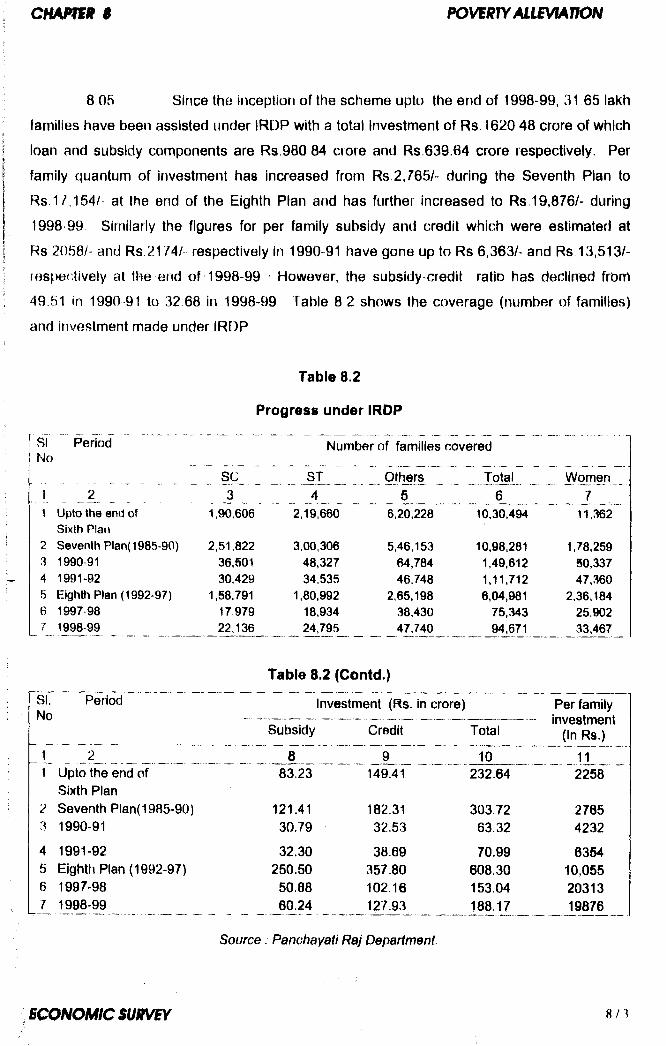
C H A m ^ $ P O V M R T Y A L L E V I A T I O N
8 05 Since the inception of the scheme upto the end of 1998-99, 31 65 lakh
families have been assisted under IRDP with a total investment of Rs. 1620.48 crore of which
loan and subsidy components are Rs.980 84 crore and Rs.639.64 crore respectively. Per
family quantum of investment has increased from Rs 2,765/- during the Seventh Plan to
Rs 7,^54/ at the end of the Eighth Plan and has further increased to Rs.19,876/- during
1998 99 Similarly the figures for per family subsidy and credit which were estimated at
Rs 2058/- and Rs 21/4/ respectively in 1990-91 have gone up to Rs 6,363/- and Rs 13,513/-
res(:)ectively at the end of 1998-99 However, the subsidy-credit ratio has declined frbm
49 51 in 1990 -91 to 32 68 in 1998-99 Table 8 2 shows the coverage (number of families)
and investment made under IRDP
Table 8.2
Progress under IRDP
sTNo
Period Number of families covered
SC _____ST_ ___ Othefs Total Women1 ___ 2_ _ 3___ ______ 5 _______ ___ 6_____ ....... 71 Upto the end of
Sixth Plan1,90,606 2,19,660 6,20,228 10,30,494 11,362
2 Seventh Plan( 1985-90) 2,51,822 3.00,306 5,46,153 10,98,281 1,78,2593 1990-91 36,501 48,327 64,784 1,49,612 SO, 3374 1991-92 30.429 34,535 46,748 1,11,712 47,3605 Eighth Plan (1992-97) 1,68,791 1,80,992 2,85,198 6,04,981 2,36,1846 1997-98 17,979 18,934 38,430 75,343 25,9027 1998-99 22,136 24,795 47,740 94,671 33,467
Table 8.2 (Contd.)
s rNo
Period----
Investment (Rs. in crore)
Subsidy Credit Total
Per family investment
(In Rs.)1 ____2________ Z ._ 'Z 8 9 10 11
Upto the end of Sixth Plan
83.23 149.41 232.64 2258
2 Seventh Plan( 1985-90) 121.41 182.31 303.72 27653 1990-91 30.79 32.53 63.32 42324 1991-92 32.30 38.69 70.99 63545 Eighth Plan (1992-97) 250.50 357.80 608.30 10,0556 1997-98 50.88 102.16 153.04 203137 1998-99 60.24 127.93 188,17 19876
Source : Panchayati Raj Department,

8.06 Table 8.2 shows that SC and ST families constituted 22 93% and
27.34% respectively of the total families assisted during the Seventh Plan period The
coverage of woman beneficiaries during the Seventh Plan period was 16.23%. The
percentages of SC, ST and women beneficiaries assisted in 1998-99 work out to 23.38,
26.19 and 35.35% respectively. There has been a substantial improvement in regard to the
coverage of women beneficiaries although the coverage is still below the prescribed norm of
40%
TRAINING OF RURAL YOUTH FOR SELF EMPLOYMENT (TRYSEM)
8.07 The objective of the programme is to equip rural youths in the age
group of 18-35 years from families below the poverty line with professional skills in different
trades and vocations so as to enable them to take up self employment ventures in the fields
of agriculture and allied activities and In business. A total of 2.41 lakh youths have been
trained since the inception of the scheme till the end of 1998-99 with an expenditure of
Rs.51 72 crore, out of which, 1.85 lakh have been rehabilitated in self or wage employment.
During 1998-99, 11,614 rural youths were trained with an expenditure of Rs.3.82 crore of
whom 4040 were rehabilitated in self-employment and 3,276 in wage employment. Against
the target to cover an additional 85,000 rural youths under the scheme during the Ninth Plan
period, 26,565 rural youth have been covered so far. Table 8.3 presents the year-wise
achievement under the scheme. With effect from April, 1999 this schme has been merged
into the new scheme called Swarnajayanti Gram Swarojagar Yojana (SGSY) with a funding
ratio of 76 : 25 between the Centre and the State.
Table 8.3
Achievement under TRYSEM
SI Period Youths trained (number)No, SC ST Others Total Women
3 4 5 T? 71 Upto the end of 22944 17563 52952 93459 26812
Seventh Plan2 1990-91 3166 3001 6559 12726 53573 1991-92 6517 5824 12853 25194 102134 1992-93 4353 3902 8530 16/85 75805 1993 94 3452 3149 8814 15416 68696 1994-95 4382 3767 7507 15656 73117 1998-96 4872 4655 7062 16689 74098 1996-97 5393 4701 8461 18555 88329 1997 98 4322 3637 6992 14951 640710 1998-99 3544 3005 5065 11614 525^
(Contd /)
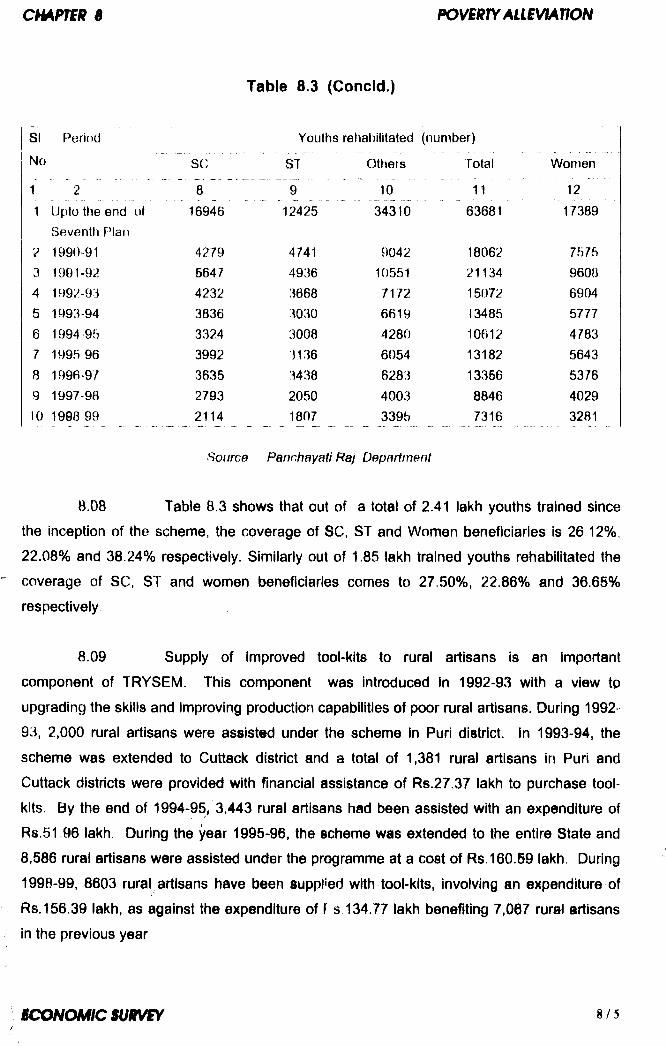
c m p m s P O V E R T Y A U i V t A r / O N
SINo
1
Table 8.3 (Concld.)
Period Youths rehabilitated (number)
SC ST Others Total Women
2 8 9 10 11 12
Upto the end of 16946 12425 34310 63681 17389
vSeventh Plan
1990 91 4279 4741 9042 18062 7575
1991-92 5647 4936 10551 21134 9608
1992-93 4232 3668 7172 15072 6904
1993 94 3836 3030 6619 13485 5777
1994 95 3324 3008 4280 10612 4783
1995 96 3992 3136 6054 13182 5643
1996 9 / 3635 3438 6283 13356 5376
1997 98 2793 2050 4003 8846 4029
1998 99 2114 1807 3395 7316 3281
Source Panchayati Raj Department
B.08 Table 8.3 shows that out of a total of 2.41 lakh youths trained since
the inception of the scheme, the coverage of SC, ST and Women beneficiaries is 26 12%.
22.08% and 38.24% respectively. Similarly out of 1.86 lakh trained youths rehabilitated the
coverage of SC, ST and women beneficiaries comes to 27.50%, 22.86% and 36.65%
respectively
8.09 Supply of Improved tool-kits to rural artisans is an important
component of TRYSEM. This component was introduced In 1992-93 with a view to
upgrading the skills and Improving production capabilities of poor rural artisans. During 1992
93, 2,000 rural artisans were assisted under the scheme In Puri district. In 1993-94, the
scheme was extended to Cuttack district and a total of 1,381 rural artisans in Puri and
Cuttack districts were provided with financial assistance of Rs.27.37 lakh to purchase tool
kits By the end of 1994-95/3,443 rural artisans had been assisted with an expenditure of
Rs.51-96 lakh During the year 1995-96, the scheme was extended to the entire State and
8,586 rural artisans were assisted under the programme at a cost of Rs. 160.59 lakh. During
1998-99, 8603 rural artisans have been suppHed with tool-kits, Involving an expenditure of
Rs. 156.39 lakh, as against the expenditure of f s 134.77 lakh benefiting 7,067 ruraJ artisans
in the previous year
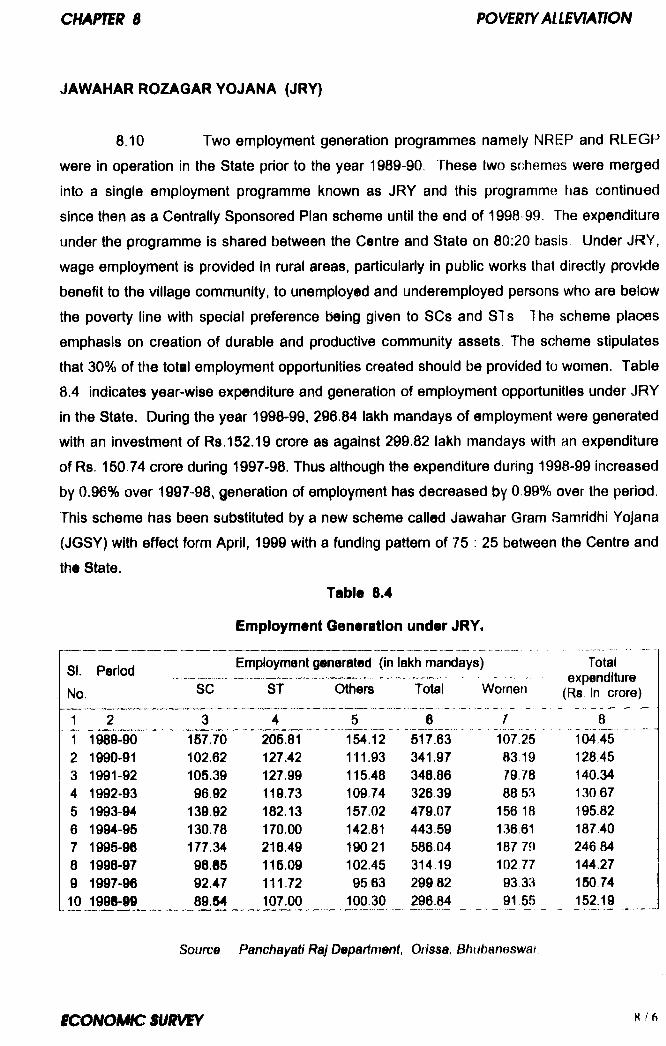
JAWAHAR ROZAGAR YOJANA (JRY)
8.10 Two employment generation programmes namely NREP and RLEGP
were in operation in the State prior to the year 1989-90, These two schemes were merged
into a single employment programme known as JRY and this programme has continued
since then as a Centrally Sponsored Plan scheme until the end of 1998 99, The expenditure
under the programme is shared between the Centre and State on 80:20 basis Under JRY,
wage employment is provided in rural areas, particularly in public works that directly provide
benefit to the village community, to unemployed and underemployed persons who are below
the poverty line with special preference being given to SCs and STs The scheme plaoes
emphasis on creation of durable and productive community assets. The scheme stipulates
that 30% of the total employment opportunities created should be provided to women. Table
8.4 indicates year-wise expenditure and generation of employment opportunities under JRY
in the State. During the year 1998-99, 296.84 lakh mandays of employment were generated
with an investment of Rs.152.19 crore as against 299.82 lakh mandays with an expenditure
of Rs. 150.74 crore during 1997-98. Thus although the expenditure during 1998-99 increased
by 0.96% over 1997-98, generation of employment has decreased by 0 99% over the period.
This scheme has been substituted by a new scheme called Jawahar Gram Samridhi Yojana
(JGSY) with effect form April, 1999 with a funding pattern of 75 : 25 between the Centre and
the State.
Table 8.4
Employment Generation under JRY<
SI. Period Employment generated (in lakh mandays) Total expenditi
(Rs. in cnNo. 80 ST Others Total Women
1 2 3 4 5 6 71 1989-90 157.70 205.81 154.12 '517.63 107’25 104 452 1990-91 102.62 127.42 111.93 341.97 83 19 128.453 1991-92 105.39 127.99 115.48 348.86 79.78 140.344 1992-93 96.92 119.73 109.74 32639 88 53 130,675 1993-94 139.92 182.13 157.02 479.07 156 18 195.826 1994-95 130.78 170.00 142.81 443.59 136.61 187.407 1995-96 177 34 218.49 19021 586.04 187 79 246.848 1998-97 96.65 115.09 102.45 314.19 102 77 144,279 1997-96 92.47 111.72 95 63 299 82 93 33 150 7410 1996-99 89.54 107.00 100 30 296 84 91 55 152.19
Source Panchayati Raj Department Orissa, Bhubaneswai

cmmu B powmYAUEVfAnoN
EMPLOYMENT ASSURANCE SCHEME (EA8)
8 11 Employment Assurance Scheme was launched as a Centrally
Sponsored Plan scheme with the cost sharing pattern of 80:20 between the Centre and the
State with effect from October 2, 1993 for generating wage employment opportunities for the
rural poor during the lean agricultural season In 143 Revamped Public Distribution System
(RPDS) blocks of 16 districts in the State Subsequently, this scheme was extended to cover
250 blocks of 21 districts and finally to all the 314 blocks in 30 districts. The scheme alms at
providing assured employment of about 100 days to persons between 18-60 years of age
during the lean agricultural season. During 1998-99, 340.14 lakh man-days were generated
with an expenditure of Rs 173.42 crore. Since the inception of the scheme up to 1998 99,
' 35.78 lakh persons including 12 71 lakh women have been provided with assured
ernploymenl under the scheme
INDIRA AWAS YOJANA
8.12 Indira Awas Yojana (lAY) was launched in the year 1995 to provide
dwelling houses free of to families below the poverty line with priority tjeing accorded toiSC and ST families. From 1989 up to the ervd of 1995-96, this scheme was operated as a
component of JRY and 10% of the funds under JRY were being earmarked for lAY. From
P AphI 1996, this scheme has been treated as a separate scheme. The unit cost under this
scheme is Rs 20,000 for plain areas and Rs.22,000 for hilly and difficult areas. Upto the end
of 1997-98 since the Inception of the scheme In 1989, 2,38,900 low cost houses have been
constructed with an expenditure of Rs.359.95 crore. During the year 1998-99, 50,671!
houses have been constructed against the target of 67,682 houses at a cost of Rs.106.08
crore. The target for the Ninth Plan is to construct 1,55,250 houses.
i MILLION WELLS SCHEME (MWS)
8.13 Originally the f llllon Wells Scheme was a part of RLEGP and NREP.
After discontinuance of NREP and RLEGP, the scheme became a component of JRY and
30% of JRY allocation was required to be provided for this scheme. From April 1996, this
sohime is being treated as a separate scheme. The objective of the MWS Is to provide open
Irrigation wells free of cost to small and marginal farmers below the poverty line with
preference to SCs and STs The unit cost of such wells ranges from Rs.12,750 to Rs.18,600
depending upon the type of soil and the size of the well Up to the end of 199/^-98 since the
inception of the scheme. 1,68,655 wells had been constructed with an expenditure of
Rs 277 39 crore During 1998-99, it was targetted to sink 18,638 wells against which 11,124
wells were constructed with an expenditure of Rs.29.84 crore. With effect from April, 1999,
the scheme has been merged into the new scheme called Swarnajayanti Gram Swarojagar
Yojana ( SGSY) with a funding ratio of 75 : 25 between the Centre and the State
OPERATION BLACK BOARD (OBB)
8.14 A large number of primary schools in the State lack adequate
buildings. The Government have taken steps for providing basic infrastructure (school
buildings) under OBB programme launched in 1990-91. The unit cost of each building under
the programme has been fixed at Rs 1.00 lakh of which 60% is met from JRY By the end of
1997-98, 5,431 primary school buildings had been constructed involving an expenditure of
Rs.58.21 crore. During 1998-99, 612 school buildings have been completed against the
target of 1,942 with the investment of Rs.8.12 crore.
DEVELOPMENT OF WOMEN AND CHILDREN IN RURAL AREAS (DWCRA)
8.15 DWCRA has been conceived as a scheme of group activity for women
with each group consisting of 10 to 15 members. Each group is provided with certain basic
skills for undertaking viable income generating activities. A one time grant of Rs.25,000/ is
provided to each group towards a revolving fund for development of infrastructure, purchase
of raw materials, marketing, childcare etc Up to the end of 1997 98 since the inception of
the scheme, 10,162 groups were formed against a target of 10,935 yroups with an
investment of Rs.19.80 crore The total membership of these DWCRA group was 1,50,845.
During the year 1998-99, 2,637 DWCRA groups have been formed covering 34,921 womeni
with an expenditure of Rs 4.08 crore. Out of 2,637 groups formed dunng 1998 99, 1,926 Ii
groups have started income generating activities The progress under the scheme since the |i
Seventh Plan upto 1998-99 is given in Table 8.5. With effect from April, 1999, this schm^ J
has been merged into the new scheme called Swarnajayanti Gram Swarojagar Yojana
(SGSY) with a funding pattern of 75 25 between the Centre an(i the State.
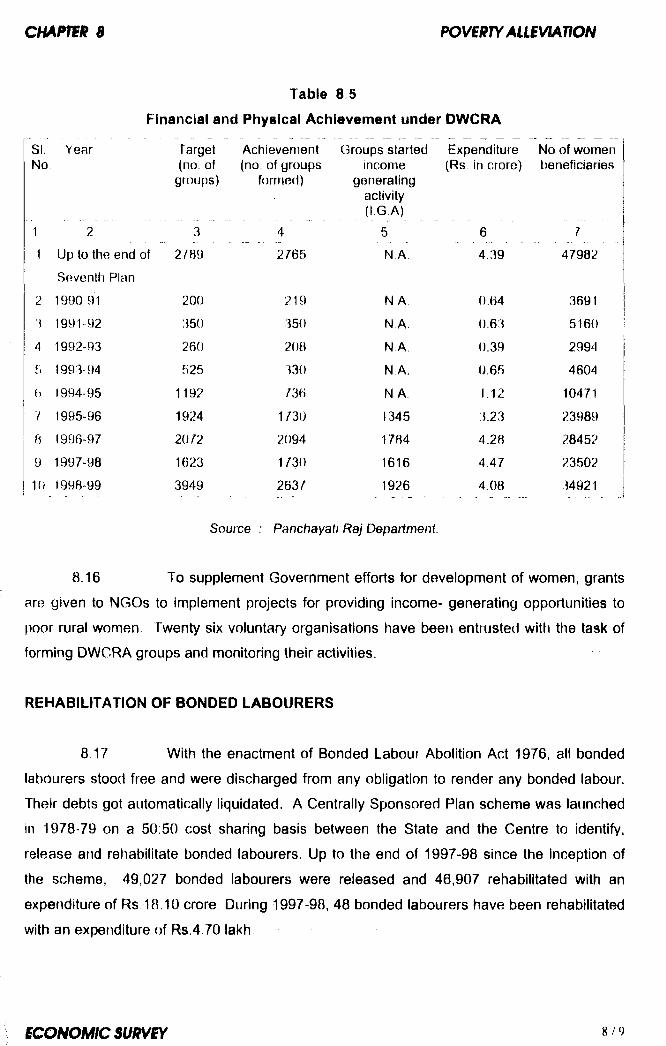
P O V g R T Y A L L B \ ^ T f O N
Table 8 5
Financial and Physical Achievement under DWCRA
SI. Year No
Target (no. of
groups)
Achievement (no. of groups
formed)
Groups started income
generating activity { \G A l
Expenditure (Rs in crore)
No of women beneficiaries
1 2 3 4 5 6 7
1 Up to the end of 2789 2765 N A 4.39 47982
Seventh Plan
2 1990 91 200 219 N A. 0.64 v3691
1991 92 350 350 N A. 0,63 5160
A 1992-93 260 208 N A. 0.39 2994
5 1993-94 525 330 N A. 0.65 4604
<) 1994-95 1192 ^30 N A. 1.12 10471
7 1995-96 1924 1730 1345 3.23 23989
8 1996-97 2072 2094 1784 4.28 28452
9 1997-98 1623 1 730 1616 4.47 23502
10 1998-99 3949 2637 1926 4.08 34921
Source : Panchayati Raj Department.
8.16 To supplement Government efforts for development of women, grants
are given to NGOs to Implement projects for providing income- generating opportunities to
poor rural women Twenty six voluntary organisations have been entrusteti with the task of
forming DWCRA groups and monitoring their activities.
REHABILITATION OF BONDED LABOURERS
8 17 With the enactment of Bonded Labour Abolition Act 1976, all bonded
labourers stood free and were discharged from any obligation to render any bonded labour.
Their debts got automatically liquidated. A Centrally Sponsored Plan scheme was launched
in 1978 79 on a 50 50 cost sharing basis between the State and the Centre to identify,
release and rehabilitate bonded labourers. Up to the end of 1997-98 since the Inception of
the scheme, 49,027 bonded labourers were released and 46,907 rehabilitated with an
expenditure of Rs 18.10 crore During 1997-98, 48 bonded labourers have been rehabilitated
with an expenditure of Rs 4.70 lakh
AREA DEVELOPMENT PROGRAMME (DROUGHT PRONE AREA PROGRAMME)
8 1B Drought prone areas ate characterised by degraded environment,
acute soil erosiofi, insufficiency of water, and moisture stress. Drought proneness has an
adverse effect on productivity The Drought Prone Area Development Programme (DPAP) is
being operated in 47 blocks in eight districts in the State (2 blocks eacit in Boudh, Sonepur,
Dhenkanal, 12 blocks in Phulbani, 1f) blocks in Kalahandi, 8 blocks in Bolangir, 6 blocks in
Baragarh and 5 blocks in Nuapada districts) Multi-pronged activities are taken up under ttie
programme on watershed basis for restoration of the ecological balance and also for
drought proofing through hartnonious management of land, water and other natural
resources.
8.19 The following activities are being taken up under the programme
i) Agriculture : Moisture conservation measures through construction of water
harvesting structures, land shaping and bunding etc
ii) Horticulture Development of vegetable and fruit nurseries
iii) Water Resources Development : Construction of community Irrigation wells for
IRDP beneficiaries, percolation tanks and water harvesting structures
iv) Animal Husbandry Fodder production and pasture development.
v) Forestry ; Establishment of nurseries, plantations in degraded forests, social
forestry and waste land development.
vi) hisherie.s Excavation and renovation of fishing ponds, production of
fingerlings
vil) Sericulture ; Development of rainfed mulbery plantations etc
8.20 Availability of funds and expenditure incurred under fJPAP from 1990-
yl to 1998 99 is presented in Table 8.6
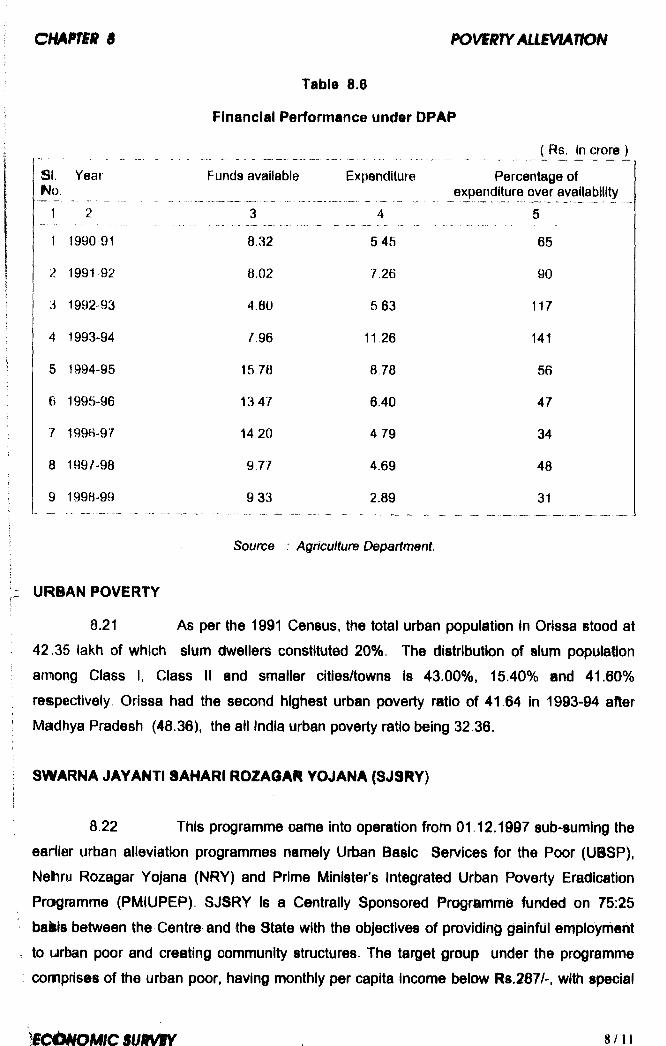
c M P m $ POWRJYALLiVlAnON
Table 8.6
Financial Performance under DPAP
{ Rs. in crore
Si.INo,
Year Funds available Expenditure Percentage of expenditure over availability
1 2 3 4 5
1 1990-91 8.32 5 45 65
2 1991 92 8.02 7,26 90
1 3 1992-93 4.80 563 1175
!A 1993-94 7.96 11.26 141
i 5 1994-95 15 78 8 78 56>
6 1995-96 13 47 6,40 47
7 1996-97 14 20 4 7 9 34
i 8 1997-98 9 77 4.69 48
I 9 1998-99 9 33 2.89 31
Source : Agriculture Department
URBAN POVERTY
8.21 As per the 1991 Census, the total urban population In Orissa stood at
42.35 lakh of which slum dwellers constituted 20%. The distribution of slum population
among Class I, Class II and smaller cities/towns Is 43.00%, 15.40% and 41.60%
respectively Orissa had the second highest urban poverty ratio of 41,64 in 1993-94 after
Madhya Pradesh (48.36), the all India urban poverty ratio being 32 36.
SWARNA JAYANTI SAMARI R0ZA6AR YOJANA (SJSRY)
8.22 This programme came into operation from 01.12.1997 sub-suming the
earlier urban alleviation programmes namely Urban Basic Services for the Poor (UiSP),
Nehru Rozagar Yojana (NRY) and Prime Minister’s Integrated Urban Poverty Eradication
Programme (PMIUPEP). SJSRY Is a Centrally Sponsored Programme funded on 75:25
bails between the Centre and the State with the objectives of providing Qalhful employment
to urban poor and creating community structures. The target group under the programme
comprises of the urban poor, having monthly per capita income below Rs.267/-, with special
focus on wofnen, SC], ST and disabled persons Th^ main nornponenls of SJGRY are Urban
Self Einf)loyment Programme (USEP), Development of Women and Children in Urban Areas
(DWCUA), Urban Wage Ernploytnent Programme (UWFF’ ), training, and social sect*ot
activities for improving the health, educational and welfare status of urban poor During
1998-99, 1,102 beneficiaries have been assisted with an investment of Rs 1 66 crore under
the programme
NATIONAL SLUM DEVELOPMENT PROGRAMME (NSDP)
8 23 For the overall improvement of slums, physical amenities (like water
supply, drainage, community baths, latrines, sewerage, street lights, community
infrastructure etc.) and social amenities { like pre-school education, non-formal adult
education, primary health care etc.) are provided under this programme NSDP covers all
the 102 urban local bodies in the State A sum of Rs 6 20 crore was spent under the
programme in 1998- 99,
♦ ♦ ♦
CHAPTER 9
INDUSTRY
9.01 Following the programme of economic reforms launched by
Government of India, the State Government reformulated its Industrial Policy in March 1996
with a view to improving the investment climate in the State and promoting opportunities for
growth of Industries and related sectors The F olicy offers a comprehensive package of
incentives to encourage investment in the State. The main objectives of the State Industrial
Policy 1996 are as follows ;
i Harnessing Orissa's vast natural resources and the potential for accelerated industrial growth consistent with the protection of environment.
ii Advancement of agriculture by establishing appropriate linkages betweenagriculture and agro and food processing industries.
iii Attracting and facilitating large investment in Infrastructure and industries both from within the country and abroad.
iv Generating employment on a large 8caie in Industrial/commercial activities.
v Development of backward areas/regions of the State through Industrial/mining ventures.
vi Strengthening the rural economy through development of agro-basedindustries, small industries, village and cottage industries, sericulture, handloom and handicraft.
vii Stimulating and strengthening local entrepreneurial base/talent.
viii Development of skills/expertise.
9.02 The Industrial Policy 1996 seeks to attract investment in priority
industries through a scheme of special incantlves. These industries Include electronics,
telecommunication, agro and food processing, aluminum based industries, garment
manufacturing including hosiery and knitwear, synthetic yarn spinning and weaving mills,
gems and jewelry, automobile components, basic drugs and pharmaceuticals,
petrochemicals, 100% export oriented industries, ship breaking etc Higtier incentives have
been provided to pioneer units (i.e. medium and large scale units in areas where there were
no such units earlier), labour intensive industries, industries set up by ST/SC, handicapped
and women entrepreneurs, small scale units with fixed capital investment less than Rs.10
lakh and large scale projects with capital investment over Rs.100 crore
9.03 The net value added by manufacture and the share of the
manufacturing sector in NSDP have been going up over the years The net value added by
manufacture in the State at constant (1980-81) prices was Rs.358.14 crore in 1980-81 which
went up to Rs.486.92 crore in 1990-91 and to Rs.726.99 crore in 1997-98 The share of the
manufacturing sector In the NSDP was 10.40% in 1980-81, 11 20% in 1990-91 and 12.09%
in 1997-98
LARGE AND MEDIUM SCALE INDUSTRIES
9.04 Industrial Promotion and Investment Corporation of Orissa Ltd.
(IPICOL), Industrial Development Corporation of Orissa ltd (IDCOL), and Orissa State
Electronics Development Corporation (OSEDC) are three nodal agencies promoting large
and medium scale industries in the State. By the end of 1997-98, Orissa had 319 large and
medium industries with an investment of Rs. 1784.43 crore and employment potential for
80,362 persons. During 1998-99, 15 large and medium industries have been set up with an
investment of Rs.57.56 crore and employment for 826 persons Table 9.1 indicates the
development of large and medium industries in the State. The table shows that 23 large and
medium industrial units went into production during 1990-91 The number of units that went
into production during a year declined in subsequent years up to 1995-96. The position has
improved thereafter and has shown an increasing trend up to 1998-99
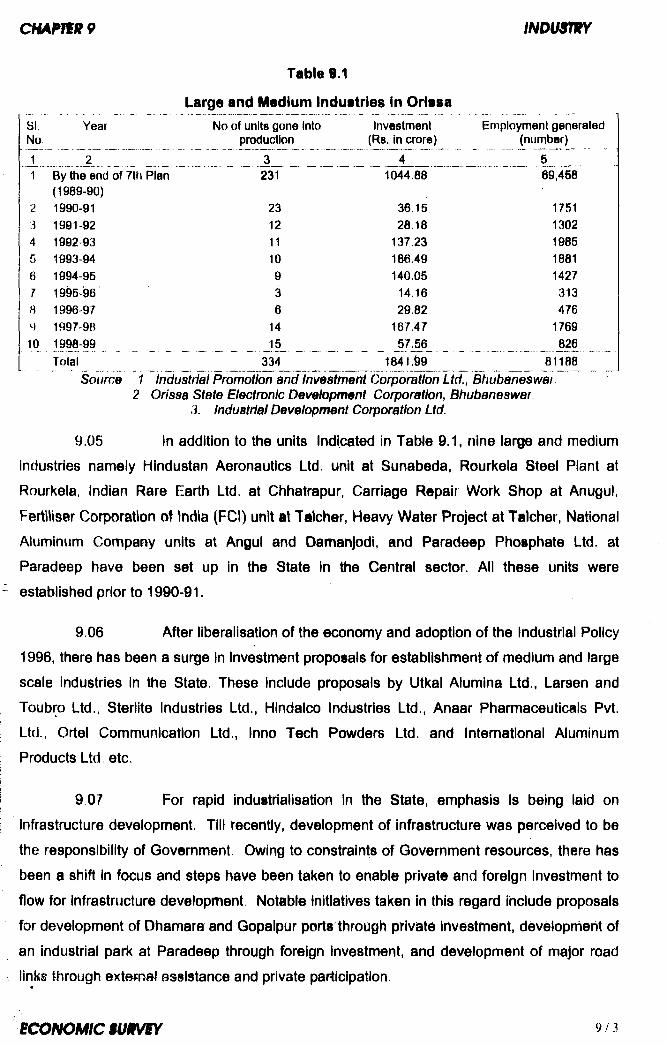
c N A W f 9 tN o m m r
Table 9.1
Large and Medium Induetries in OrissaSI. Year No of units gone into Investment Employment generatedNo production (Rs. In crore) (number)
1 2 3 4 51 By the end of 7th Plan 231 1044.88 69,458
(1989-90)2 1990-91 23 36.15 17513 1991-92 12 28.18 13024 1992-93 11 137.23 19855 1993-94 10 188.49 18816 1994-95 9 140.05 14277 1995 96 3 14.16 313B 1996 97 6 29.82 4769 1997-98 14 167.47 176910 1998 99 ____ ___________ _ J8_ ______ ___ _ J7^ 6_______________ _ 826
Total _____________ ^ 4 _ ______________ 1841.^9 ___Source 1 In^ushlal Promotion and Investment Corporation Ltd., Bhubaneswai
2 Orissa State Electronic Development Corporation, Bhubaneswar 3. Industrial Development Corporation Ltd.
9.05 In addition to the units Indicated in Table 9.1, nine large and medium
industries namely Hindustan Aeronautics Ltd. unit at Sunabeda, Rourkela Steel Plant at
Rourkela, Indian Rare Earth Ltd. at Chhatrapur, Carriage Repair Work Shop at Anugul,
FertiHser Corporation of India (FCl) unit at Tatcher, Heavy Water Project at Talcher, National
Aluminum Company units at Angul and Damanjodi, and Paradeep Phosphate Ltd. at
Paradeep have been set up in the State in the Central sector. All these units were
established prior to 1990-91.
9.06 After liberalisation of the economy and adoption of the Industrial Policy
1996, there has been a surge In Investment proposals for establishment of medium and large
scale industries in the State. These include proposals by Utkal Alumina Ltd., Larsen and
Toubro Ltd., Sterlite Industries Ltd., Hindalco Industries Ltd.. Anaar Pharmaceuticals Pvt.
Ltd., Ortel Communication Ltd., Inno Tech Powders Ltd. and International Aluminum
Products Ltd. etc.
9 07 For rapid industrialisation In the State, emphasis Is being laid on
infrastructure development. Till recently, development of infrastructure was perceived to be
the responsibility of Government. Owing to constraints of Government resources, there has
been a shift in focus and steps have been taken to enable private and foreign investment to
flow for infrastructure development. Notable initiatives taken in this regard include proposals
for development of Dhamara and Gopalpur ports through private Investmeint, development of
an industrial park at Paradeep through foreign Investment, and development of major road
links through external assistance and private participation.
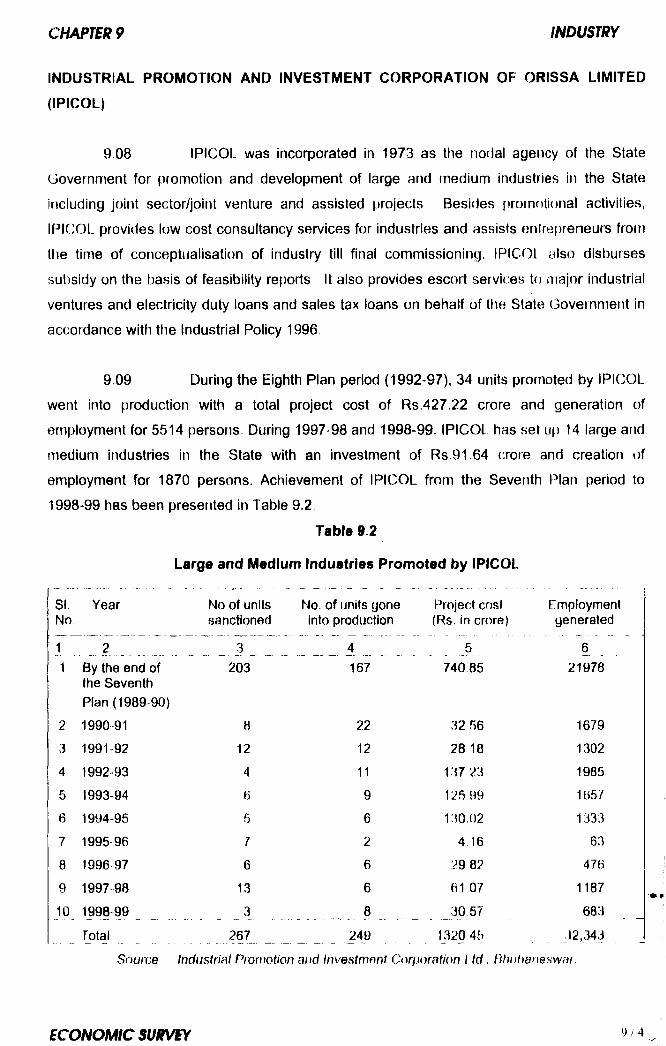
INDUSTRIAL PROMOTION AND INVESTMENT CORPORATION OF ORISSA LIMITED
(IPICOL)
9.08 IPICOL was incorporated in 1973 as the nodal agency of the State
Government for promotion and development of large and medium industries in the State
including joint sector/joint venture and assisted projects Besides promotional activities,
IPICOL provides low cost consultancy services for industries and assists entrepreneurs from
the time of conceptualisation of industry till final commissioning. IPICOL also disburses
sut)sidy on the basis of feasibility reports It also provides escort services to major industrial
ventures and electricity duty loans and sales tax loans on behalf of the Stale Government in
accordance with the Industrial Policy 1996.
9.09 During the Eighth Plan period (1992-97), 34 units promoted by IPICOL
went into production with a total project cost of Rs.427.22 crore and generation of
employment for 5514 persons. During 1997-98 and 1998-99, IPICOL has set up 14 large and
medium industries in the State with an investment of Rs.91.64 crore and creation of
employment for 1870 persons. Achievement of IPICOL from the Seventh Plan period to
1998-99 has been presented in Table 9.2.
Table 9.2
Large and Medium industries Promoted by iPICOL
SI.No
Year No of units sanctioned
No. of units gone into production
Project cost (Rs. in crore)
Employmentgenerated
1 ..2 3___ 4 5 61 By the end of
the SeventhPlan (1989 90)
203 167 740.85 21978
2 1990-91 H 22 3256 1679
3 1991 92 12 12 28 18 1302
4 1992 93 4 11 137 23 1985
5 1993-94 fi 9 125.99 16576 1994-95 5 6 130.02 1333
7 1995-96 1 2 4.16 63
8 1996 97 6 6 29 82 476
9 1997 98 13 6 61 07 1187
JO. 1998-99 ___ 3__,^ _________ 8______ ___30 57 603
fotal ____ 267___ 249 1320 45 32^43
Source Industrial Prormtion a/id lnvestmer)1 Corporation I td . Bhiibane^waf.
9.10 IF-*ICOL has received Rs7 20 crore as loan and Rs.1.00 crore as
equity from the State Government and Rs. 10.77 crore from IDBI and SIDBI as refinance
assistance during 1990-99 It has provided term loan asslstanoe of Rs,33 04 crore and
invested Rs.2.17 crore as equity in new units during the year It has also disbursed loans of
Rs 8 47 crore towards expansion, modernisation and diversification of exiting units during
the period IPICOl is at present providing escort services for a number of new industrial units
being set up in the State
INDUSTRIAL DEVELOPMENT CORPORATION OF ORISSA LIMITED (IDCOL)
9.11 IDCOL was set up in 1962 to set up and promote industrial units for
utilisation of natural resources available in the State. The Corporation, since its inception,
has set up 14 industrial units with an investment of Rs.538 58 crore till the end of March
1998 In diverse fields. Of the 14 existing industrial units, 3 are operating under direct
management of the Corporation, 7 units are under subsidiary management, and 4 units are
being run with the assistance of IDCOL. All these fourteen units have generated
employment for about 9000 persons and indirect employment for almost an equal number.
The value of output of the Corporation declined from Rs 164 11 crore during 1997-98 to
Rs. 126.60 crore during 1998-99 due to fall in the prices of finished goods like pig Iron and
high carbon ferrochrome. Consequently, the Corporation sustained a loss of Rs.32.24 crore
during 1998-99. The ferro-chrome and cement plants of IDCOL have obtained ISO-9001
certification during 1998.
9.12 Modernisation and expansion of a furnace of Kalinga Iron Works, a
unit of IDCOL, has been taken up with an estimated project cost of Rs.23.00 crore. By the
end of 1998-99, Rs.9.00 crore has been spent under the project and it is likely to be
completed by 1999-2000. After completion of the project, the annual production capacity of
1,10,000 MT will go up to 1,66,000 MT. During 1998-99, IDCOL has set up IDCOL Soft-ware
Ltd., a joint sector company with Orissa State Electronics Development Corporation, at a
project cost of Rs. 100.00 lakh, for operating In areas like training, software development,
internet services, software export etc.
ORISSA STATE ELECTRONICS DEVELOPMENT CORPORATION (08EDC)
9.13 Orissa State Electronics Development Corporation Limited was
established In 1981 as the nodal organisation in the State for promotion of electronic
industries both in the field of hardware and software By the end of 1998-99, the Corporation
has promoted 27 industrial units with total project cost of Rs.196 57 crore Including Rs 12,77
crore as equity of OSEDC, Employment opportunity has t)een created for 1732 persons in
these units. Out of the total of 27 units, seven units have been promoted during 1998-99
with total project cost of Rs.26.99 crore. These seven units have generated employment for
143 persons.
ORISSA INDUSTRIAL INFRASTRUCTURE DEVELOPMENT CORPORATIC f (IID^O)
9.14 Orissa Industrial Infrastructure Development Corporation was
established in 1981 with the objective of creating infrastructure facilities in industrial estates
and areas identified for accelerated growth of industries, trade and commerce. IIDCO has
established 66 industrial estates/areas In the State. The total turnover of the Corporation
during 1998-99 was Rs.73.44 crore towards Infrastructure projects, diversification activities,
and land acquisition etc. as compared to Rs.53.77 crore during the previous year. The
cumulative profit of the Corporation as on March 31, 1999 was Rs.8.95 crore. IIDCO has
received ISO-9001 certification for its services. 180-14000 certification for its environmental
protection and resource conservation has also been received since September, 1999.
9.15 Four Growth Centers, at Kallnganagar, Chhatrapur, Jharsuguda and
Keslnga are planned During 1998-99, l^nd acquisition for the Growth Centre at
Kallnganagar has been completed and that for Growth Centers at Chhatrapur and
Jharsuguda is in progress Master plans for these projects are under preparation. Approval
for Keslnga Growth Centre has been received from Government of India. Construction of an
Export Promotion Industrial Park In Chandaka area is in an advanced stage of completion.
Civil work for setting up an Integrated Infrastructure Development Centre at Khurda Is under
progress. Master plans have also been finalised to establish two Integrated Infrastructure
Development Centres at Paradeep and Rayagada. The Corporation lias acquired 1898
acres of land for distribution to M/s Utkal Alumina, M/s Oswal Agro Ltd, and M/s Sterlite
Industries Ltd Initiative has been taken to acquire 8635 acres of land al Jharsuguda.
Gopalpur, Rayagada and Paradeep for major projects corning up in the State in steel,
alumunium, power and petroleum sectors Land acquisition for setting up a Special Tourism
Park at F uri over 3300 acre of land is in progress.
9 16 IIDCO proposes to establish a !T)ega industrial park at Paradeep under
a joint venture with Bang Pakang Industrial Park (BPIP), Thailand for the developruent of
ancillaries and down stream industries of oil refinery and petrochemical industries It
proposes to establish a multistoried building at a cost of Rs.25 crore In Bhubaneswar for use
by the software industry IIDCO has entered into an agreement with Infrastructure Leasing
and Financial Services Ltd., Mumbai to develop 90 km of road under Bhubaneswar
Integrated Road Project with an estimated cost of Rs.170 crore and a joint venture company
namely Bhubaneswar Integrated Road Network Limited (BIRNEL) has already been
constituted for this project
AGRICULTURAL PROMOTION AND INVESTMENT CORPORATION OF ORISSA LTD (APICOL)
9 17 In pur UEjnqe to the Industrial Policy 1996, AgrloulturaJ Promotion and
Investment Corporation (APICOL) was established in March 1996 as a wholly, owned
Government corporation with a view to strengthening the rural economy by providing
financial support for promotion and development of agro-based and food processing
industhes Including commercial agriculture and horticulture activities By the end of 1997-98,
APICOL had promoted 27 agro and food processing industries in the State with an
investment of Rs.23 72 crore. These units provided employment for 200 persons During
1998-99, it had promoted 121 agro and food processing units investing R8.6.65 crore with
the potential of generating employment for 1270 persons. APICOL has also so far provided
Rs.2.76 crore to-wards Incentives In favour of 147 industrial ventures out of which Rs.2.21
crore was provided during 1998-99.
ORISSA STATE FINANCIAL CORPORATION (OSFC)
9.18 Orissa State Financial Corporation has been providing term loans for
establishment of small and medium scale industries in the State since Its Inception In 1956.
it also provides financial assistance for ventures in areas like transport, hotels, nursing
homes and clinics, and for acquisition of mining and road construction equipment etc The
Corporation receives financial assistance from the State Government and Central
Government and provides soft loans and margin money for rehabilitation of sick Industrial units.
•
9.10 By the end of 1998-99, the Corporation had disbursed loans
amounting to Rs.866.42 crore to 24,783 units. During 1998-99, Rs.46.33 crore was provided
to 473 units as compared to Rs.57.41 crore In favour of 528 units in the previous year.
During 1998-99, the disbursement of loans to no-lndustry districts and backward districts was
15.91 % and 13.43% respectively of the total Investment.
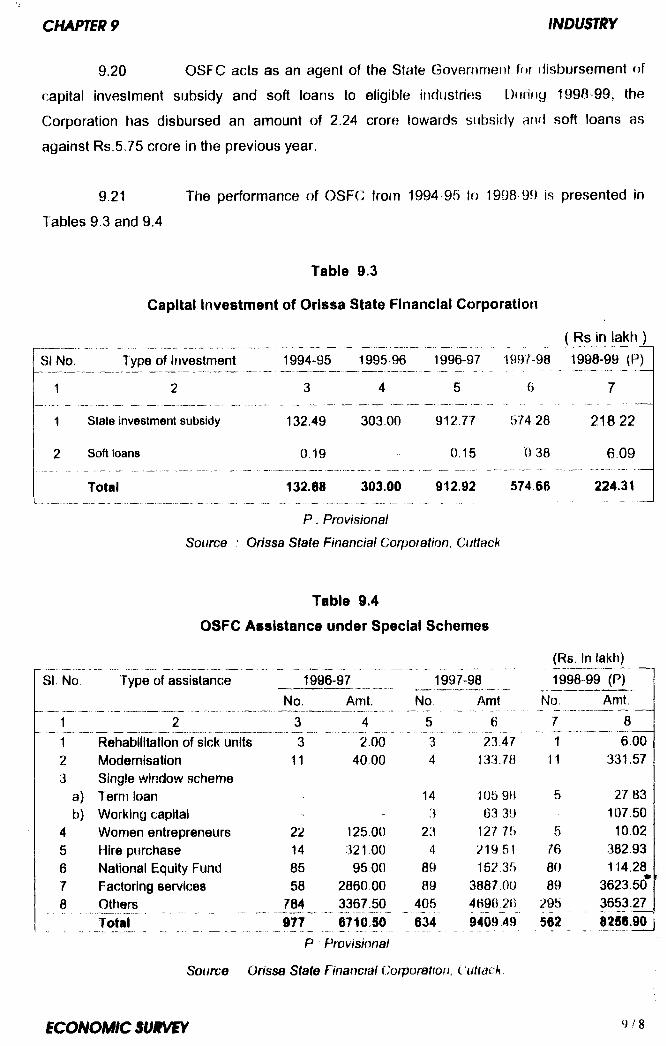
9.20 OSFC acts as an agent of the State Government for disbursement of
capital investment subsidy and soft loans to eligible itidustries Dnriny 1998 99, the
Corporation has disbursed an amount of 2.24 crore towards subsidy and soft loans as
against Rs 5.75 crore in the previous year.
9.21 The performance of OSFC from 1994 95 to 1998 99 is presented in
Tables 9.3 and 9.4
Table 9.3
Capital Investment of Orissa State Financial Corporation
( Rs In lakh )SI No. Type of Investment 1994-95 1995 96 1996-97 1997- 98 1998-99 (P
1 2 3 4 5 6 7
1 State investment subsidy 132.49 303.00 912.77 574 28 218 22
2 Soft loans 0.19 0.15 0 38 6,09
Total 132.68 303.00 912.92 574.66 224.31
P ; Provisional
Source : Orissa State Financial Corporation, Cuttack
Table 9.4
OSFC Assistance under Special Schemes
(Rs. In lakh)No Type of assistance 1996-97 1997-98 1998-99 (P)
No. Amt. No Amt No. Amt.r ~ 2 3 4 5 6 7 81 Rehabilitation of sick units 3 2 00 " 3 23 47 6.002 Modernisation 11 40 00 4 133.78 11 331.573 Single window scheme
a) Term loan - 14 105 m 5 27.83b) Working capital - 3 63 39 . 107,50
4 Women entrepreneurs 22 125 00 23 127 76 5 10025 Hire purchase 14 321.00 4 219 51 76 382.936 National Equity Fund 85 95 00 89 152 35 80 114.287 Factoring services 58 2860 00 89 3887.00 89 3623.50*8 Others 784 3367.50 405 4696 2B 295 3653.27
- ... Total _____ 9 7 7 3P
M o 50Provisional
634 9409.49 562 8256.90
Source Orissa State Financial Corporation, Cuttack.
ORISSA MARITIME AND CHILIKA AREA DEVELOPMENT CORPORATION LTD,
(OMCAD)
9.22 OMCAD was established in the year 1976 It has launched several
projects which include a fish-net manufacturing unit at Mancheswar, supply of fuel to
mechanised fishing trawlers from the diesel outlets located at marine fishing bases at
Paradeep, Chandipur, Kasafal, Dhamara and Gopalpur, and supply of high speed diesel to
deep sea fishing trawlers and vessels from its diesel out lets at Paradeep.
9.23 During 1998-99, the Corporation produced 36 66 M I of webbings at
the fish net manufacturing unit at Mancheswar and supplied these to fishermen at
reasonable price It also sold 14,289 kitr of high speed diesel and 29,467 Itr of lubricants to
fishermen at subsidised rates A total of 260 v34 quintals of coconut fibre and 123.30 quintals
of yarn were produced at the Coconut Industrial Complex, Sakhigopal with an investment of
Rs 3 95 lakh Quality cof:onul saplings and pineapple saplings were raised over an area of
3 20 acre during 1998-99. OMCAD earned a profit of Rs.8.44 lakh during 1998-99 II has
proposed to take up brackish water prawn culture on its land at Jagatjore on joint venture
basis The Corporation is in the process of establishing two ice plants and cold storages at
the fishing harbours at Gopalpur and Dhamara ports for the benefit of fishermen
ORISSA FILM DEVELOPMENT CORPORATION (OFDC)
9 24 Orissa Film Development Corporation has played a vital role in
promotion and development of film related activities along with construction and remodeling
of low cost Janata and Rural Cinema Halls in the State. The Corporation extends financial
assistance in collaboration with various commercial banks and the National Film
Development Corporation. By the end of 1997-98, the Corporation had invested a sum of Rs.
87 25 lakh for renovation/remodeling of 79 cinema halls, provided subsidy of Rs.241.85 lakh
to 214 Oriya films and extended term/soft loans amounting to Rs.345.43 lakh in favour of film
producers for production of 119 Oriya feature films. During 1998-99, it ha^ subsidised 30
Oriya feature films by providing subsidy of Rs.89.88 lakh and provided a loan amounting to
Rs 6.00 lakh in favour of producer of one film.
9 25 The Corporation has es ablished a sophisticated studio complex at
Bhubaneswar In order to provide Infrastructure facilities for production of films. This complex
has capacity for production of 16 mm, 35mm, cinema scope and video films.
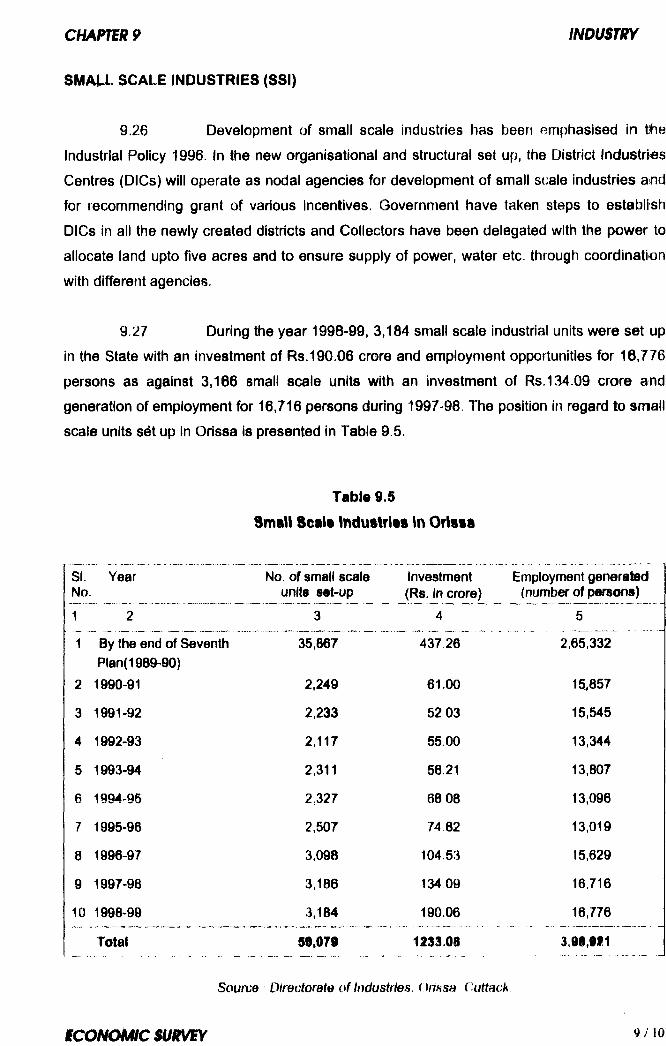
SMALL SCALE INDUSTRIES (SSI)
9.26 Development of small scale industries has been emphasised in tihe
Industrial Policy 1996. In the new organisational and structural set up, the District Industries
Centres (DICs) will operate as nodal agencies for development of small scale industries and
for recommending grant of various Incentives. Government have taken steps to establish
DICs in all the newly created districts and Collectors have been delegated with the power to
allocate land upto five acres and to ensure supply of power, water etc. through coordination
with different agencies.
9.27 During the year 1998-99, 3,184 small scale industrial units were set up
in the State with an investment of Rs. 190.06 crore and employment opportunities for 16,776
persons as against 3,166 small scale units with an investment of Rs. 134.09 crore and
generation of employment for 16,716 persons during 1997-98. The position in regard to small
scale units s^t up in Orissa is presented in Table 9.5.
Table 9.5
Small 8etl» Industrlts In Orlsta
SI. Year No. of small scale Investment Employment generatedNo. units 8«t-up (Rs. In crore) (number of persons)1 2 3 4 5
1 By the end of Seventh 35,867 437 26 2,65,332Plan(1989-90)
2 1990-91 2,249 61.00 15,857
3 1991-92 2,233 5203 15,545
4 1992-93 2,117 55.00 13,344
5 1993-94 2,311 56.21 13,807
6 1994-95 2,327 68 08 13,096
7 1995-96 2,507 74 82 13,019
8 1996-97 3,098 104,53 15,629
9 1997-98 3,186 134 09 16.716
10 1998-99 3,184 190.06 16,776
Total 98,079 1333.08 3JS,0i1
Source Directorate of Industries, Ohasa Cuttack
i C O N O M I C S U R V ^ i
iN o m m Y
F»|HME MINISTER’S ROZQAR YOJANA (PMRY)
9.28 The PMRY launched on 2nd October 1993 was originally targeted to
pimi ld© self-employment opportunities to educated unemployed youths in urban areas only.
Firtffi 1994-95, the scheme has been extended to rural areas also. Youths In the age group
o# 1fl to 35 years with requisite educational qualifications and having annual family Income of
Rs.24,000 or less are eligible to avail loan assistance upto Rs.1.00 lakh. The beneficiaries
are required to invest 5% of the project cost as margin money and can get subsidy to the
tyne of 15% of the project cost. During 1997-98, loans amounting to Rs.48 32 crore were
diisbursed to 7,024 beneficiaries under PMRY. During 1998-99, out of an amount of
Rs.65 53 crore sanctioned in favour of 8,353 beneficiaries, loans amounting to Rs.4 24 crore
have t)een disbursed to 766 beneficiaries by 31.03,99
AtNCILLARY AND DOWNSTREAM INDUSTRIES
9.29 The Directorate of Industries co-ordinates with large and medium
industrial units like Rourkela Steel Plant, National Aluminium Company, Paradeep
Plhosphate Limited, Mahanadi Coalfields Limited and Larsen and Toubro etc to obtain
ancillary status or registered manufacturer/supplier status for small and medium scale
industries. Rourkela Steel Plant has ancillarised 25 small scale units and National Aluminium
Company and Mahanadi Coalfields Limited have given ancillary status to 27 and 55 units
respectively. The Directorate also establishes linkages with large and medium scale
industries for development of downstream industries by utilising the finished goods and
waste products of the mother plants.
9.30 As per provisions of the Industrial Policy 1996, capital Investment
subsidy to the tune of Rs 821.14 lakh has been sanctioned to 126 units during 1998-99.
Sales tax exemption has been granted in favour of 1,297 units', electricity duty exemption
has been granted to 120 industrial units engaged in commercial production and octroi tax
exemption has been granted to 226 units during 1998-99 by way of Incentives
TECHNICAL EDUCTION AND TRAINING
9.31 The Industrial Policy 1996 envisages a series of measures to Improve
th© stock of technical manpower arid upgrade the skills of local entrepreneurs. It is proposed
to establish a Technical University in the State for maintaining and improving the standards
of technical education
9 32 Four Government Engineering Colleges, two IJniversily Engineering
Colleges and fourteen private Engineering Colleges are functioning in the State with a total
intake capacity of 4000 students. Diploma courses are being conducted through 13
Government Engineering Schools/ Polytechnics (of which four are exclusively meant for
women) and 12 private Engineering Schools/Polytechnics with total intake capacity of 3600
students. Craftsmanship training is being imparted in 38 disciplines through 23 Industrial
Training Institutes (ITIs) and 37 Industrial Training Centres (ITCs).
EXPORT PROMOTION AND MARKETING
9 33 Directorate of Export Promotion and Marketing plays a vital role in
rendering marketing assistance through quality control, and registration and approval of rate
contracts of small scale units for sale of their products to different Government, quasi
Government and other agencies. It also provides marketing support to eligible exporting
units. By the end of 1998-99, the Directorate has registered 1,865 small scale units and
concluded rate contracts in respect of 1,107 store items. During 1998-99, 2,050 technical
inspections were conducted and 26,139 samples were tested by the Directorate in its six
testing laboratories. An amount of Rs.21.15 lakh was collected towards testing fee, An
Export Promotion Industrial Park at Bhubaneswar has been sanctioned by Government of
India with a project cost of Rs.15.25 crore for development of export activities
ORISSA SMALL INDUSTRIES CORPORATION (OSIC)
9.34 Orissa Small Industries Corporation was established in 1972 as a
nodal promotional agency for small scale industrial units in the State The c;orporation has
been extending marketing support, financial assistance for purchase of raw materials, a sub
contracting,exchange, and factoring services to small scale unils Tlie Corporation also
administers cerlain incentives under the Industrial Policy 1996 Duritig 1998 99, the
Corporation has supplied 68,164 MT of raw materials to small scale units valued at
Rs.120.15 crore through its 12 raw material depots against 45,197 MT raw materials worth
Rs.114.52 crore supplied in the previous year Tlie achifivement of the Corporation from*
1996-97 to 1998*99 has been presented in Table 9 6
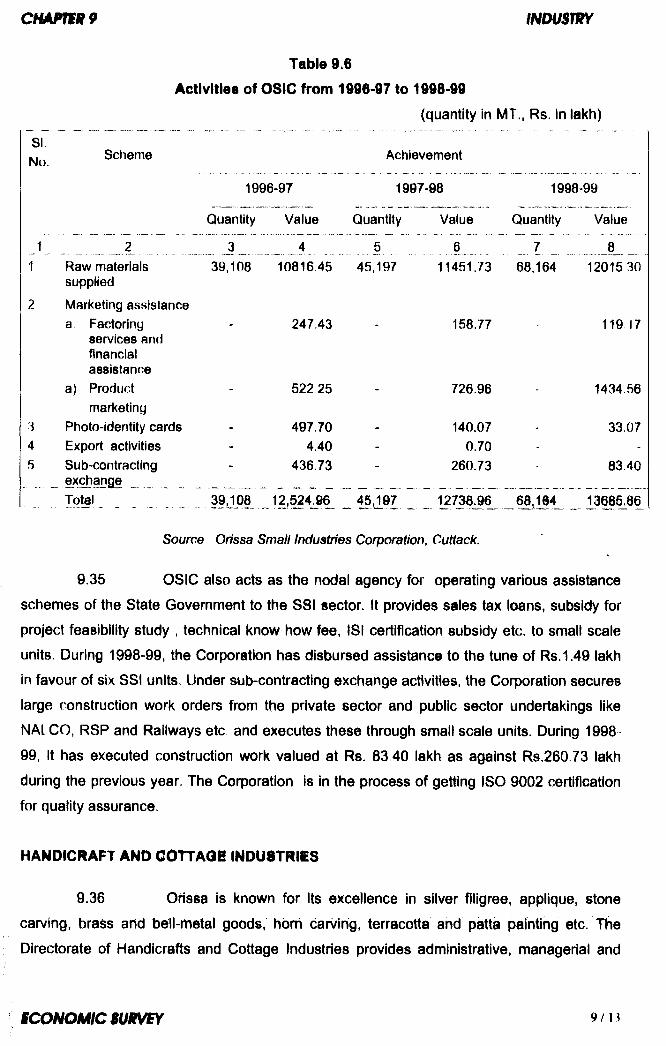
C W im R 9 fNousm
Table 9.6
Activities of OSIC from 1996-97 to 1998-99
(quantity in MT., Rs. In lakh)
SINo. Scheme
1996-97
Quantity Value
Achievement
1997-98
Raw materials suppHedMarketing assistancea Factoriny
services and financial assistance
a) Productmarketing
Photo-identity cardsExport activitiesSub-contracting exchange ___Total
39,108....A.... ...1081645
247.43
522.25
Quantity
545,197
Value
6
11451.73
158.77
726.96
1998-99
Quantity Value
7 868,164 12015 30
119 17
1434,56
33.07
83.40
39,108 12,M4Jl^ _ 11.197____ 12738.96 68,164___ 13681^86
497.704.40
436.73
140.070.70
260.73
Source Orissa Small Industries Corporation, Cuttack.
9.35 OSIC also acts as the nodal agency for operating various assistance
schemes of the State Government to the 881 sector. It provides sales tax loans, subsidy for
project feasibility study , technical know how fee, 181 certification subsidy etc. to small scale
units. During 1998-99, the Corporation has disbursed assistance to the tune of Rs.1.49 lakh
in favour of six SSI units. Under sub-contracting exchange activities, the Corporation secures
large construction work orders from the private sector and public sector undertakings like
NAl CO, RSP and Railways etc and executes these through small scale units. During 1998-
99, It has executed construction work valued at Rs. 83 40 lakh as against Rs.26073 lakh
during the previous year. The Corporation is in the process of getting ISO 9002 certification
for quality assurance.
HANDICRAFT AND COTTAOi INDUSTRIES
9.36 Orissa is known for Its excellence in silver filigree, applique, stone
carving, brass and bell-metal goods, horn carving, terracotta and patta painting etc. The
Directorate of Handicrafts and Cottage Industries provides administrative, managerial and

financial support for promotion, revival and diversification of these traditional industries
through various schemes During 1998 99, 50,607 cottage industries have been set up in the
State with an investment of Rs.5.869.00 lakh for providing employment to 92,822 persons.
Data on the growth of cottage industries in the State over the years is presented in Table 9.7.
Table 9.7Growth of Cottage Industries In Orissa
SI, Year No: of units Investment EmploymentNo. established (Rs in lakh) generated (number of
persons)^1... I Z , l 3 l 1 .1 1 .1 1 1 1 ________ __________
1 By the end of seventh Plan 1008716 20995.69 1693205
2 1990-91 68746 2070.15 1282183, 1991-92 64153 2675.67 1197884 1992-93 54940 2751.72 1005065. 1993-94 59779 3098.31 114527
6 1994-95 50289 2853.66 1041857 1995-96 48161 3616,86 914848 1996-97 41478 3925,68 765169 1997-98 45602 4886.16 8294110. 1998-99(P) 50607 5869.00 92822
P , Provisional
Source : Directorate of IHandicrafts and Cottage Industries Bhubaneswar.
9 37 At present 266 Handicrafts Co-operative Societies with a membership
of 17,971 are actively functioning in the State. These societies provided employment to 6,464
artisans and produced handicraft articles worth Rs.636.97 lakh during 1998-99 as against
f s 49378 lakh in the previous year
9 38 In order to strengthen the artisan base of enterprises in the handicrafts
sector, 30 Handicraft Training Centers are functioning in different districts of the State.
During 1998-99, 407 trainees have been trained in these centers A wonlen carpet weaving
training programme is being conducteti in collaboration with an hxport House in 33 centres
with facilities to train 1,320 persons per batch During 199B4J9, 590 women have been
trained in these training centres
9.39 I he Urissa State Co-operative Handicrafts Cor()oiatlon is engaged in
strengthening the production base, enlarging marketing opportunities encouraging
exporters, and introducing new design and technology in tl?e handicrafts sector The
(Corporation provides assistance to f’rimary Handicrafts Co-upurative Sot ielies, voluntary
organisations and individual artisans for improving the marketability of their products. The
Corporation procures a wide variety of handicraft products and markets these both Inside
and outside the country. The Corporation extends benefits to artisans through Its Common
Facility Service Centre at Mancheswar A Craft Development Centre at Jeypore is being run
by the Corporation for providing a package of services to a cluster of craftsmen under a
single umbrella for development of handicrafts. The Corporation is Implementing the Woolen
Carpet Weaving Training Schemd through Its four training centres at Banarpal, Kendrapara,
Kakatpur and Gabkund. A total of 248 persons have so far been trained in these institutions.
During 1998-99, the total procurement and sale of handicrafts and art-textile products by the
Corporation was to the tune of R8,209,O5 and Rs.526 97 lakh respectively. During 1998™99,
the Corporation has exported handicraft and art-textile goods worth Rs.28 76 lakh to
countries like Germany, Australia and France.
TEXTILE AND HANDLOOM INDUSTRIES
a. Handloom
9.40 A number of State Plan, Central Plan and Centrally Sponsored Plan
schemes are being implemented for extending support to this sector. Under the Project
Package Scheme an amount of Rs.5.67 crore has been invested during 1998-09 for
construction of 10S9 worksheds, 5 godowns, modemlsatlon of 256 looms and supply of
accessories to 607 weavers. Under Integrated Handloom Village Development Scheme, 336
worksheds and 2 godowns were constructed, 65 looms were electrified and accessories
were supplied to 286 weavers during 1998-99 with an expenditure of Rs.2.35 crore. An
amount of Rs. 98.92 lakh has been provided towards mari<etlng assurance In 1998-99 under
a Centrally Sponsored Plan scheme.
b. Power loonis
9.41 Presently, there are 1200 powertooms In the co-operative sector and
3000 power looms outside the coK>peratlve sector In the State. Due to lack of managerial
ability and shortage of working capital, power looms under the cooperative sector have
stopped functioning. Qovemment have decided to privatise these power looms.
c. Spinning mills
9.42 There are 12 spinning mills In the State of whioh 7 mills are operating in
the co-operative sector. 3 mills under the Industrial Development Corporation of Orissa
Limited (IDCOL) and one each under Orissa State Textile Corporation and National Textile

Corporation. Construction of Konark Cotton Co-operative Spinning Mill, Kesinga, one of the
greatest mills In tfie co-operative sector, has not been completed A modern ginning and
processing unit has been established at Kesinga. The Orissa State Co operative Spinning
Mills Federation has also set up a Central Cotton Yarn Testing Laboratory at Bhubaneswar
During 1998-99, all the mills under the co-operative sector except Jagannatti Spinning Mill,
Nuapatna were running on conversion basis The co operative mills pfoduced 5,778 MT of
yarn valued at Rs. 1234.40 lakh and sustained cumulative loss amounting to 12.99 crore
Since these mills are not able to meet their operating expenses and the losses are mounting,
it has been decided to privatise them.
d. Sericulture
9.43 Sericulture industry deals with tassar, mulberry and eri and provides
avenues for rural employment and income generation, Orissa State Tassar and Silk Co
operative Society Is the apex body for providing financial assistance and working capital to
primary societies. It also provides various services to cocoon producers and weavers, and
marketing support for tassar, mulberry and eri fabrics
i. Tassar
9.44 For the development of tassar products, 62 Primary Tassar Rearers’
Co-operative Societies are functioning in the State under their apex society, the Orissa
Tassar and Silk Co-operative Society. During 1998-99, 12.78 lakh tassar worms were
supplied to rearers and 32.51 MT of tassar yarn has been produced providing employment to
42,227 persons Rearers from 984 villages in the State are now actively involved in tassar
rearng in 3,006 rearing fields
il. Mulberry
9 45 Mulberry plantation and silkworm rearing have been taken up on a
large scale in 30 blocks of the State. A total of 13,469 acre of land has t»een brought under
mulberry culture involving 14,996 farmers in 39 Rearers’ Cu-operalivB Societies For
development of mulberry sericulture, two pilot projects namely Bivoltine Sericulture
Development Project and National Sericulture Project are operating In the State During *1998-99, 4.97 MT of mulberry yarn was produced witti employment ot 25 758 persons. A
cold storage for preservation of mulberry eggs has been set up at Chandr.igii i
c m m i f p i m m m
ill. Eri
9.46 Eri-culture has been promoted as a subsidiary occupation in the
undivided districts of Cuttdck, Sundargarh, Kalahandi, Phulbani, Keonjhar, Sambaipur and
Koraput. During 1998-99, 1000 l g of yarn was produced with employment of 7,060 persons.
Yarn production In 1998-99 has Increased considerably as ck)mpared to the production of
400 leg In the previous year,
KHADI AMD ViLLAai IN D U S tR lii
9.47 Khadi and village Industries are being promoted in the State by the
Orissa KhadI and Village Industries Board with financial support from the Khadi and Village
Industries Commission Assistance is provided In the shape of grants and loans to the
beneficiaries through co-operative societies operating at the btocl level. Out of 95 schemes
approved under Khadi and Village Industries Programme for assistance, 51 schemes are
being implemented in the State. At present 1724 co-operative societies/institutions are
functioning under the fold of khadi and village Industries including one black level Artisan
Industrial Multipurpose Co-operative Society In esich yimk. these fmmitor
schemes under Khadi and Village Industries Programme such as bee keeping, carpentry,
blacksmlthy, pottery, manufacture of palm gur, leather goods, oane, bamboo goods, bell
metal goods, and polyvastra etc. During 1 §98-99, goods worth Rs. 5304.69 lakh were
produced by these societies with prevision of emf^yment to 122878 pensons. The value of
production was Rs 5051.18 lakh in the prevbus year.
COIR INDUSTRIES
9.48 Orissa Co-operative Coir Corporation is the apex co-operative
organisation In the State dealing with marketing of coir and coir produots produced by
societies/individuals and its own production units. The production and sale of coir and coir
products by the Corporation during 1998-99 was Rs. 18.70 lakh and Rs.28.32 lakh
respectively. During 1907-98 there were 98 Coir Co-operative Societies funotloning In the
State. Five Regional Coir Training and Development Centres ere ftjndtloning In the State with
capacity to train 100 artisans annually.
SALT INDUSTRtli
9.49 The salt production In the State does not fully meet the requirement of
edible salt In the State. The four salt co-operative societies In the State produced 38,350 MT
of salt during 1998-99. Eight iodised salt plants have also been established in the State in
wtiich 96,000 MT of salt was iodised during the year.
TOURISM
9 50 Orissa tias vast potential for development of tourism which has
remained largely untapped. The Stale Government have formulated the Orissa Tourism
Policy 1997 with the following objectives.
i) Optimum hiirnessing of the resources to attract the maximum number ofdomestic and foreign tourists with increased average duration of their sojourn ill:,Orissa, ’ I
ii) Development of tourism-related induslrie8%hich would provide Increased employmesnt opporturiitles,
ill) Promotion of the rich handicrafts and hanc lpoms of Orissa through tourism,iv) prpmotiori of the natural grandeaur and Cultural li^ritage of Orissa through
toyrism.,/v) Promotion of uross-cultural jntoracfon, sqclo-culturni amity, ang ecpnomic
develppment through tourism and through Involvement of the pHyate sector, autonomous bpdios local authodies, and th^ people at largl lri
' promotion of tourism. ?
9 51 the growth of tourism is measejred in terms of number of tourist
arrivals. The arrival of tourists in the State during 1998 was reported to be 14,95,228 of
which 33,101 were foreign tourists. The growth of tourist traffic and estimated flow of income
from tourism In the State has tjeen presented in Table 9.8. During 1990-98, alttiough the total
tourist arrivals in the State have increased by 20 15%, the increase In the number of foreign
tourists has t)een only 2.83%
9 52 The Tourism Department maintains 15 accorTjmodation units
comprising of 10 Panthasalas, 2 Yatri Niwases, 2 Panthikas and one Aranya Niwas. In
addition, the Odssa Tourism Development Corporation operates 11 Pantha Niwases and one
Aranya Niwas• t
9 53 During 1998 99, work in augmenting the tourist infrastructure through
activities like construction/improvement of Panthasalas, construction of way-side amenities
centres, refurbllshment of temples, provision of public conveniences, iandsciapiny at different
tourist centres was taken up. The toudsrn Department organised and celebrated in a nurnbeI
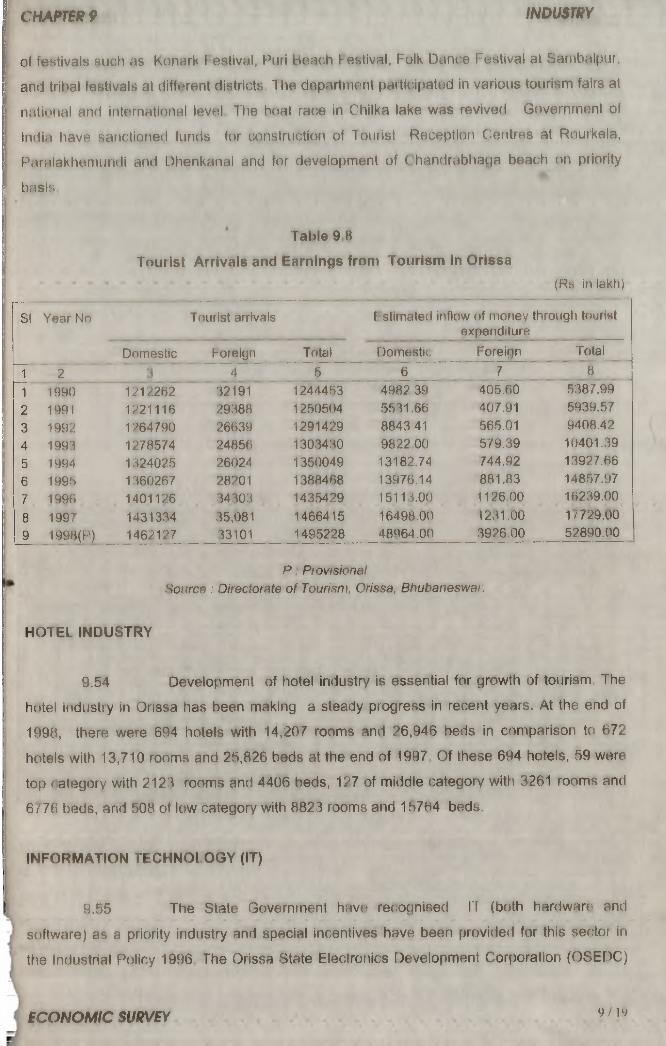
ot festival s such as Konark F estivnl, Puri Bnoch festival, Folk Dunce Fustival al SarnbHlpur,
and trihal festivals at diffHrent districts The department participated in various tourism fairs at
national and intornational level Tlie boat race in Chilka lake was revived Government of
Itidia have sanctioned funds for construction of Tourist Reception (Centres at Rourkela,
f'^aralakhemundi and Dhenkanal and for development of (-handrabhat)a beach on priority
basis
Table 9 8
Tourist Arrivals and Earnings from Tourism In Orissa(Rs. in lakfi)
SI Year No Tourist arrivals Fstirnated inflow of nioriey through touristexpenditure
Domestic Foreign Total Domestic Foreign Total1 ” 2 4 5 _ ^ ___ L __ 8 ~
1 1990 1212262 32191 1244463 4982 39 405.60 5387.99
2 1991 1?21116 29388 1250504 5531.66 407.91 5939.57
3 1992 1P64790 26639 1291429 8843 41 565.01 9408.42
4 1993 1278574 24856 1303430 9822 00 579 .39 10401,39
5 1994 1324025 26024 1350049 13182.74 744.92 13927.66
6 1995 1360267 28201 1388468 13976.14 881 .83 14857.97
7 1996 1401126 34303 1435429 15113.00 1126 00 16239.00
8 1997 1431334 35,081 1466415 16498.00 1231.00 1 /7 2 9 .0 0
9 1998(P ) 1462127 33101 1495228 48964 .00 3926 00 52890.00
P Provisional SoLircB : Directorate of Tourism, Orissa, Bhubar)eswar.
HOTEL INDUSTRY
9.54 Development of hotel industry is essential for growth of tourism The
hotel industry in Orissa has been making a steady progress in recent years. At the end of
1998, there were 694 hotels with 14,207 rooms and ?6,946 beds in comparison to 672
hotels with 13,710 rooms and 2H,826 beds at the end of 1997 Of these 694 hotels, 59 were
top c ategory with 2123 rooms and 4406 beds, 127 of middle category witfi 3261 rooms and
6/76 beds, and 508 ot low category with 8823 rooms and 1vH764 beds.
INFORMATION TECHNOLOGY (IT)
9.55 The State Government have ref;ognised IT (both hardware and
software) as a priority industry and special incentives have been provided for this sector in
the Industrial Policy 1996 The Orissa State Electronics Development Corporation (OSEDC)

is the nodal agency and single point contact forum for IT industries. Governnnent have
recently announced the Information Technology Policy 1998. The main objectives of IT
Policy 1998 are to
AGCord prlaiacy Ip Ih^ growth Qf IT industry jn tlip StaJ ,
IL Accelerate th usd of informpllon lechnology at the Governmenit level to
provide better and exppdlous service to people. " :
iii. liTiprove producijyJ|y indi ffi l npy of Governrfient service by [lastenliig the piotess of depisibjl, rpaking at Gqyernment level and providing an elfici nt and tianspOTnt to l for oion|torlng implome^nt tjuji of vyrloyi Govefnment supppftprpgrarrirn^s,
, A > ' > ' - w iiv.J important tool to increase employqient potenj^J for
^dypaled unemployed. s • t '- . • >
a destination of choice for I f industry.
Vi. Enharicp domestic and export earning in thf software and hardware areas
pf i f jndtislr)
vli. Encburage^rid ^accelerate tf»d' use of IT In schools, college and \
edilriptlpnal (nsfitutloris so as t^ fJrepure the youth for employment both
*(/jil, l^rovld^^ft aqi iinl itreillve fr^me work for quick clearanci of IT proposals by|he jGoverfiftl£?nt ar] regulatory authorities. ^
' ’ ______________..^,1
9.56 Excellent data communication facilities are in the process of being
established for use of IT companies. The Software Technology Park of India (STPI) at •»Bhubaneswar has set up a 2 mbps satellite earth station to provide high speed data links
with foreign countries Videsh Sanchar Nigam Ltd. will soon provide international gateway f]
service# from Bhubaneswar. Dedicated 64 kbps and higher band width connections would be ^
made available to bulk users. Dej)aitment of Telecommunications has commissioned I0
\CCONOM/t; Si/ffVH >-
InternHt Access Services (IAS) at Bhubaneswar recently. Internet SBrvices are available to
export oriented I I companies and educational and research institutions at competitive rates
through SI PI, Bhubaneswar Two private internet service (>roviders have been granted
licenses and will soon start ofierations.
9.57 The State Government have decided to set up an Indian Institute of
Information Technology (MIT) at Bhubaneswar. The institute would conduct research and
offer sfiort term courses in different IT areas Other initiatives in the field of IT edui.ation are
ilso boinii undertaken
9 5H ( )rir,Stj (.omputer Applications Centre (OCAC) has been set uf) by the
otato (government to undertake education cum-trainintj programmes ancJ to help
(government and puhlit sector organisations in the area of computer applications. It renriers
te(;hnicul consultancy services in respect of firocurernent, implementation and
f;ornmissioning of fiardware and software An MOL) has t)enn signed by OCAC with Of^ACl E
India making OC AC an online ORA(T t: Solution Development Partner.
9.59 OCAC has develofied ti spell checker for Oriya in collaboration withCD AC, Pune Systems studies were taken-up during 1998-99 for S.C.D. Medical College, Nilachala Ispat Nigam, Orissa Co operative Bank Ltd , Bureau (’>f Text Book Pijblication and Printing, Orissa State Housing Board, Hotel Management Institute etc. Consultancy services fnr computer infrastructure development and project development were uniiertaken by OCAC during 1998-99 in respect of a number of organisations such as GRIf") ('orporation of Orissa, Orissa Textile Mills, Institute of t ife Sciences, Directorate of Family Welfare, Orissa State Mnancial Corporation, Board of Secondary Education, Orissa Directorate of Employment, Welfare Department, Parliamentary Affairs Department, College of Accountancy and Management etc. touring 1998-99, OCAC also organised a number of training programmes.
9.60 By the end of 199H-99, 30 software exporting units including majors like Infosys and Satyam have started operations and many more such units are expected to come up in the near future Infosys has achieved an export turn over of one million US dollars per month from Orissa and has generated employment for neady 500 IT professionals It has plans to expand operations to provide employment to another 200H persons over the next three years Satyam Computers has already recruited 67 persons and has started work for constniction of Its own building at Bhubaneswar A US software conipany is setting up an industrial park namely Bhubaneswar Electronics and ‘ioftwam Technology (REST) F ark over an area of 250 acres at Bhubneswar for high tech soffwaru and electronics industries.
PUBLIC SECTOR ENTERPRISES (PSEs)
9 61 There are 36 Put)lic Sector ( nterprises, rerjisterod under the
Companies Act or created under special Acts of ttie State Giovernnrient, in the State t he
total investnnent in these PSEs as on 31 03.98 in the form of share capital and term loan was
Rs. 1364.61 crore and Rs.3318.06 crore of which the State Government’s share capital and
loan was Rs 1306.00 crore and Rs.1201.70 crore respectively During 1998-99, an amount of
Rs. 130 00 crore has been realised by the State Government from PSEs towards
outstanding loans and advances.
9.62 Government is according top priority to reform public enterprises and
to improve their performance in view of the changed economic scenario in the country. The
measures being considered by the State Government in this regard include disinvestment,
financial restructuring, and implementation of voluntary retirement schemes for the
employees of PSEs. Accordingly the State Government have constituted a Public and Co
operative Enterprises Restructuring Committee under the chairmanship of the Chief
Secretary to consider the restructuring proposals of PSEs such as disinvestment, closure,
privatization, rehabilitation etc. Financial assistance is being sought from international
financial institutions for restructuring State PSEs
♦ ♦ ♦
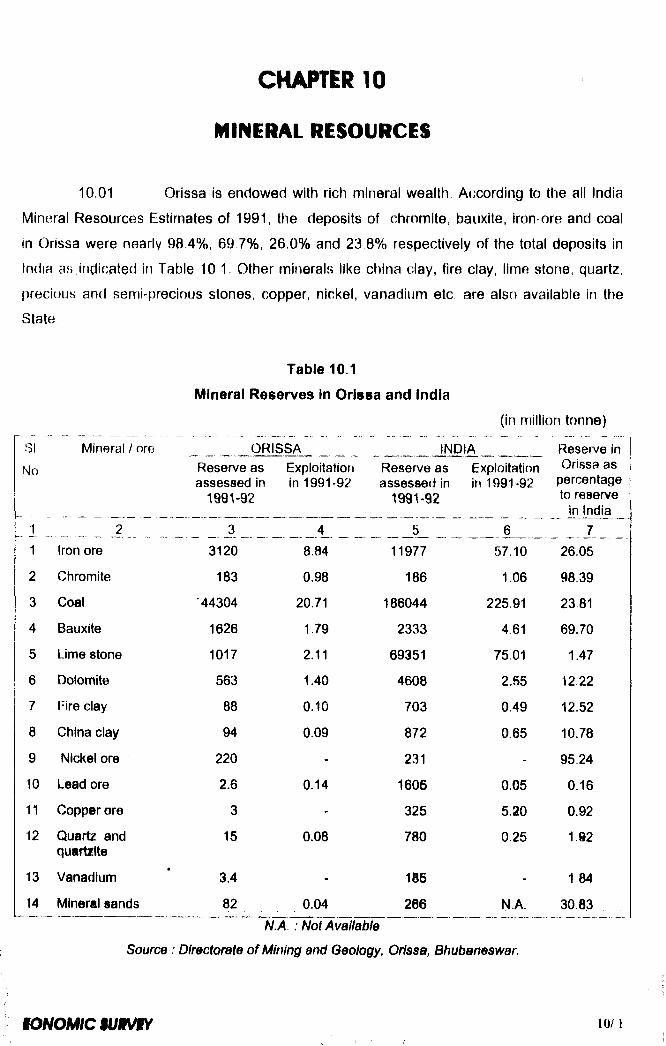
CHAPTER 10
MINERAL RESOURCES
10.01 Orissa is endowed with rich mineral wealth According to the all India
Mineral Resources Estimates of 1991, the deposits of chromite, bauxite, iron-ore and coal
in Orissa were nearly 98 4%, 69 7%, 26.0% and 23 8% respectively of the total deposits in
India as indicated in Table 10 1 Other minerals like china clay, fire clay, lime stone, quartz,
precious and semi-precious stones, copper, nickel, vanadium etc, are also available in the
State
Table 10.1
Mineral Reserves in Orissa and India
(in million tonne)
SI
NoMineral / ore ORISSA
Reserve as assessed in
1991-92
Exploitation in 1991-92
_______ INDIA_______Reserve as Exploitationassessed in
1991-92in 1991-92
Reserve in Orissa as
percentage to reserve
in India1 _________2 _______ ____ 3 _ _________ 4,....__________ 6 _ _ 71 Iron ore 3120 8.84 11977 57.10 26.05
2 Chromite 183 0.98 186 1.06 98.39
3 Coal 44304 20.71 186044 225.91 2381
4 Bauxite 1626 1.79 2333 4.61 69.70
5 Lime stone 1017 2.11 69351 75.01 1.47
6 Dolomite 563 1.40 4608 2.55 12.22
7 Fire clay 88 0.10 703 0.49 12.52
8 China clay 94 0.09 872 0.65 10.78
9 Nickel ore 220 - 231 - 95.24
10 Lead ore 2.6 0.14 1605 0.05 0.1611 Copper ore 3 - 325 5.20 0.9212 Quartz and
quartiite15 0.08 780 0.25 1.§2
13 Vanadium 3.4 - 185 - 1.84
14 Mineral sands 82 0.04 266 NA 30.83N.A. : Not Available
Source : Directorate of Mining and Geology, Orissa, Btiubaneswar.

10 02 The total production of minerals and ores in the State during 1998-99
was 634.3 lakh tonnes valued at Rs.2365.66 crore, as against the production of 628.1 lakh
tonnes valued at Rs.2148.96 crore in 1997-98, registering an increase of 0.99% in quantity
and 10 08% in value. Table 10 2 indicates the trend in total mineral production in the State
and its value from 1991-92 to 1998-99.
Table 10.2
Production and Value of Minerals/Ores in Orisaa.
Year Production Valuei.i / i i i i _ i v incr0886 OV0T I k incr®886 ov6rNo ‘akh tonne) (Rs. In crore)
1 2 3 4 5 61 1991-92 372.0 19.73 812.39 29.15
2 1992-93 398.6 7.15 1033./1 27.24
3 1993-94 405.8 1.81 1166.84 12.88
4 1994-95 438 6 8 08 1300.70 11.47
5 1995-96 511.2 16.55 1634.03 25.63
6 1996-97 569 1 11.33 1791 33 9.63
/ 1997-98 628.1 10 37 2148 96 19.96
8 1998-99(P) 634.3 0.99 2365.56 10.08
Source : Directorate o f Mining and Geology, Orissa.
10 03 Production figures of some important minerals and ores in the State
from 1991-92 to 1998 99 are given in labia 10.3. The table shows that the production of
minerals and ores ifi the State has increased by 70.51% between 1991-92 and 1998-99. The
production of coal and metallic minerals has increased by 109 9% and 32 9% respectively
while that of non metallic minerals has decreased by 14.6% over this period
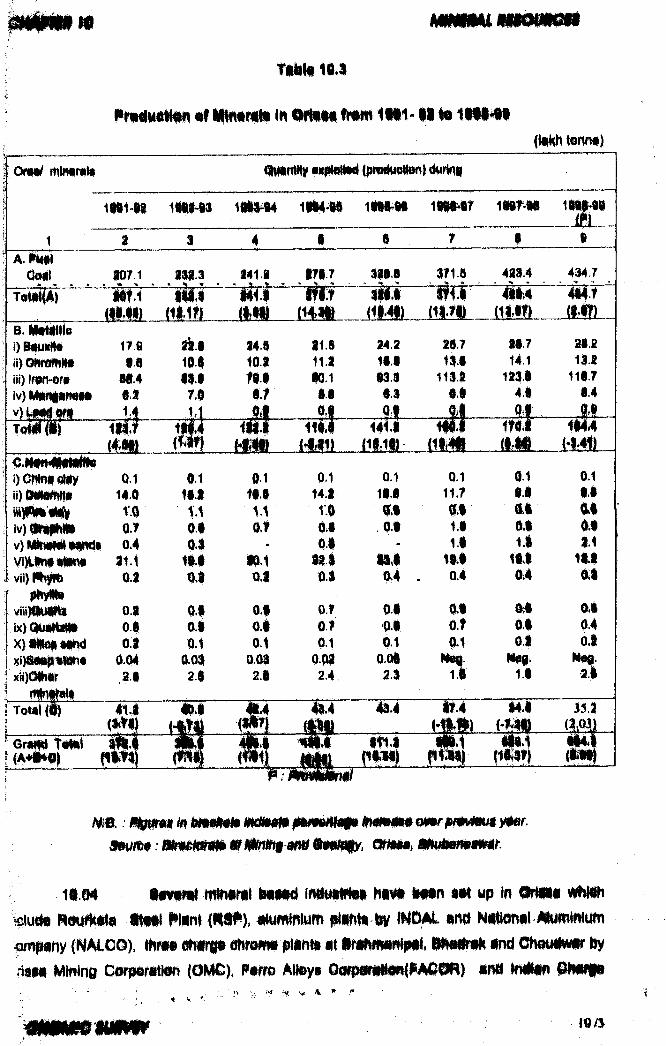
tinii 18.1
PnKhialMin •* MHwnMi tn Oiww *nm« iH l- I I I# 1WI*W(lilhh twin*)
Qmt wiwiriNi
mm i m m itMMw im m
1 a 1 4 8 8 7 8 9A. PMtl
Oofll.'to ' « '* « 207.1 ISI.3« %; % * 141.1 178.7 388.8 371.8 421.4 434.7
ToK^) Wt.1 i i l 4 i l l( i i i M m
iS [ tm m
i f i $m m ( i m ..
M l
B. MtMlllsi) 1T.9 ll.8 14.1 11.8 t4.a 18.7 18.7 28.2
90 101 101 t i.i 18.8 118 14.1 l i tiii) Iron-dre 8t# •19 f l9 •0.1 838 113.1 123.1 118.7iv) U 70 88 81 8.9 4.9 8.4v )H iK ifri §M OJ Of .........| i | .. ....41-. f l ^r S i i i i m ilS J n i l 1411 m i m i i m
(4iH ( i i f j 1 4 M I 4 i l i m m m m .(tM L
i) GWn« Qliy 0.1 0.1 0.1 0.1 0.1 0.1 0.19.8
0.1ii) 14.0 11.1 ♦i.l 14.1 18.8 11.7 98
U 11 1.1 m m U UQ.t 0.1 0>f 0.8 0.1 1.1 m 0.90.4 0.$ • U - 1.1 i i 11
Vt)lim« sHKii I t . i m •01 ^ . | m s m 191 m tvh) l%yffb OJ 0.1 m n %4 0.4 04 6.8
0.1 %9 0.| O.f 0.1 md.f
m 01OS u 0.7 m 0.1
0.104
X}9m$mv3i 01 0.1 0.1 0.1 0.1 0.1 0.10.04 0.0* Q.0I m O.Ol i m
; xii)0IHir 28 a.i 2.1 2.4 2 $ 1.1 1.8
I Total (9)
G rm total (A+i%©|
m 4
- A s
m .ii « 2 L
± m
a m im :m r n m m » i0 nih$ ano6t9mty. o tm a ,m m u m m .
1t.04 iwwM wwwil IwiKi inftwlHB* hit* Ntn «m mp in ONtll #iWi Nourfctta « •« Wim (WW), «iuminhim iMWiti (NOW. •nfl N(«ion«l #Wwl«um
pmpwny (NALCO), ifttwi efifrgs ehrema putntai at lr#»H«ntpM, INnnM und & m $ m tiy fisM Minins Corper«i«Ni Parm ARsyi eatpai«N«m(PAein} ana MMtn 0MMft
V -f: \ P
m/%
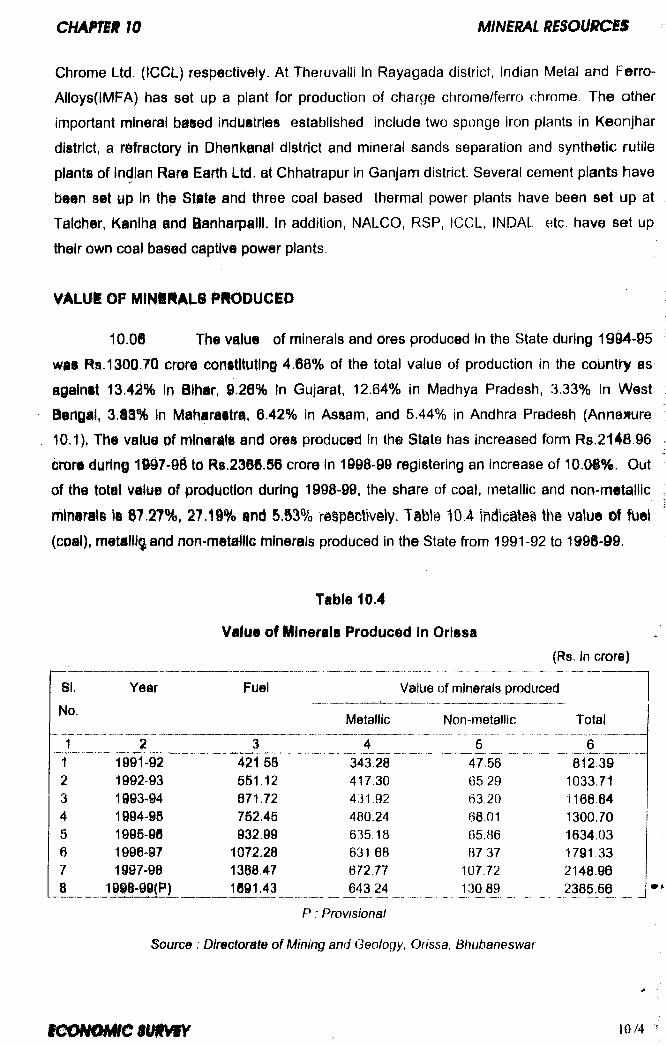
Chrome Ltd. (ICCL) respectively. At Theruvalli In Rayagada district, Indian Metal and Ferro-
Alloys(IMFA) has set up a plant for production of charge chrome/ferro chrome The other
important mineral based Industries established include two sponge iron plants in Keonjhar
district, a rsfrictory In Dhenkanal district and mineral sands separation and synthetic rutile
plants of Indian Rare garth Ltd. at Chhatrapur in Ganjam district. Several cement plants have
been set up In the State and three coal based thermal power plants have been set up at
Taldher, Kanlha and Banharpalll. In addition, NALCO, RSP, ICCL, INDAL etc, have set up
their own coal based captive power plants.
VALUi OP MtNiMALS pmmcm
10.08 The valui of minerals and ores produced in the State during 1904-05
was Rs.1300.70 cror® oonstltutlnf 4.68% of the total value of production in the country as
against 13.4^% in Bihar, 9.26% In Gujarat, 12.64% in Madhya Pradesh, 3.33% in West
iertQil, 3.iS% In Matiaraitra, 6.42% in Assam, and 5.44% in Andhra Pradesh (Annemire
10.1), The valua of minirais and ores produced in the State has increased form Rs.2l46.96
cror® during 1i97-9i to R8.236i.S6 crore in 1998-99 registering an increase of 10.0i%. Out
of the total value of prodUGtion during 1998-99, the share of coal, metallic and non-m«tallic
mlrtirais Is 87.2?%, 21A%% and 5.83% r@§p©ctiv©ly. Tabl© 10.4 indicitei the value of fuel
(coal), m@tatll|and non-metalllc minerals produced in the State from 1991-92 to 1998-99.
Table 10.4
Value of Minerals Produced In Orissa(Rs. in crore)
81.
No.
Year Fuel
Metallic
Value of minerals produced
Non-metallic Total
1 2 3 4 5 6 _1 1991-92 421 58 343.28 47.56 812.392 1992-93 551.12 417.30 65,29 1033.713 1993-94 671.72 431 92 63,20 1166.844 1994-06 752.45 48024 68.01 1300.708 199i-90 932.99 635,18 65.86 1634.036 1996-97 1072.28 631 68 87 37 1791.337 1997-98 1388.47 672.77 107.72 2148.968 IQSa-QQfP) 1091.43 64324 130 89 2385.56
P ; Provisional
Source : Directorate of Mining and Geology, Orissa. Bhubaneswar
lOM
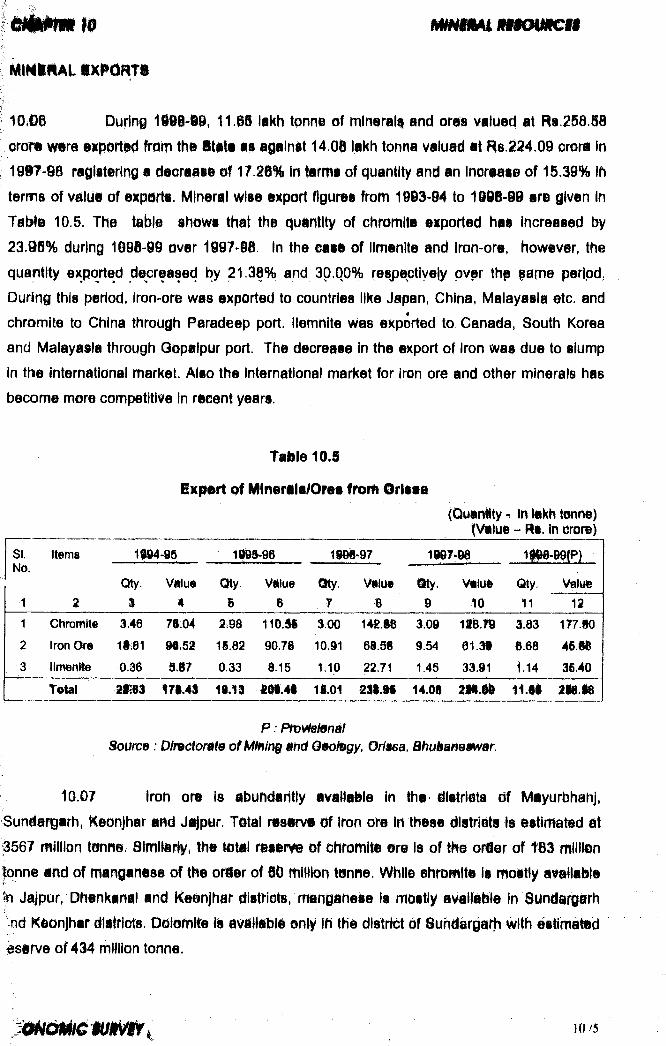
w
10,06 During IS iS -li, 11.16 lakh tqnn® of mln®riil| and orm valued at Rs JSa.SScrora wtr@ exppM from th i Staft as againit 14.0S lakh tonna valuad at Rs J24.09 omra In 1997-98 raglftarlrig a daoraaaa &f 17.18% In larms of quantity and an Incraas© of 16.39% in terms of value of exports. Mineral wise export figures from 1913-04 to 1908-10 are given In TaNe 10.5. The table shows that the quantity of chromite exported has increased by 23.9fi% during 1098-00 over 1097-00 In the case of llmenlte and Iron-ore, however, the quantity exported decreased t3y 21.38% and 30.00% respectively pvpr thp lame period. During this period, Iron-ore was exported to countries like Japan, China, Malayasla etc. and chromite to China through Paradeep port. Ilemnite was exported to. Canada, South Korea and Malayasla through Qopalpur port. The decrease in the export of iron was due to slump in the international market. Also the international market for iron ore and other minerals has become more competitive In recent years.
Table 10.9
ixpdrt of Mlneraia/Ores fmtfi ©rissa
(Quantity - Inlakhtenne) (Value - Pis. In crore)
SI. items i|$ 4 -9 a i^ § ^ 9 e tm ^9 7 1997-91 1#0-9#fP )No.
Qty. Value Qty. VSIue my. N^lue Qty. Qty.
1 2 S 4 B 6 r « 9 ^0 11 12
1 Chromit® 3.46 7S.04 i m 110.SS 3 0 0 14t.86 3 0 9 118.79 3.83 177.S0
2 Iron Ore lSi81 96.51 1S.82 90.78 10.91 68.5S 9.54 0 1 .^ ®.ea 45.88
3 IlmenKe 0.36 S.87 0.33 8.15 1.10 22.71 1.45 33.91 1.14 36.40
Tolal 2tS3 171.41 18.13 1S,01 2 ia .ti 14.0S m M ii.il m M
P :B o rn e : DImctomm o fM M ng m d 0»o/©gy. Onssa, Bhui^amm&r.
10.07 Iron ore Is abundantly available in the-ilstrlits df Mayurbhanj, Sundangarh, Keonjhar a«d Ji pur. Tttal raswvt i f Iron ore in these ilstrlits Is estimated at 3567 million t«nne. 8lmlla»%, the total reserw of chromite tre is of tt*»e orier of t83 million tonne and of manganese of the orier of 80 million tunne. While ehromlte is mostly avellable 'n Jaipur, Dhenkanal and Ketnjhar distrlGts, manganese is mostly avallaWe in iundai garh nd Keonjhar dlstrlofs. oolomte is aviitatjle only In the district of Sundargarh with estfma^d $serve of 434 million tonne.
k

c m m i B MINBIlALIUiOUm&
10.00 th ire are two major coal bearing areas In the State which arc
currintly being ^jiplaltid niitiely Talcher and the lb Valley. The total reserve of coal In these
arias Is istiltiitid to b i 43406 million tonne. Table 10.6 shows distrlctwlse figuris foi
©Kploltatjon and valU® of malor minerals In Orissa for the year 1998-99
Tabla 10 j
Platrt@t#^tii iipiDltatltiti and Value of Major Minerals in Orissa, during(Quantliy - lakh tot (Value - Hi. incr
SI.No.
DIstrfet Ghronnti Coal Dolomite Iron-ore Manganese
Qly. Vi!u» Oty. Value Qty. Value Qty. Value ^ty. V
1 1 1 4 § @ 7 8 9 10 111 Ar^u) - - ass.si 1081.94 - - - - - .
2 DHtnkanal QM 5.S3 - - - • - - -
3 JUlpur 11.31 111 S3 - - - - 2.06 3.09
4 JHargU0Ud« - - 138.09 503.05 - - -
S 141 2S95 - - - m rs 201.28 xm 3
6 Miyuffeftirfj - - - - 1 83 3.09 -
7 itindsfgim - - 6.S2 a6.44 9.S6 19.28 29.51 63.43 1.43
ratal nM i i l j i 414.73 9.8S is.as 110.68 276.21 8.11 4
$Oume: OlmotdratB of Mining end Qeoiogy, Orisse, Bhubaneswar.
10.09 Table 10.6 shows that about 86.6% of chromite is mined form Jajpur
dlitrlut and thi balane® 13.6% from Keonjhar and Dhenkanal districts. Coal Is largely
avallabla in Arigul dIstlPlct (66.7%) and the balance 33.3% Is In Jharsuguda and 8ur»dargarh
districts. Similarly, manganese ore is largely available in Keonjhar district (73.3%) followed
by iundargarh (28.7%). Iron ore Is largely available In Keonjhar district (71.4%) followed by
iundargarh (28.3%), Jajpur (1.8%) and Mayurbhanj (1.6%).
m m m m M L m B o u n m B
10.10 Mining revenue and cess collected during the year 1998-91 stood ai
Rs.315.S6 crore as against Rs.320.34 crore in 1997-98 registering a marginal decrease of
1,37%, Table 10,7 shovys thi trend of revenue receipts from mining sector over the period
10/
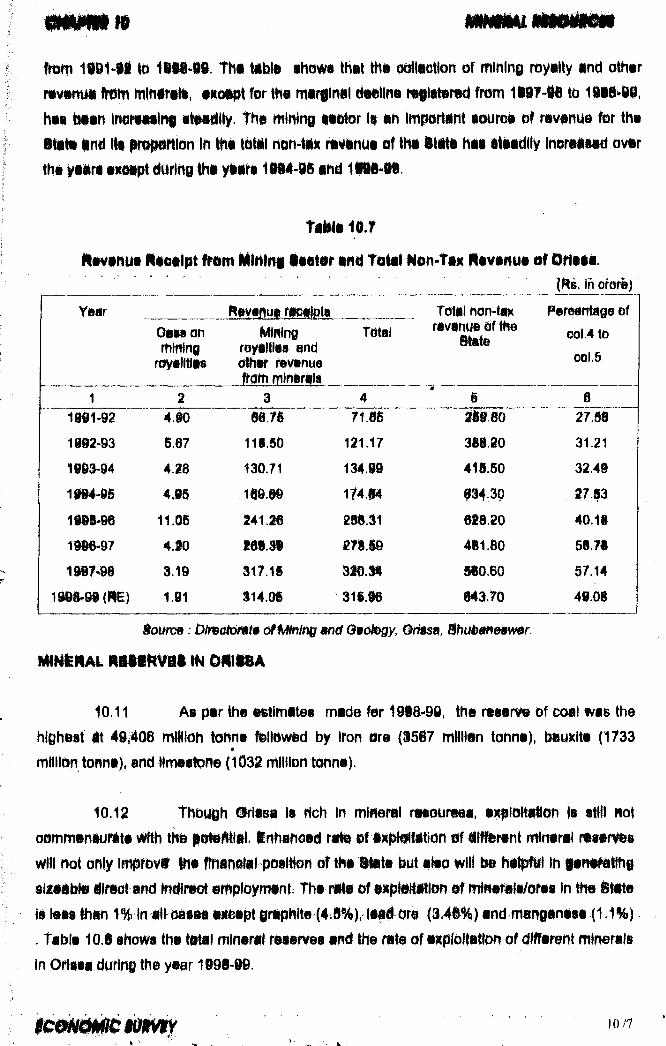
1101-11 to 1 ili*IS . Thi tib li iH0wa that IHn o^liGtlen af minlni myilty and other rtvtm it trim mtYiifiti, tio ip im r m m tfftrtil itifln fi from to isis*di,h it foiin (namaiinf t iiiillv . Thi mining l| «h impHint mum &f m¥»nu$ ter the itilK ih i III rap@rtlon In the totil h&h- t«K mvenue af iHi I t i t i h i! •tiiillly In ire iiiil ovir the y iir i except during tNe yeera 1@94-9S and 1ida-l@.
Taife mdevenite He@elpt MlNlrii ieil@r end T«ilat Nun-tax Revenue of 3rieaa.
|fts. Inchif®)
Year ^evgnui rieitoti
@ei8 0fi rfilrMni
rsyallttes
Minine rayiltlas and other revertue
1
Tital
4
Total rion-tax ravanue of the
Stit©
Pereantaie of eol.4 to
col.8
1061-92
1ie2>93
1333-94
im - m
1I3S*96
1i36>97
4J0
5J7
4J8
4 J6
11.05
4.10
3.19
1.91
m .n
Ili.SO
130.71
t41.16
71.ee
121.17
134.99
1?4.^
2^.31
S l7 .il
$14.0§
B$0 M
31i.l6
$18.20
415.60
P4-3P
m $ 2 0
411.80
510.60
843.70
27.08
3i.ai
32.49
27.S3
40.1i
§8.7a
57.14
49.08
Boarm: Dimatomm of M nir^ m i Qtote^y, #/fisa, Biubmmmr.
m m m i m $ m m $ m
10.11 As per the estimates made ^ r I9i8«98, the reserve of coai was the highest at 49|4(% mWidh tonne Hitiv^d by iron ore (3SI7 mtllitn tonne), ^uxite (1733 mftilon tonne), and imeitone (1032 million tonne).
10.12 though ©riasi is Hch in minepal n^oureea, ejipliltiHlon Is stiti not oimmenaurate with the ^o^Mal. Inhanoed ra^ of ei^fettfftidn t f ii^ re n t rr nerai msenfes v\rtli not only improvt Ihe flnaneial position of the i^ te tout aieo will ie hi^W ih fen^atlhi
lire# and Nidii ot «mployment The pale of iipleitation i f m temla/orea in the Slate ii leas iian 1% in alfoaaea ei^ept irapwte (4.8%), lead ore ($M%) and manganese (1.1%) . Table 10.8 shows the tetal mineral reierves and the rate of exploitation of differem minerals in OHsaa durini the year 1998-0i.
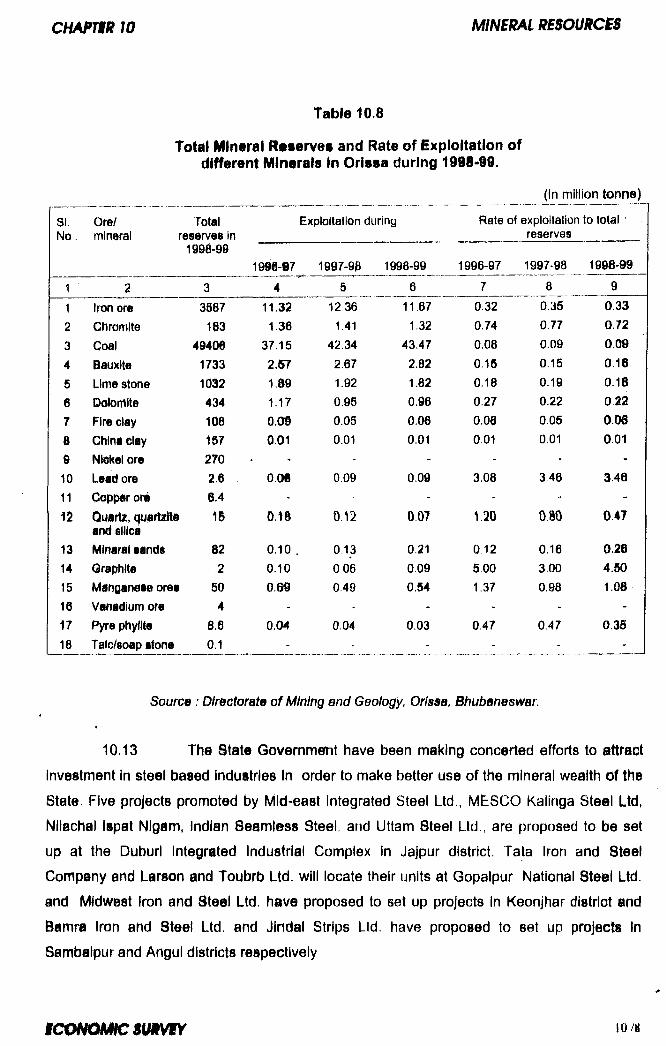
CHmSR w MINERAL mouncm
78 d 10 11 12
131415161718
Total Mln«ral deserves and Rate of ixploitatlon of different Mlrterals In Orissa during
(in million tonne)
SI. Ore/No. mineral
Total res9rv@8 in 1 @98-98
Exploitation during
1918-07 1997-98 1998-99
Rate of exploitation to total ' ___________ reserves___________
1996-97 1997-98 1998-99
Iron oreChromiteCoalBauxiteLime stoneDotomiteFine clayChina elayNiekel oreLead oreCopptr or®Quirtz, quartilti and silicaMinarai sandsOraphiteManganese oresVanadium orePyre phyllteTalc/soap stone
3S87183
494061733
10324341081572702.66.4
15
822
504
8.60.1
11,321.36
37.152.571.091.17O.OS0.01
0.0§
0.18
0.100.100,6i
0.04
12361.41
42.342.671.920.980.050.01
0.09
0.12
0 13 0.06 0.49
0.04
11.671.32
43.472.821.820.960.060.01
0.09
0.07
0.210.090.54
0.03
0.320.740.080.150.180.270.080.01
3.08
1.200 12 5.00 1.37
0.47
80.350.770.090.150.190.220.050.01
346
0.80
0.163.000.98
0.47
0.33
0.72
0.09
0.16
0.18
0J20.0§
0.01
3.46
0.47
0.26
4.00
1.08
0.36
Source : Directorate of Mining and Geology, Orissa, Bhubaneswar
10.13 The State Governm^t have been making concerted efforts to attract
investment in steel based industries in order to make better use of the mineral wealth of the
State. Five projects promoted by Mid-east integrated Steel Ltd., MESCO Kalinga Steel Ltd,
Nllachal Ispat Nigam, Indian Seamless Steel, and Uttam Steel Ltd., are proposed to be set
up at the Duburl Integrated Industrial Complex in Jajpur district. Tata Iron and Steel
Company and Larson and Toubrb Ltd. will locate their units at Gopalpur, National Steel Ltd.
and Midwest Iron and Steel Ltd. have proposed to set up projects in Keonjhar district and
Bamra iron and Steel Ltd. and Jindal Strips Ltd. have proposed to set up projects In
Sambalpur and Angul districts respectively
g c o m m c s m m 10/H
m r n i m t i m m m m m m m
10.14 The itat® Qovsmment have decided to allow leasing of captive mines
to the Iron and steel projects being set up In the State. Five projects, promoted by Tata Iren
and Steel Company, Larson and Toubro Ltd., Mideast Intlgrated Steel Ltd., Nllachal Ispat
Nlgam Ltd., and Uttam Steels Ltd., have been recommended for grant of such leases. The
Central Goyernfpent (laye so fv cqorclecl qppiroyal for leasing of captive mines to one such
project namely Mideast Integrated Steel Ltd.
10.15 During 1998, the State Government have formulated a Gemstone
Policy for promoting exploration and exploitation of gemstone resources in a scientific and
systematic manner. The Policy, inter alia, envisages steps for prevention of illegal trading
and theft of gemstones, opening of the gemstone bearing areas to private sector exploitation,
and introduction of a scheme of Issuing trading licenses to parties dealing with gemstone
resources. Out of 2d gtmstorte beirit\g tricfe in IH© Stat©, tracts have b ^ n
developed so far and opened for regrant of mining leases.
m ummQ mm mmmrmoi si#r©R
10.16 According to the 1S91 eensus, the number of f»ereons eagiged in
mining and ijuarrying acllvltiei iw ©ritsa was 1,01,247 as afalnst 71,042 In 1®81 milsftrlhg
a growth of 41%. This tncludes persons dimctly or indirectly engaged in both major and
minor mineral aitls tles. Tabte 10.9 shows that the direct employment In major mlweml
activities has been sho\Mng a ^eclinttig trend. T»!e number of workers engaged iirectly tn
major mineral activities has declined form 08,§86 in 1991-92 to 88448 dyring 19i8-t9
showing a decrease of IS. 16% over the piriod. The decrease In employment la attributed In
part to Induction of higher techholoQy and autematlon in mineral exploitation.
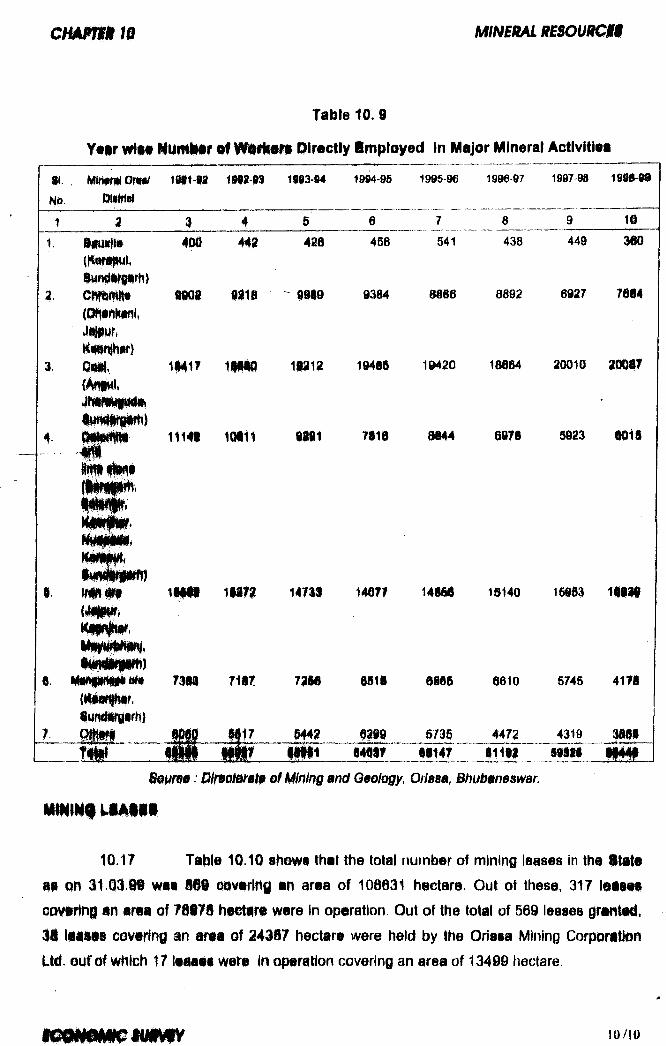
Tatile 10. 9
Y w v r t f i WumlHIr P lr tc tly Im r ilo y e d »n M ajo r M ineral Actlvltlea
9i. . Mifitmiomi/ iw i- ta m ^ M 1994-0S 1995-96 1990-97 1997-90 lasB-ia
tip OlslHei
7.
2 6
1. anuxit*(Karapui, Sund«f9«rh)
a. ChmmHtt(OHtnMnI,Jai»ur, KasNhar)
t Qaat.
400 m
99QI 8118
410
mm
456
9384
541
8886
1 _ 438
8892
1@
449 m
6927 7614
1|41f i p i l 1 l i ia 18485 19420 18864 20010 2Q0(}7
iMft ruarti)i^ liM
IW ll l lW
111« 1M11 tasi rite a«44 aS78 5B83 S01S
tlfiiminitfi r n m m \rm m i
m i l l i i f i 14719 14677 148ii 19140 159S3 t( |l||
ft. 73 r m(tlaa^ar,SurularQ rh)
8817
7286
8442
8818
6289
@865
5736
6610
4472
5745 4178
4319 3888
m . i lW l m t f W I1 M8IT 18147 m i l 88111 I P #
it^m a ‘ OlmtQmt» of Mining and Geology, Orissa, BhubanBswar.
10.17 Tatile 10.10 shawa that the total numljer of mining leases in the itata
aa m 31.Q3.I® waa S®i ©©varing an area of 108631 hectare. Out of these, 317 leaaaa
GO¥irlni an area of TftllS haetire ware in operation Out of the total of 569 leases granlart,
I I I§aai8 covering an araa of 243ST hectare were held by the Oriasa Mining CorpDratlen
Itii. out' of which 17 iaaaas wefa In operation covering an area of 13496 fiectare
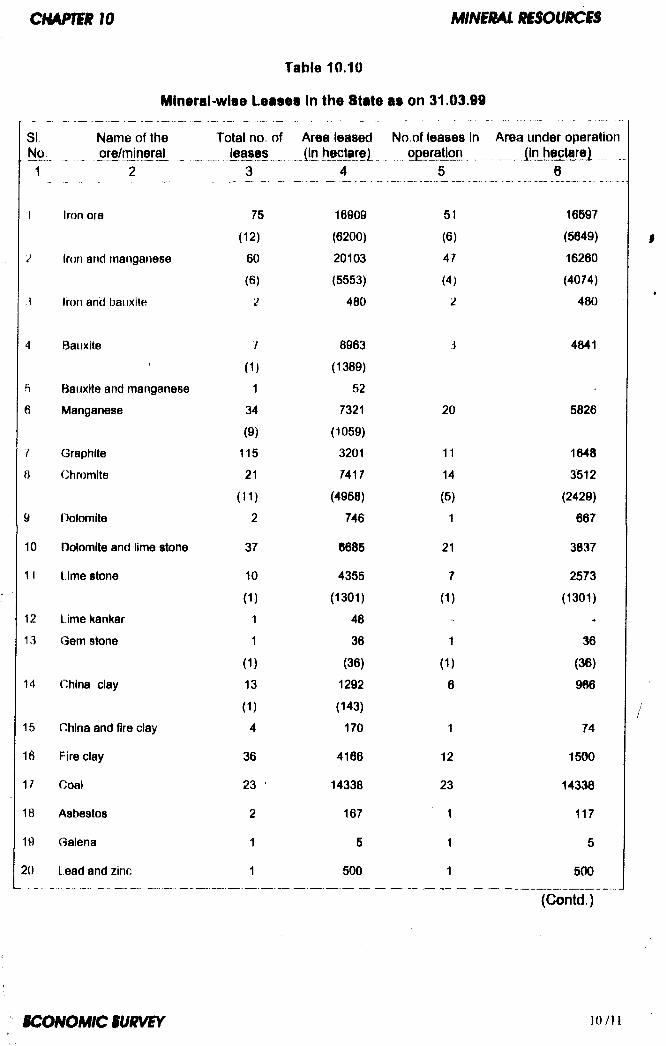
CHAFmiO M iN s im m o u K s s
Mineral-wise Leases in the State as on 3 1 .0 3 J 9
SI Name of the Total no. of Area leased No.of leases in Area under operatNo ore/mineral leases (In hectare} operation (In heqtare)
1 2 3 4 5 6
1 Iron ore 75 16909 51 16597
(12) (6200) (6) (5649)
2 Iron and manganese 60 20103 47 16260
(6) (5553) (4) (4074)
Iron and bauxite 2 480 2 480
4 Bauxite 1 8963 3 4841
■ (1) (1389)
5 Bauxite and manganese 1 52 -
6 Manganese 34 7321 20 5826
(9) (1059)
7 Graphite 115 3201 11 1648
8 Chromite 21 7417 14 3512
(11) (4958) (8) (2429)
9 Dolomite 2 746 1 667
10 Dolomite and lime stone 37 6685 21 3837
11 lim e stone 10 4355 7 2573
(1) (1301) (1) (1301)
12 Lime kankar 1 48
13 Gem stone 1 36 1 36
(1) (36) (1) (36)
14 China day 13 1292 6 966
(1) (143)
15 China and fire clay 4 170 1 74
16 Fire clay 36 4166 12 1500
17 Coal 23 ■ 14338 23 14338
18 Asbestos 2 167 1 117
19 Galena 1 5 1 5
20 Lead and zinc 1 500 1 500... ______ __ _ __ ______ , _____ _______ .. ____
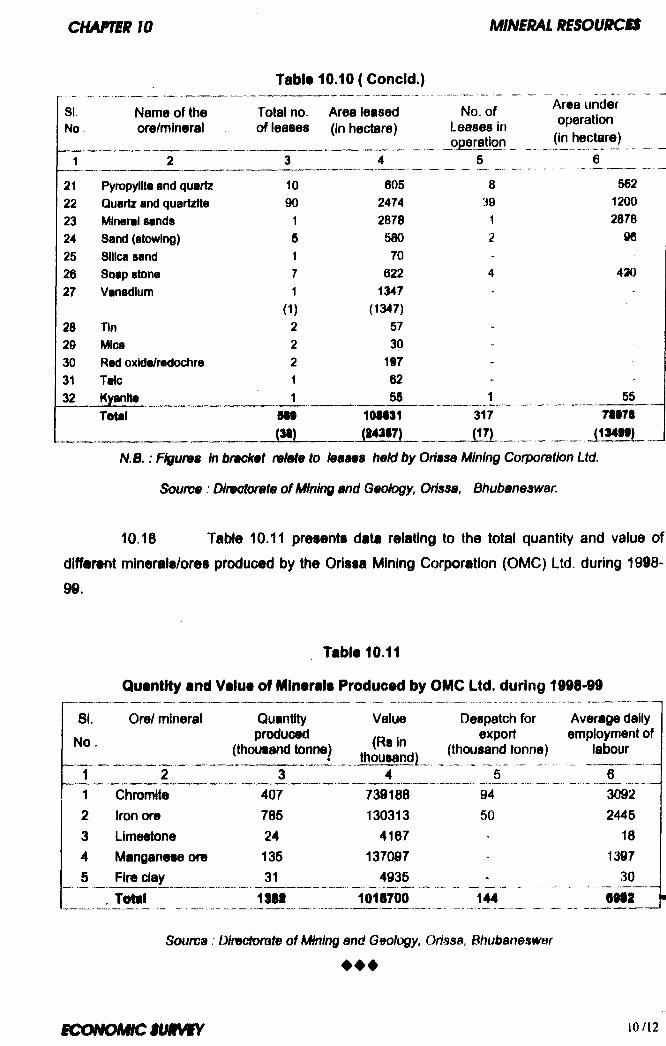
Table 10.10 (Concld.)
SI. Name of the Total no. Area leased No. ofNo ore/mineral of leases (in hectare) Leases in
operation1 2 3 4 5
21 Pyropylite and quartz 10 605 822 Quartz and quartzlte 90 2474 3923 Mineral sands 1 2878 124 Sand (stowing) 5 580 225 Silica sand 1 70 -26 Soap stone 7 622 427 Vanadium 1 1347 -
(1) (1347)28 Tin 2 57 >29 Mica 2 30 •30 Red oxide/redochre 2 197 -31 Talc 1 62 -32 Kyanite 1 55 1
Total MB lOtSii 317.. m . .... ........M m . _
Area under operation (in hectare)
56212002878
96
430
557M7I
(134H)N.B.: Figuns in bmcM mM9 to /eas«s h@ld by Orissa Mining Corporation Ltd.
S ourm : Dirwstorate of Mtnifm and Qeoiogy, Orissa, Bhubaneswar.
10.18 Table 10.11 presents data relating to the total quantity and value of different minerals/ores produced by the Orissa Mining Corporation (OMC) Ltd. during 1998-
99.
Table 10.11
Quantity and Value of Minerals Produced by OMC Ltd. during 1998-99
SI.No
Ore/ mineral Quantity produced
(thousand tonne)
Value(Rs in
thousand)
Despatch for export
(thousand tonne)
1 2 3 4 .....1 Chromite 407 739188 942 Iron ore 785 130313 503 Limestone 24 4167 ■4 Manganese ore 135 137097 *5 Fire clay 31 4935 -
. Total 1SS1 1018700
Sounca: Dimctorate of Mining and Goology, Orissa, Bhubaneswar
Average daily employment of
labour
6__30922445
181397
_ 3 06912
♦ ♦ ♦
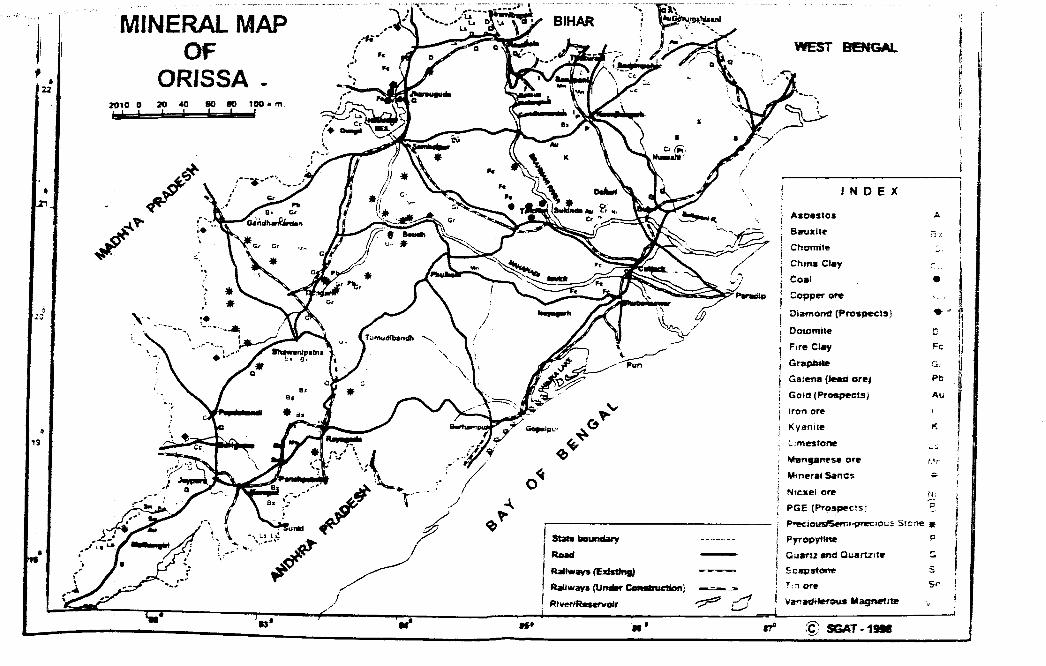
IS
MINERAL MAP
ORISSA .2010 0 * too k *n
BIHAR
Fc
«c"o 0 W S T
\ ”
u, <:
> • * '
Gandhan iirdan
NJ / OdtM
I Ay H.
\ I N D E X
*
*
t BwmII*
/
! Tumudlbantfli
A
\7 \
\
sFart
o
boundaryR o a d
RaHw» (E3d^^R a l iw a ^ s ( U n d e r C o m t e iu e t im )
Rlv«f«*Rcsefveir
A s o e s t o s
B a u x i t e
C h O T i i t e
C h in a C ia y
C o a l
P sTB iitp j C o p p e r o r e
j O ia f n o n d ( P r o s p e c t s )
j D o io m i t e
I F i r e Ctay j G ra .| :^ ii« e
G a f e n a { ) e * d o r e )
I G o ld ( P r t w p e c l s )
I I r o n o r e
i K y a n i t eii L im e s t o n e
; M a n g a n e s e o r e
; M i n e r a l S a n t i s ^
i N ic :n e i o r e >'4-,
’ P G E ( P r p s p e c t s ]
Pwecious^Semnprecious Stcne
P y r o p y f t t t e ^
— I Q u a r u « t d Q u a r t z i t e C
“ j S capstone 5^ i T ; n o r e
\ V a n » d ' f t e r o « * l i a « p w t t ' t e
»7* SiftT-tSSi
Pb
Au
Mr
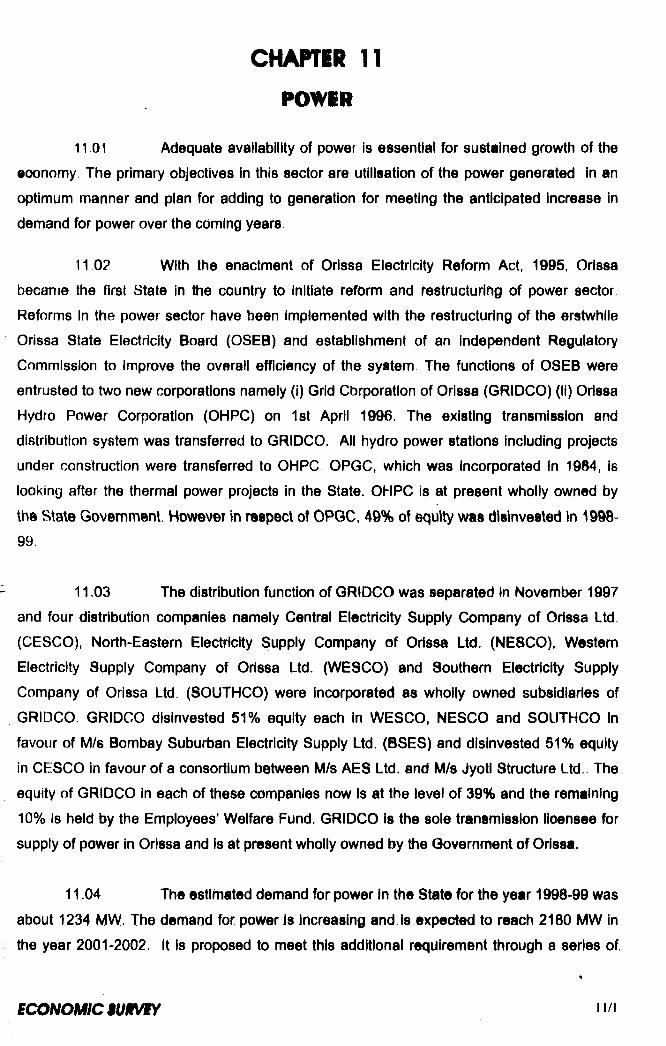
CHAPTIR 11
POWIR
11 01 Adequate availability of power is essential for sustained growth of the
eoonomy. The primary objectives in this sector are utilisation of the power generated in an
optimum manner and plan for adding to generation for meeting the anticipated increase in
demand for power over the coming years.
11 02 With the enactment of Orissa Electricity Reform Act, 1995, Orissa
became the first State in the country to Initiate reform and restructuring of power sector.
Reforms In the power sector have been Implemented with the restructuring of the erstwhile
Orissa State Electricity Board (OSEB) and establishment of an independent Regulatory
Commission to improve the overall efficiency of the system The functions of OSEB were
entrusted to two new corporations namely (i) Grid Cbrporatlon of Orissa (GRIDCO) (li) Orissa
Hydro Power Corporation (OHPC) on 1st April 1996. The existing transmission and
distribution system was transferred to GRIDCO. All hydro power stations including projects
under construction were transferred to OHPC OPGC, which was Incorporated In 1984, is
looking after the thermal power projects in the State. OHPC is at present wholly owned by
the Stale Government. However in respect of OPGC. 49% of equity was diilnvested in 1998”
99.
11.03 The distribution function of GRIDCO was separated In November 1997
and four distribution companies namely Central Electricity Supply Company of Orissa Ltd
(CESCO), North-Eastern Electricity Supply Company of Orissa Ltd. (NE8C0), Western
Electricity Supply Company of Orissa Ltd. (WESCO) and Southern Electricity Supply
Company of Orissa Ltd. (SOUTHCO) were incorporated as wholly owned subsidiaries of
GRIDCO. GRIDCO disinvested 51% equity each in WESCO. NESCO and SOUTHCO In
favour of M/s Bombay Suburban Electricity Supply Ltd, (BSES) and disinvested 51% equity
in CESCO in favour of a consortium between M/s AES Ltd. and M/s Jyotl Structure Ltd.. The
equity of GRIDCO in each of these companies now Is at the level of 39% and the remaining
10% is held by the Employees’ Welfare Fund. GRIDCO is the sole transmission licensee for
supply of power in Orissa and Is at present wholly owned by the Government of Orissa.
11.04 The estlhiated demand for power In the State for the year 1998-99 was
about 1234 MW. The demand for power Is increasing and is expected to reach 2180 MW in
the year 2001-2002. It Is proposed to meet this additional requirement through a series of
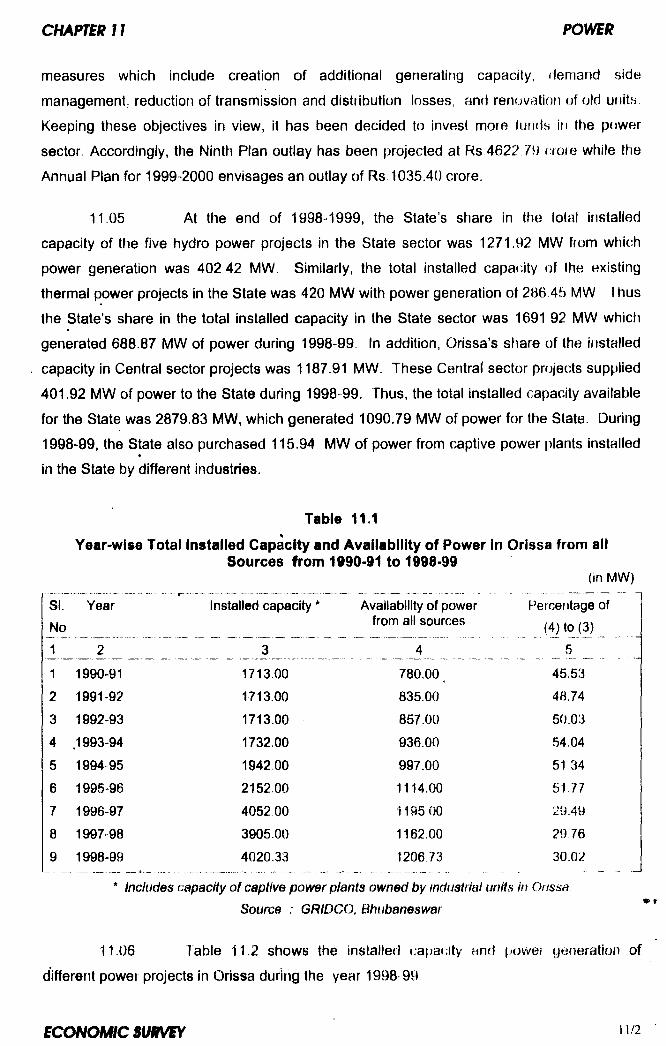
measures which include creation of additional generating capacity, demand side
management, reduction of transmission and distribution losses, and renovatiofi of old units.
Keeping these objectives in view, it has been decided to invest more funds \n the power
sector. Accordingly, the Ninth Plan outlay has been projected at Rs 4622 79 crore while the
Annual Plan for 1999 2000 envisages an outlay of Rs. 1035.40 crore.
11.05 At the end of 1998-1999, the State’s share in the total installed
capacity of the five hydro power projects in the State sector was 1271.92 MW from which
power generation was 402.42 MW. Similarly, the total installed capacity of the existing
thermal power projects in the State was 420 MW with power generation of 286 45 MW 1 hus
the State’s share in the total installed capacity in the State sector was 1691 92 MW which
generated 688.87 MW of power during 1998-99. In addition, Orissa’s share of the installed
capacity in Central sector projects was 1187.91 MW. These Centraf sector projects supplied
401.92 MW of power to the State during 1998-99. Thus, the total installed capacity available
for the State was 2879.83 MW, which generated 1090.79 MW of power for the State. During
1998-99, the State also purchased 115.94 MW of power from captive power plants installed
in the State by different industries.
TabI® 11.1
Year-wise Total Installed Capacity and Availability of Power in Orissa from allSources from 1990-91 to 1998-99
(in MW)
SI.No
Year Installed capacity * Availability of power from all sources
Percentage of W to(3)
± _ 2 3 4 5
1 1990-91 1713.00 780.00 ^ 45.532 1991-92 1713.00 835.00 48.74
3 1992-93 1713.00 857.00 50.034 .1993-94 1732.00 936.00 54.04
5 1994 95 1942.00 997.00 51 34
6 1995-96 215200 1114.00 51.77
7 1996-97 405200 1195 00 29.49
a 1997 98 3905.00 1162.00 29.769 1998-99 4020.33 1206 73 30.02
* Includes capacity of captive power plants owned by industrial units in Onssa Source : GRIDCO. Bhubaneswar
11.06 Table 11.2 shows the installed capa(;ity and power generation of
different power projects in Orissa durirtg the year 1998 99

c m m i i 1 1 POWSK
Installed Capacity and Power Generation of different Power ProjectsIn Orissa during 1998-99
( In MW )
SI No PowerProjects
Installedcapacity
State’s share in Installed
capacity (%)
State’s share in installed capacity
State’s share in power
generation
1 2 3 4 5 6
A STATE SECTORa) Hydro Power Projects.
i) Hiraknd 307 SO 100.00 307 50 135 29
ii) Balimela 360.00 100.00 360 00 88.B8ill) Machhakunda 114,75 30.00 34 42 27.97IV) Rengali 250.00 100.00 250.00 101.57
V) Upper Kolab 320.00 100.00 320.00 48.71
Total a 135^25 1271.M 402.42
h) Thermal Power Projects
lb 1 & II 420.00 100.00 420.00 286.45Total b 420.00 100.00 420.00 286.45
Total A ( a + b ) 1772.25 1691.92 688.87
B.i)
CENTRAL SECTORFarakka 1100.00 20.69 227 59 44.69
ii) Kahalgaon 630.00 22.02 138.74 29.33ill) Kaniha 1000.00 30.95 309.50 77.72iv) Chukha 336.00 15.50 52.08 27.02
V) TTPS - 1 & II 460.00 100 00 460.00 131.82
Total B 3526.00 1187.91 401.92
Total (A-t>B) 5298.25 2879.83 1090.79
Source : GRIDCO, Bhubaneswar.
11.07 Table 11.3 Indicates the installed capacity of captive power plants
owrned by industrial units located in Orissa.
\
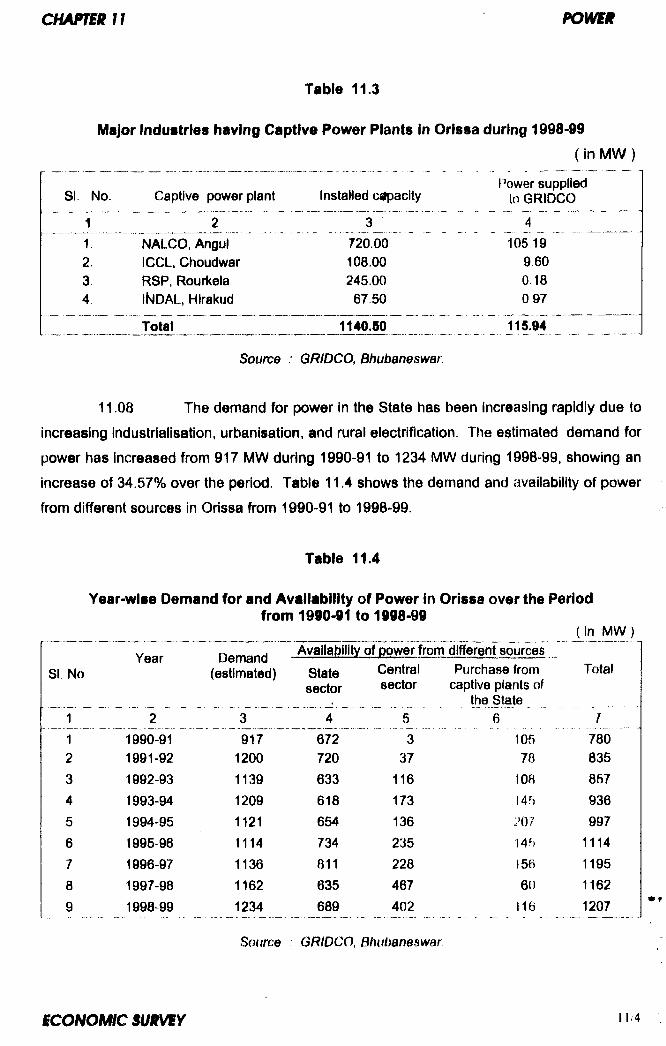
Table 11.3
Major Industries having Captive Power Plants in Orissa during 1998-99
( in M W )
Power suppliedSi- No. Captive power plant instaHed cfltpacity to GRiDCO
1 2 3 4
1. NALCO.Angul 720.00 105 192. iCCL, Choudwar 108.00 9 603 RSP, Rourkeia 245.00 0.184 INDAL, Hlrakud 67.50 0 97
Total 1140.50 115.94
Source : QRIDCO, Bhubaneswar.
11.08 The demand for power in the State has been increasing rapidly due to
increasing industrialisation, urbanisation, and rural electrification. The estimated demand for
power has increased from 917 MW during 1990-91 to 1234 MW during 1998-99, showing an
increase of 34.57% over the period. Table 11.4 shows the demand and availability of power
from different sources in Orissa from 1990-91 to 1998-99.
Table 11.4
Year-wise Demand for and Availability of Power In Orissa over the Periodfrom 1990-91 to 1998-99
_____________________________________________ ( in MW )Year Demand Availability of power from different sources
No (estimated) Statesector
Centralsector
Purchase from captive plants of
the State
Total
1 ~ 2 " 3 4 5 6 71 1990-91 917 672 3 106 7802 1991-92 1200 720 37 78 8353 1992-93 1139 633 116 108 8574 1993-94 1209 618 173 I4fi 9365 1994'95 1121 654 136 207 9976 1995-96 1114 734 235 145 11147 1996-97 1136 811 228 156 11958 1997-98 1162 635 467 60 11629 1998-99 1234 689 402 116 1207
Source GRIDCO, Bhubaneswar
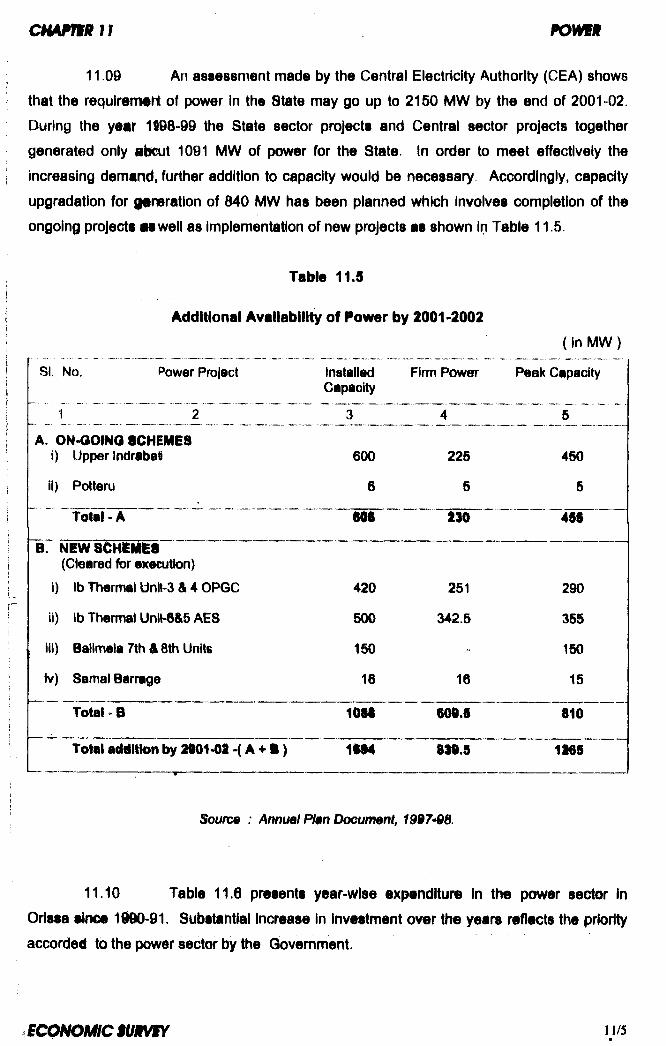
11 09 An astessment mad© by the Central Electricity Authority (CEA) shows
that the requiremtrt of power in the State may go up to 21 SO MW by the end of 2001-02.
During the year 1198-99 the State sector projects and Central sector projects together
generated only a ^ t 1091 MW of power for the State. In order to meet effectively the
increasing demand, further addition to capacity would be necessary. Accordingly, capacity
upgradation for gansration of 640 MW has been planned which Involves completion of the
ongoing projects aawell as implementation of new projects as shown in Table 11.5.
Table 11.5
Additional Availability of Power by 2001-2002( in MW)
SI, No, Power Project InstalledCapacity
Firm Power Peek Capacity
_ - ... ~ 3 5
A. ON-OOING SCHEMESi) Upper Indrabali 600 225 450
ii) Potteru 6 5 5
Total-A m m m
B. NEWSHKiMtS(Cleared for executton)
1) lb Thermal Unlt-3 & 4 OPGC 420 261 290
ii) lbThemialUnit-6&§AES 500 342.6 355
iii) Balimela 7th & 8th Units 150 150
Samal Barrage 16 16 15
Total - B 1081 60d.9 810
Total addition by 2t01-02 >( A + i )l_, -—---------- ------------ —t "" ——.. .
1iS4 8^.9 1169
Source : Annual Plan Doeumant, 1997*98.
11.10 Table 11.6 presents year-wise expenditure in the power sector in
Orissa alnea 1980-91. Substantial increase in investment over the years redacts the priority
accorded to the power sector by the Govemmeht,
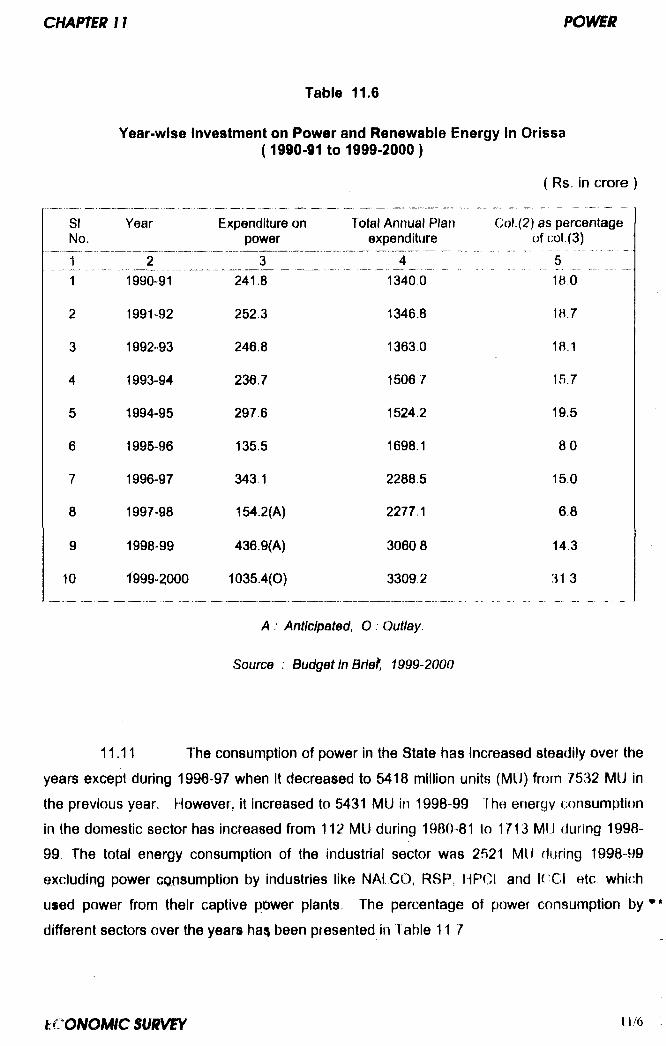
Table 11.6
Year-wise Investment on Power and Renewable Energy in Orissa (1990-91 to 1999-2000 )
( Rs. in crore ]
SINo.
Year Expenditure on Total Annual Plan Col.(2) as percentage power expenditure of col (3)
1 2 3 A 51 1990-91 241,8 1340.0 1B0
2 1991-92 252.3 1346.8 18 7
3 1992-93 246.8 1363.0 18 1
4 1993-94 236.7 1506 7 15.7
5 1994-95 297.6 1524.2 19.5
6 1995-96 135.5 1698.1 80
7 1996-97 343.1 2288.5 15,0
8 1997-98 154.2(A) 2277 1 6.8
9 1998-99 436.9(A) 3060.8 14.3
10 1999-2000 1035.4(0) 3309.2 31 3
A : Anticipated, 0 Outlay
Source : Budget In Brief, 1999-2000
11.11 The consumption of power in the State has Increased steadily over the
years except during 1996-97 when It decreased to 5418 million units (MU) from 7532 MU in
the previous year. However, it increased to 5431 MU iti 1998-99 The energy consumption
in the domestic sector has increased from 112 MU during 1980-81 to 1713 MU during 1998-
99. The total energy consumption of the industrial sector was 2521 MU during 1998-99
excluding power consumption by industries like NAt CO, RSP, HPCI and ICCI etc which
used power from their captive power plants. The percentage of power consumption by* *
different sectors over the years ha been presented in Table 117
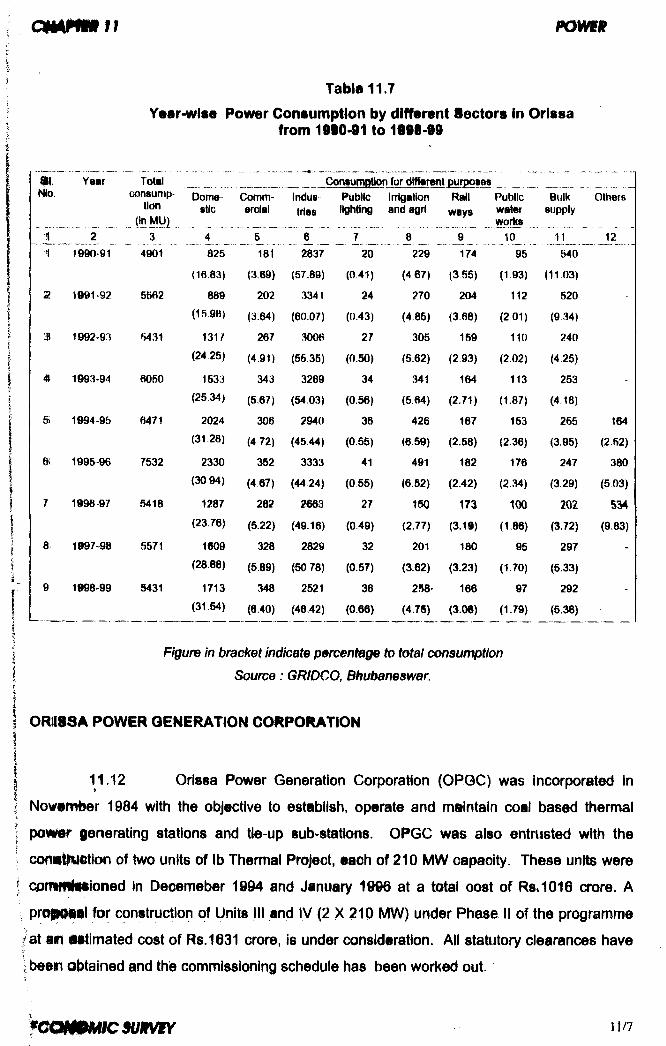
c r n m m n p o m u
Year-wise Power Contumpllon by different Sectors in Orissa from 1910-91 to 1999-99
m . Year NIo.
1 _____ ^ _1 1990*91
2 1901-92
3 1992-93
4 1993-94
5 1994-95
» 1995-96
7 1996-97
8. 1997-98
9 199899
Totalconsump
tion(InMUJ
4901
5562
5431
6050
ConsumBtion for cUffarent purpoaesDome- Comm-
stic ercialIndus Public tries
6471
7532
5418
5571
5431
4 _825
(16.83)
889(1698)
131/ (24 25)
1533
(25 34)
2024(31.28)
2330
(30 94)
1287
(23.76)
1609(28.B8)
1713(31.54)
181
(3.69)
202
(3.64)
267
(4.91)
343
(5.67)
306
(4 72)
352
(4 67)
282
(5.22)
328
(5.89)
348
(0.40)
1 _ 2837
(57.89)
3341
(60.07)
3006
(55.35)
3269
(54.03)
2940
(45 44)
3333
(44 24)
2663
(49.16)
2829
(50 78)
2521
(46.42)
L _ 20
(0.41)
24
(0.43)
27
(0.50)
34
(0.56)
36
(0.55)
41
(0 55)
27
(049)
32
(0.57)
36
(0 .66)
In^atlon and agri
B _ 229
(467)
270
(485)
305
(5.62)
341
(5.64)
426
(6.59)
491
(6.52)
150
(2.77)
201
(3.62)
2S8-
(4.76)
Railways
9174
(355)
204
(3.68)
159
(2.93)
164
(2.71)
167
(2.58)
182
(2.42)
173
(3.1f)
180
(3.23)
166
(3.00)
Publicwaterworks
Bulksupply
Others
10 11 1295 640
(193) (11 03)
112 520
(2 01) (9.14)
110 240
(2.02) (4,25)
113 253 -
(1.87) (418)
153 255 164
(2.36) (3.95) (2.52)
176 247 380
(2.34) (3.29) (503)
100 202 534
(1.86) (3.72) (9.83)
95 297 -
(1.70) (5.33)
97 292 -
(1.79) (5.38)
Figure in bracket indicate p^rcen^ge to total consumption Source: GRIDCO, Bhubaneswar.
ORISSA POWER GENERATION CORPORATION
11.12 Orissa Power Generation Corporation (OPGC) was incorporated in
November 1984 with the objective to establish, operate and m&lntain coal based thermal
po¥i«r leneratlng stations and tie-up sub-stations. OPGC was also entrusted with the
conwlNitlon of two units of lb Thermal Project, each of 210 MW capacity. These units were
j qpfwuNwiloned In Decemeber 1994 and January 1996 at a total cost of Rs*1016 crore. A
* pr@|^al for construction of Units III and IV (2 X 210 MW) under Phase II of the programme
/a t am (ittimated cost of Rs.1631 crore, Is under consideration. All statutory clearances have
; been obtained and the commissioning schedule has been worked out.
^ c m m y n c B u iM Y 11/7

ORISSA HYDRO POWER CORPORATION
11.1v3 Orissa Hydro Power Corporation (OHPC) has been in o[)eration since
April 1996. Under the Electricity Reforms Act, Government of Orissa has transferred the
existing and ongoing hydropower projects to the control of OHPd I he Corporation is
monitoring the execution and completion of two on going projects namely Upper Indravati
Hydel Project (4 x 150 MW) and Poteru Small H, E Project (2 X 3 MW) OHPC has also
undertaken the renovation and modernisation of old hydel power stations of Hirakud and
Chipilima. An outlay of Rs.132.15 crore has been proposed in the Annual Plan for 1999-2000.
GRID CORPORATION OF ORISSA
11.14 Improvement of transmission and distribution network has been taken
up by GRIDCO to minimise technical and commercial losses. A number of short term and
long-term measures have been contemplated. The short-term measures include augmenting
disthbution transformer capacity, installation of capacitors, balancing of loading arrangement,
and installation of express feeders. The long-term measures include increasing the number
of disthbution systems and upgrading 33 KV system to 132 KV and 11 KV system to 33 KV.
Adoption of a low tension loss distribution system through the use of small capacity single
phase distribution transformers is an important activity to be taken up to improve voltage
levels at the consumer level and to reduce both technical and non technical losses
substantially.
DISTRIBUTION COMPANIES
11.15 The distribution functions of GRIDCO have been transferred to four
distribution companies namely (i) Cerijral Electricity Supply Company of Orissa Ltd.
(CESCO), (ii) North-Eastern Electricity vSupply Company of Orissa Ltd (NESCO), (iii)
Western Electricity Supply Company of Orissa Ltd (WESCO) and (iv) Southern Electricity*'
Supply Company of Orissa Ltd. (SOUTHCO), The area of operation of the four distribution
companies extends to the districts listed against eacfr
CESGO Puri, Khiirda, Nayagarh, Cuttack, Kendrapara, JagatsinghpurDhenkanal and Angul
NESCO Jajpur, Bhadrak, Balasore, Mayurbhanj and Keonjhar.
WESCO Sambalpur, Sundargarh, Baragarh, Jharsuguda, Bolangir,Sonepur, Kalahandi, Nuapada and Deogarh.
4 SOUTHCO Ganjam, Gajapati, Boudh, Kandhamal, Nabarangpur,Koraput, Rayagada and Malkangiri
PRIVATE SECTOR POWER PROJECTS
11 IB It has been planned to add additional generating capacity by
supporting two thermal power projects in the private sector; (I) AES lb Valley Corporation
Units V and VI (500 MW) and (ii) Kalinga Power Corporation Ltd (KPCL) Units I and II at
Ouburi (500 MW). It is expected that one unit of each project will be commissioneci by March
2002. Two mega projects, one by Consolidated Electric Power Asia (CEPA) at Hirma (4320
MW) and another by NTPC at Talcher (2000 MW) are also on the anvil. When implemented
these two projects are likely to generate power during the Tenth Plan period, for supply to
neighbouring states.
RURAL ELECTRIFICATION
Village Electrification
11.17 Out of 46,989 inhabited villages In the State, 34,442 villages have
been electrified by the end of 1998-99, representing a coverage of 73.30%. It is proposed to
electrify 6000 villages by conventional methods and the remaining villages by non-
conventional methods during the Ninth Plan period with an Investment of about Rs.220 crore.
During 1999-2000. it was planned to electrify 2,183 villages In the State. It Is expected that
once electrification is completed, private distribution companies will lend commercial viability
to the rural electrification schemes through cross subsidisation to the extent permitted by the
Orissa Electricity Regulatory Commission.
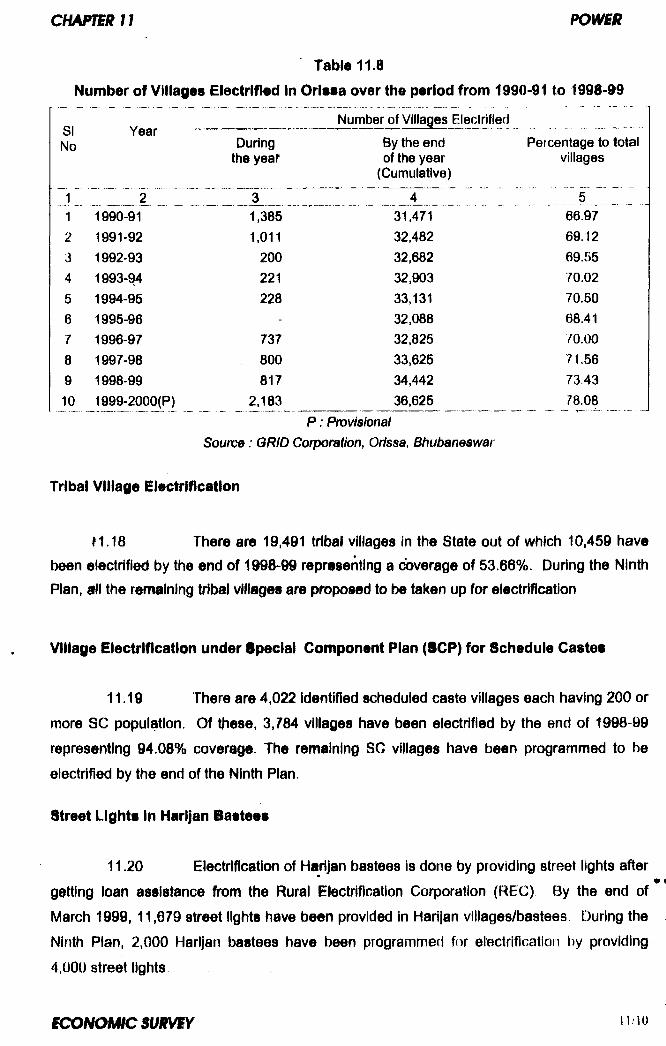
Table 11.8
Number of Villages Electrified In Orissa over the period from 1990-91 to 1998-99
SiNo
Number of Villages ElectrifiedYear
During the year
By the end of the year
(Cumulative)
Percentage to total villages
j I ____ 2 _______ 3 _____ 4__ __ __ L . I Z a Z L Z I1 1990-91 1,385 31,471 66.972 1991-92 1,011 32,482 69.123 1992-93 200 32,682 69.554 1993-^ 221 32,903 70.025 1994-95 228 33,131 70.506 1995-96 - 32,088 68.417 1996-97 737 32,825 70.008 1997-98 800 33,625 71.569 1998-99 817 34,442 73.4310 1999-2000(P) 2,183 36,625 78.08
P : ProvisionalSource: GRID Corporation, Orissa, Bhubaneswar
Tribal Village Elactrlflcatlon
f 1.18 There are 19,491 tribal villages In the State out of which 10,469 havebeen electrified by the end of 1998-99 representing a coverage of 53.66%. During the Ninth
Plan, aNI the remaining tribal vHlages are proposed to be taken up for electrification
Village Electrification under Special Component Plan (SCP) for Schedule Castes
11.19 There are 4,022 Identified scheduled caste villages each having 200 or
more SC population. Of these, 3,784 villages have been electrified by the end of 1998-99
representing 94.08% coverage. The remaining SC villages have been programmed to be
electrified by the end of the Ninth Plan.
Street Lights In Harljan Bastees
11.20 Electrification of Harljan bastees Is done by providing street lights after
getting loan assistance from the Rural Electrification Corporation (REG) By the end of
March 1999, 11,679 street lights have been provided In Harijan vlllages/baatees During the
Ninth Plan, 2,000 Harljan bastees have been programmed for etectrification liy providing
4,000 street lights,
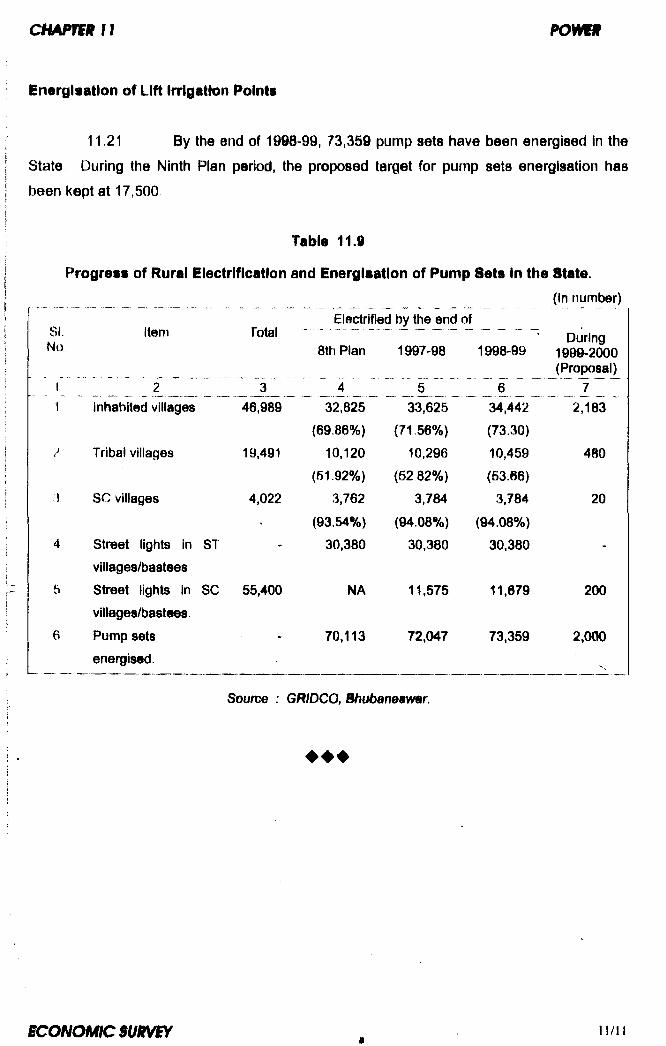
c H A m m i p o ¥ m
Energisation of Lift Irrigation Points
11.21 By the end of 1998-99, 73,359 pump sets have been energised in the
State During the Ninth Plan period, the proposed target for pump sets energisation has
been Icept at 17,500
Table 11.9
Progress of Rural Electrlfleatlon and Energisation of Pump Sets in the State.
(In number)Electrified by the end of
81. Item Total .............. . DuringNo 8th Plan 1997-98 1998-99 1999-2000
...(Proposal)_
r 1 ~ 1 r ... z ..5 I . Z® 1 11 inhabited villages 46,989 32,825 33,625 34,442 2,183
(69,86%) (71.56%) (73.30)2 Tribal villages 19,491 10,120 10,296 10,459 400
(61-92%) (52.82%) (53.66)3 SC villages 4,022 3,762 3,784 3,784 20
• (93.54%) (94.08%) (94.08%)4 Street lights in ST - 30,380 30,380 30,380 -
villages/bastees5 Street lights in SC 55,400 NA 11,575 11,679 200
villages/bastees.6 Pump sets - 70,113 72,047 73,359 2,000
energised.
Source : GRIDCO, Bhubaneswar.
♦ ♦ ♦
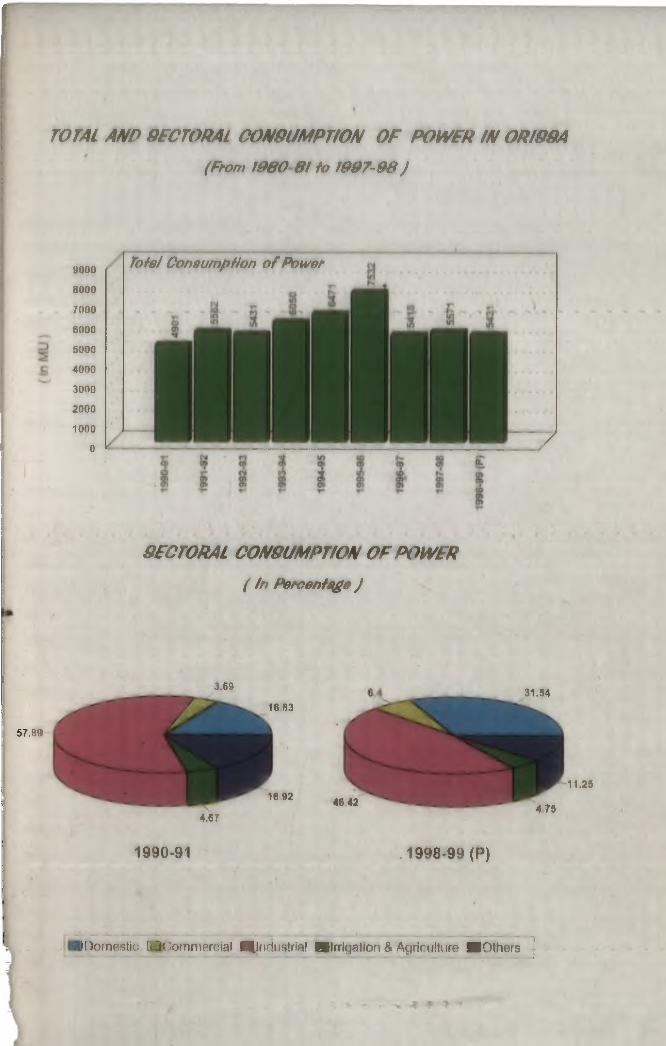
TOTAL AND 8BCTORAL CONSUMPTION OF POWER IN ORI88A
(F fo rn 1 9 8 0 8 ! fo W 9 7 -9 8 J
9000
8000
7000
6000
5000
4000
3000
2000
1000
0
T o ta l C oneum pH on o f P o w e t
Z
QFCTORAL CON9UMPTION OF POWER
( In P e t^ e n f^g e J
57.89
3.69
16 83
16 92
4.67
1990-91
46 42
. 1998-99 (P)
31.54
11.25
475
IDomestic UCofTinieroial mindustria! Bllrrigatlon & Agriciilture ■Others
CHAPTIR 12
TRANSPORT AND COMMUNICATION
12 01 A well developed network of transport and communication is a basic
infrastructural prerequisite for rapid economic development Adequacy of infrastructure in the
transport and communication sector is crucial for attracting investment. The ongoing
economic reforms, therefore, attach high priority to development of transport and
communication infrastructure. The Industrial Policy, 1996 accords special priority to
infrastructural development which in turn would facilitate flow of funds for large investments
in the industrial sector Development of transportation infrastructure is also essential for
marketing of agricultural products and helps the farmers to get a fair price
ROADS
12 02 In the absence of adequate internal rail linkages, roads are the major
means of transportation in the State The total road length in the State was 2,22,303 km as
on 31 03 99 of which 23 33% are surfaced roads. The surfaced road length per 1000 sq. km
of area comes to 333 km as compared to the n\\ India average of 363 km. The roads of
different categories in the State include 2,484 km of National Highways, 67 km. of Express
Highways, 3,977 km of State Highways, 4,463 km of Major District Roads (MDR), 4,767 km
of Other District Roads (ODR), 4,670 km of Classified Village Roads (CVR), 24,552 km of
Village Roads, 10,178 km of Panchayat Samiti Roads, 1,39,973 km of GP Roads, 7,030 km
of Forest Roads, 13,777 km of Municipal Roads, 6,277 km. of Irrigation Roads and 88 km of
GFilDCO Roads.
12 03 All-weather connectivity to every village is necessary for improving the
quality of life and economic conditions in rural areas. At the end of 1991-92, 5 sub-divisional
headquarters and 9 block headquarters were lacking all weather connectivity to the
respective district and sub-divisional headquarters. Out of these, three sub-divisional
headquarters and five block headquarters had been connected to the district and sub-
divisional headquarters respectively by the end of 1996-97. Construction of bridges to
connect the remaining 2 sub-divisions and 4 blocks is under progress Rural connectivity
has been identified as one of the basic minimum services for development of agriculture andI ■the rural economy and the State Government have accorded high priority to this sector.
During 1998-99, an amount of Rs.56.03 crore including Rs.16.03 crore as assistance from
the National Bank for Agriculture and Rural Development (NABARD) was provided to the
Rural Development Department under State Plan In addition, a provision of Rs.57.05 crore
was made under the non-Plan sector During the year 1998-99, 95 bridges, 350 km of blac4<
topped roads, 380 km of metalled roads, 320 km of morum roads were constructed and all
weather connectivity to 198 villages was provided along with generation of 74 lakh mandays
of employment. Out of 46,989 inhabited villages in the State, all weather connectivity to
19,128 villages (40.71%) has been provided by the end of 1998-99. Provision of funds to the
tune of Rs.65.52 crore under State Plan and Rs.90.29 crore under the non-Plan sector has
been made for the year 1999-2000 and it has been targeted to complete sixty ongoing
bridges, 200 km of black-topped roads, 200 km of metalled roads, 250 km of morum roads,
and 250 culverts and to provide all weather connectivity to villages not connected with their
GP Headquarters
12.04 The Works Department of Govemment of Orissa is in charge of
construction, improvement and maintenance of State Highways, Major District Roads and
Other District Roads. It also maintains 2,484 km of National Highways and 67 km of Express
Highways on behalf of Government of India. During the Eighth Plan an amount of R8.421.48
crore was spent under the Road Development Programme. Works in respect of 152 bridges,
726 km of metalling, 1169 km of black topping, and 306 km of widening and strengthening of
roads were completed during the period from 1992-93 to 1996-97. During 1997 98, a sum of
Rs.88.10 crore was provided and 28 on-going bridges, black topping of. 130 km, metalling of
130 km. and widening and strengthening of 17 km of roads were completed. During 1998-
99, 27 ongoing bridges and improvement of 55 km of roads have been completed with an
expenditure of Rs.79.22 crore. In the Annual Plan 1999-2000, an outlay of Rs 195.62 crore
has been propoped for road development.
12.05 Under a Centrally Sponsored Plan scheme, construction of three
major bridges over the rivers Safai {on Sambalpur-Rourkella road), Madhavi (on Seragada-
Medinipur road), and Mahanadi (on Sambalpur Sonepur road) has been taken up and the
projects are under progress. Reconstruction of 6 bridges in Ganjam district (damaged during
1990 floods) was taken up during 1994-95 with World Bank assistance with a project cost of
Rs.48.90 crore. All the bridges have been completed in 1998-99 incurhng total expenditure
of Rs.37 78 crore Government of India has recently approved construction of bridges over
the rivers Luna near Delanga. Budhabalanga near Ballghat, Badagenguti near Salipur, and
Mahanadi near Klakata. The total estimated cost of the three projects is Rs 38.65 crore
IS W ^ N S P O ^ T A N D C O M M U N IC A T IO N
12.06 The State Govel-nment propose to implement Bhubaneswar Integrated
Road Net work Project (BIRNEP) on Build -Operate-Transfer (BOT) basis with an estimated
cost of Rs.170 crore to remove congestion on NH 5 in the vicinity of Bhubaneswar. The
project will also provide improved road communication between the State capital and north
western districts of the State. Three roads will be constructed/upgraded under the project. An
MOU between Works Department, Industrial Development Corporation of Orissa and
Infrastructural Leasing Financial Services L td , Mumbai has been signed The project cost is
proposed to be mobilised from different funding agencies
NATIONAL HIGHWAYS
12.07 The State had seven National Highways covering 1682 km by the end
of 1997-98 which constituted 4 80% of the total NH network of the country and 0 75% of the
total road length of the State. After declaration of three more roads, i.e Chandikhol-
Kanaktora, Borlgumma-Bargarh and Bhubaneswar-Puri, as National Highways during 1998-
99, the total number of National Highways in the State has increased to ten covehng a
length of 2484 km. The Road Development Plan for India envisages that the total length of
National Highways in the State of Orissa will be 3,114 km by the year 2001. Accordingly a
proposal for declaring Gopalpur-Raipur (438 km), Panlkoili-Rajamunda 267 km), Khurda-
Bolangir (315 km), Kendrapara-Chandaball (48 km) and Cuttack-Paradeep (82 km) sections
of State Highways as National Highways was submitted to the Ministry of Surface Transport
(MOST), Government of India, during June 1998. The proposal is under consideration.
12.08 Widening (four laning) of Bhubaneswar-Cuttack-Jagatpur (28 km)
section of N.H.-5 has been taken up with World Bank assistance at an estimated cost of
Rs.218.41 crore The work is expected to be completed by the end of 2000. A loan
agreement has been signed with Overseas Economic Co-operation Fund, Japan for
completion of four laning work of Jagatpur-Chandikhol (33 km) section of N.H.-5 at a cost of
Rs. 173.70 crore The Ministry of Surface Transport have sanctioned the project and the
work has been entrusted to National Highways Authority of India for execution. Efforts are
also being made to invite Investment from financial institutions to Improve the road net-work
on Build-Operate-Transfer (BOT) basis. Information about funds released by Government of
India during last six years for N.H. development in the State has been presented In Table
12.1
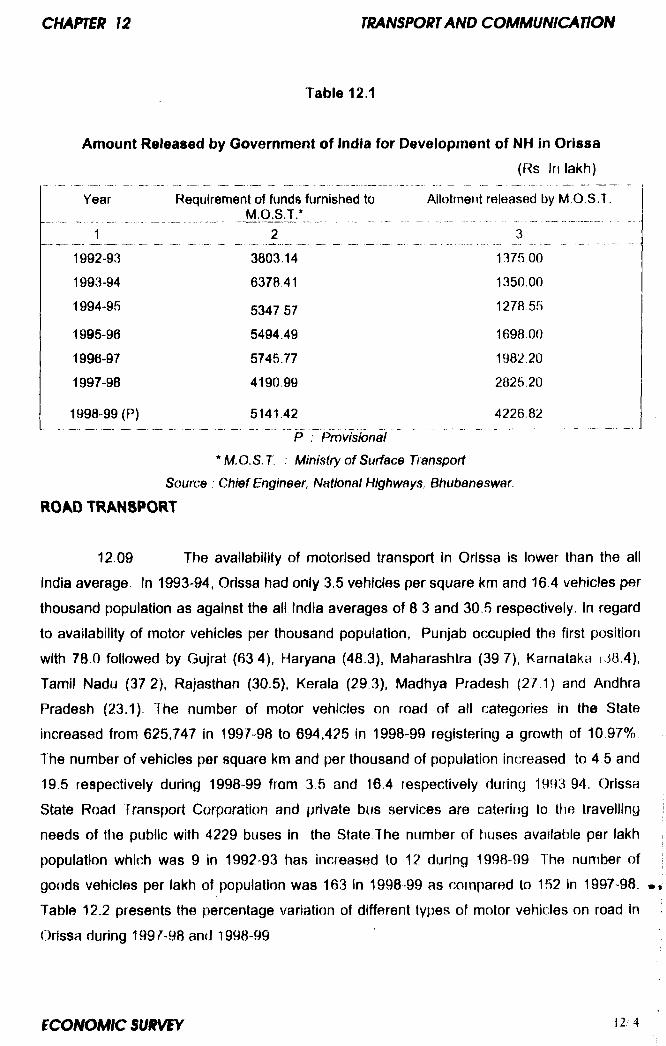
Table 12.1
Amount Released by Government of India for Development of NH In Orissa
(F s In lakh)
Year Requirement of funds furnished to Allotment released by M.O.S.T._______ _ M.O.S.T * ........ ......
_ 2 ___________________ 2 _______________ 31992-93 3803.14 137500
1993-94 6378 41 1350.00
1994-95 534757 1278.55
1995-96 5494.49 1698 00
1996-97 5745,77 1982.20
1997-98 4190.99 2825.20
1998-99 (P) 5141.42 4226.82
P , Provisional
* M.O.S.T : Ministry of Surface Transport
Source Chief Engineer, National Highways, Bhubaneswar
ROAD TRANSPORT
12 09 The availability of motorised transport in Orissa is lower than the all
India average In 1993-94, Orissa had only 3.5 vehicles per square i(m and 16 4 vehicles per
thousand population as against the all India averages of 8 3 and 30,5 respectively. In regard
to availability of motor vehicles per thousand population, Punjab occupied the first position
with 78.0 followed by Gujrat (63 4), Haryana (48.3), Maharashtra (39.7), Karnataka ( 58,4),
Tamil Nadu (37 2), Rajasthan (30.5), Kerala (29 3). Madhya Pradesh (27 1) and Andhra
Pradesh (23.1). The number of motor vehicles on road of all categories in the State
increased from 625,747 in 1997-98 to 694,425 in 1998-99 registering a growth of 10.97%.
The number of vehicles per square km and per thousand of population increased to 4 5 and
19.5 respectively during 1998-99 from 3.6 and 16 4 respectively during 1993 94. Orissa
State Road Transport Corporation and private bus services are catering to the travelling
needs of the public with 4229 buses in the State The number of tjuses available per lakh
population which was 9 in 1992 93 has increased to 12 during 1998-99 The number of
goods vehicles per lakh of population was 163 in 1998-99 as compared to 152 in 1997-98.
Table 12.2 presents the percentage variation of different types of motor vehicles on road In
Orissa during 1997-98 and 1998-99
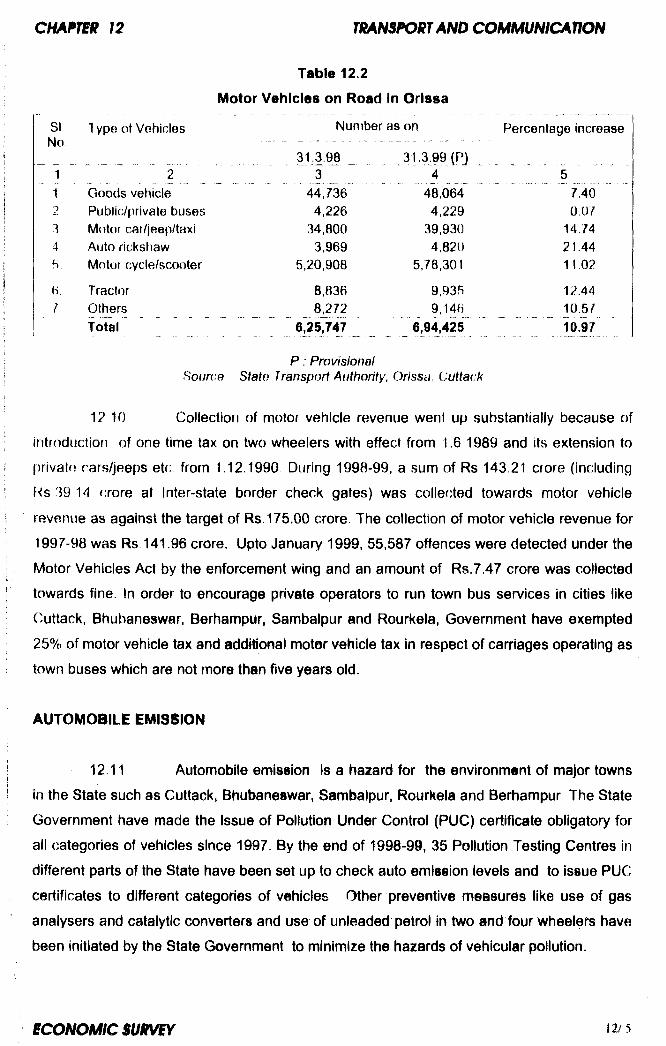
Table 12 2
Motor Vehicles on Road In Orissa
31.3.98 31.3.99 (PJ3 ...........* T ' ...... ..... ........ 5
44,736 48,0644,226 4,229 0.07
34,800 39,930 14.743,969 4,820 21.44
5,20,908 5,78,301 11,02
8,836 9,935 12.448,272 9,146 10 5 /
M5,747 6,94,4i25 10.97
SI 7 vpe of Vehicles Number as on Percentage increaseNo, ---------------------- ---- ---------------- -------------
’ 1 ..... 2 ^ .....1 Goods vehicle2 Public/private buses3 Motor car/jeep/taxi4 Auto rickshaw f) Motor cycle/scooter
6, Tractor I. Others
Total
P : Provisional Source State Transpori Authority, Orissa, Cuttack
12 10 Collection of motor vehicle revenue went up substantially because of
introduction of one time tax on two wheelers with effect from 1.6 1989 and its extension to
private cars/jeeps etc from 1.12.1990 During 1998-99, a sum of Rs 143.21 crore (including
Rs 39 14 crore at Inter-state border check gates) was collected towards motor vehicle
revenue as against the target of Rs. 175.00 crore. The collection of motor vehicle revenue for
1997-98 was Rs 141.96 crore. Upto January 1999, 55,587 offences were detected under the
Motor Vehicles Act by the enforcement wing and an amount of Rs.7.47 crore was collected
towards fine. In order to encourage private operators to run town bus services in cities like
Cuttack, Bhubaneswar, Berhampur, Sambalpur and Rourkela, Government have exempted
25% of motor vehicle tax and addttional motor vehicle tax in respect of carriages operating as
town buses which are not more than five years old.
AUTOMOBILE EMISSION
12 11 Automobile emission Is a hazard for the environment of major towns
in the State such as Cuttack, Bhubaneswar, Sambalpur, Rourkela and Berhampur The State
Government have made the issue of Pollution Under Control (PUC) certificate obligatory for
all categories of vehicles since 1997. By the end of 1998-99, 35 Pollution Testing Centres in
different parts of the State have been set up to check auto emission levels and to issue PUC
certificates to different categories of vehicles Other preventive measures like use of gas
analysers and catalytic converters and use of unleaded petrol In two and four wheelers have
been initiated by the State Government to minimize the hazards of vehicular pollution.
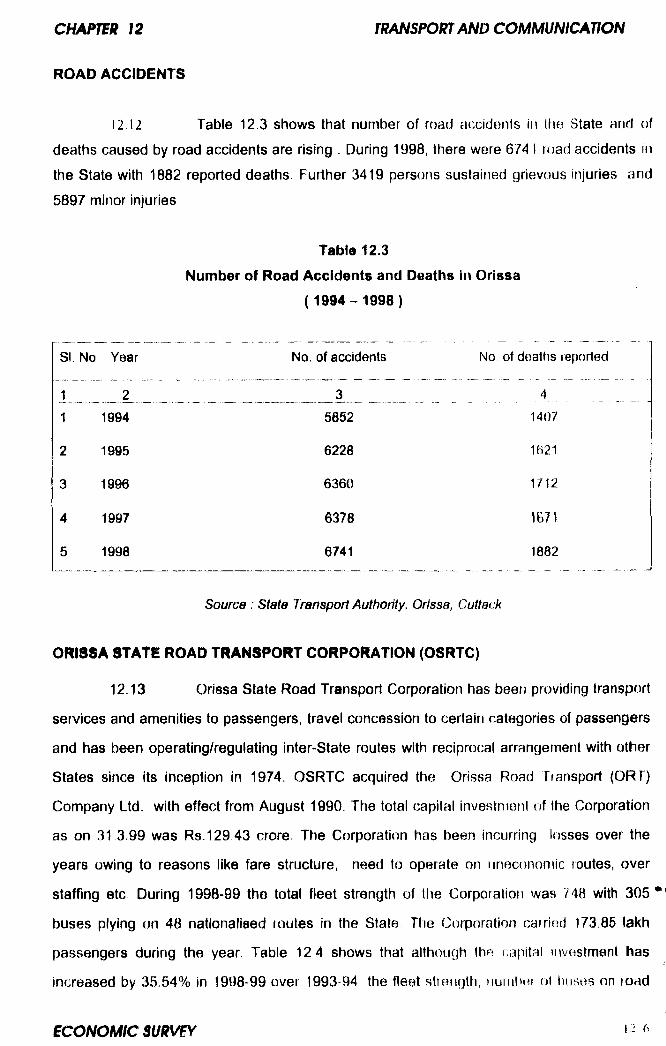
ROAD ACCIDENTS
12 12 Table 12.3 shows that number of road accidents in (tie State and of
deaths caused by road accidents are rising . During 1998, there were 6741 road accidents in
the State with 1882 reported deaths. Further 3419 persons sustained grievous injuries and
5897 minor injuries
Table 12.3
Number of Road Accidents and Deaths in Orissa
(1 9 9 4 -1 9 9 8 )
SI. No Year No. of accidents No of deaths reported
± ____ 1 ____________________ _____3___________ ______ ___1 1994 6852 1407
2 1995 6228 1B21
3 1996 6360 1712
4 1997 6378 1671
5 1998 6741 1882
Source ; State Transport Authority, Orissa, Cuttack
ORISSA STATi ROAD TRANSPORT CORPORATION (OSRTC)
12.13 Orissa State Road Transport Corporation has been providing transport
services and amenities to passengers, travel concession to certain categories of passengers
and has been operating/regulating inter-State routes with reciprocal arrangement with other
States since its Inception in 1974. OSRTC acquired the Orissa Road Transport (ORT)
Company Ltd. with effect from August 1990. The total capital investment of the Corporation
as on 31 3.99 was R8.129 43 crore. The Corporation has been incurring losses over the
years owing to reasons like fare structure, need to operate on uneconomic routes, over
staffing etc During 1998-99 the total fleet strength of the Corporation was 748 with 305**
buses plying on 48 nationalised routes in the State, The Corporation carrind 173.86 lakh
passengers during the year. Table 12 4 shows that although the rapital investment has
increased by 35.54% in 1998-99 over 1993*94, the fleet strenylh, iiumhHt of I)iisbs on road
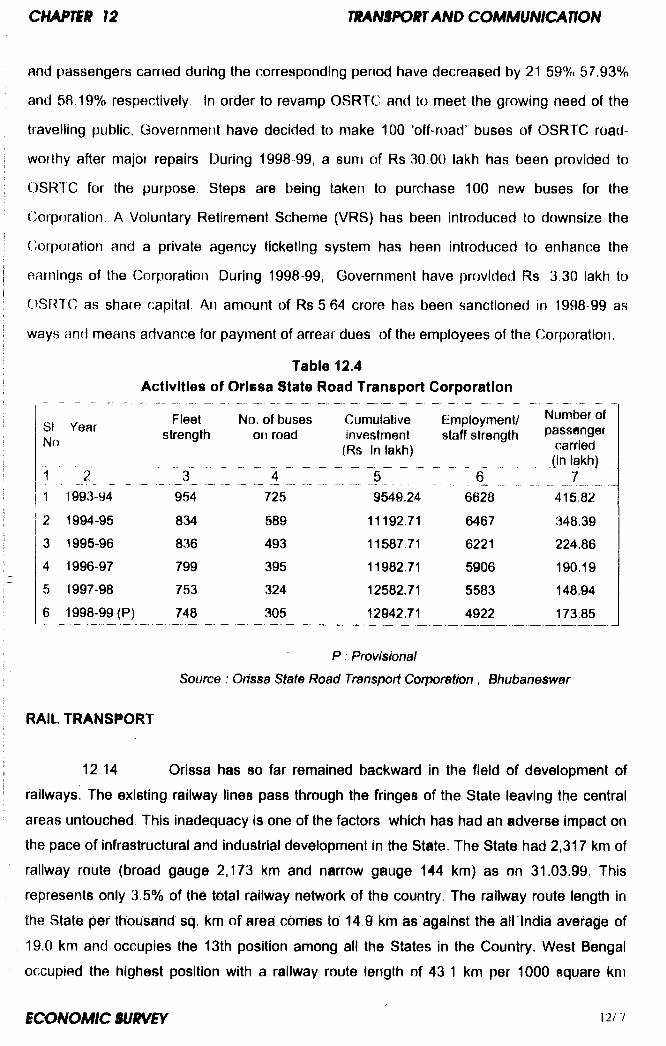
and passengers carried during the corresponding period have decreased by 21 59% 57.93%
and 58.19% respectively in order to revamp OSRTC and to meet the growing need of the
travelling public, Government have decided to make 100 ‘off-road’ buses of OSRTC road
worthy after major repairs During 1998 99, a sum of Rs 30 00 lakh has been provided to
OSRTC for the purpose. Steps are being taken to purchase 100 new buses for the
Corporation A Voluntary Retirement Scheme (VRS) has been introduced to downsize the
Corporation and a private agency ticketing system has been introduced to enhance the
earnings of the Corporation During 1998 99, Government have provided Rs 3,30 lakh to
OSRTC as share capital. An amount of Rs 5 64 crore has been sanctioned in 1998-99 as
ways and means advance for payment of arrear dues of the employees of the Corporation.
Table 12.4Activities of Orissa State Road Transport Corporation
o| y Fleet No. of buses Cumulative Employment/ Number of.. ^ strength on road investment staff strength passenger
(Rs In lakh) carried _______' _________ _(inlaj<:hi
1 2 _______ 3 ________ 4____________ 5___________ ____________ 71 1993-94 964 725 9549.24 6628 415.822 1994-95 834 589 11192.71 6467 348.393 1995-96 836 493 11587.71 6221 224.864 1996-97 799 395 11982.71 5906 190.195 1997-98 753 324 12582.71 5583 148.946 1998-99 (P) 748 305 12942.71 4922 173.85
P : ProvisionalSource : Orissa State Road Transport Corporation, Bhubaneswar
RAIL TRANSPORT
12.14 Orissa has so far remained backward in the field of development of
railways. The existing railway lines pass through the fringes of the State leaving the central
areas untouched This inadequacy is one of the factors which has had an adverse impact on
the pace of infrastructural and industrial development in the State, The State had 2,317 km of
railway route (broad gauge 2,173 km and narrow gauge 144 km) as on 31.03.99 This
represents only 3.5% of the total railway network of the country. The railway route length in
the StatiB per thousand sq. km of area comes to 14.9 km as against the all India average of
19.0 km and occupies the 13th position among all the States in the Country. West Bengal
occupied the highest position with a railway route length of 43 1 km per 1000 square km
followed by Punjab (42 1 km) .Hayrana 33.9 km, Tamilnadu (30 9 km), Bihar (30 4 km), Uttar
F’radesh (30.4 km), Assam (29,9 km), Kerala (27.1 km), Gujarat (27 1 km) Andtira Pradesh
(18.4 km), Maharashtra (17 7 km), Rajasthan (17.0 km) and Karnataka (163 ktn) Out of a
total of 2317 km of railway track in the State, a lengtfi of 329 km has been electrified
accounting for 14.2% of the total route length. This is much below the all India average of
22,3%.
12.15 The State Government have been pursuing proposals relating to tlie
expansion of the railway network in the State through the Rail (Coordination Directorate which
is functioning under the administrative control of the Transport Department The Directorate
also functions as a liasioning agency between the State Government and Railway authorities
for development of rail communication and movement of freight and essential commodities.
Of the six railway divisions of South Eastern Railways, two are located in Orissa with
headquarters at Khurda Road and Sambalpur and a new railway zone namely East Coast
Zone has been functioning at Bhubaneswar since 1996 In order to oversee the ongoing
railway projects in the State, the office of Chief Administrative Officer, South Eastern
Railways has been shifted from Calcutta to Bhubaneswar and offices of Senior Project
Manager(Construction) have been opened at Bhubaneswar, Cuttack, Angul, Sambalpur,
Keonjhar and Bhawanipatna to monitor the ongoing projects. Besides, a diesel locoshed at
Angul, Box-N repair depot at Paradeep and wagon repair depot at Khurda Road have been
set up in the State A Railway Claims Tribunal is also functioning at Bhubaneswar Other
railway facilities in the State include induction of superfast train services (DMUs) and
computerisation of reservations.
12.16 The important railway projects currently under way in the State are
listed below
i. Talcher Sambalpur (174 km) rail link sanctioned in 1984-85 with an estimated cost of
Rs 410 crore was completed and opened to traffic in 1998-99 A daily passenger
train service from Puri to Sambalpur and an express train service from Bhubaneswar
to Rourkela have been introduced through this route
ii, Lanjigarh Road- Junagarh (54 km) project was sanctioned in 1992 93, Nearly 80% of
land acquisition work has been completed and land has been handed over to railway*
authorities.

iii. Khurda Road - Bolangir (289 km) railway project was sanctioned in 1994 95 with an
estimated cost of Rs.353 crore Lanil acquisition work foi the project is under
progress
iv Daitari ~ Banspani (155 km) rail link has been taken up at an estimated cost ot
Rs.320 crore. Construction work is in progress
V Haridaspur- Paradeep (78 km) railway project was sanctioned in 1996-97 with an
estimated cost of Rs.341 crore This will connect the three coastal districts of Jajpur,
Kendrapara and Jagatsinghpur l and acquisition work for the project is under
progress
VI Cuttack-Paradeef) (74 km) doiible lining project has been sanctioned in three phases
Land acquisition for the first phase from Raghunathpur to Rahama (28 km) has been
completed, t and acquisition for the second phase from Rahama to Paradeep (23 km)
is in progress.
vii Conversion of Rupsa Bangiriposi (89 km) narrow gauge line to broad gauge is in
progress.
viii. Conversion of Nuapada-Gunupur (90 km) narrow gauge line to broad gauge has
been sanctioned,
ix Electrification of railway track from Kharagpur to Visakhapatnam was sanctioned in
1995-96. The project is to be taken up in two phases. In the first phase electrification
work from Kharagpur to Bhubaneswar has been taken up The second phase will
cover electrification of Bhubaneswar- Visakhapatnam track.
PORTS
12.17 Among the 11 major ports of the country, Paradeep is the only port
located in the State Mainly minerals and metallurgical products are exported through this
port. During 1998-99, 86.00 lakh MT of goods were exported and 45.07 lakh MT of goods
were imported through the port as against export of 88 14 lakh MT and import of 44 88 lakh
MT during 1997-98 There has been a marginal decline in export over the previous year: An
amount of Rs 813.95 crore was invested and 4,477 persons were employed in the port
during 1998-99. The port has earned Rs 59.37 crore as operating surplus in 1998-99 as
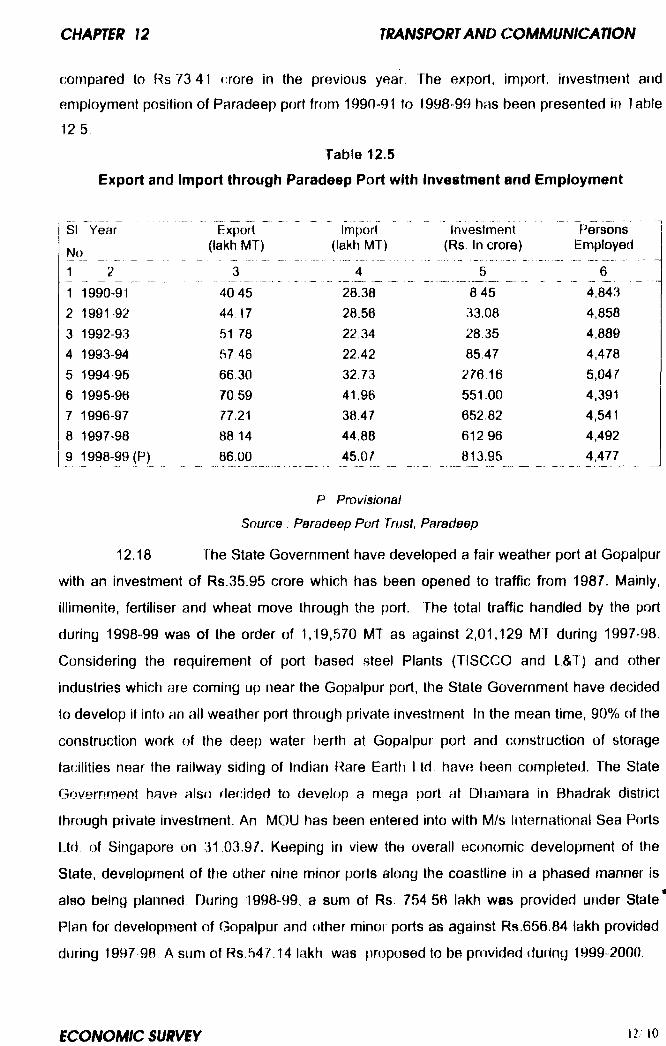
compared to Rs 73 41 crore in the previous year The export, import, investment and
employment position of Paradeep port from 1990--91 to 1998 99 has been presented in Table
12 5
Table 12.5
Export and Import through Paradeep Port with Investment and Employment
SI YearNo___________
1 _ 2
1 1990-912 1991-923 1992-934 1993-945 1994-956 1995-967 1996-978 1997 989 1998-99 (P)
Export (lakh MT)
340 45 44.17 61 78 57 46 66.30 70 59 77.21 88 14 86.00
Import (lakh MT)
28.3828.5622,3422.4232.7341.9638.4744.8845.07
Investment (Rs In crore)
_____5_845 33.08 28.35 85.47
270 16 551.00 652.82 612 96 813.95
PersonsEmployed
6_4,8434,8584,8894,4785,0474,3914,5414,4924,477
P Provisional
Source : Paradeep Port Trust, Paradeep
12.18 The State Government have developed a fair weather port at Gopalpur
with an investment of Rs.35.95 crore which has been opened to traffic from 1987. Mainly,
illimenite, fertiliser and wheat move through the port. The total traffic handled by the port
during 1998-99 was of the order of 1,19,570 MT as against 2,01,129 MT during 1997-98.
Considering the requirement of port based steel Plants (TISCCO and L&T) and other
industries which are coming up near the Gopalpur port, the State Government have decided
to develop it into an all weather port through private investment In the mean time, 90% of the
construction work of the deep water berth at Gopalpur port and construction of storage
facilities near the railway siding of Indian Rare Eartli t td have been completed. The State
Government have also rlecided to develop a mega port at Dhamara in Bhadrak district
through private investment. An MOU has been entered into with M/s International Sea Ports
Ltd. of Singapore on 31 03.97. Keeping in view the overall economic development of the
State, development of the other nine minor fjorts along the coastline in a phased manner is
also being planned During 1998-99, a sum of Rs 754 56 lakh was provided under State*
Plan for development of Gopalpur and other minor ports as against Rs.656.84 lakh provided
during 1997 98 A sum of Rs.547 14 lakh was proposed to be provided tiuring 1999 2000
INLAND WATER TRANSPORT
12.19 The State Government is providing inland water transport services
through nriotorised launches in different inaccessible areas. Ministry of Surface Transport,
Government of India extends support and assistance for improvement of inland waten/vays,
navigation control etc
12 20 The Directorate of Inleind Water Transport, Orissa is the nodal agency
for the operation of motor laiinch services. At present, 20 mechanised launches and 2
country boats are running on 8 different water routes namely ("handabali to Aradi,
Rajanagar and Talchuan, Balugaon to Krishnaprasad, Kalijai, Nuapada and Satapada, and
Nuagarh to Sribantapur The Directorate of Inland Watet Transport (DIWT) is also entrusted
with the work of registration of inland vessels, investigatiofi of new water routes for
navigation and Imparting crew training to fresh in-service personnel at the Crew Training
Institute, Chandabali During 1998-99, it has invested Rs.30.41 lakh and provided carriage
to 245307 passengers with a revenue collection of Rs. 15.89 lakh as against investment of
Rs.30 41 lakh, carriage of 243667 passengers and revenue collection of Rs 17 49 lakh
during 1997-98. A provision of Rs.65.85 lakh was available during 1998-99 to execute
different developmental works.
CIVIL AVIATION
12.21 The Directorate of Civil Aviation looks after the use and maintenance
ot the State’s passenger aircrafts and trainer aircrafts, training of student pilots and
construction and development of air strips in the State. At present there are 17 airstrips and
17 helipads in the State for landing of State Government aircrafts and helicopters and efforts
are being made for black topping all the air strips to make them fit for all weather operation
During 1999-2000, a sum of Rs. 16.00 lakh was proposed to be provided for extension of
the existing run-way of Jeypore airstrip and Rs.2.61 lakh for the improvement of Rangeilunda
airstrip
12 22 In view of its geographical, tourist and commercial importance
Government of India in the Ministry of Civil Aviation have taken up expansion and
modernization of Bhubaneswar Airport. The project includes construction of a sophisticated
terminal house, extension of run-way up to 2743 2 tntrs. for accomrTiodatioii of large jel
aircrafts, a new apron, establishment of a new fire service centre, installation of an
instrument landing system, and development of ground security system The State
Governement have provided 68.3 acre of land free of cost and the development work of the
airport is in progress. Direct flights from Bhubaneswar to cities like Delhi, Calcutta, Chennai,
Hyderabad and Mumbai are available,
12.23 Consequent upon declaration of Bhubaneswar Airport as Customs
Airport, an air cargo complex started functioning at the airport in August 1995 under the Air
Customs Division, Bhubaneswar to facilitate export and import by air Commodities like
handicrafts, applique Items, and mineral samples are exported through air. Similarly hospital
equipment, scientific equipment, machinery and spares etc are imported.
POSTAL AND TELECOM SERVICES
12.24 There were 8,120 post offices in the Slate in 1998-99 out of which
7,519 post offices were located in rural areas and the remaining 601 in urban areas. The
number of post offices per 100 sq km in Orissa is 5.2 as against the all India average of
4.7. The average number of post offices available In the State per 10,000 population comes
to 2.6. On an average in urban areas one post office in Orissa serves a population of 7,046
and an area of 4.07 sq km and in rural areas a population of 3,647 and an area of 20.38
sq km There are 68 speed post centres in the State. Other premium services such as
Express Parcel Post, Mass Mailing Service, Corporate Money Order Service and Satellite
Mail Service are also available in the State
12.25 The telecommunication service network has under gone a major
expansion in the State in the nineties. In 1994-95, there were 656 telephone exchanges, 26
Departmental Telegraph Offices and 1,15,520 telephone connections in operation, while the
number of telephone connections per 1000 persons was 3.5 as against the aii India average
of 9.0- By 1998-99, the number of telephone exchanges, telegraph offices and telephone
connections in the State increased to 794, 30 and 3,34,273 respectively. All the telephone
exchanges are electronic. The Sut)scriber Trunk Dialing (STD) service is now available at
766 stations spread over all tlie 30 districts A 1000 line internet node is available at
Bhut)aneswar which caters to the internet sut)scrihers of Oiissa on Io c h I l all Ijasis The
following box shows the profile of postal and teleconi services in OtisBa m on 31 03.99.
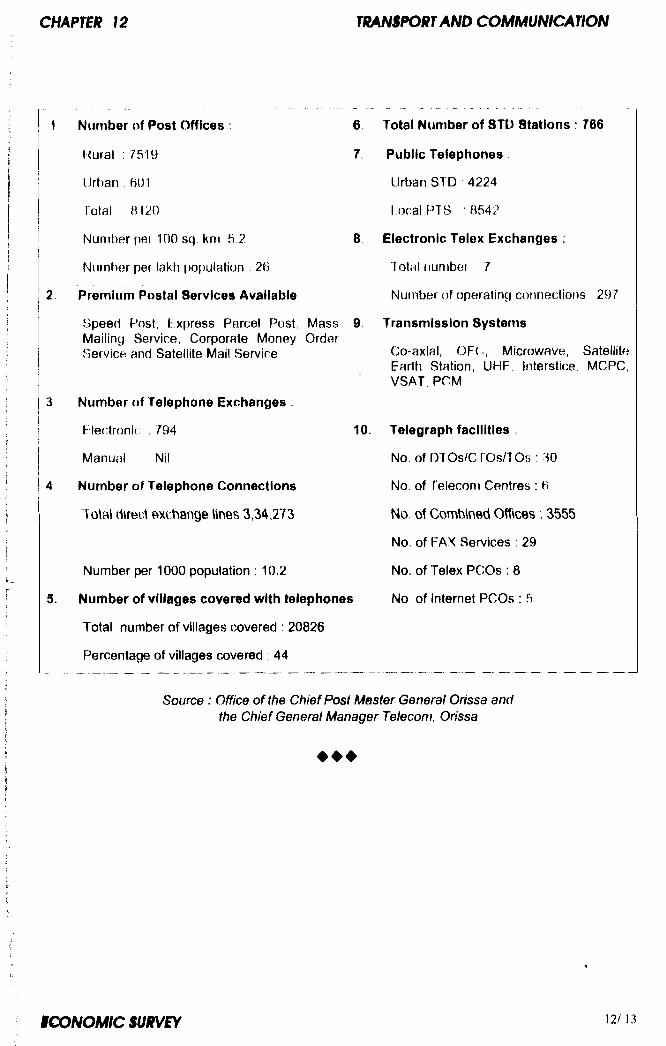
Number of Post Offices : 6
Rural ; 7519 7.
Urban : 61)1
Total H120
Number (lei lOOsq km ^ 2 8
Number per lakh population , 26
Premium Postal Services Available
Speed Post. Express Parcel Post, Mass 9. Mailing Service, Corporate Money Order Service and Satellite Mail Service
Number of Telephone Exchanges ;
l: lectroni( : 794 10,
Manual Nil
Number of Telephone Connections
To\al direct Bxchat' ge lines 3,34,273
Number per 1000 population : 10.2
Number of villages covered with telephones
Total number of villages covered : 20826
Percentage of villages covered : 44
Total Number of STD Stations : 766
Public Telephones
Urban STD 4224
localPTS 8542
Electronic Telex Exchanges :
Total number 7
Number of operating connections 297
Transmission Systems
Co-axial, OFC, Microwave, Satellite Earth Station, UHF. Interstice MCPC, VSAT, PCM
Telegraph facilities
No. of DT Os/CTOsATOs : 30
No. of Telecom Centres : 6
No. of Comt>in0d Offices : 3555
No. of FAX Services : 29
No. of Telex PCOs ; 8
No. of Internet PCOs : 5
Source : Office oftfie Chief Post Master General Orissa and the Chief General Manager Telecom, Orissa.
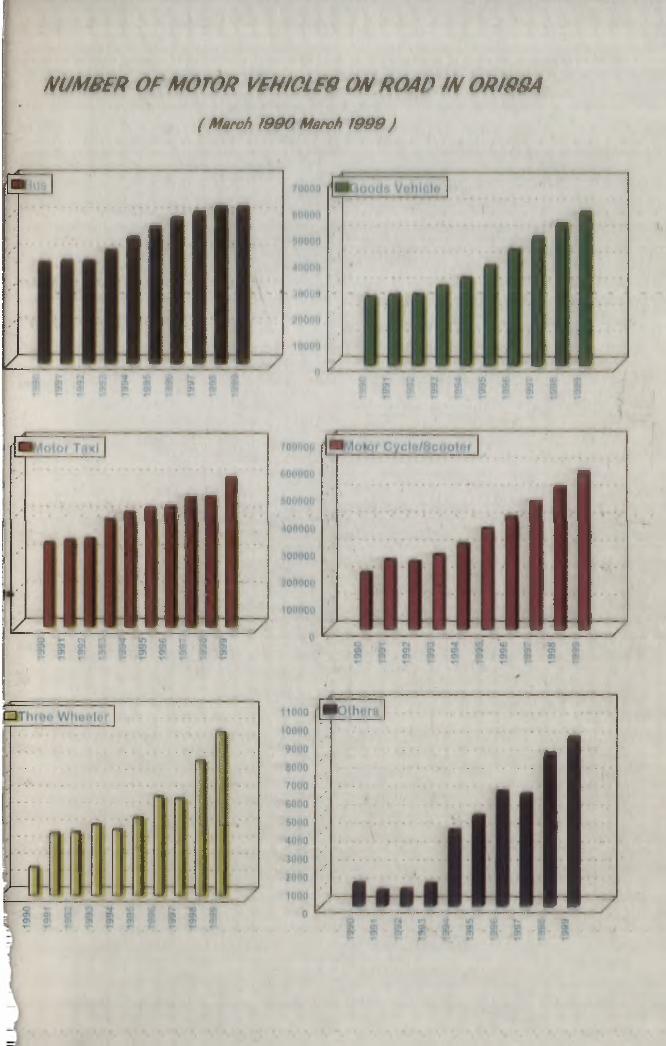
NUMBER OF MOTOR VBHICLB9 ON ROAP IN ORI89A
( March 1990 Match 1 9 9 9 )
CHAPTER 13
FINANCIAL INSTITUTIONS
13 01 The role of a well developed financial Infrastructure in stimulating and
sustaining economic growth is well recognised A network of financial institutions helps the
e( onorny to deploy its savings more efficiently Banking Institutions, Non-Banking Financial
Companies, All India Financial Institutions and the Bhubaneswar Stock Exchange have
been dealt witti in separate sections below
BANKING INSTITUTIONS
SCHEDULED COMMERCIAL BANKS
13.02 There are 25 Commercial Banks with 1371 branches and 9 Regional
Rural Banks (RRBs) with 838 branches in the State. Table 13.1 shows that the number of
bank branches increased from 2170 in 1997-98 to 2209 during 1998-99. There is one branch
for around 16.2 thousand persons While the aggregate deposits have increased by 288%
between 1990-91 to 1998-99, the gross bank credit has increased by only 105%. The credit
deposit ratio has steadily declined from 80.59 in 1990-91 to 42.51 in 1998-99 and was well
below the all India average of 55.49 in 1998-99. In 1998-99, the States with a better credit
deposit ratio than Orissa Included Tamil Nadu (92.97), Maharashtra (72.82), Andhra Pradesh
(68.48), Karnataka (64.53), Gujarat (48 92), Madhya Pradesh (48.40), Rajasthan (45.10),
and West Bengal (43.82). The decline In credit deposit ratio Is a cause for concern Steps
need to be undertaken to improve the volume of advances
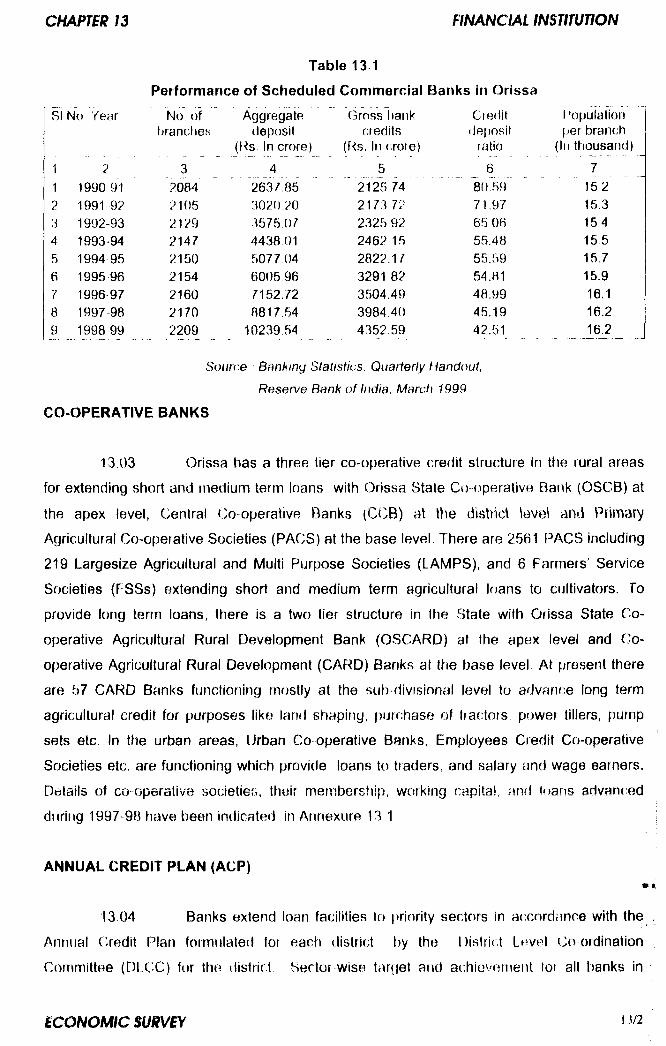
Table 13,1
Performance of Scheduled Commercial Banks in Orissa
SI No Year
21990 911991 92 1992-931993 941994 951995 96 1996-971997 981998 99
No of branches
3208421052129214721502154216021702209
Aggregate deposit
(t^s In crore)
4....2 ^ / 8 5
3020 20 3575 07 4438 01 5077 04 6005,96 n 52.72 8817 54
10239 54
Gross t^ank credits
(f^s. In crore)
5' 2125 74
2173 72 2325 92 2462 15 2822.17 3291 82 3504.49 3984.40 4352.59
Credit(Jeposit
ratio
680.59 71,97 65.06 55.4855.59 54.81 48.99 45.19 42.51
(’opulation |jer brancti
(In ttiousand)
7152 15.3 15 4 15 5 15.7 15.9 16.1 16.2 16.2
Source Banking Statistics. Quatlerly Handout,
Reserve Bank o f India, March 1999
CO-OPERATIVE BANKS
13 03 Orissa tias a three tier co-operative credit structure in the rural areas
for extending short and medium term loans with Orissa State Co-operative Bank (OSCB) at
the apex level, Central Co operative Banks (CCB) at tyie district lavei and Primary
Agricultural Co-operative Societies (PACS) at the base level There are 2561 PACS including
219 Largesize Agricultural and Multi Purpose Societies (LAMPS), and 6 Farmers’ Service
Societies (FSSs) extending short and medium term agricultural loans to cultivators. To
provide long term loans, there is a two tier structure in the State with Orissa State Co
operative Agricultural Rural Development Bank (OSCARD) at the apex level and Co
operative Agricultural Rural Development (CARD) Banks at the base level At present there
are 57 CARD Banks functioning mostly at the sub divisional level to advance long term
agricultural credit for purposes like land shaping, purchase of tractors, power tillers, pump
sets etc. In the urban areas, Urban Co operative Banks, Employees Credit Co-operative
Societies etc. are functioning which provide loans to traders, and salary and wage earners.
Details of co-operative societies, their membership, working capital, and loans advanced
during 1997-9B have been indicated in Annexure 13 1
ANNUAL CREDIT PLAN (AGP)»«
13.(J4 Banks extend loan facilities to priority sectors in accordance with the ,
Annual Credit Plan formulated for each district t)y the District Level i^o ordination
Committee (DLCC) for the district. Sectoi wise target and achievement lor all lianks in
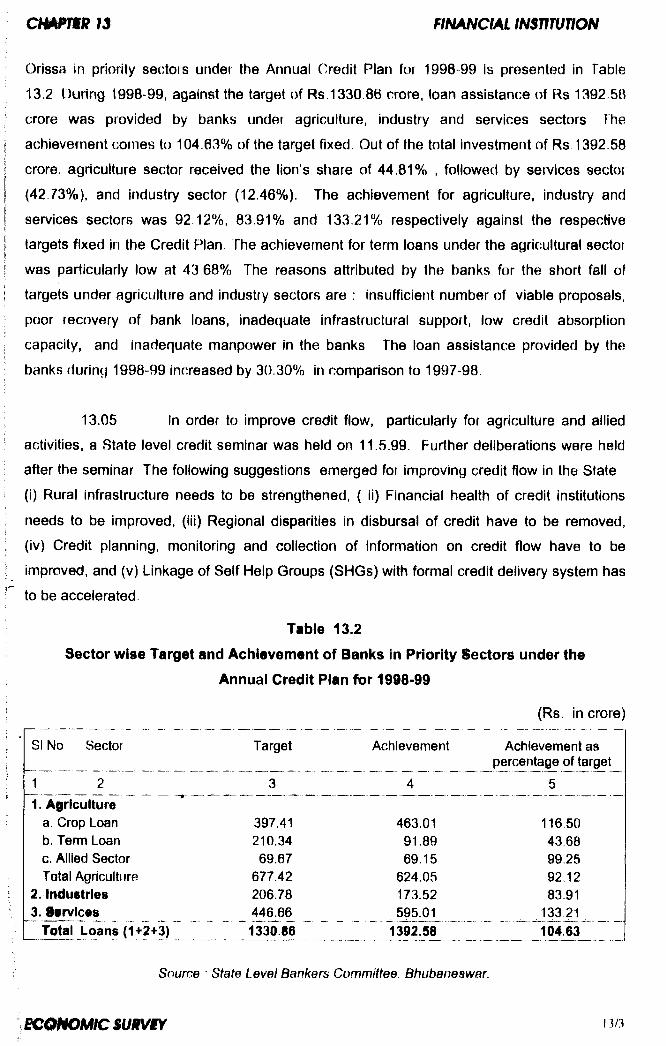
Orissa in priority sectors under the Annual Credit Plan for 1998 99 is presented in Table
13.2 During 1998-99, against the target of Rs 1330.86 crore, loan assistance of Rs 1392.5B
crore was provided by banks under agriculture, industry and services sectors The
achievement cornes to 104.63% of the target fixed. Out of the total investment of Rs 1392.58
crore, agriculture sector received the lion’s share of 44.81% , followed by services sector
(42.73%), and industry sector (12.46%). The achievement for agriculture, industry and
services sectors was 92 12%, 83.91% and 133.21% respectively against the respective
targets fixed in the Credit Plan. The achievement for term loans under the agricultural sector
was particularly low at 43 68% The reasons attributed by the banks for the short fall of
targets under agriculture and industry sectors are : insufficient number of viable proposals,
poor recovery of bank loans, inadequate infrastructural support, low credit absorption
capacity, and inadequate manpower In the banks The loan assistance provided by the
banks (iuring 1998-99 increased by 30.30% in comparison to 1997-98
13.05 In order to improve credit flow, particularly for agriculture and allied
activities, a State level credit seminar was held on 11.5.99. Further deliberations were held
after the seminar The following suggestions emerged for improving credit flow in the State
(i) Rural infrastructure needs to be strengthened, ( ii) Financial health of credit institutions
needs to be improved, (iii) Regional disparities in disbursal of credit have to be removed,
(iv) Credit planning, monitoring and collection of Information on credit flow have to be
improved, and (v) Linkage of Self Help Groups (SHGs) with formal credit delivery system has
to be accelerated.
Table 13.2
Sector wise Targdt and Achievement of Banks in Priority Sectors under tlie
Annual Credit Plan for 1998-99
SI No Sector
1 2
1. Agriculturea. Crop Loanb. Term Loanc. Allied Sector Total Agriculture
2. Industries3. Sirvices
Target
3
Tutal Loans (U2+3)
397.41 210.3469.67
677.42 206.78 446J3^ 1330 86
Achievement
4
463.01 91.8969.15
624.06173.52595.01
(Rs in crore)
Achievement as percentage of target
5
1392.58
116 50 43 6899,25 92 12 83.91
133^1 104.63
Source ■ State Level Bankers Committee, Bhubaneswar.
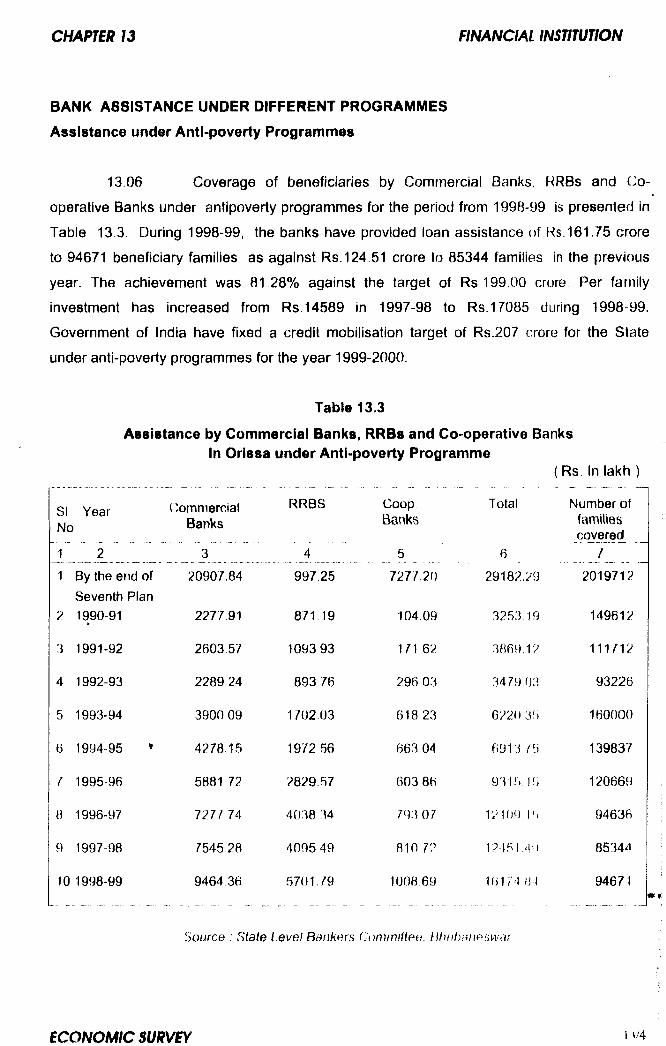
BANK ASSISTANCE UNDER DIFFERENT PROGRAMMES
Assistance under Anti-poverty Programmes
13.06 Coverage of beneficiaries by Commercial Banks, RRBs and Co
operative Banks under antipoverty programmes for the period from 1998-99 is presented in
Table 13.3. During 1998-99, the banks have provided loan assistance of F<s.161.75 crore
to 94671 beneficiary families as against Rs. 124.51 crore to 85344 families in the previous
year. The achievement was 81.28% against the target of Rs 199.00 crore Per family
investment has increased from Rs. 14589 in 1997-98 to Rs. 17085 during 1998-99.
Government of India have fixed a credit mobilisation target of Rs.207 crore for the State
under anti-poverty programmes for the year 1999-2000.
Table 13.3
Assistance by Commercial Banks, RRBs and Co-operative Banks In Orissa under Anti-poverty Programme
Rs. In lakh
SI Year No
CommercialBaraks
RRBS CoopBanks
Total Number of families covered
1__ 2 3 4 5 6 71 By the end of 20907.84 997 25 7277 20 29182.29 2019712
Seventh Plan2 1990-91 2277.91 871 19 104.09 .3253,19 149612
3 1991-92 2603.57 109393 171 62 3869.12 111712
4 1992-93 228924 893 76 296 03 3479,03 93226
5 1993-94 3900 09 1702.03 618 23 6220.3h 160000
6 1994-95 ^ 4278.15 1972 56 663 04 691375 139837
7 1995-96 5881 77 2829.57 603 86 931.'), 1') 120669
H 1996-97 7277 74 4038 34 793 07 12 lOM M) 94636
9 1997 98 7545 28 4095 49 aio 7? 12451 4‘) 85344
10 1998-99 9464 36 670179 1008 69 16174 H4 94671
Source : State Level Bankers Cnnimiiteo. ilhut)anesw'ju
a W r e n u f in a n c ia l iN s m v n o N
Aitisiance under Other Programmes
13 07 Banks are providing credit facilities under housing schemes, for
rehabJitation of sick industrial units, under Prime Minister’s Rozgar Yojana, under National
Project of Bio-gas Development etc. Under housing schemes 353 persons have been
provided with loan assistance of Rs 4 17 crore during 1998-99 which includes Rs.3 99 crore
to 30C pfer orls Under the National Housing Scheme As on 31.03.99, 1150 industrial units
have been identified as sick and out of these viability studies have been conducted in respect
of 771; ijnits A total of 116 units have been found viable out of which 90 units have been
rehabiitated through bank credit. Under PMRY during 1998-99, against the target to cover
10,IOC beneficiaries, loans amounting to Rs.65.53 crore have been sanctioned in favour of
8363 beneficiaries and an amount of Rs 4.24 crore has been disbursed to 766 beneficiaries
as against the target of 9250 beneficiaries , sanction of Rs 65.55 crore to 8224 beneficiaries
and disbursement of Rs.48.32 crore to 7024 beneficiaries during 1997-98.
RECOVERY POSITION OF BANKS
13.08 Despite several initiatives taken, the position of recovery of loans has
not been satisfactory which is one of the major constraints to the growth of the banking
business, as it increases non-performing assets and affects the resource position and
profitability of banks. In a less developed State like Orissa where public sector investment is
inadecgate to meet the requirement, the recovery position of the banks needs to be
improved for expanding credit facilities for developmental Investment. Government have
instrutted Collectors, Tahasildars and BDOs to take active Interest in recovery camps
organised by the banks.
13.09 The proportion of overdue to the total demand in respect of
ComrTBrcial Banks, RRBs and Co-operative Banks was 62.S7%, 41.21% and 56.02%
respictively as on 31.03.99 in comparison t • 61.04%, 42.44% and 62.73% at the end of
1917-® Sector-wise and bank-wise recovery and overdue position is presented in Table
13.4.
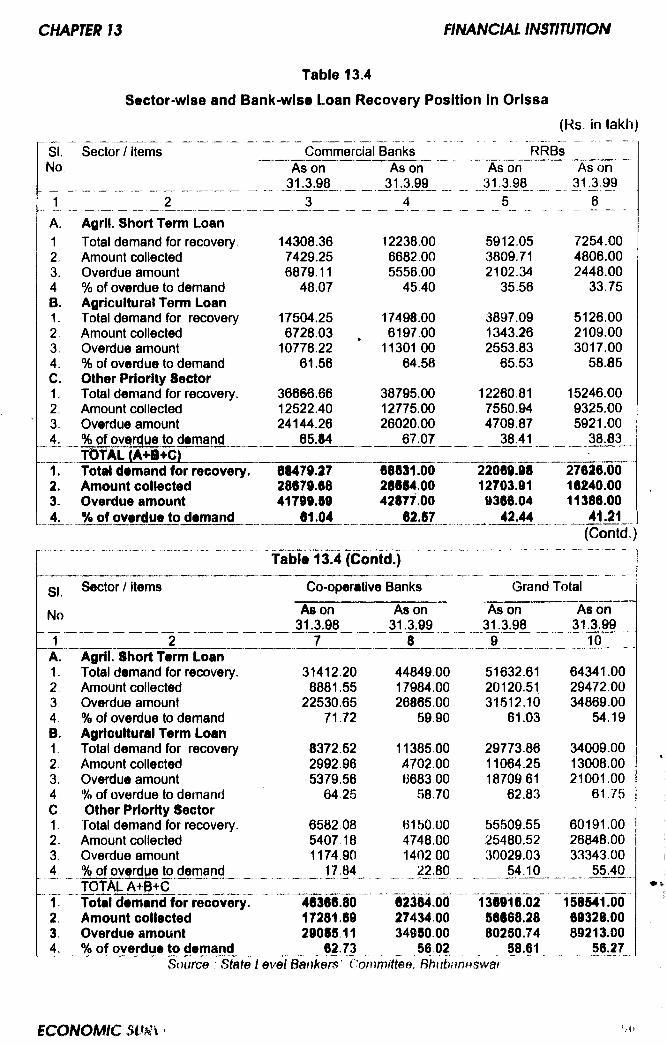
Table 13,4
Sector>wi86 and Bank-wise Loan Recovery Position in Orissa
(Rs in lakh)
SI. Sector / items Commercial Banks RRBsNo. As on As on As on As on
31.3.98 31.3.99 31 3.98 3 0 .9 91 2 3 ___4_____ _____5__ _ 6
A. Agril. Short Term Loan1 Total demand for recovery. 14308.36 12238.00 5912.05 7254.002 Amount collected 7429.25 6682.00 3809.71 4806.003= Overdue amount 6879.11 5556.00 2102.34 2448.004 % of overdue to demand 48.07 45.40 35.56 33.75B. Agricultural Term Loan1. Total demand for recovery 17504.25 17498.00 3897.09 5126.002 Amount collected 6728.03 6197.00 1343.26 2109.003. Overdue amount 10776.22 11301.00 2553.83 3017.004. % of overdue to demand 61.56 64.58 65.53 58.85C. Other Priority Sector1. Total demand for recovery. 36666.66 38795.00 12260.81 15246.002. Amount collected 12522.40 12775.00 7550.94 9325.003. Overdue amount 24144.26 26020.00 4709.87 5921.004. % of overdue to demand 65.84 67.07 38.41 38.83
T^tAL (A+S+C) -
1. Total demand for reeovery. 61479.27 68831.00 22069.98 27626.002. Amount collected 28679.68 28684.00 12703.91 16240.003. Overdue amount 41799.S9 42877.00 9366.04 11386.004. % of overdue to demand 81.04 62.87 42.44 41.21
(Contd.;
Table 13.4 (Contd.)
SI. Sector / items Co-operative Banins Grand Total
No As on As on As on As on31.3.98 31.3.99 31.3.98 31.3.99
1 2 7 8 9 10_.....A. Agril. Short Term Loan1, Total demand for recovery. 31412.20 44849.00 51632.61 64341.002. Amount collected 8881.55 17984.00 20120.51 29472.003. Overdue amount 22530.65 26865,00 31512.10 34869.004. % of overdue to demand 71.72 59.90 61.03 54.19B. Agricultural Term Loan1 Total demand for recovery 8372.52 11385.00 29773.86 34009.002 Amount collected 2992.96 4702.00 11064.25 13008.003. Overdue amount 5379.56 668300 18709.61 21001.004. % of overdue to demand 64.25 58.70 62.83 61.75C Other Priority Sector1 Total demand for recovery. 6582 08 6150.00 55509.55 60191.002. Amount collected 5407 18 4748.00 25480.52 26848.003. Overdue amount 1174 90 140200 30029.03 33343.004 _ % of overdue to demand 22,80 54.10 55.40
TOTAL A+B+C________
Total demand for recovery. 46366.80 62384.00 136916.02 ~1M84O0”2, Amount collected 17281.69 27434 00 56668.28 69328.003 Overdue amount 2908511 349S0 00 80250.74 89213.004. % of overdue to demand 62.73 56.02 58.61 56.27
Source : State l evel Bankers' Committee, Bhiibaneswar
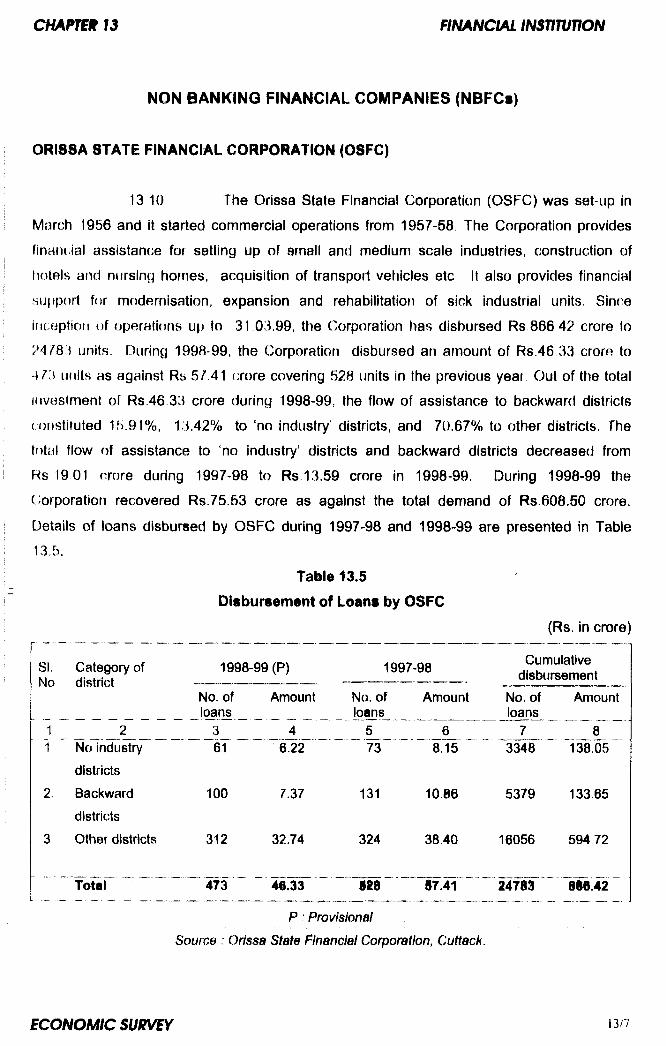
NON BANKING FINANCIAL COMPANIES (NBFCs)
ORISSA STATE FINANCIAL CORPORATION (OSFC)
13 10 The Orissa State Financial Corporation (OSFC) was set-up in
March 1956 and it started commercial operations from 1967-58. The Corporation provides
financial assistance for setting up of small and medium scale industries, construction of
hotels and nursing homes, acquisition of transport vehicles etc It also provides financial
support for modernisation, expansion and rehabilitation of sick industrial units. Since
inception of operations up to 31.03.99, the Corporation has disbursed Rs 866 42 crore to
?4783 units. During 1998-99, the Corporation disbursed an amount of Rs.46 33 crore to
4Ti units as against Rs 5/'.41 (;rore covering 628 units in the previous year Out of the total
investment of Rs.46 33 crore during 1998-99, the flow of assistance to backward districts
(ionstituted 15.91%, 13.42% to ‘no industry’ districts, and 70.67% to other districts. The
total flow of assistance to no industry’ districts and backward districts decreased from
Rs 19 01 crore during 1997-98 to Rs 13.59 crore in 1998-99. During 1998-99 the
fJorporation recovered Rs.75.63 crore as against the total demand of Rs.608.50 crore.
Details of loans disbursed by OSFC during 1997-98 and 1998-99 are presented in Table13.5.
Table 13.5
Disbursement of Loans by OSFC
(Rs. in crore)
SI.No
Category of district
J _______ 2____1 No industry
districts2. Backward
districts3 Other districts
Total
No. ofJoans
361
100
312
473
1998-99 (P)
Amount
1997-98 Cumulativedisbursement
No. of loans
Amount No. of loans
Amount
j4 _
' 6.22
7.37
32.74
46.33
73
131
324
m
8
8.15
10.86
38.40
87.41
3348
5379
16056
138.05
133.65
594 72
P Provisional Source : Orissa State Financial Corporation, Cuttack.
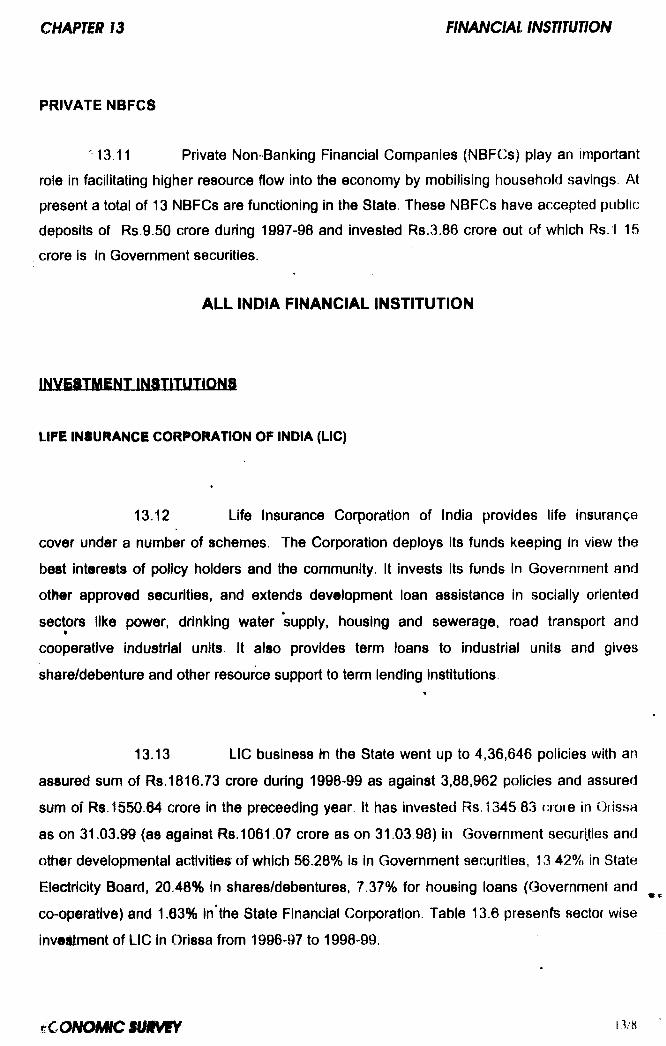
PRIVATE NBFC8
M3.11 Private Non-Banking Financial Companies (NBFCs) play an important
role in facilitating higher resource flow into the economy by mobilising household savings At
present a total of 13 N B F C s are functioning in the State, These N B F C s have accepted public
deposits of Rs.9.50 crore during 1997-98 and invested Rs.3.86 crore out of which Rs.1 15
crore is In Government securities.
ALL INDIA FINANCIAL INSTITUTION
INVBiTMINT iNSTiTUTIQNa
LIFE INSURANCE CORPORATION OF INDIA (LIC)
13.12 Life Insurance Corporation of India provides life insurange
cover under a number of schemes. The Corporation deploys its funds keeping in view the
best interests of policy holders and the community. It Invests its funds in Government and
other approved securities, and extends development loan assistance in socially oriented
sectors like power, drinking water supply, housing and sewerage, road transport and• .
cooperative industrial units. It also provides term loans to industrial units and gives
share/debenture and other resource support to term lending institutions.
13.13 LIC business In the State went up to 4,36,646 policies with an
assured sum of Rs.1816.73 crore during 1998-99 as against 3,88,962 policies and assured
sum of Rs. 1560 64 crore in the preceeding year. It has invested Rs.1345 83 crore in Orissa
as on 31.03.99 (as against Rs.1061 07 crore as on 31.03.98) in Government securities and
other developmental activities of which 56.28% is in Government securities, 13 4 2 % in State
Electricity Board, 20.48% in shares/debentures, 7.37% for housing loans (Government and
co-operative) and 1.63% in’the State Financial Corporation. Table 13.6 presenfs sector wise
invediment of LIC in Orissa from 1996-97 to 1998-99.
£ C O N < m c m M Y
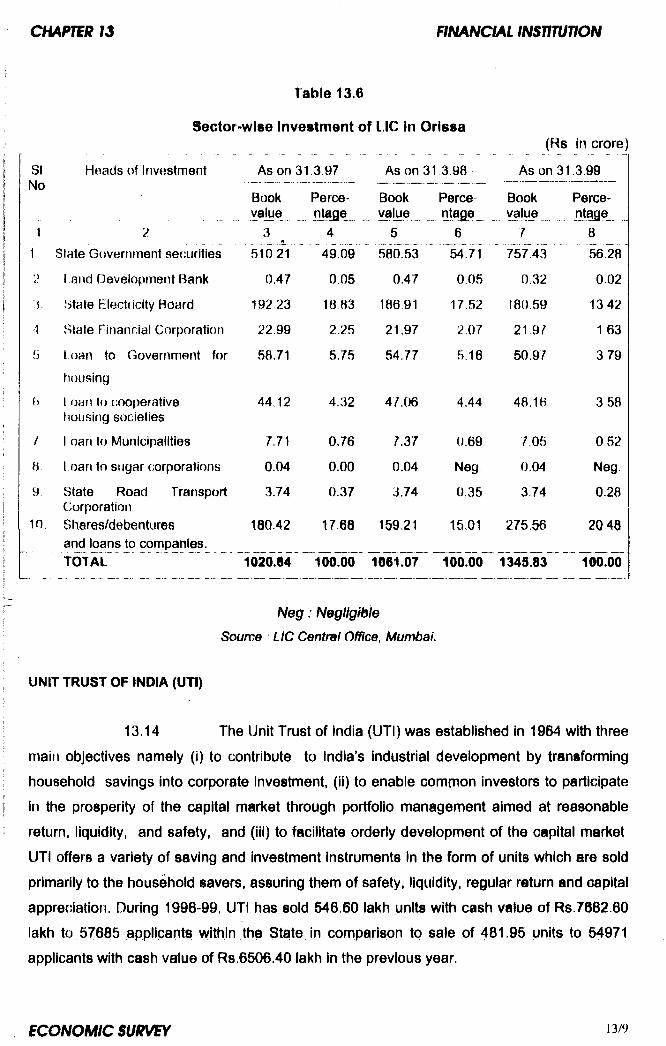
Table 13,6
Sector-wise Investment of LIC in Orissa
SINo
Heads of Investment
2
Slate Government securities
I and Developm ent Bank
State Electricity Board
vState F'inannial Corporation
Loan to Government for
fioLising
I oan to cooperative housing societies
I oan to Municipalities
l oan to sugar corporations
TransportState Road Corporation
in. Shares/debenturesand loans jo cornpanles.
TOTAL
(Rs in crore
As on 31 3 97 As on 31 3.98 As on 31.3 99
Book Perce Book Perce- Book Perce-yajue ntage value ntafle value ntafle
3 4 5 6 7 8
510 21 49 .09 ^ a 5 3 54^71 757\43 5 6 2 8
0.47 0 .05 0.47 0 .05 0.32 0 0 2
192 23 18.83 180.91 17.52 180,59 1 3 4 2
22.99 2.25 21.97 2.07 21 9 / 1 63
58.71 5.75 54.77 5.16 50,97 3 79
44.12 4.32 47 .06 4 .44 48 .16 3 58
7 .7 ] 0.76 7.37 0.69 7.05 0 5 2
0.04 0.00 0.04 Neg 0.04 Neg
3.74 0.37 3.74 0 .35 3.74 0.28
180.42 17,68 159.21 16.01 275.66 2 0 4 8
1020.64 100.00 1061.07 100.00 1345.83
N e g : N&gligtbie
S o u rc e L IC C e n tra l O ffice , M u m b a i.
100.00
UNIT TRUST OF INDIA (UTI)
13.14 The Unit Trust of India (UTI) was established in 1964 with three
main objectives namely (i) to contribute to India’s industrial development by transforming
household savings into corporate investment, (ii) to enable c o m m o n investors to participate
in the prosperity of the capital market through portfolio management aimed at reasonable
return, liquidity, and safety, and (iii) to facilitate orderly development of the capital market
UTI offers a variety of saving and investment Instruments In the form of units which are sold
primarily to the household savers, assuring them of safety, liquidity, regular return and capital
appreciation. During 1998-99. UTI has sold 546.60 lakh units with cash value of Rs.7082.60
lakh to 57685 applicants within the State in comparison to sale of 481.95 units to 54971
applicants with cash value of Rs.6506.40 lakh in the previous year.
INDUSTRIAL DEVELOPMENT BANK OF INDIA (IDBI)
13.15 The Industrial Development Bank of India is an apex financial
institution in the field of industrial financing. It extends financial support both directly and
indirectly for the promotion and development of medium and large scale industries in the
country. Its wholly owned subsidy Small Industry Development Bank of India (SIDBI)
provides assistance to the small scale sector. IDBI has diversified its activities in different
areas of credit, merchant banking, stock exchange, capital market, corporate services and
research. The promotional activities of IDBI include setting up of Technological Consultancy
Organisations, sponsoring of Quality Testing Centres, Science and Technology Parks,
Industrial Potential Survey, Enterpreneurship Development Programmes, and training
programme for the employees of other development banks.
13.16 IDBI has played an effective role in setting up of Orissa
Industrial and Technological Consultancy Organisation (ORITCO), Institute of
Entrepreneurship Development, and Orissa Quality Testing Centres. During 1998-99, it has
disbursed Rs,234.28 crore for promotion of industrial projects in the State as against
Rs.140.00 crore in the previous year registering an increase of 67.34%. The cumulative
sanction and disbursement of IDBI for the State as on 31.03.99 stood at Rs.3940.20 crore
and Rs.2002.40 crore respectively.
SMALL INDUSTRIES DEVELOPMENT BANK OF INDIA (SIDBI)
13.17 Small Industries Development Bank of India was set up in 1990 as a
wholly owned subsidiary of Industrial Development Bank of India with the objective to serve
as the principal institution for financing and promoting employment oriented small scale
industries (SSIs) especially in rural and semi urban areas, expanding the channels for
marketing the products of SSI sector in domestic and overseas markets, and coordinating
the function of other financial Institutions engaged in similar activities. SIDBI also provides
refinance assistance for expansion, upgradation, modernisation and diversification of
existing SSI units and rehabilitation of sick units tlirougb primary lending institutions such as
State Financial Corporations. It also extends financial support to small road transport
operators, qualified professionals for self employment, small hospitals and nursing homes,
and to promote hotel and tourism related activities. Up to the end of 1998-99, since its
inception, SIDBI has sanctioned a sum of Rs. 610.32 crore in favour of SSI units in the State*
and disbursed a sum of Rs.363.32 crore. It has disbursed a sum of Rs.117./0 crore to 2991
SSI units during 1998-99 as against disbursal of Rs. 124.37 crore to 3256 SSI unils in the previous year
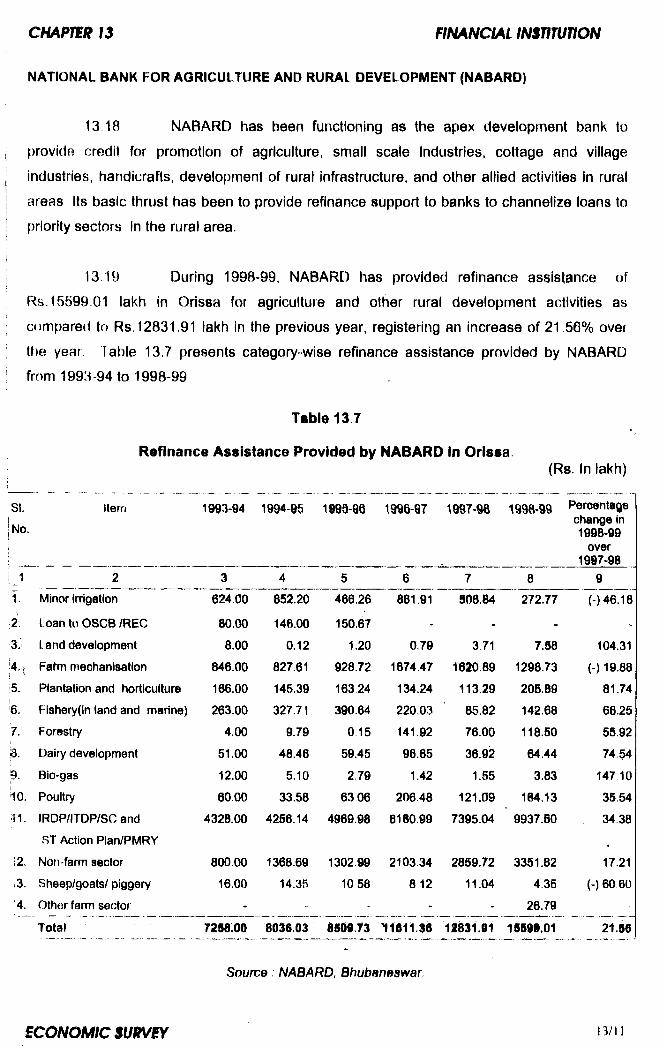
NATIONAL BANK FOR AQRICUITURE AND RURAL DEVELOPMENT (NABARD)
13 18 N A B A R D has been functioning as the apex development bank to
provide credit for promotion of agriculture, small scale Industries, cottage and village
industries, handicrafts, development of rural infrastructure, and other allied activities in rural
areas Its basic thrust has been to provide refinance support to banks to channelize loans to
priority sectors in the rural area.
13 19 During 1998-99, N A B A R D has provided refinance assistance of
Rs.16r599 01 lakh In Orissa for agriculture and other rural development activities as
compared to Rs. 12831.91 lakh in the previous year, registering an increase of 21 5 6 % over
the year Table 13.7 presents category-wise refinance assistance provided by N A B A R D
from 1993-94 to 1998-99
Table 13 J
Refinance Assistance Provided by NABARD In Orissa,(Rs. In lakh)
SI.
No.
Item 1993-94 1994-95 1999-90 1996-97 1997-96 1998-99 Percentagechange in 1998-99
over 1997-98
1J 2 3 4 5 6 7 8 9
j ' T . Minor irrigation 624.00 852.20 466.26 881.91 806.84 272.77 (-) 46.18
12. I oan to OSCB /REC 80.00 146.00 150.67 - - - -3 . i Land development 8.00 0.12 1.20 0 7 9 3.71 7.S8 104.31
k>i '' Farm mechanisation 846.00 827.61 928.72 1674 47 1620.89 1298.73 (-) 19.88
i s . Plantation and horticulture 166.00 145.39 163 24 134.24 113.29 205.89 81.741
p. Fishery(in land and marine) 263.00 327.71 390 64 220.03 85.82 142.68 66.25
7. Forestry 4.00 9.79 0.15 141.92 76.00 118.50 55.92
a . Dairy development 51.00 48.46 59.45 96.65 36.92 64.44 74.54
9 .! Bio-gas 12.00 5.10 2.79 1.42 1.55 3.83 147 10
10. Poultry 60.00 33.58 63 06 206 48 121.09 184.13 35.54
11- IRDP/ITDP/SC and
RT Action Plan/PMRY
4328.00 4256.14 4969.98 6160.99 7395.04 9937.50 34.38
12. Non-farm sector 800.00 1368.69 1302.99 2103.34 2859.72 3351.82 17.21
.3. Sheep/goats/ piggery 16.00 14.35 10 58 8 12 11.04 4.35 (-) 60,60
4. Other farm sector - - - - - 26.79
Total 7258.00 8036.03 8S09.73 H fli iJ B 12831.91 15599.01 21.56
Source NABARD, Bhuban0swar
BHUBAN18WAR STOCK EXCHANGE
13.20 The Bhubaneswar Stock Exchange was established in April 1989 as a
public company limited by guarantee in order primarily to mobilise local savings for
investment in local enterprises. The Exchange started trading operations in January 1991
after being recognised by the Ministry of Finance, Government of India under the provisions
of the Security Contracts (Regulation) Act 1956. At present there are 225 members including
10 corporate members. Currently, 72 companies including 46 regional companies i.e.
companies with head offices registered in Orissa and 26 non-regional companies i.e.
companies with head offices registered outside Orissa are listed on the Bhubaneswar Stock
Exchange. The non-regional companies listed on the Exchange are mostly those that carry
out a significant level of manufacturing or other business activity in Orissa. The listed
companies include NALCO, J. K. Corporation Ltd., Ohent Paper and Industries Ltd., Orissa
Cement Ltd., Orissa Sponge Iron Ltd., Indo Flogates Ltd., N I C C O Corporation Ltd . Orissa
Industries IJd., Ispat Alloys Ltd., Mid-east Integrated Steels Ltd. etc. In addition, trading in
the securities of a number of unlisted companies, called permitted companies, is also
allowed to take place in the Exchange.
13.21 The annual trading volume for listed companies has been less than
one crore during the past four years and was only Rs.0.006 crore and Rs 0.015 crore
respectively during 1998-99 and 1997-98. The annual trading volume for both listed and
permitted companies was Rs. 185.686 and Rs.405.05 crore during 1998-99 and 1997-98
respectively. Since the inception of operations, 29 regional and 11 non-regional companies
have issued shares worth Rs.258.24 crore and Rs. 142.50 crore respectively in initial public
offerings There have been no initial public offerings during the past two years either by
regional or by non regional companies and none by regional companies during the past three
years. Since the inception of operations, 11 regional and 6 non-regional companies have
issued shares worth Rs.34.67 crore and Rs.737.54 crore respectively on rights basis. One
regional company issued shares worth Rs.1.31 crore on rights basis during 1998 99 and two
non-regional companies Issued shares worth Rs.457.54 crore on rights basis during 1997-
98 Except for some activity in the issue of rights shares in 1997-98, tlie Exchange has not, j
by and large, been very successful in mobilising funds for investment in the region !
♦ ♦ ♦
CHAPTIR 14
EDUCATION
14.01 The Constitution of India casts an obligation on the State to provide
free and compulsory education to all children up to the age of 14 years. The literacy rate in
Orissa during 1951 was 15 8% against the all India average of 18.3% which increased to
49 i % in 1991 against the all India average of 52.1%. While the male literacy rate of 63.1%
in the State in 1991 was nearer to the national average of 64.1%, the female literacy stood at
34 7 % in 1991 which was 4 6% lower than the national average of 39.3% The literacy rates
of scheduled caste and scheduled tribe population were also comparatively low at 36.8% and
22 3 % respectively as per 1991 census as compared to 37.4% for scheduled caste and
29 6% for scheduled tribe population at the all India level
EARLY CHILDHOOD EDUCATION (EC!)
14 02 The population of children In the age group of 3-6 years as per 1991
census was 34 29 lakh which was 10.8% of the State's total population. This group of
children is being motivated towards primary education under the UNICEF assisted Early
Childhood Education (ECE) Programme to help achieve the aim of Universalisatlon of
Elementary Education (UEE). This programme Is boing impfemented In the State since 1982.
Under the programme, an early childhood education unit at the State level and a training
institute to train up early childhood educators have been set up. These units develop basic
learning and play materials for pre-school children. ICDS projects and agencies like State
Council of Child Welfare and State Social Welfare Advisory Board are administering the pre-
primary stage education through anganwadls, balwadls and creche centres. Since 1985 E C E
programme has been extended to cover pre-school component of anganwadls functioning
under ICDS projects in the State.
ELiMENTARY EDUCATION
14 03 The population of children In the age group of 8-14 years as per 1991
census was 61.10 lakh which was 19.3% of the State's total population. The strategy of
Universalisatlon of Elementary Education (UEE) covers three aspects of elementary
education i.e. i) Universal access and enrolment, ii) Universal retention of children up to 14
years of age, and iii) Substantial improvement in the quality of education to enable all
children td achieve essential levels of learning. Universalisatlon of primary education Has
been included as a component of the Basic Minimum Service Programme under which
certain thrust areas of development have been identified by Government of India for priority
implementation.
14.04 As per guidelines adopted at the national level, the State aims at
providing access to primary schools within one l<m and to upper primary schools within three
k m from habitations having a population of 300 or more and 500 or more respectively. It is
envisaged to enroll 54.47 lakh children in the age group of 6-11 years and 27.80 lakh
children in the age group of 11-14 years by the end of the Ninth Plan period.
14.05 The number of primary schools has Increased from 54,595 at the end
of 1991-92 to 65,552 by the end of 1990-99. Out of this, the number of non-formal schools is
23,448 and the others are formal primary schools. Thus, basing on the projected population
of 356.90 lakh in 1999, there is one primary school for 544 population on an average in
Orissa during 1996-99 The enrolment in both formal and non-formal streams has increased
from 39.89 lakh in 1991-92 to 46.66 lakh by the end of 1998-99. Similarly the total strength of
teachers in the two streams has gone up to from 1.11 lakh in 1991-92 to 1.34 lakh by the end
of 1998-99. The increase In the number of primary schools, enrolment and number of
teachers over the period 1991-92 to 1998-99 amounts to 20%, 1 7 % and 2 1 % respectively.
The teacher pupil ratio which was 1 : 36 in 1991-92 changed marginally to 1:35 by the end of
1998-99. Table 14.1 shows the number of primary schools, students and teachers in the
State, both in formal and non-formal streams, from 1991-92 to 1998-99.
14.06 Gross enrolment ratio In the primary, upper primary and elementary
stages is defined as the percentage of the enrolment In Classes I to V, Classes VI to VI11 and
Classes I to VIII to the estimated child population in the age groups of 6-11 years, 11-14
years, and 6-14 years respectively Enrolment in these stages includes under-age and over
age children. Hence the enrolment ratio may be more than 100 in some cases. In case of
Orissa the enrolment ratio was 90.5 in the age group of 6-11 years in September 1997. The
enrolment ratio for giris in this age group, at 76:1, was below the State average and much
below the corresponding enrolment ratio for boys at 104 4
14.07 With a view to increasing retention of children and to reduce the drop
out rates in primary schools, Government introduced a MId-Day-Meal programme from July
1995 During 1998-99, the over all dropout rate at the primary stage was 43,6%, the dropout
rate for giris was 42 4 % and for boys 44 0 % The overall drop out rate at the primary stage
declined from 47.0% in 1997-98 to 43.6% in 1998-99.
s c o N n M i r : s tm w Y !4
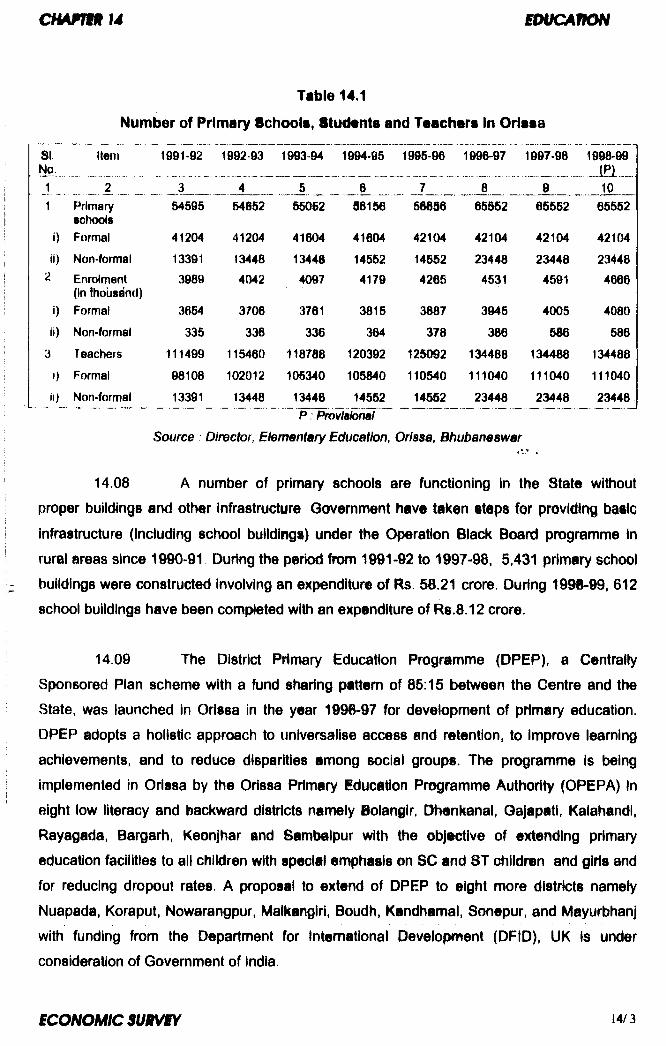
C H A P m U eoocAnoN
Table 14.1Number of Primary Schools, Stuflanta and Teachers In Orissa
SI.No11
Iterrt 1991 92 1992 93 1993-94 1994-95 1995-96 1996-97 1997-98
Primary schools
i) Formal
ii) Non-formal
2 Enrolment (in thousand)
i) Formal
Ii) Non-formal
3 Teachers
I) Formal
Ii) Non-formal
54595
41204
13391
3989
3654
335
111499
98108
13391
54652
41204
13448
4042
3706
336
115460
10201213448
55052
41604
13448
4097
3761
336
118708
105340
13446
56156
41604
14552
4179
3815
364
120392
105840
14552
56656
42104
14552
4265
3887
378
125092
110540
14552
865552 65552
42104 42104
23448 23448
4531 4591
3945 4005
386 586
134488 134488
111040 111040
23448 23448P Pmvlatonal
Source Director, Elementary Education, Orissa, Bhubaneswar
1998-99
1065552
42104
23448
4666
4080
586
134488
111040
23448
14.08 A number of primary schools are functioning in the State without
proper buildings and other Infrastructure Government have taken steps for providing basic
infrastructure (Including school buildings) under the Operation Black Board programme in
rural areas since 1990-91 During the period from 1991-92 to 1997-98, 5,431 primary school
buildings were constructed Involving an expenditure of Rs. 50.21 crore. During 19^-99, 612
school buildings have been completed with an expenditure of Rs.8.12 crore.
14.09 The District Primary Education Programme (DPEP), a Centrally
Sponsored Plan scheme with a fund sharing pattern of 85:15 between the Centre and the
State, was launched in Orissa in the year 1996-97 for development of primary education.
D P E P adopts a holistic approach to unlversalise access and retention, to Improve learning
achievements, and to reduce disparities among social groups. The programme is being
Implemented in Orissa by the Orissa Primary Education Programme Authority (OPEPA) In
eight low literacy and backward districts namely iolangir, Dhenkanal, Oajapati, Kalahandi,
Rayagada, Bargarh, Keonjhar and Sambatpur with the objective of eiftendlng primary
education facilities to all children with special emphasis on S C and ST children and giris and
for reducing dropout rates. A proposal to extend of D P E P to eight more districts namely
Nuapada, Koraput, Nowarangpur, Malkangiri, Boudh, Kandhamal, Sonepur, and Mayurbhanj
with funding from the Department for International Development (DFID), U K is under
consideration of Government of India.
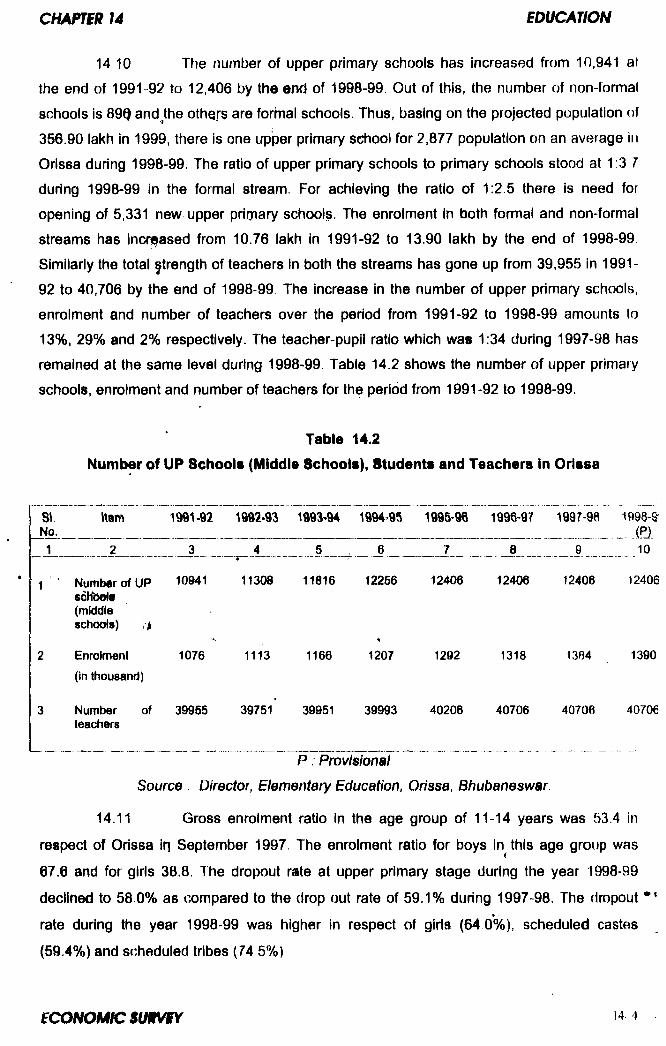
14 10 The number of upper primary schools has increased from 10,941 af
the end of 1991 92 to 12,406 by the end of 1998-99. Out of this, the number of non-formal
schools is 89^ and the othQf^ are forhial schools. Thus, basing on the projected population of
356.90 lakh in 1999, there is one upper primary school for 2,877 population on an average in
Orissa during 1998-99. The ratio of upper primary schools to primary schools stood at 1:3 7
during 1998-99 in the formal stream. For achieving the ratio of 1:2.5 there is need for
opening of 5,331 new upper pritjiary schools. The enrolment in both formal and non-formal
streams has increased from 10.76 lakh in 1991-92 to 13.90 lakh by the end of 1998-99.
Similarly the total strength of teachers In both the streams has gone up from 39,955 in 1991-
92 to 40,706 by the end of 1998-99 The increase in the number of upper primary schools,
enrolment and number of teachers over the period from 1991-92 to 1998-99 amounts to
13%, 2 9 % and 2 % respectively. The teacher-pupil ratio which was 1:34 during 1997-98 has
remained at the same level during 1998-99. Table 14.2 shows the number of upper primary
schools, enrolment and number of teachers for the period from 1991-92 to 1998-99.
Table 14.2Number of UP Schools (Middle Schools), Students and Teachers in Orissa
S\. Item 1991-92 1992-93 199^-94 1994*95 1995-96 1996-97 1997-96 19Q8-S^No.___________________ _________ _________ ________ ______________________________ ____ _
1 2 3 4 5 , 6 7 8 9 10
1 N um lw rofU P 10941 11308 11816 12266 12406 12406 12406 12406scKbcHs ,(middleschools) I
2 Enrolment 1076
(in thousand)
1113 1166 1207 1292 1318 1384 1390
3 Number of 39955 39751 39951 39993 40206 40706 40706 40706teachers
P . Provisional
Source Director, Elementary Education, Orissa, Bhubaneswar.
14.11 Gross enrolment ratio In the age group of 11-14 years was 53.4 in
respect of Orissa in September 1997 The enrolment ratio for boys in this age group was
67.6 and for girls 38.8. The dropout rate at upper primary stage during the year 1998-99
declined to 58.0% as compared to the drop out rate of 59.1% during 1997-98. The dropout **
rate during the year 1998-99 was higher in respect of girls (64 0%), scheduled castes
(59.4%) and scheduled tribes (74 5%)
14 12 The Education for All project, being funded with assistance from
UNICFF, aims at enhancing retention levels by making teaching and learning joyful
(Anandmay Shlkshya), child centred, and activity and competency based The project was
implemented in six districts namely Balangir, Keonjhar, Dhenkanal, Phulbani, Angul and
Ganjam in 1995 From 1997 onwards, the project has been discontinued in Balangir,
Keonjhar and Dhenkanal due to the coverage of these districts under DPEP. Activities
ufjdertaken by tliis programme for development of primary and upper primary education
include teachers’ ttaining, inspecting officers’ training, preparation of teachers’ guides,
learning milestones, classroom beautification, and awareness building
NON-FORMAL EDUCATION
14.13 Non-Formal Education, a Centrally Sponsored Plan scheme, is in
operation in the State to supplement the formal stream of primary and upper primary
education The objective of the scheme is to Impart minimum levels of learning and to create
awareness among children in the age group of 6-14 years (specially girl children and children
of backward areas) so as to enable them to join the main stream of education This
programme also covers working children and habitations having no primary schools. During
1998-99, 23,448 non-formal education centres at the primary level were functioning out of
which 8,830 centres were meant for boys and 14,618 for girls. At upper primary level, there
were 662 centres for boys and 234 for girls. Apart from this, 198 voluntary organisations are
- also managing 11,863 non-formal education centres with full Central Government
assistance. The enrolment In the primary level centres was 5.86 lakh and in the upper
primary level centres 0.22 lakh during the year 1998-99
MASS EDUCATION
14.14 The Mass Education Programme, as a part of National Literacy Mission,
was introduced in the State In the year 1990-91 with the objective of covering all adult
illiterates up to the age of 45 years. The programme comprises of two phases, i) Total
Literacy Campaign (TLC) and ii) Post Literacy Campaign (PLC). Up to the end of 1998-99,
since the inception of the programme, 28 districts and one special project area in Rourkela
have been covered under TLC. The target of enrolment under TL C Is 63.83 lakh illiterates
(25.83 lakh males and 38.00 lakh females) out of which achievement as on 31.03.99 was
22.67 lakh (10.07 lakh males and 12 60 lakh females) The achievement in respect of 8C
was 4.29 lakh and in respect of ST was 6.69 lakh. The Post Literacy Campaing (PLC) is
being implemented in eleven districts and the special project area in Rourkela. Against the
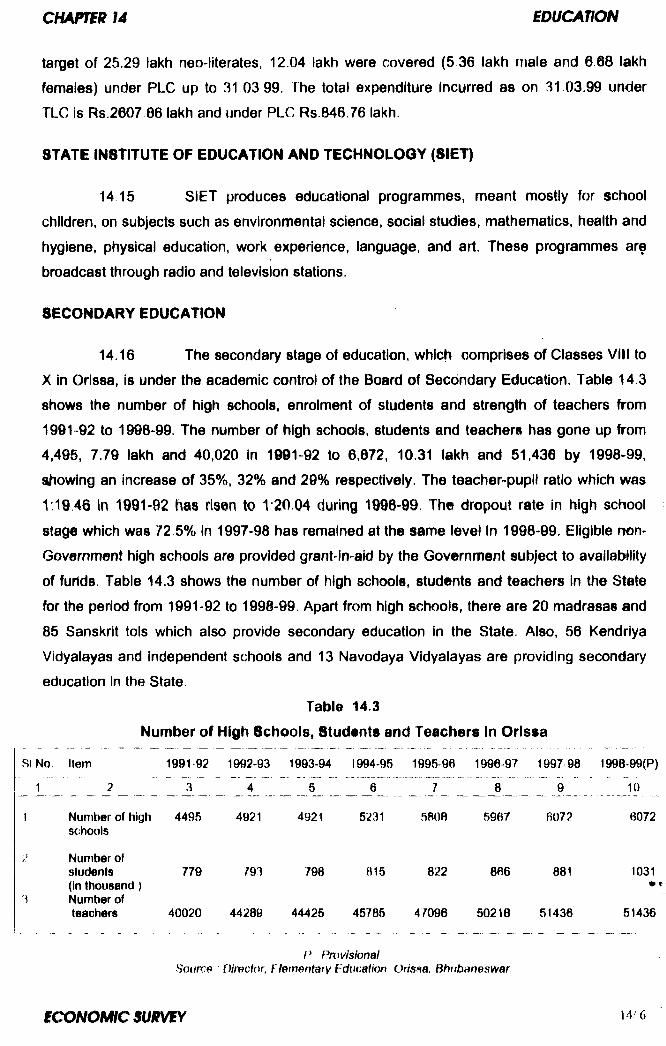
target of 25.29 lakh neo-literates, 12.04 lakh were covered (5 36 lakh male and 6.68 lakh
females) under PLC up to 31.03 99. The total expenditure Incurred as on 31 03.99 under
TLC is Rs.2607 06 lakh and under PL C Rs.846.76 lakh.
STATE INSTITUTE OF EDUCATION AND TECHNOLOGY (8IET)
14 15 SIET produces educational programmes, meant mostly for school
children, on subjects such as environmental science, social studies, mathematics, health and
hygiene, physical education, work experience, language, and art. These programmes are
broadcast through radio and television stations.
SECONDARY EDUCATION
14.16 The secondary stage of education, which comprises of Classes VIII to
X in Orissa, is under the academic control of the Board of Secondary Education. Table 14.3
shows the number of high schools, enrolment of students and strength of teachers from
1991-92 to 1998-99. The number of high schools, students and teachers has gone up from
4,495, 7.79 lakh and 40,020 in 1991-92 to 6,072, 10.31 lakh and 51,436 by 1998-99,
showing an increase of 35%, 3 2 % and 2 9 % respectively. The teacher-pupil ratio which was
1:19 46 In 1991-92 has risen to 1:20 04 durirtg 1998-99. The dropout rate in high school
stage which was 72.5% in 1997-98 has remained at the same level In 1998-99. Eligible non-
Q overnm ent high schools are provided grant-in -a id by the Government subject to availability
of furlds. Table 14.3 shows the number of high schools, students and teachers In the State
for the period from 1991-92 to 1998-99. Apart from high schools, there are 20 madrasas and
85 Sanskrit tols which also provide secondary education in the State. Also, 56 Kendriya
Vidyalayas and independent schools and 13 Navodaya Vidyalayas are providing secondary
education In the State.
Table 14.3Number of High Schools, Students and Teachers In Orissa
SI No. Item 1991 92 1992-93 1993^94 1994-95 1995»96 1990-97 1997 98 1998-99(P)
1 _ _ _____ 2 _________ 3 _______ 4 _______ 5_______ J 6 _______ 7 ________ 8 ________ 9 ____ 10
1 Number of high 4495 4921 4921 5231 .5808 5967 6072 6072schools
Number ofstudents 779 793 798 815 822 866 881 1031(In thousand ) • *
3 Number ofteachers 40020 44289 44425 45785 47096 50218 51436 51436
P ProvisionalSource OirBctor, F lementaty Fducation Orisna Bhubaneswar
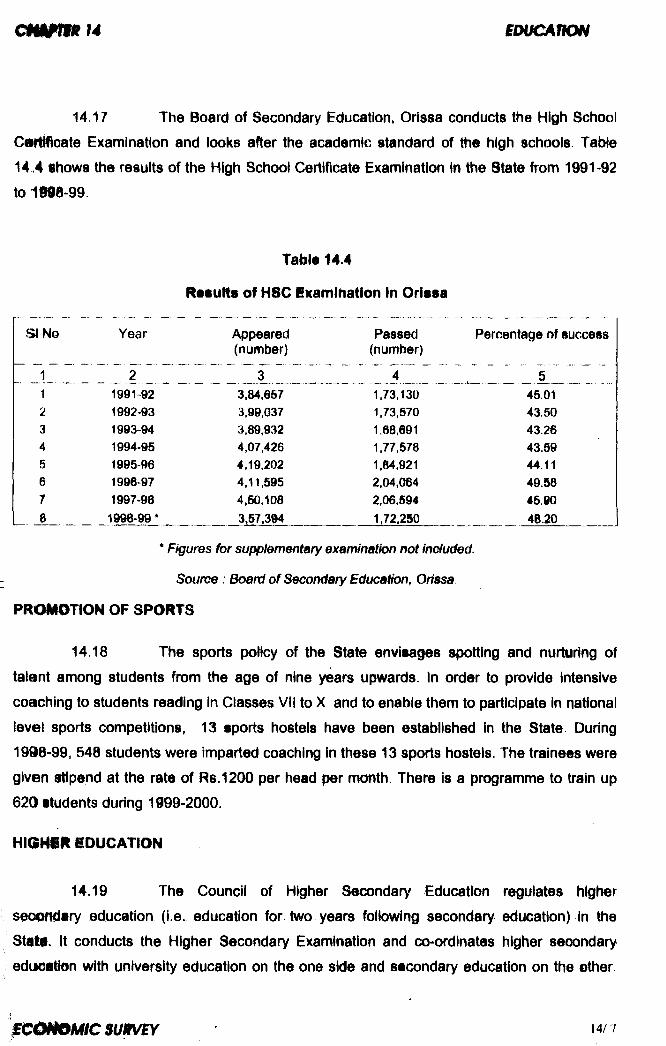
a m m i 4
14.17 The Board of Secondary Education, Orissa conducts the High School
Ciir^oate Examination and looks after the academic standard of the high schools. Table
14 .4 Shows the results of the High School Certificate Examination in the State from 1991-92 to 1®i8-99
Table 14.4
RetuKs of H8C Examihation In Orissa
SI No Year Appeared Passed Percentage of success(number) (number)
3 1 , Z . I ____ 2____ 3 Z Z a Z Z ____ _____1 1991-92 3,84,657 1,73,130 45.012 1992-93 3,99,037 1,73,570 43.503 1993-94 3,89,932 1,68,691 43.264 1994-95 4,07,426 1,77,578 43.595 1995-96 4,19,202 1,84,921 44.116 1996-97 4,11,595 2,04,064 49.58r 1997-98 4,50,108 2,06,594 45.00
.._8______ 1998-99 * 3,57,394 1,72,250 48.20
* Figures for supplementary examination not inoluded.
Source : Board of Secondary EducaHon, Orissa
PROM0HON OF SPORTS
14.18 The sports poHcy of the State envisages spotting and nurturing of
talent among students from the age of nine years upwards. In order to provide intensive
coaching to students reading in Classes VII to X and to enable them to participate in national
level sports competitions, 13 sports hostels have been established in the State. During
1998-99, 548 students were imparted coaching in these 13 sports hostels. The trainees were
given stipend at the rate of Rs.1200 per head per month. There is a programme to train up
620 Students during 1999-2000.
HK3WII iDUCATION
14.19 The Council of Higher Secondary Education regulates higher
sec^fldary education (i.e. education for two years following secondary education) in the
Staff. It conducts the Higher Secondary Examination and co-ordinates higher secondary
education with university education on the one side and secondary education on the other
f C & k m c s u m / B Y W 1
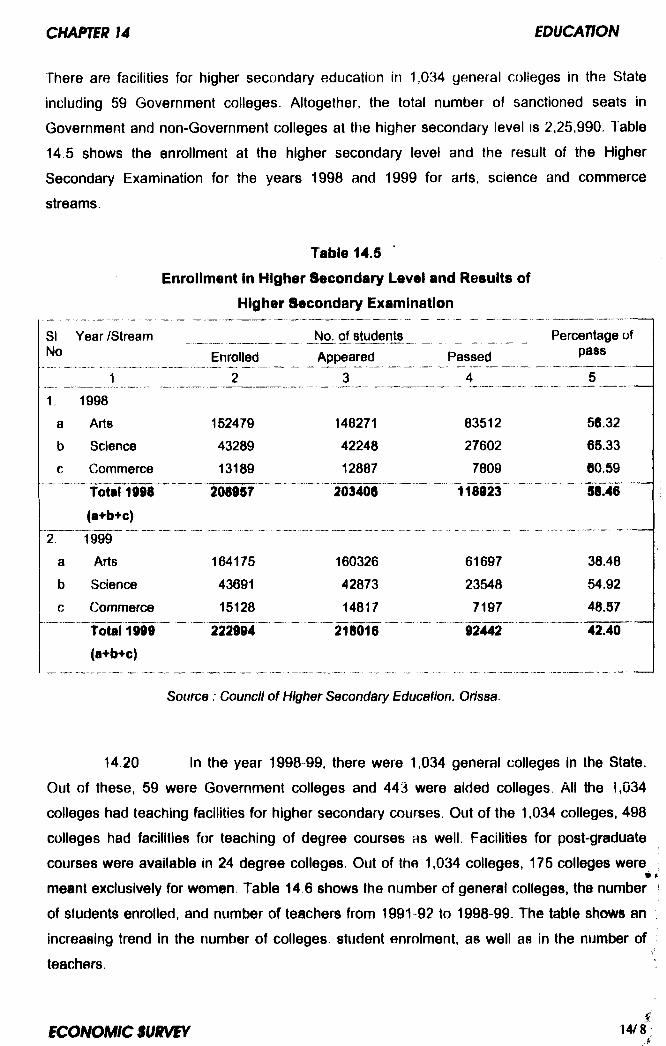
There are facilities for higher secondary education in 1,034 general colleges in the State
including 59 Government colleges. Altogether, the total number of sanctioned seats in
Government and non-Government colleges at the higher secondary level is 2,25,990. Table
14.5 shows the enrollment at the higher secondary level and the result of the Higher
Secondary Examination for the years 1998 and 1999 for arts, science and commerce
streams.
Table 14.5Enrollment In Higher Secondary Level and Results of
Higher Secondary Examination
SI Year /Stream No
1Enrolled
No. of students Percentage of
Appeared
~ 3
Passed
4
1. 1998
a Arts 152479 148271 83512 56.32
b Science 43289 42248 27602 65.33
c Com m erce 13189 12887 7809 60.69
Total 1998 208957 203406 118923 S8.46
(a+b+c)
2 1999
a Arts 164175 160326 61697 38.48
b Science 43691 42873 23548 54.92
c Com m erce 15128 14817 7197 48 .57
Total 1999 222994 218016 92442 42.40
(a+b+c)
Source : Council of Higher Secondary Education. Orissa.
14 20 In the year 1998 99, there were 1,034 general colleges in the State.
Out of these, 59 were Government colleges and 443 were aided colleges. All the 1,034
colleges had teaching facilities for higher secondary courses Out of the 1,034 colleges, 498
colleges had facilities for teaching of degree courses as well. Facilities for post-graduate
courses were available in 24 degree colleges. Out of the 1,034 colleges, 175 colleges were» f
meant exclusively for w o m e n Table 14 6 shows the number of general colleges, the number
of students enrolled, and number of teachers from 1991-92 to 1998-99 The table shows an
increasing trend In the number of colleges, student enrolment, as well as in the number of
teachers
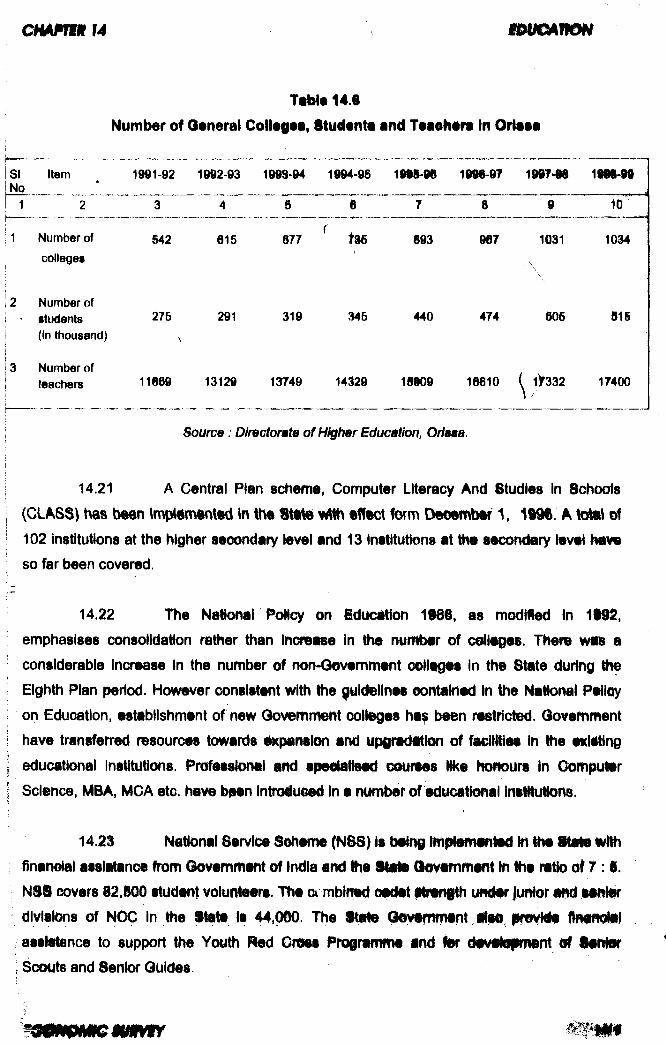
( m m i f u m m n m
T«bl«14.8Number of Qttneral Colltgta, 8tuil«nt« and TMOhtri In O rlati
SINo
Item 1991-92 1992-93 1993-94 1994-95 199S>0e 1 9 ^ -9 7 1907-98 190899
1 2 3 4 5 6 7 8 9 101!
i
1
Number of
collegesS42 615 877 ■ t35
i i
893 967 1031
■ \
1034
j
2 Number of students (in thousand)
275
\
291 319 345 440 474 505 51§
3 Number of teachers 11669 13129 15749 14329 15909 16610 1^332 17400
Source: Dimctomte o f H ighT Education, Orlaaa.
14.21 A Central Plan scheme, Computer Literacy And Studies in Schoots(GLASS) tms b«en in tNi S tM ifftd fOTtm Deeember 1, 119® A iG^t of102 institutions at the higher secondary ievei and 13 institutions at ^e secondary ievei have so far been covered.
14.22 The Nationai PoNcy on idudMon 198S. as modified in iWm, emphasises consoiida^on neither than inclose in the nuf )«r of (Sieges. Them wMs a considerabie increase in the number of non-Oovemment coiieges in the State during the Eighth Pian period, i ovvever consi ent with the ^ui eiinee eontalned in the Nalionai Peiicy on Education, establishment of new Ck)vemn^nt oolleges ha been n^tricted. dovemment have transfen ed resources towards i paneion and upgraditien of fadittiee in ^e exiiting educational Institutions. Professionai and speeiaHead im irtes INce Nsnours in Computer Science, MBA, MCA etc. have been introiu@ed in a nymber of educaHonai iniMu^ns.
14.23 National Service Seherm (NSS) is being tmpiemvnM ih thefinaneial atsiatanoe from Government of India tte M il §@vemmeni m tie r«tio of 7 :1. N il covers 82.S00 itudenf voiunteers. The a mbirvsd oadet fM fiflh t mder o r imd itN fir diviaions of NCC in ttte State is 44,000. The State Om^rrwint Ifti© fln«n^lasiMance to support the Youth Red Cries Pr@gr«mme and far divita|Niient ^n ta r SccRits and Senior Guides.
14.24 In addition to ongoing scholarship schemes, the State Government
have introduced a scheme for award of scholarships at the rate of Rs.1000 per month to
meritorious girl students who have secured admission In selected professional, technical and
management Institutions of excellence at the national level and selected Institutions within
the State. The State Government have alib decided to provide scholarships to meritorious
students the income of whose parents is Rs.24,000 or less per annum. Under the scheme,
1,050 students at higher secondary stage. 250 students at the under graduate stage, and
125 students at the post graduate stage would be fc>enefited every year.
14.25 The State has seven universities namely Utkal University, Sambalpur
University, Berhampur University, North Orissa University, Fakir l\4ohan University, Sri
Jagannath Sanskrit Univensity and Orissa University of Agriculture and Technology. Apart
from these Universities, it Is proposed to open an Adlvasi University at Koraput to expand
higher education in tribal districts of southern Orissa, In addition to the existing three
autonomous colleges namely Ravenshaw College at Cuttack, Khalikote College at
Berhampur, and Gangadhar Meher College at Sambalpur, Government had recommended
to the University Grants Commission to confer autonomous status on 12 more colleges in
the State. Out of the 12 colleges recommended to UGC, three colleges namely Buxi
Jagabandhu Bidyadhar College at Bhubaneswar, R a m a Devi W o m e n s ’ College at
Bhubaneswar and Samanta Chandra Sekhar College at Puri have been granted
autonomous status during 1990-99.
14.26 The State Government provides development grants and special
development grants to Utkal University, Berhampur University, Sambalpur University, and
Shree Jagannath Sanskrit University. During 1998-99 a sum of Rs.181.63 lakh was provided
to these universities. Orissa University of Agriculture and Technology (OUAT), which is
assisted under ihe agriculture budget, Is also provided grants in the education budget to fund
under graduate and higher secondary courses in science and a post graduate course in
micro biology. For this purpose, a sum of Rs.66.50 lakh was provided during 1998-99. O U A T
also received an amount of Rs.3.50 lakh as block grant during 1998-99
14.27 To provide educational facilities to large number of semi-urban and• f
rural youth and part time students, an open university on the pattern of Indira Gandhi
National Open University is proposed to be opened during the Ninth Plan period.
cmmm i4 eoiK^nmi
VOCATIONAL EDUCATION
14.28 A Centrally Sponsored Plan schenf for vocational education at the higher secondary stage was Introduced In the State from 1968-SS. Subsequently, the scheme was transferred to State Plan. During 1998, 1,454 students were enrolled under the vocational stream In 131 higher secondary schools. Government have constituted a State Council of Vocational Education and District Vocational Education Committees to advise on matters relating to vocational education.
TiACHERS EDUCATION AND TRAWINQ
14.29 During the year 1998-99, there Were four Government Training Colleges, six Colleges of Teachers' Education (CTts) and three Institutes of Advanced Study in Education (lASEs) In the State. The total Irttake capacity for B.Ed., M.id. and M.Phil courses in these institutions is 1516 with 3 i aeats for M.Phil., §6 seats for M.id., and 1,384 seats for B.Ed courses. There is a proposal for opening of two new training colleges, one each at Kendrapara and Phulbani, during tie Ninth Plan period. There are th ir^n District Institutes of Education and Tra^Nig (OlETs) with intake capacity of 650 trainees which provkile training to mass education Ins^uctiirs and supervlsorB. There are a ^ 52 Secondary Training Schools with Intake capa^ of 2 , ^ Mnees. The State Ck>uni)ll ef Educattonai Research and Training (SGEf T) oversees adMHes relating to quaUtaMve Impro^ment in school education trough projects and sidles that receive assistance from UNICEF, NCERT and Government ef India.
H. 30 In orctar to ensure planned and c^-ordln«ted c^velepment of teachers’education and for detenninatlon and maintenance of standards for teachers* idycation, a Regional Office of the National Council for Teachers’ iiucatton (NCTE) has been established at Bhubaneswar during 1t §-96 with tie assignee of Government of India.
14.31 During tie NInti Plan pwM, an inMiiiM^ training progn^ime has been taken up to dear ttw baikleg of untrained s#wi tMiohefs. Ineervlee ta^vHig Isto be provk ed to 1,11,940 primary school taachers working in the State. Admkislon in OlETs has been stuped f^r fresh ci^dates fmm the year 199?^ Insteail, these in s tills are exclusively utilised for ImpaHlrig training to Inservice teachers. With tl^ alrh of providing training to handle teaching aids under Deration Black itoard, a sfieciai ortantitbn course for primary teachers Is being conducted since 1994-95 with Government of India assistance.
l a m m c i u u m >4/11
Around 35,000 teachers had been trained under the scheme by the end of 1998-99 For
Improvement of quality of education at the secondary stage, Government have also decided
to focus on the training of untrained high school teachers.
TiCHNICAL EDUCATION
14.32 Technical education In the State Is Imparted at various levels through
Engineering Colleges, Engineering Schools. Polytechnics, Industrial Training institutes (ITIs),
and industrial Training Centres (ITCs). The Directorate of Technical Education and Training
(DTET) functions as the nodal agency to plan and implement technical education
programmes in the State and to maintain liaison with the State Council of Technical
Education, Universities In the State, and national level technical institutions.
14.33 By the end of 1908-99, there were twenty Engineering Colleges
in^Uding four Government Engineering Colleges, two University Engineering Colleges and
fourteen private Engineering CoMeges with a total Intake capacity of more than 4,000
students in different faculties.
14.34 In the Government sector, there are 13 Engineering
S^oola/PolytecHnios with an Intake capacity of 1,500 students. These Institutions offer
c^Nfima courses In both engineering and non-engineering disciplines as per the guidelines,
norms and standards prescribed by the Ail India Council for Technical Education (AiCTE),
Ntw-Deihi. Out of the above institutions, four polytechnics, at Rourkela, Dhenkanai,
Bhubaneswar and Berhampur with an intake capacity of 220, are meant exclusively for
women. In addition to the above institutions, 12 private Polytechnics/Engineering schools
were engaged in imparting technical education during 1996-99 with an Intake capacity of
2< 100 students.
14.35 it has been proposed to establish a University of Technology to
maintain and Improve standard of education in Engineerirjg Colleges and to upgrade the
If^t^^ural and other facilities in the State for technical education during 1999-2000 The
$ « % ^ © f the proposed Teohnoiogicai University will Include Institutions imparting education in
iilgneering anel tecNnolsip Induaiy, manegemwrn and applied sciences. Computer and^ liililfWi mm pmposed to be included in the ouniculum of the
pro^e#im(pw«ity.
14.36 The Craftsman rrainintj Scheme has been introduced In the State
8lno« 1959 to ensure a steady flow of skilled workers In different trades to meet the
requirement of Industries and to promote self-employment among the educated youth„ There
ar® 23 Industrial Training Institutes (ITIs) and Industrial Training Centres (ITCs) with a total
Intake capacity of 6,140 students in Government sector In the State. These ITIs and ITCs
Impart training in 38 designated trades in one year and two-year courses Out of the 23
Government ITIs / ITCs, 10 are exclusively meant for w o m e n trainees and cover trades like
stenography, tailoring, dress making, weaving, bleaching and dyeing
14 37 In the field of medical sciences, the State has three Medical Colleges,
one Dental College, one Pharmacy College, three Ayurvedic Colleges, four Homoeopathic
Colleges and one Nursing College in the GovernmenI sector There are also two Ayurvedic
Colleges and two Homoeopathic Colleges in the private sector. The intake capacity of the 3
Medical Colleges is 321, of the Dental College 20, and of the Pharmacy College 100
14 38 There are nine constituent colleges under the Orissa University of
Agriculture and Technology (OUAT) namely a Veterinary College, a College of Agricultural
Engineering and Technology, a College of Engineering and Technology, a College of
Fishery, a College of H o m e Science, a College of Basic Science, two Agriculture CoHeges
and a College of Computer Studies. The total intake capacity of all these constituent colleges
under O U A T is 992
EXPENDITURE ON GENERAL EDCUCATION
14.39 Table 14.7 shows the revenue expenditure on general education (I.e
education up to post graduate level In non-technical Institutions) In the State from the year
1991-92 to 1999-2000. The budget provision on general education is increasing over the
years. The major part of the resources available is being spent on salary of teaching and
non-teaching staff.
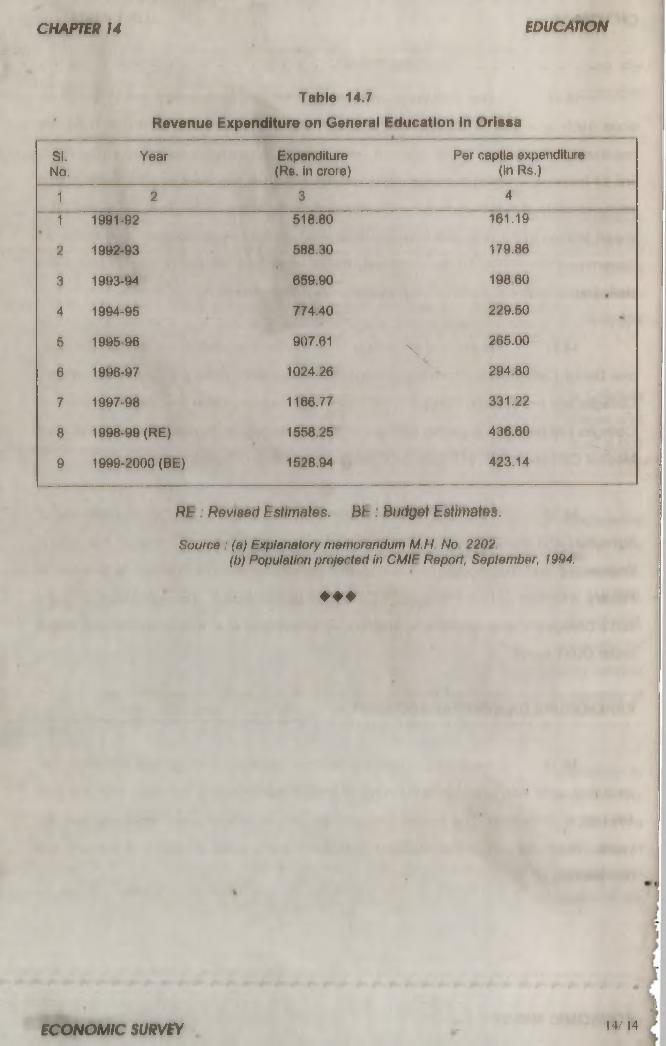
Table 14.7Revenue Expenditure on General Education In Orissa
SI.No.
Year Expenditure (Rs. in crore)
Per captia expenditure (in Rs.)
1 2 3 4
1 1991-92 518.80 161.19
2 1992-93 588.30 179.86
3 1993-94 659.90 198 60
4 1994-95 774.40 229.50
5 1995-96 907.61 ^ 265.00\
6 1996-97 1024.26 294 80
7 1997-98 1166.77 331.22
8 1998-99 (RE) 1558.25 436.60
9 1999-2000 (BE) 1528.94 423.14
RB : Raviaed Estimates. BB : Budget Esf/males,
Source : (a) Explanatory memorandum M.H No 2202(b) Population projected In CMIF Report, September, 1994.
♦ ♦ ♦
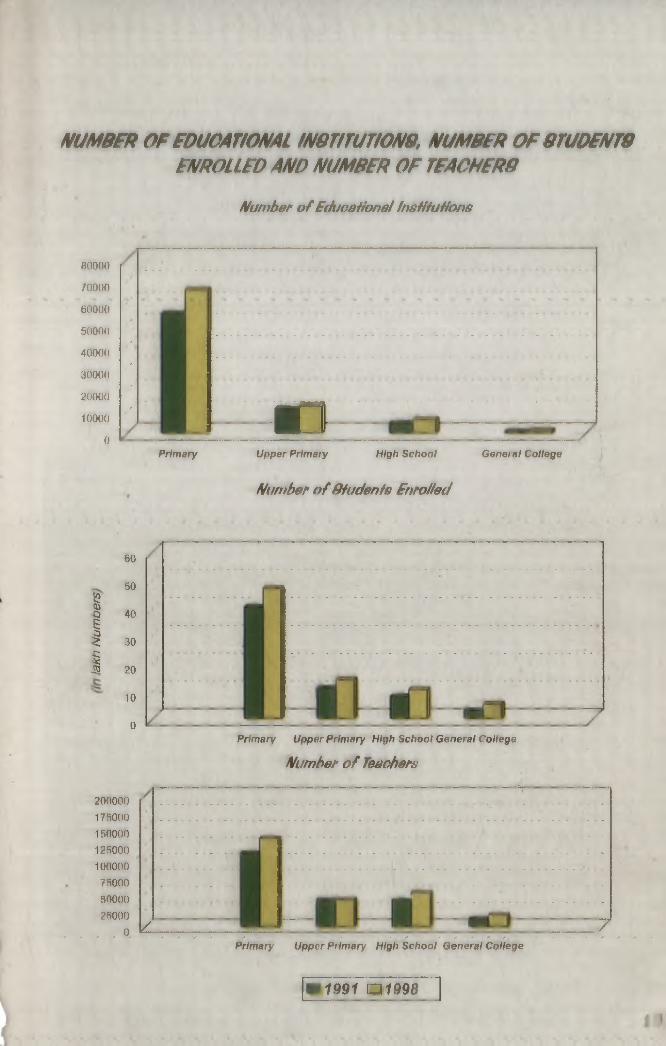
NUMBFR OF eOUCATIONAL mmUTIONO, NUMBER OF8rUD£NTO BNROLLFD AND NUMBER OF TFAOHFRff
N um ber o f E duoaH ona! h sH fu H o n s
8000(1
70000
60000
50000
40000
30000
20000
100000
lOPrimary Upper Primary High School
Number o f 9fudent6 Enrolled
General College
1
II
60
50
40
30
20
10
0
200000175000150000125000100000750005000026000
0
Primary Upper Primary High School General College
N um ber o f Teachers
\L. 7Primary Upper Primary High School General College

CHAPTER 15
HEALTH, FAMILY WELFARE, SANITATION AND SOCIAL WELFARE
HEALTH
15.01 The focus in the tiealth sector has been to improve access to health
care for the untierserved segments of the population. This is tieing achieved through
consolidation and operationalisation of the primary, secondary and tertiary health-care
infrastructure and effective implementation of National programmes for combating major
pul)lic health ptoblefns Communicable and nutrition related diseases continued to be the
major prot)lems
15.02 The main objectives for the health sector are as follows .
I. to providp cJ^qupte ind q ialitative prQver]|ive allfi care to, ' thn pedpfe of the 8tal0. ^ ^ ^
\l . ’ to improve t iaterr\ l apd child health and in particular to reduce maternal and infant mortality. ; t , ‘
I 'tii. \ to ensure equity in h^afc care to aH, particularly tQ dlsadvpr^tatf^d groups
' like sctiedulftd tribes!'lAfeduled caMe^, batJkward dassea ahd women.
* I
iv . ^ \o provi4e affordable aP|ty|i^alth pare tf> th^| eo6lft*of U ^ allopathte, homoeopMhIc ar^ aywrvedic &y^0|is"'olwedlalr|i tc. %
to give tmlning to doctor J iHJr es and other p|r|n:gdlo«l staff to rp«et |heneed of health bar# in Ihi'Stete. \
Vi. ' I f to ensure greatet. soeess to p ritp lry h e i | t ^ i r | ^ ^ | v t ^ l i f g # e d i c a l » institution! as fclose'td the people a s pog^ible o n h r o ^ n iTioblle health
• ' « ^ l u n i | a , p lr iio u la r ly |n th 6 underserve.d an g u n ae v e l!5fJeddiltrictS . » ^ ^
^ ^ t o impr^? hospital Bs^lfies af's^pontlary and tfiJaiV tey l both in termi of infraltfucture and personnel. f :< - x
viil. m to improve Ihe maintenance Qf b Ullding? by Introduoing reforms In the* "-fcsvstem .^ XX j ^■system,;;
ix ,"'^ to Imprcgi \] Inerable districts of thd Stjf
/ ' %
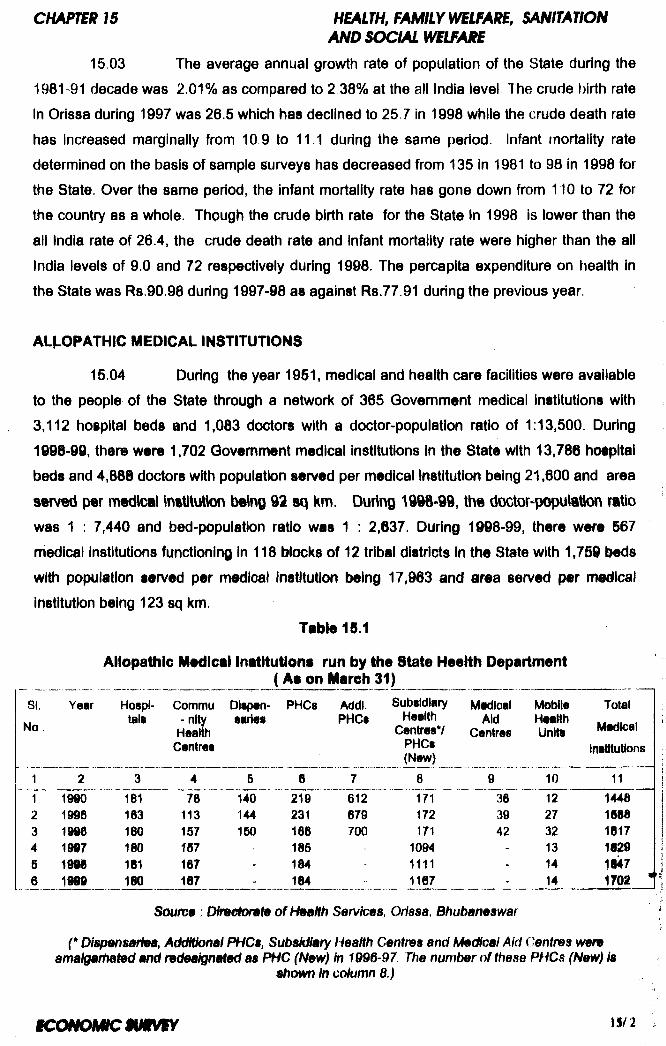
CHAPTER 15 HEALTH, FAMILY WELFARE, SANITATIONAND SOCIAL WELFARE
15.03 The average annual growth rate of population of the State during the
1981-91 decade was 2.01% as compared to 2 3 8 % at the all India level The crude birth rate
In Orissa during 1997 was 26.5 which has declined to 25.7 in 1998 while the crude death rate
has increased marginally from 10.9 to 11.1 during the same period. Infant mortality rate
determined on the basis of sample surveys has decreased from 135 in 1981 to 98 In 1998 for
the State. Over the same period, the Infant mortality rate has gone down from 110 to 72 for
the country as a whole. Though the crude birth rate for the State In 1998 is lower than the
all India rate of 26.4, the crude death rate and Infant mortality rate were higher than the all
India levels of 9.0 and 72 respectively during 1998. The percapita expenditure on tiealth in
the State was Rs.90.98 during 1997-98 as against Rs.77.91 during the previous year.
ALLOPATHIC MEDICAL INSTITUTIONS
15.04 During the year 1951, medical and health care facilities were available
to the people of the State through a network of 365 Government medical institutions with
3,112 hospital beds and 1,003 doctors with a doctor-population ratio of 1:13,500. During
1998-99, there were 1,702 Govemment medical Institutions in the State with 13,786 hoipltai
beds and 4,888 doctors with population served per medical Institution being 21,600 and area
served per medical instltutkm beir^ 92 sq km. Durirvg 19d§-99, the docior-populetion ratio was 1 ; 7,440 and bed-popuiation ratio was 1 : 2,637. During 1998-99, there were 567
medical Institutions functioning in 118 blocks of 12 tribal districts in the State with 1,759 beds
with population served per medical Institution being 17,963 and area served per medical
institution being 123 sq km.
Table ia.1
Allopathic Medlcel Inetltutlone run by the State Heetth Department
SI.No.
Year Hospitals
Commu - nity Health Centres
Dltpen-sarlis
PHCs Add!.PHCs
SubsidiaryHealth
Centres*/PHCs(New)
MedicalAid
Centres
MobileHealthUnits
TotalMedical
Institutions
1 2 3 4 5 6 7 8 9 10 1119§0 181 78 140 219 612 171 38 12 1448
2 19§6 183 113 144 231 679 172 39 27 16883 1986 160 157 150 186 700 171 42 32 18174 1987 180 tS7 185 1094 - 13 16295 1996 181 187 - 184 - 1111 - 14 18476 1999 180 187 - 184 1167 • 14 1702 •
Souw 9: Dfmolomt» of HmiHh Services, Oriasa, Bhubaneswar
(* Dispenseniea, AdcHtional PHCa, Subsidiary Health Centres and h^dlcal Aid Centres wem amalgarhated and radeaignated as PMC (New) in 1996-97 The number of these PHCs (New) is
shown in cotumn 8.)
tc o N o m m m m
15.05 During 1996-97, Dispensaries, Additional PHCs, Subsidiary Healtli
Centfii and Medical Aid Centres were amalgamated and re-designated as P H C (New) so as
to eniure at least one doctor per PHC. Table 15.1 shows the number of allopathic medical
instltuttons functioning In Orissa under the Health Department.
15 06 Rural health care services have been further strengthened through
establlahment of sub-centres for providing antl-natal check ups to pregnant mothers and
immunisation facilities to Infants. According to Government of India criteria, there should be
one sub-centre per 3,000 population In tribal areas and one sub-centre per 5,000 population
in other areas Orissa required 6,568 sub centres by 1991. As against this, the total number
of sub-centres existing at present is 5,927 The gap is proposed to be filled up during the
Ninth Plan period.
AYURVEDIC AND HOMOEOPATHIC INSTITUTIONS
15.07 The popularity of the non-allopathic systems of medicines (ayurvedic,
homoeopathic and unani) has grown over the years due to their low cost and fewer skip
effects At present there are three Government Ayurvedic colleges and four Govemment
Homoeopathic colleges Imparting graduate and post-graduate education,
15.08 During 1998-99, 5 Govemment ayurvedic hospitals (Inoludlng three
attached to colleges) and 619 ayurvedic dispensaries were rendering services in the State
with 203 hospital beds and 579 doctors. Apart from the three Government ayurvedic
hospitals, two private ayurvedic hospitals were also functioning in the State. It has been
targeted to increase the number of ayurvedic dispensaries from 519 to 637 by the end of the
Ninth Plan. There Is a proposal to establish 18 ayurvedic dispensaries during 1999-2000.
Nine unani dispensaries are functioning in the State.
15.09 During 1998-99, four Govemment homoeopathic hospitals and 460
homoeopathic dispensaries were rendering services in the State with 125 hospital beds and
497 doctors. T w o private homoeopathic hospitals are also functioning In the State, it has
been targeted to Increase the number of homoeopathic dispensaries from 460 to 578 by the
end of the Ninth Plan. It Is proposed to establirfi 18 new homoeopathic dispensaries during
1999-iOOO. Details of ayurvedic and homoeopathic nrtedlcal Institutions in the State and their
growth over the years is shown In Table 15.2
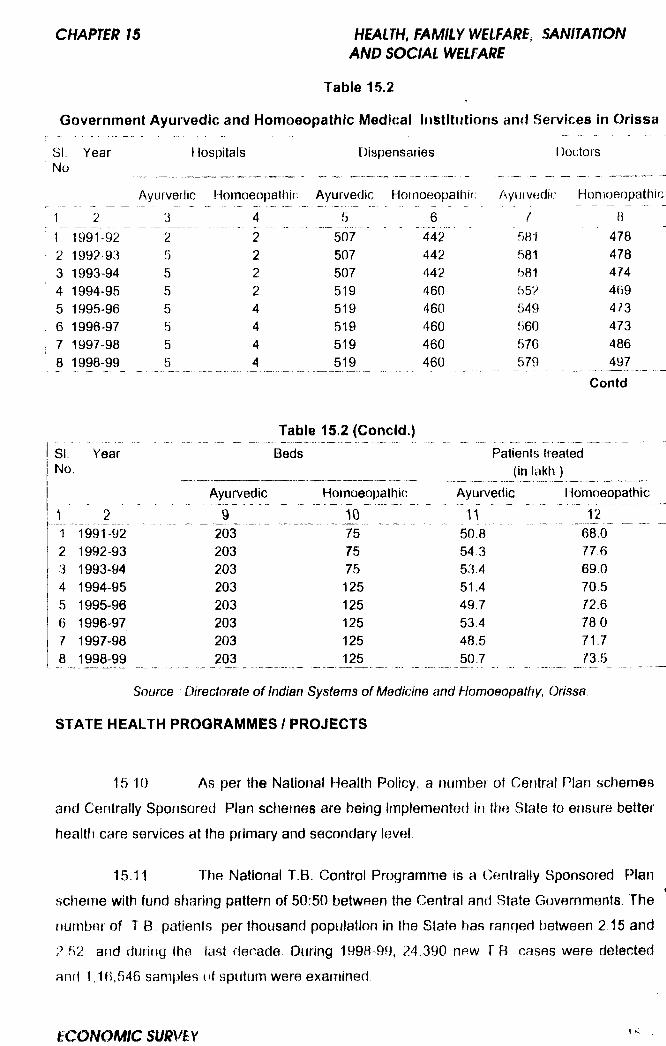
Table 15.2
Government Ayurvedic and Homoeopathic Medical hiStltiitions and Services in Orissa
Hospitals DispensariesSI.No
Year Doctors
Ayurvedic Homoeopaltiir Ayurvedic Hoinoeopathic Aytirvodic Honioeop
1 2 3 4 5 6 71 1991-92 2 2 507 442 581 4782 1992 93 5 2 507 442 581 4783 1993-94 5 2 507 442 581 4744 1994-95 5 2 519 460 552 4695 1995-96 5 4 519 460 549 4736 1996-97 5 4 519 460 560 4737 1997-98 5 4 519 460 576 4868 1998-99 5 4 519 460 579 497
Contd
Table 15.2 (Concfd.)
SI. Year Beds Patients treatedNo, (in lakh ]1
Ayurvedic Homoeopathic Ayurvedic Homoeof
T 7 2 ........”9 10 ...” ...Vi ” "... . 12..T 199T-92 203 .... . 75 50 8 ' 6ao2 1992-93 203 75 54,3 7763 1993-94 203 75 53.4 69.04 1994-95 203 125 51.4 70.55 1995-96 203 125 49.7 72.66 1996-97 203 125 53.4 7807 1997^98 203 125 48.5 71.78 1998-99 203 125 50.7 73.5
Source Directorate of Indian Systenfis of Medicine and Homoeopathy, Orissa
S T A T E H E A L T H P R O G R A M M E S I P R O J E C T S
1v5 10 As per the National Health Policy, a number of Cer)tral Plan schemes
and Centrally Sponsored Plan schemes are being implemented in the State to ensure better
health care services at the primary and secondary level,
15.11 The National T.B. Control Programme is a Centrally Sponsored Plan
scheme with fund sharing pattern of 50:50 between the Central and State Governments. The
number of I B patients per thousand population in Ihe State has ranged between 2 15 and
2 52 and during the last decade During 1998 99, 24.390 new T cases were detected
and 1,16,546 samples of sputum were examined
C H A P T E R 15 H E A L T H , F A M I L Y W E L F A R E , S A N IT A T IO NA N D S O C I A L W E L F A R E
15.12 The Nalioiial Filaiia Eradicatkjn F’ lograinniB (NFEf’) is a Centrally
Sponsored Plan scheme being implemented through a Filariasis Bureau, a F^esoarch Unit at
Puri, 15 f ilaria Control Units, 15 l ilaria Clinics, and 2 Filaria Survey Units During 199R,
blood slides of 49,660 persons were examined and 1,252 cases vyefe found positive The
micro filaria rale ( tlie number of persons found positive for micro filaria as a proportion of
numt)er of person tested duiing the yeaf) has ranged between 4 34% and 2.04% during the
last dec ade
1b 13 The National Programme for Control of Blindness (NPCB) aims at
liniigiiig down Itio latio of f>lindness from 1 4% to by the end of tfie yeai 2000 A
< iilatat t Blindness c ontrol (Project fia.s been undertaketi wifh World Bank assistance with tfie
• lirn of eradicating cataract blindness in the State During 1998 99, 79 2/1 cataract
ciperalions Wf*re performed against a target of 1,23,200 operations The target for 1999-2000
IS 1,25,000 ( ataract operations
15 14 The National Iodine Deficiency Disorders Control F*rogramme is being
implemented ifi tfie State as a Central F lan scheme tt> control goitre and other iodine
deficiency disorders A survey was conducted in the districts of Cuttack, t^uri, Sundargarh
and Keonjfiaf during 199H-99 and the incidence of goitre among the surveyed population in
these four districts was found to be 20.5%, 19.3%, 33.5% and 14 9% respectively. The sale
ami manufacture of non-iodised salt has been banned in the State with effect from 01 06.96.
At [>resent two iodination plants, one at l-iumma in Ganjam district and the other at Bolong in
l^alasore district, are under operation. A laboratory for monitoring iodine deficiency disorders
is proposed to be established.
15.15 The National leprosy Eradication Programme (NLEP) is being
implemented in the State througfi 54 Leprosy Eradication Units (LEUs), fS Modified L eprosy
( -ontrol Units (MLOUs), 78 Survey Eradication and Treatment Rural Leprosy Centres (SE1 /
IxLCs), 10 Utban Leprosy Centres, and two upgraded Ul Cs witli the objective to eradicate
leprosy by the year 2000. For treatment of critical leprosy patients. 13 temporary
fiospitalisation wards with twenty beds eacfi and a liundred bedded leprosy hospital at
CAjltat:k are functioning. Due to effective measures taken by the State Government, the
leprosy prevalence rate per thousand population has decreased from 5.4 during 1990-91 to
0.7 during 1998 99. This Is still higher than the all India prevalence rate of 0.5 per thousand
[population During 1998-99, 44,464 new leprosy patients were identified for treatment
against the target of 10,000 and 93,678 leprosy patients were discharged as cured against
the target of 70,000. There is a target to detect and treat 25,000 new cases and discharge
45,000 cases during 1999-2000.
CHAPTER IS HEALTH, FAMILY WELFARE, SANITATIONAND SOCIAL WELFARE
15 16 The National Malaria Eradication Programme (NMEP) is a Centrally
Sponsored Plan scheme with the funding pattern of 50:50 between the Central and State
Governments. The main programmes under the scheme are to maintain cleanliness of
inhabited areas, to destroy mosquitoes through spraying of DDT, and to make people
conscious of the disease through information, education and communication activities.
During 1998-99, 39.37 lakh blood slides were examined of which 4 78 lakh were found
positive and radical treatment were given to 4.61 lakh patients.
15.17 A scheme for control of AIDS is being implemented through a State
level registered society with assistance from the World Bank. The objective of the scheme is
to increase popular awareness about AIDS. Blood tests are also carried out under the
scheme and detected patients are provided with treatment.
15.18 The State Government have introduced a new scheme named Ranch
Byadhi Chlkitsa to provide free treatment to people suffering from the five c o m m o n diseases
of diarrhoea, malaria, leprosy, respiratory infections and scabies. The scheme is being
operated in all Government medical Institutions in the State experimentally for a period of 6
months from 01.06.99. The scheme envisages that the entire cost of treatment of these five diseases will be borne by the State Government.
15.19 The Orissa Health Systems Development Project commenced from
18.09.98 for a period of five years with assistance from the World Bank with the objectives to
improve the health care delivery in selected primary and secondary hospitals in the State and
to increase efficiency in the allocation and use of health resources. The cost of the project is
Rs.415.60 crore, out of which Rs.348.80 crore constitutes loan assistance from the World
Bank, while the balance Rs.66.80 crore Is to be met by the State Government During 1998-
99, an amount of Rs. 7.60 crore was utilised for activities such as construction of buildings
for 22 institutions, purchase of drugs etc An outlay of Rs.81 80 crore has been proposed for
the Annual Plan 1999-2000 including Rs.26.68 crore for building programmes
15.20 The Orissa Health and Family Welfare Reform Project is under
Implementation in the State with financial assistance of Department for International
Development (DFID), U K After completion of the first two phases, currently the third phase is
being implemented in stages. In the first stage of this third phase, 20 blocks of Keonjhar and
Bhadrak districts have been covered with estimated project cost of Rs 14 55 crore. Under the
CHAPm IS HSALTH, FAMILY WELPAI E, SANITAmNAND SOCIAL WELFARS
project, medical institutions are to be strengthened by providing medical equipment and
medicines and construction of new buildings The first stage is likely to be completed by
October 2000
MEDICAL EDUCATION AND TRAINING
15 21 There are three Medical Colleges with attached hospitals in the State
These colleges offer courses leading to M B B S and B D S degrees F’ost-graduate and post
doctoral courses are also offered There is one Nursing College, one Dental College, one
F^liarmacy College, three Government Ayurvedic colleges and four Government
Homoeopathic colleges in the State. The State Institute of Health and f-amily Welfare
functions as ttie apex in service training institute with three functional units at the State level
and cells / wings at district / block levels for imparting training support under various
programmes,
I15.22 f'acilities for super specialised treatment are being provided in three
Medical College Hospitals through ultra modern diagnostic and theraputic equipment A
cardiac catheterisation laboratory has been set up at S.C.B. Medical College Hospital,
Cuttack. The S.C B Medical College Hospital has 1208 beds and is equipped with modern
instruments like heart-lung machine, equipment for open heart surgery, auto analyser, C T
scan etc. The other two medical cotleges namely M K C G Medical College Hospital at
Berhampur and V.S.S. Medical College Hospital at Burla have 881 and 772 hospital beds
respectively.
FAMILY WELFARE
15.23 The Family Welfare Programme Is being implemented as a part of the
National Population Control Programme in the State. The programme is Implemented with
; full Central assistance to check the rapid growth of population and to bring down the high
infant mortality rate in the State by promoting universal Immunisation.
15.24 Under the Family Welfare Programme, the strategy Is to motivate
eligible couples to limit family size by adopting methods like use of Intra uterine devices
(lUDs), oral contraceptive pills (OCPs), conventional contraceptives (CCs), sterilisation etc.
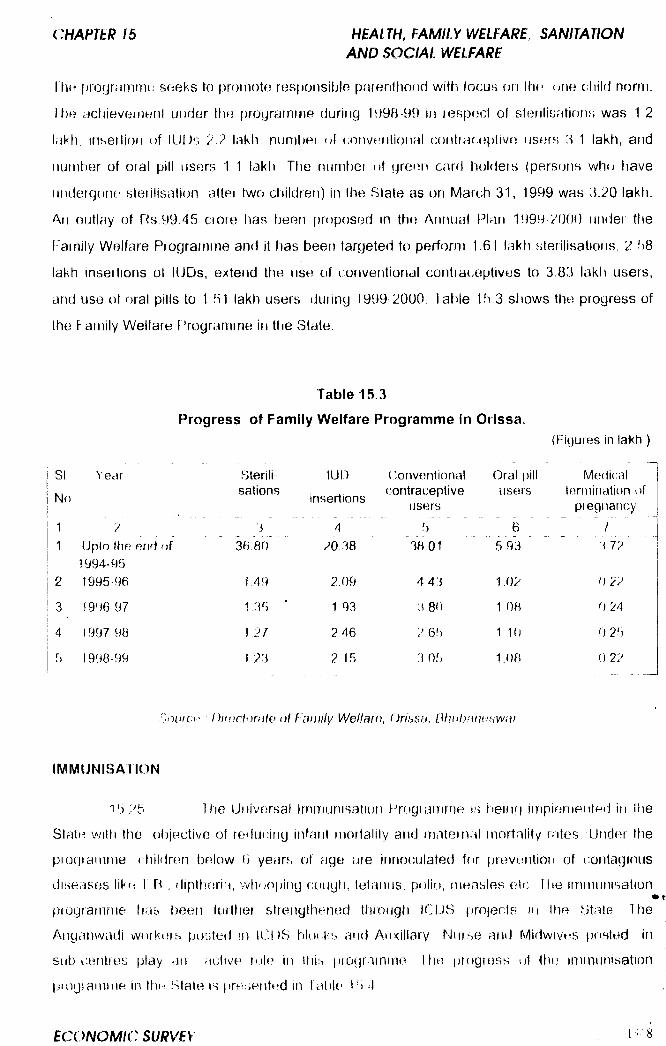
HBALTH, FAMILY WELFARE, SANITATION A N D SO CIAL WELFARE
I fu? fjroytrim iTK' sneks to prom ote responsitjie parenthood w ith focus on the one child norm.
I he dch ieve in tjn l under the proyrarnn ie during 199B-99 in fespect of sterllisntionf, was 1 2
Inkh. inse tlion of IUf)G 2 2 lakli, nun)t)ei of conventional contracoptivo users 3 1 lakh, and
num ber of o ia l pill users 1 1 lakh Tfie numt)et of green carct holders (persons who tiave
undergone s le rilisa titjn a lte i two ctiild ren) in the S la te as on M arch 31, 1999 was 3.20 lakh.
An outlay of F^s 99 4v5 c io re has been (iroposed in the Annual t^lan 1999-2000 under the
I'am ily W elfare P rografnm e and it has been targeted to perform 1.61 lakh sterilisations, 2 b8
lakh insertions ol lUDs, extend the use of i:onventional contraceptives to 3.83 lakh users,
and use of oral pills to 1 51 lakh users during 1999 2000 l able 15,3 shows the progress of
the Family W elfare P rogram m e in ttie State.
Table 15.3
Progress of Family Welfare Programme In Orissa.
(Figures in lakh )
SI Year Sterili lUD ('onventional Oral pill Medical
No sationsinsertions
contraceptive users terminatitin ofusers pregnancy
1 ? 3 4 f) g - ..... f ..1 tJpto tfie eri'i of 36 80 20,.38 38 01 5.93 ...........3 72
1994-952 1995-96 1.49 2.09 4 43 1.02 0 22
3 1996 97 1.35 ’ 1 93 3,80 1 08 0.24
4 1997 98 1.2/ 2.46 ? 65 1 10 0 25
5 1998-99 1 23 ? 15 3 05 1.08 0 2?
'ujiiiCf ' : niincli)rHt€} of Family Welfam, Oritisn, l^hubr^ne.sw^i^
IMMUNISATION
1b:^5 U ie Universal Im m unisation Pr(»giamme is being impie.mented in ihe
StatH w ith the o ljjec tive of reducing infant m ortality and m aternal m orta lity rates Under the
p iogram m e children below (> years of age are innoculated for p revtin fion of contagious
diseases lik<i TT^ . d ipthoria, w hoo|jing coug li, tetanus, polio, (neasles e ic Tlie im m unisation• t
piogram m e lias been further strenylhened througfi iCIJS projects in llie State Ih e
Anganv/vadi workers posted m iCDS blocks and Auxiliary Nurse and Midwivcis posted in
sub i;entres play an active rule in ihis p io tjram m e The prf)gress of the im m unisation
p iog iam m e in thn S ta le is p rf‘sented in t'a lile 1‘ » 4
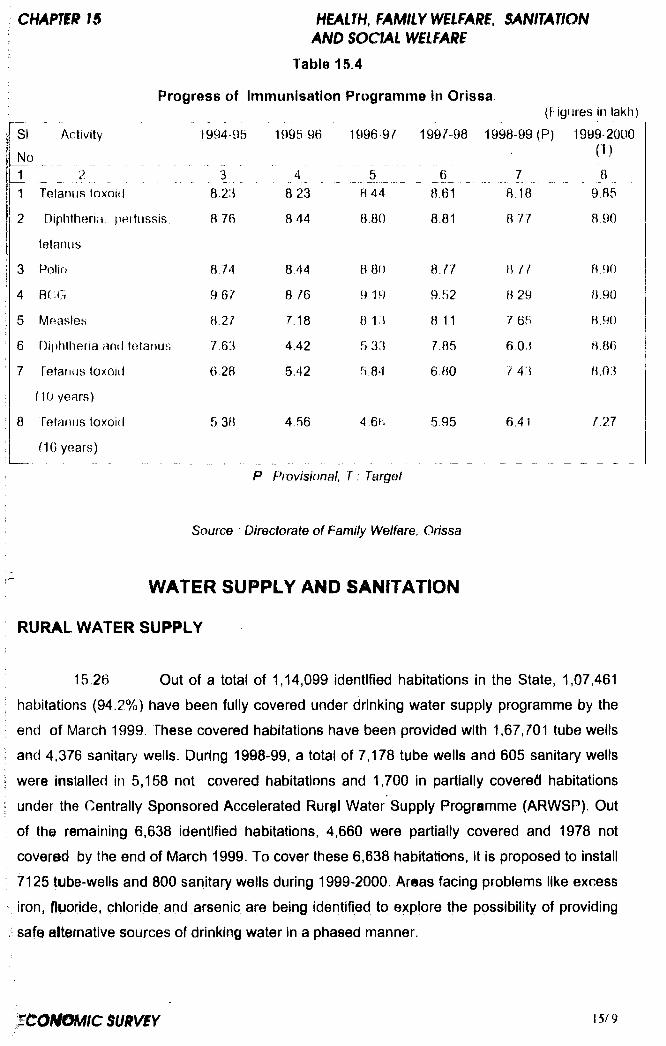
H B A LT H , F A M IL Y W S LFA R B , S A N IT A T IO N A N D S O C I A L W E L F A R E
Table 1S.4
Progress o f Immunisation Programme In Orissa(f igures in lakh)
SI
No
Activity 1994-95 1996 96 1996 97 1997 98 1998-99 (P) 1999 2000 0 )
1 ^ 2 ^ * r .3 . ^ A_____ A I A ' _ ' ....7 ___ 81 Tetanus toxoid 8.23 8 23 8 44 8.61 8 18 9,85
2 Diphtheria pertussis,
tetanus
8 76 8 44 8,80 8.81 8.77 8.90
3 Polio 8 74 844 8 80 8 77 877 8 90
4 BCG 9 6 / 8 /6 9 19 9.52 8 29 8.90
5 Measles H.2I 7.18 8 13 8.11 7 65 8.90
6 Diphtheria and tetanus 7 63 4.42 5 33 7.85 6 03 8.86
7 fetanus toxoid
(10 years)
6 28 5.42 5 84 6,80 7 43 8.03
8 Tetanus toxoifi
f16 years)
5 38 4.56 4,6(-. 595 6 41 7.27
P Provisional, T : Target
Source ■ Directorate of Family Welfare. Orissa
WATER SUPPLY AND SANITATION
RURAL WATER SUPPLY
15 26 Out of a total of 1,14,099 identified habitations in the State, 1,07,461
; habitations (94.2%) have been fully covered under drinl ing water supply programme by the
end of March 1999. These covered habitations have been provided with 1,67,701 tube wells
i and 4,376 vSanitary wells. During 1998-99, a total of 7,178 tube wells and 605 sanitary wells
! were installed in 5,158 not covered habitations and 1,700 in partially covered habitations
; under the Centrally Sponsored Accelerated Rurf I Water Supply Programme (ARWSP). Out
of the remaining 6,638 identified habitations, 4,660 were partially covered and 1978 not
covered by the end of March 1999. To cover these 6,638 habitations, it is proposed to install
: 7125 tube-wells and 800 sanitary wells during 1999-2000. Areas facing problems like excess
iron, ffuoride, chloride and arsenic are being identified to explore the possibility of providing
, safe alternative sources of drinking water in a phased manner.

CHAPTER 15 HBALTH, FAMILY WELFARE, SANITATIONAND SOCIAL WELFARE
15.27 As on 01.04.1999, there were 6,053 defunct tube wells in the 1,07,461
habitations already covered. It has been targeted to replace 1,902 defunct tube wells during
1999-2000. A programme has also been drawn-up to install 2,085 new tube wells in
unidentified drought affected villages.
15.28 Considering the scarcity of water In K B K districts, Government of India
have approved a relaxed norm of one spot source for every 150 population where the
existing norm of one spot source for 250 population has already been achieved. A total of
13,757 sites to provide spot sources have been identified in the K B K districts, out of which
732 spot sources have been provided up to the end of March 1999 It is proposed to install
2,500 new tube wells in K B K districts during 1999-2000 with a special outlay of Rs. 1000.00
lakh.
15.29 By the end of March 1999, 376 rural piped water supply schemes had
been commissioned in the State. Out of these, 55 schemes were completed and
commissioned during 1998-99. It has been targeted to complete 60 ongoing piped water
schemes during 1999-2000.
15.30 During 1997-98 and 1998-99, tube wells were installed in 6,752
primary schools and 863 upper primary schools with grants made available under the award
of the Tenth Finance Commission. During the same period, 3,455 spot sources were
provided in anganwadis with funding from the World Bank.
15.31 To ensure community participation and more effective maintenance of
hand pumps, Self-Employed Mechanic (SEM) system of hand pump maintenance has been
introduced in 38 of the 314 blocks in the State. By the end of 1998-99, 863 persons had been
trained and deployed for hand pump maintenance in rural areas
RURAL SANITATION
15.32 Sulabha International Social Service Organisation (SISSO), a non
profit voluntary social organisation has been associated with implementation of sanitation
programme In the State. This organisation has constructed 48 Sulabha Complexes
(community toilets) In rural areas. These complexes are also maintained by the Sulabha
Organisation A total of 4,124 household latrines have also been completed by this
organisation from funding from the Rural Development Department.
iC O N o m : s u im r lo
I f HiALm, FAMILY $ANITATIONANDSOOALWeiFAim
15 3v3 In order to check water borne and related diseases in districts like
Piiulbani, Gajapati and Ganjam, a UNICEF assisted project named Control of DIarrtioea
Diseases through Water Sanitation (CDD W A T 8AN) is under implementation. Under the
project, medicines are distributed and tube welts are installed to control diseases like cholera
and diarrhoea.
U R B A N W A T E R S U P P L Y
15.34 There are 102 Urban Local Bodies (ULBs) in the State comprising of
two Municipal Corporations, 30 Municipalities and 70 Notified Area Councils (NACs).
Paradeep Port Trust maintains the water supply in the Paradeep N A C area Potable drinking
water facilities have been provided in all the 102 Urban Local Bodies through piped water
distribution systems, house connections, and tube-wells. Out of the urban population of
42 35 lakh as per the 1991 census, 30.6 lakh persons (72.28%) had been covered through
piped water supply schemes by the year 1998-99. In pockets of scarcity, 11,109 hand pump
tube wells have been sunk by the end of March 1999. About 570 million litres of potable
drinking water per day i being supplied in urban areas through 1,42.627 houee conne@tions
and 14,248 public stand posts.
15.35 The Orissa Water Supply and Sewerage Board is executing six
water supply projects in the State with an estimated cost of Rs.131.00 crore. The Ji^pur
Road water supply project has already been commissioned and the project fbr Cuttack city
has been partly commissioned Out of the (Bmaining four water supply project, Kendrapara
and Jeypore projects are scheduled to be completed by June2000. Water Supply to Rmirkela
(city township) and Greater Sambalpur are scheduled for completion by the end of 2000 and
June 2001 respectively.
15.36 Four new water supply projects, at Angul, Dhenkanal, BarMI and
Bargarh, have been approved by H U D C O with an estimated cost of Rs.5000.00 lakh. Tw o
more water supply projects, for Bhawanipatna and Rayagada, astimatad to coat Rs.2i50.00
lakh are on the anvIL
15 37 Naraj water supply project, taken up far supplying watar to nmwty
developed areas of Bhubaneswar, was commisiioned in 1998.
CHAPTER 15 HEALTH, FAMILY WELFARE, SANITATIONAND SOCIAL WELFARE
15.38 Accelerated Urban Water Supply Programme (AUWSP) is being
implemented in the State under the Centrally Sponsored Plan Under this programme, water
supply projects at Balimela, Kamakhyanagar, Nayagarh, Chandbali, Panposh, Polsara,
Malkangiri, Junagarh, Boudh, Balugan and Deogarh are under implementation. A proposal
for a water supply project for Kantabanjhi has been sent to Government of India for approval.
URBAN SANITATION
15 39 Growing urbanisation and growth of slums have given rise to
problems such as water logging, congestion in discharge of drainage water, accumulation
of garbage etc. Underground sewerage clearance facilities have been provided in the
developed areas of 5 towns namely Bhut^aneswar, Puri, Cuttack, Sunabeda and Rourkela
(steel township) and cover 4.22 lakh people In these urban centres. The sewerage facilities
in Sunabeda and Rourkela steel township are being maintained by Hindustan Aeronautics
Limited and Rourkela Steel Plant respectively. The State has become a pioneer in treating
waste water through evapo-transpiration at Puri
15.40 Sulabha International Social Services Organisation (SISSO) has been
associated with implementation of sanitation programme in both urban and rural areas in the
State. Since inception of its operation in Orissa in 1981-82, the organisation has constructed
125 public toilets in 95 towns. The organisation has also completed conversion of 30,000
low cost dry latrines into water sealed latrines apart from constructing 5,900 new water
sealed latrines. Sanitation activities in two medical colleges and a number of hospitals and
public office buildings have been entrusted to Sulabh International.
SOCIAL WELFARE
CHILD WELFARE
15 41 The Integrated Child Development Scheme (ICDS) is being |
implemented in the State through 279 ICDS projects in 261 blocks, i he scherne offers a I
package of health care services covering supplementary nutrition, immunisation, pre-school j education, health check up, referral services, and health education to ctiildren within the age |
group of 0»6 years. There are 28,351 anganwadi centres under these ICDS projects. The j
number of beneficiaries covered under ICDS during 199/’-98 and 1998-99 is indicated in
Table 15 5
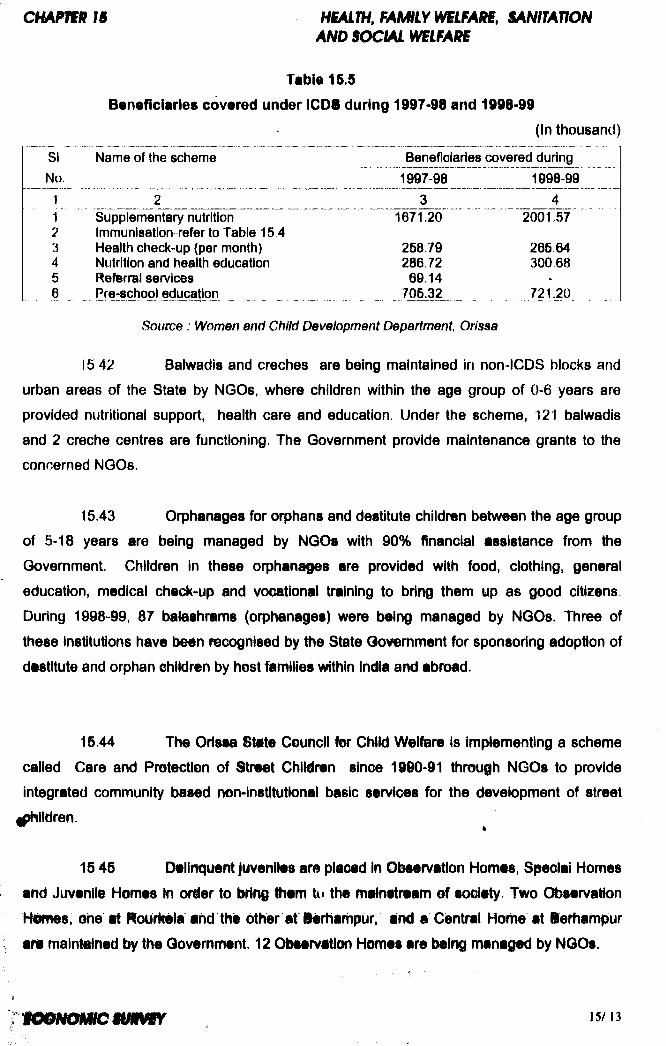
Tabid 15.5
Bonoficiaries covored under ICD8 during 1997-98 and 1998-99(In thousand)
SINo
1y23456
Name of the scheme
Supplementary nutrition Immunlsatlon refer to Table 15 4 Health check-up (per month) Nutrition and health education Referral services Pre-school education
Beneficiaries covered during 1997-98 1998-99
3 41671.20 2001.57
258.79 265.64286.72 300 6869.14 -
705.32 721.20
Source : Women and Child Development Department, Orissa
15 42 Balwadls and creches are being maintained in non-ICDS blocks and
urban areas of the State by NGOs, where children within the age group of 0-6 years are
provided nutritional support, health care and education. Under the scheme, 121 balwadls
and 2 creche centres are functioning. The Government provide maintenance grants to the
concerned NGOs.
15.43 Orphanages for orphans and destitute children between the age group
of 6-18 years are being managed by N G O s with 9 0 % flnancial assistance from the
Government. Children in these orphanages are provided with food, clothing, general
education, medical check-up and vocational training to bring them up as good citizens.
During 1998>@9, 87 balashrams (orphanages) were being managed by NGOs. Three of
these institutions have been recognised by the State Government for sponsoring adoption of
destitute and orphan ©hlldren by host families within India and abroad.
15.44 The Orissa State Council fer Child Welfare is implementing a scheme
called Care and Pretectlen of Street Children since 1990-91 through N G O s to provide
integrated community based nen-instltutlonal basic services for the development of street
I^Hdren.
15 45 Delinquent Juvenitos are placed In Observation Homes, Speolai Ho me s
and Juvenile Ho me s hi order to bring ffiem tu the mainstream ef soQiety. T w o C^servatlon
Hemes, one a! Rourkeia and the other at Berhampur, and a Central H o m e at Berhampur
art mainlined by the Government. 12 Observitlan Ho me s are belrtg managed by NGOs.
15/ 13
CHAfnSR IS HEALTH. FAMILY WELFARE, SANITATIONAND SOCIAL WELFARE
15.46 In order to increase enrolment and reduce the number of drop-outs in
primary schools, and to improve the nutritional status of children, Government have
introduced a Mid-day Meal programme since July 1, 1995. During 1998-99, 45,06,299
primary students have been benefited with an expenditure of Rs.3,773.33 lakh Under
Special Nutrition Programme (SNP), nutritious food is supplied to children in the age group of
0-6 years and expectant mothers in ICDS blocks. During 1998-99, 11,60,782 benefidaries
have been covered under S N P with an expenditure of R8.29.69 crore.
WELFARE OF THE HANDICAPPED
15.47 Under the scheme Welfare of Handicapped, the State Government,
with the financial support of Government of India, implements welfare schemes for blind,
deaf and mentally retarded children to bring these children Into the mainstream of society.
The handicapped children are imparted special training In special schools through trained
teachers. There are at present 50 special schools for handicapped children with 2,786
students. Out of 50 schools, 18 are for the blind, 21 for the deaf anti 11 for the mentally
retarded children. These schools are managed by N G O s with financial support from
Government.V.
15.48 Under the scheme Special Appliances for the Handicapped, disabled
persons are supplied with modern aids and appliances lika wheel chairs, motorised bicycles,
tri-cycles, crutches, hearing aids, and other devices. A total of 2,226 disabled persons have
been provided with special appliances under the scheme during 1998-99.
15.49 To encourage disabled students to pursue education, scholarships are
being awarded from Class I to the university level. During 1998-99, scholarships were
provided to 3,629 disabled students. Disabled persons need specialised training so that they
can find suitable employment. Accordingly, it has been decided to set up a special ITI for
disabled persons. There are 7 training centres for training disabled persons The disabled
and blind are awarded pension at the rate of Rs.lOO per month.
15.50 For imparting training to the teachers of the handicapped, three
training centres have been established In the State. One of these, for teachers of the visually
Impaired persons has been established in collaboration with the National Institute for^^
Visually Handicapped (NIVH), Dehridun Another training centre, for the teachers of the
hearing impaired, has been established in collaboration with the National Institute for Hearing
Handicapped (NIHH), Bombay One training centre for the teachers of the mentally
handicapped Is being run by an NGO.

SOCIAL SECURITY MEASURES
15 51 The National Old Age Pension (NOAP) scheme has been Introduced
by Government of India with effect from August 15, 1995 for providing relief to old persons
above 65 years of age. Government of India provide Rs 75 per month and the State
Government provide Rs 25 per month to each beneficiary under the at)ove scheme During
1998-99 as against the target of 3,33,400 beneficiaries , 3,32,206 beneficiaries including
1,47,184 women, have been covered under the scheme with an expenditure of Rs 3779.96
lakh Under the State's Old Age Pension Scheme, 5,24,980 beneficiaries including 2,96,600
women have been covered during 1998-99 with an annual expenditure of Rs.6478 86 lakh
15 52 The State Government also undertaken measures to rehabilitate
destitute old men and w o m e n by establishing Old-Age Homes, Short Stay Homes and Day
Care Centres through NGOs. During 1998-99, there were 31 Old-Age Homes. 29 Short Stay
Homes, and 69 Day Care Centres in the State The capacity of each Old Age Home, Short
Stay H o m e and Day Care Centre was 25, 30 and 50 persons respectively.
♦ ♦ ♦
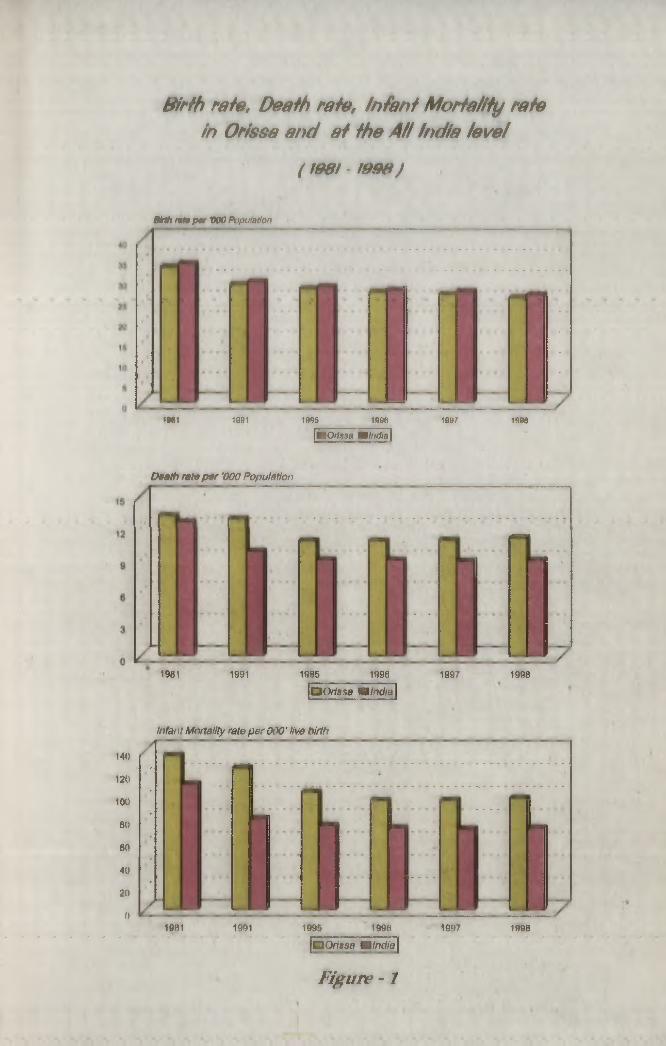
B irfh rafe, Deaih rate, In fa n t M o rta lity m te in Orissa and a t Hte AH India le ve l
( I S 8 t - l 9 9 8 J
Bkth ral» pm VOO Papulation
19*1 1991 1995 1996
(■Orfasa ■/nd/a|1997 1998
DBath ralB pm '000 Population
1981 1991 1995 1996 1997
dO rissa M lndia
1998
Infant Mortality rate per 000' live birth
140
12010080
60
40
20
010B1 1991 1995 1996 1997 1998
d Orissa M India

T. R. Prevalence Rate. Leprosy ^v a le n c e Rafe and M icro R Iaria Rafe in Orissa
(1990-91fo 1998-99J
1990 91 1991-921992 93 1993-941994-951995-961996-971997 981998-99
[DMIr.ro Fllaria rate M T, B. Prevalence rate WBL eprosy Prevalence rate
CHAPTIR \6
PRICES AND PUBLIC DISTRIBUTION
16 01 A stable price regime with mild Inflationary pressure is said to
sliiTiiilate economif development, particularly in economies wtiere resources are
Huhstantially urider employed But persistent and unchecked rise in prices engenders
Bconomi(; uncertainty and social instability and adversely affects the prospects of economic
growth. A Public Distribution System ensures availability of essential commodities to the
weaker sections of the society at reasonable prices and provides insurance against instability
wh<;n inflationary prnssures can not be controlled. The inflation rate in the country has
remained at single digit level since 1995-96
WHOLESALE PRICE INDEX (WPI)
16 02 The Wholesale Price Index at the all India level is constructed by the
Central Statistical Organisation of the Government of India. The annual rate of inflation
based on Wholesale Price Index was 2.1% in September 1999 against 8 4 % recorded
during vSeptember 1998. The wholesale Price Index increased by 1.2% during September
1999 over August 1999. Table 16.1 shows the trend of Wholesale Price Index (base year
1981-82 =100) from 1990-91 to 1998-99. The Wholesale Price Index for all commodities
reached a level of 352 4 during 1998-99 as against 329.8 during 1997-98 registering an
increase of 6.9%. The annual rise in WPI during 1990-91, 1991-92, 1992-93 and 1994-95
was double digits However, during the years 1993-94, 1996-96, 1996-97, 1997-98 and
1998-99 it was maintained at single digit level
16.03 Table 16 1 shows that the WPI for primary articles has reached the level of
379 during the year 1998 99 recording an increase of 1 1 7 % over the previous year Fuel,
power, light and lubricants reached a level of 381.2 In the year 1998-99 registering an
increase of 4.2% over the previous year. Similady in case of manufactured products, the WPI
moved up to 331.9 showing a rise of 4 5 % during the year 1998-99 over the previous year.
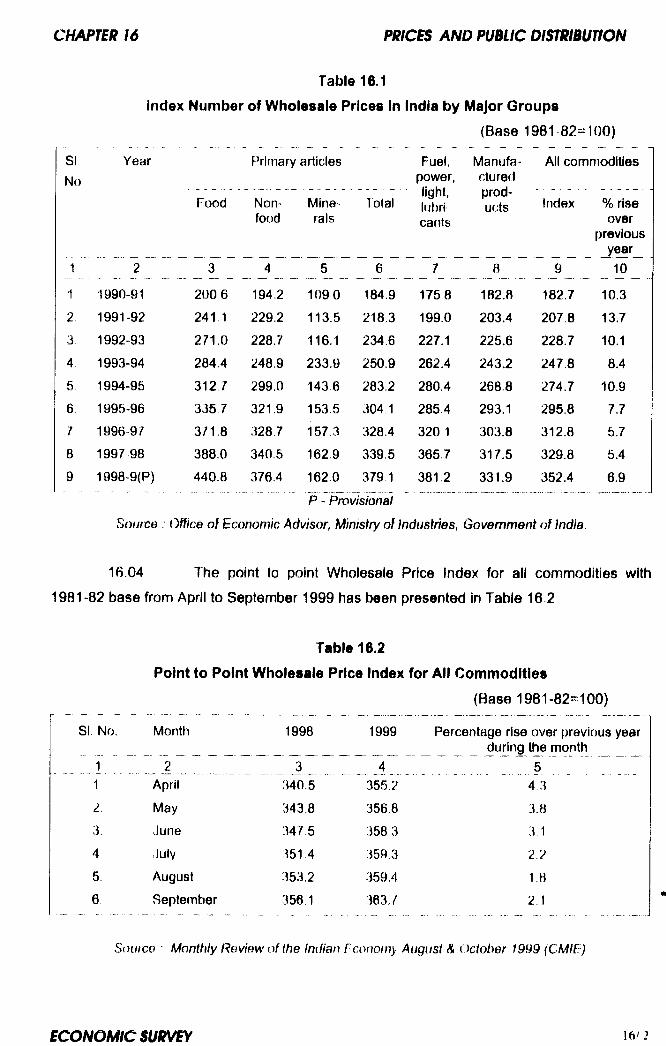
Table 16.1index Number of Wholesale Prices in India by
SINo
Year
Food
Primary articles
Non- Minefood rals
Total
Fuel.power,light,lubricants
Major Groups(Base 1981 82=: 100)
All commoditiesManufacturedproducts Index % rise
over previous
1 2 3 4 5 6 7 8 9 10
1 1990-91 200 6 194.2 109 0 184.9 1758 182.8 182.7 10.32 1991-92 241,1 229.2 113.5 218.3 199.0 203.4 207.8 13.73. 1992-93 271.0 228.7 116.1 234.6 227.1 225.6 228.7 10.14 1993-94 284.4 248.9 233.9 250.9 262.4 243.2 247.8 8.45. 1994-95 312 7 299.0 143.6 283.2 280.4 268.8 274.7 10.96 1995-96 335.7 321.9 153.5 304.1 285.4 293.1 295.8 7.77 1996-97 371,8 328.7 157 3 328.4 320 1 303.8 312.8 6.78 1997 98 388.0 340.5 162.9 339.5 365.7 317.5 329.8 5.49 1998- 9(P) 440.8 376.4 162.0 379 1
P - Provisional
381.2 331.9 352.4 6.9
Source : 0^/ce of Economic Advisor, Ministry of Industries, Government of India.
16.04 The point to point Wholesale Price Index for all commodities with
1981-82 base from April to September 1999 has been presented in Table 16.2
Table 16.2Point to Point Wholesale Price Index for All Commodities
(Base 1981-82=100)
SI No. Month 1998 1999 Percentage rise over previous year during the month
11
___ 2 ____________April 340.5 355.2
................. ...5..................4 3
2. May 3438 356.8 3.83 June 347 5 3583 3.14, July 351 4 359 3 2.25. August 353.2 359.4 1.86 September 356 1 363.7 2.1
Soutce Monthly Review of the Indian Fconotny August & October 1999 (CMIE)
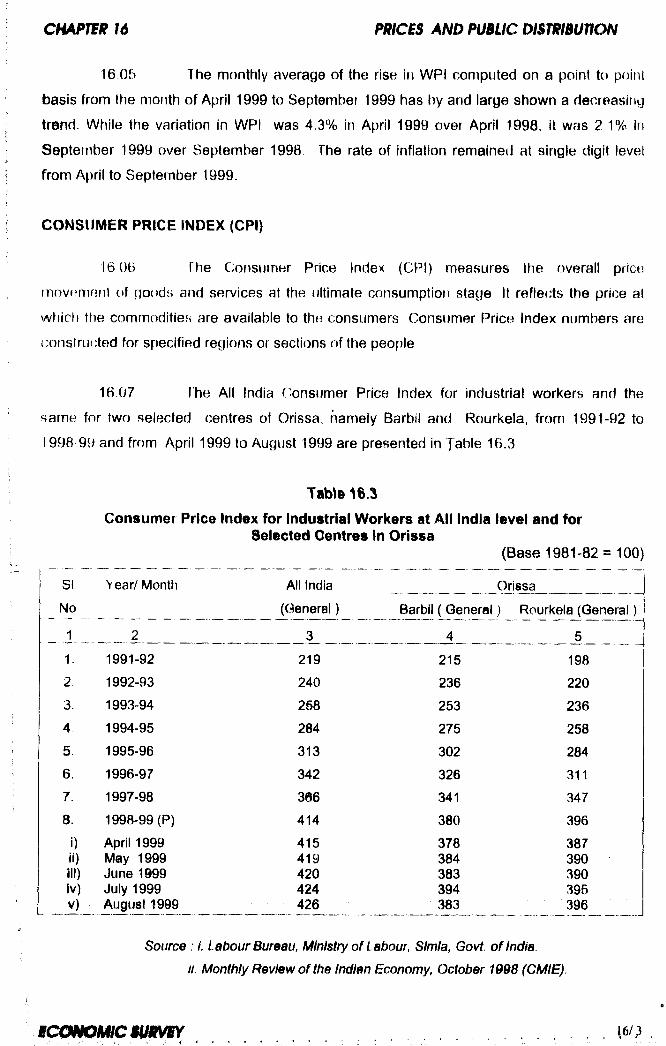
16 05 The monthly average of the rise in WPI computed on a point to point
basis from the month of April 1999 to September 1999 has by and large shown a decreasing
trsnd. While the variation in WPI was 4 3% in April 1999 over April 1998, It was 2 1% in
Septemlier 1999 over September 1998 The rate of inflation remained at single digit level
from April to September 1999.
CONSUMER PRICE INDEX (CPI)
16 06 The Consumer Price Index (CPI) measures the overall price
niovBmen! of goods and services at the ultimate consumptioti stage It reflects the price a!
which the commodities are available to the consumers Consumer Price Index numbers are
(Constructed for specified regions or sections of the peof)le
16.07 fhe All India Consumer Price Index for industrial workers and the
same for two selected centres of Orissa, namely Barbil and Rourkela, from 1991-92 to
1998 99 and from April 1999 to August 1999 are presented in Table 16.3
TaWe 16.3Consumer Price Index for Industrial Workers at All India level and for
Selected Centres in Orissa(Base 1981-82 = 100)
L___
Si Year/ Month All India OrissaNo (General) Barbil ( General) Rourkela (Get
J _ ____ ^ _______ 3 4 51. 1991-92 219 215 1982. 1992-93 240 236 2203. 1993-94 258 253 2364 1994-95 284 275 2585. 1995-96 313 302 2846. 1996-97 342 326 3117. 1997-98 366 341 3478. 1998-99 (P) 414 380 396
I) April 1999 415 378 387ii) May 1999 419 384 390ill) June 1999 420 383 390iv) July 1999 424 394 395V) August 1999 426 383 396
Source ; i. Labour Bureau, Ministry o f Labour, Simla, Govt, o f India.
II. Monthly Review o f the Indian Economy, October 1998 (CMIE).
B c o N O M i c m m m w )
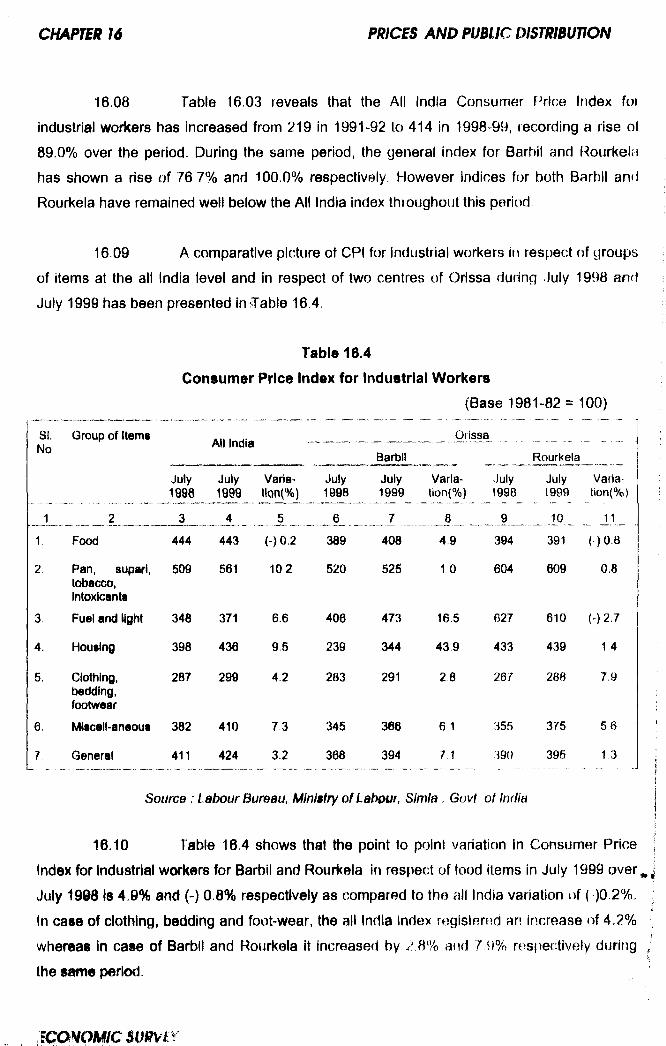
16.08 Table 16.03 reveals that the All India Consumer FYlce Index for
industrial workers has increased from 219 in 1991-92 to 414 in 1998-99, recording a rise of
89.0% over the period. During the same period, the general index for Barbil and f tourkelH
has shown a rise of 76 7 % and 100.0% respectively. However indices for both Barbil an(J
Rourkela have remained well below the All India index throughout this period
16-09 A comparative picture of CPI for industrial workers in respect of groups
of items at the all India level and in respect of two centres of Orissa during July 1998 and
July 1999 has been presented in Table 16.4
Table 16.4Consumer Price Index for Industrial Workers
(Base 1981-82= 100)
SI.No
Group of ItemsAll India ----------
Barbil
Orissa
Rourkela
July199a
July1999
Varia-llan(%)
July1998
July1999
Varia-tion{%)
July1998
July1999
Variatlon(%)
1 2 3 4 ____7 8 9 10 _ _ J 1 _
1 Food 444 443
____(~) 0.2 389 408 4 9 394 391 ( )0.B
2. Pan, supari,tobacco,Intoxicants
509 561 10.2 520 525 1 0 604 609 0,8
3. Fuel and light 348 371 6.6 406 473 16.5 627 610 ( ) 2 . 7
4. Housing 398 436 9.5 239 344 43.9 433 439 14
5. Clothing,bedding.footwear
287 299 4.2 283 291 2 8 267 288 7.9
6. Miscell-aneous 382 410 7 3 345 366 6 1 355 375 5 6
7 General 411 424 3.2 368 394 7 1 390 395 1.3
Source : Labour Bureau, Ministry of Labour, Simla , Govt of India
16.10 Table 16.4 shows that the point to point variation in Consumer Price |]
Index for industrial workers for Barbil and Rourkela in respect of food items in July 1999 over^J
July 19§8 Is 4.9% and (-) 0.8% respectively as compared to the all India variation of ( )0.2%.t
In case of clothing, bedding and foot-wear, the all India Index ragisterfid an increase of 4.2% ;
whereas in case of Barbil and Rourkela it increased by 2 8% and 7.9% respectively during .
the same period.
ECaiVp/MtfCSllfVir
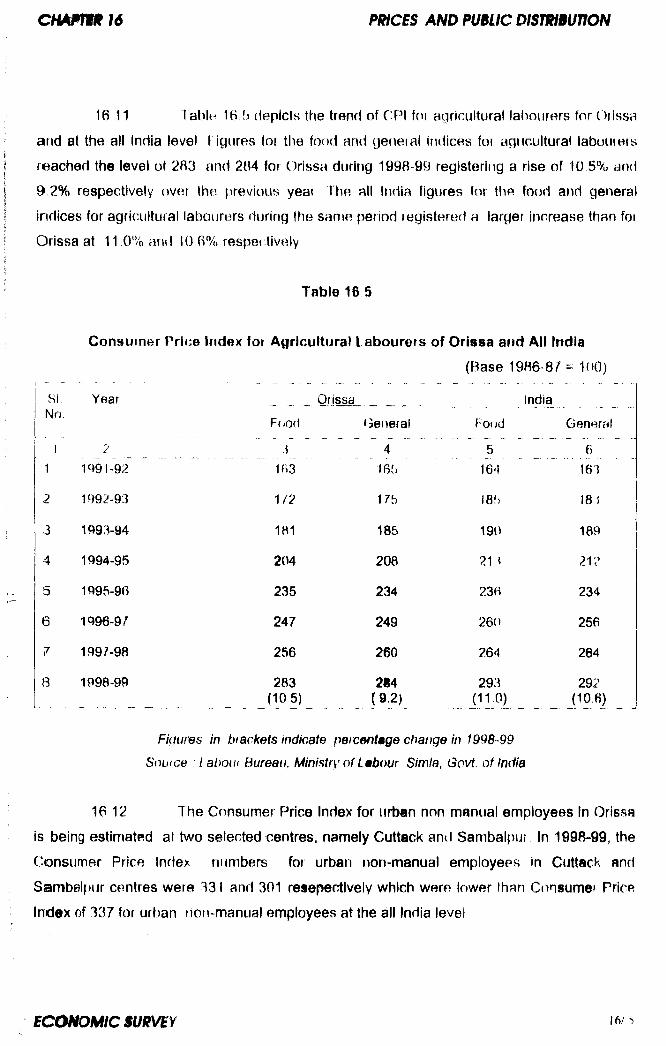
16 11 Table 16 f) depicts the trend of C PI for agricultural lafioiirers for Orissa
and at tfie all India level figures for tl)e food and general itKlices fot agricultural labouiers
reached the level of 283 and 2H4 for Orissa during 1998-99 registering a rise of 10 5 % and
9 2 % respectively over the. previous year all ln(iia figures for the food and general
indices for agricultural laloourers during lha sanie period registered a larger increase than foi
Orissa at 1 1 0 % amt 10 6% respei lively
Table 16 5
C o nsumer Price Index for Agricultural Labourers of Orissa and All India
(Base 1986 8/ 100)
SI Year Orissa _ _ IndiaNo
Food (jeneral food Genenil
1 2 3 4 5 61 1991-92 1R3 164 163
2 1992-93 1/2 17b 185 181
3 1993-94 Itti 185 190 189
4 1994-95 204 208 21
5 1996-96 235 234 236 234
6 1996-97 247 249 260 256
7 1997-98 256 260 264 264
8 1998-99 283 (10 5)
284_ 19;2)____
293J11:0^ _ _
292
Figures in brackets indicate percentage change in f 998-99
Snuice . I about Bureau; Ministry of Labour Simla, Govt, of India
16 12 The Consumer Price Index for urban non manual employees In Orissa
is being estimated at two selected centres, namely Cuttack and Sambalpur In 1998-99, the
Consumer Price Index numbers foi urban non-manual employeeB in Cuttack and
SambelfMjr centres were 331 and 301 resepectlvely which were lower than Consumer Price
Index of 337 for urban non-manual employees at the all India level
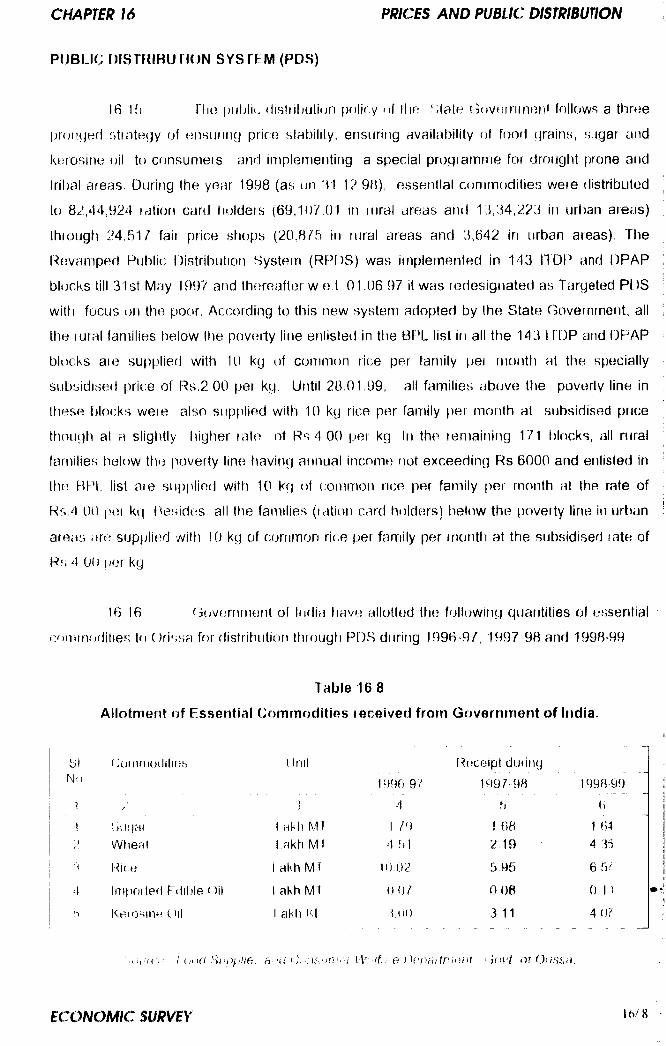
PUBLIC D I S T K I B U n O N S r S T E M (PDS)
16 If) Thi publi*. (Iisliibulion pr)li( y uf Hie ')tale Govnrntnoiil follows a three
profiled stfotegy of (Jiisunng price stability, ensuring availability of food grains, sugar atid
kerosine oil to consumers, and implementing a special programme for drought prone and
tribal areas During the year 1998 (as on 31 12 9B), essenllal commodities were distributed
to 82,44,924 ration card holders (69,107,01 in rural areas and 13,34,223 in urban areas)
Ihiough 24,51/ fair price shops (20,875 in rural areas and 3,642 in urban areas). The
l^ovamped Public Distribution System (RPDS) was implemented in 143 11 DP and DPAP
blcjcks till 31st May 1997 and thereafter w e t 01.06 97 it was redesignated as Targeted PDS
with focus on the poor. According to this new system adopted by the State Government, all
the rural families below tfie poverty line enlisted in tlie BPt. list in all the 143 I FDP and DPAP
blocks ate su|)plied with 10 kg of common rice per family pei montti at the specially
subsidise(t price of Rs.2 00 per kg. Until 28.01.99, all families above tlie poverty line in
these l)locks were also supplied with 10 kg rice per family per morrth at subsidised price
though at a sliglitly liigher rate of Rs 4 00 per kg In the remaining 171 blocks, all rural
families below the |)overty line fiaving annual income not exceeding Rs 6000 and enlisted in
the FiFM, list are supplied with 10 kg of common rice per family per month at the rate of
Rs 4 00 i?er kg tbesides all the families (ration card holders) lielow the poverty line in urlian
areas arej supplied with 10 kg of common rice per family per montti at the subsidised late of
Rs 4 00 f)er kg
16.16 Government of India liave allotted the following quarrtities of essential
cnmrrKidilies to Orissa for distribution througfi PDS during 1996-9/, 1997 98 and 1998-99
Table 16 8
Allotment of Essential CornrnodltiGS received from Governrrient of India-
Nn
1
Cuitirnotlilins iJnil f^iicelpt duiiny
..................1990 9 /
/)1997 9« 1998-99
)
1 akh MT
-I
1.7‘)
n
1 68
n
1 mWheal 1 akfi M i 4,51 2 19 4 35
Rice ! akh MT 10 02 5 95 6 5 -''
InipottefI Fditile Oil 1 akh MT 0.0 / 0 08 0 1)
KeiosinH C)il 1 akh In I iOO 3 11 4 07
I inHl Sunfjiie:y a H! Ci nsiinhyi e Pepaittvnnf hM of Onnsa.
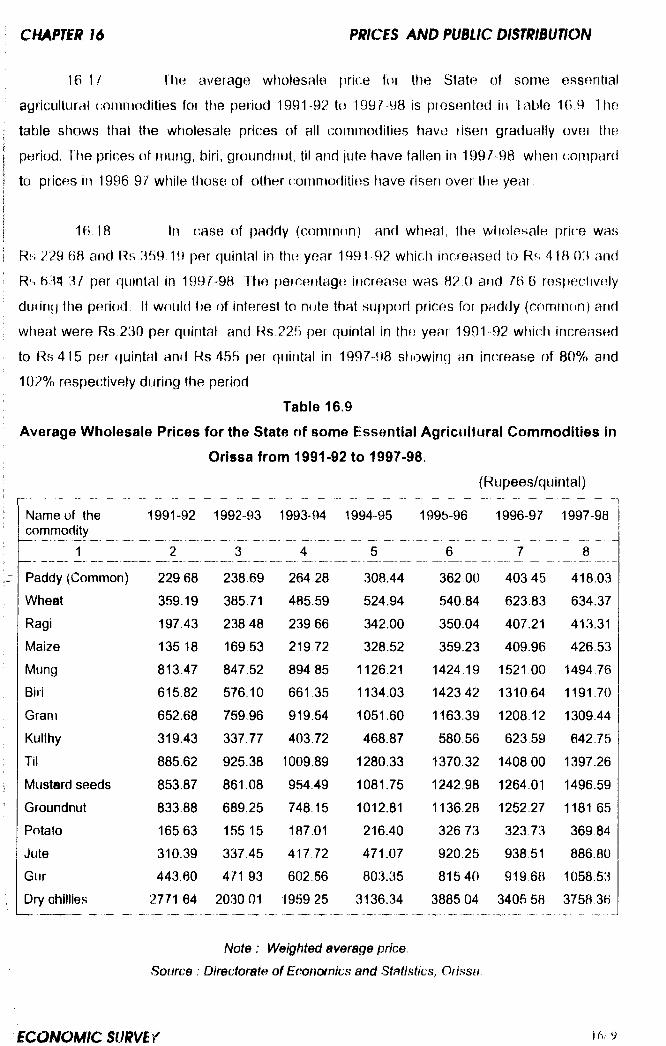
16 1/ The average wholesale price for the State of some essential
agricultural coininodities for the period 1991-92 to 199^98 is presented in Table 16.9 The
table shows that ttie wholesale prices of all commodities have risen gradually ovei the
period. The prices of mung, biri, groundnut, til and jute have fallen in 1997^98 wtieti compard
to prices in 1996 97 while those of other commodities have risen over tlie year
16.18 In case of paddy (common) and wheal, the wliolesale price was
Rs 229 68 and Rs 359 19 per quintal in the year 1991-9? which increased to Rs 418 03 and
Rs 634 3 / per quintal in 1997'9B. The percentage increase was 82 0 atid 6 respectively
dutinij the penod It would t)e of interest to note that support prices for paddy (common) and
wheat were Rs 230 per quintal and Rs 225 per quintal in thf? year 1991 92 which increased
to f^s415 per fjuintal and Rs 455 pei quintal in 1997-98 stiowing an increase of 80% arid
102% respectively during the period
Table 16.9
Average Wholesale Prices for the State of s o m e Essential Agricultural Commodities in
Orissa from 1991-92 to 1997-98.
(Rupees/quintal)
Name of the 1991-92 1992-93 1993-94 1994-95 1995-96 1996-97 1997-98commodity
1 2 3 4 5 6 7 8
Paddy (Common) 229 68 238.69 264 28 308.44 36200 403 45 418.03Wheat 359.19 385.71 485.59 524.94 540.84 623.83 634.37Ragi 197 43 238 48 239 66 342.00 350.04 407.21 413.31Maize 135 18 169.53 219 72 328.52 359.23 409.96 426.53Mung 813,47 847.52 894,85 1126.21 1424 19 1521 00 1494,76Biri 615.82 576.10 661.35 1134.03 142342 1310,64 1191.70Gram 652.68 759.96 919.54 1051.60 1163,39 1208 12 1309.44Kulthy 319.43 337.77 403.72 468.87 580.56 623.59 642.75Til 885.62 925.38 1009.89 1280.33 1370.32 1408 00 1397.26Mustard seeds 853.87 861.08 954.49 1081.75 1242,98 1264.01 1496.59Groundnut 833.88 689.25 748.15 1012.81 1136.28 1252.27 1181.65Potato 16563 155.15 187 01 216.40 326 73 32373 369.84Jute 310.39 337 45 417 72 471.07 920,25 938.51 886.80Gur 443.60 471 93 602.56 803.35 815 40 919 68 1058 53Dry chillies 2771 64 203001 1959 25 3136.34 3885.04 3405 58 3758 36
Note : Weighted average price
Source : Directorate of Economics and Statistics, Orissa
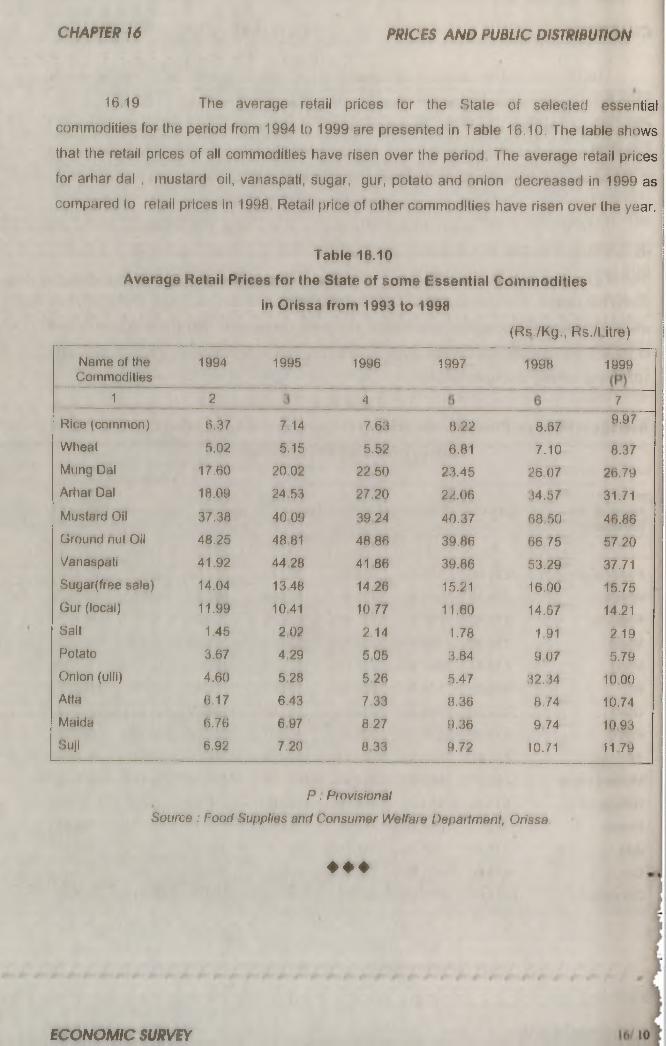
16 19 The average retail prices for the State of selected essential
commodities for the period from 1994 to 1999 are presented in Table 16.10. The table shows
that the retail prices of all commodities have risen over the period The average retail prices
for arhar dal , fnustard oil, vanaspati, sugar, gur, potato and onion (iecreased in 1999 as
compnred to retail prices in 1998 Retail price of other commodities have risen over the year.
Table 16.10Average Retail Prices for the State of some Essential Commodities
In Orissa from 1993 to 1998
Name of the Commodities
1
(Rs./Kg., Rs./IJtre)
1994
21995 1996
4
1997 1998 1999
7
Rice (cotnmon) 6.37 7.14 7.63 8.22 8.67 9.97
Wheat 5.02 5,15 5.52 6.81 7.10 8.37Miing Dal 17.60 20 02 22 50 23.45 2607 26.79Arhar Dal 18.09 24 53 27.20 22.06 34.57 31.71Mustard Oil 37.38 40 09 39 24 40.37 68 50 46.86Ground nut Oil 48.25 48 81 48 86 39.86 6675 57.20Vanaspati 41.92 44 28 41 86 39.86 53.29 37.71Sugar(free sale) 14.04 13 48 14.26 15.21 16.00 15.75Gur (local) 11.99 1041 10.77 11.60 14.57 14.21Salt 1.45 202 2.14 1.78 1 91 2.19Potato 3.67 4 29 505 3.84 9 07 5.79Onion (ulli) 4.60 5 28 5.26 5.47 32.34 10 00Atta 6.17 6.43 7.33 8.36 8.74 10.74Maida 6.76 697 8,27 9.36 9 74 1093Suji 6.92 7,20 8 33 9.72 10.71 11 79
P . Provisional
Source : Food Supplies and Consumer Welfare Depailment, Orissa.
♦ ♦ ♦

CHAPTER 17
SCIENCE AND TECHNOLOGY
17 01 Science and technology play a vital role Iti the process of development
and transformation of a traditional agrarian economy Into a modern economy Development
of science and technology in the State has the following primary objectives.
I •)
ii)
m
]o keep atpreast of the jgtest develdp^fierits In ttia field ijf soiericii ond teclinology find to take slep« fer-disbemliiatipn of these imong hnMutions like iridustrleb, research labt)r^|grl^, universities and among scler|fetiJf!d t e c h n o l o g i s t s . j ^
lo Qo-oriiln|il§ l i i i ie r c h m d s |f /< ilo p m |n t progr riejbartrnfente. trtdustf I f l r | |& # c h iHstittJtlohsf^ # fig aqcjjlfeefiniga) lO-Q^er^tipj^ ^«rionu Im tliytions snd
ITp formulate afid assist resfiar^ and application proqraiTj0^ s In t|l€? science and technology - f
Iv) To erfcoiifage, develop nd promotei the usb of renewable sources qf e p ^ |v Including energy plantations. '
.^V) To popularise Remote Sensing Technology ( R S1) dhd to m ’eke effeGljV«a.usw
V
vi) %^jfTo popularisft^Bcienoe and technology among the people in general and j students lr\ particular so ai» to Inculcate In them,^ Scientific temoer.^nij' Mitude^
'V* w ? -vil) J o promote scientific and tei nological education In sele^tgitkigtitutlohSifflU'
vHI)k n o promote and popularise appfopiriate rural t nnolQg|I Si‘.s4 ‘ ‘ V»
fjx) MO dew elop Horary and documentation centred for q|yelo|m6nt of |cteftp0\ anci technology), % ; " i4 .'"S '
> £ 3 ^SclBnce and technology Communlcat(d|St Ih rqw ariT j^ pfor^o|lon, ‘*^t"jsuppo i1 to Infetitutionsr for seminars and Worksfe|:i»TO!, developrnlht bi ’
"i.k . Sclent Centre and administration of P^lhanl?$pmarWplaHe!iilum (P8p)1' i ' '' t .-.-V
xl) ,To conduct 'Science,, and lechnOlogy fiptr F rifeneurshlp U^lgpfpm it . Progrfimhies {STEDP) ^ f * . . ' % ^
■kii) f To take up Energy Aud[t|ridAf^^ f|t>grafHpifi$ ^
viu) To irr.plomeqt IruQerftad i l 6P)#nSMW9lWny'n. :;Program m 6sUiPHnliil8tJ^^»'H
STATE COUNCIL ON SCIENCE AND TECHNOLOGY (SCST)
17.02 The State Council on Science and Technology is the apex organisation
which has been constituted to advise Government on appropriate policies for development of
science and technology in the State. It identifies key areas, reviews implementation of
programmes, and provides financial support for application ohented research projects and for
transfer of appropriate technology. Financial support amounting to Rs.5.93 lakh for five
research projects was provided during 1998-99.
17.03 The Department has provided financial support amounting to Rs.31.47
lakh to 80 research projects m far in order to encourage application oriented research and
for transfer of appropriate technology. Sy the end of 1998-99, 132 scientists had availed
finanglal assistance to the tune of Rs. 16.20 lakh to participate in national and international
workshops and seminars.
POPULARISATION OF SCIiNCi PROGRAMME
17.04 The basic objective of the Popularisation of Science Programme is
inculcation among the people in general and student community in particular of a scientific
attitude towards life, development of a scientific temper in the society, and eradication of
superstition. This programme Is organised by the Orissa Vigyan Academy (OVA). Financial
support is provided under the programme for organisation of symposia, workshops, science
exhibitions, competitions and fairs. During 1996-99 five eminent scientists of the State have
been conferred with the Samanta Chandra Sekhar Award for their contribution to researcti
Besides, six issues of the science magazine, “Bigyan Diganta” were published during the
year.
17.05 Financial assistance Is also being provided for organising Entrepreneurship
Awareness C a mp s and Training under Entrepreneurship Development Programme for
persons with scientific and technical background to enable them to set up their own
enterprise. During the year 1998-99, financial assistance of Rs.1.00 lakh has been provided
to the College of Engneering and Technology, Bhubaneswar under this programme.
17.06^ The State Government in collaboration with the National Council of
Science Museums (NC8 M) has established a Regional Science Centre (RSC) at
Bhubaneswar in order to provide activity based learning facilities to inculcate the Irlt of
enquiry and scientific temper among the students and people in general. After
commissioning of the first Sub-Regional Science Centre (SRSC) at Dhenkanai in 1995,
action has been initiated for establishment of a second S R S C at Baripada.

PATHANi 8AMANT PLANiTARIUM (PSP)
17.07 The planetarium, named after PathanI Samanta, a great luminary In
astro science, was established at Bhubaneswar in 1990 with the aim of creating awareness
ifi astronomy, astrophysics and space science among the people. During 1998-99, 1he
planetarium conducted 1,272 shows which were witnessed by 95,856 viewers as against
,412 shows witnessed by 1,27,336 viewers during 1997-98. A popular science magazine in
)rlya named “Chhayapath" is also being published by the planetarium.
INSTITUTE Of LIFE SCIiNCES
17 08 Institute of L ife Sciences undertakes fundamental, applied and inter
disciplinary research in frontier areas of Life Sciences and provides guidance to scholars
pursuing Ph.D. and M. Phil, degrees. The thrust areas of the research conducted by the
Institute are genetic engineering, blo-technology, cancer and ageing, medical genetics, plant
and animal tissue culture in the field of Molecular Biology and dynamics of plants and
animals in Chlllka Lake, mechanism of adaptation by plants and animals to environmental
stress, and brackish water acquaculture in the field of Environmental Biology. During the year
1998-99, the Institute organised a National Symposium on " Cellular Responses to Stress
and Defence Mechanisms" at Bhubaneswar.
ORISSA REMOTE SENSING APPLICATION CENTRE (ORSAC)
17.09 Orissa Remote Sensing Application Centre (ORSAC) has, since its
inception, collected valuable information on natural resources and environment through
satellite imagery The Centre undertook a number of projects during 1998-99 Including
1) Integrated Mission for Sustainable Development, 2) Watershed Development in K B K
Districts, 3) Ground Water TargettIng, 4) Crop Acreage and Production Estimation (CAPE)
and Forecasting Agricultural Output using Space Agro-meterology and Land-based
Observations (FASAL) ; 5) Site Selections for Tea/ Coffee Plantations. 6) Sericulture
Projects 7) Land Transformation Studies in Catohment Areas of Chlllka Lagoon. 8)
International Qeoaphere Biosphere Programme (IG0P) of Chlllka Project, 9) Elephant
Habitat Mapping, 10) National (Natural) Resources Information System (NRI8), 11)
Preparation of Digital Watershed Atlas, 12) Marine Data Centre (MDC) and 13) Potential
Fishing Zone Forecast.
ORISSA RiNEWABLE ENERGY DEVELOPMENT AGENCY (OREDA)
17.10 Orissa Renewable Energy Development Agency (OREDA) functions
as the State nodal agency for promotion of various renewable energy systems and energy
saving devices. The State Government provides financial support in the form of grants-ln-aid
to various programmes of the Agency.
17.11 The National Project on Biogas Development (NPBD) Is a high priority
Central Sector Scheme. This programme is being implemented through District Rural
Development Agencies (DRDAs) and some selected voluntary organisations. During 1998-
99, 6064 blogas plants were constnjcted In the State against the target of 6000. In addition,
four high capiclty bl® ^8 plants were constructed during 1998-99 for community institutional
use.
17.12 National P m g r a m m e on Improved Chullah Is being executed In the
Stale since 1983-84 under the 20 Point Programme and Minimum Needs Programme with
the ^nandal aMisfstanee of both Central and State Governments to provide smokeless
impmved chuKths. During 1996«9i, 1.01,§6@ improved chullahs were installed/sold in the
Stete i0ain^ the target of 1.00,(KK) chuHahs.
17.13 Under Solar Phote-Vi^alc Programme (SPVP) lighting of rural roads
an<i houiNih@k^ with solar light, o^ritkin T V sets and radios through solar energy, and
use solar photo voltaic lanterns are taken up In areas which do not have ready access to
elt«^c%. Government of India as well as State Government provide subsidy for this
programme. During 1998-99, 3,000 street lighting systems, 193 home lighting systems and
870 solar lanterns were Installed / sold in the State.
17.14 The Solar Thermal Extension Programme (STEP) popularises energy
•avfng devloes like Solar Water Heating Systems, Solar Distillation Systems and Solar
Cookert etc, by providing these at susbsidlsed rates. During 1998-99, Solar Water Heating
Syilimt of 6,200 litres per day capacity, Solar Distillation Systems of 10 litres per day
cfffiMSlly and 300 Solar Cookers were Installed/sold in the State
17.18 Intefirated Rural Energy Planning Programme (IREP) Is in operation in
M k te k t i blooiti of the Stite sinee 1986-87 with the objective of developing institutional
ter filsnnlng and imptementing area based Integrated Rural Energy Programmes^
use of dlftemnt types of energy sources. Till 1997-98, 16 bicoks have been
tirtl^ uniter this programme. Government of India have accorded sanction to bring 45
Mooks under the purview of IREP during 1998-99 covering 29 districts of the Stale.
E o m m m m m 17/4
17 16 O R E D A has taken steps for utilising fly ash from thermal power plants
for construction activities It is also proposed to set up plants/projects for
treatment/management of urban solid and organic wastes Furthermore, in view of the vast
potential of utilising biomass as fuel, O R E D A has initiated a programme for undertaking
survey of biomass potential in different areas of the State During 1998-99, three blocks were
surveyed One village (Similiguda) in Kashipur Block of Rayagada district has been
electrified through a biomass gassifier during 1998-99 O R E D A has executed an agreement
with India Renewable Energy Development Agency (IREDA) to act as Business
Development Associate in this activity,
INSTITUTE OF MATERIAL SCIENCES
17 Institute of Material Sciences came into being In 1996-97 The basic
obje<'tive of the Institute is to provide facilities in the State for research in the frontier areas of
material science and to conduct inter-disciplinary research on special materials. During
1998-99, the Institute published seven research papers in international and national journals
The Institute also organised talks by scientists of other research and development institutions
at Bhubaneswar.
♦ ♦ ♦
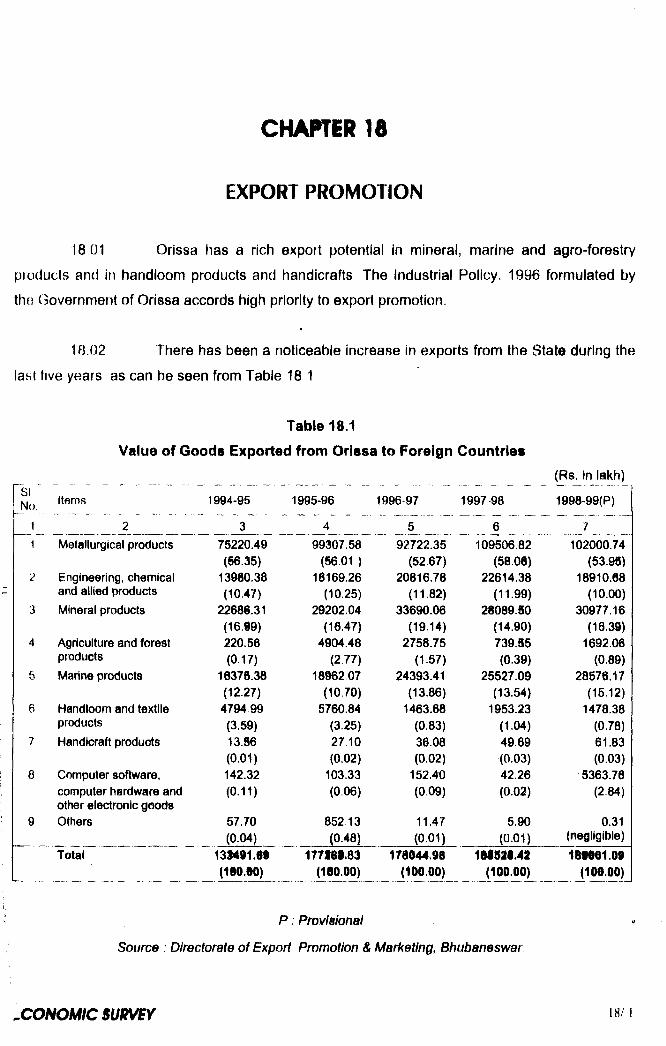
CHAPTER 18
EXPORT PROMOTION
18 01 Orissa has a rich export potential in mineral, marine and agro-forestry
pioducts and in handloom products and handicrafts The Industrial Policy, 1996 formulated by
the Government of Orissa accords high priority to export promotion.
18.02 There has been a noticeable increase in exports from the State during the
last five years as can be seen from Table 18 1
Table 18.1
Value o f Goods Exported from Orissa to Foreign Countries
(Rs. In lakh)51'Jo. Items 1994-95 1995-96 1996-97 1997-98 1998~99(P)
1 __________ 2 _ 3 4 5 6 71 Metallurgical products 75220.49 99307.58 92722.35 109506.82 102000.74
(66.35) (56.01 ) (52.67) (58.08) (53.95)2 Engineering, chemical 13980.38 18169.26 20816.78 22614.38 18910.08
and allied products (10,47) (10.25) (11.82) (11.99) (10.00)3 Mineral products 2268i.31 29202.04 33690.06 28089.50 30977.16
(16.99) (16.47) (19.14) (14.90) (16.39)4 Agriculture and forest 220.56 4904.48 2758.75 739.55 1692.06
products (0.17) (2.77) (1.57) (0.39) (0.89)5 Marine products 16375.38 18962.07 24393.41 25527.09 28578.17
(12.27) (10.70) (13.86) (13.54) (15.12)6 Handloom and textile 4794,99 5760.84 1463.68 1953.23 1478.38
products (3.59) (3.25) (0.83) (1.04) (0.78)7 Handicraft products 13.86 27,10 36.08 49.69 61.83
(0.01) (0.02) (0.02) (0.03) (0.03)8 Computer software, 142.32 103.33 152.40 42.26 5363.78
computer hardware and (0.11) (0.06) (0.09) (0.02) (2.84)other electronic goods
9 Others 57.70 852.13 11.47 5.90 0.31(0.04) (0.48) (0.01) (0.01) (negligible)
Total 13S491JI 177181.83 178044.98 181518.42 189861.09(leojo) (180.00) (100.00) (100.00) (100.00)
P : Provisional
Source Directorate of Export Promotion & Marketing, Bhubaneswar
18 03 The data presented in ttie above lable stiows ttiat Ihe total value of goods
exported from Orissa increased every year during the period from 1994 95 to 1998-99 with the
exception of 1996-97 wfien tfiere was a marginal decline. During the year 1998-99, the value of
goods exported to foreign countries was Rs 1890.61 crore which is 0.3% more than the value of
goods exported during the previous year
18.04 During 1994 95, the value of goods exported from the country was
Rs 82673 40 crore out of which the contribution of Orissa was Rs. 1334 92 crore amounting to
1.6% Dunng 1998-99. the value of goods exported form the country was Rs.141603.53 crore
including f^s 1890,61 crore from Orissa. The propotlion of the value of goods exported from
Orissa to the value of exports from India declined to 1.3% during 1998-99
18.05 Item wise analysis of the value of goods exported from Orissa shows that
during 1998-99 except for metallurgical products, engineering and chemical and allied products,
and handloom and textile products, the value of exports under all other categories has increased
over the previous year However the above three categories constitute about 65%i of the total
exports from the State Slump in demand and prices in the international market is one of the
major factors responsible for fall in the value of metallurgical and mineral products exported. The
value of computer software exported during 1998-99 rose to Rs.53.43 crore from a negligible
level during the previous year. This industry tias enormous potential and its (contribution to
exports from the State is expected to rise at a rapid rate
E X P O R T A N D I M P O R T T H R O U G H P A R A D E E P P O R T
18.06 Among the major ()orts in India, Paradeep is the only cargo handling port
In the Stale through wtiicti minerals, metallurgical prf)ducts and fertilisers are being imported and
(jx[)oitod ITio (^uanlufn of Hxpod and import through Paradeep ()ort from 1994-95 to 1998 99 is
presented in Table 1B2 Duhng 1998-99, 86.01 lakh MT cjf got)ds were exported through the
port as against 88 14 lakh MT during 1997-98 registering a decline of 2 42% over 1997-98 On
the other hand. 45.07 lakh MT of goods were imported through Paradeep port during 1998 99
against 44.88 lakh MT during 1997 98 registering an increase of 0.42% over the previous year.
ECONOMIC SUKVCY ' 8' 2

SI No.
Table 18.2Quantum of Export and Import through Paradeep Port
(in lakh Ml
Year Quantity Exported Quantity Imported Percentage of Import to Export
21994-951995 961996 9^1997 981998 99
3aaao70.5977.2188.1486.01
43 2 ^ 41 96 3847 44 88 45.07
549^37 52.44 49 83 50.92 5240
Source Paradeep Port Trust, Paradeep
18 07 Table 18.3 presents connmodity-wise export througti Paradeep port from
1994-95 to 1998-99. The table shows that the export of thermal coal and iron ore constituted a
major share of total commodity exports. Out of the total export of 86.01 lakh MT, thermal coal
and iron ore constituted 74.06% and 9.27% respectively during 1998-99 While the export of
thermal coal increased by 5 0 5 % the export of iron ore has decreased by 44 4 6 % over the
previous year
Table 18.3Commodity wise Export through Paradeep Port
(in lakh MT)
1 No Name of the commodity 1994-95 1995-96 1996-97 1997-98 1998-99
1 2 3 4 5 6 7
1 Iron ore 18.00 16.91 13.82 14.3S 7.97(28.36) (23.96) (17.90) (16.28) (9.27)
2 Thermal coal 41.18 42.32 50.06 60.64 63.70(62.10) (59.95) (64.84) (68.80) (74.06)
3 Chrome ore 3.73 3.97 3.20 3.02 1.56(5.63) (5.62) (4.14) (3.43) (1.81)
4 Charge chrome 1.04 0.76 1.17 1.00 0.87(1.57) (1.08) (1.52) (1.13) (1.01)
5 Others 1.55 6.63 8.96 9.13 11.91(2.34) (9.31) (11.60) (10.36) (13.85)
TOTAL ie.so ro.id 77*21 81.14 10.01(100.00) (100.00) (1 10 .00) ( m m ) (loo.go)
Sourae Paradeep Pori Trust, Paradeep.
18.08 The fair-weather port at Gopalpur in Ganjam district was opened to traffic
with effect from 27.02.1967. During 1998-99, 1.20 lakh M T ilmenite was exported through the
port as against 1.45 lakh M T during 1997-98. The total cargo handled by the port also
decreased form 2.01 lakh M T during 1997-98 to 1.20 lakh M T during 1998-99. An amount of
Rs.2.00 crore was collected aS revenue during the year and employment for about 1000
persons round the year and for about 3000 f^rsons for six months in the year was created
18.09 Considering the requirements of port-based steel plants and other
industries which are coming up near the port, it has been decided to develop Gopalpir port iinto
an all-weather port through private investment.
18.10 The State Government have decided to develop a mega port at Dhamara
in Bhadrak district through private investment. An M O D has been signed with M/s International
Sea Port Ltd. of Singapore in March 1997. It Is expected that the port will become operational
by the year 2003.
EXPORT PROMOTION INDUSTRIAL PARK (EPIP)
18.11 Government of India In the Ministry of Commerce have sanctioned the
establishment of an Export Promotion Industrial Park (EPIP) at Chandaka, Bhubaneswar with a
project cost of R8.25.50 crore. Central Government will provide Rs. 10.00 crore towards the cost
of the project and the balance (Rs.5.25 crore in cash and Rs 10.25 crore towards the cost of
land) will be provided by the State Government. Industrial Infrastructure Development
Corporation (IDCO) is the implementing agency for the project It is proposed to establish 155
export oriented industrial units In the proposed EPIP. These units are required to export:I
atleast 3 3 % of their production. Two hundred and five acre of land has been acquired for the
project and Rs.7.55 crore and Rs.5.25 crore have been released by the Central Government
and the State Government respectively during 1998-99.
iXPORT PROMOTION AND MARKETING
18-. 12 The Directorate of Export Promotion and Marketing, Orissa Is the nodal
agency br providing marketing support to registered Industrial units and rate contract holding
industrla* units and for rendering technical assistance for promoting export activities In the State,
he Directorate provides overseas marketing Information and maintains co-ordination with the
entrai Government, State Government and Export Promotion Agencies It provides incentives
In the form of export awards to the best exporters, it organises workshops and seminars,
conducts training programmes, and organises publicity drives etc. every year. The Directorate
iaiso assists potential exporters by providing know-how it also helps exporters by taking up their
problems with EPCs, Commodity Boards and other organisations of the Government of India
18.13 The Directorate registers reliable local Industrial units manufacturing store
items of standard specifications The Directorate has registered a total of 1865 industrial units
comprising of 1869 small scale units and 6 medium scale units, it has concluded rate contracts
|n respect of 1107 items including sub items with 745 industrial units upto the end of 1998-99 It
has also undertaken 1076 technical Inspections besides testing 14248 samples in its six
laboratories during 1998-99 to ensure quality and has received a su m of Rs. 12.91 lakh towardsItesting fees. W is obUgatory on the part of State Government departments and their agencies to
purchase their requirements of store items from the rate contract holders of the State. A
separate wing in the Directorate assists in obtaining business orders from major procuring
□rganisations like the Railways, Steel Authority of India Ltd., Hindustan Aeronautics Ltd. etc.
18.14 Orissa Small Industries Corpomtton has been accorded the status of an
Export House by Government of India frem 1194. Under Ite export actlvWes, the Corporation is
exporting products of small scale units such as readymade garments and handicrafts to U.S.A.
^nd European x)untries. The achievement of the Corperation under the above export activittes
iiuring 1992-93 to 1998-99 Is valued at Rs.2F3.34 lakh.
ftCENCY-WISi EXPORT OF DIPFIRENl ITEMS m m
18.1§ Item-Wise and aeenoy-w^ export ^ dif^Nmt p o U e frtm Orissa ^ H n g
is presented In T a Wi 184.
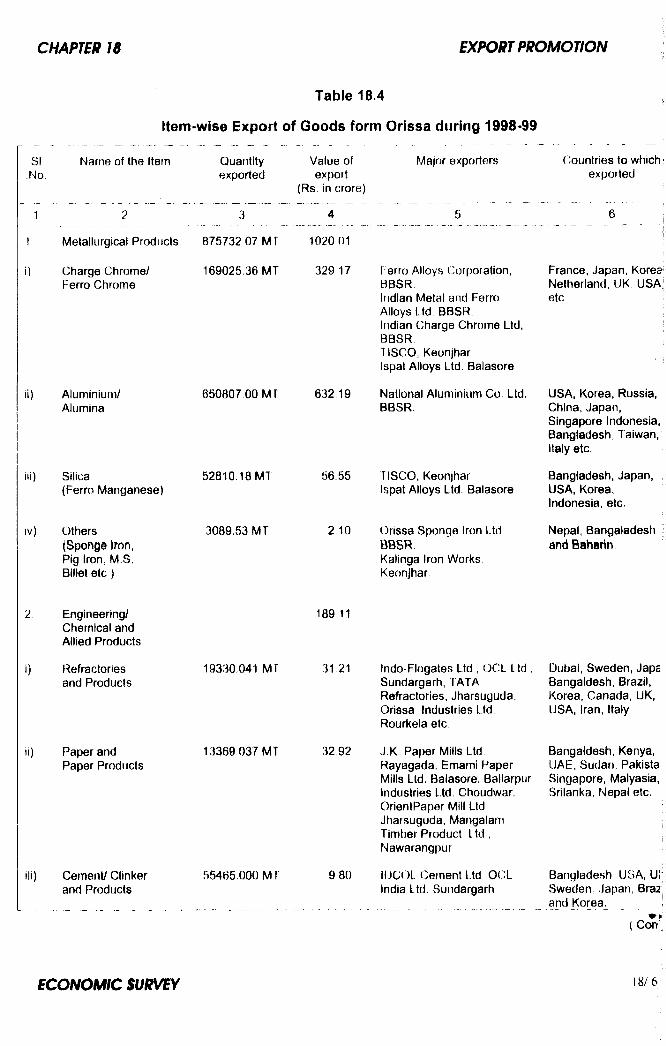
SI Name of the Item No.
Item-wise Export of Qoods form Orissa during 1998-99
Major exporters
ii)
Metallurgical Products
Charge Chrome/Ferro Chrome
Aluminium/Alumina
Silica(Ferro Manganese)
Others(Sponge Iron, Pig Iron, M.S. Billet e tc )
Quantityexported
3
875732 07 MT
169025.36 MT
Value of export
(Rs. in crore)
650807 00 M r
52810.18 MT
3089.53 MT
4
1020
329 17
632,19
56.55
2 10
5
F erro Alloys Corporation, BBSR.Indian Metal and Ferro Alloys Ltd. BBSR Indian Charge Chrome Ltd, BBSR.TISCO, Keonjhar Ispat Alloys Ltd. Balasore
National Aluminium Co. Ltd. BBSR.
TISCO, Keonjhar Ispat Alloys Ltd Balasore
Orissa Sponge Iron Ltd BBSRKalinga Iron Works. Keonjhar
Countries to which * exported
France, Japan, Korea Netherland, UK, USAetc
USA, Korea, Russia, China, Japan, Singapore Indonesia, Bangladesh, Taiwan, Italy etc.
Bangladesh, Japan, USA, Korea, Indonesia, etc.
Nepal, Bangaladesh and Baharin
Engineering/ Chemical and Allied Products
Refractories and Products
Paper and Paper Products
lii) Cement/ Clinker and Products
19330.041 M r
13369 037 MT
55465.000 M T
189 11
31 21
32.92
9 80
Indo-Flogates Ltd., OCL Ltd , Sundargarh, TATA Refractories, Jharsuguda, Orissa Industries Ltd. Rourkela etc
J K Paper Mills Ltd Rayagada, Emarni Paper Mills Ltd. Balasore, Ballarpur Industries Ltd. Choudwar, OrientPaper Mill Ltd Jharsuguda, Mangalam Timber Product Ltd , Nawarangpur
IDCOL Cement Ltd OCL India Ltd. Sundargarh
Dubai, Sweden, Japa Bangaldesh, Brazil, Korea, Canada, UK, USA, Iran, Italy
Bangaldesh, Kenya, UAE, Sudan. Pakista Singapore, Malyasia, Srilanka, Nepal etc.
Bangladesh, USA, Ur Sweden, Japan, Braz and Korea. !
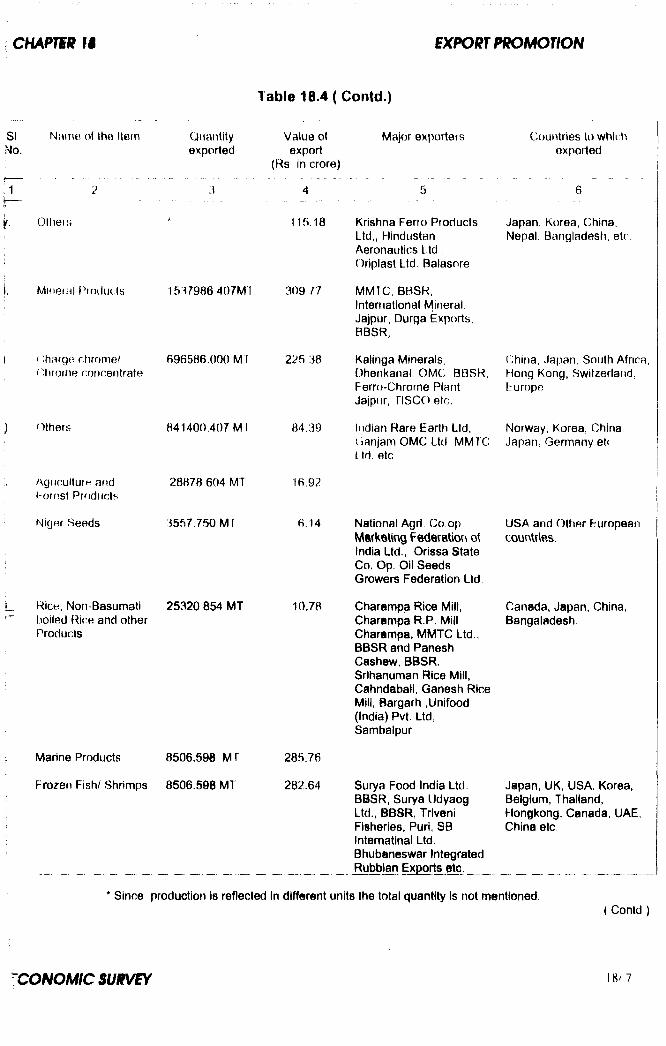
Nair\e of the Item Quantityexported
Value of export
(Rs. In crore)
Major exporters Countries to which exported
Otheis
MineiHl Pto(iu( Is 1537986 407MT
( ’.harge chrome/ 696586.000 M( :tirofne concentrate
Others
Agiiculturft arid f'otost Products
841400.407 M
28878 604 MT
115.18
309 77
225.38
84.39
16.92
Krishna Ferro Products Ltd,, Hindustan Aeronautics Ltd ,Oriplast Ltd, Balasore
MMTC, BBSR. International Mineral, Jajpur, IDurga Exports, BBSR,
Kalinga Minerals, Dhenkanal. OMC, BBSR, Ferro-Chrorne Plant Jajpur, nSCO etc.
Indian Rare Earth Ltd, GanjamOMCLtd MMTC Ltd. etc
Japan, Korea, China, Nepal. Bangladesh, etc
(>hina, Japan. South Africa, Hong Kong, Switzerland, Europe
Norway, Korea, China Japan, Germany etf
Niger Seeds 3557.750 M r 6.14
Rice, Non Basumati tioiled Rice and other Products
Marine Products
25320 854 MT
8506.598 MT
Frozen Fish/ Shrimps 8506.598 MT
10.78
285.76
282.64
National AgrI Co op MsrKsUng Federation ot India Ltd., Orissa State Co. Op. Oil Seeds Growers Federation Ltd
Charampa Rice Mill, Charampa R.P. Mill Charampa, MMTC Ltd., BBSR and Panesh Cashew, BBSR. Srlhanuman Rice Mill, Cahndabali, Ganesh Rice Mill, Bargarh ,Unifood (India) Pvt. Ltd, Sambalpur
USA and Other European counUlfts.
Canada, Japan, China, Bangaladesh
Surya Food India Ltd.BBSR, Surya Udyaog Ltd., BBSR, Triveni Fisheries, Puri, SB Internatinal Ltd.Bhubaneswar Integrated
_________ ______________________________ Rubbian Exports etc.____ __ _____
Since production is reflected in different units the total quantity Is not mentioned.
Japan, UK, USA, Korea, Belgium, Thailand, Hongkong, Canada, UAE, China etc.
Contd )
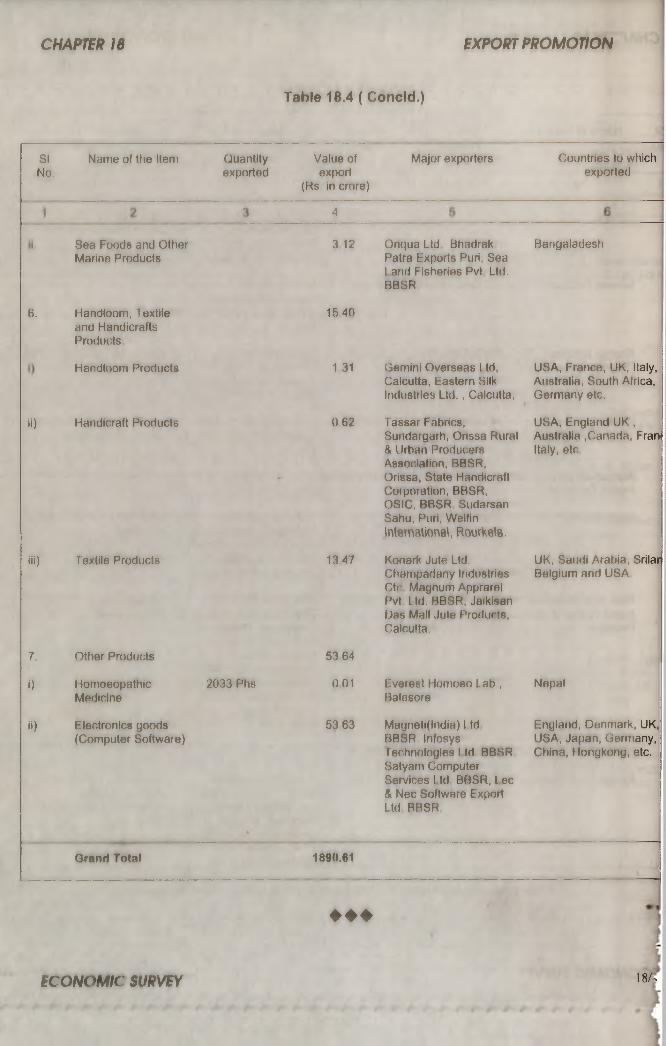
SINo.
Name of the Item Quantityexported
Value of export
(Rs- In crore)
Major exporters
4
Sea Foods and Other Marine Products
3 12 Oriqua Ltd Bhadrak Patra Exports Puri, Sea I and Fisheries Pvt Ltd. BBSR
Countries to which exported
Bangaladesh
6 .
ii)
Handloom, Textile and Handicrafts Products
Handloom Products
Handicraft Products
15 40
1.31
0.62
iii) Textile Products 1347
7.
i)
ii)
Otfier Products
HomoeopathicMedicine
Flectronics gtxjds (Computer Software)
2033 Phs
53 64
0 01
53 63
Grand Total 1890.61
Gemini Overseas ltd, Calcutta, Eastern SilK Industries Ltd., Calcutta,
Tassar Fabrics, Sundargarh, Orissa Rural & Urban Producers Association, BBSR, Orissa, State Handicraft Corporation, BBSR, OSIC, BBSR Sudarsan Sahu, Puri, Welfin Intmnalional, RourKela.
Konark Jute Ltd Champadany Industries etc Magnum Apprarel Pvt Ltd. BBSR, Jaikisan fJas Mall Jute Products, Calcutta
Everest Homoeo Lab., Balasore
Mayneti(lndia) Ltd BBSR. Infosys Technologies I Id BBSR Satyam Computer Services l td BBSR, L ec & Nec Software Export Ltd BBSR
USA, France, UK, Italy, Australia, South Africa, Germany etc.
USA, England UK , Australia .Canada, Frani Italy, etc
UK, Saudi Arabia, Srilar Belgium and USA
Nepal
England, Denmark, UK USA, Japan, Germany, China, Hongkong, etc.
♦ ♦ ♦
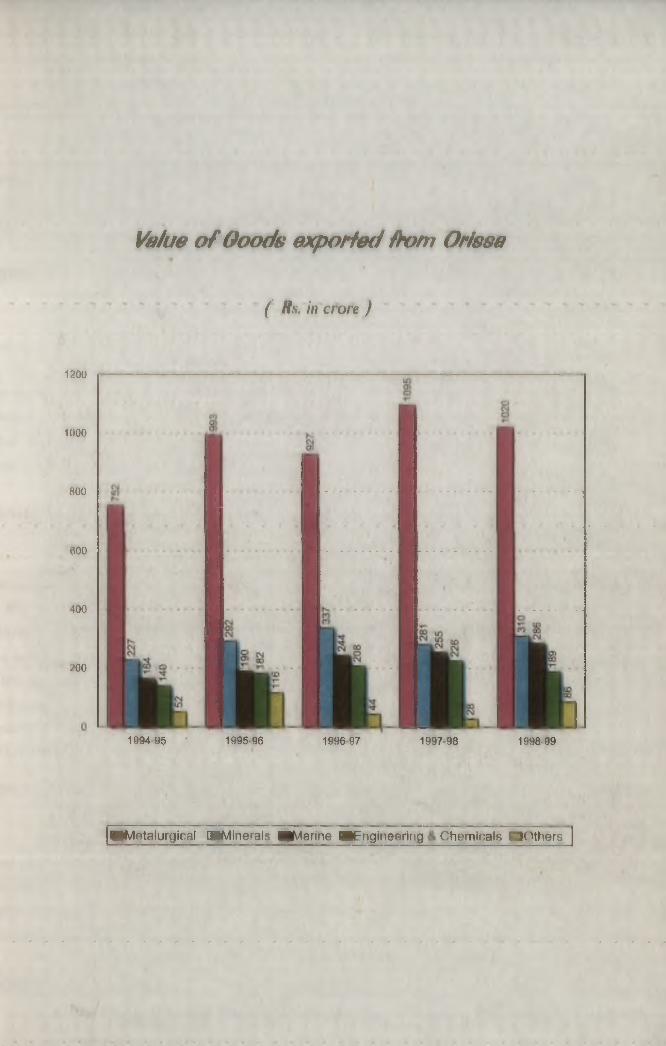
Value o f Ooods axpoH ed /hom O rissa
( Rs. in crore )
1200
1000
800
600
400
200
1994 95 • 1995-96 1996 97 1997-98 1998-99
iPMetalurgical [PMinerals MMarine MEngineering Chemicals Caothers
CHAPTIR 19
DEVELOPMENT OF WOMEN
19.01 Despite various measures taken, the status of women continues toremain relatively backward. With gradual spread of education and empowerment, the
position of women has begun to change It is the policy of Government to bring them fully
into the mainstream
F f MALE LITERACY
19 02 Female literacy rate in the State has consistently been lower than theliteracy rate among males. Though the female literacy rate in the State increased from 4 v*i%
in 1951 to 34.7% in 1991, it was lower than the national average of 39.31%, In rural areas, the female literacy rate is only 30 79% For development of female education, educational institutions have been established exclusively for gids including Kanyashrams in low literacy
trit)al areas for SC / ST girls. Education for girls, from primary to post graduate level, has
been made free. ITIs for women have been opened to provide professional training to them.
WOMEN IN WORK FORCE
19.03 According to 1991 census, only 27.28% of the total workers in Orissa
are women. The main workers and marginal workers among females constitute 58.2% and
41.8% of the total female workers respectively. The un-organlsed primary sector, which
includes agriculture, animal husbandry, fishery, forestry, mining and quarrying, plantations
and allied activities absorbs as much as 82.7% of the total female main workers. Nearly 6.2%
of the female main workers are engaged in household industries, and other sectors of the
economy provide employment to 12,1% of female main workers Women constitute an
important segment of the labour force. The unpaid economic activities of women and their contribution in the domestic sector remain un-reported and go largely un-recognised
EMPLOYMENT OF WOMENEM IN AGRICULTURE AND ALLIED SECTORS
19.04 Women play an Important role in agriculture, animal husbandry and
other related activities, which Include marketing of produce, food processing and the like. According to 1991 census, 80.9% of the female work force was engaged In agriculture, 25.8% as cultivators and 55.1% as agricultural labourers. Women as agricultural workers
gen»rally participate in all operations except ploughing. They are engaged in transplanting,
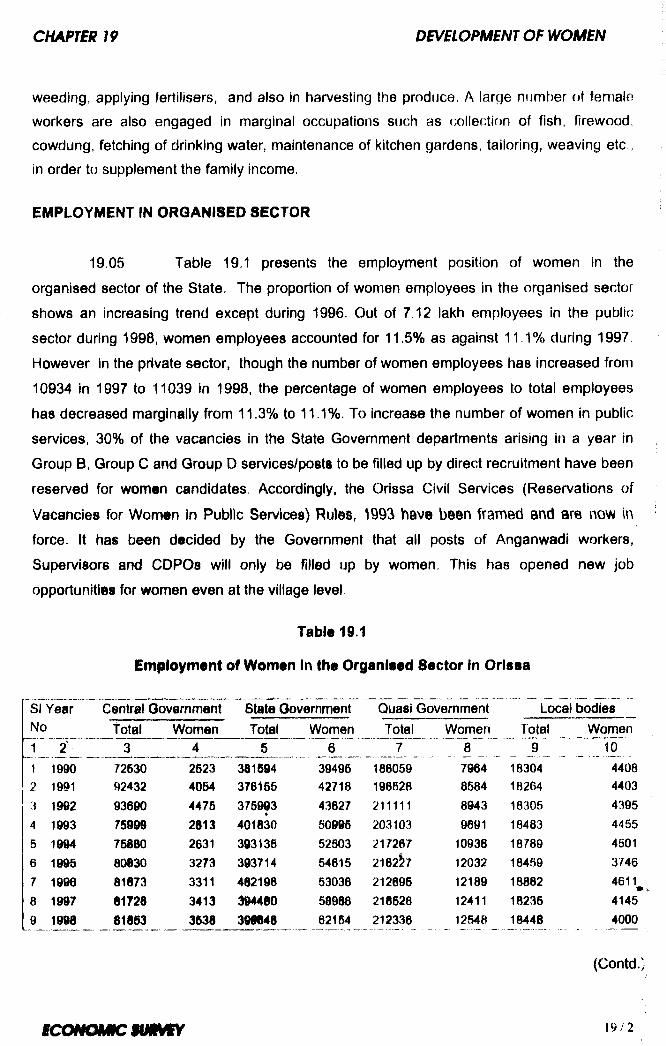
weeding, applying fertilisers, and also in harvesting the produce. A large number of female
workers are also engaged in marginal occupations such as collection of fish, firewood, cowdung, fetching of drinking water, maintenance of kitchen gardens, tailoring, weaving etc , in order to supplement the family income.
EMPLOYMENT IN ORGANISED SECTOR
19.05 Table 19.1 presents the employment position of women in the
organised sector of the State. The proportion of women employees in the organised sector
shows an increasing trend except during 1996. Out of 7 12 lakh employees in the public
sector during 1998, women employees accounted for 11.5% as against 11,1% during 1997.
However in the private sector, though the number of women employees has increased from
10934 in 1997 to 11039 in 1998, the percentage of women employees to total employees
has decreased marginally from 11.3% to 11.1%. To increase the number of women in public
services, 30% of the vacancies in the State Government departments arising in a year in
Group B, Group C and Group D services/posts to be filled up by direct recruitment have been
reserved for women candidates. Accordingly, the Orissa Civil Services (Reservations of
Vacancies for Women In Public Services) Rules, 1993 have been framed and are now in
force. It has been decided by the Government that all posts of Anganwadi workers.
Supervisors and CDPOs will only be filled up by women. This has opened new job
opportunities for women even at the village level.
Table 19,1
Em|il0ynient of Women In the Organised Sector in Orissa
SI Year Central Government State Government Quasi Government Local bodiesNo Total Women Total Women Total Women Total Women1 2' 3 4 5 6 7 8 9 101 1990 72530 2523 381594 39495 186059 7964 18304 44082 1991 92432 4054 376155 42718 19652B 8584 18264 44033 1992 93690 4478 375993 43627 211111 8943 18305 43954 1993 75999 2613 401630 50995 203103 9691 18483 44555 1994 75860 2631 393135 52503 217207 10938 18789 45016 1995 60830 3273 393714 54615 2162^ 12032 18459 37467 1996 61673 3311 462196 53038 212695 12169 18862 46118 1997 61726 3413 394460 56968 216528 12411 16235 41459 1986 61653 3536 399646 62154 212336 12548 16446 4000
(Contd.)
ecoNmncmmm 19/2
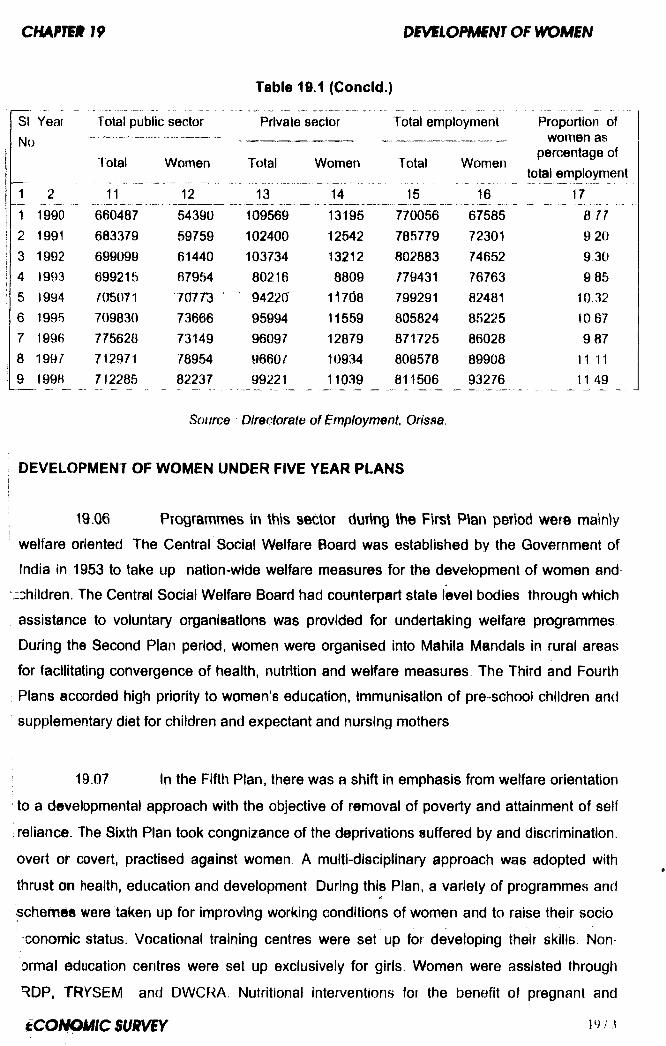
SI Year
No
Total public sector Private sector Total employment
1 2
1 1990199119921993
1994
1995
1996
8 1997
9 199fl
Total
660487683379699099699215705071709830775628712971712285
Women
12
Total
13
Women
14
Total
15
543905975961440679547077373666731497895482237
109569102400103734802169422095994960979660/99221
1319512542132128809
1170811559128791093411039
770056785779802883779431799291805824871725809578811506
Women
16675857230174652767638248185225860288990893276
Proportion of women as
percentage oftotal employment
178 779 20 9 30 985
10.3210 67 987
111111 49
Source Directorate of Employment, Orissa.
DEVELOPMENT OF WOMEN UNDER FIVE YEAR PLANS
19.06 Programmes \n this sector durtr>g the First P an period were mainly
welfare oriented The Central Social Welfare Board was established by the Government of
India in 1953 to take up nation-wide welfare measures for the development of women and
xihildren. The Central Social Welfare Board had counterpart state level bodies through which
assistance to voluntary organisations was provided for undertaking welfare programmes
During the Second Plan period, women were organised into Mahila Mandals in rural areas
for facilitating convergence of health, nutrition and welfare measures. The Third and Fourth
Plans accorded high priority to women's education, immunisation of pre-school children and
supplementary diet for children and expectant and nursing mothers
19.07 In the Fifth Plan, there was a shift in emphasis from welfare orientation
! to a developmental approach with the objective of removal of poverty and attainment of self
reliance. The Sixth Plan took congnizance of the deprivations suffered by and discrimination,
overt or covert, practised against women. A multi-disciplinary approach was adopted with
thrust on health, education and development During this Plan, a variety of programmes and#rschennes were taken up for improving working conditions of women and to raise their socio
conomic status. Vocational training centres were set up for developing their skills. Non
Drmal education centres were set up exclusively for girls Women were assisted through
RDP, TRVSEM and DWCRA. Nutritional interventions for the benefit of pregnant and
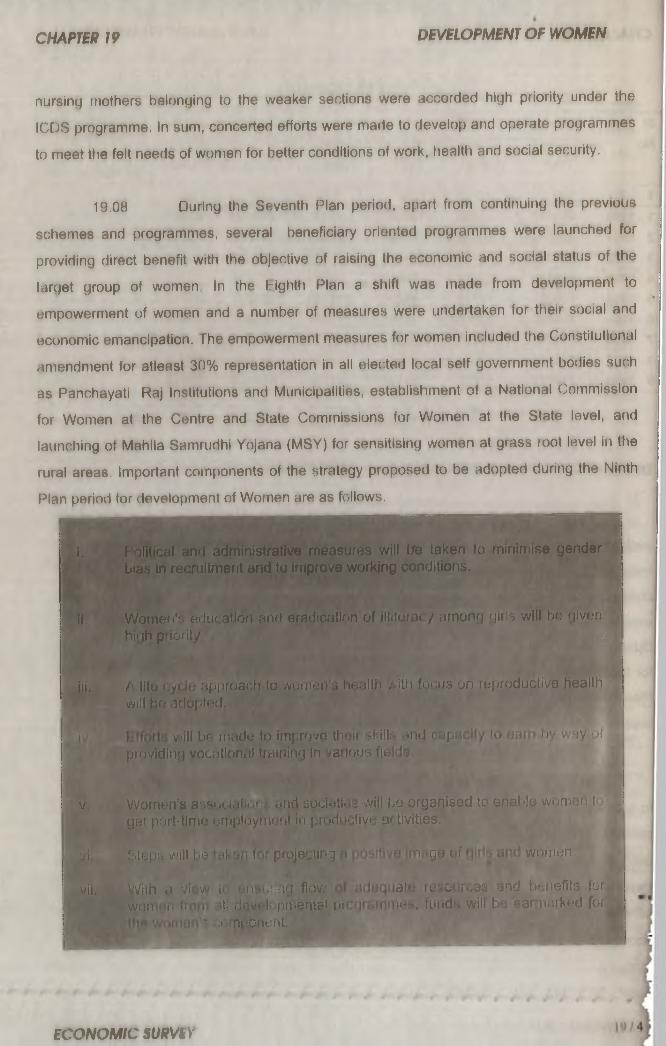
nursing mothers belonging to the weaker sections were accorded high priority under the
ICDvS programme. In sum, concerted efforts were made to develop and operate programmes
to meet tlie felt needs of women for better conditions of work, fiealth and social security.
19.08 During the Seventh Plan period, apart from continuing the previous
schemes and programmes, several beneficiary oriented programmes were launched for
providing direct benefit with the objective of raising the economic and social status of the
target group of women In the (rightti Plan a shift was made from development to
empowerment of women and a number of measures were undertaken for their social and
economic emancipation. The empowerment measures for women included the Constitutional
amendment for atleast 30% representation in all elected local self government bodies such
as Panchayati Raj Institutions and Municipalities, establishment of a National Commission
for Women at the Centre and State Commissions for Women at the State level, and
launching of Mahila Samrudhi Yojana (MSY) for sensitising women at grass root level in the
rural areas. Important coinponents of the strategy proposed to be adopted during the Ninth
Plan period tor develo()ment of Women are as follows.
i F“V)jHical and administrative measures will t/e taken to minimise gender bias in recruitment ar?d to improve working conditions.
W. Womeii's eduration arul eradication of ilfitor icy -jmong (jirls will bn fjiyorihi<jh priority i
iii. A lifu cyi ^ipjjroach to wntiitm 'i IkwiIIIi v/itli fofjus on reproductive healthVvill t)f' ^tlO('t«!il
i I v/ill Ijf: rn.idt) to imfiroyr th ir 3kilb and r if! . lo •)“* v rjy otprovjdinn vocation.jl traininij in #arioMs fie
V Women’s a'*s«»cl.ilM >r , m (\ sociBtiC i will bo organised to enal»le wunx n t<g«f pnrt'iimfi Bftijjioynif'it in |'f‘ 'dtt<:liv6 Qf tivities,
Vi THups willben|-'.*'f '-pjpjRvtir::) i i q j r f womon
vil, W ith i) ' I V i> ;ir inn(| flow at • i d ‘icos; end t)<;nGfits )cfwon I >. I: n -•/»:!. pmRritaU>i = " I i< , iuhd * will b3'earruiiM^d fpi
:;v ; infTlponeiit. -r
PREVENTION OF DOWRY
19 09 The Dowry Prohibition Act 1991 has been enacted by the StateGovernment NGOs are being given financial assistance by the Stale Governnient to
propagate and organise dowry-less marriages, anti-dowry campaigns, seminars, workshops
an(i street theatres to create mass awareness. The State Government have issued special instructions for initiation of disciplinary action against Its employees Involved in dowry
offences
STATE COMMISSION FOR WOMEN
19 10 The State C'ornmission for Women has been constituted by the StateGovernment with effect from 30.11.92 The Commission is empowered to act as a civil court and to recommend criminal prosecution against persons acciised of offences against women. The Commission makes in depth studies on the economic, educational and health
situation of women in the State with particular emphasis on tribal districts and areas which
are underdeveloped In respect to women's literacy, mortality and economic development. It looks into working conditions of women in factories, construction sites and other
establishments, and submits reports to the State Government containing recommendations
for improving the status of women. It compiles information from time to time on instances of offences against women In the State including cases related to marriage and dowry, rape, kidnapping, criminal abduction, eve teasing, immoral trafficking of women, and oases of medical negligence. It co ordinates with the State cell and district cells established to look
into cases of atrocities against women, mobilises public opinion against fuch atrocities In
the State, and interacts with the polk e for systematic follow up of pending cases. During
1998, 30 awareness camps, 16 legal awareness camps. 12 workshops and seminars, and 5
anti-dowry and anti-drug seminars were (conducted by the Commission.
STATE SOCIAL WELFARE ADVISORY BOARD
19.11 The State Social Welfare Advisory Board promotes social welfareactivities intended for the general welfare of the public, such as welfare of the family, women, children and the handicapped and for providing employment to the unemployed, underemployed, and weaker sections of the community It has been funding various welfare
schemes imder specified programmes impler.rented by voluntary organisations and for this
purpose grants are being provided by the Central Social Welfare Board. The Board has
been conducting seminars, workshops, debates etc. through voluntary organisations for
highlighting women's issues
REHABILITATION OF DISTRESSED WOMEN
19.12 The objective of the scheme is to identify women in distress and to
provide them vocational training in different trades for their economic rehabilitation. Young
widows, un-married mothers, victims of kidnapping, women driven to destitution because of
prolonged Illness are the categories of women considered to be in distress who are trained
and financially assisted. During the Eigtith Plan period a total of 800 women in distress have
l)een rehabilitated with an expenditure of Rs 13.29 lakh. During 1998-99, a sum of Rs.6.00
lakh has been spent for the benefit of 275 women in distress as against Rs.5.36 lakh spent
for the same number of women in the previous year.
MAHILA SAMITIS I MANILA MANDALS
19.13 Women In rural areas are organised into Mahlla Samitis / Mahila
Mandals for carrying out activities relating to nutrition, balwadis, adult education, and dowry
prohibition. These Samitis / Mandals also promote economic activities like sericulture, bee
keeping, tailoring, knitting, and weaving etc.
SHORT STAY HOMES
19.14 For the purpose of rehabilitation of women and girls in difficulty, short
stay homes have been established through voluntary organisations, where counseling and
treatment is provided to them. During 1998-99, 29 short stay homes with accommodation
facilities for 30 women/ girls in each were functioning in the State and 891 women and girls
were benefited During the proceeding year, 27 such homes were functioning which
accommodated a total of 450 women and girls. Grant-in-aid from Governement of India
amounting to Rs. 18.52 lakh and Rs. 19.54 lakh was received by these short stay homes
during 1998“99 and 1997-98 respectively,
WORKING WOMEN’S HOSTELS
19.15 To provide secure accommodation to working women, the State
Government have established working women’s hostels for women whose monthly income is
below Rs 5000, Eleven such working women’s hostels are functioning in the State with 711
tjeds In addition, 15 more working women's hostels with capacity to accommodate 901
boarders are under construction
CONDENSED COURSES OF EDUCATION FOR ADULT WOMEN
19.16 The scheme of Condensed Courses of Education for Adult Women
was started by the State Social Welfare Advisory Board with the objective of extending
education and training to needy widows and destitute, deserted and economically backward
women so as to enable them to acquire eligibility for suitable employment During 1998-99,
an amount of Rs 6 03 lakh has been sanctioned in favour of 7 NGOs (4 In rural area and 3 in
urban areas) for the purpose oijt of which a sum of Rs 1 74 lakh has been spent and 175
wotnen have been benefited against an expenditure of Rs.9 27 lakfi for 350 women
beneficiaries during the previous year.
VOCATIONAL TRAINING PROGRAMME
19 17 Vocational training courses are conducted for women in type writing,
stenography, tailoring, TV and radio repairing etc on an yearly basis. During 1998-99, 10
Vocational Training Institutions (9 in rural areas) provided training to 250 women of lower
income groups so as to enable them to equip themselves for employment. An amount of
Rs.8 20 lakh was sanctioned to 10 training institutions as against Rs.37.14 lakh sanctioned
to 42 -such institutions during the previous year.
VOLUNTARY ACTION BUREAUS AND FAMILY COUNSELLING CENTRES
19.18 Voluntary Action Bureaus and Family Counseling Centres started
functioning In 1983 with the objective of providing preventive, curative and rehabilitative
services to women who are victims of atrocities, exploitation, and maladjustment. These
centres also create awareness In the community about social problems affecting harmony in
the family and about laws pertaining to the welfare of women. Financial assistance is given
to NGOs through the State Social Welfare Advisory Board for setting up Family Counseling
Centres for resolving family discord and maladjustment so as to prevent break up of homes
During 1998-99, financial assistance amounting to Rs. 11.84 lakh was provided to 13 NGOs
to assist 698 beneficiaries. In the preceeding year 566 beneficiaries were assisted with an
expenditure of Rs. 10.09 lakh.
AWARENESS QNERATION PROJECTS FOR RURAL AND POOR WOMEN
19.19 The Awareness Generation Project for Rural and Poor Women was
started with the objective of providing a common platform to women to exchange their
ECONOMIC SURVSY
experience and ideas fur understanding their local problems and gain knowledge and make
analysis of the socio economic conditions l>ased on the lor:al situation The scheme fielps in
identifyirig the needs of rural and poor women and enables them to involve themselves and
others in tfie process of decision making in the family as well as in the society and prepares
them to deal with social issues like alcoholism and atrocities on women and children. During
1998 99. 50 institutions including 36 in rural areas took advantage of this programme. An
amount of Rs 5.00 lakh was sanctioned to these institutions for the purpose and 1250
women were assisted as against sanction of Rs 4 97 lakh for assisting 1776 beneficiaries
during 1997 98
STATE OLD AGE PENSION SCHEME AND NATIONAL OLD AGE PENSION SCHEME
19.20 Pension is provided to widows under the State Old Age, Pension
Scheme, and National Old Age Pension Scheme. During 19^8-99, 5,24,980 persons
including 2,96,600 (56.50%) women were benefited under the State Old Age Pension
Scheme and 3,32,286 persons including 1,47,184 women (44.29%) were benefited under
the National Old Age Pension Scheme. An amount of Rs.6479 crore under State Old Age
Pension Scheme and an amount of Rs.37.80 crore under National Old Age Pension Scheme
\i^re spent in 1998-99 as against expenditure of Rs.62.31 crore and Rs 39.90 crore
respectively during the previous year.
MAHILA VIKAS SAMABAYA NIGAM
19.21 The Orissa Mahila Vikas Samabaya Nigam (MVSN) is the State nodal
agency for empowerment of women. It has 127 affiliated societies out of which 33 are co
operative societies and the remaining 94 are registered under the Societies Registration Act,
1860. As a State nodal agency, the Nigam undertakes activities in three categories namely
economic programmes, social sensitisation programme and allied infrastructural activities
Economic Programmes
19 22 Under the Entrepreneurship Development Programme (EDP),
Management Training Programme (MTP), t eadership Development Programme (LDP) and
Trade Based Technical Training Programme (TBTTP) MVSN has conducted 8 training
programmes and has trained 221 women with an expenditure of Rs 3 46 lakh
19.23 Under Financial Assistance Scheme. MVSN has lent out funds as
margin money and working capital assistance to the tune of Rs 5 19 lakh for applique work
and production of low cost ready-made garments during 1998 99
19 24 Under Support to Training and Employment of Women Programme
(S It P), the Nigam has identified 5 proposalis from NGOs of Puri, Dhenkanal, Sundergarh
and ( -ultack during 1998-99 which are under different stage of processing.
19.25 The Rastriya Mahila Kosh (RMK) has sanctioned a short term loan
crndil limit of Rs.20 00 lakh for the MVSN for lending to poor women
19.26 Indira Mahila Yojana (IMY) was launched by Government of India in
August 1995 and MVSN was entrusted with the responsibility of conducting State level and
distric t level workshops. One district level workshop has been conducted during 1998-99
19.27 The Norwegian Agency for International Development (NORAD) offers
assistance for setting up employment generation projects on a sustained basis foi poor and
needy women both in urban slums and rural areas. During 1998-99 an amount ol Rs.53 74
lakh has been sanctioned to 26 implementing agencies to assist 1130 beneficiaries
MVSN has identified 14 women’s groups and 4 training institutions
under I tistrirt Rural Industrialisation Programme (DRIP) The training programme would
start after approval of training budget by NABARD
19.29 MVSN has been declared as the channelising agency for extending
assistance/loans to disabled persons under the schemes of the National Handicapped
Finance and Development Corporation (NHFDC) MVSN has recommended 182 loan
applications both for male and female handicapped persons for loans up to Rs.50,000.
Social Sensitisation Programme
19 30 As the State nodal agency for empowerment of women, MVSN
undertakes the task of sensitising and educating the women elected into Panchayati Raj
Institutions through a gender sensitive module. Training for women ChairpersonsA/lce-
Chalrpersons from 14 districts has been conducted at an expenditure of F s 10 25 lakh by
the end of March 1999
Allied Infrastructural Activities
19 31 MVSN proposes to set up a 20 MT ready-to-eat food plant at
Bhubaneswar as a joint venture with Modern Food Industries Ltd., a Government of India
undertaking, for processing and supplying food to children under Special Nutrition
Programme at an initial investment of Rs.1.31 crore.
19.32 MVSN has also initiated the process for setting up of a State F^esource
Centre for Women with funding from the Danish International Development Agency
(DANIDA). Orissa is one of the four States to have set up a SRCW. This SRCW would
function as a registered society for providing support for women’s development and
empowerment.
INTEGRATED CHILD DEVELOPMENT SCHEIVIE (ICD8)
19 33 279 ICDS projects are being implemented in 261 blocks of the State
Out of the 279 projects, 118 projects are in blocks with a high concentration of scheduled
tribes, 149 projects are in other rural areas, and 12 projects are in urban areas The target
group under the programme consists of children in the age group of 0 6 years and
expectant and nursing mothers in the age group of 15-45 years belonging to families
below the poverty line. The scheme provides a package of services covering supplementary
nutrition, immunisation, pre=schooi education, iiealth check-up, referral services, and nutrition
and health education for worrien. The details of actiievement under the ICFJS programme iti
Orissa during the years 1994-95 to 1998 99 are presented in Table 19 2 There has tieen a
steady improvement in coverage under ICDS The number of pro|ects and Anganwadi
Workers increased form 21B and 20,828 in 1994-95 to 279 and 28,382 respectively during
1998-99 The gross number of t)eneficiaries under the package of services increased from
:V 9 lakh in 1994 95 to 32,9 lakh in 1998-99 Covprage under the immunisation programme
in K 'DS blocks also shows a gradually increasing trend ns would (>e seen from Table 19-3.
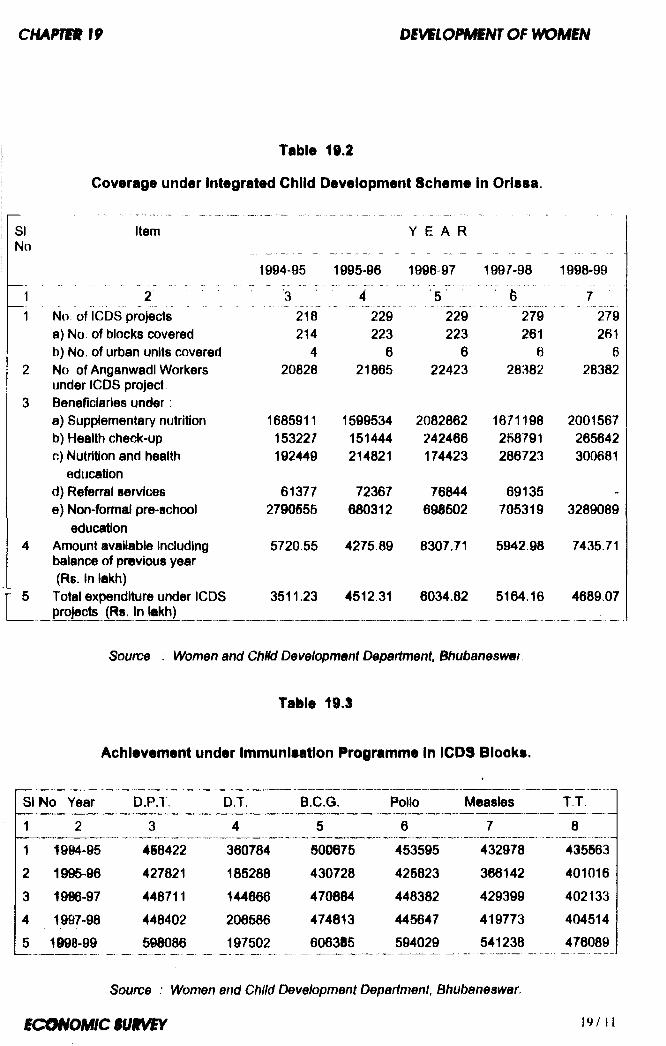
Tabie 19.2
Coverage under integrated Chiid Development Sciieme in Orissa.
SI Item........
Y E A RNo
1994-95 1995-96 1996 97 1997-98 1998-99
1 2 3 4 5 6 71 No of ICDS projects 218 “ 9 229 279 279
a) No of blocks covered 214 223 223 261 261b) No of urban units covered 4 6 6 6 6
2 No of Anganwadl Workers 20828 21865 22423 28382 28382under ICDS project
3 Beneficiaries under:a) Supplementary nutrition 1685911 1599534 2082862 1671198 2001567b) Health check-up 153227 151444 242466 258791 265642c) Nutrition and health 192449 214821 174423 286723 300681
educationd) Referral services 61377 72367 76844 69135 -
e) Non-formal pre-school 2790655 680312 698502 705319 3289089education
4 Amount available including 5720.55 4275.89 8307.71 5942 98 7435.71balance of previous year(Rs. In takh)
5 Total expenditure under ICDS 3511.23 4512.31 6034.82 5164.16 4689-07projects (Rs. In lakh)
Source : Women and ChUd Development Department, Bhubanesv^er
Table 19.3
Achievement under Immunieatlon Programme in iCDS Biooks.
SI No Year DP.T D.T. B.C.G. Polio Measles T.T.
1 2 3 4 5 6 7 81 1904-95 468422 360784 800675 453595 432978 4358632 1995-96 427821 165288 430728 425823 366142 4010163 1996-97 448711 144666 470884 448382 429399 4021334 1997-98 448402 206586 474813 445647 419773 4045145 1998-99 598086 197502 606385 594029 541238 476089
Source : Women and Child Development Department, Bhubaneswar
iCmOMICBUSVSY
DEVELOPMENT OF WOMEN AND CHILDREN IN RURAL AREAS (DWCRA)
19.34 DWCRA was introduced in 1983-84 as a sub sclieme of IRIDP The
primary objective of the scheme is to provide opportunities for gainful self employment to
women from rural families below the poverty line in order to improve their economic status
and promote their empowerment
19.35 Benefits under the scheme are extended to women belonging to
identified rural families, who form DWCRA groups consisting of 10 - 15 members each for
taking up economic activities according to their skills, aptitude and local conditions. A
revolving fund of Rs.25,000/- which is shared on 50:50 basis between the State and the
Central Government is given to each DWCRA group to take up income generating activities.
Additional credit is made available by banks. Marketing of products is organised through
District Supply and Marketing Societies at the district level and Multipurpose Co-operative
Centres at the block level. During the Eighth Plan period, 5098 DWCRA groups were formed
and a sum of Rs.967.06 lakh was spent for assisting 70,510 women beneficiaries. During
1998-99, expenditure amounting to Rs.407.94 lakh has been incurred for formation of 2637
DWCRA groups for assisting 34921 women beneficiaries as against expenditure amounting
to Rs.447.18 lakh for 23,502 beneficiaries in 1997-98.
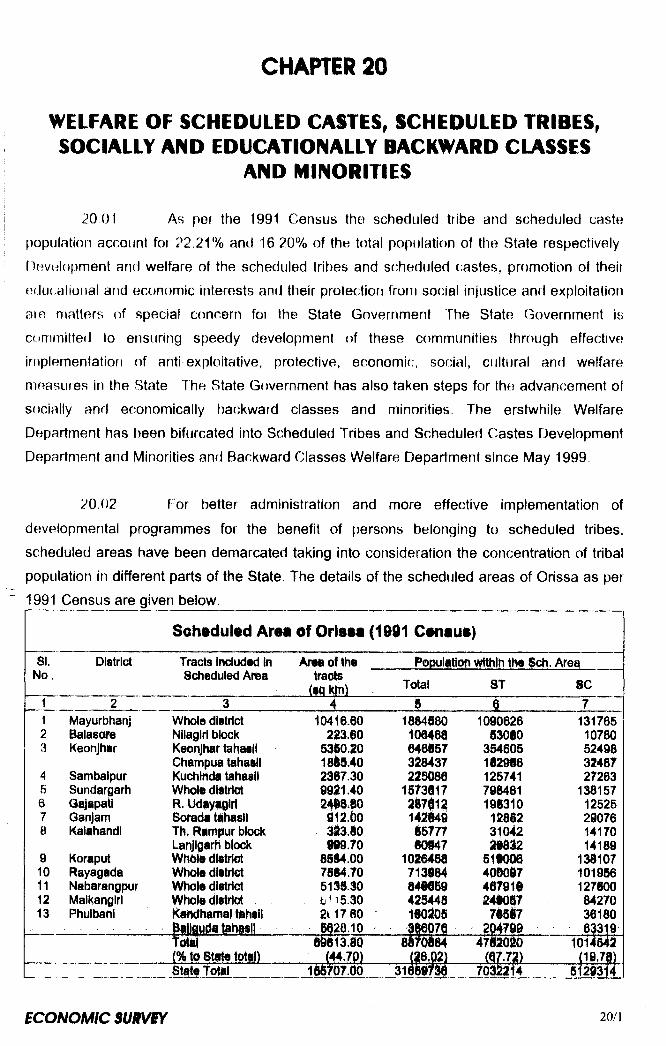
CHAPTER 20
WELFARE OF SCHEDULED CASTES, SCHEDULED TRIBES, SOCIALLY AND EDUCATIONALLY BACKWARD CLASSES
AND MINORITIES20 01 As per the 1991 Census the scheduled tribe and scheduled caste
population account fot 22 21% and 16 20% of the total population of the State respectively
fiBvelopment and welfare of the scheduled tribes and scheduled castes, promotion of theii educ,allotlal and economic interests and their protection from social injustice and exploitation
aie matters of special concern for the State Government The State Government is
committed to ensuring speedy development of these communities through effective
implementation of anti exploitative, protective, economic, social, cultural and welfare
measures in the State The State Government has also taken steps for the advancement of socially and economically backward classes and minorities. The erstwhile Welfare
Department has been bifurcated into Scheduled Tribes and Scheduled Castes Development Department and Minorities and Backward Classes Welfare Department since May 1999
20.02 For better administration and more effective implementation of
developmental programmes for the benefit of persons belonging to scheduled tribes, scheduled areas have been demarcated taking into consideration the concentration of tribal population in different parts of the State. The details of the scheduled areas of Orissa as per 1991 Census are given below.
Sdhttdul»d Area of Orissa (1991 Canaua)
SI.No.
District Tracts ir ciuded in Scheduled Area
Area of the Npulation v thlh the Sch. Areatracts
(siiKIn) Total ST SC1 2 3 4 1 6 71 Mayurbhanj Whole district 10416.60 1884580 1090626 1317652 BalasofQ Nilagiri block 2aa.0o 100468 83080 107803 Keonjhir Keonjhar tahasil 53S0.20 646857 354605 52498
Champua tahaSII 1815.40 3 8437 182986 324874 Sambalpur Kuchinda tahadii 2317.30 225086 125741 272035 Sundargarh Whole diitriet 9901.40 15 3017 798481 1381576 Qajapati R.Udiyifllrl 2mM0 287012 198310 125257 Ganjam Sorada tihasll 912.60 142649 12882 290768 Kalahandl Th. Rimpur block 3I3.S0 85777 31042 14170
Lanjigarh block 999.70 60947 mm 141899 Koraput WHble dittriet 8SS4.00 1020458 Bimm 13810710 Rayagada Whole district 7884.70 713984 400017 10195611 Nabarangpur Whole distrldt 513S.30 840839 407910 12780012 MalKanglrl Whole district tn5.30 425448 248087 8427013 Phulbani Kandhamaltahsii 2117 00 180105 7mr 36180
6028.10 380070 204780 63319Totil 13.80 8ifd884 478d0ib 1014841(% to State total) (44.70) 28,02) ( 7.72) (197f)State total 156t67.0O 31089730 7o322f4 5120314

TRIBAL SUB-PLAN APPROACH
20.03 Since the Fifth Plan period, a Tribal Siib-Plan has been formulated
with the objectives of (I) Improving the socio-economic conditions of the tribal population, (II)
strengthening of Infrastructure In the tribal areas, (III) protecting the tribals from exploitation,
and (Iv) promoting tribal Interests through legal and administrative support. About 44 70% of
the geographical area of the State has been declared as scheduled areas which Is
inhabltated by 62 tribal communities Including 12 primitive tribal groups In tribal areas,
developmental programmes are being Implemented through 21 Integrated Tribal
Development Agencies (ITDAs) and 17 micro projects. During the year 1998-99, the flow of
funds to ITDA areas was Rs.643.85 crore from the State Plan. Rs.218.46 crore from Central
Plan and Centrally Sponsored Plan and Rs.54.29 crore from Special Central Assistance.
During 1998-99, 20,699 ST families were assisted under different income generating
schemes. During 1998-99, by the end of December 1998, 145 educational buildings, 138
irrigation projects, 156 C D, works and 33 drinking water wells had been completed and 20
tribal villages had been electrified.
MICRO PROJECTS FOR PRIMITIVE TRIBAL COMMUNITIES
20.04 There are 17 micro projects covering parts of 20 blocks of 12 districts
for the development of 12 primitive tribal groups with a total population of about 68 thousand.
The primitive tribals covered under these projects are given full subsidy for individual and
family oriented income generating schemes. Particular attention is given for the development
of agriculture, horticulture, soil conservation, animal husbandry, health, drinking water
facilities, communication and education. During 1998-99 an amount of Rs.1.65 crore has
been spent for 8,998 ST beneficiaries under these mlcro-projects and a sum of Rs.1.65 crore
has been provided for the year 1999-2000.
MODIFIED AREA DEVELOPMENT APPROACH (MADA)
20.05 Modified Area Development Approach (MADA) aims at development
of tribals staying outside the ITDA areas. About 5 67 lakh tribals (as per 1991 Census) in 46
pockets with population of 10,000 or more where more than 50% inhabitants are tribals,I
spread over 47 blocks in 17 districts, are covered Lj|ider the above programme Both j
Individual beneficiary oriented schemes and community oriented schemes are under *
implementation in these pockets. During the year 1998-99 an amount of R^ 2 66 crore has
been spent covering 2,173 tribal beneficiaries.
c m m u 20 miFARe of sc, s i s§b c a n d mNcmims
CLUSTER APPROACH
20 06 Since the Seventh Plan period, the cluster approach has been adopted
for the development of contiguous areas having 5,000 population where 50% or more of the
inhat)itants are tribals. By the end of 1998-99, 14 cluster pockets comprising of parts of 13
blocks in 10 districts with 52,793 tribals have been covered under the cluster approach.
Under this programme various community oriented schemes and individual beneficiary
oriented schemes are being implemented. During 1998-99 an amount of Rs.20.45 lakh has
been spent and 276 tribals have been assisted
DISPERSED TRIBAL DEVELOPMENT PROGRAMME (DTDP)
20.07 Dispersed Tribal Development Programme is being implemented by
the Orissa Scheduled Caste and Scheduled Tribe Development Finance Co-operative
Corporation for the benefit of tribal families living outside the special project areas like ITDA,
MADA, Clusters and micro projects. During 1998 -99, an amount of Rs. 190.74 lakh has been
spent under different anti-poverty programmes under DTDP The proposed outlay for 1999-
2000 is Rs 190.79 lakh
ORISSA TRIBAL DEViLOPMENT PROJECT, KA8IPUR (OTDP)
20.08 In order to adopt an area specific approach for development, OTDP
was launched in 1988>89 in Kasipur block of Rayagada district jointly by the international
Fund for AgricuWurai Development, Government of India, and the State Government for all
round development of the tribals of the area. The implementation phase of the project was
over on 31.12.97 and its maintenance phase began from 01.01.1998.
ACADEMY OF TRIBAL DIALECTS AND CULTURE (ATDC)
20.09 An Academy of Tribal Dialects and Culture has been functioning at
Bhubaneswar since 1979 with the objective of preserving and promoting tribal art and culture
through establishment of Tribal Dialect Training Centres, publication of books in different
tribal languages, preparation of multilinguai dictionaries, conducting tribal exhibitions, and
other related activities. During 1998-99, primers for Ashram Schools in Santali and Kondha
languages were published and 71 persons were given training in Koya, Bonda, Lanjia Soura
and Didayi languages.
SCHEDUl ED CASTE SCHEDULED TRIBE RESEARCH AND TRAfNINQ INSTITUTE (SCSTRTI)
20 10 The Scheduled Chaste, Scheduled Tribe Research and TrainingInstitute is functioning since 1952 at Bhubaneswar. It is known for the following activities in the field of planning, research, training and evaluation
(i) Planning - Action Plans are formulated for the socio-ecnomic development of primitive tribal groups
(ii) Research - Research on various tribal communities, illegal land transfer, tribal herbal medicines, preparation of monographs on health and nutritional status of tribal children, ethnic status determination etc. are taken up
(iii) Training Various training programmes are conducted for officers and personnel working In tribal areas on tribal culture and development and on evaluation and monitoring. Orientation training on constitutional safeguards and protective legislations is also conducted.
(iv) Evaluation Steps liave been taken for evaluation of different programmes/ schemes implemented for the development of schedule tribes. So far, two MADA projects, two cluster approach pockets and four micro projects have been evaluated.
TRIBAL DEVELOPMENT CO-OPERATIVE CORPORATION OF ORISSA LTD (TDCCOL)
20 11 TDCCOL has been functioning since 1967 as the apex organisation for
purchase and sale of minor forest produce and surplus agricultural produce of the tribals to
protect them from exploitation by unscrupulous middlemen. The Corporation also sells
essential commodities in selected areas of tribal concentration through retail outlets and fair
price shops. I he Corporation has its head office at Bhubaneswar It has 3 divisional offices,
15 branch officos, 130 procurement cum collection centres and 360 seasonal procurement
centres in the Tribal Sub Plan area of tt»e State. It t»as 202 l arge Area Multipur|)ose Co
operative Societies and operates 70 fair price shops fill 1996-97. tlie corporation has
sustained a cumulative loss of Rs 41.04 crore TDCC has a business programme of Rs.45
I rore for 1999-2000 out of which the target for procurement of surplus agricultural produce is
Fis in crore and for procurement of minor forest produce is Rs.25 crore

C H A P m m m L F A R i O F S C , ST, S E B C A N D M IN O m m SLAND ALIENATION
2U.12 The Orissa Schedule Area Transfer of Immovable Property Regulation,
1956 prohibits alienation of land belongitig to ST persons to non-ST persons without prior
permission of competent authority. Land alienated without permission is liable to be restored
to the original land holder. Up to the end of 1998-99, 86,095 land alienation cases were
initiated and 83,636 cases were disposed of and about 38,811 acre of land were restored to
45,804 persons
DRINIKING WATER FACILITES
20 13 Nearly, 1^,150 villages out of 19,204 villages in the T S P area were
identified as having inadequate drinking water facilities. After providing safe drinking water
facilities to all of the above Identified villages by the end of 1993-94, the focus of coverage of
niral water supply has changed from “village " to “habitation” in order to cover the hamlets
which have been left out. Out of the total ST population in the State, 90% has so far been
covered under safe drinking water supply.
WELFARE OF SCHEDULED CASTES
20.14 There are 93 scheduled caste communities in the State with 51.29 lakh
population as per 1991 census constituting 16.20% of the total population of the State and
3.7% of the total SC population in the country. The rural and urban components of the SC
population in the State are 89.26% and 10.74% respectively. These communities are
scattered all over the State with relatively higher concentration in the coastal areas. The
growth rate of population among the 8Cs during 1901-91 was 32.69% as against 31.95% at
the all India level There are 15 communities in the category of sweepers/scavengers and
nomadlc/semi-nomadic and other denotlfled communities identified as specially vulnerable
groups among SCs.
20 15 The Special Component Plan (SCP) for developmant of scheduled
castes Is being implemented in the State from the Sixth Plan period. Need based composite
programmes have been taken up for the main occupational groups among the scheduled
castas like weavers, cobblers, fishermen, serlculturlsts and cultivators with emphasis on
increased production, marketing of products, and development of human resources. Special
attention has been given for economic development of specially vulnerable groups among
the SCs
20.16 During 1998-99 the flow of funds to the Special Component Plan was
of the order of Rs.379.46 crore which included Rs.304.31 crore form the State Plan,
Rs.52.19 crore from Central Plan and Centrally Sponsored Plan and Rs.22.96 crore from
Special Central Assistance. A total of 57,171 scheduled caste families were covered under
different antipoverty programmes. During 1999-2000, the flow of funds to SCP is proposed to
be of the order of Rs.446.27 crore to assist 66,000 scheduled caste families under different
anti-poverty programmes.
ORISSA SCHEDULED CASTE AND SCHEDULED TRIBE DEVELOPMENT FINANCE
CO-OPERATIVE CORPORATION (OSPDC)
20.17 The Corporation was established in 1979-80 for providing economic
assistance to SC families below the poverty line and to 8T families below the poverty line
and residing outside ISP, MADA, Cluster and micro project areas, by way of arranging
institutional credit under the Margin Money Loan Programme for various income generating
schemes. OSFDC also assists in setting up self-employment units like taxi services, xerox
units and ric® huHera for the benefit of unemployed SC and ST beneficiaries During 1998-99,
27,577 scheduled caste beneficiaries have been assisted under different income generating
schemes, which Includes 3,830 liberated scavengers. Thirty seven SC and ST beneficiaries
have been granted term loans under high cost schemes.
ENFORCEMENT OF THE ORISSA RESERVATION OF VACANCIES IN POSTS AND SERVICES (FOR SC AND ST) ACT AND LEGAL AID.
20.18 Under ORV Act, 1975 there Is provision for reservation of 16,25% and
22.50% of posts for SC and ST persons respectively In recruitment and promotion. During
1998-99 legal aid assistance amounting to Rs.0.90 lakh has been provided to 10 SC and 6
ST persons for enforcing their rights and title/possession of landed property in the civil and
revenue courts. Financial assistance amounting to Rs. 3.89 lakh has been provided to 98 SC
and ST victims of atrocities during 1998-99. Inter-caste marriage between SC persons and
persons of other castes is being encouraged by providing financial incentive at the rate of
Rs.3000 to each couple. During 1998-99 a sum of Rs. 4.02 lakh has been given as incentive
for the purpose.
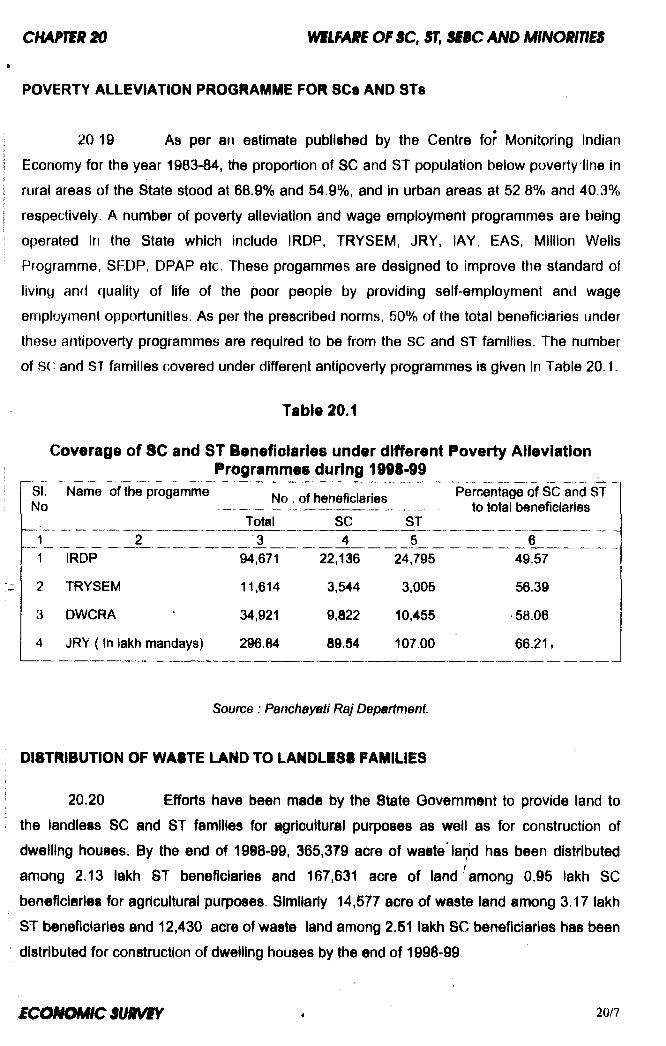
POVERTY ALLiVIATION PROGRAMME FOR 8Cs AND STs
20 19 As per an estimate published by the Centre for Monitoring Indian
Economy for the year 1983-84, the proportion of SC and ST population below poverty line in
rural areas of the State stood at 68.9% and 54.9%, and in urban areas at 52 8% and 40.3%
respectively. A number of poverty alleviation and wage employment programmes are being
operated in the State which Include IRDP, TRYSEM, JRY, lAY, EAS, Million Wells
Programme, SF.DP, DPAP etc. These progammes are designed to improve the standard of
living ahd quality of life of the poor people by providing self-employment and wage
employment opportunities. As per the prescribed norms, 50% of the total beneficiaries under
these antipoverty programmes are required to be from the SC and ST families. The number
of SC and ST families covered under different antipoverty programmes Is given in Table 20 1.
Table 20.1
Coverage of SC and ST Beneficiaries under different Poverty Aiieviation Programmes during 1998-99
SI. Name of Fhe progamme ^ nf hflnAfiH«riflf; Percentage of SC and STNo _ -------......................................... . to total benefieiarles
Total SC ST1 2 3 4 5 61 IRDP 94,671 22,136 24,795 49.57
2 TRYSEM 11,614 3,544 3,005 56.39
3 DWCRA 34,921 9,822 10,455 •58.06
4 JRY ( In lakh mandays) 296.84 89.54 107.00 66.21.
Source: PanchayBti Retj Department.
DISTRIBUTION OF WASTE LAND TO LANDLBSS FAMILIES
20.20 Efforts have been made by the State Government to provide land to
the landless SC and ST families for agricultural purposes as well as for construction of
dwelling houses. By the end of 19§8-99. 365,379 acre of waste land has been distributed
among 2.13 lakh ST beneficiaries and 167,631 acre of land among 0.95 lakh SC
beneficiaries for agricultural purposes. Similarly 14,577 acre of waste land among 3.17 lakh
ST beneficiaries and 12,430 acre of waste land among 2.51 lakh SC beneficiaries has been
distributed for construction of dwelling houses by the end of 1996-99.

MEDICAL AND PUBLIC HEALTH CARE
20 21 Emphasis has been given for providing health care bervices in remote
tribal areas. Accordingly, a three tier health services system comprising of one Sub-Centre
for every 3000 population, one F’HC/AHC for every 20,000 population, and one Community
Health Centre for every 80,000 to 1,20,000 population is being established. Nearly 2,300
Sub-Centres, 302 Primary Health Centres/Additional Health Centres, 58 Community Health
Centres/Upgraded Primary Health Centres, 64 Subsidiary Health Centres, 6 Mobile Health
Units. 166 Ayurvedic Dispensaries, 139 Homoeopathic Dispensaries and 148 Allopathic
Dispensaries have been established to provide health facilities in tribal areas.
RURAL ELECTRIFICATION
20.22 Out of 19,491 tribal villages in the State, 10,296 villages were
electrified by the end of 1997-98. During 1998-99, 163 tribal villages have been electrified.
Similarly, out of 4,022 SC villages, 3784 villages were electrified by the end of 1997 98 It
has been decided to provide power to 480 tribal villages and 20 SC villages during 1999-2000.
EDUCATIONAL DEVELOPMENT FOR SCs AND STs
20 23 The ovsrall literacy rate (1991) In Orissa was 49 1% with 36 78% for
SC and 22.31% for ST as against 21.7%, 11.6% and 7 4% In 1961 and 26.2%, 16.6% and
9.6% In 1971 respec3tlvely. Education Is the most Important thrust area for the socio
economic development of SGt and STs. The State Government have undertaken various
measures to improve the educational status of these communities through steps like
provision of scholarships, boarding facilities, free distribution of nationalised text books,
garments, and imparting special coaching facilities for appearing at various competitive
examinations. For encouraging enrollment and reducing drop-out rates in primary schools.
Mid-day Meal scheme has been Introduced for all primary schools.
20.24 Table 20.2 shows that while In 21 districts of the State literacy rate for
SC population was more than 30% , In respect of ST population literacy rate was higher than
30% only in six districts namely Baragarh, Jharsuguda, Nayagarh, Puri, Sambalpur and
Sundargarh. The ST literacy rate was less than 15% In Bhadrak and in four southern tribal
dlstrlott namely Koraput, Malkangirl, Nawarangpur and Rayagada. The female SC literacy
rate vvas hlgHtr than 30% only In the three coastal districts namely Cuttack, Jagatsinghpup
and Khuni a. The female ST lltw aoy rate was lower^fn 25% In all districts while in Bhadrak,
Koraput, Malkangirl, Nawarangpur and Rayagada it was below 5%
ICOMOMCMWWK
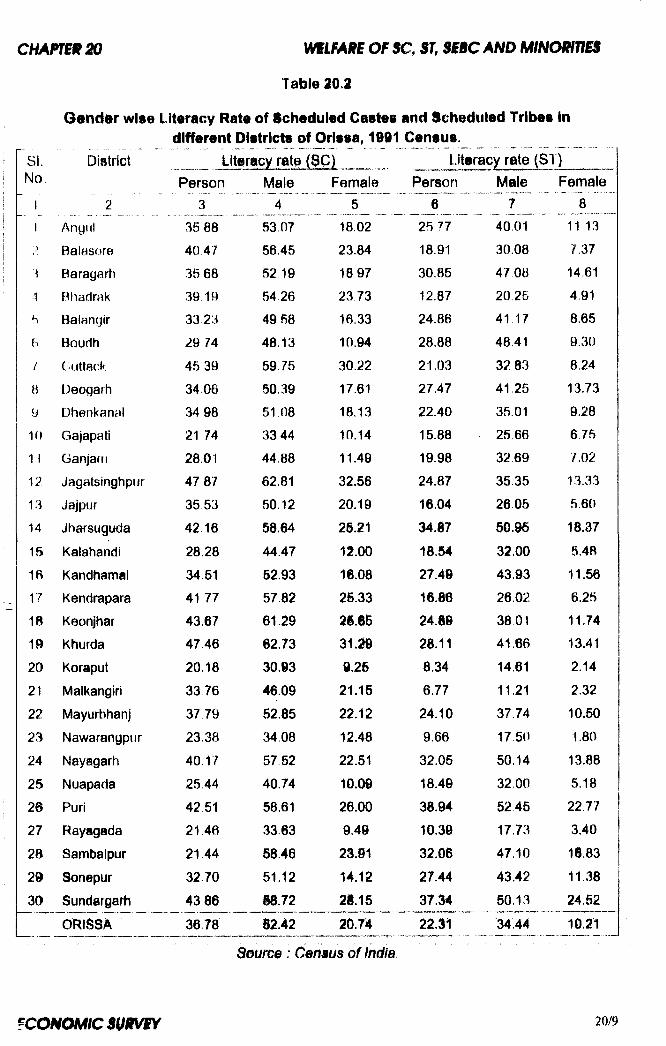
C H A P retfio W S LM Ife O F S Q ST, S iB C A N D M IN O m m S
Table 20.2
Gender wise Literacy Rate of Scheduled Castes and Scheduled Tribes indifferent Districts of Orissa, 1991 Census.
SI. District Literacy rat© ($0) Literacy rate (ST)No Person Male Female Person Male Female
1 2 3 4 5 6 7 81 Angu! 35 88 5307 1802 2577 40,01 11 13
2 Balasore 40,47 5645 23.84 18.91 30,08 7.37
Baragarh 35 68 52 19 1897 30.85 47 08 14.614 Bhadrak 39.19 54 26 23 73 12.87 20.25 4.915 Balangir 33 23 4958 16.33 24.86 41,17 8.656 Boudh 29 74 48.13 10.94 28.88 48.41 9.30/ (;uttacl< 45 39 59 75 30.22 21.03 3283 8,24
B Deogarh 34 06 50.39 17.61 27.47 41.25 13.739 Dhenkanal 34 98 51 08 18.13 22.40 35.01 9.2810 Gajapati 21 74 33 44 10.14 15.88 2566 6.751 1 Ganjarn 28.01 44.88 11.49 19.98 32 69 7.02
12 Jagatsinghpur 47 87 62.81 32.56 24.87 35.35 13 33
13 Jajpur 35 53 50.12 20.19 16.04 26.05 5.6014 Jharsuguda 42 16 5864 26.21 34.87 50.96 18.37
15 Kalahandi 28.28 44.47 12.00 18.54 32.00 5.4816 Kandhamal 34,51 52.93 16.08 27.40 43.93 11.5617 Kendrapara 41 77 57.82 25.33 16.86 26.02 6.2518 Keonjhar 43.67 61.29 2g.6S 24.80 38,01 11.741§ Khurda 47.46 02.73 31.20 28.11 41.66 13.4120 Koraput 20.18 30.i3 9.26 8.34 14.61 2.1421 Mall<angiri 33.76 46.09 21.15 6.77 11.21 2.3222 Mayurbhanj 37 79 52.85 22.12 24.10 37.74 10.5023 Nawarangpur 23.38 34.08 12.48 9.66 17,50 1.8024 Nayagarti 40,17 57.52 22.51 32.05 50.14 13.8825 Nuapada 25.44 40.74 10.09 18.40 32.00 5.1826 Puri 4251 58.61 26.00 38.94 5245 22.77
27 Rayagada 21 46 33.63 9.49 10.30 17.73 3.40
28 Sambalpur 21 44 58.46 28.01 32.06 47.10 16.8329 Sonepur 3270 51.12 14.12 27.44 43.42 11.3830 Sundargarh 43 86 S8.72 21.15 37.34 50.13 24.62
ORISSA 3678 S2.42 2D.74 22.31 34.44 10.21
Source : Census of India.
CHAPm 20 WELFARE OF SC, ST, SEBC AND MINORITIES20 25 Sevashrams and Residential Sevashrams are coeducational schools
in TSP area imparting education upto Class V Ashram Schools and Kanyashrams are
residential schools imparting education to boys and girls respectively upto Class VII By the
end of 1998-99, 218 High Schools including 55 for girls, 149 Ashram Schools including 37 for
girls (Kanyashrams), 143 Residential Sevashrams and 919 Sevashrams were functioning In
the State in TSP area. Besides, 1,548 Primary School Hostels and 7 special Adivasi Hostels
including 3 for girls were functioning in the State During 1998-99, 10 Sevashrams have
been converted into Residential Sevashrams. Also two Ashram Schools have been up
graded to High Schools, one Kanyashram has been upgraded to a girls’ High School and two
Residential Sevashrams and one Sevashram have been up-graded to Ashram Schools.
During 1999-2000 it is proposed to open 4 educational institutions (comprising of one boys’
High School, one girls’ High School, one Ashram school and one Kanyashram), upgrade 3
Ashram Schools to High Schools, 3 Sevashrams to Ashram Schools and 10 Sevashrams to
Residential Sevashrams. Besides, there is a proposal to open new High Schools in TSP
blocks having no High Schools.
20.26 During the year 1998-99, pre-matric scholarship was awarded to
6,22,265 ST and SC students and poat-matric scholarship to 71,627 ST and SC students
with an expenditure of Rs.42.46 crore and Rs. 12.86 crore respectively. An amount of
Rs.39.78 crore for pre-matric and Rs.13.19 crore for post-matric scholarship has been
proposed for the year 1999-2000.
20.27 A Cash Reward Scheme is being implemented with a view to providing
incentive to teachers for improving performance of their students in High School Certificate
Examination and in sectional trades in residential High Schools and Ashram Schools, For the
Ninth Plan an outlay of Rs.2.50 lakh has been proposed. During 1998-99 a sum of Rs 1.04
lakh has been spent under the scheme.
20.28 Several other facilities like financial aid for sharing rented
accomodation, book banks In Medical and Engineering Colleges, supply of books and writing
materials, stipend for studying in Industrial Training institutes etc are being provided for
educational development of the SC and ST students
20.29 The number of Ashrams, Sevashrams and High Schools functioning in
the State^along with the number of students on roll during the years 1990-91 to 1998-99 are
given in the following tables
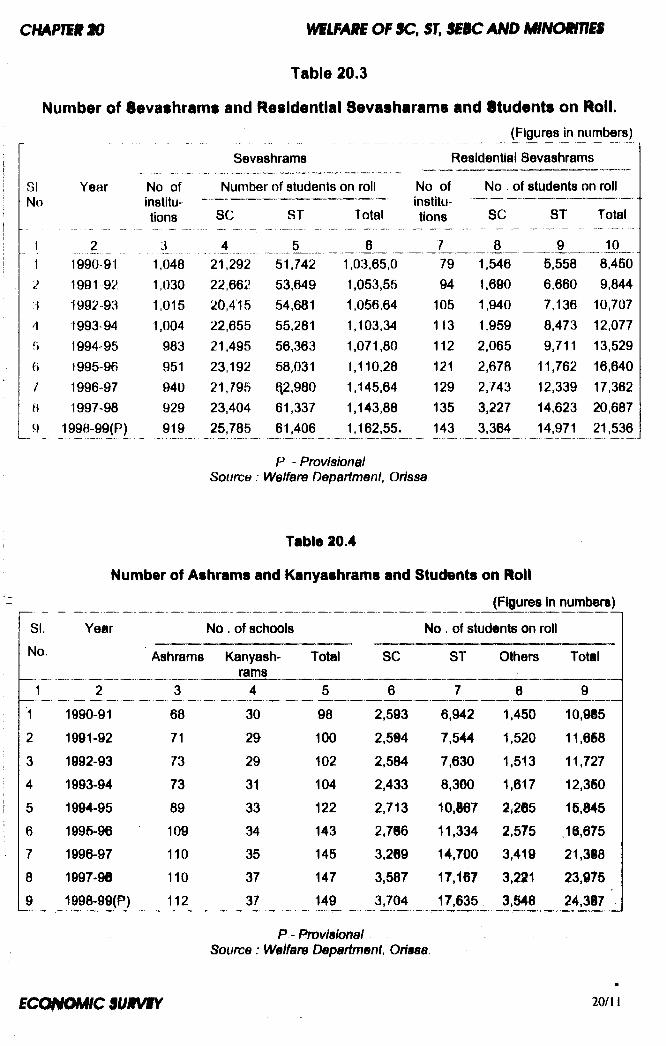
WSIMHE OF$C, SI $S»CAND NHNOmmS
Table 20.3
Number of Sevashrams and Residential devasharams and Students on Roll.(Figures in numbers)
Sevashrams Residential Sevashrams
SINo
Year
...2....1990-91 1991 921992-931993-94 1994 95 1995-961996 971997 98
1998-99(P)
No of institU" tions
3.... 1,048 1,030 1,0151,004
983 951 940 929 919
SC
_, 4_21,29222,66220,41522,65521,49523,19221,79523,40425,785
ST
.. 6__51,74253,64954,68155,28156,36358,03102.98061,33761,406
on roll No of Institutions
7
No of students on roll
Total
6
SC
8
ST
9
Total
101,03,65,0 79 1,546 5,558 8,4501,053,55 94 1,690 6,660 9,8441,056,64 105 1,940 7,136 10,7071,103,34 113 1,959 8,473 12,0771,071,80 112 2,065 9,711 13,5291,110.28 121 2,678 11,762 16,6401,145,64 129 2,743 12,339 17,3621,143,88 135 3,227 14,623 20,6871,162,55. 143 3,364 14,971 21,536
P - Provisional Source : Weifare OeparimBnt, Orissa
Table 20.4
Number of Ashrams and Kanyashrams and Students on Roll
(Figures in numbers)
SI. Year No. of schools No . of students on rollNo. Ashrams Kanyash
ramsTotal SC ST Others Total
, 1 2 3 4 5 6 7 8 91 1990-91 68 30 98 2,593 6,942 1.450 10,9852 1991-92 71 29 100 2.5S4 7,544 1,520 11,6683 1992-93 73 29 102 2,584 7,630 1,513 11,7274 1993-94 73 31 104 2,433 8,300 1,617 12,3605 1994-95 89 33 122 2,713 10,867 2,285 15,8456 1995-96 109 34 143 2,786 11,334 2,575 .18,6757 1996-97 110 35 145 3,289 14,700 3,419 21,3888 1997-98 110 37 147 3,587 17,167 3,211 23,9759 1998-99(P) 112 37 149 3,704 17,635 3,548 24,387
P - Provisional Source: Welfare Department, Oriasa.
E c m m M ic s u m /S Y 20/11
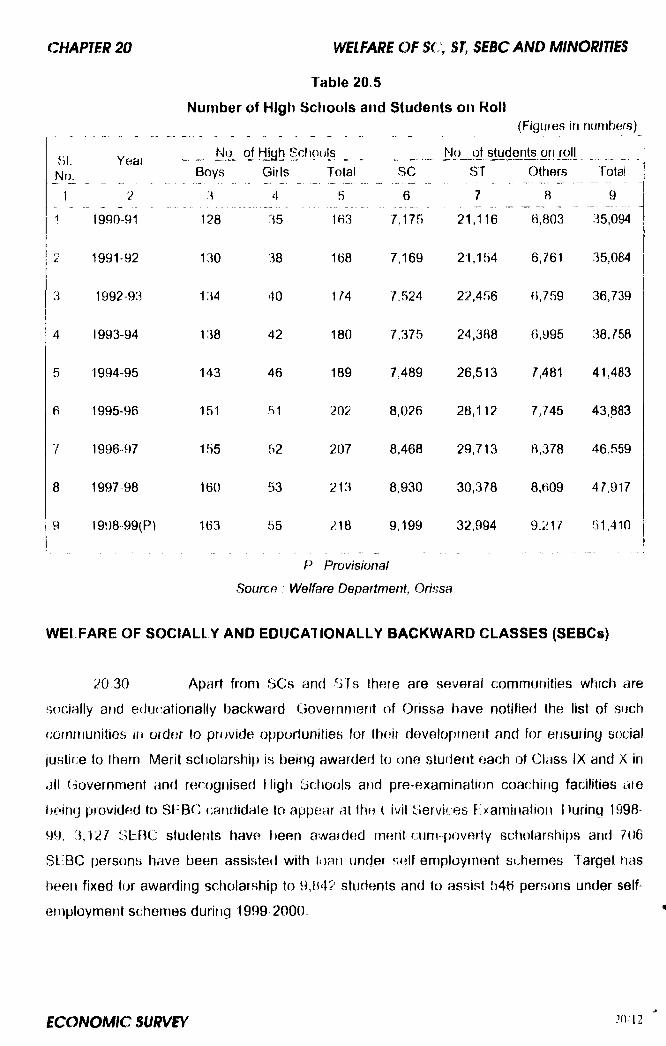
Table 20 5
Number of High Schools and Students on Roll(Figiires in numbers)
SI _ _ No of High S ]iouls No of students on rollOl. ! VfCIi
Boys Girls Total SC ST Others lota!
1 2 3 4 5 6 7 a 91 1990-91 128 35 163 7/175 21,116 6,803 35,094
2 1991-92 130 38 168 7.169 21,154 6,761 35,084
3 1992-93 134 40 1/4 7,524 22,456 6,759 36,739
4 1993-94 138 42 180 7,375 24,388 6,995 38,758
5 1994-95 143 46 189 7,489 26,513 7,481 41,483
6 1995-96 151 51 202 8,026 28,112 7,745 43,883
7 1996-97 155 52 207 8,468 29,713 0,378 46,559
8 1997 98 160 53 213 8,930 30,378 8,609 47,917
9 1998- 99(P) 163 55 218 9,199 32,994 9,217 51,410
R Provisional
Source : Welfare Department, Ori'isa
WELFARE OF SOCIALLY AND EDUCATIONALLY BACKWARD CLASSES (SEBCs)
20 30 Apart froni SCs and STs there are several communities which are
socially ar»d educationally backward Government of Orissa have notified the list of such
communities in ordtir lo provide opportunities for thoir development and for ensuring social
justice to them Merit sctiolarship is being awarded to one student each of Class IX and X in
all Government an(J recognised ttigh Sctiools and pre-examination coaching facilities are
being provided to SEBC candidate to appear at the c ivil Services Examination. During 1998-
99, 3,127 SbBC students have t)een awarded rnent cum poverty scholarships and 706
St'BC persons have been assisted with !i)an under self employment schemes Target has
been fixed for awarding scliolarship to 9,842 students and to assist 546 persons under self
employment schemes during 1999 2000.
WELFARE OF MINORITIES
20,31 According to 1991 Census, the population of minorities in the State is
V? ?? lakh, which is 4 03 percent of the State population Prime Minister’s 15-point
pinyiainme is being implemented for the welfare of minorities. F'or the economic
dpveiopment of weaker sections among the minorities, the Orissa Scheciuled Castes and
S(:heduled Tribes Development Finance Co operative Corporation (OSFDC) has been
nominated as State Chafinelising Agency to implement ecor\omic development piogrammes
as |)er the guidelines of the National Minorities Development and f inance Corporation
(NMDFC) During 1998 99, term loans amounting to Rs.55 73 lakfi have been disbursed to
275 minority beneficiaries in eight districts of the State.
♦ ♦ ♦
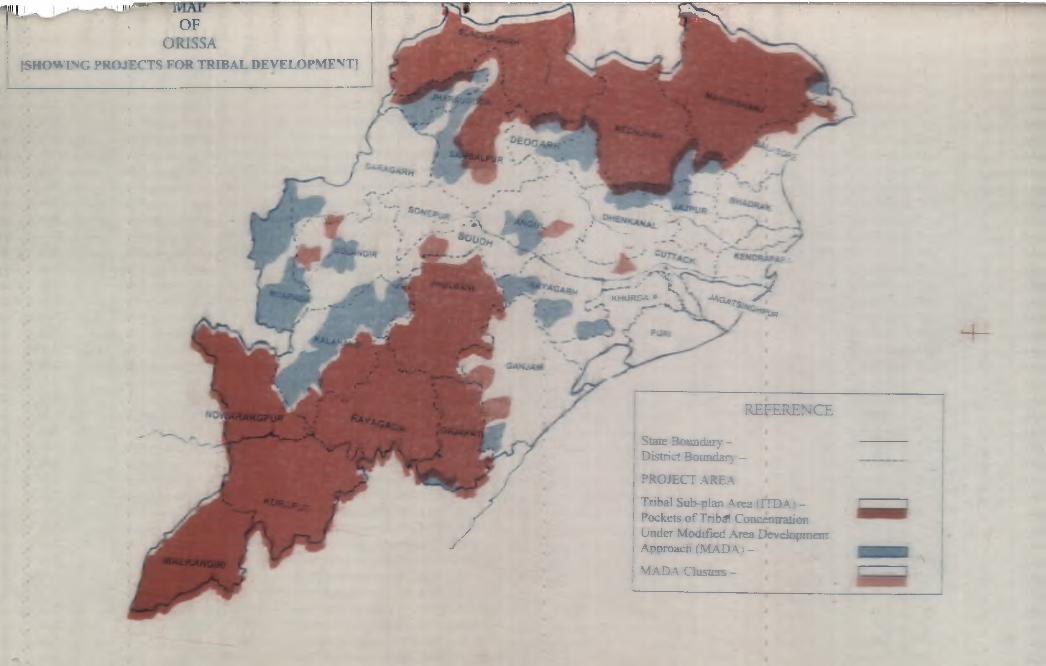
‘fUL' - --LI"!'**' — .......... .......... C ^ -\ O F
O R IS S A
JSHOWLNG p r o j e c t s f o r t r ib a l DEVELOPMENT]
- V \ * J '— ^ / — •' r _
'■ \ yK H U 1R D A » '^ XSATr. ^
UP?
y/
REFERENCE
! State Bosndar>' - I District Boundffl^ -
j PROJECT AREA
! Tribal Sub-plan Area frTDv^' - ! Pockets o f Trib^a Concentration ! Under Modified Area Dcveloqxnent I Approach (M A D A i -
* M A D A C h is te s -
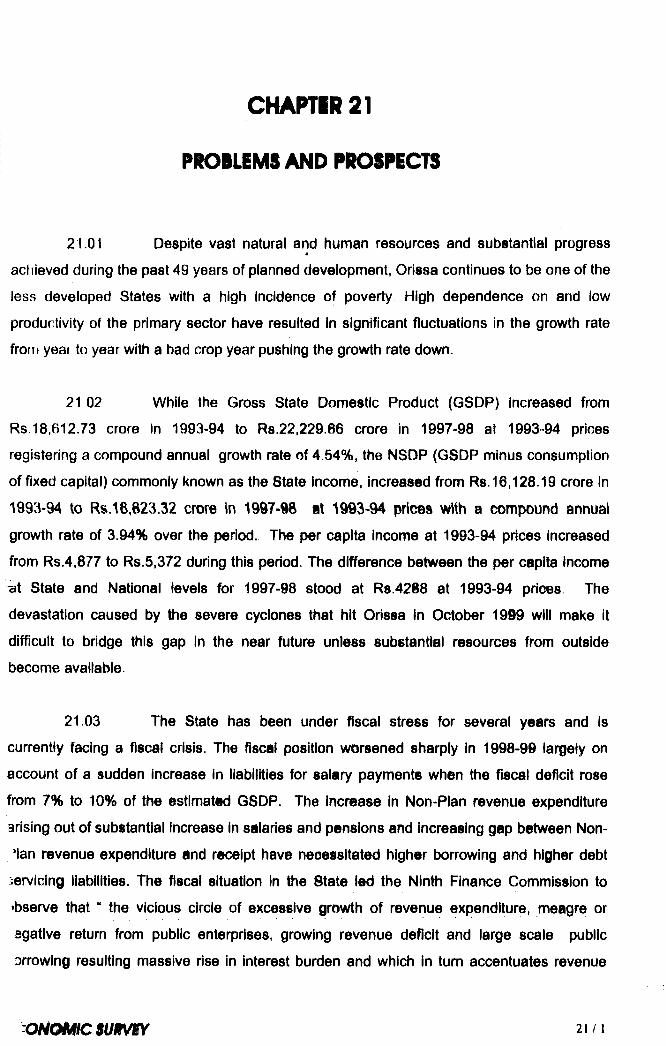
CHAPTIR21
PROBLEMS AND PROSPECTS
21.01 Despite vast natural and human resources and substantial progress
acltieved during the past 49 years of planned development, Orissa continues to be one of the
less developed States with a high incidence of poverty High dependence on and low
productivity of the primary sector have resulted In significant fluctuations in the growth rate
from year to year with a bad crop year pushing the growth rate down.
21 02 While the Gross State Domestic Product (GSDP) increased from
Rs. 18,612.73 crore in 1993-94 to Rs.22,229.66 crore in 1997-98 at 1993-94 prices
registering a compound annual growth rate of 4.54%, the NSDP (GSDP minus consumption
of fixed capital) commonly known as the State Income, increased from Rs.16,128.19 crore in
1993-94 to Rs.18,823.32 crore in 1997-98 at 1993-94 prices with a compound annual
growth rate of 3.94% over the period. The per capita Income at 1993-94 prices increased
from Rs.4,877 to Rs.5,372 during this period. The difference between the per capita Income
^ t State and National levels for 1997-98 stood at Rs.4288 at 1993-94 prices. The
devastation caused by the severe cyclones that hit Orissa In October 1999 will make it
difficult to bridge this gap in the near future unless substantial resources from outside
become available
21.03 The State has been under fiscal stress for several years and is
currently facing a fiscal crisis. The fiscal position worsened sharply In 1998-90 largely on
account of a sudden increase in liabilities for salary payments when the fiscal deficit rose
from 7% to 10% of the estimated GSDP. The Increase in Non-Plan revenue expenditure
arising out of substantial Increase in salaries and pensions and increasing gap between Non-
Man revenue expenditure and receipt have necessitated higher borrowing and higher debt
iervicing liabilities. The fiscal situation In the State led the Ninth Finance Commission to
»bserve that “ the vicious circle of excessive growth of revenue expenditure, meagre or
agatlve return from public enterprises, growing revenue deficit and large scale public
Drrowing resulting massive rise in interest burden and which in turn accentuates revenue
deficit leading to higher t)orrowing must be t)roken. If the increasing dis equilibrium between
the revenue expenditure is not effectively remissed, it may be increasingly difficult to
discharge the social and economic responsibilities of ttie Government
21 04 Ttie share of primary sector in Net State IDomestic Product continues
to be the highest even though it has declined form 44 71% in 1993-94 to 40.41% during
1997-98 at 1993-94 prices. On the other hand, the contribittion of secondary and tertiary
sectors to NSDP has increased from 17.16% to 17.23% and 38.13% to 42.36% respectivley
during the same period. Sectoral analysis thus reveals that there has tieen a marginal shift
from primary to secondary sector and a substantial shift to tertiary sector, which generally
happens in a developing economy.
21.05 Though the share of the agricultural sector in NSDP has declined from
34.24% in 1993-94 to 28.68 % in 1997-98 at 1993-94 prices, the State’s economy continues
to be dominated by this sector. Aghculture provides employment to 65.75% of the workforce
directly or indirectly. In the absence of adequate irrigation facilities, agriculture is largely
dependent on the monsoon. As a result, agricultural production fluctuates. Owing to the large
contribution of the agricultural sector to NSDP and owing to large linkages between this and
other sectors of the economy, these fluctuations influence the overall growth rate of the
State’s economy to an appriclable degree.
21 06 The productivity of foodgrains in Orissa during 1996-97 was 900 kg per
hectare which is much lower compared to some of the more developed States like Andhra
Pradesh, Gujarat, Haryana, Karnataka and Maharashtra and also below the national average
of 1600 kg per hectare. The consumption of fertilisers, at 30.52 kg per tiectare, was also
much tjelow the national average of 77.5 kg per hectare during 1996-97. Hence, there is
substantial scope for raising agricultural productivity, particularly that of food grains, through
extension of the area under assured irrigation, application of recommended dose of
fertilisers, use of HYV seeds, and adoption of modern technology. The varied agro-climatic
conditions of the State provide gooci scope for horticulture, cultivation of vegetables,
plantation crops, spices, flowers and medicinal herbs. Suitable cropping patterns tiave to be
designed taking into account the agro-climatic conditions of different zones in the State, both
for agricultural and horticultural crops. Agro based industries have to be set up to absorb the
unutilised manpower from the agricultural sector, generate income through value addition
and to reduce unemployment, underemployment and disguised unemployment in the rural
areas These Issues have t)een addressed \w the Agricultural Policy 1996 .
C M A P m n P R O B L E m A N D m > sm :T $
21.07 The main objectives of the Agricultural Policy 1996 are to double the
production of food grains and oilseeds by the end of the Ninth Plan, make agriculture
profitable and commercially viable, carry modern farming technology to the farms, encourage
entrepreneurship and establish agro-based and food processing industries, achieve self
sufficiency in fruits, flowers, vegetables, poultry and dairy products, provide Irrigation to 50%
of the cultivated area, and orient agriculture towards export.
21.08 The strategies proposed to be adopted to achieve the objectives of the
new Agricultural Policy include' pfoduCtidn &nd Supply Of cfufllity seeds, efficient distribution
of fertilisers, production of bio fertilisers through women’s societies and NGOs, supply of
soli health cards to each farmer, involvement of private sector for production of agricultural
implements, giving more attention to commercial crops, reclamation of problematic soils,
provision of adequate agricultural extension services, coverage of more crops under crop
insurance, and taking up several programmes for fisheries and animal resources
development Government have established Agricultural Promotion and Investment
Corporation Orissa Ltd. (APICOL) on the pattern of Industrial Promotion and Investment
Corporation l.imited (IPICOL) for promoting investment in agriculture and agri-businesses.
This new policy visualises revamping of the existing administrative structure and
establishment of Agricultural Aid Centres at the block level. Agriculture has been given the
status of an industry under the new Agricultural Policy.
21.09 The proportion of net area irrigated to net area sown In the State was
32 8% during 1992-93 as against 35.2% at the all India level, and was much below the
corresponding proportion in agriculturally advi^noed States like Punjab (93.3%). Haryana
(76.6%), Uttar Pradesh (65.6%), Bihar (46 7%). Tamil Nadu (46.4%), Andhra Pradesh
(38.5%) and West Bengal (35.8%). In view of favqurable ground water potential and
existence of a number of rivers and rivulets, there is ample scope for enhancing the area
under irrigation in the State. Long term measures have also to be taken for drought proofing.
Optimum and conjunctive use of surface water as well as ground water based on scientific
data has to be assigned high priority. Treatment of watersheds for prevention of water and
soil loss also needs emphasis The percentage of net irrigated area to net area sown in the
State increased from 30.5% In 1991-92 to 40.^3% in 1098-99. The State Government have
an ambitious target to bring 50% of the cultivable land under Irrigation by the end of the Ninth
Plan.
§ a m m i i c $ u i r m 21/3
21.10 The annual per capita availability of milk and eggs was 23.36 kg and
26 respectively In the State during 1998-99 which was much below the national average of
71.9 kg and 30 respectively In 1997"98. There Is ample prospect for Increasing production of
these Items In the State.
21 11 While Orissa occupied sixth position at all India level in the production
of inland fish during the year 1995-96, It ranked eighth in terms of marine fish production. In
view of long coastline of 480 km, there is considerable potential for both inland and marine
fish production. Higher production will help boost exports and earn more foreign exchange.
With a view to Increasing fish production In the State, a comprehensive policy has been
formulated which emphasises adoption of scientific methods of pisciculture, provision of
assistance to fishermen, Intensive fishing operations in deep sea, imparting training to
fishermen both for culture and capture fish, and.establishment of fish feed mills.
21.12 The rate of exploitation, when compared to total reserves, is quite low
for most minerals. During the year 1998-99, except for lead ore, manganese ore and
graphite, the rate of exploitation of minerals remained below 0.72%. In case of some
important minerals such as chromite, iron ore, bauxite and coal, the rate or exploitation was
only 0.72%, 0.33%, 0.16% and 0.09% respectively of the total reserves. The mining sector
contributes substantial income to the State exchequer. During the year 1998-99, the sector
contributed Rs.316 crore to the State revenue which Is about 49% of the State’s own non tax
revenue. Mineral exploitation also generates large employment. There Is need to attract
greater investment in this sector so as to increase the rate of exploitation and generate
further employment.
21.13 The new Industrial Policy 1996, formulated in the context of the
ongoing economic liberalisation, reflects the State Government’s commitment to growth and
development of Industries. The objeptlves of the new Industrial Policy are to exploit available
natural resources to accelerate Industrial growth with protection of environment, provide
linkages between agriculture and agro and food processing Industries, attract investment#■:
from outside, generate employment opportunities through Industries like small scale
industries, village and cotton Industries, sericultiire, handloom and handicrafts, and
strengthen and upgrade entrepreneurial skills.
cHAmim mK>BuiM$AND nomcrs
21 14 In order to achieve these objectives, the strategies to be adopted by
the State Government Include measures to develop infrastructural facilities like power,
railways, telecommunication, road network, ports, airport and banking facilities, improve
industrial climate, provide support to export oriented units, provide Incentives to Industries
generating large employment opportunities, rehabilitate sick industries, lay emphasis on
quality, productivity and skill development, and mobilise additional resources from outside
the State and private sector in view of constraints to generation of internal resources With
the introduction of the new Industrial PoHcy, there has been a surge in investment proposals
particularly in the areas of steel, power generation, aluminium, sugar and oil refining.
21 15 Power is a basic requirement for development The availability of
power in the State was 1,207 MW during 1998-99. The State Government have undertaken
pioneering steps for reforming the power sector by enacting the Orissa Electricity Reform
Act, 1995 Private investment in power sector is being encouraged. Consequently, a number
of private investment proposals for setting up power projects in Orissa have been received
In addition, the Central Government and the State Government have proposals for
installation of power projects of 1,314 MW capacity. After completion of these projects the
State will be in a better position in respect of power generation.
21.16 Environmental conservation and protection have to form Important
components of all the development programmes. Rise In populatton, urbanisation, vehicular
traffic, industrial and mining activities etc. tends to create pollution. Deforestation also
contributes to pollution 19,401.86 hectare of forest land have been lost during the last 15
years for a variety of reasons. Henoe environmental planning, joint forest management (that
is management of forests by involving people as well as Govemment agencies), and wildlife
conservation need to form an Integral part of development strategies In the State.
21.17 The credit deposit ratio In the State was 42.§ during 19i8-99 as
against the all India average of 5B.5 The ratio Is low when compared with States like
Maharashtra, Tamil Nadu, Karnataka, Andhra Pradesh, Madhya Pradeih, Gujurat, Rajasthan
and West Bengal. Further, the population odVired per bank Is 16.2 thousand as compared to
14.9 thousand at the all India level. Hence, the banking facilities In the State have to be
extended for mopping up and stimulating domestic savings: Private Inves^ent in
manufacturing, mining and Infrastructure sectors has been stimulated by the emergence of a
free and liberalised policy regime offered by the State Government, Organlsatons such as
Industrial Promotion and Investment Corporation Limited (IPICOL), Industrial Development
Corporation Limited (IDCOL), Industrial Infrastructure Development Corporation (IIDCO),
Ofissa vState Financial Corporation (OSFC) and Orissa Small Industries Corporation (OSIC)
are playing an important role in promoting new projects
21.18 Expectancy of life (at birth) in Orissa was 60.13 years in case of males
and 58 4 years in case of females during 1991-96 while the expectancy was 60 6 years and
61.7 years for males and females respectively at the all India level during the same period.
The infant mortality rate in Orissa is estimated at 96 per thousand during 1997 as compared
to the all India average of 71 and 12 in Kerala. The percapita expenditure on health including
family welfare, water supply and sanitation has to be stepped up for intensifying health
facilities and services in the State. The Ninth Plan emphasises on Improved access to health
care facilities in the rural and tribal areas.
21.19 Though the decennial growth rate of population in the State was
20.06% during the period 1981-91, which is lower than the national average of 23.5% and
marginally lower than the growth rate of 20.17% observed during the previous decade, It is
still on the higher side as compared to the growth rate of some other States like Kerala,
Tamil Nadu and Assam. Family Welfare measures have to be intensifmdl with more emphasis
in rural areas.
21.20 As per the latest estimates of Planning Commission available for the
State the percentage of population below the poverty line was 49.72 in rural areas and 41.64
in urban areas In 1993-94 as against the all India averages of 37.27 and 32.36 respectively.
As such, there Is need for continuance of poverty amelioration and employment generation
programme during the Ninth Plan period
21.21 Education is a key input In breaking the vicious circle of poverty and
low productivity. The literacy rate In the State as per the 1991 Census was a meagre
48.1 %The literacy rates of scheduled caste and scheduled tribe populations were even
lower at 36.8% and 22 3% respectively, Universalisation of primary education has been
included as a component of the basic jninlmurn services programme. Several schemes
aiming at reducing the drop-out rate and providing incentives to scheduled caste and
scheduled tribe students have been launched in the State. Greater attention needs to be*
paid to this sector.
21.22 The ptobleiTi of unemploynient and under employment deserves
special attention The dependency ratio in Orissa is higher than most other States The
estimated quantum of unemployment at the end of 1998-99 stands at 8.36 lakh. During the
Ninth Plan, it is proposed to continue all the wage employment and self employment
prografnmes of the Eighth Plan Efforts will be made to generate additional employment in
the secondary sector.
21 23 The problem of unemployment among educated persons is often a
conseqiienco of mismatch between the demand for and supply qf skiUs The number qf
educated unemployed has increased froni 5.99 lakh in 1994 to 7 60 lakh in 1998, The
education system in the State needs to be re™oriented so as to supply trained manpower in
vocational, professional and technical fields relevant to the emerging needs,
21.24 Although the availability of percapita own resources has improved from
Rs 27476 in 1990 91 to Rs 730.20 in 1998-99, the relative position of Ohssa among different States is low as shown in Annexure 21.2 . Resources transferred from the Centre to the
State through shared taxes, Plan and non-Plan grants etc have not been able to correct this imbalance. The proportion of revenue deficit to Gross Domestic Product has increased
from 1.0 percent in 1989-90 to 3.3 percent in 1997-98. The fiscal deficit has however declined from 7 5 percent to 6 5 percent during the period. Hence, there is need for better
. resource planning to improve the resource position of the State. Considering the economic
scenario and resource position of the State, an outlay of Rs. 15000 crore has t>een approved
for the State's Ninth Plan with emphasis on irrigation, energy, basic minimum services, rural infrastructure etc.
21.25 Sustaining high growth of output and employment in an environment of macro-stability requires high rate of domestic savings, supplemented by adequate
mobilisation of resources from outside the State. This requires a significant and sustained
reduction in revenue and fiscal deficit of Government. To reduce the debt burden, selective
disinvestment in public enterprises may have to be pursued. Public savings have to be
increased and deficit reduced through measures to raise the States own tax and non-tax
revenues. Steps have to be initiated to curb low priority expenditure and to enhance the
financial efficiency of public enterprises. The Ninth Plan assigns a significant role to the
private sector. Economic liberalisation has led to progressive dilution of the regulatory regime
of the pre-liberalisation era thereby creating an opportunity for large private sector participation in the process of development This will greatly help in accelerating growth of the economy and in reducing poverty.
21.26 Frequent occurrences of natural calamities like drought, flood and
cyclone stand as a barrier to economic progress of the State The recent cyclones in the
coastal districts of the State have pushed the economy of the State back by many years.
These cyclones have taken more than 10,000 human lives, around 6.4 lakh animal lives and
have caused heavy loss to dwelling houses, crops and Government and private property In
order to take up immediate relief measures Government of India, the State Government,
some other State Govemments and others have provided funds and materials. But huge
financial resources are required to take up rehabilitation, restoration and reconstruction work
wi|h a view to put the State's economy back on a path of growth. Considering the weak
financial position of the State, substantial resources from outside will be required
♦ ♦ ♦
A J\nV E X U R B
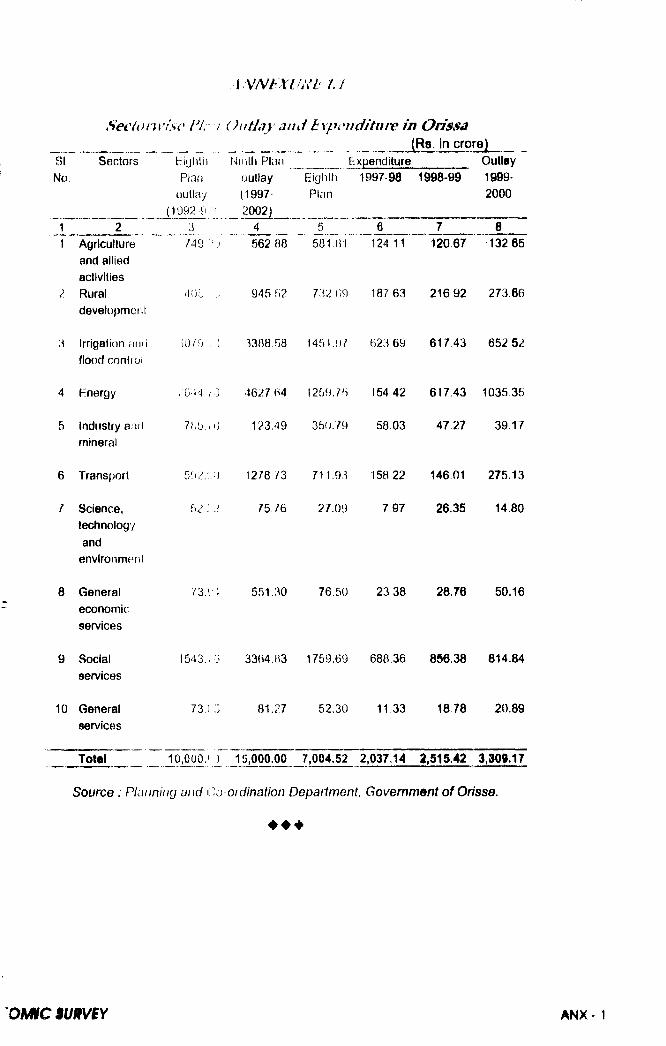
A v m x t m t 7.1
Sectoru^Lsc PL i O utlay and Expenditure in Orissa ___________ ______ (Rs. in crore)
SI Sectors l-iyhlh Niiilli Plan ______ Expenciilure OutlayNo. Plan outlay Elglith 1997-98 1998-09 1999'
outlay (1997 Plan 2000_______ (1092-9, -__________ 2002) ......... ..
1 2 3 4 5 6 7 81 Agriculture 749 : j 562 88 581 HI 124.11 120.67 -132.65
and alliedactivities
2 Rural 4 0 - . 945 52 732 H9 187 63 216 92 273.66developmenl
3 Irrigation anu 50/9 .1 3388 Tj8 1451.9 / 623 69 617 43 652,52flood contfol
4 Energy ;?G44 /O 4627 B4 1259.7'^ 154 42 617.43 1 035.35
5 Industry and 78 5 ./O 123.49 350.79 58.03 47.27 39.17mineral
6 Transport 51*2.: 0 1278 /3 711.93 158 22 146,01 275.13
7 Science, 52 ; J 75 76 27.09 7 97 26.35 14.80technologyand
environment
8 General 73.14 551,30 76.50 23 38 28.76 50.16economicservices
9 Social 1543., 3 3364.03 1759.69 688.36 856.38 814.84services
10 General 73 ( 5 81.27 52.30 11 33 18 78 20.89services
Total 10,000,! ) 15,000.00 7,004.52 2,037.14 a,515.42 3,30f.17
Source : Planning and Co-ordination Depaiiment, Government of Orissa.
♦ ♦ ♦
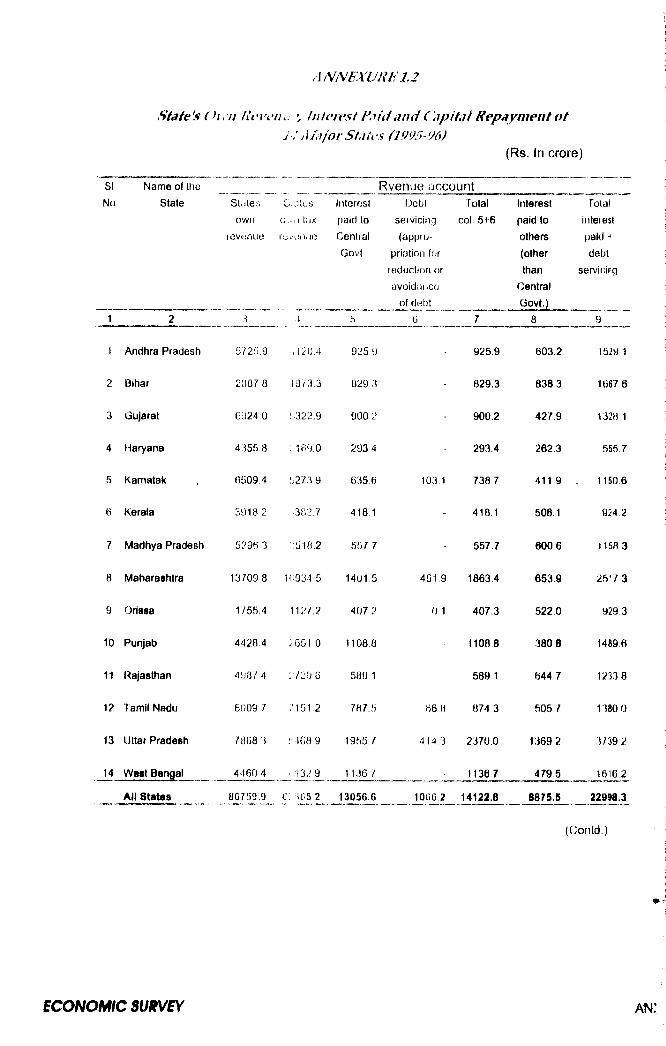
S ta te 's ( h , n R e v e n n \ I n t v j v s t P a id a n d C \ip i t a ! R e p a y m e n t o f
j ■! A / . t / o r S f J h ' (1 9 9 5 - 9 6 )
(Rs. In crore)
SI Name of the Rvenue accountNo State Stated
owniov(inu(3
o ! ti.. d
Ov.il tiiX
rei/oiiuo
InterGst paid lo
Central Govt.
Debt servicing
(appropriation for
reduction or avoidanco
of debt
Total col 5+6
ItUerest paid to
others (other than
Central Govt.)
Total interest paid deljt
servicing
1 2 S 4 5 6 7 8 9
1 Andhra Pradesh 572ri,9 ,120.4 925 9 925.9 603 2 1529 1
2 Bihar 2;187 8 1973.3 829 3 - 829.3 B38 3 1667 6
3 Gujarat 6924.0 ‘-322.9 900,2 - 900.2 427.9 1328 1
4 Haryana 4355 8 LI 69.0 2934 293.4 2623 555 7
5 Kamatak G509.4 b273,9 635,6 103.1 738 7 411 9 1150 6
6 Kerala 3918 2 L302.7 418 1 - 41B.1 506 1 924 2
7 Madhya Pradesh 5296 3 351 B.2 557 7 557,7 600 6 1158 3
8 Maharashtra 13?098 K.934.5 1401.5 461,9 1863 4 6539 25'7 3
9 Orissa 1755,4 112/.? 407 2 0 1 407.3 5220 929 3
10 Punjab 4428 4 /G51 0 1108.H 1108,8 380 8 1489 6
11 Rajasthan 4987 4 : /30 6 589,1 589 1 644 7 12.33 8
12 Tamil Nadu 6009 7 n s i 2 787.5 86 8 874 3 505 7 1380 0
13 Uttar Pradesh 7868 3 4GB 9 1955-/ 4 14,3 2370.0 1369 2 3739 2
14 West Bengal 4460 4 ■1132 9 11367 1136.7 4795 1616 2
All States 8G75D.9 c;3G5 2 13056.6 1066,2 14122.8 887S.5 22998.3
(Contd
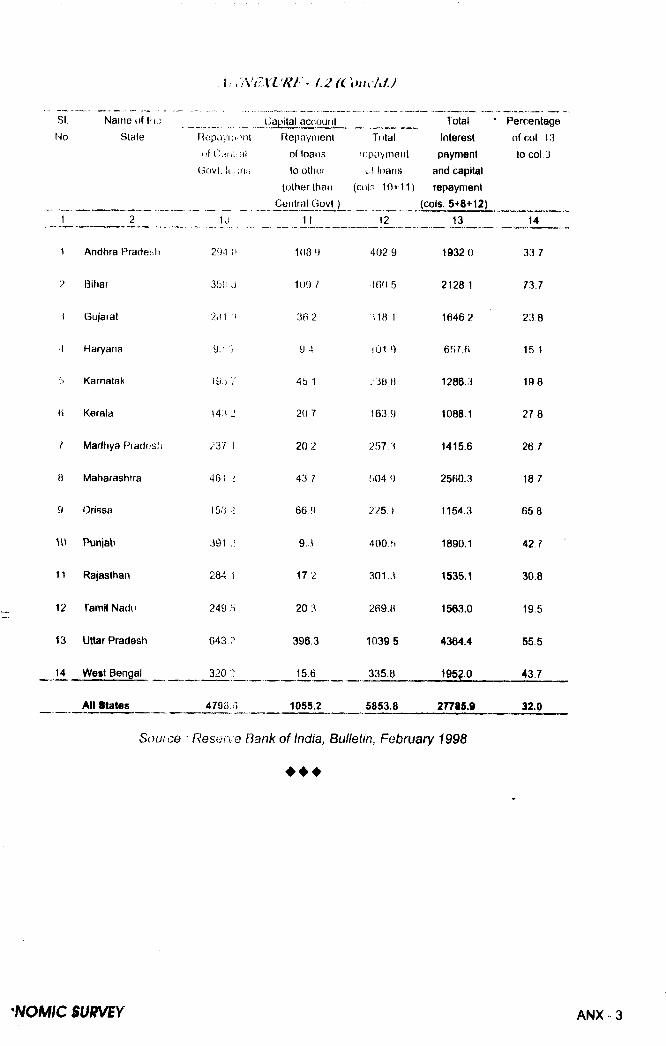
SI.No
Name uf th:: Stale
1 2 _
1 Andhra PradesI)
2 Bihar
5 Gujarat
< Haryana
Karnatak
H Kerala
I Madhya f-*fadesl I
8 Maharashtra
9 Orissa
U) Punjab
I I Rajasthan
12 I'amii Nadu
13 Uttar Pradesh
14 West Bengal
All States
F epiiyinont (if (.'en!: ni
Govl. k;- ;ru.
_1U_
29-1 (I
3!Mi a
2.i1 0
9?
i9:> 7
141 J
237 I
461 V
I5;i
3D 12
284 1
249 5
t343 ?
320;?
(Capital account Repayment
of loans to olher
(other than
Central Govt )11
4790.5
108,y
109?
36.2
9 4
46 1
20 7
20 2
43 1
66 9
9,3
17.2
20 3
3963
_1 6__
1055.2
_ _ __ TotalTotal Interest
tcipaymeiit paymenti f loans and capital
(cols 10»11) repayment______ (cols. 5-fa+12)
12 13
402 9
460 5
318 1
101 9
/38 fi
163 9
257 3
504 9
225 I
400.6
301,3
269.8
10395
335.8
5aS3.8
1932 0
2128 1
1646 2
657.6
1286 3
1088 1
1415.6
2560.3
1154.3
1890.1
1535.1
1563.0
4364.4
195g.O
27785.9
Percentage of col 13 to col 3
14
33 7
73.7
23 8
15 1
198
27 8
267
18 7
65 8
42 7
30.8
19.5
55.5
43.7
32.0
Souice • Reserva Bank of India, Bulletin, February 1998
♦ ♦ ♦

SI.No.
Year NSDP at factor cost (Rs. In lakh)
At current prices
At 1980-81 prices
Per capita NSDP (In Rs.)
At current prices
At 1980-81 prices
1 2 3 4 5 61 1990-91 966428 434470 3077 13832 1991-92 1250530 489701 3907 15303 1992-93 1341553 481371 4114 14764 1993-94 1548051 512393 4662 15435 1994-95 1815595 534288 5369 15806 1995-96(R) 2146279 562308 6236 16347 1906-97(P) 2063589 514359 5893 14698 1997-9«(Q) 2410498 601259 6767 1688
(Contd.)
ANNEXURE 1.3 (A) (ConcldJ
Annual increase (%) ofNo. Year NSDP Per capita NSDP
At current prices
At 1980-81 prices
At current prices
At 1980-81 prices
1 Z 7 8 9 101 1990-91 -• - - -
1 1991-92 29.4 12 7 270 1063 1992-93 7.3 H1.7 5.3 (~) 3 54 1993-94 15.4 64 13 3 4 5S 1994-9S 17.3 4.3 152 2.46 199S-9e(R) 18.2 52 16.2 3.47 1996-97(P) (-) 3.9 (-)8 5 ( ) 5,5 (-) 10.18 1997-0«(Q) 16.8 16.9 14,8 14.9
R : Revised Estimates, P : Provisional Estimates. Q QuicM Estimates. Source : Directorate of Economics and Statistics, Orissa Bhubaneswar
fCOfifOM CKNIM nr
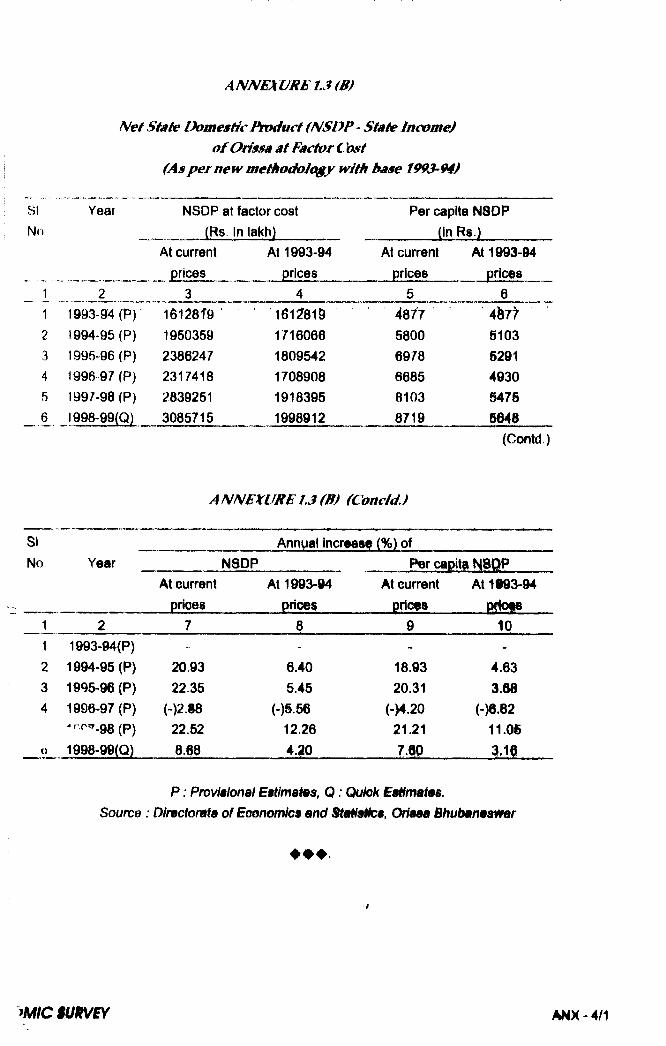
Year NSDP at factor cost (Rs. In lakh)
At current prices
At 1993-94 prices
Per capita NSDP (In Rs.)
At current prices
ANNEXURE 1.3 (B) (Condd.)
At 1993-94 pricfs
61 1993 94 (P) 16l28f9 I6 lf8 l9 4877 4b7>2 1994-95 (P) 1950359 1716066 5800 51033 1995-96 (P) 2386247 1809542 6978 52914 1996 97 (P) 2317418 1708908 6685 49305 1997-98 (P) 2839251 1918395 8103 S475
_ 6 1998-99(0) 3085715 1998912 8719 5649(Contd.)
SiNo
Annual Incrtast (%) ofYear NSDP Per capita N8QP
At current prices
At 1993-94 prioe$
At current At 1993-94 pficfs
1 2 7 9 101 1993-94(P) - ~ - -2 1994-95 (P) 20.93 6.40 18.93 4.633 1995-96 (P) 22.35 5.45 20.31 3.684 1996-97 (P) (-)2J8 (-)§.56 (-)4.20 (-)6.82
-rr^.ge 22.52 12.26 21.21 11.0®o 1998-99(0) 8.68 4.20 7-W 3,ie
P : Provisional Eatima^s, Q : Quksk Source : Dlrectorata of Eoonomics and S ta tis ts , O iaaa Bhubanaam r
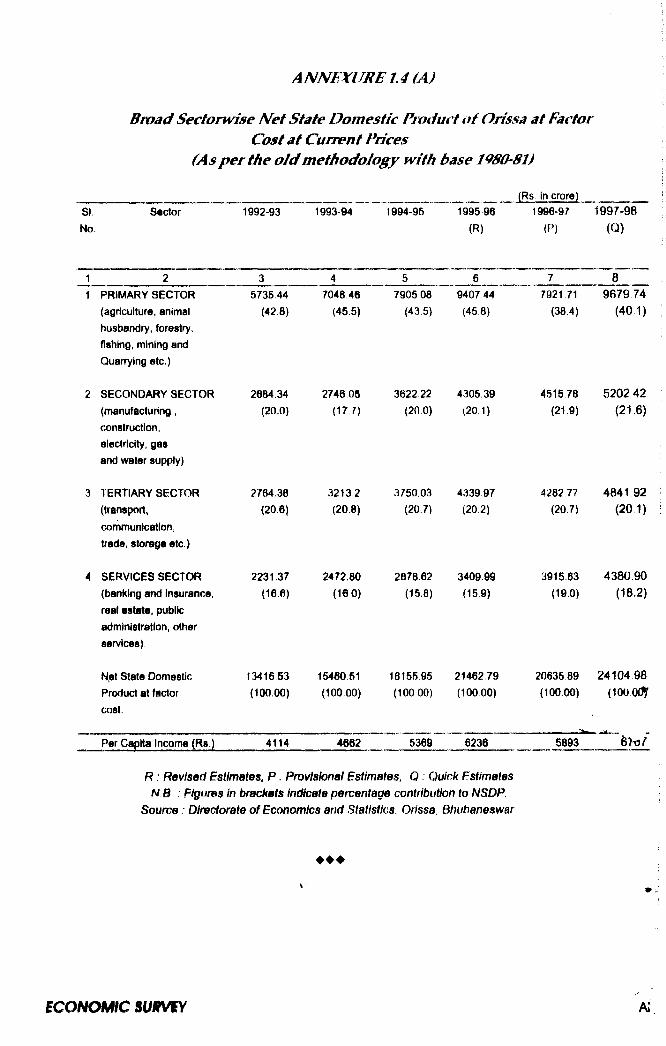
(Rs. in crore)SI Sector No
1992-93 1993-94 1994-95 1995-96
(R)
1996-97
(P)
1997-98(Q)
1 2 3 4 5 6 7 81 PRIMARY SECTOR
(agriculture, animal husbandry, forestry, fishing, mining and
Quarrying etc.)
5735 44 (42.8)
7048,46(45.5)
7905 08
(435)9407 44
(458)7921,71
(38.4)9679 74
(40 1)
2 SECONDARY SECTOR
(manufacturing, construction, electricity, gas and water supply)
2684.34(20.0)
2746 05 (177)
3622 22
(20,0)4305,39
(20 1)451578
(21.9)5 2 0 2 4 2
(21.6)
3 TERTIARY SECTOR
(transport, communication, trade, storage etc.)
2764,38(20.6)
3213.2(208)
3750.03(20.7)
433997(20,2)
4282 7? (20.7)
4841 92 (20,1)
4 SERVICES SECTOR (banking and insurance, real estate, public administration, other services)
2231.37(16.6)
2472.80 (16 0)
287862(15.8)
3409,99(159)
3915.63(19.0)
4380.90(18.2)
N.et State Oomestjc
Product at factorcost.
13416 53 (100,00)
15480 61 (100.00)
18155 96 (100 00)
21462,79 (100 00)
2063589 (100 00)
24104 98
(100 o if
Per Capita Income (Rs.) 4114 4662 5369 6236 5893
R : Revised Estimates, P : Provisional Estimates, Q . Quick Estimates N B : PlgurBS in brackets Indicate percentage contribution to NSDP
Source : Directorate of Economics and Statistics. Orissa, Bhubaneswar
♦ ♦ ♦
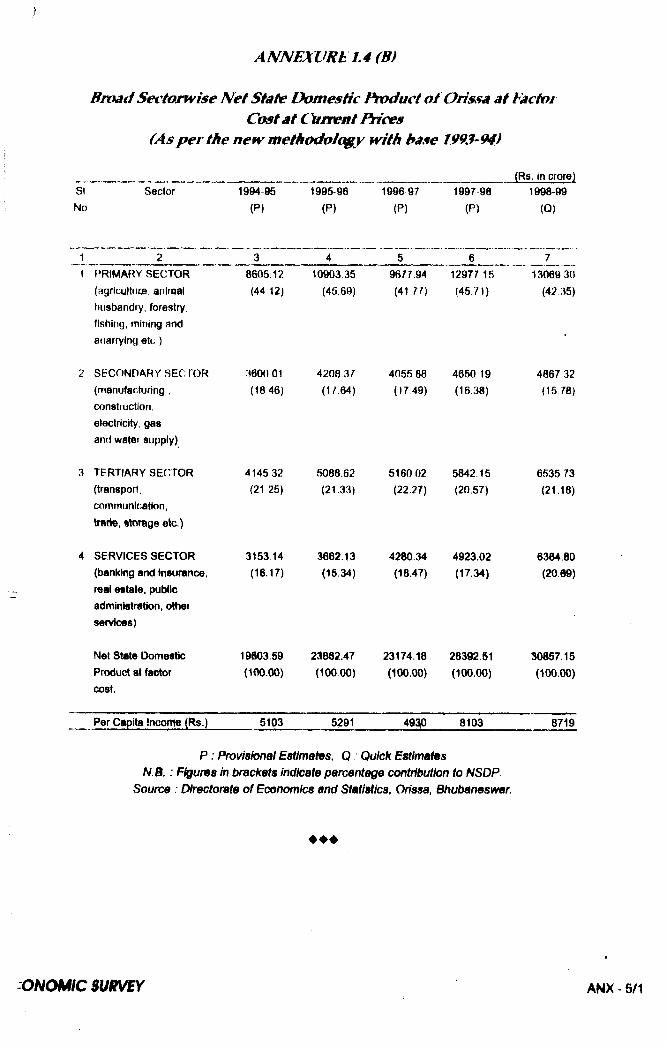
Broad Sectorfvise N et SMte Dom estic Pwduct o i Orissa a t FactorCost a t Ouivent Prices
(As p er the ne w m ethodology with base 1993-94)
Sector 1994-95(P)
1995-96
(P)1996 97
(P)1997-98
(P)
(Rs. in crore)1998 99
(Q)
f^RIMARY SECTOR
(agricultuca, anlrnal husbandry, forestry, fishing, mining and
ai tarrying etc )
8605 12 (44 12)
610903 35
(45.69)9677 94(41 77)
1297715 (45 71)
13069 30
(4235)
SECONDARY SECFOR
(manufacturing , construction, electricity, gas and water supply)
3600 01
(1846)4208,37(17,64)
4055 88
(1749)4650 19
(16.38)4867 32
(15 78)
TERTIARY SECTOR (transport, communication, trad®, storage ete.)
4145 32 (21 25)
5088.62(21,33)
516002(22.27)
5842 15 (20.57)
6535 73 (21.18)
SERVICES SECTOR (banking and fnsurance, real estate, public
admlnlstrtttion, other services)
3153 14 (16.17)
3662.13(15.34)
4280.34(18.47)
4923.02(17.34)
6384.80(20.09)
Net State Domestic Product at factor cost.
19S03.59(100.00)
23862.47( 100.00)
23174.18(100.00)
28392 S1
(100.00)30857 15
(100.00)
Per Capita Inoorne (Rs.) 5103 5291 4930 8103 8719
P ; Provis ional Estimat9s, Q : Q uick EstlmatBs
N .B . : F iguras in brackets indicate parvantage contribution to NSD P
Source Dtreetonate o f Econom ics and Statistics, Orissa, B tiubanesm ir.
♦ ♦ ♦

(R§. in crore)SI Sector No
1992-93 1993 94 1994-95 199596(R)
1996-97(P)
1997-98
(Q)
1 2 3 4 5 6 / 8
1 PRIMARY SECTOR 2006.19 2322.15 2302 01 23S7.97 189S.43 240638
(■pteyMur0> animai NiMiMMwNfyi fithins, mtnlng & quarrying etc.)
(41.7) (45.3) (43,1) (41.9) (3«:9) (40.0)
2 SECONDARY SECTOR 893.34 819.46 942.55 1018.09 986.15 1123.56(IrKtiMitry, conaMu^on, elacMctty, aU>.)
(18.6) (16.0) (17.6) (18,1) (19.1) (18.7)
3 TERTIARY SECTOR 953.96 1003.76 1063.53 1118.63 1064 58 1208.55(trarliport, communication, trad®, storage etc.)
(19.6) (196) (19.9) (19.9) (20.7) (20.1)
4 SERVICES SECTOR 960.23 97866 1034 79 1128.45 1198.43 1274,10(banking and Ir^surance, real esiirte, public
administration, other services)
(19.9) (191) (194) (20,1) (23.3) (21.2)
Net State Domestic 4813.71 5123.93 5342.88 5623.08 514359 6012.59Product at factorcost.
(100.00) (100.00) (100.00) (100.00) (100.00) (100.0)
Per Capita Income (Rs.) 1476 1543 1580 1634 1469 1688
R ; Revised Estimates, P Provisional Estimates, Q . Quick Estimates
N.B : Figures In brackets Indicate percentage contribution to NSDP Souive Directorate o f Economics and StaHstlcs, Orissa, Bhubaneswar
♦ ♦ ♦
i c o H o m : h m
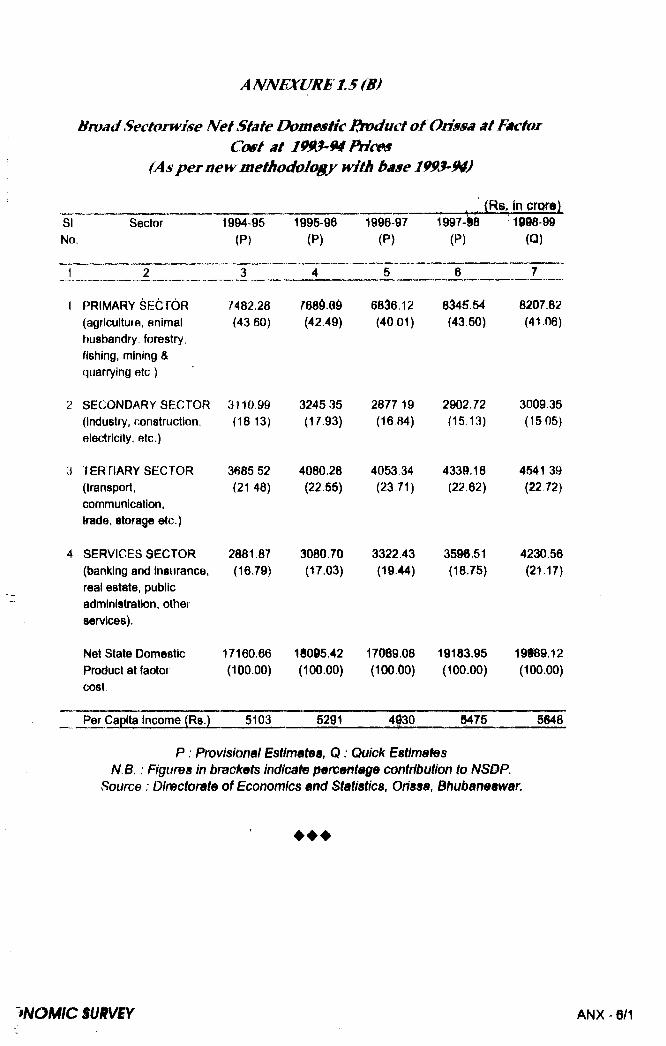
AMNEXURti 1.5 (B)Broad Sectorwise N et State Dom estic fytf duct o f Orissa at Factor
Cost at 19^-94 M c0s (A spernew m ethodolo$y with base 19^ 94)
(Rs, in crore)SI Sector No.
1994 95
(P)1995-96
(P)1996-97
(P)1997-S8
(P)1998-99
(Q)
1 2 3 4 5 6 7
1 PRIMARY SECTOR (agriculture, animal husbandry, forestry, fishing, mining & quarrying e tc )
7482,28(4360)
760d09(42.49)
6836,12 (40 01)
8345.54 (43 50)
8207.82 (41 06)
2 SECONDARY SECTOR {industry, construction, electricity, etc.)
3110.99 (18 13)
3245.35(17.93)
2877 19 (16,84)
2902.72 (15 13)
3009.35(1505)
3 TERTIARY SECTOR (transport, communication, trade, storage etc.)
3685 52 (21 48)
4080.28(22.55)
4053 34 (23.71)
4339.18(2262)
4541 39 (22 72)
4 SERVICES SECTOR (banking and Insurance, real estate, public administration, other services).
2881.87(16.79)
3080.70(17.03)
3322 43 (19.44)
3596.51(18.75)
4230 56 (21.17)
Net State Domestic Product at faotoi cost
17160.66(100.00)
18095.42(100.00)
17089.08(100.00)
19183.95(100.00)
19f89.12(100.00)
Per Capita Income (Rs.) 5103 5291 4130 ^ 7 5 s m
P : Provisional Estimates, Q : Quick Estimates N.B.: Figures in brackets indicate percentage contribution to NSDP.
Source: Directorate of Economics and Statistics, Orissa, Bhubaneswar.
♦ ♦ ♦
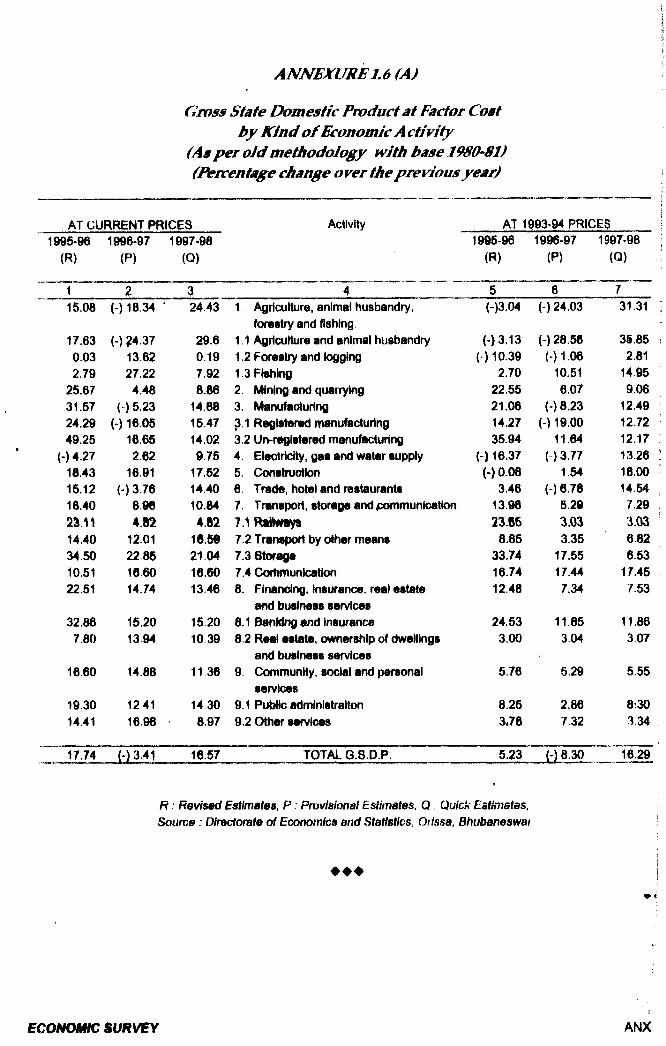
Gross State Dom estic Product at Factor Cost b y K ind o f Economic A c ti vity
(As p er o ld m ethodology with base 1980-81) (I^rcentage change over the previous year)
AT CURRENT PRICES 1995-96 1996-97 1997-98
(R) (P) (Q)
Activity AT 1993-94 PRICES1995-96 1996-97 1997-98
(R) (P) (Q)
1 615.08 (-) 18,34 ' 24.43 1. Agriculture, animat husbandry,
forestry and fishing.(-)3.04 (-) 24.03 31.31
17.63 (-)?4.37 29.6 1.1 Agriculture and animal husbandry (-)3.13 {-) 28.56 3S.850.03 13 82 0.19 1.2 Forestry and logging ( ) 10.39 (»)1.06 2.812.79 27.22 7.92 1.3 Fishing 2.70 10.51 14.95
25.67 4.48 8.86 2. Mining and quarrying 22.55 6.07 9.0631.57 H 5 2 3 14.88 3. Manufacturing 21.06 (-) 8.23 12.4924.29 (-) 16.05 15.47 3.1 Registered manufecturing 14.27 H 19.00 12.7249.25 16.65 14.02 3.2 Un-r^istered manufacturing 35.94 11.64 12.17
(-)4.27 2.62 9.75 4. Electricity, gas and water supply (-) 16.37 0 3 .7 7 13.2618.43 16.91 17.52 5. Construction (-) 0.08 1.54 18.0015.12 (-)3.76 14.40 6. Trade, hotel and restaurants 3.46 (-)6.78 14.5418.40 896 10.84 7. Transpon, storage and ixxnmunication 13.98 5.29 7.2923.11 482 4.B2 23.66 3.03 3.0314.40 12.01 16.59 7.2 Transport by other means 8.85 3.35 6.8234.50 22 86 21.04 7.3 Storage 33.74 17.55 6.5310.51 1660 16.60 7.4 Goftimunication 16.74 17.44 17.4522.51 14.74 13.46 8. Financing, insurance, real estate
and business services12.48 7.34 7.53
32.86 15.20 15.20 8.1 Banking and Insurance 24.53 11.85 11.867.80 13.94 10 39 8.2 Real estate, ownership of dwellings
and business services3.00 3.04 307
16.60 14.88 11 36 9 Community, social and personal services
5.76 5.29 5.55
19.30 1241 14.30 9.1 Public adminlstraiton 8.25 2.86 8:3014.41 16 98 8.97 9.2 Other services 3J6 7.32 3.34
17.74 16.57 TOTAL Q.8.D.P. 5.23 (-) 8.30 16.29
R RBVisBd Esiimafes, P Provisional Estiimtes, Q Quick Eatimstas, Source : Diractorate of Economics and Statistics, Oiissa, Bttubaneswar
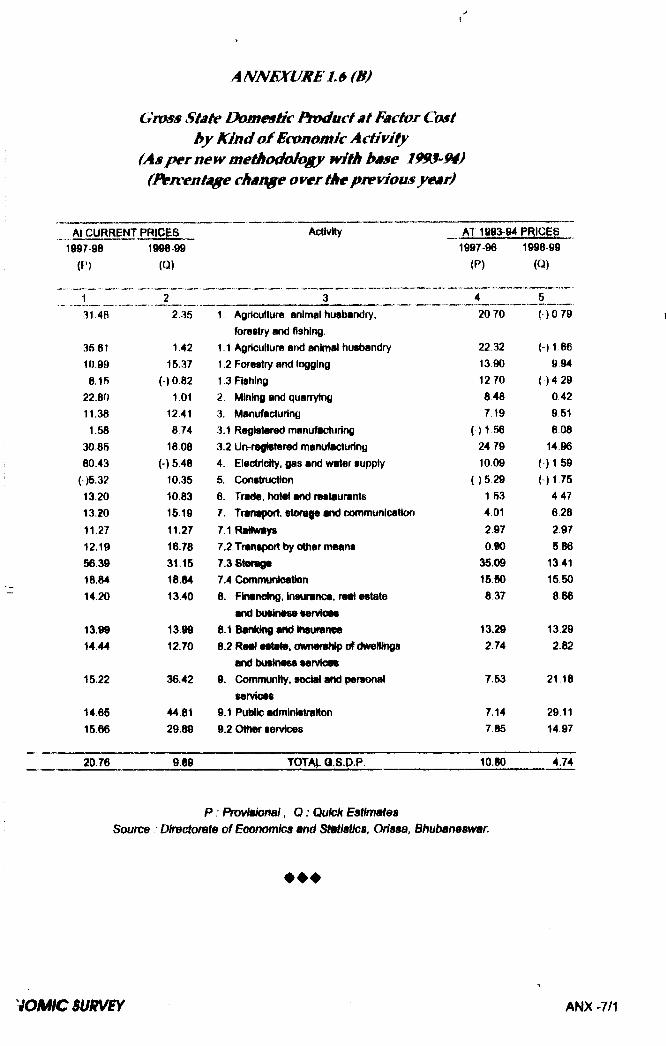
Gross State Dom estic Pwduct Mt Factor Cost b y K ind o f Economic A c ti vity
(As p er new methodoioigy with base 1^-94) (l^icentage ch aise over the previous year)
At CURRENT PRICES Activity AT 1893 94 PRICES1997 98 1998 99 1997 96 1998-99
(P) (Q) (P) (O)
1 2 3 4 531.48 2.35 1. Agriculture, animal husbandry, 20 70 ( ) 0 79
forestry and fishing.35.61 1 42 1.1 Agriculture and animal husbandry 22 32 (-) 1 6610.99 15 37 1.2 Forestry and logging 13 90 9 948.16 (00.82 1.3 Fishing 12 70 ( )4 29
22.80 1.01 2. Mining and quarrying 8 48 0 4211.38 12 41 3. Manufacturing 7 19 9 511.58 8 74 3.1 Registered manufacturing ( ) 1 S6 6 08
30.85 18.08 3.2 Un-refllstered manufacturing 24 79 14 9680.43 (-)5.48 4. Electricity, gas and water supply 10.09 ( ) 159
05 .32 10.35 5. Construction ( )5 29 ( ) 1 7513.20 10.83 6. Traiie, hotel and restaurants 1 53 4 4713.20 1519 7. Tran^tort, storaffe arid communication 4.01 6.28
11.27 11.27 7.1 Railways 2.97 29712.19 16.78 7.2 Transport by other means 0.90 5 8656.39 31.15 7 ^ Storage 35.09 13 4118.84 18.84 7.4 Communkffltlon 15.60 15 5014.20 13.40 8. FInandhg, Insurance, rwrt estate 8 37 8 66
and b tw in i^ sendees13.99 13.99 8.1 Banfciiisandtnsurainee 13.29 13 2914.44 12.70 8.2 Rettlettate, otvntrsMpc# d w e l ls 2.74 2.82
and bittirMes servicWB15.22 36.42 9. Community, sodal and personal 7.53 21 18
services14.65 44.81 9.1 PuMic admlnistraHon 7.14 29 1115.66 29.89 9.2 Other services 7 85 14 97
~20J6 ' TOTAj. Q.S.P.P^ lo j io
P : P m viB iona l, Q : Quk:k Estfm ates S oufve DkBctom te o f Econom ics and S ttitM ics , Orissa, Bhutmneswar.
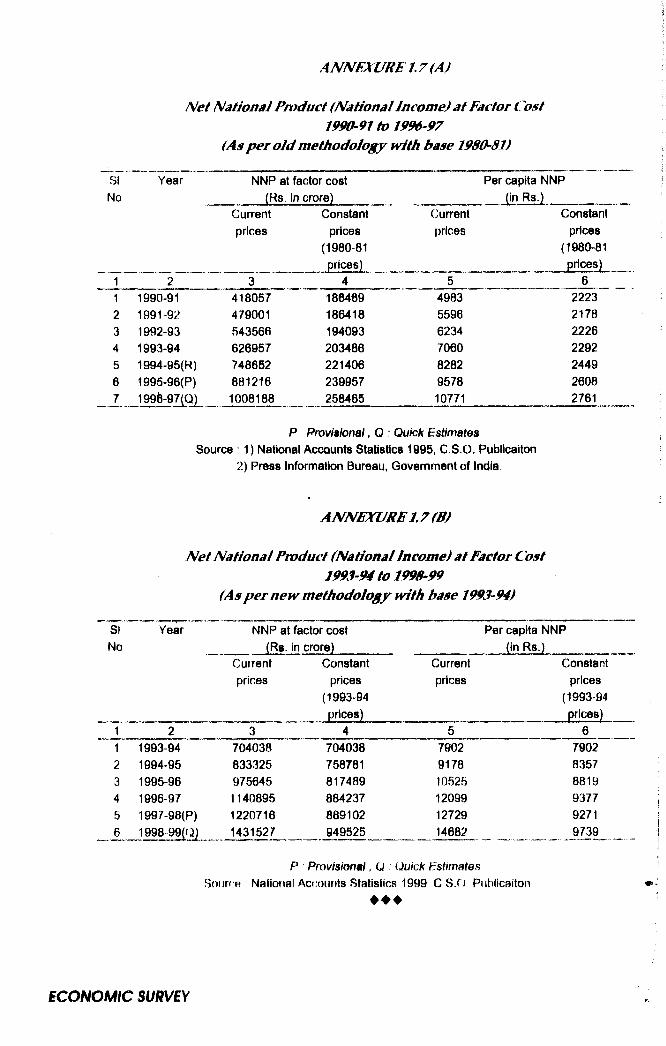
SI
No
Net National Product (National Income) at Factor Cost 1990-91 to 1996-97
(As per old methodology with base 1980-81)Year NNP at factor cost Per capita NNP
Currentprices
Constantprices
(1980-81prices)
Currentprices
Constantprices
(1980^81prices)
1 2 3 4 5 61 1990-91 418057 186469 4983 22232 1991*92 479001 186418 5596 21783 1992-93 543566 194093 6234 22264 1993-94 626957 203486 7060 22925 1994-95(R) 740652 221406 8282 24496 1995-96(P) 881216 239957 9578 26087 1996-97(0) 1008188 258465 10771 2761
P P rov is ion a l, Q : Q uick Estim ates
Source ; 1) National Accounts Statistics 1995, C.S.O. Publicaiton 2) Press Information Bureau, Government of India
ANNEXURE 1.7(B)
SINo
Net National Product (National Income) at Factor Cost 1993’94 to 1998 99
(As per new methodology with base 1993-94)Year NNP at factor cost
(Rs. in crore)Currentprices
Constantprices
(1993-94
Per capita NNP (in Rs.)
Currentprices
Constantprices
(1993-04
1 ” 2 3 4 5 61 1993-94 704038 704038 7902 79022 1994-95 833325 758781 9178 83573 1995-96 975645 817489 10525 88194 1996-97 1140895 884237 12099 93775 1997-98(P) 1220716 869102 12729 92716 1998"99(Q) 1431527 949525 14682 9739
P P rov is ion a l, Q : Quick Estimates Source : Natiotial Accounts Statistics 1999 C S.O Put>licaiton
♦ ♦ ♦

Per Capita Net State Domestic Product At Comtant (1^0-81) Prices(1992^93 to 1997-m
As on 10.03.98 (State Series)_______________________ __________________ (In Rs.)
SI Name of the state 1992-93 1993-94 1994-95 1995-96 1996-97 1997-98No. and Union Territory_____________________________ _________ (R) __ (P) (Q)
1 ~ 2 " " 3 ' “ ' 4 ’ ' ’ 5 " " 6 ~ 7 8
: 1 Andhra Pradesh 1736 1871 1973 2407 2600 24132 Aninachal Pradesh 3013 3369 3265 3667 3444 37273 Assam 1557 1583 1585 1637 1661 16734 Bihar 1017 1019 1037 983 1065 10735 Goa 53B1 5497 5743 6121 6227 A
6 Gujarat 3060 2960 3S31 3517 3799 39767 Haryana 3421 3408 M 86 3679 4019 39978 Himachal Pradesh 2267 2315 2395 2518 * *
9 Jammu and Kashmir 1804 1832 1905 1955 2009 w'
10 Karnataka 2272 2407 2454 2551 2641 *
11 Kerala 1932 2114 2169 2200 2325 244412 Madhya Practosh 1618 1747 1792 1854 1938 196113 Maharasthra 3736 4057 4299 4635 4886 479114 Manipur 1884 1896 1986 1993 2075 *
15 Meghalaya 1617 1681 1673 1808 1837 *
16 Mizoram * *
17 Nagaland 2239 2170 * ★ *
16 Ortesa 1476 1543 1580 1634 1409 168819 Punjab 3931 4022 4121 4176 4412 441620 Rajasthan 1993 1790 2053 1996 2247 221521 Sikkim ★ * * * * *
_ 22 TamilNadu 2355 2551 2796 2820 2918 305723 Tripura 1709 1886 1912 2111 21S7 •*
24 Uttar Pradesh 1615 1626 1641 1654 1748 175725 West Benfai 2295 2437 2601 2704 2086 300226 A & N Island 2884 3079 3404 3286 3486 *
27 Delhi 5453 5630 6609 6§29 6612 ♦
28 Pondiohery 2571 27T0 2793 2157 3149 *
R : RevisBd estim ates P : P rovisional estim ates Q Q uick estim ates
* Not m ade available by the concem ed State Government.
Source : S tatew ise Net State Dom estic Product, C.S.O., 1997-98
Note 1 Owing to d ifferences in m ethodology, source m ateria l used the figures
fo r d iffe rent State / UTs are not stric tly com parab^.
Note 2 The State o f M izoram prepares these estim ates a t current p rices only.
Note 3 : The Union Territories o f Chandigarh, Dadra ansi N agar Haveli, Dam an and D iu and
Lakshadweep do not prepare those estimates.
♦ ♦ ♦
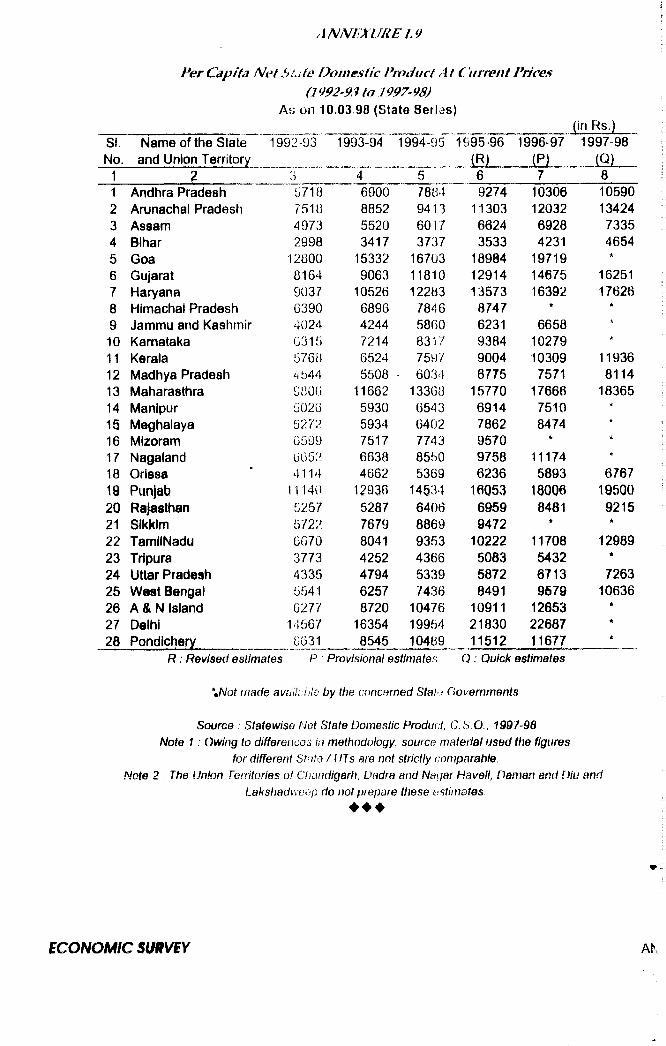
1
Per C apita N e t 5 Life Domestic P roduct A t C u rre n t Prices (1992-93 to 1997-98)
iKw on 10.03.98 (State Series)
SI. Name of the Slate 1992 -93 No. and Union Territory _____
1993-94 1994-95 1995-96 1996-97(in Rs.)
1997-98
31 Andhra Pradesh2 Arunachal Pradesh3 Assam4 Bihar5 Goa6 Gujarat7 Haryana8 Himachal Pradesh9 Jammu and Kashmir10 Karnataka11 Kerala12 Madhya Pradesh13 Maharasthra14 Manipur15 Meghalaya16 Mizoram17 Nagaland18 Orissa19 Punjab20 Rajasthan21 Sikkim22 TamllNadu23 Tripura24 Uttar Pradesh25 West Bengal26 A&N Island27 Delhi28 Poncjichery
85718 6900 78B4 9274 10306 105907510 8852 9413 11303 12032 134244973 5520 6017 6624 6928 73352998 3417 3737 3533 4231 4654
12000 15332 16703 18984 19719 ■ft
8164 9063 11810 12914 14675 162519037 10526 12283 13573 16392 17626G390 6896 7846 8747 * ★4024 4244 5860 6231 6658 •*
G315 7214 8317 9384 10279 *576a 6v524 7597 9004 10309 119364544 5508 . 6034 6775 7571 81149B0G 11662 13368 15770 17666 183655026 5930 6543 6914 7510 *5272 5934 6402 7862 8474 •*
0599 7517 7743 9570 * *
0652 6638 8550 9758 11174 k
4114 4662 5369 6236 5893 676711140 12936 14534 16053 18006 195005257 5287 6406 6959 8481 92155722 7679 8869 9472 * *6670 8041 9353 10222 11708 129893773 4252 4366 5083 5432 ★
4335 4794 5339 5872 6713 72635541 6257 7436 6491 9679 106366277 8720 10476 10911 12653 is
14567 16354 19954 21830 226878631 8545 10489 11512 11677 *
R . Revised estimates P Provisional estimates O : Quick estimates
\Not made avfii!::t,le by the cnncemed Stat > Governments
Source . Statewise Not State Domestic Product, C.S.O., 1997-98 Note 1 : Owing to differencoii in methodology, source material used the figures
for different State / LITs are not strictly comparable.Note 2 The Union Territories of Chandigarh, Dadra and Nagar Haveli, Daman and Diu and
Lakshadiveep do not prepare these estimates.♦ ♦ ♦

ANNl^XURl^-2J Growth o f PvpIllation in Orissa m id India since t9()l
SI Census Orissa IndiaNo Year Population Decennial Population Population Decennial
(in crore) growth as % to that (in crore) growth_ _ ________________ (in %) ___of In d ia ______________ (in % )
11 1901 1 03 4 32 23 84
2 1911 114 10.^4 4 51 25.21 5 7b
i 1921 1.12 ( ) 1 94 4 44 25 13 ( ) 0.31
4 1931 1.2f) 1194 4 48 27 90 11.00
5 1941 1.38 10.22 4 32 31 87 14.22
6 1951 1.46 0 38 4.05 36.11 13.31
7 1961 1 75 19 82 4.00 43.92 21 51
8 1971 2 19 25 05 4.00 54.82 24.80
9 1981* 2 64 20 17 3.86 68.33 24.64
10 1991** 3 17 20.06 374 84.63 2385
* In 1981, census was not conducted in Assam. Based on 1971 census population figures and the 1991 census provisional result, the population of Assam for
1981 has been interpolated and incorporated
** The 1991 census was not held in Jammu and Kashmir The population for Jammu and Kashmir as projected (as on 01.03.1991) by the Standing Committee of
Experts on Population Projections (October, 1989} has been incoiporated.
Source : Census of India
♦ ♦ ♦
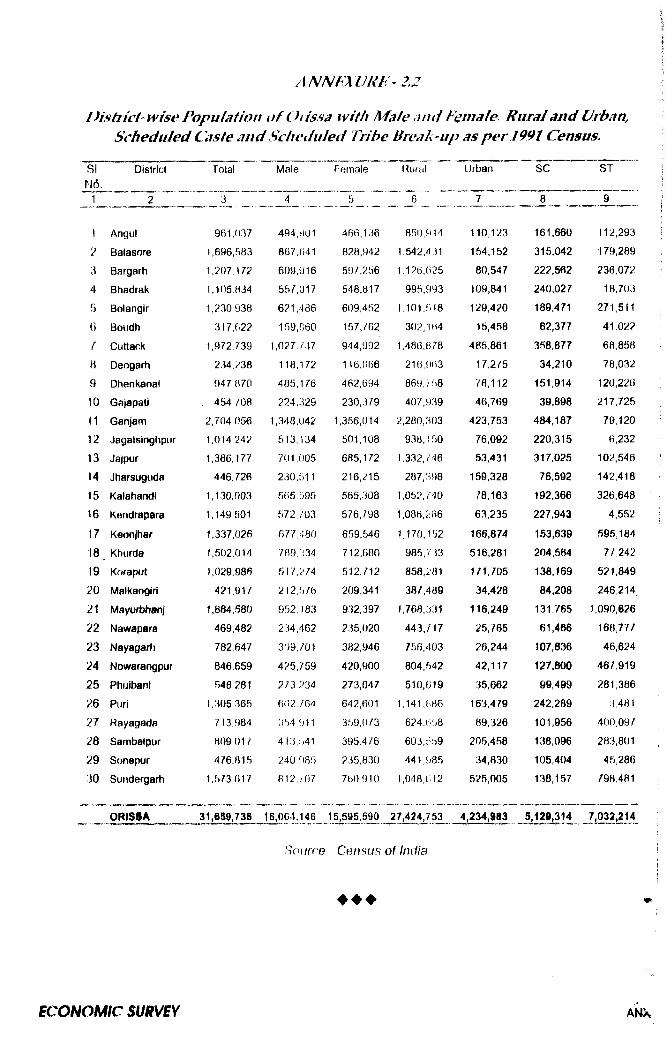
A N N m U R t: - 2 . 2
D istrict wise Population o f Orissa with Mate arnl fem ale, Rural and Urban, Scheduled Caste and Scheduled Tribe Ureak~up as per J991 Census.
DistrictSI,
1 ' 2
Total
1 Angul
2 Balasore3 Bargarh
4 Bhadrak5 Bolangir
6 Boudh J Cuttack
8 Deogarti9 Dhenkanal
10 Gajapati11 Ganjam12 Jagatsinghpur
13 Jajpur
14 Jtiarsuguda15 Kalahandi
16 Ker)drapara
17 Keonjhar18 Khurda} 9 Knraput
20 Malkangiri
21 Mayurbhanj22 Nawapara23 Nayagarti
24 Nowarangpur25 Phijibani26 Puri
27 Hayagada28 Sambalpur
29 Sonepur
30 Sundergarh
ORISSA
_ 3 _ _
9fi 1,037
1,696,583
1.207372
I.105.H34
1,230.938
3173)22
1,972,739
234,^38
947,670
454,708
2,704,056
1,014,242
1,386,177
446,726
1,130,903
1,149,501
1,337,026
1,502,014
1,029,986
421,91/
1,884,580
469,482
782,647
846,659
546,281
1.305,365
713.984
R09 017
476.816
1,573,017
Male
494,901
867,(141
609,916
557,017
621,486
159,000
1,027,747
118,172
405,176
224,329
1,348,042
513,134
701,005
230,511
565,b95
572 703
677,480
7 8 9,: 5 34
517,? 74
212.576
952,183
234,462
309,/01
425,759
273,234
602,764
3'j4,'ni 4 13,:,41
240 085
812 707
Female
466,136
828,942
597,256
548,817
609,452
157,762
944,992
116,066
462,694
230,379
1,356,014
501,108
685,172
216,215
565,308
576,798
659,546
712.600
512,712
209,341
932,397
235,020
382,946
420,900
273,047
642.601
359,073
395,476
235,830
760.910
Rural
I'-J I 'Z
850,914
1,542,4 31
1.126,025
995,993
1,101,518
302,164
1,486,878
216,963
869,758
407,939
2,280,303
938,150
1,332,746
287,398
1,052,740
1,086,266
1,170,152
985,733
858,281
387,489
1,768,331
443,717
756,403
804,542
510,619
1,141,BB6
624,b58
603,659
441,085
1,048,(312
Urban
iTzr'i
110,123
154,152
80,547
109,841
129,420
15,458
485,861
17,275
78,112
46,769
423,753
76,092
53,431
159,328
78,163
63,235
166.874
516,281
171,705
34,428
116,249
25,765
26,244
42,117
35,662
163,479
89,326
205,458
34,830
525,005
SC ST
8
161.660
315,042
222,562
240,027
189,471
62,377
358,877
34,210
151,914
39,898
484,187
220,315
317,025
76,592
192,366
227,943
153,639
204,564
138,169
84,208
131,765
61,466
107,836
127,800
99,499
242,289
101,956
138,096
105,404
138,157
9 __ _
112,293
179,289
236,072
18,703
271,511
41022
68,858
78,032
120,226
217,725
79,120
6,232
102,546
142,418
326,648
4,552
595,184
77,242
521,849
246,214
1,090,626
168,777
46,624
467,919
281,386
3,481
400,097
283,801
45,286
79B.481
31,659,736 16,064,146 15,595,590 27,424,753 4,234,983 5,129,314 7,032^214
S(Mirce Cunsus of India

Oicupatidnal Classitication o f Main Workers, Markina! Workei's and Total Workers hi Orissa according to 1991 Census.
i
District
()/B 9 I
Angul
Halasoie Har^arh
Hharirak Hf)lHngii Lioudh
{ ijftack lieoijarli >henkanal
10 (lajapati 1 I Ganjarn 1 Jagatsinghpur
13 Jajpiir14 Jharsuguda
If) Kalahandi
16 Kendrapara17 Keonjhar
18 Khurda19 Koraput20 Malkangiri21 Mayurbhanj
22 Nawapara23 Nayagarh24 Nowarangpur25 Phulbani
26 Puri
27 Rayagada
28 Sambalpur
29 Sonepur30 Sundergarh__
Culti-VBtOS
3
13U,233
229,904
205,332
1H3,799
208,6 T3
62,628
1/2,333
44,402
112,030
9f),731
368,938
124,830
14/,625
48,986
182,628
156,222
209,789
113,219
203,728
117,633
340,619
96,068
116,041
171,428
102,929
168,738
118,395
104,490
83,310
197,019
Ayricul-tuial
labOLirersj1
130,233 229,904 205,3-12 ilJ3'7')9 203,6/3
G2,628 172,333 4 1,402
112 830 9h.73l
368,938 124,830 147,625 48,986
182,028 150,222
209,789 113,219
203,728
117,633
340,619
96,068
116,041
171,428
102,929
168,738
118,395
104,490
83,310
197,019
Household
Industry_ __5 _ _
1 b,009 8,669
30.914 ' 3,4/f] lb,i;,0 b,565
19,999 3,385 8,910 2,399
28,653 7,903 8,926 5,234
11,538 5,648
10.208 9,546
5,522
974
36,923
4.790
11,311
7,046
4,731
8,794
3,636
18,195
9.791
11,556
Otherw(,)rkers
Totalmain
workers
Marginalworkers
Totalworkers
81.255 10/959 65 15/ 62 ,9/2 ' 70,23/ 13 27/
245,860
11,169 68760
26 093 237,468
79,430
96 372 59 730 57 103 60.661
112,077 229,707
81,617
14,633
101,368
19,668
42,870
32,696
31,559
105,409
51,344
83,143
20,812
208,496
315,601
473,255
446,935
2^4. fe 7'
425,507
120,675
563,792
85,696
284 289
190,707
947,048
269,022
353,280
149,756
426,175
279,392
439,953
436,036
423,115
157,765
702,511
173,459
236,575
328,200
212,946
368,044
294,522
308,397
172,599
508.139
52.506
27,503
87,834
fo,4fee
76,009
27,181
21,723
19,400
27,582
33,432
136,855
10,228
13,173
24,713
83,555
8,892
79,073
13,640
90,886
39,944
160,966
40.055
16,087
86,701
47,930
15,205
54,557
48,233
37,463
112.633
368,107
500 /58
534,769
2Sf4,655
501,516
147,856
685,515
105.096
311,871
224,136
1,083,903
279,250
366,453
1/4,469
509,730
288,284
519,026
449,676
514,001
197,709
863,477
214,314
252,662
414,901
260,876
383,249
349,079
356,630
210,062
620,672
ORISSA 4.598.500 2,976,750 324,403 2,477,982 10,377,038 1.|9S,127 11J82.T62
Source : Census of India
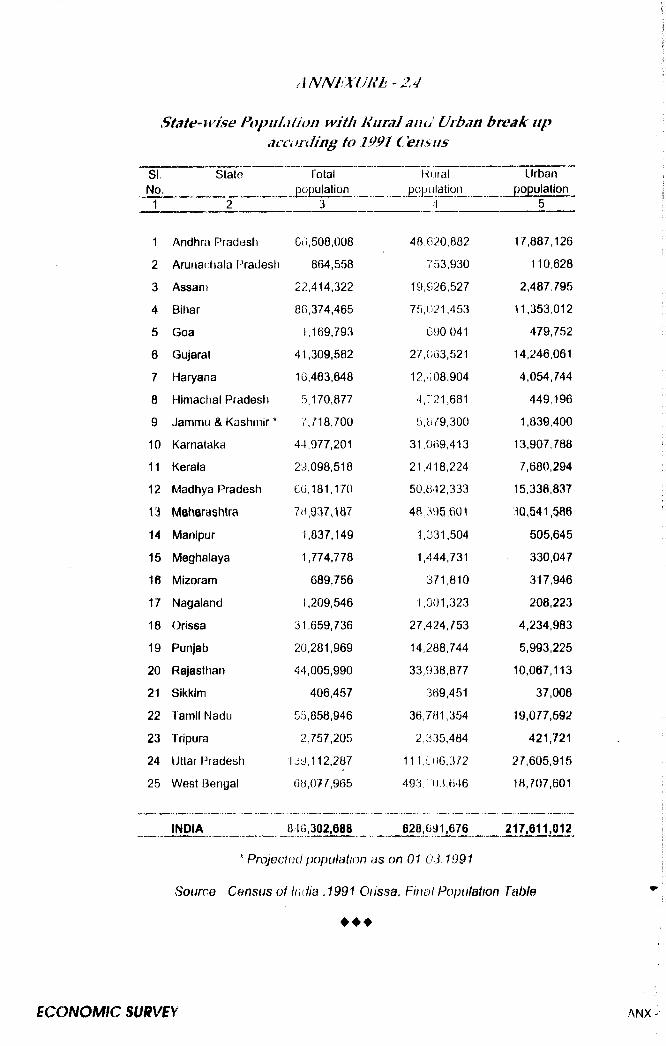
4N m iXU RE-2.4State-wise FopuLi fion with Rural and Urban break up
acconiing to 1991 CensusSINo.
State Totalpopulation
RuralpopLilation
Urbanpopulation
1 2 3 4 5
1 Andhra Pradesh Co,508,008 48,620.882 17,887,126
2 Aruriachala Pradesti 864,558 753,930 110,628
3 Assam 22,414,322 19,926,527 2,487,795
4 Bihar 80,374,465 76,021,453 11,353,012
5 Goa 1,169,793 C90041 479,752
6 Gujarat 41,309,582 27,083,521 14,246,061
7 Haryana 16,403,648 12,H 08,904 4,054,744
0 Himachal Pradesh 5,170,877 4,7’21,681 449,196
9 Jammu & Kashmir * 7,718,700 5,b79,300 1,839,400
10 Karnataka 44,977,201 31,069,413 13,907,788
11 Kerala 29,098,518 21,418,224 7,680,294
12 Madhya Pradesh 66,181,170 50,842,333 15,338,837
13 Maharashtra 7a,937.187 48 395,601 30,541,586
14 Manipur 1,837,149 1,331,504 505,645
15 Meghalaya 1,774,778 1,444,731 330,047
16 Mizoram 689,756 371,810 317,946
17 Nagaland 1,209,546 1,001,323 208,223
18 Orissa 31,659,736 27,424,^53 4,234,983
19 Punjab 20,281,969 14,288,744 5,993,225
20 Rajasthan 44,005,990 33,938,877 10,067,113
21 Sikkim 406,457 369,451 37,000
22 Tamil Nadu 55,858,946 36,781,354 19,077,592
23 T ripura 2,757,205 2,335,484 421,721
24 Uttar Pradesh 13^,112,287 iii,;:u6 ,372 27,605,915
25 West Bengal OB,077,965 493 ,03 ,646 18,707,601
INDIA 840,302,688 628,091,676 217,611,012
* Projected population as on 01 03 1991
Source Census of India .1991 Orissa, Final Population Table
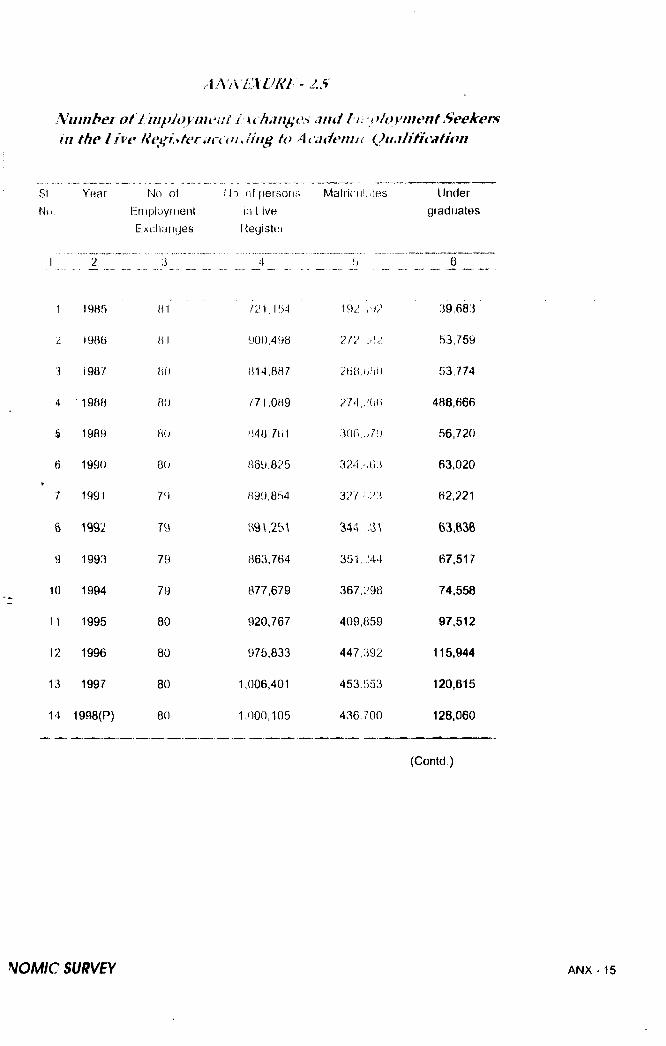
a a 7V£:a l //^i '- J .J
\'um ber o f i m ploymeut I xchmiges .ind hiupioym ent Seekers in the liv e Registerai Ciliaing to Aaiiiennc Qualification
Year No of
Enipluymenl
Exchanyes
f Jo of persons
in Live-
Register
Matricnliiles Undergraduates
r i
1 19B5 HI
2 1986 HI
3 1987 01)
4 1988 80
§ 1989 8(J
6 1990 80
7 1991 7f)
8 1992 7y
9 1993 79
10 1994 79
11 1995 80
12 1996 80
13 1997 80
14 1998{P) 80
I 2 \ , m 192 39,683
900,498 217 \0 \l 53,759
H 14,887 268Mv!.)fl 53,774
/7 1.089 274,:KjG 488,666
H48J61 306,u79 56,720
869,825 324,'i0:i 63,020
899,854 327 62,221
89^.251 344 63,B38
863,764 351, ;44 67,517
877,679 367,298 74,558
920,767 409,859 97,512
975,833 447,392 115,944
1,006,401 453,553 120,615
1,000,105 436,700 128,060
(Contd.)
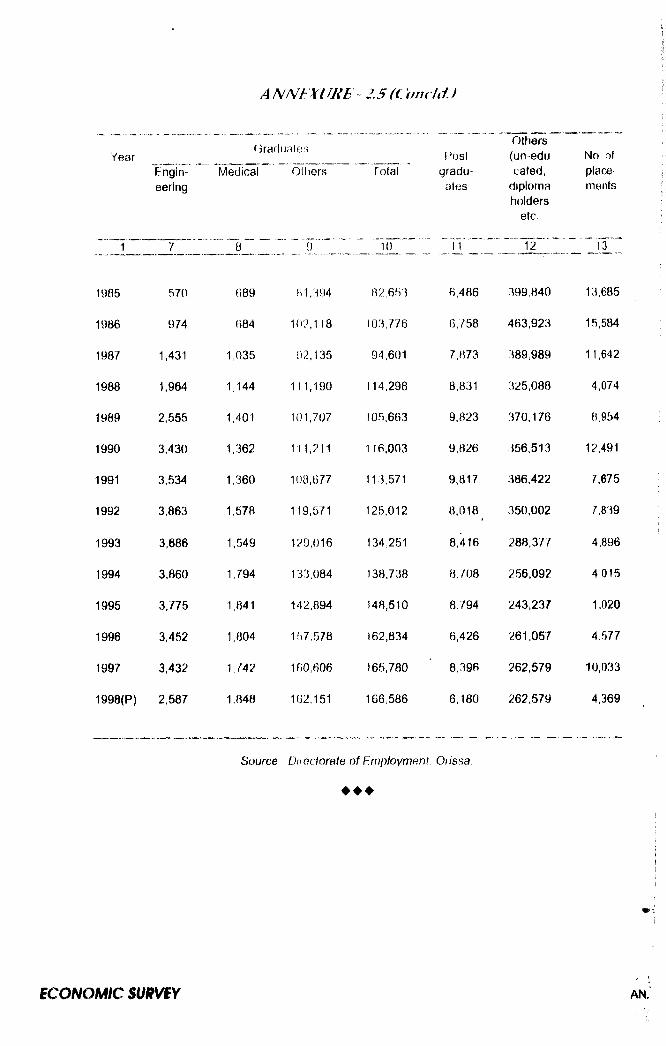
YearGraduates
I ’osIOthers(un-edu No of
Engin Medical Olliers fofal gradu cated, placeeering ates diploma
holdersetc
ments
1 7 0 1 o " “ TT^ - ZZ31ZZZ
1985 570 089 H1,:-i94 B2 653 6,486 399.840 13,685
1986 974 684 102,118 103.776 6,758 463,923 15,584
1987 1,431 1.035 92,135 94,601 7,873 389,989 11.642
1988 1,964 1.144 111,190 114,298 8,831 325,088 4,074
1989 2,555 1,401 101,707 105,663 9,823 370,176 8,954
1990 3,430 1362 111,211 116,003 9,826 356,513 12,491
1991 3,534 1,360 108,677 113,571 9,817 386,422 7,675
1992 3,863 1,578 119,571 125,012 8,018 350,002 7,839
1993 3,686 1,549 129,016 134.251 8,416 288,377 4,896
1994 3,860 1 794 133,084 138,738 8,/08 256,092 4,015
1995 3,775 1,841 142,894 148,510 8.794 243,237 1,020
1996 3,452 1,804 167,578 162,834 6,426 261,057 4,577
1997 3,432 1742 100,606 165,780 8,396 262,579 10,033
1998(P) 2,587 1,848 162,151 166.586 6,180 262,579 4,369
Source Dll ocforate of Employment Oiissa.
♦ ♦ ♦
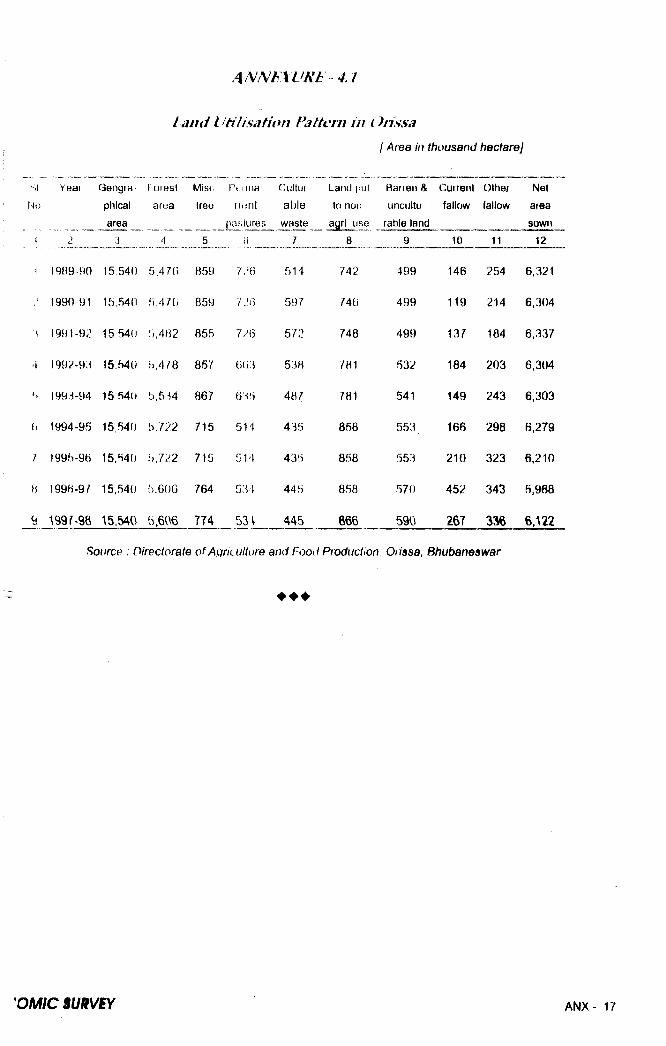
1 and l^tilisation Pattern in (hissa[ Area in thousand hectare]
SI Yeai Geogra f oiest Misc Puiiiia Ciiltur Land |iul Barren & Current Other NetNo phical area tree lujnt able to non uncultu fallow fallow area
™ waste agrl. use rabie land sownI 2 3 4 5 1) 7 8 9 10 11 12
I 1989-90 15 540 5.47G 859 7;’6 514 742 499 146 254 6,321
19904)1 15.540 5,476 859 /.'O 597 746 499 t l9 214 6,304
i 1991-92 15 540 !.,4B2 855 7.*6 572 748 499 137 184 6,337
i 199;^-93 15,540 i),478 857 603 538 781 532 184 203 6,304
1993-94 15,540 5,534 867 635 4 87 781 541 149 243 6,303
6 1994-95 15,540 5.722 715 514 435 858 553 166 298 6,279
7 1995-96 15,540 5,722 715 514 435 858 553 210 323 6,210
H 1996-97 15,540 5,606 764 534 445 858 570 452 343 5,968
9 199T‘98 15,540 5.606 774 53 445 866 590 267 3S6 6,122
Source : D irectorate o f Agriculture and Food Production, Orissa, B hubanesw ar
♦ ♦ ♦
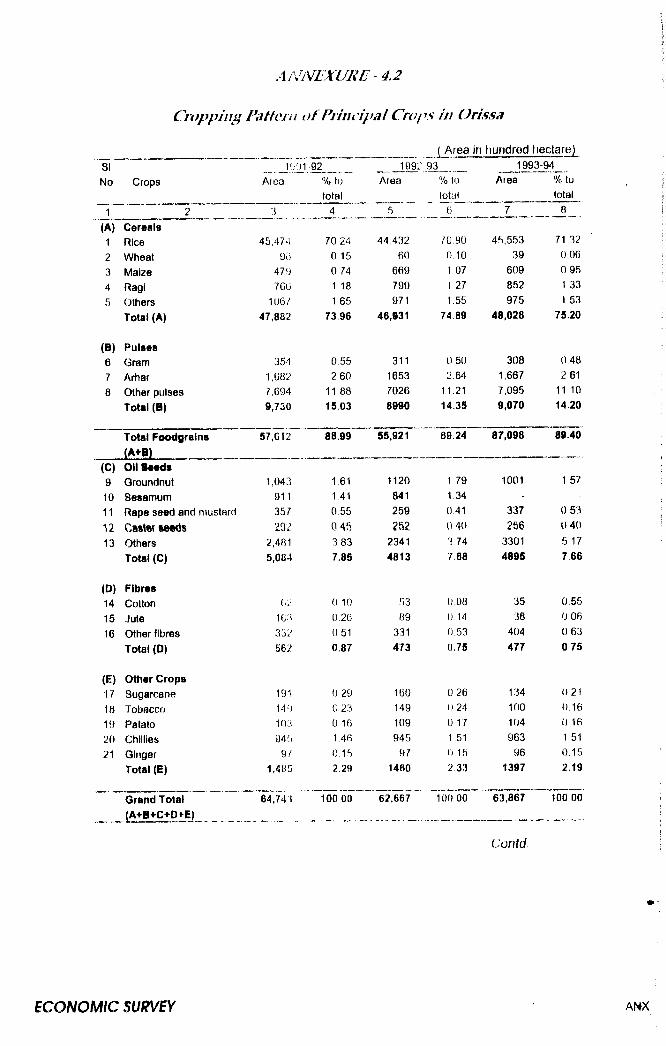
Cropping Pattern o t Principal Craps in Orissa( Area in hundred hectare)
I 'v'i1 92 1992 93 1993-94Crops Area 7o to
totalArea % to
totalArea % to
total
1 2 3 4 5 _ 6 ____ L ™ .-.___8 _
(A) Cereals1 Rice 45,474 70 24 44,432 70 90 45,553 71 32
2 Wheat 93 0 15 60 0 10 39 0 06
3 Maize 479 0 74 669 1 07 609 0 95
4 Ragi 7GG 1 18 799 1 27 852 1 33
5 Others 1067 1 65 971 1.55 975 1 53
Total (A) 47,882 73 96 46,931 74 89 48,028 75.20
(B) Pulses6 Gram 354 0.55 311 0 50 308 0.48
7 Arhar 1,G82 2 60 1653 2.64 1,667 2 61
8 Other pulses 7,094 11 88 7026 11,21 7,095 11 10
Total (B) 9,730 15.03 8990 14.35 9,070 14.20
Total Foodgralns 57,G12 88.99 55,921 89.24 87,098 89.40
(A+©)(C) Oil Seeds9 Groundnut 1,043 1 61 1120 1 79 1001 1 57
10 Sesanrium 911 1,41 841 1 3411 Rape seed and mustard 357 0.55 259 0,41 337 0 53
n 292 0 45, 282 0 40 256 040
13 Others 2,481 3 83 2341 3 74 3301 5 17
Total (C) 5,084 7.85 4813 7.68 4895 7.66
(D) Fibres14 Cotton 0 10 53 0,08 35 0.55
15 Jute 163 0.26 89 0 14 38 0 06
16 Other fibres 332 0 51 331 0 53 404 0 63
Total (0) 562 0,87 473 0.75 477 0.75
(E) Other Crops17 Sugarcane 191 0 29 160 0 26 134 0 21
18 Tobacco 149 0 23 149 () 24 100 0.16
19 Patato 103 0 16 109 0 17 104 0 16
20 Chillies 941. 1 46 945 1 51 963 1 5121 Ginger 9/ 0 15 97 0 15 96 0 15
Total(E) 1,485 2.29 1460 2 33 1397 2.19
Grand Total 64,743 100 00 62,667 100 00 63,867 100 00(A+B+C+D+E) . ...
Contd.
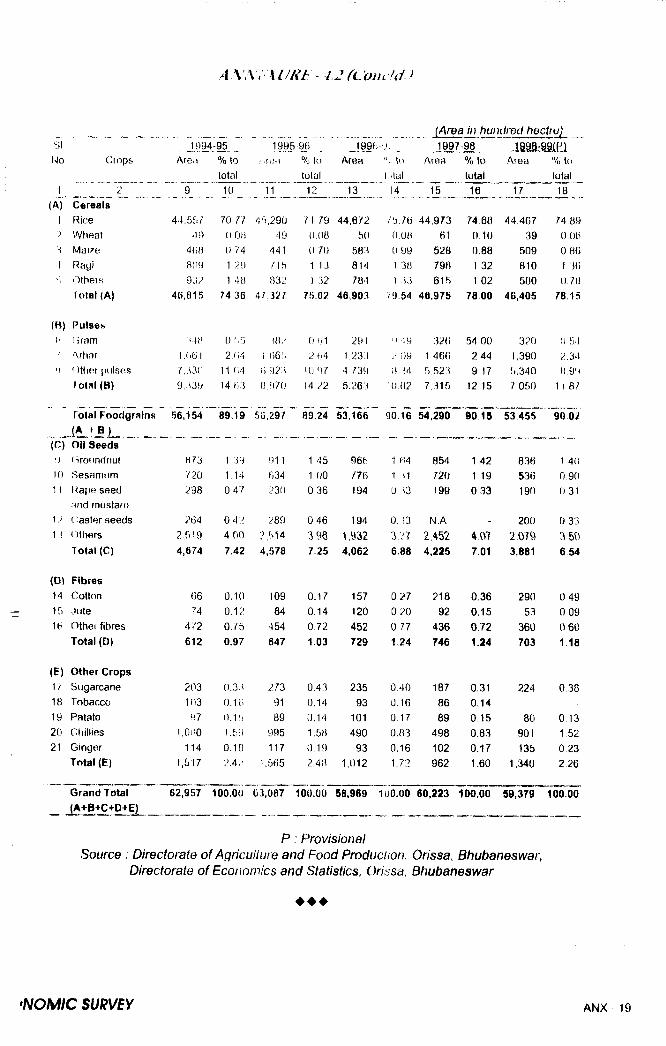
1(A)
I
J 994-95 1995 9fj <j, J9 97 -98 I f iM r M P iCfops Are,! % to < sfoa % to Area to Area % to Area % to
total total ti 'tal total total2. _ 9_ _ 10 11 12 13 14 16 Z jZ Z I ,1£
CerealsRice 44,5f./ 70.77 4.“1,2 90 71 79 44,672 75,76 44,973 74 68 44,467 74,89Wheat 49 U 0)i 49 0 08 50 0.08 61 0 ID 39 0 06
468 0 74 441 0 70 58-3 0 99 528 0.88 509 0 86F agi 8(19 1 29 n s 1 13 014 1 38 798 1 32 810 1 3fiOthers 93? 1 4B 832 1 32 7B4 1 33 615 1 02 580 0,70fotal (A) 46.815 74 36 4 ^ 3 2 / 7S 02 46,903 7 9 54 46,975 78 00 46,405 78.15
Pulses1 iram 54H 0 '^5 <8/ 0 (i1 291 0 49 320 54 00 320 0.54Arhar 1.G6I 2 H4 1 iiG.'i 2 04 1,233 2 09 1 466 2 44 1,390 2,34* )ther pulses 7,.^30 1 1 (),923 10 97 4739 3 34 5.523 9 17 5,340 B.99Total (B) 9,339 14 H3 8 970 14 22 5,263 10.02 7 315 12 15 7 050 11 8/
Total Foodgrains 56,154 89.19 5G,297 B9 24 53,166 90 16 54,290 §0.15 53,455 90.02(A t B )
(C) Oil Seeds9 (iroiindnut 873 1 39 911 1 45 966 1 64 854 1 42 836 1.4010 Sesamiim 720 1-14 634 1.00 776 1 31 720 1 19 536 0 901 \ t .apB seed 298 0 47 230 0.36 194 0 33 199 033 190 0 31
and mustard12 Caster seeds 264 0 42 289 0 46 194 0, )3 N,A - 200 0 3313 <)tt>ers 2 519 4 on 2,514 3 96 1.^32 ' i l l 2,452 4.07 2,07ft 350
Total (C) 4,674 7.42 4,578 7.25 4,062 6.88 4,225 7.01 3,881 6 54
(D) Fibres14 Cotton 66 0.10 109 0.17 157 0,27 218 0.36 290 04915 Jute 74 0.12 84 0,14 120 0 20 92 0.15 53 00910 Othet fibres 472 0.75 454 0.72 452 0,77 436 0.72 360 0 60
Total (D) 612 0.97 647 1.03 729 1,24 746 1.24 703 1.18
(E) Other Crops1 / Sugarcane 203 0.3. 273 0,43 235 0,40 187 0.31 224 03818 Tnbarxo 103 0.10 91 0.14 93 0.16 86 0.1419 Patato 97 0.15 89 0.14 101 0.17 89 0.15 80 0 1320 Chillies 1,000 1.59 995 1.58 490 0.83 498 0.83 901 1 5221 Ginger 114 0.18 117 0.19 93 0.16 102 0.17 135 0 23
Total (E) 1,517 2.42 1,565 2.48 1,012 1.72 962 1.60 1,340 2 26
Grand Total 62,957 100.00 (33,087 100.00 58,969 100.00 60,223 100.00 59,379 100.00(A+B+C-^D>E) _______ __________
P ; ProvisionalSource : Directorate of Agricullure and Food Production, Orissa, Bhubaneswar,
Directorate of Economics and Statistics, Orissa, Bhubaneswar
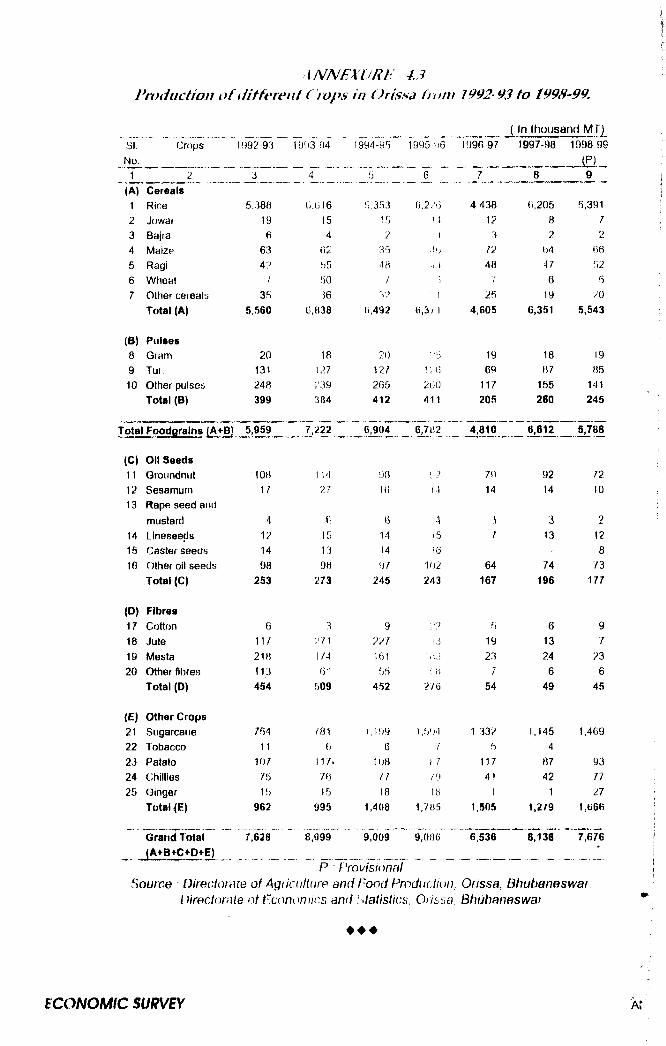
A N N E \V R l{^ 4 J P ro d u c tio n o f if i f fe re n i C rops in O rissa fu n ii 1992- 93 to 1998-99.
SINo.
Crops 1992-93 19'i3 94 1994-95 1995 !)6__ _ _L In thousand M T)
1996 97 1997-98 1998^99
iP)__1 _ 3 __ _ 4 5 6 " J L . 8 9
(A) Cereals1 Rice 5.388 6,016 5,353 0,221] 4,438 0,205 5,3912 Jowar 19 15 15 M 12 8 73 Bajra 6 4 2 -1 3 2 24 Maize 63 62 35 -M; n 64 665 Ragi 42 55 48 48 17 526 Wheat / 50 I C) 6 57 Other cereals 35 36 32 '■1 25 19 20
Total (A) 5.560 6,B38 t),492 «,3? 1 4,805 6,351 5,543
(B) Pulses8 Gram 20 18 20 ■'3 19 18 199 Tur. 131 127 127 126 69 87 8510 Other pulses 248 I'39 265 260 117 155 141
Total (8) 399 384 412 411 205 260 245
Total Foodgrains (A+B) 5,959 7,222 _ 6 ,9 0 £ _ 6 jy ^ 4,810 _ M I L __ ^ 788
(C) Oil Seeds11 Groundnut 10B 1 14 98 ‘1? 79 92 1212 Sesamum 17 27 1(5 i4 14 14 1013 Rape seed and
mustard 4 f> 4 3 214 Lineseeds 12 15 14 )5 7 13 1215 Caster seeds 14 13 14 16 - 816 Other oil seeds 98 98 97 102 64 74 73
Total (C) 2S3 273 245 243 167 196 177
(D) Fibres17 Cotton 6 3 9 ’.'2 5 6 918 Jute 11/ ;'7i 721 l-i 19 13 719 Mesta 218 174 161 lh.3 23 24 2320 Other fibres 113 61 55 7 6 6
Total (D) 4S4 509 452 276 54 49 45
(E) Other Crops21 Sugarcane 754 m \ 1,199 1,5'iJ 1 332 1,145 1,46922 Tobacco 11 () 6 7 423 Patato 107 irA 108 VJ 117 87 9324 Chillies 75 76 I I /9 41 42 7725 Ginger 15 15 18 18 1 1 27
Total (E) 962 995 1,408 1,7 H 5 1,505 i,2r9 1,«6B
Grand Total 7 M B ~ 97o09 9.0B6 6,536 8,136 T e / e
(A B»C»D+E) ______ _ ___ ___________ ______________P • Provisional
Source : Directorate of Agiicultiire and Food Prodactioii Orissa, Bhubaneswar Directorate ot tEconomir.s and S tatistica Orissa, Bhubaneswat
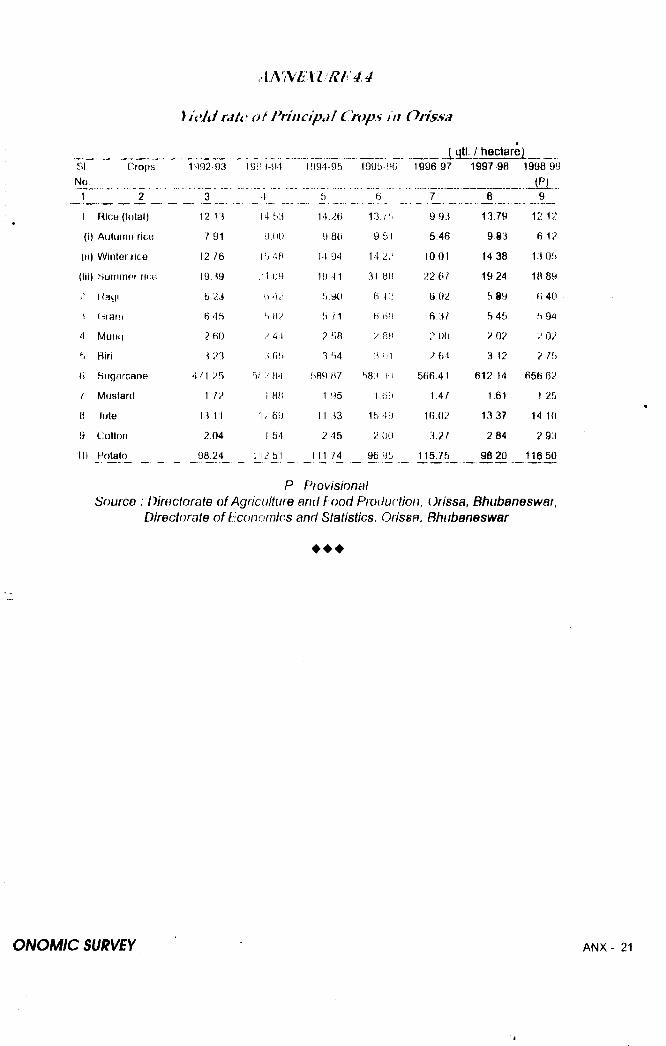
Crops
I Rice (total)
(i) Autumn rice
(il) Winter lice
(iii) Surittnet rice
'• i »yii (iratn
‘1 Muriii
b Biri
fi Hiigarcane
I Mustard
8 lute
9 CottDn
10 Potato
^\NNEXVRf^4.4
Yield rate o t Principal Cn)ps in Orissa
1H92-93 )9Ui-94
12 13 7 91
1276 19 395 236 45 2 BO 123
4H 25 172
13 11 2.04
98.24
_ ___14 53y.no
15.4 a; 1,1)9b.42-h
44 ■\ 05
5,':: 84 I 81')
12.69 1 54
112 51
1994-95
3 314.2B 9 80
14 94 19 41 5.90 5 n
2 583 54
589 H71 95
II 332 45
111
( qtl. / hectare)
M
1995-90 1996 97 1997-98 1998 99
0....
913.; 5 9 93 13 79 12 129 51 5 46 983 6 12
14 22 10 01 14 38 13 053 1 Bfi 22B7 19 24 1H 89
0,12 6,02 5 89 f i 400 riH 6.3 / 5 45 .5 942 8H 200 2 02 2 023 (i1 2 64 3 12 2 75
583 'Id 566.4 1 612 14 656 621,09 1,4/ 1 61 1 25
15 49 16.02 13 37 14 102 OU 3.2/ 284 2 93
96 95 115.75 98.20 116 50
P ProvisionalSource : Directorate of Agriculture and Food Production, Orissa, Bhubaneswar,
Directorate o f Economics and Statistics, Orissa, Bhubaneswar
♦ ♦ ♦
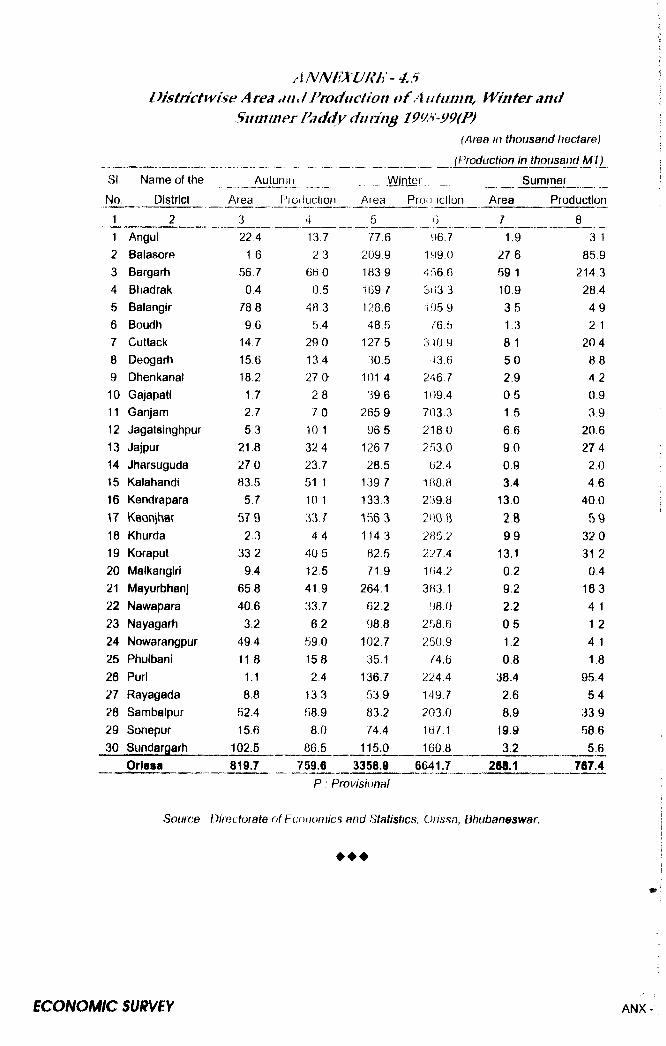
ANNEXVRt:- 4.5 Districtwise Area ,m J Production o f Autumn^ Winter ami
Summer Paddy dunng 199S-99(P)(Area in thousand hectare)
____ ______ _____ _________________________ (Production In thousand M l)SI.
No.
1
Name of the
District
1 Angul2 Balasom3 Bargarh4 Btiadrak5 Balangir6 Boudh7 Cuttacl<8 Deogarh9 Dlienkanal10 Gajapati11 Ganjam12 Jagatsinghpur13 Jajpur14 Jharsuguda 16 Kalahandi16 Kendrapara17 Keonjhar18 Khurda19 Koraput20 Malkangiri21 Mayurbhanj22 Nawapara23 Nayagarh24 Nowarangpur25 Phulbani26 Puri27 Rayagada28 Sambalpur29 Sonepur30 Sundargarti
Autunm
Area r ’roduction
22416
56 704
78 89.6
14,7 15.6 18.21.7 2 75 3
21 8 27083.5
5.757 9
2 333 2
94 65840.6
3.2494118
1.18.8
62.415.6
102.5
13.7 2 3
66 0 0.5
48.3 5 4
29.0 134 27 0 2 8 7 0
10 1
32 423.7 51 1 10 133.7
4 440 512.541 9 3376.2
59 0 15 8 24
13.3 58,98.0
86.5
.........Winter....
Area Proauction
Summer
77,6 209.9 183 9169.7 128 648 5
127 530.5
101,439.6
265996.5
126 728.5
1.39 7 133 3 156 3 114 362.5 71 9
264.1 02,2 98 8
102.7 35.1
136.7 53.9 83 2 74.4
115.0
96.7199.0456.6 3t)3.3 105 9
/6.5 310 9
13,6 246 7 109.4703.3218.0253.0
62.4188.8239.8 200. B285.2227.4164.2383.1
98.02.58.6250.9
/4.6224.4149.7203.0167.1160.8
Area Production
1-9 27 6 59 1 10 9 351.3 8.15.02.90 5 156 69.0 0 93.4
1302899
13,10.2922.2051.20.8
38.42.68.9
19.93.2
3 1 85.9
214 3 2844 9 2 1
204 8 8 4 20 93 9
20 6
27 42.04 6
40059
32 0 31 2 04
163 4 11 2 4 1 1.8
95.454
33958.65.6
Orissa 819.7 759.6 3358.9 6641.7P ■ Provisional
266.1
Source l irQctorate of Fconarnicfi and Statistics, Orissa, Bhubaneswar.
♦ ♦ ♦
767.4
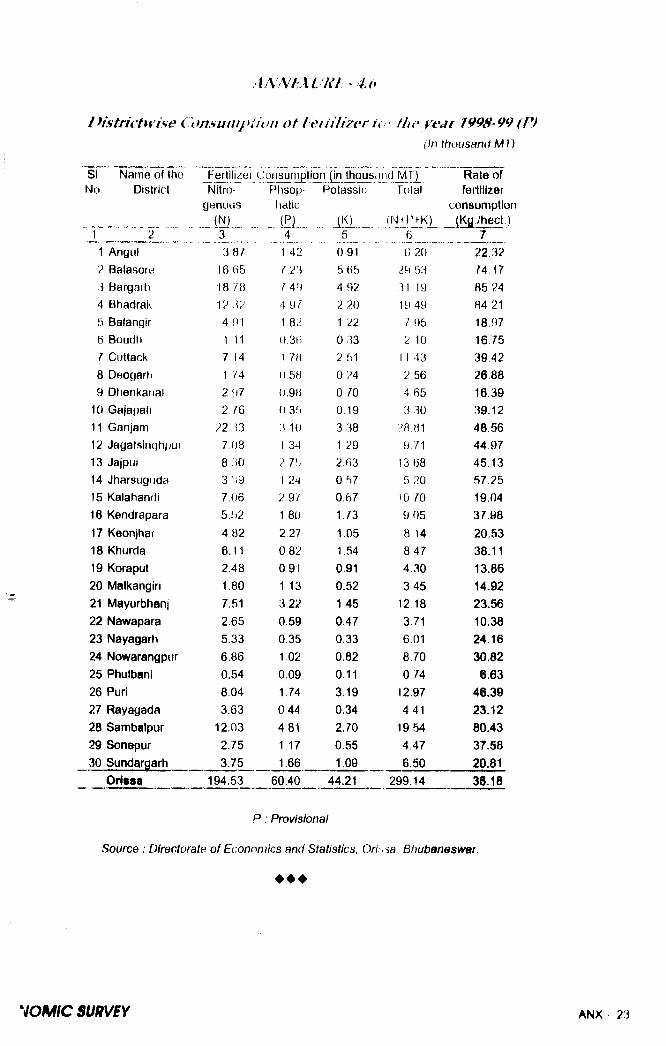
IHstrictvvise Consumpiion of Ieiiih'zer the year 1998-99 (P)(In thousand M T)
SINo
Nam e of the District
1 Angul2 Balasore3 Bargarti4 Bhadral^5 Balangir6 Boudti7 Cuttack8 Deogarh9 Dtienkanai
10 Gajapati11 Ganjam12 Jagatsinghpur13 Jajpur14 Jharsugiida15 Kalatiandl16 Kendrapara17 Keonjhar18 Khurda19 Koraput20 Matkangiri21 Mayurbhanj22 Nawapara23 Nayagart^24 Nowarangpur25 Phulbani26 Puri27 Rayagada28 Sambalpur29 Sonepur30 Sundargeirh
Orissa
Fejtilizei (.. Nitro
genous
M3 ___3 87
16 6518 7012 324 911 II7 141 742 97 2,7622 33
7(J88.303 39 7.96
5.52
4 .82
6.11
2.48
1.80
7.51
2.65
5.33
6.86 0.54
8.04
3 .63
12.03
2 .75
3.75
ofisuniptlon (in thousR isop - Potassic
liatic
..._ ... .
1,42 0 91
^ 2 3 5 65
' 49 4 92
4 97 2 20
1,82 1 2 2
0.3(i 0 33
1 7H 2 51
0 5ft 0 24
0,9B 0 70
0 35 0 19
3 10 3,38
134 1,29
2 75 2.63
1 24 0 57
2 97 0.67
1 80 1.73
2 27 1.05
0 82 1.54
0 9 1 0.91
1 13 0 .52
3,22 1,45
0.59 0 .47
0 3 5 0 .33
1 02 0 .82
0 ,09 0.11
1,74 3 .19
0 4 4 0.34
4 8 1 2 .70
1.17 0 .55
1.66 1.09
iiuJ M T) Tola!
jNMHK)6 _ f) 20
29 53
31 19
19 49
7 95
2 10
11 43
2 56
4 65
3 30
B1
9 71
13 685 20
)0 70
9 05
8 14
8 4 7
4 .30
3 45
12 18
3.71
6.018 70
0.74
12.97
4 41
19 54
4.47
6.50
194.53 60,40 44.21 299 .14
Rate of fertilizet
consumption (Kg /hect.)
22 32
74 17
85 24
84 21
18.97
16 75
39 .42
26 88
16.39
39 .12
48 .56
4 4 .97
4 5 .13
57 .25
19.04
37 .98
20 .53
38.1113.86 14.9223.5610.38 24.1630.826.63
46.3923.1280.43 37.58 20.8130.18
P : Provisional
Source : Directorate of Economics and Statistics, Orissa. Bhubaneswar.
♦ ♦ ♦
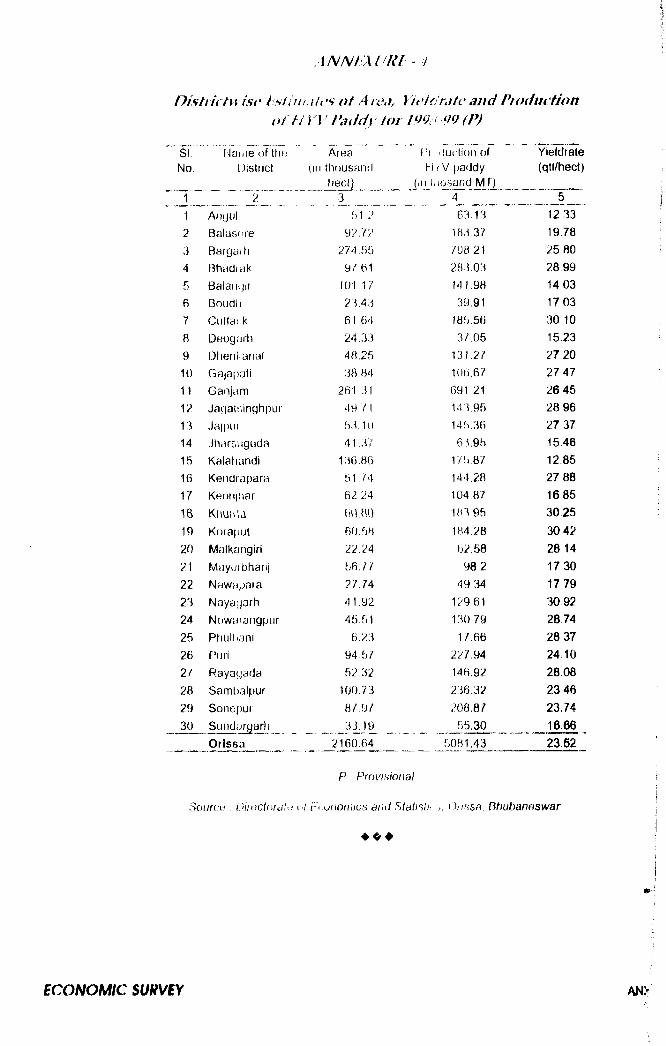
A N N ia U R f ■
llistiiftu ist' Itsiiiii.Ues o t Aiej, Yit'ldmte and Productiono f f ! Y V F a d d y f o r 199, > 99 (P )
si ‘ Name of the,i Area Pi ductioii of YieldrateNo District (ill thousand hi y V paddy (qtl/hect)
hect) (in li! iO-sand MJ2
H Z ' z , 3______ V i „ 51 Anyul ‘)1 :> 63.13 12 332 Balasore 92.72 183 37 19.78
3 Baigath 274.55 /08 21 25B0
4 fBtiadiak 97,61 283 03 28 995 Balaiiijir 101.17 141,98 14 036 Boudh 23.43 39.91 17037 Cuttaik 6 1 64 185.56 30 108 Deogarli 24.33 37 05 15.239 Dhenkanal 48.25 131.2/ 27 20
10 Gajapati 38,84 106,67 27 4711 Ganjam 261.31 691 21 264512 Jagatsinghpur 49 71 14 3,95 28 9613 Jajpui 53.10 145,36 27 3714 Jiiarsiiguda 41.37 63.95 15.4615 Kalahandi 136.86 175,87 12.8516 Kendrapara 51.74 144,28 27 8817 Keonjhar 62.24 104,87 1685
18 Kl\U(Ua 60.80 183 95 30 25
19 Koraput 60.58 184.28 30 4220 Malkangiri 22.24 62.58 28 1421 Mayurbharij 56.7/' 982 17 3022 Nawapara 27.74 49.34 177923 Nayayarh 4 1.92 12961 30 9224 Nowarangpur 45.51 130.79 28 7425 Ptiulltani 6.23 1 ^66 28 3726 F’uii 94.57 227.94 24-1027 Rayagada 52.32 146.92 28 0828 Samtjalpur 100.73 236.32 234629 Sonefjur B/.97 208.87 237430 Suddurgarli 33.19__________ 55.30 16.66
Orissa _ _2Jl0qi)4_^^^______ 5081.43 23 52
P Provisional
Source . Uimctomh! i -/Fuo/io/mca ami Statisii' Ohhsb. Bhubaneswar
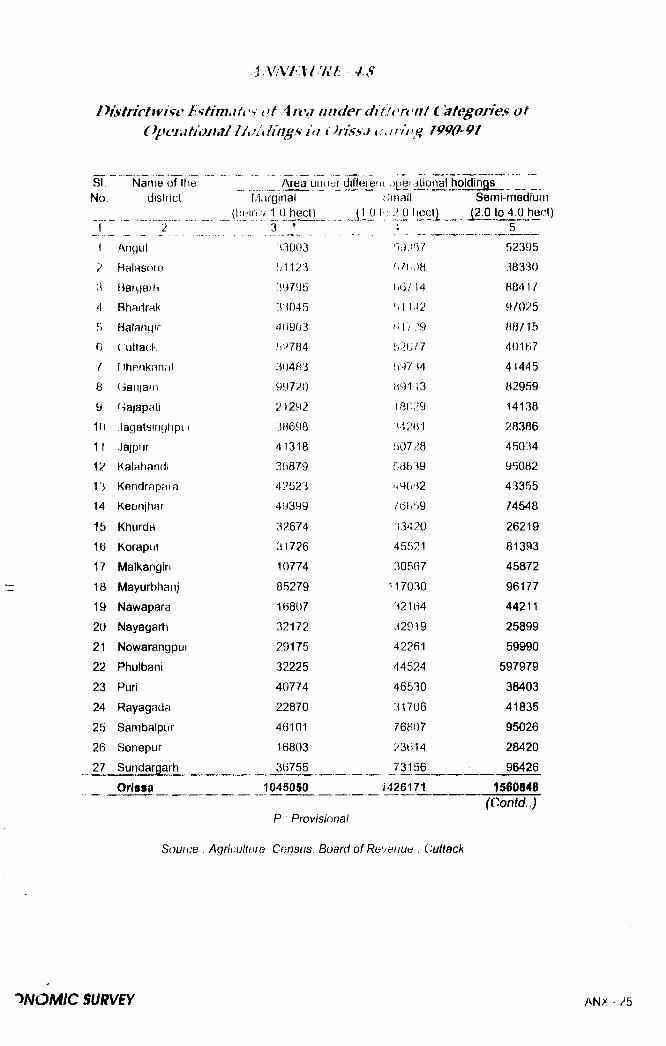
/}i3'frfctivisv Estimates of kiva under ditJen nt Categories ofOpei ational ihn ding s in i )riss. i <n/fing 1 990-91
SI Nam eoftlie Area unu«r differeiii opei alional holdingsNo. distticl Marginal
(bolow 1 0 heel) j l .Oi ...................3 J
; irnalli j 2.0 liecy^
Semi-rnediun (2,0 to 4,0 her
5
1 Angul <3003 'i9:i37 52395
2 Halasdte rn i23 08 38330
;i Haryatii 39795 f>6/14 884 17
4 Bhadrak 33045 ’>1 142 97025
5 Halanyir 40903 fn y .’9 88715
6 ( utlack .'.^704 b2()/7 40167
7 r)henknn;il 304fi3 fi9734 41445
8 (iaiijatn 997^0 891 13 82959
9 (lajapati 21292 I8(i29 14138
10 JagatsingtipLif 3H698 342H1 283B6
1 1 Jajpur 41318 f)0728 45034
12 KalahancJi 3(')879 :)BB39 95082
13 Kendrapafa 42523 'I9GH2 43355
14 Keonjhar 49399 /6059 M548
15 Khurda 32674 33420 26219
16 Koraput 31726 45521 81393
17 Malkangiri 10774 30567 45872
18 Mayurbhanj 85279 117030 96177
19 Nawapara 16807 32164 44211
20 Nayagarh 32172 32919 25899
21 Nowarangput 29175 42261 59990
22 Phulbani 32225 44524 597979
23 Puri 40774 46530 38403
24 Rayagada 22870 31706 41835
25 Sambalpur 4B101 76807 95026
26 Sonepur 16803 23614 28420
27 Sundargarh 36755 73156 96426
Orissa 1045050 1426171 1560846
P Provisional(Contd.)
Souice . Agriculture Census, Board of Revenue , Cuttack
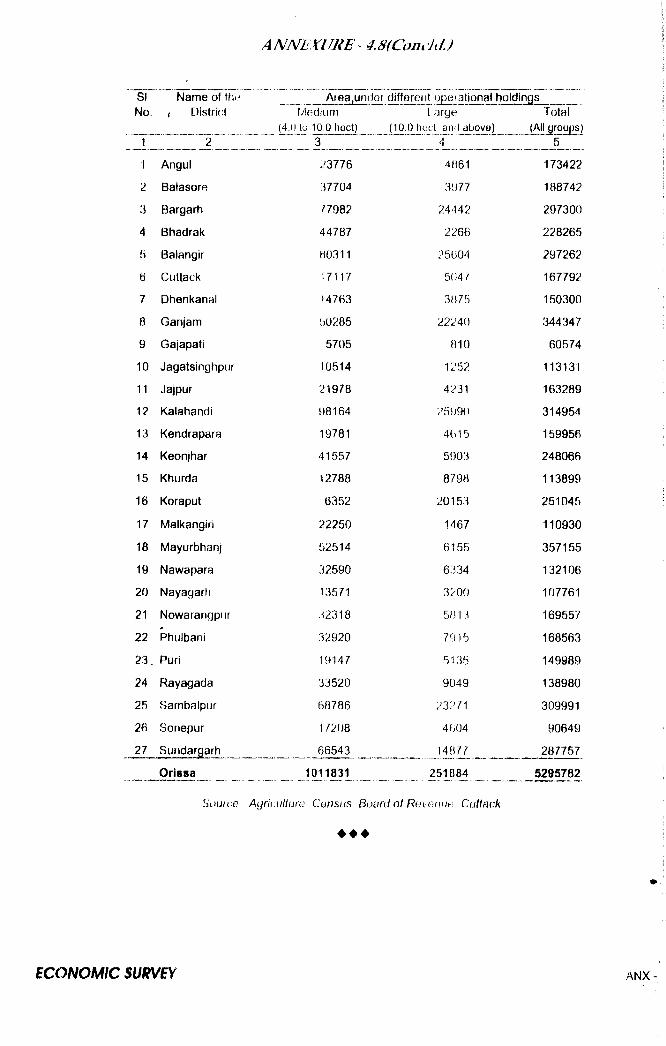
______ Area^under different operational holdingsNo. r District Medium
(4,(J to 10.0 tiect)I a rye
(10.0 heel ami aljove)Total
(All groups)1 2 3 _________ __________ _______ 5
1 Angul 23776 4861 173422
2 Balasore 37704 3977 188742
3 Bargarh /7982 24442 297300
4 Bhadrak 44787 2266 228265
5 Balangir H0311 25604 297262
6 Cuttack 17117 504? 167792
7 Dhenkanal 14763 3H75 150300
8 Ganjam ;j0285 22240 344347
9 Gajapati 5705 810 60574
10 Jagatsinghpur 10514 1252 113131
11 Jajpur 21978 4231 163289
12 Kalahandi 98164 25990 314954
13 Kendrapara 19781 4615 159956
14 Keonjhar 41557 5903 248066
15 Khurda 12788 8798 113899
16 Koraput 6352 20153 251045
17 Malkangin 22250 1467 110930
18 Mayurbhanj 52514 6155 357155
19 Nawapara 32590 6334 132106
20 Nayagarti 13571 3200 107761
21 Nowarangpiir .32318 5813 169557
22 Phulbani 32920 7915 168563
23. Puri 19147 5135 149989
24 Rayagada 33520 9049 138980
25 Sarnbalpur 60786 23271 309991
26 Sonepur 1 ^208 4604 00649
27 Sundargarh 66543 1487/ 287757
Orissa 1011831 251884 5295782
Souice Agrit'.ullum Ctjnsus. Boani of Reveswn;, Cuttack
♦ ♦ ♦
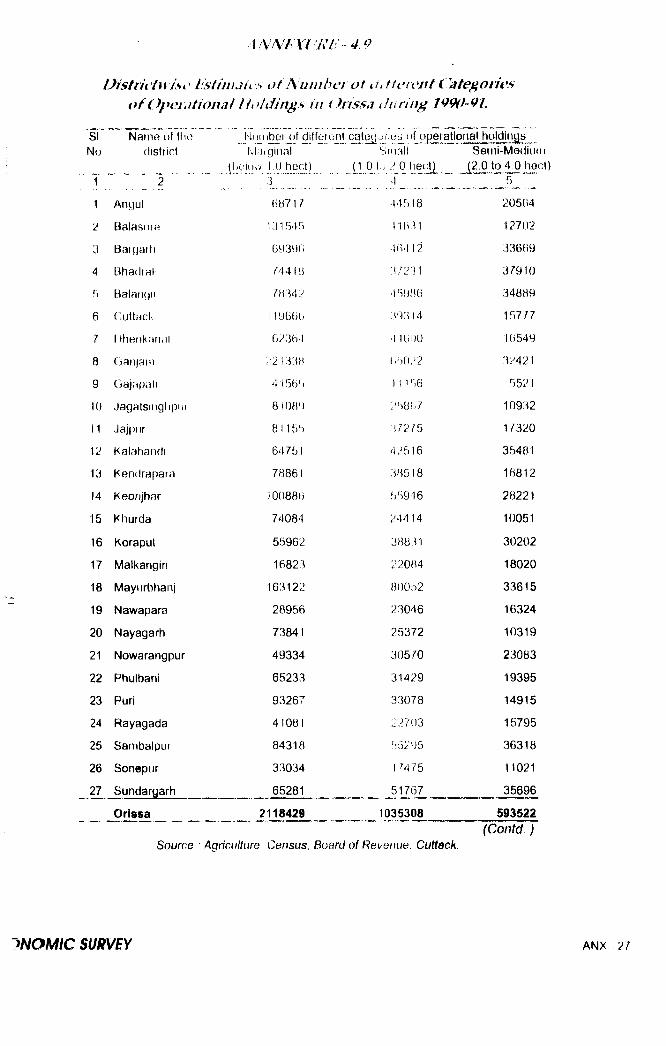
AiV/\/}'X lUU^~4.9
Distrk tin'sc Itsthiult s o t Number at iutteiviit Categorieso f Operational liohiings ui Orissa i h i ring
SI Name of II lo Number of diffei ent cateij Ji itis of operational holdingsNo district Marginal Small Serni-Mediuii
(ljfc:liKV 1.1) heict) (10 t j 2 0 (2,0 to 4 0 her......... 2.......... ........ . . 3 •1 5
1 Angul H8717 44518 20564
2 Bala sure 131545 ■I1H31 12702
3 Bargaih 6939G 4fi4 12 33669
4 BhadraK 744 IB 3/^231 37910
5 Balanyii 7H342 4‘i!)B6 34889
6 CutlHCk ! 1 U6(iG 3' -J3l4 15777
7 I (henkfitial G^3b4 4101)0 16549
8 Ganjain /2I33B (.5022 32421
9 Gajapali 4156':* M l 56 5521
10 Jagatsingliprii 8I0B‘ ) 250H7 10932
i1 Jajprir 8115h M2l b U320
12 Kalahandi 6475 1 42516 35481
13 Kendraf)ara 78861 38518 16812
14 Heonjhnr 10( )88f3 55946 28221
15 Khurda 74084 24414 10051
16 Korapul 55962 38831 30202
17 Malkangiri 16823 22084 18020
18 Mayiirbhanj 163122 80052 33615
19 Nawapara 28956 23046 16324
20 Nayagarh 73841 25372 10319
21 Nowarangpur 49334 30570 23083
22 Phulbani 65233 31429 19395
23 Puri 93267 33078 14915
24 Rayagada 41081 22703 15795
25 Sambalput 84318 55245 36318
26 Sonepur 33034 17475 11021
27 Sundargarh 65281 51767 35696
Orissa 2118429 1035308 593522
Source ■ Agriculture Census, Board of Revenue. Cuttack.
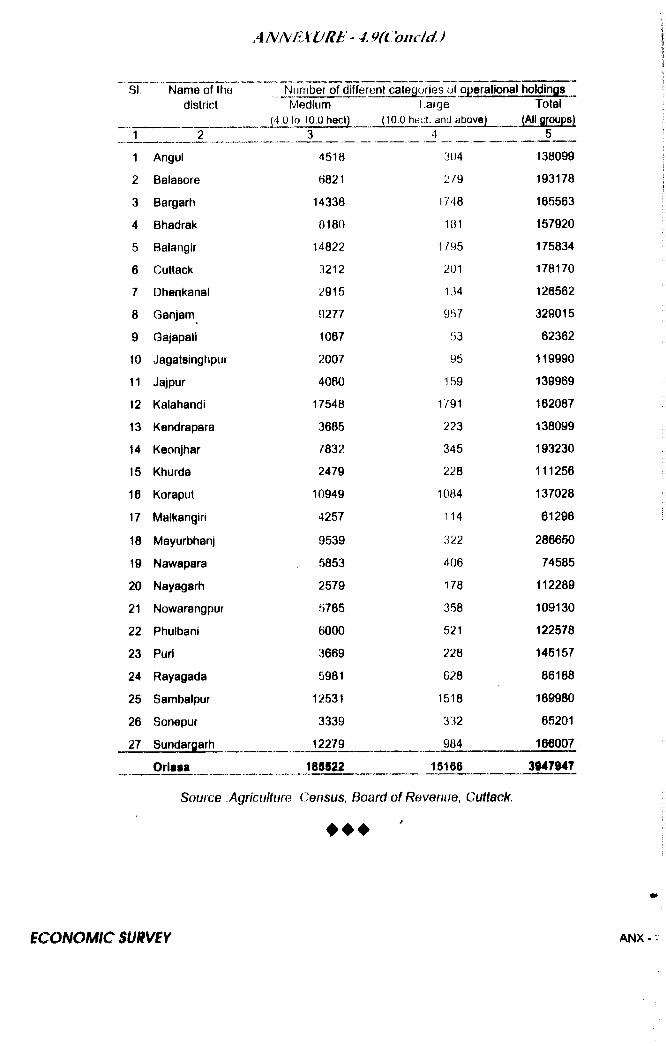
SI. Name of thej Number of different categories of operational holdinasdistrict Medium Large Total
(4.0 to lO.U hect) (10.0 heel, and above) (All groups)1 2 3 __ ______ 4
1 Angul 4518 304 138099
2 Balasore 6821 279 193178
3 Bargarti 14338 1748 165563
4 Bhadrak 0180 101 157920
5 Balangir 14822 1795 175834
6 Cuttack 3212 201 178170
7 Dhenkanal 2915 134 126562
8 Ganjam 9277 957 329015
9 Gajapati 1067 53 62362
10 Jagatsinghpur 2007 95 119990
11 Jajpur 4060 159 139969
12 Kalahandi 17548 1791 162087
13 Kendrapara 3685 223 138099
14 Keonjhar 7832 345 193230
15 Khurda 2479 228 111256
16 Korapiit 10949 1084 137028
17 Malkangiri 4257 114 61298
18 Mayurbhanj 9539 322 286650
19 Nawapara 5853 406 74585
20 Nayagarh 2579 178 112289
21 Nowarangpur 5785 358 109130
22 Phulbani 6000 521 122578
23 Puri 3669 228 145157
24 Rayagada 5981 628 86188
25 Sambalpur 12531 1518 189980
26 Sonepur 3339 332 65201
27 Sundargarh 12279 984 166007
Orissa 185522 15166 3847947
Source Agriculture Census, Board of Revenue, Cuttack,
♦ ♦ ♦
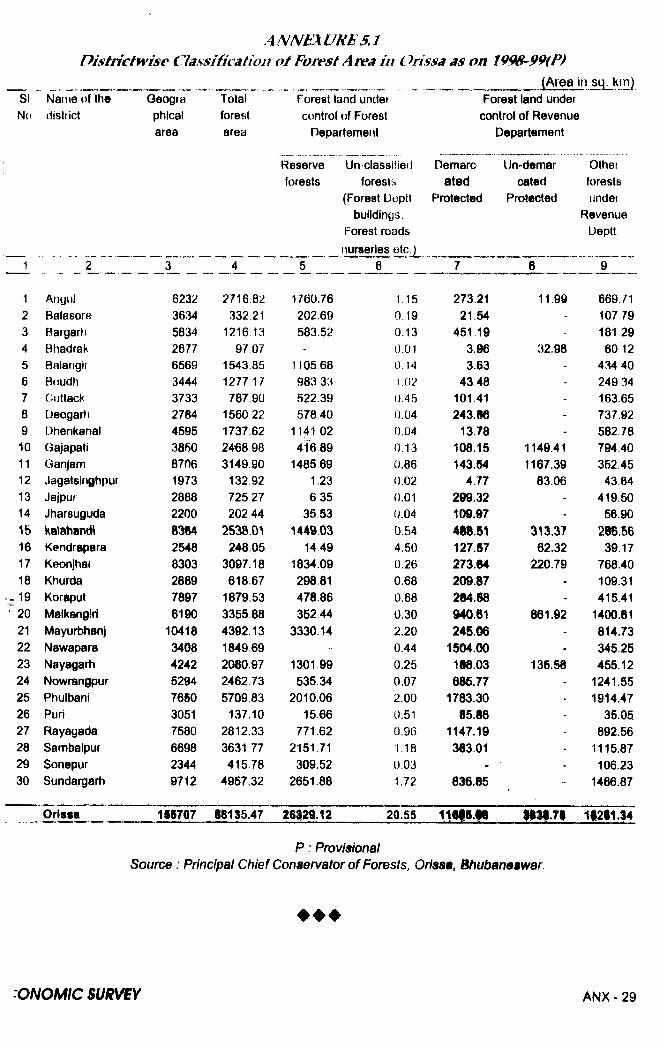
ANNkXURE 5.1 Districtwise Classification o f Forest Area in Orissa as on 1998-99iP)
(Area in sq. kin)SINo
Name of tiieilistrict
Qeographicalarea
Totalforestarea
Forest land under control of Forest
Pepartement
Reserve Un classified forests forests
(Forest Deptl buildings,
Forest roads, tiurseries etc.)
Forest land under control of Revenue
Departement
Demarc- Un-demar ated catad
Protected Protected
Otherforestsunder
RevenueDeptt
1 4 ,5 6 7 8 9
1 Angul 6232 2716.82 1760.76 1.15 273,21 11.99 669.712 Balasore 3634 332 21 202.69 0.19 21 54 - 107,793 Bargarh 5834 1216 13 583.52 0.13 451 19 - 181 294 Bhadrak 2677 97 07 - 0.01 3.96 32.98 60 125 Balangit 6569 1543.85 1105 68 0.14 3,63 - 434 406 Boudh 3444 1277 17 983 33 1.02 4348 - 249 347 Cuttack 3733 787.90 522 39 0.45 101.41 - 163658 Deogarfi 2784 1560,22 578 40 0.04 243.86 - 737.929 Dhenkanal 4595 1737 62 1141 02 0.04 13.78 - 582,7810 Gajapati 3850 2468 98 41689 0.13 108.15 1149.41 794.4011 Ganjam 8706 314990 1485 69 0.86 143.54 1167.39 352.4512 Jagatsinglipur 1973 132,92 1.23 0.02 4.77 83.06 43,8413 Jajpur 2888 72527 6 35 0.01 299.32 - 419.5014 Jharsuguda 2200 202 44 35 53 0.04 109.97 - 56.9015 Katahandi 2538.01 1449.03 0.54 488.51 313.3? 286.5616 Kendrapara 2548 248.05 14 49 4.50 127.S7 62.32 39.1717 Keonjhar 8303 3097.18 1834.09 0.26 273.84 220.79 768.4018 Khurda 2889 618.67 298.81 0.68 209.87 - 109.31
= 19 Koraput 7897 1879.53 478.86 0.68 284.88 - 415.41• 20 Malkangiri 6190 3355.88 352 44 0.30 940.61 861.92 1400.81
21 Mayurbhanj 10418 4392.13 3330.14 2.20 245.06 - 814.7322 Nawapara 3408 1849.69 0.44 1504.00 - 345.2523 Nayagarh 4242 2080.97 1301 99 0.25 188.03 135.88 455.1224 Nowrangpur 5294 2462.73 535,34 0.07 685.77 - 1241.5525 Phulbani 76S0 5709.83 2010.06 2.00 1783.30 1914.4726 Puri 3051 137.10 15.66 0.51 85.88 - 35.05.27 Rayagada 7580 2812.33 771.62 0.96 1147.19 - 892.5628 Sambalpur 6698 3631 77 2151 71 1.18 383,01 - 1115.8729 Sonepur 2344 41578 309.52 0.03 - ■ 106.2330 Sundargarh 9712 4957.32 2651,88 1.72 836.85 - 1466.87
Orissa 1IS7Q7 IS135.47 2g.58 ii9 is .ii n n .n 11211.14
P : ProvisionalSource: Principal Chief Conservator of Forests, Orissa, Bhubaneswar
♦ ♦ ♦
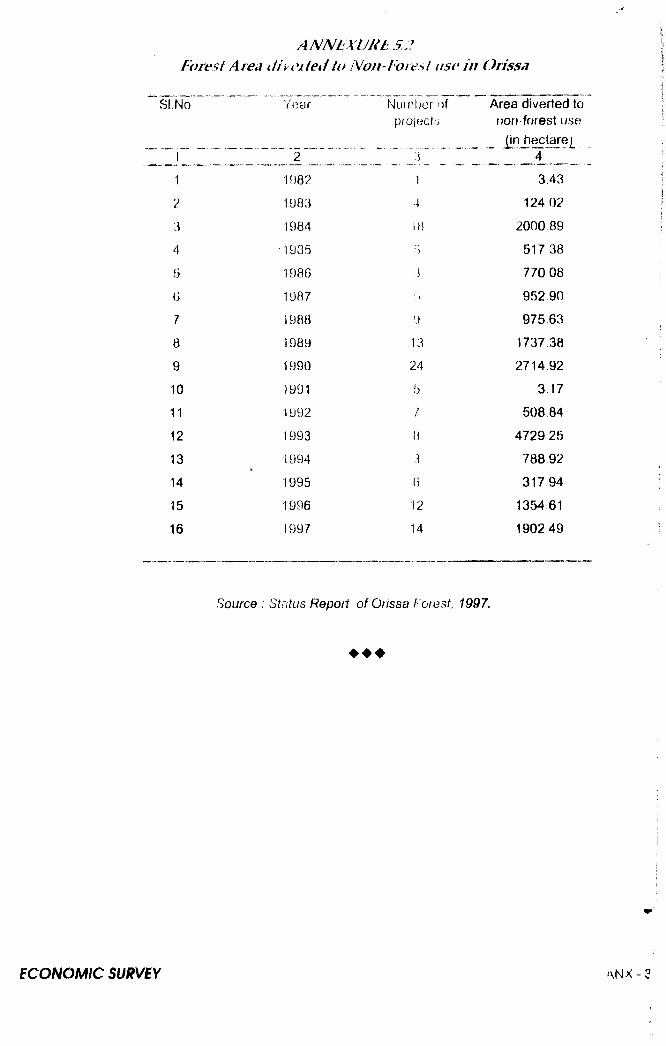
ANNEXUR£Forest Aiea dii^^cited to Non-Forest use in Orissa
SI.No Year N u in lje ro f Area diverted topiojects nof^forest use
j Z I
j[n hectare
1 1982 1 3.43
2 1983 -1 124 02
3 1984 IH 2000.89
4 ■1985 517 38
5 1986 3 770 08
6 1987 * ) 952,90
7 1988 ') 975.63
8 1989 13 1737,38
9 1990 24 2714.92
10 1991 5 3.17
11 1992 y! 508.84
12 1993 n 4729.25
13 1994 3 768.92
14 1995 317 94
15 1996 12 1354 61
16 1997 14 190249
Source : Status Report o f Orissa Forest, 1997.
♦ ♦ ♦
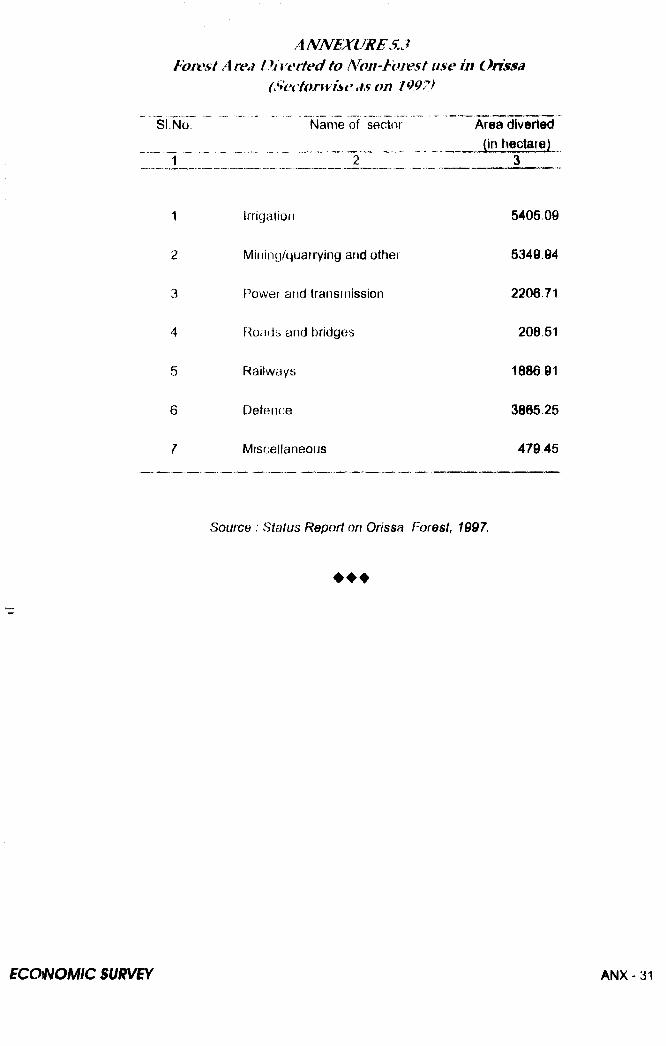
Fowsf A re^ Diverted to Non-Foivst use in Orissa (Sectorivise tis on 1997)
si,No. Name of sector Area diverted(In hectare)
1 2 3
1 Irrigation 5405.09
2 Mining/quarrying and other 5349.94
3 Flower arid transmission 2206.71
4 Roads and bridges 208 51
5 Railways 1886 91
6 Defence 3865.25
7 Miscellaneous 479 45
Source : Status Report on Orissa Forest, 1997.
♦ ♦ ♦
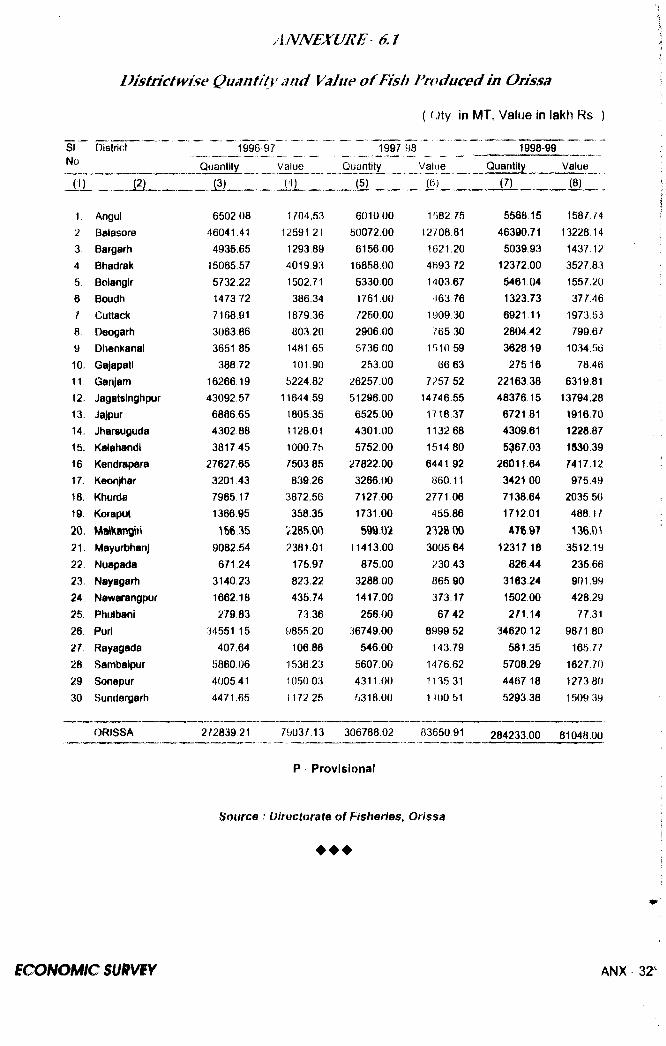
D istrict wise Quantity and Value o ffish Produced in Orissa( Qty in MT, Value in lakh Rs
SI District No
199G-97 1997 98 1998-99
Quantity
(I)
I . Angul2 Balasore3 Bargarti4 Btiadrak 5. Bolangir6 Boudh7 Cuttack8 Deogarh9 Dlienkanal 10. GajapatiI I . Ganjam12. Jagatsinghpur13. Jajpur14. Jharsuguda15. Kaiahandi16 Kendrapara17 Keonjhar18. Khurda19. Koraput
20. MatKangiri21. MayurbhanJ22. Nuapada23. Nayagarh24. Nawarangpur25. PhulbanI 26 Puri27. Rayagada28 Sambalpur29 Sonepur30 Sundergarti
(3)
6502 08 46041.414935.65
15065 575732.22
1473 72
7168.91 3063,86
3651 85388.72
16266.1943092.57
6886.65 4302 88 3817 45
27627,65
3201 43 7965 171366.05
156 359082 64
671,243140.23
1662,1827983
34551 15 407.64
5860.06
4005414471.65
Value Quantity Value Quantity Value
(4) (5) __ (7) (8)
1704.53 601000 1582 75 5568 15 1587 7412591.21 50072.00 12708.81 46390.71 13228.14
1293 89 6156.00 1621.20 5039,93 1437,124019.93 16858.00 4B93 72 12372.00 3527,831502.71 5330.00 1403 67 5461 04 1557,20386.34 1761.00 463 76 1323.73 377.46
1679.36 7250.00 1909 30 6921.11 1973.53803.20 2906 00 765 30 280442 799.6/
1481 65 5736 00 1510 59 3628 19 1034.56101.90 253,00 66 63 275 16 78.46
5224.82 26257.00 7257 52 22163.38 6319.8111644 59 51296.00 14746.55 48376.15 13794.28
1805.35 6525.00 1718 37 6721 81 1916.701128.01 4301.00 1132 68 4309.61 1228.871000.75 5752.00 151480 5^67.03 1530.397503.85 27822.00 6441 92 26011.64 7417.12839,26 3266.00 860 11 3421 00 975.49
3872.56 7127.00 2771 06 7138 64 2035,56358.35 1731.00 455.86 171201 488 17
'2285.00 m m 2328 00 478 97 136,012381,01 11413.00 3005 64 12317 18 3512.19
175.97 875.00 230 43 826.44 235 66823.22 3288.00 865 90 3163 24 901.99435.74 1417.00 373,17 1502.00 428.29
73 36 256.00 67 42 271,14 77.319855.20 36749.00 8999 52 34620.12 9871.80
106,86 546.00 143.79 581 35 165.771536,23 5607.00 1476.62 5708.29 1627 701050 03 4311 00 1135 31 4467 18 1273 801172 25 5318.00 110051 529338 1509 39
79037,13 306788.02 8365091 284233.00 81048.00ORISSA 272839 21
P Provisional
Source : Dirvctorate of Fisheries. Orissa.
♦ ♦ ♦
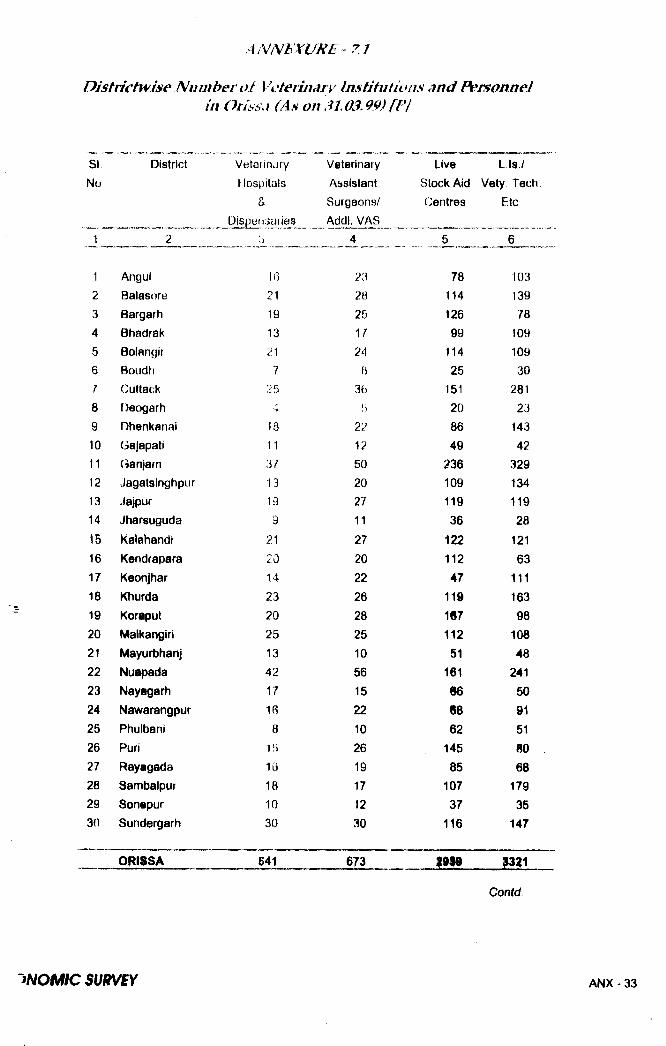
A N N E X U N E ^ ^ 7.1
D istrictw ise Number o f Veterinary Instifutiuns and Personnelm Oriss.i (As on 31.03,99)[PJ
SI District Veterinary Veterinary Live L Is./No Hospitals Assistant Stock Aid Vety Tecti.
& Surgeons/ Centres EtcDispel isuiies Add!, VAS ____
1 2 4 ______ 5 6
1 Angul 16 23 78 1032 Balasore 21 28 114 139
3 Bargarh 19 25 126 78
4 Bhadrak 13 17 99 109
5 Bolangir 21 24 114 1096 Boudti 7 B 25 307 Cuttack 25 36 151 2818 Deogarh 4 b 20 239 Dhenkanai 18 22 86 14310 Gajapati 11 12 49 4211 Ganjarn 37 50 236 32912 Jagatsinghpur 13 20 109 13413 Jajpur 19 27 119 11914 Jharsuguda 9 11 36 28
15 Katahandi 21 27 122 12116 Kendrapara 20 20 112 6317 Keonjhar 14 22 47 11118 Khurda 23 26 119 16319 Koraput 20 28 167 9820 Malkangiri 25 25 112 10821 Mayurbhanj 13 10 51 4822 Nuapada 42 56 161 24123 Nayagarh 17 15 66 5024 Nawarangpur 16 22 68 9125 Pliulbani 8 10 62 5126 Puri 1H 26 145 8027 Rayagada 16 19 85 6828 Sambalpur 18 17 107 17929 Son«pur 10 12 37 3530 Sundergarh 30 30 116 147
ORISSA 541 673 t m 1321
Contd
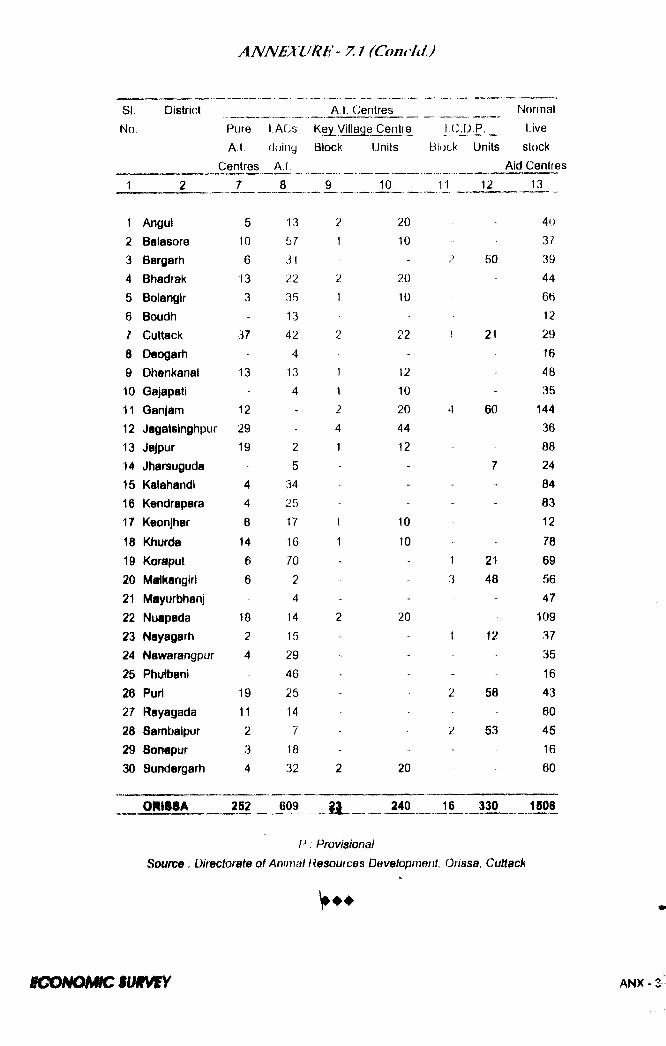
SI. District A 1. Centres Normal
No. Pure 1 ACS Kev Village Cetitre i c Live
A.I doifiy Block Units Block Units stock
Centres A.I. Aid Centres
1 2 7 8 9 10 _ 1 J _ 12 13
1 Angul 5 13 2 20 40
2 Balasore 10 57 1 10 37
3 Bargarh 6 31 - ’) 50 39
4 Bhadrak 13 22 20 44
5 Bolangir 3 35 1 10 66
6 Boudh - 13 - 12
7 Cuttack 37 42 2 22 1 21 29
8 Deogarh 4 - 16
9 Dhenkanal 13 13 1 12 48
10 Gajapatl - 4 1 10 35
11 Ganjam 12 - 2 20 4 60 144
12 Jagatsinghpur 29 - 4 44 36
13 Jajpur 19 2 1 12 88
14 Jharsuguda - 5 - 7 24
15 Kalahandi 4 34 - - 84
16 Kendrapara 4 25 - - - 83
17 Kaonjhar 8 17 1 10 12
18 Khurda 14 16 1 10 78
19 Koraput 6 70 - 1 21 69
20 Malkangirl 6 2 - 3 48 56
21 Mayurbhanj 4 - - - 47
22 Nuapada 18 14 2 20 - 109
23 Nayagarh 2 15 - - 1 12 37
24 Nawarangpur 4 29 - 35
25 Phutbani - 46 - - 16
26 Purl 19 25 - 2 58 43
27 Rayagada 11 14 60
28 Sambaipur 2 7 - - 2 53 45
29 Sonepur 3 18 - - - 16
30 Sundergarh 4 32 2 20 60
oniiSA 252 609 240 16 330 1S0B
P : ProvisionalSource : Directorate of Animal Resources Development, Orissa, Cuttack
tc o N O M K s m rv e Y

ANNhXURE Z2D is t r ic tw is e L iv e s h u k r o p u la t io n h i O ris s a (A tm 0 1 ,0 9 .9 5 )
SI District— — -----------
...— ----- -------- --------
Buffalo- --- -------
No..... ... 2''"” '...
Total milch working Total milch..7 "
working8
1 Angul 521446 154J4B
__
178784 51269 14437 182322 Balasore 912831 2200M4 333297 7180 1872 13733 Bargarti 513192 12157/ 1227566 39191 7520 189714 Bhadrak 550135 14303/ 190225 14213 5650 12735 Bolangir 5990B3 153090 244968 117014 29181 24049B Boudh 231880 61G1.2 85831 35609 8301 146287 Cuttack 640966 2020 )2 169940 62516 10772 32057
8 Deogarh 181339 tiu iy / 72801 21094 5770 87189 Dhenkanal 407218 14&4B-1 1659B2 7507 ;■) 26927 16570
10 Gajapati 272771 63007 111059 18140 8309 40511 Ganjam 1029367 3317(i9 4545 151874 J7321 7159412 Jagatsinghpiir 43^831 128 V24 154573 15804 7864 26813 Jajpur 634022 49/18 81829 11932 2770 1423414 Jharsuguda 193344 187/63 189590 21209 4046 235015 Kalatiandi 540290 138027 222720 125946 26701 5835616 Kendrapara 308767 69!)74 131134 76230 20461 2680317 Keonjhar 471102 120(i37 151419 22148 8462 90718 Khurda 695939 168497 279214 37851 12744 6359
19 Koraput 424744 220502 118412 143271 5624 1213920 Malkangiri 366796 111451 160877 39039 33210 3295121 Mayurbhanj 894541 99G94 139675 31233 10078 16287
22 Nuapada 380378 187014 439326 106961 6011 17307
23 Nayagarh 390629 91035 170Ov54 62358 15101 57092
24 Nawarangpur 289683 126364 116627 70232 10477 39703
25 Phulbani 461382 74389 121343 26232 12124 3795626 Puri 405439 148577 149597 115385 9134 439827 Rayagada 566965 107518 159787 25452 32925 4050428 Sambalpur 429453 108142 180923 36578 8987 1633229 Sonepur 258342 59956 117410 30086 5695 1673530 Sundergarti 676121 164122 296987 60929 12471 28567
o m s iA 1476S996 4021479 «174495 16S2050 400S45 •3T118
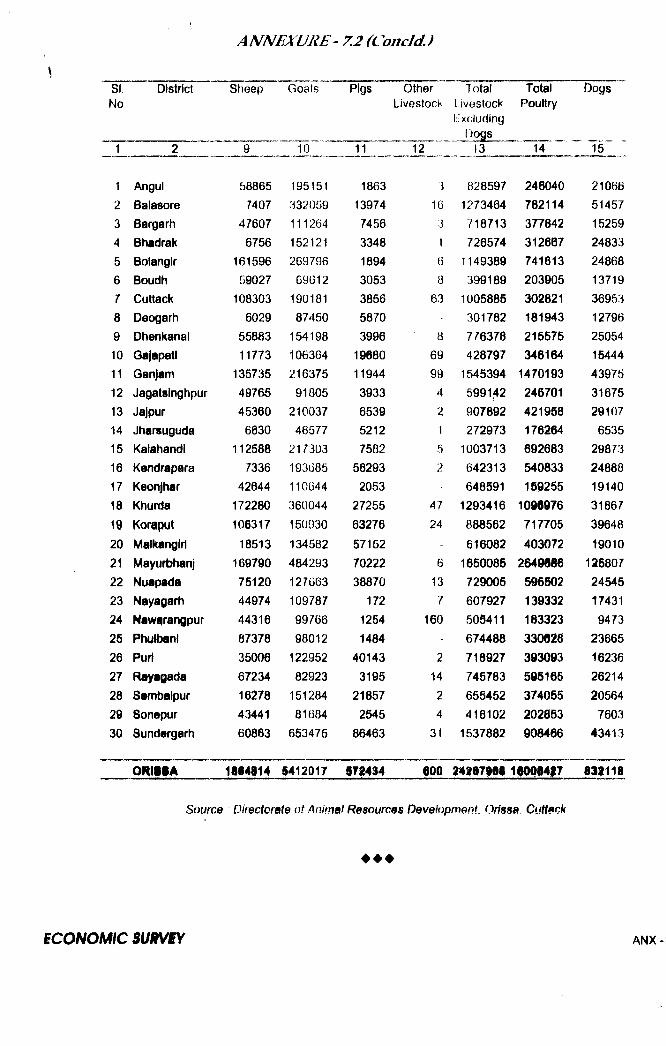
SI.No
District Sheep Goats Pigs OtherLivestock
TotalLivestock(•xcluding
i3ogs
TotalPoultry
Dogs
1 2 9 10 11 12 13 14 ” l 5 ” '
1 Angul 58865 195151 1863 3 828597 246040 21066
2 Balasore 7407 332059 13974 16 1273464 782114 51457
3 Bargarli 47607 111264 7456 3 718713 377842 15259
4 Bhadrak 6756 152121 3348 1 726574 312667 24833
5 Bolangir 161596 2G9796 1894 6 1149389 741613 24868
6 Boudh 59027 69612 3053 8 399189 203905 137197 Cuttack 108303 190181 3856 63 1005885 302821 36953
8 Deogarh 6029 87450 5870 301782 181943 12796
9 Dhenkanal 55883 154198 3996 a 776378 215575 25054
10 Gajapatl 11773 106364 19080 69 428797 346164 15444
11 Qanjam 135735 216375 11944 99 1545394 1470193 43975
12 Jagatsinghpur 49765 91805 3933 4 599142 246701 31675
13 Jajpur 45360 210037 6539 2 907892 421958 29107
14 Jharsuguda 6630 46577 5212 1 272973 176264 653515 Kalahandi 112588 217303 7582 5 1003713 692683 29873
16 Kendrapara 7336 1931585 56293 2 642313 540833 2488817 Keonjhar 42644 1101)44 2053 648591 159255 19140
18 Khurda 172280 360044 27255 47 1293416 1096976 31867
19 Koraput 106317 150930 63276 24 888562 717705 39648
20 Maikangiri 18513 134582 57152 - 616082 403072 19010
21 Mayurt»hanj 169790 484293 70222 6 1650085 2649666 126807
22 Nuapada 75120 127G63 38870 13 729005 596502 24545
23 Nayagarh 44974 109787 172 7 607927 139332 17431
24 Nawqrangpur 44316 99766 1254 160 505411 183323 9473
25 Phulbani 87378 98012 1484 - 674488 330628 23665
26 Purl 35006 122952 40143 2 718927 393093 16236
27 Rayagada 67234 82923 3195 14 745783 596165 26214
28 Sambaipur 16278 151284 21857 2 655452 374055 20564
20 Sonepur 43441 81084 2545 4 416102 202853 7603
30 Sundergarh 60863 653475 86463 31 1537882 908466 43413
o m i t A 1M4814 S412017 571434 600 24107901 1 I0 0 I4 I7 831118
Source Directorate of Animal Resources Development. Orissa, Cuttack
♦ ♦ ♦
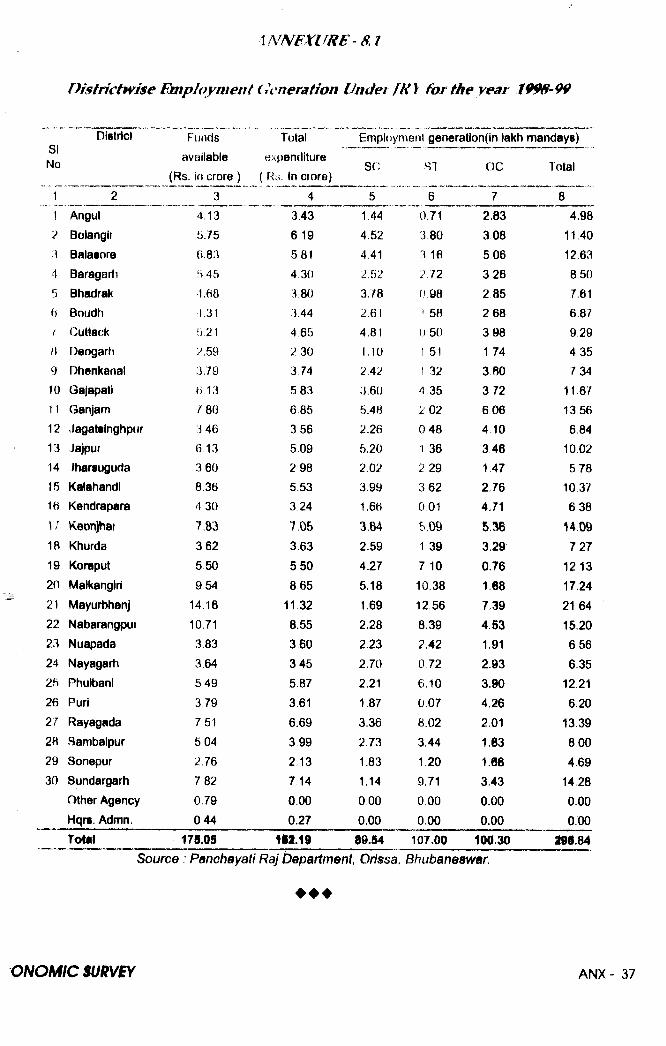
D istrictw ise Employment Ccneration Undev f H \ for the year 199&-99
DistrictSI
Funds Total Empit)ymenl generation(in lakh mandays)Ol-No availabie
(Rs. in urore)expenditure
( Rs In crore)SC ST oc Total
1 2 3 4 5 6 7 8
1 Angul 4.13 3.43 1.44 0.71 2.83 4.98
2 Bolangir 5.75 6 19 4,52 380 308 11.40
3 Balasore 6.83 5 81 4.41 3 16 506 12,63
4 Baragarti 5,45 4 30 2.52 2,72 326 8.50
5 Bhadrak 4.68 3.80 3.78 0.98 285 7.61tj Boudh 1.31 3.44 2.61 1 58 2 68 6,87
! Cuttack 5,21 4.65 4.81 0 50 3 98 9.29H Deogarh 2,59 2 30 1,10 1 51 1 74 4,35
9 Dlienkanal 3,79 3 74 2.42 1,32 3 60 7 3410 Gajapati 6,13 5,83 :).60 4 35 372 11 6711 Ganjarn /8 6 685 5.48 2 02 6 06 13 56
12 .iagatslnghpur 3 46 3 56 2.26 0 48 4,10 68413 Jaipur 6 13 5 09 5.20 1 36 346 10 0214 [harsuguda 3 60 2 98 2.02 2 29 1.47 57815 Katahandi 8.36 5.53 3.99 362 2 76 10 3716 Kendrapara 4 30 3 24 1.66 001 4.71 638
V7 Keon^at 7.83 7.05 3.64 5,09 5.36 140918 Khurda 362 3.63 2.59 1,39 3.29 727
19 Koraput 550 5.50 4.27 7 10 0.76 12 1320 Matkangiri 954 865 5.18 10.38 1.68 17.2421 Mayurbhanj 14 16 11.32 1.69 12,56 7.39 21 6422 Nabarangpur 10,71 8.55 2.28 8.39 4.S3 15.2023 Nuapada 383 3,60 2.23 2.42 1.91 6,5624 Nayagarh 3,64 345 2.70 0 72 2.93 6.3525 Phulbani 5 49 5.87 2.21 6,10 3.90 12,2126 Puri 3,79 3.61 1.87 0.07 4.26 6.2027 Rayagada 751 6.69 3.36 8.02 2.01 13.392R Sambalpur 5 04 399 2.73 3.44 1.63 8 0029 Sonepur 2 76 2.13 1.83 1.20 1.06 4.6930 Sundargarh 782 7 14 1.14 9.71 3.43 1428
Other Agency 079 0.00 0.00 0.00 0.00 0.00Hqrs. Admn. 044 0.27 0.00 0.00 0.00 000Total 17S.05 89.54 107.00 100.30 398.84
Source Panohayati Raj bepartment, Orissa, Bhubaneswar.
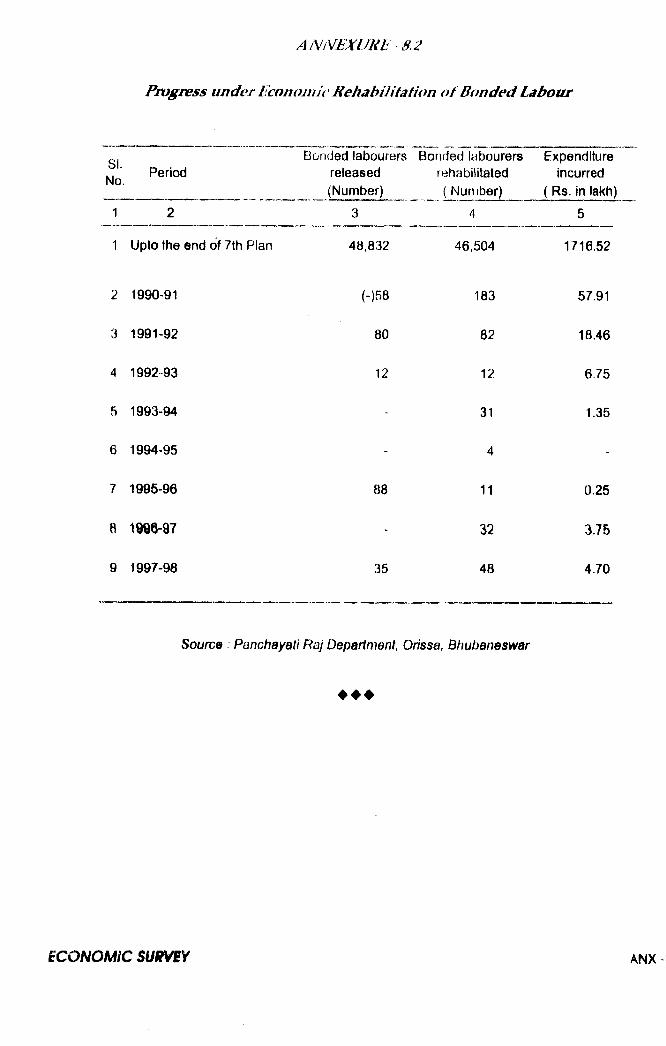
A NNEXUKh ^8.2
Progress under Economh ' Kehahilitation o f Bonded Labour
SI. „ . ^ PeriodNo.
Bonded labourers released (Number)
Bonded labourers rehabilitated ( Number)
Expenditure Incurred
( Rs. In lakh)1 2 3 4 5
1 Upto the end of 7th Plan 48,832 46,504 1716.52
2 1990-91 (-)68 183 57.91
3 1991-92 80 82 18.46
4 1992^93 12 12 6.75
5 1993*94 ■■ 31 1.35
6 1994-95 - 4 -
7 1995-96 88 11 0.25
6 1996-97 - 32 3.75
9 1997-98 35 48 4.70
Sourc& Panchayati Raj Department, Orissa, Bhubaneswar
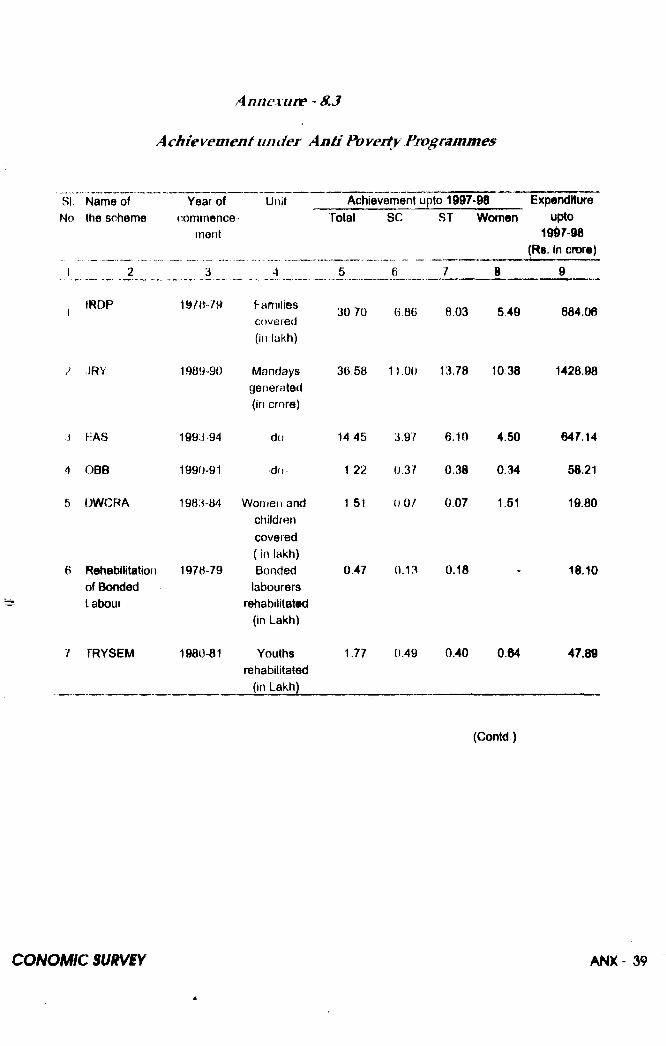
SI Name of No the scheme
Year of Unit Achievement upto 1997*90 Expenditure
1 IRDP
2 .IRY
3 HAS
4 OBB
5 DWCRA
6 Rehabilitation of Bonded Latioui
7 TRYSEM
commencernent
3 4
Total
5
vSC
6
ST
7
Women
8
upto 1967-98
(Rs. In crore)
9
1978-79 families covered (ill lakh)
30 70 6.86 8.03 549 684.06
1989-90 Mandays generated (in crore)
36 68 11.00 13.78 10 38 1428.98
1993-94 do 14 45 3.97 6.10 4.50 647.14
1990-91 do 1 22 0.37 0.38 0.34 58.21
1983-84 Womeji and children covered ( in lal<h)
1 51 0 0^ 0.07 1.51 19.80
1978-79 Bonded labourers
rehabilitated (in Lakh)
0.47 0.13 0.18 18.10
1980-81 Youths rehabilitated
(in Lakh)
1.77 0.49 0.40 0.64 47.89
(Contd.)
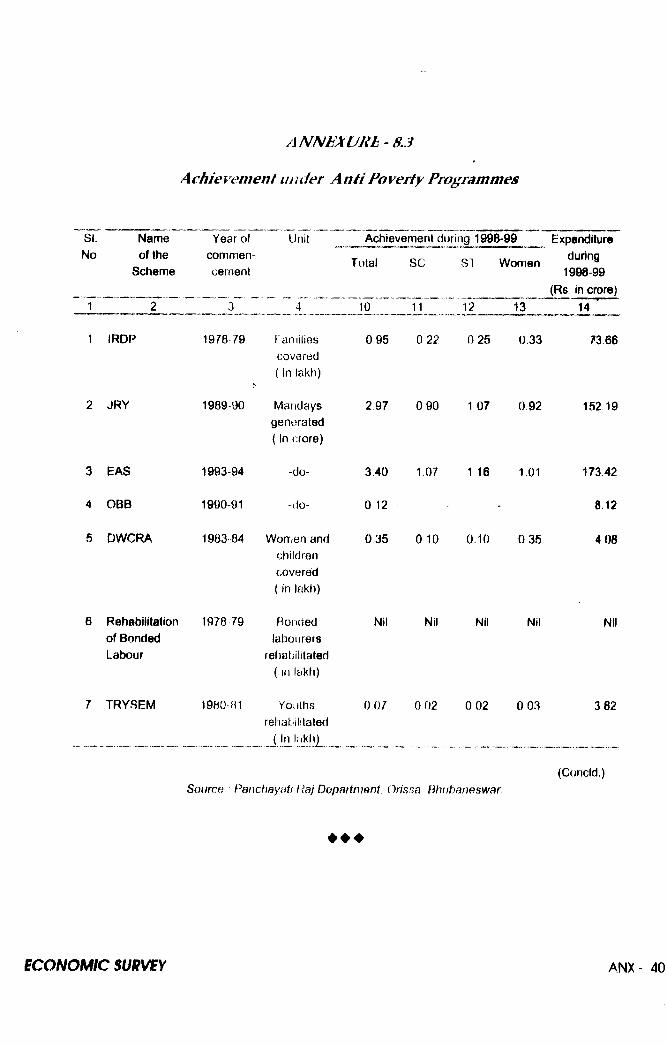
SI. Name Year of Unit Achievement during 1998-99 ExpenditureNo of the
Schemecommencement
Total SC ST Women during1998-99
(Rs. in crore)1 2 3 4 11 12 13 14
1 IRDP 1978-79 Families covered ( in lakh)
095 0 22 0 25 0.33 7366
2 JRY 1989-90 Mandays generated ( in crore)
2 97 0 90 1 07 0 92 152 19
3 EAS 1993-94 -do- 3 40 1 07 116 101 173.42
4 OBB 1990-91 -iIg 0 12 • - 8 12
5 DWCRA 1983-84 Women and children covered ( in lakh)
035 0 10 0,10 035 4 08
6 Rehabilitation of Bonded Labour
1978 79 Bonded labourers
rehabilitated ( in iakh)
Nil Nil Nil Nil Nil
7 TRYSEM 1980-01 Yoiilhs rehabilitated
( In In k t^
0,07 0-02 0 02 0 03 382
(Concld.)Soiirao Panchayati Raj Department Orissa Bhubaneswar
♦ ♦ ♦
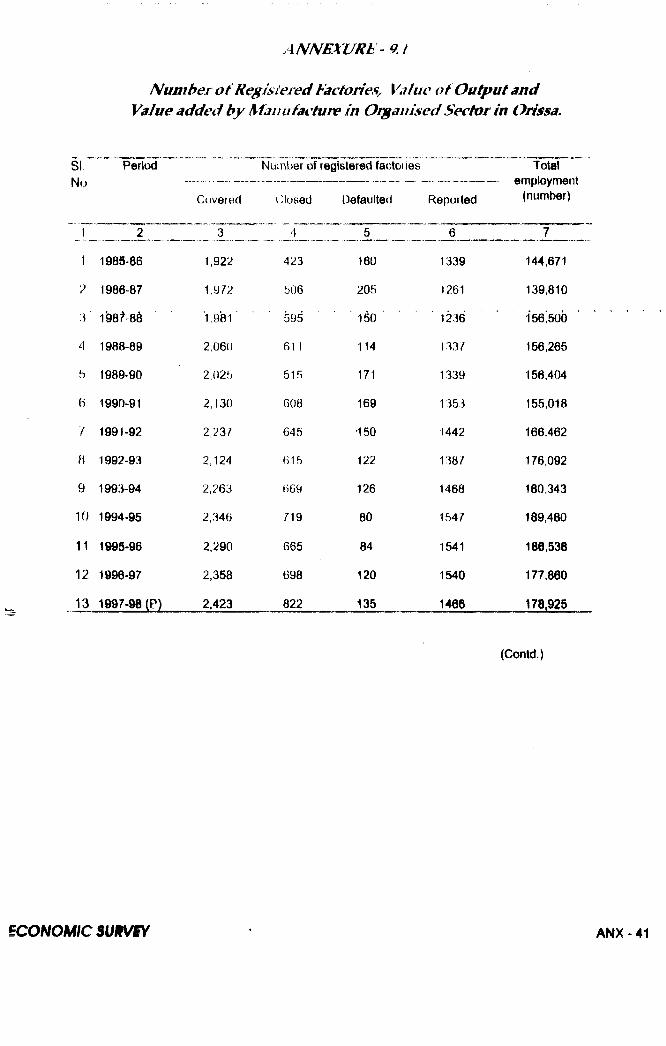
Num ber o f Regisiered Factories^ Value o f O utput and Value added by Manufacture in Organised Sector in Orissa.
SI,No
Period Number of registered factoi ies
Covered
\____ _ 2 __
1 1985-86
2 1986-87
3 1&8t86
4 1988-89
5 1989-90
6 1990-91
7 1991-92
B 1992-93
9 1993-94
10 1994-95
11 1995-96
12 1996-97
13 1997-98 (P)
1,922
1,972
'1,981
2.060
2,025
2,130
2,237
2,124
2,263
2,346
2,290
2,358
2,423
Closed Defaulted Reported
Totalemployment
(number)
423
506
595
61 I
515
608
645
616
669
719
665
698
822
160
205
150
114
171
169
•150
122
126
80
84
120135
1339
1261
1236
133/
1339
1353
1442
138/
1468
154/
1541
1540
146
144,671
139,810
1561500
156,265
156,404
155,018
166,462
176,092
180,343
189,480
180,538
177,860
m m b
(Conld.)
ecoNOMic Sum/SY ANX - 41
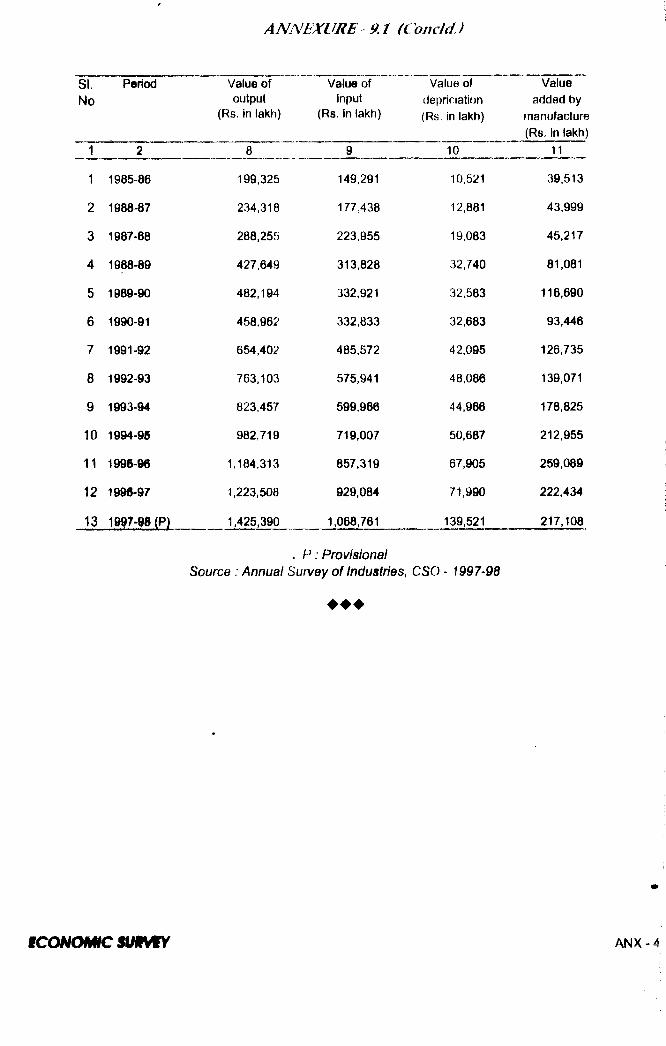
SI.No
Period Value of output
(Rs. in lakh)
Value of input
(Rs. in lal^h)
Value of (Jepriciation (Rs. in lakh)
Value added by
manufacture (Rs. in lakh]
1 2 8 9 10 11
1 1985-86 199,325 149,291 10,521 39,513
2 1988-87 234,318 177,438 12,881 43,999
3 1987-88 288,255 223,955 19,083 45,217
4 1988-89 427,649 313,828 32,740 81,081
5 1989-90 482,194 332,921 32,583 116,690
6 1990-91 458,962 332,833 32,683 93,446
7 1991-92 654,402 485,572 42,095 126,735
8 1992-93 763,103 575,941 48,086 139,071
9 1993-94 823,457 599,966 44,966 178,825
10 1994-95 982,719 719,007 50,687 212,955
11 1998-96 1,184,313 857.319 67,905 259,089
12 1996-97 1.223,508 929,084 71,990 222,434
13 1997-tS (P) 1.425,390 1,068,761 139,521 217,108
. P : Provisional Source : Annual Survey of Industries, CSC) - 19974
♦ ♦ ♦
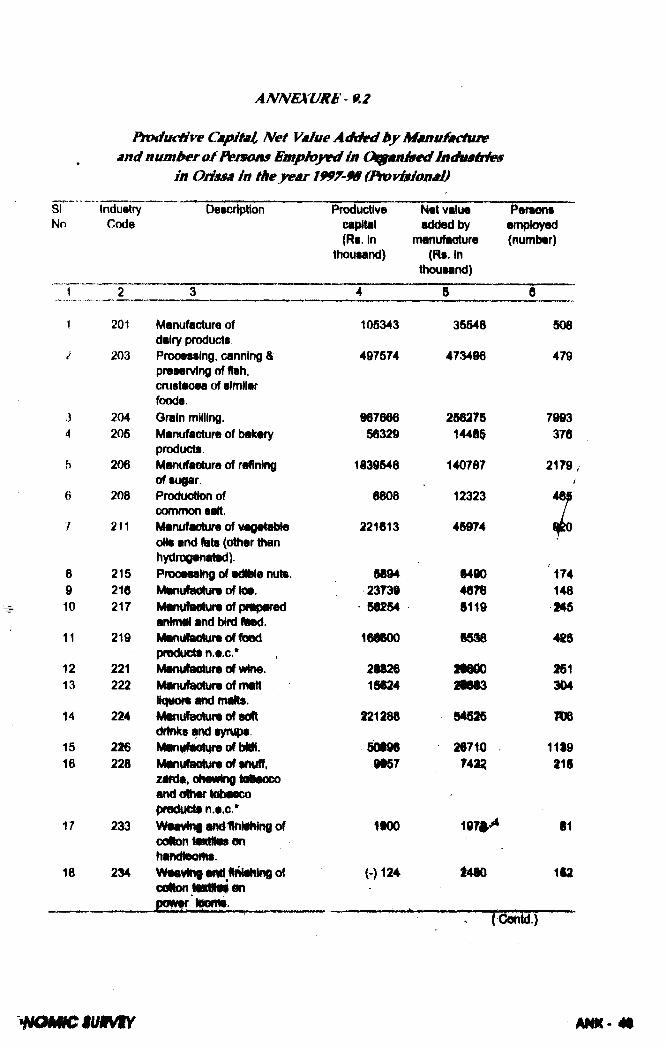
AJVNE\l/Jt£ - 0.1 PmducHve Capital Net Value A tk M k y M s n u fy d u m
and number &f fS^mons Empioyed in O^ganhed fnduaities in Orissa in the year 1997-98 (^ vision ai)
IndustryCode
DeBOiption Productive capital (Rt. In
thousand)
Net value added by
manufacture (Re. In
thoueand)
Personsemployed(number)
2 3 4 5 6
1 201 Manufacture of dairy products
105343 35548 508
203 Processing, canning & preserving of h, crustacea of similar foods.
497574 473496 479
3 204 Grain milling. 967666 256275 79934 205 Manufadure of bakery
products.56329 14485 376
5 206 Manufacture of reflning of sugar.
1839548 140787 21791
6 208 Production of common satt.
6808 12323
77 211 Manufacture of vagetabte oNe and fats (other than hydrogenated).
221613 45974 4 o
8 215 Processtng dt adlMe n\M. 5694 6490 1749 216 Manulaeturv of lot. 23T39 46T6 14810 217 MaiHiiBeture of pftpared
antantl and bird taed.56254 5119 245
11 219 Manoiactureoffood products n.e.c.*
166600 «5ie
12 221 K^MHifa^re of 2SS26 218^ 25113 222 Manulaolurs of malt
IKiyOfS mia fTWRS*15624 2ie63 304
14 224 Manufac^ra of salt drinks ayn M.
221288 94S26 m
15 216 Man^ Sot reofbMif. 5 ^ ^710 . 11S916 228 l^ulEiolure of amiff,
zafda, ctfowlng tiriNMxx) and ottwr tobaaco produeti n.e.c.*
9^7 74^ 215
17 233 ^^avln9 am^HniaNne of cotton tMtHas on haftdlooms.
1900 197^^ 81
18 234 V f vutiI lyi Hnwfmfii ot oeUon M N ti on P W f
(-)124 1480 162
0m - m
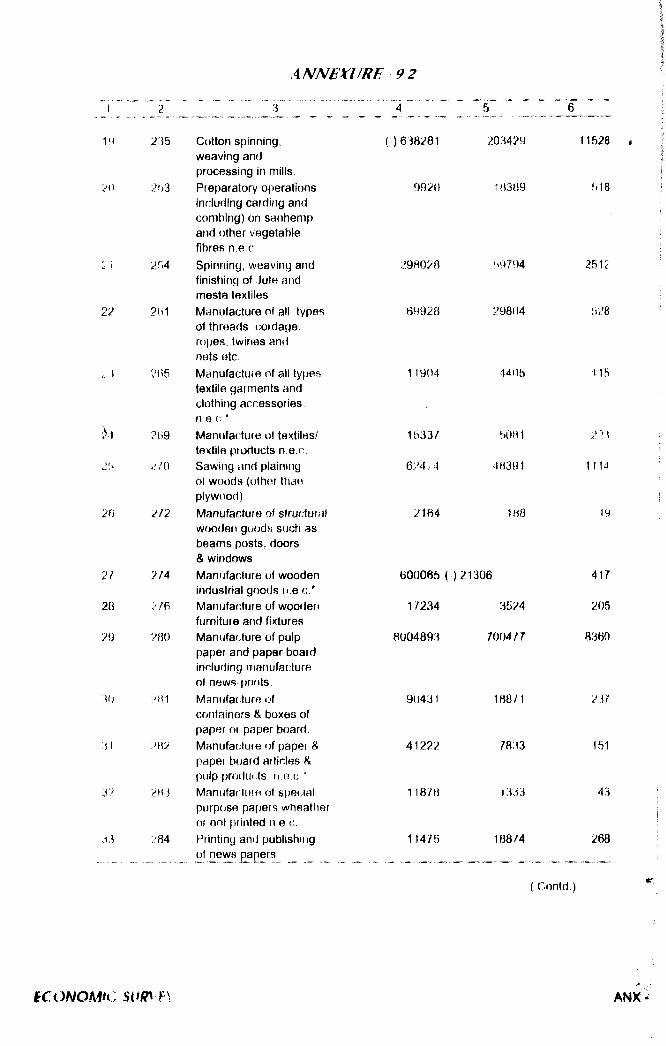
21)
26
2/
2B
29
30
33
263
2f.4
21 n
2f55
269
2/0
2/2
2M
2/6
?B0
2H1
2H2
2B3
284
Cotton spinning, weaving and processing ifi mills Preparatory operations including carding and comt)ing) on sanhemp and other vegetable fibres n e.cSpinning, weaving and finishing of Jutn and mesta textiles Manufacture of all types of threads cordage, ropes, twines and nets etcManufactute of all types textile garments and clothing accessories n e.c *Manufacture of textiles/ textile products n e.c Sawing and plaining of woods (other tt iais plywood)Manufacture of struntural wooden goods such as beams posts, doors & wiridowsManufacture of wooden industrial goods n e c.* Manufacture of wooden furniture and fixtures Manufaciture of pulp paper and paper board including manufacture of news-prints Manufacture of containers & boxes of paper or paper board. Manufacture of paper 3 paper board articles fi, pulp products n e c " Manufac ture ot special purpose papers wheather Of not printed n e c. Printing and publishirrg of news papers
( )638281
9920 1ii369
29B020
69928
1 1904
1533/
624 r4
2164
')9794
29804
4405
5081
48391
188
600065 ()21306
17234 3524
8004893 7004/7
90431
41222
1 1878
11475
188/1
/833
i333
188/4
518
2512
11ft
223
11 14
19
417
205
8360
237
151
43
268
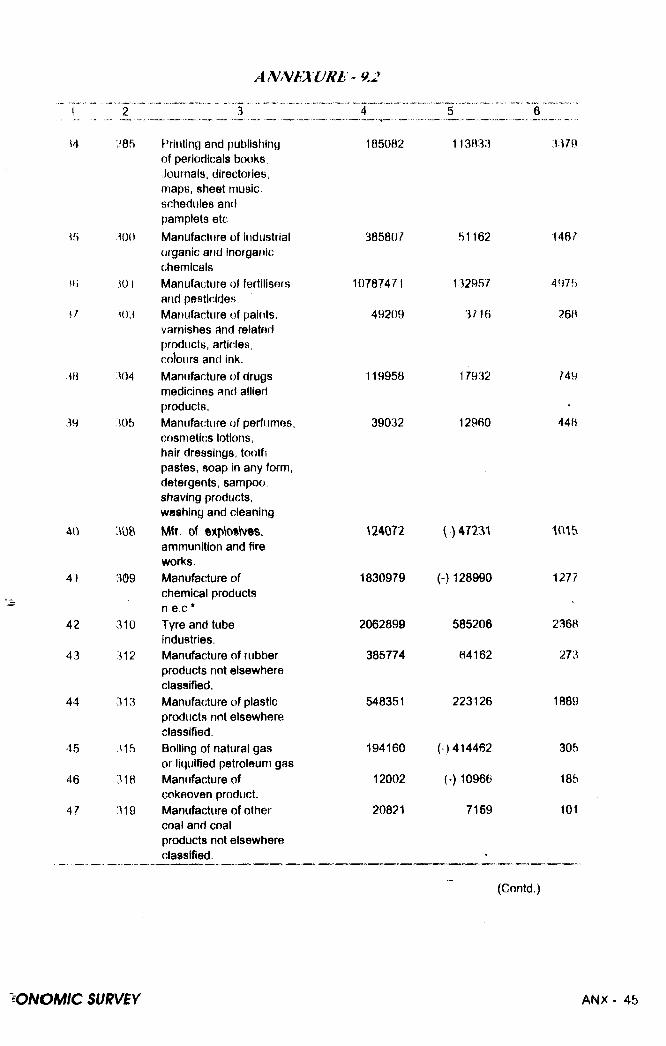
5
(6
M
m
39
41)
41
42
43
44
45
46
47
L-.
285
: 00
301
M)3
304
305
:\08
3(59
310
312
313
31fi
318
319
Printing and publishing of periodicals books. Journals, directories, maps, sheet music, schedules and pamplets etc Manufacture of industrial organic and inorganic chemicalsManufacture of fertilisers and pesticides Manufacture of paints, varnishes and related products, articles colours and ink. Manufacture of drugs medicines and allied products.Manufacture of perfumes, cosmetics lotions, hair dressings, tootfi pastes, soap in any form, detergents, sampoo, shaving products, washing and cleaning.
M!t. ot exptosives, ammunition and Are works.Manufacture of chemical products n e.c *Tyre and tube industries.Manufacture of rubber products not elsewhere classified.Manufacture of plastic products not elsewhere classified.Bolling of natural gas ot liquified petroleum gas Manufacture of cokeoven product. Manufacture of other coal and coal products not elsewhere classified.
386807
10787471
49209
119958
39032
\24072
1830979
2062899
385774
548351
194160
1200220821
51162
132957
3/16
17932
12960
1) 47231
(-) 128990
585206
64162
223126
0414462
(-) 10966
7159
146/
497f)
?6R
749
44H
1015
1277
2368
273
1889
305
185
101
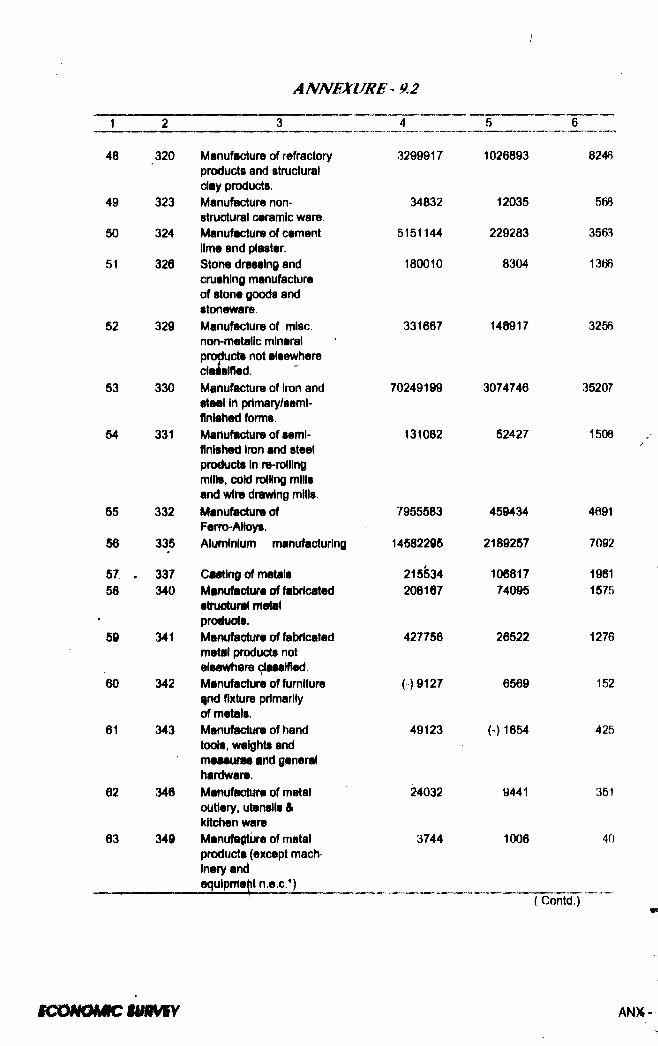
48 320 Manufacture of refractoryproducts and structural clay products.
49 323 Manufacture non-structural ceramic ware
50 324 Manufacture of cementlime and plaster.
51 326 Stone dressing andcrushing manufacture of stone goods and stoneware.
52 329 Manufacture of misc.non-metalic mineral produces not elsewhere claislfied.
53 330 Manufacture of iron andsteel In primary/semifinished fonns.
54 331 Manufticture of semi*finished iron and steel profkicto In re-rolling milhi, COM roiling mills and wire drawing mliis.
55 332 Manuftic^re ofFerro-Ailo^.
56 335 Aluminium manufacturing
57 . 337 Catting of metals58 340 Manufacture of fabricated
stri^ural matol pro#u< .
59 341 Manufacture of fabricatedmetil products not elsewhere dassified.
60 342 Manutactureoffumiture|nd fixture primarily of metals.
61 343 Manu^ure of handtools, weights and mMaums and general hardware.
62 346 Manufacture of metalouttery, utensils & kitchenware
63 349 Manufacture of metalproducts, (except machinery anfiequipment n.e.c.*) _____
3299917
34832
5151144
180010
331667
70249199
131082
7955583
14582295
215534208167
427756
()9127
49123
24032
3744
1026893
12035
229283
8304
148917
3074746
52427
459434
2189257
10681774095
26522
6569
(-) 1654
9441
1006
8246
568
3563
136B
3256
35207
1508
4691
7092
19611575
1276
152
425
351
40
fO S M O M C iM M tV ANX-
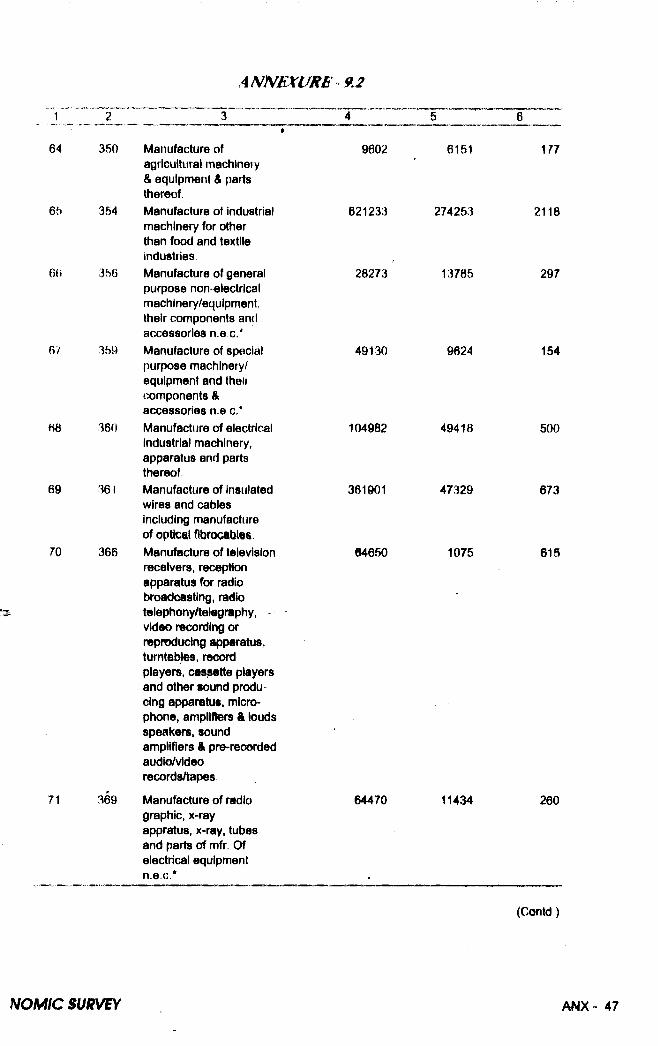
64
65
6(j
350
354
356
67 359
68
69
70
360
36
366
71 369
Manufacture of agricultural machinery & equipment & parts thereof.Manufacture of industrial machinery for other than food and textile industries.Manufacture of general purpose non electrical machinery/equipment, their components and accessories n.e.c * Manufacture of special purpose machinery/ equipment and their components It accessories n.e c.* Manufacture of electrical industrial machinery, apparatus and parts thereof.Manufacture of insulated wires and cables including manufacture of optical flbrocables. Manul^cture of television receivers, receptton apparatus for radio broadcasting, radio telephony/teisgriphy, video recording or reproducing apparatus, turntables, record players, cassette players and other sound producing appafntue, microphone, ampllfters & louds speakers, sound amplifiers & pre-necorded audio/video records/tapes
Manufacture of radio graphic, x-ray appratus, x-ray, tubes and parts of mfr. Of electrical equipment n.e.c.*
9602
621233
28273
6151
274263
13785
177
2118
297
49130 9624 154
104982
361901
04650
49418
47329
1075
500
673
615
64470 11434 260
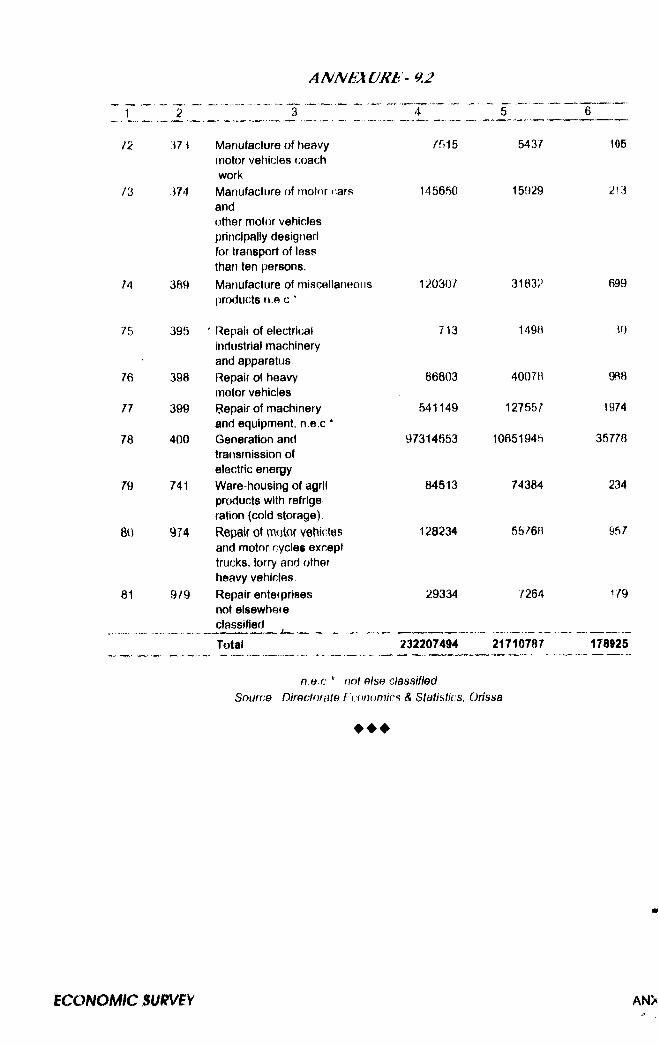
L
n
n
74
75
76
77
78
79
80
81
37 i
374
ANNbXVRk^ 9.2
389
395
398
399
400
741
9?4
9/9
Manufacture of heavy motor vehicles coach work
Manufacture of motor (-ars andother motor vehicles principally designed for transport of less than ten persons.Manufacture of miscellaneous products n.e c.‘
Repair of electrical industrial machinery and apparatus.Repair ot heavy motor vehicles Repair of machinery and equipment, n.e.c * Generation and transmission of electric energy.Ware*housing of agril products with refrige ration (cold storage)Repair of mcitor vehicles and motor cycles except trucks, lorry and other heavy vehicles.Repair enterprises not elsewhere classified
Total
145650
120307
713
66803
541149
97314653
84513
120234
29334
232207494
15929
31832
1498
4007R
127v55/
1065194ft
74384
56768
7264
21710787
n e.c * not else classified Source Directorate Foonomics & Statistics, Orissa
♦ ♦ ♦
213
699
30
988
1974
35778
234
957
179
178925
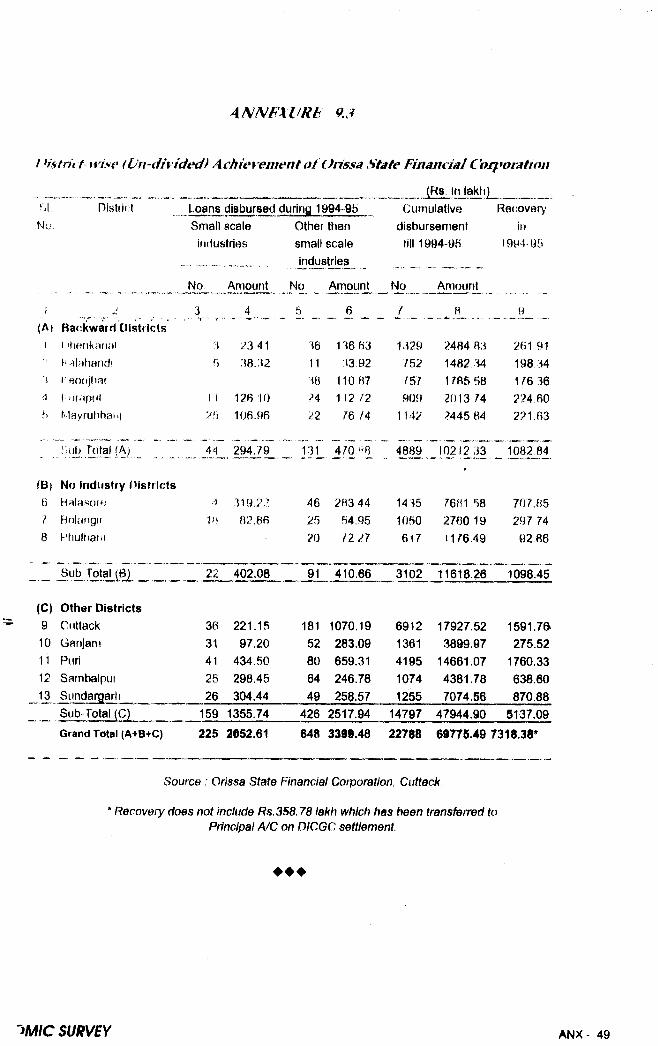
4/V/VitXmit 9J
I Hstrii t-Hise iVn~dhided) Achievement at Orissa State Financml Corfwmtion _____ _ „ __ _ ____ _ (Rs. in lakti)
NoDistridt Loans disbursed during 1994-95
Small scale Other thanindustries small scale
Cumulative disbursement
till 1994-9.^
Recoveryin
1994-95
industries ------- -
Na Amount Na _ Amount^ No Amount
! ^ 5 _ _ 6 _ _ 2 _ _» LBackward Districts
1 i shfinkanai 3 23-41 16 136 63 1329 2484 R3 261 91M alahand! B .18.32 11 33.92 752 1482 34 198 34
'1 (• eotijhar H8 110 B? 757 1785 58 176 364 i'urriptil 1 1 126 10 n 1 12 /2 909 2013 74 224 605 Mayruhhah! ?5 106.96 22 76 /4 1142 2445 B4 221.63
Sub T ^a l (A^ _ _41 294.79 47aH8 4889 _ l(^12_:i3 1082 84
(B) No industry D istricts6 BHlasofe 4 319.22 46 2A3 44 1435 76H1 58 707,B5? Bolangli 1»i 82.86 26 54.95 1050 2760 19 297 748 Phultjatu 20 7227 617 11?6.49 82,86
Sub Total ( l^ 22 402.08 91 410.66 3102 " l l6 l i r 2 6 ” 109845
(C) Other Districts9 Cuttack 36 221.15 181 1070.19 6912 17927.52 1591.7S10 Ganjam 31 97.20 52 283.09 1361 3899.97 275.5211 Puri 41 434.50 80 659.31 4195 14661.07 1760.3312 Sambalpur 25 298.45 64 246.78 1074 4381.78 638.6013 Sundargarfi 26 304.44 49 258.57 1255 7074.56 870.88
Sub-Total (C) 159 1355.74 426 2517.94 14797 47944.90 5137.09Grand Total (A+B+C) 225 2A52.61 648 3399.48 22788 69775.49 7318.38
Source : Orissa State Financial Corporation, Cuttack.
* Recovery does not include Rs.3S8.78 lakh which has heen transferred to Principal A/C on DICGC settlement.
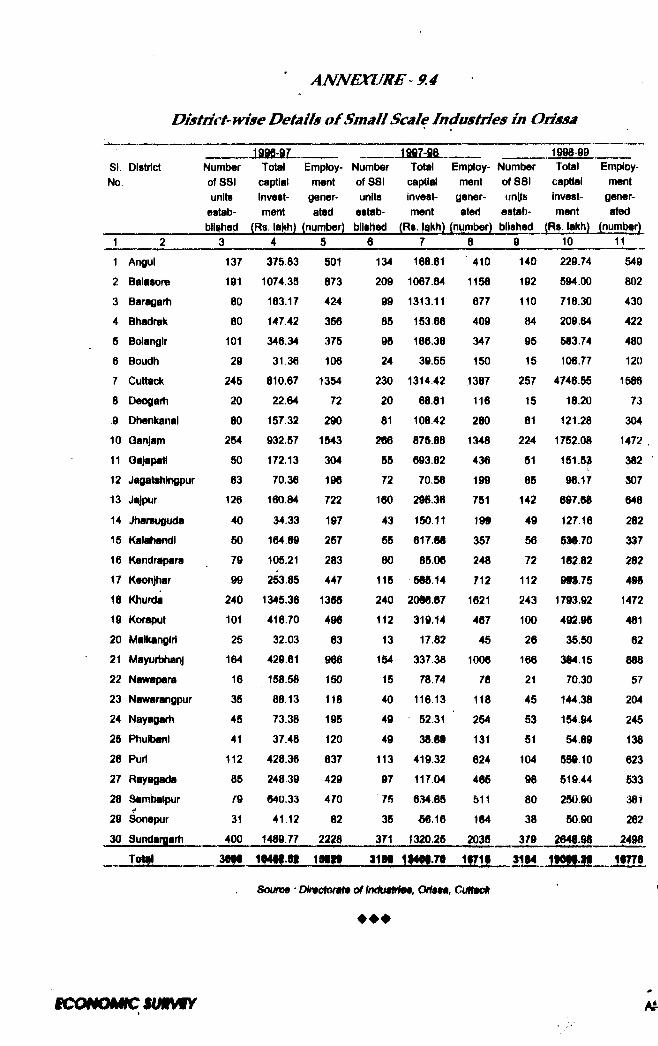
D istrict-w ise D etails o f Sm all Scale Industries in Orissa1886-87 taaz-jft
SL District No
Number of SSI units
estab‘ blished
Total captial investment
(Rs. \» m
Employment
generated
(num()er)
Number Total Employ- of SSI captial mentunits invest- gener-
estab- ment atedblUHed (Rs. lakh) (nMmber)
1998-99Number of SSI units
estab- blished
Total captial investment
(Rs. lakh)
Employment
generated
(number)1 6 8 9 10 111 Angul
2 Balasore
3 Baragarh
4 Bhadrak
5 Bolanglr
6 Boudh
7 Cuttack
8 Deogarti
9 Dhenkanai
10 Ganjam
11 Qajapatl
12 Jagatthlngpur
13 Jitipur14 Jharsuguda
15 Kalahandl
16 Kendrapara
17 Keonjhar
18 Khurda
19 Koraput
20 Malkangiri
21 MayurbhanJ
22 Nawapara
23 Nawarangpur
24 Nayagarh
26 PhulbanI
26 Purl
27 Rayagada
28 Sambalpur
29 Sonepur
30 Sumjargarh
137
191
80
80
10129
245
2080
254
50
63
126
40
50
79
99
240
10125
164
16
35
45
41
11285
931
400
375.83
1074.35
163.17
147.42
346.34
31,36
810.67
22.64
157.32
932.57
172.13
70.38
160.84
34.33
164.89
105.21
253.85
1345.36
416.70
32.03
429.61
158.58
88 13
73.38
37.48
428.36
248.39
640.33
41,12
1489.77
501
873
424
356
375
106
1354
72
290
1543
304
196
722
197
257
283
447
1355
496
63
966
150
118
195
120637
429
470
82
2128
134
209
99
85
95
24
230
2081
266
55
72
160
43
55
80
115
240
11213
154
15
40
49
49
113
97
7S
35
371
168.61
1067.64
1313.11
153,66
186.38
39.55
1314.42
68.81
108.42
875.88
693.82
70.58
295.36
150.11
617 88
85.06
586.14
2088.87
319.14
17.82
337 38
78.74
116.13
52.31
38.8S
419.32
117.04
634.89
•56.16
1320.25
410
1156
677
409
347
150
1387
116
280
1348
436
199
751
199
357
248
712
1621
467
45
1008
78
118
254
131
624
485
811184
203S
140
192
11084
95
15
257
15
81
224
51
85
142
49
56
72
112243
100
26
166
2145
53
51
104
98
80
38
379
229.74
594.00
718.30
209.64
583.74
106.77
4746.55
18.20
121.28
1752.08
151.53
96.17
697.68
127 16
538.70
182.82
993.75
1793.92
492.95
35.50
384 15
70.30
144.38
154.94
54.89
589.10
519.44
250.90
50.90
2648.98
549
802
430
422
480
1201586
73
304
1472
382
307
648
282
337
282
495
1472
461
62
888
57
204
245
138
623
533
361
262
2498
TO^ 3818 1t4it.9t la tfl 31W IKWJO KTIi 3184 19011.11 18778
Source - Dfrvcfomto oHmhuM0§, Ortsn, CuMn:#
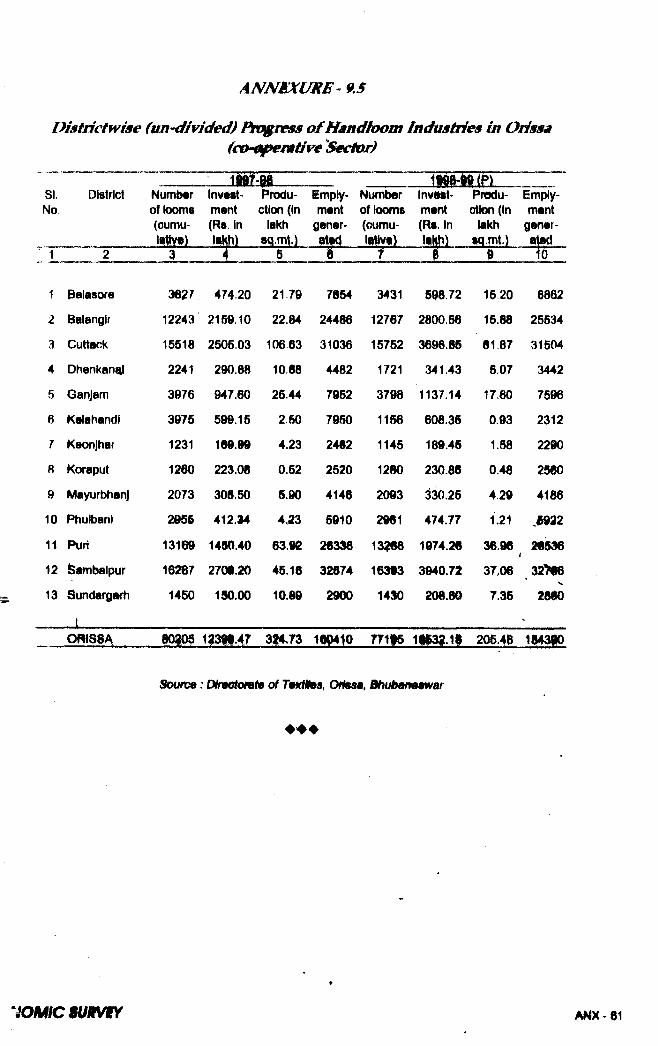
ANNMXUME9.SD istrictw ise (un-dfivided) Pst^ress o f Handloom indu stties in Orissa
(co-^pemHve Sec§0r)
SINo
District NumiMir InvAst- of looms ment (cumu* (Rs. in
. m m
t
J1|!L
rodu- imply- Number InvMt- ction (in mont of looms m«nt
lakh goner- (oumu- (Rs. in) My?) _ lia iL
^Widu- Emply- ottein (in mant
lakh genar-
§ —^1
1 Balasore
2 Balangir
3 Cuttack
4 Dhenkanql
5 Ganjam
6 Kalahandi
7 Keonjhaf
B Koraput
9 Mayurbhanj
10 Phulbani
11 Puri
12 ^ambaipur
13 Sundargarh
I
382712243
15518
2241
3976
3975
1231
1260
2073
2665
13169
16^7
1450
474.20
2169.10
2505.03
290.68
947.60
599.15
169.99
223.06
306.50
412.34
1460.40
270i.20
190.00
21,79
22.64
106 63
10.68
25.44
2,50
4.23
0.52
5.90
4.23
63.92
46.16
10.89
7854
24466
31036
4482
7952
7960
2462
2520
4146
5910
26336
32674
2900
3431
12767
15752
1721
3798
1156
1145
1280
2093
2961
13?68
163t3
14S0
598 72
2800.56
3696.85
341.43
1137.14
608.36
189.46
230.86
330.25
474.77
1974.26
3940.72
206.80
15 20
15.88
61.87
5.07
17.60
0.93
1.58
0.48
4.29
1.21
36.96
37,06
7.35
6862
25534
31504
3442
7596
2312
2290
2560
4186
J922
26636
32>i6V
2860
ORISSA «oao§ iaagi.47 3^.73 11^10 77115 ii$32.ii 206.4B ii»3go
Soimx: Dkmtoret» of TmcHha, CHieaa, E^iriMmmar
♦ ♦ ♦
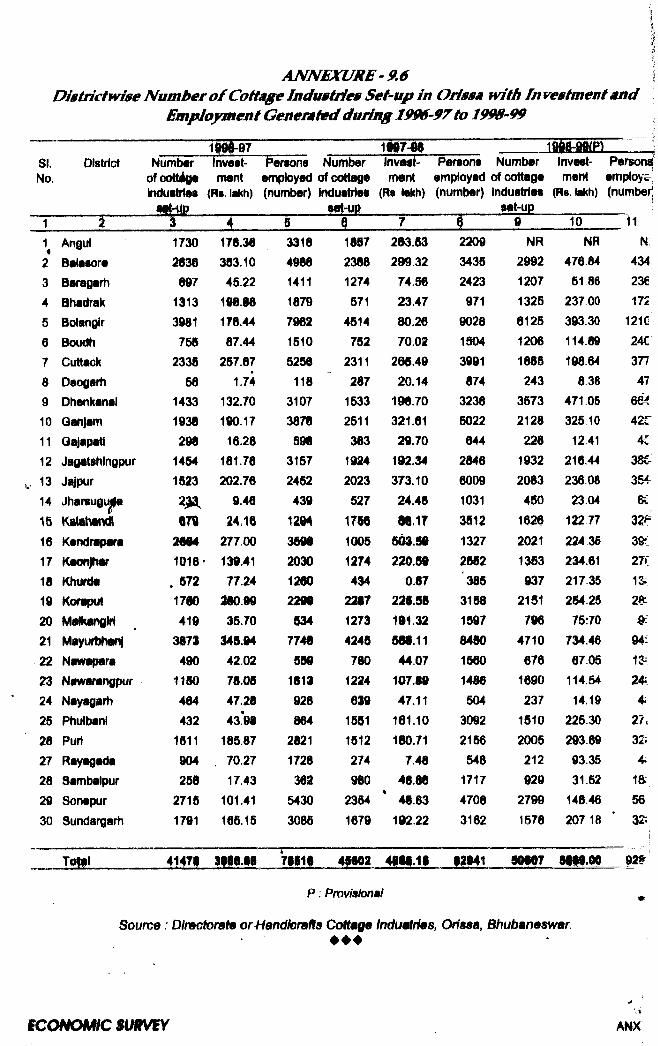
ANNEXURE9.6 D istnctw ise Num ber a/C otiage Industries Sei-up in Orissa w itli In vestm ent and
Employment Generated during J99€-97 to 1990-99
Si.No.
District Numbtr of OOtUlf IndustrUis
Invost- nrwnt
(Rt. lakh)
Penonaemptoyad(number)
Number of cottage Induttrtet- M m -
“inveiP ment
(Rs. liikh)
Personaemployed(number)
Number of cottage Industries
eet-up
lnves Personsf ment employ
(R8. lakh) (number
1 9 10Angul Balasore Baragarh Bhadnik Bolangir Boudh Cuttack Deogarh Dl^kanal
10 Qanjam11 Qs apiMI12 JagatsNngpur13 Ji pur14 Jharsugu^15 KatahiraS16 Kendfapara17 K e o r^18 Khurda19 Koraput20 Malkangiri21 Mayurihar22 Nawapara23 Nawarangpur24 Nayagarii25 Phulbani 28 Puri27 Rayagada28 Sambalpur29 Sonepur30 Sundargarh
17302836897
1313398175S
233S58
14331938298
14541S232 ^m
1018 . 672 1700 419
3873 490
11S0 484 432
1811 904 258
2718 1791
178.38383.1045.22
198.88178.4487.44
257.87 1.74
132.70190.1716.28
181.76202.76
9.4624.16
277 00139.41 77.24
M.9935.70
345.9442.0278.0847.2843.*98
185.87 70.27 17.43
101.41 165.15
3318498814111879796215105258118
31073878598
31572452439
12943898203012602299534
7748589
1813928864
28211728382
54303085
188723881274571
4514752
2311287
15332511383
19242023527
178610051274434
2;W712734245780
1224639
15511512274980
23541679
283.53299.32 74.5623.47 80.26 70.01
265.4920.14
1^.70321.6129.70
192.34373.1024.48 88,17
5^.89220.^
0.87228.88191.32 5IM.1144.07
107.8947.11
161.10 180.71
7.4848.8848.83
192.22
220934352423971
902815043991874
32385022844
284660091031381213272882385
31581597848015801486504
30922156548
171747083162
NR299212071325612512061885243
35732128228
19322083450
162620211353937
2 1S1796
4710676
1690237
15102005212929
27991578
NR 476.84 51 86
237 00393.30114.89 198.64
8.38 471.06 325.10 12.41
216.44 236 0823.04
122 77 224.36 234.61 217.35 254 2575!70
734.4667.05
114.5414.19
225.30293.89 93.35 31.52
148.46 207 18
T
13 24: 4:
27 i 32: 4.
1& 56 32:
JSIL 41478 3988.18 78818 48883 48ii.18 82941 89i<l7 8H9.98 92f
P ; Pmviatonal «
Source Dlmctomte or HandhreMa Cottage Induatries, Orissa, Bhubaneswar♦ ♦ ♦
ANX
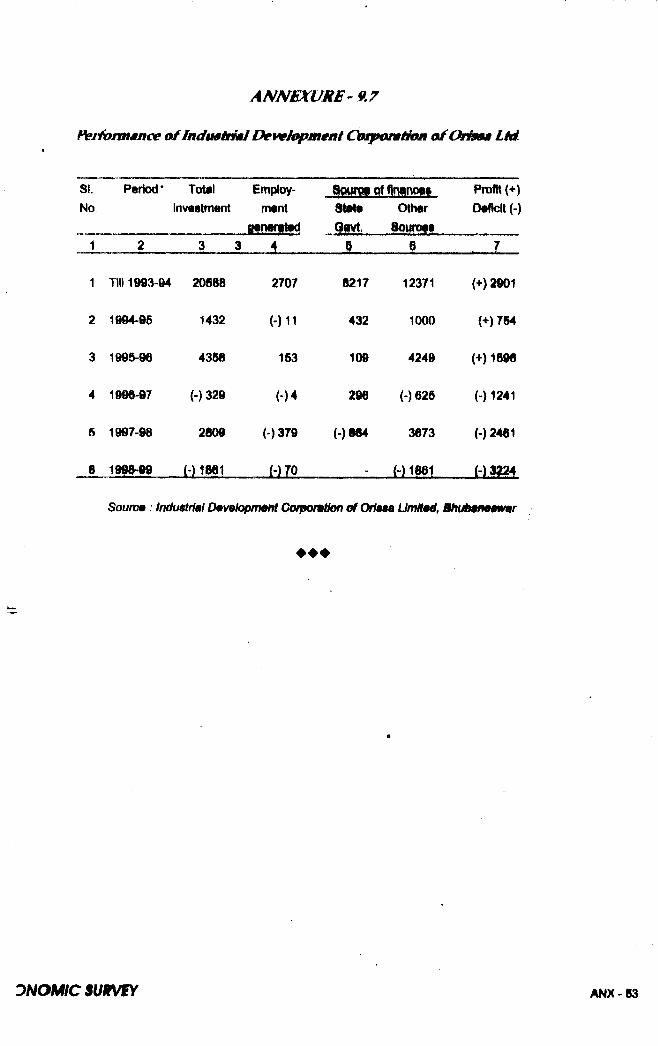
ANNEXURE-9.7 Ferfoim jm ce of IndmHmi Dev^l0pm enl deup&niieM ajfOrisas L9d
SI.No
Period* TotalInvestment
Employment
gffHWltftlStete Otheriiy i, m m m
Profit{+) Deficit (-)
1 2 3 3 4 ....... i_..... .....§ ...... ........ ..I
1 Till 1993-94 20S88 2707 8217 12371 (+)2901
2 1994 95 1432 (-) ll 432 1000 {+) 764
3 1995-96 4366 153 109 4249 (•f) 1696
4 1990-97 (-) 329 (-)4 296 (-)625 {-) 1241
6 1997-98 28(^ H379 (-)«64 3873 H2461
6 1998>09 (-) 1861 . m m
Souro9: Industrial DrnvBtopimnt Oorpomtkm of OriaM UmHad. Bhubamawar
♦ ♦ ♦
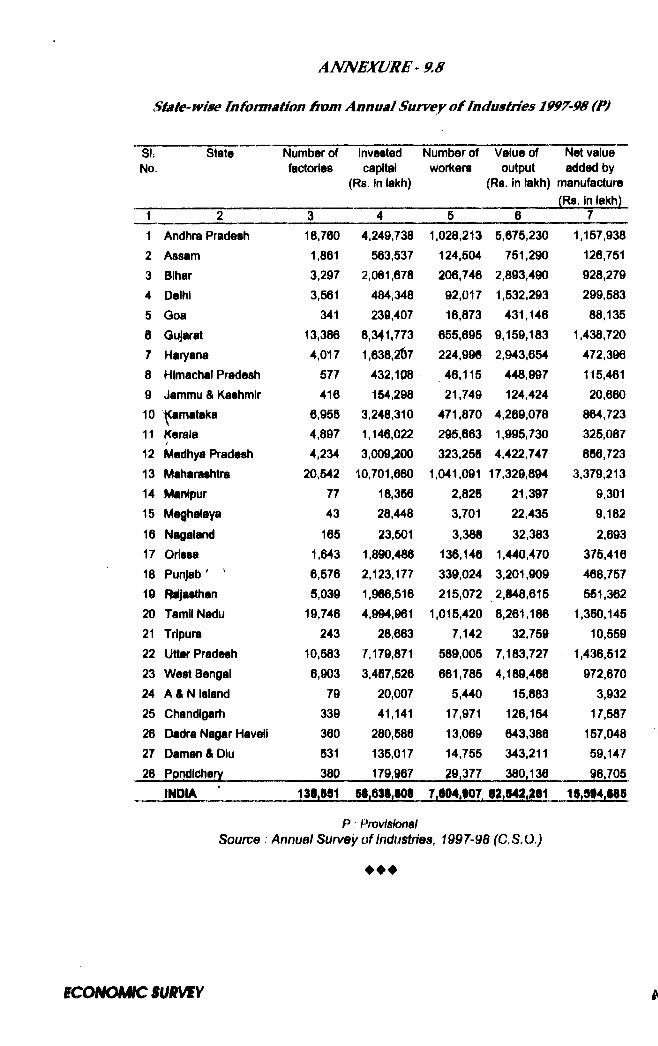
State-wise fn formation from Annual Survey o f Industries 1997-98 (P)
SI; State Number of InvestedNo. factories capital
(Rs. in laich)
Number of Value of workers output
(Rs. In lakh)
Net value added by
manufacture (Rs. in lakh)
1 5 61 Andhra Pradesh 18,700 4,249,738 1,028,213 5,675.230 1,157,9382 Assam 1,861 563,537 124,504 751,290 126,7513 Bihar 3,297 2,061,678 206,746 2,893,490 928,2794 Delhi 3,561 484,348 92,017 1,532,293 299,5835 Goa 341 239,407 18,873 431,146 88,1356 Gujarat 13,386 8,341,773 655,695 9,159,183 1,438,7207 Haryana 4,017 1,638,267 224,996 2,943,654 472,3968 Himachal Pradesh 577 432,108 46,115 448,997 115,4619 Jammu & Kashmir 416 154,298 21,749 124,424 20,66010 ^amataka 6,955 3,248,310 471.870 4,269,078 864,72311 Kerala 4,897 1,146,022 295,663 1,995,730 325,08712 Madhya Pradesh 4,234 3,009,;200 323,255 4,422,747 866,72313 Maharashtra 20,542 10,701,660 1,041,091 17,329,894 3,379,21314 Manipur 77 18,386 2,828 21,397 9,30115 Meghalaya 43 28,448 3,701 22,435 9,18216 Nagaland 165 23,501 3,386 32,383 2,69317 Orissa 1,643 1,890,486 136,146 1,440,470 375,41618 Punjab' ' 6,576 2,123,177 339,024 3,201,909 468,75719 Njasthan 5,039 1,966,516 215,072 2,848,615 561,36220 Tamil Nadu 19,746 4,994,961 1,015,420 8,261,186 1,350,14521 Tripura 243 28,663 7,142 32,759 10,55922 Uttar Pradesh 10,583 7,179,871 589,005 7,183,727 1,436,51223 West Bengal 6,903 3,467,526 661,785 4,189,466 972,67024 A&N island 79 20,007 5,440 15,883 3,93225 Chandlgarti 339 41,141 17,971 126,154 17,58726 Dadra Nagar Haveli 360 280,586 13,069 643,386 157,04827 Daman &Diu 531 135,017 14,755 343,211 59,14728 PpndiChery 380 179.967 29.377 380,136 96,705
INDIA 138,591 Si.6SI.gOI 7.604.907 83.642J61 1g.5f4J8S
P , ProvisionalSource : Annual Survey of Industries, f 997-98 ('C.S.OJ
♦ ♦ ♦

Distnct'^wise Length o fd i^ r m t Types a f Roads in O iissaas on 31. 03, 99 (B__ __________________________________________________ (In km )
SI District National Express State M.D.R O.D R C V.R.No Highway Highway Highway
J _ 2 3
1 Angul 164
2 Balasore 118
3 Baragarh 66
4 Bhadrak 40
5 Bolanglr
6 Boudh
7 Cuttack 64
8 Deogarti 84
9 Dhenkanal 89
10 Gajapati
11 Ganjanri 87
12 Jagatslnghpur 10
13 Jajpur 74
14 Jharsuguda
15 Kalahandi
16 Kandhamal -
17 Kendrapara 45
18 Keonjhar 92
19 Khurda 109
20 Koraput 157
21 Malkangirl -
22 Mayurbharv 193
23 Nawaran^ur -
24 Nayagarh -
25 Nuapada -
26 Puri -
27 Rayagada -
28 Sambaipur 168
29 Sonepur -
30 Sundargarh 117
67
47 84 169 190
31 141 211 61
100 113 177 45
88 103 88 91
86 238 189 205
168 57 29 41
56 308 312 144
55 22 6 100
5 119 241 211
251 66 39 37
669 158 452 200
62 88 197 188
39 115 270 96
21 51 105
176 79 267 282
340 182 63 279
63 50 271 45
229 142 189 289 '
58 456 207 129
121 288 30 941
158 149 56 152
82 401 392 309
- 122 - 226
144 125 235 99
110 13 79 48
55 173 221 59
248 254 50 175
104 62 138 43
72 59 62 1
279 296 76 279
OWMA ItTT* tT WtT 44W 4T6T «T 0
(Contd.)

ANNEXURE- IZ K C on tid)D istrict-w ise Length o f dif^pent Types o f Roads in O iissa
as on M 03. 99 (P)SI District Village P.S. G.P. For®8t Municipal TotalNo Road Road Road Road Roads1 2 9 10 11 12 13 141 Angul 637 450 7333 408 410 98822 Balasore 1285 303 1682 59 861 47623 Baragarh 1058 788 6560 314 235 94564 Bhadralc 468 369 1572 - 762 36615 Bolangir 1057 382 5827 250 527 87616 Boudh 755 53 3745 256 62 51667 Cuttack 890 440 2641 156 814 58258 Deogarh 571 173 2891 98 93 40939 Dhenkanal 522 383 5670 213 298 775110 Gajapati 431 153 4253 107 144 548111 Ganjam 2146 12 6717 480 1100 1202112 Jagatsinghpur 569 448 1308 - 275 313613 Jajpur 902 396 2656 36 151 480214 Jharsuguda 488 159 2860 13 672 Am15 Kaiahandi 821 126 9964 309 368 1238216 Kandhamal 682 221 5651 323 212 795317 Kendrapara 654 384 2511 20 418 446118 Keon^ar 1180 324 2436 228 536 584719 Khurda 733 257 4925 306 1115 em20 KorapUt 466 628 4973 210 957 836321 Matkangirl 647 221 2954 94 216 484722 Mayurt>hanj 2157 746 6641 799 265 1108523 N’awarangpur 826 695 5127 113 103 711224 Nayagarh 425 195 5497 322 74 711825 Nuapada 359 388 4133 270 116 ^1826 Puri ooa 166 7282 8 870 083227 Rayagada 780 603 4032 183 281 680628 Sambalpur 398 277 6499 726 741 ^1829 Sonepur 468 88 3032 50 108 304030 Sundargarh 1197 350 8621 680 991 12686
OWSiA 34SSI 10178 139fT3 7030 1|7n
P; Provisional **Totai does not Include
1. inigstlon Road - 6277 Kms 2. QRIDCO Road- 88 Kms and NH 607 Kms
* Distrfctwlse breakup of 807 km of N, H. has not been fineHaed yet.
Source Chief Engineer N H. / R & B/ RW., P.R Deptt A C C. Forest
e c o N O M ic Sum/SY
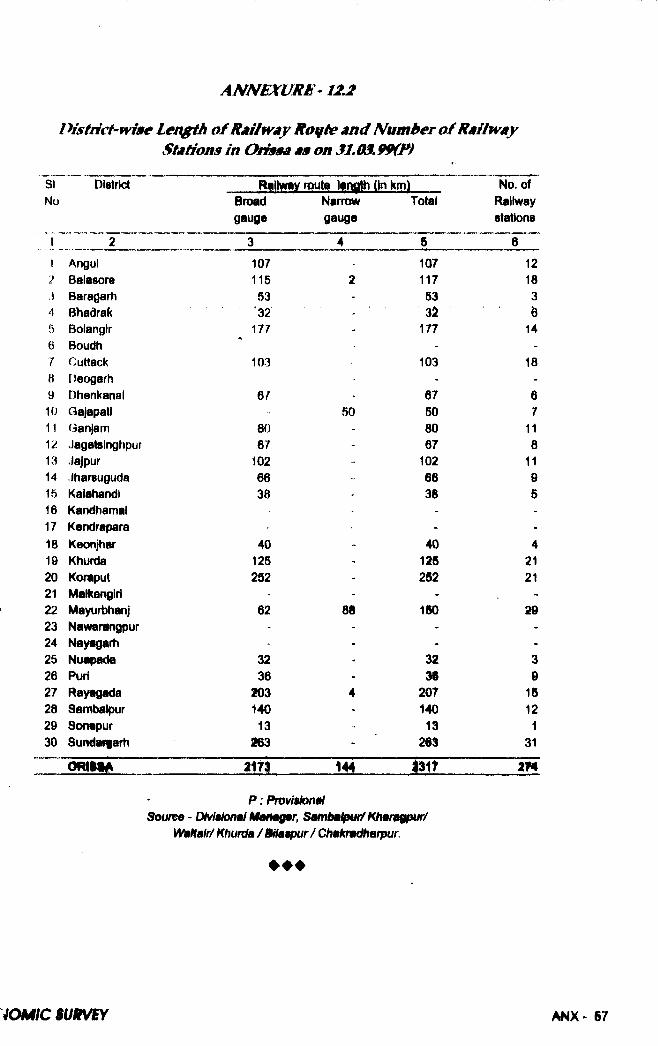
District-'Wise Lengih o f Raiiway ita ifie M d Num ber o f RuHway Stations in (hfym as on 3I.03»99(F)
SI District No
SittffliUnJmJ___Broad Narrow Total gauge gauge
No. of Railway stations
1 2 3 4 5 6
1 Angul 107 107 122 Balasore 115 2 117 18A Baragarh 53 - 53 34 Bhadra^t 32 . h5 Bolangir 177 - 177 146 Boudh - -7 Cuttack 103 103 188 Deogarh - - -9 Dtienkanal 6 / 67 610 Gajapatl 50 50 711 Ganjam 80 - 80 1112 Jagatsinghpur 67 67 813 Jajpur 102 - 102 1114 Jharsuguda 66 66 915 Kalahandi 38 - 38 516 Kandhamal - - -17 Kendrapara - -18 Keonjhar 40 - 40 419 Khurda 125 12S 2120 Kori4)ut 252 - 252 2121 Malkangiri - - -22 Mayurbhanj 62 88 150 2923 Naw«ir«ngpur - - - -24 Nayagarh ' - - -25 Nuapada 32 - 32 326 Puri 36 - 38 927 Rayagada 103 4 207 1528 Sambalpur 140 - 140 1229 Sontpur 13 - 13 130 SundsHfarii 163 - 263 31
o m im a i7 i .... m . , . . ... i l l? m
P : Pmviaional Soume' CHvitriontt! Srnnbti^^ tOwn^gpur/
mHafr/ Khurda / BUaapur/ Chakrmmarpur
♦ ♦ ♦
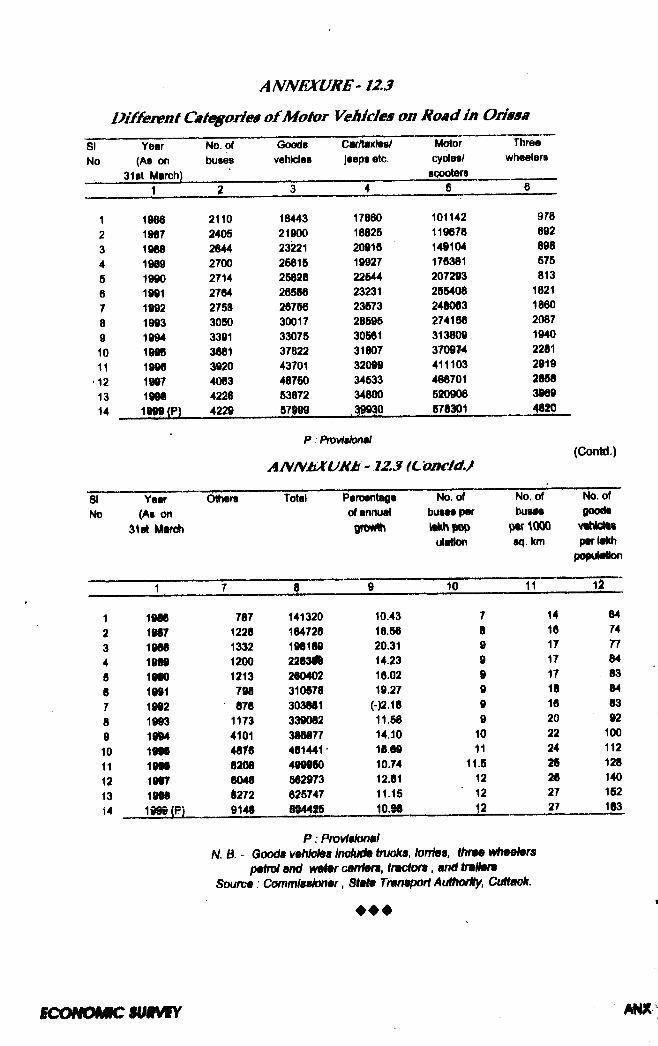
ANNEXURE -12.3 D i/feien t C at^ aiies o f M otor Vehicles on Road in O iissa
Year (As on
31 tt March)
No. of buses
Goodsvehicles
Car/taxies/ jeeps etc.
Motorcycles/
sQooters
Threewheelers
1
1 1986 2110 18443 17660 101142 978
2 1987 2405 21900 18825 119678 692
3 1988 2644 23221 20916 149104 698
4 1989 2700 26615 19927 176381 575
5 1990 2714 25826 22544 207293 813
6 1991 2764 26566 23231 255406 18217 1992 275i 26766 23573 246063 1860
8 1993 3050 30017 28595 274156 2087
9 1994 3391 33075 30561 313609 1940
10 199S 3681 37822 31807 370914 2281
11 1996 3920 43701 32099 411103 2919
12 1997 4083 48750 34533 466701 2856
13 1998 4226 53672 34800 510906 3969
14 1199 (P) 4229 57999 39910 578301 4820
P Provtafonal(Contd.)A N i^tX U K t - 12.3 (L o n c id .)
Year Ottteni Total Percentage No. of No. of No. oflo (As on of annutrt buses per buses goocNi
31 si March iiiBi 11 AktyfOVnfi p«r1Q00 vihietesulatkMi sq. km par lakh
populaion
1 7 6 9 10 11 12
1 1986 787 141320 10.43 7 14 64
2 1987 1226 164726 16.56 8 16 74
3 1988 1332 196189 20.31 9 17 77
4 1986 1200 2263H 14.23 9 17 64
5 1960 1213 260402 16.02 9 17 63
6 1991 768 310678 19.27 9 18 64
7 1962 876 303661 (-)2.16 9 16 63
8 1993 1173 339062 11.58 9 20 92
9 1i»4 4101 366677 14.10 10 22 100
10 1966 4876 461441• 16.69 11 24 112
11 1666 6206 499660 10.74 11.5 26 128
12 1967 6046 562973 12.61 12 26 140
13 1966 8272 625747 11.15 12 27 152
14 1966 (f=) 9146 884415 10.66 12 27 163
P : PmvfMkMWfN. B. Goods v9hld»B indud9 tmoka, torrtoa, thm9 whwlmrs
pefro/ and water cardan, tmctora, and tmHam Sourca: Commisakmar, Stata Tran^xfrt AuHmilty, CiMaek.
K m m m c m u M iY i m
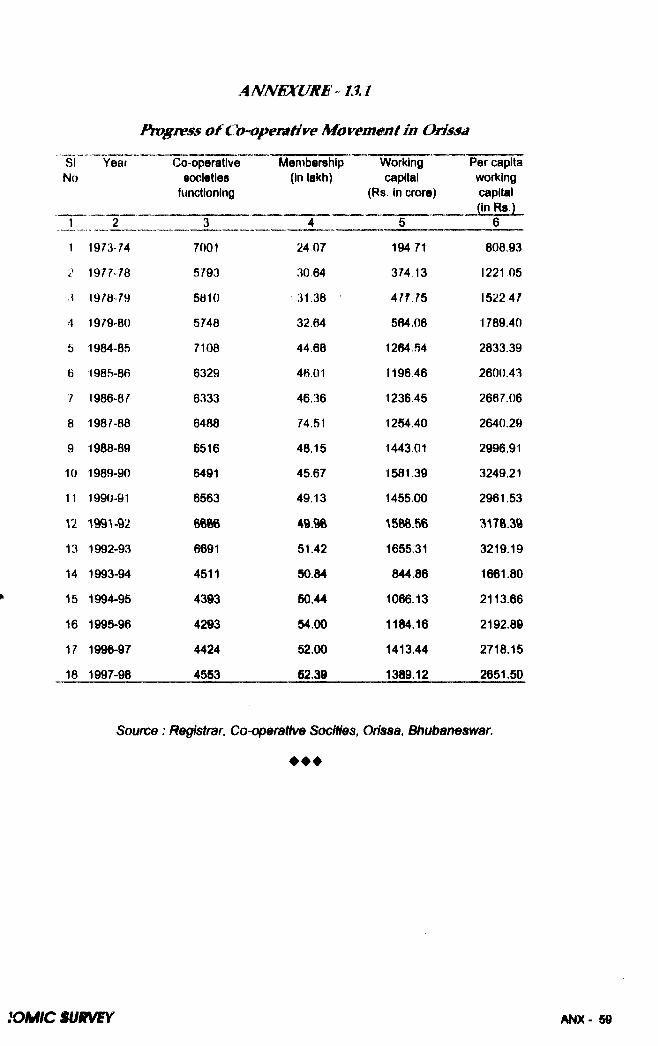
AIVNEXUXB- t i l Frt^ress o f Co-operative M ovement in Orissa
Year
1
1 1973-74
2 1977-78
< 1978-79
4 1979-80
5 1984-85
6 1985-86
7 1986-8^
8 198^88
9 1988-89
10 1989-90
11 1990-91
XI 199V92
13 1992-93
14 1993-94
15 1994-96
16 1995-96
17 1996-97
18 1997-98
Co-operativesocieties
functioning
7001
5793
5810
5748
7108
6329
6333
6488
6516
6491
6563
6691
4511
4393
4293
4424
4553
l^em birsh ip Working(In lakli) capital
(Rs. in crore)
Per capita working capital (InRs.)
6
24 07 194 71 808.93
30.64 374 13 1221,05
31,38 477 75 1522 47
32.64 584.06 1789.40
44.68 1264.54 2833.39
46.01 1196.46 2600.43
46.36 1236,45 2667.06
74.51 1284.40 2640.29
48.15 1443.01 2996.91
45.67 1581.39 3249.21
49.13 1455.00 2961.53
49.9S 1588.86 3178.39
51.42 1655.31 3219.19
50.84 844.86 1661.80
50.44 1066.13 2113.66
54.00 1184.16 2192.89
52.00 1413.44 2718.15
52.39 1389.12 2651.50
Source: Registrar, Co-operate Socities, Orissa, Bhubaneswar
♦ ♦ ♦
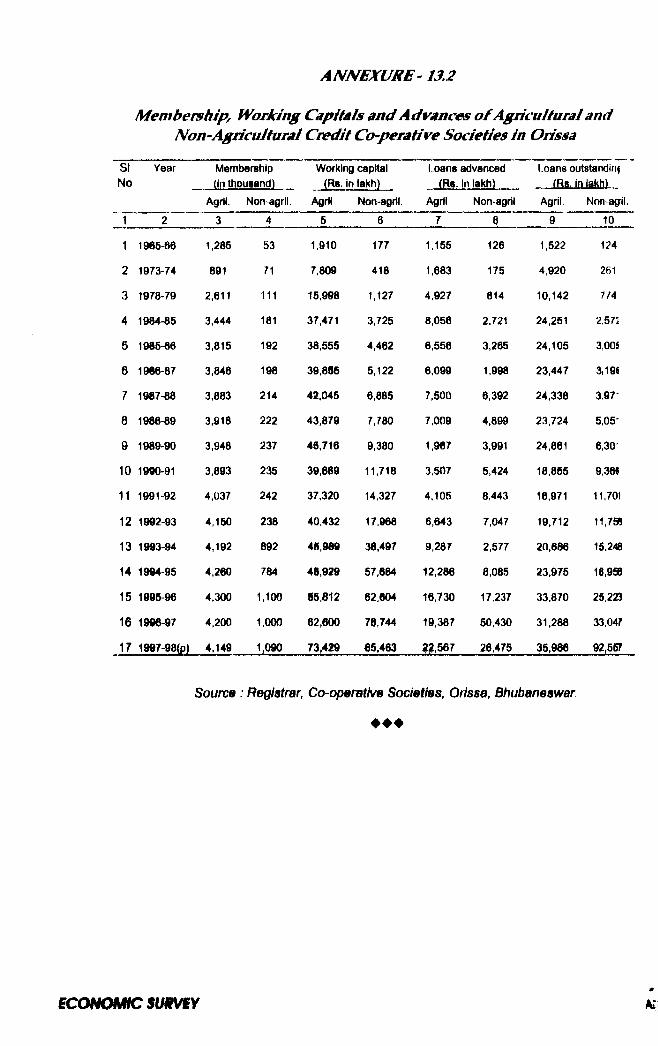
M embership, Working Capitals and Advances o f Agricultural and Non-Agricultural Credit Co-perative Societies in Orissa
SI Year No
Membership (In thouiancj)
Working capital (Rs. In laKh)
Loans advanced.-JBsJnjslShL-
Agril. Non-agrll. Agrll. Non-agrll Agrll. Non-agrit
Loans outstandlnf
Agril Non-agil.
1 6 8 10
1 1965-66 1.2B5 53 1,910 177
2 1973-74 891 71 7,809 418
3 1978-79 2,611 111 15,998 1,127
4 1984-85 3,444 181 37,471 3,725
5 1985-86 3,815 192 38,555 4,462
6 1966-87 3,846 198 39,855 5,122
7 1987-88 3,883 214 42,045 6,885
8 1988-89 3,918 222 43.879 7,780
9 1989-90 3,948 237 49,716 9,380
10 1990-91 3,893 235 39,669 11,718
11 1991-92 4,037 242 37,320 14,327
12 1992-93 4,150 238 40,432 17,968
13 1993-94 4,192 892 4S.989 36,497
14 1994-95 4,260 784 46,929 57,664
15 1995-96 4,300 1,100 55,612 62,604
16 1996-97 4,200 1,000 62.600 78.744
17 1997-98(p) 4,149 1,090 73.429 65,463
1,155 126
1,683 175
4,927 814
8,056 2.721
8,556 3.265
6,099 1.998
7,500 6,392
7,009 4,899
1,967 3.991
3.507 5.424
4.108 8,443
6,643 7,047
9,287 2.577
12,286 8,085
16.730 17,237
19,387 50.430
^2,567 26.475
1,522
4,920
10,142
24.251
24.105
23.447
24.338
23,724
24,861
18.855
16,971
19,712
20,686
23.975
124
261
7/4
2,57i
3,005
3,19<
3,97'
5,05'
6,30'
9,36e
11,701
v jm
15.248
18,958
33.870 25,223
31.288 33.047
35,966 92,567
Source : Registrar, Co-operative Societies, Orissa, Bhubaneswar
♦ ♦ ♦
e c o f H ^ ^ s u m m
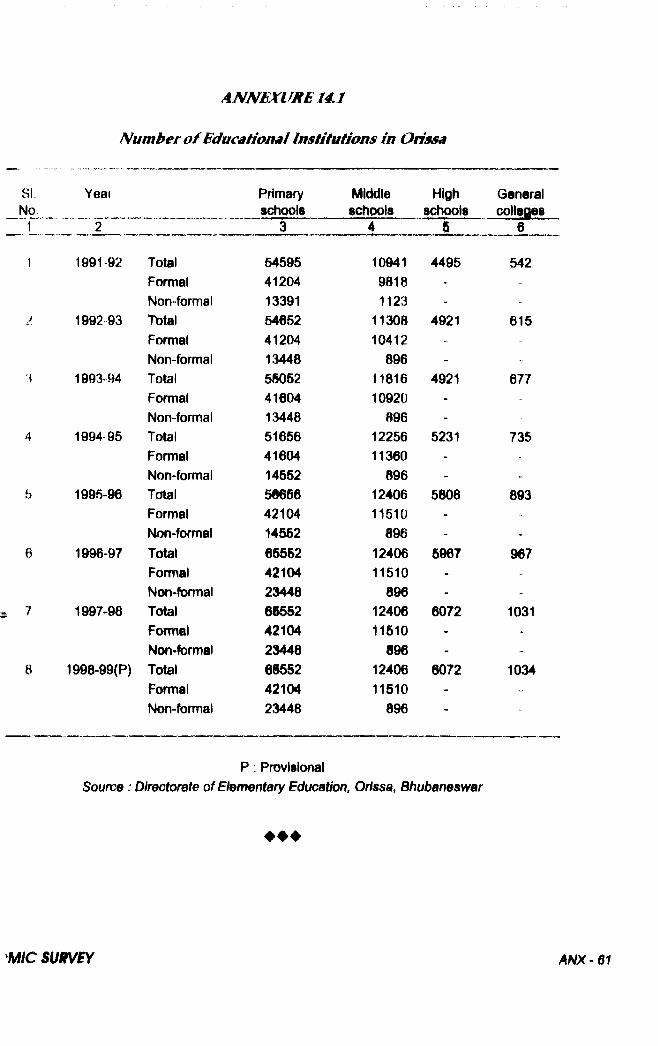
Number o f Educatianal ImHiutions in Onssa
vSI,
Na1
Year
“ T ”
Primaryschools
Middleschools
Highschools
GeneralcoHgges
6
1991-92
1992 93
1993-94
1994-95
1995-96
1996-97
1997-98
8 1908-99(P)
Total 54595 10941 4495 542Formal 41204 9818 -
Non-forma! 13391 1123 - „
Tbtal 54662 11308 4921 615Formal 41204 10412 -
Non-forma! 13448 896 -
Total 50052 11816 4921 677Formal 41604 10920 -
Non-forma 1 13448 896 -
Total 51666 12256 5231 735Formal 41604 11360 - ••
Non-formal 14552 896 -
Total 50656 12406 5808 893Formal 42104 11510 -
Non-formal 14552 896 - -
Total 65552 12406 5967 967Formal 42104 11510 -
Non-formal 23448 896 -
Total 6i5§2 12406 6072 1031Formal 42104 11510 - -
Non-formal 23448 896 -
Total 6S552 12406 6072 1034Formal 42104 11510 -
Non-formal 23448 896 -
P : ProvisionalSource : Directorate of Ehmentary Education, Orissa, Bhubaneswar
♦ ♦ ♦
M ic s u m /E Y AN X-61
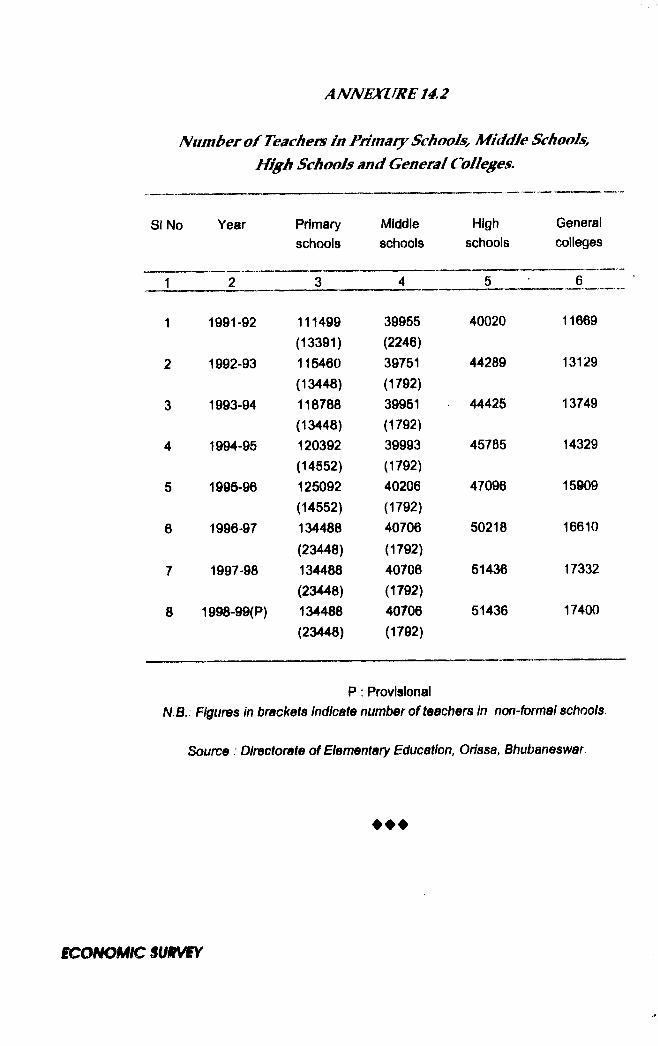
Num ber o f Teachers in Primary Schools^ M iddle Schools, High Schools and General Colleges.
SI No Year Primaryschools
Middleschools
Highschools
Generalcolleges
1 1991-92 111499 39955 40020 11669(13391) (2246)
2 1902-93 115460 39751 44289 13129(13448) (1792)
3 1993-94 118788 39951 44425 13749(13448) (1792)
4 1994-95 120392 39993 45785 14329(14652) (1792)
5 1995-96 125092 40206 47096 15909(14552) (1792)
6 1996-97 134488 40706 50218 16610(23448) (1792)
7 1997-98 134488 40706 51436 17332(23448) (1792)
8 1998-99(P) 134488 40706 51436 17400(23448) (1792)
P : ProvisionalH.B.: Figures in bracl<@ts indicate number of teachers In non-formal schools.
Source : Directorate of Elementary Education, Orissa, Bhubaneswar
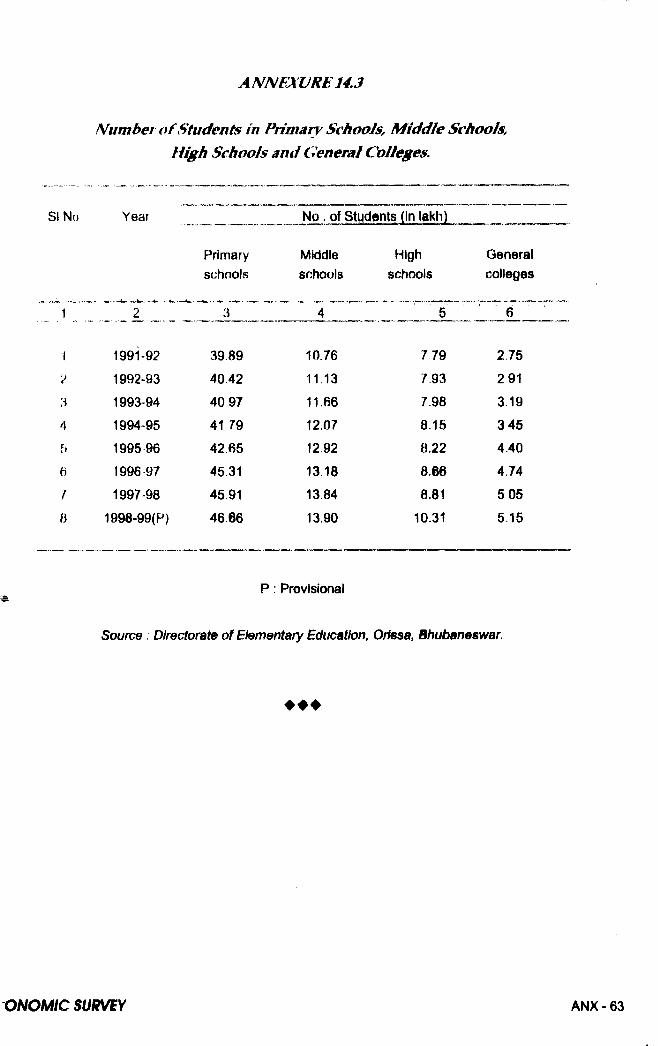
Mumber o f Students in Primary Schools, M iddle Schools, High Schools and General Colleges.
SI No Year __________ No . of Students (In iakh)
Primary Middle High Generalschools schools schools colleges
1 ^ 2 3 4 5 6
1 1991-92 39.89 10.76 779 275? 1992-93 4042 11.13 793 2913 1993-94 4097 11.66 7.98 3,19A 1994-95 41 79 12.07 8.15 3455 1995 96 42.65 1292 8.22 4.406 1996 97 45.31 13.18 8.66 4.747 1997-98 4591 13.84 8.81 5058 1998-99(P) 46.66 13.90 10.31 5 15
P : Provisional
Source : Directorate of Elementary Education, Orissa, Bhubaneswar,
♦ ♦ ♦
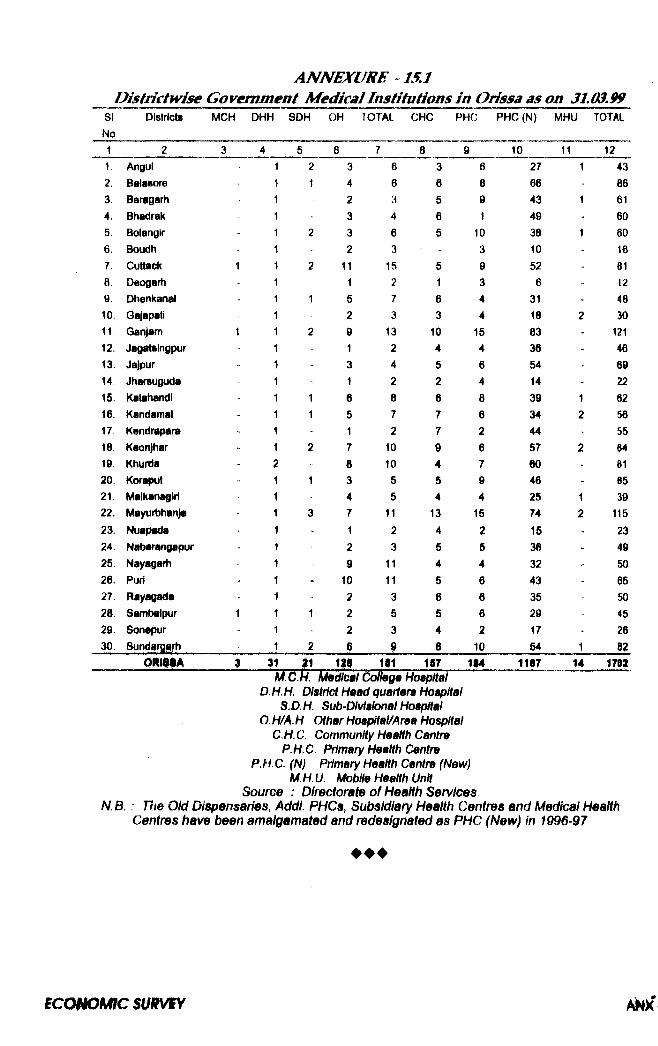
ANNEXURE 15.1 D istrictw ise Government M edical Institutions in Orissa as on 31.03.99
DIstrlcta MCH DHH SDH OH TOTAL CHC PHC PHC (N) MHU TOTAL
I Angul2. Balasore3. Baragarh4. Bhadrak5. Bolangir6. Boudh7. Cuttack8. Deogarti9. Dhenkanal10. GajapatiI I Ganjam12. Jagatelngpur13. Jajpur14. Jharsuguda15. Kalahandl16. Kandamal17. Kendrapara18. Keonjhar19. Khurda20. Koraput21. Malkanagiri22. Mayutthanja23. Nuap«Ja24. Nabarangapur25. Nayagarh26. Puri27. Rays^ada28. Sambalpur29. Sonepur30. Sundafflifli
3 6 3 6 27 1 434 6 6 8 86 862 3 5 9 43 1 613 4 6 1 49 603 6 5 10 38 1 802 3 ' - 3 10 16
11 15 5 9 52 811 2 1 3 6 125 7 6 4 31 482 3 3 4 18 309 13 10 15 83 1211 2 4 4 36 463 4 5 6 54 691 2 2 4 14 226 8 6 8 39 1 825 7 7 6 34 2 561 2 7 2 44 557 10 9 6 57 2 848 10 4 7 60 - 813 5 5 9 46 - 854 5 4 4 25 1 397 11 13 15 74 2 1151 2 4 2 15 - 232 3 5 5 36 - 499 11 4 4 32 - 50
10 11 5 6 43 - 652 3 6 6 35 502 5 6 6 29 452 3 4 2 17 - 266 9 8 10 54 1 82
101 187 114 1187 14 1702
D. H. H. District H9ad quarters Hospital S.D.H. Sub-Divisional Hospitai
O.H/A.H Othar Hospital/Araa Hospital C.H.C. Community Health Cantra
P.H.C Primary Health Centre P. H a (N) Primary Health Centre (New)
M.HU. Mobile Health Unit Source : Dirsctorate of Health Services
N.B. The Old Dispensaries, Addl. PHCs, Subsidiary Health Cerrires and Medical Health Centres have been amalgamated and redesignated as PHC (New) in 1996-97,
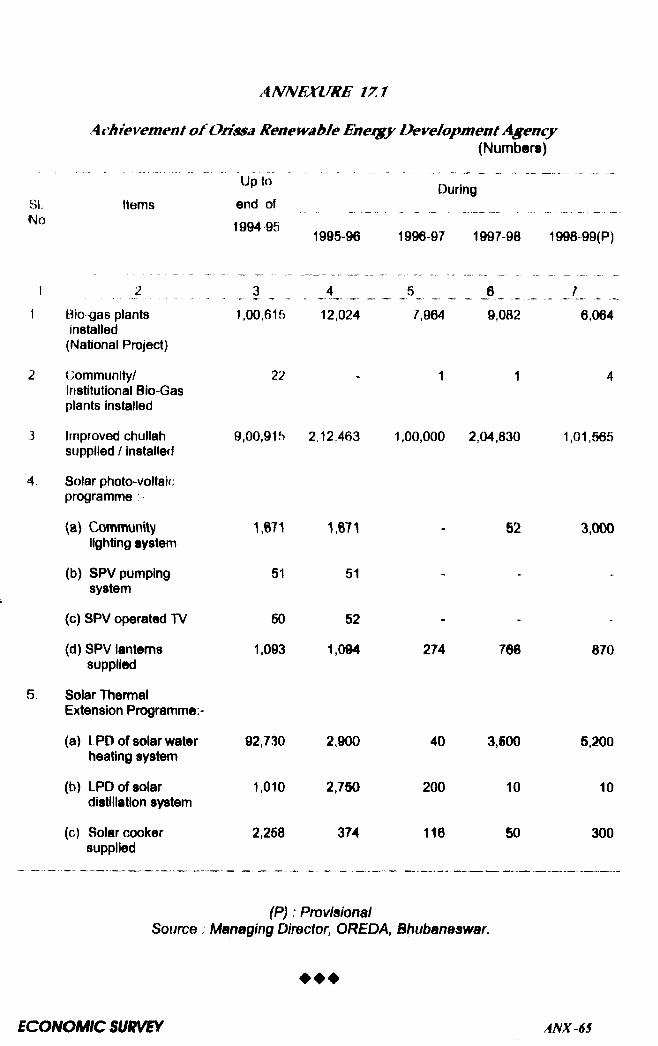
Achievement o f Orissa Renewable Eneigy D evelapm ent Agency (Numbers)
Up to , DuringSI. Items end of ______________________ _____________ ___ _
1994 951995-96 1996-97 1997-98 1998-99(P)
3 4 5 6 71 Bio gas plants 1,00,615 12,024 7,964 9,082 6,064
installed(National Project)
2 Community/ 22 - 1 1 4Institutional Bio-Gasplants installed
3 Improved chullati 9,00,915 2,12,463 1,00,000 2,04,830 1,01,565supplied / installed
4 Solar photo»voltaic programme :
(a) Communitv 1.671 - 52 3,000lighting system
(b) SPV pumping 51 51 . .system
(c) SPV operated TV 50 52 - -
(d) SPV lanterns 1,093 1,094 274 766 070supplied
5. Solar ThermalExtension Programme:-
(a) LPD of solar water 92,730 2,900 40 3,500 5,200heating system
(b) LPD of solar 1,010 2,750 200 10 10distillation system
(c) Solar cooker 2,258 374 116 50 300supplied
(P) : Provisional Source ; Managing Director, OREDA, Bhubaneswar.
♦ ♦ ♦
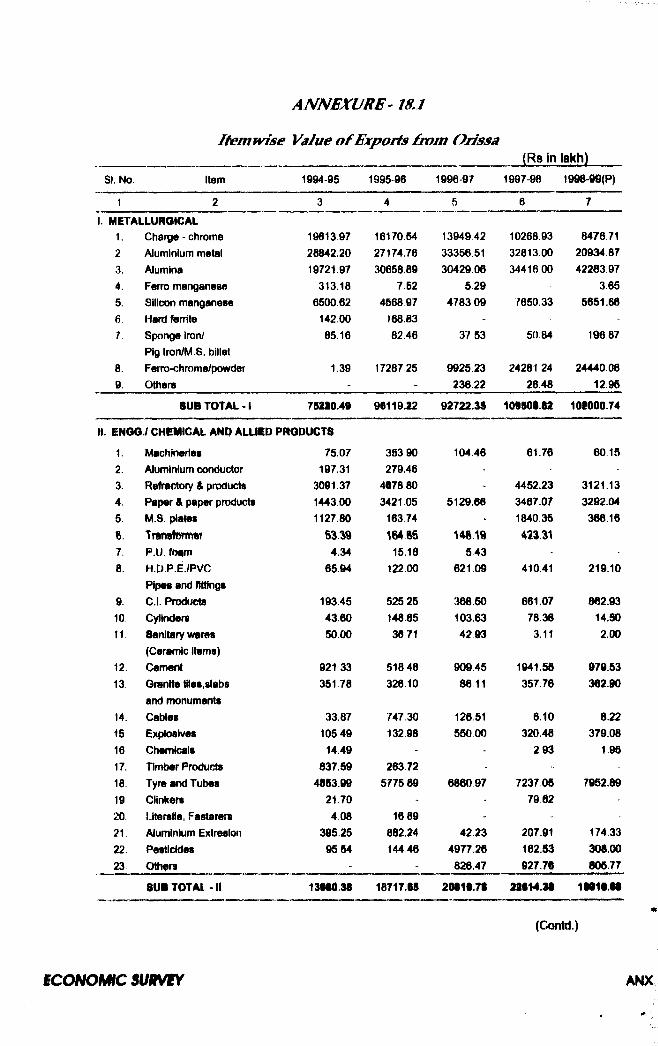
ANNEXURE- 18.1 Item w ise Value o f Exports from O iissa
(Rs in lakh)SI. No, Item 1994-95 1995-96 1996-97 1997-98 1998-09(P)
1 2 3 4 5 6 7
1, METALLURGICAL1. Charge - chrome 19613.97 16170.54 13949 42 10268,93 8476,712 Aluminium metal 28842.20 27174.76 3335651 32813 00 20934.873. Alumina 19721.97 30658.89 30429 06 34416 00 42283.974. Ferro manganese 313.18 7.52 529 3.655. Silicon manganese 6500.62 456897 4783 09 7650.33 5651.666. Hard ferrite 142.00 168,837. Sponge Iron/ 85.16 82 46 37 53 50 84 196.87
8.Pig lron/M.8. billet Ferro-chrome/powder 1,39 17287 25 992523 24281 24 24440.06
9. Others - - 236 22 26.48 12.95
SUB TOTAL • 1 75110.49 96119.12 92722.35 10980t.B2 101000.74
il. ENOO./ CHEMICAL ANO ALLIED PRODUCTS
1. Machineries 75.07 353 90 104 46 61.76 60 152. Aluminium conductor 197.31 279.463. Refractory & products 3091 37 4078 80 - 4452.23 3121.134. Paper & paper products 1443 00 3421.05 5129.66 3467.07 3292.045, M.S. i^ates 1127.80 163.74 - 1840.35 366166. Transformw 83 164B5 14819 423.317. P.U ffttm 4.34 15.18 543 -8. H.D.P.E./PVC 65.94 122.00 621.09 410.41 219.10
9.Pipes and fitUngs C.l. Produets 193.45 525 25 368.50 661.07 862.93
10 Cylinders 43 60 148 85 103,63 78.36 14.5011. Sanitary wares 50.00 38 71 4293 3.11 2,00
12.(Ceramic items) Cement 921 33 518 48 909.45 1941.55 979.53
13 Granite tiles,slabs 351 78 326 10 86 11 357.76 362.90
14.and monuments Cables 33.87 747 30 126 51 6.10 8.22
15 Explosives 105 49 132 98 550 00 320.48 379.0816 Chemicals 1449 - - 293 1.9517. Timber Products 837 59 263.72 - -18. Tyre and Tubes 4853.99 5775 89 6860 97 7237.05 7952.8919 Clinkers 21 70 - - 79 6220. Litersile, Fastsrers 408 1689 -21. Aluminium Extresion 395 25 88224 42 23 207.91 174.3322 Pesticides 95 54 144.46 4977.26 162.53 300.0023- Others - 826.47 927.76 806.77
SUB TOTAL * II 13M0.38 18717JS 2M1t.7S 226^4.31 1IS10.M
i c o N o m : suRvtY ANX
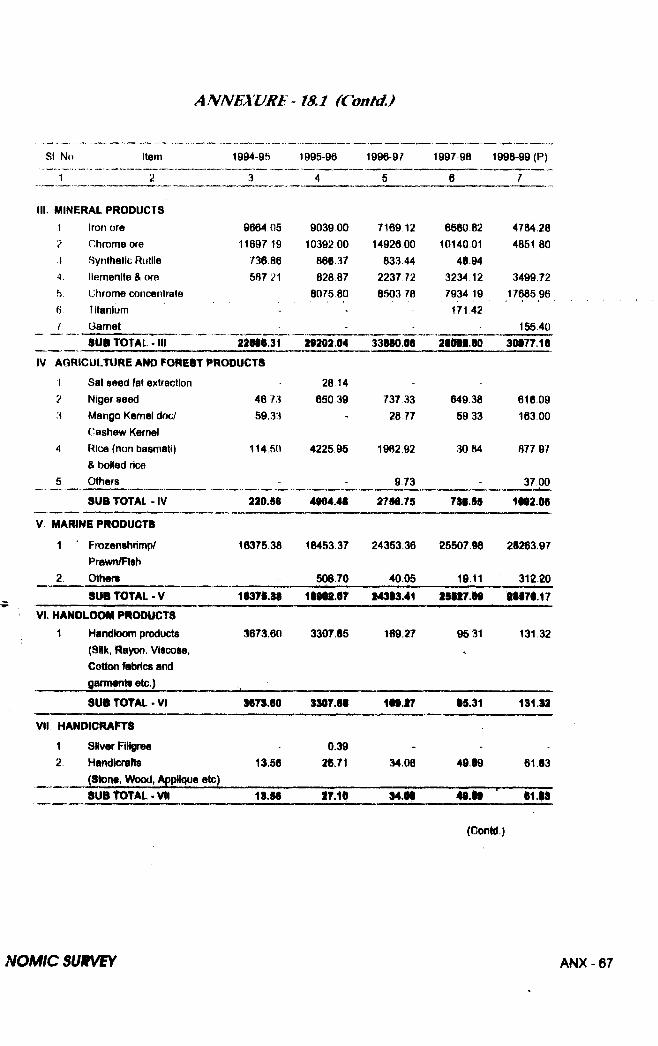
SI No Item 1994-95 1995-96 1996-97 1997-98 1998-99 (P)
1 2 3 4 5 6 7
III, MINERAL PRODUCTS1 Iron ore 9664 05 9039 00 7169 12 6660 82 4784,282 Chrome ore 11697 19 10392 00 14926 00 10140.01 4851 803 Synthetic Rutile 736 88 866 37 83344 48.944 llemenite & ore 587 21 82887 2237 72 3234 12 3499.725 Chrome concentrate 807580 8503 78 7934 p 17685^966 titanium - 171 42i Garnet - - 155.40
SUi TOTAL • III aaeM.ai 28202.04 33880 06 28088.80 30877.16IV AGRICULTURE AND F0R18T PRODUCTS
1 Sal seed fat extraction 28 142 Niger seed 46 73 650 39 737 33 649 38 616.093 Mango Kemel doc/ 59.33 - 28 77 59 33 163.00
Cashew Kernel4 Rice (non basmati) 114.50 422595 1982 92 30 84 877 97
& boiled rice5 Others - - 9 73 - 37 00
SUB TOTAL. IV 220.56 4904.48 2788.75 738.85 1882.06
V. MARINE PR0DUGT8
1 ■ Frozenshrimp/ 16375.38 18453.37 24353 36 25507 88 28263 97Prawn/Flsh
2 Others 508.70 40.05 19.11 312.20SUB TOTAL-V 1637S.38 i8982.er 24383.41 28U7.88 88878.17
VI HANDLOOM PRODUCTS1 Handloom products 367v1.60 3307.85 189.27 9531 131 32
(SHk, Rayon, Viscose,Cotton fibrics and garrmints etc.)
SUB TOTAL • VI S67S.60 3307.88 1M.27 85.31 131.32
VII HANDICRAFTS
1 Silver Filigree - 0.39 - * -
2 HarKllcrafts 13.56 28.71 34.08 49.89 61 83(Stonf, Wood, Applique eto)SUB TOTAL-VII 1186 17.18 34.98 48.M 81.13
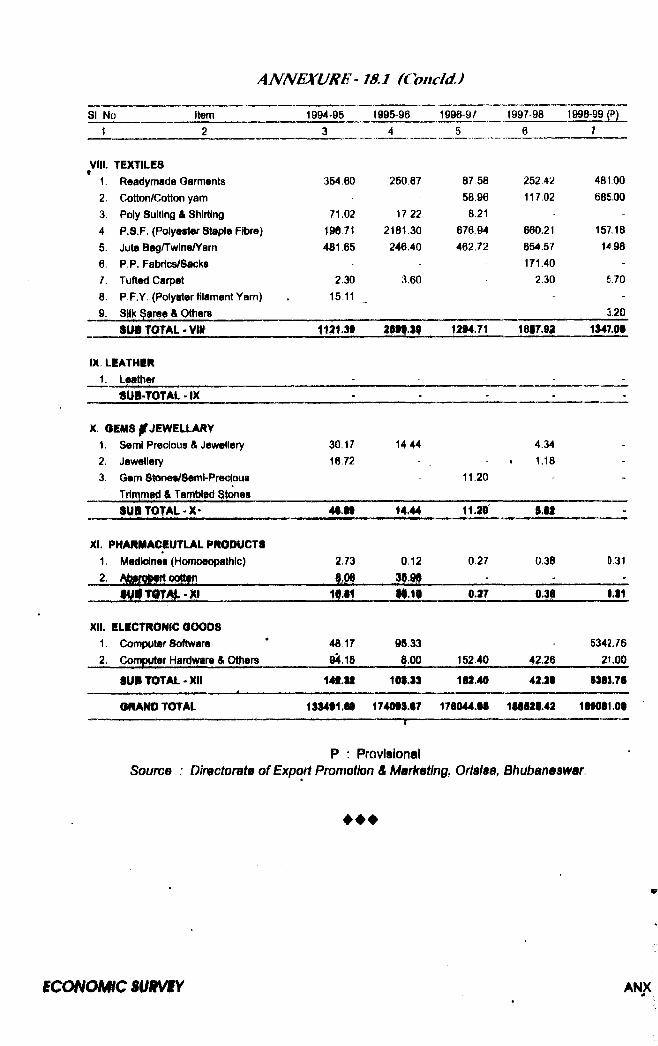
SI No Item 1994-95 1995-96 1996-9/ 1997-98 1998-99 (P)1 2 3 4 5 6 7
VIII. TEXTILES1. Readymade Garments 354.60 250,87 87 58 252,42 481.002. Cotton/Cotton yam - 58 96 117.02 685.003 Poly Suiting & Shirting 71.02 17 22 821 -4 P.8.F. (Polyester Staple Fibre) 19671 2181.30 676.94 660.21 157.185. Jute Bag/Twine/Yarn 481 65 246.40 462.72 654.57 14986. P.P. Fabrics/Sacks - 171.40 -7. Tufted Carpet 2.30 3,60 2.30 5.708. P F.Y, (PolyBter filament Yam) 1511 - -9. SilK ^aree & Others 3.20
SUitOTAt-VIH 1121.3$ 2S9I.39 1294.71 1897.91 1347.09
IX. LEATHER1. Leather - - -
fUfi-TOTAL • IX - > - - -
X. GEMS |f JEWELLARY1. Semi Precious & Jewellery 30,17 14 44 4.342. Jewellery 1672 - . - > 1.18 -3. Gem Stonee/Semi-Precious 11.20 - -
Tiimrned & Tamblid atonesSU# TOTAL-X- 4 i j i 14.44 11.20 9.92 -
XI. I>HARMACEUTLAL PRODUCTS1. Medk^nes (Homoeopathic) 2.73 0.12 027 0.38 0.31
m 3S.9» - - -
I f J I H.10 0.27 0.|9 1.91
XII. ELECTRONIC OOOOS1. Computer Software 48.17 9S.33 5342.762. Computer Hardware & Others 9^.15 8.00 152.40 4226 21.00
SUi TOTAL-XII IM . t t 10S.33 192.40 42.29 539S.79
GRAND TOTAL 13S4t1.6S 1740t3.67— s------
170044.99 199929.42 199091.09
P : Provisional Source : Dinctorate of Export Promotion & Marksting, Orlslaa, Bhubaneswar.
lE cc^oN M c s u n m AN}(
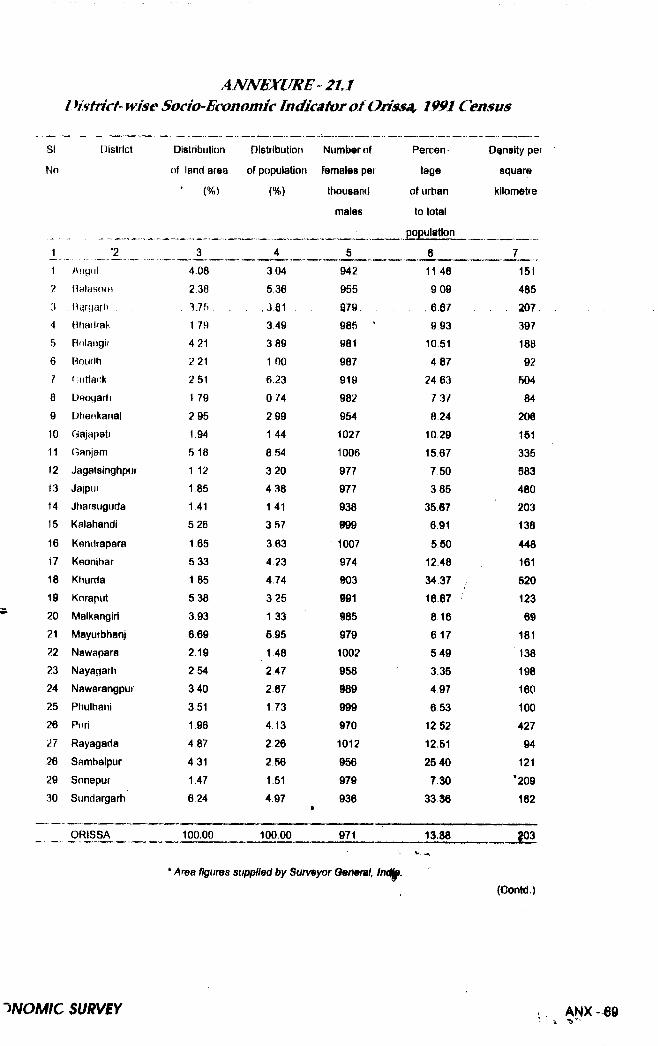
SI
No
tiistrlct
....I Angiil
7 Balasoie
3 f1i4(()affi ,
4 Hliadrak
5 Boiaiigir
6 Boiiflh
7 (-tiHank
8 Deogarh
9 Dhenkanal
10 Gajapati
I I (sanjam
12 Jagatsinghpur
13 Jajpur
14 Jharsuguda
15 Kalahandi
16 Kendrapara
17 Keonjhar
18 Khurda
19 Koraput
20 Malkangiri
21 Mayurbhanj
22 Nawapara
23 Nayagarh
24 Nawarangpur
25 Phulbani
26 Puri
27 Rayagada
26 Samhalpur
29 Sonepur
30 Sundargarh
Distribution
of land area
‘ (%)
4.08
2,38
3J51 794 21
221
2 51
1 79
295
1 945 18
1 12
1 85
1 41
526
1 65 6331 85
5 38
393
6692 19
2543 40
351
1 964 87
4 31
1.47
624
Distribution Number of
of population females per
{%) thousand
males
4 304
5.36
. 3 81 349
3 89
1 00
6.23
0 /4
299
1 44
8543 204 38
1 41
357
363
4 23
4,74
325
1 33
695
1 48
247
2.67
1 73
4.13
226
256
1.51
4.97
942955
979
985981
987
919982
954
1027
1006
977
977
938
999
1007
974
903
@91 985
979
1002 958
989
999
970
1012956
979
936
Percen
tage
of urban
to total
populgtlon
Density per
square
kilometre
611 46
909
6.67
993
1051
4 8724 63
7 3 / 824
10.2915677 50
38535 67
6.91
550
1248
34 37
16.678 16
6 17
549
335 497
6 53125212.S125 40
7.3033 36
151485207.39718892
50484
206151335S83480203138
44816162012369
181138198160100
42794
121‘ 209162
ORISSA 100.00 100 00 971 13.38 103
' Area flgures supplted by Surveyor Qen»ral,(Oontd.)
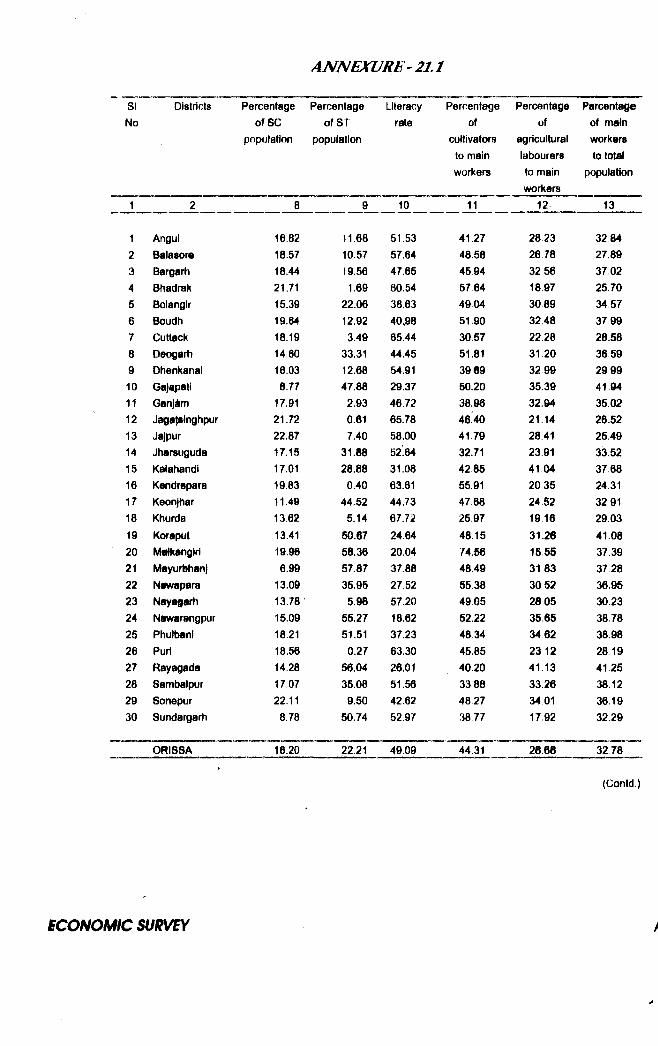
SINo
Districts Percentage of SC
population
Percentage of ST
population
Literacyrate
Percentageof
cultivators to main workers
Percentageof
agricultural labourers to main workers
Parcentage of main workers to total
population
1 2 8 9 10 11 12 13
1 Angul 16,82 11.68 51.53 41,27 2823 32,842 Balasore 18.57 10.57 57.64 48.58 26 78 27.893 Bargarh 18.44 19.56 47.65 45.94 32 56 37,024 Bhadrak 21.71 1.69 60.54 57 64 18.97 25.705 Bolangir 15.39 22.06 38.63 4904 30 89 34 576 Boudh 19.64 12.92 40.98 51.90 32 48 37 997 Cuttack 18.19 3.49 65.44 30,57 22.28 28.588 Ddogarti 14,60 33.31 44.45 51.81 31 20 36 599 Dhenkanal 16.03 12.68 54.91 39.69 32 99 29 9910 Gajapati 8.77 47.88 29.37 50.20 35,39 41.9411 Ganj^m 17.91 2.93 46.72 38.96 32.94 35 0212 Jaga^inghpur 21.72 0.61 65.78 46.40 21 14 26.5213 Jaipur 22.87 7.40 58.00 41.79 2841 25.4914 Jharsuguda 17.15 31.88 52.64 32.71 2391 33.5215 Kalahandi 17.01 28.88 31.08 4285 41 04 376816 Kendrapara 19.83 0.40 63.61 55.91 20 35 24.3117 Keonjtiar 11.49 44.52 44.73 47.68 24 52 329118 Ktiurda 13.62 5.14 67.72 25,97 19 16 29,0319 Koraput 13.41 50.67 24.64 48,15 31.26 41.0820 Matkangiri 19.96 58.36 20.04 74,56 1555 37.3921 Mayurbhanj 6.99 57.87 37.88 4849 31 83 37 2822 Nawapara 13.09 35.95 27.52 55 38 30 52 36.9523 Nayafarh 13.78 5.96 57.20 4905 28 05 30 2324 Nawarangpur 15.09 55.27 18.62 52.22 35,65 38.7825 Phulbani 18.21 51.51 37.23 48 34 34 62 38.9826 Puri 18.56 0.27 63.30 45.85 23 12 28 1927 Rayagada 14.28 56.04 26.01 40.20 41.13 41.2528 Sambalpur 17,07 35.08 51.56 3388 33.26 38,1229 Sonepur 22.11 9.50 42.62 48.27 34 01 36 1930 Sundargarh 8.78 50.74 52,9/ 3877 1792 32 29
ORISSA 16.20 22.21 49.09 44.31 28.68 3278
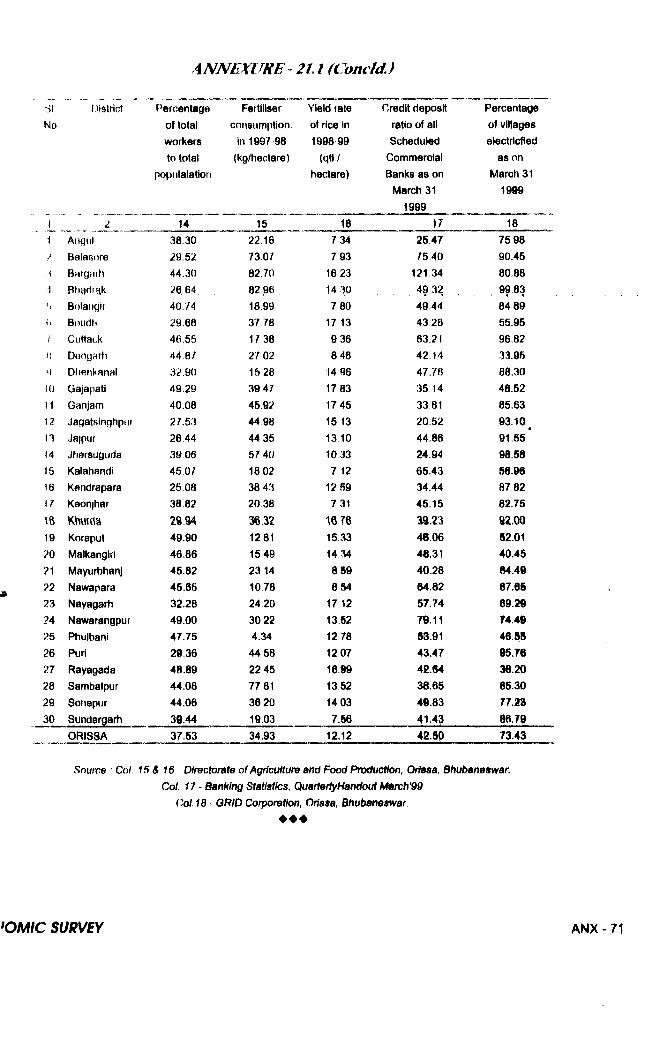
SI Oistrict Percentage Fettiliser Yield rate Credit deposit PercentageNo of total consumption of rice in ratio of all of villages
workers In 1997 98 1998 99 Scheduled electricfiedto total (kg/fiectare) (qtl/ Commercial as on
populalation hectare) Banks as on March 31
1999
March 31 1999
1 2 14 15 16 17 181 Aiigiil 38.30 22.16 7 34 25.47 7598) Balasore 29.52 73.07 7 93 7540 90.451 BargHfh 44.30 82.70 16 23 121.34 80.881 Bligflrqk 26 64 82 96 14 30 , ^9 32 9983!i Bfjiaiigir 40.74 18.99 7 80 49,44 84 89ti Boudti 29.68 37.78 17 13 43.28 55.95( Cuttauk 46.55 1738 9 36 63.21 96.82H Deoyarh 44 8f 27 02 848 42.14 33.95M Dhfirikanal 32.90 15 28 14 96 47.7H 88.30(0 Gajapati 49.29 39 47 17 83 35,14 48.5211 Ganjam 40.08 45,92 1745 33,81 856312 Jagatsinghptir 27.53 44 98 15 13 20.52 93,10^13 Jaipur 26,44 44 35 13 10 44,86 91.85*14 Jharsuguda 39.06 57 40 1033 24,94 98.5815 Kalahandj 45.0/ 1802 7,12 65.43 S6.9616 Kendrapara 25.08 38 43 12 69 34.44 87 82\ I Keonjhar 38.82 20 38 7 31 45.15 82.75AB Khvwrta 29.94 36 32 16 ?8 39.23 92.QQ19 Koraput 49.90 1281 15.33 46.06 82.0120 Malkangiti 46.86 15 49 1434 48.31 40.4521 Mayurtihanj 45.82 23 14 859 40.28 64.4922 Nawapara 45.65 10 78 854 64.82 67.6623 Nayagarh 32.28 2420 17 12 57.74 69.2924 Nawarangpur 49.00 30 22 13.62 79.11 T4.4925 Phulbani 47.75 4.34 12,78 53.91 46.6326 Puri 29.36 44 58 1207 43.47 95.T627 Rayagada 48.89 2245 16J9 42.64 36.2028 Sambalpur 44.08 7781 13 52 38.65 65.3029 Sonepur 44.06 36 20 1403 49.83 77.2330 Sundargarti 39.44 19.03 7.56 41.43 86.79
ORISSA 37.53 34.93 12.12 42.60 73.43
Snume Col 15 & 16 Dlmctorate of Agricultum and Food Production, Oriasa Bhubaneswar. Col. 17 - Banking Statistics, QuarteiiyHandout h^rch'99
Col 18 QRID Corporation, Oriasa, Bhubaneswar♦ ♦ ♦
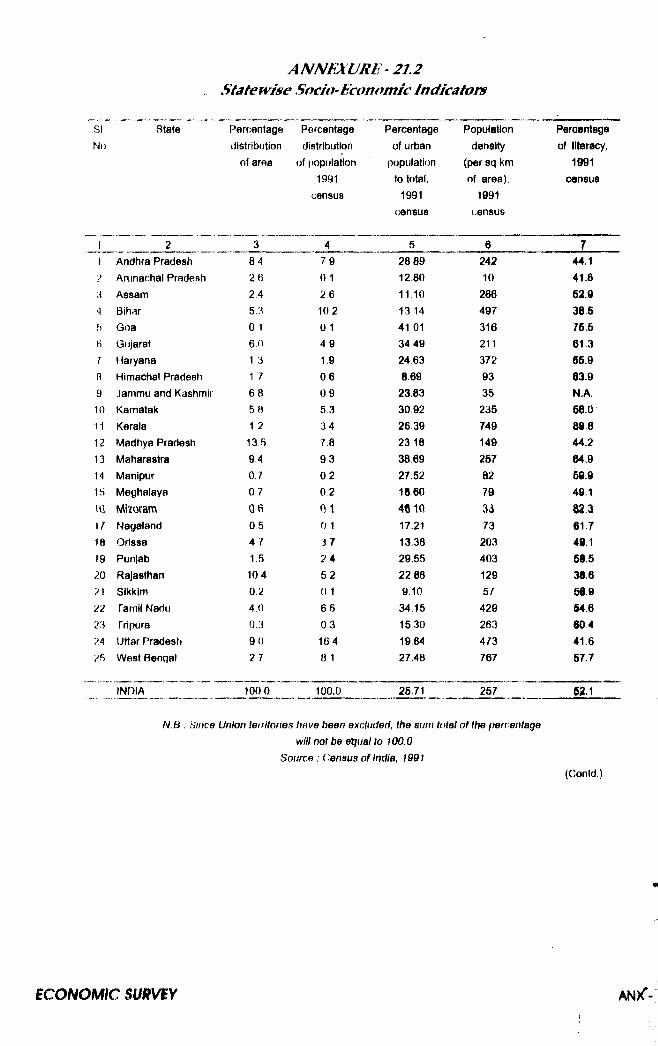
ANNFXURE-2L2 Statew ise Socio-tkonantic Indicators
SINo
State Pert;entage distribution
of area
Percentage distribution
of [lopulation 1991
census
Percentage of urban
population to total.
1991census
Population density
(per sq km of area),
1991 census
Percentage of literacy,
1991 census
1 2 3 4 5 6 71 Andhra Pradesh 8 4 79 2009 242 44.12 Arunachal Pradesh 2H 0 1 12 80 10 41.03 Assam 2,4 26 11.10 206 52.94 Bihar 5-3 10 2 13 14 497 38.5h Goa 01 0 1 41 01 316 75.5H Gujarat 6 0 4 9 34.49 211 61.37 Haryana 13 19 24.63 372 55.9R Himachal Pradesh 1 7 06 0.69 93 63.99 Jammu and Kashmir 6 8 0 9 23.03 35 N.A.10 Karnatak 58 5,3 30.92 235 56.011 Kerala 12 34 26,39 749 89.012 Madhya Pradesh 135 78 23 18 149 44.213 Maharastra 94 93 30.69 257 04.914 Manipur 0.7 02 27.52 02 59.915 Meghalaya 0 7 0.2 10 60 79 49.1U] Mlioram OR 01 46.10 33 a^3\ r Nagaland 06 0 1 17.21 73 61.718 Orissa 4 / 37 13,38 203 49.119 Punjab 1.5 2 4 29.55 403 68.5
20 Rajasthan 104 5,2 22 08 129 38.621 Sikkim 0 2 0 1 9.10 57 56.922 Tamil Nadu 4 0 6.6 34.15 429 §4.623 Tripura 0.3 0.3 15 30 263 60.424 Uttar Pradesti 9 0 164 19 84 473 41.625 West Bengal 2 7 8 1 27.48 767 57.7
INDIA 100 0 100.0 25.71 257 52.1
N.B : Since Union territofies have been excluded, the sum total o f the percentage
will not be e^ iia l to 100.0
Source : Census o f India, 1991
(Contd.
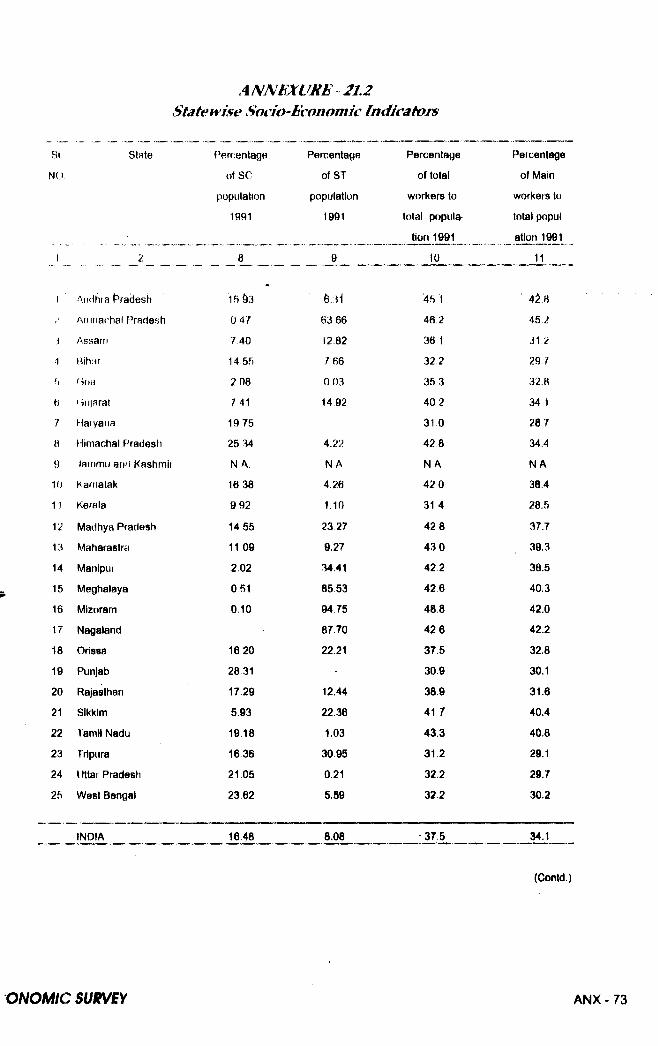
Si
N(!
SiHte Percentage
of SC
population
1991
Percentage
of ST
population
1991
Percentage
of total
workers to
total popula
tlon 1991
10
Percentage
of Main
workers to
total popul
atlon 1991
11
I Aiicihia f^radesh Anifiachal Pradesh
i Assam •1 Hiharf) f->OH
B 'iiijarat
7 Hatyana
H Himachal Pradesh
9 Jatnmu and Kashmir
10 Karnatak
11 Kerala
12 Madhya Pradesh
13 Maharastra
14 Manipur
15 Meghalaya
16 Mizoram
17 Nagaland
18 Orissa
19 Punjab
20 Rajasthan
21 Sikkim
22 lamil Nadu
23 Tripura
24 Uttar Pradesh
25 West Bengal
15&3
0 47
7 40
14 55
2 08
7 41
19 75
25 34
N A.
16 38
9 92
14 55
11 09
2,02
051
0,10
16 20
2831
17.29
593
19 18
16.36
21.05
23 62
63 66
12.82
766
0 03
14 92
4.22
N A
4.26
1,10
2327
9.27
34.41
85 53
94 75
87 70
22.21
12,44
22.36
1.03
30.95
0.21
5.S9
45 1
46 2
36 1
322
35 3
40 2
31 0
428
N A.
42 0
31 4
428
430
422
426
488
426
375
309
38.9
417
433
31 2
32.2
322
42 B 452
31 2
29,/
328
34 1
287
34.4
N A
38.4
28.5
37.7
39.3
385
40.3
42.0
42.2
32.8
30.1
31.6
40.4
40.8
29.1
29.7
30.2
INDIA 16.48 8.08 37.5 34.1
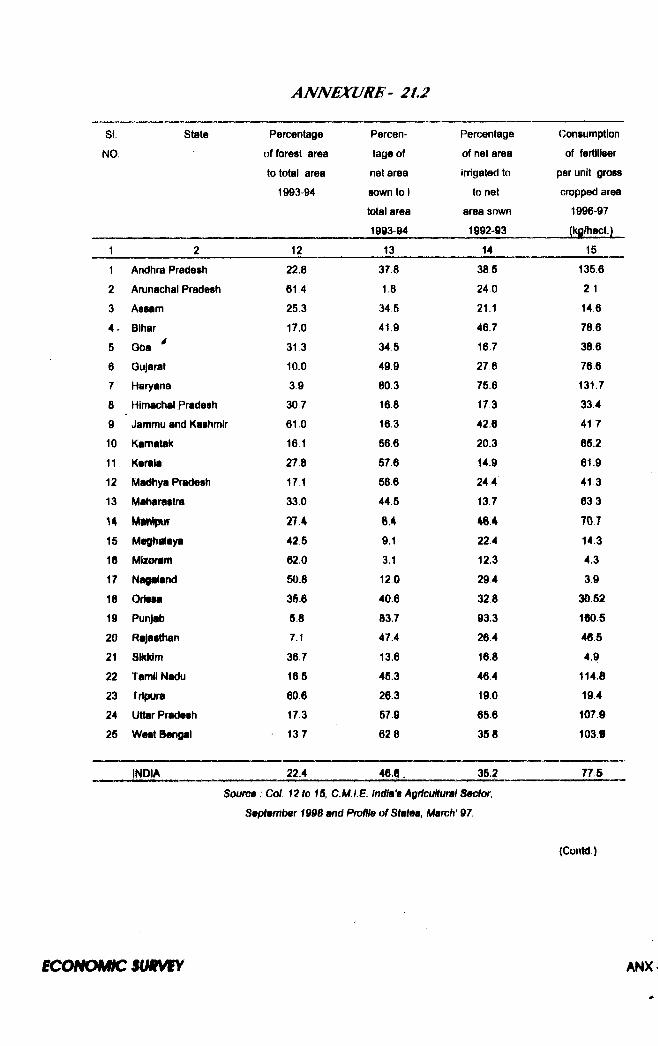
SI. State Percentage Percen Percentage Consumption
NO. afforest area tage of of net area of fertiliser
to total area net area irrigated tn per unit gross
1993-94 sown to i to net cropped area
total area area sown 1996-97
1993 94 1992-93 (kg/hect.)
1 2 12 13 14 15
1 Andhra Pradesh 22,8 37.8 385 135.6
2 Arunachal Pradesh 61 4 1.8 240 2 1
3 Assam 253 34,5 21.1 14.6
4- Bihar 17,0 41.9 46.7 786
5 Goa * 31 3 34.5 16.7 38.6
6 Gujarat 10.0 499 276 766
7 Haryana 39 80.3 75.6 131.7
8 Himachal Pradesh 30.7 16.8 17.3 33.4
9 Jammu and Kashmir 61.0 16.3 42.6 41 7
10 Kamatak 16.1 56.6 20.3 65.2
11 Kerala 27.8 57.6 14.9 61.9
12 Madhya Pradesh 17 1 58.6 24 4 41 3
13 Maharastra 33.0 445 13.7 633
U 27.4 6.4 464 707
15 Meghataya 425 9.1 224 14.3
16 Mizoram 62.0 3.1 12.3 4.3
17 Nagaland 50.8 12 0 294 39
18 Orteta 36.6 40.6 328 30.52
19 Punjab 5.8 83.7 93.3 160.5
20 Rajasthan 7.1 47.4 26.4 46.5
21 Sikkim 36 7 13.6 16.8 4.9
22 Tamil Nadu 165 45.3 46.4 114.8
23 Tripura 60.6 26.3 19.0 194
24 Uttar Pradesh 173 57.9 65.6 107.9
25 West Bengal 13.7 628 358 103.8
INDIA 22.4 46,1. 352 77.5
Sourm: Col 12 to 15, C.M.I.E. India's Agricultural Sector,
Saplmmlier 1998 and ProWe ofStatea, March' 97.
i c o w m c m m m
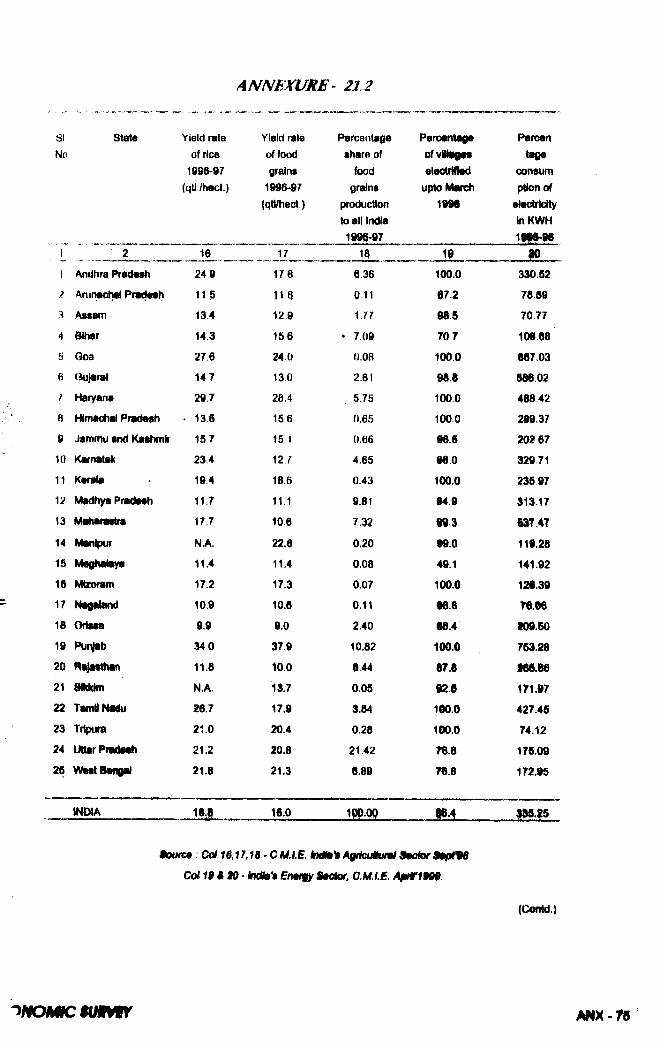
SI stateNo
Yield rale of rice
1996-97 (qtl/hect.)
Yield rate of food grains
1996-97 (qtt/hect.)
PercetUaga share of
food grains
productkm to all India 1996-97
Percantaga of vitagts elaotriflad
upto IMareh 1996
Parcan taga
consum pttonof
alactridty in KWHim-m
1 2 16 17 18 19 m1 Andhra Pradesh 249 178 6.36 100.0 330.52
2 Amnachal PradMh 11 ? 11 9 Q.11 072 78.59
) Assam 13-4 12 9 1.7? 985 7077
4 Bihar 14.3 16 6 • 7.09 70.7 108.68
5 Qoa 276 240 0.08 1000 867.03
6 Qujarat 147 13 0 2.81 988 S88 02
/ Haryana 297 28 4 5.75 100.0 468.42
A Himadial Pradash • 135 156 0.65 100.0 289.37
9 Jammu and Kashmir 157 15 1 0.66 96.5 202 67
10 Kamatai( 23.4 12J 4.65 980 329 71
11 Karaia 194 18.6 0.43 100.0 23597
12 Madh^Pradash 11.7 11.1 9.81 §49 313.17
13 MirtwrMiba 17.7 10.6 7.32 m 137 47
14 Manipur N.A. 22.6 0.20 99.0 119.28
11.4 11.4 0.08 49.1 141.92
16 Mizoram 17.2 17.3 0.07 100.0 128.39
17 htagaiand 10.9 10.6 0.11 •8.8 re.oe
18 Ortea 9.9 9.0 2.40 §8.4 t09.50
19 Pui^b 340 37.9 10.82 100.0 753.28
20 Ri^asthin 11.8 10.0 644 87.8 K6.8621 Sikkim N.A. 13.7 0.05 02.0 171.07
22 Tamil Nidu 26.7 17.9 3.84 100.0 427.45
23 Tripure 21.0 20.4 0.28 100.0 74.12
24 Uttar Pndath 21.2 20.8 21.42 T6.6 175.09
25 WestBwigal 21.8 21.3 6.89 T6.8 172.95
INDIA 18.1 16.0 10PQ0 .....___ mm...
9owc6 Col 16.17,18 • C M m *mM»% Agricullml aMtor CoHBiiO’ Undto't Enm^ 8§t^, C.M.I.B. A0W im
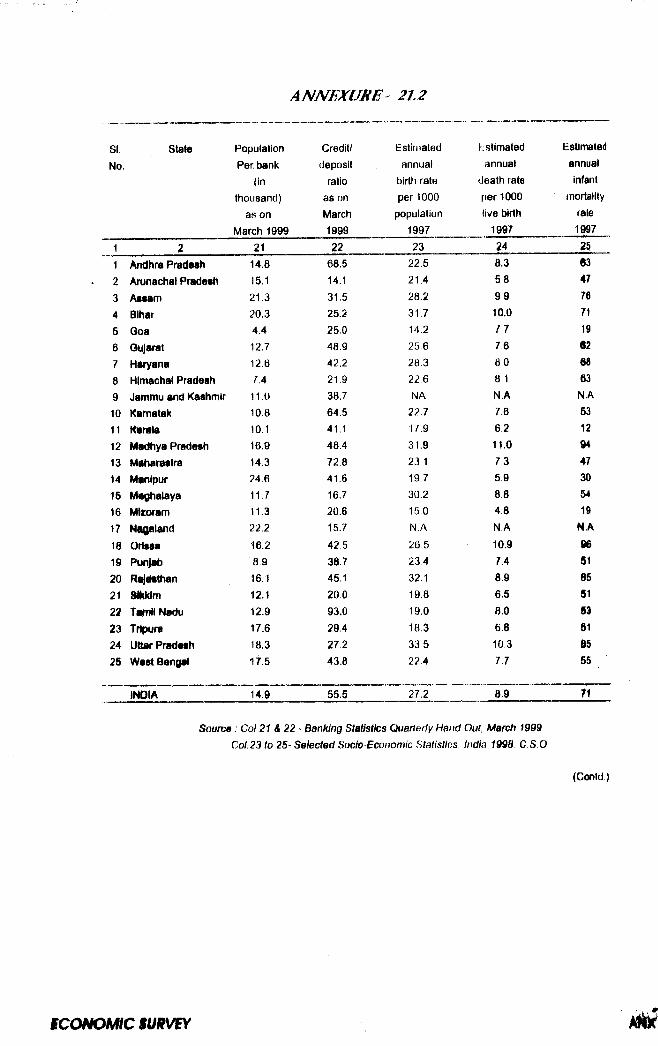
SI. state Population Credit/ Estimated hstimated Estimated
No. Per banl( deposit annual annual annual
(in ratio birth rate death rate infantthousand) as on per 1000 per 1000 mortality
as on March population live birth rateMarch 1999 1999 1997 1997 1997
1 2 21 22 23 24 .... 25...1 Andhra Pradesh 14.8 68.5 22.5 8.3 63
2 Arunachal Pradesh 15.1 14.1 21.4 5,8 47
3 Assam 21.3 31.5 28.2 99 764 Bihar 20.3 25.2 31.7 10.0 71
5 Qoa 4.4 25.0 14.2 7,7 196 Gujarat 12.7 48.9 25.6 7.6 627 Haryana 12.6 42.2 28.3 8,0 888 Himachal Pradesh 7.4 21.9 22,6 8 1 639 Jammu and Kashmir 11.0 38.7 NA N.A N.A
10 Kamatak 10.8 64.5 22.7 7.6 53
11 K«rata 10.1 41.1 17.9 6.2 1212 Madhya Pradesh 16.9 48.4 31.9 11.0 9413 Maharastra 14.3 72.8 23 1 73 4714 Manipur 24.6 41.6 19.7 5,9 3015 Meghalaya 11.7 16.7 30.2 8.8 5416 Mlioram 11.3 20.6 15 0 4.8 1917 N«8tland 22.2 15.7 N.A N A N.A
18 Orissa 16.2 42.5 26 5 10.9 9619 Punjab 8.9 38.7 23,4 7.4 5120 RajMthan 16.1 45,1 32.1 8.9 8521 mklrn 12.1 20.0 19.8 6.5 5122 TamNNadu 12.9 93.0 19.0 8.0 S323 Tripura 17.6 29.4 18.3 6.8 §124 Uttar Pradesh 18.3 27.2 33 5 10.3 6525 West Bengal 17.5 43.8 22.4 7.7 55
INDIA 14.9 55,5 27.2 8.9 n
Source . Col 21 & 22 - Banking Statistics Quarterly Hand Out, March 1999
Col. 23 to 25- Selected Sooio-Economic Statistias. India 1998 0 S O
(Contd;
§ C Q N O M iC $ U m ^
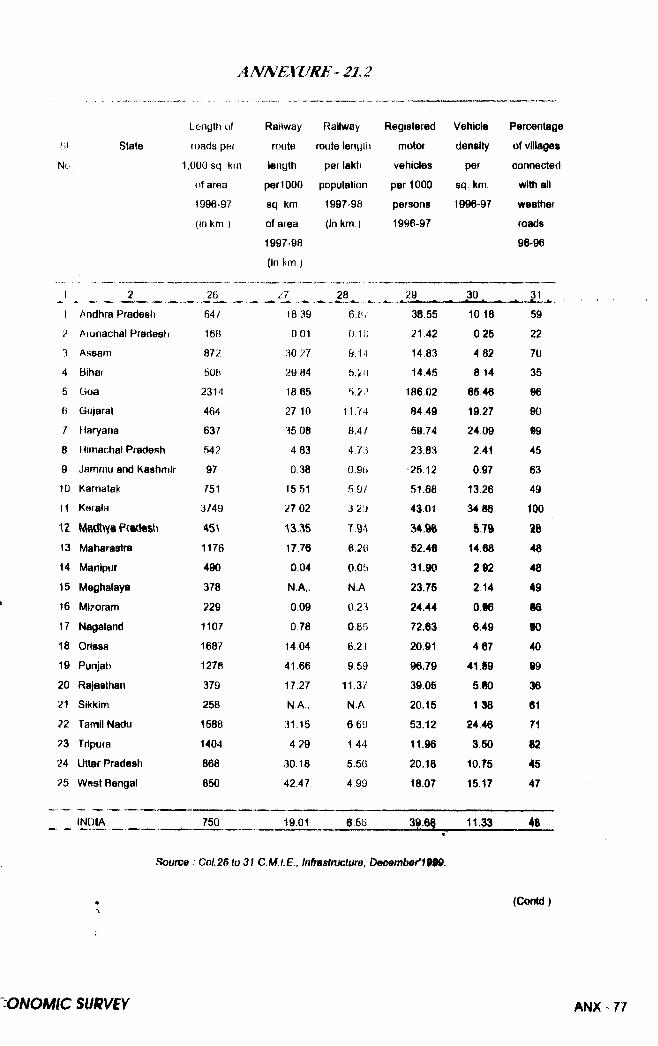
I ength of Railway Railway Registered Vehicle Percentage
SI State roads per route route length motor density of villages
No 1,000 sq. kin length per lakh vehicles per connected
of area peri000 population per 1000 sq. km. with all
1996-97 sq km 1997-98 persons 1996 97 weather
(In km ) of area
1997-98
(In km )
(in km ) 1996-97 roads
98-96
1 28 30 . .31 , ,1
^ _____Andhra Pradesfi
____
64 7 18 39 6.H/ 38.55 10 18 59
? Afunachal Pradesti 16B 0 01 n.lij 21.42 0 25 22
3 Assam 872 30 27 9.14 14.83 4 82 70
4 Bihat 508 29 84 5.k:o 14.45 8 14 35
5 Goa 2314 18 65 6.2/’ 186,02 as 46 96
6 Gujarat 464 27 10 11.74 84 49 19.27 90
7 Haryana 637 35 08 8.4/ 59.74 24 09 99
8 Himanhal Pradesh 542 4 83 4.7:i 23.83 241 45
9 Jamrnu and Kashmir 97 0.38 0.9ti ■25.12 097 63
10 Kamatak 751 15 51 5.9/ 51.68 13 26 49
11 Kerala 3749 27 02 3 2y 43.01 34 86 100
12 Madhya Prt(i«st\ 451 13,^5 7.94 % n n13 Maharastra 1176 17.76 6.2(5 52.46 1468 4814 Manipur 490 0.04 0.05 31.90 292 4815 Meghalaya 378 N.A,. N.A 23.75 214 4916 MIroram 229 0.09 0.23 24.44 o«e 8617 Nagaland 1107 078 0,85 72.63 6.49 SO18 Orissa 1687 14,04 6.21 20.91 487 4019 Punjab 1278 41 66 9.59 96.79 41.S9 9920 Rajasthan 379 17.27 t1.37 39.05 510 3621 Sikkim 258 N.A,. N.A 20.15 1 38 6122 Tamil Nadu 1588 31.15 6 69 53.12 24.46 r i
23 Tripura 1404 429 1.44 11.96 350 6224 Uttar Pradeati 868 30.18 5.56 20.10 10.?5 4525 West Bengal 850 42.47 4,99 18.07 15.17 47
INDIA 750 19.01 6.5U n m 11.33 48
Sourco ; Col.26 to 31 C M.I.E., Infmstructure, Deoember'IHO.
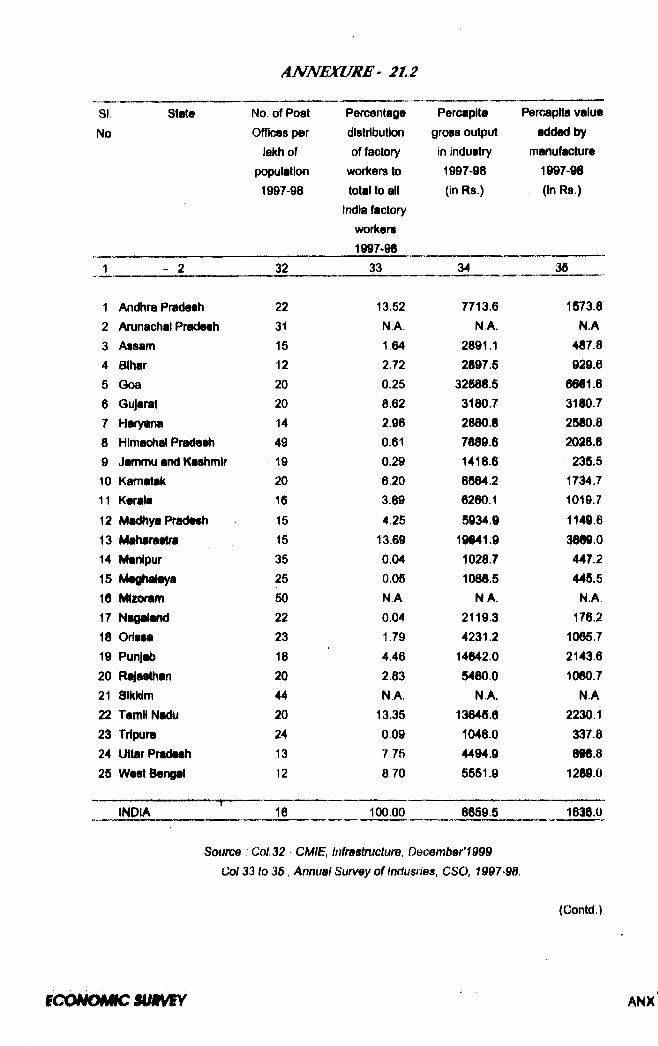
SI state No. of Post Percentage Percapita Percapita valueNo, Offices per distribution gross output added by
lakh of of factory in industry manufacturepopulation workers to 1997-98 1997-981997-98 total to all
India factory wortters 1997-98
(In Rs.) (in Rs.)
1 - 2 32 33 34 35
1 Andhra Pradeah 22 13.52 7713.6 1573.82 Arunachal Pradeah 31 N.A. N.A. N.A3 Assam 15 1.64 2891.1 487.84 Bihar 12 2.72 2897.5 929.65 Goa 20 0.25 32688.5 6661.86 Gujarat 20 8.62 3180.7 3180.77 Haryana 14 2.96 2880.8 2580.88 Himachal Pradesh 49 0.61 7889.6 2(^8.89 Jammu and Kashmir 19 0.29 1418.6 235.510 Kamatak 20 6.20 8864.2 1734.711 Kerala 16 3.89 6260.1 1019.712 Madhya Pradesh 15 4.25 5934.9 1149.613 Maharattra 15 13.69 19841.9 3889.014 Manipur 35 0.04 1028.7 447.215 Meghalaya 25 0.06 1088.5 445.516 Mizeram 50 N.A NA. N.A17 Nagaland 22 0.04 2119.3 176.218 Oriasa 23 1.79 4231.2 1065.719 Punjab 18 4.46 14642.0 2143.620 Rajasthan 20 2.83 5480.0 1060.721 Sikkim 44 N.A NA. N.A22 Tamil Nadu 20 13.35 13646.6 2230.123 Tripura 24 0.09 1048.0 337.824 Uttar Pradesh 13 7.75 4494.9 898.825 West Bengal 12 870 5551.9 1289.0
INDIA 16 100.00 8659.5 1636.0
Source Col. 32 CMIB, Infrastructure, December’IOQQ Col 33 to 36, Annual Survey of Indusries, CSO, 1997-98
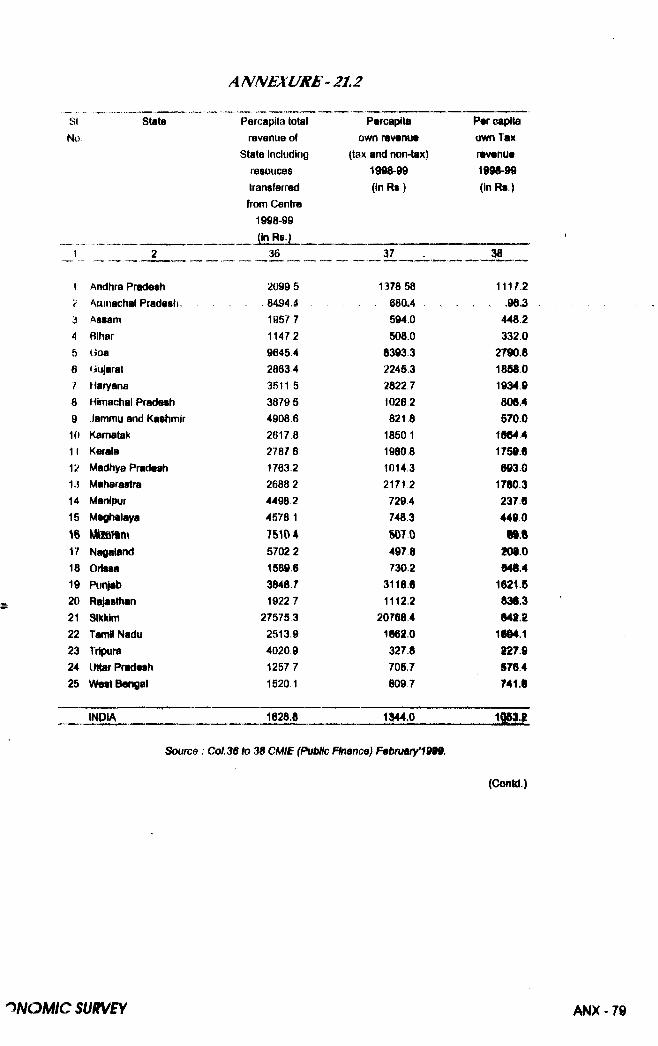
Si state No
Percapita total revenue of
State including resouces transferred from Centre
1998-99 (in Rs.)
Percapita own revenue
(tax and non-tax) 1998-99 (in Rs)
Per capita own Tax revenue 1998-99(in Rs.)
1 2 36 37 38
1 Andhra Pradesh 2099 5 1378 58 1117.22 Auinachal Pradesh . 8494.4 . . 68Q.4 . . . . ,96^3 Assam 1957 7 594.0 448.24 Bihar 1147 2 508.0 332.05 (ioa 96454 83933 2790.86 (iujarat 28634 2245.3 1858.07 Haryana 3511 5 2822 7 1934.98 Himachal Pradesh 38795 1026-2 808.49 Jammu and Kashmir 49086 821 8 570.010 Kamatak 26178 1850 1 1964 411 Kerala 2787 6 1980 8 1759.612 Madhya Pradesh 1763 2 10143 693.013 Maharastra 26882 2171 2 1780.314 Manipur 4498 2 729.4 237615 Meghalaya 4578 1 748.3 4490
75104 SOTO 8i.e17 Nagaland 57022 4978 208.018 Orissa 1SB9 6 7302 946.419 Punjab 3848.7 3118.6 1621.520 Rajasthan 1922 7 1112.2 836.321 Sikkim 27575.3 20768.4 648.222 Tamil Nadu 2513.9 1862.0 i m i23 Tripura 4020 9 327.8 127.624 Uttar Pradesh 1257 7 706.7 576.425 West Bengal 1020 1 809 7 741.6
INDIA 1628.8 1144.0 ............ 1 11 1
Source: Col 36 to 38 CMIE (PuMc Finance) F^bnMry’im .
(ConU.)
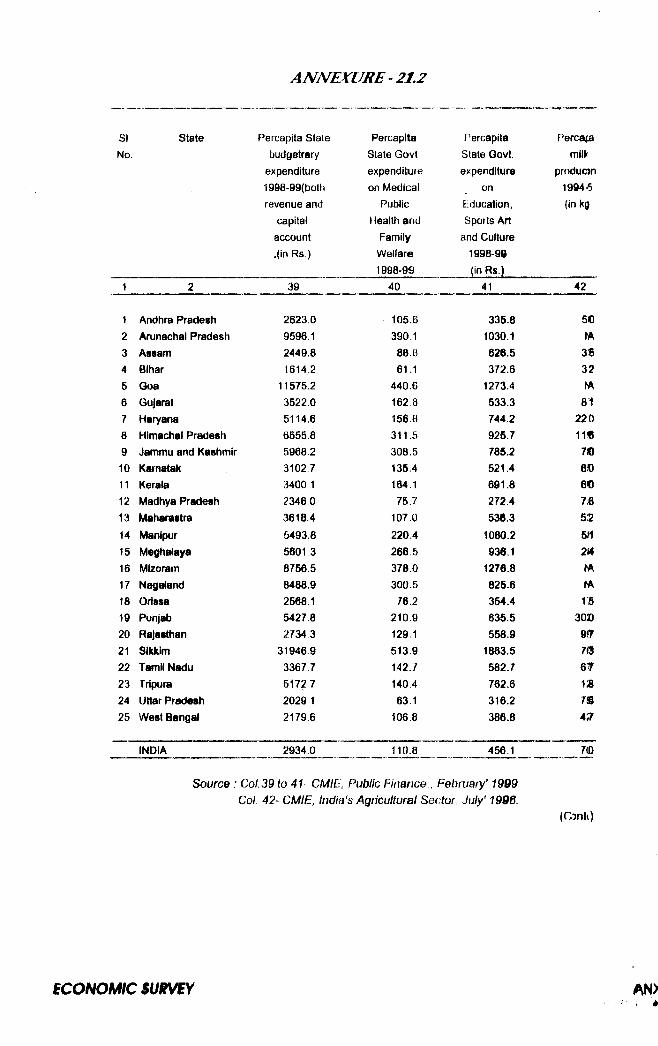
SI state Percapita State Percapita f^ercapita PercafaNo. budgetrary State Govt State Govt. milk
expenditure expenditure expenditure produon1998~99(both on Medical on 1994-6revenue and Public Education, (in kg
capital Health and Sports Artaccount Family and Culture.(in Rs ) Welfare
1998-991998-99 (in Rs.)
1 2 39 40 41 42
1 Andhra Pradesh 2623.0 105.6 335.8 502 Arunachal Pradesh 9596.1 390.1 1030.1 rA3 Assam 2449.8 88.8 626.5 3®4 Bihar 1614 2 61.1 372.6 325 Goa 11575.2 440.6 1273.4 hA6 Gujarat 3522.0 162 8 533.3 817 Haryana 5114.6 156.8 744.2 2208 Himachal Pradesh 6555.8 311.5 925.7 11«9 Jammu and Kashmir 5968.2 308.5 785.2 71010 Kamatak 3102,7 135.4 521.4 6011 Kerala 3400,1 164.1 691.8 6!012 Madhya Pradesh 2346,0 75.7 272.4 T&13 Maharastra 3618.4 107.0 538.3 5214 Manipur 5493.8 220.4 1080.2 5f115 Meghalaya 5601 3 266.5 936.1 2 416 Mizoram 8756.5 378.0 1276.8 rA17 Nagaland 8488.9 300.5 825.6 lA16 Orissa 2568.1 76.2 354.4 IB19 Punjab 5427 8 210.9 635.5 302)20 Rajasthan 2734 3 129.1 558.9 m21 Sikkim 31946.9 513.9 1863.5 m22 Tamil Nadu 3367.7 142.7 582.7 6 f23 Tripura 5172 7 140,4 762.6 1324 Uttar Pradesh 2029 1 63.1 316.2 m25 West Bengal 2179.6 106.8 386.8
INDIA 2934,0 110.8 456.1 mSource : Col.39 to 41 CMIE, Public Finance., February' 1999
Col 42- CMIE, India's Agricultural Sector, July' 1996.(GjnU)
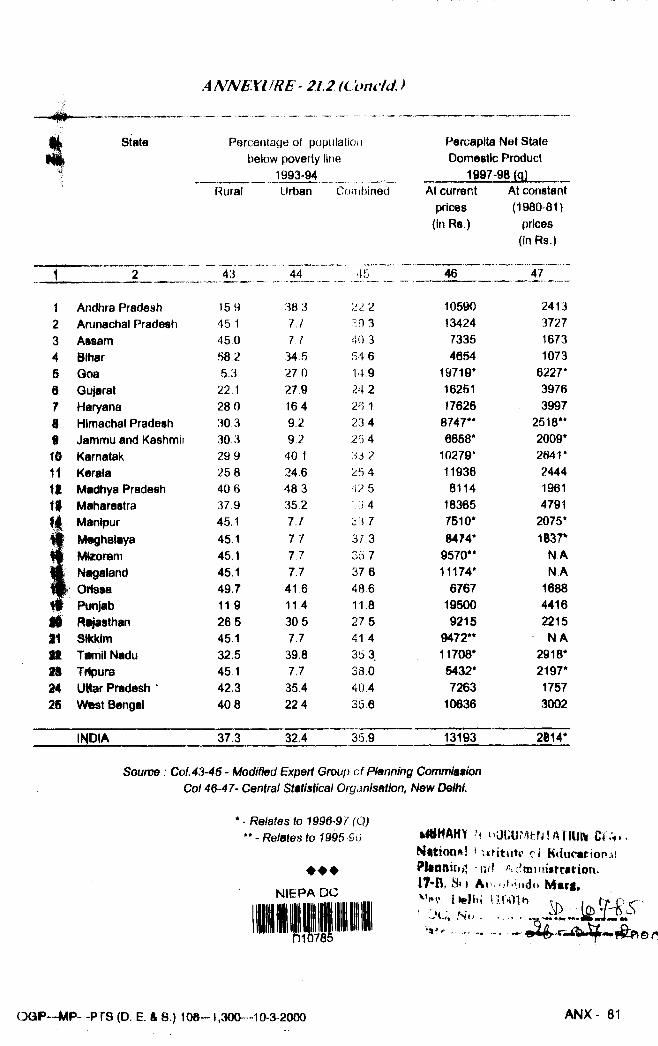
%• i l
State Percentage of population
lielow poverty line
1993-94
Percapita Net State Domestic Product
1997-90 (q)Rural Urban CoiTibined At current
prices (in Rs.)
At constant (1980-81)
prices (In Rs.)
1 2 _ __ 45^____ _ 46
1 Andhra Pradesh 1 5 9 38 3 22 2 10590 24132 Arunachal Pradesh 45 1 77 39 3 13424 37273 Assam 45 .0 7 7 40 .3 7335 16734 Bihar 58 .2 .34 5 54 6 4654 1073S Qoa 5.3 27 0 14 9 19719* 6227*3 Qujarat 22.1 27.9 24 2 16251 39767 Haryana 2 8 0 164 26,1 17626 3997
8 Himachal Pradesh 30 3 9.2 23 4 8747** 2518**t Jammu and Kashmir 30.3 9.2 25 4 6658* 2009*16 Karnatai^ 2 9 9 40 1 33 2 10279* 2641*11 Kerala 2 5 8 24 6 26 4 11936 2444
11 Madhya Pradesh 4 0 6 48 3 42 5 8114 196111 Maharastra 37.9 35 2 33 4 18365 4791| | ^ Manipur 45.1 7.7 3B 7 7510* 2075*
Meghalaya 45.1 7 7 37 3 8474* 1837*Mteoram 45.1 7 7 35 7 9570** N A
A Nagaland 45.1 7.7 37 6 11174* N A
W ' OHssa 49.7 41 6 486 6767 1688
W Ptinjab 11.9 114 118 19500 4416
m Rl^asthan 26 5 305 27 5 9215 221511 Sikkim 45,1 7.7 41 4 9472** N Aat Tamil Nadu 32.5 39.8 35 3 11708* 2918*m Trtpura 45 1 7,7 3 3 0 5432* 2197*24 UMar Pradesh ' 42.3 35.4 40.4 7263 175726 V\^st Bengal 40.8 224 35 ,6 10636 3002
INDIA 37.3 32.4 35 .9 13103 2814*
S o u im . Cof.43-45 - Modified Expert Group of Pfanning Commiasior} Col 46-47- Central Statistical Organisation, New Delhi.
* - Relates to 1 §90-9 7 (Q )
** - Relates to 1995 Go M8HAHY n s UUUMfcNrAllll^ci Kdueitional
nd A.fmnnitrttioii.17*B, Su AtvfjS'iiidc* M'trg,
fnv l>lbi ft xr fT Oc 'O C . N o . .
OQP—MP- -PTS (D. E. & 8.) 10a-1,300 -10-3-2000 ANX- 81
Copyright © 2022 FDOKUMEN