National University of Educational Planning and Administration
Upload
khangminh22Category
view
0download
0
i
Contents: Chapters
Volume I
Chapter No. Title Page No.
Chapter 1
Chapter 2
Chapter 3
Chapter 4
Chapter 5
Chapter 6
Chapter 7
Chapter 8
Chapter 9
Executive Summary
The State of West Bengal: Evaluation of School Education
Literature Review
Sampling & Methodology
Education in West Bengal: A Secondary Data Review
Implementation of Right to Education Act
Elementary Education- Analysis and Recommendations
High School Education- Analysis and Recommendations
Some Observations
Madrasahs and the way forward
ii-xxiv
2-10
11-34
35-37
38-41
42-53
54-89
90-128
129-144
145-149
Diagram No. Title Page No.
6.1
6.2
6.3
6.4
6.5
Organogram of State School Education: State Unit
Organogram of State School Education: District Unit
Organogram of State School Education: Block Unit
Organogram of State School Education: Cluster Unit
West Bengal Council of Education Research & Training
86
87
88
88
89

ii
Executive Summary
1. Introduction
The Government of West Bengal through an official order (No. 423-ES/O/P&B/10M-26/10) engaged the Indian
Institute of Management Calcutta (IIMC) to conduct a study on ‘Restructuring of School Education System in
West Bengal’ in August 2010. The study encompassed pre-school to high school education. The study focussed
on three aspects of school education: (a) The implications of the Right to Education Act (RTE) vis-à-vis Sarva
Shiksha Abhiyan (SSA) /Rashtriya Madhyamik Shiksha Abhiyan (RMSA); (b) The administrative set up and
governance structure of school education; and (c) The delivery mechanism and in-class transactions in schools.
2. Methodology and Sample
We have opted for separate sample designs for conducting surveys in rural and urban areas of West Bengal. A
stratified circular systematic sampling design is used for rural areas and stratified simple random samplingis used
for urban areas without replacement. West Bengal consists of 20 districts (including the DGHC) of which the
district of Kolkata is exclusively urban. For the rural sample the state has been divided into four regions, and two
districts were chosen from each region. Within a district six villages have been selected through systematic
circular sampling methods, in two interpenetrating subsamples of three each. The sample consists of 335 schools
across West Bengal, 3437 households, 96 Sishu Shiksha Kendras (SSK), 8 Madhyamik Shiksha Kendras (MSK)
and 126 Anganwadi Centres. In addition the survey covers a cross section of functionaries involved in school
education at the state/district/circle level. We have also visited four states– Madhya Pradesh, Gujarat, Tamil
Nadu and Kerala to understand how these states have implemented the SSA/RTE norms.
3. Right to Education Act vis-à-vis SSA/RMSA
Sarva Shiksha Abhiyan is an effort to universalise elementary education by community ownership of the school
system. The main objective of SSA is to provide useful and relevant elementary education and ensure retention
for all children in the age group of 6-14 years by 2010. Rashtriya Madhyamik Shiksha Abhiyan (RMSA) is an
extension of SSA that promises universal access to secondary level education to all children of 15-16 years by
2017 and universal retention by 2020. While SSA and RMSA offer an operational framework for universalizing
education, its provisions were used as general guidelines by each state to interpret and implement the schemes.
The Right of Children to Free and Compulsory Education Act, 2009 (RTE) makes the implementation of
compulsory education legally binding on all states/ union territories. SSA had been launched in 2001-02 and
since then various states havestarted implementing the mission of SSA by setting up necessary infrastructure
and providing operational guidelines. When the RTE was enacted in 2009 the various states faced numerous
challenges in realigning the existing rules and guidelines under SSA with the requirements of the RTE act.
A comparative analysis of the various provisions of SSA and RTE throws up the following challenges before the
State:
(a) The first step towards the implementation of RTE in a state is the notification of State RTE Rules in the official
state gazette. Such State RTE Rules may be framed in the lines of Central RTE Rules which have already been
notified. The State RTE Rules must also cover provisions for pre-primary schools/Anganwadis.
(b) Every unaided school imparting elementary education is to be registered with the appropriate authority (e.g.
District Inspector’s Office) within a given timeframe.
(c) Unaided schools are required to reserve 25% of the seats for children belonging to weaker sections of society
and disadvantaged groups in the neighbourhood.
(d) The State RTE Rules should specify the limits of neighbourhood unambiguously for primary and upper
iii
primary schools.
(e) Pupil-teacher ratio (PTR) is to be aligned to meet the guidelines of RTE. The SSA framework mentions that
there should be at least two teachers in every primary school irrespective of student enrolment, but the RTE rules
link the number of teachers to the student enrolment.
(f) Every primary school must have provisions for a library, games equipment, and playing material for children.
Neighbourhood school norms would require revaluationof the present system of SSKs at locations currently not
covered by them.
(g) The RTE Act mandates that eventually elementary education must be provided by formal and recognised
schools. All existing Education Guarantee Scheme (EGS) centres (Sishu Siksha Kendra(SSK) and Madhyamik
Siksha Kendra(MSK) in West Bengal) should be converted to regular schools or closed down when children are
transferred into mainstream neighbourhood schools.
(h) The primary responsibility of monitoring the quality of education in a school rests with the School
Management Committee (SMC). All other school committees (e.g. PTA, MTA) are to be dissolved.
(i) No teacher without the minimum qualifications as per NCTE notification can be appointed to a school after
August 2010.
(j) RTE (section 26) requires that the vacant posts of teachers in a government school or government aided
school should not exceed 10% of the total sanctioned strength. Thus the State needs to arrive at the sanctioned
strength based on enrolment and fill up vacant positions to ensure that the vacant positions do not exceed the
prescribed threshold.
(g) RTE maintains that school teachers should not engage in non-academic activities, especially private tuition.
They may however participate in census, election and disaster relief operations.
4. Problems Highlighted
The project directors and their associates met a cross section of the functionaries involved in primary education
at the district/ circle level like District Inspectors (DI), Assistant Inspectors of School (AIS), School Inspectors (SI),
head teachers and Sikshabandhus. Major problems reported by them are mentioned below:
(a) Teacher Accountability:
Teachers do not regularly spend the allotted five hours on the school premises on every working day.
They often do not take classes as per schedule.
Unit tests are not always conducted as per the annual calendar.
Class schedules compulsorily include a games period every week yet it is not implemented in the
majority of schools.
Sometimes teachers take leave for long durations without a leave petition.
A lot of teachers come to teach from areas located far from the school and hence are in a hurry to leave
the school as early as possible.
(b) Teachers’ Appointment and Transfer:
There are many schools with one or two teachers where the student enrollment demands the
appointment of more teachers.
The concept of sanctioned posts per school does not exist for the primary schools. The present practice
of transferring teachers do not follow the current ruleand should to be curbed.
Another instance of irregularity is the service/drafting transfer (which is a temporary arrangement). Such
temporary arrangement is renewed year-after-year to bypass the existing rules and thereby making it

iv
quasi-permanent.
(c) Teaching and Training: Classroom teaching gets hampered due to:
Teachers involvement in census during working hours.
Involvement of the teachers for preparing the payroll and other paperwork to help the district office
which often faces a staff crunch.
The present practice of compulsory 20 days/year training for every teacher adds to the staff
crunch.
Teachers training programmes are not well planned (e.g. same subject / topic is repeated in
successive training programmes for many years. There are several agencies providing training
leading to a lack of cohesive training.
Many teachers do not attempt to implement the new pedagogy learnt during training for class room
teaching as they feel that training is not always effective or relevant.
(d) School Inspection: Major functions of the SISs(Sub Inspector of Schools?) are supposed to include
inspection of schools, monitoring of classroom teaching and evaluating teaching effectiveness. Each
SIS has more than 80 schools to supervise, and SI positions remain vacant for long time. In
Murshidabad there are 100 schools per circle. Out of the 41 circles in Murshidabad, 19 SIS posts are
vacant. The SIS officesare equally understaffed. In Murshidabad 14 group C and 12 Group D positions
are vacant. SISs spend a lot of their time in attending various meetings often at short notice (e.g. on
health awareness programmes, disaster management etc.) These meetings are not organized during
the school vacations but throughout the year. This creates lot of problems in discharging everyday
responsibilities for the SISs. SISs need to fill up a variety of evaluation forms many of which are
cumbersome. SISs are also responsible for the maintenance of service books of primary school
teachers and the disbursal of their salary and pension. A considerable amount of timeis spentfor
managing the paperwork for such and related queries. As a result SISs fail to discharge their primary
duties – the inspection of schools. There are instances where an SIS fails to visit most of the schools
even once a year. Also the SISs /AISs (Assistant Inspector of Schools?) do not have any power to take
disciplinary actions against errant teachers. SISs are also not given feedback on the action taken
against their written complaints, thus hampering their work. As a result the authority of the SISs is under
question and the education delivery system in the schools suffer immensely.
(e) Mid-day Meal Administration: There has been a general consensus that the mid-day meal scheme has
achieved, to a very large extent, two major objectives:
Improved attendance in the schools
Removal of the caste/religion barrier amongst students and the community.
The Block Development Officer (BDO) is the executive head of mid-day meal scheme in a CD?
Block. However, SISs are required to monitor the implementation of the scheme. There is, however
a lack of coordination between office of the BDO and SISs. SISs are not invited to any meeting
concerning the mid-day meal scheme which may be convenedby the BDO though it is the duty of
the SIS to file an FIR about the relevant agencies if any irregularity is observed. Many head
teachers of schools complained that mid-day meal money/materials are not received regularly by
their schools even after the submission of regulations. The quality of rice supplied is reported to
vary between urban and rural schools greatly. Another problem faced by the teachers is that they
are unable to retain students in the school after the mid-day meal is served.

v
(f) Para-teachers and Sikshabandhus: While the role and importance of para teachers is well accepted,
the duties and responsibilities of Sikshabandhus are not specified clearly. Many sikshabandhus are not
clear about their responsibilities. Many SISs feel that the Sikshabandhus’ job is mainly to liaise between
school and CLRC/DI? office. However the Sikshabandhus believe that they can contribute more
effectively by engaging in improving the learning environment in the school. Sikshabandhus claim that
the introduction of this cadre has helped to improve teachers’ attendance in the school due to their
ability to exert moral and social pressure on the teachers to perform optimally. Since the Sikshabandhus
are drawn from the immediate locality, they understand local issues and can hence help to solve
problems involving the local community. However Sikshabandhus face many infrastructural bottlenecks.
They have no separate room/ place to sit in at the CLRC/CRC office. Wherever they do get to sit, they
do not have adequate furniture like tables and almirahs to carry out official work. No formal training is
imparted when a Sikshabandhu joins duty except for filing of DISE data. Sometimes Sikshabandhus are
asked to perform functions of group D staff. While it is expected that Sikshabandhus and SISs should
pay regular visits to schools, they are not given any transport facilities or allowance.
(g) DPSC and DPO: In most of the districts theposition of the DPO (District Project Officer) is held by part-
time employees and their offices are usually not co-located in the DPSC office. This results in poor
coordination between DPSC and DPO.
(h) School Management Committees:The Managing Committees do not spend sufficient time on academic
issues instead choosing to spend most of the time on matters concerning physical infrastructure. VEC-
level monitoring has been a failure. There are instances where a parent-teacher meeting/ Academic
Council meeting is not conducted even once a year. However, MTA meetings are more effective and it
is observed that where MTAs are active, the teaching quality in that school improves.
(i) Governance and Legal Matters: The head-teacher or head-master in a school is often not aware of the
latest government notifications or orders as they do not reach the school. The district offices are usually
heavily burdened with dealing with court cases. The officers in the district office are often not competent
in handling legal problems.
(j) Private Tuition: This trend is more evident in urban areas. Availability of private tutors is low in rural
areas. It has been reported that poor teaching in the school is not the main reason for sending one’s
ward for private tuition. Parents send their children for private tuitions for better results and academic
guidance. It is empirically found that the tendency to send children for private tuition has low correlation
with the quality of teaching in the school. The reasons for private tuition, particularly at the primary/upper
primary levels, are not related to quality of education imparted in the schools, but remain in the broader
socio-economic domain.
5. Summary of Recommendations
5.1 Access to Elementary Education: Need for Additional Schools (Ref: Chapter 6; para 6.1)
(a) The requirements of additional schools:
New primary schools required: 1557
New upper primary schools required (including upgradations): 14934
(b) The RTE Act mandates the formalization of Shishu Siksha Kendras (SSKs) and Madhyamik Siksha
Kendras (MSKs). It is suggested that all MSKs (1911 in number) be upgraded to upper primary and

vi
secondary schools. Only those SSKs having a minimum number of 40 students may be converted to a
formal primary school with the necessary infrastructure. The remaining SSKs may either be closed or
used as pre-school (Anganwadi) centres.
(c) The need for opening new primary schools would reduce in the future. Presently 51016 government
primary schools cater to a population (age group 5-9 years) of 72.86 lakhs – which gives a ratio of 143
children per school. If this average ratio is maintained in future there would not be any need for setting
up additional primary schools in the state for the next 15 years.
(d) The existing SSA norm mandates availability of primary schools within 1 km of every habitation. In the
absence of a notification defining neighbourhood schools, if one goes by the SSA mandate, it is
observed that there are 16 districts in West Bengal wherein there are places which do not have any
primary school/SSK within 1 km of habitation (Table 6.3). The Central RTE rules also states that the
area or limits of a neighbourhood for setting up a primary school (class I-V) shall be within walking
distance of 1 km of the neighbourhood. The estimate shows that there is a need to setup 1557 new
primary schools in designated areas to bridge this gap and thereby ensure adequate access.
(e) Using SSA criterion, there is a need for setting up additional 14934 upper primary schools in the state.
However a separate survey (Table 6.4) shows that the number is 14165 using a neighbourhood
definition of 2 km. The revised SSA norm provides that new upper primary schools/ sections would be
opened in the campuses of existing primary schools so they become integrated elementary schools
from class I-VIII. This way of addressing the gap in upper primary schools would also hopefully reduce
the students’ dropout rate. Hence it is necessary to identify primary schools which can be upgraded to
upper primary schools to take care of the issue of access to primary education. Such an exercise would
however be contingent on sufficient land being available with the primary schools for the upgradation.
5.2 Social Access (Ref: Chapter 5; para 5.6 and Chapter 6; para 6.1.1)
(I) The SSA Framework for Implementation states that school mapping would include the following steps:
(a) Environment building in the village.
(b) Conduct of a household survey.
(c) Preparation of a map indicating different households, the number of children in each household and
their participation status in the school.
(d) Preparation of a village/school education register; such register should contain record of all children
from their birth till they attain 14 years.
(e) Presentation of the map and its analysis to the people.
(f) Preparation of a proposal for improved educational facilities in the village; which would form the basis of
the School Development Plan mandated under the RTE Act.
(II) Children belonging to weaker sections and disadvantaged groups should not be segregated from the other
children in the classrooms nor should their classes be held at places and timings different from the classes
held for other children.
(III) In West Bengal, the Village Education Register needs to be created/maintained which should include
information on out-of-school children as well. This would have to be updated on an annual basis.
(IV) While tracking children in rural areas require special attention, urban areas have special challenges in
tracking street/ homeless children, children working in urban households/tea shops, etc. Local municipal

vii
authorities and NGOs have helped many states identify these children and ensured their enrolment in
schools.
(V) In order to ensure that children from weaker sections and disadvantaged groups are brought to the
school and are not denied admission even in unaided private schools, the village schedule must be
regularly maintained and updated as mentioned in Para 5.6 of Chapter 5. All unaided schools must be
brought under the supervision of the Directorate of School Education through a due processof
recognition.

viii
5.3 Recognition and Tracking of Unaided Schools (Ref: Chapter 5; paras 5.3 and 5.5)
(I) If an existing unaided school fails to obtain the recognition certificate within the given timeframe, the
school would be asked to close down. Similarly, no new unaided school can be opened in the state
unless recognised. Such recognition of unaided schools needs to be reviewed periodically (e.g. after
every three/five years). The recognition certificate would be subject to the following conditions:
(a) The school shall give admission to a minimum of 25% of the children belonging to weaker sections
and disadvantaged groups in the neighbourhood in class I. In the case of aided schools, they are
required to provide free and compulsory elementary education to such proportion of children
admitted therein as its annual recurring aid or grants received bears to its annual recurring
expenses, subject to a minimum of 25%.
(b) The school shall notify the fees to be charged from the children every year before the
commencement of the academic session.
(c) The school shall have to maintain norms and standards as specified in the RTE Act.
(d) The school is open to inspection by any officer authorised by the State Government / local authority
and the school shall furnish such reports and information as may be required by the State
Government.
(II) In order to ensure that unaided schools (and also partially aided schools) meet the norms and standards
of the RTE Act (and Rules), the following information may be maintained for every unaided (also
partially aided) school:
(a) Name of the cluster/block
(b) Name of the school
(c) Name of the neighbourhood village/town as per definition
(d) Total number of children in the neighbourhood belonging to weaker sections and disadvantaged groups
(this information would be available in the village education register or similar register)
(e) Target enrolment of children belonging to weaker sections and disadvantaged groups in the school in
Class I
(f) Actual enrolment
(g) Name of the official-in-charge
5.4 Neighbourhood Limits(Ref: Chapter 5; para 5.4)
It may so happen that the prescribed neighbourhood limits may not have enough number of children belonging to
weaker sections and disadvantaged groups to fill up the 25% reserved seats in unaided schools. In such a
situation, extended limits of neighbourhood may be prescribed for filling up the required percentage of seats.
5.5 Mainstreaming Informal Schools (Ref: Chapter 5; para 5.8)
(I) The RTE Act mandates that eventually elementary education must be provided by formal and
recognised schools.All existing EGS centres like the (Sishu Siksha Kendra(SSK) and Madhyamaik

ix
Siksha Kendra(MSK) in West Bengal) would be required to be converted into regular schools or closed
down when children are mainstreamed into neighbourhood schools. The process of upgradation of such
centres (kendras) to regular schools must be completed within two years from the date of the
commencement of the RTE Act. Accordingly, no new EGS centres may be opened after 2010-11.
(II) The SSA would provide necessary financial support to such schools for the period of two years. If it is
economically unsound to upgrade any of such schools into a formal school, the centre must be closed.
The SSA would not provide any financial support after the mandated period of two years.
5.6 Student Enrolment, Retention and Teacher Requirements(Ref: Chapter 5; para 5.7; Chapter 6; para 6.3)
(I) Thus, as per the RTE, it would be perfectly within law if a primary school, with sixty students, has two
teachers (including a head teacher) and two class rooms, even if the school runs all the classes.
(II) Special efforts need to be made to enrol out of school children in age appropriate classes. The RTE
requires designing special training programmes (e.g. bridge courses) for such children.
(III) The GER amongst primary schools is the highest in Uttar Dinajpur (146.82) and the lowest in Kolkata
(113.99). In case of NER, Nadia shows the highest figure (99.95) and Uttar Dinajpur shows the lowest
figure (93.92).Table 6.18 also highlights that the ratios are significantly poor at the upper primary level.
This reinforces our observation on lack of access to upper primary schools. There is an urgent need to
set up a large number of upper primary schools in the state.
(IV) We recommend the following:
(a) There is an urgent need to restructure the primary and upper-primary classes. Like in
many other states and as prescribed in the RTE, primary school should comprise of class I-
V. Upper-primary level should comprise of class VI-VIII. This restructuring will help in two
ways: better retention ratio and rationalization of teacher/infrastructure requirements.
However, there will be a need to construct additional class rooms in stand-alone primary
schools.
(b) Primary and upper primary schools should not charge any fee, irrespective of
category. Expenses for any festivals should be met out of voluntary contributions /
contingency funds.
(c) As schools do not provide notebooks, textbooks and associated stationary, textbooks
in the primary and upper primary schools should be designed in a manner to minimize the
use of separate answer books/ notebooks. Additional (blank) pages should be provided in
the text book/ exercise book for the students to answer in.
(d) Mid-day meal should be compulsorily served on all working days (including
Saturdays). Mothersof children who volunteer may be involved in the cooking/ management
of mid-day meals.
x
(e) SMC, VEC and the local authority (e.g. Gram panchayat) should develop programmes
to track children in respective areas to ensure 100% enrolment and retention. The village
education register has to be comprehensively maintained to this effect.
5.7 SchoolManagement and Monitoring (Ref: Chapter 5; para 5.9, Chapter 6, para 6.7)
(I) The RTE Act mandates, under section 21, that every school (other than an unaided school) must set up a
SMC within six months of publication of the RTE rules by the state. Such a SMC would be required to be
reconstituted every two years. The State RTE Rules should specify the size of the SMC. Three-fourths of
the members of the SMC are required to be from amongst parents or guardians of the enrolled children.
Rule 13(3) of the Central RTE Rules states that the remaining one-fourth of the SMC members shall be
chosen from amongst the following persons:
(a) One-third of the members from amongst the elected members of the local authority, to be decided by
the local authority.
(b) One-third of the members from amongst teachers of the school, to be decided by the teachers of the
school.
(c) The remaining one-third from amongst local educators/children of the school, to be decided by the
parents of the SMC.
(II) The SMC is required to elect a Chairperson and Vice-Chairperson from amongst the members of the
Committee. The head teacher or the senior most teachers may be the ex-officio secretary of the SMC.
The SMC is required to meet at least once a month. The SMC is required to ensure implementation of
clauses (a) and (e) of section 24 and section 28 of the RTE Act, ensure enrolment and continued
attendance of children, monitor implementation of the mid-day meal in the school, and monitor regularity
and punctuality of the teachers of the school. The SMC would have to prepare a three-year school
development plan. The school development plan would contain estimates of class-wise enrolment for
each year, additional teacher/infrastructural requirements and hence additional financial requirements.
School grants under SSA would be made available to the SMC based on the school development plan.
Any money received by the SMC would have to be credited in the account of the Committee. The
account should be a joint account of the Chairperson and the member secretary of the Committee.
(III) The next tier of school monitoring is prescribed at the block and cluster level. The RTE Act prescribes
that every Assistant Education Officer (or an officer with similar designation) should undertake at least
two visits to every school each year. Additionally, staff members at the BRC (Block Resource Centre)
and CRC (Cluster Resource Centre) should visit each school at least once in every two months or every
month if the circumstances so demand.
(IV) The officials at the district level may also occasionally undertake independent field visits to monitor
school performance.
(V) The State Executive Committee of the SSA should monitor, through periodic meetings, the performance
of all schools providing elementary education in the state.
(VI) A set of quality monitoring tools (QMT) have been developed in collaboration with the NCERT to provide
information on quality of education at schools. Such quality related indices cover issues relating to
student enrolment and attendance, pupil achievement, teacher availability and teacher training,
classroom practices, academic supervision of schools by BRC/CRC etc.

xi
(VII) The RTE Act prescribes that there should be only one management committee of the school, the SMC.
The SMC would have specific roles and responsibilities as defined in the State RTE Rules.
(VIII) It is thus recommended that MTA, SDC, and PTA (Parent Teacher Association) be merged with the
SMC
(IX) It can also be seen from Table 6.35 that at present only MTA has been active. Hence it is recommended
that mothers should have significant presence in the re-constructed SMC.
(X) The School Management Committee should be responsible to ensure that classes are regularly held
and all SSA and state government schemes are properly implemented. In addition to school
headmaster, representative of SMCs would interact with the AEOs at cluster level whenever necessary.
(XI) All funds under SSA would be routed through SMC. A separate bank account is to be opened with two
members of SMC as signatories.
(XII) The SMC would also prepare the School Development Plan (SDP) and such plan should be entered in
the MIS at the cluster level in Cluster Education Centre (CEC). The SDPs so collected will be collated at
the block level and forwarded to the district project office for necessary action. The entire exercise has
to be completed before the beginning of the financial year for which it is meant.
(XIII) Once the SMC is adequately strengthened, the VEC will be responsible in ensuring: (a) That all schools
under its jurisdiction are appropriately managed; (b) that all common concerns (e.g., infrastructure-
related, training-related) affecting schools are addressed; (c) that all complaints by the teachers are
addressed and acted upon; (d) that mid-day meal and other welfare schemes are properly implemented;
and (e) that enrolment and retention ratios in schools under its jurisdiction are maintained at 100%. VEC
should generally meet once in every three months. However, an emergency meeting may be convened
by the Chairperson of VEC anytime with a notice of 10 days time.
5.8 Teachers Qualification and Training(Ref: Chapter 5; para 5.10;Chapter 6; para 6.4)
(I) Teachers are required to satisfy three criteria for being eligible for recruitment in schools imparting
elementary education:
(a) Secondary/ senior secondary/bachelor degree; and
(b) 2-year Diploma in Elementary Education/4-year Bachelor of Elementary Education/ 1-year Bachelor of
Education; and
(c) Pass in the Teacher Eligibility Test (TET) to be conducted by the state government in accordance with
the guidelines framed by the NCTE.
(II) The minimum qualification criteria as per the NCTE would not be applicable for;
(a) Teachers appointed before September 3, 2001 (the date on which the NCTE (Determination of
Minimum Qualifications for Recruitment of Teachers in Schools) Regulations 2001 came into force);
(b) A teacher appointed in class I to V after September 3, 2001 provided he/she possesses a B.Ed (Special
Education)/D.Ed (Special Education) qualification and is willing to undergo an NCTE recognised 6-
month special programme on elementary education;
(c) A teacher of class I to V with B.Ed qualification who has completed a 6-month Special Basic Teacher
Course (Special BTC) approved by the NCTE.
(III) No teacher can be appointed after August 2010 who does not possess the minimum qualifications as
per NCTE notification.

xii
(IV) In-service teachers’ training is essential to continuously improve the quality of teaching.
(V) The state-level training institutions (DIETs) should be primarily responsible for providing pre-service and
in-service training.
(VI) Resources at BRCs/URCs and CLRCs are effectively used to provide training and on-site support to
schools and teachers.
(VII) Data collected from SSA office (Table 6.26) shows that there are 1327 primary schools in the state
which are single teacher schools. The RTE rules prescribe a minimum teacher strength of 2 per school.
The serious problem of teacher shortage can be solved through the following measures:
(i) The concept of a certain number of sanctioned posts per school should be introduced.
(ii) Shortfall of teachers in a school should be met initially by transferring appropriate
teachers from schools having surplus teachers in the same district.
(iii) Fresh appointment should be made only to fill up the vacant positions.
(iv) As a policy the transfer of teachers from other districts should be avoided.
(VIII) We have been informed that at present there are about 75000 ‘untrained’ teachers in primary and upper
primary schools in West Bengal. All these teachers need to acquire D.Ed/ B.Ed qualifications within
31stMarch 2015. There are currently 80 PTTIs (Primary Teacher Training Institutes) in West Bengal
which can enroll only 50 candidates for a D.Ed course per year. Following the normal process only
20000 teachers can be trained in next five years. The other teachers can be trained in the following
ways:
(a) The Education Department may write to NCTE/ other appropriate authorities and get an
approval to offer D.Ed courses through distance learning mode from the 80 DIETs (i.e. PTTIs).
Madhya Pradesh has done likewise and gotten similar approval. If the Department can enroll
an additional 200 teachers per PTTI for the D.Ed course per year, one can easily train another
60000 teachers in the next four or five years. As Madhya Pradesh has already gotten such an
approval, we hope that there will be no problem in getting a similar approval.
(b) The Department may write to IGNOU for offering similar correspondence courses. The
classes may be held in different IGNOU centres.
For in-service training, the following model is recommended:
(a) Training should be held in such a way that classes are not affected.
(b) SSA mandates 20 days training per teacher every year. This can be divided into two
modules: 10 days of a refresher course for each teacher during the summer vacation (it may be
called vacation training). Such training should be held at PTTIs/DIET. Necessary arrangements
for accommodation and other facilities should be made.
(c) The training for the remaining 10 days should be held at BEC (Block Education
Centre)/UEC (Urban Education Centre)/CLEC (Cluster Education Centre) on one Saturday of
every month.
(d) An envisioning workshop may be held for three days in the first week of April every year
to finalize the training calendar. This workshop will be organised by WBCERT at its state
headquarters. Members (may be called State Resource Group) attending the workshop may be
drawn from the West Bengal Council of Educational Research and Training (WBCERT),
eminent faculty of PTTIs/DIET, one eminent teacher (to be nominated by the district
administration) from every district. The workshop will finalize the annual training calendar as
xiii
well as the curriculum. We believe the participative method of curriculum development would
have a greater impact.
(f) The PTTI faculty would provide vacation training to all school teachers under their
jurisdiction.
(g) The BEC/UEC /CLEC trainers would conduct the Saturday training sessions at
block/cluster level.
(h) The BEC/UEC /CLEC trainers would also regularly visit schools to help teachers
improve their classroom teaching.
5.9 Accountability of Teachers (Ref: Chapter 6; para 6.5)
(I) The Pupil-Teacher Ratio (PTR) as per RTE norm is 30. Although the average PTR based on our survey
was 30, there is a significant difference between Kolkata and other areas (see Table 6.29). This
difference has to be kept in mind while formulating the recruitment and transfer policy of teachers.
(II) We recommend that the district school administration be empowered to take disciplinary action
(excluding dismissal from service) against teachers. The aggrieved teachers should also be given the
opportunity to appeal to the concerned VEC against the action. VEC can conduct periodic grievance
redressal meeting with the district/block administration, as the case may be, to sort out the matters.
Disciplinary action amounting to dismissal from service can only be taken by the State administration on
the recommendation of the VEC.
5.10 Quality of Education and Teachers’ Incentive (Ref: Chapter 6; para 6.6)
(I) In order to improve the quality of teaching in schools, the role of WBCERT assumes prime importance.
WBCERT should be the nodal centre for curriculum development, innovation in pedagogy, development
of reading materials in the form of text books and CDs, and designing training programmes for the
teachers. SSA funds available under innovation and computerisation should be utilized to develop
effective e-learning modules.
(II) We recommend the following to improve the teaching quality in primary and upper primary schools:
Primary Schools:
(a) Schools may be encouraged to follow activity based learning methods. Classrooms in primary schools
should be specially designed for this purpose. WBCERT should be entrusted with the responsibility of
preparing appropriate materials for Activity Based Learning (ABL). We have observed that ABL has two
merits – (i) each student can learn at his/her own pace; and (ii) it ensures greater participation of the
children in the class.
(b) While children should not be burdened with excessive homework, it cannot be denied that a child’s
understanding and comfort with quantitative subjects like mathematics can only improve through
practice. Hence a significant part of the classroom time should be devoted to solving problems in
mathematics.
(c) Language subjects should give more emphasis to oral and written skills. Every child, by turn, should be
asked to read a portion of the text loudly and the teacher should give particular attention to the
pronunciation and spelling.
Upper Primary Schools:

xiv
(a) The use of electronic study materials and lecture sessions should be vigorously pursued in all upper
primary schools. As the quality of students vary from one school to another, the quality of teachers also
vary. We recommend the use of the ‘Flip Method’ in teaching science and mathematic in upper primary
schools. The ‘Flip Method’ proposes flipping or reversing the traditional teaching model of learning
inside the classroom and practicing learning outside the classroom. In the ‘Flip Method’, most of the
subject learning happens outside the classroom and the classroom time is used for practicing problems
and undertaking interesting experiments. It is proposed that as a pilot case 500 upper primary schools
are initially selected to impart education through the ‘Flip Method’ on two subjects: mathematics and
science. The ‘Flip Method’ can be implemented as below:
i. WBCERT identifies 10 best subject teachers (for mathematics and science) for each
class (Class-VI to Class-VIII). DIET can help WBCERT in identifying those teachers.
The selected teachers should have good communication skills. The syllabus of a
subject will be divided into appropriate modules and a specified number of lectures
will be identified for each module. The selected teachers will be asked to prepare
lecture notes for each session of a subject. The lecture note will be vetted and
approved by a committee of experts setup for this purpose. The teachers, who have
prepared these lecture notes, will then be asked to record these sessionsonto a VCD.
ii. The subject VCD so developed will have these lecture sessions by the best of
teachers and sufficient copies of the VCDs will be sent to all upper primary schools.
iii. The computer room in each upper primary school should have a sufficient number of
computers so that there is one computer for every 5 students in a class. For example
if the average class size of an upper primary class is 40, there should be at least 8
computers in the school. Each computer should have a speaker to listen to the audio
of the lecture session.
iv. Each subject should have an adequate number of lectures and practice sessions.
Each practice session will be preceded by one or more lecture sessions. Every
student will be asked to go through the recorded lecture sessions as per their class
schedule. This will help every single student, irrespective of the location of the school,
to learn the subject from the best of teachers.
v. The role of a class teacher in a particular school for a particular subject (mathematics
or science) will be more of a facilitator or tutor. During practice sessions students will
be given problems/tasks of varying difficulty levels. The class teacher should be a
keen observer and should monitor the progress of each student in the session. The
teacher should intervene/facilitate in the learning process only when he/she thinks it is
necessary.
vi. The performance of each student should be evaluated on a continuous basis through
specially designed tests after every module.
(b) We recommend that for subjects like history and geography, Active Learning Method (ALM) or any other
similar method be used. ALM, as followed in Tamil Nadu and Madhya Pradesh, has many advantages.
It encourages students to learn in groups and go beyond what is mentioned in the text books. However
one of the critiques of ALM is that it does not allow flexibility in learning and at times discouragesthe
creativity of students. The alternative to ALM could be to develop textbooks in such a way that each
book can be unique to a particular student. For example, the history textbook can be designed in such a
way that after every chapter, a list of reference materials will be mentioned and a few blank pages will
be given. The school library must have the reference materials mentioned in the textbooks. Each

xv
student will be asked to use the reference materials (this task has to be carefully assigned by a subject
teacher so that no two student write on the same topic) to prepare a write up as an additional learning
for that chapter and reproduce it in the blank pages provided in the textbook. This exercise will
encourage students to be creative, expose students to reference materials and therefore broaden their
perspectives. We recommend that schools should be given the option of choosing a particular pedagogy
(ALM or the other alternative).
(c) While teaching language subjects adequate emphasis should be given on oral and written skills.
(III) The education of a child will be incomplete unless one can impart social awareness and basic ethics in
every child. Students should also learn to work in groups/teams. These soft skills should be imparted
informally rather than through formal classroom lectures. We propose four schemes in this regard:
(i) Every child in a primary class will be asked to maintain his/her attendance record for a particular subject
for the whole year. A class teacher will periodically (for example, fortnightly) verify the child’s attendance
record with the teacher’s attendance register.
(ii) Every upper primary school can have a ‘shopping’ period once a week. During the shopping period a
designated classroom can be converted into an unmanned Kirana Store where a select consumable
item of a reasonably low price will be kept. The price list will be displayed in a prominent place in that
classroom. Any student can enter the store and pick up an item after paying the listed price in a box kept
for this purpose. This exercise will help the students learn how to be ethical. If any student is found
cheating, the fellow students should bring it to the notice of concerned teacher.
(iii) Every upper primary school should organise social awareness programmes (eg.A cleanliness drive,
medicine collection, waste paper collection etc.) in a collaborativeeffort with NGOs/ Social Organizations
twice a year. This should be done in such a manner that every student participates in at least one such
programme per year.
(iv) Every student of an upper primary school should be a member of the school house/club. The school
should organize debates, essay competitions, sports and other cultural activities among the
houses/clubs.
(IV) It has been observed that in case of several States appropriate incentive systems positively affect the
quality of education. Incentive schemes may be developed for students as well as teachers. We
recommend the following:
(a) The State can introduce a merit scholarship examination in class V. This would in a way provide a check
on the quality of education at primary level and would also provide an incentive to children to perform
well in their studies. The scholarship amount may be paid out of funds available under the LEP
(Learning Enhancement Programme) in SSA.
(b) Teachers have a major role to play in maintaining and improving the classroom transactions and thereby
enhancing student learning capability. An incentive scheme (in the lines of Pratibha Parv in Madhya
Pradesh) may be launched for the teachers in primary and upper primary schools. The incentives may
be paid out funds available under the LEP (Learning Enhancement Programme) in SSA.
5.11 School Inspection (Ref: Chapter 6; para 6.8)
(I) In order to ensure that classes are held regularly, students’ attendance and academic performance
improve, it is necessary to strengthen the school inspection setup at the grass root level.

xvi
(II) It is recommended that the school inspection setup is significantly increased at the cluster and the block
levels. This will have three advantages – (a) close and continuous monitoring of the quality of education;
(b) timely and quick response to address any problems and (c) relieving the district administration of
substantial pressure.
(III) It is suggested that the state government allocate additional funds to augment the school education
system.
(IV) It is recommended that the designations of inspectors be changed as below:
(a) Sub-inspector of Schools be re-designated as Assistant Education Officer (AEO)
(b) Assistant Inspector of Schools be re-designated as Block Education Officer (BEO)
(c) District Inspector of Schools be re-designated as District Education Officer (DEO)
(V) The District Education Officer will be responsible for overall management and administration of school
education of the district. The DEO may not personally visit schools as a routine activity. However he/she
may visit schools whenever necessary. The primary responsibility of a DEO would be the following:
(a) Facilitate teacher recruitment process in the district.
(b) Help WBCERT in organising and conducting teacher training programmes.
(c) Periodically interact with VEC/SMC to review administrative issues.
(d) Co-ordinate with the district project officer to ensure proper implementations of SSA programmes.
(e) Monitor and review performance of children and take appropriate actions whenever required.
(f) Monitor and review attendance, transfer and other issues concerning teachers.
(g) To facilitate and participate in periodic student evaluation programmes.
(VI) In order to discharge the above functions, each district should have 6 DEOs/ADEOs to look after
elementary and high school education. The suggested staffing of DEOs/ADEOs in a district is as follows:
Elementary Education:
(i)District Elementary Education Officer and under him:
Assistant District Elementary Education Officer (Training)
Assistant District Elementary Education Officer (Academic)
Assistant District Elementary Education Officer (School Management and Administration)
High School Education:
(iii) District Education Officer (Training & Academics) and under him:
Assistant District Education Officer (Academic & Administration)
Considering the 20 districts (including DGHC) in West Bengal, the above arrangement would require 120
DEOs/ADEOs in the state. The present sanctioned strength of District Inspector of Schools (including ADI and
ADSE) is 120 and hence there is no need for creating additional posts. All vacancies should therefore be filled up
as early as possible.
(VII) There is a need of creating of 50 additional posts for BEOs.
(XIV) Our recommendation suggests a more than 3 fold increase in the sanctioned strength of Assistant
Education Officers (3411 from the present strength of 999). This would ensure that each school gets
adequate attention and timely intervention by the school administration.
(XV) The AEO in a particular cluster will look after secondary schools if any. The role of an AEO would also
include continuous interaction with CRC co-ordinator to ensure timely collection of DISE and other data
for MIS purposes

xvii
5.12 Governance Structure (Ref: Chapter 6; para 6.9)
(I) We recommend that the functions of WBPE be subsumed in WBCERT. However any activity relating to
teachers’ appointment and transfer will be handled by the Personnel & Supervision arm of the
Directorate.
(II) If RTE is fully implemented, our estimate show that there will be around 78,000 schools imparting
elementary education in the state. Hence a separate directorate for elementary education is necessary.
Similarly the directorate of the district unit of the school education should have two wings – elementary
education and high school education.
(III) It is therefore necessary to strengthen the directorate with appropriate staffing of Law Officers at the
state as well as at the district level.
(IV) The functions of directorate at the state level are divided into three segments – Personnel &
Supervision, Academic and Appointment. While the Personnel & Supervision section looks after
administrative issues related to schools and teachers and the monitoring of teachers’ attendance and
accountability; the Academic section of the directorate will be the main focal point of the school
education system.
(V) The present West Bengal Board of Madrasah Education and Rabindra Mukta Vidyalaya (West Bengal
Council of Rabindra Open School) will be retained.
(VI) Therefore it is proposed that the West Bengal School Service Commission be entrusted with the
additional responsibility of conducting TET. This will ensure uniformity in the teacher recruitment
process to a greater extent. It is desirable that at the elementary level of education, teachers are
recruited from the same/nearby villages where a school is located. Hence while the TET can be
conducted at the state level once a year, the interviews can be held at the district offices of the
directorate to avoid inconvenience to the applicants.
(VII) Similarly at the district level, the directorate of school education can be divided into two broad wings –
elementary education and high school education. The district inspector of schools may be called District
Elementary Education Officer (for elementary education) and District Education Officer (for high school
education). Such district education officers will monitor school administration and management and co-
ordinate teacher training programmes in consultation with the DIET. We propose a strong block
education office at the block level. The administrative head of the block education office will be Block
Elementary Education Officer (for elementary schools)/ Block Education Officer (for high schools). Each
block education office will have five resource persons (Block Resource Persons) specializing in different
subjects taught in elementary schools.
(VIII) Each block office should also have two Group-C staff (Computer literate), two Group-D staff and one
Block Accountant.
(IX) The Cluster Education Centre (currently called Cluster Resource Centre) will be housed in one of the
bigger schools in the cluster. Ideally the school chosen for locating the Cluster Education Centre should
be a secondary level school with adequate space. Each Cluster Education Centre will be headed by an
Assistant Education Officer (presently called Sub-Inspector of Schools). The MIS activity (including
compiling DISE data) of schools within the cluster will be managed at Cluster Education Centre.
Accordingly one MIS person-cum-clerk may be appointed in each cluster to help the Assistant Education
Officer.
5.13 Role of WBCERT Redefined (Ref: Chapter 6; para 6.10)

xviii
(I) It is proposed to significantly strengthen the WBCERT.
(II) The WBCERT is to be construed as independent academic body with the following explicit functions:
(a) Curriculum development
(b) Text book preparation and printing for formal as well as non-formal education
(c) Development of innovative learning techniques and tools
(d) Designing, administering teacher training programme and development of appropriate training materials.
(e) Conducting research in the area of school education.
(III) The WBCERT is required to be appropriately staffed in order to effectively handle the responsibilities.
The working environment of WBCERT should be similar to a university and hence the career path of
people involved in the academic wing of WBCERT should be appropriately structured. In view of
enhanced responsibilities of the WBCERT, separate administrative and finance and accounts sections
are also to be created. It is proposed that an academic advisory board be formed to guide the WBCERT
in its academic functions. Such an academic advisory board may comprise of the following members:
(a) Experienced professors in colleges (two members)
(b) Experienced teachers from government schools (three members)
(c) Representative of NCERT (one member)
(d) Representative of an NGO involved in school education (two members)
(e) Director – WBCERT, member secretary
(f) Chairman, West Bengal Board of High School Education
(IV) The advisory board would be an independent body comprising of people connected with schools/college
education. The independent character of the board is to be maintained.
(V) DIET and PTTIs are to be brought under the WBCERT. All in-service teacher training programmes will
be designed and coordinated by the WBCERT and administeredthrough DIET/PTTIs. Therefore each
district of the state should have a DIET to facilitate teacher training programmes.
(VI) We feel that if WBCERT takes care of curriculum development and text book preparation of school
education, there is no need to have separate boards for Secondary and Higher Secondary
examinations. It is therefore proposed to have only one board to take care of Secondary and Higher
Secondary examinations. We proposed that the present West Board of Secondary Education and West
Bengal Council of Higher Secondary Education be merged into a new board called West Bengal Board
of High School Education. The activities of board will include:
(a) Regulation of admission to schools
(b) Conducting secondary and higher secondary examinations
(c) Preparing annual work plan for secondary and higher secondary schools
(d) Conducting scholarship examination
(e) Managing ICT schemes
(f) Verification of educational documents and issuing of transcript
(g) Recognition of schools
The curriculum and textbook developments for secondary and higher secondary schools will be the responsibility
of WBCERT.
xix
5.14 Resource Persons (Ref: Chapter 6; para 6.11)
(I) We recommend that the Shikshabandhu cadre be abolished and the resource person cadre be
strengthened. Each BEC will have five resource persons. Such resource persons may also be called Subject
Experts. The primary responsibilities of Block Resource Persons will be as follows:
(a) Imparting teachers’ training for 10 days based on modules developed by WBCERT/DIET. Such trainings
should be conducted in a structural manner covering subjects taught in the schools.
(b) Providing teaching support to one or more schools in a block which experience poor performance of
students.
(c) Helping the school in ensuring 100% student enrolment.
(d) Coordinating with the CLEC, wherever required, in school related matters.
(II) Such Block Resource Persons could either be retired teachers or selected through School Service
Commission. Resource persons should also be placed at the PTTIs to help with in-service teacher training
programme.
In order to ensure minimum hardship while phasing out the shikshabandhu cadre, the following strategy may be
adopted:
(a) Those who fulfil the eligibility criteria should be absorbed as primary/upper-primary teachers.
(b) Those who have reasonable computer proficiency, but who do not fulfil the eligibility criteria of
becoming a school teacher, should be absorbed as MIS-cum-clerk at the cluster/block level education
centres.
(c) Those who do not possess any of the above qualification (as mentioned in (a) and (b) above) should
be asked to leave.
5.15 Abolition of District Primary School Council (DPSC) (Ref: Chapter 6; para 6.12)
We have proposed the following:
(a) The School Service Commission will periodically conduct TET.
(b) The District office of the school directorate will constitute an independent selection committee
(comprising of retired high school teachers, retired college teachers, head of the local authority) for
conducting interviews and selecting teachers in the respective districts.
(c) Teachers will be selected against respective schools, based on vacancies thereof.
(d) All administrative matters concerning teachers (including transfers) will be handled by the district
education office and the personnel and supervision section of the school directorate.
(e) A grievance redressal cell of the VEC/ education wing of the local authority will hear and dispose all
teachers’ complaints in a transparent and non-partisan manner.
(f) The present set up of DPSC be abolished.
5.16 Management Information System (Ref: Chapter 6; para 6.13)
(I) The functions of the present school portal of the State need to be substantially augmented to make the
portal an interactive one. The school portal should have a scalable architecture to accommodate more
applications and users.
(II) Records of every child, school, and teacher should be gathered and mapped in the mother database in
such a way that every child and teacher is mapped to a school. Every teacher should additionally be
mapped to a CLEC.
(III) The management information system (MIS) should be an integrated State-wide information system. The

xx
MIS should be used to identify vacancies/requirements of teachers at every school and similarly the
surplus of teachers in schools. The system should also have data on student enrolment and class-wise
performance. Such MIS should be independent of DISE.
(IV) The MIS should have the following details of the teachers:
(a) Name and address
(b) Photograph
(c) Academic qualification
(d) School attached
(e) CLEC attached
(f) Date of joining
(g) Salary details
(h) Leave details
(i) Provident fund details
(j) TDS details
(k) Other service records
(l) Date of birth
(m) Marriage day (if applicable)
(n) Achievements, if any
(V) The portal should capture school-wise subject-wise results of monthly/periodic tests to assess
competency level of students in the elementary schools.
(VI) The portal can also be used to manage out of school children by having data on registration, follow-up
and tracking.
(VII) The monthly salary bill of the teachers of all schools under a cluster would be prepared at the CLEC in
the school portal. The CLEC coordinator and AEO of the cluster would certify the monthly salary bills of
all schools of that cluster and submit the same online to district administration.
(VIII) The portal should also be effectively utilized for two more important purposes: (i) project management
and (ii) financial management.
5.17 Teacher Transfer (Ref: Chapter 6; para 6.14)
The teacher transfer policy can be monitored through the MIS. At the beginning of each academic session,
cluster-wise vacancy/surplus positions in schools would be drawn from the system. The teacher transfer
programme can be designed as below:
(a) The present system of appearing in the SSC examination for seeking atransfer should be stopped.
(b) Teachers can apply for transfers in a prescribed form to the CLEC. All applications will be time-stamped.
The AEO will screen all such applications and forward the same to the district office. All applications
submitted up to September of any year will be considered for transfer in the next academic session.
(c) Teachers from ‘teacher-surplus’ school will be compulsorily transferred to appropriate ‘teacher-deficit’
schools in the same district. Exceptions can be made for senior teachers (more than 55 years of age)
and women teachers with children below 5 years.
If after the above two steps are implemented and no vacancies are left in a district, only mutual transfers will be
allowed within the district. However, the net shortfall in a school in a district will be filled up either through fresh
recruitment or through voluntary transfer from other districts based on applications made as in (b) above. While

xxi
implementing such inter-district transfer, first-apply-first-serve method will be followed. It is also to be ensured
that if the transfer is sought outside the district, a minimum of 5 years of teaching experience is required in the
present district.
5.18 Project Management (Ref: Chapter 6; para 6.15)
(I) The delay in the construction of new schools and additional class rooms (ACR) is a major concern for
the State. It is therefore suggested that the State Project Directorate should have a separate wing for
infrastructure.
(II) We propose that the infrastructure wing of the SPD should have one State Project Engineer (in the rank
of executive engineer) who would look after all expansion activities. The SPE should be a permanent
employee of the government and not contractual staff as is the case now.
(III) The DPE (District Project Engineer) will also be responsible for the maintenance of existing schools.
(IV) The SMC should have a Civil Works Sub-committee (CWC) headed by the chairman of the SMC with
the head teacher of the concerned school, representative of the local authority, two parents of students,
and one mason of the village (co-opted) as members. The CWC would procure materials and engage
labour contractors to execute the civil work.
(V) In the school portal, all civil works will be categorized as per types and mapped with the DISE code of
schools. Monthly progress of work, including physical and financial progress, revised sanction details,
completion details, photographs of completed/ work-in-progress constructions can be uploadedto the
portal.
5.19 Financial Management (Ref: Chapter 6; para 6.16)
(I) Primary and upper-primary schools should be treated as separate schools for the purpose of school
grants even if they are functioning from the same premises.
(II) We propose that a block accountant be appointed for each block. The block accountant should be
computer literate. The block accountant should be responsible for collecting information on grants
received and utilisation of funds from every school under the block. The block accountant would also be
responsible for entering all data in the MIS.
(III) The school should not get involved in procuring items like uniform, bicycles etc. The SMC should
identify some shops in the local area which can provide school uniforms and bicycles. Expenses for
uniforms and bicycles should be reimbursed to the parents of the children on production of necessary
bills/invoices from the designated shops. Such payments would be disbursed by the clerk of the CLEC
as per the schedule drawn by the AEO.
(IV) The block accountant would maintain records of all transactions with the civil contractors and enter the
necessary data in the MIS.
(V) The head teacher of the school will only maintain a cash book to record receipts and payments of
contingency and maintenance grants.
(VI) The grants for mid-day meals (MDM) should also be directly sent to the bank account of the SMC. The
head teacher of the school should not be involved in the administration of the MDM except for certifying
the quality of the meal and the number of students who availed of the meal.
5.20 Rabindra Mukta Vidyalaya (Ref: Chapter 6; para 6.17)

xxii
(I) It has been observed that the quality of learning and evaluation of students in RMVs is poor. Therefore
children who could have joined main stream schools take the easier route and enroll themselves in
RMVs. In order to arrest this trend it is proposed that the minimum age of admission in RMVs should be
raised to 18 years. This policy will ensure that only adult citizens can participate in the open schooling
system.
(II) In order to strengthen the open schooling system the following is suggested:
(a) The responsibility of curriculum design and preparation of textbooks should be given to WBCERT.
(b) WBCRMV would approve the curriculum and textbooks designed by WBCERT.
(c) One or more upper primary schools in a cluster should be used as study centres. Such schools should
be compensated reasonably for the use of their space. However the laboratory of a nearby higher
secondary school will be used for conducting practical classes.
(d) WBCRMV should prepare a cluster-wise resource person bank for teaching in the study centres. Such
resource persons should ideally be retired high school teachers.
(e) The resource persons will be given necessary training by WBCERT.
(f) The WBCRMV will be mainly responsible for managing admissions and the examination system. For
this purpose the council should be appropriately staffed.
(g) The present system of allowing 5-6 attempts to clear an examination should be stopped. Instead
students should be given upto 3 chances to clear an examination.
(h) The school education portal should contain student related information (registration, performance and
tracking) for open schools and should contain all announcements to make them easily accessible for
open school students.
5.21 Proposed Areas for Intervention at the organisational level (Ref: Chapter 7; para 7.2.11)
(I) The Secondary Board and Higher Secondary Council could come together to form a single organisation.
(II) All work should be done at two levels: one for routine work (like upgradation, recognition renewal,
issuance of permission for new subject, etc) and ongoing process of syllabus change, publications, etc
which should be the mandate of the WBCERT.
(III) More number of Regional Offices (ROs) are required for both. Preferred areas could be the districts of
Nadia, Bankura, and Darjeeling.
(IV) The number of teachers needs to be increased for both.
(V) Decentralisation to ROs would be crucial. This should include
(a) The mandate for upgradation and recognition, including the renewal of recognition (guidelines
need to be given to the RO)
(b) Mandates for human resources (like approval for overtime payment)
(c) Admission intake increase upto a percentage of ten
(d) Issue of duplicate mark sheets
(e) Creation of database for migration, which will enable same-day issuance of migration
certificates
(VI) The above decentralisation would not require new staff but there should be provisions for
training, especially for the use of computers at every level.

xxiii
(VII) Warehouse decentralisation for books should be done.
(VIII) A Deputy Secretary needs to be posted at all Higher Secondary ROs. At the Secondary ROs,
DS should be provided with the power of delegating service when s/he is absent. Currently,
s/he is the single signatory, and her absence often makes a lot of routine work impossible.
(IX) Laboratory grant for schools should be increased, along with proper monitoring from the RO.
(X) School inspection through cluster visits should be done immediately.
(XI) Teacher sanctions for subject-wise distribution should be done by the RO with DI office liaison.
(XII) Internet account facility should be provided at the RO for monthly/ annual statements.
(XIII) The web portal needs to be regularly updated with circulars.
(XIV) Internet should be provided in all ROs at all levels.
5.22 Proposed Areas for Intervention at the school level (Ref: Chapter 7; para 7.2.11)
(I) Every school must have separate room for teachers and Headmaster or Teacher-in-Charge.
(II) Every school should have a library and office room and computer.
(III) Every school should have computers for students.
(IV) In rural areas all schools must have a electricity connection.
(V) There is a need for an increase in the number of clerks and Group-D staff in schools.
(VI) Most of the teachers come from beyonda 10 k.m. radius from the school. The appointment of teachers
should be preferably from the same district.
(VII) More schools should provide vocational training to their students.
(VIII) School Management Committee should be formed and encouraged in all rural and urban schools; in
rural areas almost no schools have Parent Teacher Associations, and they should be actively
encouraged to set up such.
(IX) Irrespective of area division, a cluster of schools should come together to arrange health check-up
camps.
(X) A large number of schools offering secondary education only need require additional infrastructure.
5.23 Proposed Areas for Intervention Concerning MSKs (Ref: Chapter 7; para 7.3.11)
(I) Along with the formation of School Management Committee, the frequency of AEO visits to MSKs
should be increased.
(II) MSKs need infrastructural improvement in a big way. Investment is required in almost all the areas: a)
increasing the number of class-rooms; b) teachers’ room c) kitchen; d) library facilities e) office room; f)
computer laboratories; g)water; h) sanitation facilities such as toilets for both teachers and students and
i) electricity.
(III) MSKs need sufficient teaching staff and teaching / learning materials to address the problems of drop
out and low attendance rates.
(IV) There is a need to appoint support staff such as clerks and Group-D staff so that teachers can pay full
attention to their primary responsibility of classroom-based teaching activities.
xxiv
(V) Since a large number of MSK teachers (75.6%) do not have any kind of professional training, they
should be prioritized in the teaching programmes of the state government otherwise the gap in terms of
quality of education in MSKs and secondary and higher secondary schools will remain insurmountable.

1
2
Chapter 1
The State of West Bengal: Evaluation of School Education
1.1 As per the census data of 2001, West Bengal, spread over 88,752 sq kms had a total
population of 80,176,197. Total male population was 41,465,985 and total female
population was 38,710,212. The provisional census data of 2011showed that the
total population in West Bengal now stands at 91,347,736 comprising of 46,927,389
male and 44,420,347 female. The sex ratio has slightly improved to 947 in 2011
compare to 934 in 2001. In terms of total population West Bengal holds the fourth
rank among the states in India. The population density is 903 per sq km. which is
highest among all states in India. As per the census data from 2001, Scheduled
Casts constituted approximately 23 percent (total SC population is 18,452,555) of the
total population and in the case of Scheduled tribes this figure is approximately 5.5
percent (total ST population is 4,406,794) of the total population.
1.2 West Bengal shares its boundary with Orissa, Bihar, Jharkhand and Nepal in the
West, Sikkim in the North, Assam, Bhutan and Bangladesh in the East and Bay of
Bengal in the South. Because of better job opportunities and a better standard of
living, a large migrating population from the states of Bihar, Jharkhand, Uttar Pradesh
and Orissa come into this state. West Bengal still holds its position as an important
commercial hub for the whole eastern and north-eastern region of the country. This
state also plays a crucial role in business and trade for neighbouring countries like
Nepal, Bhutan and Bangladesh. So many people, not only from neighbouring states
but also from neighbouring countries, particularly from Bangladesh, migrate to this
state. Economic, social and cultural bonds are still strong with Bangladesh and they
are also Bengali speaking so they have a natural advantage while migrating to this
state. The average annual exponential growth rate in West Bengal is 1.31% which is
less than the all-India figure of 1.64% and the decadal growth rate is 13.93% (all-
India figure 17.64%) as per the provisional census data of 2011. 99.39% of the total
population of West Bengal speak in scheduled languages. However, 85.34% of the
total population speak in Bengali.
1.3 The urban population of West Bengal is 22,427,251, which is about 27.97% of the
total population which is more than the all India average of 27.81% of the total
population. The total number of villages in the state is 40,783 according to the

3
census of 2001. The number of class I cities with a population 100,000 and above
rose from 42 in 1991 to 58 in 2001 and the number of class II cities with a population
between 50,000 to 100,000 decreased from 30 in 1991 to 19 in 2001. This indicates
a rapid urbanization across India.
1.4 West Bengal is one of the five states which has shown a maximum decline in the
absolute number of the child population in 2011 in comparison with the figures of the
census of 2001. As per the provisional census data of 2011, the child population in
West Bengal now stands at 10,112,599 comprising of 5,187,264 males and
4,925,335 females. West Bengal has been witnessing a negative change in
population in the age group 0-6 years since 1991. The decadal change in child
population (age group 0-6 years) was -148,075 in 2001 and -1,301,623 in 2011.
Percentage of children (age group 0-6 years) of the total population is 11.07 in 2011
as compared to around 14% in 2001. This decline in child population of the age
group 0-6 years has profound implications for the implementation of RTE norms.
1.5 Administratively West Bengal is divided into 19 districts including Kolkata and 341
Community Development Blocks. Each district is divided into many sub-divisions.
Economically, politically, and culturally, the undivided Bengal province used to hold a
leading place in the country. But its preeminent place began to decline since the
1940s. First, there was the World War II which in its wake brought the infamous
Bengal famine of 1943. The famine took a toll of millions of lives. This was followed
by the communal riots in 1946 and the partition in 1947, violently shaking the whole
social foundation of the Bengali community. Waves after waves of refugees migrated
from East Bengal (now Bangladesh) to West Bengal, a process which continued till
1971 streching the resources of the new state to its limits. The unsettled conditions,
aided and aggravated by many other complex politico-economic factors, contributed
to a process of decline both in the industrial and agricultural sector which led to
decades of intense social strife, the marks of which have left indelible imprints in the
social and cultural sphere of the community.
1.6 Politically too, the state had been very restive. The last fifty years may be conveniently
divided into two periods. From 1947 till 1967 the Congress government which was in
power had to face the crisis emerging from the partition and consequent social unrest,
shortages of food and agricultural commodities, and very high incidences of
underemployment and unemployment. There had been recurring political unrest
culminating into the now famous Naxalbari movement that shook the social fabric to its
4
core. The decade between 1967 and 1977 witnessed severe competition for political
power that brought in its wake governmental fragility, administrative uncertainties and a
lack of direction of public policy. Against this background, the emergence of the Left
Front in 1977, and more than three decades of stable rule in the state had imparted a
degree of stability to public organizations and provided a scope for meaningful and
development oriented public policy and their implementation.
1.7 One such major policy was the implementation of the land reform programmes
including "Operation Barga" with simultaneous emphasis on redistribution of land and
augmentation of agricultural production. These have yielded results. West Bengal had
also introduced the system of decentralized governance through the three-tier
Panchayati Raj. Elections to the Panchayat bodies were held regularly, developing a
local level of leadership and strengthening local self-government institutions. Much of
the state‘s development expenditurewas incurred through these politically elected
bodies. Panchayat institutions are still associated with most of the development
activities. The 73rd and 74th Amendments to the Constitution of India have further
expanded the scope of activities of the Panchayats, and have provided an opportunity
to these institutions to be more self-reliant.
1.8 However, stability does not rule out the possibility of confusion in policy matters. Nor
does it ensure efficiency. While the agrarian unrest and conflict that characterized the
rural areas in the late 60's and the 70's have subsided substantially, new types of
conflicts are taking place in the countryside that mostly originate in the atmosphere of
intense political competition over power, pelf and scarce resources. In the urban areas
on the other hand, economic recession, failure to withstand competition, transfer of
capital and absence of proper incentives for new investments have continued to make
the industrial sector sluggish with little hope of quick recovery, leading to a climate of
depression and despondency among the urban youth.
1.9 Coming to the issue of primary education, it may not be out of place to recall here that
Article 45 of the Constitution of India lays down that "The State shall endeavour to
provide within a period of ten years from the commencement of this Constitution, for
free and compulsory education for all children until they complete the age of fourteen
years". Furthermore, the very next article states: "The State shall provide with special
care the educational interests of the weaker sections of the people, and in particular, of
the Scheduled castes and Scheduled Tribes....". Pressures at the national level and the
international consensus on the need to eradicate illiteracy, led the central government to

5
draft a Bill in 1997, namely the Constitutional 83rd Amendment Bill, 1997. The draft bill
laid down that "the State shall provide free and compulsory education to all citizens of
the age six to fourteen years". To fulfill this goal the central government passed the
―Right to Education Act‖ in 2009. The RTE Act ensures the right to free and compulsory
education for all the children of the age between six to fourteen years.
1.10 Following the recommendations of the Kothari Commission, the Government of West
Bengal restructured the educational pattern to the 10+2+3 system of which the stage of
Primary Education consists of the first half of the ten years of schooling. More
specifically, it consists of the classes I to V, which is followed by the Junior High or
Upper Primary level from class VI to VIII. A child enters the system at the completed
age of 5 years and should continue without interruption at least till the age of 9
completed years so as to complete the primary stage. (If the constitutional mandate is
followed, the child is to be retained in school till the individual has at least crossed the
upper primary stage.) It is more important to ensure that during this period the child
should at least attain the Minimum Level of Learning (MLL) prescribed for the primary
stage. Thus, we can identify at least three parameters for the measurement of the
efficacy of the primary education system. The first is quantitative - whether all children
have been enrolled in primary schools. According to the census of 2001, children in the
age group of 5 to 9 in West Bengal was about 94.91 lakhs which was roughly 11.84 %
of the total population. The male population in the age group 5 to 9 was 4851125 and
the female population was4639483. To ensure their total enrolment, it is necessary to
have, apart from the generation of a demand for education, the required number of
schools with adequate classrooms and an adequate number of teachers.A favourable
teacher-student ratio as per the norms accepted by the state should be 1:40.Secondly,
to retain most of them in school for a continuous period of eight years and ensure their
regular attendance it is necessary to make the school environment attractive mentally
as well as physically and also to ensure a stimulating atmosphere both in the classroom
and outside.The participants and their guardians must feel that the time spent by their
wards in the school is not a waste of time that could be fruitfully utilized otherwise. Here
the infrastructure of the schools, the incentives provided, as well as the quality of inputs
and the agents providing them play a major role. Lastly, there is the crucial issue of the
attainment of a particular level of learning which is a function of the motivation and the
quality of teachers, their training and the nature of interaction between the teacher and
the students and the number of working days spent in the school. In all these aspects,
and particularly in the first and the second aspect the role of the community is very
important in creating an atmosphere of a learning society and in the planning and the

6
management of education. The efficiency of the administrative structure and the
monitoring process and the effectiveness of academic and other material inputs acquire
meaning and significance only in relation to the three major parameters identified
above.
1.11 On the 2nd of February 1995, the Government of West Bengal established a
registered organization named ‗Paschim Banga Rajya Prathamik Siksha Unnayan
Sanstha‘ as an autonomous and independent body for implementation of the
elementary education project in West Bengal and it seemed to function as a societal
mission for bringing about a fundamental change in the basic education system. The
implementation of the SSA in the State was assigned to this Sanstha on 14thMarch
2001 with some alterations and the name of SIS (State Implementation Society) was
also changed to ‗Paschim Banga Rajya Praramvik Siksha Unnayan Sanstha‘
(PBRPSUS). On 31stOctober, 2006 this name was again changed to ‗Paschim Banga
Sarva Siksha Mission‘.
1.12 The 86th amendment to the Indian Constitution [Constitution (Eighty-sixth
Amendment) Act, 2002] inserted Article 21-A in the Constitution which provided for
‗free and compulsory‘ education of all children in the age group of six to fourteen
years as a Fundamental Right. The Right of Children to Free and Compulsory
Education Act, 2009 (RTE) is the consequential legislation envisaged under Article
21-A. Thus, RTE makes implementation of compulsory education legally binding on
all states/ union territories.
1.13 Education is a multi-faceted programme. Any education system involves not just the
teachers and the students but society as a whole. Universalization of primary education
would depend on three main attributes: universal facilities, universal enrolment and
universal retention. The first implies the delivery system that includes the provision of
primary education, supply of teaching-learning materials and the desired quality of
teaching – learning in schools. These may be regarded as the major prerequisites for
universal enrolment and retention. But enrolment and retention also depend on
structural and attitudinal factors. These include both social and economic constraints.
Thusan evaluation of the existing status of primary education in the state involves not
just evaluating the school system but also its relationship with the socio-economic
conditions of the population.

7
1.14 The delivery system involves directly the policy makers, the bureaucracy, and teachers,
creating proper motivation, providing the right guidance, necessary infrastructure, and
development of the proper objective and subjective environment to impart knowledge to
the recipients. Proper monitoring of the delivery system is crucial at every stage. At the
primary level, thisis particularly important, as the recipients, children in the age group 5-
6 to 8-9 years, are not in a position to feel the need for education, leave alone articulate
the deficiencies in the existing system. On the receiving side, the parents thus have to
play a great role in inducing their children to go through the learning process. In a
country like India, where a large proportion of the adult population remains abysmally
poor and illiterate, the need for education of the children is often not felt by the parents.
However, it is widely accepted that, ceteris paribus, a better delivery system induces
new demand for education. To intervene meaningfully in engineering an essentially
social process, it is imperative that an assessment is made of the existing condition. It is
here that an information gap remains for most of the states in India including West
Bengal.
1.15 In the present exercise, we are mostly concerned with the first two. But before making a
realistic estimate of them, it may be profitable to take a quick look at the major policies
and administrative measures initiated by the government and their impact on the
educational scenario. According to the DISE (District Information System for Education)
Flash Statistics data for the year 2009-10, the number of primary schools in the state is
74,678 (it was 51,021 in 1995-96) and the enrolment of students upto class V is
10,545,319; up from 8,500,000 in 1995-96.
1.16 As per DISE data on an average each primary school in the state had 3.4 teachers for
the year 2009-10. The pupil-teacher ratio (PTR) in primary schools was around 34; the
percentage of trained teachers was 53.21% and the figure for teachers who received in-
service training was about 42.12%. These figures are for all the schools.
1.17 An efficient delivery system also depends extentsively on proper mobilization of physical
and human resources and the development of a well-structured management and
administrative system. Adequate allocation of funds is a precondition for developing the
delivery system.
1.18 In 2009-10, the estimated spending on primary schools was Rs.4,94,25,000 and
estimated spending on teachers training amounted to Rs.21,25,59,000. Total estimated
expenditure on teachers‘ salary was Rs.4,91,39,000. On the other hand, the estimated

8
spending on school building repairs was about Rs.1,85,75,000. Total estimated
expenditure on non-formal elementary education was about Rs.5,62,000.
1.19 It is necessary to have not just an adequate number of teachers in the schools but also
an adequate training of these teachers to undertake their duty meaningfully. The
minimum level of learning (MLL) of the students depends, among other things, to a
great extent on the teachers' ability to impart knowledge.This, in turn, depends heavily
on the teachers' knowledge, skills and motivation, all of which are to a great degree,
functions of proper training.
1.20 The West Bengal Board of Primary Education is aware of the problems and has taken a
number of steps for the improvement of quality of the teaching-learning process in the
schools. A special programme called Joyful Learning (Ananda Path) has already been
launched in a number of districts in the state with the help of UNICEF. It is primarily
aimed at improving the quality of teaching at the primary level through special training of
teachers and by improving the teaching aids and other materials and the physical
infrastructure of the schools. Base-line studies are also being conducted in these
districts to keep track of the development of the students brought under the programme.
Compared to the Ananda Path, Sarva Siksha Abhiyan (SSA) lays more emphasis on
the teaching-learning process through improvement of the quality of the textbooks and
the use of teaching-learning materials.
1.21 The level of literacy, enrolment and or retention/drop-out, are dependent not only on the
delivery system but also upon social factors. Thus gender, caste/community,
occupational and rural / urban inequalities all affect education. Available information
indicates that poverty and illiteracy are particularly prevalent among Muslims who form
a large segment of the population.All our household based analyses, hence, have been
done at multiple levels. We have not only tried to capture the features of gender
inequality by disaggregating our information for males and females for all strata, we
have also given all the information separately for the broad social categories, i.e.
scheduled castes and tribes, minority community and the general population. Kolkata,
being a cosmopolitan metropolis, has its own unique features. No other town/city in
West Bengal is comparable with the city in terms of the size of the population and
complexities related to a cosmopolitan metropolis. We have therefore considered
Kolkata separately within the urban framework.
9
1.22 It will be appropriate at this stage to inform the reader about our survey design and
method of analysis. We had organized a survey of all the households and the schools
situated in 45 villages and 9 Urban Frame Survey Blocks selected as samples from all
the districts of the state. The details of the sample design and the methodology are
described in Chapter 4 of this report. We thus covered nearly 700 households
consisting of nearly 3428 people spread all over the state. Attempts were also made to
collect information from all the schools situated in the sample villages and the urban
blocks considered. So far as the field surveys were concerned, the major task was to
identify an adequate number of surveyors from each of the districts and urban areas.
We had prepared coded questionnaires separately for the households and the schools
to be investigated. It was necessary to have sufficiently educated investigators to
understand the process of codification to conduct the survey meaningfully.We had also
to ensure that the surveyors/investigators did not have any motivation to hide the "truth".
The investigators chosen had to fulfill two important requirements – all of them had to
be sufficiently qualified to handle the complexity of the survey, and they were not
predisposed to create serious investigators' bias.
1.23 The primary education system at the all India level, and in most of the provinces of the
country, cover five classes - class I to class V. Thus a child is expected to join formal
education at the age five in class I and complete the primary education in five years
time, i.e., by the time the child completes nine years of age, she/he should be able to
join the post primary level. Thus the target population age group for the primary level in
West Bengal is five years and above but less than ten years. However, most of the
primary schools in West Bengal have only four classes - Class I to Class IV. According
to provisional DISE Data (2010-11), there are 51016 schools offering Primary Education
and 10574 schools offer Upper Primary Education in West Bengal. Total 8901 and 8822
schools offer Secondary and Higher Secondary Education in West Bengal respectively.
Thus, most of the children who desire to continue to study beyond class IV have to
change schools. This aspect of school education in West Bengal affects all the
variables related to enrolment and dropout of the primary school goers.
1.24 A major vexing phenomenon observed mainly in the low literacy regions, in the country
and elsewhere, is the high rate of dropouts at a very early stage of education. In fact,
the primary education policies in different parts of the world are aimed at reducing this
high dropout rate by creating incentives for the students and the parents to keep the
children in the school till they complete the desired level of education. The present study

10
particularly looks at dropouts at certain threshold points (e.g., class II, class V, and class
IX)
11
Chapter 2
Review of Literature: Contextualising the Issues
In the recent past, school education has been at the centre of public policy discourse in the
country. Given the immense public policy significance of education in the context of
developing economies like ours, it has engaged the sustained attention of planners, policy
makers, social science researchers, management consultants and independent
professionals. Expectedly, there is an abundance of literature which deals with different
facets of the school education system in the country. On one hand, this literature brings out
the lacunae and bottlenecks in the system; on the other, it also brings out the
accomplishments and opportunities. This literature review draws upon such previously
published reports undertaken by academic institutions and non-governmental organisations
concerning the educational landscape in West Bengal as well as other parts of the country.
Besides, it makes use of literature available in scholarly journals which mainly comprise
academic research conducted by independent researchers. At places, references are made
to empirical material dealing with countries of the developing and the developed world to the
extent that they form the basis of inferences and insights drawn by various scholars
depending on the particular aspects of the problem they were investigating.
The purpose of this literature review is to contextualise the challenges faced by the
school education system in West Bengal. It promises to offer us a comprehensive framework
for analysing the primary data collected through school and household surveys. It has the
added advantage of providing us with a comparative frame of reference against which an
assessment of the school education system in West Bengal can be fruitfully made. It does
not merely contrast the performance of the state on different parameters against the national
average but also brings in insights culled out from the experiences of other states. In this
sense, the literature review presents a set of issues which need to be addressed in order to
restructure the present system to ensure universal reach of quality education in the state. In
the interim report, these issues have just been flagged and they will be elaborated upon in
the final report. The review of literature is thematic in organisation and adheres to the terms
of references of the research project as agreed upon between the Indian Institute of
Management Calcutta and the Government of west Bengal. We wish to further explore the
issues within the current context of West Bengal, and relate them to our primary findings in
the final report.
12
2.1 Universalization of primary education
2.1.1 Effective integration of formal and non-formal education
The non-formal set up for education focuses on the education of school dropouts, working
children, girl children and all those of school-going age who fail to attend formal schools
owing to a variety of circumstances. It also includes in its scope the non-literate adults. Its
mandate is to cater to those children who could not get access to schools in and around their
locality whatever be the reason for their not being part of the formal set-up. In fact, the
quality of non-formal system of education and its compatibility with the formal system feature
in the National Policy on Education, 1986 (henceforth NPE) which recommends inclusion of
different ‗modern technological‘ (NPE, 1998:14) means to achieve an improved educational
environment at the Non Formal Educational (NFE) Centres. It suggests hiring of well-trained
young people of the adjacent locality as instructors for effective and quality instruction in
such centres. Besides, the NPE (1986) suggests a host of measures to enhance the quality
of the NFE so that it can be comparable with the formal one and also to facilitate seamless
movement between the two systems. Measures to improve the quality of the NFE include
the framing of a planned curriculum, synergy of the national core curriculum with the
learners‘ need and the local environment, provision of free of cost and high quality learning
equipment, creation of ‗participatory learning environment, and activities‘ (NPE, 1998:15)
such as excursions, games, cultural programs, etc. The same policy provides the opportunity
of lateral entry into the formal schooling system for the children with NFE.
As per official records, 30% children dropout at an early stage without completing the
first five years of schooling and 50% children drop out during the period of eight years of
compulsory schooling.1 The integrated ‗micro-planning‘ and ‗grass roots level‘ (NPE,
1998:15) networks between the formal and non-formal schooling are necessary to solve the
problems of dropouts. That type of integration with the NFE also helps to achieve free,
compulsory and quality education for all the children below 14 years. According to the NPE
(1986), the government is responsible for the NFE through different means like the
1Reddy, A.N., Sinha, S.,School Dropouts or Pushouts? Overcoming Barriers for the Right to
Education. National University of Educational Planning and Administration.(NUEPE). New Delhi. Create Pathways to Access, Research Monograph No. 40.Research commissioned by the Consortium for Research on Educational Access, Transition and Equity (CREATE). University of Sussex. UK. July. 2008.

13
Panchayati Raj Institutions (PRIs) and it also encourages different volunteer organizations to
work on that issue.2 In this regard, different government initiatives like the State Resource
Centre for Adult Education take over the responsibility of the training of the District Resource
Persons (DRP) and the Master Trainers (MT) to accelerate and improve the adult education
program under the NFE. 3
2.1.2 Adult education
According to the 2001 Population Census the literacy rate of India is 65.38%. To achieve
the goal of Education for All (EFA), the situation needs a two faceted action, i.e.
encompassing adult literacy and to promote primary education for all children of a specific
age group. The National Literacy Mission promises the education of adults especially for
those of 15-35 years of age through the ‗total literacy campaign‘ (NPE, 1998:11). That type
of adult education through the non-formal set up needs a growing awareness of the target
population about their present socio-economic condition and their firm belief and confidence
in the probable ways that can put an end to the disadvantageous condition of the non-
literate. Adult education programs should also include the vocational training, practical skills,
competencies and knowledge along with promotion of literacy. To organize a successful
NFE program and adult education, it needs wholehearted support from different parts of
society, like different educational institutions, mass media, teachers, youth, students,
voluntary agencies, etc. The adult education program also includes further educational
facilities for the neo-literate and primarily educated adults. That may help them to access an
upgraded lifestyle and comfortable work atmosphere. Some possible and popular ways of
adult education may include different measures; such as: a) the learner‘s opportunity to
choose her/his educational parameters, b) establishing educational centres, c) providing
books and other study materials, d) option for workers‘ education with the help of the
particular authority and the government, e) use of mass media and culture for education, f)
forming learners‘ community or group, g) enabling distance learning programs, etc.
2.2 Language and pedagogy
2National Policy on Education 1986 (as modified in 1992) with National Policy on Education, 1968.
Government of India, Department of Education, Ministry of Human Resource Development, New Delhi. 1998. 3 Chattopadhyay, R., Chaudhury, S., Ghosh, S.K, et.al. The Status of Primary Education in West
Bengal.IIM Calcutta. 1998.

14
2.2.1 Language and communications problem
In West Bengal, the most common languages are Bengali, Hindi, Santhali, Urdu and Nepali.
Approximately 98% (or more) of the population of the West Bengal is covered under one or
more of these five languages.4 It goes without saying that primary level education and proper
learning needs frequent interaction between teachers and students that goes beyond the
standard use of the formal language of instruction in a classroom setting. It is a well-known
fact that along with teacher- student interaction, the delivery system and different social
factors also positively influence the enrolment rate, literacy rate and drop-out rate of the
pupils. To be sure, the ease of communication between the teacher and the taught creates a
conducive learning ambience in a school. As discussed in the Pratichi Report, 2009, in
general, those teachers, who travel to the school from a distance, somehow fail to establish
an interactive bond or link with the ‗local community‘.5 The lack of organic communication is,
however, not simply a matter of lack of physical proximity or geographical distance. It is a
function of class that gets translated into the visible gap in terms of language barriers
between the teachers and the students. Teachers‘ class backgrounds predispose them
towards teaching in the mainstream and standard Bengali language which would generally
be devoid of colloquial expressions and local/regional linguistic variations. This becomes
acute in the case of tribal children and children coming from disadvantaged social
backgrounds without much exposure to the formal system of schooling. According to the
Pratichi Report (henceforth PR) (2002), teachers do not often understand the language
spoken by the tribal or the so-called ‗low-caste‘ (SC) students (Mohan, 2005:5). Such
differences in the use of language adversely affect the learning process. The students from
these categories (for example the ‗Adivasis‘) usually face an uncomfortable situation in the
classroom6 which lowers their participation level in the learning processes.
Historically, tribal groups have suffered on account of their geographical and cultural
isolation. The cumulative disadvantages that they had to suffer make it incumbent on us to
include them in our idea and practice of inclusive education. This realisation calls for an
added sensitivity to their languages keeping in mind their specific socio-cultural
backgrounds. So, it is necessary to develop the initial study materials and curricula in the
tribal languages. This should be done in such a way that the students can gradually shift to
4 Chattopadhyay, R., Chaudhury,S., Ghosh, S.K, et.al. The Status of Primary Education in West
Bengal.IIM Calcutta. 1998. 5Rana,K., Sen, S. Sarkar, M, et al.The Pratichi Education Report II—Primary Education In West
Bengal: Changes and Challenges. Pratichi (India) Trust. Delhi. Dec. 2009.p.61. 6Jha, J. Primary Schools in West Bengal.Economic and Political Weekly. July.2003.

15
the regional languages.7 For instance, in West Bengal, a large number of people belong to
the scheduled tribes like Santals. It would be erroneous to assume that Santal children will
have same felicity in Bengali as those of Hindu upper castes. Educators at the primary level
have to be conscious of the difficulty these children routinely face in understanding the
Bengali language in government primary schools. The increasing use of the Santali
language as the medium of instruction in the Santal-dominated schools of West Bengal
could be a step in the right direction. Unfortunately though, even the available textbooks in
the Santali language are not used in many schools.8
The NCERT suggests a ‗three language formula‘ (NCERT, 2007: ix) for developing
the language skills of the students. Obviously this emphasises on the mother tongue of the
students as the easiest teaching and educational medium. This attempts to solvethe problem
of a language barrier faced mostly by tribal students. The three language formula suggests
that with the help of the characteristic resources of such a multilingual country like India, a
skilful multilingual efficiency can be built up among the children. It may also help to develop
accomplishment of English language skills through proper curriculum development.9
2.2.2 Teachers’ perception
Consequently the language problem has a direct and negative impact on the perception of
teachers. Jha (2003) mentions, on the basis of the report ―The Delivery of Primary
Education: A Study in West Bengal‖ (The Pratichi Education Report, 2002), most teachers
belonging to the general caste, had a ‗poor opinion‘ about the education of SC, ST and
Muslim students. The teachers usually fail to recognize the language difficulties of these
children. The same PR report cites that a teacher in Birbhum opines that the Santali children
cannot just understand the instructions and study books though the teachers interact with
them on a regular basis. Among teachers belonging to the high and intermediate caste
groups 75% perceive that the SC and ST students lack the intelligence and motivation to
study (PR, 2002:32). Some teachers however hold a different opinion. They feel that Santali
speaking students need Santali knowing teachers. Jha (2003) reports that a few exceptional
teachers are also trying to overcome these language barriers.
7 National Policy on Education 1986(as modified in 1992).Government of India, Department of
Education, Ministry of Human Resource Development, New Delhi. 1998. 8Mohan, D. Education as Regulated Means of Representation: Methodological Failures in the First
Pratichi Report, 2002.Conference on Religious and Social Fragmentation and Economic Development in South Asia, A D White House, Cornell University.Oct. 2005.pp.5, 6, 15. 9National Council of Educational Research and Training, National Curriculum Framework 2005, 2007
(Kolkata), vii-ix, xi.

16
2.2.3 Possible ways to overcome the language problem
To overcome these barriers of communication the resolution of an ―equity policy‖ is
important. According to Sapon-Shevin (1999), the division K of the American Educational
Research Association approved the ―equity policy‖ in 1998, which states that the ‗teacher
education programs‘ should be communicated to all the students for their improvement.10 It
has been observed that qualified teachers can improve quality of students. Besides,
teachers‘ characteristics also directly influence the teaching method and the instructional
process. 11 But in many cases teacher characteristics bear no relationship with the quality of
teachers. In that case, reward on the basis of teachers‘ characteristics may be much more
effective rather than the reward on teacher‘s quality. According to Victor Lavy (2002),
performance based payments and incentives for teachers positively affect the learning
process in Israel.12 Hanushek (2006) opines that the idea of performance based payments
and incentives for teachers can be fruitfully extended to other countries as well. Stotsky
(2006:257) suggests that with ‗generic professional knowledge‘, teachers should also
acquire ‗license-specific pedagogical knowledge‘ for improving their quality.
The quality of the delivery system and the teaching-learning process are both
important for universalization of primary education (UPE). At the primary level, as per the IIM
Calcutta Report on Primary Education (1998), children of the age group of 5-6 to 8-10 years
are unable to feel the urgency and necessity of the education. They just enter the system of
primary education without much consideration on the part of the parents and the adult
members of the family. Expectedly, children‘s education comes to depend on the efficiency
and quality of schools as institutions as the other institution – family – takes a back seat in
the case of the poor and the marginalised. Reasons are not far if sought. In India, a large
proportion of the adult population is non-literate and do not have the competence to calibrate
the educational needs of their children with the quality of the available schools even if they
have the material resources to facilitate their children‘s education. In such a critical situation,
students have to totally depend on the teachers for the requisite motivation to learn, to
attend classes regularly and to be part of the school in an organic manner. For first
generation learners, the teachers‘ role is crucial so the availability of locally recruited
teachers is seen as an advantage. The decentralized recruitment procedure of the SSKs
which makes it mandatory to recruit a SSK teacher (sahayika) from that concerned or
10
Stotsky, S. Who Should Be Accountable For What Beginning Teachers Need To Know?. Journal of Teacher Education. Vol.57,No.3. American Association of Colleges for Teacher Education (AACTE). 2006. 11
Hanushek,E. Rivkin,S.G, Handbook of the Economics of Education, Vol2; Elsevier B.V. 2006. 12
Rockoff, J.E. The Impact of Individual Teachers on Student Achievement: Evidence from Panel Data. American Economic Review.Vol 94.No.2. American Economic Association. May.2004.
17
adjacent area is inspired bythisidea. The expectation is that the local teachers would be well-
equipped to interact with the students in a socially compatible fashion such as the use of the
local dialect, the familiarity with the socio-economic backgrounds of the children‘s families
and other relevant social coordinates. Even as the PR (2002) suggests that the language
problem requires sincere and urgent attention it needs to be underlined that language is an
important ingredient of the much aspired cultural capital that the first-generation learners
sorely lack.
2.3 Primary Education and its Accessibility
2.3.1 Problem of school distance and accessibility
Achieving the goal of Universalization of Primary Education (UPE) needs a large number of
schools and SSKs within an accessible distance. As per the IIM Calcutta Report on Primary
Education (1998), requirement of primary schools in West Bengal was about 7,240 in
number. In order to meet the need of additional schools, the State needs to make best use
of the available resources for developing infrastructure and school buildings for the UPE.13
The SSA Act suggests that schools may be made accessible by providing one primary
school within a kilometre of child’s habitation. After completion of five years of primary
education, a student of nine-ten years of age is required to shift to an upper primary or
secondary school. As per the SSA Act, there needs to be one upper primary school within
three kilometres of the student’s habitation. On the other hand, the RMSA Act suggests that
a secondary school should be within five kilometres of the habitation and in the case of
ahigher secondary school, it should be within seven to ten kilometres from the habitation.
The number of upper primary, secondary and higher-secondary schools needs to be
proportionate in a way that the lower level feeds into the higher level without compromising
the number of government funded schools at all the levels. In no case the lack of
accessibility for higher level schools should turn out to be a factor behind the dropout of
children at the transitional stage between two levels. Without meeting this fundamental
requirement in terms of the number of schools, the vision of the RTE will remain a distant
dream. Also a suitable school building is of utmost importance for effective and quality
13
Chattopadhyay, R., Chaudhury, S., Ghosh, S.K,et.al.The Status of Primary Education in West Bengal. IIM Calcutta. 1998.

18
education. Good physical infrastructure facilities provide a comfortable learning environment,
accelerate the learning process14 and increase the students‘ interest15.
It is widely observed that the quality of education and attendance rate of students is
closely dependentupon the school infrastructure, like the seating arrangement, toilets, and
playground facilities.16 According to Jalan (2010), three-fourth of the primary schools i.e.
approximately 240 schools in West Bengal have a permanent infrastructure, while one-fourth
of the schools possess only semi-permanent structure.
2.4 Pre-school education and formal schooling
2.4.1 Background
The UN Convention on the Rights of the Child (United Nations, 1989) internationally as well
as officially first emphasized the need to recognize children‘s rights (Rao, 2005). Later with
many other UN declarations17, the UN General Assembly (2002) also focused on the ―Care
for Every Child‖ and promised to achieve a ―World Fit for Children‖. In India, the fundamental
rights of young children are practically served by the Integrated Child Development Services
(ICDS) program. The ICDS program promotes the survival, development and early
education of young children (Rao, 2005).
2.4.2 The existing system and problems of pre-school education
―Pre-school education‖ actually designates an educational engagement, for a ‗part-day‘ in
different centres, specifically for the children above three to four years.18 According to GOI
(2001), there were 157.86 million children who are up to the age of six years. As per the
2001 Census, 14% of the total population of West Bengal was under six years of age, while
this percentage was 16% for the country as a whole. The Ministry of Human Resource
Development in collaboration with the Department of Women and Child Development
14
Pritchett, L., Pande, V. Making Primary Education Work for India‘s Rural Poor: A Proposal for Effective Decentralization. Social Development Papers, South Asia Series. Paper No. 95. June. 2006. 15
Iyengar, R. Why Do Children Go To School?.Economic and Political Weekly. June 26. 2004. 16
Jalan, J., Panda, J. Low Mean & High Variance: Quality of Primary Education in Rural West Bengal.
Centre for Studies in Social Sciences, Calcutta. 2010. 17
Rao, N. Children‘s Rights To Survival, Development, And Early Education In India: The Critical Role Of The Integrated Child Development Services Program.International Journal of Early Childhood. Vol.37, No.3. 2005. 18
Boocock, S,S. Early Childhood Programs in Other Nations: Goals and Outcomes. The Future of Children Long-Term Outcomes Early Childhood Programs. Vol.5, No.3. Winter. 1995.

19
facilitates different ‗government and government-aided programs‘ on the education and care
of the young children (Rao, 2005:16). Early childhood care and education (ECCE) are
important for children of three to six years of age, especially for the purpose of preparing
them towards their subsequent participation in the schooling system. The Government of
India promoted the ICDS schemes in 33 blocks in 1974 to fulfil the aims of ECCE. Now ICDS
centres cover 5600 blocks in the country.19 In 1995, only 12% of the children in India
received the facility of an early childhood care and pre-school education program (Boocock,
1995). According to Swaminathan (1993, 1998), in India the Early Childhood services form a
―dual track‖ (Rao, 2005:16). In the first track, the government funded programs promotes
services especially for the socio-economically disadvantaged children. The second track
refers to the services offered by the private sectors. Mostly children from the upper and
middle class backgrounds avail of the latter.
The Pratichi Report (henceforth PR) (2009:61) brings out that mothers from poor socio-
economic backgrounds generally express their eagerness and interest for pre-school
education, apart from the SNP (Supplementary Nutrition Program) in the ICDS. The PSE
(Pre School Education) gets the highest priority from 64.6% of the people, while for the SNP
it is only 14.3%. In West Bengal preschool children usually learn rhymes, short stories, the
Bengali alphabet, counting, etc. Some of the guardians contend that in some cases the PSE
level at ICDS centres is higher than that of the other private kindergarten schools. Yet, tribal
children face a language difficulty during the PSE program. This type of communication gap
in the tribal dominated centres not only leads to poor implementation of the PSE program,
but also discourages children from attending such centres. However, policy discussions do
not recognize these problems seriously. Also, the quality of the PSE program depends on
the efforts of the AWW (Anganwadi Worker), supervisor and CDPO (Child Development
Project Officer). Sixty four percent of the mothers opined that the irregularity, half-
heartedness and lack of ‗seriousness and dedication‘ of the AWW affected the PSE program
(PR, 2009:62). According to CDPOs and AWWs, the lack of infrastructure, economic
resource and ‗weak commitment‘ did not allow them to deliver a quality PSE program (PR,
2009:63).20 Rao (2004) pointed out that the dull curriculum, ‗poor learning environment‘ and
ineffective teaching discouraged the children; as a result children want to get rid of the
centres (Rao, 2005:28). Many researchers like Kaul (2002), Nair & Radhakrishnan (2004),
19
Manual for Planning and Appraisal. Sarva Shiksha Abhiyan, A Programme for Universal Elementary Education. Ministry of Human Resource Development. Department of Elementary Education & Literacy. April. 2004. 20
Rana,K. Sen, S. Kundu, M,et al.The Pratichi Child Report: A Study on The Delivery of ICDS in West Bengal with a foreword by Amartya Sen. Pratichi (India) Trust. Delhi. Feb. 2009.pp.10,61,62, 63.

20
Rao (2004) and Sharma (1998) reported that the ICDS failed to provide a high–quality pre-
school education, and maintained that it could be improved greatly (Rao, 2005).
2.4.3 Improving the pre-school education
Ideas for improving the PSE may be obtained from successful programs running in different
parts of the country. Since 1987, a successful pre-school education program is being
conducted in the state of Uttrakhand by a NGO, namely, Uttrakhand Environmental
Education Centre. Some of the reasons for the success of that program are as follows:
decentralized participation of the local women as well as the community (National Policy on
Education, 1998) in the program planning and implementation process; recruitment of local
women as teachers, professional quality development training for the teachers, need
identification and its fulfilment, etc. Recruitment of teachers from the concerned locality helps
to develop a positive interaction between the teachers and the young children and to
overcome the language barrier.21
For quality improvement, some researchers suggest the need to form small classes.
According to Krueger (1999), the kindergarten students coming from small class sizes had
better learning outcomes. The same study also revealed that teacher characteristics affected
a little on the learning outcome at the kindergarten level.22 As per the U.S. standards also, a
small group size and a low child to staff ratio are the two most important quality determining
parameters. For a better delivery of pre-school education some nations follow the child-
centered or ―developmentally appropriate‖ model (Boocock, 1995:110). New Zealand and
some industrialized Asian nations do not accept the concept of free-play to achieve a quality
PSE. Similarly in India, the National Policy on Children (1998) suggests the child oriented
ECCE programs. Avoiding the formal methods, the policy focuses on the child‘s individuality
and being engaged in play and games. In the national policy, the ECCE, first and foremost,
tries to involve and develop those children who are first generation learners. Consequently,
the pre-school education accelerates and strengthens the impetus for primary education.23
Boocock (1995) cites a 1983 study in Singapore which asserts that the children, who attend
pre-school education, perform better and easily handle the academic tasks in their future
21
Sood, N. Early Childhood Care and Education, Reflections on an Innovative Programme.Journal of Indian Education.Vol. 32, No.1.NCERT. Feb. 2007. 22
Krueger, A,B. Experimental Estimates of Education Production Functions. The Quarterly Journal of Economics. Vol.114, No.2. JSTOR. MAY.1999.pp.497-532. 23
National Policy on Education 1986(as modified in 1992) with National Policy on Education, 1968.Government of India, Department of Education, Ministry of Human Resource Development, New Delhi. 1998.

21
formal schools. A study done in the context of Hong Kong corroborates the fact that pre-
school education is a necessary first step towards the formal school, the latter being the
most common way for the socio-economic mobility. In the Indian context, the Pratichi Report
(2009:10) suggests the need for an organizational change for the purpose of making ICDS
an effective programme. Such an organizational change has, of necessity, to seek the
‗locally informed‘ arrangements rather than blindly following the ‗globally theorized‘ ones.
2.5 Primary Education and its economic dimensions
2.5.1 Free and universal primary education
Bringing primary education within the reach of the common man is the avowed goal of the
Right to Education Act. Yet, people from all classes and socio-economic backgrounds spend
a ‗considerable amount‘ of money for the education of their children. According to Tilak
(2002), the ―free‖ education is a misnomer in the Indian context given the economic barriers
to its accessibility. A host of factors such as household income, household expenditure, and
educational qualifications of the head of the household, demographic burden, caste and
religion impinge on the educational expenditure. Likewise, availability of a school in the
neighbourhood, distance of the school from home and various incentives (namely mid-day
meal, distribution of text-books, school uniforms) directly influence the quantum of
educational expenses.24
More importantly, the widely prevalent practice of private tuition has added to the
quantum of educational expenditure. SCERT (2009) refers to Pratham and states that in
West Bengal a large portion of the students under the age group of six to fourteen years are
quite habituated with private tuition. The same report of SCERT also reveals that the rate of
private tuition simultaneously increases with students‘ upgradation from primary to the
secondary level. Students‘ and parents‘ responses indicate several causal orientations for an
increased interest to private tuition. These are: A) most of the students do not get any sort of
educational guidance from family. So private tutors help and guide the students in their
study. B) Private classes help the students with their assigned home tasks of schools. C)
Students can easily communicate with private tutors. They can ask frequent questions to
solve their difficulties and queries. D) Students opine that the guiding procedure of tutorial
classes helps them to acquire high marks in the examinations. Students also claim that a
suggestive set of probable questions for examinations also helps the students to prepare
24
Tilak B.G. Jandhyala; Determinants of Household Expenditure on Education in Rural India. Series.No.88. NCAER, New Delhi. Aug. 2002.

22
forthe examinations.25 In the Pratichi (India) Report, 2002, Amartya Sen writes that the ―evil
of private tuition‖ perpetuates the ‗class divisions‘ in an uninterrupted way. It also violates the
commitment of the Indian Constitution for ―free education‖.26
2.5.2 The effects of existing class and economic barriers
Arguably, the visible and not-so-visible constraints on the availability of ―free education‖
‗disproportionately‘ affect the students from lower socio-economic backgrounds and
disadvantaged classes such as daily wage-earners, SC, ST, low castes and Muslim
students. Exceptions apart, in general, scheduled caste and scheduled tribe students suffer
more than the students belonging to the Hindu general category. As per the NSS data (Gol,
2006b), in the rural areas, 36.5% of the SC population and 45.9% of the ST populations are
below the poverty line. In urban areas, these percentages are 38.5% and 34.8 %
respectively. In particular, the proportion of the Muslims in West Bengal is comparatively
larger than in the other states of India, e.g. Uttar Pradesh, and Andhra Pradesh. Also,
Muslims in West Bengal suffer from severe economic handicaps. Their insolvent family
backgrounds and poverty accelerates the low participation level at school and leads to their
higher dropout rate.27
According to the Pratichi Report (December 2009), there are also minute differences
across socio-economic categories in terms of ability and efficiency among the students of
class III and IV. The figures show that 13% of the SC students, 29% of the ST students and
25% of the Muslim students of these classes are unable to read. On the other hand, 13% of
the SC students, 43% of the ST students and 27% of the Muslim students do not have the
requisite writing skills, only 8% students of the ‗other‘/ ‗general‘ community are lacking in
reading and writing skills.28
25
State Council Of Educational Research And Training (W.B),Department of School Education, Govt. of West Bengal, Implications of Private Tuition in West Bengal, 2009 (Kolkata), 1,95, 170-171. 26
Mohan, D. Education as Regulated Means of Representation: Methodological Failures in the First Pratichi Report, 2002. Conference on Religious and Social Fragmentation and Economic Development in South Asia, A D White House, Cornell University. Oct. 2005.p.1. 27
Govinda.R, Bandyopadhyay .M. Access to elementary education in India: Country Analytical Review, National University of Educational Planning and Administration. (NUEPE). New Delhi. Research commissioned by the Consortium for Research on Educational Access, Transition and Equity (CREATE). University of Sussex. UK. July. 2008. 28
Rana,K. Sen, S. Sarkar, M, et al.The Pratichi Education Report II—Primary Education In West Bengal: Changes and Challenges.Pratichi (India) Trust. Delhi. Dec. 2009.pp 12-25.
23
2.5.3 The ideal of equality
The present situation, regarding the class and economic barriers, is not incidental. Rather it
bears the burden of a long consequential historical background. In the Indian case, class
divisions have been actually intermeshed with ―caste-based categorization‖ (Pratichi Report,
2009:12).
To overcome these disadvantageous conditions, students from these backgrounds
need special care and attention. Well-calibrated learning procedures and the requisite
sensitivity on the part of the teachers can largely mitigate the adverse impact of class
distinction and disadvantageous conditions on the learning of the children. To provide equal
opportunities for learning despite class differences remains the foremost challenge of the
day. The role of home, social relations between the teacher and the students, the teachers‘
perception of the taught, the degree of priority, attention, delivery, accountability of the
teachers, work environment, accessibility of the school are important parameters of the
schooling process.29
2.5.4 Resources for primary education
From the coefficient of elasticity, it is clear that the government expenditures on education
and the household expenditures on the same are complementary. Logically, it is important
for the government to assign more funds for the education so that it gives fillip to the
‗mobilization‘ of household educational expenses. To fulfil the goal of universal elementary
education (UEE), as well as to eradicate the socio-economic barriers to school education, it
is necessary to augment the investment of public resources in education and strengthen the
nature of public spending. An efficient and optimal public spending for education is non-
negotiable.
The 11th Five–Year plan had proposed that the funding pattern of the Sarva Siksha
Abhiyan (SSA) – a government program for the universalization of elementary education
(UEE) - may be revised in a 50:50 funding proportion between the centre and the states.
Some states like Rajasthan and Bihar have already opposed the proposal on the ground of
increased funding burden on the states due to the ‗shortfall of funds‘. Previously, the ratio
was 75:25. According to the mid-term appraisal of the 10th five year plan such a ratio was
29
Mehrotra,S. Reforming elementary education in India: A menu of options. International Journal of Educational Development. Vol. 26. Elsevier, 2006.
24
meant to accelerate and fulfil the objectives of SSA by 2010.30 The tussle between the
Centre and the states over the ratio of funding, and the enormity of resources required for
the UEE, necessitates the continual public funding of primary education for a preeminent
public good.
2.6 Primary education and community participation
2.6.1 The role of elected representatives.
An amendment to the Indian Constitution enhances the ―strategy of so-called
decentralization of educational management through the panchayati raj‖.31 Certain problems
of elementary education could indeed be attributed to the Panchayati Raj Institutions (ibid).
Ghosh (2002) argues however, that PRIs have done a commendable job. They also serve
as a tool for linking different grassroot level institutions to achieve the goal of education for
all (EFA).32
Elected representatives of the panchayats help in carrying out programs for the identification
of non-enrolled children and drop outs to accelerate the EFA program. This type of self
initiated programs, of identifying the non-enrolled children and drop-outs, depict that these
members can play a significant role in the functioning of schools. The Gram Sansads are
responsible for ratification of the newly reformed school managing committees. In the
present context, the universalization of elementary education (UEE) needs a prominent
support from the Village Education Committee (VEC). Its active involvement in the
awareness campaigns, for the ensured enrolment and retention of the children, and in other
components of the UEE program is essential. However, the main problem remains that
interference of elected representatives results in a political polarization among the teachers.
In the worst case, it politicizes the school atmosphere and politically victimizes the teachers.
The presence of such an unhealthy political climate lowers the attendance rate of students
30
Elementary Education: A Sorry State. Economic and Political Weekly. July 14, 2007. 31
Acharya. Education: Panchayats and Decentralisation, Myths and Realities‘ Economic and Political Weekly, Feb 23, 2003:788. 32
Ghosh, B. Panchayats and Elementary Education. Economic and Political Weekly. May 11. 2002.

25
by three to four percent.33 Excessive interference of the elected representatives can also
destroy the comfortable and decentralized working atmosphere. In many cases, the
concerned panchayat members are accused of producing false enrolment records. This
false and increased enrolment status helps the members to get a spare number of allotted
books, teachers and an unnecessary amount of ration. These supplementary funds and
materials are sometimes marketed without a legal procedure. Involvement of the
panchayats and the department of rural development in the functioning of primary schools
sometimes give rise to a dilemma in decision making. Concerned decision making
committees are usually bound to please every stakeholder of the school management body,
which results in a lack of efficiency and problems with implementation.
2.6.2 Creating appropriate academic atmosphere in the schools
The school functioning system needs to organize a suitable working boundary to protect the
schools from various political problems and to achieve an appropriate academic atmosphere
with a proper decentralized management.34Rana (2003) also suggests that SSK and primary
school governing bodies need a work environment free from the political and bureaucratic
setup. It may be possible to form such an environment through the positive support and
involvement of the local communities.35
2.7 Education for children with differential abilities or special needs
2.7.1 The existing system and problems of education
The objectives of SSA include equal opportunity and quality education for children with
special needs (CWSN). Previous experience from the District Primary Education Program
(DPEP) shows that it is possible to provide quality education for CWSN in formal schools
33
Jalan, J., Panda, J. Low Mean & High Variance: Quality of Primary Education in Rural West Bengal.
Centre for Studies in Social Sciences, Calcutta. 2010. 34
Chattopadhyay, R., Chaudhury, S., Ghosh, S.K, et.al.The Role of the Panchayats in Primary Education in West Bengal. Extension of the previous study: The Status of Primary Education in West Bengal.IIM Calcutta. 1998. 35
Rana, K., Das, S, et.al.State of Primary Education in West Bengal. Economic and Political Weekly. May 31, 2003.

26
along with regular students.36 Special children need to develop confidence and courage for
their normal growth. The National Policy on Education (henceforth NPE) (1998) suggests
that these qualities for normal growth can be best developed as an integral part of the
existing system of education with normal children. The ‗children with motor handicaps‘ and
others with a low level of differential ability should have the opportunity to acquire education
with other normal pupils (NPE, 1998:11).37 Lacks of awareness regarding the capability of
these pupils, deeply entrenched social attitudes, teachers‘ perceptions and their way of
interaction and the sympathetic pathos towards these children make them socially excluded
and marginalized. The SSA manual for planning and appraisal (2004) stresses the
importance of CWSN inclusion under the regular educational system. To fulfil this objective,
the SSA promises to follow the zero rejection policy which ensures the right to education to
every CWSN. The SSA also agrees with the Persons With Disabilities Act 1995 (Equal
opportunities, Protection of Rights & Full Participation Act 1995) and advocates the option of
most comfortable educational environment for the CWSN as per their need, for example,
home-based education, special schools and provision of effective inputs through the EGS &
AIE (Education Guarantee Scheme and Alternative & Innovative Education). In case of
children with severe difficulties, the SSA has provision for special schools and hostel
facilities at district headquarters.
The NPE (1998) also provides the opportunity for vocational training for those with
differential abilities. In this regard, it positively encourages any kind of voluntary work for
their integration in the regular educational system and the provision of vocational training for
children with special needs.
2.7.2 Possible ways of reaching out
Teachers dealing with special children at the primary level need special training. Specialised
training of such teachers may have a positive impact on the teacher-student interaction.
Moreover, special study materials and resources, consciousness of the concerned
community, early childhood care and education (ECCE), are bound to facilitate the learning
abilities of these children.
36
Manual for Planning and Appraisal. Sarva Shiksha Abhiyan, A Programme for Universal Elementary Education. Ministry of Human Resource Development. Department of Elementary Education & Literacy. April. 2004. 37
National Policy on Education 1986(as modified in 1992) with National Policy on Education, 1968.Government of India, Department of Education, Ministry of Human Resource Development, New Delhi. 1998.
27
For improved learning outcome of these children, the SSA offers Rs.1200/- per
annum for every special child. That amount may be spent on their particular personal
educational requirements; special and alternative study materials, or on RCI (Rehabilitation
Council of India) approved long term teachers‘ training programmes, organizational planning
and arrangements at the district level, awareness campaigns, workshops, and development
of special devices for training, etc. Lastly, the SSA manual (2004) suggests that district level
planning may emphasize on the need identification, resource allocation and inclusive quality
education of the CWSN as the most important issues rather than the admission of the
differentially-abled children to the special schools.
Comparison with other States:
For all issues mentioned in the ToR, the IIM Calcutta team is also studying best practices
from other parts of the country which have fared well to achieve inclusive education. The
team is studying, for instance, Kerala, a state that shows effective decentralization of
education through the 73rd amendment. Madhya Pradesh and Tami Nadu, both have done
well in MIS and process changes. In this box, we focus mostly on the secondary data from
Kerala. In the final report, we wish to focus on these three states to, which will also include
first-hand experience of the study team from the state visits.
A dominant political participation is prominent in Kerala. With the presence of such a political
scenario, however, Kerala shows a gap between the rhetoric and practical procedure of
educational decentralization. Local Self-Government Institutions ( LSGIs) were formed and
strengthened as per the necessity of the state to empower the local bodies. In 1996 the state
implemented the People‘s Campaign for Decentralised Planning (PCDP).Mukundan
Mullikottu-Veettil and Bray Mark, Decentralisation and Privatisation in Education,ed. Zajda
Joseph ( Netherlands: Springerlink, 2006), 111-113. This reform program and functioning of
the PCDP is a prominent example of the difference between the planning procedure and the
actual functionary in reality. In this context of decentralization of education the Kunnur district
shows the typical features of the state as a whole.
Kerala State Literacy Mission (KSLM) provides non-formal and ‗life oriented education‘ for
the neo-literates. These help the adults to learn and to join in the continuing education
program. The Calicut University and National Service Scheme actively participate in these
programs for non-formal and adult education
<http://www.prd.kerala.gov.in/literacymission.htm>.

28
The major social groups in Kerala show some inter-relationship between the land-holding
opportunities, class and economic conditions and educational opportunities.
The state provides pre-school education to children through the ICDS program since 2
October 1975. Pre-school education mainly aims at the mental and physical capability
development. The method used for this purpose is the Thematic approach. Conversation,
stories and songs are adopted as a more useful procedure to teach the children rather than
the traditional reading, writing and arithmetic pedagogy at the pre-school level. At present
there are 163 ICDS centers in Kerala
<http://www.old.kerala.gov.in/dept_socialwelfare/Children.htm>.
There are specific schemes for education and care of differentially able children, such as
Welfare Programmes for Differently Abled, Institutions for the disabled, Home for mentally
deficient children, Care Home for differentially abled children, Pratheeksha Bhavan,
Vocational Training Centres, Scholarships for differentially abled students, Scholarships for
the mentally challenged,
etc.<http://www.kerala.gov.in/index.php?option=com_content&view=article&catid=103:social
-welfare-department&id=>.
The community participation and monitoring mechanism in the educational system here has
been activated through the ―People‘s Campaign for Decentralized Planning‖ (PCDP) since
1996 to establish the ―Empowered Deliberative Democracy‖ (EDD). (Ref. Mukundan, M. V.
in Democratic Decentralization and Primary Education: A Comparison of Continuity and
Change in Two Districts of Kerala).
Like many other states, accountability of the teachers depend on the teachers‘ education,
teachers‘ training system and opportunities of the Probation of Teachers in schools and the
inspection system. In case of the probationary teacher, one is asked to show and establish
his / her efficiency in teaching within a period of one year.
<http://www.slideshare.net/dhanurajd/pragmatic-paradigm-of-setting-up-school-kerala-
experience>. Some sources also indicate that the teachers in Kerala are largely accountable
and it needs to be maintained well.
More than 94% of the rural students accessthe primary schools within a distance ofone
kilometer. About 98% of the students access the same within a distance of two kilometers.

29
96% and 98% of the rural population get opportunity to access upper primary and secondary
schools within a distance of three kilometers and eight kilometers respectively.
2.8 Monitoring mechanisms
2.8.1 The existing system
For long, community participation has been viewed as an effective way of monitoring the
delivery of quality education at the school level. It has been projected as a superior form of
monitoring than the usual bureaucratic-governmental procedures of checks and balances
and the standard procedures of teachers‘ accountability. Statistical findings have established
that the participation of the beneficiary community results in improved service delivery and
‗better project outcomes‘ (p.175).38 Community participation and decentralized policies for
school education are practiced in many nations like Peru (1972), Philippines (1974), Nigeria
(1977), Chile (1980) and in the English-speaking nation-states. Grant (1979) argues that the
joint initiatives of the community and the schools may together lead to some effective policy
decisions and fruitful outcomes. In the Indian context, on the basis of the 73rd and 74th
Amendments to the Constitution of India, Kerala has successfully utilized 35% to 40% of
plan funds for community participation and Local Self Governments (LSGs) in the fields of
education and health. The National Policy on Education (1986) emphasizes the role of
community participation in decentralized planning and management of the educational
system.39 The planning and appraisal manual of the Sarva Siksha Abhiyan (2004) suggests
that the bottom-up approach, the interaction with the target group and community
participation, may help the planning team to find out the actual problems of the target group.
Such practices also offer possible ways for solving different problems related to weak
performance, and help to improve the proposed interventions.40 In fact, it may not be an
38
Isham, J. Narayan, D. Pritchett, L. Does Participation Improve Performance? Establishing Causality With Subjective Data. The World Bank Economic Review. Vol.9. No.2. 1995. pp.175-200. 39
Sankaran, P.N. Vijayakumar, B. Local Self Governments and Educational Development in Kerala. Dimensions of Social Development: Status, Challenges and Prospects. Social and Economic Change Monograph Series.No.8. Edited by Karanth, G.K. The Institute for Social and Economic Change. Bangalore. Mar. 2005. 40
Manual for Planning and Appraisal. Sarva Shiksha Abhiyan, A Programme for Universal Elementary Education. Ministry of Human Resource Development. Department of Elementary Education & Literacy. April. 2004.
30
exaggeration to affirm that in most of the schools and SSKs, their weak performance is
directly related to the absence of a social monitoring system and the lack of effectiveness of
the existing governing mechanisms, and the inertia of departmental supervision.Moreover,
NCERT (2007) recommends that an active involvement of the Panchayati Raj Institutions
may help to grow interactive community participation. Such well formulated community
participation adds a better quality and accountability to the educational procedure. At
different block and cluster level a proper strategic planning, distribution of different activities,
and quality improvements of educational outcomes mostly depend on school level
leadership and ‗academic planning‘ (NCERT, 2007: xi).41
To facilitate the scope of social audit and to enhance the efficiency of the educational
system, the improved notification issued in August 2008 (No. 840-SE / Pry / 2D-1/ 2007,
dated 07/ 08/08) on the Village Education Committee (VEC) stresses on parents‘
participation in the VEC and in the governance mechanism by forming school specific
committees. It suggests school specific committees consisting of ten members out of which
50% members could be parents. There is also a provision for forming a mother-teacher
committee in each school. In spite of such excellent recommendations, opportunities for the
proper functioning of these committees remain few and far between. In practice, only 35% of
the parents know about the existence of such committees in the SSKs and only 31% for the
primary schools. Ensuring greater and meaningful public participation remains a challenge in
many areas. Factors such as class barriers between the teachers and the parents, the timing
of the meetings, teacher‘s attitude towards the less educated or non-literate parents have a
discouraging effect on community participation.
2.8.2 Strengthening the monitoring mechanism
Any strengthening of community participation as a monitoring mechanism calls for innovative
thinking and new measures. More than new and improved procedures and schemes of
participation, there is a need for fundamental changes in teachers‘ attitude vis-à-vis
communities with whom they work. No doubt the formation of functional school specific
committees and increased legal governing power for such committees may enhance the
sense of participation and ‗ownership of the schools‘ (p.93) among the parents. 42
Community participation combined with an active teachers‘ union may help strengthen the
41
National Council of Educational Research and Training, National Curriculum Framework 2005, 2007 (Kolkata), xi. 42
Rana,K. Sen, S. Sarkar, M, et al.The Pratichi Education Report II—Primary Education In West
Bengal: Changes and Challenges. Pratichi (India) Trust. Delhi. Dec. 2009.
31
delivery system of the school education. The Pratichi Report (2009) posits that community
participation in the monitoring process of the SSKs positively contributed to their efficiency
and thereby helped achieve the goal of universalization of the primary education more
effectively than the other less equipped educational institutions. At the same time, the quality
of the departmental inspection should be enriched for a better monitoring system. As the
Pratichi Report (2009) suggests, both the departmental monitoring and the community-
based monitoring system together enhances the efficiency of the educational system both in
the primary schools and in the SSKs.
2.9 Accountability Mechanisms
2.9.1 Accountability procedure for teachers
The accountability procedure for teachers includes three different but related aspects of
acquired skills and knowledge. These are: a) core academic knowledge for teaching their
own subject or licensed field of interest, b) specific pedagogical skills and knowledge to
teach their license-specific subjects and c) all-encompassing common professional skills and
knowledge apart from their own subjects. The accountability of the teachers may be
restructured by appointing teachers with vivid subject knowledge and high academic scores
and qualifications. The pedagogical knowledge and teachers‘ training programs also add
positive criteria to the teachers‘ accountability.43 The UNICEF‘s model of a child friendly
school distinguishes the teachers‘ role and accountability as a ‗facilitator of learning‘.44
Teachers‘ training, motivation, competencies, systematic support and rewards to the
teachers are important for quality education (Mpokosa, 2008). Simultaneously, with a
legitimate recognition of the Universalization of Elementary Education (UEE) programme
and to achieve the goal of the Right of Children to Free and Compulsory Education Act,
2009, the educational system needs a large amount of ‗qualified and professionally trained
teachers‘.45 National Council for Teacher Education (henceforth NCTE) estimates that in
upcoming years there will be a successively rising demand of qualified and professionally
trained secondary stage teachers. On the contrary, the same report estimates that the
43
Stotsky, S. Who Should Be Accountable For What Beginning Teachers Need To Know?. Journal of Teacher Education. Vol.57,No.3. American Association of Colleges for Teacher Education (AACTE). May/June. 2006. 44
Mpokosa, C., Ndaruhutse, S, et.al.Managing Teachers. The centrality of teacher management to quality education.Lessons from developing countries. CfBT Education Trust and VSO. Sept.2008. 45
National Council for Teacher Education, National Curriculum Framework for Teacher Education: Towards Preparing Professional and Humane Teacher,2009 (New Delhi), 1-2, 6, 15.

32
demand for senior secondary stage teachers may decrease by the year of 2016-2017.
Estimated additional demand or negative demand for teachers depends on some criteria,
such as: a) projected rate of enrolment, b) pupil-teacher ratio, c) concerned factors of
teaching load, d) accumulation of several untrained teachers; yet the authorities are less
attentive to them.46 Moreover, a neutral inspection system is another important parameter
for the teachers‘ accountability. A proper inspection system offers all the stakeholders,
including the teachers, with an adequate channel to express the day-to-day coercive forces
that withhold their best performances (Gann 1998; Kogan 1986; Holly and Hopkins 1998;
Wilcox and Gray 1996).47
2.9.2 Teachers’ training and accountability procedures
National Knowledge Commission (NKC) studies show that teachers are the one and only
major element of the school educational system. A teacher performs to fulfil a wide range of
demands, related to the curriculum, goals, methodological aspects, expectations, and needs
of the student community (NCTE, 2009). So, professionally trained teachers may accelerate
the educational development and may increase the degree of accountability. National
Council for Teacher Education (2009) recommends that teachers‘ training and educational
curriculum should be framed in congruence with the framework of the school educational
curriculum. It also suggests that a professional teacher should be communicative and
understanding towards the students and their parents‘ community. This may help the
educational procedure to raise the regular attendance level and increased educational
attainment level of the students. For a full proof teachers‘ education, there is a demand for
professionally qualified educators and a well organised teachers‘ training procedure.
In the field of teachers‘ training and educational research SCERT plays a major role. G.O.
No. 7-Edn (PS) of the 25th February 1993 refers to some core functions of the SCERT.
These are- a) development of the school curriculum and relevant materials: SCERT
encourages qualitative development to education. It develops and improves syllabus, school
curriculum, methodology, instructional materials, etc for teachers and students of different
levels i.e. primary to higher secondary levels; b) in-service training and orientation or
refresher courses: SCERT provides a positive orientation course and training for developing
the professional competencies of administrative officers, office employees, inspecting
officers, teacher-educators, and teachers; c) Research and Studies: SCERT conducts
46
National Council for Teacher Education, Demand and Supply Estimates of School Teachers and Teacher Educators (2007-08—2016-17), 2010 (New Delhi), 81-85. 47
Mpokosa, C., Ndaruhutse, S, et.al.Managing Teachers. The centrality of teacher management to quality education.Lessons from developing countries. CfBT Education Trust and VSO. Sept.2008.

33
research and proper monitoring of different educational conditions, problems related to
education, teachers training programmes, etc. It also includes different studies, surveys,
projects, and evaluation of each and every layer of school education; d) co-ordination and
extension of information: SCERT co-ordinates between all levels of Teachers‘ Training
Institutes of the state. It also builds an interactive communication between different
academic perspectives of teachers‘ training, including all types of basic and elementary
educational activities related to it. Dissemination of various information and suitable
educational programmes with the help of modern educational technologies is another
important function of SCERT; e) as per the memo no. 790-SE (pry)/ES/O/OP/4P-3/2001
dated on the 13th August, 2004, SCERT (WB) should look after the academic matters of
DIET.48
In West Bengal SCERT conducts different activities. The basic functions of SCERT (WB)
are: a) necessary materials development for teachers‘ education and school education; b)
dissemination of information through different workshops, publicity materials, radio
broadcasts, kiosks, portals, publications, journals, etc; c) conducting research through
surveys, case studies, action research, content development for e-learning, etc; d)
supervision and monitoring of different programmes and conducting further consequent
activities by means of the DIETs; e) incorporation of active working ability and responsibility
of the ―School Education Committee‖. Department of School Education, Govt. of West
Bengal forms the ―School Education Committee‖ for the education oriented research and
training for necessary fields like, teaching –learning materials development mainly for the
computerised instructions, development of teaching – learning ‗activity books‘ for various
subjects, etc.(Ibid).
2.9.3 Recasting the existing inspection system
According to the UNESCO (2002), the school inspection system is very poor in the whole
world. Many schools remain ―unsupervised and unsupported‖ without a proper inspection
system.49In West Bengal, the Directorate of School Education is responsible for the
inspection of primary and secondary schools. The District Primary School Council manages
or administers the inspection system in the primary schools through the sub-inspectors (SIs).
Under the school circles the SIs are responsible for different activities like teachers‘ training
programmes, their academic and general professional activities, etc. In general the SIs are
48
State Council Of Educational Research And Training, West Bengal, SCERT ,West Bengal In Its Decadal Role: Striving Towards Quality, (West Bengal). 49
Jalan, J., Panda, J. Low Mean & High Variance: Quality of Primary Education in Rural West Bengal. Centre for Studies in Social Sciences, Calcutta. 2010.
34
overloaded with excessive responsibility. Each of the SIs bear the responsibility to inspect
more than one-hundred and five schools i.e. the total number of schools in more than two
circles. The workload should be reduced for improvement of the existing inspection system.
An increased number of circle staff may reduce the workload for the inspectors.
Communication problems also affect the quality of inspection. The state needs a better
transport system for improved inspection.50
50
Ibid.

35
Chapter 3
Sampling and Methodology
3.1 The present study involves multiple levels. We have to review the state‘s position in
spreading school education to the entire population in the relevant age group. The
purview of the study involves all the levels of school education in the state – primary,
upper primary, secondary and higher secondary. However, given the RTE Act, and
the enrolment – retention problems at the lower levels, the focus has to be on the
elementary level of education. The delivery system up to the elementary (upper
primary) level depends much more on the systemic ability of the state as the
recipients are too young to express their demands or exert their rights.
3.2 Keeping the above in mind, we made an effort to study the problem much more
extensively at the ground level. For general and ground level information regarding
various stages of the school education system in West Bengal, we opted for Stratified
Circular Systematic Sampling technique with independent interpenetrating
subsamples. For this, we first devided the state into four geographical regions,
starting with North Bengal. We considered Kolkata separately. From each of the
regions we have chosen two districts and within each of the districts, we selected six
villages each. However, for Dakshin Dinajpur we have a sample of four villages only
for reasons described below. Thus we have a total of 46 villages. We covered all the
schools – primary, upper primary, secondary, higher secondary and High Madrasas –
all that have been found to be located within the boundary of the selected villages.
We had also surveyed all the MSKs SSKs and ICDS centres located within the
boundaries of the respective sample villages. We have also surveyed 20%of all the
households of the selected villages in order to investigate the status of children in the
age group 0-18 years. We have, of course, collected other necessary information
from the sample households to study the impact of the socio-economic variables on
child education and the delivery system of education in the state. The available
information from the Village Directory of the Census 2001 were also taken into
account and updated through the survey. For Kolkata, we have a separate selection
of 9sample primary schools selected from the DISE list using the same method.
3.3 Since the number of secondary and higher secondary schools in the sample villages
were inadequate for our study, we had drawn a separate additional sample to study
them. We had selected 5% of total secondary and higher secondary schools in each
36
of selected districts from the DISE list using circular systematic sampling method. We
covered all the upper primary, secondary and higher secondary schools falling within
the boundaries of the villages in which the selected sample schools were located.
3.4 Our sample methodology has been influenced by an earlier evaluation of the status
of primary education in West Bengal undertaken by the Indian Institute of
Management Calcutta in 1998-99 on behalf of the West Bengal Board of Primary
Education and the UNICEF, Eastern India. We decided to take the opportunity of
revisiting the sample units after a gap of more than ten years and compare the key
findings with respect to primary education in West Bengal. In our previous study, we
had used the same technique as stated above but had taken samples from all the
districts of the state. Since the scope of the present study is much wider than only the
primary level, and the time given is much shorter, we opted for dividing the state into
manageable regions to select the districts. Within the selected districts, we went to all
the six villages chosen for the earlier study through Circular Systematic
Interpenetrating Subsample technique, where the first village in each subsample
case was selected using random numbers. We had sorted the villages, before
drawing samples, in terms of Female Literacy Rates obtained from the state sources
– FLR having a very high correlation with socio-economic and even the spatial
location of the villages. Thus the sample technique retained the character of
randomness and yet gave us a much better geographic and socio-economic
coverage of the districts. In 1998, when the earlier survey was undertaken, we had
considered only four villages each from the northern and southern part of the old
Paschim Dinajpur District since most of the auxiliary information was available for the
undivided district as a whole. The choice of four villages in each district was due to
the smallness of each of the newly created ones. The selected samples are given in
the Table 3.2 in volume II.
3.5 We also met officials of the district school administration, school teachers, siksha
bandhus and members of the school inspectors‘ association in West Bengal. In order
to identify the best practices in other states, we visited the states of Madhya Pradesh
and Kerala and met with the officials of SSA and the state education directorate.
3.6 Table 3.1 shows caste-wise distribution of population in the eight districts included in
our survey. The data indicates that the sample comprised people from different social
strata. Table 3.2 shows description of schools surveyed along with the year of

37
establishment, wherever found. We shall go into greater details of the sampling in the
final output of the present study.

38
Chapter 4
Education in West Bengal: A Secondary Data Review
4.1 The objective of this section is to provide an assessment of the condition of primary
education in West Bengal. For this purpose, three official sources of data have been
used; (i) Census Data 2001, (ii) Elementary Education in India; District Report Cards
Raw Data 2008-09 and (iii) DISE 2009-10. In this review, Kolkata district has been
treated separately from other urban areas for reasons discussed earlier. The major
focus in this chapter, while using the Census 2001 data, is on female literacy, gender
inequality and population distribution. The District report card data is looked at in
terms of infrastructural issues in primary schools
4.2 Table 4.1 provides an overview of the district-wise distribution of population.
Additionally this table also provides information on the number of inhabited villages
and number of households per village. It can be seen that 72% of the population and
71% of the households were from rural areas. Medinipur had the highest number of
villages with a high population per household. Population per household is the lowest
in South Dinajpur. The dispersion of population among the districts is higher in urban
areas (coefficient of variation 1.12) as compared to the rural areas (coefficient of
variation 0.59).
4.3 Table 4.2 gives us a scenario of distribution of villages according to female literacy as
per census 2001. There were 168 villages in the state with no female literacy, of
which more than 30% were in Medinipur. The female-illiterate villages constituted
less than 0.5% of the total number of villages in the state. It implies that the female
population in the state has, by and large, achieved a minimum level of literacy. Only
three districts (Howrah, Hooghly, and North 24 Parganas) have a high women‘s
literacy rate – more than 80% of the villages in these districts have a female literacy
level above 50%. Kolkata, being a fully urban district, however, is not included in this
count. On the whole it may be concluded that there is a considerable scope for
improving the female literacy in the state.
4.4 Table 4.3 provides important statistics on the level of overall illiteracy in the State.
One-third of the population in the State is illiterate (Census 2001). In three districts,

39
Malda, Murshidabad, and Purulia, more than 40% of the population is illiterate. There
is only one district,Kolkata, where less than 20% of its population is illiterate. Thus
there is a huge scope for improvement in the overall literacy of the State.
4.5 Tables 4.4 and 4.5 provide data on gender inequality in literacy. Six out of 18 districts
(Census 2001) have a gender inequality of more than 20% in literacy. The gender
inequality is worst in Purulia, where female literacy is low. Uttar Dinajpur with similar
female literacy has lower gender inequality. This may be due to the high non-general
category of population in Purulia. There is a high negative correlation between total
literacy and gender inequality – around -0.5. Kolkata with 80% literacy level recorded
around 7% gender inequality in literacy.
4.6 Table 4.6 provides data on district-wise distribution of sex ratio. It is interesting to
note that the sex ratio is inversely related to female literacy. The correlation
coefficient is about -0.3. It indicates that the female literacy is higher in districts which
have a low sex ratio. The sex ratio is lowest in Kolkata (Census 2001) which
recorded the highest female literacy rate (77.3%). Whereas Purulia with a high sex
ratio (954) has the lowest female literacy rate (36.5%). This paradox may indicate a
discouraging trend – literate female members in the household willingly or unwillingly
oppose the girl child. It also reinforces the fact that a minimum level of literacy does
not guarantee social awareness. It is all the more important to spread social
awareness among the literate female members in the household. The drive for
literacy should not confine itself to mere reading and writing skills. It is expected that
the two missions – SSA and RMSA would help in addressing this issue in the long
run.
4.7 Table 4.7 provides data on the scheduled caste (SC) and scheduled tribe (ST)
population in the districts. The percentage of SC population is highest in Cooch
Behar (50.11%). The respective female literacy rate is 56.1%. The lowest percentage
of SC population is in Kolkata (6.01%) and the respective female literacy rate is 77.3
% which is the highest among all the districts.SC population in Bankura (31.24%),
Jalpaiguri (36.71%) and South 24 Paraganas (32.12%) is about one third of its total
population. Other than Kolkata, the percentage of SC population is lowest in
Murshidabad (12%). Only three districts (Jalpaiguri, Purulia, and South Dinajpur)
have a sizable ST population – more than 15% of the total population. The level of
female literacy and the population category are not closely related. However, it is
important to note that the relationship between the SC/ST population and female
40
literacy is negative, whereas the relationship of female literacy and the general
category population is positive. The policy implication of this observation may be that
the government should make special efforts to improve the reach and delivery of
school education in these districts.
4.8 Table 4.8 provides a district-wise distribution of primary schools (Govt.) according to
the type of school buildings. These data are collected from Elementary Education in
India; District Report Cards (DISE) Raw Data 2008-09. The data shows that as of
2008-09, about 16% of the primary schools in the State did not have any building
structures and about two-thirds (72%) of primary schools had pucca buildings. The
number of primary schools (Govt.) is the highest in Paschim Medinipur (4672) among
which 2164 schools have pucca school buildings, 969 schools have partially pucca
buildings, 124 schools have kuccha buildings, one school is under tents, 1363
schools have multiple types of buildings and 508 schools have no building at all. The
lowest number of primary schools is in Siliguri (397) with 82 partially pucca buildings,
6 kuccha buildings, 17 multiple type buildings and 3 schools without a building. Most
of the districts have no schools in tents except in Hugli (1), Paschim medinipur (1),
Murshidabad (3), Nadia (10) and Uttar Dinajpur (1) where a few primary schools
were run under tents. Darjeeling (252) district has the largest number of Kuccha
school buildings and Uttar Dinajpur, Barddhaman, Birbhum and Dakshin Dinajpur
have no kuccha buildings at all. 1578 schools in North 24 Paraganas have no school
buildings. Howrah (983), Purba Medinipur (831) and South 24 Paraganas (888),
Kochbihar (790), Maldah (897) districts have a large number of schools without
buildings.
4.9 Table 4.9 gives a picture of the distribution of primary schools according to the
average number of classrooms. According to Table 4.9 the State-level average
number of class rooms per government owned primary school was 3.48 in 2008-09.
However, the average number of class rooms in primary schools in the State as per
DISE state-wise statistic was 2.7 in 2007-08, which has increased to 3.1 in 2009-10.
There were nine districts where the number of classrooms per government-run
primary school was less than the state-level average. Siliguri (9.03) had the highest
number of classrooms. The average number of classrooms is lowest in Puruliya
(2.64) district. Barddhaman (4.14), Howrah (3.81), Purba Medinipur (3.55),
Murshidabad (3.87), Jalpaiguri (3.83), Malda (3.59) and Nadia (4.06) districts had an
average number of classrooms which was more than 3.5.
41
4.10 Table 4.10 provides district-wise data on distribution of primary schools according to
the average number of teachers. The State-level average number of teachers per
government owned primary school was 3.28 in 2008-09. However, there were eight
districts where the number of teachers per government-run primary school was less
than the state-level average. Murshidabad (4.19) district had the highest number of
average teachers in primary schools and Puruliya (2.14) had the lowest. Howrah
(3.69), Hugli (3.40), Jalpaiguri (3.58), Kolkata (3.59), Maldah (4.14), Nadia (3.69),
Siliguri (4.07) and Uttar Dinajpur (3.90) district had an average number of teachers,
more than 3.5.
4.11 The RTE Act requires that the pupil-teacher ratio (PTR) does not exceed 40 in
primary schools and 35 in upper primary schools. Table 4.11 shows the PTR in West
Bengal and a select few states for primary and upper primary schools during 2009-
10. It is observed that West Bengal lagged way behind Kerala. The PTR in upper
primary schools in West Bengal was much above the national average. It implies that
there is acute shortage of upper primary schools in West Bengal. The Government
needs to take immediate steps to bring the PTR at par with the RTE norms.
4.12 Table 4.12 shows the Educational Development Index (EDI) and the rank of select
states in India based on DISE data 2009-10. EDI shows the status of a state in terms
of the effectiveness of the primary and upper primary education system. A set of 21
indicators have been used in computing EDI which are re-grouped into the four sub-
groups, namely Access, Infrastructure, Teachers and Outcome indicators. Table 4.12
is self-explanatory. Access rank for primary schools in West Bengal is above Kerala.
However, the situation is quite opposite in the case of upper primary schools. Other
states mentioned in the table have also performed better than West Bengal on most
of the indicators. A poor EDI ranking indicates that the State may have poor PTR,
students-classroom ratio, and presence of untrained teachers, among other things.
The Government of West Bengal has to make sincere and timely efforts to improve
the EDI ranking. Implementation of RTE Act norms and standards would definitely
help the State improve its EDI ranking.

42
Chapter 5
Implementation of Right to Education Act
5.1 Introduction
The Sarva Shiksha Abhiyan (SSA) is an effort to universalize elementary education
through community-ownership of the school system. The main objective of the SSA
is to provide useful and relevant elementary education (including retention) for all
children between 6 to 14 years of age by 2010. The Rashtriya Madhyamik Shiksha
Abhiyan (RMSA) is an extension of the SSA as it promises universal access to
secondary level education to all children between 15 to 16 years of age by 2017 and
universal retention by 2020. While the SSA and the RMSA offer operational
frameworks for universalizing education, their provisions have been used as general
guidelines by each state to interpret and implement the schemes. The 86th
amendment to the Indian Constitution (Constitution (Eighty-sixth Amendment) Act,
2002) inserted Article 21-A in the Constitution which provided for ‗free and
compulsory‘ education of all children betweensix and fourteen years of age as a
Fundamental Right. The Right of Children to Free and Compulsory Education Act,
2009 (RTE) is the consequential legislation envisaged under Article 21-A. Thus, the
RTE Act makes the implementation of compulsory education legally binding on all
states/ union territories. The RTE Act came into effect on April 1, 2010. The SSA had
been launched in 2001-02 and the states have since then started implementing the
mission of the SSA by setting up the necessary infrastructure and establishing
operating guidelines. When the RTE Act was enacted, one of the major challenges
faced by each state was to align the existing rules/guidelines under the SSA with the
requirements of the RTE Act.
5.2 State RTE Rules
The RTE Act provides a legally enforceable rights framework with a definite time
frame that State governments must adhere to. The first step towards the
implementation of the RTE Act in a state is a notification of the state RTE Act Rules
in the official gazette. Such state RTE Rules may be framed in the lines of Central
RTE Rules which have already been notified. The State RTE Rules must cover
provisions for pre-primary schools/Anganwadis. The Rules should provide that the
State Government/local authority shall undertake school mapping and identify all
children, including children in remote areas, children with disabilities, children

43
belonging to disadvantaged groups (e.g. SC/ST) and children belonging to weaker
sectionsof society within a period of one year from the date of publication of the
Rules and every year thereafter.
5.3 Recognition of Unaided Schools
Section 12 of the RTE Act mandates that all unaided schools shall provide free and
compulsory education to at least 25% of the children belonging to the weaker
sections and disadvantaged groups in the neighbourhood. The State Government
would reimburse the expenditure incurred, if any. This requires every unaided school
imparting elementary education to be registered with the appropriate authority (e.g.
District Inspector‘s Office) within a given timeframe. Each existing unaided school
after the promulgation of the State RTE Rules must apply in a prescribed format to
the appropriate authority to get a certificate of recognition. If an existing unaided
school fails to obtain the certificate within the given timeframe, the school would be
asked to close down. No new unaided school can be opened in the state unless
recognised. Such recognition of unaided schools needs to be reviewed periodically
(e.g. after every three/five years). The recognition certificate would be subject to the
following conditions:
The school shall give admission to a minimum of 25% of the children belonging to
weaker sections and disadvantaged groups in the neighbourhood in class I.
Aided schools are required to provide free and compulsory elementary education
to such proportion of children admitted therein as its annual recurring aid or
grants received bears to its annual recurring expenses, subject to a minimum of
25%.
The school shall notify the fees to be charged from the children every year before
the commencement of the academic session.
The school shall have to maintain norms and standards as specified in the RTE
Act.
The school is open to inspection by any officer authorised by the State
Government/ local authority; and
The school shall furnish such reports and information as may be required by the
State Government.

44
5.4 Neighbourhood Limits
The RTE Rules should specify the limits of neighbourhood unambiguously for
primary and upper primary schools. The central RTE Rules specify that a primary
school / upper primary school shall be established within the walking distance of one
km / three km of the neighbourhood. However, the general definition of
neighbourhood limits may be relaxed in areas having difficult terrain or a lack of
roads. In areas with a high population density, it is prudent to set up more than one
neighbourhood school. Similarly, for children from small hamlets where no school
exists within the limits of a neighbourhood, the State Government/local authority
would make adequate arrangements for free transport and if necessary residential
facilities for providing elementary education. It would be the responsibility of the local
authority to identify neighbourhood school(s) where children may be admitted and
make such information public for each habitation within its jurisdiction. This would
ensure that all children who are between 6 to 14 years of age are in school. The real
challenge would be to track children belonging to weaker sections and
disadvantaged groups in the neighbourhood. The basic population level data may be
collected from the Village Education Register (VER). It may so happen that the
prescribed neighbourhood limits may not have enough children belonging to weaker
sections and disadvantaged groups to fill up the 25% reserved seats in unaided
schools. In such a situation the limits of a neighbourhood may be extended for filling
up the required percentage of seats.
5.5 Tracking of Unaided Schools
In order to ensure that unaided schools (and also partially aided schools) meet the
norms and standards of the RTE Act (and rules), the following information may be
maintained for every unaided (aided) school:
Name of the cluster/block
Name of the school
Name of the neighbourhood village/town as per definition
Total number of children in the neighbourhood belonging to weaker sections and
disadvantaged groups (this information would be available in the village education
register or similar register)
Target enrolment of children belonging to weaker sections and disadvantaged
groups in the school in Class I
Actual enrolment
Name of the official-in-charge

45
5.6 Social Access
Social access requires not merely physical access to a neighbourhood school but
also access to a school without any discrimination based on caste, class, gender,
and special needs. Mapping for access to neighbourhood schools would need to
consider these social factors as well. The SSA Framework for Implementation states
that school mapping would include the following steps:
Environment building in the village;
Conduct of a household survey;
Preparation of a map indicating different households, the number of children in each
household and their participation status in the school;
Preparation of a village/school education register; such a register should contain
records of all children from their birth till 14 years of age;
Presentation of the map and its analysis thereof to the people; and
Preparation of a proposal for improved educational facilities in the village; which
would form the basis of the School Development Plan mandated under the RTE Act.
Thus, providing social access requires that children from different social backgrounds
should have free and equitable access to elementary education. Ideally children from
different social backgrounds should study in the same school within the
neighbourhood to avoid social stratification. Children belonging to weaker sections
and disadvantaged groups should not be segregated from the other children in the
classrooms nor should their classes be held at places and timings different from the
classes held for other children. However it has been observed that disadvantaged
groups (particularly scheduled tribes) stay in clusters/pockets within a
neighbourhood. Therefore even if there is a school within the limits of a
neighbourhood, such school may not be ‗accessible‘ to the children from
disadvantaged groups. Madhya Pradesh has a large tribal population: 89 blocks out
of 313 blocks have a tribal population. Social access is addressed in Madhya
Pradesh by opening separate schools for weaker sections/ disadvantaged groups
even if there is a primary school in the neighbourhood as per RTE. Alternatively,
residential facilities may be provided to the children from the targeted groups.
Another problem in such designated schools is the language of instruction. If the
language of instruction in a school in a tribal area is the state language, the children
of such a school may feel alienatedin the school environment as tribal populations

46
use different dialects. Madhya Pradesh has addressed this problem by appointing
tribal teachers in such schools. This practice has also solved a related problem –that
of the availability of teachers. Teachers from other parts of the state who were earlier
appointed in these schools would try to seek transfer from such schools at their
earliest opportunity.
In West Bengal the Village Education Register needs to be created/maintained which
should include information on out-of-school children as well. This would have to be
updated on an annual basis.
While tracking children in rural areas requires special attention, urban areas have
different challenges in tracking street/ homeless children, children working in urban
households/tea shops, etc. Local municipal authorities and NGOs have helped many
states identify these children and ensured their enrolment in schools.
5.7 Student Enrolment & Teacher Requirements
The Village Education Register forms the basis of student enrolment. Normally a birth
certificate is required at the time of school admission. Wherever a birth certificate
under the Births, Deaths and Marriages Registration Act, 1886, is not available any
one of the following documents may be accepted as proof of age of the child for the
purpose of admission:
(a) Hospital record;
(b) Anganwadi record;
(c) Declaration by the parent/guardian provided that the parent/guardian submits within
six months a certificate of verification of the date of birth of the child from any elected
representative of the local authority of the area where the child resides.
The RTE Act (section 26) requires that vacanciesfor the posts of teachers in a
government school or government-aided school should not exceed 10% of the total
sanctioned strength. The state needs to arrive at the sanctioned strength based on
enrolment and fill up vacant positions to comply with the requirements of the RTE.
The RTE supports the recruitment of female teachers and specifies that the SSA
practice of recruiting 50% female teachers should continue. Pupil-teacher ratio (PTR)
is required to be aligned to meet the guidelines of the RTE. The SSA framework
mentions that there should be at least two teachers in every primary school

47
irrespective of student enrolment, but the RTE links the number of teachers with
thestudent enrolment. The present SSA norms require a classroom for every teacher
or for every grade/class, whichever is lower, in primary and upper primary schools.
The RTE requires at least one class room for every teacher.While the RTE estimates
the teacher requirements based on student enrolment, the number of classrooms
required would be determined by the number of teachers. Thus as per the RTE, it
would be perfectly within law if a primary school with sixty students has two teachers
(including a head teacher) and two class rooms, even if the school runs all the
classes. However, if the state government decides to have at least one classroom
per class (e.g. a primary school with one section each for classes I to V would have a
minimum of five classrooms), that would be perfectly within the RTE Act. The
elementary schools in the state of Kerala follow the norm of one room for every class
and thus have classrooms more than the minimum required as per RTE norms. This
helps in ensuring personal attention to students of different classes.
If the number of enrolled children exceeds 150 in a school, the RTE provides for the
recruitment of one head teacher in addition to five teachers. The SSA norms do not
require a separate room for a head teacher in a primary school while the RTE norms
specifically require such.
Special efforts need to be made to enrol out of school children in age appropriate
classes. The RTE requires designing special training programmes (e.g. bridge
courses) for such children. The special training programmes may be conducted in
nearby school premises. Such courses may be provided by teachers working in the
school, or by teachers specially appointed for this purpose. The state may involve
NGOs to design and deliver such courses. In Madhya Pradesh, bridge courses for
out of school children are designed by SCERT (State Council of Education, Research
and Training) and imparted by special teachers. Books and an amount of Rs.1300
per child is paid to the teacher from the SSA. The SCERT provides the requisite
training to bridge course teachers. Residential facilities are also provided to needy
children.
5.8 Mainstreaming Informal Schools
The RTE Act mandates that eventually elementary education must be provided by
formal and recognised schools.All existing EGS centres (Sishu Siksha Kendra (SSK)
and Madhyamik Siksha Kendra(MSK) in West Bengal) would be required to be

48
converted into regular schools or closed down when children are mainstreamed into
regular schools. The process of upgradation of such centres (kendras) to regular
schools must be completed within two years from the date of the commencement of
the RTE Act. No new EGS centres may be opened after 2010-11. This poses a huge
challenge to West Bengal. There are more than sixteen thousand SSKs and around
two thousand MSKs in West Bengal (Table 5.1) and about sixty seven thousand
teachers in these schools.
While framing the state RTE Rules, the state government must specify implement
measures to handle non-formal schools. All primary and upper primary schools
upgraded under EGS would have to be provided with teachers, infrastructure, and
other facilities as per the RTE norms. The RTE Act provides a timeframe of two years
for upgrading EGS centres to formal schools.
The SSA would provide necessary financial support to such schools for the period of
two years. If it is economically unsound to upgrade any of such schools into a formal
school, the centre must be closed. The SSA would not provide any financial support
after the mandated period of two years.
In the states of Madhya Pradesh and Kerala, such EGS centres have already been
upgraded to formal schools and the children brought into mainstream education. In
Madhya Pradesh all the teachers of the EGS centres were asked to write the teacher
eligibility test (TET) and those who qualified were absorbed. In Kerala all EGS
teachers were already eligible but a few hundred were untrained. The state
government has developed plans to provide necessary teacher training to those
teachers within the given timeframe.
5.9 School Management and Monitoring
The first-tier of school monitoring rests with the immediate stakeholders of the
school. The primary responsibility of monitoring the quality of education in a school
rests with the School Management Committee (SMC). The RTE Act gives immense
importance to the SMCs as part of the decentralized structure, and one in which the
parents would have a very significant role. The RTE Act mandates under section 21
that every school (other than an unaided school) must set up a SMC within six
months of publication of the RTE rules by the state. Such a SMC would be required
to be reconstituted every two years. The State RTE Rules should specify the size of
the SMC. Three-fourths of the members of the SMC are required to be from
49
amongthe parents or guardians of the enrolled children. Rule 13(3) of the Central
RTE Rules states that the remaining one-fourth of the SMC members shall be
chosen from among the following persons:
One-third of the members from among the elected members of the local authority, to
be decided by the local authority;
One-third of the members from among teachers of the school, to be decided by the
teachers of the school; and
and the remaining one-third from among local educators /children of the school, to
be decided by the parents of the SMC
The SMC is required to elect a Chairperson and Vice-Chairperson from among the
members of the Committee. The head teacher or the senior most teachers may be
the ex-officio member secretary of the SMC. The SMC is required to meet at least
once a month. The SMC is required, inter alia, to ensure implementation of clauses
(a) and (e) of section 24 and section 28 of the RTE Act, ensure enrolment and
continued attendance of children, monitor implementation of the mid-day meal in the
school and monitor regularity and punctuality of the teachers of the school. The SMC
would have to prepare a three-year school development plan. The school
development plan would contain estimates of class-wise enrolment for each year,
additional personnel /infrastructural requirements and hence additional financial
requirements. School grants under SSA would be made available to the SMC based
on the school development plan. Any money received by the SMC would have to be
credited in the account of the Committee. The account should be a joint account of
the Chairperson and the member secretary of the Committee.
It isimperative that if a state has several school-level committees (e.g. PTA, MTA
etc.), those committees should be subsumed to the prescribed SMC.
The next tier of school monitoring is prescribed at the block and cluster level. The
RTE Act prescribes that every Assistant Education Officer (or an officer with similar
designation) should undertake at least two visits to every school each year.
Additionally, staff members at the BRC (Block Resource Centre) and CRC (Cluster
Resource Centre) should visit each school at least once in every two months or every
month if the circumstances so demand. In Kerala each BRC trainer is in charge of a
cluster and takes care of 10-12 schools under each cluster. Every Saturday trainers
assemble at the BRC and review the performance/progress of the school with the
BPO (Block Project Officer), DIET faculty and AEO (Assistant Education Officer). In a
situation where a particular school requires special attention (due to the

50
pooracademic performance of the children), the BRC trainer visits the school
continuously for about 10 working days to help the teachers improve the quality of
classroom transactions.
The third tier of monitoring is at the district level. The officials at the district level may
occasionally undertake independent field visits to monitor school performance.
However, the main information tool at the district level is the school-based annual
information system called District Information System for Education (DISE). The
DISE data covers all schools: recognised or un-recognised.
Finally, the State Executive Committee of the SSA should periodically monitorthe
performance of all schools providing elementary education through meetings.
A set of quality monitoring tools (QMT) have been developed in collaboration with the
NCERT to provide information on the quality of education at schools. Such quality
related indices cover issues relating to student enrolment and attendance, pupil
achievement, teacher availability, teacher training, classroom practices, and
academic supervision of schools by BRC/CRC etc.
5.10 Teachers Qualification and Training
The National Council for Teacher Education (NCTE), vide a notification in August
2010, prescribed the minimum qualifications for teachers in elementary education
(class I to VIII). Teachers are required to satisfy three criteria for being eligible for
recruitment in schools imparting elementary education:
a) Secondary/ senior secondary/ graduate degree; and
b) 2-year Diploma in Elementary Education/4-year Bachelor of Elementary Education/
1-year Bachelor of Education; and
c) Pass in the Teacher Eligibility Test (TET) to be conducted by the state government
in accordance with the guidelines framed by the NCTE.
Paragraph 4 of the above notification states that the minimum qualification criteria as
per the NCTE would not be applicable for:
Teachers appointed before September 3, 2001 (the date on which the NCTE
(Determination of Minimum Qualifications for Recruitment of Teachers in Schools)
Regulations 2001 came into force);
A teacher appointed in class I to V after September 3, 2001 provided he/she
possesses a B.Ed (Special Education)/D.Ed (Special Education) qualification and is
51
willing to undergo an NCTE recognised 6-month special programme on elementary
education;
A teacher of class I to V with B.Ed qualification who has completed a 6-month
Special Basic Teacher Course (Special BTC) approved by the NCTE.
No teacher can be appointed after August 2010 who does not possess the minimum
qualifications as per the NCTE notification. Teachers‘ training poses a major
challenge to the state of West Bengal. As per one estimate, there are about 75000
‗untrained‘ teachers in primary and upper primary schools in West Bengal.
In-service teachers‘ training is essential to continuously improve the quality of
teaching. The SSA provides financial support for organizing training programmes for
teachers, head teachers, resource persons and even for educational administrators.
The SSA mandates 20 days of training for each existing teacher in one academic
year and a 30 day induction programme for all newly recruited teachers. The SSA
provides a grant towards training of untrained teachers to enable them to acquire
professional qualifications. The state-level training institutions (DIETs) should be
primarily responsible for providing pre-service and in-service training. Resources at
BRCs/URCs and CRCs are effectively used to provide training and on-site support to
schools and teachers. In the state of Keralathe SSA mandated 10 day refresher
course is held during the summer vacation (called vacation training). Other training
(for the remaining 10 days) are held on Saturdays only at block/cluster level. Training
is imparted initially to a select State Resource Group (consisting DIET faculty,
eminent resource persons, and select school teachers from each district). The State
Resource Group (SRG) would in turn train the District Resource Group (DRG)
(consisting of BRC trainers and eminent school teachers (2 teachers from each block
under the district)of the district) at BRCs and other venues throughout the state.
Finally, the DRG trainers train teachers of schools under a cluster. The CRCs in
Kerala are located in a lead school in the cluster where the head teacher of the
school is the convener. One BRC trainer is in charge of a CRC. It is the responsibility
of that BRC trainer to help teachers on a continuous basis in improving the quality of
their classroom transactions. In Madhya Pradesh in-service teachers‘ training is
centralized. All in-service training isconducted at DIETs. Every year 33% of the
teachers in primary and upper primary schools are chosen for 20 days of training.
Teachers of poorly performing schools are given a preference in such training
programmes.

52
5.11 Organizational Restructuring
The present organizational set up for delivery of elementary education needs to be
overhauled to ensure effective implementation of RTE norms and standards. The
state project office of SSA and the state education directorate should coordinate their
activities better. While the SSA would concentrate on elementary education, the state
directorate needs to look after high school education as well. The RTE Act states that
children in class I to VIII would not need to write any qualifying examination, their
promotion would be automatic. Hence the role of the West Bengal Primary Education
Board needs to be re-examined. The major focus of RTE is on the quality of
education. The present organizational set up which looks after curriculum, text book
preparation, development of TLM, and continuous comprehensive evaluation
requires strengthening. SSA would provide all therequisite help in this regard. The
role of academic administrators also needs to be redefined. The academic
administrators should facilitate the improvement of quality of school education and
should not merely be seen as inspectors who find fault with the teachers.
5.12 Information System
It is always prudent to use information technology to monitor delivery of various
schemes/programmes under the SSA/RTE, maintain service records of teachers, pay
teachers‘ salary from the treasury, and even supervise teachers‘
recruitment/transfers. Development of an education portal on the lines of the one
currently in use in Madhya Pradesh (www.educationportal.mp.gov.in) is essential.
The data entry may be done at the block/cluster level. The educational portal would
be accessible to authorities at different levels. This would make the delivery system
more transparent and objective while helping in auditing the activities of schools/ the
district administration/ projects.
5.13 Time Frame
The following roadmap is mandated by the RTE Act:
Activity Time Frame
Establishment of neighbourhood schools 31 March 2013
Provision of school infrastructure with all mandated 31 March 2013

53
facilities
Provision of teachers as per prescribed PTR 31 March 2013
Training of untrained teachers 31 March 2015
All quality interventions and other provisions With immediate effect
Thus, it is essential to notify the State RTE Rules as soon as possible. Any delay in such
notification may lead to missing the deadlines and consequently the State may not receive
funds under the SSA. This may seriously affect the announced programme of
universalisation of elementary education.

54
Chapter 6
Elementary Education- Analysis and Recommendations
6.1 Access to Elementary Education
The Constitution (Eighty-sixth Amendment) Act, 2002 inserted Article 21-A in the
Constitution of India to provide free and compulsory education for all children in the age
group of six to fourteen years as a Fundamental Right in such a manner as the State may
determine by law. The Right of Children to Free and Compulsory Education (RTE) Act, 2009,
which came into effect on 1st April 2010, clearly states that all children in the 6-14 age group
have the right to a free and compulsory education till completion of elementary education in
a neighbourhood school. The RTE Act, 2009, further clarifies that compulsory education
means an obligation of the appropriate government to ensure compulsory admission,
attendance and completion of elementary education. Free education implies that no child
shall be liable to pay any kind of fee or charges or expenses which may prevent him/her
from pursuing and completing elementary education. The RTE provides a legally
enforceable rights framework that the government must adhere to. As per that framework
every state must establish the necessary number of neighbourhood schools.This must be
done by 31 March 2013 in order to ensure the goal of access and universalization of
elementary education (Section 6). RTE requires every state government to notify
neighbourhood norms for opening new schools under SSA. While determining the need for
access of children to neighbourhood schools, a state is required to conduct mapping of
neighbourhoods and link them to specific schools; thereby identifying gaps where new
schools need to be opened. In other words, it is the responsibility of the state government,
under the RTE Act, to ensure availability of schools within the limits of neighbourhoods.
In the state of West Bengal the total number of government schools providing primary
education is 51016 (Provisional DISE 2010-11), out of which 50604 are pure primary
schools. These figures do not include Sishu Shiksha Kendras (SSKs). Table 6.1 shows that
22.59% of the total population of West Bengal in 2001 were in the age group of 4-16 years.
Estimates show that this percentage will decline to 17.55 in 2011 and further to 13.74 by
2026. On the other hand the proportion of children who would enter into the formal education
system (children in the age group 0-4 years) was 10.69% in 2001 which is expected to go
down to 7.7% in 2011 and further to 6.68% of the total population in 2026. Thus table 6.1
55
shows that children going into the formal elementary education system would reduce over
time both in absolute numbers and in percentage.
This would imply that the need for opening new primary schools would reduce in the state in
the future. Presently 51016 government primary schools cater to a population (age group 5-9
years) of 72.86 lakhs – which gives a ratio of 143 children per school. If this average is
maintained in the future there would not be any need for setting up additional primary
schools in the state in next 15 years (Table 6.2).
However it cannot be denied that there are areas in the state which have more number of
primary schools than the minimum required and similarly there are areas which have no
primary school. Thus the overall state level statistics of the availability of primary schools
may not guarantee universal access to all school going children. In this respect it may be
noted that the West Bengal Government has not yet notified the limits or the area of a
neighbourhood as required under the RTE Act, 2009. The existing SSA norm mandates the
availability of primary schools within 1 km of every habitation. In the absence of a notification
defining neighbourhood schools, if one goes by the SSA mandate it is observed that there
are 16 districts in West Bengal where there are places which do not have any primary
school/SSK within 1 km of habitation (Table 6.3). Incidentally the Central RTE rules also
state that the area or limits of a neighbourhood for setting up a primary school (class I-V)
shall be within the walking distance of 1 km of the neighbourhood. The estimate shows that
there is a need to setup 1557 new primary schools in designated areas to bridge this gap
and thereby ensure adequate access. It is also observed (details not given for brevity) that
there are four habitations in the district of Jalpaiguri, with populations of more than 35,000
(Census 2001), which do not have any primary schools/SSKs within 1 km.
The central RTE rules mentions that the limits of an area of a neighbourhood for setting up
an upper primary school (class VI-VIII) shall be within the walking distance of 3 km of the
neighbourhood. The SSA norms prescribe setting up an upper primary school for every two
primary schools. Table 6.4 provides details of district wise availability of schools offering
primary and upper primary education (excluding SSKs and MSKs) in West Bengal. Using the
SSA criteria, there is a need for setting up an additional 14934 upper primary schools in the
state. However a separate survey (Table 6.4) shows that the number is 14165 using a
neighbourhood definition of 2 km. The revised SSA norm provides that new upper primary
schools/ sections would be opened in the campuses of existing primary schools so they
become integrated elementary schools from class I-VIII. This way of addressing the gap in
upper primary schools would also hopefully reduce the students‘ dropout rate. Hence it is

56
necessary to identify primary schools which can be upgraded to upper primary schools to
take care of the access issue. Such an exercise would be contingent on sufficient land being
available with the primary schools for the upgradation.
The RTE Act mandates the formalization of Shishu Siksha Kendras (SSKs) and Madhyamik
Siksha Kendras (MSKs). It is suggested that all MSKs (1911 in number) be upgraded to
upper primary and secondary schools. Only those SSKs having a minimum number of 40
students may be converted to a formal primary school with the necessary infrastructure. The
remaining SSKs may either be closed or used as pre-school (Anganwadi) centres.
Thus, to summarise, the requirements of additional schools are given below:
Primary schools: 1557
Upper-primary schools (including upgradation): 14934
6.1.1 Social Access
Social access implies that children from different social backgrounds should have free and
equitable access to elementary education. Thankfully, the problem of social discrimination is
low in West Bengal and it has been observed that the introduction of the mid-day-meal
scheme in schools has further eliminated the social divide. In order to ensure that children
from weaker sections and disadvantaged groups are brought to the school and are not
denied admission even in unaided private schools, the village schedule must be regularly
maintained and updated as mentioned in Para 5.6 of Chapter 5.
According to the NUEPA (National University of Educational Planning and Administration)
report, in the last three years (2007-08, 2008-09 and 2009-10), respectively 28.13, 28.28
and 32.30 of every 100 primary school children in West Bengal were Muslims, while 25.25
per cent of the State‘s population is Muslim. West Bengal‘s figures for Muslim students‘
enrolment at the primary level are better than the national average of 10.49 per cent (in
2007-08), 11.03 per cent (in 2008-09) and 13.48 per cent (in 2009-10) respectively, while
Muslims form 13.43 per cent of India‘s population. West Bengal‘s record is far better than
that of Gujarat. In Gujarat, Muslim students‘ enrolment at the primary level was 4.57 per cent
(2007-08), 4.73 per cent (2008-09) and 6.45 per cent (2009-10). In 2009-10, upper primary
school enrolment among the Muslim students in West Bengal was 26.46 per cent (Table
6.5).
In order to ensure that private schools do not deny admission to weaker sections of society,
all unaided schools must be brought under the supervision of the Directorate of School
Education through a due recognition process.
57
6.1.2 Pre- School facilities
It has been observed internationally, that a child‘s physical growth and ability to learn
depend significantly on the nutrition received in the early ages, particularly during the first
five years. It is from this standpoint that the GoI had introduced Integrated Child
Development Scheme (ICDS). Under ICDS, it was proposed to have atleast one Anganwadi
Centre for 20 infants in the age group 2.5 and 4 years in each village. The Anganwadi
worker was supposed to help the children under her care in immuinzation, developing the
child‘s cognitive capacity and provide prescribed snacks and nutritives for which central
grants were provided separately. It has been found that in the villages with Anganwadi
centres, the children were better off in terms of quality of life indices.
But the age group provisions of 2.5 and 4 years in the ICDS centres, left a gap of at least
one year before the child could join the primary education system. In absence of any Creche
facility in the villages, the primary schools faced the pressure of admitting underaged
children in class one to enable the elder siblings to attend schools, and the parents to work
for livelihood. This resulted in overcrouding of class one classrooms, and an inflated figure of
drop out between class 1 and 2. In recent years, the upper age limit to remain in the
Anganwadi centres has been extended to 6 years, which is an important step in the right
direction.
So far as the current status of ICDS in our sample villages are concerned, we find the
following:
We have surveyed 126 anganwadis from 46 mouzas (table 6.5a). The average number of
ICDS is highest (i.e. 6 ICDS/ mouza) among the mouzas with more than 1000 households
(table 6.5b) and this figure is lowest (i.e. 1 ICDS/mouza) in mouzas with less than 100
households. Most of the surveyed ICDS run in the morning (table 6.5c). Most of the ICDS
run under some shed. It is also observed by interacting with those ICDS which run in open
space, that nearly 85% (28 in number) Anganwadis had shifted to other places, 12 percent is
closed and only 3% of the Institutions changed their scheduled time in summer or rainy day
(table 6.5d). Most of the ICDS centre‘s shed are owned by the person who runs those ICDS
(table 6.5e). Supervisor is appointed by BDO, supervising and accountable to DPO, ICDS.
Apart from supervisor, there are monitoring committee in different form in different areas
supervising such institution.
Composition of Monitoring Authority: Three type of Monitoring Authorities in the form of a
Committees exist in the surveyed Anganwadis: (1). VEC; (2). Beneficiary Committee and (3).
Monitoring Committee. In VEC the President is generally the GP member of the Sansad,

58
Secretary is the Head Teacher of the Primary School and Members are some villagers
whose children are studying in any school or have school going aged children in their
household. In case of Beneficiary committee generally the GP member is the President.
Otherwise, a villager is chosen as the President. The Secretary is generally a villager of the
village while the members are some guardians of the beneficiaries. The Monitoring
Committee comprises of a President who is either the GP member of the Sansad or a
guardian of a student, the Secretary is generally a guardian of a student and the Members
include the ICDS worker, ICDS helper, Supervisor and some villagers. A high percentage of
ICDS receive toys and charts from authority (101 ICDS out of 126 ICDS). But very few ICDS
receive books and copies from authority (table 6.5f). Table 6.5g shows that the enrolment in
ICDS decreases from 3653 (including 0-6 years old child and pregnant and nursing mothers)
in 2007 to 3421 in 2009. Other than laterite region (such as Bankura and Paschim
Midnapur) the number of ICDS is adequate (table 6.5h). This may be the effect of recent
policy changes towards meeting requirements of pre-school education. The teachers in
ICDS are not sufficiently trained. They need to be trained in order to fulfil the purpose of pre-
school/play schools in West Bengal.
6.2 School Infrastructure
Section 19 of the RTE Act 2009 and the schedule thereto mention that all new schools
should have all weather school buildings and all existing school buildings should be all
weather compliant by 31 March, 2013. The schedule to the RTE Act specifies the following
features of an all weather school building:
a) One classroom one teacher.
b) Office-cum-store-cum-head teacher room.
c) Toilet and drinking water facilities.
d) Barrier-free access, including ramps with railings on both sides.
e) Playground.
f) Fencing/ boundary walls.
g) A kitchen where the mid-day meal is cooked in the school.
Table 6.6 provides important comparative statistics of school infrastructure. The table shows
that infrastructure in primary schools in West Bengal is below par in three areas - (1)
separate girls‘ toilet, (2) availability of computers, (3) availability of electricity. However the
availability of drinking water on the school premises has improved significantly in West
Bengal in 2009-10, where it crossed the national average. Availability of electricity and
computers in primary schools are matters of great concern and West Bengal‘s performance

59
on these two counts have been inferior to a low national average. Interestingly percentage of
schools having a ramp facility in West Bengal has fallen from 58.65 (2008-09) to 50.01
(2009-10). This implies that many new schools were established during 2009-10 without
ramps. This is in violation of the recommendation of RTE Act.
We have collected infrastructure related data based on our survey of 92 Govt. schools and 9
non-Govt. schools. Table 6.7 shows the distribution of Government schools by type of school
building. Survey data show that 13% of Government schools do not have a pucca building
and two schools in urban areas (other than Kolkata) are operated from rented premises.
DISE data (2008-09) showed that 72% of the Government schools had pucca buildings. Our
survey data in table 6.6 shows that about 85% of the Government schools have pucca
buildings. In the absence of latest DISE data if one assumes that 85% of the Government
primary schools have pucca buildings (which is a very optimistic assumption), about 7600
schools (15% of 50604 primary schools) should be upgraded into all weather buildings. This
is in addition to the need for setting up 1557 new primary schools. The state government
needs to take urgent measures to upgrade the existing primary schools and setup the
required number of new schools to conform to RTE standards.
Table 6.8 shows the availability of classrooms in primary schools in West Bengal. It is
observed that there are 133 schools without any classroom, which is in gross violation of the
RTE norms. Table 6.8 also shows that 5.32% of the primary schools have just one
classroom. Our survey result on this issue is given in table 6.9. Survey data also confirms
that about 5.5% of the Government primary schools have one classroom. The RTE Act
provides that the number of classrooms in a school depends on the number of teachers with
a minimum of one classroom per teacher. A primary school should also have another office-
cum-store-head teacher room.
Table 6.10 provides data on the availability of other selected infrastructure in primary
schools. Only 30% of the schools surveyed had a playground and 79.3% of the schools have
a separate teachers‘ room/head teacher room/office room/store room. Of the 92 government
schools surveyed, no primary school had any facilities for a library or computers. About 70%
of the schools had a separate kitchen/kitchen shed.
Table 6.11 shows the availability of drinking water in schools. About 83% of the schools
surveyed have facilities for drinking water. Interestingly, the percentage of schools with
drinking water facilities is more in rural areas than in urban areas.

60
Table 6.12 shows the availability and type of toilets in Government schools. Overall about
95% of schools do not have separate toilet facilities. Only four schools out of 92 schools
surveyed have separate toilet facilities for boys and girls.
Table 6.13 shows the distribution of Government schools by availability of water inside the
toilets. Only 36% of the schools have a water supply inside the toilet. If one considers
schools in rural areas only, the percentage drops to 25%. The lack of water inside a toilet is
a serious hygiene issue.
Table 6.14 shows class wise availability of fans and lights in Government primary schools.
About 65% of the schools do not have electricity (fan and light) facilities. Although this is a
slight improvement from 2009-10 (see Table 6.5), there is a huge scope for improvement.
Since classes are held in schools during the day, the lack of availability of electricity may not
be a major deterrent for school going children, provided the classrooms have sufficient
sunlight. Table 6.15 shows the availability of sufficient sunlight in classrooms. About 18% of
the classrooms do not have sufficient sunlight. In terms of general cleanliness of
classrooms,our survey results show that about 30% classrooms do not maintain normal level
of cleanliness (Table 6.16).
Thus the West Bengal Government will have to expedite upgradation of infrastructural
facilities and the SSA would be able to provide necessary funds for this purpose. The
Government has about two years to execute this responsibility. This would require a survey
of each government school to identify the infrastructure requirements and the local authority
should be involved in this exercise.
6.3 Student Enrolment and Retention
Table 6.17 provides a comparative picture of survival rate, transition rate and average
dropout rate on four selected states: West Bengal, Gujarat, Madhya Pradesh and Kerala. It
also includes the all India average. If we look at the apparent survival rate, Gujarat stands
out. In case of West Bengal the survival rate in 2006-07 and 2007-08 were 74 and 79
respectively, which are greater than the all India average in respective years. The figure did
not improve in 2008-09. In case of the transition rate from primary to upper primary Kerala
(98.01) is leading these states in 2007-08. Gujarat and Madhya Pradesh also show a
growing rate of transition throughout the years. In the case of West Bengal this rate drops
from 79.50 in 2006-07 to 69.88 in 2007-08 but then jumps to 85.88 in 2008-09. The all India
average also shows a steady growth of transition rate. The average drop-out rate is highest

61
in West Bengal among these four states. In 2006-07 the figure was 9.41 and drops to 7.98 in
2007-08 but it jumps to 8.66 in 2008-09. The dropout rate in West Bengal is less than the
national average in 2007-08 and 2008-09. Gujarat has a very low rate of dropout. One of the
reasons for a high dropout and low transition rates in West Bengal could be that the primary
classes in West Bengal are from I to IV. If class V is brought into primary schools, these
numbers may change. Such low rates also highlight that the shikshabandhus and resource
persons may not be doing their job diligently.
Table 6.18 shows the district-wise Gross Enrolment Ratio (GER) and Net Enrolment Ratio
(NER) at both Primary and Upper Primary levels for the year 2010-11. The GER, amongst
primary schools, is highest in Uttar Dinajpur (146.82) and lowest in Kolkata (113.99). In case
of NER, Nadia shows the highest figure (99.95) and Uttar Dinajpur shows the lowest figure
(93.92). In Upper Primary schools, the GER is highest in Purba Medinipur (113.38) and
lowest in Uttar Dinajpur (93.83). The NER in Upper Primary is highest in Hugli (96.12) and
lowest in Uttar Dinajpur (76.71). Table 6.18 also highlights that the ratios are significantly
poorer at the upper primary level. This reinforces our observation on the lack of access to
upper primary schools. There is an urgent need to set up large number of upper primary
schools in the State.
Table 6.19 provides an area-wise dropout scenario against the total enrolment figures. The
dropout figure for class II is calculated by subtracting the enrolment of the current academic
year in class-II from the enrolment of the previous academic year in class-I. The dropout
numbers of other classes are estimated similarly. For the year 2007-08, the dropout is very
high in rural areas (490) and this dropout figure is greater for the girls (254) than boys (200).
For the urban areas this dropout rate is much less in urban areas. Overall 90 students
dropped out in the year 2007-08 among which 48 were boys and 42 were girls. Kolkata
shows a strange figure for the same academic year. The total dropout is 99 and all of these
99 students are girls. These figures were for dropouts during transition from Class-I to Class-
II. The same picture is observed in 2008-09 except in Kolkata – dropout for boys in Kolkata
was -5. This implies that 5 more students got admission in class-II in Kolkata. As we move to
higher classes, the enrolment increases year by year and consequently the dropout rates
fall. The major concern of dropout at the primary level is in class II.
Table 6.20 shows reasons for dropouts as told by schools. It is mentioned by the school
head teachers that the main reason for dropping out is the students‘ inability to cope up with
learning. The second reason cited is the migration of households to other areas. Temporary
migration of parents for better earning (25.4%) is a major cause for dropouts. Other reasons
62
cited for low enrolment in rural areas include parents‘ ignorance andinterference by SSK
teachers. However, when we had asked the parents of children about the reasons for
dropout and low enrolment, three major reasons cited were children‘s /parents‘ lack of
interest in schools, families are unable to give school fees and children go to work to support
their families (Table 6.21a and Table 6.21b). Thus the reasons cited by the school teachers
and the parents of the children were quite different. One thing is clear that if the school
environment and classroom transactions improve, that would help in retaining children in the
school. Interestingly, quite a few parents (in the low income bracket) mentioned that they
were forced to withdraw their children from school due to financial reasons (unable to pay
fees /charges). On enquiry, we find that while schools do not charge any tuition fee, some of
the schools charge their children development/festival or other fees. Charging any fee from
children is a violation of the principles of SSA and the directives of RTE Act.
Another interesting result emerges from the household survey on the reasons for dropping
out in class II. Table 6.22a shows that about 4% of the children (5-8 years) never enrolled in
the school/ICDS/SSKs. Our survey also finds that on many cases, a child‘s name appears
simultaneously in ICDS/SSK and a formal school. Thus there is duplication in registration.
This could be another reason for a large number of dropouts in class II. Table 6.22b shows
the reasons for non-enrolment in schools. Predictably, the major reason cited for non-
enrolment for 5 year old children is age of the children. However, another common reason
cited is financial (no money for fees). Six children (age 8 years) cited a lack of interest as the
reason for non-enrolment.
Table 6.23 shows that contrary to popular belief, not all schools provide the Mid-Day Meal
(MDM). Ten out of ninety two schools surveyed did not provide the MDM. It was observed
that MDM was not offered on all working days. However, SSA mandates that children should
be provided MDM on all working days, without exception. We examined whether MDM had
any impact on the attendance of the children in the school. Based on a surprise visit on a
particular day in the schools surveyed, we observed that attendance did not drop
significantly after the MDM was served (Table 6.24). Attendance fell by about 8% in rural
areas and 12% in urban areas after MDM. We have observed in Madhya Pradesh that MDM
was served on all working days. We have also noted that in Kerala, the local authorities
(Municipal Corporation/ Gram Panchayat) provide milk, egg and breakfast separately to all
school children in the respective localities. These two states have not reported any fall in
attendance after MDM.
We recommend the following:
(a) There is an urgent need to restructure the primary and upper-primary classes. Like in
many other states and as prescribed in the RTE, primary school should comprise of
classes I-V. Upper-primary level should comprise of classes VI-VIII. This

63
restructuring will help in two ways: better retention ratio and the rationalization of
teacher/infrastructure requirements. However, there will be a need to construct
additional class rooms in stand-alone primary schools.
(b) Primary and upper primary schools should not charge any fee, by whatever name
called. Expenses for any festival should be met out of voluntary
contribution/contingencies.
(c) As schools do not provide notebooks, pen/ pencil to students, text books (including
work books) in the primary and upper primary schools should be designed in a
manner to minimize use of notebooks. Additional (blank) pages should be provided in
the text book/exercise book.
(d) Mid day Meal should be compulsorily served on all working days (including
Saturdays). Mother volunteers of children may be involved in the
cooking/management of mid day meals.
(e) SMC, VEC and the local authority (e.g. Gram panchayat) should develop
programmes to track children in respective areas to ensure 100% enrolment and
retention. The village education register has to be religiously maintained.
6.4 Teacher Requirement & Training
The RTE Act provides for rational deployment of teachers by ensuring that the specified
pupil teacher ratio is maintained for each school, rather than just as an average for the
State/District/Block, thus ensuring that there is no urban-rural imbalance in teacher postings.
RTE also specifies that only appropriately trained teachers will be appointed.
Table 6.25 shows estimates of district-wise teachers‘ requirements in West Bengal. If we
calculate the shortage of teachers as per DISE‘s current Pupil-Teacher Ratio (PTR) then we
will find that there is a shortage of 176411 Primary teachers in the state. Some of the
districts like Bankura, Darjeeling, Dakshin Dinajpur, Hugli, Kolkata, Paschim Midnapur and
Purba Midnapur have surplus teachers. But if we calculate the shortages of teachers as per
RTE norms then this figure jumps to 63777 in Primary schools. We have been informed by
the West Bengal State Directorate of School Education that the Government has recently (in
the beginning of 2011) offered appointment to about 49000 primary school teachers. If all of
them join, the additional teachers‘ requirement in government primary schools will be around
15000 teachers. Once all the vacancies are filled up, total teachers‘ strength in primary
schools would be around 220000. One needs to add a requirement of another 11,000
teachers per year due to the retirement of about 5% of the teachers every year.
Data collected from SSA office (Table 6.26) shows that there are 1327 primary schools in
the state which are single teacher schools. The RTE rules prescribe a minimum teacher

64
strength of 2 per school. This serious problem of a teachers‘ shortage can be solved through
the following measures:
(i) Concept of sanctioned post per school should be introduced.
(ii) Shortfall of teachers in a school should be met initially by transferring appropriate
teachers from schools having surplus teachers in the same district.
(iii) Fresh appointments should be made only to fill up the net vacant positions.
(iv) As a policy the transfer of teachers from other districts should be avoided.
Table 6.27 shows the status of trained teachers in only Primary schools. In Burddhaman
district 95.07% of all teachers (only primary schools) received in-service training and only
0.20% Primary teachers in Darjeeling district received in-service training. In aggregate
65.96% of Primary schools teachers received in-service training.
Para 5.10 of Chapter 5 lays down the minimum pre-service eligibility criteria for school
teachers as per NCTE norms. The State has to ensure that all school teachers involved in
elementary education (class I to VIII) are ‗adequately trained‘ and possess minimum
qualifications. We have been informed that at present there are about 75000 ‗untrained‘
teachers in primary and upper primary schools in West Bengal. All these teachers need to
acquire D.Ed/B.Ed qualifications within 31 March 2015. There are currently 80 PTTIs
(Primary teacher Training Institutes) in West Bengal which can enrol only 50 candidates for
D.Ed course per year. Hence, following the normal process, only 20000 teachers can be
trained in next five years. The other teachers can be trained in the following ways:
(a) The Education Department may write to NCTE/ other appropriate authorities and get
an approval to offer D.Ed courses through distance learning mode from the 80 DIETs
(i.e. PTTIs). Madhya Pradesh has gotten a similar approval. If the Department can
enrol an additional 200 teachers per PTTI for the D.Ed course per year, one can
easily train another 60000 teachers in next four/five years. As Madhya Pradesh has
already got such an approval, we hope that there will be no problem in getting a
similar approval.
(b) The Department may write to IGNOU for offering similar correspondence courses.
The classes may be held in different IGNOU centres.
For in-service training, the following model is recommended:
ii. Training should be held in such a way that classes are not affected.
iii. SSA mandates 20 days training per teacher every year. This can be divided into two
modules: 10 days of refresher course for each teacher during the summer vacation
(may be called vacation training). Such training should be held at PTTIs/DIET.
Necessary arrangements for accommodation and other facilities should be made.

65
iv. The training for the remaining 10 days should be held at BEC (Block Education
Centre)/UEC (Urban Education Centre)/CLEC (Cluster Education Centre) on one
Saturday every month.
v. An envisioning workshop may be held for three days in the first week of April every
year to finalize the training calendar. This workshop will be organised by WBCERT at
its state headquarters. Members (may be called the State Resource Group) attending
the workshop may be drawn from the West Bengal Council of Educational Research
and Training (WBCERT), eminent faculty of PTTIs/DIET, one eminent teacher (to be
nominated by the district administration) from every district. The workshop will finalize
the annual training calendar as well as the curriculum. We believe the participative
method of curriculum development would have a greater buy-in.
vi. The State Resource Group (SRG) would then organize a series of workshops of 3-4
days duration for the faculty members of PTTIs/DIET and select trainers of BEC/UEC
/CLEC. This process should be over by the end of April.
vii. The PTTI faculty would provide vacation training to all school teachers under their
jurisdiction.
viii. The BEC/UEC /CLEC trainers would conduct the Saturday training sessions at
block/cluster level.
ix. The BEC/UEC /CLEC trainers would also regularly visit schools to help teachers
improve their classroom transactions.
6.5 Accountability of Teachers
The Central RTE Rules provides that each teacher shall maintain a file containing the pupil‘s
cumulative record for every child which will be the basis for awarding completion certificate
of elementary education. The State RTE Rules may also specify (e.g. RTE Rules of Madhya
Pradesh) minimum number of working hours (including preparatory hours) per week. The
head teacher must ensure that each teacher adheres to the minimum working hours. A
teacher may, however, perform the following duties without interfering with regular teaching:
(a) Participation in training programmes;
(b) Participation in curriculum formulation and development of syllabi, training modules,
and text book development;
(c) Participation in Census work.
Table 6.28 shows that the average number of working days of schools in the last year in
Kolkata is less than 200 days (i.e. 176 working days), whereas the figure is more than 200
days in rural (212 working days) and urban (214 working days) areas. Kolkata also shows a
lower figure of the average number of days teachers were present in the last year. For

66
Kolkata this figure is only 169 days on the other hand this figure is 184 and 186 days for
rural and urban areas respectively. But the percentage of attendance of teachers in Kolkata
(95.9%) is almost 10% higher than rural (86.5%) and urban (86.8%) areas. Overall the
average number of days the teacher is present in the last year is 184 and the attendance
percentage was 90.7. The statistics show that schools are not open uniformly throughout the
state and the numbers of working days vary from one region to other. Also the attendance of
teachers is predictably low in areas other than Kolkata.
The Pupil-Teacher Ratio (PTR) as per RTE norm is 30. Although the average PTR based on
our survey was 30, there is a significant difference between Kolkata and other areas (see
Table 6.29). This difference has to be kept in mind while formulating the recruitment and
transfer policy of teachers.
The interactions with the district administration of schools revealed that the administration do
not have any power to take disciplinary action against errant teachers. The administration
can only file a written complaint to DPSC for disciplinary action. The D.I/S.I of schools are
not even given feedback on the action taken on their written complaints.
We recommend that the district school administration be empowered to take disciplinary
action (excluding dismissal from service) against teachers. The aggrieved teachers should
also be given the opportunity to appeal to the concerned VEC against the action. VEC can
conduct periodic grievance redressal meetings with the district/block administration, as the
case may be, to sort out the matters. Disciplinary action amounting to dismissal from service
can only be taken by the State administration on the recommendation of the VEC.
6.6 Quality of Education and Teachers’ Incentive
Table 6.30a shows students‘ performance in Class IV. Except Kolkata, more than 50% of the
students secured less than 65% marks in primary schools in the eight districts surveyed.
Also more than 10% of the children got less than 35% marks (except Kolkata). These data
show that there is a serious problem with the pedagogy and the quality of classroom
transactions.
We have conducted two separate exams for Class-I (only English test) and Class-III
(Bengali, Mathematics and English tests) students during our survey. Our objective was to
check the students‘ performance in language and quantitative courses. We find that the
students have performed, as reasonably well in Bengali, moderately in Mathematics and

67
poorly in English. From Table 6.30b, Table 6.30c and Table 6.30d, we observe that for
Class-III in the rural areas, the average marks obtained per student in Bengali is 81.10%, in
Mathematics it is 50% and in English this is 17.02%. In case of urban areas, these marks are
71.95%, 56.25% and 34.04% respectively. In case of Kolkata the respective marks are
93.90%, 68.75% and 40.43%. If we take all the areas together then the average marks
obtained per student in Bengali is 79.27%, in Mathematics it is 53.13% and in English it is
21.28%. Table 6.30e shows that in Class-I the average marks obtained per student in
English in rural areas is 20%; in urban areas this figure is 44% and in Kolkata it is 42%. If we
take all areas then the figure is only 26%. This preliminary test reinforces the fact that the
quality of teaching in primary schools is far from satisfactory. This is true in both rural and
urban areas.
Tables 6.31 and 6.32 shows the use of text books and TLMs (Teaching Learning Materials)
in the class room. It is observed that in Mathematics, teachers of 69% schools do not use
textbooks and about 45% do not use any TLMs. For science subjects, the use of TLMs is
more than mathematics. 65.5% of the schools use 4 to 6 TLMs for sciences and 34.5%
schools do not use any TLM for science subjects.
We have not observed any use of innovative methods of learning (e.g. activity based
learning the way it is followed in Madhya Pradesh, Tamil Nadu) in primary schools.
Table 6.33 shows the prevalence of private tuition for children in primary schools based on
level of income of the household. 47.1% households with income level upto Rs.1500,
provide private tuition to their children. The percentages increase with the increase in
household income. On an aggregate 66.5% households provide private tuition to their
children. Table 6.34 provides a caste-wise distribution of students taking private tuition. It is
observed that children belonging to the weaker sections/ disadvantaged groups were not
availing private tuition as actively as children from the general category.
In order to improve the quality of teaching in schools, the role of WBCERT assumes prime
importance. WBCERT should be the nodal centre for curriculum development, innovation in
pedagogy, development of reading materials in the form of text books and CDs, and
designing training programmes for the teachers. SSA funds available under innovation and
computerisation should be utilized to develop effective e-learning modules.
We recommend the following to improve the teaching quality in primary and upper primary
schools:
Primary Schools:

68
a) Schools may be encouraged to follow activity based learning methods. Classrooms
in primary schools should be specially designed for this purpose. WBCERT should
be entrusted with the responsibility of preparing appropriate materials for Activity
Based Learning (ABL). We have observed that ABL has two merits – (i) each student
can learn at his/her own pace; and (ii) it ensures greater participation of children in
the class.
b) While children should not be burdened with an overdose of homework, it cannot be
denied that a child‘s understanding and comfort with quantitative subjects like
mathematics, can only improve through practice. Hence a significant part of the
classroom time should be devoted in solving problems in mathematics.
c) Language subjects should give more emphasis to oral and written skills. Every child,
by turn, should be asked to read a portion of the text loudly and the teacher should
give particular attention to pronunciation and spelling.
Upper Primary Schools:
(d) The use of electronic study materials and lecture sessions should be vigorously
pursued in all upper primary schools. As the quality of students varies from one
school to another, similarly the quality of teachers also varies. We recommend the
use of the ‗Flip Method‘ in teaching science and mathematics subjects in upper
primary schools. The ‗Flip Method‘ proposes flipping the traditional teaching model of
learning inside the classroom and teaching outside the classroom. In the ‗Flip
Method‘, most of the subject learning happens outside the classroom and classroom
time is used for practicing problems and undertaking interesting experiments. It is
proposed that as a pilot case, 500 upper primary schools are initially selected to
impart education through the ‗Flip Method‘ on two subjects: mathematics and
science. The ‗Flip Method‘ can be implemented as below:
i. WBCERT identifies 10 best subject teachers (for mathematics and
science) for each class (Class-VI to Class-VIII). DIET can help
WBCERT in identifying those teachers. The selected teachers should
be good at communication skills. The syllabus of a subject will be
divided into appropriate modules and a specified number of lectures
will be identified for each module. The selected teachers will be asked
to prepare lecture notes for each session of a subject. The lecture
notes will be vetted and approved by a committee of experts setup for
this purpose. The teachers, who have prepared these lecture notes,
will then be asked to record these session-wise lectures in a VCD.

69
ii. The subject VCD so developed will have session-wise lectures by the
best of teachers and sufficient copies of VCDs will be sent to all upper
primary schools.
iii. The computer room in each upper primary school should have a
sufficient number of computers so that there is one computer for every
5 students in a class. For example if the average class size of an
upper primary class is 40, there should be at least 8 computers in the
school. Each computer should have a speaker to listen to the audio of
the lecture session.
iv. Each subject should have an adequate number of lectures and
practice sessions. Each practice session will be preceded by one or
more lecture sessions. Every student will be asked to go through the
recorded lecture sessions as per the class schedule. This will help
every single student, irrespective of the location of the school, to learn
the subject from the best of teachers.
v. The role of a class teacher in a particular school for a particular
subject (mathematics or science) will be more of a facilitator or tutor.
During the practice sessions students will be given problems/tasks of
varying difficulty levels. The class teacher should be a keen observer
and should monitor the progress of each student in the session. The
teacher should intervene/facilitate in the learning process only when
he/she thinks it is necessary.
vi. The performance of each student should be evaluated on a
continuous basis through specially designed tests after every module.
(e) We recommend that for subjects like history and geography, the Active Learning
Method (ALM) or any other similar method be used. ALM, as followed in Tamil Nadu
and Madhya Pradesh, has many advantages. For example, it encourages students to
learn in groups and go beyond what is mentioned in the text books. However one of
the drawbacks of ALM is that it does not allow flexibility in learning and at times
discourages creativity of the students. The alternative to ALM could be to develop
textbooks in such a way that each book can be unique to a particular student. For
example, the history textbook can be designed in such a way that after every
chapter, a list of reference materials will be mentioned and a few blank pages will be
given. The school library must have the reference materials mentioned in the
textbooks. Each student will be asked to use the reference materials (this task has to
be carefully assigned by the subject teacher so that no two students write the same

70
text) to prepare a write up as an additional learning module for that chapter and
reproduce it in the blank pages provided in the textbook. This exercise will encourage
students to be creative, expose students to reference materials and therefore
broaden their horizons. We recommend that schools should be given the option of
choosing a particular pedagogy (ALM or the other alternative).
(f) While teaching language subjects adequate emphasis should be given on oral and
written skills.
The education of a child will be incomplete unless one can impart social awareness and
basic ethics in every child. Students should also learn to work in groups/teams. These soft
skills should be imparted informally rather than through formal classroom lectures. We
propose four schemes in this regard:
i. Every child in a primary class will be asked to maintain his/her attendance record of a
particular subject for the whole year. A class teacher will periodically (for example,
fortnightly) verify the child‘s attendance record with the teacher‘s attendance register.
ii. Every upper primary can have a ‗shopping‘ period once a week. During the shopping
period a designated classroom can be converted into an unmanned Kirana Store
where a select consumable item of a reasonably low price will be kept. The price list
will be displayed in a prominent place in that classroom. Any student can enter the
store and pick up an item after paying the listed price in a box kept for this purpose.
This exercise will help students learn to be ethical. If any student is found cheating,
the fellow students should bring it to the notice of concern teacher.
iii. Every upper primary school should organise social awareness programmes (for
example cleanliness drives, medicine collection, waste paper collection etc.) in
collaboration with NGOs/Social Organizations twice every year. This should be done
in such a manner that every student participates in at least one such programme in a
year.
iv. Every student of an upper primary school should be a member of the school
house/club. The school should organize debates, essay competitions, sports and
other cultural activities among the houses/clubs
It has been observed that in the case of several States, appropriate incentive systems
positively affect the quality of education. Incentive schemes may be developed for students
as well as teachers. We recommend the following:
a) The State can introduce a merit scholarship examination in class V. This would in a
way provide a check on the quality of education at the primary level and would also
provide an incentive to children to perform well in studies. The scholarship amount

71
may be paid out of funds available under the LEP (Learning Enhancement
Programme) in SSA.
b) Teachers have a major role to play in maintaining and improving the classroom
transactions and thereby enhancing student learning capability. An incentive scheme
(on the lines of Pratibha Parv in Madhya Pradesh) may be launched for the teachers
in primary and upper primary schools. The incentives may be paid out funds
available under the LEP (Learning Enhancement Programme) in SSA.
6.7 School Management
Table 6.35 provides data on the activity of school management systems. Presently there are
a good number of school-level committees looking after various monitoring aspects of the
school. Almost every school in a rural area has a Village Education Committee (VEC), a
Mother Teacher Association (MTA) and a School Monitoring Committee (SMC). But only 6
schools in rural areas have a School Development Committee (SDC). In urban areas all
schools have Ward Education Committees (WEC) and 18 schools have MTAs. Only 41 out
of 92 schools have SMCs. The RTE Act prescribes that there should be only one
management committee of the school: the SMC. The SMC would have specific roles and
responsibilities as defined in the State RTE Rules. Such roles and responsibilities of the
SMC have been discussed in Chapter 5. It is recommended that MTA, SDC, and PTA
(Parent Teacher Association) be merged with the SMC. VEC/WEC would look after all the
schools within its jurisdiction. It can also be seen from Table 6.35 that at present only the
MTA has been active. Hence it is recommended that mothers should have a significant
presence in the re-constructed SMC. The School Management Committee should be held
responsible for ensuring that classes are regularly held and all SSA and state government
schemes are properly implemented. In addition to the school headmaster, representatives of
SMCs would interact with the AEOs at the cluster level whenever necessary. The SMC
would also prepare the School development plan (SDP) and such plan should be entered in
the MIS at the cluster level at the Cluster Education Centres (CEC). The school development
plan would contain estimates of class-wise enrolment for each year, additional personnel
/infrastructural requirements and hence additional financial requirements. School grants
under the SSA would be made available to the SMC based on the school development plan.
Any money received by the SMC would have to be credited to the account of the Committee.
The account should be a joint account of the Chairperson and the member secretary of the
Committee. The SDPs will be collated at the block level and forwarded to the district project
office for necessary action. The entire exercise has to be completed before the beginning of
the financial year for which it is meant. Once the SMC is adequately strengthened, the VEC

72
will be responsible in ensuring: (a) that all the schools under its jurisdiction are appropriately
managed; (b) that all common concerns (e.g. infrastructure-related, training-related) affecting
schools are addressed; (c) that all complaints by the teachers are addressed and acted
upon; (d) that the mid-day meal and other welfare schemes are properly implemented; and
(e) that enrolment and retention ratios in schools under its jurisdiction are maintained at
100%. VEC should generally meet once in every three months. However, an emergency
meeting may be convened by the Chairperson of the VEC anytime with a 10-day notice.
6.8 School Inspection
It is mentioned that school supervision has seriously suffered due to insufficient staff,
absence of any planning, and administrative neglect. Periodic inspection/supervision of
schools is critical. Also it is to be understood that the role of a school supervisor is not limited
to the inspection alone: it could also be advisory in nature. Although SSA takes care of the
infrastructure requirements of schools as well as provides financial support for resources,
persons and learning methods, it is felt that the quality of education depends largely on the
effectiveness of classroom interaction. In order to ensure that classes are held regularly,
students‘ attendance and academic performance improve, it is necessary to strengthen the
school inspection setup at the grass root level. It is therefore recommended that the school
inspection setup is significantly increased at the cluster and the block levels. This will have
three advantages – (a) close and continuous monitoring of the quality of education; (b) timely
and quick response to address any problem and (c) relieving the district administration of
substantial work pressure. It is suggested that the state government allocate additional funds
to augment the school education system.
It is recommended that designations of inspectors be changed as below:
a) Sub-inspector of Schools be re-designated as Assistant Education Officer (AEO)
b) Assistant Inspector of Schools be re-designated as Block Education Officer (BEO)
c) District Inspector of Schools be re-designated as District Education Officer (DEO)
The District Education Officer will be responsible for overall management and administration
of school education of the district. The DEO may not personally visit schools as a routine
activity. However he/she may visit schools whenever necessary. The primary responsibility
of a DEO would be the following:
a) Facilitate the teacher recruitment process in the district.
b) Help WBCERT in organising and conducting teacher training programmes.
c) Periodically interact with VEC/SMC to review administrative issues.
d) Co-ordinate with the district project officer to ensure proper implementation of SSA
programmes.

73
e) Monitor and review performance of the children and take appropriate action
whenever required.
f) Monitor and review attendance, transfer and other issues concerning teachers.
g) To facilitate and participate in periodic student evaluation programmes.
In order to discharge the above functions, each district should have 6 DEOs/ADEOs to look
after elementary and high school education. The suggested staffing of DEOs/ADEOs in a
district is as follows:
Elementary Education:
(i) District Elementary Education Officer
a. Assistant District Elementary Education Officer (Training)
b. Assistant District Elementary Education Officer (Academic)
c. Assistant District Elementary Education Officer (School Management and
Administration)
High School Education:
(ii) District Education Officer (Training & Academics)
a. Assistant District Education Officer (Academic & Administration)
Considering 20 districts (including the DGHC) in West Bengal, the above arrangement would
require 120 DEOs/ADEOs in the state. The present sanctioned strength of District Inspector
of Schools (including ADI and ADSE) is 120 and hence there is no need for creating
additional posts. All vacancies are to be filled up as early as possible.
There are 485 blocks in West Bengal and 3411 clusters (Source: DISE Provisional State
Report Card 2009-10). The average number of school (Primary, Upper Primary) per block
would be around 160 and per cluster would be around 30.
Each BEO should have a contingent of AEOs who would regularly visit schools under their
jurisdiction. BEOs would also make periodic visits to schools under their block in such a way
that each BEO can visit every school once a year. Assuming 200 working days in a year for
schools, if a Block Education Officer (BEO) spends 100 days for visiting schools, the
estimate shows that there is a need for 970 BEOs in the state. The present sanctioned
strength of Assistant Inspector of Schools (now renamed as BEO) is 922. Thus there is a
need for creating 50 additional posts for BEOs.

74
SSA recommends that each AEO should undertake at least two visits to every school each
year. It is believed that for effective supervision and monitoring academic activities in the
schools, each AEO should make 3 visits to every school each year. The total number of
AEOs necessary in West Bengal to monitor schools providing elementary education is
around 3411 (one AEO per cluster). Since there are around 30 schools per cluster, each
AEO can comfortably spend 100 working days in visiting all the schools under the cluster
thrice a year. The present inspection staff strength is given in table 6.36. Our
recommendation suggests a more than 3 fold increase in the sanctioned strength of
Assistant Education Officers (3411 from the present strength of 999). This would ensure that
each school gets adequate attention and timely intervention by the school administration.
The AEO in a particular cluster will also look after secondary schools if any. The role of an
AEO would also include continuous interaction with the CRC co-ordinator to ensure timely
collection of DISE and other data for MIS purposes.
6.9 Governance Structure
In order to implement the norms and standards of the RTE Act and Rules and also to align
the activities of the SSA and RTE, it is essential to re-design the present structure of the
organization. We believe that there is a scope for consolidation at the secretariat level and
strengthening a district and cluster level organization structure to improve the supervision
and delivery system. This twin approach of consolidation at the top and grass root level
decentralization would also help the school education system to respond to the requirements
of school going children in particular and society at large. The proposed organisation
structure of the School Education system in the state is given in the Diagram 6.1-6.4
The RTE Act prescribes that there would be no qualifying examination upto Class VIII. RTE
Act also prescribes a pivotal role for SCERT in designing the curriculum, preparation of text
books and other reading materials and developing innovative pedagogy. Therefore no
separate role is envisaged for the present West Bengal Board of Primary Education (WBPE).
We recommend that the functions of WBPE be subsumed intothe WBCERT. However any
activity relating to teachers‘ appointment and transfer will be handled by the Personnel &
Supervision arm of the Directorate.
The RTE Act and RMSA clearly divide school education into two broad categories –
Elementary Schooling (Class-I to VIII) and High Schooling (Class-IX to XII). In order to
properly discharge the administrative responsibilities the directorate at the state level is to be

75
restructured into two separate wings – one for elementary schools and the other for high
schools with separate directors for each wing. If the RTE is fully implemented, our estimate
shows that there will be around 78,000 schools imparting elementary education in the state.
Hence a separate directorate for elementary education is necessary. Similarly the directorate
of the district unit of the school education system should have two wings – elementary
education and high school education.
Presently the State School Education Department is inundated with a large number of legal
cases. We have observed that a sizeable part of the working hours of officers at various
levels is spent in various courts for attending cases. It is therefore necessary to strengthen
the directorate with the appropriate staffing of Law Officers at the state as well as at the
district level.
The functions of the directorate at the state level are divided into three segments –
Personnel & Supervision, Academic and Appointment. The Personnel & Supervision section
looks after administrative issues related to schools and teachers,and monitors teachers‘
attendance and accountability.The Academic section of the directorate is the focal point of
the administration of school education.
The present West Bengal Board of Madrasah Education and Rabindra Mukta Vidyalaya
(West Bengal Council of Rabindra Open Schools) will be retained.
Attracting and retaining quality school teachers is a precursor for the improvement of the
performance of school children. While the West Bengal School Service Commission in its
present form has been reasonably successful in recruitment of teachers in secondary and
higher secondary schools, the recruitment in primary and upper primary schools is
decentralised at the district level and is entrusted to the respective DPSC (District Primary
School Council). It is observed that divergent practices were followed in the recruitment of
primary teachers and there were complaintsabout favouritism. The National Council for
Teacher Education (NCTE) prescribes that a teacher must pass an eligibility test (TET) for
being eligible for recruitment in schools imparting elementary education. Therefore it is
proposed that the West Bengal School Service Commission be entrusted with the additional
responsibility of conducting TETs. This will ensure uniformity in the teacher recruitment
process to a greater extent. It is desirable that at the elementary level of education, teachers
are recruited from the same/nearby villages where a school is located. Hence while the TET
can be conducted at the state level once a year, the interviews can be held at the district
offices of the directorate to avoid inconvenience to the applicants.

76
At the district level, the directorate of school education can be divided into two broad wings –
elementary education and high school education. The district inspector of schools may be
called the District Elementary Education Officer (for elementary education) and District
Education Officer (for high school education). Such district education officers will monitor
school administration & management and co-ordinate teacher training programmes in
consultation with the DIET. We propose a strong block education office at the block level.
The administrative head of the block education office will be the Block Elementary Education
Officer (for elementary schools)/ Block Education Officer (for high schools). Each block
education office will have five resource persons (Block Resource Persons) specializing in
different subjects taught in elementary schools. Each block office should also have two
Group-C staff (Computer literate), two Group-D staff and one Block Accountant.
The Cluster Education Centre (currently called the Cluster Resource Centre) will be housed
in one of the bigger schools in the cluster. Ideally the school chosen for locating the Cluster
Education Centre should be a secondary level school with adequate space. Each Cluster
Education Centre will be headed by an Assistant Education Officer (presently called the Sub-
Inspector of Schools). The MIS activity (including compiling DISE data) of schools within the
cluster will be managed at the Cluster Education Centre. Accordingly one MIS person-cum-
clerk may be appointed in each cluster to help the Assistant Education Officer.
6.10 Role of WBCERT Redefined
It is proposed to significantly strengthen the WBCERT. Therefore a separate organisation
structure of the WBCERT is given in Diagram 6.5. The WBCERT is to be construed as an
independent academic body with the following explicit functions:
(a) Curriculum development
(b) Text book preparation and printing for formal as well as non-formal education
(c) Development of innovative learning techniques and tools
(d) Designing, administering teacher training programmes and the development of
appropriate training materials.
(e) Conducting research in the area of school education.
The WBCERT is required to be appropriately staffed in order to effectively handle the
responsibilities. The working environment of the WBCERT should be similar to a university
and hence the career path of people involved in the academic wing of the WBCERT should
be appropriately structured. In the view of enhanced responsibilities of the WBCERT,
separate administrative, finance and accounts sections are also to be created. It is proposed

77
that an academic advisory board be formed to guide the WBCERT in its academic functions.
Such an academic advisory board may comprise of the following members:
(a) Experienced professors in colleges (two members)
(b) Experienced teachers from government schools (three members)
(c) Representative of NCERT (one member)
(d) Representative of an NGO involved in school education (two members)
(e) Director – WBCERT, member secretary
(f) Chairman, West Bengal Board of High School Education
The advisory board would be an independent body comprising of people connected with
schools/college education. The independent character of the board is to be maintained.
DIET and PTTIs are to be brought under the WBCERT. All in-service teacher training
programmes will be designed and coordinated by WBCERT and administered through
DIET/PTTIs. Therefore each district of the state should have a DIET to facilitate teacher
training programmes.
We feel that if the WBCERT takes care of curriculum development and text book preparation
for school education, there is no need to have separate boards for Secondary and Higher
Secondary examinations. It is therefore proposed to have only one board to take care of the
Secondary and Higher Secondary examinations. We proposed that the present West Bengal
Board of Secondary Education and the West Bengal Council of Higher Secondary Education
be merged into a new board called the West Bengal Board of High School Education. The
activities of the board will include:
(a) Regulation of admission to schools
(b) Conducting secondary and higher secondary examinations
(c) Preparing annual work plan for secondary and higher secondary schools
(d) Conducting scholarship examination
(e) Managing ICT schemes
(f) Verification of educational documents and issuing of transcripts
(g) Recognition of schools
The curriculum and textbook development for secondary and higher secondary schools will
be the responsibility of WBCERT.
6.11 Resource Persons
78
The role of the shikshabandhu cadre in the State is quite ambiguous. People working in this
cadre are neither resource persons nor clerical staff. While the role and responsibilities of
resource persons are well defined in the SSA, the duties and responsibilities of
Shikshabandhus are not very clear. Many Shikshabandhus are not aware about their job
description and the bulk of their time is spent in liaising between the school and CLRC/D.I.
office. Shikshabandhus cannot be called resource persons in the sense that they are not
allowed to take/attend classes. No formal training is imparted when a Shikshabandhu joins
duty. The only training they get is about the filling up of DISE data. Sometimes
Shikshabandhus are asked to perform the functions of Group-D staff.
We recommend that the Shikshabandhu cadre be abolished and the resource person cadre
be strengthened. Each BEC should have five resource persons. Such resource persons may
also be called Subject Experts. The primary responsibilities of Block Resource Persons will
be as follows:
(a) Imparting teachers‘ training for 10 days based on modules developed by
WBCERT/DIET. Such trainings should be conducted in a structural manner covering
subjects taught in the schools.
(b) Providing teaching support to one or more schools in a block which experience poor
performance of students.
(c) Helping the school in ensuring 100% student enrolment.
(d) Coordinating with the CLEC, wherever required, in school related matters.
Such Block Resource Persons could either be retired teachers or selected through School
Service Commission. Resource persons should also be placed at the PTTIs to help with in-
service teacher training programmes.
In order to ensure minimum hardship while phasing out the shikshabandhu cadre, the
following strategy may be adopted:
(a) Those who fulfil the eligibility criteria should be absorbed as primary/upper-primary
teachers.
(b) Those who have reasonable computer proficiency, but who do not fulfil the eligibility
criteria of becoming a school teacher, should be absorbed as MIS-cum-clerk at the
cluster/block level education centres.
(c) Those who do not possess any of the above qualification (as mentioned in (a) and (b)
above) should be asked to leave.
6.12 Abolition of District Primary School Council (DPSC)

79
The governance structure proposed in para 6.9 makes the existence and importance of the
DPSC redundant. The DPSC is presently responsible for the appointments, postings,
transfers of the teachers and is also responsible for taking disciplinary actions against
teachers. However, we have observed that DPSCsare highly politicized and are not
discharging their functions properly. DPSCs are managed by part-time chairmen (mostly
drawn from schools) who do not necessarily have reasonable administrative capabilities and
there is no uniformity in the practices followed by different DPSCs. For example, the
selection process of school teachers is not uniform across all the districts. There are also
complaints of favouritism and political bias in their recruitment. The coordination between the
DPSC and DPO (district project office) is often poor resulting in the improper management of
various SSA schemes in the district. There are at times tussles /ego clashes between the
DPO and DPSC on the territory of intervention.
We have proposed the following:
(a) School service commission will periodically conduct the TET.
(b) The District office of the school directorate will constitute independent selection
committees (comprising of retired high school teachers, retired college teachers,
head of the local authority) for conducting interviews and selecting teachers in the
respective districts.
(c) Teachers will be selected against respective schools, based on vacancies thereof.
(d) All administrative matters concerning teachers (including transfers) will be handled by
the district education office and the personnel and supervision section of the school
directorate.
(e) A grievance redressal cell of the VEC/ education wing of the local authority will hear
and dispose all teachers‘ complaints in a transparent and non-partisan manner.
(f) The present set up of the DPSC is to be abolished.
6.13 Management Information System
Information gathering and dissemination are essential management tools to monitor proper
functioning and governance of the school education system. The functions of the present
school portal of the State needs to be substantially augmented to make the portal an
interactive one. School portal should have scalable architecture to accommodate more
applications and users.
Records of every child, school, and teacher should be gathered and mapped in the mother
database in such a way that every child and teacher is mapped to a school. Every teacher
should additionally be mapped to a CLEC. The management information system (MIS)
should be an integrated State-wide information system. The MIS should be used to identify
vacancies/requirements of teachers at every school and similarly surplus of teachers in

80
schools. The system should also have data on student enrolment and class-wise
performance. Such a MIS should be independent of DISE.
The MIS should have the following details of the teachers:
(a) Name and address
(b) Photograph
(c) Academic qualification
(d) School attached
(e) CLEC attached
(f) Date of joining
(g) Salary details
(h) Leave details
(i) Provident fund details
(j) TDS details
(k) Other service records
(l) Date of birth
(m) Marriage day (if applicable)
(n) Achievements, if any
Each school teacher will be given a login id and password. The teacher can access his page
to check the necessary details. The concerned teacher should also be able to submit any
application (for transfer, leave etc.) through this portal.
The portal should capture school-wise and subject-wise results of monthly/periodic tests to
assess the competency level of students in the elementary schools. Such data will help
analyze and monitor the performance of teachers, schools, blocks and districts. It is
proposed that the district school administration should come up with a school-rank list every
year. Such ranking should be based on the performance of children and teachers. The portal
can also be used to manage out of school children by having data on registration, follow-up
and tracking. Resource persons should gather such data in a cluster and enter the data at
the CLEC. Any citizen of the State can report an out-of-school child to the cluster education
centre coordinator. The cluster coordinator with the help of the AEO would verify and enter
the details of such a child in the portal. The CLEC should follow up with the out-of-school-
child‘s parents to ensure integration of the child into mainstream education. The portal
should similarly have information on children with special needs (CWSN), their registration,
attendance and performance tracking.

81
The monthly salary bill of the teachers of all schools under a cluster would be prepared at
the CLEC in the school portal. The CLEC coordinator and AEO of the cluster would certify
the monthly salary bills of all schools of that cluster and submit the same online to the district
administration. As other details concerning a teacher (attendance, leave etc.) are maintained
in the same MIS, it would be easier to prepare the pay bill in the system. Every teacher
would have a unique employee id (that would also be the user id for the teacher) and a
school attached. Hence, if a teacher is transferred to another school, his/her salary will not
be released unless the records are updated.
The e-service book for the teachers would help the administration in settling pension and
other retirement benefits on time. This would also save the teachers from the bother of
maintaining physical records and chasing the district school administration for the timely
release of pension and other benefits. A teachers‘ forum may be created in the portal to
highlight the achievements of school teachers across the State.
Similarly all administrative officials (including the CLEC coordinator) will have access to the
school portal. The portal will facilitate social audit through online details of key processes
and activities. Even the distribution of free textbooks, bicycles and uniforms can be tracked
through the portal. The portal will have a dedicated page for all government circulars,
administrative announcementsand training announcements.
The portal should also be effectively utilized for two more important purposes: (i) project
management and (ii) financial management. These are discussed in paras 6.15 and 6.16.
6.14 Teacher Transfer
The teacher transfer policy can be monitored through the MIS. At the beginning of each
academic session, cluster-wise vacancy/surplus positions in the schools would be drawn
from the system. The teacher transfer programme can be designed as below:
(a) The present system of appearing in SSC examination for seeking a transfer should
be stopped.
(b) Teachers can apply for transfers in a prescribed form to the CLEC. All applications
will be time-stamped. The AEO will screen all such applications and forward the
same to the district office. All applications submitted up to September of any year will
be considered for transfer in the next academic session.
(c) Teachers from ‗teacher-surplus‘ schools will be compulsorily transferred to
appropriate ‗teacher-deficit‘ schools in the same district. Exceptions can be made for
senior teachers (more than 55 years of age) and women teachers with children below
5 years.

82
(d) If after the above two steps no vacancies are left in a district, only mutual transfers
will be allowed within the district. However, the net shortfall in a school in a district
will be filled up either through fresh recruitment or through voluntary transfers from
other districts based on applications made as in (b) above. While implementing such
inter-district transfers, first-apply-first-serve method will be followed. It is also to be
ensured that if the transfer is sought outside district, a minimum of 5 years of
teaching experience is required in the present district.
District level teacher recruitment and the above transfer policies will ensure that: (i) Teachers
stay near the school and save time and energy in daily commuting; (ii) Teachers understand
local language/culture and thus interact with students more effectively; and (iii) The transfer
policy is system-driven and transparent and no discretion is allowed.
6.15 Project Management
The delay in construction of new schools and additional class rooms (ACR) is a major
concern for the State. The State Project Directorate should have a separate wing for
infrastructure (see Diagram 6.1). The SPD would be broadly divided into two major wings –
Administrative and Infrastructure. The civil maintenance job of schools will be monitored by
an assistant engineer in the administrative wing of the SPD. Any new construction of ACR,
School, ICDS would be monitored by the infrastructure wing. The infrastructure wing would
be responsible for preparing the blue print for all the civil work. In order to facilitate the SPD
to discharge this function effectively, the wing needs to be strengthened. We propose that
the infrastructure wing of the SPD should have one State Project Engineer (in the rank of
executive engineer) who would look after all expansion activities. The SPE should be a
permanent employee of the government and not contractual staff as is the case now. The
State Project Engineer would be assisted by 7-9 assistant engineers, one architect, 2-3 civil
consultants on contract (preferably retired PWD employees), 2 AutoCad operators, and one
computer operator. At each district there should similarly be a District Project Engineer (in
the rank of an assistant engineer) assisted by an adequate number of district technical
persons (on contract) so that each block has one district technical person. Such technical
persons should be diploma engineers. Their responsibilities would include- (a) weekly
inspection of civil construction under their jurisdiction, (b) taking photographs of various
stages of completion, (c) making necessary entries in the school portal at the block office
every Friday and (d) verifying contractors‘ bills and forwarding these to District Project
Engineer for approval. Such technical persons should be appointed on contract basis for a
83
minimum period of two years and renewable on satisfactory performance. The DPE (District
Project Engineer) will also be responsible for the maintenance of existing schools.
The SMC should have a Civil Works Sub-committee (CWC) headed by the chairman of the
SMC with the head teacher of the concerned school, representative of the local authority,
two parents of students, and one mason of the village (co-opted) as members. The CWC
would procure materials and engage labour contractors to execute the civil work.
In the school portal, all civil works will be categorized as per types and mapped with the
DISE code of schools. Monthly progress of work, including physical and financial progress,
revised sanction details, completion details, photographs of completed/ work-in-progress
constructions, can be captured in the portal. This will help the SPD to have updated
information on all civil work and thus enable the SPD to take timely actions.
6.16 Financial Management
The school development plans of each school will help each district prepare a three year
perspective plan. The annual work plan and budget (AWP&B) are prepared every year
based on the perspective plan. While preparing budgets for the perspective plan, the
financial norms prescribed under the SSA framework should be strictly followed. Outlays
proposed under each intervention are to be supported by relevant data to determine the
physical targets. Such AWP&B would be entered in the school portal and the State Project
Office can view such plans. This facility would help the SPD review the annual plans and
compare achievements against targets. Primary and upper-primary schools should be
treated as separate schools for the purpose of school grants even if they are functioning
from the same premises.
The financial management of various schemes would be monitored at the cluster/block level.
We propose that a block accountant be appointed for each block. The block accountant
should be computer literate. The block accountant should be responsible for collecting
information on grants received and utilisation of funds from every school under the block.
The block accountant would also be responsible for entering all data in the MIS.
Once the annual plans are firmed up, the funds for various schemes should be routed
through the DPO (District Project Office). The funds for civil construction may be transferred
to the district project office by the SPD. The DPO would transfer the funds directly to the
bank account of the respective SMC on the basis of an utilisation certificate. Same
procedure should be followed for distribution of funds for other schemes (uniforms, bicycles,
TLM, scholarships etc.). The school should not get involved in procuring items like uniforms,
bicycles etc. The SMC should identify some shops in the local area which can provide
school uniforms and bicycles. Expenses for uniforms and bicycles should be reimbursed to

84
the parents of the children on the production of necessary bills/invoices from the designated
shops. Such payments would be disbursed by the clerk of the CLEC as per the schedule
drawn by the AEO. The disbursing official will keep records of all bills/vouchers in a
prescribed format and send the details to the block accountant immediately after completion
of the disbursal. The school teachers would not be involved in this exercise. This would
substantially reduce the administrative load on schools. The block accountant would enter
the fund disbursement details to the school portal. The block accountant would maintain
records of all transactions with the civil contractors and enter the necessary data in the MIS.
The head teacher of the school will only maintain a cash book to record receipts and
payments of contingency and maintenance grants. Such grants would also be transferred to
the bank account of the SMC. The head teacher of the school can spend such grants only
on the approval of SMC. The AEO will periodically (e.g. monthly) verify the cash book of
each school and certify (in a prescribed format) the expenses incurred. In case there is any
community contribution (donation), such contribution should augment the maintenance grant
of the school and the SMC should keep records of such grants. The head teacher should be
encouraged to scout for such special contributions.
The details of school-wise contingency/maintenance grant utilization will be maintained at
the block level. The utilisation certificate for school grants should be reviewed by the SMC
and submitted to the appropriate authority on time.
The grants for mid day meals (MDM) should also be directly sent to the bank account of the
SMC. The head teacher of the school should not be involved in the administration of the
MDM except for certifying the quality of the meal and the number of students who availed
the meal.
6.17 Rabindra Mukta Vidyalaya
Rabindra Mukta Vidyalaya, setup in 1998, was initially known as the State Open School. It is
presently renamed as the West Bengal Council of Rabindra Mukta Vidyalaya
(W.B.C.R.M.V). RMSA provides that 12% of the students in a state would undergo schooling
through the open school system. Hence there is a need to strengthen the WBCRMV. The
main target groups of the open school system are presently neo-literates, school dropouts,
whole time or part time workers, peasants, elderly persons, unsuccessful learners in the
formal system and other weaker sections of society. However there is a conflict in the
objective of the RTE and WBCRMV. RTE mandates that all children in the age group 6 to 14
years should study in a formal school. Presently students seeking enrolment in a RMV
should self-certify that he/she has completed elementary education. In order to ensure the
sanctity of a student‘s claim, such an undertaking should be attested by the SMC of the
concerned school.

85
It has been observed that the quality of learning and evaluation of students in a RMV is poor.
Children, who could have joined main stream schools, take the easier route and enrolled
themselves in a RMV. In order to arrest this trend it is proposed that the minimum age of
admission in a RMV should be raised to 18 years. This policy will ensure that only over aged
citizen can participate in the open schooling system.
The WBCRMV has so far been utterly neglected by the State administration. There is no
permanent staff in the council (excepting the President and Secretary). The office space
provided to WBCRMV is inadequate and the study centres are poorly managed.
In order to strengthen the open schooling system the following is suggested:
(a) The responsibility of curriculum design and preparation of textbooks should be given
to WBCERT.
(b) WBCRMV would approve the curriculum and textbooks designed by WBCERT.
(c) One or more upper primary schools in a cluster should be used as study centres.
Such schools should be compensated reasonably for the use of their space.
Laboratories of nearby higher secondary schools will be used for conducting practical
classes.
(d) WBCRMV should prepare a resource person bank cluster-wise for teaching in the
study centres. Such resource persons should ideally be retired high school teachers.
(e) The resource persons will be given necessary training by WBCERT.
(f) The WBCRMV will be responsible for managing the admissions and examination
system. For this purpose the council should be appropriately staffed.
(g) The present system of allowing 5-6 attempts to clear an examination should be
stopped. Instead students should be given up to 3 chances to clear an examination.
(h) The school education portal should contain student related information (registration,
performance and tracking) for open schools and should contain all announcements to
make them easily accessible to open school students.

86
Diagram 6.1: Organogram of State School Education: State Unit
State School Education
Minister-in-Charge
Secratary of School Education
Directorate
Personnel & Supervision
Director of Elementary
School
Joint Director of Elementary
School
Deputy/Assistant Director of
School
Administrative Staff
Law Officer
Director of High
School
Joint Director of
High School
Deputy/Assistant Director of High
School
Administrative Staff
Law Officer
Academic
WBCERT
DIET/Training Institute
Administration
W.B. Board of High School
Education
West Bengal
Board of Madrasah Education
Rabindra Mukta
Vidyalaya Board
Appointment
School Service Commission
Elementary Education
Secondary Education
SSA
SPD
Administrative
ASPD
DSPD
Aministrative Officer &
Engineering Staff
Controler of Finance
Audit Officer
State Coordinator
Progarmme Coordinator
MIS
Infrastructure
State Project Engineer
Assistant Engineer
Architect
Civil Consultants
Auto Cad Operators
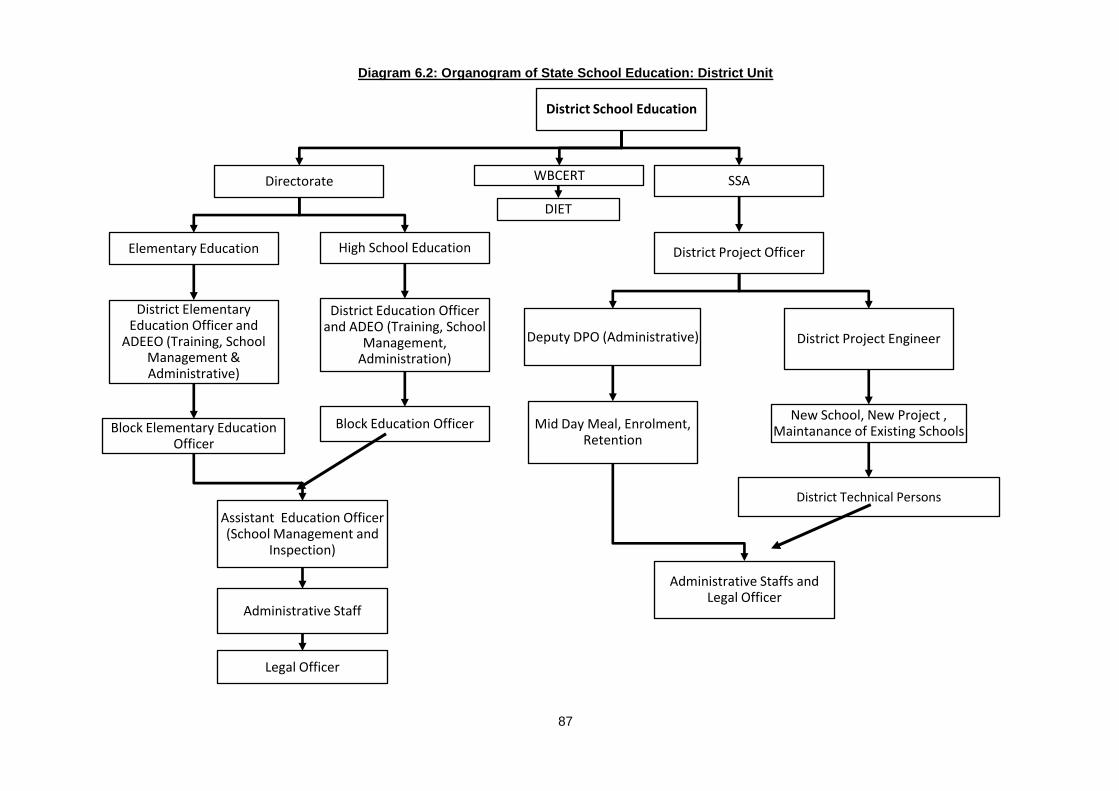
87
Diagram 6.2: Organogram of State School Education: District Unit
District School Education
Directorate
Elementary Education
District Elementary Education Officer and
ADEEO (Training, School Management & Administrative)
Block Elementary Education Officer
Assistant Education Officer (School Management and
Inspection)
Administrative Staff
Legal Officer
High School Education
District Education Officer and ADEO (Training, School
Management, Administration)
Block Education Officer
SSA
District Project Officer
Deputy DPO (Administrative)
Mid Day Meal, Enrolment, Retention
Administrative Staffs and Legal Officer
District Project Engineer
New School, New Project , Maintanance of Existing Schools
District Technical Persons
WBCERT
DIET

88
Diagram 6.3: Organogram of State School Education: Block Unit
Diagram 6.4: Organogram of State School Education: Cluster Unit
Block Education Office
Block Education Officer (A.I.)
Office Staff
Block Accountant
Block Resource Person (5 per block subject teacher)
Cluster Education Centre (CLEC)
Assistant Education Officer (S.I.)
CLEC Co-ordinator (Headmaster of the Largest School in the Cluster)
One MIS person cum clerk
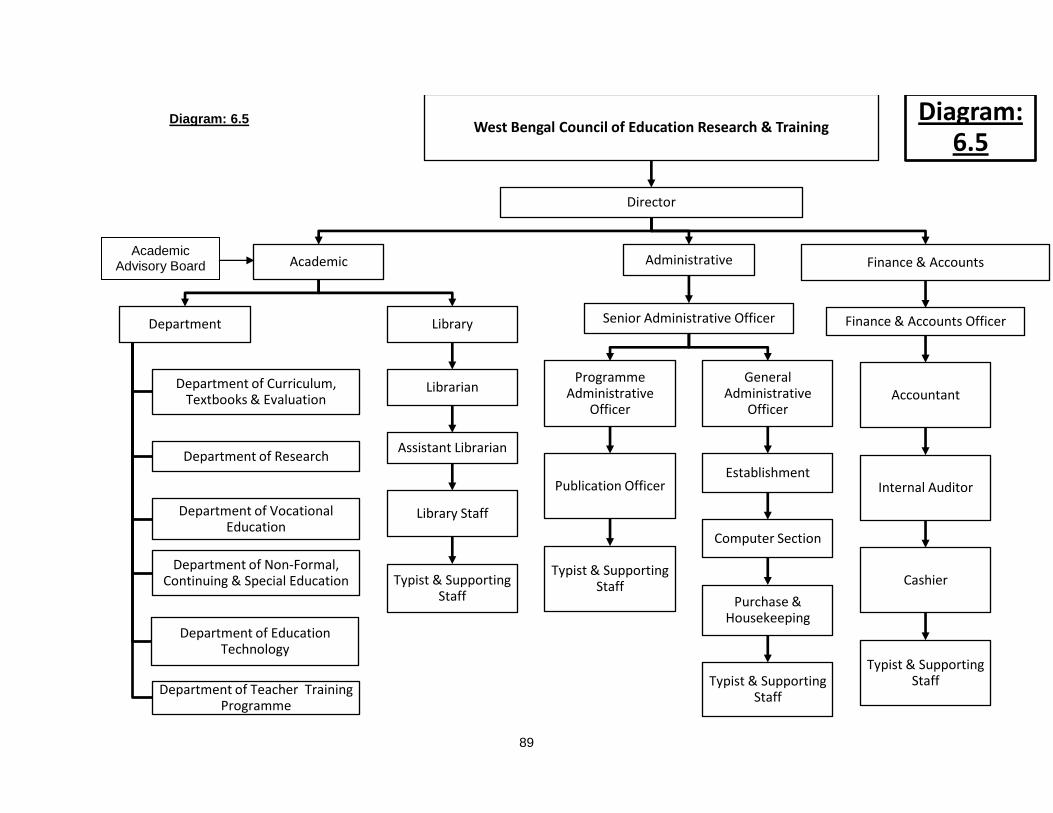
89
West Bengal Council of Education Research & Training
Director
Academic
Department
Department of Curriculum, Textbooks & Evaluation
Department of Research
Department of Vocational Education
Department of Non-Formal, Continuing & Special Education
Department of Education Technology
Department of Teacher Training Programme
Library
Librarian
Assistant Librarian
Library Staff
Typist & Supporting Staff
Administrative
Senior Administrative Officer
Programme Administrative
Officer
Publication Officer
Typist & Supporting Staff
General Administrative
Officer
Establishment
Computer Section
Purchase & Housekeeping
Typist & Supporting Staff
Finance & Accounts
Finance & Accounts Officer
Accountant
Internal Auditor
Cashier
Typist & Supporting Staff
Diagram: 6.5
Academic Advisory Board
Diagram: 6.5
90
Chapter 7
High School Education-Analysis and Recommendations
7. Introduction.
The following chapter discusses the survey data on secondary and higher secondary schools,
schools offering secondary programmes only, and MSKs. The suggested
recommendations are added after the data is discussed. Section 7.1 discusses the
data from the schools offering both secondary and higher secondary programmes, 7.2
discusses the schools offering secondary education only. Proposed areas for
intervention are discussed in Sections 7.2.11 and 7.3.11.
7.1 West Bengal Council of Higher Secondary Education.
7.1.1. The West Bengal Council of Higher Secondary Education (W.B.C.H.S.E hereafter) came
into existence as per the West Bengal Council of Higher Secondary Education, Act 1975.
Given its mandate, the Council looks after the entire gamut of activities concerning
higher secondary education at the 10+2 level as a responsible body. In practice though,
much of its resources are geared towards the conduct of 10+2 level examinations in the
state.
7.1.2. In terms of organisational structure, the Council is headed by the President. It also
consists other ex officio members such as the President of the Board of Secondary
Education and the Director of School Education. Under the overall guidance of the
President, the Secretary directly supervises the Council Head Office in Kolkata and the
four regional offices: i) New Jalpaiguri, ii) Bardhaman iii) Midnapur , and iv) Kolkata.
These regional offices are headed by deputy secretaries.
7.1.3. The main functions of the Council are:
a) Need assessment and policy development for the higher secondary level of education.
b) Inspection of recognised higher secondary institutions.
c) Providing curriculum, syllabus, regulations, study books etc. to recognised institutions.

91
d) Conducting Higher Secondary Examinations.
e) To look after the preparation, publication, and sale of the necessary text books for
recognised institutions.51
7.1.4. The Council deals with a large student body ofthe age group of 16-18 years. DISE data
2008-09 shows that 7,74,503 students are enrolled in the higher secondary schools
working under the aegis of the Council. Among them, the total number of boys are
4,43,195, and the total number of enrolled girls are 3,31,380.(Table 7.1).52
7.1.5 The district wise distribution of the higher secondary schools can be gleaned from Table
7.2, on the basis of data from the official website of the Higher Secondary Council,
WB.53 Total number of Higher Secondary Institutions in the State is 4652. Among which
71.34% are co-ed schools. 11.67% and 15.24% are the respective numbers of only
boys and only girls higher secondary institutions. Among all the districts of West
Bengal, Kolkata shows the highest number of higher secondary institutions, i.e., 385.
Burdwan district has the distinction of having the second highest number of schools i.e.
(375). By contrast, Dakshin Dinajpur has the lowest number of higher secondary
schools (82). Likewise, the highest number of girls‘ higher secondary schools is in
Kolkata (147). The second highest number of girls‘ higher secondary institutions i.e.
124 belongs to the district of North 24 Parganas. Dakshin Dinajpur has the lowest
number of girls‘ Higher Secondary Schools (10 schools). It has been observed that
save Malda, in each district the numbers of girls‘ higher secondary schools are higher
than the boys‘ higher secondary schools.
Highest and the second highest number of boys‘ higher secondary schools respectively
belong to Kolkata (126 schools) and North 24 Parganas (92 schools). Each of the
districts of Bankura, Coochbehar, and Dakshin Dinajpur possesses eight higher
secondary institutions only for boys.
In case of co-ed schools, the highest numbers of schools belong to North 24 Parganas;
and the second highest number of co-ed schools is located in the South 24 Parganas.
As expected, Dakshin Dinajpur has the lowest number of co-ed higher secondary
schools. Co-ed higher secondary schools constitute 71.34 per cent of the total number
of schools in the state. 51
http://61.95.144.78/html/history.htm (accessed on 10th August 2011.)
52www.wbsed.gov.in(DISE 2008-09)
53http://174.120.21.162/~wbchse/databank/admin/dist_school_count.php (accessed on 10
th August 2011)

92
7.1.6 Given the gap (3685) between the number of secondary and higher secondary schools
(8337 and 4652 respectively), upgradation of secondary schools to higher secondary
ones is a continuous process (Table 7.1, on the basis of 2008-09 data). The total
number of upgraded schools is 119, i.e. 2.5 per cent of the total number of schools.
7.1.7 At present the total number of Higher Secondary schools is 4652. On the basis of 2008-
09 data, table 7.3a and 7.3b show that in the year of 2016 and 2026 the projected
number of schools (on the basis of secondary pass out percentage) will be respectively
4370 and 3453. It reveals that the demand and projected number of higher secondary
schools will decrease in future.
7.1.8 In West Bengal apart from the recognized schools of the West Bengal Board of
Secondary Education (W.B.B.S.E) and West Bengal Council of Higher Secondary
Education (W.B.C.H.S.E), there are some other schools which are affiliated to the
Central Board of Secondary education (CBSE) and Indian School certificate (I.S.C)/
Indian Certificate of Secondary Education (I.C.S.E). CBSE Annual Report (2010-2011)
shows that there are total 171 CBSE affiliated schools in the state (table 7.4).54 From
the official website data, updated on 27th May 2011, it can be observed that there are
total 323 I.S.C/ I.C.S.E recognized schools in West Bengal.55 On the basis of data from
the respective official websites, table 7.5 provides district wise number of I.S.C/ I.C.S.E
schools. Kolkata possesses 120 I.S.C/ I.C.S.E schools whereas among the remaining
districts, Darjeeling has the highest number of schools (56 schools). On the contrary,
Bankura, Birbhum, and Dakshin Dinajpur hardly have any I.S.C/ I.C.S.E affiliated
schools. However the I.C.S.E and C.B.S.E affiliated schools are not part of our study
and analysis.
7.1.9 Data from the Annual Report 2009-10, Department of School Education, West Bengal
shows some over-lapping categories of the number of teachers (Table 7.6). These
categories of teachers are: a) Primary with upper primary and secondary/higher
secondary, b) Upper primary and secondary/ higher secondary, c) Secondary only, d)
Secondary with higher secondary, e) Higher secondary only.56 Such over-lapping
categories make it difficult to find out the exclusive number of teachers for any specific
level. Therefore it is difficult to get the present status of the pupil-teacher ratio at a given
level, be it secondary or higher secondary.
54
www.cbse.nic.in (accesses on 11th August, 2011)
55http://www.cisce.org/Locate.aspx (accesses on 11
th August, 2011)
56 Department of School Education, Government of West Bengal, Annul Report 2009-10, (Kolkata).

93
Findings on Secondary and Higher Secondary schools
7.1.10FORMAL INFORMATION
7.1.10.A Table 7.7a shows the location-wise distribution of Secondary and Higher Secondary
Schools. Among the total 232 (100%) surveyed secondary and higher secondary
schools, the maximum percentage of schools i.e. 64.2% schools are located in rural
areas and one-fourth (25%) of the schools are located in urban areas. Only one-tenth
(10.8%) of the surveyed Secondary and Higher Secondary schools are located in
Kolkata. Table 7.7b indicates that most of the surveyed schools i.e. 216 schools
(93.10%) were established more than thirty years ago.
7.1.1O.B Table 7.8 shows that only four urban schools (1.7%) run in the morning session. Apart
from these four, almost all of the Secondary and Higher Secondary schools (98.3%) in
all area specific categories are day schools. Table 7.9 shows gender-wise distribution
of the schools in three different categories, such as: a) only boys‘ schools, b) only girls‘
schools, and c) co-education schools. Kolkata has the maximum number of girls‘
schools (60%) but the percentage of girls‘ schools is minimum (12.1%) in rural areas.
The same percentage is 37.9% in urban areas. In rural areas, most of the schools are
co-education (81.9%) schools whereas in Kolkata there is no co-educational school at
all. The highest percentage of boys‘ schools (40%) is in Kolkata. While rural areas
show the lowest percentage (6%) of the same.
7.1.11 COMMITTEES IN SCHOOLS
7.1.11.A Table 7.10 provides data on the existence of different committees in Secondary and
Higher Secondary Schools. These committees are: a) Mother Teacher Association, b)
School Development Committee, c) School Management Committee, and d) Parent
Teacher Association. Almost half of the schools have the Mother Teacher Association
(MTA). 60% of the schools in Kolkata have a MTA and this figure is 49.2% for urban
areas. An ignorable number of schools have a School Development Committee in all
the areas. There is only one school (4%) in Kolkata with a School Development
Committee and this is the highest percentage among all the regions. Almost every
school has a School Management Committee (SMC). In rural areas 98.7% schools
94
have a SMC and this figure is 72.9% and 96% respectively for urban areas and
Kolkata. Except one school (0.7%) in rural areas, no school has a Parent Teacher
Association (PTA).
7.1.11.B Table 7.11 shows the frequency of committee meetings of Secondary and Higher
Secondary schools. Average frequency of School Development Committee and SMC
meetings per school are higher than other committee meetings. In rural areas an
average of 12 meetings are held by the School Development Committee and this figure
is 9.7 for the School Management Committee. In urban areas an average of 7 meetings
are held by School Development Committee and this figure is 8.1 for the School
Management Committee. In Kolkata, on an average, 3 meetings are held by the School
Development Committee and this figure is 5 for the School Management Committee
and an average of 3.1 meetings are held by the Mother Teacher Association.
7.1.12 VISIT BY AUTHORITIES
7.1.12.A Table 7.12 provides data on the number of school visits by SIS/ASI in the last year. In
rural areas, nearly half of the surveyed schools (45%) are visited by SIS/ASI in the last
year and the average number of visits per school is 1.4. In case of urban areas, more
than two-thirds of the surveyed schools (67.2%) schools have not been visited by
SIS/AIS in the last year, and the average number of visits per school is 1.6. In Kolkata,
more than three-fourths of the schools (76%) have not been visited by SIS/AIS in the
last year and the average number of visits per schools is 2. In total 60.3% schools are
not visited by SIS/AIS in last year and average number of visits per schools is 1.5.
7.1.12.B Table 7.13 shows the frequency of the visits of higher authority officials in the
surveyed Secondary and Higher secondary schools. In the rural areas, 88.6% schools
are not visited by officials from higher authorities and the average number of visits per
school is 1.4. In urban areas 91.4% of the schools are not visited by officials from
higher authorities and the average number of visits per school is 2. In Kolkata, 92%
schools are not visited by officials from higher authorities and the average number of
visits per school is 1. Most of the surveyed schools (89.7%) are not visited by officials
from higher authorities and the average number of visits per school is 1.5.

95
7.1.13 INFRASTRUCTURAL FACILITIES
7.1.13.A Table 7.14 shows the distribution of Secondary and Higher Secondary Schools on
the basis of building types. Here the categories of buildings are: a) pucca, b) semi-
pucca. In rural areas, except 6 semi-pucca schools, all schools (96%) have pucca
structures. In urban areas, all schools (100%) have apucca structure. In Kolkata,
except 1 semi-pucca school, all schools (96%) have a pucca structure. In total, almost
all of the schools (97%) have pucca structure and only a few (3 %) have semi-pucca
structures.
Table 7.15a reflects that except 2 buildings in Kolkata, all school buildings, i.e.
99.1% buildings among the overall total, are owned by school authorities in all areas.
Table 7.15b provides data on the number of floors in the school building. In rural
area, more than three-fourths (79.2%) of the schools have 2 storied buildings and
18.8% are 3 storied. Only 1 school belongs to ‗above than 4 storied‘ building
category. In urban area, there are 36.2% schools have 2 storied buildings and 46.6%
have 3 storied buildings. Only 1 school (1.7%) possesses a building with more than 4
stories. In Kolkata only 12% of the schools have 2 storied buildings and 72% have 3
storied buildings and 12% of the schools are 4 storied buildings. Only 1 school (4%)
has more than 4 stories.
Among all over the areas, there are more than half of the schools (61.2%) with 2
storied buildings and less than one-third (31.5%) of the schools with 3 storied
buildings. Only 3 schools (1.3%) possess more than 4 storied buildings.
7.1.13.B Table 7.16 shows classroom-wise distribution of the surveyed schools. In rural areas,
near about one-fifth of the schools (19.5%) have more than 20 classrooms and one-
tenth of the schools (10.1%) have only 10 classrooms. In urban areas, a little more
than one-third (36.2%) of the schools have more than 20 classrooms and a little less
than one-tenth of the schools (8.6%) have 16 classrooms. In Kolkata, more than one-
fourth (28%) of the schools have more than 20 rooms and one-fifth (20%) of the
schools have 12 rooms and almost 12% of the schools have only 6 classrooms. In
96
total nearly one-fourth (24.6%) of the schools have more than 20 classrooms; and
among all types of classroom categories this is found in the highest frequency.
7.1.13.C Table 7.17 is about the distribution of Secondary and Higher Secondary Schools by
the availability of rooms other than classrooms. In rural areas, almost all of the
schools (98%) schools have a teachers‘ room and near about three-fourths (72.5%) of
the schools have a separate room for the ‗Teacher-in-Charge‘. Almost half of the
schools have a computer room (47%), library (43.6%) and laboratories (43.6%). A
high percentage of schools (81.2%) have a veranda. In urban areas, about all of the
schools have a teachers‘ room (98.3%) and a separate room for the Teacher-in-
Charge (91.4%). More than half of the schools, respectively 55.2% and 55.2%
schools, have a library and laboratory. While more than two-thirds (67.2%) of the
schools have a computer room. Percentage of schools having a veranda is also high
(87.9%) in this area. In Kolkata, every school (100%) havea teachers‘ room and
almost each of them (92%) have separate rooms for the Teacher-in-Charge. 76%,
64%, and 60% schools have a computer room, library and laboratory facilities
respectively. Less than two-thirds of the schools (64%) schools have a veranda.
In total figures, almost all of the schools (98.3%) have a teachers‘ room and more
than two-thirds (79.3%) of the schools have a separate room for the Teacher-in-
Charge. Around half of the schools have a computer room (55.2%), library (48.7%)
and laboratory facilities (48.3%). A high percentage of the schools (81%) have a
veranda.
Concerning the above data, we recommended that every school must have a
separate room for teachers andthe Headmaster or the Teacher-in-Charge.
Moreover a separate office room, computer room and library should be made
available in each school.
7.1.13.D Table 7.18 shows that almost every school (98.7% of the total) has drinking water
facilities except 2 schools in rural areas and 1 school in Kolkata. Table 7.19 indicates
that every school (100%) in all areas has toilet facilities.

97
Table 7.20 provides data on availability of toilet categories in Secondary and Higher
Secondary schools. In rural areas, the average number of toilets for students is 5.9
per school and the figure is 2.3 for teachers‘ toilets. Average number of common
toilets is 1.1 per school.
In urban areas, average number of toilets for students is 6.2 per school and the
figure is 2.3 for teachers‘ toilets. Average number of common toilets is 1.3 per school.
In Kolkata, average number of toilets for students is 5.6 per school and the figure is
1.9 for teachers‘ toilets. Average number of common toilets is 1.7 per school.
Data on the distribution of Secondary and Higher Secondary schools having separate
toilets for boys & girls is available in table 7.21 In rural areas, 91.8% of the co-
education schools have separate toilet for girls and boys. In urban areas, 87.5% of
the co-education schools have separate toilets for girls and boys. In total, almost all of
the co-education schools (91.1%) have separate toilets for girls and boys.
Table 7.22 shows the distribution of Secondary and Higher Secondary Schools on the
basis of separate toilet facilities. In rural areas, except 1 school with a toilet for
teachers only and 24 schools with a toilet for students only and 1 school with a
common toilet, every school has separate toilets for teachers and students.
In urban areas, except 3 schools with toilets for teachers only and 3 schools with
toilets for students only and 1 school with a common toilet, every school has separate
toilets for teachers and students.
In Kolkata, every school has separate toilets for teachers and students.
In total, except 4 schools with a separate teachers‘ toilet only and 27 schools with a
toilet for students only and 2 schools with a common toilet, every school (199
schools), i.e. 85.77% of the schools, have separate toilets for teachers and students.
Table 7.23a reflects the picture of availability of water inside the toilet. In rural areas,
more than half of the schools (59.7%) have water inside the toilet. In urban areas,
94.8% of the schools have water inside the toilet. In Kolkata, most of the schools
(96%) have water inside the toilet.
In total, almost three-fourths (72.4%) of the schools have water inside the toilet.

98
7.1.14 OTHER FACILITIES
7.1.14.A Table 7.23b shows the distribution of Secondary and Higher Secondary schools
having a computer room by number of computers for students. In rural areas, more
than one-third (35.7%) of the schools have 6-10 computers and more than one-fifth
(22.9%) of the schools have 1-5 and 11-15 computers each. 4 schools (5.7%) do not
have any computer.
In urban areas, 33.3% schools have 1-5 computers each and 20.5% schools have 6-
10 computers each. 2 schools do not have any computers.
In Kolkata, 26.3% schools have 1-5 computers and 15.8% schools have 6-10, 11-15,
16-20 and above 20 computers. 2 schools do not have any computers.
In the overall total including all the regions, 28.1% schools have computer rooms with
6-10 computers and in 8 schools (6.3%) the computer rooms are without computers.
The average numbers of computers per school in rural areas, urban areas and in
Kolkata are 10.2, 10.6 and 11.2 respectively. The picture clearly indicates the need of
computers for students in every school.
7.1.14.B Table 7.23c highlights the data on the distribution of Secondary and Higher
Secondary schools on the basis of hostel facilities. In rural areas, less than one-third
(31.5%) of the schools have hostels and they are in use. Comparatively a high
percentage (67.8%) of schools do not have hostel facilities. 1 school (0.7%) has a
hostel but that remains unused.
In urban areas, only 2 schools (3.4%) have hostels and those are in use, whereas
94.8% of the schools do not have hostel facilities. 1 school (1.7%) has a hostel but
that is not in use.
In Kolkata, only 1 school (4.0%) has a hostel and that is in use; but nearly all of the
schools (96%) do not have hostel facilities.
In total, only 21.6% of the schools have hostels and they are in use; more than three-
fourths (77.6%) of the schools do not have hostel facilities. 2 schools (0.9%) have
unused hostels.
Table 7.23d shows the distribution of surveyed schools by having separate hostel
buildings of the concerned school authorities. In rural areas, 91.5% schools with
hostels have separate hostel buildings and only 4 schools (8.5%) do not have
99
separate hostel buildings. In urban areas and Kolkata all the schools with hostels
have separate hostel buildings.
Except 4 schools (8.0%), every school has separate hostel buildings.
Table 7.23e focuses on the data of hostel accommodation among the schools with
hostel facilities. In rural areas total 47 schools have hostel facilities. Among these less
than half (44.7%) of the schools have sufficient hostel accommodation and a high
percentage (55.3%) of the schools do not have such.
In urban areas, among the schools with separate hostel buildings, a perfect half
(50%) of the schools have sufficient hostel accommodation and another half (50%) of
the schools do not.
In Kolkata every school with separate hostel facilities has sufficient hostel
accommodation.
Among all of the surveyed schools with separate hostel buildings, less than half of the
(46%) schools have sufficient hostel accommodation and a high percentage (54%) of
schools do not have that facility.
Table 7.23f provides the data on the distribution of the schools by the number of
accommodation facilities in the running hostel. In rural areas, an average of 53.3 boys
per school and 7.8 girls per school enjoy hostel facilities. Rural areas show the
highest average among all the regions i.e.61 students per school can be
accommodated in hostels.
In urban areas, an average of 27.5 boys per school and an average of 27.5 students
per school can be accommodated in the hostel.
In Kolkata, on an average, 15 girls per school and an average 15 students per school
can be accommodated in the hostel.
In the overall total of all the regions, average 51.2 boys per school and 7.6 girls per
school and average of 58.8 students per school can be accommodated in the hostel.
Table 7.23g shows the distribution of schools depending on the caste of the students
who are accomodated in the hostels. In rural areas, more than half (51.1%) of the
schools have hostel facilities for all the students and 44.7% schools have this facility
for SC and ST students only. Likewise, in 2 schools (4.3%) this facility is available for

100
ST students only. In urban areas and Kolkata, all the schools with hostel facilities
provide this facility to all the students.
Among all the regions more than half of the schools (54%) have hostel facilities for all
the students and 42% of the schools have this facility for SC and ST students only.
Further, in only 2 schools (4.0%), this facility is available for ST students only.
Table 7.23h provides data on hostel charges. In rural areas, 63.8% of the schools do
not take hostel fees and only 2 schools charge INR 1001-1500 as hostel fees.
In urban areas, half of the schools do not take hostel fees and other half charge INR
1-100 as hostel fees.
In Kolkata, 1 school (100%) charges INR 1001-1500 as hostel fees.
In total, more than half of the schools (62%) do not take hostel fees and only 3
schools (6.0%) charge INR 1001-1500 as hostel fees. A little less than one-fifth (18%)
of the schools charge INR 501-1000 as hostel fees.
Table 7.23i shows data on the year of establishment of hostels for schools having
hostel facilities. In rural areas, 36.2% schools have hostel facilities for above 30 years
and only 14.9% schools have started this facility within 1-3 years.
In urban areas, 50% of the schools have hostel facilities for above 30 years and 50%
of the schools have started this facility within 11-20 years.
In Kolkata, all the schools have hostel facilities for above 30 years.
In total, more than one-third (38%) of the schools have hostel facilities for above 30
years and only 14% schools have started this facility within 1-3 years.
7.1.14.C Table 7.24 shows data on the availability of electricity in surveyed schools. In rural
areas most of the schools (89.9%) have electricity. In urban areas and Kolkata all
schools (100%) have electricity. It is recommended that in rural areas each of the
schools should have electricity.
In total, near about all of the schools (93.5%) enjoy electricity facility.
Table 7.25 provides data on the distribution of Secondary & Higher Secondary
schools by the availability of backup power. Other than 8 schools (5.4%), no school
in rural areas have a power backup system. Only 4 schools (6.9%) in urban areas

101
have a power backup system. There is only 1 school (4%) in Kolkata in the same
category.
Only a few schools (5.6%) i.e.13 schools out of 232 surveyed schools have a backup
power system.
7.1.14.D Table 7.26 shows the distribution of schools depending on the adequacy of lights
and fans in the classrooms. In rural areas only half of the classrooms (50.6%) have
sufficient lights and fans. 36.4% of the classrooms have an average number of lights
and fans and only 13% of the classrooms have inadequate lights and fans.
In urban areas, near about three-fourth (71.2%) classrooms have sufficient light and fans.
While, more than one-fourth (28%) of the classrooms have average light and fans and
only 8 classrooms (0.8%) have inadequate light and fans.
In Kolkata, most of the classrooms (86.3%) have sufficient lights and fans. 13.4% of the
classrooms have an average number of lights and fans and only 1 classroom (0.3%)
has inadequate lights and fans.
In total, 60.5% classrooms have sufficient lights and fans. In relation to that, less
than one-third of the (31%) classrooms have average lights and fans and only 8.1% of
the classrooms have inadequate lights and fans.
7.1.14.E Table 7.27a provides data on school uniforms. In rural areas, except 1 school, every
school (99.3%) has a uniform. In case of urban areas and Kolkata, every school
(100%) has a uniform. In conclusion, almost every school (99.6%) has a uniform.
7.1.14.F Table 7.27b shows the distribution of surveyed schools on the basis of arranging
health check-up camps for students. In rural areas, more than one-third (37.6%) of
the schools arrange health check- up camps. In urban areas, only 17.2% of the
schools arrange for health check-up camps. In Kolkata 40% of the schools arrange for
health check-up camps.
Among the total number of schools, only 32.8% of the schools arrange for health check-
up camps and 67.2% do not arrange thesekinds of camps. It is recommended that,
irrespective of area division a cluster of schools should come together to arrange
health check-up camps.

102
7.1.15 MIDDAY MEAL
7.1.15.A Table 7.28 reflects the Mid-Day Meal (MDM) scenario. In rural areas, more than half
of the surveyed schools (57%) provide Mid-Day Meals. In urban areas, a little less
than three-fourths (74.1%) of the surveyed schools do not provide Mid-Day Meals. In
Kolkatahigh percentages (84%) of the surveyed schools do not provide Mid-Day
Meals.
Less than half (44.8%) of the schools provide the MDM.
7.1.16PROBLEMS IN SCHOOLS
7.1.16.A Table 7.29 indicates the different problems of the surveyed schools. In rural areas,
almost all the schools (97.3%) do not have adequate infrastructure. Less than one-
third (32.2%) of the schools are facing the problem of inadequate teaching staff.
Respectively 22.8%, 30.9% and 24.2% schools have low attendance, high dropout
rates and low teacher turnout problems.
In urban areas 41.4% schools are suffering due to inadequate infrastructure. 27.6%
and 29.3% of the schools do not have adequate teaching and non-teaching staff
respectively. 29.3%, 27.6% and 24.1% schools have low attendance, high dropout
rates and low teacher turnout problems respectively. One-fourth (25%) of the schools
have a low enrolment problem.
In Kolkata, more than half (52%) of the schools are suffering due to the problem of
low enrolment. 44% and 28% of the schools have ‗low attendance‘ and ‗dropout‘
problems respectively. Little less than one-fourth (24%) of the schools do not have
adequate teaching staff.
In total, near about three-fourths (73.7%) of the schools do not have adequate
infrastructure. Less than one-third of the 30.2% schools are suffering due to
inadequate teaching staff. 26.7%, 29.7% and 23.3% schools are suffering due to low
attendance, dropout and low teacher turnout problems respectively.
7.1.17EXTRA CURRICULAR ACTIVITIES
7.1.17.A Table 7.30a provides data on the distribution of schools depending on the provision
of vocational training. In rural areas, a little less than three-fourths (73.8%) of the

103
schools do not provide vocational training. In urban areas, almost all of the schools
(93.1%) are running without vocational training. In case of Kolkata 88% of the schools
do not provide vocational training.
Only 19.8% of the schools provide vocational training and most of the schools
(73.8%) do not provide vocational training.
Table 7.30b shows the distribution of Secondary and Higher Secondary schools
providing vocational training by the ten major subjects. In rural areas, 38.5% of the
schools provide vocational training on ‗tailoring‘ and one-third (33.3%) of the schools
provide vocational training on ‗electrical house wiring and motor winding‘.
In urban areas, half of the schools (50%) give vocational training on ‗health work‘ and
2 schools (50%) give training on ‗tailoring‘. One-fourth of the schools, i.e. 1 school,
provides training on ‗electrical house wiring and motor winding‘.
In Kolkata 2 schools give training on ‗mobile & telephone repairing‘ and 2 give on
‗computer assembling and maintenance‘.
In total 37% of the schools give training on ‗tailoring‘ and 30% give training on
‗electrical house wiring and motor winding‘.
Table 7.30c provides information on the distribution of schools by the category of
vocational training. In rural areas 69.2% of the schools have external teachers for
vocational training. In urban areas 50% of the schools have external teachers for
vocational training. In Kolkata three-fourths (75%) of the schools have external
teachers for vocational training.
In total only 31.9% of the schools use their own teachers for vocational training and
most of the schools (68.1%) have external teachers for vocational training.
Table 7.30d discusses the distributionof schools by extra charges for vocational
training. In rural areas, more than three-fourths (76.9%) of the schools do not claim
extra charges for vocational training. In urban areas, half (50%) of the schools do not
claim extra charges for vocational training. In Kolkata, two-thirds (66.7%) of the
schools do not claim extra charges for vocational training. In total, a little more than
one-fourth (26.1%) of the schools claim extra charges for vocational training and most
of (73.9%) the schools do not claim extra charges for vocational training.
104
Table 7.30e shows the distribution of Secondary and Higher Secondary schools by
the number of students getting vocational training. In rural areas, the average number
of students per school taking vocational training is 72.5. In case of urban areas, the
average number of students per school taking vocational training is 101. Kolkata
shows that the average number of students per school taking vocational training is
173. In total, the average number of students per school taking vocational training is
81.5.
Table 7.30f focuses on the arrangement of training on social events. In rural areas
more than one-fourth (26.2%) of the schools arrange for training on social events. In
urban areas only 27.6% of the schools arrange for training on social events. Kolkata
possesses 28% of the schools which arrange for training on social events. In total, a
little more than one-fourth (26.7%) of the schools arrange for training and 73.3% do
not arrange it on social events.
Table 7.30g provides data on the distribution of Secondary and Higher Secondary
schools arranging training on social events upon subjects on which social training is
provided. In rural areas more than half (51.3%) of the schools arrange for training on
‗First Aid‘ and 20.5% of the schools arrange for training on ‗Traffic‘.
In urban areas three-fourths (75%) of the schools arrange for training on ‗First Aid‘
and 37.5% of the schools arrange for training on ‗Traffic‘ and 25% of the schools
arrange for training on ‗NCC/SCOUTS/GUIDES‘.
In Kolkata 71.4% of the schools arrange for training on ‗First Aid‘ and 42.9% of the
schools arrange for training on ‗Traffic‘ and 28.6% of the schools arrange for training
on ‗Literacy Programmes‘. In all, more than half (59.7%) of the schools arrange for
training on ‗First Aid‘ and 27.4% of the schools arrange for training on ‗Traffic‘.
Table 7.30h shows the distribution of Secondary and Higher Secondary schools on
the basis of organising inter-house competitions. In rural areas, most of the schools
(87.9%) of the schools organise ‗Outdoor Sports‘, 48.3% organise a ‗Debate
Competition‘ and 41.6% organise ‗Science Talent‘.
In urban areas, almost three-fourth (75.9%) of the schools organise ‗Outdoor Sports‘,
43.1% organise a ‗Debate Competition‘ and ‗Indoor Sports‘ and 36.2% organise
‗Science Talent‘.

105
In Kolkata, 60% of the schools organise ‗Outdoor Sports‘, 40% organise a ‗Debate
Competition‘ and 28% organise an ‗Exhibition on Art and Crafts‘ and 24% organise
‗Science Talent‘.
A high percentage (81.9%) of the schools organise ‗Outdoor Sports‘, 46.1% organise
a ‗Debate Competition‘ and 38.4% organise ‗Science Talent‘ and 30.2% arrange for
‗Indoor Sports‘.
Table 7.30i highlights the distribution of Secondary and Higher Secondary schools on
the basis of participation in Inter School Competitions. In rural areas most of the
schools (80.5%) organise inter-school ‗Outdoor Sports‘ and almost half of the schools
organise a ‗Science Talent‘ (57.7%), a ‗Debate Competition‘ (50.3%), a ‗Drawing
Competition‘ (51%) and a ‗Recitation Competition‘ (53.7%).
In urban areas, 72.4% schools organise inter-school ‗Outdoor Sports‘ and almost half
of the schools organise a ‗Science Talent‘ (50%), a ‗Debate Competition‘ (51.7%), a
‗Drawing Competition‘ (62.1%) and a ‗Recitation Competition‘ (53.4%).
In Kolkata, 76% of the schools organise an inter-school ‗Drawing Competition‘ and
‗Recitation Competition‘ while 64%organise a ‗Debate Competition‘. 40% of the
schools organise a ‗Science Talent‘ and ‗Outdoor Sports‘.
Overall, a little less than three-fourth (73.8%) of the schools organise ‗Outdoor
Sports‘, and almost half of the schools organise a ‗Science Talent‘ (53.6%), a ‗Debate
Competition‘ (51.9%), a ‗Drawing Competition‘ (56.2%) and a ‗Recitation Competition‘
(55.8%).
7.1.18 OTHER INFORMATION
7.1.18.A Table 7.31a shows the number of non-teaching staff (clerks and group D). In rural
areas, the average number of clerks per school is 1.1 and Group D staff is 1.9.
In case of urban areas, the average number of clerks per school is 1.4 and this
figure for Group D staff is 2.2. In Kolkata the average number of clerks per school is
1.1 and Group D staff is 1.7.
Total average number of clerks per school is 1.2 and Group D staff is 2.
Table 7.31b provides data on the number of sanctioned non-teaching staff in
Secondary and Higher Secondary schools. In rural areas, average number of

106
sanctioned non-teaching staff per school is 4.8. The same for urban area is 5 per
school. In Kolkata, the average number of sanctioned non-teaching staff per school
is 4.3. The total average number of sanctioned non-teaching staff per school is 4.8.
7.1.19 ENROLLMENT IN SCHOOLS FROM CLASS V TO CLASS X
7.1.19.A Table 7.32 provides data on enrolment status in Class-V to Class-X of Government
Secondary and Higher Secondary schools. In rural areas the enrolment in class-IX
and X shows a tendency to increase. Total enrolment in 2004-05 in these two classes
were 9744 and 6540 respectively whereas these figures go up to 12653 and 9749 in
2000-10 in the respective classes.
In urban areas, enrolment in class-IX and X shows an increasing trend. Total
enrolments in 2004-05 in these two classes were 4919 and 3657 respectively
whereas these figures go up to 5376 and 4487 in 2000-10 in respective classes.
In Kolkata, enrolment in class-IX and X also shows an increasing trend. Total
enrolment in 2004-05 in these two classes were 1370 and 974 respectively whereas
these figures go up to 1439 and 1076 in 2000-10 in respective classes.
7.1.19.B Table 7.33a shows the enrolment status in Class V of Govt. Secondary and Higher
Secondary schools. In rural areas the total enrolment in Class-V in 2004-05 was
18399 and the average number of students per school was 221.7. Whereas the total
enrolment in 2009-10 is 17369 and the average number of students per school is
209.3.
In urban areas the total enrolment in Class-V in 2004-05 was 6344 and the average
number of students per school was 171.5; while the total enrolment in 2009-10 is
6051 and the average number of students per school is 163.5.
In Kolkata, the total enrolment in Class-V in 2004-05 was 1509 and the average
number of students per school was 88.8; in that case the total enrolment in 2009-10
was 1387 and the average number of students per school was 81.6.
The total enrolment in Class-V in 2004-05 was 26252 and the average number of
students per school was 191.6. Likewise, the total enrolment in 2009-10 was 24807
and the average number of students per school was 181.1.

107
Table 7.33b provides data on the enrolment status in Class VI of Govt. Secondary
and Higher Secondary schools. In rural areas, total number enrolment in Class-VI in
2004-05 was 14053 and the average number of students per school was 169.3
whereas the total enrolment in 2009-10 was 15401 and the average number of
students per school was 185.6.
In urban areas, total enrolment in Class-VI in 2004-05 was 5651 and the average
number of students per school was 152.7 whereas the total enrolment in 2009-10 was
5728 and the average number of students per school was 154.8.
In Kolkata, total enrolment in Class-VI in 2004-05 was 1397 and the average number of
students per school was 82.2 whereas the total enrolment in 2009-10 was 1438 and
the average number of students per school was 84.6.
In total, the total enrolment in Class-VI in 2004-05 was 21101 and the average number
of students per school was 154 whereas the total enrolment in 2009-10 was 22567 and
the average number of students per school was 164.7.
Table 7.33c provides data on the enrolment status in Class VII of Govt. Secondary and
Higher Secondary schools. In rural areas the total enrolment in Class-VII in 2004-05 was
12003 and the average number of students per school was 144.6. Whereas the total
enrolment in 2009-10 was 14681 and the average number of students per school was
176.9.
In urban areas, total enrolment in Class-VII in 2004-05 was 4984 and the average
number of students per school was 134.7. While, total enrolment in 2009-10 was 5224
and the average number of students per school was 141.2.
In Kolkata, total enrolment in Class-VII in 2004-05 was 1506 and the average number of
students per school was 88.6. The total enrolment in 2009-10 was 1437 and the average
number of students per school was 84.5.
The total enrolment in Class-VII in 2004-05 was 18493 and the average number of
students per school was 135 whereas the total enrolment in 2009-10 was 21342 and the
average number of students per school was 155.8.
Table 7.33d presents the data on enrolment status in Class VII of Govt. Secondary and
Higher Secondary schools. In rural areas, total enrolment in Class-VIII in 2004-05 was
10466 and the average number of students per school was 126.1. Whereas the total

108
enrolment in 2009-10 was 12653 and the average number of students per school was
152.4.
In urban areas, total enrolment in Class-VIII in 2004-05 was 4984 and the average
number of students per school was 134.7. Further, the total enrolment in 2009-10 was
5224 and the average number of students per school was 141.2.
In Kolkata total enrolment in Class-VIII in 2004-05 was 1400 and the average number of
students per school was 82.4. In this case, the total enrolment in 2009-10 was 1405 and
the average number of students per school was 82.6.
In total, the total enrolment in Class-VIII in 2004-05 was 16850 and the average number
of students per school was 123. Whereas the total enrolment in 2009-10 was 19282, and
the average number of students per school was 140.7.
Table 7.33e shows data on enrolment status in Class IX of Government Secondary and
Higher Secondary schools. In rural areas, total enrolment in Class-IX in 2004-05 was
9744 and the average number of students per school was 117.4. In addition, the total
enrolment in 2009-10 was 12189, and the average number of students per school was
146.9.
In urban areas, total enrolment in Class-IX in 2004-05 was 4919 and the average
number of students per school was 132.9. However, in 2009-10, total number of enrolled
students was 5376 and the average number of students per school was 145.3.
In Kolkata, total enrolment in Class-IX in 2004-05 was 1370 and the average number of
students per school was 80.6. Further, the total enrolment in 2009-10 was 1439 and the
average number of students per school was 84.6.
In total, the total enrolment in Class-IX in 2004-05 was 16033 and the average number
of students per school was 117. In that case, the total enrolment in 2009-10 was 19004,
and the average number of students per school was 138.7.
Table 7.33f points out the enrolment status in Class X of Govt. Secondary and Higher
Secondary schools. In rural areas, total enrolment in Class-X in 2004-05 was 6540, and
the average number of students per school was 78.8; whereas the total enrolment in
2009-10 was 9749, and the average number of students per school was 117.5.
In urban areas, total enrolment in Class-X in 2004-05 was 3657, and the average
number of students per school was 98.8. Moreover, the total enrolment in 2009-10 was
4487, and the average number of students per school was 121.3.
109
In Kolkata, total enrolment in Class-X in 2004-05 was 974 and the average number of
students per school was 57.3. Simultaneously, the total enrolment in 2009-10 was 1076,
and the average number of students per school was 63.3.
In absolute terms, the total number enrolment in Class-X in 2004-05 was 11171 and the
average number of students per school was 81.5. It has been observed that the total
enrolment in 2009-10 was 15312 and the average number of students per school was
111.8.
7.1.19.C Table 7.34a shows enrolment status from Class-V to Class-X together in Govt.
Secondary and Higher Secondary schools in 2009-10. In rural areas, total enrolment is
82042 and the average number of students per school was 988.5. The percentage of
boys‘ enrolment was 57.8.
In urban areas, total enrolment was 32303 and the average number of students per
school was 873.1. The percentage of girls‘ enrolment was 52.9.
In Kolkata total enrolment was 8182 and the average number of students per school was
481.3. The percentage of girls‘ enrolment was 54.9.
In total the total enrolment was 122527 and the average number of students per school
was 894.4. The percentage of boys‘ enrolment (54.2%) was more than half of the total
students.
Table 7.34b provides data on the enrolment status from Class-V to Class-X together in
Govt. Secondary and Higher Secondary schools in 2008-09. In rural areas the total
enrolment was 79528 and the average number of students per school was 958.2. The
percentage of boys‘ enrolment was 58.2.
In urban areas the total enrolment was 31454 and the average number of students per
school was 850.1. The percentage of girls‘ enrolment was 54.1.
In Kolkata total enrolment was 8357 and the average number of students per school was
491.6. The percentage of girls‘ enrolment was 56.6.
Including all areas together, the total enrolment was 119339 and the average number of
students per school was 871.1. The percentage of boys‘ enrolment (54%) was more than
half of the total students.
Table 7.34c concentrates on the enrolment status from Class-V to Class-X together in
Govt. Secondary and Higher Secondary schools in 2007-08. In rural areas the total

110
enrolment was 77100 and the average number of students per school was 928.9. The
percentage of boys‘ enrolment was 58.6.
In urban areas total enrolment was 31282 and the average number of students per
school was 845.5. The percentage of girls‘ enrolment was 55.
In Kolkata, total enrolment was 8371 and the average number of students per school
was 492.4. The percentage of girls‘ enrolment was 56.
In absolute terms, the total enrolment was 116753, and the average number of students
per school was 852.2. The percentage of boys‘ enrolment (53.9%) was higher than the
girls‘.
Table 7.34d provides data onenrolment status from Class-V to Class-X together in Govt.
Secondary and Higher Secondary schools in 2006-07. In rural areasthe total enrolment
was 74572 and the average number of students per school was 898.5. The percentage
of boys‘ enrolment was 59.8.
In urban areas, total enrolment was 31080, and the average number of students per
school was 840. The percentage of girls‘ enrolment was 53.7.
In Kolkata total enrolment was 8263 and the average number of students per school was
486.1. The percentage of girls‘ enrolment was 55.9
In total, the total enrolment was 113915 and the average number of students per school
was 831.5. The percentage of boys‘ enrolment (54.9%) was more than half of the total
students.
Table 7.34e highlights the enrolment status from Class-V to Class-X together in Govt.
Secondary and Higher Secondary schools in 2005-06. In rural areas, total enrolment
was 73875 and the average number of students per school was 890.1. The percentage
of boys‘ enrolment was 60.7.
In urban areas, total enrolment was 31168 and the average number of students per
school was 842.4. The percentage of girls‘ enrolment was 52.7.
In Kolkata total enrolment was 8456 and the average number of students per school was
497.4. The percentage of girls‘ enrolment was 54.8.
The total enrolment is 113499, and the average number of students per school was
828.5. The percentage of boys‘ enrolment (55.9%) was higher than that of the girls.

111
Table 7.34f shows enrolment status from Class-V to Class-X together in Govt.
Secondary and Higher Secondary Schools in 2004-05. In rural areas the total enrolment
was 71205 and the average number of students per school was 857.9. The percentage
of boys‘ enrolment was 61.6.
In urban areas total enrolment was 30939, and the average number of students per
school was 836.2. The percentage of girls‘ enrolment was 52.7.
In Kolkata total enrolment was 8156 and the average number of students per school was
479.8. The percentage of girls‘ enrolment was 54.5.
In absolute terms the total enrolment was 110300, and the average number of students
per school was 805.1. The percentage of boys‘ enrolment (56.4%) was more than half of
the total students.
7.1.20 ON TEACHERS
7.1.20.A Table 7.35 shows data on number of teachers in Secondary & Higher Secondary schools.
In rural areas, the average number of full time teachers is 19.4 and the average number
of para-teachers is 4.2. The average number of teachers per school is 23.
In urban areas, the average number of full time teachers is 20.7 and the average number of
para-teachers is 4.4. The average number of teachers per school is 23.5.
In rural areas, the average number of full time teachers is 16.1 and the average number
of para-teachers is 4.3. The average number of teachers per school is 17.8.
Including all areas together, the average number of full time teachers is 19.3 and the
average number of para-teachers is 4.2. The average number of teachers per school is
22.6.
Table 7.36a provides data on average number of male and female teachers‘ in Secondary and
Higher Secondary schools. In rural areas the average number of male teacher is 15.9
and the average number of female teacher is 7.1.
In urban areas the average number of male teachers is 18.1 and the average number of
female teachers is 12.3.
In Kolkata the average number of male teachers is 15.2 and the average number of
female teachers is 12.1.
112
In gender terms the average number of male teachers is 17.9 which is higher than the
average number of female teachers i.e. 8.9.
Table 7.36b shows the percentage of male and female teachers‘ in the surveyed
schools. In rural areas the percentage of male teachers is 69.3 and the percentage of
female teachers is less than one-third (30.7%) of the total teachers.
In urban areas, the percentage of male teachers is less than half of the total teachers
(47.7%) and the percentage of female teachers (52.3%) is higher than the males.
In Kolkata, the percentage of male teachers is 37.4 and the percentage of female
teachers is highest among all the areas (62.6%).
In the overall total of all the regions, the percentage of male teachers is 60.9; and the
percentage of female teachers (39.1%) lower than that of the males.
Table 7.37 shows the distribution of teachers by distance (school to residence) in
Secondary and Higher Secondary schools. In rural areas, 60.3% teachers come from
more than 10 kilometers (K.M.) distance and only 11.3% teachers come from less than 1
K.M.
In urban areas less than half of the (41.2%) teachers come from more than 10 k.m.
distance. Moreover, a little more than one-tenth i.e. 13.6% and 13.2% teachers come
from less than 1 K.M and 1-2 K.M. distances respectively.
In Kolkata, 43.5% teachers come from more than 10 K.M. distance and only 10.1% and
10.5% teachers come from less than 1 K.M. and 1-2 K.M. distances respectively.
Among all the regions put together, more than half of the teachers (53.9%) come from
more than 10 K.M. distance. Only 9.2% teachers come from 1-2 K.M. distances. Again, a
little more than one-tenth of the (11.8%) teachers come from less than 1 K.M. distance.
To improve teaching quality and to reduce teachers’ travelling distance it
may be recommended that the appointment of teachers be preferably from the
same district.
Table 7.38 provides data on teachers‘ distribution in the surveyed schools on the basis
of their professional training. In rural areas, less than half (45.6%) of the teachers have
pre-service training and 18.8% teachers have in-service training. While more than one-
third (35.5%) of the teachers do not have any training.

113
In urban areas 50.1% teachers took training before joining and 23.6% teachers took
training after joining. 26.2% teachers do not have any training.
In Kolkata 52.2% teachers took training before joining and 27.8% teachers took training
after joining. 20% teachers do not have any training.
In the total of all the areas, less than half (47.4%) of the teachers took training before
joining and one-fifth of the (20.9%) teachers took training after joining. Less than one-
third (31.8%) of the teachers do not have any training.
Table 7.39a depicts average caste-wise distribution of teachers. In rural areas the
average number of teachers from the SC community is 4.7, from the ST community is 1,
from the minority community is 1.6, from the OBC is 1.8 and from the general category is
13.9.
In urban areas the average number of teachers from the SC community is 4.4, from the
ST community is 1, from the minority community is 1.3, from the OBC is 1.3 and from the
general category is 15.5.
In Kolkata, the average number of teachers from the SC community is 3.2; from the ST
community is 0.7, from the minority community is 0.4, from the OBC is 0.7 and from the
general category is 12.8.
The overall total indicates that the average number of teachers from the SC community
is 4.5 from the ST community is 1, from the Minority community is 1.4, from the OBC is
1.6. The same is higher for general category teachers i.e. 14.2.
Table 7.39b shows the percentage of caste-wise distribution of the teachers. In rural
areas, the percentage of teachers from the SC community is 20.6%, from the ST
community is 4.4%, from the minority community is 6.8%, from the OBC is 7.9% and
from the general category is 60.3%.
In urban areas the percentage of teachers from the SC community is 18.8%, from the ST
community is 4.2%, from the minority community is 5.6%, from the OBC is 5.5% and
from the general category is 65.9.
In Kolkata the percentage of teachers from the SC community is 17.7%, from the ST
community is 4%, from the minority community is 2.5%, from OBC is 3.8% and from the
general category is 72%.
Altogether the percentage of teachers from the SC community is near about one-fifth
(19.9%). For most of the other communities the same is less than one-tenth of the total
teachers. The teachers‘ percentage from the ST community is 4.3%, from the minority

114
community is 6.1% and from the OBC is 6.9%. The general category shows the highest
percentage of teachers with a little less than two-thirds of the teachers (62.8%).
Table 7.40a provides data on the teachers‘ educational backgrounds. In rural areas,
53.5% of the teachers are graduates, 45.5% of the teachers have degrees up to post
graduate, 0.6% have some form of professional qualification and 0.4% have completed a
PhD.
In urban areas 46.8% teachers are graduates, 51.7% teachers have degrees up to post
graduate, 0.5% have some form of professional qualification and 1% have completed a
PhD.
In Kolkata 38.1% of the teachers are graduates, 59.9% teachers have degree up to post
graduate, 0.2% have some form of professional qualification and 1.8% have completed a
PhD.
In the overall total, half of the teachers (50.4%) teachers are graduates, but less than
half of the teachers (48.3%) have post graduate degrees. Only a few (0.5%) have some
form of professional qualification and 0.7% have completed a PhD.
Table 7.40b shows the age-wise distribution of teachers. Maximum teachers (61%) in
Secondary and Higher Secondary Schools are up to 40 years of age. Only a few
teachers (16%) belong to the age group of 51-60 years.
Table 7.41 shows data on teachers‘ attendance. In rural areas, the percentage of
teachers‘ attendance was quite good i.e. 87.5%. In urban areas, the percentage of
teachers‘ attendance was 88.5%. Kolkata presents the highest percentage of teachers‘
attendance i.e. 88.8%.
In the overall total, the percentage of teachers‘ attendance was quite high i.e. 86.9%.
Table 7.42 provides data on the average number of periods taken by teachers in
Secondary and Higher secondary schools. In rural areas the average number of periods
taken by full time teachers is 47.4 and this number was 30 for part time teachers.
Whereas in urban areas the average number of periods taken by full time teachers was
43.6 and this number was 25 for part time teachers. For Kolkatathe respective averages
are 36 and 18.
Overall, the average number of periods taken by full time teachers was 45.2 and this
number was 28 for part time teachers.
Table 7.43a indicates the teacher-student ratio in Secondary schools. In rural areas, the
student-teacher ratio for 2009-10 from Class V to Class X was 40.4. The same was 36.1

115
for urban areas. In Kolkata the student-teacher ratio for 2009-10 from Class V to Class X
was 27.2.
Considering all the schools, the student-teacher ratio for 2009-10 from Class V to Class X
was 38.
Table 7.43b shows the teacher-student ratio in Secondary and Higher Secondary schools.
In rural areas the student-teacher ratio for 2009-10 from Class V to Class XII was 49.7.
In urban areas and Kolkata respectively the student-teacher ratios for 2009-10 from Class
V to Class XII was 46.7 and 37.2.
Including all area-wise categories together, it has been observed that the student-teacher
ratio for 2009-10 from Class V to Class XII was 47.4.
7.1.21 RESULTS OF MADHYAMIK EXAMINATION
7.1.21.A Table 7.44a shows three years results of the Madhyamik Examination from surveyed
secondary schools. In rural areas 20.9%, 23.5% and 24.1% students got 100%-
90%marks in 2009-10, 2008-09 and 2007-08 respectively. Around half of the
students, i.e. 51.4%, 54.4%, and 52.6% students got 89%-80% marks in 2009-10,
2008-09 and 2007-08 respectively. Except 10 students in 2008-09, no student got
below 30% in the other two academic years.
In urban areas 35.7%, 37.5% and 42.2% students got 100%-90%marks in 2009-10,
2008-09 and 2007-08 respectively. 44.1%, 46.8% and 44.4% students got 89%-
80%marks in 2009-10, 2008-09 and 2007-08 respectively. No student got below
30%in the above-mentioned three academic years.
In Kolkata 22%, 22.3% and 18.8% students got 100%-90%marks in 2009-10, 2008-
09 and 2007-08 respectively.57.1%, 68.1% and 61.6% students got 89%-80%marks
in 2009-10, 2008-09 and 2007-08 respectively. No student got below 30%in the
above-mentioned three academic years.
A totalof 24.6%, 27.2% and 29% students got 100%-90%marks in 2009-10, 2008-09
and 2007-08 respectively. Most of the students, i.e. 50%, 53.5% and 50.9%
students got 89%-80%marks in 2009-10, 2008-09 and 2007-08 respectively. No
student got below 30% in the above-mentioned three academic years.
116
Table 7.44b provides three years statement of average result of Madhyamik
Examination in Secondary Schools. In rural areasan average of 19, 17 and 14
students per school got 100%-90%marks in 2009-10, 2008-09 and 2007-08
respectively. An average of 46, 40 and 31 students per school got 89%-80%marks
in 2009-10, 2008-09 and 2007-08 respectively.
In urban areas, an average of 32, 31 and 30 students per school got 100%-
90%marks in 2009-10, 2008-09 and 2007-08 respectively. An average of 40, 39 and
32 students per school got 89%-80%marks in 2009-10, 2008-09 and 2007-08
respectively.
In Kolkata, an average of 14, 15 and 10 students per school got 100%-90%marks in
2009-10, 2008-09 and 2007-08 respectively. An average of 35, 46 and 32 students
per school got 89%-80%marks in 2009-10, 2008-09 and 2007-08 respectively.
An average of 21, 21 and 18 students per school got 100%-90%marks in 2009-10,
2008-09 and 2007-08 respectively. An average of 43, 40 and 31 students per school
got 89%-80% marks in 2009-10, 2008-09 and 2007-08 respectively.
7.1.22 RESULTS OF HIGHER SECONDARY EXAMINATIONS
7.1.22.A Table 7.45a shows results of three years forthe Higher Secondary Examination from the
Higher Secondary schools. In rural areas, 26.9%, 30.7% and 30.9% students got 100%-
80% marks the years of 2009-10, 2008-09, and 2007-08 respectively. 39.5%, 40.5% and
41% students got 79%-60%marks in 2009-10, 2008-09 and 2007-08 respectively. 1.2%
students in 2009-10, 1.1% students in 2008-09 and 1.9% students in 2007-08 got below
30%marks.
In urban areas, 45.6%, 43.2% and 41.3% students got 100%-80% marks in 2009-10,
2008-09 and 2007-08 respectively. 38.3%, 39.3% and 40.7% students got 79%-
60%marks in 2009-10, 2008-09 and 2007-08 respectively. No student got below 30%in
above-mentioned three academic years.
In Kolkata, 33.3%, 28.1% and 29.9% students got 100%-80% marks in 2009-10, 2008-09
and 2007-08 respectively. 54.6%, 58.1% and 58.1% students got 79%-60%marks in

117
2009-10, 2008-09 and 2007-08 respectively. No student got below 30%in above-
mentioned three academic years.
In total, around one-third students, i.e. 33.1%, 34.5% and 34.3% students got 100%-80%
marks in 2009-10, 2008-09 and 2007-08 respectively. Comparatively a higher percentage
of students i.e. 40.5%, 41.9% and 42.7% students got 79%-60%marks in 2009-10, 2008-
09 and 2007-08 respectively.
Table 7.45b provides data on three years statement of average result of Higher
Secondary Examination in Higher Secondary schools. In rural areasan average of 29, 27
and 29 students per school got 100%-80% marks in 2009-10, 2008-09, and 2007-08
respectively. An average of 43, 39 and 38 students per school got 79%-60%marks in
2009-10, 2008-09 and 2007-08 respectively.
In urban areas an average of 54, 48 and 44 students per school got 100%-80% marks in
2009-10, 2008-09 and 2007-08 respectively. An average of 45, 44 and 44 students per
school got 79%-60%marks in 2009-10, 2008-09 and 2007-08 respectively.
In Kolkataan average of 33, 28 and 28 students per school got 100%-80% marks in 2009-
10, 2008-09 and 2007-08 respectively. An average of 54, 57 and 54 students per school
got 79%-60%marks in 2009-10, 2008-09 and 2007-08 respectively.
In total, an average of 37, 35 and 34 students per school got 100%-80% marks in 2009-
10, 2008-09 and 2007-08 respectively. An average of 45, 42 and 42 students per school
got 79%-60% marks in 2009-10, 2008-09 and 2007-08 respectively.
7.2 West Bengal Board of Secondary Education ( W.B.B.S.E)
7.2.1 In 1951, under the Act named West Bengal Secondary Education Act of 1950; the
Board for secondary education was established by the State Government. In 1964it
was renamed as the West Bengal Board of Secondary Education under the West
Bengal Board of Secondary Education Act, 1963. The Board is entrusted with the
overall task of providing secondary level education in the state.57
7.2.2 As per the Act of 1963 which has been amended up to 2004, the Board is headed by
the President. Under the president there is a Secretary, other functioning members and
57
http://wbbse.org/history.htm (accessed on 10th August, 2011).

118
staff. Section 16 of the West Bengal Act V of 1963, as amended up to 200458,
empowers the Secretary of the Board to appoint additional staff to promote the
functions and aims of the board.
7.2.3 As per the Section 18 of the West Bengal Board of Secondary Education Act, 1963, as
amended up to 200459, the Board may consist of six committees for conducting
different functions. These committees are: i) recognition committee, ii) executive
committee, iii) syllabus committee, iv) examination committee, v) appeal committee, vi)
finance committee. Along with these committees, the Board has two more committees
at present—vii) age and record correction committee, viii) building sub-committee.
There are four regional Councils in West Bengal for decentralizing routine
administrative work. Section 25 of the West Bengal Board of Secondary Education Act,
1963, empowers the Board to constitute Regional Councils. The Board may also
decide the composition, ‗territorial jurisdiction‘, and number of Regional Councils
subject to approval from the State Government (p. 28). With the approval of the State
Government, the Board can assign different functions to Regional Councils according
to the Act. As per the Act, the different functions of the Board including the functioning
of committees such as the examination committee or the executive committee may be
decentralized through the Regional Councils.
7.2.4 Major functions of the Board are60—
a) Providing Secondary education in the State.
b) Conducting examinations on secondary education, i.e. Madhyamik Parikshya.
c) Suggesting different possible methods and policies for the improvement of the
Secondary Education system to the State Government.
d) Looking after various administrative issues of the schools.
e) Controlling and supervising different issues related to secondary educationlike:
formation of syllabus, text book publication, etc.
f) Ensuring the democratic nature of school management.
58
West Bengal Board of Secondary Education, West Bengal Act V Of 1963: The West Bengal Board of Secondary Education Act, 1963 as amended upto 2004, 2005 (Kolkata), 17-18, 21, 41, 28-29, 30, 32. 59
Ibid,18. 60
http://wbbse.org/history.htm (accessed on 10th August, 2011).
119
g) Upgrading and offering recognition to the Secondary Schools.
7.2.5 According to 2008-09 data61, table 7.1 shows that a total of 8337 schools offer
Secondary Education in West Bengal, of which 3635 schools offer education up to
class X only.
Of these 3635 schools which offer education up to class X only, Kolkata possesses 151
schools. The maximum numbers of schools (388) belong to the Burdwan district. On
the contrary, Uttar Dinajpur possesses the minimum number of schools i.e. 51
schools.
The Annual Report (2009-10) of the School Education Department, WB in table 7.46,
mentions 64 operational Kasturba Gandhi Balika Vidyalayas (KGBV). KGBVs are fully
residential girls‘ schools. Among these, construction has been completed for 53
schools.
7.2.6 The Board provides Secondary level education to the students of 15-16 years of
age. As per data from 2008-09, table 7.1highlights that a total of 1680547 students
(including class IX and X only) are enrolled under the state secondary education
system. Among them, 837816 students are boys and 842731 students are girls. Table
7.47, on the basis of the Annual Report (2009-10) of the School Education
Department, WB, shows that there are 3021 enrolled girls in the KGBVs.
7.2.7 On the basis of DISE (2008-09) data and Annual Report 2009-10 of the Department
of School Education of west Bengal, table 7.48 shows that for the years 2016 and
2026, projected numbers of Secondary schools are respectively 7576 and 6406.
While in 2011 there are 8337 schools. It shows that in future the demand and
projected numbers of schools will decrease.
Findings on schools offering up to class X level education
7.2.8 FORMAL INFORMATION
7.2.8.A Table 7.49a, on the basis of the surveyed data, shows the location-wise distribution
of total 233 (100%) surveyed secondary schools. Most of the secondary schools i.e.
61
www.wbsed.gov.in (DISE 2008-09).
120
149 (63.9%) schools are in rural areas and almost one fourth of the schools i.e. 59
(25.3%) schools are in urban areas. Almost one tenth of the surveyed schools i.e. 25
(10.7%) schools are located in Kolkata.
7.2.9 SCHOOLINFRASTUCTURE
7.2.9.A Table 7.49b indicates that apart from 2 school buildings in Kolkata, all other school
buildings in every location (rural, urban and Kolkata) are owned by the school
authorities. It depicts the data on the distribution of school buildings on the basis of
different categories of buildings. These categories are: a) pucca; b) semi-pucca; c)
kutcha; d) no building. There are only 6 (4.0%) and 1 (4%) schools with semi-pucca
buildings, respectively in rural areas and Kolkata. Except these 7 (3% of the total
sample) schools, all other schools have pucca buildings.
7.2.9.B Table 7.51 shows the distribution of schools by the number of classrooms. Most of the
secondary schools (29 schools) in the rural areas have more than 20 classrooms. The
average number of classrooms in the surveyed secondary schools of rural areas is 16
per school. In urban areas and Kolkata the maximum number of schools, i.e. 22
schools and 7 schools respectively possess more than 20 classrooms. The surveyed
secondary schools of urban areas and Kolkata respectively have an average of 22
and 7 classrooms per schools.
7.2.9.C Table 7.52 provides data on distribution of schools by availability of rooms other than
classrooms among the surveyed schools.
In rural areas almost all schools haveteachers‘ rooms (98%). Almost three-fourths of the
schools have separate rooms for the teacher-in-charge (72.5%). More than one-fourth
(27.5%) of the surveyed rural schools have anoffice room and almost 81.2% have
verandas. Almost half of the surveyed rural schools (47%) have a computer room as
well. Less than half of the rural schools (43.6%) have their own library.
In urban areas almost all schools have teachers‘ rooms (98.3%) and a separate room
for the teacher-in-charge (89.8%). Only 37.3% of the schools have an office room but a
comparatively higher percentage (67.8%) schools have a separate computer room.
Almost all schools have verandas (88.1%); and about half of the schools (55.9%) have
library facilities.
In Kolkata every school (100%) have separate rooms for teachers and the facility of
a separate room for the teacher-in-charge is also available in almost all of the schools
(92%). Likewise, more than three-fourths of the schools (76%) have computer rooms. It

121
has been observed that in Kolkata 64% of the schools have library facilities and a
veranda. In contrary less than half of the schools (44%) have an office room.
Among all the surveyed schoolsmostof the schools (98.3%) have aseparate teachers‘ room
and 79% have a separate room for the teacher-in-charge. More than half of the schools
(55.4%) schools possess separate computer rooms but less than half of the schools
(48.9%) have library facilities. In contrast, the percentage of schools having an office
room is low (31.8%).
7.2.10 Issues from Household Data
Almost one-third of the sample household members are illiterate.
Dropout percentage increases with age. Percentage of non-enrolment decreases as age
increases. This is applicable for both income-wise and caste-wise distributions.
Major reasons for dropout and non-enrolment are ‗No money for fees‘; ‗Working/earning
money‘ and ‗lost interest‘ for all the age groups for both income-wise and caste-wise
distributions.
Private tuition has no relation with income level and caste.
Private tuition also has no relation with the teaching quality in schools.
7.2.11 Proposed Areas for Intervention
At the organisational level:
The Secondary Board and Higher Secondary Council could come together to form a
single organisation.
The work should be split into two divisions: one for routine work (like upgradation,
recognition renewal, issuance of permission for new subject, etc) and the other for the
ongoing process of syllabus change, publications, etc which should be the mandate of
the WBCERT.
More Regional Offices (ROs) are required for both divisions. Preferred locations could
be the districts of Nadia, Bankura, and Darjeeling.
The number of teachers needs to be increased for both.
Decentralisation to ROs would be crucial. This should include
122
mandate for upgradation and recognition, including renewal of recognition
(guidelines need to given to RO),
mandates for human resources (like approval for overtime payment),
admission intake increase upto a percentage of ten,
issue of duplicate marksheets,
creation of database for migration, which will enable same-day issuance of
migration certificates
The above decentralisation would not require new staff but there should be provisions of
training, especially on the use of computers at every level.
Warehouse decentralisation for books should be done.
A Deputy Secretary needs to be posted at all Higher Secondary ROs. At the Secondary
ROs, the DS should be provided with the power of delegating service when s/he is
absent. Currently, s/he is the single signatory, and his/her absence makes many routine
tasks impossible.
Laboratory grant for schools should be increased, along with proper monitoring from the
RO.
School inspection through cluster visits should be done immediately.
Teacher sanctions for subject-wise distribution should be done by the RO by liaising with
the DI office.
Internet facility should be provided at the RO for monthly/ annual statements.
The web portal needs to be regularly updated with circulars.
Internet should be provided in all ROs at all levels.
At the school level:
Every school must have a separate room for teachers and the Headmaster or Teacher-
in-Charge.
Every school should have a library, office room and computer room.
Every school should have computers for students.
In rural areas all schools must have a electricity connection.
There is a need for increasingthe number of clerks and Group-D staff in schools.
Most of the teachers come from beyond 10 k.m.; The appointment of teachers should be
preferably from the same district.
More schools should provide vocational training to their students.

123
School Management Committees should be formed and encouraged in all rural and
urban schools.
Irrespective of area divisions, a cluster of schools should come together and arrange
health check-up camps.
A large number of schools offering secondary education only need proper infrastructural
improvement.
7.3 Findings on MSKs
7.3.1 BACKGROUND
7.3.1.A Table 7.53 shows that among all surveyed MSKs (8 MSKs) the maximum number of
MSKs (5 MSKs) were established 6-10 years ago. Only 1 MSK was established about
1-3 years ago. Further, table 7.54 provides data on the distribution of MSKs on the
basis of school timings. Among the surveyed MSKs, 7 functionduring the day (87.5%)
i.e. during 10.00 a.m. to 4.30 p.m. Only one MSK runs in the morning session
between 6.30 a.m. to 11.00 a.m. Survey data reveals that all MSKs are co-
educational.
7.3.2 SCHOOL COMMITTEES
7.3.2.A Table 7.55 shows that all surveyed MSKs have School Management Committees. One-
fourth (25 %)of the surveyed MSKs have a Mother Teacher Association. Table 7.56
shows that in the year of 2009-10, the average number of managing committee
meetings per school were 7.5.
7.3.3 VISIT BY AUTHORITIES
7.3.3.A Table 7.57 provides data on SIS/ ASI visits to surveyed MSKs in the last year. It shows
that only one-fourth (25%) of the surveyed MSKs were visited by SIS/ ASI in the last
year. Present study also reveals that the higher authority does not hold any vigilance
visit to the surveyed MSKs.

124
7.3.4 SCHOOL INFRASTUCTURE
7.3.4.A From the survey it is clear that almost all of the surveyed MSKs (7 out of 8 surveyed
MSKs) have their own pucca buildingand 1 MSK runs in a primary school premise.
Table 7.58 shows the distribution of MSKs depending on the number of floors. Half of
the MSKs are two storied and 37.5% possess a one storied building. Table 7.59
provides data on the class-room wise distribution of MSKs. Half of the surveyed
MSKs (50%) have 4 class-rooms. All other categories of MSKs with 1,5,8, and 9
classrooms show a percentage of 12.5% each.
Table 7.60 focuses on MSK distribution depending on the distribution of rooms other
than classrooms. Respectively one-fourth (25%) and three-fourths (75%) of the
surveyed MSKs have a separate kitchen and teachers‘ room. Moreover 12.5% of the
MSKs have a separate store room and teacher-in- charge‘s room. No MSKs have a
library room, office room, computer room or a laboratory room.
7.3.4.B Table 7.61 shows that almost all of the surveyed MSKs (7 out of 8 surveyed MSKs),
i.e. 87.5%, have available drinking water.
7.3.4.C Table 7.62 shows that near about all of the surveyed MSKs (87.5%) have toilets. Table
7.63 provides data on toilet categories. In 6 MSKs, there are toilets for students; and
the average number of toilets for students‘ per MSK is 2.2. Moreover, in 4 MSKs there
are common toilets. Again, table 7.65 shows that, there are 4 MSKs having toilets for
students only; and only 2 MSKs have separate toilets for teachers‘ and students‘.
From table 7.64, it is clear that half of the surveyed MSKs (50%) have separate toilet
facilities for boys‘ and girls‘.
Table 7.66 shows that, only 1 MSK (12.5%) provides water inside the toilet.
Proper water and sanitation facilities such as: a) separate toilets for boys and
girls, b) teachers and students, c) running water inside toilets should be
arranged to avoid ill-health and to ensure a healthy environment.
7.3.4.D Table 7.67 shows that one-fourth (25%) of the surveyed MSKs have electricity; but no
MSK has any power back up facility. Table 7.68 indicates that among the surveyed
classrooms with electricity (total 14), more than half of the classrooms (57%) enjoy
adequate electric light and fan facilities. 28% of the schools do not have adequate
electricalfixtures.
125
7.3.4.E Table 7.69 shows that most of the surveyed MSKs i.e. 62.5% have specific uniforms
for students.
7.3.5 MID-DAY MEAL.
7.3.5.A Table 7.70 reflects that three-fourths (75%) of the surveyed MSKs do not provide the
mid-day meal.
7.3.6 DIFFERENT PREVAILING PROBLEMS
7.3.6.A Table 7.71 provides data on distribution of MSKs by different prevailing problems.
Students‘ drop out is the biggest problem faced by most (62.5%) of the surveyed
MSKs. Half of the MSKs (50%) face the problem of low turnout of teachers. One-
fourth (25%) of the MSKs suffer from problems like low attendance rate of students,
inadequate teaching staff, and different infrastructural problems. Inadequate
classrooms, lack of mid-day meal infrastructure, lack of an office-room and boundary
walls are some of the infrastructuralproblems. 12.5% of the MSKs face various
problem of a low enrolment rate, low quality of mid-day meals and different
infrastructural problems such as: a) inadequacy of teaching-learning material,
insufficient infrastructure for –b) library, c) toiletswith running water, d) drinking water,
and e) play ground.
It is recommended that there is an intervention for infrastructural improvement
in the following areas: a) increasing the number of classrooms; b) teachers’
rooms; c) kitchen; d) library facilities; e) office rooms; f) computer laboratories;
g) water and sanitation facilities such as toilets for both teachers’ and students
with running water; and h) electricity.
7.3.7 SPORTS AND INTER-SCHOOL COMPETITION.
7.3.7.A Table 7.72a shows that almost all of the MSKs (87%) arrange outdoor sports as inter-
house competitions. One-fourth (25%) of the MSKs engage the students in indoor
sports. Further, table 7.72b provides data on the participation of MSKs in inter school
competitions. Respectively three-fourths (75%) and one-fourth (25%) of the MSKs
participate in out-door and in-door sports competitions. Only one (12.5%) of the

126
surveyed MSKs participates in science talent competitions. The survey data also
reveals that all MSKs celebrate different social programs like Independence Day,
Teachers‘ Day, etc.
7.3.8 CLERKS AND GROUP D STAFF.
7.3.8.A Table 7.73 shows that there is no clerk in any MSK. While the average number of
Group D staff in the surveyed MSKs is 0.1. Further, table 7.74 show that the average
number of sanctioned posts for non-teaching staff is 1.5.
There is a need to fill up the sanctioned posts of support staff such as clerks
and Group D staff so that teachers can pay full attention to their primary
responsibilities of classroom-based teaching activities.
7.3.9 ENROLMENT STATUS.
7.3.9.A Table 7.75 shows the enrolment status in class V-VIII of five MSKs which were able to
provide data. It has been observed that students‘ enrolment is decreasing gradually.
In the year of 2006-07, total student strength of class V and class VII were
respectively 434 and 319. Later, in 2009-10 the same respectively decreased to 282
and 134.
Table 7.76a—7.76d shows class-wise average enrolment per school from class V-VIII. Table
7.76a provides the data that shows the average enrolment per school in rural areas in
Class-V of MSKs has decreased from 86.8 in 2006-07 to 56.4 in 2009-10. In case of
class VI and VII the same respectively decreased from 71 to 19.6 (table 7.76b) and
65.6 to 50.4 (table 7.76c). Again table 7.76d depicts that the average enrolment per
school in rural areas in Class-VIII of the MSKs has decreased from 63.8 in 2006-07 to
26.8 in 2009-10.
Table 7.77a – 7.77d provides data on the enrolment status from Class-V to Class-VIII together
in MSKs in the year of 2009-10. The average enrolment per school for class V to VIII
has decreased from 287.2 in 2006-07 to 186.6 in 2009-10.
127
7.3.10 ON TEACHERS.
7.3.10.A Table 7.78 indicates that theaverage number of full time teachers is 4.9 and for para
teachers this figure is 2.1. Every school has an average of 5.1 teachers. Table 7.79
shows the average number and percentage of Male & Female Teachers of MSKs. In
rural areas, the average number of male teachers is higher (4.4) than female teachers
(2). The percentages of male and female teachers are respectively 85.4% and14.6%.
Table 7.80 provides data on the distance travelled by MSK teachers to reach their
workplace.The majority of the teachers come from within the locality or within a 3-5
k.m. distance from the concerned MSKs. Only 14.6% of the teachers come from a
distance greater than 10 k.m.
Table 7.81 shows the distribution of MSK teachers as per their professional training. In rural
areas, a little less than one-fourth (24.4%) of the teachers have taken up professional
training before joining and no one has received any training after joining. Most of the
MSK teachers i.e. three-fourths (75.6%) of the teachers don‘t have any kind of
professional training at all.
These teachers should be prioritised in the teaching programmes of the state
government, otherwise the gap in terms of the quality of education in MSKs and
secondary and higher secondary schools will remain insurmountable.
Table 7.82 focuses on caste-wise distribution of MSK teachers.Majority of teachers belong to
general category (53.7%); a little less than one-fourth (24.4%) of the teachers are
from the minority community.
Table 7.83 provides data on the educational qualification of MSK teachers. Most of
the MSK teachers (85.4%) have graduate degrees. Only 14.6% of the teachers have
a post-graduatedegree.
Table 7.84 shows that a majority of the MSK teachers are in the age-group of 41 to 50
years.Only 4% of the teachers are under the age of 40 years.

128
From table 7.85 it may be concluded that in the rural areas the attendence percentage of the
teachers in the surveyed MSKs is quite high i.e. 90.6%. Table 7.86 adds that the
average number of periods taken by a full-time teacher in a week is 43.4 and it is 18
for part-time teachers.
Table 7.87 provides the data that the student-teacher Ratio is 22.8 in MSKs for 2009-10 from
Class-V to Class-VIII.
7.3.11 Proposed Areas for Intervention Concerning MSKs
(proposed areas for intervention in Secondary and Higher Secondary Schools are
discussed in Section 7.2.11)
Along with the formation of School Management Committees (SMC), the frequency of
BEO/AEO visits to MSKs should be increased.
MSKs need a major investment in infrastructural improvement. Investment is required in
all the areas: a) increasing the number of class-rooms; b) teachers‘ rooms c) kitchens; d)
library facilities e) office rooms; f) computer laboratories g) water and sanitation facilities
such as toilets with running water for both teachers‘ and students and h) electricity.
MSKs need sufficient teaching staff and teaching learning materials to address the
problems of dropping out and low attendance rates from students.
There is a need to appoint support staff such as clerks and Group D staff so that
teachers can pay full attention to their primary responsibility of classroom based
teaching activities.
Since a large number of MSK teachers (75.6%) do not have any kind of professional
training, they should be prioritised in the teaching programmes of the state government
otherwise the gap in terms of the quality of education offered in MSKs and secondary
and higher secondary schools will remain insurmountable.
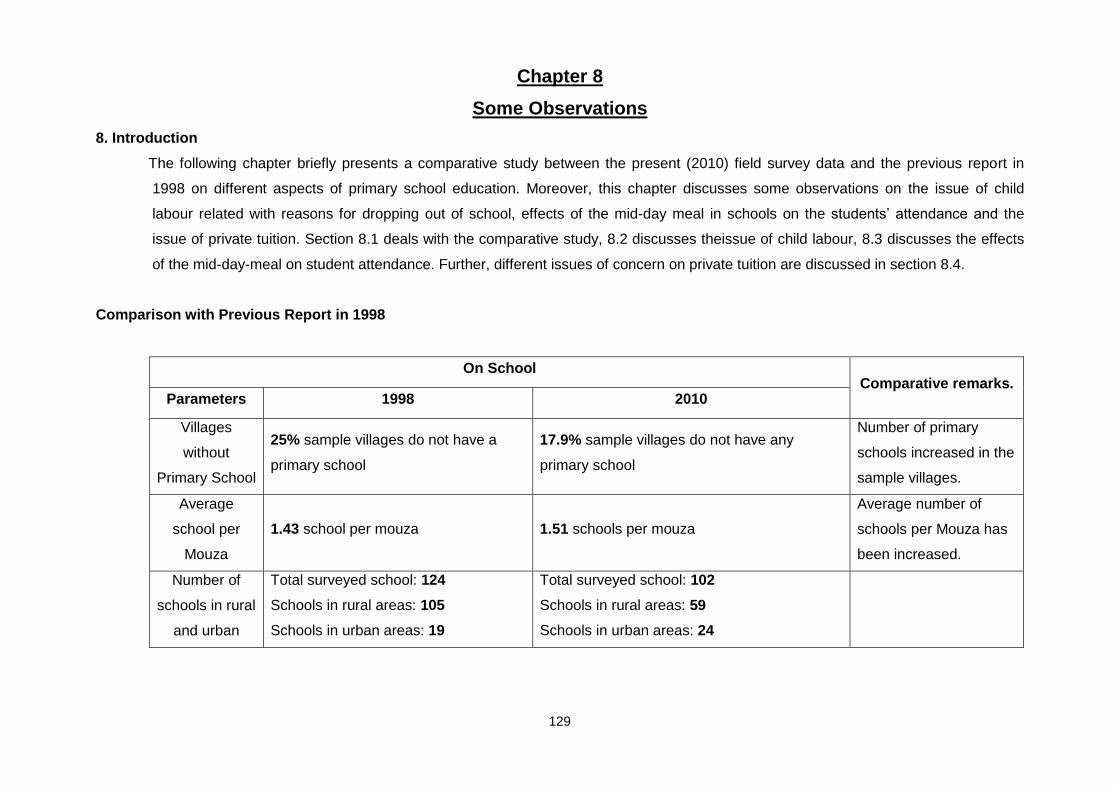
129
Chapter 8
Some Observations
8. Introduction
The following chapter briefly presents a comparative study between the present (2010) field survey data and the previous report in
1998 on different aspects of primary school education. Moreover, this chapter discusses some observations on the issue of child
labour related with reasons for dropping out of school, effects of the mid-day meal in schools on the students‘ attendance and the
issue of private tuition. Section 8.1 deals with the comparative study, 8.2 discusses theissue of child labour, 8.3 discusses the effects
of the mid-day-meal on student attendance. Further, different issues of concern on private tuition are discussed in section 8.4.
Comparison with Previous Report in 1998
On School Comparative remarks.
Parameters 1998 2010
Villages
without
Primary School
25% sample villages do not have a
primary school
17.9% sample villages do not have any
primary school
Number of primary
schools increased in the
sample villages.
Average
school per
Mouza
1.43 school per mouza 1.51 schools per mouza
Average number of
schools per Mouza has
been increased.
Number of
schools in rural
and urban
Total surveyed school: 124
Schools in rural areas: 105
Schools in urban areas: 19
Total surveyed school: 102
Schools in rural areas: 59
Schools in urban areas: 24

130
areas Private schools: 7 Private schools: 9
Classification
of schools
Total number of Government School:
117
Primary School: 115
2 attached with Junior High School and
1 attached with High School. All
schools are co-educational.
Total number of Government School: 83
81 schools have their own building. 1 attached
with other Primary school and 1 attached with
High School. Except 1 school all schools are
co-educational.
Building Type
No building: 6% (all in rural areas)
Pucca building: 50%
Kutcha building: 15%
Mixed structure: rest
6 schools out of 117 schools have no
building.
No own building: 2.2%
Pucca building: 84.8%
Kutcha building: 0%
Mixed structure: rest
Percentage of schools
with own building has
been increased.
More number of schools
possesses pucca
buildings.
Number of schools with
kutcha building dropped
to 0%.
Classrooms
Schools do not have classrooms: 20%
Schools with at most 2 classrooms in
rural areas: 46%
1 school have no classroom available for
students.
Schools with at most 2 classrooms: 17% (rural
Availability of
classrooms has been
increased.

131
There are 15 more schools where no
classroom is available for students. It
appears that in rural areas,
simultaneous multi-grade teaching is
usual norm.
areas) &29.2% (urban areas)
It appears that in rural & urban areas,
simultaneous multi-grade teaching is usual
norm.
Multi-grade teaching is
still practiced in some
schools.
Average
number of
classrooms
Avg. number of classrooms in rural
area: 1.94
Avg. number of classrooms in urban
area: 3.56
State average: 2.16
Most of schools do not have office
rooms &20% of them do not have
verandas that could use as
classrooms.
Avg. number of classrooms in rural area: 3
Avg. number of classrooms in urban area: 4
State average: 4
Most of the schools do not have separate
office rooms. 25% of them do not have
verandas. 32.3% schools are using the
verandas for serving mid-day-meal.
Average number of
classrooms has been
increased.
Still most of the schools
do not have separate
office rooms.
In some cases verandas
are used for serving
mid-day meal instead of
as a classroom.
Drinking water
Percentage of schools provides
drinking water in rural areas: 45.54%
Percentage of school do not have
such facility in urban area:18.75%
Percentage of schools provides drinking water
in rural areas: 89.83%
Percentage of school do not have such
facility in urban area:25%
Drinking water facility
has been improved in
rural schools.
In urban areas drinking
water facility has been
declined; more schools
fail to provide drinking

132
water facility.
Play ground
Percentage of schools have play
ground in rural area: 33%
Percentage of schools have play
ground in urban area: 25%
Percentage of schools have play ground in
rural area: 37.3%
Percentage of schools have play ground in
urban area: 25%
Percentage of schools
with play ground has
been increased a little in
rural areas; but in urban
areas it remains the
same.
Electric light
Number of schools in rural area: 2 out
of 101 schools
Number of schools in urban area: 5
Number of schools in rural area: 8 out of 59
schools
Number of schools in urban area: 15 out of
24 schools
Status of electric light
facility has been
improved in both rural
and urban areas.
Toilet
Percentage of schools have no urinals
in rural area: 87%
Separate urinals for girls are available
in 2 schools in rural area and 1 in
urban area.
Percentage of schools have no urinals in
rural area: 12%
Separate urinals for girls are available in 37
schools in rural area and 13 in urban area.
Availability of toilet
facility has been
improved in rural areas.
Number of schools with
separate toilet for girls
has been increased in
both rural and urban
areas.
On Teachers

133
Average number
of teachers
Avg. number of teachers in primary
schools rural area: 2.7
Avg. number of teachers in primary
schools urban area: 5.2
Avg. number of teachers in primary schools
rural area: 3.8
Avg. number of teachers in primary schools
urban area: 3.7
Average number of
teachers in primary
schools has been
increased in both: rural
and urban areas.
Number of female
teachers
Percentage of female teachers in
rural area: 12%
Percentage of female teachers in
urban area: 62.65%
Percentage of female teachers in rural area:
24.11%
Percentage of female teachers in urban area:
42.70%
Percentage of female
teachers has been
increased in rural areas
but decreased in urban
areas.
Trained teachers
Percentage of trained teachers in
rural area: 73%
Percentage of trained teachers in
urban area: 44.58%
Percentage of trained teachers in rural area:
41%
Percentage of trained teachers in urban area:
61.80%
In rural areas the
percentage of trained
teachers has been
decreased, while the
same increased in
urban areas.
Classification of
teachers by
training and caste
In rural areas there are 2.3
teachers per school and only 1.9
are trained.
Percentage of teachers from SC
In rural areas there are 3.8 teachers per
school and only 1.6 are trained.
Percentage of teachers from SC community:
18.46%
In rural areas average
number of teachers per
school has been
increased. But the

134
community: 5.22%
Percentage of teachers from ST
community: 17.16%
Percentage of teachers from
Minority community: 5.7%
Percentage of teachers from ST community:
6.06%
Percentage of teachers from Minority
community: 8%
average number of
trained teachers has
been decreased.
Percentage of teachers
from SC and Minority
community has been
increased; but the same
decreased for ST
community.
Educational status
of primary
teachers in rural
areas
Percentage of teachers have
qualification less than secondary
level: 64.82%
Percentage of teachers have
completed higher secondary level:
21%
Percentage of teachers have
completed graduation: 14.18%
Percentage of teachers have qualification less
than secondary level: 24.1%
Percentage of teachers have completed
higher secondary level: 26.3%
Percentage of teachers have completed
graduation or PG: 49.6%
Educational status of
primary teachers in rural
area has been
improved.
Student Teacher
Ratio STR in the state: 46.73 STR in the state: 31.89
Student teacher ratio
has been decreased in
the state. That means,
number of student per

135
teacher has been
decreased.
136
8.1 A brief comparison between the survey data of the previous study in 1998 and present
study (2010) shows different distinctive measures taken to improve primary school
education.The study reveals that, there is an increase in the number of primary schools per
village and per Mouza throughout the years from 1998-2010. School buildings and
infrastructural facilities have also improved in the sample villages. At present there is no
school with kuccha building; and the percentage of schools with their own buildings and
pucca buildings have improved. Classroom facilities, play grounds, electric lights, and toilet
facilities show a gradual improvement over the years. By contrast thedrinking water facilities
show a positive change in rural schools but do not show an impressive result in urban
areas.In some schoolsvarious infrastructural problems co-exist with differentissues of
progressive development. These backlogs of infrastructural facilities are: a) practice of multi-
grade teaching, b) lack of a separate office room, c) under-developed play ground facilities in
urban areas, etc.
Comparative study on teachers‘ data shows that the number of primary teachers has
increased in both rural and urban areas. While the percentage of female teachers‘ reaches a
higher level in rural areas butdeclines in urban areas. By contrary, the percentage of trained
teachers has decreased in rural areas, but increased in urban areas.The caste-wise
distribution of teachers show that thepercentage of teachers from Scheduled Casts and the
minority community have increased but the same decreased for the Scheduled Tribe
community. A comparative study shows an improvement in the educational status of primary
teachers in the rural areas. In 1998, most of the primary teachers (64%) were qualified under
the secondary level; while in 2010 a large number of the primary teachers (49.6%) have
graduate or post-graduate degrees. Throughout the years the student-teacher ratio in the
state has decreased from 46.73 to 31.89which helps to develop the quality of education.
8.2 Child Labour Issue
8.2.1 Literature review on child labour issue.
8.2.1.A Lieten (2002) opines that child labourers are those, who are engaged in any type of
productive work that hold back their sound ‗normative development‘ (p.5191). In this regard
Stein and Davies (1940: 112-113) define child labour practice as ―any work by children that
interfere with their full physical development, the opportunities for a desirable minimum

137
education and of their needed recreation‖ ( Lieten, 2002:5191).62 Antony and Gayathri(2002)
refer to Lieten (2002) and state that, there exists an acute distinction between the two
different terminologies: child labour and child work. The child labourers are in a direct
exposure to the ‗labour market‘, which adversely affects their overall development including
education. The term ‗child work‘ (Anthony and Gayathri, 2002: 5186) is applicable to those
who are engaged in any kind of paid or unpaid work. All types of household work and
outdoor work, which restrain a child‘s growth and development are categorised as ‗child
work‘.63
Siddiqi (1998) states that Asia and Africa jointly face the highest occurrence of child labour.
Among the Asian countries, India has the highest number of child labourers.64In India almost
44 million children are currently employed as an active ‗workforce‘ (Sud, 2010: 1). As per the
article 24 of the Indian Constitution, children below the age group of fourteen years should
be kept free from all types of work and ‗hazardous employment‘ (Aggarwal, 2004:173). In
addition article 45 of the same advices the states to provide the opportunity of ‗‗free and
compulsory education‘‘ to all children below fourteen years of age.65In this regard, Sinha
opines that the main occupation of a child is of a student rather than that of a worker.66 In
reality both of the factors: child labour practices and educational attainment level are in a
close proximity to each other (Aggarwal, 2004).
8.2.1.B Probable reasons and present situation of the child labour issue.
There prevails a bipartite causal argument of poverty and education behind child labour
(Antony and Gayatri 2002, Aggarwal 2004).In this regard Kabeer (2001) states that poor
economic conditionscreates the lackof demand for education following a paucity of financial
resources for educational expenditure(Antony and Gayatri 2002). There are several
unfavourable educational conditions like the problem of school accessibility, unattractive and
inappropriate syllabi for job prospects, poor infrastructure, and underdeveloped employability
of the students passing out of the school system. Thus a low educational outcome is
62
Lieten G K, ―Child Labour in India: Disentangling Essence and Solutions‖,Economic and Political Weekly 37, no. 52, (2002), 5191. 63
Antony Piush and Gayathri V, ―Cild Labour: A Perspective of Locale and Context‖,Economic and Political Weekly 37, no.52, (2002), 5186. 64
Sud Pamela, ―Can non-formal education keep working children in school? A case study from Punjab, India‖, Journal of Education and Work 23, no.1, (2010),1. 65
Aggarwal Suresh Chand, ―Child Labour and Household Characteristics in Selected Sates: Estimates from NSS 55
th Round‖, Economic and Political Weekly 39, no.02, (2004), 173,182,185.
66 Sinha Shantha, ―Emphasising Universal Principles towards Deepening of Democracy: Actualising
Children‘s Right to Education‖,Economic and Political Weekly 40, no.25, (2005), 2569.

138
concomitant with several unfavourable educational conditions. Due to such an unsatisfactory
return on investment for education, household members often lose their interest for
educating their children. Especially older children show a higher dropout rate (Aggarwal,
2004). Reddy (2008) studies that one third of the children drop out during their first five years
of schooling; further almost half of the children drop out without completing the requisite
eight years of compulsory schooling.67 In different states of India, a low enrolment rate and a
high dropout rate impoverish the educational condition followed by an increase in child
labour, and vice versa (Aggarwal, 2004).
Parents‘ educational qualifications play a significant role behind the incidence of school
dropout and child labour. In addition, the mother‘s educational level is a major influential
issue for determining the tendency for child labour.68Different unfavourable issues like
gender, livelihood security, ethnicity and caste often merge with a low socio-economic status
and make the situation vulnerable to the incidence of child labour (Antony and Gayatri,
2002). In Aggarwal‘s (2004:173) view, the monotonous and uninteresting system of
education and ‗low government expenditure on education and poverty reduction‘ prominently
accelerate the social practice of child labour.
8.2.1.C Towards the reduction of child labour incidence.
Sudden annihilation of child labour incidence is quite impossible in the present socio-
economic context of India (Aggarwal, 2004). Regarding the factor of parental and especially
maternal educational background, an increased level of education for women and improved
parental consciousness may prove beneficial towards the removal of child labour practices.69
While an effective educational facility may relief the child labourers to some extent (Bissell
2003, Basu 2003, Basu and Van 1998).70
Sud‘s (2010) study in Jalandhar, Punjab positively concludes that the non-formal educational
system, along with an incentive scheme, help to bring the child labourers under the
67
Reddy, A.N., Sinha, S.,School Dropouts or Pushouts? Overcoming Barriers for the Right to Education. National University of Educational Planning and Administration.(NUEPE). New Delhi. Create Pathways to Access, Research Monograph No. 40.Research commissioned by the Consortium for Research on Educational Access, Transition and Equity (CREATE). University of Sussex. UK. July. 2008. 68
Das Saswati and Mukherjee Diganta, ―Role of Women in Schooling and Child Labour Decision: The Case of Urban Boys in India‖, Springer 2006,Social Indicators Research 82, issue2, (July, 2007), 463, http://web.ebscohost.com/ehost/results, (accessed 11
th July, 2011).
69 Ibid.
70 Aggarwal Suresh Chand, ―Child Labour and Household Characteristics in Selected Sates:
Estimates from NSS 55th Round‖, Economic and Political Weekly 39, no.02, (2004), 173.
139
mainstream formal education system. Irrespective of the different employment status and
economic conditions of the child labourers, the non-formal schooling effectively functions as
a tool for alternative primary level education. Further the system is also responsible for
guiding the primary level educated children up to their ‗post-primary‘ education, as per the
necessity and capacity of the children (Sud, 2010). But in reality a continuous spread of non-
formal education for all the working children and a co-existence of education and
employment is not always possible and preferable (Aggarwal, 2004). Sud‘s (2010) study also
reveals that the non formal educational services are not fully compatible with the full time
work schedules of child labourers.
Some believes that compulsory primary level education may be a positive step towards the
reduction of child labour incidences (Bhargava 2003, Mishra 2000, Burra 1996, and Weiner
1991). The same group of scholars also opine that regular compulsory education is the best
way to support the child labourers (Aggarwal, 2004). Sud (2010) suggests that different
schemes should address the school enrolment and retention issues with close attention. The
issue of formal schooling for all children should be considered with the greatest importance
rather than the non-formal education of the employed children only.
Focusing on the formal educational system, Aggarwal (2004:185) suggests some probable
measures for the declination of dropout rates to reduce the child labour practice; these are:
a) to ensure appropriate educational outcome; b) rewarding students, rewards may also
serve as the household incentives; c) increasing the retention rate of the children through
primary to ‗middle school‘ level; d) giving special attention to women‘s education. Sud (2010)
also opines that prior attention on schooling may help to reduce the practice of child labour.
8.2.2 Observations
8.2.2.A Reasons for drop-out and child labour practice.
Table 8.1a shows different reasons for non-enrolment and drop-out in the age group of 6-11
years according to households‘ income slab. Among all income categories most of the
students of 6-11 years of age i.e. class II- VI students drop out for having no money for fees
(37.5%) and losing their interest to study (17.5%). Only 15% students of class II-VI are
dropping out for working or earning money. While in this age group, most of the children are
not enrolled because of some disability or illness (29%) or having no money for fees

140
(25.8%). In this age group no children show the cause of working/earning money as a
reason for their non-enrolment.
Table 8.1b indicates that irrespective of different income slabs, students of the age group of
12-16 years, i.e. class VI-X students, most drop out cases occur for working or earning
money (33.4%) and losing interest in studying (25.9%). Among the reasons of non-
enrolment of this age group, working or earning money (32.7%) is the most common reason;
while 19.2% children are not enrolled for having no money for fees.
Table 8.2a and Table 8.2b provide data on the different reasons for non-enrolment and drop-
out of students according to their caste group. Table 8.2a shows that among all the caste
groups, 48.1% students of 6-11 years of age drop-out for having no money for fees. While
working or earning money causes only 22.2% of this age group to dropout. In the case of
non-enrolment, having no money for fees (29.5%) and losing interest to study (20.5%) are
the main two reasons for such.
Table 8.2b shows that, irrespective of caste groups among all the students of 12-16 years of
age, near about one-third (32.6%) and one-fourth (25.5%) students drop out for working or
earning money and having no money for fees respectively. These two reasons are also the
most common for non-enrolment of that age group.
Previously Table 6.19 shows that at the primary level the maximum number of
student dropouts occur between Class-I to Class -II. Further, from the survey data it
is clear that child labour practices i.e. working or earning money is not an important
reason for droping out for the age group of 6-11 years, at primary level of schooling.
Survey data reveals that the median age of the child labour is that of 13 years. Most
of the students drop-out for earning money at the age group of 12-16 years of age
i.e. at the secondary level. Thus the survey data indicates that the effect of child
labour practices are very low or nil at the primary level of schooling.
N.B.: The median age for admission in school is 6 years.
8.3 Effect of mid-day-meal on students’ attendance record.
Table 8.3a shows that in 75 units of SSKs more than three-fourths (from 75.5% - 80%) of
students were present during the month of September to November, 2010 as a beneficiary
result of the mid-day-meal. Further Table 8.3b indicates that during Monday to Friday of the
same three months, the percentage of students‘ attendance is quite high i.e. from 75% to

141
82%. Contrarily the percentage decreases to 67.7% on Saturdays in the month of November
2010(Table 8.3c).
Table 8.4a shows the effect of the mid-day-meal scheme in the three months (Sep, 2010 to
Nov, 2010) and the attendance record of primary schools from Monday to Saturday. In rural
and urban areas respectively 50 and 10 primary schools were able to provide data on
attendance. A high percentage of students, respectively 66%-71% and 65%-72% in rural
and urban areas, were present from Monday to Saturday as a positive result of the mid-day-
meal. Further, Table 8. 4b and Table 8.4c indicate that, as far as attendance is concerned,
attendance on Saturdaysis quite low, rather than other week days as the school runs without
the mid-day-meal. From the Table 8.4b it is clear thatthe average attendance percentage of
students in 3 months is 70.6 per month, but in November the attendance is a little lower
(68.1%) due to the engagement in supporting economic activity for households or as a care
taker of their own households. It is also reflected that a few students (0.5%-15.4%) are not
benefited by the mid-day-meal facility. Sometimes, schools fail to deliver the mid-day-meal
due to some unavoidable circumstances for one or two days. Particularly in the month of
October schools could not provide the mid-day-meal, throughout the school working days,
due to the irregular supply of food grains. Table 8.4d and table 8.4e show that in the 10 units
of urban regions, the percentage of attendance on Saturdays is a little low.
Table 8.5a to Table 8.5e provide data on the effect of mid-day-meals on three months‘
attendance records of 45 units and 10 units of secondary schools located in rural and urban
regions respectively. These tables show the same trend that most of the students, i.e.
72.6%-75% students in rural areas and 62.8%-76% students in urban areas, remain present
from Monday to Saturday as a beneficiary result of mid-day-meal. Another issue also
matches with the primary school that on Saturday the students‘ attendance percentage
decreases a little.
Thus the survey data indicates that the mid-day-meal facility positively affectsthe
students‘ attendance rate and a high percentage of students are benefitted from the
scheme.
8.4 Issues on Private Tuition
8.4.1 Literature review on private tuition
Widely prevalent practice of private tuition has added to the quantum of
educational expenditure. SCERT (2009) refers to Pratham and states that in West Bengal a
large portion of the students under the age group of six to fourteen years are quite
142
habituated with private tuition. The same report of SCERT also reveals that the rate of
private tuition simultaneously increases with students‟ up- gradation from primary to
secondary level. Students‟ and parents‟ responses indicate several causal orientations for
an increased interest to private tuition. These are: A) most of the students do not get any
sort of educational guidance from family. So private tutors help and guide the students in
their study. B) Private classes help the students to their assigned home tasks of schools. C)
Students can easily communicate with private tutors. They can ask frequent questions to
solve their difficulties and queries. D) Students opine that, guiding procedure of tutorial
classes helps them to acquire high marks in the examinations. Students also claim that
suggestive set of probable questions for examination also helps the students in the
examinations.71 In the Pratichi (India) Report, 2002, Amartya Sen writes that the “evil of
private tuition” perpetuates the „class divisions‟ in an uninterrupted way. It also violates
the commitment of the Indian Constitution for “free education”.72
(Reproduced from Chapter 2, para 2.5.1)
8.4.2 Observations
8.4.2.A Relation between Educational Status of household members and private
tuition
Table 8.6 provides data on the distribution of household members by their educational
qualification. Most of the household members are non-literate (32%). About 24.1% and
27.2% of the population are educated up to class IV and class VIII respectively. Around
10.7% and 3.9% have completed Secondary and Higher Secondary level education
respectively. There is a huge percentage gap between the Secondary qualified and Higher
Secondary qualified population. Only 1.6% of the total population have completed
graduation or above academic levels. 74.5% households have students and 66.5% of them
provide private tutors to their children (Table 8.8). So we can conclude that most of the
households have first generation learners and parents are interested in their children‘s‘
education.
71
State Council Of Educational Research And Training (W.B),Department of School Education, Govt. of West Bengal, Implications of Private Tuition in West Bengal, 2009 (Kolkata), 1,95, 170-171. 72
Mohan, D. Education as Regulated Means of Representation: Methodological Failures in the First Pratichi Report, 2002. Conference on Religious and Social Fragmentation and Economic Development in South Asia, A D White House, Cornell University. Oct. 2005.p.1.
143
8.4.2.B Relation between caste-wise occupational Status and private tuition
Table 8.7 and Table 8.9 respectively provide data on the caste-wise occupational status and
distribution of households with private tutors. Among the overall sample, a little less than
one-third (31.9%) are of the student population.
Among SCs almost 30.38% of sample population belong to student community. Other than
students, the majority of SCs are involved in household work, labour in agriculture, labour in
other fields and child/aged/handicapped. Among the overall SC population 71.5%
households have students and among these 67.7% households have private tutors for their
children.
Almost 30.91% of the sample population of STs are students. About 15% of the sample
population are agricultural labourers, unskilled day labourers and household workers. But
72% of the households have students and among them almost 53.7% of the households
have private tutors for their children.
Other than students, minority communities are mostly engaged in household work, labour in
other fields, labour in agriculture and unskilled labour based professions. A high percentage
of minority households (80.9%) have students and 59.9% of them have private tutors.
In the case of OBCs, household work, agriculture on their own land, labour in other fields
and labour in agriculture are the major professions. Almost three-fourths (75%) OBC
households have students and 66.7% of these households provide private tutors to their
children.
The majority of general castegory people take household work, labour in other fields and
agriculture on their own land as their profession. Most of the households (72.3%) of the total
sample general category population have students and 76.2% of them have private tutors.
Majority of Buddhists are engaged as labourers in other fields. Other than this, they also
work as unskilled/skilled labourers and household workers. 73.3% of total Buddhist
households have students and among them 81.8% have private tutors for their children.
Thusthe survey data indicates that among all the caste groups and in all occupational
categories private tuition is a common factor. Further, Table 8.8 shows that in the
monthly income slab of Rs. 15,001/- -20,000/- almost all (96.3%) of the households
with studentsprovide private tuition facilities for their children. Likewise, among all

144
other income groups private tuition is also a prominent practice. In addition Table
8.10a and Table 8.10b and again Table 8.11a and Table 8.11b provide data that
shows that irrespective of having private tuitions most of the population of the
different income groups and caste groups opine that teachers give a lot of attention
to students in the schools. So it may be concluded that the practice of private tuition
is not related with the lack of teachers‘ attention in school; rather it reflects the
parents‘ interest and care for their child‘s education.

145
Chapter 9
Madrasahs and the way forward
9. Introduction.
This section discusses about the survey data on Junior and High Madrasahs. The section
starts with a brief introduction on West Bengal Madrasahs. Section 9.2 and 9.3 respectively
discuss the data from Junior and High Madrasahs.
9.1.West Bengal Madrasahs.
West Bengal has been a pioneer in the area of madrasah education since 1915, when
efforts were made to reform and modernize the curriculum prevailing in this system. In
1994, West Bengal became the first state to establish a statutory body, the West Bengal
Board of Madrasah Education and entrusted in with academic responsibilities in respect of
Madrasah Education. With the avowed objective to reform Madrash Education, the
Government of West Bengal, in 2001, constituted the Madrasah Education Committee,
under the Chairmanship of Dr. A. R. Kidwai. The Commission submitted its report in the year
2002.
There are altogether 597 recognised Madrasahs in West Bengal as on 31.12.2010. While
102 of them are under the Senior Madrasah system, the remaining 474 are under the High
Madrasah system (89 Junior High Madrasahs, 385 High Madrasahs). Upgradation of Jr.
High Madrasah to High Madrasah, High Madrasah to Higher Secondary Madrasah and
upgradation of Sr. Madrasah from Alim stage (10 th standard) to Fazil stage (12 th standard)
is a regular and continuous process.
There has been a significant growth of Madrasah system in the last decades. The chart
below shows increased number of different types of Madrasahs with year.
. 1947-1948
1977-1978
2004-05
2005-06 2006-07 2007-08 2008-09 2009-10
Jr. High Madrasah 90 71 167 130 26 35 62 101
High Madrasah 07 92 238 274 378 385 396 394
Sr.Madrasah 02 74 103 103 102* 102 102 102
( This section 9.1. West Bengal Madrasahs is copied and pasted from the web-page http://www.wbmadrasahdte.gov.in on 24
th January,2012).

146
In West Bengal there are different types of Madrasahs. This can be shown through the chart below:
9.2 Findings on Junior Madrasah
In this study, a total of Junior Madrasahs are surveyed. All are located in rural areas.
Among the surveyed Junior Madrasahs half were established more than twenty years ago
(Table 9.20).
9.2.1 SCHOOL INFRASTRUCTURE.
Table 9.2.1 shows distribution of Junior Madrasah school structure. In rural areas, half of the
surveyed schools (two schools) are only for boys; while another half of Junior Madrasah is
co-educational. In urban areas and Kolkata, no Junior Madrasah was surveyed.
Table 9.2.2 shows that, all surveyed Junior Madrasahs have pucca building. Among these,
three fourth schools belong to sub-sample-1 and the rest one fourth schools are located in
sub-sample-2. Table 9.2.3 reflects that schools have six class-rooms on average.
Respectively table 9.2.3a.i and table 9.2.3a.ii show the distribution of Madrasahs by number
of class-rooms with teachers. There are two to nine full time teachers in different Junior
Madrasahs. It seems there is a need to recruit more number of part-time and full-time
teachers for an improved educational condition. Number of class-rooms also should
be increased as per demand.
Table 9.2.4 shows distribution of Junior Madrasahs by availability of other rooms and
verandas. From this table it is clear that, only half of the Madrasahs have separate teachers‘
rooms. Further requirement of other rooms and verandas are needed in different
schools.
Tables 9.2.6.i and table 9.2.8 show that, no government Madrasahs has toilet facility and
water facility inside toilet. Further table 9.2.6.a.iii shows that, only half of the Madrasahs
have separate toilet for students. Moreover, table 9.2.7 indicates that there is no gender-
wise separate toilet facility in surveyed schools. Therefore, Madrasahs need a serious
intervention for infrastructure and toilet facility.

147
9.2.2. ON TEACHERS.
Table 9.2.9 shows that, in average there are 6.3 teachers in surveyed Junior Madrasahs.
Moreover, all teachers are males (table 9.2.10) from minority caste group (table 9.2.11).
Further table 9.2.15 reflects that none of the teachers have basic training.
Table 9.2.12 reflects that, three-fourth of surveyed Madrasahs have more than five teachers.
Most of the teachers (76%) travel less than one k.m. to reach respective schools from their
residence (table 9.2.13). Table 9.2.21 shows distribution of Madrasahs by school time and
residential distance of teachers. As per Table 9.2.21, in SS 1 all surveyed schools run in
morning session; while only one (100%) surveyed school of SS 2 runs in afternoon session.
Table 9.2.17 shows that, most of the teachers (40%) are educated up to Alim, while 8%
teachers do not want to reveal their educational qualification. Near about one third (32%)
teachers are post-graduate.
According to table 9.2.18 number of students per teacher in schools providing data of
enrolment for 2009-10 from Cl-I to Cl-IV is 12.2.
Our survey data reflects there is a need for properly trained teachers in junior Madrasahs.
9.2.3. COMMITTES IN MADRASAHS.
Table 9.2.14 shows that one-fourth of the surveyed school has School Monitoring Committee
(SMC) only. No other committee exists in rest of the surveyed school. Further table 9.2.16
indicates that in sub sample 1 average meeting of SMC per school (in the last year) is 8.5,
while the same is 5.0 for sub sample 2.
9.2.4. ENROLMENT STATUS IN MADRASAH.
Table 9.2.19.a to table 9.2.19.a.viii show enrolment status of Junior Madrasahs in different
classes and years. Among these, table 9.2.19.a indicates that only one school provided data
from 2006-07 to 2009-10 and from class-I to class-IV. The table shows that, in 2009-10
highest number of students were enrolled in class-I. Table 9.2.19.a.v shows that, in the
same year there were near about one-third (32%) girls among the enrolled students among
all classes together. Survey data makes it clear that, enrolment status of girls’ is quite
low in Junior Madrasahs.
9.2.5 MID-DAY-MEAL
Table 9.2.22 shows that, no Junior Madrasah is facilitated by mid-day-meal programme.
148
9.2.5 VISIT BY HIGHER AUTHORITIES
Table 9.2.23 and table 9.2.24 reveals that no Junior Madrasah was visited at all by SIS or
higher authority officers in the last year. It seems that, schools need regular visit and
attention from SISs and higher authorities for a better educational condition.
9.3 Findings on High Madrasah
Table 9.3.1(a-b) to table 9.3.3 provides formal information on surveyed High Madrasahs.
Table 9.3.1a shows that half (two in number) of the surveyed High Madrasahs is located in
rural areas and another half is situated in urban areas. Table 9.3.3 indicates that, all
surveyed school are co-educational.
9.3.1. COMMITTEES IN SCHOOLS and VISIT BY AUTHORITIES Table 9.3.4 to table 9.3.7 shows different data on school committees and visit of High
Madrasahs by higher authorities. Table 9.3.4 indicates that, there is only School
Management Committee (SMC) in all the High Madrasahs. Tables 9.3.6-7 shows that, no
school was visited by SIS/AIS and higher authorities. It seems that, High Madrasahs need
a serious attention from higher authorities.
9.3.2 SCHOOL INFRASTRUCTURE and OTHER FACILITIES
Table 9.3.8 to table 9.3.21a reflects different issues on infrastructure and other facilities.
Table 9.3.8 and table 9.3.9 respectively shows that all surveyed schools have pucca building
of their own possession. Further table 9.3.12 indicates that all surveyed schools have
available drinking water and toilet facilities (table 9.3.13).
Table 9.3.18 shows that only one surveyed High Madrasah in rural area does not have
electricity. It seems that, in rural areas school infrastructures should be improved as
per need.
9.3.3 MIDDAY MEAL
Table 9.3.22 shows all surveyed High Madrasahs provide mid-day-meal to students. Survey
data also reveals that in all surveyed High Madrasas of Rural and Urban areas children eat
the midday meal within the school premises. Students are allowed 100 Grams of rice and
Rs.3.05 is for other expenditure excluding remuneration of SHG. It is also reported that egg
is served once a week in the Rural High Madrasa and twice a week in the Urban High
Madrasa. In none of the surveyed High Madrasas teachers habituated to eat mead-day-
meal. For Day schools both of them serves during tiffin period from 1.15 PM - 2.00 PM and
of 4 periods are taken after the midday meal.

149
9.3.4. PROBLEMS IN HIGH MADRASAHS
Table 9.3.23 reveals that: a) low enrolment, b) low attendance, and c) lack of electricity are
major problems of rural High Madrasah; while urban one faces the problem of drop out.
9.3.5 EXTRA CURRICULAR ACTIVITIES Table 9.3.24a-c reveals data on different extra-curricular activities. No surveyed High
Madrasahs provide any vocational training. Moreover table 9.3.24.b-c shows that High
Madrasahs participate in different inter home and inter school competition. Survey data also
shows that except for Teacher's Day, Children's Day and Saraswati Puja other programmes
are celebrated by the High Madrasas in both Rural & Urban Areas. It seems that, High
Madrasahs need to arrange vocational training courses as per need.
9.3.6 OTHER INFORMATION
Table 9.3.25a-b shows that the number of non-teaching staffs and sanctioned posts of non-
teaching staffs in surveyed schools.
9.3.7 ON TEACHERS
Table 9.3.26 to table 9.3.35 reveals data on teachers of High Madrasah. Table 9.3.26 shows
that, in both rural and urban areas there are para-teachers beside full-time teachers.
Moreover, table 9.3.27a reveals that there are female teachers (21.4%: table 9.3.27 b) also
in High Madrasahs.
Table 9.3.29 shows that half of surveyed teachers do not have any professional training.
While, more than half (57.1%) of surveyed teachers are graduate (Table 9.3.32). Survey
data reveals that, in both rural and urban areas teachers need professional training
for more improved quality education.
Table 9.3.34 reflects that, respectively in rural and urban areas number of students per
teachers in school is 19 and 88.
9.3.8 RESULTS OF MADHYAMIK EXAMINATION
Table 9.36.i-ii shows data on last three years‘ result and average result of Madhyamik
Examination in secondary schools.
Copyright © 2022 FDOKUMEN