JEPA Title - National Institute of Educational Planning and ...
150
© NIEPA Journal of Educational Planning and Administration Volume XVII Number 2 April 2003 National Institute of Educational Planning and Administration 17-B, Sri Aurobindo Marg New Delhi 110016
-
Upload
khangminh22 -
Category
Documents
-
view
8 -
download
0
Transcript of JEPA Title - National Institute of Educational Planning and ...

© NIEPA
Journal of
Educational Planning and Administration
Volume X V I I Number 2 Apri l 2003
National Institute of Educational Planning and Administration
17-B, Sri Aurobindo Marg New Delhi 110016

© NIEPA
ISSN 0971-3859
© NATIONAL INSTITUTE OF EDUCATIONAL PLANNING AND ADMINISTRATION, 2003
Annual Subscription
Within India Outside India Individuals Rs. 120 US$50 Institutions Rs. 250 US$75
(Airmail extra US$ 10)
Single Issue
Individuals Rs. 40 US$ 15 Institutions Rs. 75 US$20 Annual Subscription commences with January and ends with October every year.
Advertisement Tariff (For one issue)
Full Page Rs. 2000 US $ 100 Half Page Rs. 1100 US$55 Bank draft may be sent to the Director, NIEPA in the name of the National Institute of Educational Planning and Administration payable at New Delhi
Published by the Registrar, National Institute of Educational Planning and Administration, 17-B, Sri Aurobindo Marg, New Delhi-110016 and printed by the Publication Unit, NIEPA at M/s. Prabhat Offset Press, 2622, Kucha Chellan, Darya Ganj,New Delhi- 110002.

© NIEPA
JOURNAL OF EDUCATIONAL PLANNING AND ADMINISTRATION Vol. X V I I No. 2 (April 2003)
CONTENTS
Page No A R T I C L E S
Higher Education and Development in Asia 151 Jandhaya B.G. Tilak
Socio-Economic Determinants of School Attendance in India 175 Usha Jayachandran
Grants in Aid Policies and Practices Towards Secondary Education in 199 Kerala K.K. George, George Zachariah and N. Ajith Kumar
Globalisation and the University: Myths and Realities in an Unequal 227 World Philip G. Altbach
R E S E A R C H NOTES/COMMUNICATIONS
Inter-Household and Gender Equity, Efficiency and the Measurement 249 of Literacy S. Subramanian
Post-secondary Education Persistence: A Comparison between Urban 257 and Rural Students Wenfan Yan
BOOK REVIEWS (See overleaf) 269

© NIEPA
BOOK R E V I E W S
The Quality of Education: Dimensions and Strategies, Education in 269 Developing Asia (David Chapman and Don Adams) Jacob Aikara
Indian Higher Education: A Conglomerate of Concepts, Facts and 271 Practices (K.B. Powar) PC. Bansal
The State and NGOs: Perspective from Asia, Singapore (Shinichi 275 Shigetomi) Ratna M. Sudarshan
Education and Children with Special Needs: From Segregation to 277 Inclusion (Hegarty Seamus and Mithu Alur, eds.) M. Rama Devi
Using Assessment to Improve the Quality of Education (Thomas 280 Kellaghan and Nincent Greaney) Ch. Vijayalakshmi
Reviewing Quantitative Research to Inform Educational Policy 282 Processes (Steven J. Hite) Avinash Kumar Singh
Can the Market Save Our Schools? (Chaudia R. Hepburn) 285 D. Narsimha Reddy
Understanding Learning - Learning and Outcomes (Janet Collins and 288 Deirdre Cook, ed.) R.P. Singh
Peruvian Education at a Crossroads: Challenges and Opportunities for 290 the 21 st Century (Kin Bing Wu) Jayendu Krishna
History of Japanese Policies in Education Aid to Developing 292 Countries, 1950s-1990s (Takao Kamibeppu) Jandhyala B.G. Tilak

© NIEPA
Journal of Educational Planning and Administrat ion Volume X V I I No . 2, A p r i l 2003, pp. 151-173
Higher Education and Development in Asia
Jandhyala B G Tilak**
Abstract
Higher education systems, in many developing as well as developed countries, including in Asia and the Pacific, are also characterised with a continuing crisis, with overcrowding, inadequate staffing, deteriorating standards and quality, poor physical facilities, insufficient equipment and declining public budgets. More importantly, higher education is subject to neglect and even discrimination in public policy. The World Bank policies that discouraged investment in higher education for a long period, improper use of estimates of rates of return, and excessive, rather exclusive, emphasis on Education For All (EFA) in the recent years, adverse economic conditions in many developing countries, following structural adjustment policies, etc. are some of the reasons for the neglect of higher education. Besides, the view that higher education has no significant effect on economic growth, equity, poverty and social indicators of development reduction in developing countries has also contributed significantly to this neglect. Based on the evidence in Asia and the Pacific countries, the paper reviews some of these widely held presumptions, the relationship between higher education and development, including human development and reports significant effects of higher education on development. It pleads that no nation that has not expanded reasonably well its higher education system could achieve high level of economic development. Quickly reviewing the level of development of higher education in the region, and public policies, including select policies on financing higher education and privatisation, it underlines the need for increased public financing and warns against excessive reliance on cost recovery measures and privatisation of higher education.
' This is a marginally updated/revised version of the article that is to appear in The Handbook on Educational Research in the Asia Pacific Region (Eds. John P. Kleeves and Ryo Watanabe) Kluwer Academic Publishers, 2003. An earlier version was presented in the International Conference on Equity & Efficiency in Higher Education in 21st Century. Xiamen, China: Xiamen University, Centre for Higher Education Development (26-28 September 2002). ** National Institute of Educational Planning and Adminis trat ion, 17B Sri Aurobindo Marg, N e w Delhi 1100016, E-mai l : j t i lak@vsnl .com.

© NIEPA
152 Higher Education and Development in Asia
Introduction
Higher education is an important form of investment in human capital. In fact, it can be regarded as a high level or a-specialised form of human capital, contribution of which to economic growth is very significant. It is rightly regarded as the "engine of development in the new world economy" (Castells, 1994, p. 14). The contribution of higher education to development can be varied: it helps in the rapid industrialization of the economy, by providing manpower with professional, technical and managerial skills. In the present context of transformation into knowledge societies, higher education provides not just educated workers, but knowledge workers to the growth of the economy. It creates attitudes, and makes possible attitudinal changes necessary for the socialisation of the individuals and the modernisation and overall transformation of the societies. Fourthly, and most importantly, higher education helps, through teaching and research, in the creation, absorption and dissemination of knowledge. Higher education also helps in the formation of a strong nation-state and, at the same time, helps in globalisation. Lastly, higher education allows people to enjoy an enhanced 'life of mind', offering the wider society, both cultural and political benefits (TFHES, 2000, p. 37).
Developing as well as developed economies in the Asia-Pacific region, like most other economies of the world, have long recognised the importance of higher education in development. The human investment revolution in economic thought initiated by Theodore Schultz (1961) added further boost to the efforts of the developing economies of the region during the post-War period. As Patel (1985) notes, there occurred an educational miracle in the third world countries. Asia has its own major share, and higher education has an important share in the education miracle. Compared to 1.1 million students enrolled in higher education institutions in 1950 in Asia, there are, according to the latest available figures, 35 million students (1997). This means a phenomenal rate of growth of 65 per cent per year. Women constitute nearly 40 per cent of the total enrolment, representing a fair degree of gender equality in higher education. As a proportion of the relevant (17-23) age group, enrolment in higher education forms more than 11 per cent, in contrast to about two per cent at the middle of the last century. The number of teachers in higher education institutions has increased from 0.1 million in 1950 to 2.3 million in 1997. -The growth of some of these aspects is shown in Figure 1. A l l these figures are no mean achievements for countries of the region, which were economically backward, except Japan and a few oil-rich countries in West Asia.
A l l this does not mean that all countries in the region have developed their higher education systems uniformly well. There are indeed wide

© NIEPA
Jandhyala B. G. Tilak 153
variations in the levels of development of higher education between several countries: some have very well developed higher education systems both in breadth and depth and in others it is highly restricted to a small minority of the population. The five geographic regions in Asia - West Asia, Central Asia, South Asia, East Asia (including South-East Asia) and the Pacific (Oceania) - provide wide contrasts. There are wide regional disparities even between countries within the sub-regions and even within each country. Higher education has expanded well in some of the East Asian countries, apart from Japan, and in Australia and New Zealand in the Pacific region; but several countries in South Asia, Indo-china and in West Asia lag far behind. The unequal levels of development in higher education also lead to unequal levels of economic development
Figure 1 Index of Growth in Higher Education in Asia
Enrolmetns Teachers
Higher Education and Economic Growth
What is the effect of higher education on economic growth of the countries? There is a general presumption that higher education is not necessary for economic growth and development, particularly in developing countries. It is literacy and primary education that is argued to be important. Estimates on internal rate of return also contributed to strengthening of such a presumption. Conventionally, the contribution of education to economic development is analysed in terms of education-earnings relationships and, more conveniently, in the form of rates of return. Rates of return are a summary statistic of the relationship between lifetime earnings and the costs of education. Available estimates on rates of return, given in Table 1, clearly show that the social rates of return to investment in primary education are the highest, followed by secondary education. The returns to higher education are the least. This pattern is more or less true in general with respect to private rates of return also, though in case of Asia, higher

© NIEPA
154 Higher Education and Development in Asia
education jyields a higher rate of return than secondary education to the individuals.
T A B L E 1 Rates of Return to Education in Asia (per cent)
Primary Secondary Higher Private 20.0 15.8 18.2 Social 16.2 11.1 11.0
Note: Asia includes non-OECD Asian countries. Source: Psacharopoulos and Patrinos (2002).
T A B L E 2 Rates of Return to Higher Education in Asian Countries
Country Year Social Private Country Year Social Private China 1993 11.3 15.1 Nepal 1982 21.7 Hong Kong 1976 12.4 25.2 1999 9.1 12.0 India 1965 10.3 16.2 Pakistan 1975 8.0 27.0
1978 10.8 13.2 1984-85 19.8 26.5 1995 18.2 1991 31.2
Indonesia 1978 14.8 Philippines 1971 8.5 9.5 1986 22.0 1988 10.5 11.6 1989 5.0 South Korea 1971 9.3 16.2
Iran 1972 11.5 1986 15.5 17.9 1976 13.6 18.5 Singapore 1966 24.1 25.4
Israel 1958 6.6 1998 13.9 18.7 1969 8.0 Sri Lanka 1981 16.1
Japan 1973 6.4 8.1 Taiwan 1970 15.0 18.4 1976 6.9 8.8 1972 17.7 15.8 1980 5.7 8.3 Thailand 1970 11.0 14.0
Malaysia 1978 34.5 1985 13.3 17.4 1983 7.6 12.2
Asia (excl. Japan)
1989
11.0
11.8
18.2
Secondary Source: Tilak (1994); Psacharopoulos (1994) and Psacharopoulos and Patrinos (2002)
Such evidence is extensively used to discourage public investment in higher education and to concentrate rather exclusively on primary education. Though the rate of return to higher education is less than that to primary education, it should, nevertheless, be noted that higher-education does yield

© NIEPA
Jandhyala B.G. Tilak 155
an attractive rate of return to the society (11 per cent)1 and to the individual as well (18 per cent).
The estimates in Table 1 are regional averages. There are wide variations in the rates of return in several countries. Table 2 presents the available estimates on rates of return to higher education in some of the Asian countries, for which data are available. Despite some of the severe limitations that the estimates on rates of return, particularly social rates of return, carry with, these estimates are strongly believed to be a good indicator of the economic contribution of higher education.
Some of the estimates are rather dated. Yet these estimates reveal (a) investment in higher education yields positive rates of return to the individual and also to the society at large; (b) in several countries social rates of return are high, above ten per cent, which can be considered as an alternative rate of return; and (c) rates of return seem to be increasing over the years. Generally, declining rates of return over time are often expected but this is not the case in some of the Asian countries. This may be due to rapid increase in the demand for higher educated manpower.
Contribution of higher education to economic development can also be measured better with the help of production function or even a simple regression equation. The gross enrolment ratio, a flow variable, which is the most commonly used indicator of education development, reflecting the current level of efforts of the countries for the development of higher education, shows very unequal development of higher education between the several countries of the region. The ratio ranges between one per cent and nearly 70 per cent. Higher education has expanded well in the East Asian tiger economies and a few Central and West Asian countries, the gross enrolment ratio being comparable to that in some of the developed countries. The gross enrolment ratio in Korea, Singapore, Hong Kong, Thailand, Australia and New Zealand is above twenty per cent. Countries like Indonesia and Malaysia are rapidly expanding their system, but still the enrolment ratios are only around ten per cent.
' The social rate of return to higher education in the Asian region was the second highest among the world regions, compared to 11.2 per cent in Sub-Saharan Africa, and 10.6 per cent in Europe and Middle East and North Africa. The rate of return was the highest in Latin America and the Caribbean region (Psacharopoulos, 1994). However, a recent update (Psacharopoulos and Patrinos, 2002) shows that Asia ranks second lowest among the world regions, after OECD.
© NIEPA
156 Higher Education and Development in Asia
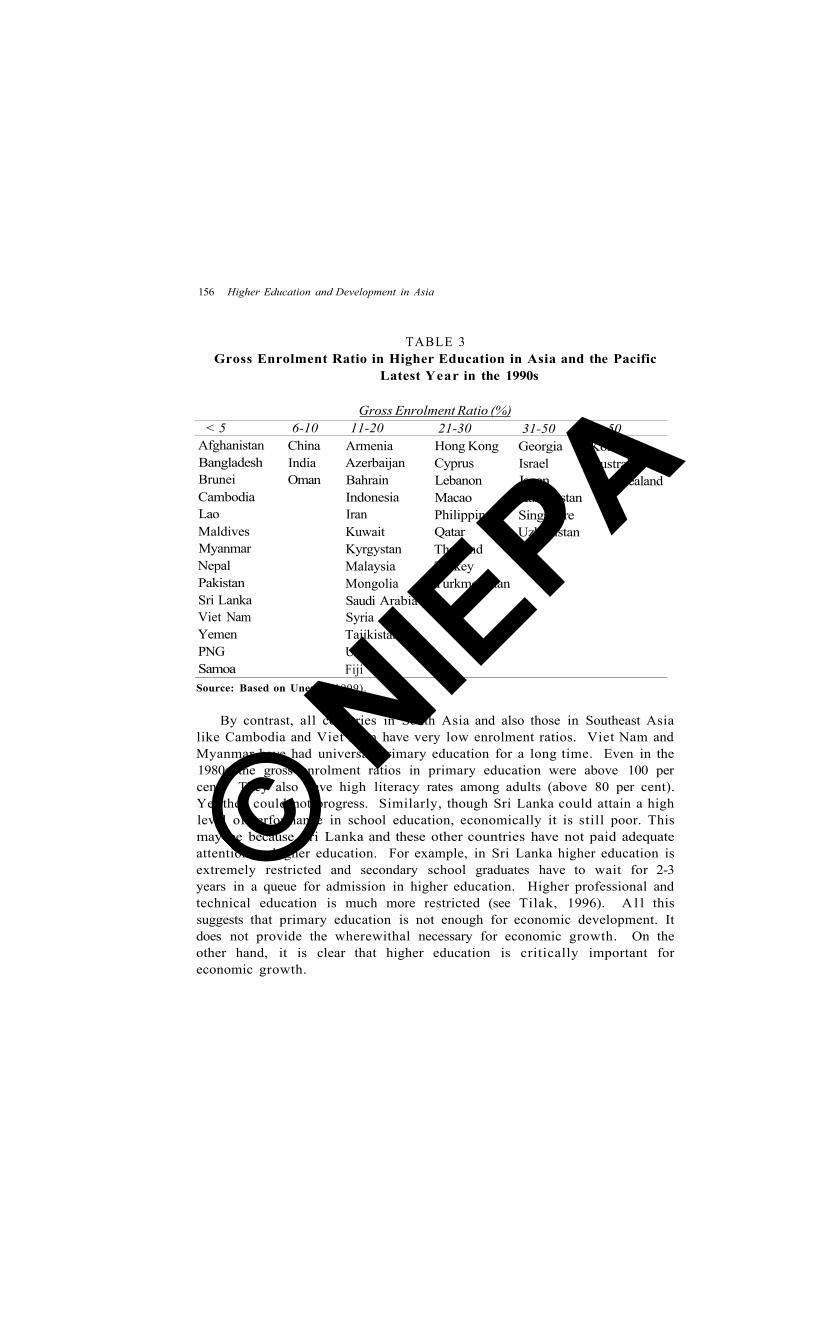
TABLE 3 Gross Enrolment Ratio in Higher Education in Asia and the Pacific
Latest Year in the 1990s
Gross Enrolment Ratio (%) < 5 6-10 11-20 21-30 31-50 >50
Afghanistan China Armenia Hong Kong Georgia Korea Bangladesh India Azerbaijan Cyprus Israel Australia Brunei Oman Bahrain Lebanon Japan New Zealand Cambodia Indonesia Macao Kazakhstan Lao Iran Philippines Singapore Maldives Kuwait Qatar Uzbekistan Myanmar Kyrgystan Thailand Nepal Malaysia Turkey Pakistan Mongolia Turkmenistan Sri Lanka Saudi Arabia Viet Nam Syria Yemen Tajikistan PNG UAE Samoa Fiji Source: Based on Unesco (1999).
By contrast, all countries in South Asia and also those in Southeast Asia like Cambodia and Viet Nam have very low enrolment ratios. Viet Nam and Myanmar have had universal primary education for a long time. Even in the 1980s the gross enrolment ratios in primary education were above 100 per cent. They also have high literacy rates among adults (above 80 per cent). Yet they could not progress. Similarly, though Sri Lanka could attain a high level of performance in school education, economically it is still poor. This may be because Sri Lanka and these other countries have not paid adequate attention to higher education. For example, in Sri Lanka higher education is extremely restricted and secondary school graduates have to wait for 2-3 years in a queue for admission in higher education. Higher professional and technical education is much more restricted (see Tilak, 1996). A l l this suggests that primary education is not enough for economic development. It does not provide the wherewithal necessary for economic growth. On the other hand, it is clear that higher education is critically important for economic growth.
© NIEPA
Jandhyala B.G. Tilak 157
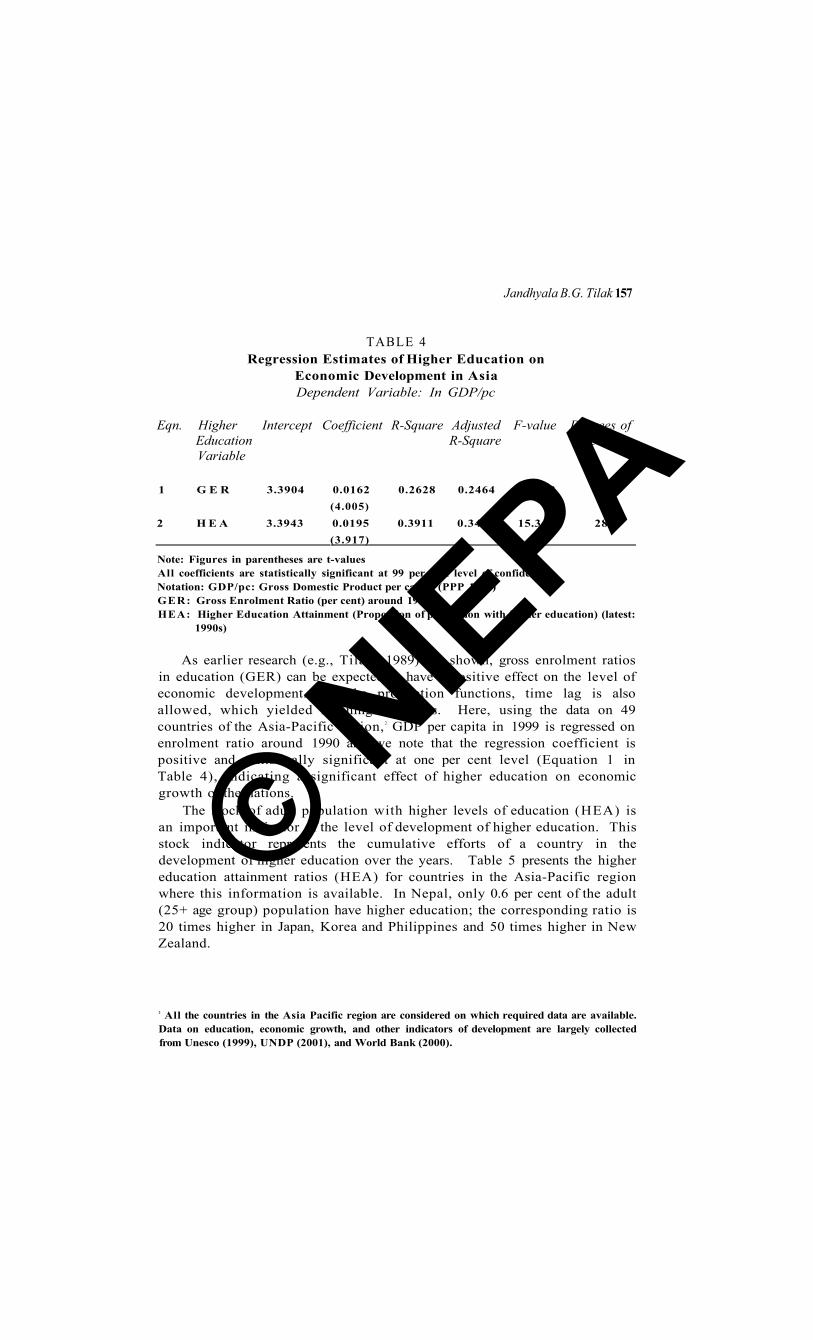
TABLE 4 Regression Estimates of Higher Education on
Economic Development in Asia Dependent Variable: In GDP/pc
Eqn. Higher Intercept Coefficient R-Square Adjusted F-value Degrees of Education R-Square Freedom Variable
1 G E R 3.3904 0.0162 0.2628 0.2464 16.038 46 (4.005)
2 H E A 3.3943 0.0195 0.3911 0.3469 15.343 28 (3.917)
Note: Figures in parentheses are t-values All coefficients are statistically significant at 99 per cent level of confidence. Notation: GDP/pc: Gross Domestic Product per capita (PPP 1999) GER: Gross Enrolment Ratio (per cent) around 1990 HEA: Higher Education Attainment (Proportion of population with higher education) (latest:
1990s)
As earlier research (e.g., Tilak, 1989) has shown, gross enrolment ratios in education (GER) can be expected to have a positive effect on the level of economic development. In the production functions, time lag is also allowed, which yielded meaningful results. Here, using the data on 49 countries of the Asia-Pacific region,2 GDP per capita in 1999 is regressed on enrolment ratio around 1990 and we note that the regression coefficient is positive and statistically significant at one per cent level (Equation 1 in Table 4), indicating a significant effect of higher education on economic growth of the nations.
The stock of adult population with higher levels of education (HEA) is an important indicator of the level of development of higher education. This stock indicator represents the cumulative efforts of a country in the development of higher education over the years. Table 5 presents the higher education attainment ratios (HEA) for countries in the Asia-Pacific region where this information is available. In Nepal, only 0.6 per cent of the adult (25+ age group) population have higher education; the corresponding ratio is 20 times higher in Japan, Korea and Philippines and 50 times higher in New Zealand.
2 All the countries in the Asia Pacific region are considered on which required data are available. Data on education, economic growth, and other indicators of development are largely collected from Unesco (1999), UNDP (2001), and World Bank (2000).

© NIEPA
158 Higher Education and Development in Asia
TABLE 5 Higher Education Attainment in Asia Pacific
(% of Adult (25+ Age-Group) Population having Post-Secondary Education (Latest available in 2001/02)
New Zealand 39.1 Israel 11.2 Iraq 4.1 Mongolia 23.4 Turkey 10.8 Viet Nam 2.6 Philippines 22.0 Bahrain 10.3 Pakistan 2.5 Korea 21.1 Brunei Darussalam 9.4 Indonesia 2.3 Japan 20.7 Singapore 7.6 Myanmar 2.0 Taiwan 17.8 India 7.3 Maldives 1.7 Cyprus 17.0 Malaysia 6.9 Afghanistan 1.6 Kuwait 16.4 Macao 5.9 Bangladesh 1.3 Hong Kong, China 14.5 Solomon Islands 5.6 Sri Lanka 1.1 Qatar 13.3 Thailand 5.1 China 1.0 Kazakhstan 12.4 Fij i 4.5 Cambodia 1.0 Tajikistan 11.7 Nepal 0.6
Source: Unesco (1999).
While Nepal and Cambodia figure at the bottom of the list of the countries in the region with respect to this indicator, in several developing countries of the region, the corresponding figure is less than five per cent; only in a few countries it is more than ten per cent (Figure 2). In contrast, in the USA nearly half the adult population has higher education.
This attribute is also expected to have a stronger effect on development, as the group considered here forms a part of the labour force; it indeed forms an important and even a large part of the skilled and educated labour force. The larger the stock of population with higher education, higher could be the economic growth. 3
Equation 2 in Table 4 gives the corresponding results - the regression estimates for the relationship between higher education attainment and GDP per capita. As expected, this gives a better result, with a higher coefficient of determination, and the variable has a higher effect, as the value of the coefficient suggests. Both the equations make it clear that higher education makes a significant and positive contribution to economic growth. Hence, it may not be proper to assume that its role is insignificant.
3 Instead of proportion of population, proportion of labour force with higher education could be expected to be more strongly related to economic growth. But such data are available for a tiny number of countries in Asia Pacific.

© NIEPA
Jandhyala B.G. Tilak 159
Figure 2
Higher Education Attaiment in Asja & the Pacific, 1990s
Nepal Cambodia
China Sri Lanka
Bangladesh Afghanistan
Maldives Myanmar Indonesia Pakistan
Viet Nam Iraq Fiji
Thailand Solomon Islands
Macau Malaysia
India Singapore
Brunei Bahrain Turkey
Israel Tajikstan
Kazakastan Qatar
Hong Kong, China Kuwait Cyprus Taiwan
Japan Korea
Philippines Mongolia
New Zealand
i s * - < * > (% of Adult (25+) Population with higher Education;
»-3 \ ^
•s
f, »•
x > * ; y .
0 10 20 30 40 50
It may be argued that simple regression equations of economic development on education suggest only correlation between the two, and not necessarily cause and effect relationship. Such an argument is partly preempted here, by allowing a time lag for higher education to cause economic development. Secondly, we also find very few countries with high levels of higher education being economically underdeveloped, while all the economically rich countries have not necessarily advanced in the development and spread of higher education.
In the rapidly technologically changing world, technology makes a significant difference to the economic growth of the nations. UNDP (2001) developed a technology achievement index (TAI), based on the degree of creation of technology in a given economy, the extent of diffusion of old and recent innovations, and human skills. The level of achievement in technology critically depends upon the level of higher education in a given economy. After all, it is higher education and research that help in developing new

© NIEPA
160 Higher Education and Development in Asia
technology; it is higher education and research that contributes to innovations and in their diffusion. So one can expect a very strong effect of higher education on the development of technology in any society. In fact, the level of achievement in technology may be a close indicator of economic growth itself. Most countries with high enrolment ratios in higher education became 'leaders' in technology, with high levels of achievement in technology, (as shown in Table 6). The converse is also true: a large number of countries with low enrolment ratios (say less than ten per cent) are 'marginalized' in the area of technology. Those with medium level of enrolment ratios, nearly 20 per cent, like Singapore and Hong Kong are indeed 'potential leaders' in technology.
TABLE 6 Higher Education (GER) and Technology (TAI)
Technology Achievement Index High Medium Low Q0.5) (0.4-0.5) (<0.4)
High(>20) New Zealand, Korea, Philippines ~ Australia, Israel, Japan •I Medium (11-20) Singapore Hong Kong Thailand, Cyprus, | •§ Syria * * Low(<10) Iran, Indonesia, £ Malaysia, India, Sri ^ Lanka, Nepal, China,
Pakistan Source: Based on UNDP (2001) and Unseco (1999).
TABLE 7 Regression Estimates of Higher Education on Achievement of
Technology in Asia Dependent Variable: In Technology Achievement Index (TAI)
Eqn. Higher Intercept Coefficient R-Square Adjusted F-value Degrees of Education R-Square Freedom Variable
1 GER -0.7405 0.0143 0.570 0.545 22.552 17 (4.749)
2 HEA -0.6535 0.0152 0.400 0.357 9.335 15 (3.055)
Note: Figures in parentheses are t-values

© NIEPA
Jandhyala B. G. Tilak 161
A few countries like Philippines and Thailand with medium and high levels of enrolment ratios are classified by the UNDP (2001) as 'dynamic leaders'. The rest, who did not expand their higher education systems well, are indeed 'marginalized.' We find not even a single country with a low enrolment ratio (less than ten per cent) in higher education to have achieved high or medium level of achieving in the technology index.
Figure 3 GER in Higher Education and Achievment in Technology
(with a logarithmic trend line)
0 5 10 15 20 25 30 35 40
Gross Enrolment Ratio
The relationship between higher education and technology could be shown statistically as well. The simple coefficient of correlation between enrolment ratio in higher education and technology achievement index is as high as 0.8 and that between technology and higher education attainment is 0.65. Though the number of observations is small, the simple regression equations estimated here (Table 7) and the trend line shown in Figure 3 do show a very strong and statistically significant effect of higher education on the level of achievement of technology.
Higher Education and Social Development
The above rates of return and regression coefficients do not capture several non-economic benefits of higher education. Most studies on the relationship between education and development indicators, such as human development, health, life expectancy, mortality rate, poverty, etc., concentrated on literacy and school education. Rarely has the role of higher education been examined in this context, probably on the presumption that higher education does not have any role in this. Such an assumption is widespread.

© NIEPA
162 Higher Education and Development in Asia
In order to present a brief idea of the relationship between higher education and a variety of aspects of well being, simple coefficients of correlation are estimated (Table 8). A l l coefficients of correlation between higher education and development indicators have expected signs whether it is in relation to gross enrolment ratio or in relation to higher education attainment.
TABLE 8 Coefficients of Correlation between
Higher Education and Social Development Indicators
Between n 1990) [54] year) [34]
49 0.60309 0.55183 42 0.63454 0.55238 11 0.60562 0.65397 54 0.5261 1 0.54091 50 -0.46108 -0.46099 54 -0.56698 -0.47447 15 -0.56614' -0.29956 +
And Human Development Index (1999) Gender Development Index Gender Empowerment Index Life Expectancy Infant Mortality Rate Total Fertility Rate Poverty (International)
Note: Figures in [ ] refer to number of valid countries for which data are available; N: number of observations; r: coefficient of correlation
Poverty (International): % of population below the line of income poverty of $1) * statistically significant at 5% level; + not significant even at 10% level; all others are significant at 1% level.
Second, most coefficients are also statistically significant with high t-values. An exception is the coefficient between higher education attainment and poverty. A l l the other coefficients are significant at 99 per cent level of confidence; except the coefficients relating to gender empowerment index and poverty, which are significant at 95 per cent level of significance,4
indicating that higher education is also positively related to several human development indicators, in addition to economic development.
Higher education is found to be very significantly related to the human development index and also to the gender development index. Higher the level of higher education in a society, whether in stock or flow forms, higher can be the level of human development, through its influence on two main components of human development index, viz., the life expectancy, and GDP per capita. It is not only life expectancy that is significantly related to higher
4 In both cases, n, the number of observations considered is very small, due to non-availability of data on their respective indicators.

© NIEPA
Jandhyala B.C. Tilak 163
education, but also infant mortality, another measure of health is significantly related to higher education. Higher education helps a lot in reducing infant mortality rates, as people with higher education would be more aware of the need for preventive health care measures and also would be aware of the availability of general healthcare facilities, leading to sound decision making within households regarding healthcare. Higher education can influence health of the population in a different way as well, through provision of skilled medical manpower to the society, thereby improving the quality and quantity of medical manpower in the society.
Similarly, the effect of higher education on fertility rates can also be two-folded: higher education may bring in attitudinal changes on the need to reduce fertility rates for development on the one hand, and secondly, prolonged education, i.e., enrolment in higher education may delay marriages, and lead to reduction in fertility rates. For example, Japan and Korea with the highest levels of higher education have somewhat lowest levels of total fertility rates, 1.4 and 1.5 respectively. In contrast, the total fertility rates in Nepal and Cambodia, where hardly one per cent of the population has higher education; the fertility rates are 4.8 and 5.3 respectively.
Finally, the relationship between higher education and poverty. Data on poverty levels are very limited. Hardly on 15 out of 49 countries in the Asia Pacific region we have data on poverty, i.e., per cent of population living below the intentionally defined poverty line of US$ one per day. The estimated coefficients of correlation do suggest that poverty is inversely related to the level of higher education. The relationship between poverty and gross enrolment ratio in higher education is negative and the coefficient is statistically significant; but the coefficient between poverty and higher education attainment is not significant, though negative as one expects. In general, one can argue that while basic education may take people out of poverty, this can be sustained well by secondary and higher education, which help in upward mobility and offer better economic opportunities.
Thus, one can note that higher education has a very signifying role in the development of the societies - in terms of economic development, human development, gender-biased development, improvement in health, life expectancy, and reduction in fertility, infant mortality and poverty. Though, in general, it is true that there exists a two-way relationship between higher education and development, the way and the facets of development analysed here, highlighted the one-way relationship, viz., the contribution of higher education to development. For instance, it does not sound logical to ague that reduction in infant mortality rate or improvement in life expectancy leads to development of higher education significantly. Similarly, current national income may influence the growth of enrolment in the future, but enrolments

© NIEPA
164 Higher Education and Development in Asia
a decade ago in higher education cannot be argued to be influenced by the current levels of national income, particularly in modern times, when rapid socio-economic developments are taking place. In short, though the statistical analysis used is very simple, the group of countries is highly heterogeneous, and that there can be several factors influencing economic growth in addition to higher education; nevertheless, it indicates a strong and positive relationship - higher education clearly influencing development.5
Public Policy and Development of Higher Education6
Despite increasing awareness of the contribution of higher education to development, many developing countries in the Asian region have not expanded their higher education systems adequately, due to a variety of factors - social, economic, political and cultural. However, one of the most important factors relates to public policies on the expansion of higher education. Several developing countries continue to pay inadequate attention to higher education. Two major areas of public policy are worth examining here. They are the (i) financing of higher education and (i i) privatisation.
Financing Higher Education
In most countries, higher education receives less than one per cent of GNP. It is only in the tiger economies of the East Asia, oil-rich west Asia and Australia and New Zealand that the corresponding proportion is above one per cent. It is less than 0.2 per cent in quite a few developing counties such as Bangladesh, Myanmar, Lao and Tajikistan (Table 9). These statistics indicate the relative priority accorded to higher education in different countries.
Generally education, including higher education is financed by the State in most societies, including the Asian economies. However, in the recent years, there has been a steady decline in the public expenditure on higher education and several changes are taking place in the pattern of funding education all over the world in terms of the introduction of financial aid, student loans and similar cost-recovery measures along with scholarships, vouchers and other protective measures (see Ziderman and Albrecht 1995).
5 This is also confirmed by intra-country studies (e.g., Tilak, 2001b). 6 Some recent studies that gave elaborate accounts of development policies in higher education in Asia - both at regional levels and also by countries, include Postiglione and Mak (1997), Unesco-PROAP (1998), and Tilak (2001a, c). Tilak (1994), Lewin (1999) and Bray (2000) covered all levels of education.

© NIEPA
Jandhyala B.G. Tilak 165
TABLE 9 Share of Expenditure on Higher Education in GNP (%)
Myanmar 1994 0.14 Philippines 1997 0.61 Lao 1997 0.16 Kyrgystan 1996 0.75 Tajikistan 1996 0.16 Thailand 1996 0.79 Bangladesh 1996 0.17 Turkey 1995 0.87 India 1995 0.22 Mongolia 1996 0.92 Azerbaijan 1996 0.25 Iran 1995 0.92 Oman 1995 0.25 Uzbekistan 1993 0.92 Armenia 1996 0.26 Jordan 1994 0.93 Cyprus 1995 0.29 Georgia 1994 0.96 Korea 1995 0.30 Singapore 1995 1.04 Sri Lanka 1996 0.32 Hong Kong 1995 1.08 Vanuatu 1994 0.32 Syrian Arab Rep. 1996 1.09 Indonesia 1996 0.34 Saudi Arabia 1997 1.17 Pakistan 1997 0.35 Malaysia 1997 1.25 China 1996 0.36 Israel 1994 1.38 Japan 1994 0.44 Kuwait 1997 1.51 Solomon Islands 1991 0.52 Vietnam 1997 1.54 Nepal 1997 0.61 Australia 1995 1.68 Kazakhstan 1997 0.61 New Zealand 1996 2.12 Source: Calculated by the author based on Unesco (1999).
An overall shift is taking place from financing the provision (or supply) of higher education to financing the demand for higher education all over. Methods of mobilizing non-governmental resources are being talked about essentially because of financial considerations (and in particular, because of the increasing inability of governments to meet rapidly rising social demand for higher education). Universities (including public ones) are being required to generate resources on their own, and as a result, many universities are making several innovations in the mobilization of non-governmental resources. For example, Hong Kong had a target of increasing the cost-recovery rate to 18 per cent through fees in higher education. China provided free higher education for a long time and also provided students with dormitory lodging and stipends for food and other allowances, but now marketization and quasi-marketization processes are occurring in post-Mao China. Fees have been introduced and student loan programmes have been launched. Furthermore, China has shifted its emphasis from traditional higher education to short-cycle programmes, in which enrollment tends to increase rapidly; it has been shown that students are ready to pay for this kind of curriculum. Non-formal and on-the-job training are also preferred in

© NIEPA
166 Higher Education and Development in Asia
China as these forms of training quickly fulfil the demand for skiiied labour. Some of the predominant ways of generating money in Chinese universities include (a) running factories, shops, stores, and so on; (b) selling research to industrial establishments; (c) procuring contracts and commissions for research and training; (d) offering consultancy services of the staff for a variety of activities including interpretation and translation; and (e) selling computer services. The system of financing higher education is gradually changing from the one dominated by the state to the one of multi-source funding, with the state taking care of the lion's, but gradually declining, share with the stipulation that it would be supplemented by multiple channels, including fund-raising campaigns and donations by individual citizens, enterprises and other social bodies, in addition to student fees. On the whole, more than 10 per cent of higher education costs are recovered from students in several East-Asian economies (see Tilak, 2001a).
Many countries are experimenting with alternative forms of financing and cost-recovery mechanisms. There are no recent detailed estimates on cost recovery in education. Available evidence shows that the rates of cost recovery in higher education vary widely between zero per cent in Sri Lanka and 50 per cent in Korea. It is below 20 per cent in most of public higher education systems in the Asian countries, except in Korea.7 It is quite interesting to note that rates of cost recovery in advanced countries are also not high: they are also less than 20 per cent, in fact, less than 15 per cent, except in case of Spain (Table 10). In this sense, the rates of cost recovery in Asian countries are somewhat comparable to those in the advanced countries and hence the general presumption that higher education in Asian countries is heavily subsidised by the state may not be true. The rates of cost recovery in private higher education institutions in the Asian countries are alarmingly high: it is 50 per cent in Taiwan, 66 per cent in Japan, 82 per cent in Korea and 85 per cent in the Philippines. With such high rates of cost recovery, private higher education may be out of reach to a majority of the students belonging to weaker economic strata. This would indeed create serious problems of equity, if these countries have higher education systems that are predominantly private.
The rate of cost recovery in private higher education in USA is quite low: less than 40 per cent. Private institutions in USA generate sizeable resources from non-governmental and non-student sources. But in Asian countries, education is funded either by the government or by the students in the form of fees. The non-governmental and non-student sources do not seem to exist. The levels of cost recovery in higher education are higher in
7 Other economies in East Asia - Singapore, Taiwan and Hong Kong, and even countries in other regions do not rely on private finances to the extent Korea does

© NIEPA
Jandhyala B.G. Tilak 167
developing countries in Asia than in many advanced countries. But again, it is in these countries that the arguments for higher and higher levels of cost recovery are being proposed.
TABLE 10
Share of Fees in Costs of Higher Education in Selected Countries (per cent)
Asian Countries* Share Non-Asian Developed Share Countries
Public/Predominantly Public Japan 1970 2.0 Norway 1987 0.0
1990 9.8 France 1975 2.9 Australia 1987 2.1 1984 4.7
1999 18.6 Germany 1986 0.0 Sri Lanka Italy 1989 7.3 Pakistan 2.1 Canada mid 1980s 12.0 Nepal 1986-87 4.4 Netherlands 1985 12.0 Malaysia
1991 5.8
>20.0 Spain United Kingdom
mid 1980s 20.0
Thailand 6.9 Universities 1970-71 12.6 Taiwan 1991 7.0 Polytechnics 1988-89 6.4 Pakistan 1987-88 1982-83 15.0
Colleges 7.4 Soviet Union 1987-88 14.0 Univs. (Gen) 1.9 early 1980s 0.0 Univs. (Tec) 1.3 U S A 1969-70 15.1
China 1998 17.0 1984-85 14.5 Hong Kong 1988-89
1997 6.5-12.1
18.0 Philippines 1985 10.9 Indonesia
1990 13.0
>20.0 India 1984-85 15.0 Vietnam 1993! >20.0 South Korea 1985 49.6
Private Taiwan Late '80s 50.0 U S A 1969-70 38.6 Japan 1971
1985 75.8 65.8
1984-85 38.7
South Korea 1985 82.3 Philippines 1977 85.0
Note: .. N i l or Negligible; * around 1980, unless otherwise mentioned. Source: Tilak (1997b; 2001a); Bray (2000); Catalano et al (1992); Woodhall (1991);
Asonuma (2002) and Department of Education, Australia (2001).

© NIEPA
168 Higher Education and Development in Asia
The dangers of high cost recovery are to be noted. Even if it is feasible to raise cost recovery rates to higher levels, it has to be seen whether it is desirable from the point of view of equity in higher education and the manpower needs of the developing economies. After all, the need for 'democratisation' or 'massification' of higher education is being increasingly felt everywhere.
On the whole, private higher education in Asia is financed mostly by the students in the form of fees, and public universities are mostly financed by the state, except in Korea. But all systems of higher education in the region are undergoing rapid changes, increasing their reliance on fees and other private finances. The 'profit syndrome' is no more uncommon in several Asian countries.
Private Higher Education
Another closely related and important issue of concern in the development of education in the last quarter century refers to private higher education. Private education is not a new phenomenon in the Asian region, though modern private education is of recent origin. Many of the private institutions in the region are privately managed, but are funded by the State to a substantial extent. 'Complete' or 'pure' private institutions may now be very few in number; but they are rapidly increasing in number. Unfortunately, data are not available to make such a distinction and to find out the exact share of 'true' private sector in education. State support to private institutions is quite common in the Asian countries.
Private higher education institutions in education have been growing rapidly in all countries of the region - not only in the transition economies of Central Asia but also in South Asia, East Asia, including in China and the Pacific. The private sector meets a large part of the demand for higher education in Japan and Korea: its share in total enrollment in higher education is above 70 per cent in Japan, Korea and Taiwan. As high as 73 per cent of all universities, 84 per cent of all junior colleges in Japan are private, enrolling more than 70 per cent of total students in these institutions in 1992. Korea provides yet another example of extensive higher education operated by the private sector: 84 per cent of higher education institutions and nearly 80 per cent of higher education enrollment were in the private sector in 1993. Private higher education institutions in Taiwan out number public institutions 2 to 1, capturing 70 per cent of the enrolment. The share of private enrollment in higher education in Japan, Korea and Taiwan are among the highest in the world; and no country except the United States has enrolment in private institutions adding up to more than 10 per cent of the total enrolment in higher education, and even there the figure is only 10 per

© NIEPA
Jandhyala B.G. Tilak 169
cent. In a sense, the Korean and Japanese experience combined seems to be in sharp contrast to the traditional welfare-state approach - not to mention the traditionally important role of the state in the provision of education that dominates the pattern of educational development in European economies such as the United Kingdom, Sweden, Switzerland and Italy, and in the United States and Canada as well. Many other economies of the region -Singapore, Taiwan, Hong Kong, and China - do not rely on private financing to the extent that Korea and Japan do.
Hong Kong was able to resist pressures to allow the establishment of private universities. The private ('independent') higher education sector is emerging slowly in China and a system of non-government-run higher education institutions is gradually taking shape, as non-state or private (or sponsored) institutions begin to take root. In Singapore, which has a very limited role for the private sector, the government takes the bulk of the responsibility for higher education. But the quality aspects of private higher education do not seem to be satisfactory. Despite flourishing growth and government support, private institutions in the region have failed to become top-quality institutions such as the ones founded in the United States. This shows us what happens when quality controls are weak and profit motives dominate other considerations. The universities in Korea are found to be producing "half-baked graduates," necessitating huge investments by the government and the industry in R&D. 8
As private universities cater to the demands of the large population, neglect of public higher education goes unnoticed. More importantly, since higher education is allowed to be guided by market signals, most higher education institutions tend to concentrate on professional fields. As Clark (1995, p. 159) notes, humanities and social sciences are thrown aside; doctoral programmes in not only social sciences but also in physical sciences are "surprisingly weak," most advanced-level education is "radically underdeveloped," and the research-teaching-study nexus has become highly problematic. This is believed to be mostly attributable to the dominant role of industry or private sector in higher education.
It is generally felt that rapid growth in public sector spending on education has resulted in rapid growth in public sector enrollment everywhere, including in East Asia, and that such a relationship between private sector investments and enrollment in private institutions (or total enrollments in all institutions) cannot be found. On the whole, the private sector is rapidly growing in size, and most public policies or the lack of the same are conductive for its growth.
8 Kim Linsu, in Far Eastern Economic Review (May 14 1998, p. 48).

© NIEPA
170 Higher Education and Development in Asia
Conclusions and Implications
Higher education systems in many developing as well as developed counties including in Asia and Pacific are also characterised with a crisis, rather a continuing crisis, with overcrowding, inadequate staffing, deteriorating standards and quality, poor physical facilities, insufficient equipment, and declining public budgets. More importantly, higher education is subject to neglect and even discrimination in public policy. As Verspoor (1994, p. 2) rightly observed, "the crisis is in part the reflection of the economic adversity that many developing countries have experienced in the 1980s, but it is also a crisis of policy or very often, lack of policies" (emphasis added). Higher education systems are undergoing rapid changes in Asia. Some have followed the British mode of welfare statism to some extent; others attach more value to individual economic gain (and thereby to the economic growth of the country) and expect the market to respond to economic incentives that higher education comes with; 9 and a few others are indeed following ad hoc or no clear policies. Coherent long-term policies for the development of higher education for development of nations are needed. Public policy has to clearly recognise the critical importance of higher education in development.
It is important to note that no nation that has not expanded reasonably well its higher education system can achieve a high level of economic development. International evidence shows that all advanced countries are those that have a gross enrolment ratio of above 20 per cent. Among the advanced countries there is no single country, where higher education was not well expanded. In most developed countries higher education is fairly democratised, and is accessible to all. In fact, there are significant trends towards massification of the base of higher education. The gross enrolment ratio in higher education in advanced countries varies between 20 per cent and as high as 90 per cent. In contrast, in most of the developing countries, it is restricted to a small fraction of youth. No country could be found in the group of high-income countries with an enrolment ratio of less than 20 per cent. It is not only international evidence, but also the evidence on Asian countries clearly shows the same. The high-income countries in Asia, viz., Japan, Korea, Singapore, Hong Kong, Israel etc., have an enrolment ratio between 20 per cent and 70 per cent. Many low income countries in the Asian region, except the Philippines have an enrolment ratio much below -below 20 per cent. Thus 20 per cent enrolment ratio in higher education
9 At the same time it may be wrong to argue that the principle of individual choice, a principle that is assigned a lot of weight by the state in European and North American economies, has been the guiding principle of state policies in financing (or rather under financing or not financing at all) higher education in Japan and Korea.

© NIEPA
JandhyalaB.G. Tilak 171
seems to be the critical threshold level for a country to become economically advanced.
The experience of the Asian countries with the policies of globalisation and structural adjustment is also rich (Tilak, 1997a). Comparing the experiences of several countries in the region, one may conclude that these policies succeeded only in those countries that have invested heavily in education, including specifically higher education. The converse is also true. These policies could not yield good results in those countries that have made low and inadequate levels of investment in higher education, reflected in low levels of educational levels of workforce, as in countries in South Asia, and also in Southeast Asia like Vietnam, Lao, Cambodia, etc., compared to the countries like Korea, and, to some extent, Thailand, Indonesia and the Philippines. After all, globalisation, including international competition, to be successful, requires highly skilled manpower, produced by higher education systems. Empirically, it was found that globalisation has contributed to reduction in poverty and inequalities in East Asia, but 'globalisation has not allowed South Asia's progress towards poverty reduction to continue at its previous pace' (Khan, 1998). The reason could be found in the differences in investment in education, higher education in particular.
Despite such an awareness, many countries in the Asian region are not able to accord due priority to higher education. South Asian countries lag far behind the other Asian countries in higher education. According to the predictions made by Unesco (see Chapman and Adams, 1998), many of the developing countries in Asia, particularly in South Asia wi l l continue to be lagging behind the developed countries in the development of higher education and wi l l have low enrolment ratios, unless significant policies of expansion of higher education are adopted.
The case of Singapore and to some extent Hong Kong and Malaysia in the East Asian region, and of India in South Asia highlights the strengths of public higher education. The rapid growth in higher education in some of these countries owes largely to state funding. The role of the state is very important in providing and financing education everywhere. Excessive reliance of the governments on private sector for the development of higher education may lead to strengthening of class inequalities and even produce new inequalities, besides adding to the problems of quality. On the whole, it seems that initial government investments on a large scale are important in higher education; but only after some time, and certain level of educational and economic development is achieved, private sector may complement the state efforts in higher education. This also depends upon the role of the private sector in economic development in general. The East Asian

© NIEPA
172 Higher Education and Development in Asia
sequencing of funding - huge public funding first, and then only some private funding - is quite important (Thant, 1999).
References
Asonuma, Akihiro (2002) Finance Reform in Japanese Higher Education. Higher Education 43 (1): 109-26.
Bray, Mark (1998) Financing Education in Developing Asia: Themes, Tensions and Policies. International Journal of Educational Research 29 (7): 627-42
Bray, M. (2000) Education in Asia: Financing Higher Education - Patterns, Trends and Options, Prospects 30 (30): 331-47.
Catalano, Giuseppe; Paolo Silvestri and Marco Todeschini (1992) Financing University Education in Italy. Higher Education Policy 5 (2): 37-43.
Castells, Manuel (1994) The University System: Engine of Development in the New World Economy, in Salmi and Verspoor (eds.), pp. 14-40.
Chapman, David W., and Donald Adams, eds. (1998) Trends and Issues in Education Across Asia, International Journal of Educational Research 29 (7): 581-685.
Clark, Burton R. (1995) Places of Inquiry: Research and Advanced Education in Modern Universities. Berkeley: University of California Press.
Department of Education, Australia (2001) Higher Education Report for the 2001 to 2003 Triennium. Canberra: Commonwealth of Australia
Khan, A.R. (1998) The Impact of Globalization on South Asia [and] Growth and Poverty in East and South-East Asia in the Era of Globalization, in Globalization, Growth and Marginalization (ed. A.S. Bhalla). London: Macmillan, pp.103-24 [and] 125-48.
Lewin, Keith M. (1997) Educational Development in Asia: Issues in Planning, Policy and Finance. Asian Development Review 15 (2): 86-130.
Patel, S.J. (1985) Educational 'Miracle' in the Third World, 1950 to 1981, Economic and Political Weekly 20 (31) (August 3): 1312-17.
Postiglione, G.A. and G.C.L. Mak (eds.) (1997) Asian Higher Education: An International Handbook and Reference Guide. Westport: Greenwood Press.
Psacharopoulos, George (1994) Returns to Investment in Education: A Global Update, World Development 22 (9): 1325-43.
Psacharopoulos, George and Harry Patrinos (2002) Returns to Investment in Education: A Further Update. World Bank Policy Research Working Paper 2881. Washington DC. [http://econ.worldbank.org/files/18081_wps2881.pdf]
Salmi, Jamil and Adriaan M. Vespoor (eds.) (1994) Revitalizing Higher Education. Oxford: Pergamon.
Schultz, Theodore W. (1961) Investment in Human Capital, American Economic Review 51 (1): 1-15.
TFHES [Task Force on Higher Education and Society] (2000): Higher Education in Developing Countries: Peril and Promise. Washington DC: World Bank.
Thant, Myo (1999) Lessons from East Asia: Financing Human Development, In: Human Capital Formation as an Engine of Growth: the East Asian Experience (ed. Joseph L.H. Tan). Singapore: Instituteof Southeast Asian Studies, pp. 202¬36.

© NIEPA
Jandhyala B.G. Tilak 173
Tilak, Jandhyala B.G. (1989) Education and its Relation to Economic Growth, Poverty and Income Distribution: Past Evidence and Further Analysis. Discussion Paper No. 46. Washington DC: World Bank.
—. (1994) Education for Development in Asia. New Delhi: Sage Publications. —. (1996) Costs and Financing of Education in Sri Lanka. Manila: Asian Development
Bank/Brisbane: UniQuest. —. (1997a) Effects of Adjustment on Education: A Review of Asian Experience,
Prospects 27 (1) (March): 85-107. —. (1997b) Lessons from Cost Recovery in Education. In: Marketising Education
and Health in Developing Countries: Miracle or Mirage? (ed. Christopher Colclough.) Oxford: Clarendon Press, pp. 63-89.
— (2001a) Building Human Capital in East Asia. Working Paper. Washington D.C.: World Bank Institute.
—. (2001b) Higher Education and Development in Kerala, CSES Working Paper no. 5. Kochi: Centre for Socio-economic & Environmental Studies.
—. (2001c) Education and Development: Lessons from Asian Experience, Indian Social Science Review (ICSSR, New Delhi) 3 (2) (July-December): 219-66.
Verspoor, Adriaan M. (1994) Introduction: Improvement and Innovation in Higher Education, in Salmi and Vespoor (eds.), pp. 1-11.
Unesco (1999) Statistical Yearbook. Paris: Unesco. Unesco-PROAP (1998) Higher Education in Transition Economies in Asia.
Bangkok. UNDP (2001) Human Development Report. New York: Oxford University Press. Woodhall, Maureen (1991) Student Loans in Higher Education. Paris: International
Institute of Educational Planning. World Bank (2000) World Development Report 2000-01. New York: Oxford
University Press. Yee, A.H. (ed.) (1995) East Asian Higher Education: Traditions and
Transformations. Oxford: Pergamon. Ziderman, Adrian and D. Albrecht (1995) Financing Universities in Developing
Countries. Washington DC: Falmer Press.

© NIEPA
Journal of Educational Planning and Administration Volume XVII No. 2, April 2003
GLOBAL BUSINESS REVIEW
With the winds of economic and financial globalisation sweeping across the world, business houses throughout the developing world are being obliged to readjust and rethink their business practices in order to meet the new challenges. Global Business Review is designed to be a forum for the wider dissemination of current management and business practice and research drawn from around the globe but with emphasis on Asian and Indian perspectives. An important feature will be its cross-cultural and comparative approach.
For Academic contributions write to: Dr C S Venkata Ratnam, Professor & Editor - G B R , International Management Institute, B -10 Qutab Institutional Area, Tara Crescent, New Delhi 110 016, India, Phone: (91>11-6529237-39, Fax: (91>11-6867539, Email: [email protected]
Address for Subscription details write to: Global Business Review, S A G E Publications (I) Pvt. Ltd, B-42 Panchsheel Enclave, New Delhi 110 017, Tel: (91>11-26491293, 26491294 Fax: (91>11-26491290.
Highlights of the Forthcoming lnue Global Business Review
January June 2003 Vol 4:1
T H E R E L E V A N C E O F N O N - T A R I F F B A R R I E R S T O R E G I O N A L T R A D E : E X P E R I E N C E S O F S O U T H A F R I C A N E X P O R T E R S WERNER SOONT1ENS
V E R T I C A L L Y C H A L L E N G E D O R S E T T O M E T A M O R P H O S I Z E ? A P R E L I M I N A R Y A S S E S S M E N T O F O R G A N I Z A T I O N A L C O M M U N I C A T I O N I N S I N G A P O R E VALERIE PR1SC1LLA GOBY
P R E P A R E D N E S S F O R I N N O V A T I O N : A N I N D I A N P E R S P E C T I V E GSDAS
C O N S U M E R S A T I S F A C T I O N A N D P E R C E I V E D Q U A L I T Y O F O U T - P A T I E N T H E A L T H C A R E S E R V I C E S VIDYADHAR REDDY AILENI
C O M P E T I T I V E N E S S O F I N D I A N A P P A R E L E X P O R T F I R M S : A N A N A L Y S I S O F S E L E C T D E L H I B A S E D F I R M S ANVRADHA BALARAM, SVRENDRA S YADA VAND RAJA T K RAISYA
C R O S S - C U L T U R A L C O M P A R I S O N S O F H R M S T Y L E S : B A S E D O N J A P A N E S E C O M P A N I E S , J A P A N E S E S U B S I D I A R I E S I N B A N G L A D E S H A N D B A N G L A D E S H C O M P A N I E S MIAHMD. KHASRO.MITSURU WAKABA YASHl AND NORIHIKO TAKEUCHI
S T R A T E G I C H U M A N R E S O U R C E M A N A G E M E N T A P P R O A C H E S T O W O R K F O R C E D I V E R S I T Y I N J A P A N - H A R N E S S I N G C O R P O R A T E C U L T U R E F O R O R G A N I Z A T I O N A L C O M P E T I T I V E N E S S DAREN MCDONALD
R E S O U R C E S S T R A T E G Y A N D S I G N A L S T O R E S O U R C E S M A R K E T I N I N D I A N S O F T W A R E PARTHASARATHIBANERJEE
H T V / A I D S A N D T H E W O R K P L A C E : C H A L L E N G E S A N D R E S P O N S E S PREMILLA D'CRUZ
E N E R G Y S A V I N G I N I T I A T I V E S I N L I G H T I N G I N I N D I A V I S - A - V I S T H E I N T E R N A T I O N A L E X P E R I E N C E : A F O C U S O N C O M P A C T F L U O R E S C E N T L A M P S ( C F L S ) ARVN KUMAR, SUDH1R K JAIN & N K BANSAL
Book Reviews

© NIEPA
Journal of Educational Planning and Administration Volume XVII No. 2, April 2003, pp. 175-197
Socio-Economic Determinants of School Attendance in India
UshaJayachandran
Abstract
Investigating the socio-economic determinants of school attendance in India, and the possible causes of disadvantage faced by the girl child, based on Census data for 1981 and 1991, the determinants of inter-district variations in school attendance are explored, separately for boys and girls. A similar analysis is applied to the gender bias in school attendance. The results indicate that school attendance is related positively to school accessibility and parental education, and negatively to poverty and household size. Interestingly, a positive association emerges between women's labour-force participation and children's school attendance; possible explanations of this pattern are discussed. The gender bias in school attendance declines with school accessibility and parental education and rises with household size. Panel data analysis based on the random-effects model supports the cross-section findings.
Introduction
This paper investigates the socio-economic determinants of school attendance in India in the 5-14 age group for boys and girls. Based on Census data for 1981 and 1991, the determinants of inter-district variations in school attendance rates by children in this age-group are explored. These are looked at separately for boys and girls and possible causes for disadvantages faced by the girl child are also researched. The paper investigates the problem by testing the relevance of alternative explanations of why children do/do not attend school in their most formative years.
The possible demand side variables include parental education, adult female work-force participation rate, poverty, wage rate in the agricultural sector, caste status, household size and urbanisation. The supply-side variables include the proportion of villages having primary schools and teacher-pupil ratios, calculated at the elementary level.
Acknowledgement: I am grateful to Jean Dreze and Badal Mukherji for their suggestions and comments from which this paper has greatly benefited. The usual disclaimer applies. ' E-mail: [email protected]

© NIEPA
176 Socio-Economic Determinants of School Attendance in India
Background
Data on school attendance from the 1991 Census1 reveals that in the 5-14 age group, 50 children out of every 100 attend school in India, of which 29 are boys and 21 are girls. In rural India, out of every 100 children 45 attend school. Of them, 27 are boys and 18 are girls. School attendance in urban India is higher with 66 out of every 100 children attending school. Of this 66, boys are 36 and girls 30.
Country level aggregates often hide state level realities. At the state level, school attendance rates at the elementary level vary from 85 per cent in Kerala to 35 per cent in Bihar. Kerala remains the best performer in rural and urban areas with school attendance rates of 85 per cent and 87 per cent respectively. Bihar shows the worst performance in the rural as well as urban areas with school attendance rates of 31 per cent and 59 per cent respectively. For all the major states, school attendance in urban areas outperforms those in rural areas.
Another interesting fact is that for all the major states, school attendance rates for males are higher than for females in rural as well as urban areas. This gender bias in schooling is glaring in Bihar, Rajasthan and Uttar Pradesh where the difference between male and female school attendance is over ten percentage points. In rural areas, Andhra Pradesh and Madhya Pradesh also show a similar disparity. In rural Rajasthan, the gender disadvantage is the maximum, with school attendance rates for girls as low as 18 per cent, as against 48 per cent for boys. In urban areas, gender disadvantage in schooling is most prominent in Rajasthan and Bihar.
The relation between school attendance and the various factors (socioeconomic) that play a role in influencing it has generated" a lot of interest and a fair amount of research in recent years in the Indian context. Some studies have investigated the possible causes for low levels of participation in primary schooling and high rates of drop-out in the same. Analysing a household choice model, Duraisamy (1988) reports that mother's time is an important determinant of fertility and child schooling while the value of father's time is not as important. The economic contribution of children encourages parents to have more children and discourages investments in their schooling. In the context of backward tribal communities, Sachidananda and Sinha (1989) find that most children belonging to these groups avail of the special programmes planned for them and that in tribal areas, teachers from the same community should be appointed in the schools.
Analysing the impact of incentive programmes such as the noon-meal scheme for Nagarcoil district, Rajan and Jaikumar (1992) find that such programmes have had a positive effect on school attendance and had curbed drop-outs. It has also had a greater impact on the enrolment of backward classes
1 Jayachandran(1998).

© NIEPA
Usha Jaichandran 177
and Muslim communities compared to the other communities investigated. Dreze and Saran (1994) attribute the low value attached to female education in India to deep-rooted features of gender relations.
An attempt is being made here to move further on these issues. It examines the determinants of school attendance in India in a multivariate framework, using a district level panel dataset that links the 1981 and 1991 census. First, the determinants of male and female schooling in the 5-14 age group are studied separately for 1981 and 1991 using cross-sectional data for both years. Cross-sectional analysis enables one to highlight differences in educational outcomes among the states and also to investigate the relationship between these outcomes and various socio-economic variables. Then, the two datasets are pooled to get a time-series cross-sectional (panel) dataset which is further studied using various econometric tools.
Issues and Hypotheses
Female Education and School Attendance
Adult female literacy can be considered an important determinant of school attendance. Parents who are educated can be expected to have a more enlightened attitude about education and may provide a more conducive environment to education as compared to uneducated parents. To test the importance of parental education, we distinguish between father's and mother's education. This enables us to check whether one of the two parents has more influence on decisions concerning the education of their children. In particular, one may expect adult female literacy to have strong effects on school attendance of girls.
Female Work and School Attendance
Adult female work-force participation can be expected to have either a positive or a negative effect on school attendance, depending on how we argue it. Higher levels of work-force participation by women could in turn require some of the children to stay at home and tend to household chores and take care of the younger siblings. In particular, it could have a negative effect on the school attendance of female children leading to a disadvantage in schooling for the latter. On the other hand, higher rates of work-force participation by women can be expected to bring them higher bargaining power in intra-households decisions. Then, if it is true that women are more concerned about the education of children, higher rates of work-force participation by them could lead to higher rates of participation in schooling by their children.
Here, it is essential to point out that adult female work-force participation is more a social variable than an economic variable and its effect on school attendance should be studied in this light. What is being implied is that in the case of adult female work-force participation, there is a high possibility of "social

© NIEPA
178 Socio-Economic Determinants of School Attendance in India
effects" involving externalities, going beyond the standard within household effects. The level of disaggregation here is the district, which captures the social aspect of this variable. Higher work-force participation rates by women could lead to their larger participation and involvement in social issues and local politics. This in turn could have an enhancing effect on school infrastructure, effective working of schools and school attendance.
Other Determinants of School Attendance
Improvements in adult male education can also be expected to raise participation in schooling. However, its impact on female schooling can be expected to be lower than its effect on male schooling. It can be expected that educated males are more concerned about educating their sons than their daughters, given that females are expected to, in the long run, look after the household chores while the males go out to earn the living.
Poverty is seen as the biggest barrier to education in India, making the direct costs of schooling too expensive for many families. Poor families thus tend to either fail to enroll their children into schools or withdraw them prematurely from primary schools. Poverty can also be expected to be the most pervasive barrier to education for female children and can be expected to have a negative effect on school attendance in general and for the female child in particular. It is important to mention that poverty moves with many other factors. Poor regions show low adult literacy rates and low levels of school attendance. A multivariate analysis enables us to study whether poverty has a positive/negative effect on school attendance, independently of caste, literacy, female work-force participation etc.
The Caste status of a child could be expected to act as a deterrent to his/her access to primary education. Lack of exposure and access to education could lead to low levels of literacy among persons belonging to scheduled castes and scheduled tribes. Cultural factors such as the lower classes not considering education as something required for upliftment could be the possible reasons for their low levels of enrolment and attendance. Discrimination could also exist within the schooling system e.g. in the form of hostile teacher's attitude towards children belonging to disadvantaged communities.
It could be supposed, when starting out, that urbanisation would exercise a positive influence on school attendance rates following the appearance of better infrastructure, more developed education facilities and a reinforcement of the Constitutional requirement of mandatory education for children over the age of 5 years.
Household size can be expected to have a negative impact on school attendance rates, mainly for the girl child. In large families with many children, the work-load increases and this may have a particularly detrimental effect on school participation of elder daughters, who are often kept back at home to

© NIEPA
UshaJaichandran 179
engage in domestic work, minding siblings and a myriad of other household chores (see also PROBE Team, 1999).
Along with various socio-economic factors that could affect the demand for schooling, we also include a supply-side factor viz. the proportion of villages in each district which have a primary school. This is included to capture school accessibility and the hypothesis is that ceteris paribus school attendance rates should be positively associated with the availability of schooling and moreso, for the girl child. It would be reasonable to think that the inavailability, inaccessibility and malfunctioning of school facilities has a negative impact on school attendance. In fact, many villages have no primary school, no books and no teaching aids. They have a single teacher, overcrowded classes and also suffer from teacher absenteeism. But data for these parameters is not available. The only data available is for the proportion of villages with primary school in the district. It can be supposed that the higher the proportion of villages having a primary school in a district, the higher the participation rates in schooling, since easy school availability and accessibility would reduce direct costs of schooling such as transportation costs.
Gender Bias in School Attendance
Aside from analysing the determinants of male and female school attendance, we shall examine the determinants of gender bias in school participation. The gender bias is captured by the ratio of male to female school attendance in the 5-14 age group. The explanatory variables are the same as in the analysis of school attendance.
Statistical Analysis
Data
The dependent variable analysed here is the school attendance rate for male and female children in the 5-14 age group. This has been calculated using information from the Census of India for 1981 and 1991. It is derived from the Census by taking the number of children (5-14 years) attending school as a percentage of total children in the 5-14 age-group, for males and females separately. The analysis here is at the district level as it is the basic unit of administration in India. Also, it captures the social dimension of participation in education at the elementary level, which is not possible at the household level.
We now turn our attention to the explanatory variables (listed in Table 1). Adult female literacy is our indicator for female education in the 15+ age group and same is the case with male education. Adult female work-force participation measures the involvement of women in the 15+ age group in the labour force. The female wage rate is the wage rate prevailing in the agricultural sector for unskilled female labour. Poverty is measured by the rural head count index (the

© NIEPA
1 8 0 Socio-Economic Determinants of School Attendance in India
proportion of rural population below the poverty line). The shares of scheduled castes and scheduled tribes in the population are used as indicators of the social composition of the population at the district level.
The proportion of villages having a school is used to measure accessibility of schooling. The ratio of female to male school attendance rate is used to capture any disadvantage that the female child faces in schooling. Three dummy variables are used to identify any regional patterns in schooling and these are: 'North' includes districts in the States of Haryana, Punjab, Madhya Pradesh, Rajasthan, Uttar Pradesh, Bihar, Himachal Pradesh and Jammu & Kashmir; 'South' refers to Andhra Pradesh, Karnataka, Kerala and Tamilnadu; and 'West' refers to Gujarat and Maharashtra. The Eastern region (Orissa, West Bengal, Assam, Arunachal Pradesh) is the default region.
The information on the various indicators used is available from the 1981 and 1991 Census. The only exceptions are poverty and the female wage rate. The estimates for poverty for the 1981 dataset have been obtained from Jain, Sundaram and Tendulkar (1988). One limitation of using this variable is that its reference year is 1972-73 rather than 1981. However, it is not unreasonable to assume that relative poverty levels in different regions have remained fairly stable in the intervening period.
Another point to be noted is that the poverty indicators here relate to NSS regions. Indicators of income or expenditure are not available at the district level for India. The NSS, which is the basic source of information of per capita expenditure, finds the sample size too small for many districts and, therefore, does not generate data at that level. It generates region-specific estimates, the NSS region being an intermediate unit between the district and the state. The justification here for using regional" level estimates for each district within a region is the assumption that intra-regional variations in poverty are small. Given that NSS regions are supposed to be relatively homogeneous in terms of agro-climatic and socio-economic features, such an assumption is quite plausible. But, there is a loss of information in such an exercise and the results should be assessed keeping in mind the imprecise nature of the poverty indices used at the district level. For the 1991 dataset, poverty estimates have been taken from Dreze and Murthi (2000).
For the 1981 dataset, the female wage rate has been taken from Acharya (1989) where real wages have been calculated for 58 regions separately for male and female labourers for the period 1980-81. For the purpose of the 1991 dataset, wage data from Sarmah (2001) have been used. Annual series of district-level real agricultural wages have been constructed by Sarmah (2001) from data published in the Ministry of Agriculture's annual Agricultural Wages in India (AWI) which provides wages at the district level for different categories of labour. Al l wages are measured in rupees per day and the AWI reports monthly averages of daily wages. Unweighted averages of the monthly wage

© NIEPA
UshaJaichandran 181
rates have been taken to obtain the average annual wage rate. The NSS region-level nominal wage rates are then calculated as weighted averages of the relevant district-level nominal wage rates, with the weights reflecting the size of the agricultural labour force.
TABLE 1 Variable Definitions, Sample Means and Standard Deviations
Variable Name Definition 1981 1991 Male school Proportion of males 5-14 years attending 52.8 56.1 attendance school (%) (12.8) (13.5) Female school Proportion of females 5-14 years attending 33.1 42.9 attendance school (%) (17,38) (18.0) Gender bias in Ratio of school attendance rate, males to 1.9 1.4 Schooling females (0.9) (0.4) Adult female work Proportion of women aged 15 and above 32.6 33.1 force participation who are working, main and marginal (%) (19.4) (19.3) Adult Male Proportion of men aged 15 and above who 51.6 58.9 Literacy are literate (%) (14.6) (13.7) Adult Female Proportion of women aged 15 and above 22.5 29.8 Literacy who are literate (%) (16.3) (16.9) Poverty Proportion of population below the 45.9 34.2
poverty line (16.4) (13.7) Scheduled Castes Proportion of scheduled castes in district 15.6 15.9
population (%) (7.7) (7.7) Scheduled Tribes Proportion of scheduled tribes in district 8.2 11.16
population (%) (14.8) (18.5) School Proportion of villages in the district having 59.6 78.5 Accessibility primary schools (%) (21.3) (17.8) Urbanisation Proportion of urban population (%) 19.8 21.4
(15.4) (16.2) Household size Average number of persons per household 5.6 5.6
(Total distt population as a proportion of (0.9) (0.7) total households in the distt)
Sample Size 356 413 (No. of Districts) Notes: Means are unweighted. Standard Deviations in parentheses. Source: Except for poverty, all the other variables have been calculated from the Census of India,
1981 and 1991.
Looking at Table 1, we note that male school attendance increased by 3.3 (from 52.8 to 56.1) percentage points between 1981 and 1991. Female school attendance for the same period increased by close to 10 percentage points (from

© NIEPA
182 Socio-Economic Determinants of School Attendance in India
33.0 to 43.0). During the same period, there were improvements in adult female and male literacy. In 1991, adult female literacy was as low as 30 per cent, about half the corresponding figure for males. The adult female work-force participation rate increased by less than one percentage point (from 32.6 to 33.1) between 1981 and 1991.
Table 2 reports the state-specific means and standard deviations for the 15 major Indian States (those which have a population above 10 million). There exists considerable cross-sectional variation in the data as seen by the results in the Table. In 1981, school attendance rates ranged from 44 per cent in Bihar to 73 per cent in Kerala for males and from 16 per cent in Rajasthan to 70 per cent in Kerala for female children. In 1991, it ranged between 43 per cent in Bihar to 85 per cent in Kerala for male children and from 23 per cent in Rajasthan to 85 per cent in Kerala for female children. The rates of increase in school attendance have also been uneven. It increased by over 7 per cent in the States of Andhra Pradesh, Haryana, Karnataka, Kerala, Madhya Pradesh and Tamilnadu. The States of Gujarat, Maharashtra, Orissa, Punjab and Rajasthan saw increases of less than 4 per cent for boys but between 7 to 10 per cent for girls. Bihar actually saw a drop in school attendance rates for boys over the ten year period of about 1.5 per cent, followed by West Bengal (1 per cent) and UP (0.4 per cent). For girls in these States, Bihar saw a rise of 4.5 per cent, West Bengal a rise of 3.3 per cent and Uttar Pradesh a rise of 6 percent.
Estimation
In our study we are dealing with panel data, i.e. successive observations over time for the same districts. It can be expected that pooling the data for several years increases the number of observations and, therefore, it increases efficiency in estimation and power in hypothesis testing. We will also be able to exploit the fundamental advantage that a panel data-set has over a cross-section, viz., greater flexibility in modelling differences across districts (such as the possibility of controlling for 'district effects').
The basic regression model for such a framework would be:
SCHATT dt = ad + p'x dt + yt + e dt (1)
where SCHATT is the school attendance rate in district d at time t, ad is a district specific effect, p is a vector of coefficients, yt is a time dummy and 6 d, is an error term. The explanatory variables are adult literacy rates (male and female), adult female work-force participation rate, female wage rate, poverty, caste, tribe, availability of schooling and regional location. The missing major State is Assam where no Census took place in 1981. In the Tables below, we present Huber-White

© NIEPA
TABLE 2
Sample Means and Standard Deviations for Major States (1981 and 1991)
Scho
ol
danc
e
•S o
4) U c <TJ "O Fem
ale
Part
n
Mal
e
s- Fem
ale
dule
d
(4 dule
d
8 c Sc
hool
nisa
tion
ehol
d c 3> * o da
nce
Mal
e At
ten 2 o t J : at u
U. Co
C
,Adu
lt W
ork
Adul
t Ll
tera
Lite
n
Pove
Sche
C
ash
I Sc
he
Trin
e
Dist
a E
Urba
i
Hou
s Si
re
Fern
s
\Sch
o A
tten
1981 1991 7987 7997 1981 1991 1981 1991 7987 1991 1981 7997 1981 7997 1981 7997 1981 7997 1981 7997 1981 7997 7987 7997 Andhra 48.9 56.2 31.3 41.6 50.5 50.8 43.0 49.2 18.5 24.8 43.0 21.2 15.0 15.9 6.4 15.9 77.6 92.3 228 26.1 5.0 4.8 1.7 1.4 Pradesh 8.1 7.1 11.4 9 5 70.3 72.7 70.2 8 9 70.8 77.7 3.5 6.5 3.5 3.7 5.7 3.7 74.2 77.0 17.8 44.7 0.4 0.5 0.3 6 2 Arunactial - 46.6 - 35.6 - 85.7 - 47 7 - 22.1 - - - 0 5 - 654 - 42.6 - 10.1 - 4.9 - 1.3 Pradesh 51.1 6 8 3.2 8.0 7.4 - 0.4 79.3 20.7 9.2 0.5 0 2 Assam 50.6 - 43.9 - 37.7 - 59 7 - 36.7 • 33.7 - 7.3 - 16.9 - 82.4 - 10.2 - 5.8 - 1.2
7.6 7.5 76.7 7.3 7.8 5.5 3 7 77.5 72.9 7.0 04 0.0 Bihar 44.1 42.5 21.4 25.9 19.9 26.3 45.1 48.6 13.2 17.1 58.7 52.2 14.9 13.8 6.9 10.7 52.5 71.9 12.6 15.7 6.1 6.1 2.2 1.7
7.6 9 2 6 6 8 5 9.9 74.2 8.3 9.4 4.5 6.6 5 8 0.7 5.4 5 9 74.5 78.4 72 6 73.0 77.7 76.2 0.6 0.6 0.4 0.2 Gujarat 59.8 62.5 44.2 51.5 33.4 40.4 57.5 67.5 30.2 40.2 42.8 26.9 6.7 7.3 17.6 18.0 87.6 968 26.4 31.0 5.7 5.4 1.4 1.2
6.3 5.9 102 8 8 72.7 74.0 74.7 70.5 9.7 73.9 74.4 70.0 3.7 3.2 25.9 26.2 9.2 2.9 75.9 769 0.4 0.5 0.3 0 2 Haryana 58.8 66.4 334 53.5 17.0 16.4 52.2 64 2 20.7 31.3 14.2 14.9 18.9 19.8 0.0 0.0 66.9 91.9 21.4 238 6.5 6.3 1.8 1.3
7.6 5.9 8.1 8.9 7.3 7.5 9.4 8 3 6.3 8.3 2.5 5.0 3.3 3.5 0.0 0 0 70 6 6.8 8.2 9.2 0.3 0.5 0.3 0.7 Kamataka 52 9 62.3 36.9 51.4 40.2 44.9 57.1 62.7 25.5 36.3 40 3 28.5 15.4 16.6 5.1 4.7 64.2 88 8 25.4 26.5 58 5.5 1.5 1.2
7.6 8.8 70.5 77 9 9 3 8.7 9.2 70.2 73.0 73.8 6.0 8.7 4.8 5.0 3.7 3.7 704 8 5 72.4 75.4 0.4 0.6 0.2 0.7 Kerala 73.4 85.4 69.4 85.4 28.8 23.6 78.2 91.8 59.7 82.3 49 1 32.6 10.2 9.8 2.9 2.2 86.6 98.8 16.8 23.4 5.7 5.3 11 1.0
14.9 2.9 20.1 3.5 8.6 7.7 74.5 4.7 20 7 7.3 6.9 7.7 4.8 3.7 4.6 4.5 76 6 7.7 70.4 75.2 0.4 0.5 0.3 0.0 Maharashtra 63.3 66.3 46.4 55.2 50.4 55.6 64.7 71.1 30.7 40.2 60.4 40.7 7.1 11.8 9.9 10.0 82.7 92.9 26.0 27.5 5.4 5.2 1.4 1.3
8.5 8.5 12.7 74.7 77.8 77.7 7.7 8.7 77.5 73.7 4 0 8.6 3.6 4.7 70.0 70.8 72.5 7.3 78.9 79.4 0.3 0.4 0 ^ 0.4 Madhya 45.2 52.1 22 2 36.7 43.8 47.4 46.6 54 6 16.1 21.7 50.3 37.2 14.4 15.3 20.9 21.5 45.4 74.5 19.7 22.5 5.7 5.7 2.4 1.5 Pradesh 9.7 8 2 9.2 70.3 768 0.3 77.7 77 0 8.6 9.4 70.5 8.8 6.0 5.7 20.4 20.2 70.7 70.7 75.3 75.3 0 4 0.6 7.9 0.3 Orissa 53.1 55.6 304 40.7 32.9 35.1 53.6 59.0 18.9 26.0 72.0 555 14.4 15.4 27.8 27.5 55.6 71.2 11.6 12.9 5.2 f 2 1.8 1.4
12.4 8.5 9 2 70 8 15.4 769 12.2 73.3 9.3 72.7 74.7 73.3 4.0 4.0 20.2 20 0 8.5 9.6 6.7 7.4 0.5 0.4 0.4 0.2 Contd. ST
3 a.
oo

© NIEPA
Scho
ol
danc
e
% o danc
e
Fem
ale
Part
n
Mal
e
Fem
ale
dule
d
«0 dule
d
8 c Sc
hool
nisa
tion
ehol
d
.5=
danc
e
Mal
e \A
tten
£ 3 Atte
n
\ Ad
ult
Wor
k
Adul
t Li
ters
1 Ute
ri £ Sche
C
ash
ocne
1 Dist
s E
Urba
i
Hou
s \S
ize £ a « c
U. Q <0 ^ 1981 1991 7981 1991 1981 1991 1981 1991 1981 1991 1981 1997 1981 1991 1981 1991 1981 1991 1981 1991 1981 1991 1981 1991
Punjab 62.9 65.6 53.4 59.7 9.2 6.9 50.1 61.2 24.5 42.8 149 11.0 26.7 28.3 0.0 0.0 58:8 90.9 26.7 27.9 6.3 6.0 1.2 1.1
9 6 7.5 11.7 10.1 3.3 2.4 8.7 10.1 27.8 10.0 0.8 2.1 4.3 5.1 0.0 0 0 12.6 5.8 7.5 8.9 0.7 0.0 0.1 0 1
Rajasthan 45.0 50.6 16.3 23.6 33.5 43.2 38.5 49.9 13.5 15.1 40.4 33.9 16.7 17.0 13.8 13.8 51.9 76.2 19.3 20.7 5.9 6.1 3.0 2.3
7.4 6.9 5.4 7.2 11.3 11.7 14.9 9.2 10.7 5.9 19.2 11.6 4.9 5.1 17.9 18.4 11.9 12.6 10.1 9.8 0.5 0.7 0.8 0.7 Tamilnadu 65.2 73.4 50.6 6.2 37.4 43.7 65.8 70.1 35.2 43.7 48.7 40.7 17.0 18.6 1.1 1.0 78.5 91.6 32.3 32.2 4.8 4.5 1.3 1.1
7.9 4.1 7J.8 6.2 17.7 12.3 10.5 8.8 13.7 12.8 4.4 10.7 6.3 5.4 . 1 2 1.1 6.8 5.1 21.6 79.9 0.3 0.5 0.2 0.7
Uttar Pradesh 47.1 46.7 23.7 30.1 16.9 24.2 47.2 55 1 16.8 21.3 41.9 32.4 20.5 21.2 0.5 0.4 435 63.3 17.8 19.1 5 7 6 1 2.2 1.7
11.5 70.6 11.S 11.8 20.2 19.8 11.8 11.9 14.5 5.6 1.3 12.1 5.7 5.6 1.6 1.3 14.3 15.1 72.3 14.8 0.6 0.6 0.6 0.3 West Bengal 49.6 48.9 37.8 41.1 14.5 19.2 576 64.3 30.7 38.7 63.4 41.8 23.1 24.8 6.9 6.7 64.7 80.4 23.2 251 5 6 5.4 1.4 1.2
11.2 10.1 12.1 10.8 9 7 71.8 11.5 11.4 13.7 14.6 5.7 9:7 10.3 •70.8 6.7 6.4 13.8 10.6 24.0 23.4 0.2 0.5 0.3 0.7
Note: Variable means are unweighted. Standard Deviations are given in italics (second line)

© NIEPA
Usha Jaichandran 185
robust estimates of standard errors2. Compared with ordinary standard errors, these are more robust to failure to meet assumptions concerning normality and homogeneity of variance of the residuals.
District-specific effects a,, can be thought of in two different ways - fixed effects or random effects. In the fixed effects model, the individual effect is ad, which is taken to be exogenous and constant over time, t, and to vary across districts. This is equivalent to taking "first differences" and proceeding with OLS estimation.
In the random effects model, the district specific effect is modelled as an additional time invariant error term for each district i.e., this model specifies ad as group specific disturbances. So we have now a composite error term (a d + e d t ) . The estimation technique used will be Generalised Least Squares (GLS) with the error term having a particular covariance structure. The random effects model assumes that the district-specific random error is uncorrected with the other explanatory variables, which may not be the case.
Before attempting panel estimates, we present cross-section regressions for 1981 and 1991 separately.
Main Results
Socio-economic Determinants of School Attendance
The main results are presented in Table 3 below. Let us begin first by studying the individual cross-sectional results for 1981 and 1991 regressions with robust standard errors. In Table 3, columns (1) & (2) report regression estimates for 1991 and columns (3) and (4) for 1981.
First, looking at the results for 1981, we find that three-fourths of the variation in male and female school attendance across districts is accounted for by the explanatory variables. For 1991, 81 per cent of the variation in male school attendance and 87 per cent of the variation in female school attendance is accounted for by the explanatory variables.
2 The statistical programme used for the econometric analysis is STATA 6.0.

© NIEPA
186 Socio-Economic Determinants of School Attendance in India
TABLE 3 School Attendance (5-14 years) in India: Main Results (1991 &1981)
1991: OLS 1991: OLS 1981.0LS 1981.0LS Male School Female School Male School Female School Attendance Attendance Attendance Attendance
Constant 8.9 3.0 29.4 7.2 (1.9) (0.6) (4.5)** (0.7) 4.6 5.2 6.5 10.5
Adult Female 0.2 0.1 0.1 -0.04 work- force (5.4)** (2.9)** (1.9)* (1.0) participation 0.03 0.03 0.03 0.04 Adult Female 0.1 0.6 0.1 0.4 Literacy (1.9) (10.2)** (1.6) (2.1)*
0.1 0.1 0.1 0.2 Adult Male 0.7 0.4 0.6 0.6 Literacy (11.6)** (6.2)** (4.5)** (3.6)**
0.1 0.1 0.13 o.r Poverty -0.1 -0.1 -0.2 -0.2
(5.0)** (4.2)** (2.7)** (2.9)** 0.03 0.03 0.1 0.1
Scheduled Castes 0.1 0.2 -0.1 -0.04 (1.6) (2.6)* (1.5) (0.5) 0.1 0.1 0.1 0.1
Scheduled Tribes -0.03 0.04 0.04 0.1 (0.8) (1.3) (0.7) (2.3)* 0.03 0.03 0.1 0.1
School 0.1 0.1 0.04 0.2 Accessibility (5.2)** (4.9)** (1.4) (3.7)**
0.02 0.02 0.03 0.04 Urbanisation 0.02 -0.02 -0.04 -0.01
(0.8) (0.8) (1.1) (0.2) 0.02 0.03 0.04 O.J
Household Size -1.1 -2.4 -0.9 -2.7 (1.9) (3.9)** (1.1) (1.8) 0.6 0.6 0.9 1.3
R 2 0.81 0.87 0.73 0.76 F ( n l , n 2 ) 213.7 311.43 62.44 106.48 (p-value) (0.00) (0.00) (0.00) (0.00) Sample Size 363 363 296 296 Note: Absolute t-ratios in parentheses. Robust standard errors in italic. * significant at 5% level, ** significant at 1% level
Adult female work-force participation turns out to have a positive and highly significant effect on school attendance, both male and female, in 1991, and also on male attendance in 1981 (the coefficient for female school attendance in 1981

© NIEPA
Usha Jaichandran 187
is not significant). This is an important finding, possibly reflecting the fact that higher rates of work-force .participation by women give them greater bargaining power in household decisions; since women can be expected to be more concerned about the education of their children; this could in turn enhance school participation by the children. In other words, women labour force participation could enhance their influence on schooling decisions making them less male centred3.
Another important line of interpretation builds on the notion that adult female work-force participation can be taken as not just an indicator of productive employment but also of the role of women in society and public life. Given the social effects of this variable, its positive association with school attendance could imply higher participation of women in social issues including the effective functioning of community schools leading to higher participation rates in education. Thus, we not only have a household level argument for the positive effects of adult female labour-force participation on schooling, but also a social argument.
Although the precise links here are not obvious, it can be argued that higher labour-force participation by women could lead to their more active participation in society and local politics. If schools can be considered a local public good, then, the quality of schooling would be dependent on local politics and the extent of monitoring by parents. If women have a say not only within the household but also in public life, it can have important implications for the effective working of the schooling system including enhancing effects on the availability of schooling facilities, the quality of schooling and ultimately school attendance. To be able to capture such important social effects, it becomes important to work with a level of aggregation higher than the household level. This is one of the motivating factors of the district level study carried out here.
Another line of argument here could be in terms of the economic returns to female education. A high level of female labour force participation raises the economic returns to female education. If there exist higher work opportunities for adult women, educating girls now could mean higher incomes, such a line of argument though does not apply to male school attendance.
For male school attendance, the coefficient for adult male literacy is positive and highly significant while adult female literacy does not have a significant coefficient both in 1981 and 1991. Female school attendance is seen to be positively related to both adult male and female literacy in both the years with the coefficients for both adult male and female literacy highly significant. Hence, we
3 In the case of female school attendance, there is also an effect in the opposite direction: when adult women work outside the household, daughters (especially elder daughters) are often expected to stay at home to look after younger siblings and do household chores. This may be the reason why the positive effect of female labour-force participation on school attendance is larger for males than for females (in fact, for females the effect is negative, though not significant, in 1981).

© NIEPA
188 Socio-Economic Determinants of School Attendance in India
can infer that if parents are literate, they are more inclined towards sending their children to school, thus, leading to high levels of school attendance.
What is interesting to note here is that in the case of the male child, adult male literacy has a higher effect on school attendance compared to adult female literacy. And for the female child, adult female literacy has a larger effect on school attendance as compared to adult male literacy. Thus, the effect of adult literacy on school attendance in the 5-14 age group is much stronger for a given sex than across sexes. Literate parents care more about the education of children of their sex, an interesting finding which suggests that higher adult female literacy could lead to an advantage within the household for the girl child. Educated women are better able to understand the ramifications of being educated. With the same bargaining power, there is a change in preferences of adult literate women, encouraging school attendance of their female children. This within-sex group effect is true both for 1981 and 1991.
One important qualification that needs to be mentioned here is that any omitted variables that specifically promote adult male and female literacy would tend to increase the effect of these variables on school attendance. This could in turn lead to an upward bias in the effect of adult male and female literacy on school attendance. Large rates of male and female school attendance could thus be a consequence of spurious correlations and adult literacy, on its own, may not have such a large effect.
Poverty has a negative and significant effect on male and female school attendance rates in 1981 and 1991. This indicates that the effect of poverty on participation in schooling at the elementary level is significant and poverty does have a retarding effect on the same. For 1991, the negative and significant coefficient for poverty implies that a rise of one percentage point in poverty leads to a fall of 0.13 percentage points in male and female school attendance.
Somewhat surprisingly perhaps, school attendance does not appear to be significantly lower, ceteris paribus, in districts with higher proportions of scheduled castes or scheduled tribes. If anything, it is the other way round in several cases. After controlling for parental literacy, poverty and related circumstances, female school attendance does not seem to be lower among scheduled castes or scheduled tribes than among other groups. This may reflect the influence of various measures aimed at promoting educational opportunities among disadvantaged communities such as incentives for lower caste and tribal children within the schooling system; the running of special schools for children belonging to the scheduled tribes by missionaries (North-East region and certain parts of Bihar) and State Governments (Tribal Development Programme); hiring of teachers specifically for these programmes etc.

© NIEPA
Usha Jaichandran 189
Many norm-based incentives4 to promote education among the scheduled castes and tribes have been put into place by the Central and State Governments such as the provision of a primary school in every habitation with 200 and above for SCs as against 300 and above for non-SC populated habitations. Under the aegis of Operation Blackboard special relaxations have been given to encourage SC/ST teachers in SC/ST habitations and the States have been advised to give higher priority to the selection of blocks which have a high concentration of SCs and STs with the construction of school buildings as a first charge against NREP and RLEGP funds. In addition to reservation of seats, relaxation in age and qualifying marks, scholarships, teacher fellowships and mid-day meals have also been kept aside for children belonging to this group of the population. A l l these could possibly be leading to positive association between school attendance and the caste and tribal factors.
The variable, capturing distance from school {school accessibility), shows a positive sign both for male and female school attendance and it is highly significant in both Census years. This is an important result as it brings out the significant role that school accessibility plays in enhancing participation in education for both boys and girls. It also confirms the belief that parents are more willing to send their children to school if it is closer to their homes. Another supply-side variable, the teacher-pupil ratio, was also introduced in the regression and for both male and female school attendance, it came up with a positive, though insignificant coefficient and was thus dropped from the analysis.
Urbanisation is seen to have a negative impact on school attendance for male and female children in 1981, the coefficient though not being significant for either the male or the female child. For 1991, urbanisation shows a positive effect on male school attendance and a negative effect on female school attendance, though both coefficients are not significant. Taking these results together, there is little evidence of any systematic association between school attendance and urbanisation, after controlling for other relevant variables.
As expected, household size has a negative impact on male and female school attendance with the coefficient being significant for female school attendance in 1991, and close to significance in two other cases. This confirms the a priori expectation that with increase in the family size, the children are kept back at home to tend to various domestic chores. The effect is larger for female school attendance. Female children are needed more at home to carry out various household chores and mind the younger siblings as the family size increases.-
Labour Demand Effects
It is useful to distinguish between two different reasons why female labour participation might vary between different districts. First, there may be variations
4 Aggarwal and Shibou (1994).

© NIEPA
190 Socio-Economic Determinants of School Attendance in India
in labour supply, associated, for instance, with different cultural norms and social practices relating to women's work outside the household. Second, there may be variations in labour demand. The latter would also influence the demand for child labour, and hence, school attendance. For instance, in districts where female labour-force participation is relatively high because of a high demand for labour, one might expect the labour-force participation of children to be relatively high also, with an adverse effect on school attendance rates.
To "control" for the labour demand effect, the female wage rate was added in the school attendance regressions (Appendix 1). Variations in female labour-force participation at a given wage are likely to be driven by variations in labour supply. As it turns out, the results are much the same as in Table 3. In particular, adult female labour-force participation appears with a positive sign and is significant again both for male and female school attendance for 1991, and for male school attendance in 1981.
An interesting difference between the regressions presented in Table 3 and Appendix 1 is that, in the latter case, the "poverty" variable has no significant effect on school attendance. This may be due to the fact that the female wage rate (which has a positive effect on school attendance, as expected) is a better proxy for poverty than the poverty variable itself, bearing in mind that the latter relates to "regions" rather than "districts".
Gender Bias in Schooling
Table 4 presents the regression results for gender bias in schooling. The dependent variable, gender bias in school attendance, has been taken as the ratio of male school attendance rate to female school attendance rate in the 5-14 age group. A positive coefficient in the regression indicates that the relevant variable enhances the gender bias in school attendance; in other words, it boosts male attendance more than female attendance (or reduces male attendance less than female attendance).
The regression results for gender bias show a positive coefficient for adult female work-force participation implying that the higher the adult female workforce participation rate, the lower is the school attendance by girls vis-a-vis boys, although the coefficients are not significant for both the years. The results here are consistent with the findings reported in Table 3, where adult fepiale workforce participation enhances male school attendance more than female school attendance (see also foot note no. 3).

© NIEPA
Usha Jaichandran 191
T A B L E 4 Gender Bias in Schooling
1991: OLS 198LOLS Gender bias in School Gender bias in School
Attendance Attendance Constant 1.8 3.4
(7.9)* (5.9)** 0.22 0.6
Adult female work-force 0.002 0.001 participation (1.8) (0.3)
0.001 0.02 Adult Female Literacy -0.01 -0.01
(3.6)** (1.9)* 0.002 0.01
Adult Male Literacy -0.01 -0.01 (2.21)** (2.8)**
0.003 0.01 Poverty 0.002 0.003
(2.16) (0.8) 0.001 0.004
Scheduled Castes -0.004 -0.01 (2.26) (1.9)* 0.002 0.01
Scheduled Tribes -0.01 -0.01 (3.97) (2.9)** 0.007 0.002
School Accessibility -0.002 -0.01 (1.72) (2.1)* 0.001 0.01
Urban 0.0002 -0.0001 (0.28) (0.01) 0.001 0.01
Household Size 0.09 0.05 (3.63)* (0.8)
0.3 0.7 R 2 0.50 0.22 F ( n l , n 2 ) F(9,353) F(9,286) (p-value) 45.96 39.14
(0.00) (0.00) Sample Size 363 296 Note : Absolute t-ratios in parentheses. Robust standard errors in italic. * significant at 5% level, ** significant at 1% level
There are a few other results of interest. First, parental literacy (both male and female) reduces the gender bias in school attendance. In the case of adult

© NIEPA
192 Socio-Economic Determinants of School Attendance in India
female literacy, this is, as one would expect from the earlier results on the relative strength of same-sex effects and cross-sex effects.5 Second, after controlling for other relevant variables, there seems to be less gender bias in school attendance among scheduled castes and scheduled tribes than among other groups. This is consistent with independent evidence of lower gender bias in general among these communities6. Third, school accessibility also comes up with a negative sign and is significant for 1981, implying that increased accessibility to schools reduces the gender bias in school attendance (i.e. it boosts female school attendance more than male school attendance). This finding, once again, is consistent with the results in Table 3.
Finally, household size shows a positive coefficient, which is significant for 1991. The positive coefficient implies that a larger household size discourages female school attendance more than male attendance, as one would expect in the light of the earlier results and discussion.
Regional Effects
Although not presented here, regional dummies were added in separate regressions to capture region-specific effects on school attendance. For 1981, only the regional dummy for the South shows a positive and significant coefficient for female school attendance with the South leading in school attendance rates. The results for 1991 indicate that regional location does have a strong influence on male and female school attendance even after controlling for other factors. The coefficients for the North, South and Western region Dummy variables come up as positive and highly significant. This implies that school attendance in these regions for both males and females is higher compared to the Eastern region. Also, school attendance rates in South India are distinctively higher than the Northern and Western regions both for boys and girls.
Regional dummies were also added to the gender bias regressions to capture region specific effects. For 1981 and 1991, although the dummy variables for all the regions exhibit positive coefficients, only the dummy variable for the Northern region exhibits a significant coefficient. Thus, belonging to the Northern region leads to lower levels of school attendance for the girl child (visa-vis boys) as compared to the Eastern region. Since for the Southern and Western regions the coefficients are not significant, no valid inferences can be made for school attendance in these regions.
5 In the case of adult male literacy, it may appear that there is a tension here with the earlier results on cross-sex versus same-sex effects. The tension is resolved if we note that these effects were defined in terms of "absolute" impact of female or male school attendance, whereas the sign of the adult-male literacy coefficient in the gender bias regressions depends on whether the "proportionate" impact of adult male literacy on female school attendance is larger or smaller than the proportionate impact on male school attendance. 6 Dreze and Sen (1995), chapter 7, and the literature cited there.

© NIEPA
Usha Jaichandran 193
Panel Analysis - Pooling the 1981 and 1991 Data
The next step is to pool the 1981 and 1991 datasets, allowing for district specific effects and a different intercept in 1991. Table 5 presents the results of the panel analysis. Here, we present the "random effects" results. The fixed effects model does not work too well here as we have only two reference years and it is effectively equivalent to taking first differences which in turn compounds measurement errors in the respective reference years. It is also found that when the district specific effects are taken as fixed, the standard errors of the coefficients increase sharply implying that the coefficients have been estimated with less precision. To be able to apply and test the fixed effects model, the data for 1971 will be added to the dataset in the forthcoming research on the subject.
TABLE 5 Panel Analysis (Random Effects Model) School Attendance in India: Main Results
Panel 1981-91 Male School Attendance Female School Attendance
Constant 21.8 1.8 (5.6)* (0.34)
Adult Female work-force 0.1 0.03 participation (5.6)* (1.2 Adult Female Literacy 0.1 0.4
(4.6)* (10.7)* Adult Male Literacy 0.6 0.5
(16.5)* (13.8)* Poverty -0.1 -0.1
(5.7)* (4.7)* Scheduled Castes 0.1 0.1
(1.1) (1.3) Scheduled Tribes -0.2 0.1
(0.9) (2.4)* School Accessibility 0.1 0.2
(4.5)* (7.9)* Urbanisation 0.03 0.1
(1.1) (0.7) Household Size -0.9 -2.3
(2.0)* (4.1)* 1991 time dummy -5.1 -2.4
(8.8)* (3.6)* R2 (between) 0.82 0.87 Wald, X
2 ( 1 0 ) 1570.6 2467.0 (p-value) (0.00) (0.00) Sample Size 659 659 Note: Absolute z-ratios in parentheses. * significant at 5% level, ** significant at 1% level

© NIEPA
194 Socio-Economic Determinants of School Attendance in India
The random effects model broadly confirms the cross-section findings. For both male and female school attendance, adult male and female literacy have positive and significant effects. Poverty has a negative and significant effect on school attendance both by sexes while school accessibility has a positive and significant effect on school attendance both by males and females. The scheduled tribe effect is positive and significant at the 5 per cent level for female school attendance. Household size comes up negative and significant for school attendance both by boys and girls. Taken together, these results conform to the earlier cross-section findings and give a consistent picture of the relationship between male and female school attendance and these explanatory variables.
Concluding Remarks
Some important lessons and confirmations emerge from the results presented here. First, the results indicate a positive association between adult female work-force participation and school attendance. The coefficient is stable to the inclusion of other variables and also to district effects, suggesting that there is a direct link between adult female work and school attendance both for male and female children. This finding illustrates the crucial role played by women in educating children, specially so, when the women are working as that increases their say in the intra-household decision making process as well as in the society at large
Second, the findings highlight adult (parental) education as an important determinant of schooling at the elementary level. Literate parents are more likely to send their children to school. The interesting finding here is that the same-sex effects are stronger than the cross-sex effects. Higher levels of adult female literacy lead to higher rates of school attendance by the female child and similarly, higher levels of adult male literacy lead to higher rates of school attendance by the male child. This result also suggests that higher adult female literacy could lead to an advantage within the household for the female sex. Educated women are better able to understand the ramifications of being educated and in turn encourage school attendance by their female children. Also, with the same bargaining power, there could be a change in preferences of literate women with more importance being given to education of the female child. As discussed in the text, an important qualification that needs to be kept in mind whilst dealing with adult male and female literacy as explanatory variables is the possibility of an upward bias in the estimated coefficients due to omitted variables.
Third, school accessibility emerges as an important determinant of attendance. In our study, we have included only one supply-side variable and it is possible that it also captures the effect of various other supply-side variables. Paucity of data on more such variables compelled us to restrict ourselves to this single determinant of school accessibility. Teacher-pupil ratios, though included, were dropped from the analysis, as they did not throw up significant regression coefficients. The highly

© NIEPA
Usha Jaichandran 195
significant and positive coefficient for school accessibility reasserts the importance of school infrastructure and its availability in school participation. Along with the various socio-economic determinants that influence decision-making about participation of children in schooling, the supply-side covering all the factors that go into school provisioning is also of importance.
Fourth, the results show that poverty remains an important determinant of male and female school attendance. Poor households can be seen to keep their children from going to school because of their inability to afford the direct costs of schooling such as school fees, study material, transportation costs etc. Incentive measures, specially targeted at poor households to encourage them to send their children to school, are needed to overcome this barrier to school participation.
Fifth, household size exerts a negative influence on female school participation implying that as the family size increases, the proportions of girls attending school decreases. This could be reflecting the fact that with larger numbers of family members, the elder daughters are required to stay home and carry out household chores, look after younger siblings, among other jobs at home.
Sixth, a somewhat unexpected result is that, ceteris paribus, school attendance rates are no lower in districts with higher proportions of scheduled castes and scheduled tribes than in other districts. This could be a consequence of the various legislative and other interventions which are in operation to provide equal educational opportunities to the children belonging to the deprived and backward communities, including many norm-based incentives through the initiatives of the central and state governments and many other such measures.
Seventh, the gender bias results highlight the fact that the gender bias in school attendance tends to decline as parental literacy and school accessibility increase, and to rise with household size. In addition, there is some evidence of lower gender bias in school attendance among scheduled castes and scheduled tribes (after controlling for other socio-economic variables) than among other communities. Regional effects bring out that both in 1981 and 1991, the gender bias in school attendance was particularly high in the Northern region.
Finally, the results of the panel analysis show that the random effects model supports the main findings of the cross-section estimations.
References
Acharya, S (1989), "Agricultural Wages in India: A Disaggregated Analysis", Indian Journal of Agricultural Economics, 44.
Aggarwal, Y and Shibou, S (1994), "Educating Scheduled Castes - A Study of Inter-District and Intra-Caste Differentials", N I E P A , New Delhi.
Colclough, C (1982), "The Impact of Primary Schooling on Development: A Review of the Evidence", World Development, 10.
Dreze, J, Murthi, M and Guio, A - C (1995), " Mortality, Fertility and Gender Bias in India: A District Level Analysis", Discussion Paper, Development Economics Research Programme, S T I C E R D , London School of Economics.

© NIEPA
196 Socio-Economic Determinants of School Attendance in India
Dreze, J and Murthi, M (2000), "Fertility, Education and Development: Further Evidence from India", The Development Economics Discussion Paper Series, S T I C E R D , London School of Economics.
Dreze, J and Saran, M (1993), "Primary Education and Economic Development in China and India: Overview and Two Case Studies", Discussion Paper, Development Economics Research Programme, London School of Economics.
Dreze, J and Sen, A K (1995), "Basic Education as a Political Issue" Journal of Educational Planning and Administration, 9.
—. (1995), Economic Development and Social Opportunity (New Delhi: Oxford University Press).
Dreze, J and Srinivasan, PV (1996), "Poverty in India: Regional Estimates, 1987-8", Working Paper, Centre for Development Economics, Delhi School of Economics.
Duraisamy, P (1988), "An Econometric Analysis of Fertility, Child Schooling and Labour Force Participation of Women in Rural Indian Households" Journal of Quantitative Economics, 4.
Government of India (1986), "Study on Distribution of Infrastructural Facilities in Different Regions and Levels of Urbanisation" Census of India 1981, Occasional Paper 1 of 1986 (New Delhi: Office of the Registrar General).
Government of India (1987), Census of India 1981, Series 1 - Part III-B(i)-B(iv) General Economic Tables, (New Delhi: Office of the Registrar General).
Government of India (1988), Census of India 1981, Series 1 - Part I V - A (iv) Social & Cultural Tables (New Delhi: Office of the Registrar General).
Government of India (1991), Census of India 1991; Selected District-Level Data Available on CD-ROM, Office of the Registrar General, New Delhi.
Green, W H (1997), Econometric Analysis (Prentice Hall). Jain, L R, Sundaram, S and Tendulkar, S D (1998), "Dimensions of Rural Poverty: An
Inter-Regional Profile", Economic and Political Weekly, November (Special Issue) Jayachandran, U (1997), "The Determinants of Primary Education in India", M. Phil
Thesis, Delhi School Of Economics, Delhi. —. (2001), "Understanding School Attendance and Children's Work Participation in
India" Journal of Educational Planning and Administration, 15 (1). Psacharopoulos, G (1985), "Returns to Education: A Further International Update and
Implications", Journal of Human Resources 20 (4) Psacharopoulos, G and Woodhall, M (1985), "Education For Development: An Analysis of
Investment Choices" Oxford University Press for the World Bank. P R O B E Team (1999), "Public Report on Basic Education in India", Oxford University
Press, New Delhi. Rajan, S I and Jaikumar, A (1992), "Impact of Noon-Meal Programme on Primary
Education-An Exploratory Study in Tamilnadu" Economic and Political Weekly, October 24-31.
Sarmah, S (2000), "Agricultural Wages: Trends and Determinants", M. Phil Thesis, Delhi School of Economics, Delhi.
Weiner, M (1991), "The Child and the State in India", Oxford University Press, New Delhi World Bank (1997), "Primary Education in India: Development in Practice" The World
Bank, Washington D . C .

© NIEPA
Usha Jaichandran 197
APPENDIX 1
School Attendance Regressions - Female Wage-rate Included
1991: OLS 1991: OLS 198LOLS 1981 :OLS Male School Female School Male School Female School Attendance Attendance Attendance Attendance
Constant 5.34 -1.31 20.94 -8.81 (0.73) (0.16) (3.00)** (0.81 7.36 8.2 6.97 10.83
Adult female work force 0.21 0.14 0.09 -0.003 participation (4.64)** (2.94)** (2.83)** (0.70)
0.04 0.05 0.03 0.04 Female wage-rate 0.11 0.06 2.14 5.07
(1.46) (0.57) (2.95)** (4.74)** 0.76 0.09 0.72 1.07
Female 15+ Literacy -0.02 0.48 0.12 0.24 (0.31) (5.44)** (1.49) (1.63) 0.08 0.09 0.08 0.15
Male 15 +Literacy 0.74 0.50 0.59 0.58 (8.89)** (5.09)** (4.52)** (4.52)**
0.08 0.09 0.13 0.13 Poverty -0.04 -0.05 -0.12 -0.008
(0.94) (1.03) (1.95)* (0.14) 0.04 0.04 0.06 0.62
Scheduled Castes -0.02 0.07 -0.07 -0.03 (0.13) (0.69) (0.92) (0.34) 0.11 0.09 0.08 0.09
Scheduled Tribes -0.09 -0.02 0.10 0.13 (2.13)* (0.55) (1.64) (1.92)*
0.04 0.04 0.06 0.07 School Accessibility 0.12 0.11 0.01 0.14
(3.12)** (2.57)** (0.46) (3.78)** 0.04 0.04 0.03 0.04
Urbanisation 0.02 -0.01 -0.01 0.10 (0.51)* (0.29) (0.13) (1.69)
0.03 0.04 0.05 0.06 Household Size -1.81 -2.75 -0.71 -3.09
(2.10)* (3.02)** (0.82) (2.53)** 0.86 0.91 0.88 1.22
R 2 0.79 0.87 0.76 0.82 F(n l ,n2) F(10,163)=77. F(10,163)=117. F( 10,228)= F( 10,228)= (p-value) 91 82 82.68 157.87
(0.00) (0.00) (0.00) (0.00) Sample Size 174 174 239 239 Note: Absolute t-ratios in parentheses. Robust standard errors in italic. •significant at 5% level, ** significant at 1% level

© NIEPA
Journal of Educational Planning and Administration Volume X V I I No. 2, April 2003
I N D I A N J O U R N A L O F A G R I C U L T U R A L E C O N O M I C S
(Organ of the Indian Society of Agricultural Economics)
Vol. 57 I O C T O B E R - D E C E M B E R 2002 No. 4
C O N T E N T S
A R T I C L E S
Investment, Agricultural Productivity and Rural Poverty B. C. Roy and in India: A State-Level Analysis
Trends, Random Walks and Structural Breaks in Indian Agriculture
Dairying in Malabar: A Venture of the Landowning based on Women's Work?
R E S E A R C H N O T E S
Land Market Activity: A Framework
Yield Gaps, Constraints and Potential in Cotton Production in North Karnataka - An Econometric Analysis
Economic Evaluation of Agro-Forestry System on Sloping Lands of Nilgiris
Suresh Pal
Madhusudan Ghosh
D. Narayana
R. Vijay
G. M. Gaddi, S. M, Mundinamani and S. A. Patil
Subhash Chand, A. K. Sikka. R. Raghupathy, P. Samraj and C. Henry Virendra Singh, S. P. R. Chaurasia andJ.S.Sharma
An Economic Analysis of Farm Income Distribution on Potato Specialised Farms in Agra District of Uttar Pradesh
R E V I E W A R T I C L E
Land Reforms - A Bus that India Missed Which May Never Come Again
B O O K R E V I E W S * R E V I E W S IN B R I E F * PH.D. T H E S E S I N A G R I C U L T U R A L E C O N O M I C S C O M P L E T E D I N U N I V E R S I T I E S rN INDIA: 2000-2002* I N D E X T O IJAE, V O L . 57,2002*
M.V.Nadkarni
P U B L I C A T I O N S R E C E I V E D *
Annual Subscription Rates
Individual Membership Fee Life Membership Fee Institutional Subscription
Rs. 150.00; £35.00; $63.00. Rs. 1,500; £350.00; $630. Rs. 300.00; £54.00; $ 100.00.
Please address correspondence to the Hon. Secretary & Treasurer, The Indian Society of Agricultural Economics, 46-48, Esplanade Mansions, M.G. Road, Mumbai-400 001 (India).
Telephone: 022-2842542 Fax:091-022-2838790 email: [email protected]

© NIEPA
Journal of Educational Planning and Administration Volume XVII No. 2, April 2003, pp. 199-225
Grants-in-Aid Policies and Practices Towards Secondary Education in Kerala
K . K . George* George Zachariah* N. Ajith Kumar*
Abstract
To examine the Grants-in-Aid policies of the government of Kerala in the broad context of the financing of secondary education in the State, the study is divided into four parts, namely (I) growth in the number of schools and enrolment according to different types of managements with a view to identifying the role of Grants-in-Aid in the development of school education in the State; (II) trends in financing of secondary education and the importance of Grants-in-Aid in the scheme of financing of this segment of school education; (III) evolution of Grants-in-Aid policies and their current status; and (IV) a critical evaluation of these policies as well as the present financial position of secondary school education in the State.
At the outset, it may be pointed out that the pattern of Kerala's school education differs from that in most other states. This makes comparison of Kerala with other states somewhat problematic. In Kerala, primary education consists of Classes I to VI I (Lower Primary - Classes I to IV; Upper Primary - Classes V -VII) as against Classes I-VIII in many states. Till recently, secondary education in Kerala consisted of classes VIII to X as against Classes IX to XII in most other states. The higher (senior) secondary education (Plus 2) was part of the higher education system in the State as Plus 2 classes were offered as pre-degree courses in Arts & Science colleges. With the introduction of Vocational Higher Secondary courses in 19 schools in 1983-84, there was a partial induction of Plus 2 stage of education in the school system. In 1990-91, higher secondary course was introduced in 31 government schools and a new Higher Secondary Directorate was formed. Then onwards, the higher secondary education was gradually de-linked from the higher education system and was brought under the school system. The process of de-linking picked up momentum only in the second half of the nineties and got completed by the 2000-01 admissions. The
" Centre for Socioeconomic & Environmental Studies. 32/2335, Prusanthi Road, Palarivattom. Kochi-682025. Kerala.

© NIEPA
200 Gmnts-in-Aid Policies and /'radices Towards Secondary Education in Kerala
gradual shifting of the higher secondary courses from the colleges to the schools, spread over a period of a decade, has created some problems in the comparative analysis of expenditure on secondary education over the years. In this paper, the secondary education includes classes VII I to X unless otherwise specified. Wherever data is available for higher secondary education and vocational higher secondary education, it is reported separately.
The pre-eminent position of Kerala in educational development dates back to the second half of the 19th century itself. As may be seen from Table 1, both during the British and the post-independence period, the literacy levels in the three erstwhile constituent units of Kerala - the princely states of Travancore and Cochin and the Malabar district of Madras Presidency- remained much higher than that at the national level1.
TABLE 1 Literacy Rates in Travancore and Other Selected Regions in India
(1875-1951) (per cent)
Area 1891 1901 1911 1921 1931 1941 1951 Travancore State 11.0 12.4 15.0 24.2 23.9 47.1 46.7 Cochin State 18.0 13.4 15.1 18.5 28.2 41.0 43.7* Malabar Dist. 9.1 10.1 11.1 12.7 14.4 N A 30.9 Madras Presidency 6.3 7.5 8.6 9.3 13.0 NA 19.3 All India 5.8 5.3 5.9 7.1 9.5 15.1 16.6
NA = Not available * Persons aged 7 years and above Source: A.Abdul Salim and P.R.Gopinathan Nair, (2002), p.53.
At the turn of the twentieth century, there was at least one government primary school in every village of Travancore. Including institutions under private agencies, there was on an average one school for 1.9 sq. miles and for 792 inhabitants.
School Education in Kerala Since its Formation
Educational development in Kerala acquired further momentum during the post-independence period especially after 1956, when the state of Kerala was formed, following the linguistic reorganisation of states in the country. In 1956, there were 762 High Schools, 1589 Upper Primary Schools and 6699 Lower Primary Schools in the State. Their number rose to 2596, 2966 and 6748 respectively by 2000-2001. Index of growth (base year 1956) for the year 2000-01 stood at 341 for High Schools, 187 for Upper Primary Schools and 101 for Lower Primary
1 For the historical account of Kerala's educational development, we have relied heavily on P.R.Gopinathan Nair, (1981and 1989) A.Abdul Salim and P.R.Gopinathan Nair, (2002) and K.V. Capon (1985).

© NIEPA
K.K. George. George /uchariah and S Ajith Kumar 201
Schools. The fact that the number of Lower Primary Schools has not increased much during this period only shows that the State had reasonably adequate number of Lower Primary Schools even at the formation of the State.
TABLE 2 Growth of Schools in Kerala
Year Number of Schools in Kerala Index of Growth (Base 1956=100) HS UPS LPS Total HS UPS LPS Total
1956 762 1589 6699 9050 100 100 100 100 1961-62 895 1932 6706 9533 117 122 100 105 1970-71 1384 2543 6895 10822 182 160 103 120 1980-81 1976 2753 6861 11590 259 173 102 128 1990-91 2452 2915 6767 12134 322 183 101 134 2000-01 2596 2966 6748 12310 341 187 101- 136 Sources: For the year 1956, Statistics Since Independence, Department of Economics & Statistics,
Government of Kerala, 1998. For other years, Economic Review, 2000 and 2001 and Educational Statistics-1999, Directorate of Public Instruction, Government of Kerala
In 1998-99, there was a High School for every 11,257 people in Kerala, an Upper Primary School for 9811 people and a Lower Primary School for 4308 people. On an average, there existed 0.67 High School, 0.76 Upper Primary School and 1.74 Lower Primary School per 10 Sq.Km. area.
TABLE 3 Growth in Enrolment in Schools in Kerala
(Enrolment in lakhs) Year Enrolment Index of Growth (Base 1956-57=100)
HS UPS LPS Total HS UPS LPS Total 1956-57 3.56 5.03 18.50 27.09 100 100 100 100 1965-66 6.15 ltf.32 25.21 41.68 173 205 136 154 1970-71 7.25 12.67 28.08 48 204 252 152 177 1975-76 9.08 17.96 26.71 53.75 255 357 144 198 1980-81 13.14 16.94 25.94 56.02 369 337 140 207 1985-86 13.43 17.77 25.95 57.15 377 353 140 211 1990-91 14.99 19.21 24.66 58.86 421 382 133 217 1995-96 16.17 18.13 21.78 56.08 454 360 118 207 2000-01 16.12 17.05 19.32 52.49 453 339 104 194 Sources: Same as in Table 2.
An analysis of the figures relating to the enrolment of schools in Kerala given in Table 3 shows that the index of enrolment in secondary schools has increased to 453 in 2000-01 (Base 1956-57 =100). In the Upper Primary Schools, the index showed an increase to 339 and in the Lower Primary Schools, the index of enrolment increased only to 104. The table shows declining trends

© NIEPA
202 Gnmts-in-AU Policies and Practices Towards Secondary Education in Kerala
in enrolment at all levels in the recent period. These declining trends in enrolment are reflections of the declining birth rates in the State from the seventies.
The Tables 2 and 3 show that the rate of increase in enrolment was higher than that of number of schools; and that the expansion in terms of the number of schools and in enrolment in the post-independence period was the largest in the secondary school sector.
TABLE 4 Share in Enrolment in Classes 1X11 by Types of Management of Schools
as on 30 September 1993
(Figures in percentage) State Government Aided Unaided Local Bodies Total Andhra Pradesh 8.7 11.1 11.8 68.3 100.0 Arunachal Pradesh 95.7 3.1 1.0 0.3 100.0 Assam 92.1 2.8 1.3 3.9 100.0 Bihar 95.8 2.3 1.6 0.3 100.0 Goa 32.7 64.4 2.9 0.0 100.0 Gujarat 1.2 22.9 10.3 65.5 100.0 Haryana 84.6 6.2 8.6 0.6 100.0 Himachal Pradesh 92.5 1.8 5.2 0.5 100.0 Jammu & Kashmir 88.7 3.0 8.4 0.0 100.0 Karnataka 68.6 19.5 11.1 0.8 100.0 Kerala 38.6 57.4 3.1 0.8 100.0 Madhya Pradesh 78.6 4.2 14.3 3.0 100.0 Maharashtra 1.6 37.6 8.0 52.8 100.0 Manipur 48.9 13.2 37.9 0.0 100.0 Meghalaya 9.0 47.0 8.5 35.5 100.0 Mizoram 77.2 15.5 6.3 1.0 100.0 Nagaland 59.7 19.9 16.3 4.2 100.0 Orissa 80.5 10.0 4.4 5.2 100.0 Punjab 84.2 9.3 6.0 0.5 100.0 Rajasthan 61.3 544.2 13.9 19.6 100.0 Sikkim 93.8 4.0 1.9 0.3 100.0 Tamil Nadu 24.4 32.5 3.7 39.4 100.0 Tripura 78.8 5.5 0.4 15.3 100.0 Uttar Pradesh 3.7 22.2 18.9 55.2 100.0 West Bengal 5.8 34.6 0.8 58.8 100.0 Delhi 34.1 8.2 21.7 36.0 100.0 All India* 38.2 20.0 9.2 32.6 100.0
Note: *- Includes Union Territories. Source: Sixth All India Education Survey, Vol. IV, N C E R T , New Delhi, 1999

© NIEPA
K.K. George. George Zachariah and N. Ajith Kumar 203
One of the major reasons for the growth in enrolment was the gradual abolition of fees at all levels. By the time of independence, lower primary education had become almost free. From 1954-55 onwards, the government began to abolish fees in stages, starting at the middle school level. By 1969-70, fee up to standard 10 was abolished. The system of free education was extended to the higher (senior) secondary level (Plus two/pre-degree) in 1991. Thus the school education in Kerala had become totally free, a decade before the dawn of the present century.
The all India distribution of enrolment according to the type of management of schools is as given in Table 4.
The Table reveals that Kerala is second only to Goa in the share of private aided schools in enrolment among the states in the country; and that local bodies play only a limited role in school education in Kerala. Only 136 schools - 18 High Schools, 47 Upper Primary Schools and 71 Lower Primary Schools - were run by the local bodies. They constituted only 1.1 per cent of the total number of schools in the State. These schools are treated as aided schools and are given grants-in-aid.
As per Table 5, during 2000-2001, in Kerala 53.8 per cent of High Schools were in the Private Aided sector as against 63.1 per cent in upper primary category, and 59.8 per cent in the lower primary category.
A notable feature of the management-wise distribution of schools in Kerala was the existence of a surprisingly large number of schools in the unaided category in the early 1950s. Their proportions were 39.9 per cent and 29.7 per cent in the High Schools and Upper Primary Schools respectively while in the Lower Primary Schools their proportion was, however, very low (2.0%) during 1950-51. The number of such schools had gradually decreased by 1980-81 probably because of the liberal grants-in-aid policies of the government including the system of direct payment to the staff. But this trend is gradually changing since the eighties, especially in the High Schools.
The Table further shows that the Private Aided schools cater to about 60 per cent of the students. A vast majority of the teachers in the Kerala schools also belongs to the aided sector. Their proportion was 55.8 per cent in the High School section, 67.7 per cent in the upper primary section and 62.4 per cent in the lower primary section.
These Tables show that the Aided school sector in Kerala enjoys a preeminent position in the number of schools, student enrolment and staff strength.
Table 8 shows the growth of higher secondary schools in Kerala. As noted earlier, the Plus 2 classes were held wholly in Arts and Science Colleges ti l l 1991. The process of transferring these classes to schools was completed only by 2000-01 admissions. Of the total number of Higher Secondary schools in the State, 416 were in the government sector (44.6 per cent), 508 in the private aided sector (54.5 per cent) and eight (0.9 per cent) in the unaided sector.

© NIEPA
204 Grants-in-Aid Policies and Practices Towards Secondary Education in Kerala
i
<u
o en
_s
s
on S3 c o <a a.
oo E
s
o o o o o o © c o d e d o o o o o o
o r— — o w-i CN O CN ( N CN CN
rs oo vo - o oo CN o< Tf <n
O © O ON <n NO NO <n
oo « (N 0> iri >n ON oo r - r~ <•<-> rn r<"> ro
O O O O O O O O O O O O O O O O
f - CN <n O ( N (N
E 55 8 3 8
— | " / " I ON ON r<-> — • —• CN cN ro r<-> r i r"> ro
o o o o o o d © © © ' © © o o o o o o
c-> <n <n ON
£ r r
- oo o n (N ON NO r~~ NO n / i ^ v i
O ON NO CNI ON - ON- 0 0 O N ^ N n n n n
NO NO m oo ON ON
-A o
© o V I © ON
-A © >n 0 0 0 0 ON ON o ON ON ON ON ON o — ' — ' — - CNl
o O
.22
§
o £ o c o o
UJ
o
I 6 a. <u
Q
C3, u
Is < o
^3 |
•§ | •I o
I -
•5 c
o o JS V
V5
<u § 0X1
s «
NO a to H
< *-t - o
OX)
•p o v
B
E
2 a u © © S
JD '£ -w .2 0
on 3 c
5 o.
3 00 U-
o o
§1
o o p © o d d © © d o o o o o
O NO oo ON r i © — CN i n
NO NO NO r - oo </-> </-> «-> «-> i n
m o o o r~ CN — O N NO
t • * • * n ( 1
p p O O p © © © © © O O O O O
o >n o ~ rs'
ON >n
O ON 0O NO ON <n CN ~ - CN CNI NO NO NO NO NO
p r~ NO NO v l V ) « TJ-' f>i n ro ro m
o o o o o d ci o o d o o o o o
O CNI <n d - ri < N
—; O0 ON CN ON od NO «n >n «n
ON oo r-". oo ON ON m n w m
0 0 0 0 ON ON O
o u i o v i o 0 0 0 0 ON ON O ON ON ON ON O
!3 i
t-~ <n CN
.E en
E
©
C5
so

© NIEPA
K.K. George. George Zachariah and V. Ajith Kumar 205
»3
3 C e
3 OD
-2 o
© © o © o © © © © © o o o o o
« O f- N M © © —• <N tN
0 0 CN ^ >c « « vo
r-- —• rn r i od od sd t n m n r<"i
p o o p o o o o o o o o o o o
rr — rN Os ro O ~ - - (N
T t 0 0 O SO
>o — <n ©
p o © © o o
— o
O O © © o o
0 0 <N —• m - ri r^, rt SO
0 0
>o v , I T , u i i n
o r- so d vd I O
- O N - O 0 0 - ~ © 0 0 f l * f ^
so so 0 0 0 0 Os ON p o •/-> ©
p 0 0 0 0 os Os OS os os OS o
1
oo
so so
>/•) r- o

© NIEPA
206 Grants-in-Aid Policies and Practices Towards Secondary Education in Kerala
TABLE 8 Higher Secondary Education in Kerala
Year Number of schools Enrolment Year Higher Secondary
(Plus 2) VHSS* Higher Secondary
(Plus 2) VHSS*
1983-84 — 19 — 570 1990-91 31 NA 1748 8687 1995-96 89 295 10449 31575 1999-00 931 374 133399 40725 *- Vocational Higher Secondary School NA- Not available Source: Economic Review, Government of Kerala, Various Issues.
A recent trend noticed in Kerala is the growth of schools, mostly unaided, following syllabus other than what is prescribed by the state government. In 1998-99, there were 1.71 lakh students in the State studying in schools following CBSE and CICSE curriculum. The number of such schools was 242 in 1998-99. (Figures relating to the number of schools and enrolment given elsewhere in this chapter do not include these figures)
In this section, we propose to take a look at the financing of secondary school sector by the State government. The entire needs of government secondary schools, both revenue and capital, are met directly by the government. The government of Kerala, unlike many other states meets only the recurring revenue expenditure of Private Aided Schools. The government's assistance to the aided schools is by way of direct payment of salaries and pensions to the teaching and non-teaching staff. Grants are also given for maintenance and for meeting the non-salary revenue expenditure. As noted earlier, schools run by local bodies receive grants-in-aid like other schools run by private agencies.
The share of secondary education in the total educational expenditure of the State is presented in Table 9.
Table 9 shows that the allocation to the secondary education has been increasing almost steadily since 1960-61 onwards. The increase was the sharpest in the seventies. Kerala spent one-third of its educational expenditure (revenue account) on secondary education in 2000-01. The increase in the share of secondary education was on account of the comparatively higher growth in the number of secondary schools and enrolment therein as noted in Tables 2 and 3.

© NIEPA
K.K. George. George Zachariah and ,V. Ajith Kumar 207
TABLE 9 Share of Different Sub-sectors in Revenue Expenditure on Education in Kerala
Year Primary Secondary Education Higher Technical Others*** Total Education High Plus2 & Total Education Education**
1960-61 67.3 18.1 18.1 5.3 - 9.2 100.0 1961-62 62.1 168 16.8 6.6 - 146 100.0 1962-63 63.4 18.9 18.9 6.2 - 11 .5 1000 1963-64 60.0 19.0 19.0 6.3 - 14.8 100.0 1964-65 58.9 19.5 19.5 4.4 6.1 1 1 1 100.0 1965-66 60.5 19.6 19.6 4.2 5.1 10.7 100.0 1966-67 57.6 19.1 19.1 7.5 5.1 10.6 100.0 1967-68 59.5 20.9 20.9 5.7 4.3 9.6 100.0 1968-69 61.4 21.0 21.0 5.1 2.9 4.6 100.0 1969-70 59.8 21.2 21.2 5.0 4.1 10.0 100.0 1970-71 58.3 21.3 21.3 7.1 3.8 9.6 100.0 1971-72 57.8 21.5 21.5 7.4 2.8 10.5 100.0 1972-73 59.0 24.1 24.1 12.0 2.8 2.1 100.0 1973-74 56.5 25.6 25.6 13.3 2.8 1.8 100.0 1974-75 58.3 26.1 26.1 1 1 . 0 3.2 1.4 100.0 1975-76 57.7 25.1 25.1 12.3 3.5 1.4 100.0 1976-77 58.0 25.6 25.6 11 .7 3.6 1.1 100.0 1977-78 57.5 25.9 25.9 11 .5 4.1 1.1 100.0 1978-79 56.5 26.9 26.9 11 .2 4.1 1.2 100.0 1979-80 55.9 27.9 27.9 10.6 4.3 1.2 100.0 1980-81 55.1 28.7 28.7 10.7 4.3 1.2 100.0
1981-82 54.4 29.0 29.0 11 .4 4.1 1.1 100.0
1982-83 53.7 29.5 29.5 12.2 3.5 1.0 100.0
1983-84 52.9 29.0 29.0 13.1 3.8 1.1 100.0
1984-85 52.2 29.2 0 . 1 29.4 13.3 4 .0 1.1 100.0
1985-86 51.3 29.6 0.2 29.8 13.0 4.7 1.2 100.0
1986-87 51.9 29.0 0.3 29.3 13.0 4.8 1.1 100.0
1987-88 52.3 28.9 0.2 29.1 13.5 4 .0 1.0 100.0
1988-89 52.8 28.3 0 .2 28.5 13.4 3.6 1.6 100.0 1989-90 51.9 289 0.2 29.1 13.2 4 .0 1.8 100.0
1990-91 52.4 29.5 0.5 29.9 12.2 4.1 1.3 100.0
1991-92 49.9 29.0 0.7 29.6 15.0 4.7 0.8 100.0
1992-93 47.5 29.2 0.6 29.9 17.2 4.7 0.8 100.0 1993-94 46.6 28.9 0 .7 29.7 18.5 4.3 0 .9 100.0
1994-95 49.2 29.5 0.7 30.2 15.8 4.1 0 .7 100.0
1995-96 47.8 30.0 0.8 30.8 15.8 4.2 1.4 100.0
1996-97 50.9 32.4 1.1 33.5 9.7 4.7 1.2 100.0
1997-98 46.9 30.0 1.3 31.3 16.5 4.4 1.0 100.0
1998-99 47.1 29.0 2.2 31.1 16.0 4.2 1.5 100.0
1999-00 48.3 30.4 3.1 33.6 13.2 4 .0 0 .9 100.0
2000-01 46.3 30.4 3.0 33.3 15.0 4.3 1.0 1 0 0 : 0
Source: Up to 1969-70, Economic Review, Government of Kerala, Various Issues. From 1970-71 onwards, Finance Accounts, Government of Kerala, Various Issues.
Note:*- Plus 2- Higher secondary education; VHSS-Vocational higher secondary education. The expenditure under this head does not include the expenditure on pre-degree courses run in Arts & Science Colleges coming under Higher Education.
" I t is likely that the expenditures on technical education in the early sixties have been included against the heads 'higher education' and 'others'.
*** The lower share of 'others' after 1971-72 may be because of the re-classification of 'other expenditure' to other heads.

© NIEPA
208 Grants-in-Aid Policies and Practices Towards Secondary Education in Kerala
Table 10 presents the per pupil cost of secondary education in Kerala.
T A B L E 1 0 Government Expenditure on Secondary Education Per Pupil in Kerala
Year Cost per Pupil Index of Growth (in Rs) (Base year 1970-71 = 100)
1970-71 176 100 1971-72 187 106 1972-73 194 110 1973-74 212 120 1974-75 218 124 1975-76 361 205 1976-77 386 219 1977-78 363 206 1978-79 356 202 1979-80 369 210 1980-81 454 258 1981-82 536 304 1982-83 589 334 1983-84 658 373 1984-85 738 419 1985-86 907 515 1986-87 1043 592 1987-88 1089 618 1988-89 1162 659 1989-90 1248 708 1990-91 1500 851 1991-92 1600 908 1992-93 1761 999 1993-94 2134 1211 1994-95 2518 1428 1995-96 2797 1587 1996-97 3184 1807 1997-98 3450 1957 1998-99 3842 2180 1999-00 4819 2734 Growth Rates 1970-71 to 1979-80 10.06 1980-81 to 1989-90 11.62 1990-91 to 1999-00 12.91 1970-71 to 1999-00 11.33
Source: Economic Review, Government of Kerala, Various Issues * Includes higher secondary education also.
Note: The growth rates are computed using the exponential trend fitting method.

© NIEPA
K.K. George. George /.uchariah and ;V. Ajith Kumar 209
The share of Secondary Schools in enrolment has increased from 10.1 per cent in 1960-61 to 23.4 per cent in 1980-81 and then to 30.7 per cent in 1999-002. It seems that the success of the State in universalising primary education has pushed the demand for secondary and higher levels of education which in turn resulted in an increased allotment for these sectors. As pointed out by the Kerala Education Commission3, students seem to take a smooth transition from the primary level to the secondary level in the State with hardly any drop-outs.
TABLE 11 Per Pupil Expenditure on Secondary Education (1998-99)
State F.xnpnditure. Per Punil Rank Sikkim 35131 1 Goa 16391 2 Puniab 12110 3 TriDura 10276 4 Arunachal Pradesh 9587 5 West Beneal 9580 6 Mizoram 9123 7 ManiDur 8428 8 Raiasthan 8046 9 Meehalava 7902 10 Himachal Pradesh 7763 11 Naealand 7628 12 Guiarat 7563 13 Harvana 7552 14 Jammu & Kashmir 6933 15 Tamil Nadu 6286 16 Maharashtra 5985 17 Uttar Pradesh 5546 18 Delhi 5184 19 Kerala 4659 20 Assam 4158 21 Andhra Pradesh 4084 22 Karnataka 4053 23 Bihar 3331 24 Madhva Pradesh 2817 25 Orissa 2800 26 All India* 5668 Source: Computed from the data on expenditure in Analysis of Budgeted Expenditure on
Education: 1998-99 to 2000-01, Ministry of Human Resource Development, Government of India and data on enrolment in Annual fleporM 999-2000, Ministry of Human Resource Development, Government of India.
2 Computed from Educational Statistics-1999, Directorate of Public Instruction, Government of Kerala 3 Ashok Mitra (Chairman), Report of the Kerala Education Commission, Kerala Sasthra Sahitva Parishat, 1999.

© NIEPA
210 Grants-in-Aid Policies and Practices Towards Secondary Education in Kerala
The cost of secondary education per pupil was Rs. 4819 in 1999-00 as against 3440 for primary education. The index of growth of cost per pupil in secondary education increased to 2734 in 1999-00 (base year 1970-71). The rate of growth in per pupil expenditure was showing a decadal increase since the seventies. Part of the reason for the increase in per pupil cost in the nineties especially after 1995-96 may lie in the shifting of Plus 2 courses from the colleges to the secondary schools. Part of the increase may also be due to the steep increase in salaries following the implementation of the Pay Commission report in 1999-004.
Though the per pupil expenditure on secondary education in Kerala has been increasing steadily, it is much lower than the Al l States average (see Table 11). In this respect, Kerala ranks only 20th among the 26 states in India. Obviously, State's financial provisioning for the sector is not increasing sufficiently to match for the growth in enrolment.
The per pupil assistance provided by government directly to its own secondary schools and private aided secondary schools is presented in Table 12.
TABLE 12 Per Pupil Direct Expenditure on Government and Aided Secondary Schools
Year Government Aided 1980-81 426 405 1981-82 467 452 1982-83 495 518 1983-84 576 609 1984-85 634 675 1985-86 795 766 1986-87 876 908 1987-88 946 970 1988-89 1049 1075 1989-90 1162 1131 1990-91 1388 1445 1991-92 1383 1484 1992-93 1430 1537 1993-94 1791 1850 1994-95 2154 2329 1995-96 2288 2490 1996-97 2551 2791 1997-98 2811 3117 1998-99 3213 3329 1999-00 4330 4764 2000-01 4339 4885
4 See Economic Review- 2000. Government of Kerala.

© NIEPA
KK. George, George Zachariah and N. Ajith Kumar 211
The Table shows that per pupil direct assistance to private aided secondary schools was higher than that of government-run schools. This is rather surprising as the government, unlike in vhe case of aided schools, has the added responsibility to meet the capital expenditure of schools run by it. The higher per pupil assistance to private aided schools may be partly because of the slightly lower pupil-teacher ratio in aided secondary schools. The number of pupils per teacher was 26 in aided high schools as against 27 in government high schools in 1999-2000. However, this phenomenon requires further exploration, as the differences in pupil-teacher ratio alone may not account it.
TABLE 13 Share of Different Sub-Heads in Revenue Expenditure
on Secondary Education in Kerala
Sub-Head 1980-81 to 1985-86 to 1990-91 to 1995-96 to 1984-85 1989-90 1994-95 1999-00
Direction and Administration 5.17 2.23 2.03 1.91 Research and Training 0.00* N 0.07 0.48
Inspection 1.08 1.21 1.12 0.96
Teachers' Training 0.04 0.05 0.02 0.00
Text Books 6.36 6.47 5.48 3.58
Scholarships 0.43 0.56 0.48 0.15
Examinations 0.00* 2.30 1.73 1.47
Govt. Secondary Schools 33.65 34.68 34.99 34.36
Assistance to Private Aided 52.98 52.40 53.85 56.10 Secondary Schools
Assistance to Local Bodies for 0.00** 0.00** 0.16 0.73 Secondary Schools
Other Expenditure 0.29 0.10 0.06 0.21
Total 100.00 100.00 100.00 100.00
Note: *May have been included under other heads ** Prior to 1991-92, no expenditure was shown under this head. The expenditure incurred on
the 18 schools managed by the local bodies was included in the assistance to private aided schools.
N-Negligible
The Table reveals that grants to non-government secondary schools is the largest single head of expenditure under secondary education. Grants account for more than half the expenditure on secondary education. Besides, the share of grants to non-government schools has been increasing. From an average of 52.9

© NIEPA
2 1 2 dmnls-iri-Aid Policies mid I'n.clU <-s I\AU„;IS SeemnLin I ,/„.. ,,III<:; A ,.•<',//.
per cent during the period 1980-81 to 1984-85, the share of assistance to nongovernment schools has increased to 56.1 per cent during the period 1995-96 to 1999-00.
The share of capital expenditure in government's total expenditure on secondary education is abysmally small (See Table 14). In this respect, Kerala, however, is not much different from other states. The share is also coming down. It was just 0.1 per cent both in 1999-2000 and 2000-01.
T A B L E 1 4 Share of Capital Expenditure in Total Expenditure on Secondary Education
Year Revenue Expenditure Capital Expenditure Share of Capital (Rs.) (Rs) Expenditure in Total
Expenditure 1995-96 4334066707 33234503 0.8
1996-97 4934618922 64780398 1.3
1997-98 5383310992 35985045 0.7
1998-99 5970425670 54226078 0.9
1999-00 8579832663 10848928 0.1
2000-01 8568909232 5405651 0.1
By implication, the expenditure on secondary education in the State is mainly used for meeting the recurring revenue expenditure and not for investing in any new infrastructure. Part of the decline in the share of capital expenditure is understandable in view of the declining enrolment in schools. Only very few new schools are being established.
A note of caution is necessary in interpreting the data given in the above Table as there have been changes both in the plan and non-plan categorisation as well as categorisation under different heads over the years. The details of these changes are not spelt out in the budget documents.
Table 15 presents the share of plan expenditure in the total revenue expenditure on secondary education.
The Table reveals that the plan component of the expenditure on secondary schools is very low in Kerala. It is also coming down steeply. While the plan component constituted 8.18 per cent of the total expenditure on secondary education during the first half of the eighties, it was less than one per cent during the fifteen year period beginning with 1985-86.

© NIEPA
K.K. George. George /.aclioriuh and A. Ajitli Kumar 2 I 3
TABLE 15 Share of Plan Expenditure in Total Revenue Expenditure
on Secondary Education in Kerala
1980-81 to 1985-86 to 1990-91 to 1995-96 to 1984-85 1989-90 1994-95 1999-00
Direction and Administration 11.87 0.22 0.00 0.00 Research and Training 0.00* 100.00 100.00 100.00 Inspection 0.00 0.00 0.00 0.00 Teachers' Training 99.24 100.00 100.00 100.00 Text Books 0.00 0.00 0.00 0.00 Scholarships 7.41 32.13 25.07 19.31 Examinations 0.00 0.00 0.00 0.00 Govt. Secondary Schools 11.43 0.42 0.12 0.10 Assistance to Private Aided 6.59 0.08 0.00 0.00 Secondary Schools Assistance to Local Bodies for 0.00** 0.00** 7.46 32.80 Secondary Schools Other Expenditure 50.60 70.60 82.14 88.43
Secondary Education-Total 8.18 0.49 0.31 0.97 Note: *- May have been included under other heads. **- Prior to 1991-92, no expenditure was shown under this head. The expenditure incurred on the
18 schools managed by the local bodies was included in the assistance to private aided schools.
The plan component of assistance to the government schools has been coming down steadily from 11.43 per cent during the first half of the eighties to just 0.42 per cent during the second half. The share went further down to just 0.10 per cent in the second half of the nineties. This is mainly because assistance to the government schools was largely confined to salary and wages, which comes under the non-plan component. Also, the rate of growth in the number of government secondary schools came down especially in the nineties as less number of schools was started during this period.
Since the assistance to aided private schools is confined to meeting the salary and pension of the teaching and non-teaching staff and maintenance expenses, the share of plan expenditure is zero. In this respect, Kerala differs from many other states which provide some plan assistance to aided schools.
The implication of the data given in Table 15 is rather disturbing, as they indicate the decline in fresh investment in secondary education in the State either for quantitative expansion or for quality upgradation.
In Table 16, we examine the share of salary and wages in the expenditure on secondary schools.

© NIEPA
214 Grants-in-Aid Policies and Practices Towards Secondary Education in Kerala
TABLE 16 Share of Salary and Wages in Expenditure on Secondary Education
Share of Salaries and Wages During 1980-81 1985-86 1990-91 1995-96
to to to to 1984-85 1989-90 1994-95 1999-00
Direct expenditure on Government Secondary Schools 95.9 98.7 99.1 99.4 Grants to Private Aided Secondary Schools 99.1 99.2 99.3 99.5 Total Expenditure on Secondary Education 88.2 89.8 91.6 93.1
The share of salary and wages has continuously increased from an average of 88.2 per cent during the period 1980-81 to 1984-85 to 93.1 per cent during the period 1995-96 to 1999-00. The share of salary and wages in the grants to private aided schools was always higher than 99 per cent. In addition to salary and wages, the government meets the maintenance expenses of these schools which formed 0.5 per cent in the total grants provided to the private aided secondary schools during the period 1995-96 to 1999-2000. In the direct expenditure on government secondary schools too, salary and wages constitute the most important component. The share of salary and wages in expenditure on government secondary schools increased from 95.9 per cent in the first half of the eighties to 99.4 per cent in the second half of the nineties, almost at par with private aided schools. Table 16 also has a disturbing implication that very small amounts are made available for meeting expenditure requirements for maintenance or investment or providing other academic inputs.
Higher Secondary Education
The pattern of expenditure on higher secondary education under the Directorate of Higher secondary education is given in Table 17.
TABLE 17 Pattern of Expenditure on Higher Secondary Education
(1998-99 to 2000-01)
Heads 1998-99 1999-00 2000-01 Salary & Wages 84.9 93.5 95.3 Office Expenses 0.3 0.4 0.3 Library & Lab Equipments 11.1 3.4 0.9 Others 3.7 2.8 3.5 Total 100.0 100.0 100.0

© NIEPA
K. K. George, George Zacltariah and N. Ajith Kumar 215
As in the case of secondary education, the share of'salary and wages' in the expenditure on higher secondary education is increasing steadily and has reached 95.3 per cent by 2000-01. The share of library and laboratory equipments shows a steep decline.
The reasons for the predominance of private sector in Kerala's education system are historical. The history of education in Kerala during the last one and a half century shows that it was the non-governmental agencies that had championed the cause of education and had taken initiatives in starting educational institutions of different kinds. Western missionaries, local churches, other local organisations, community organisations and social reformers were in the forefront of educational endeavours in the State. They received ample support from the rulers both during pre-independence and post- independence periods. It is this strong private sector government partnership that has led to the present pre-eminent position of Kerala in school education. It was not merely grants-in-aid, which the rulers offered. Often they made outright donation of government lands, building materials and the funds.
As noted earlier, the present State of Kerala was formed by the integration of Travancore and Cochin in 1949 to form the Travancore-Cochin State and by merging the Malabar district of the erstwhile Madras Presidency with it. Therefore, for tracing the evolution of grants-in-aid policies towards secondary education in the State, one has to follow the developments in the three erstwhile regions separately.
Grants-in-Aid Policies in Travancore
The rulers of Travancore, guided by the British Agents, had shown great enthusiasm in starting schools of their own and supporting schools started by non-government agencies even during the first half of the 19 ,h century. But it was in 1869 that a regular scheme of grants-in-aid to private schools was introduced for the first time, by Dewan Madhava Rao with the purpose of integrating the indigenous schools into the formal system. The schools, which opted for grant-in aid, were to introduce parity with the government schools with respect to course of instruction, books used and qualification of teachers. Twenty private schools were brought under the grants-in-aid scheme by the end of 1869.
In 1871, the Dewan took another important step by opening 'proverti' or village schools. Under the scheme, if the people of a locality were to provide the school building, the government will give a grant depending on the number of pupils. The government also agreed to pay for one master for each school and one inspector for every 14 schools to supervise their proper working. The grant was meant to be used for meeting part of the expenses on teachers' salary. Under the scheme, local support was made a condition for grant and students' strength was made a criterion for fixing the amount of grant.

© NIEPA
216 Grants-in-Aid Policies ami Practices Towards Secondary Education in Kendo
In 1875, the rules regulating grants were declared applicable to all vernacular schools "under whatever management", subject to the following conditions: (i) class should be held upto a stipulated standard; (ii) there should be a minimum of 25 pupi|s; (iii) the amount will be sufficient to cover one half the salary of the teaching staff. In 1887-88, the grants-in-aid scheme was extended to private English medium schools. With a view to helping the poor pupils attending the vernacular schools, the fee structure was rationalized in 1891-92.
In 1893-94, the government offered grants-in-aid to all the indigenous schools. This step gave the government greater control over the schools. The Education Rules and Grant-in-Aid Code provided for salary grants, special grants for buildings, furniture etc. and for the proper and effective inspection of schools. Besides, schools were classified, curricula prescribed, teachers' qualifications specified and rules framed for the proper organisation and management of schools. These reforms brought about unprecedented educational activity in the state. The rules laid down conditions of eligibility for grants-in-aid to private schools. These conditions pertained mainly to curriculum, equipment, teaching personnel etc. In 1904, fees were abolished in all schools for the backward communities and full salary grants were allowed to all private schools run for them. Further, fees in Class I in all government schools were abolished and fees in Classes II and III were reduced.
The Education Code of 1909-10 enforced strictly the rules for grants-in-aid and revised the fee rates. Consequently, a number of private schools withdrew from the field, necessitating the opening of more government schools, adding thereby to the financial burden of the State. In view of the increasing education expenditure, both the Education Expenditure Committee (1920) and the Education Reform Committee (1933) recommended the withdrawal of the government from direct involvement in managing schools. These committees suggested that private initiative, including that of local bodies, be encouraged.
The Travancore Education Code of 1941 also provided for liberal grants-in-aid to recognized schools. Grants included teaching grant, equipment grant and grants to compensate for fee concession. Some of the recommendations of the Education Reorganisation Committee (1945) were directed towards encouraging private participation in school education. The Committee recommended that parity has to be established in the salary and service conditions of private primary school teachers with those of Departmental schools. Another recommendation in this direction was to provide liberal grants to private schools to compensate for loss due to compulsory fee concessions and to make up deficiency of teachers' salary up to 75 per cent if the management remitted all fee collections in the government treasury.

© NIEPA
K A. George. George /.achariah and A. AjUll Kumar 217
Grants-in-Aid Policies in Cochin
It was in 1889 that the first set of rules for providing grants-in-aid to private schools was implemented in Cochin. This gave a big boost to the private and local initiatives in education. The Education Code of 1911 was liberal in approach. It benefited teachers by way of better pay and deserving students by way of enhanced scholarships and higher fee concession. The revised Education Code of 1921 attempted to plug the loopholes in the old code. The government fixed salary scales both for the government and private school teachers. Salary grants to private schools ranged from 50 to 85 per cent. The system of paying general and special grants was also in vogue. Education was made free in the vernacular primary schools. In other schools, half fee concession was given to girl students.
As in Travancore, a time came in Cochin also when the financial crunch was felt consequent on the heavy expenditure on education. The Education Survey Committee (1933) was appointed to go into the problem. The Committee, like its counterpart in Travancore, recommended that private agencies be further encouraged in the educational sector considering its cost advantage to the government. The Committee revised the rates of grants-in-aid in such a way as to make it incumbent on the private managements to meet one-fourth of the cost of staff. The Committee suggested that the State's expenditure on education should be around 20 per cent of the revenue of the State.
Financing Education in the Malabar District of Madras Presidency
According to the grants-in-aid rules of 1864-65, salary and other grants were given only to those private schools which collected fees from three-fourth of the students at the rate stipulated by the State. Another system of grants namely, Result Grant System was introduced in 1867, according to which, grant was given on the basis of school attendance of pupils (at least for 15 days per month). The grant-in-aid code was revised several times. To become eligible for grants, schools had to collect fees from students at stipulated rates, appoint teachers with prescribed qualification and ensure a certain percentage of students' attendance. As these conditions were difficult to fulfil during those days, most of the schools could not avail themselves of grant-in-aid. When payment of fees was insisted upon, many parents withdrew their children from schools. On account of the difficulty in complying with the rules regarding Result Grants and staff qualifications, many managers withdrew from the field. The results of the reforms were just the opposite of what was intended. In 1899, the government introduced the Fixed Grant System. Under the system, a specific amount of aid was fixed for three years to the school which satisfied the conditions of registration. The grant-in-aid code was revised several times incorporating new conditions for aid.

© NIEPA
218 Grants-in-A id Policies and Practices Towards Secondary tAucation in Kerala
The constitution of Local Fund Boards, with the passing of the Local Fund Act in 1871, was an innovation in the field of educational financing in Malabar. Til l 1909, educational institutions run by local bodies were treated just like private schools and aid given under the grant-in-aid code. From 1906, subsidies were sanctioned to local bodies. But as no general principle was laid down for this purpose, sanctioning of subsidy was arbitrarily done and the system did not work satisfactorily. Following complaints about improper implementation of the reform, the Act was revised several times and ultimately withdrawn in 1908.
In 1920, the Government of Madras passed the Madras Local Boards Act (later renamed as Madras District Board Act) and the Elementary Education Act. By the latter, an Elementary Education Fund was constituted for each local authority in every district. The sources of the fund were government grant, tax levied under the Act, fines and penalty levied within the district, fees collected in the elementary schools managed by such authority etc. The education tax, levied under the Act in the District Board areas, was linked to land revenue and it was around 10.7 per cent of the land revenue collected. In the municipal areas, education tax was levied as a surcharge on property tax, the rate of which varied from municipality to municipality. Government grants for primary education were fixed with reference to the proceeds of the education tax collected by the local bodies. But in 1941, the Elementary Education Act was amended and the government no longer was obliged to make a contribution based on taxation every year. Instead, the government started giving a fixed grant every year to local bodies. In Malabar, State grants played only a minor role in financing primary education.
Consequent on the enactment of the Madras District Boards Act of 1920, the Malabar District Board, with responsibilities in the field of education, was established in the same year. At first, it had the charge of secondary education in the non-municipal areas. The municipalities had their own secondary schools in their areas. The Taluk Boards started in 1884 had been running several schools in the non-municipal areas. They received finance from government grants, fees, land cess, profession tax and entertainment tax. The secondary schools under the Taluk Board were taken over by the District Board in 1923. The District Board and the municipalities received grants or subsidies from government. Besides, the Board collected education tax as surcharge on land tax, surcharge on profession tax and several other levies. Though there were many local taxes, fees and other sources of income, a large part of the education expenditure of the District Board and Municipalities was met from grants or subsidies of the government.
Thus, it is observed that in Malabar District, private enterprise, government's direct effort (to a very limited extent), different types of government grants and local boards were the major sources of the educational finance since the latter half of the 19th century. Local bodies were given the principal responsibility for

© NIEPA
K. K. George. George Zachariah and N. Ajith Kumar 219
mass education in Malabar. These bodies - District Boards, Panchayats and Municipalities - levied different kinds of local cess towards educational financing. Al l the schools run by the District Board and Municipalities were taken over by the government after the formation of the present State of Kerala in 1956. The District Board was abolished when panchayats were constituted under the Kerala Panchayat Act of 1960.
Grants-in-Aid in Travancore Cochin State
Following the formation of the Travancore Cochin State in July 1949, unification of grant-in-aid and education codes became necessary. A landmark in the history of school education in Kerala was the introduction of the Private Secondary School Scheme (PSS) in 1950. The Scheme was intended to offer better service conditions to teachers and ensure efficient running of private schools. According to this scheme, eighty per cent of the fees collected was to be remitted in the treasury and the balance to be retained by the management to meet the contingent and other expenses. The government would pay the salary of the teachers directly. The scheme also provided for a contributory provident fund. The managements could appoint teachers only from a list prepared by the government. Many managers viewed some of the above provisions as an attempt to infringe on their rights and freedom in running the schools. They also felt that 20 per cent of the fees collected set apart for the managements was quiet inadequate to meet the expenditure on maintenance, equipment, payment to non-teaching staff etc. As a consequence of the objections from the private managements, the scheme was diluted by deleting some of the regulatory provisions. The Private Secondary School (PSS) Scheme of 1950 brought additional burden on the State. Further, when fee was abolished in middle schools, the private managers were to be compensated for the loss of their revenue.
Kerala Education Bill of 1957
Another landmark in the history of school education in Kerala was the introduction of the Kerala Education Bill in 1957. Apart from unifying the educational codes of Travancore Cochin and Malabar, the bill was intended to eliminate under-payment of salaries to teachers and to prevent corruption and nepotism in the appointments in private schools. The bill also had provision for better service security to the teachers. A very important provision of the bill pertained to direct payment of salary to the teaching staff in aided schools. The bill also imposed restrictions on the rights of the management in making appointment. The bill , therefore, invited wide protests from the managements and the communal pressure groups. However, the bill was passed and a slightly modified version of it got presidential assent in February 1959. On account of

© NIEPA
220 Grants-in-Aid Policies and Practices Towards Secondary Education in Kerala
this bill as weli as other socio-poiiticai developments, the communist ministry, which enacted the bill, was thrown out in July 1959. The next government yielded to the pressure of the school managements and amended certain sections of the Education Bill particularly those relating to the appointment of teachers in the aided schools. The result is that the private managements are now free to appoint anyone with the minimum qualification as a teacher overlooking the relative merits of the applicants.
The financial burden on State exchequer on account of direct payment to private school staff has become prohibitive. The government spent Rs. 443 crores on the salary of private aided school staff in 2001.
Grants-in-Aid Policy - The Present Position
According to the grants-in-aid policy prevailing at present, the salaries and pensions of teaching and non-teaching staff are paid by the government directly without routing them through the school managements. There is no difference in the grants-in-aid policy towards different levels of schools, viz. primary, upper primary, secondary and higher secondary schools. For that matter, there is not much of a difference in the grants-in-aid policy towards schools and colleges except that the tuition fees collected by the latter are to be remitted to the treasury. The only difference between the government schools and the private aided schools, as far as the financial commitment of the State government is concerned, is with respect to capital expenditure. For government schools, the government has the additional responsibility of meeting the capital expenditure needs.
Decentralised Planning
Since the introduction of decentralized planning in 1996, maintenance and development activities of government schools have become the direct responsibility of local bodies. Under the three-tier system of local administration, Upper Primary Schools, High Schools and Higher Secondary Schools come under the control of the District Panchayats. Village Panchayats control the Lower Primary Schools. In the Municipal and Corporation areas, government schools at all levels are controlled by the concerned local body. For maintenance, construction etc. the required funds are routed through the local bodies by the government. In addition, the local body can utilise a portion of the unassigned grants received from the State government and their own resources for development of schools.
Maintenance Grants to Private Aided Schools
In addition to paying the salary of the teachers and non-teaching staff, the government provides maintenance grant to the aided schools on the basis of the

© NIEPA
K.K. George. George Zachariah and N. Ajilh Kumar 221
number of children enrolled. Presently, the managers are given maintenance grant of Rs. 3.25 per student for lower primary and upper primary (up to Class VII) and Rs. 5 for secondary classes per annum. The maintenance grant is paid to the manager of the aided school for the following purposes:
• Petty construction and repairs and annual maintenance of school building including compound walls, gates, wells, school premises, play grounds and replacement of tube lights and other electrical fittings.
• Purchase of educational appliances such as globes, maps, charts, apparatus for teaching geography and allied subjects and instruments of mathematical drawing.
• Repairs to furniture and its replacement. • Office expenses and miscellaneous stationery, postage and telegraph
charges. • Contingencies for purchase of chalk, dusters, cleaning materials, buckets,
ropes, registers, forms etc. • Purchase of books and periodicals relating to education other than books
of school library. . • Raw materials for craft education. • Kindergarten and sewing appliances. • Water charges and expenditure on gardening. • Electricity charges. • Travelling allowances to the staff of the school for journeys to the
Government Treasury for remittance of fee collections and encashment of salary bills.
Discussions with the private aided school managers revealed that the present rate of maintenance grant (Rs 5/- per pupil) fixed as early as in 1979 is hardly sufficient to meet the maintenance expenses of these schools. They are disbursed after much delay. In view of the smallness of the amount and the high transaction costs in getting it, many managers do not make an attempt to get these grants.
Special Fees
The special fees collected from the students is yet another source of revenue for schools. While the maintenance grant is allotted to the manager, the Head Master is entrusted with the responsibility of utilizing the amount collected through special fees. The special fees include games fee, library fee, laboratory and technical subjects fee, stationery fee, hobbies and craft fee, fee relating to excursion, scouting, fees for audio visual education and festival activities. The present rate of special fee is Rs. 13.50 per student per annum. The details are given in Table 18. These fees are grossly inadequate.

© NIEPA
222 Grants-ifi-Aid Policies and Practices Towards Secondary Education in Kerala
TABLE 18 Special Fees per Pupil per Annum in Secondary Schools
Type of Fees Amount (Rs.) Games Fee Library Fee Laboratory fee and fee for technical subjects Stationery Fee Hobbies and craft fee Excursion, scouting, etc. Audio-visual education Festival activities Total
3.00 2.00 2.00 2.50 0.50 1.00 0.50 2.00 13.50
Due to historical reasons, private aided schools occupy a pre-eminent position among the schools in Kerala. This situation has come about largely as a result of the liberal grants-in-aid policies followed by the State. The policy of encouraging private schools by the government rather than starting schools on their own is a legacy of the policy followed by the erstwhile Travancore and Cochin states. There were several reasons for this. By encouraging private initiative in the educational field, government could save on the capital expenditure and a portion of recurring expenditure. This helped the State to reduce its fiscal commitment to some extent. Secondly, the initiative for spreading education in Kerala often came from Christian missionaries from the West, local parishes and community organisations. The State was only responding positively to these initiatives.
Grants-in-aid policies of the governments in the pre-independence period had many positive features which are relevant to the present discussions on financing of education in the context of the State's escalating fiscal crisis. For instance, the grants-in-aid policies had not underwritten the total costs, not even the total recurring costs of private schools. It always had matching provisions. There were also attempts to target the grants to achieve the State's educational priorities. For instance, efforts were made linking the grants to attendance of students. Grants-in-aid were targeted specifically to increase the enrolment of students belonging to backward and depressed castes as also girl students. Fees in their case were gradually reduced and subsequently abolished. The private managements were compensated for the loss of income arising from these progressive measures. Kerala's achievements in reducing educational disparities between genders and between forward and backward castes owe much to the positive discrimination features built into the grants-in-aid system. Grant-in-aid policies of the State in the past had certain inherent strengths. They could ensure community and local participation in educational development. Besides, grants-in-aid policies were used as baits for introducing government regulations on salary and service

© NIEPA
K. K. George. George Yucharhih and A. Ajith Kumar 223
conditions of teachers, their minimum qualifications, the structure of fees, curriculum, textbooks etc.
But the present Grants-in-Aid policies do not have any specific targets. It does not link grants with any type of performance indicators. There are yet other weaknesses in the present grants-in-aid policies and practices. The rates for maintenance grants were fixed long ago in 1979 and they are not revised periodically. Considering the present day costs, the maintenance grants given are woefully inadequate. Besides, these grants are not released in time. At present, under the system of decentralized planning, grants to the government schools are routed through the local bodies. These bodies also use part of their plan grants for the development of government schools under their jurisdiction. But there are complaints that the local bodies pay more attention to new constructions rather than to maintenance work for a variety of reasons, not all of which are academic.
The grants-in-aid system and the government regulations that followed helped to prevent many malpractices of the private managements. For instance, the introduction of direct payments ensured that teachers in private schools are paid salaries fixed by the government. Prior to the direct payment system, many managers did not pay full salaries to the teachers though they obtained receipts from the teachers for the full amounts. The establishment of parity in pay and service conditions between private aided school teachers and the government school teachers improved the lot of the former. Government regulations backed by strong teachers' unions ensured job security. The collective bargaining capacity of teaching and non-teaching staff boosted their salary and pension levels. Al l these made teaching profession attractive and one would have expected the profession to attract the best talents. But just the opposite happened in aided schools.
Worst kinds of practices of corruption, nepotism and communalization in teachers' appointments have crept into the system. These practices keep growing as salaries are revised. In fact, it is the attractiveness of the profession that has scaled up the rates of corruption. Under the direct payment agreement between the private managements and the government, appointments in aided schools are made by the managements while salaries are paid by the government.
Instances of auctioning appointments are very common. Large sums of unaccounted money (in lakhs) change hands. Obviously, quality of teachers suffers as the most eligible candidates are not the ones selected as teachers. The very purpose of introducing direct payment and establishing parity in pay and service conditions between the government and aided school teachers, namely attracting the best talents to the teaching profession is thus defeated.
What has emerged in the State's educational scenario, as a result of the present liberal Grants-in-Aid policy, is a sort of 'pseudo-privatisation'5 vesting
- An expression used by Tilak (1991).

© NIEPA
224 Grants-in-Aid Policies and Practices Towards Secondary Education in Kerala
ownership and management with the private agencies while almost ail expenditure is met by the government and the hapless aspirants to teaching profession. It is a perfectly attractive situation for the managements all the way. Without investing any money on their own, most of the private managements are able to own and manage an institution and in the process exercise power and extend patronage. So, many of those who come forward to start educational institutions today, unlike their counterparts of the past, are not guided by any altruistic motive. What attracts them are money, influence and the opportunities available for promoting their personal and sectarian interests. At least to a few of the managements, running an aided school is also an attractive commercial proposition especially since it does not necessitate any promoters' contribution except the initial investment in getting sanction for the school. With the present situation, there is a big clamour for starting schools in the private aided sector. Strong lobbies operate and the coalition governments in the State, succumb to these pressures. The State's present fiscal disability and the decreasing number of students are the only obstacles which stand in the way of sanctioning more aided schools.
One has to accept, however, that there is a positive side to the corruption in appointments in aided schools. Most of the managements utilize at least a major portion of the money collected from the staff for making capital investments, maintenance works and also for developing library, laboratory, computer centre etc. As a result, the facilities available in most of the aided schools are better as compared to those in government schools. This may be one of the reasons why students in the aided schools perform better in the examinations though the academic merit of teachers is not as high as in the government schools. It is an irony that the infrastructural facilities of a majority of private aided schools today are built on the foundation of corruption. The system runs smoothly, thanks to the circulation of black money.
Despite high salaries and job security of teachers underwritten by liberal grants-in-aid, the educational standards in the State are falling. The failure rate at the secondary school leaving stage is around 50 per cent every year despite liberal valuation and moderation. Performance of the students from Kerala at the all India competitive examinations for admission to higher education is quite unsatisfactory.
There are many reasons for this situation. The low quality of teachers in aided schools appointed on extraneous considerations is one of the reasons. As for the government schools, they are the victims of the resource crunch on the part of the government. As noted earlier, the share of plan expenditure and capital expenditure in total expenditure on secondary schools has been coming down steeply. The component of capital expenditure in secondary education is negligible (0.1 per cent). The salary component eats away all funds available. Unlike their counterparts in the aided sector, they have no access to 'donations'

© NIEPA
K K. George George /.acliariah and \. Ajitli Kumar 225
cither from the teachers or students. They depend solely on the resource starved government. As a result, infrastructural facilities and students' amenities are grossly insufficient. Maintenance also suffers. The major source of finance for library and laboratory is the special fees collected from students which are quite meagre. In brief, secondary education in the government schools and private aided schools (the non-corrupt ones) is grossly under-funded.
Under-funding is not confined to the school system. The entire education system in the State is now facing the problem of gross under-funding partly due to the growing fiscal crisis of the State. Besides, the share of educational expenditure in total expenditure, particularly plan expenditure, has been decreasing in recent years. The share of education in total revenue expenditure of the government, which stood at 38.7 per cent in 1978-79 came down to 22.6 per cent in 1999-2000. This trend has got to be reversed if the major problem of resource crunch faced by the education sector in the State is to be solved.
References
Abdul Salim A and Gopinathan Nair P.R. (2002), Educational Development in India: The Kerala Experience Since 1800, Anmol Publications, New Delhi.
Ashok Mitra (Chairman), Report of the Kerala Education Commission, Kerala Sasthra Sahirya Parishat, Kochi, 1999.
Dreze, Jean and Amartya Sen (1993), Hunger and Public Action, Oxford University Press, New Delhi.
Eapen K . V . (1985), Church Missionary Society and Education in Kerala, Kollet Publications, Kottayam.
George K . K and Ajith Kumar N. (2001), Some Issues in Financing of Education in Kerala, Perspectives in Education, 17, pp.57-64.
Gopinathan Nair P.R. (1981), Primary Education, Population Growth and Socioeconomic Change in Kerala, Allied Publishers, New Delhi.
Gopinathan Nair P.R.(1989), Universalisation of Primary Education in Kerala in P.R.Panchamukhi (ed.) Studies in Educational Reforms in India, Vol II , Himalaya Publishing Company, New Delhi.
Tilak, J .B .G. (1991), Privatization of Higher Education, Prospects, 21(2), pp. 227-39. Vijayalekshmy K.G.(1993), Educational Development in South India, Mittal
Publications, New Delhi.
© NIEPA
Journal of Educational Planning and Administration Volume X V I I No. 2, April 2003
\ INDIAN JOURNAL OF INDUSTRIAL RELATIONS
C O N T E N T S V O L U M E 38 NUMBER 3 JANUARY 2003
A R T I C L E S Role Stress in the Indian Industry : A Study of Banking Organisations Farooq A. Shah Impact of Personality Factors on Ethical Frameworks and Ethical Decision Making Poonam Sharma and Kanika T. Bhal Evaluation of Role Stress in Indian Air Traffic Controllers Prabhat Kumar Mishra and Gopa Bhardwaj
C O M M U N I C A T I O N S HR Perspective in Sustainable Competitive Development: A Proposed Model Biswajeet Pattanayak Human Dimensions of Disinvestment B.D. Singh Gaining Competitive Edge: The People-oriented Approach S.P. Chauhan and Daisy Chauhan
B O O K R E V I E W S Aligning Human Resources and Business Strategy (Linda Holbeche) DM S. Saini Privatisation and Public - Private Partnerships (E.S. Savas) PC. Bonsai Assessment Centres : Identifying Potential and Developing Competency (Nitin Sawardekar) Kamlesh Jain Designing Knowledge Management Architecture'Archana Shukla and R. Sriniwasan.) Swamp k. Mohanty
INDEX OF ARTICLES Index of Articles (Based on S R C Library)
A Quarterly devoted to dissemination of knowledge in the fields of Industrial Relations and Human Resources, including relevant aspects of labour relations, personnel management and rural labour. Besides, communications from Managers and Union Leaders reflecting their views and Book Reviews are also incorporated.
EDITOR : RAMA J. JOSHI
Subscription Rates : for India - Rs. 450.00 for one year; Rs. 1150.00 for three years; Rs. 1800.00 for five years; and Rs. 130.00 for a single copy. For foreign countries (Air Mail) - $85 for one year; $240 for three years and $350 for five years. For foreign countries - (Sea mail) - $50 for one year; $140 for three years; and $220 for five years.
Draft ihiuuhl,' l,< S H R F R A M C E N T R E I O K [ \ I H M K \ [ K I I \ I I O \ S \ \ | ) H I M \ \ K l M U K ( I s
I S . lM .H ll.islimi M . I I S ; , \ , . » v I V I h i - l l . l KOI
I ' h i M U ' : : i in i: H i > : v, i ! ,i 11-: v,i-r,

© NIEPA
Journal of Educational Planning and Administration Volume X V I I No. 2, April 2003. pp. 227-247
Globalization and the University Myths and Realities in an Unequal World
Philip G. Altbach'
Abstract
Much has been said about the impact of globalization on higher education. Some have argued that globalization, Internet and the scientific community will level the playing field in the new age of knowledge interdependence. Others claim that globalization means both worldwide inequality and McDonaldization of the university. It is argued that all of the contemporary pressures on higher education, from the pressures of massification to the growth of the private sector are the results of globalization. There is a grain of truth in all of these hypotheses and a good deal of misinterpretation as well. The purpose of this attempt is to "unpack" the realities of globalization and internationalization in higher education and to highlight some of the ways in which globalization affects the university. Of special interest here is how globalization is affecting higher education in developing countries—the nations that will experience the bulk of higher education expansion in the coming decades (Task Force on Higher Education and Development, 2000).
Introduction
Universities have always figured in the global environment and have thus been affected by circumstances beyond the campus and across the national borders. This reality is all too often forgotten in analyses of 21st century globalization. A long-term perspective is useful when considering the university because of the deep historical roots and their ongoing impact both on the ethos and governance of universities. Of the institutions, established in the Western world by 1520, as many as 85 still exist—the Roman Catholic Church, the British Parliament, several Swiss cantons, and some 70 universities. Of these, perhaps the universities have experienced the least change (Kerr, 2001, p. 115). From the beginning, universities represented global institutions—in that they functioned in a common language, Latin, and served an international clientele of students. Professors, too, came from many countries, and the knowledge imparted reflected scholarly learning in the Western world at the time.
' 207 Campion Hall, Boston College, Chestunt Hil l MA 02467 USA; E-mail: [email protected]

© NIEPA
228 Globalisation and the University
It is also die case ihat all of the universities in the world today, with the exception of the Al-Azhar in Cairo, stem from the same historical roots—the medieval European university and, especially, the faculty-dominated University of Paris. Much of the non-Western world had European university models imposed on them by colonial masters. Even those countries not colonized by Western powers—such as Japan, Thailand, Ethiopia and a few others—adopted the Western academic model (Altbach and Selvaratnam, 1989). This is the case even where, as in China, well-established indigenous academic traditions already existed. The basic structure of the institution and the orientation to teaching, for example, characterize universities internationally and are derived from the medieval European tradition.
The structure of the American university itself, so influential worldwide, constitutes an amalgam of international influences. The original colonial model, imported from England, was combined with the German research university idea of the 19th century and the American concept of service to society, to produce the modern American university. Foreign models were adapted to domestic realities in creative ways. As the European Union moves toward the harmonization of national higher education systems in the "common European space," foreign influences again emerge—degree structures, the course-credit system and other elements in modified form combined to produce evolving academic patterns. Just as Japan adapted German academic models and some American ideas as it built its modern university system after 1868, the European Union looks to the "best practices" worldwide.
Today's globalization, at least for higher education, does not lack precedents. From the beginning, universities have incorporated tensions between national realities and international trends. While English now dominates as the language of research and scholarship, at one time, German held sway, as did Latin in an earlier era. Students have always travelled abroad to study and scholars have always worked outside their home countries. Globalization in the 21 s 1 century is truly worldwide in reach—few places can elude contemporary trends and innovations and practices seem to spread ever faster as a result of modern technology. But, again, similar trends have occurred in other periods as well.
Because of the centrality of the knowledge economy to 21s' century development, higher education has assumed unprecedented importance, both within countries and internationally, because of its roles in educating people for the new economy and in creating new knowledge (Altbach, 1998a). As evidence, the World Trade Organization is now focusing on higher education. The current debate, concerning the General Agreement on Trade in Services (GATS)—an effort by multinational corporations and some government agencies in the rich countries to integrate higher education into the legal structures of world trade through the WTO—indicates how important universities and knowledge have

© NIEPA
Philip G. Altbach 229
become in the contemporary world (Larsen, Martin, and Morris, 2002; Knight, 2002; Altbach, 2002).
Definitions
It will be useful to define some of the terms in the current debate about globalization. For some, globalization means everything. For others, it includes only the negative side of the contemporary soeiety. This write-up concentrates on the specific international context of higher education and the effect of globalization. Thus, the focus is not on the broader issues of the management of academic institutions—such as how universities have dealt with mass enrollments or privatization, for example.
In this analysis, globalization is defined as the broad economic, technological and scientific trends that directly affect higher education and are largely inevitable. Academic systems and institutions may accommodate these developments in different ways, but they cannot ignore them. These phenomena include information technology in its various manifestations, the use of a common language for scientific communication, and the imperatives of both mass demand for higher education (massification) and societal needs for highly educated personnel.
Internationalization includes specific policies and programmes undertaken by governments, academic systems and institutions, and even individual departments or institutions to cope with or exploit globalization. Internationalization describes the voluntary and perhaps the creative ways of coping. With much room for initiative, institutions and governments can choose the ways in which they deal with the new environment. While the forces of globalization cannot be held completely at bay, it is not inevitable that countries or institutions will necessarily be overwhelmed by them or that the terms of the encounter must be dictated from afar. Internationalization accommodates a significant degree of autonomy and initiative (Knight, 1997; Scott, 1998; De Wit, 2002).
This analysis also focuses on a new higher education trend— multinationalization, which is defined as academic programmes or institutions from one country offered in other countries. Often, the programmes are sponsored in collaboration, but this is not always the case. Joint-degree offerings among institutions in two or more countries, often called "twinning," is an example of a multinational academic enterprise. Setting up offshore institutions constitutes a variation on the trend—this may be carried out through franchising (sometimes referred to as "McDonaldization") or simply by opening a branch institution (Hayes and Wynyard, 2002). Increasingly, the Internet is used in the delivery of multinational academic programs.
Globalization cannot be completely avoided. History shows that when universities shut themselves off from economic and societal trends, they become

© NIEPA
230 Globalisation and the University
moribund and irrelevant. European universities, for example, ignored both the Renaissance and the Industrial Revolution and ceased to be relevant. Indeed, the French Revolution swept away the universities entirely, while Von Humboldt had to re-invent the German university model in 1809 in order to save the institutions (Ben-David and Zloczower, 1962). At the same time, institutions and systems do possess great latitude in how they deal with globalization. Thus, those who argue that there is just one model for higher education in the 21st century are clearly wrong.
Centres and Peripheries in an Unequal Environment
The world of globalized higher education is highly unequal. Concentrating on developing countries, and on smaller academic systems, immediately raises the spectar of inequality. While the Internet and other manifestations of globalization are heralded as bringing knowledge equality to the world, the evidence is the mixed one. In some ways, globalization opens access and makes it easier for students and scholars to study and work anywhere. But in many respects, existing inequalities are only reinforced and new barriers erected. The debate in higher education mirrors analyses of globalization generally. Economists Joseph Stiglitz and Dani Rodrik, among others, have argued that in some respects globalization works against the interests of developing countries, in some ways reinforcing international inequalities (Stiglitz, 2002; Rodrik, 1997; Rodrik, 1999). Neither is opposed to globalization—and both in any case see it as inevitable—but their critiques reveal problems that must be addressed and that tend to be overlooked in the dominant perspectives on the topic.
The powerful universities have always dominated the production and distribution of knowledge, while weaker institutions and systems with fewer resources and lower academic standards have tended to follow in their wake. Academic centres provide leadership in all aspects of science and scholarship-such as research and teaching, the organizational patterns and directions of universities, and knowledge dissemination. The centres tend to be located in larger and wealthier countries and benefit from the full array of resources including funding and infrastructures such as libraries and laboratories for research, academic staff with appropriate qualifications, traditions and legislation in support of academic freedom, and an orientation toward high achievement levels on the part of individual professors and students and by the institutions themselves. Typically, these top institutions use one of the major international languages for teaching and research, and they enjoy appropriate support from the State for their work.
The world of centres and peripheries grows ever more complex (Altbach, 1998c). The major international academic centres—namely the leading research-oriented universities in the North, especially those that use one of the key world

© NIEPA
Philip G. Altbach 231
languages (particularly, English)—occupy the top-tier. World-class universities do exist elsewhere—for example, in Japan and several smaller European countries. A number of universities in China, Singapore and South Korea are approaching the status of world-class research institutions. Even within countries at the centre of the world academic system in the early 21st century—the United States, Britain, Germany, France, and, to some extent, Australia and Canada-there are many peripheral institutions. For example, perhaps 100 of America's 3,200 post-secondary institutions can be considered research universities. These institutions receive more than 80 per cent of government research funds and dominate most aspects of American higher education. Much of the rest of the American higher education system lies on the periphery of the research centres. Other countries exhibit similarly stratified academic systems. There are also universities that play complex roles as regional centres, providing a conduit of knowledge and links to the top institutions. For example, the major universities in Egypt provide academic leadership for the Arabic-speaking world and conduits to the major centres, while contributing relatively little themselves. China's key universities are significant producers of research, mainly for internal consumption, while, at the same time, serving as links to the wider world of higher education.
In many ways, it is now more difficult to become a major player in international higher education—to achieve "center" status (Altbach, 1998b). The price of entry has risen. Top-tier research universities require vast resources, and in many fields scientific research involves a large investment in laboratory facilities and equipment. Enabling institutions to remain fully networked for the Internet and information technology is also costly, as are library acquisitions-including access to relevant databases. Universities in countries without deep financial resources wil l find it virtually impossible to join the ranks of the top academic institutions. Indeed, any new institution, regardless of location, will face similar challenges.
In some ways, academic institutions at the periphery and indeed the entire academic systems of developing, or, in some cases, small-industrialized countries depend on the centres for research, the communication of knowledge and advanced training. The major journals and databases are headquartered at the major universities—especially in the United States and the United Kingdom— since international scholarly and research journals are largely published in English. Most of the world's universities are mainly teaching institutions—in developing countries virtually all are in this category—that must look elsewhere to obtain new knowledge and analysis. Many smaller developing countries, for example, lack the facilities for research, do not provide degrees beyond the bachelor's, and are unable to keep up with current journals and databases due to ;he expense. Structural dependency is endemic in much of the world's academic institutions. Any discussion of globalization cannot thus avoid the deep

© NIEPA
232 Globalisation and the University
inequalities that are part of the world system of higher education. Globalization has added a new dimension to existing disparities in higher education.
A New Neocolonialism
The era of the Cold War was characterized by the efforts of the major powers to dominate the "hearts and minds" of the people of the world. The Soviet Union, the United States, and others spent lavishly on student exchanges, textbook subsidies, book translations, institution building, and other activities to influence the world's academic leaders, intellectuals and policymakers. The goals were political and economic, and higher education was a key battlefield. The rationale was sometimes couched in the ideological jargon of the Cold War but was often obscured by rhetoric about cooperation.
The programmes included many that offered considerable benefit to the recipients—including scholarships to study abroad, high-quality textbooks to be used in universities, scientific equipment, and other resources. Participation in programmes took place on an entirely voluntary basis, but in a context of scarcity assistance, becomes difficult to decline. Acceptance meant increased ties with the donor countries and institutions and long-term dependence on the countries providing the aid. Installation of laboratory equipment or computers, for example, meant continuing reliance on the supplier for spare parts, training and the like.
This is a new era of power and influence. Politics and ideology have taken a subordinate role to profits and market-driven policies. Now, multinational corporations, media conglomerates, and even a few leading universities can be seen as the new neo-colonists—seeking to dominate, not for ideological or political reasons, but rather for commercial gain. Governments are not entirely out of the picture—they seek to assist companies in their countries and have a residual interest in maintaining influence as well. As in the Cold War era, countries and universities are not compelled to yield to the terms of those offering aid, fostering exchanges, or offering Internet products, but the pressures in favour of participation tend to prevail. Involvement in the larger world of science and scholarship and obtaining perceived benefits, not otherwise available, present considerable inducements. The result is the same—the loss of intellectual and cultural autonomy by those who are less powerful.
Role of English
English is the Latin of the 21st century. In the current period, the use of English is central for communicating knowledge worldwide, for instruction even in countries where English is not the language of higher education, and for cross-border degree arrangements and other programmes. The dominance of English is not surprising, and it is a factor in globalization that deserves analysis if only

© NIEPA
Philip G. Alibach 233
because higher education worldwide must grapple with the role of English (Crystal, 1997).
The most widely studied foreign language in the world - English - is also the most widely used second language. In many countries, it is the required scc.:r language, and it is the second language of choice almost without exception. English is the medium of almost all of the internationally circulated scientific journals. It also dominates other academic fields as well. Universities in nanv countries stress the importance of their professors' publishing in internationals < circulated scientific journals, almost by definition in English, placing a further premium on the language. Internet websites devoted to science and scholarship function predominantly in English. Indeed, English serves as the language of Internet transactions involving science and scholarship. The 'largest number of international students goes to universities in English-speaking countries.
English is the main medium of instruction in many of the most prominent academic systems—including those of the United States, the United Kingdom, Australia, Canada, and New Zealand—all of which enroll large numbers of overseas students. Singapore, Ethiopia, and much of Anglophone Africa use English as the primary language of instruction as well. English often functions as a medium of instruction in India, Pakistan, Bangladesh, and Sri Lanka. Other countries are increasingly offering academic programmes in English—to attract international students unwilling to learn the local language and to improve the English-language skills of domestic students and thus enable them to work in an international arena. English-medium universities exist in many countries—from Azerbaijan and Bulgaria to Krgyzistan and Malaysia. In many countries- such a, Japan, the Netherlands, Germany, Mexico, and others—universities offer English-medium degree programmes and courses at local universities. Many European Union nations offer study in English as a way of attracting studettt from elsewhere in the EU. English is clearly an ubiquitous language in hij&er education worldwide.
What does this mean for globalization? The role of English affects higher education policy and the work of individual students and scholars. In many ways, the place of English at the pinnacle of scientific communication gives a significant advantage to the United States and the United Kingdom and to the other wealthy English-speaking countries. As the country with the world's largest academic system and most important user of English, the United States has a double advantage. For example, not surprisingly, many scientific journals are edited in the United States. This gives an advantage to American authors—not only are they writing in their mother tongue but the peer review system is dominated by people accustomed to both the language and the methodology of U.S. scholars. Others must communicate in a foreign language and conform to unfamiliar academic norms. As mentioned earlier, in many places academics are pressured to publish in internationally circulated journals—the sense being that

© NIEPA
234 Globalisation and the University
publication in the "best" scientific journals is a necessary validation of academic work. Increasingly, international and regional scientific meetings are exclusively in English, again placing a premium on fluency in the language.
English-language products of all kinds dominate the international academic marketplace. This is especially true for journals and books. For example, textbooks written from the U.S. or the U.K. perspective are sold worldwide, influencing students and academics in many countries and providing profits for publishers who function in English. The English-language databases in the various disciplines are the most widely used internationally. Universities must pay for these resources, which are priced to sell to American or European buyers and are thus extraordinarily expensive to users in developing or middle-income countries. Nevertheless, English-language programmes, testing materials and all the other products find a ready market in these countries.
Countries that use "small languages" may be tempted to change the medium of instruction at their universities entirely to English. A debate took place in the Netherlands on this topic, and it was decided to keep Dutch as the main language of instruction largely out of concern for the long-term survival of the Dutch language—although degree programmes in English are flourishing in the Netherlands. Where collaborative degree programmes are offered, such as in Malaysia, the language of instruction is almost always English and not the language of the country in which the joint degree is being offered.
English is supplanting such languages as French, German and Spanish as the international medium of scholarship. These languages are in no danger of disappearing in higher education, but their world role has shrunk. The use of English tends to orient those using it to the main English-speaking academic systems, and this further increases the influence of these countries. Regardless of the consequences, however, English is the predominant academic language of the current period.
Global Marketplace for Students and Scholars
Not since the medieval period have such a large proportion of the world's students been studying outside their home countries—more than 1.5 million students at any one time. Large numbers of scholars and scientists travel abroad temporarily for research or teaching. There is a substantial migration abroad for academic work as well. Globalization encourages these flows and wil l ensure that growth continues. As academic systems become more similar and academic degrees more widely accepted internationally, as immigration rules are tailored to people with high skill levels, and as universities themselves are more open to hiring the best talent worldwide, the global marketplace wil l expand.
The flow of academic talent at all levels is directed largely from South to North—from the developing countries to the large metropolitan academic systems. Perhaps 80 per cent of the world's international students come from

© NIEPA
Philip G. Altbach 235
developing countries, and virtually all of them study in the North. Most of these students pursue master's, doctoral and professional degrees. Many do not return to their countries of origin. Some 80 per cent of students from China and India, two of the largest sending countries to the United States, do not return after obtaining their degrees and take jobs in the United States. Since the collapse of the Soviet system, there has also been a flow of scientists from Russia to Western Europe and North America. Students from industrialized countries who study abroad typically do not earn a degree, they rather spend a year or two in the country to broaden their horizon, learn a language or gain knowledge that they could not acquire at home.
Most international students pay for their own studies, producing significant income-for the host countries—a drain on the economy of the developing world. According to estimates, the money spent abroad by students from some developing countries more than equals incoming foreign aid. These students not only acquire training in their fields but also absorb the norms and values of the academic systems in which they studied. They return home with a desire to transform their universities in ways that often prove to be both unrealistic and unattainable. Foreign students serve as carriers of an international academic culture—a culture that reflects the norms and values of the major metropolitan universities. In many ways this culture lacks relevance to the developing world.
An increasingly robust international migration of academic talent exists, predominantly from South to North; large numbers of the most talented academics from developing countries work in the North. Numerous visiting scholars travel across international borders to take up temporary teaching positions or to undertake research. In 2000, universities in the United States hosted almost 80,000 visiting scholars. Although the statistics do not exist, it is estimated that visiting scholars number 200,000 worldwide. The predominant South-North flow notwithstanding, there is a significant movement of academics among the industrialized countries and, to some extent, within other regions such as Latin America. Most visiting scholars return home after their sojourns abroad, although a certain number use their assignments as springboards to permanent emigration.
A much larger number of academics migrate in order to take jobs in other countries. Again, the flow is predominantly from South to North. As noted, significant number of international students do not return home, taking jobs in the countries in which they have obtained their degrees. Others compete, for positions abroad, from home. Although accurate international statistics are unavailable, the impact on many developing countries is quite substantial. For example, more Ethiopian holders of doctoral degrees work outside of Ethiopia than at home, and 30 per cent of all highly educated Ghanaians and Sierra Leoneans live and work abroad (Outward Bound, 2002, p. 24). This phenomenon is common for many African countries. South Africa is losing many of its most

© NIEPA
236 Globalisation and the University
talented academics to the North, while, at the same time, it is recruiting from elsewhere in Africa. This migration has seriously weakened the academic institutions of many developing countries.
Migration is not limited to developing countries. Academics wil l take jobs in countries with more attractive opportunities, salaries and working conditions. At present, a small but significant exodus continues from the United Kingdom to the United States and Canada because of the low salaries and deteriorating working conditions at home. To combat this trend, the U.K. authorities have provided funds to entice their best professors to remain at home. Scholars from small but well-endowed academic systems, such as in Denmark or Finland, are sometimes lured to the metropoles by the prospect of being at the centre of research activity and having access to the latest scientific equipment. In some fields, such as engineering specialties and computer science, the percentage of professors from other countries working in the U.S. universities is very high—reflecting the fact that almost half the doctoral enrollments in these fields are foreign. Academic migration takes place at all levels of the academic system, especially in the sciences, engineering, information technology and some management areas. Such migration may occur more at the top of the system, with some world-famous scholars being attracted abroad by high salaries at top universities, and at the bottom, where modest salaries are able to lure foreigners but are unappealing to local applicants.
Academic migration follows complex routes. Many Egyptian, Jordanian and Palestinian academics work at Arabian Gulf universities, attracted by higher salaries and better working conditions than are available at home. Indians and Pakistanis are similarly drawn to the Gulf as well as to Southeast Asia. Singapore and Hong Kong attract academics worldwide. Mexico and Brazil employ scholars from elsewhere in Latin America. South Africa, Namibia and Botswana currently recruit Africans from elsewhere on the continent. Some of the best scholars and scientists from Russia and a number of Central European countries have taken positions in Western Europe and North America. The existing traffic among European Union member-states will likely grow significantly, as EU policies to harmonize academic systems are implemented.
The most significant "pull" factors include better salaries and working conditions and the opportunity to be at the centres of world science and scholarship (Altbach, forthcoming). The discrepancies in salaries and conditions between North and South mean that, in most developing countries academics cannot aspire to live in a middle-class lifestyle or expect to have access to the necessary tools of research and scholarship-including the ability to obtain the most current knowledge and to connect with the international community of scholars. Among the many "push" factors, the limited extent of academic freedom in many developing countries means that the academics are sometimes subject to restrictions and even arrest, if they stray from officially approved

© NIEPA
Philip G. Altbach 237
themes. Favouritism or even corruption in academic appointments, promotions, and other areas further erode the environment of the university. In some places, job security or stability are unattainable. In some ways, conditions at the Third World universities stem inevitably from the scarcity of resources and the pressure of increased student numbers on overburdened academic institutions and systems. The "pull" factors at the centres cannot be altered much, but the "push" factors can be moderated. Overall, however, the migration of academic talent will continue in the current globalized environment.
At one time, the migration of talent was perceived as a brain drain because those who left were considered to be permanently lost, retaining negligible or zero academic links with their home countries. The situation in this respect has undergone change (Choi, 1995). Many academics who have migrated keep in close contact with their countries of origin, often maintaining scientific and academic relationships with colleagues and institutions at home. Some have even returned after establishing careers abroad as academic conditions at home have improved—some academics from South Korea and Taiwan, for example, returned from the United States or other countries to accept senior academic appointments in their home countries once academic working conditions, salaries and respect for academic freedom had improved. More commonly, academics return home for lectures or consulting, collaborate on research with colleagues in their country of origin, or accept visiting professorships. Facilitated by the Internet, these links are increasingly accepted as appropriate and useful. Such trends are especially strong in countries with well-developed academic systems, such as China, India and South Africa, among others.
The migration of academic talent is in many ways promoted by the industrialized countries, which have much to gain. Immigration policies are in some cases designed to encourage talented personnel to migrate and establish residency. In many countries, academic institutions make it easy for foreigners to fit into the career structure. Countries that place barriers to foreign participation in academe, such as Japan, suffer as a result. In general, however, the industrialized countries benefit from a large pool of well-educated scientists and scholars—people educated by developing countries—who choose to take their talents and skills to the highest bidder. In this way, the developing world has helped the North to maintain its already overwhelming lead in science and scholarship. The renewal of links between academics who migrate and their countries of origin mitigates this situation somewhat, but the fact remains that developing countries find themselves at a disadvantage in the global academic labour market. The same applies as well to smaller and more peripheral nations worldwide.

© NIEPA
238 Globalisation and the University
Internationalization of the Curriculum
The field of business and management studies illustrates the global dominance of ideas from the major English-speaking academic systems. In most countries, business administration is a new field, established over the past several decades to prepare professionals for work in multinational corporations or in firms engaged in international commerce. The dominant pattern of professional studies is the M.B.A. degree—the American-style master's of business administration. This degree originated as the way to prepare American students for work in U.S. business, based on American curricular ideas and American business practices. A key part of many M.B.A. programmes is the case study, again developed in the U.S. context. The M.B.A. model has been widely copied in other countries, in most cases by local institutions but also by American academic institutions working with local partners or setting up their own campuses overseas. While the programmes sometimes are modified in keeping with the local context, the basic degree structure and curriculum remains American.
A number of countries are contemplating including some general education in the first-degree curriculum. Part of the U.S. undergraduate curriculum for centuries, general education provides a broad background in the disciplines along with skills in critical thinking. Higher Education in Developing Countries: Peril and Promise, an influential report, sponsored by the World Bank and UNESCO, recommends general education, and it is being considered as an alternative to the existing largely specialized curriculum in higher education (Task Force on Higher Education, 2000).
As stated earlier, instructional materials go into international circulation. There is an increasing use of common textbooks, course materials and syllabi worldwide, stimulated by the expanding influence of multinational publishers, the Internet, and databases, as well as the growing cadre of professors who return home after their studies abroad with ideas concerning curriculum and instructional materials in their fields. These materials originate mainly in the large academic systems of the North—especially the United States, the United Kingdom and France. An examination of the textbooks used, the patterns of translations from one language to another and the databases used reveals a similar pattern.
Disciplines and fields vary in terms of how globally homogenous they have become. Such fields as business studies, information technology and biotechnology are almost entirely dominated by the major academic centres. Other fields—such as history, language studies and many areas in the humanities—are largely nationally based, although foreign influences are felt in methodology and approaches to research and interpretation. The internationalization of the curriculum, like other aspects of globalization, proceeds largely from North to South.

© NIEPA
Philip G. Altbach 239
Multinationalization of Higher Education
The emergence of a global education marketplace exhibits itself in the form of a variety of multinational higher education initiatives—ranging from "twinning" programmes linking academic institutions or programmes in one country with counterparts in another to universities in one country setting up branch campuses in another. The different kinds of cross-border higher education ventures include many that use the Internet and other distance education means to deliver their programmes. Many for-profit companies and institutions have invested in multinational educational initiatives as have a range of traditional higher education institutions.
The multinationalization of higher education has historical roots. During the colonial period, universities in the metropole frequently set up branch institutions or sponsored new schools in the colonies. The main examples include the British in Africa and Asia, Dutch institutions in what is now Indonesia, and French initiatives in Africa and Asia. Roman Catholic universities set up new institutions in Latin America and the Philippines; religious orders such as the Jesuits undertook what might now be referred to as multinational higher education initiatives. In the 19th century, American Protestant missionaries set up universities based on the U.S. model in Lebanon, Egypt and Turkey, among other places. This is the historical background, for example, of the American University of Beirut. Some new institutions were established using foreign models, often with direct links to universities in the metropole (Ashby, 1964).
History shows that the export of educational institutions and the linking of institutions from different countries generally represented a union of unequals. In almost all cases, the institution from the outside dominated the local institution, or the new institution was based on foreign ideas and non-indigenous values. The same is true in the 21st century. When institutions or initiatives are exported from one country to another, academic models, curricula and programmes from the more powerful academic system prevail. Thus, linkages between Australian and Malaysian institutions aimed at setting up new academic institutions in Malaysia are always designed by Australian institutions. Rarely, if ever, do academic innovations emanate from the periphery to the centre.
Multiple models of multinational initiatives exist in higher education. The export of academic institutions from one country to another is a growing, but not entirely a new phenomenon. Of course, both traditional colonialism and the government-sponsored foreign assistance programmes of the Cold War era exported institutional models, practices and curriculum from the metropole to developing countries. In the past decade, institutional exports based on nongovernmental initiatives have risen, usually on the initiative of the exporting country. In the 1980s, for example, American colleges and universities were quite interested in Japan, seeing a market there. Several hundred U.S. institutions explored the Japanese "market," and more than a dozen established campuses

© NIEPA
240 Globalisation and the University
there- usually in cooperation with a Japanese institution or company (Chambers and Cummings, 1990). A small number of Japanese institutions looked into the feasibility of a U.S. connection, and a few even set up branch campuses. However, most Japanese programmes were aimed at bringing Japanese students to the United States for study, while U.S. programmes focused on educating Japanese students in Japan. With few exceptions, the institutions engaging in export activities were not the most prestigious schools on either side. By 2000, very few of the branches were still operating. In Japan, the difficulty of obtaining Ministry of Education certification for U.S. programmes proved overwhelming, and the initiatives on both sides were affected by the protracted economic slowdown in Japan. The U.S.-Japan initiatives were unusual in that both sides were industrialized countries.
Some of the export initiatives taking place today are indicative of global trends. A small number of prestigious American universities are establishing campuses worldwide, usually in popular professional fields such as business administration. The University of Chicago's business school now has a campus in Spain. The programme offers Chicago degrees to students from Spain and other European countries, using the standard Chicago curriculum—taught mostly by Chicago faculty members—with an international focus. It includes a period of study at the home campus as well. Some other U.S. universities have developed similar programmes. An unusual but interesting model of multinationalization is being undertaken by Singapore, which is inviting a number of prestigious foreign universities, such as the University of Pennsylvania's Wharton School, to start programmes in Singapore. The institutions, which are carefully selected by the Singapore government, are given incentives to come to Singapore. In a related trend, a number of U.S.-sponsored universities have been established in Kyrgyzstan, Qatar and Bulgaria, among other places. These schools typically originate through local initiative, with strong links to American universities, and are generally supervised by the U.S. partners and accredited in the United States. The language of instruction is English and the curriculum U.S. based.
In keeping with the more standard export model, a university in an industrialized country will set up a programme abroad, often but not always in a developing country, at the invitation of a host institution. The host may be a corporation without any link to education, an educational institution or some combination of the two. Malaysia provides many examples of such arrangements, set up to satisfy unmet demand by local students. Universities from Australia and the United Kingdom are most active in Malaysia, and the new programmes have generated complaints of low quality, poor supervision, or inadequate communication between the providers and the hosts. In Israel, a number of small American colleges and universities (some of lesser quality) began to offer academic degrees when the market was opened up by the Israeli government.

© NIEPA
Philip G. Altbach 241
After considerable criticism, restrictions were later placed on the programmes-many of which have ceased to exist.
Sometimes foreign academic degree programmes are simply "franchised" by local institutions. The foreign university lends its name and curriculum, providing some (often quite limited) supervision and quality control to a local academic institution or perhaps a business firm. The new institution is given the right to grant a degree of the foreign. institution to local students. These franchising arrangements have led to many abuses and much criticism. Many highly critical articles have appeared in the British press charging that U.K. institutions, mostly the less prestigious ones, involved in overseas programmes are damaging the "good name" of British higher education. Meanwhile, "buyers"—fee-paying students—overseas think that they are getting a standard British degree, when in reality they are receiving the degree, but not the level of education provided in the United Kingdom.
There are a large number of twinning programmes worldwide. This concept links an academic institution in one country with a partner school in another country. Typically, the links are between North and South, with the university in the North providing the basic curriculum and orientation. In such arrangements, academic degrees are often jointly awarded. Twinning has the advantage of aiding institutions in the South in developing new curricular offerings, with the stamp of approval of a foreign university.
As can be seen in this brief discussion, there are many facets to the new multinationalization of higher education. However, some common perspectives and motivations can be identified. With few exceptions, a central goal for all of the stakeholders, especially those in the North, is to earn a profit. Institutions in the South that are attracted to multinational initiatives may also be interested in making money and they are also concerned with meeting the growing demand for access to higher education and providing new degree programmes that may not be available in local schools. As with other aspects of globalization in higher education, multinational arrangements between institutions are marked by inequality.
Information Technology and Globalization
The information age carries the potential of introducing revolutionary change in higher education (Castells, 2000). The elements of the revolution in information technology (IT) with the power to transform higher education include communication, storage and retrieval of knowledge. Libraries, once the repositories of books and journals, are now equally involved in providing access to databases, websites and a range of IT-based products (Hawkins and Battin, 1998). Scholars are increasingly dependent on the Internet both to undertake research and analysis and to disseminate their own work. Academic institutions are beginning to use IT to deliver degree programmes and other curricula to

© NIEPA
242 Globalisation and the University
students outside the campus. Distance education is rapidly growing both within countries and internationally. IT is beginning to shape teaching and learning and is transforming the management of academic institutions.
IT and globalization go hand in hand. Indeed, the Internet serves as the primary vehicle for the globalization of knowledge and communications. As with the other aspects of globalization, significant inequalities exist. Inevitably, the information and knowledge base, available through the Internet, reflects the realities of the knowledge system worldwide. The databases and retrieval mechanisms probably make it easier to access well-archived and electronically sophisticated scientific systems of the advanced industrialized countries than the less networked academic communities of the developing countries.
The Internet simplifies the obtaining of information for scholars and scientists at universities and other institutions that lack good libraries. This change has had a democratizing effect on scientific communication and access to information. At the same time, however, many people in developing countries have only limited access to the Internet (Teferra, forthcoming). Africa, for example, has only recently achieved full connectivity to the Internet.
The Internet and the databases on it are dominated by the major universities in the North. The Internet functions largely in English and much of the material carried on it is in English. These realities also affect access and usage of information. Multinational knowledge corporations have become key players, the owners of many of the databases, journals and other sources of information. Academic institutions and countries unable to pay for access to these information sources find it difficult to participate fully in the networks. Tightening copyright and other ownership restrictions through international treaties and regulations will further consolidate ownership and limit access (Correa, 2000).
Distance education comprises another element of higher education profoundly affected by IT. Distance education is not, however, a new phenomenon—the University of South Africa, for example, has been offering academic degrees through correspondence for many decades. The Open University in the United Kingdom has effectively used a combination of distance methods to deliver its highly regarded programmes. IT has greatly expanded the reach and methodological sophistication of distance education in the process contributing to the growth of distance education institutions. Of the 10 largest distance education institutions in the world, 7 are located in developing countries, and all use IT for at least part of their programmes. Universities and other providers in the industrialized nations are beginning to employ IT to offer academic programmes worldwide, a significant portion of which are aimed at developing countries. Entire degree programmes in fields such as business administration, can be found on the Internet, and most providers see the international market as critical for the success of their programmes. These providers include corporations—such as some of the major multinational

© NIEPA
Philip G. Altbach 243
publishers—for-profit educational providers like Sylvan Learning Systems, and others. Some universities now offer degree and certificate programmes through the Internet to international audiences. Firms such as Microsoft, Motorola, and others are offering competency certificates and other training programmes in fields relating to their areas of expertise.
As with the other aspects of globalization discussed in this analysis—the leading providers of IT consist of multinational corporations, academic institutions and other organizations in the industrialized nations. The Internet today combines a public service—e-mail and the range of websites to which access is free—with a commercial enterprise. Many databases, electronic journals, e-books, and related knowledge products are owned by profit-making companies who market them, often at prices that preclude access by those in developing countries.
Nevertheless, at the same time, developing countries have been able to take advantage of IT. For example, the largest universities using distance education are mostly located in developing countries. The African Virtual University is an innovative effort by a number of African nations to harness the Internet and other distance techniques to meet their needs. E-mail is widely used to improve communication among scientists and scholars and to create networks in the developing world.
International Agreements and Frameworks
In many ways, we are moving into a new era of globalization in higher education, characterized by the new international agreements and arrangements drawn up to manage global interactions. The arrangements between countries range from bilateral agreements relating to student and faculty exchanges to the mutual recognition of degrees—for example, the many bi-national commissions governing the American Fulbright scholarship and exchange programmes. Of the current set of international agreements in higher education, perhaps the most comprehensive are the European Union's the comprehensive Bologna framework designed to introduce changes to harmonize the higher education systems of all EU member states, to specific exchange and scholarship programmes such as ERASMUS and SOCRATES. NAFTA, the North American Free Trade Agreement, in contrast, has few implications for higher education.
An indication of the potential impact of globalization is the debate over the inclusion of higher education, in particular, and knowledge industries within the framework of the WTO through the GATS proposal. While GATS has not yet been fully formulated and is not part of the WTO framework, it is relevant not only because of its influence but also for what it reveals about the reality of globalization. GATS seeks to establish "open markets" for knowledge products of all kinds—including higher education. The idea behind GATS and, for that matter, the concept of globalization is that knowledge is a commodity like any

© NIEPA
244 Globalisation and the University
other and should be freely traded around the world. The proponents argue that free trade wil l benefit everyone by permitting competition in the marketplace of ideas and knowledge products.
GATS and related arrangements also seek to provide a legally binding framework for the circulation of educational services and for the protection of intellectual property. Thus, GATS and the WTO are very much related to TRIPS (Trade Related Intellectual Property) arrangements and copyright regulations. The motivating force behind all of these regulatory frameworks is to rationalize the global trade in knowledge and to ensure open markets and protections for the owners of knowledge products. The WTO and its related agreements, as well as international copyright, have the force of law—they are international treaties supported by a legal enforcement regime. These arrangements were created to protect the sellers and the providers, not the buyers and users, and, as a result, they have negative implications for developing countries (Raikhy, 2002).
Those favouring GATS and the regulatory framework in general are the sellers and owners—multinational knowledge companies, governments focusing on exports, and others (OECD, 2002). Testing companies such as the U.S.-based Educational Testing Service, multinational publishers, information technology and computer firms, for-profit educational providers such as Sylvan Learning Systems, and others are examples of businesses involved in global education that see GATS as benefiting their interests. In many countries, government agencies most focused on GATS include not the ministries of education but rather departments concerned with trade and export promotion. In the United States, it is the Department of Commerce that has taken the lead and not the Department of Education. In the United Kingdom, the Department of Trade and Industry has been in the forefront. Education groups in the United States, Canada and a number of other countries have been skeptical or opposed to the GATS proposal. The American Council on Education, which represents most university presidents in the United States, for example, has spoken out against GATS. Developing countries have generally not yet taken a position on the concept of free trade in education and knowledge products.
While the complicated details of a GATS treaty have not been worked out, the basic issues are straightforward. Should education in all of its manifestations be considered as a commodity to be traded in the marketplace, regulated in the same fashion as are automobiles or bananas? As Lawrence Summers, the former U.S. treasury secretary and current president of Harvard University put it in a recent interview, "I 'm skeptical as to whether bringing educational issues under the auspices of trade negotiations would be helpful. . . . To start with, many educational institutions are non-profit, their motivations are different from the motivations of commercial firms that we think of in a trade context. There may be some egregious practices that should be addressed, but I would be skeptical about treating education in a way that had any parallels with financial

© NIEPA
Philip G. Altbach 245
services, with insurance, or with foreign investments" (The World According to Larry, 2002, p. 38).
While GATS would bring developing countries into a global framework of commerce and exchange in higher education, it would remove aspects of autonomy from decision making concerning education. Extending the principle of free trade to education would open national markets in countries that sign on to GATS to testing companies, providers of distance education, and many others. Regulation or control of these entities would prove difficult, if not impossible, to achieve. Institutions or companies could, in principle, count on having access to foreign education markets. Since developing countries typically import rather than export their educational products or institutions, it is unlikely that GATS would promote their exports. Developing countries represent the markets that sellers from the industrialized world are eager to target. Most developing countries, having few educational "products" to export, would be at the mercy of the multinational providers.
Current arrangements—in which all countries retain authority over educational imports and exports, subject to some regulatory arrangement such as international copyright, patent treaties, and the like—nonetheless, permit a great deal of international higher education exchange, as this attempt illustrates. It can be argued that additional regulations are not needed. Cross-border educational transactions of all kinds are being actively pursued worldwide. At present, the developing countries are the main importers of products and services from abroad.
Conclusion
Globalization in higher education and science is inevitable. Historically, academe has always been international in scope and it has always been characterized by inequalities. Modern technology, the Internet, the increasing ease of communication, and the flow of students and highly educated personnel across borders enhances globalization. No academic system can exist by itself in the world of the 21 s t century.
The challenge is to recognize the complexities and nuances of the modern context and then seek to create a global academic environment that recognizes the need to ensure that academic relationships are as equal as possible. Recognizing inequality is the first step. The second is to create a world that ameliorates these inequalities. These tasks, in the context of marketization and the pressures of mass higher education, are not the easy ones. Yet, it is important. to ensure that globalization does not turn into the neo-colonialism of the 21st century.

© NIEPA
246 Globalisation and the University
References
Altbach, Philip G. , and Selvaratnam, Viswanathan (Eds.). (1989). From Dependence to Autonomy: The Development of Asian Universities. Dordrecht, Netherlands: Kluwer.
Altbach, Philip G. (1998a). Comparative Higher Education: Knowledge, the University, and Development. Greenwich, C T : Ablex.
~. (1998b). Gigantic Peripheries: India and China in the World Knowledge System. In Altbach Philip G . (Ed.), Comparative Higher Education: Knowledge, the University, and Development. (Pp. 133-146). Greenwich, C T : Ablex.
—. (1998c). The University as Center and Periphery. In Altbach Philip G. (Ed.), Comparative Higher Education: Knowledge, the University, and Development. (Pp. 19-36). Greenwich, C T : Ablex.
—. (2002, summer). Knowledge and Education as International Commodities: the Collapse of the Common Good. International Higher Education, no. 28, 2-5.
—. (Forthcoming). Centers and Peripheries in the Academic Profession: the Special Challenges of Developing Countries. In Altbach Philip G . (Ed.) , The Decline of the Guru: The Academic Profession in Developing and Middle-Income Countries. New York: Palgrave.
Ashby, Eric (1964). Universities: British, Indian, Africa. Cambridge: Harvard University Press.
Ben-David, Joseph, and Awraham Zloczower. (1962). Universities and Academic Systems in Modern Societies. European Journal of Sociology 3(1), 45-84.
Castells, Manuel. (2000). The Rise of the Network Society. Oxford: Blackwell. Chambers, Gail S., and William K . Cummings. (1990). Profiting from Education: Japan-
United States International Ventures in the 1980s. New York: Institute of International Education.
Choi, Hyaeweol. (1995). An International Scientific Community: Asian Scholars in the United States. Westport, C T : Praeger.
Correa, Carlos M. (2000). Intellectual Property Rights, the WTO and Developing Countries. London: Zed Books.
Crystal, David. (1997). English as a Global Language. Cambridge: Cambridge University Press.
De Wit, Hans. (2002). Internationalization of Higher Education in the United States and Europe. Westport, C T : Greenwood.
Hawkins, Brian L , and Patricia Battin (Eds.). (1998). The Mirage of Continuity: Reconfiguring Academic Information Resources for the 21st Century. Washington, D C : Council on Information and Library Resources.
Hayes, Dennis, and Robin Wynyard (Eds.). (2002). The McDonaldization of Higher Education. New York: Praeger.
Kerr, Clark. (2001). The Uses of the University. Cambridge: Harvard University Press. Knight, Jane. (1997). Internationalization of Higher Education: A Conceptual
Framework. In Jane Knight and Hans deWit (Eds.), Internationalization of Higher Education in Asia Pacific countries. Amsterdam: European Association for International Education.
—. (2002). Trade in Higher Education Services: The Implications of GATS. London: Observatory on Borderless Higher Education, (www.obhe.ac.uk)

© NIEPA
Philip G. Altbach 247
Larsen, Karl , John P. Martin, and Rosemary Morris. (2002). Trade in Educational Services: Trends and Emerging Issues. Paris: Organization for Economic Cooperation and Development.
Organization for Economic Cooperation and Development. (2002). GATS: The Case for Open Services Markets. Paris: O E C D .
Outward Bound. (2002, September 28). The Economist, 24-26. Raikhy, P. S. (2002). Trade in Education under the W T O Policy Regime: Implications for
India. (Pp. 127-133). In K . B. Powar (Ed.), Internationalization of Higher Education. New Delhi: Association of Indian Universities.
Rodrik, Dani. (1997). Has Globalization Gone Too Far? Washington, D C : Institute for International Economics.
—. (1999). The New Global Economy and the Developing Countries: Making Openness Work. Washington, D C : Overseas Development Council.
Scott, Peter. (Ed.). (1998). The Globalization of Higher Education. Buckingham, U K : Open University Press.
Stiglitz, Joseph. (2002). Globalization and Its Discontents. New York: Norton. Task Force on Higher Education and Society. (2000). Higher Education in Developing
Countries: Peril and Promise. Washington, D C : World Bank. Teferra, Damtew. (Forthcoming). Scientific Communication in African Universities:
External Agencies and National Needs. New York: Routledge Falmer. The World According to Larry. (2002, July-August). Foreign Policy, 30-39.

© NIEPA
Journal of Educational Planning and Administration Volume XVII No. 2, April 2003
INDIAN ASSOCIATION OF S O C I A L S C I E N C E INSTITUTIONS (IASSI)
VOL.20 JANUARY-MARCH 2002 NO. 3
CONTENTS
Man as Demiourgos
Culture, Society and Violence: Emerging Issues
Substainable Development: From Concept to Reality
New Mothers and Family Planning at a Glance
Agricultural Extension through Interactive Multimedia Compact Disc (IMCD)
Disturbing Trends in India's Economy
A Probe into the Child Right and Development Situation in the Chittagong Hill Tracts, Bangladesh
Development of Scheduled Castes: An Overview
Employment Assurance Scheme in Tamil Nadu: Performance and Impact Assessment
Gifted Science Writer and Innovator in Operations Research: Dr. Jagjit Singh (1912-2002)
Book Reviews Member-Institutions
SUBSCRIPTION R A T E S
For India and SAARC Countries, including postage: Rs. 250/- for one year. Single copy Rs. 70.
For other countries: US $ 40 per year or equivalent, including postage by surface mail and US $ 50 by airmail. Single copy US $ 15 by Airmail and US $ 12 by Surface mail.
Enquiries and Correspondence should be addressed to Member-Secretary, Indian Association of Social Science Institutions (IASSI) care Institute of Applied Manpower Research, Indraprastha Estate, New Delhi - 110012. (Tel: 2331-5284, 23356834, 23324581; Fax: 011-2331-5284; E-mail: [email protected]
A. K. Saran
Birinder Pal Singh
Jose J. Naduthotty
Sudhir Ranga
N. Anandaraja K. Chandrakandan & C. Karthikeyan
Baidyanath Misra
Naiz Ahmed Khan and Abul Farah M. Saleh
B. B. Mohanty
B. Sambi Reddy
Tarlok Singh

© NIEPA
Journal of Educational Planning and Administration Volume XVII No. 2, April 2003, pp. 249-255
RESEARCH NOTES/COMMUNICATIONS
Inter-Household and Gender Equity, Efficiency, and the Measurement of
Literacy S. Subramanian
Abstract
This note considers certain implications for the congruence between efficiency, inter-household equality, and gender equality of an approach to literacy measurement advanced by Basu and Foster (1998), and extended by Subramanian (2002). The approach reckons, in the calculus, the positive intra-household externality conferred by literacy and the differential magnitude of this externality attributable to the gender of the 'literacy-transmitter'. The note makes the simple point that a policymaker planning for literacy-alleviation should guard against being mechanically guided by a ranking of alternative literacy outcomes dictated by a real-valued measure: there is also a case for being informed by the problems inherent in a pursuit of multiple goals, and the possibility of conflict between outcomes in different domains of application of a single goal.
Introduction
Kaushik Basu and James Foster (1998) have advanced the view that the simple headcount measure of literacy is an inadequate reflection of the extent of literacy in a population. When literacy is measured, in the most elementary possible way, as the proportion of the population which is literate, there is a failure to reckon the intra-household externality which is generated by a literate person and which accrues to illiterate members of the household. The authors suggest a way of taking account of this externality in constructing an index of literacy; and extensions and modifications of their measure are considered by S.Subramanian (2002). The problem with the headcount ratio is compounded, as Basu and Foster observe, by its failure to assess the magnitude of the externality differentially
* Madras Institute of Development Studies, 79 Second Main Road, Gandhinagar, Adyar, Chennai -600 020, Tamilnadu, India. E-mail: [email protected], Telefax: 0091-44-24910872

© NIEPA
250 Inter-Household and Gender Equity, Efficiency, and the Measurement of Literacy
with respect to its source, namely, with respect to whether the literate member of the household is female or male; and the authors indicate how these considerations - revolving around placing a higher valuation on the externality if its source happens to be female rather than male - may be taken on board in further refining the literacy measure.
One of the interesting points which Basu and Foster make - and which is sought to be explicitly captured in the literacy measures advanced by Subramanian - is that an engagement with the intra-household externality generated by literacy precipitates a congruence between the efficient and the equitable distribution of literates across households. As they put it (Basu and Foster 1998, p. 1773) ".. . the concern for distribution need not reflect a concern about distribution per se. It is, of course, possible to argue that, as with all good things in life, a more even distribution of literacy is innately, ethically appealing. In the present paper, though, we contend that even if we ignore the inherent appeal of an equitable distribution, there are important instrumental reasons for being concerned about a 'better' distribution of literacy." An objective of this essay is to quantify, following a method outlined in Subramanian (2002), the efficiency loss arising from an inequitable inter-household and sub-optimal gender distribution of literacy and, through this route, to arrive at a comprehensive 'externality-corrected' index of literacy. A second objective is to examine the sensitivity of the resulting index to alternative patterns of distributional equality in the dimensions of households and the sexes. A third objective is to explore the complications that can arise from the pursuit of both efficiency and equity as goals in an exercise of planning for literacy.
'Correcting' the Literacy Measure for Externality
As a first step in examining the issues outlined in Section 1, one can, following Subramanian (2002) following Basu and Foster (1998), derive an 'externality-adjusted' measure of literacy, that is, a headcount measure 'corrected' for efficiency loss arising (a) from the inequitable distribution of literacy across households (what one might call an 'isolationism effect'); and (b) from the dissipation of the beneficial external effects of literacy when the source of the externality is a male rather than a female literate (what one may call a 'gender-segmentation effect'). Component (a) of the above correction has been incorporated in Subramanian's index, and in the version of the literacy index presented here the correction is extended to component (b) as well.
Employing the notation of Basu and Foster, let R stand for the 'crude' headcount measure of literacy, viz. the proportion of literates in the population; I for the proportion of isolated illiterates (namely, illiterates who belong to households each of which has only illiterate members); P for the proportion of proximate illiterates (namely, illiterates who belong to households each of which has at least one literate member); Pm for the proportion of m-proximate illiterates

© NIEPA
S. Subramanian 251
(namely, illiterates who belong to households each of which contains at least one male literate and no female literate); and Pf for the proportion of f-proximate illiterates (namely, illiterates who belong to households each of which contains at least one female literate). Basu and Foster postulate that in assessing the literacy status of a community, each literate person could be awarded a score of unity; each f-proximate illiterate a score of ocf (0 < af < 1); each m-proximate illiterate a score of am (0 < ou < af < 1); and each isolated illiterate a score of zero. The idea is that a literate member of a household confers some strictly positive externality on each of the illiterate members of the household, and that this external effect is larger in magnitude if its source is a female (the empirical plausibility of which is confirmed in Basu and Foster's brief review of relevant suggestive evidence). Let 5 stand for the quantity (a f - am)/a f, which can be naturally interpreted as a normalized 'index of female superiority'. (It may as well be to emphasize here that this note is primarily concerned with certain conceptual issues that have a bearing on both planning for, and measuring, literacy - and not with advancing procedures for empirically estimating, in any given situation, the values of af and On,, and, therefore, of 5: these values will be taken to have been - in whatever way - 'reasonably' empirically assessed.) Then, employing a general method revolving around a simple, axiomatic approach advanced in Subramanian (2002), it is possible to rationalize a comprehensive, 'externality-corrected' measure of literacy R c , which is given by:
(1) R c = R ( l - I - 5 P m ) ,
where, as stated earlier, R stands for the 'crude' literacy rate, I for the proportion of isolated illiterates, Pm for the proportion of m-proximate illiterates, and 5 for the 'index of female superiority'.
The precise details of the derivation of the index Rc are of relatively muted interest in the context of the present note; in any event, and allowing for a minor extension, these details represent ground that has already been covered in Subramanian (2002). Of more direct interest is that the expression for Rc
presented in (1) realizes the first of the objectives for this note set out earlier: it usefully suggests that in arriving at an overall 'externality-corrected' measure of literacy, the crude headcount ratio R should be penalized for the presence of isolated and m-proximate illiteracy, that is, corrected for efficiency-distortions arising from an inequitable distribution of literacy across households and a sub-optimal distribution of literacy across the sexes. The simple message delivered by Rc is that, for any given distribution of literates across households, an hypothetical redistribution which ensures the elimination of both isolated and m-proximate illiteracy will secure also the certainty of zero efficiency loss.

© NIEPA
252 Inter-Household and Gender Equity, Efficiency, and the Measurement of Literacy
The Case for Disaggregation by Source of Efficiency Loss
In addressing the second objective set out in the Introduction - that of examining the sensitivity of the index to alternative patterns of inter-household and gender-specific distributions of literacy - it is also important to note that Rc allows for a tradeoff amongst the overall level of literacy and the two types of illiteracy, isolated and m-proximate: this makes for what could be a loss of relevant information which 'comes out in the wash' in the process of aggregation. A simple numerical example will illustrate the point. Suppose there are 200 households, each household consisting of 2 males and 2 females. Imagine two situations X and Y respectively. In situation X, there are 180 literates, made up of 2 male literates in each of 90 households. In situation Y, there are 170 literates, made up of 1 male and 1 female literate in each of 85 households. Suppose that the value of 'the index of female superiority', 8, is approximately 0.2161 (arrived at, let us say, through some appropriately credible procedure of empirical estimation). Let ^ and Rf stand for the ('crude', headcount) male and female literacy rates respectively. The literacy statistics for the two situations can be summarized as follows. In situation X, R = 0.45, I = 0.10, Pm = 0.45, R™ = 0.9, and Rf = 0. In situation Y, R = 0.425, I = 0.15, Pm = 0, and R m = Rf = 0.85. Note that both the inter-household and the sex-wise distributions of literacy are different in Y from what they are in X. In particular, while the inter-household distribution is a little worse in Y than in X, the sex distribution is massively worse in X than in Y; also, the overall level of literacy is a little worse in Y than in X. Yet, it can be confirmed, employing (1), that Rc fails to discriminate between the two situations: R c
x = R C
Y = 0.36125. For those who have an 'innate, ethical' objection to gender bias in well-being (including literacy) outcomes, situations X and Y cannot be treated indifferently, as the index Rc would invite one to do. In comparing alternative situations, therefore, it is important that one should be informed not only by the aggregate efficiency loss occasioned by the presence of isolated and m-proximate illiteracy, but also by a more disaggregated picture which decomposes the inefficiency into what have earlier been called its 'isolationism' and 'gender-segmentation' components.
Plural Goals in Planning for Literacy
Finally, the third objective of this note - an examination of the complications that can arise from a pursuit of multiple objectives in planning for literacy - is addressed in what follows, again by resort to a simple example. Consider an illiterate society of M households (M even), each of which contains exactly two members - one female and one male. (The size of the population is, therefore, 2M). Suppose the society has resources which suffice to enable exactly M persons to become literate. Let us confine attention to just four of the several possible distributions of literates across households which can be achieved with

© NIEPA
S. Subramanian 253
the available resources, and let us label these distributions A, B, C and D respectively. The four distributions are described below:
Distribution A: 1 female literate from each household. Distribution B: 1 male literate from each household. Distribution C: 1 male literate and 1 female literate from each of M/2
households. Distribution D: 1 male literate from each of the first M/2 households and 1
female literate from each of the remaining M/2 households.
The value of the 'externality-corrected' literacy measure Rc can be easily computed for each of these distributions. Table 1 provides a quick summary of the value of Rc for each of the distributions A, B, C and D; it also ranks the distributions, in descending order, according to efficiency (that is, in terms of the measure R c ) , and according to inter-household equality (denoted by E h) and gender equality (denoted by Eg) in the attainment of literacy. In addition, each distribution is awarded a score which is simply the sum of the ranks of the distributions according to R c , Eh and E g. (Since the ranking everywhere is in descending order, the lower the score of a distribution, the 'better' it is.)
TABLE 1 Some Features of the Distributions A, B, C and D
Distribution R1 Ranking of Distribution Score of Distribution = Sum of According to Ranks according to Rc, Eh and Eg
R( Eh
A 0.5 1 1 2 4 B 0.5-0.255 3 1 2 6 C 0.25 4 2 1 7 D 0.5- 2 1 1 4
0.1255
Note: Rc stands for the 'externality-corrected' literacy measure; Eh stands for inter-household equality; and Eg stands for gender equality.
For the most part, Table 1 is self-contained and self-explanatory: its main purpose is to demonstrate that the simultaneous pursuit of alternative objectives is not always harmonious. Since the data presented in the Table require no elaborate commentary, the discussion wil l be confined to just two observations. Notice, first, that the 'best' distribution in terms of efficiency (Distribution A) is also the best in terms of inter-household equality, while the worst distribution in terms of efficiency (Distribution C) is also the worst in terms of inter-household equality, which is precisely in consonance with the point made by Basu and Foster; however, it also turns out that Distribution A is (one of the two) worst,

© NIEPA
254 Inter-Household and Gender Equity, Efficiency, and the Measurement of Literacy
and Distribution D (one of the two) best, in terms of gender equality. Amartya Sen (1992) has pointed out that the question 'equality of what? is an important one: as we have just seen, equality in the inter-household distribution of literacy can severely compromise the prospect of gender equality and vice versa. On the ground, this could be a matter of some significance. For example, if for some reason Distributions B and C were the only feasible ones, then a patriarchal society could always seek justification for favouring B over C on grounds of the greater inter-household equality delivered by the former, while glossing over the issue of gender equality (note that the share of female literacy is zero in Distribution B and one-half in Distribution C, describing, between them, the polarities of complete gender-inequality and perfect gender-equality respectively).
Second, Distribution D is the best one in terms of the pursuit of equality, whether equality is assessed across households or the sexes; but it turns out not to be the best in terms of efficiency. Here again, an observation of Sen is relevant. Discussing the so-called 'ethical' measures of income inequality, he warns against conflating the welfare (or efficiency) loss arising from inequality with inequality per se (see Sen, 1978). If equity and efficiency pull in opposing directions, some sort of 'balancing out' is clearly called for. In the present context, since none of the distributions A, B, C and D dominates all the others in each of the dimensions of efficiency, inter-household equality and gender equality, one might have to look for a tradeoff amongst these criteria. One possible tradeoff is afforded by choosing the distribution which displays the best overall score: in the present case, Distributions A and D, with an aggregate score of 4 each, tie for the top spot. With alternative structures of differential weighting of the dimensions, depending on the values one wishes to stress, one will obtain different results. The moral, in a general way, is a familiar one: with multiple social objectives (for example, equity and efficiency), and with multiple dimensions along which a given objective has relevance (for example, inter-household and gender equity), making 'best' choices is not always an uncomplicated exercise.
Concluding Observations
Stated briefly, this note suggests that, while well-being indicators like Rc are useful refinements of 'crude' indicators like R, the planner using these measures should acquire a clear understanding of their meaning and scope before employing them in computations to obtain a ranking of alternative relevant social states. The issues that have been examined in this connection are ones that lend themselves to really rather simple analytics; but they are presumably of some pragmatic salience, because the Basu-Foster framework does more than afford a handle for just measuring literacy: it points to larger planning and policy

© NIEPA
S. Subramanian 255
considerations, entailing questions of both efficiency and equity, related to the optimal allocation of scarce resources toward the alleviation of illiteracy.
References
Basu, K. and J.E.Foster (1998). "On Measuring Literacy", Economic Journal 108, pp. 1733-49.
Sen, A. (1978). "Ethical Measurement of Inequality: Some Difficulties", in W. Krelle and A.F.Shorrocks (eds.) Personal Income Distribution. Amsterdam: North-Holland.
Sen, A. (1992). Reexamining Inequality. New York: Russell Sage Foundation. Subramanian, S. (2002). "Measuring Literacy: Some Extensions of the Basu-Foster
Framework", Journal of Development Economics (forthcoming).

© NIEPA
Journal of Educational Planning and Administration Volume XVII No. 2, April 2003
HIGHER EDUCATION
REVIEW Contents Volume 35 Number 3 Summer 2003
3 What future for higher education? by Roger Brown. The author. Principal of Southampton Institute of Higher Education, discusses the implications of the Government's recent Strategy Paper on higher education.
23 Preparing and developing university teachers: an empirical study by Tom Bourner, Linda France and Alison Atkinson. A report of the results of a survey of the learning and teaching methods which are used by the courses aimed at preparing academic staff for teaching in British universities. The authors are from the Universities of Brighton and Sussex.
42 Was that it? An analysis of the Subject Review system from October 2000 to June 2002 by Roger Cook. The author, from Napier University, reports on some of the main trends in the final round of 'universal' subject review visits in England and Northern Ireland, and the academic review visits carried out so far in Scotland and some English universities.
57 Higher education - the flexible employment sector? by Jill Scott, Clare Ridgley and Peter Spurgeon. This article considers the extent to which policies and practices promoting work-life balance (so-called 'family friendly' policies) have been taken up within the higher education sector. The authors are from Staffordshire University and Birmingham University.
74 Notes from North America: Getting into university and staying there and Wrestling with Title IX by Paul Alper.
79 Books: Is the university possible? by Michael Rustin. Other books reviewed by Bruce Macfarlane and Patrick Ainley.
93 Select annotated list of publications received, compiled by Patricia Worgan.

© NIEPA
Journal of Educational Planning and Administration Volume X V I I No. 2, April 2003, pp. 257-267
Research Notes/Communications
Post-secondary Education Persistence A Comparison between Urban and Rural
Students Wenfan Yan "
Abstract
This study identified and analysed both individual and institutional effects on post-secondary persistence in the USA rural and urban students by utilizing a national representative sample from National Education Longitudinal Study (NELS 88/94). A logistic regression model was used to estimate the relative contribution of individual demographic background factors and family background variables, academic and social integration ,and college experiences on post-secondary persistence. After taking all individual and family background factors into account, the results indicated that financial and number of courses taken in science and discussion of the college with parents were the significant factors contributing to post-secondary education persistence.
Purpose of the Study
The issues of post-secondary persistence in rural and urban students have attracted considerable attention from policy makers, educational researchers, teachers, school administrators and parents. Studies have found that there are significant differences in educational persistence between students from rural and urban areas with students from suburban areas. Although both rural and urban populations have been shown to attend school longer, the gap in college completion rates between students from rural and urban areas and students from suburban areas has grown wider with each decade during the last 30-year period. Suburban students' completion rates consistently exceed those of their rural and urban counterparts (e.g., Herzong & Pittman, 1995). As the educational research literature documents, there are serious adverse consequences for individuals,
' Paper presented in the International Conference on Equity & Efficiency in Higher Education in 21 s t Century (Xiamen, China: Xiamen University, 26-28 September, 2002). This research was supported by a grant from the Center of Rural Pennsylvania. Opinions reflect those of the author and do not necessarily reflect those of the granting agencies. *' Davis Hall 303, Indiana University of Pennsylvania, Indiana, PA 15701, USA, E-mail: [email protected]

© NIEPA
258 Post-Secondary Education Persistence
institutions, and society when students fail to complete a college education. Given the recent accountability movement in higher education, high drop-out and low graduation rates are considered by the general public as signs of institutional failure. The higher education institutions cannot afford to be perceived as inefficient users of taxpayers' dollars. From the educational policy point of view, if any mediation is to be taken, it is necessary to investigate when and how such a phenomenon occurs'and what factors contribute to it.
The primary purposes of this study are: (a) to describe the characteristics of post-secondary persistence of high school graduates from rural and urban areas; and (b) to identify the factors influencing the post-secondary persistence in high school graduates from rural and urban areas.
Perspectives/Theoretical Framework
Many studies have focused on finding explanatory factors for the lower level of post-secondary persistence in high school graduates from rural and urban areas. Research in the field of sociology has shown that family SES is the primary factor that influences individual access to education beyond high school. On average, rural and urban family SES is below the average SES of their suburban counterparts (e.g., Swanson & Butler, 1988). Research in the field of psychology suggests that educational aspirations are important. There is considerable evidence that the educational aspirations of rural and urban youth lag behind those of their suburban counterparts (e.g., Camburn, 1990; Haller & Virkler, 1993; Khattri, Riley, & Kane, 1997).
Tinto's Integration Model has been frequently cited as a conceptual framework for the determinants of post-secondary education persistence. His model focuses on institutional characteristics that promote the social and academic integration of students (Tinto, 1975, 1982, 1988, 1993). Tinto's studies have shown that many students leave college when they fail to meet the academic demands of their schools. Their failure, in turn, can be traced back to their poor academic performance in high school and their lower academic ability. Tinto referred to this process as academic integration. Another important way, in which students can become integrated into college life, is by participating in formal and informal social systems. Students who join groups or subcultures of their schools may develop social bonds that result in their heightened commitment to their schools. Tinto referred to this process as social integration.
Previous research conducted on post-secondary persistence has three major limitations. First, Tinto's model focuses on post-secondary persistence in general. Whether the integration model proposed by Tinto is able to explain the discrepancies in post-secondary persistence between high school graduates from rural and urban areas with those from suburban areas is not clear. Second, previous studies on examining persistence issues have been limited to either a

© NIEPA
WenfanYan 2 5 9
few family variables or a few institution factors, such as family socio-economic status, family size, type of institution structure, student body composition, etc. Although these variables would allow educators to estimate the influences of these variables on the post-secondary persistence, many of these variables are difficult to change and are beyond the control of educators. Third, many previous studies dealing with the post-secondary experiences of youths from rural and urban areas relied on relatively small, local convenience samples. The generalizability of the results from these studies is quite uncertain, and the extent to which the findings could be generalized to inform educational policy is largely unknown.
To address limitations that exist in previous research, this study identifies and analyzes both individual and institutional effects on post-secondary persistence in rural and urban students by utilizing a national representative sample from NELS 88/94. Rich information provided by NELS 88/94 allows us not only to identify the family and school factors influencing post-secondary persistence in high school graduates from rural and urban areas, but also to analyze how and why the discrepancies between rural/urban and suburban students exist.
Data Source
The NCES has collected extensive data on the condition of post-secondary education. For the purpose of this study, we need a dataset that has a longitudinal nature and is able to extract high school graduates from rural, urban and suburban areas. Based on this criteria, we utilize the NELS 88/94 database as our data source.
The NELS 88/94 is the most comprehensive research database that has been collected by NCES currently. NELS: 88/94 surveyed a cohort of eighth graders in 1988 and subsequently followed them at two-year intervals through 1994. The first follow-up in 1990 provided the data necessary to understand the transition from elementary to secondary education. In the Spring of 1992, when most of the NELS sample were twelfth graders, the second follow-up took place. This survey focused on transition from high school to the labour force and post-secondary education. In Spring of 1994, the third follow-up was administered. Sample members were questioned about their labour force and post-secondary experiences and family formation.
NELS 88/94 is particularly well suited for our research purpose. First, NELS 88/94 contains extensively detailed information about high school experience and post-secondary school experience. This allows us to investigate the status and factors influencing the persistence of post-secondary education. Secondly, NELS 88/94 consists of a nationally representative sample of

© NIEPA
260 Post-Secondary Education Persistence
approximately 24,000 students. This provides us with adequate number of students from urban and rural areas.
Measure of Variables
Post-secondary education persistence. In this study, the post-secondary education persistence was defined as the students who were continuously enrolled (at any level of the institution, full-time or part-time) from the time he/she first enrolled in Fall 1992 and remained enrolled in Summer of 1994.
Family demographic background. This variable includes gender, race, ethnicity, and socio-economic status.
Academic preparation and expectation. NELS 88/94 data contains extensive information about academic preparation for post-secondary education and educational, occupational aspiration of students. Academic preparation includes: (a) number of tests taken for admission into post-secondary education (SAT and ACT); and (b) number of courses taken in science (physics, chemistry, and biology). Academic expectations have three levels: (a) high school or less; (b) some PSE; and (c) bachelor's or higher.
Social integration. This variable includes: (a) the importance of having strong friendships; (b) number of friends with no plans for college; (c) frequency of discussion about going to college with parents; and (d) level of importance peers attribute to study. This integration variable only measures high school experiences.
College experiences. This variable includes: (a) type of institution (public, private, two-year college, and four-year college, etc.); and (b) the number of financial aid received (scholarship, government grants, loans, work-study, etc.).
Data Analysis
Data analysis includes two stages. The first stage of data analysis is focused on descriptive statistics to describe the characteristics of post-secondary persistence in high school graduates from rural and urban areas. This descriptive analysis is focused on the following variables: individual demographic background and family background, academic and social integration, and college experiences.
The second stage of data analysis is focused on establishing a comprehensive statistical model to predict post-secondary persistence in high school graduates from rural and urban areas. Since our dependent variable, post-secondary education persistence is an ordinal variable, a logistic regression model was used to estimate the relative contribution of individual demographic background factors and family background variables, academic and social integration, and college experiences on post-secondary persistence.

© NIEPA
WenfanYan 261
Results
Family background and individual characteristics. Table 1 displays the family background and individual characteristics of the students who are persistent and not-persistent from rural and urban areas. There are no significant differences in gender distribution between the persistent and not-persistent students from urban and rural areas. There is a higher proportion of black and Hispanic students from the urban area than from the rural area. There is a similar pattern among the not-persistent and the persistent students. Socio-economic status is significantly related to post-secondary persistence. For the students who graduated from the urban area, the higher SES students are almost four times as likely as the lower SES students to be persistent (46% vs. 10%). For the rurai area, the higher SES students are almost three times as likely as the lower SES students to be persistent (35% vs. 13%).
TABLE 1 Per cent of Students who are Persistent vs Not-Persistent by Family
Background and Individual Characteristics
UrbVn W Variable Not Persistent Persistent Not Persistent Persistent Female 55.1 55.5 52.7 54.6 Black 26.1 18.5 8.1 6.7 Hispanic 17.8 11.4 7.0 4.8 S E S
Quartile 1 21.7 10.2 24.7 12.9 Quartile 2 24.8 18.1 30.2 22.2 Quartile 3 31.0 25.6 27.8 29.7 Quartile 4 22.5 46.0 17.3 35.2
Academic integration. Table 2 displays the academic integration of students who are persistent and not-persistent from rural and urban areas. Student post-secondary expectations are significantly related to persistence. For the students who graduated from urban schools, a significantly higher number of persistent students have a bachelor's or higher expectations than students who are not-persistent (92% vs. 76%). For the students who graduated from rural schools, a significantly higher number of persistent students have a bachelor's or higher expectations than students who are not-persistent (88% vs. 60%). The number of PSE admission tests taken are significantly related to post-secondary persistence. Almost 92% of the persistent students took at least one admission test as compared with 74% for not-persistent students who graduated from the urban area. There are similar patterns for the rural area. About 94% of the persistent students took at least one admission test vs. 76% of not-persistent

© NIEPA
262 Post-Secondary Education Persistence
students who graduated from the rural area. The data indicate that the number of courses taken in science is a significant factor of post-secondary persistence. About 71% of not-persistent students did not take any science courses. By contrast, 63% of the persistent students who graduated from the urban area have taken at least one. There are similar patterns for the rural area. About 70% of not-persistent students from schools in the rural area have not taken any courses in science. By contrast, 67% of persistent students from the rural area have taken at least one course in science.
TABLE 2 Percent of Students who are Persistent vs Not-Persistent
by Academic Integration
Urban Rural Variable Not-Persistent Persistent Not-Persistent Persistent PSE Expectations
High School or Less 0.7 0.0 1.8 0.2 Some PSE 23.7 - 8.0 38.0 12.3 BA or Higher 75.6 92.0 60.2 87.5
Admission Test for P S E None 26.1 8.2 24.3 5.6 One 47.1 51.6 47.0 50-8 Two 22.9 31.7 24.3 35.3 Three 3.8 8.0 4.3 8.0 Four 0.0 0.6 0.0 0.4
Course Taken in Science None 71.5 37.3 70.4 33.1 One 15.8 35.1 18.8 37.2 Two 12.0 23.1 9.7 23.9 Three 0.6 4.6 1.1 5.7
Social integration. Table 3 shows the social integration of students who are persistent and not persistent from rural and urban areas. The variables of importance of having strong friendships and the level of importance peers attribute to study do not have a significant relationship with post-secondary persistence. The number of friends with no plans for college and discussing going to college with parents both have a significant relationship with persistence both in rural and urban areas. A higher proportion of not-persistent students compared with persistent students from urban areas have friends with no plans for college (70% vs. 43%). There are similar patterns for the rural area. About 72% of not-persistent students have friends with no plans for college and 61% of persistent students have friends with no plans for college. A higher proportion of not-persistent students compared with persistent students from

© NIEPA
WenfanYan 263
urban areas have never discussed going to college with parents (12% vs. 5%). There are similar patterns for the rural area. About 12% of not-persistent students never discussed going to college with parents and 4% of persistent students never discussed going to college with parents.
TABLE 3 Per cent of Students who are Persistent (P) vs Not-Persistent (NP)
by Social Integration
Urban Rural Variable NP P NP P Important Having Strong Friendships
Not Important 5.5 1.0 1.7 0.6 Some Importance 19.3 12.7 19.9 16.1 Very Important 75.2 86.3 78.5 83.3
Friends with No Plans for College None of Them 29.9 43.2 28.0 38.6 A Few of Them 44.9 35.1 37.8 39.8 Some of Them 13.4 11.0 19.5 9.9 Most of Them 8.7 7.0 11.0 7.4 All of Them 3.1 3.7 3.7 4.3
Discussed Going to College with Parents Never 11.8 4.8 12.3 3.5 Sometimes 49.6 37.0 49.1 38.2 Often 38.7 58.2 38.7 58.3
Among Friends How Important to Study Not Important 9.2 7.2 12.3 9.0 Some Importance 53.1 45.2 57.3 5 U Very Important 37.7 47.5 30.4 39.9
College experience. Table 4 reveals the college experience of students who are persistent and not-persistent from rural and urban areas. The type of institution, financial aid and full-time status all have a significant relationship with persistence both in rural and urban areas. For example, a higher proportion of persistent students compared with the not-persistent students from urban areas have two or more forms of financial aid (21% vs. 13%). There are similar patterns for the rural area. About 24% of persistent students receive two or more forms of financial aid, whereas 19% of not-persistent students receive two or more forms of financial aid.

© NIEPA
264 Post-Secondary Education Persistence
TABLE 4 Percent of Students who are Persistent vs Not-Persistent
by College Experiences
Variable Urban Rural
Variable NP P NP P Type of Institution
Private for Profit 9.9 1.7 8.1 0.8 Private NFP < 4 Year 3.1 0.4 1.7 1.0 Public < 2 year 1.7 0.2 Public 2-Year 45.0 24.3 48.3 27.1 Private NFP 4-Year 9.9 28.1 8.7 20.7 Public 4 Year 32.1 45.5 31.4 50.3
Financial Aid Zero 45.2 37.9 40.3 32.8 One 40.1 29.3 37.6 31.4 Two 12.7 20.8 18.8 23.7 Three 1.9 11.4 3.2 11.9 Four 0.0 0.6 0.0 0.2
Full-Time Students 84.1 92.6 83.9 94.1
Multivariate results. The results from the cross-tabulation presented above indicate that factors such as socio-economic status, number of courses taken in science, number of friends with no plans for college, and discussing going to college with parents have a significant relationship to persistence. Because these factors may correlate with each other, it might be crucial to conduct a logistic regression analysis to examine these factors simultaneously. The results of multiple logistic regression analysis are presented in Table 5 and Table 6 for urban and rural students respectively. Model one in Table 5 and Table 6 indicates that SES status has a significant effect on post-secondary education persistence. Model two added academic integration into consideration, after adjusting for family background and individual characteristics. For the urban students, SES remained significant. The number of courses taken in science and the number of admission tests taken have a significant impact on persistence. For the rural students, SES status was no longer significant after taking academic integration factors into consideration. Al l the three academic integration indicators have a significant effect on persistence. Model three added social integration into consideration. For urban students, the number of courses taken in science remained significant. Discussion of college with parents was significant. For rural students, the PSE expectations and courses taken in science remained significant. Social integration variables do not have a significant effect on persistence. Model four added college experiences into consideration. For urban students, discussion of college with parents and number of course taken in

© NIEPA
WenfanYan 265
science remained significant. Financial aid has a significant effect on persistence. For rural students, number of courses taken in science remained significant. The number of financial aid has a significant effect on persistence. These two remaining significant factors are after simultaneously adjusting for the influence of all the other predictor variables.
TABLE 5 Predictors of Persistency Using Logistic Regression for Urban Students
Predictor Model 1 Model 2 Model 3 Model 4
Female .142 (.207) .076 (.230) .122 (.266) .248 (.287)
Black -.029 (.267) -.153 (.295) .321 (.384) .128 (.417)
Hispanic -.453 (.308) -.327 (.346) -.513 (.374) -.469 (.413)
SES .433 (.103)*** .345 (.116)*** .205 (.135) .213 (.153)
PSE Expectations
.537 (.309) .453 (.343) .204 (.408)
Admission Test for PSE
.499 (.161)*** .339 (.174) .323 (.189)
Course Taken in Science
.641 (.155)*** .979 (.202)*** .755 (.212)***
Strong Friendships
.069 (.344) .214 (.358)
Friends w/o College Plans
.011 (.126) .012 (.134)
Discussed College w/ Parents
.510 (.207)** .541 (.230)**
Study Among Friends
• .095 (.211) .278 (.229)
Longest PSE Enrollment
.169 (.129)
Financial Aid .481 (.173)**
Longest FT Students
.225 (.440)
In summary, this study identified a number of characteristics of high school seniors' academic integration, social integration and college experiences that have a statistical relationship with post-secondary education persistence. After taking all other factors into account, financial aid, number of courses taken in science and discussion of college with parents are the significant factors contributing to post-secondary education persistence.

© NIEPA
266 Post-Secondary Education Persistence
T A B L E 6
Predictors of Persistency Using Logistic Regression for Rural Students
Predictor Model 1 Model 2 Model 3 Model 4
Female .171 (.186) . .018 (.209) -.142 (.230) -.183 (.240)
Black -.022 (.343) -.361 (.382) -.318 (.422) -.411 (.455)
Hispanic .046 (.410) -.144 (.475) .012 (.561) -.033 (.580)
SES .445 (.090)*** .236 (.105) .221 (.113) .228 (.123)
PSE Expectations
.814 (.236)*** .705 (.257)** .512 (.282)
Admission Test for PSE
.313 (.140)** .273 (.153) .205 (.158)
Course Taken in Science
.767 (.151)*** .791 (.161)*** .677 (.166)***
Strong Friendships
.010 (.265) -.073 (.280)
Friends w/o College Plans
-.095 (.103) -.088 (.108)
Discussed College vv/o Parents
.305 (.192) .261 (.201)
Study Among Friends
.250 (.185) .299 (.193)
Longest PSE Enrollment
.204 (.108)
Financial A id .298 (.130)**
Longest FT Students
.354 (.400)
Educational Implications
Post-secondary persistence is a crucial factor in determining access to employment and higher earnings for students coming from rural and urban areas. In order to foster post-secondary persistence in high school graduates from rural and urban areas, it is crucial to understand the process and factors associated with persistence. T h i s study has the following features that may provide valuable information for policy recommendations and implications.
First , by utilizing the existing national data, this study described characteristics and identified the factors influencing post-secondary persistence in high school graduates from urban and rural areas. T h i s descriptive data may provide valuable information for the policy makers to identify the factors

© NIEPA
WenfanYan 267
influencing post-secondary persistence and promote post-secondary persistence for the students from rural and urban areas.
Second, by analyzing the social and academic integration of high school graduates from rural and urban areas, this study examined the factors influencing post-secondary persistence, such as post-secondary academic preparation, educational expectations, social integration and financial aid. Parents, teachers and counsellors are able to utilize this information to prepare high school students for post-secondary education and to maximize their success in higher education. Colleges and universities may be able to utilize this study to make institutional accommodations to meet the needs of students from rural and urban areas.
References
Camburn, E . M . (1990). College Completion Among Students from High Schools Located in Large Metropolitan Areas. American Journal of Education, 551-569.
Haller, E . J . , & Virkler, S.J. (1993). Another Look at Rural-Nonrural Differences in Students' Educational Aspirations. Journal of Research in Rural Education, 9, 170¬178.
Herzog, M.J.R., & Pittman, R .B . (1995). Home, Family, and Community: Ingredients on the Rural Education Equation. Phi Delta Kappan, 77, 113-118.
Khattri, N., Riley, K .W. , & Kane, M.B. (1997). Students at Risk in Poor, Rural Areas: A Review of the Research. Journal of Research in Rural Education, 13, 79-100.
Swanson, L . L . , & Butler, M.A. (1988). Rural Workers in the National Economy. In D. L . Brown, N. Reid, H. Bluestone, D.A. McGranahan, & S.M. Mazie (Eds.), Rural Economic Development in the 1980S: Prospects for the Future. (Rural Development Research Report No. 69.) Washington, D.C. : U.S. Department of Agriculture.
Tinto, V. (1975). Drop-out from Higher Education: A Theoretical Synthesis of Recent Research. Journal of Higher Education, 52, 687-700.
— (1982). Limits of the Theory and Practice in Student Attrition. Journal of Higher Education, 52, 687-700.
— (1988). Stages of Student Departure: Reflections on the Longitudinal Character of Student Leaving. Journal of Higher Education, 59, 438-455.
— (1993). Leaving College: Rethinking the Causes and Cures of Student Attrition, Chicago, I L : The University of Chicago Press.

© NIEPA
Journal of Educational Planning and Administration Volume XVII No. 2, April 2003
New Journal from Serials
******************************* **************** * • AN I N T E R N A T I O N A L J O U R N A L OF D E V E L O P M E N T E C O N O M I C S * *
* V.B. Jugale % Professor & Head, Department of Economics • Shivaji University, Kolhapur 416004 * Maharastra (India)
I N D I A N D E V E L O P M E N T R E V I E W JOURNAL OF DEVELI
C h i e f E d i t o r :
* * *
*
*
* * * *
* *
* * * *
*
*
V o l u m e 1 No. 1 J u n e 2 0 0 3
Chief Editor
V.B. Jugale, Ph.D. Professor & Head
KollJpur-416 004 (India) Editorial Board Christoper Gan Lincoln University, New Zealand D.C. Sah Centre for Social Studies. India Epaminondas Panas Athens University of Economics and Business, Greece H.G. Mannur Western New England College, USA N.S. Hiremath Kamitaka University. India Pradit Charsoinbut Kasetsarl University. Thailand R.S. Deshpande Institute Jor S«wl ami Uvnomk Cliange. India S.K. Thorat jawaharlal Nehru University, India Sukor Kasim University Sains Malaysia. Malaysia N.R. Vasudeva Murthy Creighlon University. USA William R. Dipietro Daemen College, USA
C O N T E N T S
Effect of Financial Constraints on Inventory Investment
TVS. Ramamohan Rao, Anita Singh
Globalisation and Balance of Payments Experience of India
G. Ramakrishna
The Microeconometrics of Selective Samples and Discrete Choice
T. Lakshmanasamy
Energy Consumption and Economic Growth in India: A Note
Shyamal Paul, Rabindra Nath Bhattacharya
Globalisation and its Relevance for North-East India: A Policy Perspective
A.K. Agarwal
Analysis of Environmental Kuzenets Curve Using Regional Time Series Data
Epaminondas Panas, Vassilia Ninni
Impact of Economic Reforms on Agricultural Terms of Trade in India: An Econometric Analysis Using Modified Kinked Exponential Model
K. Dhanasekaran
! «
I I «
***********************************************
Annual Subscription Rates Institutional Rs. 1000.00 or US$125.00
S E R I A L S P U B L I C A T I O N S Head Office : 4. B.S.S. Hall, Khyber Pass Market, Civil Lines. Delhi -II0 054 (India) Phone No. 91-11-23245225 Fax No.: 91-11-23272135 E-mail: [email protected] Branch Office : 4830/24 Ansari Road, Daiya Ganj, New Delhi-110 002 (India)

© NIEPA
Journal of Educational Planning and Administration Volume X V I I No. 2, April 2003, pp. 269-294
BOOK REVIEWS
CHAPMAN, DAVID and ADAMS, DON (2002): The Quality of Education: Dimensions and Strategies, Education in Developing Asia, Volume 5, Hong Kong, Asian Development Bank and Comparative Education Research Centre of the University of Hong Kong, ISBN 971-561-407-8, Pages: 72 (Paperback),
This booklet is the fourth volume of the series on "Education in Developing Asia", jointly brought out by the Asian Development Bank (ADB) and the Comparative Education Centre of the University of Hong Kong. It deals with the issue of the quality of education in the developing member countries (DMCs) of the ADB. The first section of the book discusses the very concept of the quality of education and the second, some of the school related factors related to quality of education. In the third section, certain policies and strategies for improving the quality of education are proposed.
The first section speaks of the general lack clarity in understanding the concept of the quality of education. In the prevailing confusion, quality of education may refer to input (teachers, teaching-learning materials, etc.), processes, (teaching and learning), output (student achievement) and outcome (performance in employment). The booklet does not attempt at a clearer concept of the quality of education, but is interested to show that "many dimensions can be identified and addressed" (p.2) in the matter of the quality of education. The authors seem inclined to subscribe to the concept of the quality of education as a measure of student achievement and to accept that quality of education can be raised through improvement in the input (human and material) and the process within the educational institutions.
The second section deals with the three school-related factors in the context of the quality of education, viz. teacher and teacher performance; curriculum or the contents of teaching and learning; and management or administration of schooling. Much of the discussion in this section is on teacher and teaching. A few of the research studies done in some of the Asian countries on this issue are referred to in order to show the importance of the teacher role in providing quality education in schools. In this context teacher training, remuneration and incentives to teachers, and teacher empowerment and motivation are pointed out as important factors that contribute to improvement in teacher performance. With reference to curriculum, the booklet tangentially mentions four issues relevant to quality education: well developed curriculum for each grade with clear objectives, acceptance of the curriculum by teachers, overburdened curriculum contents, and poor alignment or correspondence between curriculum contents and textbooks. With regard to management or administration of education, the booklet advocates decentralisation and emphasises the need for

© NIEPA
270 Book Reviews
school level management including school-community relations for achieving quality education.
The third section suggests certain policies and strategies for improving the quality of education. The suggested policies are decentralisation in the management of educational institutions, development of well-designed curriculum, and strengthening of research and innovations in school education. With special reference to the teacher role, the booklet speaks of recruiting qualified teachers, enhancing their competence through training and other programmes of capacity building, and improving their motivation through incentives. Other relevant suggestions include redefining management roles and improving the system of monitoring and evaluation.
Substantively, the booklet deals with teacher role, contents of education (or curriculum) and management of education as aspects relevant to quality of education. The rationale for selecting them for discussion is the notion that quality of education is dependent on these three factors. It does not give any reason why other factors, such as the physical facilities and financial input are not discussed as factors contributing to quality of education. However, the authors seem to be aware of these factors as related to quality of education, because they do make some mention of them in the booklet. Reference is made to the general situation of poor physical facilities for education existing in Pakistan (p.3). Similarly, the situation of the physical facilities existing in the schools in India is mentioned in the context of the working conditions of teachers and not as factors relevant to quality of education (p. 18). On the whole, infrastructure and other physical facilities do not appear in the booklet as important factors relevant to quality of education.
The booklet has emphasised three important factors determining the quality of education, viz. teacher performance, curriculum and administration. It has suggested certain measures for improving these factors in order to achieve higher levels of quality in education. They include evolving well-designed curriculum7, developing research and innovations in education, upgrading teacher competence, improving teacher motivation, strengthening the system of monitoring and evaluation, decentralising the management of education, and getting the local community involved in education
It is well known that teacher performance, curriculum and management affect the quality of education. In that respect, there is hardly anything new in the book. The book would have made a greater contribution if the discussions were supported by conclusions from research studies from different countries. The booklet does provide some empirical data. But in most cases they are not presented systematically as supportive evidence relevant for the discussion, but are discrete illustrations from individual countries. For instance, Table 7 (p. 18) presents the working conditions of teachers of eight districts of just one country (India) and Table 10 (p.25) on the relationship between student achievement and

© NIEPA
Journal of Educational Planning and Administration Volume X V I I No. 2, April 2003
teacher gender is given only for Pakistan. One cannot find the rationale for including or excluding individual DMCs in the presentation of the data on the issues discussed. As there is no mention of the list of the DMCs in the booklet, one does not know how many of the DMCs are totally missed in the presentation of the empirical data.
Tata Institute of Social Sciences Jacob Aikara Deonar, Mumbai - 400 088 Email: [email protected]
POWAR, K B . (2002): Indian Higher Education: A Conglomerate of Concepts, Facts and Practices, Concept Publishing Company, New Delhi, pp. xi+296, Price: Rs. 500/- (Hardcover)
The book under notice is a collection of papers, published and presented by Prof. Powar in various conferences in recent years on various aspects of higher education. These are covered in five sections: Concepts and Development; the Indian Context; the Financing of Higher Education; In Search of Quality; and Distance Education. These papers collectively examine the basic concepts of higher education; evaluate the growth, development and future of Indian higher education system; review in the Indian context some critical facets of higher education system including the management of universities, autonomy and accountability, research in universities and internationalisation of higher education. Three aspects, that is, financing of higher education, quality assurance and distance education are covered in detail. It gives suggestions, guidelines and directions for the consideration of policy makers, institutional leaders, teachers, government and non-government organisations to orient national higher education system towards development and creation of agenda for the future.
In India, the modern higher education system was established in 1857 with the founding of the three universities in Calcutta, Bombay and Madras. During the yeas, it has expanded beyond all expectations, and in the process, the quality has suffered. Now, it is the second largest in the world. It has been compared to a monolith with a large core of mediocrity surrounded by a thin and discontinuous rim of excellence. The large core of mediocrity is a matter of deep concern and the rim of excellence a matter of pride and hope.
The need for reform in higher education has been stressed by various commissions and committees. The Education Commission (1964-66) emphasised that there had to be a radical improvement in the quality and standard of higher education and research; an expression of education to meet manpower requirements of the nation and the rising social ambitions and expectations of people; and an improvement of the university organisation and administration. The Ramamurthy Committee (1990) further emphasised that the quality of higher

© NIEPA
272 Book Reviews
and technical education is to be improved in real terms not only to make them more relevant to our society but also to cater to the needs of competitive industry, indigenisation of technology, including research and development therein and their application.
It is felt that the system has not been able to change much and it has not been possible to maintain a uniform standard of education. So, it is desirable to make systematic changes that will enable the implementation of academic reforms. There is a need to improve the infrastructure and facilities in less privileged institutions. For survival, it is desirable to grant greater degree of autonomy to institutions, implement examination reforms, reduce administrative obesity and improve administrative efficiency. The open universities have an important role to play. However, there is a need for greater commitment on the part of all stakeholders and resources must be found for the academic institutions.
The political, economic and scientific development of the 1990s, especially the breakdown of political barriers, the emergence of free-market economy and the progress in information technology have highlighted the need for globalisation of education. A paradigm shift towards learner-centred, life-long education has opened up new exciting possibilities for formal, open and distance learning.
Regarding the future of the university, F.H.T. Rhodes (1999) visualised that the new American University would be one possessing institutional autonomy and academic freedom but with strong impartial public governance increasingly privately supported but publicly accountable and socially committed, campus rooted but internationally oriented, academically independent but constructively patterned; knowledge based but student centred; research driven but learning focussed; technically sophisticated but community dependent; quality obsessed but procedurally efficient and professionally attained but humanely informed. In the Indian context, Powar adds that the new university would be open to all who desire to enrol but ensure a close teachers-student relationship, be development-oriented, yet laying stress on values (pp. 23-241).
There is a suggestion that reforms and innovations have to be based upon a proper understanding of the factual position and a clear perception of future requirements. The author has presented a conceptual framework that attempts to depict the possible relationship between educational research, on the one hand, and policy formulation and reform, on the other. The foundation blocks include empirical research carried out in the spirit of academic inquiry, micro-studies on specific aspects of higher education, experiments and innovations carried out in classrooms and in the field, and external experiences from foreign countries. Lateral networking and interaction should result in a pool of collective experience leading to the development of a paradigm, which in turn could give rise to a proposal. The proposal on analysis, evaluation, discussion and criticism

© NIEPA
Book Reviews 273
could lead to the generation of a policy, which on administrative scrutiny, must result in reform (p. 66).
The higher education is essential for rational development and should receive the highest priority. It is desirable to increase the gross enrolment ratio to at least 20 per cent by the end of 2010. It is the responsibility of university managers to provide adequate research facilities to its faculty and also keep in creating proper ethos. Research must be carefully evaluated. The results will give an idea about the ability and commitment of the faculty; provide a basis for short-term and long-term planning; and for identification of areas that deserve support. Sufficient facilities and encouragement need to be provided to students to pursue research.
The leadership provided to the institution is a crucial factor in management. The chief executive needs to have a clear perception about the vision, goals and objectives of institution, a yearning for success along with willingness to accept challenges and subordinates but not over dependence on them.
Commenting on a discussion paper 'Government Subsidies in India' (1997) in which education other than elementary education and agriculture education has been classified as a non-merit service, the author writes that higher education provides the competencies that are required in different spheres of human activity. It is the primary responsibility of the State to provide the essential finance for quality higher education, but at the same time, universities must supplement income from other sources and also make efforts to curtail unnecessary expenditure. The rationalisation of fee structure is essential, and tuition fees have to be gradually raised so that user contributes about 25 per cent of the academic expenses. Provision will have to be made for providing assistance to needy students. Support from industry and alumni are other alternatives. It is suggested that government continue to shoulder the major responsibility in the funding of higher education. In this context, V.S. Raju (1996) gave a model in which the running budget would have contributions from the government (35 per cent), student contributions (15 per cent), and institutional generated funds (25 per cent). It is visualised that all capital expenditure will come from government and industry. The model may be over-optimistic about the non-government contribution. However, if the model can be put into practice, it will go a long way towards solving funding problem.
The 'Programme of Action', related to the National Policy on Education (1986) called for the development of a mechanism for accredition and assessment for maintaining and raising the quality of institutions of higher educatidn. This work is being done by a National Assessment and Accredition Council and National Board of Accredition. The approach paper to the Tenth Five Year Plan admits that expansion in the quantity of universities has been accompanied by a fall in quality. It is emphasised that in the coming years, it will be necessary for all academic institutions to maintain minimum standards in all aspects of higher

© NIEPA
274 Book Reviews
education and adopt quality assurance mechanisms to ensure that their teaching and research programmes are of globally acceptable quality. Quality assurance calls for assessment, introspection and systematic planning. The present standards have to be adjudged and compared with those prevailing in better institutions. For this, carefully chosen performance indicators need to be used and benchmarking resorted to. The author considers that accredition is important from the viewpoint of maintenance of standards.
Since its establishment more than 100 years ago, in the form of correspondence courses, distance education has come along way. It is developing very rapidly, assuming new forms. The latest vision - on-line education -promises to play a very important role in the immediate future, even threatening to replace the conventional education. It is pointed out that only about 6 to 7 per cent of those in the age group 17-23 are in the conventional stream. But distance education (with 10 open universities and over 60 regular universities offering correspondence courses) is making "access and equity" a realistic dream. The open university system responds to the demands of the information age where every one has access to knowledge and information and has opportunity to grow without limitations of time and space. The existing model, of learning over a specified period of time, is being replaced by a model of life-long learning for all. The expansion of the distance education programme wil l relate to updating of skills and to knowledge enhancement. In the Indian context, both the correspondence course model and the Open University model are equally important and have a positive role to play. Distance education presently caters to the needs of 18 to 20 per cent of persons seeking the benefit of higher education. Its contribution wil l have to increase to at least 30 per cent i f the demand is to be fully met. It is pointed out that higher education is undergoing a shift from an instruction-centred college/university model to a learner-centred network model based on access to learning resources and on student initiative.
In sum, this is a nice book, though in such a volume, there is bound to be some repetition. For the interest of the reader, each paper carries references. The book wil l be of interest to a large audience including students and teachers of education, educational administrators and policy makers. The author deserves gratitude of the reader for his endeavour. Publisher has done a good job. A paperback edition of the book wil l enable many interested persons to have a copy of the book. A useful contribution.
B-58, Inder Puri, New Delhi -110012 P.C. Bansal

© NIEPA
Journal of Educational Planning and Administration Volume X V I I No. 2, April 2003
SHIGETOMI, SHTNICHI (ed.) (2002): The State and NGOs: Perspective from Asia, Singapore, Institute of Southeast Asian Studies, Singapore, ISBN 981-230¬151-8, Pages: 337, Price: not mentioned (Soft cover).
This book is of special interest not because it deals with a topic of immense contemporary interest, but also because it is a perspective from one part of Asia (Japan) and hence presents what might be called an 'internal' perspective, at least to the region, if not to each country. This set of studies tries to develop comparative insights based on country studies, it also has a high sensitivity to the special circumstances of each country.
In the introduction, Shinichi Shigetomi presents the basic analytical framework used in all the chapters (a total of 15 countries have been studied, including four from South Asia). In contrast to much of the writing on NGOs, this book does not seek to draw attention to the policy or other interventions that could increase the role and freedom available to the NGO sector. It is, rather, focused on explanation and understanding. In particular, these studies try to understand the reasons why state-NGO relations in particular countries take on a particular form.
The two key concepts used to get at this understanding are that of 'economic space' and of 'political space'. A third factor that would influence outcomes would be the characteristics of individual NGOs. The authors have tried to understand the characteristics of selected NGOs mainly by trying to identify the philosophical/ ideological orientations and social backgrounds of its members, as well as financial basis.
The economic space is essentially concerned with that area which is left uncovered by the normal operation of the state, market and community. The focus is on the state-NGO relation, that is, when the systems of market, state and community fail to perform their resource-distributing functions properly, there is room for the NGOs to emerge as a fourth category of agents to distribute resources on their own, or to interfere with the existing distribution systems, making up for or correcting their shortcomings'. The larger the economic space in any country the greater the role one would expect NGOs to be playing.
The political space is defined by the rules established by the state and that it enforces through its laws and its agents, such as the police. In particular, the concern here is with the manner in which the State regulates NGOs, as well as what the community insists upon. 'The political space for the NGOs is not determined solely by the State. Communities have a similar 'despotic dimension' in the sense that, since they supply resources to their constituent members, they can coerce their members into behaving in accordance with certain norms.'
The operation of NGOs within the economic and political space available to them does not imply that they are to be seen as purely passive agents; but the nature of their advocacy and attempts to alter the environment can also partly be

© NIEPA
276 Book Reviews
explained by these spaces. For example, the large empty space of inadequate provision by the state, community, market or NGOs explains why advocacy efforts of NGOs in the less-developed countries in Asia are often directed at increasing rather than reducing the role of the State - 'larger government and better polities'. In contrast, one would expect to find a more competitive relationship in more developed countries, explaining the advocacy for smaller governments there. Where possible, NGOs may try both to attract resources from overseas and to determine the manner of their distribution.
The use of a common framework for all fifteen countries allows comparison as also some speculation on how the State-NGO relationship may be expected to develop over time. For example, the weakness of the Bangladesh is associated with strong NGOs, which are active both in the political and the economic space. In contrast, NGOs in the Philippines operate in a large economic space but have less political space. The 'strong tradition of voluntarism' of Indian NGOs is seen as having potential to change the resource distribution system and not just make up for the system's flaws.
Overall, this is an insightful collection of studies that helps to throw light on an area that is inherently complex and often difficult to understand. Methodologically, too, the basic concepts used have been carefully constructed and used. If there can be a criticism, it is simply that in choosing to exclude the relation of NGOs with either community or market from explicit purview, one gets at times the feeling that NGOs are being credited with greater independence of thought and neutrality of behaviour than may be the case in reality. For example, it may well be true that NGOs in Pakistan and India find some of their proclaimed ideals running counter to norms and beliefs upheld by the communities amongst which they work, and this limits their effectiveness. But it could equally well be the case that these proclaimed ideals are borrowed from the West, and are not implemented because the NGOs too share the same norms and belief systems as the people among whom they work. That is, a matrix of independent and interacting agents - State, market, community and NGO - is a useful heuristic device. But, for a full explanation of real life situations and responses, the social embeddedness of each of these agents needs to be made more explicit.
This thought provoking book provides a useful tool for further study of the complex manner in which the State and civil society interact.
N C A E R , 11 IP Estate New Delhi
Ratna M. Sudarshan Email: [email protected]

© NIEPA
Journal of Educational Planning and Administration Volume X V I I No. 2, April 2003
SEAMUS HEGARTY and MITHU ALUR (eds.) (2002): Education and Children with Special Needs: From Segregation to Inclusion, Sage Publications, New Delhi, ISBN 07619-9585-4, Pages 220, Price: Rs. 230/- (Paperback).
Bracketing the colour in the title of this review (thus to make the 'in-visible' visible) can best clarify its thrust. A politically most correct tract, this volume to which education planners, education researchers and educational authorities (directors, principals) contribute is a welcome addition to the 'disabled debate' in India. This twenty-two articles strong volume sensitises education for the disabled through a conscientizing of mainstream education in our country. Hence, the opening remark of the review.
The first of its kind on this subject, this volume explores the complex ramifications of educating children with disabilities within existing educational system. Consisting of presentations made during a series of 'well-attended' and dynamic conferences held across the country, its agenda consists of sensitising 'on area suffering centuries of neglect in India', namely, how to integrate children with disabilities and learning difficulties within the mainstream education. An exciting read, this very informative volume provides a thorough introduction to this rather neglected field.
Let us first look at Mithu Alur's 'Special Policy Needs in India' in some detail because this particular article forms the theme statement of the volume under review. From within the Foucanldian paradigm, opening up the 'paternalistic' praxis, Alur's thorough overview of historical developments in this field is a trenchant critique of the continuing marginalisation of the disabled. In Alur's opinion, identifying such students into a separate, 'segregated category' as the disabled' is a policy that excludes them from all the 'provisions made for the scheduled castes, the poor, the women and the children'. Alur further argues that the existing policy implementation in a 'highly discretionary' and 'essentially exclusionary' mode, given the 'arbitrary norms of behaviour' of the 'street level bureaucrats', makes the disabled the most 'displaced' in our country. Hence, an urgent plea for a clear policy which Alur feels has not emerged, given the Mack of commitment and political w i l l ' and a much-missed 'political lobby', for example. Alur is most critical of micro-level and rather cosmetic face-lifts attempted to give a semblance of integration. Such attempts are a direct descendent of the dual practice namely, 'continuing the policy of integration' and yet on a parallel level' continuing the 'segregation policy of promoting the idea of special schools through (government) assistance to voluntary organisations. Such 'conceptual fragmentation' that pushes the disabled debate out of the public sphere worries Alur. Hence, her impassioned plea for 'examining the impediments' that 'come in the way of universalising education' and for exploring 'culture-specific paradigms' that can sensitively help 'move the education of children with special needs into its own sphere'.

© NIEPA
278 Book Reviews
Given such a stance that children with disabilities and learning difficulties, should be educated alongside their age, peers and within the same curriculum frameworks to the greatest extent possible, the volume is an exciting read about such a process of 'normalisation'. The contributors to this volume believe that the needful action is a double bind of interventions at the level of the system and at the level of the school. This bi-directional exchange is explored in this volume through a critique of policy statements as they evolved in our country. Moreover, the volume contains reports of actual interventions at the praxis level throughout India. Such attempts help sensitise the system-level interventions that consist of legislation, administrative support, resources, research and back-up support systems. The book often refers to efforts made towards teacher sensitisation.
A data-rich exploration, the most noteworthy aspect of this volume is its enrichment of the debate through 'international perspectives on policy and practice'. Interestingly, these 'international' discussions hail both from the developed and the developing countries and hence, can help the debate in India, polish its contours within a broad panorama (of 'normalisation', 'de-institutionalisation' or of providing 'least restricted environment') that defines this debate internationally. The most appealing part of the book, however, is 'equalisation of opportunity: what does it mean'?, because it gives a voice (though, of course, as transcribed by Malini Chib) to the disabled and their woes -n - worries as they see it.
And yet, somehow the volume disappoints. To begin with, its target audience appears to be neither the larger social whole nor the beneficiaries of the 'inclusionary' mode, that is, the disabled themselves. Addressed apparently to the closed group of highly placed policy makers, it faintly seeks of a typical five star conference going ga ga over current hype, politically more correct, the better. Somehow, it sounds like the typically (air) conditioned experts taking up an issue that fetches them an aware profile.
So, the entire book i.e., discourse remains properly entrenched within the liberal - democratic mode, despite the post-modernist flogging of such a discourse in this volume. In fact, Alur and her senior(s) remain as paternalistic as that they lash at and blame. They do not try to invest the 'top-down' model either. In their debate, too, the disabled get subjected to being spoken clout so much that one wonders if the disabled have a voice at all.
Hardly is a participatory note allowed to emerge. Most interestingly - despite brief and cursory references - parents do not enter this 'inclusionary' conscientization. So, there is no discussion of the urgent need for family level counselling by a team of experts if the disabled are ever to enjoy the 'inclusionary' education.
What surprises one the most is that the book allows no space for the grass-root interventions by activists who emerge from within the disabled community itself. Instead of sharing praxis notes with such 'organic intellectual' (to quote

© NIEPA
Book Reviews 279
the gramscian concept)', change the policy at the systematic level and performance will follow in the 'mantra' of this volume. The volume nicely separates the school from the system (p. 12) and hopes that by effecting changes at these levels, 'segregation' would transform into 'inclusion'.
For such a massive change, however, a conscientizing of the perception of the entire community is needed. Policy level changes at the systemic strata have never done away with the ills that plague our policy. The book never addresses such a holistic paradigm that can truly sensitise the entire community as a whole and help emerge pressure groups beyond the elitist academia or policy making circles.
The pious declarations in the book are not so democratic. The question of sharing newer educational technologies, the tools and the modalities of pedagogy, never emerges to truly sensitise the education for the disabled by/through opening up the educational space. For example, can the 'distance education' mode which is making the 'normal', 'regular' rejects of the academia independent stake-holders (at any age and at any place, mind you) make the disabled, too less displaced? Similarly, why not address actual issues of how to make the 'inclusive' pattern of 'disabled' education more mobile? If education reaches out to the (most disadvantaged amongst the) disabled, it will really be conscientized and be truly spread-out.
True, the book is replete with accounts of some experiments tried out at various places across the country. But a reading of these reports does not appear convincing to the effect that a truly de-centralised and inclusionary educational mode is emerging. On the contrary, the book gives a feel that here is very sensible token dissent about a sensitive issue that the establishment can easily co-opt, in its supposed, more from the 'missionary' to the 'visionary' position.
It helps the privileged sense the difficulties that the rejects of the mainstream face in their journey from the margins to the mainstream and hence, this book, which basically emerges from Alur's research topic discussion to make academic thinking enriched with debates about social equality. It is a welcome volume, given the current scenario where FDI is making direct inroads into the educational establishment as well.
C & T Department, S C E R T Hyderabad-500001
M. Rama Devi

© NIEPA
Journal of Educational Planning and Administration Volume XVII No. 2, April 2003
THOMAS KELLAGHAN and VINCENT GREANEY (2001), Using Assessment to Improve the Quality of Education, Fundamentals of Educational Planning - 71, Paris, UNESCO: International Institute for Educational Planning, ISBN 92-803-1215-4, Pages: 98, Price: Not indicated (Hardcover)
The need to improve the quality of education is everyone's concern in recent years, particularly during the last two decades. Concern about educational quality is not new. Various Commissions and Committees were employed and much of research work is also being done over the years and various reforms have been proposed to achieve it. One of the major reforms proposed is the use of assessment to improve educational quality. Assessment, particularly the assessment of students' learning achievement has become the object of attention in well developed and developing countries alike. Assessment has become over the years an important key to the improvement of the quality of education. It is one of the most reliable ways of identifying problems, whether these are at the system level, the school level, or at the level of students.
The book under review poses a number of queries to education Policymakers, planners, and managers have answered many of these queries. Among them, the two basic questions were in considering whether or not to invest in the use of assessment to improve the quality of education? Should resources be invested in assessment activities? And if the answer is yes, what kind of assessment and what uses of assessment information are likely to impact on the quality of education in schools? While doing so, it clarified basic concepts such as quality, standards, accountability, assessment and characteristics of assessment and stressed the need to improve assessment in external examination and in everyday teaching in classrooms as it requires only a marginal increase in expenditure, since considerable amount of money is already spent in this direction.
It is understood that the purpose of this book is to provide the assessment options with advantages and disadvantages based on research and other kinds of evidence to the educational planners, administrators and managers. Assessment is described as a level of change in education systems leading to improve quality and higher standards of learning. The effects of assessment on curricula teaching and learning were also described. In this book, assessment is considered as an important instrument to improve educational quality, standards and accountability. These terms, along with the ideas of assessment in education, forms and purposes of assessment, the use of assessment information to evaluate schools and systems were also clarified with suitable explanation. In assessing the quality of education the focus was shifted from inputs to outcomes of education.
While mentioning many meanings and uses of assessment and current reform movements, the three main characteristics of an assessment that effect the quality

© NIEPA
Book Reviews 281
of education namely, a focus on student achievements, an assessment carried out by an agency outside the school and the expectation that assessment will act as a level of reform were pin-pointed. How these three characteristics apply to national and international assessments were described effectively with factual information. The book contains information and explanation about the meaning of national assessment, the two Models of national assessment derived from United States National Assessment of Educational Progress (NAEP) and United Kingdom's assessment need for carrying out a national assessment and growth in national assessment activity. It was explained how effectively different countries carried out these assessments with the support of UNESCO-UNICEF and HEP and with the support of World Bank and other agencies. Not only the findings were discussed but the national assessments were also assessed. The areas where the national assessment failed were focused. A variety of procedures that have been used to describe students' achievement in national assessments were stated.
While focusing the rapid spread of national assessment activity throughout the world during 1990s, the book emphasized the need for objective and systematic information about the quality of student learning at several planning and decision-making levels in the education system, the quality of assessment, the action that is taken to communicate results to those who can act on them (national, regional and local administration; curriculum developers, teachers and teacher educators) and the extent to which the assessment is aligned with other instructional guidance mechanisms in the education system. National assessments are aligned with other major instructional guidance mechanisms in the educational systems such as assessment systems, curricula, teacher education, school capacity building and measures to address inequalities.
Whereas international assessments share many procedural features with national assessments but wil l , of course, require the agreement of the participating countries. A brief description of the advantages and disadvantages of participating in an international assessment is given with respect to cost-involvement. The characteristics of international assessment as well as examples of how the information provided by assessments used, were explained.
The book under review stresses that following a decision to undertake a national assessment, a decision has to be made about the curricular areas to be assessed. Issues in international assessments, problems that arise in participating in an international assessment, the uses of international assessment data were also discussed by illustrating number of countries as examples. In addition to this, it was described how the student achievement data could be used to evaluate schools and also the factors that affect student achievement and the impact of national assessment data on schools. In the final chapter, decisions involved in the design of an assessment, and the way information derived from an assessment must be used, are described.
© NIEPA
Journal of Educational Planning and Administration Volume XVII No. 2, April 2003
While, at the same time, recognizing that national assessments are not the only way of monitoring performance and enhancing quality, the authors present and discuss in an extremely clear and concise way the most important factors to be taken into account when reflecting upon the use of assessment within a specific national context. They also warn that commitment to national assessment should not lead to a neglect of the need to improve other forms of assessment, including the system of supervision and school support, teachers' practices in their own classrooms and external (public) examinations. Policy-makers were advised to strive to ensure that national assessments are aligned with other major instructional guidance mechanisms in the education system, not only with other assessment systems, but with curricula, teacher education, school capacity building and measures to address inequities. In the absence of such alignment, a national assessment may be an ineffective instrument in improving the quality of education.
This topical piece is a useful work to serve as a guide to educational planners and managers, administrators, policy-makers, key stake-holders, school personnel in defining and implementing assessment strategies. This book is a must for all education institutions, libraries, researchers and also those who ever have a concern of education. It is of great use for educational planning and administration, in developing as well as developed countries, particularly in formal training programmes.
Department of Education Sri Padmavathi Manila Visva Vidyalayam Tirupati-517 502 (A.P) INDIA
Ch. Vijayalakshmi E-mail: [email protected]
HITE, STEVEN J. (2001): Reviewing Quantitative Research to Inform Educational Policy Processes, Paris, UNESCO, International Institute of Educational Planning, ISBN 92803-1210-3
Policy and research have strong linkages. The formulation of a policy draws heavily upon research findings. There may be research studies without any policy intent, but there is less likelihood of a policy without any research content embedded in it. In fact, on the basis of research findings highlighting needs and requirements, policies are formulated and programmes are designed. A sound policy may emerge from quality research only. The book under review is a significant contribution towards highlighting the inescapable linkage between research and policy processes in the field of education. It is the latest in the series on educational planning brought out by the International Institute of Educational Planning, Paris. It is useful for academicians, administrators and students interested in educational planning and administration. It describes the steps of

© NIEPA
Book Reviews 283
reviewing quantitative research such as locating relevant documents, analysing design elements of research reports, evaluating quality and usefulness of research reports and synthesizing research findings. Reviewing research literature becomes a precondition for policy making, because: (a) policies are informed by the research studies; (b) policy results become comparable; and (c) policies are evaluated.
Literature review is an important step in conducting research or preparing a research design. The book is very innovative in terms of guiding the researchers for locating the relevant research literature for designing a particular study. The strength of a particular research depends upon the formulation of appropriate research questions. And the appropriateness of a particular research question depends upon the selection of key words and terms. A broad and open question may not generate adequate and relevant information. In that case, the research questions should be specific and pointed, as the specificity gathers more relevant information. The author illustrates the use of Boolean operands in selecting key words for computer searches; gives the details of various useful web-sites for locating authentic materials in the field of education; cautions that web-based information should be used after careful scrutiny, as it might not have been evaluated; further points out that although routine library search and archives are useful yet for locating relevant literature and information, the people actively involved in the concerned field make the most useful source. The author highlights the significance of using different types of reliability and validity tests in analysing quantitative research but cautions against the dangers of limiting these instrumental tests in traditional terms. According to Hite, a holistic view should be taken about the use of data derived from a particular test with potential social and cultural impact of the data. In fact, the book gives a brief introduction to the main elements of research design such as purpose and problem, research methods and methodology, general procedures, sampling, measurement, data analysis, conclusion and generalization. A reviewer must be adequately familiar with all the research design elements that may help to scrutinize research studies effectively.
A good reviewer synthesizes research findings in bringing forth a new assertion, rather than repeating direct inferences mechanically. The reviewer synthesizes research findings in a logical manner. An outline helps in building narratives and bringing out proper synthesis. According to Hite, keeping in mind the objectives, the reviewer should classify research findings into three types i.e. essential, important and interesting. He should give maximum emphasis to the essential information followed by important information. Least coverage should be given to the interesting information which may be interesting but not necessary for the topic. The information should be incorporated according to the needs for a particular topic. The task of reviewing literature has become important, as very often questions are raised regarding the quality of research

© NIEPA
284 Book Reviews
studies currently being conducted in the field of education. This coincides with a general feeling that quality of the educational research in particular and social science in general in developing countries has been declining and is in deep crisis.
It is often found that most of the educational research studies are merely descriptive in nature confined to the use of simple statistical measures. These studies explore current educational conditions through the use of survey, questionnaires and interviews. The research findings are mainly descriptive with extensive use of tables and graphs in their presentation. The descriptive research studies have their own limitations: (a) the findings do not establish relationship between conditions; and (b) a scientific correlational or causal assertion is not possible from a descriptive research. Although descriptive research is useful for identifying potential areas for further correlational or causal research, it has limited significance with regard to its use for policy making. Policy making requires findings of inferential nature which inform about the impact of a particular strategy or intervention on the educational condition.
For inferential findings, one has to conduct correlational and causal research. A reviewer must always find out whether research under review is descriptive or inferential. A careful scrutiny of the purpose, problems, questions and hypotheses will highlight the nature of the study. Correlational research explores the ways in which variations in educational conditions are associated with one another in systematic ways. For example, the relationship between the academic performance in secondary schools and university can be established by analysing the marks achieved by students. Regression analysis may be used for predictive statistical procedures. Though correlational research has advantages over descriptive research, as it is predictive of a potential relationship, it does not establish causality. According to Hite, a distinction needs to be made between prediction and causality. A consistent pattern of relationship between test score does not establish that these scores are causally linked.
The causal research, which involves manipulation of educational condition to explore subsequent results, is of greater value for policy making. For instance, causal research will need to be conducted for finding out the impact of new curriculum on children's learning achievements. Causal research is usually of two types: (a) research conducted after actual exposure to a treatment or condition; and (b) research that actually identifies and manipulates the treatment or condition with the sample. Most of the causal research in education has been of post-hoc or post-facto nature where the treatment or exposure to a treatment has already taken place. Establishing antecedence is the most important element in establishing a case for causality. Very often this is neglected or not given adequate attention when a programme intervention is launched. Even if antecedence is established, later research does not build on the antecedence. One interesting case includes the baseline learner's achievement studies in India

© NIEPA
Journal of Educational Planning and Administration Volume XVII No. 2, April 2003
conducted for launching of a centrally sponsored scheme, called the District Primary Education Programme. The baseline studies of children's learning achievement were conducted to establish the case of antecedence for causal research at the midterm and the final stage of programme implementation. Unfortunately, the baseline benchmarks have not been followed by later researches. Some people argue that achievement being a multidimensional concept cannot be limited to the straight jacketed cause-effect relation just by conducting periodic studies. The case of experimental condition has its own limitation in educational research. Hite is right when he remarks that increased control over the experimental condition increases the internal validity of the study, but decreases the external validity at the same time. Isolating events in educational research is problematic and should be done cautiously.
On the whole, the book is very useful in raising important issues in educational research which a researcher or a policy maker should be aware of. It would serve as a useful manual or handbook for the beginners. The book, however, confines itself to the link between policy formation and quantitative research and misses the significance of qualitative research in policy making. Since a policy is supposed to take a holistic view of a particular problem or issue, qualitative research has much to offer. Furthermore, causal analysis useful for policy making can be grounded more effectively in the qualitative research than in the quantitative research. A reviewer should give equal emphasis to both types of research.
Unit for Research in Sociology of Education Tata Institute of Social Sciences, Deonar Mumbai-400088
Avinash Kumar Singh Email: [email protected]
HEPBURN, CHAUDIA, R. (2001): Can the Market Save Our Schools! Vancouver, The Fraser Institute, ISBN 0-88975-185-4, Pages: xv+193, Price not stated (Paperback).
It may be necessary to have clarity about the context in which the expression 'market' is used. It is in the context of school education in countries like Canada or the US where almost the entire schooling is state-funded and the schools are public neighbourhood schools. There has been a raging debate that these over-centralized school bureaucracies are not responsive to the demands of the parents and the student achievement performance leaves much to be desired. In this context, 'marketization' is used in the sense of promoting competition among schools. It may be between public and publicly-funded chartered schools or the competition may be between public schools and the public voucher-funded private schools. The question addressed by the book under review is whether

© NIEPA
286 Book Reviews
such a market, in which parents choose schools and schools compete tor students, would be good for education. In all the ten contributions, except one (Tooley), •market' is used in the limited sense of'competition'.
The papers included in the book are divided into three sections. The three papers in the first section address the question: Can the market save our schools? The first paper (Robson) discusses the Ontario public education and finds that it is suffocated by too much of centralization, leaving no incentive to improve achievement. It finds that "education tax credit", which offers a choice of alternative schools, is an answer to competitive schooling. Another paper examines the experience of the US with the charter schools, publicly-funded schools, which operate outside the bounds of a public school district as an effective alternative (Finn Jr.) The third (Coulson) contribution in this section goes into the history of public education system from the times of Athens to that of Mohammed to Malik Shah to that of recent private schools of the US. He concludes that more choice to parents has far more beneficial effects on their societies than state-run school systems.
The second section of the case studies in the so-called 'market education' includes five contributions of which four discuss 'market' choices in the sense of increased competition in schooling, while one (Tooley) belongs to a different category. Analyzing the experience of the US in providing choice of schooling, Hoxby suggests that increase in the parental choice improves student achievement and results in cost savings. He concludes that when parents have more choice in public sector, they are more likely to be satisfied by their public options and less likely to choose private options. The Alberta Charter School experience in Canada seems to suggest that a 'market' of competing public schools is more effective than a single district monopoly (Boserti). Educational vouchers - tuition that follows the child to the parents' choice of the school - as a form of promoting choice in the US (Greene) and New Zealand (Gaffney and Smith) - are analyzed by the other two papers. Though the American voucher system's efficacy is questioned and there has been a widespread controversy over it, Greene finds that substantial evidence from studies on parental response is positively in favour of it. New Zealand introduced voucher system for low-income students in 1990s and Gaffney and Smith report that it has been successful. Before turning to the last paper of this section (Tooley), we may take note of two presentations in the third section - one by a parent (Lewis) and another by a student (Harrel), both of whom had exercised voucher choice. The two authors have high praise for the efficacy of the voucher system and the editor turns much more eulogic about the contributions when he observes that two are "living, breathing, thinking - proof of how the market can save our schools" (Hepburn).
Now, to Tooley's "Serving the Needs of the Poor: The Private Sector in Developing Countries". It is a preposterous project for two reasons: one, it picks

© NIEPA
Book Reviews 287
up, for its own evidence, texts which are known to be making diametrically opposite points; and two, it seems to be arguing for 'market education' in the citadels of public education, the North, from the evidence that is sought to be collated from the South. Let us first analyze some of the chosen texts. It quotes from Heather-Jane Robertson, an arch suppprter of public-funded schooling, by picking up the following passage from her, No More Teachers, No More Books:
"Giving all children the opportunity to enjoy an equal education, determined not by the wealth of their communities, is a truly democratic ideal... a shared public commitment in achieving greater equity is the only reason for public schools to exist".
Tooley observes, such a belief is a rather touching faith and tries to disprove it. He turns to another text, Public Report on Basic Education, 1999, popularly known as PROBE 1999 in India and an acknowledged study that documents the weaknesses of ('public') government schools in India with the special objective of improving them. But that text is cited by Tooley as reason why public education needs to be replaced by private education in India. And then he turns, "as luck would have it", to private schools in the slums of Hyderabad and based on a study of 13 schools, finds them "more effective and less costly" as private schools in Thailand. But herein lies the problem. First, less costly for whom? For the poor? Less costly in terms of teachers' salaries because of low salaries paid by private schools. It is not less costly for the students, certainly not for poor students. This leads to the second problem of comparing the incomparable. Tooley uses 'market education' in the less-developed countries as synonymous with that in the West. As discussed earlier, market education in the US or Canada means competition between schools and more choice for the parents but the cost will be borne by the state in any case. But in the less-developed countries, for instance, in India, the cost of market education is borne by the parents and even the so-called lower costs are also high for poor parents who have to pay in terms of a variety of fees. Third, the voucher system in the West has no parallels in the less-developed countries. The market education is 'for profit' education. The conclusion that "for the poorest people in the world, in the slums and villages of India.... that the government education system is severely malfunctioning...." may have an element of truth but it does not suggest that the "greatest potential to help the poor" does not rest with the state but with the private sector". Whatever authenticity that the other nine papers carry in favour of promoting choice in school education, particularly in North America, are also likely to become suspect because of Tooley's blatantly selective evidence mustered in favour of globalization of privatization of school education.
Department of Economics D. Narasimha Reddy University of Hyderabad, Hyderabad E-mail: [email protected]

© NIEPA
Journal of Educational Planning and Administration Volume X V I I No. 2, April 2003
COLLINS, JANET and DEIRDRE, COOK (ed.) (2002): Understanding Learning - Learning and Outcomes, Paul Chapman Publishing Ltd., (Sage Publication Company Ltd.), London, pp. 208.
The publication under review is the second in a series of three edited collections supporting students studying The Open University Masters' Course E842; Developing Practice in Primary Education. It contains material, which brings together issues of theory and practice. The book's significant contribution is supposed to be to re-emphasize the multi-faceted nature of education and for deliberately taking a multidisciplinary approach.
The book is divided into four sections, each emphasizing four different aspects of education practices and ideas. The first section is titled as Influences on Education, the second as Views of Learning and the third as Outcomes of Assessment. The title for the last one is Cultural Capital and Learning. In all, the number of chapters is fifteen. Taken together, there is hardly any aspect of education that has been left out. The book discusses the concepts like democracy, acculturation, autonomy, authenticity and accountability. The first chapter: the politics of educational ideas by Wilfred Carr and Anthony Hartnett talks of an influence, which is universal in nature. Reading the opening lines of the first paragraph of the first chapter, it took for a moment that the authors were discussing the Indian scenario but the fact of the matter is that education per se is the obverse side of the political coin.
The significant part of the discussion is the sub-title given to the chapter, which is The Deintellectualization of Educational Policy. It underscores the nature of educational ideas. On reflection, one wil l immediately notice that this relationship between education and contemporary politics has nothing intellectual about it. It is like fire and heat. The presence of one presupposes the other. The inevitability of the relationship is absolutely compelling in its nature. The interesting aspect of this relationship is that almost all thinkers of education are essentially worried about the nature of society and wish to give direction to its political governance. They find education a convenient instrument of political change and governance. It is not necessary to feel overly worried about the "constellation of criticism, anxiety and frustration, which supposedly reflects a deep-seated sense of unease about contemporary schooling." Each age has thus far found solutions to its problems and I am sure that the present age wi l l also similarly find a solution for its problems. It is in the nature of things that some people wil l always continue to feel worried about the deteriorating standards and poor quality of education. Also, there will be some who wil l find education an area to be indifferent about. But without doubt, education must evoke interest for its easy manoeuvrability, both for personal and political ends.
Being prone to debate, education as an area allows multiple ideological systems to exist. The second chapter suggests that ideological clashes are not

© NIEPA
Book Reviews 289
inevitable. The aim is to ensure integration of ideas. 'Ideological enemies,' Aloni claims, commonly 'dogmatically demonize and delegitimate the other.' An open discourse with goodwill between those holding different views is always preferable to any other mode. The next chapter adds to the ideological debate by arguing for a new progressivism in education, which is rooted in developmental, humanistic, democratic and pragmatic ideas. He pleads for diverse, self-managed curricula to socially responsible goals and industrial needs without, in any way, diluting teacher accountability.
Section 2 introduces and develops the following issues: (a) Theory of multiple intelligences; (b) Situated cognition theory; (c) Notions of situated and non-situated learning; and (d) A social constructivist view of learning.
Chapter 4 discusses evidence from studies of 'out of school' learning and throws up a challenge to the traditional and fixed view of intelligence. This is how the theory of multiple intelligences is put forward. The next chapter outlines the way in which Situated Cognition Theory requires a critical shift from a focus on the individual to that on the settings and activities contained within them. The subsequent chapter by Carl Bereiter develops the issues raised in the preceding chapter and goes on to make comparisons between two learners in the same physical environment but in different situations with regard to their own learning. In doing so, he distinguishes between three distinct goals of learning, which are: completion, instructional and knowledge-building goals. They differ in their level of abstractedness and correspondingly, their degree of situatedness. Completion goals are highly situated, whilst knowledge building goals are only connected with the immediate situation and thus are highly transferable. Chapter 7 examines the ways in which views of childhood are changed over time in relation to gender, race, ethnicity and cultural practices.
The third section contains four chapters. Taken together these chapters consider the importance of achievement within the learning process (assessment should be located in learning and not in measurement); the current ideas about assessment and testing and their roots; the psychological, political and cultural beliefs and values and their importance on children's construction of tnen selves as learners and the possibilities of ability grouping as outcomes of assessment.
It is very different kind of a book as compared to a normal average Indian publication. It forces the readers to think and arrive at their own conclusions. It is a publication deserving notice.
Pocket A-4/206, Kalkaji Extn, New Delhi-110019
R.P. Singh E-mail: [email protected]

© NIEPA
Journal of Educational Planning and Administration Volume X V I I No. 2, April 2003
WU, KIN BING (2001): Peruvian Education at a Crossroads: Challenges and Opportunities for the 21s' Century, A World Bank Country Study, 2001, The Washington D.C.: The World Bank, ISBN: 0-8213-4961-9, ISSN: 0253-2123, Pages: 281, Price: not mentioned (Paperback).
The World Bank continually strives to study the various economic and related conditions of the developing countries. The book under review is a part of the World Bank Country Study bearing on poverty reduction. The study covers four topics: poverty, health, indigenous people and education. It elucidates the findings on education. The study has been prepared by a team of academicians from Peruvian academics, policy analysts, and public officials. The team was led by Mr. Kin Bing Wu.
Peru, like other developing countries, witnessed the policy of structural adjustment and macro-economic stability in the late twentieth century. This report is an endeavour to review educational scenario of Peru in the period from 1990 to 1997. It seeks to inform discussion of potential policy options by examining the impact of public and private finance, and policies for resource use, on education and labour market outcomes. It is also a contribution to the larger discussion of human resources development and poverty reduction in Peru. In final analysis, this study explores the issues of and lays out option for a second wave of reform. It also explores the issue of improving educational quality based on the analysis of factors contributing to fourth graders' mathematical achievement levels in 1996.
This book is divided into five chapters. The first chapter titled 'Sector Overview' summarizes the achievements of Peru in the field of education in the period 1990-1997. As these years coincided with the programme of structural adjustments and macro-economic stability, Peru also witnessed the containment of public spending and mobilization of private resources. This period is marked by three distinctive features. Firstly, in this period, Peru's constitution of 1993 extended compulsory and free education from primary to secondary education. Secondly, the private schools were encouraged to lessen the burden on public spending. Thirdly, the 1993 constitution of Peru restructured the political system by setting up of regional administration, deconcentration of education services, and creation of new ministries. These resulted in impressive accomplishments characterized by near universal school enrolment for the 6-11 year olds, about 80% of the 12 to 16 year olds, and over 30% of the 17 to 25 year olds, in 1997. Such growth could be achieved with public resources to education remaining at low level of 2.4% of GDP in 1997. This brings the study team to a puzzle. How are the increasing enrolment and low public expenditure compatible? The whole report is an attempt to find an answer to this question. To resolve this issue, the report explores several hypotheses. Is it because public resources have been well used and well targeted? Is it because Peruvian households value education highly

© NIEPA
Book Reviews 291
and spend heavily on education? Has expansion of access to basic education come at the expense of qualitative improvement? Is the low level of public spending attributable to the ability to contain the salary cost of teachers? How do this and other policies on teachers affect profession? Various hypotheses form the remaining chapters.
Chapter 2, titled 'Education Finance' is the first attempt to find an explanation for simultaneous existence of low public spending and high enrolment rates. It seeks to find an answer in efficient and equitable uses of public resources. Using Lorenz curve, Chapter 2 looks at how equitable has distribution of public expenditure been? This exercise found that public resources have been very low as demanded by the economic reform although it has been relatively well-targeted and well-used within the overall constraints. This report suggests that as the level Of public spending on education is still low in absolute and relative terms, to expand access and improve quality for the poor, additional and targeted investment needs to sustained for a long time in order to equalize educational opportunity. In Peru, households spend a very high amount of money on education totaling to about 2% of GDP according to analysis of household survey of 1994 and 1997. This is clear from the fact that education expenditure is considered to be a necessity by Peruvian household as reflected by the low-income elasticity of demand of the order of 27%. This chapter concludes that because the burden for financing education is disproportionately heavier for poor households than richer households, the public sector has a special mandate to ensure the equality of educational opportunity for all by directing more public resources to poor.
The next chapter titled 'System Performance Indictors' tries to find out whether quality has suffered because of low public spending. Towards this, the present chapter looks at educational access, internal efficiency, quality and labour market outcomes. It portrays that there has been a trade-off between access and quality as public resources were squeezed. This chapter also presents various interesting findings on returns to education. Private returns to education increased with the level of education for both men and women (except for primary education males). What is peculiar to Peru is the very small difference between private and social returns to various levels of education. Another feature of Peru is that social returns to university education were higher than those to other levels of education. Both social and private rates of return to all level of education, except primary, were higher for women than for men. Finally, this chapter suggests the need to focus on quality, especially on education of the disadvantaged group. Chapter 4 focuses on the last two hypotheses. Is the low level of public spending attributable to the ability to contain the salary cost of teachers? How does this and other policy on teachers affect the profession? The exploration of this question led the team to conclude that salary of the teacher has received a setback in the new policy paradigm. This chapter ends with the

© NIEPA
Journal of Educational Planning and Administration Volume XVII No. 2, April 2003
suggestions for Peru's government. The last Chapter 5 titled 'Second Generation Reforms' delineates the path for the second generation reforms. The First-generation reforms rationalized the public sector, balanced the budget, and mobilized the private sector. The Second-generation reform comprises reducing the large gap in school survival rates between the rich and the poor, and the rural and urban population and the large between-school variance in student achievement. These issues of improving equity, enhancing quality, improving efficiency of resource use make the last chapter. Therefore, the last chapter primarily focuses on the direction Peru's education system should take. The conclusive lines of this book are quite unlike the usual recommendation of fiscal prudence of the World Bank. It recommends that Peru needs to increase the public expenditure on education from 2.4% to 4.5% of GDP net of pension expenditure.
Barely one-fourth of the book discusses the findings. Remainder of the report is suitably filled with background notes and relevant data, which make it an easy reading even for the individual unaware of the educational system of Peru. This book is especially meant for policy makers and planners of the Peru. It is quite a useful book for the researcher in economics of education.
134, Kaveri Hostel, JNU, Jayendu Krishna New Delhi 110 067 Email: [email protected]
KAMIBEPPU, TAKAO: History of Japanese Policies in Education Aid to Developing Countries, 1950s-1990s. New York and London: Routledge, 2002, pp.l38+index, ISBN: 0-415-93404-4. Price: £ 50.00 (Hardbound)
Starting slowly in the 1950s, Japan emerged as the largest bilateral donor by the end of the 1980s. Published in the Routledge series on 'East Asia: History, Politics, Sociology and Culture' (series edited by Edward Beauchamp), the book reviews the growth of the education aid of Japan during the last few decades, the changing aid policies of the Japanese government, the historical dynamics of the Ministry of Education and of the ODA and more importantly the role of the various sub-actors, described as 'sub-governments' of Education and of the ODA, in the business of aid to developing countries. Kamibeppu, the author of the study, analyses in detail what factors - internal and external - shaped the policies of the government of Japan with respect to aid for education.
Apart from Chapter 1, in which a detailed description of the problem, a review of the literature and concepts are discussed, and a short concluding chapter, there are four major chapters. The post-war recovery efforts of the 1950s in the form of Japan's role through UNESCO, etc. form the content of chapter 2; development of education aid and emergence of Japan as a donor has been the

© NIEPA
Book Reviews 293
focus of chapter 3; chapter 4 concentrates more on the internal dynamics of aid policy making - the roles of education sub-government, the ODA sub-government, and of the JICA and their internal competition and conflicts that shaped the education aid policies of the 1970s and the 1980s. The evolving relationship between education sub-government and the ODA sub-government of the 1990s was analysed in chapter 5.
Based on extensive data collected from several sources, including projects, and interviews with several officials, Kamibeppu reconstructs the history of education aid policy, as it evolved and in the process presents a very useful and interesting account of Japan's emergence as a 'western' donor.
Using aid as a vehicle, and also as a measure of economic recovery after the war, Japan entered the international community in the aid business. During the earlier years of the post-War period, Japan's main involvement in education aid was confined to its contribution being a member of the UNESCO, and of the Colombo Plan (it participated in the Colombo plan in 1954), and provision of aid for foreign students. They laid the foundation for the Japanese education aid in the later decades. Japan entered into the arena of aid for education more systematically only in the late 1960s, which is broadly in conformity with the aid practices of the international aid community - multilateral and bilateral. Japan's recent shift in the focus of aid from secondary, vocational and higher education to basic education, from quantitative expansion to improvement in quality, from physical infrastructure to training and policy advice, from projects aid to programme/sector aid - all, in fact, are in line with the general trends of international aid for education. The late 1960s actually marks the beginning of the development of education aid by Japan and the aid flew to secondary, vocational and higher education. It is only in the very recent past, i.e., in the 1990s, the shift in aid is clearly noticeable from vocational and higher education to basic education, from physical infrastructure to training, from technical assistance to policy advice, and also from Asia to Africa. International and domestic pressures shaped the Japan's aid system in the early 1970s. It shifted its focus from development aid to international education in the early 1970s. On the whole, Japan concentrated, and even today does, on economic development-oriented aid and education aid is also viewed as contributing to economic development. It has been observed that 'like economic aid policies, education aid policies have not been the outcome of political pressure, elite decision making, nor development debates alone. They have rather reflected diverse ministry interests and diffuse structures that were reinforced by rigid, but stable bureaucracies, and weak political leadership. The competition among and within diverse ministry interests over education aid led to the expansion of education aid over time'(p. 113).
Realizing that education aid is not a simple affair of the education ministry alone, or aid is not a simple affair of the ODA alone, Kamibeppu analyses how

© NIEPA
294 Book Reviews
education sub-government and ODA sub-government interacted, each within, interacted with each other, and mutually influenced each other in shaping education aid policies of the government. In fact, the analysis of the role and function of sub-governmental process is an important contribution of the study. The author outlines the complicated 'education aid sub-government,' findings that even the ministry of education is not a monolithic organization; there are quite often internal differences and competition. Though it does not exclusively focus on JICA (Japanese International Cooperation Agency), JICA that was established in 1974 gets, understandably, an extensive treatment. The author ably describes the critical role played by JICA, itself being influenced by the ODA sub-government and the education sub-government. Ministry of Education is not a direct actor in the JICA. It is only in the recent past, ODA sub-government began seeking the help of the ministry of education and the education expertise. Obviously the education sub-government gradually wanted to play a larger role in education aid though JICA. Official development assistance has been used by many countries as a reliable diplomatic instrument. Japan is no exception. The ODA subgovernment is accordingly influenced much by the ministry of external/foreign affairs. The complicated process of interactions within the ODA subgovernment reflects these influences.
Largely Japan followed a traditional low profile, but commercial approach based on 'self-help' and non-intervention approach in domestic affairs of aid receiving countries. This may be viewed as a positive aspect of Japan's aid from the point of view of aid recipients. The author finds the need for a change in the approach. In fact, the author makes a strong demand on Japan's role: to change from a simple 'reactive OECD member' role to 'a pro-active agenda setting aid leader'. For this, it is necessary that Japan's relationship with the West needs to be changed from a low profile one to a highly visible one, 'selling' and 'marketing' ideas or concepts which leadership roles would usually require; the leadership style and the bureaucrats' behaviour characterized by maintaining of statuesque, resistance to changes and hesitation to take risk - all need to change. It should avoid double standard policy processes.
On the whole, History of Japanese Policies in Education Aid to Developing Countries is an interesting reading. Not only Japanese aid actors, but also scholars and policy makers involved in education aid business of Japan, and of other countries would feel benefited by a succinct account presented by Kamibeppu in the slim book under review.
Centre for the Study of International Cooperation in Education, Hiroshima University, and N I E P A , New Delhi 110016
Jandhyala Tilak E-mail: [email protected] [or]

© NIEPA
Subscr ip t ion Form for the
journal of Educational Planning and Administration
Please enro l l me for the subscr ip t ion of the JOURNAL OF EDUCATIONAL PLANNING AND ADMINISTRATION
Name and Address (in Capital Letters)
PIN
Subscription for the year . Annual Subscription commences
wi th January and ends wi th October every year.
[Please tick mark ( • ) the appropriate one]
• Rs. 120/- Subscription for individuals in India
• Rs. 250/- Subscription for Institutions in India • US$ 50 Subscription for individuals (plus US$ 10 for Air Mail) outside India • US$ 75 Subscription for Institutions (plus US$ 10 for Air Mail) outside India
NIEPA offers 20% discount on subscription for three years and above. Please make the payment by Bank Draft in favour of National Institute of Educational Planning and Administration payable at New Delhi.
Details of the Enclosed Bank Draft:
Bank Draft No Dated Drawn on
Date Signature
Please mail this subscription order form along wi th the Bank Draft to:
The Deputy Publication Officer National Institute of Educational Planning and Administration 17-B, Sri Aurobindo Marg, New Delhi-110016 (INDIA)
Tel: 91-11-26861635, 26962120 Fax: 91-11-26853041 E-mail: [email protected]

© NIEPA
Journal of Educational Planning and Administration
Regarding subscriptions, advertisement, circulation, missing issues, etc., please contact
Deputy Publication Officer National Institute of Educational Planning and Administration 17 B Sri Aurobindo Marg, New Delhi 110016 Tel: 26861635(D) or 26962120 Extn. 316 and 330 E-mail: [email protected]
Regarding exchange of the journal and missing issues, please contact Librarian National Institute of Educational Planning and Administration 17 B Sri Aurobindo Marg, New Delhi 110016 Tel: 2686 2507 or 26962120 Extn. 111 E-mail: [email protected] [or] [email protected]
Only editorial matters be addressed to the Editor, JEPA Tel: 26861320 or 26962120 E-mail: [email protected]
For more details please log on to our website WWW.niepa.org Also see http://niepalib.freeyellow.com