Kauffman Report 2007 052507 pdf - Issue Lab
24
Electronic copy available at: http://ssrn.com/abstract=988167 entrepreneurial activity 1996-2006 KAUFFMAN INDEX OF Robert W. Fairlie
-
Upload
khangminh22 -
Category
Documents
-
view
5 -
download
0
Transcript of Kauffman Report 2007 052507 pdf - Issue Lab

Electronic copy available at: http://ssrn.com/abstract=988167
entrepreneurial activity
1996-2006
KAUFFMAN INDEX OF
Robert W. Fairlie

Electronic copy available at: http://ssrn.com/abstract=988167
©2007 by the Ewing Marion Kauffman Foundation. All rights reserved.
Robert W. Fairlie is an Associate Professor of Economicsand the Director of the Master’s
Program in Applied Economics andFinance at the University of
California, Santa Cruz.
1
2 0 0 6 K A U F F M A N I N D E X O F E N T R E P R E N E U R I A L AC T I V I T Y
• An average of 0.29 percent of the adult population(or 290 out of 100,000 adults) created a newbusiness each month, representing approximately465,000 new businesses per month. There was nochange in this rate ofentrepreneurial activity between2005 and 2006.
• The rate of entrepreneurial activity for men (0.35 percent) did not change between 2005 and2006, ending the downward trend that began in2003. The Kauffman Index for women declinedslightly from 0.24 percent in 2005 to 0.23 percent in 2006.
• The rate of entrepreneurial activity for Asiansincreased from 0.27 percent in 2005 to 0.32 percentin 2006. The rate for non-Latino whites remainedconstant at 0.29 percent between 2005 and 2006.For African Americans, the rate of entrepreneurialactivity decreased slightly from 0.24 percent in 2005to 0.22 percent in 2006. The Latino rate increasedslightly from 0.32 percent to 0.33 percent during thesame time period.
• The immigrant rate of entrepreneurial activityincreased from 0.35 percent in 2005 to 0.37 percentin 2006. As in previous years, the rate ofentrepreneurial activity for immigrants wassubstantially higher than the rate for the native-bornpopulation (0.27 percent).
• The construction industry had the highest rate of entrepreneurial activity among all major industrygroups in 2006 (1.06 percent). The second highestrate of entrepreneurial activity was in the servicesindustry (0.40 percent).
• The rate of entrepreneurial activity decreased in theMidwest from 0.26 percent in 2005 to 0.22 percentin 2006. As a result, the Midwest had the lowestlevel of entrepreneurial activity of all regions for thefirst time in the past eleven years.
• The five states with the highest rates ofentrepreneurial activity in 2006 were Montana (0.60 percent), Mississippi (0.52 percent), Georgia(0.44 percent), Oklahoma (0.43 percent), and Maine(0.42 percent). The five states with the lowest ratesof entrepreneurial activity were Michigan (0.16 percent), Pennsylvania (0.17 percent), SouthCarolina (0.18 percent), Illinois (0.18 percent), andDelaware (0.19 percent).
• The states experiencing the largest increases in ratesof entrepreneurial activity over the past decade wereMississippi (with an increase of 0.16 percentagepoints), Hawaii (0.12 percentage points), RhodeIsland (0.11 percentage points), and Arkansas (0.11 percentage points). The states that experiencedthe largest decreases in their rates were Alaska (with a decrease of 0.22 percent percentage points), North Dakota (-0.18 percentage points), New Mexico(-0.14 percentage points), Tennessee (-0.10 percentage points), and Kansas (-0.09 percentage points).
• Among the fifteen largest MSAs in the United States,the highest rates of entrepreneurial activity in 2006 were in Miami (0.50 percent) and Atlanta (0.49 percent). The large MSAs with the lowest ratesof entrepreneurial activity were Detroit (0.13 percent)and Chicago (0.18 percent).
The Kauffman Index of Entrepreneurial Activity is a leading indicator of new business creation in the United States. Capturing new business owners in their first month of significant business activity,this measure provides the earliest documentation of new business development across the country.Analysis of matched monthly data from the Current Population Survey (CPS) allows for comparisons ofthe percent of the population of adult non-business owners who start a business over time. In addition
to this overall rate of entrepreneurial activity, separate estimates for specific demographic groups, states, andselect metropolitan statistical areas (MSAs) are presented.
New CPS data available for 2006 allow for an update to previous reports, with consideration of trends in therates of entrepreneurial activity over the eleven-year period between 1996 and 2006. While the rate ofentrepreneurial activity has remained remarkably consistent over the past decade, the Kauffman Index revealssubtle shifts in the demographic and geographic composition of new entrepreneurs across the country. Keyfindings for 2006 include:
E X E C U T I V Esummary
2
Introduction
The Kauffman Index of Entrepreneurial Activity measures
the rate of business creation at the individual owner
level. Presenting the percent of the population of adult
non-business owners who start a business each month,
the Kauffman Index captures all business owners,
including those who own incorporated or unincorporated business,
and those who are employers or non-employers. The Kauffman
Index analyzes matched data from the Current Population Survey
(CPS), a monthly survey conducted by the U.S. Bureau of the Census
and the Bureau of Labor Statistics. This report updates previous
accounts of the Kauffman Index, incorporating new CPS data
from 2006 and further refining the definition of the index.
To create the Kauffman Index, all individuals between the ages
of 20 and 64 who do not own a business as their main job are
identified in the first survey month. By matching CPS files for the
following month, it is then determined if these individuals own a
business as their main job with fifteen or more usual hours worked
per week in the following survey month. These monthly rates of
entrepreneurial activity are then averaged to calculate an average
monthly estimate for each year. More details about the datasets and
measures used are provided in previous reports and in the
Appendix.1
2 0 0 6 K A U F F M A N I N D E X O F E N T R E P R E N E U R I A L AC T I V I T Y
In 2006, an average of 0.29 percent of the adult population or
290 out of 100,000 adults created a new business each month.
In other words, approximately 465,000 new businesses were
created each month during the year. This rate of business
creation did not change between 2005 and 2006. In fact, the
rate of business creation has remained fairly steady in the range
between 0.27 percent and 0.32 percent over the past eleven years.
The average rate of entrepreneurial activity for this entire period is
also 0.29 percent. Figure 1 and Table 1 report average monthly
estimates of the Kauffman Index by year from 1996 to 2006.2
Trends in Entrepreneurial Activity
The Kauffman Index ofEntrepreneurial Activitymeasures the rate ofbusiness creation at theindividual owner level.
In 2006, an average of0.29 percent of the adultpopulation or 290 out of100,000 adults created anew business eachmonth.
2 0 0 6 K A U F F M A N I N D E X O F E N T R E P R E N E U R I A L AC T I V I T Y
3
20061996 1997 1998 1999 2000 2001 2002 2003 2004 2005
0.5%
0.1%
0.2%
0.3%
0.4%
0.0%
FIGURE 1
KAUFFMAN INDEX OF ENTREPRENEURIAL ACTIVITY
(1996–2006)
SOURCE: Robert W. Fairlie, University of California, Santa Cruz, using the Current Population Survey.
1996 0.37% 243,368 0.26% 287,639 0.31% 531,0071997 0.35% 244,863 0.22% 286,266 0.28% 531,1291998 0.33% 245,820 0.25% 286,476 0.29% 532,2961999 0.32% 246,225 0.22% 286,765 0.27% 532,9902000 0.34% 246,522 0.21% 284,901 0.27% 531,4232001 0.31% 264,693 0.23% 304,765 0.26% 569,4582002 0.36% 288,595 0.22% 334,562 0.29% 623,1572003 0.38% 284,391 0.22% 330,166 0.30% 614,5572004 0.37% 279,373 0.24% 323,314 0.30% 602,6872005 0.35% 276,836 0.24% 320,362 0.29% 597,1982006 0.35% 274,825 0.23% 316,781 0.29% 591,606
Sample Sample SampleYear Index Size Index Size Index Size
MEN WOMEN
TABLE 1
KAUFFMAN INDEX OF ENTREPRENEURIAL ACTIVITY
(1996–2006)
Notes: (1) Estimates calculated by Robert W. Fairlie, University of California, Santa Cruz,using the Current Population Survey. (2) The index of entrepreneurial activity is the percent ofindividuals (ages 20-64) who do not own a business in the first survey month that start abusiness in the following month with fifteen or more hours worked per week. (3) Allobservations with allocated labor force status, class of worker, and hours worked variablesare excluded.
TOTAL
4
2 0 0 6 K A U F F M A N I N D E X O F E N T R E P R E N E U R I A L AC T I V I T Y
0.5%
0.1%
0.2%
0.3%
0.4%
20061996 1997 1998 1999 2000 2001 2002 2003 2004 2005
0.0%
White African American Latino Asian
FIGURE 3
KAUFFMAN INDEX OFENTREPRENEURIAL ACTIVITY BY RACE
(1996–2006)
SOURCE: Robert W. Fairlie, University of California, Santa Cruz, using the Current Population Survey.
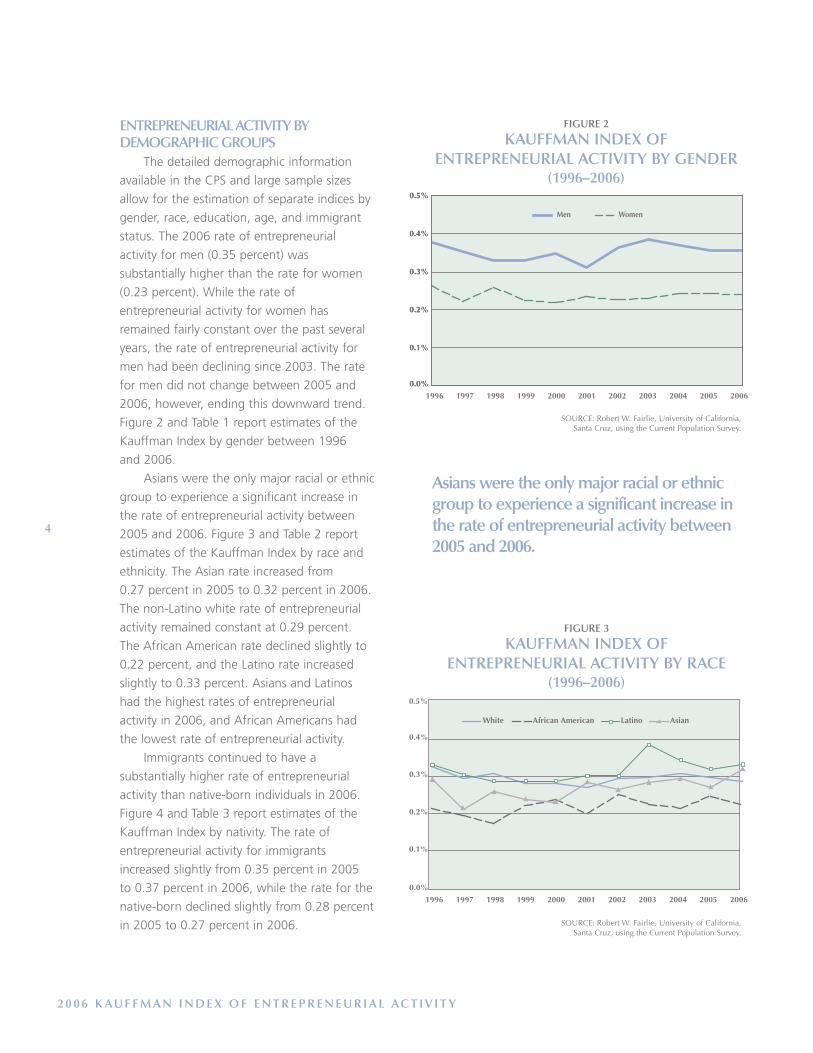
ENTREPRENEURIAL ACTIVITY BYDEMOGRAPHIC GROUPS
The detailed demographic information
available in the CPS and large sample sizes
allow for the estimation of separate indices by
gender, race, education, age, and immigrant
status. The 2006 rate of entrepreneurial
activity for men (0.35 percent) was
substantially higher than the rate for women
(0.23 percent). While the rate of
entrepreneurial activity for women has
remained fairly constant over the past several
years, the rate of entrepreneurial activity for
men had been declining since 2003. The rate
for men did not change between 2005 and
2006, however, ending this downward trend.
Figure 2 and Table 1 report estimates of the
Kauffman Index by gender between 1996
and 2006.
Asians were the only major racial or ethnic
group to experience a significant increase in
the rate of entrepreneurial activity between
2005 and 2006. Figure 3 and Table 2 report
estimates of the Kauffman Index by race and
ethnicity. The Asian rate increased from
0.27 percent in 2005 to 0.32 percent in 2006.
The non-Latino white rate of entrepreneurial
activity remained constant at 0.29 percent.
The African American rate declined slightly to
0.22 percent, and the Latino rate increased
slightly to 0.33 percent. Asians and Latinos
had the highest rates of entrepreneurial
activity in 2006, and African Americans had
the lowest rate of entrepreneurial activity.
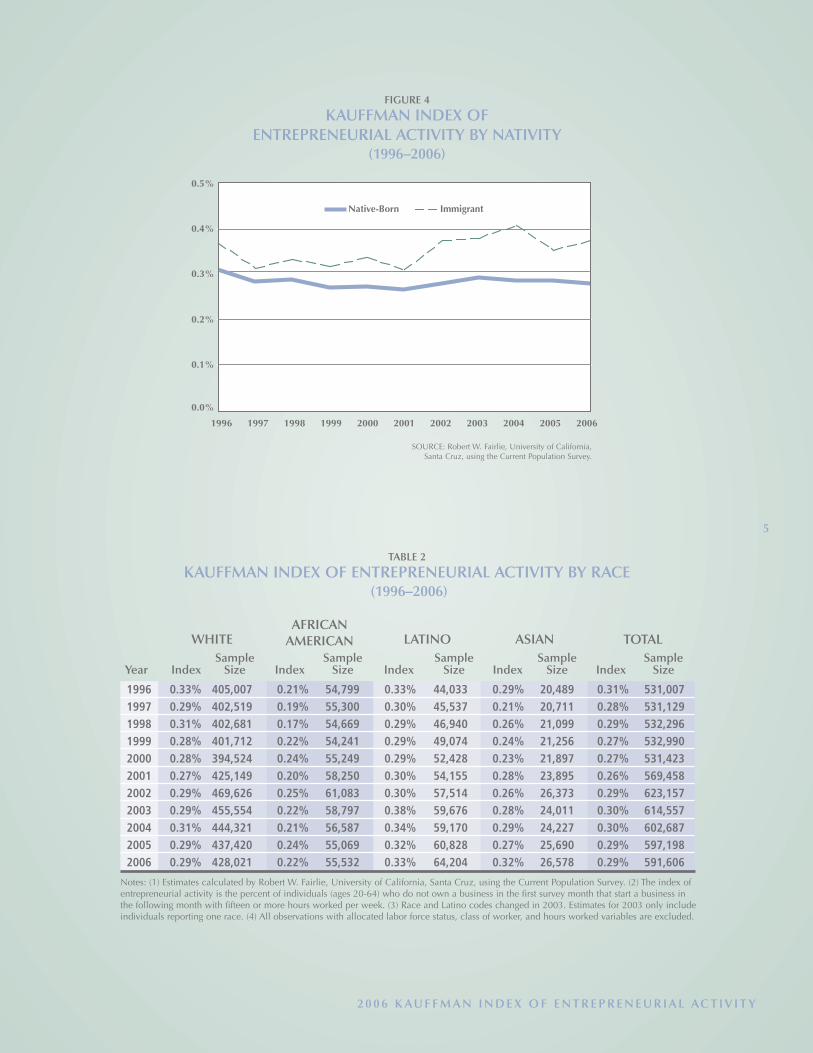
Immigrants continued to have a
substantially higher rate of entrepreneurial
activity than native-born individuals in 2006.
Figure 4 and Table 3 report estimates of the
Kauffman Index by nativity. The rate of
entrepreneurial activity for immigrants
increased slightly from 0.35 percent in 2005
to 0.37 percent in 2006, while the rate for the
native-born declined slightly from 0.28 percent
in 2005 to 0.27 percent in 2006.
20061996 1997 1998 1999 2000 2001 2002 2003 2004 2005
0.0%
0.1%
0.2%
0.3%
0.4%
0.5%
0.0%
0.1%
0.2%
0.3%
0.4%
0.5%
Men Women
FIGURE 2
KAUFFMAN INDEX OFENTREPRENEURIAL ACTIVITY BY GENDER
(1996–2006)
SOURCE: Robert W. Fairlie, University of California, Santa Cruz, using the Current Population Survey.
Asians were the only major racial or ethnicgroup to experience a significant increase inthe rate of entrepreneurial activity between2005 and 2006.
2 0 0 6 K A U F F M A N I N D E X O F E N T R E P R E N E U R I A L AC T I V I T Y
5
Sample Sample Sample Sample SampleYear Index Size Index Size Index Size Index Size Index Size
WHITEAFRICAN
AMERICAN LATINO
TABLE 2
KAUFFMAN INDEX OF ENTREPRENEURIAL ACTIVITY BY RACE(1996–2006)
Notes: (1) Estimates calculated by Robert W. Fairlie, University of California, Santa Cruz, using the Current Population Survey. (2) The index ofentrepreneurial activity is the percent of individuals (ages 20-64) who do not own a business in the first survey month that start a business inthe following month with fifteen or more hours worked per week. (3) Race and Latino codes changed in 2003. Estimates for 2003 only includeindividuals reporting one race. (4) All observations with allocated labor force status, class of worker, and hours worked variables are excluded.
ASIAN
1996 0.33% 405,007 0.21% 54,799 0.33% 44,033 0.29% 20,489 0.31% 531,0071997 0.29% 402,519 0.19% 55,300 0.30% 45,537 0.21% 20,711 0.28% 531,1291998 0.31% 402,681 0.17% 54,669 0.29% 46,940 0.26% 21,099 0.29% 532,2961999 0.28% 401,712 0.22% 54,241 0.29% 49,074 0.24% 21,256 0.27% 532,9902000 0.28% 394,524 0.24% 55,249 0.29% 52,428 0.23% 21,897 0.27% 531,4232001 0.27% 425,149 0.20% 58,250 0.30% 54,155 0.28% 23,895 0.26% 569,4582002 0.29% 469,626 0.25% 61,083 0.30% 57,514 0.26% 26,373 0.29% 623,1572003 0.29% 455,554 0.22% 58,797 0.38% 59,676 0.28% 24,011 0.30% 614,5572004 0.31% 444,321 0.21% 56,587 0.34% 59,170 0.29% 24,227 0.30% 602,6872005 0.29% 437,420 0.24% 55,069 0.32% 60,828 0.27% 25,690 0.29% 597,1982006 0.29% 428,021 0.22% 55,532 0.33% 64,204 0.32% 26,578 0.29% 591,606
20061996 1997 1998 1999 2000 2001 2002 2003 2004 2005
0.0%
0.1%
0.2%
0.3%
0.4%
0.5%
Native-Born Immigrant
FIGURE 4
KAUFFMAN INDEX OFENTREPRENEURIAL ACTIVITY BY NATIVITY
(1996–2006)
SOURCE: Robert W. Fairlie, University of California, Santa Cruz, using the Current Population Survey.
TOTAL
6
Sample Sample SampleYear Index Size Index Size Index Size
NATIVE-BORN IMMIGRANT TOTAL
TABLE 3
KAUFFMAN INDEX OF ENTREPRENEURIAL ACTIVITY BY NATIVITY
(1996-2006)
1996 0.30% 474,984 0.36% 56,023 0.31% 531,0071997 0.27% 473,208 0.31% 57,921 0.28% 531,1291998 0.28% 472,458 0.33% 59,838 0.29% 532,2961999 0.26% 472,107 0.31% 60,883 0.27% 532,9902000 0.27% 466,150 0.33% 65,273 0.27% 531,4232001 0.26% 500,292 0.30% 69,166 0.26% 569,4582002 0.27% 549,356 0.37% 73,801 0.29% 623,1572003 0.29% 539,914 0.38% 74,643 0.30% 614,5572004 0.28% 528,881 0.41% 73,806 0.30% 602,6872005 0.28% 521,967 0.35% 75,231 0.29% 597,1982006 0.27% 513,386 0.37% 78,220 0.29% 591,606
Notes: (1) Estimates calculated by Robert W. Fairlie, University of California, Santa Cruz,using the Current Population Survey. (2) The index of entrepreneurial activity is the percent ofindividuals (ages 20-64) who do not own a business in the first survey month that start abusiness in the following month with fifteen or more hours worked per week. (3) Allobservations with allocated labor force status, class of worker, and hours worked variablesare excluded.
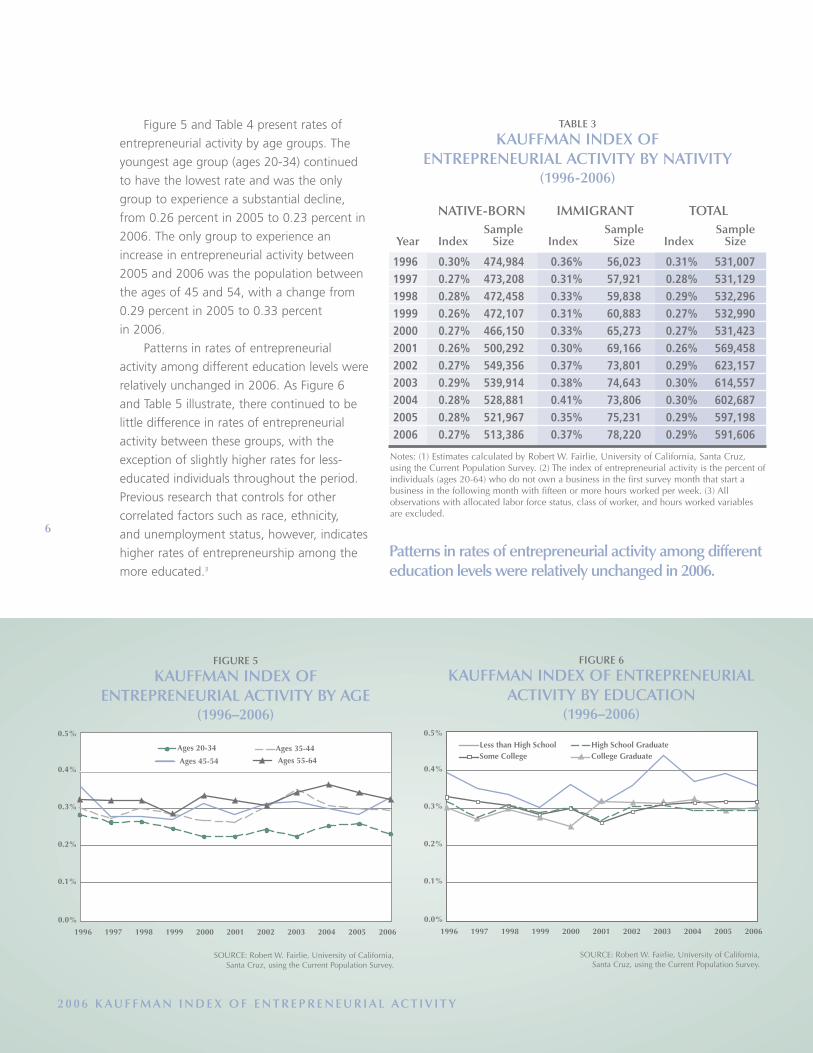
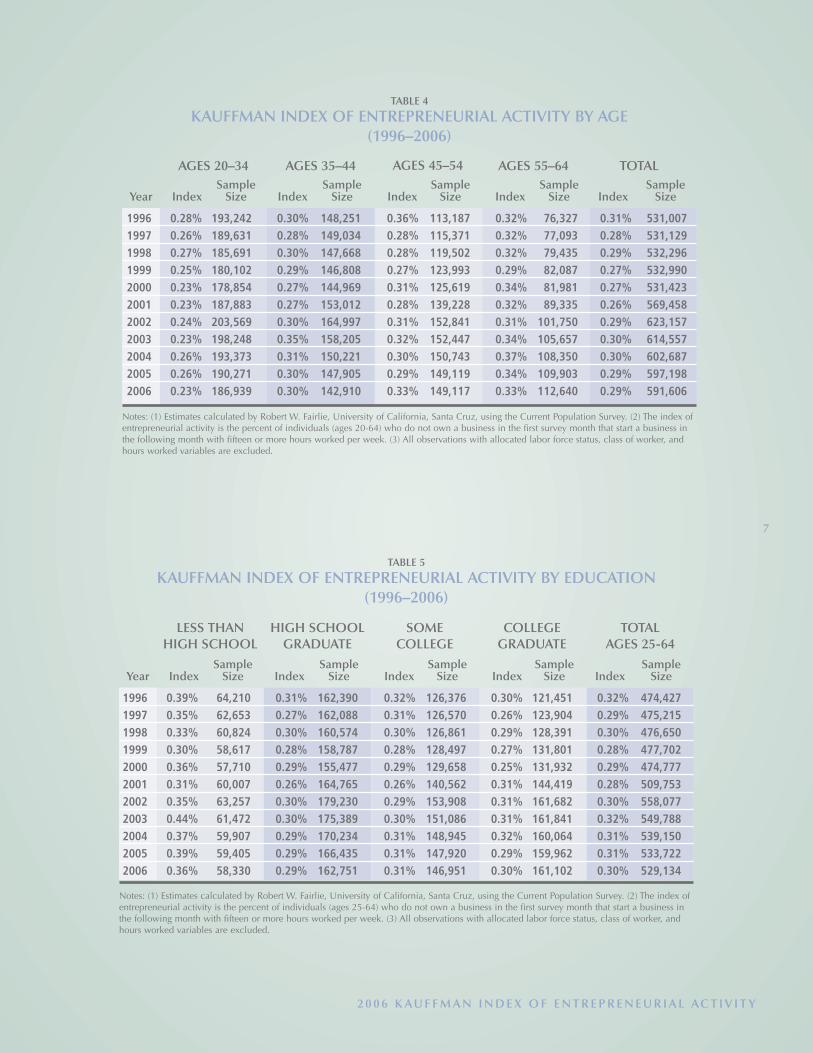
Figure 5 and Table 4 present rates of
entrepreneurial activity by age groups. The
youngest age group (ages 20-34) continued
to have the lowest rate and was the only
group to experience a substantial decline,
from 0.26 percent in 2005 to 0.23 percent in
2006. The only group to experience an
increase in entrepreneurial activity between
2005 and 2006 was the population between
the ages of 45 and 54, with a change from
0.29 percent in 2005 to 0.33 percent
in 2006.
Patterns in rates of entrepreneurial
activity among different education levels were
relatively unchanged in 2006. As Figure 6
and Table 5 illustrate, there continued to be
little difference in rates of entrepreneurial
activity between these groups, with the
exception of slightly higher rates for less-
educated individuals throughout the period.
Previous research that controls for other
correlated factors such as race, ethnicity,
and unemployment status, however, indicates
higher rates of entrepreneurship among the
more educated.3
0.5%
0.1%
0.2%
0.3%
0.4%
20061996 1997 1998 1999 2000 2001 2002 2003 2004 2005
0.0%
Ages 20-34 Ages 35-44
Ages 45-54 Ages 55-64
FIGURE 5
KAUFFMAN INDEX OFENTREPRENEURIAL ACTIVITY BY AGE
(1996–2006)
SOURCE: Robert W. Fairlie, University of California, Santa Cruz, using the Current Population Survey.
0.5%
0.1%
0.2%
0.3%
0.4%
0.0%
20061996 1997 1998 1999 2000 2001 2002 2003 2004 2005
Less than High SchoolSome College College Graduate
High School Graduate
FIGURE 6
KAUFFMAN INDEX OF ENTREPRENEURIALACTIVITY BY EDUCATION
(1996–2006)
SOURCE: Robert W. Fairlie, University of California, Santa Cruz, using the Current Population Survey.
Patterns in rates of entrepreneurial activity among differenteducation levels were relatively unchanged in 2006.
2 0 0 6 K A U F F M A N I N D E X O F E N T R E P R E N E U R I A L AC T I V I T Y
2 0 0 6 K A U F F M A N I N D E X O F E N T R E P R E N E U R I A L AC T I V I T Y
7
Sample Sample Sample Sample SampleYear Index Size Index Size Index Size Index Size Index Size
1996 0.28% 193,242 0.30% 148,251 0.36% 113,187 0.32% 76,327 0.31% 531,0071997 0.26% 189,631 0.28% 149,034 0.28% 115,371 0.32% 77,093 0.28% 531,1291998 0.27% 185,691 0.30% 147,668 0.28% 119,502 0.32% 79,435 0.29% 532,2961999 0.25% 180,102 0.29% 146,808 0.27% 123,993 0.29% 82,087 0.27% 532,9902000 0.23% 178,854 0.27% 144,969 0.31% 125,619 0.34% 81,981 0.27% 531,4232001 0.23% 187,883 0.27% 153,012 0.28% 139,228 0.32% 89,335 0.26% 569,4582002 0.24% 203,569 0.30% 164,997 0.31% 152,841 0.31% 101,750 0.29% 623,1572003 0.23% 198,248 0.35% 158,205 0.32% 152,447 0.34% 105,657 0.30% 614,5572004 0.26% 193,373 0.31% 150,221 0.30% 150,743 0.37% 108,350 0.30% 602,6872005 0.26% 190,271 0.30% 147,905 0.29% 149,119 0.34% 109,903 0.29% 597,1982006 0.23% 186,939 0.30% 142,910 0.33% 149,117 0.33% 112,640 0.29% 591,606
AGES 20–34 AGES 35–44 AGES 45–54 AGES 55–64 TOTAL
TABLE 4
KAUFFMAN INDEX OF ENTREPRENEURIAL ACTIVITY BY AGE (1996–2006)
Notes: (1) Estimates calculated by Robert W. Fairlie, University of California, Santa Cruz, using the Current Population Survey. (2) The index ofentrepreneurial activity is the percent of individuals (ages 20-64) who do not own a business in the first survey month that start a business inthe following month with fifteen or more hours worked per week. (3) All observations with allocated labor force status, class of worker, andhours worked variables are excluded.
Sample Sample Sample Sample SampleYear Index Size Index Size Index Size Index Size Index Size
1996 0.39% 64,210 0.31% 162,390 0.32% 126,376 0.30% 121,451 0.32% 474,4271997 0.35% 62,653 0.27% 162,088 0.31% 126,570 0.26% 123,904 0.29% 475,2151998 0.33% 60,824 0.30% 160,574 0.30% 126,861 0.29% 128,391 0.30% 476,6501999 0.30% 58,617 0.28% 158,787 0.28% 128,497 0.27% 131,801 0.28% 477,7022000 0.36% 57,710 0.29% 155,477 0.29% 129,658 0.25% 131,932 0.29% 474,7772001 0.31% 60,007 0.26% 164,765 0.26% 140,562 0.31% 144,419 0.28% 509,7532002 0.35% 63,257 0.30% 179,230 0.29% 153,908 0.31% 161,682 0.30% 558,0772003 0.44% 61,472 0.30% 175,389 0.30% 151,086 0.31% 161,841 0.32% 549,7882004 0.37% 59,907 0.29% 170,234 0.31% 148,945 0.32% 160,064 0.31% 539,1502005 0.39% 59,405 0.29% 166,435 0.31% 147,920 0.29% 159,962 0.31% 533,7222006 0.36% 58,330 0.29% 162,751 0.31% 146,951 0.30% 161,102 0.30% 529,134
LESS THAN HIGH SCHOOL
HIGH SCHOOLGRADUATE
SOME COLLEGE
COLLEGE GRADUATE
TOTALAGES 25-64
TABLE 5
KAUFFMAN INDEX OF ENTREPRENEURIAL ACTIVITY BY EDUCATION (1996–2006)
Notes: (1) Estimates calculated by Robert W. Fairlie, University of California, Santa Cruz, using the Current Population Survey. (2) The index ofentrepreneurial activity is the percent of individuals (ages 25-64) who do not own a business in the first survey month that start a business inthe following month with fifteen or more hours worked per week. (3) All observations with allocated labor force status, class of worker, andhours worked variables are excluded.
8
2 0 0 6 K A U F F M A N I N D E X O F E N T R E P R E N E U R I A L AC T I V I T Y
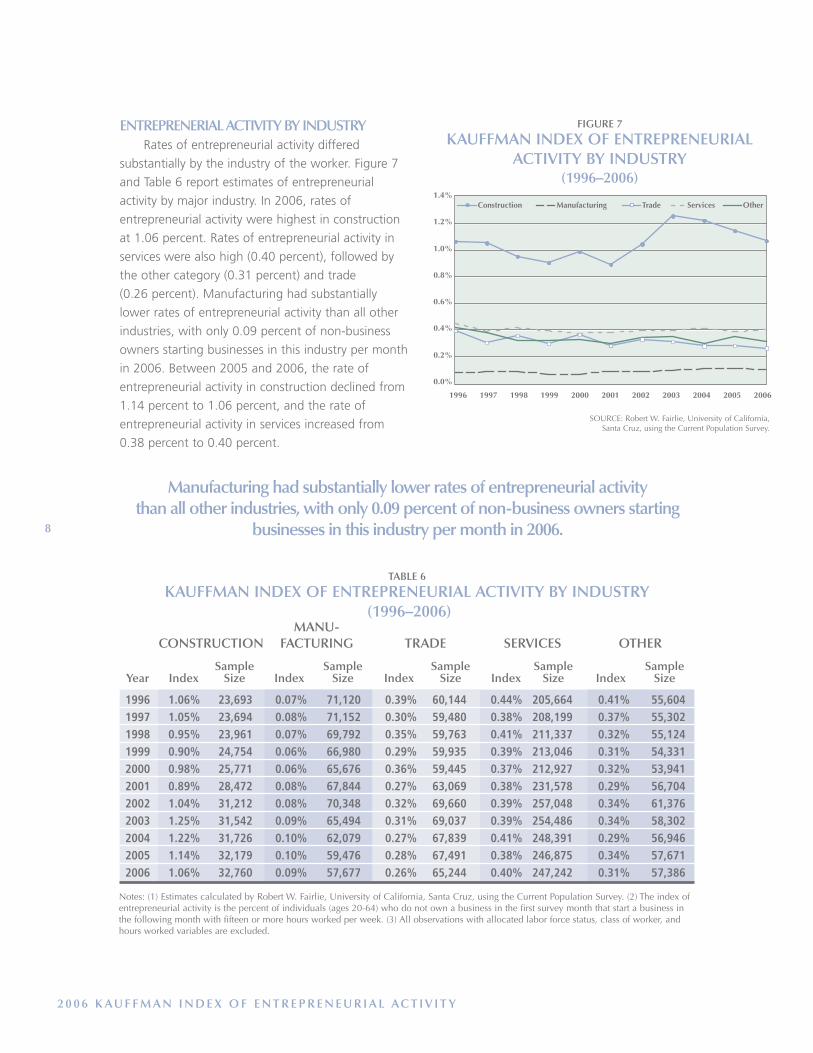
ENTREPRENERIAL ACTIVITY BY INDUSTRYRates of entrepreneurial activity differed
substantially by the industry of the worker. Figure 7
and Table 6 report estimates of entrepreneurial
activity by major industry. In 2006, rates of
entrepreneurial activity were highest in construction
at 1.06 percent. Rates of entrepreneurial activity in
services were also high (0.40 percent), followed by
the other category (0.31 percent) and trade
(0.26 percent). Manufacturing had substantially
lower rates of entrepreneurial activity than all other
industries, with only 0.09 percent of non-business
owners starting businesses in this industry per month
in 2006. Between 2005 and 2006, the rate of
entrepreneurial activity in construction declined from
1.14 percent to 1.06 percent, and the rate of
entrepreneurial activity in services increased from
0.38 percent to 0.40 percent.
0.0%
0.2%
0.4%
0.6%
0.8%
1.0%
1.2%
1.4%
20061996 1997 1998 1999 2000 2002 2003 2004 2005
Construction Manufacturing Trade Services Other
2001
FIGURE 7
KAUFFMAN INDEX OF ENTREPRENEURIALACTIVITY BY INDUSTRY
(1996–2006)
SOURCE: Robert W. Fairlie, University of California, Santa Cruz, using the Current Population Survey.
Sample Sample Sample Sample SampleYear Index Size Index Size Index Size Index Size Index Size
1996 1.06% 23,693 0.07% 71,120 0.39% 60,144 0.44% 205,664 0.41% 55,6041997 1.05% 23,694 0.08% 71,152 0.30% 59,480 0.38% 208,199 0.37% 55,3021998 0.95% 23,961 0.07% 69,792 0.35% 59,763 0.41% 211,337 0.32% 55,1241999 0.90% 24,754 0.06% 66,980 0.29% 59,935 0.39% 213,046 0.31% 54,3312000 0.98% 25,771 0.06% 65,676 0.36% 59,445 0.37% 212,927 0.32% 53,9412001 0.89% 28,472 0.08% 67,844 0.27% 63,069 0.38% 231,578 0.29% 56,7042002 1.04% 31,212 0.08% 70,348 0.32% 69,660 0.39% 257,048 0.34% 61,3762003 1.25% 31,542 0.09% 65,494 0.31% 69,037 0.39% 254,486 0.34% 58,3022004 1.22% 31,726 0.10% 62,079 0.27% 67,839 0.41% 248,391 0.29% 56,9462005 1.14% 32,179 0.10% 59,476 0.28% 67,491 0.38% 246,875 0.34% 57,6712006 1.06% 32,760 0.09% 57,677 0.26% 65,244 0.40% 247,242 0.31% 57,386
MANU-FACTURINGCONSTRUCTION TRADE SERVICES OTHER
TABLE 6
KAUFFMAN INDEX OF ENTREPRENEURIAL ACTIVITY BY INDUSTRY(1996–2006)
Notes: (1) Estimates calculated by Robert W. Fairlie, University of California, Santa Cruz, using the Current Population Survey. (2) The index ofentrepreneurial activity is the percent of individuals (ages 20-64) who do not own a business in the first survey month that start a business inthe following month with fifteen or more hours worked per week. (3) All observations with allocated labor force status, class of worker, andhours worked variables are excluded.
Manufacturing had substantially lower rates of entrepreneurial activity than all other industries, with only 0.09 percent of non-business owners starting
businesses in this industry per month in 2006.
2 0 0 6 K A U F F M A N I N D E X O F E N T R E P R E N E U R I A L AC T I V I T Y
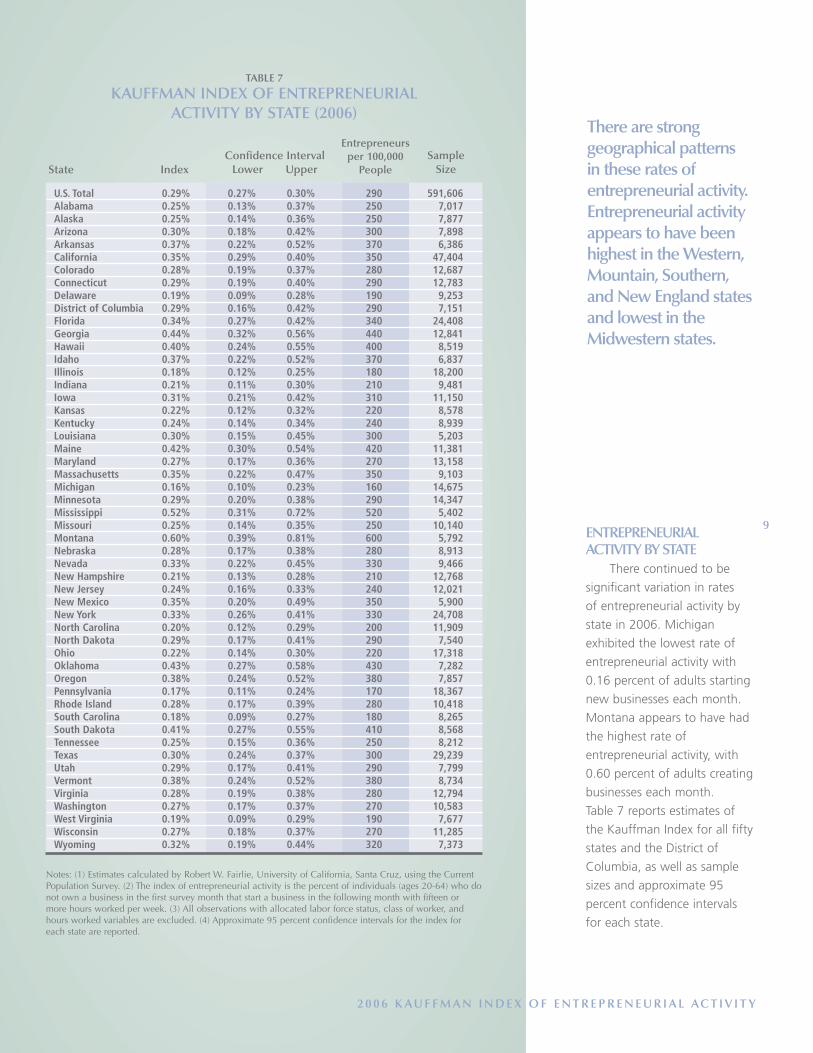
ENTREPRENEURIALACTIVITY BY STATE
There continued to be
significant variation in rates
of entrepreneurial activity by
state in 2006. Michigan
exhibited the lowest rate of
entrepreneurial activity with
0.16 percent of adults starting
new businesses each month.
Montana appears to have had
the highest rate of
entrepreneurial activity, with
0.60 percent of adults creating
businesses each month.
Table 7 reports estimates of
the Kauffman Index for all fifty
states and the District of
Columbia, as well as sample
sizes and approximate 95
percent confidence intervals
for each state.
9
There are stronggeographical patterns in these rates ofentrepreneurial activity.Entrepreneurial activityappears to have beenhighest in the Western,Mountain, Southern,and New England statesand lowest in theMidwestern states.
State Index
U.S. Total 0.29% 0.27% 0.30% 290 591,606Alabama 0.25% 0.13% 0.37% 250 7,017Alaska 0.25% 0.14% 0.36% 250 7,877Arizona 0.30% 0.18% 0.42% 300 7,898Arkansas 0.37% 0.22% 0.52% 370 6,386California 0.35% 0.29% 0.40% 350 47,404Colorado 0.28% 0.19% 0.37% 280 12,687Connecticut 0.29% 0.19% 0.40% 290 12,783Delaware 0.19% 0.09% 0.28% 190 9,253District of Columbia 0.29% 0.16% 0.42% 290 7,151Florida 0.34% 0.27% 0.42% 340 24,408Georgia 0.44% 0.32% 0.56% 440 12,841Hawaii 0.40% 0.24% 0.55% 400 8,519Idaho 0.37% 0.22% 0.52% 370 6,837Illinois 0.18% 0.12% 0.25% 180 18,200Indiana 0.21% 0.11% 0.30% 210 9,481Iowa 0.31% 0.21% 0.42% 310 11,150Kansas 0.22% 0.12% 0.32% 220 8,578Kentucky 0.24% 0.14% 0.34% 240 8,939Louisiana 0.30% 0.15% 0.45% 300 5,203Maine 0.42% 0.30% 0.54% 420 11,381Maryland 0.27% 0.17% 0.36% 270 13,158Massachusetts 0.35% 0.22% 0.47% 350 9,103Michigan 0.16% 0.10% 0.23% 160 14,675Minnesota 0.29% 0.20% 0.38% 290 14,347Mississippi 0.52% 0.31% 0.72% 520 5,402Missouri 0.25% 0.14% 0.35% 250 10,140Montana 0.60% 0.39% 0.81% 600 5,792Nebraska 0.28% 0.17% 0.38% 280 8,913Nevada 0.33% 0.22% 0.45% 330 9,466New Hampshire 0.21% 0.13% 0.28% 210 12,768New Jersey 0.24% 0.16% 0.33% 240 12,021New Mexico 0.35% 0.20% 0.49% 350 5,900New York 0.33% 0.26% 0.41% 330 24,708North Carolina 0.20% 0.12% 0.29% 200 11,909North Dakota 0.29% 0.17% 0.41% 290 7,540Ohio 0.22% 0.14% 0.30% 220 17,318Oklahoma 0.43% 0.27% 0.58% 430 7,282Oregon 0.38% 0.24% 0.52% 380 7,857Pennsylvania 0.17% 0.11% 0.24% 170 18,367Rhode Island 0.28% 0.17% 0.39% 280 10,418South Carolina 0.18% 0.09% 0.27% 180 8,265South Dakota 0.41% 0.27% 0.55% 410 8,568Tennessee 0.25% 0.15% 0.36% 250 8,212Texas 0.30% 0.24% 0.37% 300 29,239Utah 0.29% 0.17% 0.41% 290 7,799Vermont 0.38% 0.24% 0.52% 380 8,734Virginia 0.28% 0.19% 0.38% 280 12,794Washington 0.27% 0.17% 0.37% 270 10,583West Virginia 0.19% 0.09% 0.29% 190 7,677Wisconsin 0.27% 0.18% 0.37% 270 11,285Wyoming 0.32% 0.19% 0.44% 320 7,373
Confidence IntervalLower Upper
Entrepreneursper 100,000
PeopleSample
Size
TABLE 7
KAUFFMAN INDEX OF ENTREPRENEURIAL ACTIVITY BY STATE (2006)
Notes: (1) Estimates calculated by Robert W. Fairlie, University of California, Santa Cruz, using the CurrentPopulation Survey. (2) The index of entrepreneurial activity is the percent of individuals (ages 20-64) who donot own a business in the first survey month that start a business in the following month with fifteen ormore hours worked per week. (3) All observations with allocated labor force status, class of worker, andhours worked variables are excluded. (4) Approximate 95 percent confidence intervals for the index foreach state are reported.
Rates of Entrepreneurial Activity 0.33 percent to 0.60 percent0.27 percent to 0.32 percent0.16 percent to 0.26 percent
SOURCE: Robert W. Fairlie, University of California, Santa Cruz, using the Current Population Survey.
1 0
2 0 0 6 K A U F F M A N I N D E X O F E N T R E P R E N E U R I A L AC T I V I T Y
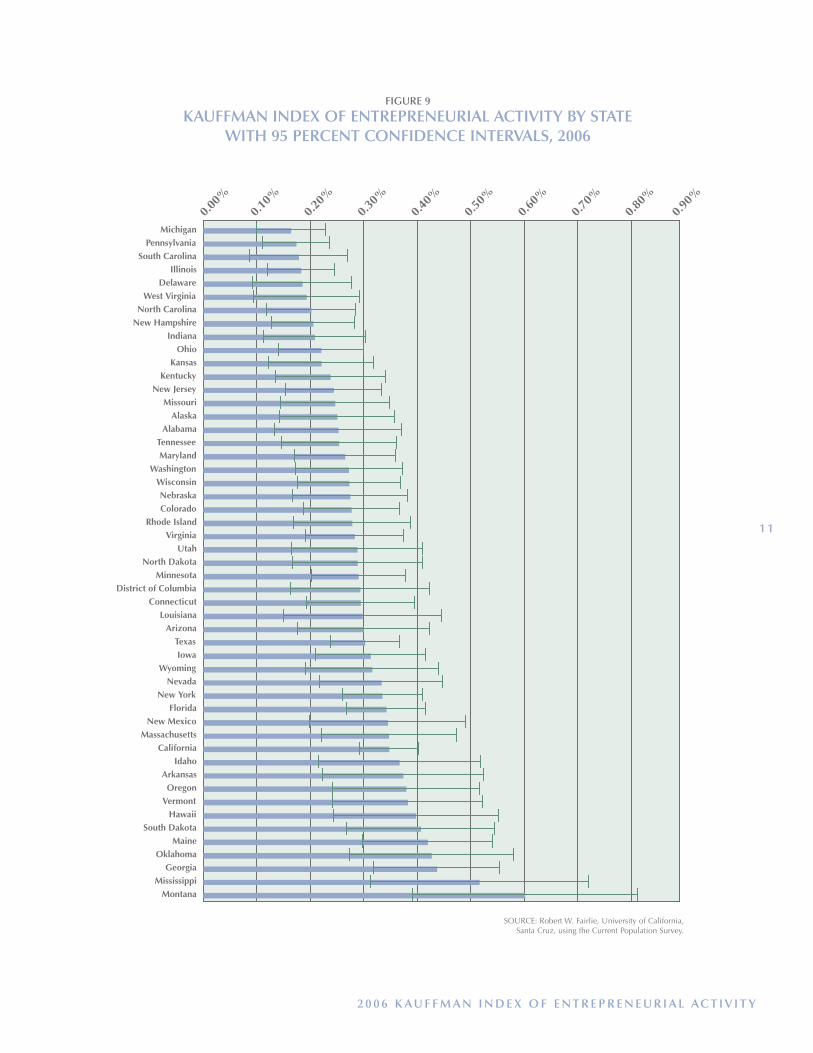
There are strong geographical patterns
in these rates of entrepreneurial activity.
Entrepreneurial activity appears to have been
highest in the Western, Mountain, Southern,
and New England states and lowest in the
Midwestern states. Figure 8 illustrates variation
in levels of entrepreneurial activity across the
United States, and Figure 9 ranks states by levels
of entrepreneurial activity, with 95 percent
confidence intervals for each state. The five states
with the highest rates of entrepreneurial activity
were Montana (0.60 percent), Mississippi
(0.52 percent), Georgia (0.44 percent), Oklahoma
(0.43 percent), and Maine (0.42 percent). The five
states with the lowest rates of entrepreneurial
activity were Michigan (0.16 percent),
Pennsylvania (0.17 percent), South Carolina
(0.18 percent), Illinois (0.18 percent), and
Delaware (0.19 percent).
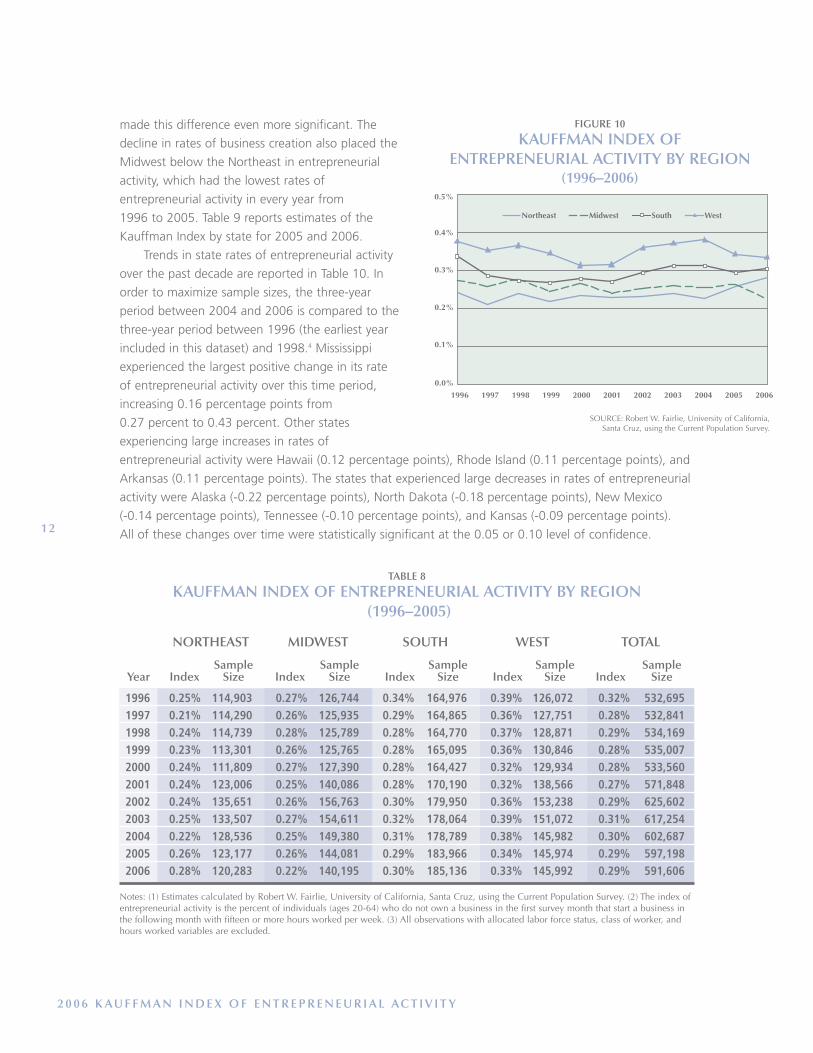
Between 2005 and 2006, rates of
entrepreneurial activity dropped in the Midwest
and increased slightly in the Northeast. The South
and West experienced very little change in
entrepreneurial activity. Estimates of the Kauffman
Index by region are reported in Figure 10 and
Table 8. The rate of entrepreneurial activity is
relatively low in the Midwest and the decline from
0.26 percent in 2005 to 0.22 percent in 2006
FIGURE 8
KAUFFMAN INDEX OF ENTREPRENEURIAL ACTIVITY BY STATE (2006)
0.00%
0.10%
0.20%
0.30%
0.40%
0.50%
0.60%
0.70%
0.80%
0.90%
MontanaMississippi
GeorgiaOklahoma
MaineSouth Dakota
HawaiiVermontOregon
ArkansasIdaho
CaliforniaMassachusetts
New MexicoFlorida
New YorkNevada
WyomingIowaTexas
ArizonaLouisiana
ConnecticutDistrict of Columbia
MinnesotaNorth Dakota
UtahVirginia
Rhode IslandColoradoNebraska
WisconsinWashington
MarylandTennessee
AlabamaAlaska
MissouriNew Jersey
KentuckyKansas
OhioIndiana
New HampshireNorth Carolina
West VirginiaDelaware
IllinoisSouth Carolina
PennsylvaniaMichigan
2 0 0 6 K A U F F M A N I N D E X O F E N T R E P R E N E U R I A L AC T I V I T Y
FIGURE 9
KAUFFMAN INDEX OF ENTREPRENEURIAL ACTIVITY BY STATE WITH 95 PERCENT CONFIDENCE INTERVALS, 2006
1 1
SOURCE: Robert W. Fairlie, University of California, Santa Cruz, using the Current Population Survey.
1 2
2 0 0 6 K A U F F M A N I N D E X O F E N T R E P R E N E U R I A L AC T I V I T Y
Sample Sample Sample Sample SampleYear Index Size Index Size Index Size Index Size Index Size
NORTHEAST MIDWEST SOUTH WEST TOTAL
TABLE 8
KAUFFMAN INDEX OF ENTREPRENEURIAL ACTIVITY BY REGION(1996–2005)
Notes: (1) Estimates calculated by Robert W. Fairlie, University of California, Santa Cruz, using the Current Population Survey. (2) The index ofentrepreneurial activity is the percent of individuals (ages 20-64) who do not own a business in the first survey month that start a business inthe following month with fifteen or more hours worked per week. (3) All observations with allocated labor force status, class of worker, andhours worked variables are excluded.
made this difference even more significant. The
decline in rates of business creation also placed the
Midwest below the Northeast in entrepreneurial
activity, which had the lowest rates of
entrepreneurial activity in every year from
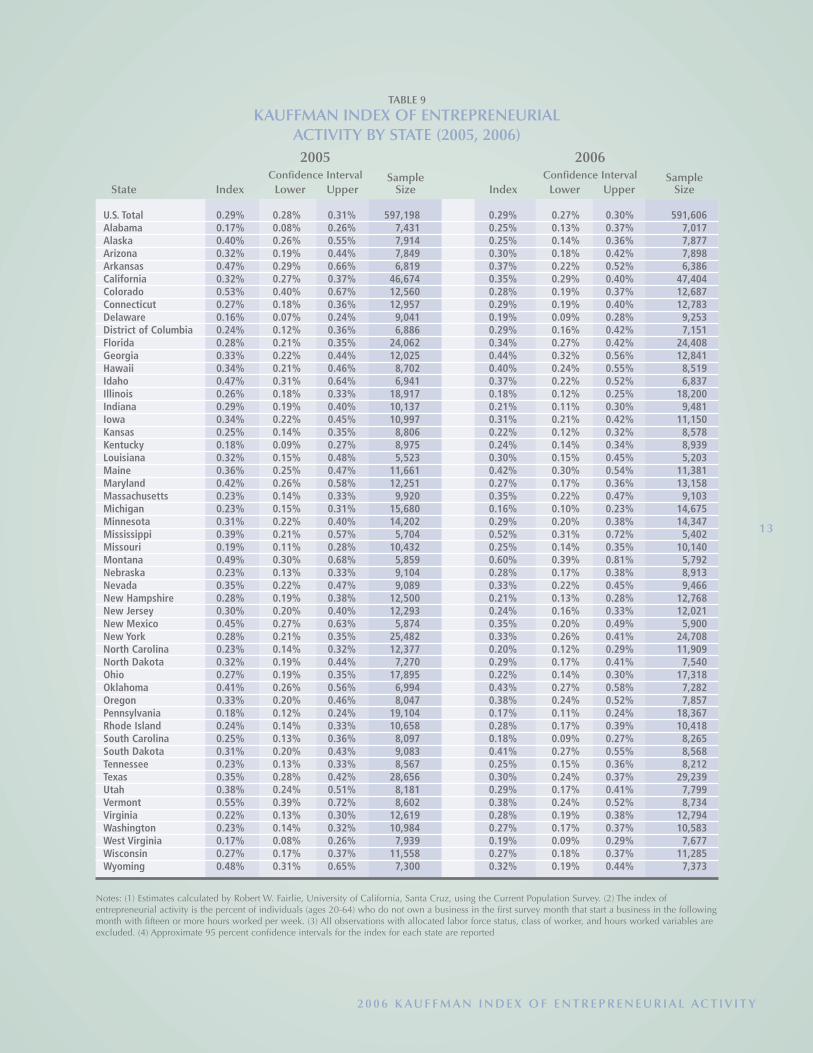
1996 to 2005. Table 9 reports estimates of the
Kauffman Index by state for 2005 and 2006.
Trends in state rates of entrepreneurial activity
over the past decade are reported in Table 10. In
order to maximize sample sizes, the three-year
period between 2004 and 2006 is compared to the
three-year period between 1996 (the earliest year
included in this dataset) and 1998.4 Mississippi
experienced the largest positive change in its rate
of entrepreneurial activity over this time period,
increasing 0.16 percentage points from
0.27 percent to 0.43 percent. Other states
experiencing large increases in rates of
entrepreneurial activity were Hawaii (0.12 percentage points), Rhode Island (0.11 percentage points), and
Arkansas (0.11 percentage points). The states that experienced large decreases in rates of entrepreneurial
activity were Alaska (-0.22 percentage points), North Dakota (-0.18 percentage points), New Mexico
(-0.14 percentage points), Tennessee (-0.10 percentage points), and Kansas (-0.09 percentage points).
All of these changes over time were statistically significant at the 0.05 or 0.10 level of confidence.
0.5%
0.1%
0.2%
0.3%
0.4%
0.0%
20061996 1997 1998 1999 2000 2001 2002 2003 2004 2005
Northeast Midwest South West
FIGURE 10
KAUFFMAN INDEX OF ENTREPRENEURIAL ACTIVITY BY REGION
(1996–2006)
SOURCE: Robert W. Fairlie, University of California, Santa Cruz, using the Current Population Survey.
1996 0.25% 114,903 0.27% 126,744 0.34% 164,976 0.39% 126,072 0.32% 532,6951997 0.21% 114,290 0.26% 125,935 0.29% 164,865 0.36% 127,751 0.28% 532,8411998 0.24% 114,739 0.28% 125,789 0.28% 164,770 0.37% 128,871 0.29% 534,1691999 0.23% 113,301 0.26% 125,765 0.28% 165,095 0.36% 130,846 0.28% 535,0072000 0.24% 111,809 0.27% 127,390 0.28% 164,427 0.32% 129,934 0.28% 533,5602001 0.24% 123,006 0.25% 140,086 0.28% 170,190 0.32% 138,566 0.27% 571,8482002 0.24% 135,651 0.26% 156,763 0.30% 179,950 0.36% 153,238 0.29% 625,6022003 0.25% 133,507 0.27% 154,611 0.32% 178,064 0.39% 151,072 0.31% 617,2542004 0.22% 128,536 0.25% 149,380 0.31% 178,789 0.38% 145,982 0.30% 602,6872005 0.26% 123,177 0.26% 144,081 0.29% 183,966 0.34% 145,974 0.29% 597,1982006 0.28% 120,283 0.22% 140,195 0.30% 185,136 0.33% 145,992 0.29% 591,606
Sample SampleState Index Lower Upper Size Index Lower Upper Size
U.S. Total 0.29% 0.28% 0.31% 597,198 0.29% 0.27% 0.30% 591,606 Alabama 0.17% 0.08% 0.26% 7,431 0.25% 0.13% 0.37% 7,017 Alaska 0.40% 0.26% 0.55% 7,914 0.25% 0.14% 0.36% 7,877 Arizona 0.32% 0.19% 0.44% 7,849 0.30% 0.18% 0.42% 7,898 Arkansas 0.47% 0.29% 0.66% 6,819 0.37% 0.22% 0.52% 6,386 California 0.32% 0.27% 0.37% 46,674 0.35% 0.29% 0.40% 47,404 Colorado 0.53% 0.40% 0.67% 12,560 0.28% 0.19% 0.37% 12,687 Connecticut 0.27% 0.18% 0.36% 12,957 0.29% 0.19% 0.40% 12,783 Delaware 0.16% 0.07% 0.24% 9,041 0.19% 0.09% 0.28% 9,253 District of Columbia 0.24% 0.12% 0.36% 6,886 0.29% 0.16% 0.42% 7,151 Florida 0.28% 0.21% 0.35% 24,062 0.34% 0.27% 0.42% 24,408 Georgia 0.33% 0.22% 0.44% 12,025 0.44% 0.32% 0.56% 12,841 Hawaii 0.34% 0.21% 0.46% 8,702 0.40% 0.24% 0.55% 8,519 Idaho 0.47% 0.31% 0.64% 6,941 0.37% 0.22% 0.52% 6,837 Illinois 0.26% 0.18% 0.33% 18,917 0.18% 0.12% 0.25% 18,200 Indiana 0.29% 0.19% 0.40% 10,137 0.21% 0.11% 0.30% 9,481 Iowa 0.34% 0.22% 0.45% 10,997 0.31% 0.21% 0.42% 11,150 Kansas 0.25% 0.14% 0.35% 8,806 0.22% 0.12% 0.32% 8,578 Kentucky 0.18% 0.09% 0.27% 8,975 0.24% 0.14% 0.34% 8,939 Louisiana 0.32% 0.15% 0.48% 5,523 0.30% 0.15% 0.45% 5,203 Maine 0.36% 0.25% 0.47% 11,661 0.42% 0.30% 0.54% 11,381 Maryland 0.42% 0.26% 0.58% 12,251 0.27% 0.17% 0.36% 13,158 Massachusetts 0.23% 0.14% 0.33% 9,920 0.35% 0.22% 0.47% 9,103 Michigan 0.23% 0.15% 0.31% 15,680 0.16% 0.10% 0.23% 14,675 Minnesota 0.31% 0.22% 0.40% 14,202 0.29% 0.20% 0.38% 14,347 Mississippi 0.39% 0.21% 0.57% 5,704 0.52% 0.31% 0.72% 5,402 Missouri 0.19% 0.11% 0.28% 10,432 0.25% 0.14% 0.35% 10,140 Montana 0.49% 0.30% 0.68% 5,859 0.60% 0.39% 0.81% 5,792 Nebraska 0.23% 0.13% 0.33% 9,104 0.28% 0.17% 0.38% 8,913 Nevada 0.35% 0.22% 0.47% 9,089 0.33% 0.22% 0.45% 9,466 New Hampshire 0.28% 0.19% 0.38% 12,500 0.21% 0.13% 0.28% 12,768 New Jersey 0.30% 0.20% 0.40% 12,293 0.24% 0.16% 0.33% 12,021 New Mexico 0.45% 0.27% 0.63% 5,874 0.35% 0.20% 0.49% 5,900 New York 0.28% 0.21% 0.35% 25,482 0.33% 0.26% 0.41% 24,708 North Carolina 0.23% 0.14% 0.32% 12,377 0.20% 0.12% 0.29% 11,909 North Dakota 0.32% 0.19% 0.44% 7,270 0.29% 0.17% 0.41% 7,540 Ohio 0.27% 0.19% 0.35% 17,895 0.22% 0.14% 0.30% 17,318 Oklahoma 0.41% 0.26% 0.56% 6,994 0.43% 0.27% 0.58% 7,282 Oregon 0.33% 0.20% 0.46% 8,047 0.38% 0.24% 0.52% 7,857 Pennsylvania 0.18% 0.12% 0.24% 19,104 0.17% 0.11% 0.24% 18,367 Rhode Island 0.24% 0.14% 0.33% 10,658 0.28% 0.17% 0.39% 10,418 South Carolina 0.25% 0.13% 0.36% 8,097 0.18% 0.09% 0.27% 8,265 South Dakota 0.31% 0.20% 0.43% 9,083 0.41% 0.27% 0.55% 8,568 Tennessee 0.23% 0.13% 0.33% 8,567 0.25% 0.15% 0.36% 8,212 Texas 0.35% 0.28% 0.42% 28,656 0.30% 0.24% 0.37% 29,239 Utah 0.38% 0.24% 0.51% 8,181 0.29% 0.17% 0.41% 7,799 Vermont 0.55% 0.39% 0.72% 8,602 0.38% 0.24% 0.52% 8,734 Virginia 0.22% 0.13% 0.30% 12,619 0.28% 0.19% 0.38% 12,794 Washington 0.23% 0.14% 0.32% 10,984 0.27% 0.17% 0.37% 10,583 West Virginia 0.17% 0.08% 0.26% 7,939 0.19% 0.09% 0.29% 7,677 Wisconsin 0.27% 0.17% 0.37% 11,558 0.27% 0.18% 0.37% 11,285 Wyoming 0.48% 0.31% 0.65% 7,300 0.32% 0.19% 0.44% 7,373
Confidence Interval
2005 2006Confidence Interval
TABLE 9
KAUFFMAN INDEX OF ENTREPRENEURIAL ACTIVITY BY STATE (2005, 2006)
Notes: (1) Estimates calculated by Robert W. Fairlie, University of California, Santa Cruz, using the Current Population Survey. (2) The index ofentrepreneurial activity is the percent of individuals (ages 20-64) who do not own a business in the first survey month that start a business in the followingmonth with fifteen or more hours worked per week. (3) All observations with allocated labor force status, class of worker, and hours worked variables areexcluded. (4) Approximate 95 percent confidence intervals for the index for each state are reported
2 0 0 6 K A U F F M A N I N D E X O F E N T R E P R E N E U R I A L AC T I V I T Y
1 3
K A U F F M A N I N D E X O F E N T R E P R E N E U R I A L AC T I V I T Y
Sample SampleState Index Lower Upper Size Index Lower Upper Size
U.S. Total 0.29% 0.28% 0.30% 1,594,432 0.29% 0.28% 0.30% 1,791,491Alabama 0.23% 0.17% 0.30% 22,508 0.24% 0.18% 0.31% 23,022Alaska 0.59% 0.47% 0.71% 18,315 0.37% 0.29% 0.45% 24,137Arizona 0.40% 0.32% 0.49% 23,278 0.32% 0.24% 0.39% 23,955Arkansas 0.31% 0.24% 0.39% 21,495 0.42% 0.32% 0.51% 20,039California 0.34% 0.31% 0.38% 131,823 0.35% 0.32% 0.39% 136,243Colorado 0.44% 0.35% 0.53% 23,331 0.39% 0.32% 0.45% 37,946Connecticut 0.21% 0.14% 0.28% 16,576 0.26% 0.21% 0.32% 37,560Delaware 0.23% 0.15% 0.31% 16,571 0.16% 0.11% 0.22% 26,657District of Columbia 0.28% 0.19% 0.36% 15,322 0.24% 0.17% 0.31% 20,226Florida 0.34% 0.29% 0.38% 70,549 0.31% 0.27% 0.35% 72,036Georgia 0.31% 0.25% 0.38% 28,903 0.38% 0.31% 0.45% 34,814Hawaii 0.21% 0.14% 0.28% 16,292 0.32% 0.25% 0.40% 25,142Idaho 0.39% 0.30% 0.48% 22,702 0.43% 0.34% 0.52% 20,645Illinois 0.25% 0.21% 0.29% 68,087 0.23% 0.19% 0.28% 57,669Indiana 0.24% 0.18% 0.31% 22,680 0.25% 0.19% 0.30% 30,860Iowa 0.38% 0.29% 0.47% 20,436 0.30% 0.24% 0.36% 32,839Kansas 0.33% 0.25% 0.41% 20,354 0.24% 0.18% 0.29% 27,328Kentucky 0.28% 0.21% 0.36% 21,966 0.22% 0.17% 0.28% 26,771Louisiana 0.32% 0.24% 0.39% 21,989 0.29% 0.21% 0.38% 17,278Maine 0.38% 0.28% 0.48% 17,566 0.39% 0.32% 0.46% 34,162Maryland 0.25% 0.18% 0.33% 18,675 0.33% 0.25% 0.40% 36,031Massachusetts 0.20% 0.15% 0.25% 39,033 0.26% 0.20% 0.32% 30,135Michigan 0.25% 0.20% 0.29% 58,156 0.19% 0.15% 0.24% 47,390Minnesota 0.31% 0.23% 0.38% 23,027 0.30% 0.24% 0.35% 41,002Mississippi 0.27% 0.19% 0.34% 20,519 0.43% 0.32% 0.54% 17,473Missouri 0.29% 0.21% 0.37% 19,321 0.22% 0.17% 0.28% 30,225Montana 0.52% 0.42% 0.62% 20,860 0.55% 0.44% 0.67% 17,724Nebraska 0.36% 0.27% 0.45% 20,216 0.28% 0.22% 0.35% 27,826Nevada 0.36% 0.26% 0.45% 20,160 0.31% 0.25% 0.38% 29,179New Hampshire 0.25% 0.18% 0.33% 16,436 0.23% 0.18% 0.28% 37,122New Jersey 0.21% 0.17% 0.26% 48,937 0.26% 0.21% 0.31% 38,610New Mexico 0.57% 0.47% 0.68% 22,522 0.43% 0.33% 0.53% 18,347New York 0.28% 0.24% 0.31% 102,328 0.29% 0.25% 0.33% 77,340North Carolina 0.28% 0.23% 0.33% 43,195 0.23% 0.18% 0.28% 37,463North Dakota 0.46% 0.36% 0.56% 19,200 0.27% 0.21% 0.34% 22,938Ohio 0.25% 0.21% 0.30% 62,180 0.25% 0.20% 0.29% 53,806Oklahoma 0.38% 0.30% 0.46% 23,839 0.44% 0.34% 0.53% 21,319Oregon 0.43% 0.33% 0.52% 19,111 0.34% 0.27% 0.42% 25,011Pennsylvania 0.17% 0.14% 0.20% 69,109 0.17% 0.14% 0.21% 58,610Rhode Island 0.17% 0.10% 0.23% 16,782 0.28% 0.22% 0.34% 32,164South Carolina 0.30% 0.22% 0.38% 18,661 0.22% 0.16% 0.28% 24,324South Dakota 0.42% 0.33% 0.52% 19,954 0.34% 0.27% 0.41% 26,702Tennessee 0.35% 0.26% 0.43% 21,189 0.25% 0.18% 0.31% 24,956Texas 0.30% 0.26% 0.34% 78,273 0.34% 0.30% 0.38% 84,914Utah 0.32% 0.24% 0.40% 22,181 0.33% 0.26% 0.41% 24,256Vermont 0.40% 0.29% 0.50% 15,784 0.45% 0.37% 0.54% 26,293Virginia 0.26% 0.20% 0.33% 25,731 0.26% 0.20% 0.32% 36,187Washington 0.29% 0.21% 0.37% 21,359 0.31% 0.24% 0.37% 32,684West Virginia 0.19% 0.12% 0.25% 23,497 0.19% 0.13% 0.24% 24,381Wisconsin 0.23% 0.17% 0.29% 23,805 0.30% 0.23% 0.36% 35,071Wyoming 0.37% 0.28% 0.46% 19,649 0.40% 0.32% 0.49% 22,679
Confidence Interval
1996-98 Period 2004-06 PeriodConfidence Interval
TABLE 10
KAUFFMAN INDEX OF ENTREPRENEURIAL ACTIVITY BY STATE (1996-98 to 2004-2006)
Notes: (1) Estimates calculated by Robert W. Fairlie, University of California, Santa Cruz, using the Current Population Survey. (2) The index ofentrepreneurial activity is the percent of individuals (ages 20-64) who do not own a business in the first survey month that start a business in the followingmonth with fifteen or more hours worked per week. (3) All observations with allocated labor force status, class of worker, and hours worked variables areexcluded. (4) Approximate 95 percent confidence intervals for the index for each state are reported.
1 4
K A U F F M A N I N D E X O F E N T R E P R E N E U R I A L AC T I V I T Y
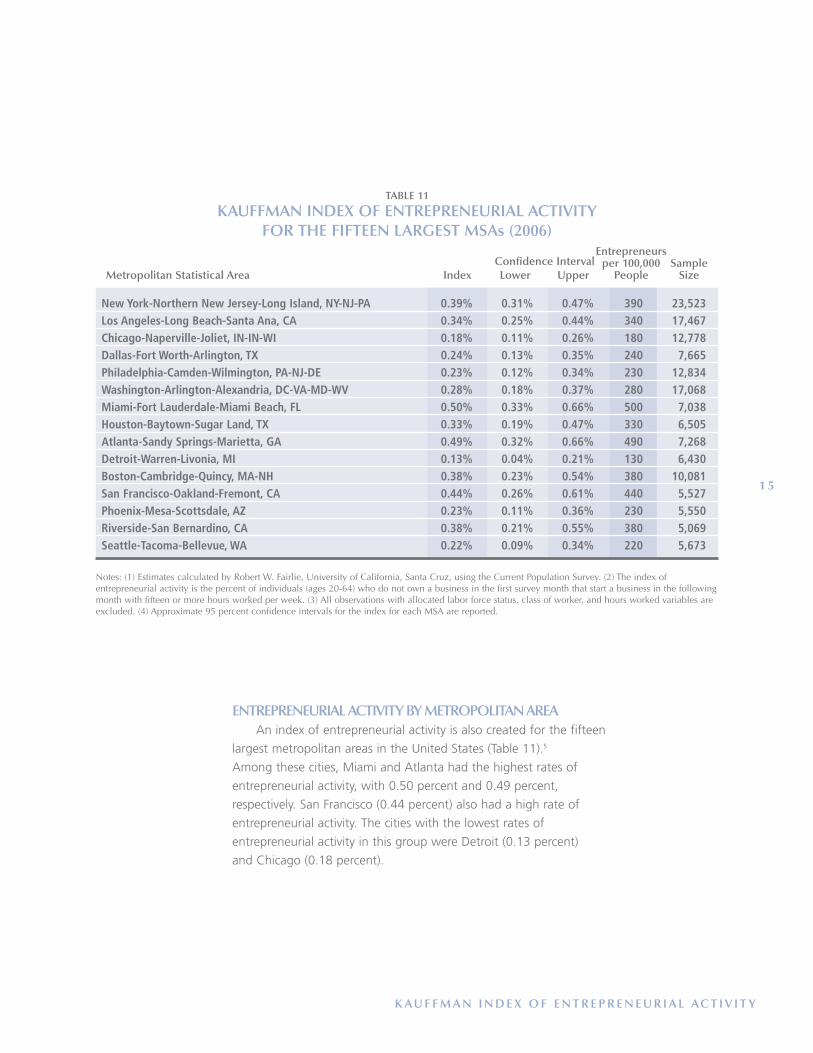
ENTREPRENEURIAL ACTIVITY BY METROPOLITAN AREAAn index of entrepreneurial activity is also created for the fifteen
largest metropolitan areas in the United States (Table 11).5
Among these cities, Miami and Atlanta had the highest rates of
entrepreneurial activity, with 0.50 percent and 0.49 percent,
respectively. San Francisco (0.44 percent) also had a high rate of
entrepreneurial activity. The cities with the lowest rates of
entrepreneurial activity in this group were Detroit (0.13 percent)
and Chicago (0.18 percent).
1 5
TABLE 11
KAUFFMAN INDEX OF ENTREPRENEURIAL ACTIVITY FOR THE FIFTEEN LARGEST MSAs (2006)
New York-Northern New Jersey-Long Island, NY-NJ-PA 0.39% 0.31% 0.47% 390 23,523Los Angeles-Long Beach-Santa Ana, CA 0.34% 0.25% 0.44% 340 17,467Chicago-Naperville-Joliet, IN-IN-WI 0.18% 0.11% 0.26% 180 12,778Dallas-Fort Worth-Arlington, TX 0.24% 0.13% 0.35% 240 7,665Philadelphia-Camden-Wilmington, PA-NJ-DE 0.23% 0.12% 0.34% 230 12,834Washington-Arlington-Alexandria, DC-VA-MD-WV 0.28% 0.18% 0.37% 280 17,068Miami-Fort Lauderdale-Miami Beach, FL 0.50% 0.33% 0.66% 500 7,038Houston-Baytown-Sugar Land, TX 0.33% 0.19% 0.47% 330 6,505Atlanta-Sandy Springs-Marietta, GA 0.49% 0.32% 0.66% 490 7,268Detroit-Warren-Livonia, MI 0.13% 0.04% 0.21% 130 6,430Boston-Cambridge-Quincy, MA-NH 0.38% 0.23% 0.54% 380 10,081San Francisco-Oakland-Fremont, CA 0.44% 0.26% 0.61% 440 5,527Phoenix-Mesa-Scottsdale, AZ 0.23% 0.11% 0.36% 230 5,550Riverside-San Bernardino, CA 0.38% 0.21% 0.55% 380 5,069Seattle-Tacoma-Bellevue, WA 0.22% 0.09% 0.34% 220 5,673
Entrepreneursper 100,000 Sample
Metropolitan Statistical Area Index Lower Upper People SizeConfidence Interval
Notes: (1) Estimates calculated by Robert W. Fairlie, University of California, Santa Cruz, using the Current Population Survey. (2) The index ofentrepreneurial activity is the percent of individuals (ages 20-64) who do not own a business in the first survey month that start a business in the followingmonth with fifteen or more hours worked per week. (3) All observations with allocated labor force status, class of worker, and hours worked variables areexcluded. (4) Approximate 95 percent confidence intervals for the index for each MSA are reported.
1 6
K A U F F M A N I N D E X O F E N T R E P R E N E U R I A L AC T I V I T Y
The Kauffman Index measures the
monthly rate of business creation at
the individual owner level, reporting
the percent of non-business owning
adults who start businesses with more
than fifteen hours worked per week. The matched
basic monthly files from the Current Population
Survey (CPS) provide a uniquely large, nationally
representative panel dataset for measuring this
entrepreneurial activity. The total sample size for
the period from 1996 to 2006 for the adult
population is over eight million. Detailed
demographic information available in the CPS and
large sample sizes also allow for estimates of
separate indices by gender, race, education, age,
and immigrant status. Indices for all states and for
the largest MSAs are also calculated.
In 2006, 0.29 percent of the adult population
or 290 out of 100,000 adults created a new
business each month, representing approximately
465,000 new businesses per month. This total
rate of business creation did not change between
2005 and 2006. There are some interesting
differences in changes in rates of entrepreneurial
activity in 2006 for subgroups of the population.
First, the rate of entrepreneurial activity for men
remained constant between 2005 and 2006,
apparently ending the downward trend over the
previous several years. Second, Asians experienced
the only notable increase in rates of
entrepreneurial activity in 2006 among major
ethnic and racial groups. The non-Latino white
rate of entrepreneurial activity remained constant,
the African American rate declined slightly, and
the Latino rate increased slightly during this time
period. A related finding is that the rate of
entrepreneurial activity among immigrants, already
high relative to the native-born, increased
between 2005 and 2006. In 2006, the rate of
entrepreneurial activity among immigrants was
0.37 percent, compared to 0.27 percent among
the native-born. Finally, the Midwest experienced
a sizeable drop in entrepreneurial activity between
2005 and 2006, making it the lowest ranked
region in the United States for the first time in
the past eleven years.
Rates of entrepreneurial activity varied
substantially across states, from a low of
0.16 percent in Michigan to a high of 0.60
percent in Montana. Rates of entrepreneurial
activity were also high in Mississippi (0.52
percent), Georgia (0.44 percent), Oklahoma
(0.43 percent), and Maine (0.42 percent). In
addition to Michigan, the lowest rates of
entrepreneurial activity were found in Pennsylvania
(0.17 percent), South Carolina (0.18 percent),
Illinois (0.18 percent), and Delaware
(0.19 percent).
The states experiencing the largest increases
in rates of entrepreneurial activity over the past
decade were Mississippi (with an increase of
0.16 percentage points), Hawaii (0.12 percentage
points), Rhode Island (0.11 percentage points),
and Arkansas (0.11 percentage points). The
states that experienced the largest decreases in
their rates were Alaska (with a decrease of
0.22 percent percentage points), North Dakota
(-0.18 percentage points), New Mexico
(-0.14 percentage points), Tennessee
(-0.10 percentage points), and Kansas
(-0.09 percentage points).
Analysis of the fifteen largest metropolitan
areas in the United States reveals that Miami
(0.50 percent) and Atlanta (0.49 percent) had the
highest rates of entrepreneurial activity in 2006.
Detroit (0.13 percent) and Chicago (0.18 percent)
had the lowest rates of entrepreneurial activity.
Summary

appendix
K A U F F M A N I N D E X O F E N T R E P R E N E U R I A L AC T I V I T Y
1 8
K A U F F M A N I N D E X O F E N T R E P R E N E U R I A L AC T I V I T Y
The underlying datasets that are used in this analysis
are the basic monthly files to the Current Population
Survey (CPS). These surveys, conducted each month by
the U.S. Bureau of the Census and the Bureau of
Labor Statistics, are representative of the entire U.S.
population and contain observations for more than
130,000 people each month. By linking the CPS files
over time, longitudinal data are created, allowing for
the examination of business creations. Combining the
2006 monthly data creates a 2006 dataset with a
sample size of roughly 600,000 adults. The dataset
built for the analysis of the eleven-year period
between 1996 and 2006 has a sample size of more
than 8 million adults.
Households in the CPS are interviewed each
month over a four-month period. Eight months later
they are re-interviewed in each month of a second
four-month period. Thus, individuals who are
interviewed in January, February, March, and April of
one year are interviewed again in January, February,
March, and April of the following year. The rotation
pattern of the CPS makes it possible to match
information on individuals monthly, and, therefore, to
create monthly panel data for 75 percent of all
respondents in the CPS. To match these data, the
household and individual identifiers provided by the
CPS are used. False matches are removed by
comparing race, sex, and age codes from the two
months. After all non-unique matches are removed,
the underlying CPS data are checked extensively for
coding errors and other problems.
Monthly match rates are generally between 94
and 96 percent (see Fairlie 2005), and the primary
reason for non-matching is household moves. A
somewhat non-random sample (mainly geographic
movers) will, therefore, be lost due to the matching
routine. Moves do not appear to create a serious
problem for month-to-month matches, however,
because the observable characteristics of the original
sample and the matched sample are very similar
(see Fairlie 2005).
DETAILED DEFINITIONSThe CPS microdata capture all business
owners, including those who own incorporated or
unincorporated business, and those who are
employers or non-employers. To create the Kauffman
Index, all individuals who do not own a business as
their main job are identified in the first survey month.
By matching CPS files, it is then determined whether
these individuals own a business as their main job with
fifteen or more usual hours worked in the following
survey month.
The main job is defined as the one with the most
hours worked. Individuals who start side businesses
will, therefore, not be counted if they are working
more hours on a wage/salary job. The requirement
that business owners work fifteen or more hours per
week in the second month is imposed to rule out part-
time business owners and very small business activities.
It may, therefore, result in an understatement of the
percent of individuals creating any type of business.
The Kauffman Index also excludes individuals who
owned a business and worked fewer than fifteen
hours in the first survey month. Thus, the Kauffman
Index does not capture business owners who increased
their hours from less than fifteen per week in one
month to fifteen or more hours per week in the
second month. In addition, the Kauffman Index does
not capture when these business owners changed
from non-business owners to business owners with
less than fifteen hours worked. These individuals are
excluded from the sample but may have been at the
earliest stages of starting a business. More information
concerning the definition is provided in Fairlie 2006.
The Kauffman Index may also overstate business
creation in certain respects because of small changes
in how individuals report their work status.
Longstanding business owners who also have salaried
positions may, for example, report that they are not
business owners as their main jobs in a particular
month because their wage/salary jobs had more hours
in that month. If the individuals then switched to
having more hours in business ownership the
following month, it would appear that a new business
had been created.
DATA
1 9
K A U F F M A N I N D E X O F E N T R E P R E N E U R I A L AC T I V I T Y
The main sample used to calculate the Kauffman
Index includes only adults between the ages of 20 and
64. For estimates of rates of entrepreneurial activity by
education level, the population between the ages of
25 and 64 is used instead. These age categories follow
the Bureau of Labor Statistics practice of publishing
unemployment rates for ages 20+ for total rates and
ages 25+ for rates by education. Older individuals are
removed from the sample because retirement in this
age group leads to lower rates of entrepreneurial
activity. There were major changes in race and industry
coding over the 1996 to 2006 period. Although every
effort was devoted to creating consistent coding,
definitions are not perfectly consistent over time.
For the definition of entrepreneurial activity
discussed in this report, all observations with allocated
labor force status, class of worker, and hours worked
variables are excluded. Rates of entrepreneurial activity
are substantially higher for allocated or imputed
observations. These observations were included in the
first Kauffman Index report (Fairlie 2005). While the
previous report (Fairlie 2006) excluded these
observations, new information on allocated
observations has resulted in further changes to a small
percent of cases from 1996 to 2003. Estimates in this
report may, therefore, differ slightly from the previous
report (Fairlie 2006). The estimates reported here for
1996 to 2006 update those from all previous reports.
See Fairlie (2006) for a complete discussion of the
exclusion of allocated observations and for
comparisons of unadjusted and adjusted rates of
entrepreneurial activity.
The CPS sample was designed to produce national
and state estimates of the unemployment rate and
other labor force characteristics of the civilian, non-
institutional population ages sixteen and over. The
total national sample size is, therefore, drawn to
ensure a high level of precision for the monthly
national unemployment rate. In addition, the sample is
designed to guarantee precise estimates of average
annual unemployment rates for each of the fifty states
and the District of Columbia (Polivka 2000). Sample
sizes for states are drawn to ensure that the coefficient
of variation, which is the standard error of the
estimate divided by the estimate, is no larger than
8 percent for an annual average unemployment rate
of 6 percent.6 For many states, the sample sizes
contained in the CPS are much larger than this
threshold. While state-level estimates are not affected
by non-random sampling by state in the same
way that national estimates are, they are still
non-representative because of non-response and
post-stratification raking (Polivka 2000). Sampling
weights provided by the CPS are used for all
state-level estimates.
STANDARD ERRORS AND CONFIDENCEINTERVALS
The analysis of entrepreneurial activity by state
includes confidence intervals that indicate confidence
bands of approximately 0.15 percent around the rates
of entrepreneurial activity. While larger states have
smaller confidence bands, the smallest states have
larger confidence bands of approximately 0.20
percent. Oversampling in the CPS ensures that these
small states have sample sizes of at least 5,000
observations, and, therefore, provides a minimum level
of precision.
The standard errors used to create the confidence
intervals reported here may understate the true
variability in the state estimates. Both stratification of
the sample and the raking procedure (post-
stratification) will reduce the variance of CPS estimates
(Polivka 2000 and Train, Cahoon, and Maken 1978).
On the other hand, the clustering of the CPS (i.e.
nearby houses on the same block and multiple
household members) leads to a larger sampling
variance than would have been obtained from simple
random sampling. It appears as though the latter
effect dominates in the CPS, and treating the CPS as
random generally understates standard errors (Polivka
2000). Estimates of the national unemployment rate
indicate that treating the CPS as a random sample
leads to an understatement of the variance of the
unemployment rate of 23 percent. Another problem
associated with the estimates reported here is that
multiple observations (up to three) may occur for the
same individual.
All of the reported confidence intervals should be
considered approximate, as the actual confidence
2 0
K A U F F M A N I N D E X O F E N T R E P R E N E U R I A L AC T I V I T Y
intervals may be slightly larger. The complete
correction for the standard errors and confidence
intervals involves obtaining confidential replicate
weights from the BLS and complicated statistical
procedures. Corrections for the possibility of multiple
observations per person, which may create the largest
bias in standard errors, are corrected for in all reported
confidence intervals. It is important to note, however,
that the estimates of rates of entrepreneurial activity
are not subject to any of these problems. By using the
sample weights provided by the CPS, all estimates of
rates of entrepreneurial activity are correct.
COMPARISON TO OTHER MEASURESThe Kauffman Index differs from many other
measures of entrepreneurial activity in that it measures
flows into business ownership rather than the number
of existing businesses at a specific point in time. Other
measures of the number of entrepreneurs, self-
employed business owners, or businesses in the United
States are readily available from several nationally-
representative government datasets. For example, the
Economic Census Surveys of Minority- and Women-
Owned Business Enterprises provide estimates of the
number of businesses every five years, and the CPS
and Census of Population provide estimates of the
number of self-employed business owners annually
and every decade, respectively. Typical measures of
business ownership based on these data, however, do
not capture the dynamic nature of entrepreneurial
activity that the Kauffman Index illustrates.
The Kauffman Index differs from the 2002 Survey
of Business Owners (SBO) conducted by the U.S.
Census Bureau in several major ways. First, the
Kauffman Index is based on household survey data
and measures individual business owners. The SBO
includes all firms operating during 2002 that filed tax
forms as individual proprietorships, partnerships, or
any type of corporation. Second, the Kauffman Index
captures business entry, whereas the SBO captures
numbers of existing businesses. Increases in the
number of existing businesses over time may be a
result of more business creation, less business closure
or a combination of the two. Third, the Kauffman
Index only includes individuals starting businesses as
their main work activity with a substantial hours
commitment. The SBO includes all firms with receipts
of $1,000 or more, which may include side or
"casual" businesses owned by wage/salary workers,
the unemployed, or retired workers. Finally, the
Kauffman Index includes all new business owners,
whereas the SBO excludes agricultural and a few other
types of businesses.
The Kauffman Index captures a broader range of
entrepreneurial activity than the national and state-
level firm birth data from the Statistics of U.S.
Businesses (SUSB). These data, collected by the U.S.
Census Bureau and summarized by the U.S. Small
Business Administration (SBA), Office of Advocacy,
include only employer firms. Employer firms represent
only approximately one-fourth of all firms,7 and many
firms start with no employees. These data, therefore,
are likely to lead to a substantial undercount in the
rate of entrepreneurial activity, particularly for certain
industries and regions, such as the high-technology
industry. Finally, the SUSB is a business-level measure,
while the CPS is a person-level measure.
The Kauffman Index also differs from the Total
Entrepreneurial Activity (TEA) index used in the Global
Entrepreneurship Monitor. The TEA captures individuals
ages 18–64 who are involved in either the start-up
phase or managing a business that is less than forty-
two months old (Reynolds, Bygrave, and Autio 2003).
This measure of nascent entrepreneurship, therefore,
includes individuals who are still in the start-up phase
of business creation and are not necessarily captured
in the Kauffman Index because they may not be
working on the new business for fifteen hours each
week. In addition, the Kauffman Index captures
entrepreneurs only once when they first create their
business.
In addition to the SUSB data, there have recently
been several state-level reports of entrepreneurial
activity, including the Advanced Research Technologies,
LLC (2005) report to the SBA and Burton: Center for
American Progress (2005). The Kauffman Index offers
more recent data than these other sources, and, unlike
the others, it provides a dynamic picture of flows into
business ownership over time.
Visit www.kauffman.org/kauffmanindex/ todownload tables and graphs.

1 See "Kauffman Index of Entrepreneurial Activity,1996 - 2004" (Fairlie 2005), "Kauffman Index ofEntrepreneurial Activity, National Report 1996 -2005" (Fairlie 2006), and “Kauffman Index ofEntrepreneurial Activity, State Report 1996-2005(Fairlie 2006).
2 Estimates of entrepreneurial activity for 1996 to2003 have been slightly revised from earlierestimates because of the removal of extra allocatedvariables that affected a small percent of cases. SeeAppendix for further explanation.
3 For evidence of the relationship between educationand entrepreneurship from a multivariate analysisthat controls for other factors, see Fairlie (2007)“Entrepreneurship in Silicon Valley during the Boomand Bust,” University of California, Santa CruzWorking Paper athttp://econ.ucsc.edu/~fairlie/papers/siliconvalley.pdf.
4 Annual estimates of state rates of entrepreneurialactivity are available for downloading atwww.kauffman.org/kauffmanindex.
5 As there is no oversampling of metropolitan areasin the CPS, only the largest cities have sufficientobservations to calculate reasonably accurate rates ofentrepreneurial activity. All MSAs reported in Table 4have at least 5,000 observations.
6 The ratio of households sampled for each staterange from 1 in 100 households to 1 in 3,000households (Polivka 2000).
7 According to the 2003 Statistics of U.S. Businesses,U.S. Census Bureau, 23.6 percent of firms haveemployees.

4801 ROCKHILL ROADKANSAS CITY, MISSOURI 64110
816-932-1000www.kauf fman.org
0506500 JP