Kate + Isaac's paper 14.04.03 - GOV.UK
44
1 Multiple shocks and downward mobility: learning from the life histories of rural Ugandans. Kate Bird 1 with Isaac Shinyekwa 2 . A paper delivered at: ‘Staying Poor: Chronic Poverty and Development Policy’. International Conference of the Chronic Poverty Research Centre. 7-9 th April 2003, Manchester. 1 Research Fellow at Overseas Development Institute (ODI), London. [email protected] 2 Research Assistant to the Chronic Poverty Research Centre, based at the Economic Policy Research Centre (EPRC), Makerere University, Kampala. [email protected]
-
Upload
khangminh22 -
Category
Documents
-
view
0 -
download
0
Transcript of Kate + Isaac's paper 14.04.03 - GOV.UK
1
Multiple shocks and downward mobility: learning from the life histories of rural Ugandans.
Kate Bird1
with
Isaac Shinyekwa2.
A paper delivered at:
‘Staying Poor: Chronic Poverty and Development Policy’.
International Conference of the Chronic Poverty Research Centre.
7-9th April 2003, Manchester.
1 Research Fellow at Overseas Development Institute (ODI), London. [email protected] 2 Research Assistant to the Chronic Poverty Research Centre, based at the Economic Policy Research Centre (EPRC), Makerere University, Kampala. [email protected]
2
Abstract: This paper presents findings from on-going research in rural Uganda. Analysis builds on the qualitative and quantitative livelihoods research undertaken in 3 Districts in Uganda by the LADDER study3. In addition to re-analysis of the LADDER dataset, the authors undertook in-depth life history interviews with the heads of nearly 25 households in 3 villages. They explored the trajectories into and out of poverty and found that the loss of assets and composite shocks have propelled a number of previously non-poor households into severe and long-term poverty. In addition, they found that those born into chronically poor households found few opportunities for accumulation and escape. Well-being decline was associated with a web of meso-level constraints and shocks which commonly combined negatively with household level shocks and socio-cultural or socio-psychological factors. Chronically poor households seldom faced a single problem or constraint, and those who reduced the intensity of their poverty generally managed to do so as a result of several serendipitous events or factors combining. Shocks with a long-run impact include the fragmentation of families, following marital breakdown or the death of a parent. The repercussions of which were particularly strong for women and their children who could be affected long into adulthood. Ill health, physical weakness and disability were strongly associated with declines in well-being. ‘Non-cooperation within the household’, resulting in the theft and sale of stored crops or household assets, was associated with high (male) alcohol consumption and was in turn linked with high levels of domestic violence and reduced levels of well-being for the whole household. Inter-ethnic conflict resulting in internal displacement, the loss of productive and household assets and the death of household members caused life-long trauma and declines into chronic poverty for many households. The complete absence of effective interventions for ‘vulnerable groups’ has left widows, orphans, the abandoned elderly, the disabled and the long-term sick with no where to turn. Difficulties in accessing markets, particularly in remote rural areas, means that the chronically poor, even the ‘non-vulnerable’, can rarely accumulate through selling their labour. Education and health provision is commonly poor, even when access is possible. With no surplus to save, low levels of human, social or political capital and few productive assets, the chronically poor’s ability to identify and capitalise on escape routes from poverty are profoundly limited. Day to day levels of well-being are extremely low and they have little hope for a brighter future. Targeted social protection measures are clearly necessary to provide long-term welfare to some and opportunities to invest and accumulate for others. Key words: Remote rural areas, Uganda, chronic poverty, social protection, shocks, vulnerability, life histories
3 Many thanks to Frank Ellis (team leader, ODG, University of East Anglia) and others in the LADDER team for sharing their dataset and qualitative data with CPRC researchers. The LADDER project, funded by DFID, has worked in Uganda, Tanzania, Kenya and Malawi. Godfrey Bahiigwa, from EPRC, led the Uganda component of this work. For more information about LADDER, see www.uea.ac.uk/dev/odg/ladder
3
1. Introduction4. This paper presents initial findings from work researching chronic poverty in rural Uganda. The added value of this research is that, being substantially based on life histories, it provides a starting point for understanding the trajectories into and out of poverty that individuals and households follow. This is work in progress and is still fairly descriptive and broad-brush, however, this paper highlights a number of issues that may be of interest to policy makers. Section 2, contextualises this research with findings from work on income poverty in Uganda, section 3 relates these findings to ideas of multi-dimensional and chronic poverty, and section 4 outlines the research methods used to collect the data for this paper, and introduces the three research sites. In section 5 we present our findings, and finally in the conclusion (section 6) we attempt to draw out some possible policy conclusions. 2. Income Poverty in Uganda. The section below contextualises our study into chronic poverty in rural Uganda. It provides a justification for a particular focus on rural chronic poverty, and indicates that although aggregate poverty has been reduced in Uganda since 1992, differentiation has increased, with rural dwellers benefiting less, or seeing declines in well-being. Uganda has experienced sustained growth and there is widespread confirmation that poverty has been reduced. Okidi and Mugambe’s examination of household panel data from 1992 and 1996 (Okidi and Mugambe, 2002) repeats the positive picture found elsewhere (Appleton, 1998, 2001a, 2001b), in terms of poverty reduction in Uganda. Aggregate figures show that all wealth groups have benefited, with poverty reductions of a third or more during the 1990s (Appleton, 2001b) Opio counters the optimism in the work of Okidi, Deninger, Appleton et al by highlighting that while economic indicators have improved social welfare has deteriorated for many of the poor (Opio, 1997). However, Okidi and Mugambe do not give a mono-dimensional picture and show that poverty is still widespread with 35% of the population still below the poverty line5 in 2000. This figure was higher in rural areas (39% aggregate) and still higher in some parts of the country (see Table 1, below). Okidi and Mugambe show that during the 1992 to 1996 period people’s poverty status was in a state of flux with some households moving out of poverty and others becoming poor. However, some households remained in chronic poverty. Over half of the households who were poor in 1992 were still poor in 1996 (54%). Households living in rural areas were more likely to be not only poor, but trapped in poverty, with 39% of poor rural households escaping poverty between 1992 and 1996. We do not know how permanent their escape from poverty was. They may have entered the ranks of the transitorily or seasonally poor, bouncing above and below the poverty line, or they may have seen a long-term improvement in well-being. The data shows that the severely poor were more than twice as likely to be trapped in poverty than 4 With thanks to John Mims, ODG, University of East Anglia, for his input in reanalysis of the LADDER dataset. 5 The Ugandan poverty line in 2002 was US$3,500, or Ush.6,510,000, using exchange rate of US$1 = Ush.1860, published in the domestic Ugandan press on 9th January 2003
4
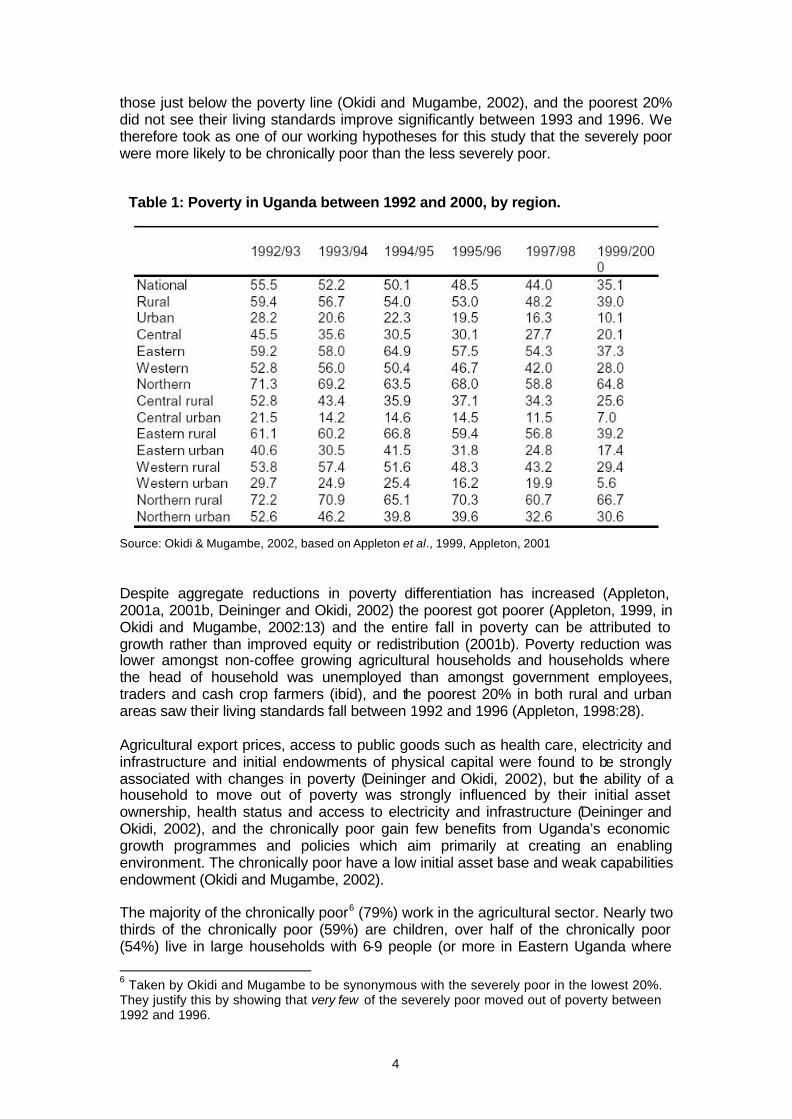
those just below the poverty line (Okidi and Mugambe, 2002), and the poorest 20% did not see their living standards improve significantly between 1993 and 1996. We therefore took as one of our working hypotheses for this study that the severely poor were more likely to be chronically poor than the less severely poor.
Table 1: Poverty in Uganda between 1992 and 2000, by region.
Source: Okidi & Mugambe, 2002, based on Appleton et al., 1999, Appleton, 2001 Despite aggregate reductions in poverty differentiation has increased (Appleton, 2001a, 2001b, Deininger and Okidi, 2002) the poorest got poorer (Appleton, 1999, in Okidi and Mugambe, 2002:13) and the entire fall in poverty can be attributed to growth rather than improved equity or redistribution (2001b). Poverty reduction was lower amongst non-coffee growing agricultural households and households where the head of household was unemployed than amongst government employees, traders and cash crop farmers (ibid), and the poorest 20% in both rural and urban areas saw their living standards fall between 1992 and 1996 (Appleton, 1998:28). Agricultural export prices, access to public goods such as health care, electricity and infrastructure and initial endowments of physical capital were found to be strongly associated with changes in poverty (Deininger and Okidi, 2002), but the ability of a household to move out of poverty was strongly influenced by their initial asset ownership, health status and access to electricity and infrastructure (Deininger and Okidi, 2002), and the chronically poor gain few benefits from Uganda’s economic growth programmes and policies which aim primarily at creating an enabling environment. The chronically poor have a low initial asset base and weak capabilities endowment (Okidi and Mugambe, 2002). The majority of the chronically poor6 (79%) work in the agricultural sector. Nearly two thirds of the chronically poor (59%) are children, over half of the chronically poor (54%) live in large households with 6-9 people (or more in Eastern Uganda where 6 Taken by Okidi and Mugambe to be synonymous with the severely poor in the lowest 20%. They justify this by showing that very few of the severely poor moved out of poverty between 1992 and 1996.
5
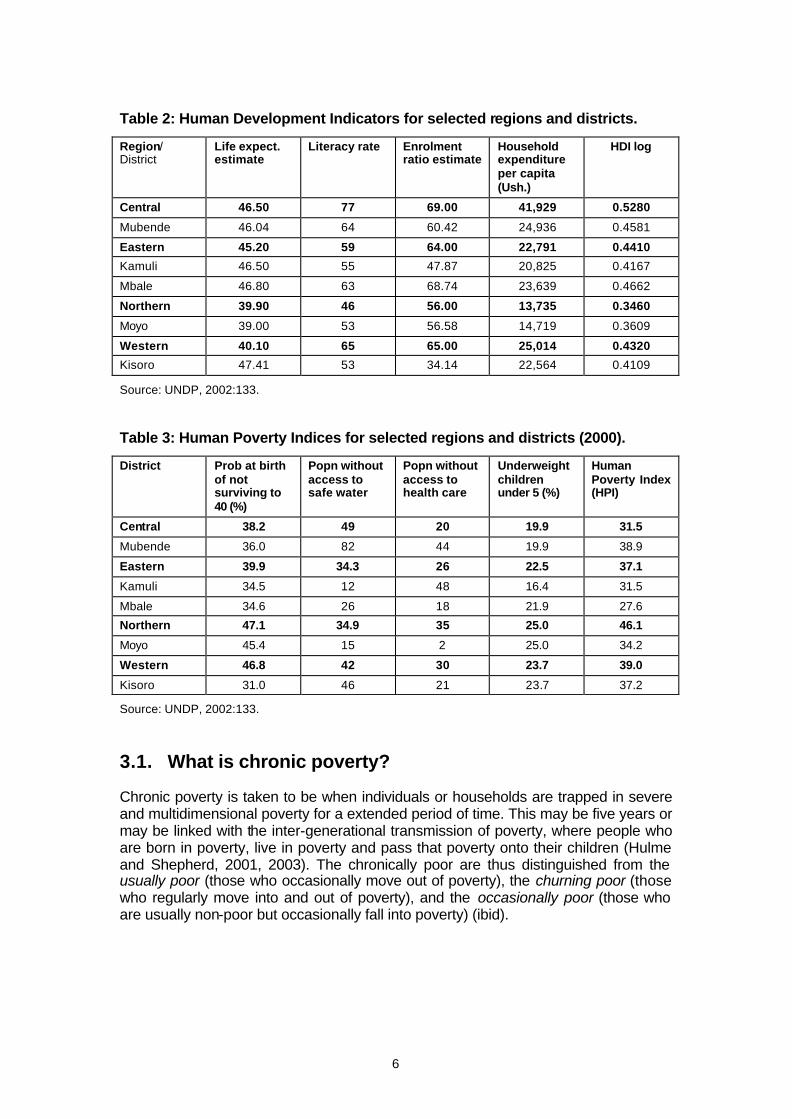
62% of households contained more than 10 people), and elderly women are disproportionately represented amongst the chronically poor. (Ministry of Finance data cited in Okidi and Mugambe, 2002:14). Nearly two thirds (63%) of the total expenditure of the chronically poor is on food indicating that they nearly meet Lipton’s criteria for the ultra poor, who meet only 80% of their daily food needs despite spending 80% of their income on food (Lipton, 1988). Although nearly all (95%) owned the house they lived in, it was of poor quality with 46% living in huts. Human capital is low, with over half (51%) of the rural chronically poor being illiterate, with larger numbers of women than men failing to read and write (Okidi and Mugambe, 2002:14). The literate are less likely to be poor and an above average proportion of non-poor households have completed some primary schooling (Ministry of Finance, 2000). Deininger and Okidi (2001) found that (income) poor households who had human and physical capital assets were able to move out of poverty between 1992 and 1996. Households with health problems and large families7 in 1992 were found to fallen into deeper poverty by 2000 (Okidi, 1999). For the income poor with few asset and low capabilities significant targeted interventions are necessary to enable an emergence from poverty. When looking for a starting point for policy interventions Okidi (1999) indicates that although improving road access is important, improving household characteristics (e.g. number of literate household members, size and quality of household workforce and size and quality of household land holdings) is more so. In addition to increased differentiation between socio-economic groups, spatial disparities widened, with differentiation increasing between urban and rural populations (Deininger and Okidi, 2002) and between regions. Poverty increased in the Northern Region due to the loss of relatives, assets and livelihoods and the destruction of social capital (Ministry of Finance, 2001). 3. Multidimensional Poverty and the Chronicity of Poverty. Hulme and Shepherd (2001, 2003) show that chronic poverty is likely to be multidimensional, with multiple causes combining to trap individuals, households and communities in long-term poverty. This is not a new idea, being first given prominence by Robert Chambers in the early 1980s (Chambers, 1983). However, in our work we attempt to show how low capabilities (Sen, 1993) and interlocking nature of their problems traps the poor in chronic poverty (Bird, 2001). Focusing once more on Uganda, the tables below show the scale of the problem in some districts. National differentiation is marked, with literacy ranging from 46-77% per capita household expenditure from Ush.14,719 to Ush.41,029, access to safe drinking water ranging from 12% of households to 49% and a lack of access to health care ranging from 2% to 44%. These figures have a low top end and mask wide disparities within districts, indicating the severity of (multi-dimensional) poverty in Uganda. Bearing in mind that the severity of poverty should not be seen as synonymous with the chronicity of poverty, it is important to remind ourselves of what we mean by chronic poverty. 7 Confirmed by Ministry of Finance, 2000, who state that in each of the four regions and in both rural and urban areas, large families (an average of more than 5 persons) are likely to be poor.
6
Table 2: Human Development Indicators for selected regions and districts.
Region/ District
Life expect. estimate
Literacy rate Enrolment ratio estimate
Household expenditure per capita (Ush.)
HDI log
Central 46.50 77 69.00 41,929 0.5280
Mubende 46.04 64 60.42 24,936 0.4581
Eastern 45.20 59 64.00 22,791 0.4410
Kamuli 46.50 55 47.87 20,825 0.4167
Mbale 46.80 63 68.74 23,639 0.4662
Northern 39.90 46 56.00 13,735 0.3460
Moyo 39.00 53 56.58 14,719 0.3609
Western 40.10 65 65.00 25,014 0.4320
Kisoro 47.41 53 34.14 22,564 0.4109
Source: UNDP, 2002:133. Table 3: Human Poverty Indices for selected regions and districts (2000).
District Prob at birth of not surviving to 40 (%)
Popn without access to safe water
Popn without access to health care
Underweight children under 5 (%)
Human Poverty Index (HPI)
Central 38.2 49 20 19.9 31.5
Mubende 36.0 82 44 19.9 38.9
Eastern 39.9 34.3 26 22.5 37.1
Kamuli 34.5 12 48 16.4 31.5
Mbale 34.6 26 18 21.9 27.6
Northern 47.1 34.9 35 25.0 46.1
Moyo 45.4 15 2 25.0 34.2
Western 46.8 42 30 23.7 39.0
Kisoro 31.0 46 21 23.7 37.2
Source: UNDP, 2002:133. 3.1. What is chronic poverty? Chronic poverty is taken to be when individuals or households are trapped in severe and multidimensional poverty for a extended period of time. This may be five years or may be linked with the inter-generational transmission of poverty, where people who are born in poverty, live in poverty and pass that poverty onto their children (Hulme and Shepherd, 2001, 2003). The chronically poor are thus distinguished from the usually poor (those who occasionally move out of poverty), the churning poor (those who regularly move into and out of poverty), and the occasionally poor (those who are usually non-poor but occasionally fall into poverty) (ibid).
7
4. Methodology. This paper is based on research in Uganda which has built on the dataset and qualitative research undertaken by the LADDER project8. This took place in 9 villages in 3 districts (Mbale, Kamuli and Mubende) (see map below). The 9 villages were selected purposively by the LADDER study to represent all the main agro-climatic zones and natural resource based livelihoods in Uganda. The study sites were not selected based on their poverty characteristics and cover an arc in the central west of the country to the central east, not touching on any of the currently poorest or conflict affected areas. The selection was effective for the original purposes of the LADDER research but may limit our ability to understand the dynamics of chronic poverty. To develop a more comprehensive understanding we are complementing the research in the ‘LADDER villages’ with additional field work in remote (Kisoro, SW Uganda) and conflict affected (Northern) rural Uganda. See Map 1 (appended). Wealth ranking exercise were used to develop the sampling frame for the LADDER study in each of the 9 study villages. These commonly placed households into 5 or 6 strata which were combined by the research team to form three groups: poor, middle and non-poor (see Annex 2 for summary tables). Thirty five households were selected9 from each village for the in-depth household survey, ten households from each of the middle and non-poor groups and fifteen from the poor group. Analysis of the results from this survey show that the wealth groupings correspond well to household asset and income data although the picture is slightly less clear with per capita income figures (see Annex 1, fig. 2 and Table 10). For this extension of the LADDER study by the Chronic Poverty Research Centre we selected one village in each of the three study districts: Buwapuwa10 (Mbale) and Kiribairya (Kamuli) were chosen because of the severity of poverty they experience, and Kalangaalo (Mubende) because of its location in the Luwero Triangle and the depth of its experience of conflict during the 1981-85 NRM (National Resistance Movement) bush war.
8 For more information about LADDER, see www.uea.ac.uk/dev/odg/ladder 9 In the fishing villages stratified random sampling ensured that roughly half of the households were fisher-folk (e.g. 17 out of 35 in Kiribairya). This was to guarantee that the survey provided adequately information on fish-based livelihoods. Unfortunately this makes other issues difficult to explore with accuracy (e.g. mean village income figures, proportion of households involved in fish-based livelihoods, proportion of landless households, proportion of households in Kiribairya displaced by Teso ethnic cleansing who are neither owners of boats or land). In addition, researchers selected alternative households when it appeared that the sampling process was generating an overly large number of widow headed households. 10 Buwapuwa was selected because the sampling frame for the poorest village in the Mbale sample, Bukhasusa, was no longer available.
8
We have re-analysed the dataset to develop a greater understanding of the three study villages, and the authors have undertaken two periods of field work in the selected study villages. Interviewees were identified using the sampling frame developed by the LADDER wealth ranking exercises, and interviewees were selected randomly from the wealth ranking lists. We interviewed predominantly those from the most severely poor group with some interviewees from the less poor groups to cross-check that the experiences associated with the severely poor were unique, or at least more common, within that wealth strata. We hypothesised that the majority of the chronically poor would be found amongst the most severely poor, but wanted to test this hypothesis as well as identifying the key drivers, maintainers and interrupters of chronic poverty (Hulme and Shepherd, 2003). During this field work, key informant interviews and focus group discussions were conducted in addition to an average of 12 in-depth life histories (oral testimonies) in each of the three study villages. The life histories were collected during semi-structured interviews which traced an individual’s life through from their earliest childhood to the present day, including key life changing events. By talking also to the non-poor we hoped to identify some of the advantages which protected them from falling into poverty, and to show in what way the experiences of the severely and persistently poor differed from those of the transitorily poor. By talking to a person about their life, rather than taking a thematic approach, we hoped to identify path-determination in individuals’ lives and to pin-point key moments of choice – or the absence of choice. The life history interviews were also used to identify themes for further investigation through focus group discussions and key informant interviews. Information gathered through the life history interviews allowed us to plot the trajectories followed by the individual and their household as they declined into poverty or moved out of poverty. It also enabled us to identify the most common covariant and idiosyncratic shocks which triggered a decline into poverty (drivers) and the constraints which prevented accumulation, investment and movement out of poverty (maintainers). In this first round of collecting life histories we interviewed only household heads who had been interviewed during the LADDER survey. This enabled us to move straight into the life history interview, without having to spend time collecting basic household asset, income and livelihood data. Due to the large number of women headed households this did not lead to an absence of women’s stories, but may have biased our findings in other ways (e.g. inadequate attention to ‘youth’, women within male headed households, the situation of co-wives, the chronic poverty of children and so on). In subsequent research we plan to systematically interview other household members to explore intrahousehold differentiation (see Bolt and Bird, 2003 for an outline of the method that we hope to use) and other issues. 4.1. The Study Sites. 4.1.1. Kiribairya, Kamuli District. Kiribairya village11 is located on flat land on the shores of Lake Kyoga12 and acts as a fish landing site (LADDER, 2001a). The area is affected by natural disasters. It is 11 Ikanda Parish, Buyende sub-county, Budiope County, Kamuli District 12 The village is bordered by Kalambo village to the south-east, and Magogo village to the south-west.
9
highly drought prone, and El Niño flooding in 2000 devastated the village, destroying half the settlement and drowning many people (own research). In November 2002 the area was lashed by storms, demolishing a primary school building and killing two children. Kiribairya was sparsely populated until the 1960s and is still small, with only 74 households (est. 520 people). The village is ethnically diverse with 5 tribes (Bakenye, 44%; Basoga, 27%; Banyoro, 18 %; Iteso, 8%; and the Jaluo, 3%) who migrated into the area at different times. The Bakenya came to the village in increased in numbers in 1986, as a result of ethnic cleansing related to the NRM bush war (see Conflict, below). This group were disproportionately represented amongst the poorest in the village (own research). The Iteso in the village were driven out in 1986 by their tribesmen for ‘siding with their enemy’, the Bakenya (own research). The Jaluo are the most recent migrants, having arrived in 2000. Despite new arrivals the village is in decline as people move away to find areas which have more plentiful fish stocks and which are less drought affected LADDER, 2001a). The village is relatively remote, and access to the village is poor, with the journey from the District Headquarters, Kamuli town taking 1½ - 2½ hours in a four wheel drive vehicle (depending on season) on a poorly maintained feeder road from Kamuli Town. This is a small and rather run down rural town, offering a limited range of goods and services. Kiribairya is served by one mutatu (minibus) service in each direction a day, but during the rainy season passengers must be prepared to walk alongside the bus, knee deep in mud, helping to pull the vehicle out of ditches. Local service provision is poor. A village school has been built by the parents (rather than government) but cannot attract a trained teacher. The nearest secondary school is 12km away. The nearest dispensary is 12 km away in Bwensunire (LADDER, 2001a), which is out of reach for many people, particularly in the rainy season when the cost of transport more than doubles. There is a basic drug shop in the village but its stock has been run down and now only sells the most basic range of drugs 13. Clean drinking water became available in 1995 when RUWASA constructed a borehole in the village (ibid). The LADDER study found fisheries had become the most important livelihood activity over the last 10 years (Table of Current Livelihood Activities, LADDER, 2001a:11). However, we found that many of the poorest households (commonly Bakenya IDPs) did not have access to fish-based livelihoods and were dependent upon casual labour (confirmed by the wealth ranking matrix in LADDER, 2001a:4-5). See Map 2 (appended). 4.1.2. Buwapuwa, Mbale District. Buwopuwa village14 is a large village of around 204 households (1,080 people15), scattered over 3km. The population is Bagishu (with the exception of some women
13 This is due to the owner having to decapitalise his business to pay for his wife’s medical treatment (she was seriously ill with an ectopic pregnancy). Since her illness she has been partially disabled and unable to undertake many household chores or livelihood activities, so they have been unable to re-accumulate and re-capitalise the business. 14 in Bumatanda Parish, Butiru Sub-county, Bubulo County, Mbale District. 15 Of these, 169 adult men, 230 adult women (33 of whom are widows), 134 ‘youth’ and 547 children.
10
who have married into the village), but are divided into 9 clans (LADDER, 2001b) of varying levels of prosperity, who migrated into the area between 1875 and 1972. The village is located on a flat plateau on land mostly used for annual crop production. It is well connected by a high quality marram feeder road which runs through the village linking Butiru and Magodeshi market on the Mbale-Tororo high way and the Uganda-Kenya border town of Lwakhakha (LADDER, 2001b). It takes just over an hour by four wheel drive from Mbale town, which is a vibrant and active service centre. The village is only a few kilometres from Kenya, and this proximity has been important in the past due to the livelihood offered by smuggling (own research). The road has stimulated the development of a trading centre, which forms the centre of the village. Shops in the trading centre provide basic drugs, food stuff, soap, matches, paraffin and local brew. Beer selling is a thriving business (LADDER, 2001b), and the trading centre is full of men ‘sitting’ from early in the day (own research) (see section on alcohol, below). The village is well connected with services. There is a health centre in approximately 2 km away in Lwanjusi and a both a health centre and a private hospital are located in Butiru under an hours walk away. The village does not have its own school, but the nearest primary schools are close by (Lwemuna, 1 km, Lwanjusi, 3 km). The village has had a borehole since 200016 and has numerous streams (LADDER, 2001b). See Map 3 (appended). 4.1.3. Kalangaalo, Mubende District. Kalangaalo village17 contrasts with the other two village we focus on in this study in that it is larger (237 households, est. 1,600 people), more accessible and well provided with services. The village is served by the Mityana-Bukuya and Kalangaalo-Kassanda feeder roads, which are well maintained and motorable both in the wet and dry seasons, plus internal community roads, which make communication straightforward. Boda-boda services18 and commuter taxis link the community with the outside world. The village is a thriving trading centre and a weekly market operates nearby. There are other small shops scattered in the village. The village has three primary schools (Anglican, Catholic and Muslim), and a nursery and secondary school are nearby. There is a government health unit/ dispensary in the village as well as a private drug shop manned by a trained health worker. The village has four wells two boreholes and a stream which provides water for livestock during the wet season. The village is ethnically mixed with Baganda, Banyarwanda, Bakiga, Banyoro, Barundi, Batoro, Banyankole, Basoga, Bagishu and Basamya (in rank order). The various tribes settled in the area at different times. The Banyoro were the original
16 constructed as a jointly by Rural Water and Sanitation programme (RUWASA) and the community, with each household contributing Ush.1,900. RUWASA provided technical input and some financial support. The borehole is now maintained by an elected village-level committee (LADDER, 2001b) 17 Kalangaalo Parish, Bulera Sub-county, Busimbi County, Mubende District. 18 Boda-boda are taxi services provided by motorcycles or bicycles. Bicycles are the more common form in rural Uganda
11
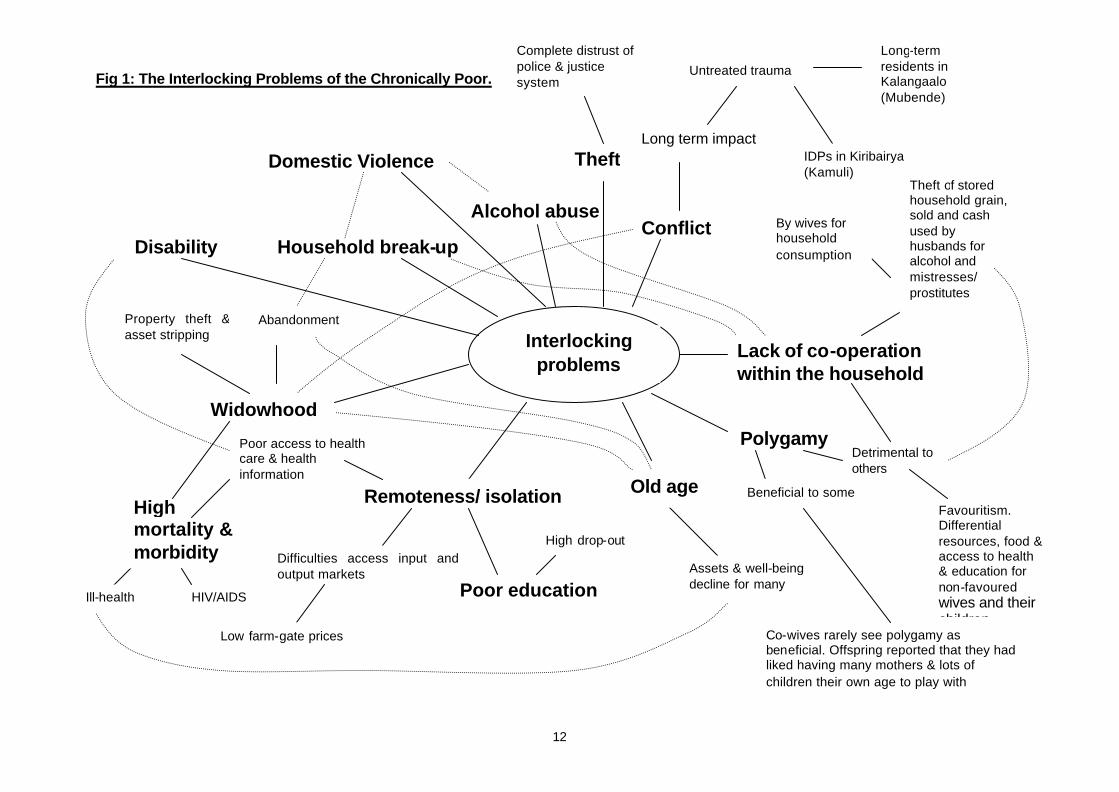
occupants, joined by others between 1800 and the present day, in search of land or employment. See Map 4 (appended). 5. Findings. The diagram below indicates the key themes identified as a result of the life-history interviews and focus group discussions in the three study villages. In the section below, we discuss each of the key themes in turn.
12
Fig 1: The Interlocking Problems of the Chronically Poor.
Interlocking problems
Remoteness/ isolation
Difficulties access input and output markets
Low farm-gate prices
Poor education
Conflict
Untreated trauma
Long term impact IDPs in Kiribairya (Kamuli)
Long-term residents in Kalangaalo (Mubende)
Poor access to health care & health information
Ill-health
Old age
Assets & well-being decline for many
High mortality & morbidity
Widowhood
Property theft & asset stripping
Abandonment
Polygamy
HIV/AIDS
Beneficial to some
Detrimental to others
Lack of co-operation within the household
Theft of stored household grain, sold and cash used by husbands for alcohol and mistresses/ prostitutes
By wives for household consumption
Alcohol abuse
Household break-up
Domestic Violence
Disability
Favouritism. Differential resources, food & access to health & education for non-favoured wives and their children
Co-wives rarely see polygamy as beneficial. Offspring reported that they had liked having many mothers & lots of children their own age to play with
Theft
Complete distrust of police & justice system
High drop-out
11
5.1. Downwards trajectories. What became evident as a result of the field work was the predominance of downward movement. Talking to older people illustrated how much more prosperous they had been, in general, during their early lives than they were now. This could be seen as simply reflecting the positive gloss that many of us like to put on the past, however, the examples that individuals gave to support their stories made it clear that there was more to it than this. A number of older people, both men and women, recounted childhoods in compounds where there was a plentiful food supply and where land and livestock was abundant. The often sharp declines in their fortunes since the 1930s, ‘40s or ‘50s illustrated the impact of the devastating impact of domestic conflict which followed on the heals of the mismanagement and repression of the Obote I and II and Amin regimes. Despite the sustained economic growth of the last decade, this growth has occurred from a very low base and is yet to bring households and individuals back up to the level of basic food security and well-being that were enjoyed towards the beginning of the 20th century. If this is the context within which these life stories were told, then the individual life histories presented below thematically illustrate the way in which covariant shocks combine with the idiosyncratic to drive people into both severe and chronic poverty. 5.2. Differential Well-being in the study sites. Data from the household survey shows per capita incomes to be low in all three study villages, particularly in Kiribairya, which has the lowest per capita income and smallest standard deviation, indicating widespread poverty and low differentiation within the community (Table 9). Household wealth ranks were correlated with a number of variables (education of household head, household education, land ownership, livestock ownership [in CEUs19], household assets, ownership of tools, migration, the household’s dependency ratio, receipt of transfers, and the livelihood diversity index). The strength of correlation varied amongst the villages and the only variables important in each of the three villages were land ownership and household assets. Education and the ownership of livestock and tools were important in some but not all of the villages (see Table 10). Looking at the dataset for all nine LADDER villages we found a significant difference (at the .01 level) between rich and poor households in terms of the ownership of land, livestock, tools and household assets. There was a significant difference also (at the .05 level) in terms of the education level of the household head and reliance on own production for subsistence20. Which way causality runs for each of these variables is difficult to know for certain. Membership of a non-poor family provides an individual with a number of positive and mutually reinforcing advantages: good diet; access to education; access to health care; higher status; a network of friends and patrons in and outside the village; access to travel outside the village, and therefore exposure to ideas; more land or livestock to inherit, and more likelihood of marrying well.
19 Cattle Equivalent Units. 20 Using a version of Dunn's test given in Siegel, S. and Castellan, N. J. Nonparametric Statistics for the Behavioral Sciences (2nd edition). New York: McGraw-Hill; 1988, pp. 213-4
12
5.3. Perceptions of the cause of poverty. The emphasis given by elite women and men21 to the causes of poverty differed. Focus group discussions with non-poor women and men in Buwapuwa, Mbale generated some interesting observations. See Boxes 1 & 2. We see from the summaries below that men emphasised meso-level problems, external to the household, while women emphasised those within the household. By combining these different perspectives we probably get nearer to the full picture. As you will note, women highlight alcohol as a direct cause of poverty and a contributory factor to many others. (See Alcohol, below)
Box 1: Male perceptions of the causes of poverty: Buwapuwa. Men discussed mostly meso-level causes of poverty. The market was seen as being a source of problems. Richer farmers can no longer afford to employ casual labourers due to the monetisation of labour. So, less land is cultivated. ‘In the past you could cultivate a lot of land by using community labour. People would come and dig and you just fed them. Now its cash.’ This problem has been compounded by devastating livestock diseases which have reduced cattle stocks and animal traction. Poor access to markets limits livelihood opportunities and makes life hard. ‘The absence of an adequate feeder road network in the sub-county limits connectivity and forces people to either take long detours or to cut across the bush with head loads or on a bicycle.’ Local markets do not function well enough for farm-households to benefit from liberalisation. As a result the changes have been damaging, particularly for small farmers. The removal of subsidies and changes in terms of trade has led to real rises in input price, and farm-gate prices have not kept pace. Only farmers producing substantial surpluses can negotiate prices with millers, who collect their output. Others have to sell to agro-traders on bicycles, who offer very poor prices. A lack of trust prevents small farmers clubbing together to negotiate with millers. ‘Whoever has a little wants to sell it quickly.’ ‘Whoever finds a market opening would rather benefit from it himself than share the knowledge.’ In addition, rises in the cost of veterinary drugs has meant that many farmers are not able to treat their animals, increasing mortality. Yields have deteriorated because of the decline in traction and seasonal inputs. One of the men gives a vivid illustration of how the death of livestock can reduce harvests. Before his two oxen died he used to harvest 40 bags of shelled maize, now he only gets 3 bags. They would like to be able to hire a tractor to plough their land, and he mentions a government scheme which used to provide one at the sub-county level. ‘But we haven’t seen a tractor around here since 1978.’ Inadequate service delivery has a negative impact. Poor local education standards prevents local children’s access to good secondary schools. ‘Without well educated young people the development of the area will be held back’. The cost of medical treatment was seen as something that could push people into poverty, as was the loss of labour associated with long-term illness. (At this point the interviewees emphasised that AIDS was not a big problem in the village). Theft was cited as a serious problem, not just as an irritant but actually limiting investment and accumulation. There is petty theft of crops, but also armed robberies by thieves from outside the community who club together with villagers with insider knowledge. They pin-point individuals with household assets or money from a recent sale of livestock or grain. As a result young people with some money would rather invest it in towns which are more secure. The community has no faith in the police, who are seen as utterly corrupt. This has led to the community taking the law into their own hands and lynching nine robbers in the last five years. Problems at the household level included land fragmentation due to population pressure. This has affected some families where ‘the land is divided first amongst four sons, then ten grandsons.’ This is particularly a problem in polygamous households, and polygamy was identified as a cause of poverty. ‘Its costly to feed and clothe the children and cover medical fees. In the short run having two wives may seem like a good deal – more people to dig etc. but then you end up with thirty mouths to feed from one acre. Lots of children are only good if they are educated and get jobs, otherwise you all end up depending on the one acre. Better to have one wife and two to three children. If you have too many children you end up all doing casual labour and coming home in the evening to take stock and see what each person has brought.’
Source: focus group discussion with older elite men in Buwapuwa, Mbale. 21 Methodological note: it was difficult to mobilise groups of either non-poor women or men for focus group discussion as they are seen as being ‘not knowledgeable’. We intend to pursue this in subsequent visits.
13
Box 2: Female perceptions of the causes of poverty: Buwapuwa. ‘Poor people have no land, no money. All they can do is casual work.’ The women listed the key causes of poverty. These were: Women ranked the key causes of poverty as: 1. Ignorance 2. Laziness 3. Animal diseases 4. Lack of co-operation within the household 5. Low education 6. Husbands selling assets. These came from a longer list of causes. ?? Ignorance: defined as a lack of knowledge; doing things which are not helpful, and an inability to
communicate the necessary information, e.g. to husband or to wife). As a result people do not use their assets well e.g. their land.
?? Laziness: defined as people who do not want to work. They are able, they have the knowledge, they aren’t stupid, but they don’t want to work. E.g. someone who has land, but instead of cultivating rents it to obtain money for alcohol or despite having their own land they do casual work to get quick money for alcohol
?? Drinking: ‘some people just get up to drink’ ?? Poor soil fertility: leading to low yields. Farm fragmentation/ small holdings mean that people cannot fallow
their land, but cultivate it continuously with food crops, leading to reduced matooke, potato and cassava yields.
?? Theft: of animals was blamed on ‘people who drink at any time of day’; of crops occurs when people steal bunches of matooke from the trees; armed theft from shops - outsiders bring guns and work with locals who identify premises. Villagers cannot afford to ‘raise security’ themselves to defend their property and the police are ineffective.
?? Animal diseases: have impoverished people, in particular those affecting cattle and pigs ?? Decline in farm-gate prices ?? Lack of cooperation within families. The problem is mainly men ‘stealing’ stored maize to sell, although
sometimes women do this too. Men use the money to go and drink whereas women buy soap, salt and other necessities for the family. An example of how little men contributed to their families was given by a former nurses aid who said that only one man in fifty will pay for their children’s medical treatment – this is left to women. Fathers pay school fees, but mothers must find money for everything else – soap, salt etc. When asked what the scale of the problem was, the women estimated that two thirds of households in the village suffered from a lack of internal cooperation
?? Men curtail their wives’ movements. When women start a self-help group their husbands stop them going to meetings and make them withdraw their savings. This was explained as men fearing women using meetings as an excuse for other activities. One of the interviewees tried to start a self-help group to help women save to buy livestock, but the members husbands put a stop to it
?? Polygamy is seen as a problem. Women are tricked into becoming 2nd or 3rd wives. The husband may have had a disagreement with his first wife and sends her away, then finds another wife, by the time his first wife has returned the new wife may be pregnant, or is trapped in the situation. Some in monogamous marriages might be poor because they don’t have enough land or money to hire labour/ oxen, but some in polygamous marriages do not care for their wives and will not allocate enough land. The husbands won’t hire oxen to plough the land. One woman is a 1st wife. She has 3 children. Her husband has a 2nd wife with 4 children, a 3rd wife with 7 children, and a 4th wife with 6 children. The last 2 wives are still producing children. She says that all his resources are concentrated on the younger 2 wives and their children
?? Education. ‘Most of the youth do not have skills so they spend their day drinking and then gang up to break into homes’. The women link the lack of education to polygamy as the husbands concentrate on one wife and her children and the others are neglected and not educated. The girls are ‘sentenced to marriage’. ‘No more school fees for you. Go and get married!’
?? Variable climate: Drought causes problems as does too much rain – unseasonal or too heavy – which can cause seeds to rot in the soil rather than germinate
?? Sale of household assets by husbands. Husbands (including those in polygamous marriages) will sell his wife’s goats to spend the money on a mistress or prostitute. The husbands feel that they can do anything they like. ‘If a wife complains s he is told to go back to her parent’s house. I am too old to want to do this, so I keep quiet to maintain the status quo.’
?? Sickness: (HIV) ‘During the 1st phase of the illness, people think that they have been bewitched and sell a lot of goats and chickens to consult traditional healers. During the 2nd phase they discover that they are sick with HIV. They become weak and cannot work hard. They have lower income and spend a lot of money on treatment. The problem of HIV is just in its beginning phase here in Buwapuwa. Most who suffer from AIDS have been migrant workers (e.g. in Kenya), and come home when they are already sick. Sometimes they ‘have relations’ with people in the village. When it becomes known that they have AIDS the people that they
14
have had sex with will keep it a secret – so HIV is spread through the community.’ The women are scared that HIV is going to take its toll in the village. ‘Sexual morals in the village are very poor. In Uganda it is taboo to have sex with a cousin, and yet this taboo is ignored. Also if a prostitute comes to the village all the men who drink in the village centre will rush to sleep with her. Men don’t use condoms. They can be bought in the trading centre, but a tiny minority bother. They might use them if they were free.’ (Malaria and diarrhoea) can be very costly – especially if children become sick. Some people have to have blood transfusions because they are anaemic – this is very expensive also.
Source: focus group discussion with elite women in Buwapuwa, Mbale. 5.4. Land Ownership. Land ownership in the study villages is closely related to wealth grouping. The poor have marginal holdings, and in Kiribairya only the rich own any land at all (See Fig 1, noting the different axes). Inheritance practices (where all sons receives a portion of his father’s land on marriage, rather than primogeniture where only the oldest son inherits) is resulting in land fragmentation. Many holdings are marginal, leading to un- and underemployment – particularly amongst the youth, reduced levels of aggregate and individual well-being and increased differentiation. Differentiation is driven by the distress sale of land by households attempting to meet contingencies or clear debts and is leading to the proletarianisation of some peasant households and the accumulation of capital by others. 5.5. Vulnerable Groups. Vulnerability is ‘an exposure to contingencies and stress, and difficulty in coping with them’ (Chambers in IDS, 1989). It does not mean ‘a lack’ or ‘a want’, but a defencelessness, insecurity, and exposure to contingencies, risk, shocks and stress (ibid), and a difficulty in coping with them. So, to be vulnerable is to lack a buffer against shock and so to risk becoming more severely poor. Vulnerability is linked with levels of net assets rather than flows of income or consumption, and different groups of people are differentially vulnerable to various shocks. The level of vulnerability that an individual or household faces to risk will vary according to the point in the agricultural cycle or life cycle. Despite vulnerability being about exposure to risk, certain groups are commonly referred to as ‘vulnerable groups’. These groups may be more exposed to risk due to their low level of capabilities, their low functionings and their failure to accumulate and retain assets. However, this use of the term ‘vulnerable’ masks the fact that individuals and categories of people may be vulnerable to certain risks at certain times. Despite this critique of the use of ‘vulnerable groups’ as an identifier, we use the term here to organise our findings because it reflects the way in which these groups of chronically poor people are described in the policy discourse in Uganda. Vulnerable groups are commonly identified by policy makers as including children (particularly orphans), the sick, people with physical and mental impairments, widows and widowers, the elderly and the landless (Babirye, 1999; Mujumbi and Okidi, 2001). While findings on some vulnerable groups in Uganda are contradictory a strong picture emerges that very high proportions of children (Ministry of Finance, 2000) and disabled people fall below the poverty line (Mijumbi and Okidi, 2001).
15
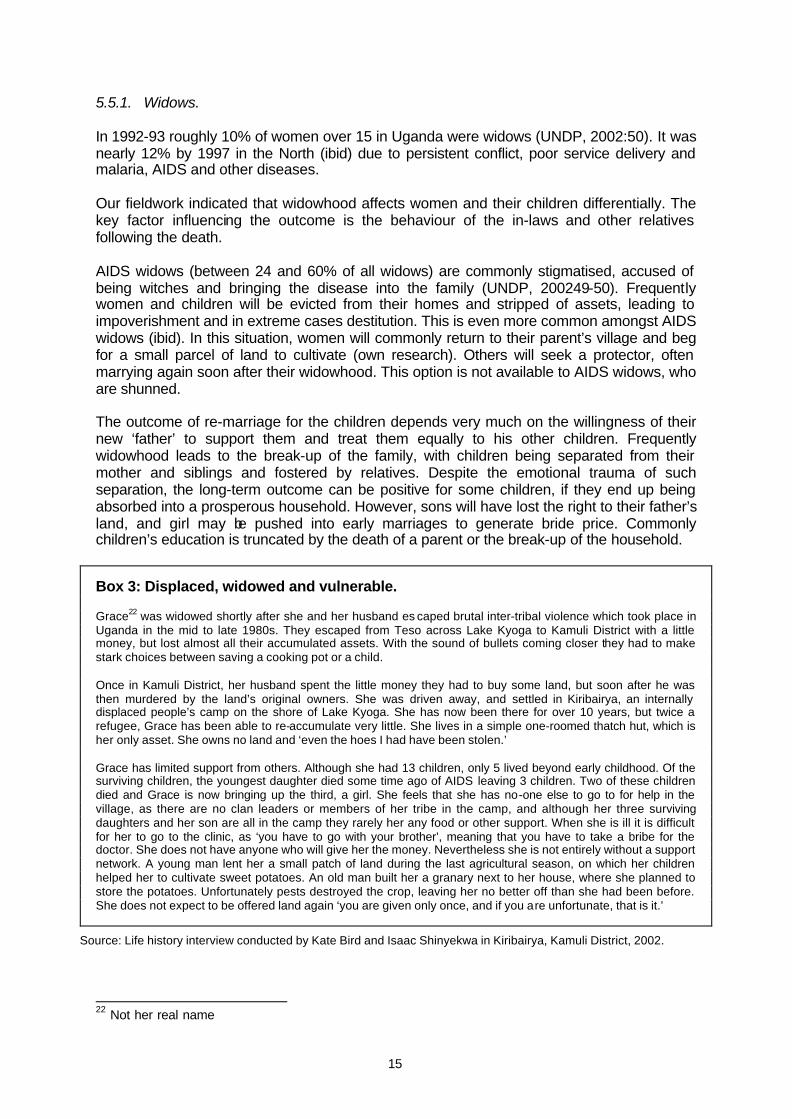
5.5.1. Widows. In 1992-93 roughly 10% of women over 15 in Uganda were widows (UNDP, 2002:50). It was nearly 12% by 1997 in the North (ibid) due to persistent conflict, poor service delivery and malaria, AIDS and other diseases. Our fieldwork indicated that widowhood affects women and their children differentially. The key factor influencing the outcome is the behaviour of the in-laws and other relatives following the death. AIDS widows (between 24 and 60% of all widows) are commonly stigmatised, accused of being witches and bringing the disease into the family (UNDP, 200249-50). Frequently women and children will be evicted from their homes and stripped of assets, leading to impoverishment and in extreme cases destitution. This is even more common amongst AIDS widows (ibid). In this situation, women will commonly return to their parent’s village and beg for a small parcel of land to cultivate (own research). Others will seek a protector, often marrying again soon after their widowhood. This option is not available to AIDS widows, who are shunned. The outcome of re-marriage for the children depends very much on the willingness of their new ‘father’ to support them and treat them equally to his other children. Frequently widowhood leads to the break-up of the family, with children being separated from their mother and siblings and fostered by relatives. Despite the emotional trauma of such separation, the long-term outcome can be positive for some children, if they end up being absorbed into a prosperous household. However, sons will have lost the right to their father’s land, and girl may be pushed into early marriages to generate bride price. Commonly children’s education is truncated by the death of a parent or the break-up of the household.
Box 3: Displaced, widowed and vulnerable. Grace22 was widowed shortly after she and her husband es caped brutal inter-tribal violence which took place in Uganda in the mid to late 1980s. They escaped from Teso across Lake Kyoga to Kamuli District with a little money, but lost almost all their accumulated assets. With the sound of bullets coming closer they had to make stark choices between saving a cooking pot or a child. Once in Kamuli District, her husband spent the little money they had to buy some land, but soon after he was then murdered by the land’s original owners. She was driven away, and settled in Kiribairya, an internally displaced people’s camp on the shore of Lake Kyoga. She has now been there for over 10 years, but twice a refugee, Grace has been able to re-accumulate very little. She lives in a simple one-roomed thatch hut, which is her only asset. She owns no land and ‘even the hoes I had have been stolen.’ Grace has limited support from others. Although she had 13 children, only 5 lived beyond early childhood. Of the surviving children, the youngest daughter died some time ago of AIDS leaving 3 children. Two of these children died and Grace is now bringing up the third, a girl. She feels that she has no-one else to go to for help in the village, as there are no clan leaders or members of her tribe in the camp, and although her three surviving daughters and her son are all in the camp they rarely her any food or other support. When she is ill it is difficult for her to go to the clinic, as ‘you have to go with your brother’, meaning that you have to take a bribe for the doctor. She does not have anyone who will give her the money. Nevertheless she is not entirely without a support network. A young man lent her a small patch of land during the last agricultural season, on which her children helped her to cultivate sweet potatoes. An old man built her a granary next to her house, where she planned to store the potatoes. Unfortunately pests destroyed the crop, leaving her no better off than she had been before. She does not expect to be offered land again ‘you are given only once, and if you are unfortunate, that is it.’
Source: Life history interview conducted by Kate Bird and Isaac Shinyekwa in Kiribairya, Kamuli District, 2002.
22 Not her real name
16
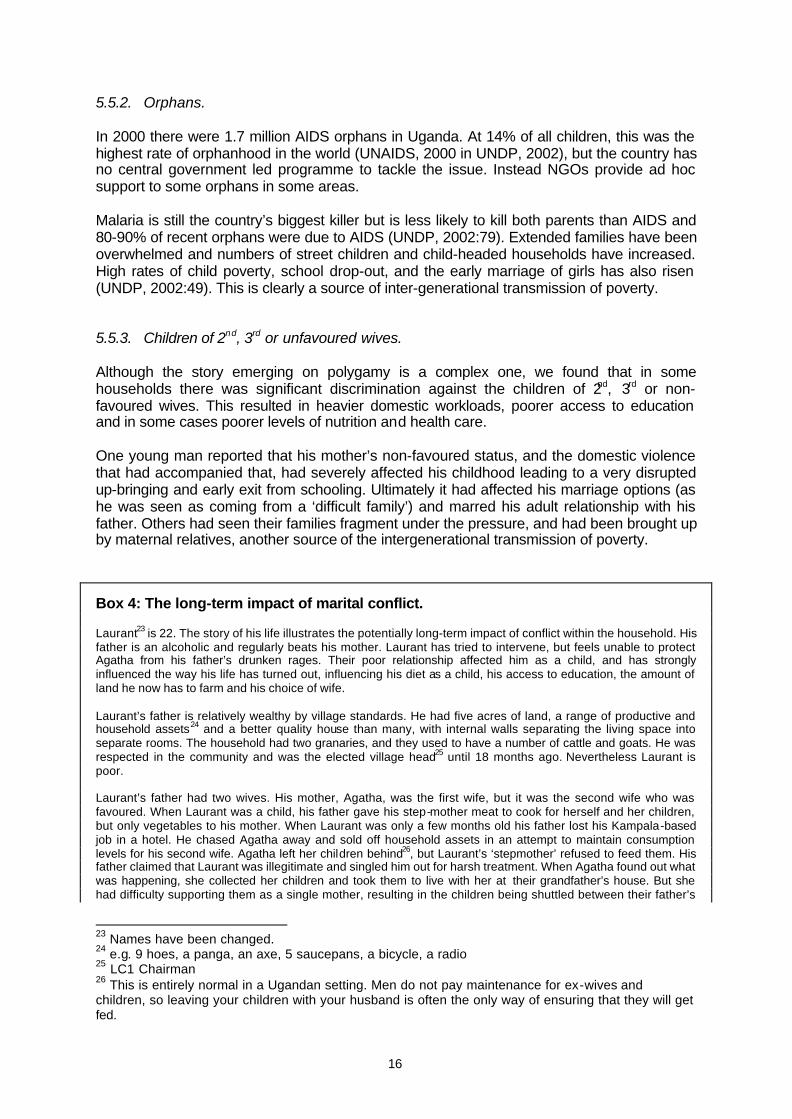
5.5.2. Orphans. In 2000 there were 1.7 million AIDS orphans in Uganda. At 14% of all children, this was the highest rate of orphanhood in the world (UNAIDS, 2000 in UNDP, 2002), but the country has no central government led programme to tackle the issue. Instead NGOs provide ad hoc support to some orphans in some areas. Malaria is still the country’s biggest killer but is less likely to kill both parents than AIDS and 80-90% of recent orphans were due to AIDS (UNDP, 2002:79). Extended families have been overwhelmed and numbers of street children and child-headed households have increased. High rates of child poverty, school drop-out, and the early marriage of girls has also risen (UNDP, 2002:49). This is clearly a source of inter-generational transmission of poverty. 5.5.3. Children of 2nd, 3rd or unfavoured wives. Although the story emerging on polygamy is a complex one, we found that in some households there was significant discrimination against the children of 2nd, 3rd or non-favoured wives. This resulted in heavier domestic workloads, poorer access to education and in some cases poorer levels of nutrition and health care. One young man reported that his mother’s non-favoured status, and the domestic violence that had accompanied that, had severely affected his childhood leading to a very disrupted up-bringing and early exit from schooling. Ultimately it had affected his marriage options (as he was seen as coming from a ‘difficult family’) and marred his adult relationship with his father. Others had seen their families fragment under the pressure, and had been brought up by maternal relatives, another source of the intergenerational transmission of poverty.
Box 4: The long-term impact of marital conflict. Laurant23 is 22. The story of his life illustrates the potentially long-term impact of conflict within the household. His father is an alcoholic and regularly beats his mother. Laurant has tried to intervene, but feels unable to protect Agatha from his father’s drunken rages. Their poor relationship affected him as a child, and has strongly influenced the way his life has turned out, influencing his diet as a child, his access to education, the amount of land he now has to farm and his choice of wife. Laurant’s father is relatively wealthy by village standards. He had five acres of land, a range of productive and household assets24 and a better quality house than many, with internal walls separating the living space into separate rooms. The household had two granaries, and they used to have a number of cattle and goats. He was respected in the community and was the elected village head25 until 18 months ago. Nevertheless Laurant is poor. Laurant’s father had two wives. His mother, Agatha, was the first wife, but it was the second wife who was favoured. When Laurant was a child, his father gave his step-mother meat to cook for herself and her children, but only vegetables to his mother. When Laurant was only a few months old his father lost his Kampala-based job in a hotel. He chased Agatha away and sold off household assets in an attempt to maintain consumption levels for his second wife. Agatha left her children behind26, but Laurant’s ‘stepmother’ refused to feed them. His father claimed that Laurant was illegitimate and singled him out for harsh treatment. When Agatha found out what was happening, she collected her children and took them to live with her at their grandfather’s house. But she had difficulty supporting them as a single mother, resulting in the children being shuttled between their father’s
23 Names have been changed. 24 e.g. 9 hoes, a panga, an axe, 5 saucepans, a bicycle, a radio 25 LC1 Chairman 26 This is entirely normal in a Ugandan setting. Men do not pay maintenance for ex-wives and children, so leaving your children with your husband is often the only way of ensuring that they will get fed.
17
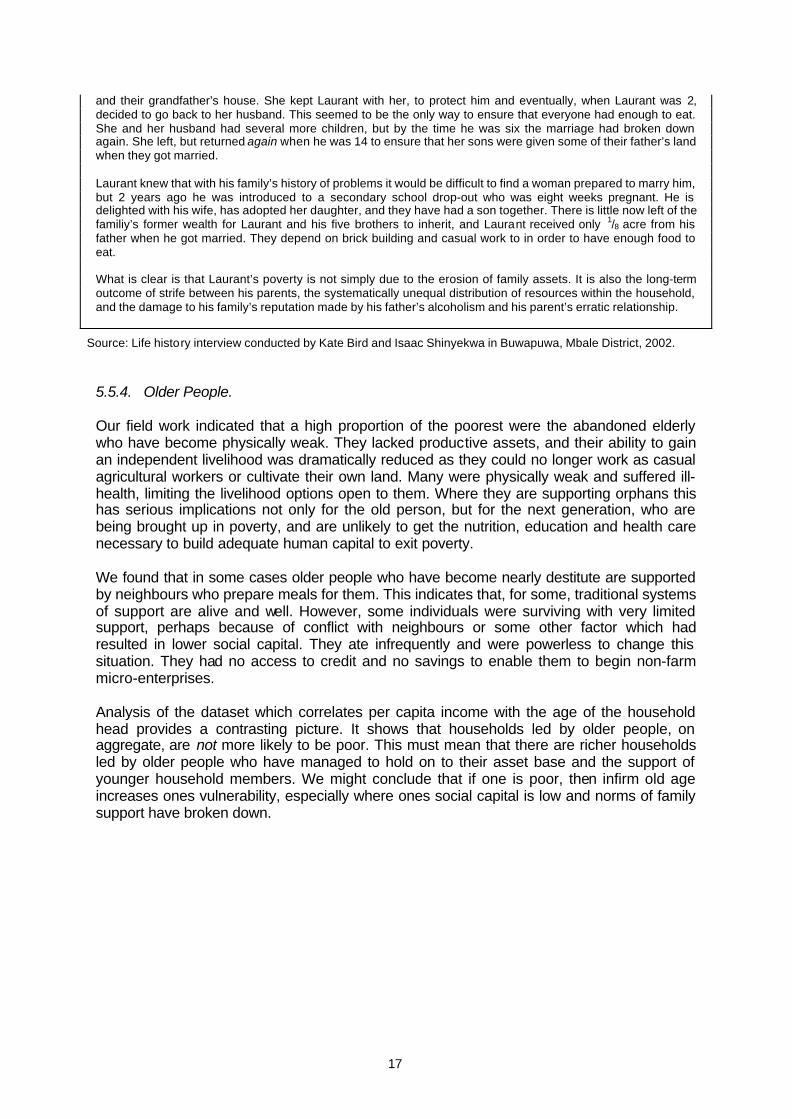
and their grandfather’s house. She kept Laurant with her, to protect him and eventually, when Laurant was 2, decided to go back to her husband. This seemed to be the only way to ensure that everyone had enough to eat. She and her husband had several more children, but by the time he was six the marriage had broken down again. She left, but returned again when he was 14 to ensure that her sons were given some of their father’s land when they got married. Laurant knew that with his family’s history of problems it would be difficult to find a woman prepared to marry him, but 2 years ago he was introduced to a secondary school drop-out who was eight weeks pregnant. He is delighted with his wife, has adopted her daughter, and they have had a son together. There is little now left of the familiy’s former wealth for Laurant and his five brothers to inherit, and Laurant received only 1/8 acre from his father when he got married. They depend on brick building and casual work to in order to have enough food to eat. What is clear is that Laurant’s poverty is not simply due to the erosion of family assets. It is also the long-term outcome of strife between his parents, the systematically unequal distribution of resources within the household, and the damage to his family’s reputation made by his father’s alcoholism and his parent’s erratic relationship.
Source: Life history interview conducted by Kate Bird and Isaac Shinyekwa in Buwapuwa, Mbale District, 2002. 5.5.4. Older People. Our field work indicated that a high proportion of the poorest were the abandoned elderly who have become physically weak. They lacked productive assets, and their ability to gain an independent livelihood was dramatically reduced as they could no longer work as casual agricultural workers or cultivate their own land. Many were physically weak and suffered ill-health, limiting the livelihood options open to them. Where they are supporting orphans this has serious implications not only for the old person, but for the next generation, who are being brought up in poverty, and are unlikely to get the nutrition, education and health care necessary to build adequate human capital to exit poverty. We found that in some cases older people who have become nearly destitute are supported by neighbours who prepare meals for them. This indicates that, for some, traditional systems of support are alive and well. However, some individuals were surviving with very limited support, perhaps because of conflict with neighbours or some other factor which had resulted in lower social capital. They ate infrequently and were powerless to change this situation. They had no access to credit and no savings to enable them to begin non-farm micro-enterprises. Analysis of the dataset which correlates per capita income with the age of the household head provides a contrasting picture. It shows that households led by older people, on aggregate, are not more likely to be poor. This must mean that there are richer households led by older people who have managed to hold on to their asset base and the support of younger household members. We might conclude that if one is poor, then infirm old age increases ones vulnerability, especially where ones social capital is low and norms of family support have broken down.
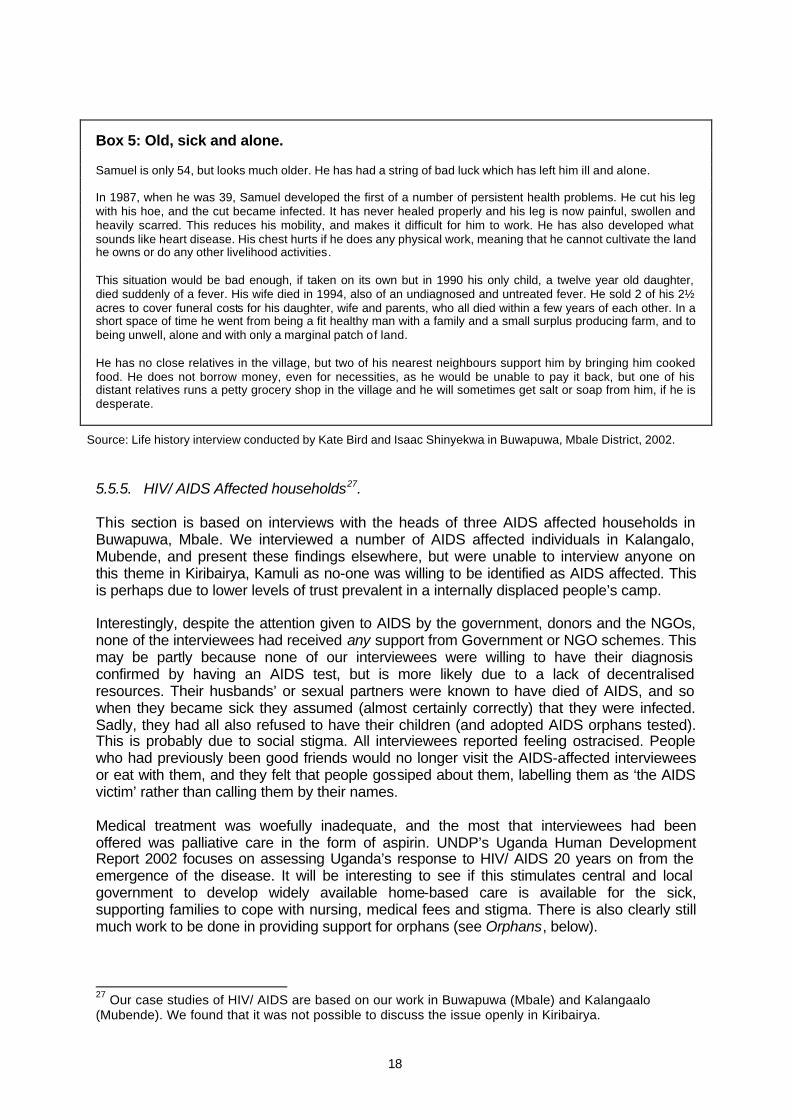
18
Box 5: Old, sick and alone. Samuel is only 54, but looks much older. He has had a string of bad luck which has left him ill and alone. In 1987, when he was 39, Samuel developed the first of a number of persistent health problems. He cut his leg with his hoe, and the cut became infected. It has never healed properly and his leg is now painful, swollen and heavily scarred. This reduces his mobility, and makes it difficult for him to work. He has also developed what sounds like heart disease. His chest hurts if he does any physical work, meaning that he cannot cultivate the land he owns or do any other livelihood activities. This situation would be bad enough, if taken on its own but in 1990 his only child, a twelve year old daughter, died suddenly of a fever. His wife died in 1994, also of an undiagnosed and untreated fever. He sold 2 of his 2½ acres to cover funeral costs for his daughter, wife and parents, who all died within a few years of each other. In a short space of time he went from being a fit healthy man with a family and a small surplus producing farm, and to being unwell, alone and with only a marginal patch of land. He has no close relatives in the village, but two of his nearest neighbours support him by bringing him cooked food. He does not borrow money, even for necessities, as he would be unable to pay it back, but one of his distant relatives runs a petty grocery shop in the village and he will sometimes get salt or soap from him, if he is desperate.
Source: Life history interview conducted by Kate Bird and Isaac Shinyekwa in Buwapuwa, Mbale District, 2002. 5.5.5. HIV/ AIDS Affected households27. This section is based on interviews with the heads of three AIDS affected households in Buwapuwa, Mbale. We interviewed a number of AIDS affected individuals in Kalangalo, Mubende, and present these findings elsewhere, but were unable to interview anyone on this theme in Kiribairya, Kamuli as no-one was willing to be identified as AIDS affected. This is perhaps due to lower levels of trust prevalent in a internally displaced people’s camp. Interestingly, despite the attention given to AIDS by the government, donors and the NGOs, none of the interviewees had received any support from Government or NGO schemes. This may be partly because none of our interviewees were willing to have their diagnosis confirmed by having an AIDS test, but is more likely due to a lack of decentralised resources. Their husbands’ or sexual partners were known to have died of AIDS, and so when they became sick they assumed (almost certainly correctly) that they were infected. Sadly, they had all also refused to have their children (and adopted AIDS orphans tested). This is probably due to social stigma. All interviewees reported feeling ostracised. People who had previously been good friends would no longer visit the AIDS-affected interviewees or eat with them, and they felt that people gossiped about them, labelling them as ‘the AIDS victim’ rather than calling them by their names. Medical treatment was woefully inadequate, and the most that interviewees had been offered was palliative care in the form of aspirin. UNDP’s Uganda Human Development Report 2002 focuses on assessing Uganda’s response to HIV/ AIDS 20 years on from the emergence of the disease. It will be interesting to see if this stimulates central and local government to develop widely available home-based care is available for the sick, supporting families to cope with nursing, medical fees and stigma. There is also clearly still much work to be done in providing support for orphans (see Orphans, below).
27 Our case studies of HIV/ AIDS are based on our work in Buwapuwa (Mbale) and Kalangaalo (Mubende). We found that it was not possible to discuss the issue openly in Kiribairya.
19
Surprisingly in a country which is renowned for its robust and open response to AIDS, two out of the three AIDS sufferers in Buwapuwa (the women) claimed not to have known how to avoid HIV infection. It was not clear whether this was a genuine failure in health promotion or whether the women preferred this version of reality to the alternative – that they knew about HIV/ AIDS and how to avoid it, but nevertheless had unsafe sex. All of the AIDS affected interviewees expressed a fear for the future. Not surprisingly they worried what would happen to their children without them. The absence of social protection interventions makes this fear all the more pertinent. There is currently a low infection rate in Buwapuwa, but villagers fear for the future now that the disease is present in the village. Key informants told the authors that the disease might spread through the village at an alarming rate, because of promiscuity. There appeared to have been limited health promotion in the area. High underemployment amongst the ‘youth’ of the village was undermining traditional norms. Without land to farm, or other enterprises to keep them busy young men commonly congregate at the trading centre in the middle of the village. Alcohol consumption is high, and in an attempt to keep themselves entertained the ‘youth’ have casual sex with prostitutes and local women. This environment of boredom coupled with poverty and alcohol is also linked with increased crime (key informant interviews), with young men from the village linking with outsiders with guns to raid local houses.
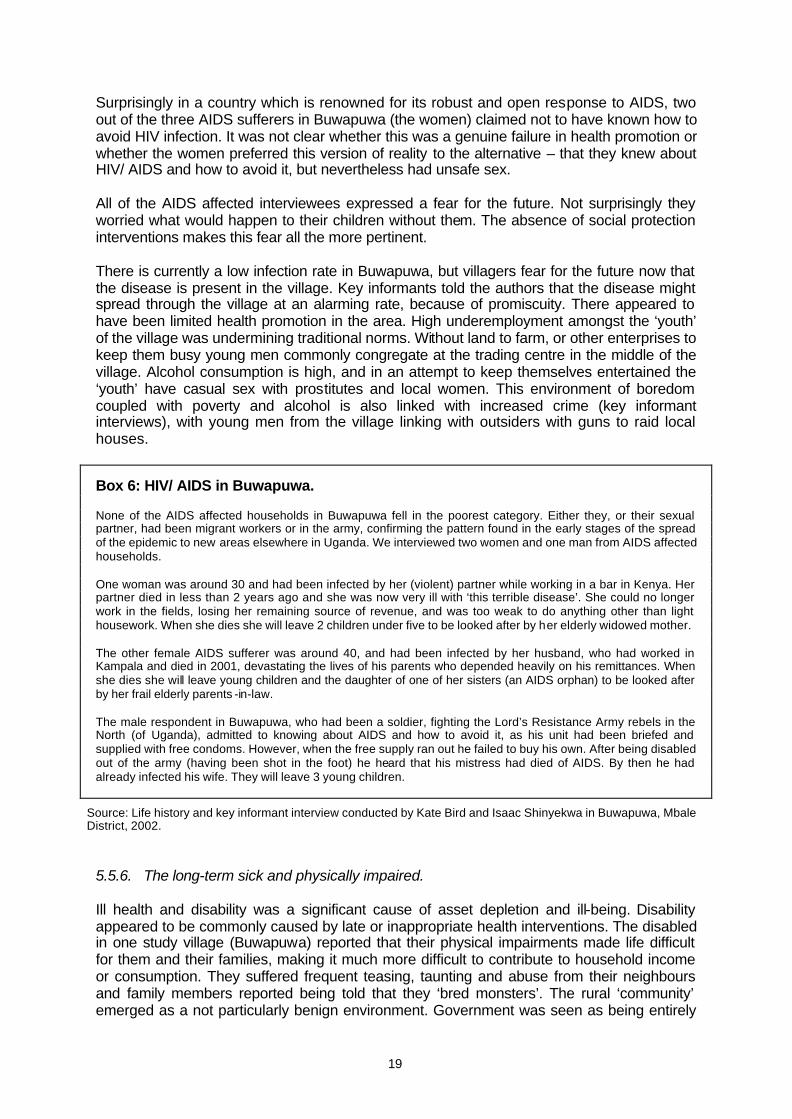
Box 6: HIV/ AIDS in Buwapuwa. None of the AIDS affected households in Buwapuwa fell in the poorest category. Either they, or their sexual partner, had been migrant workers or in the army, confirming the pattern found in the early stages of the spread of the epidemic to new areas elsewhere in Uganda. We interviewed two women and one man from AIDS affected households. One woman was around 30 and had been infected by her (violent) partner while working in a bar in Kenya. Her partner died in less than 2 years ago and she was now very ill with ‘this terrible disease’. She could no longer work in the fields, losing her remaining source of revenue, and was too weak to do anything other than light housework. When she dies she will leave 2 children under five to be looked after by her elderly widowed mother. The other female AIDS sufferer was around 40, and had been infected by her husband, who had worked in Kampala and died in 2001, devastating the lives of his parents who depended heavily on his remittances. When she dies she will leave young children and the daughter of one of her sisters (an AIDS orphan) to be looked after by her frail elderly parents -in-law. The male respondent in Buwapuwa, who had been a soldier, fighting the Lord’s Resistance Army rebels in the North (of Uganda), admitted to knowing about AIDS and how to avoid it, as his unit had been briefed and supplied with free condoms. However, when the free supply ran out he failed to buy his own. After being disabled out of the army (having been shot in the foot) he heard that his mistress had died of AIDS. By then he had already infected his wife. They will leave 3 young children.
Source: Life history and key informant interview conducted by Kate Bird and Isaac Shinyekwa in Buwapuwa, Mbale District, 2002.
5.5.6. The long-term sick and physically impaired. Ill health and disability was a significant cause of asset depletion and ill-being. Disability appeared to be commonly caused by late or inappropriate health interventions. The disabled in one study village (Buwapuwa) reported that their physical impairments made life difficult for them and their families, making it much more difficult to contribute to household income or consumption. They suffered frequent teasing, taunting and abuse from their neighbours and family members reported being told that they ‘bred monsters’. The rural ‘community’ emerged as a not particularly benign environment. Government was seen as being entirely
20
ineffective in providing assistance, as it had neither encouraged less discriminatory cultures at the village level, provided targeted economic or developmental support, or supplied individuals with wheelchairs, calipers, glasses or other aids. 5.5.7. Vulnerable Groups: A Conclusion. There is a clear need for Ugandan policy makers to reconsider social protection, and to provide a clear lead to District administrations on how and when to intervene. With the poorest 20% not benefiting from the past decade of sustained growth (see Income Poverty in Uganda, above) we cannot continue to wait for trickle down to work. There are patchy interventions for orphans and people living with HIV/AIDS, commonly implemented by NGOs, and these should now be used as the model for scaling up interventions and providing extended coverage in the form of pensions for the poorest abandoned elderly and targeted support to orphans, widows and the disabled. Legal innovations are needed to support the rights of divorced women, widows and wives in polygamous marriages, to ensure that women and their children are protected. 5.6. Domestic Conflict, Separation and Divorce. Domestic conflict, separation and divorce emerged as a recurrent theme in our work in the study villages. Both women and men would end marriages and abandonment, separation and divorce were all surprisingly common. Some of our interviewees (both men and women) were on their third marriage and many on their second. Domestic violence was reportedly widespread, with women commonly suffering years of persistent and severe beatings to avoid breaking up the family. Women might seek arbitration by clan leadership but others were ‘reluctant to interfere in the business between a husband and wife’. Violence was strongly associated with husbands’ heavy alcohol consumption (see Alcohol, below), but was also linked to a ‘lack of co-operation within the household’. Women explained that where marital relationships were poor, husbands would take livestock and ‘steal’ from household granaries and fields, to sell, using the cash to support heavy alcohol consumption and expenditure on mistresses and prostitutes. However, women would also steal from household granaries. They claimed to use the resulting money for household necessities (e.g. salt and soap), but men complained that women spent money on frivolous things, were silly and lazy. Patrilocal marriages and the low status of women meant that women lived their lives as a visitor in their husband’s house. All stocks and assets were seen as the property of the husband, who might dispute his wife’s right to anything by pointing out that ‘the food and livestock come from my father’s land’. Women feared that their attempts to curb their husbands’ behaviour might result in savage beatings and expulsion from the household. It was common for adults who had experienced downward mobility to trace the start of their misfortunes to the breakdown of their parent’s marriage. In many cases it was having an impact on their lives decades on (see Box 4, above). As with widowhood, families commonly break down on the separation of parents. If the mother did not rapidly remarry she would rarely be able to access adequate land to ‘dig’ and feed the family. As a result she would leave children with her former husband or take them to live with maternal relatives. Second husband’s rarely accept another man’s children into his house and mothers were found to commonly leave children with relatives or on re-marriage establish a separate household with the children from her previous marriage(s) (and then
21
any additional children). Widows commonly marry into polygamous households, which can complicate family arrangements and lead to children being treated unequally, having limited access to education, poorer quality food and clothing and a greater burden of productive or reproductive work to do. It could also cause tension between wives (see Polygamy, below). In addition, if sons do not leave their current homes to return to their father’s village they lose their land rights. A question for future research is whether separation, divorce and family fragmentation is more widespread amongst the poorest, or whether it is equally common throughout the spread of wealth groups. Our field work leads us towards the working hypothesis that such problems are more commonly found in the poorest households, because the stresses are greater. 5.7. Polygamy. Analysis of the dataset showed that nuclear families had higher mean incomes than non-nuclear households in most of the 9 LADDER villages and in each of the three study villages. Non-nuclear households were larger than nuclear households in all villages except for Kiribairya, which may be explained by survivors from ethnic cleansing re-marrying to form (smaller) polygamous households. There were divergent field study findings on the impact of polygamous marriages. They were sometimes advantageous to both wives and their children (if the children were from the current husband, and the wives lived on one compound). Women more rarely saw polygamy as beneficial, commenting that if men took a second or third wife they tended to divert resources unfairly to her and her children – to the point of not feeding and clothing their other children. However, some of the children of polygamous marriages stated that they had enjoyed having a number of ‘step-mothers’ to turn to, and lots of children their own age to play with. In some life histories polygamy emerged as a serious source of conflict, contributing to increased domestic violence and eventual family break-up. 5.8. Alcohol. The social and economic cost of heavy alcohol consumption was a recurrent theme in many of our life history interviews and focus group discussions. We found that alcohol consumption was not just a case of a cheery beer on a Friday afternoon. In all three study villages men would congregate in the centre of the village and in compounds around the village and start drinking millet beer from early in the morning. Addiction to waragi (local ‘gin’ – in fact a raw and powerful rum distilled from cane juice or molasses) had blighted the lives of several respondents. UPPAP II (the 2nd Uganda Participatory Poverty Assessment) confirms this, by singling out alcohol as a key cause of poverty, second only to ill-health (MoF, 2003). In our study villages, women drank far more rarely than men, probably due to cultural norms. Male drinking was common and associated by women with the squandering of household resources; domestic violence and family breakdown; male promiscuity and a failure to contribute to the household. Men countered the women’s accusations by pointing out that it gave them access to information that they would not get access to if they stayed at home, they added the Andy Capp-style comment that drinking took them out of the house, getting them out from under their wives feet and preventing them from picking fights with them.
22
Because of the apparently strong two way link between heavy drinking and poverty (drinking to forget and further impoverishment), we have developed this area as a major theme in this paper. Crisis levels of alcoholism are now found in rural Uganda, with a high proportion (50-70%) of households profoundly negatively affected (focus group discussions, own research). We argue that this is due to socio-economic shifts which have introduced new alcoholic beverages and altered the population’s relationship with alcohol. Historically, locally brewed alcohol was cloudy and had a reasonably high nutritional and low alcoholic content, ranging from 2 – 11% proof (see Table 12). It was used to mobilise work parties and to mark traditional ceremonies (own research). Community values and norms were constructed around alcohol consumption to moderate negative impacts (Willis, 2002). From the 1950s to mid 1970s alcohol consumption was regulated. Sale was only permitted through regulated bars, during specific opening hours. Individuals would brew alcohol privately for home consumption and celebrations but regulations appeared to contain excess. Under-age youths were not allowed into bars and women rarely stayed in them for long. The norms around hosting beer parties have changed. The monetisation of the economy means that people are less willing to work for food and beer, which is now more commonly brewed for sale in bars and from people’s homes. This coincided with the relaxation of regulation following the fall of Amin has resulted in the proliferation of alcohol manufacture and retailing. Alcohol producers have innovated, producing stronger strained beers and distilling waragi. All of this has made alcohol consumption more difficult to regulate. We see this as an important but complex area for policy intervention. Alcohol production is a source of employment and provides important local agro-processing value-addition. It is a significant and central source of revenue for many households, particularly for those led by widows and divorced women, who are no longer to access land. Nevertheless the social costs of over-consumption are considerable. Policy-makers need to explore a suitable entry-point for tackling this problem, be it through health promotion, education or the development of credible local ‘women’s courts’, designed to tackle the fall-out from marriage-breakdown and domestic violence.
Box 7: The history changing role of alcohol in Kalangaalo Village. In the past the only form of alcohol available in the area (tonto) was brewed from banana juice (from kisubi bananas), but other stronger brews and distillates are now on sale. Tonto was made by adding yeast to the juice and allowing it to ferment for around two days. This produces a beer with a low alcohol content and some nutrients. Tonto has survived over the decades, and is still used for ceremonies, indicating that it is rooted in the system. Between 1955-58 the Alur, a tribe from West Nile introduced kwete, a nutritious beer fermented from maize and yeast. Only a minority of people within Kalangaalo consume kwete and it is only mildly alcoholic so has not resulted in a significant change within the community. In the 1990s, people who had moved into the area to work for the government introduced malwa which is similar to kwete. Munnansi, made from pineapples, has been brewed on a small scale in Kalangaalo for some time although it is known to cause impotence. Bottled beer was introduced by employees of the ‘colonial masters’. People who drank it despised those who took tonto and other traditional brews. It was western and modern to drink bottled beer. Other western drinks, such as wines and spirits were also introduced at this time, but only consumed by the elite. The equivalent waragi, which some people drank because they could not afford western spirits. Eventually waragi carved a significant niche for itself. Waragi was introduced by the Nubians in the 1950s. Initially few people drank it, but it is reputed to be highly addictive and over time its market increased. In Kalangaalo it is made by fermenting banana juice for three days then distilling the resulting liquor to make waragi. In Kalangaalo one in five households regularly distil and sell warragi, and half of all households brew it once in a while.
23
If we rank the different forms of alcohol we find that tonto is most commonly consumed, followed by waragi, kwete, malwa, munanansi and bottled beer. Key informants in Kalangaalo claimed all the ‘new’ brews had introduced problems, but the most problematic was waragi. It was the ‘drug of choice’ of many young people and destitutes. However, it was emphasised that alcohol-related problems were also due to the erosion of the moral fabric of their community by civil war. Many people had ‘faced frustrations and lost hope in life’. Younger people had been exposed to crime and western culture and no longer value traditional social ethics, which included the ethics around alcohol consumption. People argued that the only way to reduce the problems associated with alcohol was to restore the entire moral fabric that governed society in the past.
Source: Life history and key informant interview conducted by Isaac Shinyekwa in Kalangaalo village, Mubende, 2002.
Box 8: The benefits and problems of alcohol consumption and sale. Benefits of Consumption: ‘At drinking places people make new friends and maintain the old friendships. People discuss family issues while drinking, and some people will be rebuked and advised on how to handle family problems and conflicts. Alcohol is used during arbitration of family and clan conflicts. The elders are invited and entertained as they attempt to reconcile the opposing parties. It gives some people courage to face problems and to tackle tough issues.’ ‘Alcohol is used for leisure and enjoying life. It is used during ceremonies like marriage, rituals and traditional worship. Alcohol is also used during political campaigns as it colours the whole process. Voters are entertained as they gather to attend political rallies. Politicians, administrators and NGOs use drinking places to pass on information and communicate urgent and important issues.’ ‘When you are poor or have problems that cause you to think a lot so that you do not sleep, alcohol helps you to find sleep.’ Benefits of Sale: Brewing local brew and distilling of waragi provides contribute strongly to household income. This helps them to meet household needs, e.g. costs associated with the education of their children, accessing medical treatment, feeding their families and buying household items. It allows some to hire labourers to work on their farms, build houses by offering alcohol to labourers instead of money. Problems: These are caused by heavy consumption and addiction. Regulated, disciplined alcohol consumption does not cause problems. ?? Sometimes when people get drunk at drinking places, they fight and destroy property. ?? Some individuals sell property such as land and household items to raise money for drinking. Their family
ends up deprived. ?? When one drinks too much, he/she they spend all that they earn on drink. There is no time to work and they
sink into poverty. ?? Many young people resort to gambling to get money for buying alcohol. ?? Some of those who drink become addicted and steal and rob to raise money for their habit. ?? Many young people are becoming wasted because of being addicted to waragi. They do not spend their time
in a valuable way (working to support themselves and the families). This is a major cause of poverty. (One male informant lamented that all the young people in his clan are wasted because of alcohol).
?? Families break up especially when the husband does not provide for the family and abuses his wife and children.
?? When men are too drunk to perform their marital duties their marriages end up on rocks. ?? Over-consumption of alcohol causes hangover, which makes people ineffective at work. Sometimes they
look for more alcohol to alleviate the problem, ending up in a spiral of drinking. ?? Drunkards often pose a discipline problem to society. They say and do things without reasoning. ?? Rape cases sometimes occur after and during the drinking time. ?? Some of those who drink excessively become a public nuisance. They urinate and sometimes defecate in
their pants. When under the influence of alcohol, instincts prevail over reason.
24
?? It is a health problem to those with chronic and terminal illnesses like AIDS leading to early deaths. Many of the addicts are in poor health conditions with swollen bellies and cheeks. Excessive waragi drinking affects some of the internal organs of some individuals. ?? When people are under the influence of alcohol, they fall short of reason and as a result they get exposed to higher chances of HIV infection. Many in drunken state do not have the ability to refrain from having sex with HIV infected persons. When they use condoms, they may not use them effectively given their drunken state. In the village most victims of AIDS were thought to have contracted it under such circumstances. (One female informant mentioned that when some women are drunk, they will have sex with a man for only Ush.200, under US$0.10).
?? Those under the influence of alcohol get into all sorts of accidents. Sometimes they fall by the wayside in the night, and stay there until morning or when discovered by ‘good Samaritans'.
?? Parents addicted to alcohol become a nuisance and fail to instil discipline in their children. The children constantly see the parents under the influence of alcohol.
Source: Life history and key informant interview conducted by Isaac Shinyekwa in Kalangaalo village, Mubende, 2002.
5.9. Female Infertility. Infertility amongst women was found to be a cause for abandonment, and could lead to a life of misery. Because women can only access land through their fathers, brothers or husbands infertile women might seek successive marriages until ultimately abandoned back to their parent’s compound. 5.10. Poor education. Richer families more able to educate their children, providing them with enhanced human capital and allowing for the transmission of relative wealth. Prior to UPE (free Universal Primary Education) the constraints facing poorer families in educating their children to even primary level were severe. Children from poorer families may now be educated to P7 (the end of primary schooling and free education), but this depends on the opportunity cost of their time, the perceived values of education, and the quality of local provision. Many poor children drop out at or before the end of primary education, and the fees charged by secondary schools (Ush.50,000/ term) places continued education beyond the reach of most poor families. 5.11. Conflict and Internally Displaced People. Conflict emerged as an important theme in this study. Mubende was known to be conflict affected, and we selected Kalangala village because it was known to have been highly conflict affected. However, in Kiribairya (Kamuli) conflict emerged unexpectedly as a major source of ill-being. 5.11.1. A failure to recover from conflict in Kiribairya. The village of Kiribairya developed into its current form in 1986 when internally displaced people (IDPs) settled in the area having escaped across Lake Kyoga to the escape the ethnic cleansing of Bantu speaking peoples from Teso (non-Bantu). Ethnic tensions heightened following Museveni’s ascension to power in 1986, when a Bantu president replaced the incumbent, Obote, a non-Bantu. These inter-ethnic tensions were exacerbated by seemingly co-ordinated cattle raids by the Karamajong who swept south and east into Teso lands, looted and left with the majority of the Teso herd. The Karamajong were
25
regarded by some as having been encouraged to raid the Teso in order to impoverish them and undermine their attempts to raise an opposition force to Museveni. The Bakenya seen by the Teso as having collective guilt for aiding the Karamajong. The Teso retaliated brutally, burning and looting houses, raping women, hounding people from their homes and killing the men, women and children who failed to flee in time. Those who escaped across Lake Kyoga were pursued and the Teso raided Kiribairya and other IDP camps on the southern shore of the Lake in an attempt to eradicate the Bakenya. NRM militia were assigned to protect the lake shore villages and raids were rebuffed. The Bakenya fled to the Kiribairya area because their kin had settled in the area over the preceding decades. Many residents in the area took the IDPs into their households providing them with food and shelter for sometimes 2 years. A local land owner agreed to loan the IDPs land to build a camp, on the condition that it was temporary. Small huts were built crowded together on the lake shore and they are still there. There are few ‘permanent houses’ partly due to poverty and partly because the villagers do not own the land they live on. In the immediate aftermath of the crisis the Government and the International Red Cross provided initial support, but this appears to have been limited to emergency feeding and the distribution of household items (jerry cans, saucepans and blankets)28. There was no relief-to-development phase, and the destitute and assetless remain largely that. District officials and the staff of a well-known international NGO claimed not to know that there was still an internally displaced population in the District, commenting ‘oh, haven’t they gone back’ (i.e. returned to Teso). Many the IDPs arrived in Kiribairya with literally only the clothes they stood up in, others escaped with cash and resources. The difference between these two groups has largely determined where they are now. Those with resources have been able to move on, and have bought land or established enterprises, usually elsewhere. Those who arrived destitute have found it very difficult to accumulate and leave the village, and those living in Kiribairya now are either fisher-folk or are IDPs who are too poor to move on. This population subsists cultivating small parcels of rented land and working as casual labourers fishing the lake. A few have been able to accumulate and acquire boats and nets. Few have returned to Teso. Some of those who tried have been murdered or driven out again. Despite this continued tension, some of the poorest in Kiribairya travel across the lake to find casual agricultural work, but they refuse to stay after dusk, explaining that ‘there are too many bushes over there’. On probing it emerged that the Teso whisper to them that they will ‘kill them like chickens’ if they are given the chance. So, seventeen years on, conflict still casts a long shadow. The Bakenya are still visibly distressed when talking about their past. Many saw relatives killed in front of their eyes. They still suffer from untreated trauma. In addition, they have lost whatever land and livestock they owned, and feel diminished to be living crowded onto land that does not even belong to them. The long term impact of dislocation and asset loss can be seen in the asset profile of the village. Fewer households own land in Kiribairya than in any of the other 8 LADDER villages (see Table 3). 83% of households own no land at all and none own more than 2 hectares. Table 4shows that this compares poorly with the other study villages. The lack of land leads to households relying more heavily on purchased food than households in any of the other sample villages (see Table 8). Livestock ownership is low. Under 9% of households own
28 The International Red Cross does not appear to have any institutional memory and despite repeated pleas for information has not been able to confirm the support given, quantify it or provide us with information about its duration.
26
cattle and less than a third own chickens, compared with averages across the nine LADDER villages of 29% and 65% respectively (Figure 1). Table 5 shows that mean livestock assets (expressed in CEUs – cattle equivalent units) at 0.30 in Kiribairya are below the whole sample average (1.96) and the figures for the other 2 sites selected for the Chronic Poverty study (Buwapuwa, 1.72, and Kalangaalo, 1.64). Despite the involvement of some in fish-based livelihoods income is lower in Kiribairya than in any of the nine LADDER study sites (see section on Income Poverty, above) In addition social capital is low. An indicator of this is that there are few self-help groups (e.g. ROSCAs – rotational savings and credit associations) due to low levels of trust (‘borrowers could abscond across the lake’). Political capital is low, indicated by the community’s failure to have its existence openly registered by District Officials and by the failure of local government to provide services in the form of accessible health clinics, and improved feeder road, and a resourced and staffed primary school. 6. Conclusion. The field research that went into making this paper was emotionally harrowing. What struck us in each of the study villages was how widespread the problems were and how intractable they appeared to be. We were confronted by the misery in many people’s lives and the absence of choices and opportunities open to them. The depth and multidimensionality of the problems facing individuals and households was sobering. We found many of the chronically poor to be low in capabilities and functionings(Sen, 1996), with low and in many cases declining asset bases (social, political, human, natural, physical and financial). We found surprising levels of downward mobility, with many of the poorest interviewees having come from non-poor families. This highlighted that despite nearly 17 years of post-conflict reconstruction and a sustained period of economic growth, Uganda is still in a process of recovery. Levels of well-being appear to be commonly lower than those enjoyed in rural areas in the 1950s. A recurrent finding from our in-depth interviews was that the poorest had suffered recurrent and composite shocks and personal tragedies. Those who had retained their non-poor status had simply managed to avoid personal disaster, allowing them to retain their assets and even continue to accumulate. Conflict and dislocation, ill-health, abandonment in old age, death of the head of household, alcohol abuse and household disputes and breakdown appeared to be some of the most serious and widespread causes of declines in well-being. Government programmes are not reaching the poorest in a way that alters their lives. NGOs are not active in any of the study areas, and local village-level institutions do not appear to be helpful to the poor, although charity from neighbours keep the destitute alive. Knowing how to sequence interventions to start raising the well-being of the chronically poor is a challenge, but it appears that it is not a challenge that the Government or NGOs have even begun to address. Without some form of targeted social protection it is difficult to see how the short-term well-being of the poorest can be improved to allow for long-term investments. Without efforts to generate the political will and the public (or elite) acceptance of this as a central issue in Uganda’s next PRSP, Uganda will continue to fail to extend the benefits of growth to the poorest.
27
Bibliography. Appleton, S. (1998) ‘Changes in Poverty in Uganda, 1992-1996.’ Centre for the Study of
African Economies, University of Oxford. Appleton, S. (2001a) ‘Poverty in Uganda, 1999/2000: Preliminary Estimates from the UNHS.’
University of Nottingham Appleton, S. (2001b) ‘Poverty Reduction During Growth: The Case of Uganda, 1992-2000.’
University of Nottingham. Babirye, D. (1999) ‘Uganda Participatory Poverty Assessment Progress Report.’ Kampala,
Ministry of Finance Planning and Economic Development. Barrows, S. and R. Room (eds) (1991) ‘Drinking: Behaviour and Belief in Modern Society.’
Los Angeles /London, Berkeley. Bird, K. (2001) ‘Multi-dimensional Approaches to Understanding Poverty.’ Paper presented
at the ‘CPRC Theory Workshop. Birmingham 18th December 2001. Birmingham, mimeo.
Bolt, V. and Bird, K. (2003) ‘A Framework for the Analysis of Intra-household Difference and
Inequality.’ CPRC Draft Working Paper. London: ODI/ Chronic Poverty Research Centre.
Chambers, R. (1983) ‘Rural Development: Putting the Last First.’ Harlow, Longman Scientific
and Technical. Chambers, R. (1989) ‘Editorial Introduction: Vulnerability, Coping and Policy.’ IDS Bulletin,
Vol. 20, No.2, April 1989 pp1-7. CDRN (1996) ‘A study of Poverty in Selected Districts of Uganda: Summary Arising from
Research by the CDRN on Behalf of Novib, Oxfam and Actionaid.’ Community Development Resource Network, Kampala, Uganda.
Deininger, K, and Okidi J. (2001), ‘Rural Households: Incomes. Productivity and Non-Farm
Enterprises,’ In Uganda’s Recovery, the Role of farms, Firms and Governments, (eds). Reinikka, R. and Collier, P., Washington, World Bank
Deininger, K. and Okidi, J. (2002) ‘Growth and poverty reduction in Uganda, 1992-2000: Panel data
evidence.’ Mimeo, World Bank, Washington DC and Economic Policy Research Council, Kampala. May 19, 2003.
Deininger, K. and Okidi, J. (2002) ‘Growth and Poverty reduction in Uganda, 1992-2000:
Panel Data Evidence.’ Kampala, Economic Policy Research Centre.. Hulme and Shepherd (2001) Meanings Paper. CPRC Working Paper 1. Manchester,
Chronic Poverty Research Centre. www.chronicpoverty.org Hulme, D. and Shepherd, A. (2003) ‘Conceptualising Chronic Poverty.’ World Development,
Vol 31, No.3, pp403-423.
28
LADDER (2001a) ‘Draft Report for Kiribairya Village -Kamuli District.’ April 2001, Kampala, EPRC.
LADDER (2001b) ‘Draft Report for Buwopuwa Village Mbale District.’ April 2001, Kampala,
EPRC. LADDER (2001c) ‘Draft Village Report for Kalaangalo Village-Mubende District.’ May 2001,
Kampala, EPRC. Lipton, M. (1988) ‘The poor and the poorest : some interim findings.’ Washington, World
Bank. Mijumbi, P. and Okidi, J. (2001). ‘Analysis of Poor and Vulnerable Groups in Uganda.’
Occasional Paper No. 16. Kampala, Economic Policy Research Centre with support from DFID.
Mijumbi, P. Okidi, J. (2001) ‘Analysis of Poor and Vulnerable Groups in Uganda.’ Occasional
Paper No. 16. Kampala, Economic Policy Research Centre with support from DFID. Ministry of Finance Planning and Economic Development (2001) ‘Rapid Rural Appraisal on
the Poverty Situation in the North. Synthesised Study Report.’ Kampala, Poverty Monitoring Unit of MFPED.
Ministry of Finance, Planning and Economic Development (2000) ‘Uganda Poverty Profile:
What do we know about the Poor?’ Discussion Paper 3, August 2000. Kampala MFPED.. www.finance.go.ug
Ministry of Finance Planning and Economic Development (2003) ‘Uganda Participatory
Poverty Assessment.’ Kampala, Uganda Nsimbi ,M.B. (1956) ‘Village Life and Customs in Buganda.’ Uganda Journal, 20:27-36 Okidi J. (1999) ‘Regional Growth Disparities and Household Economic Performance in
Uganda.’ Research Series No.17. Kampala, Economic Policy Research Centre. Okidi, J.A. and Mugambe, G.K. (2002) ‘An Overview of Chronic Poverty and Development
Policy in Uganda.’ CPRC Working Paper 11, Manchester, CPRC. Opio, F. (1997) ‘Structural Adjustment, Growth and Poverty in Uganda.’ Research Series No.
3. Kampala Economic Policy Research Centre. Sen, A. (1996) ‘Capability and well-being. The quality of life’ in M. Nussbaum, & A. Sen
(eds.) ‘The quality of life.’ Oxford: Clarendon. UNDP (2002) ‘Uganda Human Development Report: Draft.’ Kampala, UNDP.
www.finance.go.ug Willis, J. (2002) ‘Potent Brews: A Social History of Alcohol in East Africa 1850-1999.’
Kampala. Fountain Publishers.
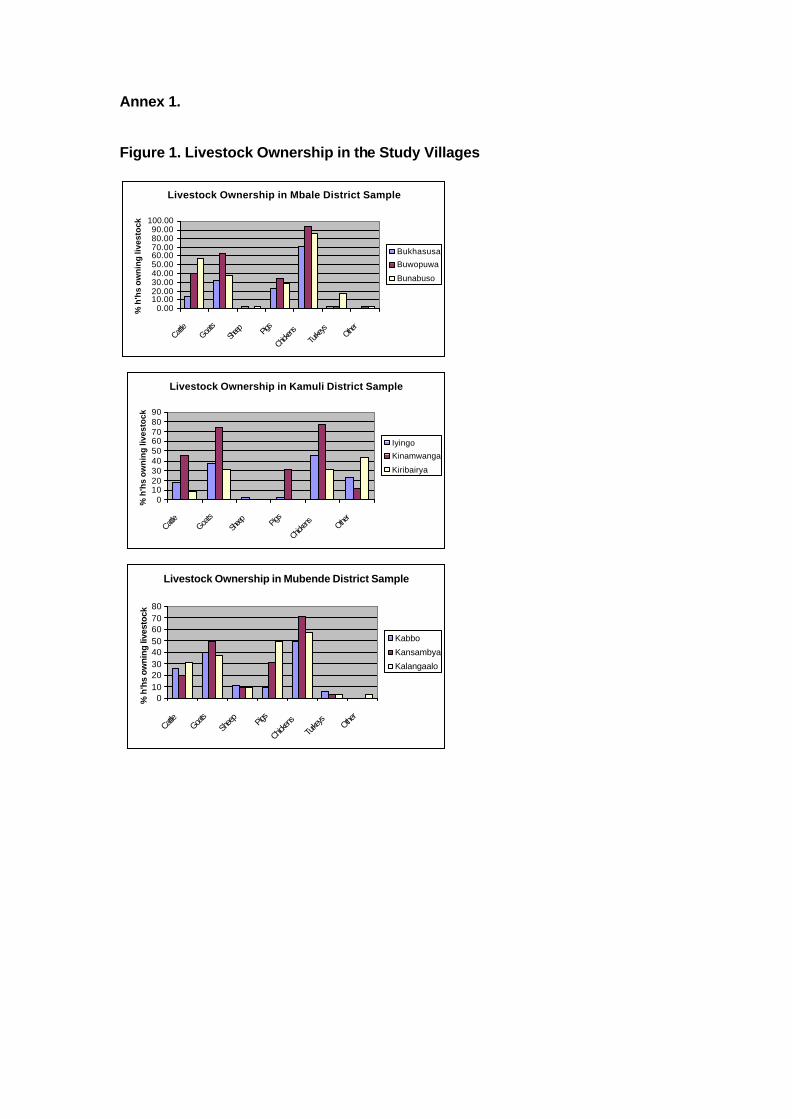
Annex 1. Figure 1. Livestock Ownership in the Study Villages
Livestock Ownership in Mbale District Sample
0.0010.0020.0030.0040.0050.0060.0070.0080.0090.00
100.00
Cattle
Goats
Sheep Pig
s
Chicke
nsTu
rkeys
Other
% h
'hs
ow
nin
g li
vest
ock
Bukhasusa
Buwopuwa
Bunabuso
Livestock Ownership in Kamuli District Sample
0102030405060708090
Cattle
Goats
Sheep Pig
s
Chicken
sOthe
r
% h
'hs
ow
nin
g li
vest
ock
Iyingo
Kinamwanga
Kiribairya
Livestock Ownership in Mubende District Sample
01020304050607080
Cattle
Goats
Shee
pPig
s
Chicken
s
Turke
ys Other
% h
'hs
owni
ng li
vest
ock
Kabbo
Kansambya
Kalangaalo
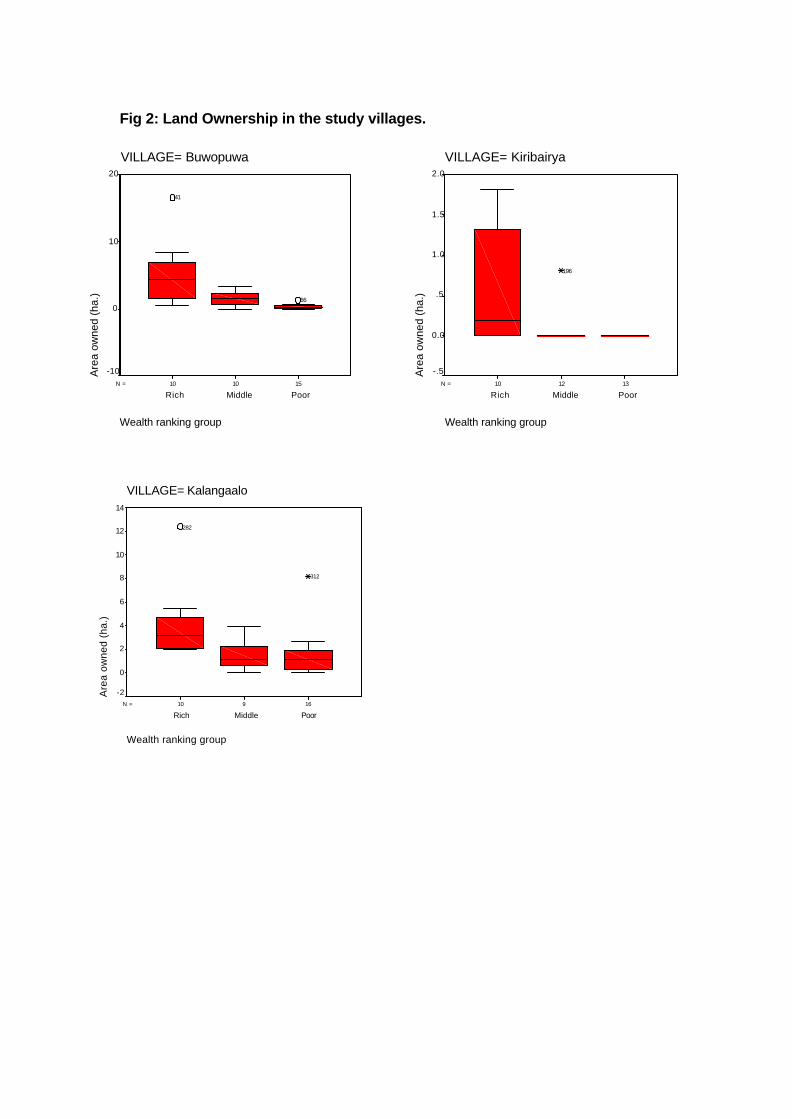
Fig 2: Land Ownership in the study villages.
151010N =
VILLAGE= Buwopuwa
Wealth ranking group
PoorMiddleRich
Are
a ow
ned
(ha.
)
20
10
0
-10
66
41
131210N =
VILLAGE= Kiribairya
Wealth ranking group
PoorMiddleRich
Are
a ow
ned
(ha.
)
2.0
1.5
1.0
.5
0.0
-.5
196
16910N =
VILLAGE= Kalangaalo
Wealth ranking group
PoorMiddleRich
Are
a ow
ned
(ha.
)
14
12
10
8
6
4
2
0
-2
312
282
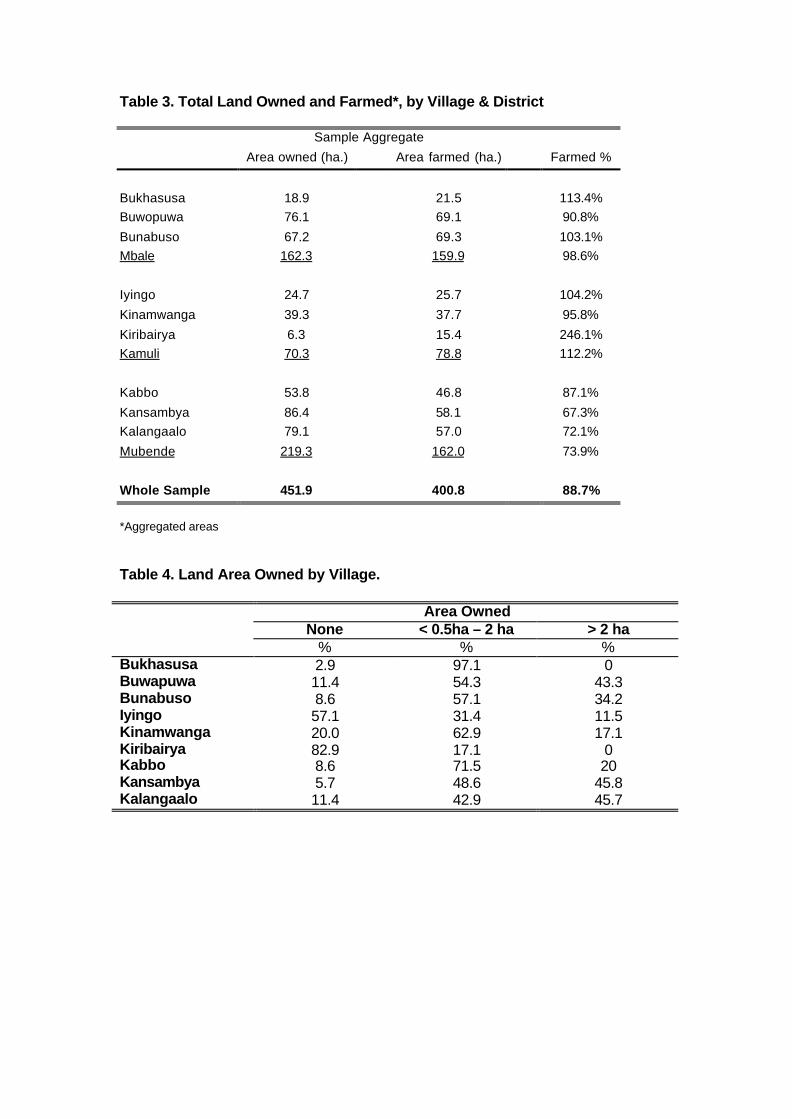
Table 3. Total Land Owned and Farmed*, by Village & District
Sample Aggregate
Area owned (ha.) Area farmed (ha.) Farmed %
Bukhasusa 18.9 21.5 113.4% Buwopuwa 76.1 69.1 90.8%
Bunabuso 67.2 69.3 103.1% Mbale 162.3 159.9 98.6%
Iyingo 24.7 25.7 104.2%
Kinamwanga 39.3 37.7 95.8%
Kiribairya 6.3 15.4 246.1% Kamuli 70.3 78.8 112.2%
Kabbo 53.8 46.8 87.1%
Kansambya 86.4 58.1 67.3% Kalangaalo 79.1 57.0 72.1%
Mubende 219.3 162.0 73.9%
Whole Sample 451.9 400.8 88.7%
*Aggregated areas Table 4. Land Area Owned by Village. Area Owned
None < 0.5ha – 2 ha > 2 ha % % %
Bukhasusa 2.9 97.1 0 Buwapuwa 11.4 54.3 43.3 Bunabuso 8.6 57.1 34.2 Iyingo 57.1 31.4 11.5 Kinamwanga 20.0 62.9 17.1 Kiribairya 82.9 17.1 0 Kabbo 8.6 71.5 20 Kansambya 5.7 48.6 45.8 Kalangaalo 11.4 42.9 45.7
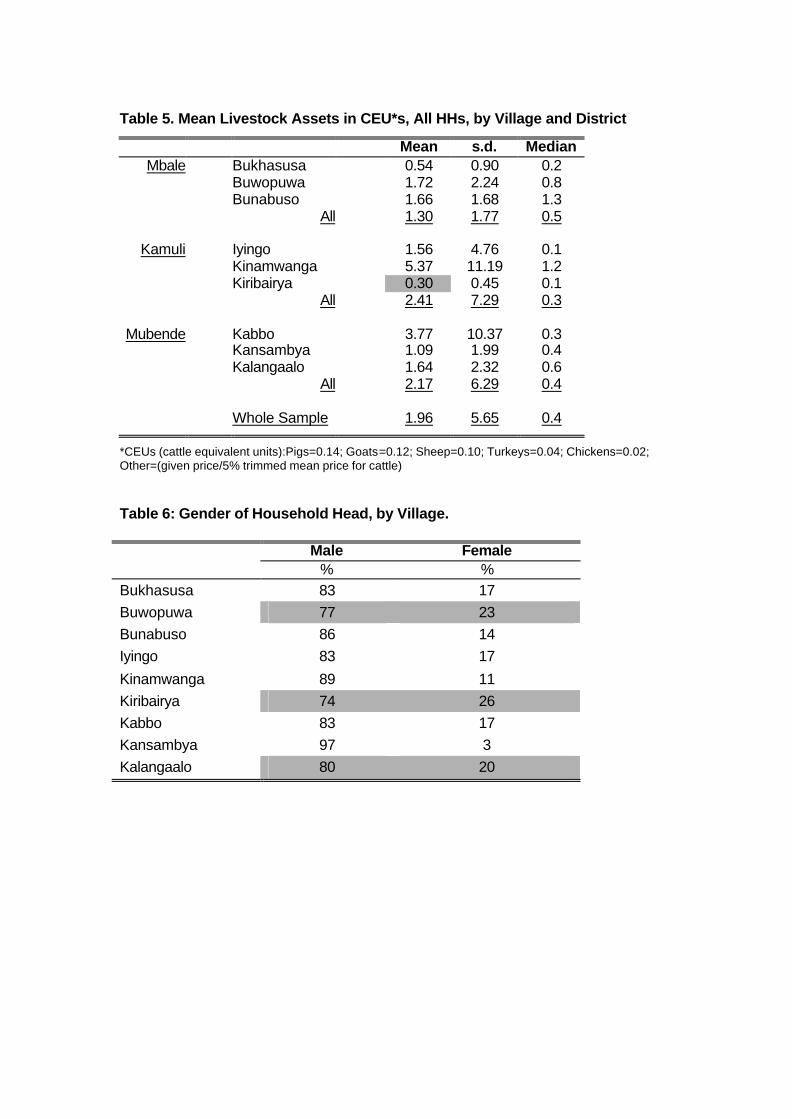
Table 5. Mean Livestock Assets in CEU*s, All HHs, by Village and District
Mean s.d. Median Mbale Bukhasusa 0.54 0.90 0.2
Buwopuwa 1.72 2.24 0.8 Bunabuso 1.66 1.68 1.3
All 1.30 1.77 0.5
Kamuli Iyingo 1.56 4.76 0.1 Kinamwanga 5.37 11.19 1.2 Kiribairya 0.30 0.45 0.1
All 2.41 7.29 0.3
Mubende Kabbo 3.77 10.37 0.3 Kansambya 1.09 1.99 0.4 Kalangaalo 1.64 2.32 0.6
All 2.17 6.29 0.4 Whole Sample 1.96 5.65 0.4
*CEUs (cattle equivalent units):Pigs=0.14; Goats=0.12; Sheep=0.10; Turkeys=0.04; Chickens=0.02; Other=(given price/5% trimmed mean price for cattle) Table 6: Gender of Household Head, by Village. Male Female % % Bukhasusa 83 17 Buwopuwa 77 23 Bunabuso 86 14 Iyingo 83 17
Kinamwanga 89 11 Kiribairya 74 26 Kabbo 83 17 Kansambya 97 3 Kalangaalo 80 20
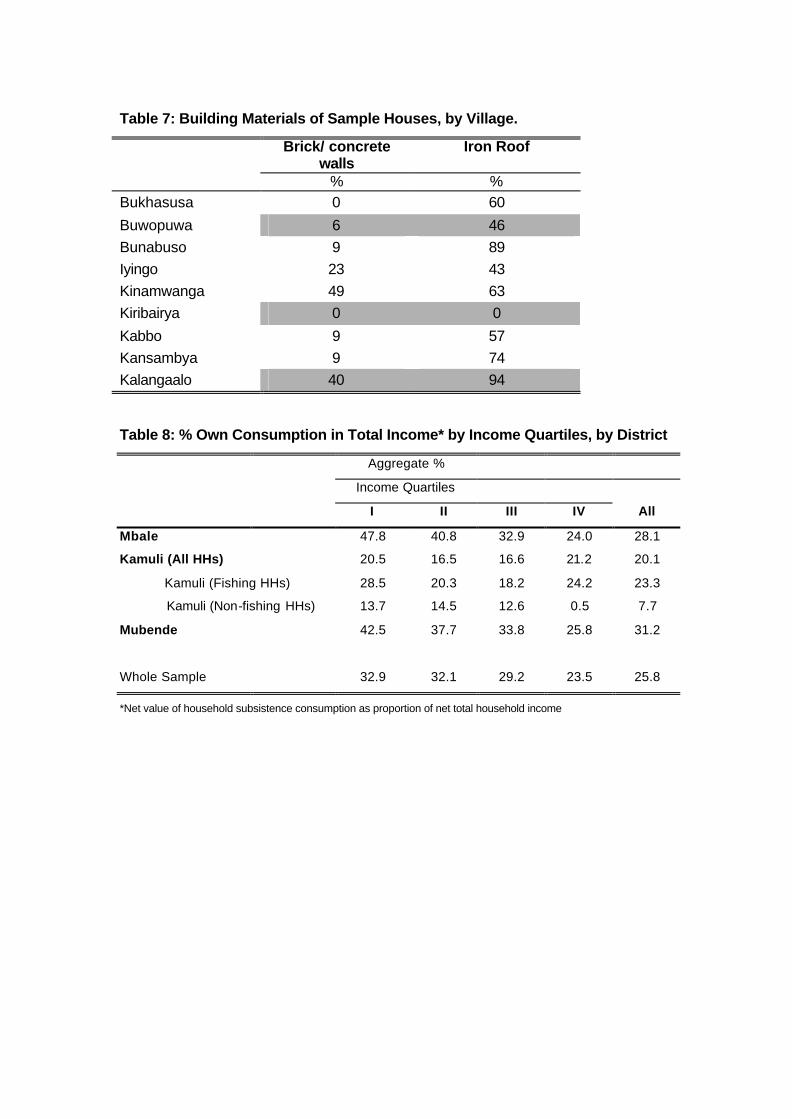
Table 7: Building Materials of Sample Houses, by Village.
Brick/ concrete walls
Iron Roof
% % Bukhasusa 0 60
Buwopuwa 6 46 Bunabuso 9 89 Iyingo 23 43 Kinamwanga 49 63 Kiribairya 0 0
Kabbo 9 57 Kansambya 9 74 Kalangaalo 40 94 Table 8: % Own Consumption in Total Income* by Income Quartiles, by District
Aggregate %
Income Quartiles
I II III IV All
Mbale 47.8 40.8 32.9 24.0 28.1
Kamuli (All HHs) 20.5 16.5 16.6 21.2 20.1
Kamuli (Fishing HHs) 28.5 20.3 18.2 24.2 23.3
Kamuli (Non-fishing HHs) 13.7 14.5 12.6 0.5 7.7
Mubende 42.5 37.7 33.8 25.8 31.2
Whole Sample 32.9 32.1 29.2 23.5 25.8
*Net value of household subsistence consumption as proportion of net total household income
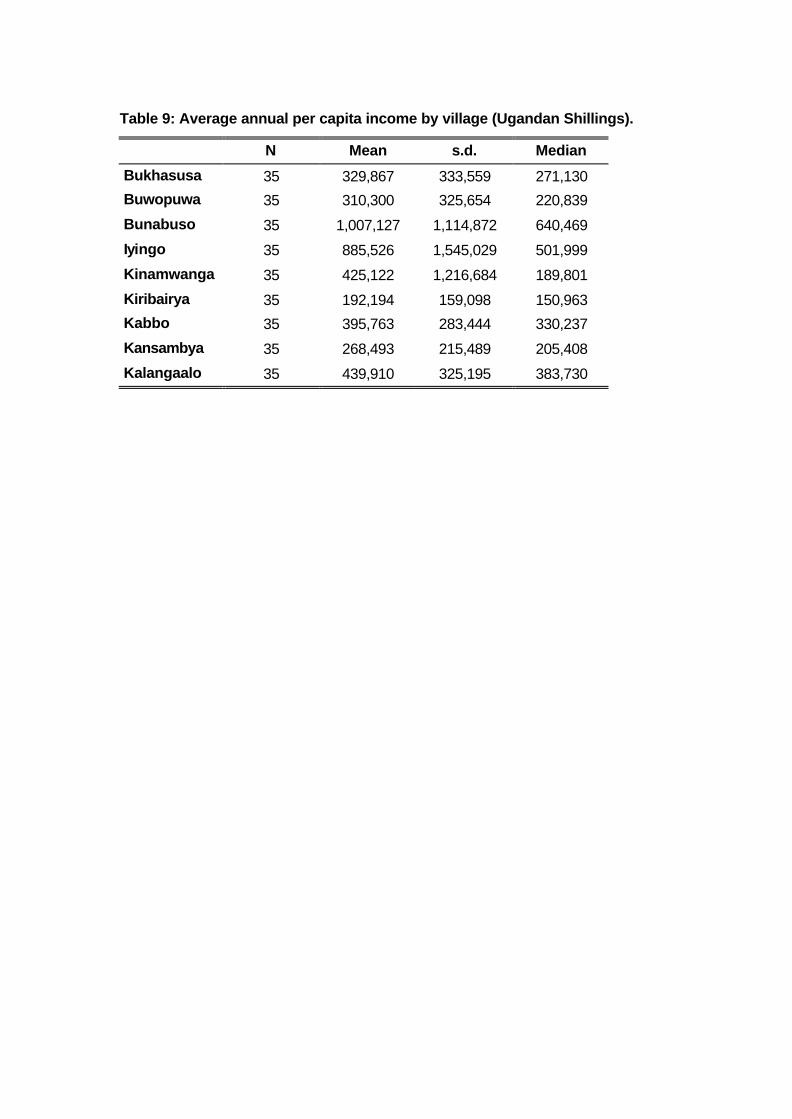
Table 9: Average annual per capita income by village (Ugandan Shillings).
N Mean s.d. Median
Bukhasusa 35 329,867 333,559 271,130
Buwopuwa 35 310,300 325,654 220,839
Bunabuso 35 1,007,127 1,114,872 640,469
Iyingo 35 885,526 1,545,029 501,999
Kinamwanga 35 425,122 1,216,684 189,801
Kiribairya 35 192,194 159,098 150,963
Kabbo 35 395,763 283,444 330,237
Kansambya 35 268,493 215,489 205,408
Kalangaalo 35 439,910 325,195 383,730
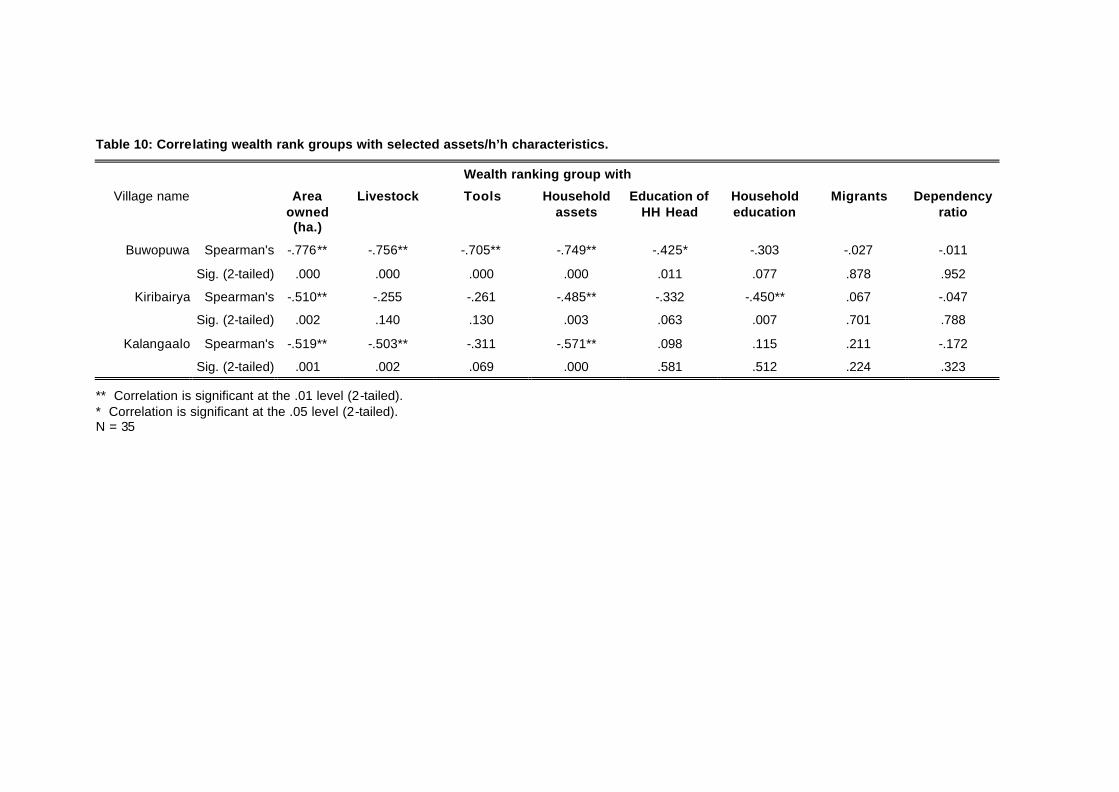
Table 10: Correlating wealth rank groups with selected assets/h’h characteristics.
Wealth ranking group with
Village name Area owned (ha.)
Livestock Tools Household assets
Education of HH Head
Household education
Migrants Dependency ratio
Buwopuwa Spearman's -.776** -.756** -.705** -.749** -.425* -.303 -.027 -.011
Sig. (2-tailed) .000 .000 .000 .000 .011 .077 .878 .952
Kiribairya Spearman's -.510** -.255 -.261 -.485** -.332 -.450** .067 -.047
Sig. (2-tailed) .002 .140 .130 .003 .063 .007 .701 .788
Kalangaalo Spearman's -.519** -.503** -.311 -.571** .098 .115 .211 -.172
Sig. (2-tailed) .001 .002 .069 .000 .581 .512 .224 .323
** Correlation is significant at the .01 level (2-tailed). * Correlation is significant at the .05 level (2-tailed). N = 35
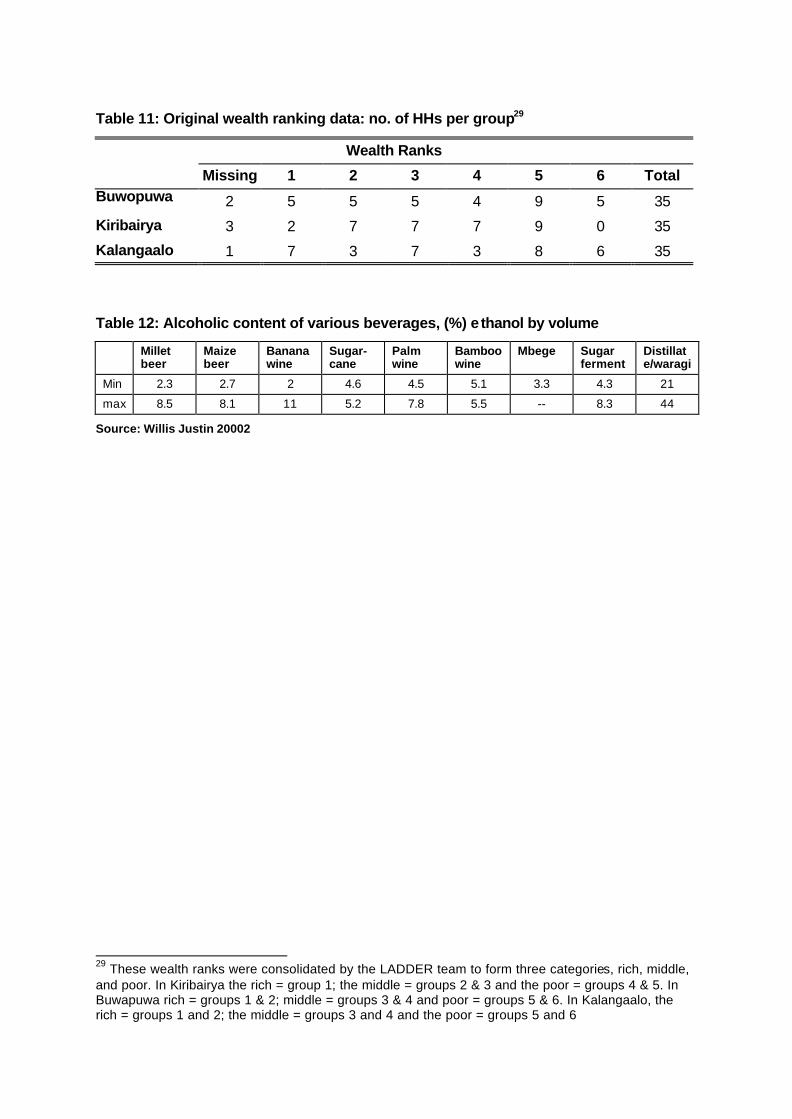
Table 11: Original wealth ranking data: no. of HHs per group29
Wealth Ranks
Missing 1 2 3 4 5 6 Total Buwopuwa 2 5 5 5 4 9 5 35
Kiribairya 3 2 7 7 7 9 0 35
Kalangaalo 1 7 3 7 3 8 6 35 Table 12: Alcoholic content of various beverages, (%) e thanol by volume
Millet beer
Maize beer
Banana wine
Sugar-cane
Palm wine
Bamboo wine
Mbege Sugar ferment
Distillate/waragi
Min 2.3 2.7 2 4.6 4.5 5.1 3.3 4.3 21
max 8.5 8.1 11 5.2 7.8 5.5 -- 8.3 44
Source: Willis Justin 20002
29 These wealth ranks were consolidated by the LADDER team to form three categories, rich, middle, and poor. In Kiribairya the rich = group 1; the middle = groups 2 & 3 and the poor = groups 4 & 5. In Buwapuwa rich = groups 1 & 2; middle = groups 3 & 4 and poor = groups 5 & 6. In Kalangaalo, the rich = groups 1 and 2; the middle = groups 3 and 4 and the poor = groups 5 and 6
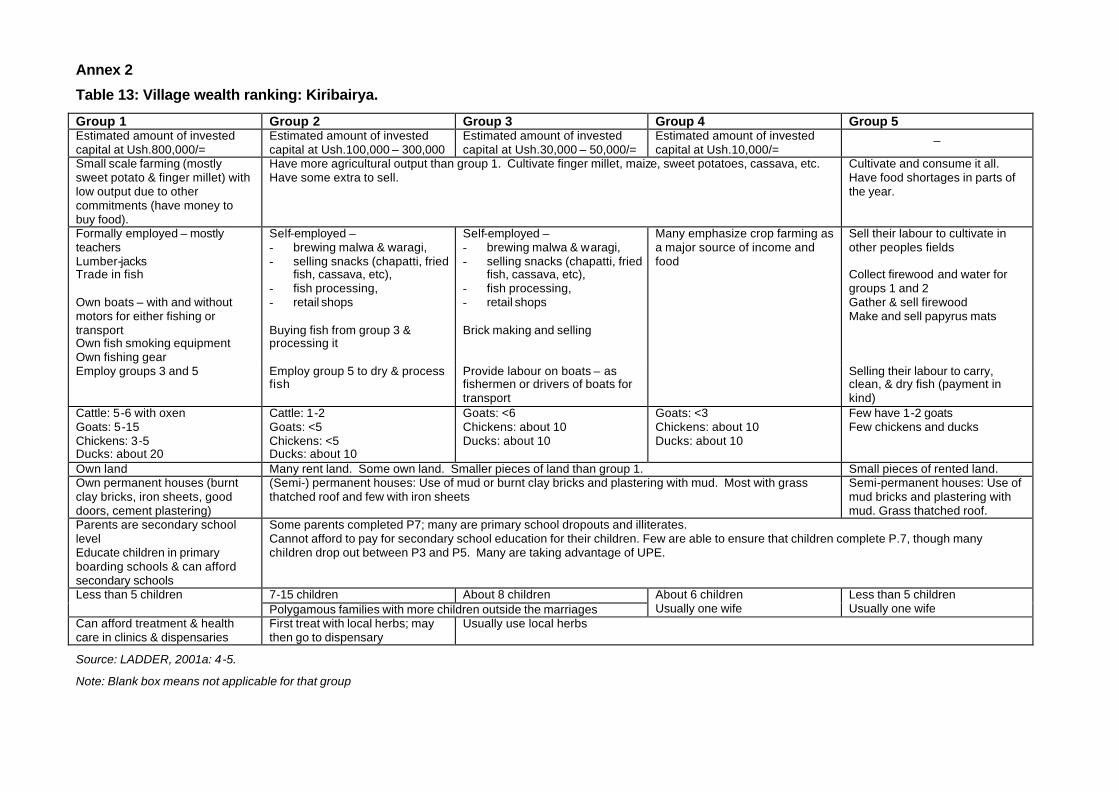
Annex 2
Table 13: Village wealth ranking: Kiribairya.
Group 1 Group 2 Group 3 Group 4 Group 5 Estimated amount of invested capital at Ush.800,000/=
Estimated amount of invested capital at Ush.100,000 – 300,000
Estimated amount of invested capital at Ush.30,000 – 50,000/=
Estimated amount of invested capital at Ush.10,000/=
_
Small scale farming (mostly sweet potato & finger millet) with low output due to other commitments (have money to buy food).
Have more agricultural output than group 1. Cultivate finger millet, maize, sweet potatoes, cassava, etc. Have some extra to sell.
Cultivate and consume it all. Have food shortages in parts of the year.
Formally employed – mostly teachers Lumber-jacks Trade in fish Own boats – with and without motors for either fishing or transport Own fish smoking equipment Own fishing gear
Self-employed – - brewing malwa & waragi, - selling snacks (chapatti, fried
fish, cassava, etc), - fish processing, - retail shops Buying fish from group 3 & processing it
Self-employed – - brewing malwa & waragi, - selling snacks (chapatti, fried
fish, cassava, etc), - fish processing, - retail shops Brick making and selling
Many emphasize crop farming as a major source of income and food
Sell their labour to cultivate in other peoples fields Collect firewood and water for groups 1 and 2 Gather & sell firewood Make and sell papyrus mats
Employ groups 3 and 5 Employ group 5 to dry & process fish
Provide labour on boats – as fishermen or drivers of boats for transport
Selling their labour to carry, clean, & dry fish (payment in kind)
Cattle: 5-6 with oxen Goats: 5-15 Chickens: 3-5 Ducks: about 20
Cattle: 1-2 Goats: <5 Chickens: <5 Ducks: about 10
Goats: <6 Chickens: about 10 Ducks: about 10
Goats: <3 Chickens: about 10 Ducks: about 10
Few have 1-2 goats Few chickens and ducks
Own land Many rent land. Some own land. Smaller pieces of land than group 1. Small pieces of rented land. Own permanent houses (burnt clay bricks, iron sheets, good doors, cement plastering)
(Semi-) permanent houses: Use of mud or burnt clay bricks and plastering with mud. Most with grass thatched roof and few with iron sheets
Semi-permanent houses: Use of mud bricks and plastering with mud. Grass thatched roof.
Parents are secondary school level Educate children in primary boarding schools & can afford secondary schools
Some parents completed P7; many are primary school dropouts and illiterates. Cannot afford to pay for secondary school education for their children. Few are able to ensure that children complete P.7, though many children drop out between P3 and P5. Many are taking advantage of UPE.
7-15 children About 8 children Less than 5 children Polygamous families with more children outside the marriages
About 6 children Usually one wife
Less than 5 children Usually one wife
Can afford treatment & health care in clinics & dispensaries
First treat with local herbs; may then go to dispensary
Usually use local herbs
Source: LADDER, 2001a: 4-5.
Note: Blank box means not applicable for that group
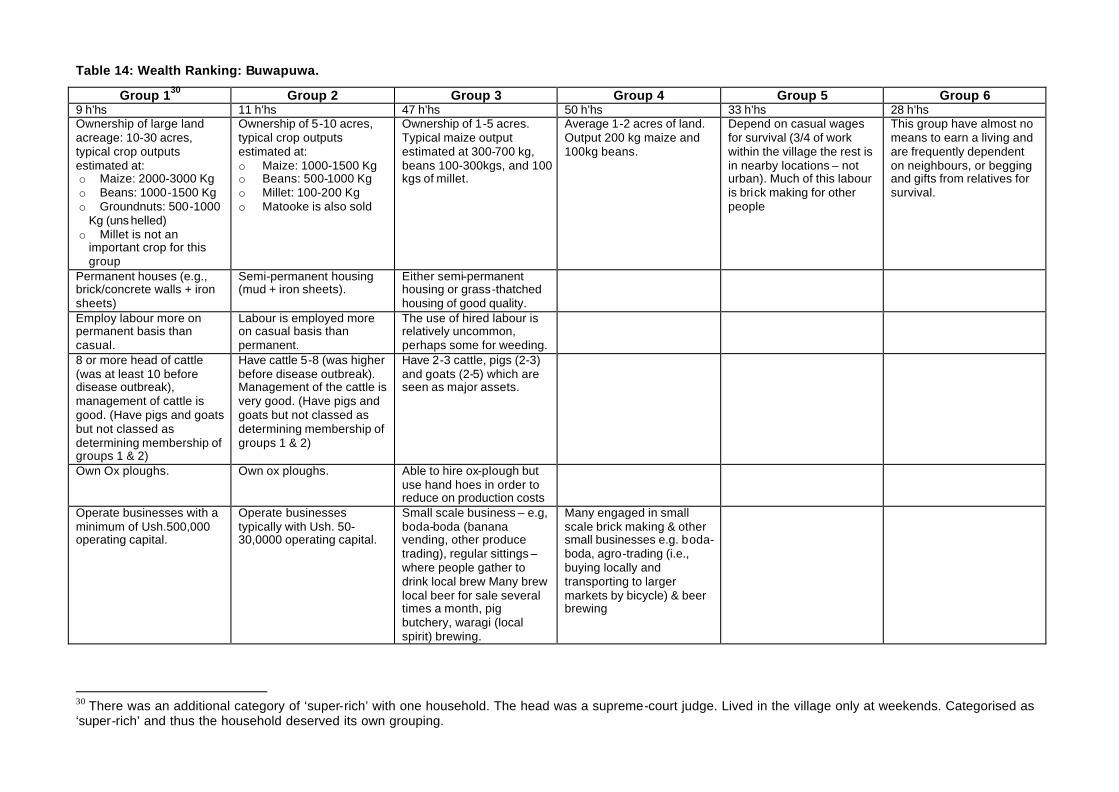
Table 14: Wealth Ranking: Buwapuwa.
Group 130 Group 2 Group 3 Group 4 Group 5 Group 6 9 h’hs 11 h’hs 47 h’hs 50 h’hs 33 h’hs 28 h’hs Ownership of large land acreage: 10-30 acres, typical crop outputs estimated at: o Maize: 2000-3000 Kg o Beans: 1000-1500 Kg o Groundnuts: 500-1000
Kg (uns helled) o Millet is not an
important crop for this group
Ownership of 5-10 acres, typical crop outputs estimated at: o Maize: 1000-1500 Kg o Beans: 500-1000 Kg o Millet: 100-200 Kg o Matooke is also sold
Ownership of 1-5 acres. Typical maize output estimated at 300-700 kg, beans 100-300kgs, and 100 kgs of millet.
Average 1-2 acres of land. Output 200 kg maize and 100kg beans.
Depend on casual wages for survival (3/4 of work within the village the rest is in nearby locations – not urban). Much of this labour is brick making for other people
This group have almost no means to earn a living and are frequently dependent on neighbours, or begging and gifts from relatives for survival.
Permanent houses (e.g., brick/concrete walls + iron sheets)
Semi-permanent housing (mud + iron sheets).
Either semi-permanent housing or grass-thatched housing of good quality.
Employ labour more on permanent basis than casual.
Labour is employed more on casual basis than permanent.
The use of hired labour is relatively uncommon, perhaps some for weeding.
8 or more head of cattle (was at least 10 before disease outbreak), management of cattle is good. (Have pigs and goats but not classed as determining membership of groups 1 & 2)
Have cattle 5-8 (was higher before disease outbreak). Management of the cattle is very good. (Have pigs and goats but not classed as determining membership of groups 1 & 2)
Have 2-3 cattle, pigs (2-3) and goats (2-5) which are seen as major assets.
Own Ox ploughs. Own ox ploughs. Able to hire ox-plough but use hand hoes in order to reduce on production costs
Operate businesses with a minimum of Ush.500,000 operating capital.
Operate businesses typically with Ush. 50-30,0000 operating capital.
Small scale business – e.g, boda-boda (banana vending, other produce trading), regular sittings – where people gather to drink local brew Many brew local beer for sale several times a month, pig butchery, waragi (local spirit) brewing.
Many engaged in small scale brick making & other small businesses e.g. boda-boda, agro-trading (i.e., buying locally and transporting to larger markets by bicycle) & beer brewing
30 There was an additional category of ‘super-rich’ with one household. The head was a supreme-court judge. Lived in the village only at weekends. Categorised as ‘super-rich’ and thus the household deserved its own grouping.
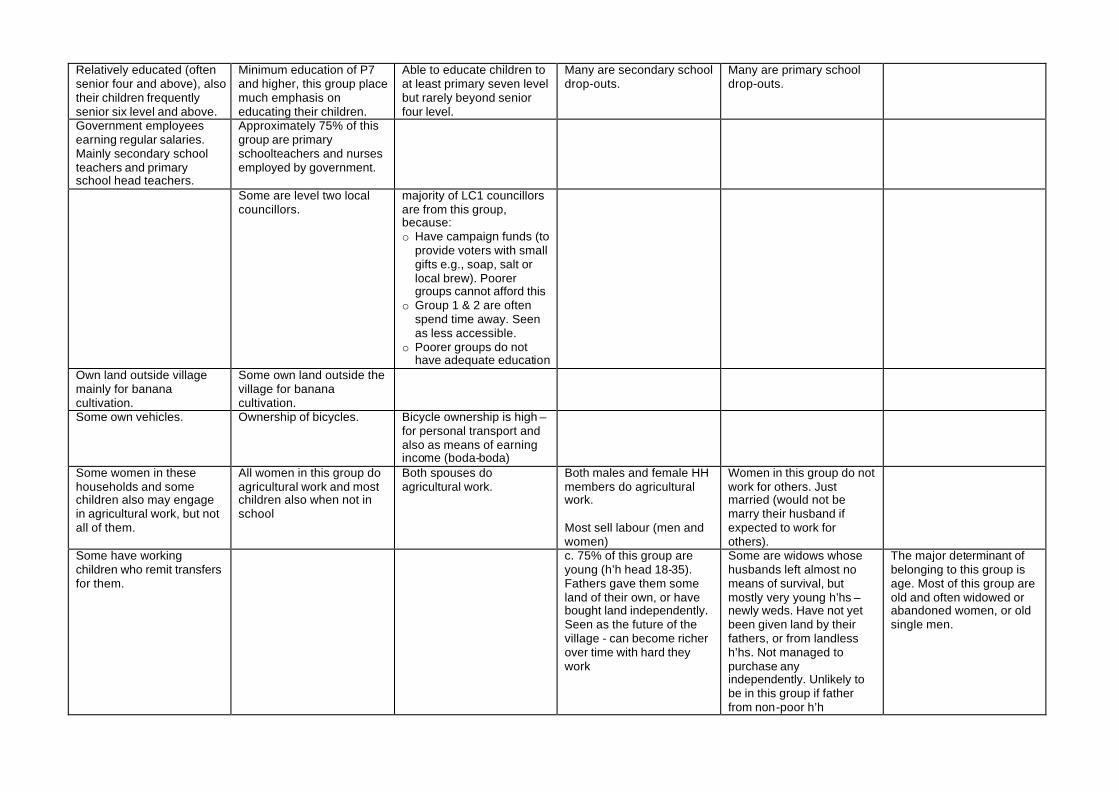
Relatively educated (often senior four and above), also their children frequently senior six level and above.
Minimum education of P7 and higher, this group place much emphasis on educating their children.
Able to educate children to at least primary seven level but rarely beyond senior four level.
Many are secondary school drop-outs.
Many are primary school drop-outs.
Government employees earning regular salaries. Mainly secondary school teachers and primary school head teachers.
Approximately 75% of this group are primary schoolteachers and nurses employed by government.
Some are level two local councillors.
majority of LC1 councillors are from this group, because: o Have campaign funds (to
provide voters with small gifts e.g., soap, salt or local brew). Poorer groups cannot afford this
o Group 1 & 2 are often spend time away. Seen as less accessible.
o Poorer groups do not have adequate education
Own land outside village mainly for banana cultivation.
Some own land outside the village for banana cultivation.
Some own vehicles.
Ownership of bicycles.
Bicycle ownership is high – for personal transport and also as means of earning income (boda-boda)
Some women in these households and some children also may engage in agricultural work, but not all of them.
All women in this group do agricultural work and most children also when not in school
Both spouses do agricultural work.
Both males and female HH members do agricultural work. Most sell labour (men and women)
Women in this group do not work for others. Just married (would not be marry their husband if expected to work for others).
Some have working children who remit transfers for them.
c. 75% of this group are young (h’h head 18-35). Fathers gave them some land of their own, or have bought land independently. Seen as the future of the village - can become richer over time with hard they work
Some are widows whose husbands left almost no means of survival, but mostly very young h’hs – newly weds. Have not yet been given land by their fathers, or from landless h’hs. Not managed to purchase any independently. Unlikely to be in this group if father from non-poor h’h
The major determinant of belonging to this group is age. Most of this group are old and often widowed or abandoned women, or old single men.
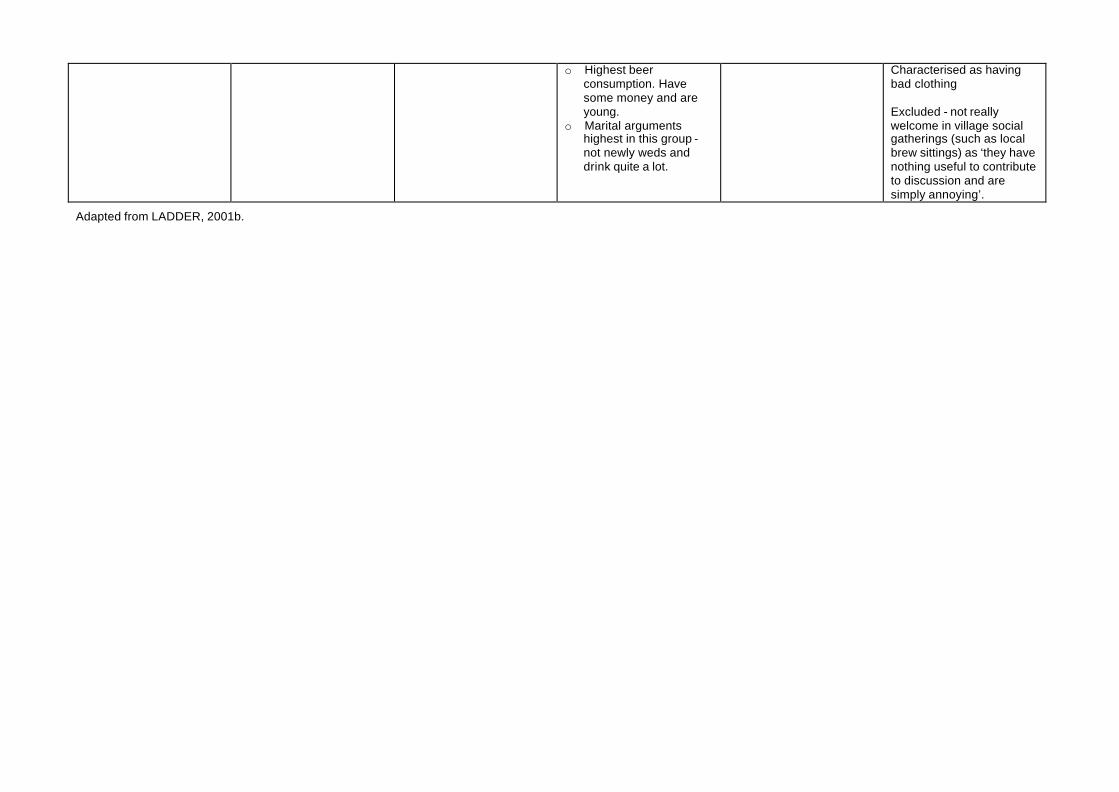
o Highest beer consumption. Have some money and are young.
o Marital arguments highest in this group - not newly weds and drink quite a lot.
Characterised as having bad clothing Excluded - not really welcome in village social gatherings (such as local brew sittings) as ‘they have nothing useful to contribute to discussion and are simply annoying’.
Adapted from LADDER, 2001b.
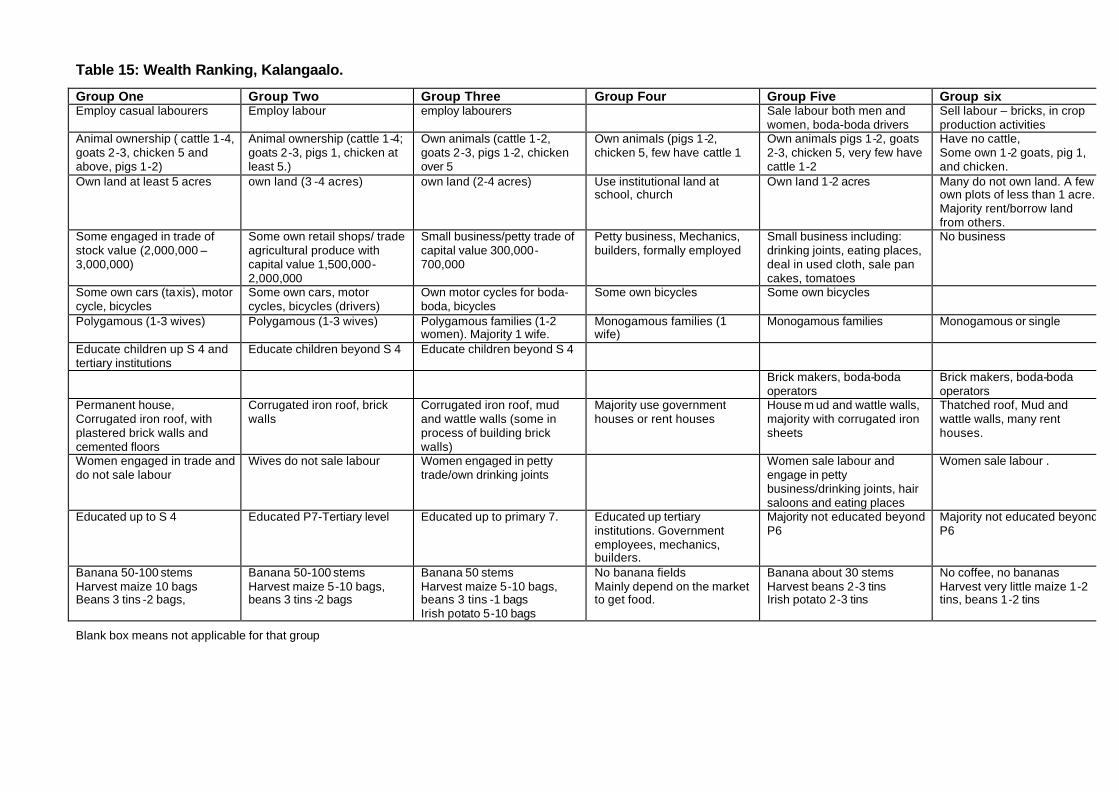
Table 15: Wealth Ranking, Kalangaalo.
Group One Group Two Group Three Group Four Group Five Group six Employ casual labourers Employ labour employ labourers Sale labour both men and
women, boda-boda drivers Sell labour – bricks, in crop production activities
Animal ownership ( cattle 1-4, goats 2-3, chicken 5 and above, pigs 1-2)
Animal ownership (cattle 1-4; goats 2-3, pigs 1, chicken at least 5.)
Own animals (cattle 1-2, goats 2-3, pigs 1-2, chicken over 5
Own animals (pigs 1-2, chicken 5, few have cattle 1
Own animals pigs 1-2, goats 2-3, chicken 5, very few have cattle 1-2
Have no cattle, Some own 1-2 goats, pig 1, and chicken.
Own land at least 5 acres own land (3 -4 acres) own land (2-4 acres) Use institutional land at school, church
Own land 1-2 acres Many do not own land. A few own plots of less than 1 acre. Majority rent/borrow land from others.
Some engaged in trade of stock value (2,000,000 – 3,000,000)
Some own retail shops/ trade agricultural produce with capital value 1,500,000-2,000,000
Small business/petty trade of capital value 300,000-700,000
Petty business, Mechanics, builders, formally employed
Small business including: drinking joints, eating places, deal in used cloth, sale pan cakes, tomatoes
No business
Some own cars (taxis), motor cycle, bicycles
Some own cars, motor cycles, bicycles (drivers)
Own motor cycles for boda-boda, bicycles
Some own bicycles Some own bicycles
Polygamous (1-3 wives) Polygamous (1-3 wives) Polygamous families (1-2 women). Majority 1 wife.
Monogamous families (1 wife)
Monogamous families Monogamous or single
Educate children up S 4 and tertiary institutions
Educate children beyond S 4 Educate children beyond S 4
Brick makers, boda-boda operators
Brick makers, boda-boda operators
Permanent house, Corrugated iron roof, with plastered brick walls and cemented floors
Corrugated iron roof, brick walls
Corrugated iron roof, mud and wattle walls (some in process of building brick walls)
Majority use government houses or rent houses
House m ud and wattle walls, majority with corrugated iron sheets
Thatched roof, Mud and wattle walls, many rent houses.
Women engaged in trade and do not sale labour
Wives do not sale labour Women engaged in petty trade/own drinking joints
Women sale labour and engage in petty business/drinking joints, hair saloons and eating places
Women sale labour .
Educated up to S 4 Educated P7-Tertiary level Educated up to primary 7. Educated up tertiary institutions. Government employees, mechanics, builders.
Majority not educated beyond P6
Majority not educated beyond P6
Banana 50-100 stems Harvest maize 10 bags Beans 3 tins -2 bags,
Banana 50-100 stems Harvest maize 5-10 bags, beans 3 tins -2 bags
Banana 50 stems Harvest maize 5-10 bags, beans 3 tins -1 bags Irish potato 5-10 bags
No banana fields Mainly depend on the market to get food.
Banana about 30 stems Harvest beans 2-3 tins Irish potato 2-3 tins
No coffee, no bananas Harvest very little maize 1-2 tins, beans 1-2 tins
Blank box means not applicable for that group