Karbonopptak i betong - Norsk Betongforening -
128
Rapport nr. 4 Karbonopptak i betong – En studie i CO 2 opptak fra karbonatisering i norske betongkonstruksjoner og inkludering av CO 2 opptak i miljøregnskap Juni 2014 Utarbeidet av Miljøkomiteen i Norsk Betongforening
-
Upload
khangminh22 -
Category
Documents
-
view
0 -
download
0
Transcript of Karbonopptak i betong - Norsk Betongforening -
Rapport nr. 4
Karbonopptak i betong– En studie i CO2 opptak fra karbonatisering
i norske betongkonstruksjoner og inkludering av CO2 opptak i miljøregnskap
Juni 2014
Utarbeidet av Miljøkomiteen i Norsk Betongforening
Forbehold om ansvar
Denne rapporten fra Norsk Betongforening er utarbeidet av en prosjektgruppe sammensatt av fagpersoner utnevnt av foreningen. I prosessen med utarbeiding av rapporten er det lagt vekt på å sikre at innholdet er i samsvar med kjent viten og de standarder som var gjeldende da arbeidet ble avsluttet.
Noen feil eller mangler kan likevel forekomme.
Norsk Betongforening forutsetter at rapporten brukes av personer med den nødvendige faglige kompetansen, og med forståelse for de begrensningene og forutsetningene som er lagt til grunn. Feil tolking og bruk av innholdet i rapporten er ikke Norsk Betongforeningen sitt ansvar.
Norsk Betongforening og medlemmer i prosjektgruppen, har ikke ansvar for direkte eller indirekte følger av eventuelle feil eller mangler i publikasjonen, eller bruken av innholdet i publikasjonen.
INNHOLDSFORTEGNELSE
Forord
Innledning og oppsummering
Vedlegg 1: Rapport ‘CO2 binding by Concrete’, Rapport nr. SBF2014A0019, SINTEF Building and Infrastructure, 2014.
Vedlegg 2: Rapport ‘Karbonopptak i Betong I LCA og EPD’, Rapport nr. OR.01.14, Østfoldforskning, 2014.

FORORD
Betong opptar CO2 fra luften. Denne naturlige prosessen, som kalles karbonatisering, er godt dokumentert og har vært kjent i over 100 år. Det har vært gjort en rekke undersøkelser omkring karbonatisering, og om hvor mye CO2 som tas opp i betong fra luften. I takt med økt oppmerksomhet om miljøspørsmål generelt, og CO2 utslipp spesielt, har det særlig de siste 10-15 årene vært et økende fokus på CO2 opptak fra kar-bonatisering. Det har vært reist spørsmål om det kan være grunnlag for at opptaket av CO2 kan inkluderes i miljødokumentasjon av betong- og betongprodukter.
På denne bakgrunn tok Norsk Betongforenings Miljøkomite i 2012 initiativ til en større utredning med føl-gende hoved målsetninger:
1: Tallfeste CO2 opptaket i norske betongkonstruksjoner 2: Vurdere hvordan CO2 opptak kan inkluderes i ulike typer miljødokumentasjon
Arbeidet ble organisert som et prosjekt hvor SINTEF Byggforsk fikk ansvaret for første del. Østfoldforsk-ing var ansvarlig for å besvare andre del. Miljøkomiteen har fungert som styringsgruppe for prosjektet. Følgende partnere har finansiert prosjektet; Norsk Betongforening, Norcem AS, Betongelementforeningen, Contiga AS, Norsk Fabrikkbetongforening FABEKO, Spenncon AS, Statens Vegvesen, BA Gjenvinning AS og Skarpnes AS. Partnerne har utgjort en referansegruppe til prosjektet. Miljøkomiteen vil takke partnerne for den økonomiske støtten, og for deres deltagelse i prosjektarbeidet. Denne rapporten er et viktig bidrag i Miljøhandlingsplanen for betong. Vi håper at rapporten bidrar til større kunnskap om CO2 opptak i betong og vil bli til nytte for betongbransjen.
Oslo, 04.06.2014Norsk Betongforenings Miljøkomite
Per Jahren Knut O. Kjellsen (leder) Stefan JacobsenP.J. Consult AS Norcem AS NTNU
Agnar Løbakk Hallvard Magerøy Kristin HoltheUnicon AS FABEKO Multiconsult AS
Arne Vatnar Knut Bryne (sekretær) Skanska AS Norsk Betongforening
Betong er samfunnets viktigste byggemateriale, og helt nødvendig for bygging av nær sagt all infrastruk-tur, industrianlegg, nærings- og boligbygg. Betong er med å sikre robuste og økonomisk forutsigbare byg-gverk med lang levetid. Betong framstilles ved industrielle prosesser og som for alle slike prosesser følger det miljøutslipp, i første rekke utslipp av CO2. Utslippet av CO2 kommer hovedsakelig fra produksjonen av Portlandsement, som er bindemiddelet i betong. Ved tilvirkning av Portlandsement brennes (kalsineres) kalkstein (CaCO3=>CO2+CaO), CO2 frigjøres til atmosfæren mens CaO inngår i dannelsen av sement. Over livsløpet til en betongkonstruksjon, og etter at byggverket er blitt revet, vil CO2 fra omgivelsene diffundere inn i betongen og reagere med den CaO som finnes i betongen, og danne CaCO3 - det samme mineralet som Portlandsement ble dannet av. Prosessen kalles karbonatisering. Vi kan betrakte prosessen kalsiner-ing-karbonatisering som betongens karbonkretsløp.
Karbonatisering av betong har vært kjent lenge og det er forsket mye på dette feltet. Tidligere forskning fokuserte blant annet på de-passivisering av armeringsstål som følge av karbonatisering. Det er nemlig slik at når betong karbonatiserer så synker pH i betongen til et nivå hvor armeringsstålet ikke lenger be-finner seg i et passivt område med hensyn på korrosjon. Karbonatisering skjer som kjent fra konstruksjo-nens overflate mot luft og innover i betongen. Det er derfor svært viktig at karbonatiseringsfronten ikke når inn til armeringsstålet i løpet av den dimensjonerende levetid for en konstruksjon. Regelverket for pros-jektering av betongbyggverk ivaretar dette sikkerhetshensynet ved å beskrive minimumskrav til betong-kvalitet og armerings-overdekning.
Senere års forskning innen karbonatisering har fokusert spesielt på mekanismer og på det CO2 oppta-ket som faktisk skjer når betongen karbonatiserer. En målsetning med rapporten fra SINTEF Byggforsk har vært å gjennomgå gjeldende kunnskap når det gjelder spørsmål knyttet til mekanismer så som kar-bonatiseringshastighet og binding av CO2 ved karbonatisering. På bakgrunn av gjennomgangen er det utarbeidet en oversikt som viser karbonatiseringshastighet for ulike norske betongtyper og eksponer-ingsbetingelser. Dette sammen med oppdaterte tall på CO2 binding ved karbonatisering, samt statistikk over sement- og betongforbruk har muliggjort beregning av den mengden CO2 som tas opp og bindes i norske betongkonstruksjoneri. Beregningen utført av SINTEF Byggforsk viser at betongkonstruksjoner som ble bygget i Norge i 2011 vil ta opp 140.000 tonn CO2 i løpet av en antatt levetid (brukstid) på 100 år. Statistikk viser at rivningsandelen pr i dag er i underkant av 10% i forhold til den mengde betong som produseres hvert år. Omkring 90% av denne rivningsmassen knuses og gjenbrukes til ulike formål. Det er beregnet at CO2 opptaket i denne rivningsmassen over 100 år er 25.000 tonn. Totalt blir altså opptaket av CO2 165.000 tonn i norske betongkonstruksjoner og betongprodukter produsert i 2011 over en 200 års periode. Dette utgjør 15% av det totale CO2 utslippet fra norsk sementindustri (dvs. Norcem AS) i 2011. Det er altså høyst betydelige mengder CO2 som tas opp i norske betongkonstruksjoner i forhold til utslip-pene. Dersom andelen betong som rives og gjenbrukes øker i framtiden, hvilket er ganske trolig, vil CO2 opptaket kunne bli betydelig høyere enn tallene presentert her.
Betydelig mengder CO2 fra atmosfæren tas altså opp i norske betongbyggverk hvert år gjennom karbona-tisering, som dokumentert i rapporten fra SINTEF Byggforsk. Dette har i svært liten grad blitt tatt hensyn til i ulike typer miljødokumentasjon for sement og betong. Østfoldforskning har vurdert muligheten for å kunne ta CO2 opptak inn i livsløpsvurderinger (LCA) og miljødeklarasjoner (EPD), og hva som eventuelt mangler og kreves for å kunne gjøre dette.
INNLEDNING OG OPPSUMMERING
i) Det har vært en klar føring fra styringsgruppen at det skal tas fram og anvendes konservative og etterrettelige tall i det utførte arbeidet. Dette innebærer at der det er usikkerhet eller variasjoner i tallunderlag skal det anvendes verdier slik at en heller underesti-merer karbonatisering og CO2 opptak enn det motsatte.

Østfoldforskning konkluderer med at det i forhold til gjeldende standarder er mulig å ta CO2 opptak fra karbonatisering inn i LCA-analyser. Dette er imidlertid i liten grad gjort. Østfoldforskning mener dette skyldes usikkerhet om hvordan CO2 opptaket bør beregnes og manglende kunnskap om karbonatisering i LCA miljøene. For EPD er det pr. i dag ikke mulig å ta hensyn til CO2 opptak fra karbonatisering i CO2 regnskapsdelen. Dette skyldes at produktkategorireglene (PCR) for sement, betong- og betongprodukter ikke åpner for at det inkluderes, eller ikke i tilstrekkelig grad omtaler karbonatisering. Dersom CO2 opptak skal kunne tas med i en EPD må dette være beskrevet i gjeldende PCR. Det pågår et PCR utviklingsar-beid for betong i den Europeiske Standardiseringsorganisasjonen (CEN) hvor karbonatisering er et av hovedtemaene. Dette arbeidet vil bli bestemmende for hvordan EPDer i fremtiden vil bli utviklet, og hvilket beregningsgrunnlag som skal legges til grunn for CO2 opptak i EPD sammenheng.
Østfoldforskning påpeker at for å få en akseptabel dokumentasjon så bør karbonatiseringseffekten bereg-nes så produktspesifikt som mulig. Selv om det altså ikke pr i dag finnes gjeldende PCR med CO2 opptak er det utarbeidet eksempel EPDer for 3 produkttyper hvor CO2 opptak er inkludert. Dette for å vise hvor-dan CO2 opptak kan inkluderes, og for å vise hvor stor effekten i et CO2 regnskap kan bli:
Innervegg av betong (M60):For 100 års levetid vil klimagassutslippet (GWP i kg CO2-ekv/m2 vegg) reduseres med 10% dersom CO2 opptak fra karbonatisering inkluderes. For 60 års levetid blir klimagassutslippet redusert med 8%.
Etasjeskiller av betongelement (hulldekke):For 100 års levetid vil klimagassutslippet (kg CO2-ekv/m2 dekke) reduseres med 16% dersom CO2 opptak fra karbonatisering inkluderes. For 60 års levetid blir klimagassutslippet redusert med 12%.
Takstein av betong:For 30, 60 eller 100 års levetid vil klimagassutslippet (kg CO2-ekv/m2) reduseres med 47% dersom CO2 opptak fra karbonatisering inkluderes.
Det er i prøveberegningene forutsatt at 9% av betongproduktet knuses etter endt levetid. Denne delen er definert som avfall, og det CO2 utslipp som skjer ved avfallsbehandling og det CO2 opptaket som senere skjer i den nedknuste betongen inngår i EPDen for det deklarerte produktet. Det betyr at dersom denne knuste betongen anvendes i et annet produkt senere vil den bli uten miljøbelastning i det nye produktet.

Rapport ‘CO2 binding by Concrete’, Rapport nr. SBF2014A0019, SINTEF Building and Infrastructure, 2014.
VEDLEGG 1

SINTEF Building and Infrastructure Construction Technology 2014-04-15
SBF2014A0019 - Unrestricted
Report
CO2-binding by concrete Summary of the state of the art and an assessment of the total binding of CO2 by carbonation in the Norwegian concrete stock Author(s) Christian J. Engelsen Harald Justnes
1 of 62
SINTEF Byggforsk SINTEF Building and Infrastructure
Address: Postboks 124 Blindern NO-0314 Oslo NORWAY
Telephone:+47 Telefax:+47 22699438
Enterprise /VAT No:
Report
CO2-binding by concrete Summary of the state of the art and an assessment of the total binding of CO2 by carbonation in the Norwegian concrete stock
KEYWORDS: Concrete Carbonation CO2-binding Cement Chemistry
VERSION
Final DATE
2014-04-15
AUTHOR(S)
Christian J. Engelsen Harald Justnes CLIENT(S)
Environmental Committee, Norwegian Concrete Association
CLIENT’S REF.
Knut O. Kjellsen
PROJECT NO.
102002942 NUMBER OF PAGES + APPENDICES
62 + 4
ABSTRACT The current knowledge regarding the concrete carbonation speed and carbonation degree has been summarized in order to form the basis for new CO2-binding calculations. The findings were used in the CO2-binding estimates for the Norwegian concrete stock. A review of the current state of the art knowledge showed that the development has come forward the last 5-10 years. This included a better insight of the carbonation mechanisms, increased quantity of field data, and developments of models that calculate the CO2-binding by concrete in service life and in the recovery phase. These developments have resulted in more accurate and reliable CO2-binding assessments than earlier attempts. It was found that the Norwegian concrete stock in 2011 will bind around 165 000 tonnes of CO2 assuming a service life and a recovery phase of 100 years each. Most of the CO2 will be bound in service life, as the model calculated the binding to be 140 000 tonnes in this phase. Furthermore, it was found that the specific CO2-binding to cement was 111 kg CO2/ton of cement consumed, for which 94 kg CO2/ton of cement was bound in the service life of concrete. The model calculations were considered to be conservative to avoid overestimations.
PREPARED BY
Christian J. Engelsen SIGNATURE
CHECKED BY
Harald Justnes SIGNATURE
APPROVED BY
Halvard Høilund-Kaupang SIGNATURE
REPORT NO. SBF2014A0019
ISBN
CLASSIFICATION
Unrestricted CLASSIFICATION THIS PAGE
Unrestricted
PROJECT NO. 102002942
REPORT NO. SBF2014A0019
VERSION Final
2 of 62
Table of contents
Preface .................................................................................................................................................. 4
Abbreviations ........................................................................................................................................ 5
1 Introduction .................................................................................................................................. 6
2 Objective ....................................................................................................................................... 7
3 Chemistry of carbonation .............................................................................................................. 8 3.1 General ........................................................................................................................................... 8 3.2 Mode of carbonation ..................................................................................................................... 9 3.3 Carbonation speed ....................................................................................................................... 11 3.4 Carbonation chemistry of blended cement ................................................................................. 12 3.5 CO2-binding capacity in concrete ................................................................................................. 15
3.5.1 Theoretical binding capacity of Portland cement............................................................ 16 3.5.2 Normal binding capacity of Portland cement .................................................................. 17 3.5.3 Normal binding capacity of fly ash cement ..................................................................... 18 3.5.4 Normal binding capacity of slag cement ......................................................................... 19
4 Carbonation controlling factors .................................................................................................... 19 4.1 Humidity ....................................................................................................................................... 19 4.2 Porosity ........................................................................................................................................ 20 4.3 Temperature ................................................................................................................................ 20 4.4 Binder content ............................................................................................................................. 20 4.5 Concrete quality ........................................................................................................................... 21 4.6 Particle size .................................................................................................................................. 21 4.7 Partial pressure of CO2 ................................................................................................................. 21 4.8 Effects of pozzolanas .................................................................................................................... 22 4.9 Outer environment ...................................................................................................................... 22
5 Accelerated trials ......................................................................................................................... 23 5.1 Uncrushed material with natural aggregates .............................................................................. 23 5.2 Uncrushed material with recycled aggregates ............................................................................ 24 5.3 Crushed material .......................................................................................................................... 25
6 Carbonation under non-accelerated conditions ............................................................................ 28 6.1 Carbonation measurements of indoor concrete ......................................................................... 28 6.2 Other carbonation studies and corresponding k-values for Portland cements .......................... 30 6.3 Other carbonation studies and corresponding k-values for blended cements ........................... 32
PROJECT NO. 102002942
REPORT NO. SBF2014A0019
VERSION Final
3 of 62
6.4 Carbonation degree ..................................................................................................................... 33 6.5 Recent carbonation models ......................................................................................................... 36 6.6 Carbonation rate factors (k-values) for concrete classes ............................................................ 38
7 Calculation of CO2 uptake in Norwegian concrete ......................................................................... 39 7.1 General concept and assumptions .............................................................................................. 39 7.2 Cement and concrete consumption in Norway ........................................................................... 41 7.3 CO2-binding by the Norwegian concrete volume ........................................................................ 43
7.3.1 CO2-binding by ready-mixed concrete ............................................................................. 43 7.3.2 CO2-binding by precast concrete elements ..................................................................... 44 7.3.3 CO2-binding by precast concrete products ...................................................................... 45 7.3.4 Total CO2-binding ............................................................................................................. 45
7.4 Model reliability, data gaps and further developments .............................................................. 46
8 Suggestions for future work ......................................................................................................... 49
9 Conclusion................................................................................................................................... 50
10 References .................................................................................................................................. 51
Appendix A. Ready mixed concrete data in 2011 ........................................................................ 55
Appendix B. Precast element concrete data in 2011 ................................................................... 58
Appendix C. Precast concrete product data in 2011 .................................................................... 60
Appendix D. Crushed concrete input data in recovery phase ....................................................... 62
PROJECT NO. 102002942
REPORT NO. SBF2014A0019
VERSION Final
4 of 62
Preface The Environmental committee of the Norwegian Concrete Association initiated in 2012 the project "CO2-
binding by concrete". In the first part of the project, the objective was to estimate the total CO2-binding by
the Norwegian concrete building stock in service life and in the recovery phase due to carbonation of
concrete. The estimates were based on the latest data and modelling tools regarding CO2-binding by concrete
carbonation. In the second part of the project, the objective was to evaluate the feasibility of including the
CO2-binding into life cycle assessments (LCA) and environmental declarations (EPD).
SINTEF Building and Infrastructure and Østfoldforskning have conducted Part 1 and Part 2 of the studies,
respectively.
PROJECT NO. 102002942
REPORT NO. SBF2014A0019
VERSION Final
5 of 62
Abbreviations
AFm: Aluminoferrite mono-substituted
AFt: Aluminoferrite tri-substituted
CSH: Calcium silicate hydrate
CH: Calcium hydroxide
RAC: Recycled aggregate concrete (concrete that contains RCA)
RCA: Recycled concrete aggregates
PC: Portland cement
FA: Fly ash
RSD: Relative standard deviation
SD: Standard deviation
PROJECT NO. 102002942
REPORT NO. SBF2014A0019
VERSION Final
6 of 62
1 Introduction Carbonation of concrete is a well-known aging process in concrete. As thermodynamic stable CaCO3 is
formed when air or water-borne CO2 dissolves in the concrete pore water, it can be regarded as a natural
process in time. When the carbonation layer are formed during service life, the carbonate species need to
penetrate through the denser carbonated layer and thus deeper and deeper into the concrete and the
carbonation rate slows down with the square root of time (roughly described). When concrete structures are
demolished and refined to Recycled Concrete Aggregates (RCA) the surface area is largely increased. The
CO2-binding rate per unit mass of concrete and thus the total amount of CO2-binding may therefore increase
in the recovery phase (after demolishing stage) provided sufficiently access to CO2.
Historically, carbonation has been studied due to the risk for initiation of corrosion of the reinforcement in
concrete and measures that have to be taken to minimize this risk. However, it is indisputable that the
carbonation process consumes CO2 and thereby reduces the net CO2 footprint of the concrete. Moreover, in
carbonated concrete, the strength may be increased by about 20-30 % due to the pore filling effect of
carbonation (Jahren and Tongbo, 2013). It should be noted that it is mandatory to remove the steel
reinforcement in concrete rubble (e.g. Norway). This means that steel reinforced concrete rubble often is
crushed to smaller concrete pieces or refined to recycled concrete aggregates with increased surface and thus
carbonation potential, see Fig. 1.1.
One of the first estimates on how much CO2 that can be bound in concrete, due to carbonation, was carried
out by Jahren (1998). In this study, 5-25 % of the CO2 released from cement production was anticipated to be
bound globally in concrete during its service life as a result of carbonation. In a more systematic study, a
CO2-binding of 11 % was found, i.e. 112 kg CO2 per ton cement clinker produced (Jacobsen and Jahren,
2001). A service life of only 20 years and a recovery phase where 10 % by mass of the annual Norwegian
concrete production was converted to RCA for which the remaining depth was carbonated, were assumed.
PROJECT NO. 102002942
REPORT NO. SBF2014A0019
VERSION Final
7 of 62
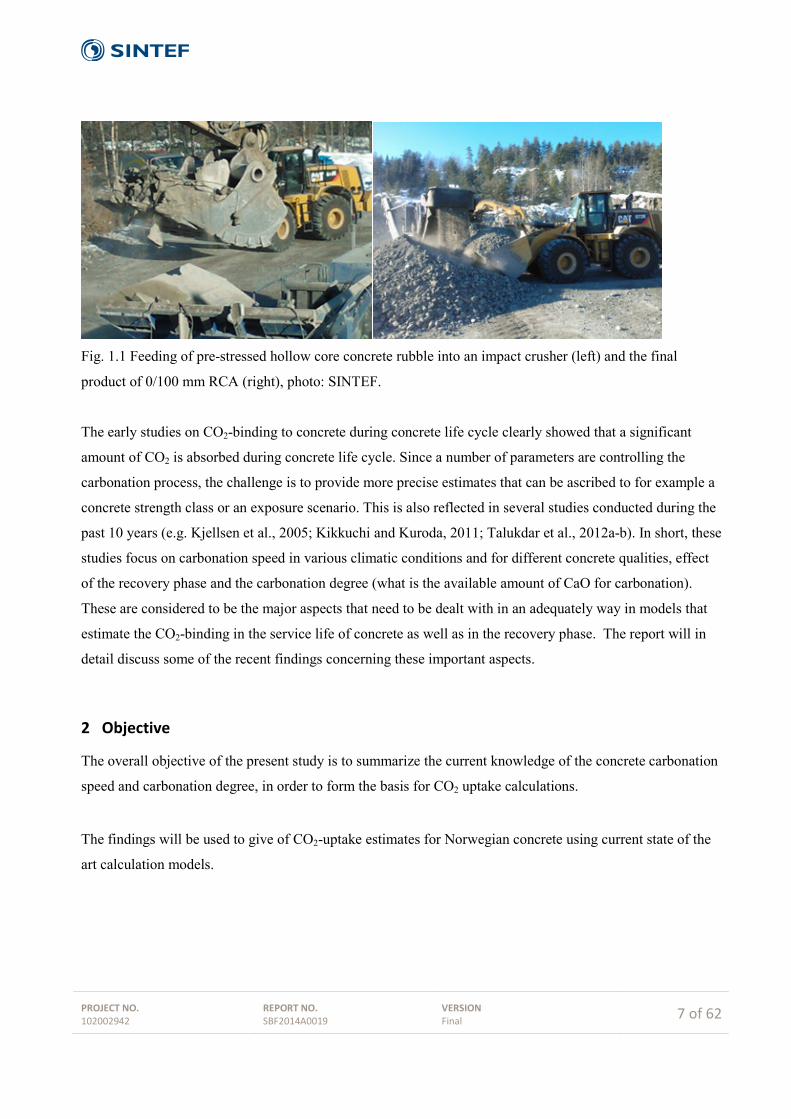
Fig. 1.1 Feeding of pre-stressed hollow core concrete rubble into an impact crusher (left) and the final
product of 0/100 mm RCA (right), photo: SINTEF.
The early studies on CO2-binding to concrete during concrete life cycle clearly showed that a significant
amount of CO2 is absorbed during concrete life cycle. Since a number of parameters are controlling the
carbonation process, the challenge is to provide more precise estimates that can be ascribed to for example a
concrete strength class or an exposure scenario. This is also reflected in several studies conducted during the
past 10 years (e.g. Kjellsen et al., 2005; Kikkuchi and Kuroda, 2011; Talukdar et al., 2012a-b). In short, these
studies focus on carbonation speed in various climatic conditions and for different concrete qualities, effect
of the recovery phase and the carbonation degree (what is the available amount of CaO for carbonation).
These are considered to be the major aspects that need to be dealt with in an adequately way in models that
estimate the CO2-binding in the service life of concrete as well as in the recovery phase. The report will in
detail discuss some of the recent findings concerning these important aspects.
2 Objective
The overall objective of the present study is to summarize the current knowledge of the concrete carbonation
speed and carbonation degree, in order to form the basis for CO2 uptake calculations.
The findings will be used to give of CO2-uptake estimates for Norwegian concrete using current state of the
art calculation models.
PROJECT NO. 102002942
REPORT NO. SBF2014A0019
VERSION Final
8 of 62
3 Chemistry of carbonation
3.1 General Carbonation involves chemical processes like dissolution of portlandite, decalcification of calcium silicate
hydrates (C–S–H), dissolution of mono- and tri-substituted calcium aluminate hydrates (AFm and AFt),
which will be explained in the following.
The carbonation reaction is taking place in the aqueous phase. Thus the atmospheric CO2 must dissolve in
water before it can react with CH to form calcium carbonate (C C ). The chemical reactions in the carbonate
system can be described in the following way:
3222 )( COHOHgCO =+ (1)
35.6,332 =+= +−apKHHCOCOH (2)
33.10,233 =+= +−−
apKHCOHCO (3)
When CO2 dissolves in water, the bicarbonate (HCO3-) or carbonate ion (CO3
2-) will form dependent on the
pH of the water according to reaction 2 and 3. Note that under normal atmospheric conditions, only a small
part of the "dissolved" CO2 is actually hydrolysed to H2CO3 (carbonic acid).
In the case of pore water in concrete, HCO3- ions will be the major specie in carbonated zone (intermediate
pH) while the CO32- ions will be present in the pore water in the uncarbonated cement paste (high pH). Intact
cement paste pore water is often saturated with calcium hydroxide (CH) and together with the alkali ions
result in the high pH in concrete. The carbonation process can thus be described as follows:
)()(2
)(2 2)( aqaqS OHCaOHCa −+ +<=> (4)
)(3)(2
3)(2
Saqaq CaCOCOCa =+ −+ (5)
Due to carbonation (Equation 5), the system will maintain the equilibrium by dissolution of Ca(OH)2 from
the cement hydrate phases which are stabilised by the high pH. This is a process that normally starts at the
concrete surface and moves inwards, i.e. a carbonation layer will form that is growing from surface and
inwards the concrete. The pore water will first be equilibrated by dissolution of Portlandite, Ca(OH)2, giving
a pH of about 12.5 (Equation 4) due to its limited solubility (about 1.73 g/l at 20°C).

PROJECT NO. 102002942
REPORT NO. SBF2014A0019
VERSION Final
9 of 62
When most of the portlandite in a commencing carbonation zone has been dissolved and precipitated as
calcium carbonate, the calcium silicate hydrates (C-S-H) will release Ca(OH)2, hence decalcification of C-S-
H starts1. Monosulphate ( 124 H SAC ) and ettringite ( 3236 HSAC ) belong to the broad groups of AFm and
AFt phases respectively. The former group is more generally written [Ca2(Al,Fe)(OH)6]X · xH2O where X
denotes one formula unit of a singly charged anion or half a formula unit of a doubly charged anion (e.g.
OH-, SO42- or CO3
2- often referred to as OH-AFm, SO4-AFm and CO3-AFm ). Due to carbonation, the pH in
the pore solution will eventually decrease and the X-AFm will decompose into ettringite and other aluminate
compounds. At pH around 11.6, SO4-AFm ( 124 H SAC ) and the iron containing AFm (from hydration of
C4AF) will decompose. Ettringite will decompose into gypsum, calcium carbonate and aluminium hydroxide
compounds, as pH is brought down to around 10.5 (Baur et al., 2004). When the phenolphthalein colour
change occur at pH <10, the amorphous C-S-H has a low CaO/SiO2 ratio of approximately 0.85 (Bary and
Sellier, 2004). Since the carbonation starts from the concrete surface, there will be a gradient ranging from a
full carbonated zone to the inner uncarbonated zone.
Equation (1)-(5) show that the transport mechanism of CO2 consists of a diffusion process of carbonate
species in the aqueous phase and also diffusion of CO2 gas in the pore system (connective pores). The
transport speed in the latter case is order of magnitudes higher due to the gas diffusion but the carbonation
reaction, however, needs free water. Thus, the CO2 gas has to dissolve in the pore water before it can react
with the calcium ions. This makes the carbonation process a coupled mechanism where the humidity and the
porosity of uncarbonated and the carbonated layer in concrete determine the speed of carbonation, which
generally is considered to have an optimum at 60 % RH. In a study of steel slag carbonation, it was found
that under certain conditions, diffusion of Ca towards the surface of the particle most likely determine the
overall reaction rate for this type of alkaline materials (Huijgen et al 2005).
3.2 Mode of carbonation
Since carbonation is a coupled process consisting of diffusion of species in both gas and liquid phase, the
formation or precipitation of C∁� may occur at different spots in the cement paste. The main places for C C
formation include:
1 Cement chemistry notation: C = CaO; S = SiO2; A = Al2O3; m = mono; F = Fe2O3; t = tri; H = H2O; S = SO3 C =CO2
PROJECT NO. 102002942
REPORT NO. SBF2014A0019
VERSION Final
10 of 62
1. Precipitation in the capillary pores as minute crystals
2. Precipitation in the C-S-H (gel pores)
3. Formation at Portlandite surface
Precipitation of C C in the capillary pore water will decrease the overall porosity in the carbonated layer.
This will typically occur when "high" concentration of Ca2+ is available in the pore water. Due to the much
higher aqueous diffusion rate of Ca2+ compared to CO32-, the precipitation reaction may take place in the pore
water. A distinct carbonation front is seen when the concrete is submerged in water or at high RH that will
limit the CO2 gas diffusion inwards the concrete (thus mainly by aqueous diffusion). In dryer conditions
(indoor) the carbonation front can be more broad as gas diffusion in the connective pores is more pronounced
which has been confirmed be field measurements of indoor concrete (Fridh and Lagerblad, 2011). This may
also cause difficulties in assessing a carbonation depth by using the phenolphthalein method only.
When the alkali hydroxides (can lead to pore water pH as high as 13.5) are eventually neutralised by the
carbonic acid, the buffering pH in the pore water will be around 12.5 since portlandite are controlling the pH
and the solubility of Ca. Thus, the concentration of Ca2+ (1.8∙10-2 mol/l at 20°C) is significant higher than
CO32- (about 1.5·10-3 mole CO2/l at 400 ppm CO2 in air, but conversion to CO3
2- depends on the pH of the
water). However, when all portlandite is consumed by carbonation, the other hydrate phases or precipitates
will control the solubility of Ca including C-S-H, one of the X-AFm phases (depending on cement type),
ettringite and calcite. All of these phases have orders of magnitude lower solubility than portlandite which
results in decreased concentration of Ca2+ in pore water which means that the reaction occur near the source.
The most important hydrate phase with respect to carbonation is C-S-H and with slow release of Ca,
carbonates have time to diffuse into C-S-H and calcite may be formed within the gel. If portlandite is not
present due to high SCM addition, it has been indicated that densification of the gel pores occurs. This may
result in an increase in capillary porosity compared to precipitation in the capillary pores (Lagerblad, 2011).
The formation of CaCO3 at the portlandite surface has recently been observed in the context of CO2 uptake
during concrete life cycle (Thiery et al., 2013). This carbonation mode is coating the hexagonal calcium
hydroxide crystals and may in some cases prevent any further Ca dissolution from portlandite. Calcite coated
portlandite has been identified from almost 50 years old indoor concrete (Fridh and Lagerblad, 2011). This
carbonation mode may cause an earlier carbonation attack on the C-S-H than expected. Obviously, a high
carbonate concentration (e.g. elevated CO2 concentrations) will promote calcite precipitation near or onto the
portlandite surface. This may be faced in accelerated carbonation experiments (e.g. Villain et al., 2007).
Since this carbonation mode is also faced under normal atmospheric conditions, it makes the estimation of
PROJECT NO. 102002942
REPORT NO. SBF2014A0019
VERSION Final
11 of 62
the maximum CO2 uptake more challenging. Note that CO2 concentration indoors can be substantially
increased above the natural level of about 380 ppm simply by people breathing (e.g. classrooms, bedrooms
with closed windows, etc.).
The different modes of carbonation discussed above give rise to some principle discussions. First of all, it
seems that a combination of the above mentioned processes is taking place during the concrete life cycle
dependent on the binder type (Portland cement or blended cement), external conditions (e.g. precipitation)
and the actual use (indoor, outdoor, submerged, crushed, etc.). Nearly all measurements of carbonation depth
at field site are conducted by the phenolphthalein indicator test. This test normally gives a sharp carbonation
front, but will in some cases not provide a clear front. In cases where calcite coatings are formed, the test
correctly indicates the depth and pH in the pore water, which is important in reference to corrosion of
reinforcement, but it may be difficult to estimate precisely the carbonation degree in the uncoloured area
based on only phenolphthalein test. More complicated methods like X-ray diffraction (XRD) or
thermogravimetry (TG) measuring on powders from different layers may provide a more exact answer.
3.3 Carbonation speed
Carbonation speed is normally referred to as carbonation depth versus time. In order to model or estimate
carbonation depth in a long term perspective, a mechanistic approach is usually applied. It is well accepted
that carbonation may be described by the Fickian laws of mass transport by diffusion. Fick's first law applies
to steady-state diffusion in one dimension with mass transport over a concentration gradient. In reality the
driving force is the chemical potential. However, the concentration gradient is usually changing in time and
space and Fick's second law may be applied according to Equation (6):
∂c / ∂t = D (∂2c / ∂x2) (6) where c = concentration, t = time, x = surface area and D = diffusion coefficient.
In general, the diffusion coefficient is proportional with the squared particle velocity which is influenced by
temperature, viscosity and size of particles. Fick's second law express how the concentration changes with
time (∂c / ∂t) due to the diffusion process. Applying Equation (6) to describe the carbonation process in
concrete system, the diffusion coefficient D will be dependent on the connective porosity as the main
material parameter. In addition, both gas and liquid transport need to be described which complicates the
solution of the differential equation.
PROJECT NO. 102002942
REPORT NO. SBF2014A0019
VERSION Final
12 of 62
One way to simplify is to describe the carbonation depth versus time. This requires empirically obtained
diffusion coefficients for specific concrete types and environments. By systemising the observed diffusivity
for the most typical exposure conditions with the most conventional concrete types, model predictions of
depth can be made by the following equation:
dc = 𝑘𝑘 ∙ √𝑡𝑡 (7)
where dc = carbonation depth (mm), k = rate diffusion coefficient ( 𝑚𝑚𝑚𝑚
√𝑦𝑦𝑦𝑦𝑦𝑦𝑦𝑦), t = exposure time (year).
It follows from Equation (7) that by measuring carbonation depth and the exposure time, the rate coefficient
k can be estimated. In Lagerblad (2005), a range of k-values were given for different concrete strength
classes in different exposure environments.
Although the time dependent modelling of carbonation depth has been described mechanistically, it is still a
challenge to calculate the carbonation degree as will be discussed in later sections.
3.4 Carbonation chemistry of blended cement
In Norway, the national blended cement is made with about 20 % clinker replacement with siliceous fly ash
(CEM II/A-V). However, cement is also imported where clinker is replaced with 33 % ground, granulated
blast furnace slag (CEM II/B-S).
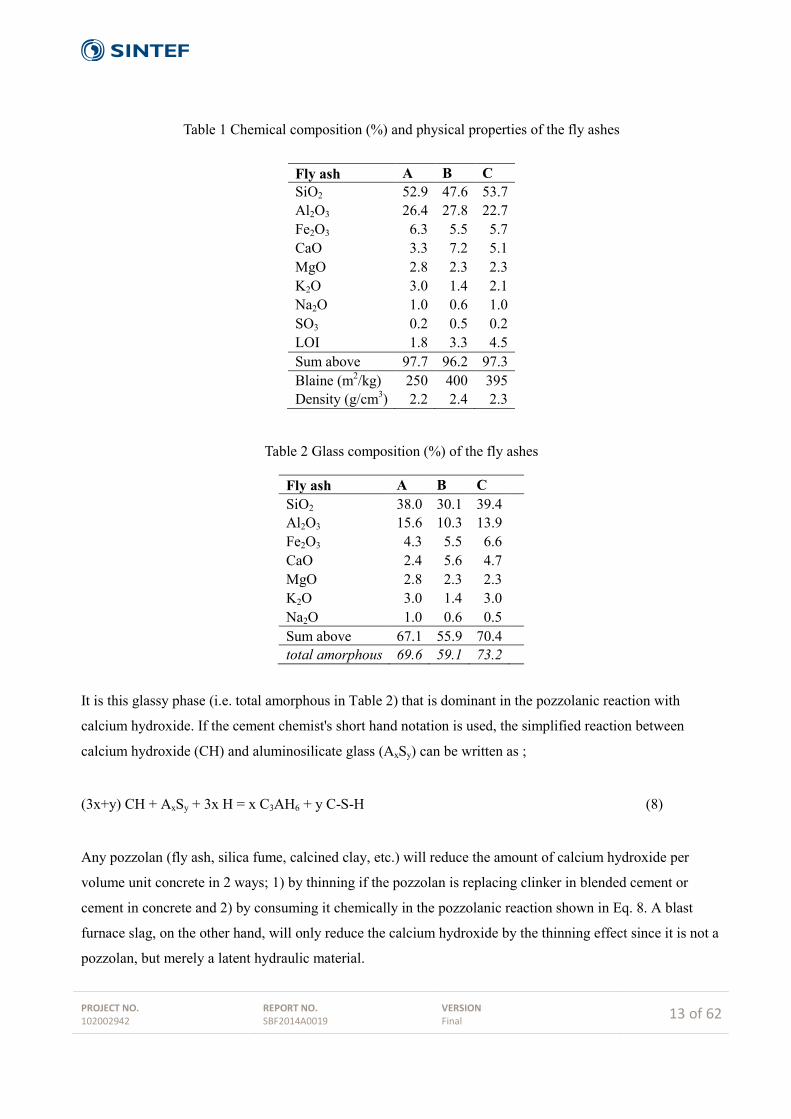
Fly ash is retrieved from the flue gas of coal fired energy plants in an electrostatic filter. It consists of more
or less spherical, glassy particles. The total compositions of some siliceous fly ashes are given in Table 1,
while the compositions of the amorphous glassy phase of the same fly ashes are given in Table 2. Fly ashes
A, B and C are siliceous fly ashes (Type V) according to EN 197-1 as their CaO content is lower than 10 %
as shown in Table 1.
PROJECT NO. 102002942
REPORT NO. SBF2014A0019
VERSION Final
13 of 62
Table 1 Chemical composition (%) and physical properties of the fly ashes
Fly ash A B C SiO2 52.9 47.6 53.7 Al2O3 26.4 27.8 22.7 Fe2O3 6.3 5.5 5.7 CaO 3.3 7.2 5.1 MgO 2.8 2.3 2.3 K2O 3.0 1.4 2.1 Na2O 1.0 0.6 1.0 SO3 0.2 0.5 0.2 LOI 1.8 3.3 4.5 Sum above 97.7 96.2 97.3 Blaine (m2/kg) 250 400 395 Density (g/cm3) 2.2 2.4 2.3
Table 2 Glass composition (%) of the fly ashes
Fly ash A B C SiO2 38.0 30.1 39.4 Al2O3 15.6 10.3 13.9 Fe2O3 4.3 5.5 6.6 CaO 2.4 5.6 4.7 MgO 2.8 2.3 2.3 K2O 3.0 1.4 3.0 Na2O 1.0 0.6 0.5 Sum above 67.1 55.9 70.4 total amorphous 69.6 59.1 73.2
It is this glassy phase (i.e. total amorphous in Table 2) that is dominant in the pozzolanic reaction with
calcium hydroxide. If the cement chemist's short hand notation is used, the simplified reaction between
calcium hydroxide (CH) and aluminosilicate glass (AxSy) can be written as ;
(3x+y) CH + AxSy + 3x H = x C3AH6 + y C-S-H (8)
Any pozzolan (fly ash, silica fume, calcined clay, etc.) will reduce the amount of calcium hydroxide per
volume unit concrete in 2 ways; 1) by thinning if the pozzolan is replacing clinker in blended cement or
cement in concrete and 2) by consuming it chemically in the pozzolanic reaction shown in Eq. 8. A blast
furnace slag, on the other hand, will only reduce the calcium hydroxide by the thinning effect since it is not a
pozzolan, but merely a latent hydraulic material.
PROJECT NO. 102002942
REPORT NO. SBF2014A0019
VERSION Final
14 of 62
When the pozzolanic reaction is producing more C3AH6 in line with reaction 8, it will transform ettringite
formed in the initial cement hydration to so called “monosulphate”, or more correctly calcium
monosulphoaluminate hydrate (C4A S H12);
2 C3AH6 + C6A S 3H32 = 3 C4A S H12 + 8 H (9)
However, when calcium carbonate is formed by carbonation;
CH + H C = C C + 2 H (10)
It will form calcium carboaluminate hydrate (C4A C H11) and the released sulphate may then react with
“monosulphate” to form ettringite again, which is stable in presence of limestone;
2 C C + 3 C4A S H12 + 18 H = 2 C4A C H11 + C6A S 3H32 (11)
Any surplus of C3AH6 from the pozzolanic reaction will also react with calcium carbonate;
C C + C3AH6 + 5 H = C4A C H11 (12)
So even though reactions 9 and 10 release water, reactions 11 and 12 bind more water so there will be a net
consumption of water and a volume increase of solids probably leading to less porosity lowering the
carbonation rate by itself. However, the fact that there will be less calcium hydroxide per volume unit will
override this so the carbonation rate for a blended cement in general will be higher than for an ordinary
Portland cement (CEM I). A higher carbonation rate for fly ash cement was already indicated during the
development of the fly ash cement in Norway (Meland, 1985).
An example of carbonation depth versus square root of time for mortar where cement is replaced with up to
65% calcined marl as pozzolan is plotted in Fig. 3.1 after Østnor et al. (2013). The composition of calcined
marl is resembling the composition of fly ash, with the exception that it contains some calcium carbonate.
The mortar was cured for 90 days at 95% RH before exposure to 1% CO2 and 60% RH. As expected the
carbonation rate is faster for the highest cement replacements, but unexpectedly the carbonation depth versus
square root of time is not linear as for the theory of pure diffusion controlled reaction, but rather exponential
for the samples with pozzolan. The reason for this could be the combination of the two on-going parallel

PROJECT NO. 102002942
REPORT NO. SBF2014A0019
VERSION Final
15 of 62
reactions; 1) the pozzolanic reaction consuming calcium hydroxide and 2) the carbonation reaction also
consuming calcium hydroxide.
When it comes to blended cement, it is important to realize that the C-S-H from the pozzolanic reaction will
have a lower Ca/Si than in the C-S-H from the cement reaction. Hence, the C-S-H from the pozzolanic
reaction may be less prone to carbonation than the one from the cement hydration. The two co-existing C-S-
Hs may equilibrate over time to one C-S-H type with average Ca/Si.
Fig. 3.1 Carbonation depth versus square root of time of mortar where cement is replaced with 0 (M0), 20
(M20), 35 (M35), 50 (M50) and 65 (M65) vol% calcined marl (Østnor et al., 2013).
3.5 CO2-binding capacity in concrete
The carbonation chemistry clearly shows that the reactants (CO2 and CaO) need to be dissolved in the
aqueous phase in order to form CaCO3. This is also the reason why the carbonation depth sometimes is
difficult to measure with a phenolphthalein indicator due to an unclear carbonation front. Phenolphthalein
solution contains water that may dissolve unhydrated cement grains or slightly calcite embedded Ca(OH)2
that will raise the pH. It is therefore important to distinguish between the CO2-uptake under theoretical and
normal carbonation. The former is expressed by the maximum CO2-binding capacity and the latter is the CO2
02468
101214161820
30 40 50 60 70 80
Carb
onat
ion
dept
h [m
m]
Time of exposure [√h]
M0 (Ref)M20M35M50M65
PROJECT NO. 102002942
REPORT NO. SBF2014A0019
VERSION Final
16 of 62
bound in a carbonated zone indicated by the phenolphthalein test. Studies have shown that the CO2 bound
under normal carbonation conditions is always lower than the CO2-binding capacity in concrete. Carbonation
degree is treated in more detail in section 3.5.2 and section 6.3.
3.5.1 Theoretical binding capacity of Portland cement The CO2-binding capacity in concrete is proportional with the quantity of cement used. Hence, it is more
useful to express it as the quantity of CO2 bound per mass of cement clinker. The net chemical reaction of
carbonation is given in Equation 13:
32 CaCOCaOCO =+ (13)
From this reaction it is evident that the stoichiometric ratio between the involved species is 1:1, i.e. when one
molecule of CaCO3 is formed one molecule of CO2 and one molecule of CaO are consumed. Thus, the CO2-
binding capacity is directly related to the amount of CaO in the clinker. In Table 5, the chemical composition
ranges of final Portland cements are given. Portland cements contain 95-100 % cement clinker depending on
the amount of gypsum (~ 3-4 %) and limestone powder added to the cement mill. The CaO content is on
average 64 % and the content available for carbonation can be assumed to be around 60 % due to the
addition of gypsum (CaSO4·2H2O)
Table 3 Chemical composition of Portland cement expressed as oxides (Hewlett, 1998) Element Minimum
(%) Average (%)
Maximum (%)
Number of samples
CaO 58 64 68 284 SiO2 18 21 25 284 Al2O3 3.1 5.0 7.6 284 Fe2O3 0.16 2.9 5.8 284 SO3 < LOD1 2.6 5.4 280 MgO 0.02 1.7 7.1 285 K2O 0.04 0.70 1.7 280 Na2O < LOD1 0.24 0.78 263 1 LOD Limit of detection In 1000 kg Portland cement that consists of 95 % clinker, 617 kg of CaO can theoretically be converted to
CaCO3 by consuming CO2 from the air (in further calculations 600 kg of CaO was used). Thus, the CO2-
binding capacity in Portland cement (CO2-binding Max, Portland cement) is:

PROJECT NO. 102002942
REPORT NO. SBF2014A0019
VERSION Final
17 of 62
CO2-binding theoretical, Portland cement = 600 kg CaO x (MCO2/MCaO)2 = 600 kg x (44/56) = 471 kg CO2 /ton cement
Then the theoretical binding capacity per cubic meter concrete can easily be derived based on the cement
content used. The question remains whether or not all phases will be carbonated under the prevailing natural
concentrations of CO2.
3.5.2 Normal binding capacity of Portland cement In order to estimate the normal CO2-binding capacity, the quantity of the formed hydrate phases needs to be
considered in addition to the chemistry during the carbonation of each hydrate phase. The mechanisms of
carbonation are explained in detail in section 3.1. In short, carbonation is basically degrading the C-S-H
phase by incongruent dissolution. The C/S-ratio is decreased from around 1.5 to less than 0.85 by normal
carbonation, i.e. when phenolphthalein indicator shift from pink to colorless. The AFm/AFt phases will
eventually decompose to aluminum and iron hydroxides, gypsum and calcium carbonate.
In Table 4, the principle CaO-containing hydrate phases are shown and assumed to make up 95 % of the
cement paste. The CaO molar ratio is given from the stoichiometry of their chemical formulas. The
carbonation degree is used as follows in the calculations:
• 100 % of CH carbonates (complete dissolution of CH);
• 50 % carbonation of C-S-H (de-calcification to a CaO/SiO2-ratio of around 0.8);
• 75 % carbonation of AFm due to stoichiometry of calcium monosulfoaluminate (C4A S H12) and the
formation of gypsum in the carbonation process;
• 50 % AFt due to stoichiometry of ettringite (C6A 3S H32) and the formation of gypsum in the
carbonation process.
It is shown in Table 4 that the available CaO content for normal carbonation is around 72 % of the total CaO.
The calculated quantity of CaO is in agreement to what has been reported earlier (Engelsen and Justnes,
2014; Engelsen et al., 2005; Lagerblad, 2005). In section 6.4, the carbonation degree is further discussed.
2 MCO2 = molar mass of CO2 and MCaO = molar mass of CaO

PROJECT NO. 102002942
REPORT NO. SBF2014A0019
VERSION Final
18 of 62
Table 4 CaO in hydrated Portland cement and the available content for carbonation
Element CH C-S-H1 AFm2 AFt3 Sum Phase content (%) 25 50 10 10 95 CaO molar ratio 0,76 0,42 0,36 0,27 - CaO content in hydrated cement (%) 19 21 3,6 2,7 46 Assumed carbonation degree 1 0,5 0,75 0,5 - CaO available for carbonation in hydrated cement (%) 19 11 2,7 1,3 33 CaO available relative to total CaO (%) 41 23 5,8 2,9 72 1 Ideal composition of C-S-H is used: C3S2H4 2 Calcium monosulfoaluminate is used: C4A S H12 3 Ettringite is used: C6A 3S H32
Note that the presence of limestone powder in the cement (frequently used in CEM I) will change the phase
assembly slightly. Calcium hemicarboaluminate (C4A 5.0C H12 ) and ettringite will be the stable phases at
small limestone powder addition (< 0.4 % as CaCO3). At higher contents, monocarboaluminate (C4A C H11)
will be stable together with ettringite. These changes in the AFm phases will not affect the CaO available for
carbonation significantly. It can also be mentioned that the presence of the iron analogues of AFm (e.g. C4F
5.0C H12, C4F S H12, etc.) will not change the CaO available for carbonation significantly as the stoichiometry
is the same and the molar ratio is only slightly decreased provided that the thermodynamic stability is
roughly the same.
From the calculations and estimates above, the theoretical binding capacity of Portland cement can be
converted to the normal binding capacity when applied in concrete:
CO2-binding normal, Portland cement = CO2-binding theoretical, Portland cement x CaO % available for carbonation
= 471 kg CO2 x 0.7 = 330 kg CO2 / ton
3.5.3 Normal binding capacity of fly ash cement If one in line with Table 1 and 2 assume a siliceous fly ash with a glass content of 65% consisting of 35%
SiO2 and 15% Al2O3 and where 80% of the glass phase has reacted over time, the consumption of calcium
hydroxide according to Equation 8 would have been per gram fly ash; Ca(OH)2
0.80 x 0.65 x 0.35 x 1 x MCa(OH)2/MSiO2 = 0.22 g to form C-S-H of C/S = 1 not available for carbonation
And;
0.80 x 0.65 x 0.15 x 3 x MCa(OH)2/MAl2O3 = 0.17 g to form C3AH6 presumably available for carbonation (see
Fernández-Carrasco, 2012)
PROJECT NO. 102002942
REPORT NO. SBF2014A0019
VERSION Final
19 of 62
Hence for a CEM II/A-V cement where 20% clinker is replaced with fly ash, the CO2-binding is reduced
from 330 kg CO2/ton cement to 330 x 0.80 = 264 kg CO2/ton cement simply by the “thinning effect” since a
siliceous fly ash is assumed to have no carbonation potential (i.e. very low CaO content bound in other
minerals), but also further reduced by the pozzolanic effect forming C-S-H of low C/S to 264-
330x0.20x0.22xMCO2 /MCa(OH)2 = 264-8.6 = 255 kg /ton cement.
3.5.4 Normal binding capacity of slag cement In the Norwegian market there has also been "slag cement" where about 33% blast furnace slag has been
replacing portland cement clinker classified as CEM II/B-S. The slag has been of German origin, and
German slag has a typical composition of 40 % CaO, 9 % MgO, 11 % Al2O3 and 40 % SiO2.
Hence for a CEM II/B-S cement where 33% clinker is replaced with slag, the CO2-binding is reduced from
330 kg CO2/ton cement to 330 x 0.67 = 221 kg CO2/ton cement by the “thinning effect” if nothing of the
calcium oxide in the slag can be carbonated. On the other hand, if 70 % of the CaO in the slag can be
carbonated in one ton of slag cement, there will be an additional quantity equal to 330 x 0.40 x 0.7 x 44/56
(molar ratio of CO2 and CaO) = 73 kg CO2 bound, amounting to a total of 221+73 = 294
kg CO2/ton cement.
Whether or not the value of bound CO2 should be 221 or 294 kg CO2/ton cement for the slag cement depends
on the hydration products of the slag and to what extent they will carbonate under the normal partial pressure
of CO2.
4 Carbonation controlling factors
4.1 Humidity
Due to the coupled diffusion mechanism, humidity is one controlling factor. In concrete with water filled
connective pores the transport mechanism is ion diffusion leading to slow carbonation. In dry concrete the
CO2 gas diffusion is fast but the lack of water also leads to slow carbonation. Thus, there will be a relative
humidity (RH) optimum for optimal carbonation rate which is recognized to be in the RH range of 50-60 %
(Gjerp and Oppsal, 1998).

PROJECT NO. 102002942
REPORT NO. SBF2014A0019
VERSION Final
20 of 62
4.2 Porosity From the above it is obvious that porosity of the intact concrete is an important controlling factor,
influencing on both mechanisms, the ion and gas diffusion of CO2. In general a low water/binder ratio gives
a low porosity which in turn gives slow carbonation. Also the porosity of the carbonated layer will determine
the carbonation rate. In the latter the influence can be related to where in the pore system C C precipitates,
i.e. as minute crystals in the capillary system or on the surface of the hydrate phases. The first case will lead
to decrease in the porosity (finer capillary system). This is typically the case in pure Portland cement paste
where portlandite is the first to be carbonated. Decrease in porosity is also found to be more important with
increasing w/c ratio (van Gerven et al 2004).
In cement paste with less CH, i.e. concrete with silica fume, GBFS or fly ash the precipitation may occur in
the vicinity of the C-S-H thus affecting the gel porosity. This retains the sizes of the capillary pores in the
carbonated layer that in turn maintains the carbonation rate (i.e. the expected decrease in carbonation rate is
less pronounced). The mode of precipitation is dependent on the diffusivity and the concentration gradient
(chemical potential) of the carbonate- and calcium species. A detailed description of these mechanisms is
found in Lagerblad (2011).
4.3 Temperature
The carbonation process increases with increasing temperature due to increased diffusion rate of species
involved. For recycled concrete aggregates used in unbound application underground, the temperature will
be relatively low all the year. It can be expected that this will slow down the carbonation (even with an
increase of solubility of CO2 and calcium hydroxide in water at low temperatures).
4.4 Binder content
In general the binder content in concrete with the same water cement ratio (w/c) will not affect the
carbonation rate (as depth – however the amount of CO2-uptake per unit time is different) and influence
service life. However, for crushed concrete the fine particles tend to be cement paste particles. In general
smaller grain sizes, i.e. 0/8 mm, contain more cement paste particles compared to a grain size of 8/16 mm
when the material is crushed. This difference will be less for crushed concrete material originally produced
with higher binder content.
PROJECT NO. 102002942
REPORT NO. SBF2014A0019
VERSION Final
21 of 62
4.5 Concrete quality
As mentioned earlier, low w/c ratio will slow down the carbonation due to the porosity. It is also assumed
that the carbonated layer will be dense for low w/c concrete. Furthermore, the degree of hydration will affect
the porosity. In climate with low RH one can expect low degree of hydration leading to a porous cement
paste.
When crushing high strength concrete, the breakdown of aggregate grains (e.g. granite) will appear as well as
breakdown of the cement paste. This will make a more even distribution of the cement paste when crushed
into different grain sizes. More stone surfaces will give less surface for carbonation of cement paste.
4.6 Particle size
Carbonation rate will be faster after demolition compared to the service life of concrete due to the increased
surface area of finer particles when calculated by weight. Thus, the rate will increase with decreasing grain
size fraction, i.e. the grain size 0/8 mm will carbonate faster than 8/16 mm.
4.7 Partial pressure of CO2
Increasing the partial pressure of CO2 will increase the carbonation rate. Significant increase in the
carbonation rate has been reported in some suburban areas with increased CO2 partial pressure (Lagerblad,
2005). For secondary use, i.e. application of crushed concrete in road base or as backfill material in utility
trenches, the differences in CO2 pressure can be substantial. Degradation of organic matter will increase the
CO2 in soil, and the critical factor will be the access of CO2 in terms of diffusion and exchange with the
atmosphere in the specific application.
An open question is whether or not accelerated test using higher partial pressures of CO2 (e.g. 4% CO2) will
carbonate phases that will not occur under natural conditions (0.04% CO2). The driving force for any
chemical reaction is the Gibb's free energy;
ΔG = ΔH-T∙ΔS = -R∙T∙lnK (14)
For carbonation at 2 different partial pressures of CO2 (P1 = 0.04% and P2 = 4%), the ratio in Gibb's free
energy for carbonation of C-S-H will be proportional to (assuming solids components other than CO2);
PROJECT NO. 102002942
REPORT NO. SBF2014A0019
VERSION Final
22 of 62
C3S2H4 (s) + CO2 (g) = CaCO3 (s) + C2S2H (s), K = PCO2 (15)
ΔG2/ΔG1 ~ ln(P2/P1) = ln (4/0.04) = ln (100) = 4.6 (16)
Equation 16 indicates that the "energy drive" of the C-S-H carbonation may increase 5-fold when the partial
pressure of CO2 is increased 100 times from natural level.
Hence, the rate constant derived from accelerated tests will increase correspondingly. To be able to use
results from accelerated carbonation test, the same mechanistic modelling principle (𝑘𝑘 ∙ √𝑡𝑡 ) must be valid
for elevated and normal CO2 concentrations.
4.8 Effects of pozzolanas
Inorganic materials that harden in water mixed with calcium hydroxide (lime) is by definition a pozzolan
(Hewlett 1998). This means that CH is consumed in the reaction that forms more C-S-H. Silica fume and fly
ash is the most common types of artificial pozzolanas in the Nordic countries. Studies have shown somewhat
increased carbonation rate for concrete with fly ash or silica fume (Lagerblad, 2008). It is, however, difficult
to make a proper comparison in the literature due to the different basis for the assessments.
Silica fume is a highly reactive pozzolan and will be consuming CH from the hydration already at an early
stage (Justnes et al., 1992). Thus the eventually precipitation of C C will form a more porous carbonated
layer that will enhance the diffusion of both gas and carbonate ion through this layer. On the other hand,
concrete with silica fume is denser which partly compensate for the otherwise higher carbonation rate caused
by less calcium hydroxide per volume unit.
4.9 Outer environment
Besides the CO2 partial pressure, crushed concrete is highly dependent on the application scenario, i.e. above
or below ground. Today most applications are below ground in road base or as fill material in ditches and
utility trenches. Applications can also be in the saturated zone. Under saturated conditions (below ground
water table) the leaching of CH into ground water will enter as a significant process together with
conventional carbonation. In the leaching process dissolved CH will eventually react with carbonate ions but
on a different place compared with the dissolution point of CH. To what extent the leaching process will
occur depends on the groundwater speed and its chemistry. In the unsaturated zone the cycles of intermittent
PROJECT NO. 102002942
REPORT NO. SBF2014A0019
VERSION Final
23 of 62
wetting will cause a combination of the two processes (Gervais et al., 2004). However, a carbonation of
calcium hydroxide leached out of the concrete will count as if it was carbonated within the concrete in the
calculation of total CO2-binding capacity.
5 Accelerated trials
5.1 Uncrushed material with natural aggregates
Carbonation of cement pastes of pure PC and of a ternary blend (PC, FA and activated paper sludge) were
measured by Frias and Goni (2013) under highly accelerated conditions (100 % CO2). They found that the
carbonation in the ternary mix was 2 times higher than the control (w/c ratio of 0.5 of both). Furthermore, the
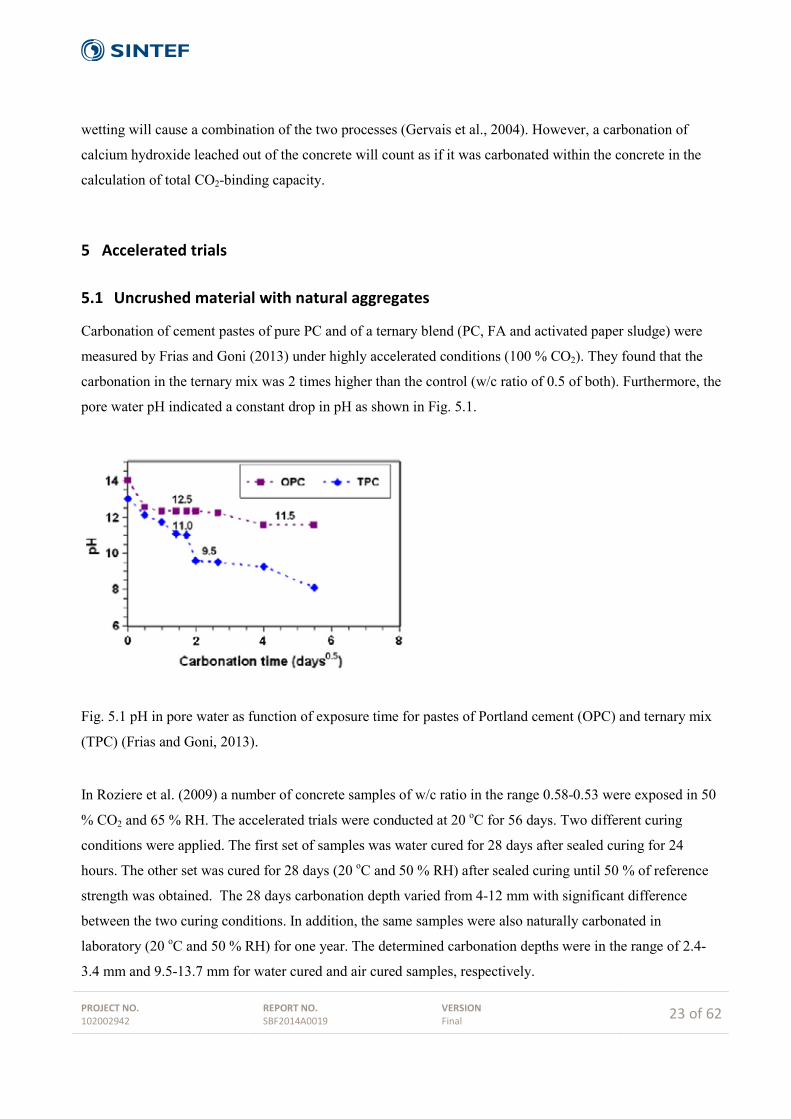
pore water pH indicated a constant drop in pH as shown in Fig. 5.1.
Fig. 5.1 pH in pore water as function of exposure time for pastes of Portland cement (OPC) and ternary mix
(TPC) (Frias and Goni, 2013).
In Roziere et al. (2009) a number of concrete samples of w/c ratio in the range 0.58-0.53 were exposed in 50
% CO2 and 65 % RH. The accelerated trials were conducted at 20 oC for 56 days. Two different curing
conditions were applied. The first set of samples was water cured for 28 days after sealed curing for 24
hours. The other set was cured for 28 days (20 oC and 50 % RH) after sealed curing until 50 % of reference
strength was obtained. The 28 days carbonation depth varied from 4-12 mm with significant difference
between the two curing conditions. In addition, the same samples were also naturally carbonated in
laboratory (20 oC and 50 % RH) for one year. The determined carbonation depths were in the range of 2.4-
3.4 mm and 9.5-13.7 mm for water cured and air cured samples, respectively.

PROJECT NO. 102002942
REPORT NO. SBF2014A0019
VERSION Final
24 of 62
5.2 Uncrushed material with recycled aggregates Carbonation depth of concrete made with recycled aggregates (RAC) is dependent on the substitution level.
The general trend is an increase in depth at high substitution levels of the coarse natural aggregate fraction
with RCA in RAC. In recent findings it was reported that the carbonation depth was 2 times higher (112 days
exposure) when 100% of the natural aggregate coarse fraction was replaced by RCA (Zhu et al., 2013). In
this study, the samples were exposed in 4 % CO2 and the carbonation depth was determined according to
CPC-18 method (Rilem, 1988). Furthermore, it was also found in the same study that a silane-based water
repellent improved the carbonation resistance significantly. Similar results were found by Evangalista and
Brito (2010) at 100 % replacement of the coarse aggregate fraction using the same test method with 5 % CO2
concentration.
Xiao et al. (2012) found that carbonation depth was increased as function of replacement level of the natural
coarse aggregates up to 70 % applying 20 % CO2 in the accelerated test. At this level the depth had increased
around 2 times (20 to 40 mm) at 80 days exposure. At 100 % replacement, the carbonation depth was
somehow improved compared to 70 % replacement, see Fig. 5.2.
Fig. 5.2 Carbonation of RAC as function of replacement level of natural coarse aggregates by RCA (Xiao et
al., 2012)
In another recent study, 1.4 times higher carbonation depth was found for RAC with 100 % replacement of
both fine and coarse natural aggregate fractions applying 6 % CO2 in their test ( Lovato et al., 2012). It
should be emphasised that the mixes were prepared to a fixed slump of 100 mm with no addition of water
reducing admixtures resulting in large variation of w/c ratio of regular concrete and RAC.
PROJECT NO. 102002942
REPORT NO. SBF2014A0019
VERSION Final
25 of 62
In the experiments of Zega et al. (2011), no difference was found in carbonation depth between RAC and
conventional concrete after exposure of concrete cubes (w/c of 0.45) for 620 days. The exposure was
conducted in an industrial area with average RH of 70 %. The replacement level was 20 and 30 %. Although
the exposure time is short, it is in agreement with the general trend for RAC at low w/c ratios and moderate
replacement levels.
The results from Sim and Park (2011) were somehow not straightforward to interpret because carbonation
depth seems to increase (slightly) up to 60 % replacement of coarse aggregate fraction. At 100 %
replacement, insignificant carbonation was found. The exposure was conducted at 30 oC with 10 % CO2
concentration for 28 days. It should be noted that the w/c ratio of 0.35 was applied which in general decrease
the carbonation differences with increasing replacement levels. In Gomes and Brito (2009) an effective w/c
ratio of 0.43 was applied and small differences in carbonation depth were found up to 100 % replacement of
coarse aggregate fraction.
Levy and Helene (2004) determined the carbonation depth in concrete with slag cement and 0-100 % RCA
under accelerated conditions according to CPC-18 (Rilem, 1988). The CO2 concentration used was not
reported. The comparisons were made with respect to specimens with the same strengths (20, 30 and 40 MPa
at 28 days curing), i.e. adjusting cement contents and w/c ratios. They found that the carbonation depth did
not increase when either 100 % fine or coarse aggregates were used for all three strength classes. Since the
cement contents varied in this study, it can be noted that in for instance the reference samples, the cement
contents used were 179, 291 and 397 kg/m3 and the corresponding carbonation depths determined were 9.6,
6.0 and 3.5 mm for the strengths 20, 30 and 40 MPa, respectively. Comparing the 20 and 40 MPa samples,
the depth decreased 2.7 times while the cement content was increased 2.2 times. Assuming a fixed
carbonation degree, the absorbed quantity of CO2 is 2.7 times lower for the 40 MPa sample when calculation
is solely based on depth. Adjusting for the cement content, the uptake is only 1.2 times lower (equal
exposure time). Thus, it is important to adjust for cement content when calculating the CO2 uptake solely
based on depth with a fixed assumed carbonation degree.
5.3 Crushed material
Carbonation of concrete is obviously important in the recovery phase, due to the conversion of bulk harden
concrete to RCA and thus increased surface area exposed to air. However, uncertainty exists regarding the
carbonation degree in the secondary user phase (e.g. as sub-base material). Thiery et al. (2013) have recently
conducted accelerated laboratory experiments where CO2 concentrations at 50 %, 10 % and 0.04 % (air)
PROJECT NO. 102002942
REPORT NO. SBF2014A0019
VERSION Final
26 of 62
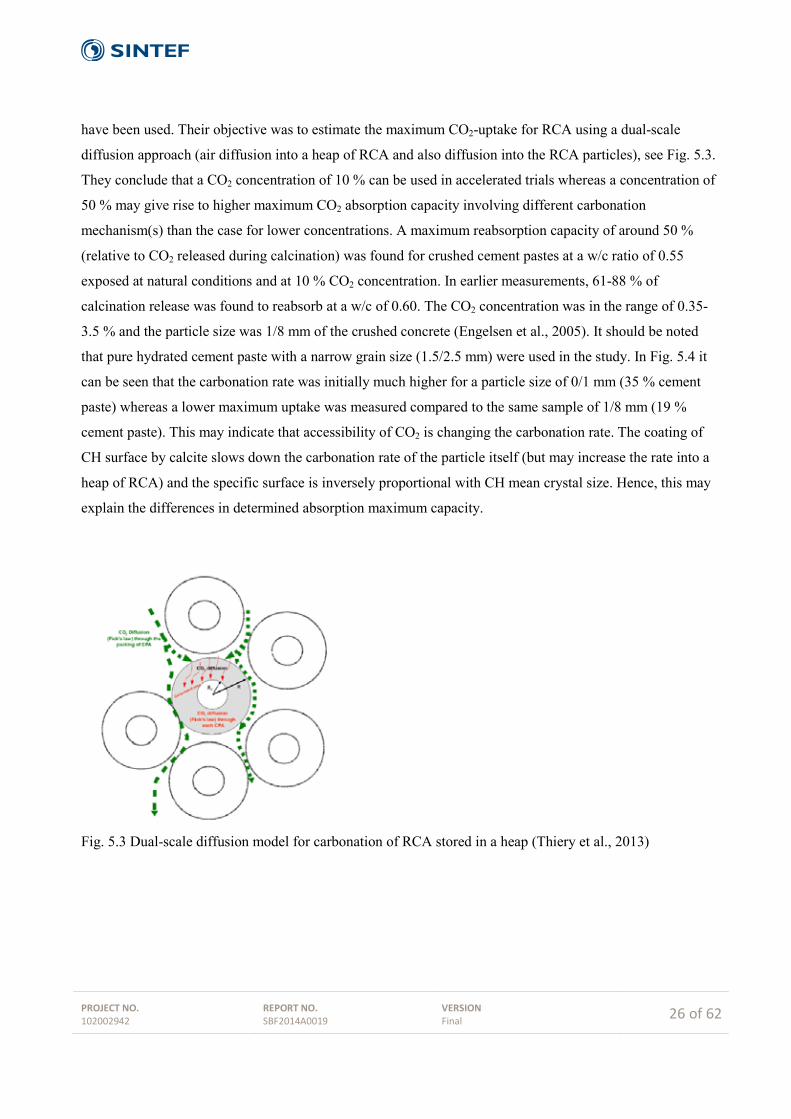
have been used. Their objective was to estimate the maximum CO2-uptake for RCA using a dual-scale
diffusion approach (air diffusion into a heap of RCA and also diffusion into the RCA particles), see Fig. 5.3.
They conclude that a CO2 concentration of 10 % can be used in accelerated trials whereas a concentration of
50 % may give rise to higher maximum CO2 absorption capacity involving different carbonation
mechanism(s) than the case for lower concentrations. A maximum reabsorption capacity of around 50 %
(relative to CO2 released during calcination) was found for crushed cement pastes at a w/c ratio of 0.55
exposed at natural conditions and at 10 % CO2 concentration. In earlier measurements, 61-88 % of
calcination release was found to reabsorb at a w/c of 0.60. The CO2 concentration was in the range of 0.35-
3.5 % and the particle size was 1/8 mm of the crushed concrete (Engelsen et al., 2005). It should be noted
that pure hydrated cement paste with a narrow grain size (1.5/2.5 mm) were used in the study. In Fig. 5.4 it
can be seen that the carbonation rate was initially much higher for a particle size of 0/1 mm (35 % cement
paste) whereas a lower maximum uptake was measured compared to the same sample of 1/8 mm (19 %
cement paste). This may indicate that accessibility of CO2 is changing the carbonation rate. The coating of
CH surface by calcite slows down the carbonation rate of the particle itself (but may increase the rate into a
heap of RCA) and the specific surface is inversely proportional with CH mean crystal size. Hence, this may
explain the differences in determined absorption maximum capacity.
Fig. 5.3 Dual-scale diffusion model for carbonation of RCA stored in a heap (Thiery et al., 2013)

PROJECT NO. 102002942
REPORT NO. SBF2014A0019
VERSION Final
27 of 62
Fig. 5.4 CO2-uptake as function of exposure time (Engelsen et al. 2005)
In another recent study performed by Kikuchi and Kuroda (2011), CO2-binding measurements were
performed on laboratory cast specimens as well as commercially produced and stored RCA for 1-3 month.
The concrete samples were exposed to air under both normal "dry" conditions and intermittent wetting for up
to 91 days. Based on their measurements, they calculate that 180 kg CO2 was absorbed per ton of cement
used in the RCA production during service life, demolition and the recycling process. This calculation is
based on the following:
• 1000 kg of initial cement in fresh concrete is equivalent to 1350 kg of hydrated cement paste.
• Samples from 8 different recycling plants in Tokyo area.
• The average CaCO3 content in the cement paste was found to be 30 %.
It should be noted that the calculation does not consider further uptake in the recovery phase by the RCA.
Moreover, the estimation applies to concrete that are demolished, crushed and stored outdoor (up to 3 month)
before use. The extent of carbonation during service life of original concrete is not available.
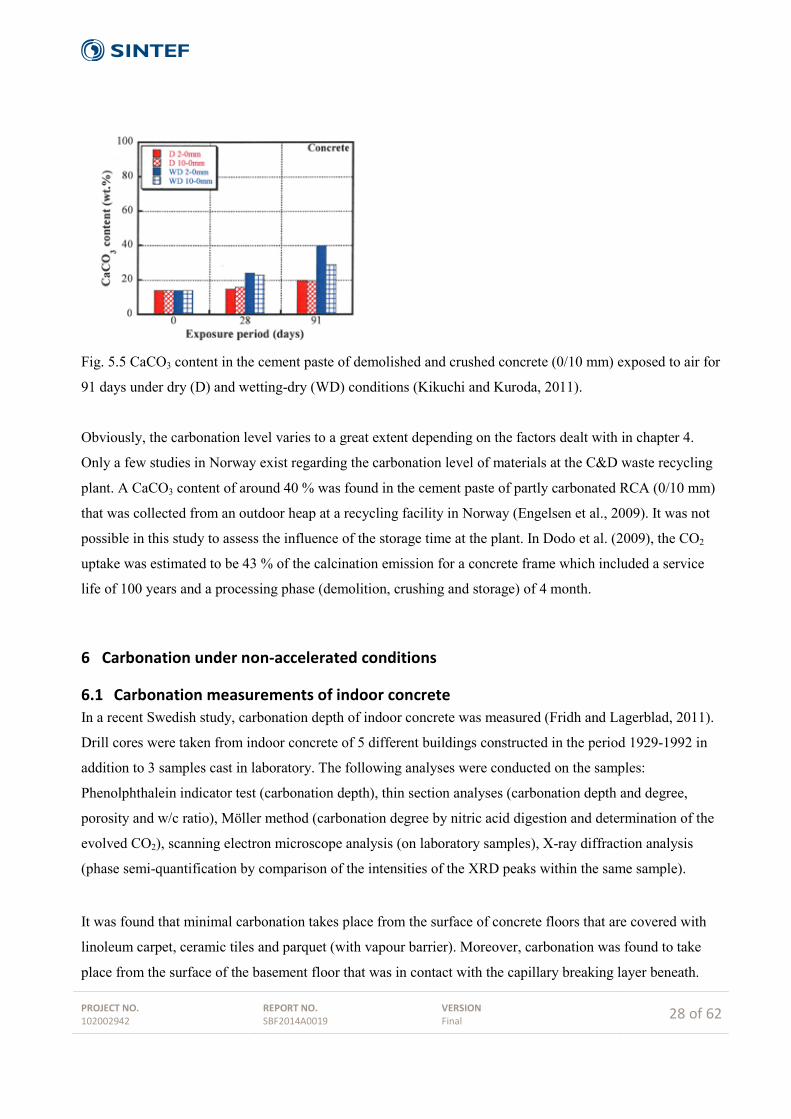
However, they show that a significant quantity of CO2 was absorbed to the real RCA samples during
exposure to air in laboratory for 91 days, see Fig. 5.5. It can also be seen that the effect of intermittent
wetting (WD) is huge.
In another study, it was estimated that CO2 emissions (primary from cement making) is overestimated for
concrete by 13-48 % considering a service life of 100 years and a recovery phase of 30 years because
binding of CO2 was not considered (Collins, 2010). In contrast to Kikuchi and Kuroda (2011), who measured
the uptake on real samples and obtained data for the stages before the recovery phase, Collins (2010)
assumed that the majority of the CO2 was absorbed in the recovery phase (based on estimates only).
PROJECT NO. 102002942
REPORT NO. SBF2014A0019
VERSION Final
28 of 62
Fig. 5.5 CaCO3 content in the cement paste of demolished and crushed concrete (0/10 mm) exposed to air for
91 days under dry (D) and wetting-dry (WD) conditions (Kikuchi and Kuroda, 2011).
Obviously, the carbonation level varies to a great extent depending on the factors dealt with in chapter 4.
Only a few studies in Norway exist regarding the carbonation level of materials at the C&D waste recycling
plant. A CaCO3 content of around 40 % was found in the cement paste of partly carbonated RCA (0/10 mm)
that was collected from an outdoor heap at a recycling facility in Norway (Engelsen et al., 2009). It was not
possible in this study to assess the influence of the storage time at the plant. In Dodo et al. (2009), the CO2
uptake was estimated to be 43 % of the calcination emission for a concrete frame which included a service
life of 100 years and a processing phase (demolition, crushing and storage) of 4 month.
6 Carbonation under non-accelerated conditions
6.1 Carbonation measurements of indoor concrete In a recent Swedish study, carbonation depth of indoor concrete was measured (Fridh and Lagerblad, 2011).
Drill cores were taken from indoor concrete of 5 different buildings constructed in the period 1929-1992 in
addition to 3 samples cast in laboratory. The following analyses were conducted on the samples:
Phenolphthalein indicator test (carbonation depth), thin section analyses (carbonation depth and degree,
porosity and w/c ratio), Möller method (carbonation degree by nitric acid digestion and determination of the
evolved CO2), scanning electron microscope analysis (on laboratory samples), X-ray diffraction analysis
(phase semi-quantification by comparison of the intensities of the XRD peaks within the same sample).
It was found that minimal carbonation takes place from the surface of concrete floors that are covered with
linoleum carpet, ceramic tiles and parquet (with vapour barrier). Moreover, carbonation was found to take
place from the surface of the basement floor that was in contact with the capillary breaking layer beneath.
PROJECT NO. 102002942
REPORT NO. SBF2014A0019
VERSION Final
29 of 62
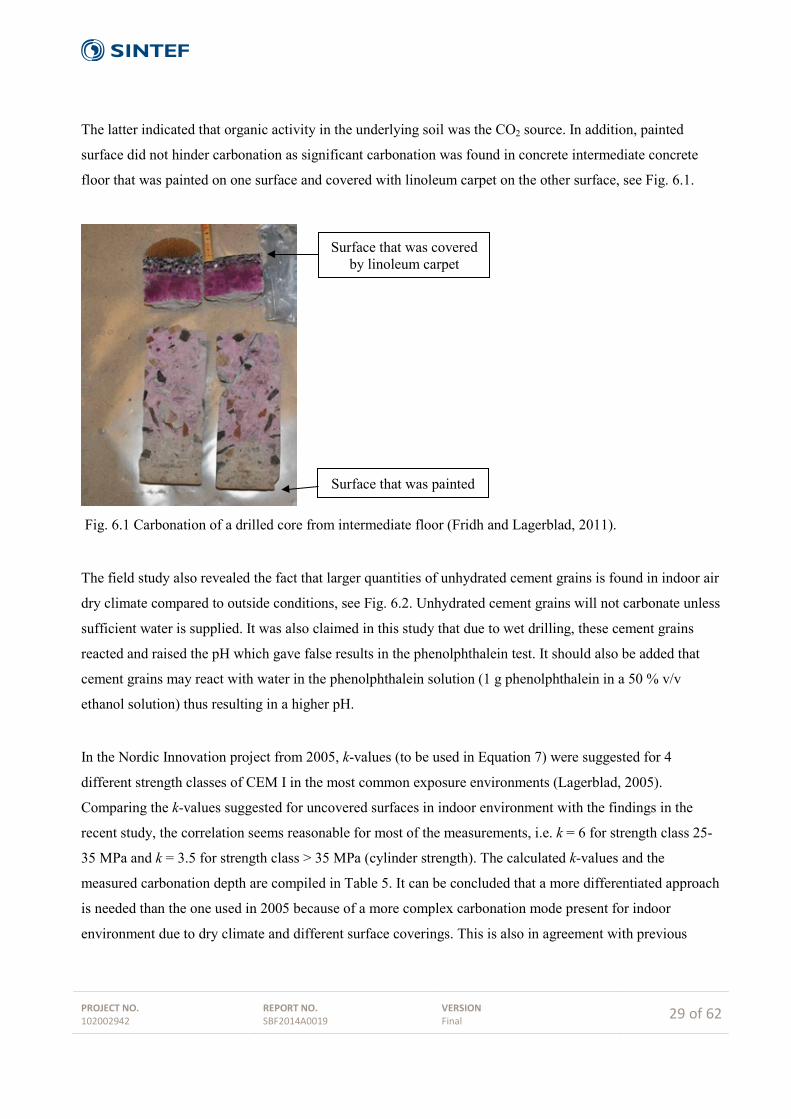
The latter indicated that organic activity in the underlying soil was the CO2 source. In addition, painted
surface did not hinder carbonation as significant carbonation was found in concrete intermediate concrete
floor that was painted on one surface and covered with linoleum carpet on the other surface, see Fig. 6.1.
Fig. 6.1 Carbonation of a drilled core from intermediate floor (Fridh and Lagerblad, 2011).
The field study also revealed the fact that larger quantities of unhydrated cement grains is found in indoor air
dry climate compared to outside conditions, see Fig. 6.2. Unhydrated cement grains will not carbonate unless
sufficient water is supplied. It was also claimed in this study that due to wet drilling, these cement grains
reacted and raised the pH which gave false results in the phenolphthalein test. It should also be added that
cement grains may react with water in the phenolphthalein solution (1 g phenolphthalein in a 50 % v/v
ethanol solution) thus resulting in a higher pH.
In the Nordic Innovation project from 2005, k-values (to be used in Equation 7) were suggested for 4
different strength classes of CEM I in the most common exposure environments (Lagerblad, 2005).
Comparing the k-values suggested for uncovered surfaces in indoor environment with the findings in the
recent study, the correlation seems reasonable for most of the measurements, i.e. k = 6 for strength class 25-
35 MPa and k = 3.5 for strength class > 35 MPa (cylinder strength). The calculated k-values and the
measured carbonation depth are compiled in Table 5. It can be concluded that a more differentiated approach
is needed than the one used in 2005 because of a more complex carbonation mode present for indoor
environment due to dry climate and different surface coverings. This is also in agreement with previous
Surface that was painted
Surface that was covered by linoleum carpet

PROJECT NO. 102002942
REPORT NO. SBF2014A0019
VERSION Final
30 of 62
studies (Nilsson, 2011; Nilsson and Fridh, 2009). However, it should be noted from the results in Table 5
that the paint normally used for indoor applications do not prevent carbonation.
Fig. 6.2 Thin section of the carbonated layer of intermediate floor. Dark areas illustrate unhydrated cement
grains (Fridh and Lagerblad, 2011).
Table 5 Measured carbonation depth and calculated k-values. Compiled from Fridh and Lagerblad (2011).
Construction Part
Surface Age Carbonation depth measured (mm)
k-value calc
Number of samples
k-valuea 2005
Floor Painted 42 13-45 2.0-6.9 3 6 Floor Painted 18 9-20 3.5 1 6 (4)b
Floor Oil and fat 80 25 2.8 1 6 Floor Naked on
macadam 42-62 10-45 1.3-6.9 3 Not given
Floor Painted 42 20 3.1 1 6 (4)b
Wall Painted 42, 18 24, 9 3.7, 2.1 2 6 (4)b
Wall Uncovered 80 > 50 > 5.6 2 6 Wall Uncovered 22 12 2.6 1 3.5 (2.5)b
Garage column Uncovered 40 23 3.6 1 3.5 Garage roof Uncovered 40 32 5.5c 1 3.5 Lab. sample Uncovered 1.5 7 3.1 1 3.5 Lab. sample Uncovered 10 8-10 2.8 1 3 Lab. sample Uncovered 3.5 10-11 4.7 1 9 a Values from Lagerblad (2005) b Values in brackets are assumed due to properties falling in between two classes c May be accelerated conditions due to additional CO2 emission from cars
6.2 Other carbonation studies and corresponding k-values for Portland cements In the experiments of Zega et al. (2011), 2 mm carbonation depth (phenolphthalein indicator) was found after
exposure of concrete cubes (w/c of 0.45) for 620 days in an industrial area with average RH of 70 %. In
general, the exposure time is too short to reasonably estimate the k-value. However, they are relevant to
PROJECT NO. 102002942
REPORT NO. SBF2014A0019
VERSION Final
31 of 62
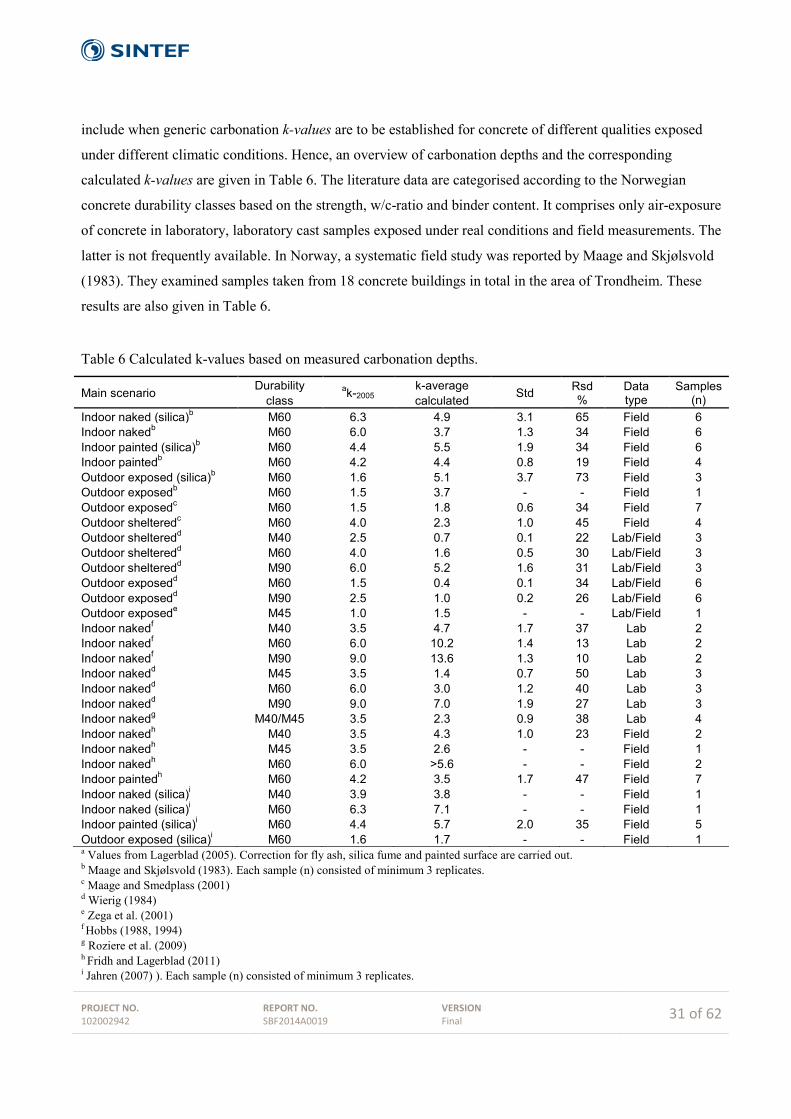
include when generic carbonation k-values are to be established for concrete of different qualities exposed
under different climatic conditions. Hence, an overview of carbonation depths and the corresponding
calculated k-values are given in Table 6. The literature data are categorised according to the Norwegian
concrete durability classes based on the strength, w/c-ratio and binder content. It comprises only air-exposure
of concrete in laboratory, laboratory cast samples exposed under real conditions and field measurements. The
latter is not frequently available. In Norway, a systematic field study was reported by Maage and Skjølsvold
(1983). They examined samples taken from 18 concrete buildings in total in the area of Trondheim. These
results are also given in Table 6.
Table 6 Calculated k-values based on measured carbonation depths.
Main scenario Durability class
ak-2005 k-average calculated Std Rsd
% Data type
Samples (n)
Indoor naked (silica)b M60 6.3 4.9 3.1 65 Field 6 Indoor nakedb M60 6.0 3.7 1.3 34 Field 6 Indoor painted (silica)b M60 4.4 5.5 1.9 34 Field 6 Indoor paintedb M60 4.2 4.4 0.8 19 Field 4 Outdoor exposed (silica)b M60 1.6 5.1 3.7 73 Field 3 Outdoor exposedb M60 1.5 3.7 - - Field 1 Outdoor exposedc M60 1.5 1.8 0.6 34 Field 7 Outdoor shelteredc M60 4.0 2.3 1.0 45 Field 4 Outdoor shelteredd M40 2.5 0.7 0.1 22 Lab/Field 3 Outdoor shelteredd M60 4.0 1.6 0.5 30 Lab/Field 3 Outdoor shelteredd M90 6.0 5.2 1.6 31 Lab/Field 3 Outdoor exposedd M60 1.5 0.4 0.1 34 Lab/Field 6 Outdoor exposedd M90 2.5 1.0 0.2 26 Lab/Field 6 Outdoor exposede M45 1.0 1.5 - - Lab/Field 1 Indoor nakedf M40 3.5 4.7 1.7 37 Lab 2 Indoor nakedf M60 6.0 10.2 1.4 13 Lab 2 Indoor nakedf M90 9.0 13.6 1.3 10 Lab 2 Indoor nakedd M45 3.5 1.4 0.7 50 Lab 3 Indoor nakedd M60 6.0 3.0 1.2 40 Lab 3 Indoor nakedd M90 9.0 7.0 1.9 27 Lab 3 Indoor nakedg M40/M45 3.5 2.3 0.9 38 Lab 4 Indoor nakedh M40 3.5 4.3 1.0 23 Field 2 Indoor nakedh M45 3.5 2.6 - - Field 1 Indoor nakedh M60 6.0 >5.6 - - Field 2 Indoor paintedh M60 4.2 3.5 1.7 47 Field 7 Indoor naked (silica)i M40 3.9 3.8 - - Field 1 Indoor naked (silica)i M60 6.3 7.1 - - Field 1 Indoor painted (silica)i M60 4.4 5.7 2.0 35 Field 5 Outdoor exposed (silica)i M60 1.6 1.7 - - Field 1 a Values from Lagerblad (2005). Correction for fly ash, silica fume and painted surface are carried out. b Maage and Skjølsvold (1983). Each sample (n) consisted of minimum 3 replicates. c Maage and Smedplass (2001)
d Wierig (1984)
e Zega et al. (2001) f Hobbs (1988, 1994) g Roziere et al. (2009) h Fridh and Lagerblad (2011) i Jahren (2007) ). Each sample (n) consisted of minimum 3 replicates.
PROJECT NO. 102002942
REPORT NO. SBF2014A0019
VERSION Final
32 of 62
Eight sampling sites (buildings) in the study carried out by Maage and Skjøsvold (1983) were followed up in
2005. The calculated k-values after 26 years of carbonation differed only in the range of ± 30 % compared to
those obtained in 1983 (Jahren, 2007). This shows the consistency in the carbonation process in these cross-
checked cases. Reasonable consistency was also found in by Hobbs (1988, 1994). It can also be observed in
Table 6 that the data of Wierig (1984) resulted in k-values that are systematically lower than data obtained
from other studies within the same main scenario (e.g. Maage and Smedplass, 2001). Note that concrete
categorised in the same durability class and exposed under the same main scenario (e.g. outdoor exposed),
will in reality be exposed under different climatic conditions due to geographical differences. Also note that
the data in Table 6 were retrieved from both field and laboratory studies. These factors induce differences in
carbonation of concrete.
The standard deviations of the data in Table 6 were in most cases below 50%. Higher precision was obtained
for carbonation measurements conducted on samples prepared in laboratory, as expected. The data survey in
Table 6 is compared with the generic values obtained in the Nordic study in 2005. As expected, large
deviation to good agreement was found in the comparison. Concrete homogeneity and curing conditions are
parameters that are difficult to account for when carbonation in different studies are compared. Natural
variations in concrete homogeneity during production are normal and the curing conditions will in practice
be different from day to day and from place to place. This is due to varying climatic conditions. It should
also be emphasised that the practice and experience of the construction workers are different. These factors
increase the variation of the carbonation results obtained at field site. By continuously collection and
systemisation of carbonation field data, the calculated k-values are approaching normal distribution. Hence, a
generic k-value represents the average carbonation rate for the durability class under consideration. This
means that over- and underestimations of the carbonation rates contribute to the same extent. The data in
Table 6 are considered to contribute significantly to the development of generic k-values for the main
concrete durability classes.
6.3 Other carbonation studies and corresponding k-values for blended cements Nagataki et al. (1988) reported carbonation measurements of laboratory prepared fly ash concrete cylinders
that were exposed outdoor in open air for 15 years. Hobbs (1988, 1994) determined the carbonation depth in
fly ash concrete cubes exposed under laboratory conditions (20 OC and 65% RH) for 3 and 8.3 years.
Regarding carbonation measurements of concrete containing slag, Wierig (1984) has conducted an extensive
study of laboratory prepared cylinders exposed to indoor and outdoor environments. The exposure time was
in total 16 years.

PROJECT NO. 102002942
REPORT NO. SBF2014A0019
VERSION Final
33 of 62
The referred carbonation studies above have been systemised in Table 7 and Table 8 for concrete containing
fly ash and slag, respectively. In general, the precision was found to be 10-35 %. In addition, a recent
Norwegian field study has been carried out on existing fly ash concrete structures that were built 7-13 years
ago. These results are included in Table 7. Compared to the results for the outdoor exposed M60 samples of
Nagataki et al. (1986), a somewhat higher averaged k-value was found. However, the mean values were not
statistically different (F-test and t-test) due to relatively large spreading of the measured carbonation depths
in the field measurements, as expected.
Table 7 Measured carbonation depth in concrete containing fly ash and calculated k-values.
Main scenario Durability class
ak-2005 k-average calculated Std Rsd
% Data type Samples
Outdoor exposedb M60 1.6 2.2 0.7 31 Lab 10 Outdoor exposedb M90 2.8 4.3 0.9 20 Lab 8 Outdoor exposedc M60 1.6 2.6 1.5 53 Field 15 Indoor nakedd M60 6.6 7.5 2.4 32 Lab 10 a Values from Lagerblad (2005). Correction for fly ash, silica fume and painted surface are carried out. b Nagataki et al., (1986), fly ash content in binder was 30 %. c Fossum (2013), values are averaged project wise. In total, carbonation was determined in 70 drill cores. Fly ash
content in binder was 20 %. d Nagataki et al., (1986); Hobbs (1988, 1994), fly ash content in binder was 35 %.
Table 8 Measured carbonation depth in concrete containing slag and calculated k-values.
Main scenariob Durability class
ak-2005 k-average calculated Std Rsd
% Data type Samples
Indoor naked M40 4.0 1.3 0.4 34 Lab 8 Indoor naked M45 4.0 3.6 0.8 24 Lab 6 Indoor naked M60 6.9 4.5 1.0 23 Lab 10 Indoor naked M90 10 7.2 1.4 19 Lab 12 Outdoor sheltered M40 2.9 0.6 0.2 35 Lab 8 Outdoor sheltered M45 2.9 2.0 0.2 10 Lab 6 Outdoor sheltered M60 4.6 2.7 0.9 34 Lab 10 Outdoor sheltered M90 6.9 5.7 1.6 28 Lab 12 a Values from Lagerblad (2005). Correction for fly ash, silica fume and painted surface are carried out. b Wierig (1984), blast furnace slag content in binder was 20-75 %.
6.4 Carbonation degree Carbonation degree can be defined as the quantity of CaO that can be converted to CaCO3 relative to the
total CaO in the cement clinker. A carbonation degree of 72 % was calculated earlier in the report, see Table
4. However, the carbonation degree in field measurement may vary. In previous chapter the carbonation
depth was assessed by mainly phenolphthalein indicator and thin section analysis. It was shown that the
depth versus time sometimes correlated excellently with a diffusion controlled carbonation process. Hence, it
is possible to estimate the carbonated concrete volume at various ages. However, in order to calculate CO2
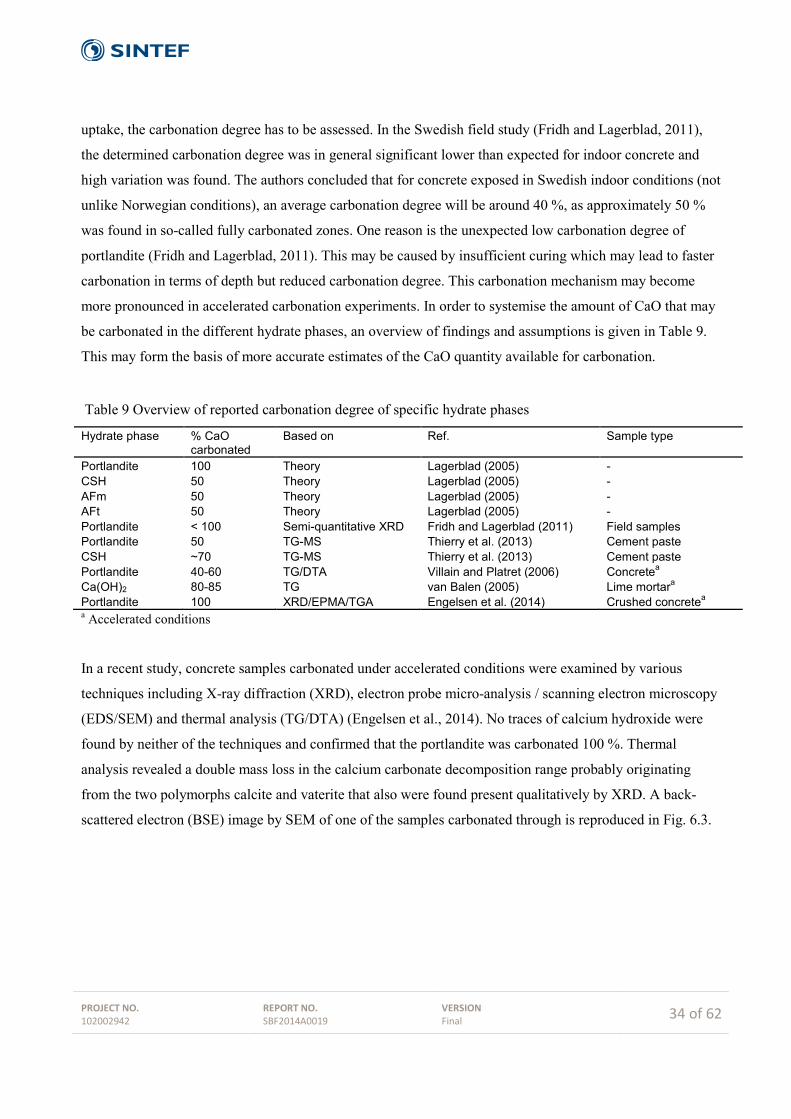
PROJECT NO. 102002942
REPORT NO. SBF2014A0019
VERSION Final
34 of 62
uptake, the carbonation degree has to be assessed. In the Swedish field study (Fridh and Lagerblad, 2011),
the determined carbonation degree was in general significant lower than expected for indoor concrete and
high variation was found. The authors concluded that for concrete exposed in Swedish indoor conditions (not
unlike Norwegian conditions), an average carbonation degree will be around 40 %, as approximately 50 %
was found in so-called fully carbonated zones. One reason is the unexpected low carbonation degree of
portlandite (Fridh and Lagerblad, 2011). This may be caused by insufficient curing which may lead to faster
carbonation in terms of depth but reduced carbonation degree. This carbonation mechanism may become
more pronounced in accelerated carbonation experiments. In order to systemise the amount of CaO that may
be carbonated in the different hydrate phases, an overview of findings and assumptions is given in Table 9.
This may form the basis of more accurate estimates of the CaO quantity available for carbonation.
Table 9 Overview of reported carbonation degree of specific hydrate phases
Hydrate phase % CaO carbonated
Based on Ref. Sample type
Portlandite 100 Theory Lagerblad (2005) - CSH 50 Theory Lagerblad (2005) - AFm 50 Theory Lagerblad (2005) - AFt 50 Theory Lagerblad (2005) - Portlandite < 100 Semi-quantitative XRD Fridh and Lagerblad (2011) Field samples Portlandite 50 TG-MS Thierry et al. (2013) Cement paste CSH ~70 TG-MS Thierry et al. (2013) Cement paste Portlandite 40-60 TG/DTA Villain and Platret (2006) Concretea
Ca(OH)2 80-85 TG van Balen (2005) Lime mortara
Portlandite 100 XRD/EPMA/TGA Engelsen et al. (2014) Crushed concretea
a Accelerated conditions
In a recent study, concrete samples carbonated under accelerated conditions were examined by various
techniques including X-ray diffraction (XRD), electron probe micro-analysis / scanning electron microscopy
(EDS/SEM) and thermal analysis (TG/DTA) (Engelsen et al., 2014). No traces of calcium hydroxide were
found by neither of the techniques and confirmed that the portlandite was carbonated 100 %. Thermal
analysis revealed a double mass loss in the calcium carbonate decomposition range probably originating
from the two polymorphs calcite and vaterite that also were found present qualitatively by XRD. A back-
scattered electron (BSE) image by SEM of one of the samples carbonated through is reproduced in Fig. 6.3.

PROJECT NO. 102002942
REPORT NO. SBF2014A0019
VERSION Final
35 of 62
Fig 6.3 A section of the binder of concrete with CEM I (w/c = 0.60) that has carbonated through
The image in Fig. 6.3 reveals a binder consisting of a dense light grey area with some dark grey (nearly
black) areas in between. According to EDS both contain the main elements of a CSH, but the light grey has
an atomic ratio C/S of 2.7 while the darker grey had C/S = 0.34. A normal CSH would have a C/S in the
range 1.5-1.7 for a CEM I. A possible explanation is that the carbonation of CH and CSH (usually more or
less interweaved) have carbonated to form a dense light grey mass, probably with domains of carbonated CH
and CSH that are difficult to distinguish by only grey values. These domains could only have been found by
comparing element mapping of Ca and Si at high resolution. The darker grey regions are de-calcified CSH
where calcium carbonate possibly has preferred to grow on already formed calcium carbonate in the
densified area by a through-solution mechanism onto an already formed calcium carbonate substrate. This is
why the study failed to find pure calcium carbonate particles in the microstructure.
The "two-phase" microstructure of binder with light grey areas together with darker grey areas was typical
for a number of the samples that were reacted through and with similar differences in C/S ratios. For some
reason, the darker grey areas were often simultaneously rich in aluminium. CSH with low C/S will
compensate the lack of Ca by polymerizing the silicate anions, and it is known from literature that
aluminium may participate in the polymerization by substituting for silicon. The aluminium may have been
made available by AFt and AFm phases being decomposed by carbonation.

PROJECT NO. 102002942
REPORT NO. SBF2014A0019
VERSION Final
36 of 62
The carbonation degree found in Engelsen et al. (2005) was in the area of 68-83 %. The recent study by
Engelsen et al. (2014) (conducted on the same samples) confirmed the carbonation degree by TG/DTA
analysis. The results showed that a total carbonation degree of 70 % of total CaO is reasonable to be used in
further calculations of the CO2-binding by concrete.
6.5 Recent carbonation models Carbonation depth models have traditionally been developed to forecast the carbonation induced corrosion in
reinforced concrete and not with the sole aim to calculate the quantity of bound CO2. However, the same
carbonation mechanisms have to be considered and dealt with, except for the carbonation degree.
In a recent study, a numerical model was developed to predict the carbonation depth as function of time
considering a number of factors that influence carbonation (Talukdar et al., 2012a). The numerical model
describes the diffusion of CO2 in concrete and includes the effects of porosity, humidity, temperature,
atmospheric CO2 concentration and chemical reaction rates. It is based on accelerated experiments at 6-10 %
CO2 and excellent correlation between the measured and predicted carbonation depth was obtained. They
applied the model to predict what effects the forecasted global increase in temperature and CO2 have on the
carbonation depth in non-pozzolanic concrete in the two Canadian cities Vancouver and Toronto (Talukdar
et al., 2012b). Data from official IPCC reports have been used regarding the forecast of temperature, CO2
levels and humidity and the results are shown in Fig. 6.4 and an increase in carbonation depth of up to 45 %
was predicted. The same model was also used for other metropolitan cities and an increase in the range of
27-32 % was found (Talukdar and Banthia, 2013). It should be noted that the predictions are conducted for
urban areas with elevated CO2 levels. Furthermore, no field data are reported in these studies.
Fig. 6.4 Simulated carbonation depths as function of time in the climate of Vancouver (left) and Toronto
(right) assuming no increase in CO2 concentration (control), best case scenario (B1) and worst case scenario
(AIF1) (Talukdar et al., 2012b).
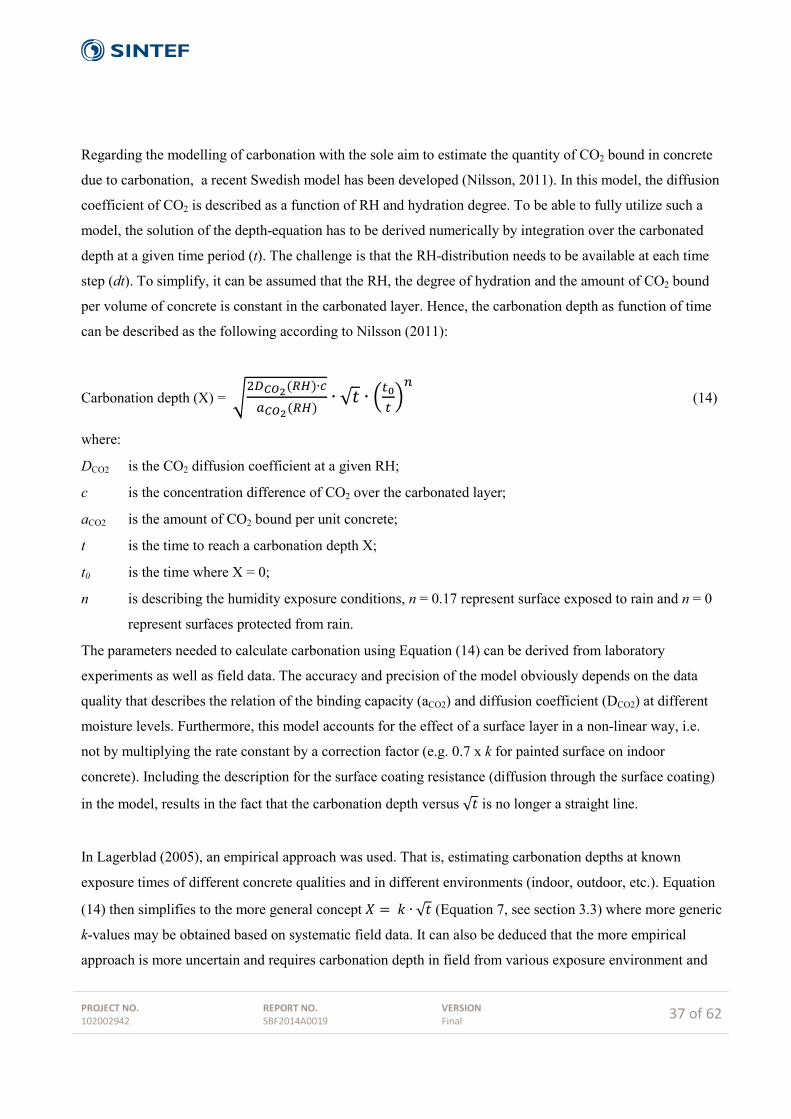
PROJECT NO. 102002942
REPORT NO. SBF2014A0019
VERSION Final
37 of 62
Regarding the modelling of carbonation with the sole aim to estimate the quantity of CO2 bound in concrete
due to carbonation, a recent Swedish model has been developed (Nilsson, 2011). In this model, the diffusion
coefficient of CO2 is described as a function of RH and hydration degree. To be able to fully utilize such a
model, the solution of the depth-equation has to be derived numerically by integration over the carbonated
depth at a given time period (t). The challenge is that the RH-distribution needs to be available at each time
step (dt). To simplify, it can be assumed that the RH, the degree of hydration and the amount of CO2 bound
per volume of concrete is constant in the carbonated layer. Hence, the carbonation depth as function of time
can be described as the following according to Nilsson (2011):
Carbonation depth (X) = �2𝐷𝐷𝐶𝐶𝐶𝐶2(𝑅𝑅𝑅𝑅)∙𝑐𝑐𝑎𝑎𝐶𝐶𝐶𝐶2(𝑅𝑅𝑅𝑅)
∙ √𝑡𝑡 ∙ �𝑡𝑡0𝑡𝑡 �𝑛𝑛
(14)
where:
DCO2 is the CO2 diffusion coefficient at a given RH;
c is the concentration difference of CO2 over the carbonated layer;
aCO2 is the amount of CO2 bound per unit concrete;
t is the time to reach a carbonation depth X;
t0 is the time where X = 0;
n is describing the humidity exposure conditions, n = 0.17 represent surface exposed to rain and n = 0
represent surfaces protected from rain.
The parameters needed to calculate carbonation using Equation (14) can be derived from laboratory
experiments as well as field data. The accuracy and precision of the model obviously depends on the data
quality that describes the relation of the binding capacity (aCO2) and diffusion coefficient (DCO2) at different
moisture levels. Furthermore, this model accounts for the effect of a surface layer in a non-linear way, i.e.
not by multiplying the rate constant by a correction factor (e.g. 0.7 x k for painted surface on indoor
concrete). Including the description for the surface coating resistance (diffusion through the surface coating)
in the model, results in the fact that the carbonation depth versus √𝑡𝑡 is no longer a straight line.
In Lagerblad (2005), an empirical approach was used. That is, estimating carbonation depths at known
exposure times of different concrete qualities and in different environments (indoor, outdoor, etc.). Equation
(14) then simplifies to the more general concept 𝑋𝑋 = 𝑘𝑘 ∙ √𝑡𝑡 (Equation 7, see section 3.3) where more generic
k-values may be obtained based on systematic field data. It can also be deduced that the more empirical
approach is more uncertain and requires carbonation depth in field from various exposure environment and

PROJECT NO. 102002942
REPORT NO. SBF2014A0019
VERSION Final
38 of 62
various concrete qualities. In addition, the influence of surface covering (e.g. paint) on the carbonation speed
is corrected by a factor. However, generic k-values may still be seen as a viable way of calculating the
overall CO2-binding to concrete as remarkable good correlation to Equation 7 are found in some field studies
(see chapter 6.3). One parameter that significantly influences the carbonation degree and speed is the degree
of hydration. Due to lack of data, it is challenging to include this parameter in the model.
The theoretical model of Nilsson (2011) has recently been used to calculate the CO2-uptake in all existing
Swedish concrete structures (Andersson et al., 2013). They estimated that around 300 000 tonnes of CO2
were bound to Swedish concrete structures in 2011, i.e. 17 % of the total emission from cement production in
Sweden in 2011 is estimated to be bound to concrete due to carbonation. The authors calculated the
accumulated CO2-binding the last 100 years based on actual cement production data in the same time period.
The estimated quantity bound in 2011 equals to 125 kg of CO2 per tonne cement in Sweden. Note that the
uptake from the recovery phase is not included. Furthermore, Andersson et al. conducted the same
calculations by applying the model based on field measurements (Lagerblad, 2005) and the results
corresponded remarkably well with the new theoretical model.
6.6 Carbonation rate factors (k-values) for concrete classes Based on the literature findings previously assessed (see 6.1-6.3), carbonation rate factors (k-values) are
given in Table 10 categorised according to Norwegian concrete classes. The values estimated in Table 10 are
based on experiments under non-accelerated conditions. They can be considered to be of generic nature and
improvements can be done by including more field data into the database.
By considering the CO2-binding capacities, the carbonation degree and the carbonation rate, the total CO2
bound to Norwegian concrete volume can be estimated (se next chapter). Most of the field data for CEM II
are not available. The values from Lagerblad (2005) are used which means that the CEM I value are
increased with 5 % in order to represent CEM II/A-V, see Table 10. Furthermore, the values used for
M/MF40 are also used for M/MF45. However, for some important main scenarios and durability classes, the
given k-values are based on the updated field measurements (and laboratory trials), as shown in Table 10.
Due to limited field data on concrete with slag cement (CEM II/B-S), the k-values for Portland cement (CEM
I) concrete are used in order to be conservative (i.e. small risk for overestimation), not shown in Table 10.

PROJECT NO. 102002942
REPORT NO. SBF2014A0019
VERSION Final
39 of 62
Table 10 k-values for Norwegian concrete classes.
Parameter M90 M60 M/MF45 M/MF40 CEM I CEM II
A-V CEMI CEM II
A-V CEM I CEM II
A-V CEM I CEM II
A-V Max w/b ratio 0.90 0.90 0.60 0.60 0.45 0.45 0.40 0.40 Minimum cement (kg/m3) 225 225 250 250 300 300 330 330 Strength class B10/B20 B10/B20 B25/B30 B25/B30 B35 B35 B45-B95 B45-B95 Strength, fck, cyl (MPa) <25 <25 ≥25-35 ≥25-35 ≥35-45 ≥35-45 ≥45 ≥45 Binding capacity (kg CO2/ton cement 330 255 330 255 330 255 330 255
k-values for the main scenarios:
Outdoor exposed1 2.5 4.03 1.5 2.44 1.0 1.05 1.0 1.05 Outdoor sheltered1 6.0 6.3 4.0 4.2 2.5 2.63 2.5 2.63 Indoor naked1 9.0 9.45 4.9 ± 1.35 7.06 3.5 3.67 4.3 ± 1.37 3.67 Indoor painted1 6.3 6.6 3.6 ± 1.48 4.9 2.45 2.57 2.45 2.57 Indoor covered2 2.0 2.0 2.0 2.0 0.59 0.539 0.59 0.539
Outdoor wet1 1.0 1.05 0.75 0.79 0.5 0.53 0.5 0.53 Outdoor buried1 1.5 1.58 1.0 1.05 0.75 0.79 0.75 0.79 1 Values from Lagerblad (2005). If other references are not given the following apply: CEM II/A-V values are CEM I
multiplied by the factor 1.05; Values for indoor painted and indoor covered are the value for indoor naked multiplied by the factor 0.7.
2 Other than painted surfaces (e.g. tiles). The polynomial equation in Andersson et al. 2013 is used (average between B2 and B3).
3 Based on Nagataki et al. (1986), see Table 7. 4 Based on average between Fossum (2013) and Nagataki et al. (1986), see Table 7. 5 Compilation based on Fridh and Lagerblad (2011); Lagerblad (2005); Maage and Skjølsvold (1984), n = 8. 6 Based on the average between Lagerblad (2005) and Nagataki et al. (1986), see Table 7. 7 Based on Fridh and Lagerblad (2011), n = 4. 8 Based on Fridh and Lagerblad (2011), n = 11. 9 Values from outdoor wet scenario used for indoor covered surfaces (not painted) of Precast Concrete Elements.
7 Calculation of CO2 uptake in Norwegian concrete
7.1 General concept and assumptions A working group was established with participants from the Norwegian Ready-Mixed Concrete Association,
Norwegian Precast Concrete Federation and SINTEF. The working group had close interactions with the
majority of the Norwegian cement and concrete producers. In addition, data received from Prognosesenteret,
Statistics Norway and some of the major concrete demolition contractors have been used in the present
study. The following data were assessed:
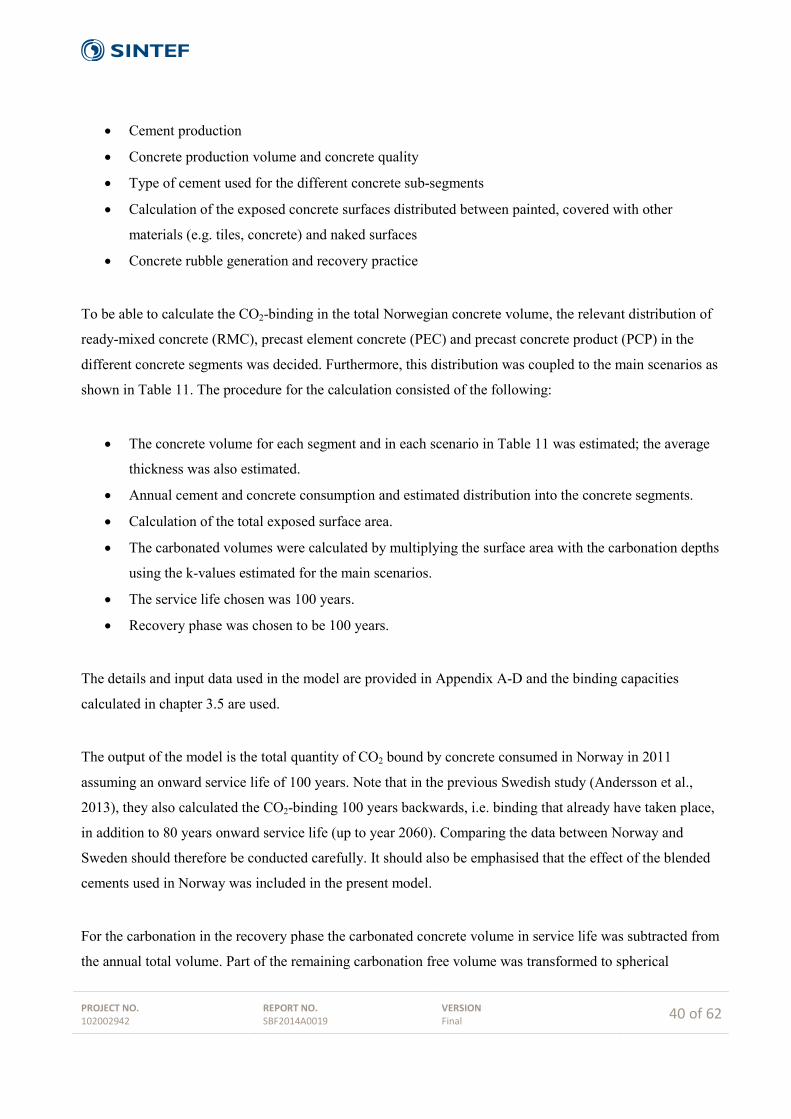
PROJECT NO. 102002942
REPORT NO. SBF2014A0019
VERSION Final
40 of 62
• Cement production
• Concrete production volume and concrete quality
• Type of cement used for the different concrete sub-segments
• Calculation of the exposed concrete surfaces distributed between painted, covered with other
materials (e.g. tiles, concrete) and naked surfaces
• Concrete rubble generation and recovery practice
To be able to calculate the CO2-binding in the total Norwegian concrete volume, the relevant distribution of
ready-mixed concrete (RMC), precast element concrete (PEC) and precast concrete product (PCP) in the
different concrete segments was decided. Furthermore, this distribution was coupled to the main scenarios as
shown in Table 11. The procedure for the calculation consisted of the following:
• The concrete volume for each segment and in each scenario in Table 11 was estimated; the average
thickness was also estimated.
• Annual cement and concrete consumption and estimated distribution into the concrete segments.
• Calculation of the total exposed surface area.
• The carbonated volumes were calculated by multiplying the surface area with the carbonation depths
using the k-values estimated for the main scenarios.
• The service life chosen was 100 years.
• Recovery phase was chosen to be 100 years.
The details and input data used in the model are provided in Appendix A-D and the binding capacities
calculated in chapter 3.5 are used.
The output of the model is the total quantity of CO2 bound by concrete consumed in Norway in 2011
assuming an onward service life of 100 years. Note that in the previous Swedish study (Andersson et al.,
2013), they also calculated the CO2-binding 100 years backwards, i.e. binding that already have taken place,
in addition to 80 years onward service life (up to year 2060). Comparing the data between Norway and
Sweden should therefore be conducted carefully. It should also be emphasised that the effect of the blended
cements used in Norway was included in the present model.
For the carbonation in the recovery phase the carbonated concrete volume in service life was subtracted from
the annual total volume. Part of the remaining carbonation free volume was transformed to spherical
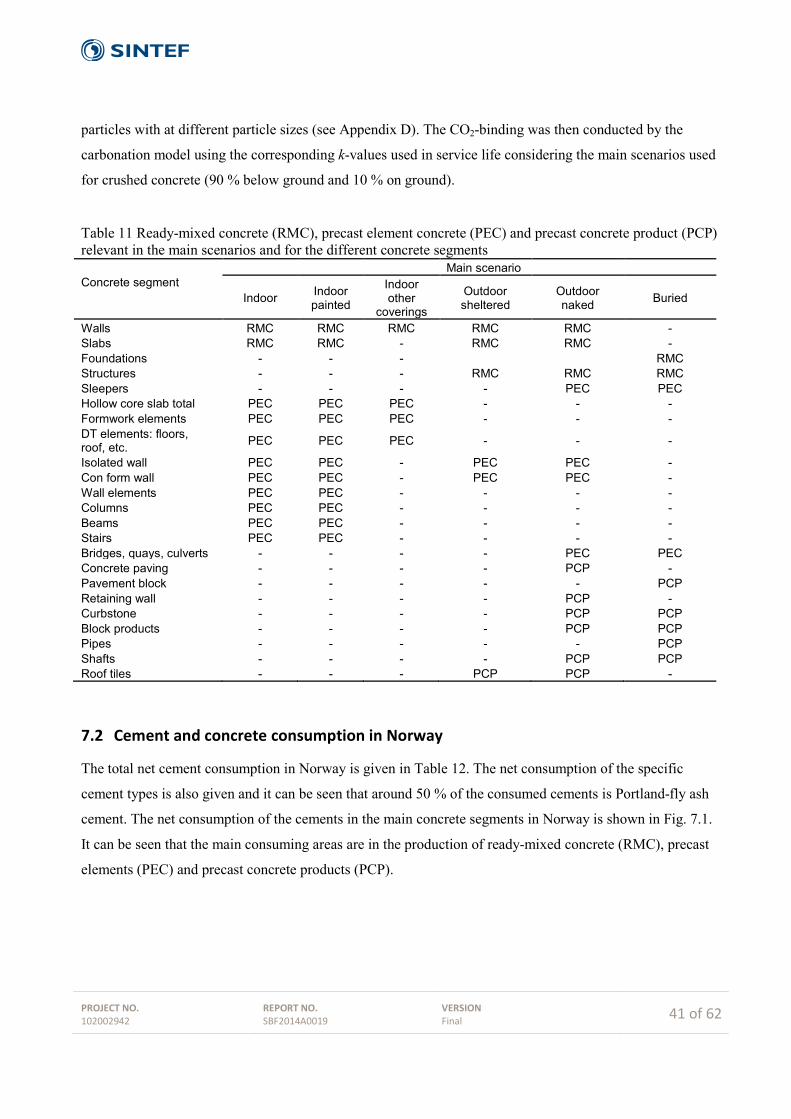
PROJECT NO. 102002942
REPORT NO. SBF2014A0019
VERSION Final
41 of 62
particles with at different particle sizes (see Appendix D). The CO2-binding was then conducted by the
carbonation model using the corresponding k-values used in service life considering the main scenarios used
for crushed concrete (90 % below ground and 10 % on ground).
Table 11 Ready-mixed concrete (RMC), precast element concrete (PEC) and precast concrete product (PCP) relevant in the main scenarios and for the different concrete segments
Concrete segment
Main scenario
Indoor Indoor painted
Indoor other
coverings
Outdoor sheltered
Outdoor naked Buried
Walls RMC RMC RMC RMC RMC - Slabs RMC RMC - RMC RMC - Foundations - - - RMC Structures - - - RMC RMC RMC Sleepers - - - - PEC PEC Hollow core slab total PEC PEC PEC - - - Formwork elements PEC PEC PEC - - - DT elements: floors, roof, etc. PEC PEC PEC - - -
Isolated wall PEC PEC - PEC PEC - Con form wall PEC PEC - PEC PEC - Wall elements PEC PEC - - - - Columns PEC PEC - - - - Beams PEC PEC - - - - Stairs PEC PEC - - - - Bridges, quays, culverts - - - - PEC PEC Concrete paving - - - - PCP - Pavement block - - - - - PCP Retaining wall - - - - PCP - Curbstone - - - - PCP PCP Block products - - - - PCP PCP Pipes - - - - - PCP Shafts - - - - PCP PCP Roof tiles - - - PCP PCP -
7.2 Cement and concrete consumption in Norway
The total net cement consumption in Norway is given in Table 12. The net consumption of the specific
cement types is also given and it can be seen that around 50 % of the consumed cements is Portland-fly ash
cement. The net consumption of the cements in the main concrete segments in Norway is shown in Fig. 7.1.
It can be seen that the main consuming areas are in the production of ready-mixed concrete (RMC), precast
elements (PEC) and precast concrete products (PCP).

PROJECT NO. 102002942
REPORT NO. SBF2014A0019
VERSION Final
42 of 62
Table 12 Norwegian production and net consumption of cement (in mill. tons)
Year Norwegian
cement production
Imported Exported Net consumption
Net consumption of cement types
CEM I CEM II/A-V CEM II/B-S
2011 1,547 0,371 0,094 1,824 0,650 0,988 0,186 2012 1,698 0,400 0,150 1,948 0,695 1,053 0,200
Fig. 7.1 Distribution of the total marketed cement in Norway in 2011. Figures are corrected for the volume of
exported and imported cement.
The total concrete production in Norway is given in Table 13 and it shows that 4.5 million m3 concrete was
consumed in Norway in 2011. This corresponds to 10.6 million tonnes of concrete. The total concrete
consumption is calculated from production data given for the concrete sub segments (e.g. hollow slab
concrete, formwork elements, etc.). In the next chapter, these data are used in detail to calculate the
carbonated volume in Norway. Note that the annual concrete rubble generation in Norway is around 0.75
million tons (Statistics Norway, 2014), i.e. less than 10 % of the annual concrete consumption.
Table 13 Concrete consumption in Norway countries in 2011 (million m3)
Main concrete segment Norwegian production Imported Total consumption
Ready-mixeda 3,49 - 3,49 Precast elementb 0,52 0,091 0,61 Precast productsc 0,42 0,037 0,45 Total 4,43 0,13 4,55 a Data from European Ready Mixed Concrete Organization and Norwegian Ready mixed Concrete Association b Data from Norwegian Precast Element Association, Prognosesenteret and the industry c Data separately retrieved from the major manufactures of PCP
Ready-mixed; 70 %
PEC; 14 %
PCP; 12 %
Bagged; 2 % Offshore; 2 % Miks; 2 %
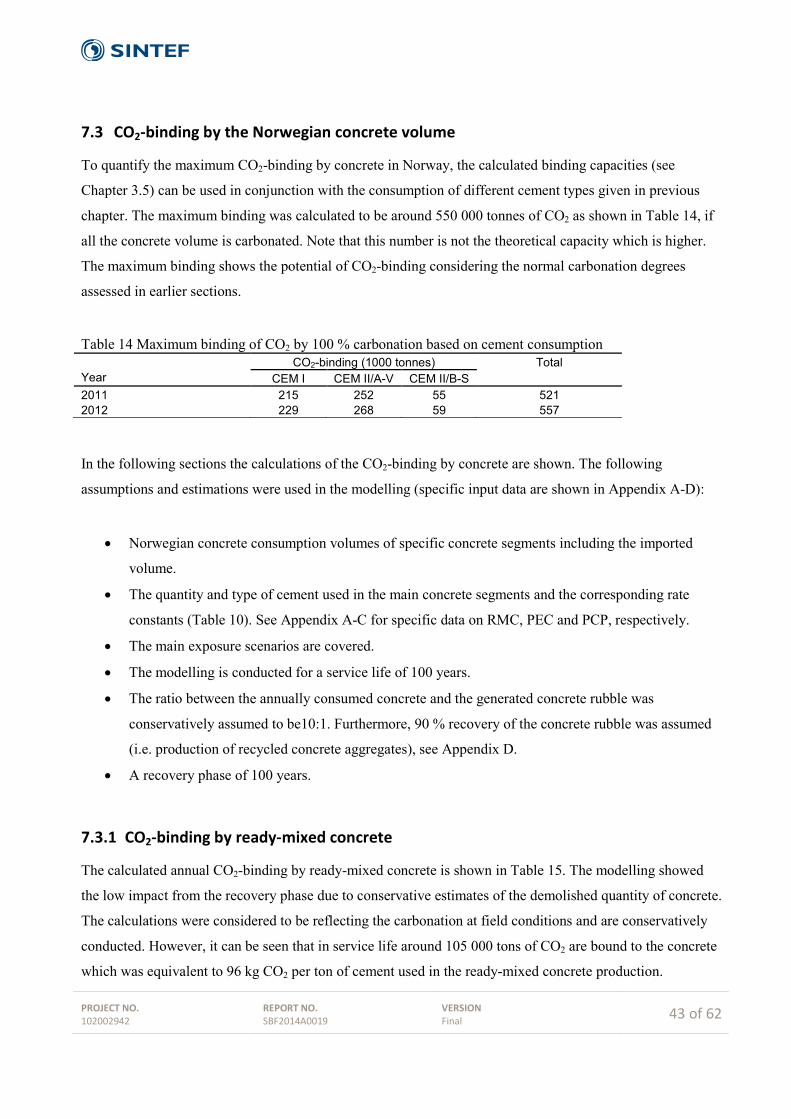
PROJECT NO. 102002942
REPORT NO. SBF2014A0019
VERSION Final
43 of 62
7.3 CO2-binding by the Norwegian concrete volume
To quantify the maximum CO2-binding by concrete in Norway, the calculated binding capacities (see
Chapter 3.5) can be used in conjunction with the consumption of different cement types given in previous
chapter. The maximum binding was calculated to be around 550 000 tonnes of CO2 as shown in Table 14, if
all the concrete volume is carbonated. Note that this number is not the theoretical capacity which is higher.
The maximum binding shows the potential of CO2-binding considering the normal carbonation degrees
assessed in earlier sections.
Table 14 Maximum binding of CO2 by 100 % carbonation based on cement consumption Year
CO2-binding (1000 tonnes) Total CEM I CEM II/A-V CEM II/B-S
2011 215 252 55 521 2012 229 268 59 557 In the following sections the calculations of the CO2-binding by concrete are shown. The following
assumptions and estimations were used in the modelling (specific input data are shown in Appendix A-D):
• Norwegian concrete consumption volumes of specific concrete segments including the imported
volume.
• The quantity and type of cement used in the main concrete segments and the corresponding rate
constants (Table 10). See Appendix A-C for specific data on RMC, PEC and PCP, respectively.
• The main exposure scenarios are covered.
• The modelling is conducted for a service life of 100 years.
• The ratio between the annually consumed concrete and the generated concrete rubble was
conservatively assumed to be10:1. Furthermore, 90 % recovery of the concrete rubble was assumed
(i.e. production of recycled concrete aggregates), see Appendix D.
• A recovery phase of 100 years.
7.3.1 CO2-binding by ready-mixed concrete
The calculated annual CO2-binding by ready-mixed concrete is shown in Table 15. The modelling showed
the low impact from the recovery phase due to conservative estimates of the demolished quantity of concrete.
The calculations were considered to be reflecting the carbonation at field conditions and are conservatively
conducted. However, it can be seen that in service life around 105 000 tons of CO2 are bound to the concrete
which was equivalent to 96 kg CO2 per ton of cement used in the ready-mixed concrete production.
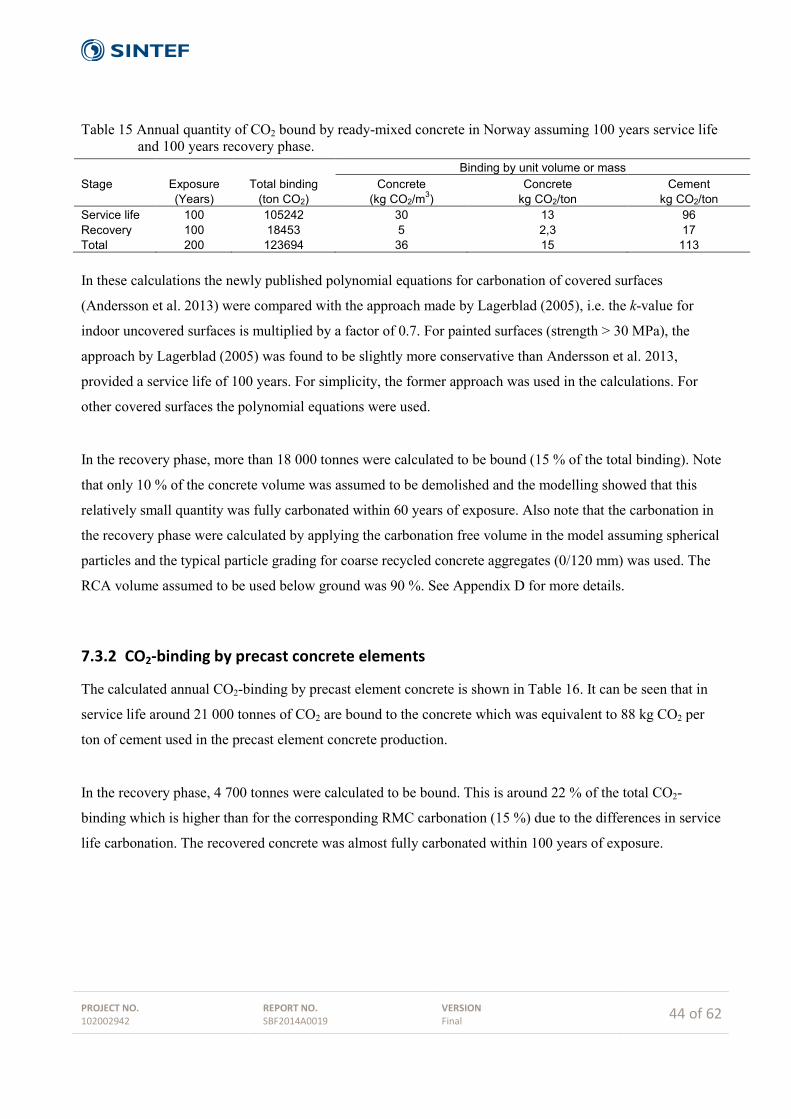
PROJECT NO. 102002942
REPORT NO. SBF2014A0019
VERSION Final
44 of 62
Table 15 Annual quantity of CO2 bound by ready-mixed concrete in Norway assuming 100 years service life and 100 years recovery phase.
Stage
Exposure (Years)
Total binding (ton CO2)
Binding by unit volume or mass Concrete
(kg CO2/m3) Concrete
kg CO2/ton Cement
kg CO2/ton Service life 100 105242 30 13 96 Recovery 100 18453 5 2,3 17 Total 200 123694 36 15 113 In these calculations the newly published polynomial equations for carbonation of covered surfaces
(Andersson et al. 2013) were compared with the approach made by Lagerblad (2005), i.e. the k-value for
indoor uncovered surfaces is multiplied by a factor of 0.7. For painted surfaces (strength > 30 MPa), the
approach by Lagerblad (2005) was found to be slightly more conservative than Andersson et al. 2013,
provided a service life of 100 years. For simplicity, the former approach was used in the calculations. For
other covered surfaces the polynomial equations were used.
In the recovery phase, more than 18 000 tonnes were calculated to be bound (15 % of the total binding). Note
that only 10 % of the concrete volume was assumed to be demolished and the modelling showed that this
relatively small quantity was fully carbonated within 60 years of exposure. Also note that the carbonation in
the recovery phase were calculated by applying the carbonation free volume in the model assuming spherical
particles and the typical particle grading for coarse recycled concrete aggregates (0/120 mm) was used. The
RCA volume assumed to be used below ground was 90 %. See Appendix D for more details.
7.3.2 CO2-binding by precast concrete elements
The calculated annual CO2-binding by precast element concrete is shown in Table 16. It can be seen that in
service life around 21 000 tonnes of CO2 are bound to the concrete which was equivalent to 88 kg CO2 per
ton of cement used in the precast element concrete production.
In the recovery phase, 4 700 tonnes were calculated to be bound. This is around 22 % of the total CO2-
binding which is higher than for the corresponding RMC carbonation (15 %) due to the differences in service
life carbonation. The recovered concrete was almost fully carbonated within 100 years of exposure.

PROJECT NO. 102002942
REPORT NO. SBF2014A0019
VERSION Final
45 of 62
Table 16 Annual quantity of CO2 bound by precast element concrete in Norway assuming 100 years service life and 100 years secondary recovery phase.
Stage
Exposure (Years)
Total binding (ton CO2)
Binding by unit volume or mass Concrete
(kg CO2/m3) Concrete
kg CO2/ton Cement
kg CO2/ton Service life 100 21563 35 15 88 Recovery 100 4767 8 3.4 20 Total 200 26330 43 19 108
7.3.3 CO2-binding by precast concrete products
The calculated annual CO2-binding by precast element concrete is shown in Table 17. It can be seen that in
service life around 13 500 tonnes of CO2 are bound to the concrete which was equivalent to 87 kg CO2 per
ton of cement used in the precast concrete product production.
In the recovery phase, 1900 tonnes were calculated to be bound. The recovered concrete was almost fully
carbonated within 100 years of exposure. The carbonation among the coarsest particles (> 30 mm) was
around 30 %.
Table 17 Annual quantity of CO2 bound by precast concrete product in Norway assuming 100 years service life and 100 years secondary recovery phase.
Stage
Exposure (Years)
Total binding (ton CO2)
Binding by unit volume or mass Concrete
(kg CO2/m3) Concrete
kg CO2/ton Cement
kg CO2/ton Service life 100 13449 32 14 87 Recovery 100 1933 4.6 2.0 13 Total 200 15382 37 16 100
7.3.4 Total CO2-binding
The total CO2-binding for all concrete qualities and segments is given in Table 18. It can be seen that a
significant quantity of CO2 is bound to concrete life-cycle. It is interesting to see that the modelling showed
that the binding during service life was calculated to be 94 kg CO2/ton cement consumed. Considering a
recovery phase with conservative assumptions, the total binding was found to be 111 kg CO2/ton cement
consumed. Considering the share of blended cements consumed on the Norwegian market, the total CO2
emission is around 700 kg CO2/ton cement produced. Hence, around 15 % of the emission is bound during
the life cycle of concrete.
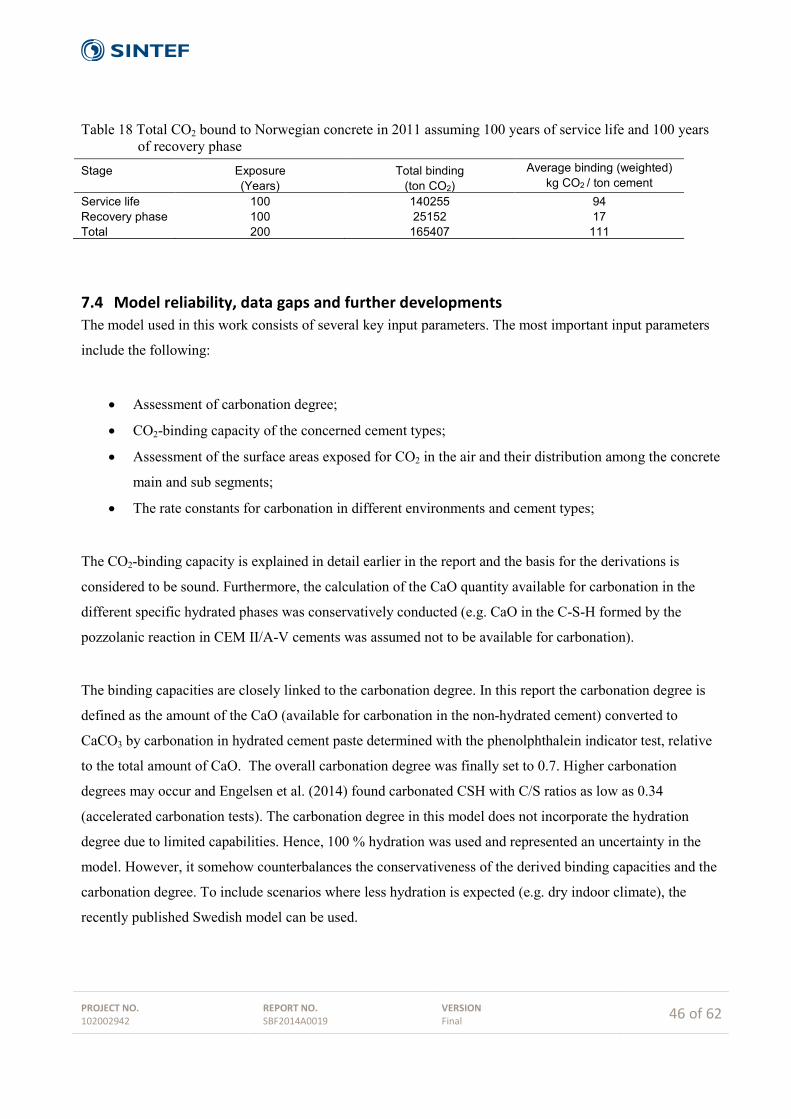
PROJECT NO. 102002942
REPORT NO. SBF2014A0019
VERSION Final
46 of 62
Table 18 Total CO2 bound to Norwegian concrete in 2011 assuming 100 years of service life and 100 years of recovery phase
Stage
Exposure (Years)
Total binding (ton CO2)
Average binding (weighted) kg CO2 / ton cement
Service life 100 140255 94 Recovery phase 100 25152 17 Total 200 165407 111
7.4 Model reliability, data gaps and further developments The model used in this work consists of several key input parameters. The most important input parameters
include the following:
• Assessment of carbonation degree;
• CO2-binding capacity of the concerned cement types;
• Assessment of the surface areas exposed for CO2 in the air and their distribution among the concrete
main and sub segments;
• The rate constants for carbonation in different environments and cement types;
The CO2-binding capacity is explained in detail earlier in the report and the basis for the derivations is
considered to be sound. Furthermore, the calculation of the CaO quantity available for carbonation in the
different specific hydrated phases was conservatively conducted (e.g. CaO in the C-S-H formed by the
pozzolanic reaction in CEM II/A-V cements was assumed not to be available for carbonation).
The binding capacities are closely linked to the carbonation degree. In this report the carbonation degree is
defined as the amount of the CaO (available for carbonation in the non-hydrated cement) converted to
CaCO3 by carbonation in hydrated cement paste determined with the phenolphthalein indicator test, relative
to the total amount of CaO. The overall carbonation degree was finally set to 0.7. Higher carbonation
degrees may occur and Engelsen et al. (2014) found carbonated CSH with C/S ratios as low as 0.34
(accelerated carbonation tests). The carbonation degree in this model does not incorporate the hydration
degree due to limited capabilities. Hence, 100 % hydration was used and represented an uncertainty in the
model. However, it somehow counterbalances the conservativeness of the derived binding capacities and the
carbonation degree. To include scenarios where less hydration is expected (e.g. dry indoor climate), the
recently published Swedish model can be used.
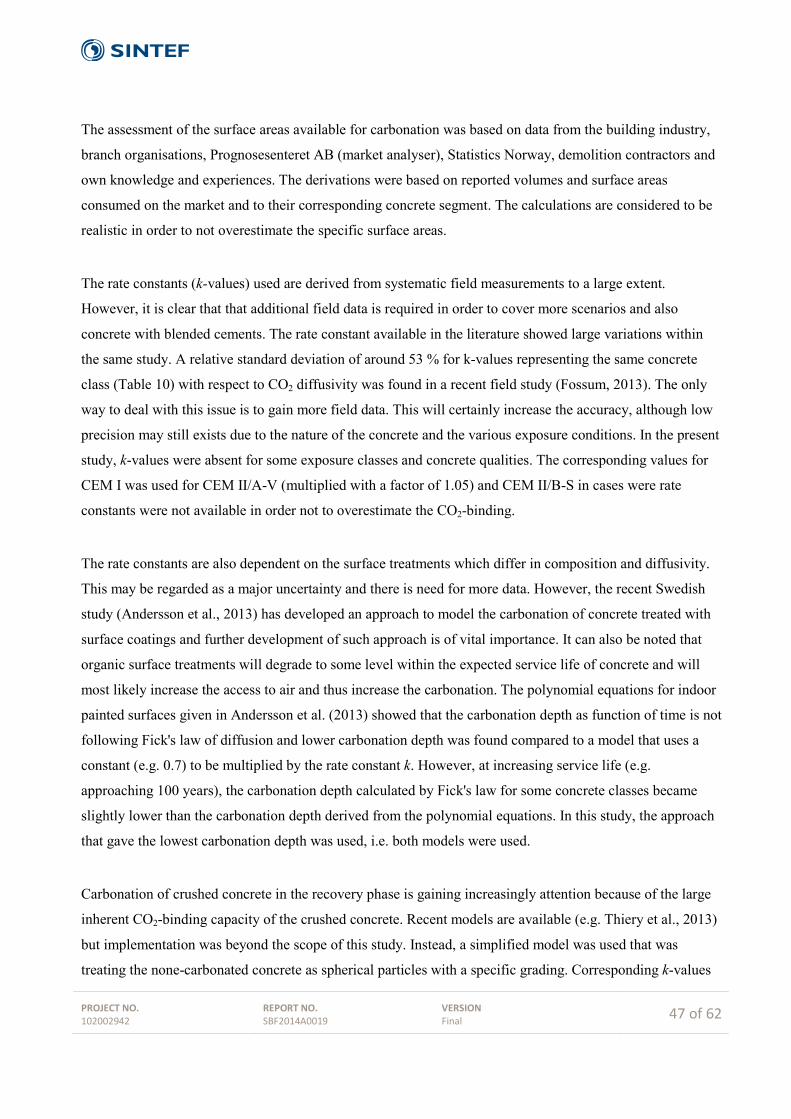
PROJECT NO. 102002942
REPORT NO. SBF2014A0019
VERSION Final
47 of 62
The assessment of the surface areas available for carbonation was based on data from the building industry,
branch organisations, Prognosesenteret AB (market analyser), Statistics Norway, demolition contractors and
own knowledge and experiences. The derivations were based on reported volumes and surface areas
consumed on the market and to their corresponding concrete segment. The calculations are considered to be
realistic in order to not overestimate the specific surface areas.
The rate constants (k-values) used are derived from systematic field measurements to a large extent.
However, it is clear that that additional field data is required in order to cover more scenarios and also
concrete with blended cements. The rate constant available in the literature showed large variations within
the same study. A relative standard deviation of around 53 % for k-values representing the same concrete
class (Table 10) with respect to CO2 diffusivity was found in a recent field study (Fossum, 2013). The only
way to deal with this issue is to gain more field data. This will certainly increase the accuracy, although low
precision may still exists due to the nature of the concrete and the various exposure conditions. In the present
study, k-values were absent for some exposure classes and concrete qualities. The corresponding values for
CEM I was used for CEM II/A-V (multiplied with a factor of 1.05) and CEM II/B-S in cases were rate
constants were not available in order not to overestimate the CO2-binding.
The rate constants are also dependent on the surface treatments which differ in composition and diffusivity.
This may be regarded as a major uncertainty and there is need for more data. However, the recent Swedish
study (Andersson et al., 2013) has developed an approach to model the carbonation of concrete treated with
surface coatings and further development of such approach is of vital importance. It can also be noted that
organic surface treatments will degrade to some level within the expected service life of concrete and will
most likely increase the access to air and thus increase the carbonation. The polynomial equations for indoor
painted surfaces given in Andersson et al. (2013) showed that the carbonation depth as function of time is not
following Fick's law of diffusion and lower carbonation depth was found compared to a model that uses a
constant (e.g. 0.7) to be multiplied by the rate constant k. However, at increasing service life (e.g.
approaching 100 years), the carbonation depth calculated by Fick's law for some concrete classes became
slightly lower than the carbonation depth derived from the polynomial equations. In this study, the approach
that gave the lowest carbonation depth was used, i.e. both models were used.
Carbonation of crushed concrete in the recovery phase is gaining increasingly attention because of the large
inherent CO2-binding capacity of the crushed concrete. Recent models are available (e.g. Thiery et al., 2013)
but implementation was beyond the scope of this study. Instead, a simplified model was used that was
treating the none-carbonated concrete as spherical particles with a specific grading. Corresponding k-values
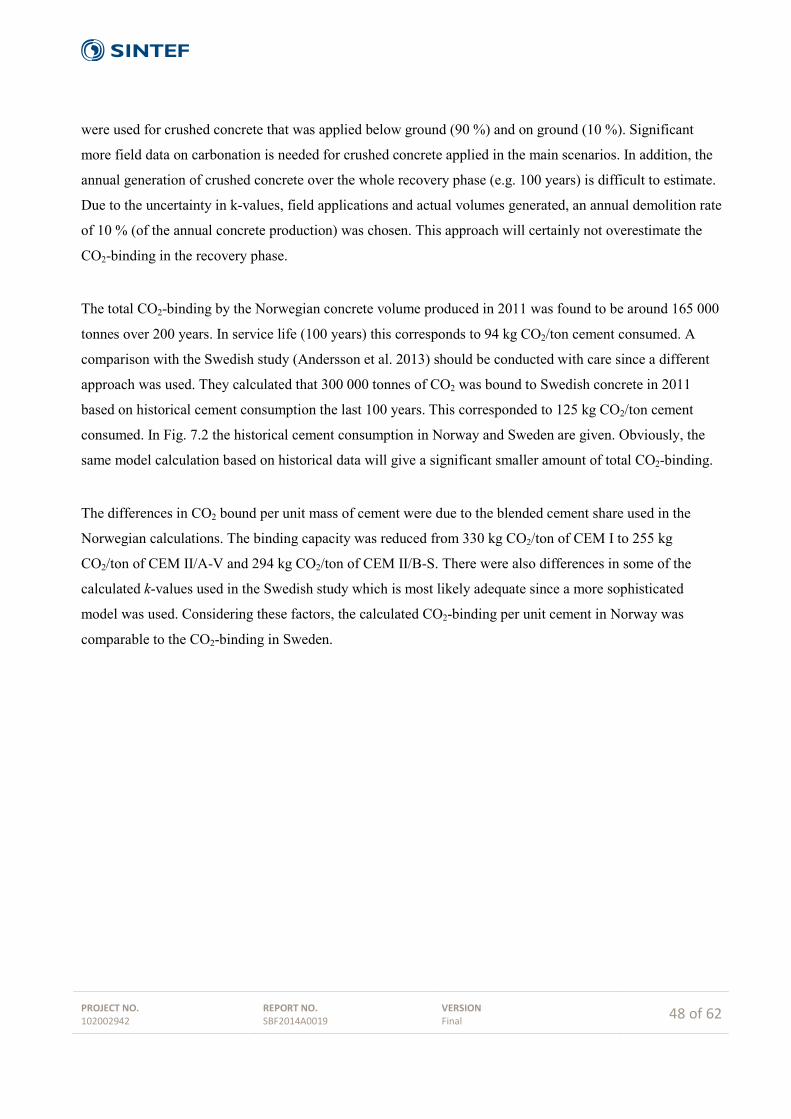
PROJECT NO. 102002942
REPORT NO. SBF2014A0019
VERSION Final
48 of 62
were used for crushed concrete that was applied below ground (90 %) and on ground (10 %). Significant
more field data on carbonation is needed for crushed concrete applied in the main scenarios. In addition, the
annual generation of crushed concrete over the whole recovery phase (e.g. 100 years) is difficult to estimate.
Due to the uncertainty in k-values, field applications and actual volumes generated, an annual demolition rate
of 10 % (of the annual concrete production) was chosen. This approach will certainly not overestimate the
CO2-binding in the recovery phase.
The total CO2-binding by the Norwegian concrete volume produced in 2011 was found to be around 165 000
tonnes over 200 years. In service life (100 years) this corresponds to 94 kg CO2/ton cement consumed. A
comparison with the Swedish study (Andersson et al. 2013) should be conducted with care since a different
approach was used. They calculated that 300 000 tonnes of CO2 was bound to Swedish concrete in 2011
based on historical cement consumption the last 100 years. This corresponded to 125 kg CO2/ton cement
consumed. In Fig. 7.2 the historical cement consumption in Norway and Sweden are given. Obviously, the
same model calculation based on historical data will give a significant smaller amount of total CO2-binding.
The differences in CO2 bound per unit mass of cement were due to the blended cement share used in the
Norwegian calculations. The binding capacity was reduced from 330 kg CO2/ton of CEM I to 255 kg
CO2/ton of CEM II/A-V and 294 kg CO2/ton of CEM II/B-S. There were also differences in some of the
calculated k-values used in the Swedish study which is most likely adequate since a more sophisticated
model was used. Considering these factors, the calculated CO2-binding per unit cement in Norway was
comparable to the CO2-binding in Sweden.

PROJECT NO. 102002942
REPORT NO. SBF2014A0019
VERSION Final
49 of 62
Fig. 7.2 Historical cement consumption in Norway and Sweden
8 Suggestions for future work
Limitations and uncertainties in the model were discussed in the previous section. It became clear that the
calculations conducted in this study were on the conservative side, i.e. the risk for overestimation is low. To
strengthen the model some activities are suggested in the following.
It is suggested to gain more field data on blended cement concrete. This is also important for cements with
higher amount than 20 % fly ash (quantity normally used in Norway). It includes to improve the existing k-
values and also to develop k-values that are lacking for certain concrete qualities and scenarios. Moreover,
further improvements in describing the diffusivity of different surface coatings will increase the accuracy of
the CO2-binding model. Preferably, the developments should lead to a user friendly and reliable model
applicable for the most important surface coatings. Systematic field investigations regarding this issue will
be valuable.
The previous section also revealed that there are strong needs for more information regarding carbonation in
the recovery phases. It is suggested to investigate different construction sites were RCA is used (e.g. road
construction, utility trenches, etc.). Investigation at demolition sites where the concrete rubble is backfilled
will also provide valuable information as this is a frequent recovery scenario today. By providing more
insight of the carbonation in the recovery phase and its CO2-binding potential, it may result in increased
recovery of concrete rubble in more higher-value applications like applying recycled concrete aggregates
0
500 000
1 000 000
1 500 000
2 000 000
2 500 000
3 000 000
3 500 000
4 000 000
4 500 000
1900 1920 1940 1960 1980 2000 2020Annu
al c
emen
t con
sum
ptio
n (to
ns)
Year
Norwegian consumptionSwedish consumption

PROJECT NO. 102002942
REPORT NO. SBF2014A0019
VERSION Final
50 of 62
with a specific grading in road sub-base compared to backfilling of concrete rubble at the demolition site.
The recovered concrete in the former scenario will bind more CO2 due to smaller particle size.
9 Conclusion The current knowledge regarding the concrete carbonation rate and carbonation degree has been
summarised. The findings were used in CO2-binding estimates for Norwegian concrete stock using current
state of the art knowledge. Based on the recent studies available, the knowledge has significantly increased
the last 5-10 years regarding the capability to estimate the binding of CO2 by concrete carbonation. This
included better insight of the carbonation mechanisms, increased quantity of field data, and developments of
models that calculate the CO2-binding by concrete in service life and in the recovery phase. These
developments have resulted in more accurate and reliable CO2-binding assessments than earlier attempts.
Moreover, the increased knowledge has contributed to develop models that treat key parameters (e.g.
hydration degree) in a more systematic way than earlier. As more field data will be available, model
modification can easily be conducted to still improve the prediction of CO2-binding by concrete k-values
provided for Norwegian cement and concrete types.
It was found that the derivation of CO2-binding capacities was convenient and important to differentiate
between the Portland cement and the blended cements. In the present study the binding capacities for CEM I,
CEM II/A-V and CEM II/B-S were found to be 330, 255 and 294 kg CO2/ton of cement, respectively. The
approach can easily be used to derive binding capacities for other cement types as well. Furthermore, the
binding capacities will be valuable in view of the strong shift from Portland cement to blended cements in
Europe the past 10-20 years.
By using the binding capacities in the model, it was found that the Norwegian concrete stock built in 2011
will bind around 165 000 tonnes CO2 assuming a service life and a recovery phase of 100 years each. Most
of the CO2 will be bound in service life, as the model calculated the binding to be 140 000 tonnes in this
phase. Furthermore, it was found that the specific CO2-binding to cement was 111 kg CO2/ton of cement
consumed, for which 94 kg CO2/ton of cement was bound in the service life of concrete. The model
calculations were considered to be conservative in order to avoid an overestimation. The calculated CO2-
binding per unit cement in Norway can be regarded to be roughly in the same range as the CO2-binding in
Sweden given the fact that a significant larger share of blended cement was used in the Norwegian model.
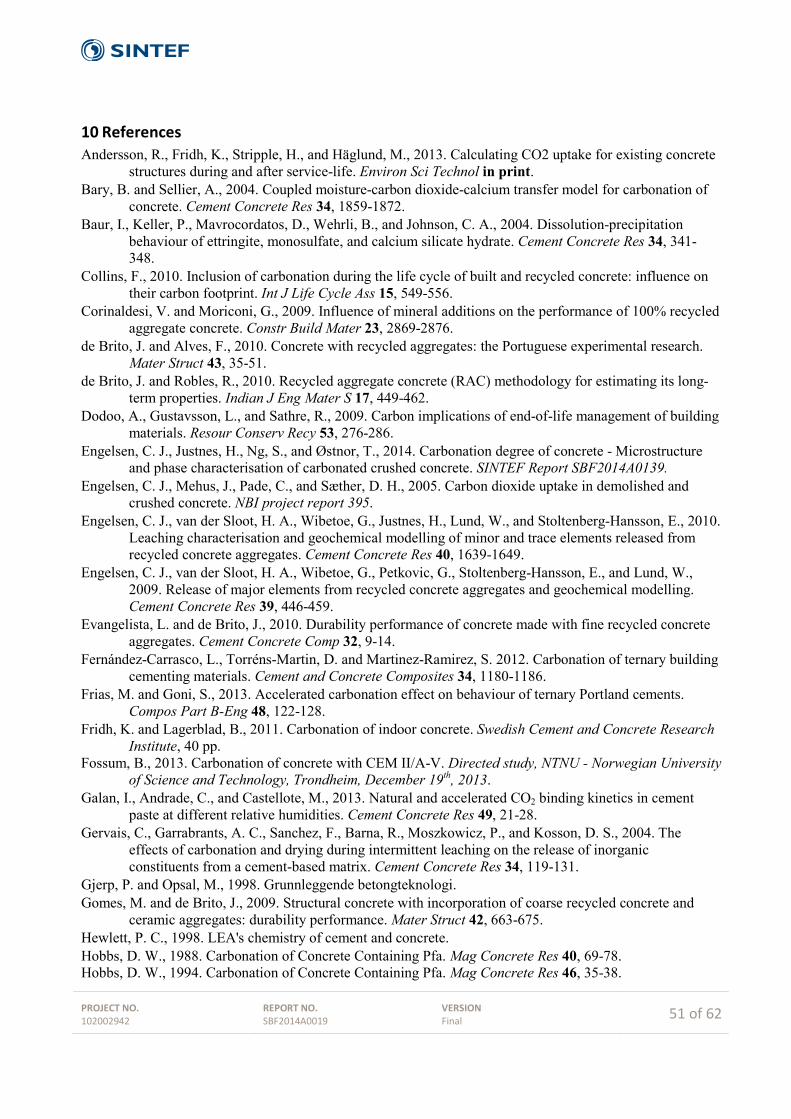
PROJECT NO. 102002942
REPORT NO. SBF2014A0019
VERSION Final
51 of 62
10 References Andersson, R., Fridh, K., Stripple, H., and Häglund, M., 2013. Calculating CO2 uptake for existing concrete
structures during and after service-life. Environ Sci Technol in print. Bary, B. and Sellier, A., 2004. Coupled moisture-carbon dioxide-calcium transfer model for carbonation of
concrete. Cement Concrete Res 34, 1859-1872. Baur, I., Keller, P., Mavrocordatos, D., Wehrli, B., and Johnson, C. A., 2004. Dissolution-precipitation
behaviour of ettringite, monosulfate, and calcium silicate hydrate. Cement Concrete Res 34, 341-348.
Collins, F., 2010. Inclusion of carbonation during the life cycle of built and recycled concrete: influence on their carbon footprint. Int J Life Cycle Ass 15, 549-556.
Corinaldesi, V. and Moriconi, G., 2009. Influence of mineral additions on the performance of 100% recycled aggregate concrete. Constr Build Mater 23, 2869-2876.
de Brito, J. and Alves, F., 2010. Concrete with recycled aggregates: the Portuguese experimental research. Mater Struct 43, 35-51.
de Brito, J. and Robles, R., 2010. Recycled aggregate concrete (RAC) methodology for estimating its long-term properties. Indian J Eng Mater S 17, 449-462.
Dodoo, A., Gustavsson, L., and Sathre, R., 2009. Carbon implications of end-of-life management of building materials. Resour Conserv Recy 53, 276-286.
Engelsen, C. J., Justnes, H., Ng, S., and Østnor, T., 2014. Carbonation degree of concrete - Microstructure and phase characterisation of carbonated crushed concrete. SINTEF Report SBF2014A0139.
Engelsen, C. J., Mehus, J., Pade, C., and Sæther, D. H., 2005. Carbon dioxide uptake in demolished and crushed concrete. NBI project report 395.
Engelsen, C. J., van der Sloot, H. A., Wibetoe, G., Justnes, H., Lund, W., and Stoltenberg-Hansson, E., 2010. Leaching characterisation and geochemical modelling of minor and trace elements released from recycled concrete aggregates. Cement Concrete Res 40, 1639-1649.
Engelsen, C. J., van der Sloot, H. A., Wibetoe, G., Petkovic, G., Stoltenberg-Hansson, E., and Lund, W., 2009. Release of major elements from recycled concrete aggregates and geochemical modelling. Cement Concrete Res 39, 446-459.
Evangelista, L. and de Brito, J., 2010. Durability performance of concrete made with fine recycled concrete aggregates. Cement Concrete Comp 32, 9-14.
Fernández-Carrasco, L., Torréns-Martin, D. and Martinez-Ramirez, S. 2012. Carbonation of ternary building cementing materials. Cement and Concrete Composites 34, 1180-1186.
Frias, M. and Goni, S., 2013. Accelerated carbonation effect on behaviour of ternary Portland cements. Compos Part B-Eng 48, 122-128.
Fridh, K. and Lagerblad, B., 2011. Carbonation of indoor concrete. Swedish Cement and Concrete Research Institute, 40 pp.
Fossum, B., 2013. Carbonation of concrete with CEM II/A-V. Directed study, NTNU - Norwegian University of Science and Technology, Trondheim, December 19th, 2013.
Galan, I., Andrade, C., and Castellote, M., 2013. Natural and accelerated CO2 binding kinetics in cement paste at different relative humidities. Cement Concrete Res 49, 21-28.
Gervais, C., Garrabrants, A. C., Sanchez, F., Barna, R., Moszkowicz, P., and Kosson, D. S., 2004. The effects of carbonation and drying during intermittent leaching on the release of inorganic constituents from a cement-based matrix. Cement Concrete Res 34, 119-131.
Gjerp, P. and Opsal, M., 1998. Grunnleggende betongteknologi. Gomes, M. and de Brito, J., 2009. Structural concrete with incorporation of coarse recycled concrete and
ceramic aggregates: durability performance. Mater Struct 42, 663-675. Hewlett, P. C., 1998. LEA's chemistry of cement and concrete. Hobbs, D. W., 1988. Carbonation of Concrete Containing Pfa. Mag Concrete Res 40, 69-78. Hobbs, D. W., 1994. Carbonation of Concrete Containing Pfa. Mag Concrete Res 46, 35-38.

PROJECT NO. 102002942
REPORT NO. SBF2014A0019
VERSION Final
52 of 62
Huijgen, W. J. J., Witkamp, G. J., and Comans, R. N. J., 2005. Mineral CO2 sequestration by steel slag carbonation. Environ Sci Technol 39, 9676-9682.
Hunkeler, F. and Baurle, L., 2010. Corrosion Resistance of a Stainless Chromium-Steel in Carbonated Ordinary, Light-Weight and Recovery Concrete. Beton- Stahlbetonbau 105, 797-804.
Iwabuchi, N., Takahashi, N., Xiao, J. Z., Yonezawa, S., Yaeshima, T., Iwatsuki, K., and Hachimura, S., 2009. Suppressive effects of Bifidobacterium longum on the production of Th2-attracting chemokines induced with T cell-antigen-presenting cell interactions. Fems Immunol Med Mic 55, 324-334.
Jacobsen, S. and Jahren, P., 2001. Binding of CO2 by Carbonation of Norwegian OPC Concrete. Canmet/ACI three days symposium on sustainable development and concrete technology, San Francisco, USA, September 16-19.
Jahren, P., 1998. : Sustainable development for the cement and concrete Industry. Betong Industrien 4 (in Norwegian).
Jahren, P., 2007. Long-term experience with silica fume in concrete. Ninth CANMET/ACI International Conference on Fly Ash, Silica Fume, Slag and Natural Pozzolans in Concrete,Warsaw, Poland May 20-25, pp 9.
Jahren, P. and Tongbo, S., 2013. Concrete and Sustainability. Taylor & Francis Inc pp 462. Jones, M. R., Dhir, R. K., Newlands, M. D., and Abbas, A. M. O., 2000. A study of the CEN test method for
measurement of the carbonation depth of hardened concrete. Mater Struct 33, 135-142. Justnes, H., Sellevold, E.J. and Lundevall, G., 1992. High Strength Concrete Binders. Part A: Reactivity and
Composition of Cement Pastes with and without Condensed Silica Fume. 4th International Conference on Fly Ash, Silica Fume, Slag and Natural Pozzolana in Concrete, Istanbul, May 3-8, 1992, CANMET/ACI SP 132-47 (Volume 2) pp. 873-889.
Kikuchi, T. and Kuroda, Y., 2011. Carbon dioxide uptake in demolished and crushed concrete. Journal of Advanced Concrete Technology 9, 115-124. Kjellsen, K. O., Guimaraes, M., and Nilsson, Å., 2005. The CO2 Balance of Concrete in a Life Cycle
Perspective. Nordic Innovation Centre project, ISBN: 87-7756-758-7. Lagerblad, B., 2005. Carbon Dioxide Uptake during Concrete life cycle CBI report. Lagerblad, B., 2008. Carbonation of low pH silica concrete. Swedish Cement and Concrete Research
Institute, Report No. 2008-167. Lagerblad, B., 2011. Mechanism and mode of carbonation of cementitious materials. Swedish Cement and
Concrete Research Institute, Sweden, 28 pp. Lagerblad, B., 2012. Mechanism of carbonation. Internationalle Bausofftagung (ibausil) Weimar; 12-15
September 2012. Levy, S. M. and Helene, P., 2004. Durability of recycled aggregates concrete: a safe way to sustainable
development. Cement Concrete Res 34, 1975-1980. Lim, M., Han, G. C., Ahn, J. W., and You, K. S., 2010. Environmental Remediation and Conversion of
Carbon Dioxide (CO2) into Useful Green Products by Accelerated Carbonation Technology. Int J Env Res Pub He 7, 203-228.
Limbachiya, M., Meddah, M. S., and Ouchagour, Y., 2012a. Performance of Portland/Silica Fume Cement Concrete Produced with Recycled Concrete Aggregate. Aci Mater J 109, 91-100.
Limbachiya, M., Meddah, M. S., and Ouchagour, Y., 2012b. Use of recycled concrete aggregate in fly-ash concrete. Constr Build Mater 27, 439-449.
Liu, K., Zhang, X. Y., and Xiao, J. Z., 2009. Effects of Interfacial Polarization on Voltage Tunability of Pb(Fe1/2Nb1/2)(1-x)TixO3 Single Crystals. Chinese Phys Lett 26.
Lovato, P. S., Possan, E., Dal Molin, D. C. C., Masuero, A. B., and Ribeiro, J. L. D., 2012. Modeling of mechanical properties and durability of recycled aggregate concretes. Constr Build Mater 26, 437-447.
Maage, M. and Skjølsvold, O., 1983. Carbonation of concrete with and without silica fume. SINTEF Report STF65 A83090 (in Norwegian).

PROJECT NO. 102002942
REPORT NO. SBF2014A0019
VERSION Final
53 of 62
Maage, M. and Smedplass, S., 2001. A probabilistic approach to derive provisions for EN 206-1. DuraNet Third workshop on the theme: Service Life Design of Concrete Structures - From Theory to standardisation, Tromsø 10-12 June, Norway.
Meland, I., 1985. Carbonation in fly ash cement and in standard Portland cement with and without silica fume. SINTEF Report STF65 A85049 (in Norwegian).
Medina, C., Frias, M., de Rojas, M. I. S., Thomas, C., and Polanco, J. A., 2012. Gas permeability in concrete containing recycled ceramic sanitary ware aggregate. Constr Build Mater 37, 597-605.
Nagataki, S., 1986. Effect of curing conditions on carbonation and corrosion in fly ash concrete. ACI SP-91 Madrid Proceedings1986 V1 521-540.
Neves, R., Branco, F., and de Brito, J., 2013. Field assessment of the relationship between natural and accelerated concrete carbonation resistance. Cement Concrete Comp 41, 9-15.
Nilsson, L.-O., 2011a. CO2-cycle in cement and concrete. Part 7: Models for CO2-absorption. A new model for CO2-absorption of concrete structures. Lund Institute of Technology, Report TVBM-3158, 33.
Nilsson, L.-O., 2011b. A new model for CO2-absorption of concrete structures. Lund Institute of Technology, Report TVBM-3158.
Nilsson, L.-O. and Fridh, K., 2009. CO2-cycle in cement and concrete Part 1: Examination of a previous NIC-project Part 2: Further literature study on mechanisms/models. Lund Institute of Technology, Report TVBM-7201, 18.
Otsuki, N., Miyazato, S., and Yodsudjai, W., 2003. Influence of recycled aggregate on interfacial transition zone, strength, chloride penetration and carbonation of concrete. J Mater Civil Eng 15, 443-451.
Rilem, 1988. RILEM RECOMMENDATIONS CPC-18 Measurement of hardened concrete carbonation depth. Mater Struct, 453-455.
Roziere, E., Loukili, A., and Cussigh, F., 2009. A performance based approach for durability of concrete exposed to carbonation. Constr Build Mater 23, 190-199.
Sagoe-Crentsil, K. K., Brown, T., and Taylor, A. H., 2001. Performance of concrete made with commercially produced coarse recycled concrete aggregate. Cement Concrete Res 31, 707-712.
Sanchez, F., White, M. K. L., and Hoang, A., 2009. Leaching from granular cement-based materials during infiltration/wetting coupled with freezing and thawing. J Environ Manage 90, 983-993.
Silva, R. V., de Brito, J., and Saikia, N., 2013. Influence of curing conditions on the durability-related performance of concrete made with selected plastic waste aggregates. Cement Concrete Comp 35, 23-31.
Sim, J. and Park, C., 2011. Compressive strength and resistance to chloride ion penetration and carbonation of recycled aggregate concrete with varying amount of fly ash and fine recycled aggregate. Waste Manage 31, 2352-2360.
Statistics Norway 2014. Waste generated from construction, rehabilitation and demolition of buildings in 2012 (Table 2), Statistics Norway. http://www.ssb.no/natur-og-miljo/statistikker/avfbygganl/aar/2014-01-29?fane=tabell&sort=nummer&tabell=160587, accessed March 2014.
Talukdar, S. and Banthia, N., 2013. Carbonation in concrete infrastructure in the context of global climate change:, Development of a service lifespan model. Constr Build Mater 40, 775-782.
Talukdar, S., Banthia, N., and Grace, J. R., 2012a. Carbonation in concrete infrastructure in the context of global climate change - Part 1: Experimental results and model development. Cement Concrete Comp 34, 924-930.
Talukdar, S., Banthia, N., Grace, J. R., and Cohen, S., 2012b. Carbonation in concrete infrastructure in the context of global climate change: Part 2-Canadian urban simulations. Cement Concrete Comp 34, 931-935.
Thiery, M., Dangla, P., Belin, P., Habert, G., and Roussel, N., 2013. Carbonation kinetics of a bed of recycled concrete aggregates: A laboratory study on model materials. Cement Concrete Res 46, 50-65.

PROJECT NO. 102002942
REPORT NO. SBF2014A0019
VERSION Final
54 of 62
Torgal, F. P., Miraldo, S., Labrincha, J. A., and De Brito, J., 2012. An overview on concrete carbonation in the context of eco-efficient construction: Evaluation, use of SCMs and/or RAC. Constr Build Mater 36, 141-150.
Van Balen, K., 2005. Carbonation reaction of lime, kinetics at ambient temperature. Cement Concrete Res 35, 647-657.
Van Gerven, T., Van Baelen, D., Dutre, V., and Vandecasteele, C., 2004. Influence of carbonation and carbonation methods on leaching of metals from mortars. Cement Concrete Res 34, 149-156.
Villain, G. and Platret, G., 2006. Two experimental methods to determine carbonation profiles in concrete. Aci Mater J 103, 265-271.
Villain, G., Thiery, M., and Platret, G., 2007. Measurement methods of carbonation profiles in concrete: Thermogravimetry, chemical analysis and gammadensimetry. Cement Concrete Res 37, 1182-1192.
Wei, W., Mao, J., Peng, Z., Xiao, J. Z., Liu, Y., Gong, S. Q., Wang, D., and Zhou, B., 2009. High-resolution X-ray microdiffraction analysis of NaOH-treated dentin. J Appl Crystallogr 42, 616-620.
Wierig, H.-J., 1984. Longtime studies on the carbonation of concrete under normal outdoor exposure. Proceedings of Rilem Seminar on the Durability of concretestructures under normal outdoor exposure, Hanover, March 1984, pp. 239-249.
Xiao, J. Z., Lei, B., and Zhang, C. Z., 2012. On carbonation behavior of recycled aggregate concrete. Sci China Technol Sc 55, 2609-2616.
Xiao, J. Z., Wu, A. Y., Vilarinho, P. M., Ramos, A. R., and Alves, E., 2009. Electrical properties of sol-gel derived MPB 0.37BiScO(3)-0.63PbTiO(3) thin films deposited on iridium oxide electrodes. J Mater Chem 19, 5572-5579.
Xiao, J. Z. and Zhu, X. H., 2009a. Conjugate topology of pointwise metric molecular lattices. Fuzzy Set Syst 160, 1256-1266.
Xiao, J. Z. and Zhu, X. H., 2009b. Metric topology on the L-fuzzy real line. Fuzzy Set Syst 160, 1267-1276. Yang, Z. J., Xiao, J. Z., Bu, S., Ruan, D. J., Li, Y. F., Wang, N., and Yang, W. Y., 2009. Markers of Liver
Dysfunction and Risk of Type 2 Diabetes in Chinese Adult Population. Diabetes 58, A580-A580. Zega, C. J. and Di Maio, A. A., 2011. Use of recycled fine aggregate in concretes with durable requirements.
Waste Manage 31, 2336-2340. Zhang, Z. X., Feng, X. L., Mao, J., Xiao, J. Z., Liu, C. M., and Qiu, J. J., 2009. In vitro cytotoxicity of a
novel injectable and biodegradable alveolar bone substitute. Biochem Bioph Res Co 379, 557-561. Zhao, P., Chen, J. H., and Xiao, J. Z., 2009. Determination of Anionic Surfactants in Waters by On-line
Double Microporous Membrane Extraction-Flow Injection Spectrophotometry. Chinese J Anal Chem 37, 1853-1856.
Zhu, Y. G., Kou, S. C., Poon, C. S., Dai, J. G., and Li, Q. Y., 2013. Influence of silane-based water repellent on the durability properties of recycled aggregate concrete. Cement Concrete Comp 35, 32-38.
Østnor, T., Justnes, H., and Rudolfsen, S. R., 2013. Strength development and durability of mortars with calcined marl as supplementary cementing material. Proceedings of the 1st International Conference on Concrete Sustainability, Paper S2-4-1, pp. 567-572, May 27-29, 2013, Tokyo, Japan. (ISBN 978-4-86384-041-6-C3050).

PRO
JECT
NO
. 10
2002
942
REPO
RT N
O.
SBF2
014A
0019
VERS
ION
Fi
nal
55 o
f 62
Appe
ndix
A. R
eady
mix
ed c
oncr
ete
data
in 2
011
Tabl
e A
.1 C
oncr
ete
cons
umpt
ion
Coc
rete
Cla
ss
Vol
ume
(100
0 m
3)
B10
2
B25
(+B
20)+
B30
19
17
B35
11
08
B45
44
8 B
55-B
95
8 R
est
10

PRO
JECT
NO
. 10
2002
942
REPO
RT N
O.
SBF2
014A
0019
VERS
ION
Fi
nal
56 o
f 62
Ta
ble
A.2
Dat
a fo
r cal
cula
ting
the
bind
ing
of C
O2 b
y re
ady
mix
ed c
oncr
ete
in N
orw
ay. C
emen
t con
tent
s use
d ar
e of
305
kg/
m3 (C
EM I)
and
315
kg/
m3
(CEM
II/A
-V a
nd C
EM II
/B-S
) for
B25
/B30
and
350
kg/
m3
for B
35-
95 (c
ontin
ues o
n ne
xt p
age)
.
Con
cret
eM
ain
scen
ario
Dis
trib
utio
nC
lass
Cla
ssC
lass
Cla
ssC
lass
Cla
ssTh
ickn
ess
Tota
l exp
osed
Tota
l exp
osed
Segm
ent
with
inB
25/B
30B
25/B
30B
25/B
30B
35-B
95B
35-B
95B
35-B
95ar
eaar
ease
gmen
tC
EM I
CEM
II/A
-VC
EM II
/A-S
CEM
IC
EM II
/A-V
CEM
II/A
-SC
EM I
CEM
II/A
-V≥2
5-35
≥25-
35≥2
5-35
≥ B
35≥
B35
≥ B
35≥2
5-35
≥25-
35%
m3
m3
m3
m3
m3
m3
mm
2m
2w
alls
indo
or12
1225
9422
0668
6538
30,
1813
6215
024
5187
0w
alls
indo
or p
aint
7,0
7355
613
2401
3923
00,
1881
7290
1471
122
wal
lsIn
door
cov
ered
4,7
4903
788
267
2615
30,
1854
4860
9807
48w
alls
outd
oor s
helte
red
5,9
6129
711
0334
3269
20,
1868
1075
1225
935
wal
lsou
tdoo
r10
1021
6118
3890
5448
60,
1811
3512
520
4322
5sl
abs
indo
or12
1271
3422
8841
6780
50,
2012
7134
022
8841
2sl
abs
indo
or p
aint
ed7,
376
280
1373
0540
683
0,20
7628
0413
7304
7sl
abs
indo
or c
over
ed4,
950
854
9153
627
122
0,20
5085
3691
5365
slab
sou
tdoo
r she
ltere
d1,
515
892
2860
584
760,
2015
8918
2860
52sl
abs
outd
oor
4,6
4767
585
815
2542
70,
2047
6753
8581
55fo
unda
tion
burie
d8,
790
810
1634
5848
432
0,24
7567
5013
6215
0fo
unda
tion
wet
8,7
9081
016
3458
4843
20,
2475
6750
1362
150
stru
ctur
esou
tdoo
r she
ltere
d2,
627
360
4924
814
592
0,40
stru
ctur
esou
tdoo
r5,
254
720
9849
629
184
0,40
stru
ctur
esbu
ried
2,6
2736
049
248
1459
20,
40st
ruct
ures
wet
2,6
2736
049
248
1459
20,
40S
ub to
tal
100
9081
0016
3458
048
4320
1368
0024
6240
7296
092
3235
016
6182
30To
tal
3483
000
3305
4500

PRO
JECT
NO
. 10
2002
942
REPO
RT N
O.
SBF2
014A
0019
VERS
ION
Fi
nal
57 o
f 62
Ta
ble
A.2
Dat
a fo
r cal
cula
ting
the
bind
ing
of C
O2 b
y re
ady
mix
ed c
oncr
ete
in N
orw
ay. C
emen
t con
tent
s use
d ar
e of
305
kg/
m3 (C
EM I)
and
315
kg/
m3
(CEM
II/A
-V a
nd C
EM II
/B-S
) for
B25
/B30
and
350
kg/
m3 fo
r B 3
5-95
(con
tinue
d fr
om p
revi
ous p
age)
.
Tota
l exp
osed
Tota
l exp
osed
Tota
l exp
osed
Tota
l exp
osed
Expo
sed
Area
Cho
sen
Cho
sen
area
area
area
area
side
svo
lum
ek-
valu
ek-
valu
eC
EM II
/A-S
CEM
IC
EM II
/A-V
CEM
II/A
-Sra
tiom
/y0,
5m
/y0,
5≥2
5-35
≥ B
35≥
B35
≥ B
35≥2
5-35
≥25-
35≥2
5-35
≥ B
35≥
B35
≥ B
35m
2m
2m
2m
2C
EM I
CEM
II/A
-VC
EM II
/A-S
CEM
IC
EM II
/A-V
CEM
II/A
-S72
6480
20,
0054
0,00
770,
0054
4358
882
0,00
400,
0054
0,00
4029
0592
20,
0020
0,00
200,
0020
3632
402
0,00
440,
0046
0,00
4460
5400
20,
0017
0,00
240,
0017
6780
482
0,00
540,
0077
0,00
5440
6829
20,
0040
0,00
540,
0040
2712
192
0,00
200,
0020
0,00
2084
756
20,
0044
0,00
460,
0044
2542
682
0,00
170,
0017
0,00
1740
3600
20,
0011
0,00
120,
0011
4036
002
0,00
083
0,00
087
0,00
083
1368
0024
6240
7296
02
0,00
275
0,00
289
0,00
275
2736
0049
2480
1459
202
0,00
110
0,00
116
0,00
110
1368
0024
6240
7296
02
0,00
083
0,00
087
0,00
083
1368
0024
6240
7296
02
0,00
055
0,00
058
0,00
055
4923
920
6840
0012
3120
036
4800
9,5

PRO
JECT
NO
. 10
2002
942
REPO
RT N
O.
SBF2
014A
0019
VERS
ION
Fi
nal
58 o
f 62
Appe
ndix
B.
Prec
ast e
lem
ent c
oncr
ete
data
in 2
011
Tabl
e B
.1 D
ata
for c
alcu
latin
g th
e bi
ndin
g of
CO
2 by
prec
ast e
lem
ent c
oncr
ete
in N
orw
ay. A
vera
ge c
emen
t con
tent
of
400
kg/
m3 is
use
d ba
sed
on th
eir p
rese
nce
in th
e co
ncre
te se
gmen
t (co
ntin
ues o
n ne
xt p
age)
.
Con
cret
eM
ain
scen
ario
%C
lass
Cla
ssC
em II
/A-V
Aver
age
Bui
ltSe
gmen
t>
B35
> B
35sh
are
Thic
knes
son
e-si
deC
EM I
CEM
II/A
-Var
eavo
lum
evo
lum
em
3m
3%
mm
2S
leep
ers
Out
door
exp
osed
100
8350
8350
500,
175
Hol
low
sla
b to
tal
Indo
or50
1373
8334
346
2011
1775
0H
ollo
w s
lab
tota
lIn
door
pai
nted
4010
9906
2747
720
8942
00H
ollo
w s
lab
tota
lIn
door
cov
ered
with
con
cret
e10
2747
768
6920
2235
50Fo
rmw
ork
elem
ents
thic
kIn
door
5024
160
0,07
830
978
Form
wor
k el
emen
ts th
ick
Indo
or p
aint
ed40
1933
00,
078
2478
2Fo
rmw
ork
elem
ents
thic
kIn
door
cov
ered
with
con
cret
e10
483
00,
078
6196
Form
wor
k el
emen
ts th
inIn
door
5025
560
0,05
546
467
Form
wor
k el
emen
ts th
inIn
door
pai
nted
4020
450
0,05
537
174
Form
wor
k el
emen
ts th
inIn
door
cov
ered
with
con
cret
e10
511
00,
055
9293
DT
cove
rs: f
loor
s, ro
of p
arki
ng g
arag
eIn
door
5058
6628
8933
6948
6D
T co
vers
: flo
ors,
roof
par
king
gar
age
Indo
or p
aint
ed40
4693
2311
3355
589
DT
cove
rs: f
loor
s, ro
of p
arki
ng g
arag
eIn
door
cov
ered
with
con
cret
e10
1173
578
3313
897
Isol
ated
wal
lIn
door
2510
505
00,
075
9337
4Is
olat
ed w
all
Indo
or p
aint
ed75
3151
40
0,07
528
0121
Isol
ated
wal
lO
utdo
or e
xpos
ed50
2100
90
0,15
018
6748
Isol
ated
wal
lO
utdo
or p
aint
ed50
2100
90
0,15
018
6748
Con
form
wal
lIn
door
2542
60
0,10
042
58C
on fo
rm w
all
Indo
or p
aint
ed75
1277
00,
100
1277
3C
on fo
rm w
all
Out
door
exp
osed
5085
20
0,10
085
16C
on fo
rm w
all
Out
door
pai
nted
5085
20
0,10
085
16W
all e
lem
ents
Indo
or25
1360
20
0,20
068
010
Wal
l ele
men
tsIn
door
pai
nted
7540
806
00,
200
2040
30C
olum
nsIn
door
9075
2175
2150
0,30
0C
olum
nsIn
door
pai
nted
1083
683
650
0,30
0B
eam
sIn
door
9014
519
1451
950
0,30
0B
eam
sIn
door
pai
nted
1016
1316
1350
0,30
0S
tairs
Indo
or90
7308
00,
150
Sta
irsIn
door
pai
nted
1081
20
0,15
0B
ridge
s, q
uays
, cul
verts
Out
door
exp
osed
100
1205
712
057
500,
300
Sub
tota
l49
1310
1193
6735
8245
6To
tal
6106
77
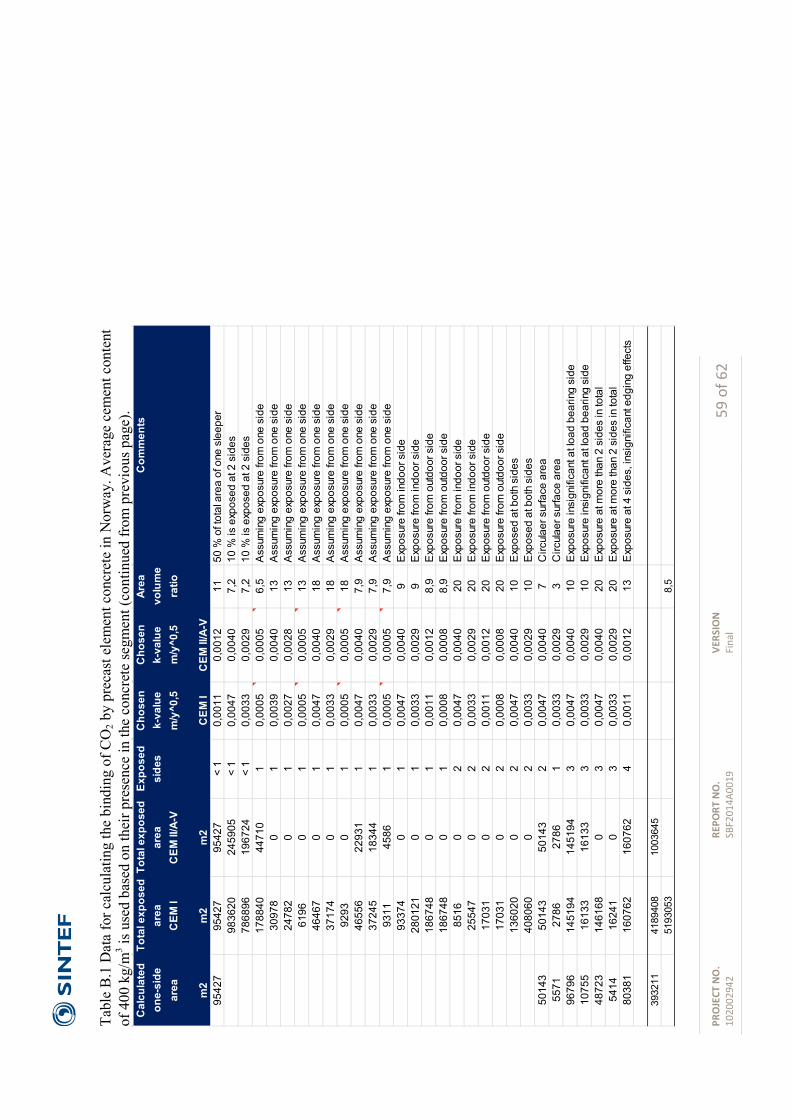
PRO
JECT
NO
. 10
2002
942
REPO
RT N
O.
SBF2
014A
0019
VERS
ION
Fi
nal
59 o
f 62
Ta
ble
B.1
Dat
a fo
r cal
cula
ting
the
bind
ing
of C
O2 b
y pr
ecas
t ele
men
t con
cret
e in
Nor
way
. Ave
rage
cem
ent c
onte
nt
of 4
00 k
g/m
3 is u
sed
base
d on
thei
r pre
senc
e in
the
conc
rete
segm
ent (
cont
inue
d fro
m p
revi
ous p
age)
.
Cal
cula
ted
Tota
l exp
osed
Tota
l exp
osed
Expo
sed
Cho
sen
Cho
sen
Area
Com
men
tson
e-si
dear
eaar
easi
des
k-va
lue
k-va
lue
volu
me
area
CEM
IC
EM II
/A-V
m/y
^0,5
m/y
^0,5
ratio
m2
m2
m2
CEM
IC
EM II
/A-V
9542
795
427
9542
7<
10,
0011
0,00
1211
50 %
of t
otal
are
a of
one
sle
eper
9836
2024
5905
< 1
0,00
470,
0040
7,2
10 %
is e
xpos
ed a
t 2 s
ides
7868
9619
6724
< 1
0,00
330,
0029
7,2
10 %
is e
xpos
ed a
t 2 s
ides
1788
4044
710
10,
0005
0,00
056,
5A
ssum
ing
expo
sure
from
one
sid
e30
978
01
0,00
390,
0040
13A
ssum
ing
expo
sure
from
one
sid
e24
782
01
0,00
270,
0028
13A
ssum
ing
expo
sure
from
one
sid
e61
960
10,
0005
0,00
0513
Ass
umin
g ex
posu
re fr
om o
ne s
ide
4646
70
10,
0047
0,00
4018
Ass
umin
g ex
posu
re fr
om o
ne s
ide
3717
40
10,
0033
0,00
2918
Ass
umin
g ex
posu
re fr
om o
ne s
ide
9293
01
0,00
050,
0005
18A
ssum
ing
expo
sure
from
one
sid
e46
556
2293
11
0,00
470,
0040
7,9
Ass
umin
g ex
posu
re fr
om o
ne s
ide
3724
518
344
10,
0033
0,00
297,
9A
ssum
ing
expo
sure
from
one
sid
e93
1145
861
0,00
050,
0005
7,9
Ass
umin
g ex
posu
re fr
om o
ne s
ide
9337
40
10,
0047
0,00
409
Exp
osur
e fro
m in
door
sid
e28
0121
01
0,00
330,
0029
9E
xpos
ure
from
indo
or s
ide
1867
480
10,
0011
0,00
128,
9E
xpos
ure
from
out
door
sid
e18
6748
01
0,00
080,
0008
8,9
Exp
osur
e fro
m o
utdo
or s
ide
8516
02
0,00
470,
0040
20E
xpos
ure
from
indo
or s
ide
2554
70
20,
0033
0,00
2920
Exp
osur
e fro
m in
door
sid
e17
031
02
0,00
110,
0012
20E
xpos
ure
from
out
door
sid
e17
031
02
0,00
080,
0008
20E
xpos
ure
from
out
door
sid
e13
6020
02
0,00
470,
0040
10E
xpos
ed a
t bot
h si
des
4080
600
20,
0033
0,00
2910
Exp
osed
at b
oth
side
s50
143
5014
350
143
20,
0047
0,00
407
Circ
ulae
r sur
face
are
a55
7127
8627
861
0,00
330,
0029
3C
ircul
aer s
urfa
ce a
rea
9679
614
5194
1451
943
0,00
470,
0040
10E
xpos
ure
insi
gnifi
cant
at l
oad
bear
ing
side
1075
516
133
1613
33
0,00
330,
0029
10E
xpos
ure
insi
gnifi
cant
at l
oad
bear
ing
side
4872
314
6168
03
0,00
470,
0040
20E
xpos
ure
at m
ore
than
2 s
ides
in to
tal
5414
1624
10
30,
0033
0,00
2920
Exp
osur
e at
mor
e th
an 2
sid
es in
tota
l80
381
1607
6216
0762
40,
0011
0,00
1213
Exp
osur
e at
4 s
ides
, ins
igni
fican
t edg
ing
effe
cts
3932
1141
8940
810
0364
551
9305
38,
5

PRO
JECT
NO
. 10
2002
942
REPO
RT N
O.
SBF2
014A
0019
VERS
ION
Fi
nal
60 o
f 62
Appe
ndix
C.
Prec
ast c
oncr
ete
prod
uct d
ata
in 2
011
Tabl
e C
.1 D
ata
for c
alcu
latin
g th
e bi
ndin
g of
CO
2 by
prec
ast c
oncr
ete
prod
ucts
in N
orw
ay. A
vera
ge c
emen
t con
tent
of
370
kg/
m3 is
use
d ba
sed
on th
eir p
rese
nce
in th
e co
ncre
te su
b se
gmen
t (co
ntin
ues o
n ne
xt p
age)
.
Con
cret
e su
bM
ain
scen
ario
> B
35>
B35
Cem
II/A
-VAv
erag
eEx
pose
d
Segm
ent
CEM
IC
EM II
/A-V
shar
eTh
ickn
ess
area
one
sid
e
volu
me
volu
me
m3
m3
%m
m2
Con
cret
e pa
ving
Out
door
exp
osed
1244
682
9840
0,04
842
4155
Pav
emen
t blo
ckO
utdo
or e
xpos
ed54
774
3651
640
0,05
815
4477
0R
etai
ning
wal
lO
utdo
or e
xpos
ed59
373
00
0,16
036
4201
Cur
bsto
neO
utdo
or e
xpos
ed56
670
00,
160
3476
2B
lock
pro
duct
sO
utdo
or e
xpos
ed20
541
00
0,16
012
6000
Pip
es o
utsi
de a
rea
Bur
ied
outs
ide
area
4024
3621
590
0,10
435
7348
Pip
es in
side
are
aW
et e
xpos
ed in
side
are
a0
900,
104
3073
30S
hafts
out
side
are
aB
urie
d ou
tsid
e ar
ea58
0852
272
900,
128
5452
87S
hafts
insi
de a
rea
Wet
exp
osed
insi
de a
rea
090
0,12
847
5989
Roo
f tile
sO
utdo
or e
xpos
ed12
0536
00
0,02
538
5714
3R
oof t
iles
pain
ted
Out
door
exp
osed
6780
10
00,
025
2169
643
Roo
f tile
s pa
inte
dO
utdo
or e
xpos
ed0
00,
025
2169
643
Sub
tota
l35
0970
1333
0012
3762
71To
tal
4842
71
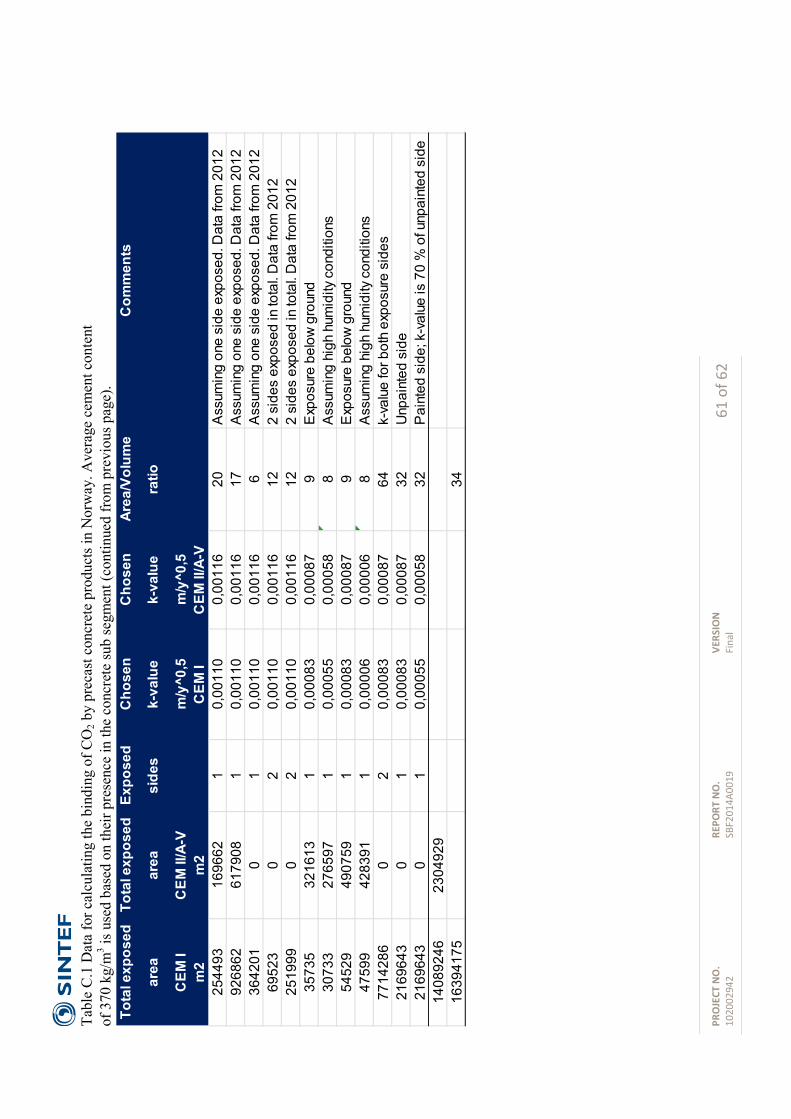
PRO
JECT
NO
. 10
2002
942
REPO
RT N
O.
SBF2
014A
0019
VERS
ION
Fi
nal
61 o
f 62
Ta
ble
C.1
Dat
a fo
r cal
cula
ting
the
bind
ing
of C
O2 b
y pr
ecas
t con
cret
e pr
oduc
ts in
Nor
way
. Ave
rage
cem
ent c
onte
nt
of 3
70 k
g/m
3 is u
sed
base
d on
thei
r pre
senc
e in
the
conc
rete
sub
segm
ent (
cont
inue
d fr
om p
revi
ous p
age)
.
Tota
l exp
osed
Tota
l exp
osed
Expo
sed
Cho
sen
Cho
sen
Area
/Vol
ume
Com
men
ts
area
area
side
sk-
valu
ek-
valu
era
tio
CEM
IC
EM II
/A-V
m/y
^0,5
m/y
^0,5
m2
m2
CEM
IC
EM II
/A-V
2544
9316
9662
10,
0011
00,
0011
620
Ass
umin
g on
e si
de e
xpos
ed. D
ata
from
201
292
6862
6179
081
0,00
110
0,00
116
17A
ssum
ing
one
side
exp
osed
. Dat
a fro
m 2
012
3642
010
10,
0011
00,
0011
66
Ass
umin
g on
e si
de e
xpos
ed. D
ata
from
201
269
523
02
0,00
110
0,00
116
122
side
s ex
pose
d in
tota
l. D
ata
from
201
225
1999
02
0,00
110
0,00
116
122
side
s ex
pose
d in
tota
l. D
ata
from
201
235
735
3216
131
0,00
083
0,00
087
9E
xpos
ure
belo
w g
roun
d30
733
2765
971
0,00
055
0,00
058
8A
ssum
ing
high
hum
idity
con
ditio
ns54
529
4907
591
0,00
083
0,00
087
9E
xpos
ure
belo
w g
roun
d47
599
4283
911
0,00
006
0,00
006
8A
ssum
ing
high
hum
idity
con
ditio
ns77
1428
60
20,
0008
30,
0008
764
k-va
lue
for b
oth
expo
sure
sid
es21
6964
30
10,
0008
30,
0008
732
Unp
aint
ed s
ide
2169
643
01
0,00
055
0,00
058
32P
aint
ed s
ide;
k-v
alue
is 7
0 %
of u
npai
nted
sid
e14
0892
4623
0492
916
3941
7534
PROJECT NO. 102002942
REPORT NO. SBF2014A0019
VERSION Final
62 of 62
Appendix D. Crushed concrete input data in recovery phase
For the carbonation in the recovery phase the carbonated concrete volume in service life was subtracted from
the annual total volume. This means that the level of carbonation in service life influences the carbonation in
the recovery phase. In the following the parameters used are described or listed.
• Concrete demolition rate: 10 % of the annual consumed concrete volume. This is based on the
annual C&D waste generation in Norway (Statistics Norway, 2014) and the corresponding concrete
rubble part. A 10 % demolition rate gives a concrete rubble generation of around 1 million tonnes of
demolished concrete which is higher than the estimates for 2012 (~ 750 000 tons). However, 10 % is
still considered to be relevant since the statistic most likely is underestimating the generation
significantly.
• Recovery rate: This means that 90 % of the demolished concrete was crushed and available for
carbonation. The remaining 10 % is not considered in the model although this part also will bind
CO2.
• The particles were treated as spherical particles. The particle sizes used were < 1mm (5 %), 1/10 mm
(10 %), 10/30 mm (30 %) and > 30 mm (55 %) with the mean diameters of 1 mm, 5 mm, 20 mm and
50 mm, respectively.
• Main scenarios: 10 % is considered to be applied above ground (outdoor exposed) and 90 % is
assumed to be applied below ground (buried). The corresponding k-values used for service life were
applied (see Appendix A-C).
• A recovery phase of 100 years was applied in the model.
Part of the remaining carbonation free volume was transformed to spherical particles with at different
particle sizes (see Appendix D). The CO2-binding was then conducted by the carbonation model using the
corresponding k-values on the crushed concrete.

Technology for a better society www.sintef.no

Rapport ‘Karbonopptak i Betong I LCA og EPD’, Rapport nr. OR.01.14, Østfoldforskning, 2014.
VEDLEGG 2
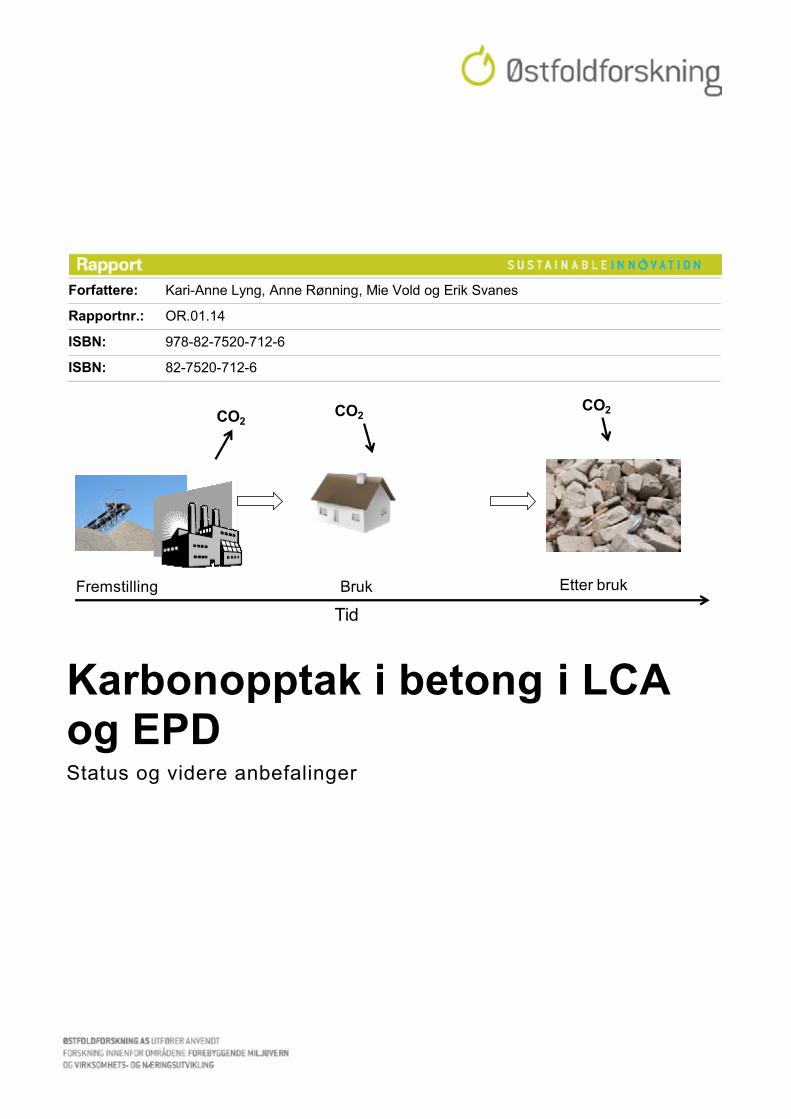
Forfattere: Kari-Anne Lyng, Anne Rønning, Mie Vold og Erik Svanes
Rapportnr.: OR.01.14
ISBN: 978-82-7520-712-6
ISBN: 82-7520-712-6
Karbonopptak i betong i LCA og EPD Status og videre anbefalinger
CO2CO2
CO2
TidFremstilling Bruk Etter bruk

Karbonopptak i betong i LCA og EPD Status og videre anbefalinger
Karbonopptak i betong i LCA og EPD Status og videre anbefalinger
© Østfoldforskning
Rapportnr.: OR.01.14 ISBN nr.: 978-82-7520-712-6 Rapporttype:
ISBN nr.: 82-7520-712-6 Oppdragsrapport
ISSN nr.: 0803-6659
Rapporttittel:
Karbonopptak i betong i LCA og EPD
Status og videre anbefalinger
Forfattere: Kari-Anne Lyng, Anne Rønning, Mie Vold og Erik Svanes
Prosjektnummer: 1499 Prosjekttittel: CO2-opptak i betong
Oppdragsgivere: Oppdragsgivers referanse:
Miljøkomiteen Knut O. Kjellsen
Emneord: Tilgjengelighet: Antall sider inkl. bilag:
Karbonatisering Karbonopptak Betong LCA EPD
Åpen 48
Godkjent: Dato: 10.06.2014 Prosjektleder Forskningsleder

Karbonopptak i betong i LCA og EPD Status og videre anbefalinger
© Østfoldforskning
Innholdsfortegnelse
Sammendrag ............................................................................................................................................. 1 Forkortelser ............................................................................................................................................... 3 Oversikt standarder og retningslinjer .......................................................................................................... 3 1 Innledning ......................................................................................................................................... 3 2 LCA, PCR og EPD ............................................................................................................................ 5
2.1 Kort om LCA ............................................................................................................................ 5 2.2 Hva er EPD og PCR? .............................................................................................................. 7 2.3 Hvem etterspør EPDer? .......................................................................................................... 8
3 Karbonopptak, karbonatisering og karbonlagring i et livsløpsperspektiv ......................................... 10 3.1 ’Iboende’ karbon og karbonlagring ......................................................................................... 10 3.2 Karbonatisering av betong i et livsløpsperspektiv .................................................................. 11 3.3 CO2-opptak for biologisk materiale i et livsløpsperspektiv ...................................................... 12 3.4 Aktiv karbonlagring: Carbon capture and storage (CCS) ....................................................... 13
4 Gjennomgang av litteratur ............................................................................................................... 14 4.1 Litteratursøk i vitenskapelige databaser ................................................................................. 14 4.2 Det nordiske prosjektet CO2 uptake during the concrete life cycle ......................................... 15 4.3 Det svenske prosjektet CO2 Cycle in Cement and Concrete .................................................. 16 4.4 Oppsummering litteratur ........................................................................................................ 17
5 Karbonopptak i relevante standarder og formelle retningslinjer ....................................................... 18 5.1 Generelt om standarder for miljø og bygg .............................................................................. 18 5.2 LCA-standarder ..................................................................................................................... 18 5.3 PCR og EPD-standarder ....................................................................................................... 19
5.3.1 NS-EN 15804 Core rules for the product category of construction products ................. 19 5.3.2 Produktspesifikke PCRer .............................................................................................. 21 5.3.3 ECO Platform ............................................................................................................... 23
5.4 Standarder og retningslinjer for klimagassregnskap og klimaspor .......................................... 23 5.4.1 GHG Protocol Products Standard ................................................................................. 23 5.4.2 ISO/TS 14067:2013 ...................................................................................................... 24 5.4.3 PAS 2050:2011 ............................................................................................................ 24 5.4.4 Klimagassberegninger for bygg .................................................................................... 25
6 Karbonopptak – erfaringer fra EPD-programmer og PCR’er ........................................................... 26 6.1 Karbonopptak i retningslinjer til EPD-programmer ................................................................. 26 6.2 Revelante og gjeldende PCR’er ............................................................................................. 27 6.3 EPD-eksempler ..................................................................................................................... 27 6.4 Oppsummering EPD’er og PCR’er ......................................................................................... 29
7 Prøveberegninger ........................................................................................................................... 30 7.1 Innledning .............................................................................................................................. 30 7.2 Kort om resultater fra delprosjekt 1: CO2-opptak i betong ...................................................... 30 7.3 Metodikk for inkludering av karbonopptak i LCA-beregninger ................................................ 31 7.4 Eksempelberegning for innervegg ......................................................................................... 34 7.5 Eksempelberegning for hulldekke .......................................................................................... 35 7.6 Eksempelberegning for takstein ............................................................................................. 36

Karbonopptak i betong i LCA og EPD Status og videre anbefalinger
© Østfoldforskning 2
7.7 Oppsummering av erfaringer fra prøveberegninger ............................................................... 38 8 Diskusjon og konklusjon ................................................................................................................. 39
8.1 Aksept for inkludering av karbonopptak ................................................................................. 39 8.2 Kunnskap om karbonatisering hos brukere av EPD ............................................................... 39 8.3 Kvantifisering av karbonatisering ........................................................................................... 39 8.4 PCR-arbeid ............................................................................................................................ 40 8.5 Videre arbeid ......................................................................................................................... 40
9 Referanser ...................................................................................................................................... 42 Vedlegg 1 Estimering av karbonopptak ......................................................................................... 45
Karbonopptak i betong i LCA og EPD Status og videre anbefalinger
© Østfoldforskning 1
Sammendrag
Norsk Betongforenings miljøkomité besluttet våren 2012 å starte et prosjekt med en målsetning om å utarbeide en STAR (state-of-the-art-rapport), hvor de siste data på karbonatiseringshastighet og CO2-opptak er inkludert, samt en vurdering av muligheten for å kunne ta CO2-opptak inn i livsløpsvurderinger (LCA) og miljødeklarasjoner (Environmental declaration –EPD) og hva som eventuelt mangler og kreves for å kunne gjøre dette. SINTEF Byggforsk og Østfoldforskning ble derfor engasjert til å bistå med fagekspertise hhv. innen områdene betongkjemi/karbonatisering og LCA/EPD. Prosjektet ble delt i to delprosjekter; del 1 CO2-opptak i betong med SINTEF Byggforsk som fagansvarlig og del 2 LCA/EPD med CO2-opptak hvor Østfoldforskning har hatt det faglige ansvaret. Denne rapporten er et resultat av arbeidet som er gjort i delprosjekt 2 I dette delprosjektet er det utført litteratursøk i vitenskapelige databaser med tanke på karbonatisering i LCA og EPD, gjennomgang av relevante standarder, EPD-programmer, PCR’er og EPD’er. Standardiseringsarbeid for PCR (produktkategoriregler) for betongprodukter i CEN er fulgt, det er utført prøveberegninger og gitt anbefalinger på videre arbeid. Rapporten oppsummerer status på kunnskap om og praksis for håndtering av karbonatisering i LCA og EPD, samt beskrivelse av pågående prosesser for utvikling av standarder for dette. Arbeidet viser at karbonatisering i liten grad inkluderes i LCA. Dette begrunnes med stor usikkerhet og at opptaket er så lite at det er neglisjerbart. Det er ikke funnet eksempler på EPD’er av betongprodukter som inkluderer karbonatisering i bruksfasen eller etter endt levetid. Dette kommer av at eksisterende PCR’er for sement og betongprodukter ikke åpner for at det inkluderes eller ikke i tilstrekkelig grad omtaler karbonatisering til at det er akseptert å inkludere det. Det er foretatt prøveberegninger for inkludering av karbonatisering for tre betongprodukter; innervegg, hulldekke og taksten. Utgangspunktet for utslipp gjennom livsløpet til innervegg og hulldekke er eksisterende EPDer. For taksten er det fortatt en enkel LCA med utgangspunkt i estimert resept for dette produktet. Resultatene fra beregningene kan oppsummeres slik: Innervegg:
Med antatt levetid på 100 år for en innervegg i ubehandlet betong vil de totale klimabelastningene gjennom hele livsløpet bli redusert med 10% hvis karbonatisering inkluderes. Dersom en antar 60 års levetid vil klimabelastningen bli redusert med 8%.
Hulldekke: Inkludering av karbonatisering medfører en reduksjon i klimabelastninger på mellom 12 og 16 % gjennom hele livsløpet til 1 m2 hulldekke, avhengig av om det antas 60 eller 100 års levetid
Taksten: Ved inkludering av karbonatisering blir klimabelastningene redusert med 47 % for en takstein, uavhengig av om en antar 30, 60 eller 100 års levetid. Siden utslippstallene ikke er basert på spesifikke produksjonsdata for takstein, bør det gjøres mer nøyaktige beregninger for å konkludere om utslippene i livsløpet er riktige og realistiske
Karbonopptak i betong i LCA og EPD Status og videre anbefalinger
© Østfoldforskning 2
Prøveberegningene viser at estimatene for hvor mye karbon som tas opp gjennom livsløpet til betongprodukter bør være så produktspesifikke som mulig. Det er derfor viktig at modeller utvikles for ulike produkter; taksten gjennomkarbonatiseres, mens andre produkter kan ha betydelig mindre karbonatiseringsgrad gjennom dets levetid. Ved å ta hensyn til både type produkt, type sement og hvor i livsløpet karbonopptaket skjer vil en kunne inkludere så realistiske og spesifikke scenarioer som mulig for karbonopptak i livsløpsanalyser og EPDer. Dette er i tråd med grunnprinsippene for EPD, der en søker å vise miljøbelastninger som er mest mulig realistiske og spesifikke for det konkrete produktet som deklareres. Estimering av levetiden er viktig (med unntak av produkter med relativt stor overflate der en oppnår opptak tett opp til bindingskapasiteten). Dersom en skal ha med karbonopptak i en EPD må dette være beskrevet i gjeldende PCR. Det pågår et PCR-utviklingsarbeid for betongprodukter i den europeiske standardiseringsorganisasjonens produktkomité - CEN/TC 104. Dette arbeidet er viktig for norsk så vel som europeisk betongindustri. Resultater fra dette prosjektet kan anvendes som innspill til komiteens arbeid og vil være et viktig bidrag til å øke troverdigheten til at og hvordan karbonopptak før inkluderes i EPDer. For å styrke presisjonsnivået på tallgrunnlaget anbefales det å foreta beregninger på karbonopptak for betongprodukter innen hvert undersegment (taksten, belegningsten, rør etc.). I tillegg bør en nyansere tallgrunnlaget på flere sementtyper (for eksempel lavkarbonsement). Det anbefales også at man også benytter den svenske modellen fra Andersson et al. (2013) parallelt for derigjennom å sikre tallgrunnlaget. For å ta ut potensialet for karbonopptak i gjenbruksfasen i EPDer, bør tallgrunnlaget bedres. Dette kan gjøres ved flere feltmålinger.
Karbonopptak i betong i LCA og EPD Status og videre anbefalinger
© Østfoldforskning 3
Forkortelser
CCS – Carbon Capture and Storage (karbonfangst og lagring) EPD – Environmental Declartion (miljødeklarasjon) GHG – Greenhouse gas (klimagass) GWP – Global Warming Potential (global oppvarmingspotensial) LCA – Life Cycle Assessment (livsløpsanalyse/livsløpsvurdering) PCR – Product Category Rule (produktkategoriregel)
Oversikt standarder og retningslinjer NS-ISO 14025:2010, Environmental labels and declarations — Type III environmental declarations — Principles and procedures (ISO 14025:2006).
ISO/TS 14067:2013, Carbon footprint of products – Requirements and guidelines for quantification and communication (ISO 2013) NS-ISO 14040, Environmental management — Life cycle assessment — Principles and framework (ISO 14040).
NS-ISO 14044:2006, Environmental management — Life cycle assessment — Requirements and guidelines (ISO 14044:2006).
NS-ISO 21930:2007, Sustainability in building construction — Environmental declaration of building products
NS-EN 15804:2012, Sustainability of construction works — Environmental product declarations — Core rules for the product category of construction products.
PAS 2050:2011, Specification for the assessment of the life cycle greenhouse gas emissions of goods and services (BSI 2011)


Karbonopptak i betong i LCA og EPD Status og videre anbefalinger
© Østfoldforskning 3
1 Innledning
Omtrent halvparten av karbondioksidutslippene fra sementproduksjon stammer fra kalsineringsprosessen, der kalkstein brennes og frigir CO2. Teoretisk vil herdet betong gradvis binde opp igjen den samme mengden CO2 når den er i kontakt med luft, og det er dette som kalles karbonatisering (Kjellsen et al., 2005). Mens i praksis er betongens evne til å binde CO2 og hastigheten av prosessen, avhengig av mange variabler, inkludert typen av betong og dens anvendelse. Det har de siste årene vært ulike forskningsprosjekter som har arbeidet med å kvantifisere opptaket for ulike betongprodukter og –kvaliteter (Andersson et al., 2013, Engelsen et al., 2005, Kjellsen et al., 2005, Pade og Guimaraes, 2007, Pommer og Pade, 2005). Etter hvert som krav om miljødokumentasjon av byggevarer har kommet, har også behovet for å dokumentere klimagassutslipp og –opptak gjennom hele levetid til byggevarer økt. Det er ingen tvil om at karbonatisering skjer, men for at en skal kunne gjøre nytte av denne prosessen i miljødokumentasjon, er det viktig at det foreligge en konsensus om når og hvor i levetiden til betongproduktene, samt hvor mye karbonatiseres. Norsk Betongforenings miljøkomité besluttet våren 2012 å starte et prosjekt med en målsetning om å utarbeide en STAR (state-of-the-art-rapport), hvor de siste data på karbonatiseringshastighet og CO2-opptak er inkludert, samt en vurdering av muligheten for å kunne ta CO2-opptak inn i livsløpsvurderinger(LCA) og miljødeklarasjoner (Environmental declaration –EPD) og hva som eventuelt mangler og kreves for å kunne gjøre dette. Målsetningen er å oppnå så riktig miljøregnskap for sement- og betongprodukter som mulig ved at det oppnås gevinst for at karbonatisering inkluderes. Dette kan ikke oppnås uten at det eksisterer en ’bred enighet og troverdighet’ om konsept og tall- og metodegrunnlag. SINTEF Byggforsk og Østfoldforskning ble derfor engasjert til å bistå med fagekspertise hhv. innen områdene betongkjemi/karbonatisering og LCA/EPD. Prosjektet ble delt i to delprosjekter; del 1 CO2-opptak i betong med SINTEF Byggforsk som fagansvarlig og del 2 LCA/EPD med CO2-opptak hvor Østfoldforskning har hatt det faglige ansvaret. Del 1 CO2-opptak i betong Det overordnete målet i dette delprosjektet var å klarlegge gjeldene status når det gjelder karbonatiseringshastighet (k-faktor) for ulike betongkvaliteter (bestandighetsklasser), sementtyper (særlig de aktuelle på det norske markedet), og eksponeringsbetingelser med relevans til norske forhold. Dette for å legge grunnlag for hvordan estimere karbonatiseringsmengde (CO2 opptak pr enhet betong) og karbonatiseringsgrad dvs. hvor stor del av CO2 utslippet fra sementen (CO2 fra kalsineringen) som faktisk tas opp ved karbonatisering. Basert på gjeldende status for beregningsmodeller CO2-opptak, er det i dette delprosjektet estimert CO2-opptak for norsk betong. Det foreligger en egen rapport fra dette delprosjektet, Engelsen og Justnes (2014). Det vises til denne rapporten for en detaljert beskrivelse av gjennomføring, detaljert beskrivelse av kjemien knyttet til karbonatisering og resultater.
Karbonopptak i betong i LCA og EPD Status og videre anbefalinger
© Østfoldforskning 4
Del 2 LCA/EPD med CO2-opptak Dette delprosjektet og denne rapporten tar sikter på å besvare følgende spørsmål:
Hvorfor inkluderes som regel ikke CO2-opptak i betong i EPD’er og i LCA-studier? Hvordan håndteres CO2-opptak i LCA og EPD av produkter som inneholder biologisk
materiale, som for eksempel trevirke? Kan karbonatisering i betongprodukter inkluderes i LCA? Kan karbonatisering i betongprodukter inkluderes i en EPD?
Fremgangsmåte for arbeidet i prosjektet har vært å utføre litteratursøk i vitenskapelige databaser for å undersøke hvordan kunnskap om og praksis for håndtering av karbonatisering er blant LCA-eksperter. Videre er det gjort en gjennomgang av relevante standarder og retningslinjer for å beskrive rammeverk og mulighetsrom for inkludering av karbonatisering i LCA og EPD. Det er gjort en gjennomgang av eksisterende EPD-programmer, PCR’er og EPD’er for å definere hva som er dagens praksis angående karbonopptak i EPD’er. Underveis i prosjektet ble standardiseringsarbeid for PCR for betongprodukter i CEN fulgt for å kartlegge hva som kan bli fremtidig praksis og hvordan påvirke slike prosesser. Videre er det utført prøveberegninger (basert på resultater fra delprosjekt 1) som viser hvordan karbonopptak kan inkluderes for innervegg, hulldekkelement og taksten. I tillegg er det beskrevet hva som eventuelt skal til for at karbonatisering kan inkluderes, både regneteknisk og for at denne kunnskap og tilnærming oppfattes som troverdig og derigjennom bli akseptert. På bakgrunn av aktivitetene i prosjektet gis det anbefalinger til videre arbeid.

Karbonopptak i betong i LCA og EPD Status og videre anbefalinger
© Østfoldforskning 5
2 LCA, PCR og EPD
2.1 Kort om LCA
LCA (Life Cycle Assessment) er et metodisk verktøy standardisert gjennom NS-ISO 14040 (generelt rammeverk) og NS-ISO14044 (metodikk) og er en systematisk kartlegging og vurdering av miljø- og ressurspåvirkninger gjennom hele livsløpet til et produkt/produktsystem. En livsløpsvurdering tar utgangspunkt i et produktsystem, og vurderer miljø- og ressursmessige forhold ved dette systemet gjennom hele produktets livsløp, fra "vugge til grav", eller helst "vugge til vugge". Tre sentrale poenger ved en livsløpsvurdering er:
Man ser på hele det tekniske systemet som skal til for å frembringe, bruke og avhende produktet eller tjenesten (systemanalyse) sett i lys av den funksjonen det skal oppfylle.
Man ser på hele materialsyklusen langs produktets verdikjede og ikke bare på en enkel operasjon eller bearbeidingsprosess for et produkt eller en tjeneste. På denne måten fanger man opp at en endring eller forbedring et sted i verdikjeden påvirker aktiviteter eller innsatsfaktorer et annet sted. Det er netto endring som er interessant og som blir fanget opp.
Man ser på alle relevante miljø- og helsepåvirkninger for hele systemet og ikke bare på en enkelt miljøfaktor (f.eks. både utslipp av klimagasser og toksisitet).
En kartlegging og analyse av hele produktsystemet er en mer helhetlig tilnærming til helse-, miljø- og ressursproblemene enn det vi ofte har vært vitne til tidligere, der enkeltfaktorer eller enkeltstående prosesser har vært fokusert.
Figur 1 Illustrasjon av livsløpet til et byggemateriale (uten avhending).
Fuel &energy
Water Area
Natural resources
Emissions towater
Emissionsto air
Soil pollution
Noise, smell, dust, etc.
Waste
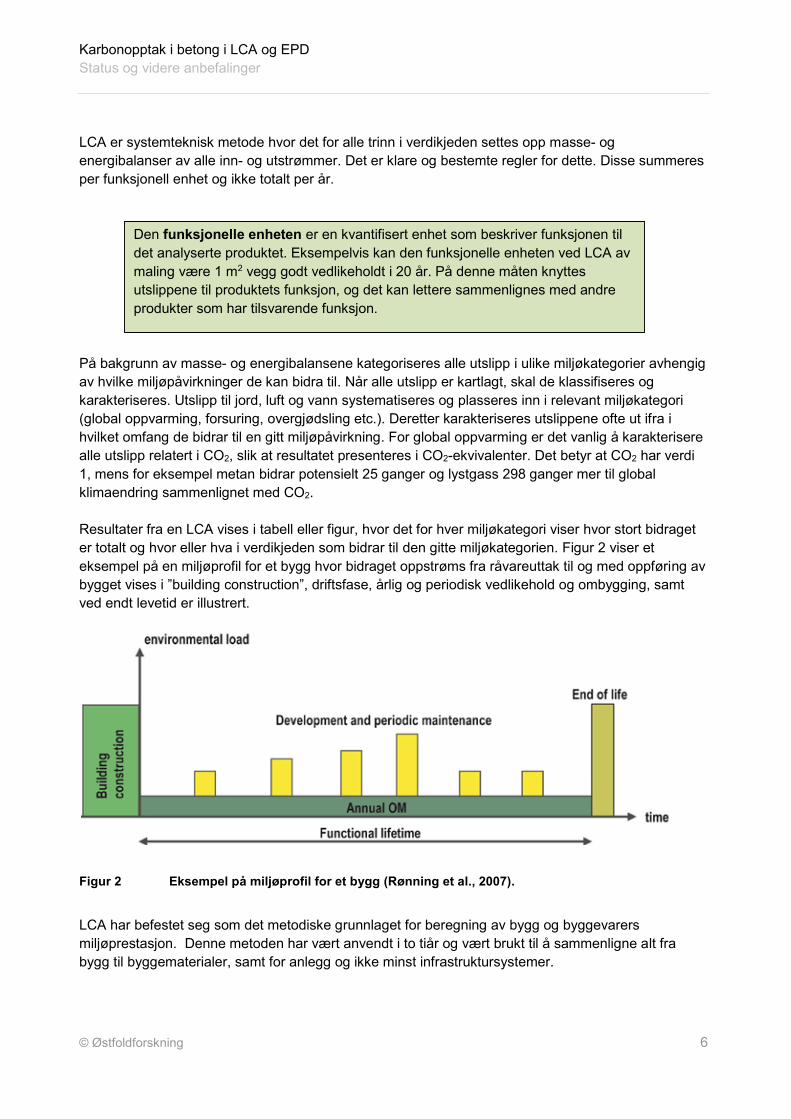
Karbonopptak i betong i LCA og EPD Status og videre anbefalinger
© Østfoldforskning 6
LCA er systemteknisk metode hvor det for alle trinn i verdikjeden settes opp masse- og energibalanser av alle inn- og utstrømmer. Det er klare og bestemte regler for dette. Disse summeres per funksjonell enhet og ikke totalt per år. På bakgrunn av masse- og energibalansene kategoriseres alle utslipp i ulike miljøkategorier avhengig av hvilke miljøpåvirkninger de kan bidra til. Når alle utslipp er kartlagt, skal de klassifiseres og karakteriseres. Utslipp til jord, luft og vann systematiseres og plasseres inn i relevant miljøkategori (global oppvarming, forsuring, overgjødsling etc.). Deretter karakteriseres utslippene ofte ut ifra i hvilket omfang de bidrar til en gitt miljøpåvirkning. For global oppvarming er det vanlig å karakterisere alle utslipp relatert i CO2, slik at resultatet presenteres i CO2-ekvivalenter. Det betyr at CO2 har verdi 1, mens for eksempel metan bidrar potensielt 25 ganger og lystgass 298 ganger mer til global klimaendring sammenlignet med CO2. Resultater fra en LCA vises i tabell eller figur, hvor det for hver miljøkategori viser hvor stort bidraget er totalt og hvor eller hva i verdikjeden som bidrar til den gitte miljøkategorien. Figur 2 viser et eksempel på en miljøprofil for et bygg hvor bidraget oppstrøms fra råvareuttak til og med oppføring av bygget vises i ”building construction”, driftsfase, årlig og periodisk vedlikehold og ombygging, samt ved endt levetid er illustrert.
Figur 2 Eksempel på miljøprofil for et bygg (Rønning et al., 2007).
LCA har befestet seg som det metodiske grunnlaget for beregning av bygg og byggevarers miljøprestasjon. Denne metoden har vært anvendt i to tiår og vært brukt til å sammenligne alt fra bygg til byggematerialer, samt for anlegg og ikke minst infrastruktursystemer.
Den funksjonelle enheten er en kvantifisert enhet som beskriver funksjonen til det analyserte produktet. Eksempelvis kan den funksjonelle enheten ved LCA av maling være 1 m2 vegg godt vedlikeholdt i 20 år. På denne måten knyttes utslippene til produktets funksjon, og det kan lettere sammenlignes med andre produkter som har tilsvarende funksjon.

Karbonopptak i betong i LCA og EPD Status og videre anbefalinger
© Østfoldforskning 7
LCA-metodikken som er beskrevet i standardene ISO 14040 og ISO14044, gjelder alle typer produkter og tjenester. Standarder for LCA krever en omfattende dokumentasjon av bl.a. metodiske valg som tas og beregningsmetoder og data som benyttes ved gjennomføring av en LCA. Ved bruk av LCA til intern kommunikasjon, kreves ingen standardisert dokumentasjon. Men, når resultater fra LCA skal kommuniseres til en tredjepart og eventuelt sammenlignes med konkurrerende produkter eller tjenester, foreligger det andre standarder for dette. Miljødeklarasjon (EPD) er et eksempel på en slik dokumentasjon.
2.2 Hva er EPD og PCR?
Driver for utvikling av EPDer var behovet for å gjøre resultater mer tilgjengelig for andre enn LCA-eksperter og derigjennom sikre økt bruk av resultater inn i beslutningsprosesser. Både i forhold til markedsføring overfor kunder og internt i bedrifter til produktutvikling/-forbedring. På slutten av ’90-tallet ble det utviklet metodikk for både å forenkle kommunikasjonen av LCA’er og sikre sammenlignbarhet. EPD kan sees på som et ”executive summary” av en LCA der alle EPD’er skal ha et felles innhold og hvor bestemte indikatorer og bruk av ressurser presenteres. Det ble dermed utviklet standarder for EPDer – ISO 14025:2006 Miljødeklarasjoner type III - Prinsipper og prosedyrer (alle typer produkter og tjenester)1. For å sikre sammenlignbarhet av EPDer, er det viktig at produkter innen samme produktgruppe eller som skal løse en bestemt funksjon, har benyttet samme metodiske regler. Dette gjelder bl.a. hvilke data som skal benyttes, at de har samme systemgrenser for å sikre at like innsatsfaktorer og aktiviteter gjennom livsløpet blir benyttet. Den generelle LCA-metodikken er ikke presis nok i denne sammenhengen. Det skal derfor gjøres en spesifisering av denne slik at den sikrer sammenlignbarhet og troverdighet når det gjelder hvordan beregninger er foretatt og gjerne også utseende på EPD’er. Det er dette som kalles PCR – produktspesifikke regler. En PCR utvikles for hver produktgruppe. Det er de ulike nasjonale programoperatørene som er ansvarlig for at PCRer blir utviklet og som står for godkjenning og verifisering av disse. Det betyr at per i dag kan det være utviklet PCR for samme produktgruppe i ulike land. Dette har vært/er et problem. Men, det pågår arbeid for å sikre samordning av PCR-arbeidet internasjonalt, se kapittel 5.3.3. Parallelt med utvikling av EPD-standarden ISO 14025:2006, ble det utviklet en EPD-standard for byggevarer, NS-ISO 21930:2007 (byggevarer2). Dette med begrunnelse i at det var et behov for å stramme metodikken ytterligere ved å gjøre den gjeldende bare for byggevarer og at siden disse har et felles bruksområde – byggverket – kan standarden spisses ytterligere når det gjelder bruksfasen. Denne standarden har vært lagt til grunn for utvikling av EPDer nasjonalt og internasjonalt siden 2007. I 2004 formulerte EU-kommisjonen et mandat til å utvikle horisontale standardiserte metoder for vurdering bygningers miljøprestasjon. Dette arbeidet ble etter hvert satt i gang i regi av den
1 Ble norsk standard i 2010 – NS-ISO 21930:2010. 2 Det foreligger ingen EPD-standarder for infrastruktur eller andre typer anlegg verken i ISO eller CEN. Derimot er det påbegynt diskusjoner om slike standarder og arbeidsgrupper er etablert i regi av både ISO og CEN.
Karbonopptak i betong i LCA og EPD Status og videre anbefalinger
© Østfoldforskning 8
europeiske standardiseringsorganisasjonen, CEN, og komiteen TC350 Sustainability of construction works ble og er ansvarlig for dette arbeidet.
The goal of the Commission is to provide a method for the voluntary delivery of environmental information that supports the construction of sustainable works including new and existing buildings (not all construction works will be included). One way to achieve this goal is to provide environmental information on the construction products and the materials that are used. This results in voluntary Environmental Product Declarations (EPD). To ensure that comparable environmental information is generated and used, without creating barriers to trade, national schemes need to be based on a common European programme founded upon European or International standards for EPD (European Commission, 2004)
EU-kommisjonen vurderte den gang at standardene for EPD av byggevarer ikke er gode nok med tanke på ikke å bidra til handelshindring og at de ikke ga god nok sammenlignbarhet. Siden PCR er der man beskriver hvordan beregne, utvikle og kommunisere EPD for et produkt innen en bestemt produktgruppe, ble det bl.a. besluttet å utvikle en standard med kjerneregler for utvikling og bruk av PCR. Denne standarden – NS-EN 15804:2013+A1:20133 – blir beskrevet i kap. 5.3.
2.3 Hvem etterspør EPDer?
Mange byggevareprodusenter har gjennomført livsløpsanalyser av sine byggevarer siden midten av ’90-tallet. Dette for å øke kunnskapen om eget produkt; både for å forstå hvordan produktet bidrar til byggets totale miljøprestasjon, men også som kommunikasjonsgrunnlag for kunder og internt i sammenheng med produktforbedringer. De første EPDene ble utviklet lenge før standardene ble utviklet. Men, selv etter at standardene forelå, var det laber interesse i markedet. Det var først da Statsbygg utarbeidet sin miljøstrategi hvor man tydeliggjorde at man skulle sette krav til EPDer i anbudsprosessen ved R6-utbyggingen. Ikke lenge etter ble det en økende interesse for sertifiseringssystemer for bygg hvor man i Norge satset på det britiske systemet BREEAM. En norsk tilpasning av dette ble utviklet - BREEAM Nor. BREEAM Nor er på full fart inn i det norske markedet, og dette har ført til økt etterspørsel etter LCA-rapporter, EPD’er og klimagassregnskap. Kommunene Oslo, Bærum, Asker og Drammen er partnere i FutureBuilt, som er et tiårig program og som går frem til 2020. Program som inngår i Framtidens byer som igjen er et samarbeid mellom staten og de 13 største byene i Norge om bl.a. å redusere klimagassutslipp.
FutureBuilt skal i perioden realisere 50 forbildeprosjekter med 50 prosent reduksjon av klimagassutslipp fra transport, energibruk og materialbruk sammenlignet med dagens praksis. Dette betyr blant annet bruk av klimavennlige byggematerialer. Som grunnlag for vurdering av
3 Ble godkjent som europeisk standard i 2012, men har gjennomgått en mindre endring i 2013, samt at karakteriseringsfaktorer er lagt til i vedlegg A1.
Karbonopptak i betong i LCA og EPD Status og videre anbefalinger
© Østfoldforskning 9
klimavennlige byggematerialer skal det innhentes miljødokumentasjon for de viktigste bygningsproduktene (EPD).
Norske arkitekters landsforbund (NAL) viser til ECOproduct som et verktøy for å gjøre miljøriktige valg av byggprodukter i prosjekteringen. Her vises det til at: ECOproduct er en metode og en database laget for å kunne gjennomføre miljøriktig materiale og produktvalg i et byggeprosjekt basert på informasjon fra miljødeklarasjoner i henhold til ISO 14025 (Environmental Product Declaration, forkortet EPD). ECOproduct versjon 2.0 ECOproduct 2.0 inneholder et sett med kriterier som man måler miljødokumentasjon for et produkt opp mot. Det anbefales at man bruker 3. parts sertifisert Miljødeklarasjon (Environmental Product Declaration, ISO 14025) til denne vurderingen. Dermed er det ikke lengre mulig for en produsent å legge inn miljødata selv. I tilknytning til den oppdaterte versjonen av ECOproduct 2.0 presiseres følgende:
Når det gjelder utslipp av klimagasser er foreløpig ikke karbonatisering eller karbonlagring medtatt i metoden. Dersom EPDene i fremtiden vil inkludere dette, vil ECOproduct også trekke dette med i beregningen.

Karbonopptak i betong i LCA og EPD Status og videre anbefalinger
© Østfoldforskning 10
3 Karbonopptak, karbonatisering og karbonlagring i et livsløpsperspektiv
Karbon forekommer som CO2 i atmosfæren, hvor økte mengder har en uønsket klima (og miljø) –effekt. I en livsløpsanalyse er det viktig å kartlegge i hvor stor grad et produkt eller en tjeneste bidrar til økt konsentrasjon av CO2 i atmosfæren (hvor mye karbon er introdusert fra jordskorpa til atmosfæren). Dette kapitlet gir en oversikt over hva som skiller produkters iboende mengde karbon fra aktiv karbonlagring og hva som er forskjellen på karbonopptak- og lagring i betongprodukter og produkter av biologisk materiale. Definisjonene og begrepsbruken er viktig for å forstå hvordan de ulike standardene og retningslinjene som er gjennomgått behandler karbonopptak og lagring i betongprodukter når en skal avgjøre om det er tillatt eller ikke å inkludere karbonatisering i LCA-beregninger og EPD’er. Det er viktig å være oppmerksom på at en livsløpsanalyse også inkluderer utslipp knyttet til infrastrukturen som skal til for å produsere, bruke og avfallshåndtere et produkt (slik som elektrisitetsbruken for å produsere produktet og oppføring av bygningsmassen til fabrikken som produserer produktet). Dette kapittelet tar derimot kun for seg direkte utslipp og opptak av karbondioksid fra selve produktet for å synliggjøre forskjellen på ulike begreper.
3.1 ’Iboende’ karbon og karbonlagring
Karbon er et viktig grunnstoff som forekommer i et stort antall produkter og livsformer. Mange produkter har en iboende mengde karbon som ’lagres’ i løpet av levetiden og som slippes ut ved produktets endte levetid. Avhengig av hvilke råstoffer et produkt er laget av, er dette karbonet hentet fra atmosfæren eller fra jordskorpa. At produktet har en iboende mengde karbon anses normalt ikke som aktiv karbonlagring i LCA-metodikken, da dette krever at man minsker mengden karbon i atmosfæren og å lagre karbonet over mye lengre tid. Aktiv karbonlagring er beskrevet i kapittel 3.4. Figur 3 viser et eksempel på utslipp av iboende karbon i livsløpet til et plastprodukt. Dersom det ikke består av gjenvunne materialer, er råvarene hentet fra jordskorpa (oljeressurser som inneholder karbon). Disse er ’lagret’ i produktet til det brennes i en forbrenningsovn ved avfallshåndtering. I en livsløpsanalyse regnes dette som utslipp i avfallshåndteringsfasen til produktet. Dette utslippet kommer i tillegg til andre direkte og indirekte utslipp som følge av aktivitetene som kreves for at produktet skal produseres og opprettholde sin funksjon.
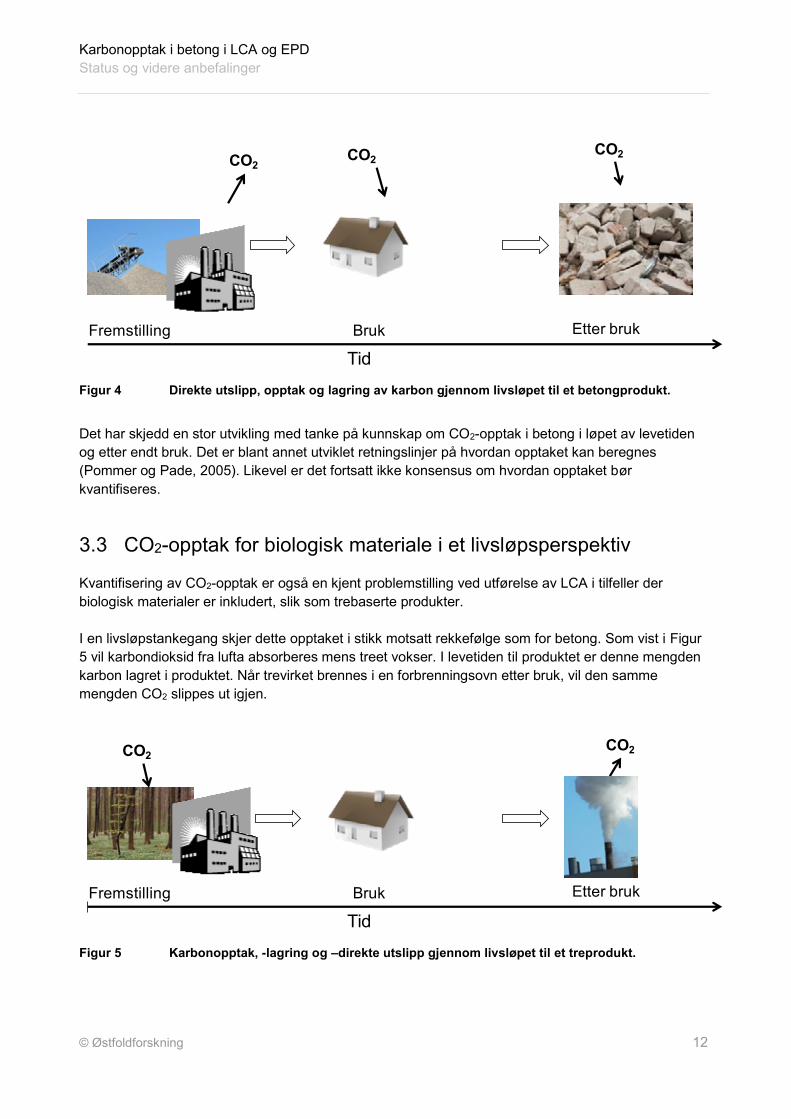
Karbonopptak i betong i LCA og EPD Status og videre anbefalinger
© Østfoldforskning 12
Figur 4 Direkte utslipp, opptak og lagring av karbon gjennom livsløpet til et betongprodukt.
Det har skjedd en stor utvikling med tanke på kunnskap om CO2-opptak i betong i løpet av levetiden og etter endt bruk. Det er blant annet utviklet retningslinjer på hvordan opptaket kan beregnes (Pommer og Pade, 2005). Likevel er det fortsatt ikke konsensus om hvordan opptaket bør kvantifiseres.
3.3 CO2-opptak for biologisk materiale i et livsløpsperspektiv
Kvantifisering av CO2-opptak er også en kjent problemstilling ved utførelse av LCA i tilfeller der biologisk materialer er inkludert, slik som trebaserte produkter. I en livsløpstankegang skjer dette opptaket i stikk motsatt rekkefølge som for betong. Som vist i Figur 5 vil karbondioksid fra lufta absorberes mens treet vokser. I levetiden til produktet er denne mengden karbon lagret i produktet. Når trevirket brennes i en forbrenningsovn etter bruk, vil den samme mengden CO2 slippes ut igjen.
Figur 5 Karbonopptak, -lagring og –direkte utslipp gjennom livsløpet til et treprodukt.
CO2CO2
CO2
TidFremstilling Bruk Etter bruk
TidFremstilling Bruk Etter bruk
CO2CO2

Karbonopptak i betong i LCA og EPD Status og videre anbefalinger
© Østfoldforskning 13
Karbonopptak i biologiske produkter er mindre komplisert enn for betong da mengden som tas opp og slippes ut som regel er den samme innenfor en rimelig tidshorisont. For livsløpsanalyser av treprodukter og andre produkter som består av biologisk materiale, kalles ofte de direkte klimagassutslippene for biologisk CO2. Benevnelsen kommer av at karbonet det er snakk om er tilgjengelig i atmosfæren og har blitt tatt opp og lagret i biologiske produkter. Motsatsen er fossil CO2 som hentes opp fra jordskorpa der den normalt ville vært lagret over en mye lengre tidsperiode. Det er relativt vanlig ikke å inkludere utslipp av biologisk CO2 i LCA-beregninger, da det forutsettes at opptaket av den samme mengden CO2 skjer innenfor systemgrensene og innenfor akseptabel tidshorisont, og at netto utslipp dermed er lik null. I enkelte analyser antas det at det hogges flere trær enn det plantes, eller at det plantes flere trær enn det hogges. En kan derfor finne studier der en ikke antar at netto utslipp av biologisk CO2 fra treprodukter er lik null. Det går her et skille mellom konsekvens-LCA og bokførings-LCA (attributional), som gir ulik tolkning på hvor systemgrensene skal settes. En EPD er basert på en bokførings-LCA og det er i denne rapporten derfor fokusert på dette, og ikke valgt å gå mer inn på konsekvensiell tankegang. Det er i litteraturgjennomgangen valgt å vise eksempler på hvordan biologisk CO2 er håndtert i EPD’er (se kapittel 6.3).
3.4 Aktiv karbonlagring: Carbon capture and storage (CCS)
I IPCC sin fjerde “Assessment report on Mitigation” blir karbonfangst og lagring definert som “A process consisting of separation of CO2 from industrial and energy-related sources, transport to a storage location, and longterm isolation from the atmosphere.” Karbonfangst og lagring blir altså definert som en prosess som separerer CO2 fra industrielle og energi-relaterte kilder, og som transporterer CO2 til et lager for langsiktig isolasjon fra atmosfæren (IPCC 2007). Teknologi for å fange CO2 i stor skala er allerede kommersielt tilgjengelig og godt utviklet, og har vært i bruk i mange år for å fange CO2 fra naturgass på Sleipner-området i Nordsjøen. Statoil fanger også CO2 ved LNG-produksjonen på Snøhvit ved Hammerfest og i In Salah i Algerie. CO2 fra Sleipner har blitt lagret i geologiske formasjoner siden 1996. CO2-innholdet i gassene der karbonfangst blir gjennomført i dag er relativt høy, og det er per i dag ingen kommersielle anlegg som renser CO2 fra forbrenningsgasser (eksos) der konsentrasjonen er mye lavere. I livsløpsanalyser av karbonfangstanlegg (f. eks Modahl et al., 2012) tas det hensyn til at en mengde karbon fjernes fra atmosfæren, ved at den mengden CO2 som lagres ”trekkes fra” den mengden som slippes ut i utslippsberegningene.
Karbonopptak i betong i LCA og EPD Status og videre anbefalinger
© Østfoldforskning 14
4 Gjennomgang av litteratur Målsetning er å kartlegge hva som er ”normal praksis i dag” i forhold til inkludering av karbonopptak i betong i LCAstudier, og begrenser seg derfor til karbonatisering i forhold til LCA.
4.1 Litteratursøk i vitenskapelige databaser
Det er utført søk i ulike vitenskapelige databaser, slik som Sciencedirect, Springerlink og Google Scholar. Eksempler på søkeord er: LCA, EPD, concrete, carbonation, uptake og kombinasjoner av disse. Kun studier som er nyere enn 2003 er tatt med Det finnes mye litteratur som tar for seg karbonatiseringens innvirkning på betongens kvalitet, uten å koble dette direkte til den totale påvirkningen betongstrukturer har på global oppvarming (f. eks Van den Heede og Belie, 2012, Dosho, 2007, Hallberg og Racutanu, 2007). Dette litteraturstudiet har i hovedsak hatt som mål å finne ut om karbonatisering er inkludert i LCA av betongprodukter, og i så fall hvordan, eller eventuelt hvorfor ikke det er inkludert. Det er funnet casestudier for en rekke ulike produkter som broer (Collins, 2010), veidekker (Santero og Horvath, 2009), betong i bygninger (Flower og Sanjayan, 2007, Doodo et a., 2009, Gustavsson og Sathre, 2006). Karbonatisering er ofte ikke inkludert i LCA fordi det krever kvantifisering, og det mangler forskning på hvordan dette bør gjøres (Santero og Horvath, 2009). Andre studier inkluderer ikke karbonopptaket fordi det anses å være neglisjerbart (Flower and Sanjayan, 2007). Det er likevel funnet en del vitenskapelige artikler som inkluderer karbonatisering. En del studier tar kun hensyn til karbonatisering i levetiden. I følge Collins (2010) tas det sjelden hensyn til karbonatisering som følge av at materialet gjenvinnes (kvernes) og gjenbrukes. I følge Collins (2010) er karbonopptak i bruksfasen til en betongstruktur er nesten neglisjerbar sammenlignet med utslipp fra fremstilling av råmaterialer, betongproduksjon og oppføring. Derimot er effektene av karbonatisering etter endt levetid signifikant og bør inkluderes i LCAberegninger for betongkonstruksjoner. Hvis karbonatisering utelates, kan dette medføre at globalt oppvarmingspotensiale overestimeres med så mye som 13-48 %, avhengig av bindemiddel og bruk av betongen etter endt levetid. Doodo et al. (2009) viser også til at karbonatisering blir underestimert hvis en ikke tar hensyn til det som skjer etter bruksfasen. I deres studie blir bærestrukturen til en bygning i betong sammenlignet med bærestruktur i tre. Studien viser at karbonatisering av kvernet betong medfører et betydelig CO2-opptak. Det påpekes likevel at kverningen av betongen etter bruk medfører et betydelig energiforbruk som er med på å redusere gevinsten. Hvor lenge den kvernede betongmassen lagres har betydning for hvor mye karbon som tas opp. Men langsiktig lagring av massen over en lang periode kan være upraktisk på grunn av plassbehov. De konkluderer dermed med at samlet sett er effekten av karbonatisering etter bruk liten, ved sammenligning av tre som materiale. Studien er basert på en
Karbonopptak i betong i LCA og EPD Status og videre anbefalinger
© Østfoldforskning 15
konsekvens-LCA og disse konklusjonene vil ikke være direkte overførbare til EPD, som baserer seg på bokførings-LCA. Også Gustavsson og Sathre (2005) har sammenlignet bærestrukturer i tre og betong i bygninger og inkludert under levetiden, uten at karbonatiseringen påvirker resultatet. Denne studien er også en konsekvens-LCA. Santero og Horvath (2009) presenterer ulike faktorer som påvirker globalt oppvarmingspotensiale til veidekker, hvor karbonatisering er en av faktorene. De har satt opp et ideelt scenario og et worst case scenario med tanke på globalt oppvarmingspotensiale for å vise fram variasjonene som kan oppstå på grunn av eksponert overflate, innholdet i betongen og ytre omstendigheter som fukt og temperatur. Artikkelen beskriver ikke hvordan karbonopptaket er beregnet eller hvor mye karbonatisering utgjør av det totale klimaregnskapet. Det er få vitenskapelige artikler som omtaler EPD’er. Det er funnet en relevant artikkel som omhandler EPD av betong, men EPD’en omfatter kun vugge til port og CO2-opptak er ikke omtalt (Strazza et al., 2010).
4.2 Det nordiske prosjektet CO2 uptake during the concrete life cycle
Prosjektet CO2 uptake during the concrete life cycle foregikk mellom 2003 og 2005 og hadde som mål å dokumentere karbonopptak i betong i løpet av levetid og sekundær bruk. Prosjektdeltakerne var Danish Technological Institute, Aalborg Portland AS, Norwegian Building Research Institute, Norcem AS, Elkem ASA Materials, Cementa AB, Swedish Cement and Concrete Research Institute og Icelandic Building Research Institute. Prosjektet fokuserte spesielt på de nordiske landene og resulterte i tre bakgrunnsrapporter og to resultatrapporter. I Kjellsen et al. (2005) blir karbonatisering gjennom en levetid på 70 og en 30 års periode etter riving kartlagt for hvert av de nordiske landene. Prosjektet viser at opp til 30% av de totale klimagassutslippene, eller 57% av kalsineringsutslippene under produksjonen absorberes i de nordiske landene. Over 100 år estimerer prosjektet at 0,22 millioner tonn absorberes bare i Norge, noe som utgjør omtrent 0,5% av de totale nasjonale utslippene. I beregningene ble det skilt mellom ulike betongprodukter og deres eksponerte overflate, som vist i tabellen nedenfor.

Karbonopptak i betong i LCA og EPD Status og videre anbefalinger
© Østfoldforskning 16
Tabell 1 Beregnet tykkelse på ulike betongprodukter (Kjellsen et al., 2005)
I Pommer and Pade (2005) gis det retningslinjer på hvordan karbonatisering kan beregnes og inkluderes i livsløpsberegninger. Figuren nedenfor viser eksempelberegninger for takstein (Pommer og Pade, 2005).
Figur 6 Regneeksempel på CO2balanse for en takstein (Pommer og Pade, 2005).
Det nordiske prosjektet representerer en god kunnskapsbase og har bidratt til økt kunnskap om hvordan en kan kvantifisere karbonopptaket i betongprodukter.
4.3 Det svenske prosjektet CO2 Cycle in Cement and Concrete
Det Svenske prosjektet “CO2 Cycle in Cement and Concrete” som ledes av Cementa har nylig resultert i publikasjon av paperet ”Calculating CO2 Uptake for Existing Concrete Structures during and after Service Life” i det vitenskapelige tidsskriftet Environmental Science and Technology. Paperet presenter en modell for beregning av CO2 -opptak i eksisterende betongprodukter, basert på teoretiske beregninger og feltmålinger.

Karbonopptak i betong i LCA og EPD Status og videre anbefalinger
© Østfoldforskning 17
Dette arbeidet vil gi innspill til utviklingen av CEN/TC104-standarden PCR for betongprodukter, på hvordan karbonatisering skal håndteres i fremtidige EPD’er.
4.4 Oppsummering litteratur
Gjennomgang av litteratur som omhandler LCA og karbonatisering viser at karbonatisering av betong i levetiden og etter endt levetid i liten grad er inkludert i LCAstudier. Dette begrunnes med at kvantifiseringen av karbonopptaket er vanskelig og usikkert, og med at opptaket utgjør en liten gevinst i forhold til utslippene i løpet av levetiden. Flere studier som derimot har inkludert opptaket peker på at karbonopptaket utgjør en betydelig mengde, og at globalt oppvarmingspotensialet for betongprodukter kan underestimeres dersom det ikke inkluderes. Det er de siste årene gjennomført en del prosjekter for å øke kunnskapen om karbonatisering. Dette bidrar til å minske usikkerhetsfaktorene på hvordan opptaket skal kvantifiseres og økt aksept for at det kan inkluderes i miljødeklarasjoner for betongprodukter. Siste status på kunnskap om dette er dokumentert i delprosjekt 1 (Engelsen og Justnes, 2014).

Karbonopptak i betong i LCA og EPD Status og videre anbefalinger
© Østfoldforskning 18
5 Karbonopptak i relevante standarder og formelle retningslinjer
5.1 Generelt om standarder for miljø og bygg
LCA-metoden har vært gjenstand for standardisering både av ISO og CEN. Prosessen med å standardisere LCA begynte tidlig på 90-tallet og de to standardene ISO 14040 og ISO 14044 er i dag vedtatt og implementer i mange land. Som nevnt i kapittelet om LCA, gjelder disse standardene alle typer produkter og tjenester og ikke bygg og anleggsprodukter spesielt. Utviklingen av standardiseringen har gått i to akser. Den ene er behovet for å gjøre LCA-metodikken mer spesifikk for gitte produkter og tjenester. Den andre er det faktum at klimaendringer er satt på den politiske dagsorden og dermed har det blitt et økt behov for standarder og metoder for beregning av klimagasser. I dette kapittelet vil vi vise om og eventuelt hvordan de ulike standardene håndterer CO2-opptak enten standarden har gått langs den første aksen; spesifisere LCA-metodikk eller den andre aksen; metodikk for beregning av klimagassutslipp.
5.2 LCA-standarder
Arbeidet med utvikling av standardene for LCA ble som nevnt påbegynt tidlig på 1990-tallet. Dette arbeidet resulterte i flere standarder og det er disse to som i dag er gyldige og i bruk for mange produkter og tjeneste både nasjonalt og internasjonalt; NS-ISO 14040 og NS-ISO 14044. Kapittel 2.1 gir en kort beskrivelse av hva LCA er. Som beskrevet gir den generelle regler for hvordan kartlegge og beregne utslipp. Et sentralt prinsnipp i LCA-metoden er at hensikten med studien er veldig førende for hva du kan inkludere i studien; m.a.o. hvilke systemgrenser og herunder livsløpsfaser som inkluderes. Standardene omhandler ikke spesifikk prosesser og dermed gir den på den ene siden ingen føringer for hvordan for eksempel karbonatisering skal håndteres, men på den andre siden sier den heller ikke at man ikke kan inkludere det. Systemtekniske prinsipper for masse- og energibalanser står sentralt som et metodisk grunnlag. På bakgrunn av det er det mulig å inkludere CO2opptak i levetiden i en LCA. Spesielt dersom det er hensiktsmessig med tanke på hensikten med studien, og det er definert som innenfor systemgrensene. Hvis formålet er å beregne effekten karbonatisering har for det totale klimagassregnskapet for et betongprodukt i løpet av et tidsrom, ja så er det fullt mulig. Derimot sier standarden klar at skal en sammenligne denne studien med et konkurrerende produkt og kommunisere det eksternt, må andre regler følges.
Karbonopptak i betong i LCA og EPD Status og videre anbefalinger
© Østfoldforskning 19
5.3 PCR og EPD-standarder
5.3.1 NS-EN 15804 Core rules for the product category of construction products
Som nevnt i kapittel 2 har LCA-standardenes generelle karakter, omfattende dokumentasjonskrav og deres bruk i praksis, vist nødvendigheten av å utvikle mer spesifikke standarder for å sikre sammenlignbarhet og øke troverdigheten ved kommunikasjon av miljøegenskapene ved byggevarer eksternt. Det foreligger både en europeisk (NS-EN 15804:2012) og en internasjonal standard (NS-ISO 21930:2007) for utvikling og bruk av PCRer og EPDer. Den siste er under revisjon og vil etter stor sannsynlighet følge hovedprinsippene i den europeiske standarden og vil derfor ikke bli diskutert i denne rapporten NS-EN 15804 er en såkalt horisontal standard der felles produktkategoriregler for utarbeidelse av EPD gjeldene alle byggevarer er beskrevet. Dette for å unngå bransjespesifikke avvik fra disse felles regler. Den gir i tillegg regler for hvordan PCR for byggevarer skal utvikles. Standarden er et verktøy for byggenæringen til å utvikle omforente PCR for sine produktgrupper. Slike omforente regler gir harmoniserte EPD som igjen gir et godt sammenlikningsgrunnlag som input i beslutningsprosesser. Med andre ord; formålet med standarden er å sikre at miljødeklarasjon (EPD) for byggevarer, blir beregnet, verifisert og presentert på en harmonisert måte. Denne rapporten gir ikke nærmere beskrivelse av kravene til innholdet i en PCR i detalj, men viser til standarden NS-EN 15804. Vi vil likevel i denne rapporten trekke fram ”systemgrenser” og ”modularitet” spesielt. Dette fordi ved diskusjon om hvordan karbonatisering kan introduseres i EPDer, blir dette sentrale elementer. Det andre vi vil trekke fram er det faktum at standarden ikke er en PCR som alene skal brukes til å utarbeide en EPD. Ulike byggevarer anvendes ikke for samme formål, har ulik levetid etc. og har dermed nødvendigvis ikke samme bruksscenarioer gjennom byggeverkets levetid. Det skal derfor utarbeides egne scenarioer for dette. Standarden spesifiserer hvilken type teknisk informasjon som er nødvendig å spesifisere for å kunne utforme bruksscenarioene for ulike byggevarer. Modularitet Modulprinsippet ble først utviklet i EPD-standarden (NS-ISO 21930:2007) for byggevarer og videreført og utdypet i NS-EN15804. Modulprinsippet muliggjør å beskrive miljøprestasjonen for et helt bygg ved å summere EPDer for de ulike byggevarene som inngår. Dette er videreført i det europeiske standardiseringsarbeidet. Figur 7 viser ulike typer EPDer og informasjonsmoduler gjennom livsløpet til en byggevare.
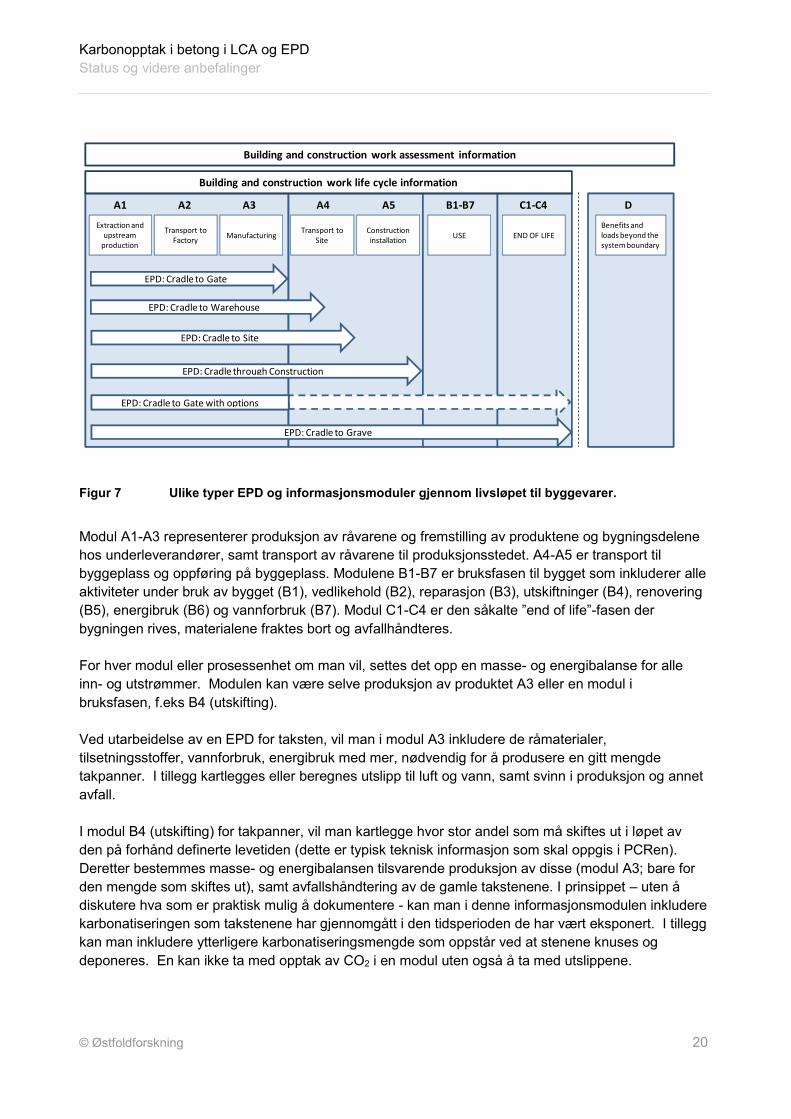
Karbonopptak i betong i LCA og EPD Status og videre anbefalinger
© Østfoldforskning 20
Figur 7 Ulike typer EPD og informasjonsmoduler gjennom livsløpet til byggevarer.
Modul A1-A3 representerer produksjon av råvarene og fremstilling av produktene og bygningsdelene hos underleverandører, samt transport av råvarene til produksjonsstedet. A4-A5 er transport til byggeplass og oppføring på byggeplass. Modulene B1-B7 er bruksfasen til bygget som inkluderer alle aktiviteter under bruk av bygget (B1), vedlikehold (B2), reparasjon (B3), utskiftninger (B4), renovering (B5), energibruk (B6) og vannforbruk (B7). Modul C1-C4 er den såkalte ”end of life”-fasen der bygningen rives, materialene fraktes bort og avfallhåndteres. For hver modul eller prosessenhet om man vil, settes det opp en masse- og energibalanse for alle inn- og utstrømmer. Modulen kan være selve produksjon av produktet A3 eller en modul i bruksfasen, f.eks B4 (utskifting). Ved utarbeidelse av en EPD for taksten, vil man i modul A3 inkludere de råmaterialer, tilsetningsstoffer, vannforbruk, energibruk med mer, nødvendig for å produsere en gitt mengde takpanner. I tillegg kartlegges eller beregnes utslipp til luft og vann, samt svinn i produksjon og annet avfall. I modul B4 (utskifting) for takpanner, vil man kartlegge hvor stor andel som må skiftes ut i løpet av den på forhånd definerte levetiden (dette er typisk teknisk informasjon som skal oppgis i PCRen). Deretter bestemmes masse- og energibalansen tilsvarende produksjon av disse (modul A3; bare for den mengde som skiftes ut), samt avfallshåndtering av de gamle takstenene. I prinsippet – uten å diskutere hva som er praktisk mulig å dokumentere - kan man i denne informasjonsmodulen inkludere karbonatiseringen som takstenene har gjennomgått i den tidsperioden de har vært eksponert. I tillegg kan man inkludere ytterligere karbonatiseringsmengde som oppstår ved at stenene knuses og deponeres. En kan ikke ta med opptak av CO2 i en modul uten også å ta med utslippene.
Extraction and upstream
production
Transport to Factory Manufacturing Transport to
SiteConstructioninstallation USE END OF LIFE
Building and construction work life cycle information
A1 A2 A3 A4 A5 B1-B7 C1-C4
EPD: Cradle to Gate
EPD: Cradle to Site
EPD: Cradle through Construction
Benefits and loads beyond the system boundary
D
Building and construction work assessment information
EPD: Cradle to Grave
EPD: Cradle to Gate with options
EPD: Cradle to Warehouse

Karbonopptak i betong i LCA og EPD Status og videre anbefalinger
© Østfoldforskning 21
I en EPD vil utslipp og opptak av CO2 vises i de modulene dette foregår.
5.3.2 Produktspesifikke PCRer
EN 15804 er som sagt en horisontal standard. Fasene A1-A3 – vugge til port – gjelder for alle produkter. EN15804 beskriver også hvordan de neste modulene kan utvikles og hvilke type teknisk informasjon en om produktene en bør beskvire for å kunne utvikle scenarioer eller tilrettelegge for at en kan utvikle scenarioer på bygningsnivå. Det er derfor spesielt for fasene etter fabrikkport det må utvikles egne PCR. I CEN skal dette arbeidet ivareta av de ulike produkt-TCene. Det er allerede i gang flere arbeider med utvikling av PCRer i regi av CENs ulike produkt-TC’er (Technical Committees). Eksempler på det er betong- isolasjons- og treprodukter. I tillegg er det nå under utvikling en veiledning for hvordan bruke EN15804. Mulig det også blir trukket fram noen nye felles regler for beregning som er utelatt i EN15804. Østfoldforskning er kjent med at karbonatisering ikke er av bransjen trukket fram som et slikt tema, men at det skal behandles i betong-PCRer. Figur 8 viser sammenhengen mellom de ulike standardene; EN15804 gjeldende for alle byggevarer, guideline for hvordan bruke EN15804 og ulike produkt-standarder.
Figur 8 Sammenheng mellom de ulike PCR-standardene og guideline for bruk og implementering.
I CEN er det etablert flere ti-talls produktkomiteer. I figuren over vises det til tre komiteer hvor det pågår PCR-utvikling. Status for deres arbeid er kort beskrevet under: CEN TC 104: Denne PCRen skal gjelde for “concrete conforming to EN206”; mao. ”concrete for structures cast in situ, precast structures, and structural precast products for buildings and civil engineering works”.
EN 15804 – Core rules for product category of construction products
Guidance document for use of EN 15804
Product TC 175
EN 16485 Round and sawn timber -Environmental Product Declarations -PCR for wood and wood-based products foruse in construction
Product TC 104
PCR for All precast products
for buildings and other construction
works
Product TC NN
PCR for building product N
Product TC 229
PCR for concrete for
structures cast in situ, precast
structures, and structural precast
products for buildings and civil engineering works
Karbonopptak i betong i LCA og EPD Status og videre anbefalinger
© Østfoldforskning 22
Her foreligger det et utkast til PCR som viser at karbonatisering skal inkluderes gjennom levetiden til betongproduktene. Metodikk for hvordan beregne karbonatisering foreslås her følge det svenske studiets metodikk, Andersson et al. (2013). Dette arbeidet forventes ferdigstilt i løpet av 2014. TC 229/WG4: Skal utvikle PCR for “All precast products for buildings and other construction works”. Arbeidet startet 4. kvartal 2013. Det er en intensjon om at karbonatisering skal håndteres likt i de to PCRene som kommer fra hhv. TC 104 og TC 229. CEN/TC 175 Wood and wood-based products Denne komiteen utvikler to standarder av interesse. Den ene er PCR for byggevarer i tre og den andre for hvordan beregne CO2-opptak og lagring i trebaserte byggevarer. Begge har status ”under approval” og er dermed så og si klare for publisering våren 2014. Kort om disse to standard-utkastene: FprEN 16485 Round and sawn timber - Environmental Product Declarations - Product category
rules for wood and wood-based products for use in construction FprEN 16449 Wood and wood-based products - Calculation of sequestration of atmospheric carbon
dioxide
This standard provides a simple calculation method for estimation of the amount of carbon dioxide sequestered by the growing tree which is then stored as biogenic carbon in wood products until end of life. A full LCA and carbon footprint assessment is both time consuming and costly but the ecological benefits of the use of wood are now widely recognised for both ‘simple’ carbon sequestration and for the more involved carbon footprint offset potential. There is much to be considered when undertaking full life-cycle assessments; the purpose of this document is to enable swift determination of the potential benefit based on the use of wood. This document can be used in the context of life-cycle assessment and carbon-footprinting and in the elaboration of Environmental Product Declarations.
I påvente av at den europeiske standarden FprEN 16485 skal ferdigstilles, har EPD-Norge godkjent PCR for produktgruppen ”Wood and wood-based products for use in construction”. I kapittel 7.3 er det illustrert hvordan standard FprEN 16485 beregner CO2-opptak i og utslipp av iboende karbon for treprodukter i en EPD.
Karbonopptak i betong i LCA og EPD Status og videre anbefalinger
© Østfoldforskning 23
5.3.3 ECO Platform
I juli 2013 ble ECO Platform stiftet. Stifterne av ECO Platform er 11 programoperatører for EPD i Europa. EPD-Norge er en av stifterne. ECO Platform har som formål å fremme og styrke bærekraftig utvikling innen byggesektoren. Dette skal gjøres gjennom å bidra til å utvikle konsistente EPD-programmer i Europa og stimulere innføring av felles EPD-metodikk i det europeiske markedet. Dette vil føre til at en i større grad vil oppleve gjensidig anerkjennelse av EPD’er mellom programoperatørene i Europa. Et viktig redskap for harmonisering av EPD’ene innen byggevaresektoren, er felles forståelse bruk av EN 15804 for utvikling av PCR’er og EN 15942 for kommunikasjon av EPD. Det er allerede utviklet et felles rammeverk for verifikasjon av LCA og EPD som benyttes av ECO Platforms medlemmer.
5.4 Standarder og retningslinjer for klimagassregnskap og klimaspor
For LCA og EPDutvikling av betongprodukter vil det være mest hensiktsmessig å forholde seg til de generelle LCA og EPD-standardene og de spesifikke standardene for bygg. Likevel er det valgt å gjøre en gjennomgang av standarder og retningslinjer som beskriver hvordan en utfører klimagassregnskap for produkter, for å vise at beregningene kan gjøres på ulike måter i ulike sammenhenger og for å trekke fram systemer som beskriver karbonatisering direkte og anbefaler hvordan dette skal håndteres.
5.4.1 GHG Protocol Products Standard
GHG protocol er internasjonale anerkjente retningslinjer på hvordan en gjør klimagassregnskap. GHG protocol er publisert av World Resources Institute (WRI) and the World Business Council for Sustainable Development (WBCSD). I GHG protocol for produkter nevnes karbonopptak i betong eksplisitt: “When CO2 is removed from the atmosphere by the product during the use phase (e.g. CO2 uptake by cement), the removal data may come in the form of a removal rate per mass or volume of product.” “In some cases removals may occur during the use stage (e.g. the absorption of CO2 by cement). If the removals are large enough to create a negative percent impact from that stage, this should be noted clearly in the inventory report)” Sitatene over viser at det er lagt til rette for at karbonopptak i levetiden skal inkluderes. For opptak som skjer etter produktets endte levetid er ikke retningslinjene like klare.
Karbonopptak i betong i LCA og EPD Status og videre anbefalinger
© Østfoldforskning 24
5.4.2 ISO/TS 14067:2013
I ISO/TS4 14067:2013 Carbon footprint of products – Requirements and guidelines for quantification and communication (ISO 2013), er en ny teknisk spesifikasjon som beskriver hvordan en skal utforme klimaspor til produkter. I ISO/TS 14067 nevnes ikke opptak av CO2 i betong spesifikt. Det er derfor avgjørende om karbonatisering håndteres på lik linje med lagring av ’iboende’ mengde karbon eller som et opptak på lik linje med CCS (Carbon Capture and Storage). Dersom en betrakter karbonatisering av betong som ’iboende karbon’ er det tillatt å beregne karbonlagringseffekten (i kg CO2/funksjonell enhet) og presentere tallet separat, men det er ikke tillatt å regne det inn i selve klimasportallet. Hvis det derimot regnes som et opptak på linje med CCS, gjelder den generelle regel om at alle utslipp og opptak (emissions and removals) innenfor de bestemte systemgrensene skal inkluderes hvis de er over cut-off (skal defineres i PCR) og at det ligger innenfor formålet med studien. I så måte er det naturlig å ta med reduserte utslipp som følge av karbonatisering i klimasporet til betongproduktet. Karbonopptak i løpet av levetiden til et betongprodukt vil i så fall ligge inn under bruksfasen. Når det gjelder etter endt levetid sier standarden eksplisitt at både pre-prosessering som ”shredding and sorting” og selve materialgjenvinningsprosessen skal være inkludert. Den sier også at alle ”removals” og ”emissions” skal være med. ISO/TS 14067:2013 følger eksplisitt reglene i LCA standarden ISO 14044, som er beskrevet i kapittelet om generelle standarder for LCA over.
5.4.3 PAS 2050:2011
PAS 2050, Specification for the assessment of the life cycle greenhouse gas emissions of goods and services (BSI 2011) er retningslinjer publisert av British Standards Institution for hvordan lage klimagassregnskap for varer og tjenester. I PAS 2050 kan man ta hensyn til karbonatisering og det vil regnes dette som et karbonlagringsspørsmål. 5.5.1 Treatment of stored carbon Where some or all removed carbon will not be emitted to the atmosphere within the 100-year assessment period, the portion of carbon not emitted to the atmosphere during that period shall be treated as stored carbon. Note 1 Carbon storage might arise where biogenic carbon forms part or all of a product (e.g. wood fibre in a table), or where atmospheric carbon is taken up by a product over its life cycle (e.g. cement). I motsetning til ISO 14067 kan karbonlagring tas med i selve klimagassregnskapet (og ikke bare som en separat informasjon) i PAS 2050. I PAS 2050 møter en også på et definisjonsproblem i forhold til når det første livsløpet slutter og når det neste begynner.
4TS – Technical Specification: A normative document representing the technical consensus within an ISO committee
Karbonopptak i betong i LCA og EPD Status og videre anbefalinger
© Østfoldforskning 25
5.4.4 Klimagassberegninger for bygg
Etter et initiativ fra Statsbygg ble det besluttet i Standard Norges BAE sektorstyremøte at det skal etableres en Standard Norge komité (SN/K) for å utarbeide en nasjonal standard som skal beskrive metodikk for klimagassberegninger i bygg. Mandatet til SN/K 356 “Klimagassberegninger for bygninger” ble formelt godkjent den 5. desember 2013. Det skal oppnevnes en komité med følgende mandat:
Komiteen skal utarbeide en ny norsk standard metode for klimagassberegninger for bygninger. Standarden skal definere en entydig metodikk for beregning av klimagasser for bygninger slik at resultater fra ulike modeller/verktøy som anvender denne metodikken blir sammenliknbare.
Bakgrunnen for dette er mandatet er som beskrevet i invitasjon til deltagelse i komitéarbeidet:
Klima er et av satsningsområdene til Standard Norge som svar på økt behov i samfunnet og fra myndighetene, for kunnskap om klimabelastningen av ulike aktiviteter og produkter samt behov for identifisering av effektive tiltak for å minske utslipp av klimagasser på kort og lang sikt. Dette gjelder utslipp av all slags karakter også utslipp fra bygninger. Det er selvsagt snakk om beregning av utslipp i en bygnings totale levetid, fra produksjon, gjennom brukstiden og avhendingen. I de statlige utviklingsprogrammene Framtidens byer og FutureBuilt samt i Breeam-NOR, en miljømerkeordning for bygg, stilles det i dag krav til klimagassberegninger for byggeprosjekter gjennom deres livsløp. Det finnes flere aktører som har etablert beregningsmodeller (verktøy) til bruk i planlegging, prosjektering og dokumentasjon av byggenes klimagassutslipp. På grunn av mangel på standardisert metodikk for klimagassberegninger for bygninger kan ikke resultatene fra de ulike modellene sammenlignes. For å kunne ha riktig og likt sammenlikningsgrunnlag er det behov for standardisering av metode og ikke minst sentrale forutsetninger. Dette arbeidet igangsettes etter initiativ fra Statsbygg som har identifisert behovet og ønsker en standardisering av en metodikk for klimagassberegninger for bygninger. Standarden skal blant annet være i samsvar med NS-EN 15978, men skal i tillegg inkludere metodikk for beregning av klimagassutslipp knyttet til byggegrunn (tomtevalg/arealbruk) og transport av byggets brukere i driftsfasen til og fra bygget. Metodikken som standardiseres kan med visse tilpasninger trolig også anvendes for andre typer byggverk som broer, tunneler, veier, elektrisitetsnett, vannkraftverk, mv., og utvides til å omfatte andre miljøbelastninger som utslipp av nitrogenoksider, partikler, metaller, mv.
Komiteen hadde sitt første møte hos Standard Norge medio januar 2014. Dette arbeidet er en viktig arena for å adressere karbonatisering som grunnlag for å beregne klimagassregnskap for bygg hvor betong anvendes.

Karbonopptak i betong i LCA og EPD Status og videre anbefalinger
© Østfoldforskning 26
6 Karbonopptak – erfaringer fra EPD-programmer og PCR’er
Hensikten med dette kapitlet er å vise hva som er dagens praksis i EPD’er med tanke på karbonatisering av betong og karbonopptak i andre typer produkter.
6.1 Karbonopptak i retningslinjer til EPD-programmer
EPDprogrammene er ansvarlige for å sørge for at kravene fra standardene blir stilt og det er påkrevd å ha generelle programinstruksjoner, samt å kvalitetssikre at disse følges (ISO 2006). De mest relevante EPD-programmene er EPD Norge, International EPD system (basert i Sverige), Institut Bauwen unt Umwelt (Tyskland) og NRMCA (National Ready Mix Concrete Association, Nord Amerika). Hvert program har sine egne veiledere og retningslinjer. EPD Norges Veileder for utarbeidelse av miljødeklarasjoner (EPD Norge, 2011) tar for seg fremgangsmåten for å lage en EPD, uten å gi noen metodiske føringer for hvordan livsløpsanalysen skal utføre. Det er derfor hver enkelt PCR som må beskrive hvordan en skal håndtere metodiske utfordringer som karbonopptak. Programinstruksjonene til det svenske EPD-programmet (International EPD system) er mer spesifikk en det norske EPD-programmet (International EPD system, 2008). Det presenterer ingen regler for om karbonatisering skal inkluderes, men i vedlegget til programinstruksjonene står det hvordan en skal sette systemgrensene mellom det første og det andre produktet ved materialgjenvinning.
Figur 9 Systemgrenser til det analyserte systemet (International EPD system, 2008)
I juni 2013 ble Eco Platform etablert. Dette er en nettverksorganisasjon som har som formål å samordne EPD-utviklingen i Europa. Dette for å stimulere til utvikling av flere og mer troverdige EPDer ved at format og layout skal være felles for alle EPDer uavhengig av under hvilket EPDprogram de er registrert. I tillegg skal Eco Platform tilrettelegge for enklere implementering av nye krav fra standarder og metodiske oppdateringer med mer. På denne måten sikres informasjonsflyt og kompetanseoverføring. De nasjonale programordningene blir der med harmonisert og sammenlignbarheten for EPDer øker ved at harmonisering av beregningsmetodikk og formatet (man skal sikre at en EPD gjenkjennes som samme ”produkt” i alle land). Gjennomgang av retningslinjene i EPD-programmene viser at de er for overordnede til å gi føringer på hvorvidt karbonatisering skal inkluderes i EPD’er og eventuelt hvordan dette inkluderes. Dermed er det opp til PCR’ene for de aktuelle produktgruppene å definere dette.

Karbonopptak i betong i LCA og EPD Status og videre anbefalinger
© Østfoldforskning 27
6.2 Revelante og gjeldende PCR’er
PCR - Product Category rules beskriver hvordan LCA skal utføres og EPD skal utformes for en spesifikk produktgruppe. Når en PCR skal utarbeides skal relevante aktører i bransjen involveres. EPDprogrammene er ansvarlige for at utarbeidelsen og innholdet i PCR’en følger standarden og programinstruksjonene. Det har hittil vært vanlig at PCR’ene utarbeides i regi av hvert enkelt EPDprogram i de ulike landene. For å oppnå harmonisering er PCR-arbeidet for byggematerialer og –produktet løftet opp på Europeisk standardiseringsnivå. Det betyr at de PCR’ene som beskrives nedenfor er de PCR’er som er gjeldende på dette tidspunkt, men at de vil erstattes av de europeiske standardene i løpet av få år. I PCR for Precast Concrete products publisert av EPD Norge som tillater både vugge til port- og vugge til grav-EPD’er. Denne nevner ikke karbonatisering spesifikt (EPD Norge, 2012). I PCR for concrete publisert i februar 2013 av EPD-programmet International EPD system (basert i Sverige) indikeres det at karbonatisering kan inkluderes i EPD under additional information (The International EPD system, 2013). Det legges dermed ikke opp til at karbonopptak i betong skal inkluderes i LCA-beregningene som presenteres i en EPD, med begrunnelsen manglende korrekte og kvantifiserte data. Det åpnes for at dette kan inkluderes i fremtiden, og PCR’en henviser til en studie utført av ECRA der en gjennomgang av forskning gjort på området er presentert. PCR for sement som er publisert av International EPD system er utdatert. Arbeidet med å oppdatere PCR’en startet i 2010, men dokumentet er fortsatt på høring og har ikke blitt endelig godkjent. Dokumentutkastet tar opp opptak av såkalt biologisk CO2, men tar ikke stilling til karbonopptak i betong. Den nord-amerikanske PCR’en for betong skiller mellom aktiv og passivt CO2-opptak (Carbon Leadership Forum, 2012). I dokumentet slås det fast at passivt opptak av CO2 i betong skjer i løpet av bruksfasen eller etter endt levetid. Og PCR’en gjelder fra vugge til port og disse livsløpsfasene ikke er inkludert, er heller ikke karbonopptak behandlet. Dersom karbonatisering skal inkluderes i EPD’er må karbonatisering beskrives i de fremtidige PCR-standardene som beskrives i kapittel 5.3.
6.3 EPD-eksempler
Nedenfor gis noen eksempler der CO2-opptak er inkludert eller nevnt i EPD. Det er ikke funnet noen EPD’er som omhandler betong eller sement som inkluderer karbonopptak. I EPD for den biodegraderbare plasten MATER-BI som er publisert gjennom International EPD system er ikke CO2opptak fra plantene inkludert i EPD-resultatene, men det er i teksten under tabellen oppgitt at det atmosfæriske CO2-opptaket under plantens vekst er 1,07 kg per kg plastgranulat (International EPD system, 2012).

Karbonopptak i betong i LCA og EPD Status og videre anbefalinger
© Østfoldforskning 28
I EPD for sterk kartongpapp til emballering fra produsenten Korsnes Carry (International EPD system, 2011), er opptak av CO2 inkludert i en egen tabell i form av negative utslipp. Opptaket er ikke inkludert i de andre EPD-resultatene.
Tabell 2 Utdrag fra EPD for biodegraderbar plast
Begrunnelsen for å inkludere opptaket er at opptak av karbondioksid i biomassen i Svenske skoger er økende fordi vekstraten er større enn hogstraten, og at fremtidige scenarioer for skogdrift i Sverige i løpet av de neste 20 år konkluderer med at hogstraten vil holde seg betydelig lavere enn vekstraten. Den høye vekstraten resulterer i effektiv og bærekraftig skogdrift. Den langsiktige skogdriften er i stor grad drevet av etterspørselen etter trevirke. Netto uttak av biologisk karbondioksid er kalkulert basert på andel netto vekst av biologisk materiale som er allokert til kartongen. Det understrekes i EPD-dokumentet at systemgrensene som benyttes ved beregning av karbonopptaket kommer inn under skogdrift, og at skogdrift regnes som utenfor systemgrensene i resten av EPD’en. Dokumentet skal være utført i henhold til ISO 14025. I EPD av massiv trepanel (cross laminated timber) vises resultatet for klimagassutslipp per kvadratmeter laminat på mellom -46 kg og -246 kg CO2-ekvivalenter, avhengig av tykkelsen, som vist i tabellen nedenfor (Institut Bauen unt Umwelt, 2012).
Tabell 3 Utdrag fra EPD for trepanel,
Det har så langt ikke vært vanlig at EPDer har et netto negativt resultat. EPD’en er en vugge til port-EPD og de negative utslippene begrunnes med at en innenfor systemgrensene har karbonlagring under vekst av trevirket, i tillegg til fossile og biogene karbonutslipp fra produksjon av panelet5. Utenfor de definerte systemgrensene er det lagt til en belastning på bruk av elektrisitet og termisk energi for bruksfasen til 1m2 ferdig trepanel (25-140 kg CO2-ekvivalenter). Det beskrives også at klimagassutslipp fra forbrenning er på mellom 43 og 246 kg CO2-ekvivalenter, men disse tallene er ikke synlige i tabellen som er vist over. Opptak av karbon håndteres ulikt av ulike EPDprogrammer for produkter som inneholder biologisk materiale. Det er ikke funnet eksempler på inkludering av negative utslipp i EPD’er publisert av EPD Norge. For å kunne inkludere karbonopptak vil det være nødvendig med troverdige beregninger og
5 EN 15804:2012+A1:2013 viser til IPCCs metode for beregning av GWP. Her det kun fossilt CO2 som skal inkluderes ved beregning av GWP. Dermed bør en påpeke i denne type EPDer at en ikke følger EN 15804 eller ikke inkudere biogent karbon ved beregning av GWP.
Karbonopptak i betong i LCA og EPD Status og videre anbefalinger
© Østfoldforskning 29
konsensus om at karbonatisering kan inkluderes og hvordan det bør inkluderes. Dette kan gjøres gjennom PCR-utvikling med bred involvering.
6.4 Oppsummering EPD’er og PCR’er
Det er ikke funnet eksempler på EPD’er av betongprodukter som inkluderer karbonatisering i bruksfasen eller etter endt levetid. Dette kommer av at eksisterende PCR’er for sement og betongprodukter ikke åpner for at det inkluderes eller ikke i tilstrekkelig grad omtaler karbonatisering til at det er akseptert å inkludere det. Hva som vil bli akseptert å inkludere i fremtidige EPD’er avhenger av hvordan PCR-standardene under utarbeidelse håndterer karbonatisering. Det er derimot funnet eksempler på andre produkttyper som trepanel og bioplast som inkluderer karbonopptak i EPD. I disse eksemplene inkluderes opptaket som negative utslipp under den aktuelle livsløpsfasen.
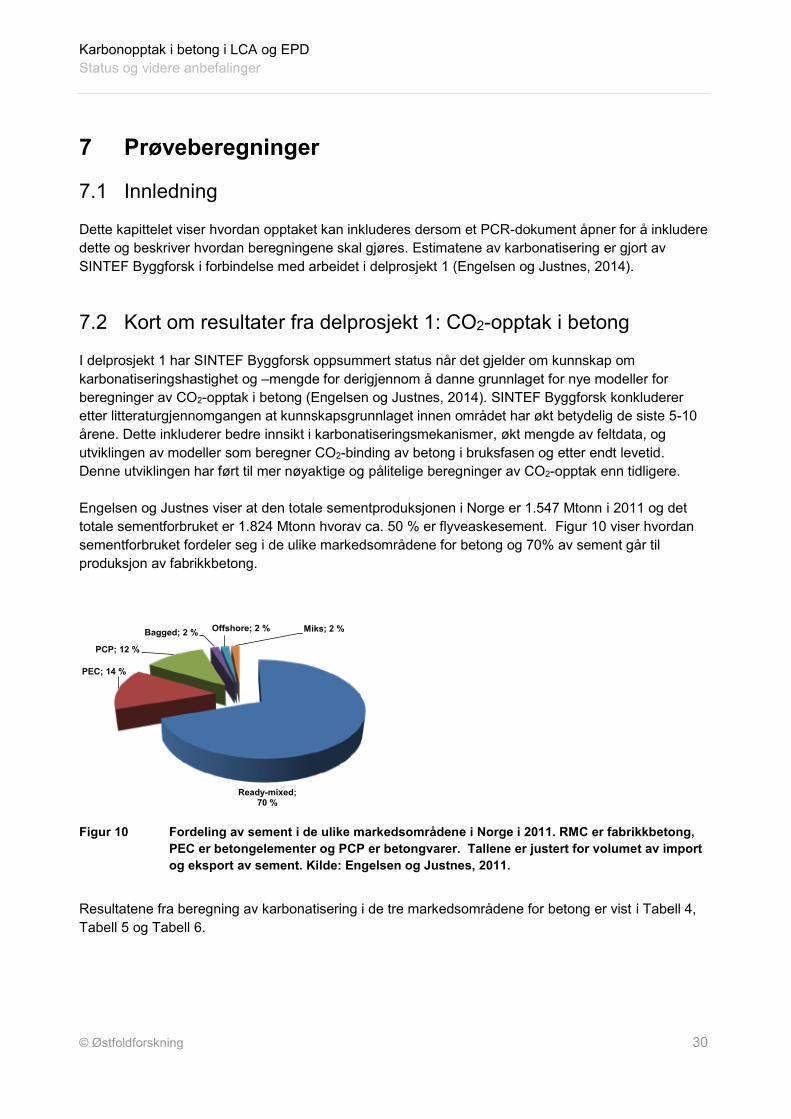
Karbonopptak i betong i LCA og EPD Status og videre anbefalinger
© Østfoldforskning 30
7 Prøveberegninger
7.1 Innledning
Dette kapittelet viser hvordan opptaket kan inkluderes dersom et PCR-dokument åpner for å inkludere dette og beskriver hvordan beregningene skal gjøres. Estimatene av karbonatisering er gjort av SINTEF Byggforsk i forbindelse med arbeidet i delprosjekt 1 (Engelsen og Justnes, 2014).
7.2 Kort om resultater fra delprosjekt 1: CO2-opptak i betong
I delprosjekt 1 har SINTEF Byggforsk oppsummert status når det gjelder om kunnskap om karbonatiseringshastighet og –mengde for derigjennom å danne grunnlaget for nye modeller for beregninger av CO2-opptak i betong (Engelsen og Justnes, 2014). SINTEF Byggforsk konkluderer etter litteraturgjennomgangen at kunnskapsgrunnlaget innen området har økt betydelig de siste 5-10 årene. Dette inkluderer bedre innsikt i karbonatiseringsmekanismer, økt mengde av feltdata, og utviklingen av modeller som beregner CO2-binding av betong i bruksfasen og etter endt levetid. Denne utviklingen har ført til mer nøyaktige og pålitelige beregninger av CO2-opptak enn tidligere. Engelsen og Justnes viser at den totale sementproduksjonen i Norge er 1.547 Mtonn i 2011 og det totale sementforbruket er 1.824 Mtonn hvorav ca. 50 % er flyveaskesement. Figur 10 viser hvordan sementforbruket fordeler seg i de ulike markedsområdene for betong og 70% av sement går til produksjon av fabrikkbetong.
Figur 10 Fordeling av sement i de ulike markedsområdene i Norge i 2011. RMC er fabrikkbetong,
PEC er betongelementer og PCP er betongvarer. Tallene er justert for volumet av import og eksport av sement. Kilde: Engelsen og Justnes, 2011.
Resultatene fra beregning av karbonatisering i de tre markedsområdene for betong er vist i Tabell 4, Tabell 5 og Tabell 6.
Ready-mixed; 70 %
PEC; 14 %
PCP; 12 %
Bagged; 2 % Offshore; 2 % Miks; 2 %
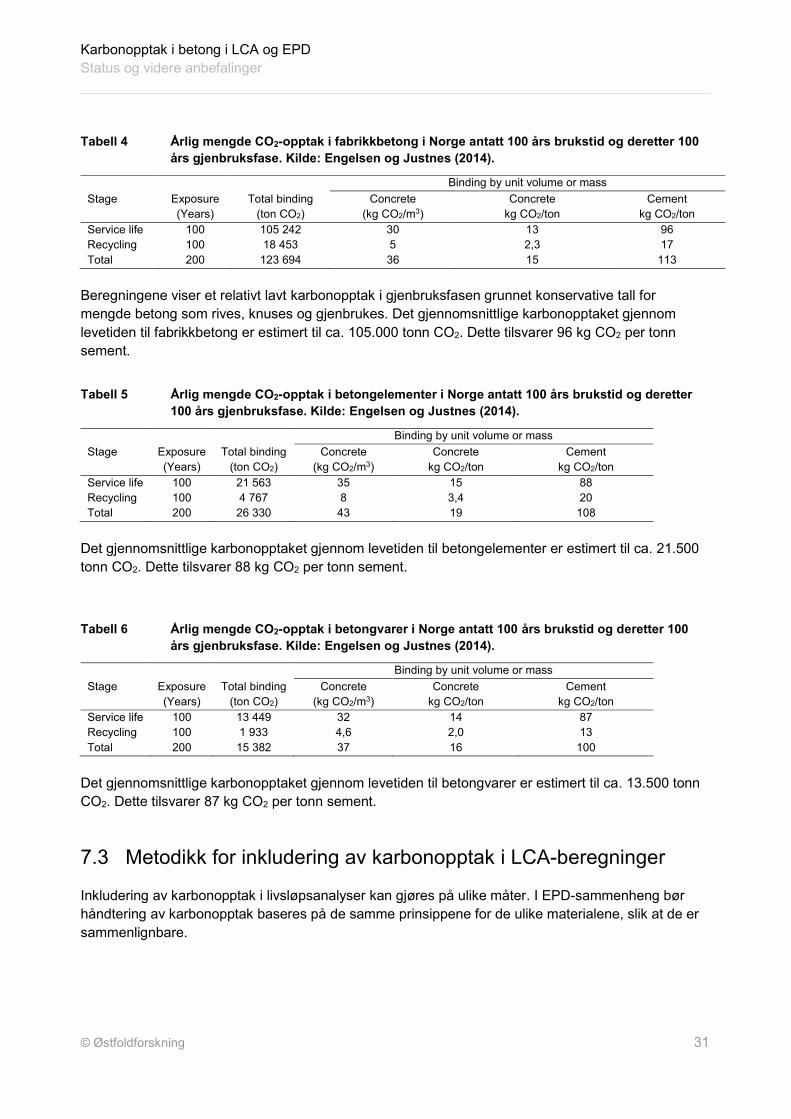
Karbonopptak i betong i LCA og EPD Status og videre anbefalinger
© Østfoldforskning 31
Tabell 4 Årlig mengde CO2-opptak i fabrikkbetong i Norge antatt 100 års brukstid og deretter 100 års gjenbruksfase. Kilde: Engelsen og Justnes (2014).
Stage
Exposure (Years)
Total binding (ton CO2)
Binding by unit volume or mass Concrete
(kg CO2/m3) Concrete
kg CO2/ton Cement
kg CO2/ton Service life 100 105 242 30 13 96 Recycling 100 18 453 5 2,3 17 Total 200 123 694 36 15 113
Beregningene viser et relativt lavt karbonopptak i gjenbruksfasen grunnet konservative tall for mengde betong som rives, knuses og gjenbrukes. Det gjennomsnittlige karbonopptaket gjennom levetiden til fabrikkbetong er estimert til ca. 105.000 tonn CO2. Dette tilsvarer 96 kg CO2 per tonn sement.
Tabell 5 Årlig mengde CO2-opptak i betongelementer i Norge antatt 100 års brukstid og deretter 100 års gjenbruksfase. Kilde: Engelsen og Justnes (2014).
Stage
Exposure (Years)
Total binding (ton CO2)
Binding by unit volume or mass Concrete
(kg CO2/m3) Concrete
kg CO2/ton Cement
kg CO2/ton Service life 100 21 563 35 15 88 Recycling 100 4 767 8 3,4 20 Total 200 26 330 43 19 108
Det gjennomsnittlige karbonopptaket gjennom levetiden til betongelementer er estimert til ca. 21.500 tonn CO2. Dette tilsvarer 88 kg CO2 per tonn sement.
Tabell 6 Årlig mengde CO2-opptak i betongvarer i Norge antatt 100 års brukstid og deretter 100 års gjenbruksfase. Kilde: Engelsen og Justnes (2014).
Stage
Exposure (Years)
Total binding (ton CO2)
Binding by unit volume or mass Concrete
(kg CO2/m3) Concrete
kg CO2/ton Cement
kg CO2/ton Service life 100 13 449 32 14 87 Recycling 100 1 933 4,6 2,0 13 Total 200 15 382 37 16 100
Det gjennomsnittlige karbonopptaket gjennom levetiden til betongvarer er estimert til ca. 13.500 tonn CO2. Dette tilsvarer 87 kg CO2 per tonn sement.
7.3 Metodikk for inkludering av karbonopptak i LCA-beregninger
Inkludering av karbonopptak i livsløpsanalyser kan gjøres på ulike måter. I EPD-sammenheng bør håndtering av karbonopptak baseres på de samme prinsippene for de ulike materialene, slik at de er sammenlignbare.

Karbonopptak i betong i LCA og EPD Status og videre anbefalinger
© Østfoldforskning 32
I biologiske produkter viste gjennomgang av internasjonale EPD’er at det finnes eksempler på EPD’er der karbonopptaket er inkludert. Den konvensjonelle måten å ta høyde for karbonopptak for treprodukter i EPD er som beskrevet i kapittel 3.3 å anta at det som tas opp under vekst av trærne slippes ut på slutten av livsløpet ved avfallshåndtering. Dermed vil summen av opptak og utslipp bli null, og dette ekskluderes fra beregningene, som vist i første linje i figuren nedenfor.
Figur 11 Ulike metoder for håndtering av opptak og utslipp av iboende karbon for treprodukter i
en EPD
I utkastet som foreligger for CEN standarden for PCR for wood products (EN 16485) derimot, er det lagt opp til at både opptaket og utslippene skal synliggjøres i den aktuelle livsløpsfasen, såfremt det kan dokumenteres at skogdriften er bærekraftig. Den totale miljøbelastningen skal dermed bli lik som for den konvensjonelle metoden, men EPD’en vil inneholde negative utslipp i Product stage. Dersom bærekraftig skogdrift ikke kan dokumenteres, skal en bare ta med utslippene og ikke opptaket. I motsetning til for treprodukter skjer utslippene av iboende karbon i begynnelsen av levetiden for betongprodukter. Opptak av karbon kan skje i løpet av levetiden og etter endt levetid, men dette avhenger av betongtype, overflateareal og det omkringliggende miljø. Summen av karbonopptaket gjennom et betongprodukts levetid vil dessuten aldri tilsvare 100% av utslippene i begynnelsen av levetiden. En kan derfor ikke håndtere karbonopptak i betong- og treprodukter helt likt, men metodikken bør likevel bygges på de samme prinsipper. Som beskrevet i tidligere kapitler er dagens praksis (konvensjonell metode) for betongprodukter å ikke ta hensyn til karbonopptaket, som vist i første linje i figuren nedenfor.
Den blå del+ den røde skal stå i PCR og i LCA-rapporten
C 1 - 4A 4 -5A 1 -3 B 1 - 7 D
PRODUCTstage
CONSTRUCTIONPROCESS
stage
Raw
mat
erial
Supp
ly
Tran
spor
t
Man
ufac
torin
g
Tran
spor
t
Cons
truct
ion
inst
alatio
n
USE stage END OF LIFE stage
Scenario Scenario Scenario Scenario
Scenario
Scenario
Scenario
Scenario Scenario Scenario Scenario Scenario Scenario
Benefits and loads beyond the system
boundary
Reuse -Recovery -Recycling -Potential -
Cradle to gateDeclared unit
Cradle to gate with option
Functional unit
Type
of E
PD
Building life cycle informationSupplementary
information beyond the building life cycle
Operationa water use
Operational energy use
A1 A2 A3 A4 A5 B1 B2 B3 B4 B5 C1 C2 C3 C4
B6
B7
Use
Repa
ir(in
cl. tr
ansp
ort)
Main
tana
nce
(incl.
tran
spor
t)
Repl
acem
ent
(incl.
tran
spor
t)
Refu
rbish
men
t(in
cl. tr
ansp
ort)
De-c
onst
ruct
ion
/ Dem
oliti
on
Tran
spor
t
Was
te
proc
essin
g
Disp
osal
Cradle to grave
Functional unitMandatory
Inclusionoptional
Mandatory
Mandatory
Mandatory
Inclusion optional
Inclusion optional
RSLif all scenario
givenMandatory
Inclusionoptional
Mandatory
Inclusionoptional
Mandatory
Inclusionoptional
Mandatory
Inclusionoptional
Mandatory
Inclusionoptional
Mandatory
Inclusionoptional
Mandatory
Inclusionoptional
Mandatory
Inclusionoptional
Mandatory
Inclusionoptional
Mandatory
Inclusionoptional
included incradle to gate
excluded
included incradle to gate with options
Konvensjonell metode
CEN-standardBærekraftig skogdrift
Håndtering av CO2-opptak
CEN-standard ikke bærekraftig skogdrift
0
-1
0
+1
+1
0

Karbonopptak i betong i LCA og EPD Status og videre anbefalinger
© Østfoldforskning 33
Figur 12 Ulike metoder for håndtering av opptak og utslipp av iboende karbon for
betongprodukter i en EPD
Dersom en fremtidig PCR åpner for at karbonatisering av betongprodukter kan inkluderes i EPD’er finnes det to hovedalternativer for hvordan dette kan tas med: inkludere opptak som negative utslipp i de aktuelle livsløpsfasene eller fratrekk av opptaket fra utslippene som skjer i produksjonsfasen (Modul A3 - Product stage). Synliggjøring av utslippene i de aktuelle livsløpsfasene er den metoden som er mest i henhold til det som er foreslått for PCR-standarden for treprodukter, og representerer også den mest transperente metoden for synliggjøring av størrelsesorden på estimert mengde absorbert karbon. Det er derfor besluttet å bruke denne løsningen i prøveberegningene i de følgende delkapitler. Et viktig grunnprinsipp for EPD’er er adderbarhet. I dette ligger at dersom et produkt går til gjenbruk eller gjenvinning, settes det en systemgrense mellom første og andre produktsystem. Dersom karbonatisering i fremtiden skal inkluderes i EPD må det derfor i en PCR gis retningslinjer på hvor skillet går mellom første og andre livsløp går. Fastsettelse av denne systemgrensen kan ha stor betydning på resultatene, siden karbonatiseringen kan skje over tid etter knusing av betongen etter endt levetid. Definisjon av systemgrensen kan behandles ulikt for produkter som går til gjenbruk, gjenvinning eller til deponering. Definisjonen av et produkts sluttdestinasjon defineres ofte etter det gjenvinnende produktets funksjon og om det har en verdi etter omforming eller ikke. Eksempelvis kan det være naturlig å skille mellom knust betong som har en funksjon som fyllmasse og knust betong som oppbevares (deponeres) et sted den ikke har en funksjon. For knust betong som har en funksjon og selges på markedet vil et eventuelt karbonopptak skje i løpet av bruksfasen til produktet (Modul B – use stage). EPD av sement og betongprodukter er ofte fra vugge til port, og opptak i bruksfasen og etter endt levetid er dermed ikke inkludert. Eksempel på dette vises i Figur 13.
Den blå del+ den røde skal stå i PCR og i LCA-rapporten
C 1 - 4A 4 -5A 1 -3 B 1 - 7 D
PRODUCTstage
CONSTRUCTIONPROCESS
stage
Raw
mat
erial
Supp
ly
Tran
spor
t
Man
ufac
torin
g
Tran
spor
t
Cons
truct
ion
inst
alatio
n
USE stage END OF LIFE stage
Scenario Scenario Scenario Scenario
Scenario
Scenario
Scenario
Scenario Scenario Scenario Scenario Scenario Scenario
Benefits and loads beyond the system
boundary
Reuse -Recovery -Recycling -Potential -
Cradle to gateDeclared unit
Cradle to gate with option
Functional unit
Type
of E
PD
Building life cycle informationSupplementary
information beyond the building life cycle
Operationa water use
Operational energy use
A1 A2 A3 A4 A5 B1 B2 B3 B4 B5 C1 C2 C3 C4
B6
B7
Use
Repa
ir(in
cl. tr
ansp
ort)
Main
tana
nce
(incl.
tran
spor
t)
Repl
acem
ent
(incl.
tran
spor
t)
Refu
rbish
men
t(in
cl. tr
ansp
ort)
De-c
onst
ruct
ion
/ Dem
oliti
on
Tran
spor
t
Was
te
proc
essin
g
Disp
osal
Cradle to grave
Functional unitMandatory
Inclusionoptional
Mandatory
Mandatory
Mandatory
Inclusion optional
Inclusion optional
RSLif all scenario
givenMandatory
Inclusionoptional
Mandatory
Inclusionoptional
Mandatory
Inclusionoptional
Mandatory
Inclusionoptional
Mandatory
Inclusionoptional
Mandatory
Inclusionoptional
Mandatory
Inclusionoptional
Mandatory
Inclusionoptional
Mandatory
Inclusionoptional
Mandatory
Inclusionoptional
included incradle to gate
excluded
included incradle to gate with options
Konvensjonell metode
Håndtering av CO2-opptak
Alternativ 1: fordelt på livsløpsfasene
Alternativ 2: trukket fra utslippet
+1 0 0
+1
+1 -(0,x +0,y)
0
-0,x -0,y -0,z
-0,z
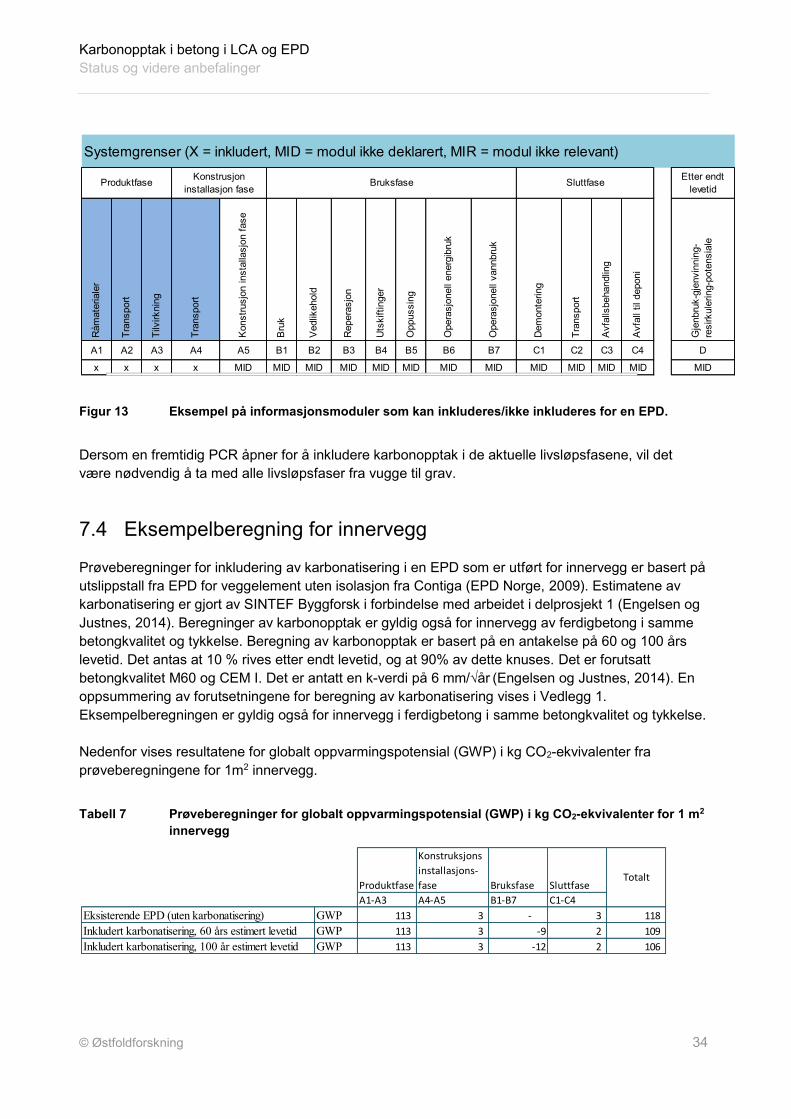
Karbonopptak i betong i LCA og EPD Status og videre anbefalinger
© Østfoldforskning 34
Figur 13 Eksempel på informasjonsmoduler som kan inkluderes/ikke inkluderes for en EPD.
Dersom en fremtidig PCR åpner for å inkludere karbonopptak i de aktuelle livsløpsfasene, vil det være nødvendig å ta med alle livsløpsfaser fra vugge til grav.
7.4 Eksempelberegning for innervegg
Prøveberegninger for inkludering av karbonatisering i en EPD som er utført for innervegg er basert på utslippstall fra EPD for veggelement uten isolasjon fra Contiga (EPD Norge, 2009). Estimatene av karbonatisering er gjort av SINTEF Byggforsk i forbindelse med arbeidet i delprosjekt 1 (Engelsen og Justnes, 2014). Beregninger av karbonopptak er gyldig også for innervegg av ferdigbetong i samme betongkvalitet og tykkelse. Beregning av karbonopptak er basert på en antakelse på 60 og 100 års levetid. Det antas at 10 % rives etter endt levetid, og at 90% av dette knuses. Det er forutsatt betongkvalitet M60 og CEM I. Det er antatt en k-verdi på 6 mm/√år (Engelsen og Justnes, 2014). En oppsummering av forutsetningene for beregning av karbonatisering vises i Vedlegg 1. Eksempelberegningen er gyldig også for innervegg i ferdigbetong i samme betongkvalitet og tykkelse. Nedenfor vises resultatene for globalt oppvarmingspotensial (GWP) i kg CO2-ekvivalenter fra prøveberegningene for 1m2 innervegg.
Tabell 7 Prøveberegninger for globalt oppvarmingspotensial (GWP) i kg CO2-ekvivalenter for 1 m2 innervegg
Systemgrenser (X = inkludert, MID = modul ikke deklarert, MIR = modul ikke relevant)
MID
DC3
MID
Avf
all t
il de
poni
Opp
ussi
ng
B6 C4
Tran
spor
t
Gje
nbru
k-gj
envi
nnin
g-re
sirk
uler
ing-
pote
nsia
le
MID MIDMID MID MID MID
Ved
likeh
old
x
Etter endt levetid
MID MID
B3
Sluttfase
A2
Råm
ater
iale
r
x
Dem
onte
ring
C1
Produktfase Konstrusjon installasjon fase
A5A4 B1 B2A1 C2B5
Avf
alls
beha
ndlin
g
Bruksfase
Kon
stru
sjon
inst
alla
sjon
fase
Tilv
irkni
ng
x x MID MID MID
Tran
spor
t
Bru
k
Tran
spor
t
A3R
eper
asjo
n
Uts
kifti
nger
B7
Ope
rasj
onel
l van
nbru
k
B4
Ope
rasj
onel
l ene
rgib
ruk
-
100
200
300
400
500
600
700
800
Råva
rer t
il Rå
møl
le
Råva
rer t
il Se
men
tmøl
le
Trp,
råva
rer t
il rå
møl
le
Trp,
råva
rer t
il se
men
tmøl
le
Pros
ess,
Råm
ølle
Pros
ess K
linke
r
Pros
ess S
emen
tmøl
le
Andr
e fu
nksjo
ner
Trp
til m
arke
d
CO2-
ekv
per t
onn
GWP fra CEM I Anlegg, fordelt på de ulike moduldelene i livsløpet
Produktfase
Konstruksjons installasjons-fase Bruksfase Sluttfase
A1-A3 A4-A5 B1-B7 C1-C4Eksisterende EPD (uten karbonatisering) GWP 113 3 - 3 118 Inkludert karbonatisering, 60 års estimert levetid GWP 113 3 -9 2 109 Inkludert karbonatisering, 100 år estimert levetid GWP 113 3 -12 2 106
Totalt

Karbonopptak i betong i LCA og EPD Status og videre anbefalinger
© Østfoldforskning 35
Karbonopptaket er estimert til å være mellom 9,2 og 11,9 kg CO2-ekvivalenter i bruksfasen per m2 ubehandlet innervegg fritt eksponert på begge sider, avhengig av om en antar 60 eller 100 års levetid. Opptaket etter endt levetid er estimert til å være henholdsvis 0,12 og 0,8 kg CO2-ekvivalenter per m2.
Figur 14 Prøveberegninger for globalt oppvarmingspotensial (GWP) i kg CO2-ekvivalenter for 1 m2
innervegg
Med antatt levetid på 100 år for en innervegg i ubehandlet betong vil de totale klimabelastningene gjennom hele livsløpet bli redusert med 10%. Dersom en antar 60 års levetid vil klimabelastningen bli redusert med 8%.
7.5 Eksempelberegning for hulldekke
Prøveberegninger for hulldekke er basert på utslippstall fra EPD for hulldekke fra Contiga (EPD Norge, 2013). Det er forutsatt betongkvalitet M40 og CEM I. Dette medfører en k-verdi på 3,5 mm/√år
(Engelsen og Justnes, 2014). Utslippene er omregnet fra per tonn til per m2. Estimatene av karbonatisering er gjort av SINTEF Byggforsk i forbindelse med arbeidet i delprosjekt 1 (Engelsen og Justnes, 2014). Beregning av karbonopptak er basert på en antakelse på 60 og 100 års levetid. Det antas at 10 % rives etter endt levetid, og at 90% av dette knuses. En oppsummering av forutsetningene for beregning av karbonatisering vises i Vedlegg 1. Nedenfor vises resultatene for globalt oppvarmingspotensial (GWP) i kg CO2-ekvivalenter fra prøveberegningene for 1m2 hulldekke.
-
20
40
60
80
100
120
140
Eksisterende EPD (uten karbonatisering)
Inkludert karbonatisering, 60 års brukstid
Inkludert karbonatisering, 100 års brukstid
kg C
O2-
ekvi
vale
nter
/m2
inne
rveg
g
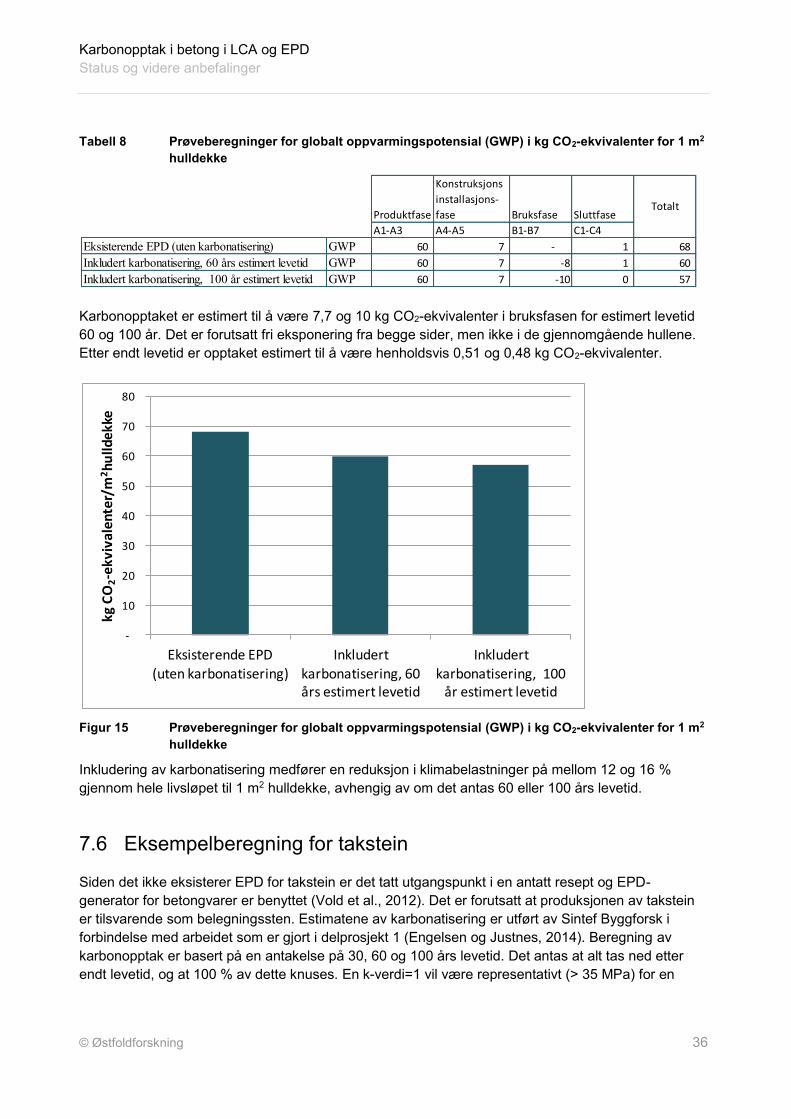
Karbonopptak i betong i LCA og EPD Status og videre anbefalinger
© Østfoldforskning 36
Tabell 8 Prøveberegninger for globalt oppvarmingspotensial (GWP) i kg CO2-ekvivalenter for 1 m2 hulldekke
Karbonopptaket er estimert til å være 7,7 og 10 kg CO2-ekvivalenter i bruksfasen for estimert levetid 60 og 100 år. Det er forutsatt fri eksponering fra begge sider, men ikke i de gjennomgående hullene. Etter endt levetid er opptaket estimert til å være henholdsvis 0,51 og 0,48 kg CO2-ekvivalenter.
Figur 15 Prøveberegninger for globalt oppvarmingspotensial (GWP) i kg CO2-ekvivalenter for 1 m2
hulldekke
Inkludering av karbonatisering medfører en reduksjon i klimabelastninger på mellom 12 og 16 % gjennom hele livsløpet til 1 m2 hulldekke, avhengig av om det antas 60 eller 100 års levetid.
7.6 Eksempelberegning for takstein
Siden det ikke eksisterer EPD for takstein er det tatt utgangspunkt i en antatt resept og EPD-generator for betongvarer er benyttet (Vold et al., 2012). Det er forutsatt at produksjonen av takstein er tilsvarende som belegningssten. Estimatene av karbonatisering er utført av Sintef Byggforsk i forbindelse med arbeidet som er gjort i delprosjekt 1 (Engelsen og Justnes, 2014). Beregning av karbonopptak er basert på en antakelse på 30, 60 og 100 års levetid. Det antas at alt tas ned etter endt levetid, og at 100 % av dette knuses. En k-verdi=1 vil være representativt (> 35 MPa) for en
Produktfase
Konstruksjons installasjons-fase Bruksfase Sluttfase
A1-A3 A4-A5 B1-B7 C1-C4Eksisterende EPD (uten karbonatisering) GWP 60 7 - 1 68 Inkludert karbonatisering, 60 års estimert levetid GWP 60 7 -8 1 60 Inkludert karbonatisering, 100 år estimert levetid GWP 60 7 -10 0 57
Totalt
-
10
20
30
40
50
60
70
80
Eksisterende EPD (uten karbonatisering)
Inkludert karbonatisering, 60 års estimert levetid
Inkludert karbonatisering, 100
år estimert levetid
kg C
O2-
ekvi
vale
nter
/m2 h
ulld
ekke
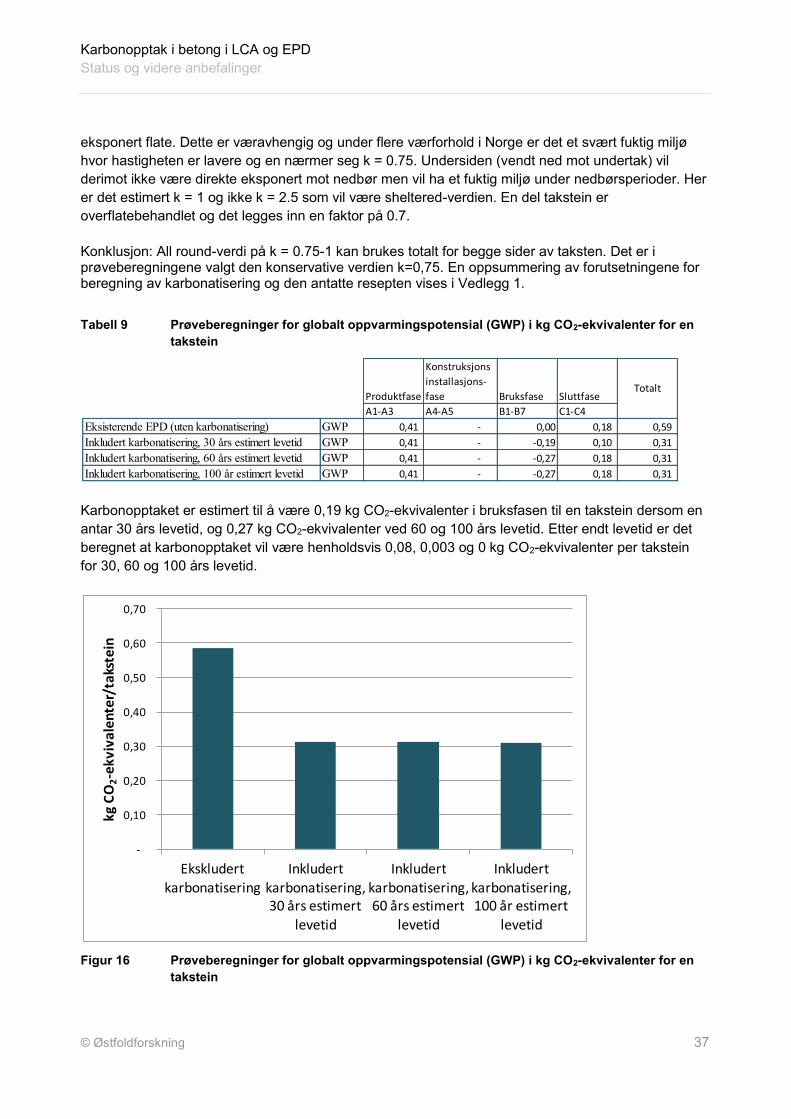
Karbonopptak i betong i LCA og EPD Status og videre anbefalinger
© Østfoldforskning 37
eksponert flate. Dette er væravhengig og under flere værforhold i Norge er det et svært fuktig miljø hvor hastigheten er lavere og en nærmer seg k = 0.75. Undersiden (vendt ned mot undertak) vil derimot ikke være direkte eksponert mot nedbør men vil ha et fuktig miljø under nedbørsperioder. Her er det estimert k = 1 og ikke k = 2.5 som vil være sheltered-verdien. En del takstein er overflatebehandlet og det legges inn en faktor på 0.7. Konklusjon: All round-verdi på k = 0.75-1 kan brukes totalt for begge sider av taksten. Det er i prøveberegningene valgt den konservative verdien k=0,75. En oppsummering av forutsetningene for beregning av karbonatisering og den antatte resepten vises i Vedlegg 1.
Tabell 9 Prøveberegninger for globalt oppvarmingspotensial (GWP) i kg CO2-ekvivalenter for en takstein
Karbonopptaket er estimert til å være 0,19 kg CO2-ekvivalenter i bruksfasen til en takstein dersom en antar 30 års levetid, og 0,27 kg CO2-ekvivalenter ved 60 og 100 års levetid. Etter endt levetid er det beregnet at karbonopptaket vil være henholdsvis 0,08, 0,003 og 0 kg CO2-ekvivalenter per takstein for 30, 60 og 100 års levetid.
Figur 16 Prøveberegninger for globalt oppvarmingspotensial (GWP) i kg CO2-ekvivalenter for en
takstein
Produktfase
Konstruksjons installasjons-fase Bruksfase Sluttfase
A1-A3 A4-A5 B1-B7 C1-C4Eksisterende EPD (uten karbonatisering) GWP 0,41 - 0,00 0,18 0,59 Inkludert karbonatisering, 30 års estimert levetid GWP 0,41 - -0,19 0,10 0,31 Inkludert karbonatisering, 60 års estimert levetid GWP 0,41 - -0,27 0,18 0,31 Inkludert karbonatisering, 100 år estimert levetid GWP 0,41 - -0,27 0,18 0,31
Totalt
-
0,10
0,20
0,30
0,40
0,50
0,60
0,70
Ekskludert karbonatisering
Inkludert karbonatisering, 30 års estimert
levetid
Inkludert karbonatisering, 60 års estimert
levetid
Inkludert karbonatisering, 100 år estimert
levetid
kg C
O2-
ekvi
vale
nter
/tak
stei
n

Karbonopptak i betong i LCA og EPD Status og videre anbefalinger
© Østfoldforskning 38
Ved inkludering av karbonatisering i LCA-beregningene blir klimabelastningene redusert med 47 % for en takstein, uavhengig av om en antar 30, 60 eller 100 års levetid. Siden utslippstallene ikke er basert på spesifikke produksjons data for takstein bør det gjøres mer nøyaktige beregninger for å konkludere om utslippene i livsløpet er riktige og realistiske. De relativt høye verdiene for karbonopptak sammenlignet med de andre produktene det er foretatt prøveberegninger for kommer av at takstein av betong er et produkt med stor overflate. Beregningene viser at estimatene for levetid dermed blir mindre viktig for akkurat dette produktet.
7.7 Oppsummering av erfaringer fra prøveberegninger
I tabellene 4, 5 og 6 vises karbon-opptak i betongprodukter fordelt på de tre hovedsegmentene fabrikkbetong, betongelementer og betongprodukter. Det presiseres at disse tallene representerer alle produkter innen hvert av de tre hovedsegmentene. Innen hvert segment vil det være stor variasjon i karbonopptaksmengde gitt både type produkt (taksten, belegningsten, rør etc.) og sementtype. Figur 17 illustrerer hvordan ulike funksjoner for karbonopptak i ulike betongprodukter kan beskrives. Det er derfor ønskelig at man i PCRer for betong i størst mulig grad gir anbefalinger for karbonopptak for ulike anvendelsesområder.
Figur 17 Karbonopptak gjennom levetiden til ulike betongprodukter
Prøveberegningene viser at estimatene for hvor mye karbon som tas opp gjennom livsløpet til betongprodukter bør være så produktspesifikke som mulig. Dette er i tråd med grunnprinsippene for EPD, der en søker å vise miljøbelastninger som er mest mulig realistiske og spesifikke for det konkrete produktet som deklareres. Estimering av levetiden er viktig (med unntak av produkter med relativt stor overflate, der en oppnår opptak tett opp til bindingskapasiteten). Det er behov for bedre data på knusing (energibruk) og informasjon hvor mye som blir knust og hva knust betong brukes til i det markedsområdet produktet har.
Takstein
Produkt a
Produkt b
Produkt c
Produkt n
Bro
Karbonopptak i betong i LCA og EPD Status og videre anbefalinger
© Østfoldforskning 39
8 Diskusjon og konklusjon
8.1 Aksept for inkludering av karbonopptak
Gjeldende standarder for LCA åpner for inkludering av karbonatisering så lenge det gjenspeiler hensikt og omfang med studien og det er beskrevet i underlagsrapporten hvordan opptaket er estimert. Det er også naturlig å inkludere sensitivitetsanalyser som belyser usikkerheten rundt kvantifiseringen og hvordan denne påvirker resultatene. Likevel er CO2-opptak i betongprodukter i liten grad inkludert i LCA-analyser. Det synes å være akademisk konsensus (innen fagfeltene betong-/materialkunnskap spesielt) om at karbonatisering foregår, men det har til nå vært stor usikkerhet rundt hvordan dette bør beregnes. Men, innen LCA-miljøene finner en i liten grad karbonatisering som en del av de faglige diskusjoner som føres. Dette kan like gjerne være et uttrykk for manglende kjennskap til enn aksept for at karbonatisering bør og må inkluderes i LCA-/EPD-sammenheng. Det er først i de siste par årene en ser at karbonatisering trekkes fram som et viktig element i utvikling av PCRer etter påtrykk fra sement- og betongindustrien. Engelsen og Justnes (2014) konkluderer i delprosjekt 1, at kunnskapsgrunnlaget innen området har økt betydelig de siste 5-10 årene. Dette inkluderer bedre innsikt i karbonatiseringsmekanismer, økt mengde av feltdata, og utviklingen av modeller som beregner CO2-binding av betong i bruksfasen og etter endt levetid. Denne utviklingen har ført til mer nøyaktige og pålitelige beregninger av CO2-opptak enn tidligere. Dette arbeidet er en viktig dokumentasjon som bekrefter at karbonopptak i betong skjer og må derfor inkluderes i miljøvurderinger av betongprodukter.
8.2 Kunnskap om karbonatisering hos brukere av EPD
Karbonopptak i biologiske produkter når de vokser synes å være allment kjent. Karbonatisering hos betongprodukter er derimot et mer ukjent fenomen i miljødebatten. Ved inkludering av negative utslipp i en EPD er det viktig at brukeren av EPD’en (innkjøperen) forstår hva dette betyr. Dette handler i hovedsak om informasjon gjennom de riktige kanaler og å ”avmystifisere” karbonopptaket som foregår. Kunnskap om hva karbonatisering er og når og hvordan det skal inkluderes, er også viktig hos de som utvikler EPD’ene, nemlig LCA-ekspertene. LCA-ekspertene baserer sine beregninger på vitenskapelige publiseringer og faktiske tall der det er mulig. Det er viktig med tydelige retningslinjer og god dokumentasjon av målinger og forskning på å kvantifisere karbonopptak i betongprodukter.
8.3 Kvantifisering av karbonatisering
En av de mest brukte begrunnelsene for ikke å inkludere karbonatisering i LCA har vært at det er for usikkert. Gjennom arbeidet i delprosjekt 1 har en dokumentert at kunnskapsgrunnlaget innen området har økt betydelig og at denne utviklingen har ført til mer nøyaktige og pålitelige beregninger av CO2-opptak enn tidligere.
Karbonopptak i betong i LCA og EPD Status og videre anbefalinger
© Østfoldforskning 40
All den tid en vet at ulike betongprodukter har ulik grad av karbonatisering, er det viktig at modeller utvikles for ulike produkter; taksten gjennomkarbonatiseres, mens andre produkter kan ha betydelig mindre karbonatiseringsgrad gjennom dets levetid. Ved å ta hensyn til både type produkt, type sement og hvor i livsløpet karbonopptaket skjer vil en kunne inkludere så realistiske og spesifikke scenarioer som mulig for karbonopptak i livsløpsanalyser og EPDer.
8.4 PCR-arbeid
Dersom en skal ha med karbonopptak i en EPD må dette være beskrevet i gjeldende PCR. PCR-utviklingen av betongprodukter er nøkkelen til inkludering av karbonatisering i EPDer. LCA-ekspertene forholder seg til de relevante standarder og PCR’er. For å sikre transparens og sammenlignbarhet bør PCR’ene være så konkrete som mulig på når karbonatisering kan inkluderes og beskrive hvordan kvantifiseringen skal gjøres på en slik måte at det er gjennomførbart for LCA-eksperter. PCRene bør derfor beskrive:
at karbonatisering kan inkluderes hvordan det skal beregnes for:
o ulike undersegmenter for de tre hovedsegmentene fabrikkbetong, betongelementer og betongprodukter og
o ulike sementkvaliteter hvor i EPD’en dette skal synliggjøres (hvilke moduler/livsløpsfaser)
Det pågående PCR-arbeidet i regi av CEN har karbonatisering som et av hovedtemaene. Dette vil bli førende for hvordan EPDer i framtiden blir utviklet og hvilket beregningsgrunnlag som skal legges til grunn for karbonopptak. Karbonatisering kan ikke inkluderes dersom EPD’en kun omfatter vugge til port. En kan ikke bare inkludere opptak og ikke utslipp for livsløpsfasene. Derimot kan en vugge til port-EPD oppgi tilleggsinformasjon som gjøre det mulig for brukeren av EPD å beregne ulike scenarioer for bruksfasen og avfallshåndtering. Den bør da også gi informasjon om eventuelle aktiviteter i disse fasene som kan medføre utslipp.
8.5 Videre arbeid
I dette prosjektet har en i delprosjekt 1 beregnet karbonopptak for alle betongprodukter produsert samlet i Norge i 2011 og for ulike sementkvaliteter. Det er også beregnet karbonopptak for betongprodukter innen tre hovedsegmentene fabrikkbetong, betongelementer og betongprodukter og for noen sementkvaliteter. Basert på dette arbeidet bør en beregne karbonopptak for betongprodukter innen hvert undersegment (taksten, belegningssten, rør etc.). I tillegg bør en nyansere tallgrunnlaget på flere sementtyper (for eksempel lavkarbonsement). Det anbefales også at man også benytter den svenske modellen fra Andersson et al. (2013) parallelt for derigjennom å sikre tallgrunnlaget.

Karbonopptak i betong i LCA og EPD Status og videre anbefalinger
© Østfoldforskning 41
For å ta ut potensialet for karbonopptak i gjenbruksfasen i EPDer, bør tallgrunnlaget bedres. Dette kan gjøres ved å ta flere målinger i felten.
Karbonopptak i betong i LCA og EPD Status og videre anbefalinger
© Østfoldforskning 42
9 Referanser
Andersson, R., Fridh, K., Stripple, H., and Häglund, M. (2013): Calculating CO2 uptake for existing concrete structures during and after service-life. Environ Sci Technol , 47 (20), pp. 11625–11633. BSI (2011): PAS 2050, Specification for the assessment of the life cycle greenhouse gas emissions of goods and services, British Standard Institute, 2011. http://shop.bsigroup.com/en/Browse-By-Subject/Environmental-Management-and-Sustainability/PAS-2050/
Collins, F (2010): Inclusion of carbonation during the life cycle of built and recycled concrete: influence on their carbon footprint. International Journal of Life Cycle Assessment (2010) 15:549-556.
Carbon Leadership Forum (2012): North American Product Category Rules (PCR) for ISO 14025 Type III Environmental Product Declarations (EPDs) and/or GHG Protocol conformant product carbon footprint of concrete. University of Washington College of Built Environments Department of Architecture Dodoo, A., Gustavsson, L. and Sathre, R. (2009): Carbon implications of end-of-life management of building materials, Resource, Conservation and Recycling 53 (2009) 276-286. Dosho, Y (2007): Development of a Sustainable Concrete Waste Recycling System, Application of Recycled Aggregate Concrete Produced by Aggregate Replacing Method. Japan Concrete Institute. Journal of Advanced Concrete Technology Vol. 5, No. 1, 27-42, February 2007. Engelsen, C. J., Justnes H. (2014): CO2 binding by concrete. Summary of the state of the art and an assessment of the total binding in by carbonation in the Norwegian concrete stock, Sintef Byggforsk, SINTEF report SBF2014A0019. Engelsen, C. J., Mehus, J., Pade, C. og Sæther, D. H. (2005): Carbon dioxide uptake in demolished and crushed concrete. CO2 uptake during the concrete life cycle, Nordic Innovation Centre Project 03018. Project report 395-2005. Norwegian Building Research Institute, 2005. EPD Norge (2013): Environmental Product Declaration for Hulldekke, Contiga, NEPD 160N, 05.03.2013. EPD Norge (2012): Product category rules (PCR) for preparng an environmental declaration (EPD) for product group “Precast concrete products”, NPCR 20, mars 2012. EPD Norge (2011): Veileder for utarbeidelse av miljødeklarasjoner, Versjon 2 – revidert august 2011, Sintef Byggforsk, 9/16/2011 EPD Norge (2009): Environmental Product Declaration for Veggelement uten Isolasjon, Contiga, NEPD 128N. 13.05.2009.
Karbonopptak i betong i LCA og EPD Status og videre anbefalinger
© Østfoldforskning 43
European Commission (2004): Development of horizontal standardised methods for the Assessment of the integrated environmental performance of Buildings, M/350 EN Standardisation Mandate to CEN 29 March 2004 Flower, D. J. M. and Sanjayan, J. G (2007): Greenhouse gas emissions due to concrete manufacture, International Journal of LCA 12 (5) 282-288 Gustavsson L og Sathre R (2006): Variability in energy and carbon dioxide balances of wood and concrete building materials, Building and Environmental 41 (2006) 940-951. Hallberg, D. og Racutanu, G. (2007): Development of the Swedish bridge management system by introducing LMS concept, materials and structures (2007) 40:627-639. Insitut Bauen und umwelt (2012a): Environmental Product Declaration, KLH solid timber panels (Cross laminated timber), EPD-KLH-2012111-E,01.02.2012, utviklet av PE international
International EPD system (2013): Product Category Rules for concrete, UN CPC 375, februar 2013. International EPD system (2012): EPD for MATER-BII® CF05S, Novamont, Publisert av International EPD system, November 2012. International EPD system (2011): EPD for Korsnes Carry, The International EPD system (Environdec), S-P-00243. International EPD system (2008): Supporting Annexes for Environmental Product Declarations, EPD. Version 1.0, februar 2008. IPCC (2007): Climate Change 2007 - Mitigation of Climate Change. Annex I. Glossary. http://www.ipcc-wg3.de/assessment-reports/fourth-assessment-report/.files-ar4/Annex-I.pdf ISO (2013): ISO 14067 Carbon footprint of products – Requirements and guidelines for quantification and communication. ISO, 2013. ISO (2006): ISO 14025, Environmental labels and declarations – Type III environmental declarations – Principles and procedures, ISO, 2006. Lagerblad (2005): Carbon dioxide uptake during concrete life cycle, state of the art. Swedish Cement and Concrete Research Institute. CBI Report 2:2005 Kjellsen, K.O., Guimaraes, M. og Nilsson, Å. (2005): CO2 uptake during the concrete life cycle: The CO2 Balance of Concrete in a Life Cycle Perspective. Main Project report: Results and conclusions, Nordic Innovation Centre, December 2005. Ingunn Saur Modahl, Cecilia Askham, Kari-Anne Lyng, Andreas Brekke (2012): Weighting of environmental trade-offs in CCS—an LCA case study of electricity from a fossil gas power plant with

Karbonopptak i betong i LCA og EPD Status og videre anbefalinger
© Østfoldforskning 44
post-combustion CO2 capture, transport and storage. The International Journal of Life Cycle Assessment August 2012, Volume 17, Issue 7, pp 932-943 Pade, C. og Guimaraes, M. (2007): The CO2 uptake of concrete in a 100 year perspective, Cement and Concrete Research 37 (2007) 1348-1356. Pommer, K og Pade, C (2005): Guidelines – Uptake of carbon dioxide in the life cycle inventory of concrete, Danish Technological Institute, oktober 2005.
Rønning, A.; Nereng, G.; Vold, M.; Bjørberg S.; Lassen, N. (2007): “JOMAR - A Model for Accounting the Environmental Loads from Building Constructions”, OR.07.07, STØ, Fredrikstad. Strazza, C., Del Borghi,A., Blengini, G. A., Gallo, M. (2010): Definition of the methodoligy for a sector EPD (Environmental Product Declaration): case study of the average Italian cement. International Journal of Life Cycle Assessment (2010) 15:540-548 Santero, N., Loijos, A., Akbarian, M., og Ochsendorf, J. (2011): Methods, Impacts, and opportunities in the Concrete Pavement Life Cycle, Concrete Sustainability Hub, Massachusetts Institute of Technology, august 2011. Van den Heede og Belie (2012): Environmental Impact and life cycle assessment (LCA) of traditional and ‘green’ concretes: Literature review and theoretical calculations. Cement & Concrete composites 34 (2012) 431-442. Vold, M., Rønning, A. og Shakenda, V. (2012): EPD-generator: A tool for generation of EPDs in Norwegian Concrete Industry. Concrete Sustainability Conference, Seattle, May 2012.

Karbonopptak i betong i LCA og EPD Status og videre anbefalinger
© Østfoldforskning 45
Vedlegg 1 Estimering av karbonopptak
Innervegg (ubehandlet) Funksjonell enhet 1m2 Tykkelse mm 180 180 180 Lengde m 1 1 1 Bredde m 1 1 1 Volum m3 0,18 0,18 0,18 Nettovolum - - - Eksponert areal funksjonell enhet m2 2,00 2,00 2,00 Vekt kg 432 432 432 Type betong Sement mengde kg 54 54 54 Bindingskapasitet i funksjonell enhet kg CO2 18 18 18 Sementmengde kg/m3 300 300 300 Bindingskapasitet kg CO2/tonn sement 330 330 330 Bindingskapasitet kg CO2/m3 betong 99 99 99 Estimert levetid (år) 30 60 100 Vedlikehold/ utskiftning 0 Antatt avfallshåndtering 90 % knusing 90 % knusing 90 % knusing Antatt k-verdi mm/y^2 6 6 6 Karbonatiseringsdybde mm 66 93 120 Karbonatisert volum m3 0,066 0,093 0,120 Kg CO2opptak bruksfase 6,5 9,2 11,9 % av max 37 52 67 % rives ved end of life 10 10 10 % karebonatisering ved end-of life 15 15 15 Kg CO2opptak end of life 0,153 0,116 0,080 % av max 0,86 0,65 0,45
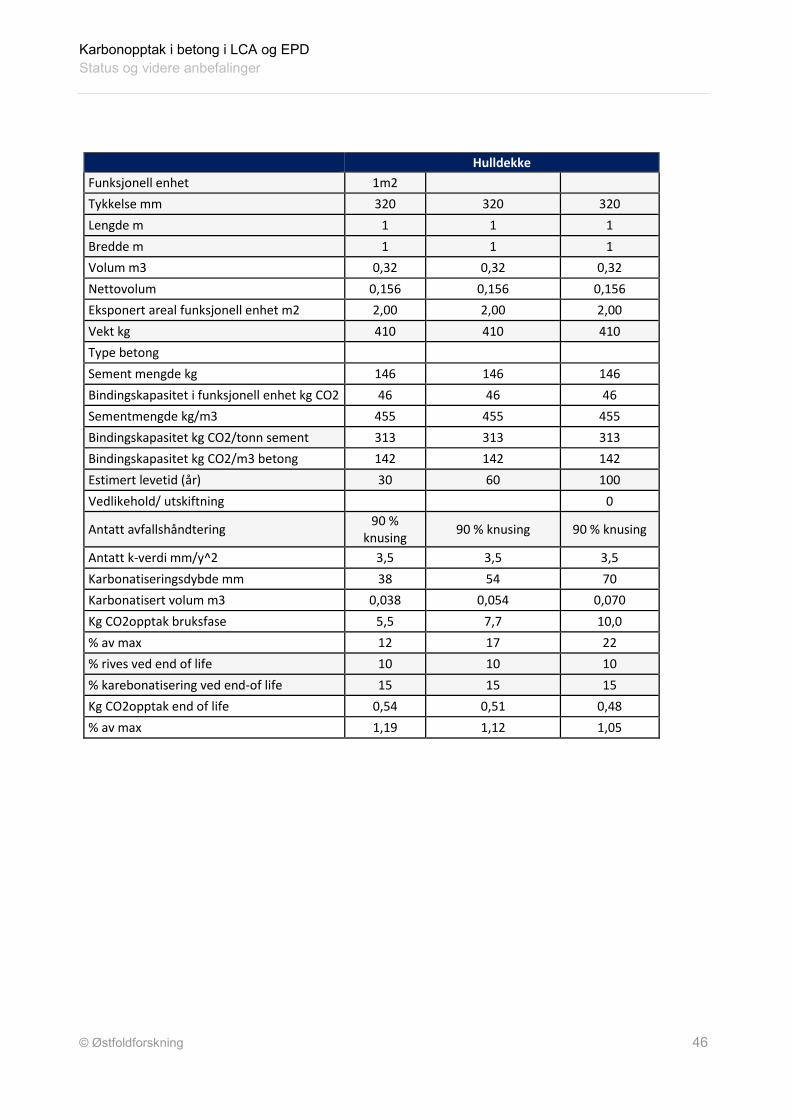
Karbonopptak i betong i LCA og EPD Status og videre anbefalinger
© Østfoldforskning 46
Hulldekke Funksjonell enhet 1m2 Tykkelse mm 320 320 320 Lengde m 1 1 1 Bredde m 1 1 1 Volum m3 0,32 0,32 0,32 Nettovolum 0,156 0,156 0,156 Eksponert areal funksjonell enhet m2 2,00 2,00 2,00 Vekt kg 410 410 410 Type betong Sement mengde kg 146 146 146 Bindingskapasitet i funksjonell enhet kg CO2 46 46 46 Sementmengde kg/m3 455 455 455 Bindingskapasitet kg CO2/tonn sement 313 313 313 Bindingskapasitet kg CO2/m3 betong 142 142 142 Estimert levetid (år) 30 60 100 Vedlikehold/ utskiftning 0
Antatt avfallshåndtering 90 % knusing 90 % knusing 90 % knusing
Antatt k-verdi mm/y^2 3,5 3,5 3,5 Karbonatiseringsdybde mm 38 54 70 Karbonatisert volum m3 0,038 0,054 0,070 Kg CO2opptak bruksfase 5,5 7,7 10,0 % av max 12 17 22 % rives ved end of life 10 10 10 % karebonatisering ved end-of life 15 15 15 Kg CO2opptak end of life 0,54 0,51 0,48 % av max 1,19 1,12 1,05
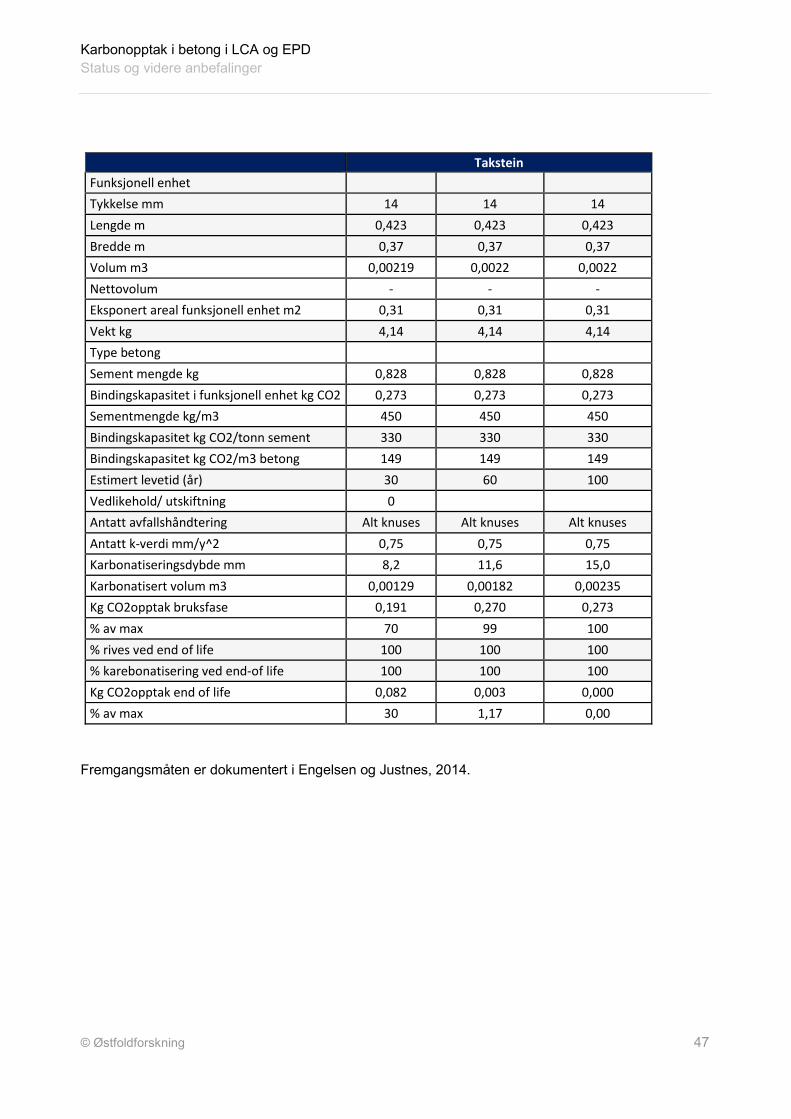
Karbonopptak i betong i LCA og EPD Status og videre anbefalinger
© Østfoldforskning 47
Takstein Funksjonell enhet Tykkelse mm 14 14 14 Lengde m 0,423 0,423 0,423 Bredde m 0,37 0,37 0,37 Volum m3 0,00219 0,0022 0,0022 Nettovolum - - - Eksponert areal funksjonell enhet m2 0,31 0,31 0,31 Vekt kg 4,14 4,14 4,14 Type betong Sement mengde kg 0,828 0,828 0,828 Bindingskapasitet i funksjonell enhet kg CO2 0,273 0,273 0,273 Sementmengde kg/m3 450 450 450 Bindingskapasitet kg CO2/tonn sement 330 330 330 Bindingskapasitet kg CO2/m3 betong 149 149 149 Estimert levetid (år) 30 60 100 Vedlikehold/ utskiftning 0 Antatt avfallshåndtering Alt knuses Alt knuses Alt knuses Antatt k-verdi mm/y^2 0,75 0,75 0,75 Karbonatiseringsdybde mm 8,2 11,6 15,0 Karbonatisert volum m3 0,00129 0,00182 0,00235 Kg CO2opptak bruksfase 0,191 0,270 0,273 % av max 70 99 100 % rives ved end of life 100 100 100 % karebonatisering ved end-of life 100 100 100 Kg CO2opptak end of life 0,082 0,003 0,000 % av max 30 1,17 0,00
Fremgangsmåten er dokumentert i Engelsen og Justnes, 2014.

© Østfoldforskning 4

Trykk: HELLI - Visuell kommunikasjon - www.helli.no
Postboks 2312 Solli, 0201 Oslo • www.betong.net
er en forening tilknyttet