Just One Thing Twelve Of The World's Best Investors Reveal ...
273
-
Upload
khangminh22 -
Category
Documents
-
view
0 -
download
0
Transcript of Just One Thing Twelve Of The World's Best Investors Reveal ...

JUST ONE THING
ffirs.qxd 10/4/05 3:18 PM Page i

ffirs.qxd 10/4/05 3:18 PM Page ii
JUST ONE THINGTwelve of the World’s Best Investors Reveal
the One Strategy You Can’t Overlook
JOHN MAULDIN, Editor
JOHN WILEY & SONS, INC.
ffirs.qxd 10/4/05 3:18 PM Page iii

Copyright © 2006 by John Mauldin. All rights reserved.
Published by John Wiley & Sons, Inc., Hoboken, New Jersey.Published simultaneously in Canada.
No part of this publication may be reproduced, stored in a retrieval system, or transmitted inany form or by any means, electronic, mechanical, photocopying, recording, scanning, orotherwise, except as permitted under Section 107 or 108 of the 1976 United States CopyrightAct, without either the prior written permission of the Publisher, or authorization throughpayment of the appropriate per-copy fee to the Copyright Clearance Center, Inc., 222 Rosewood Drive, Danvers, MA 01923, (978) 750-8400, fax (978) 646-8600, or on the Webat www.copyright.com. Requests to the Publisher for permission should be addressed to thePermissions Department, John Wiley & Sons, Inc., 111 River Street, Hoboken, NJ 07030,(201) 748-6011, fax (201) 748-6008, or online at http://www.wiley.com/go/permissions.
Limit of Liability/Disclaimer of Warranty: While the publisher and author have used theirbest efforts in preparing this book, they make no representations or warranties with respectto the accuracy or completeness of the contents of this book and specifically disclaim anyimplied warranties of merchantability or fitness for a particular purpose. No warranty may becreated or extended by sales representatives or written sales materials. The advice andstrategies contained herein may not be suitable for your situation. You should consult with aprofessional where appropriate. Neither the publisher nor author shall be liable for any lossof profit or any other commercial damages, including but not limited to special, incidental,consequential, or other damages.
For general information on our other products and services or for technical support, pleasecontact our Customer Care Department within the United States at (800) 762-2974, outsidethe United States at (317) 572-3993, or fax at (317) 572-4002.
Wiley also publishes its books in a variety of electronic formats. Some content that appearsin print may not be available in electronic books. For more information about Wileyproducts, visit our Web site at www.wiley.com.
Library of Congress Cataloging-in-Publication Data:
Mauldin, John.Just one thing : twelve of the world’s best investors reveal the one
strategy you can’t overlook / John Mauldin.p. cm.
Includes bibliographical references.ISBN-13: 978-0-471-73873-2 (cloth)ISBN-10: 0-471-73873-5 (cloth)
1. Investments—Handbooks, manuals, etc. I. Title: Twelve of the world’sbest investors reveal the one strategy you can’t overlook. II. Title.
HG4527.M365 2006332.67'8—dc22
2005025979
Printed in the United States of America.10 9 8 7 6 5 4 3 2 1
ffirs.qxd 10/4/05 3:18 PM Page iv
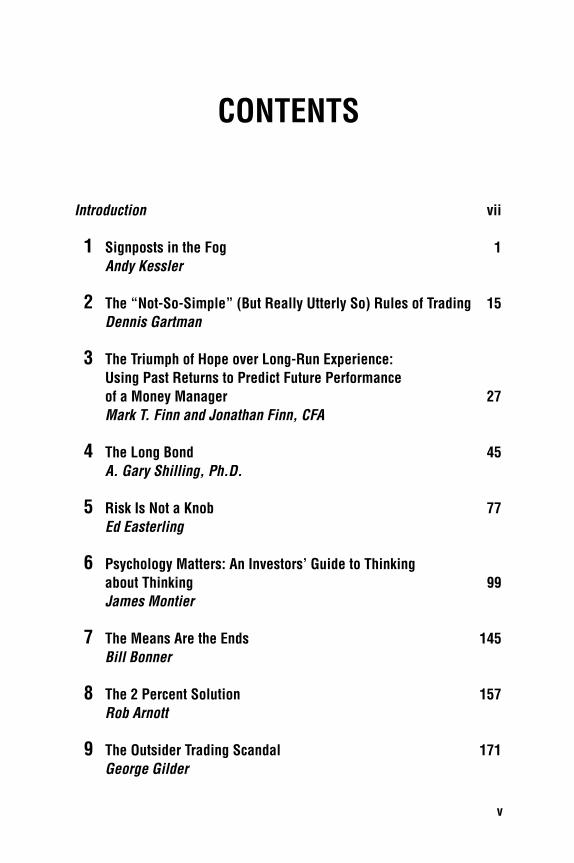
CONTENTS
Introduction vii
1 Signposts in the Fog 1Andy Kessler
2 The “Not-So-Simple” (But Really Utterly So) Rules of Trading 15Dennis Gartman
3 The Triumph of Hope over Long-Run Experience: Using Past Returns to Predict Future Performance of a Money Manager 27Mark T. Finn and Jonathan Finn, CFA
4 The Long Bond 45A. Gary Shilling, Ph.D.
5 Risk Is Not a Knob 77Ed Easterling
6 Psychology Matters: An Investors’ Guide to Thinking about Thinking 99James Montier
7 The Means Are the Ends 145Bill Bonner
8 The 2 Percent Solution 157Rob Arnott
9 The Outsider Trading Scandal 171George Gilder
v
ftoc.qxd 10/4/05 3:18 PM Page v

10 The Winner’s Rule 185Michael Masterson
11 Rich Man, Poor Man 199Richard Russell
12 The Millennium Wave 213John Mauldin
Notes 247
Index 253
vi CONTENTS
ftoc.qxd 10/4/05 3:18 PM Page vi

INTRODUCTION
“JUST ONE THING,” I TOLD THEM.“Give me the one best investing concept that you want to pass
on to your kids.”One of the great things about working in my field is that I get to
run around with some very smart people. I get to pick their brainsand learn from the best. If you could get a chance to sit down witha Gartman or Kessler or any of the other contributors to this bookyou would undoubtedly leap at the chance. What one thing couldeach of them tell you that would make a difference in your invest-ing life? It’s impossible to calculate the value of one idea if it helpsus become better investors, or saves us the pain of losses.
I asked the contributors to share their insights. The authors ofthese chapters have all learned a lot along the way. “Why not,” Ithought, “ask them to share the wealth of their wisdom?” And so Idid. There were no rules, so that’s why the chapters vary in lengthand topic.
What I wanted to get was material that would be readable andaccessible to the average investor. Nothing is more frustrating to methan a great idea I can’t understand. I asked them to make it some-thing that will give readers an “aha” moment. Just share it with us.
Now, I could guess what a few of them would write about be-fore I asked. Mark Finn was going to write about the problems ofpast performance. He is absolutely brilliant on that (and a lot ofother things), which is why he gets big institutions to keep comingback for his consulting. And you knew that Dennis Gartman wouldwrite on his Rules of Trading. Gartman has forgotten more abouttrading than most of us will ever know. Which, he would tell you, iswhy he writes his rules down so he can remember them and followthem! You break these rules, you are gonna lose. If you want totrade, you need these near your desk.
But I didn’t know how some of the other contributors could
vii
flast.qxd 10/4/05 3:19 PM Page vii
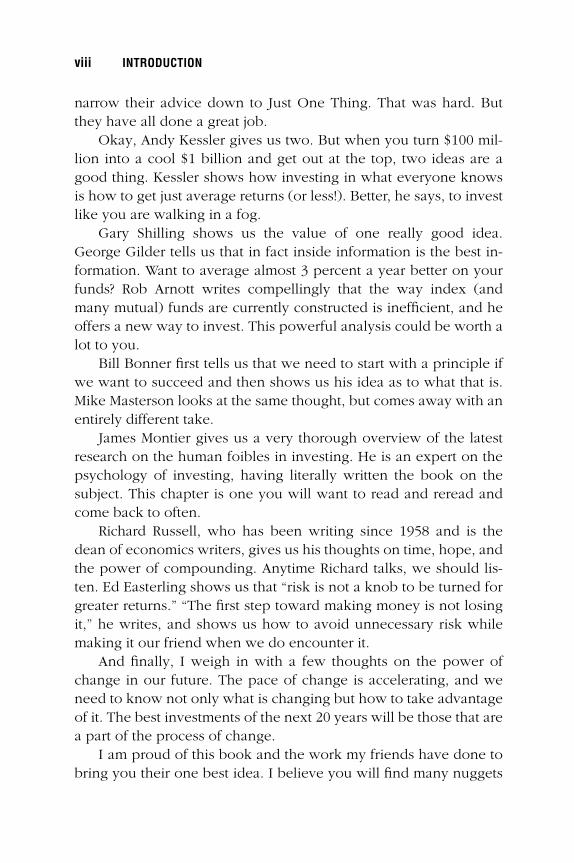
narrow their advice down to Just One Thing. That was hard. Butthey have all done a great job.
Okay, Andy Kessler gives us two. But when you turn $100 mil-lion into a cool $1 billion and get out at the top, two ideas are agood thing. Kessler shows how investing in what everyone knowsis how to get just average returns (or less!). Better, he says, to investlike you are walking in a fog.
Gary Shilling shows us the value of one really good idea.George Gilder tells us that in fact inside information is the best in-formation. Want to average almost 3 percent a year better on yourfunds? Rob Arnott writes compellingly that the way index (andmany mutual) funds are currently constructed is inefficient, and heoffers a new way to invest. This powerful analysis could be worth alot to you.
Bill Bonner first tells us that we need to start with a principle ifwe want to succeed and then shows us his idea as to what that is.Mike Masterson looks at the same thought, but comes away with anentirely different take.
James Montier gives us a very thorough overview of the latestresearch on the human foibles in investing. He is an expert on thepsychology of investing, having literally written the book on thesubject. This chapter is one you will want to read and reread andcome back to often.
Richard Russell, who has been writing since 1958 and is thedean of economics writers, gives us his thoughts on time, hope, andthe power of compounding. Anytime Richard talks, we should lis-ten. Ed Easterling shows us that “risk is not a knob to be turned forgreater returns.” “The first step toward making money is not losingit,” he writes, and shows us how to avoid unnecessary risk whilemaking it our friend when we do encounter it.
And finally, I weigh in with a few thoughts on the power ofchange in our future. The pace of change is accelerating, and weneed to know not only what is changing but how to take advantageof it. The best investments of the next 20 years will be those that area part of the process of change.
I am proud of this book and the work my friends have done tobring you their one best idea. I believe you will find many nuggets
viii INTRODUCTION
flast.qxd 10/4/05 3:19 PM Page viii

you can use in your own life and investing. As to the order of thechapters, it was just too much to decide who should be first andthen second and so on; each chapter deserves to be a lead chapter.So I let the way they were organized in my inbox be the prime fac-tor. You can start at the beginning or in the middle or the end, butread them all.
And Just One More Thing: There are a lot of great ideas in thenext few hundred pages, but you have to put them into practice. Soas you read, think about how you will put the principles, tips, andideas to use in your personal life. And that will make this book be avery good thing.
Introduction ix
flast.qxd 10/4/05 3:19 PM Page ix

flast.qxd 10/4/05 3:19 PM Page x
C H A P T E R 1
Signposts in the Fog
Andy Kessler is a modern-day Investment Renaissance Man. He
does it all. He was a research analyst and investment banker for
some of the biggest firms on Wall Street. He wrote about his
experiences in his first book, Wall Street Meat. He then went on to
co-found Velocity Capital Management, a hedge fund that raised
$80 million. Kessler turned it into a cool $1 billion in a matter of
five years, and then got out at the top! He chronicled those days in
the book Running Money. He now writes Wall Street Journal op-eds,
as well as articles for Forbes and Wired, and appears frequently on
CNBC, CNN, Fox News, and Dateline NBC. And he stays in top
physical shape by keeping up with his four sons!
His latest book, How We Got Here, talks about industrial
development, from the steam engine through the Internet. Andy
lives in Northern California with his wife and four sons and is
working on a mysterious new project, which he promises to share
with me once he has it figured out. You can find out more about
Andy at www.andykessler.com, where you can also get a free
download of his latest book. —John Mauldin
�
�
1
ccc_mauldin_ch01_1-14.qxd 9/23/05 10:34 AM Page 1

ccc_mauldin_ch01_1-14.qxd 9/23/05 10:34 AM Page 2

Signposts in the Fogby Andy Kessler
YEARS AGO, I DECIDED TO CLIMB MOUNT WASHINGTON, DRAGGING A RELUC-tant friend, Paul, along with me. It was a beautiful August morningin New Hampshire, not a cloud in the sky, birds chirping—couldn’tbe better. Paul ran marathons and had already run eight miles thatmorning but agreed to my “little hike.” He still had his runningclothes on; I was sporting a fresh Blue Öyster Cult T-shirt.
We parked the car and found the trailhead. Next to the usualwarnings about poison ivy and rabid squirrels hung a huge signthat read, “STOP. The area ahead has the worst weather in America.Many have died there from exposure, even in the summer. Turnback now if the weather is bad.”
I looked up at the cloudless sky and said sarcastically, “Lookspretty bad to me; let’s roll.”
The climb was strenuous, for me anyway, but not a killer. Atsome point the trees gave way to rocks, the temperature dropped,and a fog bank came out of nowhere to sit not 10 feet above ourheads. We kept climbing until we were engulfed in the fog.
“Any idea where the trail is, Einstein?” Paul asked.“No.”“I can’t see a damn thing.”“I heard there were trail markers—signposts or something,” I
said.“Like that?” Paul asked, pointing to a barely visible yellow rock
sitting on top of a vertical stack of four larger rocks.We headed through the fog to the yellow rock. When we got
there, we were almost able to make out another yellow rock on an-other stack 10 or 15 feet away. And so we proceeded, making outsignposts in the fog, slowly, surely—steady progress, freezing our
3
�
ccc_mauldin_ch01_1-14.qxd 9/23/05 10:34 AM Page 3
asses off. At one point we couldn’t make out anything. You couldbarely see your feet. I wasn’t sure if I was making out yellow rocksor just hallucinating; but we kept heading upward and, sureenough, found another yellow rock, closer to our goal.
It stopped being fun, but it was sure exhilarating. Around twoin the afternoon, hungry, cold, and barely speaking, we made it tothe top of Mount Washington. Rather than planting a flag, weheaded into the restaurant and fought the crowds who took the CogRailway, drove, or were bussed to the top. Paul and I both boughtrather overpriced Mount Washington sweatshirts, wolfed downgreasy cheeseburgers, and hung out for about five minutes untilPaul said, “Ready to head down the hill?” This time we knew whatwe were doing.
And that, my friends, is how I learned how to invest.
INVESTING IN THE FOG
Investing is hard—as hard as Chinese arithmetic, as another friendof mine used to say. It’s onerous, treacherous, humiliating, and sub-ject to extreme weather conditions.
My old partner Fred Kittler said it best: “The stock market tradesto inflict the maximum amount of pain.” I don’t know about you,but I have a very low threshold of pain. Yet I spent a career on WallStreet, first as an analyst following volatile technology companies,as an investment banker, a venture capitalist, and finally runningwhat ended up as a billion-dollar hedge fund.
I did it by investing in the fog.
YOU CAN’T MAKE MONEY STANDING IN THE SUNSHINE
As any junior-year “Stocks for Jocks” course will tell you, a stockprice is nothing more than the net present value of a company’s fu-ture earnings. How easy is that? All you need to know is how mucha company is earning today, how fast it is growing, and what dis-count rate to apply to future earnings to get that net present value.
4 JUST ONE THING
ccc_mauldin_ch01_1-14.qxd 9/23/05 10:34 AM Page 4
This reminds me of the Saturday Night Live routine with ChevyChase playing President Gerald Ford in the election debates. Askedabout the effect of inflation on budget deficits, Ford/Chase answers,“Uh, I was told there wouldn’t be any math.”
On any given day, the math is quite easy. Widgets ‘R’ Us earneda dollar per share last year. Its growth rate was 12 percent. The in-flation deflator is 2.83 percent; hence, the stock is worth exactly$18.42. You can get the formula out of any good economics text-book. Good luck with that.
Maybe the stock really is $18.42. Maybe it’s $20 and you shouldshort it, or maybe it’s $15 and you should buy it. I wouldn’t touch iteither way. Why?
Because everybody already knows about the $1, 12 percent,2.83 percent deflator. The sun is shining bright. Say what you wantabout the efficient market theory, if everybody knows something,you ain’t gonna make money on it. “But the widget business isgrowing nicely,” you tell me. Yeah, so what? We don’t live in a staticworld. As my baby’s bib reads, “Spit happens.”
The widget business is not going to stay that way. It’s either go-ing to get better or it’s going to get worse; but unless they are cook-ing the books, it’s not going to grow exactly 12 percent for theforeseeable future. Yet the stock, today at least, is valued for 12 per-cent growth.
Inputs to the model change every day. That’s why the stockmarket is open Monday through Friday. That’s why it is neverclosed more than one day a week during holidays. Values of com-panies change. There are a lot of inputs to those silly formulas, al-most none of them written in concrete. Sales need to be closed.Profits need to be earned. Spending plans at the beginning of aquarter only guess at how much revenue might support them.Growth is based on global economics. A butterfly batting its wingsin Indonesia won’t necessarily change stock values, but a coup inThailand just might (such events happen every couple of years).
Formulas rarely have an input for risk. Even if they did, it’s anunquantifiable number. A risk-adjusted growth rate is about as spe-cific as economists can come up with.
The problem with Widgets ‘R’ Us, the stock anyway, is that it’s
Signposts in the Fog 5
ccc_mauldin_ch01_1-14.qxd 9/23/05 10:34 AM Page 5
out in the open, right out there in the sunshine. Everybody can seeit. Everybody agrees on its prospects. Whoop-dee-doo. Theweather’s gonna change.
I’d rather be out in the fog where nobody knows nothin’. Then,if I’m good, I can peer out into the fog and spot some yellow rocksto show the way to a higher level. Once I get to the signpost, it’squite clear, and my stocks based on getting to that signpost will beproperly valued; so I slog on looking for the next signpost.
THE IMPORTANCE OF SPOTTING THE SIGNPOSTS IN THE FOG
If I haven’t scared you away from investing yet, you are either per-sistent or a fool. That’s good; one of these is a good attribute forsuccessful investing.
This whole idea of investing in the fog is not about being a con-trarian. It’s about seeing things before others. If you think everybodyis going to sit in Starbucks sipping lattes using laptops connected tothe Internet via Wi-Fi (like I am now), that’s a pretty investable idea.There might be half a dozen interesting investment ideas that wouldbenefit from that trend. But might I suggest that you look aroundStarbucks, and if everyone is already sitting around sipping and surf-ing, you are too late. The stock market already knows about it andhas discounted the potential growth for chip software and servicecompanies. Sip enough lattes, and you too can hallucinate the future.
Investing in the fog is about seeing things others can’t. Mostpeople get in the fog and panic; but the trick is to get in the fog andfeel comfortable, let your imagination run wild, imagine what thingsmight look like up ahead, make out vague outlines in the distance,and invest as if those outlines were real things.
I remember a comedian on Ed Sullivan (I’m dating myself, Iknow, but it was funny) saying his mother-in-law drank so much, shesaw color television years before anyone else. Get her a fund to run!
Over time, if those outlines become real, or even close to beingreal, you will have invested at such a discount to the eventual valuethat you will make a killing. Just don’t forget that you are no longer
6 JUST ONE THING
ccc_mauldin_ch01_1-14.qxd 9/23/05 10:34 AM Page 6
in the fog when you can see what was once an outline and is nowliving breathing reality. Get ye back into the fog. The stock marketalways looks ahead. A great investor has a continued paranoia con-cerning who knows what, what they know, and when they knew it.
Step onto any trading desk or into any money management firmand you enter a bizarre world. Lots of screens, all filled with blink-ing information. Stock prices, headlines, press releases, news sto-ries, CNBC on monitors scattered around the room, often muted.Money managers read the Wall Street Journal cover to cover, theNew York Times business section, Barron’s on weekends, scanForbes and Fortune, have their assistants read BusinessWeek, sub-scribe to thestreet.com, get MarketWatch e-mail alerts, and scanmessage boards on Yahoo! and Motley Fool. And that’s before themarket opens. They also get e-mails from every major brokeragefirm, with comments from their Morning Calls, what analysts have tosay about everything. Bigger firms get calls from salesmen and sales-women from Wall Street with a synopsis, and then the analysts callas the day goes on to provide color. Every firm I know has ex-panded its voicemail systems, which would often stop acceptingmessages by 10 a.m., so full of hyperbabble they were.
Do they get stock ideas from all this stuff? I highly doubt it. Thefire hose of information is for one reason and one reason only—totake the pulse of the market and figure out what everyone else al-ready knows. Information is sunshine. I want to know everything,because then and only then can I know if my investment ideas arealready out there—or are they still just figments of my twisted mind,outlines in the fog, flutters in my gut.
The trick is to figure out what the fire hose of information over-load is going to say in three months, six months, 18 months, eventhree to five years if you are really patient. When all that informa-tion is blaring loud and clear what you squinted to see way backwhen, then that’s it, it’s over, you win. The market has caught upwith you and is sitting right on top of the yellow rock you couldbarely make out before. You get the return for seeing it first whenno one else believed it. The stocks you own based on that trend arenow worth not 20 percent or 30 percent more, but two times, threetimes, ten times more. Now that’s investing.
Signposts in the Fog 7
ccc_mauldin_ch01_1-14.qxd 9/23/05 10:34 AM Page 7
PICKING THE RIGHT SIGNPOSTS
Okay, okay, enough about fog and sunshine, I think you get thepoint. So what are these signposts or trail markers I’m talking about?Quite simply, they are big trends that you believe in, have confidencein, know in your gut to be true, have 99.99 percent probability ofcoming to fruition. These aren’t picked randomly or without lots ofwork, tons of sweat, and consternation. As my hero Bullwinkle oncesaid, holding up a drawing of two people, “This is Froth with Portent.”
Pick the wrong trend and you are following signposts off a cliff.Sometimes worse—pick too obvious a trend and you’ll never findyour way into the fog to discover the hidden paths to riches. In thetwenty years I spent on Wall Street, I have only been able to find tworeal signposts for investing in the fog. Two. How lame, really. I was aprofessional, recommending stocks and then running a billion ofother people’s money, and it was all based on two stinking trends.
Yup. But what wonderful trends they were—probably still are.I thought about writing ten or fifteen more paragraphs about
how cool these trends are and then suggest you send a thousanddollars in small bills to a post office box in Palo Alto and then Imight tell you one of them. But what the heck, I’ve written a coupleof books that more or less spilled the beans, so here they are (drumroll please):
• Elasticity: lower cost creates its own huge markets.• Intelligence moves out to the edge of the network.
If you’re disappointed and saying, “Huh? That’s it? You mademe read this stupid chapter and that’s all I get?” take it easy and letme explain.
Elasticity in the Marketplace
Back in 1985 and 1986, I was a 26-year-old know-nothing-about-stocks electrical engineer hired to be the semiconductor analyst atPaineWebber in New York. The industry had just seen a jolt of ordersin 1985 and then a big whopping recession by April of 1986. Intel, TI,
8 JUST ONE THING
ccc_mauldin_ch01_1-14.qxd 9/23/05 10:34 AM Page 8
Motorola, and AMD all saw their stocks plummet. Orders dried upand prices for memory and microprocessors were plummeting.
I somehow figured out it was distributors buying chips in 1985,not IBM, so I actually had one of the rare sell recommendations onthese stocks. My star was rising on Wall Street. With these stocksheaded to hat sizes 6-7/8, 7 . . . I was looking for an excuse to turnaround and recommend them. I read an article in Electronics maga-zine about EPROMs—Eraseable Programmable Read-Only Memo-ries. It suggested that every time prices dropped for EPROMs, somenew device would use them, or use more EPROM—16,000 bits in-stead of 1,000 bits (remember, this was 1986!).
Videogames, PCs, modems, each of them would somehow de-sign in more EPROMs, or denser EPROMs, whenever prices col-lapsed; and at some point, when the cycle turned, even thoughprices were still low, sales would increase because more EPROMswould be sold. I looked it up, and the word that describes this phe-nomenon is elasticity.
As an engineer, I was forced to take Econ 101 (and blew awayecon majors because they couldn’t handle the math), but not muchelse on the econ or financial front. Good thing. Elasticity is one ofthose things that doesn’t model well. Economists don’t understandit, so they don’t talk about it much (except for things that are inelas-tic, like cigarettes and booze, which economists may have a bit toomuch of).
So anyway, I went to work on this wacky concept of elasticityof chips and semiconductors, looked back in time at other cycles,and sure enough, it was real. Intel founder Gordon Moore made theobservation that chip density doubles every eighteen months (inElectronics magazine, it turns out), and Moore’s Law was relentless.Elasticity is just the financial explanation of how the industry growswhenever prices of bits or gates or functions drop. The industrymagically grows (and stocks eventually go up), and a smart semi-conductor analyst would get ahead of this curve.
So I went out with that call. Done selling? Great, now buy backIntel and Motorola, because elasticity will kick in and this will be agreat growth market for microprocessors with faster and fasterclock speeds.
Signposts in the Fog 9
ccc_mauldin_ch01_1-14.qxd 9/23/05 10:34 AM Page 9
I got a lot of “what the hell are you talking about” looks from myportfolio manager clients. Oddly, I was used to this look from friendsand family.
So I calmly explained that every time prices dropped, some newapplication would open up to take advantage of the cheaper func-tionality. Told them I wouldn’t be surprised if we saw laser printersput all that cheap memory into them to print pages faster andcheaper. Lucky for me, desktop publishing was soon born, and myelasticity argument proved out.
I’ve been milking this old elasticity thing ever since.In 1996 my partner and I started Velocity Capital with the simple
premise that while semiconductor elasticity was still playing out(and still, no one on the Street really understood it), telecommuni-cations bandwidth would follow the same pattern. As bandwidth tobusinesses and homes got cheaper, new applications would openup to take advantage of the cheaper functionality. Modem speedswent from 14.4K to 56K to 256K DSL to 1 meg cable modem. Ten-megabit-per-second local area networks moved to 100 megabit togigabit. Fiber optics brought multi-gigabit speeds. The Internet andall its permutated businesses were the new applications.
In practice, with every company we looked at, my partnerwould assess management (I never trusted anyone), and then thetwo of us would think out elasticity for the company. We would tryto map out the next two to five years of products or services. If wecouldn’t figure out how the company could scale and benefit fromelasticity, we would not walk, but run away as fast as we could.
Talk about the fog: In 1996 most people would respond “howcute” to our idea of bandwidth elasticity. By 1999 it was every in-vestor’s mantra in some form or another.
Elasticity still works. Bandwidth prices are in the gutter, but I’llbet end demand is still elastic. More memory goes into cameras andphones, faster microprocessors go into PCs, 10-gigabit networks arerolling out, and on and on.
Still investable? Perhaps.But I’ll bet you can find your own elastic markets (e-mail them
to me and I’ll send the best five ideas a Blue Öyster Cult T-shirt).Does the healthcare business scale? Not obviously, but some
10 JUST ONE THING
ccc_mauldin_ch01_1-14.qxd 9/23/05 10:34 AM Page 10
part of it must. Aspirin is a drug that was elastic over the years. Mostprescription drugs are inelastic, but something might break out.
Financial services can exhibit elasticity—talk to Charles Schwab.Autos? Electronics content is rising. And on and on. Look deep, findthe elasticity, and you’ll be in the middle of the fog with signpoststo lead the way.
Finding Intelligence at the Outer Edges
I know this book is titled Just One Thing, and I’m about to describea second trend, but really, it’s just a byproduct of elasticity. It’s whathappens when you have all these cheap PCs and smartphones andever-cheaper bandwidth scattered around.
Sometimes you are not able to recognize elasticity, or maybeeverybody already does recognize it—but if it jumps out at you, somuch the better.
A sage person once noted:
The network is too large to have all its affairs directed by a sin-gle central entity. Control at such a distance, and from under theeye of their constituents, must be unable to administer andoverlook all the details necessary for the good governance ofthe users; and the same circumstance, by rendering detectionimpossible to their users, will invite agents to corruption, plun-der and waste.
Who said this? Bill Gates? Bernie Ebbers? Michael Powell? Actu-ally, it was Thomas Jefferson in 1800 (okay, I swapped country fornetwork and government for entity, but the concept is there). Jeffer-son’s federalist beliefs were driven by his agrarian upbringing andfear of centralized control, but actually he would have made a greattech geek.
There is a saying out here in Silicon Valley that most people liveand invest by: “Intelligence moves out to the edge of the network.” Itexplains the proliferation of PCs, iPods, smartphones, Tivos, GPSmaps, digital cameras, and every other gadget on the constantly de-clining cost treadmill in techland. This is a world of few regulations,
Signposts in the Fog 11
ccc_mauldin_ch01_1-14.qxd 9/23/05 10:34 AM Page 11
nine-month product cycles, and a mix of massive wealth and bro-ken dreams.
For those who live east of the Sierra Nevadas, you most likelyfeel the heavy hand of Hamiltonian central planners stamping outinnovation. Almost every network invented before 1983 is con-trolled by old analog monopolies—SBC, Comcast, Cingular, Time-Warner Cable, Verizon. Rules are set by government committees.Prices are set by collusion—er, lobbied regulators. Innovation islimited to call waiting and news crawls. The center of the networkis sclerotic and milked for the benefit of moguls first and sharehold-ers second. Users are a distant last. These guys love to be regulated,as it freezes technology and innovation and business models intheir tracks.
Ask SBC. It charges $20 a month for a phone service thatshould cost pennies. It has drab phones with twelve buttons atthe edge and expensive switches and zillions of lines of coderunning at control centers in the network. Meanwhile, you candownload a program called Skype to talk from PC to PC for free. Same service, voice in, voice out. Twenty bucks versus free.What gives?
It’s the network, stupid. Literally. The beauty of the Internet isthat it is plain old stupid—Blaster, not Master. Packets of informa-tion fly around effortlessly. They contain an address where they area-comin’ from and where they are a-goin’. Cisco and Juniper aretwo companies that make routers that move trillions of these pack-ets around, like an octopus on speed. What is in the packet is of noconcern—a Web page, a Google search result, Amazon book order,voice call to Vanuatu, pirated videos of Dodgeball—it doesn’t mat-ter. The network is a sprinter, not a quarterback.
Why should you care? As the post-Internet-boom phone com-panies consolidate, cheerleaders of these deals see a return of giants who can afford the massive spending to bring fiber toevery home and business in America. Will we get it? Yup, but notfrom them.
The day of the Verizon–MCI deal announcement, CNBC’s DylanRatigan interviewed Verizon CEO Ivan Seidenberg and MCI CEO
12 JUST ONE THING
ccc_mauldin_ch01_1-14.qxd 9/23/05 10:34 AM Page 12
Michael Cappellas. Neither could articulate why they wanted to dothis deal, until this doozy came out of Ivan’s mouth:
We need to install networks, because networks represent ourlifeblood to the customer. All the intelligence gets put into thenetwork—all the interesting features and function get put intothe network.
This is what Jefferson was warning us about. Forget gadgets,Verizon wants to offer all the services it thinks you need in the net-work. Its track record is lame. It took Bell Labs several years to de-velop and certify call waiting; three-way calling took a bit longer.Caller ID took a decade and still doesn’t really work.
Meanwhile, a clever programmer chugging Jolt cola can pull anall-nighter (with a few breaks for Nerf gun battles) and add featuresto Internet calling. Want eight-way calling? No problem. CD-qualityvoice? Simple. Transcripts from your last three conversations? Done.
When intelligence is out at the edge of the network, makingchanges or ramping innovation is simple. I know it sounds bizarre,but as long as the connecting network is dumb, the value of thenetwork can increase.
Cellular companies have barely added features to their basicservice, so they keep inventing calling plans to confuse us into pay-ing more. But meanwhile, by opening a browser on my phone andmoving packets through a dumb Internet versus “smart” voice net-work, I can pull up maps and directions.
Thank you, Thomas Jefferson.The best example of intelligence at the edge is one that may not
be so obvious: Google.A hundred thousand servers sitting in data centers programmed
by 2,000 programmers with doctorates doesn’t sound like intelli-gence at the edge, but it really is. Minitel in France was a break-through twenty years ago by providing pages of information for theFrench. Weather, news, train schedules. It was centrally managed.Any new pages had to be programmed by the folks at Minitel, atmuch time and expense. Google, by contrast, doesn’t tell you what
Signposts in the Fog 13
ccc_mauldin_ch01_1-14.qxd 9/23/05 10:34 AM Page 13
you are searching for; it scours the edge of the network for that infor-mation and uses an algorithm to calculate if it might be what you arelooking for. The smart servers hosting Web pages and the millions ofusers with PCs putting up those Web pages are the intelligence at theedge. There are billions of Web pages to crawl, specifically becausethe intelligence is at the edge versus the center.
Subtle stuff perhaps, but I can sniff out a short-lived business,even if it is regulated to exist, if it violates this principle.
The good news is that our networks are getting dumber and ourdevices at the edge are getting smarter and better everyday.Megapixel cameras, programmable TVs, GPS-enabled phones—thepossibilities are endless, at the edge.
A GLANCE BACK AT SATISFACTION AND REWARDS
After climbing Mount Washington, Paul and I got back to our car,hot from wearing Mt. Washington sweatshirts in such nice, cloud-less weather on a summer day in New Hampshire. At the bottom ofthat hill we just climbed, anyway. And we were famished, in that “Icould eat a horse” mood.
I got out a map, found the road that led due east, broke severalstate and federal speed-limit laws, and hit the coast of Maine a cou-ple of hours later.
We pulled into the first shack we could find and ordered three1-pound lobsters each—a just reward for the day and a perfectmetaphor to reflect back upon.
14 JUST ONE THING
ccc_mauldin_ch01_1-14.qxd 9/23/05 10:34 AM Page 14
C H A P T E R 2
The “Not-So-Simple”(But Really Utterly So)
Rules of Trading
Dennis Gartman is the trader’s trader. He is up at 2 to 3 a.m. and
writes a daily letter (the eponymous The Gartman Letter) every
morning by 6 a.m. Eastern time, wherever he is in the world. He
analyzes the currency, commodity, energy, and metals markets, and
has been doing so for nearly twenty years. A wide range of people
read Gartman—the rich and famous, the small investor along with
staffers at nearly every major trading house and fund in the world.
His wisdom and insights are often seen on TV, and he is in constant
demand as a speaker at investment conferences. He has forgotten
more about trading than most people will ever know. He trades every
day, and his trades are on the record for all the world to see.
Dennis is one of my best sources for ideas and is a great
sounding board. He lives in Suffolk, Virginia, and is a five
handicap golfer. His one “vice” (that I know of) is a penchant for
great hotels and big suites when he travels—which is a lot, so he
deserves it. —John Mauldin
�
15
�
ccc_mauldin_ch02_15-26.qxd 9/23/05 10:35 AM Page 15

ccc_mauldin_ch02_15-26.qxd 9/23/05 10:35 AM Page 16
The “Not-So-Simple”(But Really Utterly So)
Rules of Tradingby Dennis Gartman
THE WORLD OF INVESTING/TRADING, EVEN AT THE VERY HIGHEST LEVELS,where we are supposed to believe that wisdom prevails and profitsabound, is littered with the wreckage of wealth that has hit the var-ious myriad rocks that exist just beneath the tranquil surface of theglobal economy. It matters not what level of supposed wisdom, oreducation, that the money managers or individuals in questionhave. We can make a list of wondrously large financial failures thathave come to flounder upon these rocks for the very same reasons.Let us, for a bit, have a moment of collective silence for Long TermCapital Management; for Barings Brothers; for Sumitomo Copper. . . and for the tens of thousands of individuals each year who fol-low their lead into financial oblivion.
I’ve been in the business of trading since the early 1970s as abank trader, as a member of the Chicago Board of Trade, as a pri-vate investor, and as the writer of The Gartman Letter, a dailynewsletter I’ve been producing for primarily institutional clientelesince the middle 1980s. I’ve survived, but often just barely. I’vemade preposterous errors of judgment. I’ve made wondrously in-sightful “plays.” I’ve understood, from time to time, basis eco-nomic fundamentals that should drive prices—and then don’t. I’vemisunderstood other economic fundamentals that, in retrospect,were 180 degrees out of logic and yet prevailed profitably. I’veprospered; I’ve almost failed utterly. I’ve won, I’ve lost, and I’vebroken even.
17
�
ccc_mauldin_ch02_15-26.qxd 9/23/05 10:35 AM Page 17
As I get older, and in my mid-50s, having seen so much of thegame—for a game it is, with bad players who get lucky; great play-ers who get unlucky; mediocre players who find their slot in thelineup and produce nice, steady results over long periods of time;“streak-y” players who score big for a while and lose big at othertimes—I have distilled what it is that we do to survive into a seriesof “Not-So-Simple” Rules of Trading that I try my best to live byevery day . . . every week . . . every month. When I do stand by myrules, I prosper; when I don’t, I don’t. I am convinced that had LongTerm Capital Management not listened to its myriad Nobel Laure-ates in Economics and had instead followed these rules, it wouldnot only still be extant, it would be enormously larger, preposter-ously profitable, and an example to everyone. I am convinced thathad Nick Leeson and Barings Brothers adhered to these rules, Bar-ings too would be alive and functioning. Perhaps the same mighteven be said for Mr. Hamanaka and Sumitomo Copper.
Now, onto the Rules:
NEVER ADD TO A LOSING POSITION
Averaging down into a losing trade is the only thing that will as-suredly take you out of the investment business. This is what tookLTCM out. This is what took Barings Brothers out; this is what tookSumitomo Copper out, and this is what takes most losing investorsout. The only thing that can happen to you when you averagedown into a long position (or up into a short position) is that yournet worth must decline. Oh, it may turn around eventually and yourdecision to average down may be proven fortuitous, but for every
18 JUST ONE THING
R U L E # 1
Never, ever, under any circumstance, should one add to a los-ing position . . . not EVER!
ccc_mauldin_ch02_15-26.qxd 9/23/05 10:35 AM Page 18
example of fortune shining we can give an example of fortune turn-ing bleak and deadly.
By contrast, if you buy a stock or a commodity or a currency atprogressively higher prices, the only thing that can happen to yournet worth is that it shall rise. Eventually, all prices tumble. Eventu-ally, the last position you buy, at progressively higher prices, shallprove to be a loser, and it is at that point that you will have to exityour position. However, as long as you buy at higher prices, themarket is telling you that you are correct in your analysis and youshould continue to trade accordingly.
We trust our point is made. If “location, location, location” arethe first three rules of investing in real estate, then the first two rulesof trading equities, debt, commodities, currencies, and so on arethese: never add to a losing position.
INVEST ON THE SIDE THAT IS WINNING
The great Jesse Livermore once said that it is not our duty to tradeupon the bullish side, nor the bearish side, but upon the winningside. This is brilliance of the first order. We must indeed learn tofight/invest on the winning side, and we must be willing to changesides immediately when one side has gained the upper hand.
The “Not-So-Simple” (But Really Utterly So) Rules of Trading 19
R U L E # 2
Never, ever, under any circumstance, should one add to a los-ing position . . . not EVER!
R U L E # 3
Learn to trade like a mercenary guerrilla.
ccc_mauldin_ch02_15-26.qxd 9/23/05 10:35 AM Page 19
Once, when Lord Keynes was appearing at a conference he hadspoken to the year previous, at which he had suggested an investmentin a particular stock that he was now suggesting should be shorted, agentleman in the audience took him to task for having changed hisview. This gentleman wondered how it was possible that Lord Keynescould shift in this manner and thought that Keynes was a charlatan forhaving changed his opinion. Lord Keynes responded in a wonderfullyprescient manner when he said, “Sir, the facts have changed regard-ing this company, and when the facts change, I change. What do youdo, Sir?” Lord Keynes understood the rationality of trading as a merce-nary guerrilla, choosing to invest/fight upon the winning side. Whenthe facts change, we must change. It is illogical to do otherwise.
DON’T HOLD ON TO LOSING POSITIONS
Holding on to losing positions costs real capital as one’s accountbalance is depleted, but it can exhaust one’s mental capital evenmore seriously as one holds to the losing trade, becoming more andmore fearful with each passing minute, day, and week, avoidingpotentially profitable trades while one nurtures the losing position.
GO WHERE THE STRENGTH IS
20 JUST ONE THING
R U L E # 4
Capital is in two varieties: Mental and Real, and, of the two, themental capital is the most important.
R U L E # 5
The objective of what we are after is not to buy low and to sellhigh, but to buy high and to sell higher, or to sell short lowand to buy lower.
ccc_mauldin_ch02_15-26.qxd 9/23/05 10:35 AM Page 20
We can never know what price is really “low,” nor what price is re-ally “high.” We can, however, have a modest chance at knowingwhat the trend is and acting on that trend. We can buy higher andwe can sell higher still if the trend is up. Conversely, we can sellshort at low prices and we can cover at lower prices if the trend isstill down. However, we’ve no idea how high high is, nor how lowlow is.
Nortel went from approximately the split-adjusted price of $1share back in the early 1980s, to just under $90/share in early2000 and back to near $1 share by 2002 (where it has hoveredever since). On the way up, it looked expensive at $20, at $30, at$70, and at $85, and on the way down it may have looked inex-pensive at $70, and $30, and $20—and even at $10 and $5. Thelesson here is that we really cannot tell what is high and/or whatis low, but when the trend becomes established, it can run muchfarther than the most optimistic or most pessimistic among us canforesee.
Metaphorically, when bearish we need to throw our rocks intothe wettest paper sack for it will break the most readily, while inbull markets we need to ride the strongest wind for it shall carry usfarther than others.
Those in the women’s apparel business understand this rule bet-ter than others, for when they carry an inventory of various dressesand designers they watch which designer’s work moves off the shelfmost readily and which does not. They instinctively mark down thework of those designers who sell poorly, recovering what capitalthey can as swiftly as they can, and use that capital to buy moreworks by the successful designer. To do otherwise is counterintuitive.They instinctively buy the “strongest” designers and sell the “weak-est.” Investors in stocks all too often, and by contrast, watch their
The “Not-So-Simple” (But Really Utterly So) Rules of Trading 21
R U L E # 6
Sell markets that show the greatest weakness; buy markets thatshow the greatest strength.
ccc_mauldin_ch02_15-26.qxd 9/23/05 10:35 AM Page 21
portfolio shift over time and sell out the best stocks, often deployingthis capital into the shares that have lagged. They are, in essence,selling the best designers while buying more of the worst. A clothingshop owner would never do this; stock investors do it all the timeand think they are wise for doing so!
MAKING “LOGICAL” PLAYS IS COSTLY
Rule 6 addresses what might seem like a logical play: selling out ofa long position after a sharp rush higher or covering a short posi-tion after a sharp break lower—and then trying to play the marketfrom the other direction, hoping to profit from the supposedly in-evitable correction, only to see the market continue on in the origi-nal direction that we had gotten ourselves exposed to. At this point,we are not only losing real capital, we are losing mental capital atan explosive rate, and we are bound to make more and more errorsof judgment along the way.
Actually, in a bull market we can be neutral, modestly long, oraggressively long—getting into the last position after a protractedbull run into which we’ve added to our winning position all alongthe way. Conversely, in a bear market we can be neutral, modestlyshort, or aggressively short, but never, ever can we—or shouldwe—be the opposite way even so slightly.
Many years ago I was standing on the top step of the CBOTbond-trading pit with an old friend, Bradley Rotter, looking downinto the tumult below in awe. When asked what he thought, Bradreplied, “I’m flat . . . and I’m nervous.” That, we think, says it all . . .that the markets are often so terrifying that no position is a positionof consequence.
22 JUST ONE THING
R U L E # 7
In a bull market we can only be long or neutral; in a bear mar-ket we can only be bearish or neutral.
ccc_mauldin_ch02_15-26.qxd 9/23/05 10:35 AM Page 22
I understand that it was Lord Keynes who said this first, but thefirst time I heard it was one morning many years ago when talkingwith a very good friend and mentor, Dr. A. Gary Shilling, as he wor-ried over a position in U.S. debt that was going against him andseemed to go against the most obvious economic fundamentals atthe time. Worried about his losing position and obviously dismayedby it, Gary said over the phone, “Dennis, the markets are illogical attimes, and they can remain illogical far longer than you or I can re-main solvent.” The University of Chicago “boys” have argued fordecades that the markets are rational, but we in the markets everyday know otherwise. We must learn to accept that irrationality, dealwith it, and move on. There is not much else one can say. (Dr.Shilling’s position shortly thereafter proved to have been wise andprofitable, but not before further “mental” capital was expended.)
The academics will never understand this, but those of us whotrade for a living know that there are times when every trade wemake (even the errors) is profitable and there is nothing we can do tochange that. Conversely, there are times that no matter what we do—no matter how wise and considered are our insights; no matter howsophisticated our analysis—our trades will surrender nothing otherthan losses. Thus, when things are going well, trade often, tradelarge, and try to maximize the good fortune that is being bestowed
The “Not-So-Simple” (But Really Utterly So) Rules of Trading 23
R U L E # 8
“Markets can remain illogical far longer than you or I can re-main solvent.”
R U L E # 9
Trading runs in cycles; some are good, some are bad, andthere is nothing we can do about that other than accept it andact accordingly.
ccc_mauldin_ch02_15-26.qxd 9/23/05 10:35 AM Page 23
upon you. However, when trading poorly, trade infrequently, tradevery small, and continue to get steadily smaller until the winds havechanged and the trading “gods” have chosen to smile upon you onceagain. The latter usually happens when we begin following the rulesof trading again. Funny how that happens!
THINK LIKE A FUNDAMENTALIST; TRADE LIKE A TECHNICIAN
It is obviously imperative that we understand the economic funda-mentals that will drive a market higher or lower, but we must under-stand the technicals as well. When we do, then and only then canwe, or should we, trade. If the market fundamentals as we under-stand them are bullish and the trend is down, it is illogical to buy;conversely, if the fundamentals as we understand them are bearishbut the market’s trend is up, it is illogical to sell that market short.Ah, but if we understand the market’s fundamentals to be bullishand if the trend is up, it is even more illogical not to trade bullishly.
Over the years we have listened to inordinately bright youngmen and women explain the most complicated and clearly sophisti-cated trading systems. These are systems that they have laboredover, nurtured, expended huge sums of money and time upon, butour history has shown that they rarely make money for those em-ploying them. Complexity breeds confusion; simplicity breeds an
24 JUST ONE THING
R U L E # 10
To trade/invest successfully, think like a fundamentalist; tradelike a technician.
R U L E # 11
Keep your technical systems simple.
ccc_mauldin_ch02_15-26.qxd 9/23/05 10:35 AM Page 24
ability to make decisions swiftly, and to admit error when wrong.Simplicity breeds elegance.
The greatest traders/investors we’ve had the honor to know overthe years continue to employ the simplest trading schemes. Theydraw simple trend lines, they see and act on simple technical signals,they react swiftly, and they attribute it to their knowledge gained overthe years that complexity is the home of the young and untested.
UNDERSTAND THE ENVIRONMENT
Markets are, as we like to say, the sum total of the wisdom and stu-pidity of all who trade in them, and they are collectively given overto the most basic components of the collective psychology. Thedot-com bubble was indeed a bubble, but it grew from a smallgroup to a larger group to the largest group, collectively fed bymass mania, until it ended. The economists among us missed thebull-run entirely, but that proves only that markets can indeed re-main irrational, and that economic fundamentals may eventuallyhold the day but in the interim, psychology holds the moment.
And finally the most important rule of all:
THE RULE THAT SUMS UP THE REST
This is a simple rule in writing; this is a difficult rule to act upon.However, it synthesizes all the modest wisdom we’ve accumulated
The “Not-So-Simple” (But Really Utterly So) Rules of Trading 25
R U L E # 12
In trading/investing, an understanding of mass psychology isoften more important than an understanding of economics.
R U L E # 13
Do more of that which is working and do less of that whichis not.
ccc_mauldin_ch02_15-26.qxd 9/23/05 10:35 AM Page 25
over thirty years of watching and trading in markets. Adding to awinning trade while cutting back on losing trades is the one truerule that holds—and it holds in life as well as in trading/investing.
If you would go to the golf course to play a tournament and findat the practice tee that you are hitting the ball with a slight “left-to-right” tendency that day, it would be best to take that notion out tothe course rather than attempt to re-work your swing. Doing more ofwhat is working works on the golf course, and it works in investing.
If you find that writing thank-you notes, following the niceties oflife that are extended to you, gets you more niceties in the future, youshould write more thank-you notes. If you find that being pleasant tothose around you elicits more pleasantness, then be more pleasant.
And if you find that cutting losses while letting profits run—oreven more directly, that cutting losses and adding to winning trades—works best of all, then that is the course of action you must takewhen trading/investing. Here in our offices, as we trade for ourown account, we constantly ask each other, “What’s working today,and what’s not?” Then we try to the very best of our ability “to domore of that which is working and less of that which is not.” We’veno set rule on how much more or how much less we are to do, weknow only that we are to do “some” more of the former and “some”less of the latter. If our long positions are up, we look at which ofthose long positions is doing us the most good and we do more ofthat. If short positions are also up, we cut back on that which is do-ing us the most ill. Our process is simple.
We are certain that great—even vast—holes can and will beproven in our rules by doctoral candidates in business and econom-ics, but we care not a whit, for they work. They’ve proven so throughtime and under pressure. We try our best to adhere to them.
This is what I have learned about the world of investing overthree decades. I try each day to stand by my rules. I fail miserably attimes, for I break them often, and when I do I lose money and mentalcapital, until such time as I return to my rules and try my very best tohold strongly to them. The losses incurred are the inevitable tithe Imust make to the markets to atone for my trading sins. I accept them,and I move on, but only after vowing that “I’ll never do that again.”
26 JUST ONE THING
ccc_mauldin_ch02_15-26.qxd 9/23/05 10:35 AM Page 26
C H A P T E R 3
The Triumph of Hope over Long-Run Experience:Using Past Returns to
Predict Future Performance of a Money Manager
Mark Finn is chairman of Vantage Consulting Group. He is the
former chairman of the Virginia Retirement System Investment
Advisory Committee and the state of Alaska Investment Advisory
Committee and has a distinguished investment career. He
consults with large pension funds and high-net-worth investors,
as well as sits on the board of a large mutual fund family. He is
also on the adjunct faculty of the College of William & Mary
Graduate Business School. His specialty is finding little-known
(or even start-up) managers and funding them, and he has a
stellar team of researchers. His firm has probably helped launch
more start-up managers than any other single group. His team is
a who’s who of research. Along with his son, Jonathan, who is the
Chief Investment Officer at Vantage, he shows us why past
performance is the most widely abused investment statistic there
is. I predict that this will be the essay that will be the hardest for
you to incorporate into your investment strategy, but it may be
the most important! I have seen more investors lose money or
27
�
ccc_mauldin_ch03_27-44.qxd 9/23/05 10:37 AM Page 27

make mistakes using past performance than any other one single
thing. Read this one over and over.
Mark is an avid golfer and Jon a competitive sailor. They live in
Virginia Beach, Virginia. —John Mauldin
28 JUST ONE THING
�
ccc_mauldin_ch03_27-44.qxd 9/23/05 10:37 AM Page 28
The Triumph of Hope over Long-Run Experience:Using Past Returns to
Predict Future Performance of a Money Manager
by Mark T. Finn and Jonathan Finn, CFA
“The path of least resistance and least trouble is a mentalrut already made. It requires troublesome work toundertake the alternation of old beliefs. Self-conceit oftenregards it as a sign of weakness to admit that a belief towhich we have once committed ourselves is wrong. We getso identified with an idea that it is literally a ‘pet’ notionand we rise to its defense and stop our eyes and ears toanything different.”
—John Dewey
THE PATH OF LEAST RESISTANCE THAT MANY PEOPLE TAKE WHEN MAKING THE
decision to invest with a money manager is to choose the onewith the best track record. We do this despite the fact that “pastperformance may not be predictive of future returns” is a well-known phrase plastered all over the marketing material of everySEC-registered investment adviser. Yet people do not act in a man-ner consistent with this mandated disclosure. Our observation isthat past performance dominates investors’ decision processes somuch that we contend that past performance data may be themost misused information in the investment business.
29
�
ccc_mauldin_ch03_27-44.qxd 9/23/05 10:37 AM Page 29
Performance measurement can be useful in understanding thesources of a manager’s performance and in comparing a manager toa peer group or benchmark. However, this is a process of explana-tion of how the manager achieved past success (or lack thereof),not prediction, and is not the same thing as relying on past perfor-mance to predict future performance. Unfortunately, in practice, de-cision makers overweight historical returns in the decision equation.Sadly, they continue to repeat this mistake time after time, despitebad outcomes. We call this the triumph of irrational hope over long-run experience. Past performance may contain some informationuseful for prediction, but almost certainly not in its raw, reportedform. If only life were that simple!
The reasons that life is not that simple are many, and their ex-ploration is beyond the scope of this chapter. However, in thepages that follow we’ll frame problems associated with the data(manager returns) and offer a simple model of investor thoughtprocesses that may help to clarify the issue.
IDENTIFYING NOISE IN MARKET DECISION MAKING
The data problem can be thought of as analogous to an engineeringconcept called the signal to noise ratio. This statistic measures theratio of radio signals received relative to the noise that is created bythe receiving system. The analogy to investing would be the ratio ofthe return caused by a manager’s actions relative to the returncaused by events and factors that were independent of the man-ager’s decisions (noise). The reality is that there is a tremendousamount of variability, or noise, in security and manager returns.
What causes this variability? There are three main components:
1. Systematic risk: what happens to the overall stock market2. Residual common factor risk: what happens to subgroups such
as industries3. Residual specific risk: what happens to a particular stock
For each component there are literally hundreds, or perhapsthousands, of factors, each with differing impact in different time
30 JUST ONE THING
ccc_mauldin_ch03_27-44.qxd 9/23/05 10:37 AM Page 30
periods. Even if one had a best guess for each factor, there stillwould be uncertainty or variability around that best guess. The real-ity is that what an investor “knows” about the future is small com-pared to what he can’t know. This simple concept is so important itis worth repeating. What we know about the future is tiny com-pared to what we do not—and in all likelihood cannot—know.Many of the most widely accepted theories in modern finance makesimplifying assumptions that discount the tremendous uncertaintyof potential future events. We believe the next revolution in financetheory will be in the area of more accurately recognizing and mod-eling uncertainty.
This distinction between what is known and unknown is fur-ther compounded by the likelihood that information about the fu-ture that is known by one investor might also be known by otherinvestors. To the extent the information is known by other in-vestors, it should already be reflected in the price of the stock.Thus, if the anticipated event occurs as expected, it will not causethe price to change. The uncertainty or variability in asset returns iscaused by information or events that are not correctly anticipatedby investors.
DEALING WITH THE NOISE PROBLEM
The problem of noise has been around for a long time. How haveinvestors dealt with this issue in the past? At first, they didn’t. Theytried to compare a specific manager to some broad benchmark suchas the S&P 500, with the presumption that all portfolios were as di-versified and as risky as the S&P 500. This was clearly not the casefor many managers.
Well, if there were too many different portfolio risk levels tocompare them to one market benchmark, perhaps there was an-other way. The next attempt focused on comparing a manager to auniverse of similar managers. It was hoped that similarity in pre-sumed client objectives would mean that the risk of the portfoliosmight be similar. Unfortunately this peer group idea, while havingintuitive appeal, is fraught with problems.
The Triumph of Hope over Long-Run Experience 31
ccc_mauldin_ch03_27-44.qxd 9/23/05 10:37 AM Page 31
In the 1970s the focus of risk measurement became “beta.” Betameasures the sensitivity of an investment relative to some appropri-ate benchmark. Because of the risk-canceling benefits of diversifica-tion when you combine, say, fifty stocks across different industriesinto a portfolio, the portion of the portfolio’s risk that is attributableto specific stock risk is reduced from roughly 50 percent to approx-imately 4 percent. The dominant element of risk becomes system-atic risk. This systematic risk, or market risk, is the element that betameasures.
However, a key problem with beta (and there are several prob-lems) is that it assumes all portfolios are diversified or that any com-mon factor emphasis within a portfolio won’t matter over the longerrun. Evidence has shown that assumption to be quite inappropriate.Indeed, even small biases toward or away from some common fac-tors have a major impact on performance. It turns out that thesecommon factors are often equated with a manager’s style; growthversus value, large-capitalization companies versus small, high-techversus cyclical, and so on.1
This understanding has led to an emphasis on defining the mostrefined benchmark possible to measure a given manager. The moreaccurate the benchmark is in reflecting the manager’s habitat orstyle, the more accurate will be the measure of his skill. By compar-ing apples to apples you reduce a significant amount of noise. Thiscan be seen in the following illustration.
Assume that in a typical year Manager A had the monthly port-folio returns listed in Table 3.1. Also for that same period, the S&P500 had the returns shown in Column 2 and the Russell Small CapIndex had the returns listed in the third column. The active returnfor Manager A versus the S&P 500 is shown in Column 4, and theactive return relative to the Russell Small Cap Index is listed inColumn 5.
Notice that the annualized active return relative to both the S&P500 and the Russell Small Cap Index are identical: 3.9 percent.However, Manager A’s portfolio tracks much more closely to theRussell Small Cap Index. This can be seen in the fact that the stan-dard deviation of the active return relative to the Russell Small CapIndex is only 5.0 percent, compared to 10.0 percent relative to the
32 JUST ONE THING
ccc_mauldin_ch03_27-44.qxd 9/23/05 10:37 AM Page 32
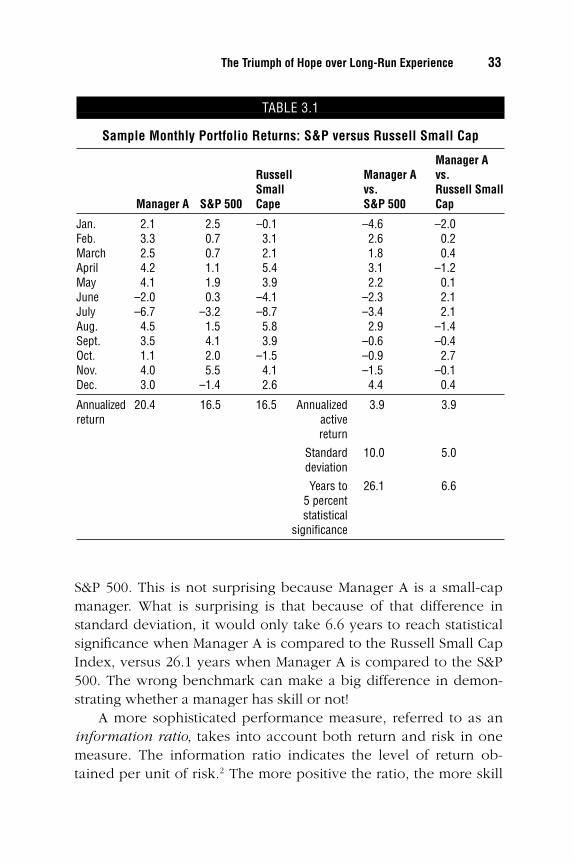
S&P 500. This is not surprising because Manager A is a small-capmanager. What is surprising is that because of that difference instandard deviation, it would only take 6.6 years to reach statisticalsignificance when Manager A is compared to the Russell Small CapIndex, versus 26.1 years when Manager A is compared to the S&P500. The wrong benchmark can make a big difference in demon-strating whether a manager has skill or not!
A more sophisticated performance measure, referred to as aninformation ratio, takes into account both return and risk in onemeasure. The information ratio indicates the level of return ob-tained per unit of risk.2 The more positive the ratio, the more skill
The Triumph of Hope over Long-Run Experience 33
TABLE 3.1
Sample Monthly Portfolio Returns: S&P versus Russell Small Cap
Manager ARussell Manager A vs.Small vs. Russell Small
Manager A S&P 500 Cape S&P 500 Cap
Jan. 2.1 2.5 –0.1 –4.6 –2.0Feb. 3.3 0.7 3.1 2.6 0.2March 2.5 0.7 2.1 1.8 0.4April 4.2 1.1 5.4 3.1 –1.2May 4.1 1.9 3.9 2.2 0.1June –2.0 0.3 –4.1 –2.3 2.1July –6.7 –3.2 –8.7 –3.4 2.1Aug. 4.5 1.5 5.8 2.9 –1.4Sept. 3.5 4.1 3.9 –0.6 –0.4Oct. 1.1 2.0 –1.5 –0.9 2.7Nov. 4.0 5.5 4.1 –1.5 –0.1Dec. 3.0 –1.4 2.6 4.4 0.4
Annualized 20.4 16.5 16.5 Annualized 3.9 3.9return active
return
Standard 10.0 5.0deviation
Years to 26.1 6.65 percentstatistical
significance
ccc_mauldin_ch03_27-44.qxd 9/23/05 10:37 AM Page 33
is demonstrated.3 A more widely used variant of the information ra-tio is the Sharpe ratio, which measures excess return per unit ofrisk.4 The Sharpe ratio can be a useful way to compare the skill oftwo or more different investment managers who employ differentstrategies to earn different returns and take different levels of risk.
At the end of the day, what we find is that it takes an inordi-nately long time to determine if a manager’s risk adjusted returnsare a reflection of skill or simply luck (noise).5 Using just the pastfew years of a manager’s returns is pointless from a statistical pointof view.
PERFORMANCE STUDIES
What do the studies show about whether past performance is pre-dictive? The overwhelming evidence is that it is not.
First we would like to provide a brief history of these studies togive you some perspective. Most of the early studies looked at theperformance of mutual funds since data for those funds were mostreadily available. (Later on, data from pension and endowmentfunds were also used.) The studies focused on a key issue: Didmanagers as a group outperform the market? In any large group ofmanagers, you would expect a certain percentage of them to out-perform and a certain percentage to underperform due to randomfluctuations (noise). A key question was: Did the group of man-agers, on average, outperform the market? The answer was no. Thatis, professional investors as a group did not exhibit superior perfor-mance to the overall market of all investors. The next question: Wasthe percentage of managers that did outperform the market greaterthan you would expect by chance? The answer for the most partwas again no. Of course this doesn’t mean there couldn’t be a supe-rior manager within this subset. Our conclusion is that you couldn’tidentify him or her by using past performance.
Also, most of the early performance studies were subject to akey defect: survivor bias. Survivor bias is caused when you focus onmanagers that had data for an entire period. Those managers thatwent out of business or merged often were dropped out of the sam-
34 JUST ONE THING
ccc_mauldin_ch03_27-44.qxd 9/23/05 10:37 AM Page 34
ple. Since this subset of managers was most likely to have had theworst performance, the results were biased upward.
Since it is more difficult to measure each manager relative to hisown custom benchmark (i.e., a small-cap value manager against theRussell 2000 Value Index) than just the market as a whole, manystudies just compared managers to the performance of the S&P 500or NYSE.
One study that did a good job of measuring managers againstthe proper benchmark was conducted by Ronald Kahn and AndrewRudd.6 After adjusting for style, the authors found that past perfor-mance had no correlation with future performance for the equitymanagers studied.
REASONS PAST PERFORMANCE FAILS AS AN INVESTING TOOL
Past performance is useful in explaining why a manager performedthe way he did during a specific period. This is called performanceattribution. Performance attribution can tell you what portion of theportfolio’s return could be attributed to its different industry selec-tions, what portion was attributed to the beta or systematic risk level,what portion was due to different exposures to common factors suchas size, and what portion could be attributed to stock selection. How-ever, knowing where the performance came from is not the same aspredicting where and at what level it will come from in the future.
We already discussed noise as a key contributor to the failure ofpast performance data as an investment decision tool, but wewould be remiss if we didn’t mention a few other reasons past per-formance is not predictive.
First there is the problem of the performance of a portfolio ver-sus the performance of a specific fund manager. Turnover in the in-vestment management team that has produced the past performancerecord will minimize the usefulness of that record.
Another more subtle but nonetheless very real problem in ana-lyzing past performance studies is the weighting given to each man-ager. Most studies weight each manager in the study equally. That
The Triumph of Hope over Long-Run Experience 35
ccc_mauldin_ch03_27-44.qxd 9/23/05 10:37 AM Page 35
may tell you what the average manager has done, but it doesn’t tellyou anything about how the typical client has done. The largest mu-tual funds may manage hundreds of times as many assets as the av-erage money manager, and their performance would consequentlyaffect a larger number of investors. We must be careful in drawingconclusions about how well clients have fared because client assetsare not distributed equally among all investment managers.
There is also the problem of time period. In the past it was as-sumed that any five-year period would encompass both a bull anda bear market. This is, however, a very naive assumption. Even if apast track record includes an up and a down market period, thatstill might not be good enough. After all, there are different factorsat work that produce each up and down market. Just because amanager may have made good decisions in one set of economiccircumstances doesn’t mean he will be able to perform as well in adifferent economic environment. The divergent performance ofgrowth managers before and after the bursting of the technologybubble is a noteworthy example.
Also for those of us who tend to the cynical side, there are twoadditional problems with past performance. Often, smaller man-agers who are trying to get big will make bigger bets earlier in thelife of their firm. As assets come in and revenues increase, the man-agers become more interested in not losing the assets they have, sothey tend to become more conservative.
Even if that wasn’t a conscious decision, it is sometimes the casethat a manager who can effectively manage $500 million can’t applythose skills as effectively managing $5 billion.
Finally, this is a competitive business. If a manager has found atechnique that works (such as earnings surprise or insider trading),there will be a tendency for other managers to want to use thosesame techniques, and if enough of them do so, the advantage willbe arbitraged away.
The whole issue of past performance might be amusing if it didn’t lead to some tragic consequences. Let us give you someexamples.
Few people will hire a manager with a sub-par performancerecord. Indeed, performance is often the first and most important
36 JUST ONE THING
ccc_mauldin_ch03_27-44.qxd 9/23/05 10:37 AM Page 36
screen used to select managers. We have seen plan sponsors lookonly at managers that were in the top quartile over the last fiveyears. However, if a common factor has been especially importantover that five-year period, then there will be a disproportionatenumber of managers who made it to the top quartile simply be-cause they had an above average exposure to that factor. While themanager should get credit if he intentionally raised his exposure tothat factor in anticipation of its positive impact, that isn’t usually thecase. More often, the manager has a style or habitat that he or shefeels comfortable with. Remember, 90 percent of a manager’s differ-ential performance can be ascribed to the manager’s style. If youare a value manager when value stocks are doing well, you willhave a great performance advantage over other managers who arenot selecting stocks within the value style.
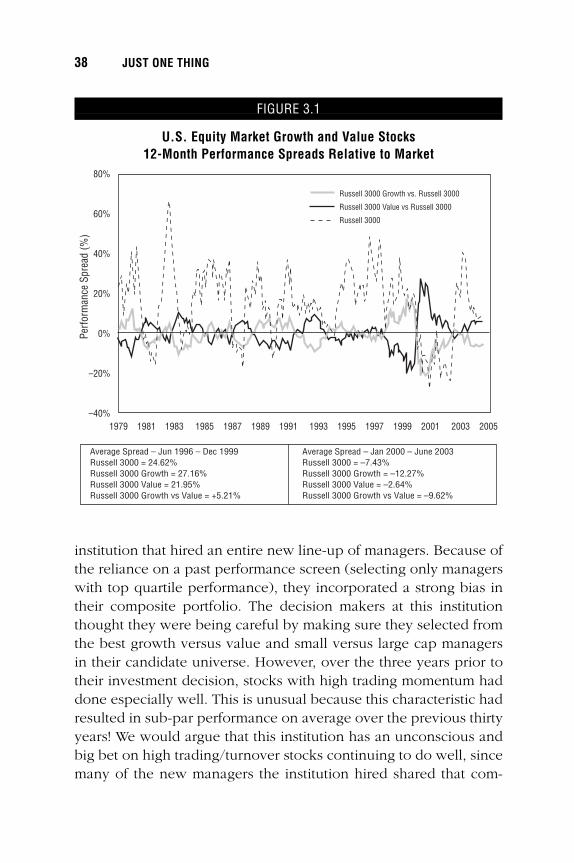
Figure 3.1 shows the relative performance of value stocks ver-sus growth stocks. The black line represents the cumulative 12-month rolling performance of value stocks less the performance ofall stocks. When the line is above zero, value stocks are outper-forming the overall market and vice versa. The performance ofgrowth stocks, after subtracting the performance of all stocks, isshown in gray. As can be seen, there are significant periods of timewhen growth stocks do well relative to the overall market, andvalue stocks tend not to do as well. In those periods when growthstocks are doing well, any manager who has growth stocks as hisor her habitat will have a tremendous performance advantage rela-tive to any value manager. As the graph illustrates, the perfor-mance differentials can be significant and they can reverse sharply.As an aside, new research that the performance differential attrib-uted to this so-called value effect may in fact also explain a signifi-cant portion of the size effect (small vs. large-cap) is forcing theindustry to more closely examine style issues. The fact is that themajority of investors who decided to invest in growth managers inthe latter part of 1999 because of a solid five-year track record ofsuperior performance got a painful reminder that past performanceis not predictive.
By using past performance as a criteria for selection, investorsoften unwittingly introduce a bias into their portfolio. We know one
The Triumph of Hope over Long-Run Experience 37
ccc_mauldin_ch03_27-44.qxd 9/23/05 10:37 AM Page 37
institution that hired an entire new line-up of managers. Because ofthe reliance on a past performance screen (selecting only managerswith top quartile performance), they incorporated a strong bias intheir composite portfolio. The decision makers at this institutionthought they were being careful by making sure they selected fromthe best growth versus value and small versus large cap managersin their candidate universe. However, over the three years prior totheir investment decision, stocks with high trading momentum haddone especially well. This is unusual because this characteristic hadresulted in sub-par performance on average over the previous thirtyyears! We would argue that this institution has an unconscious andbig bet on high trading/turnover stocks continuing to do well, sincemany of the new managers the institution hired shared that com-
38 JUST ONE THING
FIGURE 3.1
U.S. Equity Market Growth and Value Stocks 12-Month Performance Spreads Relative to Market
80%
60%
40%
20%
0%
–20%
–40%1979 1981 1983 1985 1987 1989 1991 1993 1995 1997 1999 2001 2003 2005
Russell 3000 Growth vs. Russell 3000
Russell 3000 Value vs Russell 3000
Russell 3000
Perf
orm
ance
Spr
ead
(%)
Average Spread – Jan 2000 – June 2003Russell 3000 = –7.43%Russell 3000 Growth = –12.27% Russell 3000 Value = –2.64%Russell 3000 Growth vs Value = –9.62%
Average Spread – Jun 1996 – Dec 1999Russell 3000 = 24.62%Russell 3000 Growth = 27.16%Russell 3000 Value = 21.95% Russell 3000 Growth vs Value = +5.21%
ccc_mauldin_ch03_27-44.qxd 9/23/05 10:37 AM Page 38
mon characteristic. Indeed, one could postulate that those samemanagers wound up in the top quartile precisely because they hadthat exposure.
The fact is that relying on past performance can often introducebiases into a portfolio that you neither know of nor want.
WHY DO INVESTORS RELY ON PAST PERFORMANCE?
Studies have shown that even managers with the best long-termrecords commonly underperform the market 40 percent of the time,and it is not unusual for them to have periods of three to five yearsof sub-par performance. Why do investors assume past perfor-mance is predictive? A big factor is our lack of appreciation of thelevel of uncertainty and the central role uncertainty plays in justabout everything related to investing. Most of us focus on trying tounderstand or explain why a particular event occurred. We spendlittle effort gathering all the possible scenarios before the fact. Ingeneral, people feel uncomfortable dealing with uncertainty. Afterall, uncertainty is directly related to the degree of control we havein our own lives. It is also directly related to how much we know.The less we know about different factors, causation, relationship,and so on, the more uncertainty there is. Indeed, predicting isbased on one’s causal understanding of how the world works. Itcan be very discouraging to realize how limited is our understand-ing of cause and effect.
Couple this natural discomfort and uncertainty with hindsightbias and you have the ingredients for self-delusion. Essentially,hindsight bias is the group of distortions that are created when wehave knowledge of an event that has already occurred. When weremember the past, we find it almost impossible to remember thefull range of uncertainties facing us at the time. Rather, we remem-ber a reconstruction of past events in terms of what actually hap-pened. This makes what happened seem much more inevitablethan it actually was. Thus, if we know a manager has had a certainperformance record, we will also selectively remember all the factsthat were available at the time that would support the link between
The Triumph of Hope over Long-Run Experience 39
ccc_mauldin_ch03_27-44.qxd 9/23/05 10:37 AM Page 39
the manager’s actions and that performance record. This will resultin the impression that past performance data are more predictivethan they actually are.
Two additional factors may be at work here. First, we (in theWestern World in particular) have been educated in a framework bestdescribed by reference to Sir Isaac Newton. This is a world of causeand effect. We believe that things are connected in a causal way, andwhen we see an outcome we naturally tend to attribute a cause. Sec-ond, the information processing limitations of the human mind maycontribute to our tendency to overweight historical performance. Ourminds have evolved shortcuts designed to simplify our lives. The oldsaying, “If it looks like a duck and quacks like a duck, then it must bea duck,” is an example. The problem is that a bad manager can havegood numbers—look and sound good—just by random luck.
Finally, a number of studies in behavioral finance have shown thataccuracy does not improve linearly (one for one) with the amount ofinformation used to reach a decision. However, humans tend to act ina manner consistent with the view that the more information we con-sider the more accurate our conclusion will be. This relationship is cap-tured by the confidence expressed by subjects during testing. Studieshave shown a nearly one-to-one relationship between the amount ofinformation people have about a problem and the degree of confi-dence they have in their solution. In experiments where participantswere required to make a decision as each new piece of informationwas revealed, the accuracy of their decision did not increase with newinformation, only their confidence in their decision. Why is this impor-tant? Because when we are looking for data points to base our invest-ment decision on, we too often rely on the most accessible and readilyavailable data we can find—past performance. Although this past per-formance information may help us feel better about our decision, itdoes not make us better decision makers. In this case we would arguethat it makes us more likely to choose an investment manager that hasbeen lucky, but has no real skill, because we have in fact deluded our-selves rather than searching for the clues to skill that really matter.
In summary, people have great difficulty in dealing with therandomness that abounds in the real world. They want to believethe world is more predictable than it is. Many studies document this
40 JUST ONE THING
ccc_mauldin_ch03_27-44.qxd 9/23/05 10:37 AM Page 40
tendency. (For an example, see the classic studies done by W.A.Wagenaar in Acta Psychologica.)
HOW SHOULD YOU USE PERFORMANCE DATA?
There is a branch of probability theory that offers some useful in-sights into how to integrate different sources of information whenmaking predictions. It is called Bayesian statistics. In assessing an in-vestment manager’s ability (and hence likelihood of producing supe-rior future performance), there are three sources of information.
First is one’s prior belief as to the range of abilities across activemanagers in general. What would the range of alphas be so thattwo-thirds of all managers’ alphas will fall within that range? Themore one believed in efficient markets, the more likely one wouldestimate the average alpha to be negative (because of fees andtransaction costs). Also, a believer in efficient markets would thinkthere was very little range of true alphas around that negative aver-age alpha. As a reference point, informal surveys done with groupsof professional investment managers showed that they thought theaverage manager would produce a zero alpha and that two-thirdsof all managers would fall within –2 percent to +2 percent alpha.
The next source of information is one’s belief as to a manager’s al-pha based on an in-depth understanding of the people, process, andphilosophy employed by that manager. In other words, this source ofinformation is any information about that particular manager indepen-dent of historical performance. With access to all this non-past perfor-mance information, what do you think the chances are that youwould mistakenly conclude that an average or unskillful manager wasactually a superior/skillful manager? Again, as a point of reference,surveys of professional investors showed that the standard deviationof their estimate was 1.5 percent. That is, professional investors had afair degree of confidence in their ability to analyze the likely skill of amoney manager independent of past performance data.
The final source of information is the historical performancerecord of a manager. Let us assume for illustrative purposes that aparticular manager produced a positive alpha relative to his or her
The Triumph of Hope over Long-Run Experience 41
ccc_mauldin_ch03_27-44.qxd 9/23/05 10:37 AM Page 41
benchmark of 3.0 percent with a standard deviation of 6 percentover the last five years.
How should we incorporate all this information? Based on thenumbers provided by surveys of professional investors, how muchweight should one give to past performance? Bayesian statistics cancalculate an answer. The results are that prior beliefs about therange of skill of money managers in general should get a 35 percentweight. Information about the particular money manager excludingpast performance data should get a 61 percent weight. Past perfor-mance should get only a 4 percent weight.7
You can substitute your own assumptions, but we doubt whetherany reasonable assumptions would justify the overwhelming weightcommonly given past performance when people try to predict amanager’s future performance. Under most reasonable assumptions,we would guess that the most important source of information whenpredicting future performance would be external information aboutthe particular manager, exclusive of past performance.
However, evaluating this source of information is a very com-plex and subtle topic in its own right. Suffice it to say that manageranalysis is a very intense and time-consuming process.
There are a few situations where past performance may be pre-dictive of future performance. These situations arise when severalcriteria are met:
1. The benchmark is a very good representation of all aspects ofthe manager’s style or habitat.
2. The performance record is the result of many decisions madeover many different market environments.
3. Either the portfolio is well diversified or the manager specifiedin advance why certain investment decisions would result in su-perior performance.
4. The regime in which the manager was operating does not radi-cally change and the manager produced an alpha that was largerelative to the portfolio’s level of diversification.
However, situations where these criteria hold are quite rare andinvolve uncertainty in their own right (i.e., regime change). Indeed,
42 JUST ONE THING
ccc_mauldin_ch03_27-44.qxd 9/23/05 10:37 AM Page 42
they are so rare that past performance in most cases is useless inpredicting future performance. Believing otherwise can be verydangerous to your financial health. Unfortunately that is how mostpeople, even those who know better, weight their decision calcu-lus—thus our claim that past performance is the most misused in-formation in the investment business.
In conclusion, we recommend the following:
• Look hard at all the risks associated with estimating informationratios.
• Bring into the decision equation all the information on the man-ager’s process you can.
• Factor measurable beta out of historic performance, while re-lentlessly searching for uncorrelated strategies.
• Use a Bayesian approach.• Dampen your enthusiasm and let common sense and experi-
ence play an important role in the decision process.
When the time comes to put the portfolio together, weight the al-location to your various managers by the inverse of their variance (orvolatility). This is called volatility throttling. In other words, take theirvolatility and weight your allocation to them by the inverse of thevolatility (one over their volatility). This means the lower-volatilitymanagers will get more of your portfolio because they probably haveless noise in their particular portfolio management style. In essence,this will tend to dampen the noise in your personal portfolio.
But remember, past performance is about hope. We hope that themanager will deliver those great returns to us going forward, but as awise man once said, “Hope is a good companion but a poor guide.”
The Triumph of Hope over Long-Run Experience 43
ccc_mauldin_ch03_27-44.qxd 9/23/05 10:37 AM Page 43

ccc_mauldin_ch03_27-44.qxd 9/23/05 10:37 AM Page 44
C H A P T E R 4
The Long Bond
Most of us were first introduced to A. Gary Shilling through
Forbes, where he has been a columnist for more than twenty
years. He made his reputation with a number of outstanding calls
early in his career. In the spring of 1969, he was among the few
who correctly saw that a recession would start late in that year.
In 1973, he stood almost alone in forecasting that the world was
entering a massive inventory-building spree, to be followed by the
first major worldwide recession since the 1930s. In the late 1970s,
when most people thought that raging inflation would last
forever, Shilling was the first to predict that the changing political
mood of the country would lead to an end of severe inflation, as
well as to potentially serious financial and economic
readjustment problems, and a shift in investment strategy from
one favoring tangible assets to emphasis on stocks and bonds.
Subsequently, he has become known as “Doctor Disinflation.” The
Wall Street Journal once noted that among economists predicting
bond rates, Shilling had the best track record. Gary is well known
for his forecasting record.
And he has kept that track record going. When almost no one
agreed with him, he wrote the definitive book titled Deflation in
1998, which accurately predicted the continued move toward far
lower inflation and to what Gary thinks will ultimately be a good
deflation of 1 to 2 percent.
45
�
ccc_mauldin_ch04_45-76.qxd 9/23/05 3:16 PM Page 45

This chapter discusses the right way to evaluate investment
themes. You should look for the large out-of-consensus calls as
the way to grow your capital, and Gary tells us how to spot those
calls. —John Mauldin
46 JUST ONE THING
�
ccc_mauldin_ch04_45-76.qxd 9/23/05 3:16 PM Page 46
The Long Bondby A. Gary Shilling, Ph.D.
FIND AN IMPORTANT, NONCONSENSUS AND LONG-TERM INVESTMENT THEME—and stick with it. That’s the most important thing I’ve learned from38 years in the economic consulting and investment business.
INVESTMENTS MUST MAKE MONEY
To be useful, an investment theme must have the potential to makeserious money. This may seem intuitively obvious, but it isn’t tomany economists. Years ago, the chief economist at a major mutualfund and investment advisory firm was visiting me in our officeswhen the latest quarterly GDP numbers were announced. He wasvery upset because his forecast was off the mark by 0.2 percentagepoints, and he spent half an hour poring over the GDP componentsand repeatedly telling me that he couldn’t understand why he wasn’tright on the money. At no point did he express any interest in whatthese numbers might mean for stocks, bonds, or other investments.I tried to introduce a note of reality by asking him on which ex-change GDP traded, but he only responded with a quizzical look.
This chief economist is not alone—at least to the extent thatforecasting accuracy reflects the emphasis that forecasters put onthe various series they try to prognosticate. A study of the WallStreet Journal ’s semi-annual poll of economists found that theirforecasts of inflation six months hence were better than the as-sumptions of no change in the inflation rate. So far, so good. Buttheir translations of those inflation forecasts into interest rate pre-dictions were disastrous. Taking the exact opposite position fromthat poll’s average forecast of the change in the thirty-year Treasury
47
�
ccc_mauldin_ch04_45-76.qxd 9/23/05 3:16 PM Page 47
bond yield, semester-by-semester, would have produced double-digit returns.
BE NONCONSENSUS AND LONG-TERM
A useful investment theme must also be nonconsensus. With today’swidespread and instantly available information, the consensus viewis fully reflected, or discounted, by security markets. If the vast ma-jority of pundits expects overall corporate earnings to be up 10 per-cent in a given quarter, stocks won’t move much if that forecastdoes, in fact, turn out to be true. Only a correct forecast of, say, a 20percent gain adds any value because when it is realized, equitieswill move appreciably.
An investment theme must also be valid for many years to behighly successful for most investors. Sure, skilled day traders canprofit handsomely from short-term themes, but for the rest, randommarket fluctuations make even correct ideas difficult to implement,and they will likely be old hat before most investors take action. Acorrect forecast of unexpected weakness in payroll employment ina particular month would probably spur Treasury bond prices, butthe gains might erode quickly if the weekly jobless benefit claims insucceeding weeks were well below the consensus forecasts.
THE LATE 1970S
In the late 1970s, I developed an important, nonconsensus, andlong-term investment theme that has worked well ever since. At thattime, inflation was leaping and most observers believed it wouldpersist forever (see Figure 4.1). As usual, theory followed fact, andseveral were concocted to explain chronic inflation. Furthermore,surging prices of crude oil and other commodities, wages, and al-most everything else made these constructs very credible to many.
One especially potent theory was that in democracies with uni-versal suffrage, the numerous low-income voters will demand andget more and more government programs that benefited them, fi-
48 JUST ONE THING
ccc_mauldin_ch04_45-76.qxd 9/23/05 3:16 PM Page 48
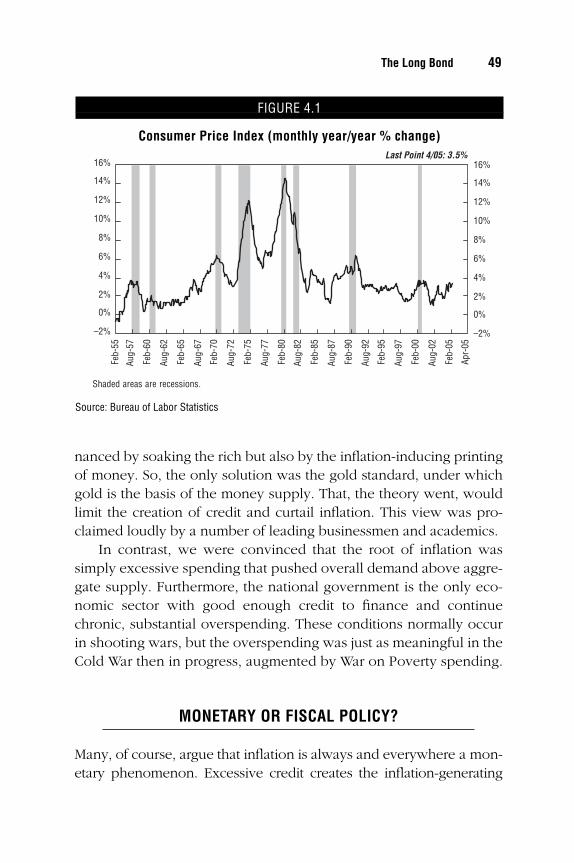
nanced by soaking the rich but also by the inflation-inducing printingof money. So, the only solution was the gold standard, under whichgold is the basis of the money supply. That, the theory went, wouldlimit the creation of credit and curtail inflation. This view was pro-claimed loudly by a number of leading businessmen and academics.
In contrast, we were convinced that the root of inflation wassimply excessive spending that pushed overall demand above aggre-gate supply. Furthermore, the national government is the only eco-nomic sector with good enough credit to finance and continuechronic, substantial overspending. These conditions normally occurin shooting wars, but the overspending was just as meaningful in theCold War then in progress, augmented by War on Poverty spending.
MONETARY OR FISCAL POLICY?
Many, of course, argue that inflation is always and everywhere a mon-etary phenomenon. Excessive credit creates the inflation-generating
The Long Bond 49
FIGURE 4.1
Consumer Price Index (monthly year/year % change)Last Point 4/05: 3.5%
Shaded areas are recessions.
–2%
0%
2%
4%
6%
8%
10%
12%
14%
16%
–2%
0%
2%
4%
6%
8%
10%
12%
14%
16%
Feb-
55
Aug-
57
Feb-
60
Aug-
62
Feb-
65
Aug-
67
Feb-
70
Aug-
72
Feb-
75
Aug-
77
Feb-
80
Aug-
82
Feb-
85
Aug-
87
Feb-
90
Aug-
92
Feb-
95
Aug-
97
Feb-
00
Aug-
02
Feb-
05
Apr-
05
Source: Bureau of Labor Statistics
ccc_mauldin_ch04_45-76.qxd 9/23/05 3:16 PM Page 49
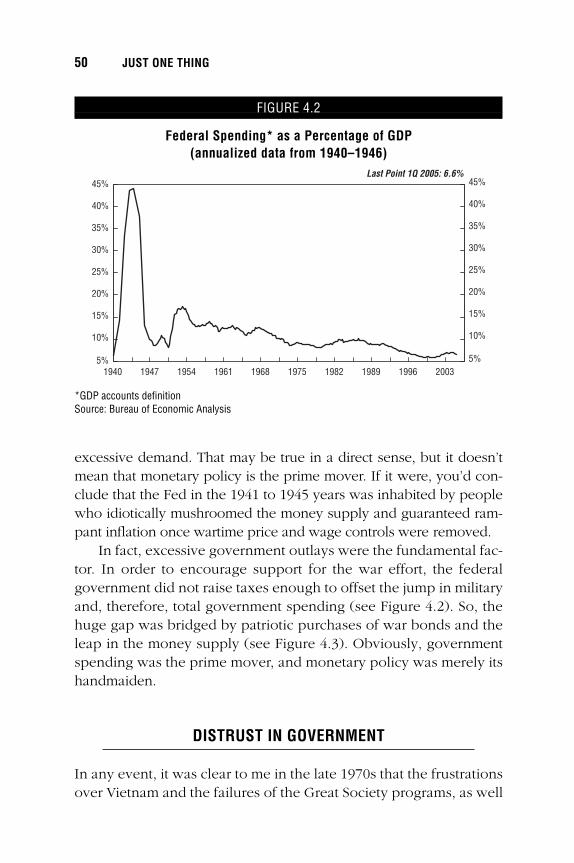
excessive demand. That may be true in a direct sense, but it doesn’tmean that monetary policy is the prime mover. If it were, you’d con-clude that the Fed in the 1941 to 1945 years was inhabited by peoplewho idiotically mushroomed the money supply and guaranteed ram-pant inflation once wartime price and wage controls were removed.
In fact, excessive government outlays were the fundamental fac-tor. In order to encourage support for the war effort, the federalgovernment did not raise taxes enough to offset the jump in militaryand, therefore, total government spending (see Figure 4.2). So, thehuge gap was bridged by patriotic purchases of war bonds and theleap in the money supply (see Figure 4.3). Obviously, governmentspending was the prime mover, and monetary policy was merely itshandmaiden.
DISTRUST IN GOVERNMENT
In any event, it was clear to me in the late 1970s that the frustrationsover Vietnam and the failures of the Great Society programs, as well
50 JUST ONE THING
FIGURE 4.2
Federal Spending* as a Percentage of GDP (annualized data from 1940–1946)
Last Point 1Q 2005: 6.6%
1940 1947 1954 1961 1968 1975 1982 1989 1996 20035%
10%
15%
20%
25%
30%
35%
40%
45%
5%
10%
15%
20%
25%
30%
35%
40%
45%
*GDP accounts definitionSource: Bureau of Economic Analysis
ccc_mauldin_ch04_45-76.qxd 9/23/05 3:16 PM Page 50
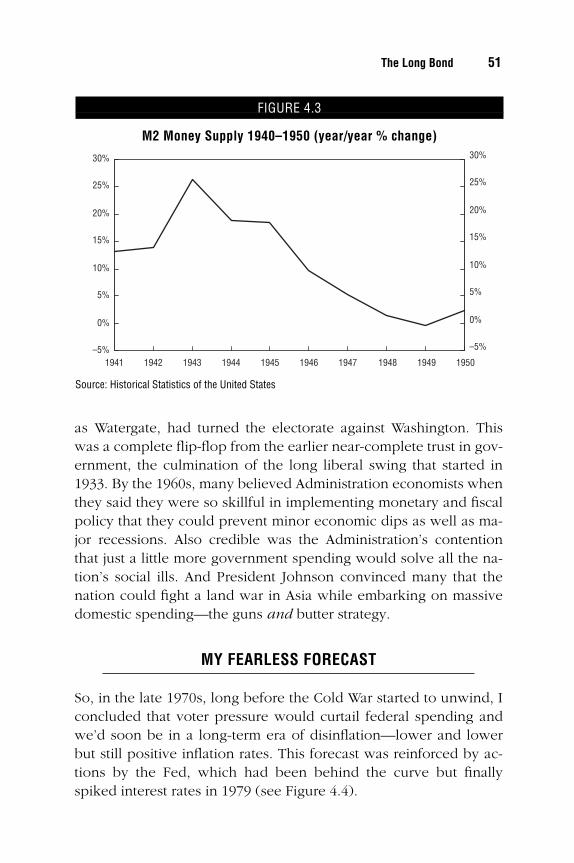
as Watergate, had turned the electorate against Washington. Thiswas a complete flip-flop from the earlier near-complete trust in gov-ernment, the culmination of the long liberal swing that started in1933. By the 1960s, many believed Administration economists whenthey said they were so skillful in implementing monetary and fiscalpolicy that they could prevent minor economic dips as well as ma-jor recessions. Also credible was the Administration’s contentionthat just a little more government spending would solve all the na-tion’s social ills. And President Johnson convinced many that thenation could fight a land war in Asia while embarking on massivedomestic spending—the guns and butter strategy.
MY FEARLESS FORECAST
So, in the late 1970s, long before the Cold War started to unwind, Iconcluded that voter pressure would curtail federal spending andwe’d soon be in a long-term era of disinflation—lower and lowerbut still positive inflation rates. This forecast was reinforced by ac-tions by the Fed, which had been behind the curve but finallyspiked interest rates in 1979 (see Figure 4.4).
The Long Bond 51
FIGURE 4.3
M2 Money Supply 1940–1950 (year/year % change)
1941 1942 1943 1944 1945 1946 1947 1948 1949 1950
–5%
0%
5%
10%
15%
20%
25%
30%
–5%
0%
5%
10%
15%
20%
25%
30%
Source: Historical Statistics of the United States
ccc_mauldin_ch04_45-76.qxd 9/23/05 3:16 PM Page 51
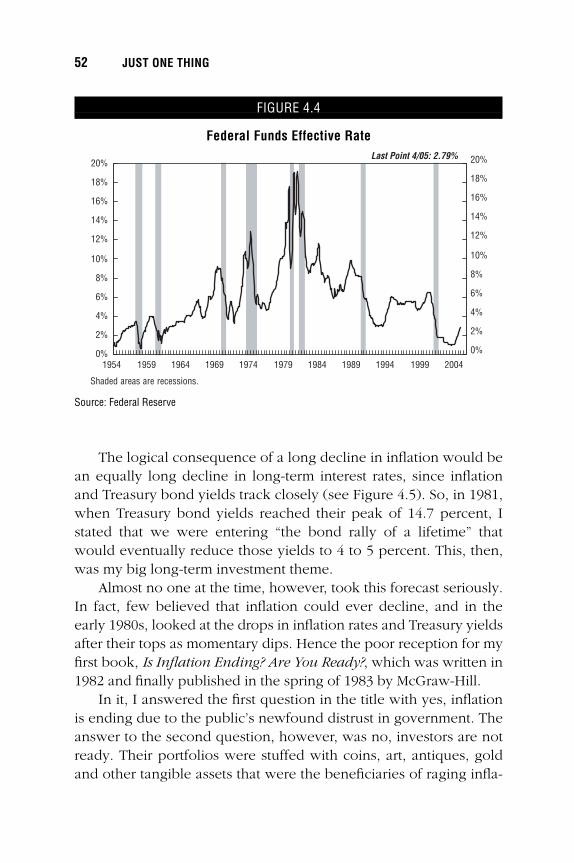
The logical consequence of a long decline in inflation would bean equally long decline in long-term interest rates, since inflationand Treasury bond yields track closely (see Figure 4.5). So, in 1981,when Treasury bond yields reached their peak of 14.7 percent, Istated that we were entering “the bond rally of a lifetime” thatwould eventually reduce those yields to 4 to 5 percent. This, then,was my big long-term investment theme.
Almost no one at the time, however, took this forecast seriously.In fact, few believed that inflation could ever decline, and in theearly 1980s, looked at the drops in inflation rates and Treasury yieldsafter their tops as momentary dips. Hence the poor reception for myfirst book, Is Inflation Ending? Are You Ready?, which was written in1982 and finally published in the spring of 1983 by McGraw-Hill.
In it, I answered the first question in the title with yes, inflationis ending due to the public’s newfound distrust in government. Theanswer to the second question, however, was no, investors are notready. Their portfolios were stuffed with coins, art, antiques, goldand other tangible assets that were the beneficiaries of raging infla-
52 JUST ONE THING
FIGURE 4.4
Federal Funds Effective Rate
Shaded areas are recessions.
Last Point 4/05: 2.79%
1954 1959 1964 1969 1974 1979 1984 1989 1994 1999 2004
0%
2%
4%
6%
8%
10%
12%
14%
16%
18%
20%
0%
2%
4%
6%
8%
10%
12%
14%
16%
18%
20%
Source: Federal Reserve
ccc_mauldin_ch04_45-76.qxd 9/23/05 3:16 PM Page 52
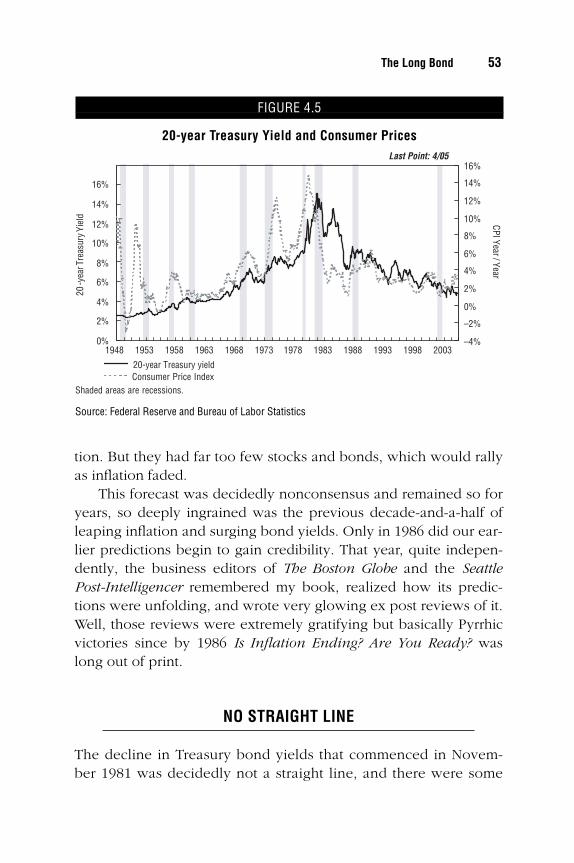
tion. But they had far too few stocks and bonds, which would rallyas inflation faded.
This forecast was decidedly nonconsensus and remained so foryears, so deeply ingrained was the previous decade-and-a-half ofleaping inflation and surging bond yields. Only in 1986 did our ear-lier predictions begin to gain credibility. That year, quite indepen-dently, the business editors of The Boston Globe and the SeattlePost-Intelligencer remembered my book, realized how its predic-tions were unfolding, and wrote very glowing ex post reviews of it.Well, those reviews were extremely gratifying but basically Pyrrhicvictories since by 1986 Is Inflation Ending? Are You Ready? waslong out of print.
NO STRAIGHT LINE
The decline in Treasury bond yields that commenced in Novem-ber 1981 was decidedly not a straight line, and there were some
The Long Bond 53
FIGURE 4.5
20-year Treasury Yield and Consumer PricesLast Point: 4/05
Shaded areas are recessions. Consumer Price Index
1948 1953 1958 1963 1968 1973 1978 1983 1988 1993 1998 2003
20 -y
ear T
reas
ury Y
ield CPI Year / Year
20-year Treasury yield
0%
2%
4%
6%
8%
10%
12%
14%
16%
–4%
–2%
0%
2%
4%
6%
8%
10%
12%
14%
16%
Source: Federal Reserve and Bureau of Labor Statistics
ccc_mauldin_ch04_45-76.qxd 9/23/05 3:16 PM Page 53
hair-curling back-ups in interest rates (see Figure 4.5). My basicreasons for the long-term decline in inflation and Treasury bondyields never changed, but there were trying times. As I’ve said foryears to myself and to anyone who will listen, markets can remainirrational a lot longer than most of us can remain solvent.
Sure, with perfect hindsight, the best strategy would have beento buy long Treasurys in 1981 and then take a vacation in the inter-vening 24 years on some island where there are no newspapers orsecurities quote machines. But that’s not the real world. The buy-and-hold forever strategy is difficult to stick to and, not surpris-ingly, normally only comes into vogue at the end of a long run ofsuccess. That was true of stocks in the late 1990s after the lengthyand robust rally that started in August 1982 and ended with specu-lative extremes.
In normal times, investment positions need to be adjusted inlight of current market conditions. Call it market timing if you will,but for most it’s essential for investment survival. Otherwise, therisk is that investors who attempt to maintain their positionsthrough what they hope are temporary setbacks will get scared outjust at the point that markets reverse in their favor. The trick is tomaintain the courage of your convictions, even if you get frightenedout, and re-enter despite previous substantial losses. I certainlylearned that when I first put my money where my mouth was in“the bond rally of a lifetime.”
REAL MONEY
In the early 1980s, I investigated various leverage plays on 30-yearTreasury bonds, and found I could leverage them in the repo marketthrough a small bond firm owned by a friend, Edward A. Moos. Es-sentially, Ed bought the bonds in my account and then financed thepurchase with 100 percent loans in the short-term market. I didn’tput up any money, but had to cover any losses on a daily basis.
And initially there were losses. Big losses. I was stunned. I re-member driving my car around town thinking, here I am, a world-class forecaster, prognosticating a major investment opportunity,
54 JUST ONE THING
ccc_mauldin_ch04_45-76.qxd 9/23/05 3:16 PM Page 54
and I manage to lose money on it in the first try. Am I half as smartas I thought?
But after a few weeks, I regained my composure and repeatedthe exercise. And with considerable success. In fact, by the mid-1980s, the result was financial independence for the Shilling family,achieved through aggressive investment in “the long bond,” as themost recently issued 30-year maturity Treasury is called. The Trea-sury stopped issuing 30-year maturities in 2001 when forecasts ofhuge federal surpluses made them unnecessary. Recently, however,it decided to resume semi-annual auctions in 2006 due to the returnof chronic federal deficits, the Treasury’s desire to keep the averagematurities of its obligations from falling, and private pension funds’newfound zeal for safe long-term investments. I’m glad because Ihave a very warm spot for that instrument.
THE LONG (UNLAUNCHED) BOND
I’m also sentimental about the long bond because that almost becamethe name of a boat. We never owned a powerboat at our beachhouse on Fire Island, off the south coast of Long Island, because wewanted our four kids to learn to sail and figured that a powerboatwould be a big distraction. By the mid-1980s, however, the kids hadbecome good sailors, and I was becoming increasingly frustrated bywhat I call the tyranny of the ferry schedule. You need to take a ferryto get to Fire Island, and I do have a chronic tendency to run late—very late. So, owning a powerboat was an attractive idea.
At the time, we were doing consulting work for CML Group,based in the Boston area and named for Charles M. Leighton, theCEO and a former professor at Harvard Business School. The firmowned a number of upscale consumer product lines, includingBoston Whaler boats. I asked Charlie Leighton if I could take outsome of our consulting fees in trade, specifically in the form of aWhaler. He said fine, and to let him know when I’d have a half-dayfree so I could visit the Whaler production facilities in Hingham,south of Boston.
We arranged a time when I was going to be in Boston anyway,
The Long Bond 55
ccc_mauldin_ch04_45-76.qxd 9/23/05 3:16 PM Page 55
and they sent a limo to pick me up. The head of the Whaler divi-sion, Joe Lawler, and the boat’s original designer, who had sold thebusiness years earlier but was still on the payroll, personally gaveme a tour of the manufacturing operation. It was interesting to seehow they sprayed the fiberglass on the molds, installed floats insidethe seats, and did the finishing.
Then on to the showroom. “What do you want to do with yourboat?” Joe asked. I explained that I wanted to use the Whaler to getback and forth across the Great South Bay, to go fishing out in theocean, to take the kids water skiing, etc.—in other words, I neededyour all-purpose boat.
“Well, if you want to fish in the ocean, you’ll need the big jobover here,” he said, walking toward their largest model. “And youshould have two outboard engines in case one conks out thirtymiles offshore with a storm brewing.” We also decided that I’d needthe console and windshield to hide behind in heavy weather, thebuilt-in fish tanks, heavy-duty railings, miscellaneous storage lock-ers, and so on.
On the ride back to the airport in Boston, I began to wonderabout the cost of The Long Bond, as my boat would be christened. Ifound out when the numbers—at Whaler’s lowest wholesaleprices—arrived from Joe a few days later. Then came the sharppencil work. I figured the depreciation on the boat, the cost of themoney tied up, maintenance, summer docking fees, winter storagecosts, fuel, insurance, license fees, and taxes. Then I estimated howoften I’d use it on fishing trips, water skiing, cruising and, of course,ferry-avoiding trips across the bay.
The results were shocking. The ferry ride cost $5 at that time,but each trip across the bay in The Long Bond would run $500.Now, it wasn’t a matter of being able to afford the craft. This wasn’tquite up to the vessel J.P. Morgan was referring to when he said thatif you have to ask the price, you can’t afford a yacht. I wasn’t evenscared off by the old definition of a boat—a hole in the water intowhich you pour money. I just simply couldn’t justify paying a hun-dred times the ferry’s fare for the privilege of avoiding its tyranny.
Needless to say, “The Long Bond” remains unbought—andunlaunched.
56 JUST ONE THING
ccc_mauldin_ch04_45-76.qxd 9/23/05 3:16 PM Page 56
HANG IN THERE
What made my personal investment success possible, the success inother people’s portfolios that we manage, and the useful recommen-dations I made to our economic consulting clients over many yearswas persistence in the face of occasional adversity and constant dis-belief by others. Luckily, having a personality that’s contrarian by na-ture is a good trait to have in my trade. Still, being comfortable, evenhappy, when I’m out of the mainstream can be embarrassing, espe-cially for my wife. We’ll go to a cocktail party and someone will re-mark, “Oh, what a beautiful yellow moon tonight!” My instinctivereply is, “What makes you think it isn’t green?”
This attitude is enhanced by the ability, the result of decades ofhard experience, to keep the big picture in perspective, to not getcarried away with the ongoing chatter on the financial news TVchannels or the seemingly important but ephemeral stories in the fi-nancial press. Bear in mind that the media offers absolutely noguidance on what’s important and what isn’t. No financial TVscreen ever goes black for an hour after the anchor announces thatthey have nothing of significance to report in the next sixty min-utes. No financial newspaper ever prints columns on the front pagethat are entirely white except for a brief notice that they have nostories that warrant front page coverage.
After the 1987 stock market crash, I, along with many others,was convinced that dire times lay ahead for equities and the econ-omy. I spent many hours each day devouring the legions of Crash-related stories in the Wall Street Journal and other financialpublications, and amassed huge files of clippings. We even wrote abook with the title, After The Crash—Recession or Depression?
Well, of course, neither recession nor depression occurred. Theeconomy paused briefly before resuming growth, and stocks re-gained their upward trend in a matter of months. In retrospective,the Crash was simply a correction of the speculative leap in early1987 and a mere blip in a robust upward trend (see Figure 4.6).
I learned from this experience. So when the 9/11 terrorist attacksoccurred in 2001, I read the related news accounts but skipped lotsof the details. I didn’t accumulate files of press clippings. We didn’t
The Long Bond 57
ccc_mauldin_ch04_45-76.qxd 9/23/05 3:16 PM Page 57
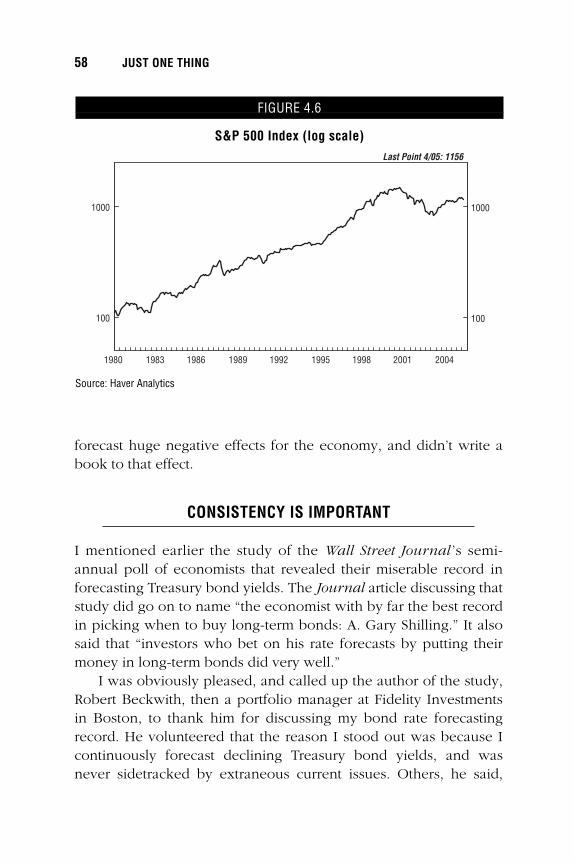
forecast huge negative effects for the economy, and didn’t write abook to that effect.
CONSISTENCY IS IMPORTANT
I mentioned earlier the study of the Wall Street Journal ’s semi-annual poll of economists that revealed their miserable record inforecasting Treasury bond yields. The Journal article discussing thatstudy did go on to name “the economist with by far the best recordin picking when to buy long-term bonds: A. Gary Shilling.” It alsosaid that “investors who bet on his rate forecasts by putting theirmoney in long-term bonds did very well.”
I was obviously pleased, and called up the author of the study,Robert Beckwith, then a portfolio manager at Fidelity Investmentsin Boston, to thank him for discussing my bond rate forecastingrecord. He volunteered that the reason I stood out was because Icontinuously forecast declining Treasury bond yields, and wasnever sidetracked by extraneous current issues. Others, he said,
58 JUST ONE THING
FIGURE 4.6
S&P 500 Index (log scale)Last Point 4/05: 1156
1980 1983 1986 1989 1992 1995 1998 2001 2004
100
1000
100
1000
Source: Haver Analytics
ccc_mauldin_ch04_45-76.qxd 9/23/05 3:16 PM Page 58
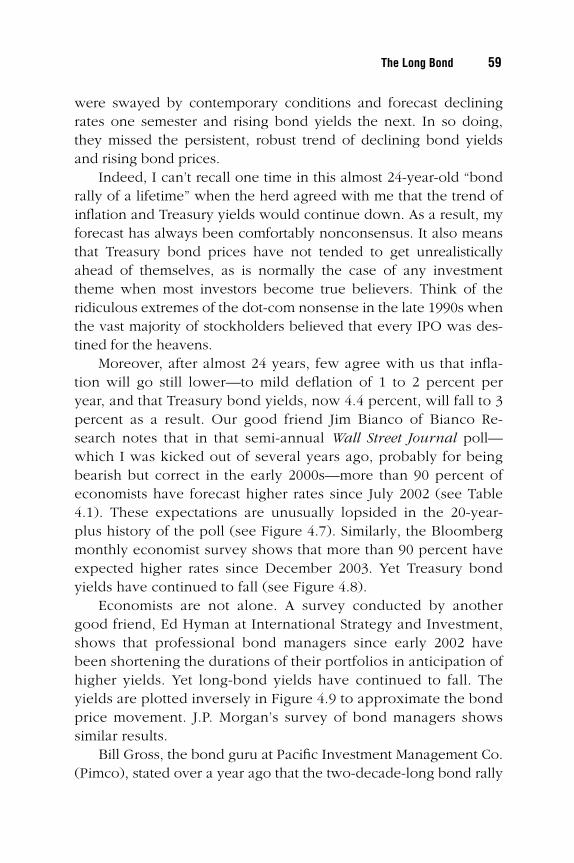
were swayed by contemporary conditions and forecast decliningrates one semester and rising bond yields the next. In so doing,they missed the persistent, robust trend of declining bond yieldsand rising bond prices.
Indeed, I can’t recall one time in this almost 24-year-old “bondrally of a lifetime” when the herd agreed with me that the trend ofinflation and Treasury yields would continue down. As a result, myforecast has always been comfortably nonconsensus. It also meansthat Treasury bond prices have not tended to get unrealisticallyahead of themselves, as is normally the case of any investmenttheme when most investors become true believers. Think of theridiculous extremes of the dot-com nonsense in the late 1990s whenthe vast majority of stockholders believed that every IPO was des-tined for the heavens.
Moreover, after almost 24 years, few agree with us that infla-tion will go still lower—to mild deflation of 1 to 2 percent peryear, and that Treasury bond yields, now 4.4 percent, will fall to 3percent as a result. Our good friend Jim Bianco of Bianco Re-search notes that in that semi-annual Wall Street Journal poll—which I was kicked out of several years ago, probably for beingbearish but correct in the early 2000s—more than 90 percent ofeconomists have forecast higher rates since July 2002 (see Table4.1). These expectations are unusually lopsided in the 20-year-plus history of the poll (see Figure 4.7). Similarly, the Bloombergmonthly economist survey shows that more than 90 percent haveexpected higher rates since December 2003. Yet Treasury bondyields have continued to fall (see Figure 4.8).
Economists are not alone. A survey conducted by anothergood friend, Ed Hyman at International Strategy and Investment,shows that professional bond managers since early 2002 havebeen shortening the durations of their portfolios in anticipation ofhigher yields. Yet long-bond yields have continued to fall. Theyields are plotted inversely in Figure 4.9 to approximate the bondprice movement. J.P. Morgan’s survey of bond managers showssimilar results.
Bill Gross, the bond guru at Pacific Investment Management Co.(Pimco), stated over a year ago that the two-decade-long bond rally
The Long Bond 59
ccc_mauldin_ch04_45-76.qxd 9/23/05 3:16 PM Page 59
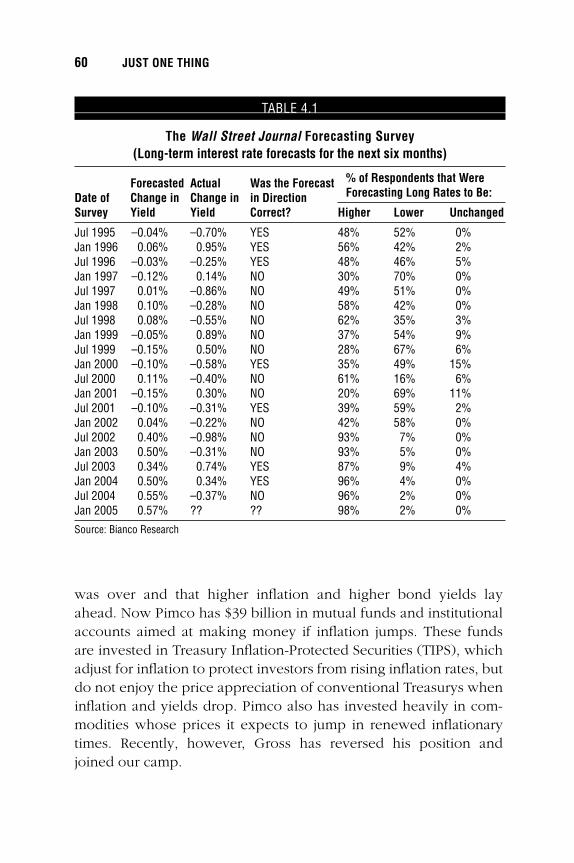
was over and that higher inflation and higher bond yields layahead. Now Pimco has $39 billion in mutual funds and institutionalaccounts aimed at making money if inflation jumps. These fundsare invested in Treasury Inflation-Protected Securities (TIPS), whichadjust for inflation to protect investors from rising inflation rates, butdo not enjoy the price appreciation of conventional Treasurys wheninflation and yields drop. Pimco also has invested heavily in com-modities whose prices it expects to jump in renewed inflationarytimes. Recently, however, Gross has reversed his position andjoined our camp.
60 JUST ONE THING
TABLE 4.1
The Wall Street Journal Forecasting Survey(Long-term interest rate forecasts for the next six months)
Forecasted Actual Was the Forecast % of Respondents that Were
Date of Change in Change in in Direction Forecasting Long Rates to Be:
Survey Yield Yield Correct? Higher Lower Unchanged
Jul 1995 –0.04% –0.70% YES 48% 52% 0%Jan 1996 0.06% 0.95% YES 56% 42% 2%Jul 1996 –0.03% –0.25% YES 48% 46% 5%Jan 1997 –0.12% 0.14% NO 30% 70% 0%Jul 1997 0.01% –0.86% NO 49% 51% 0%Jan 1998 0.10% –0.28% NO 58% 42% 0%Jul 1998 0.08% –0.55% NO 62% 35% 3%Jan 1999 –0.05% 0.89% NO 37% 54% 9%Jul 1999 –0.15% 0.50% NO 28% 67% 6%Jan 2000 –0.10% –0.58% YES 35% 49% 15%Jul 2000 0.11% –0.40% NO 61% 16% 6%Jan 2001 –0.15% 0.30% NO 20% 69% 11%Jul 2001 –0.10% –0.31% YES 39% 59% 2%Jan 2002 0.04% –0.22% NO 42% 58% 0%Jul 2002 0.40% –0.98% NO 93% 7% 0%Jan 2003 0.50% –0.31% NO 93% 5% 0%Jul 2003 0.34% 0.74% YES 87% 9% 4%Jan 2004 0.50% 0.34% YES 96% 4% 0%Jul 2004 0.55% –0.37% NO 96% 2% 0%Jan 2005 0.57% ?? ?? 98% 2% 0%
Source: Bianco Research
ccc_mauldin_ch04_45-76.qxd 9/23/05 3:16 PM Page 60
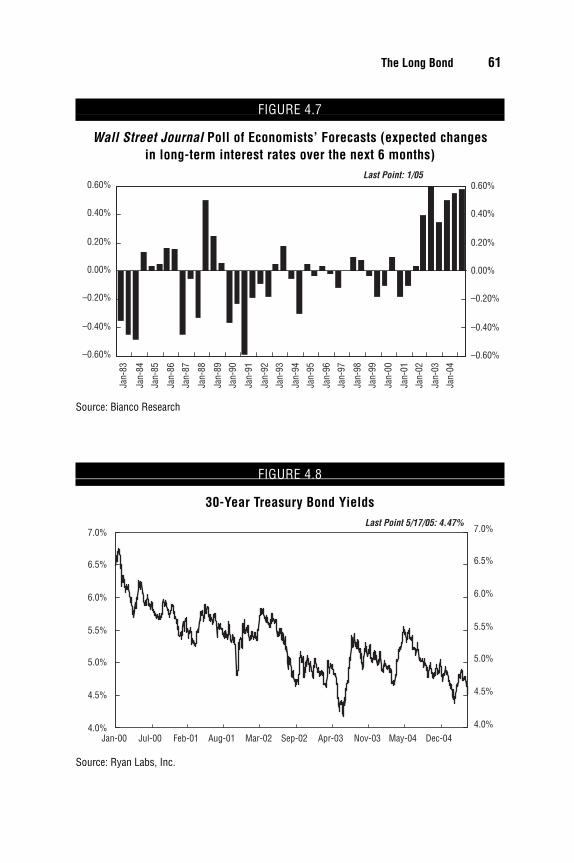
The Long Bond 61
FIGURE 4.7
Wall Street Journal Poll of Economists’ Forecasts (expected changesin long-term interest rates over the next 6 months)
Last Point: 1/05
–0.60%
–0.40%
–0.20%
0.00%
0.20%
0.40%
0.60%
–0.60%
–0.40%
–0.20%
0.00%
0.20%
0.40%
0.60%
Jan-
83
Jan-
84
Jan-
85
Jan-
86
Jan-
87
Jan-
88
Jan-
89
Jan-
90
Jan-
91
Jan-
92
Jan-
93
Jan-
94
Jan-
95
Jan-
96
Jan-
97
Jan-
98
Jan-
99
Jan-
00
Jan-
01
Jan-
02
Jan-
03
Jan-
04
Source: Bianco Research
FIGURE 4.8
30-Year Treasury Bond YieldsLast Point 5/17/05: 4.47%
Jan-00 Jul-00 Feb-01 Aug-01 Mar-02 Sep-02 Apr-03 Nov-03 May-04 Dec-044.0%
4.5%
5.0%
5.5%
6.0%
6.5%
7.0%
4.0%
4.5%
5.0%
5.5%
6.0%
6.5%
7.0%
Source: Ryan Labs, Inc.
ccc_mauldin_ch04_45-76.qxd 9/23/05 3:16 PM Page 61
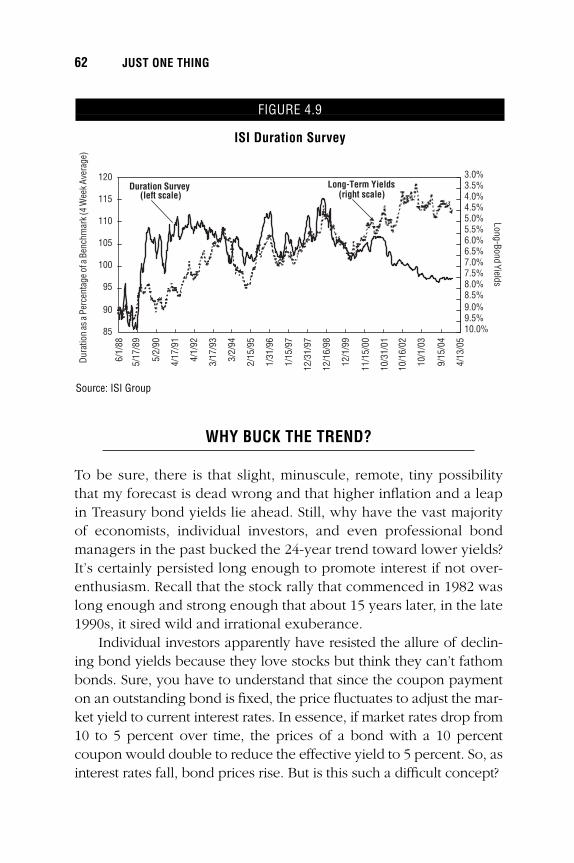
WHY BUCK THE TREND?
To be sure, there is that slight, minuscule, remote, tiny possibilitythat my forecast is dead wrong and that higher inflation and a leapin Treasury bond yields lie ahead. Still, why have the vast majorityof economists, individual investors, and even professional bondmanagers in the past bucked the 24-year trend toward lower yields?It’s certainly persisted long enough to promote interest if not over-enthusiasm. Recall that the stock rally that commenced in 1982 waslong enough and strong enough that about 15 years later, in the late1990s, it sired wild and irrational exuberance.
Individual investors apparently have resisted the allure of declin-ing bond yields because they love stocks but think they can’t fathombonds. Sure, you have to understand that since the coupon paymenton an outstanding bond is fixed, the price fluctuates to adjust the mar-ket yield to current interest rates. In essence, if market rates drop from10 to 5 percent over time, the prices of a bond with a 10 percentcoupon would double to reduce the effective yield to 5 percent. So, asinterest rates fall, bond prices rise. But is this such a difficult concept?
62 JUST ONE THING
FIGURE 4.9
ISI Duration Survey
Dura
tion
as a
Perc
enta
ge o
f a B
ench
mar
k (4
Wee
k Ave
rage
)
3.0%3.5%4.0%4.5%5.0%5.5%6.0%6.5%7.0%7.5%8.0%8.5%9.0%9.5%10.0%
Long-Bond Yields
Duration Survey(left scale)
Long-Term Yields(right scale)
6/1/
88
5/17
/89
5/2/
90
4/17
/91
4/1/
92
3/17
/93
3/2/
94
2/15
/95
1/31
/96
1/15
/97
12/3
1/97
12/1
6/98
12/1
/99
11/1
5/00
10/3
1/01
10/1
6/02
10/1
/03
9/15
/04
4/13
/05
85
90
95
100
105
110
115
120
Source: ISI Group
ccc_mauldin_ch04_45-76.qxd 9/23/05 3:16 PM Page 62
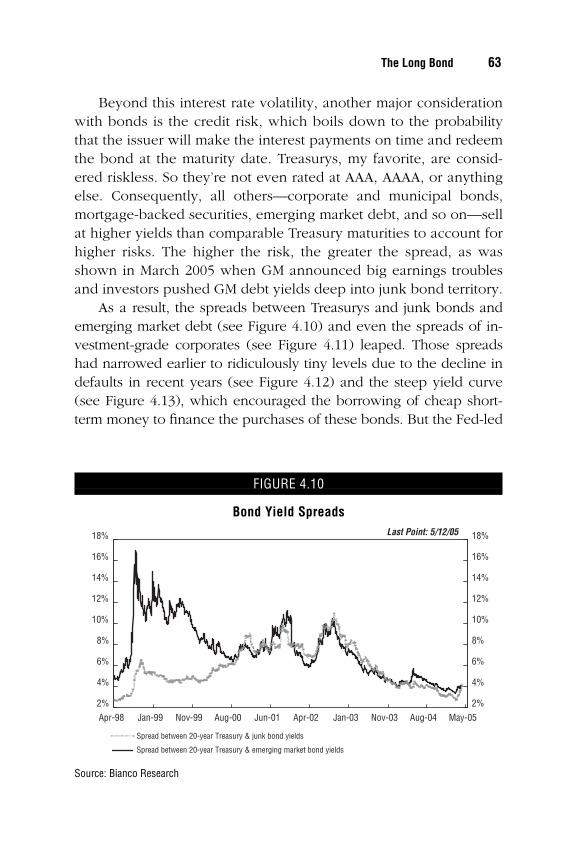
Beyond this interest rate volatility, another major considerationwith bonds is the credit risk, which boils down to the probabilitythat the issuer will make the interest payments on time and redeemthe bond at the maturity date. Treasurys, my favorite, are consid-ered riskless. So they’re not even rated at AAA, AAAA, or anythingelse. Consequently, all others—corporate and municipal bonds,mortgage-backed securities, emerging market debt, and so on—sellat higher yields than comparable Treasury maturities to account forhigher risks. The higher the risk, the greater the spread, as wasshown in March 2005 when GM announced big earnings troublesand investors pushed GM debt yields deep into junk bond territory.
As a result, the spreads between Treasurys and junk bonds andemerging market debt (see Figure 4.10) and even the spreads of in-vestment-grade corporates (see Figure 4.11) leaped. Those spreadshad narrowed earlier to ridiculously tiny levels due to the decline indefaults in recent years (see Figure 4.12) and the steep yield curve(see Figure 4.13), which encouraged the borrowing of cheap short-term money to finance the purchases of these bonds. But the Fed-led
The Long Bond 63
FIGURE 4.10
Bond Yield SpreadsLast Point: 5/12/05
Apr-98 Jan-99 Nov-99 Aug-00 Jun-01 Apr-02 Jan-03 Nov-03 Aug-04 May-052%
4%
6%
8%
10%
12%
14%
16%
18%
2%
4%
6%
8%
10%
12%
14%
16%
18%
Spread between 20-year Treasury & junk bond yields
Spread between 20-year Treasury & emerging market bond yields
Source: Bianco Research
ccc_mauldin_ch04_45-76.qxd 9/23/05 3:16 PM Page 63
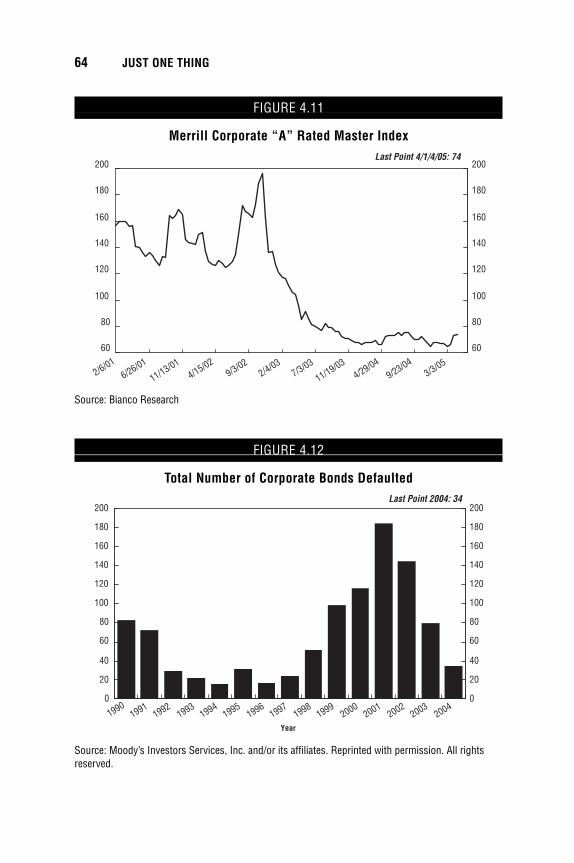
64 JUST ONE THING
FIGURE 4.11
Merrill Corporate “A” Rated Master IndexLast Point 4/1/4/05: 74
2/6/016/26/01
11/13/014/15/02
9/3/022/4/03
7/3/03
11/19/034/29/04
9/23/043/3/05
60
80
100
120
140
160
180
200
60
80
100
120
140
160
180
200
Source: Bianco Research
FIGURE 4.12
Total Number of Corporate Bonds DefaultedLast Point 2004: 34
19901991
19921993
19941995
19961997
19981999
20002001
20022003
20040
20
40
60
80
100
120
140
160
180
200
0
20
40
60
80
100
120
140
160
180
200
Year
Source: Moody’s Investors Services, Inc. and/or its affiliates. Reprinted with permission. All rightsreserved.
ccc_mauldin_ch04_45-76.qxd 9/23/05 3:16 PM Page 64
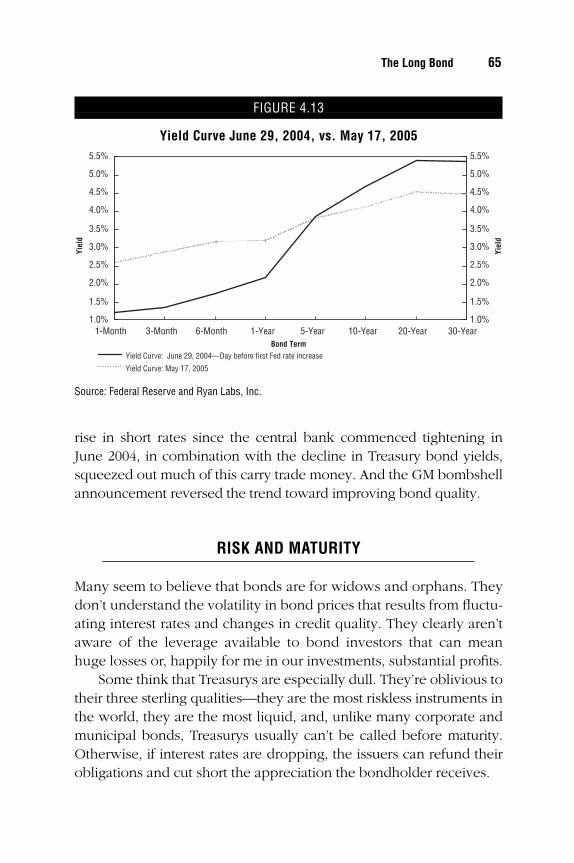
rise in short rates since the central bank commenced tightening inJune 2004, in combination with the decline in Treasury bond yields,squeezed out much of this carry trade money. And the GM bombshellannouncement reversed the trend toward improving bond quality.
RISK AND MATURITY
Many seem to believe that bonds are for widows and orphans. Theydon’t understand the volatility in bond prices that results from fluctu-ating interest rates and changes in credit quality. They clearly aren’taware of the leverage available to bond investors that can meanhuge losses or, happily for me in our investments, substantial profits.
Some think that Treasurys are especially dull. They’re oblivious totheir three sterling qualities—they are the most riskless instruments inthe world, they are the most liquid, and, unlike many corporate andmunicipal bonds, Treasurys usually can’t be called before maturity.Otherwise, if interest rates are dropping, the issuers can refund theirobligations and cut short the appreciation the bondholder receives.
The Long Bond 65
FIGURE 4.13
Yield Curve June 29, 2004, vs. May 17, 2005
1-Month 3-Month 6-Month 1-Year 5-Year 10-Year 20-Year 30-Year1.0%
1.5%
2.0%
2.5%
3.0%
3.5%
4.0%
4.5%
5.0%
5.5%
1.0%
1.5%
2.0%
2.5%
3.0%
3.5%
4.0%
4.5%
5.0%
5.5%
Yield Curve: June 29, 2004—Day before first Fed rate increase
Yield Curve: May 17, 2005
Yiel
d
Yiel
d
Bond Term
Source: Federal Reserve and Ryan Labs, Inc.
ccc_mauldin_ch04_45-76.qxd 9/23/05 3:16 PM Page 65
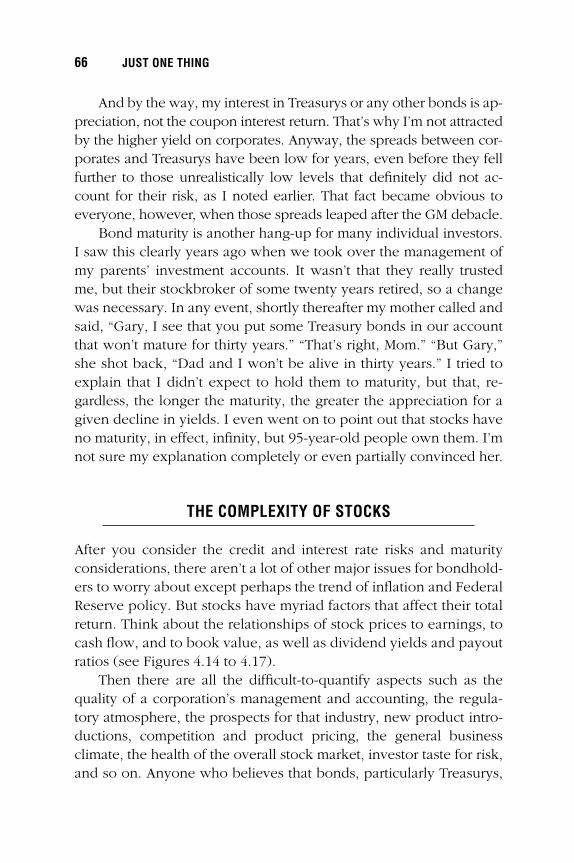
And by the way, my interest in Treasurys or any other bonds is ap-preciation, not the coupon interest return. That’s why I’m not attractedby the higher yield on corporates. Anyway, the spreads between cor-porates and Treasurys have been low for years, even before they fellfurther to those unrealistically low levels that definitely did not ac-count for their risk, as I noted earlier. That fact became obvious toeveryone, however, when those spreads leaped after the GM debacle.
Bond maturity is another hang-up for many individual investors.I saw this clearly years ago when we took over the management ofmy parents’ investment accounts. It wasn’t that they really trustedme, but their stockbroker of some twenty years retired, so a changewas necessary. In any event, shortly thereafter my mother called andsaid, “Gary, I see that you put some Treasury bonds in our accountthat won’t mature for thirty years.” “That’s right, Mom.” “But Gary,”she shot back, “Dad and I won’t be alive in thirty years.” I tried toexplain that I didn’t expect to hold them to maturity, but that, re-gardless, the longer the maturity, the greater the appreciation for agiven decline in yields. I even went on to point out that stocks haveno maturity, in effect, infinity, but 95-year-old people own them. I’mnot sure my explanation completely or even partially convinced her.
THE COMPLEXITY OF STOCKS
After you consider the credit and interest rate risks and maturityconsiderations, there aren’t a lot of other major issues for bondhold-ers to worry about except perhaps the trend of inflation and FederalReserve policy. But stocks have myriad factors that affect their totalreturn. Think about the relationships of stock prices to earnings, tocash flow, and to book value, as well as dividend yields and payoutratios (see Figures 4.14 to 4.17).
Then there are all the difficult-to-quantify aspects such as thequality of a corporation’s management and accounting, the regula-tory atmosphere, the prospects for that industry, new product intro-ductions, competition and product pricing, the general businessclimate, the health of the overall stock market, investor taste for risk,and so on. Anyone who believes that bonds, particularly Treasurys,
66 JUST ONE THING
ccc_mauldin_ch04_45-76.qxd 9/23/05 3:16 PM Page 66
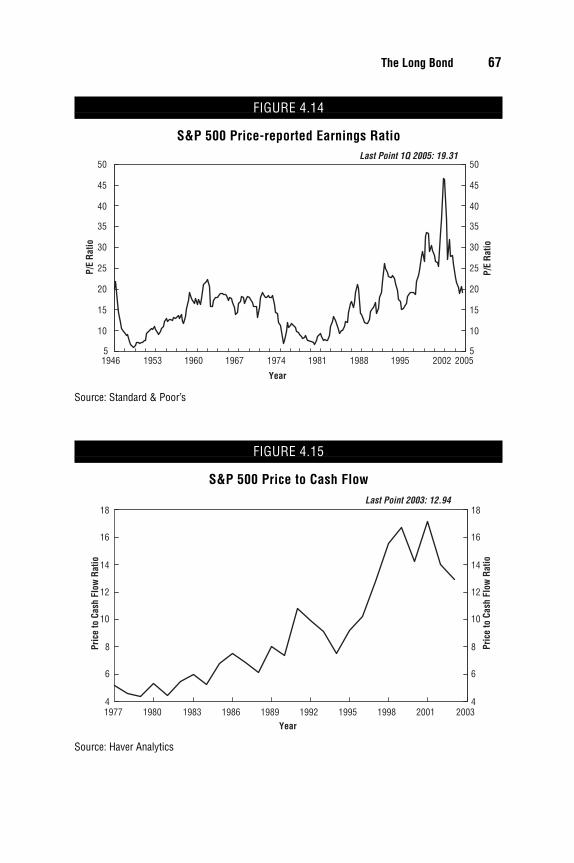
The Long Bond 67
FIGURE 4.14
S&P 500 Price-reported Earnings RatioLast Point 1Q 2005: 19.31
1946 1953 1960 1967 1974 1981 1988 1995 2002 20055
10
15
20
25
30
35
40
45
50
5
10
15
20
25
30
35
40
45
50
Year
P/E
Ratio
P/E
Ratio
Source: Standard & Poor’s
FIGURE 4.15
S&P 500 Price to Cash FlowLast Point 2003: 12.94
1977 1980 1983 1986 1989 1992 1995 1998 2001 20034
6
8
10
12
14
16
18
4
6
8
10
12
14
16
18
Year
Pric
e to
Cas
h Fl
ow R
atio
Pric
e to
Cas
h Fl
ow R
atio
Source: Haver Analytics
ccc_mauldin_ch04_45-76.qxd 9/23/05 3:16 PM Page 67
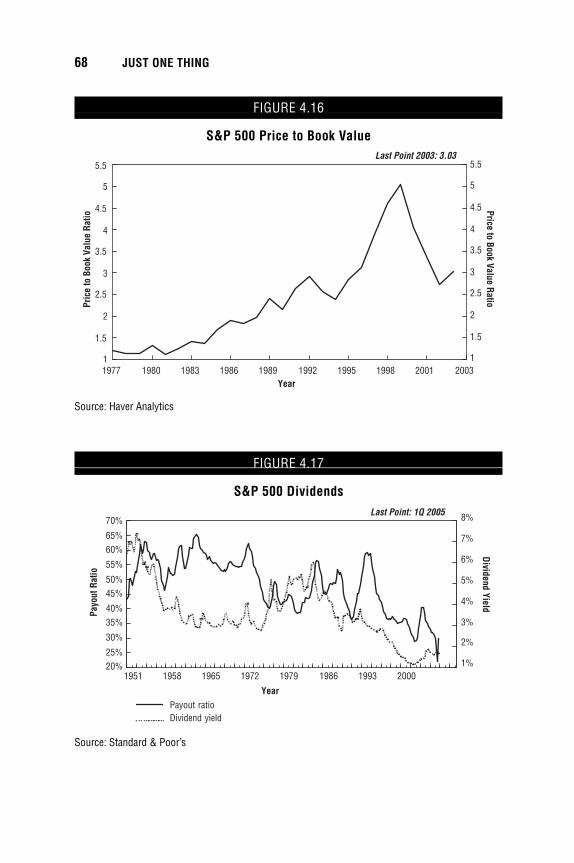
68 JUST ONE THING
FIGURE 4.16
S&P 500 Price to Book ValueLast Point 2003: 3.03
1977 1980 1983 1986 1989 1992 1995 1998 2001 20031
1.5
2
2.5
3
3.5
4
4.5
5
5.5
1
1.5
2
2.5
3
3.5
4
4.5
5
5.5
Year
Pric
e to
Boo
k Va
lue
Ratio
Price to Book Value Ratio
Source: Haver Analytics
FIGURE 4.17
S&P 500 DividendsLast Point: 1Q 2005
1951 1958 1965 1972 1979 1986 1993 2000
Payo
ut R
atio
1%
2%
3%
4%
5%
6%
7%
8%
Dividend Yield
Payout ratioDividend yield
20%25%
30%
35%40%
45%50%
55%
60%65%
70%
Year
Source: Standard & Poor’s
ccc_mauldin_ch04_45-76.qxd 9/23/05 3:16 PM Page 68
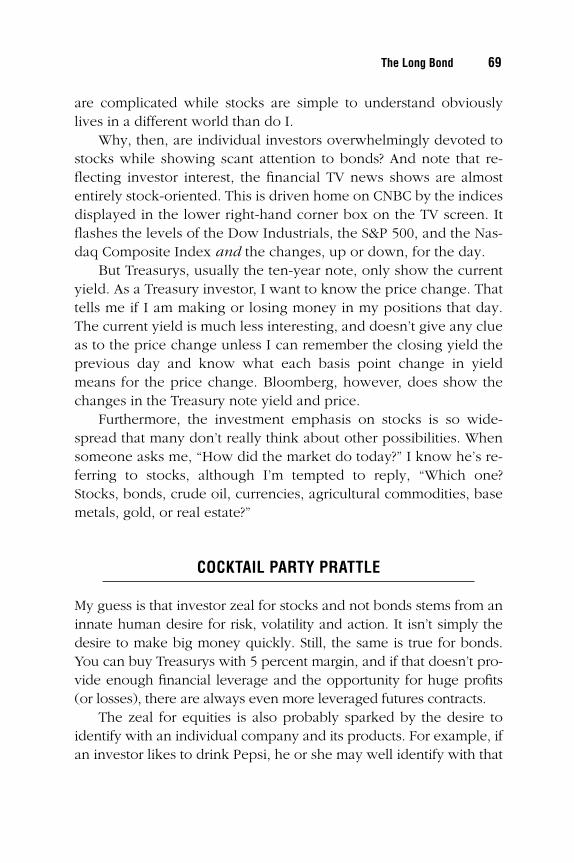
are complicated while stocks are simple to understand obviouslylives in a different world than do I.
Why, then, are individual investors overwhelmingly devoted tostocks while showing scant attention to bonds? And note that re-flecting investor interest, the financial TV news shows are almostentirely stock-oriented. This is driven home on CNBC by the indicesdisplayed in the lower right-hand corner box on the TV screen. Itflashes the levels of the Dow Industrials, the S&P 500, and the Nas-daq Composite Index and the changes, up or down, for the day.
But Treasurys, usually the ten-year note, only show the currentyield. As a Treasury investor, I want to know the price change. Thattells me if I am making or losing money in my positions that day.The current yield is much less interesting, and doesn’t give any clueas to the price change unless I can remember the closing yield theprevious day and know what each basis point change in yieldmeans for the price change. Bloomberg, however, does show thechanges in the Treasury note yield and price.
Furthermore, the investment emphasis on stocks is so wide-spread that many don’t really think about other possibilities. Whensomeone asks me, “How did the market do today?” I know he’s re-ferring to stocks, although I’m tempted to reply, “Which one?Stocks, bonds, crude oil, currencies, agricultural commodities, basemetals, gold, or real estate?”
COCKTAIL PARTY PRATTLE
My guess is that investor zeal for stocks and not bonds stems from aninnate human desire for risk, volatility and action. It isn’t simply thedesire to make big money quickly. Still, the same is true for bonds.You can buy Treasurys with 5 percent margin, and if that doesn’t pro-vide enough financial leverage and the opportunity for huge profits(or losses), there are always even more leveraged futures contracts.
The zeal for equities is also probably sparked by the desire toidentify with an individual company and its products. For example, ifan investor likes to drink Pepsi, he or she may well identify with that
The Long Bond 69
ccc_mauldin_ch04_45-76.qxd 9/23/05 3:16 PM Page 69
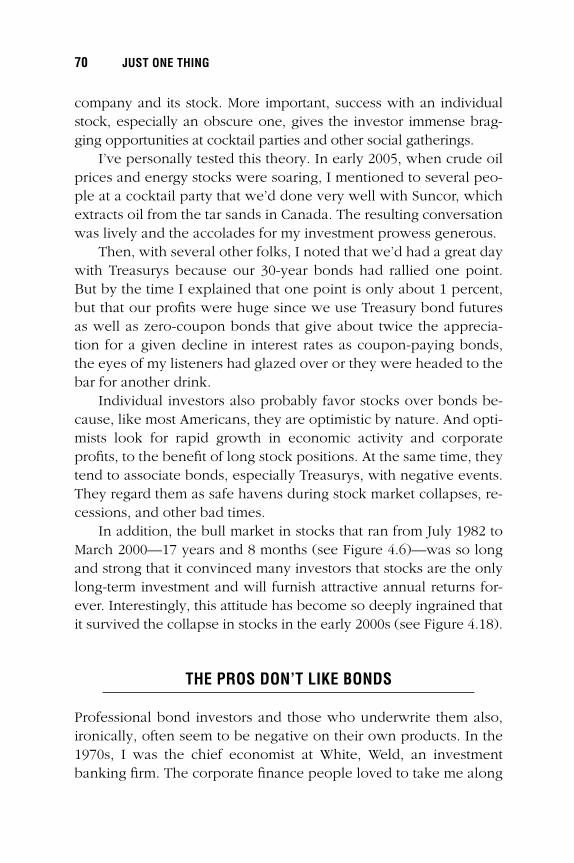
company and its stock. More important, success with an individualstock, especially an obscure one, gives the investor immense brag-ging opportunities at cocktail parties and other social gatherings.
I’ve personally tested this theory. In early 2005, when crude oilprices and energy stocks were soaring, I mentioned to several peo-ple at a cocktail party that we’d done very well with Suncor, whichextracts oil from the tar sands in Canada. The resulting conversationwas lively and the accolades for my investment prowess generous.
Then, with several other folks, I noted that we’d had a great daywith Treasurys because our 30-year bonds had rallied one point.But by the time I explained that one point is only about 1 percent,but that our profits were huge since we use Treasury bond futuresas well as zero-coupon bonds that give about twice the apprecia-tion for a given decline in interest rates as coupon-paying bonds,the eyes of my listeners had glazed over or they were headed to thebar for another drink.
Individual investors also probably favor stocks over bonds be-cause, like most Americans, they are optimistic by nature. And opti-mists look for rapid growth in economic activity and corporateprofits, to the benefit of long stock positions. At the same time, theytend to associate bonds, especially Treasurys, with negative events.They regard them as safe havens during stock market collapses, re-cessions, and other bad times.
In addition, the bull market in stocks that ran from July 1982 toMarch 2000—17 years and 8 months (see Figure 4.6)—was so longand strong that it convinced many investors that stocks are the onlylong-term investment and will furnish attractive annual returns for-ever. Interestingly, this attitude has become so deeply ingrained thatit survived the collapse in stocks in the early 2000s (see Figure 4.18).
THE PROS DON’T LIKE BONDS
Professional bond investors and those who underwrite them also,ironically, often seem to be negative on their own products. In the1970s, I was the chief economist at White, Weld, an investmentbanking firm. The corporate finance people loved to take me along
70 JUST ONE THING
ccc_mauldin_ch04_45-76.qxd 9/23/05 3:16 PM Page 70
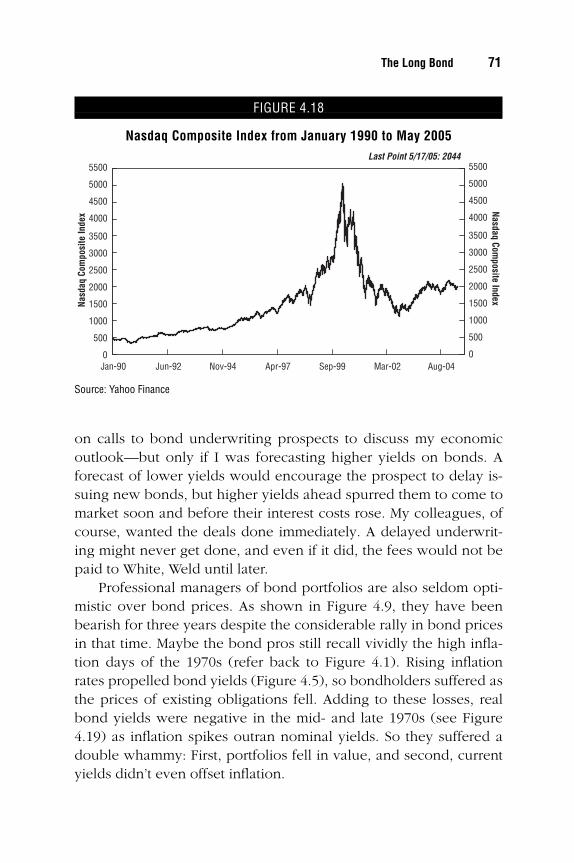
on calls to bond underwriting prospects to discuss my economicoutlook—but only if I was forecasting higher yields on bonds. Aforecast of lower yields would encourage the prospect to delay is-suing new bonds, but higher yields ahead spurred them to come tomarket soon and before their interest costs rose. My colleagues, ofcourse, wanted the deals done immediately. A delayed underwrit-ing might never get done, and even if it did, the fees would not bepaid to White, Weld until later.
Professional managers of bond portfolios are also seldom opti-mistic over bond prices. As shown in Figure 4.9, they have beenbearish for three years despite the considerable rally in bond pricesin that time. Maybe the bond pros still recall vividly the high infla-tion days of the 1970s (refer back to Figure 4.1). Rising inflationrates propelled bond yields (Figure 4.5), so bondholders suffered asthe prices of existing obligations fell. Adding to these losses, realbond yields were negative in the mid- and late 1970s (see Figure4.19) as inflation spikes outran nominal yields. So they suffered adouble whammy: First, portfolios fell in value, and second, currentyields didn’t even offset inflation.
The Long Bond 71
FIGURE 4.18
Nasdaq Composite Index from January 1990 to May 2005Last Point 5/17/05: 2044
Jan-90 Jun-92 Nov-94 Apr-97 Sep-99 Mar-02 Aug-040
500
1000
1500
2000
2500
3000
3500
4000
4500
5000
5500
0
500
1000
1500
2000
2500
3000
3500
4000
4500
5000
5500
Nasd
aq C
ompo
site
Inde
x Nasdaq Composite Index
Source: Yahoo Finance
ccc_mauldin_ch04_45-76.qxd 9/23/05 3:16 PM Page 71
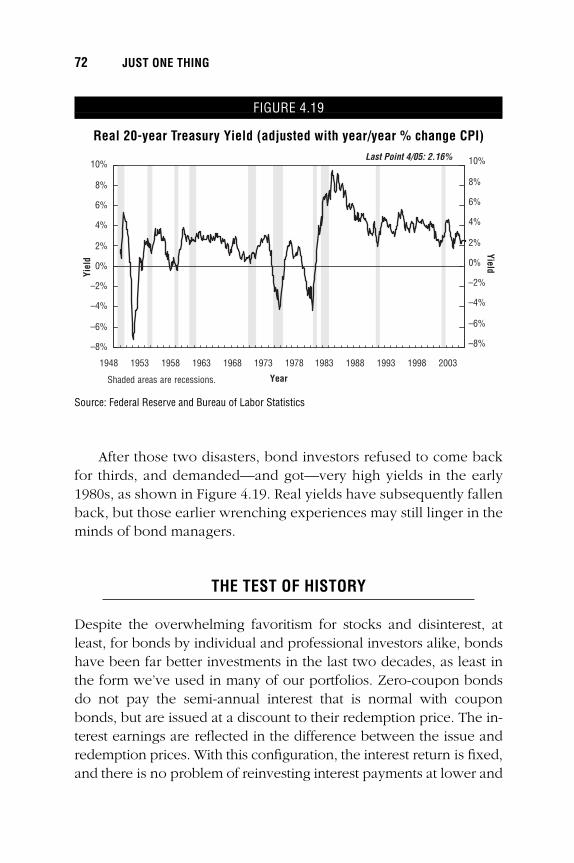
After those two disasters, bond investors refused to come backfor thirds, and demanded—and got—very high yields in the early1980s, as shown in Figure 4.19. Real yields have subsequently fallenback, but those earlier wrenching experiences may still linger in theminds of bond managers.
THE TEST OF HISTORY
Despite the overwhelming favoritism for stocks and disinterest, atleast, for bonds by individual and professional investors alike, bondshave been far better investments in the last two decades, as least inthe form we’ve used in many of our portfolios. Zero-coupon bondsdo not pay the semi-annual interest that is normal with couponbonds, but are issued at a discount to their redemption price. The in-terest earnings are reflected in the difference between the issue andredemption prices. With this configuration, the interest return is fixed,and there is no problem of reinvesting interest payments at lower and
72 JUST ONE THING
FIGURE 4.19
Real 20-year Treasury Yield (adjusted with year/year % change CPI)
Shaded areas are recessions.
Last Point 4/05: 2.16%
1948 1953 1958 1963 1968 1973 1978 1983 1988 1993 1998 2003
–8%
–6%
–4%
–2%
0%
2%
4%
6%
8%
10%
–8%
–6%
–4%
–2%
0%
2%
4%
6%
8%
10%
Year
Yiel
dYield
Source: Federal Reserve and Bureau of Labor Statistics
ccc_mauldin_ch04_45-76.qxd 9/23/05 3:16 PM Page 72
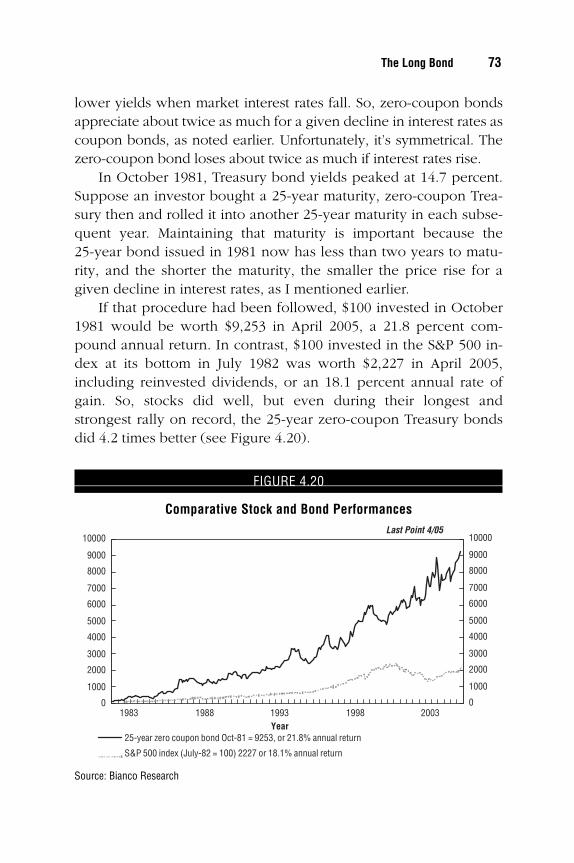
lower yields when market interest rates fall. So, zero-coupon bondsappreciate about twice as much for a given decline in interest rates ascoupon bonds, as noted earlier. Unfortunately, it’s symmetrical. Thezero-coupon bond loses about twice as much if interest rates rise.
In October 1981, Treasury bond yields peaked at 14.7 percent.Suppose an investor bought a 25-year maturity, zero-coupon Trea-sury then and rolled it into another 25-year maturity in each subse-quent year. Maintaining that maturity is important because the25-year bond issued in 1981 now has less than two years to matu-rity, and the shorter the maturity, the smaller the price rise for agiven decline in interest rates, as I mentioned earlier.
If that procedure had been followed, $100 invested in October1981 would be worth $9,253 in April 2005, a 21.8 percent com-pound annual return. In contrast, $100 invested in the S&P 500 in-dex at its bottom in July 1982 was worth $2,227 in April 2005,including reinvested dividends, or an 18.1 percent annual rate ofgain. So, stocks did well, but even during their longest andstrongest rally on record, the 25-year zero-coupon Treasury bondsdid 4.2 times better (see Figure 4.20).
The Long Bond 73
FIGURE 4.20
Comparative Stock and Bond PerformancesLast Point 4/05
1983 1988 1993 1998 2003
25-year zero coupon bond Oct-81 = 9253, or 21.8% annual return
S&P 500 index (July-82 = 100) 2227 or 18.1% annual return
0
1000
2000
3000
4000
5000
6000
7000
8000
9000
10000
0
1000
2000
3000
4000
5000
6000
7000
8000
9000
10000
Year
Source: Bianco Research
ccc_mauldin_ch04_45-76.qxd 9/23/05 3:16 PM Page 73
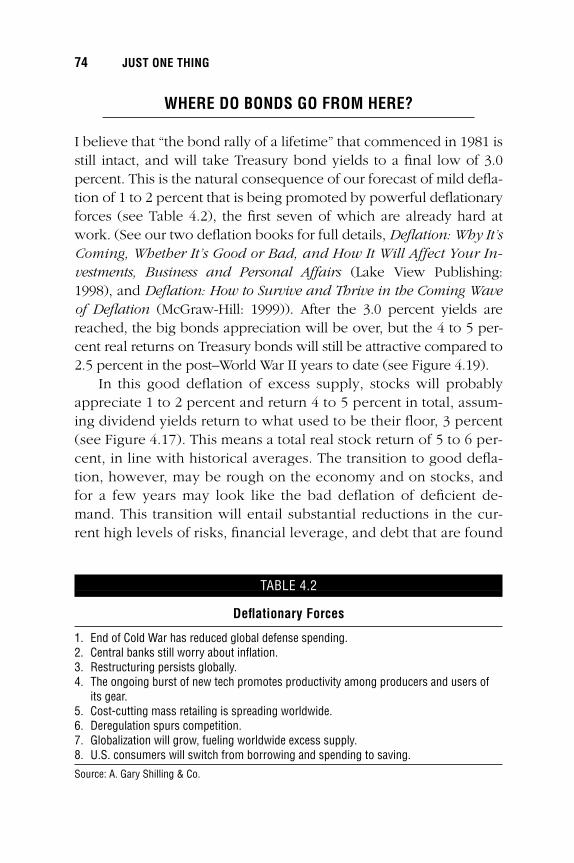
WHERE DO BONDS GO FROM HERE?
I believe that “the bond rally of a lifetime” that commenced in 1981 isstill intact, and will take Treasury bond yields to a final low of 3.0percent. This is the natural consequence of our forecast of mild defla-tion of 1 to 2 percent that is being promoted by powerful deflationaryforces (see Table 4.2), the first seven of which are already hard atwork. (See our two deflation books for full details, Deflation: Why It’sComing, Whether It’s Good or Bad, and How It Will Affect Your In-vestments, Business and Personal Affairs (Lake View Publishing:1998), and Deflation: How to Survive and Thrive in the Coming Waveof Deflation (McGraw-Hill: 1999)). After the 3.0 percent yields arereached, the big bonds appreciation will be over, but the 4 to 5 per-cent real returns on Treasury bonds will still be attractive compared to2.5 percent in the post–World War II years to date (see Figure 4.19).
In this good deflation of excess supply, stocks will probablyappreciate 1 to 2 percent and return 4 to 5 percent in total, assum-ing dividend yields return to what used to be their floor, 3 percent(see Figure 4.17). This means a total real stock return of 5 to 6 per-cent, in line with historical averages. The transition to good defla-tion, however, may be rough on the economy and on stocks, andfor a few years may look like the bad deflation of deficient de-mand. This transition will entail substantial reductions in the cur-rent high levels of risks, financial leverage, and debt that are found
74 JUST ONE THING
TABLE 4.2
Deflationary Forces
1. End of Cold War has reduced global defense spending.2. Central banks still worry about inflation.3. Restructuring persists globally.4. The ongoing burst of new tech promotes productivity among producers and users of
its gear.5. Cost-cutting mass retailing is spreading worldwide.6. Deregulation spurs competition.7. Globalization will grow, fueling worldwide excess supply.8. U.S. consumers will switch from borrowing and spending to saving.
Source: A. Gary Shilling & Co.
ccc_mauldin_ch04_45-76.qxd 9/23/05 3:16 PM Page 74

throughout financial markets and the economy, notably in the cur-rent housing bubble.
In any event, I’m sticking to the long-term investment theme thathas served me well for almost 24 years—the unwinding of inflationand the resulting decline in Treasury bond yields. And I’m hopingthat after more than two decades of unfolding, this theme remainsdistinctly nonconsensus. Only when the herd stampedes into mycorral will I worry that “the bond rally of a lifetime” is ending.
The Long Bond 75
ccc_mauldin_ch04_45-76.qxd 9/23/05 3:16 PM Page 75

ccc_mauldin_ch04_45-76.qxd 9/23/05 3:16 PM Page 76
C H A P T E R 5
Risk Is Not a Knob
Ed Easterling, president of Crestmont Holdings, a Dallas-based
investment and research firm, is the author of the book UnexpectedReturns. He also manages and advises on hedge fund portfolios. Ed
is somewhat of an academic, serving on the adjunct faculty at the
Cox School of Business at Southern Methodist University, where he
teaches a course on hedge fund investment management for
business school graduate students.
Unexpected Returns is one of the best easy-to-read books on
stock market cycles. One of Ed’s main focuses is the analysis and
control of risk. If you’re a serious investor, you’ll find yourself
returning to this chapter again and again. —John Mauldin
�
77
�
ccc_mauldin_ch05_77-98.qxd 9/23/05 10:42 AM Page 77

ccc_mauldin_ch05_77-98.qxd 9/23/05 10:42 AM Page 78
Risk Is Not a Knobby Ed Easterling
“The first step toward making money is not losing it.”
RISK CAN BE FRIEND OR FOE, AND AS AN INVESTOR YOU WILL SUCCEED OR FAIL
depending on how you deal with it. Risk is an inherent condition ofall investments and should be respected, assessed, managed, andprudently controlled. Your journey starts inside Wonderland, where“traditional” investment thinking operates. The journey continuesthrough the looking glass into a state of reality.
You may have heard, “If you want greater returns, you have totake more risk.” The implication is that risk creates returns—asthough risk represents an element that mixes with investment capi-tal to morph into returns. In reality, risk represents a condition thatdrives investors to demand compensation and protection. As a re-sult, in the financial markets, higher returns tend to be associatedwith higher risks, which is far different than the notion that risk dri-ves returns. By the end of this chapter, you will not view risk as fer-tilizer for your returns but rather as weeds in your investmentgarden. Your investment strategies will change to one that seekshigher returns and lower risk. This is important in all market envi-ronments, especially when market conditions reflect above-averagevaluations.
This chapter will explore return and risk and dispel the tradi-tional view of risk and return. You will find ways to measure riskand examine why risk and volatility matter. As a result, you willidentify ways to make better investment decisions.
79
�
ccc_mauldin_ch05_77-98.qxd 9/23/05 10:42 AM Page 79
RISKY BUSINESS
Risk is not an assumption based on historical averages; it is uniqueto each situation. Although risks can often be assessed in the con-text of history, the future does not necessarily mirror the past. Acaution readily recognized (and often ignored!) appears in most in-vestment documents: “Past performance is not an indication of fu-ture results.” Likewise, past levels of risk do not necessarily indicatefuture risk.
Conventional wisdom about risk and long-term returns pro-motes a false sense of security based on the erroneous belief thatinterim losses yield future gains. Some investors assume that higherrisk merely means near-term volatility rather than the possibility ofpermanent losses to their account.
Risk is uncertainty of a loss. Without uncertainty, the situationalready would be a loss and not a risk. Further, without the possi-bility for loss—if the uncertainty is only about the size of yourgain—there is hardly risk. Thus, despite all of the ways that risk can be measured and assessed, risk is the likelihood thatyour investment will lose money. It is often measured in terms ofprobability and magnitude. For example, an investment mighthave a 20 percent chance of a loss. Further, the investment couldhave a risk of losing 50 percent of the investment. As the proba-bility of a loss increases and as the magnitude of potential loss increases, investments become more risky. The result is that investors should require greater potential for returns as risk increases.
Assessed together, returns and risk are elements that investorsconsider to determine the price and terms of an investment. If theassessment of return and risk is accurate, a properly structured port-folio of investments should deliver its expected return. Bear inmind, however, that on the other side of your transactions may besomeone as diligent as you. As a buyer, you will believe that youhave found great opportunity; the seller on the other side of yourtransaction believes that the opportunity was not worth the price.This capitalistic tension will be similar when you are the seller.
80 JUST ONE THING
ccc_mauldin_ch05_77-98.qxd 9/23/05 10:42 AM Page 80
Therefore, be careful to use the diligence of a business decision toaccurately assess the risks and potential returns.
MODERN PORTFOLIO MISUNDERSTANDINGS
Traditional portfolio logic holds that stocks are riskier than bondssince they have a greater potential for loss. An efficient market, as aresult, will price stocks to deliver higher returns than bonds overthe long term. Therefore, the logic goes, investors should increasetheir stock holdings in order to generate higher returns. For risk-averse investors, an efficient mix of stocks and bonds offers the bestcharacteristics of return and risk.
The flaw in this argument is that market fundamentals candrive stocks to price levels that make it difficult to earn good re-turns in the future. The expected returns for highly priced stockscan be very low; they may even remain negative for years. Inthese circumstances, stocks are priced at levels that may provide alower return than bonds. An investor who adopts the traditionallogic that higher risk leads to higher returns and increases hisstock allocation at a time of high stock valuations may be lower-ing his expected return rather than increasing it. The investor is si-multaneously increasing his risk and lowering his expected returnfor years into the future.
Stocks are indeed riskier than bonds. History and the operationof rational markets have shown that stocks should return more thanbonds over the long run, but the degree of risk in stocks variesgreatly, depending on market valuations. Stocks are most riskywhen valuations, reflected in prices, are high. This is when the risksof decline and loss are greatest.
Higher risks can lead to higher losses unless addressed withthe tools of risk management. To reiterate, risk is not a knob to beturned for greater returns. Turning the knob invites more risk; itdoes not drive returns. During the past few decades, modernportfolio theories became inverted as investors were led to be-lieve that higher returns necessarily emanate from higher risk.
Risk Is Not a Knob 81
ccc_mauldin_ch05_77-98.qxd 9/23/05 10:42 AM Page 81
However, risk does not drive returns; returns are what investorsseek to compensate for the effects of risk by appropriately pricingthe investment.
RISK MISCONCEPTIONS
Rational investors generally require riskier investments to offer higherreturns than less risky investments. This bedrock financial conceptgoverns much investment thinking and is why lower-quality bondsyield more than higher-quality bonds. But the risk/reward relationshipis not always as direct as many might assume. Did Jack Welch at GEor Warren Buffett take on higher levels of risk to achieve their higher-than-average levels of return? Most analysts would say that Welch andBuffett achieved higher returns by exercising higher levels of skill thantheir counterparts. Analysts might even argue that a portion of theirsuccess lies in their ability to reduce risk by identifying particularlyhigh-quality companies to add to their investment and corporate port-folios. Some investment strategies employing an absolute-return ap-proach have generated higher returns over market cycles whileassuming demonstrably less risk than the overall market.
Another misconception is that higher risk automatically means apotential for higher rewards. Risk is what rational investors assessand price into the expected return of an investment. The reasonlower-quality bonds have higher yields than higher-quality bonds isthat investors demand more yield for the riskier bond. The price ofthe lower-quality bond is set by rational investors who would notpay a price that does not compensate for the risk. It is the functionof the market to set the price and terms of assets or investmentswith the expected financial payback based on the anticipated levelof risk and losses.
EXPECTED RETURNS AND PROBABLE RETURNS
The phrase expected returns is used in the financial community torefer to the rate of return that an investor should require from a cer-
82 JUST ONE THING
ccc_mauldin_ch05_77-98.qxd 9/23/05 10:42 AM Page 82
tain investment, given its risk profile. In 1952, when HarryMarkowitz published the principles of Modern Portfolio Theory inThe Journal of Finance, he referred to the “expected returns—vari-ance of returns” rule, where the expected returns “include an al-lowance for risk.”
And so, expected returns, other than yields from risk-free Trea-sury bills, include a risk premium—a gross yield before any losses.In comparing higher- and lower-quality bonds, the lower-qualitybond is priced to yield higher interest payments due its greaterrisks. Compare, for example, a higher-quality U.S. Treasury bondyielding 5 percent, with a lower-quality bond issued by a risky com-pany. Due to the greater risk of loss, investors should require thatthe corporate bond have a higher yield, say 10 percent. Since thereis generally no risk of loss on the Treasury bond, the expected re-turn of 5 percent will be 5 percent. But the expected return of 10percent on the corporate bond may be realized at 10 percent, or itmay be less if there is a credit loss.
In a portfolio diversified across numerous corporate bondsyielding 10 percent, it should be expected that the realized portfolioreturn will be less than 10 percent. It is likely that at least a fewlosses will occur given the higher risk profile of the bonds. As a re-sult, there will be a difference between pre-risk expected yield andpost-risk probable yield. Investors are often seduced into higher-yielding investments without considering the likely post-risk return.It is important to understand this when considering the risk pre-mium of asset classes, including stocks.
MEASURING RISK
There are many ways to assess and measure risk, including meth-ods for quantifying the probability or magnitude of a loss. Investorsuse these measures to determine the likelihood of losing money onan investment and to estimate how much they could lose if the in-vestment fails to perform as expected.
Risks can be categorized as general risks of an asset class or asrisks associated with individual investment choices. For example,
Risk Is Not a Knob 83
ccc_mauldin_ch05_77-98.qxd 9/23/05 10:42 AM Page 83
the risk of the stock market as a whole is different from the risksassociated with individual securities. It is important to understandthis difference in order to manage the risks and the source ofyour returns.
ABSOLUTE PROBABILITIES
Probabilities are only true if they are statistically valid. Without apreponderance of evidence, a probability is little more than an edu-cated guess. For example, one investment with a 10 percent proba-bility of a total loss will result in either a total success or a total loss.A 10 percent probability of total loss over 100 transactions, how-ever, usually results in losses of close to 10 percent across the port-folio. Unless your portfolio is sufficiently diversified, most measuresof risk will not accurately assess the threat to your portfolio.
Let’s say you have the opportunity to invest in an oil well with a25 percent probability of success and a payoff of ten times your in-vestment. Your expected return would be 250 percent. If, on theone hand, you invest $12,000 across a portfolio of a dozen ven-tures, you can expect to lose $9,000 with nine of them but make$30,000 from the three in which you invested $3,000. Your net re-turn of $30,000 represents a 250 percent return on your $12,000.
On the other hand, if you invest all $12,000 in one project, theprobabilities and expected return are the same, but the outcomewill be binary—it will either succeed or fail. If you succeed, your re-turn is 1,000 percent and if you fail, your loss is 100 percent. Thestatistical probabilities may be the same, but the risk and return pro-files are quite different. This is one of the benefits and strengths ofdiversification.
SHORT-TERM AND LONG-TERM
For the stock you buy today, risk can be regarded as the probabilityand magnitude of a loss tomorrow, or whenever you sell it. Somebelieve a “loss is not a loss until you take it.” As a result, many as-
84 JUST ONE THING
ccc_mauldin_ch05_77-98.qxd 9/23/05 10:42 AM Page 84
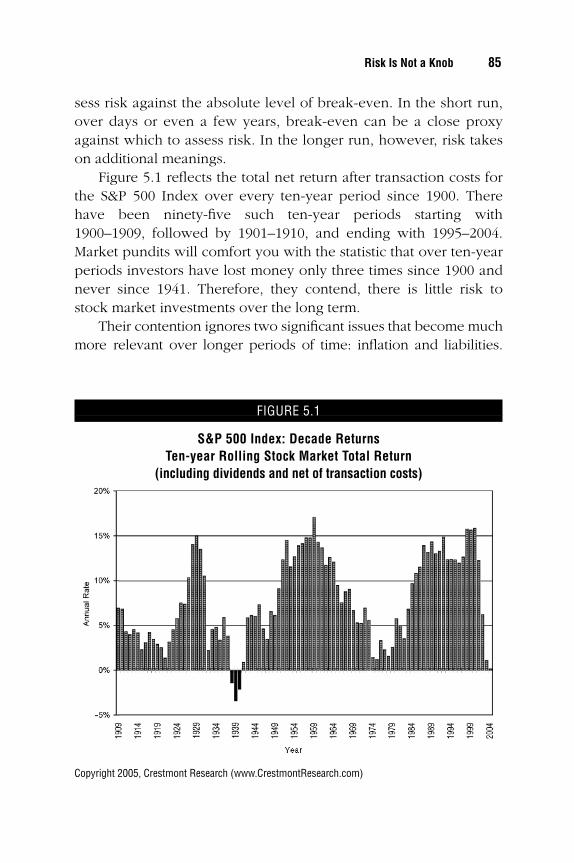
sess risk against the absolute level of break-even. In the short run,over days or even a few years, break-even can be a close proxyagainst which to assess risk. In the longer run, however, risk takeson additional meanings.
Figure 5.1 reflects the total net return after transaction costs forthe S&P 500 Index over every ten-year period since 1900. Therehave been ninety-five such ten-year periods starting with1900–1909, followed by 1901–1910, and ending with 1995–2004.Market pundits will comfort you with the statistic that over ten-yearperiods investors have lost money only three times since 1900 andnever since 1941. Therefore, they contend, there is little risk tostock market investments over the long term.
Their contention ignores two significant issues that become muchmore relevant over longer periods of time: inflation and liabilities.
Risk Is Not a Knob 85
FIGURE 5.1
S&P 500 Index: Decade ReturnsTen-year Rolling Stock Market Total Return
(including dividends and net of transaction costs)
Copyright 2005, Crestmont Research (www.CrestmontResearch.com)
ccc_mauldin_ch05_77-98.qxd 9/23/05 10:42 AM Page 85
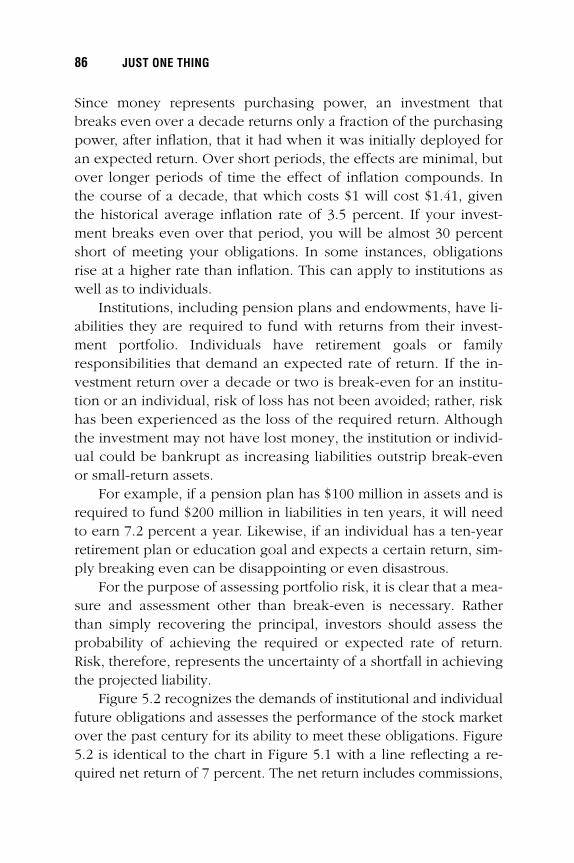
Since money represents purchasing power, an investment thatbreaks even over a decade returns only a fraction of the purchasingpower, after inflation, that it had when it was initially deployed foran expected return. Over short periods, the effects are minimal, butover longer periods of time the effect of inflation compounds. Inthe course of a decade, that which costs $1 will cost $1.41, giventhe historical average inflation rate of 3.5 percent. If your invest-ment breaks even over that period, you will be almost 30 percentshort of meeting your obligations. In some instances, obligationsrise at a higher rate than inflation. This can apply to institutions aswell as to individuals.
Institutions, including pension plans and endowments, have li-abilities they are required to fund with returns from their invest-ment portfolio. Individuals have retirement goals or familyresponsibilities that demand an expected rate of return. If the in-vestment return over a decade or two is break-even for an institu-tion or an individual, risk of loss has not been avoided; rather, riskhas been experienced as the loss of the required return. Althoughthe investment may not have lost money, the institution or individ-ual could be bankrupt as increasing liabilities outstrip break-evenor small-return assets.
For example, if a pension plan has $100 million in assets and isrequired to fund $200 million in liabilities in ten years, it will needto earn 7.2 percent a year. Likewise, if an individual has a ten-yearretirement plan or education goal and expects a certain return, sim-ply breaking even can be disappointing or even disastrous.
For the purpose of assessing portfolio risk, it is clear that a mea-sure and assessment other than break-even is necessary. Ratherthan simply recovering the principal, investors should assess theprobability of achieving the required or expected rate of return.Risk, therefore, represents the uncertainty of a shortfall in achievingthe projected liability.
Figure 5.2 recognizes the demands of institutional and individualfuture obligations and assesses the performance of the stock marketover the past century for its ability to meet these obligations. Figure5.2 is identical to the chart in Figure 5.1 with a line reflecting a re-quired net return of 7 percent. The net return includes commissions,
86 JUST ONE THING
ccc_mauldin_ch05_77-98.qxd 9/23/05 10:42 AM Page 86
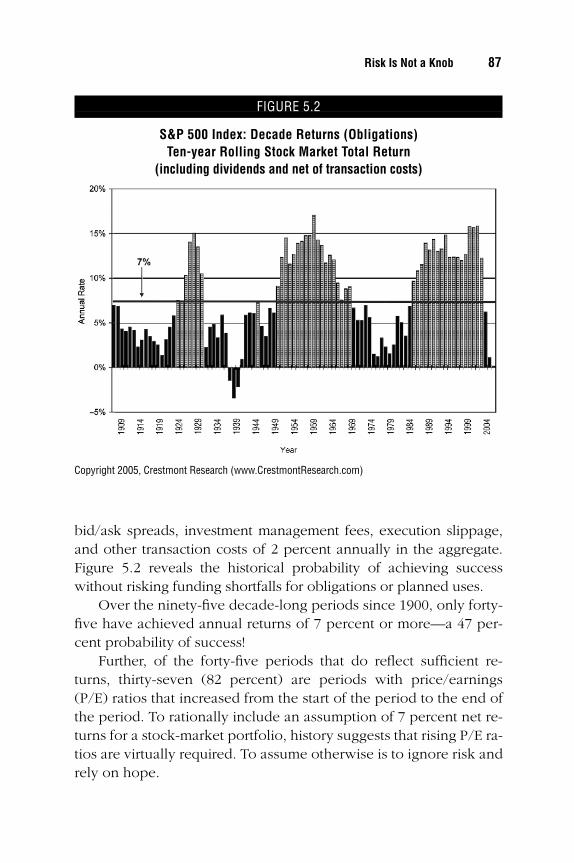
bid/ask spreads, investment management fees, execution slippage,and other transaction costs of 2 percent annually in the aggregate.Figure 5.2 reveals the historical probability of achieving successwithout risking funding shortfalls for obligations or planned uses.
Over the ninety-five decade-long periods since 1900, only forty-five have achieved annual returns of 7 percent or more—a 47 per-cent probability of success!
Further, of the forty-five periods that do reflect sufficient re-turns, thirty-seven (82 percent) are periods with price/earnings(P/E) ratios that increased from the start of the period to the end ofthe period. To rationally include an assumption of 7 percent net re-turns for a stock-market portfolio, history suggests that rising P/E ra-tios are virtually required. To assume otherwise is to ignore risk andrely on hope.
Risk Is Not a Knob 87
FIGURE 5.2
S&P 500 Index: Decade Returns (Obligations) Ten-year Rolling Stock Market Total Return
(including dividends and net of transaction costs)
Copyright 2005, Crestmont Research (www.CrestmontResearch.com)
ccc_mauldin_ch05_77-98.qxd 9/23/05 10:42 AM Page 87
VOLATILITY GREMLINS
Beyond probabilities and actual losses, many market experts mea-sure risk by volatility of the returns. The most common measure isstandard deviation, a statistic that reflects the width of the range forreturns. A low value indicates that returns are expected to be in anarrow range, while a higher value indicates that the returns aremore dispersed.
This matters over time because volatility diminishes com-pounded returns compared to average returns. The quality of theride also makes a difference. Sharp downdrafts and roller-coastervolatility can drive many investors to divest their stock holdings. Asa result, investors would experience the decline but not the recov-ery. Further, significant volatility can leave an investor vulnerable tohis need for capital just when it would be required to enjoy the in-vestment benefits of an upward swing.
Investors cannot spend the average returns that are often citedto promote stocks as consistently good investments. Investors canonly spend compounded returns. The distinction between the twois important; an example will highlight the differences.
A simple return is the mathematical average of a set of num-bers. For example, the simple average of 10 percent and 20 percentis 15 percent. A compounded return is the single annual percent-age that provides the cumulative effect of a series of returns. If aninvestment grew by 10 percent and then again by 20 percent, itscumulative increase would be 32 percent. This is greater than thesum of 10 percent and 20 percent as a result of compounding.However, the single percentage that would grow to 32 percentover two periods is 14.9 percent, slightly less than the simple aver-age of 15 percent.
In Figure 5.3, the simple average of the annual changes for thestock market was 7.3 percent during the period from 1900–2004.The compounded annual change, reflecting a more accurate viewof realized annual returns, was only 5 percent for the same period.Although total returns were slightly higher, since dividends gener-ally were greater than transaction costs over that period, the differ-ence between simple returns and compounded returns is dramatic.
88 JUST ONE THING
ccc_mauldin_ch05_77-98.qxd 9/23/05 10:42 AM Page 88
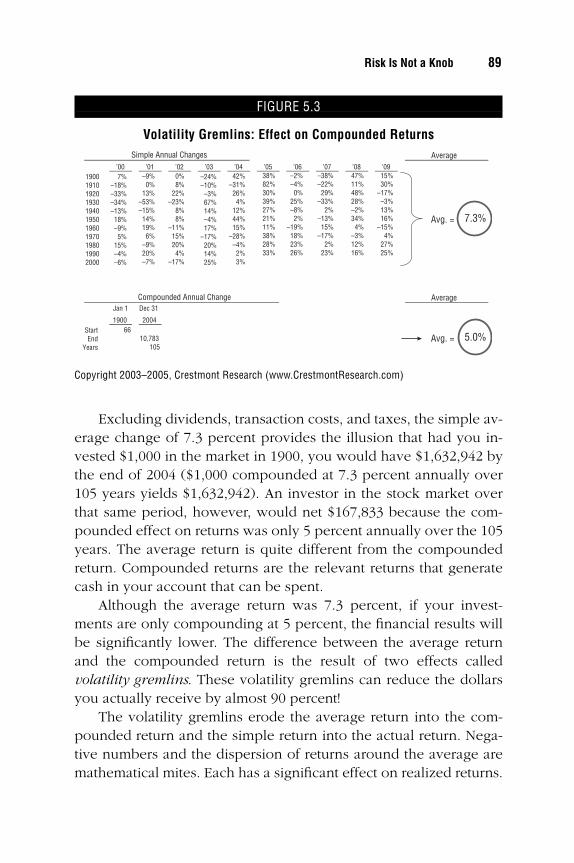
Excluding dividends, transaction costs, and taxes, the simple av-erage change of 7.3 percent provides the illusion that had you in-vested $1,000 in the market in 1900, you would have $1,632,942 bythe end of 2004 ($1,000 compounded at 7.3 percent annually over105 years yields $1,632,942). An investor in the stock market overthat same period, however, would net $167,833 because the com-pounded effect on returns was only 5 percent annually over the 105years. The average return is quite different from the compoundedreturn. Compounded returns are the relevant returns that generatecash in your account that can be spent.
Although the average return was 7.3 percent, if your invest-ments are only compounding at 5 percent, the financial results willbe significantly lower. The difference between the average returnand the compounded return is the result of two effects calledvolatility gremlins. These volatility gremlins can reduce the dollarsyou actually receive by almost 90 percent!
The volatility gremlins erode the average return into the com-pounded return and the simple return into the actual return. Nega-tive numbers and the dispersion of returns around the average aremathematical mites. Each has a significant effect on realized returns.
Risk Is Not a Knob 89
FIGURE 5.3
Volatility Gremlins: Effect on Compounded Returns
’00 ’01 ’02 ’03 ’04 ’05 ’06 ’07 ’08 ’0919001910192019301940195019601970198019902000
Jan 1 Dec 31
1900 200466
10,783 105
Average
Avg. = 7.3%
Average
Avg. = 5.0%
Simple Annual Changes
Compounded Annual Change
StartEnd
Years
7%–18%–33%–34%–13%18%–9%5%
15%–4%–6%
–9%0%
13%–53%–15%14%19%6%
–9%20%–7%
0%8%
22%–23%
8%8%
–11%15%20%4%
–17%
–24%–10%–3%67%14%–4%17%
–17%20%14%25%
42%–31%
26%4%
12%44%15%
–28%–4%2%3%
38%82%30%39%27%21%11%38%28%33%
–2%–4%
0%25%–8%
2%–19%
18%23%26%
–38%–22%29%
–33%2%
–13%15%
–17%2%
23%
47%11%48%28%–2%34%4%
–3%12%16%
15%30%
–17%–3%13%16%
–15%4%
27%25%
Copyright 2003–2005, Crestmont Research (www.CrestmontResearch.com)
ccc_mauldin_ch05_77-98.qxd 9/23/05 10:42 AM Page 89
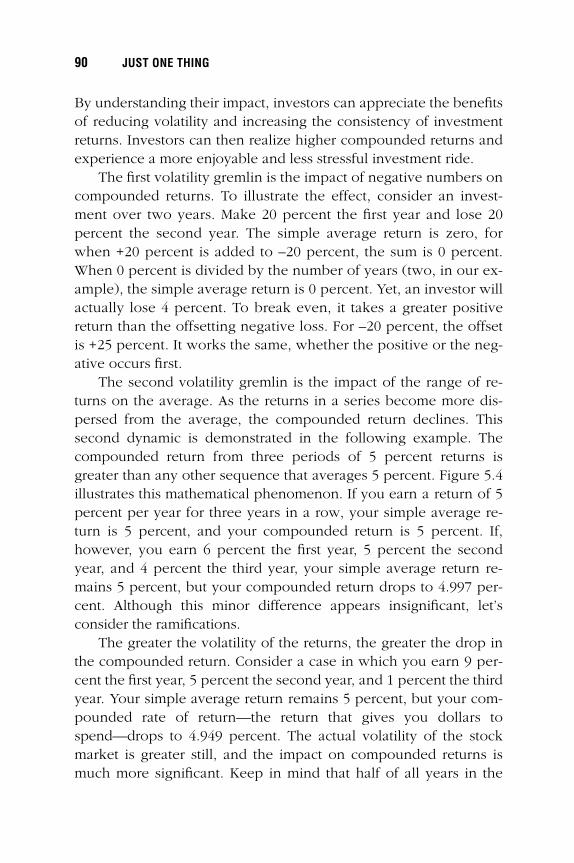
By understanding their impact, investors can appreciate the benefitsof reducing volatility and increasing the consistency of investmentreturns. Investors can then realize higher compounded returns andexperience a more enjoyable and less stressful investment ride.
The first volatility gremlin is the impact of negative numbers oncompounded returns. To illustrate the effect, consider an invest-ment over two years. Make 20 percent the first year and lose 20percent the second year. The simple average return is zero, forwhen +20 percent is added to –20 percent, the sum is 0 percent.When 0 percent is divided by the number of years (two, in our ex-ample), the simple average return is 0 percent. Yet, an investor willactually lose 4 percent. To break even, it takes a greater positivereturn than the offsetting negative loss. For –20 percent, the offsetis +25 percent. It works the same, whether the positive or the neg-ative occurs first.
The second volatility gremlin is the impact of the range of re-turns on the average. As the returns in a series become more dis-persed from the average, the compounded return declines. Thissecond dynamic is demonstrated in the following example. Thecompounded return from three periods of 5 percent returns isgreater than any other sequence that averages 5 percent. Figure 5.4illustrates this mathematical phenomenon. If you earn a return of 5percent per year for three years in a row, your simple average re-turn is 5 percent, and your compounded return is 5 percent. If,however, you earn 6 percent the first year, 5 percent the secondyear, and 4 percent the third year, your simple average return re-mains 5 percent, but your compounded return drops to 4.997 per-cent. Although this minor difference appears insignificant, let’sconsider the ramifications.
The greater the volatility of the returns, the greater the drop inthe compounded return. Consider a case in which you earn 9 per-cent the first year, 5 percent the second year, and 1 percent the thirdyear. Your simple average return remains 5 percent, but your com-pounded rate of return—the return that gives you dollars tospend—drops to 4.949 percent. The actual volatility of the stockmarket is greater still, and the impact on compounded returns ismuch more significant. Keep in mind that half of all years in the
90 JUST ONE THING
ccc_mauldin_ch05_77-98.qxd 9/23/05 10:42 AM Page 90
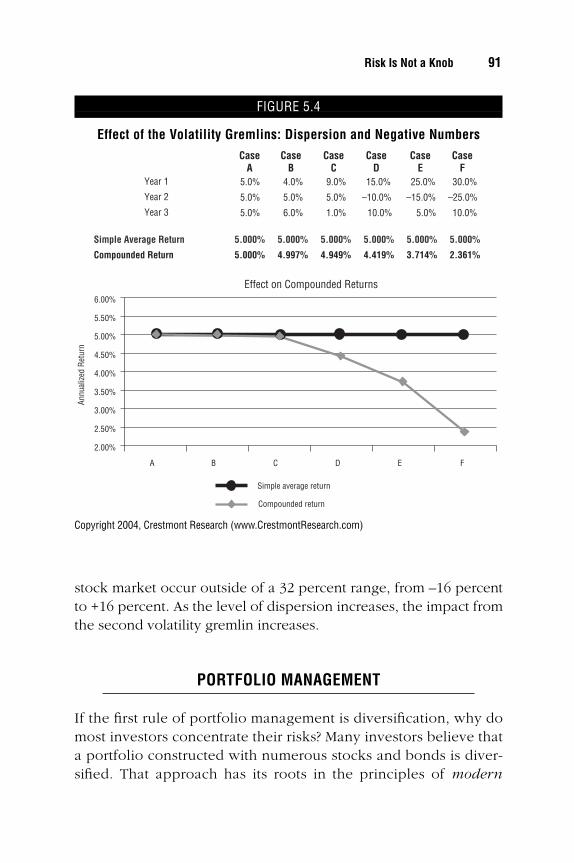
stock market occur outside of a 32 percent range, from –16 percentto +16 percent. As the level of dispersion increases, the impact fromthe second volatility gremlin increases.
PORTFOLIO MANAGEMENT
If the first rule of portfolio management is diversification, why domost investors concentrate their risks? Many investors believe thata portfolio constructed with numerous stocks and bonds is diver-sified. That approach has its roots in the principles of modern
Risk Is Not a Knob 91
FIGURE 5.4
Effect of the Volatility Gremlins: Dispersion and Negative Numbers
Effect on Compounded Returns
A B C D E F
Annu
alize
d Re
turn
Simple average return
Compounded return
2.00%
2.50%
3.00%
3.50%
4.00%
4.50%
5.00%
5.50%
6.00%
5.0% 4.0% 9.0% 15.0% 25.0% 30.0%
5.0% 5.0% 5.0% –10.0% –15.0% –25.0%
5.0% 6.0% 1.0% 10.0% 5.0% 10.0%
Simple Average Return 5.000% 5.000% 5.000% 5.000% 5.000% 5.000%
Compounded Return 5.000% 4.997% 4.949% 4.419% 3.714% 2.361%
Year 1
Year 2
Year 3
Case Case Case Case Case Case A B C D E F
Copyright 2004, Crestmont Research (www.CrestmontResearch.com)
ccc_mauldin_ch05_77-98.qxd 9/23/05 10:42 AM Page 91
portfolio theory (MPT). But when MPT is misapplied, it does notprovide the road map to secure investing and leaves investorsvulnerable to substantial risk.
A key principle of MPT, which was developed by HarryMarkowitz in the early 1950s, is simple to understand yet striking inits implications: Diversification can eliminate the risks that do notprovide returns while retaining the risks that do provide returns.William F. Sharpe further developed these principles into the capitalasset pricing model (CAPM). Every investment carries two distinctrisks. One is the risk of being in the market, which Sharpe calledsystematic risk. This risk, later dubbed beta, cannot be diversifiedaway. The other, unsystematic risk, is specific to a company’s for-tunes. Since this uncertainty can be mitigated through appropriatediversification, Sharpe figured that a portfolio’s expected returnhinges solely on its beta—its relationship to the overall market. TheCAPM helps measure portfolio risk and the return an investor canexpect for taking that risk.
In combination, MPT and CAPM have been the means for struc-turing investment portfolios for the past several decades. Based onan investor’s risk profile, allocations are made across investment al-ternatives. Decades ago, there were stocks and bonds, and occa-sionally an alternative investment. As a result, portfolios weredeveloped from a very limited palette. MPT and CAPM weregroundbreaking principles that helped investors and advisors struc-ture diversified portfolios of stocks and bonds rather than concen-trated portfolios.
As simple as this sounds—and those concepts are second na-ture in investing today—Dr. Sharpe determined that market risk isthe only risk investors are paid to include in their portfolios. Sincethe risks associated with individual companies can be diversifiedaway, the systematic market risk is the source of returns. Investorsmay have heard this put another way: “Eighty to 90 percent of re-turns come from being in the market, and a fraction comes fromstock selection.” Actually, if an investor is diversified in accord withtheory, then CAPM indicates that the percentage of the returns thatis due to the market should be 100 percent. As a result, effective di-
92 JUST ONE THING
ccc_mauldin_ch05_77-98.qxd 9/23/05 10:42 AM Page 92
versification under MPT and CAPM should provide investors withinvestment returns that are consistent with market returns.
These principles can be applied both to stocks and bonds. A di-versified portfolio of stocks tends to provide the returns of the stockmarket as a whole. Once individual company risk is diversified, thepure stock market risk remains. Thus, the portfolio moves with thestock market. Stock market returns are driven by earnings, growth,and valuation changes (as measured by the price/earnings ratio, orP/E). If P/E increases, stock market returns are generally high, sincethe P/E ratio multiplies the effect of rising earnings. If P/E ratios de-crease, stock market returns will be low or negative, since decliningP/Es generally offset the benefit of rising earnings.
For example, consider a stock that sells for $15 and has earn-ings per share of $1. The P/E ratio is fifteen ($15 divided by $1). Ifthe earnings increase by 5 percent to $1.05 and the P/E ratio re-mains the same, the stock price will rise to $15.75, since the stockprice equals the earnings per share multiplied by the P/E ratio. If,however, the P/E rises to twenty in addition to the increase in earn-ings to $1.05, the stock price will be $21.00, a gain of 40 percentover the initial price of $15.00. As a result, approximately one-eighth (5 percent) of the gain comes from the 5 percent growth inearnings, and the balance comes from the increase in the P/E ratio.However, if the P/E ratio declines to ten while earnings increase to$1.05, the stock price will be $10.50. Even though earnings grew by5 percent, the investor will lose 30 percent on the investment. Asyou can see, the impact of changes in the P/E ratio can have a dra-matic impact on the stock price and an investor’s return.
With bonds, once the individual company risks are diversified,the portfolio moves in concert with the bond market, which islargely driven by trends in interest rates. As many investors have ex-perienced, when interest rates decline, bond values increase. Like-wise, rising interest rates cause bond values to decline. Thus, ifinterest rates are falling, the yield from the bond portfolio is supple-mented with increases in the value of the bonds. If rates are rising,the decline in bond prices offsets some of the portfolio yield, result-ing in lower total returns.
Risk Is Not a Knob 93
ccc_mauldin_ch05_77-98.qxd 9/23/05 10:42 AM Page 93
Therefore, an investment portfolio with allocations of 60 per-cent in a diversified stock portfolio, 30 percent in a diversified bondportfolio, and 10 percent in other investments, has a 90 percentconcentration across two risks: stock market risk and bond marketrisk. Over time, these two markets tend to move in the same direc-tion and essentially represent a similar risk to the investor.
This does not indicate that MPT and CAPM are not solid princi-ples, but that the application of the principles has not evolved alongwith the increasingly complex financial markets. Dr. Markowitz’s1952 publication of MPT discussed the concept of “performances ofavailable securities.” In 1952, stocks and bonds were the predomi-nant investment vehicles. A portfolio allocated across the two assetclasses was about as diversified as you could get.
Mutual funds were uncommon before the 1980s: There werefewer than 300 in the 1960s but more than 10,000 today. Moreover,investment choices and available securities have exploded over thepast two decades. Today, there are asset-backed securities, foreignexchanges, real estate, options, a variety of commodities, invest-ment trusts, hedge funds, inflation-protected bonds, and so on.
Most investors remember only the market risks and conditionsof the past two decades, when annual trends strongly supportedstock and bond investors. Interim dips were always buying oppor-tunities. Investors with battle scars from the 1970s and earlier, how-ever, know that stock and bond market risks are not always soforgiving. The driver of stocks—the P/E ratio—is again at historichighs. The driver of bonds—interest rates—is near recent historiclows. Given the position of the traditional asset classes, the oddsappear to favor Mr. Risk over Mr. Return for stocks and bonds.
The financial community has also realized that Eugene Fama’sefficient market hypothesis (EMH), an important assumption forMPT and CAPM, may not be as strict as originally theorized. Finan-cial markets are a process rather than a condition. In other words,while markets attempt to find the right prices over time, they do notpossess all the information all the time. Many alternative invest-ments today—hedge funds, for example—profit from mispricingsand inefficiencies, and in doing so contribute to the efficiency ofthe markets.
94 JUST ONE THING
ccc_mauldin_ch05_77-98.qxd 9/23/05 10:42 AM Page 94
Returning to Dr. Markowitz, diversification in a portfolio appliesto risks, not securities. Other than not being familiar with invest-ment alternatives, what else might explain why investors concen-trate their portfolios in two similar risks when so many options areavailable?
FRONT STAGE: YOUR ASSUMPTIONS
The relative return investment philosophy is largely based on threetheories: Harry Markowitz’s modern portfolio theory (MPT), EugeneFama’s efficient market hypothesis (EMH), and William Sharpe’scapital asset pricing model (CAPM). Stated simply, MPT explainshow risk-averse investors can construct portfolios to optimize ex-pected returns based upon a given level of market risk. EMH positsthat the price of securities reflects all known information and in-hibits investors from choosing mispriced securities. CAPM providesa framework for constructing portfolios with an optimal reward andrisk relationship.
MPT, EMH, and CAPM profoundly influence the thinking ofmany of the world’s largest institutional investors, and rightly so.They provide valuable insights into risk, market efficiency, invest-ment theory, and portfolio construction. MPT and CAPM most di-rectly affect investment management and portfolio construction.They rely on key assumptions regarding rational investors and effi-cient markets. They also rely on the user to determine appropriateassumptions for future returns. As Dr. Markowitz stated in his 1952article, “Portfolio Theory” in The Journal of Finance:
The process of selecting a portfolio may be divided into twostages. The first stage starts with observation and experience andends with beliefs about the future performances of available se-curities. The second stage starts with the relevant beliefs aboutfuture performances and ends with the choice of the portfolio.
Dr. Markowitz emphasized that MPT relies on the user to iden-tify the available securities and develop assumptions about their
Risk Is Not a Knob 95
ccc_mauldin_ch05_77-98.qxd 9/23/05 10:42 AM Page 95
future performances. If market conditions value an asset class at arelatively high level, and it is therefore expected to perform belowaverage for a period of time, MPT requires that its assumptions in-clude below-average returns for that asset class. If average returnsare assumed, the results from MPT will be skewed. Estimating fu-ture returns is always a challenge, but too many investors rely onaverage historical returns rather than base likely future returns onexisting valuations. Particularly when the environment is biased inthe direction of below-average returns, investors often underesti-mate the level of risk in their portfolios.
IN CONCLUSION: CAVEAT INVESTOR
Determine the risks inherent in potential investments, assess the re-ward potential, and make rational and prudent decisions. Shy awayfrom unacceptable risks, and position your portfolio to profit con-sistently.
Whether you take the traditional approach of relative returninvesting or the progressive approach of skill-based investing, riskis integral in your portfolio. Savvy investors understand the risksand their underlying assumptions and adopt a more businesslikeapproach to investing, reducing or hedging unwanted or undesir-able risks.
Investors are too often surprised by losses from unexpected orunintended risks. A well-constructed investment portfolio, like awell-run business, addresses its vulnerabilities and reacts to theever-changing environment.
Risk, when it becomes a loss, undermines the value of previousor future gains. The power of losses exceeds the power of gains, re-quiring ever-greater gains to restore increasing losses. As risk andthe variability of returns increase, the force of Albert Einstein’seighth wonder of the world—compound interest—is diminished.
Beware the pundit who cheers an investment for not losingmoney over the long term. The effects of inflation and potentiallyrising financial obligations require that success be measured by the
96 JUST ONE THING
ccc_mauldin_ch05_77-98.qxd 9/23/05 10:42 AM Page 96

achievement of solid returns. There is much risk in simply breakingeven in the long run.
Most important, remember the first principle of Markowitz’s No-bel Prize-winning modern portfolio theory: Assumptions are yourresponsibility. Be sure that your assumptions reasonably and ratio-nally assess risk as you develop, structure, and diversify your invest-ment portfolio. Keep in mind that the long-term average is rarely agood assumption.
Risk is an ingredient in every investment, not simply a key tohigher returns.
Risk Is Not a Knob 97
ccc_mauldin_ch05_77-98.qxd 9/23/05 10:42 AM Page 97

ccc_mauldin_ch05_77-98.qxd 9/23/05 10:42 AM Page 98
C H A P T E R 6
Psychology Matters: An Investors’ Guide to
Thinking about Thinking
James Montier is the global equity strategist for Dresdner, Kleinwort
Wasserstein based in London, England. He is the author of
Behavioural Finance—Insights Into Irrational Minds and Markets.At age 33, he has already produced a significant body of work
analyzing numerous books, studies, and research papers on the
neurological and psychological reasons for our investment
decision-making process.
James is an economist by training who has worked in
financial markets for the last ten years. James spent time in
Japan and Hong Kong, a great stomping ground for bear
market training. He has also taught behavioral finance at a
U.K. university. —John Mauldin
�
99
�
ccc_mauldin_ch06_99-144.qxd 9/23/05 10:44 AM Page 99

ccc_mauldin_ch06_99-144.qxd 9/23/05 10:44 AM Page 100
Psychology Matters: An Investors’ Guide to
Thinking about Thinkingby James Montier
INVESTING IS ALL ABOUT MAKING CHOICES AND DECISIONS. YET MANY IN-vestors give little or no thought as to how they actually go aboutmaking decisions. Imagine that you receive a new oven. Would youunpack it, plug it in, and try and cook something? (Obviously if youare male the answer is yes, falling back on the instruction manualonly when all else fails!). Of course, the prudent answer would beno. Having an oven and being able to cook are two very differentthings. However, we assume that simply because we have a brain,we all know how to use it perfectly.
What goes on inside our heads when we make decisions? Un-derstanding how our brains work is vital to understanding the deci-sions we take. One of the most exciting developments in cognitivepsychology over recent years has been the development of dualprocess theories of thought. I know that sounds dreadful, but it isn’t.It is really a way of saying that we tend to have two different waysof thinking embedded in our minds.
ARE YOU SPOCK OR McCOY?
For the Trekkies out there, these two systems can, perhaps, becharacterized as Dr. McCoy and Mr. Spock. In the TV series StarTrek, McCoy was irrepressibly human, forever allowing his emo-tions to rule the day. In contrast, Spock (half human, half Vulcan)
101
�
ccc_mauldin_ch06_99-144.qxd 9/23/05 10:44 AM Page 101
was determined to suppress his emotions, letting logic drive hisdecisions.
McCoy’s approach would seem to be founded in system X. Sys-tem X is essentially the emotional part of the brain. It is automaticand effortless in the way that it processes information. That is tosay, the X-system prescreens information before we are consciouslyaware that it even made an impact on our minds. Hence, X-systemis effectively the default option. X-system deals with information inan associative way. Its judgments tend to be based on similarity (ofappearance) and closeness in time. Because of the way X-systemdeals with information, it can handle vast amounts of data simulta-neously. To computer geeks, it is a rapid parallel processing unit.For the X-system to believe that something is valid it may simplyneed to wish that it were so.
System C is the “Vulcan” part of the brain. To use it requires de-liberate effort. It is logical and deductive in the way in which it han-dles information. Because it is logical, it can only follow one step ata time. Hence, in computing terms it is a slow serial processing unit.In order to convince the C-system that something is true, logical ar-gument and empirical evidence will be required. Table 6.1 providesa summary of the main differences between the two systems.
This dual system approach to the way the mind works has re-ceived support from very recent studies by neuroscientists. Theyhave begun to attach certain parts of the brain to certain functions.In order to do this, neuroscientists ask experiment participants toperform tasks while their brains are being monitored via electro-encephalograms (EEG), positron emission tomography (PET), or—most often of late—functional magnetic resonance imaging (fMRI).The outcomes are then compared to base cases and the differ-ences between the scans highlight the areas of the brain that arebeing utilized.
Table 6.2 lays out some of the major neural correlates for thetwo systems of thinking that were previously outlined. There is onevery important thing to note about these groupings: the X-systemcomponents are much older in terms of human development. Theyevolved a long time before the C-system correlates.
102 JUST ONE THING
ccc_mauldin_ch06_99-144.qxd 9/23/05 10:44 AM Page 102

Psychology Matters 103
TABLE 6.1
Two Systems of Reasoning
System One: Experiential System Two: RationalX-system/Reflexive/Intuitive C-system/Reflective
Holistic Analytic
Affective (what feels good) Logical
Associative—judgments based on Deductivesimilarity and temporal contiguity
Rapid parallel processing Slow, serial processing
Concrete images Abstract images
Slower to change Changes with speed of thought
Crudely differentiated—broad More highly differentiatedgeneralization
Crudely integrated—context-specific More high integrated—cross-context processing processing
Experienced passively and Experienced actively and consciouslypreconsciously
Automatic and effortless Controlled and effortful
Self-evidently valid: “Experiencing Requires justification via logic is believing,” or perhaps wishing is and evidencebelieving
Source: Modified from Epstein (1991)
TABLE 6.2
Neural Correlates of the Two Reasoning Systems
X-system C-system
Amygdala Anterior cingulate cortexBasal ganglia Prefrontal cortexLateral temporal cortex Medial temporal lobe
Source: DrKW Macro Research
ccc_mauldin_ch06_99-144.qxd 9/23/05 10:44 AM Page 103
THE PRIMACY OF EMOTION
This evolutionary age edge helps to explain why the X-system is thedefault option for information processing. We needed emotions farbefore we needed logic. This is perhaps best explained by an ex-ample using fear. As explained by Joseph LeDoux, fear is one of thebetter-understood emotions.1 Fear seems to be served by twoneural pathways. One is fast and dirty (LeDoux’s low road), theother more reflective and logical (the high road). The links to thetwo systems of thinking should be obvious.
Imagine standing in front of a glass container with a snake in-side. The snake rears up, the danger is perceived, and the sensorythalamus processes the information. From here, two signals emerge.On the low road, the signal is sent to the amygdala, part of the X-system (also known as the limbic system), and the brain’s center forfear and risk. The amygdala reacts fast, and forces you to jumpback.
However, the second signal (taking the high road) sends the in-formation to the sensory cortex, which in a more conscious fashionassesses the possible threat. This is the system that points out thatthere is a layer of glass between you and the snake. However, froma survival viewpoint, a false positive is a far better response than afalse negative!
EMOTIONS: BODY OR BRAIN?
Most people tend to think that emotions are the conscious re-sponse to events or actions. That is, something happens and yourbrain works out the emotional response—be it sadness, anger,happiness, or some other emotion. Then your brain tells your bodyhow to react—for example, tear up, pump blood, or increase thebreathing rate.
William James, the grandfather of modern psychology, wasamong the first to posit that true causality may well flow from thebody to the brain. In James’s view of the world, the brain assessesthe situation so quickly that there simply isn’t time for us to become
104 JUST ONE THING
ccc_mauldin_ch06_99-144.qxd 9/23/05 10:44 AM Page 104
consciously aware of how we should feel. Instead, the brain sur-veys the body, takes the results (i.e., skin sweating, increased heart-beat), and then infers the emotion that matches physical signals thatthe body has generated.
If you want to try this yourself, try creating the face that matchesthe emotion you wish to experience. For instance, try smiling. Ifyou sit with a smile on your face, concentrating on that smile, soonenough you are likely to start to feel the positive emotions that oneassociates with smiling.2
An entertaining example of the body’s impact on decisions isprovided by Epley and Gilovich (2001).3 They asked people to eval-uate headphones. While conducting the evaluation, participantswere asked to either nod or shake their heads. Those who wereasked to nod their heads during the evaluation gave much more fa-vorable ratings than those asked to shake their heads.
In the words of Gilbert and Gill,4 we are momentary realists.That is to say, we have a tendency to trust our initial emotional re-action and correct that initial view “only subsequently, occasionallyand effortfully.” For instance, when we stub a toe on a rock or bangour head on a beam (an easy thing to do in my house), we cursethe inanimate object despite the fact it could not possibly havedone anything to avoid our own mistake.
EMOTION: GOOD, BAD, OR BOTH?
However, emotion may be needed in order to allow us to actuallymake decisions. There are a group of people who, through tragicaccidents or radical surgery, have had the emotional areas of theirminds damaged. These individuals did not become the walkingoptimizers known as homo economicus. Rather, in many cases,these individuals are now actually incapable of making decisions.They make endless plans but never get around to implementingany of them.5
Bechara et al.6 devised an experiment to show how the lack ofemotion in such individuals can lead them to make suboptimal de-cisions. They played a gambling game with both controls (players
Psychology Matters 105
ccc_mauldin_ch06_99-144.qxd 9/23/05 10:44 AM Page 105
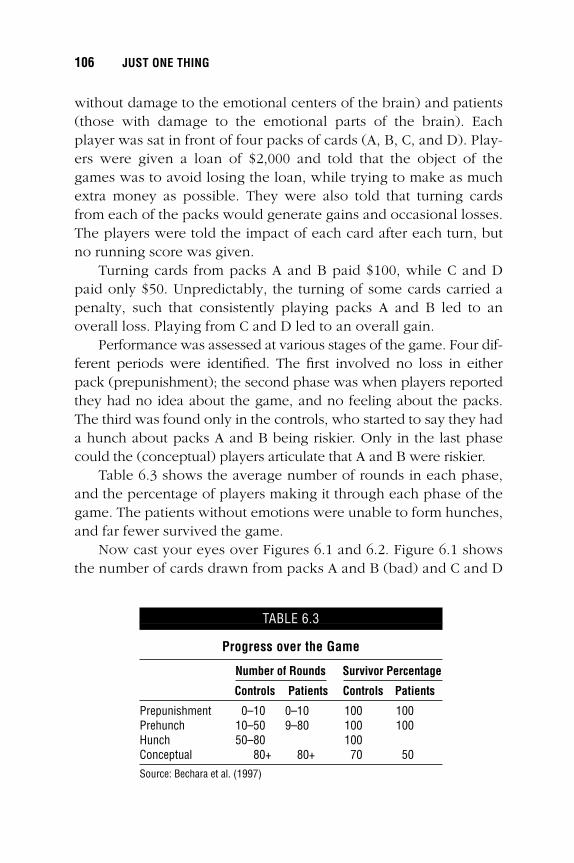
without damage to the emotional centers of the brain) and patients(those with damage to the emotional parts of the brain). Eachplayer was sat in front of four packs of cards (A, B, C, and D). Play-ers were given a loan of $2,000 and told that the object of thegames was to avoid losing the loan, while trying to make as muchextra money as possible. They were also told that turning cardsfrom each of the packs would generate gains and occasional losses.The players were told the impact of each card after each turn, butno running score was given.
Turning cards from packs A and B paid $100, while C and Dpaid only $50. Unpredictably, the turning of some cards carried apenalty, such that consistently playing packs A and B led to anoverall loss. Playing from C and D led to an overall gain.
Performance was assessed at various stages of the game. Four dif-ferent periods were identified. The first involved no loss in eitherpack (prepunishment); the second phase was when players reportedthey had no idea about the game, and no feeling about the packs.The third was found only in the controls, who started to say they hada hunch about packs A and B being riskier. Only in the last phasecould the (conceptual) players articulate that A and B were riskier.
Table 6.3 shows the average number of rounds in each phase,and the percentage of players making it through each phase of thegame. The patients without emotions were unable to form hunches,and far fewer survived the game.
Now cast your eyes over Figures 6.1 and 6.2. Figure 6.1 showsthe number of cards drawn from packs A and B (bad) and C and D
106 JUST ONE THING
TABLE 6.3
Progress over the Game
Number of Rounds Survivor Percentage
Controls Patients Controls Patients
Prepunishment 0–10 0–10 100 100Prehunch 10–50 9–80 100 100Hunch 50–80 100Conceptual 80+ 80+ 70 50
Source: Bechara et al. (1997)
ccc_mauldin_ch06_99-144.qxd 9/23/05 10:44 AM Page 106
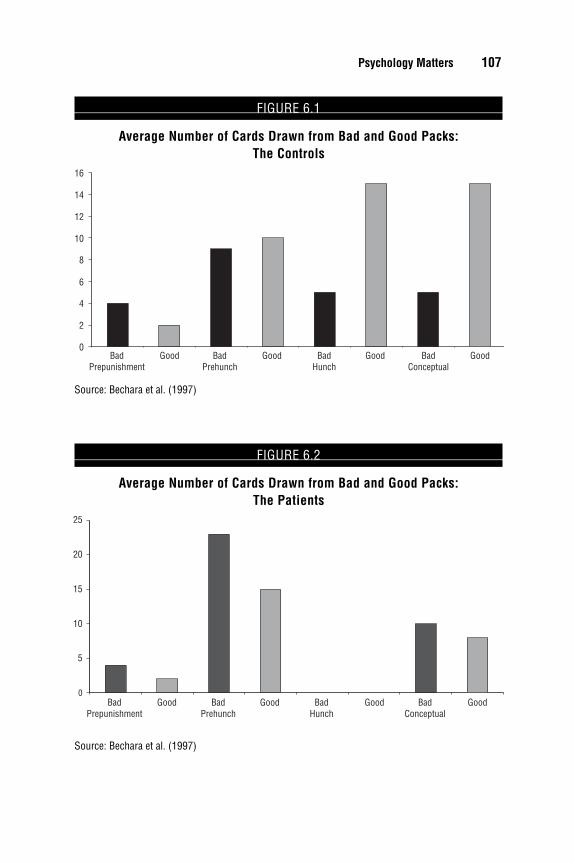
Psychology Matters 107
FIGURE 6.1
Average Number of Cards Drawn from Bad and Good Packs: The Controls
BadPrepunishment
Good BadPrehunch
Good BadHunch
Good BadConceptual
Good0
2
4
6
8
10
12
14
16
Source: Bechara et al. (1997)
FIGURE 6.2
Average Number of Cards Drawn from Bad and Good Packs: The Patients
BadPrepunishment
Good BadPrehunch
Good BadHunch
Good BadConceptual
Good0
5
10
15
20
25
Source: Bechara et al. (1997)
ccc_mauldin_ch06_99-144.qxd 9/23/05 10:44 AM Page 107
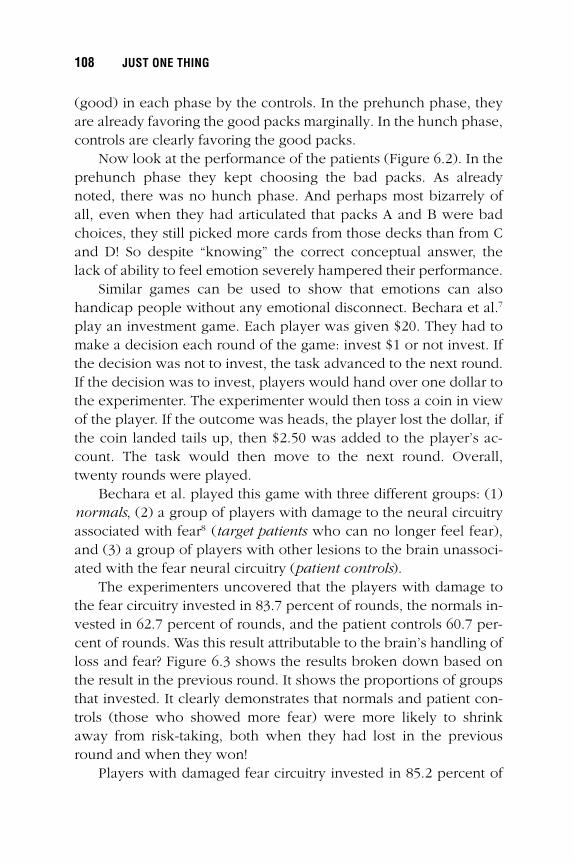
(good) in each phase by the controls. In the prehunch phase, theyare already favoring the good packs marginally. In the hunch phase,controls are clearly favoring the good packs.
Now look at the performance of the patients (Figure 6.2). In theprehunch phase they kept choosing the bad packs. As alreadynoted, there was no hunch phase. And perhaps most bizarrely ofall, even when they had articulated that packs A and B were badchoices, they still picked more cards from those decks than from Cand D! So despite “knowing” the correct conceptual answer, thelack of ability to feel emotion severely hampered their performance.
Similar games can be used to show that emotions can alsohandicap people without any emotional disconnect. Bechara et al.7
play an investment game. Each player was given $20. They had tomake a decision each round of the game: invest $1 or not invest. Ifthe decision was not to invest, the task advanced to the next round.If the decision was to invest, players would hand over one dollar tothe experimenter. The experimenter would then toss a coin in viewof the player. If the outcome was heads, the player lost the dollar, ifthe coin landed tails up, then $2.50 was added to the player’s ac-count. The task would then move to the next round. Overall,twenty rounds were played.
Bechara et al. played this game with three different groups: (1)normals, (2) a group of players with damage to the neural circuitryassociated with fear8 (target patients who can no longer feel fear),and (3) a group of players with other lesions to the brain unassoci-ated with the fear neural circuitry (patient controls).
The experimenters uncovered that the players with damage tothe fear circuitry invested in 83.7 percent of rounds, the normals in-vested in 62.7 percent of rounds, and the patient controls 60.7 per-cent of rounds. Was this result attributable to the brain’s handling ofloss and fear? Figure 6.3 shows the results broken down based onthe result in the previous round. It shows the proportions of groupsthat invested. It clearly demonstrates that normals and patient con-trols (those who showed more fear) were more likely to shrinkaway from risk-taking, both when they had lost in the previousround and when they won!
Players with damaged fear circuitry invested in 85.2 percent of
108 JUST ONE THING
ccc_mauldin_ch06_99-144.qxd 9/23/05 10:44 AM Page 108
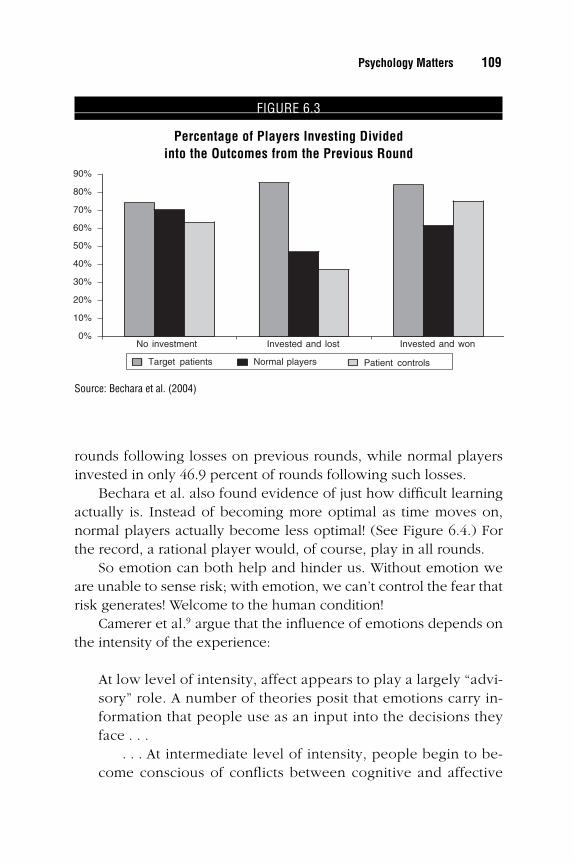
rounds following losses on previous rounds, while normal playersinvested in only 46.9 percent of rounds following such losses.
Bechara et al. also found evidence of just how difficult learningactually is. Instead of becoming more optimal as time moves on,normal players actually become less optimal! (See Figure 6.4.) Forthe record, a rational player would, of course, play in all rounds.
So emotion can both help and hinder us. Without emotion weare unable to sense risk; with emotion, we can’t control the fear thatrisk generates! Welcome to the human condition!
Camerer et al.9 argue that the influence of emotions depends onthe intensity of the experience:
At low level of intensity, affect appears to play a largely “advi-sory” role. A number of theories posit that emotions carry in-formation that people use as an input into the decisions theyface . . .
. . . At intermediate level of intensity, people begin to be-come conscious of conflicts between cognitive and affective
Psychology Matters 109
FIGURE 6.3
Percentage of Players Investing Divided into the Outcomes from the Previous Round
No investment Invested and lost
Target patients Normal players Patient controls
0%
10%
20%
30%
40%
50%
60%
70%
80%
90%
Invested and won
Source: Bechara et al. (2004)
ccc_mauldin_ch06_99-144.qxd 9/23/05 10:44 AM Page 109
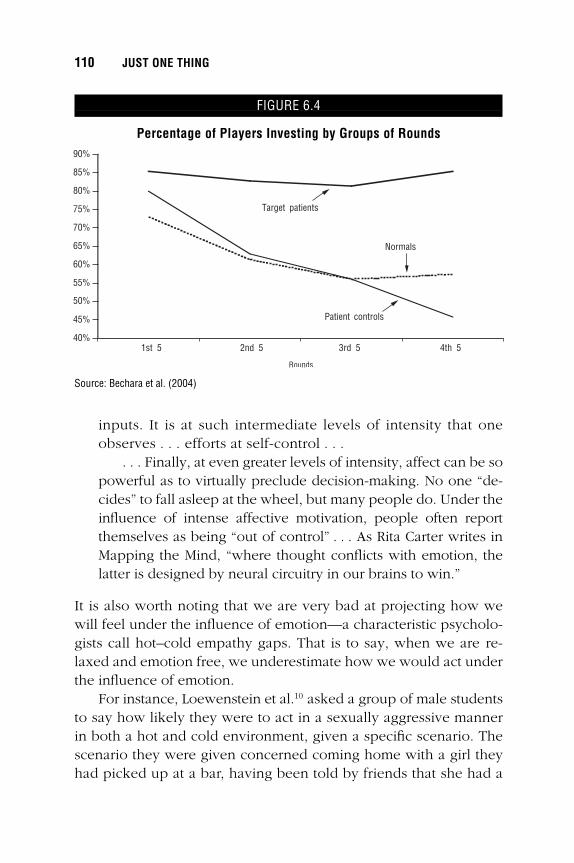
inputs. It is at such intermediate levels of intensity that oneobserves . . . efforts at self-control . . .
. . . Finally, at even greater levels of intensity, affect can be sopowerful as to virtually preclude decision-making. No one “de-cides” to fall asleep at the wheel, but many people do. Under theinfluence of intense affective motivation, people often reportthemselves as being “out of control” . . . As Rita Carter writes inMapping the Mind, “where thought conflicts with emotion, thelatter is designed by neural circuitry in our brains to win.”
It is also worth noting that we are very bad at projecting how wewill feel under the influence of emotion—a characteristic psycholo-gists call hot–cold empathy gaps. That is to say, when we are re-laxed and emotion free, we underestimate how we would act underthe influence of emotion.
For instance, Loewenstein et al.10 asked a group of male studentsto say how likely they were to act in a sexually aggressive mannerin both a hot and cold environment, given a specific scenario. Thescenario they were given concerned coming home with a girl theyhad picked up at a bar, having been told by friends that she had a
110 JUST ONE THING
FIGURE 6.4
Percentage of Players Investing by Groups of Rounds
Target patients
Normals
Patient controls
1st 5 2nd 5 3rd 5 4th 540%
45%
50%
55%
60%
65%
70%
75%
80%
85%
90%
Rounds
Source: Bechara et al. (2004)
ccc_mauldin_ch06_99-144.qxd 9/23/05 10:44 AM Page 110

reputation for being “easy.” The story went on that the participantsand the girl were beginning to get into physical genital contact onthe sofa. The participants were then told they had started to try andremove the girl’s clothes, and she said she wasn’t interested in hav-ing sex.
Participants were then asked to assign probabilities as towhether they would (1) coax the girl to remove her clothes, or (2)have sex with her even after her protests. Figure 6.5 shows the self-reported probability of sexual aggressiveness (defined as the sum ofthe probabilities of 1 + 2). Under the no-arousal condition, therewas an average 56 percent probability of sexual aggression. Afterhaving been shown sexually arousing photos, the average probabil-ity of aggression rose to nearly 80 percent!
SELF-CONTROL IS LIKE A MUSCLE
Unfortunately, a vast array of psychological research11 suggests thatour ability to use self-control to force our cognitive process to override
Psychology Matters 111
FIGURE 6.5
Probability of Forceful Behavior by Arousal State
Sexually aroused No arousal0%
10%
20%
30%
40%
50%
60%
70%
80%
90%
Source: Loewenstein et al. (1997)
ccc_mauldin_ch06_99-144.qxd 9/23/05 10:44 AM Page 111

our emotional reaction is limited. Each effort at self-control reducesthe amount available for subsequent self-control efforts.
A classic example of Baumeister’s work concerns the followingexperiment. Participants were asked to avoid eating food for threehours before the experiment began (timed so they were forced to skiplunch). When they arrived, they were put into one of three groups.
The first group were taken into a room which cookies had re-cently been baked, so the aroma of freshly made chocolate chip de-lights wafted around. This room also contained a tray laid out withthe freshly baked cookies and other chocolate delights, and a trayfull of radishes. This group were told they should eat as manyradishes as they could in the next five minutes, but they were alsotold they weren’t allowed to touch the cookies. A second group wastaken to a similar room with the same two trays, but told they couldeat the cookies. The third group was taken to an empty room.
All the food was then removed and the individuals were givenproblems to solve. These problems took the form of tracing geo-metric shapes without retracing lines or lifting the pen from the pa-per. The problems were, sadly, unsolvable. However, the amount oftime before participants gave up and the number of attempts madebefore they gave up were both recorded.
The results were dramatic. Those who had eaten the radishes(and had therefore expended large amounts of self-control in re-sisting the cookies) gave up in less than half the time that thosewho had eaten chocolate or eaten nothing had done. They alsohad far less attempts at solving the problems before giving up (seeFigure 6.6).
Baumeister (2003)12 concludes his survey by highlighting thekey findings of his research:
1. Under emotional distress, people shift toward favoring high-risk, high payoff options, even if these are objectively poorchoices. This appears based on a failure to think things through,caused by emotional distress.
2. When self-esteem is threatened, people become upset and losetheir capacity to regulate themselves. In particular, people whohold a high opinion of themselves often get quite upset in re-
112 JUST ONE THING
ccc_mauldin_ch06_99-144.qxd 9/23/05 10:44 AM Page 112
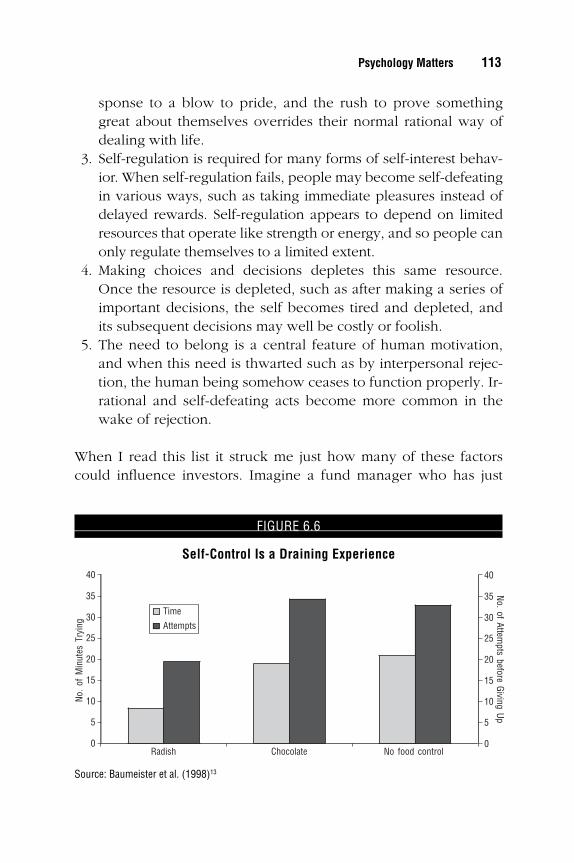
sponse to a blow to pride, and the rush to prove somethinggreat about themselves overrides their normal rational way ofdealing with life.
3. Self-regulation is required for many forms of self-interest behav-ior. When self-regulation fails, people may become self-defeatingin various ways, such as taking immediate pleasures instead ofdelayed rewards. Self-regulation appears to depend on limitedresources that operate like strength or energy, and so people canonly regulate themselves to a limited extent.
4. Making choices and decisions depletes this same resource.Once the resource is depleted, such as after making a series ofimportant decisions, the self becomes tired and depleted, andits subsequent decisions may well be costly or foolish.
5. The need to belong is a central feature of human motivation,and when this need is thwarted such as by interpersonal rejec-tion, the human being somehow ceases to function properly. Ir-rational and self-defeating acts become more common in thewake of rejection.
When I read this list it struck me just how many of these factorscould influence investors. Imagine a fund manager who has just
Psychology Matters 113
FIGURE 6.6
Self-Control Is a Draining Experience
Radish Chocolate No food control
Time
Attempts
0
5
10
15
20
25
30
35
40
0
5
10
15
20
25
30
35
40
No.
of M
inut
es T
ryin
gNo. of Attem
pts before Giving Up
Source: Baumeister et al. (1998)13
ccc_mauldin_ch06_99-144.qxd 9/23/05 10:44 AM Page 113

had a noticeable period of underperformance. This manager is likelyto feel under pressure to start to focus on high-risk, high-payoff op-tions to make up the performance deficit. He is also likely to feelhis self-esteem is under threat, as outlined in point 2. The fundmanager is also likely to begin to become increasingly myopic, fo-cusing more and more on the short term. All of this is likely to beparticularly pronounced if the position run resulting in the under-performance is a contrarian one. Effectively, pretty much all the ele-ments that lead to the psychology of irrationality are likely to bepresent in large quantities.
PLASTICITY AS SALVATION
All of this may make for fairly depressing reading. With emotionswe can’t control ourselves, and without them we can’t make deci-sions. We appear to be doomed to chase short-term rewards andrun with the herd. When we try to resist these temptations, we suf-fer subsequent declines in our ability to exercise self-control. Not apretty picture.
However, all is not lost. For many years it was thought that thenumber of brain cells was fixed and that they decayed over time.The good news is that this isn’t the case. We are capable of generat-ing new brain cells pretty much over our lifetime.
In addition, the brain isn’t fixed into a certain format. The easi-est way of thinking about this is to imagine the brain as a cobweb.Some strands of that cobweb are thicker than others. The more thebrain uses a certain pathway, the thicker the strand becomes. Thethicker the strand, the more the brain will tend to use that path. Soif we get into bad mental habits, they can become persistent.
However, we are also capable of rearranging those pathways(neurons). This is how the brain learns. It is properly called plastic-ity. We aren’t doomed; we can learn, but it isn’t easy!
Perhaps the first step down this path is becoming aware ofthe fact that we are all likely to suffer from what psychologistscall heuristics and biases. Heuristics are just rules of thumb thatallow us to deal with informational deluge. In many cases they
114 JUST ONE THING
ccc_mauldin_ch06_99-144.qxd 9/23/05 10:44 AM Page 114

work well, but sometimes they lead us far astray from rational de-cision making.
Of course, we all like to think that we are immune to the influ-ences of biases. But the reality is, of course, we are all likely to suf-fer some of these mental errors on some occasions. For instance,Pronin et al.14 asked people to rate on a nine-point scale (with 5 be-ing “somewhat”) how likely the average American was to suffer aparticular bias, and how likely they were to suffer the same biases.A booklet describing the biases was provided. Figure 6.7 shows theresults. In all cases, people rated themselves less likely to suffer agiven bias than average. Across the biases, the average score for theaverage American was 6.75. For those taking part, the average scorewas 5.31. All the differences were statistically significant. Pronin etal. refer to this as bias blind spot.
THE BIASES WE FACE
Psychologists have spent years documenting and cataloging thetypes of errors to which we are prone. The main results are surpris-ingly universal across cultures and countries.
Psychology Matters 115
FIGURE 6.7
The Self versus Others’ Susceptibility to Biases
Average American Self
Self-
serv
ing
Self-
inte
rest
Reac
tive
deva
luat
ion
Fund
amen
tal
attri
butio
ner
ror
Halo
effe
ct
Bias
edas
sim
ilatio
n
Cogn
itive
diss
onan
ce
4
5
6
7
8
9
Ratin
g Sc
ale
Source: Adapted from Pronin et al. (2002)
ccc_mauldin_ch06_99-144.qxd 9/23/05 10:44 AM Page 115

Hirschleifer15 suggests that most of these mistakes can be tracedto four common causes: self-deception, heuristic simplification,emotion, and social interaction. Figure 6.8 tries to classify the majorbiases along these lines. It outlines the most common of the variousbiases that have been found, and also tries to highlight those withdirect implications for investment.
This may look like a mass of mistakes, and indeed it is. How-ever, for the purposes of exposition, let’s focus on the ten most im-portant biases that we come across.
Let me start by asking you three questions. First, are you anabove-average driver? Second, are you above average at your job?Third, are you above average as a lover?
116 JUST ONE THING
B I A S # 1
I know better, because I know more.
FIGURE 6.8
A Taxonomy of Biases
Conservatism bias
Cognitive dissonance
Hindsight bias
Confirmation bias
Self-attribution bias
Overconfidence
OveroptimismIllusion of control
Illusion of knowledge
Self-deception(Limits to learning)
Loss aversion/prospect theory
Cue competition
Availability bias
Anchoring/salience
Catergorization
Framing
Representativeness
Heuristic simplification(Information processing errors)
Regret theory
Ambiguity aversion
Self-control(Hyperbolic discounting)
Mood
Emotion/affect
Cascades
Herding
Contagion
Imitation
Social
Biases
Source: DrKW Macro Research
ccc_mauldin_ch06_99-144.qxd 9/23/05 10:44 AM Page 116
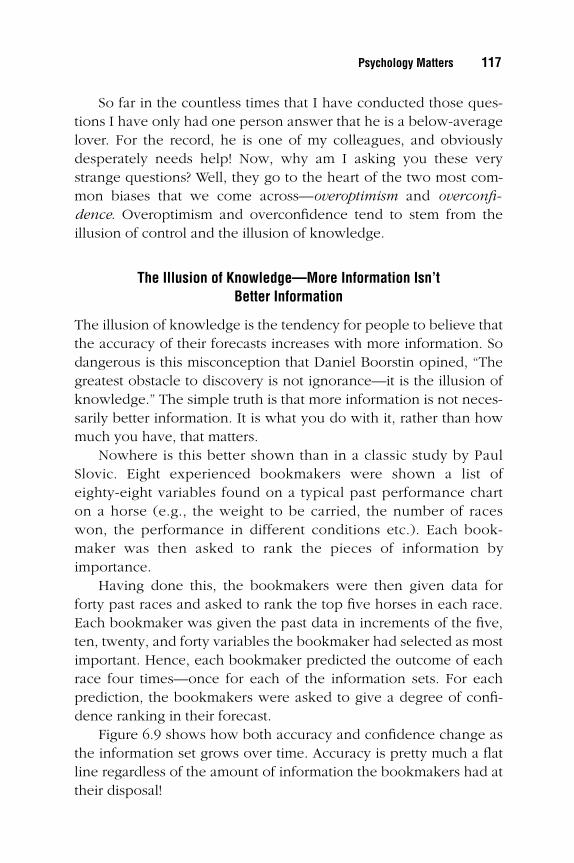
So far in the countless times that I have conducted those ques-tions I have only had one person answer that he is a below-averagelover. For the record, he is one of my colleagues, and obviouslydesperately needs help! Now, why am I asking you these verystrange questions? Well, they go to the heart of the two most com-mon biases that we come across—overoptimism and overconfi-dence. Overoptimism and overconfidence tend to stem from theillusion of control and the illusion of knowledge.
The Illusion of Knowledge—More Information Isn’t Better Information
The illusion of knowledge is the tendency for people to believe thatthe accuracy of their forecasts increases with more information. Sodangerous is this misconception that Daniel Boorstin opined, “Thegreatest obstacle to discovery is not ignorance—it is the illusion ofknowledge.” The simple truth is that more information is not neces-sarily better information. It is what you do with it, rather than howmuch you have, that matters.
Nowhere is this better shown than in a classic study by PaulSlovic. Eight experienced bookmakers were shown a list ofeighty-eight variables found on a typical past performance charton a horse (e.g., the weight to be carried, the number of raceswon, the performance in different conditions etc.). Each book-maker was then asked to rank the pieces of information by importance.
Having done this, the bookmakers were then given data forforty past races and asked to rank the top five horses in each race.Each bookmaker was given the past data in increments of the five,ten, twenty, and forty variables the bookmaker had selected as mostimportant. Hence, each bookmaker predicted the outcome of eachrace four times—once for each of the information sets. For eachprediction, the bookmakers were asked to give a degree of confi-dence ranking in their forecast.
Figure 6.9 shows how both accuracy and confidence change asthe information set grows over time. Accuracy is pretty much a flatline regardless of the amount of information the bookmakers had attheir disposal!
Psychology Matters 117
ccc_mauldin_ch06_99-144.qxd 9/23/05 10:44 AM Page 117
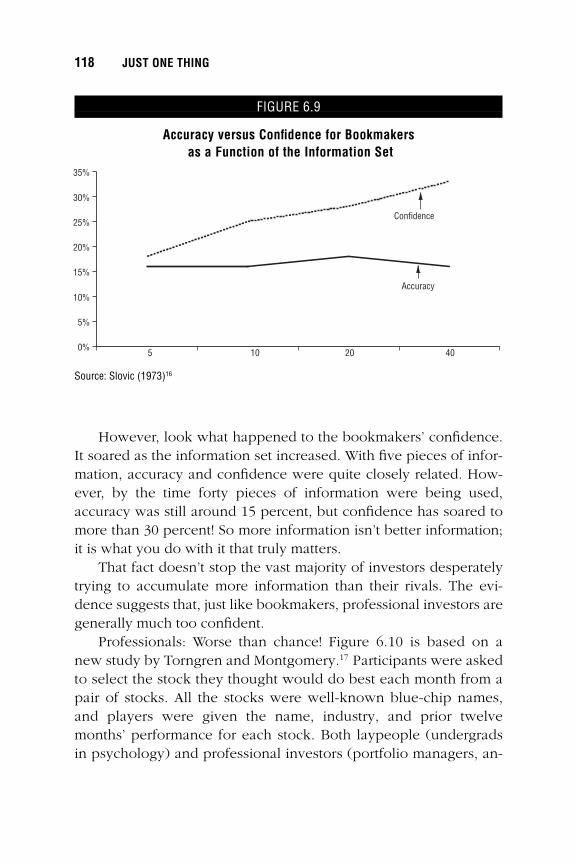
However, look what happened to the bookmakers’ confidence.It soared as the information set increased. With five pieces of infor-mation, accuracy and confidence were quite closely related. How-ever, by the time forty pieces of information were being used,accuracy was still around 15 percent, but confidence has soared tomore than 30 percent! So more information isn’t better information;it is what you do with it that truly matters.
That fact doesn’t stop the vast majority of investors desperatelytrying to accumulate more information than their rivals. The evi-dence suggests that, just like bookmakers, professional investors aregenerally much too confident.
Professionals: Worse than chance! Figure 6.10 is based on anew study by Torngren and Montgomery.17 Participants were askedto select the stock they thought would do best each month from apair of stocks. All the stocks were well-known blue-chip names,and players were given the name, industry, and prior twelvemonths’ performance for each stock. Both laypeople (undergradsin psychology) and professional investors (portfolio managers, an-
118 JUST ONE THING
FIGURE 6.9
Accuracy versus Confidence for Bookmakersas a Function of the Information Set
5 10 20 40
Accuracy
Confidence
0%
5%
10%
15%
20%
25%
30%
35%
Source: Slovic (1973)16
ccc_mauldin_ch06_99-144.qxd 9/23/05 10:44 AM Page 118
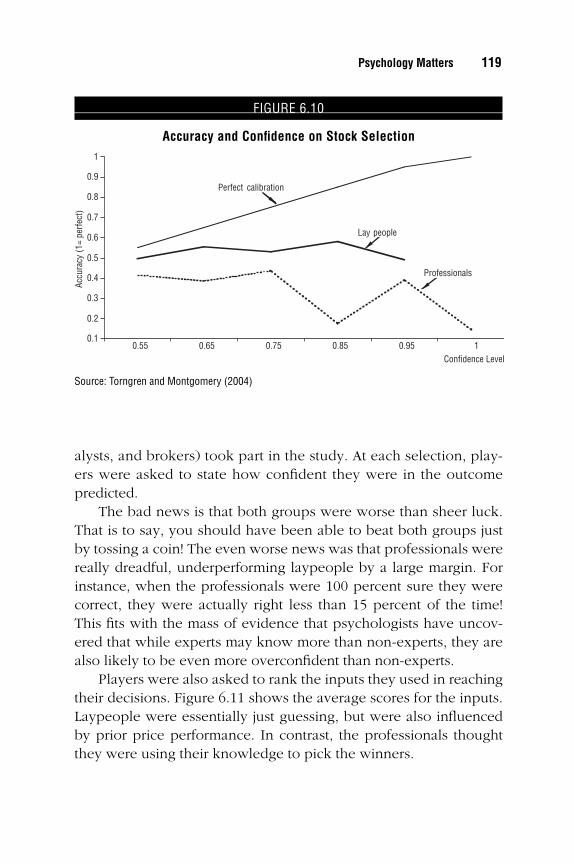
alysts, and brokers) took part in the study. At each selection, play-ers were asked to state how confident they were in the outcomepredicted.
The bad news is that both groups were worse than sheer luck.That is to say, you should have been able to beat both groups justby tossing a coin! The even worse news was that professionals werereally dreadful, underperforming laypeople by a large margin. Forinstance, when the professionals were 100 percent sure they werecorrect, they were actually right less than 15 percent of the time!This fits with the mass of evidence that psychologists have uncov-ered that while experts may know more than non-experts, they arealso likely to be even more overconfident than non-experts.
Players were also asked to rank the inputs they used in reachingtheir decisions. Figure 6.11 shows the average scores for the inputs.Laypeople were essentially just guessing, but were also influencedby prior price performance. In contrast, the professionals thoughtthey were using their knowledge to pick the winners.
Psychology Matters 119
FIGURE 6.10
Accuracy and Confidence on Stock Selection
0.55 0.65 0.75 0.85 0.95 1
Lay people
Professionals
Perfect calibration
0.1
0.2
0.3
0.4
0.5
0.6
0.7
0.8
0.9
1
Accu
racy
(1=
perfe
ct)
Confidence Level
Source: Torngren and Montgomery (2004)
ccc_mauldin_ch06_99-144.qxd 9/23/05 10:44 AM Page 119
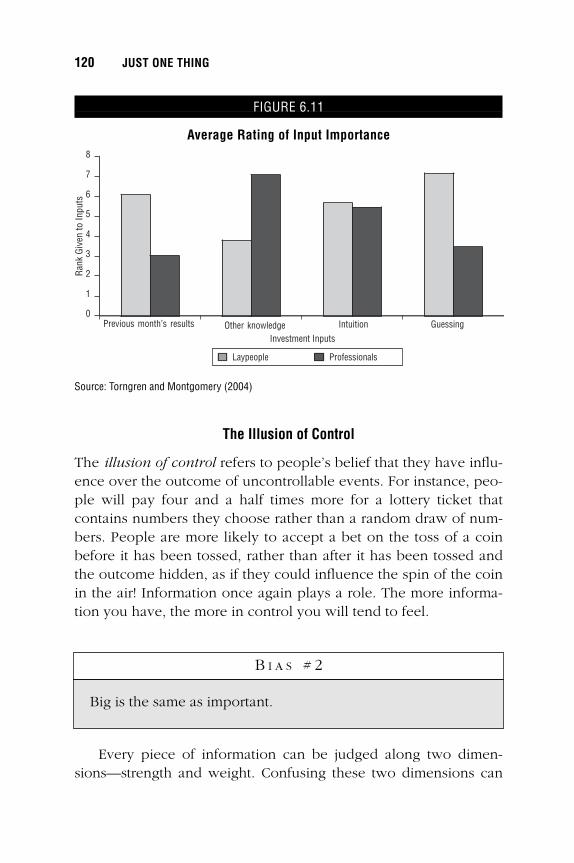
The Illusion of Control
The illusion of control refers to people’s belief that they have influ-ence over the outcome of uncontrollable events. For instance, peo-ple will pay four and a half times more for a lottery ticket thatcontains numbers they choose rather than a random draw of num-bers. People are more likely to accept a bet on the toss of a coinbefore it has been tossed, rather than after it has been tossed andthe outcome hidden, as if they could influence the spin of the coinin the air! Information once again plays a role. The more informa-tion you have, the more in control you will tend to feel.
Every piece of information can be judged along two dimen-sions—strength and weight. Confusing these two dimensions can
120 JUST ONE THING
FIGURE 6.11
Average Rating of Input Importance
0
1
2
3
4
5
6
7
8
Previous month’s results Other knowledge Intuition Guessing
Laypeople Professionals
Ran
k G
iven
to In
puts
Investment Inputs
Source: Torngren and Montgomery (2004)
B I A S # 2
Big is the same as important.
ccc_mauldin_ch06_99-144.qxd 9/23/05 10:44 AM Page 120
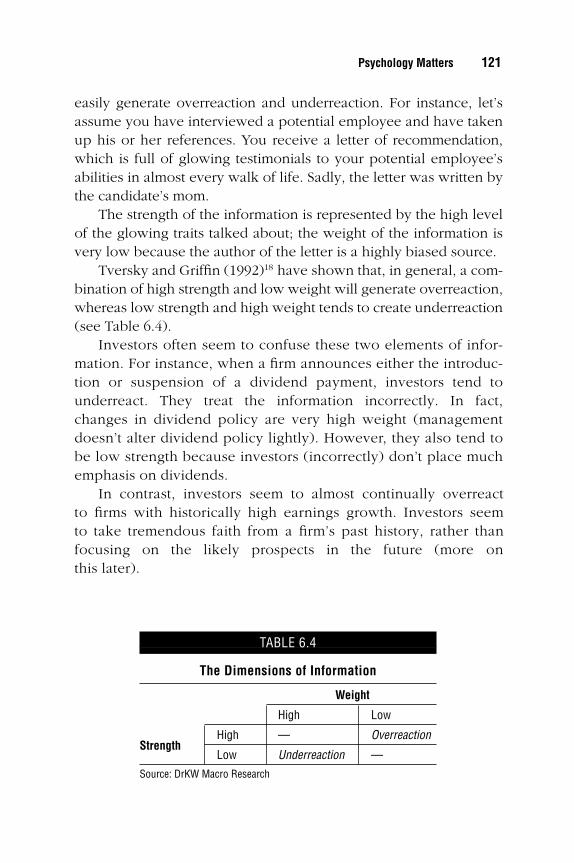
easily generate overreaction and underreaction. For instance, let’sassume you have interviewed a potential employee and have takenup his or her references. You receive a letter of recommendation,which is full of glowing testimonials to your potential employee’sabilities in almost every walk of life. Sadly, the letter was written bythe candidate’s mom.
The strength of the information is represented by the high levelof the glowing traits talked about; the weight of the information isvery low because the author of the letter is a highly biased source.
Tversky and Griffin (1992)18 have shown that, in general, a com-bination of high strength and low weight will generate overreaction,whereas low strength and high weight tends to create underreaction(see Table 6.4).
Investors often seem to confuse these two elements of infor-mation. For instance, when a firm announces either the introduc-tion or suspension of a dividend payment, investors tend tounderreact. They treat the information incorrectly. In fact,changes in dividend policy are very high weight (managementdoesn’t alter dividend policy lightly). However, they also tend tobe low strength because investors (incorrectly) don’t place muchemphasis on dividends.
In contrast, investors seem to almost continually overreact to firms with historically high earnings growth. Investors seem to take tremendous faith from a firm’s past history, rather than focusing on the likely prospects in the future (more on this later).
Psychology Matters 121
TABLE 6.4
The Dimensions of Information
Weight
High Low
StrengthHigh — Overreaction
Low Underreaction —
Source: DrKW Macro Research
ccc_mauldin_ch06_99-144.qxd 9/23/05 10:44 AM Page 121

Consider the following situation: Four cards are laid out in frontof you, and each card carries one alphanumeric symbol. The setcomprises E, 4, K, 7. If I tell you that if a card has a vowel on oneside, then it should have an even number on the other, whichcard(s) do you need to turn over to see if I am telling the truth?
Give it some thought. Most people go for E and 4. The correctanswer is E and 7; only these two cards are capable of proving Iam lying. If you turn the E over and find an odd number, then Iwas lying, and if you turn the 7 over and find a vowel then youknow I was lying. By turning the 4 over you can prove nothing. Ifit has a vowel then you have found information that agrees withmy statement but doesn’t prove it. If you turn the 4 over and finda consonant, you have proved nothing. At the outset I stated avowel must have an even number. I didn’t say an even numbermust have a vowel!
So why are we drawn to the E and the 4? We have a very badhabit of looking for information that agrees with us. This thirst foragreement rather than refutation is known as confirmatory bias.When Karl Popper wrote about his philosophy of science, he statedthat the only way of testing a view is to form the hypothesis andthen spend the rest of the day looking for all the information thatdisagrees with us. But that isn’t the way most of us work. We tendto form our views and then spend the rest of the day looking for allthe data that make us look right.
Our natural tendency is to listen to people who agree with us. Itfeels good to hear our own opinions reflected back to us. We getthose warm, fuzzy feelings of content. Sadly, this isn’t the best wayof making optimal decisions. What we should do is sit down withthe people who disagree with us most. Not so we change ourminds (because the odds are staked massively against such an out-come), but rather, so we become aware of the opposite point of
122 JUST ONE THING
B I A S # 3
Show me what I want to see.
ccc_mauldin_ch06_99-144.qxd 9/23/05 10:44 AM Page 122
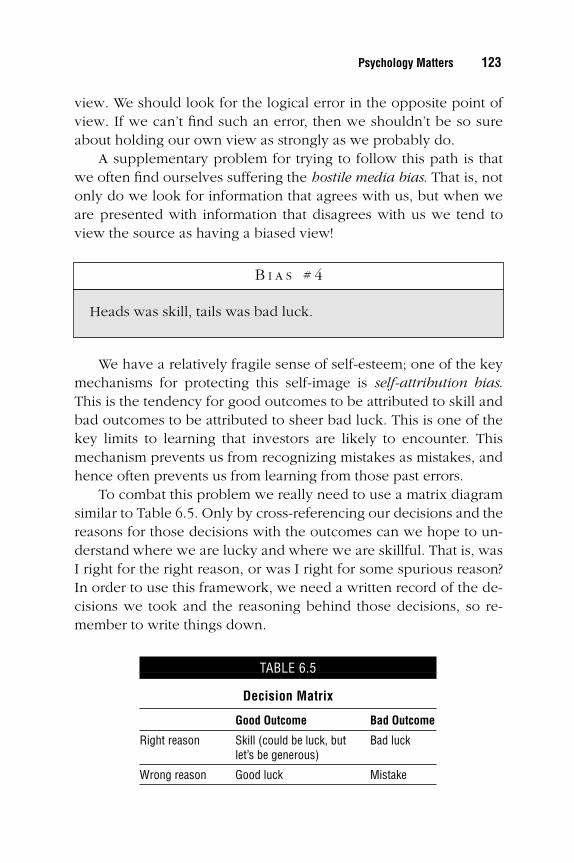
view. We should look for the logical error in the opposite point ofview. If we can’t find such an error, then we shouldn’t be so sureabout holding our own view as strongly as we probably do.
A supplementary problem for trying to follow this path is thatwe often find ourselves suffering the hostile media bias. That is, notonly do we look for information that agrees with us, but when weare presented with information that disagrees with us we tend toview the source as having a biased view!
We have a relatively fragile sense of self-esteem; one of the keymechanisms for protecting this self-image is self-attribution bias.This is the tendency for good outcomes to be attributed to skill andbad outcomes to be attributed to sheer bad luck. This is one of thekey limits to learning that investors are likely to encounter. Thismechanism prevents us from recognizing mistakes as mistakes, andhence often prevents us from learning from those past errors.
To combat this problem we really need to use a matrix diagramsimilar to Table 6.5. Only by cross-referencing our decisions and thereasons for those decisions with the outcomes can we hope to un-derstand where we are lucky and where we are skillful. That is, wasI right for the right reason, or was I right for some spurious reason?In order to use this framework, we need a written record of the de-cisions we took and the reasoning behind those decisions, so re-member to write things down.
Psychology Matters 123
B I A S # 4
Heads was skill, tails was bad luck.
TABLE 6.5
Decision Matrix
Good Outcome Bad Outcome
Right reason Skill (could be luck, but Bad lucklet’s be generous)
Wrong reason Good luck Mistake
ccc_mauldin_ch06_99-144.qxd 9/23/05 10:44 AM Page 123

One of the most dangerous biases we encounter when teachingbehavioral psychology is hindsight bias. This refers to the fact thatafter something has happened we are all really sure we knew aboutit beforehand! The best example of hindsight bias among investorsis the dot-com bubble of the late 1990s. Going around talking withinvestors and telling them it was a bubble used to result in physicalthreats of violence against us. Yet now, going around seeing exactlythe same set of investors, there has been an Orwellian rewriting ofhistory. Now everyone sits there saying they knew it was a bub-ble—they were investing in it, but they knew it as a bubble!
Of course, if everyone thinks they can predict the past, they arelikely to be far too sure about their ability to predict the future.Hence, hindsight is one of the dynamic generators of overconfi-dence. I mentioned that hindsight was one of the most dangerousbiases when teaching behavioral psychology, because there is a riskthat after reading this you will get up and walk away, saying, “Well,that was kind of interesting . . . but I knew it all along!”
When faced with uncertainty we have a tendency to grab onto the irrelevant as a crutch. The incorporation of the irrelevantoften happens without any conscious acknowledgment at all (aclassic X-system trait).
The classic example of anchoring comes from Tversky andKahneman’s landmark paper.19 They asked people to answer gen-eral knowledge questions, such as what percentage of the UnitedNations is made up of African nations? A wheel of fortune with thenumbers 1 to 100 was spun in front of the participants before they
124 JUST ONE THING
B I A S # 5
I knew it all along.
B I A S # 6
The irrelevant has value as input.
ccc_mauldin_ch06_99-144.qxd 9/23/05 10:44 AM Page 124
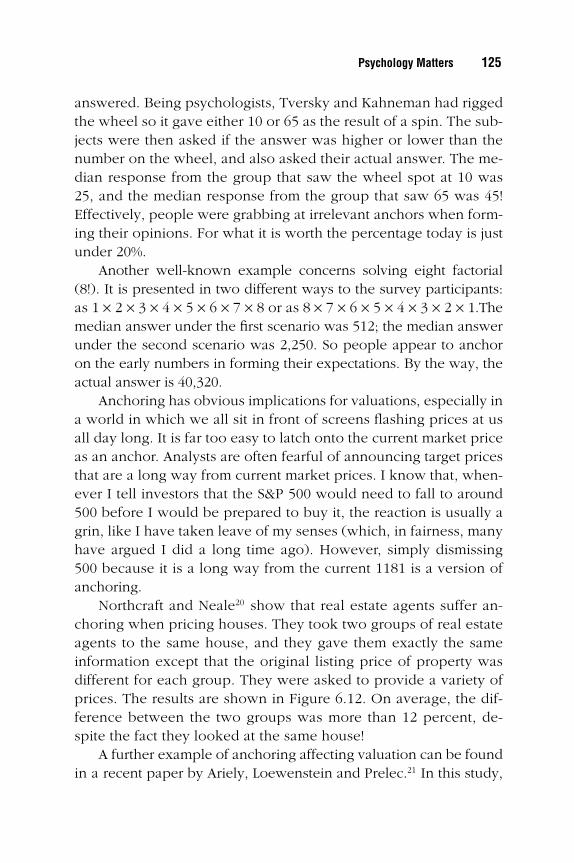
answered. Being psychologists, Tversky and Kahneman had riggedthe wheel so it gave either 10 or 65 as the result of a spin. The sub-jects were then asked if the answer was higher or lower than thenumber on the wheel, and also asked their actual answer. The me-dian response from the group that saw the wheel spot at 10 was25, and the median response from the group that saw 65 was 45!Effectively, people were grabbing at irrelevant anchors when form-ing their opinions. For what it is worth the percentage today is justunder 20%.
Another well-known example concerns solving eight factorial(8!). It is presented in two different ways to the survey participants:as 1 × 2 × 3 × 4 × 5 × 6 × 7 × 8 or as 8 × 7 × 6 × 5 × 4 × 3 × 2 × 1.Themedian answer under the first scenario was 512; the median answerunder the second scenario was 2,250. So people appear to anchoron the early numbers in forming their expectations. By the way, theactual answer is 40,320.
Anchoring has obvious implications for valuations, especially ina world in which we all sit in front of screens flashing prices at usall day long. It is far too easy to latch onto the current market priceas an anchor. Analysts are often fearful of announcing target pricesthat are a long way from current market prices. I know that, when-ever I tell investors that the S&P 500 would need to fall to around500 before I would be prepared to buy it, the reaction is usually agrin, like I have taken leave of my senses (which, in fairness, manyhave argued I did a long time ago). However, simply dismissing500 because it is a long way from the current 1181 is a version ofanchoring.
Northcraft and Neale20 show that real estate agents suffer an-choring when pricing houses. They took two groups of real estateagents to the same house, and they gave them exactly the sameinformation except that the original listing price of property wasdifferent for each group. They were asked to provide a variety ofprices. The results are shown in Figure 6.12. On average, the dif-ference between the two groups was more than 12 percent, de-spite the fact they looked at the same house!
A further example of anchoring affecting valuation can be foundin a recent paper by Ariely, Loewenstein and Prelec.21 In this study,
Psychology Matters 125
ccc_mauldin_ch06_99-144.qxd 9/23/05 10:44 AM Page 125
participants were shown a variety of common(ish) objects. Theywere then asked whether they would buy the object for a dollaramount equal to the last two digits of their Social Security number.The participants were then asked the maximum price they wouldpay for each item. The idea of asking the first question was to setup the anchor (i.e., the last two digits of their Social Security num-ber). If people anchor, then there should be some differences be-tween those with a high/low Social Security number.
Figure 6.13 shows the results of Ariely et al.’s experiment. Theaverage ratio of high Social Security number participants’ maximumpurchases prices to low Social Security number participants’ maxi-mum purchase prices was an incredible 2.7 times! The highest dif-ferential was just under 3.5 times. So, despite the fact that the SocialSecurity numbers had nothing to do with the objects, they createdvast valuation gaps.
The degree of anchoring is heavily influenced by the salience ofthe anchor. That is to say, the more seemingly relevant the anchor,the more people will tend to cling to it, which helps explain whyanalysts are so frequently afraid to have target prices that differvastly from market prices. However, as already shown, even totallyirrelevant anchors can have a massive effect on valuation.
126 JUST ONE THING
FIGURE 6.12
Anchoring and Housing Valuations
Low anchor High anchor
Original given listing priceListingApprasialLowest acceptable offerPurchase
100,000
110,000
120,000
130,000
140,000
150,000
160,000
(Val
uatio
n in
$U
.S.)
Source: Northcraft and Neale (1997)
ccc_mauldin_ch06_99-144.qxd 9/23/05 10:44 AM Page 126
From an aggregate market perspective, what are the likely an-chors? Prices are flashed at us all day long—TV ads, newspaper in-serts, ticker tape numbers scrolling across the bottom of the TV newschannel, stock analysts’ e-newsletters, real estate listings, and more.Investors seem to latch onto these price mirages and mistakenlyequate them with values. Of course, we can guard against such mis-takes by using reverse engineered models of valuation. Take marketprices and back out what they imply for growth, and then assesswhether there is any hope of that growth actually being delivered.
Consider the following: Linda is 31, single, outspoken, and verybright. She majored in philosophy at her university, and as a stu-dent was deeply concerned with issues surrounding equality anddiscrimination. Is it more likely that Linda works in a bank, or is itmore likely that Linda works in a bank and is active in the feministmovement?
Psychology Matters 127
B I A S # 7
I can make a judgment based on what it looks like.
ccc_mauldin_ch06_99-144.qxd 9/23/05 10:44 AM Page 127
Image rights not available.Image rights not available.
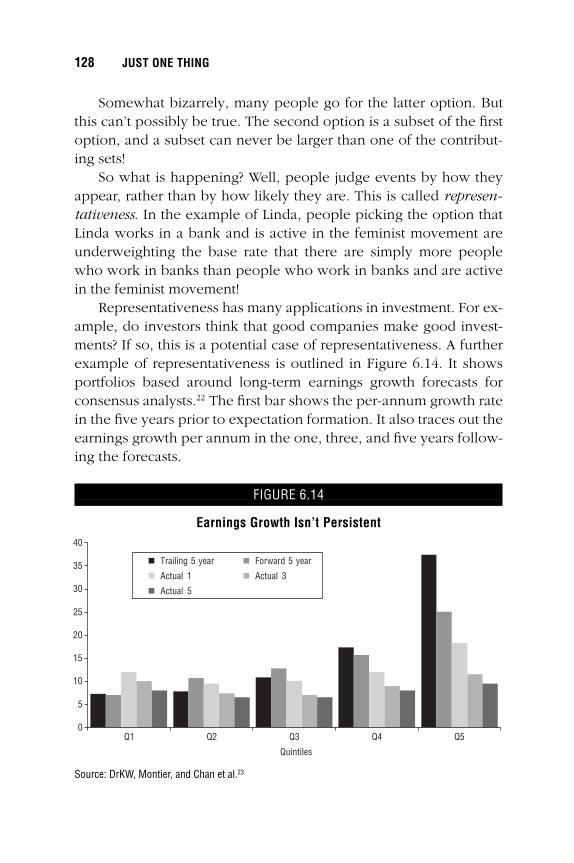
Somewhat bizarrely, many people go for the latter option. Butthis can’t possibly be true. The second option is a subset of the firstoption, and a subset can never be larger than one of the contribut-ing sets!
So what is happening? Well, people judge events by how theyappear, rather than by how likely they are. This is called represen-tativeness. In the example of Linda, people picking the option thatLinda works in a bank and is active in the feminist movement areunderweighting the base rate that there are simply more peoplewho work in banks than people who work in banks and are activein the feminist movement!
Representativeness has many applications in investment. For ex-ample, do investors think that good companies make good invest-ments? If so, this is a potential case of representativeness. A furtherexample of representativeness is outlined in Figure 6.14. It showsportfolios based around long-term earnings growth forecasts forconsensus analysts.22 The first bar shows the per-annum growth ratein the five years prior to expectation formation. It also traces out theearnings growth per annum in the one, three, and five years follow-ing the forecasts.
128 JUST ONE THING
FIGURE 6.14
Earnings Growth Isn’t Persistent
Q1 Q2 Q3 Q4 Q5
Trailing 5 year Forward 5 year
Actual 1 Actual 3
Actual 5
0
5
10
15
20
25
30
35
40
Quintiles
Source: DrKW, Montier, and Chan et al.23
ccc_mauldin_ch06_99-144.qxd 9/23/05 10:44 AM Page 128
The results show that analysts suffer representativeness twiceover. First, companies that have seen high growth in the previousfive years are forecast to continue to see very high earnings growthin the next five years. Analysts are effectively looking at the com-pany’s past performance and saying this company has been great,and hence it will continue to be great, or this company is a dogand it will always be a dog. This is exactly the same logic as theLinda problem!
Second, analysts fail to understand that earnings growth is ahighly mean-reverting process over a five-year time period. Thebase rate for mean reversion is very high. The low-growth portfoliogenerates nearly as much long-term earnings growth as the high-growth portfolio. Effectively, analysts judge companies by how theyappear, rather than how likely they are to sustain their competitiveedge with a growing earnings base.
Our minds are not supercomputers, or even good filing cabi-nets. They bear more resemblance to post-it notes that have beenthrown into the bin, and covered in coffee, which we then try tounfold and read! However, we all tend to think of our memories asperfect, like picture postcards or photos. The psychological truth isthat memory is a mental process. One input into that process is thetruth, but it is certainly not the only, let alone the major, input. Ingeneral, people are more likely to recall vivid, well-publicized, orrecent information.
The recency effect is also reinforced by the fact that people tendto rely on their own experiences in preference to statistics or theexperiences of others. In a wonderfully titled new paper—“TheTree of Experience in the Forest of Information”—Simonsohn etal.24 show through a series of experiments that direct experience isfrequently much more heavily weighted than general experience,even if the information is equally relevant and objective.
Psychology Matters 129
B I A S # 8
That’s not the way I remember it.
ccc_mauldin_ch06_99-144.qxd 9/23/05 10:44 AM Page 129

Simonsohn et al. hypothesize that one reason for the over-weighting of direct experience “is the impact of emotion. . . .[D]irectly experienced information triggers emotional reactionswhich vicarious information doesn’t.”
They continue, “If people use their direct experience to assessthe likelihood of events, they are likely to overweight the impor-tance of unlikely events that have occurred to them, and to under-estimate the importance of those that have not.” In fact, in one oftheir experiments, Simonsohn et al. find that personal experience isweighted twice as heavily as vicarious experience! All of this meansthat investors’ experience will be a major determinant of their per-ception of reality.
The emotional impact of information also has its role to play.For instance, when asked which is a more likely cause of death inthe United States, shark attacks or lightning strikes, a large numberof people opt for shark attacks. Why? Because shark attacks areeasy to recall, and they are easily available to the memory. Whensomeone gets nibbled off the coast of Florida we all get to hearabout it, and, to those of us of a certain age, Jaws was a truly terri-fying film. In fact, the chances of being killed by a lightning strikeare thirty times greater than the chance of getting killed by a shark.More people die each year from pig attacks or coconuts falling ontheir heads—or even getting their head stuck in an electric car doorwindow—than die of shark attacks!
A less drastic example comes from Kahneman and Tversky (1973).They asked people the following: “In a typical sample of text in theEnglish language, is it more likely that a word starts with the letter k orthat k is its third letter?” Of the 152 people in the sample, 105 generallythought that words with the letter k in the first position were moreprobable. In reality, there are approximately twice as many wordswith k as the third letter as there are words that begin with k. Yet be-cause we index on the first letter, we can recall them more easily.
The shark example has applications in finance. Investors are al-ways looking for the big trigger event. However, in focusing on thebig trigger, often investors miss the cumulative impact of small piecesof news. The press help perpetuate the myth that every infinitesi-mally small wiggle in the markets can be accounted for by some ra-
130 JUST ONE THING
ccc_mauldin_ch06_99-144.qxd 9/23/05 10:44 AM Page 130
tional explanation. For instance, a recent paper contained the follow-ing explanation for a significant up day in the stock market: “U.S.stocks on Wednesday put up their best one-day showing in almostfour months as falling crude prices and some positive corporate newsbolstered the bulls in the lead up to the end of the first quarter.”
WYSIWYG (pronounced wizzy-wig—what you see is what youget) was a computer term that described the on-screen appearancebeing identical to the printed version. All too often, financial data isn’tWYSIWYG. Obstrufication (or obfuscation: confusion resulting fromfailure to understand) is frequently the name of the game when itcomes to financial information. Of course, the financial markets em-ploy a veritable army of analysts to check through the numbers andexpose what is really going on. Well, that is the theory, at least!
However, the reality of analysis may be very different. I suspectthat investors and analysts frequently suffer from narrow framing orframe dependence. That is to say, we simply don’t see through theway in which information is presented to us. Any decent pollstercan extract exactly the desired answer simply by framing the ques-tion in differing ways.
The following question represents a classic example of narrowframing:
Imagine that you are preparing for an outbreak of an unusualAsian disease that is expected to kill around 600 people. Twoalternative programs to combat the disease have been pro-posed. Scientific estimates of the outcomes from the two pro-grams are as follows:
If program A is adopted, 200 people will be saved.
If program B is adopted, there is a 1/3 probability that 600people will be saved and a 2/3 probability that none ofthe 600 people will be saved.
Psychology Matters 131
B I A S # 9
If you tell me it is so, it must be true.
ccc_mauldin_ch06_99-144.qxd 9/23/05 10:44 AM Page 131
Which program would you favor?When Kahneman and Tversky asked this question they found
that 72 percent of subjects favored Program A.But now consider the same problem but with the following esti-
mated outcomes:
If program C is adopted, 400 will die.
If program D is adopted, there is 1/3 probability that nobodywill die, and 2/3 probability that 600 will die.
Kahneman and Tversky found that only 22 percent of subjectsfavored C.
Of course, the astute among you will have quickly spotted thatprogram A is identical to program C, and program B is identical toprogram D. However, the way in which the question was presentedcreated this oddity of preference reversal.
The importance of framing is probably due to cognitive limits.Our brains are not supercomputers; they have only limited ability todeal with information. In particular, we tend to suffer from some-thing known as inattentional blindness.25 Inattentional blindness isa phenomenon in which people fail to notice stimuli appearing infront of their eyes when they are preoccupied with an attentionallydemanding task.
My favorite example involves people being asked to watch twogroups of players (one dressed in white, the other dressed in black)pass a basketball between members of their own team. Watchersare asked to count the number of passes between players wearingwhite tops. They were also asked to note if anything unusual occursduring the watching of the video. As the film is played, a gorillawalks into view, faces the camera and beats his chest. Despite theobvious incongruity of this occurring, 46 percent of watchers failedto notice anything out of the ordinary!26
Let me give you an example from the field of finance. We arefrequently told that repurchases have surpassed dividends as amethod of distributing cash to shareholders. Indeed, a quickglance at Figure 6.15 would seem to decisively answer in the affirmative.
132 JUST ONE THING
ccc_mauldin_ch06_99-144.qxd 9/23/05 10:44 AM Page 132
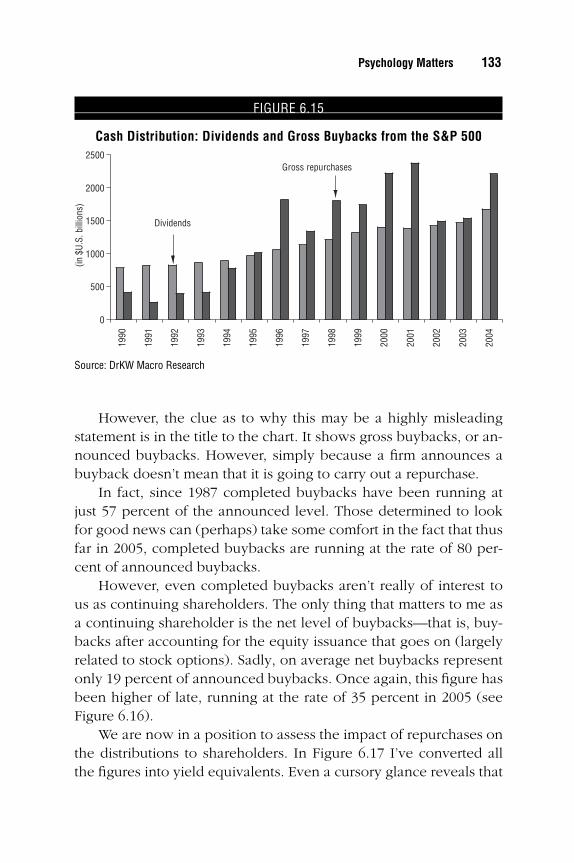
However, the clue as to why this may be a highly misleadingstatement is in the title to the chart. It shows gross buybacks, or an-nounced buybacks. However, simply because a firm announces abuyback doesn’t mean that it is going to carry out a repurchase.
In fact, since 1987 completed buybacks have been running atjust 57 percent of the announced level. Those determined to lookfor good news can (perhaps) take some comfort in the fact that thusfar in 2005, completed buybacks are running at the rate of 80 per-cent of announced buybacks.
However, even completed buybacks aren’t really of interest tous as continuing shareholders. The only thing that matters to me asa continuing shareholder is the net level of buybacks—that is, buy-backs after accounting for the equity issuance that goes on (largelyrelated to stock options). Sadly, on average net buybacks representonly 19 percent of announced buybacks. Once again, this figure hasbeen higher of late, running at the rate of 35 percent in 2005 (seeFigure 6.16).
We are now in a position to assess the impact of repurchases onthe distributions to shareholders. In Figure 6.17 I’ve converted allthe figures into yield equivalents. Even a cursory glance reveals that
Psychology Matters 133
FIGURE 6.15
Cash Distribution: Dividends and Gross Buybacks from the S&P 500
Dividends
Gross repurchases
0
500
1000
1500
2000
2500
2004
2003
2002
2001
2000
1999
1998
1997
1996
1995
1994
1993
1992
1991
1990
(in $
U.S.
bill
ions
)
Source: DrKW Macro Research
ccc_mauldin_ch06_99-144.qxd 9/23/05 10:44 AM Page 133
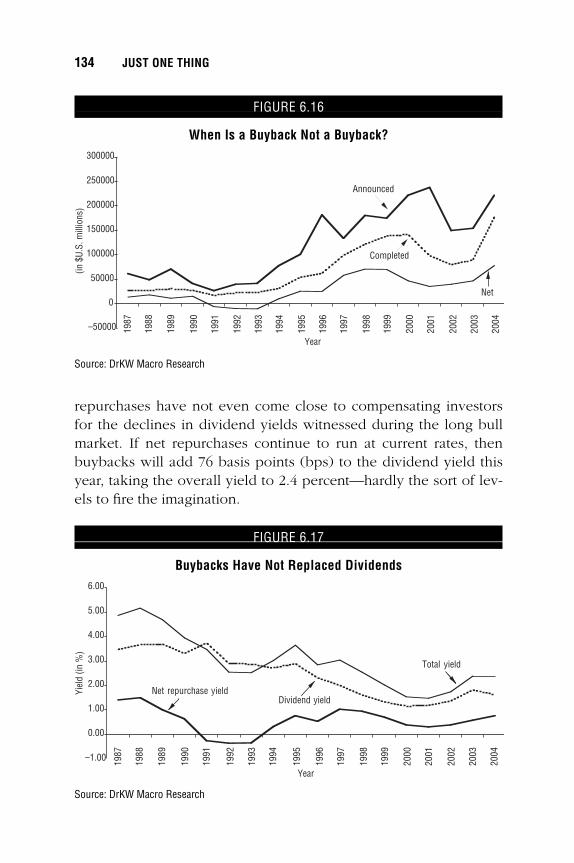
repurchases have not even come close to compensating investorsfor the declines in dividend yields witnessed during the long bullmarket. If net repurchases continue to run at current rates, thenbuybacks will add 76 basis points (bps) to the dividend yield thisyear, taking the overall yield to 2.4 percent—hardly the sort of lev-els to fire the imagination.
134 JUST ONE THING
FIGURE 6.16
When Is a Buyback Not a Buyback?
–50000
0
50000
100000
150000
200000
250000
300000
Announced
Completed
Net
2004
2003
2002
2001
2000
1999
1998
1997
1996
1995
1994
1993
1992
1991
1990
1989
1988
1987
(in $
U.S.
mill
ions
)
Year
Source: DrKW Macro Research
FIGURE 6.17
Buybacks Have Not Replaced Dividends
–1.00
0.00
1.00
2.00
3.00
4.00
5.00
6.00
Total yield
Dividend yieldNet repurchase yield
2004
2003
2002
2001
2000
1999
1998
1997
1996
1995
1994
1993
1992
1991
1990
1989
1988
1987
Yiel
d (in
%)
Year
Source: DrKW Macro Research
ccc_mauldin_ch06_99-144.qxd 9/23/05 10:44 AM Page 134
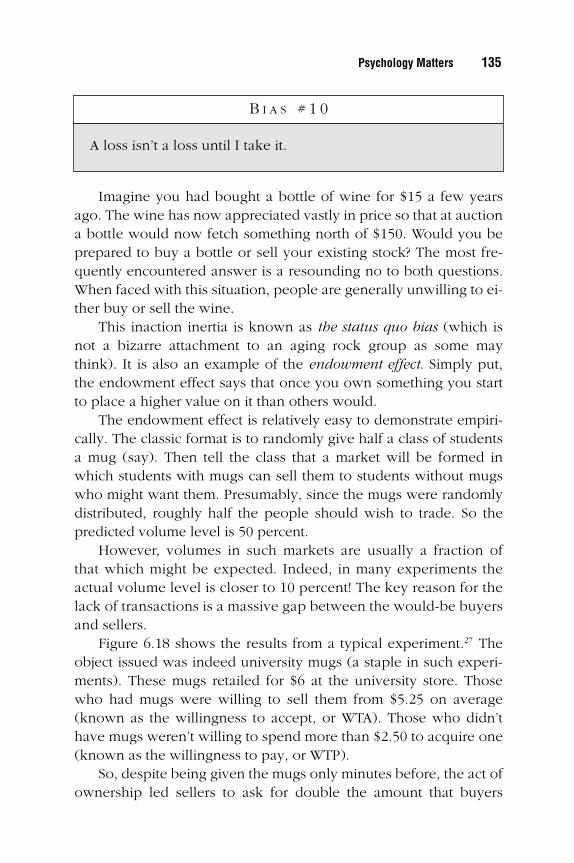
Imagine you had bought a bottle of wine for $15 a few yearsago. The wine has now appreciated vastly in price so that at auctiona bottle would now fetch something north of $150. Would you beprepared to buy a bottle or sell your existing stock? The most fre-quently encountered answer is a resounding no to both questions.When faced with this situation, people are generally unwilling to ei-ther buy or sell the wine.
This inaction inertia is known as the status quo bias (which isnot a bizarre attachment to an aging rock group as some maythink). It is also an example of the endowment effect. Simply put,the endowment effect says that once you own something you startto place a higher value on it than others would.
The endowment effect is relatively easy to demonstrate empiri-cally. The classic format is to randomly give half a class of studentsa mug (say). Then tell the class that a market will be formed inwhich students with mugs can sell them to students without mugswho might want them. Presumably, since the mugs were randomlydistributed, roughly half the people should wish to trade. So thepredicted volume level is 50 percent.
However, volumes in such markets are usually a fraction ofthat which might be expected. Indeed, in many experiments theactual volume level is closer to 10 percent! The key reason for thelack of transactions is a massive gap between the would-be buyersand sellers.
Figure 6.18 shows the results from a typical experiment.27 Theobject issued was indeed university mugs (a staple in such experi-ments). These mugs retailed for $6 at the university store. Thosewho had mugs were willing to sell them from $5.25 on average(known as the willingness to accept, or WTA). Those who didn’thave mugs weren’t willing to spend more than $2.50 to acquire one(known as the willingness to pay, or WTP).
So, despite being given the mugs only minutes before, the act ofownership led sellers to ask for double the amount that buyers
Psychology Matters 135
B I A S # 1 0
A loss isn’t a loss until I take it.
ccc_mauldin_ch06_99-144.qxd 9/23/05 10:44 AM Page 135
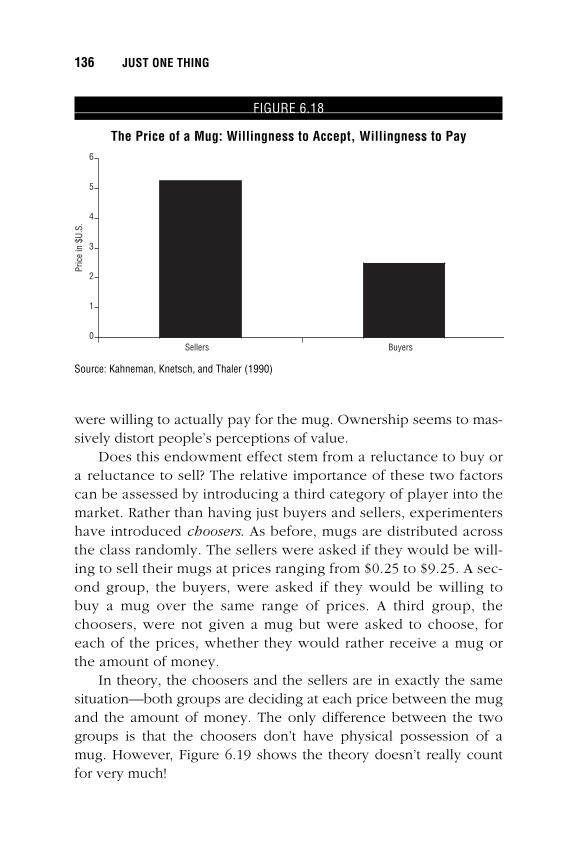
were willing to actually pay for the mug. Ownership seems to mas-sively distort people’s perceptions of value.
Does this endowment effect stem from a reluctance to buy ora reluctance to sell? The relative importance of these two factorscan be assessed by introducing a third category of player into themarket. Rather than having just buyers and sellers, experimentershave introduced choosers. As before, mugs are distributed acrossthe class randomly. The sellers were asked if they would be will-ing to sell their mugs at prices ranging from $0.25 to $9.25. A sec-ond group, the buyers, were asked if they would be willing tobuy a mug over the same range of prices. A third group, thechoosers, were not given a mug but were asked to choose, foreach of the prices, whether they would rather receive a mug orthe amount of money.
In theory, the choosers and the sellers are in exactly the samesituation—both groups are deciding at each price between the mugand the amount of money. The only difference between the twogroups is that the choosers don’t have physical possession of amug. However, Figure 6.19 shows the theory doesn’t really countfor very much!
136 JUST ONE THING
FIGURE 6.18
The Price of a Mug: Willingness to Accept, Willingness to Pay
0
1
2
3
4
5
6
Sellers Buyers
Pric
e in
$U.
S.
Source: Kahneman, Knetsch, and Thaler (1990)
ccc_mauldin_ch06_99-144.qxd 9/23/05 10:44 AM Page 136
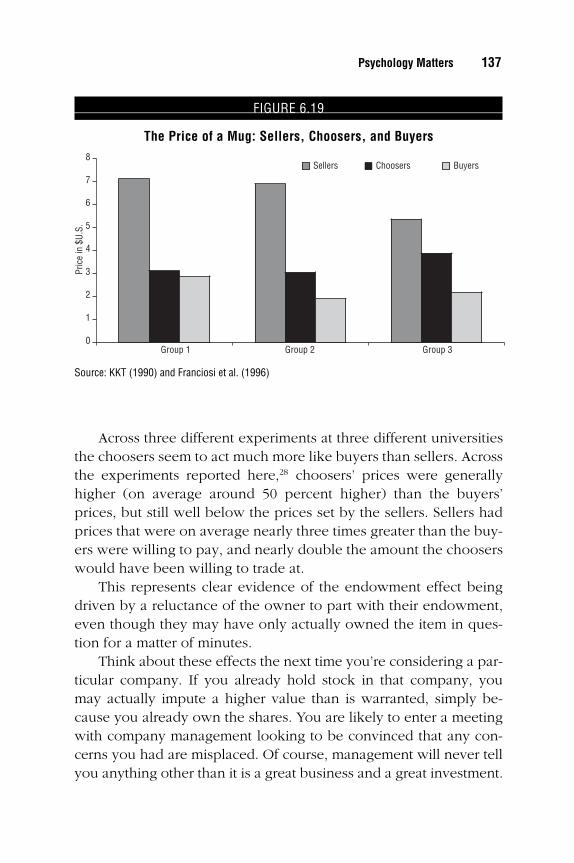
Across three different experiments at three different universitiesthe choosers seem to act much more like buyers than sellers. Acrossthe experiments reported here,28 choosers’ prices were generallyhigher (on average around 50 percent higher) than the buyers’prices, but still well below the prices set by the sellers. Sellers hadprices that were on average nearly three times greater than the buy-ers were willing to pay, and nearly double the amount the chooserswould have been willing to trade at.
This represents clear evidence of the endowment effect beingdriven by a reluctance of the owner to part with their endowment,even though they may have only actually owned the item in ques-tion for a matter of minutes.
Think about these effects the next time you’re considering a par-ticular company. If you already hold stock in that company, youmay actually impute a higher value than is warranted, simply be-cause you already own the shares. You are likely to enter a meetingwith company management looking to be convinced that any con-cerns you had are misplaced. Of course, management will never tellyou anything other than it is a great business and a great investment.
Psychology Matters 137
FIGURE 6.19
The Price of a Mug: Sellers, Choosers, and Buyers
0
1
2
3
4
5
6
7
8
Group 1 Group 2 Group 3
Sellers Choosers Buyers
Pric
e in
$U.
S.
Source: KKT (1990) and Franciosi et al. (1996)
ccc_mauldin_ch06_99-144.qxd 9/23/05 10:44 AM Page 137
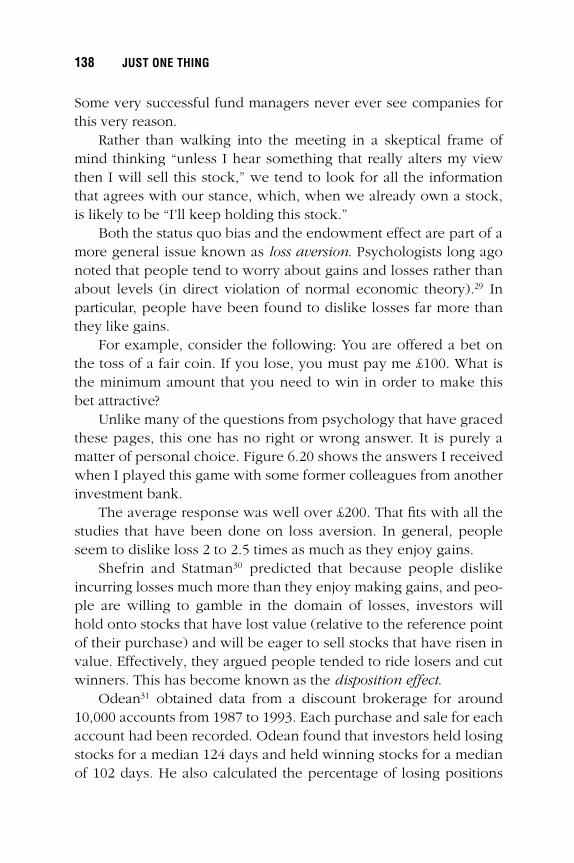
Some very successful fund managers never ever see companies forthis very reason.
Rather than walking into the meeting in a skeptical frame ofmind thinking “unless I hear something that really alters my viewthen I will sell this stock,” we tend to look for all the informationthat agrees with our stance, which, when we already own a stock,is likely to be “I’ll keep holding this stock.”
Both the status quo bias and the endowment effect are part of amore general issue known as loss aversion. Psychologists long agonoted that people tend to worry about gains and losses rather thanabout levels (in direct violation of normal economic theory).29 Inparticular, people have been found to dislike losses far more thanthey like gains.
For example, consider the following: You are offered a bet onthe toss of a fair coin. If you lose, you must pay me £100. What isthe minimum amount that you need to win in order to make thisbet attractive?
Unlike many of the questions from psychology that have gracedthese pages, this one has no right or wrong answer. It is purely amatter of personal choice. Figure 6.20 shows the answers I receivedwhen I played this game with some former colleagues from anotherinvestment bank.
The average response was well over £200. That fits with all thestudies that have been done on loss aversion. In general, peopleseem to dislike loss 2 to 2.5 times as much as they enjoy gains.
Shefrin and Statman30 predicted that because people dislikeincurring losses much more than they enjoy making gains, and peo-ple are willing to gamble in the domain of losses, investors willhold onto stocks that have lost value (relative to the reference pointof their purchase) and will be eager to sell stocks that have risen invalue. Effectively, they argued people tended to ride losers and cutwinners. This has become known as the disposition effect.
Odean31 obtained data from a discount brokerage for around10,000 accounts from 1987 to 1993. Each purchase and sale for eachaccount had been recorded. Odean found that investors held losingstocks for a median 124 days and held winning stocks for a medianof 102 days. He also calculated the percentage of losing positions
138 JUST ONE THING
ccc_mauldin_ch06_99-144.qxd 9/23/05 10:44 AM Page 138
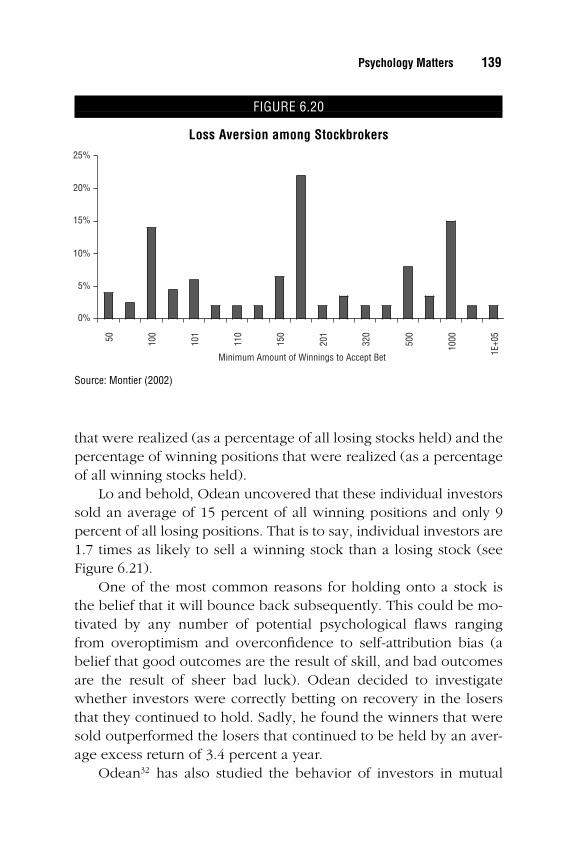
that were realized (as a percentage of all losing stocks held) and thepercentage of winning positions that were realized (as a percentageof all winning stocks held).
Lo and behold, Odean uncovered that these individual investorssold an average of 15 percent of all winning positions and only 9percent of all losing positions. That is to say, individual investors are1.7 times as likely to sell a winning stock than a losing stock (seeFigure 6.21).
One of the most common reasons for holding onto a stock isthe belief that it will bounce back subsequently. This could be mo-tivated by any number of potential psychological flaws rangingfrom overoptimism and overconfidence to self-attribution bias (abelief that good outcomes are the result of skill, and bad outcomesare the result of sheer bad luck). Odean decided to investigatewhether investors were correctly betting on recovery in the losersthat they continued to hold. Sadly, he found the winners that weresold outperformed the losers that continued to be held by an aver-age excess return of 3.4 percent a year.
Odean32 has also studied the behavior of investors in mutual
Psychology Matters 139
FIGURE 6.20
Loss Aversion among Stockbrokers
50 100
101
110
150
201
320
500
1000
1E+0
5
0%
5%
10%
15%
20%
25%
Minimum Amount of Winnings to Accept Bet
Source: Montier (2002)
ccc_mauldin_ch06_99-144.qxd 9/23/05 10:44 AM Page 139
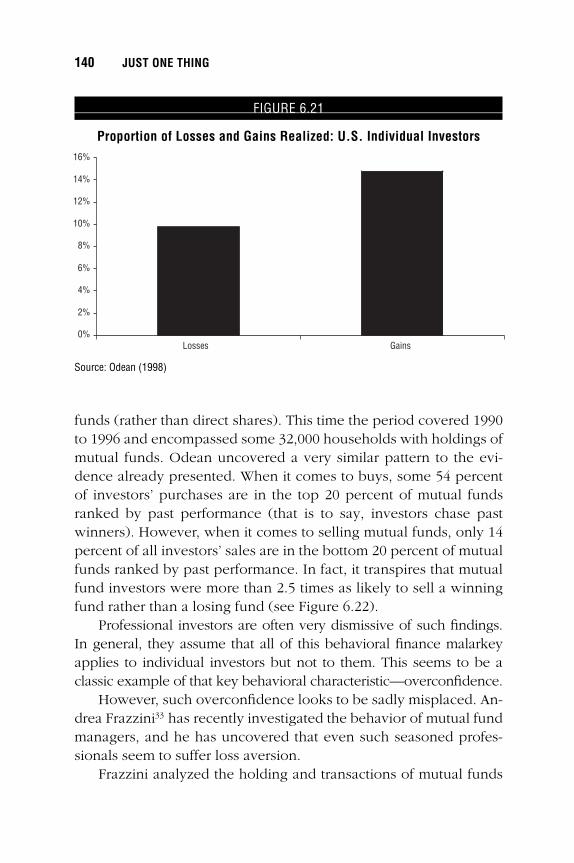
funds (rather than direct shares). This time the period covered 1990to 1996 and encompassed some 32,000 households with holdings ofmutual funds. Odean uncovered a very similar pattern to the evi-dence already presented. When it comes to buys, some 54 percentof investors’ purchases are in the top 20 percent of mutual fundsranked by past performance (that is to say, investors chase pastwinners). However, when it comes to selling mutual funds, only 14percent of all investors’ sales are in the bottom 20 percent of mutualfunds ranked by past performance. In fact, it transpires that mutualfund investors were more than 2.5 times as likely to sell a winningfund rather than a losing fund (see Figure 6.22).
Professional investors are often very dismissive of such findings.In general, they assume that all of this behavioral finance malarkeyapplies to individual investors but not to them. This seems to be aclassic example of that key behavioral characteristic—overconfidence.
However, such overconfidence looks to be sadly misplaced. An-drea Frazzini33 has recently investigated the behavior of mutual fundmanagers, and he has uncovered that even such seasoned profes-sionals seem to suffer loss aversion.
Frazzini analyzed the holding and transactions of mutual funds
140 JUST ONE THING
FIGURE 6.21
Proportion of Losses and Gains Realized: U.S. Individual Investors
Losses Gains0%
2%
4%
6%
8%
10%
12%
14%
16%
Source: Odean (1998)
ccc_mauldin_ch06_99-144.qxd 9/23/05 10:44 AM Page 140
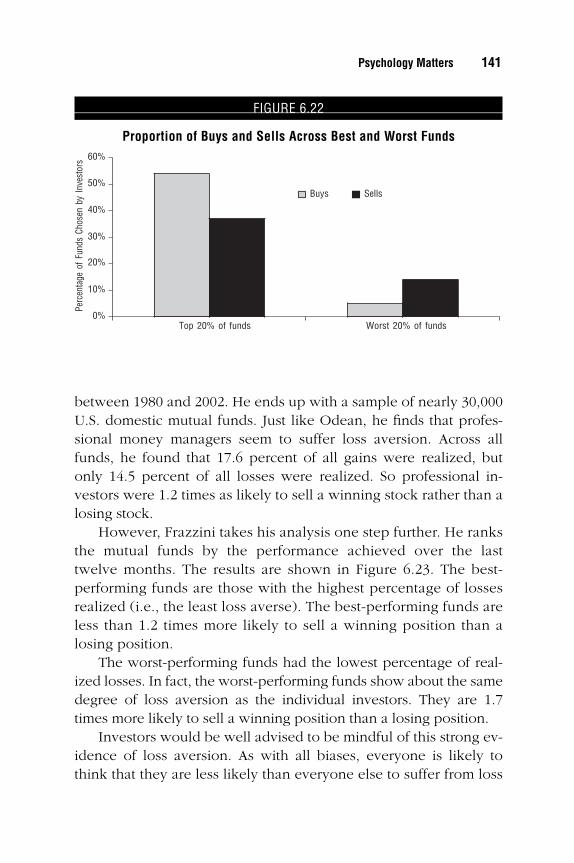
between 1980 and 2002. He ends up with a sample of nearly 30,000U.S. domestic mutual funds. Just like Odean, he finds that profes-sional money managers seem to suffer loss aversion. Across allfunds, he found that 17.6 percent of all gains were realized, butonly 14.5 percent of all losses were realized. So professional in-vestors were 1.2 times as likely to sell a winning stock rather than alosing stock.
However, Frazzini takes his analysis one step further. He ranksthe mutual funds by the performance achieved over the lasttwelve months. The results are shown in Figure 6.23. The best-performing funds are those with the highest percentage of lossesrealized (i.e., the least loss averse). The best-performing funds areless than 1.2 times more likely to sell a winning position than alosing position.
The worst-performing funds had the lowest percentage of real-ized losses. In fact, the worst-performing funds show about the samedegree of loss aversion as the individual investors. They are 1.7times more likely to sell a winning position than a losing position.
Investors would be well advised to be mindful of this strong ev-idence of loss aversion. As with all biases, everyone is likely tothink that they are less likely than everyone else to suffer from loss
Psychology Matters 141
FIGURE 6.22
Proportion of Buys and Sells Across Best and Worst Funds
Top 20% of funds Worst 20% of funds
Buys Sells
0%
10%
20%
30%
40%
50%
60%
Perc
enta
ge o
f Fun
ds C
hose
n by
Inve
stor
s
ccc_mauldin_ch06_99-144.qxd 9/23/05 10:44 AM Page 141
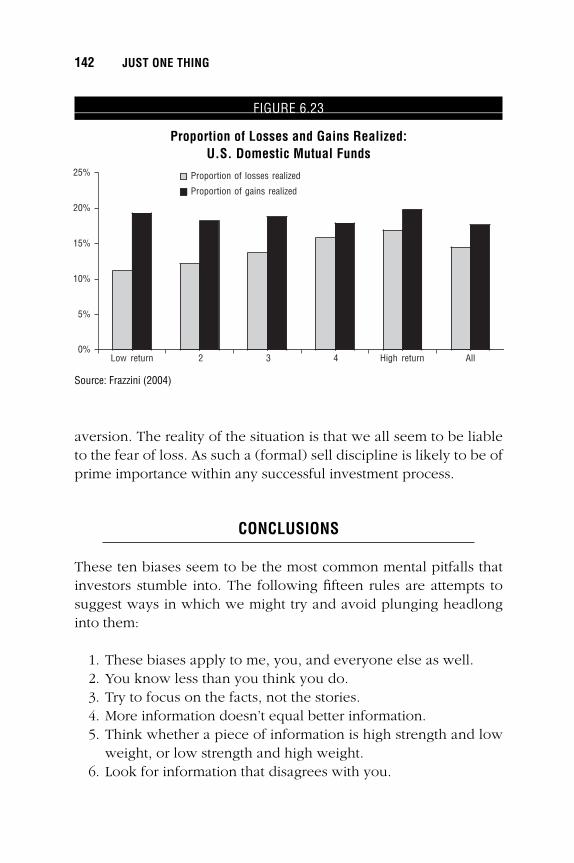
aversion. The reality of the situation is that we all seem to be liableto the fear of loss. As such a (formal) sell discipline is likely to be ofprime importance within any successful investment process.
CONCLUSIONS
These ten biases seem to be the most common mental pitfalls thatinvestors stumble into. The following fifteen rules are attempts tosuggest ways in which we might try and avoid plunging headlonginto them:
1. These biases apply to me, you, and everyone else as well.2. You know less than you think you do.3. Try to focus on the facts, not the stories.4. More information doesn’t equal better information.5. Think whether a piece of information is high strength and low
weight, or low strength and high weight.6. Look for information that disagrees with you.
142 JUST ONE THING
FIGURE 6.23
Proportion of Losses and Gains Realized: U.S. Domestic Mutual Funds
Low return 2 3 4 High return All
Proportion of losses realized
Proportion of gains realized
0%
5%
10%
15%
20%
25%
Source: Frazzini (2004)
ccc_mauldin_ch06_99-144.qxd 9/23/05 10:44 AM Page 142
7. Your failures aren’t just bad luck; examine mistakes to improveperformance.
8. You didn’t know it all along, you just think you did.9. If you can’t debias, then rebias—we know people will anchor
on the irrelevant, so let’s replace the unimportant with the rel-evant. Set up a sensible valuation framework.
10. Judge things by how statistically likely they are, not how theyappear.
11. Don’t overweight personal experience.12. Big, vivid, easy to recall events are less likely than you think
they are.13. Don’t take information at face value; think carefully about how
it was presented to you.14. Don’t value something more, simply because you own it.15. Sell your losers and ride your winners.
Of course, these may all seem very obvious. However, a little likeNew Year’s resolutions, they are easy to say and hard to implement.Having an investment process that incorporates best mental practicerequires you to step back from the hurly burly of day-to-day marketturbulence and understand how to apply psychology’s findings toyour own behavior.
Psychology Matters 143
ccc_mauldin_ch06_99-144.qxd 9/23/05 10:44 AM Page 143

ccc_mauldin_ch06_99-144.qxd 9/23/05 10:44 AM Page 144

145
C H A P T E R 7
The Means Are the Ends
Bill Bonner is the president and CEO of Agora publishing, one of
the largest financial newsletter companies. It is headquartered in
Baltimore with offices in London, Paris, Ireland, Bonn, and
Johannesburg. Bill is also the creator and key contributor to TheDaily Reckoning, the contrary financial newsletter sent out via
e-mail (www.dailyreckoning.com). The newsletter now has more
than 500,000 readers and is translated from English into German
and French. Bill is also the co-author of the best-selling FinancialReckoning Day.
Bill is the father of six great kids. He (along with his wife,
Elizabeth) moved the entire group to Paris to give them a view
of life outside America and to learn new languages. Most of
them now speak at least two or three fluently. He then bought
a chateau (also known as a pile of old stones) in the south of
France at Ouzilly. He then enlisted his kids on summers and
weekends to help him restore it. I have had the pleasure of
visiting him on several occasions and marveling at his
ability to get his kids to work. If he can just put his secret
into a research report, it would become extremely
popular.
Bill is one of my favorite writers. I have often said I feel
like a house painter in front of a Rembrandt while reading
his prose. He is an iconoclastic reader and thinker with a strong
libertarian bent, mixed in with Austrian economics. Bill was
�
ccc_mauldin_ch07_145-156.qxd 9/23/05 10:46 AM Page 145

in one of his cynical moments, thinking about governments
and economics, when he wrote a particularly humorous
and thought-provoking essay. Here, in its edited version,
is Bill’s take on the folly of government meddling with the
economy. —John Mauldin
146 JUST ONE THING
�
ccc_mauldin_ch07_145-156.qxd 9/23/05 10:46 AM Page 146
The Means Are the Endsby Bill Bonner
ECONOMICS HAS BEEN CALLED THE DISMAL SCIENCE. BUT EVEN THAT IS MERELY
fraud and flattery. Economics is dismal, but it isn’t science. At itsbest it is merely voyeurism—peeping into people’s windows as theygo about their business, trying to figure out what they are doing. Atworst, it is pompous theorizing about how to get the schmucks todo better.
We doubt that you are especially interested in economics, dearreader. We know we are not. But we are giving advice; economistscan help us find it. Besides, we can’t resist a good comedy . . . or agood opportunity to point and giggle. We keep our eye on econo-mists and politicians the way children watch clowns; we can’t waitto see them get whacked in the head or trip over each other.
But what is amusing is also instructive. Are not clowns people,too? Are they not part of human life . . . human organization . . . andhuman economy? Economists, like politicians, are driven by thesame motors that power everyone else. Some want power, othersglory, others money—and some want all three. But how do they getit? Can we not watch politicians and economists and learn some-thing about ourselves?
One of the many conceits of politicians and economists is thatthey are somehow out of the ordinary. They are godlike, or so theypretend, with the power to look into the future and improve it beforeit happens. No sparrow can fall in a deserted patch of earth without itregistering, somehow, on their meters and troubling their sensitivesouls. For they claim no other ambition but to make the world a betterplace. Neither drink, nor meat, nor false witness cross their lips. Theysweat for no material gain and know no lust—save for the bettermentof all mankind. They pass laws and enact codes and regulations as if
147
�
ccc_mauldin_ch07_145-156.qxd 9/23/05 10:46 AM Page 147

they were the masters of the whole human race, tinkering with it froma distance until they get it right. Since they float above it all, they arenot subject to the normal temptations, while the rest of us spend ourwhole lives like raccoons searching for a garbage pail without a lid.Unless we are kept in tight cages, who knows what we will do?
But thank God there are leaders! Thinkers! Theorists with their“isms,” and their rat wire . . . ready not merely to keep us from hurt-ing one another, but also to give us a sense of moral purpose. It isnot enough that we should each seek happiness in our own privateway, we must free the Sudetenland! Abolish poverty! Make theworld safe for democracy! We must realize our manifest destiny . . .and provide Lebensraum (living space) for the German people! Fullemployment! A minimum wage! No humbug left behind!
We bring this up to laugh at it—and to reach for instruction. Weare taught to admire leaders and opinion setters without being toldthat almost all they say is self-serving claptrap and most of whatthey do is counterproductive, fraudulent, and sometimes lethal. Butwe realize, intuitively, that they are mere mortals. That is why weget such perverse joy when the press reports that some governmentofficial has been caught having an affair with his secretary, or somepublic figure is convicted of embezzling.
KEYNESIAN MEDDLING IN THE TWENTIETH CENTURY
In the early twentieth century, John Maynard Keynes came up witha new idea about economics. Keynes argued that a governmentcould take the edge off a business recession by making more creditavailable when money got tight—and by spending more money it-self to make up for the lack of spending on the part of consumersand businessmen. He suggested, whimsically, hiding bottles of cashall around town, where boys might find them, spend the money,and revive the economy. The politicians loved it; Keynes had ex-plained how they could meddle in private affairs on a grand scale.
The new idea caught on. Soon economists were advising all ma-jor governments about how to implement the new ism. It did notseem to bother anyone that the new system was a scam. Where
148 JUST ONE THING
ccc_mauldin_ch07_145-156.qxd 9/23/05 10:46 AM Page 148
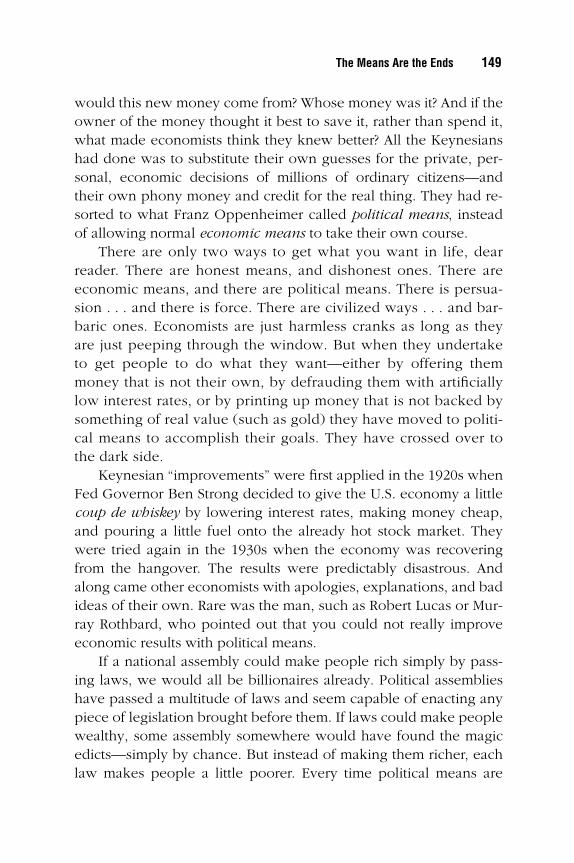
would this new money come from? Whose money was it? And if theowner of the money thought it best to save it, rather than spend it,what made economists think they knew better? All the Keynesianshad done was to substitute their own guesses for the private, per-sonal, economic decisions of millions of ordinary citizens—andtheir own phony money and credit for the real thing. They had re-sorted to what Franz Oppenheimer called political means, insteadof allowing normal economic means to take their own course.
There are only two ways to get what you want in life, dearreader. There are honest means, and dishonest ones. There areeconomic means, and there are political means. There is persua-sion . . . and there is force. There are civilized ways . . . and bar-baric ones. Economists are just harmless cranks as long as theyare just peeping through the window. But when they undertaketo get people to do what they want—either by offering themmoney that is not their own, by defrauding them with artificiallylow interest rates, or by printing up money that is not backed bysomething of real value (such as gold) they have moved to politi-cal means to accomplish their goals. They have crossed over tothe dark side.
Keynesian “improvements” were first applied in the 1920s whenFed Governor Ben Strong decided to give the U.S. economy a littlecoup de whiskey by lowering interest rates, making money cheap,and pouring a little fuel onto the already hot stock market. Theywere tried again in the 1930s when the economy was recoveringfrom the hangover. The results were predictably disastrous. Andalong came other economists with apologies, explanations, and badideas of their own. Rare was the man, such as Robert Lucas or Mur-ray Rothbard, who pointed out that you could not really improveeconomic results with political means.
If a national assembly could make people rich simply by pass-ing laws, we would all be billionaires already. Political assemblieshave passed a multitude of laws and seem capable of enacting anypiece of legislation brought before them. If laws could make peoplewealthy, some assembly somewhere would have found the magicedicts—simply by chance. But instead of making them richer, eachlaw makes people a little poorer. Every time political means are
The Means Are the Ends 149
ccc_mauldin_ch07_145-156.qxd 9/23/05 10:46 AM Page 149
used, they interfere with the private, civilized economic arrange-ments that actually get people what they want. One man makesshoes. Another grows potatoes. The potato grower goes to the cob-bler to buy a pair of shoes. He must exchange two sacks of pota-toes for one pair of penny loafers. But then the meddlers show upand tell the cobbler he must charge three sacks so that he can payone in taxes to the meddlers themselves. And then he needs to putan alarm system in his shop, buy a hardhat, pay his helper mini-mum wage, and fill out forms for all manner of laudable purposes.When the potato farmer finally shows up at the cobbler’s, he is in-formed that the shoes will cost seven sacks of potatoes! That is justwhat the cobbler has to charge in order to end up with the sametwo sacks he needed to charge in the beginning. “No thanks,” saysthe potato man, “At that price, I can’t afford a pair of shoes.”
What the potato grower needs, say the economists, is moremoney! The money supply has failed to keep pace, they add. Thatwas why they urged the government to set up the Federal Reservein the first place; they wanted a stooge currency that would goalong with their goofy plans. Gold is fine, they said, but it’s antiso-cial. It resists progress and drags its feet on financing new socialprograms. Why, it is positively recalcitrant! Clearly, when we face awar or a Great National Purpose we need money that is more patri-otic. Gold malingers. Gold hesitates. Gold is reticent. Gold keeps toitself, offering neither advice nor encouragement. What we need isa more public-spirited money—a source of public funding, a flexi-ble, expandable national currency, a political money that we canwork with. We need a dollar that is not linked to gold.
In the many years since the creation of the Federal Reserve Systemas America’s central bank, gold has remained as steadfast and immo-bile as ever. An ounce of it today buys about the same amount ofgoods and services as an ounce in 1913. But the dollar has gone alongwith every bit of political gimcrackery that has come along—the warin Europe, the New Deal, WWII, the Cold War, the Vietnam War, thewar on poverty, the war on illiteracy, the New Frontier, the Great Soci-ety, Social Security, Medicare, Medicaid, the war in Iraq, the war onterror . . . the list is long and sordid. As a result, guess how much adollar is worth today in comparison to one in 1913? Five cents.
150 JUST ONE THING
ccc_mauldin_ch07_145-156.qxd 9/23/05 10:46 AM Page 150

Keynesianism is a fraud. Supply-siderism is a con. The dollar it-self is a scam. All were developed by people with good intentions,but these good intentions not only paved the road to hell, theygreased it. There was no point putting on the brakes. Once under-way, there was no stopping.
Right now, the United States might be sliding toward some sortof hell. A half-century of deceit has produced a population as cred-ulous as its money. Americans are ready to believe anything—andgo along with anything. But they will be very disappointed whenthey discover that all the political means they counted on—thephony money, the laws, the regulations, the wars—have madethem poorer. That is when we will really need cages.
MORALITY AS AN ECONOMIC TOOL
“Nothing in nature is evil,” said Marcus Aurelius. Keynes was hu-man. Even Adolph Hitler was a man, a part of nature himself. Andthe Evil Empire—was it not created by men too, men who likeeconomists and politicians followed their own natural impulses?Adolph may have erred and strayed. Hitler thought he was buildinga better world, and he could argue all day that his plan was the bestway forward.
Not that there weren’t arguments on the other side. Germanuniversities were among the finest in the world. Some argued thatGerman scientists and philosophers were the best the world had tooffer. What did all these smart people think? They thought all kindsof things—and argued the relative merits of one plan over another.Jews were a nuisance, said some. Jews were good merchants, saidothers. We must defeat Russia, many believed. Avoid a two-frontwar, thought others. There were so many thoughts available, peo-ple could think anything they wanted.
What would an observer think? No amount of logic could dis-suade Hitler from his chosen course. So what is an observer todo? The preacher would say, “Love the sinner but hate the sin.”That is a useful point. There is no point hating Hitler—or Stalin,or Osama—they are God’s creatures, too, just like the rest of us.
The Means Are the Ends 151
ccc_mauldin_ch07_145-156.qxd 9/23/05 10:46 AM Page 151

Of course, God’s creatures have a certain consensus about whatconstitutes heinous sin. It is fairly cut and dried to say that geno-cide is a bad thing.
People argued about Keynesianism for many years, too. If wewere to give one piece of advice to a young person—or even anold person—what better counsel could be offered than to avoid ar-rogance? It is such vanity that makes a politician strut and crow . . .and an economist paw the earth. It is vanity that makes him pre-sume that his plans are so important, so beneficent, that theyshould override the plans of millions of others. It is vanity thatmakes him think that he knows better than other adults what theyshould do with their lives and their money.
And yet, we all like to look at our own faces in the mirror. Thatis human, too. And without that necessary arrogance, how will thepolitician ever get his name in the paper? Would he not live in theshadows of great men all his life? Would he be considered a niceguy, to be walked all over in business and ignored at cocktail par-ties? Would his rivals not get elected to high office, run major cor-porations, and marry trophy wives? Even if thoughtful peopleregard him as a pompous buffoon, isn’t this “great man” the winnerin the eyes of many?
If only the world were simpler. If only people whom wethought deserved to win always did win! If only the buffoons car-ried signs around their necks, rather than medals on their chests.
And yet, we cling to a stubborn faith and dumb observation thatmodesty is a virtue and virtue is rewarded and vice punished. Wehave seen how vice is punished in the public sphere. When aneconomist crosses over to the dark side and begins telling otherpeople what to do, the result is always and everywhere completedisaster. Economic disaster is merely the most humane example.Economists cost people a lot of money, but what is money com-pared to the millions of people murdered, enslaved, starved todeath, or imprisoned in the name of making the world a betterplace? People tend to underestimate, wrote French historian Ray-mond Aron, “the persistence of history’s traditional side, the riseand fall of empires, the rivalry of regimes, the disastrous or benefi-cent exploits of great men.”
152 JUST ONE THING
ccc_mauldin_ch07_145-156.qxd 9/23/05 10:46 AM Page 152
The names of the “great men” are recorded in history books andchiseled in granite. We know of no examples of “beneficent ex-ploits,” so we presume Aron was being sarcastic. Of disastrous ex-ploits, on the other hand, the history books are full: Genghis Khan,Tamerlane the Great, Caesar, Alexander . . . and more recently, Mus-solini, Wilson, Hitler, Bush . . . few national leaders fail to make thelist. For all have their desired “improvements,” and nearly all areready to resort to violence to see them realized.
Is the world a better place for all their bloody efforts? We don’tknow. Alas, you can never know where your actions will lead, orwhat will happen next in the world around you. So, what is a per-son to do? All you can do is to become engaged in the struggle fora better world, say the existentialists. But that is what all the worldimprovers and “Great Leaders” do. We have other advice: Mindyour own business.
“I beseech you in the bowels of Christ to consider that you maybe wrong,” wrote Oliver Cromwell to the General Assembly of theChurch of Scotland in 1650.
In public life, you may be wrong more often than not. If youradvice involves forcing someone else to do something . . . or de-ceiving them into doing it . . . or any other political means of gettingwhat you want, you are almost certainly wrong. For you are merelyinterrupting someone else’s private ambitions—and his economicmeans of realizing them. Nothing much can be done to improve onthe private arrangements of millions of free people. There are nobetter means for people to get what they want than the economicmeans—that is, the private, civilized, voluntary arrangements thatthey work out among themselves. Any attempt to interfere withthese private deals, trades, and programs inevitably causes prob-lems. People already know what they want. Their private arrange-ments are all designed to help them get it. All the leader can do isto divert them away from getting what they actually want towardsome theoretical good that, in the end, always turns out to be badfor everyone.
A modest man would not presume to tell other adults what todo. He feels lucky to be able to direct his own activities, let alonegive orders to millions of others. He is never completely sure he’s
The Means Are the Ends 153
ccc_mauldin_ch07_145-156.qxd 9/23/05 10:46 AM Page 153

doing the right thing. But in his own, private world he is the onewho pays the price for his mistakes; as soon as he recognizesthem, he usually corrects them quickly—or, if he is bent for self-destruction, gets what he is after. He may or may not realize hisambitions, but as long as he sticks to economic means, at least hewon’t go to Hell.
The Great Leader, by contrast, never doubts that he is making abetter world. Even when the evidence piles up all around, as it didaround Hitler in his 1945 bunker, he is still sure that he did the rightthing. When things go wrong, he blames his subordinates as incom-petent and ungrateful. Hitler was so disappointed by the ingratitudeof the German people that he came to feel they were not worthy ofhis improvement efforts. The Third Reich failed, he said, becausethey were unwilling to give it the sacrifices it needed. Now that theRussian army was entering Berlin and the German population wasstarving, they deserved to suffer, said he.
The real problem of the Great Leader is the same problem aswith the little follower—and the problem we all face. All humanswant more or less the same things—power, money, prestige, status.Getting them by civilized means—that is, working for them, earningthem, deserving them—is a long and difficult process. Nor is thereever any guarantee that lightning won’t strike you dead just beforeyou get where you are going. That is why the temptation to cheat—to take up dishonest, political shortcuts—is almost irresistible.
If you meet a pretty woman and you know you will never seeher again, what do you have to lose? You may want to have yourway with her—using seductive lies or maybe brute force—that is, ifyou are a cad. But if you think you will have to live with her for therest of your life, you will be more careful. Force and fraud won’twork for long. You will need something else. The qualities that areuseful in politics, war, and adultery—being strong, smart, unpre-dictable, and able to lie with a straight face—are the very samequalities that often get you into trouble in the rest of life.
We’re not smart enough to know whether one person’s plan forworld improvement will actually make the place better. All weknow is whether the means the person uses are civilized. That isthe problem with history’s monsters—its great leaders, its world im-
154 JUST ONE THING
ccc_mauldin_ch07_145-156.qxd 9/23/05 10:46 AM Page 154

provers, its gigolos, central bankers, and connivers. Not that theyhad outrageous ideas, but that they resorted to political means toget what they wanted. But we do not hate them; we just hope theyget what they deserve.
“Bad boys” may get the girls, but they have trouble keepingthem. Good husbands, on the other hand, may be boring, but asmart woman treasures one as she would a set of old china. Like-wise, a businessman can cheat his customers and gain a temporaryadvantage. So can a Great Leader invade a neighbor and seem to beon top of the world—for a while. A grump, annoyed by his neigh-bor’s trash, might decide to shoot the man. Or a woman, irritated byher husband, might decide to run the man down. These are all so-lutions to problems. But in every case, resorting to political meansto achieve the ends they craved took them over to the dark side oflife. They are no longer doing civilized things, but barbaric ones.They are doing the things the Baptist preachers tell you to hate.They are doing the things that bring bad karma . . . things the godspunish . . . and things that make other men seek revenge.
For all we know, of course, all these stories will have happyendings. The woman who ran over her husband might be delightedwith the results. The businessman might take the profits he madefrom cheating his customers and use them to make a killing on WallStreet. It is not for us to know how things work out.
The ends are beyond us. We never know what will happen. Nordo we know what God’s Own Plan may be—either for us, or forthe world itself. All we have is the means. That is all we control. Butif we use the means of civilized people—the economic means—toget what we want, we will not necessarily get what we want, but atleast we will deserve it.
The Means Are the Ends 155
ccc_mauldin_ch07_145-156.qxd 9/23/05 10:46 AM Page 155

ccc_mauldin_ch07_145-156.qxd 9/23/05 10:46 AM Page 156
C H A P T E R 8
The 2 Percent Solution
Rob Arnott is one of those guys who—with few exceptions—becomes
the smartest guy in the room just by walking into it. He is chairman
of Research Affiliates, runs an $8 billion fund for Pimco (which will
probably be $10 billion by the end of 2005), manages a few hedge
funds, and is launching a new index fund or two. He is also the
editor of the Financial Analysts Journal, one of the most prestigious
publications on investments and finance. Rob has authored more
than sixty articles for journals such as the Financial AnalystsJournal, the Journal of Portfolio Management, and the HarvardBusiness Review. He has been awarded not one but five Graham
and Dodd Scrolls awards, awarded annually by the CFA Institute
(formerly AIMR), and two Bernstein-Fabozzi/Jacobs-Levy awards,
awarded by the Journal of Portfolio Management and InstitutionalInvestor, for the best articles of the year. For financial analysts, this
is the equivalent of being selected the MVP in the major leagues.
Rob is a wine connoisseur (thus, it is always a good idea to go
to his home to discuss ideas late in the evening). He collects vintage
motorbikes and is a good friend. Here, he tells us how to get 2
percent more a year out of the stock market simply by restructuring
our portfolios. —John Mauldin
�
157
�
ccc_mauldin_ch08_157-170.qxd 9/23/05 10:48 AM Page 157

ccc_mauldin_ch08_157-170.qxd 9/23/05 10:48 AM Page 158
The 2 Percent Solutionby Rob Arnott
ONE OF THE MOST IMPORTANT MODELS IN MODERN FINANCE IS THE CAPITAL
asset pricing model (CAPM).1 It is the basis for a number of indexmodels, especially capitalization-weighted indexes like the S&P 500.Many hundreds of billions of dollars are invested in index fundsand cap-weighted indexes by individuals and institutions alike. Thisis a big deal.
ASSESSING THE STRENGTH OF CAPITALIZATION-WEIGHTED INVESTING
For most of us, our biggest bet is in equities. Is this the right bet? Toget a handle on that, let’s suppose we have a perfect crystal ball. Itcan’t tell us the share prices of every asset in the years ahead, but itcan tell us what cash flows we’re going to get from every invest-ment we could make, into the future forever. It lets us calculate thetrue fair value of every asset in the market, as the discounted netpresent value of all of these future cash flows.
If we know what the earnings from a company will be, and weknow what interest rate or rates of return we need to justify the riskof holding a stock, then we can assign a fair value to the presentprice of the stock. In essence, the fair value would be what we arewilling to pay to get those future earnings.
If we all know that true fair value, then the market value willmatch that value. In this world, the capital asset pricing model willbe correct, in the sense that there is no way to boost returns with-out boosting risk. In the parlance of the finance world, this indexwill be perfectly mean-variance efficient.
159
�
ccc_mauldin_ch08_157-170.qxd 9/23/05 10:48 AM Page 159
Now let’s suppose our crystal ball is just a little bit cloudy andwe can’t see the future precisely. Then we can’t know what true fairvalue is. But we can know that every stock, every asset, every bondis going to be trading above or below what its ultimate true fairvalue is. Even the most ardent fans of the efficient markets hypoth-esis would say, “That’s reasonable. That’s reality.”
Now if every asset is trading above or below its true fair value,then any index that is capitalization-weighted (price-weighted orvaluation-weighted) is automatically going to have us overexposedto every single asset that’s trading above its true fair value and un-derexposed to every single asset that’s trading below its true fairvalue. Far more than half of the index will be invested in the half ofthe market that’s overvalued, for the simple reason that the indexweight of an asset is directly related to the size of the pricing error.
This notion of an unknowable true fair value is not mere intel-lectual game playing. It has some concrete implications for themarket. It means that capitalization-weighted indexes, on whichthe majority of our entire investment portfolios rely, are fundamen-tally, structurally flawed and will inherently overweight every stockthat’s above fair value and underweight every stock that’s belowfair value.
Let’s look at what that does to returns. If you put most of yourmoney in assets that are above fair value—and, reciprocally, too lit-tle in assets that are below fair value—you get a return drag. Thecap-weighted indexes are producing returns that are below whatthey should be or below what they would be in a true-fair-value-weighted portfolio. Importantly, the returns are also below whatwould be available in a valuation-indifferent index (one that is notbased on the valuation of a company, its price to earnings (P/E) ra-tio, or its book value, for instance).
INVESTING IN EQUAL-WEIGHTED INDEXES: A BETTER ALTERNATIVE
If you construct an index that is valuation indifferent—that doesn’tcare what the P/E ratios are, and doesn’t care what the market cap-
160 JUST ONE THING
ccc_mauldin_ch08_157-170.qxd 9/23/05 10:48 AM Page 160
italization is—then return drag disappears. Even better, you canquantify return. It’s about 2 to 4 percent per year. How many man-agers out there reliably add 2 to 4 percent per year in the very longrun? Darn few of them.
This is what can happen in an equal-weighted index, where thesame amount of money is put in each stock, no matter what thestock price is. Although it’s a seriously flawed index, equal weight-ing will outperform a cap-weighted index. Many observers thinkthat equal-weighted indexes outperform mainstream capitalizationindexes because they have a small-stock bias: Small companies beatlarge because they have a value bias, and cheap stocks outperformexpensive ones. That’s not quite correct.
What equal weighting does is to weight the portfolio in a valua-tion-indifferent fashion: It will underweight every stock that’s large,regardless of whether it’s cheap or dear, and overweight every stockthat’s small, regardless of whether it’s cheap or dear. How does thiscompare with the cap-weighted index, where every stock that’sovervalued is overweight? In the equal-weighted index it’s randomluck—50/50. You have even odds of being over- or underweight,whether it’s overvalued or undervalued.
Let’s look at a concrete example. Suppose we have a world withtwo groups of stocks, one consisting of all of the overvalued com-panies, and another consisting of all of the undervalued companies.Each has a true fair value of $100, although the marketplace doesn’tknow this true fair value. One group of stocks is estimated by themarket to really be worth $50, while the other is estimated to reallybe worth $150, but both valuations are wrong. Capitalizationweighting puts 75 percent on that overvalued group of stocks.
Now suppose that over the next ten years, today’s errors arecorrected. Both portfolios move to $100. However, a new 50 per-cent error is introduced in each asset, because various news or ana-lyst reports convince investors that some of these companies nowlook really good and the others look really bad. The portfolio is re-allocated into a new overvalued and undervalued component,drawing from some of each of the first two portfolios. The result isa steady state: The size of the errors stays steady, but the old errorshave been corrected and replaced with new errors.
The 2 Percent Solution 161
ccc_mauldin_ch08_157-170.qxd 9/23/05 10:48 AM Page 161
In this world, the long-run capitalization-weighted return iszero. You gain nothing.
So, how does a valuation-indifferent portfolio help us? Insteadof having 75 percent invested in the portfolio of overvalued and 25percent in the portfolio of undervalued stocks, we have randomizedto 50 percent in the overvalued stocks and 50 percent in the under-valued stocks. The former drops 33 percent, the latter doubles. So,the valuation-indifferent portfolio gains the average of these, or 33percent.2 The return is 2.8 percent per year, compounded annually.Capitalization weighting has cost us 2.8 percent per year, even if wehave no way of knowing which stocks are over- or undervalued.
One implication of this world of uncertain true fair value is thatwe should expect a size effect; namely, that large-capitalizationstocks should underperform small-capitalization stocks on average,over time. Why? Suppose our crystal ball allows us to see a list of theten highest true-fair-value companies. What’s the likelihood that thehighest true-fair-value company will also be the largest-capitalizationcompany? It’ll happen from time to time, but it’s not likely in anygiven year. Some less-valuable company will most likely haveenough positive error (overvaluation) to eclipse that top-rankedlargest-capitalization company. That positive pricing error turns intoa return drag, as the market seeks out the company’s true fair value.
This means that, most of the time, the largest-capitalization com-pany should underperform the average stock. Does it? Yes!
In the April/May 2005 issue of the Financial Analysts Journal, Ipublished a short study in which I looked back over the last eightyyears and asked the question, “How often does the number-one-ranked company in market capitalization outperform the averagestock over the next one year, three years, five years, and ten years?”The simple answer seems to be that on average, over time, about 80percent of the time, the largest-capitalization company underper-forms over the next ten years. The magnitude of that underperfor-mance is huge: The largest-capitalization company, on average,underperforms the average stock by 40 to 50 percentage pointsover the next ten years. This is illustrated in Table 8.1.
You’d expect the same pattern but with less reliability in the top-ten companies. What’s the likelihood that the ten highest true-fair-
162 JUST ONE THING
ccc_mauldin_ch08_157-170.qxd 9/23/05 10:48 AM Page 162
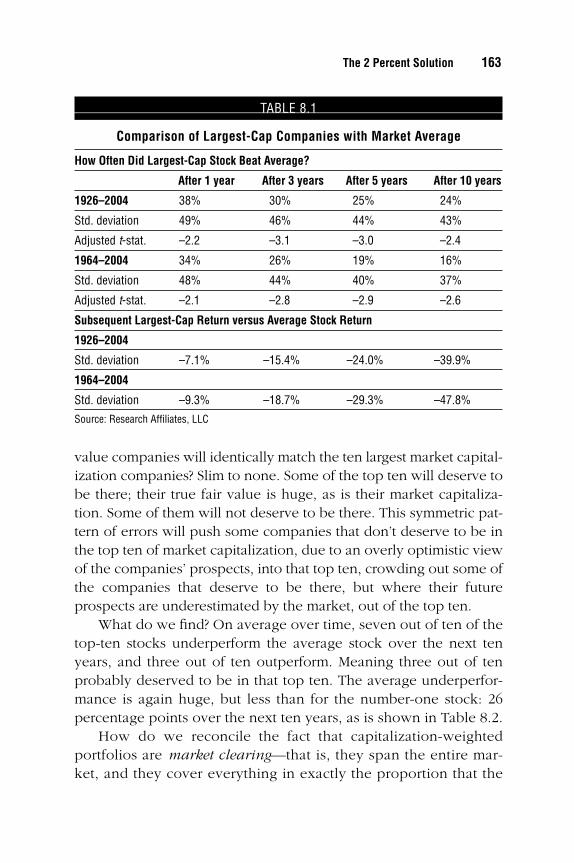
value companies will identically match the ten largest market capital-ization companies? Slim to none. Some of the top ten will deserve tobe there; their true fair value is huge, as is their market capitaliza-tion. Some of them will not deserve to be there. This symmetric pat-tern of errors will push some companies that don’t deserve to be inthe top ten of market capitalization, due to an overly optimistic viewof the companies’ prospects, into that top ten, crowding out some ofthe companies that deserve to be there, but where their futureprospects are underestimated by the market, out of the top ten.
What do we find? On average over time, seven out of ten of thetop-ten stocks underperform the average stock over the next tenyears, and three out of ten outperform. Meaning three out of tenprobably deserved to be in that top ten. The average underperfor-mance is again huge, but less than for the number-one stock: 26percentage points over the next ten years, as is shown in Table 8.2.
How do we reconcile the fact that capitalization-weightedportfolios are market clearing—that is, they span the entire mar-ket, and they cover everything in exactly the proportion that the
The 2 Percent Solution 163
TABLE 8.1
Comparison of Largest-Cap Companies with Market Average
How Often Did Largest-Cap Stock Beat Average?
After 1 year After 3 years After 5 years After 10 years
1926–2004 38% 30% 25% 24%
Std. deviation 49% 46% 44% 43%
Adjusted t-stat. –2.2 –3.1 –3.0 –2.4
1964–2004 34% 26% 19% 16%
Std. deviation 48% 44% 40% 37%
Adjusted t-stat. –2.1 –2.8 –2.9 –2.6
Subsequent Largest-Cap Return versus Average Stock Return
1926–2004
Std. deviation –7.1% –15.4% –24.0% –39.9%
1964–2004
Std. deviation –9.3% –18.7% –29.3% –47.8%
Source: Research Affiliates, LLC
ccc_mauldin_ch08_157-170.qxd 9/23/05 10:48 AM Page 163
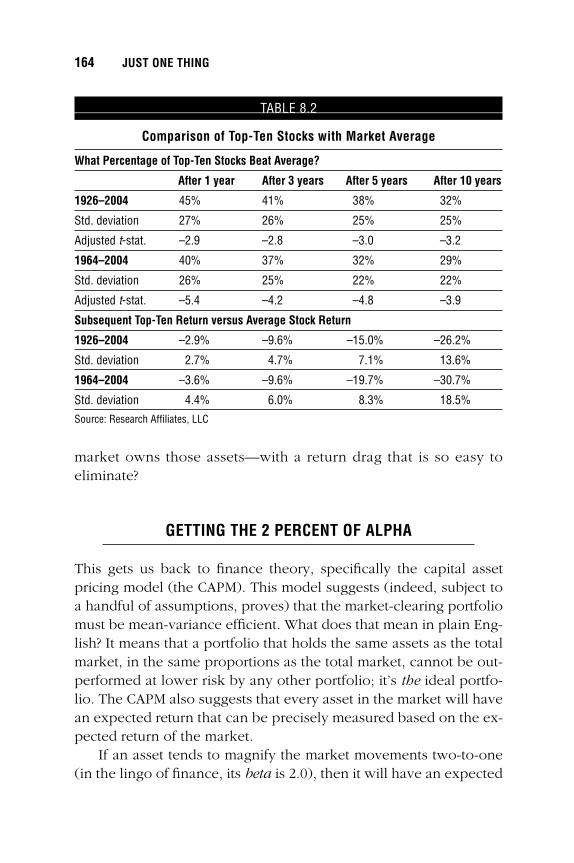
market owns those assets—with a return drag that is so easy toeliminate?
GETTING THE 2 PERCENT OF ALPHA
This gets us back to finance theory, specifically the capital assetpricing model (the CAPM). This model suggests (indeed, subject toa handful of assumptions, proves) that the market-clearing portfoliomust be mean-variance efficient. What does that mean in plain Eng-lish? It means that a portfolio that holds the same assets as the totalmarket, in the same proportions as the total market, cannot be out-performed at lower risk by any other portfolio; it’s the ideal portfo-lio. The CAPM also suggests that every asset in the market will havean expected return that can be precisely measured based on the ex-pected return of the market.
If an asset tends to magnify the market movements two-to-one(in the lingo of finance, its beta is 2.0), then it will have an expected
164 JUST ONE THING
TABLE 8.2
Comparison of Top-Ten Stocks with Market Average
What Percentage of Top-Ten Stocks Beat Average?
After 1 year After 3 years After 5 years After 10 years
1926–2004 45% 41% 38% 32%
Std. deviation 27% 26% 25% 25%
Adjusted t-stat. –2.9 –2.8 –3.0 –3.2
1964–2004 40% 37% 32% 29%
Std. deviation 26% 25% 22% 22%
Adjusted t-stat. –5.4 –4.2 –4.8 –3.9
Subsequent Top-Ten Return versus Average Stock Return
1926–2004 –2.9% –9.6% –15.0% –26.2%
Std. deviation 2.7% 4.7% 7.1% 13.6%
1964–2004 –3.6% –9.6% –19.7% –30.7%
Std. deviation 4.4% 6.0% 8.3% 18.5%
Source: Research Affiliates, LLC
ccc_mauldin_ch08_157-170.qxd 9/23/05 10:48 AM Page 164
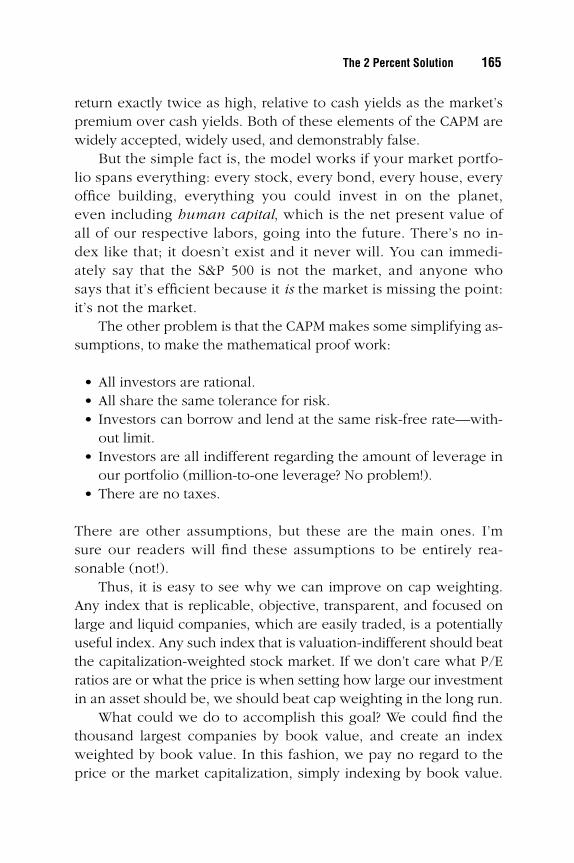
return exactly twice as high, relative to cash yields as the market’spremium over cash yields. Both of these elements of the CAPM arewidely accepted, widely used, and demonstrably false.
But the simple fact is, the model works if your market portfo-lio spans everything: every stock, every bond, every house, everyoffice building, everything you could invest in on the planet,even including human capital, which is the net present value ofall of our respective labors, going into the future. There’s no in-dex like that; it doesn’t exist and it never will. You can immedi-ately say that the S&P 500 is not the market, and anyone whosays that it’s efficient because it is the market is missing the point:it’s not the market.
The other problem is that the CAPM makes some simplifying as-sumptions, to make the mathematical proof work:
• All investors are rational.• All share the same tolerance for risk.• Investors can borrow and lend at the same risk-free rate—with-
out limit.• Investors are all indifferent regarding the amount of leverage in
our portfolio (million-to-one leverage? No problem!).• There are no taxes.
There are other assumptions, but these are the main ones. I’msure our readers will find these assumptions to be entirely rea-sonable (not!).
Thus, it is easy to see why we can improve on cap weighting.Any index that is replicable, objective, transparent, and focused onlarge and liquid companies, which are easily traded, is a potentiallyuseful index. Any such index that is valuation-indifferent should beatthe capitalization-weighted stock market. If we don’t care what P/Eratios are or what the price is when setting how large our investmentin an asset should be, we should beat cap weighting in the long run.
What could we do to accomplish this goal? We could find thethousand largest companies by book value, and create an indexweighted by book value. In this fashion, we pay no regard to theprice or the market capitalization, simply indexing by book value.
The 2 Percent Solution 165
ccc_mauldin_ch08_157-170.qxd 9/23/05 10:48 AM Page 165
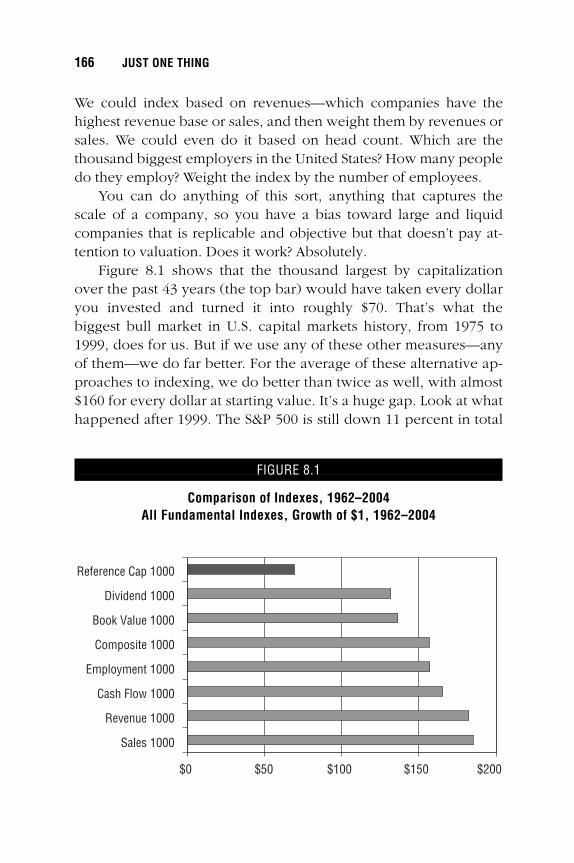
We could index based on revenues—which companies have thehighest revenue base or sales, and then weight them by revenues orsales. We could even do it based on head count. Which are thethousand biggest employers in the United States? How many peopledo they employ? Weight the index by the number of employees.
You can do anything of this sort, anything that captures thescale of a company, so you have a bias toward large and liquidcompanies that is replicable and objective but that doesn’t pay at-tention to valuation. Does it work? Absolutely.
Figure 8.1 shows that the thousand largest by capitalizationover the past 43 years (the top bar) would have taken every dollaryou invested and turned it into roughly $70. That’s what thebiggest bull market in U.S. capital markets history, from 1975 to1999, does for us. But if we use any of these other measures—anyof them—we do far better. For the average of these alternative ap-proaches to indexing, we do better than twice as well, with almost$160 for every dollar at starting value. It’s a huge gap. Look at whathappened after 1999. The S&P 500 is still down 11 percent in total
166 JUST ONE THING
FIGURE 8.1
Comparison of Indexes, 1962–2004All Fundamental Indexes, Growth of $1, 1962–2004
$0 $50 $100 $150 $200
Reference Cap 1000
Dividend 1000
Book Value 1000
Composite 1000
Employment 1000
Cash Flow 1000
Revenue 1000
Sales 1000
ccc_mauldin_ch08_157-170.qxd 9/23/05 10:48 AM Page 166
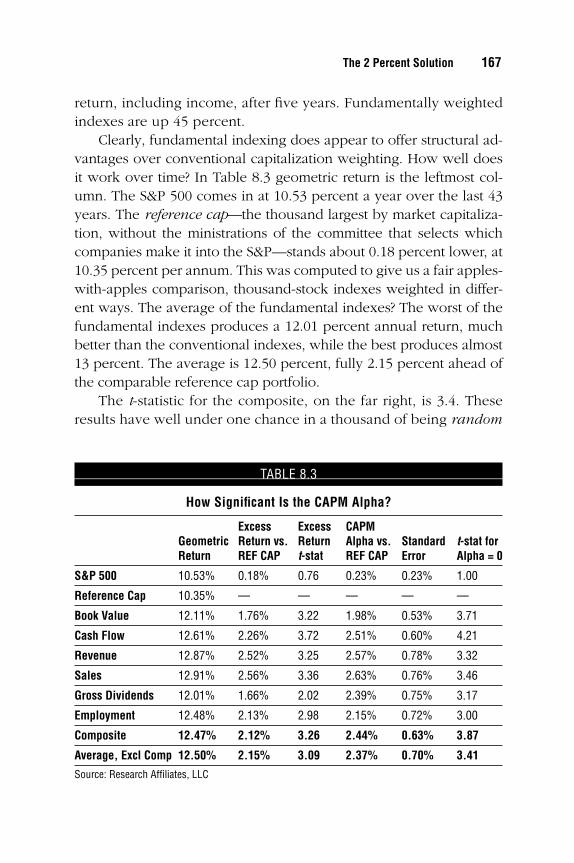
return, including income, after five years. Fundamentally weightedindexes are up 45 percent.
Clearly, fundamental indexing does appear to offer structural ad-vantages over conventional capitalization weighting. How well doesit work over time? In Table 8.3 geometric return is the leftmost col-umn. The S&P 500 comes in at 10.53 percent a year over the last 43years. The reference cap—the thousand largest by market capitaliza-tion, without the ministrations of the committee that selects whichcompanies make it into the S&P—stands about 0.18 percent lower, at10.35 percent per annum. This was computed to give us a fair apples-with-apples comparison, thousand-stock indexes weighted in differ-ent ways. The average of the fundamental indexes? The worst of thefundamental indexes produces a 12.01 percent annual return, muchbetter than the conventional indexes, while the best produces almost13 percent. The average is 12.50 percent, fully 2.15 percent ahead ofthe comparable reference cap portfolio.
The t-statistic for the composite, on the far right, is 3.4. Theseresults have well under one chance in a thousand of being random
The 2 Percent Solution 167
TABLE 8.3
How Significant Is the CAPM Alpha?
Excess Excess CAPMGeometric Return vs. Return Alpha vs. Standard t-stat forReturn REF CAP t-stat REF CAP Error Alpha = 0
S&P 500 10.53% 0.18% 0.76 0.23% 0.23% 1.00
Reference Cap 10.35% — — — — —
Book Value 12.11% 1.76% 3.22 1.98% 0.53% 3.71
Cash Flow 12.61% 2.26% 3.72 2.51% 0.60% 4.21
Revenue 12.87% 2.52% 3.25 2.57% 0.78% 3.32
Sales 12.91% 2.56% 3.36 2.63% 0.76% 3.46
Gross Dividends 12.01% 1.66% 2.02 2.39% 0.75% 3.17
Employment 12.48% 2.13% 2.98 2.15% 0.72% 3.00
Composite 12.47% 2.12% 3.26 2.44% 0.63% 3.87
Average, Excl Comp 12.50% 2.15% 3.09 2.37% 0.70% 3.41
Source: Research Affiliates, LLC
ccc_mauldin_ch08_157-170.qxd 9/23/05 10:48 AM Page 167
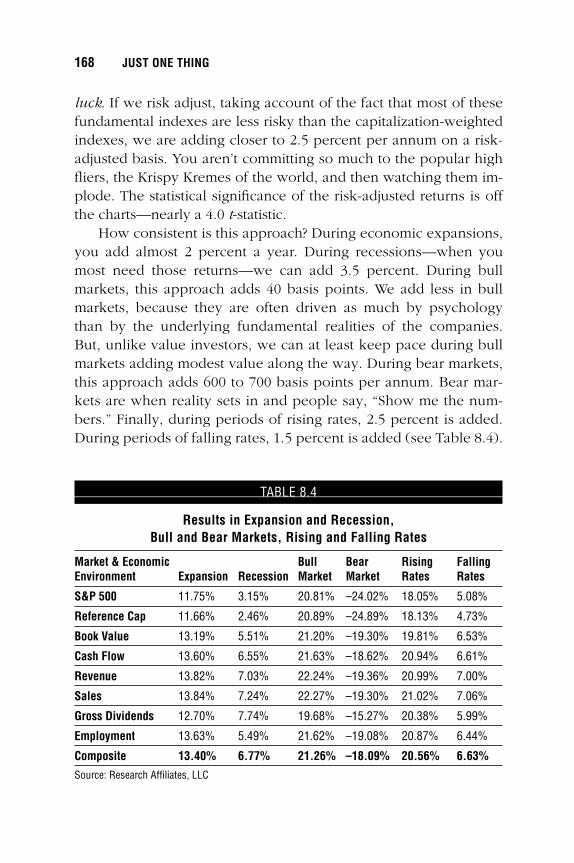
luck. If we risk adjust, taking account of the fact that most of thesefundamental indexes are less risky than the capitalization-weightedindexes, we are adding closer to 2.5 percent per annum on a risk-adjusted basis. You aren’t committing so much to the popular highfliers, the Krispy Kremes of the world, and then watching them im-plode. The statistical significance of the risk-adjusted returns is offthe charts—nearly a 4.0 t-statistic.
How consistent is this approach? During economic expansions,you add almost 2 percent a year. During recessions—when youmost need those returns—we can add 3.5 percent. During bullmarkets, this approach adds 40 basis points. We add less in bullmarkets, because they are often driven as much by psychologythan by the underlying fundamental realities of the companies.But, unlike value investors, we can at least keep pace during bullmarkets adding modest value along the way. During bear markets,this approach adds 600 to 700 basis points per annum. Bear mar-kets are when reality sets in and people say, “Show me the num-bers.” Finally, during periods of rising rates, 2.5 percent is added.During periods of falling rates, 1.5 percent is added (see Table 8.4).
168 JUST ONE THING
TABLE 8.4
Results in Expansion and Recession, Bull and Bear Markets, Rising and Falling Rates
Market & Economic Bull Bear Rising FallingEnvironment Expansion Recession Market Market Rates Rates
S&P 500 11.75% 3.15% 20.81% –24.02% 18.05% 5.08%
Reference Cap 11.66% 2.46% 20.89% –24.89% 18.13% 4.73%
Book Value 13.19% 5.51% 21.20% –19.30% 19.81% 6.53%
Cash Flow 13.60% 6.55% 21.63% –18.62% 20.94% 6.61%
Revenue 13.82% 7.03% 22.24% –19.36% 20.99% 7.00%
Sales 13.84% 7.24% 22.27% –19.30% 21.02% 7.06%
Gross Dividends 12.70% 7.74% 19.68% –15.27% 20.38% 5.99%
Employment 13.63% 5.49% 21.62% –19.08% 20.87% 6.44%
Composite 13.40% 6.77% 21.26% –18.09% 20.56% 6.63%
Source: Research Affiliates, LLC
ccc_mauldin_ch08_157-170.qxd 9/23/05 10:48 AM Page 168
CONCLUSION
In short, we find that fundamental indexing works especially well inan environment of recession or a bear market or rising rates. But italso adds modest value in the more benign environments, with eco-nomic expansion, falling interest rates, and a bull market in stocks.Value investing generally does not add value during expansions,bull markets, or periods of rising rates.
Is it an index? Of course it can be an index. Is it passive? Yes:It’s replicable, formulaic, transparent, and objectively constructed. Isit a total market portfolio? Not in a capital asset pricing model con-text, because it doesn’t span all marketable assets equivalent to theirweight in the actual market. But, as we’ve already observed, no in-dex fits this criterion.
Are the cap-weighted indexes efficient? That is to say, can youimprove on them by constructing better indexes, without taking onmore risk? Yes, you can, so the cap-weighted indexes are not effi-cient. The classic indexes are not the market, and no commerciallyviable market portfolio exists; and even if one did it wouldn’t matter,because the capital-asset pricing model is predicated on so manystructurally flawed assumptions that the notion that the cap-weighted indexes must be efficient is the same as the notion that theunderlying assumptions must be true.
Finally, there are very real implications in this model for long-short investing. I suspect that large institutions and pension planswill eventually move large portions of their equity assets into in-dexes like this. What’s a 2 percent difference worth? Let’s assumethat, with your current portfolio, in 36 years you end up with $1 bil-lion. If you can increase portfolio performance by just 2 percent,you will end up with $2 billion. A 2 percent alpha doubles your cu-mulative assets over these longer time horizons of pensions.
If you are an individual, the same principle applies. Over 36years, that 2 percent will double your return. And that’s a big num-ber in anybody’s book.
The 2 Percent Solution 169
ccc_mauldin_ch08_157-170.qxd 9/23/05 10:48 AM Page 169

ccc_mauldin_ch08_157-170.qxd 9/23/05 10:48 AM Page 170
171
C H A P T E R 9
The Outsider Trading Scandal
The official bio of George Gilder is a tad intimidating. He is editor
of the Gilder Technology Report, chairman of Gilder Publishing,
LLC, and a senior fellow of the Discovery Institute.
Gilder attended Exeter Academy and Harvard University,
studying under and working with Henry Kissinger. He co-authored
The Party That Lost Its Head and served as a speechwriter for
Nelson Rockefeller, George Romney, and Richard Nixon. In the
1970s, Gilder began an excursion into the causes of poverty, which
resulted in his books Men and Marriage (1972); Visible Man (1978);
and Wealth and Poverty (1981). Wealth and Poverty was a seminal
book for the conservative movement and was an intellectual source
for much of the Reagan Revolution.
Gilder pioneered the formulation of supply-side economics. His
investigation into wealth creation led to a deeper examination of
the lives of entrepreneurs, culminating in The Spirit of Enterprise(1986) and his best-selling work, Microcosm (1989). A subsequent
book, Life After Television, was a prophecy of the future of
computers and telecommunications and a prelude to his book on
the future of telecommunications, Telecosm (2000).
George’s latest book is The Silicon Eye (2005), a fascinating
narrative of personality and technology in which Gilder shares his
inside knowledge of Silicon Valley and illustrates how the
unpredictable mix of genius, drive, and luck can turn a startup
into a Fortune 500 company.
�
ccc_mauldin_ch09_171-184.qxd 9/23/05 10:50 AM Page 171

George lives with his wife, Nini, and has four children. He is a
runner and cross-country skier. (I remember him once passing the
horse-drawn sleigh I was riding in—a moment that inspired me to
get my derriere in gear and start exercising.) And he is one heck of
a nice guy, a great bon vivant and wonderful storyteller. Here,
George tells us to “ignore the outside noise and focus on acquiring
real fundamental knowledge.” —John Mauldin
172 JUST ONE THING
�
ccc_mauldin_ch09_171-184.qxd 9/23/05 10:50 AM Page 172
The Outsider Trading Scandalby George Gilder
VALUE VERSUS VANITY. DAY-TRADING VERSUS BUY-AND-HOLD. EFFICIENT MAR-kets versus random walk. Growth versus value. Momentum versusdiscounted cash flow. Buffett versus Lynch. Graham and Dodd ver-sus Aswath Damodaran or Mary Meeker. Technical analysis versustechnology paradigms. Risk-enhanced riches versus gambler’s ruin.The beat goes on, and the battle never ends until the fat-laden gu-rus gag, and the investors’ money runs out.
Ruffling the waves on a Forbes investment cruise in the Baltic inmid-2005 was a pungent debate on these contentious issues of per-sonal investment. Technical Titan Ralph Bloch cited his own annual42 percent gains and sneered at bubble-era fundamentalists such asMeeker and Henry Blodget and current technology writers such asmyself and Nanotech guru Josh Wolfe. Bloch and fellow technicianJim Stack made a powerful case that the best and most objectiveguidance to the future movement of the markets comes from themarket itself. Regularly making similar arguments are the Investor’sBusiness Daily, Barron’s, and scores of investment newsletters.
It seems like a plausible idea. Watch the movements of the mar-ket and interpret their significance. No other source of informationcan yield so objective a view of securities as the changes in theprices themselves. Reflecting all the knowledge available in themarket and all the decisions to buy and sell, the patterns of changein market prices offer empirical scientific data. By comparison, theinformation divulged by companies and experts is skewed by bias,subjectivity, self-interest, and murky interpretation.
Only rarely does anyone point out that without fundamen-tals—without close and necessarily subjective scrutiny of the
173
�
ccc_mauldin_ch09_171-184.qxd 9/23/05 10:50 AM Page 173
actual performance and potential of each company—marketswould contain virtually no information at all. Markets wouldslouch through the kind of random walk that Burton Malkiel andothers have famously described. In a random world, luck woulddominate skill. Like casinos or lotteries, markets would fall to theinexorable law of gambler’s ruin.
THE VALUE OF INFORMATION
To avoid this grim fate, what is the one thing that investors shouldknow as they engage in buying and selling securities? They shouldknow that an economy is not a casino or a lottery. Nor is it a physi-cal or material system. It is an arena of information. It is governedby mathematical laws of information similar to the laws that deter-mine the capacity of telephone lines and wireless spectrum—thesame laws of information that shape biological change through thegenetic code or shepherd calls through your code division multipleaccess (CDMA) digital cell phone. In markets, the winners are thepeople with the best information, mostly inside information.
The key insight of information theory is that information ismeasured by the degree to which it is unexpected. Information is“news,” gauged by its surprisal, technically called entropy. A streamof predictable bits conveys no information at all. A stream ofchaotic noise conveys no information. To convey a high-entropymessage—lots of information—takes a low-entropy carrier, a pre-dictable vessel, that allows the receiver to distinguish the messagefrom the noise.
Why do you care? Entropy, the technical word for news value,is at the heart of markets and making money. Entropy is the sourceof profit. The predictable returns are already incorporated in theprice, which in the end will settle to the risk-adjusted return on cap-ital, or the interest rate plus a risk premium.
Technical analysts parade their market models down the run-ways in undulating patterns: comely regularities and curvaceoussymmetries. What’s not to like? A popular school of analysis cele-brates the market as a fractal, evincing the fashionable swirls and
174 JUST ONE THING
ccc_mauldin_ch09_171-184.qxd 9/23/05 10:50 AM Page 174
whorls and “strange attractors” of chaos theory. In the last year,Benoit Mandelbrot has published his Misbehavior of Markets andPhillip Ball Critical Mass to show that the laws of fractals andphysics capture the deep reality of markets.
What does information theory tell you about such ideas? Stan-ford University’s Thomas Cover, the leading information theorist ofthe day, put Mandelbrot’s set—the colorful whorls of intricate de-sign and apparent complexity of Mandelbrot’s fractal display—onthe jacket of his canonical book Elements of Information Theory.Graphic artists often use the Mandelbrot set as an epitome of denseinformation.
But information theory itself is full of surprises. Inside the jacketof his book, Cover writes, “The information content of the fractal onthe cover is essentially zero.” Nada. Complexity is measured by thenumber of lines in the computer code needed to produce the effect.The product of a simple computer algorithm, Mandlebrot’s fractalbears virtually no content at all according to this measure of infor-mation theory. It is all froth on a core of simple algebra.
In a 2005 book, A Different Universe, Nobel Laureate physicistRobert Loughlin of Stanford describes such studies of froth as“baubles” and “supremely unimportant.” It is like analyzing waterby focusing on the bubbles as it boils, a phase change phenomenonstill not understood and full of chaotic enigmas. Such frothy dataanalysis epitomizes spurious science. It focuses on trivial patternsyielding small or chaotic effects that are divorced from the actualsubstance of causes and consequences.
In a similar way, information theory dismisses the many booksthat attempt to reduce markets to material laws. The legendary in-formation theorist Gregory Chaitin demonstrates that the laws ofphysics, measured by the same gauge of algorithmic complexity,bear far less information than do social phenomena such as people,companies, and markets. To predict the markets by physical law islike predicting the outcome of the Super Bowl by studying the lawsof football.
Markets are living things fraught with all the complexity and in-formation of life. The essence of life is that it is governed by infor-mation that is separate from its substrate. Just as computer
The Outsider Trading Scandal 175
ccc_mauldin_ch09_171-184.qxd 9/23/05 10:50 AM Page 175

information can be put on any kind of regular carrier, from a pieceof paper to a grain of sand, information is not intrinsically chemicalor physical. As MIT’s Norbert Wiener explained: “Information is in-formation, not matter or energy. No materialism that does not admitthis can survive in the present day.” As Wiener put it, “The braindoes not secrete thought as the liver does bile.”
As manifestations of the interplay of human minds, markets areanalogous to biological phenomena. Although the analogy is notexact, it conveys a deep truth. The controlling knowledge of eco-nomics and biology both reside deep inside the nuclei of cells andcompanies.
In biology, this order of things is termed the Central Dogma, asframed by Nobel Laureate Francis Crick who with James Watsonfirst defined the structure of DNA. The Central Dogma ordains thatDNA comes first and programs the proteins. DNA is a predictablecarrier that can bear any possible sequence of coded nucleotides.The content is entirely separate from the contents. That is why DNAcould carry the genetic information of all the living creatures thathave ever existed or presumably will exist.
Because there are 64 DNA codons and an alphabet of only 20amino acids, biological information has to flow from the more po-tent information source (the DNA with its 64 possible symbols) tothe less potent one (the amino acid proteins with just 20 symbols).Lamarck and his follower Lysenko were wrong. You cannot changethe DNA program by altering the arrangement of physical proteins.You cannot create a new Soviet man by changing his environment.
In economics, the analogous principle—the central dogma—isthat the concept precedes the concrete. The design precedes theproduct. The plan precedes the company. You cannot predict thefuture of markets or companies by examining the fractal patterns oftheir previous price movements.
The contrary temptation has persisted throughout history. Peoplehave relentlessly tried to read the mind of God or the destiny of menand nations and companies in patterns in the sands or the stars. Butyou cannot fathom the DNA by contemplating the shape of people’sheads (phrenology) or reading the lines on their hands (palmistry)or examining the constellations at the moment of their birth (astrol-
176 JUST ONE THING
ccc_mauldin_ch09_171-184.qxd 9/23/05 10:50 AM Page 176
ogy). Similarly, you cannot predict future movements of markets byweighing the current patterns of stock prices. There simply is notenough information in current prices to reveal future prices.
Outsiders doing technical analysis can occasionally be effective,particularly when guided and seasoned by an intuitive or stealthymastery of fundamentals. But technical analysis is essentially para-sitic. It is outside information. For its validity, it depends on the fun-damental judgments of insiders and the insights of knowledgeableanalysts who appraise the DNA of companies: their management,their financial data, and their technological endowments.
Ultimately ruling markets are the real facts of supply and de-mand, the realities of finance, and the intricate details of technologyparadigms and execution. But the outside temptation persists. Theconventional wisdom, once again invoked on the Forbes cruise, isthat stock markets ride on toxic tides of greed and fear and can bebest appraised through technical indices of their movements.Through the long history chronicled by Charles Mackay in Extraor-dinary Delusions and the Madness of Crowds, shares have all too of-ten behaved like chaotic fractals, soaring wildly up on mad swirls ofignorant momentum and then plummeting down in dire spirals ofpanic. From the Tulipmania of the seventeenth century to theplunge of 1987 and the technology depression of 2000, chaos andvolatility have all too often ruled.
The promise of the Internet is infocopia: the instant spread ofdetailed information. Largely fulfilled, this promise brings the worldmore instantaneous information on more companies and securitiesthan ever before. So why in the midst of an information age, whencapital and data zip around the planet at the speed of light, do mar-kets still behave like tulip auctions in 1690, when high-speed datatraveled by carrier pigeons?
THE DEARTH OF INSIDE INFORMATION
A key reason is the outsider trading scandal. The law for informa-tion disclosure by public companies and aspirant public compa-nies prohibits the release of materially significant news unless it is
The Outsider Trading Scandal 177
ccc_mauldin_ch09_171-184.qxd 9/23/05 10:50 AM Page 177
published simultaneously to the world. This well-meaning rule issupposed to create a level playing field where no investors have theadvantage of inside knowledge. But a level playing field means noinformation, which is defined as a deformation of the level. Infor-mation, like life, is disequilibrium. What the SEC accomplishes is toreduce the amount of real information in stock prices.
Less information means increased volatility and more vulnera-bility to outside events. With the entire field of information aboutcompanies a regulated arena, information does not bubble upfrom firms spontaneously in raw and ambiguous form with execu-tives and engineers freely expressing their views and even invest-ing on the basis of them. It emerges as various forms of processedpublic relations.
Intended to prevent fraud and illegal insider trading, this ruledoes not prevent criminals from manipulating markets. Criminals,by definition, observe the law only to break it more ingeniously.The idea of stopping them by reducing information for everyoneelse is like stopping terrorists by making everyone else lie at air-ports about the complete control of their luggage. It makes the reg-ulator feel he is doing something, but it does not affect the criminal.
What the regulation of material information accomplishes in-stead is to sharply inhibit the flow of inside news from companies.Inside information—the flow of intimate detail about the progressof technologies and product tests and research and developmentand diurnal sales data—is in fact the only force that makes anylong-term difference in stock performance. Yet it is precisely this in-formation that is denied to public investors. Information about tech-nology cannot filter out day by day from different inside sources toknowledgeable people who might grasp the significance of it. In-stead, information is parceled out by departments of public affairsunder guidance of lawyers. The resulting press releases are mostlybombast and bafflegab, zero-entropy documents teetering over abay of safe-harbor statements often larger than the release itself.
Entrepreneurial information from deep inside companies, notfrom the investment counsel or PR firm, is the chief real knowl-edge in the economy. Acquiring and comprehending it is the chiefwork of inside entrepreneurs. Such knowledge is by no means self-
178 JUST ONE THING
ccc_mauldin_ch09_171-184.qxd 9/23/05 10:50 AM Page 178
evident; insiders often get it wrong. But nothing else is of muchvalue at all. By excluding inside news from influencing the day-to-day movements of prices, the United States effectively blinds itsstock markets
As a result, the pullulating mass of data and news about tech-nology companies is constipated into a few synthetic disclosureevents. What should be a steady outpouring of knowledge—someof it hype, some confusing, most of it ambiguous, like business lifeitself—emerges instead as a series of media events that leave outeverything interesting. Pivotal are quarterly financial reports andmerger and acquisition announcements.
Concentrated rather than diffused, such information takes theform of discrete nuggets and events—P&L or M&A—that are moresubject to theft and manipulation. Thus, the government’s control ofinformation creates more binary moments of disclosure and moreopportunities for inside trading. Moreover, because only acquiringcompanies can know all the intimate inside details about companiesthey are purchasing, mergers and acquisitions become the decisivemoments of value recognition. Anticipating them becomes a majorpreoccupation of analysts.
With inside information banished from public markets, priva-teers capture the wealth. The flow of capital gains bifurcates to theresidual inside traders who are legally permitted to learn the inti-mate facts of the companies in which they invest. Huge winners areconglomerateurs such as Warren Buffett of Berkshire Hathaway andJeffrey Immelt of General Electric and venture capitalists such asDonald Valentine of Sequoia and John Doerr of Kleiner PerkinsCaulfield and Byers.
GE and Berkshire Hathaway are not companies at all, but port-folios of diverse assets. Their strength is full access to inside knowl-edge about their holdings and potential purchases. Similarly,venture capitalists command full intimate knowledge of their targetfirms. When Google went public at $87 per share, most of the re-turns went to venture partnerships such as Kleiner that bought theshares for 40 cents.
The irony is that when the company went public, its informa-tion went private. As it plunged into the enforced secrecy of fair
The Outsider Trading Scandal 179
ccc_mauldin_ch09_171-184.qxd 9/23/05 10:50 AM Page 179
disclosure regulations, Google drastically reduced the flow of infor-mation to its shareholders. The public is left largely in the dark,learning little about their holdings outside of quarterly announce-ments, occasional press releases, and personality profiles in busi-ness magazines.
Such markets are vulnerable to outside information—the out-sider trading scandal. Mostly working in the dark, investors becomeparanoid and jump at every movement in the shadows. They de-bate the implicit punctuation in speeches by Alan Greenspan. Theygauge the relative milligrams in the weight of merger rumors. Theyeven speculate on what will be the next company deemed to holdan “ascendant technology” by the Gilder Technology Report. Theycontemplate technical charts and invest on the basis of momentum,by definition ignorant.
In their ignorance, investors become manic-depressive. Theybecome prey to pundits and politicians who may know even lessthan they do, but who command the media.
THE FALLACY OF IMBALANCE FEARS
During a trade tussle with China in the midst of the first decade ofthe new century, the U.S. Secretary of the Treasury John Snowchose to expound his economic wisdom in a prominent article onthe op-ed page of the Wall Street Journal (May 26, 2005). As the for-mer railroad executive saw it, the world economic system faced adire crisis of imbalance. In his thousand-word essay, he used theword imbalance, inflected with rhetorical frowns, no fewer thantwelve times.
By paying this almost liturgical tribute to the virtues of equilib-rium in international economics, Snow invoked the single most per-vasive fallacy in the minds of investors and their guides and gurus:the idea that economies should be balanced or are naturally bal-anced at their borders. Following from this insight is the notion thatimbalances must be rectified. If they persist, they portend a cata-strophic “Day of Reckoning,” as Benjamin Friedman of Harvard putit in a famous text.
180 JUST ONE THING
ccc_mauldin_ch09_171-184.qxd 9/23/05 10:50 AM Page 180
Such litanies of equilibrium economics annually agitate theEconomic Summit in Davos, Switzerland, and lugubriate in theworldly wisdom of such sages as Buffett and Gates who believethat the U.S. economy is insightfully depicted as Squanderville be-cause foreigners prefer its assets to its goods. From all parts of thepolitical spectrum, tomes pile up in an Amazonian delta, invokingwith biblical resonance a “Great Reckoning” (James Dale David-son), or “Great Unravelling” (Paul Krugman of Princeton), or “Fi-nancial Reckoning Day” (William Bonner), or “Coming Collapse”(James Turk) or “Coming Crash” (John Talbot), capped off withseveral prophetic schools of “Coming Depression”: “Inflationary”(Ravi Batra), “Deflationary” (Robert Prechter), and just “Great”(Doug Casey).
In the absence of real inside information, such outside noisecan carry the day. Snow did not divulge just what imbalances wereupsetting him. Was the problem that for more than a decade Chinaand the United States have been growing far faster than the rest ofthe world? Snow did express the idea that Europe and Japan werenot growing fast enough. He also deplored, by innuendo, the tradegap, which has persisted for a hundred years or so while the UnitedStates came to dominate the world economy.
Perhaps the basic problem is that U.S. companies collectivelycommand close to half of the market capitalization of the world’spublicly traded corporations and that the United States producesclose to 30 percent of global gross domestic product (GDP) withjust 5 percent of the world’s population. Growing since the early1980s, these skews of wealth and growth favoring the United Statesunderstandably evoke envy and distress among many of the suavecontinental equilibrists at Davos. But only Snow knows why theyshould concern U.S. investors, or why we should blame China forits immensely fruitful tie to the dollar that creates a dollar zone inwhich both countries flourish.
The imbalances concern U.S. investors chiefly because theyconcern Snow, and artificial crises mean more government inter-vention in global markets by ignorant politicians who think the Chi-nese are manipulating their currency price by tying it to the dollar.With a trade balance the most unlikely possible configuration of
The Outsider Trading Scandal 181
ccc_mauldin_ch09_171-184.qxd 9/23/05 10:50 AM Page 181
capital and goods movements, concern about a trade gap meansconstant government intervention in the global economy and lowerstock prices everywhere.
With market prices moving by multiples on the basis of politicalnoise from the likes of Snow, investors spend most of their time in ahair trigger trance. When the Fed makes a mistake on interest ratesor the government makes another blunder on broadband policy orimmigration rules or tax rates, the markets overreact. Volatility is aneffect of the very ignorance that the new information tools are de-signed to overcome.
Even on the World Wide Web, blinded pundits cover blindedmarkets. With inquiring analysts barred from any “material” infor-mation not divulged at once to the world, reporters focus on thepersonalities of executives and on financial data, necessarily retro-spective and thus irrelevant to future prices. Business magazines,for example, must check all facts with the companies. Because ofinformation disclosure laws, all data must be closely held until it isofficially announced. No facts can be revealed or verified until theyare fully understood by the firms’ executives and deemed safe to bedivulged without risk of future embarrassment. Such news is obso-lete by the time it is announced. With an omerta on the companiesthemselves and paralysis of insiders around them, the markets fillup with misinformation, momentum, and so-called “technical”twaddle about the market itself.
In mid-July 2005, analysts discounted PowerOne’s (PWER) as-sertion that it had twenty customers for its key product. In fact,they estimated the correct number was forty customers, but CEOSteve Goldman could not divulge such new information until itwas thoroughly vetted by the company lawyers for unveiling tothe world. By that time, the number will in all likelihood havechanged again.
Because of such distortions amplified and propagated throughthe markets, the huge expansion of financial coverage on the Inter-net has not resulted in more rational and informed pricing of stocks.In an information economy, inside information is the basis of sharevalue. It is the DNA that ultimately shapes the behavior of compa-
182 JUST ONE THING
ccc_mauldin_ch09_171-184.qxd 9/23/05 10:50 AM Page 182
nies. Yet such inside information is barred as much as possible fromthe markets.
The essence of SEC rules is “don’t invest in anything you knowabout.” The chief message of many state governments is to invest inthe state lottery, where no one knows more than you do. The safeststock market investment is an index fund that bears no information atall. Executives at companies avoid insider rules by putting their ownpurchases and sales of stock on an automated program. This may pro-tect the executives from litigation, but it also protects the public fromthe information that insider activity might otherwise impart. Pricescontain less information, making the market a more perilous arena.
As Richard Vigilante and Andy Readleaf of Whitebox Strategiesput it in their forthcoming book, Minds and Markets: “In pursuit offairness, the SEC is trying to create a market in which all availableinformation circulates perfectly.” Perfect competition is the implicitideal. “No doubt they would prefer this to be a market of perfect in-formation (which is impossible). But since they can’t do that, theyare creating a market of scarce information, in which the job of re-solving uncertainty contains a much greater share of luck than ofjudgment. It’s the replacement of judgment with guessing, entrepre-neurship with luck, that is the general problem of which technicaltrading is only an instance.”
To realize the benefit of the World Wide Web on those informa-tion markets that focus on stocks, the current rules on the disclo-sure of material information should be rescinded. At a minimum,they are in clear violation of the first amendment. Fraudulent ma-nipulation of shares will remain a criminal act and can be prose-cuted without at the same time regulating and stultifying the entireflow of information from companies.
Information wants to be free and the more of it incorporated inthe prices of shares the more robust will be the market and the lesssubject to manipulation, euphoria, and panic. Through the Internet,stock exchanges can escape the popular Keynesian characterizationas a casino and fulfill still better their real role in the intelligent in-vestment of capital. Greed and fear can only give way to knowl-edge if knowledge is legal.
The Outsider Trading Scandal 183
ccc_mauldin_ch09_171-184.qxd 9/23/05 10:50 AM Page 183

THE INVESTOR’S CHALLENGE
The key rule for investors is to ignore the outside noise and focuson acquiring real, fundamental knowledge about companies. Thefundamentals will ultimately prevail. DNA will trump the manifesta-tions of matter. Cryptically coiled in the nuclei of companies, insideknowledge is harder to get under the new regime. But it remains ir-repressible.
The Internet is full of sources of competitive analysis and tech-nological expertise. New companies are emerging with powerfulways of obtaining and revealing the crucial troves of inside knowl-edge that determine the destiny of companies. Some of this infor-mation is being made available to the public by vendors such asGerson-Lehrman with software that enables quick links from in-vestors to hundreds of thousands of available experts. A new gener-ation of information companies, focused on the real sources ofvalue in markets, is creating a new topology of information amidthe leveled playing fields of government-enforced ignorance. Watchfor these developments and take heed. Skill and information areyour remedies for the dismal economics of gamblers’ ruin.
184 JUST ONE THING
ccc_mauldin_ch09_171-184.qxd 9/23/05 10:50 AM Page 184

C H A P T E R 1 0
The Winner’s Rule
I have known Michael Masterson for more than 20 years. He has
one of the smartest business minds I know. Michael has developed a
loyal following to his writings in Early to Rise (www.earlytorise.com),
an e-newsletter that mentors more than 400,000 readers. He has
been making money for himself and for others for almost two
decades. In that time, he’s taken only two breaks—each time for two
years. The first was after a stint with the Peace Corps, where he
came to appreciate relative values and the joy of teaching. The
second came at age 39, when he retired from the $100-million-plus
business that he and his partner had built over the course of a
remarkably successful business career. Michael has been involved
in the development of dozens of successful businesses, including two
that grew beyond $100 million. And he is the author of the best-
selling book Automatic Wealth (which I highly recommend for
entrepreneurs of all ages). I know, personally, that Michael
practices what he preaches. And we should all pay attention
when he preaches. —John Mauldin
�
185
�
ccc_mauldin_ch10_185-198.qxd 9/23/05 12:25 PM Page 185

ccc_mauldin_ch10_185-198.qxd 9/23/05 12:25 PM Page 186
The Winner’s Ruleby Michael Masterson
IT’S A TOUGH QUESTION: IF YOU COULD GIVE ONLY ONE PIECE OF ADVICE TO
a loved one about the world of wealth, what would it be?Since I write about wealth building almost every day, worthy
candidates spring to mind:
• Business doesn’t happen until you make the first sale.When I first heard this oft-quoted business adage, I found it ab-surd. There are so many things to do before a sale can be made,I thought, like setting up an office and installing telephones—not to mention getting the product ready. Later, after I had par-ticipated in the stillbirth of dozens of businesses that never hada chance of working in the first place, I realized the wisdom ofthis axiom. Buying office furniture and printing cards doesn’tmake the business go. Selling product does. Yes, there are somepreparations you need to make before the first sale can bemade, but until you have that first check in hand, all you are re-ally doing is spending money.
• The single most effective way of entering a new market isto offer a popular product at a drastically reduced price.This was another lesson I bridled against, yet it proved equallyimportant in my business career. In every industry, there is agood market for specialty and high-quality product produc-ers—but capturing a reasonable share of those niche marketsegments takes lots of money, time, and experience. When youare starting a new business, you are usually short in these threeessentials. That’s why it’s better to resist the allure of high-priced, prestige products in favor of getting at the big market
187
�
ccc_mauldin_ch10_185-198.qxd 9/23/05 12:25 PM Page 187
and selling the most desired products and services at ludi-crously cheap prices. It’s not always easy to figure out how toundersell the giants, but if you can you will be in a very happystarting place.
• It’s ultimately about selling. Conventional business wisdomsays you make money when you buy, not when you sell. I dis-agree. Although it helps to buy your product properly, it doesn’ttake a genius to do that. Anybody with a modicum of commonsense can figure out where the market is and haggle for theright price. Great businesspeople make their fortunes by in-creasing the perceived value of their products, thus ramping upprices and drastically increasing profit margins. (Think Chanel,Rolex, Range Rover.)
• When choosing a business, select one that can be grownwithout your personal involvement. Most professionals, nomatter how much they get paid, are wage slaves. And manyclosely held businesses—especially those built around the per-sonality or drive of a single person—depend for their growth onthe commitment of the founder. Avoid getting yourself into thistype of business. It flatters the ego but drastically limits yourgrowth potential. In growing your business, make sure it canexpand with the addition of more money, property, or people—but not more of you.
• Before you invest in anything, know exactly how muchyou are willing to lose—and get out if you hit that stop-loss point. We begin new ventures with optimism. That’s ex-actly why we need to plan for the worst. With every businessventure you invest in, figure out beforehand how you can getout if things fall apart. And make sure you can afford your exitplan. In stock investing, this is easy enough to do by setting astop-loss point. With other forms of investing—real estate, lim-ited partnerships, and entrepreneurial ventures, for example—itwill require more thoughtful planning. Do the planning andstick with it.
• First, improve your strengths. Then, eliminate yourweaknesses. Generally speaking, you will achieve more inbusiness by learning to do better what you already do well
188 JUST ONE THING
ccc_mauldin_ch10_185-198.qxd 9/23/05 12:25 PM Page 188
rather than by correcting your weaknesses. If you are a suc-cessful real estate broker who is really good at sales presenta-tions but weak on contracts, don’t worry so much aboutgetting better at contracts. If necessary, hire someone to han-dle that part of your business. Spend your self-improvementtime advancing from being “really good” to “really great” atsales presentations. This is not to say you should ignore yourweaknesses. We should all strive to eliminate those. But youwill find that you’ll have more success by attending first toyour strengths.
• Focused effort is more effective than a diversified ap-proach to business building. Ambitious people tend to fallinto two groups: those who focus almost entirely on one projectat a time and those who prefer to spread themselves out onmany projects. The focused approach allows you to acquiremastery faster. The diversified approach gives you more bal-ance. In my career, I’ve done both. And I have to say that al-though I’m naturally inclined toward diversification, I’ve had themost success and made the most money from the focused work.I believe there is a good reason for that. Success in businesscomes after you have learned the secrets of the industry you arein. That learning process takes time—four or five thousandhours is the norm. If your attention span is limited and you findyourself jumping too quickly to that other lawn (where the grassseems greener), you’ll find yourself with too many challengesthat you are simply not experienced enough to overcome. Ifyou find that your tendency in business is to skip from one ex-citing thing to another, train yourself to conquer one field be-fore you step foot in another.
• Let your winners run and cut your losses short. Despitewhat you may have gleaned about success from listening toentertainers and watching movies, most business ideas orventures that start out poorly fail. This is a very important les-son to learn. It’s very easy to get emotionally attached to pro-jects/investments we believe in. That’s why it’s so importantto follow this rule. When the marketplace tells you that yourgreat idea is a loser, don’t keep pushing. Close the project
The Winner’s Rule 189
ccc_mauldin_ch10_185-198.qxd 9/23/05 12:25 PM Page 189

and minimize your losses. If you really have a good idea, itwill come back to you in the future in another, perhaps better,set of clothing.
• Pareto’s Principle (the 80-20 Rule): 80 percent of your suc-cess comes from 20 percent of your resources. This is per-haps the best-known and most useful axiom of success. Most ofthe success/income/satisfaction you will get in your career willcome from a small portion of your skills/projects/efforts. Makeit a regular habit to periodically ask yourself, “Where am I get-ting most of the benefit here?” and comparing that to where youare putting in the most work.
There may be a few secrets I’ve forgotten, but these wouldcertainly be on my list of “the most important things I’d like toteach my children about business.” But if I had only one secret to teach?
THAT ONE MOST IMPORTANT THING
I have three boys. My oldest son is a computer engineer in themovie industry. My second son is a composer of music. And number three, still in high school, doesn’t yet know what hewants to do.
Is there a single “secret of success” that might be helpful to allthree of them, given that they have different interests, hopes, andexpectations?
The answer isn’t obvious. Like any parent, I want them to behappy. But there is something else I want—something I’ve come tounderstand now that they are getting out in the world and conduct-ing their own affairs: I want them to be good. I want them to havegood manners, to treat other people kindly, to be considerate ofthose who are less fortunate, and so on.
When they were youngsters, I wanted them to be good too, butfor pragmatic reasons. I wanted them to behave themselves in the
190 JUST ONE THING
ccc_mauldin_ch10_185-198.qxd 9/23/05 12:25 PM Page 190

back of the car so I could drive in peace. I wanted them to stayaway from the railroad tracks so they wouldn’t get killed. And Iwanted them to complete their homework assignments so theycould learn.
Now I want them to be good for altruistic reasons. I want themto be able to do what my parents wanted me to do: Leave the worlda little better than I found it. Or better yet, to make their world a lit-tle better because they are in it. This is not, I’m sure, an unusual no-tion. Most parents must feel this way.
So that’s what I want—that my children accomplish their goalswithout sacrificing their fun, and become successful without com-promising their integrity. I want them to be both good at what theydo and good in doing it. Is there something I can tell them that willhelp them do both?
I think there is. It’s a way of conducting yourself in business(and other areas of your life) that can give you success, peace ofmind, and happiness. Best of all, perhaps, once learned, it is aston-ishingly easy to practice.
That secret is this: In every relationship you get into—every busi-ness, social, or personal transaction—make sure that the other per-son gets as much benefit from it as you do. When considering yourown advantages and disadvantages in taking any course of action,consider those of everyone else involved.
I realize this idea flies in the face of some thinking. It cer-tainly contradicts the way many prominent corporate executiveshave been behaving lately. Today, the dominant idea of suc-cess might be classified as some version of “Looking Out forNumber One.”
I’ve tried that approach, I’m embarrassed to say. In my early yearsas a marketer, I sold products I wasn’t proud of at prices I couldn’t jus-tify. I rationalized it all by telling myself that I was taking care of myfamily. That approach didn’t work for the long-term success of thebusiness, and it didn’t work with regard to the way I felt about myself.
When I took the initiative to do things right, everything turnedout better. Business grew. Relationships developed. And my senseof personal satisfaction skyrocketed.
The Winner’s Rule 191
ccc_mauldin_ch10_185-198.qxd 9/23/05 12:25 PM Page 191
I realized that by making my efforts good for everyone else, myeventual success was all but guaranteed. When people begin to seeyou as someone they benefit from, they are inclined to bring youmore and better deals.
Often, focusing on the other person’s interests means taking arisk—taking the chance that the time and money you invest in himwill pay off. To some businesspeople, giving before you get is afoolish idea. For me, it’s been the source of all my best and mostenjoyed accomplishments.
Let me give you an example of how a colleague of mine putthis principle to work. About 10 years ago, he decided he wantedto take over a failing periodical business in England. Instead of do-ing the “smart” thing—putting the squeeze on the business until itwas a breath away from death and then stealing it for pennies onthe dollar—he voluntarily moved himself and his family to Londonfor six months to nurse the business back to health. He did thisbased on nothing more than an oral agreement that if he suc-ceeded in doing that, they would then sell him half of the businessat some “fair” price.
At that point in my career, I was already an advocate of win-win deals, but it seemed to me that this was taking the good-spirited concept to a new level. By fixing the business before hebought it, my colleague was dramatically raising the price hewould have to pay for it. He was doing so without compensation.And by doing it all on an oral contract, he was leaving himselfopen to being double-crossed.
What happened was very much a happy ending. His new part-ners got a very nice paycheck for a business they knew was on theverge of bankruptcy. And they returned the favor a few years laterwhen he bought out the rest of the shares by agreeing to the buy-out and not haggling over the price.
Today, that business is one of his most productive assets. Justas importantly, he has great relationships with hundreds of people—employees, vendors, and colleagues—who saw how he behaved and subsequently felt good about doing businesswith him.
192 JUST ONE THING
ccc_mauldin_ch10_185-198.qxd 9/23/05 12:25 PM Page 192
BECOMING AN INVALUABLE EMPLOYEE
If my eldest son were to apply this rule—to think about the inter-ests of the other person/people in the relationship first and yourssecond—to his current job, he would make sure that the value heis giving his business, as an employee, is worth a good deal morethan the cost of his employment (the salary and benefits he isearning).
In my book Automatic Wealth, I talk a good deal about how tobecome an “invaluable” employee. Here is a short list of what myson would do to achieve that status within his company:
• Be among the first to arrive every morning.• Understand the most important secrets of the business, includ-
ing how sales are made, how customers are retained, and hownew products are created.
• In his spare time, develop skills to help the company achieve itsmost important goals: growth, profitability, and good customerservice.
• Find ways to make his boss more successful.• Ignore company politics and focus on worthy company
goals.
Employees who quickly “get” the core purpose of their busi-ness and focus their time and energies on helping the businessachieve that goal will be recognized as potential superstars. Such employees will be rewarded, not only with signifi-cantly higher financial remuneration but also with greater respon-sibility and direct access to the people who can advance their futures.
But in explaining all this to my son, I’d make this point veryclear: Although you’ll get the best rewards for making yourself in-valuable to your employer, you won’t be invaluable if you do whatyou do in order to get those rewards. That’s the catch. To get thebenefits of putting your business partners first, you must really putthem first.
The Winner’s Rule 193
ccc_mauldin_ch10_185-198.qxd 9/23/05 12:25 PM Page 193
BEING AN EFFECTIVE MENTOR
Here’s another example of the way this rule works—this time fromthe management side.
At least half of the success I’ve enjoyed in business has comefrom riding on the coattails of young men and women who haveworked for me. If I were to take a look at the checks that flowinto my consulting practice every month, many more than half of them are signed by individuals who were, at one time, my protégés.
If I’ve had extraordinary success in mentoring people—and Ithink I have—it has happened because I never sought to get any-thing out of my mentorship other than the pleasure of seeingthose people succeed. I know that sounds like the most de-plorable sort of chest pounding, but I do believe it’s true. I havealways enjoyed teaching what I’ve learned to others—and that in-cluded showing bright, young employees exactly how I was ableto achieve certain things.
By imitating my successes and avoiding my mistakes, they allhad faster (and in some cases steeper) ascents in their careers. Inmany of those cases, I retained business relationships with them—relationships that have proven both very lucrative and personallyrewarding.
If my goal had been to use those people to take care of me, Ibelieve they would have sensed it. As a result, I wouldn’t be enjoy-ing the close connections and loyalty that I have today.
NICE GUYS FINISH BEST
In an airport bookstore yesterday, I picked up a copy of WinnersNever Cheat by Jon M. Huntsman. Doubting the premise of thebook from the outset (“A self-made billionaire speaks out on hon-esty and generosity”), I read it with a good degree of skepticism.Here was the owner of one of the largest privately held businesses
194 JUST ONE THING
ccc_mauldin_ch10_185-198.qxd 9/23/05 12:25 PM Page 194
in the world bragging about how ethical he is. I wondered whatsome of his former employees and business associates would haveto say about his integrity.
It reminded me of a presentation I made a year ago to a groupof extremely successful businessmen. My topic was “How to Suc-ceed in Business Without Losing Your Soul.” I talked frankly aboutsome of the ethical compromises I’d made in my career, how guiltyI’d felt about them, and how it left me wondering if I could havedone as well by doing things right.
With one exception, they were unanimous in being shockedand even appalled by what I said. Of course, you can succeed with-out compromise! Each of them had done it. None of them had evercheated a little, lied a bit, treated someone a tad unfairly. Theywere, by their own accounts, angels of virtue who had spent theircareers making the world a better place.
A few of these holy men, I discovered later, had worked for such eminently laudable companies as WorldCom, Tyco, and Enron.
Only one of those listening to my confession that day admittedto any peccadilloes. A top broker with one of the country’s largesthouses, he told me, “What you said really hit home. Every day, I goto work thinking, ‘My job is to lie. I lie to all my clients. Not big,black lies all the time, but lies that have to do with exaggerationand omission. If I didn’t lie, I’d be unemployed.’ That’s how I ratio-nalize what I do.”
I told him that I admired his honesty and that he might be ableto find a way out of his quandary by believing in a very simpleproposition: that in the long run, he’d make plenty of money forhimself and plenty of money for his business if he could forgetabout being the number one salesperson in his firm and begin tothink about making sure that his customers benefited from him atleast as much as he was benefiting from them.
“Think about what you’d like to get from a broker,” I toldhim. “Then find a way to give your customers that . . . and then alittle more.”
Surely if he did that—and he could do that, for he was a smart,
The Winner’s Rule 195
ccc_mauldin_ch10_185-198.qxd 9/23/05 12:25 PM Page 195
energetic, and resourceful person—he would gradually develop aRolodex full of loyal, satisfied customers. The best thing about mak-ing sure your customers get as much or more out of your relation-ship as you do is that you don’t have to keep finding newcustomers as the years go by. The old ones stay because they trustyou, and they send their friends to you as well.
Following the “other guy first” policy not only guarantees suc-cess in the long run, it ensures that the dollars you earn later willcome much more easily than the dollars you earn today.
In Winners Never Cheat, Huntsman tells a story about a dealhe made with Emerson Kampen, CEO of Great Lakes ChemicalCompany in 1986. Huntsman agreed to sell 40 percent of a divi-sion of his company for $54 million. A handshake sealed the deal.Four months after the oral agreement, the documents weredrafted. But during that time, the price of raw materials had de-creased substantially and the profit margins of Huntsman’s com-pany were reaching all-time highs. Nothing had been signed andno documents had been exchanged. Kampen called him and pro-posed that instead of sticking with the $54 million they had orallyagreed to, he would pay half of the $250 million the company hadappreciated to. Huntsman told him no, that he was going to stickwith his original deal.
“But that’s not fair to you,” Kampen responded.“You negotiate for your company, Emerson, and let me negoti-
ate for mine,” Huntsman replied.That’s an amazing example of making sure your business asso-
ciate gets at least as good a deal as you get. And that anecdoteerased a good deal of the skepticism I had toward Huntsman whenI opened his book.
As Larry King said in his foreword to Winners Never Cheat, “LeoDurocher was quite wrong when he said nice guys finish last. Notonly can nice people finish first, they finish better.”
In thinking about this principle recently, it’s occurred to me thatequity in business is the same as equity in personal relationships. Itis the result of a long-term approach to value. If you want yourmarriage to last a long time, you must focus your energy on whatyou can do for your spouse, not what you can get from the mar-
196 JUST ONE THING
ccc_mauldin_ch10_185-198.qxd 9/23/05 12:25 PM Page 196

riage. The same is true in business. People who have trouble mak-ing long-term personal relationships are seldom able to developlong-term, appreciating businesses.
Thinking about the other guy first may not be instinctual behav-ior. But the course of human progress could be said to be the his-tory of our efforts to do just that.
The Winner’s Rule 197
ccc_mauldin_ch10_185-198.qxd 9/23/05 12:25 PM Page 197

ccc_mauldin_ch10_185-198.qxd 9/23/05 12:25 PM Page 198
C H A P T E R 1 1
Rich Man, Poor Man
What can I say about my friend Richard Russell without using a lot
of superlatives? Richard has been writing and publishing the DowTheory Letters since 1958. This newsletter service holds the record
for being the longest continuously published newsletter by one
person in the investment business. Richard is now 81 years old and
still writes an extremely popular daily e-letter, full of commentary
on the markets and whatever interests him that day. He gets up at
3 a.m. or so and starts his massive daily reading, finishing the letter
just after the markets close. He is my business hero.
He was the first writer to recommend gold stocks in 1960. He
called the top of the 1949 to 1966 bull market, and called the
bottom of the bear market in 1974 almost to the day, predicting a
new bull market. (Think how tough it was to call for a bull market
in late 1974, when things looked really miserable!) He was a
bombardier in WWII, lived through the Depression, wars, and bull
and bear markets. I would say that Russell is another one of those
true innate market geniuses who have simply forgotten more than
most of us will ever know, except I am not certain he has forgotten
anything. His daily letter is loaded with references and wisdom
from the past and gives us a guide to the future. (You can learn
more at www.dowtheoryletters.com.) —John Mauldin
�
199
�
ccc_mauldin_ch11_199-212.qxd 9/23/05 10:53 AM Page 199

ccc_mauldin_ch11_199-212.qxd 9/23/05 10:53 AM Page 200
Rich Man, Poor Manby Richard Russell
MAKING MONEY ENTAILS A LOT MORE THAN PREDICTING WHICH WAY THE
stock or bond markets are heading or trying to figure which stockor fund will double over the next few years. For the great majorityof investors, making money requires a plan, self-discipline, and de-sire. I say “for the great majority of people,” because if you’re aSteven Spielberg or a Bill Gates you don’t have to know about theDow or the markets or about yields or price/earnings ratios. You’rea phenomenon in your own field, and you’re going to make bigmoney as a byproduct of your talent and ability. But this kind of ge-nius is rare.
The average investor—like you and me—needs to have a finan-cial plan. Here, I’ll offer some rules on investing that should be fol-lowed if you are serious about wanting to make money.
THE POWER OF COMPOUNDING
One of the most important lessons for living in the modern worldis that to survive you’ve got to have money. But to live (survive)happily, you must have love, health (mental and physical), free-dom, intellectual stimulation—and money. When I taught my kidsabout money, the first thing I taught them was the use of the money
201
�
R U L E # 1
Compounding works.
ccc_mauldin_ch11_199-212.qxd 9/23/05 10:53 AM Page 201
bible. What’s the money bible? Simple; it’s a volume of the com-pounding interest tables.
Compounding is the royal road to riches. Compounding is thesafe road, the sure road, and fortunately, anybody can do it. Tocompound successfully, you need the following: perseverance inorder to keep you firmly on the savings path. You need intelligencein order to understand what you are doing and why. You needknowledge of the mathematical tables in order to comprehend theamazing rewards that will come to you if you faithfully follow thecompounding road. And, of course, you need time, time to allowthe power of compounding to work for you. Remember, com-pounding only works through time.
But there are two catches in the compounding process. The firstis obvious—compounding may involve sacrifice (you can’t spend itand still save it). Second, compounding is boring—b-o-r-i-n-g. Or Ishould say it’s boring until (after seven or eight years) the moneystarts to pour in. Then, believe me, compounding becomes very in-teresting. In fact, it becomes downright fascinating!
In order to emphasize the power of compounding, I am includ-ing the following extraordinary study, courtesy of Market Logic, anewsletter by Norman Fosback.
In this study we assume that investor B opens an IRA at age19. For seven consecutive periods he puts $2,000 into the IRA atan average growth rate of 10 percent (7 percent interest plusgrowth). After seven years, this fellow makes no more contribu-tions—he’s finished.
A second investor, A, makes no contributions until age 26 (thisis the age when investor B was finished making contributions).Then A continues faithfully to contribute $2,000 every year until age65 (at the same theoretical 10 percent rate).
Now study the incredible results show in Table 11.1. InvestorB, who made contributions earlier and who made only sevencontributions, ends up with more money than A, who made 40contributions but at a later time. The difference in the two is thatB had seven more early years of compounding than A. Thoseseven early years were worth more than all of A’s 33 additionalcontributions.
202 JUST ONE THING
ccc_mauldin_ch11_199-212.qxd 9/23/05 10:53 AM Page 202
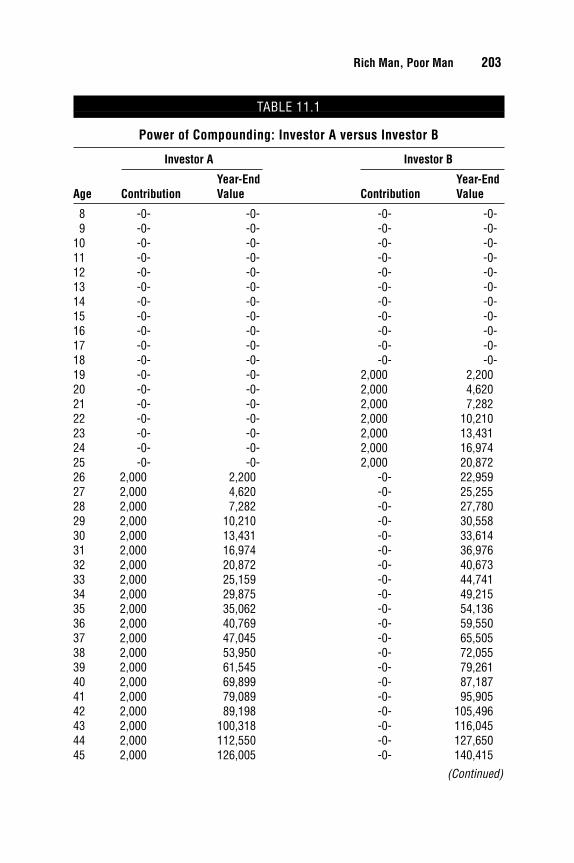
Rich Man, Poor Man 203
TABLE 11.1
Power of Compounding: Investor A versus Investor B
Investor A Investor B
Year-End Year-EndAge Contribution Value Contribution Value
8 -0- -0- -0- -0-9 -0- -0- -0- -0-
10 -0- -0- -0- -0-11 -0- -0- -0- -0-12 -0- -0- -0- -0-13 -0- -0- -0- -0-14 -0- -0- -0- -0-15 -0- -0- -0- -0-16 -0- -0- -0- -0-17 -0- -0- -0- -0-18 -0- -0- -0- -0-19 -0- -0- 2,000 2,20020 -0- -0- 2,000 4,62021 -0- -0- 2,000 7,28222 -0- -0- 2,000 10,21023 -0- -0- 2,000 13,43124 -0- -0- 2,000 16,97425 -0- -0- 2,000 20,87226 2,000 2,200 -0- 22,95927 2,000 4,620 -0- 25,25528 2,000 7,282 -0- 27,78029 2,000 10,210 -0- 30,55830 2,000 13,431 -0- 33,61431 2,000 16,974 -0- 36,97632 2,000 20,872 -0- 40,67333 2,000 25,159 -0- 44,74134 2,000 29,875 -0- 49,21535 2,000 35,062 -0- 54,13636 2,000 40,769 -0- 59,55037 2,000 47,045 -0- 65,50538 2,000 53,950 -0- 72,05539 2,000 61,545 -0- 79,26140 2,000 69,899 -0- 87,18741 2,000 79,089 -0- 95,90542 2,000 89,198 -0- 105,49643 2,000 100,318 -0- 116,04544 2,000 112,550 -0- 127,65045 2,000 126,005 -0- 140,415
(Continued)
ccc_mauldin_ch11_199-212.qxd 9/23/05 10:53 AM Page 203
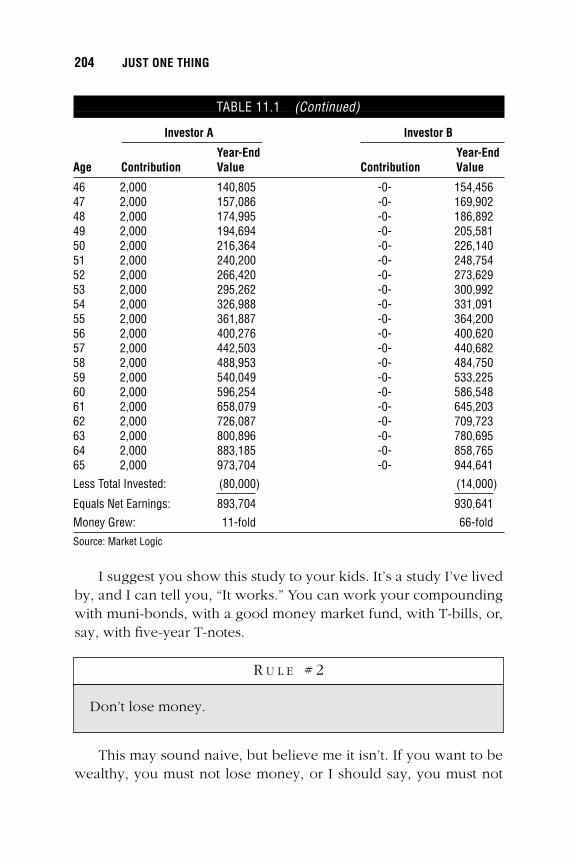
I suggest you show this study to your kids. It’s a study I’ve livedby, and I can tell you, “It works.” You can work your compoundingwith muni-bonds, with a good money market fund, with T-bills, or,say, with five-year T-notes.
This may sound naive, but believe me it isn’t. If you want to bewealthy, you must not lose money, or I should say, you must not
204 JUST ONE THING
TABLE 11.1 (Continued)
Investor A Investor B
Year-End Year-EndAge Contribution Value Contribution Value
46 2,000 140,805 -0- 154,45647 2,000 157,086 -0- 169,90248 2,000 174,995 -0- 186,89249 2,000 194,694 -0- 205,58150 2,000 216,364 -0- 226,14051 2,000 240,200 -0- 248,75452 2,000 266,420 -0- 273,62953 2,000 295,262 -0- 300,99254 2,000 326,988 -0- 331,09155 2,000 361,887 -0- 364,20056 2,000 400,276 -0- 400,62057 2,000 442,503 -0- 440,68258 2,000 488,953 -0- 484,75059 2,000 540,049 -0- 533,22560 2,000 596,254 -0- 586,54861 2,000 658,079 -0- 645,20362 2,000 726,087 -0- 709,72363 2,000 800,896 -0- 780,69564 2,000 883,185 -0- 858,76565 2,000 973,704 -0- 944,641
Less Total Invested: (80,000) (14,000)
Equals Net Earnings: 893,704 930,641
Money Grew: 11-fold 66-fold
Source: Market Logic
R U L E # 2
Don’t lose money.
ccc_mauldin_ch11_199-212.qxd 9/23/05 10:53 AM Page 204
lose big money. Absurd rule, silly rule? Maybe, but most people losemoney in disastrous investments, gambling, rotten business deals,greed, poor timing. Yes, after almost five decades of investing andtalking to investors, I can tell you that most people definitely dolose money, lose big-time—in the stock market, in options and fu-tures, in real estate, in bad loans, in mindless gambling, and in theirown businesses.
In the investment world the wealthy investor has one major ad-vantage over the little guy, the stock market amateur, and the neo-phyte trader. The advantage that wealthy investors enjoy is that theydon’t need the markets. I can’t begin to tell you what a differencethat makes, both in one’s mental attitude and in the way one actu-ally handles one’s money.
Wealthy investors don’t need the markets, because they alreadyhave all the income they need. Money is being generated frombonds, T-bills, money-market funds, stocks, and real estate. In otherwords, the wealthy investors never feel pressured to “make money”in the market.
Wealthy investors tend to be an expert on values. When bondsare cheap and bond yields are irresistibly high, they buy bonds.When stocks are on the bargain table and stock yields are attractive,they buy stocks. When real estate is a great value, they buy real es-tate. When great art or fine jewelry or gold is on the “giveaway”table, they buy art or diamonds or gold. In other words, the wealthyinvestor puts his money where the great values are.
And if no outstanding values are available, the wealthy investorswait. They have money coming in daily, weekly, monthly. They canafford to wait until a good investment comes along. This is knownas patience.
But what about the little guy? This fellow always feels pressuredto “make money.” And in return, he’s always pressuring the market
Rich Man, Poor Man 205
R U L E # 3
Wealthy people don’t need the markets.
ccc_mauldin_ch11_199-212.qxd 9/23/05 10:53 AM Page 205
to “do something” for him. But sadly, the market isn’t interested.When the little guy isn’t buying stocks offering 1 percent or 2 per-cent yields, he’s off to Las Vegas or Atlantic City trying to beat thehouse at roulette. Or he’s spending 20 bucks a week on lottery tick-ets, or he’s “investing” in some crackpot scheme that his neighbortold him about (in strictest confidence, of course).
And because the little guy is trying to force the market to dosomething, he’s a guaranteed loser. The little guy doesn’t under-stand values, so he constantly overpays. He doesn’t comprehendthe power of compounding, and he doesn’t understand money.He’s never heard the adage, “He who understands interest, earns it.He who doesn’t understand interest, pays it.” The little guy is thetypical American, and he’s deeply in debt.
The little guy is in hock up to his ears. As a result, he’s alwayssweating—sweating to make payments on his house, his refrigera-tor, his car, or his lawn mower. He’s impatient, and he feels perpet-ually put upon. He tells himself that he has to make money—fast.And he dreams of those “big, juicy mega-bucks.” In the end, the lit-tle guy wastes his money in the market, or he loses his money gam-bling, or he dribbles it away on senseless schemes. In short, this“money-nerd” spends life dashing up the financial down escalator.
But here’s the ironic part of it. If, from the beginning, the littleguy had adopted a strict policy of never spending more than hemade, if he had taken his extra savings and compounded it in intel-ligent, income-producing securities, then in due time he’d havemoney coming in daily, weekly, monthly, just like the rich man.The little guy would have become a financial winner, instead of apathetic loser.
The only time the average investor should stray outside the ba-sic compounding system is when a given market offers outstandingvalue. I judge an investment to be a great value when it offers (a)
206 JUST ONE THING
R U L E # 4
Look for values.
ccc_mauldin_ch11_199-212.qxd 9/23/05 10:53 AM Page 206
safety; (b) an attractive return; and (c) a good chance of appreciat-ing in price. At all other times, the compounding route is safer andprobably a lot more profitable, at least in the long run.
THE TRICK IS TO BEAT TIME
Here’s something you won’t hear from your broker or read about inthe “How to Beat the Market” books. All investing and speculationis basically an exercise in attempting to beat time.
When you try to pick the winning stock or when you try to sellout near the top of a bull market or when you try in-and-out trading,you may not realize it but what you’re doing is trying to beat time.
Time is the single most valuable asset you can ever have in yourinvestment arsenal. The problem is that none of us has enough of it.
But let’s indulge in a bit of fantasy. Let’s say you have 200years to live, 200 years in which to invest. Here’s what you coulddo. You could buy $20,000 worth of municipal bonds yielding,say, 5.5 percent.
At 5.5 percent percent, money doubles in thirteen years. Sohere’s your plan: Each time your money doubles you add another$10,000. So at the end of thirteen years you have $40,000 plus the$10,000 you’ve added, meaning that at the end of thirteen years youhave $50,000.
At the end of the next thirteen years you have $100,000, youadd $10,000, and then you have $110,000. You reinvest it all in 5.5percent munis, and at the end of the next thirteen years you have$220,000 and you add $10,000, making it $230,000.
At the end of the next thirteen years you have $460,000 and youadd $10,000, making it $470,000.
In 200 years there are 15.3 doubles. You do the math. By the endof the 200th year you wouldn’t know what to do with all your money.It would be coming out of your ears. And all with minimum risk.
So with enough time, you would be rich—guaranteed. Youwouldn’t have to waste any time picking the right stock or the rightgroup or the right mutual fund. You would just compound yourway to riches, using your greatest asset: time.
Rich Man, Poor Man 207
ccc_mauldin_ch11_199-212.qxd 9/23/05 10:53 AM Page 207
There’s only one problem: in the real world you’re not going tolive 200 years. But if you start young enough or if you start yourkids early, you or they might have anywhere from thirty to sixtyyears of time ahead of you.
Because most people have run out of time, they spend endlesshours and nervous energy trying to beat time, which, by the way,is really what investing is all about. Pick a stock that advancesfrom 3 to 100, and if you’ve put enough money in that stock you’llhave beaten time. Or join a company that gives you a million op-tions, and your option moves up from 3 to 25, and again you’vebeaten time.
How about this real example of beating time: John Walter joinedAT&T, but after nine short months he was out of a job. The com-plaint was that Walter “lacked intellectual leadership.” Walter got$26 million for that little stint in a severance package. That’s whatyou call really beating time. Of course, a few of us might have an-other word for it—and for AT&T.
IN THE MARKETS, HOPE IS THE DANGEROUS SIREN SONG
It’s human nature to be optimistic. It’s human nature to hope.Furthermore, hope is a component of a healthy state of mind.Hope is the opposite of negativity. Negativity in life can lead toanger, disappointment, and depression. After all, if the world is anegative place, what’s the point of living in it? To be negative isto be anti-life.
Ironically, it doesn’t work that way in the stock market. In thestock market, hope is a hindrance, not a help. Once you take a po-sition in a stock, you obviously want that stock to advance. But ifthe stock you bought is a real value, and you bought it right, youshould be content to sit with that stock in the knowledge that overtime its value will rise without your help, without your hoping.
So in the case of this stock, you have value on your side—andall you need is patience. In the end, your patience will pay off with
208 JUST ONE THING
ccc_mauldin_ch11_199-212.qxd 9/23/05 10:53 AM Page 208
a higher price for your stock. Hope shouldn’t play any part in thisprocess. You don’t need hope, because you bought the stock whenit was a great value, and you bought it at the right time.
Any time you find yourself hoping in this business, the odds arethat you are on the wrong path—or that you did something stupidthat should be corrected.
Unfortunately, hope is a money-loser in the investment busi-ness. This is counterintuitive but true. Hope will keep you ridinga stock that is headed down. Hope will keep you from taking asmall loss and, instead, allowing that small loss to develop into alarge loss.
In the stock market hope gets in the way of reality, hope gets inthe way of common sense. One of the first rules in investing is“Don’t take the big loss.” In order to do that, you’ve got to be will-ing to take a small loss.
If the stock market turns bearish, and you’re staying put withyour whole position, and you’re hoping that what you see is not re-ally happening—then welcome to poverty city. In this situation, allyour hoping isn’t going to save you or make you a penny. In fact,in this situation hope is the devil that bids you to sit—while yourportfolio of stocks goes down the drain.
In the investing business my suggestion is that you avoid hope.Forget the siren, hope; instead, embrace cold, clear reality.
THERE IS NO SUBSTITUTE FOR ACTION
A few days ago a young subscriber asked me, “Russell, you’vebeen dealing with the markets since the late 1940s. This is astrange question, but what is the most important lesson you’velearned in all that time?”
I didn’t have to think too long. I told him, “The most importantlesson I’ve learned comes from something Freud said. He said,‘Thinking is rehearsing.’ What Freud meant was that thinking is nosubstitute for acting. In this world, in investing, in any field, there isno substitute for taking action.”
Rich Man, Poor Man 209
ccc_mauldin_ch11_199-212.qxd 9/23/05 10:53 AM Page 209
This brings up another story that illustrates the same theme. J. P. Morgan was “Master of the Universe” back in the 1920s. Oneday a young man came up to Morgan and said, “Mr. Morgan, I’msorry to bother you, but I own some stocks that have been actingpoorly, and I’m very anxious about these stocks. In fact, worryingabout those stocks is starting to ruin my health. Yet, I still like the stocks. It’s a terrible dilemma. What do you think I should do, sir?”
Without hesitating Morgan said, “Young man, sell to the sleep-ing point.”
The lesson is the same. There’s no substitute for acting. In thebusiness of investing or the business of life, thinking is not going todo it for you. Thinking is just rehearsing. You must learn to act.
That’s the single most important lesson that I’ve learned in thisbusiness.
Again, and I’ve written about this episode before, a verywealthy and successful investor once said to me, “Russell, do youknow why stockbrokers never become rich in this business?”
I confessed that I didn’t know. He explained, “They don’t getrich because they never believe their own bull.”
Again, it’s the same lesson. If you want to make money (or getrich) in a bull market, thinking and talking isn’t going to do it.You’ve got to buy stocks. Brokers never do that. Do you know onebroker who has?
A painful lesson: Back in 1991 when we had a perfect opportu-nity, we could have ended Saddam Hussein’s career, and we couldhave done it with ease. But those in command, for political reasons,didn’t want to face the adverse publicity of taking additional U.S.casualties. So we stopped short, and Saddam was home free. Wewere afraid to act. And now we’re dealing with that failure to actwith another and messier war.
In my own life, many of the mistakes I’ve made have come be-cause I forgot or ignored the “acting lesson.” Thinking is rehearsing,and I was rehearsing instead of acting. Bad marriages, bad invest-ments, lost opportunities, bad business decisions—they are all madeworse because we fail for any number of reasons to act.
210 JUST ONE THING
ccc_mauldin_ch11_199-212.qxd 9/23/05 10:53 AM Page 210

The reasons to act are almost always better than the reasonsyou can think up not to act. If you, my dear readers, can under-stand the meaning of what is expressed in this one sentence, thenbelieve me, you’ve learned a most valuable lesson. It’s a lessonthat has saved my life many times. And I mean literally, it’s a les-son that has saved my life.
Rich Man, Poor Man 211
ccc_mauldin_ch11_199-212.qxd 9/23/05 10:53 AM Page 211

ccc_mauldin_ch11_199-212.qxd 9/23/05 10:53 AM Page 212
213
C H A P T E R 1 2
The Millennium Wave
As a recognized expert and leader on investment issues,
Millennium Wave Investments President John Mauldin is
primarily involved in private money management, financial
services, and investments. John Mauldin is a prolific author,
writer, and editor of the popular Thoughts from the Frontlinee-letter, which goes to more than 1,500,000 readers weekly and is
posted on numerous independent Web sites. He is the author
of the best-selling Bull’s Eye Investing. He also writes a free
letter on hedge funds and private offerings for accredited
investors.
John demonstrates an unusual breadth of expertise, as
illustrated by the wide variety of issues addressed in-depth in his
writings. He has a unique ability to present complex financial
topics and make them understandable to the lay reader. His
background includes a wide variety of studies and experiences,
and he has traveled extensively, visiting well over forty countries
and forty-eight states. A popular public speaker, John addresses
numerous investment conferences and seminars.
John Mauldin is an Arlington, Texas, businessman, and the
father of seven children, ranging from ages 11 through 28, five
of whom are adopted. His offices are in right field of the
Ballpark in Arlington. (To learn more about him, go to
www.johnmauldin.com.)
�
ccc_mauldin_ch12_213-246.qxd 9/23/05 10:55 AM Page 213

In this chapter, John explains why we are entering a decade
where change will come faster and be more profound than at any
time in history. In fact, there are numerous waves of change that
are all joining together to form what he calls the Millennium Wave,
a period of accelerating change at the beginning of this
millennium—which will be the single largest period of
transformation in human history.
214 JUST ONE THING
�
ccc_mauldin_ch12_213-246.qxd 9/23/05 10:55 AM Page 214
The Millennium Waveby John Mauldin
“It will therefore be crucial that you see the world anew.That means looking from the outside in to reanalyze muchthat you have probably taken for granted. This will enableyou to come to an understanding. If you fail to transcendconventional thinking at a time when conventional thinkingis losing touch with reality, then you will be more likely tofall prey to an epidemic of disorientation that lies ahead.Disorientation breeds mistakes that could threaten yourbusiness, your investments and your way of life.”
—James Dale Davidson and Lord William Rees-Mogg, The Sovereign Individual, in 1997
OVER THE NEXT TEN TO TWELVE YEARS, WE WILL SEE THREE RECESSIONS THAT
will slowly move the average price-to-earnings ratio of stocks tohistoric lows. Rising oil and energy prices will be a main culprit ofboth the slowdown in the economy and an increase in inflation.Ever-increasing monetary inflation will, in fact, trigger a huge in-crease in all commodity prices, as well as a decline in bonds. Assetinflation will show up in the housing markets as home values con-tinue to skyrocket. The dollar will continue to weaken against majorforeign currencies. The current war will become increasingly un-popular, and the next administration will be forced to withdrawtroops, under guise of declaring victory. The American voting pub-lic will be split as never before, with major patterns in voting habitsmaking a generational change. The newspapers will continue to
215
�
ccc_mauldin_ch12_213-246.qxd 9/23/05 10:55 AM Page 215
write about how an Asian country will dominate the world econom-ically in less than a few decades.
Following this period of malaise, there will be an amazing cycleof new technical innovation that will spark yet another major bullmarket. The new technologies will change the world in ways thatsimply cannot now be imagined and will lead to whole new indus-tries, putting amazing new power and abilities into the hands of in-dividuals and governments.
The preceding scenario would, in fact, all come to pass. Exceptthat the year was 1970 and not today. The forces that havechanged the world in the decades following 1970 were only writ-ten about in science fiction and a few obscure books and journals.Who dreamed of the Internet in 1970? Who could envision that theBerlin Wall would come down in 1989? That Japan would not, infact, dominate the world of economics and overwhelm the UnitedStates? Or that the China of Mao would become a capitalisticgrowth machine and that the USSR would break up? A personalcomputer on every desk and more computing power in an auto-mobile than existed in the largest computers of the time? A global-ized world economy? The prospect that a falling population (andnot overcrowding) would be a problem, or that a Green Revolutionwould mean enough food for all (except where governments keptout a free market)?
In the 1970s, the mood of the country was decidedly negative.Japan was eroding our manufacturing base and unemploymentwas increasing. Reagan spoke of the Misery Index in his raceagainst Jimmy Carter, which was a combination of inflation andunemployment.
And yet it all changed. In fact, the one constant in the modernworld is that the pace of change is accelerating.
“My interest is in the future, because I am going to spendthe rest of my life here.”
—Charles F. Kettering
In his groundbreaking book, The Third Wave, Alvin Toffler de-picted the First Wave as the agricultural revolution, the Second
216 JUST ONE THING
ccc_mauldin_ch12_213-246.qxd 9/23/05 10:55 AM Page 216

Wave as the industrial revolution, and the Third Wave as the elec-tronic data and communication revolution. He depicted a societythat would be working in “electronic hamlets” sending their dailywork over “electronic highways” to “virtual places of business.”
Written twenty-five years ago, The Third Wave was an amaz-ingly prescient book. Toffler saw a world of mass customization,with government and business interwoven and a world filled withambiguity and change. Although some suggest that we’re still in themiddle of Toffler’s Third Wave, I would suggest that what we arefacing is different in both substance and character.
The Third Wave was actually the result of an innovation cyclethat we can call the Information Age. I believe we are only halfwaythrough the Information Age, with more profound changes as tohow we work and play just around the corner.
But this time something is different. Instead of one wave of in-novation following another, I believe that we are going to seemultiple waves of significant change and innovation surge all overthe world at roughly the same time. The combined effects are go-ing to produce a period of change unlike anything seen in the his-tory of man.
I call the combination of these factors the Millennium Wave. Itwill change things in ways that almost defy the imagination and at apace that will leave one breathless. On the one hand, the Millen-nium Wave will be seen as a source of good, as we will live health-ier and longer and there will be more of the basic necessities of lifeand more life options. On the other hand, the very ground we walkon will seem like it is shifting. The roadmap we have in our mindfor our future will require a constant fine-tuning (if not major repro-gramming) in order to determine our position.
The more precisely you plan your future, the harder that changewill hit you. Flexibility will be the order of the day. To paraphrasethe prayer from Alcoholics Anonymous, “Please grant me theknowledge of what will change, the understanding of what will notchange, and the wisdom to understand the difference.”
As I pondered the question I put to the other writers in thisbook, “What is the one thing you have learned that you want topass on?” I came to realize that the key talent in the future would be
The Millennium Wave 217
ccc_mauldin_ch12_213-246.qxd 9/23/05 10:55 AM Page 217
the ability to deal with the tremendous technological and culturalchanges that are coming at an ever-increasing pace while develop-ing an understanding of how those changes will evolve in the age-old patterns of life. There are patterns that change very slowly orcycle or trend. Learning how all these patterns fit together with thechanges of the Millennium Wave is at the heart of not just the in-vestment enterprise, but modern life in general.
But let’s deal with the investment enterprise first. Anyone famil-iar with the research on the psychology of investing knows that itpoints to the overwhelming conclusion that the broad class of in-vestors (which does not include you or me, of course) consistentlyassumes that the current trend will continue long into the future.
They may give lip service to believing things will change, theymay constantly worry about changing trends, but they do not investthat way. The late and deservedly famous economist Herbert Steintaught us the simple concept: “An unsustainable trend will not besustained.” And yet investors (and indeed all humans on almostevery level) allow the current trend to be the primary force in theirvision of the future. As Mark Finn noted in Chapter 3, we use pastperformance, even when we know we shouldn’t, to be the guidefor picking our future investments.
Investors all too often rationalize their actions with the mantraof “this time it’s different” or assume they will be able to nimbly re-act to or avoid the effects of the change when it happens. It never isand they hardly ever do.
My personal career path has been one of almost constantchange. Yet it is but an echo of a million other entrepreneurs andbusinessmen and women. We all deal with change. In fact, theamount of change that I have had to deal with is rather unremark-able, in the grand scheme of things. There are millions—perhapsbillions—of people who go through far more abrupt changes al-most daily.
How well we deal with life (not just our investments!) in thenext thirty-five years is going to be directly related to how well wedeal with what will be an accelerating pace in the rate of change.
My personal experience of continuing change will be echoedthroughout the world. Some of the changes were forced upon me.
218 JUST ONE THING
ccc_mauldin_ch12_213-246.qxd 9/23/05 10:55 AM Page 218

Some of them I willingly embraced. I have told my friends on sev-eral of these changes that I hope this is the last time I have to “rein-vent” myself. I succumb to the fantasy that most investors have: thatthe trend of today will continue. And yet, I know that this is notlikely. The field in which I plow and reap is changing rapidly, and itis unlikely that in ten years it will even look the same.
When I began my career thirty years ago, there was no fax, noovernight delivery, and phone service was expensive. Computers?Not until twenty years ago, and they were toys compared to today’smachines. It cost a lot of money to deliver a newsletter up until justa few years ago. Now the marginal cost is almost nothing. One orone million is pretty much the same to me.
Research was a visit to the library, in addition to a personal col-lection of books and a few magazines and newsletters. Now I getscores of letters and articles every day delivered to my “mailbox,”plus an almost infinite amount of data at my fingertips using some-thing called Google. I have almost five gigabytes of research and ar-ticles stored from just the past few years on my computer, which Ican search with a few strokes. To write an eight- to ten-pageweekly letter as I do would have taken a week with a month to re-search just a decade ago. Now I can access huge amounts of dataeach week, and I write my weekly letter on a computer in aboutfive hours on a Friday afternoon. (I read where they will soon havepills that will help our memories. I am going to need them.)
International readers? Very few ever graced my musings in thelast decade. Now, I have thousands of international readers, oftenfrom some amazingly remote locations.
In short, the changes have been dramatic. At times, I complain,it has been hard to adjust. A lot of times those changes were justplain not fun. Some of them were very expensive lessons. Yet, Icontinue on down my current business path. But I know thatchange is coming. Change is like a train. It can either run over you,or you can catch it to the future.
But I can hear that peasant from China, as he follows an oxon the way to the city, telling me I can’t even begin to imaginethe speed of change. Think about the changes in China and Rus-sia or other parts of the developing world in the last ten years.
The Millennium Wave 219
ccc_mauldin_ch12_213-246.qxd 9/23/05 10:55 AM Page 219
My less-than-sainted Dad last hitched a wagon to drive to town inthe 1920s. He saw a man put on the moon with a slide rule, a yel-low pad, and pencils forty years later. That pace of change hasonly increased.
In 1967, the movie The Graduate was the hit of the season. Weremember that famous scene where a young Benjamin Braddock(Dustin Hoffman) was told to seek a career in plastics. That was therage at the time. But it turns out that was bad advice. Over 40 per-cent of jobs in plastics have disappeared since 1967.
And yet, there has been plenty of job growth. There wereclearly better opportunities than plastics. Princeton Professor AlanKrueger tells us a quarter of all workers are now in occupations thatwere not listed in the Census Bureau’s occupation codes in 1967.1
In 1967, if asked where the jobs and opportunities were going tocome from, the proper and correct answer would have been, “Idon’t know, but they will.” It is still the correct answer today.
Personal computers were yet a dream. AT&T was still a monop-oly. Fiber optics? The Internet? Cell phones? Robotics? Biotech?Global positioning? Faxes? Video? MP3? Computer-aided design?They didn’t exist.
In less than thirty years, we will look back at the changes thatare still in our future and realize they were far, even vastly, morerevolutionary than what we have seen in the last thirty. But just asin 1975, when it would be hard to imagine the coming changes, in2005 it is even harder to imagine what 2035 will be. We delude our-selves into thinking we know, but we really don’t. The truly amaz-ing things and inventions are still not even on a drawing board or ina garage.
There is plenty of entrepreneurial activity in the world, and thefuture foundation for large companies that will reward their in-vestors is even now being laid. The driver for the next Microsoft,eBay, or Amgen will be the new opportunities brought about by thepace of change.
What kind of pace of change are we talking about? RayKurzweil, the inventor of speech recognition, scanners, music syn-thesizers and many other technical marvels, has a team of ten whotrack the progress of technology and predict where it will be in ten
220 JUST ONE THING
ccc_mauldin_ch12_213-246.qxd 9/23/05 10:55 AM Page 220
or twenty or one hundred years. He is an unabashed enthusiastwhen it comes to thinking about the future. It helps that he hasbeen right so far, so it behooves us to pay attention when he notes(this was written in 2001):
The first technological steps—sharp edges, fire, the wheel—took tens of thousands of years. For people living in this era,there was little noticeable technological change in even a thou-sand years. By 1000 A.D., progress was much faster and a para-digm shift required only a century or two. In the nineteenthcentury, we saw more technological change than in the ninecenturies preceding it. Then in the first twenty years of thetwentieth century, we saw more advancement than in all of thenineteenth century. Now, paradigm shifts occur in only a fewyears time. The World Wide Web did not exist in anything likeits current form just a few years ago; it didn’t exist at all adecade ago.
“The paradigm shift rate (i.e., the overall rate of technicalprogress) is currently doubling (approximately) every decade;that is, paradigm shift times are halving every decade (and therate of acceleration is itself growing exponentially). So, the tech-nological progress in the twenty-first century will be equivalentto what would require (in the linear view) on the order of twohundred centuries. In contrast, the twentieth century saw onlyabout twenty-five years of progress (again at today’s rate ofprogress) since we have been speeding up to current rates. Sothe twenty-first century will see almost a thousand times greatertechnological change than its predecessor.”2
What Ray is saying is that most people project future growthin technology at today’s rate of change. But the rate of change isaccelerating, so that more and more change is packed intosmaller and smaller amounts of time. Although the vast majorityof the thousand times greater technological change Ray is talkingabout happens in the last part of this century, some of it happensin the next twenty years. How much change are we talkingabout? Well, from when he first penned those words, the pace of
The Millennium Wave 221
ccc_mauldin_ch12_213-246.qxd 9/23/05 10:55 AM Page 221

change has picked up. At current levels, that means the twentiethcentury was equivalent to about twenty years of progress at to-day’s rate of change. That pace will continue to increase theamount of innovation we pack into just a few years. From hisbook Fantastic Voyage:
. . . And we’ll make another twenty years of progress at today’srate [of growth], equivalent to that of the entire twentieth cen-tury, in the next fourteen years. And then we’ll do it again injust seven years.
That means in the next twenty-one years we will see double thetechnological change that we saw in the entire twentieth century. Atthat pace, we will see almost four times the rate of change withintwenty-five years.
How can this be? To get an idea, during the week I finalized thisessay, the Wall Street Journal ran a front-page story about the mostrecent project of J. Craig Venter. Venter was the president of Celera,the private project to generate a copy of the human genome. Usingmuch newer and faster equipment than the government-sponsoredproject, Celera achieved its goal in just two years.
The parts of a DNA synthesizer can now be purchased for$10,000. Rob Carlson speculates that by 2010 a single person willbe able to sequence or synthesize tens of millions of sequencebases a day. Within a decade, a single person could sequence orsynthesize all the DNA describing all the people on the planetmany times over in an eight-hour day—or sequence his own DNAin seconds.
So what is Venter doing now? He has taken his fortune made inCelera and is going to create an artificial life form. We have beenable to splice genes into a cell or bacteria for three decades. Venterintends to start from scratch, creating his own entirely new lifeform. He expects to succeed in a few years.3
When he (or those who are in competition with him) succeeds,we will have a building block to start adding new functionalities. Ven-ter imagines a bacteria that would chew up cellulose and turn it intoethanol. Another could turn sunlight into hydrogen. The list is endless.
222 JUST ONE THING
ccc_mauldin_ch12_213-246.qxd 9/23/05 10:55 AM Page 222

Today, 99 percent of drugs in existence are created in what isbasically a trial and error format. We test substance after substance,trying to find a use for it. Will this one stop a cancer or decreaseblood pressure? Every now and then we find one, but we oftendon’t really know why it works on a molecular level. It is crude andexpensive. What Venter and a thousand others like him are trying todo is figure out the programming for the DNA and RNA sequences.
Wouldn’t it be nice to turn off the gene that causes us to storefat? This gene was quite useful ten thousand years ago, but today itis a health hazard. Or stop the genetic process that causes the arter-ies to harden? Or as Venter speculates, turn our grass clippings intoclean-burning fuel for our cars?
As our knowledge expands, as our tools grow in number anddecrease in cost, our ability to find useful products increases at anever-growing rate. The tool that Venter will create will allow for allsorts of new products and discoveries.
And that is just one small tool. There are thousands of suchtools, big and small, being created by scientists and inventors in re-search labs all over the world every month in scores of different in-dustries. Each one allows the next group of inventors to create evenmore and better tools and ultimately products. As we will note be-low, globalization is not just a manufacturing and sales process. It isalso an intellectual process, as scientists from many parts of theglobe can collaborate on a project, each bringing a specialized partof knowledge to the project. That allows scientists in smaller coun-tries or in countries without significant resources to add to the sumtotal or brainpower being thrown at a project.
All this will mean change is going to come faster than everbefore. But faster technological change does not mean that every-thing changes.
La plus ca change, la plus c’est la meme chose.The more things change, the more things stay the same.
What of the future? Can we really stand here in 2005 and havesome idea of what will transpire in the next two to three decades?Looking at which things will not change will give us some clues as
The Millennium Wave 223
ccc_mauldin_ch12_213-246.qxd 9/23/05 10:55 AM Page 223
to what will change, and some ideas as to the future in which weand our children will assuredly live.
There are three things that over the next forty years are not go-ing to change.
The innovation cycle is not going to change—it will be with usas it is simply part of our human progression, although it is going toincrease in intensity and frequency.
The business cycle and its cousins, secular bull and bear mar-kets, will not change. As long as the business cycle remains in place(and Congress has yet to find a way to repeal it), this tendency togo from overvalued to undervalued markets that started when theMedes were trading with the Persians, will persist.
Human psychology is not going to change. Human psychol-ogy is the reason we get these cycles, and the reason we getbusts and booms.
THE INNOVATION CYCLE
A Russian economist, Nikolas Kondratieff, noticed that we can lookat cycles in the markets, and his research led to these long wavesbecoming known as the Kondratieff Wave.4 Many argued that theseup-and-down cycles lasted 56 years, 73 years, or 69.3 years. Mostpeople, including me, look at that research and think that it isvoodoo economics. What is implied by many of the adherents ofthe K-Wave theory is that the markets and actual prices themselvesare predetermined in some fixed, almost linear, fashion, like a pre-determined destiny in a science fiction novel. The Kondratieff Wavefollowers were the guys that were telling you, if you were readingthe sales letters published in the late 1980s, about the crash of 1990,the crash of 1987 or the crash of 1994.
The Kondratieff Wave disciples tried to predict market directionwith a precise cycle determining the precise numbers of years, andwhen they dated the beginning of the last cycle. They had figuredout that there were in fact cycles, but Joseph Schumpeter camealong and said the cycles really relate more to innovation cyclesthan fixed waves in time.
224 JUST ONE THING
ccc_mauldin_ch12_213-246.qxd 9/23/05 10:55 AM Page 224
What Schumpeter found was that a new innovation takes agreat deal of time to get to a 10 percent penetration in any givenmarket, but the growth from 10 percent to 90 percent is one ofrapid change. The cycle follows what we call an S-Curve, and asyou get to the mature phase (or the last 10 percent of growth),everyone eventually gets access to the innovation. The innovationnow has complete penetration and growth slows until it is basicallyin line with the economy’s growth, which is GDP (gross domesticproduct) plus inflation. The innovation can go into other placeswhere it hasn’t penetrated, but once it has saturated the majorworld economies like the United States or Europe, it is no longer aninnovation, but a commodity. Its price goes down as more andmore firms can produce the product.
Harry Dent came along and said let’s rework this innovation cycleidea a little bit and try to define it better. Although his book The Roar-ing 2000s 5 is an excellent analysis of the innovation cycle, please payno attention to the investment projections that he makes, like the Dowgoing to 40,000 by 2008. What he says is that when you look backover time, there are five phases to the innovation cycle. First is the in-novation period, second a growth boom followed by a shakeout, thenthe maturity phase, and then the ending or final phase.
What happens during the shakeout is that a frenzy developswhere too many people are throwing money at the innovation,overbuilding, and adding way too much capacity, because that’swhat we as humans do. We chase what is already hot rather thanwhat might become hot in the future. We throw money at stuffthat’s going up, create too much of it, and then there’s not enoughmarket demand for that capacity and you get a shakeout. It hap-pens almost invariably in all innovation cycles.
The words “this time it is different” are spoken. We project cur-rent trends far into the future, not realizing that overbuilding willcause prices to collapse.
We are all familiar with the overdevelopment of transocean fiberoptic capacity. The first few lines were projected to have (and someactually did have) fabulous profit potential. But then everyonejumped in and too much capacity was built, forcing a dramatic dropin price.
The Millennium Wave 225
ccc_mauldin_ch12_213-246.qxd 9/23/05 10:55 AM Page 225
This is not far different from railroads. When the first twenty-mile railroad was built in England, the investors found their profitprojections were way off. Profits were much higher than antici-pated. In fact, the early railroads were showing 100 percent profit inthe first year. Just like fiber optics 150 years later, too many railroadswere built and bankruptcies were soon the order of the day. Therewere hundreds of automobile manufacturing companies in the firstpart of the twentieth century and thousands of phone companies.As I said, it happens with almost every new major innovation.
But over time, demand catches up with supply, and (using ourrailroad example) more railroads were needed and the maturityboom took over. While hard for the initial investors, it was actuallygood for society, as all that capacity and lower prices meant newbusiness opportunities developed as whole new markets openedup. The same thing will happen with transoceanic fiber optics. Oneday, as incredulous as it seems now, there will be another buildingwave of transoceanic fiber (or its futuristic equivalent).
As an example, right now, in my opinion, we are still in thegrowth boom of the information age. We haven’t seen the trueshakeout yet. No one knows how the development of broadband toU.S. homes will play out. Will it be on cable or fiber or even onyour power lines? Who will be your phone/cable/wireless/cell/Internet/entertainment company in ten years? What bundled ser-vices will we all feel we need? The dot-com era was a precursorto the potential shakeout coming. When we see the true informa-tion age shakeout, I think it will look like all classic growth boomshakeouts. We will see too much capacity, and prices will plum-met. Some major companies will not survive; others will standtall. The excess capacity will soon be swallowed up in growingdemand and then this Information Age innovation cycle will startits mature boom phase.
When you are looking at change, remember that the InnovationCycle will be how that change comes about. You don’t have to bethere at the beginning, but when the new innovation shows itshead, you need to invest with a view to the longer term. And re-member that when there is too much of a good thing, it is time tosit on the sidelines. My bet is that the innovation cycles of the Mil-
226 JUST ONE THING
ccc_mauldin_ch12_213-246.qxd 9/23/05 10:55 AM Page 226
lennium Wave will be much shorter in duration (products going tofull market penetration) than those of the past.
SECULAR BULL AND SECULAR BEAR MARKETS
Another cycle that will always be there is the business cycle, ac-companied by secular bull and secular bear investment markets. Weuse secular, not in the terms of religion, but from the Latin wordsecula, which means an age or period of time. What I argue in mybook Bull’s Eye Investing is that we shouldn’t look at these cycles interms of price, which most people do, but rather we should look atthem in terms of valuation.
Michael Alexander wrote a great, though often overlooked,book called Stock Cycles in 1999. In it, he says, “Here’s why we’regoing to have this crash,” completely apart from everything else. Heseems to have pegged the markets with the way he views cycles.Alexander finds that valuation cycles in secular bear/bull marketsrun anywhere from eight to seventeen years, which suggests thatwe’re currently in the middle innings of a secular bear cycle. In thepast, a secular bear never stopped in the middle of going down; italways went to the full extent of the pendulum. There will be bullmarket rallies during a secular bear market, but the next secular bullmarket will begin after we go through what I call The Puke Factor,when very few want to talk about or own equities anymore.
The race is not always to the swift or the battle to the strong,but that is the way to bet. You don’t want to make a long-shot beton the slowest horse winning when you are going to a horse race.You want to look for the horse that is likely to win that day. Historyshows us that bear markets always start with high price-to-earnings(P/E) ratios and bull markets always start with low P/E ratios. Thelower the P/E ratio at the beginning of the period, the higher yourreturns are going to be when the P/E ratio tops out.
Where (in terms of P/E) you start investing makes a huge differ-ence as to what your results are going to be over time. In fact, therehave been periods of twenty years or more that a market index hasmade zero real (after inflation) returns. That’s not what the guys tell
The Millennium Wave 227
ccc_mauldin_ch12_213-246.qxd 9/23/05 10:55 AM Page 227
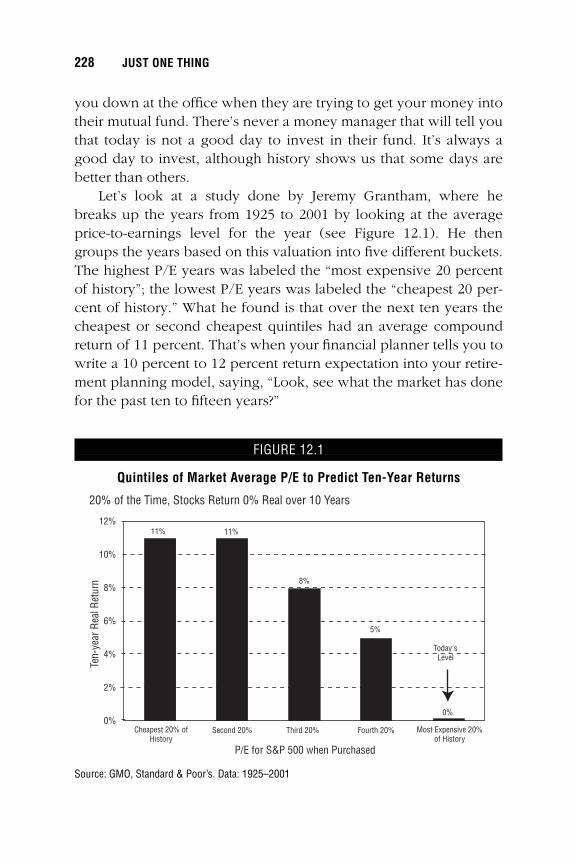
you down at the office when they are trying to get your money intotheir mutual fund. There’s never a money manager that will tell youthat today is not a good day to invest in their fund. It’s always agood day to invest, although history shows us that some days arebetter than others.
Let’s look at a study done by Jeremy Grantham, where hebreaks up the years from 1925 to 2001 by looking at the averageprice-to-earnings level for the year (see Figure 12.1). He thengroups the years based on this valuation into five different buckets.The highest P/E years was labeled the “most expensive 20 percentof history”; the lowest P/E years was labeled the “cheapest 20 per-cent of history.” What he found is that over the next ten years thecheapest or second cheapest quintiles had an average compoundreturn of 11 percent. That’s when your financial planner tells you towrite a 10 percent to 12 percent return expectation into your retire-ment planning model, saying, “Look, see what the market has donefor the past ten to fifteen years?”
228 JUST ONE THING
FIGURE 12.1
Quintiles of Market Average P/E to Predict Ten-Year Returns
12%
10%
8%
6%
4%
2%
0%Cheapest 20% of
HistorySecond 20% Third 20% Fourth 20% Most Expensive 20%
of History
11% 11%
8%
5%
0%
Today'sLevel
P/E for S&P 500 when Purchased
Ten-
year
Rea
l Ret
urn
20% of the Time, Stocks Return 0% Real over 10 Years
Source: GMO, Standard & Poor’s. Data: 1925–2001
ccc_mauldin_ch12_213-246.qxd 9/23/05 10:55 AM Page 228
However, if you invested in the most expensive quintile in his-tory, the average compound return over the next ten years waszero. That’s not a good deal, except for the managers charging a feeto manage your money. So, getting into the market during times oflow valuations has been the best choice in the past.
Again, this cycle between high and low valuations in unlikely tochange. It is driven by human psychology. Using this cycle to informyour investment behavior will result in much more favorable returns.
Markets are volatile. What you find is that over the last 103years the Dow Jones Industrial Average’s annual return was be-tween +/– 10 percent around 30 percent of the time. Over 70 per-cent of the time, the annual return was either above 10 percent orbelow 10 percent.6 A company called Dalbar has done some studiesthat show the average investor does not do nearly as well as the av-erage mutual fund does because they chase returns.7 They switchinto a fund that is “hot.” Chasing returns is momentum investing—ifsomething goes up, let’s invest in it. What happens is, people typi-cally get into something at the top, then it turns down and they getout. This strategy is essentially a formula for buy high, sell low, andis a poor way to invest. It is a result of investors projecting past per-formance into the future.
Let’s talk about the real effect of compounding. Take the last103 years from 1900 to 2002. The market’s simple annual arith-metic average return is 7.2 percent. That’s what the brokers andother salespeople are trotting out when they try and raise money.The problem is, over the same period of time, if the returns arecompounded annually, the average is only 4.8 percent. Keep inmind that this is the compound average over long periods of time(in this case, 103 years). This negative compounding effect, if youwill, stems from the fact that if you are down 33 percent early on,you are going to have to make 50 percent to bring you back (seeTable 12.1).
At my Web site, www.2000wave.com, there are four charts forinvestment returns over the last 103 years (showing you the ef-fects of taxes, inflation, and commissions). You can see in thischart what your returns would have been for any given period oftime starting with any year you choose. The chart is color-coded;
The Millennium Wave 229
ccc_mauldin_ch12_213-246.qxd 9/23/05 10:55 AM Page 229
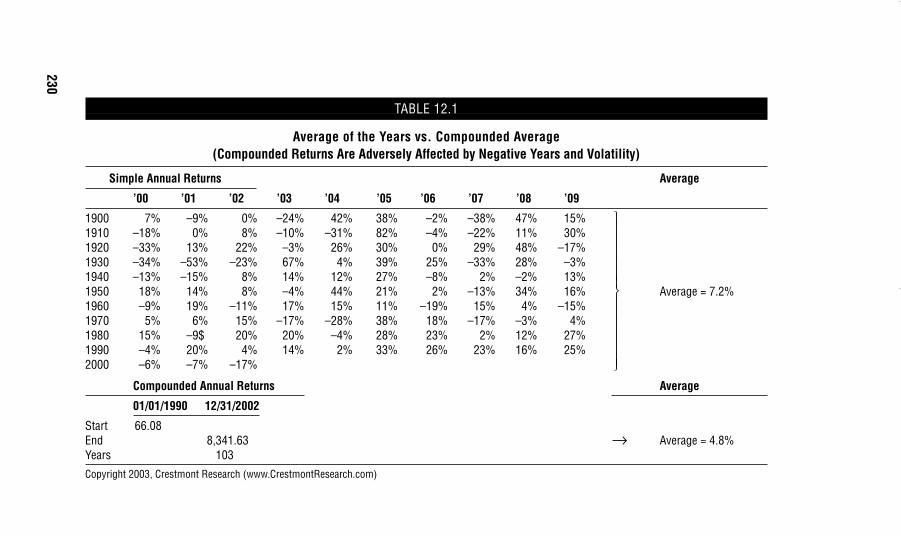
TABLE 12.1
Average of the Years vs. Compounded Average (Compounded Returns Are Adversely Affected by Negative Years and Volatility)
Simple Annual Returns Average
’00 ’01 ’02 ’03 ’04 ’05 ’06 ’07 ’08 ’09
1900 7% –9% 0% –24% 42% 38% –2% –38% 47% 15%1910 –18% 0% 8% –10% –31% 82% –4% –22% 11% 30%1920 –33% 13% 22% –3% 26% 30% 0% 29% 48% –17%1930 –34% –53% –23% 67% 4% 39% 25% –33% 28% –3%1940 –13% –15% 8% 14% 12% 27% –8% 2% –2% 13%1950 18% 14% 8% –4% 44% 21% 2% –13% 34% 16% Average = 7.2%1960 –9% 19% –11% 17% 15% 11% –19% 15% 4% –15%1970 5% 6% 15% –17% –28% 38% 18% –17% –3% 4%1980 15% –9$ 20% 20% –4% 28% 23% 2% 12% 27%1990 –4% 20% 4% 14% 2% 33% 26% 23% 16% 25%2000 –6% –7% –17%
Compounded Annual Returns Average
01/01/1990 12/31/2002
Start 66.08End 8,341.63 → Average = 4.8%Years 103
Copyright 2003, Crestmont Research (www.CrestmontResearch.com)
230
ccc_mauldin_ch12_213-246.qxd 9/23/05 10:55 AM Page 230
the reds are below-zero returns; pink is between zero and 3 per-cent; blue is between 3 percent and 7 percent, and light and darkgreen cover the periods with annual compounded returns over 7percent. The annually compounded numbers are in white or blackand indicate whether the price to earnings ratios were falling orrising during that period.
Surprise, surprise—you find out that almost all the light anddark green squares are periods of rising price to earnings ratios, orblack numbers. However, the red and pink squares are predomi-nately periods of contracting price to earnings ratios, or white num-bers. This graph also helps visualize the long-term historical returnspatterns in the market. You can easily find periods of ten or fifteenyears where you’re making 0 to 3 percent net. This tells me thatwhen I see a period of high P/E valuations, better returns might befound elsewhere.
There is always a bull market somewhere in something. Whenyou’re in secular bear cycles, become more concerned about pro-tecting against a loss and try for absolute returns; when you’re insecular bull cycles, buying an index for relative returns has histor-ically done well in the past. What I mean by that is, if price toearnings are at low valuations and you put money in index fundshistorically you will do well even if there are events like October1987, because as the P/E rises it will, we hope, be due to theprice going up rather than earnings coming down. All you needto do is follow the market because the market’s going up, and ifyou actually beat the market by active management, you did agood job.
Now, if we are in a secular bear cycle, you want to do just theopposite. In secular bears, market valuations are going down overtime. Now you want to focus on absolute returns and the need toprotect against negative returns. Your measure, in a secular bear cy-cle, is a money market fund. In a secular bear cycle, the personwho loses the least is the winner. That’s just the way things are.Typically, you could have beaten stock market index returns dra-matically in this period simply by being in bonds.
If you are under the age of 30, the good news for you is thatyou will probably get to see at least two more bull markets. Since
The Millennium Wave 231
ccc_mauldin_ch12_213-246.qxd 9/23/05 10:55 AM Page 231

average cycles are about thirteen years, you will see the end of thecurrent bear, followed by what I think will be a rather large bullmarket. You are also young enough to see one more complete cy-cle prior to being 75 (which will seem young in another forty-fiveyears, trust me!). Save every penny now and let them compoundover time!
HUMAN PSYCHOLOGY
Human psychology, for better or worse, will always be with us. De-veloped over millennia, it is unlikely to change in the course of justa few years. The 2002 winners of the Nobel Prize for Economicswere two psychologists (Daniel Kahneman and Vernon L. Smith),who came up with the sometimes-obvious idea that investors are ir-rational. Their contribution, however, was that humans are not justirrational, but predictably irrational. We keep on making the samemistakes time and again. I am reminded of one of my favoritequotes from Alfred Einstein, “Insanity is doing the same thing overand over and expecting different results.”
It is this predictable irrationality that causes us to become irra-tionally exuberant and thus prone to creating investment bubbles,or groundlessly fearful, avoiding good value. Human psychology isat the root of secular bull and bear markets. It is also at the root ofthe innovation cycle, causing us to overbuild in moments of enthu-siasm, always to the cry of “this time it’s different.”
I encourage you to read Chapter 6 on the Psychology of Invest-ing by James Montier in this book, to learn why we make the mis-takes we do. And then stop doing them! But also realize that yourfellow human beings will look at the trends and cycles I discuss inthe next section and, quite predictably, make the same mistakesover and over. There will be more bubbles in your future. Enjoythem. They can be great wealth builders if you don’t get caught upin the hype. Remember, it is almost never different this time. Andthat goes double for trends that are driven by human emotions. Wenever learn.
232 JUST ONE THING
ccc_mauldin_ch12_213-246.qxd 9/23/05 10:55 AM Page 232

SURFING THE MILLENNIUM WAVE
The Millennium Wave is a combination of multiple innovationwaves coupled with profound societal changes, all happening at anaccelerating pace of change that is unprecedented in human his-tory. Although we cannot deal with each smaller wave in detail inthis small chapter, let’s briefly look at the components of the Millen-nium Wave. I think these will be positive forces that will help us getthrough the problems brought on by other aspects of the Millen-nium Wave.
As I already noted, I think in another few years that we will seea shakeout of the Information Age and then a follow-on maturityboom that will last another twenty years. Looking at past such cy-cles, the boom should be every bit as big as the innovation boomwas in 1980 to 2005. That, in and of itself, will create an evengreater worldwide technology and productivity boom, creating jobsand wealth.
Such a boom is not all that hard to forecast, and it will be wel-come. But I think there is a surprise coming, something that wehave not seen in human history. I believe we will get multiple ma-jor innovation booms overlaid on top of the maturity boom of theInformation Age.
Currently, the Biotech Revolution is still in its initial innovationphase. It has barely made an impact in comparison to what mostexperts think it will in the next fifteen to twenty years. In anotherfew years, we will start to see the beginning of the growth boomfrom the Biotech Revolution kick in. Amazing new drugs andprocesses will change the way we live. We will live longer andhealthier lives, eat better and less expensive foods, clean up ourwaste (and our waists), and even develop new energy sources.
The Biotech Revolution promises to be far more life-changingthan the Information Age, generating a wide array of new compa-nies with technologies for extending our lives, preventing and heal-ing diseases, and more efficiently feeding and clothing us. There aremany of us who are at mid-life today who will live to see a robust100 years. My children will be part of the first generation to cele-
The Millennium Wave 233
ccc_mauldin_ch12_213-246.qxd 9/23/05 10:55 AM Page 233
brate the coming of two centuries, thanks to the life-enhancing andlife-prolonging drugs and biotechnologies that lay just around thecorner. And it will happen faster than most people currently think.Remember, the pace of innovation and change is accelerating.
Coming right on the heels of the Biotech Revolution will be theQuantum Revolution and nanotechnology—a world of unbelievablysmall machines and processes. What sounds like science fiction to-day will be reality in twenty to thirty years. Let me give just onesmall example. I read science fiction for relaxation, and have doneso for forty-five years. There is a significant change in the subjectmatter of science fiction in the last ten years. More and more writersare thinking about the changes that will be brought about by nano-technology.
One common theme is a programmable dust, which whendropped on a pile of raw materials can reshape that pile of materi-als into roads, bridges, machines, or food. Remember, I said thiswas science fiction. But it turns out that Intel is funding research byprofessors at Carnegie-Mellon to create machines that can formthemselves into any shape. You scan something in one location,send the digital scan to another, and a three-dimensional objectforms. Right now, the “dust” is rather large egg-sized objects. It’sstill just in progress. But people at Intel feel they will be able to re-duce the size over time. They are talking in terms of ten to twentyyears. These are serious people and serious money looking at pro-jects that seem to be right out of Star Wars.
I do recognize that there is another side of science fiction(mostly of the cyberpunk subgenre)—the dark side of the biotechand nanotech developments. It will be increasingly easy for some-one to do something that will be profoundly destructive. Preventingthese types of problems, and mere accidents, will be one of themore profound challenges of the next thirty years.
Dovetailing with the Biotech Revolution is the drive for new en-ergy sources. $100 oil is not the problem; it’s the solution, as con-verting to new energy sources is a huge growth dynamic. The needfor new and cheaper sources of energy will compel all sorts of in-novation and new invention. The steam engine was basically devel-oped to pump water out of coalmines, because England needed
234 JUST ONE THING
ccc_mauldin_ch12_213-246.qxd 9/23/05 10:55 AM Page 234
new forms of energy to substitute for dwindling forests. Yet the col-lateral uses propelled the British Empire to its peak of economicpower. Think of the resources and the money and the innovationsthat will come to play with the development of a new energy para-digm for the world.
There is a consortium that is starting work on a nuclear fusionpower plant in France. This is a huge, $10 billion-plus project. Theyare working on a twenty-year timeline. But fusion will provide analmost unlimited amount of clean, environmentally friendly, andcheap power. But I deeply suspect that in the meantime smaller,less well-funded inventors will surprise us.
An article in The Scotsman reports, “A team of scientists has dis-covered a completely new way to make electricity from nothing morethan flowing water. The breakthrough, the first new method of elec-tricity production for 160 years, could provide free, clean energy fordevices such as mobile phones and calculators. On a large scale, itcould conceivably be used to feed power into the national grid. DrDavid Lynch, Dean of the Faculty of Engineering at the University ofAlberta in Canada, where the technology was developed, said: ‘Thediscovery of an entirely new way of producing power is an incrediblefundamental research breakthrough that occurs once in a lifetime. . . .The system relies on the natural “electrokinetic” effect of a fluid flow-ing over a solid surface. An interplay of forces results in a thin layerof water—where it meets the surface—with a net electric charge.’ ”8
For the first time in history, we could get multiple major Inno-vation Booms—the Information, Biotech, Quantum, and EnergyWaves—all creating change and economic progress at the same time.It would be like Watts and Edison and Ford and Bell and Whitney andCrick all doing their thing at the same time. How different might ourworld have been? How would things have progressed? Just imaginingthe possibilities will give you some idea of what may lie in our future.
Not all of the waves of change will be technological. A greatdeal of the Millennium Wave, and perhaps the more profoundlydisruptive, will be the changes in society. These will be broughtabout because of the inevitable consequences of demographics,and the increase in globalization combined with significantgeopolitical changes.
The Millennium Wave 235
ccc_mauldin_ch12_213-246.qxd 9/23/05 10:55 AM Page 235
DEMOGRAPHY IS DESTINY
Another thing that is cooked into the books is demography. We canmake a fairly realistic projection of how many people will be over60 in twenty years by looking at how many people are over 40 to-day. By projecting birth and death rates, which change slowly overtime, we can get a fairly realistic handle on world populationtrends. And what we see is an aging Europe, Japan, and America,and a slowdown in the birth rates almost everywhere.
This will have a major effect on the pace and shift of globaliza-tion. The developed countries (North America, Europe, and Japan)have gone from about 33 percent of world population in 1950 tothe 18 percent range right now. The current developed countrieswill be 12 percent of the population in forty-five years. The currentunderdeveloped countries (many well on the way to being fully de-veloped) are going to grow to roughly 87 percent. That’s a hugeshift of economic power and markets.
Another important shift will be in the ten major Islamic coun-tries. By 2050 their population will be about the same as the devel-oped countries. Today, Russia has 145 million people; at its currentrate, it will be 100 million in 2050. Iran and Iraq currently have 87million people combined. Today they are roughly 60 percent of thepopulation of Russia, and in just 2025 those two countries will have10 million more people than Russia. Iran alone will have a greaterpopulation than Russia in forty-five years. How do you think a nu-clear and militaristic power like Russia is going to be able to dealwith that change? It makes me wonder if the reason Iran wants nu-clear power is simply the United States.
Yemen is projected to have a population bigger than Germanyin forty-five years. Yemen is a small country; where will the peoplego?8 It is almost physically impossible for Yemen to grow from18,000,000 to a UN-projected 84,000,000 people. Either birth ratesmust slow down dramatically, or they will have to migrate. Thisproblem will be duplicated many times over.
We have already witnessed the largest migration of humanity inhuman history. More than 200 million Chinese have moved fromthe interior and the west to within 90 miles of the coast in the last
236 JUST ONE THING
ccc_mauldin_ch12_213-246.qxd 9/23/05 10:55 AM Page 236

20 years. That is almost too large to grasp. It is as if almost all of thepopulation of the middle part of United States decided to move tothe coast. The clear implication of demographic change is that wewill see more migration of people. Part of this will be caused by theneed of developing countries, whose populations are aging, forworkers.
What implications does demography have on the aging popula-tion of the world? The percentage of population over 60 years oldwill grow dramatically in the developed world from 2005 to 2040.The United States will go from 16 percent today over the age of 60to 26 percent; Japan grows from 23 percent to 44 percent; Italygrows from 24 percent to 46 percent. Given that some of the popu-lation will be below age 20 and/or in school, that is less than oneworker per retired person in many European countries. Besides theproblem of who will pay for retirement benefits, there is the prob-lem of who will be available to take care of the elderly. There sim-ply will not be enough workers without massive immigration inmany countries.
The Center for Strategic and International Studies notes that “formost of human history, until about a century ago, the elderly (peo-ple aged 65 and over) never amounted to more than 2 or 3 percentof the population.”9
These are major problems that will affect worker productivity,affect health care, and strain the economy. The percentage of GDPthat countries will have to tax if they keep the promises they madeto the retirees will be a problem, as there will be less workers topay into the pay-as-you-go retirement systems. France will be at 64percent and Germany will be at 60 percent of GDP just for socialservices, without adding other government costs such as education,military, roads, and so on.
Bluntly, these countries (including the United States) simplywill not be able to meet their current commitments. That meanseither significant tax increases or large benefit cuts or a combina-tion of both.
Do you think young, educated entrepreneurial people are goingto stay in France or Germany and see tax rates of 75 percent ormore? The strain on the systems clearly can’t work.10 Europe and
The Millennium Wave 237
ccc_mauldin_ch12_213-246.qxd 9/23/05 10:55 AM Page 237

Japan are destined to go through enormous social and economicstrains. Farm subsidies, a deeply engrained part of Europe andJapan, will be cut or done away with. How can I say this? There willbe more elderly voters who want their health care and pensionsthan there are farmers. Just the threat of a drop of a small part offarm subsidies in France brings out farmers who riot, block roads,and create mass protests. Think about what will happen as theylose those subsidies over the next ten to fifteen years.
Although not as bad as Europe and Japan, the United States hasits own problems coming down the demographic highway. TheUnited States will be forced to change its Social Security system. Ifwe don’t change it by the end of 2006, my prediction is that it willnot change until 2013. Whoever is elected president by either partyin 2008 will not touch the “third rail” of politics (Social Security) un-til a second term. By then, the problems will be much bigger.
Social Security in the United States can be fixed. The real prob-lem is Medicare and health care. Health care costs will rise from 14percent of GDP in 2003 to 17 percent in 2010 and keep on rising asBaby Boomers need more care and as better and ever more expen-sive solutions are found to keep us healthy. This portends a massiveshift in consumer spending patterns.
A reported $40 trillion deficit to pay for Medicare looms in frontof U.S. taxpayers. The options are not pretty. We can raise taxes sig-nificantly over time, cut back on other spending like our military,farm subsidies, education and welfare, or cut back on health care.What politician will want to run on that platform?
And there are even more profound cultural changes, as docu-mented in a book I highly recommend called Fewer by Ben Watten-berg. The book is based on the implications of a new UN projectionof future population growth. Prior to 2002, the United Nations as-sumed that worldwide population growth would slow to about 2.1children per woman. Now it is assumed that worldwide populationgrowth will be 1.85. (2.1 is the replacement level, by the way.) Thatnumber is the total fertility rate, or TFR.
The TFR of what the United States considers the more devel-oped countries (basically the countries thought of as the West andJapan) is 1.6, well below replacement rate. The United States has
238 JUST ONE THING
ccc_mauldin_ch12_213-246.qxd 9/23/05 10:55 AM Page 238
the highest rate among all these countries at 2.0, while Europe as awhole is only 1.38. Using a slightly higher TFR for Europe, or 1.45,European population is expected decline from 728 million peopletoday to about 632 million by 2050.
But this trend is not limited to developed countries: The rest ofthe world is moving to lower fertility rates at a very rapid pace.While most everyone is aware that China has had its TFR drop toaround 1.8 because of the one-child policy, I was surprised to readthat Iran has dropped from a TFR of 7.0 in 1960 to just 2.1 today!Egypt has watched its TFR drop in half in the last forty years, toslightly above 3.0, and it is dropping every year. Brazil is now be-low the replacement level of 2.1. India has seen its TFR droppedfrom 6.0 to just over 3.0 in only a few decades and the trend is de-cidedly down, especially among the new Indian middle-class.
Demographers in Mexico expect the TFR of our southern neigh-bor to drop below replacement level this year! Think about whatthat means for U.S. immigration policy in twenty years. South Koreahas gone from a TFR of 6.3 in the late 1950s to only 1.17 in 2003.Russia is at 1.1. Bulgaria is at 1.1. Japan is at 1.3. Germany is at 1.35.All told, there are sixty-three nations whose TFR is below 2.1.
I suppose it intellectually follows that a low birth rate will meanthat there will be a high percentage of women who have no chil-dren. I was rather surprised, though, by the number of women withno children at the end of their childbearing years: Germany 26 per-cent, Finland 21 percent, United Kingdom 21 percent, Italy 19 per-cent, Netherlands 19 percent, and Canada 14 percent. The UnitedStates stands at 16 percent, up from 11 percent in the early 1970s.
There is a stark contrast between retirement in Europe and re-tirement in the United States. Today, retirement age is traditionally65 in the United States. The retirement age (for Social Security ben-efits) was raised in the United States in 1983 to 67, which will takefull effect by 2022. The following are examples of the average re-tirement age for men in Europe: Belgium, 58.1; France, 58.8; Ger-many 61.0; Italy and the Netherlands are slightly under 60; UnitedKingdom, 62.9; in Switzerland, 64.5.
Wattenberg makes the point that a nation whose population isnot growing and is not increasing its tax base and economic base
The Millennium Wave 239
ccc_mauldin_ch12_213-246.qxd 9/23/05 10:55 AM Page 239
cannot continue to thrive. The United States needs its immigrants.Without them, our Social Security and Medicare problems aregreatly increased to the severe breaking point. We could see ourproblems become as large as Europe’s. Forgetting the cultural impli-cations, and from a pure economic standpoint, the United Statesshould be aggressively seeking to increase immigration of the rightkind. Our policy today is haphazard and ill informed, but at least al-lows for one million immigrants per year. If we were smart, wewould be doing everything we could to get young, educated peo-ple to come to the United States, as well as educating our own chil-dren better.
It is a far different world in Europe. Quoting from Wattenberg:“. . . consider Europe, according to [a UN publication called] ‘Re-placement Migration.’ Today, Europe has more than twice as manypeople as the United States, but the whole continent takes in a netof 376,000 immigrants per year, about a third of the American num-ber. In order to keep a total constant population, that European im-migration number would have to rise to 1,917,000 per year, anannual increase of more than 500 percent. To maintain a constantage group of workers aged 15 to 64, the number of immigrantswould have to rise to 3,227,000 per year, an annual increase ofmore than 900 percent. The United Nations also calculated what itwould take to keep the dependency ratio constant—that is, the pro-portions of working-age persons to those over age 65 and under 15.That would require an annual immigration of 27,139,000, an in-crease of more than 7100 percent. That is not likely to happen.”11
Quite the understatement. Forget about energy. We will one daysee that young people are the true natural and limited resource.
Demographics cannot be legislated against. Demonstrations willnot change their reality. These trends are going to force profoundchanges on our countries and cultures, as well as our economies.
As an aside, culturally the new demographics means therewill be big changes in the way we look at family and marriage.On a variety of levels, this is going to be difficult, as it will beseen as an assault on traditional marriage. But if we are talkingabout traditional as in the historical model, and still the model inmany places in the world today, where the woman is more or
240 JUST ONE THING
ccc_mauldin_ch12_213-246.qxd 9/23/05 10:55 AM Page 240
less property and has no rights, then a little redefinition of tradi-tional is needed. As Stephanie Coontz points out in Marriage: AHistory, it has only been relatively recently (in terms of humanhistory) that we see people marrying for love. Already, we areseeing a significant difference in marriage rates, as women put offmarrying longer and longer, as well as forgo having children. Theindependence of women (a very good thing!) has produced anew dynamic in relationships that has yet to settle out. These arechanges with unintended consequences that we will only learnabout as we see them unfold.
THE GLOBALIZATION WAVE
Globalization refers to the increasing economic integration and in-terdependence of countries. Economic globalization in this centuryhas proceeded along two main lines: trade liberalization (the in-creased circulation of goods) and financial liberalization (the ex-panded circulation of capital).
We are familiar with the problem of U.S. manufacturing jobs go-ing to China, as well as service jobs being outsourced to India. Eachfactory that closes down has the local news team at its door whenthe announcement is made.
But what we do not focus on is the fact that more jobs are out-sourced to the United States from foreign countries than the otherway around. Globalization has many aspects, but it means thateverything is going to change even faster. Tom Friedman has it rightin his best-selling book, The World Is Flat. He notes that new tech-nologies have enabled new processes that make it easier to do busi-ness anywhere in the world. The playing field for business hasbecome horizontal:
Just as we finished creating this new, more horizontal playingfield, and companies and individuals primarily in the Weststarted quickly adapting to it, 3 billion people who had beenfrozen out of the field suddenly found themselves liberated toplug-and-play with everybody else.
The Millennium Wave 241
ccc_mauldin_ch12_213-246.qxd 9/23/05 10:55 AM Page 241
Save for a tiny minority, these 3 billion people had neverbeen allowed to compete and collaborate before, because theylived in largely closed economies with very vertical, hierarchicalpolitical and economic structures. I’m talking about the peopleof China, India, Russia, Eastern Europe, Latin America, and Cen-tral Asia. Their economies and political systems all opened upduring the course of the 1990s, so that their people were in-creasingly free to join the free market game. And when didthese 3 billion people converge with the new playing field inthe new processes? Right when the field was being flattened,right when millions of them could compete and collaboratemore equally, more horizontally, and with cheaper and morereadily available tools than ever before. Indeed, thanks to theflattening of the world, many of these new entrants didn’t evenhave to leave home to participate . . . the playing field came tothem!
It is this triple convergence—of new players, on a new play-ing field, developing new processes and habits for horizontalcollaboration—that I believe is the most important force shap-ing global economies and politics in the early 21st century. Giv-ing so many people access to all these tools of collaboration,along with the ability through search engines and the Web toaccess billions of pages of raw information, ensures that thenext generation of innovations will come from all over PlanetFlat. The scale of the global community that is soon going to beable to participate in all sorts of discovery and innovation issomething the world has simply never seen before.12
The pace of globalization is going to change. Apart from govern-ments interfering with protectionist legislation, there is little to stop thetrend. But this has produced some severe imbalances in the world.Right now, the United States is running a huge trade deficit, absorbingthe products and the savings of the developing world. This is a trendthat simply cannot go on forever. The shift from a U.S.-centric worldto a more balanced world is going to create a great deal of pain andopportunity, but when the world does sort it out (and it will, if noteasily!) we will have a more balanced world economy.
242 JUST ONE THING
ccc_mauldin_ch12_213-246.qxd 9/23/05 10:55 AM Page 242

This will all produce a shift of economic power to the East.China, India, and the rest of Asia will come to the fore by the middleof this century. This shift will be forced because of the economic,political, and demographic changes that will happen in the West.The United States and Europe have guaranteed our Baby Boomersand our elders “X” amount of our GDP. We have bet the farm onour future, yet we haven’t saved enough money for it and we’re ex-pecting our kids to pay it. That’s going to force fundamental restruc-turing. China, India, and other parts of Asia don’t have thoseobligations because the elderly population is a much smaller per-centage, so they will be able to devote more of their dollars to re-search and to economic development. It will be many years beforetheir R&D budgets equal those in the West, but over time, the ad-vantage the West has will be reduced.
A NEW WORLD ORDER
James Dale Davidson and Lord William Rees-Mogg wrote these veryprescient words in The Sovereign Individual in 1997:
In short, the future is likely to confound the expectations ofthose who have absorbed the civic myths of 20th-century indus-trial society. Among them are the illusions of social democracythat once thrilled and motivated the most gifted minds. Theypresuppose that societies evolve in whatever way governmentswished them to—preferably in response to opinion polls ofscrupulously counted votes. This was never as true as it seemed50 years ago. Now it is an anachronism, as much an artifact ofindustrialism as a rusting smokestack. The civic myths reflectnot only a mindset that sees society’s problems as susceptible toengineering solutions; they also reflect a false confidence thatresources and individuals will remain as vulnerable to politicalcompulsion in the future as they have been in the 20th century.We doubt it. Market forces, not political majorities, will compelsocieties to reconfigure themselves in ways that public opinionwill neither comprehend nor welcome.13
The Millennium Wave 243
ccc_mauldin_ch12_213-246.qxd 9/23/05 10:55 AM Page 243
The waves of new technologies, demographics, and globaliza-tion are going to force a wave of government changes that asDavidson and Rees-Mogg state: “. . . will compel societies to recon-figure themselves in ways that public opinion will neither compre-hend nor welcome.”
Governments are the problem, not the solution. If government isthe answer, then we are asking the wrong question. Less govern-ment, from a business standpoint, generally means less cost, and thatis a better thing. The less money that you are paying in taxes, theless money your corporations and your investors pay in taxes, themore the customers are going to be able to pay to put your productson the table and in their homes. Not to mention the more money toreturn to investors. And that means more opportunity for everyone.
We are going to have to learn to reallocate resources. Thatmeans that some people will not be getting the government aidthey thought they had been promised. That is a change few willlike. But there will be no choice. At some point, reality will meetwith expectations. Reality always wins.
“The economic and financial world is changing in ways that westill do not fully comprehend,” Greenspan told a recent bankers’conference in Beijing. “Policymakers accordingly cannot alwayscount on an ability to anticipate potentially adverse developmentssufficiently in advance to effectively address them.”14
How do you deal with the Millennium Wave and the changes itwill bring? First, recognize that change is an opportunity. It will cre-ate new prospects for work, investment, and your life. But it willalso require you to understand that sometimes change is going tobe thrust upon you. This process has already started and is only go-ing to increase in size.
Some economists have been slow to recognize the new orderof employment, but it hasn’t escaped everyone. Erica Groshen andSimon Potter of the New York Fed summarized the situation inAugust 2003: “We find evidence of structural change in two fea-tures of the 2001 recession: the predominance of permanent joblosses over temporary layoffs and the relocation of jobs from oneindustry to another” (which is a far different pattern than previousrecessions). The data suggest that most of the jobs added in the
244 JUST ONE THING
ccc_mauldin_ch12_213-246.qxd 9/23/05 10:55 AM Page 244
recovery have been new positions in different firms and indus-tries, not rehires.
Instead of “layoff, then rehire,” the economy must: “fire, retrain(if possible), move, and hire.” They write: “An unusually high shareof unemployed workers must now find new positions in differentfirms or industries. The task of finding such jobs, difficult and time-consuming under the best of conditions, is likely to be even morecomplicated now, when financial market weakness and economicuncertainty prevail.”15
Therefore, you must realize that change requires flexibility. TheMillennium Wave will require constant learning and relearning. Col-lege is now just the beginning of an education. Very few peoplewill have a job that will not change substantially over time. And thatis a good thing, because if you keep up with the changing world, itwill create opportunity.
I keep using that word—opportunity. But that is the right wayto look at the Millennium Wave. It would be all too easy to focuson the negative aspects of the changes that are coming our way,and there are a lot of them. But focusing on the negative will notwork in the coming years. In fact, it has not been a good strategyin the past.
WHAT THIS MEANS FOR INVESTORS
Albert Wang in an article in the 2001 Academy of Sciences Journalof Financial Intermediation shows us that a cautious optimism isthe appropriate approach. Wang uses evolutionary game theory tostudy the population dynamics of a securities market. In his model,the growth rate of wealth accumulation drives the evolutionaryprocess, and is endogenously determined (by that it means thatonly the data and not some outside factors influenced the determi-nation of winners and losers). He finds that neither underconfidentinvestors nor bearish sentiment can survive in the market. Massivelyoverconfident or bullish investors are also incapable of long-runsurvival. However, investors who are only moderately overconfi-dent can actually come to dominate the market!
The Millennium Wave 245
ccc_mauldin_ch12_213-246.qxd 9/23/05 10:55 AM Page 245

In the world of our ancestors, overconfidence would get youkilled. Lack of confidence would mean you sat around and starved.Cautious optimism was the right approach!
And it still is.The Millennium Wave is also going to offer the greatest invest-
ment opportunities ever seen, as whole new companies andprocesses are created. Of course, this means that what Schumpetercalled “creative destruction” will be in full force, as many compa-nies become the buggy whip manufacturers of the new century.Taking advantage of all these changes will require a nimbleness andan ability to make decisions, rather than passively investing in in-dexes, which will reflect the companies that have already becomelarge or are getting ready to go the way of dinosaurs.
Change. You’d better get to know and love it. It is coming. Thatis one thing that for certain will not change.
246 JUST ONE THING
ccc_mauldin_ch12_213-246.qxd 9/23/05 10:55 AM Page 246
NOTES
Chapter 3
1. Two important papers confirm the importance of style: one byWilliam F. Sharpe analyzing 395 mutual funds and one by RogerIbbotson analyzing 3,100 funds. Both studies confirmed thatstyle could explain 90 percent of the variation in returns. Thespecific stocks chosen by the manager explained only 10 per-cent of the monthly variation in return.
2. Technically, the information ratio it is the ratio of the averageexcess return over an appropriate benchmark to the variabilityof that average excess return. The importance of the informa-tion ratio as a theoretical construct has been developed atlength over a very long time starting in the early 1970s (seeTreynor-Black, 1973; Brealey & Hodges, 1973; Ambechtscheer,1974; Ferguson, 1975; and Rosenberg, 1976.)
3. The interpretation of the information ratio is conceptually relatedto a t-statistic. The t-statistic is a term (scalar) for the difference be-tween a random variable and its mean, divided by the standarddeviation of the random variable. When the random variable is estimated from a population of n observations and the standarddeviation is estimated from the residual variability of that popula-tion, the resulting ratio has a well-known distribution called the t-distribution. Consequently, the t-statistic can be used to do a testof whether the random variable differs significantly from the hy-pothesized mean. Where the number of observations, n, is greaterthan 30, the distribution is quite close to the normal distribution.When using a t-statistic for skill or information content, we arelooking for large positive values of the statistic that urge us to re-ject the null hypothesis that no skill or information is present (thatthe mean is zero).
4. See William F. Sharpe, “Capital Asset Prices: A Theory of MarketEquilibrium under Conditions of Risk,” Journal of Finance 19(1964), 425–442.
247
ccc_mauldin_notes_247-252.qxd 9/23/05 10:56 AM Page 247
5. In order to understand how to use the information ratio, we mustdiscuss the effect of time. Suppose that a manager can outperformthe market (or, more precisely, a passive benchmark appropriateto the manager’s strategy) by 2 percent per year. This is an “alphaof 2 percent.” Suppose also that the manager takes a certain levelof active risk to achieve this. In other words, the standard devia-tion of the difference between the manager’s annual performanceand the performance of a benchmark—which is called the track-ing error—is 6 percent. This is a realistic value for active managerswho have a chance of producing an alpha of 2 percent, but whomanage diversified portfolios. Then in a typical year, the ratio (al-pha/tracking error) is one-third. This ratio is a measure of pureskill. How long will it take, with this amount of skill, for a man-ager’s performance history to have an expected t-statistic of 2.0,which is a common measure of statistical significance? This re-quires that the ratio be 2.0. For a cumulative performance historyover a number of years, the alpha is not affected. However, thestandard deviation around that alpha is reduced by the squareroot of the number of years. In order to increase the ratio from 1/3to 2, or by a factor of six, 36 years is required. In order to gain anexpected t-statistic of 2.5, or the 99 percent confidence level, theone-year ratio must be increased by a factor of 7.5. To accomplishthis, 56 years is required. For more information, see Chapter 5.
6. See Ronald Kahn and Andrew Rudd, “Does Historical Perfor-mance Predict Future Performance?” Financial Analysts Journal(November/December, 1995), 43–52.
7. This calculation is available upon request at [email protected].
Chapter 6
1. Largely thanks to the work of Joseph LeDoux; see his wonderfulbook for details. The Emotional Brain: The Mysterious Under-pinnings of Emotional Life (New York: Simon & Schuster, 1998).
2. For more on this, see Paul Ekman, Emotions Revealed: Recog-nizing Faces and Feelings to Improve Communication andEmotional Life (New York: Owl Books, 2004).
It is also worth noting that some developmental psycholo-gists have designed programs to teach children to recognize the
248 NOTES
ccc_mauldin_notes_247-252.qxd 9/23/05 10:56 AM Page 248
physical signs of emotions (such as anger) and then use thoughtto control those emotions. See Mark Greenberg’s work at Penn-sylvania State University, Harrisburg Center for Healthy ChildDevelopment Prevention Research Center, “PATHS Curriculum”(www.prevention.psu.edu/projects/PATHScurriculum.htm).Much of the work has focused on teaching children to constraintheir anger—a modern-day equivalent of counting to ten.
3. N. Epley and T. Gilovich, “Putting Adjustment Back in the An-choring and Adjustment Heuristic,” Psychological Science, vol.12, no. 5 (2001), 391–396.
4. D. T. Gilbert and M. J. Gill, “The Momentary Realist,” Psycholog-ical Science, vol. 11, no. 5 (2000), 394–398.
5. For more on this, see Antonio R. Damasio, Descartes’ Error: Emo-tion, Reason, and the Human Brain (New York: Quill, 1995).
6. A. Bechara, H. Damasio, D. Tranel, and A. R. Damasio, “Decid-ing Advantageously before Knowing the Advantageous Strat-egy,” Science, 275 (1997).
7. Antoine Bechara, Hanna Damasio, Antonio R. Damasio, GeorgeLoewenstein, and Baba Shiv, “Investment Behavior and theDark Side of Emotion,” unpublished paper (2004).
8. Technically speaking, this group had suffered lesions to theamygdala, orbitofrontal, and insular/somatosensory cortex—allparts of the X-system.
9. Colin Camerer, George Loewenstein, and Drazen Prelec, “Neu-roeconomics: How Neuroscience Can Inform Economics,” Jour-nal of Economic Literature, Vol. XLIII (March 2005), 9–64.
10. G. Loewenstein, D. Nagin, and R. Paternoster, “The Effect ofSexual Arousal on Expectations of Sexual Forcefulness,” Jour-nal of Research in Crime and Delinquency, vol. 34, no. 4(1997).
11. M. Muraven and R. F. Baumeister, “Self-Regulation and Deple-tion of Limited Resources: Does Self-Control Resemble a Mus-cle?” Psychological Bulletin, vol. 126, no. 2 (2000). Also, R. F.Baumeister, “The Psychology of Irrationality: Why PeopleMake Foolish, Self-Defeating Choices,” in Isabelle Brocas and Juan D. Carrillo, The Psychology of Economic DecisionVolume I: Rationality and Well-Being (Oxford UniversityPress: 2003).
Notes 249
ccc_mauldin_notes_247-252.qxd 9/23/05 10:56 AM Page 249
12. Baumeister (2003). 13. R. F. Baumeister, E. Bratslavsky, M. Muraven, and D. M. Tice.
“Ego Depletion: Is the Active Self a Limited Resource?” Journalof Personality and Social Psychology, vol. 74 (1998), 1252–1265.Reprinted with permission.
14. E. Pronin, D. Y. Lin, L. Ross, “The Bias Blind Spot: Perceptionsof Bias in Self versus Others,” Personality and Social PsychologyBulletin, vol. 28 (2002).
15. D. Hirschleifer, “Investor Psychology and Asset Pricing,” Jour-nal of Finance, vol. 56 (2001).
16. Paul Slovic, “Behavioral Problems of Adhering to Decision Pol-icy,” unpublished manuscript (1973).
17. Gustaf Torngren and Henry Montgomery, “Worse thanChance? Performance and Confidence among Professionalsand Laypeople in the Stock Market,” Journal of BehaviouralFinance, vol. 5 (2004).
18. A. Tversky and D. Griffin, “The Weighing of Evidence and theDeterminants of Confidence,” Cognitive Psychology, vol. 24(1992), 411–435.
19. A. Tversky and D. Kahneman, “Judgment under Uncertainty,Heuristics and Biases,” Science, vol. 185 (1974).
20. G. Northcraft and M. A. Neale, “Experts, Amateurs, and Real Es-tate,” Organizational Behaviour and Human Decisions Processes,vol. 39 (1987).
21. Dan Ariely, George F. Loewenstein, and Drazen Prelec, “Coher-ent Arbitrariness: Stable Demand Curves without Stable Prefer-ences,” Quarterly Journal of Economics, vol. 118 (2003).
22. It draws on work by L. Chan, J. Karceski, and J. Lakonishok,“The Level and Persistence of Growth Rates,” Journal of Fi-nance, vol. 58 (2003), 634–684.
23. Louis K. C. Chan, Jason J. Karceski, and Josef Lakonishok, “TheLevel and Persistence of Growth Rates,” Journal of Finance, vol.58 (2003), 643–684.
24. Uri Simonsohn, Niklas Karlsson, George F. Loewenstein, andDan Ariely, “The Tree of Experience in the Forest of Informa-tion,” available from www.ssrn.com (2004).
25. For more on this see the work of Daniel Simons, the leader inthis field: http://viscog.beckman.uiuc.edu/djs_lab/.
250 NOTES
ccc_mauldin_notes_247-252.qxd 9/23/05 10:56 AM Page 250
26. Daniel J. Simons and Christopher F. Chabris, “Gorillas in OurMidst: Sustained Inattentional Blindness for Dynamic Events,”Perception, vol. 28 (1999).
27. D. Kahneman, J. Knetsch, and R. Thaler, “Experimental Tests ofthe Endowment Effect and the Coase Theorem,” Journal of Po-litical Economy, vol. 98 (1990).
28. Ibid., and Robert Franciosi, Praveen Kujal, Roland Michelitsch,Vernon Smith, and Gang Deng, “Experimental Tests of the En-dowment Effect,” Journal of Economic Behaviour and Organi-zation, vol. 30 (1996).
29. Prospect theory is the most frequently used behavioral alterna-tive to classical economics. It incorporates loss aversion neatly.
30. Hersh Shefrin and Meir Statman, “The Disposition to Sell Win-ners Too Early and Ride Losers Too Long: Theory and Evi-dence,” Journal of Finance, vol. 40 (1985).
31. Terrance Odean, “Are Investors Reluctant to Realize TheirLosses,” Journal of Finance (October 1998).
32. Terrance Odean, Brad M. Barber, and Ju Zheng, “The Behaviorof Mutual Fund Investors,” unpublished paper (2001).
33. Andrea Frazzini, “The Disposition Effect and Underreaction toNews,” Journal of Finance, Yale IFC working paper, availablefrom www.ssrn.com (2004).
Chapter 8
1. CAPM is an economic theory that describes the relationship be-tween risk and expected return, and serves as a model for thepricing of risky securities. The CAPM asserts that the only risk thatis priced by rational investors is systematic risk, because that riskcannot be eliminated by diversification. The CAPM says that theexpected return of a security or a portfolio is equal to the rate ona risk-free security plus a risk premium multiplied by the asset’ssystematic risk. The theory was invented by William Sharpe(1964) and John Lintner (1965). The early work of Jack Treynorwas also instrumental in the development of this model.
2. Group 1 drops from a valuation of $100 to $67. Group 2 in-creases from a valuation of $100 to $200. Total profit is $67 on atotal $200 portfolio, or 33%.
Notes 251
ccc_mauldin_notes_247-252.qxd 9/23/05 10:56 AM Page 251
Chapter 12
1. Dr. Alan Krueger, “Economic Scene: Rapid Productivity GrowthProbably Did Not Cause Slow Post-Recession Job Growth.” NewYork Times (November 13, 2003), Section C, p. 2.
2. http://www.kurzweilai.net/articles/art0134.html?printable=1.3. Wall Street Journal (June 29, 2005), page 1.4. Michael A. Alexander, Stock Cycles: Why Stocks Won’t Beat
Money Markets over the Next Twenty Years (Lincoln, NE: iUni-verse.com, 2000).
5. Harry S. Dent Jr., The Roaring 2000s: Building the Wealth andLifestyle You Desire in the Greatest Boom in History (New York:Simon & Schuster, 1998).
6. Study done by Crestmont Research, www.crestmontresearch.com.7. Dalbar Inc., www.dalbar.com.8. John Innes, “Scientists Find Way to Power Mobile Phones by
Water,” The Scotsman (October 20, 2003). http://news.scotsman.com/archive.cfm?id=1158372003.
9. Martin Barnes, The Bank Credit Analyst (March 2003), www.bcaresearch.com.
10. Richard Jackson and Neil Howe, “The 2003 Aging VulnerabilityIndex: An Assessment of the Capacity of Twelve DevelopedCountries to Meet the Aging Challenge,” Center for Strategic andInternational Studies (CSIS) (March 2003).
11. Ben J. Fewer and Ivan R. Wattenberg, Fewer: How the New De-mography of Depopulation Will Shape Our Future (December2004), 37.
12. Thomas L. Friedman, The World Is Flat (New York: Farrar,Strauss and Giroux, 2005), 181.
13. James Dale Davidson and Lord William Rees-Mogg, The Sover-eign Individual (New York: Simon & Schuster, 1997), 25–26.
14. Greenspan speaking before an International Monetary Confer-ence in Beijing, China, June 2005, and also available atwww.federalreserve.gov.
15. http://www.newyorkfed.org/research/current_issues/ci9-8.pdf.
252 NOTES
ccc_mauldin_notes_247-252.qxd 9/23/05 10:56 AM Page 252

INDEX
253
Absolute probabilities, 84Absolute returns, 82Accounting methods, 66Action, importance of, 209–211Advanced Micro Devices (AMD), 9Affect, significance of, 109–110After The Crash—Recession or Depression?
(Shilling), 57Aggregate market, 127Aging population, demographic changes,
237–239, 243Agricultural revolution, 216–217Alexander, Michael, 227Alpha:
defined, 412 percent of, 164–169
Alternative energy sources, 223, 233–235Analysts, functions of, 7, 126–127, 131Anchoring, 124–127Announcements, economic impact of,
177–178, 182Annual returns, implications of, 229Arnott, Robert:
awards and recognitions, 157capitalization-weighted investing,
159–160, 169equal-weighted indexes, 160–164, 169lifestyle, 157professional background, 157publications, 1572 percent of alpha, 164–169
Aron, Raymond, 152–153Asia, economic changes in, 242–243Asset-backed securities, 94Asset classes, 83, 86AT&T, 208Automatic Wealth (Masterson), 193Averaging down, 18
Ball, Phillip, 175Bandwidth elasticity, 10Barings Brothers, 17–18Barron’s, as information resource, 7,
173
Basis, fundamental indexing and, 168Batra, Ravi, 181Bayesian statistics, 41–43Bear markets/bearish markets, 21–22, 24, 36,
168–169, 199, 209Bearish sentiment, 245Behavioral finance, 40, 140. See also
Montier, JamesBehavioral psychology, 124Below-average returns, 96Beneficent exploits, 153Berkshire Hathaway, 179Beta, 32, 35, 43, 164Bianco, Jim, 59Bias(es):
anchoring and, 124–127avoidance strategies, 142–143blind spot, 115confirmatory, 122–123control illusion, 120framing questions and, 131–132hindsight, 124hostile media, 123impact of, generally, 173influential factors, 114–115, 142information dimensions, 120–121, 142judgments, 127–129knowledge illusion, 116–120loss aversion, 138–142memory and, 129–131self-attribution, 123, 139small-stock, 161status quo, 135–138taxonomy of, 116
Biotech Revolution, 233–235Bloch, Ralph, 173Blodget, Henry, 173Bloomberg, as information resource, 59,
69Blue-chip stocks, 118–119Bond investments, see specific types of bonds
benefits of, 205bond market risk, 94bond maturity, 66
ccc_mauldin_ind_253-262.qxd 9/23/05 10:58 AM Page 253

Bond investments (Continued)bond prices, 215bond rallies, 52, 54, 59–60, 74–75bond ratings, 63–64inflation-protected, 94 portfolio diversification, 93–94
Bonner, William (Bill):“Financial Reckoning Day,” 181lifestyle, 145“Means Are the Ends, The,” 147–155professional background, 145success factors, viii
Book value, 66, 68, 160, 165, 168Boorstin, Daniel, 117Break-even, 85, 90Broadband technology, 226Bubble-era fundamentalists, 173Buffett, Warren, 179, 181Bullish investors, 245Bull markets/bullish market, 21–22, 24, 36,
70, 134, 166, 168, 199, 207, 210, 216Bull’s Eye Investing (Mauldin), 227Burton, Jonathan, 92Business cycle, 224BusinessWeek, as information resource, 7Bust and boom cycles, 224Buy-and-hold strategy, 54Buybacks, 133–134Buy high, sell higher strategy, 20–21Buy high, sell low strategy, 229
Canada, population trends, 238–239Capital asset pricing model (CAPM), 92–96,
159, 164–165, 169Capital gains, 179Capitalization indexes, 161Capitalization-weighted investing, 159–161, 169Cappellas, Michael, 13Card game experiment, 105–108Casey, Doug, 181Cash distribution, 133Cash flow, influential factors, 66–67, 168Cause and effect, 40Celera, 222Center for Strategic and International
Studies, 237Central Dogma, 176Chaitin, Gregory, 175Change:
acceptance of, 245–246daily impact of, 219–220dealing with, 218–219, 245–246
demographic, 236–241Innovation Cycle, 224–227 management, 35, 42as opportunity, 244paradigm shifts, 221power of, viiirate of, 217–222, 234
Chaos theory:characteristics of, 174–175market applications, 177
Cheap stock, 161China:
currency price tied to U.S. dollar, 181demographic changes, 236–237economic changes in, 242–243as economic power, 181manufacturing industry, 241
Cingular, 12Cisco, 12Coin-toss game, 108, 120Cold War, economic impact of, 49, 51,
74Comcast, 12“Coming Collapse,” 181“Coming Crash,” 181“Coming Depression,” 181Commodities, 94, 215Complexity, economic impact of, 175–176Compounding, power of, 86, 88–90, 162,
201–204, 206–207, 229–231Confidence, significance of, 117–118Confirmatory bias, 122–123Consensus forecasts, 48Consumer Price Index (CPI), 49Control, illusion of, 120–121Coontz, Stephanie, 241Corporate bonds, 63–64, 66Coupon bonds, 72Cover, Thomas, 175Creative destruction, 246Credit, generally:
inflation and, 49–50risk, 63, 66
Crick, Francis, 176Critical Mass (Ball), 175Customer loyalty, 195–196Cyclical trading runs, 23–24
Dalbar, 229Davidson, James Dale, 181, 243–244“Day of Reckoning,” 180–181Day traders, 48
254 INDEX
ccc_mauldin_ind_253-262.qxd 9/23/05 10:58 AM Page 254

Debt level, 206Decision-making process:
affect, as influential factor, 110–111, 113behavioral finance studies, 40 emotional influences, 105heuristics and, 114–115market conditions, 42variability in, 30–31
Deflation, 74Deflation: How to Survive and Thrive in
the Coming Wave of Deflation (Shilling),74
Deflation: Why It’s Coming, Whether It’sGood or Bad, and How It Will AffectYour Investments, Business andPersonal Affairs (Shilling), 45, 74
“Deflationary,” 181Demographic changes, 236–241, 244Dent, Harry, 225Deregulation, 74Different Universe, A (Loughlin), 175Direct experience, 129–130Disclosure laws, 29, 177–178, 182–183Disposition effect, 138–139Diversification, 32, 42, 83, 92–94, 96Dividends, 66, 68, 132–134DNA, generally:
analogy, 176sequence analysis, 222–223
Doctor Disinflation, see Shilling, A. GaryDoerr, John, 179Dot-com bubble, 25, 59Dot-com era, 226Dow Jones Industrial Average, 229Dow Theory Letters, 199Drug development, 223, 233
Earnings, 36, 66–67, 93Easterling, Ed:
absolute probabilities, 84assumptions, 95–97caveat investor theme, 96–97compounded returns, 88–90expected returns, 82–84, 86inflation, 85–87, 96long-term investments, 80, 84–87modern portfolio theory (MPT), 81–83,
91–97portfolio management, 91–95probable returns, 82–83professional background, 77publications, 77
risk, impact of, viii, 79, 96–97risk assessment, 86–87, 96risk measurement, 83–84risk misconceptions, 82risk/return analysis, 80–82short-term investments, 84–87uncertainty, 80–81volatility, impact of, 80, 88–91
Economic conditions, 25Economic expansions, 168Economic means, significance of, 153–155Economists, influence of, 152–153Education, importance of, 245Efficient market, generally:
hypothesis (EMH), 5, 94–95, 160implications of, 41
80–20 rule, 190Elasticity, 8–11Electronic data and communication
revolution, 217Emerging market debt, 63Emotion, as influential factor, 116, 130–131Endowment effect, 135–138Endowments, 86Energy prices, 215Energy Wave, 234–235Enron, 195Entrepreneurial information, 178–179Entropy, 174Entry strategy, 187–188Equilibrium economics, 180–181Equity investments, 69–70Ethics, importance of, 195–196Europe, demographic changes, 240Europe:
economic changes in, 242–243population trends, 236–237, 239
Evolutionary game theory, 245Exit strategy, 19, 188–189Expected returns, 82–84, 86Extraordinary Delusions and the Madness of
Crowds (Mackay), 177
Fair disclosure regulations, 179–180Fair value, 159–160Fama, Eugene, 94–95Farm subsidies, 238Fear:
dealing with, 104, 108–109of imbalance, 180–183of loss, 142as motivation, 177, 183
Index 255
ccc_mauldin_ind_253-262.qxd 9/23/05 10:58 AM Page 255

Federal Reserve/Federal Reserve System,150, 182
Fertility rates, see Population trendsFewer (Wattenberg), 238–240Fiber optics technology, 10, 12, 225–226Financial Analysts Journal, 162Financial liberalization, 241Financial ratios, types of, 66–68. See also
specific financial ratios“Financial Reckoning Day,” 181Financial reports, 179–180Financial services industry, 11Financial television, as information resource,
7, 57, 69, 127Finn, Jonathan, 27Finn, Mark:
Bayesian statistics, 41–43information ratio, 33–34lifestyle, 27managerial biases, 37–39performance-based investments, 29–30,
35–41performance data, significance of, 41–43performance studies, 34–35professional background, 27risk measurement, 31–34, 43uncertainty, 39–41, 218volatility throttling, 43
Fiscal policy, 49–51Flexibility, importance of, 245Focus, significance of, 189, 193Forbes, as information resource, 7Forecasting, 45, 47, 177, 227–229, 233Foreign currency, 215Foreign exchanges, 94Fortune, as information resource, 7Fosback, Norman, 202Fractals, laws of, 175Frazzini, Andrea, 140–141Friedman, Benjamin, 180Friedman, Tom, 241–242Fundamental analysis, 81Fundamental indexing, 160–164, 167–169Fundamentals, significance of, 24–25,
173–174. See also Fundamental analysis;Fundamental indexing
Futures contracts, 69–70
Game theory, 245Gartman, Dennis:
lifestyle, 15popularity of, 15
Rules of Trading, see “Not-So-Simple”Rules of Trading
Gartman Letter, The, 15, 17Gates, Bill, 181General Electric (GE), 179General experience, 129General Motors (GM), 63, 65–66Gilder, George:
educational background, 171lifestyle, 172professional background, 171publications, 171
Global economy, 216Global markets, 181–182Globalization:
impact of, 223, 241–244influential factors, 74, 235–236pace of, 242–243
Gold/gold standard, 49, 149–150Goldman, Steve, 182Google, 13–14, 179–180, 219Grantham, Jeremy, 228“Great,” 181Great Leader, 154–155“Great Reckoning,” 181“Great Unravelling,” 181Greed, 177, 183Greenspan, Alan, 180, 244Groshen, Erica, 244Gross, Bill, 59–60Gross domestic product (GDP), 47, 181, 225,
237, 243Growth investing, see Kessler, AndyGrowth rate, 93, 128Growth stocks, 37Guerrilla investing, 19–20
Hamanaka, 18Health care, demographic changes and,
237–238Hedge funds, 94Hedging, 96Herd psychology, 75, 114Heuristics:
characteristics of, generally, 114–115simplification, 116
Higher-quality bonds, 83Hindsight bias, 39, 124Historical performance, 40–41, 227Historical returns, 30, 231Homo economicus, 105Hope, implications of, 208–209
256 INDEX
ccc_mauldin_ind_253-262.qxd 9/23/05 10:58 AM Page 256

Hostile media bias, 123Hot-cold empathy gaps, 110–111Housing bubble, 75Housing market, 215How We Got Here (Kessler), 1Human capital, 165Human psychology, 224, 232Huntsman, Jon M., 194–196Hyman, Edward, 59
Illogical markets, 23–24Imbalance fallacy, 180–183Immelt, Jeffrey, 179Immigration trends, 240Inattentional blindness, 132Index funds:
characteristics of, 159, 183in secular bull market, 231
Indexes, equal-weighted, 160–164, 169India:
economic changes in, 242–243job outsourcing to, 241
Individual investors:investment strategies for, 62, 66, 70, 72, 86loss aversion, 139, 141
Industrial revolution, 217Inflation:
historical perspectives, 48–50, 52–53implications of, 59–60, 85–87, 215–216,
225“Inflationary,” 181Inflation-protected bonds, 94Infocopia, 177Information, generally:
dimensions of, 121inside vs. outside, 177–184overload, 7ratio, 33resources, 173theory, 174value of, 174–177
Information Age, 177, 217, 226, 233, 235Innovation cycle:
characteristics of, 224–225examples of, 225–226phases of, 225
Inside information, 177–184Insider rules, 183Insider trading, 36, 178–179Institutional investors, 86Intel, 8–9, 234“Intelligence at outer edges” theory, 8, 11–14
Interest rate, generally:forecasting, 59–61historical perspectives, 51–52, 54impact of, 61–63, 73, 93risk, 66significance of, 149, 168–169, 174, 182
International economics, equilibrium in, 180Internet, as information resource, 182, 184Investment trusts, 94Investor psychology, 168, 218Investor’s Business Daily, 173Irrational exuberance, 62Irrational hope, 30Irrationality, influential factors, 23, 114,
232Is Inflation Ending? Are You Ready?
(Shilling), 52–53
James, William, 104–105Japan, population trends, 237–239Jefferson, Thomas, 11, 13Job growth, 220, 244–245Journal of Financial Intermediation, 245Judgment, 143Juniper, 12Junk bonds, 63
Kahn, Ronald, 35Kampen, Emerson, 196Kessler, Andy:
average returns, viiicontact information, 1growth, significance of, 4–5information overload, 7“intelligence at outer edges,” 8, 11–14lifestyle, 1market elasticity, 8–11Mount Washington climb, 3–4, 14professional background, 1, 4publications, 1trend identification, 7–8on valuation, 5–6
Keynes, John Maynard, Lord, 20, 23,148–150
Keynesianism, 149–152, 183Kissinger, Henry, 171Kittler, Fred, 4Kondratieff, Nikolas, 224Kondratieff Wave (K-Wave theory), 224Krueger, Alan, 220Krugman, Paul, 181Kurzweil, Ray, 220–221
Index 257
ccc_mauldin_ind_253-262.qxd 9/23/05 10:58 AM Page 257

Large-capitalization stocks, 32, 162–163Latin America, economic changes in, 242Learning process, 109–110, 114LeDoux, Joseph, 104Leeson, Nick, 18Leighton, Charlie, 55Leverage/leveraging, 54–55, 74, 165Liabilities, 85–87Livermore, Jesse, 19Long bond investments, 55–56Long positions, 26, 70Long-run capitalization-weighted return, 162Long Term Capital Management, 17–18Long-term investments, 47–48, 52, 75Losing position:
never add to rule, 18–19selling out of, 20, 22
Loss, generally:aversion, 138–142reasons for, 204–205
Lottery tickets, 206Loughlin, Robert, 175Low-/lower-quality bonds, 82–83Lucas, Robert, 149Lynch, David, 235
Mackay, Charles, 177Malkiel, Burton, 174Management/managerial:
change, 35, 42emotional responses, 113–114quality, 35–36, 66selection factors, 36–38style, impact of, 32, 37, 42–43
Mandelbrot, Benoit, 175Marcus Aurelius, 151Market, generally:
capitalization, 160–163, 165, 181clearing portfolios, 163–164complexity, 175–176penetration, in innovation cycle, 225, 227rallies, 54, 227risk, 32, 92, 94value, 159
Markowitz, Harry, 83, 92, 94–95, 97Marriage: A History (Coontz), 241Marriage, demographic changes of, 240–241Mass psychology, 25. See also Herd
psychologyMasterson, Michael:
ethics, 195invaluable employees, 193
mentoring, 194“other guy first” policy, 195–197professional background, 185publications, 185success strategies, viii, 190–192wealth-building strategies, 187–190
Materialism, 176Maturity boom, in innovation cycle,
225–226, 233Mauldin, John:
on compounding, 230–231innovation cycle, 224–227Millennium Wave, 214, 217–218, 226–227,
233–236, 244–246personal life, 213professional background, 213publications, 213secular bear/bull markets, 227–232web site, 229
MCI, 12–13Mean-variance efficient index, 159Media, influence on market, 123, 130–131,
179Medicare, 238–240Meeker, Mary, 173Mental attitude, significance of, 205Mental capital, 20, 22–23, 26Mentoring, 194Mercenary guerrillas, 19–20Mergers and acquisitions (M&A), 179Mexico, population trends, 239Millennium Wave, 214, 217–218, 226–227,
233–236, 244–246Minitel, 13Misbehavior of Markets (Mandelbrot), 175Misery Index, 216Mistakes, dealing with, 143Modern portfolio theory (MPT), 31, 81–83,
91–97Momentary realists, 105Momentum investing/trading, 180, 229Monetary policy, 49–51Money bible, 201–202Money market funds, 204Money supply, 49–51, 149–150Montier, James:
accuracy vs. confidence study, 117–119anchoring, 124–127on brain functions, 102coin-toss game, 108, 120control, illusion of, 120–121emotional influences, 104–108
258 INDEX
ccc_mauldin_ind_253-262.qxd 9/23/05 10:58 AM Page 258

information, dimensions of, 121investor psychology, viii, 101overreaction study, 120–121professional background, 99publications, 99reasoning systems, 103self-control, 111–114thinking processes, 101–102uncertainty, 124, 232
Moore’s Law, 9Moos, Edward A., 54Morgan, J. P., 210Mortgage-backed securities, 63Motorola, 9Municipal bonds, 63, 204, 207Mutual funds:
benefits of, 94, 229loss aversion and, 139–141
Nanotechnology, 234Negative compounding, 229Negativity, impact of, 208Net present value, 4, 165New world order, 243–245New York Times, as information resource, 7Newsletters, 127, 173Newton, Sir Isaac, 40Niche markets, 187Noise, in decision-making process, 30–34“Not-So-Simple” Rules of Trading:
don’t hold losing positions, 20do what is working, 25–26go where strength is, 20–22invest on winning side, 19–20“logical” plays are costly, 22–24never add to losing position, 18–19significance of, vii, 17–18think like a fundamentalist; trade like a
technician, 24–25understanding the environment, 25
Nuclear fusion power plants, 235
Obstrufication, 131Oil prices, 215Omerta, 182Opportunity, identification of, 206–207Optimism, 245–246Options, 94“Other guy first” policy, 195–197Outperforming stocks, 163Outsider trading scandal, 173, 177, 180Outsourcing, impact of, 241
Overbuilding, economic impact of, 225Overconfidence, 117, 119, 139–140, 245–246Overoptimism, 117, 139Overreaction, 120–121Overvaluation, implications of, 162Overvalued markets, 160, 224Overvalued stock, 162Overweighting, 130Ownership, impact of, 135–138, 143
Paradigm shift, 221Pareto’s principle, 190Patience, importance of, 205–206, 208–209Pension plans, 86, 169, 237–238Performance attribution, 35Performance-based investments, 29–30, 39–40Performance measurement, 30, 34–35Perseverance, importance of, 202Pharmaceuticals, 10–11. See also Drug
developmentPhysics laws, market applications, 175Pimco, 60Plasticity, 114Political money, 150Population trends, demographic changes,
236, 238–239, 245Post-risk probable yield, 83Potter, Simon, 244PowerOne, 182Prechter, Robert, 181Pre-risk expected yield, 83Press releases, 178, 180. See also
AnnouncementsPrice/earnings (P/E) ratio, 87, 93–94, 160,
165, 215, 227–228, 231Price-weighted index, 160Pricing strategies:
fair value and, 160influential factors, 31
Probabilities:absolute, 84post-risk yield, 83
Probable returns, 82–83Professional investors, loss aversion and,
140Professional money managers, loss aversion
and, 141Programmable dust, 234Puke Factor, The, 227
Quantum Revolution, 234–235Questions, framing, 131–132
Index 259
ccc_mauldin_ind_253-262.qxd 9/23/05 10:58 AM Page 259

Railroad industry, 226Random walk, 174Rate of return, 82–83Ratigan, Dylan, 12–13Rational investors, 165Rationality/rationalization, 130–131, 218Rational markets, 81–82Readleaf, Andy, 183Real estate:
investments, 94, 205listings, 127
Reasoning systems, 103Recency effect, 129–131Recessions, 168–169, 215, 244Rees-Mogg, William, Lord, 243–244Reference cap, 167–168Regulatory agencies, 66. See also Monetary
policyReinvestment, 72Relative return investment philosophy, 95Representativeness, 128–129Repurchases, 132–134Residual common factor risk, 30Residual specific risk, 30Resource allocation, changes in, 244Retirement age, 239Retirement benefits, 237. See also Pension
plans; Social SecurityReturn drag, 160–161Returns:
absolute, 82annual, 88below-average, 96compounded, 88–90expected, 82–84 historical, 30price/earnings (P/E) ratio and, 93probable, 82–83range, 90realized, 89 risk-adjusted, 34, 174simple, 88–89
Revenues, implications of, 166, 168Risk, generally:
assessment, 86management, 65–66, 159measurement, 32minimization strategies, 164premium, 174profile, 83tolerance, 66, 165, 169types of, 30
Risk-adjusted basis, 168Risk-adjusted growth, 5Risk-adjusted returns, 34, 174Risk-free rate, 165Riskless investments, see Treasury bills;
Treasury bond yieldsRisk/return analysis, 80–82Risk-reward relationship, 95RNA sequence analysis, 223Roaring 2000s, The (Dent), 225Rothbard, Murray, 149Rotter, Bradley, 22Rudd, Andrew, 35Rumors, 180Running Money (Kessler), 1Russell, Richard:
action, importance of, 209–211compounding, power of, viii, 201–204,
206–207Dow Theory Letters, 199hope, implications, 208–209loss, reasons for, 204–205opportunity, identification of, 206–207professional background, 199timing, significance of, 207–208wealthy investors, success factors,
205–206Russell Small Cap Index, 32–33Russia, population trends, 236
S&P 500, 31–33, 58, 67, 85, 125, 165,166–167
Safe harbor statements, 178SBC, 12Schumpeter, Joseph, 224–225, 246S-Curve, 225Secular bear/bull markets, 224, 227–232Securities and Exchange Commission (SEC),
178, 183Seidenberg, Ivan, 12–13Self-attribution bias, 123, 139Self-control, 111–114Self-deception, 116Self-esteem, 113Self-interest, 173Self-regulation, 113Selling signals:
losing positions, 20weakening stocks, 20–22
Semiconductor elasticity, 10Shakeout phase, in innovation cycle,
225–226
260 INDEX
ccc_mauldin_ind_253-262.qxd 9/23/05 10:58 AM Page 260
Sharpe, William F., 92, 95Sharpe ratio, 34Shilling, A. Gary:
on bond maturity, 65–66bond rallies, 52, 54, 59–60, 74–75consistency, importance of, 58–62contrarian personality, 57deflation, 59, 74disinflation, 51–53“Doctor Disinflation,” 45government regulation, 50–51equity investments, 69–70on inflation, 48–50, 52–53, 59, 71inside information, viiion irrational markets, 23leveraging, 54–55, 74long bond, 55–56, 58long-term investment theme, 47–48, 52, 75market conditions, historical perspectives,
48–49nonconsensus and long-term investments,
47–48, 59publications, 45, 52–53, 57, 74risk tolerance, 65–66stock vs. bond investments, 73stock market complexity, influential
factors, 66–69successful investments, 47–48, 57–58,
72–74Treasury bond yields, 47–48, 52–54,
58–65, 69–75Short sales, 20–21, 24Signal-to-noise ratio analogy, 30–31Signposts in the fog, 6–8Silicon Eye, The (Gilder), 171Silicon Valley, 11Simple trading schemes, 24–25Size effect, 37, 162Skill-based investing, 96Skype, 12Slovic, Paul, 117Small-capitalization stocks, 162Small-return assets, 86Small-stock bias, 161Snow, John, 180–182Social democracy, 243Social interaction, 116Social Security, demographic changes and,
238–240Sovereign Individual, The (Davidson/Rees-
Mogg), 243Speculation, 180, 207
Stack, Jim, 173Standard deviation, 41–42, 88Status quo bias, 135–142Steady state, 161Stein, Herbert, 218Stock Cycles (Alexander), 227Stock investments:
characteristics of, generally, 205portfolio diversification, 93risk analysis, 84–85selection process, 207–208
Stock market:collapses, implications of, 70complexity of, 66–69crash of 1987, 57rallies, 62risk, 94
Stop-loss points, 188Strong markets, advice for, 21–22Subjectivity, impact of, 173Sumitomo Copper, 17–18Supply and demand, 177, 226Supply-side economics, historical
perspectives, 171Survivor bias, 34–35Systematic risk, 30, 32, 35, 92
Talbot, John, 181Tax rates:
influential factors, 244projection of, 237–238
Technical analysis, 177Technical analysts, characteristics of,
174–175Technicians, 24–25Technological advances, 244Technological change, rate of, 220–222Terrorist attack (9/11), economic impact of,
57–58Texas Instruments (TI), 8Third Wave, The (Toffler), 216–217Time horizon, 169Time-Warner Cable, 12Timing, significance of, 207–208Toffler, Alvin, 216–217Top-ten stocks, 162–164Total fertility rate (TFR), 238–239Trade, generally:
deficit, 242gap, 181–182liberalization, 241
Treasury bills, 83, 204
Index 261
ccc_mauldin_ind_253-262.qxd 9/23/05 10:58 AM Page 261

Treasury bond yields, 47–48, 52–54, 58–65,70–75, 83
Treasury Inflation-Protected Securities(TIPS), 60
Treasury notes, 204“Tree of Experience in the Forest of
Information, The,” 129–130Trigger events, 130True-fair-value-weighted portfolio, 160t-statistic, 167Tulipmania, 177Turk, James, 181Tyco, 195
Uncertainty, 31, 39–41, 80–81, 124, 183, 218,232
Underconfident investors, 245Underperforming stocks, 162Underreaction, 121Undervalued markets, 224Undervalued stock, 162Underwriting, bond, 71Unemployment rates, influential factors, 216,
244–245Unexpected Returns (Easterling),
77United States, generally:
demographic changes, 240manufacturing industry, 241population trends, 237–239trade deficit/gap, 181–182, 242
U.S. dollar:foreign currency tied to, 181value of, 150–151weakening of, 215
Unsystematic risk, 92
Valentine, Donald, 179Valuation:
above-average, 79anchoring and, 125–127changes in, 93cycles, 227gaps, 126high, 81reverse engineering models of, 127secular bear market, 228–229, 231–232in secular bull market, 228–231
Valuation-indifferent index, 160, 162, 165
Valuation-weighted index, 160
Value, generally:bias, 161effect, 37investors, 168perception, influential factors of, 136stocks, 37
Vantage Consulting Group, 27Variability in decision-making, influential
factors, 30–31Velocity Capital, 10Venter, J. Craig, 222–223Venture capitalists, 179Verizon, 12–13Vigilante, Richard, 183Volatility:
bond prices and, 65gremlins, 89–91impact of, 80, 88–91, 177–178, 182, 229interest rates and, 63, 65throttling, 43
Voodoo economics, 224
Wall Street Journal, as information resource,7, 45, 47, 57–58, 60, 180, 222
Walter, John, 208Wang, Albert, 245War bonds, 50Watson, James, 176Wattenberg, Ben, 238Weak markets, advice for, 21–22Wealth creation, 233Web sites, as information resource, 7Wiener, Norbert, 176Willingness to accept (WTA), 135–137Winners Never Cheat (Huntsman), 194–196Winning stocks, sale of, 138–141, 143Winning trades, identification of, 25–26Wolfe, Josh, 173WorldCom, 195World economy, balance in, 242–243. See
also GlobalizationWorld Is Flat, The (Friedman), 241–242WYSIWYG, 131
Yield:post-risk probable, 83pre-risk expected, 83U.S. Treasury bonds, 47–48, 52–54, 58–65,
70–75, 83
Zero coupon bonds, 70, 73
262 INDEX
ccc_mauldin_ind_253-262.qxd 9/23/05 10:58 AM Page 262