
juliet ingrid puchert 2019 - SEALS Digital Commons
390
AN EVALUATION OF A PROFILING AND SELECTION PROCESS FOR APPRENTICES IN THE SOUTH AFRICAN AUTOMOTIVE INDUSTRY ------------------------------------------------------------------------------------ JULIET INGRID PUCHERT 2019
-
Upload
khangminh22 -
Category
Documents
-
view
0 -
download
0
Transcript of juliet ingrid puchert 2019 - SEALS Digital Commons

AN EVALUATION OF A PROFILING AND SELECTION PROCESS
FOR APPRENTICES IN THE SOUTH AFRICAN AUTOMOTIVE
INDUSTRY
------------------------------------------------------------------------------------
JULIET INGRID PUCHERT
2019
2
AN EVALUATION OF A PROFILING AND SELECTION PROCESS FOR APPRENTICES
IN THE SOUTH AFRICAN AUTOMOTIVE INDUSTRY
1
by
JULIET INGRID PUCHERT
200329049
Thesis submitted in fulfilment of the requirements for the degree
DOCTOR OF PHILOSOPHY (INDUSTRIAL AND ORGANISATIONAL PSYCHOLOGY)
in the
Faculty of Business and Economic Sciences
at the
Nelson Mandela University
April 2019
Supervisor: Prof. R. van Niekerk
Co-Supervisor: Dr K. Viljoen
ii

iii
DECLARATION
I, Juliet Ingrid Puchert, declare that this research report on “An evaluation of a profiling
and selection process for apprentices in the South African automotive industry” is my original
work and has never been submitted by the author or anyone else at any university for a degree.
All the sources that I have used and/or quoted have been indicated and acknowledged by means
of complete references. This dissertation is submitted in fulfilment of the requirements for the
degree: Doctor of Philosophy (Industrial and Organisational Psychology) at the Nelson
Mandela University.
26th November 2018
LANGUAGE EDITING DECLARATION
I hereby confirm that I have proofread and edited the following doctoral thesis using the
Windows “Tracking” system to reflect my comments and suggested corrections for the student
to action:
An evaluation of a profiling and selection process for apprentices in the South African
automotive industry, by Juliet Puchert, a thesis submitted in fulfilment of the requirements for
the degree of Doctor of Philosophy (Industrial and Organisational Psychology) at the Nelson
Mandela University.
26th November 2018

iv
ACKNOWLEDGEMENTS
I gratefully acknowledge the following individuals:
My supervisor, Prof. Roelf van Niekerk, and my co-supervisor, Dr. Kim Viljoen, for their
commitment, encouragement and professional guidance. You have both made this a
meaningful learning process.
My thanks are also extended to my statistician, Dr. Syden Mishi, who sufficiently de-
mystified statistics for me to be able to write this thesis.
The Human Resource staff at the automotive industry involved in this study. Without
their hard work and persistence this research would not have been possible.
DEDICATION
This research project is dedicated to my children, Joy and Jacob. Thank you for your
patience with my after-hours work and your smiles while I ‘plodded’ on. I love you to the moon
and back!
v
ABSTRACT
The South African automotive industry is the biggest manufacturing sector and the largest
contributor to the domestic economy. Within the national manufacturing sector, the artisan job
family has been identified as a scarce and critical skill. Artisans are a number one area of
concern with regard to filling vacancies in the country. The domestic economy as well as the
effectiveness and success of the automotive industry could be negatively affected if this
artisanal crisis is not adequately addressed. This study aimed to evaluate a profiling and
selection process for apprentices in the South African automotive industry. A multiple-stage
selection method was used to screen the applicants. The selection process included the
following phases: application review, rating of the application documentation, aptitude testing,
skills-based teamwork assessment and interviews. The researcher obtained access to the
documentation generated through an annual apprentice selection process at a large multi-
national automotive firm. The final sample consisted of 3 412 individuals that had applied for
two types of apprenticeship programmes, namely, automotive electrician and millwright,
across three intake years. Descriptive statistics such as frequency distribution tables and
medians were used. Inferential statistical analysis, using survival analysis, was used to assess
whether the survival curves were statistically different across the groups.
The findings of this study are relevant to the South African automotive industry, as well
as the manufacturing sector. The findings are also of value to human resource practitioners,
educators, social scientists and other researchers. The 13 constructs investigated in the study
showed a high association with longer survival time in the selection process. The positive
evaluation of this selection process provides evidence to support its confirmation as the national
selection tool. Four recommendations are proposed to the HRM field and four to the automotive
industry. The multiple-hurdle selection process employed in this study should be replicated by
the automotive industry in their selection of apprenticeship applicants. Standardisation
practices, the use of on-line technology and the marketing of the apprenticeship position are
also recommended. Furthermore, it is recommended that educational providers provide job
preparation workshops to assist applicants to improve their survival opportunity within the
selection processes.
Keywords: Artisans, apprenticeship, aptitude, selection, survival, automotive industry
vi
LIST OF ABBREVIATIONS
AAC&U Association of American Colleges and Universities
AC Assessment Centre
ACM Automotive Component Manufacturer
AIEC Automotive Industry Export Council
APDP Automotive Production and Development Programme
ASCCI Automotive Supply Chain Competitiveness Initiative
BRICS Brazil, Russia, India, China and South Africa
CDA Car Distributors Assembly
COTVET Council for Technical and Vocational Education and Training
CV Curriculum Vitae
DAT Differential Aptitude Test
DHET Department of Higher Education and Training
DOL Department of Labour
DTI Department of Trade and Industry
EEA Employment Equity Act (No. 55 of 1998)
EEAA Employment Equity Amendment Act (No. 47 of 2013)
G20ewg G20 Employment Working Group
GDP Gross Domestic Profit
GM General Motors
GMA General Mental Ability
HPCSA Health Professions Council of South Africa
HSRC Human Sciences Research Council
HR Human Resource
HRM Human Resource Management
HRS Human Resource Selection
JIPSA Joint Initiative on Priority Skills Acquisition
LRA Labour Relations Act (No. 66 of 1995)
merSETA Manufacturing, Engineering and Related Services SETA
MIDP Motor Industry Development Programme
NAAMSA National Association of Automobile Manufacturers of South Africa
NAMB National Artisan Moderating Body

vii
NAPS National Apprenticeship Promotion Scheme
NAS National Apprenticeship Service
NDP National Development Plan
OECD Organisation for Economic Co-operation and Development
OEM Original Equipment Manufacturers
OICA Internal Organisation of Motor Vehicle Manufacturers
QCTO Quality Council for Trades and Occupations
SA South Africa
SAMAD South African Motor Assemblers and Distributors
SETA Sector Education and Training Authority
SPSS Statistical Package for the Social Sciences
ST Survival Time
STEM Science, Technology, Engineering and Mathematical
TVET Technical and Vocational Education and Training
TRAT Trade Aptitude Test
UK United Kingdom
USA United States of America
VWSA Volkswagen South Africa
viii
TABLE OF CONTENTS
Page No.
Declaration iii
Acknowledgements and Dedication iv
Abstract v
List of Abbreviations vi
Table of Contents viii
List of Appendices xvii
List of Tables xviii
List of Figures xxi
Chapter One: Introduction and Overview 1
1.1. Introduction 1
1.2. Background to research problem 2
1.3. Problem statement, objectives and hypotheses 5
1.3.1. Problem statement 5
1.3.2. Objectives 8
1.3.3. Hypotheses 9
1.4. Literature review 11
1.4.1. Theoretical framework 11
1.4.2. Human resource selection 12
1.4.3. Empirical literature 13
1.5. Research methodology 15
1.5.1. Research paradigm 15
1.5.2. Research design 15
1.5.3. Research approach 16
1.5.4. Data collection methods 16
1.5.5. Data analysis 19
1.6. Definitions of key terms 20
1.7. Limitations 22
1.8. Delimitations 22
1.9. Significance of the study 22
ix
Page No.
1.10. Ethical considerations 23
1.11. Structure of thesis 24
1.12. Summary 24
Chapter Two: South African Automotive Industry 25
2.1. Introduction 25
2.2. History of the South African automotive industry 25
2.3. Representation of the automotive industry 27
2.4. Contribution of the automotive industry 29
2.4.1. Economic contribution 29
2.4.2. Capital expenditure 32
2.5. Future trends 33
2.6. Contribution to employment 35
2.7. Summary 36
Chapter Three: Artisan and Apprenticeship Context 37
3.1. Introduction 37
3.2. Defining apprenticeship 37
3.3. International apprenticeship systems 39
3.3.1. German apprenticeship system 41
3.3.2. North American apprenticeship system 43
3.3.3. Chinese apprenticeship system 45
3.3.4. Indian apprenticeship system 47
3.4. South African apprenticeship system 51
3.4.1. Recruitment, selection and induction 51
3.4.2. Training and assessment 53
3.4.3. Support during the apprenticeship 54
3.4.4. Completion and beyond 55
3.5. Nature of demand for artisans 56
3.5.1. Benefits of apprenticeship programmes 56
3.5.2. Extent and requirements of demand 61
x
Page No.
3.6. Nature of artisanal supply 63
3.7. Challenges in the apprenticeship system 66
3.7.1. Quality of schooling 66
3.7.2. Attraction and recruitment 68
3.7.2.1. Potential applicants 69
3.7.2.2. Employers 73
3.7.2.3. Sponsors 74
3.7.3. Selection 74
3.8. Summary 77
Chapter Four: Human Resource Selection Context 78
4.1. Introduction 78
4.2. Human capital theory 78
4.2.1. Relevance of human capital theory 79
4.2.2. Criticism of human capital theory 81
4.3. Human resource selection 82
4.3.1. Importance of human resource selection 84
4.4. Human resource selection methods 86
4.4.1. Overview of selection methods 86
4.4.2. Preliminary screening methods 88
4.4.2.1. Application blanks 88
4.4.2.2. Curriculum vitae 89
4.4.3. Reference checking and verification 94
4.4.4. Testing and assessment methods 96
4.4.4.1. Aptitude and intelligence 97
4.4.4.2. Competencies 100
4.4.5. Interviewing methods 103
4.5. Challenges in human resource selection 105
4.5.1. Evaluation of human resource selection 106
4.5.2. Labour market challenges 107
4.5.2.1. Educational profile of applicants 107
4.5.2.2. Skill deficiency of applicants 108
xi
Page No.
4.5.3. Impact of legislation 110
4.6. Selection of apprentices 112
4.6.1. Global apprentice selection practices 113
4.6.2. National apprentice selection practices 119
4.7. Summary 121
Chapter Five: Research Methodology 123
5.1. Introduction 123
5.2. The research process 123
5.3. Step one: Research topic and questions 125
5.4. Step two: Literature review and research problem 125
5.4.1. Types of literature reviewed 125
5.4.2. Defining the research problem 126
5.5. Step three: Research objectives and hypotheses 126
5.6. Step four: Research paradigm 127
5.7. Step five: Research design and approach 129
5.7.1. Selection of research design type 129
5.7.2. Identification of research approach 130
5.8. Step six: Primary data stage 131
5.8.1. Step six: Task one – Sampling plan 132
5.8.2. Step six: Task two – Instrument design 133
5.8.2.1. Research instrument one 134
5.8.2.2. Research instrument two 134
5.8.2.3. Research instrument three 135
5.8.2.4. Research instrument four 135
5.8.2.5. Research instrument five 135
5.8.2.6. Research instrument six 136
5.8.3. Step six: Task three – Pilot study 136
5.8.4. Step six: Task four – Data collection 136
5.8.5. Step six: Task five – Data processing 137
5.9. Step seven: Secondary data stage 139
5.9.1. Step seven: Task one – Sampling plan 139
xii
Page No.
5.9.2. Step seven: Task two – Data extraction 139
5.9.2.1. Data preparation 142
5.9.2.2. Data coding 142
5.9.2.3. Data editing 142
5.9.2.4. Data tabulation 143
5.9.3. Step seven: Task three – Operationalisation of the constructs 145
5.9.3.1. Operationalisation of phase one constructs 145
5.9.3.2. Operationalisation of phase two constructs 145
5.9.3.3. Operationalisation of phase three constructs 146
5.9.3.4. Operationalisation of phase four constructs 147
5.9.3.5. Operationalisation of phase five constructs 148
5.9.4. Step seven: Task four – Data analysis 148
5.9.4.1. Descriptive statistics 149
5.9.4.2. Reliability of measuring instruments 150
5.9.4.3. Validity of measuring instruments 152
5.9.4.4. Assessment of research hypotheses 153
5.10. Step eight: Interpretation of results 156
5.11. Step nine: Conclusions and recommendations 157
5.12. Step ten: Dissemination of results 157
5.13. Ethical considerations 157
5.14. Summary 158
Chapter Six: Presentation of Empirical Findings 159
6.1. Introduction 159
6.2. Demographic profile of applicants 159
6.2.1. Race profile 159
6.2.2. Gender profile 160
6.2.3. Age profile 160
6.2.4. Geographical location profile 161
6.3. Survival rates in selection phases 162
6.3.1. Phase one survival rate 162
6.3.2. Phase two survival rate 163
xiii
Page No.
6.3.3. Phase three survival rate 163
6.3.4. Phase four survival rate 164
6.3.5. Phase five survival rate 164
6.4. Profile results from selection phases 165
6.4.1. Phase one: Preliminary curriculum vitae review 165
6.4.1.1. Selected apprenticeship type 165
6.4.2. Phase two: Secondary curriculum vitae review 166
6.4.2.1. Secondary education type 166
6.4.2.2. Mathematics performance 167
6.4.2.3. Science performance 167
6.4.2.4. Motivational letter 168
6.4.2.5. Curriculum vitae 169
6.4.2.6. Practical experience 170
6.4.2.7. Qualification 170
6.4.2.8. Leadership potential 171
6.4.3. Phase three: Psychological assessment 172
6.4.3.1. General aptitude 172
6.4.3.2. Technical aptitude 172
6.4.3.3. Teamwork competence 173
6.4.4. Phase four: Panel interviews 174
6.4.4.1. Standard interview 174
6.4.4.2. General impression 174
6.5. Median survival time 175
6.5.1. Phase two medians 175
6.5.2. Phase three medians 178
6.5.3. Phase four medians 179
6.6. Assessment of hypotheses 180
6.6.1. Hypothesis one: Secondary education type 181
6.6.2. Hypothesis two: Mathematics performance 183
6.6.3. Hypothesis three: Science performance 185
6.6.4. Hypothesis four: Motivational letter 188
6.6.5. Hypothesis five: Curriculum vitae 190
xiv
Page No.
6.6.6. Hypothesis six: Practical experience 193
6.6.7. Hypothesis seven: Qualification 195
6.6.8. Hypothesis eight: Leadership potential 197
6.6.9. Hypothesis nine: General aptitude 199
6.6.10. Hypothesis ten: Technical aptitude 202
6.6.11. Hypothesis eleven: Teamwork competence 204
6.6.12. Hypothesis twelve: Standard interview 206
6.6.13. Hypothesis thirteen: General impression 208
6.6.14. Overall results 210
6.7 Summary 212
Chapter Seven: Discussion of Findings 213
7.1. Introduction 213
7.2. Demographic profile of applicants 216
7.3. Phase one: Preliminary curriculum vitae review 218
7.4. Phase two: Secondary curriculum vitae review 218
7.4.1. Secondary education type 218
7.4.2. Mathematics and science performance 221
7.4.3. Motivational letter 222
7.4.4. Curriculum vitae 223
7.4.5. Practical experience 225
7.4.6. Qualification 226
7.4.7. Leadership potential 227
7.4.8. Recommendation status 228
7.5. Phase three: Psychological assessment 229
7.5.1. General aptitude 229
7.5.2. Technical aptitude 232
7.5.3. Teamwork competence 235
7.5.4. Recommendation status 236
7.6. Phase four: Panel interviews 236
7.6.1. Standard interview 236
7.6.2. General impression 238
xv
Page No.
7.6.3. Recommendation status 240
7.7. Phase five: Trade test results 241
7.8. Overall results 241
7.9. Summary 242
Chapter Eight: Summary, Conclusions and Recommendations 243
8.1. Introduction 243
8.2. Overview of the study 246
8.2.1. Literature overview 246
8.2.2. Objectives of the study 247
8.2.3. Summary of the methodology 248
8.3. Conclusions derived from the secondary objectives 249
8.3.1. Secondary objective one: Educational profile 249
8.3.1.1. Conclusion one: Type of secondary education 249
8.3.1.2. Conclusion two: Mathematics performance 250
8.3.1.3. Conclusion three: Science performance 250
8.3.2. Secondary objective two: Application profile 250
8.3.2.1. Conclusion four: Motivational letter 251
8.3.2.2. Conclusion five: Curriculum vitae 251
8.3.2.3. Conclusion six: Practical experience 251
8.3.2.4. Conclusion seven: Qualification 251
8.3.2.5. Conclusion eight: Leadership potential 252
8.3.3. Secondary objective three: Aptitude and teamwork profile 252
8.3.3.1. Conclusion nine: General aptitude 252
8.3.3.2. Conclusion ten: Technical aptitude 253
8.3.3.3. Conclusion eleven: Teamwork competence 253
8.3.4. Secondary objective four: Interview profile 253
8.3.4.1. Conclusion twelve: Standard interview 254
8.3.4.2. Conclusion thirteen: General impression 254
8.4. Conclusions derived from the primary research objective 254
8.5. Recommendations stemming from the objectives 255
8.5.1. Recommendation to the South African government 255
xvi
Page No.
8.5.1.1. Recommendation one: Confirm national selection tool 255
8.5.2. Recommendations for the human resource management field 257
8.5.2.1. Recommendation one: Use of a multiple-hurdle selection
process
257
8.5.2.2. Recommendation two: Use of standardised application
documentation
258
8.5.2.3. Recommendation three: Use of online technology 259
8.5.2.4. Recommendation four: Subject pass rates 260
8.5.3. Recommendations for the automotive industry 261
8.5.3.1. Recommendation one: Replication of selection process 261
8.5.3.2. Recommendation two: Marketing of the apprentice position 261
8.5.3.3. Recommendation three: Career guidance 262
8.5.3.4. Recommendation four: Standardisation exercises 263
8.5.4. Recommendation for educational providers 263
8.5.4.1. Recommendation one: Job application preparation workshops 263
8.5.5. Recommendation to test developer 265
8.5.5.1. Recommendation one: Formal validation 265
8.6. Contributions of the study 266
8.6.1. Recommended selection process for automotive apprentices 266
8.6.2. Development of an automotive apprentice profile 267
8.6.3. Use of survival analysis in the human resource management field 267
8.7. Limitations of the study 268
8.8. Recommendations for future research 270
8.9. Concluding remarks 271
References 273
xvii
LIST OF APPENDICES
3
Page No.
A Conceptual Framework of Study 328
B Apprenticeship Intake Selection Process 329
C Secondary Curriculum Vitae Review Screening Guidelines (A & B) 331
D Apprenticeship Interview Sheet 333
E Key Differences between the DAT-K Sub-tests 340
F Key Differences between the TRAT Sub-tests 341
G Description of Teamwork Competencies 342
H Applicant Consent Form 344
I Permission Letter from the Client 347
J Ethical Clearance Letter 348
K Turnitin Similarity Index Report 349
L Differences between Apprenticeships and Other Forms of Training 350
M Summary of Key Characteristics of Apprenticeships by Country 352
N Detailed Discussion of Research Instruments 354
O Primary Data Collection and Processing 363
P Detailed Secondary Data Sample Realisation Rate 367
Q Reliability and Validity of the DAT-K Sub-tests 368
R Reliability of the TRAT Sub-tests 369
4
5

xviii
LIST OF TABLES
Page No.
Table 1.1: Sample frame 17
Table 1.2: Chapter outline 24
Table 2.1: South Africa’s Share of the Global New Vehicle Production (in R
millions): 2000-2017
30
Table 2.2: Vehicle Manufacturing Industry Capital Expenditure: 2007-2017 33
Table 3.2: Ranking of Countries: Global Competitiveness Report 2017-2018
(part 1)
59
Table 4.1: Ranking of Countries: Global Competitiveness Report 2017-2018
(part 2)
85
Table 5.1: Differences between Quantitative and Qualitative Research
Approaches
130
Table 5.2: Sampling Plan for the Primary Data Stage of the Study 132
Table 5.3: Research Instruments used in the Primary Data Stage of the Study 134
Table 5.4: Sample Realisation Rate in the Primary Data Stage of the Study 138
Table 5.5: Detail on the Information Extracted for Secondary Data Analysis
Purposes
140
Table 5.6: Summary Sample Realisation Rate per Phase: 2012-2014 144
Table 5.7: Operationalisation of Phase Two Constructs 146
Table 5.8: Operationalisation of Phase Three Constructs 147
Table 5.9: Operationalisation of Phase Four Constructs 148
Table 5.10: Secondary Data Analysis Strategy 149
Table 5.11: Explanation of Survival Analysis Terms 154
Table 6.1: Frequency Distribution of the Race of Applicants 160
Table 6.2: Frequency Distribution of the Gender of Applicants 160
Table 6.3: Frequency Distribution of the Age of Applicants 161
Table 6.4: Frequency Distribution of the Geographical Location of
Applicants
162
Table 6.5: Cross-tabulation of Phase One Survival Rate Outcomes 162
Table 6.6: Cross-tabulation of Phase Two Survival Rate Outcomes 163
Table 6.7: Cross-tabulation of Phase Three Survival Rate Outcomes 164
xix
Page No.
Table 6.8: Cross-tabulation of Phase Four Survival Rate Outcomes 164
Table 6.9: Cross-tabulation of Phase Five Survival Rate Outcomes 165
Table 6.10: Frequency Distribution of Selected Apprenticeship Type 166
Table 6.11: Frequency Distribution of Secondary Education Type 166
Table 6.12: Frequency Distribution of Mathematics Performance 167
Table 6.13: Frequency Distribution of Science Performance 168
Table 6.14: Frequency Distribution of Motivational Letter 168
Table 6.15: Frequency Distribution of CurriculumVitae 169
Table 6.16: Frequency Distribution of Practical Experience 170
Table 6.17: Frequency Distribution of Qualification 171
Table 6.18: Frequency Distribution of Leadership Potential 171
Table 6.19: Frequency Distribution of General Aptitude 172
Table 6.20: Frequency Distribution of Technical Aptitude 173
Table 6.21: Frequency Distribution of Teamwork Competence 173
Table 6.22: Frequency Distribution of Standard Interview 174
Table 6.23: Frequency Distribution of General Impression 175
Table 6.24: Summary Table of Median Survival Times: Phase Two 176
Table 6.25: Summary Table of Median Survival Times: Phase Three 179
Table 6.26: Summary Table of Median Survival Times: Phase Four 180
Table 6.27: Life Table of Secondary Education Type 182
Table 6.28: Life Table of Mathematics Performance 184
Table 6.29: Life Table of Science Performance 186
Table 6.30: Life Table of Motivational Letter 189
Table 6.31: Life Table of Curriculum Vitae 191
Table 6.32: Life Table of Practical Experience 194
Table 6.33: Life Table of Qualification 196
Table 6.34: Life Table of Leadership Potential 198
Table 6.35: Life Table of General Aptitude 201
Table 6.36: Life Table of Technical Aptitude 203
Table 6.37: Life Table of Teamwork Competence 205
Table 6.38: Life Table of Standard Interview 207
Table 6.39: Life Table of General Impression 209
xx
Page No.
Table 6.40: Life Table of Overall Results 211
Table 7.1: Linkages between Objectives, Hypotheses, Selection Phases and
Findings
214
Table 7.2: Summary of Phase Two Descriptive Analysis 220
Table 7.3: Summary of Phase Two Inferential Analysis 224
Table 7.4: Summary of Phase Three Descriptive Analysis 231
Table 7.5: Summary of Phase Three Inferential Analysis 233
Table 7.6: Summary of Phase Four Descriptive Analysis 237
Table 7.7: Summary of Phase Four Inferential Analysis 239
Table 8.1: Linkages between Objectives, Hypotheses, Selection Phases,
Findings, Conclusions and Recommendations
244
Table 8.2: Summary of the Recommendations 256
6
7
xxi
LIST OF FIGURES
Page No.
Figure 2.1: Significant milestones in the South African automotive industry’s
history
26
Figure 2.2: Geographical representation of original equipment manufacturers
in South Africa
28
Figure 2.3: Increased export market share of the South African automotive
industry post-1995
32
Figure 3.1: The apprenticeship life cycle 38
Figure 3.2: Continuum of apprenticeship types 40
Figure 3.3: Stakeholder challenges in apprentice recruitment and attraction 69
Figure 4.1: A selection process 83
Figure 5.1: The research process followed in the study 124
Figure 5.2: The core ontological assumption of the study 128
Figure 6.1: Survival chart 210
8
1
9 CHAPTER ONE
10 INTRODUCTION AND OVERVIEW
1.1. Introduction
The global automobile manufacturing industry is commonly referred to as “the industry
of industries” (Drucker, 1946, p. 149), being a mature industry (Bandyopadhyay, 2010).
Despite some major obstacles over the past decade, it is still regarded as one of the world’s
largest manufacturing sectors (Becker, 2018; Nieuwenhuis & Wells, 2015; Wickham, 2017).
The extensive network of suppliers that contribute to the industry has resulted in the automotive
industry being “so embedded that its removal would lead to widespread social and economic
crisis” (Nieuwenhuis & Wells, 2015, p. 3).
Fierce competition dominates the global automotive industry (Mohr et al., 2013).
According to the Automotive Industry Export Council (AIEC), in 2016 an international
benchmark was set with twenty countries exceeding the one million vehicle production mark.
The countries with the highest global vehicle production were China, the United States of
America (USA), Japan, Germany and India (AIEC, 2017). There is, increasingly, a shift in
production from west to east (Becker, 2018; Nieuwenhuis & Wells, 2015; Wickham, 2017).
With its production of 28.1 million vehicles and sales of 28 million units in 2016, China made
and sold more vehicles than Japan and the USA combined (AIEC, 2017).
According to the International Organisation of Motor Vehicle Manufacturers (OICA,
2018a), the global automotive industry employs over eight million people. This is more than
five percent of the global manufacturing employment figure. China employs 1 605 000 people,
the USA 954 210, Germany 773 217 and India 270 000 people (Wickham, 2017). In addition,
more than 50 million are indirectly employed in related manufacturing and service provision
(Mohr et al., 2013; OICA, 2018a).
There is significant pressure to focus on enhanced technologies to improve overall cost
competitiveness as well as the reliability of supply through the just-in-time delivery system
(Mashilo, 2010; Meyer, 2013). The voice of the consumer has also become stronger as the
demand for greener technologies in vehicle production increases (AIEC, 2017; Nieuwenhuis
& Wells, 2015; OICA, 2018a). The advancements in vehicle manufacture will necessitate an
increase in the innovation rate within the automotive industry. Traditional five to eight-year
2
model cycles are set to be replaced by annual updates in order to ensure the latest hardware and
software developments are integrated into the vehicle (Kuhnert, Stűrmer, & Koster, 2018).
There is thus also an increasing need for the automotive industry to employ more highly skilled
workers in order to facilitate its expansion into these new technologies (Wickham, 2017).
In comparison to the global vehicle supply chain, the South African automotive industry
is small (AECI, 2017; Naude, 2013). South Africa’s global vehicle production market share in
2016 was 0.63%, a slight drop from the 2015 0.68% figure (AECI, 2017). Seven global players
in the automobile manufacturing industry currently operate within South Africa (SA). These
large original equipment manufacturers (OEMs) are: BMW, Ford Motor Company, Isuzu,
Mercedes-Benz, Nissan, Toyota and Volkswagen South Africa (VWSA). These OEMs have
plants in various provinces, assembling vehicles for both the national and international markets
(Moothilal, 2017; Naude & O'Neill, 2011; Nzimande & Patel, 2012).
The national automotive industry has considerable impact on the country (Davies, 2012;
Deloitte, 2015; Vermeulen, 2017). Currently, the broader automotive industry contributes 7.4%
to the national Gross Domestic Profit (GDP) (AIEC, 2017; Vermeulen, 2018). Projections for
2020 indicate that this contribution may increase to 8.5% (De Lange, 2017). The automotive
industry also accounts for 15.6% of the country’s manufacturing exports, with total automotive
export earnings being over R170 billion (AIEC, 2017). The national government has
acknowledged that the achievement of its economic goals significantly depend on the
continued success of several priority sectors, including the automotive industry (AIEC, 2017;
Nomvete, Patel, & Baleni, 2017).
1.2. Background to the research problem
Globally, there is a move to source low cost countries to host manufacturing concerns. It
is projected that by 2020, emerging markets, such as Brazil, Russia, India, China and SA will
constitute about two-thirds of the total automotive profit, with China at the front (Mohr et al.,
2013). In this regard, SA is competing with more advanced economies, such as Mexico and
Thailand. However, these countries enjoy lower labour costs and have greater proximity to the
major export markets (AIEC, 2017; Barnes & Morris, 2008; Moodley, Morris, & Barnes,
2001). If SA is not able to profitably and timeously deliver quality products at competitive
international prices, it may result in the OEMs deciding to locate elsewhere (AIEC, 2017).
3
The increase in production pressure, the rise of emerging markets and alternative
technology advancements have resulted in substantial changes in the South African automotive
industry (Giffi et al., 2015; JIPSA, 2010; Meyer, 2013). Indications are that in order for the
national automotive industry to survive beyond 2020, it will need to increase its production
volumes through exports, and improve its ability to provide more support to the component
supplier sector (AIEC, 2017). Over the past decade the OEMs have made substantial
investments into developing their efficiencies in order to be able to profitably and flexibly deal
with new trends (Mashilo, 2010; Meyer, 2013). The amount recently spent in various capital
expenditure categories has more than doubled over the past decade (Vermeulen, 2016).
Given these new production techniques, the industry’s reliance on artisanal skills has
been steadily increasing (Nomvete et al., 2017; Reddy & Kruss, 2015; Wildschut, Gamble,
Mbatha, & Meyer, 2015). Artisans are regarded as a vital enabler to the manufacturing
competiveness of the SA economy and artisanal development is hence a priority within the
manufacturing sector (Brown, 2012; merSETA, 2016; Nomvete et al., 2017). The lack of these
skills is regarded as one of the key factors contributing to the “slow adoption of technology,
lowered productivity, lowered competitiveness and high cost of production over time” within
the sector (Nomvete et al., 2017, p. iii).
However, the artisan job family has been identified as the number one area of concern
with regard to recruitment and selection in SA (Government Gazette, 2018; Pandor, 2018; Peo,
2013). Demand outweighs supply and the need to attract and retain this critical skills base has
led to a war for this talent (Mbatha, Wildschut, Mncwango, Ngazimbi, & Twalo, 2014). Five
of the top 10 pivotal occupations within the manufacturing sector are automotive related
apprenticeships. Automotive motor mechanics are rated the occupation most in demand
(Nomvete et al., 2017).
The future development and growth of SA can be meaningfully improved through
artisanal development (JIPSA, 2010; Mahembe, 2012). One of the National Development Plan
(NDP)’s key objectives is the production of 30 000 artisans per year by 2030 (NDP, 2012;
Pienaar, Venter, Govender, & Jitsing, 2016; Qonde, 2018). The national New Growth Path also
aims to significantly increase the number of artisans successfully exiting the artisanal
development system (Patel, 2011). Whilst there has been some improvement in the national
4
number of artisans produced per year, these numbers have not come close to reaching the
projected targets (JIPSA, 2010; Qonde, 2018).
In their ranking of the competiveness of 137 countries, the World Economic Forum’s
Global Competitiveness Report (2017-2018) listed SA in 61st position. This is a significant
decline of 14 positions on the 2016-2017 listing when SA was ranked 47th out of 138 countries.
In the 2016-2017 report, SA ranked 114 out of 137 in the quality of its education system. In
terms of the quality of the South African mathematics and science education, SA ranked 128th.
Therefore, the eighth most problematic factor influencing doing business in SA was an
inadequately educated workforce (Schwab & Sala-i-Martin, 2017). SA is not able to optimise
its business sophistication and technology readiness due to the lack of adequate skills and low
education in the country (Craig, Thomas, Hou, & Mathur, 2011; Schwab & Sala-i-Martin,
2017).
Education enhances the possibility of securing a better job and improves productivity and
income potential. The upgrading of the educational and skills levels of the employed is also
needed to enable companies to compete in the global economy (Brewer, 2013). However, an
unfortunate dichotomy currently exists in SA. The high youth unemployment rate currently
exists alongside a high demand for skilled labour. Since 2008, the national youth
unemployment rate has been steadily growing (Reddy, Bhorat, Powell, Visser, & Arends, 2016;
Shankar, Cooper, & Koh, 2016). The government, in its design and implementation of national
educational and employment policies, has an immense challenge in dealing with this
contradiction (Evans-Klock & Dar, 2013; Rauner, Heinemann, Hauschildt, & Piening, 2012;
Shankar et al., 2016).
Within this context of pervasive and growing youth unemployment levels, addressing
artisan skills levels will assist in achieving economic and social development (Mbatha et al.,
2014). Artisanal skills development has therefore been accepted as an urgent priority for the
South African government (DHET, 2012; Reddy et al., 2016). The national economy,
organisational effectiveness and the success of the automotive industry would benefit if the
artisanal crisis was adequately addressed (Kruss et al., 2014; Pienaar et al., 2016).
5
1.3. Problem statement, objectives and hypotheses
Section 1.3.1 provides an explanation of the research problem, with section 1.3.2
clarifying the primary as well as the four secondary objectives of the study. In section 1.3.3 the
13 hypotheses of the study are provided.
1.3.1. Problem statement
Staffing finds itself in a curious position in the twenty-first century. Given the economic,
societal and cultural changes prevalent in this century, organisational success and survival have
become dependent on staffing practices (Hoffman, Kahn, & Li, 2018; ManpowerGroup, 2016).
Many business decision makers continue to disregard the value of staffing. Staffing researchers
and practitioners may be partially to blame for this as they fail to highlight the strategic value
of their discipline and practice (Ployhart, 2006).
There has been a noteworthy decrease in staffing research since the 1980s (Schreuder &
Coetzee, 2010). This is contrary to national and industry needs. Human capital development,
through the attraction, selection, remuneration, development and retention, of scarce skills has
been highlighted as a national priority (Reddy et al., 2016). The industrial/organisational
psychology field, therefore, needs to positively respond to the research needs expressed by the
business community. This should be done through ensuring research can accurately predict
emerging challenges and offer potential solutions to these challenges (Anderson, Herriot, &
Hodgkinson, 2001; Pietersen, 2018; Vernon, Hocking, & Tyler, 2016).
One such challenge requiring credible answers is the global and national shortage of
skilled trade workers (Martin, 2016; Smith & Kemmis, 2013). Despite enhanced employment
prospects and potentially higher earnings, organisations are struggling to source skilled
individuals to fill vacant technical positions. It is predicted that this problem will worsen in the
years to come as technology and globalisation quicken and deepen (Deloitte, 2018; Giffi et al.,
2015; Jacoby, 2014).
A skills mismatch in the labour force is evident as high unemployment rates are globally
prevalent (ManpowerGroup, 2016; Shankar et al., 2016; Trindale, 2015). Immediate job skills
are required by new labour market entrants in the twenty-first century. However, concurrently,
they also require the career and cognitive capacities to sustain their learning capacity through
the various jobs they are bound to fulfil in the working landscape of this century. Given the
6
high level of technological change inherent in the current workplace many skill requirements
are volatile. A higher level of technical skills is increasingly demanded (Duarte, 2017;
Government Gazette, 2018; merSETA, 2016; Nomvete et al., 2017).
There is greater awareness within industry that the science, technology, engineering and
mathematics (STEM) areas play an interactive role with business success (Chalikias,
Kyriakopoulos, Skordoulis, & Koniordos, 2014). STEM skills are critical for economic
growth, improved innovation, enhanced entrepreneurship and business productivity. There
is, however, a STEM crisis. The global economic growth and ability to develop solutions to
the most pertinent problems of the world are being stifled due to the widespread shortage of
STEM professionals (Craig et al., 2011).
It is widely recognised that there is an artisanal skills shortage, both nationally and
globally (Evans-Klock & Dar, 2013; Peo, 2013; Van Rooyen, Du Toit, Botha, & Rothmann,
2010). Globally, businesses regularly state that the most difficult job to fill is that of technicians
(Giffi et al., 2015; ManpowerGroup, 2016). A significant portion of technical vacancies in SA
cannot be filled as individuals do not meet the educational and skill requirements (De Kock,
2012). Despite various governmental and non-governmental initiatives, there remains a dire
need to explicate and alleviate the artisanal scarce skills problem in the country (Bhorat,
Oosthuizen, & Cassim, 2014; Pandor, 2018; Pienaar et al., 2016). In 2018, the government
issued the National List of Occupations in High Demand, to clarify and draw attention to these
artisanal trades (Government Gazette, 2018).
There is currently a lack of certainty surrounding the exact nature of both the demand
and supply of artisan skills within the country (Kraak, 2012; Reddy & Kruss, 2015; Wildschut
et al., 2015). While there are various routes to the completion of an apprenticeship, there is a
lack of knowledge and certainty about the contribution made by each of these routes.
Furthermore, there is insufficient awareness of the factors that underpin the demand for
artisans. Whilst it is clear that there is a quantifiable demand for artisans, there is less
confidence regarding what constitutes a successful artisan in terms of quality standards (Kraak,
2012; Kruss et al., 2014; Reddy & Kruss, 2015).
Data on national skills development, specifically within vocational education and
training, is scarce. There is especially a lack of data pertaining to the supply side of learnerships
7
and apprenticeships and the role of staffing practices in these developmental initiatives. An
important issue contributing to the malfunctioning of research into the artisanal labour market
is that these positions fall within the Major Occupation Group 7: Craft and related trade
workers. However, not all craft and related trade workers are qualified artisans (Mukora, 2008).
This makes the understanding of both the supply and demand of artisans in SA quite
problematic. This is especially true of tracking their trajectory into employment (Kruss et al.,
2012).
The implementation of appropriate human resource (HR) practices, such as
recruitment, selection, education and skills training are regarded as determining factors to the
continued prosperity of the manufacturing industry (Chalikias et al., 2014). National
employers and training providers have therefore encouraged governmental support agencies,
such as the Manufacturing, Engineering and Related Services Sector Education and Training
Authority (merSETA), to invest in enhanced screening and selection techniques for learners
partaking in an artisanal learning pathway (Government Gazette, 2015a; merSETA, 2016).
With the cost of training an apprentice being approximately R400 000, it is vital that the correct
learners are accepted onto these apprenticeship programmes. Besides implementing the
minimum entry requirements, government has also recommended that aptitude and attitude
testing need to be done to assist in the selection process (Government Gazette, 2015a). The use
of stringent selection practices has been linked to lower drop-out rates (Goastellec & Ruiz,
2015; Imdorf, 2017; Rowe, Moss, Moore, & Perrin, 2017). Multiple selection criteria have also
assisted training providers to reduce their drop-out rate by 98-99% per intake (Mummenthey,
Kruss, & Wildschut, 2012).
International researchers have advised stakeholders in the South African manufacturing
sector to disclose best practice cases in artisanal development. Not only will this disclosure
improve the image of apprenticeships but, more significantly, it will also stimulate innovation
and improvement within the sector (Evans-Klock, 2012; Rauner et al., 2012). Despite this
recommendation, there is still a lack of national and international empirical research on the
optimum profile of a successful apprentice. Only modest outdated national and international
research exists on the profile of a successful apprentice applicant (e.g., Barnes & Meadows,
2008; Gump, 2006; Mottram, Clarke, & Downs, 1980).
8
Furthermore, the ideal steps to be used in the selection and training of apprentices need
to be determined in order to accurately identify and retain artisans within organisations. Once
again, limited, and mostly outdated, international empirical research on the broad processes
employed in the selection of apprentices are available. Scant research exists on the situation in
SA. There is, therefore, a need for specific research on the profiling and selection of apprentices
(Puchert, Dodd, & Viljoen, 2017a, 2017b). The decline in staffing research was noted earlier.
Specifically, there is currently little national research on the evaluation of human resource
selection (HRS) processes (Louw, 2012; Louw-Potgieter, 2012).
This study focused on the selection process employed by a national OEM. For purposes
of anonymity this organisation will be referred to as the Client. The study aimed to address the
gap in the literature pertaining to the profiling of apprentices, the optimum selection process to
be employed for this form of tradesman and the evaluation of HRS processes. To achieve this
the selection process for apprentices, designed and implemented by the Client, was evaluated.
From the problem statement the primary objective, four secondary objectives and 13
hypotheses were delineated.
1.3.2. Objectives
The primary objective of this study was to evaluate a profiling and selection process for
apprentices in the South African automotive industry.
The secondary objectives were as follows:
a) To assess the contribution of the educational profile on apprenticeship programme
selection
b) To appraise the value of the application profile on apprenticeship programme selection
c) To evaluate the influence of the aptitude and teamwork profile on apprenticeship
programme selection
d) To assess the impact of the interview profile on apprenticeship programme selection.
A conceptual framework for the study indicating the variables being investigated is
provided in Appendix A.

9
1.3.3. Hypotheses
Following on the primary and secondary objectives, the 13 hypotheses for this study
were:
H01 The type of secondary education does not have a significant effect on the applicants’
selection onto the apprenticeship programme.
H1 The type of secondary education has a significant effect on the applicants’ selection onto
the apprenticeship programme.
H02
The Grade 12 mathematics mark does not have a significant effect on the applicants’
selection onto the apprenticeship programme.
H2 The Grade 12 mathematics mark has a significant effect on the applicants’ selection onto
the apprenticeship programme.
H03
The Grade 12 science mark does not have a significant effect on the applicants’ selection
onto the apprenticeship programme.
H3 The Grade 12 science mark has a significant effect on the applicants’ selection onto the
apprenticeship programme.
H04 The motivational letter rating does not have a significant effect on the applicants’ selection
onto the apprenticeship programme.
H4 The motivational letter rating has a significant effect on the applicants’ selection onto the
apprenticeship programme.
H05
The curriculum vitae rating does not have a significant effect on the applicants’ selection
onto the apprenticeship programme.
H5 The curriculum vitae rating has a significant effect on the applicants’ selection onto the
apprenticeship programme.
H06
The practical experience rating does not have a significant effect on the applicants’
selection onto the apprenticeship programme.
H6 The practical experience rating has a significant effect on the applicants’ selection onto the
apprenticeship programme.

10
H07 The qualification rating does not have a significant effect on the applicants’ selection onto
the apprenticeship programme.
H7 The qualification rating has a significant effect on the applicants’ selection onto the
apprenticeship programme.
H08
The leadership potential rating does not have a significant effect on the applicants’ selection
onto the apprenticeship programme.
H8 The leadership potential rating has a significant effect on the applicants’ selection onto the
apprenticeship programme.
H09
The general aptitude rating does not have a significant effect on the applicants’ selection
onto the apprenticeship programme.
H9 The general aptitude rating has a significant effect on the applicants’ selection onto the
apprenticeship programme.
H010
The technical aptitude rating does not have a significant effect on the applicants’ selection
onto the apprenticeship programme.
H10 The technical aptitude rating has a significant effect on the applicants’ selection onto the
apprenticeship programme.
H011
The teamwork competence rating does not have a significant effect on the applicants’
selection onto the apprenticeship programme.
H11 The teamwork competence rating has a significant effect on the applicants’ selection onto
the apprenticeship programme.
H012
The standard interview rating does not have a significant effect on the applicants’ selection
onto the apprenticeship programme.
H12 The standard interview rating has a significant effect on the applicants’ selection onto the
apprenticeship programme.
H013
The general impression rating does not have a significant effect on the applicants’ selection
onto the apprenticeship programme.
H13 The general impression rating has a significant effect on the applicants’ selection onto the
apprenticeship programme.
11
1.4. Literature review
Initially, the theoretical framework underpinning the study is discussed, with section
1.4.2 providing a brief overview of the HRS process. Section 1.4.3 then offers a synopsis of
selected empirical research in the study area.
1.4.1. Theoretical framework
The HR talent management approach highlights the need for organisations to focus their
attention on managing the capacity, ability and talent within the top 10 to 20% or ‘A level’
(Beechler & Woodward, 2009; Tarique & Schuler, 2012). It is these selected and gifted
employees that should be the beneficiaries of HR practices and initiatives (Hughes & Rog,
2008). According to this theoretical framework, the talents held by individuals should be
viewed as the resource leveraging the competitive advantage of organisations. As such, this
elite group of employees should be treated differently to the rest of the workforce (Beechler &
Woodward, 2009; Hughes & Rog, 2008; Tarique & Schuler, 2012).
The talent management theory has come under significant criticism in the twenty-first
century. The theory has specifically been reproached for its singular concentration on only the
‘A level’ sub-set of employees (Lewis & Heckman, 2006; Piansoongnern, Anurit, &
Kuiyawattananonta, 2011). The twenty-first century has witnessed significant global economic
changes, tumultuous business environments, substantial technological advances and innovation
as well as the increased mobility and diversity of the workforce (Beechler & Woodward, 2009).
Critiques of the theory have indicated that this HR management approach is no longer valid
and realistic within the highly complex, competitive and global context (Beechler &
Woodward, 2009; Lewis & Heckman, 2006; Piansoongnern et al., 2011). Rather than adopting
a narrow focus, as proposed by the talent management approach, the international shortage of
talent has resulted in firms needing to be more creative and aggressive in their HR management
(HRM) tactics (Berenson & Smith, 2009; Tarique & Schuler, 2012). In order for the current
organisation to survive and be successful, a more wide-ranging HR approach, beyond just the
‘A level’ employees, needs to be adopted (Beechler & Woodward, 2009).
Therefore, the theoretical framework selected for this study is the human capital theory.
According to this theory, the entire labour force should be regarded as the strategic leverage
feature of an organisation, rather than a select group within this pool of labour (Abhayawansa
& Abeysekera, 2008). Instead of solely focusing on tangible assets, this theory proposes that
12
the intangible human capital resource is the vital strategic resource of any firm. This is
specifically valid given the increased reliance on knowledge (Todericiu & Muscalu, 2008).
This classification of the labour force as human capital relies on the workforce being
regarded as rare, valuable and inimitable with no reliable alternatives for the resource
(Abhayawansa & Abeysekera, 2008; Coff, 1997). Whilst all employees are regarded as
important resources to a business, only some are perceived as human capital and a source of
competitive advantage (Moon & Kym, 2006; Pearse, 2009). A pivotal issue within this theory
is the optimisation of the human capital potential through the implementation of HRM
techniques and systems (Abhayawansa & Abeysekera, 2008; Coff, 1997; Wright, McMahan,
& McWilliams, 1994). Specifically, the recruitment and selection processes implemented by
organisations can heighten the latent competitive advantage through the optimal matching of
the required skills for a position with individuals who have these skills (Cabello-Medina,
López-Cabrales, & Valle-Cabrera, 2011; Jiang, Lepak, Hu, & Baer, 2012; Takeuchi, Lepak,
Wang, & Takeuchi, 2007).
1.4.2. Human resource selection
People represent the competitive edge for a country and are the most important asset in
an organisation (Grobler, Wärnich, Carrell, Elbert, & Hatfield, 2011; Nel et al., 2011; Noe,
Hollenbeck, Gerhart, & Wright, 2011). Whilst there are numerous factors that make an
organisation successful, the HR element is regarded as a vital input into the production process
of an organisation (Breaugh, 2013; Naude & O’Neill, 2011; Shatouri, Omar, & Igusa, 2012).
An investment in HRM activities, such as recruitment and selection, training and
development, as well as compensation, can produce better organisational performance
(Ghebregiorgis, & Karsten, 2007). Conversely, poor selection decisions can be a significant
cost for a business (Lough & Ryan, 2010; Mueller & Wolter, 2014; Paterson & Uys, 2005).
There are major costs involved in re-training individuals following an ill-fit or match of an
incumbent to a job (Piro, 2011).
Selection criteria are essential to expedite the decision-making process (Breaugh, 2013;
Byars & Rue, 2011). A comprehensive job analysis should be conducted, resulting in a job
description and a job specification. Employing information from these documents within the
selection process should facilitate obtaining an effective match or fit between position
13
requirements and incumbent abilities (Giffi et al., 2015; Grobler et al., 2011; Nel et al., 2011;
Noe et al., 2011).
Two selection models can be employed by organisations, namely, the multiple-hurdle
and the compensatory models. In the multiple-hurdle model, the selection process consists of
various steps with each step needing to be overcome to advance. This technique results in the
pool of applicants becoming increasingly smaller after each step in the selection process. The
compensatory model entails the total pool of candidates fulfilling all the selection steps. The
information obtained at each step is then taken into account to make the final selection decision
(Grobler et al., 2011; Nel et al., 2011).
No set, typical and/or generally accepted HRS processes exist. A wide assortment of
selection procedures and methods are utilised and no two organisations conduct selection in
the same fashion (Van der Merwe, 2002). Selection methods should be employed based on the
selection criteria specified in the job description and job specification. These include the initial
assessment of curricula vitae (CV), appraising application forms, conducting interviews,
conducting assessment and testing, as well as executing medical and reference checks (Chan
& Kuok, 2011; Grobler et al., 2011; Nel et al., 2011; Noe et al., 2011). A singular method (i.e.,
using just the CV, interviewing or testing) is used by some organisations in order to make
selection decisions (Chan & Kuok, 2011). However, research has highlighted that a systematic
selection approach can improve the success rates obtained (Grigoryev, 2006). Having précised
the foundational literature underpinning this study the next section summarises the empirical
literature on the subject.
1.4.3. Empirical literature
The automotive industry has needed to implement novel and proactive recruitment and
selection tactics in order to attract and successfully identify the potential talent required within
the sector (Giffi et al., 2015; Piro, 2011). Increased competition and rapid technological change
in the manufacturing sector has resulted in challenges that have affected the selection methods,
as well as training content and processes traditionally used for apprenticeship development
(Evans-Klock, 2012; merSETA, 2016; Nomvete et al., 2017). Rigorous recruitment and
selection practices for apprentices are therefore encouraged (Government Gazette, 2015a;
Lovender, 2015).
14
International research has highlighted the high value placed on above average academic
attainments, specifically a fundamental knowledge of engineering and science, when sourcing
technical staff (Brewer, 2013; Forsblom, Negrini, Gurtner, & Schumann, 2016; Kramer,
Tallant, Goldberger, & Lebus, 2015). Automotive firms therefore use the possession of a
reliable technical qualification and/or technical subjects as selection criteria (COTVET, 2014;
Martin, 2016; Schafmeister, 2013).
Whilst practical and technical skills are vital, the automotive industry has also stressed
the significant role of other qualities such as flexibility and teamwork. Research into the
selection measures used by automobile manufacturing organisations has revealed that effective
communication and problem solving competencies, ingenuity, business insight and a zeal for
working in the automotive industry are all central aspects to be considered (De Guzman & Ok
Choi, 2013; Giffi et al., 2015; Mueller & Wolter, 2014; Rothstein, 2010). In order to improve
the effectiveness of apprenticeship programmes, applicants who have shown vocational
identity and commitment to the trades should be prioritised during the selection process.
Selection processes should also assess the discipline and commitment of the applicants as
maturity levels are regarded as key criteria for success on the programme (Mahembe, 2012).
The use of psychological testing has become a more common selection tool within the
automotive industry (Grosvenor, 2017; Piro, 2011; Van der Merwe, 2005). This is primarily
due to inconsistent standards and the inability to fairly compare applicants using their
educational attainment as well as a general mistrust of the school grades (Mueller & Wolter,
2014; Siegenthaler, 2011). An assortment of assessments and tests have been used
internationally in the selection of operator level employees. These included the testing of
mathematics, reading comprehension, group problem-solving and simulated work assessments
(Gump, 2006). The assessment of aptitudes in the selection of apprentices has been able to
predict the success of these candidates in their first year of studying (Mottram et al., 1980).
Selecting for apprenticeship positions is different to selecting for other forms of staff.
Applicants applying for apprenticeship positions are likely to be very similar in many regards
(i.e., recent school-leavers with similar qualifications and little work experience). Using
various tests, such as ability tests, interest and values questionnaires, personality measures and
situational judgement assessments, can therefore be useful in ensuring objective and informed
selection decisions are made (Grosvenor, 2017).
15
Research conducted on learnerships and apprenticeships revealed that specific
demographic and geographical criteria had a significant impact on the employment
opportunities. Patterns with regard to the gender, socio-economic status, race, educational
level, geographical location of applicants and positive employment outcomes were established.
Specifically, applicants who are female, African, have both a low socio-economic status as
well as educational level and/or are from the poorer provinces are less likely to be employed
upon completion of their training (Kruss et al., 2014; Mukora & Visser, 2008; Wildschut et al.,
2013).
1.5. Research methodology
This section outlines the research paradigm, design and approach employed in this study.
The primary and secondary data collection as well as data analysis methods utilised are
discussed.
1.5.1. Research paradigm
This study is positioned at the contextual field of information stage on the continuum of
core ontological assumptions between constructivism and objectivism proposed by Collis and
Hussey (2014). Whilst objective criteria were used in the study, the author and several senior
instructors employed at the Client were involved in the design and execution of the selection
process. The data, therefore, cannot be regarded as completely independent of the feelings and
opinions of these individuals.
The predominant epistomological stance adopted for this study was a positivistic one.
Whilst challenged by other epistemological viewpoints, positivism upholds that reality is
logically ordered and objective, the comprehension of which can be better known (Babbie,
2007; Bryman, 2016). The research questions, objectives and hypotheses of the study required
quantification, replicability and objectivity.
1.5.2. Research design
There are three common research designs used in the business and management
discipline, namely, exploratory, descriptive and causal research (Bless, Higson-Smith, &
Sithole, 2013; Bryman & Bell, 2015a; Cant, Gerber-Nel, Nel, & Kotze, 2012). A descriptive
research design seeks to provide answers to questions such as who, what, where, when and
how. This type of research is careful and deliberate in nature as it seeks to provide a more
16
detailed understanding of the identified research problem (Babbie & Mouton, 2012; Burns &
Bush, 2014). The central aim of this research study was to evaluate a profiling and selection
process of apprentices in the national automotive industry. Specifically, the study sought to
provide specific details of ‘what’ attributes (i.e., education type, qualification and experience
levels, aptitudes, competencies) the successful applicants held and the ‘how’ of the selection
process. A descriptive research design type was therefore applied in this study.
Research design involves making decisions regarding what will be observed, who and
for what purpose. Another important consideration in research design is the time dimension.
Longitudinal studies facilitate observations of the same phenomenon over an extended period
(Babbie, 2007). These types of studies have been recognised for the advantage they offer in
terms of analysing a sequence of events over time, thus allowing for a more in-depth
understanding of pathways between variables (Ornstein, 2013). Longitudinal studies therefore
have the dual advantage of prospectivity and representativeness (Gomm, 2008). This research
was a longitudinal study tracking the applicants from three intake years through the various
phases of the selection process. After their four-year apprenticeship period, the selected
apprentices sat for the trade test.
1.5.3. Research approach
Two broad research approaches, namely, quantitative and qualitative, have been
historically distinguished from one another (Bless et al., 2013; Collis & Hussey, 2014;
Neuman, 2012). This study aimed to determine if a difference in any of the variables would
have an impact on the success of the applicants in the selection process. The nature of the data
resulting from the various phases of the selection phases was structured, specific and objective.
A quantitative research approach was therefore appropriate for this study (Quinlan, Babin,
Carr, Griffen, & Zikmund, 2015).
1.5.4. Data collection methods
In terms of data collection, there was a primary and secondary data stage. The primary
data of the study was collected through the annual recruitment and selection process for
apprentices facilitated by the Client. As depicted in Table 1.1, applicants applied over three
intake project years, namely, 2012 to 2014. Following a recruitment drive to fulfill the
automotive electrical and millwright apprenticeship vacancies, a mulitiple-hurdle selection
17
process was employed. Given there was existing data, this research was therefore an archival
study of the selection process utilised by the Client.
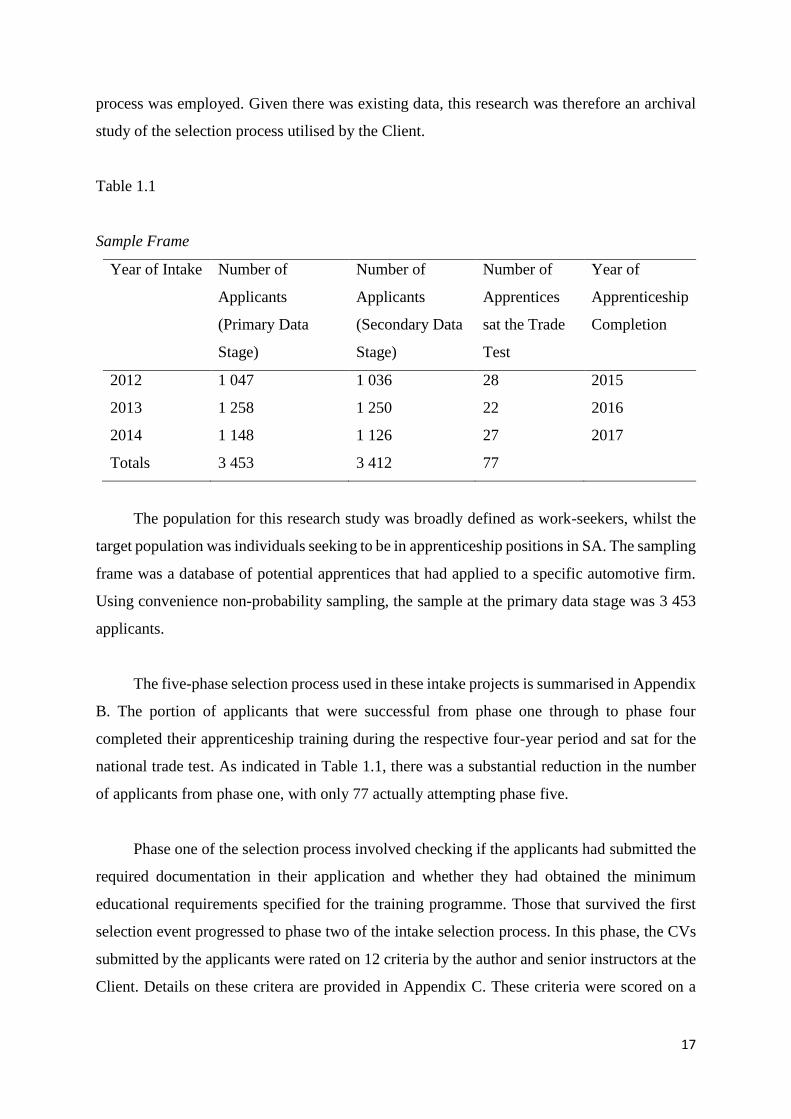
Table 1.1
Sample Frame
Year of Intake Number of
Applicants
(Primary Data
Stage)
Number of
Applicants
(Secondary Data
Stage)
Number of
Apprentices
sat the Trade
Test
Year of
Apprenticeship
Completion
2012 1 047 1 036 28 2015
2013 1 258 1 250 22 2016
2014 1 148 1 126 27 2017
Totals 3 453 3 412 77
The population for this research study was broadly defined as work-seekers, whilst the
target population was individuals seeking to be in apprenticeship positions in SA. The sampling
frame was a database of potential apprentices that had applied to a specific automotive firm.
Using convenience non-probability sampling, the sample at the primary data stage was 3 453
applicants.
The five-phase selection process used in these intake projects is summarised in Appendix
B. The portion of applicants that were successful from phase one through to phase four
completed their apprenticeship training during the respective four-year period and sat for the
national trade test. As indicated in Table 1.1, there was a substantial reduction in the number
of applicants from phase one, with only 77 actually attempting phase five.
Phase one of the selection process involved checking if the applicants had submitted the
required documentation in their application and whether they had obtained the minimum
educational requirements specified for the training programme. Those that survived the first
selection event progressed to phase two of the intake selection process. In this phase, the CVs
submitted by the applicants were rated on 12 criteria by the author and senior instructors at the
Client. Details on these critera are provided in Appendix C. These criteria were scored on a
18
five-point Likert scale ranging from well below average to outstanding. Applicants that did not
perform adequately in the second selection event were terminated.
Those that survived the second hazard progressed to phase three, which culminated in a
psychological assessment recommendation. This rating was derived from three forms of
testing, namely, general aptitude, technical aptitude and a teamwork competency assessment.
These three measures are discussed in more detail later in this section. Applicants that were not
recommended from the phase three event were terminated. Phase four of the selection process
involved a panel interview. A minimum of two senior instructors, from within the Client, used
a structured interview sheet and scored the applicants on a four-point Likert scale, from well
below average to excellent. Details of the questions asked and criteria the applicants were rated
on is provided in Appendix D. Top performing applicants from this selection event were then
accepted onto the apprenticeship programme. The final hazard, phase five, was the
demonstration of competence in the national trade test.
As previously stated phase three involved psychological testing. Two aptitude
assessment instruments, namely, the Differential and Trade Aptitude test batteries, were used
for psychological testing which was the objective of phase three of the selection process. The
following paragraphs provide brief details on these two batteries and the sub-tests employed in
this study.
The Differential Aptitude Test
The Differential Aptitude Test (DAT) was designed under the auspices of the Human
Sciences Research Council (HSRC). The overall aim of this test battery is for counselling
purposes or to assist in producing the best match between individuals and certain jobs or in
post-school training centres (Coetzee & Vosloo, 2000). Six sub-tests from the standard version
of the DAT, termed the DAT-K battery, were utilised in this study. These sub-tests are:
Vocabulary; Verbal Reasoning; Non-verbal Reasoning; Reading Comprehension; Comparison
and Memory. Details with regard to the purpose, number of items and time limit per sub-test
are provided in Appendix E. Scoring of these sub-tests was done manually with a scoring mask.
19
The Trade Aptitude Test
The Trade Aptitude Test (TRAT) assessment battery also originated from the HSRC. The
purpose of the test battery is to assist in the selection of potential students for admittance into
technical institutes and colleges. The test battery also indicates the candidate’s potential to
progress and successfully finish training in a specific technical field (Taljaard, 1983). Six sub-
tests from the test battery were employed in this study. These sub-tests are: Dexterity;
Coordination; Assembly; Calculations; Spatial Perception 2-D and Spatial Perception 3-D.
Details with regard to the intention, number of items and time limit per sub-test are provided
in Appendix F. Scoring of the sub-tests was done manually with a scoring mask, except for the
Dexterity and Coordination sub-tests. These two sub-tests were visually scored according to
the requirements within the test manual.
Besides these two psychological assessment instruments, phase three also included a
teamwork competency assessment. During a practical group exercise, applicants were observed
and assessed on nine dimensions. These were: Assertiveness, Conflict Management, Feedback,
Initiative, Influence/persuasion, Listening, Questioning, Problem-solving and Teamwork.
Descriptions of these dimensions are provided in Appendix G.
The study’s secondary data therefore already existed in the Client’s records, yet to be
used for research purposes. This data needed to be synthesised, reduced and interpreted. From
the primary data, 19 constructs were regarded as suitable for secondary data extraction. This
information was aligned to the research questions, objectives and hypotheses of the study.
Following the various steps of data preparation, the sample size was reduced to 3 412
applicants as portrayed in Table 1.1. Having outlined the data collection strategies employed
in the study, the next section clarifies the data analysis techniques applied.
1.5.5. Data Analysis
Descriptive statistics were used in this study to explain the gathered data (Quinlan, 2011).
Frequency tables were used to show the number of people and percentage that were successful
in each of the five phases within the multi-hurdle selection process (Bryman & Bell, 2011).
The demographic details (i.e., age, race and gender) of the applicants were provided in this
format, along with the geographical location of the applicants. Frequency distribution tables
were used for nine particular aspects of the applications and cross-tabulations depicted the
transitions of the applicants across the five selection phases. The median survival times (ST)
20
of the 13 constructs investigated in this study were provided in tabular format according to the
selection phases.
Inferential statistics were used to draw inferences and make predictions about the
population from a sample’s data (Quinlan, 2011). The Statistical Package for the Social
Sciences’ (SPSS), version 21, software package was used for statistical analyses. From this
package the survival analysis procedure was used. The Gehan-Wilcoxon proportional hazards
statistical tool, a non-parametric test, compared the survival curves of the applicants across the
five phases of the selection process. The statistical significance level was set at .05. This
provided an indication of the survival probability of the applicants at each selection phase
(Austin, 2017; Hosmer, Lemeshow, & May, 2011; Morita, Lee, & Mowday, 1993). The life
table for each of the constructs were provided as well as the overall life table and survival chart.
1.6. Definitions of key terms
When explicit, the definition of a term is provided from the secondary literature.
However, the meanings of other terms have been manipulated to suit the purposes of the study.
Applicant: a person that has applied for a position and has entered into a selection process
to be considered for this vacancy. Thereafter, this term indicates an individual that has
undergone at least one of the five selection phases within the research study.
Apprentice: an individual that has enrolled on structured on-the-job training programme
with related technical off-the-job training, to learn a skilled occupation, which culminates in
an industry-recognised certification (Fazio, Fernández-Coto, & Ripani, 2016).
Aptitude: the potential within an individual to obtain a certain level of skill or ability,
following training and/or practice (Coetzee & Vosloo, 2000; Van der Merwe, 2005).
Artisan: a person who has fulfilled the requirements of a formal or informal trade
apprenticeship and has passed the requisite trade test (Evans-Klock, 2012; Mahembe, 2012;
Rauner et al., 2012).
Evaluation: the “determination of the value, nature, character, or quality of something”
(Merriam-Webster dictionary online, n.d.).
21
Event: this term refers to what terminates a selection phase (i.e., it is the change that
causes the applicant to transition from one selection phase to another).
General aptitude: collectively refers to Vocabulary, Verbal Reasoning, Non-verbal
Reasoning, Reading Comprehension, Comparison and Memory.
Hazard: this term refers to the event of interest (i.e., being unsuccessful in a selection
phase).
Secondary education: refers collectively to technical high schools, academic high schools
and technical and vocational education and training (TVET) institutions. In this thesis the
terminology ‘secondary education’, ‘matriculation’ and ‘Grade 12 qualification’ are used
interchangeably. Specifically, this study outlines the following as the minimum secondary
education entrance requirements into the Client’s apprenticeship programmes and these are
therefore regarded as synonymous forms of secondary education within this thesis:
A full seven subject Grade 12/ Matric/National Certificate (Vocational) Level 4
qualification, with mathematics and physical science and inclusive of applicable related
subjects such as electrical technology, mechanical technology, automotive repair and
maintenance, engineering graphics and design,
A full four subject N3 Technical Certificate with supporting language subjects at Grade
12 level.
In this thesis a distinction is made between a technical and a non-technical form of
secondary education. To be rated as having attended a technical form of secondary education,
the qualification must have included mathematics, science and two technical subjects. This is
a unique operational distinction made by the Client.
Survival: this term is synonymous with being successful in a selection phase and hence
progressing to the next selection phase.
Teamwork competencies: collectively refers to Assertiveness, Conflict Management,
Feedback, Influence/persuasion, Initiative, Listening, Questioning, Problem-solving and
Teamwork.
22
Technical aptitude: collectively refers to Dexterity, Co-ordination, Assembly,
Calculations, Spatial Perception 2-D and Spatial Perception 3-D.
Termination: this term is synonymous with being unsuccessful in a selection phase and
hence not progressing to the next selection phase.
1.7. Limitations
Given the sampling method used, broad guidelines can be formulated from the identified
sample. However, the results are still valuable for the automotive industry and the field of
HRM. Secondly, one of the aptitude tools used has not been validated nor revised since its
publication date. Whilst the culture friendliness of the test could be questioned, it is a registered
and approved test battery within SA. The third limitation concerns the dilution of the scores at
the various phases in the selection process. This may have weakened the intensity and subtleties
of the scores actually obtained by the applicants.
1.8. Delimitations
This study was delineated to the apprentice intake selection process utilised at the Client
for the 2012 to 2014 time periods. The study did not consider the selection process employed
in other years nor the selection process conducted at other automobile manufacturing firms.
Additionally, this study did not consider all of the available aptitudes or teamwork
competencies but was delineated to those indicated in section 1.6.4. The formative theoretical
and practical assessments done during the apprenticeship training programme and the annual
individual performance reviews of the apprentices were also not included in this study. These
other aspects should be investigated in further research or an alternative study.
1.9. Significance of the study
Since 1994, South African economic and skills policies have emphasised that artisan and
technical training be given prominence (Mbatha et al., 2014). The Skills Development Act (No.
97 of 1998) has sought to improve the quality and quantity of artisanal skilling and the Sector
Education and Training Authorities (SETAs) were created to plan and co-ordinate skills
development processes in designated sectors. Learnerships were introduced in 2001
specifically to address the weaknesses of the apprenticeship system. Given remaining
challenges and blockages in the technical skills system, the National Qualifications Framework
Act (No. 67 of 2008) created new qualifications, including the National Technical Certificate
23
and the National Certificate (Vocational) (Evans-Klock & Dar, 2013; Fraught, 2012; Mbatha
et al., 2014). To support the economic growth of the country, the New Growth Path and the
NDP propose the development of technical human capital, including artisans and engineers
(Patel, 2011; NDP, 2012). The Department of Higher Education (DHET) has also highlighted
artisanal development in the White Paper for Post-School Education and Training (DHET,
2013). Since 2007, the critical scarcity of qualified artisans in the manufacturing and
engineering sector has been emphasised (JIPSA, 2010; Mahembe, 2012; Mlambo-Ngcuka,
2008). Despite this increased and sustained focus on improving the artisanal throughput rate
there is still limited understanding of the nature, extent and context of the artisanal skills
development problem (Reddy & Kruss, 2015; Wildschut et al., 2015).
This study aimed to reduce the gap in knowledge pertaining to the optimum process to
be utilised in the selection of applicants for an artisanal development programme within the
national automotive industry. This study contributed by evaluating a profiling and selection
process currently being used within one automotive plant. This process could then be
considered for implementation within the broader automotive industry and manufacturing
sector. The recommendations offered by this study also contribute in assisting to increase the
number of successful apprentices in SA. This research is aligned to national educational and
labour planning initiatives as well as the international interest in this profession.
1.10. Ethical considerations
The ethical principles and guidelines for research involving human subjects indicated in
the Belmont Report (1979) were followed in this study. There was no risk of harm to the
applicants. The personal details of the applicants were recorded and respected. Psychometric
assessment protocol was utilised so results were objective, standardised and accurately
reported. Informed consent was also obtained from each applicant (Appendix H). No data was
manipulated and the data will be stored for five years to enable other researchers to interrogate
such data to ensure its veracity. Permission to conduct the research study and utilize the data
collected was obtained from the Client (Appendix I). Ethical clearance for this study was also
obtained from the Nelson Mandela University (Appendix J). An acceptable Turnitin similarity
index report is provided in Appendix K.
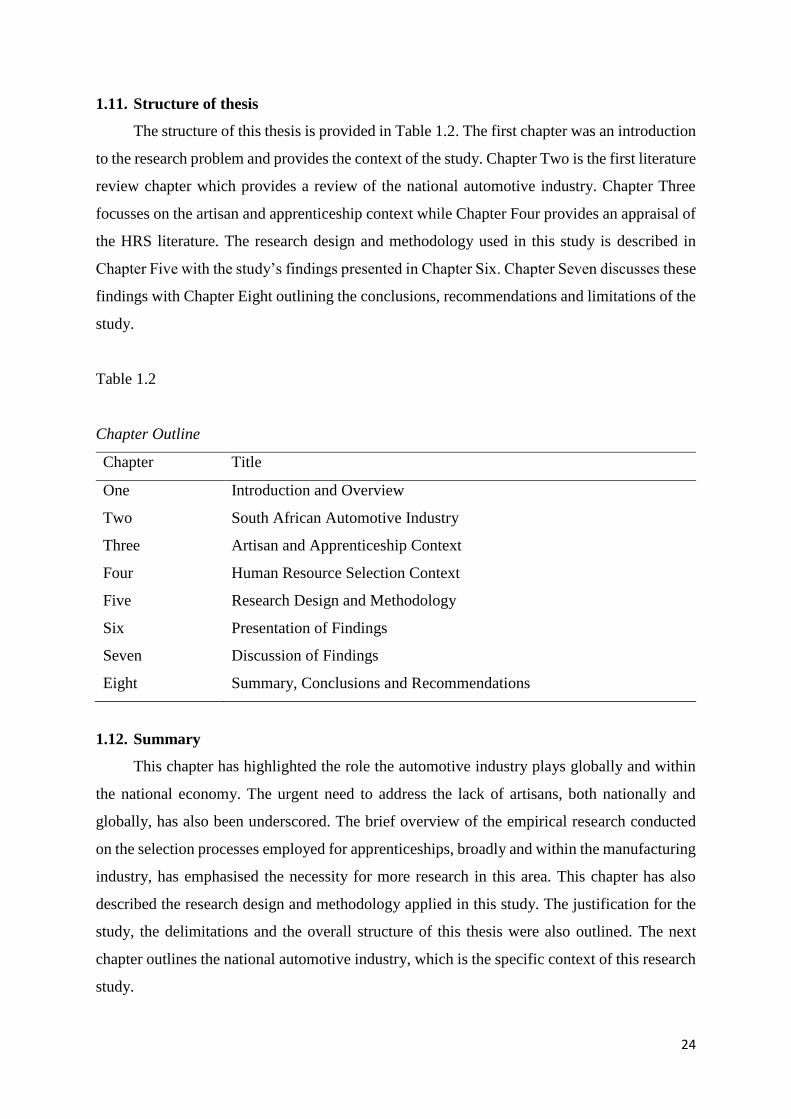
24
1.11. Structure of thesis
The structure of this thesis is provided in Table 1.2. The first chapter was an introduction
to the research problem and provides the context of the study. Chapter Two is the first literature
review chapter which provides a review of the national automotive industry. Chapter Three
focusses on the artisan and apprenticeship context while Chapter Four provides an appraisal of
the HRS literature. The research design and methodology used in this study is described in
Chapter Five with the study’s findings presented in Chapter Six. Chapter Seven discusses these
findings with Chapter Eight outlining the conclusions, recommendations and limitations of the
study.
Table 1.2
Chapter Outline
Chapter Title
One Introduction and Overview
Two South African Automotive Industry
Three Artisan and Apprenticeship Context
Four Human Resource Selection Context
Five Research Design and Methodology
Six Presentation of Findings
Seven Discussion of Findings
Eight Summary, Conclusions and Recommendations
1.12. Summary
This chapter has highlighted the role the automotive industry plays globally and within
the national economy. The urgent need to address the lack of artisans, both nationally and
globally, has also been underscored. The brief overview of the empirical research conducted
on the selection processes employed for apprenticeships, broadly and within the manufacturing
industry, has emphasised the necessity for more research in this area. This chapter has also
described the research design and methodology applied in this study. The justification for the
study, the delimitations and the overall structure of this thesis were also outlined. The next
chapter outlines the national automotive industry, which is the specific context of this research
study.

25
CHAPTER TWO
SOUTH AFRICAN AUTOMOTIVE INDUSTRY
2.1. Introduction
With Chapter One providing a broad overview of the research study, the purpose of
Chapter Two is to present the specific context of the research study, the national automotive
industry. The industry is profiled in terms of its history and current national representation. The
industry’s contribution to the country, economically and in terms of capital expenditure, are
briefly discussed. The envisaged trends that may impact on the automotive industry in the
future are explored as well as the contribution of the industry to employment levels. Section
2.2 commences the chapter with a brief historical overview of the automotive industry in SA.
2.2. History of the South African automotive industry
The national large vehicle manufacturing history commenced in 1924 with the first
vehicle, a Model T Ford, being assembled in Africa. As portrayed in Figure 2.1, in 1926,
General Motors (GM) SA was founded in Port Elizabeth, with four other plants opening across
the country over the next two decades. The Chrysler plant opened in Johannesburg in 1937 and
Peugeot entered SA under the National Motor Assemblers in 1939. The South African Motor
Assemblers and Distributors (SAMAD) was formed to manufacture Studebakers in Uitenhage
in 1946 and in 1949 the Car Distributors Assembly (CDA) plant opened in East London to
manufacture Mercedes-Benz automobiles. This era of the automotive history was crowned with
the first Beetle manufactured at the Volkswagen (VW) Uitenhage plant in 1951 (DTI, 2015;
Naude, 2013; VWSA, 2016).
In 1956, Volkswagen Aktiengesellschaft (VWAG) bought controlling interest in
SAMAD and announced a R1 million expansion programme resulting in production output
increasing from 42 to 75 units per day. The first Datsun car was assembled in 1959 in Durban.
The 1960s was a busy time in the national automotive industry as Fiat and Datsun opened their
factories in Rosslyn; Toyota produced the first Corona and BMW opened their doors in Rosslyn
(Naude, 2013; Nzimande & Patel, 2012; Pitot, 2011).
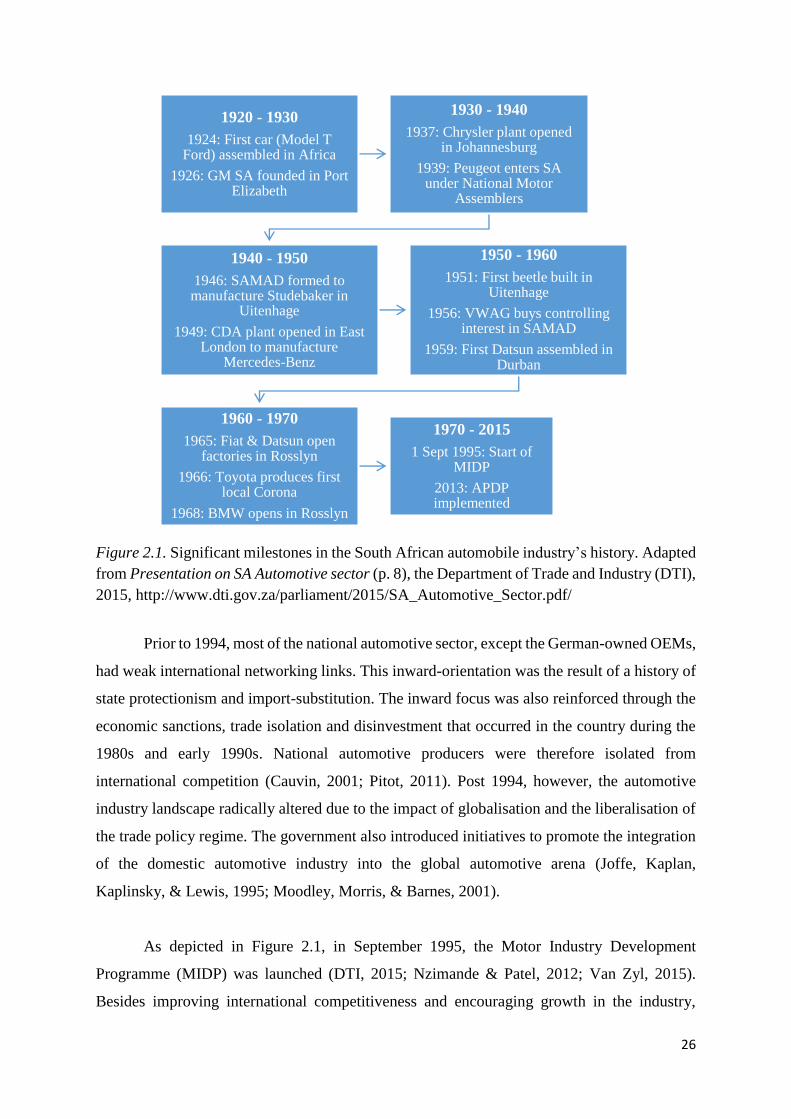
26
Figure 2.1. Significant milestones in the South African automobile industry’s history. Adapted
from Presentation on SA Automotive sector (p. 8), the Department of Trade and Industry (DTI),
2015, http://www.dti.gov.za/parliament/2015/SA_Automotive_Sector.pdf/
Prior to 1994, most of the national automotive sector, except the German-owned OEMs,
had weak international networking links. This inward-orientation was the result of a history of
state protectionism and import-substitution. The inward focus was also reinforced through the
economic sanctions, trade isolation and disinvestment that occurred in the country during the
1980s and early 1990s. National automotive producers were therefore isolated from
international competition (Cauvin, 2001; Pitot, 2011). Post 1994, however, the automotive
industry landscape radically altered due to the impact of globalisation and the liberalisation of
the trade policy regime. The government also introduced initiatives to promote the integration
of the domestic automotive industry into the global automotive arena (Joffe, Kaplan,
Kaplinsky, & Lewis, 1995; Moodley, Morris, & Barnes, 2001).
As depicted in Figure 2.1, in September 1995, the Motor Industry Development
Programme (MIDP) was launched (DTI, 2015; Nzimande & Patel, 2012; Van Zyl, 2015).
Besides improving international competitiveness and encouraging growth in the industry,
1920 - 1930
1924: First car (Model T Ford) assembled in Africa
1926: GM SA founded in Port Elizabeth
1930 - 1940
1937: Chrysler plant opened in Johannesburg
1939: Peugeot enters SA under National Motor
Assemblers
1940 - 1950
1946: SAMAD formed to manufacture Studebaker in
Uitenhage
1949: CDA plant opened in East London to manufacture
Mercedes-Benz
1950 - 1960
1951: First beetle built in Uitenhage
1956: VWAG buys controlling interest in SAMAD
1959: First Datsun assembled in Durban
1960 - 1970
1965: Fiat & Datsun open factories in Rosslyn
1966: Toyota produces first local Corona
1968: BMW opens in Rosslyn
1970 - 2015
1 Sept 1995: Start of MIDP
2013: APDP implemented
27
specifically in exports, the MIDP also had three other objectives. There was a move to improve
the affordability of domestic market vehicles; a need to stabilise employment levels in the
country as well as stimulate an enhanced industry foreign exchange balance (Cauvin, 2001;
Pitot, 2011). The MIDP was, however, viewed as an essential but temporary measure for the
national automotive industry (Cauvin, 2001).
The MIDP’s successor, the Automotive Production Development Programme (APDP)
was implemented in 2013 (DTI, 2015; Pitot, 2011; Van Zyl, 2015). The APDP supports and
develops the South African automotive industry through four pillars, namely, stable import
tariffs, a vehicle assembly allowance (i.e., allowing higher volume manufacturers to import a
percentage of their components duty free), a production incentive (i.e., an allowance for duty
free import of vehicles or components) and the automotive investment scheme. The latter
scheme aims to enhance investment and job creation in the local automotive sector through
increasing plant production volumes, strengthening the automotive value chain and stimulating
investment in technologically advanced automotive production and new or replacement models
or components (DTI, 2015; Pitot, 2011). The South African Automotive Masterplan 2021-2035
goes beyond the APDP and aims to assist in offering policy and support mechanisms to ensure
the long-term sustainability of the automotive industry. Through the Masterplan, higher levels
of investment and production are sought (AIEC, 2017; ASCCI, 2018).
2.3. Representation of the automotive industry
Section 1.1 indicated that there are currently seven large OEMs or automotive assemblers
in SA. This category of role-player assembles both passenger and commercial vehicles.
Mercedes-Benz, BMW and VWSA are European light automobile manufacturers and are
solely owned subsidiaries. The Japanese and North American manufacturers are Toyota,
Nissan, Isuzu and Ford Motor Company who are also 100% controlled subsidiaries (ASCCI,
2018; Moodley et al., 2001; Naude, 2013).
The national automotive industry has grown organically over the past few decades and
is currently geographically located in three of the nine provinces as shown in Figure 2.2. The
Ford Motor Company (including Mazda), Nissan and BMW vehicle manufacturers are in
Gauteng. Toyota is positioned in Kwazulu Natal while VWSA, Isuzu and Mercedes-Benz are
located in the Eastern Cape (DTI, 2015; Moothilal, 2017; Naude, 2013). At the end of 2017,
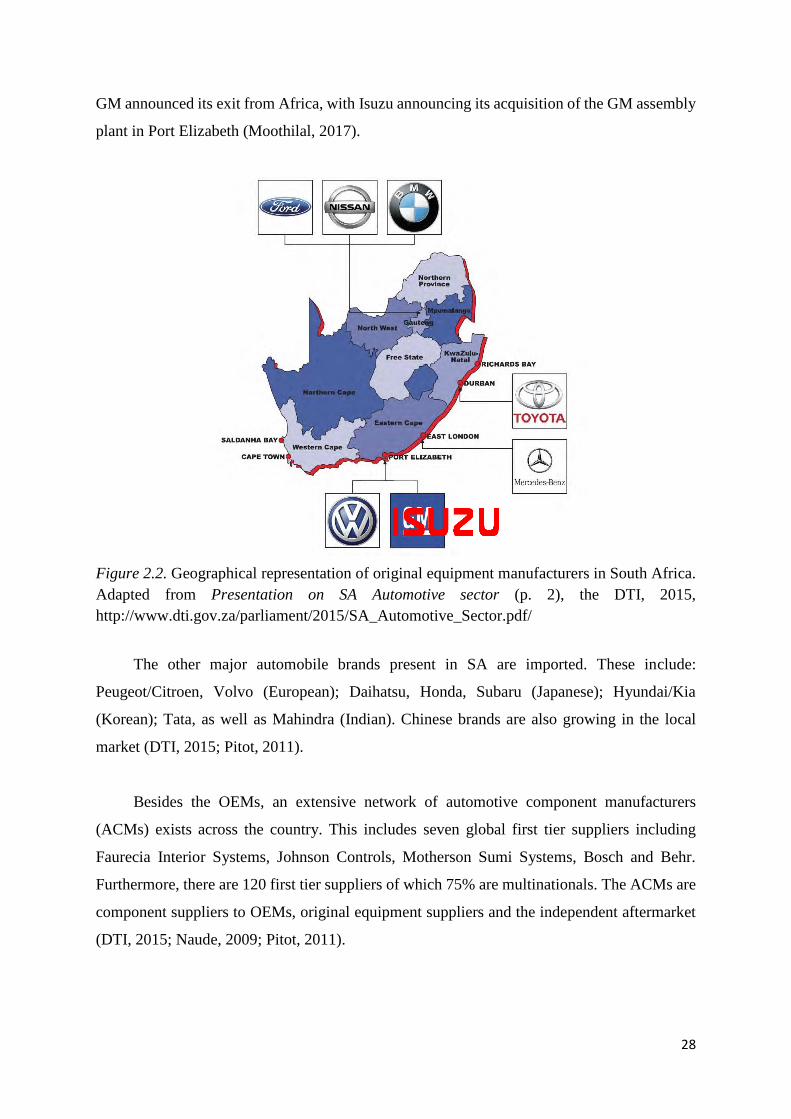
28
GM announced its exit from Africa, with Isuzu announcing its acquisition of the GM assembly
plant in Port Elizabeth (Moothilal, 2017).
Figure 2.2. Geographical representation of original equipment manufacturers in South Africa.
Adapted from Presentation on SA Automotive sector (p. 2), the DTI, 2015,
http://www.dti.gov.za/parliament/2015/SA_Automotive_Sector.pdf/
The other major automobile brands present in SA are imported. These include:
Peugeot/Citroen, Volvo (European); Daihatsu, Honda, Subaru (Japanese); Hyundai/Kia
(Korean); Tata, as well as Mahindra (Indian). Chinese brands are also growing in the local
market (DTI, 2015; Pitot, 2011).
Besides the OEMs, an extensive network of automotive component manufacturers
(ACMs) exists across the country. This includes seven global first tier suppliers including
Faurecia Interior Systems, Johnson Controls, Motherson Sumi Systems, Bosch and Behr.
Furthermore, there are 120 first tier suppliers of which 75% are multinationals. The ACMs are
component suppliers to OEMs, original equipment suppliers and the independent aftermarket
(DTI, 2015; Naude, 2009; Pitot, 2011).
29
Original equipment suppliers, also known as the second-tier, supply automotive parts and
accessory sales through the OEMs. The third-tier or automotive retail and aftermarket, provide
automotive parts and accessory sales via independent retailers and repair outlets (DTI, 2015;
Naude, 2009; Pitot, 2011). Most of the 200 second tier and third tier suppliers are South
African. Just under half of these suppliers are in Gauteng, a third are located in the Eastern
Cape, a quarter in Kwazulu-Natal and a few are in the Western Cape (AIEC, 2017). This review
of the automotive industry’s wide network leads to the discussion that follows on its overall
contribution to the country.
2.4. Contribution of the automotive industry
Section 2.4.1 gives an account of the industry’s economic contribution, including
information pertaining to Gross Domestic Profit (GDP), production and capacity levels as well
as exports. The capital expenditure contribution of the OEMs is discussed in section 2.4.2.
2.4.1. Economic contribution
The fourth-largest sector in the national economy is the manufacturing sector (Vass &
Raidani, 2016). Within the manufacturing sector, the automotive industry is the largest. Vehicle
and component manufacturing comprises about 30% of the national overall manufacturing
output (De Lange, 2017).
The wider automotive network industry contribution to GDP has steadily grown post the
economic recession in 2008. The contribution from this industry rose to a record high of 7.5%
in 2015 (DTI, 2015; Naude, 2013; Vermeulen, 2016). The industry currently contributes
approximately 7.4% to the national GDP, which has remained constant since 2016 (AIEC,
2017; Vermeulen, 2018). It is estimated that this contribution could increase to 8.5% by 2020
if it can annually produce 900 000 units (De Lange, 2017).
The nature of productivity within the South African automobile industry has significantly
changed over the past two decades. Productivity is measured as the average number of vehicles
produced per employee per year. In 1995, ten cars were produced per employee, with this
increasing to 17 vehicles per employee in 2010. By 2012, productivity had increased to 18.5
units per employee (DTI, 2015; Pitot, 2011). In terms of global vehicle production ranking SA
is ranked in position 22, with 599 004 vehicles produced in 2016, a slight decrease from the
616 082 vehicles produced in 2015 (AIEC, 2017; ASCCI, 2018).
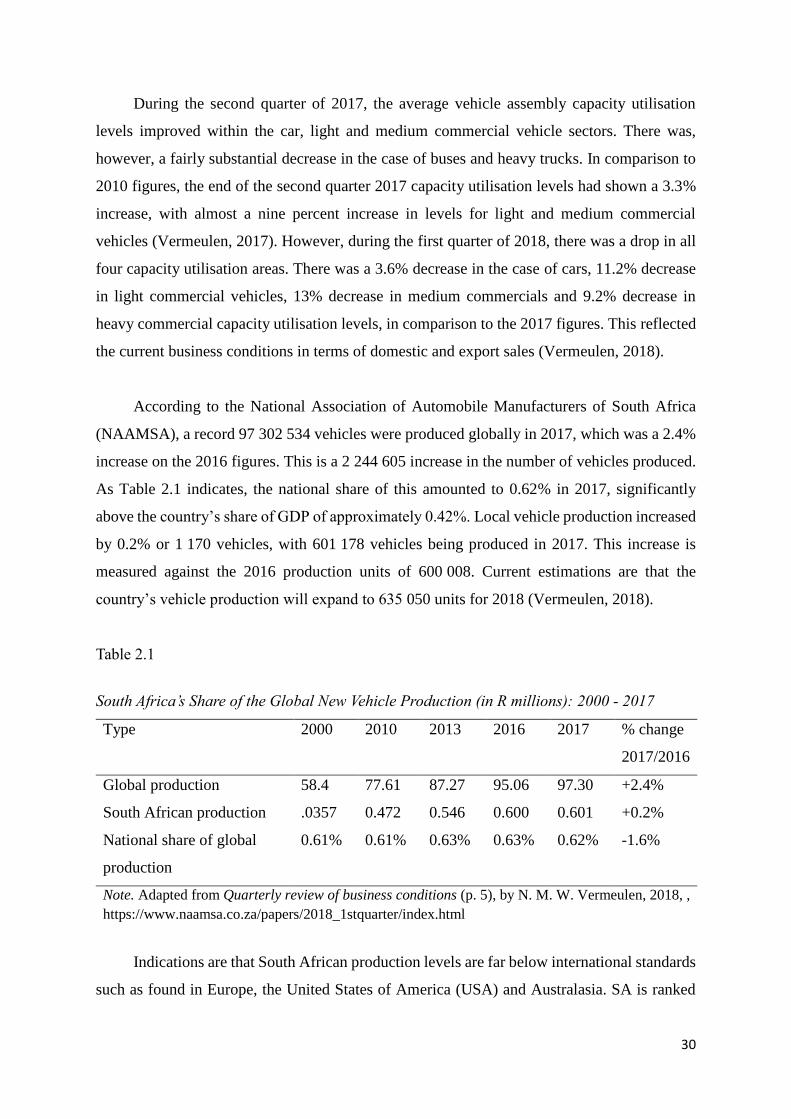
30
During the second quarter of 2017, the average vehicle assembly capacity utilisation
levels improved within the car, light and medium commercial vehicle sectors. There was,
however, a fairly substantial decrease in the case of buses and heavy trucks. In comparison to
2010 figures, the end of the second quarter 2017 capacity utilisation levels had shown a 3.3%
increase, with almost a nine percent increase in levels for light and medium commercial
vehicles (Vermeulen, 2017). However, during the first quarter of 2018, there was a drop in all
four capacity utilisation areas. There was a 3.6% decrease in the case of cars, 11.2% decrease
in light commercial vehicles, 13% decrease in medium commercials and 9.2% decrease in
heavy commercial capacity utilisation levels, in comparison to the 2017 figures. This reflected
the current business conditions in terms of domestic and export sales (Vermeulen, 2018).
According to the National Association of Automobile Manufacturers of South Africa
(NAAMSA), a record 97 302 534 vehicles were produced globally in 2017, which was a 2.4%
increase on the 2016 figures. This is a 2 244 605 increase in the number of vehicles produced.
As Table 2.1 indicates, the national share of this amounted to 0.62% in 2017, significantly
above the country’s share of GDP of approximately 0.42%. Local vehicle production increased
by 0.2% or 1 170 vehicles, with 601 178 vehicles being produced in 2017. This increase is
measured against the 2016 production units of 600 008. Current estimations are that the
country’s vehicle production will expand to 635 050 units for 2018 (Vermeulen, 2018).
Table 2.1
South Africa’s Share of the Global New Vehicle Production (in R millions): 2000 - 2017
Type 2000 2010 2013 2016 2017 % change
2017/2016
Global production 58.4 77.61 87.27 95.06 97.30 +2.4%
South African production .0357 0.472 0.546 0.600 0.601 +0.2%
National share of global
production
0.61% 0.61% 0.63% 0.63% 0.62% -1.6%
Note. Adapted from Quarterly review of business conditions (p. 5), by N. M. W. Vermeulen, 2018, ,
https://www.naamsa.co.za/papers/2018_1stquarter/index.html
Indications are that South African production levels are far below international standards
such as found in Europe, the United States of America (USA) and Australasia. SA is ranked
31
twenty-second in global vehicle production, with China ranked first, the USA second, Japan
third, Germany fourth and India fifth (AIEC, 2017). Year to date vehicle production figures as
at the end of the first quarter of 2018 revealed that the USA produced 2 948 283 vehicles, China
7 022 164, India 1 371 953 and Germany 1 427 979 vehicles (OICA, 2018b). Local production
is, however, expected to rise further over the 2016-2020 period due to the APDP and the rise
in vehicle exports (Vermeulen, 2016). The national annual production as at the first quarter of
2018 was 134 603 vehicles, with 58.7% being exported (AIEC, 2017; OICA, 2018b).
Following the 2008-economic recession, the national automotive industry was forced to
focus on new markets and partners to create new growth avenues and to diversify its risk. From
2012 to 2013 the export value more than doubled to 21 of the 152 country export destinations
(AIEC, 2017). Nissan now exports its 1-ton pickup into Africa; VWSA sells the Polo series to
the European Union, whilst BMW exports the 3 Series to Japan, Australia and America.
Mercedes-Benz sells the C-Class to several overseas countries and Toyota exports the
Corolla/Hilux to the European Union and Africa (DTI, 2015).
As graphically illustrated in Figure 2.3, there has been strong growth in South African
vehicle exports, with the export-led growth model used by the industry proving sustainable
since the global economic crisis post-2009. In 1995 the export value of both vehicles and
components was R4.2 billion with 15 764 vehicles being exported. By 2012 the export value
figure had risen to R86.9 billion with 277 893 units being exported. This is a 1 662% increase
in 17 years (DTI, 2015). In 2015 approximately 630 000 vehicles were exported, a record
industry vehicle production (Van Zyl, 2015). Total automotive industry exports increased to
R118.1 billion in 2016 from R94.9 billion in 2012 (AIEC, 2017). A comparison between local
export data between 2015 and 2017, however, is not as positive. In 2015, 333 847 vehicles
were exported from SA, with 344 859 in 2016 and 338 093 in 2017. This is a 1.9% decrease in
a 12-month period. This negative trend is reflected in the exports to Europe, North/Central
America and South America. Exports to Europe declined by 2.6%, South America declined by
24.5% and 15.6% to North America. Exports to North America decreased as the exports of the
BMW 3-series concluded. This trend is therefore expected to continue. Exports to Asia showed
a positive growth of 10.9% and an increase of 10.5% to Australasia in 2017. Following sharp
decreases over the past two years, a 1.3% increase in export sales to Africa was noted for the
first time, suggesting a stabilisation in demand (Vermeulen, 2018).
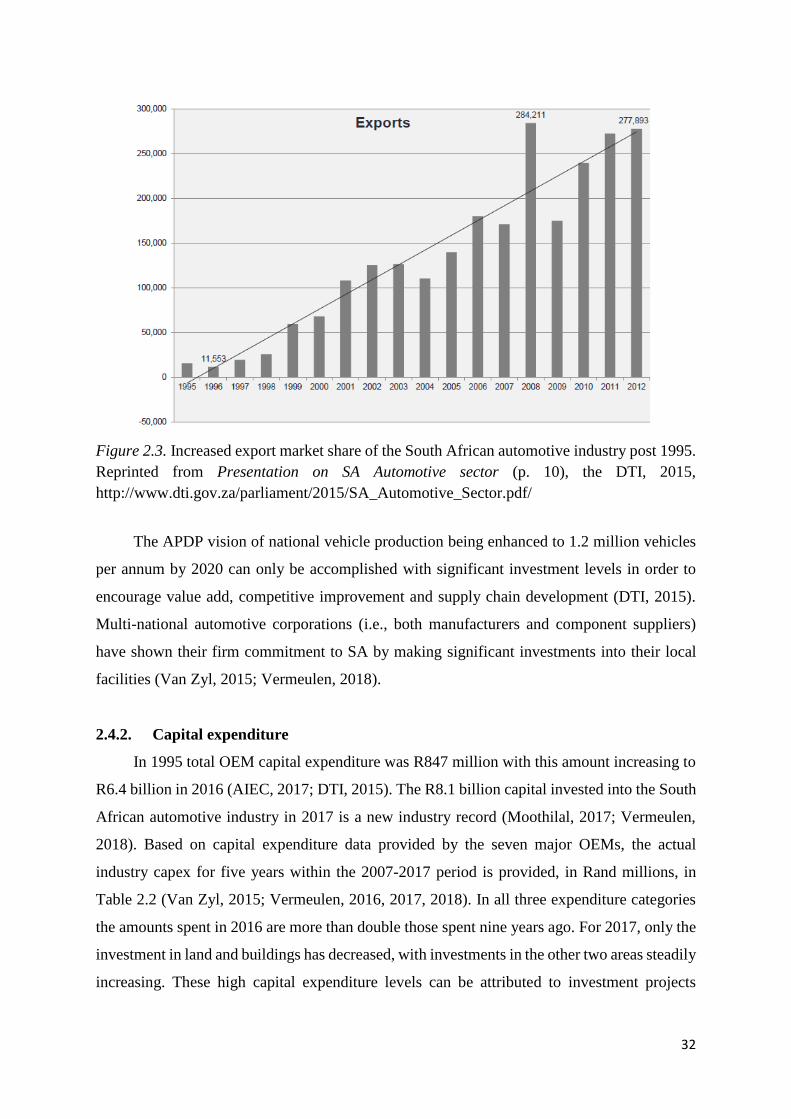
32
Figure 2.3. Increased export market share of the South African automotive industry post 1995.
Reprinted from Presentation on SA Automotive sector (p. 10), the DTI, 2015,
http://www.dti.gov.za/parliament/2015/SA_Automotive_Sector.pdf/
The APDP vision of national vehicle production being enhanced to 1.2 million vehicles
per annum by 2020 can only be accomplished with significant investment levels in order to
encourage value add, competitive improvement and supply chain development (DTI, 2015).
Multi-national automotive corporations (i.e., both manufacturers and component suppliers)
have shown their firm commitment to SA by making significant investments into their local
facilities (Van Zyl, 2015; Vermeulen, 2018).
2.4.2. Capital expenditure
In 1995 total OEM capital expenditure was R847 million with this amount increasing to
R6.4 billion in 2016 (AIEC, 2017; DTI, 2015). The R8.1 billion capital invested into the South
African automotive industry in 2017 is a new industry record (Moothilal, 2017; Vermeulen,
2018). Based on capital expenditure data provided by the seven major OEMs, the actual
industry capex for five years within the 2007-2017 period is provided, in Rand millions, in
Table 2.2 (Van Zyl, 2015; Vermeulen, 2016, 2017, 2018). In all three expenditure categories
the amounts spent in 2016 are more than double those spent nine years ago. For 2017, only the
investment in land and buildings has decreased, with investments in the other two areas steadily
increasing. These high capital expenditure levels can be attributed to investment projects
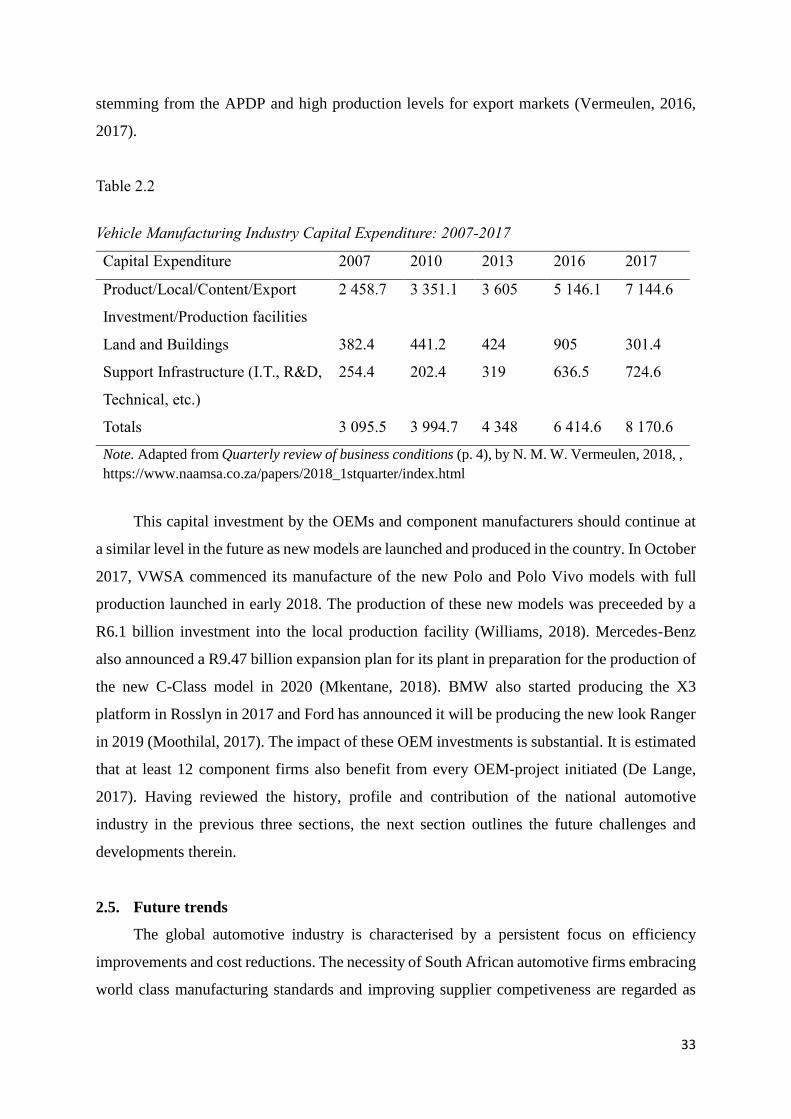
33
stemming from the APDP and high production levels for export markets (Vermeulen, 2016,
2017).
Table 2.2
Vehicle Manufacturing Industry Capital Expenditure: 2007-2017
Capital Expenditure 2007 2010 2013 2016 2017
Product/Local/Content/Export
Investment/Production facilities
2 458.7 3 351.1 3 605 5 146.1 7 144.6
Land and Buildings 382.4 441.2 424 905 301.4
Support Infrastructure (I.T., R&D,
Technical, etc.)
254.4 202.4 319 636.5 724.6
Totals 3 095.5 3 994.7 4 348 6 414.6 8 170.6
Note. Adapted from Quarterly review of business conditions (p. 4), by N. M. W. Vermeulen, 2018, ,
https://www.naamsa.co.za/papers/2018_1stquarter/index.html
This capital investment by the OEMs and component manufacturers should continue at
a similar level in the future as new models are launched and produced in the country. In October
2017, VWSA commenced its manufacture of the new Polo and Polo Vivo models with full
production launched in early 2018. The production of these new models was preceeded by a
R6.1 billion investment into the local production facility (Williams, 2018). Mercedes-Benz
also announced a R9.47 billion expansion plan for its plant in preparation for the production of
the new C-Class model in 2020 (Mkentane, 2018). BMW also started producing the X3
platform in Rosslyn in 2017 and Ford has announced it will be producing the new look Ranger
in 2019 (Moothilal, 2017). The impact of these OEM investments is substantial. It is estimated
that at least 12 component firms also benefit from every OEM-project initiated (De Lange,
2017). Having reviewed the history, profile and contribution of the national automotive
industry in the previous three sections, the next section outlines the future challenges and
developments therein.
2.5. Future trends
The global automotive industry is characterised by a persistent focus on efficiency
improvements and cost reductions. The necessity of South African automotive firms embracing
world class manufacturing standards and improving supplier competiveness are regarded as
34
two key issues for the future success of the national automotive industry (Naude, 2013; Van
Zyl, 2015). Without these, the development and long-term sustainability of the national
industry is questionable. The ongoing upgrading and implementation of world class
manufacturing standards is pivotal for the industry to have a chance of penetrating the global
automotive value chain. SA now competes directly with medium-sized market economies such
as Thailand and Mexico. However, these countries have greater proximity to the major export
markets and enjoy lower costs (AIEC, 2017; Barnes & Morris, 2008; Moodley et al., 2001).
Major policy developments have impacted on the South African automotive industry.
Firstly, governmental agencies are encouraging electric vehicles and green production which
involves supporting the development and production of this form of technology and its
associated components. Secondly, there have been significant moves towards enhancing the
medium to heavy commercial vehicle segment. Increased investment levels into researching
and developing this area has been encouraged as well as enhancing support for component
manufacture to service this segment of the industry (DTI, 2015).
Section 2.4.1 indicated that national automobile production is a small segment of the
world’s total production. Even before the 2009 economic recession, the global industry was
reaching capacity saturation point (Cauvin, 2001; Naude, 2013). Transnational companies
currently have significant control of international production and trade networks making it
difficult for local automotive firms to export independently. This could have a fundamental
impact on the ability of the industry to survive and compete in the global arena (AIEC, 2017;
Moodley et al., 2001). However, SA is regarded as the foremost destination for investment in
Africa. Global investors and business leaders have indicated an overwhelming preference for
SA as both a place of business and an investment destination (AIEC, 2017; Deloitte, 2015). SA
was ranked 82nd out of 190 countries for ease of doing business and 24th for good practice in
protecting business investors (World Bank, 2018). Forty-one percent of the global leaders
surveyed rated SA in first place (i.e., with Morocco second at eight percent) and 61% placed
the country in their top three (i.e., with Morocco and Nigeria tying at second place with 20%).
This preference is reflected in the consistent inward flow of foreign direct investment into SA
with a 10% year-on-year growth. Specifically, since 2003, the automotive industry has been
attracting close to 10% of the foreign capital invested in SA (Lalor & Taku, 2013).
35
Other challenges experienced within the industry include high labour costs, modest
infrastructure and outmoded technology. These issues are specifically impacting on the ACMs
as they compete against cheaper, and even counterfeit, imported parts (Ambe & Badenhorst-
Weiss, 2011; Moodley et al., 2001). The ACMs are being placed under significant strain by
their cutomers to compete on price and non-price factors These ACMs will need to source
innovative methods to deal with this global competitive pressure if they are to be sustainable
(Barnes & Meadows, 2008; Moodley et al., 2001; Naude, 2013).
Given these challenges, the human capital element within the industry has been
prioritised (Mashilo, 2010; Nomvete, Patel, & Baleni, 2017; Nzimande & Patel, 2012).
Specifically, more technical knowledge and skill is required. Over the past decade, this demand
for core technical skills, particularly at the level of technician and artisan, has significantly
increased (Brown, 2013; DeSimone & Werner, 2012; Peo, 2013). There is also a global need
for increased interest in pursuing a career within the manufacturing sector. It has been cited
that the biggest challenge facing the sector is sourcing potential employees (Giffi et al., 2014,
2015; Kramer et al., 2015). However, in an American public poll, respondents indicated a high
degree of interest in programmes such as internships, work studies and apprenticeships (Giffi
et al., 2014).
2.6. Contribution to employment
Direct employment levels within the South African motor vehicle manufacturing
industry have remained fairly stable over the past few years (Van Zyl, 2015; Vermeulen, 2016).
At the end of the first quarter in 2018, there were 30 032 employees on the payroll. These
figures are comprised from major new vehicle manufacturers and specialist commercial vehicle
and bus manufacturers (Vermeulen, 2018). There has been a slight decrease in head count on
the March 2017 figure of 30 197. This decrease is also seen in a comparison to the average
2016 employment number of 30 953 and 31 260 in 2015 (Vermeulen, 2017). However, there
was a 0.75% or 224 jobs gained on the 29 808 industry head count as at the end of December
2017 (Vermeulen, 2018).
Broadly speaking, about 900 000 people are employed in the local automotive industry
(De Lange, 2017). Within the service and sales outlets of the automotive industry, employment
levels are over 200 000. This segment of the industry includes petrol stations, workshops,
dealers, panel beaters and spare parts dealers (Pitot, 2011). It is estimated that the automotive
36
industry contributed R55.9 billion or three percent of the total compensation provided to
national employees in 2015. Of these job opportunities offered by the industry, over 76% are
medium to low-skilled positions (Cokayne, 2017). Taking into account the dependants
supported by these employees, therefore, about four million South Africans currently rely on
the automotive industry (De Lange, 2017).
Besides direct and indirect employment, the automotive industry also supports society in
several other ways. Between 2013 and 2015, the OEMs spent R1.5 billion on socioeconomic
projects. Over R569 million was contributed to skills development, R346.6 million to
healthcare, R13 million to conservation and environmental concerns and over R118 million to
education. Over R306 million was also spent on small, medium and micro business
development and education (Cokayne, 2017; De Lange, 2017). Furthermore, the national
automotive industry is committed to the creation and development of Black owned
manufacturing suppliers. Several OEMs implemented plans in 2017 to drive this
transformation. These included the VWSA R86 million Black supplier fund and the Black
empowerment fund set up by Toyota with an initial R42 million investment (Moothilal, 2017).
2.7. Summary
Chapter Two has discussed the national automotive industry, which is the context area
for the study. This chapter has outlined the local profile of the industry, including a historical
perspective and the major role-players therein. The industry’s contribution to the country in
terms of GDP and capital expenditure were also discussed. The future trends impacting on the
sector were outlined in the latter part of the chapter. Whilst the automotive industry is a
significant contributor to the growth of the country, it has been placed under pressure to
adequately align itself with global trends. Keeping abreast of technological innovations given
the current skills shortages in core technical areas, such as artisans, is an area of concern.
The next chapter describes the artisan and apprenticeship context. In creating a
background, the broad nature of apprenticeship programmes is discussed, as well as
highlighting the latest developments both globally and nationally in this form of training. The
dichotomy between the current demand and supply of artisans is also debated. In doing so,
Chapter Three discusses the difficulties being faced within artisanal development as well as
proposed solutions to these challenges.
37
CHAPTER THREE
11 ARTISAN AND APPRENTICESHIP CONTEXT
3.1. Introduction
Chapter Two outlined the specific context of this research study, the national automotive
industry. The chapter highlighted the role of human capital in the long-term sustainability of
the industry. Specifically, the need for addressing the current skills shortages in core technical
areas, such as artisans, was emphasised. Chapter Three, the second literature review chapter of
this thesis, considers the artisan and apprenticeship context, both internationally and within
SA. The apprenticeship system is described and the apprenticeship life cycle is explained. The
implementation of apprenticeship systems in SA and four international countries are outlined.
The supply and demand issues, as well as the selection challenges experienced within the
artisanal landscape, are discussed in the latter sections of the chapter. Section 3.2 commences
with a generic explanation of the apprenticeship system.
3.2. Defining apprenticeship
An artisan is an individual who has successfully fulfilled the requirements of a formal or
informal trade internship or apprenticeship and has passed the requisite trade test (Evans-
Klock, 2012; Mahembe, 2012; Rauner et al., 2012). An artisan typically works in the categories
of millwright, electrician, plumber, boilermaker, carpenter, mechanic, fitter and turner, pattern
maker or injection moulder (Smith & Kemmis, 2013; Van Rooyen et al., 2010; Windapo,
2016).
Apprenticeships are regarded as a type of workplace or on-the-job learning that imparts
general skills (Mohrenweiser & Zwick, 2009; OECD, 2011). However, a range of practices are
encompassed in this form of training. Apprenticeship programmes are in fact quite distinct
from other on-the-job training programmes in several ways. These unique elements include the
legal framework, the use of off-the-job-training and formal assessment as well as the training
model culminating in industry-recognised certification (Fazio et al., 2016). Appendix L
summarises the key similarities and differences between an apprenticeship programme and
four other forms of training, namely pre-apprenticeship or traineeship, internship, informal
apprenticeship and workplace learning.
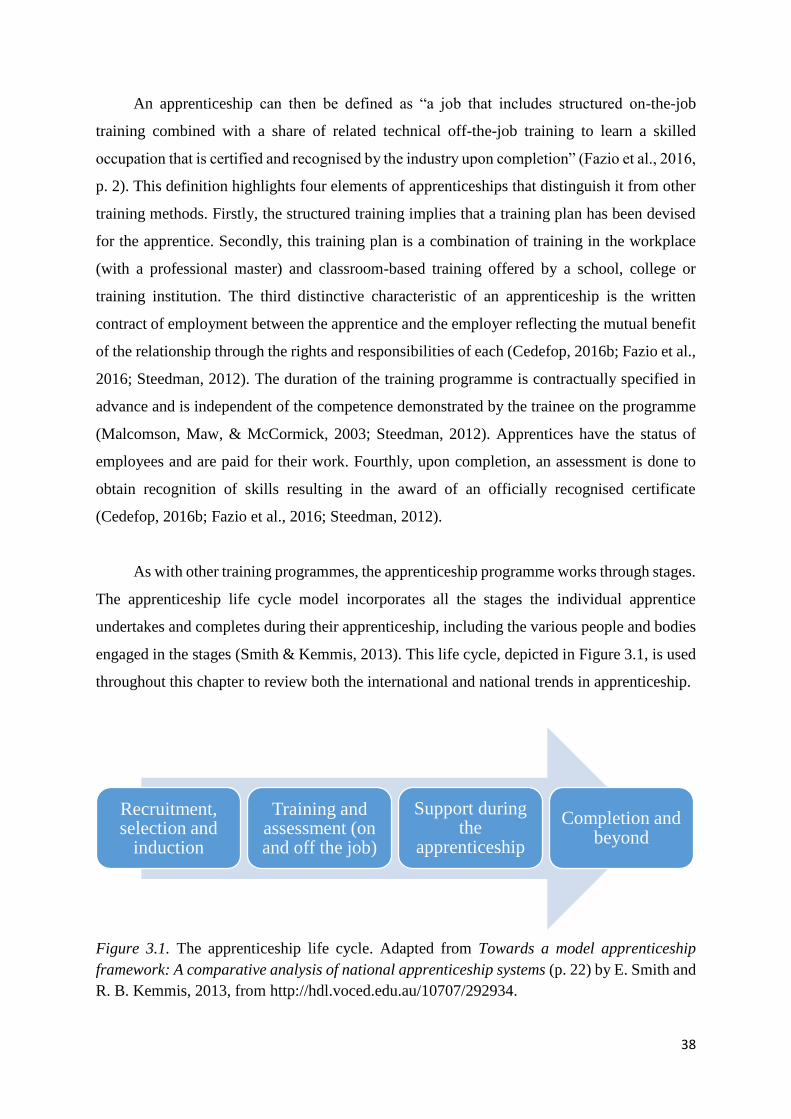
38
An apprenticeship can then be defined as “a job that includes structured on-the-job
training combined with a share of related technical off-the-job training to learn a skilled
occupation that is certified and recognised by the industry upon completion” (Fazio et al., 2016,
p. 2). This definition highlights four elements of apprenticeships that distinguish it from other
training methods. Firstly, the structured training implies that a training plan has been devised
for the apprentice. Secondly, this training plan is a combination of training in the workplace
(with a professional master) and classroom-based training offered by a school, college or
training institution. The third distinctive characteristic of an apprenticeship is the written
contract of employment between the apprentice and the employer reflecting the mutual benefit
of the relationship through the rights and responsibilities of each (Cedefop, 2016b; Fazio et al.,
2016; Steedman, 2012). The duration of the training programme is contractually specified in
advance and is independent of the competence demonstrated by the trainee on the programme
(Malcomson, Maw, & McCormick, 2003; Steedman, 2012). Apprentices have the status of
employees and are paid for their work. Fourthly, upon completion, an assessment is done to
obtain recognition of skills resulting in the award of an officially recognised certificate
(Cedefop, 2016b; Fazio et al., 2016; Steedman, 2012).
As with other training programmes, the apprenticeship programme works through stages.
The apprenticeship life cycle model incorporates all the stages the individual apprentice
undertakes and completes during their apprenticeship, including the various people and bodies
engaged in the stages (Smith & Kemmis, 2013). This life cycle, depicted in Figure 3.1, is used
throughout this chapter to review both the international and national trends in apprenticeship.
Figure 3.1. The apprenticeship life cycle. Adapted from Towards a model apprenticeship
framework: A comparative analysis of national apprenticeship systems (p. 22) by E. Smith and
R. B. Kemmis, 2013, from http://hdl.voced.edu.au/10707/292934.
Recruitment, selection and
induction
Training and assessment (on and off the job)
Support during the
apprenticeship
Completion and beyond
39
During the first stage of the life cycle, processes are implemented to attract potential
apprentices and screen for the appropriateness of match between applicants and the particular
industry. Induction is a practice instigated to assist in the retention of these apprentices selected
for the organisation. These aspects are done either directly by the employer or organising agents
at local or provincial level. In this stage, apprentices may be required to enter into a formal
legal contract with the employer or agency and/or commence a probationary period before
entering into this apprenticeship agreement.
As illustrated in Figure 3.1, in the second stage of this life cycle, apprentices engage in
the training and assessment stage of the programme. The implementation context of the
apprenticeship determines the quality of training and assessment as well as the ratio of on-the-
job training to off-the-job training experienced by apprentices. This training and assessment
can be established and controlled centrally, either provincially or nationally, or be decentralised
into the hands of the employer or training provider. Assessment can take various forms, from
log books to final examinations, which lead to recognised qualifications.
The third stage centres on supporting the apprentice during the life cycle. This support
comes from various sources with the aim to increase the likelihood of the apprentice
completing the programme with the highest skill level possible. Forms of support can range
from a tutor to masters or even case managers.
In the final stage of the life cycle, termed completion and beyond, the focus is on the
future of the apprentice post the programme. In some cases, the apprentice continues with the
training firm and becomes a full-time employee. However, this is not a consistent phenomenon.
Another factor considered within this stage are the opportunities available for the apprentice to
build on their apprenticeship qualification. Further training possibilities (e.g., journeyman
training) or other off-the-job qualifications could be recommended. But, once again, this is not
compulsory (Smith & Kemmis, 2013).
3.3. International apprenticeship systems
The global vocational education and training practices have been documented by
Eichhorst, Rodríguez-Planas, Schmidl and Zimmerman (2015). They distinguish the various
types of systems on two characteristics: firstly, the comparative weighting provided to learning
versus workplace training and, secondly, whether the learning is provided as part of the
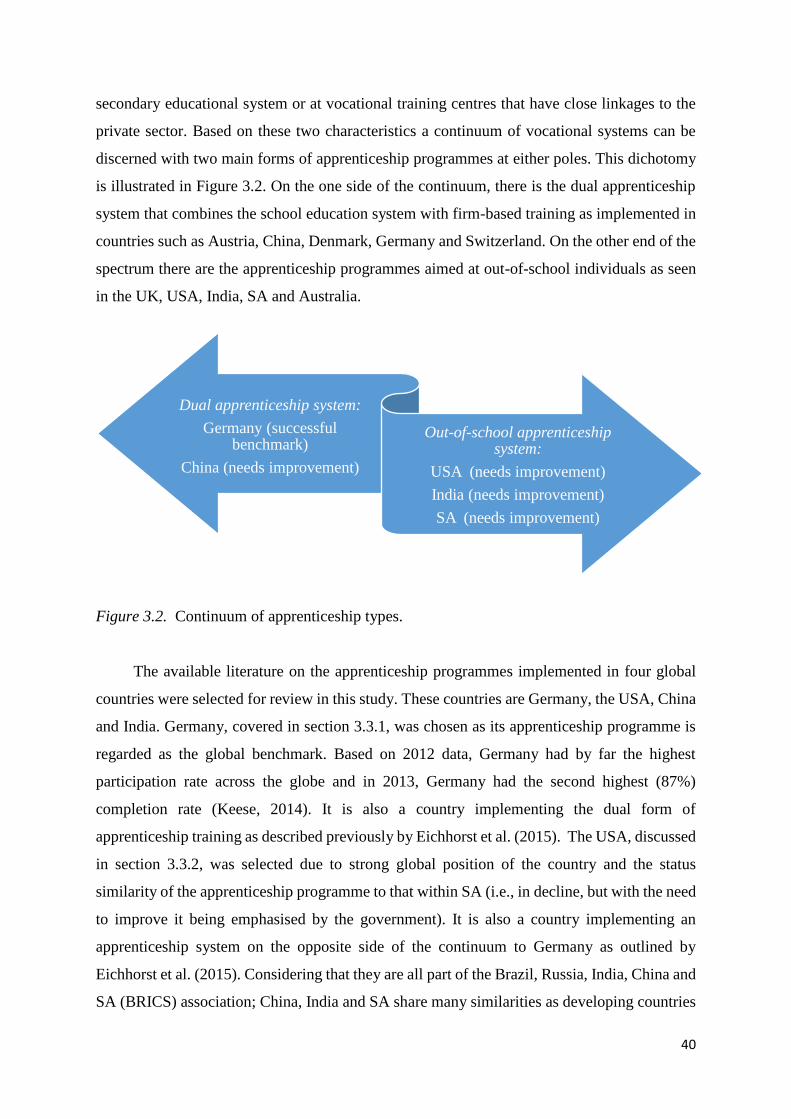
40
secondary educational system or at vocational training centres that have close linkages to the
private sector. Based on these two characteristics a continuum of vocational systems can be
discerned with two main forms of apprenticeship programmes at either poles. This dichotomy
is illustrated in Figure 3.2. On the one side of the continuum, there is the dual apprenticeship
system that combines the school education system with firm-based training as implemented in
countries such as Austria, China, Denmark, Germany and Switzerland. On the other end of the
spectrum there are the apprenticeship programmes aimed at out-of-school individuals as seen
in the UK, USA, India, SA and Australia.
Figure 3.2. Continuum of apprenticeship types.
The available literature on the apprenticeship programmes implemented in four global
countries were selected for review in this study. These countries are Germany, the USA, China
and India. Germany, covered in section 3.3.1, was chosen as its apprenticeship programme is
regarded as the global benchmark. Based on 2012 data, Germany had by far the highest
participation rate across the globe and in 2013, Germany had the second highest (87%)
completion rate (Keese, 2014). It is also a country implementing the dual form of
apprenticeship training as described previously by Eichhorst et al. (2015). The USA, discussed
in section 3.3.2, was selected due to strong global position of the country and the status
similarity of the apprenticeship programme to that within SA (i.e., in decline, but with the need
to improve it being emphasised by the government). It is also a country implementing an
apprenticeship system on the opposite side of the continuum to Germany as outlined by
Eichhorst et al. (2015). Considering that they are all part of the Brazil, Russia, India, China and
SA (BRICS) association; China, India and SA share many similarities as developing countries
Dual apprenticeship system:
Germany (successful benchmark)
China (needs improvement)
Out-of-school apprenticeship system:
USA (needs improvement)
India (needs improvement)
SA (needs improvement)
41
(Jayan, 2012). As is the case with the USA and SA, China and India are attempting to revitalise
their apprenticeship systems. China and India were therefore chosen as the third and fourth
comparative countries in this literature review. Furthermore, as indicated in section 2.4.1, these
four countries are also positioned within the top five countries in terms of global vehicle
production. Appendix M tabulates the key differences between these four countries and SA, in
terms of the implementation of their respective apprenticeship programmes. The benchmark
apprenticeship programme is discussed in the section that follows.
3.3.1. German apprenticeship system
In Germany, there is a long-standing apprenticeship tradition in many industries,
including manufacturing, banking and services (Fairless, 2016; Malcomson et al., 2003;
Muehlemann, Pfeifer, Walden, Wenzelmann, & Wolter, 2010). There are approximately 350
officially recognised apprenticeship programmes in the country (Fazio et al., 2016; G20ewg,
2012; Kahlen, 2016). However, a third of the apprenticeship training schemes are for craft
related professions. The remaining two-thirds of occupations trained in this manner are white-
collar professions, such as sales, banking and insurance (Dustmann & Schönberg, 2007; Smith
& Kemmis, 2013).
Acceptance onto a German apprenticeship programme is no mean feat with several firms
advertising their trainee vacancies at least a year in advance (Kahlen, 2016). Researchers
indicate that only about 3.7% of applicants are successful in acquiring an apprenticeship
position (Jacoby, 2014). Companies commit to contributing towards the national goal of
apprenticeship placements through a focus on their recruitment and selection practices (Fazio
et al., 2016). A school-leaving certificate is not compulsory to start this form of training in
Germany as each sponsoring firm decides on the entrance qualifications required. However, if
there are numerous applicants, a school-leaving certificate, good results therein and adequate
German language skills has been shown to be advantageous (Kahlen, 2016).
The German apprenticeship system is regulated by the Vocational Training Act of 1969.
This Act specifies the legal rights and obligations of both employers and apprentices. Employer
bodies (chambers) and trade unions have significant authority under this legislation (Dustmann
& Schönberg, 2007; G20ewg, 2012). At the onset of the apprenticeship, the two parties (i.e.,
firm and apprentice) are usually required to sign a legally-binding contract. This binds the
employer to providing an occupation-specific curriculum according to the training regulations
42
of the country. The employer also needs to provide the apprentice with a wage whilst on
training (Kahlen, 2016; Muehlemann et al., 2010; Smith & Kemmis, 2013).
As indicated in Appendix M, which summarises the main characteristics of the German
apprenticeship programme, there is a combination of theory and practice. The apprentice is
required to spend a set amount of time in the publicly financed vocational school, usually one
to two days per week. The rest of the apprentice’s time is spent in the training firm (Fazio et
al., 2016; Kahlen, 2016; Muehlemann et al., 2010). The curriculum of the apprenticeship
programme is directly regulated by governmental intervention in the implementation thereof
(Elbaum, 1989; Kahlen, 2016; Malcomson et al., 2003). This ensures high quality programmes
and enables mobility and flexibility for apprentices aiming to move from the training firm upon
apprenticeship completion (Dustmann & Schönberg, 2007; Jacoby, 2014; Smith & Kemmis,
2013).
Apprentices are required to sit for an external examination at the end of the
apprenticeship period, which culminates in the receipt of a nationally recognised training
certificate (G20ewg, 2012; Kahlen, 2016; Muehlemann et al., 2010). Both employers and
apprentices in the country value and respect practical work and vocational training (OECD,
2011). These parties are seeking more than short-term upskilling through the apprenticeship
programme. Rather than only developing technical skills, the apprenticeship system therefore
also aims to enhance the problem-solving, innovation and self-reliance skills demonstrated by
the apprentices. Thoughtful artisans, that can make insightful and flexible judgements, are
required to interpret the preferred strategies and methods of their training firms (Jacoby, 2014).
The apprenticeship certificate is therefore also nationally recognised as a vital skill
qualification (Dustmann & Schönberg, 2007; Fazio et al., 2016; OECD, 2011).
Despite this recognition of the qualification, there is limited capacity to meet industry
demands given the high demand for young talent in Germany. A large number of positions in
vocational training have not been filled (Kahlen, 2016). Notwithstanding improved access to
vocational training in the country, there is an increasing trend of the youth moving directly to
university. The actual numbers entering the dual apprenticeship system are declining (Fazio et
al., 2016).
43
Given the long-standing tradition of apprenticeship in the country, Germany is
expounded as an authority on the dual apprenticeship training model (Fazio et al., 2016; Jacoby,
2014; Mohrenweiser & Zwick, 2009). The German apprenticeship scheme is regarded as a role
model for similar systems in other countries, such as the UK, USA, Canada, France and
Norway. These countries have therefore implemented either new apprenticeship programmes
or expanded their existing apprenticeship schemes based on the German dual apprenticeship
model (Dustmann & Schönberg, 2007; Grosvenor, 2016; Lehmann, 2000). The apprenticeship
system employed in one of these countries, the USA, is described in the next section.
3.3.2. North American apprenticeship system
Apprenticeship practices and its related legal arrangements were imported from Britain
into the American colonies as part of the discovering and claiming of the New World (Elbaum,
1989; Martin, 2016). There are now over 1 000 apprenticeable trades in the USA, divided into
two broad groupings, namely, construction and manufacturing (Martin, 2016; Reed et al.,
2012). However, there are currently incentives to design apprenticeship programmes in high-
growth industries, such as information technology, health care, social services, transportation
and advanced manufacturing, since the establishment of the Apprenticeship Grant in 2015
(Fazio, et al., 2016; Martin, 2016; Reed et al., 2012).
North American youth may start an apprenticeship at 16 years of age. However, firms
working under hazardous conditions may require the trainees to be 18 years of age (Fazio et
al., 2016; Torpey, 2013). The entrance requirement into most apprenticeships is a high school
diploma or equivalent. Furthermore, regardless of trade, basic mathematics and measurement
are regarded as essential entrance requirements (Martin, 2016; Torpey, 2013). Work experience
related to the trade being embarked upon is also sometimes necessary in the selection of
potential apprentices (Torpey, 2013).
The average apprenticeship runs for four years. However, as shown in the summary of
the North American apprenticeship system in Appendix M, some apprenticeship programmes
take as little as one year and others six years (Fazio et al., 2016). In terms of certain specific
trades, a millwright apprenticeship is three to four years in duration, an automobile mechanic
trains for four years whilst a machine operator is in apprenticeship for one year (Torpey, 2013).
A discerning feature of the North American apprenticeship system is the defining role of
employers. Eligible employers or ‘sponsors’ have their programmes registered by the
44
government. The content and characteristics thereof are designed specifically to meet the needs
of the sponsor. Sponsors also determine the minimum qualifications required, develop their
own formal agreements, identify the length of the programme and determine the wage payment
amounts and timing (Fazio et al., 2016; Smith & Kemmis, 2013). Union involvement in
apprenticeship programmes results in better enrolments, higher numbers of females and
minority groups registering on the programmes and better overall performance and completion
rates (Glover & Bilginsoy, 2005).
Formal apprenticeship programmes are registered with the Department of Labour (DOL)
and are required to meet specific guidelines set by the DOL (Reed et al., 2012; Torpey, 2013).
Most apprenticeships in the USA require 8 000 hours of on-the-job training, with 500 to 700
hours of theoretical training (Martin, 2016; Reed et al., 2012; Smith & Kemmis, 2013; Torpey,
2013). The theoretical component of the training is conducted by technical schools, community
colleges or internally through employers hosting apprentices within their firms, known as
apprenticeship training centres. Trainees attend classes before or after work, one or two days a
week. Other apprenticeships are structured into blocks where apprentices attend classes full-
time for several weeks in a year (Martin, 2016; Smith & Kemmis, 2013; Torpey, 2013). To
meet the total hours required, however, most apprentices in the country work full-time, under
the supervision of experienced artisans, within the sponsoring firm (Martin, 2016; Reed et al.,
2012; Torpey, 2013).
Upon completion of their apprenticeship, trainees are awarded a nationally recognised
certificate in acknowledgement of their skills attained. This is provided by the DOL directly,
or by an approved state agency (Reed et al., 2012; Torpey, 2013). Apprenticeship graduates
can also receive the credential equivalent of a two- or four-year college qualification (Perez,
2016). Employment prospects significantly improve for certified artisans post their
apprenticeship (Obama, 2016; Torpey, 2013). Research indicates that 91% find employment
with above average wages being earned (Perez & Zients, 2016; Wu, 2016). Estimated career
earnings of apprenticeship graduates, on average, are more than similar non-participants (Reed
et al., 2012).
Despite these enhanced employment prospects and higher earnings, there is currently a
shortage of skilled trade workers within the USA which is impacting on the country’s ability
to compete and grow (Martin, 2016; Smith & Kemmis, 2013). Whilst there are 9.3 million
45
unemployed North Americans, 4.8 million jobs are vacant due to an inability to source
adequately skilled individuals to fill these positions. A skills mismatch in the labour force is
therefore clear. It is also evident that this problem will worsen in the years to come as
technology and globalisation quicken and deepen (Jacoby, 2014).
A further challenge is the fact that the North American culture has been encouraging its
youth to attend college, towards obtaining a degree, rather than entering vocational training
(Smith & Kemmis, 2013). Almost 70% of the youth plan to attend college after completing
high school (Jacoby, 2014; Martin, 2016; Reed et al., 2012). Less than five percent of the North
American youth train as apprentices, the majority in the construction trades. This is in stark
contrast to Germany, where close to 60% of its youth enrol in an apprenticeship in diverse
fields (Jacoby, 2014).
Apprenticeship programmes are nevertheless touted as win-win initiatives for workers
and employers within the USA. On the back of significant improvements already made in the
advocacy of the programme, the government is pushing for further renaissance through the
‘earn-while-you- learn’ training model (Perez, 2016). There is a strong drive to assist service
members, veterans and historically under-represented individuals (i.e., women, minorities,
and people with disabilities) in entering apprenticeship programmes. There is also emphasis
being placed on starting apprenticeship programmes in new industries (Obama, 2016; Perez
& Zients, 2016). However, currently the apprenticeship system is predominantly
concentrated within the construction industry (Glover & Bilginsoy, 2005). The apprenticeship
programmes employed by two economically developed countries, namely, Germany and the
USA, have been discussed. The programme within China is outlined in the next section.
3.3.3. Chinese apprenticeship system
Apprenticeship has a long history in China. Some trace the Chinese origin of
apprenticeship to Confucius (Wang, 2014) and there are reports of apprenticeships operating
in China dating back to the Tang (i.e., 618 - 906) dynasty (Risler & Zhiqun, 2013). For
thousands of years then this form of training has been used to train handcraft workers (Wang,
2014). Currently, apprenticeships are mostly used in trades where manual competence or skills
is especially important, such as hair cutting and cooking in the services sector and carpentry,
plumbing and masonry in the construction industry (Risler & Zhiqun, 2013).
46
Apprenticeship job offers occur regularly in China. Over 220 companies, in six cities,
advertised 1 578 apprenticeship posts in a one-year period. More than 50% of these positions
were for manufacturing workers to repair production and transport equipment. Workers in
commerce and service were ranked second most in demand at 34% (Junlan, 2013). However,
despite a significant growth in educational attainment within the country, firms experience
sourcing sufficiently skilled labour difficult (Li, Li & Su, 2014; Risler & Zhiqun, 2013).
Essential shifts in the economy has led to newly emerging industries struggling to recruit the
skilled required within their labour force (Molnar, Wang, & Gao, 2015).
As summarised in Appendix M, legislation stipulates that a minimum of a year, during
an apprenticeship, is spent on workplace training. However, this is not monitored nor enforced.
There are also few quality standards regarding the workplace training with the result that the
skills obtained are either too narrow in focus or of insufficient quality to meet industry
requirements (Li et al., 2014; OECD, 2011). There is also minimal incentive offered to
industry. with regard to implementing apprenticeship training within their firms. From the
prospective employer’s perspective, apprenticeship programmes therefore involve high costs
and low benefits (Li et al., 2014; Wang, 2014).
Chinese apprentices are exploited in several ways through the current apprenticeship
system (Risler & Zhiqun, 2013). The national labour law stipulates that work conducted by
apprentices is not to be regarded as employment and is hence not part of a formal labour
relationship. This has the implication that labour contracts are not deemed necessary.
Apprentices, therefore, do not enjoy the benefits and protection awarded to workers engaged
in work regarded as formal labour by the government (OECD, 2011; Wang, 2014). Apprentice
students also have to pay for their own schooling. They are required to obtain double
certification in order to qualify for employment readiness. Firstly, a school-based examination
is written to indicate competence in the theoretical areas resulting in a diploma and, secondly,
a workshop-based examination is completed within the company documenting their vocational
skills. There is, however, a lack of standardisation pertaining to these examinations.
Furthermore, the apprentices are required to source their own one-year internship in a firm.
With the current lack of co-ordination from the government in terms of monitoring the
involvement of these firms in their training, human resource managers have been documented
as requiring compensation from potential apprentices before agreeing to accept them onto
internships within their firms (Risler & Zhiqun, 2013).
47
Being a leading global player, China is facing challenges in terms of the availability,
capacity and competency of its labour force. Competency requirements are exponentially
increasing. There is rising pressure within the country for an external and independent testing
and certification body for the apprenticeship trades, rather than this being operationalised
internally within firms. This would also aid in the differentiation between skill grades (i.e.,
highly skilled, technologist or ‘master’) and between the various trades and vocations (Risler
& Zhiqun, 2013).
In China, 2014 was the year of TVET and the commencement of significant reforms
within the national TVET field. Part of this transformation includes an initiative to build a
‘modern apprenticeship’ (Wang, 2014). This stemmed from a decision, taken in 2005, to
promote the combining of work and study thereby linking schools and firms again. However,
this decision has come under severe criticism. Companies are still regarded as the ‘junior
partner’ in the dual training system with their contribution being only to provide part-time
trainers and practical sites and equipment (Risler & Zhiqun, 2013). To sincerely revitalise the
Chinese apprenticeship system, a comprehensive reform of the vocational educational
institutions will be required from what is currently mainstream practice. This will entail
curriculum restructuring, redesigning assessment and evaluation methods, reorganising the
teaching and learning approaches, as well as reworking methods employed in recruiting and
selecting teachers (Li et al., 2014; Wang, 2014).
As shown in Figure 3.2, China, like Germany, adopts a dual apprenticeship system. On
the opposite side of the continuum are out-of-school apprenticeship programmes. The USA
and India offer this form of apprenticeship. India is the third country in the BRICS association
and their apprenticeship system is discussed in the next section.
3.3.4. Indian apprenticeship system
The National Apprenticeship Training Scheme was established through the Apprentices
Act in 1961. State apprenticeship advisors are required to ensure the implementation of the
scheme in all government departments and within private enterprises (Fazio et al., 2016;
G20ewg, 2012; Smith & Kemmis, 2013). The purpose of the Scheme is imparting practical
skills in order to meet industry requirements for skilled manpower (Fazio et al., 2016; G20ewg,
2012).
48
The Indian apprenticeship system is well-established with three types operating at
different levels, namely, trade, technician and graduate. Central government regulates the ratio
of apprentices to workers in each trade. Whilst most apprenticeships are formally arranged
through a contract registered by apprenticeship advisors, informal apprenticeships are also
recognised (Fazio et al., 2016; G20ewg, 2012). A wide variety of sectors are covered under
apprenticeship training. Agricultural services, automobile, construction, food processing,
mining, production and manufacturing, tourism and the security industry are a few of the
sectors. Apprenticeship training can be offered in designated and optional trades. A designated
trade is a trade or occupation reported as such by the government. Currently 259 designated
trades are available for apprenticeship training. Optional trades are those decided upon by the
employer. These are either from the Prime Minister’s Kaushal Vikas Yojana/Modular
Employable Skills courses or a trade decided and designed by the employer in order to meet
their specific requirements. Between 2.5% to 10% of the firm’s total labour force, including
contractual workers, are required to be apprentices. Employers with 100 workers may engage
a minimum of three and a maximum of 10 apprentices. The scope of apprenticeships has been
extended to include non-engineering pass-outs (NAPS, 2016).
Of the almost 500 million people in the Indian labour force, only 300 000 are apprentices
(Fazio et al., 2016; Smith & Kemmis, 2013). Therefore, in 2016, the Indian government
launched the National Apprenticeship Promotion Scheme (NAPS). Besides promoting
apprenticeship training, NAPS incentivises employers to engage with apprenticeships and
thereby aims to increase apprentice enrolments to 500 000 youth by 2020 (NAPS, 2016;
Saravanabava, 2016). As reflected in Appendix M, NAPS offers two incentives to promote
apprenticeship programmes. Firstly, a 25% reimbursement of the prescribed stipend is offered
up to a maximum of 1500 rupees per month per apprentice to all employers who contract with
apprentices. Secondly, the government reimburses the cost of basic training for the apprentices
who enrol on apprenticeship training without any prior formal training. The latter
reimbursement is set at a maximum limit of 7500 rupees for a maximum of 500 hours per three
months (NAPS, 2016; Saravanabava, 2016; Smith & Kemmis, 2013).
The Indian apprenticeship scheme is targeted at persons above 14 years of age. There is
no maximum age limit although apprenticeships are not specifically designed for the adult
workforce. Physical fitness and the completion of education standards required for the trade
are prerequisites to entering the programme. Students who have completed their schooling
49
successfully benefit from a considerably shorter apprenticeship training programme (Fazio et
al., 2016; G20ewg, 2012; NAPS, 2016).
Basic training centres established by government or government training institutes can
provide the off-the-job training (Fazio et al., 2016; G20ewg, 2012). Since 2014 the outsourcing
of basic training to an institute of choice was also allowed. Basic training is comprised of both
theoretical and practical training within the trade to be adopted. It is one fifth to a quarter of
the total duration of the apprenticeship training, with the majority of the time being on-the-job
training. Basic training is compulsory for those who have not done any formal training at a
government or private Industrial Training Institute as well as for those who have done courses
under the Prime Minister Kaushal Vikas Yojana/Modular Employable Skills that have been
conceded as equivalent to basic training (NAPS, 2016).
On-the-job practical training is provided in the workplace of the employer. In firms with
a workforce exceeding 500 workers a distinct training area needs to be determined for the
purpose of training apprentices. Government loans are made available to assist with this
requirement. Practical training is specifically emphasised in Indian apprenticeships and
employers are expected to optimise their facilities to realise this expectation (Fazio et al., 2016;
G20ewg, 2012; Smith & Kemmis, 2013).
Central apprenticeship advisors conduct extensive monitoring of the programmes
through the right of inspection. There are high levels of regulatory requirements for employers
and noncompliance is met with penalties. Noncompliance includes employing an ineligible
apprentice, not adhering to contract specifications and failure to employ the required number
of apprentices (Fazio et al., 2016). For designated trades the registration of an apprenticeship
contract is mandatory. For optional trades a contract is not required unless the benefits under
NAPS are sought to be claimed. In the latter case the registration of a contract is compulsory
(NAPS, 2016). The employer is however not obligated to offer full-time employment to the
apprentice following the completion of the programme, and no incentives exist for them to do
so (G20ewg, 2012).
Apprenticeship training programmes vary in duration, according to type of trade, from
six months to four years. Apprentices are required to pass the All India Trade Test conducted
by the National Council for Vocational Training to qualify for the nationally and internationally
50
recognised National Apprenticeship Certificate. The testing is conducted through the National
Council for Vocational Training. When seeking employment, the certificate serves as an
indicator of an obtained qualification (Fazio et al., 2016; G20ewg, 2012; NAPS, 2016). The
assessment and certification of apprenticeship outcomes is however not compulsory in India
(Steedman, 2012).
The minimum monthly stipend paid to apprentices is specified in government regulations
and is uniform across all trades. The pay scale is revised every two years based on the consumer
price index. The stipend increases, from 70% to 90% of the minimum wage for semi-skilled
workers, over the duration of the training programme. Employers of trade apprentices pay the
stipend in full. The stipend for graduate, technician and technician (vocational) apprentices is
shared equally between the employer and government. Upon graduation these stipend
payments are refunded to the employer (Fazio et al., 2016; G20ewg, 2012; Smith & Kemmis,
2013). Despite a low monthly stipend, employment conditions and protection offered to
apprentices are better than other employees in India. Nevertheless, manual occupations (which
are mostly apprenticeships) have a low status in the country which makes promoting the
apprenticeship scheme difficult (Fazio et al., 2016).
Inadequate training is provided as the reason for a low trade test pass rate in the country.
Of those that undertake the apprentice certificate tests there is only a pass rate of 70%.
Furthermore, this certificate is currently outside of the formal education scheme and until
apprenticeship certificates are integrated into the national qualification framework (i.e.,
currently in process) these certificates remain unattractive to the youth (Fazio et al., 2016;
Smith & Kemmis, 2013). Another challenge is that the curriculum is unfortunately regarded as
outdated and inflexible with regard to the industry’s needs. In consultation with industry, the
government designs and updates the curricula of these training programmes. However, this
process needs to be revised as there is currently insufficient consultation and transparency
(Fazio et al., 2016; G20ewg, 2012; Smith & Kemmis, 2013; Steedman, 2012).
Thus far, this section has summarised the context, nature of, challenges and future trends
within the apprenticeship programmes of four international countries. In the section that
follows the national apprenticeship programme is discussed.
51
3.4. South African apprenticeship system
In section 3.2 the four stages of the apprenticeship life cycle were discussed. In this
section the characteristics of the national artisanal system are outlined according to these
stages.
3.4.1. Recruitment, selection and induction
Compared to countries such as Australia, Germany, Canada, England and France, SA has
relatively low numbers in the formal apprenticeship system. However, there is currently a focus
on increasing these participation numbers (Smith & Kemmis, 2013). Apprenticeship enrolment
figures have been steadily increasing over the past seven years. In 2011 24 415 learners
enrolled on artisanal development programmes. In the 2015 this enrolment figure increased to
28 640 and to 30 817 in 2016 (Qonde, 2018).
The vast majority of learners currently enrolled on an artisanal pathway within SA are
African males. A 2012 national study reported that 72% of apprentices are Black African, 22%
White with six percent unknown (Janse van Rensburg, Visser, Wildschut, Roodt, & Kruss,
2012). Of the 1 483 registered apprentices within a trajectory study, 76% were Black African,
six percent were Coloured, three percent Indian and 15% White (Wildschut, Kruss, Janse van
Rensburg, Haupt, & Visser, 2012). According to the DHET, almost 77% of the learners
entering an artisanal learning programme in 2016 were male. The gender difference in
enrolment figures is more pronounced in the larger cities of the country (Qonde, 2018).
A minimum age of 15 is set for individuals commencing an apprentice, with no maximum
age cap specified (Janse van Rensburg et al., 2012). National policy further indicates that
individuals that have successfully completed a Grade nine may be admitted into TVET
programmes (DHET, 2011). However, in practice the policy is deemed too flexible in terms of
entrance requirements. Qualitative research has revealed that an individual who expresses
interest in obtaining a skill or trade is admitted. A significant challenge then is that learners are
admitted into TVET programmes without adequate attention being paid to their performance
(Arfo, 2015).
Only 3.9% of apprentices enter the development programme directly after school. The
most likely trajectory for entering an apprenticeship is after the second or third transition.
Students are most likely to study after completing school. A national study established that at
52
least 56% of the youth either studied, or studied then worked, before commencing an
apprenticeship (Wildschut et al., 2012). However, this profile may have changed or be different
within the manufacturing industry. In a more recent tracer report, merSETA (2016) found that
44% of apprentices entered the programme directly after completing school. There is a
significant difference (i.e., about 40%) between the national statistic and that found within the
manufacturing industry. Notwithstanding this, the merSETA (2016) study also found that 40%
of the sample held undergraduate degrees, diplomas and certificates at the time of entering their
apprenticeship.
With regards to geographical location, there are learners from all nine provinces
registered for apprenticeship training (Qonde, 2018). The majority (40%) of apprentices are
studying in Gauteng, with 18% in KwaZulu Natal and 16% in Mpumulanga. Only five percent
of apprentices have been recorded as registered within the Eastern Cape (merSETA, 2016).
This profile has not substantially changed in eight years. In 2008, Mukora established that most
apprentices were registered in Gauteng (35%), KwaZulu Natal (14%) and the Western Cape
(10%). Nine percent of the apprentices were registered in the Eastern Cape.
Across all sectors, there is a significantly high registration rate for the electrical trade
(Qonde, 2018). Between 20 to 30% of learners register for this type of apprenticeship. The
mechanical fitter apprenticeship has approximately 11 to 13% of the registrations and is the
second most popular apprenticeship type (Janse van Rensburg et al., 2012; Qonde, 2018). In
comparison, only 1.1% chose the automotive electrical and 6.3% the millwright
apprenticeships (Janse van Rensburg et al., 2012). In contrast, Wildschut et al. (2013) found
that the plumber trade was the most prevalent with 12.9% of the registrations, with the boiler-
maker a close second with 12.4%.
An impact report of apprenticeships and learnerships within the manufacturing industry,
done by Mukora and Visser (2008), investigated the enrolment of over 23 500 apprentices
across 54 trades. Motor mechanic was the most popular (19%) trade, with the fitter and turner
(7.6%), diesel mechanic (7.3%) and electrician (7.1%) trades being the other four most popular.
The fifth most prevalent was the millwright trade with 6.9% of the registrations and the
automotive electrician trade obtaining 3.7% of the registrations. Eight years later a tracer study
within the manufacturing sector revealed a similar popularity rating. The most popular trades
were mechanic, electrician, welder and fitter. Of the 900 apprentices surveyed, six percent were
53
registered for the millwright trade and 2.3% as automotive electricians (merSETA, 2016). The
next section progresses to the second stage of the apprenticeship life cycle, dealing with the
implementation of training and assessment.
3.4.2. Training and assessment
In SA, an apprenticeship is governed by sections 13 to 29 of the Manpower Training Act
(No. 56 of 1981). It is a non-unit standard aligned registered qualification. The integration of
workplace and institutional learning culminates in a national qualification at the appropriate
level. Off-the-job training for apprentices is done by both public colleges and private training
providers (Smith & Kemmis, 2013).
For some apprenticeship trades, there is a stipulation of 72 practical weeks, with the
maximum duration being three years. For other trades, there is a minimum period of 85 weeks
of practical on-the-job training with a maximum of four years to complete. For both of these
types of apprenticeships the minimum time period excludes time spent at a training provider,
extended sick leave and any other leave of absence beyond the control of the apprentice
(merSETA, 2016; Smith & Kemmis, 2013). On average, however, apprentices take 36 months
to complete their learning programme and graduate. Within this, welding is regarded as the
quickest trade to complete, with the motor mechanic trade being the longest (merSETA, 2016).
A trade test is the final external summative assessment for an apprentice conducted by
an assessor registered with the National Artisan Moderating Body (NAMB) at a trade test
centre accredited by the Quality Council for Trades and Occupations (QCTO) (Mummenthey
et al., 2012; Nzimande, 2012). Prior to 2000, there was only one central national testing centre
for apprentices. However, private providers can now gain trade testing status through obtaining
accreditation with the relevant Sector Education and Training Authority (SETA) offering the
specific trade (Parliamentary Monitoring Group, 2010). Different sources provide different
pass rates. Some sources indicate that about 54% of the learners are passing the trade test each
year, whilst others indicate only between 24 to 45% (Government Gazette, 2015a; Pienaar et
al., 2016; Van Rooyen et al., 2010). According to the DHET, the number of learners completing
artisanal learning programmes has improved by 13% over the past year. The pass rate in
2015/2016 was 56% and in 2016/2017 this had increased to 69% (Qonde, 2018). A recent tracer
study in the manufacturing sector revealed that pass rates of 70% at first attempt, 20% at
54
second, three percent at the third attempt, with the remaining seven percent being unspecified
(merSETA, 2016).
There are currently four pathways to being accepted for this trade test, namely, a Section
13 apprenticeship; a learnership; an occupational qualification; or a Section 28 apprenticeship
through Recognition of Prior Learning (Evans-Klock & Dar, 2013; Mummenthey et al., 2012;
Smith & Kemmis, 2013). The third stage of the apprenticeship life cycle, namely, support
offered to apprentices during the apprenticeship programme, is discussed in the next section.
3.4.3. Support during the apprenticeship
The official regulatory body responsible for artisan development and the apprenticeship
system is the NAMB. This statutory entity falls under the auspices of the Department of Higher
Education and Training (DHET) and is responsible for all trades under the QCTO (Smith &
Kemmis, 2013). However, there is confusion amongst the various stakeholders regarding
funding options and procedures, certification and the apprenticeship system in general
(Mummenthey et al., 2012; Smith & Kemmis, 2013).
In SA, apprentices are paid as employees. Local apprentice wages differ according to
occupation, as pay rates are linked to the occupation being trained for. The learnership system
offers a short term financial window of opportunity for learners. With the high rate of
unemployment in the country, the learnership stipend is regarded as a life-line for most post-
school candidates. Thus, even though they have already obtained a matriculation equivalent,
individuals are attracted to the lower level learnership system allowing themselves some
financial sustainability (Smith & Kemmis, 2013).
Employers in SA obtain financial incentives or tax rebates for training apprentices.
Within the country a compulsory skills levy of one percent of payroll over R500 000 is
implemented. Through this levy system an employer can apply for an apprenticeship grant
through the relevant SETA. The funding regime procedure and amounts available differ per
SETA (Smith & Kemmis, 2013). The next section details how the fourth stage of the
apprenticeship life cycle is implemented in SA.
55
3.4.4. Completion and beyond
Section 3.4.1 discussed the race, gender, age and geographical location of learners
registered for artisanal learning programmes. The majority are African young males from
Gauteng. The profile of the graduated apprentice seems to be very similar. However, there are
more men that complete apprenticeship programmes compared to women (merSETA, 2016).
Of the apprentices that graduated in 2016, 82% were male (Qonde, 2018). Of those that
graduated in 2012 and 2013, 62% were African males with White males comprising 17% of
the sample. African females made up 11%, Coloured males six percent and Indian males
comprised four percent of the cohort. There was inadequate representation of the categories
White females, Coloured females and Indian females (merSETA, 2016). Of the 21 198 learners
that completed their artisanal learning in 2016, the vast majority (48.3%) were from Gauteng.
Sixteen percent of the learners were from KwaZulu-Natal, 10.2% from the Western Cape and
five percent from the Eastern Cape (Qonde, 2018).
The apprenticeship and learnership routes provide successful pathways for the skills
development of the unemployed (merSETA, 2016; Smith & Kemmis, 2013). In a national study
only 9.4% that entered the apprenticeship system were unemployed at the time of completion.
The majority of those finding employment were young, previously unemployed individuals
and they found employment immediately after completing their apprenticeship. Similarly,
those entering a learnership qualification are likely to find employment, even though the
numbers are still relatively low for this category of potential artisan (Janse van Rensburg et al.,
2012).
A more recent tracer study, however, painted a less encouraging picture. Whilst 48% of
the learners were employed full-time and four percent part-time by their original training firm,
16% of the sample could not find employment. Employment by another firm, not the original
training firm, was nevertheless obtained by some of the learners. A further 25% were employed
full-time and five percent part-time by a different employer post-graduation (merSETA, 2016).
Remuneration is the most important factor for artisan retention (Jordaan & Barry, 2009;
Shabane, Schultz, & Van Hoek, 2017; Van Rooyen et al., 2010). In Jordaan and Barry’s (2009)
study, 40% of the sample indicated that remuneration was the key factor contributing to the
shortage of artisans in the country. A further 30% blamed a lack of training for this deficiency.
All 14 candidates in the research completed by Van Rooyen et al. (2010) rated remuneration
56
as an important determinant of artisan retention. Development opportunities and equity were
rated as the second and third contributors. Shabane et al. (2017) also recently established that
local artisans are dissatisfied with their remuneration but suggested enhancing transformational
leadership within the superiors of the artisans as a means to improving artisan retention levels.
In contrast, Schlechter, Faught and Bussin (2014) found that an environment commiserate with
a work-life balance was more important to artisans than compensation. Similarly, Naidoo and
Hoque (2017) concurred that a positive and enabling working environment was the most
critical success factor amongst permanently employed artisans.
3.5. Nature of demand for artisans
Having reviewed the broad characteristics of the South African artisanal system in section
3.4, the next section discusses the nature of the demand for artisans both nationally and
globally. Section 3.5.1 provides an overview of the benefits realised by organisations through
implementing apprenticeship programmes, with section 3.5.2 discussing the extent of the
demand for artisans as well as the requirements inherent in this demand.
3.5.1. Benefits of apprenticeship programmes
There are several benefits that can be realised through the apprenticeship training model.
A wide variety of stakeholders - from government to employers, the youth and the currently
employed - have interest in pursuing the broad range of benefits stemming from this form of
training (Fazio et al., 2016).
The first benefit is an increase in productivity levels (Brewer, 2013; Fazio et al., 2016;
Kramer et al., 2015). One study noted a seven to 10% increase in profits and revenues per
assigned apprentice (McCasland, 2015). The main cause of weak economic growth in certain
countries is low productivity. In order to increase this productivity rate more efficient methods
of employing resources, such as the physical and human capital, need to be designed and
implemented (Pagés-Serra, 2010). A positive and noteworthy improvement on all productivity
measures has been realised in several countries, namely, Italy, Norway and the UK, following
apprenticeship reform (Cappellari, Dell’Aringa, & Leonardi, 2012; Fazio et al., 2016; NAS,
2017).
Secondly, innovation can be enhanced through the implementation of apprenticeship
training programmes (Cedefop, 2016a; Fazio et al., 2016). One of the main obstacles to
57
improving innovation is a shortage of adequately trained employees. Through improving the
education of workers, training firms will be in a better position to innovate (Pagés-Serra, 2010).
Specifically, apprenticeship programmes develop the skills required for innovation to occur.
They impart the techniques required by workers to adapt and develop new technologies and
they facilitate human capital coming closer to the operational needs of firms by increasing
competiveness and productivity (Fazio et al., 2016; Kramer et al., 2015; OECD, 2011).
Apprenticeship programmes are also more successful in facilitating the transition of new
labour market entrants. This third benefit assists in reducing youth unemployment (Cedefop,
2016a; Dustmann & Schönberg, 2007; Fazio et al., 2016; Keese, 2014; Ryan, 2001). Young
people who have undergone an apprenticeship programme are regarded as being ‘job ready’.
Employers prefer these individuals especially in countries where employing the inexperienced
youth is expensive in terms of employment rules (Cedefop, 2016c; Nkosi, 2012; OECD, 2011).
The fourth benefit of apprenticeships is the reduction of mismatch between employers
and employees. Through apprenticeships, skills supply and demand are aligned (Cedefop,
2016a; Fazio et al., 2016; Steedman, 2012). For the past decade skilled tradespersons have been
globally recorded as the hardest positions to fill. Firms are currently training and developing
the talent required from within (Giffi et al., 2015; ManpowerGroup, 2016). The education
system in most countries is not adequately aligned with industry needs. Many of the unfilled
STEM positions require mid-level skills, yet students often complete higher-level
qualifications, resulting in them being overqualified for the available jobs in the marketplace
(Kramer et al., 2015).
The fifth benefit is the access to a stable career ladder as apprenticeships provide a
positive employability pathway for the youth. Not only are the skills and experience of the
apprentices enhanced but they also gain the ability to deal with more responsibilities, increase
their earning capacity and progress up the career ladder (Fazio et al., 2016).
The sixth benefit is lower dismissal costs through using the programme as a selection
screening device. Over the duration of the training employers are able to assess the abilities of
the apprentice and can evaluate the suitability of a good match to their internal requirements
(Acemoglu & Pischke, 1998; Soskice, 1994). This information advantage leads to longer tenure
compared to those employees hired externally from the company (Malcomson et al., 2003;
58
Muehlemann et al, 2010). Apprenticeship programmes, therefore, operates as a selection or
rejection mechanism for training firms (Lene & Cart, 2018).
A related seventh benefit is lower hiring costs, including those pertaining to recruitment
and adaptation. Through hiring former apprentices, the need for job interviews, advertising the
post and agency fees are negated. Externally hired employees also initially have lower
productivity (i.e., in comparison to internally hired workers) due to their lack of knowledge on
firm-specific issues. On-the-job training is hence required before the externally employed
individual has adequately adapted to the specific requirements of the company (Malcomson et
al., 2003; Muehlemann et al., 2010).
Benefit number eight is that apprenticeship training programmes are a more effective
manner of imparting knowledge and certain skills than traditional school-based education
(Carling & Richardson, 2004; Dustmann & Schönberg, 2007). Regular practical experience
and training results in better student performance and improves employment prospects. On-
the-job training programmes therefore achieve better outcomes than classroom-based
vocational training (Carling & Richardson, 2004). Teaching skills in a practical work context
is more conducive to skills transfer, than the classroom. Through this training methodology
trainees obtain first-hand exposure to the internal mechanisms of firms, they experience how
to interact with customers and other workers as well as comprehend how their jobs are
conceptualised and implemented within the grander scheme of the organisation (Dustmann &
Schönberg, 2007).
In addition to the eight benefits documented, the recent findings of the World Economic
Forum added input to the argument that there is an increased demand for apprenticeship
programmes in SA. The Forum’s Global Competitiveness Report offers a comprehensive
review of the performance of 137 countries on 12 pillars and 114 indicators. As reported in
section 1.2, the 2017-2018 ranking placed SA in 61st position, showing a decline of 14 positions
on the ratings attained in the previous year. In section 3.3, the apprenticeship programmes
employed in four countries were reviewed, as a form of comparison to that implemented within
SA. In this section, SA is compared with these same four countries in terms of global
competitiveness. The USA and Germany are rated as stage three countries being innovation
driven. China and SA are stage two countries, being efficiency-driven, and India is a stage one
country being factor driven (Schwab & Sala-i-Martin, 2017).
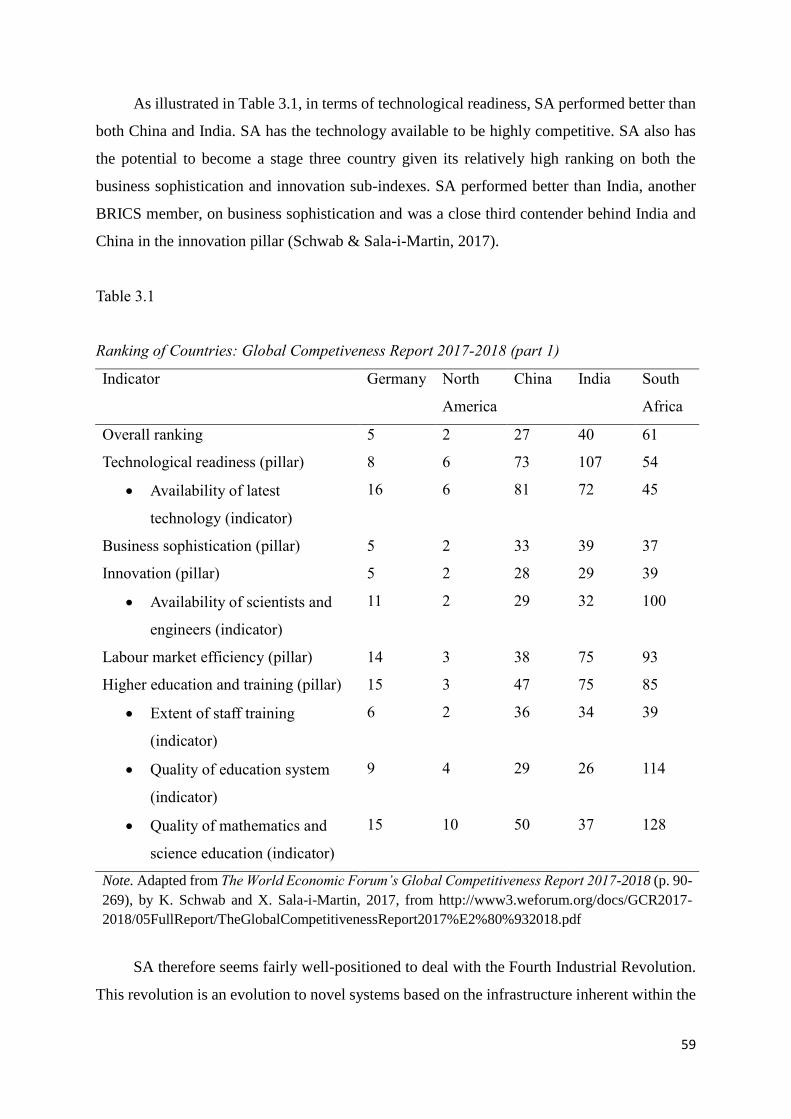
59
As illustrated in Table 3.1, in terms of technological readiness, SA performed better than
both China and India. SA has the technology available to be highly competitive. SA also has
the potential to become a stage three country given its relatively high ranking on both the
business sophistication and innovation sub-indexes. SA performed better than India, another
BRICS member, on business sophistication and was a close third contender behind India and
China in the innovation pillar (Schwab & Sala-i-Martin, 2017).
Table 3.1
Ranking of Countries: Global Competiveness Report 2017-2018 (part 1)
Indicator Germany North
America
China India South
Africa
Overall ranking 5 2 27 40 61
Technological readiness (pillar) 8 6 73 107 54
Availability of latest
technology (indicator)
16 6 81 72 45
Business sophistication (pillar) 5 2 33 39 37
Innovation (pillar) 5 2 28 29 39
Availability of scientists and
engineers (indicator)
11 2 29 32 100
Labour market efficiency (pillar) 14 3 38 75 93
Higher education and training (pillar) 15 3 47 75 85
Extent of staff training
(indicator)
6 2 36 34 39
Quality of education system
(indicator)
9 4 29 26 114
Quality of mathematics and
science education (indicator)
15 10 50 37 128
Note. Adapted from The World Economic Forum’s Global Competitiveness Report 2017-2018 (p. 90-
269), by K. Schwab and X. Sala-i-Martin, 2017, from http://www3.weforum.org/docs/GCR2017-
2018/05FullReport/TheGlobalCompetitivenessReport2017%E2%80%932018.pdf
SA therefore seems fairly well-positioned to deal with the Fourth Industrial Revolution.
This revolution is an evolution to novel systems based on the infrastructure inherent within the
60
digital revolution. Whilst this revolution does not rest on any particular suite of emerging
technologies it is predicted that as these new systems and technologies become more universal
and permeating they will profoundly impact on the way we behave (Schwab & Sala-i-Martin,
2016). However, innovation breakthroughs do not automatically happen. They require
complementary efforts of ensuring that both people and organisations are able to access and
make use of the technologies that are available.
Whilst SA appears to have prioritised the importance of vocational and on-the-job
training (i.e., as evidenced in the moderate extent of staff training indicator ranking), the
national low ratings in the other five rankings provided in Table 3.1 are poignant. SA is
currently not performing well in labour market efficiency, higher education and training
(specifically, mathematics and science performance) as well as in the availability of scientists
and engineers. SA is one of the countries that is “leaving sections of their population behind”,
thus limiting the ability of the country to compete with more advanced economies (Schwab &
Sala-i-Martin, 2017, p. 17).
Specifically, SA does not have the technical human capital to optimise this vital research
and development commodity in the country (Vass & Raidani, 2016). In terms of the availability
of scientists and engineers, the country performed in the bottom half of the 137 countries
compared on this indicator. As indicated in Table 3.1, SA scored significantly worse than China
and India in this indicator (Schwab & Sala-i-Martin, 2017). A deficiency of adequate technical
abilities within a workforce could negatively impact on the countries overall innovation,
growth and ability to remain competitive (Nomvete et al., 2017; Vass & Raidani, 2016). This
lack of core technical skills, specifically at the levels of technician and artisan, urgently requires
attention, specifically within the national manufacturing sector (JIPSA, 2010; merSETA, 2016;
Nomvete et al., 2017).
Given the extensive growth in various global industrial sectors, there has been an
increased demand for engineers, project managers and skilled artisans. South African
apprenticeship programmes are regarded by some international firms as world class resulting
in them recruiting from the local artisan pool (Jordaan & Barry, 2009). Having documented the
benefits of apprenticeship programmes, both globally and within SA, the next section looks at
the scope and magnitude of the demand for artisans.
61
3.5.2. Extent and requirements of demand
Skilled trade positions are currently the most difficult to fill globally (Deloitte, 2018;
Giffi et al., 2015; Jacoby, 2014). It has occupied this top position since 2010. Included within
this skilled trade position category are jobs such as electricians, carpenters, welders,
bricklayers, plasterers, plumbers and masons (ManpowerGroup, 2016; Prising, 2016). At any
given time, there are about 28 000 apprenticeship vacancies advertised on-line (NAS, 2017).
A similar picture is found in SA. The 2016/2017 Talent Shortage Survey results revealed that
34% of South African employers are experiencing problems filling open positions. This is a
three percent increase from the 2015 survey results and a significant 26% increase in
comparison to the 2014 results. The most difficult position to fill was in the skilled trades, the
same as the global rating (ManpowerGroup, 2016).
There are three main categories of technical occupations in SA, namely, engineers and
technologists, technicians and artisans. Artisans constitute the largest quota of the key technical
occupations in the country. They currently represent at least 72% of the occupational category,
decreasing by approximately 0.7% per year (Vass & Raidani, 2016). Technicians and trade
workers as wells as machinery operators and drivers are the two largest scarce and critical skills
within the manufacturing sector. Toolmakers, electricians, millwrights, as well as fitters and
turners, are also noted as skills shortage areas (Mummenthey et al., 2012). A scarce skill is one
that has inadequate supply and a critical skill is regarded as being core to the sector (merSETA,
2009; Mukora, 2008). In another occupational category, construction contractors are
experiencing difficulty in sourcing workers with technical scarce skills, such as in the fields of
carpenters, electricians and plumbers (Windapo, 2016).
In 2014, the government published the National Scarce Skills List (Government Gazette,
2014a), with artisans being included in this list. According to this document, scarce skills were
regarded as the job types for which employers were unable to source adequately qualified
and/or experienced applicants. Given the consistent shortfall of certain skills in the country,
the government legislated the critical skills work visa in 2014. This legislation aims to attract
skills from abroad to meet the national needs. Occupations or critical skill areas identified are,
amongst others, automotive electrician, automotive motor mechanic, boiler maker, diesel
mechanic, fitter and turner, mechatronics technician, millwright and toolmaker. There is no
limit on the number of foreign professionals that can be employed and the application process
has deliberately been made simpler by the Department of Home Affairs. A job offer is not a
62
requirement for this visa (Government Gazette, 2014b). However, the demand remains and the
government therefore issued the National List of Occupations in High Demand in 2018, where
similar artisanal trades were specified (Government Gazette, 2018).
Artisans are regarded as vital facilitators of competiveness within the manufacturing
sector (Brown, 2013; Pandor, 2018). To enable this, vocational programmes need to provide
students with a skills set and knowledge mix that will enable them to operate within a complex
work landscape (Wedekind, 2015). Job specific, technically oriented skills are hence in high
demand. At least 76% of the employers within the South African manufacturing sector upheld
that practical and technical skills are principal in their recruitment of artisans (Peo, 2013).
Given its reliance on modern production techniques, such as lean manufacturing practices,
these skills are specifically required within the automobile industry (Shatouri et al., 2012).
Rather than a narrow focus on only these skills, however, a broader inter-disciplinary
approach is required. Basic and generic skills such as verbal and numerical literacy as well as
planning and communication abilities are vital. Various managerial and leadership skills are
also considered essential, specifically the ability to work effectively in teams of a diverse
nature. Furthermore, a range of information technology skills are becoming increasingly
necessary within the field (merSETA, 2016; Ramdass, 2009).
Twenty-first century workers need advanced problem-solving skills. A recent report
published by the World Economic Forum indicates that by 2020 robust problem solving skills
will be required by 36% of jobs (Schwab & Samans, 2016). Competence in problem
identification, analysis and solution have increasingly been expected from artisans within
industry. A number of contextual issues, such as social, ethical and environmental factors have
to also simultaneously be taken into account in these problem resolution activities (Laberge et
al., 2016). Within the automobile industry, mechanics need to comprehend the complex
modern systems being employed which entail an interaction between software, electronics and
mechanical components (Wedekind, 2015). Section 3.5 has outlined the nature of the demand
for artisans both internationally and within SA. The section that follows discusses the nature
of the supply of this form of human capital both nationally and globally.
63
3.6. Nature of artisanal supply
According to Fazio et al. (2016), apprentices tend to be the out-of-school youth, about 20
years of age, probably unemployed, with an interest in working while learning a skilled
occupation. They possibly do not have the interest and/or economic opportunities to pursue an
academic career. However, individuals aiming to gain access to an apprenticeship programme
must possess sufficient basic and soft skills in order to enter the programme. These are
considered vital as it is a means to entering a position within a formal company setting.
Internationally, apprenticeships tend to benefit women less than men, in terms of entry,
occupational access and employment outcomes upon completion of the programme (Bonnal,
Mendes, & Sofer, 2002; Lodovici et al., 2013). Females are more likely to discontinue their
apprenticeship within the first 12 months than their male counterparts (Bonnal et al., 2002; Hill
& Dalley-Trim, 2008). However, organisations that avoid hiring female apprentices
significantly constrain the applicant pool of applicants to choose from (Glover & Bilginsoy,
2005). A significant correlation remains between female apprentices and non-trade
apprenticeships, especially in the service sector. Apprenticeships in this sector include business
administration, health and social care and child care (Leung-Syke, 2016). However, the female-
dominated occupations, such as health care, business administration and child care, tend to
have lower pay and less favourable career progression routes than apprenticeships in the
traditional male-dominated occupations (Gambin & Hogarth, 2015). In SA, the engineering
profession remains male-dominated. The absorption of women into the profession is slow given
various systemic constraints. Less than 10% of engineers and technologists and just below a
third of the technicians in the country are women (Vass & Raidani, 2016). A trajectory study
on apprenticeship programmes revealed that 83% of those registered for an apprenticeship were
male (Wildshut et al., 2012). However, a more recent tracer study stated that 89% of registered
apprentices were male (merSETA, 2016).
Several countries specifically focus on promoting apprenticeships within the minorities
and disadvantaged people within their population. The USA gives strong prominence to
enhancing participation amongst the minorities within the country, while Germany and
Australia have initiatives that focus on assisting their disadvantaged youth in apprenticeship
programmes. In SA, previously disadvantaged racial groups are well-represented in
apprenticeships. This is in stark contrast to the former situation under the apartheid regime
when apprenticeships were routinely White-dominated (Smith & Kemmis, 2013). A recent
64
technical report has, however, revealed that White apprentices are still more likely to be
employed than their Black African counterparts (Janse van Rensburg et al., 2012).
Nevertheless, there is a continuing decrease in White engineers, technologists and technicians
as the race profile of these technical occupations deepens into the other racial groupings within
the country (Vass & Raidani, 2016).
Globally there are different age focus areas within countries. Countries such as Egypt,
France, Germany, India and Turkey predominantly focus on providing apprenticeship
programmes for young people. In contrast, Canada and the USA focus primarily on offering
this form of training to adults. Australia, England, Indonesia and SA, however, routinely extend
apprenticeships to both young people and adults (Smith & Kemmis, 2013). SA’s technical
skills pipeline is relatively young. Specifically, 44.2% of engineers and technologists are in the
25 to 34-year age group. This is particularly worrying given the centrality of these two
occupational categories in the production process. Within the technician segment there is a
more balanced mix of experience and youth. Almost 30% are in the 25 to 34-year age group,
33.8% are between 35-44 years and 28.4% constitute the 45-64 age category. This enhances
the possibility of skills transfer to the incoming youth in this employment category. However,
the number of technicians in their prime productive years (25-34 years) has substantially
decreased (-24.9%) between the years 2002 to 2014. There has also been minimal growth of
entry-level technicians between the ages of 15 and 24 years of age (Vass & Raidani, 2016).
The average age of registered apprentices in SA is about 26 (Hauschildt, 2016; Naidoo &
Hoque, 2017; Wildschut et al., 2012). White apprentices, however, tend to be younger than
those of other races (Wildschut et al., 2012).
According to Vass and Raidani (2016), artisans constitute the vast majority of SA’s
technical positions with at least 72% being within this occupational category. However, it is
noteworthy that these authors make no commentary in their information brief regarding the
demographic profile of artisans within the country. Detailed analysis of the gender, population
group and age distributions of engineers, technologists and technicians are provided, but no
similar data on the artisan segment of this occupational category is provided. This dearth of
information on artisans is regarded as comprehensive and is hindering national planning
processes. There is a lack of information regarding the number of apprentices being trained,
passing trade tests and having qualified as artisans. Information regarding their race, gender,
65
which field they are qualified in, where they are and what they are currently doing is severely
lacking (Du Toit & Roodt, 2008; Hauschildt, 2016; Pandor, 2018).
As discussed in section 3.5.2, there is currently an acute talent shortage being experienced
globally, the highest level since 2007. In the 2016/2017 Talent Shortage Survey, 42 300
employers reported the category of skilled trade workers as being the most difficult position to
fill, for the fifth consecutive year. The two main reasons given for this difficulty are a lack of
available applicants and a deficiency in hard skills or technical competence (ManpowerGroup,
2016). In an American survey, just less than half of the manufacturing concerns indicated that
potential employees lacked basic employability (e.g., punctuality) and teamwork skills (Giffi
et al., 2015).
With regard to the first issue, a lack of suitable applicants, studies and reports from a wide
variety of sources consistently highlight that technical apprentices and artisans are a scarce and
critical skill in SA (Government Gazette, 2014b, 2018; Nomvete et al., 2017; Pandor, 2018).
There has been a longstanding shortage of prospective candidates for artisan training in the
country (Kleynhans, 2006; Kruss et al., 2012)
In terms of the second reason provided, there is a clear dichotomy between the demand
for technical human capital and the current supply thereof in the South African context. There
is a concerning disparity between industry requirements and artisan training (Mukora, 2008;
Patel, 2012; Peo, 2013; Vass & Raidani, 2016). In a recent survey, 36% of employers in the
national manufacturing sector stated that their artisans were deficient in the vital skills required
(Peo, 2013). Furthermore, the current quality of graduate technicians and artisans is regarded
as poor and variable (Hauschildt, 2016; Nzimande & Patel, 2012). Estimations of the actual
annual number required within the country varies according to source, ranging from 53 000 to
60 000 (Duarte, 2017; JIPSA, 2010). Nevertheless, there is a significant shortfall with the
current annual production rate being approximately 13 000 artisans (Duarte, 2017). Statistics
reveal that only between 24 to 45% of learners are passing the trade test each year (Government
Gazette, 2015a; Van Rooyen et al., 2010). The human capital within the national manufacturing
sector is therefore currently not capable of embracing the new technology and innovation
prevalent within the sector (Mummenthey et al., 2012; Nzimande & Patel, 2012). This lack of
core technical skills in the national labour pool needs to be urgently addressed (DeSimone &
Werner, 2012; Patel, 2008; Peo, 2013). It is regarded as being in the best interests of both
66
manufacturers and government to remain committed to developing and implementing skills
development programs that alleviate this challenging issue (Giffi et al., 2015). Several factors
have been found to be contributing to the shortage of skilled artisans. The section that follows
outlines various reasons for the shortfall between demand and supply of artisans, both
internationally and nationally.
3.7. Challenges in the apprenticeship system
In this section three challenges to the implementation of apprenticeship programmes,
both nationally and globally, are offered. Whilst there are numerous other problems that trouble
apprenticeship implementation, these three are elaborated on as they pertain to the study’s
focus area. Section 3.7.1 commences by discussing the poor quality of the national education
system.
3.7.1. Quality of schooling
Despite the global increase in education the economic progress of many third world
countries, including SA, has been slow. Researchers indicate that the type and quality of
education offered may be the key factor (Alam, 2008; Arfo, 2015). Current educational systems
are not satisfactorily preparing youth with the skills required to progress within the STEM
fields (Spaull, 2013). Out of five basic skills, Malaysian final year technical students scored
the worst in mathematics, being the only skill rated below the moderate level (Kazalin,
Hamzah, & Bakar, 2009). Nigerian apprentices have low educational qualifications, with the
majority only having completed primary school level (Evawoma-Enuku & Mgbor, 2005).
The quality of the South African labour market entrants is largely dependent on their
quality and quantity of formal education. The deficiencies within the national education system
is hence a significant constraint on the quality of potential workers seeking employment. This
can also hinder the capacity of the youth to source acceptable employment. Whilst the youth
are more educated than their older cohorts, they are not regarded as having the skills required
by the economy (National Treasury, 2011). Forty years of apartheid education in SA has
certainly left a huge backlog in the current skill level of the population (Mukora, 2008; Puchert
et al., 2017a, 2017b; Rasool & Botha, 2011). School leavers are currently lacking in general
life and work-readiness skills. Aspects such as business ethics, dress code, team work and
communication are believed to have been sorely neglected in the general education of the
67
youth. This lack of ability to manage themselves is resulting in the youth being under prepared
in their transition from school to the workplace (Mummenthey et al., 2012).
As discussed in section 3.5.1, SA was assessed and ranked in the Global Competitiveness
Report recently released by the World Economic Forum. The 2017-2018 rankings of SA and
the four global countries on the higher education and training pillar, alongside four of the
indicators within this pillar were provided in Table 3.1. These rankings highlight that the
quality of education is extremely low in SA, significantly worse than the other BRICS
countries. In mathematics and science education, specifically, the country ranks with the
bottom 10 countries (Schwab & Sala-i-Martin, 2017). The national mathematics and science
matriculation results are extremely poor, which may be contributing to the lack of available
scientists and engineers (Mummenthey et al., 2012; Vass & Raidani, 2016; Wedekind, 2015).
In a local study within the automotive industry, the science performance of applicants was
significantly worse than their performance in mathematics. Of 1 748 applicants that had
completed their secondary education, incorporating the subjects’ mathematics and science,
10.7% attained 39% and less for mathematics. Just over a quarter (25.6%) attained the same
level of performance in science. Whilst 63.7% of the sample obtained a mark 50% and above
for mathematics, only 30.7% obtained a similar level of performance in science (Puchert, Dodd,
& Viljoen, 2014).
The poor quality of schooling within SA has been identified as a key factor contributing
to the shortage of skilled artisans within the country. Primarily, the lack of high-quality basic
education amongst potential employees was noted as inhibiting the entry of these individuals
into TVET colleges (Windapo, 2016). Researchers have recommended that the national
government proactively establish strategies to subsidise technical and vocational schools in
order for this form of secondary education to be improved. It is believed that this will improve
the likelihood of capable individuals entering and exiting TVET colleges and apprenticeship
programmes (Kruss et al., 2012; National Treasury, 2011; Windapo, 2016). Vocational training
is therefore being aggressively pursued through the offering of the National Certificate
(Vocational) by TVET colleges as a suitable alternative to traditional academic programmes
offered by schools (National Treasury, 2011; Smith & Kemmis, 2013).
However, there are significant challenges currently being faced by these national TVET
institutions (DHET, 2014; Manuel, 2011). The TVET system has not attained anticipated
68
output targets, despite substantial investments to improve curriculum development and learner
performance. This has resulted in an increasing skills gap being evident in the SA potential
labour market (Mayer et al., 2011; Ramdass, 2009; Smith, 2011). In comparison to the other
types available, individuals with a technical type matriculation consistently performed poorly
in several general and technical aptitude tests employed in a selection process for automotive
operators (Puchert et al., 2017a, 2017b). The weak relationships between TVET colleges and
the workplace, which results in unsuitable levels and forms of training, may be the cause of
this unfortunate phenomenon in the national landscape (Arfo, 2015; Manuel, 2011).
SA needs to promote an educational environment where academic, technical and
vocational skills are valued. In order to achieve this, foundational skills, such as mathematics
and science, need to be fostered. Adequate achievements in these subjects encourage
technology shifts and innovation which is vital for a country’s social and economic future
(Manuel, 2011; Mayer et al., 2011; National Treasury, 2011; Ramdass, 2009; Smith, 2011;
Spaull, 2013; Van der Berg, Taylor, Gustafsson, Spaull, & Armstrong, 2011). Specifically,
there is a need to revitalise the current SA TVET system in order for the quality and quantity
of artisans required within the country to be realised (Smith & Kemmis, 2013). In the next
section improving the value of the training programme for potential trainees, employers and
sponsors is discussed.
3.7.2. Attraction and recruitment
Apprenticeship programmes can be efficient human capital development mechanisms.
However, in order to optimise this efficiency they need to be perceived as valuable to the youth
as well as being viewed as attractive to employers and funders or sponsors (Fazio et al., 2016;
Keese, 2014). This section provides an account of the challenges inherent in realising the value
and attraction of apprenticeship programmes to these three stakeholders, as is summarised in
Figure 3.3.
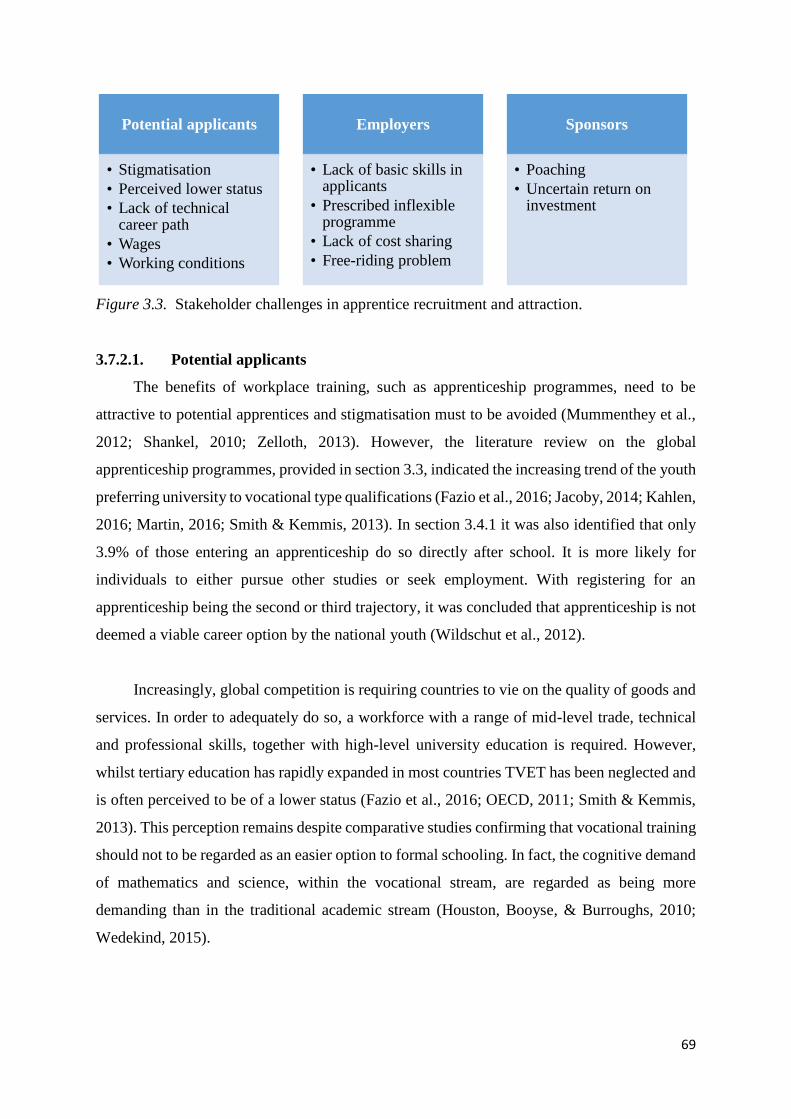
69
Figure 3.3. Stakeholder challenges in apprentice recruitment and attraction.
3.7.2.1. Potential applicants
The benefits of workplace training, such as apprenticeship programmes, need to be
attractive to potential apprentices and stigmatisation must to be avoided (Mummenthey et al.,
2012; Shankel, 2010; Zelloth, 2013). However, the literature review on the global
apprenticeship programmes, provided in section 3.3, indicated the increasing trend of the youth
preferring university to vocational type qualifications (Fazio et al., 2016; Jacoby, 2014; Kahlen,
2016; Martin, 2016; Smith & Kemmis, 2013). In section 3.4.1 it was also identified that only
3.9% of those entering an apprenticeship do so directly after school. It is more likely for
individuals to either pursue other studies or seek employment. With registering for an
apprenticeship being the second or third trajectory, it was concluded that apprenticeship is not
deemed a viable career option by the national youth (Wildschut et al., 2012).
Increasingly, global competition is requiring countries to vie on the quality of goods and
services. In order to adequately do so, a workforce with a range of mid-level trade, technical
and professional skills, together with high-level university education is required. However,
whilst tertiary education has rapidly expanded in most countries TVET has been neglected and
is often perceived to be of a lower status (Fazio et al., 2016; OECD, 2011; Smith & Kemmis,
2013). This perception remains despite comparative studies confirming that vocational training
should not to be regarded as an easier option to formal schooling. In fact, the cognitive demand
of mathematics and science, within the vocational stream, are regarded as being more
demanding than in the traditional academic stream (Houston, Booyse, & Burroughs, 2010;
Wedekind, 2015).
Potential applicants
• Stigmatisation
• Perceived lower status
• Lack of technical career path
• Wages
• Working conditions
Employers
• Lack of basic skills in applicants
• Prescribed inflexible programme
• Lack of cost sharing
• Free-riding problem
Sponsors
• Poaching
• Uncertain return on investment
70
Furthermore, apprenticeships tend to be perceived as being the development option to be
selected if all else fails, whilst academic programmes are believed to hold higher prestige (Giffi
et al., 2015; Grosvenor, 2016; Keese, 2014). Several countries, such as the UK, Australia and
Turkey, have reported difficulty in enticing an adequate quality of applicants into their
apprenticeship programmes. The prime reason for this is the perceived low status of
apprenticed occupations in these countries (Grosvenor, 2016; Kramer et al., 2015; Smith &
Kemmis, 2013).
Schooling systems are regarded as not adequately encouraging students to pursue careers
in manufacturing, such as apprenticeships (Giffi et al., 2014). The status of apprenticeship
programmes is also minimised if they do not lead to recognised qualifications, the acquired
skills are too specific and there is a lack of transferability across occupations or sub-fields.
These aspects have been successfully addressed within the apprenticeship programmes
implemented in Australia, Japan, Netherlands and Switzerland (Keese, 2014). British training
providers and organisational councils have implemented novel techniques to improve the
awareness of their youth regarding vocational opportunities and thereby aim to attract a more
diverse pool of applicants. A directory of available apprenticeships has been produced and
circulated at schools, community centres and libraries. A website listing apprenticeship
vacancies has been designed and plays are being delivered at schools to showcase the benefits
of selecting non-traditional training and work (Miller, 2005).
Amongst the youth in SA, there is an overall lack of interest and understanding of the
worth of technical training. Despite the dire need for qualified artisans the value of a technical
career path has not successfully been instilled in the South African population (Mummenthey
et al., 2012; Pandor, 2018; Patel, 2008, 2012). There is a widespread belief that vocational
training does not lead to good jobs and TVET colleges are therefore struggling to attract a large
student body. University education is perceived as first prize with vocational training being the
second best option (i.e., essentially for those who could not make it into tertiary education)
(Mummenthey et al., 2012; Pandor, 2018; Smith & Kemmis, 2013). In China, at least one in
five secondary school students enrol in TVET. In the Russian Federation it is more than one in
six children. This is a significantly higher enrolment rate than found in SA (Bokova, 2014).
The image of vocational training in the local context therefore needs to be enhanced (Evans-
Klock, 2012; Manuel, 2011; Mukora, 2008).
71
This problem exists within the context of most countries providing incentives and setting
targets for apprenticeship intake. In Germany, despite incentives being in place, the numbers
entering the dual apprenticeship programme are declining (Fazio et al., 2016). America has
invested substantial amounts of money into supporting the expansion of apprenticeships in the
country (Perez & Zients, 2016; Wu, 2016). President Obama signed the first-ever annual
federal funding for apprenticeship programmes into law in 2015 and over $50 million in new
grants to states were awarded. This initiative also involves close to 300 colleges offering
apprentices college credits for the skills they have gained on-the-job (Obama, 2016; Perez,
2016; Perez & Zients, 2016; Wu, 2016). In Brazil, a minimum of five percent and a maximum
of 15% of the work force employed in jobs requiring formal training must be composed of
apprentices. Furthermore, employers are not permitted to hire any apprentice without first
enrolling them on technical or professional training relevant to the position they are hired to
fulfil (Fazio et al., 2016; G20ewg, 2012). The Indian NAPS incentivises employers to engage
with apprenticeships and thereby aims to increase apprentice enrolments (NAPS, 2016;
Saravanabava, 2016). Furthermore, between 2.5% to 10% of the firm’s total labour force,
including contractual workers, are required to be apprentices. Employers with 100 workers
may engage a minimum of three and a maximum of 10 apprentices (NAPS, 2016).
Rather than only increasing apprenticeship enrolment by enforcing minimum
participation numbers and through financial incentives, it is recommended that there be
professionalisation of the artisan career path. This includes creating platforms for the national
recognition of various pathways and qualification to obtaining the trades, increased focus on
the quality of artisan training and assessment as well as the monitoring of the progress of
artisans through national registers (Evans-Klock, 2012; JIPSA, 2010; Manuel, 2011). The
selection of apprentices, specifically section 18.2 learnership students, has been recognised as
a key challenge. Care should be exercised in identifying these students as those who have low
interest and/or aptitude for either the trade and/or the industry may prematurely terminate their
registration on the programme. Adequate standards and selection procedures therefore need to
be implemented by employers of apprentices (Mummenthey & du Preez, 2010).
Researchers in the field have called for an awareness drive of technical trades to be
undertaken through career and recruitment vehicles thereby attracting learners to these career
types (merSETA, 2016; Pandor, 2018). According to Griffin and Fox (2000), a North American
firm successfully introduced an innovative apprentice enrichment programme to assist in the
72
recruitment of talent into the organisation and reduce their high staff turnover rate. The
programme centred on changing the mind-set of existing employees towards embracing their
position within the firm as a career versus just a job. The programme included pamphlets,
presentations and one-on-one meetings to affirm the commitment of the firm to developing the
employees. The apprentices are also tracked across predetermined skill levels. Upon
certification of attaining a particular skill level, the apprentice progresses to the next higher
complexity level. Apprentices can move into other business areas and progress into branch
management. Given that most individuals prefer a career over a job, “young people are hungry
for this type of employment solution” (Griffin & Fox, 2000, p. 38). Since the introduction of
the programme, staff turnover has been reduced by 60% and hiring capacity improved to 97%,
in one year.
A crucial ingredient for a quality apprenticeship programme is the establishment of
effective career guidance for potential applicants (Brewer, 2013; Pandor, 2018). Apprentices
who have a misguided perception of the nature and requirements of an apprenticeship are
unlikely to successfully complete the training programme (Hill & Dalley-Trim, 2008). This
was echoed by the Organisation for Economic Co-operation and Development (OECD) (2011)
when they included the provision of effective career guidance and advice as one of the five key
challenges with regard to the implementation of vocational education and training. Career
guidance should provide information on the opportunities and benefits of vocational learning
and provide up-to-date labour market information to assist the youth to make informed
decisions. It is believed this will facilitate their efficient transition from school to further
training, and then to work (Brewer, 2013). In SA, the university failure rate is about 50%.
Career guidance to the youth could facilitate the consideration of a career as an artisan, thus
enhancing their full-time employment opportunities as well as earning potential (Duarte, 2017).
There is also a need for a specialist technical career path that will attract the youth to
progress as technical practitioners. This will also eradicate the need for individuals with
technical jobs to redirect their career plan into a management career in order to be promoted
(Manuel, 2011). Other challenges to be overcome in order to enhance the perceived value of
apprenticeships for the youth are the issues of wages and working conditions (Keese, 2014).
Besides the perceived low profile of the apprenticeship position, potential applicants are
also not attracted to the manufacturing industry. The future talent pool within the global
73
manufacturing industry is therefore being thwarted by the low level of attractiveness of the
industry. Over 60% of the executives surveyed believe this aspect is having a significant to
high impact, whilst another 29% believe it is having a moderate impact (Giffi et al., 2015).
Rather than the manufacturing industry, individuals are more attracted to the financial,
healthcare and services sectors (Giffi et al., 2014; Kramer et al., 2015). In an American poll,
52% of the youth stated they had a zero interest in a manufacturing career. Two thirds of these
individuals stated their reason as being that a manufacturing career involved working in a
“dirty, dangerous place that requires little thinking or skill from its workers and offers minimal
opportunity for personal growth or career advancement” (Shankel, 2010, p. 2). A more recent
poll found that the Generation Y (i.e., aged 19-33 years) youth ranked a career in manufacturing
as their least choice. Furthermore, only a third of the respondents stated that they would
encourage their children to pursue a manufacturing career (Giffi et al., 2014).
3.7.2.2. Employers
The second stakeholder, employers, also need to perceive the apprenticeship programme
as being an attractive employment option (Fazio et al., 2016; Smith & Kemmis, 2013; Zelloth,
2013). This is specifically true during times of economic pressure as firms tend to restrict the
number of apprenticeship positions they offer (Juul & Jørgensen, 2011; Steedman, 2012). Some
industries have built a strong apprenticeship culture, which assists in enhancing the
attractiveness and status of their programmes. However, firms tend to be unwilling to hire
apprentices if there is a general lack of basic skills amongst the youth as this may exacerbate
the nature and duration of the training needed to be provided (Dustman & Schönberg, 2007).
Germany and the USA have overcome this obstacle through the introduction of pre-
apprenticeship programmes (Smith & Kemmis, 2013).
Employers may also be reluctant to embark on apprenticeship programmes if they are
not involved in the development of the programme itself and/or if the contracts are too rigid
(Fazio et al., 2016; Steedman, 2012). The Australian government therefore built flexibility into
their apprenticeship contracts in order to minimise this hurdle in attracting employers. In
Germany and the USA employers and trade unions are highly involved in the design and
management of apprenticeship systems. Another deterrent for employers is the lack of cost
sharing amongst themselves, the public sector and the apprentices themselves. Canada,
Germany, France and the Russian Federation share the cost equally and offer incentives to
employers for hiring apprentices (Keese, 2014). In contrast, 23% of artisan respondents
74
indicated that the lack of recognition by the employer for the value and need for artisans in
their industry was a significant employment factor contributing to the lack of retention of
artisans in SA (Jordaan & Barry, 2009).
The market-failure, or free-riding problem, is a significant deterrent to apprenticeship
training (OECD, 2011; Steedman, 2012). Employers may be hesitant to invest in this type of
training due to fearing their trainee apprentices will be poached by other firms. This leads to
imparting only firm-specific skills in the training as a means of securing their investment of
time and resources. However, this has the negative consequence of the apprentices obtaining
skills that are not easily transferable to other firms. Even in countries with long-standing
traditions of apprenticeship, this free-riding problem still persists. The one potential solution is
for governments to encourage firms to see their investment in the general training of
apprentices as an investment in the public good, as is apparent in Germany. The alternative is
for governments to become more involved in the training through offering incentives to
employers (Fazio et al., 2016).
3.7.2.3. Sponsors
Besides apprentices and training firms, apprenticeship programmes also need to be
perceived as a worthwhile endeavour by potential sponsors or funders. The poaching issue
being one deterrent, there are several other barriers that can deter these investors. The
uncertainty of the return on their investment makes cost-benefit analyses and impact
evaluations vital tools to convince these stakeholders. This is especially true in small and
medium sized enterprises as these firms probably face higher costs in participating in
apprenticeship programmes (Fazio et al., 2016; Gambin & Hogarth, 2017). Within well-
functioning artisanal development systems, the majority of training firms recoup their training
costs by the end of the training period. Using the apprenticeship programme is therefore a
useful recruitment strategy for the training firm who can retain the most suitable candidates.
However, other firms can also benefit as they recruit skilled workers from the pool of graduates
that are not initially employed by their training firms (merSETA, 2016).
3.7.3. Selection
Apprentice training is often used as a screening mechanism within firms (Malcomson et
al., 2003; merSETA, 2016; Steedman, 2012). In countries with a deregulated labour market,
firms can recruit the young apprentices at lower wages, train them and then retain those that
75
are most productive as employees (OECD, 2011). Given that apprenticeship programmes are
on average at least three years in duration the training firm has ample time to get to know the
apprentice. Information concerning the abilities and characteristics of the apprentices are
readily available throughout the training programme and firms can use this valuable
information to retain the most skilled individuals as employees at the completion of their
training (Dustmann & Schönberg, 2007; Malcomson et al., 2003; Muehlemann et al., 2010).
The quality of the match between worker and firm is therefore much higher through the use of
the apprenticeship programme as a screening device. This also has an additional knock-on
effect of reduced layoffs, compared to hiring from the external market (Malcomson et al., 2003;
Muehlemann et al., 2010). However, there is a perception that the apprentices do not have
sufficient practical skills and are therefore not able to complete the tasks desired of them.
Rather than employing apprentices, Chinese firms would rather employ graduates from the
secondary schools that have completed sufficient training (Li et al., 2014; Wang, 2014).
Using the apprenticeship programme as a selection technique is not used
indiscriminately. Dustmann and Schönberg (2007) argue that students from school-based
vocational training institutions are likely to be well marketed by these institutions as they have
no vested interest in not sharing information on their students. However, these authors also
found that firms hosting apprentice students are unlikely to reveal such information on their
students to external sources as they probably aim to employ some of them later. A cross-
sectional analysis of German firms training apprentices established that employers are willing
to incur the costs of training apprentices, in lieu of hiring them thereafter, given that three
conditions exist. These are: the skills sought are fairly specific, there is a high retention rate of
apprentices in this sector and thirdly, the labour market makes hiring this form of skilled
employee difficult (Mohrenweiser & Zwick, 2009).
Organisations require a unique blend of technical and human relations skills that move
the employee beyond the step-by-step completion of delegated tasks (Hauschildt, 2016;
Overtoom, 2000; Sermsuk, Triwichitkhunb, & Wongwanich, 2014). Core skills, such as
teamwork, are a high priority for most employers as they build on the individuals’ basic
education. Other skills sought by employers include analytical skills, effective communication,
creative thinking, ability to solve problems independently, leadership, motivation and
organisational ability (Ahmad & Schroeder, 2002; Brewer, 2013; Zhu & Dowling, 2002).
Employability skills, such as communication, adaptability, group effectiveness and influencing
76
skills are also regarded as key (AAC&U, 2013; Carnevale, Gainer, & Meltzer 1990; Husain,
Mokhtara, Ahmada, & Mustapha, 2010). Managing oneself at work is also a key employability
skill (Brewer, 2013). For individuals in low-level positions, higher levels of self-directedness
have been linked to a higher probability of promotion to higher-level job positions (i.e.,
vertical job mobility) (Raemdonck, Tillema, De Grip, Valcke, & Segers, 2012).
However, according to the 2017 Job Outlook Survey, 50% of employers believe that
recent graduates lack these desired core employability skills and are not adequately prepared
for the workplace (AAC&U, 2013; Burning Glass Technologies, 2013; Gallup Inc., 2014;
NACE, 2016). Specifically, technical graduates lack generic employability skills (Rahman,
Mokhtar, Yasin, & Hamzah, 2011; Rasul, Rauf, Mansor, Yasib, & Mahamod, 2012; Rasul et
al., 2013). Global studies on technical graduates have consistently established that while the
students may have mastered the technical skills, they lack the core employability skills required
by industry (Bakar & Hanafi, 2007; Husain et al., 2010; Kazalin et al., 2009; Markes, 2005;
Mustapha & Greenan, 2002; Rasul et al., 2013). STEM graduates lack the basic personal
professional skills such as teamwork, communication and problem solving skills to enhance
their employability (Kramer et al., 2015). Researchers advise educators to have a balanced
approach in the training of technical students. Employability and technical skills need to be
integrated into the curriculum. The curriculum also needs to be sufficiently flexible to
accommodate current and future needs (Mustapha & Greenan, 2002).
There is a pervasive skills shortage within SA, specifically amongst the supervisor and
artisan positions (Hall & Sandelands, 2009). In studies investigating the occupational
competence of apprentice students and artisans, deficiencies in their holistic problem solving
and thinking skills was established. This is particularly disturbing as it is believed that these
specific skills assist in the transition of these students from school/college to the workplace
(Hauschildt, 2016; Jacobs, 2015; merSETA, 2016). Apprentices, within the learnership track,
were found to have a low level of applied competence or work readiness. The training providers
of these students rated 43% as having achieved a fair level of overall competence with industry-
related bodies rating the majority of these students as having fair (40%) to poor (10%) work
readiness (Mummenthey & du Preez, 2010).
77
The difficulty in sourcing applicants with the correct skills set is evidenced in the lengthy
turnaround time for the recruitment and selection of apprentices. The average lead-time is five
months in Brazil (Gray & Wragg, 2015), six months in India (Fazio et al., 2016; Smith &
Kemmis, 2013), three months in North America (Giffi et al., 2015) and four months in SA
(Barnes & Meadows, 2008).
3.8. Summary
This chapter has outlined the pertinent issues related to the artisanal context. The
apprenticeship training programme system, being the most commonly employed method of
obtaining artisanal status, was considered. The national apprenticeship system was outlined as
well as that implemented in four international countries. The nature of the demand and supply
of artisans, both nationally and globally, were discussed. This chapter also elucidated three
current challenges faced in the development of artisans. SA, as is the case in the USA, China
and India, is attempting to revitalise its apprenticeship system. Many private and governmental
initiatives are being implemented to assist in this revitalisation. These are, however, mostly
focussed on improving the attraction of stakeholders to the training programme as well as
implementing improvements to the methods of training and assessment. Germany, unlike SA
and these three global countries, places emphasis on the selection phase of the apprenticeship
life cycle.
The next chapter clarifies the underpinning theoretical framework of the study, namely
the human capital theory. Chapter Four also deals with the managerial activity of human
resource selection. The nature and importance thereof as well as the various methods employed
by industry are discussed. The key challenges experienced in human resource selection as well
as the current practices, adopted both nationally and globally, in sourcing apprentices are
elucidated.
78
CHAPTER FOUR
12 HUMAN RESOURCE SELECTION CONTEXT
4.1. Introduction
Chapter Three provided an overview of the artisan and apprenticeship context, both
internationally and within SA. The current inadequate supply to meet the high demand for
artisans requires a holistic solution. The three challenges discussed in Chapter Three pertaining
to the recruitment, selection and induction phase of the apprenticeship life cycle have not been
adequately addressed in research to date. Chapter Four, the third literature review chapter of
this thesis, considers the HRS perspective of the study. The underpinning theoretical
framework, the human capital theory, is examined as well as the concept of HRS. Various
methods employed in HRS as well as the challenges experienced within this managerial task
are elucidated. The specific selection practices utilised, globally and nationally, for apprentices
are also discussed. Section 4.2 commences the chapter with a discussion on the study’s
theoretical framework.
4.2. Human capital theory
Economist, Gary Becker (1962, 1964), is known for commercialising the term ‘human
capital’. In his 2002 analysis of the term he extended his definition to encompass the
“knowledge, information, ideas, skills, and health of individuals” (p. 3). Whilst other forms of
capital, such as factories, machinery and financial capital are important, he believed that human
capital was the most significant. According to Weatherly (2003, p. 1), the human capital asset
of a firm is “the collective sum of the attributes, life experience, knowledge, inventiveness,
energy, and enthusiasm that its people choose to invest in their work”. The knowledge and
skills that employees jointly possess comprises the human capital of an organisation
(Subramanian & Youndt, 2005).
Within Becker’s (1962) classical human capital theory, there is a distinction between
general and firm-specific human capital. General human capital are skills or abilities that have
the same value in various firms and are hence compensated accordingly. Firm-specific abilities
or skills are solely valued within the firm they were acquired (Wright et al., 1994). Both general
and firm-specific human capital can be employed to enhance the financial and operational
performance of firms (Ployhart & Moliterno, 2011; Snell & Dean, 1992). However, HR
practices, such as selection and training, should be used to create and maintain the valuable
79
firm-specific human capital for the organisation. This high quality firm-specific human capital
then has the potential to operate as the competitive advantage of the organisation (Wright et
al., 1994).
A key aspect of the human capital theory is the term ‘employability’. Employability skills
are those that assist individuals to prepare successfully to obtain positions and progress in their
careers (Fugate, Kinicki, & Ashforth, 2004). Employability skills also substantiate the value of
employees to the organisation (Askov & Gordon, 1999). Employability then has more to do
with the ability to implement the work expected of the incumbent than only the techniques,
experience and talent the individual brings with them. Whilst these employability skills are
transferable, they are core to the job and encompass the knowledge, skills and attitudes required
to be outstanding in their positions (Rasul, Rauf, & Mansor, 2013). It is these employability
skills that are deemed to be the most valued raw material within the firm (Wesselink, De Jong,
& Biemans, 2009). Having described the depth of the theory, the next section outlines the
relevance of the theory within the management context and section 4.2.2 discusses the
criticisms levelled against the theory.
4.2.1. Relevance of the human capital theory
Organisations in the modern economy cannot ignore the necessity of investing in the
human capital of their workers. Consistently, human capital is regarded as the key determinant
of productivity. A pool of high quality employees is more likely to achieve organisational
objectives such as high productivity and quality, better service and higher levels of innovation
(Crook, Todd, Combs, Woehr, & Ketchen, 2011; Dess & Shaw, 2001). However, research has
also indicated that the competitive advantage of human capital as a strategic asset will only be
realised if organisations select and retain individuals with knowledge that is both valuable and
unique for the firm (Barney & Wright, 1998; Boxall, 1996; Subramaniam & Youndt, 2005).
Furthermore, human capital is a source of competitive advantage not only due to the
competencies brought into the organisation, but given the capacity these can offer to solve
organisational problems and dilemmas (Coff & Kryscynski, 2011).
HR practices have been conceptualised as falling into three primary facets, namely, skill-
enhancing, motivation-enhancing and opportunity-enhancing (Lepak, Liao, Chung, & Harden,
2006). These three facets have a differential impact on organisational outcomes. Skill-
enhancing HR practices, such as recruitment, selection and training, are more influential in
80
enhancing human capital, with motivation- and opportunity-enhancing HR practices having a
significant impact on improving employee motivation (Jiang et al., 2012). This is consistent
with previous research that established the heterogeneous influence of HR practices on
organisational outcomes (Batt & Colvin, 2011; Gardner, Wright, & Moynihan, 2011; Shaw,
Dineen, Fang, & Vellella, 2009).
The human capital of a business is influenced through its HRM practices. The acquisition
and development of skills is leveraged through the firm’s recruiting and selection procedures.
A large pool of qualified candidates and a reliable and valid selection procedure will have a
significant impact on the type and quality of skills new employees will possess (Huselid, 1995).
There is agreement amongst authors that the use of effective and thorough selection practices
will result in the collective human capital of an organisation being enhanced (Cabello-Medina
et al., 2011; Takeuchi et al., 2007; Yang & Lin, 2009). A significant link between rigorous
staffing practices, improved customer service and increased profits has also been established
(Van Iddekinge et al., 2009).
New hires should be selected on their potential to learn (i.e., their aptitudes, cognitive
abilities and motivation), rather than their current level of knowledge, skills and experience
(Lepak & Snell, 1999, 2002). This form of selection will enable the organisation to source
potential employees that can obtain firm-specific human capital. This will then facilitate the
acquisition of the valuable and unique knowledge required to enhance the competitiveness of
an organisation (Subramaniam & Youndt, 2005). Staffing practices should therefore ensure
that employees have task-specific and organisation-specific skills to enable optimum work
performance (Jiang et al., 2012). Organisational learning can be enhanced through establishing
the candidates that have potential and the willingness to develop new and specific knowledge
(Collins & Smith, 2006; Lepak & Snell, 1999; López-Cabrales, Real, & Valle, 2011).
In order to improve their social capital, organisations should also include the attitudes of
teamwork, interpersonal adaptability and other similar criteria in their selection processes
(Lengnick-Hall & Lengnick-Hall, 2003). In knowledge-intense contexts, technical abilities are
not regarded as the most important criteria within selection practices. Sharing of creative ideas
and knowledge within a team are prized as being more predictive of success (Swart & Kinnie,
2003). Incorporating interpersonal skills as a selection criteria and using people interaction
81
exercises as a selection practice will identify high-potential individuals that could enhance the
organisational human capital and learning capability (López-Cabrales et al., 2011).
The human capital theory has informed this research study by highlighting the significant
impact selection processes have on optimising human capital competitive advantage
(Abhayawansa & Abeysekera, 2008; Wright et al., 1994). This study aims to evaluate a specific
profiling and selection process and identify the key criteria for acceptance of applicants onto
an apprenticeship programme. As indicated in Chapter Two and Three, the skills and abilities
attained through completing an artisanal qualification are regarded as key to the long-term
sustainability of the automotive industry. The human capital theory also emphasises the
meaningful contribution of education and training on increased ability, performance and
productivity within the workforce (Akinyemi & Abiddin, 2013). The problem statement in
Chapter One has alluded to a lack of education and skills being the cause of copious technical
positions remaining vacant within the country. It is one of the objectives of this study to
investigate the impact of the educational profile possessed by applicants on their success within
the apprenticeship programme.
4.2.2. Criticism of human capital theory
In contrast to the human capital theory, behavioural theorists advocate that it is not the
competencies of the employees that enable organisations to perform well. Rather, HR practices
identify and encourage the behaviours required for organisational productivity and through
these practices improved operational and financial performance is achieved (Jackson, Schuler,
& Rivero, 1989). The HR practices of organisations seeking different employee behaviour are
therefore likely to differ. HR practices can be regarded as effective when employees behave in
ways that assist in achieving business objectives and enhance the implementation of strategies
chosen by the firm (Jiang et al., 2012).
Unlike other resources and forms of capital, human capital cannot be owned (Brymer,
Molloy, & Gilbert, 2014; Coff, 1997). Behavioural researchers therefore suggest that optimal
human capital cannot be realised unless employees are willing to utilise their capabilities
(Jackson & Schuler, 1995). A weak positive relationship has been established between firm-
specific human capital and organisational performance through the mediating influence of
restricted employee mobility (Campbell, Coff, & Kryscynski, 2012). It has therefore been
argued that the human capital approach ignores the workings of the labour market and it is
82
questionable whether mechanisms such as firm specificity are actually efficient in limiting the
mobility of a firm’s human capital (Delery & Roumpi, 2017).
Another criticism of the human capital theory is that HRM practices are viewed as simple
‘levers’ in the influence of human capital resources and organisational competitive advantage
(Delery & Roumpi, 2017). Researchers believe that it is impossible for HR strategies to be rare,
inimitable and non-substitutable (Wright et al., 1994). Furthermore, it is contended that no
human capital based study has established a causal link between HR practices and
organisational performance (Wright, Dunford, & Snell, 2001). Micro and macro-level human
capital research is also criticised for making inferences and assumptions beyond their
respective levels. Rather than adhering to and limiting their findings to their particular
discipline level, researchers tend to inappropriately generalise their findings to either a higher
or lower level of analysis, known as the cross-level fallacy (Ployhart, 2006). Section 4.2 has
discussed the nature and relevance of the human capital theory as well as the criticisms
pertaining to the theory. In the next section the HRM activity of selection is discussed.
4.3. Human resource selection
Staffing is defined as “the process of attracting, selecting, and retaining competent
individuals to achieve organisational goals” (Ployhart, 2006, p. 868). Others categorise staffing
according to three main activities, namely, recruitment, selection and career planning (Rynes,
Brown, & Colbert, 2002a). Whilst both are focussed on identifying and securing suitable
people to meet the HR needs base within organisations, recruitment and selection are two
distinct processes (Nel et al., 2011; Noe et al., 2011). Both processes, however, commence with
the recognition of the need for labour. Following on this, it is highly recommended that a job
analysis first be conducted resulting in the development of clear job and person specifications
(Coetzee & Schreuder, 2010; Greenidge, Alleyne, Parris, & Grant, 2012; Scolarios, Lockyer,
& Johnson, 2003).
Recruitment pertains to the first half of the hiring process. It aims to source a wide
network or pool of suitable candidates, whilst selection focuses on making a choice of the best
from this candidate pool (Nel et al., 2011; Noe et al., 2011). The primary goal of the selection
process is to determine which candidates will provide the highest value to the organisation over
time. Besides determining the human capital within an organisation, selection also influences
the level of diversity within firms (Lievens, Van Dam, & Anderson, 2002; Ployhart, 2006).
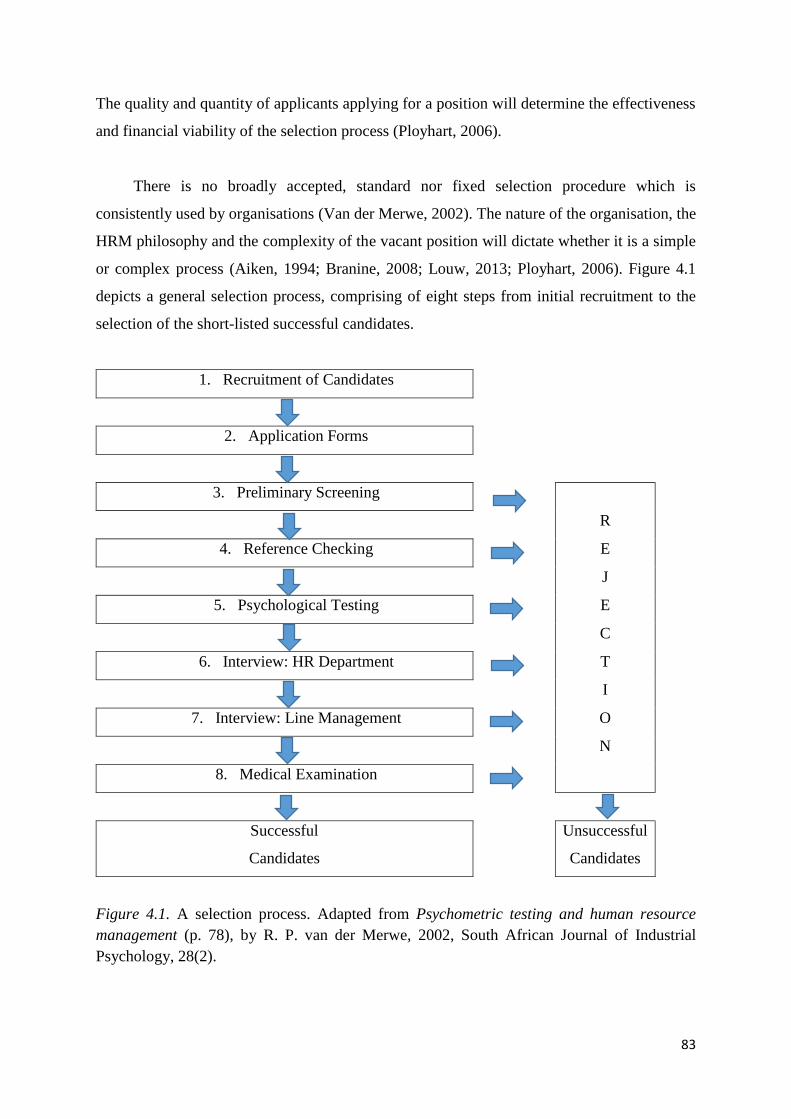
83
The quality and quantity of applicants applying for a position will determine the effectiveness
and financial viability of the selection process (Ployhart, 2006).
There is no broadly accepted, standard nor fixed selection procedure which is
consistently used by organisations (Van der Merwe, 2002). The nature of the organisation, the
HRM philosophy and the complexity of the vacant position will dictate whether it is a simple
or complex process (Aiken, 1994; Branine, 2008; Louw, 2013; Ployhart, 2006). Figure 4.1
depicts a general selection process, comprising of eight steps from initial recruitment to the
selection of the short-listed successful candidates.
1. Recruitment of Candidates
2. Application Forms
3. Preliminary Screening
R
4. Reference Checking E
J
5. Psychological Testing E
C
6. Interview: HR Department T
I
7. Interview: Line Management O
N
8. Medical Examination
Successful
Candidates
Unsuccessful
Candidates
Figure 4.1. A selection process. Adapted from Psychometric testing and human resource
management (p. 78), by R. P. van der Merwe, 2002, South African Journal of Industrial
Psychology, 28(2).
84
Figure 4.1 outlines a successive-hurdle selection process. When this technique is
employed, applicants need to successfully proceed through various screening phases or hurdles
in order to be hired. Each step could result in the candidate being rejected from the selection
process. This successive or multiple-hurdle approach is utilised by the vast majority of
organisations in their selection activities (Van der Merwe, 2002). Having provided an overview
of various definitions of the HRS function, the next section outlines the importance of selection
for firms and individuals alike.
4.3.1. Importance of human resource selection
The most difficult and important challenge facing organisations within the twenty-first
century is procuring the right workers (Hoffman et al., 2018; Ployhart, 2006). Globally, there
is a lack of suitable applicants to fill vacant positions. Applicants are believed to be deficient
in the key skills and competencies required within organisations. Innovative and alternative
recruitment and selection processes are hence being employed. The training and development
of the internal talent pool is also often cited as a means to address this challenge (Lievens et
al., 2002; ManpowerGroup, 2016).
Effective selection procedures can have a significant impact on various aspects of
performance within a business (Liu, Combs, Ketchen, & Ireland, 2007; Ployhart, 2006).
According to Huselid (1995), firms with well-developed selection practices will have better
overall performance. By utilising selection methods with high validity, an employer can save
a significant amount of money as well as increase their revenue and profits. Whether measured
in percentage increase in output or dollar value of increased output, there are both practical and
economic benefits to using a valid selection measure (or combination of measures) (Schmidt,
Oh, & Shaffer, 2016). Investments in best practice HR initiatives result in significantly lower
employee turnover as well as higher productivity and corporate financial performance
(Huselid, 1995).
Chapter Three provided a comparison of SA with four other global countries, namely,
Germany, the USA, China and India. In contrast to these countries, SA was ranked the lowest
at position 61, in terms of global competitiveness. As indicated in Table 4.1, the labour market
efficiency in SA is the lowest in comparison to the other four countries. Specifically, SA
performs significantly worse on the hiring and firing practices indicator. The ability of the
country to attract and retain talent is also lower than these other global countries (Schwab &
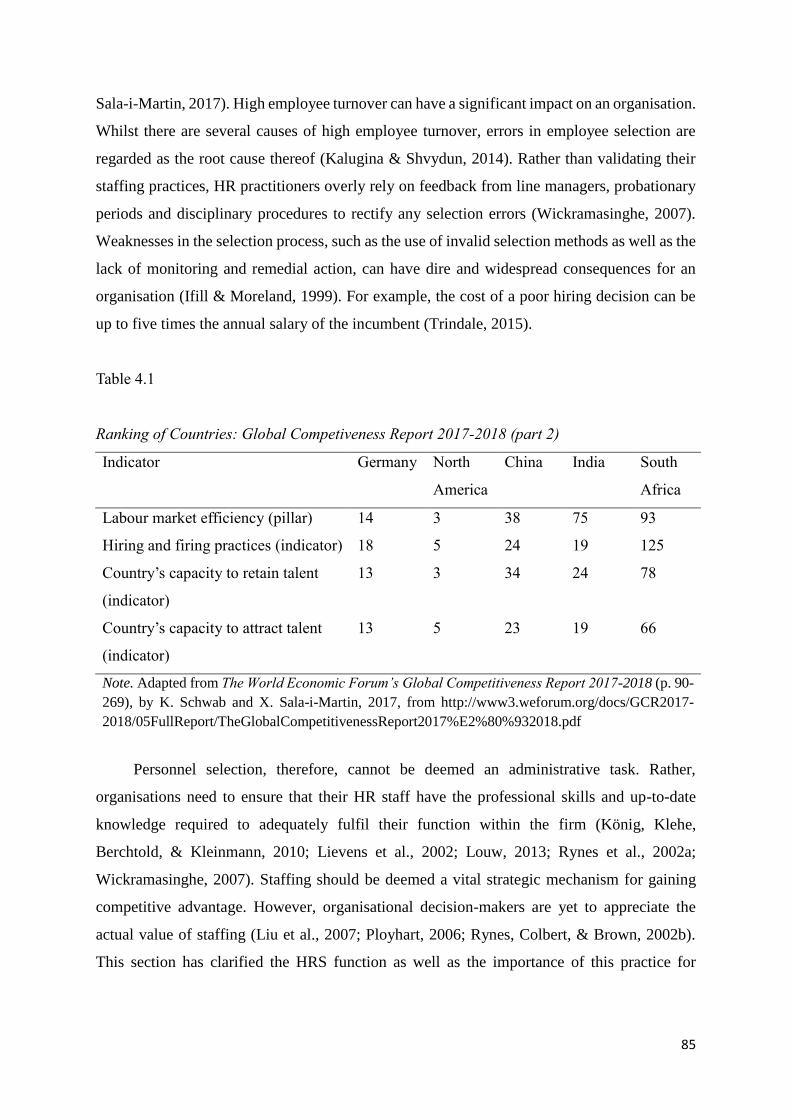
85
Sala-i-Martin, 2017). High employee turnover can have a significant impact on an organisation.
Whilst there are several causes of high employee turnover, errors in employee selection are
regarded as the root cause thereof (Kalugina & Shvydun, 2014). Rather than validating their
staffing practices, HR practitioners overly rely on feedback from line managers, probationary
periods and disciplinary procedures to rectify any selection errors (Wickramasinghe, 2007).
Weaknesses in the selection process, such as the use of invalid selection methods as well as the
lack of monitoring and remedial action, can have dire and widespread consequences for an
organisation (Ifill & Moreland, 1999). For example, the cost of a poor hiring decision can be
up to five times the annual salary of the incumbent (Trindale, 2015).
Table 4.1
Ranking of Countries: Global Competiveness Report 2017-2018 (part 2)
Indicator Germany North
America
China India South
Africa
Labour market efficiency (pillar) 14 3 38 75 93
Hiring and firing practices (indicator) 18 5 24 19 125
Country’s capacity to retain talent
(indicator)
13 3 34 24 78
Country’s capacity to attract talent
(indicator)
13 5 23 19 66
Note. Adapted from The World Economic Forum’s Global Competitiveness Report 2017-2018 (p. 90-
269), by K. Schwab and X. Sala-i-Martin, 2017, from http://www3.weforum.org/docs/GCR2017-
2018/05FullReport/TheGlobalCompetitivenessReport2017%E2%80%932018.pdf
Personnel selection, therefore, cannot be deemed an administrative task. Rather,
organisations need to ensure that their HR staff have the professional skills and up-to-date
knowledge required to adequately fulfil their function within the firm (König, Klehe,
Berchtold, & Kleinmann, 2010; Lievens et al., 2002; Louw, 2013; Rynes et al., 2002a;
Wickramasinghe, 2007). Staffing should be deemed a vital strategic mechanism for gaining
competitive advantage. However, organisational decision-makers are yet to appreciate the
actual value of staffing (Liu et al., 2007; Ployhart, 2006; Rynes, Colbert, & Brown, 2002b).
This section has clarified the HRS function as well as the importance of this practice for
86
organisations and potential employees. Section 4.4 describes the various methods employed in
the practice.
4.4. Human resource selection methods
Initially an overview of selection methods in general is provided. Thereafter, each section
discusses a selection method category. Section 4.4.2 discusses preliminary screening methods
and section 4.4.3 outlines reference checking and other types of verification. Section 4.4.4
deliberates testing and assessment methods employed within selection and section 4.4.5
discusses the interviewing method.
4.4.1. Overview of selection methods
Since the beginning of the twentieth century studies have been conducted to establish the
effectiveness of selection methods in predicting future job performance and learning (Schmidt
et al., 2016). Nevertheless, there is a gap between the provided research findings and the actual
implementation of these selection practices. This is more so than any other task within HRM
(Rynes et al., 2002a; Rynes, Giluk, & Brown, 2007; Zibarras & Woods, 2010). Employers and
practitioners should note that the use of selection methods with enhanced predictive validity
will result in significant improvements in employee performance, as seen in increases in output
and increased learning of skills (Bartram, 2004; Schmidt et al., 2016; Wickramasinghe, 2007).
Countries differ in terms of the methods used in employee selection. Labour legislation
within the country as well as whether the applicants are sourced from within or outside the
organisation are key determinants of the techniques employed (Louw, 2013; Nzukuma &
Bussin, 2011). In the UK the CV is the most popular method, followed by the triad of the
application form, interviews and reference checking (Zibarras & Woods, 2010). Selection
practices in Sri Lanka are predominantly a triad of the application blank, the interview and
assessment centres (Wickramasinghe, 2007). This was similar to a local study’s findings
conducted by Louw (2013).
Organisations employ various blends of selection methods to assist them in screening job
applicants (El-Kot & Leat, 2008; Louw, 2013). Selection methods range on a continuum from
traditional forms, such as interviews, application forms and references, to the more
sophisticated techniques including psychological testing, assessment centres and work samples
(Wickramasinghe, 2007). The traditional triad or classic trio is known as the application form,
87
interview and reference checks (Cook, 1991). However, according to a study by Sackett and
Lievens (2008), a combination of the application form, interviews, reference checking and an
assessment centre is the most popular. In terms of validity in predicting job performance, the
combination of general mental ability (GMA) and integrity testing yields the highest composite
validity (.78), with the combination of a GMA test and a structured interview rated as the
second most valid combination (.76). Given that these two combinations are also less expensive
to implement, they are regarded as the best combinations (Schmidt et al., 2016).
Should applicants have a negative experience during the recruitment or selection process
this could have a negative impact on the organisation’s brand and reputation (Anderson,
Salgado, & Hűlsheger, 2010; Bartram, 2004; Schmitt, 2014; Trindale, 2015). More research
has been done regarding the experiential perceptions of job applicants than any other aspect of
personnel selection (Schmitt, 2014). Enhancing candidates’ experience of the screening
process is therefore a core goal of most global employers. Through making the screening
process more transparent as well as improving the access and quality of information
communicated to applicants can minimise the level of confusion and uncertainty experienced
by applicants, thereby creating a more positive experience (Trindale, 2015). A relationship
between the reactions of applicants to employers’ selection procedures and their attraction to
the organisation has been noted (Ryan & Ployhart, 2000). An explanation for this trend is that
applicants, with little information pertaining to the organisation at this stage of the selection
process, uses the selection procedure characteristics as signals of the characteristics of the
employing organisation (Lievens et al., 2002). However, other researchers have concluded that
the perceptions of the selection process held by applicants and/or the tools employed have little
to no impact on their actual pre-hire decisions (Ployhart, 2006; Ryan, Sacco, McFarland, &
Kriska, 2000; Schmit & Ryan, 1997).
The selection methods perceived most favourably by applicants are work samples and
interviews (Anderson et al., 2010). Whilst not the most preferred method, applicants perceive
GMA tests favourably as they are deemed more relevant to job performance than other
selection measures such as application blanks, personality and integrity tests (Anderson et al.,
2010; Hausknecht, Day, & Thomas, 2004). Applicants perceive the selection process as being
more stringent when GMA tests are included and this increases their perception of the
attractiveness and status of the applied position. Cognitive testing, the use of résumés,
references, biodata and personality measures fall within the second category of being
88
favourably evaluated, whilst honesty tests, personal contacts and graphology were the least
preferred selection methods by applicants (Anderson et al., 2010). Regardless of preferred
selection method, applicants need to portray themselves in a dynamic fashion consistently
across the various methods (Fox, 2018).
4.4.2. Preliminary screening methods
For the purposes of this literature review, two preliminary screening methods are outlined
in this section, namely, application forms and the CV. This section therefore covers the second
and third steps of the selection process illustrated in Figure 4.1.
4.4.2.1. Application blanks
Application blanks, or biographical data measures, request information pertaining to past
life experiences, such as in their family and at high school, as well as hobbies and other lifestyle
pursuits (Schmidt et al., 2016). Application forms also provide information pertaining to
education completed, work experience obtained and the general state of health of applicants
(Booi, 2005). Whilst each item on the application form contains information about the
candidate, it is rare for any one aspect to be regarded as adequate to screen out an applicant
(Catano, Wiesner, Hackett, & Methot, 2009).
Pre-screening devices, such as the application form, are increasingly being used when
large numbers of applicants are received for vacancies. The tool facilitates the easy comparison
and filtering of applications in order to identify high-potential candidates (Wickramasinghe,
2007). Another reason for their popularity is their equivalent validity to other selection tests
(Reilly & Chao, 1982). Some researchers in fact believe that biographical data measures are,
in part, an indirect assessment of GMA (Schmidt et al., 2016).
The application blank is the most popular selection method used in SA. In one study,
all the HRS practitioners surveyed indicated that they made use of application blanks in their
selection process (Louw, 2013). In a recent study, Grobler, Wärnich and Mokobane (2018)
found that 69.2% of South African companies used applications forms when selecting
professionals. However, in an earlier survey, only 14% of the HR managers indicated the use
of this diagnostic assessment (Krause, Rossberger, Dowdeswell, Venter, & Joubert, 2011).
This may be due to improved abilities in choosing questions to be included in an application
blank (Schmidt et al., 2016). In SA, the questions must comply with the Employment Equity
89
Act (No. 55 of 1998) (EEA) requirements. These requiremnts are covered in detail within
section 4.5.3.
Application forms have been criticised for their lack of objectivity. Based on the
information provided in an application form and their knowledge of the vacant job, the HR
practitioner and/or line manager makes a subjective decision about the candidate. The
alternative is the development of a weighted application blank. This is a quantitative method
of assessing an application form. Weighting is done on the basis of prior job success by current
and previous job incumbents (Catano et al., 2009; Kaak, Feild, Giles, & Norris, 1998). This
method is both economical and easy to use. Being well received by job applicants they are also
effective predictors of a variety of work behaviours ranging from absenteeism to turnover
(Catano et al., 2009).
4.4.2.2. Curriculum vitae
Whilst interviews are part of almost every selection process, CVs are used even more
frequently (Schmidt & Zimmerman, 2004). A British study across 579 organisations,
representing different sizes and sectors, found the CV to be the most commonly employed
selection method (Zibarras & Woods, 2010). The CV and covering letter are commonly
employed to facilitate the shortlisting of applicants for interview purposes (Breaugh, 2009;
Cole, Rubin, Feild, & Giles, 2007; Stewart & Knowles, 2000; Tsai, Chi, Huang, & Hsu, 2011).
In a survey of small and medium-sized organisations, 53% indicated a preference for the
combination of a CV and covering letter (Branine, 2008). Covering or motivational letters are
used to assess the degree of match between the job description and the skills and experience
possessed by applicants (Ogden, 2016). A well composed covering letter can act as a catalyst
for promoting the candidate into the next phases of the selection process (Stewart & Knowles,
2000; Tomaska & Nosek, 2018). Recruiters rated two-page covering letters more favourably
than one-page letters for entry-level positions (Blackburn-Brockman & Belanger, 2001) and
recommend that the content should be tailored to the specific occupation and field being
applied for (Ross & Young, 2005). Most employers prefer the electronic delivery of CVs,
résumés and covering letters, either by e-mail or via the company’s website (Schullery, Ickes,
& Schullery, 2009).
A CV can be regarded as the most important document one will ever write. It is suggested
that a CV should be written specifically for the position applied for and be able to attract the
90
attention of the reader within two to three seconds. The content should also be presented in an
accurate, concise and honest manner (Wallwork, 2014). Research has focussed on the three
categories of information primarily obtained from CVs. These are: academic qualifications,
work experience and extracurricular activities, and thirdly, employability ratings obtained from
recruiters (Brown & Campion, 1994). Academic qualifications and extracurricular activities
are positively correlated with the judgements made by reviewers on the employability of
applicants. Work experience is also a factor, but is not as highly correlated as qualifications
and extracurricular activities (Cole et al., 2007).
In terms of the first category of information (i.e., academic qualifications), more weight
tends to be given to these and/or grades for entry-level positions (Roth & Bobko, 2000; Rynes,
Orlitzky, & Bretz, 1997). Type of secondary education (incorporating subject choice), was
revealing of the general and technical aptitudes of operator-level applicants, which in turn had
a high correlation with employability. The case was made for the use of education as a cost-
effective preliminary screening technique to reduce the applicant pool prior to the use of
costlier psychometric tests (Puchert et al., 2017a, 2017b). The use of marks attained for
mathematics has also revealed predictive validity for student performance at tertiary level (Van
der Flier, Thijs, & Zaaiman, 2003). However, Azar, Sebt, Ahmadi and Rajaeian (2013)
concluded that examination scores in areas such as English, mathematics and general
knowledge had no impact on performance and promotion post-employment.
Education is regarded as a key determinant of the job level, quality and income an
individual can attain (Brewer, 2013; Schmidt et al., 2016). Consistently, therefore,
organisations place strong emphasis on the use of educational qualifications as a selection
criterion (Wickramasinghe, 2007). Applicants with higher levels of qualification had higher
external employability than those with lower qualifications (Juhdi, Pa’Wan, Othman, &
Moksin, 2010). In contrast, Nunley, Pugh, Romero and Seals (2016) found no evidence to
support the assertion that higher educational attainments increased employment prospects.
Similarly, Azar et al. (2013) also established that increased educational levels only lead to some
promotional upgrades post-employment.
CVs that included the grade point average obtained by applicants were assessed more
favourably than those that did not include this information (Oliphant & Alexander, 1982).
Furthermore, CVs that revealed higher grade point average results were evaluated as better
91
than CVs with lower scores (Thoms, McMasters, Roberts, & Dombkowski, 1999). These
findings are probably due to the beliefs of HRS practitioners that grade point average scores
reflect intelligence, motivation as well as other competencies required in the workplace (Roth
& Bobko, 2000; Schmit, Ryan, Stierwalt, & Powell, 1995; Wolfe & Johnson, 1995).
However, future job performance cannot be successfully predicted based on the years of
education obtained. On average, the job performance of those with 12 years of education is
only slightly higher than those with nine to 11 years of education (Schmidt et al., 2016).
Psychological tests, especially cognitive ability tools, are deemed as more reliable and valid
predictors of the future performance of applicants than their attained qualifications (Berry,
Gruys, & Sackett, 2006; Jenkins & Wolf, 2002). An increase in the manipulation of
qualifications by applicants has however made the use of CVs as a selection method more
difficult (Cook & Cripps, 2005; Wolf & Jenkins, 2006).
The second type of information gained from a CV is years of job experience, specifically
in a position similar to the vacant job. Applicants with both high levels of work experience and
academic achievement are most likely to be hired (Azar et al., 2013). However, applicants with
only a few years of working experience and high academic qualifications are least likely to be
hired (Singer & Bruhns, 1991). According to Nunley et al. (2016), experience significantly
enhances employment prospects. In comparison to only having post-secondary level
qualifications, internship experience was found to enhance hiring opportunities by at least 14%.
This increase is even larger if applicants had both experience and high academic abilities.
Experience appears to operate as a signal of other unobservable qualities for employers (Juhdi
et al., 2010; Nunley et al., 2016). Applicant work experience appears to act as a signal of
perceived person–organisation fit. Furthermore, the work experience and educational
background held by an applicant increases their perceived person–job fit. Both of these then
result in improved hiring recommendations (Tsai et al., 2011).
Regardless of the form, experience is valued by recruiters. Relevant experience is rated
the highest, with a combination of volunteer and paid experience also being perceived
favourably. There were no significant differences between the ratings provided for paid versus
volunteer experience (Wilkin & Connelly, 2012). However, the key to maximising the value
of part-time work is being able to determine the learning gained to potential employers during
the recruitment and selection process. It is recommended that students reflect on and record
92
(i.e., in a logbook) their work experience in order to provide specific examples of the skills
gained (Evans & Richardson, 2017).
However, the impact of job experience on job performance is regarded as indirect,
mediated through job knowledge (Schmidt, et al., 2016). Job performance tends to linearly
increase in the first five years of job experience but thereafter flattens horizontally with little
increase in job knowledge, skills or performance (Schmidt & Hunter, 1992; Schmidt, Hunter,
& Outerbridge, 1986). This window period for gaining optimum exposure from job experience
may be longer than five years in professional, scientific and high level managerial positions
(Schmidt et al., 2016). A study investigating the relationship between previous work experience
and the subsequent academic success of students in a post-graduate programme found little
support for the notion that prior work experience led to enhanced academic achievement. There
was only a slight variance in first-semester grades and the two factors were unrelated at second
semester (Dreher & Ryan, 2000).
The third category of information gained from CVs pertains to the extracurricular
activities enjoyed by applicants. The perceptions of recruiters on the academic qualifications,
work experience and extracurricular activities documented by job applicants in their CVs
interact and accurately predict the employability of these individuals (Cole et al., 2007). The
number of activities, professional versus social types of activities, as well as the number of
leadership positions held by an applicant, positively influenced the judgements made by
reviewers on the CV (Nemanick & Clark, 2002). Furthermore, the applicants’ membership in
professional and social societies or fraternities improved reviewers’ overall impression ratings
and their likelihood of further consideration (Campion, 1978). These positive ratings may be
linked to the attribution of interpersonal skill, leadership and high motivational qualities to
applicants with several extracurricular activities (Brown & Campion, 1994; Rubin, Bommer,
& Baldwin, 2002). Recreational activities can assist individuals to develop competencies
similar to those required within the business context. For example, playing and coaching sports
develops communication, team-building and leadership capacities. Through these activities
people develop their confidence and learn how to effectively deal with competition. Volunteer
work, especially to people with disabilities or special needs, develops skills in problem-solving,
communication, planning and organising (Duggan, 2017).
93
Recruiters make inferences regarding the personality profile of applicants from the
structure, layout and content of CVs. These inferences were found to accurately predict the
subsequent employability results of the applicants. This is specifically the case if recruiters
infer extraversion, openness to experience and conscientiousness from the CV (Cole, Feild, &
Giles, 2003; Cole, Feild, Giles, & Harris, 2009; Burns, Christiansen, Morris, Periard, &
Coaster, 2014). Furthermore, the actual content and aesthetics of a résumé influences the hiring
recommendations made by recruiters. Recruiters made inferences regarding the professional
knowledge, interpersonal skills and general mental ability of the applicant from the résumé
information (i.e., content and aesthetics), which influences the type of hiring recommendation
given on the applicant (Chen, Huang, & Lee, 2011). The layout of a résumé has a significant
impact on short-listing opportunities. Formal layout designs (i.e., printed on white paper) are
preferred over more creative options (i.e., printed on coloured paper or an informal layout).
Non-professional recruiters were only slightly more influenced by the graphical design of the
résumé than professional recruiters (Arnulf, Tegner, & Larssen, 2010). The ratings given to
résumés with an informal e-mail address were significantly lower than the ratings for résumés
that contained a formal e-mail address. The impact of e-mail address on hireability ratings was
as strong as the impact of spelling errors and was even stronger than that of typeface (Van
Toorenburg, Oostrom, & Pollet, 2015).
Information on applicants gained from CVs has been shown in previous research to be
highly predictive of employee performance and turnover. However, Breaugh (2009) cautions
against blindly following this research and highlights that the validity, reliability and
generalisability of this research may be questionable. Rather, he suggests that making use of
advanced technological tools can enhance the accuracy of biodata information. Furthermore,
given the high volumes of CVs being up-loaded onto the recruitment webpages of companies,
researchers are seeking to find more time and cost-effective methods of dealing with this
information. A technique called competency management allows recruiters to upfront specify
the competencies required for a specific position on their website. Job seekers are then tasked
to explicitly link their knowledge, skills, motives and personality attributes to these identified
competencies. This form of CV design facilitates refinement of the matching process between
job and applicants (Harzallah, Leclère, & Trichet, 2002). Other similar technologies and portals
have been designed to facilitate the effective matching of advertised positions with CVs
submitted by applicants (García-Sánchez, Martínez-Béjar, Contreras, Fernández-Breis, &
Castellanos-Nieves, 2006; Hawkes, Cek, & Handler, 2017; Amdouni & Ben Abdessalem
94
Karaa, 2010). Realistic job preview tools are also being used to provide applicants with
accurate and realistic information about an advertised position. Subsequently, applicants make
more informed decisions regarding proceeding with the application process or not. This is
specifically useful for positions that traditionally attract high volumes of applications (Lachu,
2014). On-line technology has also been suggested in tracking CVs during the recruitment and
selection process. Following the applicant uploading their CV on the company website, the
applicant is allocated a tracking code. The applicant can then follow the processing of their CV
at any time. Applicants know if their CV is under consideration or not, as well as the result to
date of this consideration (Perinot, 2016).
Misrepresentation and/or lying on job applications or CVs is a major talent management
risk. A global survey of 3 000 organisations, from various sectors and with differing sizes,
revealed that 86% had discovered this form of fraud (Trindale, 2015). Another criticism is the
time-consuming nature of manually processing the large volume of information contained in
CVs. Selectors also generally use their subjective opinion in this process and the identification
of the best candidates is not guaranteed (Kalugina & Shvydun, 2014). This subjectivity was
also noted in the impact of physical attractiveness and/or gender on the evaluation of CVs
(Steinpreis, Anders, & Ritzke, 1999; Van den Brink, Brouns, & Waslander, 2006; Watkins &
Johnston, 2000).
4.4.3. Reference checking and verification
This section covers step four of the selection process shown in Figure 4.1. However,
Cooper (2001) states that reference checking is usually done as one of the final steps in the
screening of candidates, immediately prior to a job offer being extended. Other companies
conduct reference checking after the preliminary interviews but prior to the final interview
(Wickramasinghe, 2007).
There is widespread usage of reference checks as a selection tool (Heraty & Morley,
1998; Stewart & Knowles, 2000; Zottoli & Wanous, 2000). Both employers and prospective
employees deem reference checking as valuable. Employers specifically believe that vital
information is gleaned from this selection method if reliable and detailed information is
provided (Cooper, 2001). Over 84% of South African organisations employ this technique as
part of their selection procedure, making it the third most popular selection method (Booi,
95
2005; Louw, 2013). However, reference checking is predominantly used in conjunction with
other selection methods, such as application blanks and interviews (Louw, 2013).
Reference checks should be used to evaluate whether applicants have essential qualities
such as honesty and integrity. However, they should also be used to ascertain whether there is
a match between their personal values and those of the organisation. Leadership abilities can
also be assessed through reference checks, establishing whether the applicant has displayed the
skills in the past, under similar conditions (Fernández-Aráoz, 2014).
There are several vital aspects to implementing effective background checking. Firstly,
the enquiries conducted must relate to, and be relevant to, the position the applicant applied
for. Secondly, it is imperative that firms disclose the intent to perform background checks and
obtain consent from the applicants. This can be done orally or in writing (Trindale, 2015). The
imposition of structure has also been found to be useful. When conducted in a structured
telephone-based format, reference checks were able to significantly predict supervisory ratings
(Taylor, Pajo, Cheung, & Springfield, 2004).
A challenge with the use of reference checking as a selection method is the increased
trend towards limited reference policies (Schmidt et al., 2016). The increased number of highly
publicised international defamation cases has resulted in many businesses indicating only the
name, job title and employee number as standard practice in their job referencing. This is
especially the case when information is requested in writing. Despite reference immunity laws,
past employers remain reluctant to provide detailed information of their employees (Cooper,
2001; Schmidt et al., 2016).
Besides reference checking, various other types of verification can be conducted by
organisations in order to minimise risk and ensure compliance to certain regulations. Criminal
searches and identity verification are most commonly performed. Past employment, motor
vehicle record, professional licence and education verification are also conducted depending
on the nature of the position and level (Trindale, 2015). The next section discusses the
techniques and range of attributes analysed through testing and assessment of potential
employees.
96
4.4.4. Testing and assessment methods
There is a well-documented increase in organisations using formal tests in their selection
activities (Lievens et al., 2002; Louw, 2013; Wolf & Jenkins, 2006). Psychometric testing was
deemed the fourth most popular selection method in a survey of South African organisations
(Louw, 2013). However, Grobler et al. (2018) established that only 26.7% of local firms are
using psychometric testing for the professional category of workers, whilst 45% made use of
these selection measures for the managerial category. Psychological assessments are generally
more regularly used in larger organisations due to the cost implications (Branine, 2008;
Greenidge et al., 2012; Zibarras & Woods, 2010).
A wide range of factors, both external and internal to the organisation, is driving this
increased usage of testing in the selection process. External issues include economic variables
driving the amount of training needed, the nature of the labour market, and the type of position
being filled as well as the rate of pay. Internal organisational issues such as, the role of the
union, the existence of personnel staff and whether it is a public or private sector firm also play
a role in the decision to use selection tests (Jenkins & Wolf, 2002). A British study established
that the most important factor driving this increase was the regulatory environment. Tests are
increasingly being used as a precautionary measure to circumvent challenges of selection
decisions (Wolf & Jenkins, 2006). A similar trend has been identified in the USA (DeCenzo &
Robbins, 2007) and within SA (Louw, 2013).
As discussed in section 4.4.2.2, increasingly on-line technology is being used to assist in
the screening of CVs and their matching to advertised positions. This has extended into the use
of gamification, where selection questionnaires and assessments operate like a game. These
tools may have a scoring element and/or require interaction with other on-line applicants
(Lachu, 2014). Gamification has been listed as one of the top 10 human capital trends of the
future (Deloitte, 2018). There are various forms of gamification being used in talent
management projects. Customisable situational judgement games on WhatsApp and Facebook
Messenger are available for mobile devices (Grosvenor, 2017). Recruitment chatbots are
interacting with applicants, identifying and scoring video interviews. Examples include Ari
used by Textrecruit, Mya employed by Hiremya.com and Olivia used by Paradox.ai (Deloitte,
2018). The benefits of gamification are higher levels of involvement, longer attention and
participation rates as well as investigating the competitive nature of the applicants (Lachu,
2014). These assessments have strong appeal for the youth as they are comfortable with using
97
these forms of technology (i.e., instant messaging) in their everyday life (Grosvenor, 2017). In
comparison to traditional methods of testing, gamification is time and cost effective, for both
the applicants and the recruiting company (Giffi et al., 2014; Hawkes et al., 2017; Joy, 2017;
Perinot, 2016). However, designing these gamification tools to meet the expectations of
recruiters can also be costly (Deloitte, 2018; Hamari, Koivisho, & Sarsa, 2014).
Despite its increased usage, there are several criticisms of on-line psychological testing.
Psychologists may have made the use of testing overly technical at the expense of industry
needs. Research indicates that most organisations prefer selection methods that require little
technical capability to develop and implement (Anderson et al., 2001). However, given the
advancements in technology, the wide availability of many psychological tests on-line, the
rapid reduction in the cost of on-line psychological tests and the need for increased speed in
selection decisions, these tools may be open to abuse (Kwiatkowski, 2003; Lievens, et al.,
2002; McHenry, 2001). Specifically, there is a high incidence of faking, the risk to test security
and confidentiality, especially in proctored settings, as well as the impact of coaching effects
(Bartram, 2004; Burke, 2009; Kuncel & Hezlett, 2007; Schmitt, 2014; Tippins, 2009).
Nevertheless, this proliferation of internet-based measures also has its benefits – efficiency
given that neither party has to be simultaneously present at the same venue, wider access to a
geographically diverse applicant pool and the provision of a high tech image (Joy, 2017;
Ployhart, 2006; Sackett & Lievens, 2008).
4.4.4.1. Aptitude and intelligence
More than any other area, the measurement of intelligence is one of psychology’s most
significant achievements. However, it is simultaneously also the domain most fraught with
controversy and difficulties (Deary, Strand, Smith, & Fernandes, 2007; Foxcroft & Roodt,
2013; Nisbett, 2013). Cognitive test scores are not the simplistic outcome of the intrinsic
abilities of individuals. Rather, they are the complex reflection of a sum of talents, learned
knowledge and skills, and other environmental factors such as past experience, education, and
training (Kuncel & Hezlett, 2010; Wicherts, Dolan, & Van der Maas, 2010).
Despite the debate on the intricacies of the subject, there are decades of empirical
research showing the relationship between cognitive ability and other measures of
psychological performance (Macpherson & Stanovich, 2007; Schmitt, 2014). This body of
evidence has consistently revealed the significance of cognitive ability tests in predicting
98
academic success, such as grades and outcomes beyond these; work success, such as job
performance assessments; and everyday life, such as divorce and mortality (Deary et al., 2007;
Heaven & Ciarrochi, 2012; Kuncel & Hezlett, 2010; Kuncel, Ones, & Sackett, 2010; Luo,
Thompson, & Detterman, 2003; Nisbett, 2013; Schmitt, 2014; Van der Flier et al., 2003).
GMA has a significant causal relationship with the acquisition of job knowledge.
Improved job performance is therefore often seen in those with higher levels of intelligence.
They acquire more job knowledge faster than others and this results in higher job performance
(Hunter, 1986). This implies an indirect relationship between GMA and job performance,
mediated by job knowledge (Schmidt et al., 2016). However, other researchers have established
a small yet direct relationship between mental ability and job performance independent of job
knowledge. In supervisory positions, the direct impact is about 50% as large as the indirect
effect, with only about 20% as large in nonsupervisory positions (Borman, White, Pulakos, &
Oppler, 1991; Schmidt, et al., 2016). This was supported by more recent studies where GMA
tests demonstrated significantly higher operational validity for more complex job families and
occupations assessed (Bertua, Anderson, & Salgado, 2005; Salgado et al., 2003).
There is widespread support that the majority of the validity of GMA tests comes from
general intelligence or general cognitive ability (Carroll, 1993; Ree & Carretta, 2002).
However, given Gardner’s (1999) multiple intelligences model, there is increasing focus on the
specific abilities or aptitudes and their usage in combination with GMA (Campbell & Catano,
2004; Mount, Oh, & Burns, 2008). Psychomotor and dexterity testing has also successfully
been used in the selection of candidates for surgical training (Gallagher, Leonard, & Traynor,
2009). Experienced surgeons and medical students were tested on three aptitude tests. The
surgeons had higher than average eye-hand co-ordination and dexterity but lower visual-spatial
abilities than the medical students (Francis, Hanna, Cresswell, Carter, & Cuschieri, 2001). Two
specific aptitude tests, namely, two-hand coordination and complex coordination, assisted in
the selection of pilots and accurately differentiated between those that were ultimately
recommended to fighter pilot status (Bordelon & Kantor, 1984).
Specific cognitive abilities, such as spatial and psychomotor aptitudes, fulfil a key role
in academic achievements and innovations within the STEM areas (Johnson & Bouchard,
2005; Kell & Lubinski, 2013; Wai, Lubinski, & Benbow, 2009). Higher performance levels in
three specific aptitudes, namely, Verbal reasoning, Non-verbal Reasoning and Visual
99
Perceptual Speed was established amongst automotive operator candidates with a matriculation
certificate incorporating mathematics or both mathematics and science (Puchert et al., 2017a).
Significant relationships were also established between these matriculation types and two
technically-oriented aptitudes, namely, Eye-hand Coordination and Spatial Visualisation
(Puchert et al., 2017b). Furthermore, four aptitudes, Verbal Reasoning, Numerical Ability,
Mechanical Reasoning and Space Visualisation, accurately predicted the job performance of
apprentices in eight trade occupations (Hattrup & Schmitt, 1990).
Many selection methods, whilst valid predictors of job performance, have little or no
incremental validity over assessments of GMA (Schmidt & Hunter, 1998). Furthermore, the
incremental validity contribution made by specific abilities to general intelligence also
continues to be investigated (Schmitt, 2014). A meta-analysis of 100 years of research studies
has affirmed the dominance of GMA in terms of its validity (r = .65) and utility as a selection
tool. Specifically, when hiring individuals with no previous experience in a particular job, the
most valid predictor of future performance and learning is GMA (Schmidt et al., 2016). Even
the use of specific aptitude tests that closely match the core aspects of job performance, such
as spatial perception for mechanical positions, will not yield more valid results than GMA
measures (Schmidt, 2011). According to leading experts on the subject, it is wisest to use
measures of general intelligence whenever possible in selection (Schmidt & Hunter, 1998;
Schmitt, 2014). However, substantial differences in the results obtained for GMA and specific
aptitude measures were found in a study documenting the selection of automotive operators.
Stanine scores of three and below were regarded as low average, meaning that the pool of
candidates would be outperformed by at least 60% of the national population. For the GMA
measures, 17.1% scored at this level in the Verbal Reasoning sub-test and 44.5% in the Non-
verbal Reasoning sub-test. In the specific aptitude measures, this performance level was
attained by 11% for Assembly, 30.5% for Coordination, 80.9% for Dexterity, 19.7% for Spatial
Perception 2-D, 13.2% for Spatial Perception 3-D and 41.3% for Visual Perceptual Speed
(Puchert et al., 2014).
Despite this proliferation of evidence supporting the validity of GMA in predicting job
performance, the majority of global HR practitioners are not employing the tool as a primary
selection measure. The assessment of values and conscientiousness are regarded as better
predictors of high performance. A significant portion of HR practitioners also falsely believe
that GMA is a disadvantage for effective performance at a low-skill level (Rynes et al., 2002a).
100
Locally, only seven percent of organisations employ intelligence testing in their selection
procedures. HR practitioners may be hesitant to use this tool given the large mean differences
found across racial and ethnic subgroups in SA (Krause et al., 2011). Certain applicants may
also be hesitant to have their cognitive abilities assessed. High level managers and skilled
tradespeople, such as machinists, computer programmers and machine repairmen, may insist
on their past achievements rather being assessed (Schmidt et al., 2016).
4.4.4.2. Competencies
A lack of workplace competencies was cited as the fifth most common reason for
difficulty in filling vacant positions. Besides technical competence and general workplace
experience, there is also a pervasive lack of the softer skills required by firms
(ManpowerGroup, 2016). Several tools can be used to assess skill levels. Two broad forms of
competency testing are discussed here, namely, assessment centres (ACs) and work sample
tests.
According to Schlebusch and Roodt (2008), ACs involve participants undertaking
simulation exercises that are based on pre-determined job-related behavioural competencies.
ACs are generally formal and multi-day in nature (Campbell & Bray, 1993). The exercises
employed are observed and evaluated by trained assessors. These assessors, through a process
of consensus, agree on the scores or the scores can also be derived through statistical integration
(Ballantyne & Povah, 2004). Muleya, Fourie and Schlebusch (2017) recently published an
article providing 93 concrete recommendations to various stakeholders involved in AC usage.
These recommendations aimed to increase awareness of the possible risk involved in ethical
AC use.
ACs have a lengthy and effective track record as a screening mechanism for selection,
diagnosis and developmental purposes. This is due to their numerous strengths, including
apparent fairness, practical utility and an established relationship with actual performance on-
the-job (Meiring & Buckett, 2016; Thornton & Rupp, 2005). Skills such as influence,
persuasion, competitiveness, motivation and leadership can be observed in various situations
(Branine, 2008; Krause & Gebert, 2003; Lievens, Harris, Van Keer, & Bisqueret, 2003). South
African research revealed that over 73% of organisations make use of ACs. Another 21.05%
used presentations and 10.53% in-basket exercises separate to a fully-fledged AC (Louw,
101
2013). In contrast, Grobler et al. (2018) found that only 20.8% of firms used this selection
method for professionals and 30.8% for the managerial category.
There is no consensus in the literature regarding the minimum or maximum number of
competencies that should ideally be measured in an AC exercise. However, current guidelines
are that between four and six competencies per behavioural simulation exercise is optimal
(Meiring & Buckett, 2016). In a survey of 54 American organisations, more than half indicated
that they assessed between six and 10 dimensions and less than 10% employed more than 15
dimensions in their ACs (Eurich, Krause, Cigularov, & Thornton, 2009). Nevertheless, better
prediction of on-the-job performance arises when fewer competencies are assessed per exercise
(Bowler & Woehr, 2006; Krause et al., 2011; Lievens & Conway, 2001; Thornton & Mueller-
Hanson, 2004).
Certain competencies assessed in ACs yield more validity than others. Specific
competencies, such as communication, influence, planning and organising as well as problem
solving, are more construct valid than others, such as drive and awareness of others (Bowler &
Woehr, 2006). In terms of construct and criterion validity, other researchers have agreed that
six AC dimensions can be regarded as valid. These are: communication, consideration of
others, drive, influencing others, organisation and planning as well as problem solving (Arthur,
Day, McNelly, & Edens, 2003; Eurich et al., 2009; Ployhart, 2006; Woehr & Arthur, 2003).
The predictive validity of an AC increases with the number of exercises utilised (Gaugler,
Rosenthal, Thornton, & Benson, 1987). Researchers concur that the exercises employed in ACs
are more significant than the actual constructs measured (Bowler & Woehr, 2006; Lance,
Lambert, Gewin, Lievens, & Conway, 2004). The majority (64%) of American organisations
use between four and five exercises per AC. The most popular exercises are: role-playing
(76%), presentations (64%) and an in-basket exercise (57%) (Eurich et al., 2009). A wide
variety of exercises are used in ACs conducted in South African organisations. These include
in-baskets, presentations, role-plays, case studies, planning exercises and group discussions
(Eurich et al., 2009; Krause et al., 2011; Wickramasinghe, 2007). The majority of local
organisations use less than three exercises per AC (Krause et al., 2011), which is lower than
that employed globally (Krause & Thornton, 2009). There is therefore a need for improvement
in this aspect (Krause et al., 2011).
102
There is consistent empirical evidence highlighting the higher predictive validity of ACs
when used in conjunction with cognitive ability tests (Dayan, Fox, & Kasten, 2008; Dilchert &
Ones, 2009; Meriac, Hoffman, Woehr, & Fleisher, 2008). However, Krause et al. (2011)
established that only the minority of national organisations employed one other assessment
method. In order to improve overall predictive validity, national organisations are therefore
encouraged to integrate at least one additional selection tool into their ACs. A well-designed
AC is regarded as key to enhancing the construct validity of the AC (Arthur, Woehr, &
Maldegen, 2000; Lievens & Conway, 2001; Ployhart, 2006).
The number and type of assessors overseeing the AC is regarded as an important
moderating variable of an AC’s validity. The recommended ratio of participants to assessors is
1:2 with the majority of assessors in South African organisations being HR professionals
(Krause et al., 2011). The use of line managers as assessors has revealed an increase in the
construct validity of the AC (Lievens, 2002). However, line managers are used significantly
less as assessors in SA in comparison to organisations in North America and Western Europe
(Krause & Thornton, 2009). This is most likely due to local practitioners being highly sensitive
to the labour legislation in the country and their understanding that they may need to defend
the legality of their selection actions in this context (Krause et al., 2011). Whilst there is no
minimum academic qualification stipulated to become an assessor nationally, it is widely
recommended that assessors are adequately trained in the various simulation exercises of an
AC (Krause et al., 2011; Meiring & Buckett, 2016; Muleya et al., 2017). However, should the
AC incorporate additional psychological tests, there are more stringent guidelines regarding
minimum qualifications of the assessor (Meiring & Buckett, 2016).
Despite its many advantages, ACs have also been criticised. ACs are time-consuming
and expensive selection measures to employ (Schmidt et al., 2016; Thornton, Murphy, Everest,
& Hoffman, 2000; Wickramasinghe, 2007). It is also highlighted that whilst ACs have
significant criterion-related validity, they have only slight incremental validity (i.e., two
percent increase) over GMA in predicting job performance (Schmidt et al., 2016). Overall
assessment ratings, which is scoring using a combination of assessments on various dimensions
across diverse exercises, in comparison to its individual predictors, have also come under
criticism. Whilst practically important, employing a composite of the individually assessed
dimensions results in higher validity than the overall assessment ratings (Arthur et al., 2003).
103
Work sample tests are regarded as practical simulations of part or most aspects of the
tasks expected of the employee and are regularly used in the hiring of skilled workers, such as
machinists, welders and carpenters (Jenkins & Wolf, 2002; Ployhart, 2006; Schmidt et al.,
2016). These tests are often implemented when employers have the expectation that applicants
already possess the competencies required to perform the job adequately (Jenkins & Wolf,
2002). Some knowledge and a certain level of skill is therefore necessary in order to be able to
adequately complete this form of selection technique (Schmidt et al., 2016). Work sample tests
are regarded as one of the optimal methods of concurrently achieving validity and diversity
(Ployhart, 2006).
ACs and work sample tests have been praised for their contextualisation. They provide
an indication of behavioural consistency between behaviour displayed during the selection
process and expected job behaviour (Sackett & Lievens, 2008). Competency-based
assessments can also assist with compliance issues. A strong commitment to equal
opportunities and the prevalence of grievance procedures plays a significant role in the regular
use of competency tests in British organisations. These tests were linked to organisational
efforts to ensure fairness in their selection practices (Jenkins & Wolf, 2002).
Work sample tests, however, are not as valid as was previously indicated in research
findings. The incremental validity of these selection measures over GMA is almost zero
(Schmidt et al., 2016). Another problem with this method are the large sub-group differences
(Ployhart, Weekley, & Baughman, 2006). This may explain why South African organisations
seldom employ work sample tests (Krause et al., 2011), despite the fact that applicants evaluate
them favourably (Anderson et al., 2010). This section has discussed two testing and assessment
methods employed in HRS. In the section that follows the interviewing approach is discussed,
which fulfils steps six and seven of the selection process indicated in Figure 4.1.
4.4.5. Interviewing methods
Interviews are the most frequently used selection method and are regarded as standard
practice in HRS (Anderson & Witvliet, 2008; El-Kot & Leat, 2008; Louw, 2013). The
frequency of their use is probably due to interviews being perceived by organisations as the
cheapest, easiest and quickest selection method to employ (Stewart & Knowles, 2000).
Globally, interviews are a preferred selection method as selection is more person than job-
specific. Recruiters are mostly interested in the attitudes, personality and portable skills of
104
applicants, in comparison to the level or type of qualification (Branine, 2008). According to
Azar et al. (2013), interview scores are highly predictive of on-the-job performance and the
likelihood of promotion post-employment. These researchers therefore suggest the training of
applicants before conducting interviews.
Over 94% of South African organisations employ interviews as part of their selection
procedure. This selection technique is therefore the second most popular method utilised, with
the application blank being the most popular (Louw, 2013). In another local study, interviews
were rated the most popular by applicants, in comparison to nine other assessment methods
(Anderson & Witvliet, 2008). Structured interview ratings and verbal reasoning were found to
be predictive of the work performance of retail managers (Nzama, De Beer & Visser, 2008).
Most organisations use a series of interviews, with each stage resulting in fewer
candidates being selected for the next stage. The preliminary stages are usually conducted by
line management, sometimes with assistance from HR. However, final interviews are
traditionally done by a panel of three to four line managers and the HR manager. A pre-
interview discussion is usually conducted with the panel prior to facilitating the interviews
(Wickramasinghe, 2007). Scoring systems are also commonly employed in interviews when
more than one person is assessing the candidate (Stewart & Knowles, 2000).
The primary goal of interviews is to assess the consistency of the applicants’ knowledge,
skills, abilities and other characteristics against those required for the position (Straus, Miles,
& Levesque, 2001). Interviews are hence a reliable source of additional information on the
candidate. Key qualities such as honesty and integrity can be gleaned as well as leadership
abilities. A match between the personal values of the applicants and those of the organisation
can also be established (Fernández-Aráoz, 2014). According to Huffcutt, Conway, Roth and
Stone (2001), seven latent elements are assessed in interviews: cognitive ability, interests and
preferences, fit, knowledge and skills, physical abilities and attributes, personality and social
skills. Most importantly, however, interviews indicate whether applicants have displayed the
key skills required for a position in the past, under similar conditions (Fernández-Aráoz, 2014).
Employment interviews are either structured or unstructured. A job analysis determines
the questions to be asked in structured interviews, which may not be altered by the interviewer
(Schmidt et al., 2016). Structured interviews primarily assess four constructs, namely,
105
cognitive ability, behavioural skills, person-organisation fit and tacit knowledge (Harris, 1999).
They are regarded as better performance predictors, as measured by job knowledge,
interpersonal skills and organisational fit (Cortina, Goldstein, Payne, Davison, & Gilliland,
2000; Huffcutt et al., 2001; Nzama et al., 2008; Salgado & Moscoso, 2002; Ziegler, Dietl,
Danay, Vogel, & Bühner, 2011). Structured interviews are, however, significantly costlier to
design and implement than unstructured interviews (Schmidt et al., 2016). Nevertheless, they
are a more popular selection method than their unstructured counterpart (Zibarras & Woods,
2010). The combination of GMA and a structured interview has substantial predictive power
in hiring decisions (Ziegler et al., 2011).
Typically, interviewers dislike using structured interview formats given the restriction on
format and question bank (Schmidt & Zimmerman, 2004). However, at least 70% of HR
practitioners surveyed concurred that the most valid interviews are structured and are
consistently applied across all the applicants applying for a job (Rynes et al, 2002a). Through
using three or more interviewers, and averaging their ratings, an unstructured interview
provides the same level of validity (r = .58) for predicting job performance as a structured
interview with one interviewer (Schmidt & Zimmerman, 2004). Regardless of whether
structured or unstructured, interviews then accurately predict performance and add to
prediction over and above GMA tools (Schmidt et al., 2016).
Interviews have been critiqued as unreliable and subjective (Louw, 2013). This is due to
the faking and impression management potentially inherent in this selection measure
(McFarland, Yun, Harold, Viera, & Moore, 2005; Van Iddekinge, Raymark, & Roth, 2005). It
is suggested that these disadvantages can be minimised through the use of panel interviews and
successive stages of interviews (Wickramasinghe, 2007). In this section four central kinds of
HRS techniques were discussed. These were the preliminary screening methods, reference
checking and verification, testing and assessment and interviewing methods. The next section
provides an account of the challenges experienced within HRS.
4.5. Challenges in human resource selection
Section 4.4 highlighted the various challenges inherent within the four selection methods
discussed. This section introduces three other broad challenges pertaining specifically to the
task of selection. The section is initiated with a discussion on the evaluation challenge within
106
HRS. Section 4.5.2 examines the problems inherent in the labour market with section 4.5.3
outlining the impact of national legislation on HRS.
4.5.1. Evaluation of human resource selection
The significant role of HRM and HRS in various aspects of organisational performance
has been confirmed in several studies (Liu et al., 2007; Ployhart, 2006; Schmidt et al., 2016).
However, the scepticism regarding the value of HRS remains, especially amongst senior
executives of businesses. As pertinently summarised by Pfeffer (1998), half of executives deem
HR as useful and only a quarter actually put that belief into practice in their actions. These
decision-makers need to move from a micro perspective on recruitment and selection to engage
at a macro and multi-level understanding of the impact of staffing practices on the holistic
functioning of the organisation (Ployhart, 2006).
Liu et al. (2007) propose that this scepticism may be due to HR investments being
difficult to measure. Whilst progress has been made in designing and conducting return on
investment initiatives, conflicting results have led to confusion and a continued lack of
confidence in the merit of HRM. Pietersen (2018) has highlighted that local HRM needs to
provide practical solutions to the problems being experienced within the workplace. In her
analysis of research articles being produced she concluded that the research-practice gap is still
too large within South African research, with a need for more practical advice being generated.
Louw (2012), however, believes that most evaluations of HR practices done within SA
organisations remain in-house and are not published. This knowledge of good practices,
reliable relationships and strong links between HR practices and outcomes is hence not shared.
Besides the HR programme evaluations done by Edwards and his peers (Edwards, Scott, &
Raju, 2003, 2007), research in this area is scarce. A special edition of articles documenting the
evaluations of South African HR interventions was published in 2012. This edition was
regarded as the first compilation of HR programme evaluations in SA (Louw, 2012). Articles
were produced documenting evaluations of programmes within the five phases of the HR value
chain. These were recruitment and selection, pay and reward, training and development,
performance management and employee relations. For the first phase, the evaluation of an
induction programme was provided. However, Louw-Potgieter (2012) notes, in the rationale
for this special edition, that an evaluation of a selection programme was missing from this
107
recruitment and selection category. This omission was regarded as being noteworthy given that
the HR intervention of recruitment and selection is a high-cost one.
In the next volume of the respective journal, Azar et al. (2013), published a case study
documenting a personnel selection model using a data mining approach. The article
documented the value of using this decision-making technique in recruitment. Covert patterns
of relationship between entrance test scores and work performance were established for five
variables, namely, employment province, educational level, work experience as well as exam
and interview scores.
Lodovici et al. (2013) concur that, internationally, there are limited studies on
apprenticeships that employ an impact evaluative approach. They cite several potential reasons
for this, including the newness of the approach, difficulties in sourcing retrospective data and
the large-scale nature needed for such studies. The lack of research evaluating the impact of
selection practices is therefore the first challenge documented in this section.
4.5.2. Labour market challenges
As discussed in section 2.4.1, the South African automotive industry has been criticised
for not being as competitive as its global counterparts. In order for the national manufacturing
sector, and specifically the automotive industry, to remain viable its human capital needs to
have the necessary knowledge and skills (Deloitte, 2013). Whilst there are potentially many
areas to discuss, this section deals with two primary challenges to the efficient sourcing of
human capital. These are the current educational profile and skill deficiency within the
applicant pool.
4.5.2.1. Educational profile of applicants
In comparison to other middle-income countries, SA has the poorest education system.
SA also performs worse than many low-income African countries in educational achievement
assessments (Spaull, 2013). As discussed in section 3.7.1, the national education system is
faced with several gaps and misalignments. Specifically, a mismatch of technical skills with an
inadequate focus, level and quality of the training has been identified (Mayer et al., 2011;
Ramdass, 2009; Smith, 2011).
108
When confronted with a mass educated labour force, especially when supply exceeds
demand, employers need to employ additional selection criteria beyond educational
attainments. This has become known as credential inflation (Van de Werfhorst, 2014). The low
quality of education obtained from certain types of secondary education in SA is a cause for
concern amongst HR practitioners (Ramdass, 2009; Spaull, 2013; Van der Berg et al., 2011;
Van de Werfhost, 2014). In light of this, researchers have recommended educational
institutions update their current programmes and create better alignment to the specific
aptitudes required by industry (Puchert et al., 2017a, 2017b).
Researchers have suggested that the traditional staffing methods used by the private
sector should be reformed. Shankar et al. (2016) have proposed that the screening and selection
tools, emphasising educational attainments, currently being used are filtering out the
disadvantaged youth in the country. This challenge is, however, not unique to SA. Similar
problems are being experienced in America (Giffi et al., 2014; 2015), Brazil (Gray & Wragg,
2015), China (OECD, 2011) and Switzerland (Mueller & Wolter, 2014). The second challenge
experienced within HRS, namely, skill deficiency, is discussed in the next section.
4.5.2.2. Skill deficiency of applicants
Traditionally, HR practitioners benefitted from the long-standing assumption that they
were able to identify the best candidates for a vacancy from a large pool of applicants.
However, this belief can no longer be taken for granted in the current labour market (Lievens
et al., 2002). Employers have become deliberate regarding the skills, attributes and behaviours
they expect from applicants, whether through academic studies or work experience (Evans &
Richardson, 2017). However, there is a global shortage of qualified and competent applicants
given the widespread societal, cultural and demographic changes (Ployhart, 2006; Trindale,
2015).
The majority of global employers therefore cite their most significant current business
challenge being sourcing, developing and/or keeping human talent (Shankel, 2010; Trindale,
2015). Almost 70% of Brazilian employers’ experience difficulty in recruiting an adequately
skilled workforce, citing an average of 150 days to complete a recruitment cycle (Gray &
Wragg, 2015). With China becoming one of the fastest growing economies in the world, and
its large modern establishments with high technology levels, firms are experiencing difficulty
in sourcing skilled labour (Li et al., 2014; Risler & Zhiqun, 2013).
109
Within SA, there is an undersupply of suitably skilled applicants to fill job vacancies as
well as an oversupply of unskilled workers (Louw, 2013; Masibigiri & Nienaber, 2011;
Shankar et al., 2016). Over a quarter of local organisations indicate a lack of hard skills as the
source of their human capital problems (ManpowerGroup, 2016). The South African talent
pool is also limited by equity legislation and the emigration of skilled workers. Furthermore,
there is a high labour turnover of Black African employees as they move rapidly between
organisations to optimise their career and financial prospects (Nzukuma & Bussin, 2011). From
this it can reasonably be assumed that organisations need to be very cautious when selecting
future employees (Louw, 2013).
Researchers cite a discrepancy between the self-perception of students and the
perceptions of employers regarding preparedness for work. Due to an inability to articulate and
make meaning of their education and acquired skills, students may actually be more prepared
than they reveal. Whilst they may have participated in meaningful educational initiatives, they
are not able to explain what they have learnt and/or achieved (Fox, 2018). This inability to
confidently interpret the value of their skills and experiences is known as the interpretation
gap. This contributes to the beliefs held by employers that students have a deficiency in the
skills they desire (DuRose & Stebleton, 2016). However, whether a skills gap or a gap in
interpretation, there is room for improvement in the manner in which students prepare for the
world of work (Fox, 2018; DuRose & Stebleton, 2016). Various suggestions are offered to
potential employers to assist in the recruitment and retention of the youth in their organisations.
Amongst others, these include conducting orientation sessions, providing career guidance and
fostering socialisation (Hessler & Ritchie, 2006; merSETA, 2016).
The imminent retirement of baby-boomers (i.e., born between 1946 and 1964) will also
have a significant impact on businesses. As these older, more experienced employees retire,
businesses will lose their embedded knowledge and find replacing their talent pool onerous.
Given that skilled production positions account for over 50% of the total manufacturing
workforce, shortages within this category will be a major problem for companies. The
manufacturing industry will need to consider ways to overcome the exodus of personnel in the
areas of skilled production (e.g., machinists, operators and artisans) as well as highly
specialised and innovative workers, such as scientists and design engineers (Giffi et al., 2014).
Section 4.5.2 has commented on the likely problems for HRS in SA given the current labour
market. Section 4.5.3 introduces another challenge, being the legislation within SA.
110
4.5.3. Impact of legislation
With the changes in the South African political landscape post-apartheid, several pieces
of legislation were promulgated by the new government. One of these pieces of legislation, the
EEA (1998), and the later Employment Equity Amendment Act (No. 47 of 2013) (EEAA), has
bearing on the task of HRS. The purpose and impact of this national act is discussed in the
paragraphs that follow.
The EEA (1998) provides clear specific stipulations to eliminate and prohibit the practice
of unfair discrimination in the workplace. One of these stipulations is that job applicants can
only be assessed against the inherent requirements of a job. Furthermore, the EEA (1998, p. 7)
provides stipulations pertaining to psychological testing and other assessments:
Psychometric testing and other similar assessments of an employee are prohibited
unless the test or assessment being used-
a) has been scientifically shown to be valid and reliable;
b) can be applied fairly to all employees; and
c) is not biased against any employee or group.
The EEAA (2013, p. 6) added a fourth condition, clause (d), into Section 8, namely,
that:
d) has been certified by the Health Professions Council of South Africa, established
by section 2 of the Health Professions Act, 1974 (Act No. 56 of 1974), or any other
body which may be authorized by law to certify those tests or assessments.
Besides providing specific guidelines on testing and assessments, the EEA (1998) also
makes clear the need to appoint certain ethnic groups in preference to other groups (Nzukuma
& Bussin, 2011). However, this is made challenging given that several personnel selection
instruments, whilst valid, can still present large racial score differences in test results (Hough,
Oswald, & Ployhart, 2001; Ployhart & Holtz, 2008; Sackett, Schmitt, Ellingson, & Kabin,
2001). In the literature this occurrence has been labelled “the diversity-validity dilemma’
(Ployhart & Holtz, 2008; Pyburn, Ployhart, & Kravitz, 2008). In selection exercises, this
dilemma implies that the goals of performance and validity do not always converge (De Soete,
Lievens, & Druart, 2013).
111
From six issues potentially effecting their choice of selection methods, HR practitioners
rated the perceived legality of procedures as a significant factor. This was rated at the same
level of importance as the method’s predictive validity and utility in organisational self-
promotion. However, three other variables (i.e., applicant reactions, cost and the diffusion of
the measure in the field), were rated as being marginally more important (König et al., 2010).
The value of good selection practices in increasing job performance, however, significantly
outweighs the potential costs that can result from defending selection-related lawsuits (Pyburn
et al., 2008; Schmidt et al., 2016).
The legal risk of using GMA testing in selection exercises is fairly low. These measures
are highly defensible given the significant evidence of their validity as predictors of job
performance (Schmidt et al., 2016). Despite this high degree of legal defensibility, the issue of
increased workplace diversity still remains. A lower ratio of non-Whites are typically hired in
selection practices where GMA assessment results are used. However, refraining from
employing GMA tools in order to increase workplace diversity has been found to result in
decreased work performance (Sackett et al., 2001). Other forms of testing have therefore
become increasingly significant (Ployhart, 2006; Ployhart & Holtz, 2008). Ployhart (2006)
recommends that organisational decision-makers need to recognise the implausibility of fairly
hiring a diverse workforce through the sole use of cognitive ability tests.
A proposed solution is the implementation of a composite battery of tools that could
reduce group differences linked to GMA measures, whilst still being effective predictors of job
performance. The idea is to supplement GMA tools with non-cognitive measures such as
interviews, integrity and conscientiousness tests that reveal only very small group differences
(Schmidt et al., 2016). Smaller subgroup differences are also found in structured interviews, in
comparison to unstructured ones. Subgroup differences can also be further reduced through the
employment of panel interviews with a variety of interviewers (McFarland, Ryan, Sacco, &
Kriska, 2004). This proposed solution, however, has shown only slight reductions in
differential hiring rates (Sackett et al., 2001).
Staffing decision-makers, who seek the best balance between prediction and diversity,
should potentially make use of selection tools such as ACs and work sample tests. Evidence
indicates that they reveal comparable levels of validity, more favourable user reactions and
smaller subgroup differences than cognitive testing (Ployhart, 2006). The use of other selection
112
tools, besides expensive and often time-consuming psychological tests, could also be of value
to HR practitioners. Type of secondary education, inclusive of subject choice, could be
specifically valuable as a preliminary screening technique. The concerns linked to
psychological testing and the associated compliance with the EEAA (2013) regulations can
then be alleviated (Puchert et al., 2017a, 2017b).
It has been recommended that labour legislation be relaxed in order to facilitate the use
of creative initiatives in recruitment and selection practices. This is specifically required in the
poorer provinces of the country, such as the Eastern Cape, in order to stimulate job creation
(Louw, 2013). Other national researchers have highlighted that organisations need a clear
recruitment and selection policy, with specific procedures. In a context where all HR tasks are
closely examined by equity legislation, these policies and procedures will afford the
organisation some protection against legal errors in the selection process (Nzukuma & Bussin,
2011).
Another identified labour legislation blockage is the fact that apprentices are regarded as
employees in terms of both the Labour Relations Act (No. 66 of 1995) (LRA) and the Skills
Development Act (No. 97 of 1998). Once apprentices commence the workplace component of
the programme, the organisational disciplinary process has to be applied. Employers have
indicated that if apprentices were excluded from the employee category, more employers would
consider opening up their workplaces to apprentices (Pandor, 2018). Section 4.5 has considered
three broad categories of likely challenges within HRS in SA. In the section that follows the
selection practices employed for apprentices are described.
4.6. Selection of apprentices
In section 3.2, the four phases of the apprenticeship life cycle were illustrated and
described. The first phase involves recruitment, selection, induction and contracting
arrangements (Smith, 2010). This section will elucidate the processes and techniques employed
to operationalise one aspect of the first phase, namely the selection of apprentices. This section
builds on the information provided in section 3.7.3 where the selection challenges within the
implementation of apprenticeship programmes were discussed. Initially the different methods
employed globally are discussed in section 4.6.1. This is followed by a review of those used in
the national context, specifically within the manufacturing sector.
113
4.6.1. Global apprentice selection practices
Selecting apprentices is more difficult than the screening of other employees. The
applicants mostly all have the same qualifications and are inexperienced. Answering
competency-based interviews questions is therefore very difficult for them. Global recruiters,
such as in Germany and the UK, are finding the solution to be the use of assessments
(Grosvenor, 2016; NAS, 2017). The choice on offer within apprenticeship programmes is often
challenging for these young and inexperienced applicants. To deal with this problem the UK-
based firms of Siemens and Meiko created on-line ‘pre-application’ assessments that helped
them populate the applicant pool for each apprenticeship type with better-suited candidates.
These tools analysed the strengths and preferences of each applicant and then guided them by
suggesting which apprenticeship programme was better suited to them (Grosvenor, 2017;
Langner, 2015). The Australian and New Zealand-based plants of Komatsu also make use of
an on-line application form. However, applicants are also required to attach their current CV
(Komatsu, 2013). The Australian National Electrical and Communications Association uses an
on-line pre-selection tool that assesses numeracy, literacy and mechanical reasoning. Their
website offers sample papers to review prior to taking the assessment (NECA, 2018).
The UK’s National Apprenticeship Scheme (NAS) recently generated a 10-step
employer guide on apprentice recruitment. This booklet aims to stimulate good practice
amongst British firms deciding to embark on apprenticeship programmes. The steps range from
writing the person and job specification to creating an apprentice agreement. Templates for job
adverts and application forms are provided as well as an interview question bank. This
organisation has recommended the use of on-line applications to facilitate the easy comparison
of applicants. This on-line tool facilitates the capturing of the basic entrance requirements but
also allows for additional probing into the applicants’ passion and interests (NAS, 2017). A
similar guideline document was developed by the University of Cumbria (n.d.).
Most countries have specified the entrance requirements into TVET in their national
policies (COTVET, 2014). Scholastic achievement is given high priority in the selection of
apprentices (ABCMA, 2018; Forsblom et al., 2016; Imdorf & Leemann, 2012; Lodovici et al.,
2013; Moser, 2004). A strong base of literacy and numeracy skills is required for entering into
vocational training (Brewer, 2013). The age of apprenticeship commencement has risen as
some employers, for example in Germany, Austria and Denmark are becoming more
discriminate in only selecting apprentices with good or very good school results. Less-qualified
114
applicants are needing to complete remedial education to increase their chances of acceptance
onto the programme (Steedman, 2012). An Australian study investigated the factors that
supported the continuation of apprenticeship studies during the first year. Apprentices that had
completed 12 years of schooling and had studied VET subjects at school had an increased
likelihood of surviving the first year of their apprenticeship (Hill & Dalley-Trim, 2008). The
increased usage of higher educational achievements as a screening mechanism may also be due
to the large number of applicants and the need for low cost pre-selection methods (Imdorf &
Leemann, 2012).
However, in countries (i.e., Switzerland and UK) with education systems that lack
consistent standards and examinations comparability of applicants using this method is difficult
(Langner, 2015; Mueller & Wolter, 2014). Whilst making employment decisions using
scholastic achievement may seem cheap, in the apprenticeship training context this may be
regarded as erroneous. Unlike ordinary employment contracts, apprenticeship contracts in
some countries cannot be terminated without difficulty and wages are fixed for a defined
period. A poor selection decision could mean a significant loss for the firm (Mueller & Wolter,
2014). Furthermore, schooling systems have also been criticised for not adequately exposing
students to manufacturing skills and encouraging a career in this field (Giffi et al., 2014).
Recruiters in the manufacturing sector regularly make use of covering letters in their
screening practices. This assists to determine the best candidates in terms of a match between
the job requirements and the skills and experience of the applicant. Specifically, applicants are
expected to tailor their covering letters to highlight these aspects to the recruiter (Ogden, 2016;
Tomaska & Nosek, 2018). Drug tests and physical examinations may also be requested to
ensure the applicant is capable of completing certain key tasks within the apprenticeship
(Torpey, 2013). Core skills required of an apprenticeship applicant are algebra, geometry,
mechanical comprehension, spatial visualisation, technical reading and interpersonal relations
(Martin, 2016; Torpey, 2013). Good performance or aptitude in technical courses as well as
mathematics and science are also recommended (COTVET, 2014). The interest of students in
mathematics and science as well as their confidence in their ability to succeed are significant
factors in their success on the programme (Besterfield-Sacre, Atman, & Shuman, 1997).
Reading literacy is also deemed an essential competency in successfully dealing with the
theoretical part of apprenticeship training as well as being able to effectively manage work life
(Mueller & Wolter, 2014).
115
Employability and teamwork skills are regarded as important attributes facilitating the
adaption of technical students to workplace demands (De Guzman & Ok Choi, 2013;
Goastellec & Ruiz, 2015; Grosvenor, 2017). This could explain why Hill and Dalley-Trim
(2008) established that apprentices who had completed a related job placement programme,
prior to registering for their apprenticeship, were more likely to progress post the first year of
their studies. Worthen and Haynes (2009) documented the selection process for a pre-
apprenticeship programme in the construction trades of Chicago, North America. Initially, the
applicants were requested to fulfil various hurdles, such as, appearing at a distant unknown
address, completing a lengthy mathematics, mechanical reasoning and reading test and drawing
road maps in groups. Besides also investigating the social skills of the applicants in the latter
exercise, all three hurdles aimed to assess the level of commitment and motivation the
applicants held for the programme. Once this process had terminated the less interested
applicants, the last phase of the selection process commenced. Here, the remaining applicants
were screened using an interview, drug test and physical ability test.
A battery of tests measuring some of these fundamental entry requirement skills is
usually administered as part of the selection process (Martin, 2016; Torpey, 2013). Globally,
standardised aptitude tests have increasingly been used as a selection measure for apprentices.
This is mostly due to employers distrusting school grades (Siegenthaler, 2011). Aptitude testing
is used to detect under-achievers, rather than over-achievers, in order to de-select them out of
the training programme and prevent these high-risk and high-cost eventualities (Grosvenor,
2017; Mueller & Wolter, 2014). Through these standardised tests the cognitive abilities of
applicants can be effectively compared to their scholastic achievement and hence provide
additional useful information (Siegenthaler, 2011). A Ghanaian study established that
applicants that performed better on cognitive ability tests were more likely to progress and
enter the apprenticeship programme (McCasland, 2015). However, a study on a mandatory
aptitude test revealed that the aptitude test results did not accurately predict the training success
of students in the first and third semester of their first year of training (Siegenthaler, 2011).
Another criticism of this paper-based assessment phase is the lengthy processing time in short-
listing applicants before group assessments can commence. On-line assessments are therefore
preferred (Langner, 2015). The prevalence of gamification tools in selection was discussed in
section 4.4.2.2. One such tool, chatAssess, has been used in the selection of apprentices. The
communications assessment is a situational judgement test in the form of an instant messenger
(Hawkes et al., 2017).
116
Applicants may also be expected to undertake one or several interviews with the
prospective sponsor. These interviews are to confirm the applicant’s qualifications, level of
interest in the programme as well as assess their reliability as students (ABCMA, 2018;
Goastellec & Ruiz, 2015; Grosvenor, 2016; Komatsu, 2013; Torpey, 2013; Worthen & Haynes,
2009). A structured interview format was used to screen applicants for a shipyard
apprenticeship programme. Dimensions identified as key to the retention of these apprentices
were incorporated into the interview schedule to decrease attrition on the programme (Baker
& Spier, 1990). When screening for technical positions, 97% of manufacturing executives
stated that face-to-face interviews were the most effective method of filtering applicants for
technical positions. CV reviews were rated as the second most popular method with 78% of
the respondents stating they use this screening practice. However, both of these screening
methods are time consuming (Giffi et al., 2015). The use of scoring grids in interviews is
recommended to ensure a fair and equitable assessment process, thereby complying with
relevant legislation (NAS, 2017). The overall ‘personal impression’ of apprentice applicants is
also regarded as significant in their selection (Schmid & Storni, 2004; Stalder, 2000).
Companies using job interviews and company visits have significantly less premature
terminations than those that do not utilise these selection methods (Forsblom et al., 2016; Tang,
2015).
The use of rigorous practices in the recruitment and selection of apprentices is
encouraged (Goastellec & Ruiz, 2015; Imdorf, 2017; Lovender, 2015). A key theme in the
successful management of apprenticeship programmes is the implementation of effective
employer-driven recruitment and selection processes. Intense processes result in the correct
individuals being identified upfront (Employing apprentices, n.d.; Rowe et al., 2017; US DoL,
n.d.). Within Germany, the use of personality tests is recommended in apprentice selection.
The Big Five personality facets of openness and conscientiousness are predictive of
performance on the apprenticeship programmes. German apprentices are expected to display
the attributes of dutifulness and deliberation, whilst minimising their compulsion to follow
their own thoughts. Within this context, therefore, personality assessment is regarded as a key
contributor to apprentice selection (Ziegler et al., 2014).
In pursuit of a fair selection process, international organisations have implemented a four
phase selection process, comprised of application form review, aptitude testing, face-to-face
interviews and finally a short internship in the training organisation (Imdorf & Leemann, 2012).
117
Applicants that meet these various hurdles in the selection process are then ranked. Aptitude
test results, interview performance, educational level and work experience are the factors used
to calculate the ranking order of applicants. The applicants with the highest scores are chosen
first (Torpey, 2013). Larger, more experienced employers with well-established staffing
systems for apprentices, have a higher apprenticeship completion rate. Smaller and less
experienced employers in HR matters tended to have more drop-outs (Lovender, 2015;
McCasland, 2015). Anderson (2001) empirically confirmed that a significant delay in the hiring
and/or training completion time of apprentices would be detrimental to organisational
performance levels. He therefore suggests the streamlining of staffing policies to minimise
these risks. In contrast, Horn (2016) established that individuals with personal links to firms
are more likely to obtain apprenticeship positions within these firms.
Some countries, such as Germany, Australia and Canada, make use of pre-apprenticeship
programmes as part of their selection process (Smith & Kemmis, 2013). These off-the-job
programmes incorporate a wide variety of tasks to assist and prepare the individuals wanting
to pursue an apprenticeship. An additional benefit of these programmes is that people that may
have misunderstood the nature of an apprenticeship and/or being an artisan exit before the main
programme commences (Forsblom et al., 2016; Smith & Kemmis, 2013). It is often this pre-
completion exiting that make employers risk-averse to apprenticeships. The main challenge to
increasing apprenticeship enrolments in England is convincing more employers to participate.
Gambin and Hogarth (2017) conclude their article by stating that “if the financial risk to the
employer could be reduced in some way then this should increase the demand for this type of
training” (p. 19). Several options are then proposed to reduce these costs, however, no mention
is made of improving the selection of apprentices as the potential solution to this challenge.
An extensive literature review on apprenticeship programmes by Fazio et al. (2016)
concluded that global innovative and efficient apprenticeship programmes contained ten core
elements. This list includes aspects such as curriculum design, quality control to employer
engagement and funding and incentive structures. It is noteworthy that this broad study made
no mention of the selection criteria nor the optimal methods for the selection of individuals to
attend these apprenticeship programmes. This is similar to other studies on technical and
vocational programmes. For example, none of the following documents gave due consideration
to staffing issues: the role of TVET in the national development of Bangladesh (Alam, 2008),
a review of the state of TVET in Pakistan (Allam, 2015), a review of technical education in
118
America (Rojewski, 2002), a review of the European TVET research (Mulder & Roelofs, 2012)
and a review of the Nigerian apprenticeship scheme (Evawoma-Enuku & Mgbor, 2005).
Furthermore, of the 39 presentations covering eight broad topics within the 2015 International
Network for Innovative Apprenticeships conference, two made mention of the skills needed by
applicant apprentices and two briefly mentioned selection techniques to be employed (Smith,
Gonon, & Foley, 2015). None of the 39 presentations, spanning eight topics, from the 2017
International Network for Innovative Apprenticeships conference covered any aspect of the
apprentice staffing (Lerman & Okoli, 2017). A recent comprehensive study, drawing on 337
initiatives across Europe, investigated the role of TVET in the early leaving of students from
apprenticeship programmes. One of the documented critical success factors is the identification
and recruitment of learners. This section discussed issues such as early detection, monitoring,
developing trustful relationships and outreach activities (Cedefop, 2016a). However, no
information is provided on student selection into these TVET programmes. The preventative
measures section did not even make mention of the sourcing or selection of students.
When there is discussion of apprentice recruitment and selection, research then often
refers to the staffing of graduate apprentices not student apprentices (e.g., Mohrenweiser, 2016;
Rasul, et al., 2012; Smith, Comyn, Kemmis, & Smith, 2011). It is noteworthy that even within
one of these aforementioned papers, the author mentions the scant research in this area by
stating “I am not aware of any empirical paper analysing a firms’ demand for apprenticeship
graduates or firms’ recruiting strategy in regards to apprenticeship graduates” (Mohrenweiser,
2016, p. 11). Mulder and Roelofs (2012) summarised the conference and research journal
publications of 2011 pertaining to the field of TVET. Of the 119 documents reviewed, only
one (i.e., Siegenthaler, 2011) discussed issues pertaining to the staffing of applicant
apprentices. Despite the large amount of TVET research, these authors concluded that it is
“quite diverse and fragmented . . . there are various urgent topics for further research, which
are not being discussed” (p. 19). Imdorf and Leemann (2012) also conclude that to date, within
Swiss and German research, there has been “very little about the issue of recruitment and
selection” (p. 59). Whilst there are several studies documenting the selection process for other
training programmes, with regards to apprenticeships the “actual selection criteria applied . . .
have hitherto hardly been subject to any investigation” (p. 60). Forsblom et al. (2016) further
adds that “few studies exist that systematically examine the selection methods of training
companies” involved in apprenticeship programmes (p. 403). Horn (2016) has also voiced his
concern by recently documenting that there “is only anecdotal evidence about the process of
119
apprenticeship selection” (p. 144). The next section describes the selection methods used for
apprentices within the national context.
4.6.2. South African apprentice selection practices
The bulk of local artisans are underqualified, with over half (59%) having obtained less
than a matriculation qualification and 26% holding a Grade 12 secondary education. A post-
matric qualification is only held by eight percent of the artisans, which may be due to the latest
trend of Grade 12 being the entrance requirement into an apprenticeship programme (Vass &
Raidani, 2016). Within the manufacturing sector, the principle entry requirement for a
learnership and an apprenticeship is either a Grade 10 or a Grade 12 educational certificate
depending on the type of learnership or apprenticeship. There are no age restrictions for gaining
entry into a learnership (Mummenthey et al., 2012). Individuals are unlikely to enter an
apprenticeship from an unemployed position. Whilst regarded as ideal that individuals enter
the apprenticeship directly after school, job experience tends to facilitate access onto an
apprenticeship programme (Wildschut et al., 2012). This is particularly evident in registrations
for a section 28 apprenticeship. This form of apprenticeship is designed for older individuals
who have obtained work experience (Janse van Rensburg et al., 2012).
The manufacturing sector is seeking technical graduates that have skills in three primary
areas. Firstly, they seek individuals with strong thinking and academic skills; enhanced
technical skills within their specific field, and thirdly, employability skills such as effective
communication and teamwork skills (Nomvete et al., 2017). Within the employability skills,
interpersonal skills such as coaching others, working within culturally diverse teams, as well
as leadership abilities are the most valued (Rasul et al., 2013). Apprenticeship programmes
develop both the technical and teamwork skills of participants. One of the employability
benefits of participation on the programme is the boost to the self-confidence of participants
(Wildschut et al., 2012). In addition to these, work safety, customer service, integrity,
creative/innovative thinking and problem solving are also prized (Nomvete et al., 2017; Rasul
et al., 2012).
Hiring within the automotive industry is currently especially challenging. Not only does
the industry have specific standards and processes, there is also a high demand for skilled
technical professionals whose loyalty is often not linked to salary nor prestige (Bodnár, 2016).
An academic-type Grade 12 qualification, inclusive of the subject(s) mathematics and/or
120
science, has been recommended to the automotive industry as a preliminary screening
mechanism. It is postulated that this form of secondary education will facilitate the acquisition
of the aptitudes required within the sector, specifically as they aim to optimise their capacity
within the STEM areas (Puchert et al., 2017a, 2017b). However, in contexts where supply
exceeds demand and the applicant pool has been educated through mass education, additional
information sources are required to effectively screen through the pool (Kuncel et al., 2010;
Van de Werfhorst, 2014). In-depth selection techniques are employed by most manufacturing
employers in their selection of apprentices (merSETA, 2016; Mummenthey et al., 2012). Apart
from aptitude and ability, an assessment of the motivation, personality and learning ability of
individuals are regarded as key. Employers are searching for learners with the right attitude for
success in the development programme (Mummenthey et al., 2012; Nomvete et al., 2017). A
multiple, rather than a singular phase selection process for entry-level operators was therefore
recommended (Puchert et al., 2017a, 2017b).
The Holburn (1992) paper, called Recommendations for fair and unbiased apprentice
selection, is the only available national analysis on apprenticeship staffing practices. Whilst
significantly outdated, this paper nevertheless still contains relevant advice for today’s firms
on recruiting and selecting apprenticeship students. A brief summary of this information is
provided. Firstly, Holburn recommends the use of a multi-phase selection process. Secondly,
given that apprentices are selected for the sole reason of being trained, the assessment of
potential should be a key criterion. Employing cognitive ability tests, especially a non-verbal
test, should screen out applicants who do not have the potential to succeed on the training
programme. Thirdly, psychomotor tests (i.e., eye-hand and two-hand coordination) were
recommended as a selection method. Fourthly, application forms can be useful in initially
dealing with large volumes of applicants. Fifthly, trainability tests were strongly recommended
for use after the application form and psychometric selection phases. Whilst the latter two
phases would screen out those who clearly did not have the potential to succeed, the former
test would assist the organisation to identify the best candidates from the remaining pool.
National studies have consistently and comprehensively investigated the local TVET
system (DHET, 2014; Manuel, 2011; Mayer et al., 2011; Pandor, 2018; Ramdass, 2009; Smith,
2011; Spaull, 2013; Van der Berg et al., 2011; Van de Werfhost, 2014). These studies have
revealed the lack of success of the system and continuously attempt to identify the reasons for
this (e.g., early leavers, lack of retention, poorly trained, lacks responsiveness of labour market
121
needs). The focus of these studies is also to propose remediation methods (e.g., curriculum
redesign, upskilling of trainers’ skills, upgrading of machinery and equipment, better
remuneration packages and working conditions for apprentices, enhanced funding, effective
governance, intensified quality assurance). However, none of the recommendations or
conclusions derived from these studies investigate the role of staffing practices (i.e., beyond
minimum recommended entrance requirements).
A recent national tracer study has recommended that more longitudinal studies be
conducted on apprenticeship programmes in order to systematically measure the progress of
apprentices over time (merSETA, 2016). Furthermore, several national articles (e.g., Jordaan
& Barry, 2009; Shabane et al., 2017; Van Rooyen et al., 2010) discuss the retention of artisans
at great length without referring to apprentice selection. In the recently released Draft National
Artisan Development Strategy and Implementation Plan 2017, the seven steps to becoming an
artisan in SA were described as the vision of the DHET in achieving the goals of the NDP. The
first of these steps is career development and the Plan mentions a selection and recruitment tool
as part of the implementation of this step (Pandor, 2018). However, as found with the
Government Gazette (2015a), there was no additional information or clarification on what this
tool should encompass. Based on the literature reviewed, it is apparent there is a lack of
questioning of apprentice selection as a possible cause for the lack of success of apprenticeship
programmes.
4.7. Summary
Chapter Four has summarised the literature pertaining to the theoretical framework,
namely the human capital theory, underpinning this study. Various perspectives of this theory
were offered as well as the significance of the theory to the HRM field. A brief overview of
some of the critiques of the theory were also provided. HRS was defined and the relevance of
this practice for organisations discussed. An empirical literature review of four broad selection
methods was presented. Three challenges implicit in HRS, namely, evaluation, labour market
issues and the impact of national legislation were discussed. The final section of the chapter
outlined the processes and methods employed in the selection of apprentices and artisans, both
globally and nationally. This chapter has highlighted the need for more research into the role
of staffing practices in apprenticeship programmes. Through engineering an effective selection
process, firm-specific human capital can be sourced to generate competitive advantage for the
employers of these artisans.

122
The next chapter presents the research process followed within this study. Chapter Five
outlines the research problem, with resultant objectives and hypotheses. The research
paradigm, design and methodology are discussed as well as the data collection method. A
distinction is made between the primary and secondary data stages. The data analysis strategies
employed in this study are also presented.
123
13 CHAPTER FIVE
14 RESEARCH METHODOLOGY
5.1. Introduction
The purpose of the previous three chapters was to review the literature underpinning the
study. Chapter Five outlines the research methodology used in the form of the 10 steps of the
research process. This chapter, therefore, presents the selected research paradigm, the research
design and approach. The methodology used in the primary data stage of the study is clarified
as well as that used in the secondary data stage. The methodology takes into account the
sampling plan, instrument design, data collection and data analysis strategies. Section 5.2
commences the chapter with an outline of the particular research process adopted for this study.
5.2. The research process
Research assists in solving problems in managerial practices and enhances the efficiency
of managerial decisions (Bryman & Bell, 2015b). Personal choice and random decision-making
can be replaced with professional decisions that are based on expertise and judgement derived
from scientific evidence (Cooper & Schindler, 2014). This formation of new knowledge,
however, needs to be a scientific process (Fraser, 2013; Rukwaru, 2015). A research process is
usually highly structured and involves a sequence of interrelated activities (Collis & Hussey,
2014; Zikmund, Babin, Carr, & Griffin, 2013). Nevertheless, it is cyclic, rather than linear, in
nature (Bless et al., 2013).
The research process followed in this study is depicted in Figure 5.1. It commenced with
the identification of the global and local need for artisans as a broad area of study and the
recognition of apprenticeship programmes as a key factor in the development of artisans. The
literature review focussed the research area to the profile of apprentices and the HRS practices
used on apprenticeship applicants within the automotive industry. The third step specified the
research objectives and hypotheses of the study, with a positivist research paradigm being
chosen in the fifth step. This informed the choice of a quantitative research approach in step
five.
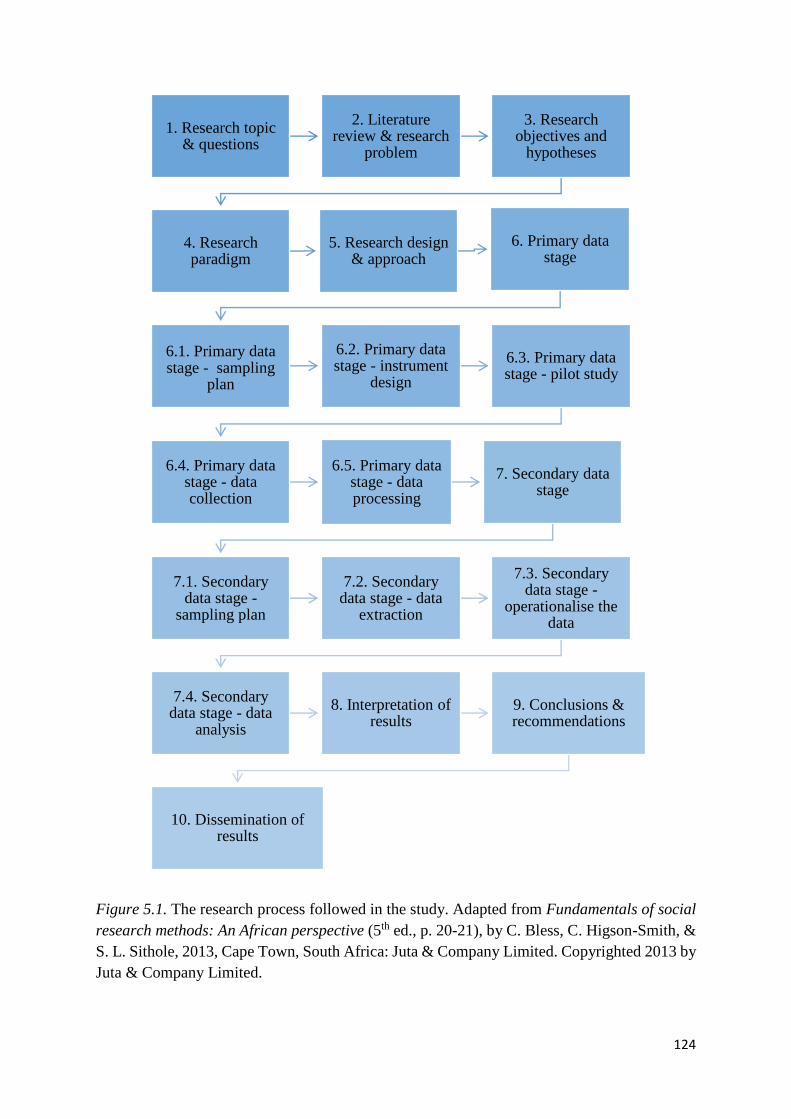
124
Figure 5.1. The research process followed in the study. Adapted from Fundamentals of social
research methods: An African perspective (5th ed., p. 20-21), by C. Bless, C. Higson-Smith, &
S. L. Sithole, 2013, Cape Town, South Africa: Juta & Company Limited. Copyrighted 2013 by
Juta & Company Limited.
1. Research topic & questions
2. Literature review & research
problem
3. Research objectives and
hypotheses
4. Research paradigm
5. Research design & approach
6. Primary data stage
6.1. Primary data stage - sampling
plan
6.2. Primary data stage - instrument
design
6.3. Primary data stage - pilot study
6.4. Primary data stage - data collection
6.5. Primary data stage - data processing
7. Secondary data stage
7.1. Secondary data stage -
sampling plan
7.2. Secondary data stage - data
extraction
7.3. Secondary data stage -
operationalise the data
7.4. Secondary data stage - data
analysis
8. Interpretation of results
9. Conclusions & recommendations
10. Dissemination of results
125
Following step five of the research process, the design is split into two components,
namely, the primary and secondary stages. In step six, the primary data stage was the HRS
method used by a particular automotive firm, referred to as the Client. In steps 6.1 to 6.5, the
associated sampling plan, instrument design, pilot study, data collection method and data
processing techniques of the primary data stage are discussed. Secondary data was extracted
from the Client in the seventh step of the research process. Steps 7.1 to 7.4 document the
sampling plan, extraction method and data analysis of this secondary data. The culmination of
this led to the completion of the research process through steps eight to 10. The next section
outines the research topic and questions, which is the first step of the research process.
5.3. Step one: Research topic and questions
In this step a researcher selects an area of study and formulates research questions in this
area (Bryman & Bell, 2015a). During the completion of a masters’ dissertation within the
automotive industry, the author was exposed to the increased need for artisans both nationally
and internationally. The quest to understand what contributes to the successful completion of
an apprenticeship programme prompted the formulation of three broad research questions:
1. What is the demographic and educational profile of an apprentice?
2. What is the aptitude and competency profile of an apprentice?
3. What is the impact of HRS in an apprenticeship programme?
5.4. Step two: Literature review and research problem
This section begins with a discussion on the types of literature consulted in the review.
In section 5.4.2 the research problem is considered with the constructs of the study being
identified.
5.4.1. Types of literature reviewed
Bless et al. (2013) suggest that through reviewing the current theory and research within
the broad topic area, the researcher will acquire knowledge and insight into the field. This will
inform the identification and operational description of the research variables, leading to
testable hypotheses (Cant et al., 2012; Krishnaswami & Satyaprasad, 2010). This movement
from the known to the unknown may result in the discovery of new knowledge within an
existing branch of knowledge (Supino & Borer, 2012). In operationalising this aspect of step
two, the author reviewed both primary and secondary literature sources. There were three clear
126
themes in the literature review, namely, artisans, apprentices and apprenticeship programmes,
the human capital theory and thirdly, HRS.
5.4.2. Defining the research problem
Chapter Two reviewed the challenges faced by the national automobile manufacturing
sector, such as significant growth, increased technological change and globalisation (Deloitte,
2009; Mashilo, 2010; Nzimande & Patel, 2012). The need for core technical competencies,
particularly at the level of technician and artisan, has hence become important (Brown, 2013;
merSETA, 2016; Peo, 2013). Chapter Three emphasised that this demand for artisans is,
however, not particular to the automotive industry. Rather the need for this scarce and critical
skill is a widespread national and international priority. Organisations are struggling to attract,
select and retain adequately skilled individuals to fill vacant technical positions
(ManpowerGroup, 2016; Prising, 2016; Vass & Raidani, 2016). Furthermore, it was
highlighted that this challenge is expected to worsen (Cedefop, 2016a; Jacoby, 2014).
Chapter Four documented the significant role staffing practices fulfil in organisational
success and survival (Ployhart, 2006; Schmidt et al., 2016). Specifically, improved screening
and selection techniques for apprentices are required to assist in their retention and reduce drop-
out rates (Lovender, 2015; Smith & Kemmis, 2013). However, contrary to national and
industry needs, the value of staffing is often disregarded by decision-makers. Furthermore, this
chapter highlighted the noteworthy decrease in staffing research. Whilst the literature review
revealed comprehensive research into vocational training there is currently a lack of
information pertaining to the role of staffing practices in apprenticeship recruitment and
development (Forsblom et al., 2016; Imdorf & Leemann, 2012). There is also a dearth of
studies evaluating the impact of staffing practices (Louw, 2012; Louw-Potgieter, 2012). As
discussed in section 1.3.1, it is important to determine the optimal profile of successful
apprentices and the most influential methods in their selection. Having provided a brief
synopsis of the research problem, the associated objectives and hypotheses are discussed in the
next section.
5.5. Step three: Research objectives and hypotheses
The primary objective of the study was to evaluate a profiling and selection process for
apprentices in the South African automotive industry.
127
Four secondary objectives were also ascertained:
a) To assess the contribution of the educational profile on apprenticeship programme
selection
b) To appraise the value of the generic application profile on apprenticeship programme
selection
c) To evaluate the influence of aptitude and teamwork profile on apprenticeship programme
selection
d) To assess the impact of interview profile on apprenticeship programme selection.
In order to operationalise these objectives, 13 hypotheses were formulated in the study.
These hypotheses are documented in section 1.3.3. A conceptual framework, portraying the
hypotheses within each of the selection phases are provided in Appendix A.
5.6. Step four: Research paradigm
It is essential for researchers to understand their philosophical approach and assumptions
with regards to research (Johnson & Christensen, 2014; Saunders, Lewis, & Thornhill, 2012).
The research paradigm adopted will have an ontological and epistemological viewpoint which
will influence the researcher’s perspective whilst conducting research (Collis & Hussey, 2014;
Johnson & Christensen, 2014).
Ontology is specifically concerned with the nature of being and reality. The main issue
is whether social units can and should be regarded as objective with a reality external to social
actors, or if their reality should be deemed a construction of the social actors’ perceptions and
actions (Terre Blanche, Durrheim, & Painter, 2006). Two positions on this issue are available,
being constructivism and objectivism. From an ontological viewpoint, the objectivistic position
was most suited for this study. The primary and secondary objectives of the study aimed to
objectively assess the process employed by an automotive industry in their selection of
apprentices. However, the author was involved in the design and implementation of this
selection process and the apprentice applicants were also assessed and rated by the author and
several senior instructors employed by the Client. Whilst using objective criteria to rate these
applicants, the author and senior instructors were involved in the data collection. This data can
therefore not be regarded as being completely independent of the feelings and opinions of the
actors during the selection process. The positioning of this study at the third stage on the
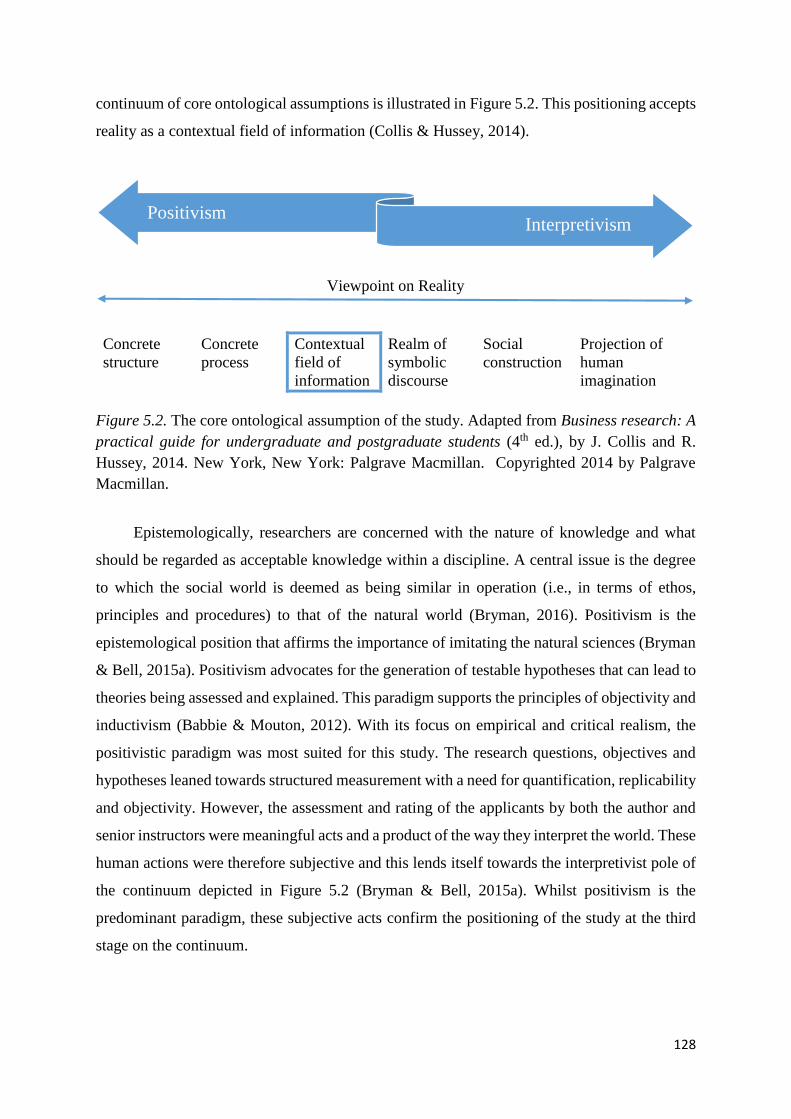
128
continuum of core ontological assumptions is illustrated in Figure 5.2. This positioning accepts
reality as a contextual field of information (Collis & Hussey, 2014).
Viewpoint on Reality
Concrete
structure
Concrete
process
Contextual
field of
information
Realm of
symbolic
discourse
Social
construction
Projection of
human
imagination
Figure 5.2. The core ontological assumption of the study. Adapted from Business research: A
practical guide for undergraduate and postgraduate students (4th ed.), by J. Collis and R.
Hussey, 2014. New York, New York: Palgrave Macmillan. Copyrighted 2014 by Palgrave
Macmillan.
Epistemologically, researchers are concerned with the nature of knowledge and what
should be regarded as acceptable knowledge within a discipline. A central issue is the degree
to which the social world is deemed as being similar in operation (i.e., in terms of ethos,
principles and procedures) to that of the natural world (Bryman, 2016). Positivism is the
epistemological position that affirms the importance of imitating the natural sciences (Bryman
& Bell, 2015a). Positivism advocates for the generation of testable hypotheses that can lead to
theories being assessed and explained. This paradigm supports the principles of objectivity and
inductivism (Babbie & Mouton, 2012). With its focus on empirical and critical realism, the
positivistic paradigm was most suited for this study. The research questions, objectives and
hypotheses leaned towards structured measurement with a need for quantification, replicability
and objectivity. However, the assessment and rating of the applicants by both the author and
senior instructors were meaningful acts and a product of the way they interpret the world. These
human actions were therefore subjective and this lends itself towards the interpretivist pole of
the continuum depicted in Figure 5.2 (Bryman & Bell, 2015a). Whilst positivism is the
predominant paradigm, these subjective acts confirm the positioning of the study at the third
stage on the continuum.
PositivismInterpretivism
129
5.7. Step five: Research design and approach
Section 5.7.1 discusses the explanatory research design adopted for this study and the
reasons for this choice. Section 5.7.2 then discusses the quantitative research approach
employed.
5.7.1. Selection of research design type
The research problem, objectives and hypotheses of this study have been provided in
section 5.5. These have given a clear indication of the purpose of the research. With this in
mind, as well as the identified positivistic research paradigm, a research design was chosen
(Babbie & Mouton, 2012).
Depending on the purpose of a study researchers can adopt various design forms. Within
the business and management discipline, three forms are common, namely, exploratory,
descriptive and explanatory research (Bless et al., 2013; Bryman & Bell, 2015a; Cant et al.,
2012). Explanatory or causal research, unlike the other research design types, aims to discover
the cause preceding beliefs, behaviours, events and conditions through testing hypotheses and
documenting possible reasons for these phenomena (Babbie & Mouton, 2012; Neuman, 2012).
This research design type was selected for this study. The study’s objectives and hypotheses
aimed to determine whether certain constructs had a significant effect on the selection of
applicants onto an apprenticeship programme. This required the evaluation of a structured field
study to establish if a change in the value of any of the selection constructs or ‘causes’ had an
effect on the outcome (Cooper & Schindler, 2014).
Other authors use temporal classification to distinguish between research designs
(Zikmund et al., 2013). Cross-sectional research seeks to establish patterns of association
between variables by collecting data on more than one case, usually at the same point in time.
In contrast, longitudinal research seeks to obtain data over a number of years (Bryman & Bell,
2015b). The data is collected several times, usually at the same time of the year in the different
years of the study, in order for the results to be comparable. The aim of longitudinal studies is
therefore to ascertain if there is a predictable trend in the matter of investigation (Bless et al.,
2013). A few longitudinal studies have been completed on artisans and apprenticeship
programmes. A large longitudinal administrative dataset, spanning from 1996 to 2010, was
used in a study investigating the formal jobs held by Brazilian workers post apprenticeship
training (Corseuil, Foguel, Gonzaga, & Ribeiro, 2012). Similar longitudinal data was used to
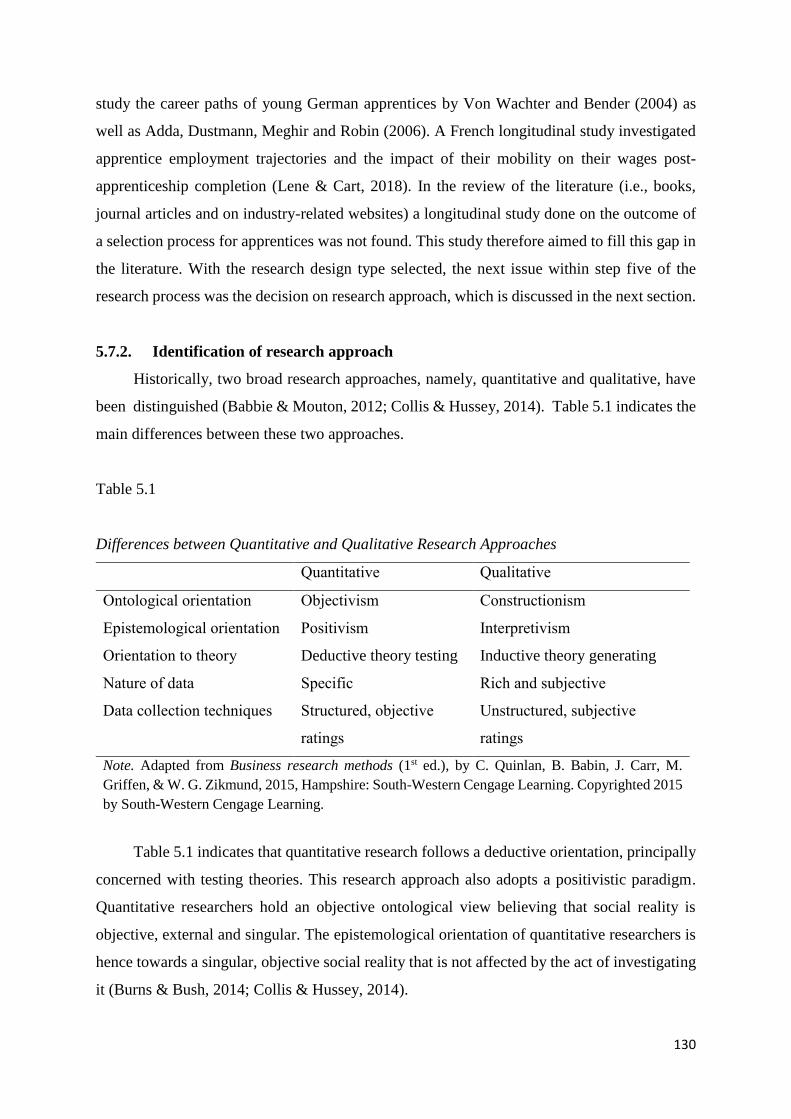
130
study the career paths of young German apprentices by Von Wachter and Bender (2004) as
well as Adda, Dustmann, Meghir and Robin (2006). A French longitudinal study investigated
apprentice employment trajectories and the impact of their mobility on their wages post-
apprenticeship completion (Lene & Cart, 2018). In the review of the literature (i.e., books,
journal articles and on industry-related websites) a longitudinal study done on the outcome of
a selection process for apprentices was not found. This study therefore aimed to fill this gap in
the literature. With the research design type selected, the next issue within step five of the
research process was the decision on research approach, which is discussed in the next section.
5.7.2. Identification of research approach
Historically, two broad research approaches, namely, quantitative and qualitative, have
been distinguished (Babbie & Mouton, 2012; Collis & Hussey, 2014). Table 5.1 indicates the
main differences between these two approaches.
Table 5.1
Differences between Quantitative and Qualitative Research Approaches
Quantitative Qualitative
Ontological orientation Objectivism Constructionism
Epistemological orientation Positivism Interpretivism
Orientation to theory Deductive theory testing Inductive theory generating
Nature of data Specific Rich and subjective
Data collection techniques Structured, objective
ratings
Unstructured, subjective
ratings
Note. Adapted from Business research methods (1st ed.), by C. Quinlan, B. Babin, J. Carr, M.
Griffen, & W. G. Zikmund, 2015, Hampshire: South-Western Cengage Learning. Copyrighted 2015
by South-Western Cengage Learning.
Table 5.1 indicates that quantitative research follows a deductive orientation, principally
concerned with testing theories. This research approach also adopts a positivistic paradigm.
Quantitative researchers hold an objective ontological view believing that social reality is
objective, external and singular. The epistemological orientation of quantitative researchers is
hence towards a singular, objective social reality that is not affected by the act of investigating
it (Burns & Bush, 2014; Collis & Hussey, 2014).
131
The objective of this study was to quantitatively evaluate a selection process for
apprentices employed by an automotive firm. Furthermore, the study aimed to establish
whether the 13 hypotheses derived from this objective could be proven. To determine variation
and examine relationships between variables in a longitudinal research design, quantitative data
is required (Quinlan et al., 2015). Furthermore, the nature of the data derived from the
structured and objective ratings of the apprenticeship applicants in this study were specific. A
quantitative research approach was therefore appropriate for this study.
5.8. Step six: Primary data stage
Traditionally, primary data is known as that collected and analysed by the researcher and
secondary data being that collected by others and analysed by the researcher (Zikmund et al.,
2013). However, Bryman (2016) indicates that there are many scenarios where such a
distinction between primary and secondary data collection and analysis is not clear. In this
study the author was involved in both the primary and secondary data stages. Her role in these
two stages is provided as the research process is discussed in this chapter.
The primary data stage of this study was based on the annual selection process for
apprentices employed by the Client. Following an advert placed in a local newspaper and on
internal organisational noticeboards, applicants were required to submit the mandatory
application documentation via FaxtoMail. The selection process commenced thereafter. This
annual recruitment drive is usually conducted during April, with the subsequent five selection
phases being conducted from May to November each year. The author is contracted by the
Client as a human resource consultant to assist in the design and implementation of this annual
selection process. The author’s involvement in these five selection phases are clarified in
Appendices N and O as well as in the sections that follow.
There were five tasks within step six of the research process. From the first task,
documented in section 5.8.1, the sampling plan was realised. The second task involved
instrument design, whilst the third task was the implementation of the pilot study. In the fourth
task, discussed in section 5.8.4, the data was collected, with the fifth task being preparation and
data processing.
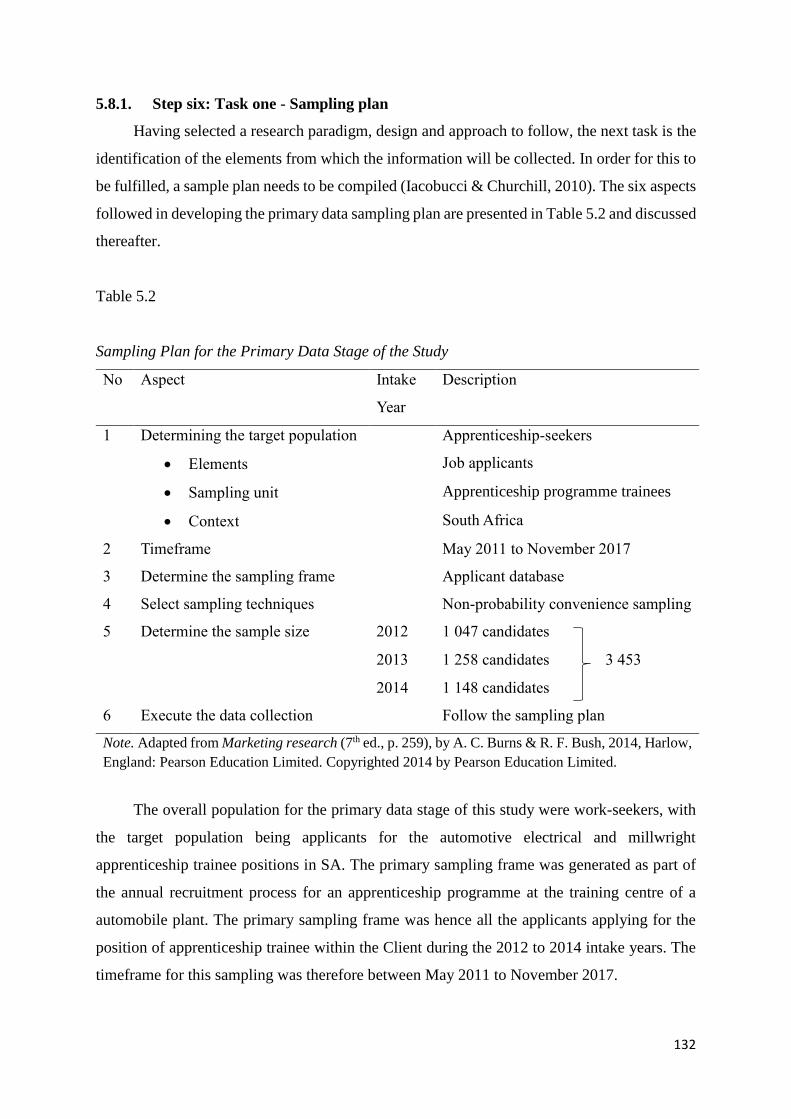
132
5.8.1. Step six: Task one - Sampling plan
Having selected a research paradigm, design and approach to follow, the next task is the
identification of the elements from which the information will be collected. In order for this to
be fulfilled, a sample plan needs to be compiled (Iacobucci & Churchill, 2010). The six aspects
followed in developing the primary data sampling plan are presented in Table 5.2 and discussed
thereafter.
Table 5.2
Sampling Plan for the Primary Data Stage of the Study
No Aspect Intake
Year
Description
1 Determining the target population Apprenticeship-seekers
Elements Job applicants
Sampling unit Apprenticeship programme trainees
Context South Africa
2 Timeframe May 2011 to November 2017
3 Determine the sampling frame Applicant database
4 Select sampling techniques Non-probability convenience sampling
5 Determine the sample size 2012 1 047 candidates
2013 1 258 candidates 3 453
2014 1 148 candidates
6 Execute the data collection Follow the sampling plan
Note. Adapted from Marketing research (7th ed., p. 259), by A. C. Burns & R. F. Bush, 2014, Harlow,
England: Pearson Education Limited. Copyrighted 2014 by Pearson Education Limited.
The overall population for the primary data stage of this study were work-seekers, with
the target population being applicants for the automotive electrical and millwright
apprenticeship trainee positions in SA. The primary sampling frame was generated as part of
the annual recruitment process for an apprenticeship programme at the training centre of a
automobile plant. The primary sampling frame was hence all the applicants applying for the
position of apprenticeship trainee within the Client during the 2012 to 2014 intake years. The
timeframe for this sampling was therefore between May 2011 to November 2017.
133
As indicated in Table 5.2, the primary data stage employed a non-probability
convenience sampling technique. As its name implies, convenience sampling entails selecting
participants based on their willingness and availability. This technique is regarded as a weaker
form of sampling as it is difficult to generalise findings from the sample to the broader
population (Gravetter & Forzano, 2015; Hair, Celsi, Money, Samouel, & Page, 2011).
However, the availability of the large sample size across the three intake years served as
justification for the use of this sampling technique (Struwig & Stead, 2013; Zickmund et al.,
2013).
In non-probability sampling the sample size is defined by the researcher. Judgement is
used to determine the value of the information obtained versus the cost thereof (Burns & Bush,
2014; Cant et al., 2012). To enhance the accuracy of the study’s findings, the complete
sampling frame constituted the sample size. The sample size of the primary data stage of the
study, as depicted in Table 5.2, was 3 453 work-seeking applicants for an apprenticeship
programme with the Client. This total sample size was derived across the three intake years.
The execution of data collection, aspect six of the sampling plan process, is covered in detail
in sections 5.8.3 and 5.8.4.
5.8.2. Step six: Task two – Instrument design
Bryman (2016) distinguishes between two techniques used for collecting data, namely
structured or unstructured. Table 5.3 documents the six structured instruments designed and/or
chosen to be utilised in the primary data stage of the study.
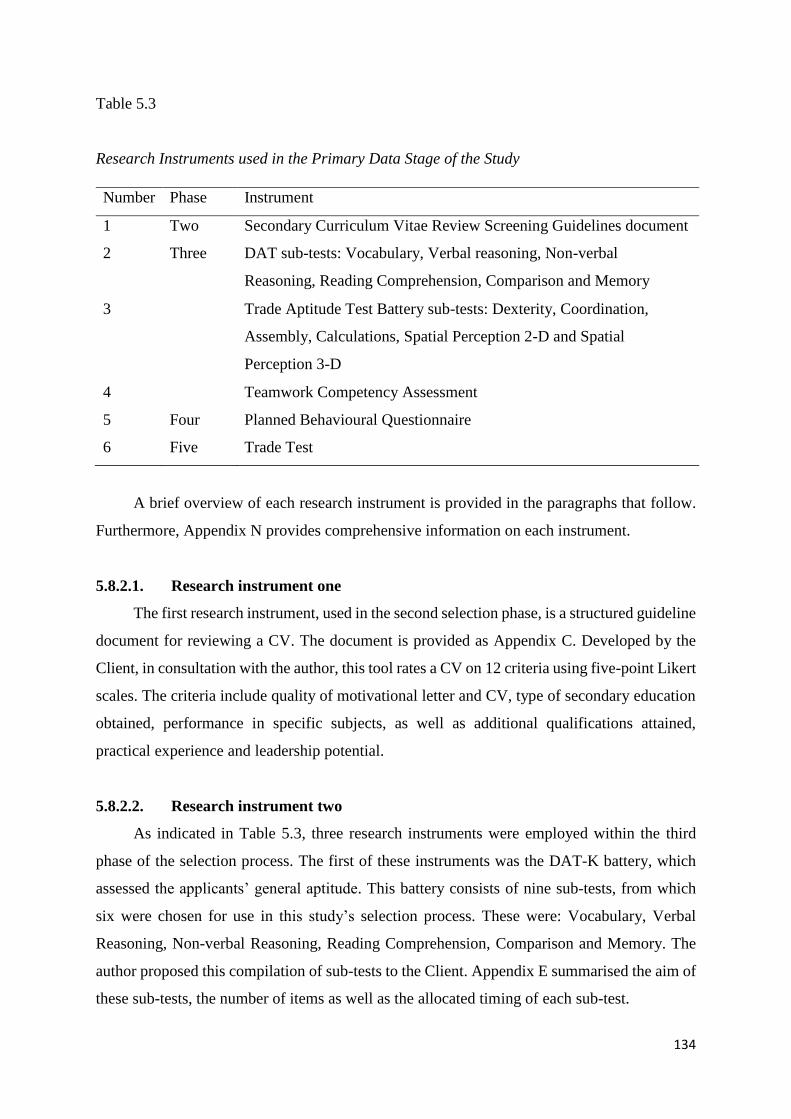
134
Table 5.3
Research Instruments used in the Primary Data Stage of the Study
Number Phase Instrument
1 Two Secondary Curriculum Vitae Review Screening Guidelines document
2 Three DAT sub-tests: Vocabulary, Verbal reasoning, Non-verbal
Reasoning, Reading Comprehension, Comparison and Memory
3 Trade Aptitude Test Battery sub-tests: Dexterity, Coordination,
Assembly, Calculations, Spatial Perception 2-D and Spatial
Perception 3-D
4 Teamwork Competency Assessment
5 Four Planned Behavioural Questionnaire
6 Five Trade Test
A brief overview of each research instrument is provided in the paragraphs that follow.
Furthermore, Appendix N provides comprehensive information on each instrument.
5.8.2.1. Research instrument one
The first research instrument, used in the second selection phase, is a structured guideline
document for reviewing a CV. The document is provided as Appendix C. Developed by the
Client, in consultation with the author, this tool rates a CV on 12 criteria using five-point Likert
scales. The criteria include quality of motivational letter and CV, type of secondary education
obtained, performance in specific subjects, as well as additional qualifications attained,
practical experience and leadership potential.
5.8.2.2. Research instrument two
As indicated in Table 5.3, three research instruments were employed within the third
phase of the selection process. The first of these instruments was the DAT-K battery, which
assessed the applicants’ general aptitude. This battery consists of nine sub-tests, from which
six were chosen for use in this study’s selection process. These were: Vocabulary, Verbal
Reasoning, Non-verbal Reasoning, Reading Comprehension, Comparison and Memory. The
author proposed this compilation of sub-tests to the Client. Appendix E summarised the aim of
these sub-tests, the number of items as well as the allocated timing of each sub-test.
135
5.8.2.3. Research instrument three
The second instrument used in the third phase of the selection process was the TRAT
battery. This battery is comprised of 11 sub-tests, with six being employed in this study. These
were: Dexterity, Coordination, Assembly, Calculations, Spatial Perception 2-D and Spatial
Perception 3-D. The author recommended these sub-tests to be employed in this selection
phase. Appendix F provides a summary of the key differences between these sub-tests in terms
of purpose, number of items per sub-test as well as the allocated timing per sub-test.
The DAT-K battery was selected to ascertain the identified general aptitudes and the
TRAT battery for the specific techical aptitudes required for an apprentice within the Client.
These two psychological test batteries meet the EEA (1998), the EEAA (2013) and the LRA
(1995) requirements. These test batteries are registered and approved psychological tests by
the Health Professions Council of SA (HPCSA, 2006; 2010).
5.8.2.4. Research instrument four
An AC type tool was the third instrument used in the third phase of the selection process.
Nine competencies were assessed as outlined in Appendix G. Given the lack of these
competencies in previous applicants and in apprentices within previous intake years, the Client
specifically requested the assessment of these nine skills. The author designed and employed
competency-based assessment techniques and guidelines to develop a number of suitable
exercises to assess these competencies (Foxcroft & Roodt, 2013). Applicants were observed
and scored by trained assessors using a five-point Likert scale ranging from significantly below
average to significantly above average.
5.8.2.5. Research instrument five
In the fourth phase of the selection process another internal instrument was developed by
the Client in consultation with the author. The Planned Behavioural Questionnaire, provided
as Appendix D, was used in the facilitation of the interviews of the applicants. This document
details seven standard category questions, with three to four options per category. The
applicants’ responses to these structured questions were scored on a four-point Likert scale.
Within the eighth category, five general post-interview impression ratings were required, with
the applicants again being rated on a four-point Likert scale.
136
5.8.2.6. Research instrument six
The sixth and final instrument used in this study is the national trade test. Table 5.3
indicates that the trade test was operationalised in phase five of the selection process. All trade
tests in SA are approved by section 26D (4) of the SDA (1998) and outlined in the Trade Test
Regulations document. They are also regulated by the QCTO. All trade tests are integrated and
simulated summative assessments that can only be conducted by an accredited trade test centre
(Government Gazette, 2015b). The internally designed assessments for the automotive
electrical and millwright apprenticeships have been approved by the QCTO and the Client is
an accredited trade test centre for these specific trades. There is a practical as well as a
theoretical aspect to these assessments (Anonymous within the Client, personal
communication, February 7, 2018).
5.8.3. Step six: Task three – Pilot study
According to Quinlan (2011), a pilot study indicates the rigour and validity of the
research instruments selected to be employed in a study. One pilot test was conducted with the
initial five research instruments employed in the primary data stage of this study. This was
implemented from May to November 2011. The participants of this pilot study were 1 047 job
applicants for the 2012 apprenticeship programme intake year. The author, with guidance from
the senior instructors at the Client, completed the scoring of the Secondary CV Review
Screening Guidelines documents used in the second phase of the pilot study. The author, a
registered Psychometrist (Independent/Private Practice) administered and scored the third
stage of the selection process. The fourth phase was conducted by the senior instructors at the
Client, with observation and moderation by the author. The pilot study confirmed the face
validity of the selected research instruments, and was thus conducted as is, for the next two
intake years.
5.8.4. Step six: Task four - Data collection
Data collection is the process of gathering information in a systematic and logical manner
(Ruane, 2015). The methodical process followed in the collection of this primary type of data
is documented in Appendix O. This provides detail on the administration and scoring of the
five phases of the selection process. The role of the author in this primary data collection is
highlighted in the paragraphs that follow.
137
For the 2013 intake year, the author screened and scored all of the applications using the
Secondary CV Review Screening Guidelines document. The author also administered and
scored the third stage of the selection process. However, the fourth phase was solely conducted
by the senior instructors at the Client. The senior instructors and the author screened the
applications in the second phase for the 2014 intake year. The author completed approximately
half of the applications with the rest being completed by five senior instructors. Once again,
the third phase was conducted by the author and the fourth phase by the senior instructors.
5.8.5. Step six: Task five - Data processing
After collection, the data needs to be transformed into a format that will assist in
answering the questions posed. The raw data needed to be mined in order to extract the specific
information required (Zikmund et al., 2013). The data processing resulted in two groups, either
successful or rejected. This data was then captured onto a Microsoft Excel spreadsheet in May
each year by the in-house administrators. All the information on each applicant (i.e., whether
successful in this phase or rejected) was captured, including the reason(s) for their rejection
from this phase. Post the scoring of the CVs in phase two, the applications were sorted into
five groups based on the total percentage score attained on the Secondary CV Review
Screening documents. These groups were created per apprenticeship type. Applicants in the
top scoring categories progressed to the next phase. The overall decision plus the scores
attained by each applicant on the 12 criteria in this CV review were captured onto the same
Microsoft Excel spreadsheet used in phase one. Whether successful or rejected in this phase,
the information pertaining to all the applicants as well as the reason(s) for their rejection were
captured. Information obtained from phase two was managed in June annually.
Following phase three, the stanine scores attained for each aptitude sub-test and the raw
scores for the teamwork competency assessment were captured, per applicant, on a separate
Excel spreadsheet by the author. Reviewing all the information provided across the various
tools used in this phase, the author used clinical judgement to determine the suitability of each
applicant and captured a recommendation category for each applicant. Reason(s) for rejection
were also captured on this spreadsheet. Processing and capturing of the phase three data was
done in July each year. Data from phase four was handled annually between August and
September. The information, scores and judgements attained per applicant in phase four
remained on the hard copy interview sheets and were not yet electronically captured. Two
groups (i.e., successful or rejected) were created per apprenticeship type.
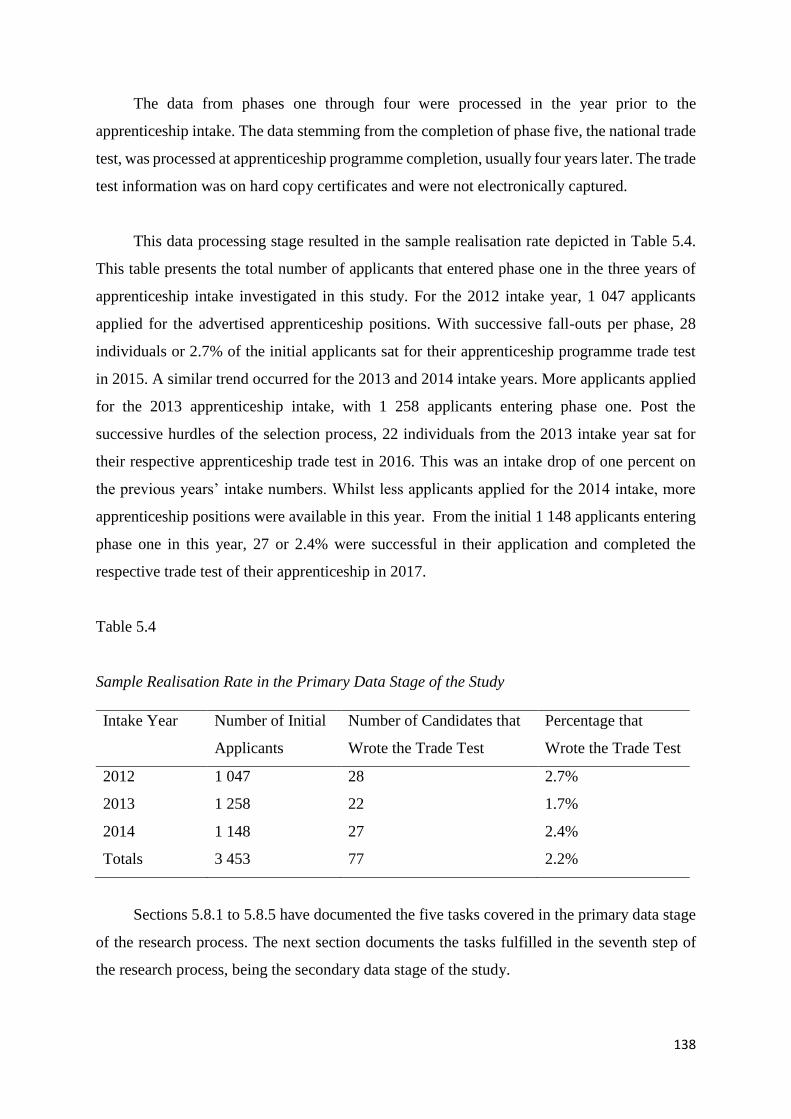
138
The data from phases one through four were processed in the year prior to the
apprenticeship intake. The data stemming from the completion of phase five, the national trade
test, was processed at apprenticeship programme completion, usually four years later. The trade
test information was on hard copy certificates and were not electronically captured.
This data processing stage resulted in the sample realisation rate depicted in Table 5.4.
This table presents the total number of applicants that entered phase one in the three years of
apprenticeship intake investigated in this study. For the 2012 intake year, 1 047 applicants
applied for the advertised apprenticeship positions. With successive fall-outs per phase, 28
individuals or 2.7% of the initial applicants sat for their apprenticeship programme trade test
in 2015. A similar trend occurred for the 2013 and 2014 intake years. More applicants applied
for the 2013 apprenticeship intake, with 1 258 applicants entering phase one. Post the
successive hurdles of the selection process, 22 individuals from the 2013 intake year sat for
their respective apprenticeship trade test in 2016. This was an intake drop of one percent on
the previous years’ intake numbers. Whilst less applicants applied for the 2014 intake, more
apprenticeship positions were available in this year. From the initial 1 148 applicants entering
phase one in this year, 27 or 2.4% were successful in their application and completed the
respective trade test of their apprenticeship in 2017.
Table 5.4
Sample Realisation Rate in the Primary Data Stage of the Study
Intake Year Number of Initial
Applicants
Number of Candidates that
Wrote the Trade Test
Percentage that
Wrote the Trade Test
2012 1 047 28 2.7%
2013 1 258 22 1.7%
2014 1 148 27 2.4%
Totals 3 453 77 2.2%
Sections 5.8.1 to 5.8.5 have documented the five tasks covered in the primary data stage
of the research process. The next section documents the tasks fulfilled in the seventh step of
the research process, being the secondary data stage of the study.
139
5.9. Step seven: Secondary data stage
The primary data had been collected as part of the selection process for apprentices by
the Client. This primary data was used by the Client to analyse trends and to make predictions
regarding future apprenticeship intakes. This data was readily available to the author to use.
Through further research the author was able to realise the benefits of this secondary data.
These included high-quality data, the opportunity for longitudinal and subset analysis as well
as the advantages of new interpretations from the re-analysis of the data (Bryman & Bell,
2015b). Sections 5.9.1 to 5.9.4 outline the four tasks implemented by the author to gather this
secondary data for analysis purposes. Sampling, data collection and the final sample realisation
rate are also documented in these sections.
5.9.1. Step seven: Task one - Sampling plan
The sampling plan for the secondary data stage was very similar to that indicated for the
primary data stage, as set out in Table 5.2. The elements, sampling unit and context of the target
population were the same, being applicants for an apprenticeship programme in SA. However,
the sampling timeframe was different in that the secondary data stage of the study took place
during February to May 2018, whilst the primary data stage occurred during 2011 to 2017.
The sampling frame used in the secondary data stage was the same as used in the
primary stage, namely, the applicant database. A non-probability convenience sampling
technique was also used for the secondary data stage. This meant that every element of the
sampling frame became part of the sample.
5.9.2. Step seven: Task two – Data extraction
A large amount of information was available from the Client. As highlighted in the
section 5.9, there are several benefits to using secondary data. However, there are also several
disadvantages. One of these disadvantages is the complexity of the data. The large volume of
information can be problematic to manage (Bryman & Bell, 2015b). The subject matter of
secondary data may also not be consistent with the researcher’s needs and problem definition
(Zikmund et al., 2013). To avoid these potential disadvantages certain information from the
data was regarded as necessary for further secondary data extraction. This data was aligned to
the research questions and objectives of the study as well as the hypotheses posed. The
categories of information and detail on the 19 constructs selected for secondary data analysis
purposes are documented per phase in Table 5.5 and discussed thereafter.
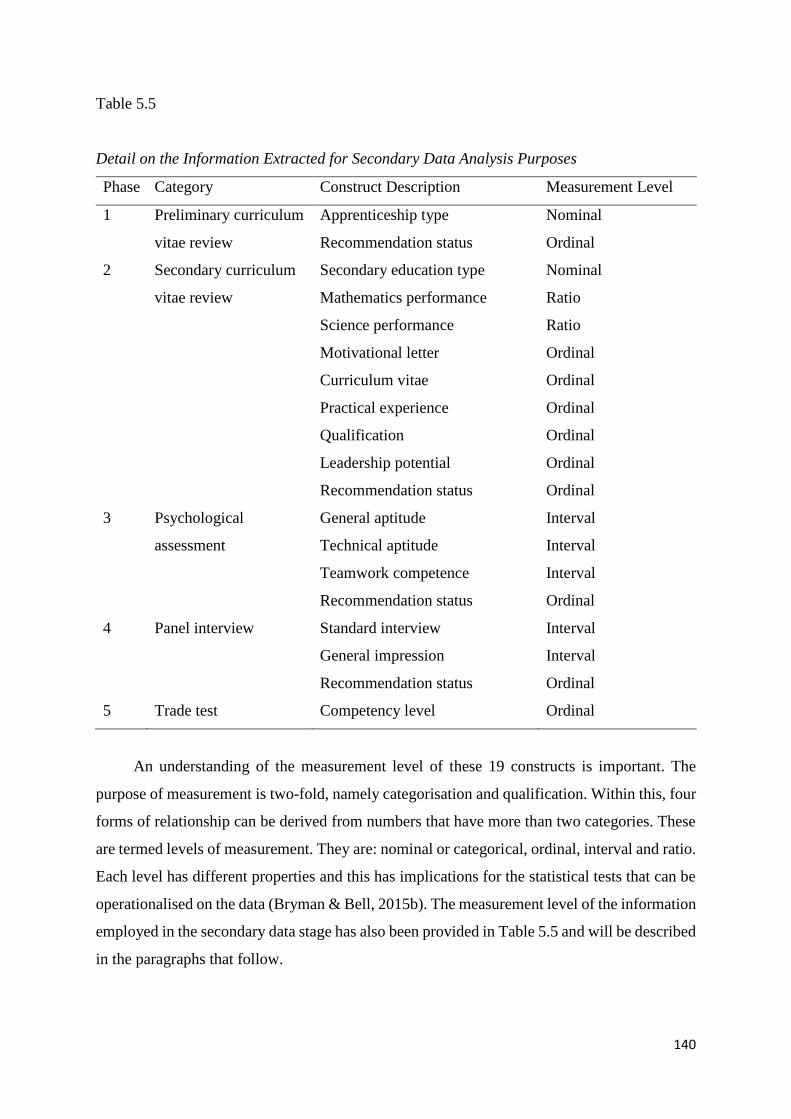
140
Table 5.5
Detail on the Information Extracted for Secondary Data Analysis Purposes
Phase Category Construct Description Measurement Level
1 Preliminary curriculum
vitae review
Apprenticeship type
Recommendation status
Nominal
Ordinal
2 Secondary curriculum
vitae review
Secondary education type
Mathematics performance
Science performance
Motivational letter
Curriculum vitae
Practical experience
Qualification
Leadership potential
Recommendation status
Nominal
Ratio
Ratio
Ordinal
Ordinal
Ordinal
Ordinal
Ordinal
Ordinal
3 Psychological
assessment
General aptitude
Technical aptitude
Teamwork competence
Recommendation status
Interval
Interval
Interval
Ordinal
4 Panel interview Standard interview
General impression
Recommendation status
Interval
Interval
Ordinal
5 Trade test Competency level Ordinal
An understanding of the measurement level of these 19 constructs is important. The
purpose of measurement is two-fold, namely categorisation and qualification. Within this, four
forms of relationship can be derived from numbers that have more than two categories. These
are termed levels of measurement. They are: nominal or categorical, ordinal, interval and ratio.
Each level has different properties and this has implications for the statistical tests that can be
operationalised on the data (Bryman & Bell, 2015b). The measurement level of the information
employed in the secondary data stage has also been provided in Table 5.5 and will be described
in the paragraphs that follow.
141
From the first phase of the selection process, the information regarding whether the
applicants were recommended or not to progress to phase two as well as the type of
apprenticeship the applicants had applied for were chosen for further analysis. This information
needed to be extracted from the three Microsoft Excel spreadsheets used per intake year to
capture the phase one results. This information needed to be retrieved from the Client’s intranet
back-up system. Being rank-ordered, this information is ordinal in nature.
Nine constructs were selected from phase two for secondary data analysis. This
information was initially collected from the Secondary CV Review Screening documents. This
information needed to be retrieved from the same three spreadsheets used per year to capture
the phase one information. This information also needed to be retrieved and extracted from the
Client. The applicant’s type of secondary education is a nominal measure, with the mathematics
and science performance being ratio measures. As portrayed in Table 5.5, the other six
constructs analysed from this phase were ordinal in nature.
From the third phase, the psychological assessment, four constructs were identified for
secondary analysis. This information was available on three different spreadsheets, one per
intake year. These spreadsheets were electronically stored by the author and she needed to
retrieve them from her archiving system for analysis purposes. Three constructs pertaining to
performance in these assessments were selected, namely, average general aptitude, average
technical aptitude and average teamwork competence. These three are interval measures. The
overall recommendation from this phase is an ordinal measure.
The overall ratings achieved in the two categories within the interview phase are interval
measures. The recommendation status (i.e., either recommended or not) construct from the
fourth phase was an ordinal measurement. This information was available in hard copy format,
archived in the Client’s storeroom. The boxes of scripts were retrieved and captured
electronically onto three Microsoft Excel spreadsheets, one per intake year. The information
extracted was taken from the interview sheets that held the combined ratings of the two
instructors. The trade test result information was also archived on the company’s intranet
system and needed to be retrieved and captured. The information was taken from the trade test
reports and captured onto three spreadsheets, one per intake year. This information was ordinal
in nature.
142
The secondary data on the five selection phases obtained from the Client was available
in various formats. The data subsequently needed to be prepared for data analysis purposes.
This required several aspects to be completed, namely, coding, editing and tabulation (Zikmund
et al, 2013). The fulfilment of these aspects is documented in the sections that follow. Section
5.9.2.1 discusses the initial preparation of this data with section 5.9.2.2 considering the data
coding method used. Section 5.9.2.3 describes the editing mechanisms employed and 5.9.2.4
the sample realisation rate.
5.9.2.1. Data preparation
The data had been captured onto four different sets of spreadsheets, per intake year.
Spreadsheets A1, A2 and A3 contained the information from phase one and two, a spreadsheet
per intake year. Spreadsheets B1, B2 and B3 had the third phase assessment results, a
spreadsheet per intake year. Spreadsheets C1, C2 and C3 contained the interview phase results
and spreadsheets D1, D2 and D3 the trade test results, a spreadsheet per intake year. These 12
spreadsheets were merged into one consolidated spreadsheet to facilitate further data
preparation and analysis.
5.9.2.2. Data coding
The next step in data preparation is coding. Coding is the process of applying rules to
data in order to transform the information from one format to another (Terre Blanche et al.,
2006). A data code book was generated to ensure the accurate assignment of values to the data
collected (Burns & Bush, 2014). It was determined that the racial categories from the national
2011 census, namely, Black African, Coloured, Indian/Asian and White, were to be applied.
Furthermore, the age categories from the same census were slightly manipulated for
implementation in this study (Lehohla, 2015). The naming regulations for preparing a
codebook, stipulated within the technical manual of the Statistical Package for the Social
Sciences (SPSS), were also followed (Pallant, 2013).
5.9.2.3. Data editing
Having generated the code regulations, the data was ready for the cleansing and sorting
process to be applied. For the 2012 intake, there were initially 1 047 applicants that were
entered as having applied for the apprenticeship training programme. However, during data
validation, seven duplicate applications were found. These seven duplicate applications were
cleansed from the data. It was also established whilst working through the hard copy
143
documentation that one applicant had died during the time of the selection process. Whilst there
was phase three assessment results captured, the phase two results of three applicants could not
be found and these three were also cleansed from the data. This editing resulted in 1 036
applicants being the total 2012 sample size for the study.
Six duplicate applications were found in the initial 2013 intake data. After cleansing these
from the spreadsheet, the intake numbers were reduced from 1 258 to 1 252 applicants. Two
applicants were also cleansed from the data as there was no phase two information captured
for them, despite there being phase three assessment results for them. This cleansing resulted
in 1 250 constituting the total 2013 intake sample for the study.
Eight duplicate applications were found in the 2014 intake data and were cleansed from
the data. This resulted in the initial total changing from 1 148 to 1 140 applicants entering phase
one. However, a further 14 entries were terminated from the data after cleansing. One row of
data contained incomplete information and was deleted. Thirteen applicants were cleansed
from the data as there was no recorded phase two results for them, despite there being phase
three assessment results for them. This editing resulted in 1 126 applicants being the total 2014
sample size for the study. In the section that follows detail is provided on the final sample size
realised for this study.
5.9.2.4. Data tabulation
Tabulation is counting the number of cases that are applicable to each category (Zikmund
et al., 2013). This aspect was operationalised through the generation of a detailed sample
realisation table provided in Appendix P. This table provides the survival rate per phase of the
selection process, per intake year, which are discussed in the paragraphs that follow.
Of the 1 036 applicants that applied for the 2012 apprenticeship programme intake, 484
were successful in phase one. Of these, 100 were selected to progress from phase two into the
assessment phase. Of the 40 successful in this third phase and interviewed, thirty were
successful and were initially accepted onto the apprenticeship programme. However, one
applicant had already gained work elsewhere and did not accept the position. Another applicant
failed the medical testing and was therefore not accepted onto the programme. This resulted in
28 apprentices commencing their apprenticeship in 2012 and passing their trade test in 2015.
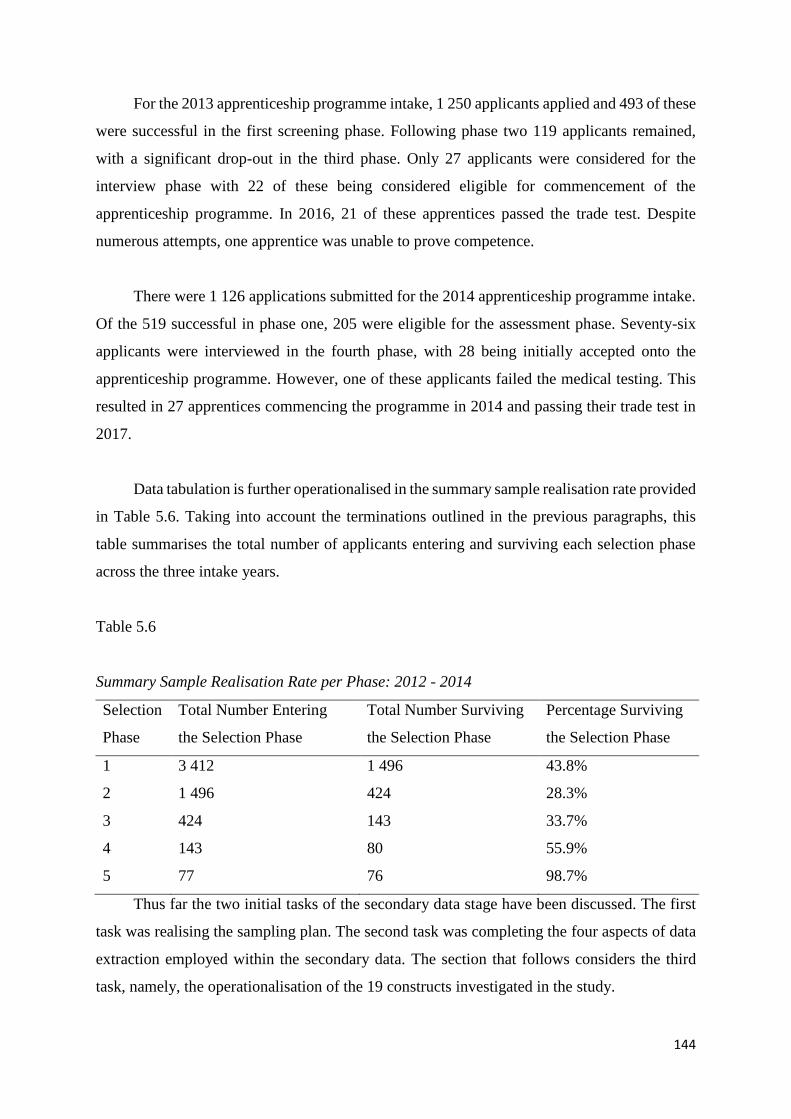
144
For the 2013 apprenticeship programme intake, 1 250 applicants applied and 493 of these
were successful in the first screening phase. Following phase two 119 applicants remained,
with a significant drop-out in the third phase. Only 27 applicants were considered for the
interview phase with 22 of these being considered eligible for commencement of the
apprenticeship programme. In 2016, 21 of these apprentices passed the trade test. Despite
numerous attempts, one apprentice was unable to prove competence.
There were 1 126 applications submitted for the 2014 apprenticeship programme intake.
Of the 519 successful in phase one, 205 were eligible for the assessment phase. Seventy-six
applicants were interviewed in the fourth phase, with 28 being initially accepted onto the
apprenticeship programme. However, one of these applicants failed the medical testing. This
resulted in 27 apprentices commencing the programme in 2014 and passing their trade test in
2017.
Data tabulation is further operationalised in the summary sample realisation rate provided
in Table 5.6. Taking into account the terminations outlined in the previous paragraphs, this
table summarises the total number of applicants entering and surviving each selection phase
across the three intake years.
Table 5.6
Summary Sample Realisation Rate per Phase: 2012 - 2014
Selection
Phase
Total Number Entering
the Selection Phase
Total Number Surviving
the Selection Phase
Percentage Surviving
the Selection Phase
1 3 412 1 496 43.8%
2 1 496 424 28.3%
3 424 143 33.7%
4 143 80 55.9%
5 77 76 98.7%
Thus far the two initial tasks of the secondary data stage have been discussed. The first
task was realising the sampling plan. The second task was completing the four aspects of data
extraction employed within the secondary data. The section that follows considers the third
task, namely, the operationalisation of the 19 constructs investigated in the study.
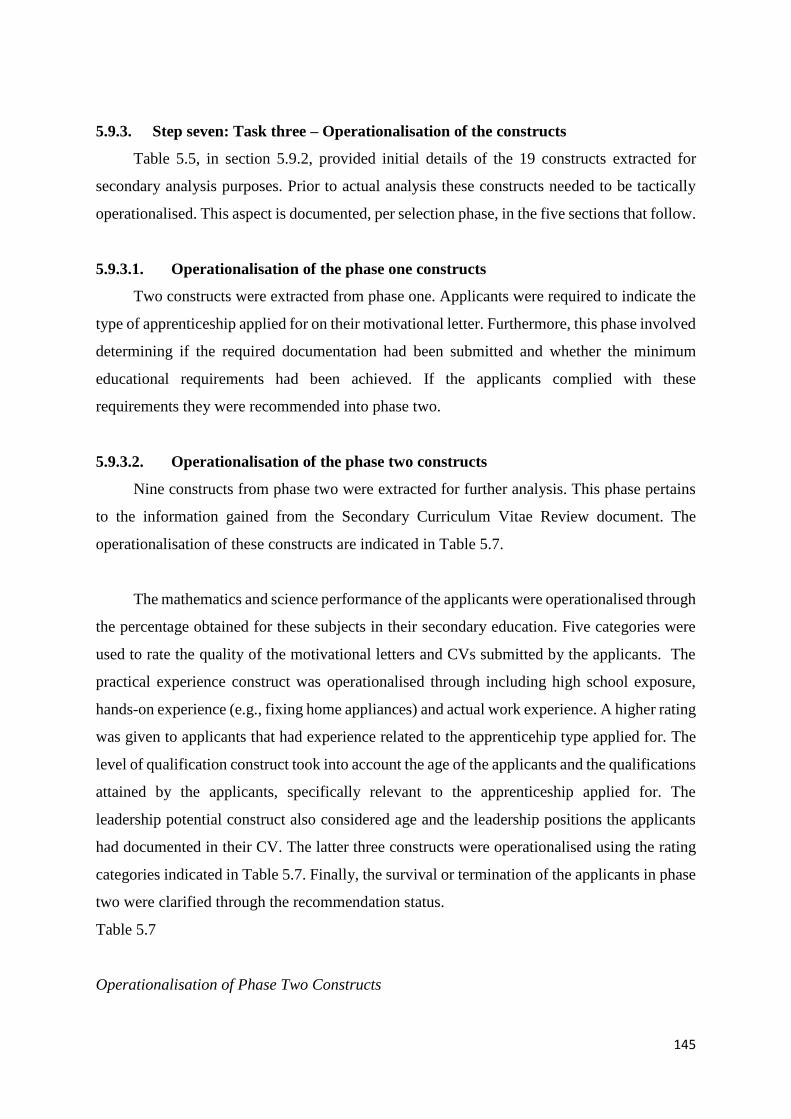
145
5.9.3. Step seven: Task three – Operationalisation of the constructs
Table 5.5, in section 5.9.2, provided initial details of the 19 constructs extracted for
secondary analysis purposes. Prior to actual analysis these constructs needed to be tactically
operationalised. This aspect is documented, per selection phase, in the five sections that follow.
5.9.3.1. Operationalisation of the phase one constructs
Two constructs were extracted from phase one. Applicants were required to indicate the
type of apprenticeship applied for on their motivational letter. Furthermore, this phase involved
determining if the required documentation had been submitted and whether the minimum
educational requirements had been achieved. If the applicants complied with these
requirements they were recommended into phase two.
5.9.3.2. Operationalisation of the phase two constructs
Nine constructs from phase two were extracted for further analysis. This phase pertains
to the information gained from the Secondary Curriculum Vitae Review document. The
operationalisation of these constructs are indicated in Table 5.7.
The mathematics and science performance of the applicants were operationalised through
the percentage obtained for these subjects in their secondary education. Five categories were
used to rate the quality of the motivational letters and CVs submitted by the applicants. The
practical experience construct was operationalised through including high school exposure,
hands-on experience (e.g., fixing home appliances) and actual work experience. A higher rating
was given to applicants that had experience related to the apprenticehip type applied for. The
level of qualification construct took into account the age of the applicants and the qualifications
attained by the applicants, specifically relevant to the apprenticeship applied for. The
leadership potential construct also considered age and the leadership positions the applicants
had documented in their CV. The latter three constructs were operationalised using the rating
categories indicated in Table 5.7. Finally, the survival or termination of the applicants in phase
two were clarified through the recommendation status.
Table 5.7
Operationalisation of Phase Two Constructs
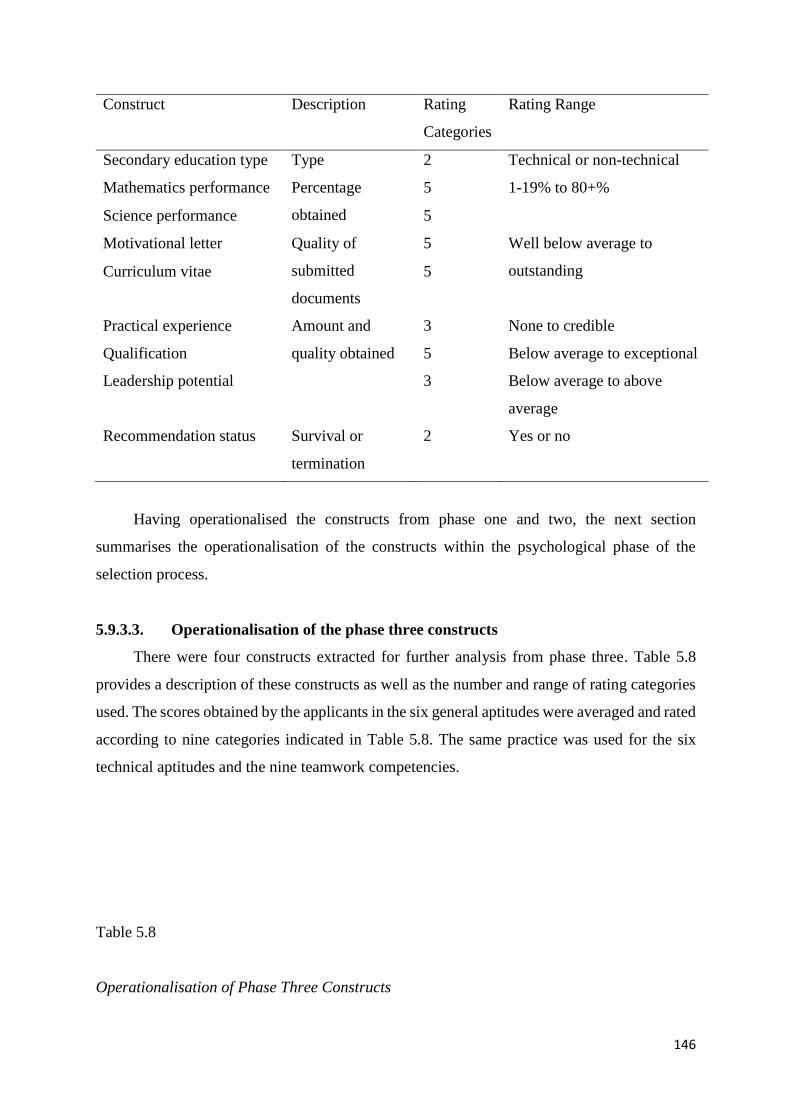
146
Construct Description Rating
Categories
Rating Range
Secondary education type Type 2 Technical or non-technical
Mathematics performance Percentage
obtained
5 1-19% to 80+%
Science performance 5
Motivational letter Quality of
submitted
documents
5 Well below average to
outstanding Curriculum vitae 5
Practical experience Amount and
quality obtained
3 None to credible
Qualification 5 Below average to exceptional
Leadership potential 3 Below average to above
average
Recommendation status Survival or
termination
2 Yes or no
Having operationalised the constructs from phase one and two, the next section
summarises the operationalisation of the constructs within the psychological phase of the
selection process.
5.9.3.3. Operationalisation of the phase three constructs
There were four constructs extracted for further analysis from phase three. Table 5.8
provides a description of these constructs as well as the number and range of rating categories
used. The scores obtained by the applicants in the six general aptitudes were averaged and rated
according to nine categories indicated in Table 5.8. The same practice was used for the six
technical aptitudes and the nine teamwork competencies.
Table 5.8
Operationalisation of Phase Three Constructs
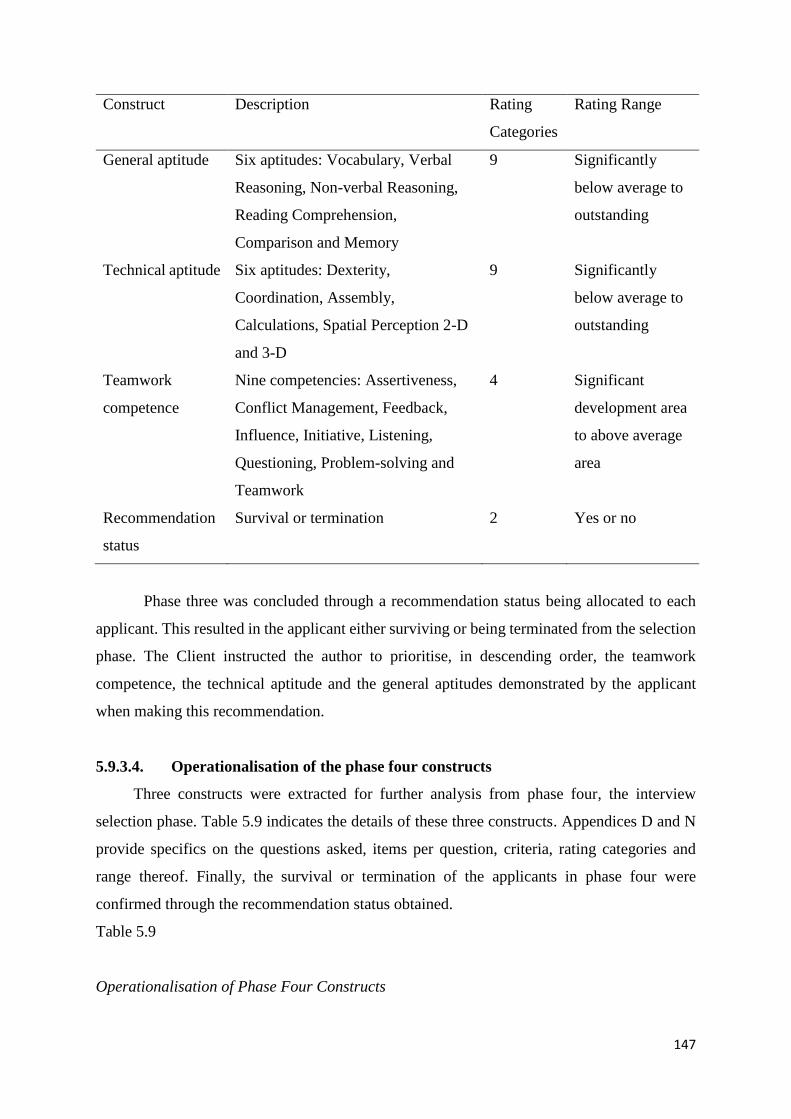
147
Construct Description Rating
Categories
Rating Range
General aptitude Six aptitudes: Vocabulary, Verbal
Reasoning, Non-verbal Reasoning,
Reading Comprehension,
Comparison and Memory
9 Significantly
below average to
outstanding
Technical aptitude Six aptitudes: Dexterity,
Coordination, Assembly,
Calculations, Spatial Perception 2-D
and 3-D
9 Significantly
below average to
outstanding
Teamwork
competence
Nine competencies: Assertiveness,
Conflict Management, Feedback,
Influence, Initiative, Listening,
Questioning, Problem-solving and
Teamwork
4 Significant
development area
to above average
area
Recommendation
status
Survival or termination 2 Yes or no
Phase three was concluded through a recommendation status being allocated to each
applicant. This resulted in the applicant either surviving or being terminated from the selection
phase. The Client instructed the author to prioritise, in descending order, the teamwork
competence, the technical aptitude and the general aptitudes demonstrated by the applicant
when making this recommendation.
5.9.3.4. Operationalisation of the phase four constructs
Three constructs were extracted for further analysis from phase four, the interview
selection phase. Table 5.9 indicates the details of these three constructs. Appendices D and N
provide specifics on the questions asked, items per question, criteria, rating categories and
range thereof. Finally, the survival or termination of the applicants in phase four were
confirmed through the recommendation status obtained.
Table 5.9
Operationalisation of Phase Four Constructs
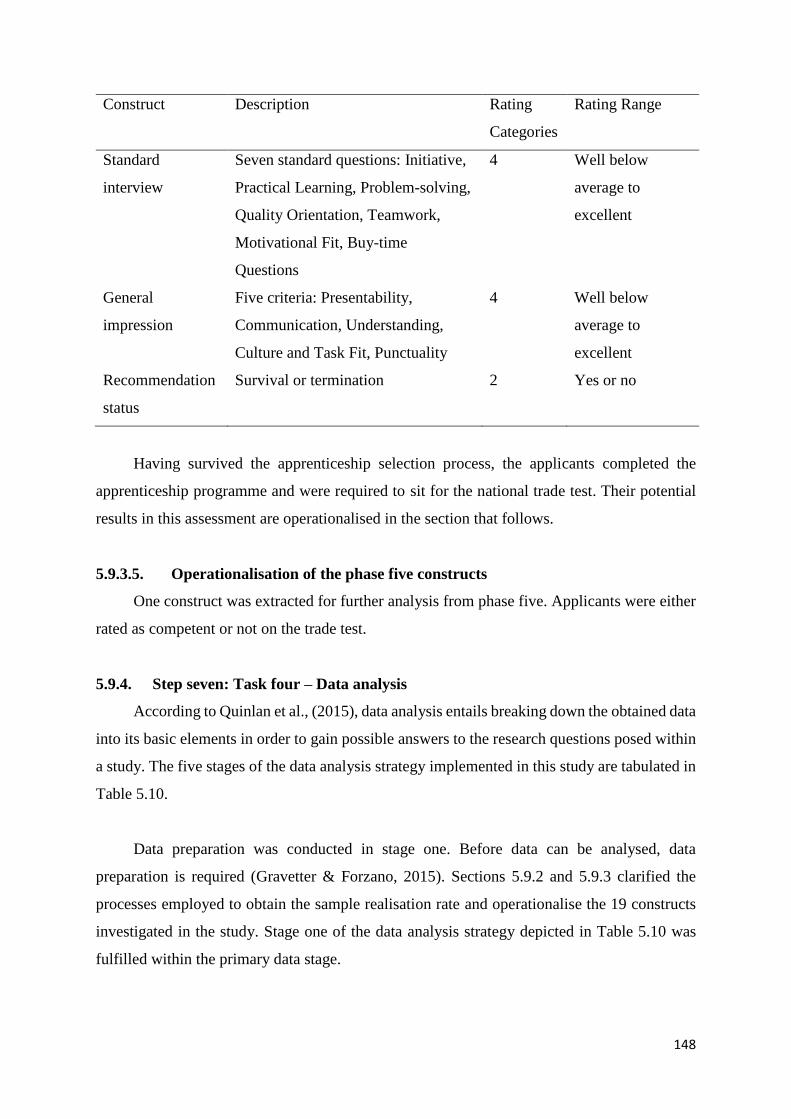
148
Construct Description Rating
Categories
Rating Range
Standard
interview
Seven standard questions: Initiative,
Practical Learning, Problem-solving,
Quality Orientation, Teamwork,
Motivational Fit, Buy-time
Questions
4 Well below
average to
excellent
General
impression
Five criteria: Presentability,
Communication, Understanding,
Culture and Task Fit, Punctuality
4 Well below
average to
excellent
Recommendation
status
Survival or termination 2 Yes or no
Having survived the apprenticeship selection process, the applicants completed the
apprenticeship programme and were required to sit for the national trade test. Their potential
results in this assessment are operationalised in the section that follows.
5.9.3.5. Operationalisation of the phase five constructs
One construct was extracted for further analysis from phase five. Applicants were either
rated as competent or not on the trade test.
5.9.4. Step seven: Task four – Data analysis
According to Quinlan et al., (2015), data analysis entails breaking down the obtained data
into its basic elements in order to gain possible answers to the research questions posed within
a study. The five stages of the data analysis strategy implemented in this study are tabulated in
Table 5.10.
Data preparation was conducted in stage one. Before data can be analysed, data
preparation is required (Gravetter & Forzano, 2015). Sections 5.9.2 and 5.9.3 clarified the
processes employed to obtain the sample realisation rate and operationalise the 19 constructs
investigated in the study. Stage one of the data analysis strategy depicted in Table 5.10 was
fulfilled within the primary data stage.
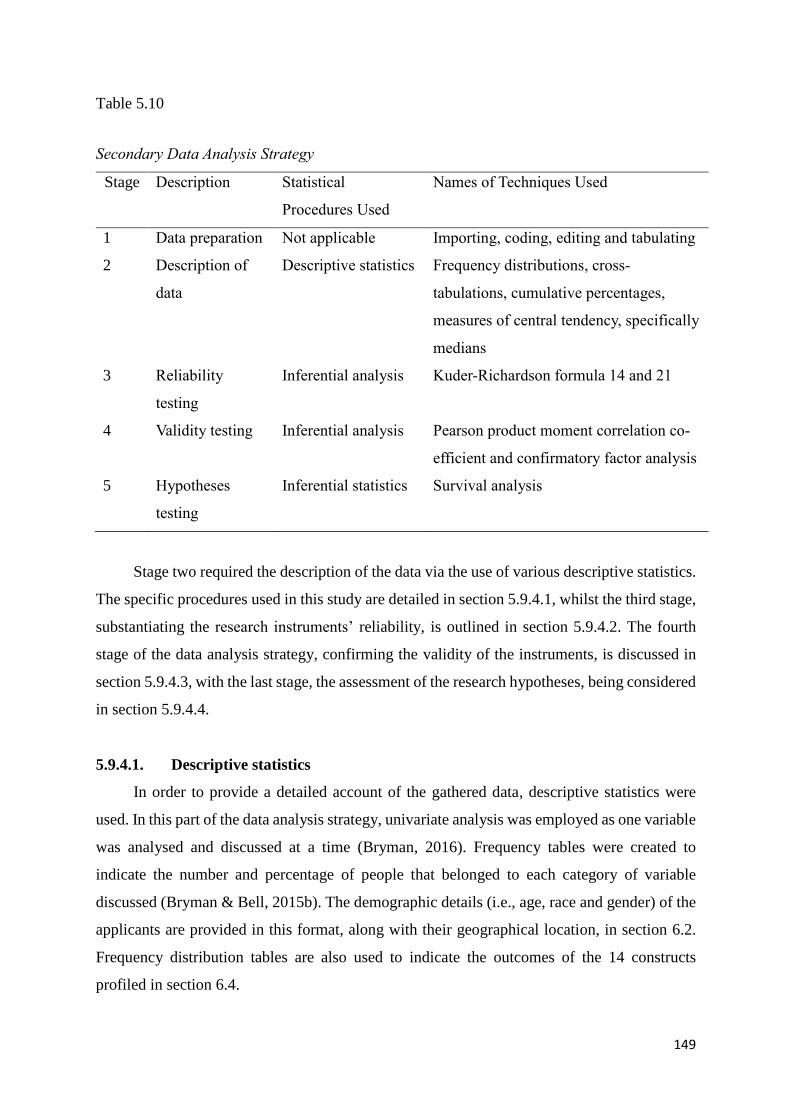
149
Table 5.10
Secondary Data Analysis Strategy
Stage Description Statistical
Procedures Used
Names of Techniques Used
1 Data preparation Not applicable Importing, coding, editing and tabulating
2 Description of
data
Descriptive statistics Frequency distributions, cross-
tabulations, cumulative percentages,
measures of central tendency, specifically
medians
3 Reliability
testing
Inferential analysis Kuder-Richardson formula 14 and 21
4 Validity testing Inferential analysis Pearson product moment correlation co-
efficient and confirmatory factor analysis
5 Hypotheses
testing
Inferential statistics Survival analysis
Stage two required the description of the data via the use of various descriptive statistics.
The specific procedures used in this study are detailed in section 5.9.4.1, whilst the third stage,
substantiating the research instruments’ reliability, is outlined in section 5.9.4.2. The fourth
stage of the data analysis strategy, confirming the validity of the instruments, is discussed in
section 5.9.4.3, with the last stage, the assessment of the research hypotheses, being considered
in section 5.9.4.4.
5.9.4.1. Descriptive statistics
In order to provide a detailed account of the gathered data, descriptive statistics were
used. In this part of the data analysis strategy, univariate analysis was employed as one variable
was analysed and discussed at a time (Bryman, 2016). Frequency tables were created to
indicate the number and percentage of people that belonged to each category of variable
discussed (Bryman & Bell, 2015b). The demographic details (i.e., age, race and gender) of the
applicants are provided in this format, along with their geographical location, in section 6.2.
Frequency distribution tables are also used to indicate the outcomes of the 14 constructs
profiled in section 6.4.
150
Cross-tabulations are able to simultaneously reflect two or more variables that have a few
categories each (Zikmund et al., 2013). In section 6.3 this form of descriptive statistic was used
to depict the survival rates of the applicants across the five selection phases. Phases one, two
and four had two outcomes each, either survival or termination. However, phase three had five
outcome values and phase five had four outcome categories.
Another element of descriptive statistics is the distribution of the data. Measures of
central tendency summarised and compressed the information to confirm its overall meaning
for the study. One type of central tendency measure, namely, the median, was used to précis
the ST of the applicants (Hair et al., 2011). In section 6.5, the median STs are provided in
tabular format according to the selection phases. The eight constructs within phase two, the
three constructs within phase three and the two constructs within phase four are provided in
this format.
5.9.4.2. Reliability of measuring instruments
The third aspect of the data analysis strategy necessitates the establishment of reliability
within the instruments of the study. Reliability is “the extent to which the observable (or
empirical) measures that represent a theoretical concept are accurate and stable over repeated
observations” (Bless et al., 2013, p. 221). Five techniques for measuring the reliability of
instruments are commonly used. These are: test-retest reliability, parallel-forms reliability,
internal consistency, split-halves reliability and inter-rater reliability (Collis & Hussey, 2014;
Quinlan et al., 2015). This section discusses the fulfilment of this requirement for the six
instruments used in this study.
The purpose of the Secondary CV Review Screening Guidelines document, used in phase
one, was to improve objectivity in the screening process. An applicant was independently
assessed in part A and B by the author or two senior instructors. The second assessor would
therefore provide a double-check on the suitability of the applicant and the judgement made by
the first assessor in part A. This would provide inter-rater reliability and thereby avoid
subjective judgement and a lack of consistency in decision-making (Bryman & Bell, 2015b).
The two selected aptitude instruments comply with the requirements of the EEA (1998),
EEAA (2013) and the LRA (1995). These two aptitude measures are also registered and
approved psychological tests by the HPCSA. Furthermore, the reliability status established for
151
these aptitude instruments is outlined in the subsequent paragraphs. Initially, the reliability of
the DAT-K sub-tests is deliberated, followed by that of the TRAT measures.
The reliability of the DAT-K sub-tests were established with the aid of the Kuder-
Richardson formula 14. This statistic measures the internal consistency of items through
averaging all the correlations beteween the items (Vehkalahti, 2000). The reliability
coefficients of these DAT-K measures in respect of Grade 12 candidates are indicated in
Appendix Q. These coefficients are reasonably consistent with those realised for the Grade 10
and 11 groups. The reliability coefficients of the Vocabulary and Verbal Reasoning sub-tests
are on the low side (i.e., at 0.75), however, the reliability of the DAT-K is still regarded as
being at an acceptable standard (Coetzee & Vosloo, 2000). Given that the Comparison sub-test
is a speed test, the Kuder-Richardson formula 14 was not applicable.
The reliability of the TRAT sub-tests used in this study are tabulated in Appendix R. The
reliability of four measures within the TRAT battery were determined by the Kuder-Richardson
formula 21. The coefficients range from 0.72 to 0.92 and are regarded as being satisfactory
(Taljaard, 1983). The Dexterity and Coordination sub-tests are speed tests and the Kuder-
Richardson formula 21 was therefore not applicable.
In terms of the teamwork assessment, also used in phase three, Appendix N outlined the
necessity for the assessors conducting this assessment to be trained in its facilitation and
scoring. A standardised instruction pack, including a clear scoring sheet, was used. Assessors
were also required to regularly engage in standardisation practices, with the author, to ensure
similar ratings were consistently obtained across applicant groups. Similarly, Appendix N
indicated that two senior instructors should simultaneously interview and independently score
an applicant in phase four of the selection process. Following discussion and negotiation, a
final score should then be allocated on a third Planned Behavioural Questionnaire document.
There is a rigorous quality assurance and verification process inherent within national trade
testing, phase five of the selection process. Assessors are required to have specific
qualifications and/or experience and their assessment judgements are verified through
moderators confirming a sample of the assessor’s decisions (QCTO, 2013). These steps
facilitate the inter-rater reliability for these research tools and processes. With the reliability
requirements of the six instruments having being clarified, the second aspect of inferential
statistics, the validity of these measures, is investigated in the next section.
152
5.9.4.3. Validity of measuring instruments
In the fourth aspect under consideration within data analysis, the validity of the
measuring instruments needed to be confirmed. According to Babbie and Mouton (2012, p.
122), validity is concerned with “the extent to which an empirical measure adequately reflects
the real meaning of the concept under consideration”. There are several forms of validity that
assist researchers to ascertain the success of tools in attaining this criterion. These are face
validity, concurrent validity, predictive validity, construct validity, convergent and
discriminant validity (Bryman & Bell, 2011).
Face validity refers to the empirical measure accurately reflecting the true meaning of
the construct or concept under investigation. This is established through confirmation of
common agreement on the measure of a concept (Babbie & Mouton, 2012). Within Appendix
N details were provided on the development of the Secondary CV Review Screening
Guidelines document and the Planned Behavioural Questionnaire. These instruments were
used in phase one and four, respectively, of the selection process. Both of these tools were
initially developed, in consultation with the author, by the training centre manager within the
Client, based on what was considered valuable criteria for the selection of apprentices within
the organisation. Following affirmation from other senior instructors within the training centre
these tools were confirmed as valid.
Independent of the test developers the content validity of the DAT-K battery was
confirmed by a committee of experts. The construct validity of the sub-tests was confirmed by
the test developers. The established predictive validity of the six DAT-K sub-tests used in this
study are recorded in Appendix Q. The significant Pearson product moment correlation
coefficients realised between the sub-tests and two year-end school subject results, namely,
English and mathematics, are provided. For the Vocabulary, Reading Comprehension, Verbal
and Non-verbal Reasoning measures, correlations with a p-value ≤ .01 were established for
both these subjects. The Comparison sub-test obtained a correlation with a p-value of ≤ .05 for
English and a correlation with a p-value ≤ .01 for mathematics. The Memory sub-test obtained
a correlation with a p-value of ≤ .01 for English and a correlation with a p-value ≤ .05 for
mathematics (Coetzee & Vosloo, 2000).
153
Whilst the TRAT battery manual specifically mentions that no validity data was available
at the time of printing, it also indicates that a comprehensive validity investigation was planned
(Taljaard, 1983). Subsequent to following-up on this issue it was confirmed that this validation
study had still not been done (F. Kriek, personal communication, March 9, 2018). Nevertheless,
the TRAT battery is a registered and approved psychological test (HPCSA, 2010). Given the
status of the test it was agreed that the information gleaned from this instrument could still be
utilised in this study.
Prior to the implementation of the teamwork assessment, the Client’s training centre
manager confirmed to the author that the nine competencies, listed in Appendix G, were
required by apprentices. Furthermore, as part of the pilot study, this manager also observed the
initial teamwork exercises conducted to confirm whether the exercises were measuring the
teamwork competencies required by the firm and at the required complexity level. Therefore,
as a subject matter expert, this manager endorsed the face validity of the teamwork assessment.
In order to become an accredited assessment centre of artisan training, providers are
required to submit their curricula for evaluation and record keeping to the NAMB. Failure to
do this can result in forfeiture of the accreditation status awarded to a provider (Government
Gazette, 2015b). This facilitates the establishment of the curriculum’s face validity.
Furthermore, NAMB verifies all trade test results, ensuring that the applicable moderation
criteria and guidelines have been adhered to (QCTO, 2013). This enables the body to confirm
the convergent and discriminant validity of these assessments. Having confirmed the reliability
and validity of the six research instruments, the next section outlines that the data analysis
techniques to be employed for the assessment of the hypotheses.
5.9.4.4. Assessment of research hypotheses
The 13 hypotheses of the study were provided in section 1.3.3. To assess these
hypotheses, draw inferences and make predictions concerning the sample, inferential statistics
were employed (Quinlan, 2011). The SPSS software package was used for statistical analyses.
Within this package a type of regression analysis, named the survival analysis procedure, was
used. This is the “analysis of time-to-event data” (Kartsonaki, 2016, p. 263). This statistical
procedure describes the data from an origin point to a fixed endpoint in time, known as the
measurement window (Hosmer et al., 2011; Morita et al., 1993). Table 5.11 provides
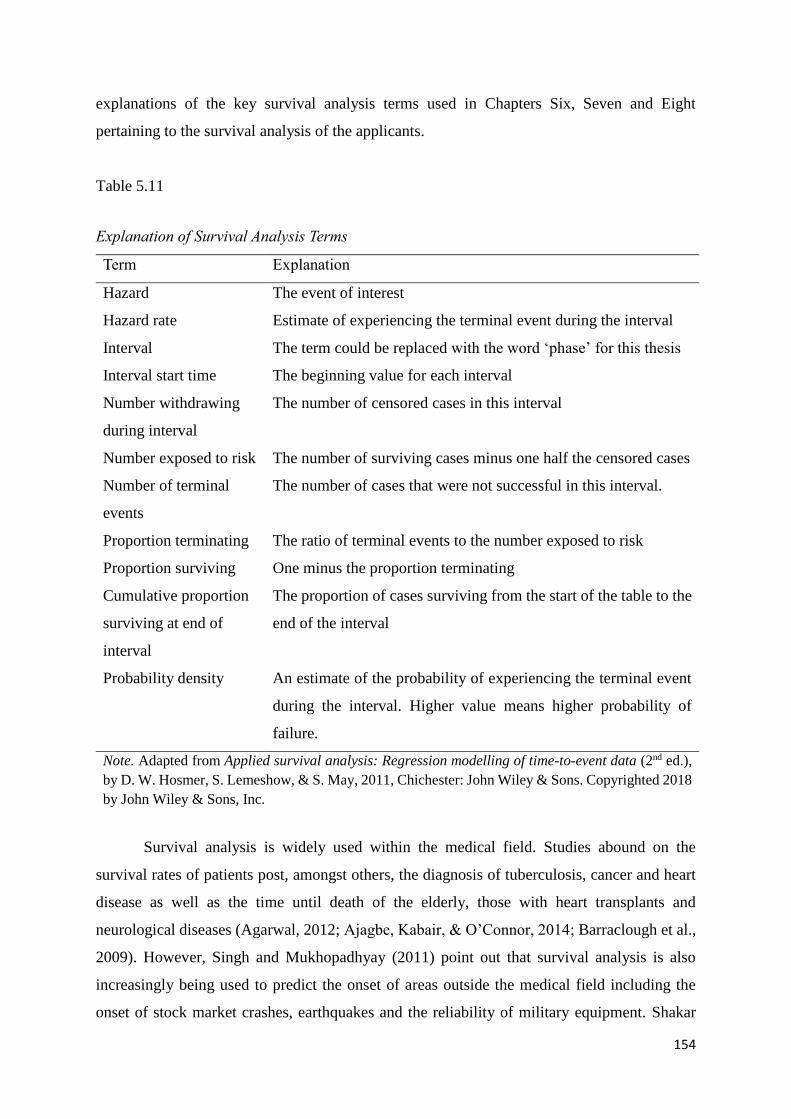
154
explanations of the key survival analysis terms used in Chapters Six, Seven and Eight
pertaining to the survival analysis of the applicants.
Table 5.11
Explanation of Survival Analysis Terms
Term Explanation
Hazard The event of interest
Hazard rate Estimate of experiencing the terminal event during the interval
Interval The term could be replaced with the word ‘phase’ for this thesis
Interval start time The beginning value for each interval
Number withdrawing
during interval
The number of censored cases in this interval
Number exposed to risk The number of surviving cases minus one half the censored cases
Number of terminal
events
The number of cases that were not successful in this interval.
Proportion terminating The ratio of terminal events to the number exposed to risk
Proportion surviving One minus the proportion terminating
Cumulative proportion
surviving at end of
interval
The proportion of cases surviving from the start of the table to the
end of the interval
Probability density An estimate of the probability of experiencing the terminal event
during the interval. Higher value means higher probability of
failure.
Note. Adapted from Applied survival analysis: Regression modelling of time-to-event data (2nd ed.),
by D. W. Hosmer, S. Lemeshow, & S. May, 2011, Chichester: John Wiley & Sons. Copyrighted 2018
by John Wiley & Sons, Inc.
Survival analysis is widely used within the medical field. Studies abound on the
survival rates of patients post, amongst others, the diagnosis of tuberculosis, cancer and heart
disease as well as the time until death of the elderly, those with heart transplants and
neurological diseases (Agarwal, 2012; Ajagbe, Kabair, & O’Connor, 2014; Barraclough et al.,
2009). However, Singh and Mukhopadhyay (2011) point out that survival analysis is also
increasingly being used to predict the onset of areas outside the medical field including the
onset of stock market crashes, earthquakes and the reliability of military equipment. Shakar
155
and Hűllermeier (2014) used the survival analysis technique to study data streams obtained
from earthquakes and Twitter. Chung, Schmidt, Witte and Witte (1991) documented the
application of survival analysis in criminology, specifically in predicting the time until
recidivism amongst prison releasees.
This procedure was employed to analyse the progression of the applicants through the
five phases or hazards of the selection process. This statistical procedure was useful in this
study as it facilitated an understanding of the applicant drop-out rate per phase in the selection
process. The assumption of survival analysis is that the probability of the event of interest (i.e.,
being successful or not in a selection phase) occurring depends only on time. It is the evaluation
that occurs at a particular phase that results in the applicant being successful or not. Cases that
enter the study at different times should then behave similarly (Hosmer et al., 2011).
The Gehan-Wilcoxon proportional hazards statistical tool provided an indication of the
survival probability of the applicants, that is, their likelihood of staying beyond a specific time
or phase implementation (Austin, 2017; Morita et al., 1993). The Gehan-Wilcoxon statistic, a
linear-rank statistic, is a non-parametric paired differenced statistical test. It compares related
or matched samples, or repeated measurements on a single sample to compare the survival
distribution amongst the groups and to determine if the population mean ranks differ. The test
statistic is based on the differences in group mean scores and ascertains if two or more samples
were selected from populations with the same distribution (Lou & Lan, 1998). The statistical
significance level was set at .05.
Within survival analysis, life tables are the descriptive procedure used to examine the
distribution of time-to-event variables. Life tables subdivide the period of observation into
smaller time intervals to estimate the probability of survival for each hazard. When testing
hypotheses, a comparison of the distribution of levels (e.g., probability density value) across
the different categories of the factor variable is useful (Hosmer et al., 2011). Life tables provide
the survival function of candidates without controlling for any factor variable or hazard. Any
point on the survival curve shows the probability that the candidate will remain under
consideration post the phase (Hosmer et al., 2011).
Section 5.9.2 indicated that 19 constructs were extracted from the primary data for
secondary analysis purposes. Thirteen of these 19 constructs pertained to the hypotheses of the
156
study. In section 6.6 life tables are used to depict the survival function of the applicants across
these 13 constructs. The findings derived from the life tables, and the associated descriptive
statistics, are then discussed per selection phase in Chapter Seven. In section 6.6.14 the life
table depicting the overall selection process as well as the associated survival chart are offered
and then discussed in section 7.8. This section has detailed the data analysis strategy employed
in the study. The sixth step in the research process has hence been fulfilled. The following
section document steps eight to 10 of the research process.
5.10. Step eight: Interpretation of results
This step in the research process pertains to reviewing the findings from the statistical
analysis with the view to drawing potential answers to the initial research questions posed in
step one. The reliability and validity of these findings in providing these answers is a vital
component of this step (Bless et al., 2013). Both of these issues are accomplished in Chapters
Six and Seven of this document.
According to the definition of evaluation provided in section 1.6, this action involves the
judgement or determination of the merit of something (Louw-Potgieter 2012; Rossi, Lipsey, &
Freeman, 2004). Section 4.5.1 discussed the challenge of sporadic evaluation studies
investigating the impact of HR staffing practices. The step-wise model of evaluation,
developed by Rossi et al. (2004), can be used to evaluate HR practices. The five-step hierarchy
assesses the need for the programme, the design and theory, process and implementation and
fourthly, outcome or impact. The final step is an evaluation of the cost and efficiency of the
programme. All five aspects can be evaluated simultaneously or they can be isolated and
evaluated independently of one another. In a review of the available research, Liu et al. (2007)
found fifteen studies that evaluated the effect or impact of various staffing practices on
performance, thus using the fourth step of the five-step hierarchical model. Outcomes refers to
some form of change, either in the short, medium or long-term. Impact, however, denotes a
causal relationship. When evaluating HR activities using this fourth step, one is determining
whether the HR practice has resulted in the change or not (Rossi et al., 2004).
Monitoring or evaluation tracks the implementation, outcomes or both of a practice over
time. In order to do this, the best representation of the outcome, or indicators, need to be
evaluated (Kusek & Rist, 2004). With regard to the selection of apprentices, the pass rate of
these students could be a valuable measure of the impact of the staffing practice. In section 7.8
157
the trade test pass rate achieved by the 77 apprentices within the study was compared to the
baseline indicator proposed by government and the pass rate documented in other industry-
related reports.
5.11. Step nine: Conclusions and recommendations
This step requires the development of conclusions and recommendations being drawn
from the interpretation of the results (Bryman & Bell, 2015b). Thirteen conclusions were
derived from the primary and secondary objectives as well as the various hypotheses within
the study. Eleven recommendations, to various stakeholders, were then extracted from these
conclusions. The fulfilment of the requirements of this step are provided in Chapter Eight of
this document.
5.12. Step ten: Dissemination of results
This step invites the presentation and sharing of the results, conclusions and
recommendations derived from the research to be shared in various formats (Bless et al., 2013).
The completion of this thesis is the first realisation of this step. Conference papers and journal
articles are anticipated further outcomes of this dissemination.
5.13. Ethical considerations
Ethics is a broad term, widely used by various individuals in quite different contexts.
Within research, though, the concept of ethics offers guidelines and behavioural expectations
regarding the correct conduct towards the various stakeholders involved in any study (Ruane,
2015). In this study, ethical considerations were realised in various ways with the different
stakeholders in the research process. This study was subject to research ethics approval
procedures at the Nelson Mandela University. Ethical clearance was gained from the relevant
bodies as it was understood that no harmful or adverse effects would be experienced by the
applicants. This approval is documented in Appendix J.
In terms of the right to confidentiality, permission to gain access to the primary data used
in this study was obtained from the Client. With the names excluded, the approval from this
sponsor to conduct the research is documented in Appendix I. This aspect also highlights the
right of anonymity of this sponsor. Permission to use the applicants’ data was obtained through
requesting the applicants to complete a consent form (Appendix H). This consent form
informed the applicants of the nature of the research and highlighted that they were under no
158
obligation to participate in the study. These two steps fulfilled the right to anonymity and the
right to voluntary participation (Bryman & Bell, 2015a; Quinlan et al., 2015).
Several steps were taken to ensure the privacy of the data gained from the applicants was
protected. Researchers need to ensure that the personal information of respondents is not
publically disclosed, without the consent of these individuals (Ruane, 2015). Besides obtaining
consent from the applicants to use their data in this study, the capturing and transformation of
the data was done on-site at the Client. A specific securely locked venue was allocated to the
author for this purpose and all archived and other data had to remain within this venue. The
final spreadsheet sent for analysis purposes did not include any identifying information, thereby
ensuring the privacy and anonymity of the applicants.
According to Zikmund et al. (2013), researchers need to guard against the
misrepresentation of their research results. The author therefore made use of an experienced
statistician to ensure the integrity of the results presented in Chapter Six and discussed in
Chapter Seven and Eight. Neither of the two supervisors of this thesis are involved in the
author’s consulting business and there was hence no conflict of interest.
5.14. Summary
This chapter has provided a detailed account of the 10 steps of the research process
followed in this study. The research topic and related questions have been indicated along with
a refinement of the research problem. The selected research paradigm, design and approach
have been considered and the motivation for their selection provided. The sampling plan
employed as well as the rationale for the development and/or choice of the research instruments
were discussed. The methods employed in the primary and secondary data collection inherent
in the study have been documented as well as the data analysis strategy. The ethical issues
requiring consideration in this study have also been outlined.
Whilst a brief account of steps eight to 10 of the research process have been indicated in
this chapter, the chapters that follow provide a detailed report on these. Chapter Six presents
the descriptive and inferential findings of the study, with Chapter Seven interpreting these
findings. Chapter Eight then draws conclusions and recommendations from these findings.
159
CHAPTER SIX
PRESENTATION OF EMPIRICAL FINDINGS
6.1. Introduction
Chapter Five documented the 10 steps in the research process followed for this study.
Chapter Six commences the fulfilment of step seven in this process through the presentation
and interpretation of the empirical findings obtained from the data analysis. The initial four
sections of this chapter offer the findings obtained from the descriptive statistics. The
demographic profile of the applicants is clarified in section 6.2 with the survival rate outcomes
for the five selection phases examined in section 6.3. The profile results of the applications
from the five selection phases are then discussed in section 6.4 and section 6.5 provides the
median STs of the 13 constructs investigated in this study. The final section examines the
results obtained for the 13 hypotheses. Section 6.2 commences the chapter with an appraisal of
the demographic profile of the applicants.
6.2. Demographic profile of applicants
The information pertaining to four demographic constructs are offered in this section.
The race, gender and age of the applicants, provided in sections 6.2.1 to 6.2.3, were obtained
in phase one of the selection process. The total sample for this first phase was 3 412 applicants.
The geographical location of the applicants was obtained in phase two, where there were 1 496
survivors. This demographic aspect is discussed in section 6.2.4.
6.2.1. Race profile
Table 6.1 portrays the frequency distribution of the race of the initial 3 412 applicants
within the study. In terms of race distribution, a noteworthy proportion (90.6%) of the
applicants were Black African. The second highest race distribution category was the Coloured
category at 7.3%. The remainder of the candidates were Indian/Asian (0.2%) and Whites
(1.9%).
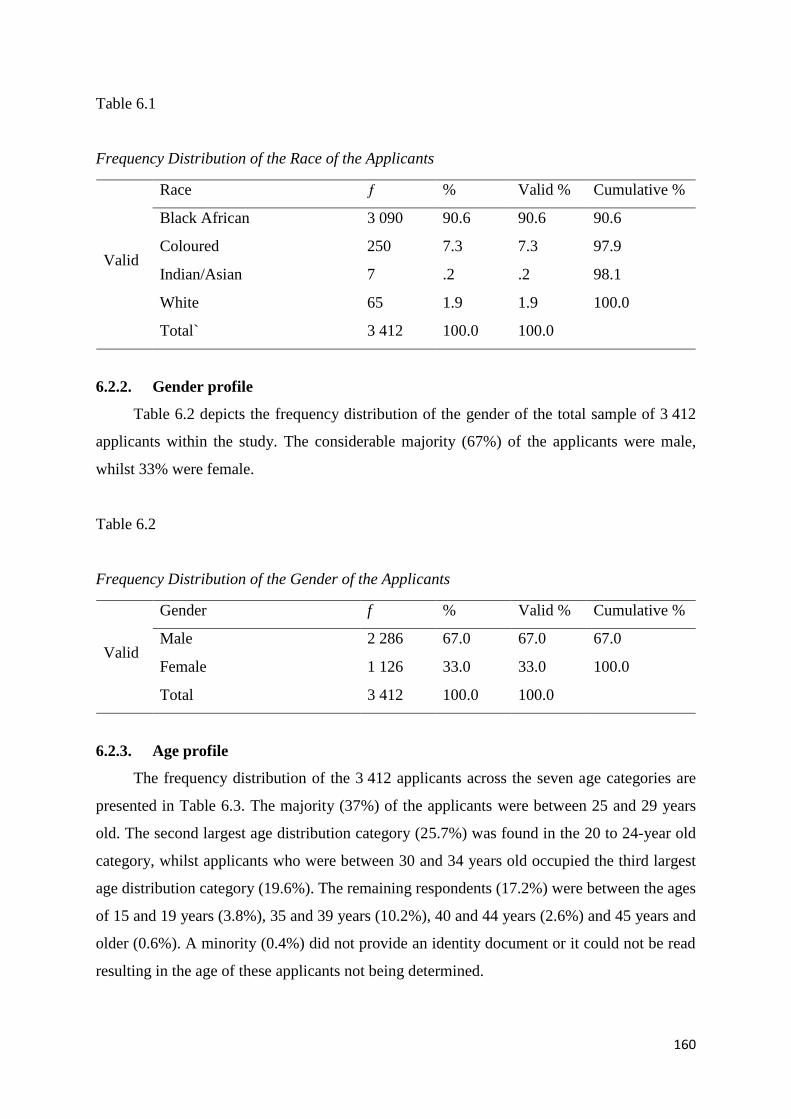
160
Table 6.1
Frequency Distribution of the Race of the Applicants
Valid
Race ƒ % Valid % Cumulative %
Black African 3 090 90.6 90.6 90.6
Coloured 250 7.3 7.3 97.9
Indian/Asian 7 .2 .2 98.1
White 65 1.9 1.9 100.0
Total` 3 412 100.0 100.0
6.2.2. Gender profile
Table 6.2 depicts the frequency distribution of the gender of the total sample of 3 412
applicants within the study. The considerable majority (67%) of the applicants were male,
whilst 33% were female.
Table 6.2
Frequency Distribution of the Gender of the Applicants
Valid
Gender f % Valid % Cumulative %
Male 2 286 67.0 67.0 67.0
Female 1 126 33.0 33.0 100.0
Total 3 412 100.0 100.0
6.2.3. Age profile
The frequency distribution of the 3 412 applicants across the seven age categories are
presented in Table 6.3. The majority (37%) of the applicants were between 25 and 29 years
old. The second largest age distribution category (25.7%) was found in the 20 to 24-year old
category, whilst applicants who were between 30 and 34 years old occupied the third largest
age distribution category (19.6%). The remaining respondents (17.2%) were between the ages
of 15 and 19 years (3.8%), 35 and 39 years (10.2%), 40 and 44 years (2.6%) and 45 years and
older (0.6%). A minority (0.4%) did not provide an identity document or it could not be read
resulting in the age of these applicants not being determined.
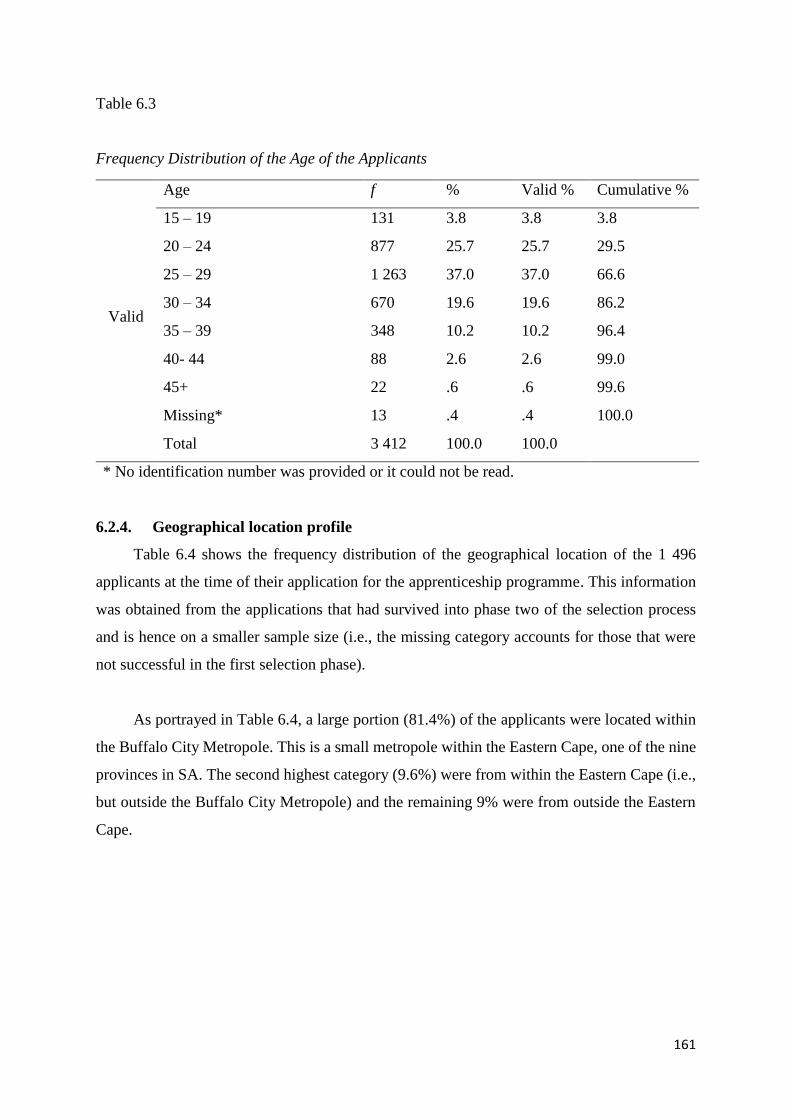
161
Table 6.3
Frequency Distribution of the Age of the Applicants
Valid
Age f % Valid % Cumulative %
15 – 19 131 3.8 3.8 3.8
20 – 24 877 25.7 25.7 29.5
25 – 29 1 263 37.0 37.0 66.6
30 – 34 670 19.6 19.6 86.2
35 – 39 348 10.2 10.2 96.4
40- 44 88 2.6 2.6 99.0
45+ 22 .6 .6 99.6
Missing* 13 .4 .4 100.0
Total 3 412 100.0 100.0
* No identification number was provided or it could not be read.
6.2.4. Geographical location profile
Table 6.4 shows the frequency distribution of the geographical location of the 1 496
applicants at the time of their application for the apprenticeship programme. This information
was obtained from the applications that had survived into phase two of the selection process
and is hence on a smaller sample size (i.e., the missing category accounts for those that were
not successful in the first selection phase).
As portrayed in Table 6.4, a large portion (81.4%) of the applicants were located within
the Buffalo City Metropole. This is a small metropole within the Eastern Cape, one of the nine
provinces in SA. The second highest category (9.6%) were from within the Eastern Cape (i.e.,
but outside the Buffalo City Metropole) and the remaining 9% were from outside the Eastern
Cape.
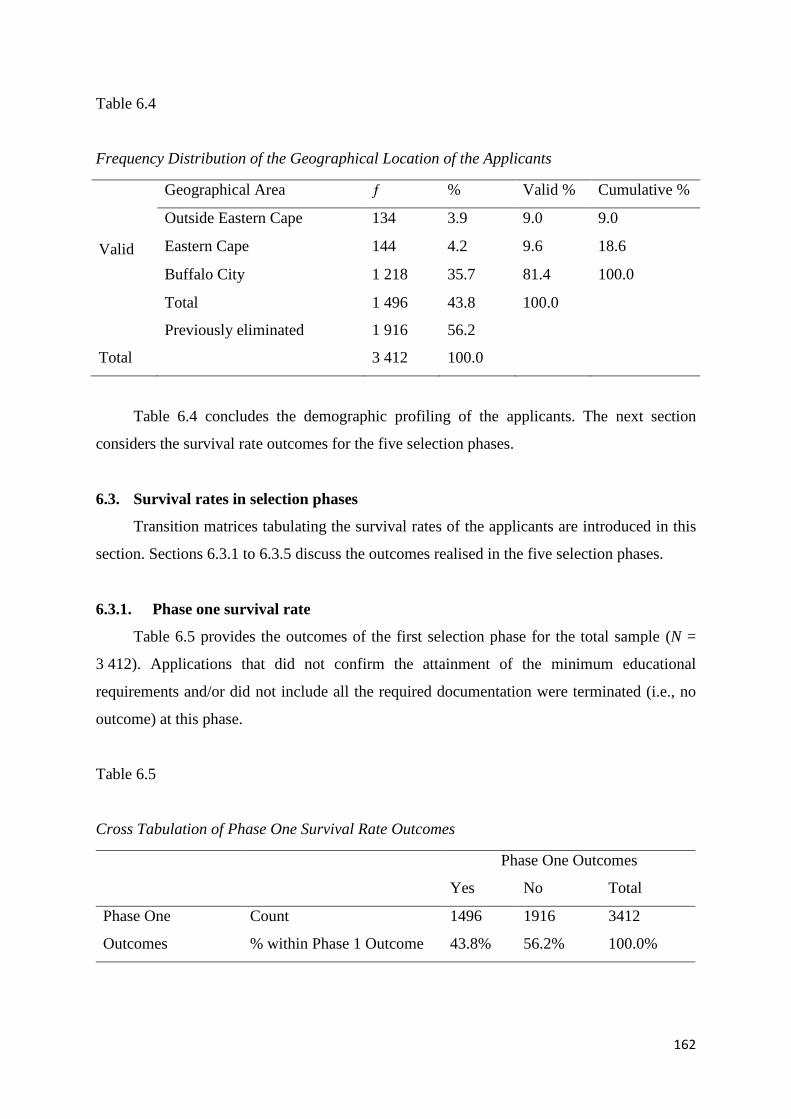
162
Table 6.4
Frequency Distribution of the Geographical Location of the Applicants
Valid
Geographical Area ƒ % Valid % Cumulative %
Outside Eastern Cape 134 3.9 9.0 9.0
Eastern Cape 144 4.2 9.6 18.6
Buffalo City 1 218 35.7 81.4 100.0
Total 1 496 43.8 100.0
Previously eliminated 1 916 56.2
Total 3 412 100.0
Table 6.4 concludes the demographic profiling of the applicants. The next section
considers the survival rate outcomes for the five selection phases.
6.3. Survival rates in selection phases
Transition matrices tabulating the survival rates of the applicants are introduced in this
section. Sections 6.3.1 to 6.3.5 discuss the outcomes realised in the five selection phases.
6.3.1. Phase one survival rate
Table 6.5 provides the outcomes of the first selection phase for the total sample (N =
3 412). Applications that did not confirm the attainment of the minimum educational
requirements and/or did not include all the required documentation were terminated (i.e., no
outcome) at this phase.
Table 6.5
Cross Tabulation of Phase One Survival Rate Outcomes
Phase One Outcomes
Yes No Total
Phase One
Outcomes
Count 1496 1916 3412
% within Phase 1 Outcome 43.8% 56.2% 100.0%
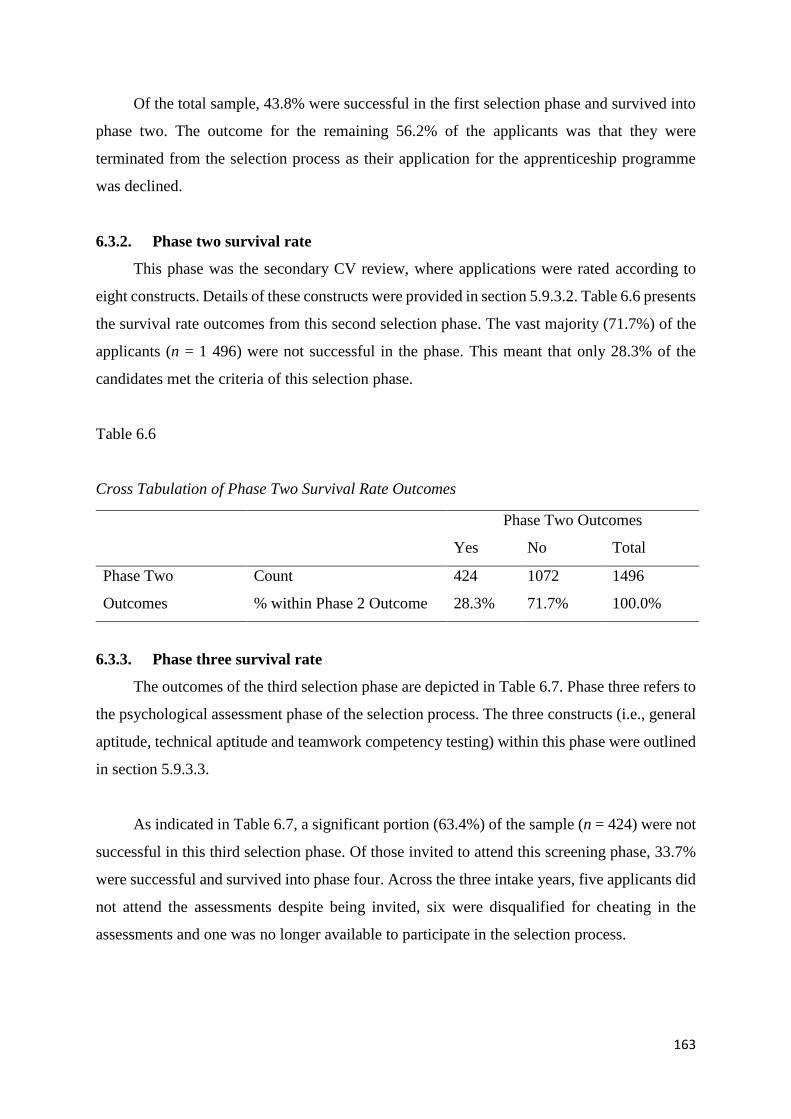
163
Of the total sample, 43.8% were successful in the first selection phase and survived into
phase two. The outcome for the remaining 56.2% of the applicants was that they were
terminated from the selection process as their application for the apprenticeship programme
was declined.
6.3.2. Phase two survival rate
This phase was the secondary CV review, where applications were rated according to
eight constructs. Details of these constructs were provided in section 5.9.3.2. Table 6.6 presents
the survival rate outcomes from this second selection phase. The vast majority (71.7%) of the
applicants (n = 1 496) were not successful in the phase. This meant that only 28.3% of the
candidates met the criteria of this selection phase.
Table 6.6
Cross Tabulation of Phase Two Survival Rate Outcomes
Phase Two Outcomes
Yes No Total
Phase Two
Outcomes
Count 424 1072 1496
% within Phase 2 Outcome 28.3% 71.7% 100.0%
6.3.3. Phase three survival rate
The outcomes of the third selection phase are depicted in Table 6.7. Phase three refers to
the psychological assessment phase of the selection process. The three constructs (i.e., general
aptitude, technical aptitude and teamwork competency testing) within this phase were outlined
in section 5.9.3.3.
As indicated in Table 6.7, a significant portion (63.4%) of the sample (n = 424) were not
successful in this third selection phase. Of those invited to attend this screening phase, 33.7%
were successful and survived into phase four. Across the three intake years, five applicants did
not attend the assessments despite being invited, six were disqualified for cheating in the
assessments and one was no longer available to participate in the selection process.
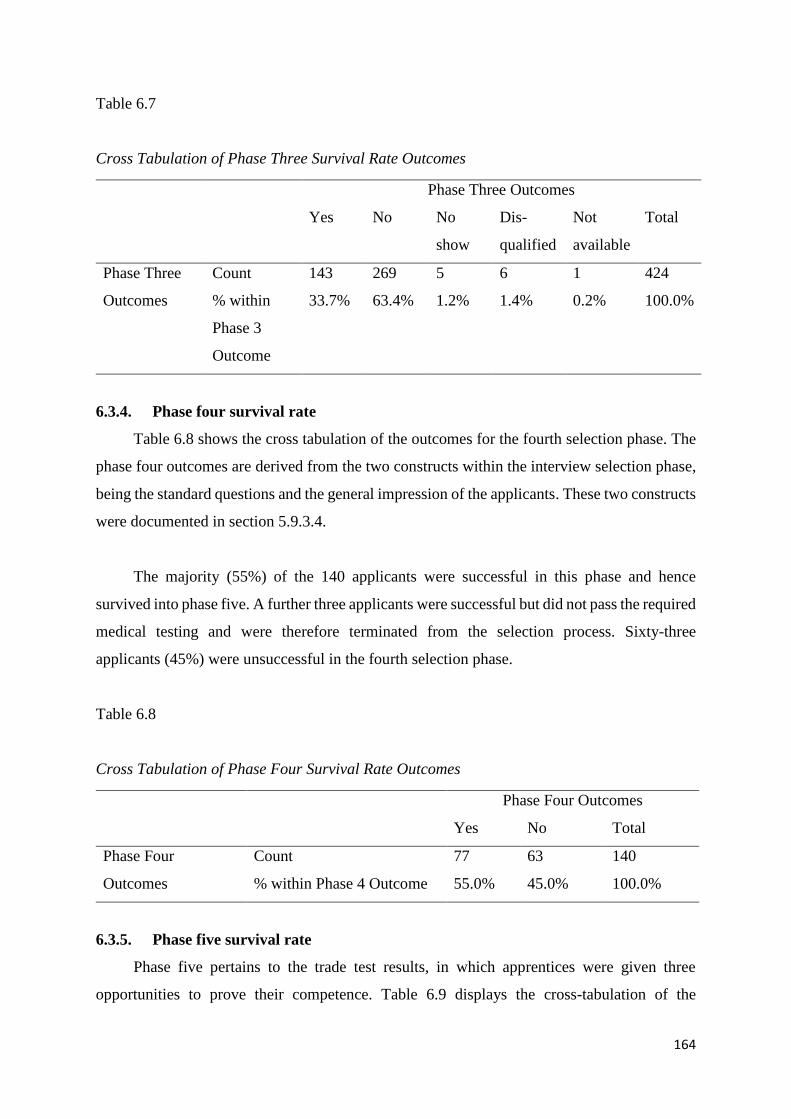
164
Table 6.7
Cross Tabulation of Phase Three Survival Rate Outcomes
Phase Three Outcomes
Yes No No
show
Dis-
qualified
Not
available
Total
Phase Three
Outcomes
Count 143 269 5 6 1 424
% within
Phase 3
Outcome
33.7% 63.4% 1.2% 1.4% 0.2% 100.0%
6.3.4. Phase four survival rate
Table 6.8 shows the cross tabulation of the outcomes for the fourth selection phase. The
phase four outcomes are derived from the two constructs within the interview selection phase,
being the standard questions and the general impression of the applicants. These two constructs
were documented in section 5.9.3.4.
The majority (55%) of the 140 applicants were successful in this phase and hence
survived into phase five. A further three applicants were successful but did not pass the required
medical testing and were therefore terminated from the selection process. Sixty-three
applicants (45%) were unsuccessful in the fourth selection phase.
Table 6.8
Cross Tabulation of Phase Four Survival Rate Outcomes
Phase Four Outcomes
Yes No Total
Phase Four
Outcomes
Count 77 63 140
% within Phase 4 Outcome 55.0% 45.0% 100.0%
6.3.5. Phase five survival rate
Phase five pertains to the trade test results, in which apprentices were given three
opportunities to prove their competence. Table 6.9 displays the cross-tabulation of the
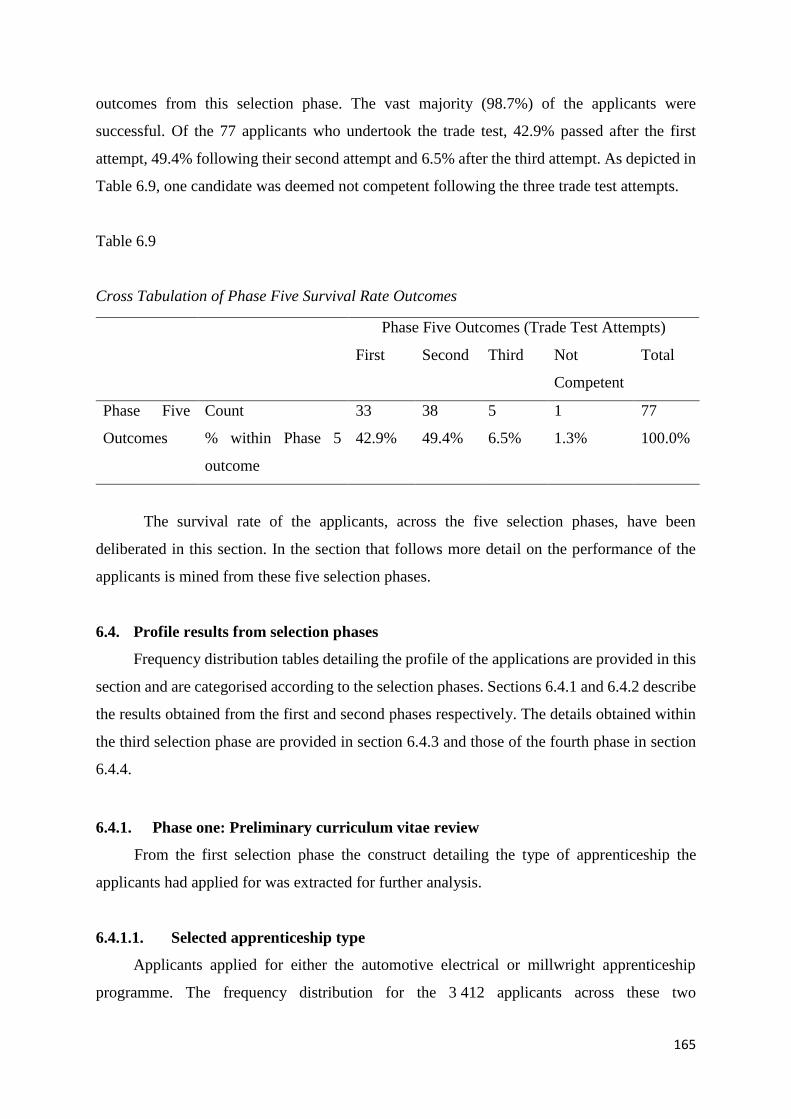
165
outcomes from this selection phase. The vast majority (98.7%) of the applicants were
successful. Of the 77 applicants who undertook the trade test, 42.9% passed after the first
attempt, 49.4% following their second attempt and 6.5% after the third attempt. As depicted in
Table 6.9, one candidate was deemed not competent following the three trade test attempts.
Table 6.9
Cross Tabulation of Phase Five Survival Rate Outcomes
Phase Five Outcomes (Trade Test Attempts)
First Second Third Not
Competent
Total
Phase Five
Outcomes
Count 33 38 5 1 77
% within Phase 5
outcome
42.9% 49.4% 6.5% 1.3% 100.0%
The survival rate of the applicants, across the five selection phases, have been
deliberated in this section. In the section that follows more detail on the performance of the
applicants is mined from these five selection phases.
6.4. Profile results from selection phases
Frequency distribution tables detailing the profile of the applications are provided in this
section and are categorised according to the selection phases. Sections 6.4.1 and 6.4.2 describe
the results obtained from the first and second phases respectively. The details obtained within
the third selection phase are provided in section 6.4.3 and those of the fourth phase in section
6.4.4.
6.4.1. Phase one: Preliminary curriculum vitae review
From the first selection phase the construct detailing the type of apprenticeship the
applicants had applied for was extracted for further analysis.
6.4.1.1. Selected apprenticeship type
Applicants applied for either the automotive electrical or millwright apprenticeship
programme. The frequency distribution for the 3 412 applicants across these two
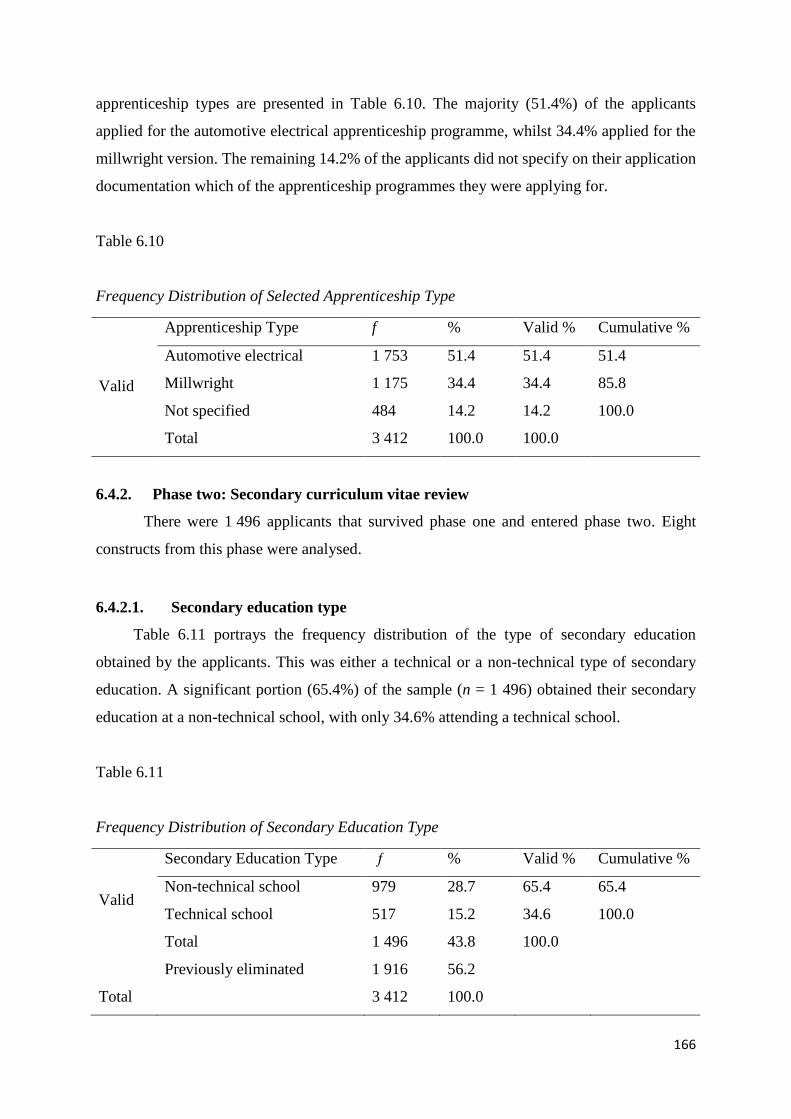
166
apprenticeship types are presented in Table 6.10. The majority (51.4%) of the applicants
applied for the automotive electrical apprenticeship programme, whilst 34.4% applied for the
millwright version. The remaining 14.2% of the applicants did not specify on their application
documentation which of the apprenticeship programmes they were applying for.
Table 6.10
Frequency Distribution of Selected Apprenticeship Type
Valid
Apprenticeship Type f % Valid % Cumulative %
Automotive electrical 1 753 51.4 51.4 51.4
Millwright 1 175 34.4 34.4 85.8
Not specified 484 14.2 14.2 100.0
Total 3 412 100.0 100.0
6.4.2. Phase two: Secondary curriculum vitae review
There were 1 496 applicants that survived phase one and entered phase two. Eight
constructs from this phase were analysed.
6.4.2.1. Secondary education type
Table 6.11 portrays the frequency distribution of the type of secondary education
obtained by the applicants. This was either a technical or a non-technical type of secondary
education. A significant portion (65.4%) of the sample (n = 1 496) obtained their secondary
education at a non-technical school, with only 34.6% attending a technical school.
Table 6.11
Frequency Distribution of Secondary Education Type
Valid
Secondary Education Type ƒ % Valid % Cumulative %
Non-technical school 979 28.7 65.4 65.4
Technical school 517 15.2 34.6 100.0
Total 1 496 43.8 100.0
Previously eliminated 1 916 56.2
Total 3 412 100.0
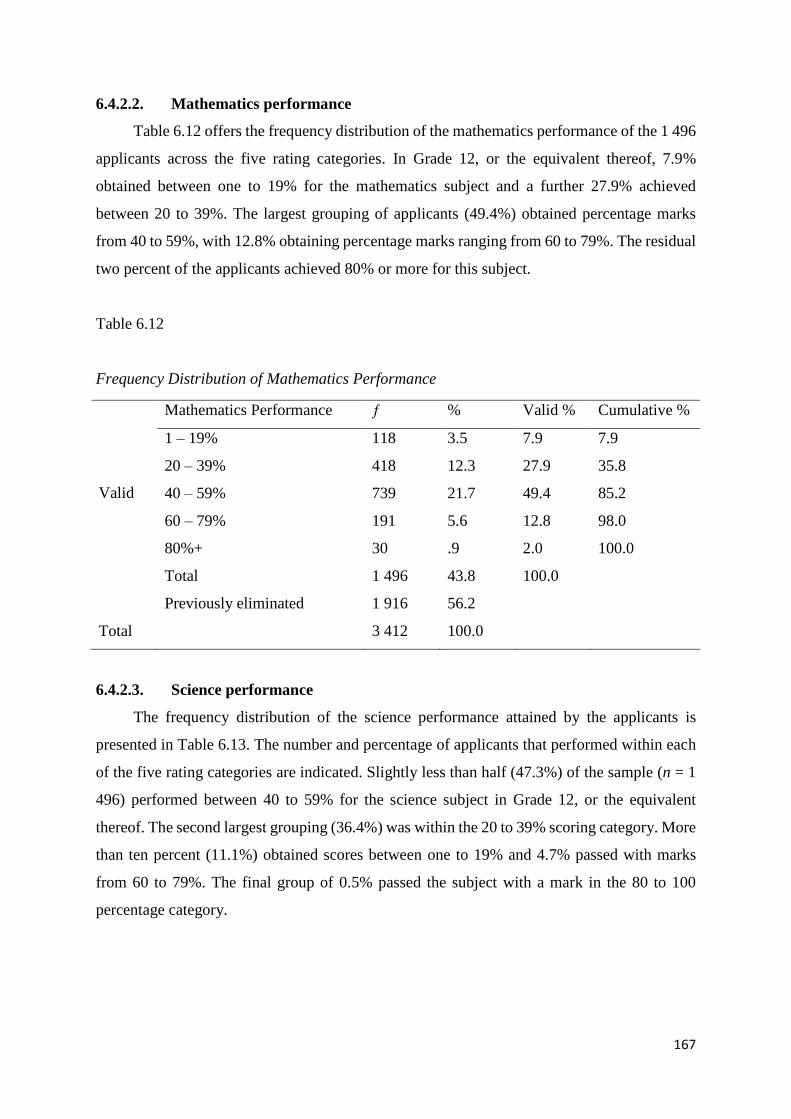
167
6.4.2.2. Mathematics performance
Table 6.12 offers the frequency distribution of the mathematics performance of the 1 496
applicants across the five rating categories. In Grade 12, or the equivalent thereof, 7.9%
obtained between one to 19% for the mathematics subject and a further 27.9% achieved
between 20 to 39%. The largest grouping of applicants (49.4%) obtained percentage marks
from 40 to 59%, with 12.8% obtaining percentage marks ranging from 60 to 79%. The residual
two percent of the applicants achieved 80% or more for this subject.
Table 6.12
Frequency Distribution of Mathematics Performance
Valid
Mathematics Performance ƒ % Valid % Cumulative %
1 – 19% 118 3.5 7.9 7.9
20 – 39% 418 12.3 27.9 35.8
40 – 59% 739 21.7 49.4 85.2
60 – 79% 191 5.6 12.8 98.0
80%+ 30 .9 2.0 100.0
Total 1 496 43.8 100.0
Previously eliminated 1 916 56.2
Total 3 412 100.0
6.4.2.3. Science performance
The frequency distribution of the science performance attained by the applicants is
presented in Table 6.13. The number and percentage of applicants that performed within each
of the five rating categories are indicated. Slightly less than half (47.3%) of the sample (n = 1
496) performed between 40 to 59% for the science subject in Grade 12, or the equivalent
thereof. The second largest grouping (36.4%) was within the 20 to 39% scoring category. More
than ten percent (11.1%) obtained scores between one to 19% and 4.7% passed with marks
from 60 to 79%. The final group of 0.5% passed the subject with a mark in the 80 to 100
percentage category.
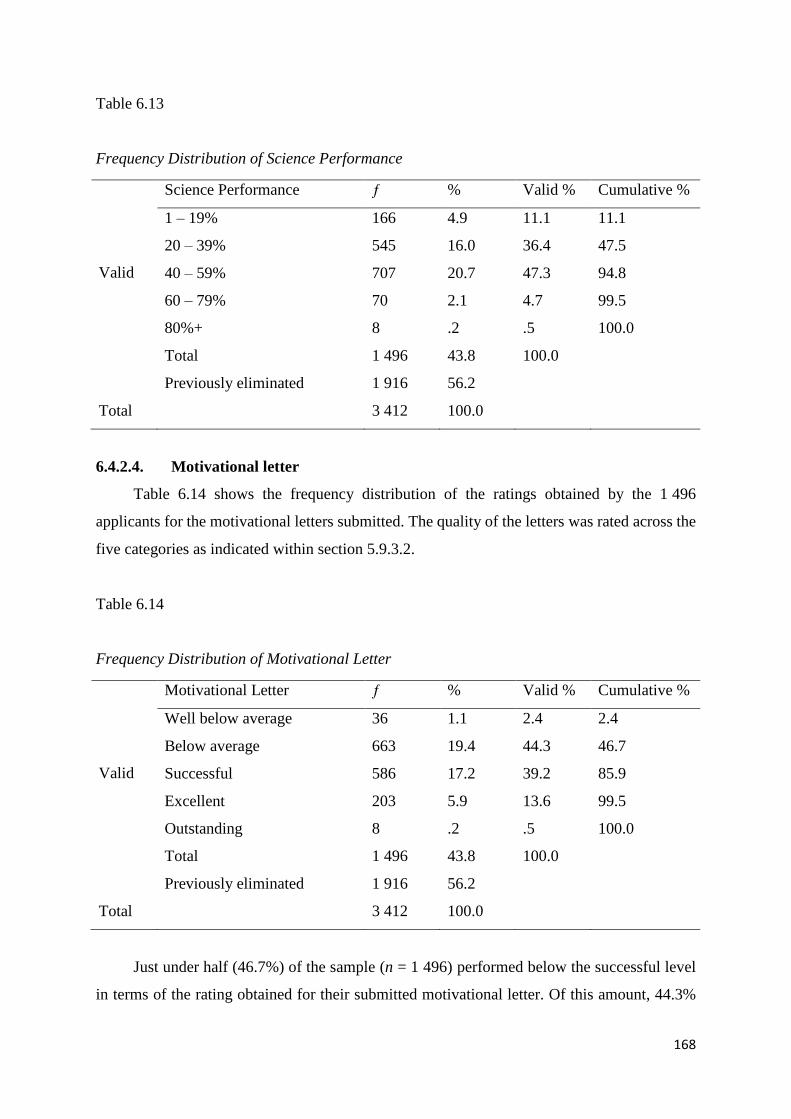
168
Table 6.13
Frequency Distribution of Science Performance
Valid
Science Performance ƒ % Valid % Cumulative %
1 – 19% 166 4.9 11.1 11.1
20 – 39% 545 16.0 36.4 47.5
40 – 59% 707 20.7 47.3 94.8
60 – 79% 70 2.1 4.7 99.5
80%+ 8 .2 .5 100.0
Total 1 496 43.8 100.0
Previously eliminated 1 916 56.2
Total 3 412 100.0
6.4.2.4. Motivational letter
Table 6.14 shows the frequency distribution of the ratings obtained by the 1 496
applicants for the motivational letters submitted. The quality of the letters was rated across the
five categories as indicated within section 5.9.3.2.
Table 6.14
Frequency Distribution of Motivational Letter
Valid
Motivational Letter ƒ % Valid % Cumulative %
Well below average 36 1.1 2.4 2.4
Below average 663 19.4 44.3 46.7
Successful 586 17.2 39.2 85.9
Excellent 203 5.9 13.6 99.5
Outstanding 8 .2 .5 100.0
Total 1 496 43.8 100.0
Previously eliminated 1 916 56.2
Total 3 412 100.0
Just under half (46.7%) of the sample (n = 1 496) performed below the successful level
in terms of the rating obtained for their submitted motivational letter. Of this amount, 44.3%
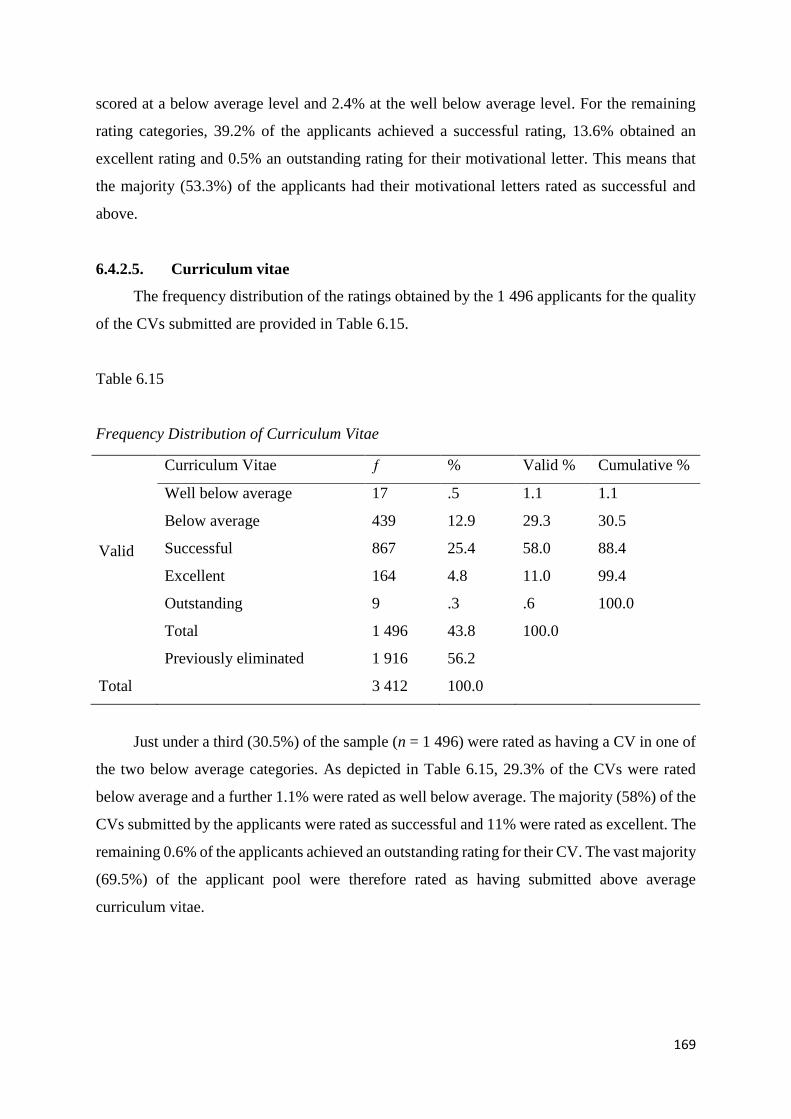
169
scored at a below average level and 2.4% at the well below average level. For the remaining
rating categories, 39.2% of the applicants achieved a successful rating, 13.6% obtained an
excellent rating and 0.5% an outstanding rating for their motivational letter. This means that
the majority (53.3%) of the applicants had their motivational letters rated as successful and
above.
6.4.2.5. Curriculum vitae
The frequency distribution of the ratings obtained by the 1 496 applicants for the quality
of the CVs submitted are provided in Table 6.15.
Table 6.15
Frequency Distribution of Curriculum Vitae
Valid
Curriculum Vitae ƒ % Valid % Cumulative %
Well below average 17 .5 1.1 1.1
Below average 439 12.9 29.3 30.5
Successful 867 25.4 58.0 88.4
Excellent 164 4.8 11.0 99.4
Outstanding 9 .3 .6 100.0
Total 1 496 43.8 100.0
Previously eliminated 1 916 56.2
Total 3 412 100.0
Just under a third (30.5%) of the sample (n = 1 496) were rated as having a CV in one of
the two below average categories. As depicted in Table 6.15, 29.3% of the CVs were rated
below average and a further 1.1% were rated as well below average. The majority (58%) of the
CVs submitted by the applicants were rated as successful and 11% were rated as excellent. The
remaining 0.6% of the applicants achieved an outstanding rating for their CV. The vast majority
(69.5%) of the applicant pool were therefore rated as having submitted above average
curriculum vitae.
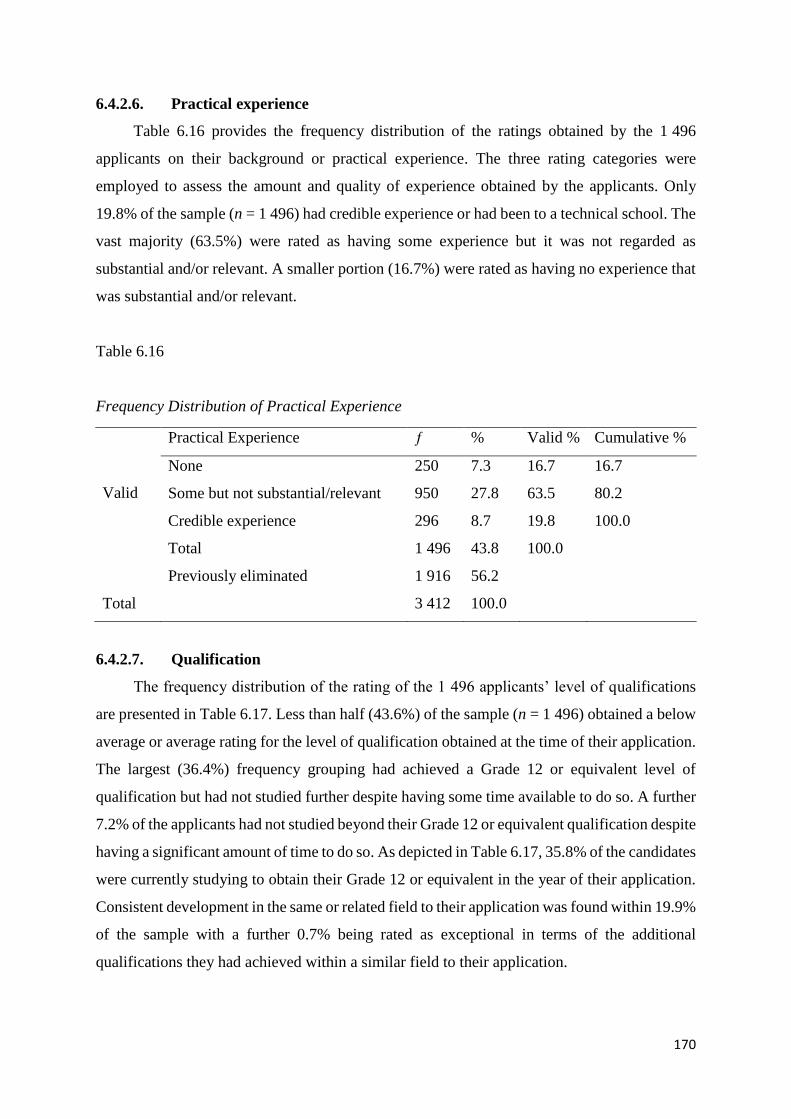
170
6.4.2.6. Practical experience
Table 6.16 provides the frequency distribution of the ratings obtained by the 1 496
applicants on their background or practical experience. The three rating categories were
employed to assess the amount and quality of experience obtained by the applicants. Only
19.8% of the sample (n = 1 496) had credible experience or had been to a technical school. The
vast majority (63.5%) were rated as having some experience but it was not regarded as
substantial and/or relevant. A smaller portion (16.7%) were rated as having no experience that
was substantial and/or relevant.
Table 6.16
Frequency Distribution of Practical Experience
Valid
Practical Experience ƒ % Valid % Cumulative %
None 250 7.3 16.7 16.7
Some but not substantial/relevant 950 27.8 63.5 80.2
Credible experience 296 8.7 19.8 100.0
Total 1 496 43.8 100.0
Previously eliminated 1 916 56.2
Total 3 412 100.0
6.4.2.7. Qualification
The frequency distribution of the rating of the 1 496 applicants’ level of qualifications
are presented in Table 6.17. Less than half (43.6%) of the sample (n = 1 496) obtained a below
average or average rating for the level of qualification obtained at the time of their application.
The largest (36.4%) frequency grouping had achieved a Grade 12 or equivalent level of
qualification but had not studied further despite having some time available to do so. A further
7.2% of the applicants had not studied beyond their Grade 12 or equivalent qualification despite
having a significant amount of time to do so. As depicted in Table 6.17, 35.8% of the candidates
were currently studying to obtain their Grade 12 or equivalent in the year of their application.
Consistent development in the same or related field to their application was found within 19.9%
of the sample with a further 0.7% being rated as exceptional in terms of the additional
qualifications they had achieved within a similar field to their application.
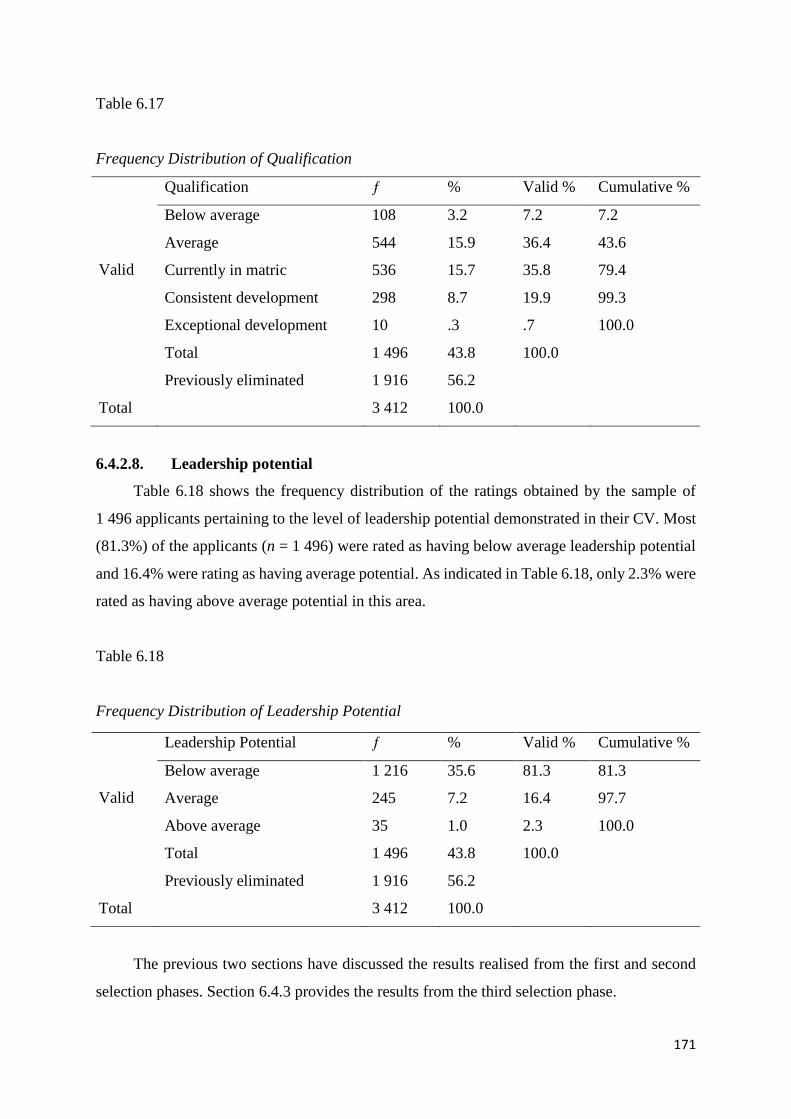
171
Table 6.17
Frequency Distribution of Qualification
Valid
Qualification ƒ % Valid % Cumulative %
Below average 108 3.2 7.2 7.2
Average 544 15.9 36.4 43.6
Currently in matric 536 15.7 35.8 79.4
Consistent development 298 8.7 19.9 99.3
Exceptional development 10 .3 .7 100.0
Total 1 496 43.8 100.0
Previously eliminated 1 916 56.2
Total 3 412 100.0
6.4.2.8. Leadership potential
Table 6.18 shows the frequency distribution of the ratings obtained by the sample of
1 496 applicants pertaining to the level of leadership potential demonstrated in their CV. Most
(81.3%) of the applicants (n = 1 496) were rated as having below average leadership potential
and 16.4% were rating as having average potential. As indicated in Table 6.18, only 2.3% were
rated as having above average potential in this area.
Table 6.18
Frequency Distribution of Leadership Potential
Valid
Leadership Potential ƒ % Valid % Cumulative %
Below average 1 216 35.6 81.3 81.3
Average 245 7.2 16.4 97.7
Above average 35 1.0 2.3 100.0
Total 1 496 43.8 100.0
Previously eliminated 1 916 56.2
Total 3 412 100.0
The previous two sections have discussed the results realised from the first and second
selection phases. Section 6.4.3 provides the results from the third selection phase.
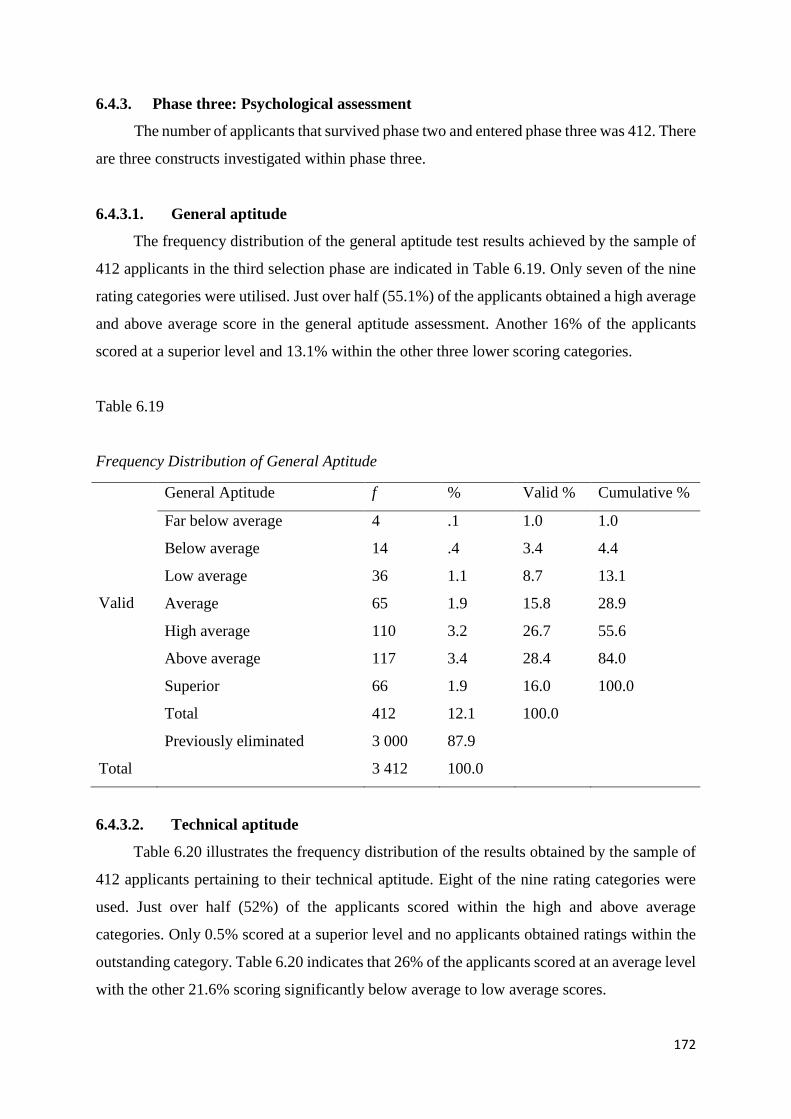
172
6.4.3. Phase three: Psychological assessment
The number of applicants that survived phase two and entered phase three was 412. There
are three constructs investigated within phase three.
6.4.3.1. General aptitude
The frequency distribution of the general aptitude test results achieved by the sample of
412 applicants in the third selection phase are indicated in Table 6.19. Only seven of the nine
rating categories were utilised. Just over half (55.1%) of the applicants obtained a high average
and above average score in the general aptitude assessment. Another 16% of the applicants
scored at a superior level and 13.1% within the other three lower scoring categories.
Table 6.19
Frequency Distribution of General Aptitude
Valid
General Aptitude f % Valid % Cumulative %
Far below average 4 .1 1.0 1.0
Below average 14 .4 3.4 4.4
Low average 36 1.1 8.7 13.1
Average 65 1.9 15.8 28.9
High average 110 3.2 26.7 55.6
Above average 117 3.4 28.4 84.0
Superior 66 1.9 16.0 100.0
Total 412 12.1 100.0
Previously eliminated 3 000 87.9
Total 3 412 100.0
6.4.3.2. Technical aptitude
Table 6.20 illustrates the frequency distribution of the results obtained by the sample of
412 applicants pertaining to their technical aptitude. Eight of the nine rating categories were
used. Just over half (52%) of the applicants scored within the high and above average
categories. Only 0.5% scored at a superior level and no applicants obtained ratings within the
outstanding category. Table 6.20 indicates that 26% of the applicants scored at an average level
with the other 21.6% scoring significantly below average to low average scores.
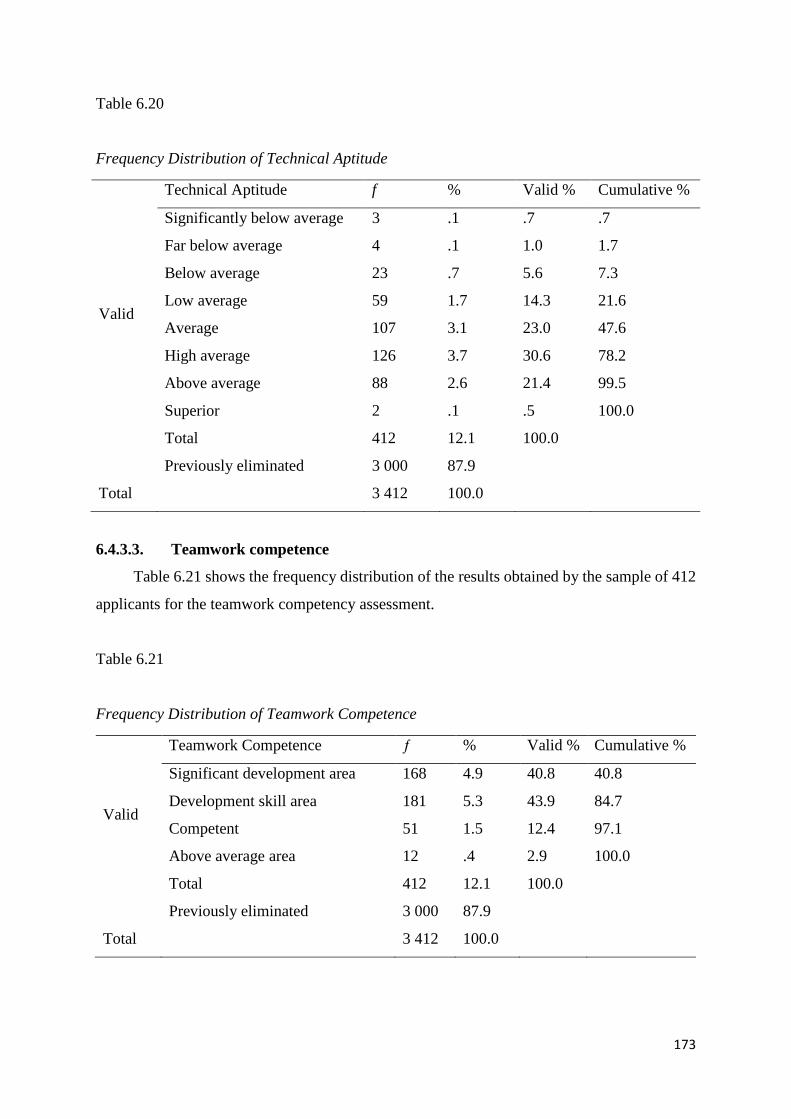
173
Table 6.20
Frequency Distribution of Technical Aptitude
Valid
Technical Aptitude f % Valid % Cumulative %
Significantly below average 3 .1 .7 .7
Far below average 4 .1 1.0 1.7
Below average 23 .7 5.6 7.3
Low average 59 1.7 14.3 21.6
Average 107 3.1 23.0 47.6
High average 126 3.7 30.6 78.2
Above average 88 2.6 21.4 99.5
Superior 2 .1 .5 100.0
Total 412 12.1 100.0
Previously eliminated 3 000 87.9
Total 3 412 100.0
6.4.3.3. Teamwork competence
Table 6.21 shows the frequency distribution of the results obtained by the sample of 412
applicants for the teamwork competency assessment.
Table 6.21
Frequency Distribution of Teamwork Competence
Valid
Teamwork Competence ƒ % Valid % Cumulative %
Significant development area 168 4.9 40.8 40.8
Development skill area 181 5.3 43.9 84.7
Competent 51 1.5 12.4 97.1
Above average area 12 .4 2.9 100.0
Total 412 12.1 100.0
Previously eliminated 3 000 87.9
Total 3 412 100.0
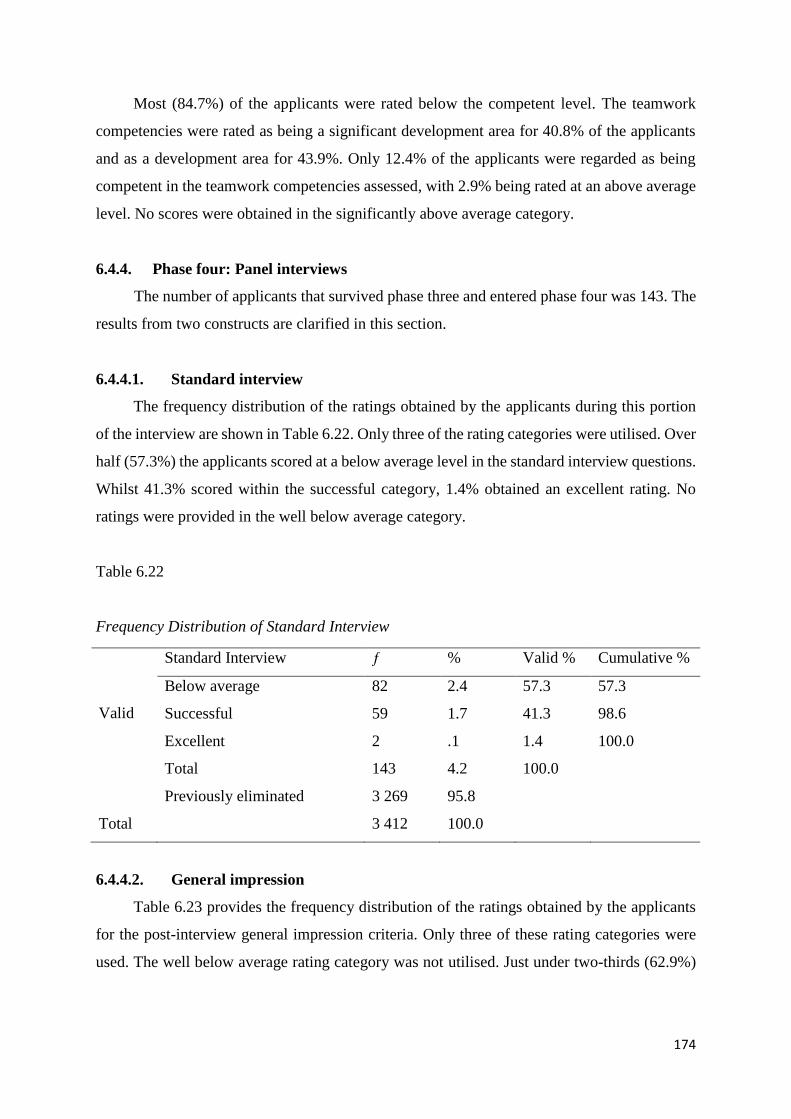
174
Most (84.7%) of the applicants were rated below the competent level. The teamwork
competencies were rated as being a significant development area for 40.8% of the applicants
and as a development area for 43.9%. Only 12.4% of the applicants were regarded as being
competent in the teamwork competencies assessed, with 2.9% being rated at an above average
level. No scores were obtained in the significantly above average category.
6.4.4. Phase four: Panel interviews
The number of applicants that survived phase three and entered phase four was 143. The
results from two constructs are clarified in this section.
6.4.4.1. Standard interview
The frequency distribution of the ratings obtained by the applicants during this portion
of the interview are shown in Table 6.22. Only three of the rating categories were utilised. Over
half (57.3%) the applicants scored at a below average level in the standard interview questions.
Whilst 41.3% scored within the successful category, 1.4% obtained an excellent rating. No
ratings were provided in the well below average category.
Table 6.22
Frequency Distribution of Standard Interview
Valid
Standard Interview ƒ % Valid % Cumulative %
Below average 82 2.4 57.3 57.3
Successful 59 1.7 41.3 98.6
Excellent 2 .1 1.4 100.0
Total 143 4.2 100.0
Previously eliminated 3 269 95.8
Total 3 412 100.0
6.4.4.2. General impression
Table 6.23 provides the frequency distribution of the ratings obtained by the applicants
for the post-interview general impression criteria. Only three of these rating categories were
used. The well below average rating category was not utilised. Just under two-thirds (62.9%)
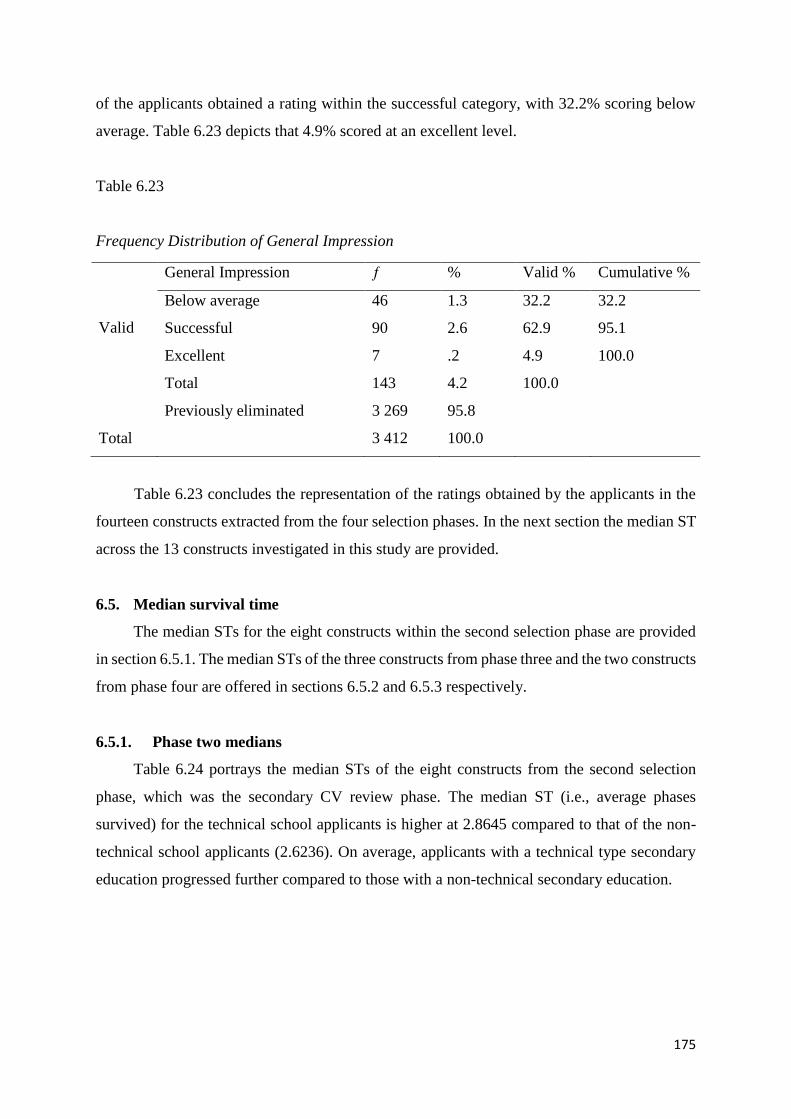
175
of the applicants obtained a rating within the successful category, with 32.2% scoring below
average. Table 6.23 depicts that 4.9% scored at an excellent level.
Table 6.23
Frequency Distribution of General Impression
Valid
General Impression ƒ % Valid % Cumulative %
Below average 46 1.3 32.2 32.2
Successful 90 2.6 62.9 95.1
Excellent 7 .2 4.9 100.0
Total 143 4.2 100.0
Previously eliminated 3 269 95.8
Total 3 412 100.0
Table 6.23 concludes the representation of the ratings obtained by the applicants in the
fourteen constructs extracted from the four selection phases. In the next section the median ST
across the 13 constructs investigated in this study are provided.
6.5. Median survival time
The median STs for the eight constructs within the second selection phase are provided
in section 6.5.1. The median STs of the three constructs from phase three and the two constructs
from phase four are offered in sections 6.5.2 and 6.5.3 respectively.
6.5.1. Phase two medians
Table 6.24 portrays the median STs of the eight constructs from the second selection
phase, which was the secondary CV review phase. The median ST (i.e., average phases
survived) for the technical school applicants is higher at 2.8645 compared to that of the non-
technical school applicants (2.6236). On average, applicants with a technical type secondary
education progressed further compared to those with a non-technical secondary education.
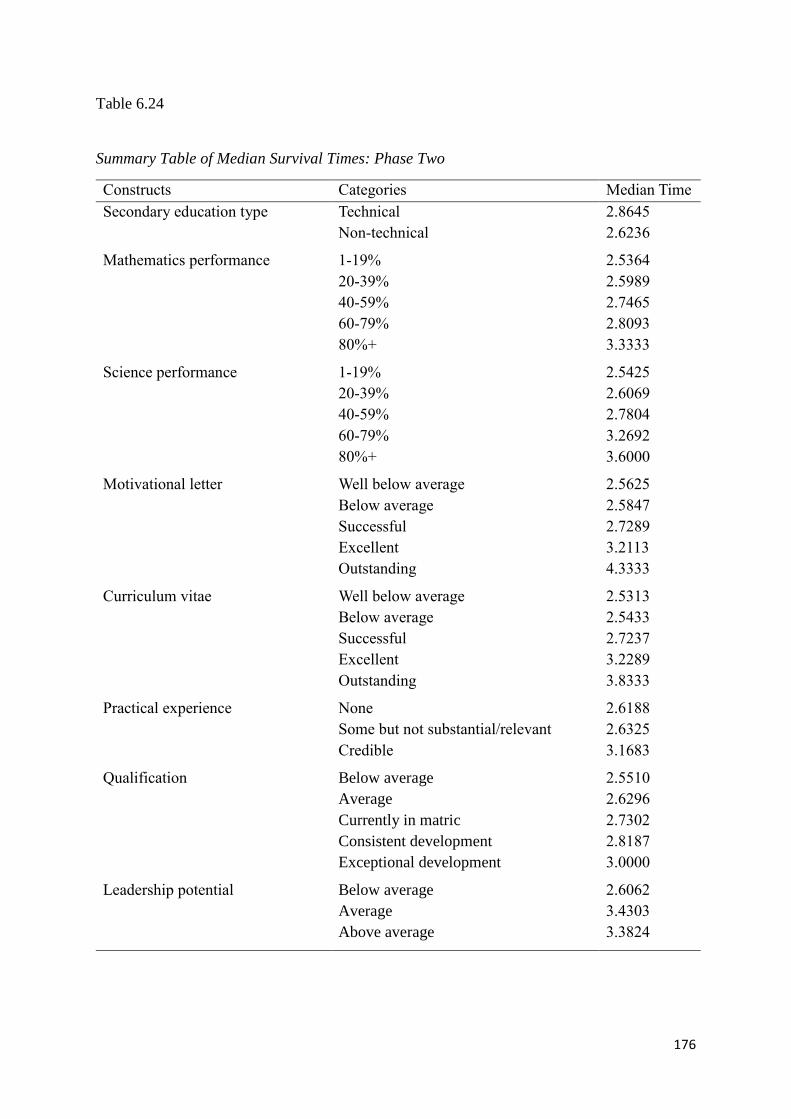
176
Table 6.24
Summary Table of Median Survival Times: Phase Two
Constructs Categories Median Time
Secondary education type Technical 2.8645
Non-technical 2.6236
Mathematics performance 1-19% 2.5364
20-39% 2.5989
40-59% 2.7465
60-79% 2.8093
80%+ 3.3333
Science performance 1-19% 2.5425
20-39% 2.6069
40-59% 2.7804
60-79% 3.2692
80%+ 3.6000
Motivational letter Well below average 2.5625
Below average 2.5847
Successful 2.7289
Excellent 3.2113
Outstanding 4.3333
Curriculum vitae Well below average 2.5313
Below average 2.5433
Successful 2.7237
Excellent 3.2289
Outstanding 3.8333
Practical experience None 2.6188
Some but not substantial/relevant 2.6325
Credible 3.1683
Qualification Below average 2.5510
Average 2.6296
Currently in matric 2.7302
Consistent development 2.8187
Exceptional development 3.0000
Leadership potential Below average 2.6062
Average 3.4303
Above average 3.3824
177
Applicants with higher mathematics scores survived the longest. This is indicated by the
progressively increased median ST as the performance of the applicants in mathematics
improved. The applicants with the lowest mathematics marks remained in the selection process
for less time than those with better marks. Applicants with mathematics marks of 80% and
above survived more phases as seen in the 3.3333 median ST for this grouping in Table 6.24.
Applicants with performance of 80% and above in science had a high median ST of
3.6000 compared to the lowest median ST of 2.5425 for the one to 19% performance interval.
This implies that applicants in the 80% and above interval had a better chance of survival, in
comparison to those that scored in the lower percentage categories. As mentioned for the
mathematics performance construct, applicants with higher science scores survived longer than
those with lower marks.
With regard to the quality of the motivational letter submitted, Table 6.24 indicates that
those rated as well below average had a lower median ST (2.5625) in comparison to those
whose motivational letters were rated as outstanding (4.3333). Applicants with better quality
motivational letters survived more selection phases than those with poorer rated motivational
letters.
Applicants with CVs rated in the higher scoring intervals had better survival chances
than those with lower quality rated CVs. Applicants with CVs rated as being of an outstanding
quality had the highest median ST of 3.8333, whilst those with a well below average rating had
a lower median ST of 2.5313.
The median ST for applicants that were rated as having credible experience and/or that
obtained a technical type secondary education was higher (3.1683) than that of the applicants
in the other two rating categories provided in Table 6.24. Those who had no experience
obtained a median ST of 2.6188 whilst those with some but not substantial and/or relevant
experience obtained only a slightly higher median ST of 2.6325. This means that applicants
with credible experience survived more selection phases than those applicants in the other two
rating categories.
In terms of rating the level of qualification obtained by the applicants, those within the
exceptional category had the highest median ST of 3.000. The applicants that were rated within
178
the other categories did not fare as well, with 2.5510 being the lowest median ST attained. The
median ST improved as the rating of the qualification increased.
Table 6.24 reveals that the median ST was higher for the applicants rated as having
average leadership potential (3.4303) in comparison to the other two rating categories. Those
rated as having above average leadership potential followed with a median ST of 3.3824.
Applicants regarded as having below average potential obtained the lowest median time of
2.6062. This concludes the discussion on the median ST findings of the eight constructs within
the second selection phase.
6.5.2. Phase three medians
The median STs of the three constructs from the third selection phase, the psychological
assessment phase, are portrayed in Table 6.25. Overall, applicants with higher general aptitude
ratings survived longer. This is indicated by the progressively increased median ST as the
general aptitude ratings of the applicants improved. Applicants with superior general aptitude
survived more phases as seen in the 4.4138 median ST for this grouping in Table 6.25. The
applicants with lower general aptitude ratings remained in the selection process for less time
than those with better ratings. The only exception was at the below average rating where the
median ST was 3.7778. This was higher than the other rating categories, except for the above
average and superior categories.
As shown in Table 6.25, applicants with better technical aptitude ratings had higher
median ST as the number of selection phases survived increased as their rating in this aptitude
improved. Applicants with superior aptitude obtained a median ST of 5.0000 compared to the
lowest 3.5000 median ST for the significantly below average category.
The median ST was higher for the applicants rated as having development areas (4.1563)
within their teamwork competencies in comparison to those that scored in the significant
development area and competent rating categories. Those rated as having above average
teamwork competencies, however, had the highest median ST of 5.0000.
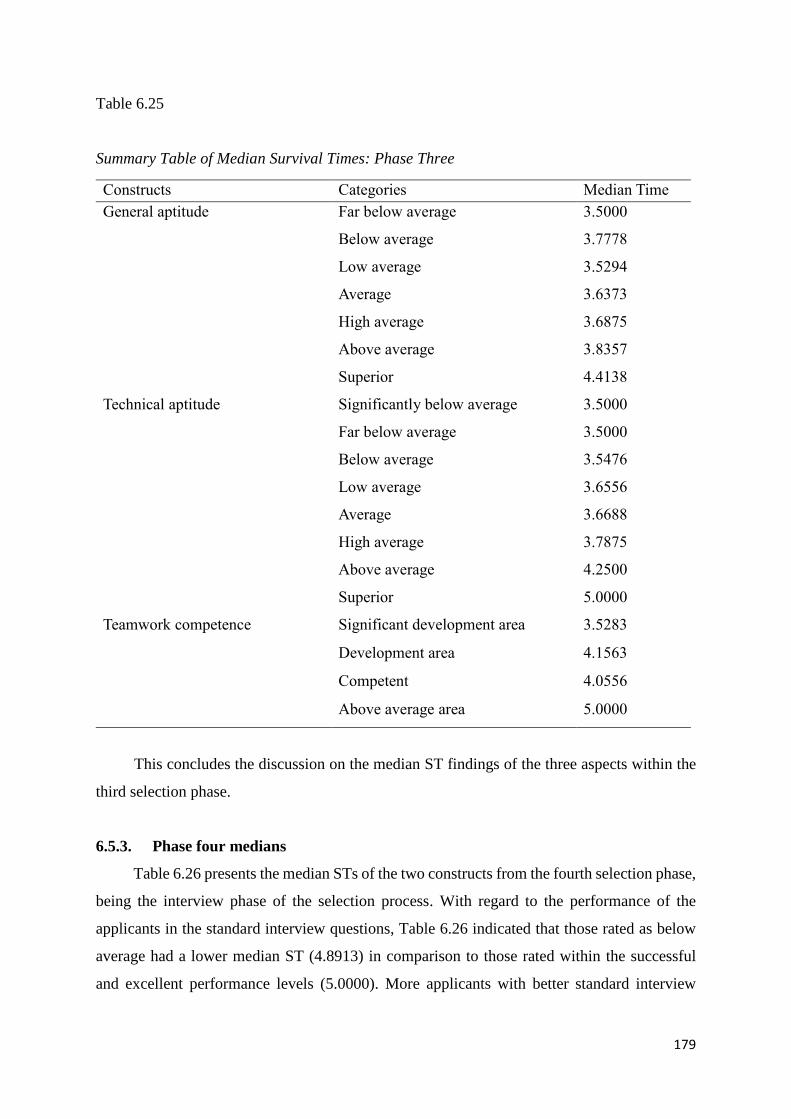
179
Table 6.25
Summary Table of Median Survival Times: Phase Three
This concludes the discussion on the median ST findings of the three aspects within the
third selection phase.
6.5.3. Phase four medians
Table 6.26 presents the median STs of the two constructs from the fourth selection phase,
being the interview phase of the selection process. With regard to the performance of the
applicants in the standard interview questions, Table 6.26 indicated that those rated as below
average had a lower median ST (4.8913) in comparison to those rated within the successful
and excellent performance levels (5.0000). More applicants with better standard interview
Constructs Categories Median Time
General aptitude Far below average 3.5000
Below average 3.7778
Low average 3.5294
Average 3.6373
High average 3.6875
Above average 3.8357
Superior 4.4138
Technical aptitude Significantly below average 3.5000
Far below average 3.5000
Below average 3.5476
Low average 3.6556
Average 3.6688
High average 3.7875
Above average 4.2500
Superior 5.0000
Teamwork competence Significant development area 3.5283
Development area 4.1563
Competent 4.0556
Above average area 5.0000
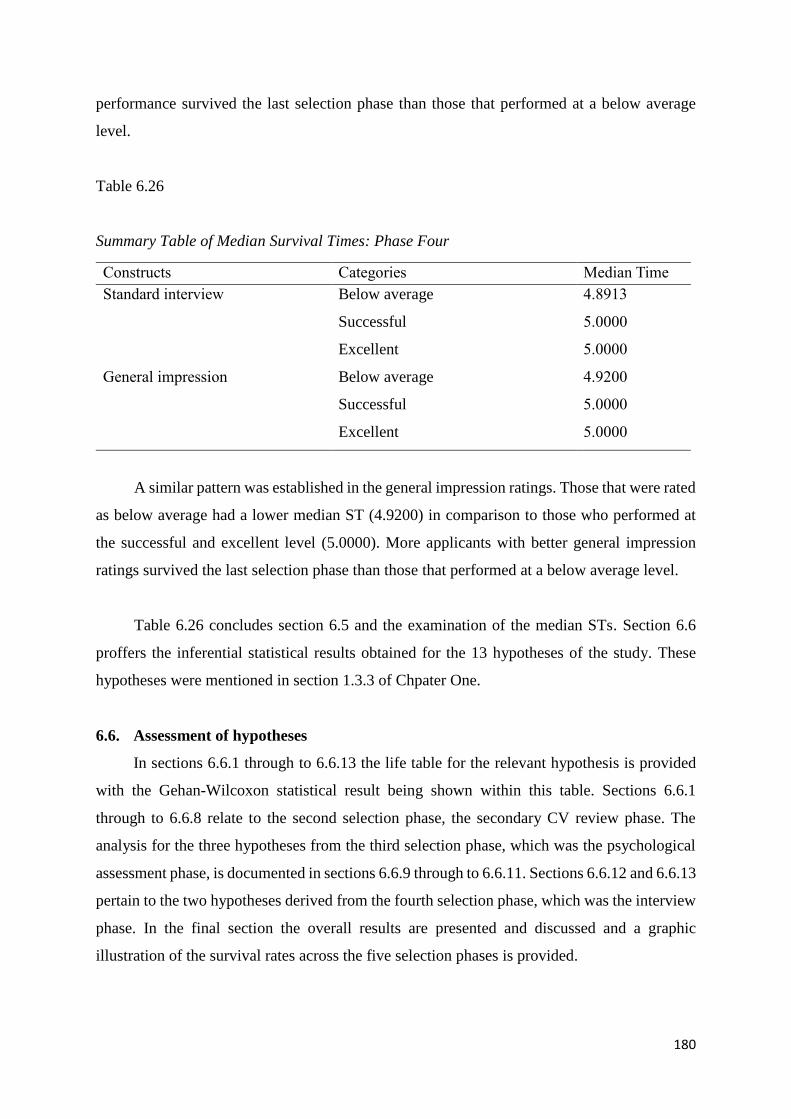
180
performance survived the last selection phase than those that performed at a below average
level.
Table 6.26
Summary Table of Median Survival Times: Phase Four
A similar pattern was established in the general impression ratings. Those that were rated
as below average had a lower median ST (4.9200) in comparison to those who performed at
the successful and excellent level (5.0000). More applicants with better general impression
ratings survived the last selection phase than those that performed at a below average level.
Table 6.26 concludes section 6.5 and the examination of the median STs. Section 6.6
proffers the inferential statistical results obtained for the 13 hypotheses of the study. These
hypotheses were mentioned in section 1.3.3 of Chpater One.
6.6. Assessment of hypotheses
In sections 6.6.1 through to 6.6.13 the life table for the relevant hypothesis is provided
with the Gehan-Wilcoxon statistical result being shown within this table. Sections 6.6.1
through to 6.6.8 relate to the second selection phase, the secondary CV review phase. The
analysis for the three hypotheses from the third selection phase, which was the psychological
assessment phase, is documented in sections 6.6.9 through to 6.6.11. Sections 6.6.12 and 6.6.13
pertain to the two hypotheses derived from the fourth selection phase, which was the interview
phase. In the final section the overall results are presented and discussed and a graphic
illustration of the survival rates across the five selection phases is provided.
Constructs Categories Median Time
Standard interview Below average 4.8913
Successful 5.0000
Excellent 5.0000
General impression Below average 4.9200
Successful 5.0000
Excellent 5.0000
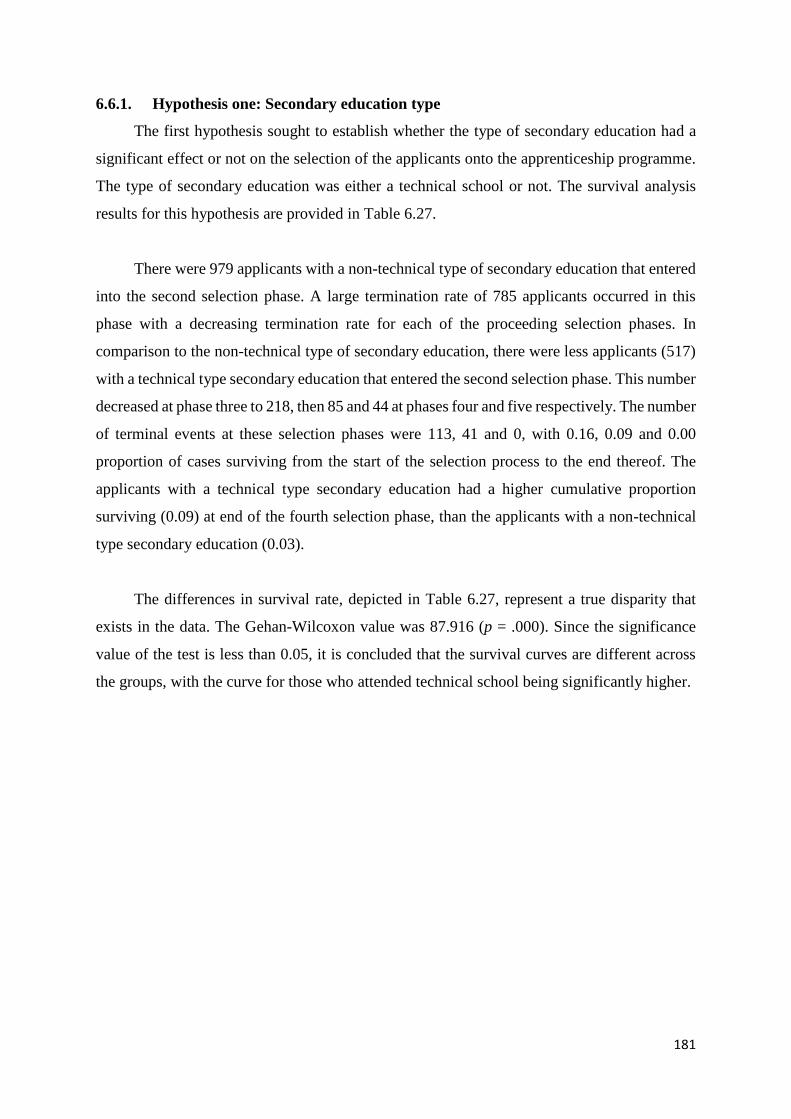
181
6.6.1. Hypothesis one: Secondary education type
The first hypothesis sought to establish whether the type of secondary education had a
significant effect or not on the selection of the applicants onto the apprenticeship programme.
The type of secondary education was either a technical school or not. The survival analysis
results for this hypothesis are provided in Table 6.27.
There were 979 applicants with a non-technical type of secondary education that entered
into the second selection phase. A large termination rate of 785 applicants occurred in this
phase with a decreasing termination rate for each of the proceeding selection phases. In
comparison to the non-technical type of secondary education, there were less applicants (517)
with a technical type secondary education that entered the second selection phase. This number
decreased at phase three to 218, then 85 and 44 at phases four and five respectively. The number
of terminal events at these selection phases were 113, 41 and 0, with 0.16, 0.09 and 0.00
proportion of cases surviving from the start of the selection process to the end thereof. The
applicants with a technical type secondary education had a higher cumulative proportion
surviving (0.09) at end of the fourth selection phase, than the applicants with a non-technical
type secondary education (0.03).
The differences in survival rate, depicted in Table 6.27, represent a true disparity that
exists in the data. The Gehan-Wilcoxon value was 87.916 (p = .000). Since the significance
value of the test is less than 0.05, it is concluded that the survival curves are different across
the groups, with the curve for those who attended technical school being significantly higher.
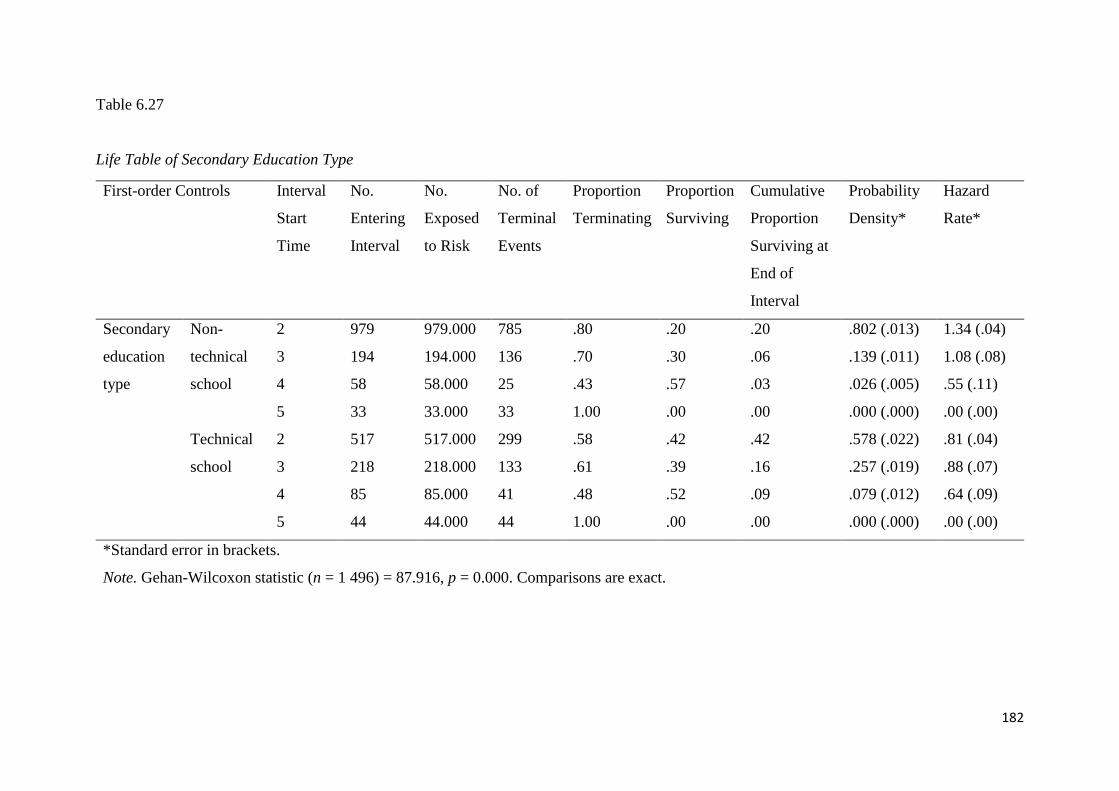
182
Table 6.27
Life Table of Secondary Education Type
First-order Controls Interval
Start
Time
No.
Entering
Interval
No.
Exposed
to Risk
No. of
Terminal
Events
Proportion
Terminating
Proportion
Surviving
Cumulative
Proportion
Surviving at
End of
Interval
Probability
Density*
Hazard
Rate*
Secondary
education
type
Non-
technical
school
2 979 979.000 785 .80 .20 .20 .802 (.013) 1.34 (.04)
3 194 194.000 136 .70 .30 .06 .139 (.011) 1.08 (.08)
4 58 58.000 25 .43 .57 .03 .026 (.005) .55 (.11)
5 33 33.000 33 1.00 .00 .00 .000 (.000) .00 (.00)
Technical
school
2 517 517.000 299 .58 .42 .42 .578 (.022) .81 (.04)
3 218 218.000 133 .61 .39 .16 .257 (.019) .88 (.07)
4 85 85.000 41 .48 .52 .09 .079 (.012) .64 (.09)
5 44 44.000 44 1.00 .00 .00 .000 (.000) .00 (.00)
*Standard error in brackets.
Note. Gehan-Wilcoxon statistic (n = 1 496) = 87.916, p = 0.000. Comparisons are exact.
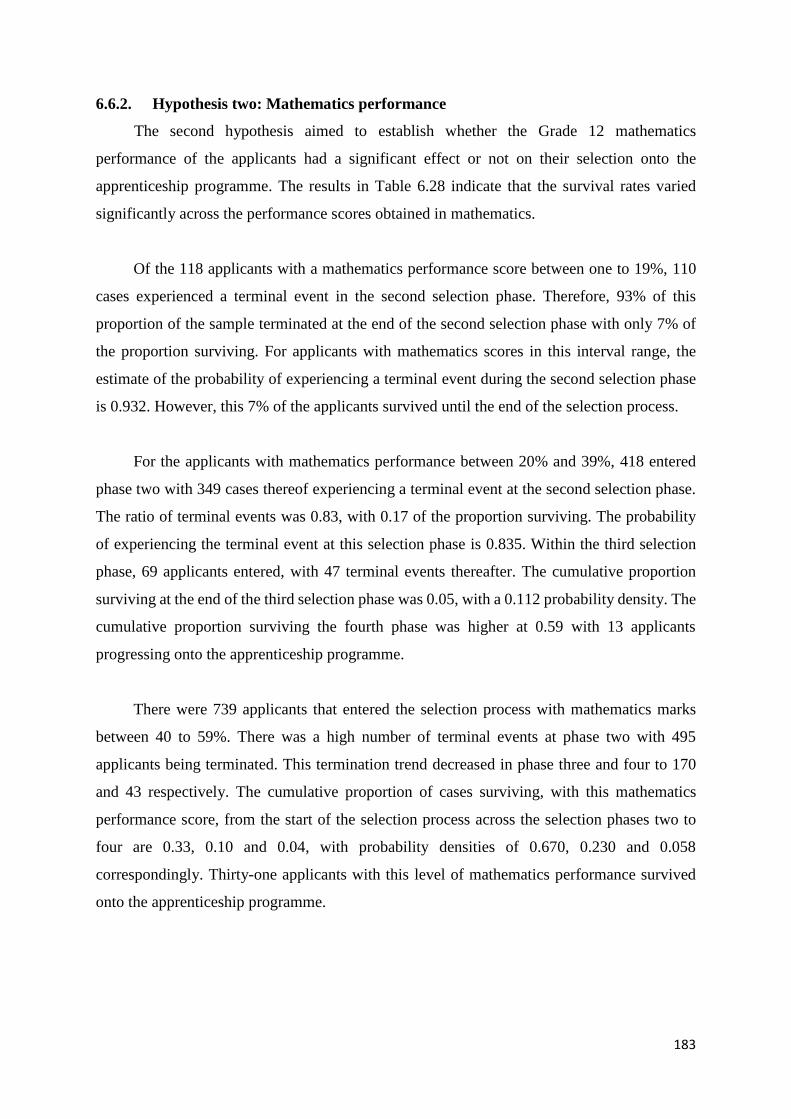
183
6.6.2. Hypothesis two: Mathematics performance
The second hypothesis aimed to establish whether the Grade 12 mathematics
performance of the applicants had a significant effect or not on their selection onto the
apprenticeship programme. The results in Table 6.28 indicate that the survival rates varied
significantly across the performance scores obtained in mathematics.
Of the 118 applicants with a mathematics performance score between one to 19%, 110
cases experienced a terminal event in the second selection phase. Therefore, 93% of this
proportion of the sample terminated at the end of the second selection phase with only 7% of
the proportion surviving. For applicants with mathematics scores in this interval range, the
estimate of the probability of experiencing a terminal event during the second selection phase
is 0.932. However, this 7% of the applicants survived until the end of the selection process.
For the applicants with mathematics performance between 20% and 39%, 418 entered
phase two with 349 cases thereof experiencing a terminal event at the second selection phase.
The ratio of terminal events was 0.83, with 0.17 of the proportion surviving. The probability
of experiencing the terminal event at this selection phase is 0.835. Within the third selection
phase, 69 applicants entered, with 47 terminal events thereafter. The cumulative proportion
surviving at the end of the third selection phase was 0.05, with a 0.112 probability density. The
cumulative proportion surviving the fourth phase was higher at 0.59 with 13 applicants
progressing onto the apprenticeship programme.
There were 739 applicants that entered the selection process with mathematics marks
between 40 to 59%. There was a high number of terminal events at phase two with 495
applicants being terminated. This termination trend decreased in phase three and four to 170
and 43 respectively. The cumulative proportion of cases surviving, with this mathematics
performance score, from the start of the selection process across the selection phases two to
four are 0.33, 0.10 and 0.04, with probability densities of 0.670, 0.230 and 0.058
correspondingly. Thirty-one applicants with this level of mathematics performance survived
onto the apprenticeship programme.
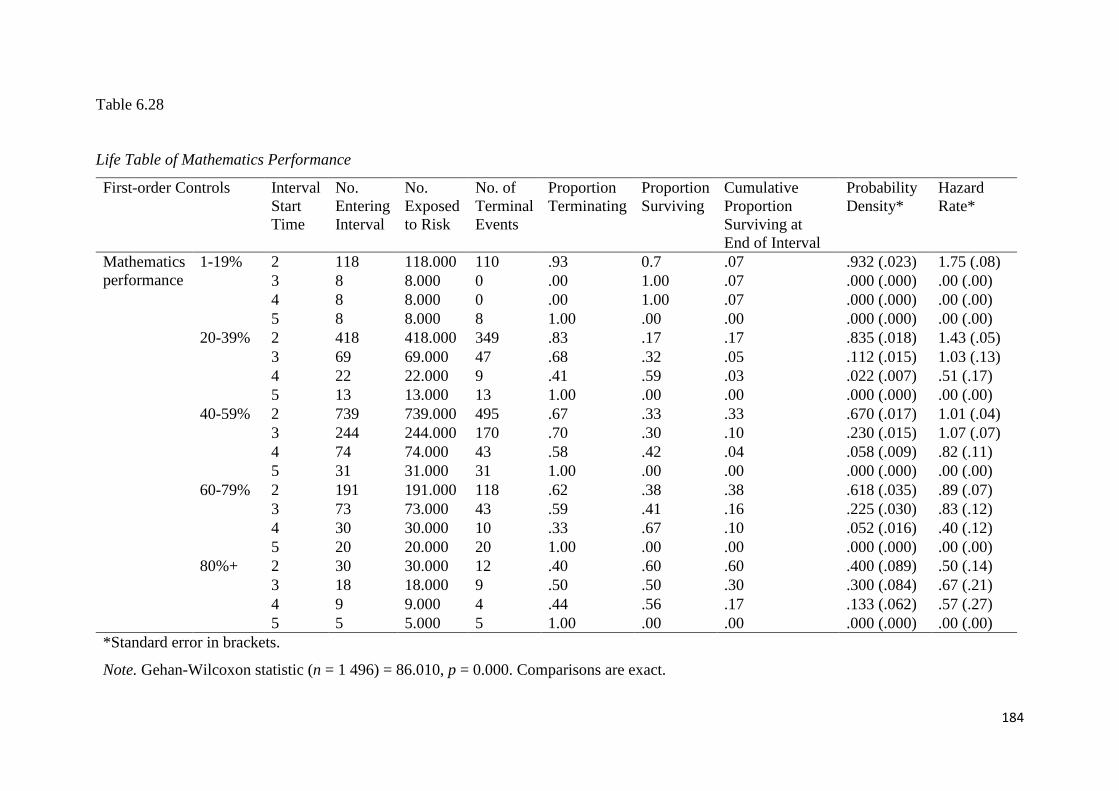
184
Table 6.28
Life Table of Mathematics Performance
First-order Controls Interval
Start
Time
No.
Entering
Interval
No.
Exposed
to Risk
No. of
Terminal
Events
Proportion
Terminating
Proportion
Surviving
Cumulative
Proportion
Surviving at
End of Interval
Probability
Density*
Hazard
Rate*
Mathematics
performance
1-19% 2 118 118.000 110 .93 0.7 .07 .932 (.023) 1.75 (.08)
3 8 8.000 0 .00 1.00 .07 .000 (.000) .00 (.00) 4 8 8.000 0 .00 1.00 .07 .000 (.000) .00 (.00) 5 8 8.000 8 1.00 .00 .00 .000 (.000) .00 (.00)
20-39% 2 418 418.000 349 .83 .17 .17 .835 (.018) 1.43 (.05) 3 69 69.000 47 .68 .32 .05 .112 (.015) 1.03 (.13) 4 22 22.000 9 .41 .59 .03 .022 (.007) .51 (.17) 5 13 13.000 13 1.00 .00 .00 .000 (.000) .00 (.00)
40-59% 2 739 739.000 495 .67 .33 .33 .670 (.017) 1.01 (.04) 3 244 244.000 170 .70 .30 .10 .230 (.015) 1.07 (.07) 4 74 74.000 43 .58 .42 .04 .058 (.009) .82 (.11) 5 31 31.000 31 1.00 .00 .00 .000 (.000) .00 (.00)
60-79% 2 191 191.000 118 .62 .38 .38 .618 (.035) .89 (.07) 3 73 73.000 43 .59 .41 .16 .225 (.030) .83 (.12) 4 30 30.000 10 .33 .67 .10 .052 (.016) .40 (.12) 5 20 20.000 20 1.00 .00 .00 .000 (.000) .00 (.00)
80%+ 2 30 30.000 12 .40 .60 .60 .400 (.089) .50 (.14) 3 18 18.000 9 .50 .50 .30 .300 (.084) .67 (.21) 4 9 9.000 4 .44 .56 .17 .133 (.062) .57 (.27) 5 5 5.000 5 1.00 .00 .00 .000 (.000) .00 (.00)
*Standard error in brackets.
Note. Gehan-Wilcoxon statistic (n = 1 496) = 86.010, p = 0.000. Comparisons are exact.
185
There were 191 applicants with mathematics performance scores ranging from 60 to
79%. A large proportion (0.62) were terminated at phase three, with a probability density of
0.618. The number of applicants surviving at phase three was 73, then 30 and 20 at phases four
and five respectively. The number of terminal events were 43 at phase three and 10 at phase
four. Twenty applicants with this level of performance in mathematics survived onto the
apprenticeship programme.
Of the 30 applicants with mathematics scores 80% and above, there were 12 terminal
events at phase two, nine at phase three and four at phase four. The proportion terminating
increased from 0.40 to 0.50, then decreased to 0.44. Five applicants with this level of
mathematics performance survived to continue with the programme. As reflected in Table 6.28,
the cumulative proportion surviving the entire selection process was higher (0.10 and 0.17
respectively) for those with mathematics marks between 60 to 79% and 80% and above, in
comparison to the other performance categories. This cumulative proportion stayed constant,
with no further terminations, through the fourth phase for both these mathematics categories.
Given the statistical significance of the Gehan-Wilcoxon value of 86.010 with a p-value
of 0.000 reflected in Table 6.28, the survival curves are regarded as statistically different across
the groups.These survival rates across the groups indicate that applicants with higher Grade 12
mathematics performance had a better chance of surviving onto the next selection phase.
6.6.3. Hypothesis three: Science performance
This set of analyses for the third hypothesis sought to determine whether or not the Grade
12 science performance of the applicants had a significant effect on their selection onto the
apprenticeship programme. As depicted in Table 6.29, performance pertaining to science as a
subject was captured across five categories.
For the performance category ranging from one to 19%, 166 applicants entered the
selection process with 153 terminal events at the end of the second phase. The cumulative
proportion surviving at the end of this phase was 0.08. The probability density was high at
0.922, which decreased with every additional selection phase. Eight applicants within this
rating category survived the selection process and entered onto the apprenticeship programme.
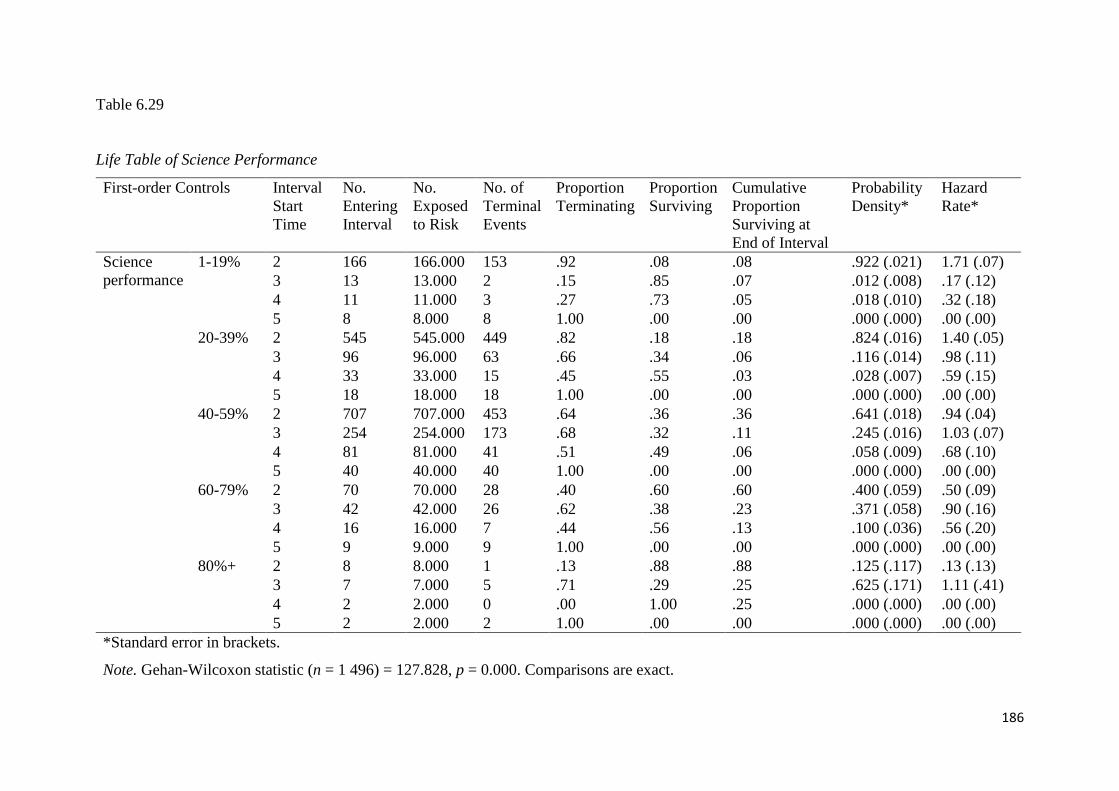
186
Table 6.29
Life Table of Science Performance
First-order Controls Interval
Start
Time
No.
Entering
Interval
No.
Exposed
to Risk
No. of
Terminal
Events
Proportion
Terminating
Proportion
Surviving
Cumulative
Proportion
Surviving at
End of Interval
Probability
Density*
Hazard
Rate*
Science
performance
1-19% 2 166 166.000 153 .92 .08 .08 .922 (.021) 1.71 (.07)
3 13 13.000 2 .15 .85 .07 .012 (.008) .17 (.12)
4 11 11.000 3 .27 .73 .05 .018 (.010) .32 (.18)
5 8 8.000 8 1.00 .00 .00 .000 (.000) .00 (.00)
20-39% 2 545 545.000 449 .82 .18 .18 .824 (.016) 1.40 (.05)
3 96 96.000 63 .66 .34 .06 .116 (.014) .98 (.11)
4 33 33.000 15 .45 .55 .03 .028 (.007) .59 (.15)
5 18 18.000 18 1.00 .00 .00 .000 (.000) .00 (.00)
40-59% 2 707 707.000 453 .64 .36 .36 .641 (.018) .94 (.04)
3 254 254.000 173 .68 .32 .11 .245 (.016) 1.03 (.07)
4 81 81.000 41 .51 .49 .06 .058 (.009) .68 (.10)
5 40 40.000 40 1.00 .00 .00 .000 (.000) .00 (.00)
60-79% 2 70 70.000 28 .40 .60 .60 .400 (.059) .50 (.09)
3 42 42.000 26 .62 .38 .23 .371 (.058) .90 (.16)
4 16 16.000 7 .44 .56 .13 .100 (.036) .56 (.20)
5 9 9.000 9 1.00 .00 .00 .000 (.000) .00 (.00)
80%+ 2 8 8.000 1 .13 .88 .88 .125 (.117) .13 (.13)
3 7 7.000 5 .71 .29 .25 .625 (.171) 1.11 (.41)
4 2 2.000 0 .00 1.00 .25 .000 (.000) .00 (.00)
5 2 2.000 2 1.00 .00 .00 .000 (.000) .00 (.00)
*Standard error in brackets.
Note. Gehan-Wilcoxon statistic (n = 1 496) = 127.828, p = 0.000. Comparisons are exact.
187
Of the 545 applicants with a performance rating between 20 and 39%, 449 cases
experienced the terminal event in the second selection phase. Therefore, 82% were terminated
at this selection phase with only 18% of the proportion surviving. For applicants with scores in
this interval range, the estimate of the probability of experiencing the terminal event during the
second selection phase was 0.824. The proportion surviving each subsequent selection phase
steadily increased with 18 applicants entering phase five.
For the 40 to 59% performance category, a similar high termination rate was revealed at
phase two. Of the 707 applicants entering phase two only 254 progressed to phase three. This
was a 64% termination rate. A further 68% were terminated at phase three and 51% at phase
four. Forty applicants with science marks between 40 and 59% survived onto the
apprenticeship programme.
A lower probability rate of termination is noted during the second phase for the applicants
with science performance in the 60 to 79% category. The cumulative proportion surviving at
the end of the second selection phase is 0.60, with a 0.400 probability density. However, this
trend changed in the third phase where 62% of the applicants were terminated. The termination
rate decreased at the fourth phase for this performance category. Nine applicants with this level
of performance in science were successful in their application and were accepted onto the
apprenticeship programme.
Eight applicants entered phase two with science performance scores of 80% and above.
There was only one terminal event at this phase. A lower survival rate is noted at phase three
where 71% of the number entering the phase were terminated. The estimate of the probability
of experiencing a terminal event at this phase is 0.625. There were, however, no further
terminal events for this performance category in the selection process with two applicants being
selected onto the programme.
The survival rate of the applicants, documented in Table 6.29, reveals that applicants
with better performance in science were able to survive for longer across the five selection
phases. A statistically significant result was shown with the Gehan-Wilcoxon statistical value
at 127.828, with a 0.000 p-value. The test statistic is significant as the p-value is less than 0.05.
188
6.6.4. Hypothesis four: Motivational letter
Hypothesis four aimed to ascertain whether the quality of the motivational letters
submitted by the applicants had a significant effect on their selection onto the apprenticeship
programme. There were five rating levels ranging from well below average to outstanding.
There were 36 applicants that were rated within the well below average category. This
category had a high number (89%) of terminal events during the second selection phase. The
proportion of cases surviving from the start to the end of the second phase is 0.11, with a high
estimate of the probability of experiencing the terminal event during the interval at 0.889.
Termination of 50% of the applicants occurred at phase three with the surviving two applicants
entering the apprenticeship programme.
A high termination rate at the second selection phase is also noted for the below average
rating category. Of the 663 applicants with this rating at the start of the second phase only 96
survived to enter the third phase. This too resulted in a high probability density statistic of
0.855. A steady, yet decreasing, number of terminations continued through the next two phases
for this rating category until 38 applicants survived into phase five.
For the applicants with a successful rating for their motivational letter, 586 entered phase
two with 402 cases thereof experiencing a terminal event. The ratio of terminal events is 0.69,
with 0.31 of the proportion surviving. The probability of experiencing the terminal event at this
selection phase is 0.686. Within the third selection phase, 184 applicants entered, with 130
terminal events thereafter. The cumulative proportion surviving at the end of the third selection
phase is 0.09, with a 0.222 probability density. Fifty-two percent of these applicants survived
phase four, with 28 entering the apprenticeship programme.
There were 203 applicants that entered the selection process with an excellent rating for
their motivational letters. Forty percent of the applicants were terminated at phase two. There
was a high number of terminal events at phase three with 97 applicants, 80% of those entering
the phase, being terminated. This termination rate was double that experienced at the second
selection phase. The termination trend, however, slightly decreased in phase four to 64%, with
only 16 applicants not progressing to the fifth phase.
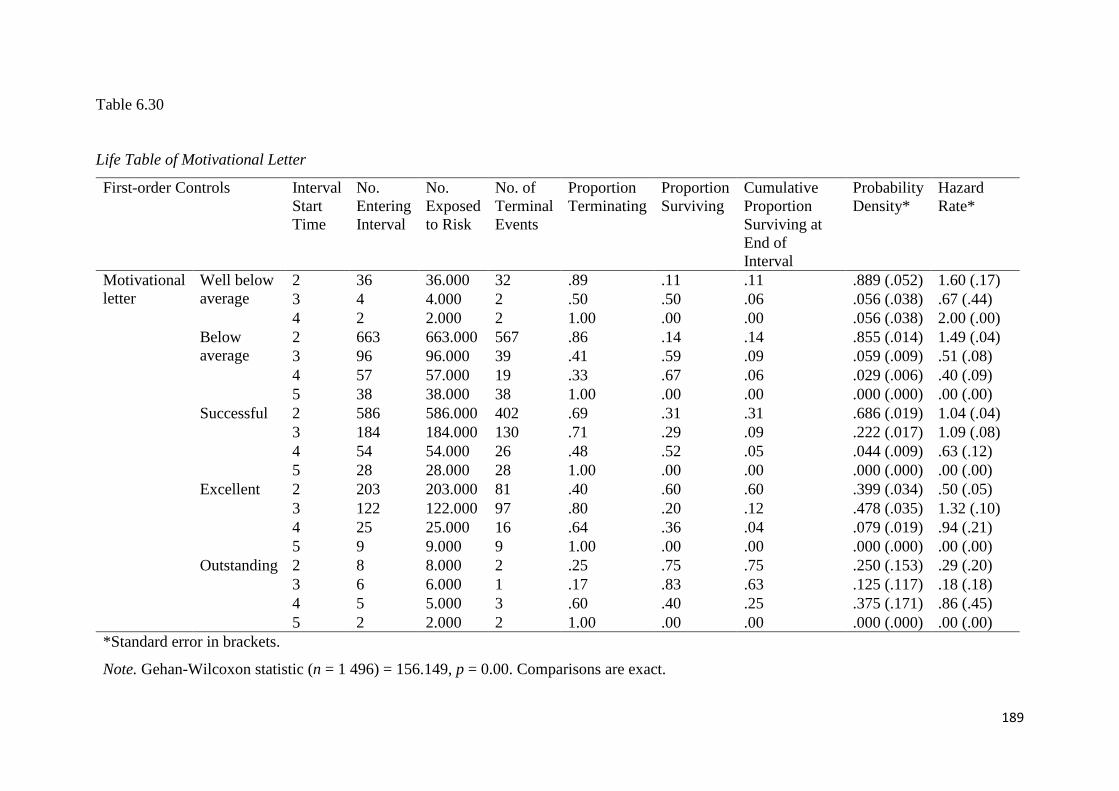
189
Table 6.30
Life Table of Motivational Letter
First-order Controls Interval
Start
Time
No.
Entering
Interval
No.
Exposed
to Risk
No. of
Terminal
Events
Proportion
Terminating
Proportion
Surviving
Cumulative
Proportion
Surviving at
End of
Interval
Probability
Density*
Hazard
Rate*
Motivational
letter
Well below
average
2 36 36.000 32 .89 .11 .11 .889 (.052) 1.60 (.17)
3 4 4.000 2 .50 .50 .06 .056 (.038) .67 (.44)
4 2 2.000 2 1.00 .00 .00 .056 (.038) 2.00 (.00)
Below
average
2 663 663.000 567 .86 .14 .14 .855 (.014) 1.49 (.04)
3 96 96.000 39 .41 .59 .09 .059 (.009) .51 (.08)
4 57 57.000 19 .33 .67 .06 .029 (.006) .40 (.09)
5 38 38.000 38 1.00 .00 .00 .000 (.000) .00 (.00)
Successful 2 586 586.000 402 .69 .31 .31 .686 (.019) 1.04 (.04)
3 184 184.000 130 .71 .29 .09 .222 (.017) 1.09 (.08)
4 54 54.000 26 .48 .52 .05 .044 (.009) .63 (.12)
5 28 28.000 28 1.00 .00 .00 .000 (.000) .00 (.00)
Excellent 2 203 203.000 81 .40 .60 .60 .399 (.034) .50 (.05)
3 122 122.000 97 .80 .20 .12 .478 (.035) 1.32 (.10)
4 25 25.000 16 .64 .36 .04 .079 (.019) .94 (.21)
5 9 9.000 9 1.00 .00 .00 .000 (.000) .00 (.00)
Outstanding 2 8 8.000 2 .25 .75 .75 .250 (.153) .29 (.20)
3 6 6.000 1 .17 .83 .63 .125 (.117) .18 (.18)
4 5 5.000 3 .60 .40 .25 .375 (.171) .86 (.45)
5 2 2.000 2 1.00 .00 .00 .000 (.000) .00 (.00)
*Standard error in brackets.
Note. Gehan-Wilcoxon statistic (n = 1 496) = 156.149, p = 0.00. Comparisons are exact.
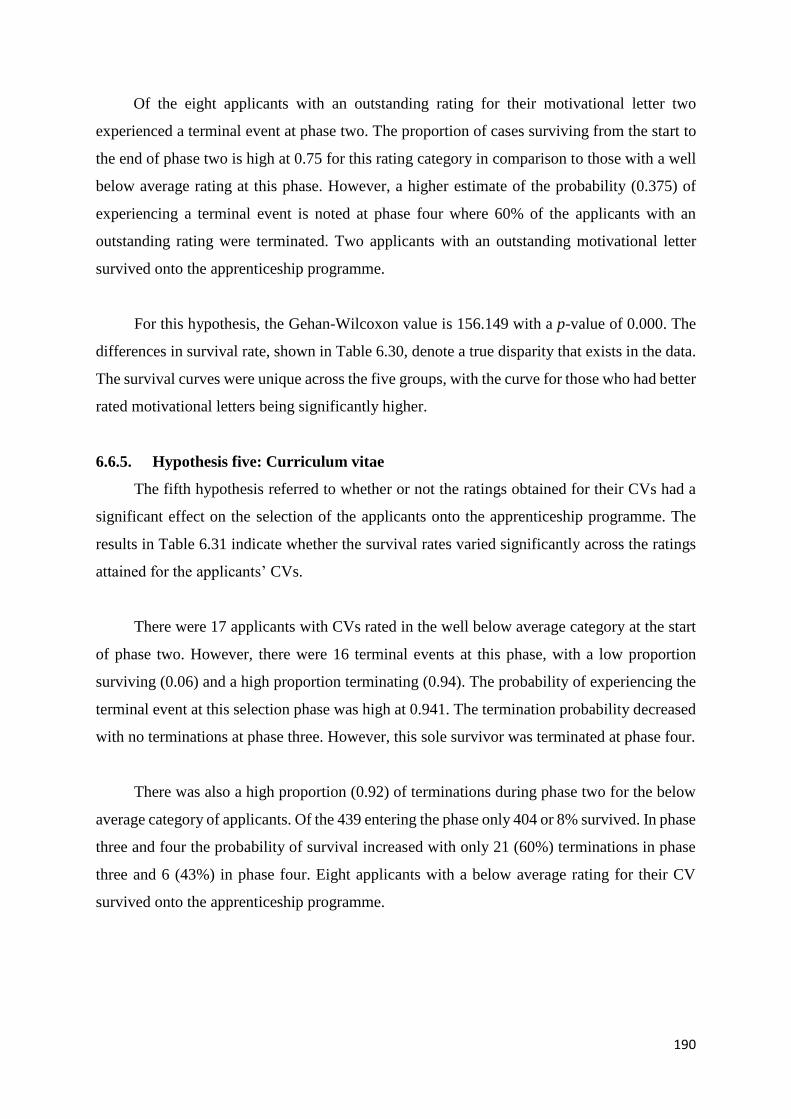
190
Of the eight applicants with an outstanding rating for their motivational letter two
experienced a terminal event at phase two. The proportion of cases surviving from the start to
the end of phase two is high at 0.75 for this rating category in comparison to those with a well
below average rating at this phase. However, a higher estimate of the probability (0.375) of
experiencing a terminal event is noted at phase four where 60% of the applicants with an
outstanding rating were terminated. Two applicants with an outstanding motivational letter
survived onto the apprenticeship programme.
For this hypothesis, the Gehan-Wilcoxon value is 156.149 with a p-value of 0.000. The
differences in survival rate, shown in Table 6.30, denote a true disparity that exists in the data.
The survival curves were unique across the five groups, with the curve for those who had better
rated motivational letters being significantly higher.
6.6.5. Hypothesis five: Curriculum vitae
The fifth hypothesis referred to whether or not the ratings obtained for their CVs had a
significant effect on the selection of the applicants onto the apprenticeship programme. The
results in Table 6.31 indicate whether the survival rates varied significantly across the ratings
attained for the applicants’ CVs.
There were 17 applicants with CVs rated in the well below average category at the start
of phase two. However, there were 16 terminal events at this phase, with a low proportion
surviving (0.06) and a high proportion terminating (0.94). The probability of experiencing the
terminal event at this selection phase was high at 0.941. The termination probability decreased
with no terminations at phase three. However, this sole survivor was terminated at phase four.
There was also a high proportion (0.92) of terminations during phase two for the below
average category of applicants. Of the 439 entering the phase only 404 or 8% survived. In phase
three and four the probability of survival increased with only 21 (60%) terminations in phase
three and 6 (43%) in phase four. Eight applicants with a below average rating for their CV
survived onto the apprenticeship programme.
191
Table 6.31
Life Table of Curriculum Vitae
First-order Controls Interval
Start
Time
No.
Entering
Interval
No.
Exposed
to Risk
No. of
Terminal
Events
Proportion
Terminating
Proportion
Surviving
Cumulative
Proportion
Surviving at
End of Interval
Probability
Density*
Hazard
Rate*
Curriculum
vitae
Well below
average
2 17 17.000 16 .94 .06 .06 .941 (.057) 1.78 (.20)
3 1 1.000 0 .00 1.00 .06 .000 (.000) .00 (.00)
4 1 1.000 1 1.00 .00 .00 .059 (.057) 2.00 (.00)
Below
average
2 439 439.000 404 .92 .08 .08 .920 (.013) 1.70 (.04)
3 35 35.000 21 .60 .40 .03 .048 (.010) .86 (.17)
4 14 14.000 6 .43 .57 .02 .014 (.006) .55 (.21)
5 8 8.000 8 1.00 .00 .00 .000 (.000) .00 (.00)
Successful 2 867 867.000 599 .69 .31 .31 .691(.016) 1.06 (.04)
3 268 268.000 162 .60 .40 .12 .187 (.013) .87 (.06)
4 106 106.000 44 .42 .58 .07 .051 (.007) .52 (.08)
5 62 62.000 62 1.00 .00 .00 .000 (.000) .00 (.00)
Excellent 2 164 164.000 63 .38 .62 .62 .384 (.038) .48 (.06)
3 101 101.000 83 .82 .18 .11 .506 (.039) 1.39 (.11)
4 18 18.000 12 .67 .33 .04 .073 (.020) 1.00 (.25)
5 6 6.000 6 1.00 .00 .00 .000 (.000) .00 (.00)
Outstanding 2 9 9.000 2 .22 .78 .78 .222 (.139) .25 (.18)
3 7 7.000 3 .43 .57 .44 .333 (.157) .55 (.30)
4 4 4.000 3 .75 .25 .11 .333 (.157) 1.20 (.55)
5 1 1.000 1 1.00 .00 .00 .000 (.000) .00 (.00)
*Standard error in brackets.
Note. Gehan-Wilcoxon statistic (n = 1 496) = 180.532, p = 0.00. Comparisons are exact.
192
Of the 867 applicants with CVs rated in the successful category, 599 experienced the
terminal event in the second selection phase. Therefore, 69% of this proportion of the sample
were terminated at the end of the second selection phase with 31% of the proportion surviving.
For applicants with this CV rating the estimate of the probability of experiencing the terminal
event during the second selection phase was 0.691. Thereafter, the rate of terminations per
phase steadily decreased, with 162 (60%) being terminated during phase three and 44 (42%) in
phase four. Sixty-two applicants with a successful rating for their CV survived onto the
programme.
For the applicants with an excellent rating for their CV, 164 entered phase two with 63
cases thereof experiencing a terminal event at phase two. The ratio of terminal events was 0.38,
with 0.62 of the proportion surviving. The probability of experiencing the terminal event at this
selection phase was low at 0.384. This trend, however, changed in the third phase where 82%
of the applicants were terminated resulting in the probability of experiencing termination
during this third phase rising to 0.506. Within the fourth selection phase, 18 applicants entered,
with 12 terminal events thereafter. The cumulative proportion surviving at the end of the fourth
selection phase was 0.67, with a 0.073 probability density. Six applicants with this rating,
therefore, survived onto the apprenticeship programme.
There was a low rate of terminations during phases two and three for applicants with an
outstanding rating for their CVs. A low 22% of applicants were terminated at the end of phase
two, which increased to 43% in phase three. There was, however, a significant increase in the
rate of terminations in phase four. The rate of survival was low at 25%, with a relatively low
probability density of 0.333. One of these applicants survived onto the programme and was
accepted onto the apprenticeship programme.
Given the statistical significance of the Gehan-Wilcoxon value at 180.532, with a p-value
of 0.000 shown in Table 6.31, the survival curves are regarded as statistically different across
the groups.The survival rates across the groups were not due to chance. Rather, applicants with
higher ratings for their CVs had a better chance of surviving onto the next selection phase.
193
6.6.6. Hypothesis six: Practical experience
The analysis of the sixth hypothesis aimed to determine whether or not the rating obtained
for the experience of the applicants had a significant effect on their selection onto the
apprenticeship programme. Three rating categories were used, namely, none, some but not
substantial or relevant and, thirdly, credible experience.
The probability of applicants with no experience entering phase two and surviving was
low at .019 with a probability density of 0.808. Of the 250 applicants entering this phase, there
was a high number (202) of terminal events. An even higher proportion (85%) were terminated
at the third phase. The cumulative proportion of surviving at the end of the third phase was
0.03 with a probability density of 0.164. The probability rate of survival then decreased with
only 43% of the applicants being terminated at phase four. Four applicants with no experience
were selected onto the apprenticeship programme.
Applicants rated as having some but not substantial or relevant experience also had a
high probability density (0.791) of termination at phase two. With 950 entering at phase two,
there were 751 terminal events. The termination rate decreased across phase three and four,
however, the cumulative probability of survival was low at 0.05 at phase four. Forty-three
applicants with some experience were accepted onto the apprenticeship programme. This was
the highest number of applicants across the three rating categories.
The trend of a higher termination rate at phase two changed for the applicants rated with
credible background experience. For this category, a higher termination rate was experienced
during phase three. There was, hence, less probability in terms of a terminal event during phase
two with 296 entering the phase and only 44% being terminated. However, at phase three, the
proportion surviving was only 0.39 with 61% of the applicants being terminated. There was a
slight drop in the termination rate at phase four but the proportion surviving was nevertheless
still low at 0.47. Thirty applicants with credible experience were selected onto the
apprenticeship programme.
The comparison of the survival curves across the three groups, shown in Table 6.32,
shows statistical significance. The Gehan-Wilcoxon value is 149.206 and the p-value is 0.000.
Applicants with a better rating for their practical experience were able to survive for longer
through the selection phases, in comparison to those who had no experience.
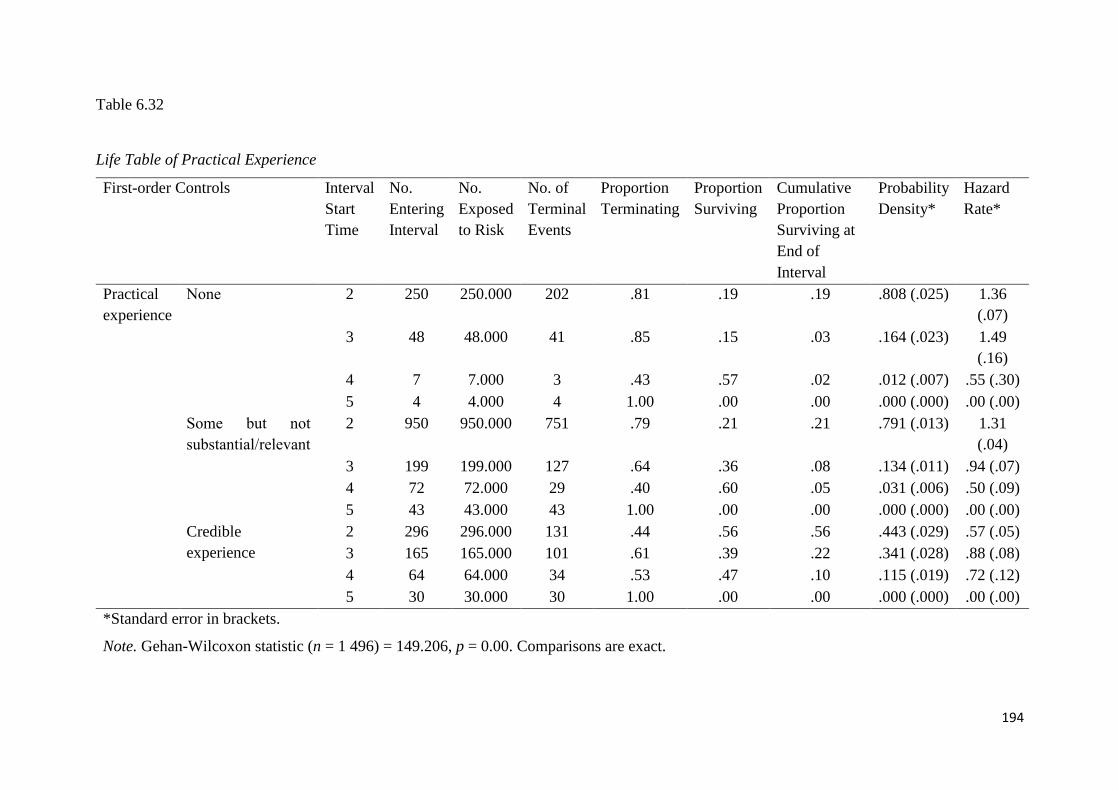
194
Table 6.32
Life Table of Practical Experience
First-order Controls Interval
Start
Time
No.
Entering
Interval
No.
Exposed
to Risk
No. of
Terminal
Events
Proportion
Terminating
Proportion
Surviving
Cumulative
Proportion
Surviving at
End of
Interval
Probability
Density*
Hazard
Rate*
Practical
experience
None
2 250 250.000 202 .81 .19 .19 .808 (.025) 1.36
(.07)
3 48 48.000 41 .85 .15 .03 .164 (.023) 1.49
(.16)
4 7 7.000 3 .43 .57 .02 .012 (.007) .55 (.30)
5 4 4.000 4 1.00 .00 .00 .000 (.000) .00 (.00)
Some but not
substantial/relevant
2 950 950.000 751 .79 .21 .21 .791 (.013) 1.31
(.04)
3 199 199.000 127 .64 .36 .08 .134 (.011) .94 (.07)
4 72 72.000 29 .40 .60 .05 .031 (.006) .50 (.09)
5 43 43.000 43 1.00 .00 .00 .000 (.000) .00 (.00)
Credible
experience
2 296 296.000 131 .44 .56 .56 .443 (.029) .57 (.05)
3 165 165.000 101 .61 .39 .22 .341 (.028) .88 (.08)
4 64 64.000 34 .53 .47 .10 .115 (.019) .72 (.12)
5 30 30.000 30 1.00 .00 .00 .000 (.000) .00 (.00)
*Standard error in brackets.
Note. Gehan-Wilcoxon statistic (n = 1 496) = 149.206, p = 0.00. Comparisons are exact.
195
6.6.7. Hypothesis seven: Qualification
The seventh hypothesis tested whether the rating provided to applicants on the amount
and quality of qualifications obtained had a significant effect on their selection onto the
apprenticeship programme. There were five categories ranging from below average to
exceptional development.
As portrayed in Table 6.33, there were 108 applicants rated as having a below average
level of qualification. In the second phase there were 98 terminal events. The proportion of
cases surviving from the start of phase two to the end of the phase was 0.09 with a high
probability density of 0.907, compared to the other phases. In the third phase 50% of the
applicants were terminated with a low probability density of 0.046. There was, however, a
slight increase in the proportion being terminated in the fourth phase with only 40% surviving
this selection phase. Two applicants with a below average rating for their qualification level
were selected onto the apprenticeship programme.
As in the below average rating category, there was also a high proportion of terminations
in the second phase for the average rated category. In this category, 79% of the applicants were
terminated with a probability density of 0.794. The number of terminal events decreased at the
third and fourth phases, with 48% and 67% surviving each phase respectively. Thirty-six
applicants survived onto the programme.
The applicants that were currently studying for their Grade 12 or equivalent qualification
at the time of applying had a high termination rate during phase two. Of the 536 that entered
the selection process, 367 (68%) were terminated at phase two, 111 (66%) at phase four. Fifty-
five percent of the 58 applicants entering phase four survived, resulting in 32 of these applicants
being accepted onto the programme.
For those rated as having consistent development, the highest termination rate was
experienced at the third selection phase. At this point, 80% of the applicants were terminated
with a probability density of 0.312. In comparison, 182 (61%) of the 298 applicants were
terminated at phase two and 17 (74%) of the 23 applicants at the fourth phase. This indicated
a 0.611 probability density at the second phase and 0.057 at phase four. Six applicants with a
consistent development rating were selected onto the apprenticeship programme.
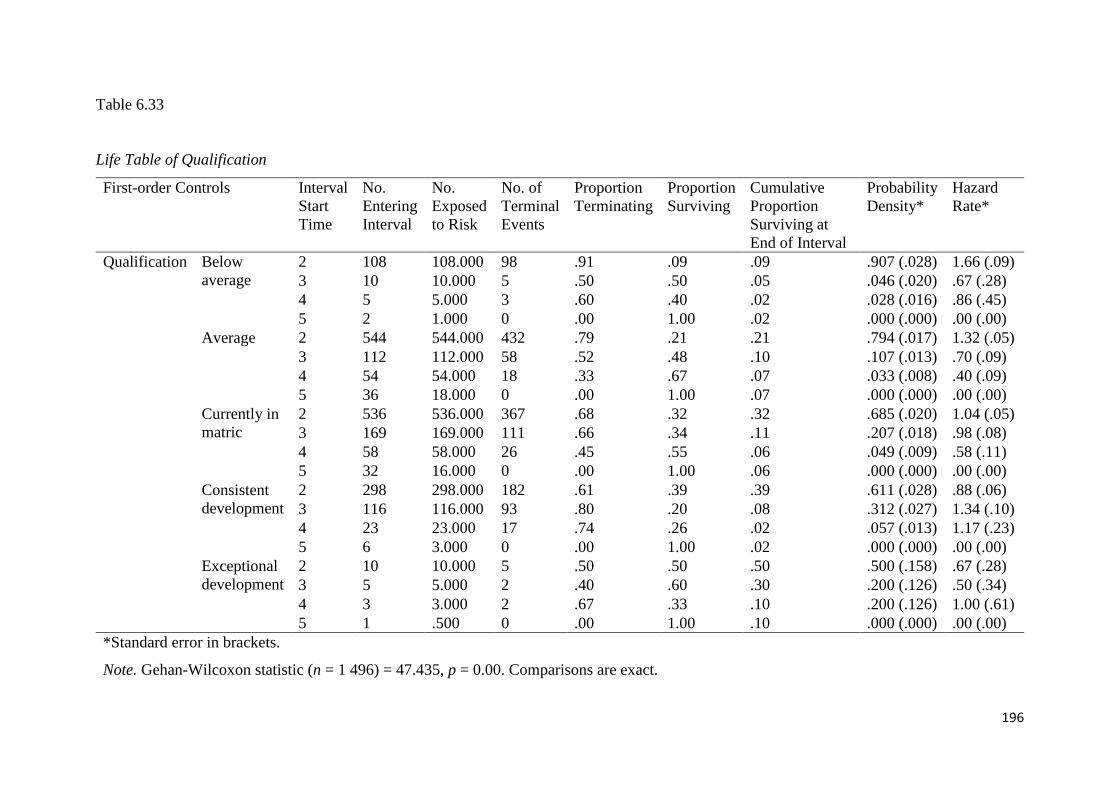
196
Table 6.33
Life Table of Qualification
First-order Controls Interval
Start
Time
No.
Entering
Interval
No.
Exposed
to Risk
No. of
Terminal
Events
Proportion
Terminating
Proportion
Surviving
Cumulative
Proportion
Surviving at
End of Interval
Probability
Density*
Hazard
Rate*
Qualification Below
average
2 108 108.000 98 .91 .09 .09 .907 (.028) 1.66 (.09)
3 10 10.000 5 .50 .50 .05 .046 (.020) .67 (.28)
4 5 5.000 3 .60 .40 .02 .028 (.016) .86 (.45)
5 2 1.000 0 .00 1.00 .02 .000 (.000) .00 (.00)
Average 2 544 544.000 432 .79 .21 .21 .794 (.017) 1.32 (.05)
3 112 112.000 58 .52 .48 .10 .107 (.013) .70 (.09)
4 54 54.000 18 .33 .67 .07 .033 (.008) .40 (.09)
5 36 18.000 0 .00 1.00 .07 .000 (.000) .00 (.00)
Currently in
matric
2 536 536.000 367 .68 .32 .32 .685 (.020) 1.04 (.05)
3 169 169.000 111 .66 .34 .11 .207 (.018) .98 (.08)
4 58 58.000 26 .45 .55 .06 .049 (.009) .58 (.11)
5 32 16.000 0 .00 1.00 .06 .000 (.000) .00 (.00)
Consistent
development
2 298 298.000 182 .61 .39 .39 .611 (.028) .88 (.06)
3 116 116.000 93 .80 .20 .08 .312 (.027) 1.34 (.10)
4 23 23.000 17 .74 .26 .02 .057 (.013) 1.17 (.23)
5 6 3.000 0 .00 1.00 .02 .000 (.000) .00 (.00)
Exceptional
development
2 10 10.000 5 .50 .50 .50 .500 (.158) .67 (.28)
3 5 5.000 2 .40 .60 .30 .200 (.126) .50 (.34)
4 3 3.000 2 .67 .33 .10 .200 (.126) 1.00 (.61)
5 1 .500 0 .00 1.00 .10 .000 (.000) .00 (.00)
*Standard error in brackets.
Note. Gehan-Wilcoxon statistic (n = 1 496) = 47.435, p = 0.00. Comparisons are exact.
197
For applicants rated as having an exceptional level of qualification, a 0.500 probability
of experiencing the terminal event during the second phase was experienced and the proportion
of cases surviving from the start to the end of this phase was 50%. The proportion of terminal
events decreased to 40% at phase three but increased to 67% at phase four. Of the 10 applicants
with this rating, only one survived onto the apprenticeship programme.
The survival rate of the applicants, provided in Table 6.33, indicates that applicants with
a better rating for their qualification level were able to survive for longer across the five
selection phases. A statistically significant result was shown with the Gehan-Wilcoxon
statistical value at 47.435, with a 0.000 p-value. The test statistic is significant as the p-value
is less than 0.05.
6.6.8. Hypothesis eight: Leadership potential
The analysis for the eighth hypothesis aimed to determine whether or not the leadership
potential rating obtained by the applicants had a significant effect on their selection onto the
apprenticeship programme. Three rating categories were used, ranging from below average to
above average.
The number of applicants entering phase two with a below average rating was 1 216,
with 1 003 terminal events. The proportion of cases surviving this phase was 0.18 with an
estimate of the probability of experiencing the terminal event during the phase at 0.825. In the
third phase, 61% of the applicants were terminated with a probability density of 0.107. The
lowest number of terminal events were experienced at the fourth phase with 60% of the
applicants surviving with a probability density of 0.027. Fifty applicants with below average
leadership potential were accepted onto the apprenticeship programme.
For those rated as having average leadership potential, the phase with the highest
probability (0.498) of experiencing a terminal event was at the third phase. Of the 175
applicants entering this phase, 122 (70%) were terminated. In comparison, only 29% and 55%
of the applicants entering phases two and four, respectively, were terminated. Twenty-four
applicants with high average leadership potential survived and entered onto the apprenticeship
programme.
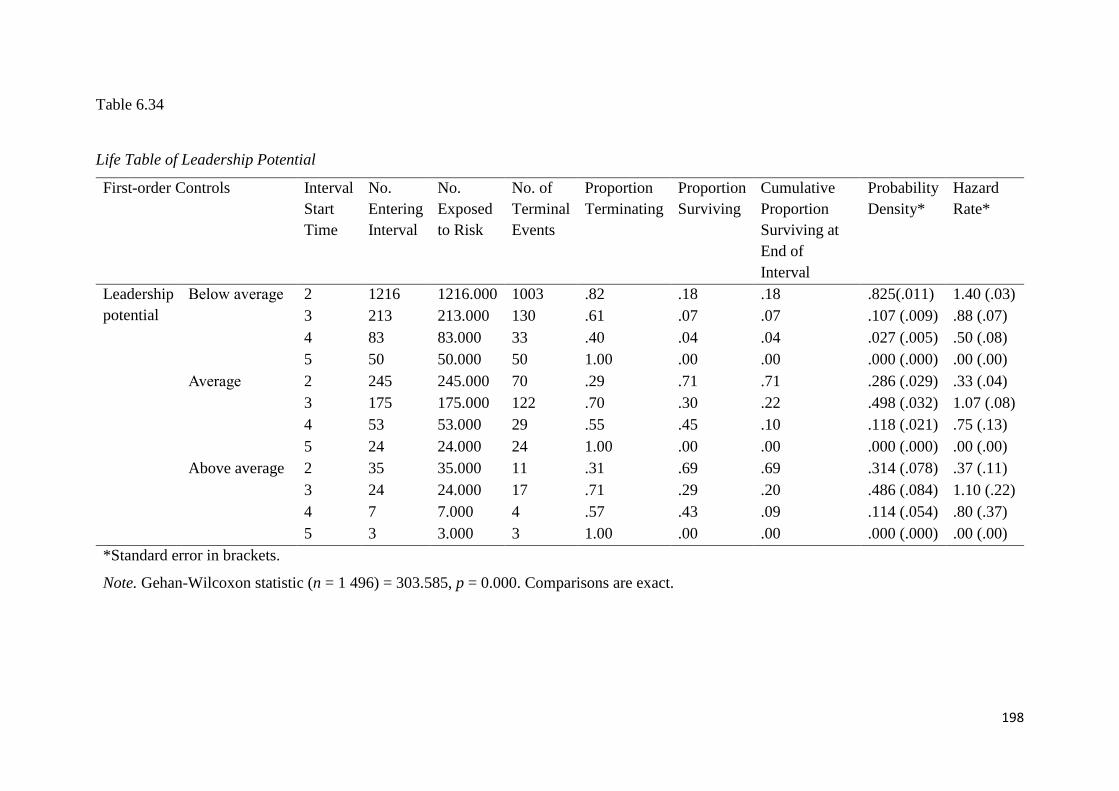
198
Table 6.34
Life Table of Leadership Potential
First-order Controls Interval
Start
Time
No.
Entering
Interval
No.
Exposed
to Risk
No. of
Terminal
Events
Proportion
Terminating
Proportion
Surviving
Cumulative
Proportion
Surviving at
End of
Interval
Probability
Density*
Hazard
Rate*
Leadership
potential
Below average 2 1216 1216.000 1003 .82 .18 .18 .825(.011) 1.40 (.03)
3 213 213.000 130 .61 .07 .07 .107 (.009) .88 (.07)
4 83 83.000 33 .40 .04 .04 .027 (.005) .50 (.08)
5 50 50.000 50 1.00 .00 .00 .000 (.000) .00 (.00)
Average
2 245 245.000 70 .29 .71 .71 .286 (.029) .33 (.04)
3 175 175.000 122 .70 .30 .22 .498 (.032) 1.07 (.08)
4 53 53.000 29 .55 .45 .10 .118 (.021) .75 (.13)
5 24 24.000 24 1.00 .00 .00 .000 (.000) .00 (.00)
Above average 2 35 35.000 11 .31 .69 .69 .314 (.078) .37 (.11)
3 24 24.000 17 .71 .29 .20 .486 (.084) 1.10 (.22)
4 7 7.000 4 .57 .43 .09 .114 (.054) .80 (.37)
5 3 3.000 3 1.00 .00 .00 .000 (.000) .00 (.00)
*Standard error in brackets.
Note. Gehan-Wilcoxon statistic (n = 1 496) = 303.585, p = 0.000. Comparisons are exact.
199
In the exceptional leadership potential category, the number of applicants entering phase
two was 35, with 11 terminal events. The estimate of the probability of experiencing the
terminal event during this phase was 0.314 with a proportion of cases surviving from the start
of the phase to the end being 0.69. This trend changed in the third phase where 71% of the
applicants were terminated. A lower percentage (43%), but still higher than in phase two, were
terminated in phase four. In this fourth phase there were four terminations with a 0.57
proportion terminating. Three applicants rated as having exceptional leadership potential
survived onto the apprenticeship programme.
The results depicted in Table 6.34 are statistically significant as the survival rates across
the three groups were different. The Gehan-Wilcoxon value of 303.585 with a p-value of 0.000
indicates that the survival distribution was not due to chance but reflects a true difference in
the data. The rating obtained by the applicants for their leadership potential had an impact on
the probability of surviving across the selection phases. Those with more potential had a higher
survival rate than those rated with less leadership potential.
6.6.9. Hypothesis nine: General aptitude
Hypothesis nine aimed to determine whether the general aptitude rating attained by the
applicants had a significant effect or not on their selection onto the apprenticeship programme.
Seven of the nine available rating categories were used.
Four applicants with a far below average rating remained in the selection process until
the third selection phase when they were terminated. Of the 14 applicants with a below average
rating, nine were terminated at phase three, with a high probability density of 0.0643. There
was an 80% termination rate at the fourth phase with one applicant with this general aptitude
rating remaining until the end of the selection process. For the applicants with a low average
rating, 36 applicants survived until the third phase when there was a high termination rate of
94%. The probability density was high at 0.944. The two applicants that survived this phase
where then terminated at the fourth phase.
Sixty-five applicants with an average rating for their general aptitude entered phase three
at which stage 78% were terminated. This was a high probability density of 0.785. A further
six applicants were terminated at the fourth phase with 57% of the proportion surviving into
200
the fifth selection phase. These eight applicants were selected onto the apprenticeship
programme.
Of the applicant grouping with a high average rating for their general aptitude, 110
entered the third selection phase. Eighty of these applicants were then terminated at this phase.
This was a 73% termination rate with a high (0.727) probability density for the phase. Of the
30 applicants entering phase four 37% were terminated at the end of this phase. The remaining
19 applicants with a high average general aptitude survived the rest of the selection process
and were selected onto the apprenticeship programme.
The applicants who achieved an above average rating for their general aptitude obtained
40% and 70% proportions surviving phase three and four respectively. A fairly high probability
density of 0.598 was achieved for this rating category at the third selection phase. The highest
number (33) of applicants from a scoring category that survived onto the apprenticeship
programme were from this above average category.
For those with a superior rating, the probability of surviving was also higher than for
those at the lower scoring categories. However, the proportion terminated doubled from the
third to the fourth selection phase. Of the 66 applicants entering phase three, 32% were
terminated at the end of this selection phase. At the end of the fourth selection phase, 64% of
the 45 applicants were terminated. The remaining 16 applicants with superior general aptitude
were accepted onto the apprenticeship programme.
The survival distribution amongst the groups, with the test statistic based on differences
in group mean scores, in Table 6.35 was not due to chance. The Gehan-Wilcoxon value is
48.998 with a p-value of 0.000. This implies that a statistical significance exists between the
six rating category groups for general aptitude, as their survival curves were unalike.
Applicants with higher rating for their general aptitude were able to survive more selection
phases than those with lower ratings for this form of aptitude.
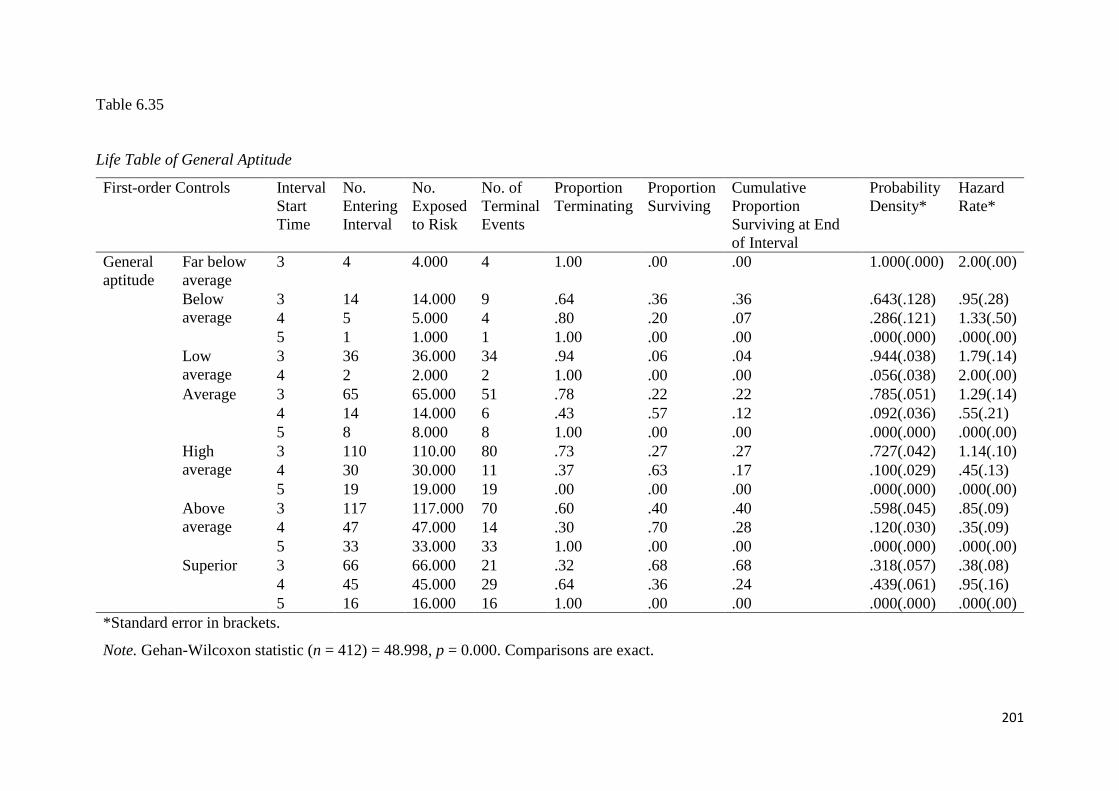
201
Table 6.35
Life Table of General Aptitude
First-order Controls Interval
Start
Time
No.
Entering
Interval
No.
Exposed
to Risk
No. of
Terminal
Events
Proportion
Terminating
Proportion
Surviving
Cumulative
Proportion
Surviving at End
of Interval
Probability
Density*
Hazard
Rate*
General
aptitude
Far below
average
3 4 4.000 4 1.00 .00 .00 1.000(.000) 2.00(.00)
Below
average
3 14 14.000 9 .64 .36 .36 .643(.128) .95(.28)
4 5 5.000 4 .80 .20 .07 .286(.121) 1.33(.50)
5 1 1.000 1 1.00 .00 .00 .000(.000) .000(.00)
Low
average
3 36 36.000 34 .94 .06 .04 .944(.038) 1.79(.14)
4 2 2.000 2 1.00 .00 .00 .056(.038) 2.00(.00)
Average 3 65 65.000 51 .78 .22 .22 .785(.051) 1.29(.14)
4 14 14.000 6 .43 .57 .12 .092(.036) .55(.21)
5 8 8.000 8 1.00 .00 .00 .000(.000) .000(.00)
High
average
3 110 110.00 80 .73 .27 .27 .727(.042) 1.14(.10)
4 30 30.000 11 .37 .63 .17 .100(.029) .45(.13)
5 19 19.000 19 .00 .00 .00 .000(.000) .000(.00)
Above
average
3 117 117.000 70 .60 .40 .40 .598(.045) .85(.09)
4 47 47.000 14 .30 .70 .28 .120(.030) .35(.09)
5 33 33.000 33 1.00 .00 .00 .000(.000) .000(.00)
Superior 3 66 66.000 21 .32 .68 .68 .318(.057) .38(.08)
4 45 45.000 29 .64 .36 .24 .439(.061) .95(.16)
5 16 16.000 16 1.00 .00 .00 .000(.000) .000(.00)
*Standard error in brackets.
Note. Gehan-Wilcoxon statistic (n = 412) = 48.998, p = 0.000. Comparisons are exact.
202
6.6.10. Hypothesis ten: Technical aptitude
The tenth hypothesis sought to ascertain whether or not the technical aptitude ratings
obtained by the applicants had a significant effect on their selection onto the apprenticeship
programme. As indicated, eight of the nine rating categories were used. These ranged from
significantly below average to a superior rating for technical aptitude.
Three applicants with significantly below average and four applicants with far below
average technical aptitude survived until phase three where they were terminated. Similarly,
23 with below average technical aptitude survived until phase three where 91% were
terminated. This resulted in a high probability density (0.913) of being terminated at this phase.
The remaining two applicants were then terminated at phase four.
Fifty-nine applicants with low average technical aptitude survived until phase three. Of
the 59 applicants entering the third phase, there was a high number (45) of terminal events. The
cumulative proportion surviving at the end of the third phase was 0.24 with a high probability
density of 0.763. The probability rate of survival then increased with only 43% of the applicants
being terminated at phase four. Eight applicants with low average technical aptitude were
selected onto the apprenticeship programme.
A similar pattern of survival was seen for the applicants with average and high average
technical aptitude. Of those rated as having average technical aptitude, a large proportion (75%)
were terminated at phase three, with a decrease to 41% at phase four. Sixteen of these applicants
proceeded onto the programme. For those with high average technical aptitude, a 63%
termination rate at phase three was followed by a lower 33% at phase four. The largest number
(31) of applicants being selected onto the apprenticeship programme came from this technical
aptitude scoring category.
Applicants rated as having above average technical aptitude had a fairly low probability
density (0.409) of termination at phase three. With 88 entering this phase, there were 36 (41%)
terminal events. The termination rate then increased to 62% at phase four. Twenty applicants
with above average technical aptitude were accepted onto the apprenticeship programme. Two
applicants, with superior technical aptitude, survived the entire selection process.
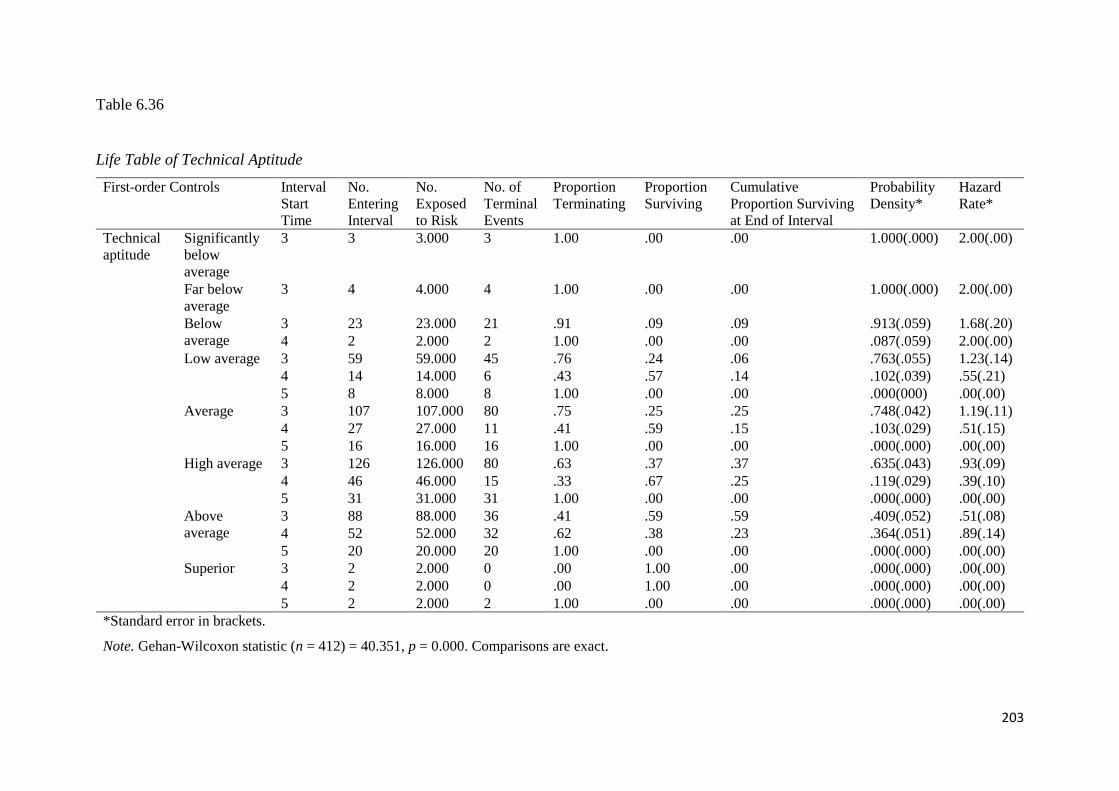
203
Table 6.36
Life Table of Technical Aptitude
First-order Controls Interval
Start
Time
No.
Entering
Interval
No.
Exposed
to Risk
No. of
Terminal
Events
Proportion
Terminating
Proportion
Surviving
Cumulative
Proportion Surviving
at End of Interval
Probability
Density*
Hazard
Rate*
Technical
aptitude
Significantly
below
average
3 3 3.000 3 1.00 .00 .00 1.000(.000) 2.00(.00)
Far below
average
3 4 4.000 4 1.00 .00 .00 1.000(.000) 2.00(.00)
Below
average
3 23 23.000 21 .91 .09 .09 .913(.059) 1.68(.20)
4 2 2.000 2 1.00 .00 .00 .087(.059) 2.00(.00)
Low average 3 59 59.000 45 .76 .24 .06 .763(.055) 1.23(.14)
4 14 14.000 6 .43 .57 .14 .102(.039) .55(.21)
5 8 8.000 8 1.00 .00 .00 .000(000) .00(.00)
Average 3 107 107.000 80 .75 .25 .25 .748(.042) 1.19(.11)
4 27 27.000 11 .41 .59 .15 .103(.029) .51(.15)
5 16 16.000 16 1.00 .00 .00 .000(.000) .00(.00)
High average 3 126 126.000 80 .63 .37 .37 .635(.043) .93(.09)
4 46 46.000 15 .33 .67 .25 .119(.029) .39(.10)
5 31 31.000 31 1.00 .00 .00 .000(.000) .00(.00)
Above
average
3 88 88.000 36 .41 .59 .59 .409(.052) .51(.08)
4 52 52.000 32 .62 .38 .23 .364(.051) .89(.14)
5 20 20.000 20 1.00 .00 .00 .000(.000) .00(.00)
Superior 3 2 2.000 0 .00 1.00 .00 .000(.000) .00(.00)
4 2 2.000 0 .00 1.00 .00 .000(.000) .00(.00)
5 2 2.000 2 1.00 .00 .00 .000(.000) .00(.00)
*Standard error in brackets.
Note. Gehan-Wilcoxon statistic (n = 412) = 40.351, p = 0.000. Comparisons are exact.
204
Table 6.36 indicates that the Gehan-Wilcoxon value achieved for this construct is 40.351
and the p-value was 0.000. The differences in survival rate therefore reflect that a true disparity
exists in the data. The survival rates across the groups indicate that applicants with higher
technical aptitude had a better chance of surviving onto the next selection phase.
6.6.11. Hypothesis eleven: Teamwork competence
The eleventh hypothesis aimed to determine whether the teamwork competence rating
assigned to the applicants had a significant effect or not on their selection onto the
apprenticeship programme. Three of the four rating categories were used. These ranged from
being a significant development area to an above average competency area.
As portrayed in Table 6.37, there were 168 applicants rated as having significant
development areas within their teamwork competence. In the third phase there was a high (159)
number of terminal events. The proportion of cases surviving from the start of phase three to
the end of the phase was 0.05 with a high probability density of 0.946, compared to the other
phases. In the fourth phase 89% of the applicants were terminated with a low probability
density of 0.048. One applicant with this rating for the teamwork competence assessment was
selected onto the apprenticeship programme.
There was a much lower rate of terminations within the development skill area rating
category. Of the 181 applicants with this rating, 83 were terminated at phase three and 48 at
phase four, resulting in 54% and 51%, respectively, surviving these two phases. Fifty applicants
with this rating were selected onto the apprenticeship programme. This was by far the largest
number of applicants accepted across the various rating categories.
For those rated as being competent in the teamwork competencies assessed, 49% were
terminated at phase three, with another 35% being terminated at phase four. This resulted in
the remaining 17 applicants being selected onto the apprenticeship programme. Twelve
applicants with above average teamwork competencies survived the selection process until
phase three. At this stage, a small proportion (2) were terminated with 83% surviving. A further
one applicant was terminated at phase four with the survival percentage increasing to 90%. The
remaining nine applicants were accepted onto the apprenticeship programme.
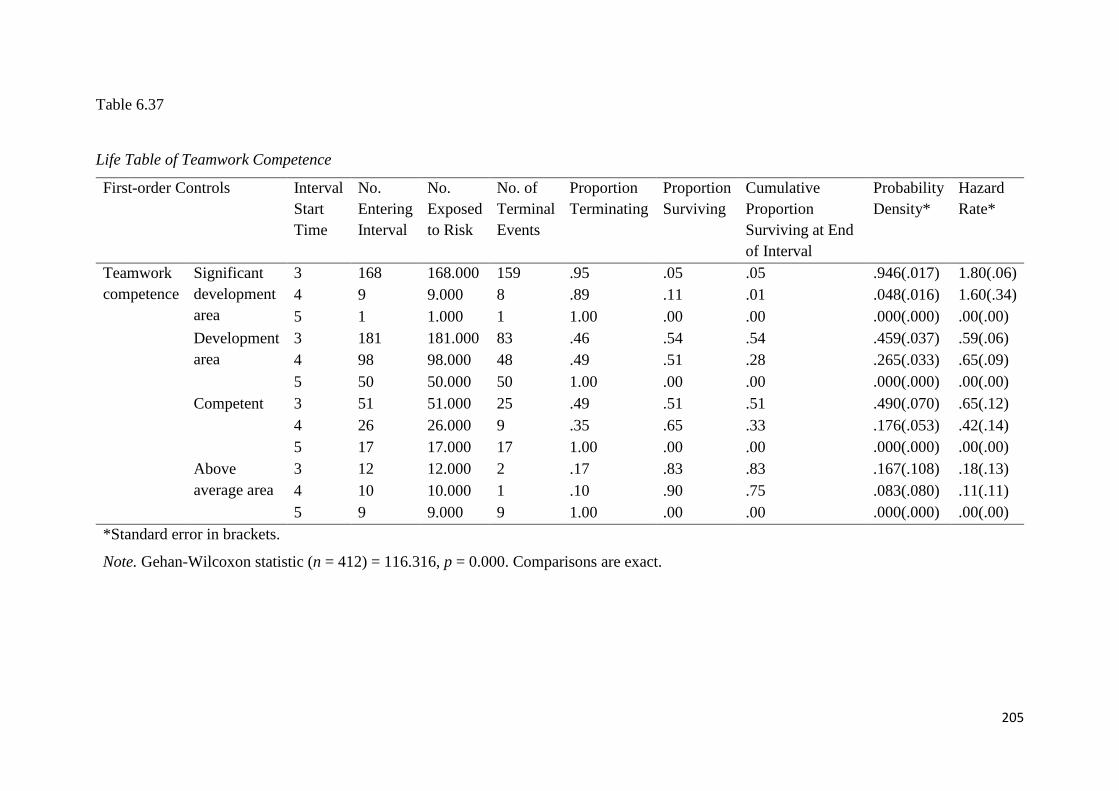
205
Table 6.37
Life Table of Teamwork Competence
First-order Controls Interval
Start
Time
No.
Entering
Interval
No.
Exposed
to Risk
No. of
Terminal
Events
Proportion
Terminating
Proportion
Surviving
Cumulative
Proportion
Surviving at End
of Interval
Probability
Density*
Hazard
Rate*
Teamwork
competence
Significant
development
area
3 168 168.000 159 .95 .05 .05 .946(.017) 1.80(.06)
4 9 9.000 8 .89 .11 .01 .048(.016) 1.60(.34)
5 1 1.000 1 1.00 .00 .00 .000(.000) .00(.00)
Development
area
3 181 181.000 83 .46 .54 .54 .459(.037) .59(.06)
4 98 98.000 48 .49 .51 .28 .265(.033) .65(.09)
5 50 50.000 50 1.00 .00 .00 .000(.000) .00(.00)
Competent 3 51 51.000 25 .49 .51 .51 .490(.070) .65(.12)
4 26 26.000 9 .35 .65 .33 .176(.053) .42(.14)
5 17 17.000 17 1.00 .00 .00 .000(.000) .00(.00)
Above
average area
3 12 12.000 2 .17 .83 .83 .167(.108) .18(.13)
4 10 10.000 1 .10 .90 .75 .083(.080) .11(.11)
5 9 9.000 9 1.00 .00 .00 .000(.000) .00(.00)
*Standard error in brackets.
Note. Gehan-Wilcoxon statistic (n = 412) = 116.316, p = 0.000. Comparisons are exact.
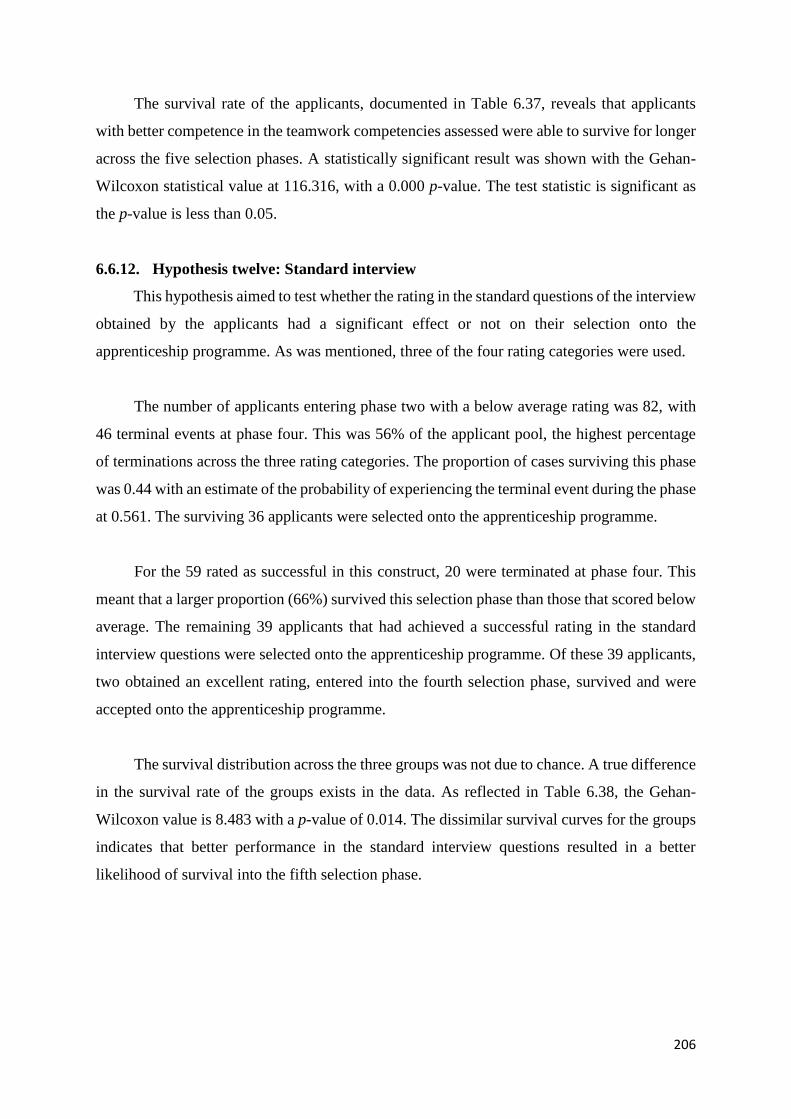
206
The survival rate of the applicants, documented in Table 6.37, reveals that applicants
with better competence in the teamwork competencies assessed were able to survive for longer
across the five selection phases. A statistically significant result was shown with the Gehan-
Wilcoxon statistical value at 116.316, with a 0.000 p-value. The test statistic is significant as
the p-value is less than 0.05.
6.6.12. Hypothesis twelve: Standard interview
This hypothesis aimed to test whether the rating in the standard questions of the interview
obtained by the applicants had a significant effect or not on their selection onto the
apprenticeship programme. As was mentioned, three of the four rating categories were used.
The number of applicants entering phase two with a below average rating was 82, with
46 terminal events at phase four. This was 56% of the applicant pool, the highest percentage
of terminations across the three rating categories. The proportion of cases surviving this phase
was 0.44 with an estimate of the probability of experiencing the terminal event during the phase
at 0.561. The surviving 36 applicants were selected onto the apprenticeship programme.
For the 59 rated as successful in this construct, 20 were terminated at phase four. This
meant that a larger proportion (66%) survived this selection phase than those that scored below
average. The remaining 39 applicants that had achieved a successful rating in the standard
interview questions were selected onto the apprenticeship programme. Of these 39 applicants,
two obtained an excellent rating, entered into the fourth selection phase, survived and were
accepted onto the apprenticeship programme.
The survival distribution across the three groups was not due to chance. A true difference
in the survival rate of the groups exists in the data. As reflected in Table 6.38, the Gehan-
Wilcoxon value is 8.483 with a p-value of 0.014. The dissimilar survival curves for the groups
indicates that better performance in the standard interview questions resulted in a better
likelihood of survival into the fifth selection phase.
207
Table 6.38
Life Table of Standard Interview
First-order Controls Interval
Start
Time
No.
Entering
Interval
No.
Exposed
to Risk
No. of
Terminal
Events
Proportion
Terminating
Proportion
Surviving
Cumulative
Proportion
Surviving at End
of Interval
Probability
Density*
Hazard
Rate*
Standard
interview
Below
average
4 82 82.000 46 .56 .44 .44 .561(.055) .78(.11)
5 36 36.000 36 1.00 .00 .00 .000(.000) .00(.00)
Successful 4 59 59.000 20 .34 .66 .66 .339(.062) .41(.09)
5 39 39.000 39 1.00 .00 .00 .000(.000) .00(.00)
Excellent 4 2 2.000 0 1.00 1.00 .00 .000(.000) .00(.00)
5 2 2.000 2 1.00 .00 .00 .000(.000) .00(.00)
*Standard error in brackets.
Note. Gehan-Wilcoxon statistic (n = 77) = 8.483, p = 0.014. Comparisons are exact.
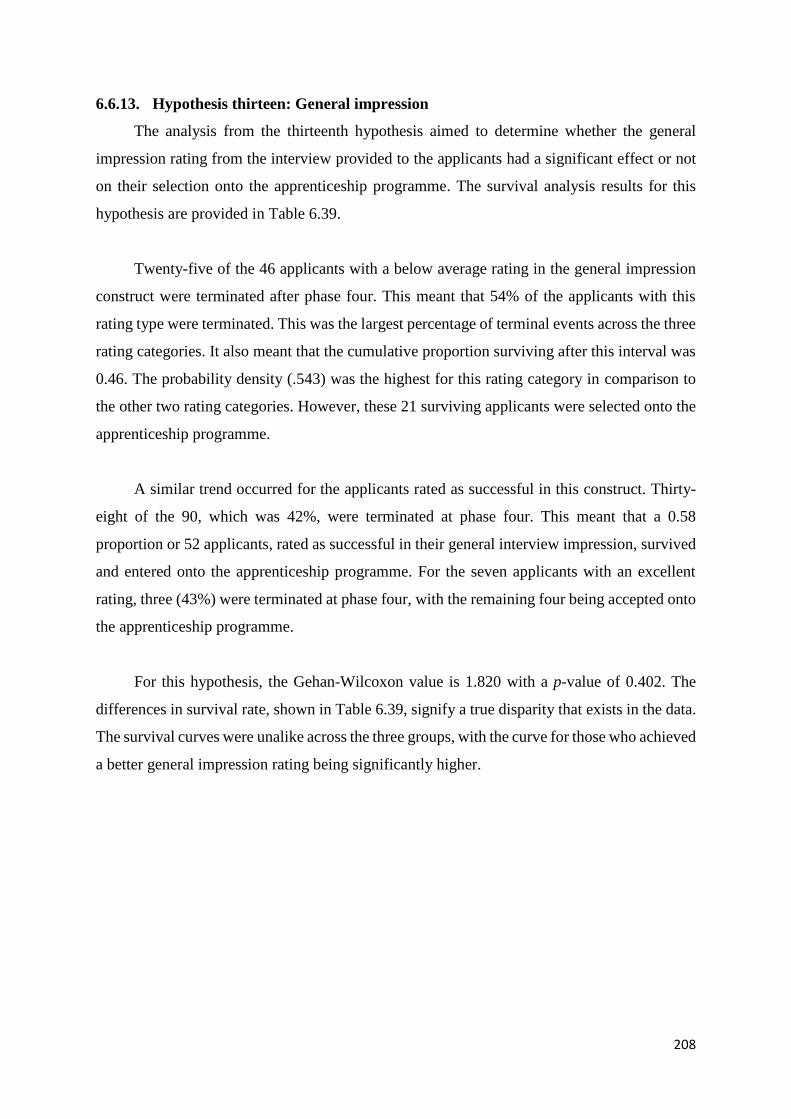
208
6.6.13. Hypothesis thirteen: General impression
The analysis from the thirteenth hypothesis aimed to determine whether the general
impression rating from the interview provided to the applicants had a significant effect or not
on their selection onto the apprenticeship programme. The survival analysis results for this
hypothesis are provided in Table 6.39.
Twenty-five of the 46 applicants with a below average rating in the general impression
construct were terminated after phase four. This meant that 54% of the applicants with this
rating type were terminated. This was the largest percentage of terminal events across the three
rating categories. It also meant that the cumulative proportion surviving after this interval was
0.46. The probability density (.543) was the highest for this rating category in comparison to
the other two rating categories. However, these 21 surviving applicants were selected onto the
apprenticeship programme.
A similar trend occurred for the applicants rated as successful in this construct. Thirty-
eight of the 90, which was 42%, were terminated at phase four. This meant that a 0.58
proportion or 52 applicants, rated as successful in their general interview impression, survived
and entered onto the apprenticeship programme. For the seven applicants with an excellent
rating, three (43%) were terminated at phase four, with the remaining four being accepted onto
the apprenticeship programme.
For this hypothesis, the Gehan-Wilcoxon value is 1.820 with a p-value of 0.402. The
differences in survival rate, shown in Table 6.39, signify a true disparity that exists in the data.
The survival curves were unalike across the three groups, with the curve for those who achieved
a better general impression rating being significantly higher.
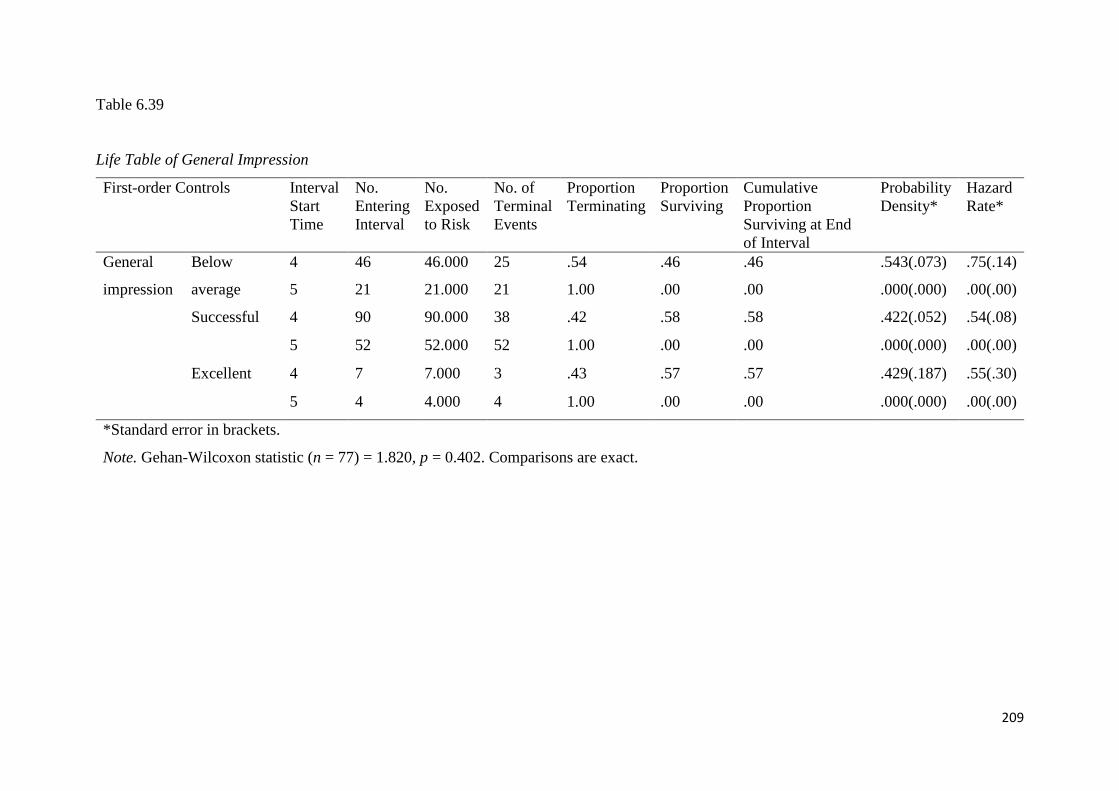
209
Table 6.39
Life Table of General Impression
First-order Controls Interval
Start
Time
No.
Entering
Interval
No.
Exposed
to Risk
No. of
Terminal
Events
Proportion
Terminating
Proportion
Surviving
Cumulative
Proportion
Surviving at End
of Interval
Probability
Density*
Hazard
Rate*
General
impression
Below
average
4 46 46.000 25 .54 .46 .46 .543(.073) .75(.14)
5 21 21.000 21 1.00 .00 .00 .000(.000) .00(.00)
Successful 4 90 90.000 38 .42 .58 .58 .422(.052) .54(.08)
5 52 52.000 52 1.00 .00 .00 .000(.000) .00(.00)
Excellent 4 7 7.000 3 .43 .57 .57 .429(.187) .55(.30)
5 4 4.000 4 1.00 .00 .00 .000(.000) .00(.00)
*Standard error in brackets.
Note. Gehan-Wilcoxon statistic (n = 77) = 1.820, p = 0.402. Comparisons are exact.
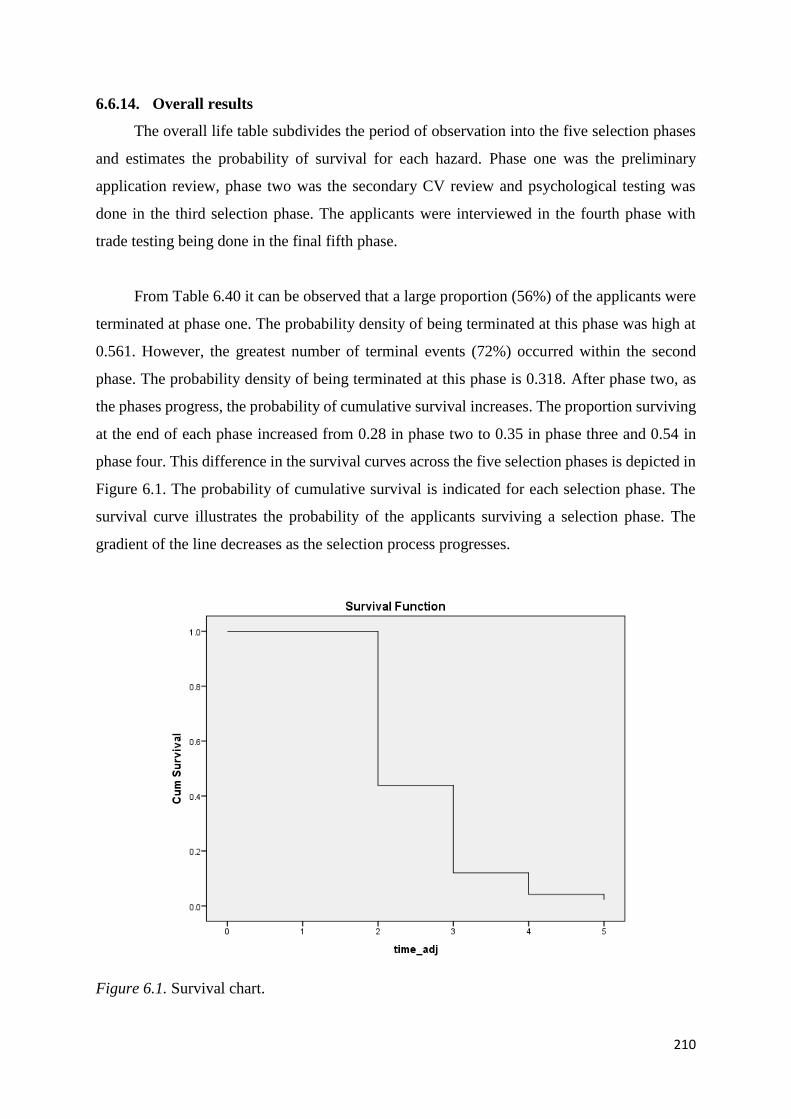
210
6.6.14. Overall results
The overall life table subdivides the period of observation into the five selection phases
and estimates the probability of survival for each hazard. Phase one was the preliminary
application review, phase two was the secondary CV review and psychological testing was
done in the third selection phase. The applicants were interviewed in the fourth phase with
trade testing being done in the final fifth phase.
From Table 6.40 it can be observed that a large proportion (56%) of the applicants were
terminated at phase one. The probability density of being terminated at this phase was high at
0.561. However, the greatest number of terminal events (72%) occurred within the second
phase. The probability density of being terminated at this phase is 0.318. After phase two, as
the phases progress, the probability of cumulative survival increases. The proportion surviving
at the end of each phase increased from 0.28 in phase two to 0.35 in phase three and 0.54 in
phase four. This difference in the survival curves across the five selection phases is depicted in
Figure 6.1. The probability of cumulative survival is indicated for each selection phase. The
survival curve illustrates the probability of the applicants surviving a selection phase. The
gradient of the line decreases as the selection process progresses.
Figure 6.1. Survival chart.
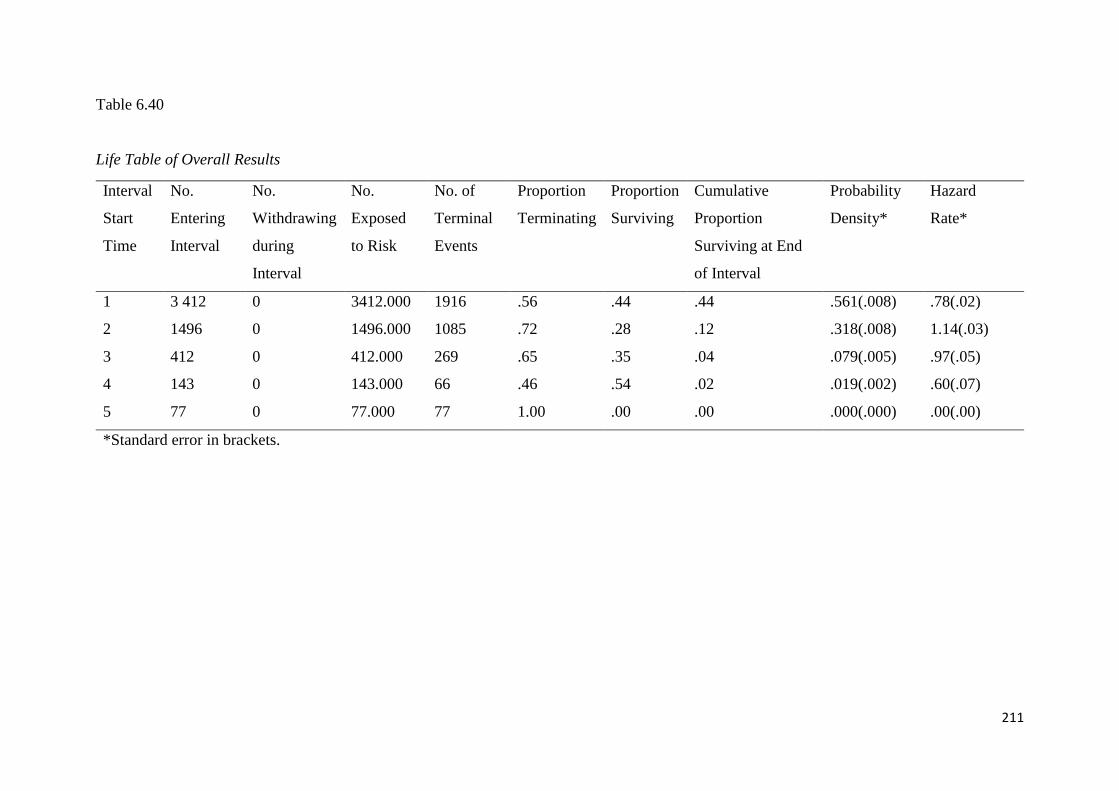
211
Table 6.40
Life Table of Overall Results
Interval
Start
Time
No.
Entering
Interval
No.
Withdrawing
during
Interval
No.
Exposed
to Risk
No. of
Terminal
Events
Proportion
Terminating
Proportion
Surviving
Cumulative
Proportion
Surviving at End
of Interval
Probability
Density*
Hazard
Rate*
1 3 412 0 3412.000 1916 .56 .44 .44 .561(.008) .78(.02)
2 1496 0 1496.000 1085 .72 .28 .12 .318(.008) 1.14(.03)
3 412 0 412.000 269 .65 .35 .04 .079(.005) .97(.05)
4 143 0 143.000 66 .46 .54 .02 .019(.002) .60(.07)
5 77 0 77.000 77 1.00 .00 .00 .000(.000) .00(.00)
*Standard error in brackets.
212
6.7. Summary
Chapter Six documented the findings of this study. The demographic profile of the
applicants was initially discussed, with the survival rate outcomes attained in the five selection
phases presented in cross-tabulation format and analysed in section 6.3. The frequency
distribution of fourteen constructs profiling the applications were provided, according to
selection phase, and discussed in section 6.4. The median STs of 13 constructs, according to
selection phase, were provided in a summary table and examined in section 6.5. In the final
section the findings from the assessment of the 13 hypotheses were presented in life tables and
clarified. The overall life table and survival chart were also presented and discussed in this
section. In Chapter Seven these findings are discussed and contrasted in relation to relevant
industry reports and other empirical literature.
213
15 CHAPTER SEVEN
16 DISCUSSION OF FINDINGS
7.1. Introduction
Step eight of the research process followed in this study is the interpretation of the results.
Chapter Six presented and explained the findings of the descriptive and inferential statistics
conducted. The purpose of Chapter Seven is to further discuss these findings, thus fulfilling the
requirements of this eighth step in the research process. The initial section of this chapter
debates the demographic profile of the applicants.
The collection of the demographic details on the applicants and the preliminary CV
review was conducted in the first selection phase. Whilst the information gleaned from this
phase is valuable, there are no hypotheses nor objectives directly related to this selection phase.
The demographic information on the applicants pertains to the four aspects covered in section
6.2 and discussed in section 7.2. These are the race, gender, age and geographical location of
the applicants. Thereafter, two descriptive sets of results from the first selection phase are
discussed in section 7.3. The results on the preferred selection type were derived from section
6.4.1.1 and the phase one survival rate outcomes were sourced from section 6.3.1.
Table 7.1 provides a summary of the linkages between the objectives, hypotheses,
selection phases and the findings achieved in this study. The four secondary objectives and the
thirteen hypotheses of the study were investigated through phases two, three and four of the
selection process. Table 7.1 indicates the sections within Chapter Six where the findings were
presented and described, with the final column providing a link to the sections in Chapter Seven
where there is further elaboration on these findings. Section 7.4 through to section 7.6 interpret
the descriptive and inferential findings obtained for the second to fourth selection phases.
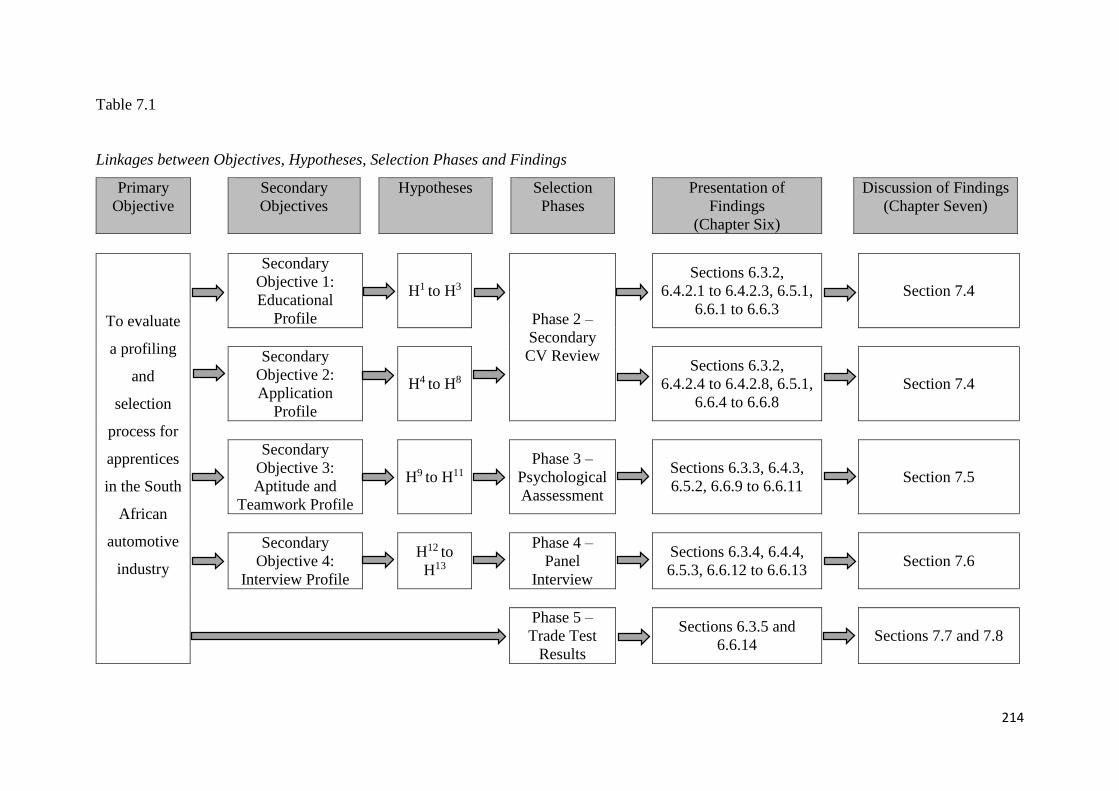
214
Table 7.1
Linkages between Objectives, Hypotheses, Selection Phases and Findings
Primary
Objective
Secondary
Objectives
Hypotheses Selection
Phases
Presentation of
Findings
(Chapter Six)
Discussion of Findings
(Chapter Seven)
To evaluate
a profiling
and
selection
process for
apprentices
in the South
African
automotive
industry
Secondary
Objective 1:
Educational
Profile
H1 to H3
Phase 2 –
Secondary
CV Review
Sections 6.3.2,
6.4.2.1 to 6.4.2.3, 6.5.1,
6.6.1 to 6.6.3
Section 7.4
Secondary
Objective 2:
Application
Profile
H4 to H8
Sections 6.3.2,
6.4.2.4 to 6.4.2.8, 6.5.1,
6.6.4 to 6.6.8
Section 7.4
Secondary
Objective 3:
Aptitude and
Teamwork Profile
H9 to H11
Phase 3 –
Psychological
Aassessment
Sections 6.3.3, 6.4.3,
6.5.2, 6.6.9 to 6.6.11
Section 7.5
Secondary
Objective 4:
Interview Profile
H12 to
H13
Phase 4 –
Panel
Interview
Sections 6.3.4, 6.4.4,
6.5.3, 6.6.12 to 6.6.13
Section 7.6
Phase 5 –
Trade Test
Results
Sections 6.3.5 and
6.6.14
Sections 7.7 and 7.8
215
As reflected in Table 7.1, the second selection phase pertained to hypotheses one to eight.
The results from hypotheses one to three were presented in sections 6.6.1 to 6.6.3 and relate to
the first secondary objective. The outcomes from hypotheses four to eight, associated with the
second secondary objective, were provided in sections 6.6.4 to 6.6.8. The nine findings
obtained from these eight hypotheses are discussed in section 7.4. The findings of the first
construct, secondary education type, is discussed in section 7.4.1, with the performance in
mathematics and science being examined together within section 7.4.2. Sections 7.4.3 through
to 7.4.7 analyse the findings achieved from the other five constructs, namely, the ratings
provided on the motivational letter, CV, experience, qualification and leadership potential of
the applicants. These descriptive findings were discussed in sections 6.4.2 and 6.5.1, with the
inferential analysis presented in section 6.6. The descriptive statistics concerning the
recommendation results from this selection phase were examined in section 6.3.2 and clarified
in section 7.4.8.
There are three hypotheses, namely, hypotheses nine to 11, associated with the third
secondary objective and the third selection phase. These hypotheses relate to the three forms
of psychological assessment implemented in this phase which was operationalised in section
5.9.3.3. The descriptive statistics for these three constructs were documented in sections 6.4.3
and 6.5.2, with the inferential analysis of the three hypotheses portrayed in sections 6.6.9 to
6.6.11. Section 7.5 then gives an account of these descriptive and inferential results. The
general aptitude results are analysed in section 7.5.1, the technical aptitude ratings in section
7.5.2 and teamwork competence results in section 7.5.3. Section 6.3.3 presented the overall
recommendation outcomes achieved by the sample within this third selection phase. These
results are then discussed within section 7.5.4.
Secondary objective four, as depicted in Table 7.1, is concerned with the results obtained
from the fourth selection phase and hypotheses 12 and 13. Three constructs were extracted
from this phase and were operationalised in section 5.9.3.4. The findings of the first construct,
the ratings of the standard interview questions, are discussed in section 7.6.1, with the second
construct, the general impression ratings, being analysed within section 7.6.2. These findings
were initially presented in sections 6.4.4, 6.5.3 and 6.6.12 to 6.6.13. The recommendation
results from this fourth selection phase were shown in section 6.3.4 and scrutinised in section
7.6.3.
216
From the fifth selection phase, the overall survival rate outcomes were clarified in section
6.3.5 and are discussed in section 7.7. Whilst not directly related to any of the study’s
hypotheses or secondary objectives, this finding has bearing on the primary objective of the
study. The overall results attained within this study were presented in section 6.6.14 and are
further analysed in section 7.8.
Besides providing a summary of the linkages between the objectives, hypotheses,
selection phases and the findings, Table 7.1 also offers a map linking the findings in Chapter
Six to the discussions in this chapter. Section 7.2 commences the chapter with an outline of the
demographic profile of the applicants.
7.2. Demographic profile of applicants
Four central findings were extracted from the demographic information pertaining to the
race, gender, age and geographical location of the applicants. The geographical profile of the
sample is discussed first as this has bearing on the other demographic attributes.
The majority (81.4%) of the applicants that progressed to the second phase of the
selection process were from the Buffalo City Metropole. This is primarily due to the Client
implementing a strategy to provide employment and development opportunities to individuals
that are located in the same town as the assembly plant. Individuals who reside in the Eastern
Cape are given second priority. This strategy is not implemented indiscriminately. Applicants
from the Buffalo City Metropole and Eastern Cape are still assessed and ranked through the
four selection phases. Given this strategy, it is therefore very rare for applicants from outside
the Eastern Cape to be successful in their application onto the apprenticeship programme. This
is despite only 11.5% of the SA population residing in this province (Statistics SA, 2017). As
discussed in section 3.4.1, only five percent of apprentices are recorded as registered within
the Eastern Cape (merSETA, 2016).
Secondly, in terms of racial profile, over 90% of the applicants are Black African, with
the second largest group (7.3%) being Coloured. According to Statistics SA (2017),
approximately 81% of the national population is Black African, nine percent is Coloured, 2.5%
Indian/Asian and eight percent White. The Eastern Cape racial profile is 83% Black African,
11.5% Coloured, 0.2% Indian/Asian and 5.4% are White. The racial profile of the sample was
hence in line with that of the overall and provincial populations. As discussed in section 3.4.1,
217
the majority of national apprenticeship registrations are Black African learners. The racial
profile of the sample is therefore also comparable to those revealed by other national studies
(Hauschildt, 2016; Janse van Rensburg et al., 2012; Wildschut et al., 2012). However, the racial
profile is in contrast to that established by Van Rooyen et al. (2010) who found that most South
African artisans are White.
Thirdly, with reference to gender, the majority (67%) of the sample are male. Statistics
SA (2017) reported that just over 51% of the national population is female, with approximately
53% of the Eastern Cape population being female. The gender profile of the applicants within
this study is therefore contrary to that of the actual population profile. This finding therefore
lends credence to the statement that apprenticeships remain male-dominated as discussed in
sections 3.4.1 and 3.6. Similar traditional profiles (i.e., more males than females) have been
established in other studies ((Janse van Rensburg et al., 2012; merSETA, 2016; Van Rooyen
et al., 2010; Wildschut et al., 2012). Nevertheless, the percentage of females in this study (i.e.,
approximately 30%) is less than that obtained in these other national studies (i.e., roughly 10
to 20%).
Fourthly, in terms of age, the majority (37%) of the sample was between 25 and 29 years
of age at the time of their application onto the apprenticeship programme. Only 8.3% of the
Eastern Cape and 9.7% of the total SA population falls within this age category (Statistics SA,
2017). The age profile of this sample is therefore not aligned to either the provincial or national
age profile. However, it is comparable to that established in other national studies and the
average age of apprentices in the national population as discussed in section 3.6. Whilst
apprenticeships predominantly cater for minors and school-leavers, the average age of
registered apprentices is about 26 years of age (Hauschildt, 2016; Vass & Raidani, 2016;
Wildschut et al., 2012). This is also consistent with the age profile of local artisans established
by Van Rooyen et al. (2010). In this study the majority were between 30 to 39 years of age,
which equates to them being in the 25 to 29-year age category at the start of their apprenticeship
training.
This concludes the discussion pertaining to the demographical profile of the applicants.
Section 7.3 that follows analyses the descriptive statistical results achieved from the first
selection phase.
218
7.3. Phase one: Preliminary curriculum vitae review
The two main findings gleaned from the first selection phase pertained to the preferred
apprenticeship type and the survival outcomes of the phase. With regard to the preferred
apprenticeship type, the majority (51.4%) of the applicants applied for the automotive electrical
apprenticeship programme, in comparison to the millwright position. This is in contrast to other
national datasets mentioned in section 3.4.1. Other South African studies have found that
students registering for an apprenticeship prefer the millwright trade over the automotive
electrical trade. While a larger differential percentage has been established (Janse van Rensburg
et al., 2012), several studies have confirmed at least double the number of registrations for the
millwright trade in comparison to that for an automotive electrical trade (merSETA, 2016;
Mukora & Visser, 2008). As discussed in Appendix N, the curricula of these two trades is very
different. In comparison to millwrights, who install and repair different types of machines, an
automotive electrician works primarily with the electrical wiring of motor vehicles. The latter
trade may be perceived by the public as being more relevant to an OEM. Nevertheless, these
trades are two of the priority training areas identified from the National Scarce Skills List
(Government Gazette, 2014a; Wildschut et al., 2013) discussed in section 3.5.2.
Furthermore, the majority (56.2%) of the candidates were terminated in the first selection
phase. The purpose of this selection phase was establishing whether all the required
documentation had been submitted and that minimum educational requirements had been met.
The high termination rate at this phase suggests that the applicants needed to make reasonable
effort to understand and comply with the submission requirements before applying for a vacant
position.
7.4. P hase two: Secondary curriculum vitae review
Nine main findings were obtained from the constructs investigated within the second
selection phase. A summary of the descriptive statistics achieved from these nine constructs is
provided in Table 7.2 whilst Table 7.3 summarises the inferential statistics.
7.4.1. Secondary education type
Table 7.2 indicates that most (65.4%) of the applicants attended a non-technical
secondary school. This is significantly less than the 92.7% that applied for an automotive
operator position within the automotive industry (Puchert et al, 2017a, 2017b). The high
percentage of non-technical applicants may lend weight to the discussion in section 3.7.2.1 that
219
there is currently a lack of interest and understanding in technical training amongst the
country’s youth (Mummenthey et al., 2012; Pandor, 2018; Patel, 2008, 2012). However, it is
important to draw attention to the unique definition of these two forms of secondary education
within this thesis. In section 1.6 the operational definitions of the technical and non-technical
forms of secondary education were made clear. As defined by the Client, a technical form of
secondary education includes mathematics, science and two technical subjects. Accordingly, a
National Certificate (Vocational) is not defined as a technical form of secondary education. By
the Client’s definition, depending on the subjects taken, a N3 Technical Certificate may or may
not be deemed a technical form of secondary education. This may not be the common
operationalisation of these types of secondary education.
Despite the higher number of non-technical applicants, the median STs for this secondary
education construct showed that the applicants with a technical type secondary education
survived longer than those with a non-technical type of secondary education. The life table for
this construct also revealed that the applicants with a technical type secondary education
survived more selection phases compared to those with a non-technical secondary education.
As summarised in Table 7.3 a significant relationship was hence established between the type
of secondary education and the applicants’ selection onto the apprenticeship programme. The
null hypothesis was rejected on the basis of there being a statistically significant (p = 0.000)
relationship between the variables.
Applicants with a technical secondary education had a lower termination rate in the
apprenticeship selection process. This is contrary to the findings of Puchert et al. (2017a,
2017b) who established that applicants with a technical type of secondary education were less
likely to be employed as an automotive operator. However, as discussed in the previous
paragraph, the operationalisation of these two forms of secondary education (i.e., technical and
non-technical) is specific to this study as they are based on the definition provided by the Client.
The advantages the applicants with a technical type secondary education, as defined in this
study, had over the non-technical applicants seems to be the attainment of the two technical
subjects and the practical exposure gained during attending these subjects. This finding is in
line with global and national trends to prefer a technical type qualification for the selection of
apprentices and in the automotive industry in general (Nomvete et al., 2017; Schafmeister,
2013; Vass & Raidani, 2016), as discussed in section 4.6.
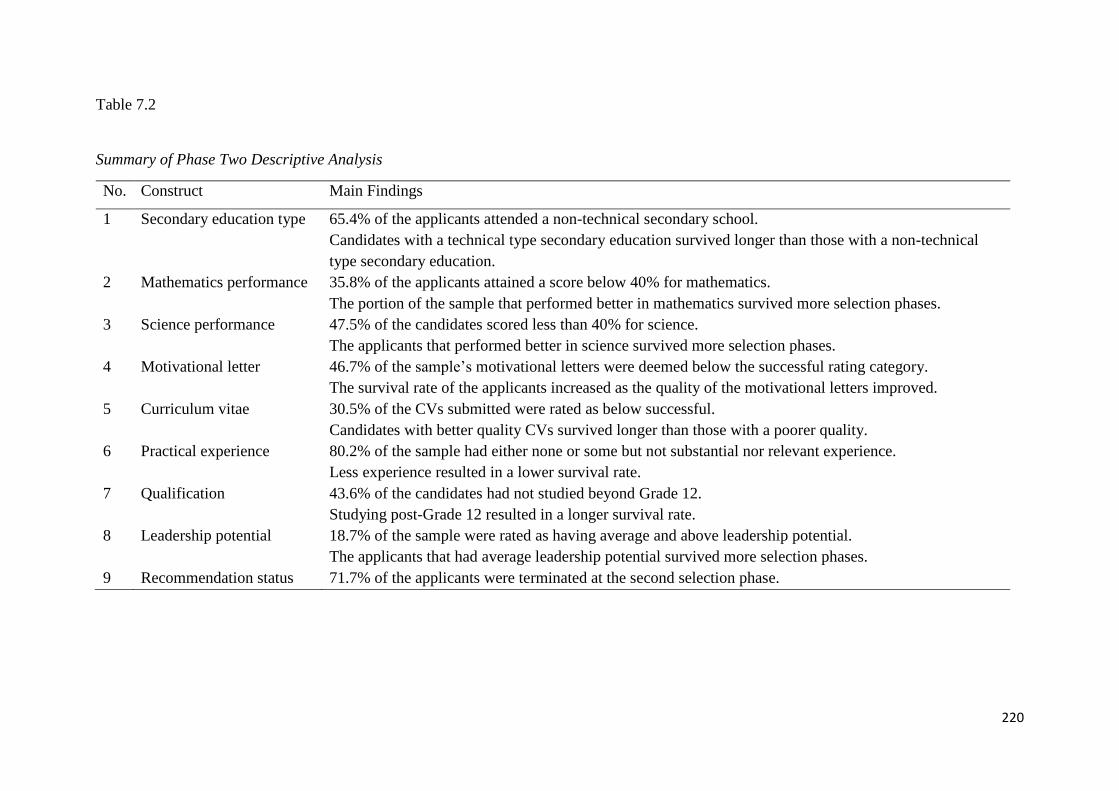
220
Table 7.2
Summary of Phase Two Descriptive Analysis
No. Construct Main Findings
1 Secondary education type 65.4% of the applicants attended a non-technical secondary school.
Candidates with a technical type secondary education survived longer than those with a non-technical
type secondary education.
2 Mathematics performance 35.8% of the applicants attained a score below 40% for mathematics.
The portion of the sample that performed better in mathematics survived more selection phases.
3 Science performance 47.5% of the candidates scored less than 40% for science.
The applicants that performed better in science survived more selection phases.
4 Motivational letter 46.7% of the sample’s motivational letters were deemed below the successful rating category.
The survival rate of the applicants increased as the quality of the motivational letters improved.
5 Curriculum vitae 30.5% of the CVs submitted were rated as below successful.
Candidates with better quality CVs survived longer than those with a poorer quality.
6 Practical experience 80.2% of the sample had either none or some but not substantial nor relevant experience.
Less experience resulted in a lower survival rate.
7 Qualification 43.6% of the candidates had not studied beyond Grade 12.
Studying post-Grade 12 resulted in a longer survival rate.
8 Leadership potential 18.7% of the sample were rated as having average and above leadership potential.
The applicants that had average leadership potential survived more selection phases.
9 Recommendation status 71.7% of the applicants were terminated at the second selection phase.
221
7.4.2. Mathematics and science performance
Over a third (35.8%) of the applicants achieved a score below 40% for mathematics.
Furthermore, almost half (47.5%) of the sample attained a score in the same performance
category for science. A low level of mathematics skills was also found amongst technical
students in Malaysia (Kazalin et al., 2009). In a similar study on the selection of automotive
operators, discussed in section 3.7.1, only 10.7% of the applicants scored in the same
performance category for mathematics and 25.6% for science. However, in this latter study the
applicant pool also included individuals with an academic type of secondary education (Puchert
et al., 2014). The very poor results obtained in this study may be an illustration of the dire
quality of mathematics and science TVET education in SA confirmed in other national studies
(Schwab & Sala-i-Martin, 2017; Vass & Raidani, 2016; Wedekind, 2015) and discussed in
sections 3.5.1 and 4.5.2.1.
However, the applicants that performed better in mathematics and science survived more
selection phases as seen in their higher median STs. The second and third central finding from
the second selection phase, summarised in Table 7.2, is hence that improved marks in these
two subjects resulted in optimal performance as measured by the selection success of the
applicants. As discussed in section 1.3.1, enhanced STEM skills has been linked to optimal
success in many areas, such as productivity, innovation, technology shifts and economic
growth (Chalikias et al., 2014; Craig et al., 2011; Spaull, 2013). At the other end of this
debate, section 3.7.1 summarises literature suggesting that poor results in these two subjects
may be a contributing factor to the lack of technical skills in SA (Mummenthey et al., 2012;
Vass & Raidani, 2016; Wedekind, 2015).
The analysis for the second hypothesis was based on whether the Grade 12 mathematics
performance of the applicants had a significant effect or not on their selection onto the
apprenticeship programme. Overall, the analysis reflected statistical significance with a p-value
of 0.000 and a Gehan-Wilcoxon statistical value of 86.010. Since the significance value is less
than 0.05, the survival curves are regarded as statistically different across the groups.Therefore,
the null hypothesis is rejected as summarised in Table 7.3. The Grade 12 mathematics mark
obtained by the applicants had a significant effect on their selection onto the apprenticeship
programme, with those having higher marks having a better chance of progressing onto the
next selection phase. Specifically, applicants with mathematics and science marks above 60%
222
survived and had a higher cumulative proportion surviving through the selection phases, in
comparison to the other performance categories.
With regards to the third hypothesis, the analysis sought to establish whether the Grade
12 science performance of the applicants had a significant effect on their selection onto the
apprenticeship programme. The overall comparison across the science performance categories
represented a statistical significant result, with a 0.000 p-value and a 127.828 Gehan-Wilcoxon
statistical value. It can therefore be concluded that the Grade 12 science marks achieved by the
applicants had a significant effect on their selection onto the apprenticeship programme. As
summarised in Table 7.3 the null hypothesis is rejected since the p-value is less than 0.05.
This is in line with the findings and recommendations made globally in terms of
apprenticeship applicants, discussed in section 4.6.1. Whilst Besterfield-Sacre et al. (1997)
indicate that a strong interest in these two subjects is likely to lead to success on an
apprenticeship programme, good performance in mathematics and science is recommended by
other researchers (COTVET, 2014; Martin, 2016; Torpey, 2013). Students that do not achieve
good or very good school achievements are less likely to find an apprentice place and remedial
education may even be required (Steedman, 2012). National research, mentioned in section
4.6.2, has recommended to the automotive industry the inclusion of the mathematics and/or
science subjects in the secondary education achieved. This recommendation was, however,
aimed at entry-level operator screening processes. Nevertheless, the use of these subjects as
preliminary screening mechanisms will still assist the industry to ensure they have the STEM-
related aptitudes and capacities required (Puchert et al., 2017a, 2017b).
7.4.3. Motivational letter
As summarised in Table 7.2, almost half (46.7%) of the motivational letters were rated
as below average and well below average. However, applicants with motivational letters rated
as outstanding had double the median ST of those whose letters were rated as well below
average. The inferential analysis tested whether the quality of the motivational letter sumitted
by the applicants had a significant effect on their selection onto the apprenticeship programme.
For this fourth hypothesis the Gehan-Wilcoxon value is 156.149 with a p-value of 0.000. The
test statistic is significant as the p-value is less than 0.05. It is therefore concluded that the
rating of the motivational letters had a significant effect on the selection of the applicants onto
223
the apprenticeship programme. This forms the basis for rejecting the null hypothesis as
summarised in Table 7.3.
This is similar to the findings of other authors that a well-crafted covering letter could
act as a catalyst for continued consideration in future selection stages as outlined in section
4.4.2.2. Ogden (2016) as well as Ross and Young (2005) found that most employers use
covering letters to assess the match between the applicant and the requirements of the vacant
position. The motivational letter rating was based on neatness, layout as well as spelling and
grammar usage. However, the reason for and logic behind the application, the trade specified
and any contradiction to school subjects were criteria given priority in the rating of these
motivational letters. Through the motivational letter the Client aimed to establish the goodness-
of-fit between the applicant and their specific artisanal needs. The applicants who were able to
tailor the content of their covering letter to make this match clear were given better ratings.
This ultimately resulted in them surviving through more selection phases. Whilst not in
apprenticeship selection practices, Stewart and Knowles (2000) as well as Tomaska and Nosek
(2018) established similar findings in generic selection practices.
Thus far in section 7.4 the findings from four of the constructs within the second selection
phase have been discussed. These are the secondary education type, the mathematics and
science performance of the applicants and the motivational letter rating. In the next section the
fifth construct, the CV rating attained, is examined.
7.4.4. Curriculum vitae
Table 7.2 indicates that almost a third (30.5%) of the CVs submitted by the applicants
were rated as below successful. Higher ratings in CV quality did, however, result in improved
median STs of applicants across the selection phases. Hypothesis five tested whether or not the
ratings the applicants obtained for their CV had a significant effect on their selection onto the
apprenticeship programme. The differences in survival rates across the groups reflects a true
variance in the data. As indicated in Table 7.3, the Gehan-Wilcoxon value is 180.532 (p =
.000). Since the significance value of the test is less than 0.05, it is concluded that the survival
curves are different across the groups. A significant relationship was hence established between
the rating obtained for CVs presented by the applicants and their selection onto the
apprenticeship programme. The null hypothesis was rejected on the basis of there being a
statistically significant (p = .000) relationship between the variables.
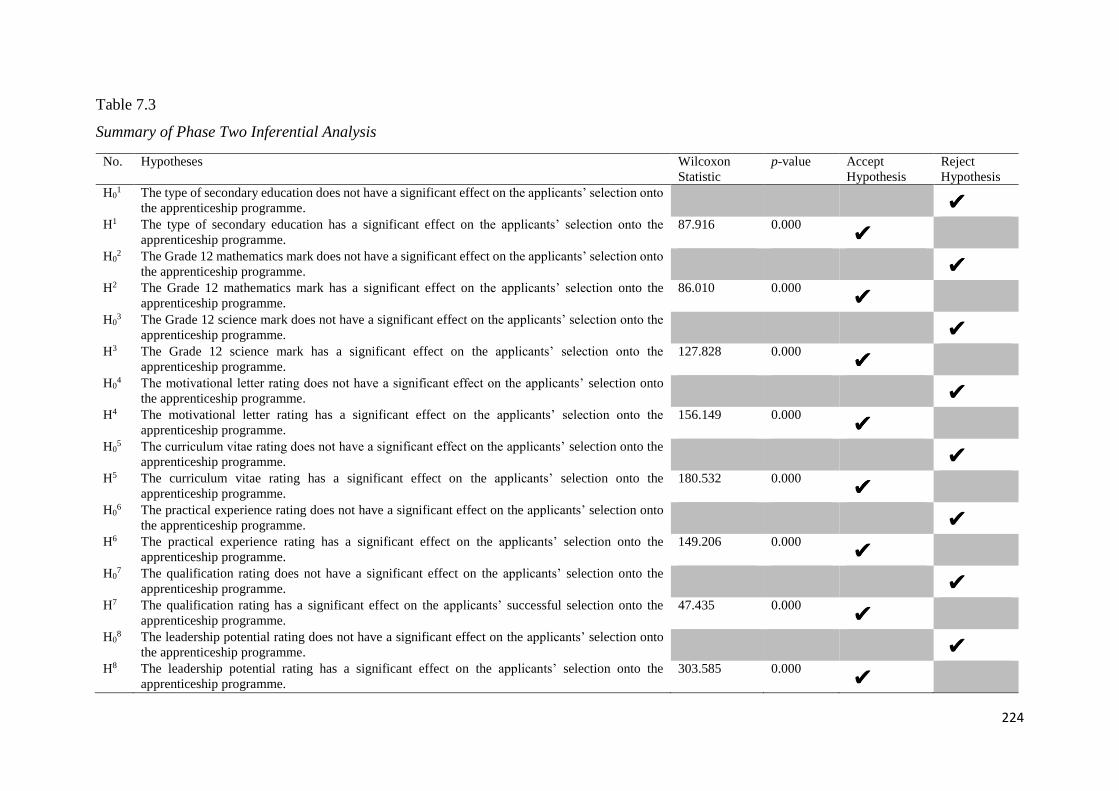
224
Table 7.3
Summary of Phase Two Inferential Analysis
No. Hypotheses Wilcoxon
Statistic
p-value Accept
Hypothesis
Reject
Hypothesis
H01 The type of secondary education does not have a significant effect on the applicants’ selection onto
the apprenticeship programme.
H1 The type of secondary education has a significant effect on the applicants’ selection onto the
apprenticeship programme.
87.916 0.000
H02 The Grade 12 mathematics mark does not have a significant effect on the applicants’ selection onto
the apprenticeship programme.
H2 The Grade 12 mathematics mark has a significant effect on the applicants’ selection onto the
apprenticeship programme.
86.010 0.000
H03 The Grade 12 science mark does not have a significant effect on the applicants’ selection onto the
apprenticeship programme.
H3 The Grade 12 science mark has a significant effect on the applicants’ selection onto the
apprenticeship programme.
127.828 0.000
H04 The motivational letter rating does not have a significant effect on the applicants’ selection onto
the apprenticeship programme.
H4 The motivational letter rating has a significant effect on the applicants’ selection onto the
apprenticeship programme.
156.149 0.000
H05 The curriculum vitae rating does not have a significant effect on the applicants’ selection onto the
apprenticeship programme.
H5 The curriculum vitae rating has a significant effect on the applicants’ selection onto the
apprenticeship programme.
180.532 0.000
H06 The practical experience rating does not have a significant effect on the applicants’ selection onto
the apprenticeship programme.
H6 The practical experience rating has a significant effect on the applicants’ selection onto the
apprenticeship programme.
149.206 0.000
H07 The qualification rating does not have a significant effect on the applicants’ selection onto the
apprenticeship programme.
H7 The qualification rating has a significant effect on the applicants’ successful selection onto the
apprenticeship programme.
47.435 0.000
H08 The leadership potential rating does not have a significant effect on the applicants’ selection onto
the apprenticeship programme.
H8 The leadership potential rating has a significant effect on the applicants’ selection onto the
apprenticeship programme.
303.585 0.000
225
Only one of the five criteria used to rate the quality of the CVs pertained to the content
thereof. The other four criteria were neatness, layout, spelling and grammar. The CVs were
hence primarily rated on their aesthetics. Similar findings of a predictive relationship between
the positive ratings by recruiters of CVs and their employability have been established in
previous research. This research was discussed in detail within section 4.4.2.2. In a
comprehensive study across various industries, Chen et al. (2011) found that recruiters used
both the content and aesthetics of CVs to make hiring recommendations. Cole et al. (2007) and
Tsai et al. (2011) also found that the content provided within CVs (i.e., work experience and
educational background) resulted in better perceptions of fit to job and organisation, thus
leading to improved selection opportunities. However, as with this study, the research
conducted by Arnulf et al. (2010) found that CV layout predominantly had a significant impact
on further selection prospects. Several authors state that the reason for this is that recruiters
infer certain personality traits (e.g., extraversion and openness to experience) from the
aesthetics and layout of the CV (Cole et al., 2003, 2009; Burns et al., 2014). In the appraisal of
the CVs in this study, as suggested by the predominance given to the four criteria mentioned
earlier, the assessors were looking for conscientiousness within the CVs presented by the
applicants.
7.4.5. Practical experience
As indicated in Table 7.2, 16.7% of the sample had no experience, whilst 63.5% had
some experience. The majority (80.2%) of the applicants therefore did not have credible
experience. However, obtaining a higher rating for the experience criteria improved the median
ST of applicants across the selection phases. The more experience the candidate had, the higher
where the prospects of remaining in the selection process.
The inferential analysis on this construct tested whether the rating obtained by the
applicants for their experience had a significant effect on their selection onto the apprenticeship
programme. From this analysis it can be concluded that applicants rated with no experience
had a higher probability of being terminated or not progressing onto the programme compared
to those rated with some or credible background experience. The Gehan-Wilcoxon value is
149.206 (p = .000). This implies a statistical significance when comparing the survival
distribution amongst the groups, with the test statistic based on differences in group mean
scores. Since the significance value of the test is less than 0.05, it is concluded that the survival
curves are different across the groups. As indicated in Table 7.3, the null hypothesis is rejected
226
as the rating of the experience gained by the applicants had a significant effect on their selection
onto the apprenticeship programme.
This is contrary to the findings of Cole et al. (2007) discussed in section 4.4.2.2. These
researchers established a positive correlation between academic qualifications, extracurricular
activities and the judgments made by reviewers on the employability of applicants. Work
experience was not as highly correlated as qualifications and extracurricular activities.
Nevertheless, the finding of this study regarding experience is consistent with the findings of
other researchers (Juhdi et al., 2010; Wilkin & Connelly, 2012).
The results from this construct are linked to those of Wildschut et al. (2012) and Janse
van Rensburg et al. (2012) who confirmed that individuals are least likely to enter an
apprenticeship in SA from an unemployed position. As discussed in section 4.6.2, job
experience facilitated access to a career path that required the completion of an apprenticeship.
Whilst this study found that a better experience rating improved the prospects of candidates
remaining in the selection process, the highest number of successful applicants (i.e., were
accepted onto the apprenticeship programme) came from the second best rating category. The
Client has a specific preference for accepting a good mix of both experienced and
unexperienced candidates. Candidates who are young school-leavers that aim to embark on an
apprenticeship programme immediately after completing Grade 12 are also given preference.
These applicants would typically be scored as having some but not substantial experience.
These candidates are likely to have had technically-oriented extra-curricular activities recorded
on their CVs so had gained some practical experience but would not have entered into
employment yet.
7.4.6. Qualification
The seventh central finding from the second selection phase, depicted in Table 7.2, was
that almost half (43.6%) of the applicants had not studied beyond Grade 12 or equivalent
despite having at least some time to do so. This is contrary to a national study where 40% of
those registered for an apprenticeship had either undergraduate degrees, diplomas or
certificates (merSETA, 2016). Another national trajectory study, also discussed in section
3.4.1, similarly found that only 3.9% of the sample entered an apprenticeship directly after
school, given that most first studied and/or gained employment elsewhere (Wildschut et al.,
2012).
227
Obtaining higher ratings in level of qualification improved the median ST of applicants
across the selection phases. Furthermore, as indicated in Table 7.3, the seventh null hypothesis
of this study was rejected as it is concluded that the qualification rating obtained by the
applicants had a significant effect on their selection onto the apprenticeship programme. The
Gehan-Wilcoxon value realised for this hypothesis is 47.435 (p = 0.000). This implies
statistical significance as the p-value is less than 0.05.
This conclusion is consistent with the findings of other researchers that applicants with
higher qualifications and self-directedness have higher employability rates than those with
lower qualifications (Brewer, 2013; Raemdonck et al., 2012; Schmidt et al., 2016). This was
collaborated through the research of Wildschut et al. (2012) which established that the
majority of apprenticeship participants had studied post-secondary education before entering
into the programme. However, Nunley et al. (2016) concluded from a résumé audit that
employment prospects were not significantly affected by higher college qualifications or
internship experience.
Seven of the nine constructs extracted from the second selection phase have been
analysed thus far in this section. The second last construct, leadership potential, from this phase
is examined in the section that follows.
7.4.7. Leadership potential
The eighth core finding from this selection phase was that the majority (81.3%) of the
applicants were rated as not having leadership potential. This is consistent with the global
literature emphasising the lack of employability skills outlined in section 3.7.3. This deficiency
has been established in graduates in general (Burning Glass Technologies, 2013; Gallup Inc.,
2014; NACE, 2016) and specifically within technical students and STEM graduates (Husain et
al., 2010; Kramer et al., 2015; Rahman et al., 2011; Rasul et al., 2012, 2013).
Table 7.2 indicated that a central finding from this construct was that applicants rated as
having average leadership potential survived slightly longer, as evidenced in the median ST,
than those rated as having above average leadership potential. As discussed in section 3.4.4,
the retention of artisans is a key factor for organisations. Van Rooyen et al. (2010) concluded
that development opportunities and career progression are regarded as being as important as
remuneration for artisans. In terms of leadership potential, the reviewers within this study may
228
have judged the applicants with above average leadership potential as being higher risk
candidates for exiting the artisanal profession and entering either self-employment or a
managerial career, post the apprenticeship programme. Candidates rated as having average and
above average leadership potential both had higher median STs that those with a below average
rating and hence survived further into the selection process.
The inferential analysis of this construct tested whether the leadership potential rating
attained by the applicants had a significant effect on their selection onto the apprenticeship
programme. There were three rating categories, namely, below average, average and above
average. As reflected in Table 7.3, the statistic value shows significance through a Gehan-
Wilcoxon value of 303.585 (p = 0.000). This suggests that the survival distribution among the
groups is not due to chance but represents a true difference that exists in the data. Since the
significance value of the test is less than 0.05, it is concluded that the survival curves are
different across the groups. Therefore, the null hypothesis is rejected as the leadership potential
ratings had a significant effect on the selection of the applicants onto the apprenticeship
programme.
Other researchers have also established a link between the number, type and quality of
extracurricular activities and positive outcomes in terms of skill acquisition, the likelihood of
further consideration in selection process and being employed. Nemanick and Clark (2002)
also concluded from a résumé evaluation that the number of leadership positions documented
by applicants had a positive impact of the selection judgements made. Other researchers have
indicated that recruiters infer effective interpersonal skills and leadership potential from extra-
curricular activities, such as membership in professional or social societies or coaching of
sports. These inferences were found to enhance employability prospects (Brown & Campion,
1994; Duggan, 2017; Rubin et al., 2002). A link between the perceptions made by recruiters
on extracurricular activities and the employability ratings of graduates has also been
established (Cole et al., 2007).
7.4.8. Recommendation status
Most (71.7%) of the applicants were rejected after the second selection phase. This phase
was concerned with scrutinising the quality of the submitted documentation as well as assessing
the documentation on the eight screening criteria discussed in section 7.4. The low survival
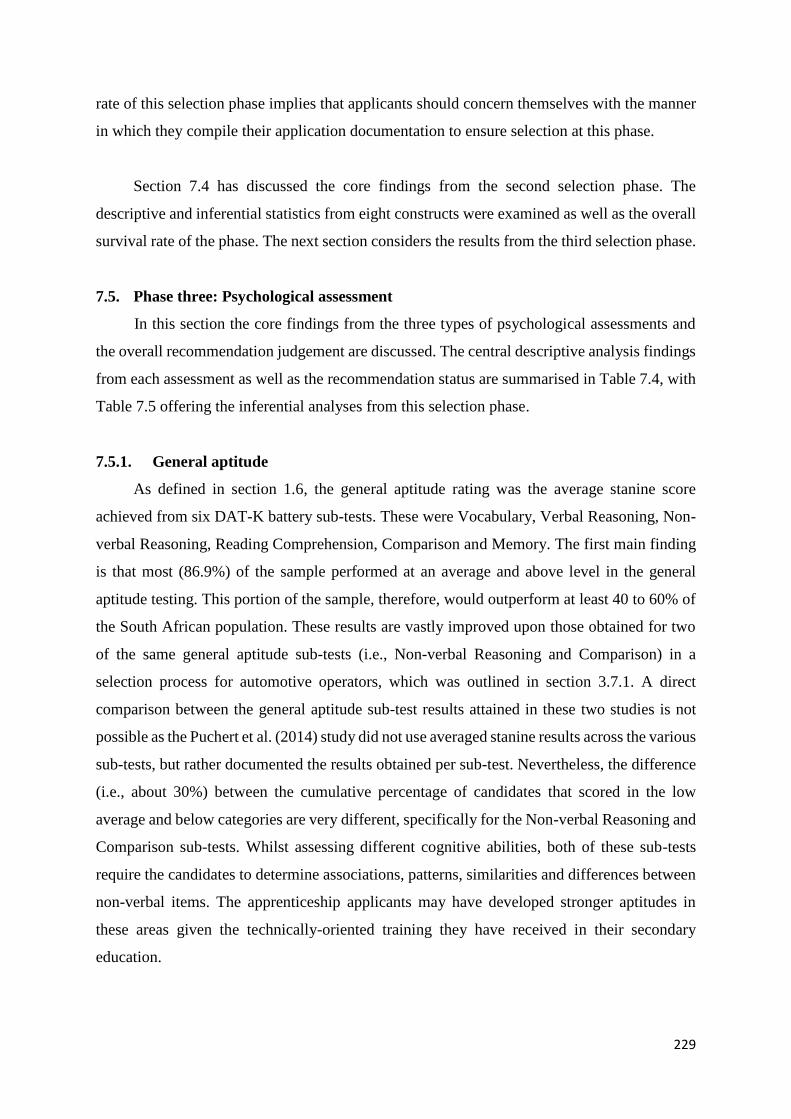
229
rate of this selection phase implies that applicants should concern themselves with the manner
in which they compile their application documentation to ensure selection at this phase.
Section 7.4 has discussed the core findings from the second selection phase. The
descriptive and inferential statistics from eight constructs were examined as well as the overall
survival rate of the phase. The next section considers the results from the third selection phase.
7.5. Phase three: Psychological assessment
In this section the core findings from the three types of psychological assessments and
the overall recommendation judgement are discussed. The central descriptive analysis findings
from each assessment as well as the recommendation status are summarised in Table 7.4, with
Table 7.5 offering the inferential analyses from this selection phase.
7.5.1. General aptitude
As defined in section 1.6, the general aptitude rating was the average stanine score
achieved from six DAT-K battery sub-tests. These were Vocabulary, Verbal Reasoning, Non-
verbal Reasoning, Reading Comprehension, Comparison and Memory. The first main finding
is that most (86.9%) of the sample performed at an average and above level in the general
aptitude testing. This portion of the sample, therefore, would outperform at least 40 to 60% of
the South African population. These results are vastly improved upon those obtained for two
of the same general aptitude sub-tests (i.e., Non-verbal Reasoning and Comparison) in a
selection process for automotive operators, which was outlined in section 3.7.1. A direct
comparison between the general aptitude sub-test results attained in these two studies is not
possible as the Puchert et al. (2014) study did not use averaged stanine results across the various
sub-tests, but rather documented the results obtained per sub-test. Nevertheless, the difference
(i.e., about 30%) between the cumulative percentage of candidates that scored in the low
average and below categories are very different, specifically for the Non-verbal Reasoning and
Comparison sub-tests. Whilst assessing different cognitive abilities, both of these sub-tests
require the candidates to determine associations, patterns, similarities and differences between
non-verbal items. The apprenticeship applicants may have developed stronger aptitudes in
these areas given the technically-oriented training they have received in their secondary
education.
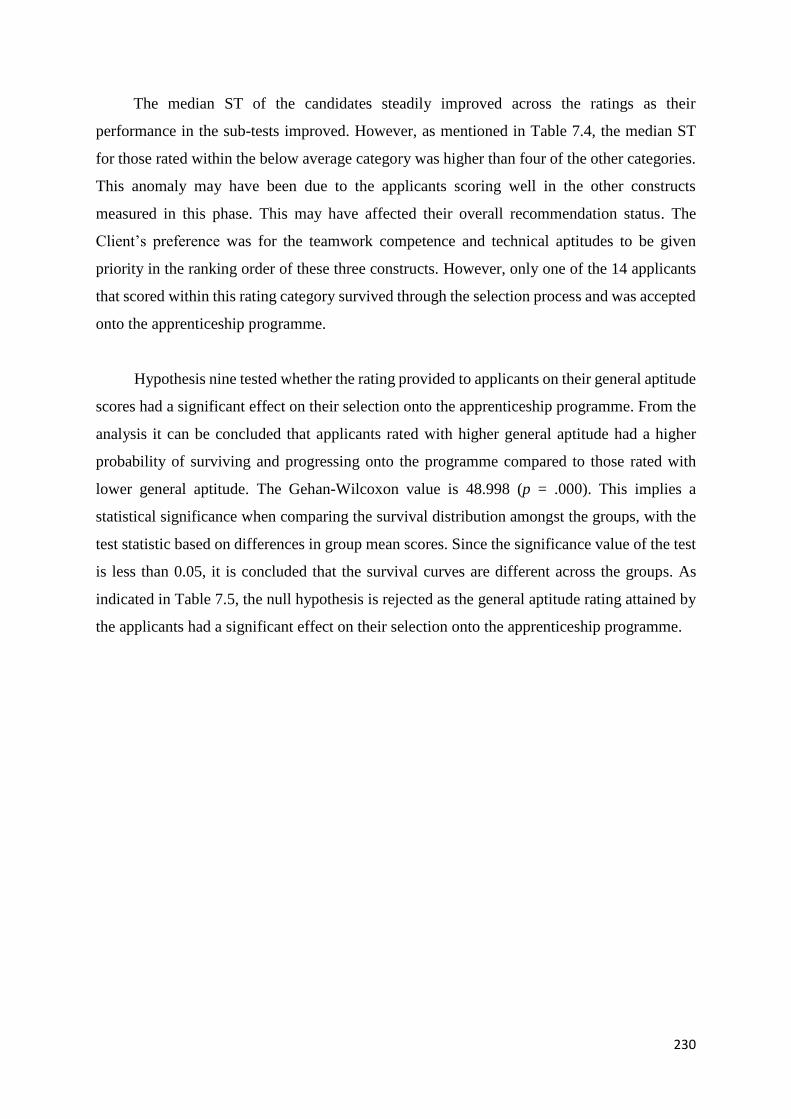
230
The median ST of the candidates steadily improved across the ratings as their
performance in the sub-tests improved. However, as mentioned in Table 7.4, the median ST
for those rated within the below average category was higher than four of the other categories.
This anomaly may have been due to the applicants scoring well in the other constructs
measured in this phase. This may have affected their overall recommendation status. The
Client’s preference was for the teamwork competence and technical aptitudes to be given
priority in the ranking order of these three constructs. However, only one of the 14 applicants
that scored within this rating category survived through the selection process and was accepted
onto the apprenticeship programme.
Hypothesis nine tested whether the rating provided to applicants on their general aptitude
scores had a significant effect on their selection onto the apprenticeship programme. From the
analysis it can be concluded that applicants rated with higher general aptitude had a higher
probability of surviving and progressing onto the programme compared to those rated with
lower general aptitude. The Gehan-Wilcoxon value is 48.998 (p = .000). This implies a
statistical significance when comparing the survival distribution amongst the groups, with the
test statistic based on differences in group mean scores. Since the significance value of the test
is less than 0.05, it is concluded that the survival curves are different across the groups. As
indicated in Table 7.5, the null hypothesis is rejected as the general aptitude rating attained by
the applicants had a significant effect on their selection onto the apprenticeship programme.
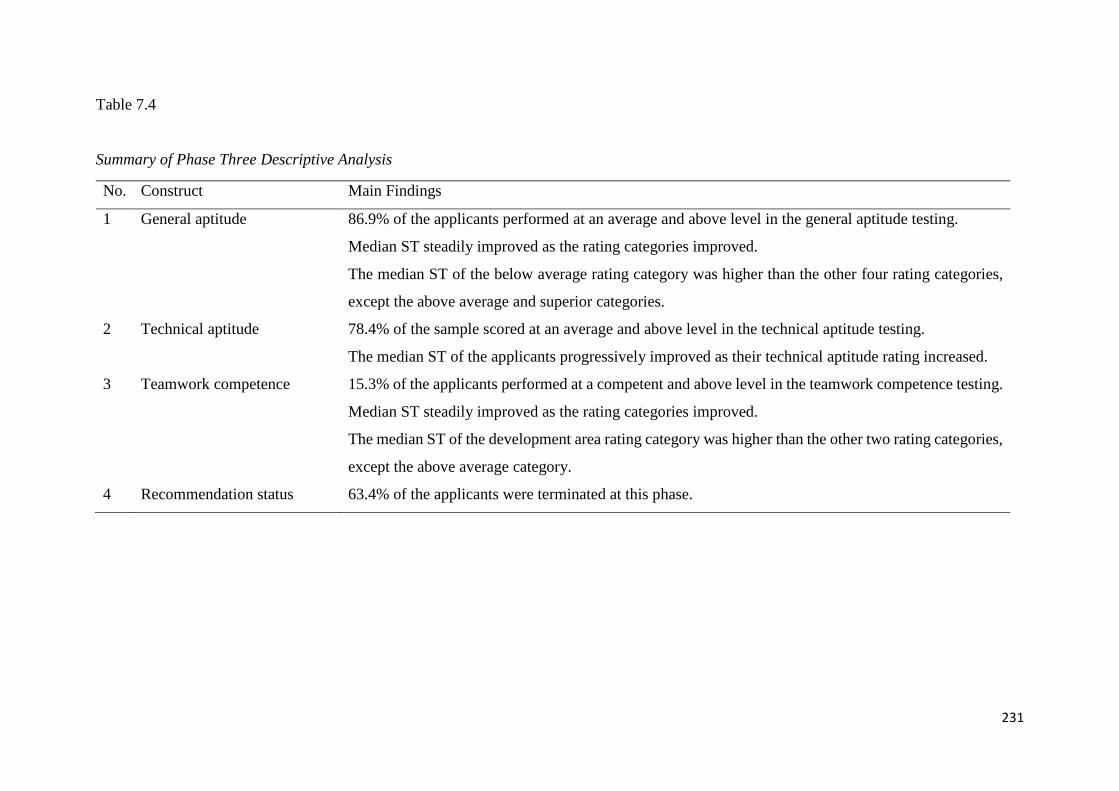
231
Table 7.4
Summary of Phase Three Descriptive Analysis
No. Construct Main Findings
1 General aptitude 86.9% of the applicants performed at an average and above level in the general aptitude testing.
Median ST steadily improved as the rating categories improved.
The median ST of the below average rating category was higher than the other four rating categories,
except the above average and superior categories.
2 Technical aptitude 78.4% of the sample scored at an average and above level in the technical aptitude testing.
The median ST of the applicants progressively improved as their technical aptitude rating increased.
3 Teamwork competence 15.3% of the applicants performed at a competent and above level in the teamwork competence testing.
Median ST steadily improved as the rating categories improved.
The median ST of the development area rating category was higher than the other two rating categories,
except the above average category.
4 Recommendation status 63.4% of the applicants were terminated at this phase.
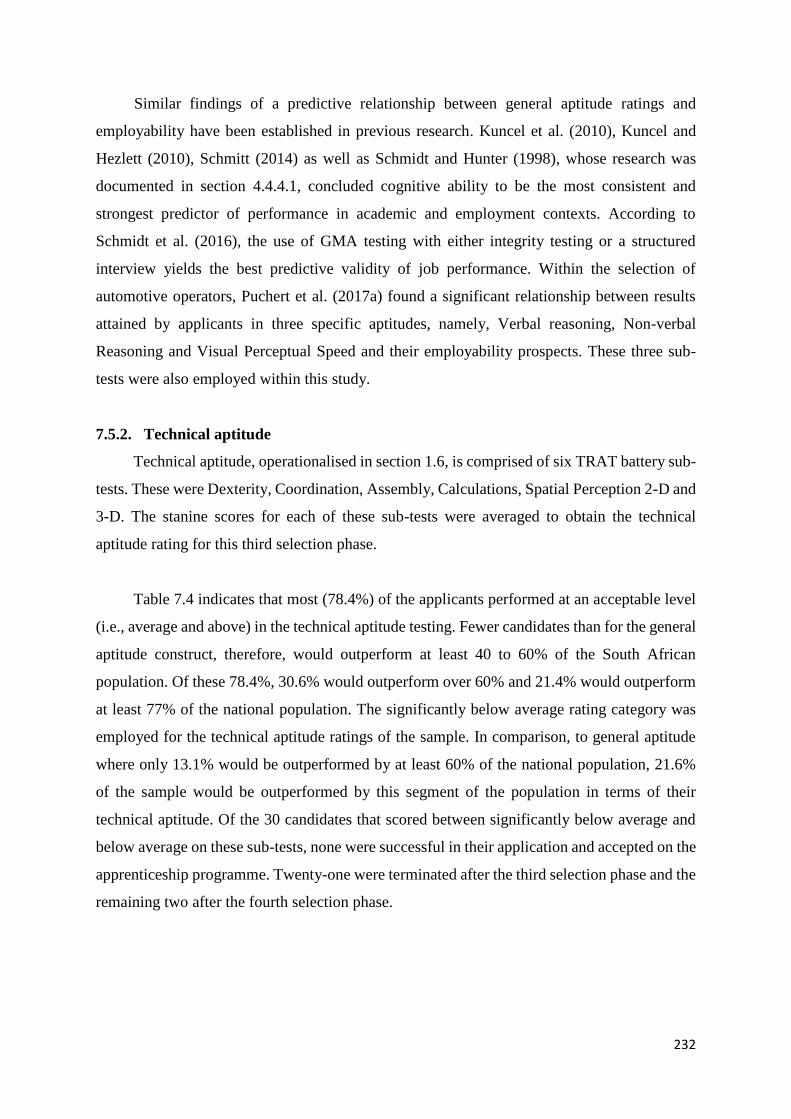
232
Similar findings of a predictive relationship between general aptitude ratings and
employability have been established in previous research. Kuncel et al. (2010), Kuncel and
Hezlett (2010), Schmitt (2014) as well as Schmidt and Hunter (1998), whose research was
documented in section 4.4.4.1, concluded cognitive ability to be the most consistent and
strongest predictor of performance in academic and employment contexts. According to
Schmidt et al. (2016), the use of GMA testing with either integrity testing or a structured
interview yields the best predictive validity of job performance. Within the selection of
automotive operators, Puchert et al. (2017a) found a significant relationship between results
attained by applicants in three specific aptitudes, namely, Verbal reasoning, Non-verbal
Reasoning and Visual Perceptual Speed and their employability prospects. These three sub-
tests were also employed within this study.
7.5.2. Technical aptitude
Technical aptitude, operationalised in section 1.6, is comprised of six TRAT battery sub-
tests. These were Dexterity, Coordination, Assembly, Calculations, Spatial Perception 2-D and
3-D. The stanine scores for each of these sub-tests were averaged to obtain the technical
aptitude rating for this third selection phase.
Table 7.4 indicates that most (78.4%) of the applicants performed at an acceptable level
(i.e., average and above) in the technical aptitude testing. Fewer candidates than for the general
aptitude construct, therefore, would outperform at least 40 to 60% of the South African
population. Of these 78.4%, 30.6% would outperform over 60% and 21.4% would outperform
at least 77% of the national population. The significantly below average rating category was
employed for the technical aptitude ratings of the sample. In comparison, to general aptitude
where only 13.1% would be outperformed by at least 60% of the national population, 21.6%
of the sample would be outperformed by this segment of the population in terms of their
technical aptitude. Of the 30 candidates that scored between significantly below average and
below average on these sub-tests, none were successful in their application and accepted on the
apprenticeship programme. Twenty-one were terminated after the third selection phase and the
remaining two after the fourth selection phase.
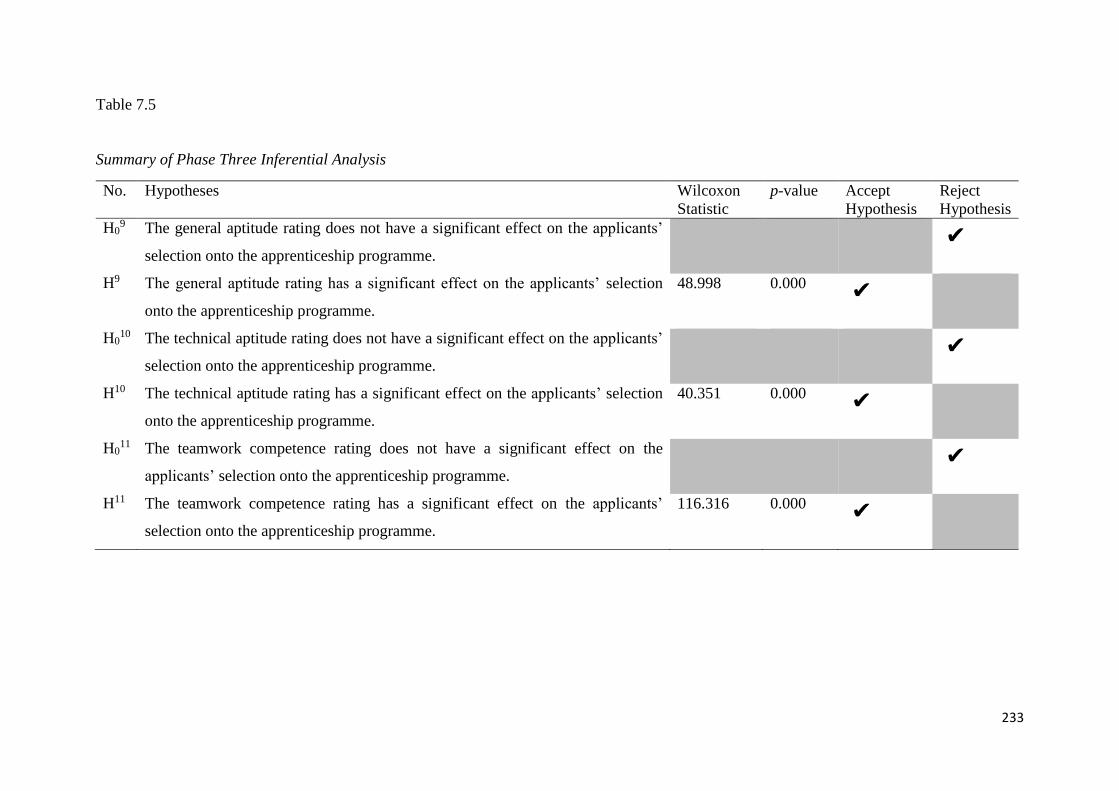
233
Table 7.5
Summary of Phase Three Inferential Analysis
No. Hypotheses Wilcoxon
Statistic
p-value Accept
Hypothesis
Reject
Hypothesis
H09 The general aptitude rating does not have a significant effect on the applicants’
selection onto the apprenticeship programme.
H9 The general aptitude rating has a significant effect on the applicants’ selection
onto the apprenticeship programme.
48.998 0.000
H010 The technical aptitude rating does not have a significant effect on the applicants’
selection onto the apprenticeship programme.
H10 The technical aptitude rating has a significant effect on the applicants’ selection
onto the apprenticeship programme.
40.351 0.000
H011 The teamwork competence rating does not have a significant effect on the
applicants’ selection onto the apprenticeship programme.
H11 The teamwork competence rating has a significant effect on the applicants’
selection onto the apprenticeship programme.
116.316 0.000
234
In the previous section, a study done by Puchert et al. (2014) was discussed, which also
assessed five of the same technical aptitude sub-tests as this study. These were the Dexterity,
Coordination, Assembly, Spatial Perception 2-D and Spatial Perception 3-D sub-tests of the
TRAT battery. Once again a direct comparison is not possible (e.g., the Calculations sub-test
was not used in the automotive operator study) but it is noteworthy that there is a 10%
difference between the averages obtained by the two samples in these technical aptitude sub-
tests. That the apprenticeship sample had better ability in these aptitudes is to be expected given
their educational background and future career aspirations.
Hypothesis ten determined whether or not the ratings the applicants obtained for their
technical aptitude had a significant effect on their selection onto the apprenticeship programme.
The technical aptitude of the applicants was rated according to eight categories, ranging from
significantly below average to superior. The highest scoring category, namely, outstanding,
was not operationalised. The differences in survival rate showed a true variance across the
groups in the data. Table 7.4 indicates a key finding from this construct being the median ST
of the applicants progressively improving as their technical aptitude rating increased.
Furthermore, the Gehan-Wilcoxon value realised for the inferential analysis of this construct
was 40.351 (p = .000). Since the significance value of the test is less than 0.05, it is concluded
that the survival curves are different across the groups. A significant relationship was hence
established between the technical aptitude rating obtained by the applicants and their selection
onto the apprenticeship programme. The null hypothesis was therefore rejected on the basis of
there being a statistically significant (p = .000) relationship between the variables.
This is consistent with the findings of other researchers that discovered a predictive
relationship between technical aptitude ratings and employability. Bordelon and Kantor (1984)
also used two Co-ordination technical aptitude tests and were able to accurately predict
candidates that were successful as pilots, while Francis et al. (2001) and Gallagher et al. (2009)
used technically-oriented aptitude tests to differentiate between applicants applying for surgical
positions.
Thus far this section has analysed the results obtained for two of the three constructs
assessed in the third selection phase. In the final section the teamwork competence attained by
the sample is scrutinised.
235
7.5.3. Teamwork competence
The teamwork competence rating was based on the performance of the applicants on nine
competencies. In section 5.8.2.4 it was clarified that the Client requested the assessment of
these competencies as the lack thereof had been experienced in the intake of apprentices in
previous years. The Client clarified that successful applicants needed to enter the
apprenticeship programme with many of these competencies as the development thereof could
not be incorporated into the curriculum of the programme. For this reason, the constructs within
this third selection phase were prioritised with the teamwork competencies being the most
important, as discussed in section 5.9.3.3. The need for these employability competencies, such
as teamwork, interpersonal, thinking and problem solving skills, is a regular feature within
vocational training and employment literature (Brewer, 2013; De Guzman & Ok Choi, 2013;
Hauschildt, 2016; López-Cabrales et al., 2011).
However, the third central finding for the third selection phase depicted in Table 7.4, is
that only a minority (15.3%) scored at a competent and above level in these competencies. This
is similar to the findings of other researchers who concluded that vocational students may have
obtained technical competencies but they lack teamwork, communication and problem solving
skills required by industry. Several local studies have established that apprentices lack the
problem solving and thinking skills needed by industry (Hauschildt, 2016; Jacobs, 2015;
merSETA, 2016). Rahman et al. (2011) also established a lack of these two generic
competencies amongst technical students in Malaysia. Thinking skills, resource management
competence, as well as system and technology competence, were the least developed
employability competencies, according to another study on employability skills amongst
Malaysian technical-vocational students (Bakar & Hanafi, 2007). Information skills were the
least developed of seven employability competencies assessed amongst final year technical
students (Kazalin et al., 2009).
The median ST steadily increased as the teamwork competency level of the applicants
improved. However, the median ST of the development area rating category was minimally
higher than the competent rating category. Whilst this at face-value seems contradictory to the
stance of the Client regarding these teamwork competencies described in the previous
paragraph, only 28% of the candidates with teamwork competency at this rating level were
accepted onto the apprenticeship programme. This is in comparison to 33% of those with a
competent rating and 75% of the applicants that were rated as having above average teamwork
236
competencies. Applicants with developmental needs within their teamwork capabilities may
have been accepted onto the programme due to employment equity requirements and the
necessity for adequate consideration of internal applicants.
Hypothesis 11 tested whether the rating provided to applicants on their teamwork
competence had a significant effect on their selection onto the apprenticeship programme.
There were four rating categories, namely; significant development area, development area,
competent and above average area. The exceptional rating category was not employed in the
ratings provided to the applicants. The Gehan-Wilcoxon value obtained for this hypotheses is
116.316 (p = 0.000). Since the significance value was less than 0.05, it was concluded that the
association between the covariates and the ST was statistically significant. As indicated in
Table 7.5, the null hypothesis is therefore rejected and it is concluded that the teamwork
competence rating obtained by the applicants had a significant effect on their selection onto the
apprenticeship programme.
7.5.4. Recommendation status
As indicated in Table 7.4, a significant portion (63.4%) of the sample were terminated at
the third selection phase. Obtaining higher ratings in the general aptitude, technical aptitude
and teamwork assessments therefore improved the median ST of applicants across the selection
phases. Section 7.5.4 concludes the analysis of the findings derived from the third selection
phase. The next section progresses onto the fourth phase, which was the panel interview.
7.6. Phase four: Panel interviews
In this section the three main findings from the fourth selection phase are debated. Table
7.6 summarises the descriptive statistics from these three constructs and Table 7.7 provides a
summary of the findings from the inferential statistics.
7.6.1. Standard interview
The first core finding from this selection phase, as summarised in Table 7.6, was that less
than half (42.7%) of the applicants scored at a successful and above level. The questions posed
to the candidates clarified their competence in initiative, problem solving, planning and
organising, quality orientation and teamwork. Overall, therefore, the applicants lacked the level
of employability competencies as defined by several authors in section 4.2 (Askov & Gordon,
1999; Fugate et al., 2004; Rasul et al., 2013; Wesselink et al., 2009).
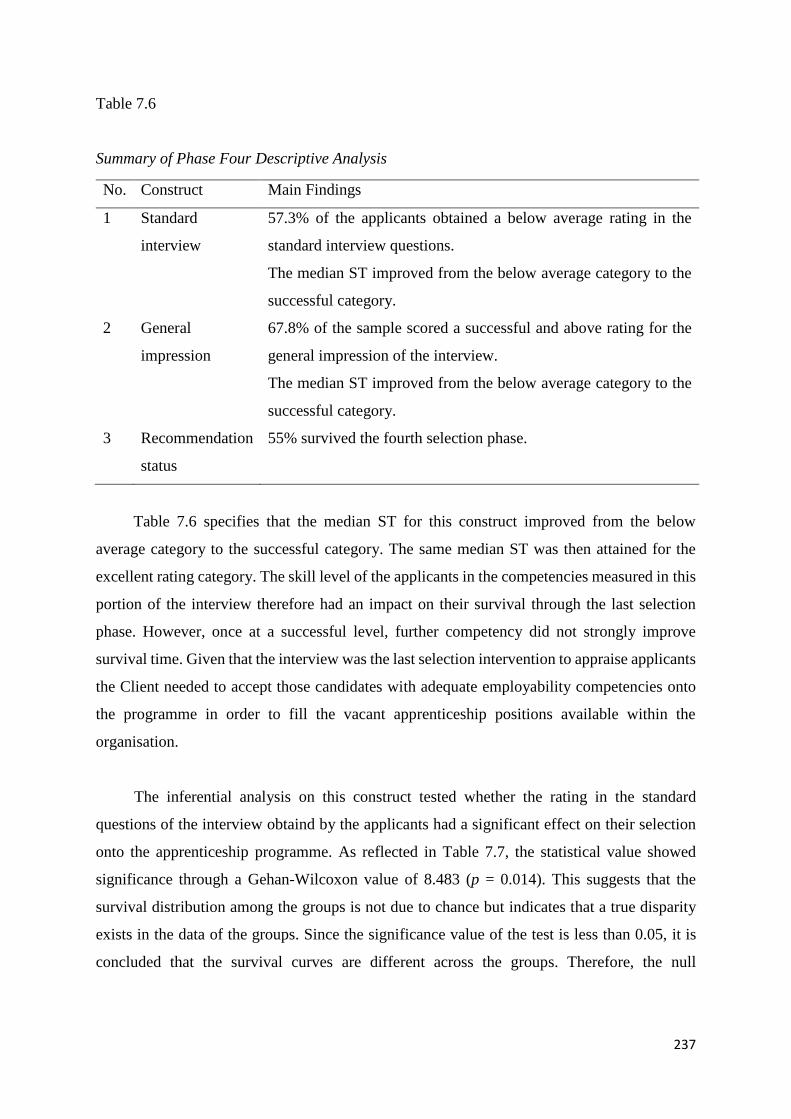
237
Table 7.6
Summary of Phase Four Descriptive Analysis
No. Construct Main Findings
1 Standard
interview
57.3% of the applicants obtained a below average rating in the
standard interview questions.
The median ST improved from the below average category to the
successful category.
2 General
impression
67.8% of the sample scored a successful and above rating for the
general impression of the interview.
The median ST improved from the below average category to the
successful category.
3 Recommendation
status
55% survived the fourth selection phase.
Table 7.6 specifies that the median ST for this construct improved from the below
average category to the successful category. The same median ST was then attained for the
excellent rating category. The skill level of the applicants in the competencies measured in this
portion of the interview therefore had an impact on their survival through the last selection
phase. However, once at a successful level, further competency did not strongly improve
survival time. Given that the interview was the last selection intervention to appraise applicants
the Client needed to accept those candidates with adequate employability competencies onto
the programme in order to fill the vacant apprenticeship positions available within the
organisation.
The inferential analysis on this construct tested whether the rating in the standard
questions of the interview obtaind by the applicants had a significant effect on their selection
onto the apprenticeship programme. As reflected in Table 7.7, the statistical value showed
significance through a Gehan-Wilcoxon value of 8.483 (p = 0.014). This suggests that the
survival distribution among the groups is not due to chance but indicates that a true disparity
exists in the data of the groups. Since the significance value of the test is less than 0.05, it is
concluded that the survival curves are different across the groups. Therefore, the null
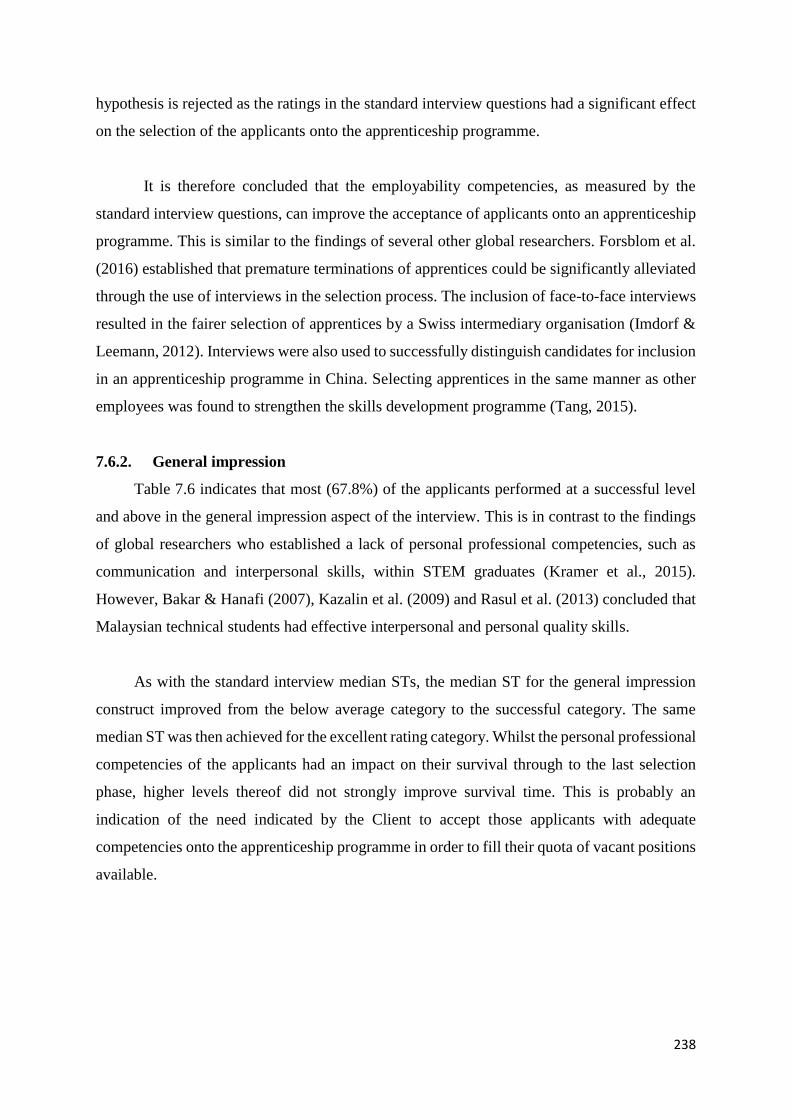
238
hypothesis is rejected as the ratings in the standard interview questions had a significant effect
on the selection of the applicants onto the apprenticeship programme.
It is therefore concluded that the employability competencies, as measured by the
standard interview questions, can improve the acceptance of applicants onto an apprenticeship
programme. This is similar to the findings of several other global researchers. Forsblom et al.
(2016) established that premature terminations of apprentices could be significantly alleviated
through the use of interviews in the selection process. The inclusion of face-to-face interviews
resulted in the fairer selection of apprentices by a Swiss intermediary organisation (Imdorf &
Leemann, 2012). Interviews were also used to successfully distinguish candidates for inclusion
in an apprenticeship programme in China. Selecting apprentices in the same manner as other
employees was found to strengthen the skills development programme (Tang, 2015).
7.6.2. General impression
Table 7.6 indicates that most (67.8%) of the applicants performed at a successful level
and above in the general impression aspect of the interview. This is in contrast to the findings
of global researchers who established a lack of personal professional competencies, such as
communication and interpersonal skills, within STEM graduates (Kramer et al., 2015).
However, Bakar & Hanafi (2007), Kazalin et al. (2009) and Rasul et al. (2013) concluded that
Malaysian technical students had effective interpersonal and personal quality skills.
As with the standard interview median STs, the median ST for the general impression
construct improved from the below average category to the successful category. The same
median ST was then achieved for the excellent rating category. Whilst the personal professional
competencies of the applicants had an impact on their survival through to the last selection
phase, higher levels thereof did not strongly improve survival time. This is probably an
indication of the need indicated by the Client to accept those applicants with adequate
competencies onto the apprenticeship programme in order to fill their quota of vacant positions
available.
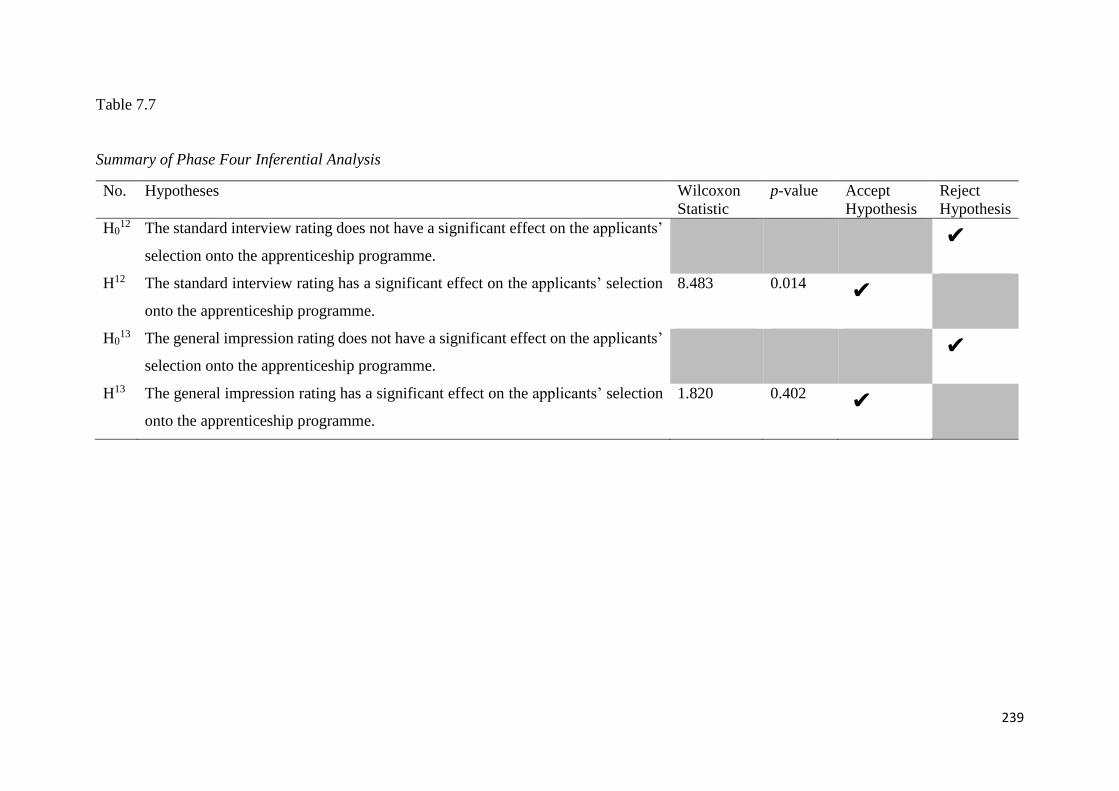
239
Table 7.7
Summary of Phase Four Inferential Analysis
No. Hypotheses Wilcoxon
Statistic
p-value Accept
Hypothesis
Reject
Hypothesis
H012 The standard interview rating does not have a significant effect on the applicants’
selection onto the apprenticeship programme.
H12 The standard interview rating has a significant effect on the applicants’ selection
onto the apprenticeship programme.
8.483 0.014
H013 The general impression rating does not have a significant effect on the applicants’
selection onto the apprenticeship programme.
H13 The general impression rating has a significant effect on the applicants’ selection
onto the apprenticeship programme.
1.820 0.402
240
The inferential analysis on this construct sought to establish whether the rating for the
general impression aspect of the interview had a significant effect on the selection of the
applicants onto the apprenticeship programme. The overall comparison across the general
impression rating categories represents a statistical significant result, with a 0.402 p-value and
a 1.820 Gehan-Wilcoxon statistical value. It can therefore be concluded that the performance
of the applicants in the general impression part of the interview had a significant effect on their
selection onto the apprenticeship programme. As summarised in Table 7.7 the null hypothesis
is rejected since the p-value is less than 0.05.
It is therefore concluded that better employability competencies, as measured by the
general impression attributes, can improve the acceptance of applicants onto an apprenticeship
programme. International researchers (Forsblom et al., 2016; Imdorf & Leemann, 2012; Tang,
2015) have indicated that the use of interviews are helpful in screening apprenticeship
applicants, as outlined in section 7.6.1. However, there is no similar research in SA.
7.6.3. Recommendation status
Table 7.6 highlights that the majority (55%) of the applicants survived the fourth
selection phase. The applicants that performed better in the standard interview and general
impression aspect of the interview survived more selection phases. This is consistent with other
research concluding the success of the interview technique in assessing the latent competencies
of applicants (Branine, 2008; Fernández-Aráoz, 2014; Huffcutt et al., 2001). Interview
performance has been confirmed as a reliable indicator or predictor of on-the-job functioning
(Schmidt et al., 2016; Schmidt & Zimmerman, 2004). Interviews are widely used as a selection
technique within the manufacturing sector (Giffi et al., 2015) and within the selection of
apprentices (e.g., Goastellec & Ruiz, 2015; Grosvenor, 2016; NAS, 2017; Torpey, 2013).
However, there are only two global studies that provide conclusive evidence of the predictive
value of interviews in apprentice selection. Both Forsblom et al. (2016) and Tang (2015)
established that the use of job interviews reduced the number of premature terminations by
apprentices within the companies surveyed.
This discussion on the survival rate outcomes obtained within the fourth selection
concludes section 7.6. In the next section the outcomes from the trade test results are analysed.
241
7.7. Phase five: Trade test results
Most (98.7%) of the 77 applicants were successful in the fifth selection phase with most
(49.4%) passing the trade test after the second attempt. This trade test pass rate (98.7%) far
exceeds the national baseline pass rate of 45% (Government Gazette, 2015a) and the average
attained within the manufacturing industry of 68% (merSETA, 2016). It also exceeds the 2020
improvement target of a 65% pass rate (Government Gazette, 2015a). The pass rate attained in
this study is especially commendable given that 42.9% passed at first attempt and 49.4%
following their second attempt. This lends support to the contention that a structured
apprenticeship development system will improve the pass rate of apprentices at the first sitting
(Mahembe, 2012). The positive impact of this selection intervention could only be established
at the end of the apprenticeship programme. This highlights the importance of using data that
follows workers for a lengthy time period after an intervention (Corseuil et al., 2012).
The demographic profile findings, the results from each of the five selection phases as
well as the nineteen constructs extracted from these phases have been debated in sections 7.2
to 7.7. The next section examines the overall results stemming from this analysis, specifically
pertaining to the evaluation of the selection process employed.
7.8. Overall results
The findings for hypotheses one through to 13 show that a higher level of each covariate
was associated with longer ST. Lower levels of each covariate resulted in a higher probability
density value and hence a higher probability of termination in any selection phase. The
significance of the Gehan-Wilcoxon statistic attained for each hypothesis suggested that the
survival distribution among the groups was not due to chance but rather represented a true
difference that existed in the data. The null hypotheses for each of the 13 variables were
therefore rejected.
In section 1.6 evaluation was defined as the establishment of the value and quality of
something. The selection process evaluated in this study is concluded to be valuable. The
termination rate of the applicants was steady across the four phases. More than half of the
submitted applicants were terminated at phase one. The highest termination rate (71.7%) was
at the second phase. At this phase the secondary screening of the CVs was done and the
applicants’ submitted documentation was screened on eight criteria. The null hypotheses for
each of the eight constructs investigated within this phase were rejected indicating that the
242
variable under investigation did have a significant effect on the selection success of the
applicants onto the apprenticeship programme. The early detection in a selection process of
applicants that have the required attributes needed, allows the organisation to focus on the best
candidates to fill the vacancy (Grosvenor, 2017). This was facilitated in a creditable manner by
the Client. With a significant portion of the applicant pool already being terminated, the Client
was able to invest in the costlier and time consuming psychological assessments in the third
phase and interviews in the fourth phase.
Only 2% of the applicants in the study were successful in their application and accepted
onto the apprenticeship programme. This is less than the 3.7% success rate within German
apprenticeship programmes (Jacoby, 2014). Given that this country’s vocational training
system is regarded as the benchmark (Fazio et al., 2016; G20ewg, 2012; Kahlen, 2016; OECD,
2011; Smith & Kemmis, 2013), this statistic reveals that the selection process used by the Client
is a rigorous one.
The selection process investigated in this study can also be concluded to be of a high
quality. One of the evaluation methods discussed in section 5.10, proposed by Rossi et al.
(2004), is the assessment of programme outcome or impact. Rusek and Rist (2004) suggest the
use of baseline indicators as a representation of outcomes or impact. An example of a baseline
indicator within the apprenticeship context is the use of pass rates. The merit of any
apprenticeship programme can then potentially be judged based on a comparison of their
respective pass rates. Section 7.7 successfully drew this comparison.
7.9. Summary
Chapter Six presented the findings from the descriptive and inferential statistical analyses
of the study. Chapter Seven discussed these findings in relation to industry reports and other
empirical studies. These two chapters therefore conclude step eight of the research process
provided in Chapter Five. In Chapter Eight a summary of the literature review, objectives of
the study and methodology employed is provided. A summary of the main findings of this
study are provided along with the conclusions derived from the secondary and primary
objectives. Recommendations are offered to the five sets of stakeholders as well as those
pertaining to possible future research. The contribution and limitations are also outlined.
243
17 CHAPTER EIGHT
18 SUMMARY, CONCLUSIONS AND RECOMMENDATIONS
8.1. Introduction
Chapters Six and Seven presented and discussed the empirical findings of the study. The
descriptive and inferential statistics for the 13 hypotheses were analysed and interpreted.
Chapter Eight fulfils the requirements of the ninth step of the research process followed in this
study. The first section provides a summary of the linkages between the objectives, hypotheses,
selection phases, findings, conclusions and recommendations realised in this study. Thereafter,
an overview of the study is provided in section 8.2. Pertinent aspects from the literature review
are offered, the objectives of the study are recapitulated and a summary of the research
methodology is provided. The conclusions and recommendations stemming from the
secondary and primary objectives are then provided in sections 8.3 through to 8.5.
Subsequently, the contributions and limitations of the study are discussed with the final section
proposing suggestions for future research.
Table 8.1 builds on Table 7.1 provided in Chapter Seven through the addition of the last
column on the table. This column summarises how the conclusions and recommendations
documented in this chapter are linked to the four secondary objectives as well as the primary
objective, through the hypotheses and selection phases.
The second selection phase pertains to hypotheses one to eight. The conclusions derived
from secondary objective one, discussed in section 8.3.1, relate to hypotheses one to three. As
discussed in section 7.4, the type of secondary education as well as the Grade 12 mathematics
and science performance level attained by the applicants had a significant effect on their
selection onto the apprenticeship programme. Five recommendations are derived from these
findings, as summarised in Table 8.1. These pertain to the use of standardised application
documents, the use of on-line technology, advisable subject pass rates as well as the provision
of career guidance and job application preparation workshops. These recommendations are
clarified in sections 8.5.2.2 through to 8.5.2.4, which are three of the recommendations made
to the HRM field. The recommendation pertaining to the provision of career guidance is
discussed in section 8.5.3.3, which is within the section outlining the recommendations to the
automotive industry. The fifth recommendation is suggested to educational providers in section
8.5.4.
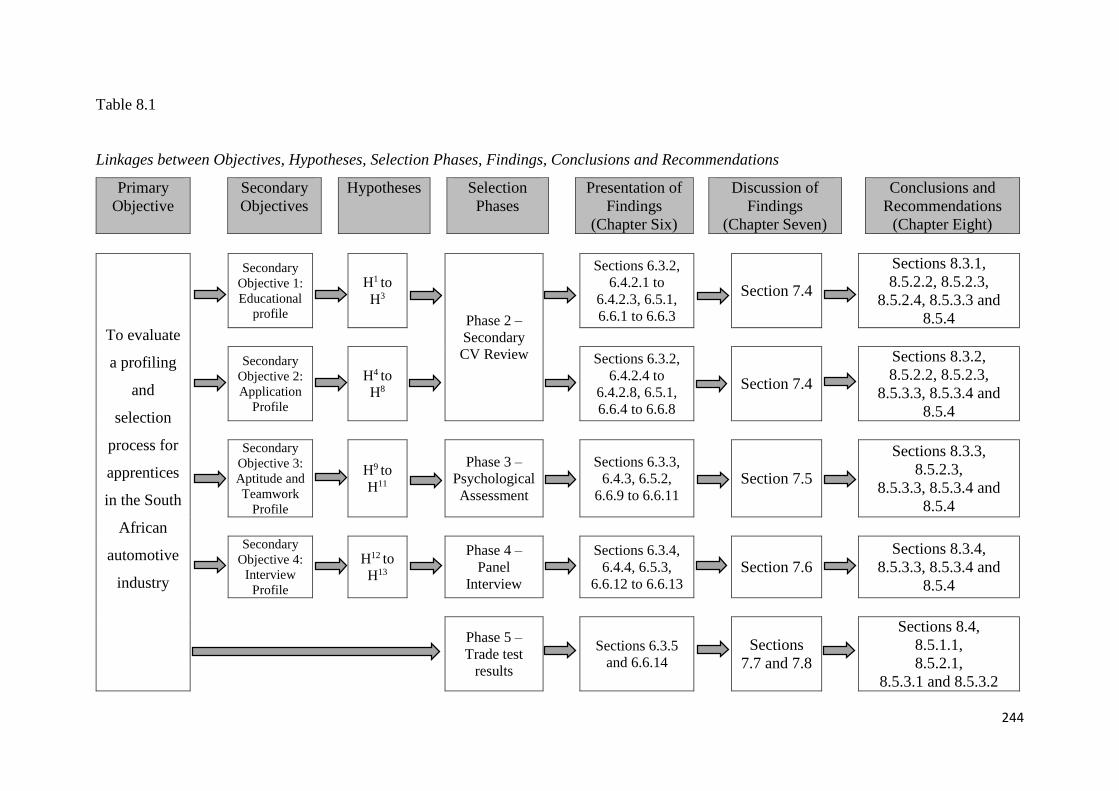
244
Table 8.1
Linkages between Objectives, Hypotheses, Selection Phases, Findings, Conclusions and Recommendations
Primary
Objective
Secondary
Objectives
Hypotheses Selection
Phases
Presentation of
Findings
(Chapter Six)
Discussion of
Findings
(Chapter Seven)
Conclusions and
Recommendations
(Chapter Eight)
To evaluate
a profiling
and
selection
process for
apprentices
in the South
African
automotive
industry
Secondary
Objective 1:
Educational
profile
H1 to
H3
Phase 2 –
Secondary
CV Review
Sections 6.3.2,
6.4.2.1 to
6.4.2.3, 6.5.1,
6.6.1 to 6.6.3
Section 7.4
Sections 8.3.1,
8.5.2.2, 8.5.2.3,
8.5.2.4, 8.5.3.3 and
8.5.4
Secondary
Objective 2:
Application
Profile
H4 to
H8
Sections 6.3.2,
6.4.2.4 to
6.4.2.8, 6.5.1,
6.6.4 to 6.6.8
Section 7.4
Sections 8.3.2,
8.5.2.2, 8.5.2.3,
8.5.3.3, 8.5.3.4 and
8.5.4
Secondary
Objective 3:
Aptitude and
Teamwork
Profile
H9 to
H11
Phase 3 –
Psychological
Assessment
Sections 6.3.3,
6.4.3, 6.5.2,
6.6.9 to 6.6.11
Section 7.5
Sections 8.3.3,
8.5.2.3,
8.5.3.3, 8.5.3.4 and
8.5.4
Secondary
Objective 4:
Interview
Profile
H12 to
H13
Phase 4 –
Panel
Interview
Sections 6.3.4,
6.4.4, 6.5.3,
6.6.12 to 6.6.13
Section 7.6
Sections 8.3.4,
8.5.3.3, 8.5.3.4 and
8.5.4
Phase 5 –
Trade test
results
Sections 6.3.5
and 6.6.14
Sections
7.7 and 7.8
Sections 8.4,
8.5.1.1,
8.5.2.1,
8.5.3.1 and 8.5.3.2
245
Hypotheses four to eight, also linked to the second selection phase, relate to the second
secondary objective. The results from these hypotheses were discussed in section 7.4. The null
hypotheses pertaining to each of the five constructs investigated were rejected. The
motivational letter, CV, experience, qualification and leadership potential ratings had a
significant effect on the selection of the applicants onto the apprenticeship programme. From
these findings four recommendations are made. The first is the use of standardised application
documentation, secondly, the use of on-line technology, thirdly, the provision of career
guidance workshops and fourthly, the delivery of job application preparation workshops. These
are four of the same recommendations mentioned in the previous paragraph.
There are three hypotheses, namely, hypotheses nine to 11, associated with the third
secondary objective and the third selection phase. Section 7.5 gives an account of these
findings. The general aptitude, technical aptitude and teamwork competence ratings had a
significant effect on the selection of the applicants onto the apprenticeship programme. The
null hypotheses were therefore rejected. Three recommendations stemmed from these findings,
namely, the implementation of career guidance, standardisation exercises and job application
preparation workshops, outlined in sections 8.5.3.3, 8.5.3.4 and 8.5.4 respectively.
Secondary objective four is concerned with the results from the fourth selection phase
and hypotheses 12 and 13. The results of these two hypotheses were discussed in section 7.6.
The null hypotheses of both were rejected as the standard interview and general impression
ratings had a significant effect on the selection of the applicants onto the apprenticeship
programme. From these findings three recommendations are made. As with the third secondary
objective, these were executing career guidance, standardisation exercises and job application
preparation workshops.
From the fifth selection phase, it was clarified that the vast majority (98.7%) of the
apprentices selected onto the apprenticeship programme passed the trade test. This finding was
clarified in section 7.7. Whilst not directly related to any of the hypotheses or secondary
objectives, this finding has bearing on the primary objective of the study. Furthermore, the
overall results attained within this study were discussed in section 7.8. Four recommendations
are derived from these findings. The first recommendation, made to the local government,
pertains to the completion of the national selection tool, discussed in section 8.5.1. The second
recommendation is made to the HRM field, in section 8.5.2.1, relating to the use of a multi-
246
hurdle selection process. The third and fourth recommendations are discussed in sections
8.5.3.1 and 8.5.3.2 and are concerned with the replication of the selection process and the
marketing of the apprentice position.
The eleventh, and final, recommendation derived from this study was made to the TRAT
test developer. This recommendation, documented in section 8.5.5, does not pertain to either
the primary or secondary objectives of the study. However, before discussing these conclusions
and recommendations in detail, a brief overview of the study is necessary.
8.2. Overview of the study
In this overview, the key considerations from the literature are provided, followed by a
reiteration of the objectives of the study. In the last section a précis of the research methodology
is presented.
8.2.1. Literature overview
The automotive industry is the largest manufacturing sub-sector within SA (De Lange,
2017) and is regarded as a mature industry (Bandyopadhyay, 2010). The industry contributes
approximately 7.4% to the national GDP, has over 110 000 direct employees and a high portion
of its production is exported (AIEC, 2017; ASCCI, 2018; Vermeulen, 2018). The automotive
industry is also highly competitive. World-class management techniques, such as just-in-time
production, total quality management and continuous improvement, are prevalent across the
industry (Naude, 2009; Shatouri et al., 2012).
The national automotive industry is under pressure given key international trends
impacting the sector. Higher volumes of units per model are expected to be produced,
specifically for export markets, whilst simultaneously cutting costs and improving quality
(DTI, 2015; Naude, 2013; Van Zyl, 2015). Upgrading of the infrastructure and technology
within the South African automotive industry has therefore been necessary (AEIC, 2017).
However, local automotive production still needs to radically improve if the industry is to
survive long-term. The challenge is for national automakers to firmly establish themselves
within the global supply chain (ASCCI, 2018; Naude, 2013).
In order to enable this, the automotive industry requires an efficient source of technical
competencies, specifically at the technician and artisan levels (Brown, 2013; Nzimande &
247
Patel, 2012; Reddy et al., 2016). However, the number of artisans being produced in the country
is decreasing by approximately 0.7% per year (Vass & Raidani, 2016). Technicians and artisans
are two of the scarce and critical skills both globally (ManpowerGroup, 2016) and nationally
(Government Gazette, 2014a, 2014b, 2018). Specifically, toolmakers, electricians, millwrights,
automotive electricians as well as fitters and turners, are regarded as critical skills shortage
areas within the manufacturing sector (Mummenthey et al., 2012; Wildschut et al., 2013).
According to the human capital theory, the underpinning theoretical framework of the
study, both general and firm-specific human capital can be used to improve the financial and
operational performance of firms (Becker, 1962; Ployhart & Moliterno, 2011; Wright et al.,
1994). However, the potential of high quality firm-specific human capital to become an
organisation’s competitive advantage can be operationalised through HR practices, such as
selection and training (Wright et al., 1994). The human capital theory has thus informed this
study with regard to the manner in which the artisan job family, a vital portion of the automotive
industry’s labour force, should be managed with regard to recruitment and selection.
While there is some, mostly outdated, international research on the broad practices
employed in the selection of apprentices and artisans, there is limited similar national research
(Forsblom et al., 2016; Horn, 2016; Imdorf & Leeman, 2012). This is despite the conclusion
drawn that recruitment and selection is the second highest immediate need to improve the pass
rate and quality of artisans in the country (Government Gazette, 2015a). Furthermore, there is
minimal national and international research on the profile of a successful artisan applicant.
There is, therefore, the need for specific research on the profiling and selection of apprentices
in the automobile industry in SA.
8.2.2. Objectives of the study
The primary objective of this study was to evaluate a profiling and selection process for
apprentices in the South African automotive industry. Following on from this, there were four
secondary objectives and 13 hypotheses stemmed from these objectives.
The four secondary objectives of this study were:
a) To assess the contribution of the educational profile on apprenticeship programme
selection
b) To appraise the value of the generic application profile on apprenticeship programme
selection
248
c) To evaluate the influence of aptitude and teamwork profile on apprenticeship programme
selection
d) To assess the impact of interview profile on apprenticeship programme selection.
Prior to discussing the findings from these objectives and their associated hypotheses, a
précis of the research methodology followed in the study is provided in the next section.
8.2.3. Summary of the methodology
As was illustrated in Figure 5.1, the research methodology of the study followed a 10-
step research process. The initial two steps of the process culminated in the refinement of the
research problem and identification of an appropriate research paradigm. The philosophical
positioning of a study can have a significant impact on a study in terms of choices and decisions
made. Research paradigms frame the beliefs, inferences and practices of researchers and can
inform the way they view the nature of knowledge (Johnson & Christensen, 2014). This study
was positioned at the third stage on the continuum of core ontological assumptions between
the two core poles of positivism and interpretivism presented in Figure 5.2. This positioning
accepts reality as a contextual field of information (Collis & Hussey, 2014). In line with this
philosophy and the objectives of the study, a quantitative research approach was adopted for
this study, employing longitudinal data.
The research process included both primary and secondary data stages. These were steps
six and seven of the research process. In the primary data stage, the author was contracted as a
HR consultant to assist in the design and implementation of an annual selection process for
apprentices in a South African automotive firm, called the Client. The primary data stage
employed a non-probability convenience sampling technique of applicants for the automotive
electrical and millwright apprenticeship trainee positions at the Client. The primary sampling
frame was hence all the applicants applying for these two positions during the 2012 to 2014
intake years. Six structured instruments, documented in Table 5.3, were designed and/or chosen
to be employed in the five selection phases of the study. Following a pilot study, conducted
during the 2012 intake year, primary data collection commenced. The author and the senior
instructors at the Client fulfilled the primary data collection during the three intake years. The
data from phases one through four was processed in the year prior to the apprenticeship intake
with the data from phase five being processed at apprenticeship programme completion,
usually four years later.
249
The primary data, collected for a specific purpose by the Client, was readily available to
the author to use for secondary research purposes. The same sampling plan used in the primary
data stage was employed, with the secondary data stage of the study taking place during the
first five months of 2018. From the large amount of information available, 19 constructs from
the five selection phases were selected, extracted and prepared for secondary data analysis
purposes. The operationalisation of these 19 constructs was discussed in section 5.9.3.
The data analysis strategy incorporated both descriptive and inferential statistics.
Frequency distribution tables were used to indicate the demographic details of the applicants
as well as indicate the distributions of the groups on nine particular aspects of their applications,
across the five selection phases. Cross-tabulations were used to depict the transitions across
these five selection phases and medians were used to summarise the STs of the applicants
across the 13 variables of the study. The survival analysis procedure was used to analyse the
progression of the applicants through the five phases and the 13 hazards of the selection
process. The Gehan-Wilcoxon proportional hazards statistical tool facilitated an understanding
of the applicant termination rate per selection phase and provided an indication of the survival
probability per variable and phase under investigation. This facilitated the analysis of the 13
hypotheses described in Chapter Six and further interpreted in Chapter Seven. These latter two
chapters fulfilled step eight of the research process documented in Chapter Five. From this
analysis, the central findings of the study and the the conclusions of the study could be
extrapolated.
8.3. Conclusions derived from the secondary objectives
This section is comprised of four sections with each section discussing the conclusions
derived from one of the four secondary objectives.
8.3.1. Secondary objective one: Educational profile
The first secondary objective of the study aimed to assess the contribution of the
educational profile of the applicants on apprenticeship programme selection. The findings from
hypotheses one to three led to the generation of three conclusions considered in the sections
that follow.
250
8.3.1.1. Conclusion one: Type of secondary education
There were almost double the number of applicants with a non-technical type of
secondary education in comparison to those with a technical type. However, the median ST of
the applicants with a technical type secondary education was larger than that for the applicants
with a non-technical type of secondary education. The cumulative proportion of applicants
surviving each selection phase, except in the second phase, was higher for the applicants with
a technical type secondary education. Furthermore, there were more applicants with a technical
type secondary education that survived the entire selection process and became apprentices.
Therefore, the first conclusion drawn from this study was that a technical type secondary
education positively influenced the likelihood of applicants being selected onto the
apprenticeship programme.
8.3.1.2. Conclusion two: Mathematics performance
The largest frequency of applicants obtained a score between 40 to 59% for mathematics.
In terms of the median ST across the selection phases, the higher the percentage obtained for
this subject the longer the applicants survived the selection process. Applicants scoring in the
two highest percentage categories for this subject had higher cumulative proportions surviving
at the end of each selection phase. Therefore, it can be concluded that higher marks in the
mathematics subject engenders a stronger possibility of being selected onto an apprenticeship
programme.
8.3.1.3. Conclusion three: Science performance
As with mathematics, the largest frequency of applicants scored between 40 to 59% for
science and the median ST of applicants improved as their performance in the subject
improved. Applicants scoring 60% and above had more than double the cumulative proportion
surviving post the third selection phase, in comparison to the 40 to 59% category. This
proportion again further doubled if the applicants scored 80% and above. Hence the third
conclusion extracted from this study was that applicants with higher performance in science
are more reliably able to be successful in selection as apprentices.
8.3.2. Secondary objective two: Application profile
The second secondary objective aimed to appraise the value of the application profile on
apprenticeship programme selection. This objective related to the results of the fourth through
to the eighth hypotheses. Five conclusions were drawn from these findings.
251
8.3.2.1. Conclusion four: Motivational letter
The majority of the applicants submitted motivational letters that were assessed as being
acceptable. The median ST of the applicants steadily increased as the rating of the quality of
their motivational letters improved. The cumulative proportion of applicants surviving through
the selection phases was the highest for the applicants with excellent and outstanding ratings.
In comparison, those with motivational letters rated in the lower two categories had a larger
number being terminated at each selection phase. The fourth conclusion derived from these
findings was that higher ratings of motivational letters results in better survival opportunities
across the selection phases.
8.3.2.2. Conclusion five: Curriculum vitae
Applicants, on average, submitted better quality CVs than motivational letters. The
median ST of the applicants through the selection phases increased according to the rating
attained for the quality of their CV. More applicants with lower ratings were terminated in the
early selection phases than those with higher ratings for their CVs. A higher cumulative
proportion of applicants with better ratings survived into the third and fourth selection phases.
It was therefore concluded that a good quality CV improved the likelihood of applicants’
selection onto the apprenticeship programme.
8.3.2.3. Conclusion six: Practical experience
The majority of the applicants had some practical experience although not regarded as
substantial and/or relevant. Nevertheless, this rating improved their median survival rate in
comparison to those rated with no experience. Those that were rated as having credible
experience attained the longest median ST. The cumulative proportion of applicants surviving
through the selection phases, therefore, was the highest for those with the latter rating. In
comparison, those with no experience or with experience regarded as not substantial and/or
relevant had a larger proportion being terminated at each selection phase. The conclusion
derived from this was that the higher the rating of applicants’ experience the better their
chances of survival across the selection phases.
8.3.2.4. Conclusion seven: Qualification
Only a small percentage of the applicant pool had studied after secondary education in a
field consistent with the apprenticeship type selected in their application, despite having the
time available to do so. However, the median ST of applicants steadily increased with an
252
improved rating in their level of qualification. Applicants rated as having consistent
qualifications in line with the selected apprenticeship type had the highest cumulative
proportion of applicants surviving through the selection phases. Those currently in matric had
the second highest cumulative proportion of applicants surviving through the selection phases.
The deduction drawn for these results was that consistent development in the area of interest
can result in effectual outcomes in the selection of applicants onto an apprenticeship
programme.
8.3.2.5. Conclusion seven: Leadership potential
Most of the applicants did not obtain a good rating with regard to their leadership
potential. However, those that received an average rating in this criteria had the highest median
ST. As a result, those rated with average leadership potential had the highest cumulative
proportion of applicants surviving through the selection phases. This was higher than those
rated as having above average potential. Whilst having a fairly large proportion surviving phase
two, those with an above average leadership potential rating did not fare as well as the average
rating category applicants in the third and fourth selection phases. Those with above average
leadership potential did not survive as long as those with average potential. This could be due
to the perception that those with above average potential may not remain within the
apprenticeship programme and/or as an artisan but may be more interested in progressing into
a managerial position or starting their own trade business in the future. It was, nevertheless,
concluded that the leadership potential rating obtained by applicants is an important criterion
to be considered in the selection of apprentices.
8.3.3. Secondary objective three: Aptitude and teamwork profile
The third secondary objective sought to evaluate the influence of aptitude and teamwork
competence on apprenticeship programme selection. The findings from hypotheses nine
through to 11 led to the generation of three conclusions that are clarified in the sections that
follow.
8.3.3.1. Conclusion nine: General aptitude
Most (86.9%) applicants obtained an average and above rating for their general aptitude.
Of the 54 applicants that scored below this rating level only one was selected onto the
apprenticeship programme. The median ST of the applicants through the selection phases
253
steadily increased according to their aptitude rating attained. More applicants with lower
ratings were terminated in the early selection phases than those with higher general aptitude
ratings. A higher cumulative proportion of applicants with better ratings survived into the third
and fourth selection phases. These findings show that a higher level of this covariate was
associated with longer ST. It was therefore concluded that average and above average general
aptitude improved the likelihood of selection onto the apprenticeship programme.
8.3.3.2. Conclusion ten: Technical aptitude
The majority (78.4%) of the applicants had technical aptitude rated as average and above.
Of those that obtained ratings below this level, only eight that scored low average were
accepted onto the apprenticeship programme. The rating obtained in these aptitudes therefore
improved the applicants’ median survival rate through the selection phases. The median ST
steadily improved as the technical aptitude rating increased. A larger proportion of applicants
with higher technical aptitude ratings survived through the selection phases. The conclusion
derived from this was that average and above ratings for the technical aptitudes resulted in a
better chance of survival across the selection phases and hence acceptance onto the
apprenticeship programme.
8.3.3.3. Conclusion eleven: Teamwork competence
The largest frequency of applicants obtained ratings within the significant development
area and development area categories. The development skill area had the highest median ST
across the selection phases. However, the competence and above average skill area categories
had higher median ST than the significant development area category. Therefore, it was
concluded that better teamwork competencies enhanced the possibility of being selected onto
the apprenticeship programme.
8.3.4. Secondary objective four: Interview profile
The fourth secondary objective aimed to assess the impact of interview competence on
apprenticeship programme selection. Table 8.1 reflected that the results from the assessment
of hypotheses 12 and 13 pertained to this secondary objective. The findings from these two
hypotheses led to the generation of two conclusions.
254
8.3.4.1. Conclusion twelve: Standard interview
The majority (57.3%) of the 143 applicants that were interviewed obtained below average
ratings in the standard interview questions. Five of the seven questions posed to the applicants
assessed the Initiative, Problem-solving, Motivational Fit, Teamwork and Planning and
Organising dimensions. Therefore, this further collaborates the finding for hypothesis 11 and
the eleventh conclusion drawn in this chapter. The applicants within the below average rating
category had the lowest median ST and the highest proportion of terminal events. It was
therefore concluded that better performance, as measured by the standard interview questions,
improved the acceptance of applicants onto the apprenticeship programme.
8.3.4.2. Conclusion thirteen: General impression
A third of the applicants were rated as below average in the general impression element
of the interview. All five of the dimensions assessed in the general impression aspect of the
interview were related to employability competencies. Furthermore, as with the ratings for the
standard interview questions, applicants within the below average rating category had the
lowest median ST and the highest proportion being terminated at phase four. More applicants
from the successful and excellent rating categories were accepted onto the apprenticeship
programme. From this it was concluded that enhanced general impression ratings improved the
likelihood of being selected onto the apprenticeship programme.
8.4. Conclusions derived from the primary research objective
The primary objective of this study was to evaluate a profiling and selection process for
apprentices in the South African automotive industry. This objective relates to the 13
hypotheses and the results obtained from each phase in the selection process. As discussed in
the previous sections, the null hypotheses of these 13 hypotheses were rejected as the constructs
investigated did have a significant effect on the selection of the applicants onto the
apprenticeship programme. Candidates who were assessed as having a better rating on each of
the 13 constructs survived longer in the selection process and were more likely to be successful
in their application to be apprentices.
From these overall findings, the evaluation of the selection process was concluded to be
rigorous, valuable and of high quality. The termination rate across the selection phases was
steady and the process provided for early detection of the applicants who did not possess the
required attributes. The ultimate goal of the apprenticeship programme is the demonstration of
255
competence in the trade test. The pass rates achieved by the apprentices in this study far
exceeded those attained in other national apprenticeship programmes.
8.5. Recommendations stemming from the objectives
In section 8.5, each sub-section provides recommendations for a particular stakeholder.
The section commences with a recommendation offered to the national government.
Thereafter, four recommendations pertaining to the broad field of HRM are provided, with
section 8.5.3 outlining another four suggestions to the automobile industry. Section 8.5.4
provides a proposal to educational providers of apprenticeship programmes and section 8.5.5
makes a recommendation to one of the test developers.
8.5.1. Recommendation to the South African government
One recommendation suggested to the national government is with regards to their
announcement of a pending national selection tool for apprentices. As illustrated in Table 8.2,
this recommendation was derived from the primary objective of the study.
8.5.1.1. Recommendation one: Confirm national selection tool
The literature review in section 3.3 highlighted that Germany focuses on the recruitment
and selection phase of the apprenticeship life cycle (Fazio et al., 2016; Jacoby, 2014; Kahlen,
2016). The other three countries, as well as SA, reviewed in this study do not adopt this focus
in their apprenticeship systems, despite their stating they were revitalising the apprenticeship
systems in their countries. This difference in focus may be one of the key contributing factors
for the outstanding success of the German apprenticeship system and a reason for its
benchmark status (Grosvenor, 2016).
It is recommended that the national government follow-up on its suggestion that a
recruitment and selection tool be designed to facilitate the effective entry of applicants onto
apprenticeship programmes (Government Gazette, 2015a). A call was made to collaborate with
employers and establish the strengths and weaknesses of current selection methods in order for
the best practices to be incorporated by other employers in their selection policies.
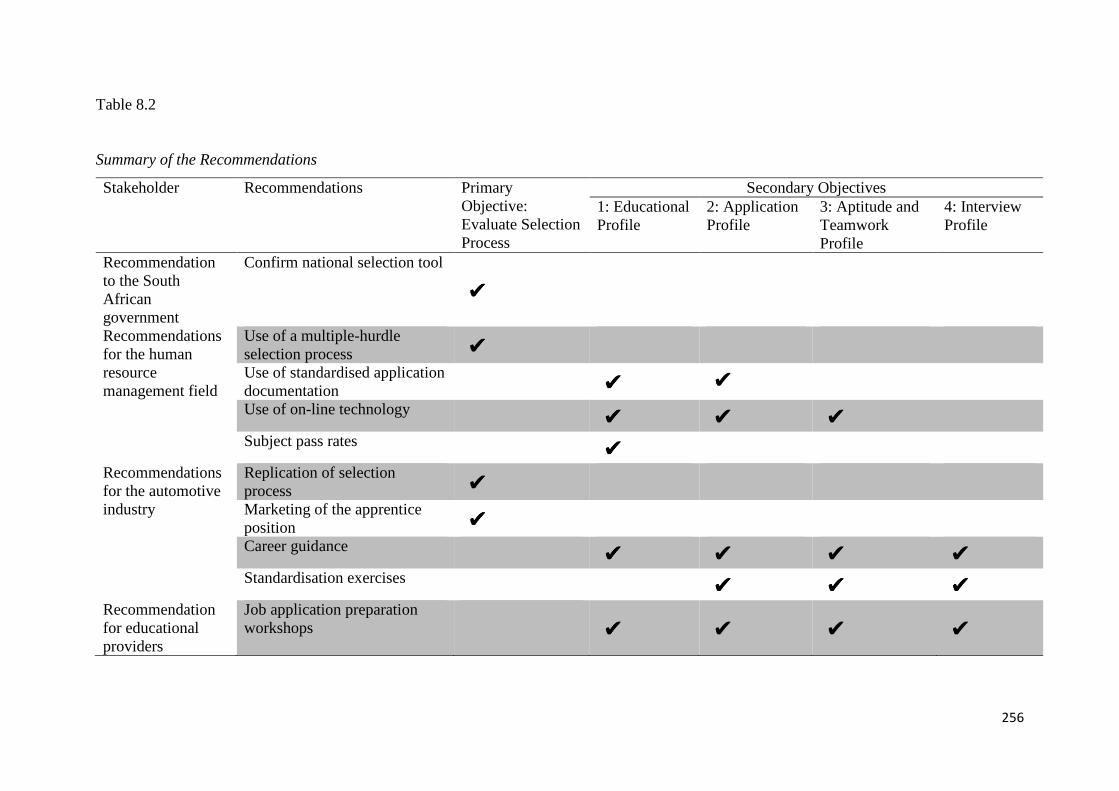
256
Table 8.2
Summary of the Recommendations
Stakeholder Recommendations Primary
Objective:
Evaluate Selection
Process
Secondary Objectives
1: Educational
Profile
2: Application
Profile
3: Aptitude and
Teamwork
Profile
4: Interview
Profile
Recommendation
to the South
African
government
Confirm national selection tool
Recommendations
for the human
resource
management field
Use of a multiple-hurdle
selection process
Use of standardised application
documentation
Use of on-line technology
Subject pass rates
Recommendations
for the automotive
industry
Replication of selection
process
Marketing of the apprentice
position
Career guidance
Standardisation exercises
Recommendation
for educational
providers
Job application preparation
workshops
It is hence recommended that the selection process evaluated in this study be adopted for
replication by the government. The selection process could initially be piloted in another
automotive plant to ensure the process is sufficiently streamlined and replicable beyond the Client.
Once the initial replication issues have been resolved the selection process could be offered on a
national basis. An implementation guideline booklet, similar to that produced by NAS (2017),
could be composed and distributed to interested parties. Implementation workshops should also be
facilitated at a provincial level, specifically in towns were the OEMs are located.
8.5.2. Recommendations for the human resource management field
Four recommendations are tendered to the HRM discipline with regards to apprenticeship
selection practices. As portrayed in Table 8.2, the first recommendation is linked to the primary
objective with the other three recommendations being linked to three of the four secondary
objectives.
8.5.2.1. Recommendation one: Use of a multiple-hurdle selection process
Figure 4.1 depicted a successive or multiple-hurdle selection approach. This general
selection process had eight steps from initial recruitment to the short-listing of successful
candidates. According to Van der Merwe (2002) this process is used by most organisations in SA.
Multiple level selection processes can be used if the reliability of employing a singular approach
is under question (Piro, 2011). A multi-stage selection process could alleviate the risk associated
with misrepresentation and/or lying discovered on job applications or CVs (Trindale, 2015). The
subjectivity associated with certain singular screening techniques and the associated incorrect
identification of the best candidates (Kalugina & Shvydun, 2014; Watkins & Johnston, 2000) can
hence be alleviated through the use of various selection phases. A composite battery of tools
supplemented with non-cognitive measures such as interviews could also assist in reducing the
potential legal risks associated with certain types of testing (McFarland et al., 2004; Schmidt et
al., 2016).
The effectiveness and fairness of using multiple tools to make a selection decision can
therefore enhance the predictive validity of the process (Van der Flier et al., 2003). A multiple
rather than a singular phase selection process for entry-level operators has been previously
258
recommended to the automotive industry (Gump, 2006; Puchert et al., 2017a, 2017b). In line with
this previous research and the conclusions derived in this study, it is recommended that HR
practitioners adopt a multiple-hurdle selection process on a consistent basis. This recommendation
is therefore related to the primary objective. As discussed in section 7.7, the selection process
investigated in this study was concluded to be valuable and of high quality. The 13 constructs were
established to be predictive of high quality incumbents and the trade test pass rate far exceeded
that of any other documented by an accredited test centre in SA.
8.5.2.2. Recommendation two: Use of standardised application documentation
In this selection process, applicants were terminated at phase one due to non-compliance on
a number of stipulations. This included not submitting all the required documentation (e.g.,
certified copies of actual qualifications and identity document) as well as the minimum educational
requirements not being met. Other reasons for termination at this phase included: not specifying
the apprenticeship type applied for in the motivational letter, not indicating the internal application
number (e.g., TECH 2012), handwritten applications, not completed pure mathematics (i.e.,
applicant had done mathemtical literacy or not done this subject at all) and/or science at Grade 12
or equivalent.
Over half the initial sample of applications (N = 3 412) in this study were not successful in
phase one. This was due to one or more of the reasons mentioned in the previous paragraph. As
clarified in section 1.4.3, apprentice applicants are unlike other staff as this pool of candidates is
usually young and inexperienced (Grosvenor, 2017). To address this issue, and to reduce the
likelihood of high calibre candidates being terminated due to carelessness on their part in
compiling their application documentation, it is recommended that standardised applications forms
should be used in the initial apprenticeship selection practices. This recommendation therefore
stems from the first and second secondary objectives of the study.
The host organisation is encouraged to design template documents in order to facilitate the
stated advantages (e.g., easy comparison and filtering) of this pre-screening device (Schmidt et al.,
2016; Wickramasinghe, 2007). Through the use of these standardised forms the applicants would
be prompted to provide certain information that was often omitted and resulted in them being
259
terminated at this early stage in the selection process. The process would also be more streamlined,
time and cost-effective as information needed for screening purposes would be readily available.
This could also be extended to providing templates for applicants to use in terms of the layout of
a good CV and motivational letter. Initial briefing or training workshops could be implemented to
assist the applicants to understand the requirements and the manner in which the documentation
should be completed. This recommendation relates to the first and second secondary objectives.
8.5.2.3. Recommendation three: Use of on-line technology
Following on recommendation two, the third recommendation centres on making use of on-
line technology to assist alleviate the manual screening of mass applicants at the early stages in
the selection process. There are many on-line technology options available, with only a few being
suggested here. The first proposal is that the standardised application documentation and
templates, suggested in section 8.5.2.2, be made available on-line.
Another proposal is the development and implementation of realistic on-line job previews.
As discussed in section 4.4.2.2, Lachu (2014) has suggested that these on-line job previews will
enable apprenticeship applicants to obtain a realistic appraisal of the different apprenticeship types
being offered by an organisation and facilitate the accurate identification of the correct type in
their application. In the first phase of the selection process investigated in this study, applicants
were often terminated due to their lack of identification of apprenticeship type in their application
documentation. Furthermore, applicants often identified an apprenticeship type but failed to
appropriately link their existing qualifications and/or experience to this apprenticeship type. This
resulted in their obtaining a low rating for their motivational letter. This could be alleviated through
the applicants previewing each apprenticeship type using this on-line tool, thereby more
successfully understanding the requirements and better aligning their application with these. An
on-line ‘pre-application’ assessment, such as developed by Siemens, could be useful in assisting
apprenticeship applicants in their decision on the most suitable apprenticeship type to apply for
(Grosvenor, 2017).
Novel on-line preliminary CV screening and tracking techniques has been proposed by
several researchers (Amdouni & Ben Abdessalem Karaa, 2010; García-Sánchez et al., 2006;
260
Perinot, 2016) and were considered in sections 4.4.2.2 and 4.4.4. These on-line screening and
tracking systems are worthy of consideration for apprenticeship selection practices. The option of
the tool having some initial pre-selection criteria built into the system would be advantageous in
filtering through the large volume of applications received for apprenticeship programmes.
Besides being helpful in facilitating the refinement of the matching process between positions and
applicants, these tools will also assist the applicants who have not been successful to have a
positive impression of the selection process. The tracking and feedback mechanisms would allow
even rejected applicants experiencing the application process as being fair, transparent and cutting
edge. This is regarded as important for the branding and image of organisations (Anderson et al.,
2010; Schmitt, 2014; Trindale, 2015).
Despite the disadvantages of on-line psychological testing provided in section 4.4.4, the
general and technical aptitudes tested in the third phase of the selection process could also be done
on-line. The use of gamification tools were also discussed in section 4.4.4. These forms of
assessment have a strong appeal for millennials and can hence be a powerful tool to attract potential
applicants into apprenticeship programmes (Hawkes et al., 2017). For the competencies assessed
in the third tool of phase three, namely, the teamwork competencies, a gamification tool could also
be designed.
8.5.2.4. Recommendation four: Subject pass rates
The fourth and final recommendation to HR practitioners involved in the selection of
apprentices is the setting of minimum pass rates for the mathematics and science subjects. In this
study, regardless of the type of secondary education obtained, applicants that performed better in
mathematics and science survived more selection phases. It is proposed that the minimum pass
rate for acceptance onto an apprenticeship programme be 50% and above for both these subjects.
Whist this is aligned to the national standpoint on the minimum entrance requirements for
apprenticeship candidates (Government Gazette, 2015a), this is seldom upheld (Arfo, 2015). In
this study too, eight apprentices had obtained between one to 19% for mathematics and 13 had
attained between 20 to 39%. In science, eight apprentices had achieved between one to 19% and
18 had achieved scores between 20 to 39%. That is 27% and 34% of the total sample of applicants
that were accepted onto the apprenticeship programme. However, improving these minimum
261
entrance requirements would substantially stream-line the initial selection of these candidates and
would be a more time and cost-effective manner of initially reducing the number of applicants
progressing to the expensive phase three where psychological testing was done. In this study at
least 56 applicants were tested in phase three that did not achieve 40% or more for mathematics
and 78 that did not achieve 40% or more for science. These candidates were ultimately not
successful in phase three and the cost of their assessment could have been alleviated earlier in the
selection process through the use of their subject performance as a preliminary screening tool.
8.5.3. Recommendations for the automotive industry
The four recommendations provided in section 8.5.2 are also relevant for the automotive
industry. In addition, however, four other recommendations are submitted to the sector. As
illustrated in Table 8.2, the first two recommendations pertain to the primary objective of the study
and the other two recommendations to the four secondary objectives of the study.
8.5.3.1. Recommendation one: Replication of selection process
The trade test pass rate attained post the selection process followed in this study far exceeded
that of current national trends (e.g., as discussed in the Government Gazette, 2015a; Mahembe,
2012; Mbatha et al., 2014). This means that the selection process was able to ascertain those that
were most suited for the Client and this resulted in good pass rates. Other automotive plants are
therefore encouraged to adopt a similar rigorous selection process for their apprentices. This would
improve the likelihood of these organisations also achieving high trade test pass rates. This aligns
with the recommendation for investment in improved selection and screening of apprentices made
by others (Government Gazette, 2015b; merSETA, 2016).
8.5.3.2. Recommendation two: Marketing of the apprentice position
The literature review of the global apprenticeship programmes in section 3.3 highlighted the
increasing trend of the youth favouring university over vocational type qualifications (Fazio et al.,
2016; Jacoby, 2014; Kahlen, 2016). An account of the challenges in realising the value and
attraction of apprenticeship programmes to various stakeholders was provided in section 3.7. In
order to deal with this dilemma, it is recommended that the national automotive industry use
proactive steps to entice the youth into their apprenticeship programmes. Other sectors, such as
262
the financial, healthcare and services sectors, are successfully targeting and promoting their
apprenticeship programmes to this pool of applicants (Giffi et al., 2014, 2015; Kramer et al., 2015).
The automotive industry should adopt a similar stance to these sectors and convey the positive
attributes of their apprenticeship programmes to their target audience. Higher calibre candidates
may also be attracted to apply for these programmes within the automotive industry if the profile
and attractiveness of working in the industry was made clear (Giffi et al., 2014; Shankel, 2010).
This recommendation is in line with that made by several global and national authors (Duarte,
2017; Kramer et al., 2015; Government Gazette, 2015a; OECD, 2011). This enhancement of a
career within the manufacturing industry should be done in collaboration with educational
providers (Shankel, 2010).
8.5.3.3. Recommendation three: Career guidance
As discussed in sections 8.5.2.2 and 8.5.2.3, applicants did not accurately reflect on their
career options, nor indicate the type of apprenticeship that best suited their subject choice and
extra-curricular activities. This resulted in the candidates often not indicating a preferred
apprenticeship type on their motivational letter, which would have resulted in them being
terminated at phase one. If they did indicate a preference on their motivational letter and this was
in contradiction to their subject choice and extra-curricular activities, this would have been
discovered in the CV review within selection phase two. These candidates are likely to have
received a very low rating for both their motivational letters and their CV. This may then have
resulted in their termination at this second selection phase.
It is advised that career guidance practitioners be made available within the automotive
industry to guide existing employees in terms of development opportunities. Applicants should be
guided in terms of the appropriate type of apprenticeship to apply for in terms of their previous
subject choice and experience. Where applicable, applicants could also be advised to pursue the
shorter ARPL option rather than the longer route of attending an apprenticeship programme. The
need for career guidance to job applicants is in line with recommendations made by other
researchers (Brewer, 2013; Hessler & Ritchie, 2006; merSETA, 2016).
263
8.5.3.4. Recommendation four: Standardisation exercises
The subjectivity of raters in their review of CVs is a common criticism of the selection tool
(Breaugh, 2009; Kalugina & Shvydun, 2014; Watkins & Johnston, 2000). To address this aspect,
it is recommended that the Client, and other automotive plants replicating this selection process,
periodically use inter-rater standardisation exercises to ensure consistency in the rating of the CVs.
Section 4.4.4.2 highlighted that in AC-type exercises, consensus between the assessors is a
key determinant of the tool’s reliability (Ballantyne & Povah, 2004). Section 4.4.5 indicated that
the disadvantages of interviews (e.g., faking and impression management) can be minimised
through the use of panel interviews (Wickramasinghe, 2007). The implementation of inter-rater
standardisation exercises for the phase three assessors and the phase four interviewers would also
facilitate enhanced consistency in the ratings done by these reviewers. The guidelines and
procedures presented by the Assessment Centre Guidelines for SA (Meiring & Buckett, 2016)
could be useful for the automotive industry to follow in this regard. Refresher training for these
assessors and/or reviewers could also be useful (Cole et al., 2009; Fritzsche & Brannick, 2002).
This section concludes the four recommendations submitted to the automotive industry.
8.5.4. Recommendation for educational providers
One recommendation is offered to secondary educational providers to assist these
institutions enhance the future selection possibilities of their students. This recommendation
pertains to the four secondary objectives as depicted in Table 8.2.
8.5.4.1. Recommendation one: Job application preparation workshops
In this study better ratings were obtained for the CVs than for the motivational letters
submitted by the applicants. However, a significant portion of applicants were terminated in both
the first and second phase due to their inappropriate completion of the application documentation.
It is therefore recommended that educational institutions offer job application preparation
workshops to their students, specifically in their final year of study. These workshops should
provide guidance to the students on how to compile a good CV and motivational letter. This could
be part of the English curriculum in terms of creative writing exercises. Furthermore, these
workshops could equip the students with an understanding of what to expect from a selection
264
process and an appreciation of basic work ethic principles, such as punctuality and
professionalism.
This is in line with recent suggestions made to formal and informal education and training
providers to enhance employability. These researchers suggested incorporating work readiness or
core work skills workshops into the training to better facilitate the transition of students into the
workplace (Brewer, 2013; Shankar et al., 2016). The provision of support to candidates during
their application for new positions has also been highlighted by other researchers (Azar et al.,
2013; Fox, 2018; Hessler & Ritchie, 2006). These preparation workshops should focus on assisting
the potential applicants to address two fundamental flaws in their application as discovered in this
study. These are, firstly, following the instructions provided within the advertisement and,
secondly, enhancing their profile provided in their CV. These two issues are discussed in the
following two paragraphs.
Potential applicants should be encouraged to focus on following the instructions included in
job or position advertisements. In this study, a large portion of the applications were terminated at
phase one due to the inappropriate and incomplete documentation submitted. High potential
candidates could have been terminated at this early stage and not understand the reason for their
application not being successful, especially if they had attained the minimum entrance
requirements. Furthermore, applicants should be encouraged to pay attention to the layout,
structure and quality of the CVs and motivational letters compiled and submitted in their
application for positions. This is important given the empirical findings established in section
4.4.2.2 between CV content, perceptions thereof and the judgements made by reviewers related to
hireability (Arnulf et al., 2010; Burns et al., 2014; Van Toorenburg et al., 2015). This would also
assist in reducing the interpretation gap (DuRose & Stebleton, 2016; Fox, 2018) discussed in
section 4.5.2.2.
Secondly, applicants should be encouraged to gain credible experience in their field of
interest and application. This may entail volunteering and doing work for no pay until the
opportunity arises to be selected onto an apprenticeship programme. Working in a related area
265
(e.g., operator or assembler in the production environment) is regarded as better than having no
experience at all and would improve ratings.
Applicants are also encouraged to continue studying in their area of interest and obtain post-
secondary education level qualifications whilst waiting for the opportunity to be selected onto an
apprenticeship programme. Applicants should also be advised to be active in their participation in
extra-curricular activities while studying. This contributes to their rating in terms of leadership
potential. One of the reasons provided for the current global STEM paradox is the lack of basic
employability and soft skills within the graduate pool (Giffi et al., 2015; Kramer et al., 2015).
Apprentice applicants need to take a proactive role in developing these skill sets in order to enhance
their employability opportunities. This recommendation is in line with that tendered by other
researchers that individuals use part-time employment and various extra-mural activities to
develop the core work competencies and behaviours required by employers (Brewer, 2013; Evans
& Richardson, 2017; Fox, 2018).
8.5.5. Recommendation to test developer
The eleventh recommendation gained from this study is presented to the TRAT test
developers. This recommendation does not relate to either the primary or secondary objectives of
the study.
8.5.5.1. Recommendation one: Formal validation
The TRAT battery was produced in 1983 and has not been revised since this publication
date. The culture friendliness of the test could therefore be questioned. The tool has also not been
validated, as proposed would be done in the test manual. These two issues could draw concern to
the reliability and validity of this instrument.
The instrument is registered and approved by the HPCSA and is also a popular test within
SA. It is hence recommended that the test developer conduct a validation study to formally confirm
the credibility and status of this battery. The results attained in this study could be used to assist in
this regard.
266
8.6. Contributions of the study
The contribution of this research study is three-fold. Firstly, the study has confirmed the
quality and value of this selection process for apprentices within the automotive industry.
Secondly, the study offers vital information pertaining to the optimum profile of successful
apprentice applicants. The third contribution relates to the use of the survival analysis statistical
procedure in the HRM field. These contributions are discussed in detail within the next three
sections.
8.6.1. Recommended selection process for automotive apprentices
It was established in Chapter Four that there is limited global and national research on the
profile and selection process for apprentices. This study can therefore be regarded as a significant
contribution to the HRM field as it is the first study, globally, to provide longitudinal data on the
impact of a selection process for an apprenticeship programme.
Section 4.6.1 presented the empirical literature available in terms of global apprentice
selection practices. Besides the specification of minimum scholastic achievement (e.g., Forsblom
et al., 2016; Imdorf & Leemann, 2012), cognitive and other aptitudes tests are regularly used (e.g.,
Mueller & Wolter, 2014; Siegenthaler, 2011; Torpey, 2013) in the selection of apprenticeship
applicants. Interviews are also a commonly used selection tool (e.g., Tang, 2015; Schmid & Storni,
2004; Stalder, 2000). Regardless of the specific tools used, rigorous and multi-phase selection
processes are encouraged (Imdorf & Leemann, 2012; Lovender, 2015; Torpey, 2013).
Nationally, less empirical research is available on the selection practices employed and more
research insight has been provided on the following of minimum educational requirements set per
apprenticeship (Mummenthey et al., 2012). Several national bodies have highlighted the need for
in-depth selection techniques (merSETA, 2016; Mummenthey et al., 2012) as well as the
assessment of various aspects such as aptitude, ability, motivation, personality and learning ability
(Mummenthey et al., 2012). A study on the optimum selection process for automotive operators
has recommended a multiple rather than a singular phase selection process (Puchert et al., 2017a,
2017b).
267
This research study has provided evidence of the importance of a multiple-hurdle
standardised selection process for apprentices within the automotive industry. The study has
confirmed the significant impact of several criteria on the optimum selection of apprentices. Rather
than any one aspect (e.g., scholastic achievement or aptitude) being a sole determinant of those
most suitable to becoming an apprentice, this study has highlighted that several factors contribute
to the identification of the best applicants for this position.
It has been recommended that the selection process investigated in this study be replicated
across the automotive industry in the establishment of the best potential artisans. However, this
selection process could also be employed cross-industry. This would fulfil the need recently
identified by the local government for the development of a recruitment and selection tool to
improve the throughput rate of apprentices (Government Gazette, 2015a).
8.6.2. Development of an automotive apprentice profile
Prior to this study, limited research had been done on the optimum profile of apprentices.
Besides the age stipulations and minimum educational requirements, outlined in section 4.6, there
is no empirical information regarding the criteria that could be useful in predetermining those
applicants that could be successful in an apprenticeship programme. This study sought to bridge
that gap in the literature.
This study has resulted in the identification of 13 broad criteria that have a significant impact
on the selection of applicants onto an apprenticeship programme. The use of these criteria can now
be used across the automobile industry and potentially other manufacturing concerns too. This is
the first comprehensive profile of criteria that are predictive of successful selection onto an
apprenticeship programme. This profile has shed light on the importance of further research on the
selection of potential artisans. This research can therefore be regarded as a major contribution to
the field of HRM, specifically in terms of recruitment and selection.
8.6.3. Use of survival analysis in the human resource management field
Section 5.9.4.4 outlined that the survival analysis statistical procedure has been regularly
applied within the medical field (Ajagbe et al., 2014; Agarwal, 2012; Barraclough et al., 2009).
268
Survival analysis is also increasingly being used to predict the onset of areas outside the medical
field (Chung et al., 1991; Shakar & Hűllermeier, 2014; Singh & Mukhopadhyay, 2011). This study
has provided empirical research illustrating the effective use of the statistical tool within the HRM
field. This is the first study in the discipline making use of this statistical procedure.
The survival analysis procedure has provided a novel and scientific manner to analyse the
termination rate of the applicants across the selection process. This statistical method of analysis
could be used to understand the survival rate of applicants across other selection processes.
Survival analysis could also be used in other HR activities. The method is particularly useful in
enhancing understanding of terminations across a time span. The method could therefore be used
to appreciate when and why individuals terminate from development programmes as well as their
exit from organisations.
The significance of the study has been summarised. Nevertheless, and not withstanding these
three contributions, there are also limitations inherent in the research study. These are discussed
in the next section.
8.7. Limitations of the study
There are three limitations pertaining specifically to the research methodology used in this
study. The first limitation is concerned with the study’s sample, the second limitation is concerned
with one of the data collection instruments used and the final limitation relates to the data analysis
approach employed.
This study stemmed from an annual recruitment process completed by a national automotive
assembly plant. Whilst this enabled a large sample of applicants to be investigated it was a
convenience sampling method which has its own disadvantages (Bryman, 2016). This sample was
drawn from a limited geographical area as indicated as a selection priority of the Client.
Furthermore, the selection process and several of the tools used in the selection process were
designed by the Client and/or were used for the express purpose of fulfilling the mandate set by
the Client. A potential shortcoming of this research is therefore that broad guidelines can only be
submitted to the South African automotive industry. The application of these guidelines beyond
269
this sector may be limited. However, the decisions taken in the design of any selection process are
common to most organisations. Amongst others, that is, firstly, the reduction of unemployment
within their immediate environment (i.e., as part of their social responsibility initiatives) and,
secondly, the improvement of the calibre of applicants absorbed into the organisation.
The second limitation pertains to the TRAT battery. In section 8.5.5 it was recommended
that the test developer formally validate this tool. The instrument is nevertheless registered and
approved by the HPCSA and is a widely used test battery within SA.
The third limitation concerns the dilution of the scores obtained by the applicants within the
selection process. In the second phase the applicants’ performance in two subjects were classified
into five categories. Two of these categories, namely 40 to 59% and 60 to 79%, were very broad.
If there had been more categories, the performance of the applicants may have been more
sensitively differentiated. Furthermore, within the third phase of the selection process three broad
areas were assessed, namely, general aptitude, technical aptitude and teamwork competence. In
the two aptitude assessment areas, standard psychometric testing protocol was utilised and the
obtained raw scores were converted to stanine scores for reporting purposes. Furthermore, the
average scores attained by applicants, across several sub-tests, was computed as an indication of
their general aptitude and technical aptitude performance. The teamwork competence of the
applicants, across several dimensions, was also diluted into an average score. The intensity and
subtleties between the actual scores achieved in specific sub-tests and/or dimensions may have
been weakened by this data analysis technique.
Another limitation, recognised during this study, is the limited amount of research literature
available on the selection of apprentices and artisans. Whilst there is more global information than
that available within SA, a substantial amount is not original, peer-reviewed research. It is with
these limitations in mind that the recommendations for future research are propounded in the
section that follows.
270
8.8. Recommendations for future research
Future research that could potentially stem from this study are within four main research
areas. These are the replication of the study, the extension of the study to a broader sample, adding
a qualitative dimension to the study and extending the study to investigate the output of the
apprenticeship programme.
The suggestions are that the selection process employed in this study be replicated for an
operator position. Given the similarity in the nature of work done and the need for this pool of
talent, future research of this nature could provide fruitful benefits for the HRM field as well as
the broader manufacturing sector.
Replications of this study could also be done with alternative forms of aptitude and/or
teamwork competence batteries to ascertain the repetition of the obtained results. Future research
should also investigate whether similar results were attained in the selection drives of the intake
years post the study. This would provide an indication of the consistency in the results obtained in
this study.
With regard to a broader sample, it is recommended that similar research be conducted in
other automotive plants and/or in the broader manufacturing sector to ascertain the nature of the
selection processes employed as well as the success of these. Future research may also consider
replicating the same selection process on apprentices in other automotive firms in different
provinces of SA and/or in alternative manufacturing industries such as the tyre industry or the
chemical sector.
A qualitative study focussing on the experiences of applicants during the selection process
for an apprenticeship programme would add value. This could be facilitated though focus groups.
Even if the applicants were not successful, it is considered a vital component in the branding or
image of world class organisations that applicants have a positive impression of the organisation
and perceive that they have undergone a fair and transparent selection process. Future research
could also include a qualitative review of the instructors’ insights regarding the selection processes
271
conducted for an apprenticeship programme. This may provide their recommendations for the
improvement of the calibre of apprentices they need to train to become artisans.
It is recommended that future research investigate the group of apprentices selected onto the
Client’s apprenticeship programme to determine their specific profile in terms of the constructs
investigated in this study. This could also be extrapolated to investigate if there is significance in
these variables and the number of attempts taken to complete the trade test.
Finally, further longitudinal research could be conducted on this sample of apprentices that
completed their apprenticeship within the Client. Information with regard to their performance on
the apprenticeship programme (i.e., formative theoretical and practical assessments) could be
analysed to further evaluate their suitability as apprentices. Furthermore, performance appraisal
documents could be examined to establish whether the apprentices from this study are performing
optimally as artisans on-the-job.
8.9. Concluding remarks
This eighth and final chapter of this dissertation has provided a summation of the study’s
main findings and described the fourteen conclusions established from these findings. These
conclusions primarily focused on the contribution of the 13 constructs to the selection of applicants
onto an apprenticeship programme. Drawing from these conclusions, one recommendation was
offered to the national government, four recommendations were proposed to the HRM field and
four to the automotive industry. Specifically, it was recommended that the selection phases
employed in this study be retained and replicated by the automobile industry in their selection of
apprenticeship applicants. Furthermore, one recommendation was submitted to educational
providers to assist applicants improve their survival rate within selection processes. The final
recommendation was made to the TRAT test developer regarding the formal validation of the tool.
The recruitment and selection of apprentices has become a major area of concern as “the
correct recruitment and selection of apprentices affects the whole artisan development value chain”
(Government Gazette, 2015a, p. 13). The recruitment and selection of apprentices is regarded as
an area needing speedy attention in order to realise the national goals of improving trade test pass

272
rates and producing higher quality artisans (merSETA, 2016; Pienaar et al., 2016). This study has
hence made a significant contribution to both the HRM field and the automotive industry in
addressing this area of trepidation. This study is the first national longitudinal study of a selection
process for apprentices and is the first national study to make use of the survival analysis procedure
within HRM.
This study is also powerful as it adds value to the automotive industry. Through this selection
process the calibre of apprentices drawn into the industry can be enhanced thereby enabling the
industry to be better equipped to deal with the productivity and technological challenges currently
faced by the local industry. As one of the applicants from this study stated in their covering letter:
“Being part of this apprenticeship programme will not only help me to contribute to our
economy and the upliftment of the people within my community, but I will become part of a
priviledged group of people making phenomenal cars”
(Anonymous, personal communication, April 12, 2013).
273
References
Abhayawansa, S., & Abeysekera, I. (2008). An explanation of human capital disclosure from the
resource-based perspective. Journal of Human Resource Costing and Accounting, 12(1), 51-
64. doi:10.1108/14013380810872752
Acemoglu, D., & Pischke, J. (1998). Why do firms train? Theory and evidence. Quarterly Journal
of Economics, 113(1), 79-119. doi:10.3386/w5605
Adda, J., Dustmann, C., Meghir, C., & Robin, J-M. (2006). Career progression and formal versus
on-the-job training (Discussion paper No. 2260). Bonn, Germany: The Institute for the Study
of Labor, Retrieved from http://ftp.iza.org/dp2260.pdf
Agarwal, G. G. (2012). Statistics for surgeons – Understanding survival analysis. Indian Journal
of Surgical Oncology, 3(3), 208–214. doi:10.1007/s13193-012-0149-z
Ahmad, S., & Schroeder, R. G. (2002). The importance of recruitment and selection process for
sustainability of total quality management. International Journal of Quality and Reliability
Management, 19(5), 540-550. doi:10.1108/02656710210427511
Aiken, L. R. (1994). Psychological testing and assessment (8th ed.). Massachusetts: Allyn &
Bacon.
Ajagbe, O. B., Kabair, Z., & O’Connor, T. (2014). Survival analysis of adult tuberculosis disease.
PLoS ONE 9(11): e112838. doi:10.1371/journal.pone.0112838
Akinyemi, G. M., & Abiddin, N. Z. (2013). Human capital developments an interdisciplinary
approach for individual, organisational advancement and economic improvement. Asian
Social Science, 9(4), 150-157. doi:10.5539/ass.v9n4p150
Alam, G. M. (2008). The role of technical and vocational education in the national development
of Bangladesh. Asia‐Pacific Journal of Cooperative Education, 9(1), 25‐44. Retrieved from
http://www.apjce.org/files/APJCE_09_1_25_44.pdf
Ambe, I. M., & Badenhorst-Weiss, J. A. (2011). South African automotive industry: trends and
challenges in the supply chain. Journal of Contemporary Management, 8(1), 337-362.
Retrieved from http://hdl.handle.net/10520/EJC51107
Amdouni, S., & Ben Abdessalem Karaa, W. (2010). Web-based recruiting: Framework for CV
structuring. ACS/IEEE International Conference on Computer Systems and Applications -
AICCSA 2010, Hammamet, Tunisia, 2010, 1-7. doi:10.1109/AICCSA.2010.5587018
274
Anderson, E. (2001). The nonstationary staff-planning problem with business cycle and learning
effects. Management Science, 47(6), 817-832. doi:10.1287/mnsc.47.6.817
Anderson, N., Herriot, P., & Hodgkinson, G. P. (2001). The practitioner-researcher divide in
industrial, work and organizational (IWO) psychology: Where are we now, and where do we
go from here? Journal of Occupational and Organizational Psychology, 74(4), 391-412.
doi:10.1348/096317901167451
Anderson, N., Salgado, J. F., & Hűelsheger, U. R. (2010). Applicant reactions in selection:
Comprehensive meta-analysis into reaction generalization versus situational specificity.
International Journal of Selection and Assessment, 18, 291–304. doi:10.1111/j.1468-
2389.2010.00512.x
Anderson, N., & Witvliet, C. (2008). Fairness reactions to personnel selection methods: An
international comparison between the Netherlands, the United States, France, Spain,
Portugal, and Singapore. International Journal of Selection and Assessment, 16(1), 1-13.
doi:10.1111/j.1468-2389.2008.00404.x
Arfo, E. B. (2015). A comparative analysis of technical and vocational education and training
policy in selected African countries (Unpublished Doctoral thesis).
University of KwaZulu Natal, KwaZulu Natal, South Africa.
Arnulf, J. K., Tegner, L., & Larssen, Ø. (2010). Impression making by résumé layout: Its impact
on the probability of being shortlisted. European Journal of Work and Organizational
Psychology, 19(2), 221-230. doi:10.1080/13594320902903613
Arthur, W. A., Jr., Day, E. A., McNelly, T. U., & Edens, P. S. (2003). A meta-analysis of the
criterion-related validity of assessment center dimensions. Personnel Psychology, 56(1),
125-149. doi:10.1111/j.1744-6570.2003.tb00146.x
Arthur, W., Jr., Woehr, D. J., & Maldegen, R. (2000). Convergent and discriminant validity of
assessment center dimensions: A conceptual and empirical re-examination of the assessment
confer construct-related validity paradox. Journal of Management, 26(4), 813-835.
doi:10.1016/S0149-2063(00)00057-X
Askov, E. N., & Gordon, E. E. (1999). The brave new world of workforce education. New
Directions for Adult and Continuing Education, 83, 59-68. doi:10.002/ace.8305
275
Associated Builders and Contractors of Massachusetts (ABCMA). (2018). Merit Apprenticeship
Program: Selection Process. Retrieved from
http://www.meritapprentice.org/Selection_Process.html
Association of American Colleges and Universities (AAC&U). (2013). It takes more than a major:
Employer priorities for college learning and student success: Overview and key findings.
Washington, DC: Hart Research Associates. Retrieved from
https://www.colorado.edu/odece/sites/default/files/attached-files/rba07-sb4converted_2.pdf
Austin, P. C. (2017). A tutorial on multilevel survival analysis: Methods, models and applications.
International Statistical Review, 85(2), 185-203. doi:10.1111/insr.12214
Automotive Industry Export Council (AIEC). (2017). South African Automotive Export Manual.
Retrieved from http://www.aiec.co.za/Reports/AutomotiveExportManual.pdf
Automotive Supply Chain Competitiveness Initiative (ASCCI). (2018). Annual Report 2018.
Retrieved from https://ip.bmanalysts.com/?f=ascci
Azar, A., Sebt, M. V., Ahmadi, P., & Rajaeian, A. (2013). A model for personnel selection with a
data mining approach: A case study in a commercial bank. South African Journal of Human
Resource Management, 11(1), 1-10. doi: 10.4102/sajhrm.v11i1.449
Babbie, E. (2007). The practice of social research (11th ed.). Belmont: Thomson Higher Education.
Babbie, E., & Mouton, J. (2012). The practice of social research (South African ed.). Cape Town,
South Africa: Oxford University Press.
Bakar, A., & Hanafi, I. (2007). Assessing employability skills of technical-vocational students in
Malaysia. Journal of Social Sciences, 3(4), 202-207. doi:10.3844/jssp.2007.202.207
Baker, H. G., & Spier, M. S. (1990). The employment interview: Guaranteed improvement in
reliability. Public Personnel Management, 19(1), 85-90. Retrieved from http://0-
search.ebscohost.com.warm.seals.ac.za/login.aspx?direct=true&bth&AN=9607031209&sit
e=ehost-live&scope=site
Ballantyne, I., & Povah, N. (2004). Assessment and development centres (2nd ed.). Aldershot,
England: Gower.
Bandyopadhyay, I. (2010). The impact of institutions on the innovations of firms belonging to an
emerging versus a mature industry in a developing country, South Africa (Unpublished
master’s thesis). University of Pretoria, Pretoria: South Africa.
276
Barnes, J., & Meadows, B. (2008). On the brink? Skills demand and supply issues in the South
African automotive components industry. Retrieved from http://www.
labour.gov.za/downloads/documents/research-documents/automotive_DOL_report.pdf/
Barnes, J., & Morris, M. (2008). Staying alive in the global automotive industry: What can
developing economies learn from South Africa about linking into global automotive value
chains? The European Journal of Development Research, 20(1), 31-55.
doi:10.1080/09578810701853157
Barney, J. B., & Wright, P. M. (1998). On becoming a strategic player: The role of human
resources in gaining competitive advantage. Human Resource Management, 37(1), 31-46.
Retrieved from
http://digitalcommons.ilr.cornell.edu/cgi/viewcontent.cgi?article=1149&context=cahrswp
Barraclough, D. L., Platt-Higgins, A., de Silva Rudland, S., Barraclough, R., Winstanley, J., West,
C. R., & Rudland, P. S. (2009). The metastasis-associated anterior gradient 2 protein is
correlated with poor survival of breast cancer patients. The American Journal of Pathology,
175(5), 1848-1857. doi:10.2353/ajpath.2009.090246
Bartram, D. (2004). Assessment in organisations. Applied Psychology: An International Review,
53(2), 237-259. doi:10.1111/j.1464-0597.2004.00170.x
Batt, R., & Colvin, A. J. S. (2011). An employment systems approach to turnover, HR practices,
quits, dismissals, and performance. The Academy of Management Journal, 54(4), 695-717.
Retrieved from http://digitalcommons.ilr.cornell.edu/artciles/576
Becker, D. (2018). Global automotive executive survey 2018. Retrieved from
https://assets.kpmg.com/content/dam/kpmg/tr/pdf/2018/03/global-automotive-executive-
survey-2018.pdf
Becker, G. S. (1962). Investment in human capital: A theoretical analysis. The Journal of Political
Economy, 70(5), 9-49. Retrieved from http://www.jstor.org/stable/1829103
Becker, G. S. (1964). Human capital: A theoretical and empirical analysis. Chicago: University
of Chicago Press.
Beechler, S., & Woodward, I. C. (2009). The global “war for talent”. Journal of International
Management, 15, 273-285. doi:10.1016/j.intman.2009.01.002
Belmont Report (1979). The Belmont Report: Ethical principles and guidelines for the protection
of human subjects of research. Retrieved from
277
https://www.fda.gov/ohrms/dockets/ac/05/briefing/2005-4178b 09 02
Belmont%20Report.pdf.
Berenson, M., & Smith, M. (2009). Beyond hiring: An integrated approach to talent management.
Retrieved from http://www.mckinsey.com/~/media/.../TG_MoG_6_Beyond_hiring.ashx/
Berry, C. M., Gruys, M. L, & Sackett, P. R. (2006). Educational attainment as a proxy for cognitive
ability in selection: Effects on levels of cognitive ability and adverse impact. Journal of
Applied Psychology, 91, 696-705. doi:10.1037/0021-9010.91.3.696
Bertua, C., Anderson, N., & Salgado, J. F. (2005). The predictive validity of cognitive ability tests:
A UK meta-analysis. Journal of Occupational and Organizational Psychology, 78(3), 387–
409. doi:10.1348/096317905X26994
Besterfield-Sacre, M., Atman, C. J., & Shuman, L. J. (1997). Characteristics of freshman
engineering students: Models for determining student attrition in engineering. Journal of
Engineering Education, 86, 139-149. doi:10.1002/j.2168-9830.1997.tb00277.x
Bhorat, H., Oosthuizen, M., & Cassim, A. (2014). Occupational shifts and skills challenges facing
the South African economy: LMIP policy brief. Pretoria, South Africa: Human Sciences
Research Council. Retrieved from
http://www.lmip.org.za/sites/default/files/documentfiles/LMIP%20Policy%20Brief%203%
20web%20final_0.pdf/
Blackburn-Brockman, E., & Belanger, K. (2001). One page or two?: A national study of CPA
recruiter’s preferences for résumé length. International Journal of Business Communication,
38(1), 29-45. doi:10.1177/002194360103800104
Bless, C., Higson-Smith, C., & Sithole, S. L. (2013). Fundamentals of social research methods:
An African perspective (5th ed.). Cape Town, South Africa: Juta & Company Limited.
Bodnár, S. (2016). Hiring poses greatest challenge to automotive industry. Budapest Business
Journal, July 1 – July 14. Retrieved from https://bbj.hu/opinion/hiring-poses-greatest-
challenge--to-automotive-industry_118670
Bokova, I. (2014). BRICS building education for the future: Priorities for national development
and international co-operation. Retrieved from
http://www.skillsforemployment.org/KSP/en/Countries/RUS/index.htm.
Booi, S. K. (2005). An assessment of the recruitment and selection strategies used in the sales
department of Old Mutual Group Schemes in the Eastern Cape (Unpublished masters’
278
dissertation). Nelson Mandela Metropolitan University, Nelson Mandela Metropolitan,
Eastern Cape, South Africa.
Bonnal, L., Mendes, S., & Sofer, C. (2002). School-to-work transition: apprenticeship versus
vocational school in France. International Journal of Manpower, 23(5), 426-442. doi:
10.1108/01437720210436046
Bordelon, V. P., & Kantor, J. E. (1984). Utilization of psychomotor screening for USAF pilot
candidates: Independent and integrated selection methodologies (Final report for period
1978-August 1984). Air Force Labs, Brooks AFB, Texas. Retrieved from
http://www.dtic.mil/dtic/tr/fulltext/u2/a170353.pdf
Borman, W. C., White, L. A., Pulakos, E. D., & Oppler, S. H. (1991). Models evaluating the effects
of ratee ability, knowledge, proficiency, temperament, awards, and problem behaviour on
supervisory ratings. Journal of Applied Psychology, 76(6), 863-872. doi:10.1037/0021-
9010.76.6.863
Bowler, M. C., & Woehr, D. J. (2006). A meta-analytic evaluation of the impact of dimension and
exercise factors on assessment center ratings. Journal of Applied Psychology, 91(5), 1114-
1124. doi:10.1037/0021-9010.91.5.114
Boxall, P. (1996). The strategic HRM debate and the resource based view of the firm. Human
Resource Management Journal, 6(3), 59-75. doi:10.1111/j.1748-8583.1996.tb00412.x
Branine, M. (2008). Graduate recruitment and selection in the UK: A study of the recent changes
in methods and expectations. Career Development International, 13(6), 497–513.
doi:10.1108/1362043081090166
Breaugh, J. A. (2009). The use of biodata for employee selection: Past research and future
directions. Human Resource Management Review, 19(3), 219-231.
doi:10.1016/j.hrmr.2009.02.003
Breaugh, J. A. (2013). Employee recruitment. Annual Review of Psychology, 64(1), 389-416.
doi:10.1146/annurev-psych-113011-143757.
Brewer, L. (2013). Enhancing youth employability: What? Why? And how? Guide to core work
skills. Geneva, Switzerland: International Labour Office, Skills and Employability
Department. Retrieved from
http://www.oitcinterfor.org/sites/default/files/file_publicacion/wcms_213452_0.pdf
279
Brown, H. (2012). Artisan development unit. Retrieved from
http://www.merseta.org.za/StrategyResearch/ProjectsDevelopment.aspx/
Brown, H. (2013). Artisan development unit. Retrieved from
http://www.merseta.org.za/Innovation,ResearchandDevelopment/ArtisanDevelopment.asp
x/
Brown, B. K., & Campion, M. A. (1994). Biodata phenomenology: Recruiters’ perceptions and
use of biographical information in résumé screening. Journal of Applied Psychology, 79(6),
897–908. Retrieved from
http://www.krannert.purdue.edu/faculty/campionm/biodata_phenomenolgy.pdf
Bryman, A. (2016). Social research methods (5th ed.). Cape Town, South Africa: Oxford
University Press.
Bryman, A., & Bell, E. (2011). Business research methods (3rd ed.). New York, NY: Oxford
University Press.
Bryman, A., & Bell, E. (2015a). Business research methods (International 4th ed.). Oxford, United
Kingdom: Oxford University Press.
Bryman, A., & Bell, E. (2015b). Research methodology: Business and management contexts (3rd
ed.). Cape Town, South Africa: Oxford University Press.
Brymer, R. A., Molloy, J. C., & Gilbert, B. A. (2014). Human capital pipelines: Competitive
implications of repeated interorganizational hiring. Journal of Management, 40(2), 483-508.
doi:10.1177/0149206313516797
Burning Glass Technologies. (2013). The art of employment: How liberal arts graduates can
improve their labor market prospects. Retrieved from https://burning-
glass.com/research/liberal-arts/
Burns, A. C., & Bush, R. F. (2014). Marketing Research (7th ed.). Harlow, England: Pearson
Education Limited.
Burns, G. N., Christiansen, N. D., Morris, M. B., Periard, D. A., & Coaster, J. A. (2014). Effects
of applicant personality on résumé evaluations. Journal of Business and Psychology, 29(4),
573-591. doi:10.1007/s10869-014-9349-6
Byars, L. L., & Rue, L. W. (2011). Human resource management (10th ed.). New York, NY:
McGraw-Hill Irwin.
280
Cabello-Medina, C., López-Cabrales, A., & Valle-Cabrera, R. (2011). Leveraging the innovative
performance of human capital through HRM and social capital in Spanish firms.
International Journal of Human Resource Management, 22(4), 807-828.
doi:10.1080/09585192.2011.555125
Campbell, R. J., & Bray, D. W. (1993). Use of an assessment center as an aid in management
selection. Personnel Psychology, 46(3), 691-699. doi:10.1111/j.1744-6570.1993.tb00894.x
Campbell, S. K., & Catano, V. M. (2004). Using measures of specific abilities to predict training
performance in Canadian forces operator occupations. Military Psychology, 16(3), 183-201.
doi:10.1207/s15327876mp1603_3
Campbell, B. A., Coff, R., & Kryscynski, D. (2012). Rethinking sustained competitive advantage
from human capital. Academy of Management Review, 37(3), 376-395.
doi:10.5465/amr.2010.0276
Campion, M. A. (1978). Identification of variables most influential in determining interviewers’
evaluations of applicants in a college placement center. Psychological Reports, 42, 947–952.
Retrieved from
http://www.krannert.purdue.edu/faculty/campionm/Identification_Variables_Influential.pd
f
Cant, M., Gerber-Nel, C., Nel, G., & Kotze, I. (2012). Marketing research (11th ed.). Cape Town,
South Africa: Van Schaik.
Cappellari, L., Dell’Aringa, C., & Leonardi, M. (2012). Temporary employment, job flows and
productivity: A tale of two reforms. Retrieved from http://ftp.iza.org/dp6526.pdf
Carnevale, A. P., Gainer, L. J., & Meltzer, A. S. (1990). Workplace basics: The essential skills
employers want. San Francisco: Jossey-Bass.
Carling, K., & Richardson, K. (2004). The relative efficiency of labor market programs: Swedish
experience from the 1990s. Labour Economics, 11, 335-354.
doi:10.1016/j.labeco.2003.09.002
Carroll, J. B. (1993). Human cognitive abilities: A survey of factor-analytic studies. New York,
NY: Cambridge University Press.
Catano, V. M., Wiesner, W. H., Hackett, R. D., & Methot, L. L. (2009). Recruitment and selection
in Canada (4th ed.). Toronto, Ontario: Nelson Education Limited.
281
Cauvin, H. E. (2001, November 24). A quest to promote the quality of cars made in South Africa.
The New York Times. Retrieved from http://www.nytimes.com/2001/11/24/business/a-
quest-to-promote-the-quality-of-cars-made-in-south-africa.html
Cedefop (2016a). European sectoral trends: The next decade (Research paper No. 8093).
Luxembourg: Publications Office. doi:10.2801/25967
Cedefop (2016b). Governance and financing of apprenticeships (Research paper No. 53).
Luxembourg: Publications Office. doi:10.2801/201055
Cedefop (2016c). Leaving education early: putting vocational education and training centre stage.
Volume II: evaluating policy impact (Research paper No. 58). Luxembourg: Publications
Office. doi:10.2801/967263
Chalikias, M., Kyriakopoulos, G., Skordoulis, M., & Koniordos, M. (2014). Knowledge
management for business processes: Employees’ recruitment and human resources’
selection: A combined literature review and a case study. In A. Kravets, M. Shcherbakov,
M. Kultsova, & T. Iijima (Eds.). Knowledge-Based Software Engineering. JCKBSE
2014. Communications in Computer and Information Science (pp. 505-520).
doi:10.1007/978-3-319-11854-3_44
Chan, S. H., & Kuok, O. M. (2011). A study of human resources recruitment, selection, and
retention issues in the hospitality and tourism industry in Macau. Journal of Human
Resources in Hospitality and Tourism, 10(4), 421-441. doi:10.1080/15332845.2011.588579
Chen, C., Huang, Y., & Lee, M. (2011). Test of a model linking applicant résumé information and
hiring recommendations. International Journal of Selection and Assessment, 19(4), 374-387.
doi:10.1111/j.1468.2389.2011.00566.x
Chung, C., Schmidt, P., Witte, A., & Witte, A. (1991). Survival analysis: A survey. Journal of
Quantitative Criminology, 7(1), 59-98. Retrieved from
http://www.jstor.org/stable/23365824
Coetzee, N., & Vosloo, H. N. (2000). Manual for the Differential Aptitude Tests Form K. Pretoria,
South Africa: Human Sciences Research Council.
Coetzee, M., & Schreuder, D. (Eds.). (2010). Personnel psychology: An applied perspective. Cape
Town, South Africa: Oxford University Press.
282
Coff, R. W. (1997). Human assets and management dilemmas: Coping with hazards on the road
to resource-based theory. Academy of Management Review, 22(2), 374-402.
doi:10.5465/AMR.1997.9707154063
Coff, R. W., & Kryscynski, D. G. (2011). Drilling for micro-foundations of human-capital based
competitive advantages. Journal of Management, 37(5), 1429-1443.
doi:10.1177/0149206310397772
Cokayne, R. (2017, March 3). Millions depend on SA’s auto industry. Business Report. Retrieved
from https://www.iol.co.za/business-report/economy/millions-depend-on-sas-motor-
industry-8020463
Cole, M. S., Feild, H. S., & Giles, W. F. (2003). Using recruiter assessments of applicants’ résumé
content to predict applicant mental ability and Big Five personality dimensions.
International Journal of Selection and Assessment, 11(1), 78-88. Retrieved from
http://www.sbuweb.tcu.edu/mscole/docs/Cole%20et%20al.%202003.%20Using%20Recr
uiter%20Assessments.%20IJSA.pdf
Cole, M. S., Feild, H. S., Giles, W. F., & Harris, S. G. (2009). Recruiters' inferences of applicant
personality based on résumé screening: Do paper people have a personality? Journal of
Business and Psychology, 24(1), 5-18. doi:10.1007/s10869-008-9086-9
Cole, M. S., Rubin, R. S., Feild, H. S., & Giles, W. F. (2007). Recruiters’ perceptions and use of
applicant résumé information: Screening the recent graduate. Applied Psychology: An
International Review, 56(2), 319-343. doi:10.1111/j.1464-0597.2007.00288.x
Collins, C., & Smith, K. (2006). Knowledge exchange and combination: The role of human
resource practices in the performance of high-technology firms. Academy of Management
Journal, 49(3), 544-560. doi:10.5465/AMJ.2006.21794671
Collis, J., & Hussey, R. (2014). Business research: A practical guide for undergraduate and
postgraduate students (4th ed.). New York, NY: Palgrave Macmillan.
Cook, M. (1991). Personnel selection and productivity. New York, NY: Wiley.
Cook, M., & Cripps, B. C. (2005). Psychological assessment in the workplace: A management
guide. Chichester: John Wiley & Sons.
Cooper, M. D. (2001). Job reference immunity statutes: Prevalent but irrelevant. Cornell Journal
of Law and Public Policy, 11(1). Retrieved from
http://scholarship.law.cornell.edu/cgi/viewcontent.cgi?article=1027&context=cjlpp
283
Cooper, D., & Schindler, P. S. (2014). Business research methods (12th ed.). New York, New York:
McGraw-Hill.
Corseuil, C. H. L., Foguel, M. N., Gonzaga, G., & Ribeiro, E. P. (2012). The effects of a youth
training program on youth turnover in Brazil (Working paper No. 042). Rio de Janeiro,
Brazil: Rede de Economia Aplicada. Retrieved from http://reap.org.br/wp-
content/uploads/2012/06/042-The-Effects-of-a-Youth-Training-Program.pdf
Cortina, J. M., Goldstein, N. B., Payne, S. C., Davison, H. K., & Gilliland, S. W. (2000). The
incremental validity of interview scores over and above cognitive ability and
conscientiousness scores. Personnel Psychology, 53(2), 325-351. doi:10.1111/j.1744-
6570.2000.tb00204x
Council for Technical and Vocational Education and Training (COTVET). (2014). Mid-term
review report. Retrieved from
http://www.sdfghana.org/cp/images/reports/Final%20DRaft%20GSTDP%20MRT%20Rep
ort.pdf
Craig, E., Thomas, R. J., Hou, C., & Mathur, S. (2011). No shortage of talent: How the global
market is producing the STEM skills needed for growth (Research report). Accenture
Institute for High Performance. Retrieved from http://www.holconsultingservices.com/wp-
content/uploads/2014/07/Accenture-No-Shortage-of-Talent.pdf
Crook, T. R., Todd, S. Y., Combs, J. G., Woehr, D. J., & Ketchen, D. J. (2011). Does human
capital matter? A meta-analysis of the relationship between human capital and firm
performance. Journal of Applied Psychology, 96(3), 443-456. doi:10.1037/a0022147
Curriculum Document: Automotive Electrician. (n.d.). Retrieved from
http://www.merseta.org.za/AutomotiveElectricianFullCurriculumandEASfor/tabid/245/Ite
mId/446/Default.aspx
Curriculum Document: Millwright. (n.d.). Retrieved from
http://www.merseta.org.za/Millwrightcurriculumforpubliccomment.aspx
Davies, R. (2012). Launch of manufacturing competitiveness enhancement programme. Retrieved
from http://www.thedti.gov.za/delegationpeechdetail.html/
Dayan, K., Fox, S., & Kasten, R. (2008). The preliminary employment interview as a predictor of
assessment center outcomes. International Journal of Selection and Assessment, 16(2), 102–
111. doi:10.1111/j.1468-2389.2008.00415.x
284
Deary, I. J., Strand, S., Smith, P., & Fernandes, C. (2007). Intelligence and educational
achievement. Intelligence, 35, 13-21. doi:10.1016/j.intell.2006.02.001
DeCenzo, D. A., & Robbins, S. P. (2007). Fundamentals of human resource management.
Chichester: John Wiley & Sons.
De Guzman, A. B., & Ok Choi, K. (2013). The relations of employability skills to career
adaptability among technical school students. Journal of Vocational Behavior, 82(3), 199-
207. doi:10.1016/j.jvb.2013.01.009
De Kock, P. (2012). Skills drive needed for the auto industry. Retrieved from
http://www.mediaclubsouthafrica.com/economy and business.html/
De Lange, R. (2017). R256.7 billion – the vehicle industry’s massive GDP contribution. Retrieved
from https://city-press.news24.com/Business/r2567-billion-the-vehicle-industrys-massive-
gdp-contribution-20170310
Delery, J. E., & Roumpi, D. (2017). Strategic human resource management, human capital and
competitive advantage: Is the field going in circles? Human Resource Management Journal,
27(1), 1-21. doi:10.1111/1748-8583.12137
Deloitte. (2009). A new era: Accelerating toward 2020 – an automotive industry transformed.
Retrieved from http://www.deloitte.com/assets/Dcom-SouthAfrica.pdf/
Deloitte. (2013). Enhancing manufacturing competitiveness in South Africa. Retrieved from
https://www2.deloitte.com/content/dam/Deloitte/dk/Documents/manufacturing/manufactur
ing-competitiveness-South-africa.pdf
Deloitte. (2015). South Africa: Investor’s handbook 2014/2015. Retrieved from
https://www2.deloitte.com/content/dam/Deloitte/za/Documents/tax/ZA_DTI-
InvestinginSA_2014-15.pdf
Deloitte. (2018). The rise of the social enterprise: 2018 Deloitte Global Human Capital Trends.
Retrieved from
https://www2.deloitte.com/content/dam/insights/us/articles/HCTrends2018/2018-
HCtrends_Rise-of-the-social-enterprise.pdf
Department of Higher Education and Training (DHET). (2011). Further education and training:
A guide to opportunities for further learning. Retrieved from
http://www.dhet.gov.za/Publications/Further%20Education%20and%20Training%20A%2
0guide%20to%20opportunities%20for%20further%20learning.pdf
285
Department of Higher Education and Training (DHET). (2012). Green paper for post-school
education and training. Pretoria, South Africa: DHET. Retrieved from
http://www.che.ac.za/sites/default/files/publications/DHET_green_paper_post_school_edu
cation_training.pdf
Department of Higher Education and Training (DHET). (2013). White paper for post-school
education and training. Pretoria, South Africa: DHET. Retrieved from
http://www.dhet.gov.za/SiteAssets/Latest%20News/White%20paper%20for%20post-
school%20education%20and%20training.pdf
Department: Higher Education and Training (DHET). (2014). National skills development strategy
111: Progress report 2011-2013. Pretoria, South Africa: DHET. Retrieved from
http://www.dhet.gov.za/LinkClick.aspx?fileticket=AOv8W%2Bm3xHI%3D&tabid=113
1
Department of Trade and Industry (DTI). (2015). Presentation on SA automotive sector. Retrieved
from http://www.dti.gov.za/parliament/2015/SA_Automotive_Sector.pdf/
Dess, G. G., & Shaw, J. D. (2001). Voluntary turnover, social capital and organizational
performance. Academy of Management Review, 26(3), 446-456. Retrieved from
https://www.polyu.edu.hk/mm/jason/doc/Dess%20and%20Shaw%202001%20AMR.pdf
DeSimone, R. L., & Werner, J. M. (2012). Human resource development (6th ed.). Canada: South-
Western Cengage Learning.
De Soete, B., Lievens P., & Druart, C. (2013). Strategies for dealing with the diversity-validity
dilemma in personnel selection: Where are we and where should we go? Journal of Work
and Organizational Psychology, 29, 3-12. doi:10.5093/tr2013a2
Dilchert, S., & Ones, D. S. (2009). Assessment center dimensions: Individual differences
correlates and meta-analytic incremental validity. International Journal of Selection and
Assessment, 17(3), 254–270. doi:10.111/j.1468-2389.2009.00468.x
Duarte, J. (2017). Skilled young artisans needed. Retrieved from https://www.iol.co.za/pretoria-
news/skilled-young-artisans-needed-10816669
Duggan, T. (2017). Do sports help improve leadership skills? Retrieved from
https://www.livestrong.com/article/537884-do-sports-help-improve-leadership-skills/
Dustmann, C., & Schönberg, U. (2007). Apprenticeship training and commitment to training
provision. Retrieved from
286
http://www.educationeconomics.uzh.ch/conferences/archive/IntConference/Download/Dus
tmann.pdf
DuRose, L., & Stebleton, M. J. (2016). Lost in translation: Preparing students to articulate the
meaning of a college degree. Journal of College & Character, 17(4), 271–277.
doi:10.1080/2194587X.2016.1230759
Du Toit, R., & Roodt, J. (2008). Engineering professionals: Crucial key to development and
growth in South Africa. Retrieved from
http://www.labour.gov.za/DOL/downloads/documents/research-
documents/Engineering_DOL_long%20report_19Sept.pdf
Dreher, G. F., & Ryan, K. C. (2000). Prior work experience and academic achievement among
first-year MBA students. Research in Higher Education, 41(4), 505-525.
doi:10.1023/A:1007036626439
Drucker, P. (1946). The concept of the corporation. New York, NY: John Day.
Edwards, J. E., Scott, J. C., & Raju, N. S. (2003). The human-resources program-evaluation
handbook. Thousand Oaks: Sage.
Edwards, J. E., Scott, J. C., & Raju, N. S. (2007). Evaluating human resources programs: A six-
phase approach for optimizing performance. San Francisco: John Wiley & Sons.
Eichhorst, W., Rodríguez-Planas, N., Schmidl, R., & Zimmerman, K. F. (2015). A road map to
vocational education and training in industrialized countries (Discussion paper No. 7110).
Bonn, Germany: Institute for the Study of Labor. Retrieved from
http://repec.iza.org/dp7110.pdf
Elbaum, B. (1989). Why apprenticeship persisted in Britain but not in the United States. The
Journal of Economic History, 49(2), 337-349. Retrieved from
http://www.jstor.org/stable/2124067
El-Kot, G., & Leat, M. (2008). A survey of recruitment and selection practices in Egypt.
Education, Business and Society: Contemporary Eastern Issues, 1(3), 200-212.
doi:10.1108/17537980810909823
Employing apprentices (n.d.). What to look for in a potential apprentice. Retrieved from
https://www.employingapprentices.com.au/wp-
content/uploads/2015/05/TRA1001_PDF_3ci_v4.pdf
287
Eurich, T. L., Krause, D. E., Cigularov, K., & Thornton, G. C., III. (2009). Assessment centers:
Current practices in the United States. Journal of Business and Psychology, 24(4), 387-407.
doi:10.1007/s10869-009-9123-3
Evans, C., & Richardson, M. (2017). Enhancing graduate prospects by recording and reflecting on
part-time work. Industry and Higher Education, 31(5), 283-288.
doi:10.1177/0950422217715200
Evans-Klock, C. (2012). Upgrading informal apprenticeship: A resource guide for Africa. New
Delhi, India: International Labour Office. Retrieved from
http://www.ilo.org/skills/pubs/WCMS_171393/lang--en/index.htm/
Evans-Klock, C., & Dar, A. (2013). Towards a model apprenticeship framework: A comparative
analysis of national apprenticeship systems. New Delhi, India: International Labour
Organisation. Retrieved from http://www.ilo.org/wcmsp5/groups/public/---asia/---ro-
bangkok/---sro-new_delhi/documents/publication/wcms_234728.pdf
Evawoma-Enuku, U., & Mgbor, M. (2005). The National Directorate of Employment’s Open
Apprenticeship Scheme in Nigeria: New wine in old wineskins? Education + Training,
47(4/5), 325-336. doi:10.1108/00400910510601904
External Assessment Specifications Document: Automotive Electrician. (n.d.). Retrieved from
http://www.merseta.org.za/AutomotiveElectricianFullCurriculumandEASfor/tabid/245/Ite
mId/446/Default.aspx
External Assessment Specifications Document: Millwright. (n.d.). Retrieved from
http://www.merseta.org.za/Millwrightcurriculumforpubliccomment.aspx
Fairless, T. (2016). Germany’s apprenticeship system comes under attack. Retrieved from
http://www.wsj.com/articles/germanys-apprenticeship-system-comes-under-attack-
1476642363
Fazio, M., Fernández-Coto, R., & Ripani, L. (2016). Apprenticeships for the XXI century: A model
for Latin America and the Caribbean? Retrieved from
http://www.skillsforemployment.org/wcmstest4/idcplg?IdcService=GET_FILE&dID=243
635&dDocName=WCMSTEST4_182890&allowInterrupt=1.
Fernández-Aráoz, C. (2014, June). 21st-century talent spotting. Harvard Business Review.
Retrieved from https://hbr.org/2014/06/21st-century-talent-spotting
288
Forsblom, L., Negrini, L., Gurtner, J-L., & Schumann, S. (2016). Dropouts in Swiss vocational
education & the effect of training companies’ trainee selection methods. Journal of
Vocational Education & Training, 68(4), 399-415. doi:10.1080/13636820.2016.1222596
Fox, K. F. (2018). Leveraging a leadership development framework for career readiness. New
Directions for Student Leadership, 157, 13-26. doi:10.1002/yd.20276
Foxcroft, C., & Roodt, G. (2013). Introduction to psychological assessment in the South African
context (4th ed.). Cape Town, South Africa: Oxford University Press.
Francis, N. K., Hanna, G. B., Cresswell, A. B., Carter, F. J., & Cuschieri, A. (2001). The
performance of master surgeons on standard aptitude testing. The American Journal of
Surgery, 182(1), 30-33. Retrieved from https://www.ncbi.nlm.nih.gov/pubmed/11532411
Fraser, M. (2013). Design research in architecture: An overview. Litchfield: Ashgate Publishing.
Fraught, C. (2012). Total rewards: a study of artisan attraction and retention within a South
African context (Unpublished master’s thesis). University of Cape Town, Cape Town, South
Africa.
Fritzsche, B. A., & Brannick, M. T. (2002). The importance of representative design in judgment
tasks: The case of résumé screening. Journal of Occupational and Organizational
Psychology, 75(2), 163-169. doi:10.1348/09631790260098749
Fugate, M., Kinicki, A. J., & Ashforth, B. E. (2004). Employability: A psycho-social construct, its
dimensions, and applications. Journal of Vocational Behaviour, 65, 14-38.
doi:10.1016/j.jvb.2003.10.005
G20 Employment Working Group (G20ewg). (2012). Country experiences on quality
apprenticeships. Retrieved from
http://www.g20ewg.org/index.php/component/phocadownload/category/15-
apprenticeships?download=127: country-experiences-on-quality-apprenticeships
Gallagher, A. G., Leonard, G., & Traynor, O. J. (2009). Role and feasibility of psychomotor and
dexterity testing in selection for surgical training. Surgical Education, 79(3), 108-113.
doi:10.1111/j.1445-2197.2008.04824.x
Gallup Inc. (2014). Gallup‐Purdue index inaugural national report. Retrieved
from https://www.gallup.com/services/176768/2014-gallup-purdue-index-report.aspx
289
Gambin, L., & Hogarth, T. (2015). Factors affecting completion of apprenticeship training in
England. Journal of Education and Work, 29(4), 470-493.
doi:10.1080/13639080.2014.997679
Gambin, L., & Hogarth, T. (2017). Employers and apprenticeships in England: Costs, risks and
policy reforms. Empirical Research in Vocational Education and Training, 9(16), 1-22.
doi:10.1186/s40461-017-0060-5
García-Sánchez, F., Martínez-Béjar, R., Contreras, L., Fernández-Breis, J. T., & Castellanos-
Nieves, D. (2006). An ontology-based intelligent system for recruitment. Expert Systems with
Applications, 31(2), 248-263. doi:10.1016/j.eswa.2005.09.023
Gardner, H. (1999). Intelligence reframed. New York, USA: Basic Books.
Gardner, T. M., Wright, P. M., & Moynihan, L. M. (2011). The impact of motivation,
empowerment, and skill-enhancing practices on aggregate voluntary turnover: The
mediating effect of collective affective commitment. Personnel Psychology, 64, 315-350.
doi:10.1111/j.1744-6570.2011.01212.x
Gaugler, B. B., Rosenthal, D. B., Thornton, G. C., III., & Benson, C. (1987). Meta-analysis of
assessment center validity. Journal of Applied Psychology, 72(3), 493–511.
doi:10.1037/0021-9010.72.3.493
Ghebregiorgis, F., & Karsten, L. (2007). Human resource management and performance in a
developing country: The case of Eritrea. International Journal of Human Resource
Management, 18(2), 321-332. doi:10.1080/09585190601102547.
Giffi, C., McNelly, J., Dollar, B., & Carrick, G. (2014). The skills gap in U.S. manufacturing 2015
and beyond. Retrieved from
http://www.themanufacturinginstitute.org/~/media/DD8C9A2E99B34E89B2438453755E6
0E8/2015_Public_Perception_of_Manufacturing.pdf
Giffi, C., McNelly, J., Dollar, B., Carrick, G., Drew, M., & Gangula, B. (2015). Overwhelming
support: U.S. public opinions on the manufacturing industry. Retrieved from
http://www.themanufacturinginstitute.org/~/media/827DBC76533942679A15EF7067A70
4CD.ashx
Goastellec, G., & Ruiz, G. (2015). Finding an apprenticeship: Hidden curriculum and social
consequences. Frontiers in Psychology, 6(1441). doi:10.3389/fpsyg.2015.01441
290
Gomm, R. (2008). Social research methodolgy: A critical introduction. New York, NY: Palgrave
MacMillan.
Government Gazette (2014a). National Scarce Skills List (Vol. 380, No. 37678). Retrieved from
https://www.greengazette.co.za/pages/national-gazette-37678-of-23-may-2014-vol-
587_20140523-GGN-37678-004.pdf
Government Gazette (2014b). Skills or qualifications determined to be critical for the Republic of
South Africa in relation to an application for critical skills visa or permanent residence
permit (Vol. 588, No. 37716). Retrieved from
https://www.vfsglobal.com/dha/southafrica/pdf/immigration_critical_skills_160416.pdf
Government Gazette (2015a). Draft national artisan development trade test pass rate and quality
improvement strategy (Vol. 602, No. 39077). Retrieved from
http://www.dhet.gov.za/LegislationActs/Draft%20National%20Artisan%20Development
%20Trade%20Test%20Pass%20Rate%20and%20Quality%20Improvement%20Strategy
%202015.pdf
Government Gazette (2015b). Trade test regulations (Vol. 376, No. 38758). Retrieved from
https://www.gov.za/sites/default/files/38758_rg10425_gon376.pdf
Government Gazette (2018). National list of occupations in high demand: 2018 (Vol. 636, No.
41728). Retrieved from
http://www.dhet.gov.za/Information%20Systems%20Coordination/GAZETTE.pdf
Gray, D., & Wragg, E. (2015). Education in Brazil: laying the foundations for change. Retrieved
from http://www.the-report.com/site/assets/files/4360/brazil2015_guardian_g_64_mail.pdf.
Gravetter, F. J., & Forzano, L. B. (2015). Research methods for the behavioural sciences (8th ed.).
Wadsworth: South-Western Cengage Learning.
Greenidge, D., Alleyne, P., Parris, B., & Grant, S. (2012). A comparative study of recruitment and
training practices between small and large businesses in an emerging market economy: The
case of Barbados. Journal of Small Business and Enterprise Development, 19(1), 164-182.
doi:10.1108/14626001211196460
Griffin, F. J., & Fox, J. (2000). Facing up to the labor shortage. Compensation and Benefits Review,
32(5), 34-39. doi:10.1177/08863680022098019
Grigoryev, P. (2006). Hiring by competency models. The Journal for Quality and Participation,
29(4), 16-18. Retrieved from
291
https://search.proquest.com/openview/cc18d0ca96e55b6858e750d7b18d5e9c/1?pq-
origsite=gscholar&cbl=37083
Grobler, P. A., Wärnich, S., Carrell, M. R., Elbert, N. F., & Hatfield, R. D. (2011). Human resource
management in South Africa (4th ed.). Hampshire, UK: South-Western Cengage Learning.
Grobler, P. A., Wärnich, S., & Mokobane, G. (2018). Human resource management practices in
South Africa. Retrieved from
https://www.researchgate.net/publication/254381276_Managing_Human_Resources_in_S
outh_Africa_A_Guide_for_Internationals
Grosvenor, H. (2016). Selecting apprentices: lessons we can learn from Germany. Retrieved from
https://www.cut-e.com/fileadmin/user_upload/cut-
e_in_the_media/ART_Selecting_apprentices_lessons_C1138INT_6139-web.pdf
Grosvenor, H. (2017). Five steps to create value from your apprenticeship programme. Retrieved
from https://www.cut-
e.com/fileadmin/user_upload/Articles/Five_Steps__single_pages_.pdf
Gump, S. E. (2006). Who gets the job? Recruitment and selection at a ‘second-generation’
Japanese automotive components transplant in the US. International Journal of Human
Resource Management, 17(5), 842-859. doi:10.1080/09585190600640877
Hair, J. F., Celsi, M. W., Money, A. H., Samouel, P., & Page, M. J. (2011). Essentials of business
research (2nd ed.). New York: M. E. Sharpe.
Hall, J., & Sandelands, E. (2009). Addressing South Africa’s engineering skills gaps. Education
+ Training, 51(3), 215-219. doi:10.1108/00400910910960759
Hamari, J., Koivisho, J., & Sarsa, H. (2014). Does gamification work? A literature review of
empirical studies on gamification. Retrieved from https://people.uta.fi/~kljuham/2014-
hamari_et_al-does_gamification_work.pdf
Harris, M. M. (1999). What is being measured? In R. W. Eder & M. M. Harris (Eds.), The
Employment Interview Handbook (pp. 143-147). Thousand Oaks, California: Sage
Publications Incorporated.
Harzallah, M., Leclère, M., & Trichet, F. (2002). CommonCV: Modelling the competencies
underlying a curriculum vitae. SEKE '02 proceedings of the 14th international conference
on software engineering and knowledge engineering. Ischia, Italy, 65-71.
doi:10.1145/568760.568773
292
Hattrup, K., & Schmitt, N. (1990). Prediction of trades apprentices’ performance on job sample
criteria. Personnel Psychology, 43(3), 453-466. doi:10.1111/j.1744-6570.1990.tb02392.x
Hauschildt, U. (2016). COMET South Africa: Final report and documentation of test results of
electricians, mechatronics, motor mechanics, and welders including an analysis of test
motivation, vocational identity and occupational commitment, pre-test analysis for
fabricators and millwrights and an analysis of pre-tests for teachers and trainers. Retrieved
from
http://www.merseta.org.za/Portals/0/artisan_development/Final%20COMET%20Report%2
0-%20December%202016.pdf
Hausknecht, J. P., Day, D. V., & Thomas, S. C. (2004). Applicant reactions to selection
procedures: An updated model and meta-analysis. Personnel Psychology, 75(3), 639-683.
doi:10.1111/j.1744-6570.2004.00003.xn
Hawkes, B., Cek, I., & Handler, C. (2017). The gamification of employee selection tools. In J.
Scott, D. Bartram, & D. Reynolds (Eds.), Next generation technology-enhanced assessment:
Global perspectives on occupational and workplace testing (Educational and psychological
testing in a global context) (pp. 288-314). Cambridge: Cambridge University Press.
Health Professions Council of South Africa (HPCSA). (2006). Policy on the classification of
psychometric measuring devices, instruments, methods and techniques. Retrieved from
http://www.hpcsa.co.za/downloads/psycho_policy/form_208.pdf/
Health Professions Council of South Africa (HPCSA). (2010). List of tests classified as being
psychological tests. Retrieved from
http://www.hpcsa.co.za/downloads/psychology/psychom_form_207.pdf/
Heaven, P. C. L., & Ciarrochi, J. (2012). When IQ is not everything: Intelligence, personality and
academic performance at school. Personality and Individual Differences, 53(4), 518-522.
doi:10.1016/j.paid.2012.04.024
Heraty, N., & Morley, M. (1998). In search of good fit: policy and practice in recruitment and
selection in Ireland. Journal of Management Development, 17(9), 662-685.
doi:10.1108/02621719810244490
Hessler, K., & Ritchie, H. (2006). Recruitment and retention of novice faculty. Journal of Nursing
Education, 45(5). Retrieved from https://www.healio.com/journals/jne/2006-5-45-
293
5/%7B2bb2c5d5-bf78-476c-ad0c-24fabb463500%7D/recruitment-and-retention-of-novice-
faculty
Hill, A., & Dalley-Trim, L. (2008). Hanging in there: What makes a difference in the first year of
an apprenticeship. Youth Studies Australia, 27(1), 36-42. Retrieved from http://0-
web.a.ebscohost.com.wam.seals.ac.za/ehost/pdfviewer/pdfviewer?vid=5&sid=740dc5a2-
3487-4f22-8d5f-a60e4adc9c9b%40sdc-v-sessmgr05
Hoffman, M., Kahn, L. B., & Li, D. (2018). Discretion in hiring. The Quarterly Journal of
Economics, 133(2), 765-800. doi:10.1093/qje/qjx042
Holburn, P. T. (1992). Recommendations for fair and unbiased apprentice selection. A NTB/HSRC
report. Pretoria, South Africa: Human Sciences Research Council. Retrieved from
https://files.eric.ed.gov/fulltext/ED354369.pdf
Horn, D. (2016). The effectiveness of apprenticeship training: A within-track comparison of
workplace-based and school-based vocational training in Hungary. Social Science Research,
55, 139-154. doi:10.1016/j.ssresearch.2015.09.002
Hosmer, D.W., Lemeshow, S., & May, S. (2011). Applied survival analysis: Regression modelling
of time-to-event data (2nd ed.). Chichester: John Wiley & Sons. doi:10.1002/9780470258019
Hough, L. M., Oswald, F. L., & Ployhart, R. E. (2001). Determinants, detection and amelioration
of adverse impact in personnel selection procedures: Issues, evidence and lessons learned.
International Journal of Selection and Assessment, 9(1-2), 152-154. doi:10.1111/1468-
2389.00171
Houston, J., Booyse, C., & Burroughs, E. (2010). The ‘F’ in NC(V): Benchmarking common
subjects in the NSC and the NC(V). Retrieved from
http://www.umalusi.org.za/docs/assurance/2010/f_ncv_report.pdf.
Huffcutt, A. L., Conway, J. M., Roth, P. L., & Stone, N. J. (2001). Identification and meta-analytic
assessment of psychological constructs measured in employment interviews. Journal of
Applied Psychology, 86(5), 897-913. doi:10.1037//0021-9010.86.5.897
Hughes, J. C., & Rog, E. (2008). A strategy for improving employee recruitment, retention and
engagement within hospitality organizations. International Journal of Contemporary
Hospitality Management, 20(7), 743-757. doi:10.1108/09596110810899086
Hunter, J. E. (1986). Cognitive ability, cognitive aptitudes, job knowledge, and job performance.
Journal of Vocational Behavior, 29(3), 340-362. doi:10.1016/0001-8791(86)90013-8
294
Husain, M. Y., Mokhtara, S. B., Ahmada, A. A., & Mustapha, R. (2010). Importance of
employability skills from employers’ perspective. Procedia Social and Behavioral Sciences,
7(C), 430–438. doi:10.1016/j.sbspro.2010.10.059
Huselid, M. A. (1995). The impact of human resource management practices on turnover,
productivity, and corporate financial performance. The Academy of Management Journal,
38(3), 635-672. Retrieved from
http://www.markhuselid.com/pdfs/articles/1995_AMJ_HPWS_Paper.pdf
Iacobucci, D., & Churchill, G. A. (2010). Marketing research methodological foundations (10th
ed.). Canada: South-Western Cengage Learning.
Ifill, S., & Moreland, N. (1999). Auditing recruitment and selection using generic benchmarking:
a case study. The TQM Magazine, 11(5), 333-341. doi:10.1108/09544789910282435
Imdorf, C., & Leemann, R. J. (2012). New models of apprenticeship and equal opportunity. Do
training networks enhance fair hiring practices? Journal of Vocational Education &
Training, 64(1), 57-74. doi:10.1080/13636820.2011.622445
Imdorf, C. (2017). Understanding discrimination in hiring apprentices: How training companies
use ethnicity to avoid organisational trouble. Journal of Vocational Education & Training,
69(3), 405-423. doi:10.1080/13636820.2016.1278397
International Organization of Motor Vehicle Manufacturers (OICA). (2018a). The world’s
automotive industry: Some key figures. Retrieved from http://oica.net/wp-
content/uploads/2007/06/oica-depliant-final.pdf
International Organization of Motor Vehicle Manufacturers (OICA). (2018b). World Motor
Vehicle Production – Quarters 2017-2018. Retrieved from
https://cdn.lightstoneauto.co.za/NAAMSA/OICA-WORLDPRO-03months2018.pdf
Jackson, S. E., & Schuler, R. S (1995). Understanding human resource management in the context
of organizations and their environments. In J. T. Spence, J. M. Darley, & D. J. Foss (Eds.).
Annual Review of Psychology, 46, 237-264. Palo Alto, CA: Annual Reviews
Jackson, S. E., Schuler, R. S., & Rivero, J. C. (1989). Organizational characteristics as predictors
of personnel practices. Personnel Psychology, 42, 727-786. doi:10.1111/j.1744-
6570.1989.tb00674.x
Jacobs, P. (2015). Creating pathways to enhance college to work transition using COMET
competence diagnostic model to assess and develop occupational competence and
295
commitment in Technical Vocational Education and Training (TVET). Proceedings of the
Sixth Research Conference of the International Network for Innovative Apprenticeships
(2015). Retrieved from http://www.inap.uni-
bremen.de/dl/inap%20conference%20proceedings%202015.pdf
Jacoby, T. (2014). Why Germany is so much better at training its workers. Retrieved from
http://www.theatlantic.com/business/archive/2014/10/why-germany-is-so-much-better-at-
training-its-workers/381550/
Janse van Rensburg, D., Visser, M., Wildschut, A., Roodt, J. A., & Kruss, G. (2012). A technical
report on learnership and apprenticeship population databases in South Africa: Patterns
and shifts in skills formation. Pretoria, South Africa: Human Sciences Research Council.
Retrieved from http://www.hsrc.ac.za/en/research-data/ktree-doc/9841
Jayan, P. A. (2012). BRICS: Advancing cooperation and strengthening regionalism. India
Quarterly: A Journal of International Affairs, 68(4), 363-384.
doi:10.1177/0974928412467249.
Jenkins, A., & Wolf, A. (2002). Why do employers use selection tests? Evidence from British
workplaces. Retrieved from
http://eprints.lse.ac.uk/19503/1/Why_Do_Employers_Use_Selection_Tests_Evidence_fro
m_British_Workplaces.pdf
Jiang, K., Lepak, D. P., Hu, J., & Baer, J. C. (2012). How does human resource management
influence organizational outcomes? A meta-analytic investigation of mediating mechanisms.
Academy of Management Journal, 55(6), 1264-1294. doi:10.5465/amj.2011.0088
Joffe, A., Kaplan, D. E., Kaplinsky, R., & Lewis, D. (1995). Improving manufacturing
performance: The report of the ISP. Cape Town, South Africa: UCT Press.
Johnson, W., & Bouchard, T. J. (2005). The structure of human intelligence: It is verbal,
perceptual, and image rotation (VPR), not fluid and crystallized. Intelligence, 33(4), 393-
416. doi:10.1016/j.intell.2004.12.002
Johnson, R. B., & Christensen, L. (2014). Quantitative, qualitative, and mixed approaches (5th
ed.). Los Angeles: Sage Publication.
Joint Initiative on Priority Skills Acquisition (JIPSA). (2010). Growing priority skills in South
Africa: Final report on JIPSA. Pretoria, South Africa: Human Resource Development
296
Council of South Africa. Retrieved from http://hrdcsa.org.za/wp-content/uploads/research-
reports/Consolidated%20JIPSA%20close%20out%20report_0.pdf
Jordaan, N., & Barry, M. L. (2009). Investigating the reasons for lack of skilled artisans in South
Africa: The perspective of artisans. South African Journal of Industrial Engineering, 20(1),
173-184. Retrieved from
http://www.scielo.org.za/scielo.php?script=sci_arttext&pid=S2224-
78902009000100015&lng=en&tlng=en
Joy, M. M. (2017). An investigation into gamification as a tool for enhancing recruitment process.
Retrieved from
https://www.researchgate.net/publication/318899587_An_investigation_into_gamification
_as_a_tool_for_enhancing_recruitment_process
Juhdi, N., Pa’Wan, F., Othman, N. A., & Moksin, H. (2010). Factors influencing internal and
external employability of employees. Business and Economics Journal, 11, 1-10. Retrieved
from https://s3.amazonaws.com/academia.edu.documents/33382929/BEJ-
11_Vol2010.pdf?AWSAccessKeyId=AKIAIWOWYYGZ2Y53UL3A&Expires=15338182
22&Signature=mbHvZa9Y2S0iOKFtfvTpHmCZtSI%3D&response-content-
disposition=inline%3B%20filename%3DFactors_Influencing_Internal_And_Externa.pdf
Junlan, J. (2013). Rationality, reality and legitimacy research on modern apprenticeship of
vocational education in China (Unpublished Doctoral thesis). Beijing Normal University:
Peking, China.
Juul, I., & Jørgensen, C. H. (2011). Challenges for the dual system and occupational self-
governance in Denmark. Journal of Vocational Education and Training, 63(3), 289-303.
doi:10.100/13636820.2011.560393
Kaak, S. R., Feild, H. S., Giles, W. F., & Norris, D. R. (1998). The weighted application blank: A
cost-effective tool that can reduce employee turnover. Cornell Hotel and Restaurant
Administration Quarterly, 39(2), 18-24. doi:10.1177/001088049803900204
Kahlen, C. (2016). Vocational training in Germany. Retrieved from http://www.make-it-in-
germany.com/en/for-qualified-professionals/training-learning/training/vocational-training-
in-germany-how-does-it-work
Kalugina, E., & Shvydun, S. (2014). An effective personnel selection model. Procedia Computer
Science, 31, 1102-1106. doi:10.1016/j.procs.2014.05.365
297
Kartsonaki, C. (2016). Survival analysis. Diagnostic Histopathology, 22(7), 263-270.
doi:10.1016/j.mpdhp.2016.06.005
Kazalin, F., Hamzah, R., & Bakar, A. (2009). Employability skills among students of technical
and vocational training centers in Malaysia. European Journal of Social Sciences, 9(1), 147-
160. Retrieved from
https://www.researchgate.net/profile/Abrahim_Bakar/publication/228768574_Employabilit
y_Skills_Among_the_Students_of_Technical_and_Vocational_Training_Centers_in_Mala
ysia/links/563db46f08aec6f17dd835bf.pdf
Keese, M. (2014). Improving access and making apprenticeships valuable for youth and attractive
to employers. Retrieved from
https://www.oecd.org/els/emp/M_KEESE_Apprenticeships.pdf
Kell, H. J., & Lubinski, D. (2013). Spatial ability: A neglected talent in educational and
occupational settings. Roeper Review, 35(4), 219-230. doi:10.1080/02783193.2013.829896
Kleynhans, E. P. J. (2006). The role of human capital in the competitive platform of South African
industries. South African Journal of Human Resource Management, 4(3), 55-62. Retrieved
from https://journals.co.za/content/sajhrm/4/3/EJC95839
Komatsu (2013). Komatsu Apprentice Development Program. Retrieved from
http://www.komatsu.com.au/AboutKomatsu/NewsAndPublications/Brochures/General%20
Brochures/Apprenticeship%20Program/Apprenticeship%20Program_AUG14.pdf
König, C. J., Klehe, U-C., Berchtold, M., & Kleinmann, M. (2010). Reasons for being selective
when choosing personnel selection procedures. International Journal of Selection and
Assessment, 18(1), 17–27. doi:10.1111/j.1468-2389.2010.00485.x
Kraak, A. (2003). HRD and the skills crisis. In A. Kraak (Eds.), Human resources development
review 2003: Education, employment and skills in South Africa. Pretoria, South Africa:
Human Sciences Research Council. Pretoria, South Africa: Human Sciences Research
Council.
Kraak, A. (2012). Differentiation in the post-school sector. (LMIP Working Paper No. 16).
Pretoria, South Africa: Human Sciences Research Council. Retrieved from
http://www.lmip.org.za/sites/default/files/documentfiles/16%20Kraak%20%20Differentiati
on.pdf/
298
Kramer, M., Tallant, K., Goldberger, A. E., & Lebus, F. (2015). The global STEM paradox. New
York, NY, The New York Academy of Sciences. Retrieved from
https://www.fsg.org/publications/global-stem-paradox#download-area
Krause, D. E., & Gebert, D. (2003). A comparison of assessment center practices in organizations
in German-speaking regions and the United States. International Journal of Selection and
Assessment, 11(4), 297–312. doi:10.1111/j.0965-075X.2003.00253.x
Krause, D. E., Rossberger, R. J., Dowdeswell, K., Venter, N., & Joubert, T. (2011). Assessment
practices in South Africa. International Journal of Selection and Assessment, 19(3), 262-
275. doi:10.1111/j.1468-2389.2011.00555.x
Krause, D. E., & Thornton, G. C. II (2009). A cross-cultural look at assessment center practices:
A survey in Western Europe and Northern America. Applied Psychology: An International
Review, 58(4), 557–585. doi:10.1111/j.1464-0597.2008.00371.x
Krishnaswami, O., & Satyaprasad, B. (2010). Business research methods. Retrieved from
https://ebookcentral.proquest.com
Kruss, G., Wildschut, A., Janse van Rensburg, D., Visser, M., Haupt, G., & Roodt, J. (2012).
Developing skills and capabilities through the learnership and apprenticeship pathway
systems. Retrieved from http://www.hsrc.ac.za/en/research-data/view/5675
Kruss, G., Wildschut, A., Janse van Rensburg, D., Visser, M., Haupt, G., & Roodt, J. (2014).
Learnerships and apprenticeships: Key mechanisms for skills development and capability
building in South Africa. Retrieved from http://www.hsrc.ac.za/en/research-data/ktree-
doc/13717
Kuhnert, F., Stűrmer, C., & Koster, A. (2018). Five trends transforming the automotive industry.
Retrieved from https://www.pwc.at/de/publikationen/branchen-und-
wirtschaftsstudien/eascy-five-trends-transforming-the-automotive-industry_2018.pdf
Kuncel, N. R., & Hezlett, S. A. (2007). Standardized tests predict graduate students’ success.
Science, 315(5815), 1080-1081. doi:10.1126/science.1136618
Kuncel, N. R., & Hezlett, S. A. (2010). Fact and fiction in cognitive ability testing for admissions
and hiring decisions. Current Directions in Psychological Science, 19(6), 339-345.
doi:10.1177/0963721410389459
299
Kuncel, N. R., Ones, D. S., & Sackett, P. R. (2010). Individual differences as predictors of work,
educational, and broad life outcomes. Personality and Individual Differences, 49(4), 331-
336. doi:10.1016/j.paid.2010.03.042
Kusek, J. Z., & Rist, R. C. (2004). Ten steps to a results-based monitoring and evaluation system.
Washington DC: the World Bank. Retrieved from https://www.oecd.org/dac/peer-
reviews/World%20bank%202004%2010_Steps_to_a_Results_Based_ME_System.pdf
Kwiatkowski, R. (2003). Trends in organisations and selection: An introduction. Journal of
Managerial Psychology, 18(5), 382-394. doi:10.1108/02683940310483991.
Laberge, M., Calvet, B., Fredette, M., Tabet, N., Tondoux, A., Bayard, D., & Breslin, C. (2016).
Unexpected events: learning opportunities or injury risks for apprentices in low-skilled jobs?
A pilot study. Safety Science, 86, 1-9. doi:10.1016/j.ssci.2016.02.005
Lachu, S. K. (2014). Gamification: the future of talent profiling. Retrieved from
http://mystarjob.com/articles/story.aspx?file=/2014/3/22/mystarjob_careerguide/14547588
&sec=mystarjob_careerguide
Lalor, M., & Taku, S. (2013). Repositioning the South African investment case. Retrieved from
http://www.zuidafrika.nl/viewer/file.aspx?fileinfoID=360
Lance, C. E., Lambert, T. A., Gewin, A. G., Lievens, F., & Conway, J. M. (2004). Revised
estimates of dimension and exercise variance components in assessment center postexercise
dimension ratings. Journal of Applied Psychology, 89(2), 377-385. doi:10.1037/0021-
9010.89.2.377
Langner, M. (2015). Increasing efficiency in apprentice selection with online assessment. Case
study: Meiko. Retrieved from https://www.tts-
talent.com/images/2015/BlogDocs/Meiko%20case%20study.pdf
Lehohla, P. (2015). Census 2011: Population dynamics in South Africa. Retrieved from
http://www.statssa.gov.za/publications/Report-03-01-67/Report-03-01-672011.pdf
Lehmann, W. (2000). Is Germany’s dual system still a model for Canadian youth apprenticeship
initiatives? Canadian Public Policy, 26(2), 225-240. Retrieved from
http://qed.econ.queensu.ca/pub/cpp/June2000/Lehmann.pdf
Lene, A., & Cart, B. (2018). Apprenticeships, mobility and wages an investigation on French data.
International Journal of Manpower, 39(1), 166-186. doi:10.1108/IJM-05-2016-0105
300
Lengnick-Hall, M., & Lengnick-Hall, C. (2003). HR’s role in building relationship networks.
Academy of Management Executive, 17(4), 53-63. Retrieved from
http://www.jstor.org/stable/4166006
Lepak, D. P., Liao, H., Chung, Y., & Harden, E. E. (2006). A conceptual review of human resource
management systems in strategic human resource management research. In J. J. Martocchio
(Ed.). Research in Personnel and Human Resource Management, 25, 217–271. Greenwich,
CT: JAI.
Lepak, D. P., & Snell, S. A. (1999). The human resource architecture: Toward a theory of human
capital allocation and development. Academy of Management Review, 24(1), 31-48.
Retrieved from http://www.jstor.org/stable/259035
Lepak, D. P., & Snell, S. A. (2002). Examining the human resource architecture: The relationships
among human capital, employment, and human resource configurations. Journal of
Management, 28(4), 517-543. doi:10.1016/S0149-2063(02)00142-3
Lerman, R. I., & Okoli, E. A. (Eds.). (2017). Modern apprenticeships: Widening their scope,
sustaining their quality. Proceedings of the Seventh Research Conference of the
International Network for Innovative Apprenticeships (2017). Retrieved from
http://www.inap.uni-bremen.de/dl/inap%20conference%20proceedings%202017.pdf
Leung-Syke, K. (2016). Making apprenticeships work for young women. Retrieved from
https://www.youngwomenstrust.org/assets/0000/2906/Making_Apprenticeships_Work_for
_Young_Women.pdf/
Lewis, R. E., & Heckman, R. J. (2006). Talent management: A critical review. Human Resource
Management Review, 16, 139-154. doi:10.1016/j.hrmr.2006.03.001
Li, J., Li, M., & Su, L. (2014). Case study of accounting ‘modern apprenticeship’ in vocational
school in China. International Journal of Education and Research, 2(7), 293-300. Retrieved
from http://www.ijern.com/journal/July-2014/24.pdf
Lievens, F. (2002). Trying to understand the different pieces of the construct validity puzzle of
assessment centers: An examination of assessor and assessee effects. Journal of Applied
Psychology, 87(4), 675–686. doi:10.1037//0021-9010.87.4.675
Lievens, F., & Conway, J. M. (2001). Dimension and exercise variance in assessment center
scores: A large-scale evaluation of multitrait-multimethod studies. Journal of Applied
Psychology, 86(6), 1202-1222. doi: 10.1037/0021-9010.86.6.1202
301
Lievens, F., Decaesteker, C., Coetsier, P., & Geirnaert, J. (2001). Organisational attractiveness for
prospective applicants: A person-organisation fit perspective. Applied Psychology: An
International Review, 50(1), 30-51. Retrieved from
https://ink.library.smu.edu.sg/cgi/viewcontent.cgi?article=6654&context=lkcsb_research
Lievens, F., Harris, M. M., Van Keer, E., & Bisqueret, C. (2003). Predicting cross-cultural training
performance: The validity of personality, cognitive ability, and dimensions measured by an
assessment center and a behavioral description interview. Journal of Applied Psychology,
88(3), 476-489. doi:10.1037/0021-9010.88.3.476
Lievens, F., Van Dam, K., & Anderson, N. (2002). Recent trends and challenges in personnel
selection. Personnel Selection, 31(5), 580-601. doi:10.1108/0048348021043877
Liu, Y., Combs, J. G., Ketchen, D. J., & Ireland, R. D. (2007). The value of human resource
management for organizational performance. Business Horizons, 50, 503-511.
doi:10.1016/j.bushor.2007.07.002
Lodovici, M. S., Comi, S., Origi, F., Patrizio, M., Torchio, N., Speckesser, S., & Montalt, J., V.
(2013). The effectiveness and costs-benefits of apprenticeships: Results of the quantitative
analysis. Retrieved from http://ec.europa.eu/social/BlobServlet?docId=11352&langId=en
López-Cabrales, A., Real, J. C., & Valle, R. (2011). Relationships between human resource
management practices and organizational learning capability: The mediating role of human
capital. Personnel Review, 40(3), 344-363. doi:10.1108/00483481111118658
Lou, W.Y., & Lan, K.G. (1998). A note on the Gehan-Wilcoxon statistic. Communications in
Statistics - Theory and Methods, 27(6), 1453-1459. doi:10.1080/03610929808832169
Lough, J., & Ryan, M. (2010). Research note: Psychological profiling of Australian police officers:
A three-year examination of post-selection performance. International Journal of Police
Science and Management, 12(3), 480-486. doi:10.1350/ijps.2010.12.3188laut
Louw, J. (2012). Programme evaluation: Can it improve human resource management practice?
South African Journal of Human Resource Management, 10(3), Art. #428, 5 pages.
doi:10.1402/sajhrm.v10i3.428
Louw, G. (2013). Exploring recruitment and selection trends in the Eastern Cape. South African
Journal of Human Resource Management, 11(1), 1-10. doi:10.4102/ sajhrm.v11i1.319
Louw-Potgieter, J. (2012). Evaluating human resource interventions. South African Journal of
Human Resource Management, 10(3), Art. #420, 6 pages. doi:10.4102/ sajhrm.v10i3.420
302
Lovender, P. (2015). Why apprentices drop out in Australia and the policy implications.
Proceedings of the Sixth Research Conference of the International Network for Innovative
Apprenticeships (2015). Retrieved from http://www.inap.uni-
bremen.de/dl/inap%20conference%20proceedings%202015.pdf
Luo, D., Thompson, L. A., & Detterman, D. K. (2003). The causal factor underlying the correlation
between psychometric g and scholastic performance. Intelligence, 31, 67-83.
doi:10.1016/S0160-2896(02)00113-7
Macpherson, R., & Stanovich, K. E. (2007). Cognitive ability, thinking dispositions, and
instructional set as predictors of critical thinking. Learning and Individual Differences, 17,
115-127. doi:10.1016/j.lindif2007.05.003
Mahembe, E. (2012). AATP post trade test tracer study: Final Report. Pretoria, South Africa:
Underhill Corporate Solutions. Retrieved from
http://www.merseta.org.za/artisandevelopment.asp/
Malcomson, J. M., Maw, J. W., & McCormick, B. (2003). General traning by firms, apprentice
contracts, and public policy. European Economic Review, 47, 197-227. doi:10.1016/S0014-
2921(02)00207-6
ManpowerGroup (2016). Talent shortage survey 2016/2017. Retrieved from
http://www.manpowergroup.com/talent-shortage-2016/
Manuel, T. (2011). National development plan: Vision for 2030. Retrieved from
http://www.npconline.co.za/medialib/downloads/home/NPC%20National%20Developmen
t%20Plan%20Vision%202030%20-lo-res.pdf/
Markes, I. (2005). A review of literature on employability skill needs in engineering. European
Journal of Engineering Education, 31(6), 637-650. doi:10.1080/03043790600911704
Martin, J. (2016, April). Lead students to high-paying jobs and lower debt through apprenticeships.
Tech Directions. Retrieved from
http://www.careertechpa.org/LinkClick.aspx?fileticket=ARKYqgVqog4%3D&tabid=115
&portalid=0&mid=658.
Mashilo, A. M. (2010). Changes in work and production organisation in the automotive industry
value chain (Unpublished master’s thesis). University of Witwatersrand, Johannesburg,
South Africa.
303
Masibigiri, V., & Nienaber, H. (2011). Factors affecting the retention of Generation X public
servants: An exploratory study. South African Journal of Human Resource Management,
9(1), 1-11 pages. doi:10.4102/sajhrm.v9i1.318
Mayer, M. J., Gordhan, S., Manxeba, R., Hughes, C., Feley, P., Maroc, C., Lolwana, P., & Nell,
M. (2011). Towards a youth employment strategy for South Africa. Development Planning
Division Working Paper Series No. 28, Development Bank of Southern Africa. Retrieved
from https://www.dbsa.org/EN/About-
Us/Publications/Documents/DPD%20No28.%20Towards%20a%20youth%20employment
%20strategy%20for%20South%20Africa.pdf
Mbatha, N., Wildschut, A., Mncwango, B., Ngazimbi, X., & Twalo, T. (2014). Towards
understanding the distinctive nature of artisan training: Implications for skills planning in
South Africa (LMIP Report No. 2). Pretoria, South Africa: Human Sciences Research
Council. Retrieved from
http://www.lmip.org.za/sites/default/files/documentfiles/HSRC%20LMIP%20Report%202
%20Web_0.pdf/
McCasland, J. L. (2015). Essays in development economics: Lessons from an apprentice
placement programme in Ghana. Retrieved from
https://cloudfront.escholarship.org/dist/prd/content/qt91k726n9/qt91k726n9.pdf
McFarland, L. A., Ryan, A. M., Sacco, J. M., & Kriska, S. D. (2004). Examination of structured
interview ratings across time: The effects of applicant race, rater race and panel composition.
Journal of Management, 30(4), 435-452. doi:10.1016/j.jm.2003.09.004
McFarland, L. A., Yun, G. J., Harold, C. M., Viera, L., & Moore, L. G. (2005). An examination
of impression management use and effectiveness across assessment centre exercises: The
role of competency demands. Personnel Psychology, 58(4), 949-980. doi:10.1111/j.1744-
6570.2005.00374.x
McHenry, R. (2001). Frames of mind: online psychometrics (panel debate), People Management,
14 June, p. 31. Retrieved from
http://www2.cipd.co.uk/pm/peoplemanagement/b/weblog/archive/2013/01/29/738a-2001-
06.aspx
304
Meiring, D., & Buckett, A. (2016). Best practice guidelines for the use of assessment centre
method in South Africa (5th ed.). South African Journal of Industrial Psychology, 42(1),
a1298. doi:10.4102/sajip.v42i1.1298
Meriac, J. P., Hoffman, B. J., Woehr, D. J., & Fleisher, M. S. (2008). Further evidence for the
validity of assessment center dimensions: A meta-analysis of the incremental criterion
related validity of dimension ratings. Journal of Applied Psychology, 93(5), 1042–1052.
doi:10.1037/0021-9010.93.5.1042
Merriam-Webster dictionary online. (n.d.). Retrieved from http://www.merriam-
webster.com/dictionary/evaluation
merSETA. (2009). Analysis of workplace skills plans (WSP) and annual training reports (ATR)
for merSETA member companies: 2005-2007. Retrieved from
http://www.merseta.org.za/innovation,researchanddevelopment.asp/
merSETA. (2014). Top 10 occupations pivotal 2014 revised. Retrieved from
http://www.merseta.org.za/Portals/0/documents/0merSETA%20Top%2010%20PIVOTAL
%20Occupations.pdf/
merSETA. (2016). Tracer study: Final report 30 March 2016. Retrieved from
http://www.lmip.org.za/document/tracer-study-final-report
Meyer, M. (2013). KPMG’s global automotive executive survey 2013. Retrieved from
http://www.kpmg.com/KZ/ru/IssuesAndInsights/ArticlesAndPublications/Documents/KP
MGs-Global-Automotive-Executive-Survey-2013.pdf/
Miller, L. (2005). Addressing gender segregation in apprenticeships in England. Education +
Training, 47(4/5), 283-297. doi:10.1108/00400910510601878
Mkentane, L. (2018, June 27). Mercedes-Benz SA in R9.47bn plant expansion plan. Business
Report. Retrieved from https://www.iol.co.za/business-report/companies/mercedes-benz-
sa-in-r947bn-plant-expansion-plan-15711721
Mlambo-Ngcuka, P. (2008). Joint Initiative on Priority Skills Acquisition (JIPSA): Report on
activities in 2007. Retrieved from http://www.thepresidency.gov.za/pebble.asp?relid=485/
Mohr, D., Müller, N., Krieg, A., Gao, P., Kaas, H., Krieger, A., & Hensley, R. (2013). The road
to 2020 and beyond: What’s driving the global automotive industry? Retrieved from
https://www.mckinsey.com/~/media/mckinsey/dotcom/client_service/Automotive%20and
%20Assembly/PDFs/McK_The_road_to_2020_and_beyond.ashx
305
Mohrenweiser, J. (2016). Recruitment and apprenticeship training. Industrielle Beziehungen,
23(1), 6-24. doi:10.1688/IndB-2016-01-Mohrenweiser
Mohrenweiser, J., & Zwick, T. (2009). Why do firms train apprentices? The net cost puzzle
reconsidered. Labour Economics, 16(6), 631-637. doi:10.1016/J.LABECO.2009.08.004
Molnar, M., Wang, B., & Gao, R. (2015). Assessing China's skills gap and inequalities in
education. OECD Economics Working Papers, No. 1220, OECD Publishing, Paris.
doi:10.1787/5js1j1805czs-en
Moodley, S., Morris, M., & Barnes, J. (2001). Unlocking value in the 'New Economy': the
implications of B2B E-commerce for South African apparel and automotive component
firms. Trade and Industrial Policy Strategies (TIPS) 2001 Annual Forum at Misty Hills,
Muldersdrift. doi:10.1.1.515.6531
Moon, Y. J., & Kym, H. G. (2006). A model for the value of intellectual capital. Canadian Journal
of Administrative Sciences, 23(3), 253-269. doi:10.111/j.1936-4490.2006.tb00630.x
Moothilal, R. (2017). National Association of Automotive Component and Allied Manufacturers
Newsletter, 53. Retrieved from
http://www.naacam.co.za/Portals/13/Documents/Newsletter%2053%20Digital.pdf
Morita, J. G., Lee, T. W., & Mowday, R. T. (1993). The regression-analog to survival analysis: A
selected application to turnover research. A selected application to turnover research.
Academy of Management Journal, 36(6), 1430-1464. doi:10.2307/256818
Moser, U. (2004). Jugendliche zwischen Schule und Berufsbildung. Eine Evaluation bei Schweizer
Grossunternehmen unter Berücksichtigung des internationalen Schulleistungsvergleich
PISA. Bern: h.e.p. Verlag. In C. Imdorf & R. J. Leemann (2012). New models of
apprenticeship and equal opportunity. Do training networks enhance fair hiring practices?
Journal of Vocational Education & Training, 64(1), 57-74.
doi:10.1080/13636820.2011.622445
Mottram, R., Clarke, A., & Downs, S. (1980). Recruiting apprentices: The use of the Job
Disposition Questionnaire. Journal of Occupational Psychology, 53, 265-279.
doi:10.1111/j.2044-8325.1980.tb00033.x
Mount, M. K., Oh, I.-S., & Burns, M. (2008). Incremental validity of perceptual speed and
accuracy over general mental ability. Personnel Psychology, 61(1), 113-139.
doi:10.1111/j.1744-6570.2008.00107.x
306
Muehlemann, S., Pfeifer, H., Walden, G., Wenzelmann, F., & Wolter, S. C. (2010). The financing
of apprenticeship training in the light of labour market regulations. Labour Economics, 17,
799-809. doi:10.1016/j.labeco.2010.04.006
Mueller, B., & Wolter, S. C. (2014). The role of hard-to-obtain information on ability for the
school-to-work transition. Empirical Economics, 46(4), 1447-1471. doi:10.1007/s00181-
013-0709-2
Mukora, J. (2008). Scarce and critical skills research report. Pretoria, South Africa: Department
of Labour. Retrieved from
http://www.lmip.org.za/sites/default/files/documentfiles//Artisans%20trades_DoL_Repor
t.pdf
Mukora, J., & Visser, M. M. (2008). Impact assessment of learnerships and apprenticeships:
Report for MerSETA. Retrieved from
http://www.merseta.org.za/Portals/0/MERSETA%20Learnerships%20and%20Apprentices
hips%20Impact%20Assessement.pdf/
Mulder, M., & Roelofs, E. (2012). A critical review of vocational education and training research
and suggestions for research agenda. Retrieved from http://www.mmulder.nl/wp-
content/uploads/2011/11/2012-Mulder-Roelofs-Critical-Review-of-VET-Research-and-
Research-Agenda.pdf
Muleya, V. R., Fourie, L., & Schlebusch, S. (2017). Ethical challenges in assessment centres in
South Africa. South African Journal of Industrial Psychology, 43(0), a1324.
doi:10.4102/sajip.v43i0.1324
Mummenthey, C., & du Preez, R. (2010). Implementing efficient and effective learnerships in the
construction industry. South African Journal of Industrial Psychology, 36(1), Art. #766, 11
pages. doi:10.4102/sajip.v36i1.766
Mummenthey, C., Kruss, G., & Wildschut, A. (2012). MerSETA case study 2011: Skills
development for the metal and related services sector. Retrieved from
http://www.hsrc.ac.za/en/research-data/ktree-doc/9837
Mustapha, R. B., & Greenan, J. P. (2002). The role of vocational education in economic
development in Malaysia: Educators’ and employers’ perspectives. Journal of Industrial
Teacher Education, 39(2). Retrieved from
http://scholar.lib.vt.edu/ejournals/JITE/v39n2/mustapha.html
307
Naidoo, M., & Hoque, M. E. (2017). Reducing youth unemployment beyond the Youth Wage
Subsidy: A study of Simtech apprentices. South African Journal of Human Resource
Management, 15(0), a845. doi:10.4102/sajhrm.v15i0.845
National Electrical and Communications Association (NECA) (2018). 5 things to know about the
apprentice pre-selection assessment. Retrieved from https://necaeducation.com.au/5-things-
to-know-about-the-apprentice-pre-selection-assessment/
National Apprenticeship Promotion Scheme (NAPS). (2016). Frequently asked questions.
Retrieved from http://msde.gov.in/assets/images/announcements/FAQ-NAPS.pdf
National Apprenticeship Service (NAS). (2017). Employer guide to apprentice recruitment.
Retrieved from
https://assets.publishing.service.gov.uk/government/uploads/system/uploads/attachment_d
ata/file/609449/Employer_Guide_February_2017.pdf
National Association of Colleges and Employers (NACE). (2016). Job outlook 2017 survey.
Retrieved from https://www.naceweb.org/mynace/job-outlook/
National Development Plan (NDP) 2030: Our future: make it work. Executive summary. (2012).
Retrieved from http://www.gov.za/sites/www.gov.za/files/Executive%20Summary-
NDP%202030%20-%20Our%20future%20-%20make%20it%20work.pdf
National Treasury. (2011). Confronting youth unemployment: Policy options for South Africa.
(Discussion Paper). Retrieved from
http://www.treasury.gov.za/documents/national%20budget/2011/Confronting%20youth%2
0unemployment%20-%20Policy%20options.pdf
Naude, M. J. (2009). Supply chain management challenges experienced by South African
automotive component manufacturers (Unpublished Doctoral thesis). University of South
Africa, Pretoria, South Africa.
Naude, M. J. (2013). Supply chain challenges in the South African automotive sector: do location,
size and age matter? South African Journal of Economic and Management Sciences, 16(4),
407-417. Retrieved from
http://www.scielo.org.za/scielo.php?script=sci_arttext&pid=S2222-34362013000400004
Naude, M. J., & O’Neill, C. (2011). The quest for survival in the South African automotive
industry: A supply chain perspective. Alternation, 18(1), 111-131. Retrieved from
http://alternation.ukzn.ac.za/Files/docs/18.1/07%20Nau%20FIN.pdf
308
Nel, P., Werner, A., Poisat, P., Sono, T., Du Plessis, A., & Ngalo, 0. (2011). Human resources
management (8th ed.). Cape Town, South Africa: Oxford University Press.
Nemanick, R. C. Jr., & Clark, E. M. (2002). The differential effects of extracurricular activities on
attributions in résumé evaluation. International Journal of Selection and Assessment, 10(3),
206–217. doi:10.1111/1468-2389.00210
Neuman, W. L. (2012). Basics of social research: Qualitative and quantitative approaches (3rd
ed.). New Jersey, USA: Pearson Education, Inc.
Nieuwenhuis, P., & Wells, P (Eds.). (2015). The global automotive industry. Retrieved from
https://media.wiley.com/product_data/excerpt/9X/11188023/111880239X-8.pdf
Nisbett, B. R. E. (2013). Schooling makes you smarter: What teachers need to know about IQ.
American Educator, 37(1), 10–19. Retrieved from
https://www.aft.org/sites/default/files/periodicals/Nisbett.pdf
Nkosi, B. (2012, November 12). Vocational educational not an ‘option for losers’. Mail &
Guardian. Retrieved from http://mg.co.za/article/2012-11-14-vocational-educational-not-
an-option-for-losers
Noe, R. A., Hollenbeck, J. R., Gerhart, B., & Wright, P. M. (2011). Fundamentals of human
resource management (4th ed.). New York, NY: McGraw-Hill/Irwin.
Nomvete, S., Patel, R., & Baleni, P. (2017). Sector skills plan update 2017/2018-2012/2022:
Promoting artisan development for employability. Retrieved from
http://www.merseta.org.za/Knowledgerepository/SECTORSKILLSPLANNING.aspx
Nunley, J. M., Pugh, A., Romero, N., & Seals, R. A. (2016). College major, internship experience,
and employment opportunities: Estimates from a résumé audit. Labour Economics, 38, 37-
46. doi:10.1016/j.labeco.2015.11.002
Nzama, L., De Beer, M., & Visser, D. (2008). Predicting work performance through selection
interview ratings and psychological assessment. South African Journal of Industrial
Psychology, 34(3), 39-47. Retrieved from https://core.ac.uk/download/pdf/43163726.pdf
Nzimande, P. (2012). Skills Development Act (97/1998): Trade test regulations, 2012
(Government Gazette No. 35625, Notice 685, 31 August 2012). Pretoria: Government
Printer.
309
Nzimande, P., & Patel, R. (2012). merSETA sector skills plan update 2012/13–2016/17:
Promoting artisan development for employability. Retrieved from
http://www.merseta.org.za/innovation,researchanddevelopment.asp/
Nzukuma, K. C. C., & Bussin, M. (2011). Job-hopping amongst African Black senior management
in South Africa. South African Journal of Human Resource Management, 9(1), a360.
doi:10.4102/sajhrm.v9i1.360
Obama, B. (2016). Presidential proclamation: National apprenticship week 2016. Retrieved , from
https://www.whitehouse.gov/the-press-office/2016/11/10/presidential-proclamation-
national-apprenticeship-week-2016
Ogden, L.E. (2016). Job applications: Under the covers. Nature, 538, 129-130.
doi:10.1038/nj7623-129a
Oliphant, V. N., & Alexander, III, E. R. (1982). Reactions to résumés as a function of résumé
determinateness, applicant characteristics, and sex of raters. Personnel Psychology, 35(4),
829–842. doi:10.1111/j.1744-6570.1982.tb02225.x
Organisation for Economic Co-operation and Development (OECD). (2011). OECD reviews of
vocational education and training: Learning for jobs. Pointers for policy development.
Retrieved from https://www.oecd.org/edu/skills-beyond-
school/LearningForJobsPointersfor%20PolicyDevelopment.pdf
Ornstein, M. (2013). A companion to survive research. London: SAGE Publications Ltd.
Overtoom, C. (2000). Employability skills: An update. ERIC Digest No. 220. Retrieved from
https://files.eric.ed.gov/fulltext/ED445236.pdf.
Pagés-Serra, C. (2010). The age of productivity: Transforming economies from the bottom up.
(Executive summary). Retrieved from
http://www.iadb.org/WMSfiles/products/research/dia/2010/summary/DIA_booklet_eng.pd
f
Pallant, J. (2013). SPSS survival manual (5th ed.). New York, New York: Open University Press.
Pandor, G. M. N. (2018). Draft national artisan development strategy and implementation plan
2017. Retrieved from
http://www.merseta.org.za/Portals/0/announcements/Draft%20National%20Artisan%20De
velopment%20Strategy%20And%20Implementation%20Plan%202017%20-
%20For%20Public%20Comment.pdf
310
Parliamentary Monitoring Group. (2010). The New Growth Path: The framework. Retrieved from
http://pmg-assets.s3-website-eu-west-1.amazonaws.com/docs/101123new-growth-path.pdf
Patel, R. (2011). The New Growth Path: framework. Retrieved from
http://www.economic.gov.za/communications/publications/new-growth-path-series/
Patel, R. (2008). Impact assessment study of leanerships and apprenticeships. Retrieved from
http://www.merseta.org.za/innovation,researchanddevelopment.asp/
Patel, R. (2012). ECSA mobilises support for engineering graduates. Achieve: Leaders in closing
the skills gap, 18, 13-15. Retrieved from
http://www.merseta.org.za/merMEDIA/tabid/97/Itemld/279/Default.aspx/
Paterson, H., & Uys, K. (2005). Critical issues in psychological test use in the South African
workplace. South African Journal of Industrial Psychology, 31(3), 12-22. Retrieved from
https://pdfs.semanticscholar.org/db87/e1ea847667dc1e620eaeba3641b46dac0871.pdf
Pearse, N. J. (2009). The role of experiences in creating and developing intellectual capital.
Management Research News, 32(4), 371-382. doi:10.1108/01409170910944317
Peo, D. (2013). Strengthening leadership in closing the skills gap: An overview of merSETA
research-in-action. Retrieved from
http://www.merseta.org.za/innovation,researchanddevelopment.asp/
Perez, T. (2016). ApprenticeshipUSA: U.S. Department of Labour fact sheet. Retrieved from
https://www.dol.gov/apprenticeship/NAW/pdf/Final_DOL_NAW_Factsheet.pdf
Perez, T., & Zients, J. (2016). ApprenticeshipUSA is upskilling America. Retrieved from
https://blog.dol.gov/2016/10/21/apprenticeshipusa-is-upskilling-america/
Perinot, C (2016). Gamification in the field of human resource management: Gamified solutions
for recruitment (Unpublished masters’ dissertation). Università Ca’Foscari, Dorsoduro,
Venezia. Retrieved from http://dspace.unive.it/bitstream/handle/10579/7886/833362-
1191686.pdf?sequence=2
Pfeffer, J. (1998). The human equation: Building profits by putting people first. Boston: Harvard
Business School Press.
Piansoongnern, O., Anurit, P., & Kuiyawattananonta, S. (2011). Talent management in Thai
cement companies: A study of strategies and factors influencing employee engagement.
African Journal of Business Management, 5(5), 1578-1583. doi:10.5897/AJBM10.022
311
Pienaar, D., Venter, F., Govender, M., & Jitsing, A. (2016). Performance and expenditure review:
Technical and vocational education & training. Retrieved from
https://www.gtac.gov.za/perdetail/10.2%20Techical%20report.pdf
Pietersen, C. (2018). Research trends in the South African Journal of Human Resource
Management. South African Journal of Human Resource Management, 16(0), a825.
doi:10.4102/sajhrm.v16i0.825
Piro, K. (2011). Investigating the impact of a psychometric assessment technique in the South
African automotive industry (Unpublished Doctoral thesis). Nelson Mandela Metropolitan
University, Nelson Mandela Metropole, Eastern Cape, South Africa.
Pitot, R. (2011). The South African automotive industry, the MIDP and the ADP. Retrieved from
http://www.automechanikasa.co.za/pdf/saauto/NAACAM-Presentation.pdf.
Ployhart, R. E. (2006). Staffing in the 21st century: New challenges and strategic opportunities.
Journal of Management, 32(6), 868-897. doi:10.1177/0149206306293625
Ployhart, R. E., & Holtz, B. C. (2008). The diversity-validity dilemma: Strategies for reducing
racioethnic and sex subgroup differences and adverse impact in selection. Personnel
Psychology, 61, 53-172. doi:10.111/j.1744-6570.2008.00109.X
Ployhart, R. E., & Moliterno, T. P. (2011). Emergence of the human capital resource: A multilevel
model. Academy of Management Review, 36(1), 127-150. doi:10.5465/amr.2009.0318
Ployhart, R. E., Weekley, J. A., & Baughman, K. (2006). The structure and function of human
capital emergence: A multilevel examination of the attraction-selection-attrition
model. Academy of Management Journal, 49(4), 661-677.
doi:10.5465/AMJ.2006.22083023
Puchert, J. I., Dodd, N., & Viljoen, K. L. (2014). The role of secondary education in operator
employability in the automotive industry. (Published masters’ dissertation). University of
Fort Hare, East London, Eastern Cape, South Africa.
Puchert, J. I., Dodd, N., & Viljoen, K. L. (2017a). Secondary education as a predictor of aptitude:
Implications for selection in the automotive sector. South African Journal of Industrial
Psychology, 43(0), a1416. doi:10.4102/sajip.v43i0.1416
Puchert, J. I., Dodd, N., & Viljoen, K. L. (2017b). The relationship between type of secondary
education and subject choice with technically-oriented aptitudes for automotive operators.
South African Journal of Industrial Psychology, 43(0), a1435. doi:10.4102/sajip.v43i0.1435
312
Prising, J. (2016). The 2016/2017 talent shortage survey (11th annual). Retrieved from
http://www.manpowergroup.com/talent-shortage-explorer/#.WBhfm9V97IU
Pyburn, K. M., Jr., Ployhart, R. E., & Kravitz, D. A. (2008). The diversity-validity dilemma:
Overview and legal context. Personnel Psychology, 61, 143-151. doi:10.1111/j.1744-
6570.2008.00108.x
Qonde, G. F. (2018). Statistics on post-school education and training in South Africa: 2016.
Pretoria, South Africa: Department of Higher Education and Training. Retrieved from
http://www.dhet.gov.za/DHET%20Statistics%20Publication/Statistics%20on%20Post-
School%20Education%20and%20Training%20in%20South%20Africa%202016.pdf
Quality Council for Trades and Occupations (QCTO). (2013). Accredited assessment centres for
new occupational qualifications (trades). Retrieved from
http://www.qcto.org.za/index.php/accredited-assessment-centres
Quinlan, C. (2011). Business research methods. China: South-Western Cengage Learning.
Quinlan, C., Babin, B., Carr, J., Griffen, M., & Zikmund, W. G. (2015). Business research methods
(1st ed.). Hampshire: South-Western Cengage Learning.
Raemdonck, I., Tillema, H., De Grip, A., Valcke, M., & Segers, M. (2012). Does self-
directedness in learning and careers predict the employability of low-qualified employees?
Vocations and Learning, 5(2), 137-151. doi:10.1007/s12186-011-9072-7
Rahman, S., Mokhtar, S. B., Yasin, R. M., & Hamzah, M. I. M. (2011). Generic skills among
technical students in Malaysia. Procedia Social and Behavioral Sciences, 15, 3713-3717.
doi:10.1016/j.sbspro.2011.04.361
Ramdass, K. (2009). The challenges facing education in South Africa. Educational and
Development Conference, 111–130. Retrieved from
https://ujcontent.uj.ac.za/vital/access/services/Download/uj:6232/CONTENT1
Rasool, F., & Botha, C. J. (2011). The nature, extent and effect of skills shortages on skills
migration in South Africa. SA Journal of Human Resource Management, 9(1), Art. #287, 12
pages. doi:10.4102/sajhrm.v9i1.287
Rasul, M. S., Rauf, R. A. A., & Mansor, A. N. (2013). Employability skills indicator as perceived
by manufacturing employers. Asian Social Science, 9(8), 42-46. doi:10.5539/ass.v9n8p42
Rasul, M. S., Rauf, R. A. A., Mansor, A. N., Yasib, R. M., & Mahamod, Z. (2012). Importance of
employability skills for technical and vocational students. The 3rd International Conference
313
on Learner Diversity, University Kebangsaan Malaysia. Retrieved from
http://repository.um.edu.my/26818/1/icld.pdf
Rauner, F., Heinemann, L., Hauschildt, U., & Piening, D. (2012). Project report: COMET-pilot
test South Africa. Retrieved from http://www.merseta.org.za/artisandevelopment.asp/
Reddy, V., Bhorat, H., Powell, M., Visser, M., & Arends, A. (2016). Skills supply and demand in
South Africa. LMIP Publication. Pretoria, South Africa: Human Sciences Research Council.
Retrieved from
http://www.hsrc.ac.za/uploads/pageContent/7429/LMIP_SkillsSupplyandDemand_Sept201
6.pdf
Reddy, V., & Kruss, G. (2015). The Labour Market Intelligence Partnership: Update 2014.
Pretoria, South Africa: Human Sciences Research Council. Retrieved from:
http://www.lmip.org.za/sites/default/files/news/LMIP%20Update2014_Web_.pdf
Ree, M. J., & Carretta, T. R. (2002). G2K. Human Performance, 15(1-2), 3-24.
doi:10.1207/s15327043hup1501&02_02
Reed, D., Yung-His Liu, A., Kleinman, R., Mastri, A., Reed, D., Sattar, S., & Ziegler, J. (2012).
An effectiveness assessment and cost-benefit analysis of registered apprenticeships in 10
states. Retrieved from
https://wdr.doleta.gov/research/FullText_Documents/ETAOP_2012_10.pdf
Reilly, R. R., & Chao, G. T. (1982). Validity and fairness of some alternative selection procedures.
Personnel Psychology, 35(1), 1-62. doi:10.1111/j.1744-6570.1982.tb02184.x
Risler, M., & Zhiqun, Z. (2013). Apprenticeship and small and medium-sized enterprises: The
China case. Retrieved from http://www.tvet-online.asia/series/RaD_vol-
8_Risler_Zhiqun.pdf
Rojewski, J. W. (2002). Preparing the workforce of tomorrow: A conceptual framework for career
and technical education. Journal of Vocational Education Research, 27(1), 7-35. Retrieved
from https://files.eric.ed.gov/fulltext/ED461771.pdf
Ross, C. M., & Young, S. J. (2005). Résumé preferences: Is it really ‘business as usual”? Journal
of Career Development, 32(2), 153-164. doi:10.1177/0894845305279162
Rossi, P. H., Lipsey, M. W., & Freeman, H. E. (2004). Evaluation. A systematic approach (7th
ed.). Thousand Oaks: Sage.
314
Roth, P. L., & Bobko, P. (2000). College grade point average as a personnel selection device:
Ethnic group differences and potential adverse impact. Journal of Applied Psychology,
85(3), 399–406. doi:10.1037/0021-9010.85.3.399
Rothstein, J. S. (2010). A good job is hard to find: U.S. and Mexican autoworkers in the global
economy. New Labour Forum, 19(3), 70-74. doi:10.4179/NLF.193.0000012
Rowe, L., Moss, D., Moore, N., & Perrin, D. (2017). The challenges of managing degree
apprentices in the workplace: A manager’s perspective. Journal of Work-Applied
Management, 9(2), 185-199. doi:10.1108/JWAM-07-2017-0021
Ruane, J. M. (2015). Introducing social research methods: Essentials for getting the edge.
Retrieved from https://0-ebookcentral.proquest.com.wam.seals.ac.za
Rubin, R. S., Bommer, W. H., & Baldwin, T. T. (2002). Using extracurricular activity as an
indicator of interpersonal skill: Prudent evaluation or recruiting malpractice? Human
Resource Management, 41(4), 441–454. doi:10.1002/hrm.10053
Rukwaru, M. (2015). Social research methods: A complete guide. Nairobi: Eureka Publishers.
Rusek, J. Z., & Rist, R.C. (2004). Ten steps to a results-based monitoring and evaluation system.
Washington, DC: The World Bank. doi:10.1596/0-8213-5823-5
Ryan, P. (2001). The school-to-work transition: A cross-national perspective. Retrieved from
http://www.econ.cam.ac.uk/dae/repec/cam/pdf/Wp0014.pdf
Ryan, A. M., & Ployhart, R. E. (2000). Applicants’ perceptions of selection procedures and
decisions: A critical review and agenda for the future. Journal of Management, 26(3), 565-
606. doi:10.1016/S0149-2063(00)00041-6.
Ryan, A. M., Sacco, J. M., McFarland, L. A., & Kriska, S. D. (2000). Applicant self-selection:
Correlates of withdrawal from a multiple hurdle process. Journal of Applied Psychology,
85(2), 163-179. Retrieved from https://www.ncbi.nlm.nih.gov/pubmed/10783534
Rynes, S. L., Brown, K. G., & Colbert, A. E. (2002a). Seven misconceptions about human resource
practices: Research findings versus practitioner beliefs. Academy of Management Executive,
16(3), 92-103. doi:10.5465/AME.2002.8540341
Rynes, S. L., Colbert, A. E., & Brown, K. G. (2002b). HR professionals’ beliefs about effective
human resource practices: Correspondence between research and practice. Human Resource
Management, 41(2), 149 – 174. doi:10.1002/hrm.10029
315
Rynes, S. L., Giluk, T. L., & Brown, K. G. (2007). The very separate worlds of academic and
practitioner periodicals in human resource management: Implications for evidence-based
management. Academy of Management Journal, 50, 987 – 1008.
doi:10.5465/amj.2007.27151939
Rynes, S. L., Orlitzky, M. O., & Bretz, R. D. (1997). Experienced hiring versus college recruiting:
Practices and emerging trends. Personnel Psychology, 50(2), 309– 339. doi:10.1111/j.1744-
6570.1997.tb00910.x
Sackett, P. R., & Lievens, F. (2008). Personnel selection. Annual Review of Psychology, 59, 16.1-
16.32. doi:10.1146/annurev.psych.59.103006.093716
Sackett, P. R., Schmitt, N., Ellingson, J. E., & Kabin, M. B. (2001). High-stakes testing in
employment, credentialing, and higher education: Prospects in a post-affirmative-action
world. American Psychologist, 56, 302-318. doi;10.1037/AJ003-066X.56.4.302
Salgado, J. F., & Anderson, N., Moscoso, S., Bertua, C., De Fruyt, F., & Rolland, J. P. (2003). A
meta-analytic study of general mental ability validity for different occupations in the
European community. Journal of Applied Psychology, 88(6), 1068-1081. doi:10.1037/0021-
9010.88.6.1068
Salgado, J. F., & Moscoso, S. (2002). Comprehensive meta-analysis of the construct validity of
the employment interview. European Journal of Work and Organizational Psychology,
11(3), 299-324. doi:10.1080/13594320244000184
Saravanabava, T. C. (2016). Implementation of the National Apprenticeship Promotion Scheme.
Retrieved from http://msde.gov.in/assets/images/latest%20news/NAPS-
Notification%20Of%20Guidelines%20Revised.pdf
Saunders, M., Lewis, P., & Thornhill, A. (2012). Research methods for business students (6th ed.).
England: Pearson Education Incorporated.
Schafmeister, A. (2013). Johnson Controls expands its interiors plant in East London, South
Africa. Published company pamphlet. Burscheid, Germany: Johnson Controls GmbH.
Schlebusch, S., & Roodt, G. (2008). Assessment centres: Unlocking potential for growth.
Johannesburg, South Africa: Knowres Publishing.
Schlechter, A., Faught, C., & Bussin, M. (2014). Total rewards: A study of artisan attraction and
retention within a South African context. South African Journal of Human Resource
Management, 12(1), Art. #648, 15 pages, doi:10.4102/sajhrm.v12i1.648
316
Schmid, M., & Storni, M. (2004). Transition. Zur Qualifikation und Rekrutierung von Lehrlingen
im Kanton Basel-Stadt. Basel: ecce gemeinschaft für sozialforschung. In C. Imdorf & R. J.
Leemann (2012). New models of apprenticeship and equal opportunity. Do training
networks enhance fair hiring practices? Journal of Vocational Education & Training, 64(1),
57-74. doi:10.1080/13636820.2011.622445
Schmidt, F. L. (2011). A theory of sex differences in technical aptitude and some supporting
evidence. Perspectives on Psychological Science, 6(6), 560-573.
doi:10.1177/1745691611419670
Schmidt, F. L., & Hunter, J. E. (1992). Development of a causal model of processes determining
job performance. Current Directions in Psychological Science, 1(3), 89-92.
doi:10.1111/1467-8721.ep10768758
Schmidt, F. L., & Hunter, J. E. (1998). The validity and utility of selection methods in personnel
psychology: Practical and theoretical implications of 85 years of research finding.
Psychological Bulletin, 124(2), 262–274. doi:10.1037/0033-2909.124.2.262
Schmidt, F. L., Hunter, J. E., & Outerbridge, A. N. (1986). Impact of job experience and ability
on job knowledge, work sample performance, and supervisory ratings of job performance.
Journal of Applied Psychology, 71(3), 432-439. doi:10.1037/0021-9010.71.3.432
Schmidt, F. L., Oh, I-S., & Shaffer, J. A. (2016). The validity and utility of selection methods in
personnel psychology: Practical and theoretical implications of 100 years of research
findings (Working Paper). doi:10.13140/RG.2.2.18843.26400
Schmidt, F. L., & Zimmerman, R. D. (2004). A counterintuitive hypothesis about employment
interview validity and some supporting evidence. Journal of Applied Psychology, 89(3), 553-
561. doi:10.1037/0021-9010.89.3.553
Schmit, M. J., & Ryan, A. M. (1997). Applicant withdrawal: The role of test-taking attitudes and
racial differences. Personnel Psychology, 50, 855-876. doi:10.1111/j.1744-
6570.1997.tb01485.x
Schmit, M. J., Ryan, A. M., Stierwalt, S. L., & Powell, A. B. (1995). Frame-of-reference effects
on personality scale scores and criterion-related validity. Journal of Applied Psychology,
80(5), 607–620. Retrieved from
http://www.jwalkonline.org/docs/Grad%20Classes/Fall%2007/Org%20Psy/Cases/leadershi
p/leadership%20articles/frame%20of%20reference%20effects.pdf
317
Schmitt, N. (2014). Personality and cognitive ability as predictors of effective performance at
work. Annual Review of Organizational Psychology and Organizational Behavior, 1, 45-65.
doi:10.1146/annurev-orgpsych-031413-091255
Schreuder, D., & Coetzee, M. (2010). An overview of Industrial and Organisational Psychology
research in South Africa: A preliminary study. South African Journal of Industrial
Psychology, 36(1), Art. #903, 11 pages. doi:10.4102/sajip.v36i1.903
Schullery, N. M., Ickes, L., & Schullery, S. E. (2009). Employer preferences for résumés and cover
letters. Business and Professional Communication Quarterly, 72(2), 163-176.
doi:10.1177/1080569909334015
Schwab, K., & Sala-i-Martin, X. (2015). The World Economic Forum’s Global Competitiveness
Report 2015-2016. Retrieved from http://www3.weforum.org/docs/gcr/2015-
2016/Global_Competitiveness_Report_2015-2016.pdf
Schwab, K., & Sala-i-Martin, X. (2016). The World Economic Forum’s Global Competitiveness
Report 2016-2017. Retrieved from http://www3.weforum.org/docs/GCR2016-
2017/05FullReport/TheGlobalCompetitivenessReport2016-2017_FINAL.pdf
Schwab, K., & Sala-i-Martin, X. (2017). The World Economic Forum’s Global Competitiveness
Report 2017-2018. Retrieved from http://www3.weforum.org/docs/GCR2017-
2018/05FullReport/TheGlobalCompetitivenessReport2017%E2%80%932018.pdf
Schwab, K., & Samans, R. (2016). The future of jobs: Employment, skills and workforce strategy
for the fourth Industrial revolution. Retrieved from
http://www3.weforum.org/docs/WEF_Future_of_Jobs.pdf
Scolarios, D., Lockyer, C., & Johnson, H. (2003). Anticipatory socialisation: The effect of
recruitment and selection experiences on career expectations. Career Development
International, 8(4), 182-197. doi:10.1108/13620430310482562
Sermsuk, S., Triwichitkhunb, D., & Wongwanich, S. (2014). Employment conditions and essential
employability skills required by employers for secondary school graduates. Procedia - Social
and Behavioral Sciences, 116, 1848-1854. doi:10.1016/j.sbspro.2014.01.482
Shabane, Z. W., Schultz, C. M., & Van Hoek, C. E. (2017). Transformational leadership as a
mediator in the relationship between satisfaction with remuneration and the retention of
artisans in the military. South African Journal of Human Resource Management, 15(0), a923.
doi:10.4102/sajhrm.v15i0.923
318
Shakar, A., & Hűllermeier, E. (2014). Survival analysis of data streams: Analyzing temporal
events in dynamically changing environments. International Journal of Applied
Mathematics and Computer Science, 24(1), 199-212. doi: 10.2478/amcs-2014-0015
Shankar, V., Cooper, A., & Koh, H. (2016). Reducing youth unemployment in South Africa.
Retrieved from
https://youtheconomicopportunities.org/sites/default/files/uploads/resource/Reducing%20Y
outh%20Unemployment%20in%20South%20Africa.pdf
Shankel, G. (2010). America’s most wanted: Skilled Workers. A highly-skilled workforce is
necessary to meet 21st century manufacturing needs. Retrieved from
https://www.nutsandboltsfoundation.org/wp-content/uploads/skilled-labor-
shortage2010.pdf
Shatouri, R. M., Omar, R., & Igusa, K. (2012). Towards a new era of sustainability in the
automotive industry: Strategic human resource management and green technology
innovation. World Academy of Science, Engineering and Technology, 6(9), 217-222.
Retrieved from http://www.scholar.waset.org/1307-6892/10249
Shaw, J. D., Dineen, B. R., Fang, R., & Vellella, R. F. (2009). Employee-organization exchange
relationships, HRM practices, and quit rates of good and poor performers. Academy of
Management Journal, 52(5), 1016-1033. Retrieved from
http://www.jstor.org/stable/40390329
Siegenthaler, M. (2011). Can a standardised aptitude test predict the training success of
apprentices? Evidence from a case study in Switzerland. Empirical Research in Vocational
Education and Training, 3(2), 105-128. Retrieved from
https://www.pedocs.de/volltexte/2013/8255/pdf/ERVET_2011_2_Siegenthaler_Can_a_sta
ndardised_aptitude.pdf
Singer, M. S., & Bruhns, C. (1991). Relative effect of applicant work experience and academic
qualification on selection interview decisions: A study of between-sample generalizability.
Journal of Applied Psychology, 76(4), 550–559. doi:10.1037/0021-9010.76.4.550
Smith, E. (2010). Apprenticeships. In P. Peterson, B. McGaw, & E. Baker (Eds.). International
Encyclopedia of Education, 3(8), Oxford: Elsevier.
319
Smith, E., Comyn, P., Kemmis, R. B., & Smith, A. (2011). Australian employers’ adoption of
traineeships. Journal of Vocational Education and Training, 63(3), 363-375.
doi:10.1080/13636820.2011.559267
Smith, E., Gonon, P., & Foley, A. (Eds.). (2015). Architecture for Apprenticeships: Achieving
Economic and Social Goals. Proceedings of the Sixth Research Conference of the
International Network for Innovative Apprenticeships (2015). Retrieved from
http://www.inap.uni-bremen.de/dl/inap%20conference%20proceedings%202015.pdf
Smith, E., & Kemmis, R. B. (2013). Towards a model apprenticeship framework: A comparative
analysis of national apprenticeship systems. Retrieved from
http://hdl.voced.edu.au/10707/292934.
Smith, J. M. (2011). Connecting young South Africans to opportunity: Literature review and
strategy. Cape Town: DG Murray Trust. Available from:
http://www.dgmt.co.za/files/2011/05/Literature-Review-Strategy.pdf.
Snell, S. A., & Dean, J. W. (1992). Integrated manufacturing and human resource management: A
human capital perspective. Academy of Management Journal, 35(3), 467-504. Retrieved
from http://www.jstor.org/stable/256484
Soskice, D. (1994). Reconciling markets and institutions: The German apprenticeship system. In
L. M. Lynch (Ed.), Training and the private sector: International comparisons. Chicago,
University of Chicago Press.
Spaull, N. (2013). South Africa’s education crisis: The quality of education in South Africa 1994-
2011. Report commissioned by Centre for Development & Enterprise, Johannesburg: South
Africa. Retrieved from http://www.section27.org.za/wp-content/uploads/2013/10/Spaull-
2013-CDE-report-South-Africas-Education-Crisis.pdf
Stalder, B. (2000). Gesucht wird . . . Rekrutierung und Selektion von Lehrlingen im Kanton Bern.
Bern: Amt für Bildungsforschung. In C. Imdorf & R. J. Leemann (2012), New models of
apprenticeship and equal opportunity. Do training networks enhance fair hiring practices?
Journal of Vocational Education & Training, 64(1), 57-74.
doi:10.1080/13636820.2011.622445
Statistics South Africa (2017). Mid-year population estimates 2017. Pretoria, South Africa.
Retrieved from https://www.statssa.gov.za/publications/P0302/P03022017.pdf
320
Steedman, H. (2012). Overview of apprenticeship systems and issues: ILO contribution to the G20
task force on employment. Geneva, Switzerland: International Labour Organisation.
Retrieved from http://www.ilo.org/wcmsp5/groups/public/---ed_emp/---
ifp_skills/documents/genericdocument/wcms_190188.pdf
Steinpreis, R. E., Anders, K. A., & Ritzke, D. (1999). The impact of gender on the review of the
curricula vitae of job applicants and tenure candidates: A national empirical study. Sex Roles,
41(7-8), 509-528. doi:10.1023/A:1018839203698
Stewart, J., & Knowles, V. (2000). Graduate recruitment and selection practices in small
businesses. Career Development International, 5(1), 21-38.
doi:10.1108/13620430010309332
Straus, S. G., Miles, J. A., & Levesque, L. L. (2001). The effects of videoconference, telephone
and face-to-face media on interviewer and applicant judgements in employment interviews.
Journal of Management, 27(3), 363-381. doi:10.1177/014920630102700308
Struwig, F. W., & Stead, G. B. (2013). Research: Planning, design and reporting (2nd ed.). Cape
Town, South Africa: Pearson Education Publishing.
Subramanian, M., & Youndt, M. (2005). The influence of intellectual capital on the types of
innovative capabilities. Academy of Management Journal, 48(3), 450-464.
doi:10.5465/AMJ.2005.17407911
Supino, P. G., & Borer, J. S. (2012). Principles of research methodology: A guide for clinical
investigators. London: Springer.
Swart, J., & Kinnie, N. (2003). Sharing knowledge in knowledge-intensive firms. Human Resource
Management Journal, 13(2), 60-75. Retrieved from
https://pdfs.semanticscholar.org/2454/dc30795babdf1490db5d267b6ece66d1aef3.pdf
Takeuchi, R., Lepak, D. P., Wang, H., & Takeuchi, K. (2007). An empirical examination of the
mechanisms mediating between high-performance work systems and the performance of
Japanese organizations. Journal of Applied Psychology, 92(4), 1069-1083.
doi:10.1037/0021-9010.92.4.1069
Taljaard, J. J. (1983). Manual for the Trade Aptitude Test Battery (TRAT). Pretoria, South Africa:
Human Sciences Research Council.
Tang, W. (2015). Exploration and practice of modern apprenticeship training with school-
enterprise dual system: A case study of Guangzhou Industry & Trade Technician College.
321
Proceedings of the Sixth Research Conference of the International Network for Innovative
Apprenticeships (2015). Retrieved from http://www.inap.uni-
bremen.de/dl/inap%20conference%20proceedings%202015.pdf
Tarique, I., & Schuler, R. (2012). Global talent management literature review. Retrieved from
http://www.shrm.org/about/.../global%20tm%20lit%20review-final.doc/
Taylor, P. J., Pajo, K., Cheung, G. W., & Springfield, P. (2004). Dimensionality and validity of a
structured telephone reference check procedure. Personnel Psychology, 57(3), 745-772.
doi:10.1111/j.1744-6570.2004.00006.x
Terre Blanche, M., Durrheim, K., & Painter, D. (2006). Research in practice: Applied methods for
the social sciences (2nd ed.). Cape Town, South Africa: University of Cape Town Press.
The Employment Equity Act (No. 55 of 1998) (EEA). Retrieved from
http://www.labour.gov.za/DOL/downloads/legislation/acts/employment-
equity/eegazette2015.pdf
The Employment Equity Amendment Act (No. 47 of 2013) (EEAA). Retrieved from
http://www.labour.gov.za/DOL/downloads/legislation/acts/employment-
equity/eea_amend2014.pdf
The Labour Relations Act (No. 66 of 1995). Retrieved from
http://www.labour.gov.za/DOL/legislation/acts/labour-relations/labour-relations-act
The Skills Development Act (No. 97 of 1998). Retrieved from
http://www.saqa.org.za/docs/legislation/2010/act97.pdf
Thoms, P., McMasters, R., Roberts, M. R., & Dombkowski, D. A. (1999). Résumé characteristics
as predictors of an invitation to interview. Journal of Business and Psychology, 13(3), 339–
356. Retrieved from https://www.jstor.org/stable/pdf/25092643.pdf
Thornton, G. C., III., & Mueller-Hanson, R. (2004). Developing organizational simulations: A
guide for practitioners and students. Mahwah, New Jersey. Routledge.
Thornton, G. C., III., Murphy, K. R., Everest, T. M., & Hoffman, C. C. (2000). Higher cost, lower
validity and higher utility: Comparing the utilities of two tests that differ in validity, costs,
and selectivity. International Journal of Selection and Assessment, 8(2), 61-75.
doi:10.1111/1468-2389.00134
322
Thornton, G. C., III., & Rupp, D. E. (2005). Assessment centers in human resource management:
Strategies for prediction, diagnosis, and development. Mahwah, New Jersey: Lawrence
Erlbaum.
Todericiu, R., & Muscalu, E. (2008). Talent management – a priority for the modern enterprise.
Buletin Stiintific, 13(2), 64-68. Retrieved from
http://www.armyacademy.ro/buletin/articole/bul2en_2008/a13.pdf
Tomaska, L., & Nosek, J. (2018). Ten simple rules for writing a cover letter to accompany a job
application for an academic position. PLoS Comput Biol 14(5), e1006132.
doi:10.1371/journal.pcbi.1006132
Torpey, E. (2013). Apprenticeship: Earn while you learn. Occupational Outlook Quarterly
(Summer 2013). Retrieved from http://www.bls.gov/careeroutlook/2013/summer/art01.pdf
Tsai, W., Chi, N., Huang, T., & Hsu, A. (2011). The effects of applicant résumé contents on
recruiters’ hiring recommendations: The mediating roles of recruiter fit perceptions. Applied
Psychology, 60(2), 231-254. doi:10.1111/j.1464-0597.2010.00434.x
Trindale, R. (2015). Is your background screening keeping up with today’s hiring challenges?
Employment Relations Today (Summer, 2015). doi:10.1002/ert.21492
Van de Werfhorst, H. G. (2014). Changing societies and four tasks of schooling: Challenges for
strongly differentiated educational systems. International Review of Education, 60(1), 123–
144. doi:10.1007/s11159-014-9410-8
United States Department of Labor (US DoL) (n.d.). Resources to identify non-discriminatory
apprentice selection procedures. Retrieved from https://doleta.gov/oa/eeo/selection/
University of Cumbria (n.d.). How to recruit an apprentice guide. Retrieved from
https://www.cumbria.ac.uk/media/university-of-cumbria-website/content-
assets/public/hla/How-to-Recruit-an-Apprentice-Guide.pdf
Van den Brink, M., Brouns, M., & Waslander, S. (2006). Does excellence have a gender?: A
national research study on recruitment and selection procedures for professorial
appointments in The Netherlands. Employee Relations, 28(6), 523-539.
doi:10.1108/0142514061074470
Van der Berg, S., Taylor, S., Gustafsson, M., Spaull, N., & Armstrong, P. (2011). Improving
education quality in South Africa. Report for the National Planning Commission.
323
Department of Economics: University of Stellenbosch. Retrieved from
http://resep.sun.ac.za/wp-content/uploads/2012/10/2011-Report-for-NPC.pdf
Van der Flier, H., Thijs, G. D., & Zaaiman, H. (2003). Selecting students for a South African
mathematics and science foundation programme: effectiveness and fairness of school-
leaving examinations and aptitude tests. International Journal of Educational Development,
23(4), 399-409. doi:10.1016/S0738-0593(02)00071-8
Van der Merwe, R. P. (2002). Psychometric testing and human resource management. South
African Journal of Industrial Psychology, 28(2), 77-86. Retrieved from
https://pdfs.semanticscholar.org/b24f/c4d2e846156d415e4256f5b8784d41ba1094.pdf
Van der Merwe, G. (2005). The construct validity of the First View™ for selection purposes in
South Africa (Unpublished master’s thesis). University of Pretoria, Pretoria, South Africa.
Van Iddekinge, C. H., Raymark, P. H., & Roth, P. L. (2005). Assessing personality with a
structured employment interview: Construct-related validity and susceptibility to response
inflation. Journal of Applied Psychology, 90(3), 536-552. doi:10.1037/0021-9010.90.3.536
Van Iddekinge, C. H., Ferris, G. R., Perrewe, P. L., Perryman, A. Z., Blass, F. R., & Heetderks, T.
D. (2009). Effects of selection and training on unit-level performance over time: A latent
growth modelling approach. Journal of Applied Psychology, 94(4), 829-843.
doi:10.1037/a0014453
Van Rooyen, L., Du Toit, D. H., Botha, E., & Rothmann, S. (2010). Artisan retention in an
organisation in South Africa. South African Journal of Human Resource Management, 8(1),
1-8. doi:10.4102/sajhrm.v8i1.300
Van Toorenburg, M., Oostrom, J. K., & Pollet, T. V. (2015). What a difference your e-mail makes:
Effects of informal e-mail addresses in online résumé screening. Cyberpsychology,
Behavior, and Social Networking, 18(3). doi:10.1089/cyber.2014.0542
Van Zyl, J. (2015). NAAMSA media release on the Automotive Production Development
Programme. Retrieved from http://www.naamsa.co.za/papers/20150515/index.html
Vass, J. R., & Raidani, P. (2016). Facts and figures on skills in manufacturing: Information brief
no. 3, 2016. Retrieved from https://www.thedti.gov.za/DownloadFileAction?id=1079
Vehkalahti, K. (2000). Reliability of measurement scales. Retrieved from
https://notendur.hi.is/adg11/Proffraedi/Reliability%20of%20measurement%20scales.pdf
324
Vermeulen, N. M. W. (2016). Quarterly review of business conditions: New vehicle manufacturing
industry/automotive sector: 2nd Quarter 2016. Retrieved from
http://www.naamsa.co.za/papers/2016_2ndquarter/index.html/
Vermeulen, N. M. W. (2017). Quarterly review of business conditions: New vehicle manufacturing
industry/automotive sector: 2nd Quarter 2017. Retrieved from
https://www.naamsa.co.za/papers/2017_2ndquarter/index.html
Vermeulen, N. M. W. (2018). Quarterly review of business conditions: New vehicle manufacturing
industry/automotive sector: 1st Quarter 2018. Retrieved from
https://www.naamsa.co.za/papers/2018_1stquarter/index.html
Vernon, D., Hocking, I., & Tyler, T. C. (2016). An evidenced-based review of creative problem
solving tools: A practitioner’s resource. Human Resource Development Review, 15(2), 230-
259. doi:10.1177/1534484316641512
Volkswagen South Africa (VWSA). (2016). History and Milestones. Retrieved from
http://www.vw.co.za/en/volkswagen-groupsouthafrica/about/history-and-milestones-
test.html
Von Wachter, T., & Bender, S. (2004). At the right place at the wrong time: The role of firms and
luck in young workers’ careers. The Institute for the Study of Labor (Discussion Paper No.
1348). Retrieved from http://ftp.iza.org/dp1348.pdf
Wai, J., Lubinski, D., & Benbow, C.P. (2009). Spatial ability for STEM domains: Aligning over
fifty years of cumulative psychological knowledge solidifies its importance. Journal of
Educational Psychology, 101(4), 817-835. doi:10.1037/a0016127
Wallwork A. (2014). The qualities of a good CV and résumé. In CVs, Résumés, and LinkedIn.
Guides to Professional English. New York, NY: Springer.
Wang, C. Y. (2014). Apprenticeships in China: Experiences, lessons and challenges. Retrieved
from https://www.oecd.org/els/emp/C_WANG-
Apprenticeships%20in%20China%20Update.pdf
Watkins, L. M., & Johnston, L. (2000). Screening job applicants: The impact of physical
attractiveness and application quality. International Journal of Selection and Assessment,
8(2), 76–84. doi:10.1111/1468-2389.00135
Weatherly, L. A. (2003). Human capital – the elusive asset. Measuring and managing human
capital: A strategic imperative for HR. Research Quarterly. Retrieved from
325
https://www.academia.edu/2654600/Human_Capital_The_Elusive_Asset_Measuring_and_
Managing_Human_Capital_A_Strategic_Imperative_for_HR
Wedekind, V. (2015, July 10). Vocational training is not an easy alternative to formal schooling,
The Conversation. Retrieved from http://theconversation.com/vocational-training-is-not-an-
easy-alternative-to-formal-schooling-42274
Wesselink, R., De Jong, C., & Biemans, H. J. A (2009). Aspects of competence-based education
as footholds to improve the connectivity between learning in school and the workplace.
Vocations and Learning, 3(1), 19-38. doi:10.1007/s12186-009-9027-4.
Wickham, A. (2017). The automotive industry employs more people than you think. Retrieved
from https://www.fircroft.com/blogs/the-automotive-industry-employs-more-people-than-
you-think-71462610395
Wicherts, J. M., Dolan, C. V., & Van der Maas, H. L. J. (2010). A systematic literature review on
the average IQ of sub-Saharan Africans. Intelligence, 38(1), 1-20.
doi:10.1016/j.intell.2009.05.002
Wickramasinghe, V. (2007). Staffing practices in the private sector in Sri Lanka. Career
Development International, 12(2), 108-128. doi:10.1108/13620430710733613
Wildschut, A., Gamble, J., Mbatha, N., & Meyer, T. (2015). Planning for artisanal skills: The
importance of understanding changing artisanal milieus and identities. Labour Market
Intelligence Partnership Ministerial briefing note (March 2015): Creating a credible
institutional mechanism for skills planning in South Africa. Pretoria, South Africa: Human
Sciences Research Council. Retrieved from
http://www.lmip.org.za/sites/default/files/documentfiles/LMIP%20Briefing%20Note_0.pdf
/
Wildschut, A., Kruss, G., Janse van Rensburg, D., Haupt, G., & Visser, M. (2012). Learnerships
and apprenticeships survey 2010 technical report: Identifying transitions and trajectories
through the learnership and apprenticeship systems. Pretoria, South Africa: Human
Sciences Research Council. Retrieved from www.hsrc.ac.za/en/research-data/ktree-
doc/9840
Wildschut, A., Kruss, G., Roodt, J., Visser, M., Ngazimbi, X., Twalo, T., & Meyer, T. (2013).
Studying artisans in the manufacturing, engineering and related services sector. Pretoria,
South Africa: Human Sciences Research Council. Retrieved from
326
http://www.lmip.org.za/document/studying-artisans-manufacturing-engineering-and-
related-services-sector/
Wilkin, C. L., & Connelly, C. E. (2012). Do I look like someone who cares? Recruiters’ ratings of
applicants’ paid and volunteer experience. International Journal of Selection and
Assessment, 20(3), 308-318. doi:10.1111/j.1468-2389.2012.00602.x
Williams, G. (2018, January 30). New Polo launched at upgraded Uitenhage plant. Finweek.
Retrieved from https://www.fin24.com/Finweek/Featured/new-polo-launched-at-upgraded-
uitenhage-plant-20180130
Windapo, A. O. (2016). Skilled labour supply in the South African construction industry: The
nexus between certification, quality of work output and shortages. South African Journal of
Human Resource Management, 14(1), a750. doi:10.4102/sajhrm.v14i1.750
Woehr, D. J., & Arthur, W, Jr. (2003). The construct-related validity of assessment center ratings:
A review and meta-analysis of the role of methodological factors. Journal of Management,
29(2), 231-258. doi:10.1016/S0149-2063(0200216-7
Wolf, A., & Jenkins, A. (2006). Explaining greater test use for selection: The role of HR
professionals in a world of expanding regulation. Human Resource Management Journal,
16(2), 193-216. doi:10.1111/j.1748-8583.2006.00008.x
Wolfe, R. N., & Johnson, S. D. (1995). Personality as a predictor of college performance.
Educational and Psychological Measurement, 55(2), 177–185.
doi:10.1177/0013164495055002002
World Bank. (2018). Doing business 2018: Reforming to create jobs. A World Bank Group
Flagship report. Washington, DC: International Bank for Reconstruction and
Development/The World Bank. Retrieved from
http://espanol.doingbusiness.org/~/media/WBG/DoingBusiness/Documents/Annual-
Reports/English/DB2018-Full-Report.pdf
Worthen, H., & Haynes, A. (2009). Outcomes of two construction trades pre-apprenticeship
programs: A comparison. Journal of Community Practice, 17, 207-222.
doi:10.1080/10705420902856191
Wright, P. M., Dunford, B. B., & Snell, S. A. (2001). Human resources and the resource based
view of the firm. Journal of Management, 27(6), 701-721.
doi:10.1177/014920630102700607
327
Wright, P. M., McMahan, G. C., & McWilliams, A. (1994). Human resources and sustained
competitive advantage: A resource-based perspective. International Journal of Human
Resource Management, 5(2), 301-326. doi:10.1080/09585199400000020
Wu, P. (2016). National apprenticeship week: Join the movement, now half a million strong.
Retrieved from https://blog.dol.gov/2016/11/14/national-apprenticeship-week-join-the-
movement-now-half-a-million-strong/
Yang, C., & Lin, C. Y. (2009). Does intellectual capital mediate the relationship between HRM
and organizational performance? Perspective of a healthcare industry in Taiwan.
International Journal of Human Resource Management, 20(9), 1965-1984.
doi:10.1080/09585190903142415
Zelloth, H. (2013). Apprenticeship in low and middle-income countries: Ways for development.
Retrieved from http://www.cedefop.europa.eu/files/11_Apprenticeship_in_low-_middle-
income_couyntries_-_Ways _for _development_Helmut_Zelloth.pdf.
Zhu, C. J., & Dowling, P. J. (2002). Staffing practices in transition: some empirical evidence from
China. International Journal of Human Resource Management, 13(4), 569-597.
doi:10.1080/09585190110092776
Zibarras, L. D., & Woods, S. A. (2010). A survey of UK selection practices across different
organization sizes and industry sectors. Journal of Occupational and Organizational
Psychology, 83(2), 499-511. doi:10.1348/096317909X425203.
Ziegler, M., Bensch, D., Maaß, U., Schult, V., Vogel, M., & Bühner, M. (2014). Big Five facets
as predictor of job training performance: The role of specific job demands. Learning and
Individual Differences, 29, 1-7. doi:10.1016/j.lindif.2013.10.008
Ziegler, M., Dietl, E., Danay, E., Vogel, M., & Bühner, M. (2011). Predicting training success
with general mental ability, specific ability tests, and
(un)structured interviews: A meta-analysis with unique samples. International Journal of
Selection and Assessment, 19(2), 170-182. doi:10.1111/j.1468-2389.2011.00544.x
Zikmund, W. G., Babin, B. J., Carr, J. C., & Griffin, M. (2013). Business research methods (9th
ed.). Canada: South-Western Cengage Learning.
Zottoli, M. A., & Wanous, J. P. (2000). Recruitment source research: current status and future
directions. Human Resource Management Review, 10(4), 353-382. doi:10.1016/S1053-
4822(00)00032-2
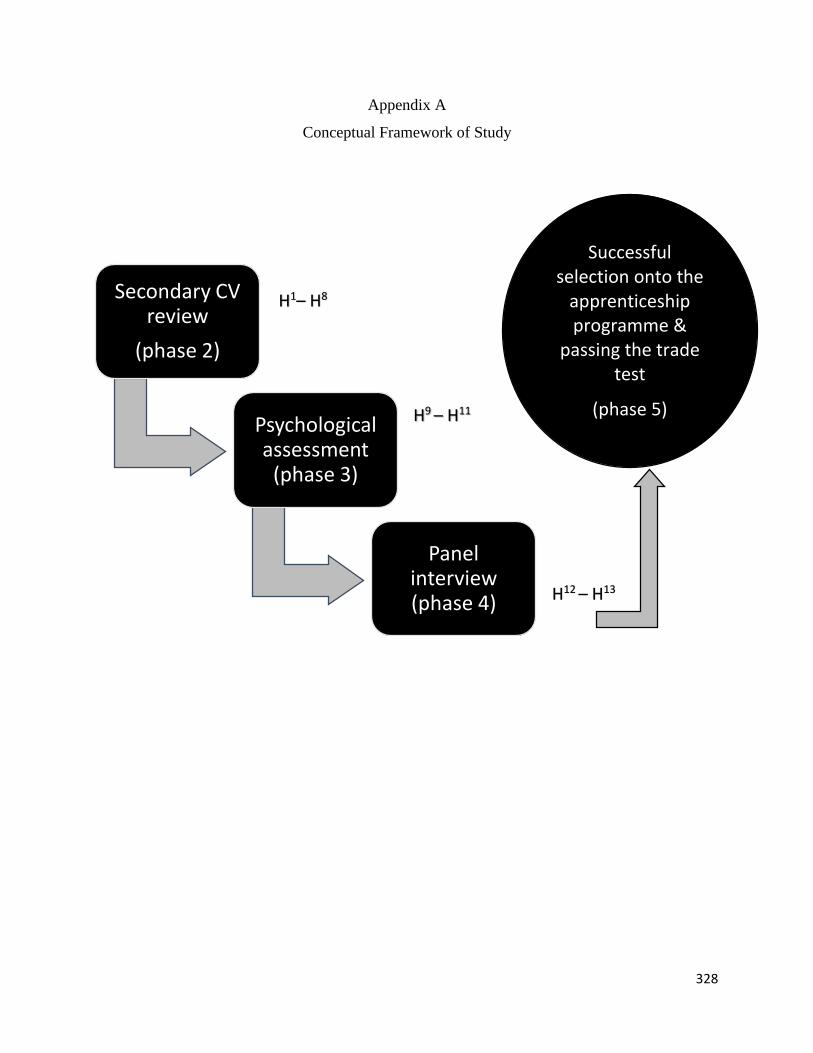
328
Appendix A
Conceptual Framework of Study
Secondary CV review
(phase 2)
Psychological assessment
(phase 3)
Panel interview (phase 4) H12
– H13
H14
H14
• H12 -
H14
H9 – H11 H14
H14
• H12 -
H14
H1– H8H14
H4 H14
H14
• H12 -
H14
Successful selection onto the
apprenticeship programme &
passing the trade test
(phase 5)
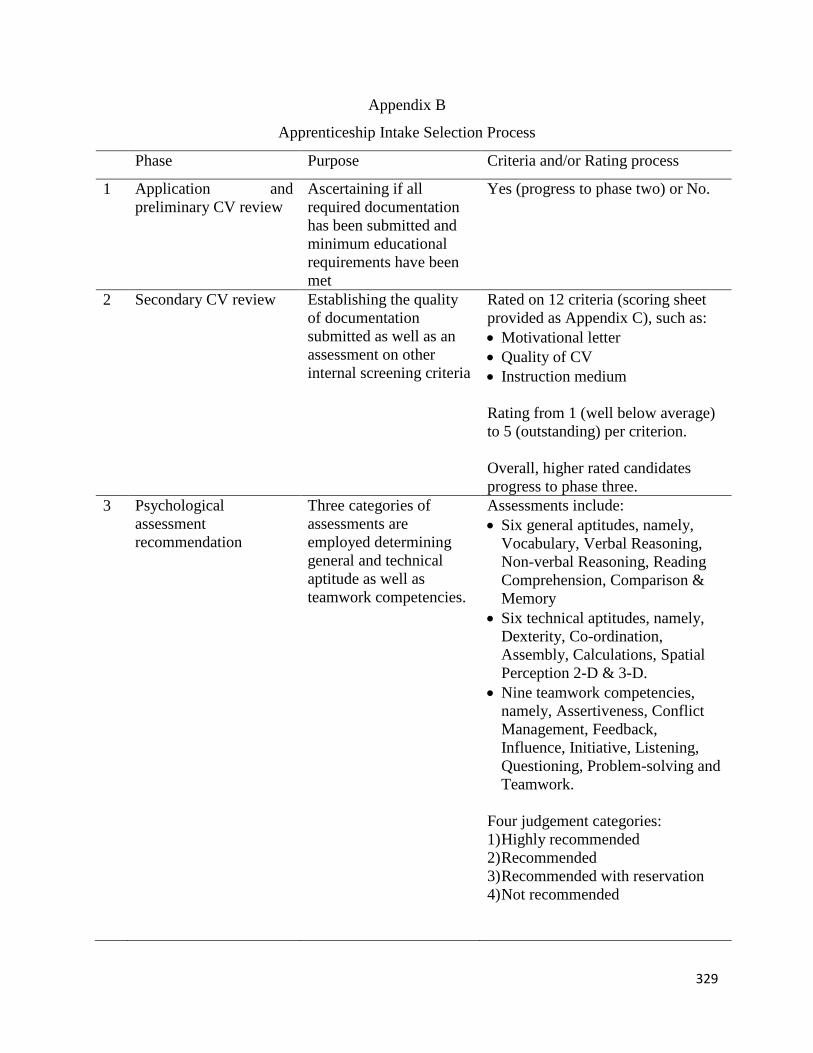
329
Appendix B
Apprenticeship Intake Selection Process
Phase Purpose Criteria and/or Rating process
1 Application and
preliminary CV review
Ascertaining if all
required documentation
has been submitted and
minimum educational
requirements have been
met
Yes (progress to phase two) or No.
2 Secondary CV review Establishing the quality
of documentation
submitted as well as an
assessment on other
internal screening criteria
Rated on 12 criteria (scoring sheet
provided as Appendix C), such as:
Motivational letter
Quality of CV
Instruction medium
Rating from 1 (well below average)
to 5 (outstanding) per criterion.
Overall, higher rated candidates
progress to phase three.
3 Psychological
assessment
recommendation
Three categories of
assessments are
employed determining
general and technical
aptitude as well as
teamwork competencies.
Assessments include:
Six general aptitudes, namely,
Vocabulary, Verbal Reasoning,
Non-verbal Reasoning, Reading
Comprehension, Comparison &
Memory
Six technical aptitudes, namely,
Dexterity, Co-ordination,
Assembly, Calculations, Spatial
Perception 2-D & 3-D.
Nine teamwork competencies,
namely, Assertiveness, Conflict
Management, Feedback,
Influence, Initiative, Listening,
Questioning, Problem-solving and
Teamwork.
Four judgement categories:
1) Highly recommended
2) Recommended
3) Recommended with reservation
4) Not recommended
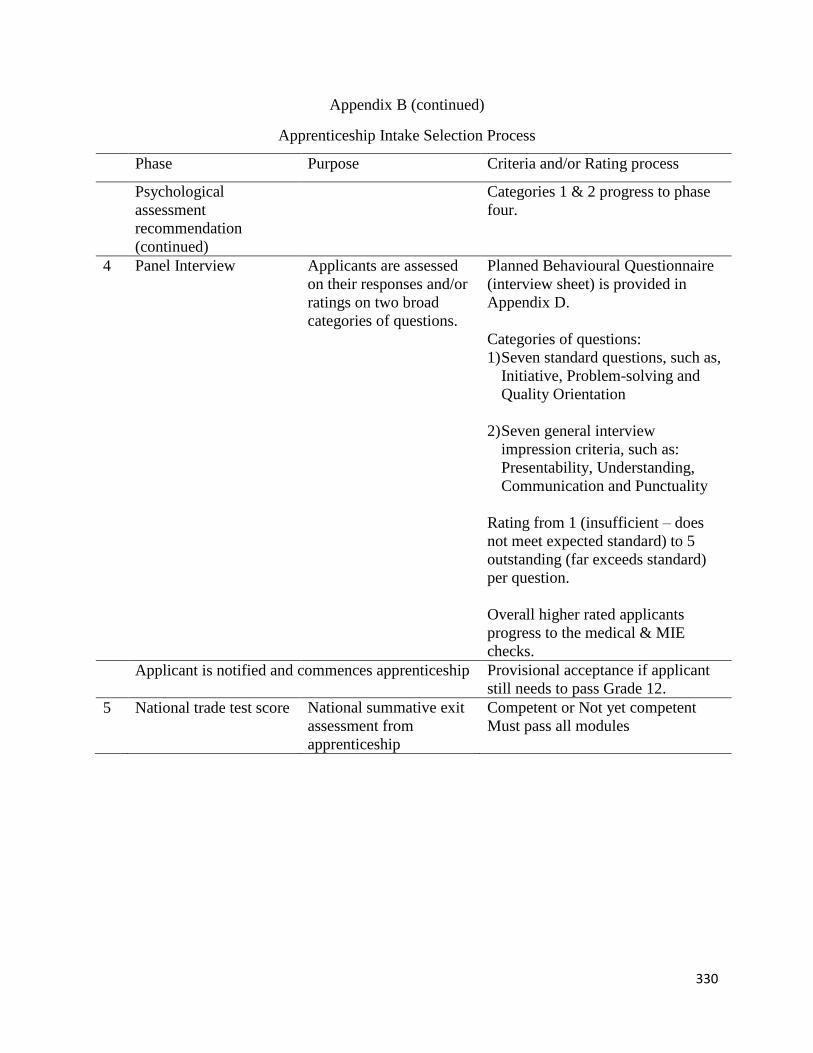
330
Appendix B (continued)
Apprenticeship Intake Selection Process
Phase Purpose Criteria and/or Rating process
Psychological
assessment
recommendation
(continued)
Categories 1 & 2 progress to phase
four.
4 Panel Interview Applicants are assessed
on their responses and/or
ratings on two broad
categories of questions.
Planned Behavioural Questionnaire
(interview sheet) is provided in
Appendix D.
Categories of questions:
1) Seven standard questions, such as,
Initiative, Problem-solving and
Quality Orientation
2) Seven general interview
impression criteria, such as:
Presentability, Understanding,
Communication and Punctuality
Rating from 1 (insufficient – does
not meet expected standard) to 5
outstanding (far exceeds standard)
per question.
Overall higher rated applicants
progress to the medical & MIE
checks.
Applicant is notified and commences apprenticeship Provisional acceptance if applicant
still needs to pass Grade 12.
5 National trade test score National summative exit
assessment from
apprenticeship
Competent or Not yet competent
Must pass all modules

331
Appendix C
Secondary Curriculum Vitae Review Screening Guidelines (A & B)
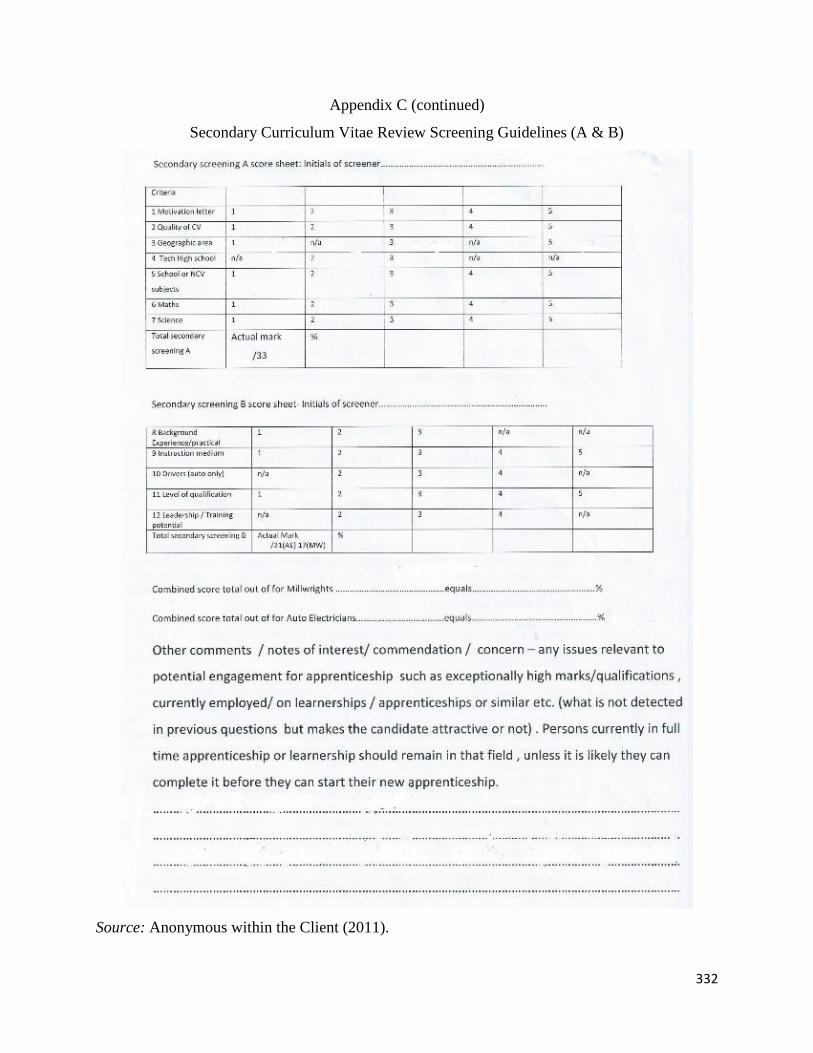
332
Appendix C (continued)
Secondary Curriculum Vitae Review Screening Guidelines (A & B)
Source: Anonymous within the Client (2011).

333
Appendix D
Apprenticeship Interview Sheet

334
Appendix D (continued)
Apprenticeship Interview Sheet

335
Appendix D (continued)
Apprenticeship Interview Sheet

336
Appendix D (continued)
Apprenticeship Interview Sheet

337
Appendix D (continued)
Apprenticeship Interview Sheet
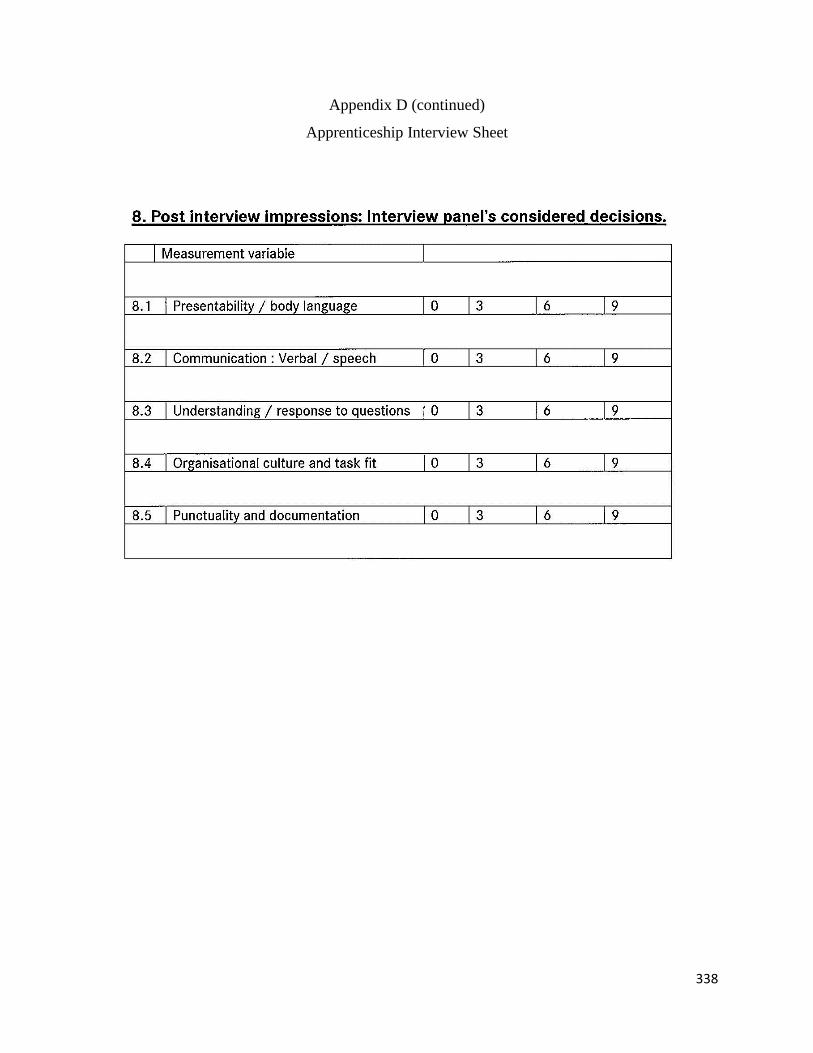
338
Appendix D (continued)
Apprenticeship Interview Sheet
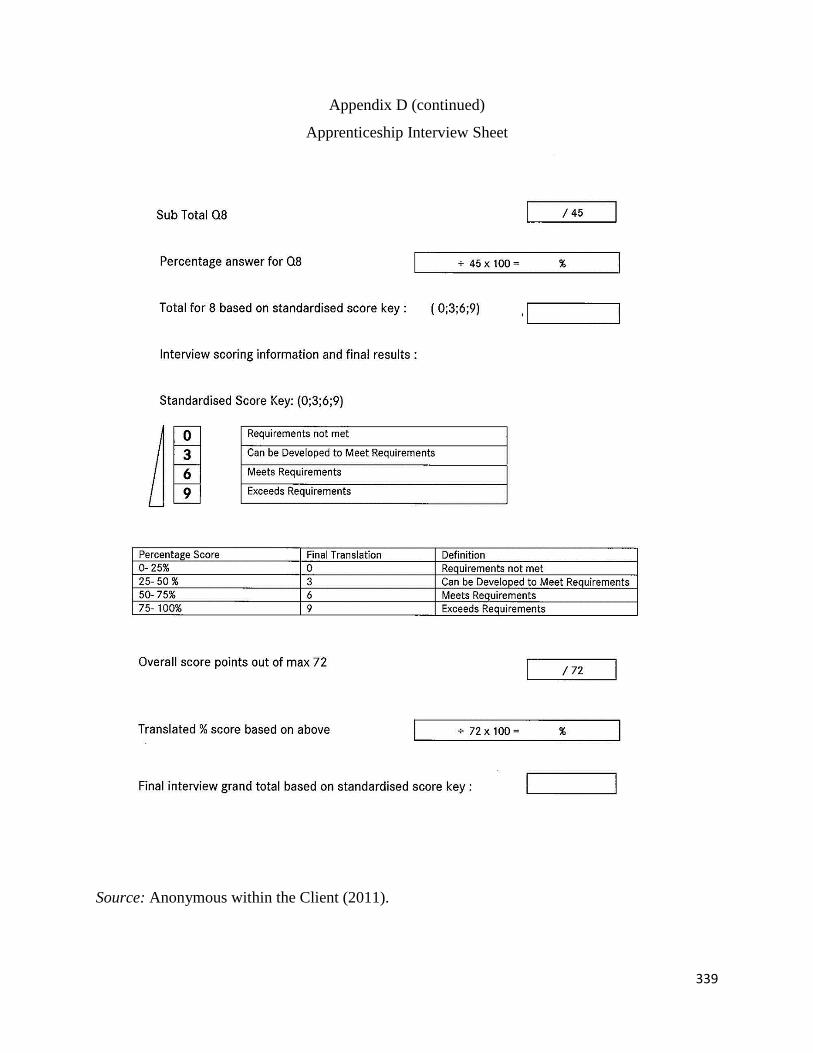
339
Appendix D (continued)
Apprenticeship Interview Sheet
Source: Anonymous within the Client (2011).
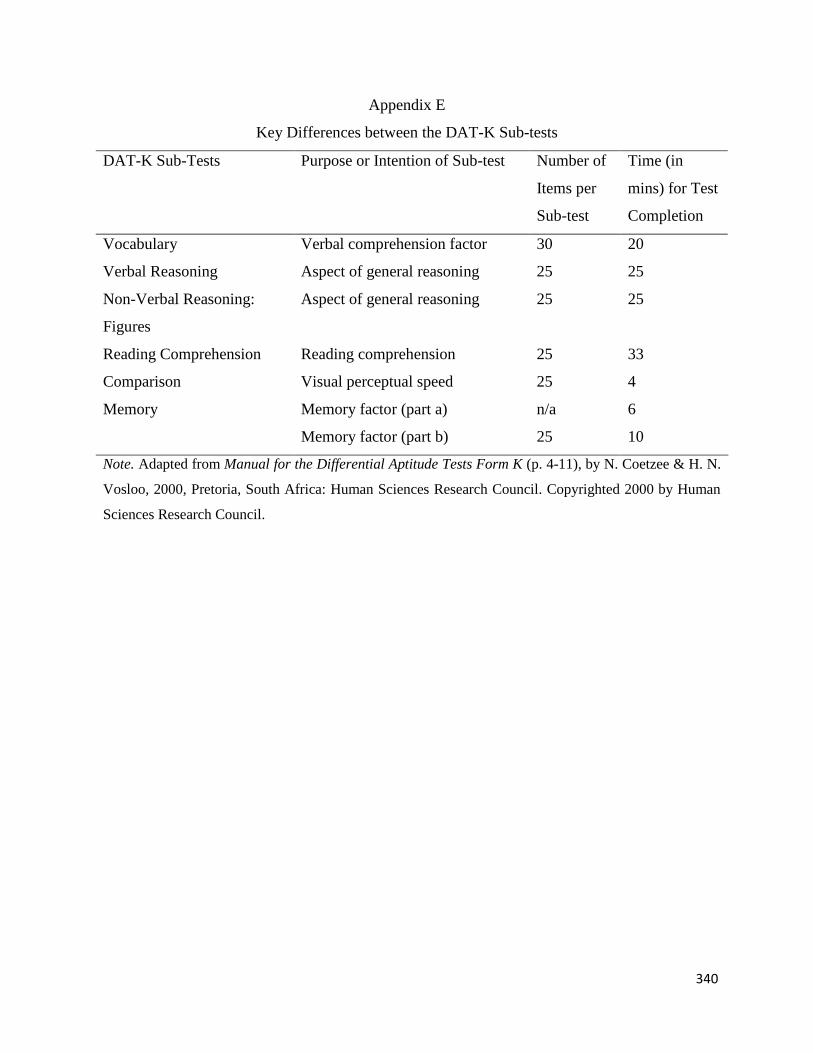
340
Appendix E
Key Differences between the DAT-K Sub-tests
DAT-K Sub-Tests Purpose or Intention of Sub-test Number of
Items per
Sub-test
Time (in
mins) for Test
Completion
Vocabulary Verbal comprehension factor 30 20
Verbal Reasoning Aspect of general reasoning 25 25
Non-Verbal Reasoning:
Figures
Aspect of general reasoning 25 25
Reading Comprehension Reading comprehension 25 33
Comparison Visual perceptual speed 25 4
Memory Memory factor (part a) n/a 6
Memory factor (part b) 25 10
Note. Adapted from Manual for the Differential Aptitude Tests Form K (p. 4-11), by N. Coetzee & H. N.
Vosloo, 2000, Pretoria, South Africa: Human Sciences Research Council. Copyrighted 2000 by Human
Sciences Research Council.
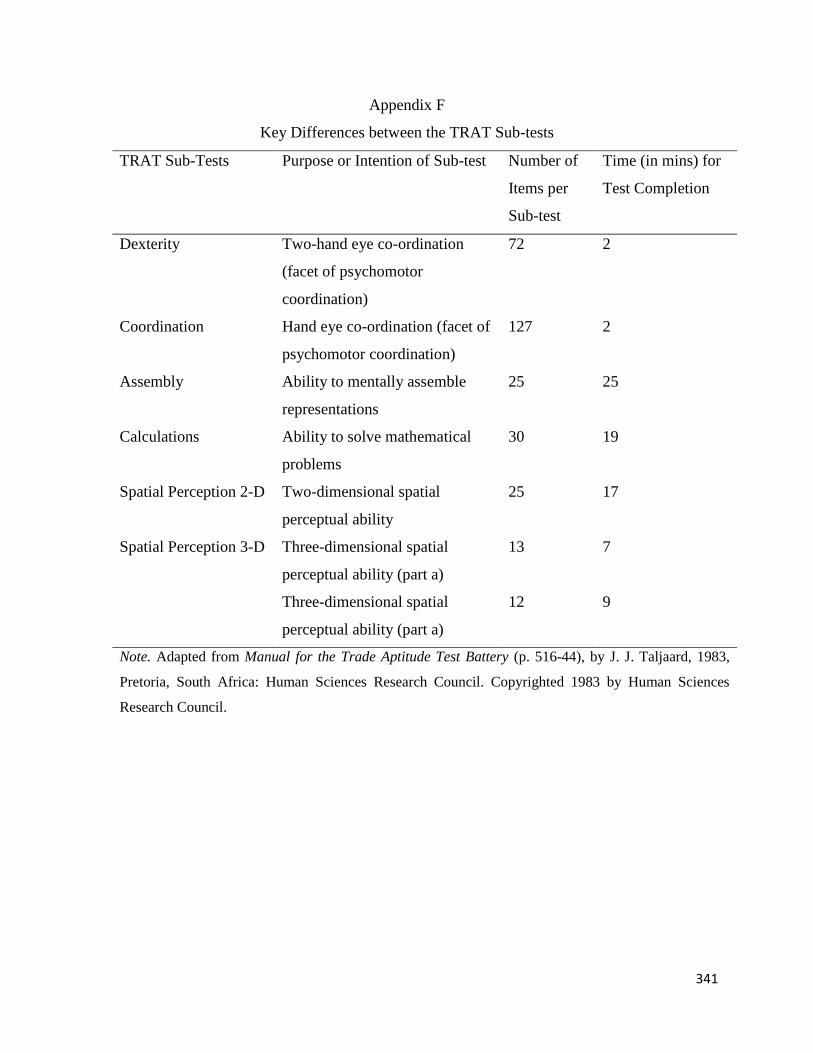
341
Appendix F
Key Differences between the TRAT Sub-tests
TRAT Sub-Tests Purpose or Intention of Sub-test Number of
Items per
Sub-test
Time (in mins) for
Test Completion
Dexterity Two-hand eye co-ordination
(facet of psychomotor
coordination)
72 2
Coordination Hand eye co-ordination (facet of
psychomotor coordination)
127 2
Assembly Ability to mentally assemble
representations
25 25
Calculations Ability to solve mathematical
problems
30 19
Spatial Perception 2-D Two-dimensional spatial
perceptual ability
25 17
Spatial Perception 3-D Three-dimensional spatial
perceptual ability (part a)
13 7
Three-dimensional spatial
perceptual ability (part a)
12 9
Note. Adapted from Manual for the Trade Aptitude Test Battery (p. 516-44), by J. J. Taljaard, 1983,
Pretoria, South Africa: Human Sciences Research Council. Copyrighted 1983 by Human Sciences
Research Council.
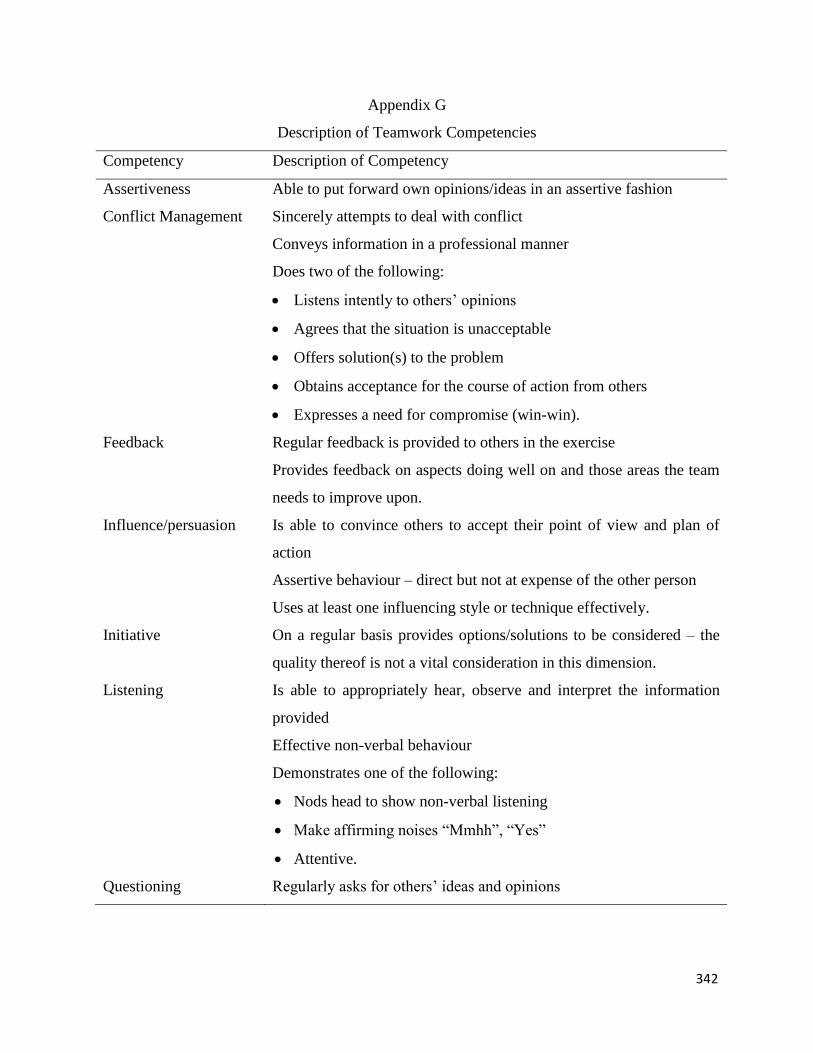
342
Appendix G
Description of Teamwork Competencies
Competency Description of Competency
Assertiveness Able to put forward own opinions/ideas in an assertive fashion
Conflict Management Sincerely attempts to deal with conflict
Conveys information in a professional manner
Does two of the following:
Listens intently to others’ opinions
Agrees that the situation is unacceptable
Offers solution(s) to the problem
Obtains acceptance for the course of action from others
Expresses a need for compromise (win-win).
Feedback Regular feedback is provided to others in the exercise
Provides feedback on aspects doing well on and those areas the team
needs to improve upon.
Influence/persuasion Is able to convince others to accept their point of view and plan of
action
Assertive behaviour – direct but not at expense of the other person
Uses at least one influencing style or technique effectively.
Initiative On a regular basis provides options/solutions to be considered – the
quality thereof is not a vital consideration in this dimension.
Listening Is able to appropriately hear, observe and interpret the information
provided
Effective non-verbal behaviour
Demonstrates one of the following:
Nods head to show non-verbal listening
Make affirming noises “Mmhh”, “Yes”
Attentive.
Questioning Regularly asks for others’ ideas and opinions
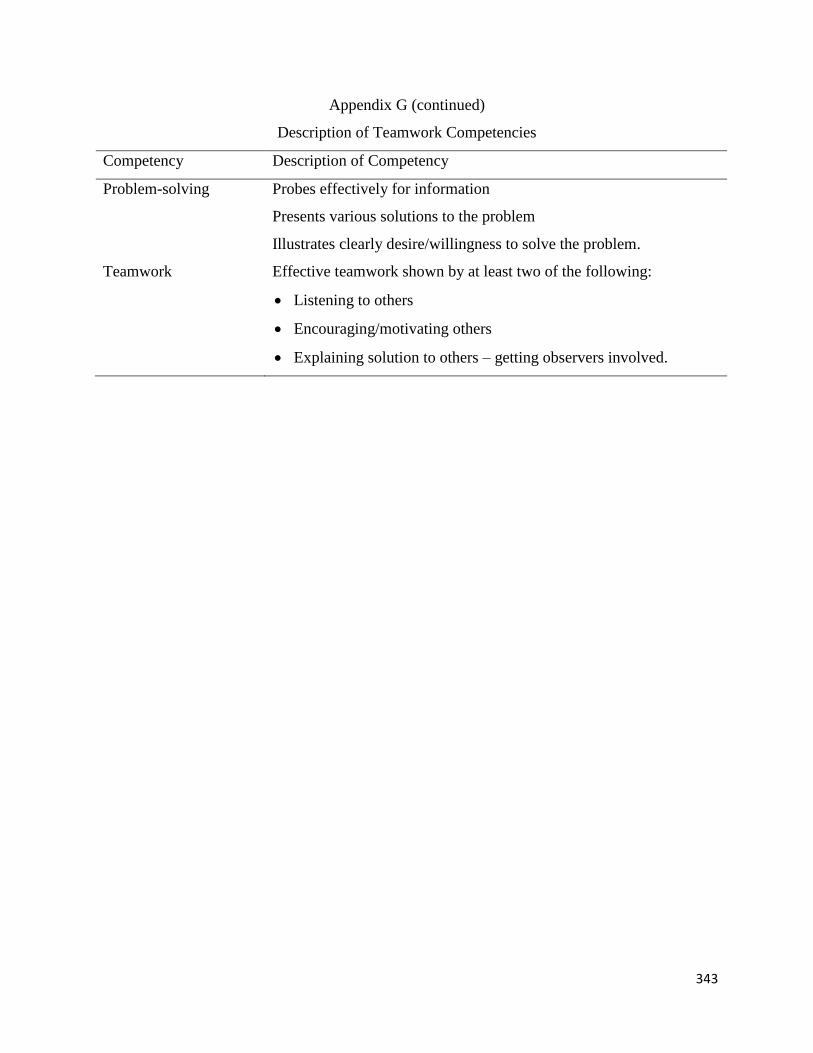
343
Appendix G (continued)
Description of Teamwork Competencies
Competency Description of Competency
Problem-solving Probes effectively for information
Presents various solutions to the problem
Illustrates clearly desire/willingness to solve the problem.
Teamwork Effective teamwork shown by at least two of the following:
Listening to others
Encouraging/motivating others
Explaining solution to others – getting observers involved.
344
Appendix H
Applicant Consent Form
Ethics Research Confidentiality and Informed Consent Form
Juliet Ingrid Puchert (an academic writing her Doctor of Philosophy (Industrial
Psychology) through NMU) is asking people from your group for access to specific
information pertaining to your apprenticeship journey within the company. It is hoped this
information will benefit the company, and possibly other companies and organisations in
the future.
Juliet Ingrid Puchert is conducting research regarding THE EVALUATION OF A
PROFILING AND SELECTION MODEL FOR APPRENTICES IN THE SOUTH
AFRICAN AUTOMOTIVE INDUSTRY. She is interested in finding out more about the
optimum demographic, educational and skills profile of successful apprentices in the
automotive industry as well as establish the impact of the selection steps on the success
of apprentice applicants within the automotive industry. She is carrying out this research
to help inform human resource selection practices in general and specifically within the
South African automotive industry. As a result of this study, she aims to make
recommendations to the automobile industry in order to improve their selection process
for apprentices.
Please understand that you are not being forced to take part in this study and the choice
whether to participate or not is yours alone. However, Juliet Ingrid Puchert would really
appreciate it if you do provide her with access to your information pertaining to your
apprenticeship journey with her. If you choose not take part in completed these tests, you
will not be affected in any way. If you initially agree to participate, you may deny access
at any time and your information will be removed from the study. If you do this there will
be no penalties and you will NOT be prejudiced in ANY way. Confidentiality will be
observed professionally.
For the purposes of this doctoral study, you are requested to provide Juliet Ingrid Puchert
access to the following information:
345
1) The results achieved in the five steps of the company’s selection process. This
includes:
a) your CV and attachments as well as motivational letter
b) Internal screening documents pertaining to the CV review
c) Psychological assessment information (i.e., general aptitude, technical aptitude
and teamwork assessment scores)
d) Internal screening documents pertaining to the panel interview
e) Internal screening documents pertaining to the final selection decision
2) Your apprenticeship programme results (e.g., module results and performance
reviews)
3) Trade Test results (i.e., internal and external body reports).
As part of the study you may also be requested to participate in an interview with Juliet
Ingrid Puchert.
During the data collection phase of this study Juliet Ingrid Puchert will make use of one
data-capturer, Mrs Loretta van Heerden, to assist her in this process. Mrs van Heerden
will sign a non-disclosure agreement documenting her commitment to maintaining the
confidentiality of your information. Data capturing will initially entail the recording of your
names and ID number on an Excel spreadsheet alongside the information indicated in
numbers (1) to (3) above. However, once all of your information across the various steps
and phases of the apprenticeship programme have been accurately captured and
integrated, these personal details will be deleted. Your information will then only be
reflected as an identifier (e.g., a unique numbered code such as candidate #1, 2 or 3).
Therefore, in terms of the research component, no one will be able to link you to the
information or results you give. Only the researcher will have access to the unlinked
information. The information will remain confidential and there will be no “come-backs”
from the information you give. Furthermore, the information you provide Juliet Ingrid
Puchert access to will not be removed off the company’s premises. All data-capturing will
be done on-site on a secure laptop solely used for that purpose. Only once your personal
information (i.e., a unique identifier has been assigned to your information) is deleted will
this information be removed off-site.
If possible, Juliet Ingrid Puchert would like to come back to the company once she has
completed her study to inform you and the company of what the results were. It is hoped
that there may then be a discussion on these findings and proposals around the research
and what this means for apprenticeship selection and training in the industry and possible
country in general.

346
Should you be willing to participate in this study, kindly complete the informed consent
form provided overleaf.
Kind regards,
JULIET INGRID PUCHERT
Cell #: 083 4568208
Home #: 043 – 726 9565
e-mail: [email protected]
INFORMED CONSENT I hereby agree to participate in research regarding THE EVALUATION OF A PROFILING AND SELECTION MODEL FOR APPRENTICES IN THE SOUTH AFRICAN AUTOMOTIVE INDUSTRY. I understand that I am participating freely and without being forced in any way to do so. I also understand that I can stop participating at any point should I not want to continue and that this decision will not in any way affect me negatively. I understand that this is a research project whose purpose is not necessarily to benefit me personally. I have received the details of a person to contact should I need to speak about any issues which may arise from agreeing to participate in this study. I understand that this consent form will ultimately not be linked to the information given access to, and that my information will remain confidential. I understand that if at all possible, feedback will be given to me and the company on the results of the completed research. I understand that I may withdraw from the study at any time without any penalty. …………………………….. Name of participant …………………………….. Signature of participant Date:…………………..

347
Appendix I
Permission Letter from the Client

348
Appendix J
Ethical Clearance Letter
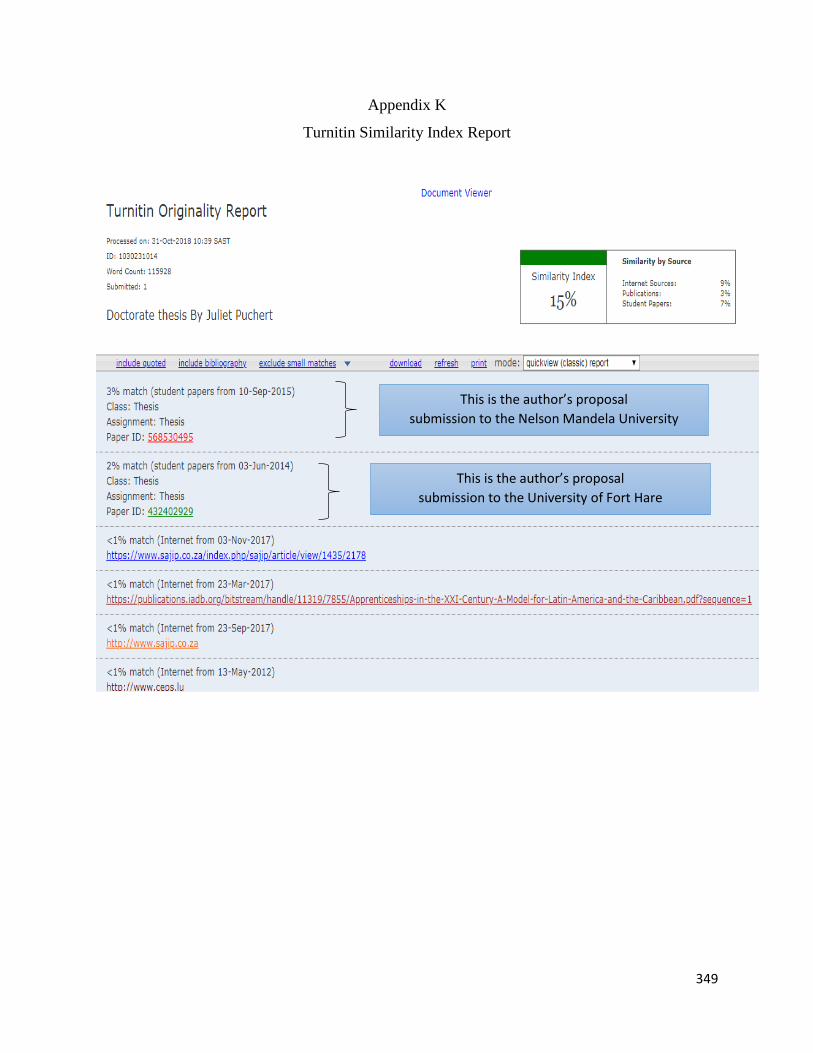
349
Appendix K
Turnitin Similarity Index Report
This is the author’s proposal
submission to the Nelson Mandela University
This is the author’s proposal
submission to the University of Fort Hare
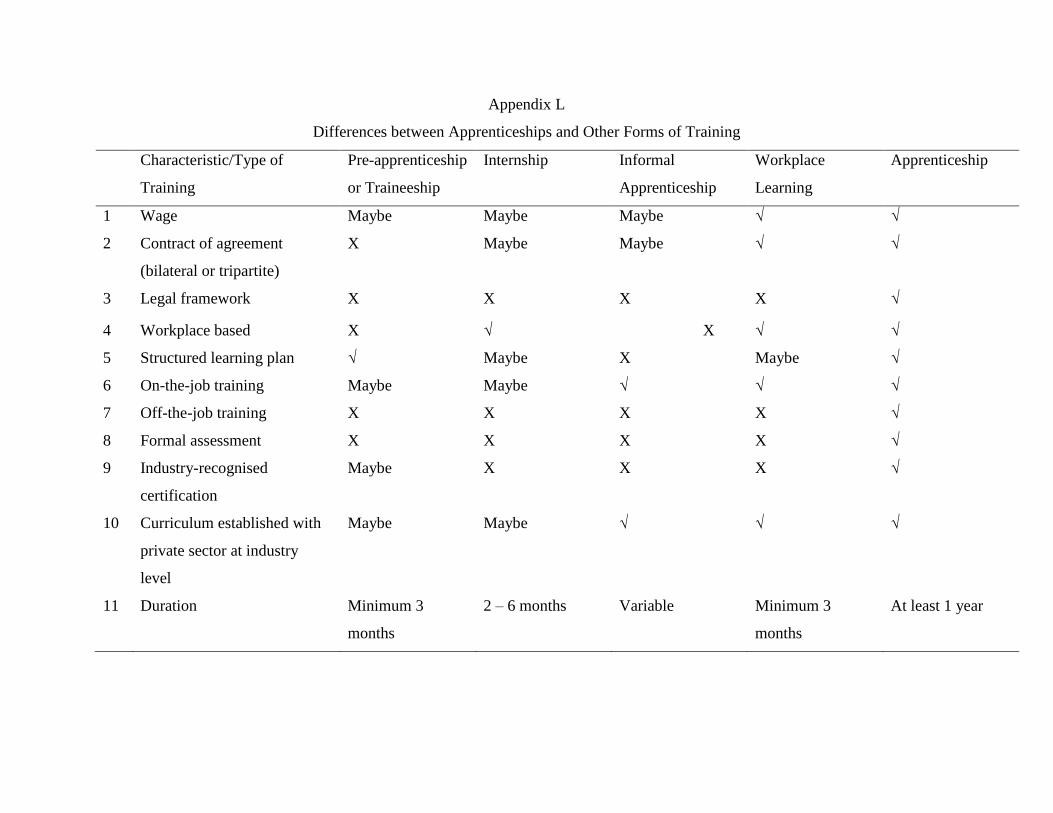
Appendix L
Differences between Apprenticeships and Other Forms of Training
Characteristic/Type of
Training
Pre-apprenticeship
or Traineeship
Internship Informal
Apprenticeship
Workplace
Learning
Apprenticeship
1 Wage Maybe Maybe Maybe √ √
2 Contract of agreement
(bilateral or tripartite)
X Maybe Maybe √ √
3 Legal framework X X X X √
4 Workplace based X √ X √ √
5 Structured learning plan √ Maybe X Maybe √
6 On-the-job training Maybe Maybe √ √ √
7 Off-the-job training X X X X √
8 Formal assessment X X X X √
9 Industry-recognised
certification
Maybe X X X √
10 Curriculum established with
private sector at industry
level
Maybe Maybe √ √ √
11 Duration Minimum 3
months
2 – 6 months Variable Minimum 3
months
At least 1 year
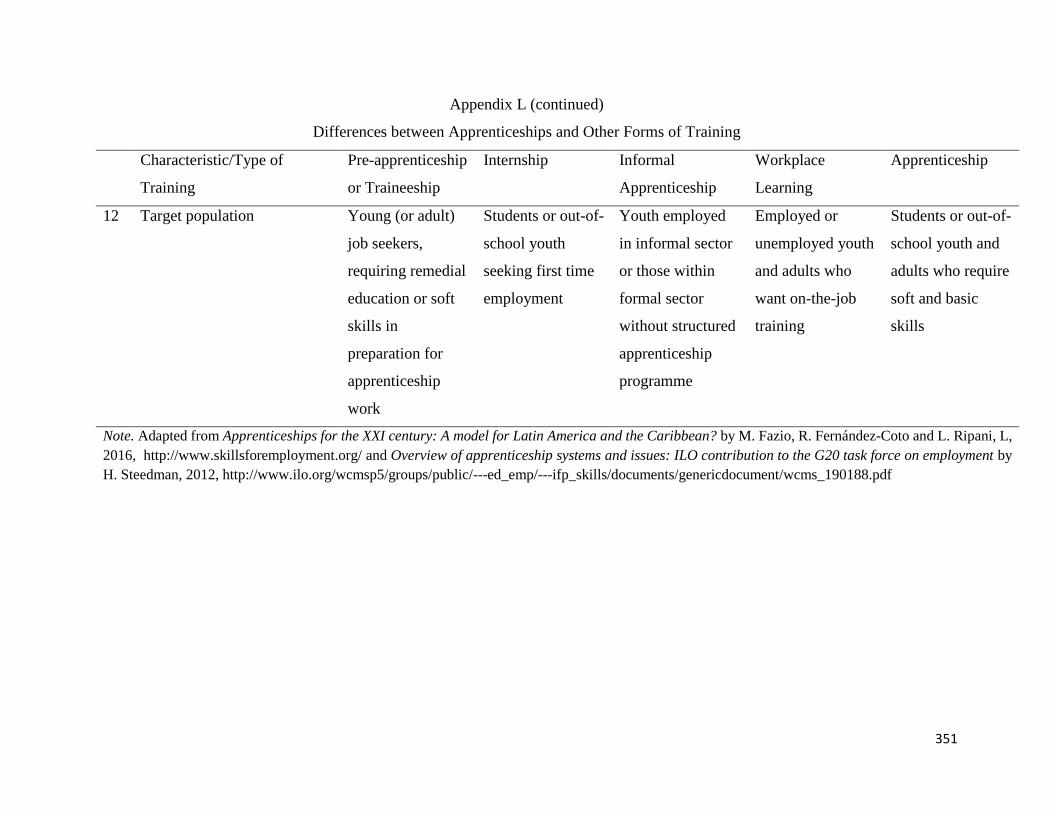
351
Appendix L (continued)
Differences between Apprenticeships and Other Forms of Training
Characteristic/Type of
Training
Pre-apprenticeship
or Traineeship
Internship Informal
Apprenticeship
Workplace
Learning
Apprenticeship
12 Target population Young (or adult)
job seekers,
requiring remedial
education or soft
skills in
preparation for
apprenticeship
work
Students or out-of-
school youth
seeking first time
employment
Youth employed
in informal sector
or those within
formal sector
without structured
apprenticeship
programme
Employed or
unemployed youth
and adults who
want on-the-job
training
Students or out-of-
school youth and
adults who require
soft and basic
skills
Note. Adapted from Apprenticeships for the XXI century: A model for Latin America and the Caribbean? by M. Fazio, R. Fernández-Coto and L. Ripani, L,
2016, http://www.skillsforemployment.org/ and Overview of apprenticeship systems and issues: ILO contribution to the G20 task force on employment by
H. Steedman, 2012, http://www.ilo.org/wcmsp5/groups/public/---ed_emp/---ifp_skills/documents/genericdocument/wcms_190188.pdf
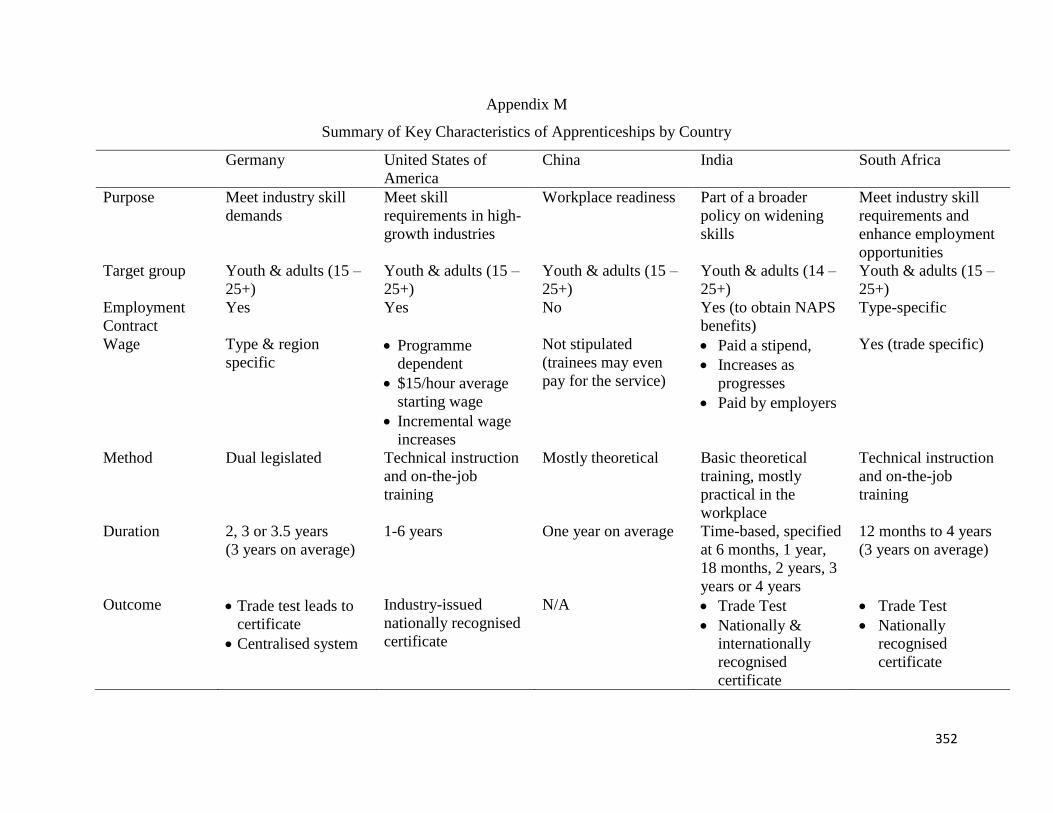
352
Appendix M
Summary of Key Characteristics of Apprenticeships by Country
Germany United States of
America
China India South Africa
Purpose Meet industry skill
demands
Meet skill
requirements in high-
growth industries
Workplace readiness Part of a broader
policy on widening
skills
Meet industry skill
requirements and
enhance employment
opportunities
Target group Youth & adults (15 –
25+)
Youth & adults (15 –
25+)
Youth & adults (15 –
25+)
Youth & adults (14 –
25+)
Youth & adults (15 –
25+)
Employment
Contract
Yes Yes No Yes (to obtain NAPS
benefits)
Type-specific
Wage Type & region
specific Programme
dependent
$15/hour average
starting wage
Incremental wage
increases
Not stipulated
(trainees may even
pay for the service)
Paid a stipend,
Increases as
progresses
Paid by employers
Yes (trade specific)
Method Dual legislated
Technical instruction
and on-the-job
training
Mostly theoretical Basic theoretical
training, mostly
practical in the
workplace
Technical instruction
and on-the-job
training
Duration 2, 3 or 3.5 years
(3 years on average)
1-6 years One year on average Time-based, specified
at 6 months, 1 year,
18 months, 2 years, 3
years or 4 years
12 months to 4 years
(3 years on average)
Outcome Trade test leads to
certificate
Centralised system
Industry-issued
nationally recognised
certificate
N/A Trade Test
Nationally &
internationally
recognised
certificate
Trade Test
Nationally
recognised
certificate
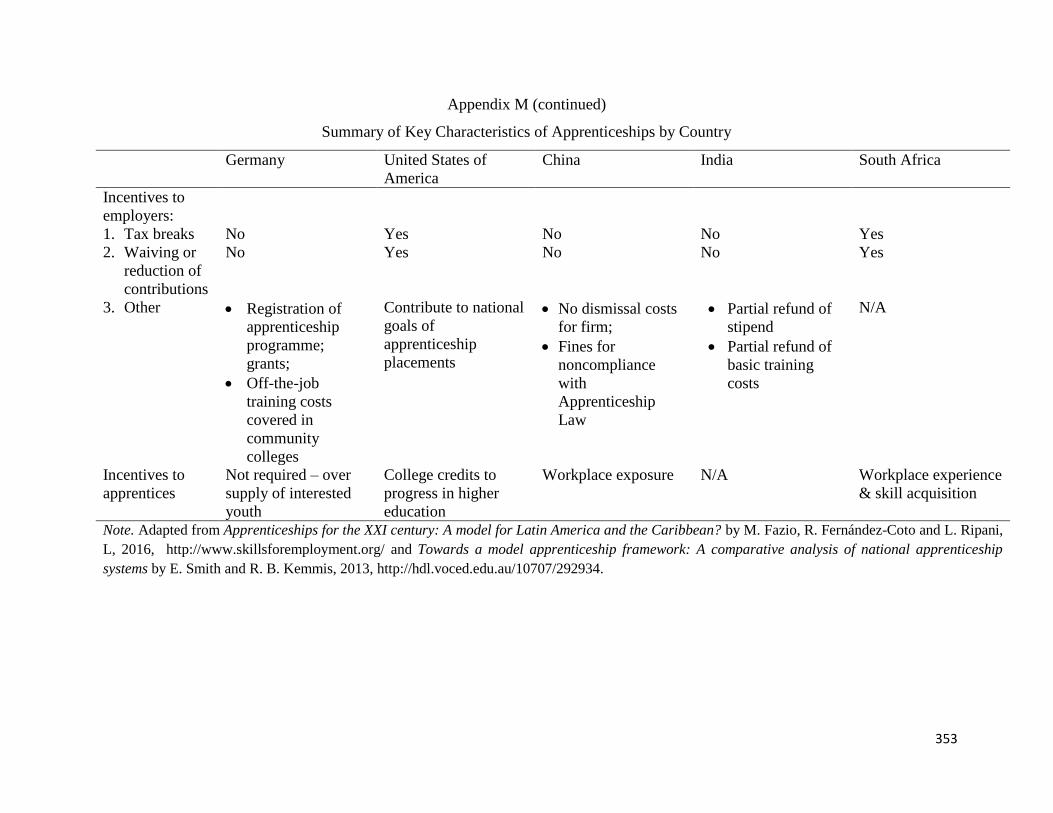
353
Appendix M (continued)
Summary of Key Characteristics of Apprenticeships by Country
Germany United States of
America
China India South Africa
Incentives to
employers:
1. Tax breaks No Yes No No Yes
2. Waiving or
reduction of
contributions
No Yes No No Yes
3. Other Registration of
apprenticeship
programme;
grants;
Off-the-job
training costs
covered in
community
colleges
Contribute to national
goals of
apprenticeship
placements
No dismissal costs
for firm;
Fines for
noncompliance
with
Apprenticeship
Law
Partial refund of
stipend
Partial refund of
basic training
costs
N/A
Incentives to
apprentices
Not required – over
supply of interested
youth
College credits to
progress in higher
education
Workplace exposure N/A Workplace experience
& skill acquisition
Note. Adapted from Apprenticeships for the XXI century: A model for Latin America and the Caribbean? by M. Fazio, R. Fernández-Coto and L. Ripani,
L, 2016, http://www.skillsforemployment.org/ and Towards a model apprenticeship framework: A comparative analysis of national apprenticeship
systems by E. Smith and R. B. Kemmis, 2013, http://hdl.voced.edu.au/10707/292934.
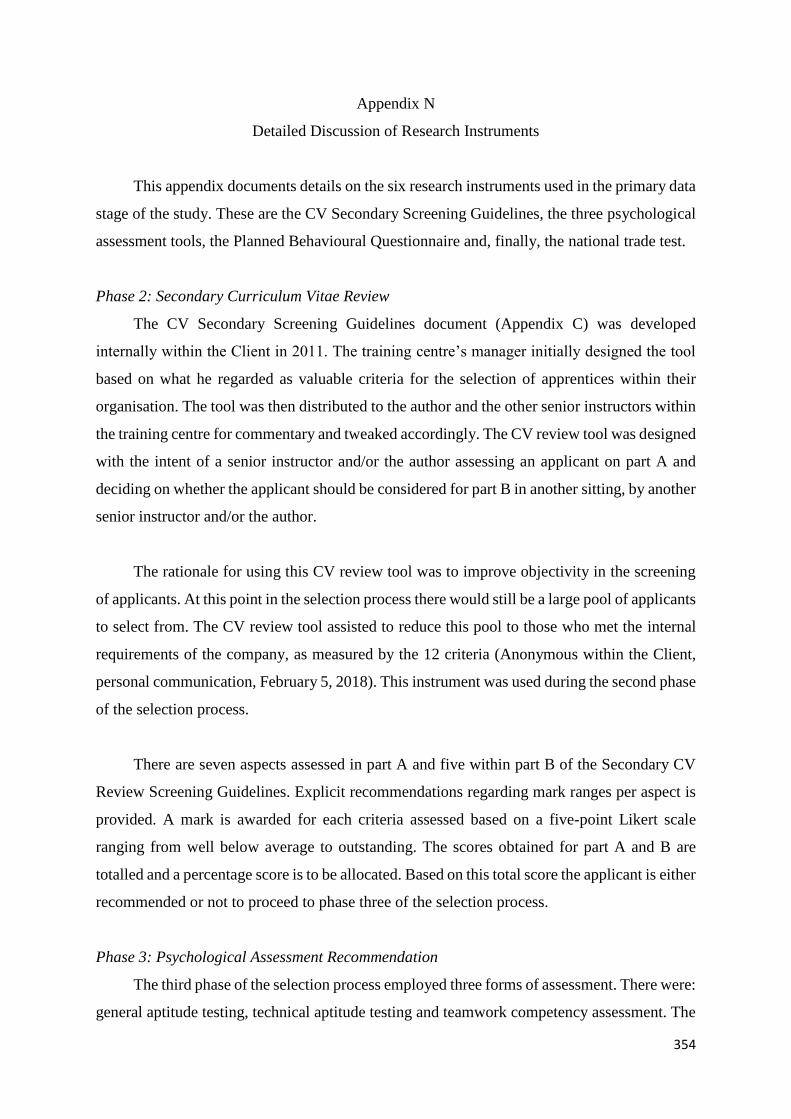
354
Appendix N
Detailed Discussion of Research Instruments
This appendix documents details on the six research instruments used in the primary data
stage of the study. These are the CV Secondary Screening Guidelines, the three psychological
assessment tools, the Planned Behavioural Questionnaire and, finally, the national trade test.
Phase 2: Secondary Curriculum Vitae Review
The CV Secondary Screening Guidelines document (Appendix C) was developed
internally within the Client in 2011. The training centre’s manager initially designed the tool
based on what he regarded as valuable criteria for the selection of apprentices within their
organisation. The tool was then distributed to the author and the other senior instructors within
the training centre for commentary and tweaked accordingly. The CV review tool was designed
with the intent of a senior instructor and/or the author assessing an applicant on part A and
deciding on whether the applicant should be considered for part B in another sitting, by another
senior instructor and/or the author.
The rationale for using this CV review tool was to improve objectivity in the screening
of applicants. At this point in the selection process there would still be a large pool of applicants
to select from. The CV review tool assisted to reduce this pool to those who met the internal
requirements of the company, as measured by the 12 criteria (Anonymous within the Client,
personal communication, February 5, 2018). This instrument was used during the second phase
of the selection process.
There are seven aspects assessed in part A and five within part B of the Secondary CV
Review Screening Guidelines. Explicit recommendations regarding mark ranges per aspect is
provided. A mark is awarded for each criteria assessed based on a five-point Likert scale
ranging from well below average to outstanding. The scores obtained for part A and B are
totalled and a percentage score is to be allocated. Based on this total score the applicant is either
recommended or not to proceed to phase three of the selection process.
Phase 3: Psychological Assessment Recommendation
The third phase of the selection process employed three forms of assessment. There were:
general aptitude testing, technical aptitude testing and teamwork competency assessment. The
355
three instruments employed to conduct each of these three forms of testing are now
summarised.
a) The Differential Aptitude Test battery
The intent of the DAT battery is to offer insight on the “differential aptitudes of Grade
10, 11 and 12 learners as well as of adults who wish to undergo post-school training or who
wish to enter a particular occupation” (Coetzee & Vosloo, 2000, p. 2). The HSRC authorised
the development of this psychological tool for the purpose of counselling and assisting in the
production of an optimal match between individuals and work positions or post-school training
(Coetzee & Vosloo, 2000).
The first purpose of the third phase of the selection process was to hone the applicant
pool to those candidates that were deemed suitable in terms of potential for further training. To
fulfil this need, the DAT battery was selected as an instrument. Given the expectation that the
applicant pool may not have experienced advantageous education and training, the standard
version, termed DAT-K, was deemed appropriate. Of the four versions of the battery available,
the DAT-K version is suitable for candidates who have completed Grades 10 to 12 but may not
have benefitted from favourable growth experiences (Coetzee & Vosloo, 2000).
The second purpose of the third phase of the selection process was to identify if the
applicants had certain specific aptitudes identified in the job analysis. Six sub-tests from the
DAT-K battery were therefore intentionally selected for use in this phase of the selection
process. These are: Vocabulary, Verbal reasoning, Non-verbal reasoning, Reading
Comprehension, Comparison and Memory. Appendix E summarised the assessment intention,
the number of items per sub-test as well as the allocated timing of each of these sub-tests. These
aspects are clarified in detail in the subsequent paragraphs.
The Vocabulary sub-test
The aim of this test is to measure the Verbal Comprehension index, which is understood
as the knowledge of words and their meaning. It also includes the ability to apply this
knowledge in spoken and written formats. The ability of candidates to recognize a word and
then to select a synonym for that word is regarded as a valid indication of their knowledge of
words’ meanings and hence a valid gauge for the verbal comprehension factor. The sub-test
356
involves 30 multiple-choice type questions to be completed within 20 minutes (Coetzee &
Vosloo, 2000).
The Verbal Reasoning sub-test
The objective of this sub-test is to assess an attribute of General Reasoning on the basis
of verbal material. The tool assumes that the skill of identifying relationships, conducting word
similarities, deciphering general problems utilising logical thought, as well as an individual’s
vocabulary experience, are valid criteria of this aspect of general reasoning. There are 25
multiple-choice type questions in this sub-test with a 25-minute time limit (Coetzee & Vosloo,
2000).
The Non-verbal Reasoning sub-test
Another aspect of General Reasoning is sought to be determined in this sub-test through
the basis of non-verbal items. The instrument comprises of two types of questions. In the first
set of questions, the relationship between two figures must be correctly identified and the same
relational principle is then to be applied to a second pair of figures. The second type of
questions consists of a series of modified figures. The underlying principle for the changes in
the figures needs to be identified and applied to complete the series. The ability to adequately
identify and apply the underlying principles informing these two forms of modification is
regarded as a valid sign of non-verbal reasoning ability. Within 25 minutes, 25 multiple-choice
type questions need to be attempted in this sub-test (Coetzee & Vosloo, 2000).
The Reading Comprehension sub-test
The intention of this sub-test is to measure the ability to comprehend what is being read.
It is assumed that a candidate’s ability to choose the correct answers to questions on written
passages is a valid gauge of reading comprehension. The sub-test consists of 25 multiple-choice
type questions with a 33-minute test completion time (Coetzee & Vosloo, 2000).
The Comparison sub-test
This sub-test investigates Visual Perceptual Speed, which is defined as the ability to
quickly and precisely discern similarities and dissimilarities between visual configurations.
The sub-test rests on the assumption that the ability to identify a group of characters (e.g.,
numerical, alphabetical or diagrammatical) that is not consistent with the other groups offered
357
is a valid indication of Visual Perceptual Speed. There are 25 multiple-choice type questions
to be completed within a four-minute time limit (Coetzee & Vosloo, 2000).
The Memory sub-test
This sub-test aims to assess an aspect of the Memory factor by using meaningful material.
It is based on the assumption that being able to memorize written paragraphs containing
meaningful material and then to correctly answer questions on this summarised content, is a
valid measure of an aspect of memory. There are two parts to this sub-test. In the first part, the
candidate is given six minutes to read and memorise the two-page passage. In the second part,
approximately 90 minutes later, 10 minutes is provided to answer 25 multiple-choice questions
on the passage (without referring back to the passage) (Coetzee & Vosloo, 2000).
b) The Trade Aptitude Test battery
The objective of the TRAT battery is to provide assistance in the selection of prospective
students for admission into technical institutes and colleges. The test battery is also specifically
designed to identify candidates’ potential to progress and successfully complete training in
specific technical fields. The HSRC authorised the development of this psychological tool for
use amongst Grade eight and above students who needed help in distinguishing their best match
to the various specialised fields of artisan training available (Taljaard, 1983).
As with the first aptitude battery chosen for use in the third phase, the intent behind the
second assessment instrument selected was to reduce the number of candidates in the applicant
pool and to identify those with the requisite aptitudes to be effective in the apprenticeship
training programme. To achieve this, six sub-tests from the TRAT battery were identified by
the author as suitable for this phase of the selection process. These were: Dexterity,
Coordination, Assembly, Calculations, Spatial Perception 2-D and 3-D. The key differences
with regard to purpose, items per instrument and timing of these TRAT sub-measures are
indicated in Appendix F. The specifics of these six TRAT tools are examined in detail in the
ensuing paragraphs.
The Dexterity sub-test
This sub-test measures two-hand eye co-ordination, a facet of psychomotor co-
ordination. It is based on the assumption that the ability to simultaneously, rapidly and
358
accurately draw circles between pairs of concentric circles, by using a pencil in each hand, is a
valid gauge of two-hand eye co-ordination. The sub-test consists of 72 items (i.e., 36 pairs of
circles) with a two-minute test completion time (Taljaard, 1983).
The Co-ordination sub-test
The intent of this sub-test is to assess hand-eye co-ordination, a facet of psychomotor
ability. The assumption underpinning this sub-test is that the ability to draw an unbroken line,
quickly and precisely, between circular areas by going above one and below the other, without
touching the areas or picking up one’s pencil, is regarded as a valid measure of hand-eye co-
ordination. Within two minutes, a line needs to be drawn between 72 circles with 127 marks
available (Taljaard, 1983).
The Assembly sub-test
This sub-test determines the ability to mentally assemble illustrations of mechanical
parts, on the basis of fixed regulations, to form a provided mechanical object. In this sub-test
25 multiple-choice type questions are required to be finished within 25 minutes (Taljaard,
1983).
The Calculations sub-test
The aim of this sub-test is to obtain an indication of ability to apply basic mathematical
principles and carry out mathematical operations (i.e., adding, subtracting, dividing and
multiplying). The mathematical operations within this sub-test must be done mentally, without
any computations being written down. There are 30 multiple-choice type questions with a 19-
minute time limit (Taljaard, 1983).
The Spatial Perception 2-D sub-test
The sub-test assumes that the degree to which a candidate sees two-dimensional
geometrical shapes and is able to mentally rotate them on a flat surface, is regarded to be a
valid measurement of two-dimensional spatial perceptual ability. Twenty-five multiple-choice
type questions are required to be accomplished within 17 minutes (Taljaard, 1983).
359
The Spatial Perception 3-D sub-test
This tool assumes that the degree to which candidates are able to mentally visualise, turn
and merge three-dimensional figures, in order to make them look like a given figure, and to
mentally shape a three-dimensional structure from a two-dimensional plan, is a valid indication
of their three-dimensional spatial perceptual ability. There are two parts to this sub-test: part
(a) consists of 13 multiple-choice type questions to be attempted in seven minutes and part (b)
has 12 multiple-choice type questions to be completed in nine minutes (Taljaard, 1983).
Scoring mechanisms of the aptitude tests
The scoring of the DAT-K sub-tests should be done manually with a scoring mask, as
per the test manual. The same is true for the TRAT sub-tests, except for the Dexterity and
Coordination sub-tests. These two sub-tests are to be visually scored in accordance with the
test manual requirements. For the general aptitude ability score (i.e., used for hypothesis 11),
the stanine scores obtained for the six DAT-K sub-tests were averaged. The same was true for
the technical aptitude ability score obtained for testing hypothesis 12.
c) Teamwork competency assessment
The author developed various competency-based exercises for use in this third aspect of
the testing phase. These exercises were designed to assess the nine competencies described in
Appendix G. These exercises included, amongst others: building a house with spaghetti and
marshmallows, making the tallest tower possible with pieces of cardboard, pins and masking
tape or building a bridge between two tables with straws, pins, string and masking tape. The
various exercises were to be used on a random and rotational basis to ensure there was no
predictability across each day of the assessments. Applicants should be divided into groups
with a maximum of five participants. Due consideration should be given to age, gender and
race variables in the composition of these groups.
Assessors are to be trained in the facilitation and scoring of the exercises. A standardised
instruction pack should be provided to the assessors which indicates the apparatus and
instructions to be provided per exercise. Part of the assessors’ training should include the
provision of clear instructions on what and how the applicants would be observed. It is vital
that the applicants understand that it is a practical assessment of their teamwork abilities, not
their technical abilities.
360
Assessors should be provided with a standardised scoring sheet to record their judgments
and comments on the behaviours observed. The applicants should be scored using a five-point
Likert scale ranging from significantly below average to significantly above average. This
scoring system is in line with the levels of competence proposed by several other researchers
(Bryman & Bell, 2015a; Foxcroft & Roodt, 2013). To ensure reliability is maintained in the
assessment, the assessors should also participate in standardisation practices. This entails two
assessors observing and assessing the same group to ensure they derive the same scoring results
for the applicants.
Phase 4: Panel Interview
The Planned Behavioural Questionnaire (Appendix D) (i.e., apprenticeship interview
document) was initially designed by the Client’s training centre manager in 2011. Following a
desk-top review of the ‘top’ interview questions, he used his knowledge and understanding of
what the organisation needs, in terms of apprentice attributes, to develop the questions within
this Interview Sheet. The other senior instructors at the training centre and the author were then
requested to add their comments and suggestions before the interview questions were finalised
(Anonymous within the Client, personal communication, February 5, 2018). The interview
document provides guidelines on the standard structured questions to be asked. There are seven
categories of standard questions, with three to four question options per category provided.
The second part of the interview document pertains to the post-interview impression of
the applicant. The applicant is assessed on five aspects, namely, presentation and body
language; verbal communication ability; understanding and response to questions;
organisational culture and task fit, and finally, punctuality and documentation.
This structured Planned Behavioural Questionnaire employs a four-point Likert scoring
scale, ranging from ‘requirements not met’ to ‘exceeds requirements’. The interview document
was designed to be employed by two senior instructors simultaneously interviewing one
applicant. The instructors are required to independently score the applicant on the interview
sheet and then, following debate on their performance, agree on the final scores to be allocated
to the applicant on a third document.
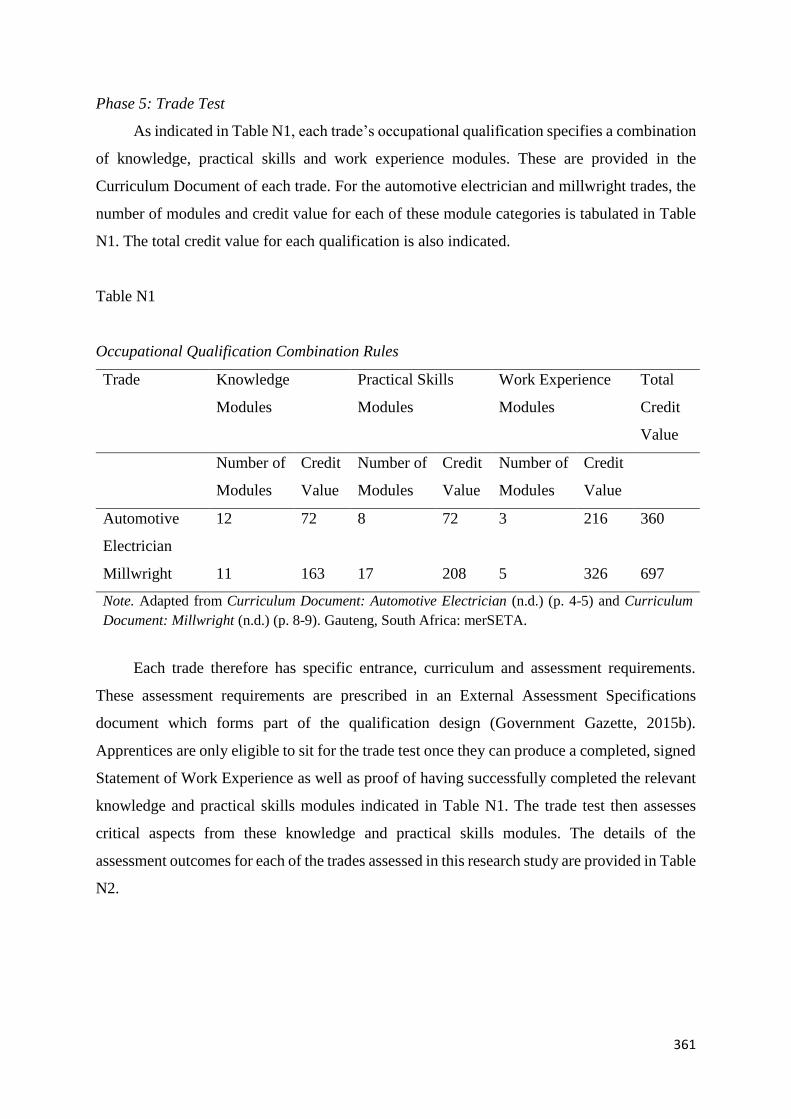
361
Phase 5: Trade Test
As indicated in Table N1, each trade’s occupational qualification specifies a combination
of knowledge, practical skills and work experience modules. These are provided in the
Curriculum Document of each trade. For the automotive electrician and millwright trades, the
number of modules and credit value for each of these module categories is tabulated in Table
N1. The total credit value for each qualification is also indicated.
Table N1
Occupational Qualification Combination Rules
Trade Knowledge
Modules
Practical Skills
Modules
Work Experience
Modules
Total
Credit
Value
Number of
Modules
Credit
Value
Number of
Modules
Credit
Value
Number of
Modules
Credit
Value
Automotive
Electrician
12 72 8 72 3 216 360
Millwright 11 163 17 208 5 326 697
Note. Adapted from Curriculum Document: Automotive Electrician (n.d.) (p. 4-5) and Curriculum
Document: Millwright (n.d.) (p. 8-9). Gauteng, South Africa: merSETA.
Each trade therefore has specific entrance, curriculum and assessment requirements.
These assessment requirements are prescribed in an External Assessment Specifications
document which forms part of the qualification design (Government Gazette, 2015b).
Apprentices are only eligible to sit for the trade test once they can produce a completed, signed
Statement of Work Experience as well as proof of having successfully completed the relevant
knowledge and practical skills modules indicated in Table N1. The trade test then assesses
critical aspects from these knowledge and practical skills modules. The details of the
assessment outcomes for each of the trades assessed in this research study are provided in Table
N2.
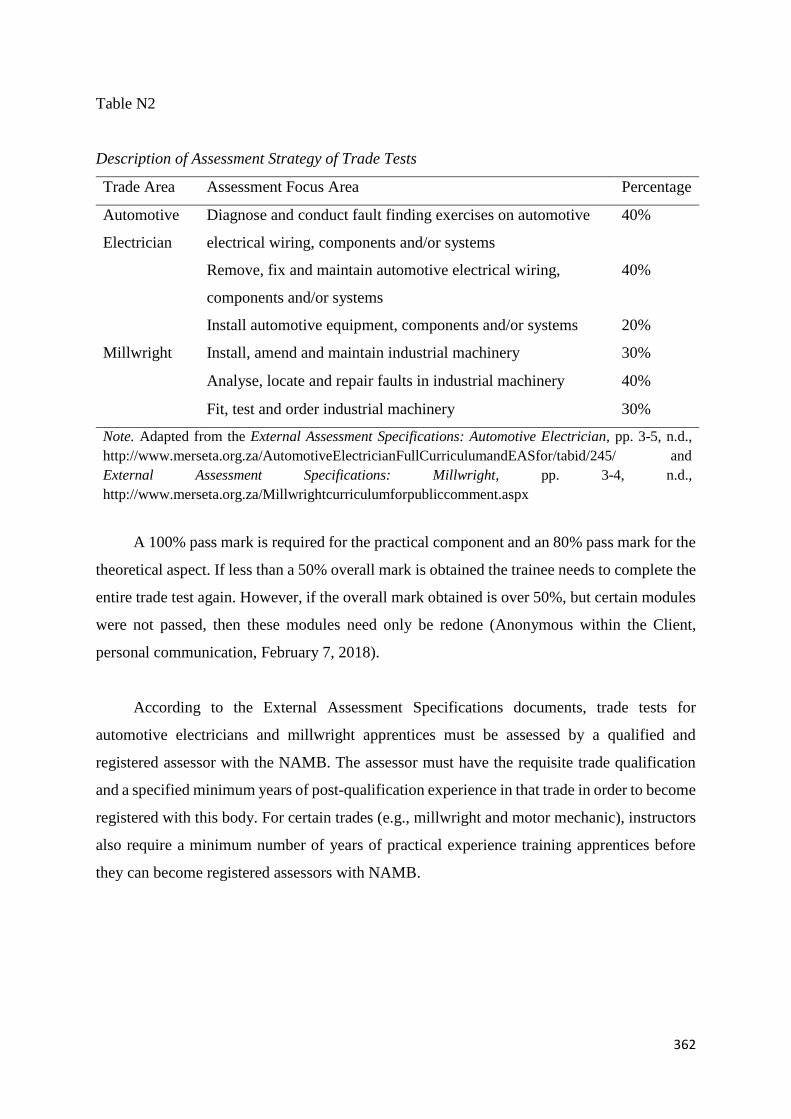
362
Table N2
Description of Assessment Strategy of Trade Tests
Trade Area Assessment Focus Area Percentage
Automotive
Electrician
Diagnose and conduct fault finding exercises on automotive
electrical wiring, components and/or systems
40%
Remove, fix and maintain automotive electrical wiring,
components and/or systems
40%
Install automotive equipment, components and/or systems 20%
Millwright Install, amend and maintain industrial machinery 30%
Analyse, locate and repair faults in industrial machinery 40%
Fit, test and order industrial machinery 30%
Note. Adapted from the External Assessment Specifications: Automotive Electrician, pp. 3-5, n.d.,
http://www.merseta.org.za/AutomotiveElectricianFullCurriculumandEASfor/tabid/245/ and
External Assessment Specifications: Millwright, pp. 3-4, n.d.,
http://www.merseta.org.za/Millwrightcurriculumforpubliccomment.aspx
A 100% pass mark is required for the practical component and an 80% pass mark for the
theoretical aspect. If less than a 50% overall mark is obtained the trainee needs to complete the
entire trade test again. However, if the overall mark obtained is over 50%, but certain modules
were not passed, then these modules need only be redone (Anonymous within the Client,
personal communication, February 7, 2018).
According to the External Assessment Specifications documents, trade tests for
automotive electricians and millwright apprentices must be assessed by a qualified and
registered assessor with the NAMB. The assessor must have the requisite trade qualification
and a specified minimum years of post-qualification experience in that trade in order to become
registered with this body. For certain trades (e.g., millwright and motor mechanic), instructors
also require a minimum number of years of practical experience training apprentices before
they can become registered assessors with NAMB.
363
Appendix O
Primary Data Collection and Processing
The information provided in this appendix was gained from interviews with the Client’s
training centre manager (Anonymous within the Client, personal communication, April 2,
2015, February 7, 2018).
Phase 1: Application Review and Curriculum Vitae Review
This phase was conducted in May annually by the in-house administrators. The purpose
of this phase was two-fold. Firstly, to check that the correct documents had been submitted by
the applicants and, secondly, that the minimum educational qualifications had been obtained.
Through this process, two piles were created and the results captured on a Microsoft Excel
spreadsheet (i.e., progress or reject). The information pertaining to all the applicants (i.e.,
whether successful in this phase or rejected) were captured, including the reason(s) for their
rejection from this phase. Besides not having attained the minimum educational requirements,
other reasons for rejecting the application included: not specifying the apprenticeship type
applying for, not including their CV, identity documents or qualifications, and/or not including
a covering letter.
Phase 2: Secondary Curriculum Vitae Review
In June annually, the author and the senior instructors at the Client’s training centre were
responsible for this aspect of the selection process. The application documents of applicants
who had successfully progressed from phase one were manually reviewed. The procedure and
scoring rubric in the Secondary CV Review Screening Guidelines (Appendix C) were followed.
One assessor would review a candidate’s application and complete part A of the scoring rubric.
Another assessor would then rate that application on part B of the scoring rubric. It took
approximately 15 minutes to complete this phase per applicant.
The applications, with the completed scoring matrices, were then collated into five piles
according to the total percentage score obtained in this secondary CV review by the centre’s
administrators. These five piles were: 0% to 20%; 21% to 40%; 41% to 60%; 61% to 80% and
above 81%. These five piles were created per apprenticeship type applied for (i.e., five piles
for the Automotive Electrical position and another five piles for those that applied for the
millwright position). The highest scoring applicants (i.e., those scoring 81% and above) per
364
apprenticeship type were then considered as eligible to proceed to phase three of the selection
process. However, depending on the centre’s requirements, the number already considered
eligible, as well as the discrepancy between this demand and supply, the applications in the
61% to 80% pile were also considered for phase three. The applications in this latter pile were
then more finely sorted. A senior instructor, per apprenticeship type, worked in a focus group
of other instructors within that trade to make the final selection decisions for this phase. The
completion of this phase then also ultimately resulted in two piles of applications being formed
(i.e., progress or reject). The scores attained by each applicant for the 12 criteria, as well as the
overall decision made, were captured on the same Microsoft Excel spreadsheet used in phase
one. The information pertaining to all the applicants (i.e., whether successful in this phase or
rejected) were captured, including the reason(s) for their rejection from this phase.
Phase 3: Psychological Assessment Recommendation
This phase was overseen by the author’s external consultancy firm. A minimum of two
trained assessors conducted this phase, overseen by a registered Psychometrist
(Independent/Private Practice). The testing in this phase was executed in accordance with the
guidelines stipulated in the selected psychological test manuals. An explanation of the manner
in which research ethics were accommodated in this assessment process is provided in section
5.13. Assessments were executed in groups of up to 50 applicants per day. This testing was
done during the July school holidays to enable the applicants currently in matric to attend.
The results for this phase were captured onto a Microsoft Excel spreadsheet. The stanine
score obtained for each of the 12 aptitude sub-tests tests were recorded and further rated
according to the following criteria: (a) stanine scores between one and three are regarded as
below the requirement level; (b) stanine scores between four and five meet the requirements;
(c) stanine scores between seven and nine are regarded as exceeding the requirements for the
apprenticeship programme. The ratings for each of the nine teamwork exercise competencies
were also recorded on this spreadsheet. The criteria here were: (a) competency ratings between
one and two are development areas; (b) ratings of three were deemed competent in the
dimension assessed; (c) ratings of four and five are regarded as exceptional and above average
demonstration of the competency being assessed. Notes on the behaviour of the applicants in
the teamwork exercises were also documented. Based on this information, clinical judgement
was used by the author to make an overall recommendation rating per applicant, which was
also recorded on this spreadsheet. Four rating categories were employed, namely, highly
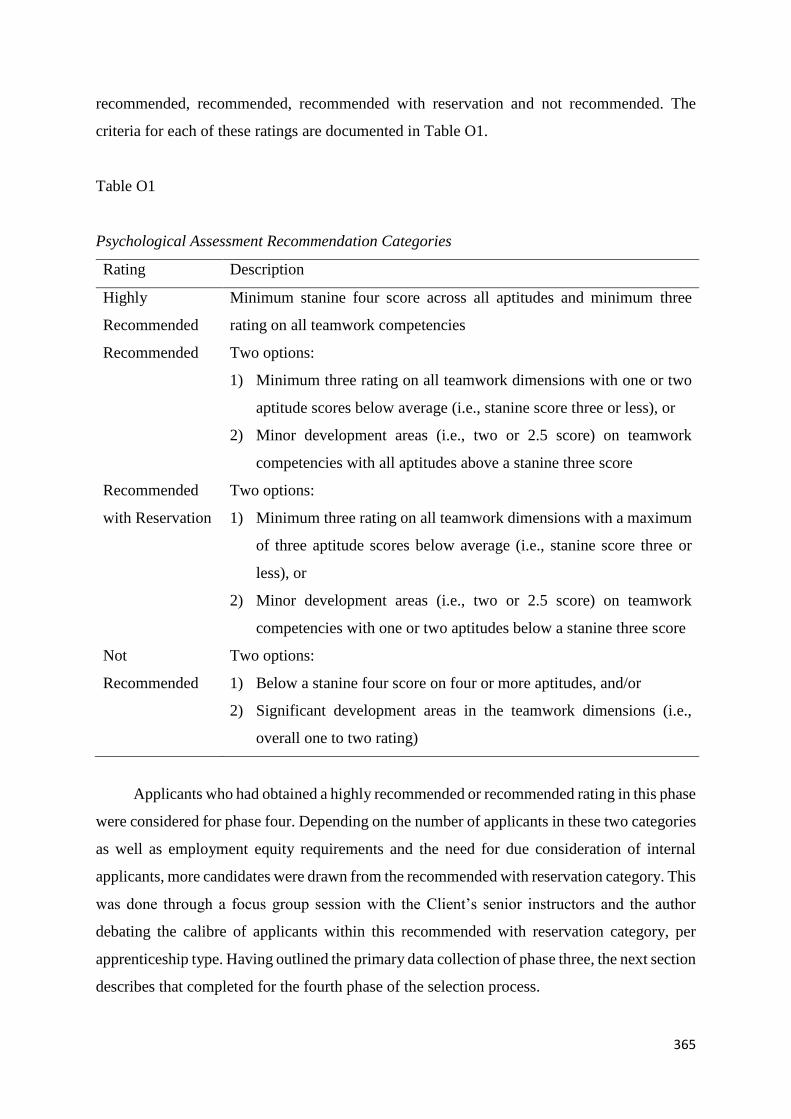
365
recommended, recommended, recommended with reservation and not recommended. The
criteria for each of these ratings are documented in Table O1.
Table O1
Psychological Assessment Recommendation Categories
Rating Description
Highly
Recommended
Minimum stanine four score across all aptitudes and minimum three
rating on all teamwork competencies
Recommended Two options:
1) Minimum three rating on all teamwork dimensions with one or two
aptitude scores below average (i.e., stanine score three or less), or
2) Minor development areas (i.e., two or 2.5 score) on teamwork
competencies with all aptitudes above a stanine three score
Recommended
with Reservation
Two options:
1) Minimum three rating on all teamwork dimensions with a maximum
of three aptitude scores below average (i.e., stanine score three or
less), or
2) Minor development areas (i.e., two or 2.5 score) on teamwork
competencies with one or two aptitudes below a stanine three score
Not
Recommended
Two options:
1) Below a stanine four score on four or more aptitudes, and/or
2) Significant development areas in the teamwork dimensions (i.e.,
overall one to two rating)
Applicants who had obtained a highly recommended or recommended rating in this phase
were considered for phase four. Depending on the number of applicants in these two categories
as well as employment equity requirements and the need for due consideration of internal
applicants, more candidates were drawn from the recommended with reservation category. This
was done through a focus group session with the Client’s senior instructors and the author
debating the calibre of applicants within this recommended with reservation category, per
apprenticeship type. Having outlined the primary data collection of phase three, the next section
describes that completed for the fourth phase of the selection process.
366
Phase 4: Panel Interview
These interviews were conducted annually during August and September, according to
the instructions indicated in the Planned Behavioural Questionnaire (Appendix D), by the
training centre’s senior instructors and/or the author. Three applicants were interviewed per
pair of interviewers per day, usually two in the morning and one in the afternoon session. The
duration of an interview was approximately one hour per applicant. The scores were indicated,
by hand, on the various interview sheets.
The top scorers in the interviews, with consideration to employment equity issues, were
then considered successful in the fifth phase of the selection process. The senior instructors, in
a focus group, then debated the calibre and qualities of the successful applicants and made a
joint decision on the final group of successful apprenticeship applicants. This group then
proceeded to the final stage of the organisational selection process, which included medical
testing and qualification verification. These applicants were subsequently provisionally
accepted (i.e., if they still needed to pass a qualification) and/or notified of their successful
application onto the apprenticeship programme.
Phase 5: Trade test
As the Client is a registered national trade test centre, this final testing was done in-house.
Depending on the apprenticeship type, this summative testing was facilitated over two to three
consecutive working days. To build the confidence of the applicants, the practical component
was usually conducted first, followed by the written theoretical component of the assessment.
For the millwright apprenticeship two apprentices were tested per day, with three being tested
per day for the automotive electrician trade. First attempt assessments were done in November
annually. If deemed competent in this summative assessment, the results were forwarded to the
NAMB for certification as a graduate apprentice. If the apprentice was deemed not yet
competent, re-assessment was scheduled within one to two months. During this time, the
apprentice is required to do self-study revision (Anonymous within the Client, personal
communication, February 7, 2018). An apprentice may, however, only sit the trade test a
maximum of three times during the apprenticeship period (Government Gazette, 2015b).
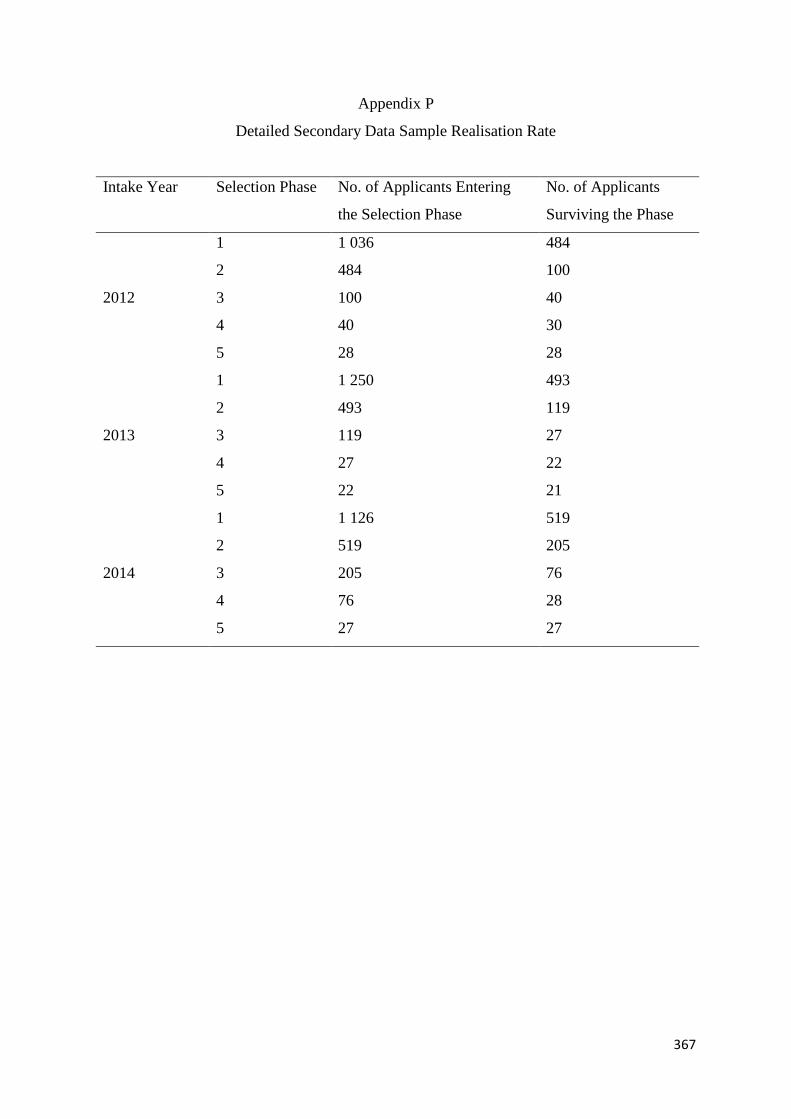
367
Appendix P
Detailed Secondary Data Sample Realisation Rate
Intake Year Selection Phase No. of Applicants Entering
the Selection Phase
No. of Applicants
Surviving the Phase
2012
1 1 036 484
2 484 100
3 100 40
4 40 30
5 28 28
2013
1 1 250 493
2 493 119
3 119 27
4 27 22
5 22 21
2014
1 1 126 519
2 519 205
3 205 76
4 76 28
5 27 27
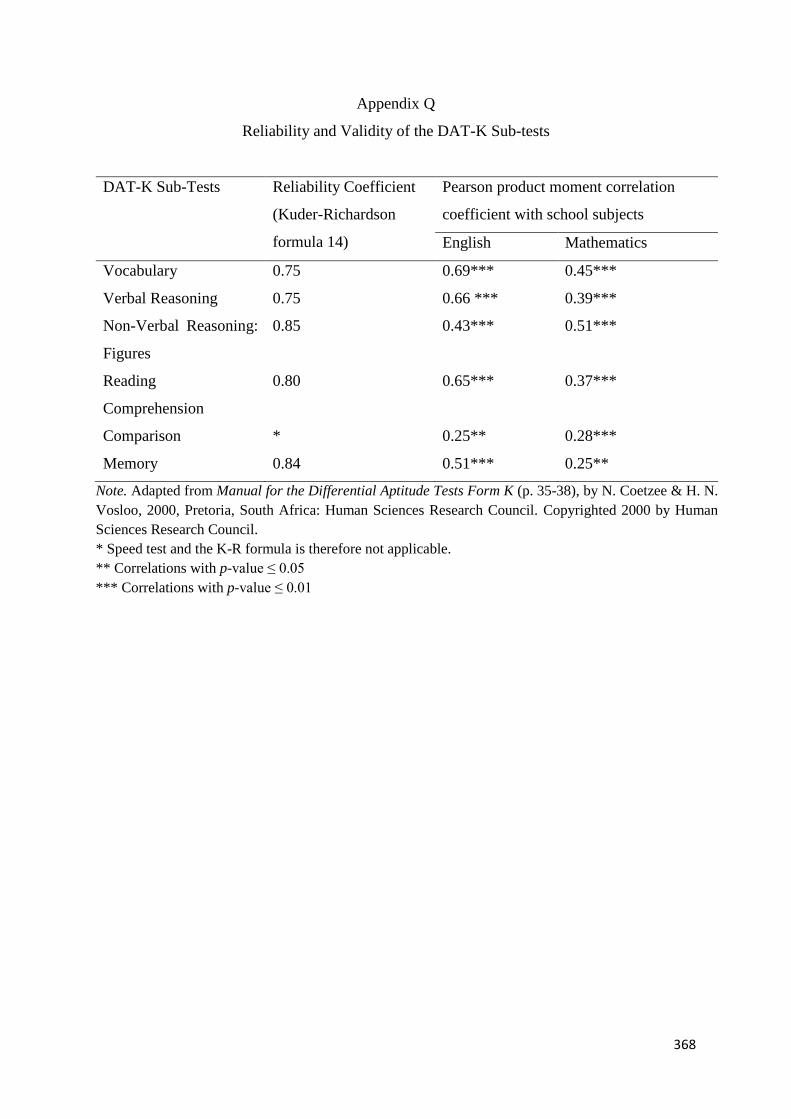
368
Appendix Q
Reliability and Validity of the DAT-K Sub-tests
DAT-K Sub-Tests Reliability Coefficient
(Kuder-Richardson
formula 14)
Pearson product moment correlation
coefficient with school subjects
English Mathematics
Vocabulary 0.75 0.69*** 0.45***
Verbal Reasoning 0.75 0.66 *** 0.39***
Non-Verbal Reasoning:
Figures
0.85 0.43*** 0.51***
Reading
Comprehension
0.80 0.65*** 0.37***
Comparison * 0.25** 0.28***
Memory 0.84 0.51*** 0.25**
Note. Adapted from Manual for the Differential Aptitude Tests Form K (p. 35-38), by N. Coetzee & H. N.
Vosloo, 2000, Pretoria, South Africa: Human Sciences Research Council. Copyrighted 2000 by Human
Sciences Research Council.
* Speed test and the K-R formula is therefore not applicable.
** Correlations with p-value ≤ 0.05
*** Correlations with p-value ≤ 0.01
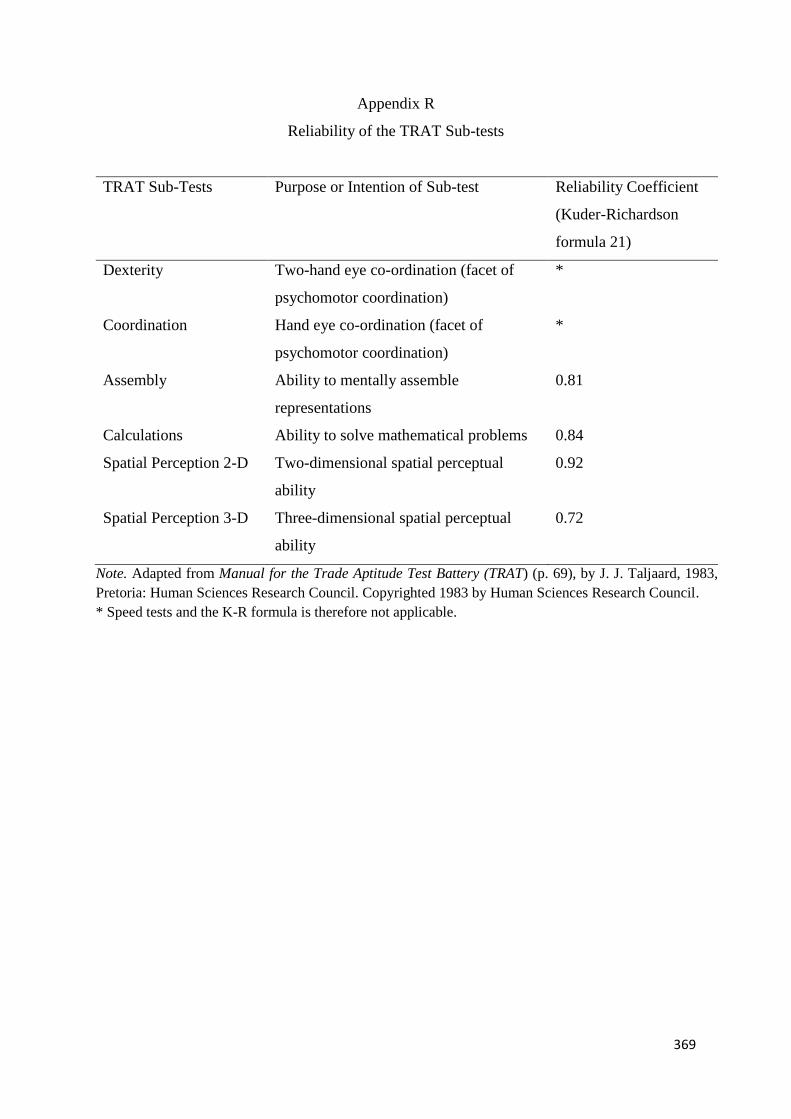
369
Appendix R
Reliability of the TRAT Sub-tests
TRAT Sub-Tests Purpose or Intention of Sub-test Reliability Coefficient
(Kuder-Richardson
formula 21)
Dexterity Two-hand eye co-ordination (facet of
psychomotor coordination)
*
Coordination Hand eye co-ordination (facet of
psychomotor coordination)
*
Assembly Ability to mentally assemble
representations
0.81
Calculations Ability to solve mathematical problems 0.84
Spatial Perception 2-D Two-dimensional spatial perceptual
ability
0.92
Spatial Perception 3-D Three-dimensional spatial perceptual
ability
0.72
Note. Adapted from Manual for the Trade Aptitude Test Battery (TRAT) (p. 69), by J. J. Taljaard, 1983,
Pretoria: Human Sciences Research Council. Copyrighted 1983 by Human Sciences Research Council.
* Speed tests and the K-R formula is therefore not applicable.