JTAS full view 2014
100
VOL. 36 (3) AUG. 2013
-
Upload
terengganu -
Category
Documents
-
view
0 -
download
0
Transcript of JTAS full view 2014
Vol. 36 (3) Aug. 2013
VOL. 36 (3) AUG. 2013
Pertanika Journal of Tropical Agricultural ScienceVol. 36 (3) Aug 2013
Contents
Pertanika JTAS
Pertanika Editorial O�ceO�ce of the Deputy Vice Chancellor (R&I) 1st Floor, IDEA Tower II UPM-MTDC Technology CentreUniversiti Putra Malaysia43400 UPM SerdangSelangor Darul EhsanMalaysia
http://www.pertanika.upm.edu.my/E-mail: [email protected]: +603 8947 1622 / 1619
Foreword
Nayan Deep S. Kanwal i
Short CommunicationPresence of Parasite Larvae in Goat Manure for Use as Fertiliser 211
Basripuzi, H. B., Sani, R. A., Ariff, O. M. and Chandrawathani, P.
Regular ArticlesA Case Study of Protozoan Parasite Gregarine Nematopsis spp. (Apicomplexa: Sporozoa) Infestation in Mangrove Oyster Crassostrea belcheri Imported from Thailand
217
Kua, B. C., Mohd. Salleh, M. T. and Noraziah, M. R.
Genetic variations and population structure of the genus Cynopterus in Malaysia
225
Fong, P. H., Yuzine, E. and Abdullah, M. T.
Lignosus rhinocerus 249Lai Wei Hong, Ninie Noor Diana Enche Baharuddin, Shu San Loo, Azura Amid, Fauzi Daud, Abas Mazni Othman and Norihan Mohd Saleh
Feed Restriction and Realimentation on Performance and Carcass Characteristics of Growing Rabbits in a Humid Environment
261
O. A. Adeyemi, O. O. Ajeboriogbon and S. A. Aderinoye
Management of Root Knot Nematodes (Meloidogyne incognita) on Cowpea with Plant Extracts
275
Chimbekujwo, I. B., Bukar, A. M. and Channya, F. K.
Case StudyElectroejaculation in a Perineal Urethrostomy Goat 285
Sringam, S., Suwanathada, P., Sangkaew A., Thuangsanthia, A. and Leingchareon, N.
Journal of Tropical Agricultural Science
About the JournalPertanika is an international peer-reviewed journal devoted to the publication of original papers, and it serves as a forum for practical approaches to improving quality in issues pertaining to tropical agriculture and its related fields. Pertanika Journal of Tropical Agricultural Science which began publication in 1978 is a leading agricultural journal in Malaysia. After 29 years as a multidisciplinary journal, the revamped Pertanika Journal of Tropical Agricultural Science (JTAS) is now focusing on tropical agricultural research. Other Pertanika series include Pertanika Journal of Science and Technology (JST) and Pertanika Journal of Social Sciences and Humanities (JSSH).
JTAS is published in English and it is open to authors around the world regardless of the nationality. It is currently published four times a year, i.e. in February, May, August and November.
Goal of PertanikaOur goal is to bring the highest quality research to the widest possible audience.
Quality We aim for excellence, sustained by a responsible and professional approach to journal publishing. Submissions are guaranteed to receive a decision within 12 weeks. The elapsed time from submission to publication for the articles averages 5-6 months.
Indexing of PertanikaPertanika is now over 33 years old; this accumulated knowledge has resulted in Pertanika JTAS being indexed in SCOPUS (Elsevier), Thomson (ISI) Web of Knowledge (BIOSIS & CAB Abstracts), EBSCO, DOAJ, CABI, AGRICOLA, ISC and MyAIS.
Future visionWe are continuously improving access to our journal archives, content, and research services. We have the drive to realise exciting new horizons that will benefit not only the academic community, but society itself.
We also have views on the future of our journals. The emergence of the online medium as the predominant vehicle for the ‘consumption’ and distribution of much academic research will be the ultimate instrument in the dissemination of research news to our scientists and readers.
Aims and ScopePertanika Journal of Tropical Agricultural Science aims to provide a forum for high quality research related to tropical agricultural research. Areas relevant to the scope of the journal include: agricultural biotechnology, biochemistry, biology, ecology, fisheries, forestry, food sciences, genetics, microbiology, pathology and management, physiology, plant and animal sciences, production of plants and animals of economic importance, and veterinary medicine.
Editorial StatementPertanika is the official journal of Universiti Putra Malaysia. The abbreviation for Pertanika Journal of Tropical Agricultural Science is Pertanika J. Trop. Agric. Sci.Jo
urn
al o
f Tro
pic
al A
gricu
ltura
l Sci
ence
Jo
urn
al o
f Tro
pic
al A
gricu
ltura
l Sci
ence
Jo
urn
al o
f Tro
pic
al A
gricu
ltura
l Sci
ence

Editorial Board2013-2015
Editor-in-ChiefSoon Guan TAN, Malaysia Molecular population genetics
Chief Executive EditorNayan D.S. KANWAL, Malaysia
Environmental issues- landscape plant modelling applications
Editorial Board Members
Anuar Abd. Rahim (Associate Professor Dr), Soil Fertility and Management, Universiti Putra Malaysia, Malaysia.
Baharuddin Salleh (Professor Dr), Plant Pathologist/ Mycologist, Universiti Sains Malaysia, Malaysia.
Chee-Kong YAP (Associate Professor Dr), Biology, Ecotoxicology, Universiti Putra Malaysia, Malaysia.
David Edward BIGNELL (Professor Dr), Soil Biology and Termite Biology, University of London, U.K.
Eric STANBRIDGE (Professor Dr), Microbiology, Molecular Genetics, University California, USA.
Ghizan SALEH (Professor Dr), Plant Breeding and Genetics, Universiti Putra Malaysia, Malaysia.
Idris Abd. Ghani (Professor Dr), Entomology, Insect taxonomy and Biodiversity, Integrated Pest Management, Biological Control, Biopesticides, Universiti Kebangsaan Malaysia, Malaysia.
Jamilah BAKAR (Professor Dr), Food Science and Technology, Food Quality /Processing and Preservation, Universiti Putra Malaysia, Malaysia.
Kadambot H. M. SIDDIQUE, FTSE (Winthrop Professor Dr), Hackett Professor of Agriculture, and Director, UWA Institute of Agriculture, Crop and Environment Physiology, Germplasm Enhancement, The University of Western Australia, Australia.
Leng-Guan SAW (Dr), Botany and Conservation, Plant Ecology, Forest Research Institute Malaysia (FRIM), Kepong, Malaysia.
Mohd. Azmi AMBAK (Professor Dr), Fisheries and Aquaculture, Universiti Malaysia Terengganu, Malaysia.
Mohd. Zamri-Saad (Professor Dr), Veterinary Pathology, Universiti Putra Malaysia, Malaysia.
Nor Aini AB-SHUKOR (Professor Dr), Tree Improvement, Forestry Genetics and Biotechnology, Universiti Putra Malaysia, Malaysia.
Richard T. CORLETT (Professor Dr), Biological Sciences, Terrestrial Ecology, Climate Change, Conservation Biology, Biogeography, Xishuangbanna Tropical Botanical Garden, Chinese Academy of Sciences, China.
Shamshuddin Jusop (Professor Dr), Soil Science, Soil Mineralogy, Universiti Putra Malaysia, Malaysia.
Son RADU (Professor Dr), Food Safety, Risk Assessment, Molecular Biology, Universiti Putra Malaysia, Malaysia.
Srini KAVERI (Dr), Veterinary, Immunology, INSERM, Centre de Recherche Cordeliers, Paris, France.
Suman KAPUR (Professor Dr), Biological Sciences, Agricultural and Animal Biotechnology, Biochemistry, Birla Institute of Technology and Science (BITS-Pilani), Hyderabad, India.
Wen-Siang TAN (Professor Dr), Molecular Biology, Virology, Protein Chemistry, Universiti Putra Malaysia, Malaysia.
Yusof IBRAHIM (Professor Dr), Agricultural Entomology, Universiti Pendidikan Sultan Idris, Malaysia.
International Advisory Board
Alexander SALENIKOVICH (Associate Professor Dr), Forestry, Wood and Forest Sciences, Université Laval, Canada.
Banpot NAPOMPETH (Professor Dr), Entomology, Kasetsart University, Thailand.
Denis J. WRIGHT (Professor Dr), Pest Management, Imperial College London, U.K.
Graham MATTHEWS (Emeritus Professor Dr), Pest Management, Imperial College London, U.K.
Jane M. HUGHES (Professor Dr), Genetics, Griffith University, Australia.
Malcolm WALKINSHAW (Professor Dr), Biochemistry, University of Edinburgh, Scotland.
Manjit S. KANG (Emeritus Professor Dr), Plant Breeding and Genetics, Louisiana State University Agric. Center, Baton Rouge, USA.
Peter B. MATHER (Professor Dr), Ecology and Genetics, Queensland University of Technology, Australia.
Syed M. ILYAS (Professor Dr), Project Director, National Institute of Rural Development, Post Harvest Engineering and Technology, Indian Council of Agricultural Research, Hyderabad, India.
Tanveer N. KHAN (Professor Dr), Plant Breeding and Genetics, The UWA Institute of Agriculture, The University of Western Australia, Australia.
Pertanika Editorial OfficeOffice of the Deputy Vice Chancellor (R&I), 1st Floor, IDEA Tower II, UPM-MTDC Technology Centre
Universiti Putra Malaysia, 43400 Serdang, Selangor, MalaysiaTel: +603 8947 1622
E-mail: [email protected]: http://www.pertanika.upm.edu.my/editorial_board.htm
PublisherThe UPM Press
Universiti Putra Malaysia43400 UPM, Serdang, Selangor, Malaysia
Tel: +603 8946 8855, 8946 8854 • Fax: +603 8941 6172E-mail: [email protected]
URL : http://penerbit.upm.edu.my
The publisher of Pertanika will not be responsible for the statements made by the authors in any articles published in the journal. Under no circumstances will the publisher of this publication be liable for any loss or damage caused by your reliance on the advice, opinion or information obtained either explicitly or implied through the contents of this publication.
All rights of reproduction are reserved in respect of all papers, articles, illustrations, etc., published in Pertanika. Pertanika provides free access to the full text of research articles for anyone, web-wide. It does not charge either its authors or author-institution for refereeing/ publishing outgoing articles or user-institution for accessing incoming articles.
No material published in Pertanika may be reproduced or stored on microfilm or in electronic, optical or magnetic form without the written authorization of the Publisher.
Copyright © 2013 Universiti Putra Malaysia Press. All Rights Reserved.
Pertanika Journal of Tropical Agricultural Science Vol. 36 (3) Aug. 2013
Contents
ForewordNayan Deep S. Kanwal i
Short CommunicationPresence of Parasite Larvae in Goat Manure for Use as Fertiliser 211
Basripuzi, H. B., Sani, R. A., Ariff, O. M. and Chandrawathani, P.
Regular ArticlesA Case Study of Protozoan Parasite Gregarine Nematopsis spp. (Apicomplexa: Sporozoa) Infestation in Mangrove Oyster Crassostrea belcheri Imported from Thailand
217
Kua, B. C., Mohd. Salleh, M. T. and Noraziah, M. R.
Genetic variations and population structure of the genus Cynopterus in Malaysia
225
Fong, P. H., Yuzine, E. and Abdullah, M. T.
Vitrification of Dikaryotic Mycelial Cells from Lignosus rhinocerus 249Lai Wei Hong, Ninie Noor Diana Enche Baharuddin, Shu San Loo, Azura Amid, Fauzi Daud, Abas Mazni Othman and Norihan Mohd Saleh
Feed Restriction and Realimentation on Performance and Carcass Characteristics of Growing Rabbits in a Humid Environment
261
O. A. Adeyemi, O. O. Ajeboriogbon and S. A. Aderinoye
Management of Root Knot Nematodes (Meloidogyne incognita) on Cowpea with Plant Extracts
275
Chimbekujwo, I. B., Bukar, A. M. and Channya, F. K.
Case StudyElectroejaculation in a Perineal Urethrostomy Goat 285
Sringam, S., Suwanathada, P., Sangkaew A., Thuangsanthia, A. and Leingchareon, N.

Foreword
Welcome to the Third Issue 2013 of the Journal of Tropical Agricultural Science (JTAS)!
JTAS is an open-access journal for the Tropical Agricultural Science published by Universiti Putra Malaysia Press. It is independently owned and managed by the university and run on a non-profit basis for the benefit of the world-wide science community.
This issue contains seven articles, out of which one is short communication, while five are regular research papers and one is a case study. The authors of these articles are from Malaysia, Nigeria and Thailand.
The short communication reports an update made by the group of researchers in Malaysia. The group reports that the use of goat manure to fertilise grasses grown for animal feed may lead to parasitic diseases, specifically by strongyle infection (Basripuzi, H. B., Sani, R. A., Ariff, O. M. and Chandrawathani, P.). The study also suggests that the manure can still be applied as a safe fertiliser.
The five research papers cover a wide range of topics. A group of researchers from the National Fish Health Research Centre, Malaysia, reports an infestation of protozoan parasites in imported mangrove oysters. (Kua, B. C., Mohd. Salleh, M. T. and Noraziah, M. R.). The other research group from Universiti Malaysia Sarawak, Malaysia, describes in detail the genetic variations and population structure of the genus Cynopterus, a megabat in Malaysia (Fong, P. H., Yuzine, E. and Abdullah, M. T.), while another group from Malaysia describes the vitrification technique on Lignosus rhinocerus that can preserve dikaryotic mycelial cells with 100% regeneration and without trace of genotoxicity (Lai Wei Hong, Ninie Noor Diana Enche Baharuddin, Shu San Loo, Azura Amid, Fauzi Daud, Abas Mazni Othman and Norihan Mohd Saleh).
The researchers from Nigeria describe in detail the influence of feed restriction and realimentation on performance and carcass characteristics of growing rabbits in a humid environment (Adeyemi, O.A, Ajeboriogbon, O.O. and Aderinoye, S.A.), while another group from Nigeria reports that the root knot nematodes infection on cowpea can be managed with the leaf powder of Azadirachta indica, Parkia biglobosa, Eucalyptus gigantea and Cassia siamea (Chimbekujwo, I. B., Bukar, A. M. and Channya, F. K.).
The last manuscript in this issue is a case study by a group of researchers from Thailand. They report that electroejaculation was useful for semen collection in perineal urethrostomy goat. (Sringam, S., Suwanathada, P., Sangkaew A., Thuangsanthia, A. and Leingchareon, N.).

I anticipate that you will find the evidence presented in this issue to be intriguing, thought-provoking and useful in reaching new milestones in your own research. Please recommend the journal to your colleagues and students to make this endeavour meaningful.
I would also like to express my gratitude to all the contributors, namely, the authors, reviewers and editors who have made this issue possible. Last but not least, the editorial assistance of the journal division staff is fully appreciated.
JTAS is currently accepting manuscripts for upcoming issues based on original qualitative or quantitative research that opens new areas of inquiry and investigation.
Chief Executive EditorNayan Deep S. KANWAL, FRSA, ABIM, AMIS, Ph.D.
Pertanika J. Trop. Agric. Sci. 36 (3): 211 - 216 (2013)
ISSN: 1511-3701 © Universiti Putra Malaysia Press
TROPICAL AGRICULTURAL SCIENCEJournal homepage: http://www.pertanika.upm.edu.my/
Article history:Received: 15 August 2012Accepted: 2 November 2012
ARTICLE INFO
E-mail addresses: [email protected] (Basripuzi, H. B.) [email protected] (Sani, R. A.), [email protected] (Ariff, O. M.), [email protected] (Chandrawathani, P.)* Corresponding author
Short Communication
Presence of Parasite Larvae in Goat Manure for Use as Fertiliser
Basripuzi, H. B.*1, Sani, R. A.2, Ariff, O. M.3 and Chandrawathani, P.4 1Faculty of Veterinary Medicine, Universiti Malaysia Kelantan, Locked Bag 36, 16100 Pengkalan Chepa, Kota Bharu, Kelantan, Malaysia2Research Centre for Ruminant Diseases, Faculty of Veterinary Medicine, Universiti Putra Malaysia, 43400 Serdang, Selangor, Malaysia3Faculty of Veterinary Medicine, Universiti Putra Malaysia, 43400 Serdang, Selangor, Malaysia4Veterinary Research Institute, 59 Jalan Sultan Azlan Shah, 31400 Ipoh, Perak, Malaysia
ABSTRACT
Some livestock farmers utilise goat manure to fertilise grasses grown for animal feed, which may lead to parasitic diseases caused by strongyle infection. Therefore, the presence of strongyle larvae in manure needs to be determined. In this study, goat faeces containing strongyle eggs were deposited into five replicates for daily sampling throughout 23 days and subjected to faecal egg count, larvae identification and enumeration. Absence of eggs was detected on Day 4 when the infective larvae of Haemonchus contortus, Trichostrongylus sp. and Oesophagostomum sp. were found. Larvae counts reached a maximum of 164 larvae on Day 8 and were negligible by Day 14, by which time the manure can be used as fertiliser to grow forage crops for animal feed.
Keywords: Strongyle larvae, goats, manure, fertiliser
INTRODUCTION
One of the major infections affecting small ruminants throughout the tropics and sub-tropics is gastrointestinal strongylosis (Sani et al., 2004a; Jackson & Miller, 2006; Krecek & Waller, 2006). The infected animal passes out strongyle eggs with its faeces and upon hatching, develop into free-
Basripuzi, H. B., Sani, R. A., Ariff, O. M. and Chandrawathani, P.
212 Pertanika J. Trop. Agric. Sci. 36 (3): 211 - 216 (2013)
living stages, namely, first (L1), second (L2) and third (L3) stage larvae. The infective larvae L3 migrate to grass and are the source of infection to the grazing animal (Barger, 1999).
The survival of L3 in tropical or sub-tropical countries is much shorter than in temperate regions because of the limited feed reserves in the non-feeding larval stage (Waller, 2006). An investigation on the survival of L3 on open pasture and vegetation under tree crops in Malaysia revealed that L3 emerged within one week with a minimum time of 3.5 days after faecal deposition and survived up to eight weeks (Sani et al., 2004b). Livestock farmers usually apply the available manure on their farms to fertilise grasses grown for animal feed. Knowing the survival period of strongyle L3 in animal manure is essential to reduce L3 ingestion by the animals.
Therefore, the objective of the present study was to determine the presence of strongyle larvae in goat manure to assess its safety for use as fertiliser.
MATERIALS AND METHODS
Site and Animals
A study was carried out at the Goat Unit, Livestock Section, University Agricultural Park, Universiti Putra Malaysia (UPM). Information on weather parameters during the study was obtained from the Department of Land Management, Faculty of Agriculture, UPM. The location was recorded as having a total rainfall of 273.5 mm in November 2011 when this study was conducted.
A goat house with raised wooden slatted floor and concrete ground floor was located at this unit. The grass growing in the fenced area around the goat house was maintained at a height of approximately 5 cm throughout the year. Twenty-two goats of both sexes comprising the breeds of Katjang, Saanen and Boer crosses which ranged from less than 1 year-old to more than 5 year-old were raised in this house. The goats were last dewormed with ivermectin six months prior to the study.
Faecal Egg Count
Out of the 22 goats, 18 were detected to be infected with gastrointestinal strongyles by the modified McMaster technique (Lyndall-Murphy, 1993) 24 hours before the start of the study. The faecal egg counts (FEC) of the 18 goats ranged from 100 to 8900 eggs per gram (epg) of faeces with a mean FEC of 2078 epg.
Deposition and Sampling of Faeces on Plots
Five plots separated by a distance of at least 1.5 m representing five replicates were identified in the area to deposit the faeces. The faeces deposited by animals over a 24-hour period were collected from the concrete ground floor and mixed thoroughly prior to deposition on plots. The bulked faeces were divided into five replicates weighing approximately 1 kg each and heaped on each plot to imitate a natural deposit in mound-form as usually practised by the farmers. Faecal samples were collected daily in the
Parasite Larvae in Goat Manure
213Pertanika J. Trop. Agric. Sci. 36 (3): 211 - 216 (2013)
morning from each mound of faeces until eggs and strongyle larvae were no longer detected. One gram of faeces was need for FEC, whereas approximately 5 grams of faeces was collected for larvae recovery from each mound of replicate.
Parasitological Techniques
Each faecal sample was subjected to FEC by the modified McMaster technique until zero epg was detected to confirm the absence of eggs in all replicates. The samples were also subjected for larvae recovery by the modified Baermann method (van Bezooijen, 2006) that was carried out from Day 4 of zero epg until no free-living larva was recovered. The larvae were collected for identification and enumeration of pre-infective and infective stages. Identification of L3 was done to the genus level.
RESULTS AND DISCUSSION
FEC of 2000 epg indicated a worm burden of 1800 adult Haemonchus contortus and 1500 adult Trichostrongylus sp. (Israf et al., 1996). The results of the present study indicated that the goat farm with a mean FEC of 2078 epg revealed a parasitic problem. Mean FEC of manure replicates declined from 660 epg on Day 1 to 0 epg on Day 4. The absence of strongyle eggs starting from Day 4 indicated that by then all eggs had hatched. This led to the detection of both pre-infective and infective larvae on Day 4 until Day 22 (Fig.1). The pre-infective strongyle larvae consisted of L1 and L2, which were observed on Days 4 and 5. Their absence thereafter indicated
that the pre-infective larvae had moulted into infective larvae by Day 6. The findings were consistent with those of Sam-Mohan (1995), who observed that L3 emerged from the faeces on Day 4 and migrated to herbage on Day 6.
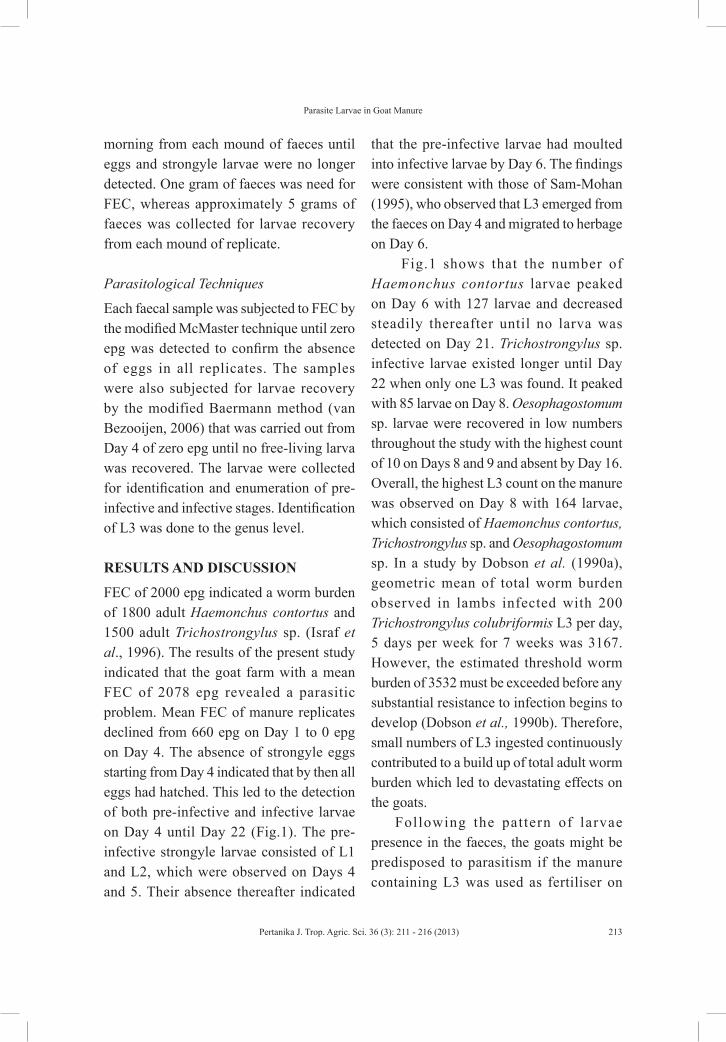
Fig.1 shows that the number of Haemonchus contortus larvae peaked on Day 6 with 127 larvae and decreased steadily thereafter until no larva was detected on Day 21. Trichostrongylus sp. infective larvae existed longer until Day 22 when only one L3 was found. It peaked with 85 larvae on Day 8. Oesophagostomum sp. larvae were recovered in low numbers throughout the study with the highest count of 10 on Days 8 and 9 and absent by Day 16. Overall, the highest L3 count on the manure was observed on Day 8 with 164 larvae, which consisted of Haemonchus contortus, Trichostrongylus sp. and Oesophagostomum sp. In a study by Dobson et al. (1990a), geometric mean of total worm burden observed in lambs infected with 200 Trichostrongylus colubriformis L3 per day, 5 days per week for 7 weeks was 3167. However, the estimated threshold worm burden of 3532 must be exceeded before any substantial resistance to infection begins to develop (Dobson et al., 1990b). Therefore, small numbers of L3 ingested continuously contributed to a build up of total adult worm burden which led to devastating effects on the goats.
Following the pattern of larvae presence in the faeces, the goats might be predisposed to parasitism if the manure containing L3 was used as fertiliser on
Basripuzi, H. B., Sani, R. A., Ariff, O. M. and Chandrawathani, P.
214 Pertanika J. Trop. Agric. Sci. 36 (3): 211 - 216 (2013)
grasses between Days 4 to 14 of faecal deposition. However, all the larvae were undetected on Day 23 due to their ability to migrate to a more favourable micro-environment, which also attributed to their longevity (O’Connor, 2006). Consequently, goat manure purposely accumulated in the farm to be used as fertiliser should be kept for at least 14 days before being applied on grasses meant for animal feed as the larvae count was found to be negligible by that time. Throughout the study, Haemonchus contortus (51%) was the most predominant species followed by Trichostrongylus sp. (43%) and Oesophagostomum sp. (6%).
CONCLUSION
The most hazardous time to use goat manure as fertiliser was on the eighth day after manure deposition as it contained the highest number of infective larvae. The recovery of infective larvae of gastrointestinal strongyles in goat manure until Day 22 indicated that an original manure mound made without continuous addition of fresh faeces was free of the larvae from Day 23. However, the negligible number of L3 in the mound by Day 14 suggests that the manure when applied as fertiliser to grasses and other forage crops did not harbour many infective larvae.
Fig.1: Presence of strongyle L1, L2 and L3 in goat manure.
Parasite Larvae in Goat Manure
215Pertanika J. Trop. Agric. Sci. 36 (3): 211 - 216 (2013)
REFERENCESBarger, I. A. (1999). The role of epidemiological
knowledge and grazing management for helminth control in small ruminants. International Journal for Parasitology, 29(1), 41-47.
Dobson, R. J., Waller, P. J., & Donald, A. D. (1990a). Population dynamics of Trichostrongylus columriformis in sheep : The effect of infection rate on loss of adult parasites. International Journal of Parasitology, 20(3), 359-363.
Dobson, R. J., Donald, A. D., Barnes, E. H., & Waller, P. J. (1990b). Population dynamics of Trichostrongylus columriformis in sheep: Model to predict the worm population over time as a function of infection rate and host age. International Journal of Parasitology, 20(3), 365-373.
Israf, D. A., Sani, R. A. and Halim, R. A. (1996). Caprine helminthiasis : Relationship between faecal egg count and worm burden. Jurnal Veterinar Malaysia, 8(1), 33-35.
Jackson, F., & Miller, J. (2006). Alternative approaches to control—Quo vadit?. Veterinary Parasitology, 139, 371-384.
Lyndall-Murphy, M. (1993). Anthelmintic resistance in sheep. In L. A. Corner & Bagust, T. J., Australian standard diagnostic techniques for animal diseases (pp. 8-9). CSIRO Publications.
Krecek, R. C., & Waller. P. J. (2006). Towards the implementation of the ‘‘basket of options’’ approach to helminth parasite control of livestock: Emphasis on the tropics/subtropics. Veterinary Parasitology, 139, 270–282.
O’Connor, L. J., Walkden-Brown, S. W., & Kahn, L.P. (2006). Ecology of the free-living stages of major trichostrongylid parasites of sheep. Veterinary Parasitology, 142, 1–15.
S a m - M o h a n . ( 1 9 9 5 ) . E p i d e m i o l o g y o f Trichostrongylus of sheep grazing under oil palm. (MSc. Thesis dissertation). Faculty of Veterinary Medicine, Universiti Putra Malaysia, Serdang, Selangor, Malaysia.
Sani , R. A. , Adnan, M. , Cheah, T. S . , & Chandrawathani, P. (2004a). Helminth control for small ruminants in Malaysia. Jurnal Veterinar Malaysia, 16 (1 & 2), 1-8.
Sani , R. A. , Adnan, M. , Cheah, T. S . , & Chandrawathani, P. (2004b) Worm control for small ruminants in Malaysia. In Sani, R. A., G. D. Gray, & R. L. Baker, Worm control for small ruminants in Tropical Asia (pp. 189-199.). ACIAR Monograph 113.
van Bezooijen, J. (2006). Methods and techniques for nematology. p. 20. Wageningen University.
Waller, P. J. (2006). Sustainable nematode parasite control strategies for ruminant livestock by grazing management and biological control. Animal Feed Science and Technology, 126, 277–289.

Pertanika J. Trop. Agric. Sci. 36 (3): 217 - 224 (2013)
ISSN: 1511-3701 © Universiti Putra Malaysia Press
TROPICAL AGRICULTURAL SCIENCEJournal homepage: http://www.pertanika.upm.edu.my/
Article history:Received: 5 July 2010Accepted: 26 January 2013
ARTICLE INFO
E-mail addresses: [email protected] (Kua, B. C.) [email protected] (Mohd. Salleh, M. T.), [email protected] (Noraziah, M. R.)* Corresponding author
A Case Study of Protozoan Parasite Gregarine Nematopsis spp. (Apicomplexa: Sporozoa) Infestation in Mangrove Oyster Crassostrea belcheri Imported from Thailand
Kua, B. C.1*, Mohd. Salleh, M. T.2 and Noraziah, M. R.1
1National Fish Health Research Centre, NaFisH FRI Batu Maung, 11960 Batu Maung, Penang, Malaysia2National Fish and Prawn Production and Research Centre, FRI Pulau Sayak, 08500 Kota Kuala Muda, Kedah, Malaysia
ABSTRACT
One hundred mangrove oysters (weight: 248.41 ± 28.41g and length: 10.69 ± 0.73cm) from Thailand meant for human consumption were examined for parasite infestation. Gross observation showed that the infestation comprised mostly cliona (43%) followed by mud (1%) and water blister (1%). Histopathological study revealed high prevalence of gregarine Nematopsis sp oocysts (99%), metaplasia (92%), inclusion cells (15%), brown cells (14%), oedema (5%), ceriod (8%) and abscess (1%). A large number of phagocytes with gregarine oocysts inside the gill and connective tissues were observed. Most of the oocysts were located within parasitophorous vacuoles and phagocytes. The oocysts appeared ellipsoidal at 73.55µm wide and 140.56µm long with a thick outer surface. The clusters of oocysts consisted of a single vermiform sporozoite engulfed by phagocytes. The number of oocysts in each phagocyte varied ranging from 1 to 9 with an average of 4.9. The findings revealed that gregarine oocysts did not cause much pathological damage as there was no irregular arrangement and disruption of gill filament or loss of cilia. Similar histopathology was also observed in four molluscs (i.e. Anadara granosa, Perna viridis and Arcuatula arcuatula and Paphia undulate) as reported in Thailand, and three cultivated molluscs (A. granosa, P. viridis and C. iredalei) as reported in Malaysia. The present study provides significant baseline information on the health profile of the important molluscan species, particularly on Nematopsis spp. infestation in oysters.
Keywords: Mangrove oyster, Crassostrea belcheri,
protozoa, Nematopsis sp., oocysts

Kua, B. C., Mohd. Salleh, M. T. and Noraziah, M. R.
218 Pertanika J. Trop. Agric. Sci. 36 (3): 217 - 224 (2013)
INTRODUCTION
Crassostrea belcheri, known locally as mangrove oyster or white-scar oyster in Thailand, is mainly cultured in Asia, particularly in Thailand and Malaysia. Four species of oysters are found in Malaysia, namely, Crassostrea belcheri, C. rivularis, Saccostrea cucullata and Ostrea folium. Among the four species, C. belcheri is mainly cultured with an average production of 1000 tones per year. The production of oysters in Malaysia is low compared to the production of other bivalve species (Table 1) (Annual Fisheries Statistics 2006, 2007, 2008, 2009 & 2010). Crassostrea belcheri is in high demand from the local Malaysian seafood market, and generally, the demand is higher than the local supply. The importation of oysters from Thailand is an alternative measure by local suppliers to fulfill the high demands. Generally, the oysters are sold in shell-on forms which are consumed fresh.
In Malaysia, a monitoring programme on the molluscan health focusing on the Office International des Epizooties (OIE) revealed that gregarine was the most frequently listed parasite since 1999 until 2009, which showed that gymnospores of gregarine (Nematopsis sp.) were the
parasites most frequently encountered in tropical oysters (Crassostrea iredalei) and blood cockles (Anadara granosa). Although they can be observed in most of the specimens in both cultured species, no significant health effects have been found. Bower and McGladdery (2001) reported that gymnospores and oocysts of gregarines are usually associated with a focal, benign inflammatory response and there is no serious effect on or damage to the host. Gymnospores need marine arthropods such as crabs or shrimps in order to complete their life cycle. Hence, multiplication of gregarines is limited to bivalves.
Mass mortality caused by gregarine Nematopsis sp. has not been reported in Malaysia although mass mortality of cockles and clams in Portugal had been associated with it (Azevedo & Cachola, 1992). Infection of Apicomplexan protozoan Nematopsis has been regularly reported in molluscs, which acts as the intermediate host with crustaceans as the definitive host (Spraque, 1970; Lee et al., 2000; Tuntiwaranuruk et al., 2004 and 2008). In Thailand, infestation of gregarine Nematopsis spp. has been widely reported in bivalve species, such as cockles (A. granosa), mytilid mussels (P. viridis and A. arcuatula) and venerid
TABLE 1 Total production of cultured molluscan (tonnes) in Malaysia from 2006 to 2010.
Species 2006 2007 2008 2009 2010Blood cockle 45.674 49.620 61,138 64,938 78,024Green mussels 6.904 4.034 8,993 10,596 10,529Oysters 915 869 275 2,128 812
A Case Study of Protozoan Parasite Gregarine Nematopsis spp. (Apicomplexa: Sporozoa) Infestation in Mangrove Oyster
219Pertanika J. Trop. Agric. Sci. 36 (3): 217 - 224 (2013)
clams (P. undulate) except rock oysters (Saccostrea cucullata) during a survey of infestation of Nematopsis spp sporozoites in Thailand (Tuntiwaranuruk et al., 2004). Nematopsis sp., Tylocephalum sp., digenetic trematodes and ciliates were also reported from C. iredalei in the Philippines (Erazo-Pagador, 2010). In Malaysia, our survey of OIE listed parasites in tropical oysters (C. iredalei) in 2000 and 2003 found a prevalence of gregarine Nematopsis sp. oocyst, ranging from 33.33% to 73.33% (Kua & Taha, 2004).
Despite the commercial value and gradual increase in the production of C. belcheri in Malaysia, there has been no report or any specific study on problematic diseases of the oysters. Several reports on the diseases, particularly those caused by parasites, have been described from various shellfish in other countries (Sindermann, 1990). Itoh (2002) reported the paramysean ovarian parasite in pacific oysters and the economic loss caused by the disease, which was estimated to be a few hundred million Japanese yen in Okayama Prefecture. Imanaka et al. (2001) reported that the ovarian parasite may kill wild oysters. Taveekijakarn et al. (2008) also highlighted on the occurrence of Marteilia sp., Perkinsus sp., and trematodes in oyster samples from the Gulf of Thailand. In Malaysia, a molluscan health monitoring programme has been initiated focusing on the OIE listed parasites in three main species (C. iredalei, P. viridis and A. granosa). In 2007, we had an opportunity to investigate 100 specimens of mangrove oysters (C. belcheri)
imported from Thailand as provided by the Fish Quarantine Centre, Bukit Kayu Hitam, Kedah. Thus, the main objective of this study was to examine the presence of parasites in these imported mangrove oysters. The findings were significant and contributed new knowledge to the research community, especially on Nematopsis infestation in the commercially important mangrove oysters, C. belcheri.
MATERIALS AND METHODS
All the 100 specimens of C. belcheri were measured, opened and examined for colour, conditions (fat, medium or watery), macroparasites, as well as shell and tissue abnormalities. The body was removed and fixed in 10% buffered formalin for 4 hours. The fixed specimens were then cut in cross-section at the gills, stomach, digestive gland and intestine with 2-3 cm of thickness. The specimens were fixed again with the same fixative for another 24 hours before being processed by an automatic tissue processor (Leica ASP 300, Germany) and embedded in paraffin wax. The embedded specimens were sectioned at 5 µm thick, stained with haematoxylin and eosin (H&E), and finally mounted with DPX before being examined under a compound microscope (Leica DM5000B, Leica Microsystems, Germany) connected to a digital camera (Leica DFC 320, Leica Microsystems, Germany) and equipped with a computer software (Leica QWin, Leica Microsystems, Germany). The histological techniques were based on the method suggested by Humason (1979).
Kua, B. C., Mohd. Salleh, M. T. and Noraziah, M. R.
220 Pertanika J. Trop. Agric. Sci. 36 (3): 217 - 224 (2013)
RESULTS AND DISCUSSION
Gross observation on the mangrove oysters showed mostly cliona (43%) followed by mud (1%) and water blister (1%). Fouling organisms, such as barnacles, ascidians and algae, were not observed during the study. The post-harvest cleaning process should have largely reduced the fouling organisms on the oysters before being exported to Malaysia, therefore, only a few fouling organisms were observed in the present study. Apart from the fouling organisms, small crabs and polychaete worms were also found on the soft tissues of the oysters. The cleaning process after the mangrove oysters were harvested from the culture sites before exporting to Malaysia resulted in the observation of a few fouling organisms.
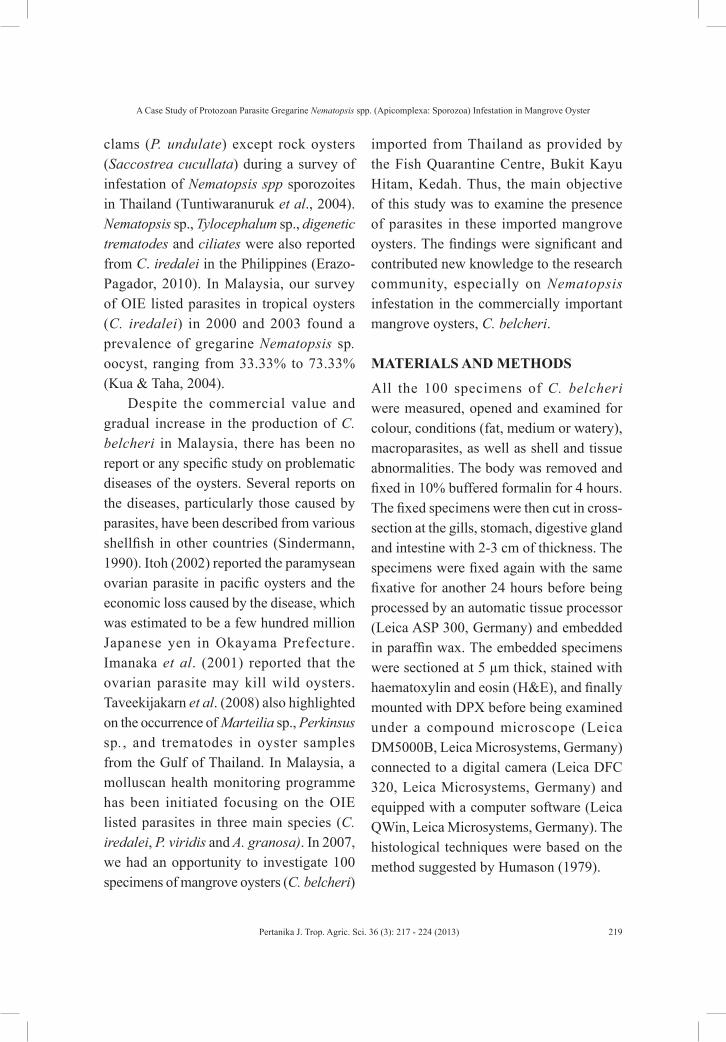
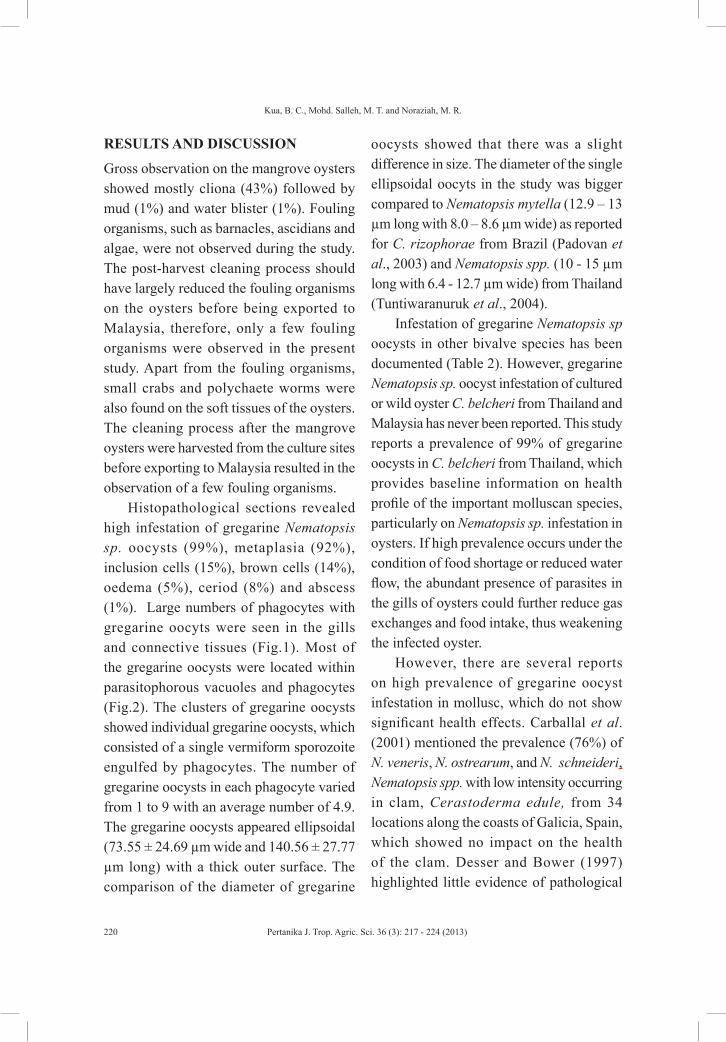
Histopathological sections revealed high infestation of gregarine Nematopsis sp. oocysts (99%), metaplasia (92%), inclusion cells (15%), brown cells (14%), oedema (5%), ceriod (8%) and abscess (1%). Large numbers of phagocytes with gregarine oocyts were seen in the gills and connective tissues (Fig.1). Most of the gregarine oocysts were located within parasitophorous vacuoles and phagocytes (Fig.2). The clusters of gregarine oocysts showed individual gregarine oocysts, which consisted of a single vermiform sporozoite engulfed by phagocytes. The number of gregarine oocysts in each phagocyte varied from 1 to 9 with an average number of 4.9. The gregarine oocysts appeared ellipsoidal (73.55 ± 24.69 µm wide and 140.56 ± 27.77 µm long) with a thick outer surface. The comparison of the diameter of gregarine
oocysts showed that there was a slight difference in size. The diameter of the single ellipsoidal oocyts in the study was bigger compared to Nematopsis mytella (12.9 – 13 µm long with 8.0 – 8.6 µm wide) as reported for C. rizophorae from Brazil (Padovan et al., 2003) and Nematopsis spp. (10 - 15 µm long with 6.4 - 12.7 µm wide) from Thailand (Tuntiwaranuruk et al., 2004).
Infestation of gregarine Nematopsis sp oocysts in other bivalve species has been documented (Table 2). However, gregarine Nematopsis sp. oocyst infestation of cultured or wild oyster C. belcheri from Thailand and Malaysia has never been reported. This study reports a prevalence of 99% of gregarine oocysts in C. belcheri from Thailand, which provides baseline information on health profile of the important molluscan species, particularly on Nematopsis sp. infestation in oysters. If high prevalence occurs under the condition of food shortage or reduced water flow, the abundant presence of parasites in the gills of oysters could further reduce gas exchanges and food intake, thus weakening the infected oyster.
However, there are several reports on high prevalence of gregarine oocyst infestation in mollusc, which do not show significant health effects. Carballal et al. (2001) mentioned the prevalence (76%) of N. veneris, N. ostrearum, and N. schneideri, Nematopsis spp. with low intensity occurring in clam, Cerastoderma edule, from 34 locations along the coasts of Galicia, Spain, which showed no impact on the health of the clam. Desser and Bower (1997) highlighted little evidence of pathological
A Case Study of Protozoan Parasite Gregarine Nematopsis spp. (Apicomplexa: Sporozoa) Infestation in Mangrove Oyster
221Pertanika J. Trop. Agric. Sci. 36 (3): 217 - 224 (2013)
Fig.1: Phagocytes with gregarine oocyts (arrow) in connective tissues of mangrove oyster infested with Nematopsis sp. Hematoxylin and Eosin. Magnification: x40. Scale bar: 12 mm = 980 µm.
Fig.2: Histological section of connective tissue in mangrove oyster infected with Nematopsis sp. (a). Three phagocytes (Ph) of C. belcheri showing oocyts (Oc) within parasitophorous vacuoles (Pv) and (b). One phagocyte (Ph) with three oocysts (Oc), each one in a parasitophorous vacuole (Pv) with sporozoite(Sz). Hematoxylin and Eosin. Magnification: (a).x200, (b).x1000, Scale bar: (a). 3cm = 20 µm and (b). 1cm = 9 µm.
Kua, B. C., Mohd. Salleh, M. T. and Noraziah, M. R.
222 Pertanika J. Trop. Agric. Sci. 36 (3): 217 - 224 (2013)
effect on Protothaca staminea even though cyst infestations were 70 and 100%. Uddin et al. (2011) showed that the blood cockles from the Straits of Malacca were infected with Nematopsis sp. without any sign of pathological damage. Despite wide reports of no pathogical impact of Nematopsis sp. infestation on bivalves, there were a few reports on the pathological significance of Nematopsis sp. (Azevedo & Cachola, 1992, Tuntiwaranuruk et al., 2004 and 2008).
In this study, pathological damage was caused by gregarine Nematopsis sp. Oocysts, which was comparatively minimal as compared to some irregular arrangement and disruption of gill filaments
and loss of cilia in severe infection as reported by Tuntiwaranuruk et al. (2008). According to them, high infestation of Nematopsis sp. oocysts could cause a large number of phagocyte presence in the gill lumen of Perna viridis leading to the obstruction of water flow and indirectly reducing the filtering efficiency and food intake (Tuntiwaranuruk et al., 2004). The histopathology of this study was similar to previous cases on A. granosa, P. viridis and A. arcuatula and P. undulate reported in Thailand (Tuntiwaranuruk et al., 2004) and three cultivated bivalves (A. granosa, P. viridis and C. iredalei) in Malaysia .
TABLE 2 Nematopsis spp. reported from wild or cultured bivalves.
Host species Bivalves group Reported Nematopsis species
Location References
Crassostrea rizophorae Oyster Nematopsis mytella Brazil Padovan et al., 2003Callista chione Clam Nematopsis sp. Italy Canestri-Trotti et al.,
2000Anadara granosa Blood cockle Nematopsis sp. Thailand Tuntiwaranuruk et
al., 2004Anadara granosa Blood cockle Nematopsis sp. Malaysia Uddin et al., 2010Perna viridis Green Mussel Nematopsis sp. Thailand Tuntiwaranuruk et
al., 2004Perna viridis Green Mussel Nematopsis sp. Malaysia Kua and Taha, 2004Cerastoderme edule Clam Nematopsis sp. Portugal Azevedo and
Cachola, 1992Ruditapes decussatus Clam Nematopsis sp. Portugal Azevedo and
Cachola, 1992Arcuatula arcuatula Clam Nematopsis sp. Thailand Tuntiwaranuruk et
al., 2004Paphia undulate mussel Nematopsis sp. Thailand Tuntiwaranuruk et
al., 2004Crassostrea iredalei Tropical oyster Nematopsis sp. Philippines Erazo-Pagador, 2010Crassostrea iredalei Tropical osyter Nematopsis sp. Malaysia Kua and Taha, 2004
A Case Study of Protozoan Parasite Gregarine Nematopsis spp. (Apicomplexa: Sporozoa) Infestation in Mangrove Oyster
223Pertanika J. Trop. Agric. Sci. 36 (3): 217 - 224 (2013)
CONCLUSION
In this study, high prevalence (99%) of mild to moderate gregarine Nematopsis infestation with phagocytic response was observed in the C. belcheri specimens imported from Thailand. This study provides important baseline information on health profile of the mangrove oyster C. belcheri to the research community, especially on Nematopsis infestation in oysters.
ACKNOWLEDGEMENTS
The authors are grateful to the Fish Quarantine Centre, Kedah, for supplying the specimens for this study.
REFERENCESAzevedo, C., & Cachola, R. (1992). Fine structure
of the apicomplexa oocyst of Nematopsis sp, of two marine bivalve mollusc. Diseases of Aquatic Organism, 14, 69-73.
Bower, S. M., & MacGladdery, S. E. (2001). Synopisis of infectious Diseases and parasites of commercially exploited shellfish: Gregarine Parsitism of oysters and clam. Retrieved from http://www-sci.pac.dfo-mpo.gc.ca/shelldis/pages/gegpoy_e.htm.
Carballal, M. J., Iglesias, D., Santamarina, J., Ferro-Soto, B., & Villalba, A. (2001). Parasites and pathologic conditions of the cockle Cerastoderma edule populations of the coast of Galicia (NW Spain). Journal of Invertebrate Pathology, 78, 87-97.
Department of Fisheries Malaysia (2006). Annual Fisheries Statistics, 2006. Department of Fisheries Malaysia (p.1-2). Retrieved from http://www.dof.gov.my/c/document_library/get_file?uuid=e7d61379-45cf-40d7-b0b1-fb1e08027518&groupId=10131
Department of Fisheries Malaysia (2007). Annual Fisheries Statistics, 2007. Department of Fisheries Malaysia.
Department of Fisheries Malaysia (2008). Annual Fisheries Statistics, 2008. Department of Fisheries Malaysia. Retrieved from http://www.dof.gov.my/html/themes/moa_dof/documents/Jadual_akuakultur_V_ii.pdf.
Department of Fisheries Malaysia (2009). Annual Fisheries Statistics, 2009 (pp. 2-3). Department of Fisheries Malaysia. Retrieved from http://www.dof.gov.my/html/themes/moa_dof/documents/Jadual_akuakultur_V_ii.pdf
Department of Fisheries Malaysia (2010). Annual Fisheries Statistics, 2010 (pp. 2-3). Department of Fisheries Malaysia. Retrieved from http://www.dof.gov.my/html/themes/moa_dof/documents/jadual_pendaratan_marin_%20aquaculture.pdf
Desser, S. S., & Bower, S. M. (1997). The distribution, prevalence, and morphological features of the cystic stage of an apicomplexan parasite of native littleneck clams (Protothaca staminea) in British Columbia. The Journal of Parasitology, 83, 642-646.
Erazo-Pagador, G. (2010). A parasitological survey of slipper-cupped oyster (Crassostrea iredalei Faustino, 1932) in the Philippines. Journal of Shellfish Research, 29, 177-179.
FAO (1988). Status of oyster culture in selected Asian countries. Fisheries and Aquaculture Department. p. 97
Humsaon, G. L. (1979). Animal tissue techniques. San Francisco: W. H. Freeman and Company.
Imanaka, S., Itoh, N., Ogawa, K., & Wakanayashi, H. (2001). Seasonal fluctuations in the occurrence of abnormal enlargement of the ovary of pacific oyster Crassostrea gigas at Gokasho Bay, Mie, Japan. Fish pathology, 36, 83-91.
Kua, B. C., Mohd. Salleh, M. T. and Noraziah, M. R.
224 Pertanika J. Trop. Agric. Sci. 36 (3): 217 - 224 (2013)
Itoh, N., Tadashi, O., Ogawa, K., & Wakanayashi, H. (2002). Identification and development of a paramyxean ovarian parasite in the pacific oyster Crassostrea gigas. Fish pathology, 37, 23-28.
Kua, B. C., & Taha, M.S. (2004). A Preliminary Observation of Parasitic Infestation on Blood Cockles (Anadara granosa) and Tropical Oyster (Crassostrea iredalei) in Northern Peninsular Malaysia. Malaysian Fisheries Journal, 3, 125-129.
Lee, J. J., Leedale, G. F., & Bradbury, P. (2000). An illustrated guide to the protozoa (2nd Ed.), Society of Protozoologists (pp. 190-369). USA: Allen Press.
Sindermann, C. J. (1990). Principal diseases of marine fish and shellfish (Vol. 2). Diseases of marine shellfish (2nd Edn). San Diego: Academic Press.
Somwang, S., Pairat, S., Janthira, K., & Toshiaki, O. (2010). Quality changes in oyster (Crassostrea belcheri) during frozen storage as affected by freezing and antioxidant. Food Chemistry, 123, 286–290.
Taveekijakarn, P., Somsiri, T., Puttinaowarat,S., Tundavanitj, S., Chinabut, S., & Nash, G. (2008). Parasitic fauna of rock oyster (Saccostrea forskali) cultured in Thailand. In M. G. Bondad-Reantaso, C. V. Mohan, M. Crumlish & R. P. Subasinghe (Eds.), Diseases in Asian aquaculture VI (p. 335-342). Manila, Philippines: Fish Health Section. Asian Fisheries Society.
Tuntiwaranuruk, C., Chalermwat, K., Upatham, E.S., Kruatrachue, M., & Azevedo, C. (2004). Investigation of Nematopsis spp. Oocysts in 7 species of bivalves from Chonburi province, Gulf of Thailand. Diseases of Aquatic Organisms, 58, 47-53.
Tuntiwaranuruk, C., Chalermwat, K., Pongsakchat, V., Meepool, A., Upatham, E. S., & Kruatrachue, M. (2008). Infection of Nematopsis oocysts in different size classes of farmed mussel Perna viridis in Thailand. Aquaculture, 281, 12-16.
Uddin, M. Jasim., Zulfigar,Y., Munawar, K., & Shau-Hwai, A.T. (2010). Parasites of blood cockle (Anadara granosa Linnaeus, 1758) from the Straits of Malacca. Journal of Shellfish Research., 30(3), 875-880.
Pertanika J. Trop. Agric. Sci. 36 (3): 225 - 248 (2013)
ISSN: 1511-3701 © Universiti Putra Malaysia Press
TROPICAL AGRICULTURAL SCIENCEJournal homepage: http://www.pertanika.upm.edu.my/
Article history:Received: 20 June 2011Accepted: 13 August 2012
ARTICLE INFO
E-mail addresses: [email protected] (Fong, P. H.) [email protected] (Yuzine, E.), [email protected] (Abdullah, M. T.)* Corresponding author
Genetic variations and population structure of the genus Cynopterus in Malaysia
Fong, P. H.1*, Yuzine, E.1 and Abdullah, M. T.1,2
1Molecular Ecology Laboratory, Department of Zoology, Faculty of Resource Science and Technology, Universiti Malaysia Sarawak, 94300 Kota Samarahan, Sarawak, Malaysia2Centre For Pre-University Studies, Universiti Malaysia Sarawak, 94300 Kota Samarahan, Sarawak, Malaysia
ABSTRACT
Nuclear microsatellite analysis of Cynopterus was aimed at characterising the microsatellite genotypes and the population structure of this genus especially in the large form of C. brachyotis and the small form of C. brachyotis. Nine pairs of existing microsatellite primers isolated from Indian C. sphinx were used. A total of 51 alleles and 97 genotypes were documented from four forms of Cynopterus. Genetic variations revealed from AMOVA analysis showed that there was low genetic variation among the four forms. The interspecies Global AMOVA comparison analysis showed that the genetic variation between the large and small forms of C. brachyotis was the lowest among interspecies comparisons. This resulted in low genetic structure in the UPGMA tree, and species boundary of each form was not clearly defined. This might due to the microsatellite primers that were isolated from Indian C. sphinx being low in sensitivity to detect variations in Malaysian cynopterans.
Keywords: Microsatellite analysis, Cynopterus
INTRODUCTION
Microsatellites or Simple Sequence Repeats (SSRs) are nuclear markers, as well as co-dominant Mendelian markers
(DeWoody and Avise, 2000; Srikwan et al., 2002; Scandura, 2004). In microsatellites, sequences are composed of repeated units of sequences; these repeats are generally two to five base pairs in length and are called di-, tri-, tetra- or pentanucleotides (Srikwan et al., 2002). The dinucleotide CA repeats are most commonly found in many eukaryotes (Page & Holmes, 1998; Scandura, 2004).
Fong, P. H., Yuzine, E. and Abdullah, M. T.
226 Pertanika J. Trop. Agric. Sci. 36 (3): 225 - 248 (2013)
The mutation rate of microsatellites was estimated between 10-2 and 10-5 per gamete, per generation (Page and Holmes, 1998; Wright et al., 2005), and these mutations directly influence the changes of repeat units (Degnan et al., 1999). They vary greatly in copy number between individuals (Page and Holmes, 1998). This high level of diversity, together with characteristics such as neutral evolution, codominance and simple Mendelian inheritance allows microsatellites to be used to identify closely related individuals, recent migration events and sex dispersal patterns (Hedrick, 1999; Flagstad et al., 2003; Hansson et al., 2003).
The difference in the repeat units of nucleotides carries the information that was passed through from generations to generations from their common ancestral alleles. Recent common ancestry is shown by the similarity of the repeat number, thus the microsatellite approach can be used to examine some phylogenetic applications in mtDNA (Degnan et al., 1999). The highly polymorphic nuclear loci can also be used to identify population specific polymorphisms (Bruford & Wayne, 1993).
Analysis of microsatellites can provide both paternal and maternal information (Burg et al., 1999). These are important in providing more reliable genetic information such as evolutionary lineages between closely related species which cannot be answered or revealed using mtDNA based genetic markers. In one instance, Campbell et al. (2004) stated that without comparison of nuclear markers, they cannot rule out the possibility that C. brachyotis lineage
may have a significantly longer and more complex evolutionary history than what was revealed from mitochondrial haplotype data.
In Malaysia, research focused on the species complex of C. brachyotis has been ongoing for many years. The first indication on the existence of two forms of C. brachyotis dates back to 1985 where Payne et al. (1985) noticed that there were two forms of C. brachyotis, namely, large-sized C. brachyotis, which can be found in forest edges and gardens, and small-sized C. brachyotis, which can be found in tall forests. Later, Francis (1990) mentioned the size difference of C. brachyotis captured in primary versus secondary forests. They stated that there was some morphological overlap and that the taxonomic situation of C. brachyotis was unresolved (Payne et al., 1985; Francis, 1990).
Abdullah et al. (2000) and Abdullah (2003) were the first to present significant genetic data on the existence of two forms of C. brachyotis, with clear indication that these two forms were found in distinct habitats – C. brachyotis I (large-sized) in open habitat and C. brachyotis II (small-sized) in closed habitat – but also exist sympatrically in ecotones between forests (closed habitat) and open areas (open habitat). Abdullah (2003) also speculated the existence of hybrids in the ecotonal areas based on clustered individuals that were found in his phylogenetic analysis based on 635bp partial cytchrome b gene in the mtDNA. His conclusion on the existence of the two forms of C. brachyotis was later confirmed in similar studies by Campbell et al. (2004,
Genetic Variations and Population Structure in the Genus Cynopterus (Mammalia, Chiroptera) in Malaysia
227Pertanika J. Trop. Agric. Sci. 36 (3): 225 - 248 (2013)
2006). Campbell et al. (2004) used 690bp partial mitochondrial cytchrome b gene and 576bp of partial mitochondrial control region to infer phylogenetic relationships of the cynopterans in Malaysia. Subsequently, Campbell et al. (2006) used 567bp of partial mitochondrial control region as mtDNA molecular marker to examine evolutionary relationships of these species. Later, these two forms of C. brachyotis were referred as C. cf. brachyotis “Forest” for the small size and C. cf. brachyotis “Sunda” for the large size (Campbell et al., 2004; 2006; Francis, 2008).
Morphological evidence was also presented by Abdullah (2003) using five external morphological characters. Furthermore, Jayaraj et al. (2004) collected data on 28 morphological characters and used multivariate analyses to assess the morphometrics of the Cynopterus complex based on Abdullah’s (2003) results. Jayaraj et al. (2004) observed congruent results with Abdullah (2003); both studies were in-agreement with the existence of two forms of C. brachyotis. Jayaraj et al. (2004) found that the large-sized C. brachyotis and the small-sized C. brachyotis can be differentiated using forearm length as stated by Abdullah (2003), and measurements of the palatal length (Jayaraj, 2009). Later, Jayaraj et al. (2012) developed two predictive models with eight measurements from the skull, dental and external characters to discriminate these two forms of C. brachyotis. Furthermore, Abdullah and Jayaraj (2006) deduced that the type specimen was a large form of C.
brachyotis based on limited data from the original descriptions and morphological measurements by Müller (1938).
According to Francis (2008), the small-sized C. brachyotis consumes mostly fruits especially figs, while the large-sized C. brachyotis consumes a wider range of food as compared to the small-sized C. brachyotis. The large-sized C. brachyotis consumes small fruits, bananas, nectar, pollens, and soft pulp, whereby it sucks out the juice from the pulp. In terms of habitat type, the large-sized C. brachyotis and small-sized C. brachyotis occupy different habitat types. The large-sized C. brachyotis is found in open habitats, such as secondary forests, agricultural lands, forest fringes and swamps, while the small-sized C. brachyotis is found in closed habitats, such as primary forests, old regenerated forests, and forest fringes near primary forests. However, as indicated by Abdullah (2003), these two forms of C. brachyotis are sympatric at forest edges where hybridisation could occur. Unfortunately, this cannot be investigated using mtDNA molecular markers as mtDNA only reflects the gene flow and dispersal pattern of the female founders in the population (García-Moreno et al., 1996).
To study the species boundary and genetic variations between C. sphinx and C. brachyotis in Peninsular India, Storz (2000) developed nine pairs of microsatellite primers from C. sphinx (n = 413 individuals). In the preliminary study of taxonomic relationship between C. sphinx and C. brachyotis, a total of 300 cynopterans (additional 189 C. sphinx and 111 C.
Fong, P. H., Yuzine, E. and Abdullah, M. T.
228 Pertanika J. Trop. Agric. Sci. 36 (3): 225 - 248 (2013)
brachyotis) were screened using five pairs of the microsatellite primers (CSP1, CSP2, CSP5, CSP7 and CSP9). As a result, CSP2 was found monomorphic in 20 individuals of C. brachyotis and the allele segregations were relatively shorter in C. brachyotis compared to C. sphinx (Storz, 2000). Besides, he also used these microsatellite primers to investigate the polygyny and social structure of C. sphinx using the population genetic structure (Storz, 2001; Storz et al., 2001a, 2001b).
This study aimed to investigate the utility and reproducibility of the existing microsatellite markers designed by Storz (2000) for population studies of Cynopterus in Malaysia; and subsequently to include more samples of this taxon from Malaysia especially from Sabah and Sarawak. Second, this study aimed to elucidate the possibility of hybridisation of the two forms of C. brachyotis occurring in the ecotone as speculated by Abdullah (2003) by using microsatellite analysis.
MATERIALS AND METHOD
Sample Identification and Collection
The samples for this study were from two sources, namely, the sample collection from the field and museum deposits in Malaysia. The distinction of the large form and small form was based on the C. brachyotis forearm measurements (> 60 mm = large form, < 60 mm = small form) as described in previous studies (see Abdullah, 2003; Campbell et al., 2004, 2006, 2007; Jayaraj et al., 2004, 2005; Francis, 2008; Jayaraj, 2009). C. sphinx
and C. horsfieldii were identified based on forearm measurements and dentition as described in Payne et al. (1985), Lekagul and McNeely (1988), as well as Corbet and Hill (1992). Sampling locations were selected from open habitats (i.e. agricultural areas, secondary forests and swamp areas), closed habitats (i.e. primary forests and old regenerated forests) and forest edges in Peninsular Malaysia and Borneo. Museum samples were collected from the Sarawak Museum, Kinabalu Park Museum, the zoological museum of the Faculty of Resource Science and Technology (FRST) in Universiti Malaysia Sarawak (UNIMAS) (Abdullah et al., 2010) and the zoological museum of the Department of Wildlife and National Parks (DWNP) at Bukit Rengit, Pahang.
DNA Extraction and Microsatellite Genotyping
All instruments were sterilised by autoclave to avoid cross-contamination of DNA. DNA extractions were done using the standard cetyl trimethyl ammonium bromide (C-TAB) protocol following Grewe et al. (1993). Nine pairs of microsatellite primers designed by Storz (2000) were used to screen cynopterans in this study. The PCR amplifications were performed following the standard protocol as described by Sambrook et al. (1989). The amplifications were performed in a 25 μl of PCR mixture containing 3.5 μl of 10× PCR buffer, 1.5 μl of magnesium chloride (MgCl2) (25 mM), 0.5 µl of dNTP mixture (10 mM), 1.25 µl of each primer (10 µM), 0.2 µl of
Genetic Variations and Population Structure in the Genus Cynopterus (Mammalia, Chiroptera) in Malaysia
229Pertanika J. Trop. Agric. Sci. 36 (3): 225 - 248 (2013)
Taq polymerase and 1.0 to 2.0 µl of DNA template. Negative control (a reaction without a DNA template) was included in each PCR amplification to ensure that no DNA cross-contamination occurred during the preparation of PCR reagents.
PCR amplifications for all microsatellite p r i m e r s u s e d w e r e d o n e u s i n g a programmable thermal cycler (MyCyclerTM
by Bio-Rad) with standard-3 PCR protocol (Fong, 2011). The PCR programme was set as follows: a preliminary denaturation at 94°C for 2 minutes and 30 seconds, followed by denaturation of double stranded DNA at 94°C (30 seconds), primer annealing at optimised temperature (45 seconds), and primer extension at 72°C (50 seconds) for one complete cycle. Each cycle was repeated for 30 times and subsequently a final extension at 72°C for 2 minutes and 30 seconds was included to avoid generation of incomplete double stranded DNA.
Three percent of TBE-agarose gel was used to screen the DNA products in microsatellite analysis. All the results of the gel runs were photographed under UV illumination.
Microsatellite Data Analysis
The numbers of alleles per locus and between species were directly calculated. Overall allele frequencies for each species across loci were generated using POPGENE (version 1.31; Yeh et al., 1999). Probability tests for Hardy-Weinberg equilibrium (p-value < 0.05) were carried out for each locus for each species by using the
algorithm of Levene (1949) in POPGENE (version 1.31; Yeh et al., 1999). GENEPOP (version 3.2; Raymond and Rousset, 1995) online analysis was used to test for linkage equilibrium across loci for each species.
The numbers of genotypes for each population, interspecies as well as intraspecies genotype sharing and gene diversity were generated using Arlequin (version 3.1; Excoffier et al., 2005). The Ewens-Watter neutrality test was performed to test the selection pressure for each locus using POPGENE (version 1.31; Yeh et al., 1999). The statistics in the neutrality test were calculated using 1000 simulated samples.
Global analysis of molecular variance (AMOVA) was used to perform the hierarchical analysis for overall species and inter-species level (Excoffier et al., 2005). Four covariance components from the total variance of the hierarchical analysis were used to compute four fixation indices generated using Arlequin (version 3.1; Excoffier et al., 2005). A total of 1000 permutations were used to carry out the significance tests between the covariance components and the correlated fixation indices with p-value less than 0.05.
A dendogram based on the unweighted pair group method with arithmetic mean (UPGMA) was constructed using the FST
estimates between populations across the four species implemented in Molecular Evolutionary Genetics Analysis (MEGA) (version 4.0; Tamura et al., 2007). The number of migrants per generation, Nm for
Fong, P. H., Yuzine, E. and Abdullah, M. T.
230 Pertanika J. Trop. Agric. Sci. 36 (3): 225 - 248 (2013)
interspecies as well as between populations was calculated using the FST estimates as follows:
14
STm
ST
FNF
-=
where, FST is the fixation index, and Nm is the number of migrants per generation.
RESULTS AND DISCUSSION
Allelic Diversity in Cynopterus
Overall, 173 individuals of cynopterans comprising 64 large form of C. brachyotis, 41 small form of C. brachyotis, 38 C. horsfieldii, and 30 C. sphinx were tested using nine pairs of microsatellite primers (Fig.1). Seven out of the nine microsatellite primer pairs produced distinct and reproducible genotypic patterns and showed polymorphism in all the four forms of Cynnopterus examined. The two remaining primer sets (CSP2 and CSP8) were excluded from the analysis as these primers did not generate any band. Similarly, the failure of both primer sets to generate bands was also observed in a similar study carried out in Peninsular Malaysia (Campbell et al., 2006). All nine pairs of primers utilised in the study were originally isolated from C. sphinx caught in India (Storz, 2000). Thus, it is safe to presume that the two primer sets failed to amplify the targeted region in the cynopterans due to inter and intraspecies variations that occurred between both sources of samples (India and Malaysia).
In reference to locus CSP4, the populations of C. horsfieldii and small
form of C. brachyotis were found to be monomorphic with only two alleles produced (Table 1). In contrast, Campbell et al. (2006) found that CSP4 showed monomorphism in C. brachyotis Sunda only (referred here as large form of C. brachyotis) in contrast with this study where there were three alleles produced in the large form of C. brachyotis from Peninsular Malaysia. The allele was contributed by a sample captured from Gua Batu Puteh, Pulau Langkawi, previously not sampled by Campbell et al. (2006). Thus, inclusion of samples from other areas in the population as well as phylogeography study would show not only the distribution of the genotypes and gene flow of the studied species but also reveal more alleles that may not be found by restricted sampling efforts especially in bats which are highly mobile.
The allele frequencies for each locus in each species are presented in Table 1. Several private alleles were found in loci CSP3, CPS4, CSP6, CSP7 and CSP9 in each species, except the large-seized C. brachyotis (Table 1). This indicates that the remaining cynopterans in this study diverged from the large form of C. brachyotis. The founder population would have the greatest number of alleles, haplotypes, as well as genetic diversity, and shares its haplotypes with its descent groups. The descent group might hold their own unique haplotypes or private alleles as well as loss of certain haplotypes inherited from the founders due to genetic drift and other evolutionary processes during speciation (Kaestle & Smith, 2001; Merriwether et al., 1996).
Genetic Variations and Population Structure in the Genus Cynopterus (Mammalia, Chiroptera) in Malaysia
231Pertanika J. Trop. Agric. Sci. 36 (3): 225 - 248 (2013)
TAB
LE 1
A
llele
freq
uenc
ies,
obse
rved
het
eroz
ygos
ities
(Obs
Het
), an
d ex
pect
ed h
eter
ozyg
ositi
es (E
xp H
et) a
t eac
h lo
cus i
n re
pres
enta
tives
of C
ynop
teru
s. B
old
valu
es
indi
cate
priv
ate
alle
les i
n ea
ch sp
ecie
s.
CSP
1Sp
ecie
s\A
llele
200
210
220
230
240
250
Obs
Het
Exp
Het
Larg
e C
. bra
chyo
tis0.
0690
0.03
450.
5172
0.21
550.
1034
0.06
030.
3966
0.67
15Sm
all C
. bra
chyo
tis0.
1316
0.07
890.
2632
0.36
840.
0658
0.09
210.
7895
0.76
88C
. sph
inx
0.10
000.
0000
0.23
330.
2833
0.10
000.
2833
0.30
000.
7780
C. h
orsfi
eldi
i0.
1184
0.00
000.
2500
0.40
790.
1447
0.07
890.
3947
0.73
96
CSP
3Sp
ecie
s\A
llele
100
110
120
130
140
150
Obs
Het
Exp
Het
Larg
e C
. bra
chyo
tis0.
5678
0.07
630.
2797
0.03
390.
0424
0.00
000.
2881
0.59
57Sm
all C
. bra
chyo
tis0.
6148
0.14
470.
1053
0.07
890.
0526
0.00
000.
4734
0.58
42C
. sph
inx
0.35
000.
2333
0.30
000.
1167
0.00
000.
0000
0.20
000.
7316
C. h
orsfi
eldi
i0.
7895
0.00
000.
0000
0.10
530.
0000
0.10
530.
3158
0.35
93
CSP
4Sp
ecie
s\A
llele
100
120
130
140
150
Obs
Het
Exp
Het
Larg
e C
. bra
chyo
tis0.
0169
0.00
000.
9068
0.00
850.
0678
0.10
170.
1743
Smal
l C. b
rach
yotis
0.00
000.
0000
0.94
740.
0000
0.05
260.
1053
0.10
11C
. sph
inx
0.01
720.
0172
0.25
860.
0690
0.63
790.
4138
0.52
99C
. hor
sfiel
dii
0.00
000.
0000
0.93
420.
0000
0.06
580.
1316
0.12
29
CSP
5Sp
ecie
s\A
llele
130
140
150
160
170
180
190
200
Obs
Het
Exp
Het
Larg
e C
. bra
chyo
tis0.
1525
0.00
850.
4576
0.09
320.
2203
0.01
690.
0508
0.00
000.
6610
0.71
32Sm
all C
. bra
chyo
tis0.
1974
0.01
320.
2632
0.03
950.
3026
0.05
260.
1316
0.00
000.
7368
0.78
88C
. sph
inx
0.00
000.
1379
0.44
830.
1724
0.10
340.
0517
0.03
450.
0517
0.27
590.
7459
C. h
orsfi
eldi
i0.
0000
0.05
260.
1447
0.19
740.
2368
0.17
110.
0000
0.19
740.
7105
0.82
39
Fong, P. H., Yuzine, E. and Abdullah, M. T.
232 Pertanika J. Trop. Agric. Sci. 36 (3): 225 - 248 (2013)
CSP
6Sp
ecie
s\A
llele
130
140
150
160
170
180
190
200
220
Obs
Het
Exp
Het
Larg
e C
. bra
chyo
tis0.
0085
0.16
900.
4237
0.01
700.
2458
0.00
000.
0508
0.15
250.
0000
0.55
930.
7297
Smal
l C. b
rach
yotis
0.09
210.
0526
0.34
210.
0921
0.10
530.
0000
0.23
680.
0789
0.00
000.
5263
0.80
04C
. sph
inx
0.07
690.
0000
0.63
460.
0000
0.07
690.
0577
0.00
000.
0769
0.07
690.
3077
0.58
14C
. hor
sfiel
dii
0.05
880.
1029
0.26
470.
1029
0.32
350.
0735
0.07
350.
0000
0.00
000.
2647
0.80
16
CSP
7Sp
ecie
s\A
llele
220
230
240
250
260
270
280
290
300
310
Obs
Het
Exp
Het
Larg
e C
. bra
chyo
tis0.
0000
0.00
000.
0169
0.32
200.
1780
0.07
630.
2203
0.04
240.
1441
0.00
000.
7627
0.76
41Sm
all C
. bra
chyo
tis0.
0000
0.00
000.
0000
0.14
470.
2237
0.13
160.
3026
0.01
320.
1711
0.13
200.
7895
0.80
11C
. sph
inx
0.01
670.
0000
0.01
670.
3833
0.16
670.
0833
0.16
670.
1000
0.06
670.
0000
0.83
330.
7887
C. h
orsfi
eldi
i0.
0000
0.11
840.
0263
0.17
110.
0395
0.40
790.
2105
0.00
000.
0263
0.00
000.
4474
0.75
3
CSP
9Sp
ecie
s\A
llele
280
290
300
310
320
330
350
Obs
Het
Exp
Het
Larg
e C
. bra
chyo
tis0.
2797
0.18
640.
4407
0.02
540.
0339
0.03
390.
0000
0.22
030.
6958
Smal
l C. b
rach
yotis
0.42
420.
1667
0.31
820.
0455
0.00
000.
0303
0.01
520.
1515
0.69
84C
. sph
inx
0.48
210.
0357
0.41
070.
0000
0.07
140.
0000
0.00
000.
5000
0.60
32C
. hor
sfiel
dii
0.27
630.
1842
0.42
110.
0526
0.02
630.
0395
0.00
000.
2368
0.71
68
Genetic Variations and Population Structure in the Genus Cynopterus (Mammalia, Chiroptera) in Malaysia
233Pertanika J. Trop. Agric. Sci. 36 (3): 225 - 248 (2013)
Fig.1: Representative gel pictures of each microsatellite marker used in this study. M1 indicates the GeneRulerTM 50 bp DNA Ladder, M2 is the GeneRulerTM 100 bp DNA Ladder Plus and –v is negative control. Each lane in the gels is labelled by number following the sample ID: 1 = I19; 2 = I20, 3 = I21; 4 = I22; 5 = I23; 6 = I24; 7 = I26; 8 = I29; 9 = I30; 10 = I31; 11 = H3; 12 = H4; 13 = H5; 14 = H6; 15 = H7; 16 = H8; 17 = H9; 18 = H10; 19 = H11; 20 = H12; 21 = H13; 22 = H14; 23 = K31; 24 = K32; 25 = K40; 26 = K92; 27 = I19; 28 = I20; 29 = I21; 30 = I22; 31 = I23; 32 = I24; 33 = PB026; 34 = PB012; 35 = B1; 36 = B2; 37 = B12; 38 = 01274; 39 = I20; 40 = I21; 41 = I23; 42 = I26; 43 = I30; 44 = H2; 45 = H7; 46 = FK1; 47 = FK2; 48 = FK3; 49 = FK4; 50 = FK5; 51 = FK6; 52 = FK7; 53 = FK8; 54 = FK9; 55 = FK10; 56 = S131; 57 = S184; 58 = S192; 59 = S185; 60 = S220; 61 = S221; 62 = S222.
Fong, P. H., Yuzine, E. and Abdullah, M. T.
234 Pertanika J. Trop. Agric. Sci. 36 (3): 225 - 248 (2013)
There were 51 alleles documented in this study, where the highest number of alleles was found in the large form of C. brachyotis (42 alleles), while the lowest number of alleles was found in C. horsfieldii (36 alleles). The average observed heterozygosity ranged from 0.3574 in C. horsfieldii up to 0.5103 in the small form of C. brachyotis populations (Table 2). All loci in this study deviated from Hardy-Weinberg equilibrium across the four Cynopterus species (data not shown). No linkage disequilibrium was detected in all loci across all four cynopterans.
Deviation from Hardy-Weinberg expectations was detected across species over seven screened loci. However, not all genotype frequencies over seven loci deviated from Hardy-Weinberg expectation when observed within the populations of all species in this study. In this study, the populations with small sample size (less than or equal to seven individuals) were prone to follow Hardy-Weinberg equilibrium. Nevertheless, larger sample size for each region is still required to show the actual situation in the test of Hardy-Weinberg equilibrium. Non-deviation from Hardy-Weinberg equilibrium does not mean there
were no evolutionary forces acting on these populations (Halliburton, 2004). Hardy-Weinberg principle is a null hypothesis to describe an ideal population; however, in reality, there are many evolutionary processes or factors that may influence genotype frequencies and cause deficiency and excess of heterozygosity in a population of a particular species (Snustad & Simmons, 2010; Halliburton, 2004).
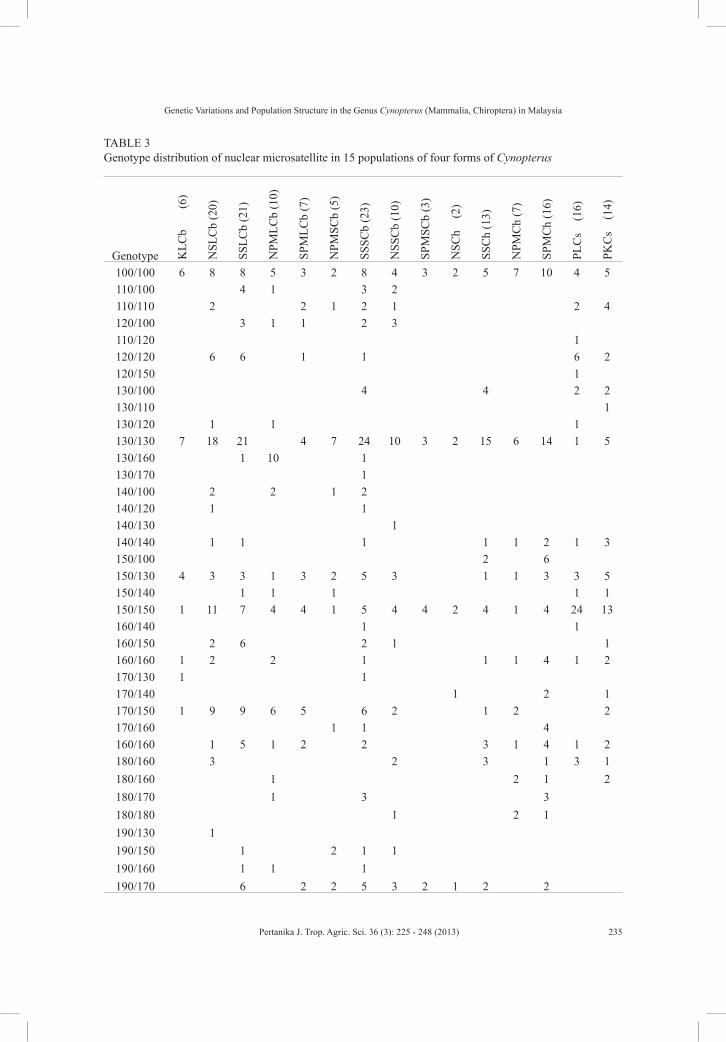
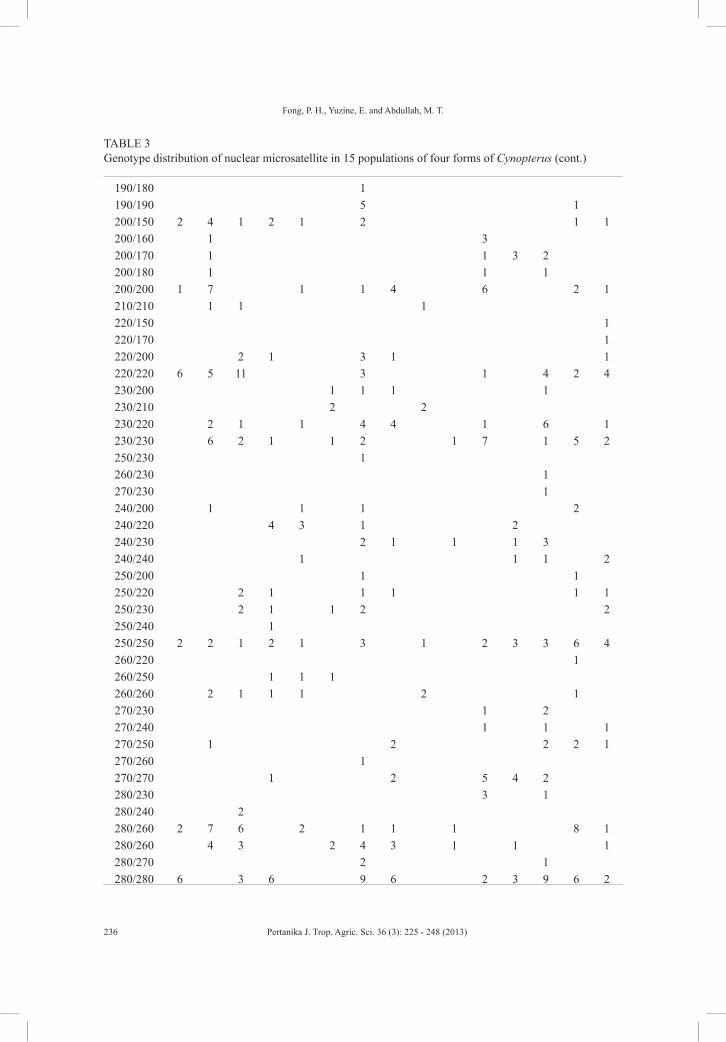
A total of 97 unique genotypes were found across the four forms of Cynopterus in 15 regions (28 sites) of this study (Table 3). There were three common genotypes across the four forms. Among the four forms of cynopterans, the large and small forms of C. brachyotis shared the most genotypes compared to others. Besides, null alleles were found in all cynopteran bats (Table 3).
Population Structure
High genotype numbers were detected in the populations of large and small forms of C. brachyotis from southern Sarawak. C. sphinx from Perak had higher number of genotypes (44 genotypes) compared to the population from Perlis (38 genotypes), whereas in C. horsfieldii, the population from southern Peninsular Malaysia had
TABLE 2 Genetic variability of cynopterans across seven microsatellite loci and average observed (Obs) and expected (Exp) Hardy-Weinberg heterozygosities (Het)
Species Total visible alleles Average allelic genotypes Average Obs Het
Average Exp Het
Large C. brachyotis 42 118 0.4271 0.6206Small C. brachyotis 40 75 0.5103 0.6490C. sphinx 39 58 0.4044 0.6798C. horsfieldii 36 75 0.3574 0.6167
Genetic Variations and Population Structure in the Genus Cynopterus (Mammalia, Chiroptera) in Malaysia
235Pertanika J. Trop. Agric. Sci. 36 (3): 225 - 248 (2013)
TABLE 3 Genotype distribution of nuclear microsatellite in 15 populations of four forms of Cynopterus
Genotype KLC
b
(6
)
NSL
Cb
(20)
SSLC
b (2
1)
NPM
LCb
(10)
SPM
LCb
(7)
NPM
SCb
(5)
SSSC
b (2
3)
NSS
Cb
(10)
SPM
SCb
(3)
NSC
h
(2)
SSC
h (1
3)
NPM
Ch
(7)
SPM
Ch
(16)
PLC
s (
16)
PKC
s (
14)
100/100 6 8 8 5 3 2 8 4 3 2 5 7 10 4 5110/100 4 1 3 2110/110 2 2 1 2 1 2 4120/100 3 1 1 2 3110/120 1120/120 6 6 1 1 6 2120/150 1130/100 4 4 2 2130/110 1130/120 1 1 1130/130 7 18 21 4 7 24 10 3 2 15 6 14 1 5130/160 1 10 1130/170 1140/100 2 2 1 2140/120 1 1140/130 1140/140 1 1 1 1 1 2 1 3150/100 2 6150/130 4 3 3 1 3 2 5 3 1 1 3 3 5150/140 1 1 1 1 1150/150 1 11 7 4 4 1 5 4 4 2 4 1 4 24 13160/140 1 1160/150 2 6 2 1 1160/160 1 2 2 1 1 1 4 1 2170/130 1 1170/140 1 2 1170/150 1 9 9 6 5 6 2 1 2 2170/160 1 1 4160/160 1 5 1 2 2 3 1 4 1 2180/160 3 2 3 1 3 1180/160 1 2 1 2180/170 1 3 3180/180 1 2 1190/130 1190/150 1 2 1 1190/160 1 1 1190/170 6 2 2 5 3 2 1 2 2
Fong, P. H., Yuzine, E. and Abdullah, M. T.
236 Pertanika J. Trop. Agric. Sci. 36 (3): 225 - 248 (2013)
TABLE 3 Genotype distribution of nuclear microsatellite in 15 populations of four forms of Cynopterus (cont.)
190/180 1190/190 5 1200/150 2 4 1 2 1 2 1 1200/160 1 3200/170 1 1 3 2200/180 1 1 1200/200 1 7 1 1 4 6 2 1210/210 1 1 1220/150 1220/170 1220/200 2 1 3 1 1220/220 6 5 11 3 1 4 2 4230/200 1 1 1 1230/210 2 2230/220 2 1 1 4 4 1 6 1230/230 6 2 1 1 2 1 7 1 5 2250/230 1260/230 1270/230 1240/200 1 1 1 2240/220 4 3 1 2240/230 2 1 1 1 3240/240 1 1 1 2250/200 1 1250/220 2 1 1 1 1 1250/230 2 1 1 2 2250/240 1250/250 2 2 1 2 1 3 1 2 3 3 6 4260/220 1260/250 1 1 1260/260 2 1 1 1 2 1270/230 1 2270/240 1 1 1270/250 1 2 2 2 1270/260 1270/270 1 2 5 4 2280/230 3 1280/240 2280/260 2 7 6 2 1 1 1 8 1280/260 4 3 2 4 3 1 1 1280/270 2 1280/280 6 3 6 9 6 2 3 9 6 2
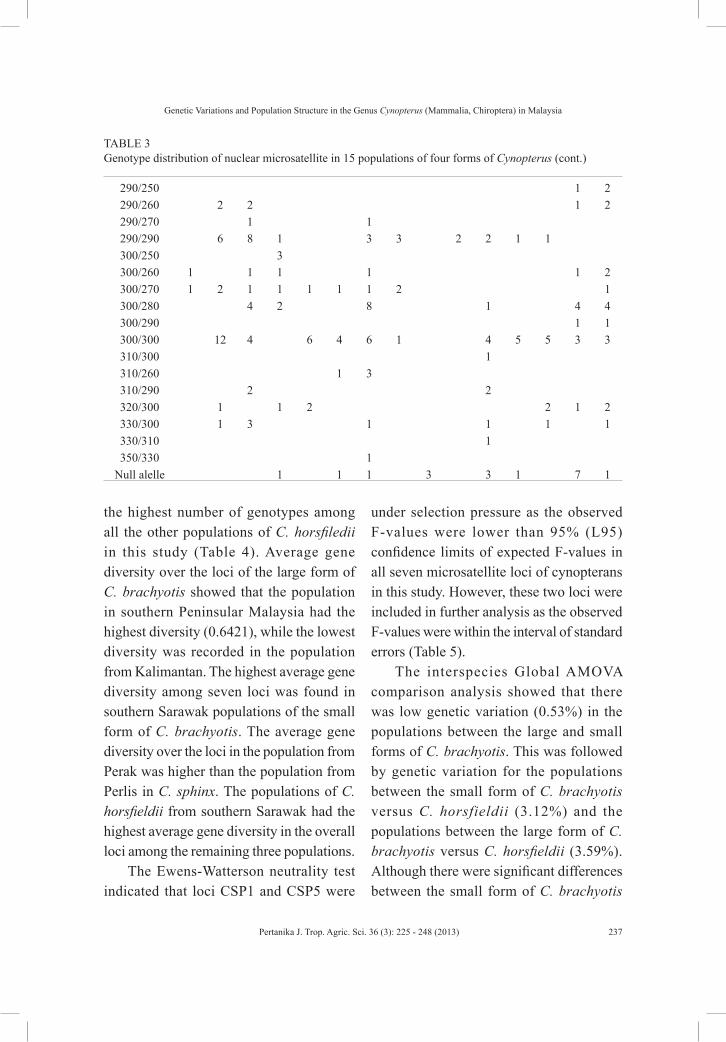
Genetic Variations and Population Structure in the Genus Cynopterus (Mammalia, Chiroptera) in Malaysia
237Pertanika J. Trop. Agric. Sci. 36 (3): 225 - 248 (2013)
the highest number of genotypes among all the other populations of C. horsfiledii in this study (Table 4). Average gene diversity over the loci of the large form of C. brachyotis showed that the population in southern Peninsular Malaysia had the highest diversity (0.6421), while the lowest diversity was recorded in the population from Kalimantan. The highest average gene diversity among seven loci was found in southern Sarawak populations of the small form of C. brachyotis. The average gene diversity over the loci in the population from Perak was higher than the population from Perlis in C. sphinx. The populations of C. horsfieldii from southern Sarawak had the highest average gene diversity in the overall loci among the remaining three populations.
The Ewens-Watterson neutrality test indicated that loci CSP1 and CSP5 were
under selection pressure as the observed F-values were lower than 95% (L95) confidence limits of expected F-values in all seven microsatellite loci of cynopterans in this study. However, these two loci were included in further analysis as the observed F-values were within the interval of standard errors (Table 5).
The interspecies Global AMOVA comparison analysis showed that there was low genetic variation (0.53%) in the populations between the large and small forms of C. brachyotis. This was followed by genetic variation for the populations between the small form of C. brachyotis versus C. horsfieldii (3.12%) and the populations between the large form of C. brachyotis versus C. horsfieldii (3.59%). Although there were significant differences between the small form of C. brachyotis
TABLE 3 Genotype distribution of nuclear microsatellite in 15 populations of four forms of Cynopterus (cont.)
290/250 1 2290/260 2 2 1 2290/270 1 1290/290 6 8 1 3 3 2 2 1 1300/250 3300/260 1 1 1 1 1 2300/270 1 2 1 1 1 1 1 2 1300/280 4 2 8 1 4 4300/290 1 1300/300 12 4 6 4 6 1 4 5 5 3 3310/300 1310/260 1 3310/290 2 2320/300 1 1 2 2 1 2330/300 1 3 1 1 1 1330/310 1350/330 1
Null alelle 1 1 1 3 3 1 7 1
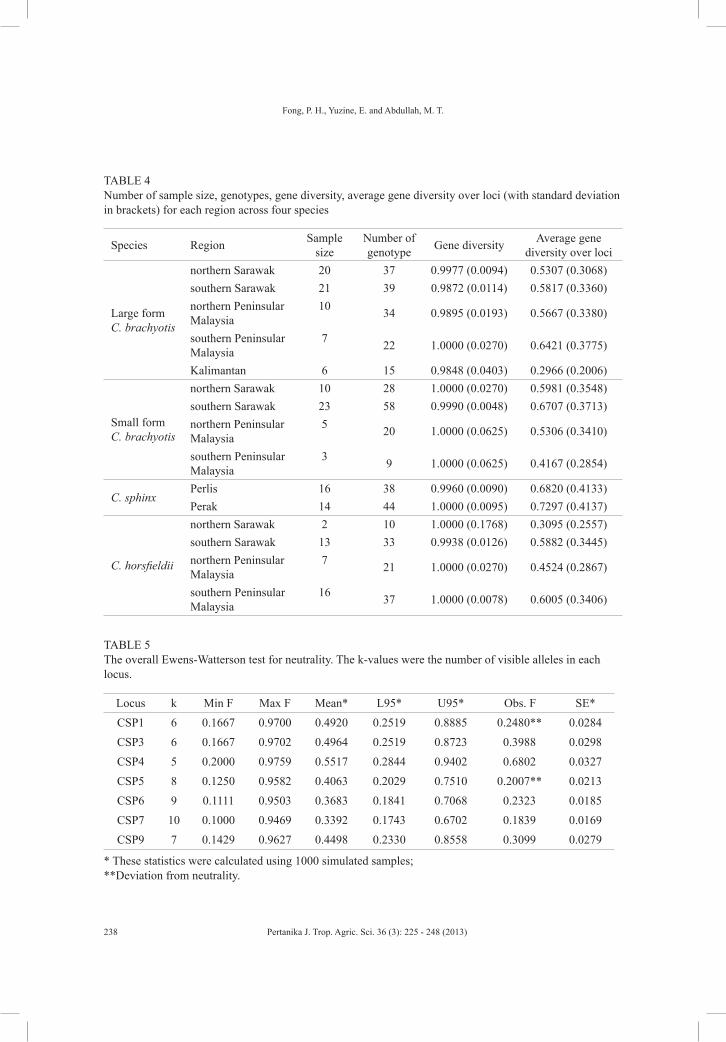
Fong, P. H., Yuzine, E. and Abdullah, M. T.
238 Pertanika J. Trop. Agric. Sci. 36 (3): 225 - 248 (2013)
TABLE 4 Number of sample size, genotypes, gene diversity, average gene diversity over loci (with standard deviation in brackets) for each region across four species
Species Region Sample size
Number of genotype Gene diversity Average gene
diversity over loci
Large form C. brachyotis
northern Sarawak 20 37 0.9977 (0.0094) 0.5307 (0.3068)southern Sarawak 21 39 0.9872 (0.0114) 0.5817 (0.3360)northern Peninsular Malaysia
10 34 0.9895 (0.0193) 0.5667 (0.3380)
southern Peninsular Malaysia
7 22 1.0000 (0.0270) 0.6421 (0.3775)
Kalimantan 6 15 0.9848 (0.0403) 0.2966 (0.2006)
Small form C. brachyotis
northern Sarawak 10 28 1.0000 (0.0270) 0.5981 (0.3548)southern Sarawak 23 58 0.9990 (0.0048) 0.6707 (0.3713)northern Peninsular Malaysia
5 20 1.0000 (0.0625) 0.5306 (0.3410)
southern Peninsular Malaysia
3 9 1.0000 (0.0625) 0.4167 (0.2854)
C. sphinxPerlis 16 38 0.9960 (0.0090) 0.6820 (0.4133)Perak 14 44 1.0000 (0.0095) 0.7297 (0.4137)
C. horsfieldii
northern Sarawak 2 10 1.0000 (0.1768) 0.3095 (0.2557)southern Sarawak 13 33 0.9938 (0.0126) 0.5882 (0.3445)northern Peninsular Malaysia
7 21 1.0000 (0.0270) 0.4524 (0.2867)
southern Peninsular Malaysia
16 37 1.0000 (0.0078) 0.6005 (0.3406)
TABLE 5 The overall Ewens-Watterson test for neutrality. The k-values were the number of visible alleles in each locus.
Locus k Min F Max F Mean* L95* U95* Obs. F SE*CSP1 6 0.1667 0.9700 0.4920 0.2519 0.8885 0.2480** 0.0284CSP3 6 0.1667 0.9702 0.4964 0.2519 0.8723 0.3988 0.0298CSP4 5 0.2000 0.9759 0.5517 0.2844 0.9402 0.6802 0.0327CSP5 8 0.1250 0.9582 0.4063 0.2029 0.7510 0.2007** 0.0213CSP6 9 0.1111 0.9503 0.3683 0.1841 0.7068 0.2323 0.0185CSP7 10 0.1000 0.9469 0.3392 0.1743 0.6702 0.1839 0.0169CSP9 7 0.1429 0.9627 0.4498 0.2330 0.8558 0.3099 0.0279
* These statistics were calculated using 1000 simulated samples; **Deviation from neutrality.
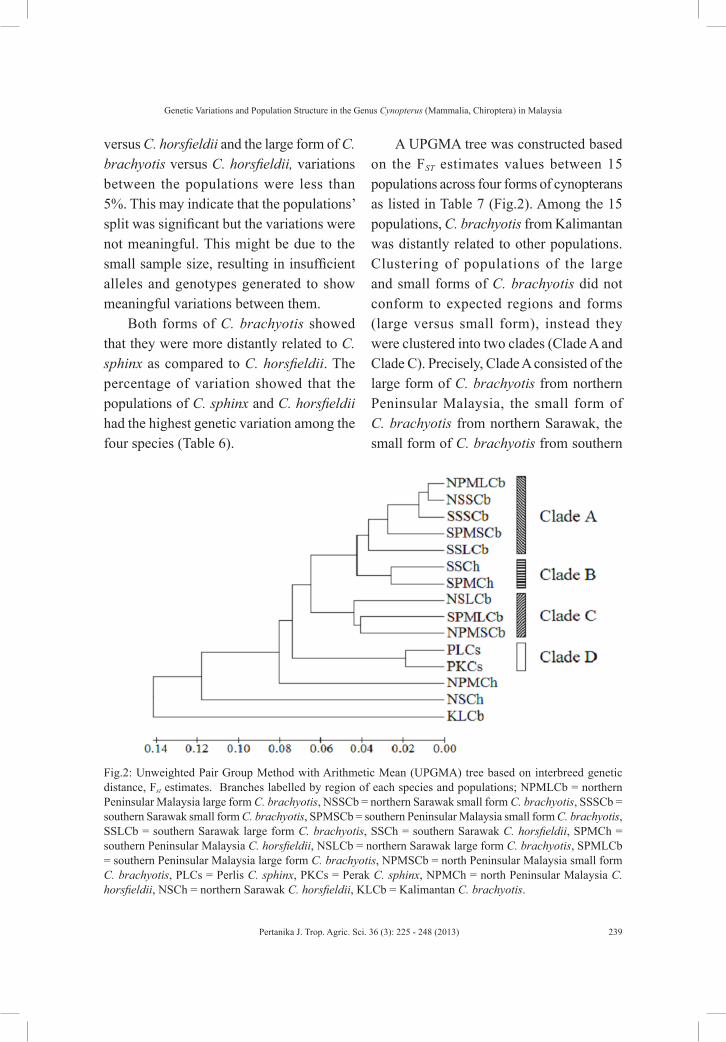
Genetic Variations and Population Structure in the Genus Cynopterus (Mammalia, Chiroptera) in Malaysia
239Pertanika J. Trop. Agric. Sci. 36 (3): 225 - 248 (2013)
versus C. horsfieldii and the large form of C. brachyotis versus C. horsfieldii, variations between the populations were less than 5%. This may indicate that the populations’ split was significant but the variations were not meaningful. This might be due to the small sample size, resulting in insufficient alleles and genotypes generated to show meaningful variations between them.
Both forms of C. brachyotis showed that they were more distantly related to C. sphinx as compared to C. horsfieldii. The percentage of variation showed that the populations of C. sphinx and C. horsfieldii had the highest genetic variation among the four species (Table 6).
A UPGMA tree was constructed based on the FST estimates values between 15 populations across four forms of cynopterans as listed in Table 7 (Fig.2). Among the 15 populations, C. brachyotis from Kalimantan was distantly related to other populations. Clustering of populations of the large and small forms of C. brachyotis did not conform to expected regions and forms (large versus small form), instead they were clustered into two clades (Clade A and Clade C). Precisely, Clade A consisted of the large form of C. brachyotis from northern Peninsular Malaysia, the small form of C. brachyotis from northern Sarawak, the small form of C. brachyotis from southern
Fig.2: Unweighted Pair Group Method with Arithmetic Mean (UPGMA) tree based on interbreed genetic distance, Fst estimates. Branches labelled by region of each species and populations; NPMLCb = northern Peninsular Malaysia large form C. brachyotis, NSSCb = northern Sarawak small form C. brachyotis, SSSCb = southern Sarawak small form C. brachyotis, SPMSCb = southern Peninsular Malaysia small form C. brachyotis, SSLCb = southern Sarawak large form C. brachyotis, SSCh = southern Sarawak C. horsfieldii, SPMCh = southern Peninsular Malaysia C. horsfieldii, NSLCb = northern Sarawak large form C. brachyotis, SPMLCb = southern Peninsular Malaysia large form C. brachyotis, NPMSCb = north Peninsular Malaysia small form C. brachyotis, PLCs = Perlis C. sphinx, PKCs = Perak C. sphinx, NPMCh = north Peninsular Malaysia C. horsfieldii, NSCh = northern Sarawak C. horsfieldii, KLCb = Kalimantan C. brachyotis.
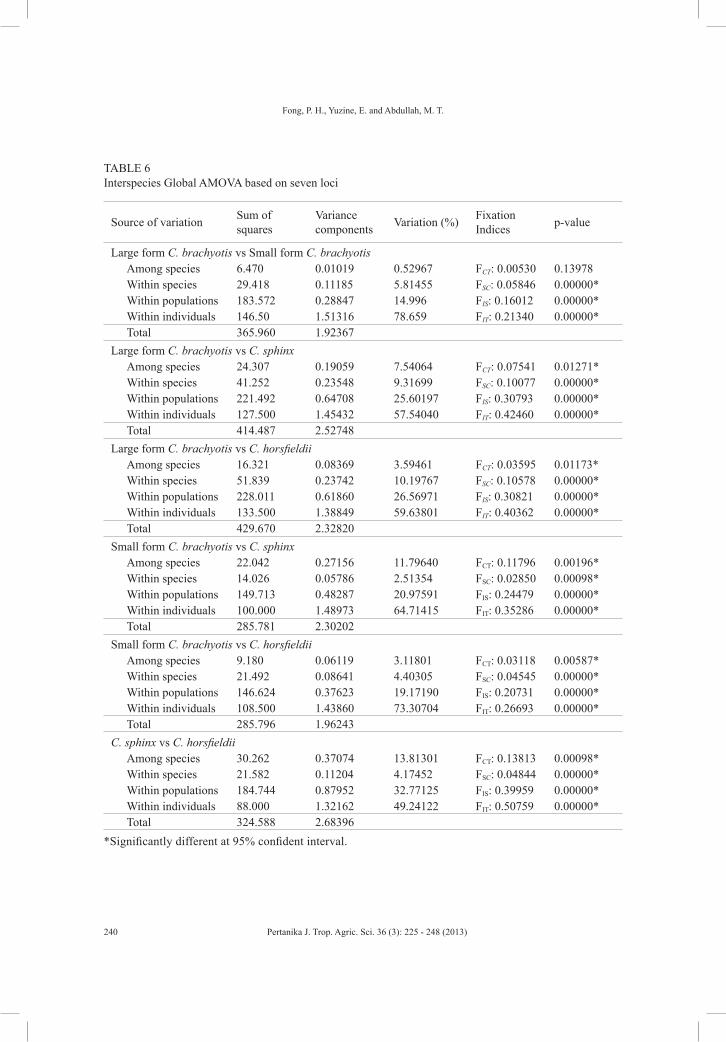
Fong, P. H., Yuzine, E. and Abdullah, M. T.
240 Pertanika J. Trop. Agric. Sci. 36 (3): 225 - 248 (2013)
TABLE 6 Interspecies Global AMOVA based on seven loci
Source of variation Sum of squares
Variance components Variation (%) Fixation
Indices p-value
Large form C. brachyotis vs Small form C. brachyotisAmong species 6.470 0.01019 0.52967 FCT: 0.00530 0.13978Within species 29.418 0.11185 5.81455 FSC: 0.05846 0.00000*Within populations 183.572 0.28847 14.996 FIS: 0.16012 0.00000*Within individuals 146.50 1.51316 78.659 FIT: 0.21340 0.00000*Total 365.960 1.92367
Large form C. brachyotis vs C. sphinxAmong species 24.307 0.19059 7.54064 FCT: 0.07541 0.01271* Within species 41.252 0.23548 9.31699 FSC: 0.10077 0.00000*Within populations 221.492 0.64708 25.60197 FIS: 0.30793 0.00000* Within individuals 127.500 1.45432 57.54040 FIT: 0.42460 0.00000*Total 414.487 2.52748
Large form C. brachyotis vs C. horsfieldiiAmong species 16.321 0.08369 3.59461 FCT: 0.03595 0.01173*Within species 51.839 0.23742 10.19767 FSC: 0.10578 0.00000*Within populations 228.011 0.61860 26.56971 FIS: 0.30821 0.00000*Within individuals 133.500 1.38849 59.63801 FIT: 0.40362 0.00000*Total 429.670 2.32820
Small form C. brachyotis vs C. sphinxAmong species 22.042 0.27156 11.79640 FCT: 0.11796 0.00196*Within species 14.026 0.05786 2.51354 FSC: 0.02850 0.00098*Within populations 149.713 0.48287 20.97591 FIS: 0.24479 0.00000*Within individuals 100.000 1.48973 64.71415 FIT: 0.35286 0.00000*Total 285.781 2.30202
Small form C. brachyotis vs C. horsfieldiiAmong species 9.180 0.06119 3.11801 FCT: 0.03118 0.00587*Within species 21.492 0.08641 4.40305 FSC: 0.04545 0.00000*Within populations 146.624 0.37623 19.17190 FIS: 0.20731 0.00000*Within individuals 108.500 1.43860 73.30704 FIT: 0.26693 0.00000*Total 285.796 1.96243
C. sphinx vs C. horsfieldiiAmong species 30.262 0.37074 13.81301 FCT: 0.13813 0.00098*Within species 21.582 0.11204 4.17452 FSC: 0.04844 0.00000*Within populations 184.744 0.87952 32.77125 FIS: 0.39959 0.00000*Within individuals 88.000 1.32162 49.24122 FIT: 0.50759 0.00000*Total 324.588 2.68396
*Significantly different at 95% confident interval.
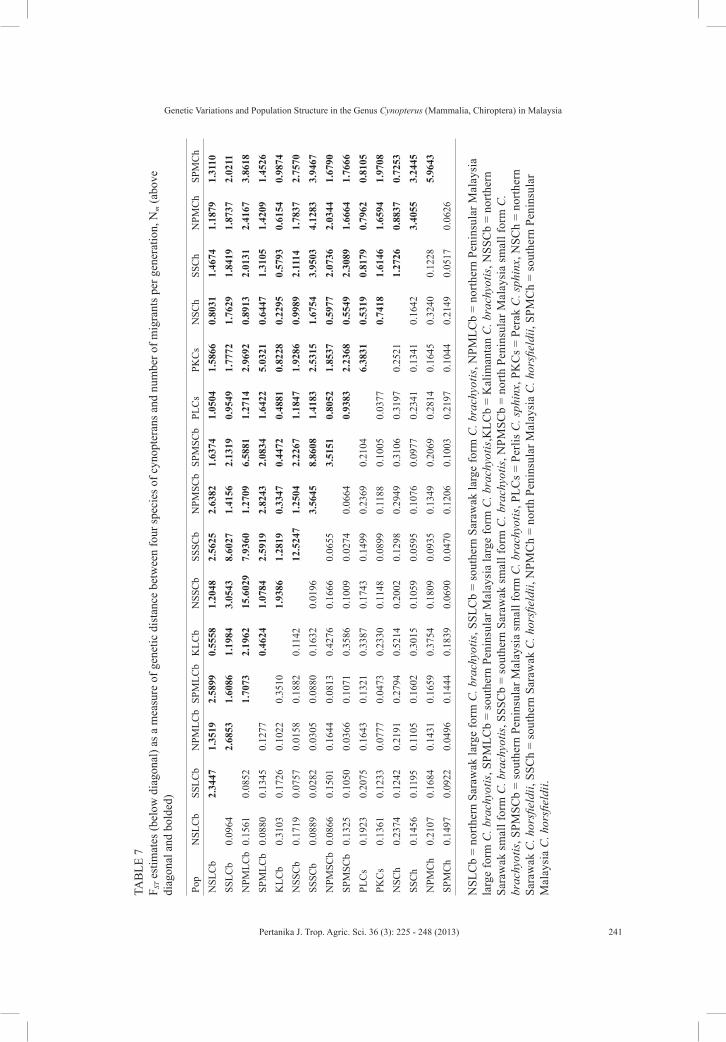
Genetic Variations and Population Structure in the Genus Cynopterus (Mammalia, Chiroptera) in Malaysia
241Pertanika J. Trop. Agric. Sci. 36 (3): 225 - 248 (2013)
TAB
LE 7
F S
T est
imat
es (b
elow
dia
gona
l) as
a m
easu
re o
f gen
etic
dis
tanc
e be
twee
n fo
ur sp
ecie
s of c
ynop
tera
ns a
nd n
umbe
r of m
igra
nts p
er g
ener
atio
n, N
m (a
bove
di
agon
al a
nd b
olde
d)
Pop
NSL
Cb
SSLC
bN
PMLC
bSP
MLC
bK
LCb
NSS
Cb
SSSC
bN
PMSC
bSP
MSC
bPL
Cs
PKC
sN
SCh
SSC
hN
PMC
hSP
MC
hN
SLC
b2.
3447
1.35
192.
5899
0.55
581.
2048
2.56
252.
6382
1.63
741.
0504
1.58
660.
8031
1.46
741.
1879
1.31
10SS
LCb
0.09
642.
6853
1.60
861.
1984
3.05
438.
6027
1.41
562.
1319
0.95
491.
7772
1.76
291.
8419
1.87
372.
0211
NPM
LCb
0.15
610.
0852
1.70
732.
1962
15.6
029
7.93
601.
2709
6.58
811.
2714
2.96
920.
8913
2.01
312.
4167
3.86
18SP
MLC
b0.
0880
0.13
450.
1277
0.46
241.
0784
2.59
192.
8243
2.08
341.
6422
5.03
210.
6447
1.31
051.
4209
1.45
26K
LCb
0.31
030.
1726
0.10
220.
3510
1.93
861.
2819
0.33
470.
4472
0.48
810.
8228
0.22
950.
5793
0.61
540.
9874
NSS
Cb
0.17
190.
0757
0.01
580.
1882
0.11
4212
.524
71.
2504
2.22
671.
1847
1.92
860.
9989
2.11
141.
7837
2.75
70SS
SCb
0.08
890.
0282
0.03
050.
0880
0.16
320.
0196
3.56
458.
8608
1.41
832.
5315
1.67
543.
9503
4.12
833.
9467
NPM
SCb
0.08
660.
1501
0.16
440.
0813
0.42
760.
1666
0.06
553.
5151
0.80
521.
8537
0.59
772.
0736
2.03
441.
6790
SPM
SCb
0.13
250.
1050
0.03
660.
1071
0.35
860.
1009
0.02
740.
0664
0.93
832.
2368
0.55
492.
3089
1.66
641.
7666
PLC
s0.
1923
0.20
750.
1643
0.13
210.
3387
0.17
430.
1499
0.23
690.
2104
6.38
310.
5319
0.81
790.
7962
0.81
05PK
Cs
0.13
610.
1233
0.07
770.
0473
0.23
300.
1148
0.08
990.
1188
0.10
050.
0377
0.74
181.
6146
1.65
941.
9708
NSC
h0.
2374
0.12
420.
2191
0.27
940.
5214
0.20
020.
1298
0.29
490.
3106
0.31
970.
2521
1.27
260.
8837
0.72
53SS
Ch
0.14
560.
1195
0.11
050.
1602
0.30
150.
1059
0.05
950.
1076
0.09
770.
2341
0.13
410.
1642
3.40
553.
2445
NPM
Ch
0.21
070.
1684
0.14
310.
1659
0.37
540.
1809
0.09
350.
1349
0.20
690.
2814
0.16
450.
3240
0.12
285.
9643
SPM
Ch
0.14
970.
0922
0.04
960.
1444
0.18
390.
0690
0.04
700.
1206
0.10
030.
2197
0.10
440.
2149
0.05
170.
0626
NSL
Cb
= no
rther
n Sa
raw
ak la
rge
form
C. b
rach
yotis
, SSL
Cb
= so
uthe
rn S
araw
ak la
rge
form
C. b
rach
yotis
, NPM
LCb
= no
rther
n Pe
nins
ular
Mal
aysi
a la
rge
form
C. b
rach
yotis
, SPM
LCb
= so
uthe
rn P
enin
sula
r Mal
aysi
a la
rge
form
C. b
rach
yotis
,KLC
b =
Kal
iman
tan
C. b
rach
yotis
, NSS
Cb
= no
rther
n Sa
raw
ak s
mal
l for
m C
. bra
chyo
tis, S
SSC
b =
sout
hern
Sar
awak
sm
all f
orm
C. b
rach
yotis
, NPM
SCb
= no
rth P
enin
sula
r Mal
aysi
a sm
all f
orm
C.
brac
hyot
is, S
PMSC
b =
sout
hern
Pen
insu
lar M
alay
sia
smal
l for
m C
. bra
chyo
tis, P
LCs
= Pe
rlis
C. s
phin
x, P
KC
s =
Pera
k C
. sph
inx,
NSC
h =
north
ern
Sara
wak
C. h
orsfi
eldi
i, SS
Ch
= so
uthe
rn S
araw
ak C
. hor
sfiel
dii,
NPM
Ch
= no
rth P
enin
sula
r Mal
aysi
a C
. hor
sfiel
dii,
SPM
Ch
= so
uthe
rn P
enin
sula
r M
alay
sia
C. h
orsfi
eldi
i.
Fong, P. H., Yuzine, E. and Abdullah, M. T.
242 Pertanika J. Trop. Agric. Sci. 36 (3): 225 - 248 (2013)
Sarawak, the small form of C. brachyotis from southern Peninsular Malaysia, and the large form of C. brachyotis from southern Sarawak. Meanwhile, Clade C comprised the large form of C. brachyotis populations from northern Sarawak, the large form of C. brachyotis from southern Peninsular Malaysia, and the small form of C. brachyotis from northern Peninsular Malaysia. C. horsfieldii from southern Peninsular Malaysia and C. horsfieldii from southern Sarawak were clustered in Clade B, whereas both populations of C. sphinx were clustered together in Clade D.
Based on the UPGMA tree constructed using the seven pairs of microsatellite primers, all cynopterans within this genus were very closely related to each other. There was a lack of distinct clusters for each form, dissimilar with what was revealed in mtDNA data. Besides, greater number of migrants per generation (Nm) between the large form and small form of C. brachyotis was observed compared with other forms of cynopterans (Table 7). Thus, the populations of both forms of C. brachyotis were mixed up, while C. sphinx and C. horsfieldii were grouped within their own phylogroups in the tree. This basically shed some light on the paternal inheritance in the genus of Cynopterus.
The low genetic structure in the bi-parental phylogenetic tree in the genus Cynopterus might be caused by low genetic diversity and limited Y chromosome inheritance in the male germ line. Several studies have shown that there is low genetic diversity of Y chromosome in most
mammalians including humans (Hellborg & Ellegren, 2004; Handley et al., 2006; Goetting-Minesky & Makova, 2006). The low genetic variations in the Y chromosome are caused by the non-recombinant nature in the Y chromosome, where only the common genealogy is shared in the male germ line (Charlesworth & Charlesworth, 2000; Hellborg & Ellegren, 2004; Handley et al., 2006). In addition, selections and mutations, especially favourable mutations, may contribute to the reduction of the diversity of Y chromosome where these mechanisms could reduce the effective population size of the Y chromosome in a random mating population (Boissinot & Boursot, 1997; Charlesworth & Charlesworth, 2000; Hellborg & Ellegren, 2004).
Besides, low structuring in the microsatellite data might be caused by low sensitivity of microsatellite primers used in this study to examine Malaysian cynopterans. The existing primers used in this study were designed by Storz (2000) using C. sphinx from India, and currently, there are no existing microsatellite primers for Malaysian cynopterans. Different evolutionary forces may have been acting on Indian C. sphinx as compared to Malaysian C. sphinx. The study done by Campbell et al. (2006) on Malaysia Cynopterus spp. showed a similar result, where no distinctive genetic structure was generated using the same microsatellite loci used in this study. Several factors such as geographical barriers, the climate and forest ecology between India and Malaysia might be the possible explanation to the different genetic
Genetic Variations and Population Structure in the Genus Cynopterus (Mammalia, Chiroptera) in Malaysia
243Pertanika J. Trop. Agric. Sci. 36 (3): 225 - 248 (2013)
profiles in the cynopterans. In Chen et al. (2010), little genetic variation of C. sphinx was found using eight out nice microsatellite loci by Storz (2000) although there was greater genetic mtDNA differentiation between the C. sphinx samples from India and those from China and Vietnam. In addition, the sample size used in this study for each form of cynopterans was unequal and small, thus the generated allelic profiles might result in the loss of other alleles as well as private alleles. Large and equal population sizes have great influence in determining the number of private alleles and distinct alleles in a population, which in turn can reveal genetic diversity and relationships (Szpiech et al., 2008).
CONCLUSIONThe objective of this study was to investigate the utility of the existing microsatellite markers designed by Storz (2000) for the population study of Cynopterus in Malaysia. We found that seven out of the nine existing microsatellite markers isolated from C. sphinx can be utilised on cynopterans in Malaysian and Kalimantan samples. These seven primer pairs produced mixed results of distinctiveness, polymorphism and monomorphism as opposed to the two remaining primers that did not produce any band.Subsequent ly, the u t i l i ty of these microsatellite markers on Cynopterus was tested using the samples from Malaysia, especially from Sabah and Sarawak. The results showed that there were a total of 51 alleles and 97 genotypes generated from
four forms, large and small forms of C. brachyotis, C. sphinx and C. horsfieldii. Although these primers were able to produce microsatellite bands, the data generated were not enough to clearly differentiate both forms of C. brachyotis, and thus, these primers cannot be used to clearly define the species boundary of these two forms of C. brachyotis as suggested by previous authors.
Second, on elucidating the possibility of hybridisation of both forms of C. brachyotis occurring in the ecotone as the contact zone that was speculated by Abdullah (2003), intermixing between the two forms of C. brachyotis could not be observed as most of the microsatellite alleles were shared amongst the species. Besides, genetic variations between the species were also low without any significant genetic difference. Thus, no distinctive genetic structure was exhibited between the four species using microsatellite analysis and without clear indication of hybridisation happening between the small and large forms of C. brachyotis.
Based on the results of previous and the current studies, the existing microsatellite primers isolated from C. sphinx by Storz (2000) could not clearly define the species boundary of both forms of C. brachyotis. Most of the alleles generated in this study were common among all cynopterans leading to no genetic structuring using the bi-parental genetic data. Thus, it is recommended that new microsatellite primers should be designed using local cynopterans especially the large form of C. brachyotis, which is the founder and
Fong, P. H., Yuzine, E. and Abdullah, M. T.
244 Pertanika J. Trop. Agric. Sci. 36 (3): 225 - 248 (2013)
its cryptic species in this region. More polymorphisms between the two forms of C. brachyotis as well as C. sphinx and C. horsfieldii may be detected and can be used to further elucidate the genotype and genetic structure from bi-parental inheritance.
ACKNOWLEDGEMENTS
The main research funding for this study came from the Ministry of Science and Technology, the Environment (MoSTI) Zamalah Pascasiswazah to FPH, and IRPA grant 09-02-09-1022 EA001 led by Professor Mohd. Tajuddin Abdullah, with co-researchers Dr. Yuzine Esa and Dr. Awg. Ahmad Sallehin Awg. Husaini. We would like to express our gratitude to the zoological museum of the Faculty of Resource Science and Technology, as well as the zoological museum of the Department of Wildlife and National Parks (DWNP) for allowing us to examine the specimens and tissue samples; Sarawak Forestry Department and Sarawak Forestry Corporation for the data collection and research permits; the Molecular Ecology Laboratory (MEL) staff; and the undergraduate students of the Animal Resource Science Programme for collecting the bat specimens used in this study. Special thanks also go to Dr. Jessica Worthington Wilmer for her precious comments and suggestions in this study. We would also like to express our gratitude to the Faculty of Resource Science and Technology, Universiti Malaysia Sarawak, for the various administrative and logistic supports.
REFERENCESAbdullah, M. T. (2003). Biogeography and variation
of Cynopterus brachyotis in Southeast Asia. (PhD thesis dissertation). The University of Queensland, St. Lucia, Australia.
Abdullah, M. T., & Jayaraj, V. K. (2006). Preliminary investigation on the relationship of the nominate C. brachyotis with the small-sized and large-sized C. brachyotis using clustering analysis. Sarawak Museum Journal, 62(83), 223-236.
Abdullah, M.T., Moritz, C., Grigg, G. C., & Hall, L. S. (2000). Evidence of cryptic species within Cynopterus brachyotis by using mtDNA sequence. In Yaacob, Z., Moo-Tan, S. and Yorath, S. (Eds.). Proceedings of the International Conference on In-Situ and Ex-Situ Biodiversity Conservation in the New Millenium. Yayasan Sabah, Kota Kinabalu.
Abdullah, M. T., Wong, S. F., & Ketol, B. (2010). Catalogue of Mammals of UNIMAS Zoological Museum. Universiti Malaysia Sarawak, Kota Samarahan.
Boissinot, S., & Boursot, P. (1997). Discordant phylogeographic patterns between the Y chromosome and mitochondrial DNA in the house mouse: Selection on the Y chromosome? Genetics, 146, 1019-1034.
Bruford, M. W., & Wayne, R. K. (1993). Microsatellites and their application to population genetic studies. Current Biology, 3, 939-943.
Bruford, M. W., & Wayne, R. K. (1993). Microsatellites and their application to population genetic studies. Current Biology, 3, 939-943.
Burg, T. M., Trites, A. W., & Smith, M. J. (1999). Mitochondrial and microsatellite DNA analyses of harbour seal population structure in the northeast Pacific Ocean. Canadian Journal of Zoology, 77, 930-943.
Genetic Variations and Population Structure in the Genus Cynopterus (Mammalia, Chiroptera) in Malaysia
245Pertanika J. Trop. Agric. Sci. 36 (3): 225 - 248 (2013)
Campbell, P., Schneider, C. J., Adnan, A. M., Zubaid, A., & Kunz, T. H. (2004). Phylogeny and phylogeography of Old World fruit bats in the Cynopterus brachyotis complex. Molecular Phylogenetics and Evolution, 33, 764-781.
Campbell, P., Schneider, C. J., Adnan, A. M., Zubaid, A., & Kunz, T. H. (2006). Comparative population structure of Cynopterus fruit bats in Peninsular Malaysia and southern Thailand. Molecular Ecology, 15, 29-47.
Campbell, P., Schneider, C. J., Zubaid, A., Adnan, A. M., & Kunz, T. H. (2007). Morphological and ecological correlates of coexistence in Malaysian fruit bats (Chiroptera: Pteropodidae). Journal of Mammalogy, 88(1), 105-118.
Charlesworth, B., & Charlesworth, D. (2000). The degeneration of Y chromosomes. Philosophical Transactions B, 355, 1563-1572.
Chen J., Rossiter S. J., Flanders J. R., Sun Y., Hua P., Miller-Butterworth, C., Liu, X. Rajan, K. E., & Zhang, S. (2010). Contrasting genetic structure in two co-distributed species of Old World fruit bat. PLoSONE 5(11), e13903. doi:10.1371/journal.pone.0013903.
Corbet, G. B., & Hill, J. E. (1992). The Mammals of the Indomalayan Region: A Systematic Review. Oxford: Oxford University Press.
Degnan, S. M., Owens, I. P. F., Clegg, S. M., Moritz, C. C., & Kikkawa, J. (1999). MtDNA, microsatellites and coalescence: Tracing the colonisation of Silvereyes through the southwest Pacific. In N. J. Adams, & R. H. Slotow (Eds.), Proceeding of 22 International Ornithology Congress, Durban: 1881-1898. Johannesburg: BirdLife South Africa.
DeWoody, J. A., & Avise J. C. (2000). Microsatellite variation in marine, freshwater and anadromous fishes compared with other animals. Journal of Fish Biology, 56, 461-473.
Excoffier, L., Laval, G., & Schneider, S. (2005). Arlequin ver. 3.0: An integrated software package for population genetics data analysis. Evolutionary Bioinformatics Online, 1, 47-50.
Flagstad, Ø., Walker, C. W., & Vilá, C. (2003). Two centuries of the Scandinavian wolf population: Patterns of genetic variability and migration during an era of dramatic decline. Molecular Ecology, 12, 869-880.
Fong, P. H. (2011). Genetic variation and population structure of the genus Cynopterus in Malaysia. (MSc thesis dissertation). Universiti Malaysia Sarawak, Kota Samarahan.
Francis, C. M. (1990). Trophic structure of bat communities in the understorey of lowland dipterocarp rain forest in Malaysia. Journal of Tropical Ecology, 6(4), 421-431.
Francis, C. M. (2008). A Field Guide to the Mammals of South-East Asia. New Holland Publishers (UK) Ltd., London.
García-Moreno, J., Matocq, M. D., Roy, M. S., Geffen, E., & Wayne, R. K. (1996). Relationships and genetic purity of the endangered Mexican wolf based on analysis of microsatellite loci. Conservation Biology, 10, 376-389.
Goetting-Minesky, M. P., & Makova, K. D. (2006). Mammalian male mutation bias: Impacts of generation time and regional variation in substitution rates. Journal of Molecular Evolution, 63, 537-544.
Grewe, P. M., Krueger, C. C., Aquadro, C. F., Bermingham, E., Kincaid, H. L., & May, B. (1993). Mitochondrial variation among Lake Trout (Salvenilus namaycush) strains stocked into Lake Ontorio. Canadian Journal of Fisheries and Aquatic Science, 50, 2397-2403.
Halliburton, R. (2004). Introduction to Population Genetics. New Jersey: Pearson Education Inc.

Fong, P. H., Yuzine, E. and Abdullah, M. T.
246 Pertanika J. Trop. Agric. Sci. 36 (3): 225 - 248 (2013)
Handley, L. J. L., Berset-Brändli, L., & Perrin, N. (2006). Disentangling reasons for low Y chromosome variation in the Greater White-toothed Shrew (Crocidura russula). Genetics, 173, 935-942.
Hansson, B., Bensch, S., & Hasselquist, D. (2003). A new approach to study dispersal: Immigration of novel alleles reveals female biased dispersal in Great Reed Warblers. Molecular Ecology, 12, 631-637.
Hedrick, P. W. (1999). Highly variable loci and their interpretation in evolution and conservation. Evolution, 53, 313-318.
Hellborg, L., & Ellegren, H. (2004). Low levels of nucleotide diversity in mammalian Y chromosomes. Molecular Biology and Evolution, 21(1), 158-163.
Jayaraj, V. K. (2009). The phylogenetic relationships of Megachiroptera in Malaysia inferred from morphological and DNA analyses. (MSc thesis dissertation). Universiti Malaysia Sarawak, Kota Samarahan.
Jayaraj, V. K., Laman, C. J., & Abdullah, M. T. (2004). Morphological variation in the genus Cynopterus of Peninsular Malaysia and Borneo. In Ismail A. I. M., Koh H. L., & Hasan Y. A. (Eds). Proceedings of the Regional Conference on Ecological and Enviromental Modelling (ECOMOD 2004). , pp. 69-81.
Jayaraj V. K., Laman C. J., & Abdullah M. T. (2005). Application of multivariate techniques in determining morphological variation in the genus Cynopterus of Peninsular Malaysia and Borneo. In Tuen, A. A., & Das, I. (Eds.). International Conference on Biogeography and Biodiversity: Wallace in Sarawak – 150 years later. , pp. 226.
Jayaraj, V. K., Laman, C. J., & Abdullah, M. T. (2012). A predictive model to differentiate C. brachyotis from C. cf. brachyotis Forest (Chiroptera: Pteropodidae) from Malaysia using Multivariate Analysis. Zoological Studies, 51(2), 259-271.
Kaestle, F. A., & Smith, D. G. (2001). Ancient mitochondrial DNA evidence for prehistoric population movement: the numic expansion. American Journal of Physical Anthropology, 115, 1-12.
Lekagul, B., & McNeely, J. A. (1988). Mammals of Thailand. Sahankarnbhat, Bangkok.
Levene, H. (1949). On a matching problem in genetics. Annals of Mathematical Statistics, 20, 91-94.
Merriwether, D. A., Hall, W. W., Vahlne, A., & Ferrell, R. E. (1996). MtDNA variation indicates Mongolia may have been the source for the founding population for the New World. American Journal of Human Genetics, 59, 204-212.
Müller, S. (1838). Over eenige nieuwe zoogdieren van Borneo [On some new mammals from Borneo]. Tijdschrift voor Natuurlijke Geschiedenis en Physiologie, 5, 134-150.
Page, R. D. M., & Holmes, E. C. (1998). Molecular Evolution: A Phylogenetic Approach. Oxford: Blackwell Science Ltd.
Payne, J., Francis, C. M., & Phillipps, K. (1985). A Field Guide to the Mammals of Borneo. The Sabah Society and World Wildlife Fund Malaysia, Kota Kinabalu.
Raymond, N., & Rousset, F. (1995). GENEPOP (version 1.2): Population genetics software for exact tests and ecumenicism. Journal of Heredity, 86, 248-249.
Sambrook, J., Fritsch, E. F., & Maniatis, T. (1989). Molecular Cloning: A Laboratory Manual (2nd edn.). New York: Cold Spring Harbor Laboratory Press.
Scandura, M. (2004). The use of microsatellites in the study of social structure in large mammals: Italian wolf and fallow deer as case studies. (PhD thesis dissertation). University of Bielefeld, Bielefeld.
Genetic Variations and Population Structure in the Genus Cynopterus (Mammalia, Chiroptera) in Malaysia
247Pertanika J. Trop. Agric. Sci. 36 (3): 225 - 248 (2013)
Snustad, D. P., & Simmons, M. J. (2010). Principle of Genetics (5th Edn.). New York: John Wiley and Sons Inc.
Srikwan, S., Hufford, K., Eggert, L., & Woodruff, D. S. (2002). Variable microsatellite markers for genotyping tree shrews, Tupaia, and their potential use in genetic studies of fragmented populations. Science Asia, 28, 93-97.
Storz, J. F. (2000). Variation at tri- and tetranucleotide repeat microsatellite loci in the fruit bat genus Cynopterus (Chiroptera: Pteropodidae). Molecular Ecology, 9, 1198-2200.
Storz, J. F., Bhat, H. R., & Kunz, T. H. (2001a). Genetic consequences of polygyny and social structure in an Indian fruit bat, Cynopterus sphinx. I. Inbreeding, outbreeding, and population subdivision. Evolution, 55(6), 1215-1223.
Storz, J. F., Bhat, H. R., & Kunz, T. H. (2001b). Genetic consequences of polygyny and social structure in an indian fruit bat, Cynopterus sphinx. II. Variance in male mating success and effective population size. Evolution, 55(6), 1224-1232.
Szpiech, Z. A., Jakobsson, M., & Rosenberg, N.A. (2008). ADZE: A rarefaction approach for counting alleles private to combinations of populations. Bioinformatics, 24(21), 2498-2504.
Tamura, K., Dudley, J., Nei, M., & Kumar, S. (2007). MEGA4: Molecular Evolutionary Genetics Analysis (MEGA) software version 4.0. Molecular Biology and Evolution, 24, 1596-1599.
Wright, T. F., Rodriguez, A. M., & Fleischer, R. C. (2005). Vocal dialects, sex-biased dispersal, and microsatellite population structure in the Parrot, Amazona auropalliata. Molecular Ecology, 14, 1197-1205.
Yeh, F. C., Yang, R., & Boyle, T. (1999). A Microsoft Window Based Freeware for Population Genetic Analysis. Version 1.31. University of Alberta, Canada.

Pertanika J. Trop. Agric. Sci. 36 (3): 249 - 260 (2013)
ISSN: 1511-3701 © Universiti Putra Malaysia Press
TROPICAL AGRICULTURAL SCIENCEJournal homepage: http://www.pertanika.upm.edu.my/
Article history:Received: 1 November 2011Accepted: 4 October 2012
ARTICLE INFO
E-mail addresses: [email protected] (Lai Wei Hong) [email protected] (Ninie Noor Diana Enche Baharuddin), [email protected] (Shu San Loo), [email protected] (Azura Amid), [email protected] (Fauzi Daud), [email protected] (Abas Mazni Othman), (Norihan Mohd Saleh)* Corresponding author
Vitrification of Dikaryotic Mycelial Cells from Lignosus rhinocerus
Lai Wei Hong1*, Ninie Noor Diana Enche Baharuddin2, Shu San Loo1, Azura Amid2, Fauzi Daud3, Abas Mazni Othman4 and Norihan Mohd Saleh1 1Agro-Biotechnology Institute Malaysia (ABI), Ministry of Science, Technology and Innovation, c/o Malaysian Agricultural Research and Development Institute, 43400 Serdang, Selangor, Malaysia2Kulliyyah of Engineering, International Islamic University Malaysia, P.O. Box 10, 50728 Kuala Lumpur, Malaysia3School of Biosciences and Biotechnology, Faculty of Science and Technology, Universiti Kebangsaan Malaysia, 43600 Bangi, Selangor, Malaysia4Strategic Livestock Research Centre, Malaysian Agricultural Research and Development Institute, 43400 Serdang, Selangor, Malaysia
ABSTRACT
In Malaysia, Lignosus rhinocerus is one of the few important traditional medicinal mushrooms being used by indigenous communities to treat diseases. Currently, this rare mushroom can be found in the deep forest in Peninsular Malaysia, but its number is insufficient to meet the increasing local demand. Therefore, a vitrification technique previously used in the cryopreservation of actinomycetes was adapted in this study to preserve and maintain the commercially potential L. rhinocerus strain in a viable state. In this study, combinations of different sucrose concentrations and exposure time were experimented without serial washing phase after thawing. In addition, electron microscopy and comet assay were applied to study the cryoinjury and genotoxity of vitrified mycelial cells. Mycelial cells incubated for 10 minutes in 1.6 M sucrose of Plant Vitrification Solution 2 (PVS2) yielded largest radial mycelial growth with 100% survival rate. Scanning electron microscopy results indicated the swelling of mycelial cells due to osmotic shock which
occurred from thawing procedure, while transmission electron microscopy findings revealed fusion of two nucleus membranes of dikaryotic mycelium. Comet assay suggested insignificant differences (p > 0.05) of comet formation between the normal and vitrified mycelial cells, suggesting cryoprotectants used in vitrification will
Lai Wei Hong et al.
250 Pertanika J. Trop. Agric. Sci. 36 (3): 249 - 260 (2013)
not cause genotoxity to mycelial cells of L. rhinocerus. In conclusion, the current vitrification technique is suitable to cryopreserve the dikaryotic mycelial cells of L. rhinocerus with 100% regeneration and without trace of genotoxicity.
Keywords: Lignosus rhinocerus, vitrification,
electron microscopy, comet assay
INTRODUCTION
Various organisms in nature are found to be able to survive at low temperature (Cannon & Block, 1988; Storey et al., 1988). Those that have adapted to the subzero temperatures are generally classified as either freeze tolerant or freeze avoidant organisms (Cannon & Block, 1988). Freeze avoidant organisms are able to prevent their body fluid from freezing together whilst freeze tolerant counterparts can survive body fluid freezing (Duman, 2001). The cold tolerance strategy raise the interest among cryobiologists to understand these mechanisms which are important for the cryopreservation of mammalian tissues and organs, environment security, as well as the sustainable use of biological resources.
Maintenance of active cultures is expensive, time consuming and prone to contamination for many types of biological samples. Thus, the most practicable way is to cryopreserve the cells. Cryopreservation has long been developed since 50 years ago from the studies of cell freezing to the application in living plant cells. Sakai (1960) first initiated the plant cryopreservation by studying the response of dormant plant buds to liquid nitrogen, and subsequently,
freezing of callus tissues in liquid nitrogen was done by Quatrano (1968). This was followed by the first storage of differentiated plant tissues, such as the shoot tips of strawberry (Kartha et al., 1980) and potato (Schafer-Menuhr, 1996). Vitrification (Langis et al., 1990; Sakai et al., 1991) was developed and sharply increased the number of species cryopreserved over the years (Sakai et al., 1990, 1991; Sakai & Engelmann, 2007).
Vitrification happens when a highly concentrated cryoprotective solution supercools to very low temperatures (at or below glass transition temperature, Tg) and eventually molecular motion ceases and a glassy solid is formed without undergoing crystallization (Fahy et al., 1984). As a glass, it is extremely viscous, thus at this stage, all chemical reactions that require molecular diffusion will stop and lead to metabolic inactivity, and stability can be sustained over prolonged time (Burke, 1986). Vitrification is generally applied for cryopreservation of cultured plant materials (Sakai et al., 1990, 1991; Niino et al., 1990). Normally, serial dilution is not often practised in vitrification of plant materials such as shoot tips during rewarming procedure, but it still gives promising growth and survival rate (Martin & González-Benito, 2005; Panis et al., 2005; Kami et al., 2009). Therefore, Engelmann’s (2009) vitrification protocol for shoot tips in combination with vitrification protocol for Actinomycetes by Stalper and Tan (1996) were adapted to cryopreserve the dikaryotic mycelial cells of Tiger’s Milk Mushroom (Lignosus rhinocerus).
Vitrification of Dikaryotic Mycelial Cells from Lignosus rhinocerus
251Pertanika J. Trop. Agric. Sci. 36 (3): 249 - 260 (2013)
Lignosus is a macrofungal genus that belongs to Polyporaceae family in Basidiomycota phylum. Lignosus comprises 5 species, namely, L. dimiticus, L. ekombitii, L. goetzii, L. rhinocerus, and L. sacer (Douanla-Meli & Langer, 2003; Núñez & Ryvarden, 2001; Ryvarden & Johansen, 1980), until just recently, a new species called L. hainanensis was discovered in the tropical forest of Hainan Province, southern China (Cui et al., 2010). In Malaysia, L. rhinocerus is singled out as one of the most popular medicinal mushrooms sought by indigenous communities upon request by herbalists (Lee et al., 2009). The local community has been using L. rhinocerus for medicinal purposes since 1930 as described by a local in Pahang, Tuan Haji Mat Yusop (Corner, 1989). L. rhinocerus is believed to have therapeutic properties and is used as treatment for asthma, breast cancer, cough, fever, food poisoning and wound healing, as well as a tonic to maintain health (Chang & Lee, 2001).
However, L. rhinocerus is rarely found in nature and the amount of wild mushrooms is not sufficient for commercial exploitation and research purposes. Thus, vitrification of mycelial cells for this mushroom was studied. In addition, electron microscopy observation and comet assay were employed to study the effect of vitrification to the ultra-structure and genetic materials of mycelial cells.
MATERIALS AND METHODS
Mycelial Growth
The fruit bodies and tubers of L. rhinocerus were collected at the state of Pahang, Malaysia, in June 2009. Pure cultures of L. rhinocerus were obtained from the sterilized surface of small pieces of pileus, stipe, and tuber, which were then innoculated to Potato Dextrose Agar (PDA) supplemented with streptomycin (200 μg/L) and incubated in the dark condition for 15 days at 25oC to be used as inoculums. The radial mycelial growth was observed and measured after 10 days. All experiments in this study were conducted in triplicates.
Vitrification
Vitrification experiment was designed using Design-Expert version 6 (DX6) with conduction of two parameters (sucrose concentration and exposure time) and one response (mycelia diameter) as shown in Table 1. Vitrification procedure was applied to a modified procedure of Tan and Stalper (1996). The mycelia from the solid media were placed into 2 mL cryovials followed with loading solution (2 M glycerol and 0.4 M sucrose) for 20-30 min at 25°C. Two millilitres of Plant Vitrification Solution 2 (PVS2) solution containing 30% (w/v) glycerol, 15% (w/v) ethylene glycol, 15% (w/v) dimethyl sulfoxide (DMSO) and different concentrations (0.4, 1.0, and 1.6 M) of sucrose at pH 5.8 was added and gently mixed vigorously for 5 min after removing the loading solution. Replacement of another 2 mL fresh PVS2 was held at
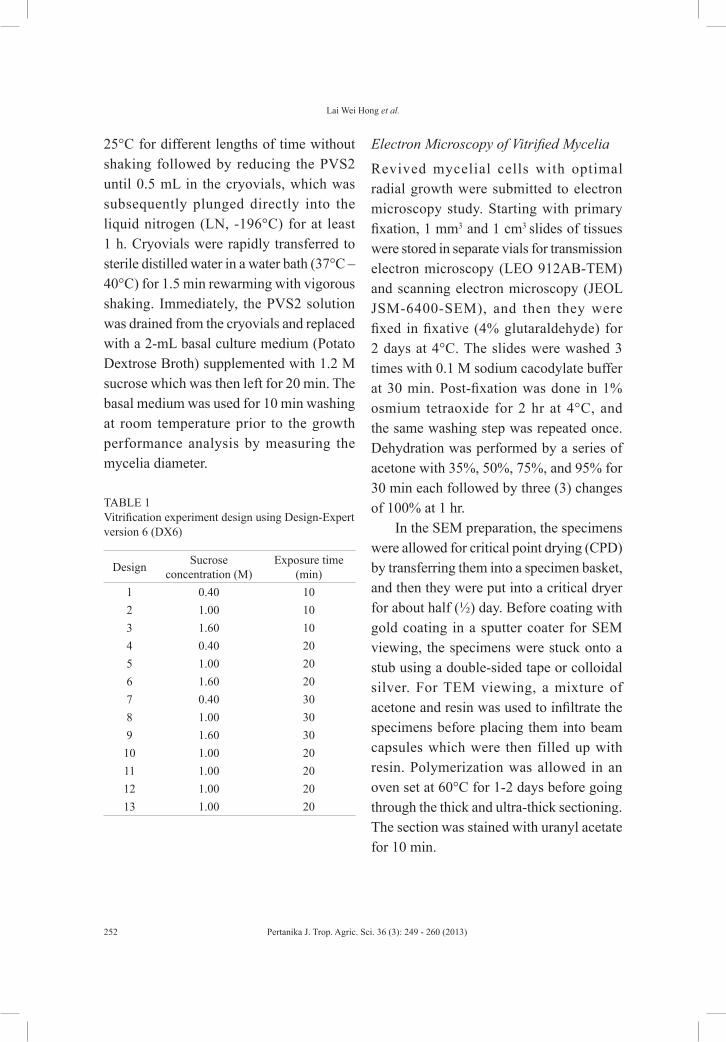
Lai Wei Hong et al.
252 Pertanika J. Trop. Agric. Sci. 36 (3): 249 - 260 (2013)
25°C for different lengths of time without shaking followed by reducing the PVS2 until 0.5 mL in the cryovials, which was subsequently plunged directly into the liquid nitrogen (LN, -196°C) for at least 1 h. Cryovials were rapidly transferred to sterile distilled water in a water bath (37°C – 40°C) for 1.5 min rewarming with vigorous shaking. Immediately, the PVS2 solution was drained from the cryovials and replaced with a 2-mL basal culture medium (Potato Dextrose Broth) supplemented with 1.2 M sucrose which was then left for 20 min. The basal medium was used for 10 min washing at room temperature prior to the growth performance analysis by measuring the mycelia diameter.
TABLE 1 Vitrification experiment design using Design-Expert version 6 (DX6)
Design Sucrose concentration (M)
Exposure time (min)
1 0.40 102 1.00 103 1.60 104 0.40 205 1.00 206 1.60 207 0.40 308 1.00 309 1.60 3010 1.00 2011 1.00 2012 1.00 2013 1.00 20
Electron Microscopy of Vitrified Mycelia
Revived mycelial cells with optimal radial growth were submitted to electron microscopy study. Starting with primary fixation, 1 mm3 and 1 cm3 slides of tissues were stored in separate vials for transmission electron microscopy (LEO 912AB-TEM) and scanning electron microscopy (JEOL JSM-6400-SEM), and then they were fixed in fixative (4% glutaraldehyde) for 2 days at 4°C. The slides were washed 3 times with 0.1 M sodium cacodylate buffer at 30 min. Post-fixation was done in 1% osmium tetraoxide for 2 hr at 4°C, and the same washing step was repeated once. Dehydration was performed by a series of acetone with 35%, 50%, 75%, and 95% for 30 min each followed by three (3) changes of 100% at 1 hr.
In the SEM preparation, the specimens were allowed for critical point drying (CPD) by transferring them into a specimen basket, and then they were put into a critical dryer for about half (½) day. Before coating with gold coating in a sputter coater for SEM viewing, the specimens were stuck onto a stub using a double-sided tape or colloidal silver. For TEM viewing, a mixture of acetone and resin was used to infiltrate the specimens before placing them into beam capsules which were then filled up with resin. Polymerization was allowed in an oven set at 60°C for 1-2 days before going through the thick and ultra-thick sectioning. The section was stained with uranyl acetate for 10 min.
Vitrification of Dikaryotic Mycelial Cells from Lignosus rhinocerus
253Pertanika J. Trop. Agric. Sci. 36 (3): 249 - 260 (2013)
Comet Assay of Vitrified Mycelia
In addition to electron microscopy study, the revived mycelial cells with optimal radial growth were also submitted to comet assay. Approximately 0.03 g of untreated and cryopreserved mycelia from the agar medium was added into 1 mL of Y1 buffer (1 M sorbitol, 0.1 M ethylenediaminetetraacetic acid (EDTA), pH 7.4 and 0.1% beta-mercaptoethanol) before the addition of 0.25 mg/mL enzyme chitinase (Torres-Bauza & Riggsby, 1980) and incubated at 37°C with mild shaking for 2 hr.
Comet assay was performed with minor modification from Singh et al. (1988). A base layer of 1.0% agarose on a microscope slide was added with 50 µL of the cell agarose mixture (50 µL of 0.7% agarose mixed with 10 µL of spheroplasts in Y1 buffer) and covered with a cover slip. The slides were then allowed to dry on a flat surface on ice for 2 min before the addition of the last layer of 0.7% agarose. Again, the agarose was allowed to solidify on ice for 2 min. The uncovered slides were then immersed in a freshly made lysing solution composed of a 100-mL stock solution (1.25 M NaCl, 50 mM EDTA, 100 mM Tris base, adjusted to pH 10 and topped up with 0.1% sodium dodecyl sulphate). Subsequently, 1.5 mg/mL proteinase K was added and incubated at 37°C overnight. After lysis, the slides were transferred to the electrophoresis unit, filled up with a fresh electrophoresis solution (300 mM NaOH, 1 mM EDTA, 0.2% DMSO and 0.1% hydroxyquinoline) and left for 20 min. A current of 12 V (0.4 V/
cm, 250 mA) was applied for 20 min before the slides were immerged in a neutralization buffer (50% ethanol, 20 mM Tris-HCl, pH 7.4) for 30 min. Followed by another 30 min in a new buffer, they were then oven dried at 50°C. Lastly, the slides were stained with the SYBR-Green dye and evaluated at 20x magnification using a ZeissAxiovert 200M fluorescence microscope.
DNA damage on the untreated and cryopreserved mycelial cells was evaluated using the Tritek Comet ScoreTM (Ver. 1.5) software. During evaluation, the percentage of DNA in the tail of each cell was recorded. The comets were categorized into four classes (0, 1, 2, and 3), namely; (0) tail size with no tail, (1) short tail length smaller than the diameter of the head (nucleus), (2) tail length between 1 and 2 times the head diameter, and (3) long tail more than twice the diameter of the head. The comets with no head and very wide tail observed were excluded from the analysis which represented dead cells (Hartmann & Speit, 1997).
RESULTS AND DISCUSSIONS
Radial Growth of Vitrified Mycelial Cells
The current results suggest that the mycelial cells exposed to PVS2 at 1.6 M sucrose and 10 min yielded the largest radial mycelial growth diameter, while those treated with 0.4 M sucrose at 30 min yielded the smallest radial mycelial growth diameter (Table 2). PVS2 plays an important role in obtaining a sufficient level of dehydration, which allows growth after cryopreservation (Yamada et
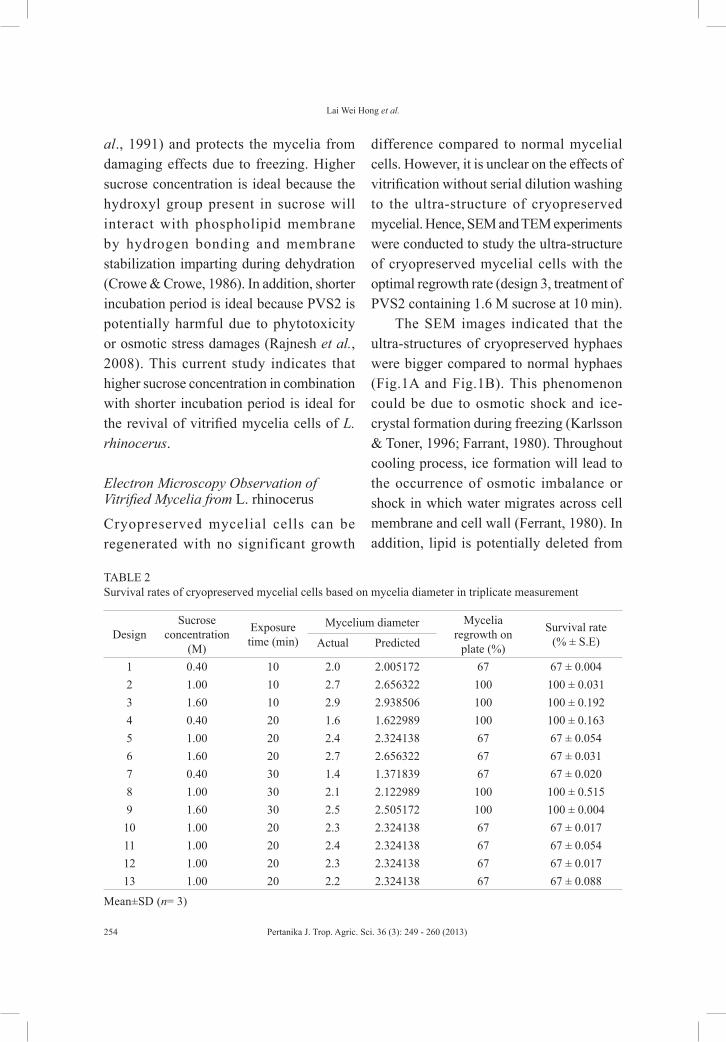
Lai Wei Hong et al.
254 Pertanika J. Trop. Agric. Sci. 36 (3): 249 - 260 (2013)
al., 1991) and protects the mycelia from damaging effects due to freezing. Higher sucrose concentration is ideal because the hydroxyl group present in sucrose will interact with phospholipid membrane by hydrogen bonding and membrane stabilization imparting during dehydration (Crowe & Crowe, 1986). In addition, shorter incubation period is ideal because PVS2 is potentially harmful due to phytotoxicity or osmotic stress damages (Rajnesh et al., 2008). This current study indicates that higher sucrose concentration in combination with shorter incubation period is ideal for the revival of vitrified mycelia cells of L. rhinocerus.
Electron Microscopy Observation of Vitrified Mycelia from L. rhinocerus
Cryopreserved mycelial cells can be regenerated with no significant growth
difference compared to normal mycelial cells. However, it is unclear on the effects of vitrification without serial dilution washing to the ultra-structure of cryopreserved mycelial. Hence, SEM and TEM experiments were conducted to study the ultra-structure of cryopreserved mycelial cells with the optimal regrowth rate (design 3, treatment of PVS2 containing 1.6 M sucrose at 10 min).
The SEM images indicated that the ultra-structures of cryopreserved hyphaes were bigger compared to normal hyphaes (Fig.1A and Fig.1B). This phenomenon could be due to osmotic shock and ice-crystal formation during freezing (Karlsson & Toner, 1996; Farrant, 1980). Throughout cooling process, ice formation will lead to the occurrence of osmotic imbalance or shock in which water migrates across cell membrane and cell wall (Ferrant, 1980). In addition, lipid is potentially deleted from
TABLE 2 Survival rates of cryopreserved mycelial cells based on mycelia diameter in triplicate measurement
DesignSucrose
concentration (M)
Exposure time (min)
Mycelium diameter Mycelia regrowth on
plate (%)
Survival rate(% ± S.E)Actual Predicted
1 0.40 10 2.0 2.005172 67 67 ± 0.0042 1.00 10 2.7 2.656322 100 100 ± 0.0313 1.60 10 2.9 2.938506 100 100 ± 0.1924 0.40 20 1.6 1.622989 100 100 ± 0.1635 1.00 20 2.4 2.324138 67 67 ± 0.0546 1.60 20 2.7 2.656322 67 67 ± 0.0317 0.40 30 1.4 1.371839 67 67 ± 0.0208 1.00 30 2.1 2.122989 100 100 ± 0.5159 1.60 30 2.5 2.505172 100 100 ± 0.00410 1.00 20 2.3 2.324138 67 67 ± 0.01711 1.00 20 2.4 2.324138 67 67 ± 0.05412 1.00 20 2.3 2.324138 67 67 ± 0.01713 1.00 20 2.2 2.324138 67 67 ± 0.088
Mean±SD (n= 3)
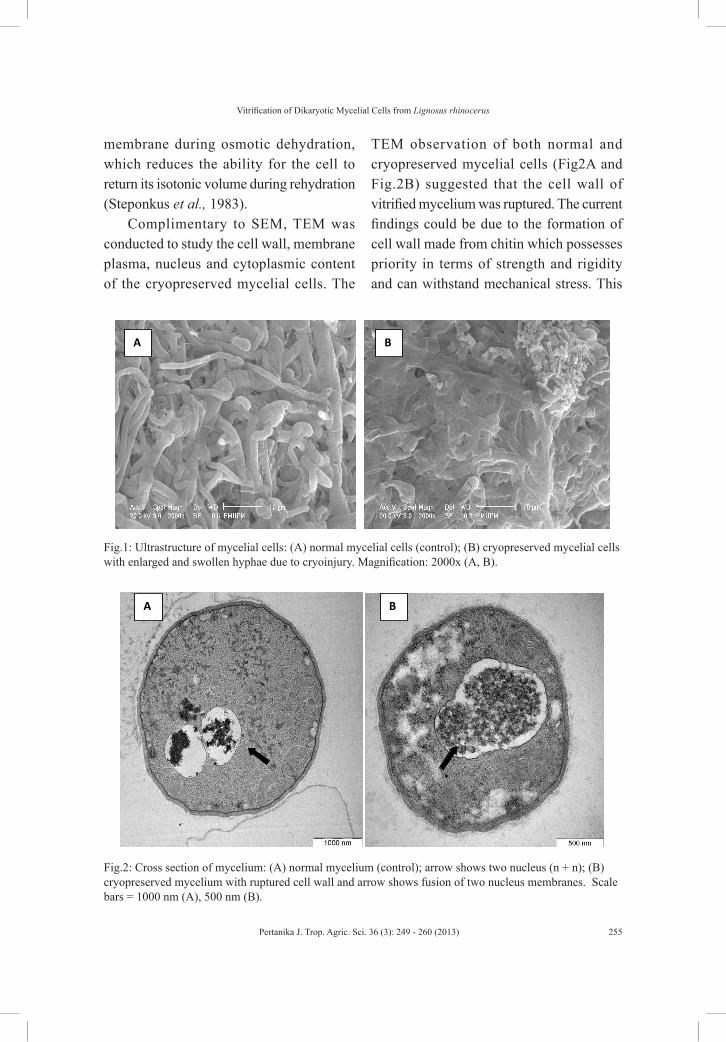
Vitrification of Dikaryotic Mycelial Cells from Lignosus rhinocerus
255Pertanika J. Trop. Agric. Sci. 36 (3): 249 - 260 (2013)
membrane during osmotic dehydration, which reduces the ability for the cell to return its isotonic volume during rehydration (Steponkus et al., 1983).
Complimentary to SEM, TEM was conducted to study the cell wall, membrane plasma, nucleus and cytoplasmic content of the cryopreserved mycelial cells. The
TEM observation of both normal and cryopreserved mycelial cells (Fig2A and Fig.2B) suggested that the cell wall of vitrified mycelium was ruptured. The current findings could be due to the formation of cell wall made from chitin which possesses priority in terms of strength and rigidity and can withstand mechanical stress. This
B A
Fig.1: Ultrastructure of mycelial cells: (A) normal mycelial cells (control); (B) cryopreserved mycelial cells with enlarged and swollen hyphae due to cryoinjury. Magnification: 2000x (A, B).
A B
Fig.2: Cross section of mycelium: (A) normal mycelium (control); arrow shows two nucleus (n + n); (B) cryopreserved mycelium with ruptured cell wall and arrow shows fusion of two nucleus membranes. Scale bars = 1000 nm (A), 500 nm (B).
Lai Wei Hong et al.
256 Pertanika J. Trop. Agric. Sci. 36 (3): 249 - 260 (2013)
could be due to branched polysaccharide linked by α-1,4 and β-1,4 glycosidic bond in chitin that is composed of amino sugar N-acetyl-D glucosamine [GlcNAc] (Ibrahim et al., 2000), which is not in cellulose that can strengthen the bond and cell wall structure. Thus, the cell wall is strong enough to withstand the osmotic pressure from the difference in solute concentration between the cell interior and distilled water (Howland, 2000), which in turn makes the cell wall remain intact.
In addition, Fig.2B illustrates the fusion of nuclear membrane from two nucleuses, and the occurrence of this phenomenon was unclear. The white region probably represented non-dehydrated zone where water still remained in the cell after vitrification. Farrant (1980) suggested that if too much water remains inside the cell, damage due to ice crystal formation and recrystallization during warming might occur.
Comet Assay of Vitrified Mycelia from L. rhinocerus
Table 3 summarizes the percentage of comet tails of the untreated and cyropreserved L. rhinocerus mycelial cells with 10.506 ± 0.898 and 10.836 ± 0.807, respectively. Sta t i s t i ca l ana lys i s demons t ra t ed insignificant differences (p > 0.05) of comet formation between the untreated and cryopreserved L. rhinocerus mycelial cells, indicating that the DNA damage inflicted by cryopreservation to the mycelial cells was minimal.
Vi t r i f i ca t ion i s an a l t e rna t ive cryopreservation method for those organisms that cannot stand at slow cooling as studying species. The cooling rate is important for a period of time before cooling to liquid nitrogen temperatures. This process enhances the dehydration of the cytoplasm prior to freezing. The noxious effects of toxic vitrification solution are minimized by performing the exposure towards PVS2 as brief as possible (Tan & Stalper, 1996). The choice of a cryoprotective agent is dependent upon the type of cell to be preserved. Cryoprotectants work as an antifreeze to prevent formation of ice crystals and aid in the process of vitrification. As in PVS2 solution, a mixture of cryoprotectants (glycerol, ethylene glycol, and DMSO) was used. When used together, cryroprotection was enhanced as much as double than when used alone, possibly because of a decrease in toxic effect (Ulrich et al., 1979). They work by diffusing into cells and replacing much of the cells’ water. This indicates that PVS2 solution is an applicable cryoprotectant for vitrification of L. rhinocerus.
TABLE 3 The percentage of DNA in comet tail of the untreated (control) and cryopreserved L. rhinocerus mycelial cells
Samples Percentage of DNA in tail (%)Mean ± SD
Untreated (control)
10.506 ± 0.898
Cryopreserved 10.836 ± 0.807
Mean±SD (n= 3).*p > 0.05; t test.
Vitrification of Dikaryotic Mycelial Cells from Lignosus rhinocerus
257Pertanika J. Trop. Agric. Sci. 36 (3): 249 - 260 (2013)
CONCLUSION
The current study elucidates the efficiency of vitrification technique and subsequent impact towards dikaryotic mycelial cells of L. rhinocerus. Although serial dilution during the washing stage was not applied in the thawing phase, all vitrified samples were successfully regenerated. The current findings suggest that vitrification method remains an easy and inexpensive method for long-term preservation of mycelial cells from Basidioamycetes or more specifically Polyporaceae.
ACKNOWLEDGEMENTS
This work was supported by the Ministry of Science, Technology, and Innovation of Malaysia (ABI R&B Initiative Fund: MOSTI/08-05-ABI-PB030). We greatly appreciate the assis tance from the Department of Orang Asli Affairs, and most of all, the local indigenous communities that have been very generous in sharing their knowledge and providing us with the wild Tiger’s milk mushroom specimens.
REFERENCESBurke, M. J. (1986). The glassy state and survival
of anhydrous biological systems. In A.C. Leopold (Ed.), Membrane, Metabolism and Dry Organisms, Cornell University Press (pp. 358-364). Ithaca, NewYork.
Cannon, R. J. C., & Block, W. (1988). Cold tolerance of microarthropods. Biological Reviews, 63, 23–77.
Chang, Y. S., & Lee, S. S. (2001). Utilisation of wild mushrooms by the Temuans in Selangor, Malaysia. Poster presented at CFFPR 2001,
100 Year Celebration of Forestry Research, 1-3 October 2001, Nikko Hotel, Kuala Lumpur.
Corner, E. J. H. (1989). Ad Polyporaceae IV. Nova Hedwigia Beihefte, 97, 147.
Cui, B. K., Wang, Z., & Dai, Y. C. (2010). Albatrelluspiceiphilus sp. nov.on the basis of morphological and molecular characters. Fungal Diversity, 28, 41–48.
Crowe, J. H., & Crowe, L. M. (1986). Stabilisation of membranes in anhy-drobiotic organisms. In C. Leopold (Ed.), Membranes, metabolism and dry organisms (pp. 188-209). Ithaca: Comstock Publishing Associates.
Douanla-Meli, C., & Langer, E. (2003). A new species of Lignosus (Polyporaceae) from Cameroon. Mycotaxon, 86, 389–394.
Duman, J. G. (2001). Antifreeze and ice nucleator proteins in terrestrial arthropods. Annual Review of Physiology, 63, 327–357.
Engelmann, F. (2009). Cryopreservation for Long-term Conservation of Agrobiodiversity: Progress and Prospects. France: IRD.
Fahy, G. M., MacFarlane, D. R., Angell, C. A., & Meryman, H. T. (1984). Vitrification as an approach to cryopreservation. Cryobiology, 21, 407-426.
Farrant, J. (1980). General observations on cell preservation. In M. J. Ashwood-Smith & J. Farrant (Eds.), Low Temperature Preservation in Medicine and Biology (pp. 1 – 18). Kent, England: Pitman Medical Limited.
Hartmann, A., & Speit, G. (1997). The contribution of cytotoxicity to effects seen in the alkaline comet assay. Toxicology Letters, 90, 183-188.
Howland, J. L. (2000). The Surprising Archaea: Discovering Another Domain of Life. Oxford: Oxford University Press. pp. 69–71.
Ibrahim, G. H., Smartt, C. T., Kiley, L. M., & Christensen, B. M. (2000). Cloning and
Lai Wei Hong et al.
258 Pertanika J. Trop. Agric. Sci. 36 (3): 249 - 260 (2013)
characterization of a chitin synthase cDNA from the mosquito Aedesaegypti. Insect Biochemistry and Molecular Biology, 30, 1213-1222.
Kami, D., Shi, L., Sato, T., Suzuki, T., & Oosawa, K. (2009). Cryopreservation of shoot apices of hawthorn in vitro cultures originating from East Asia. Scientia Horticulturae, 120, 84–88.
Karlsson, J. O. M., & M. Toner. (1996). Long-term storage of tissues by cryopreservation: critical issues. Biomaterials, 17, 243–256.
Kartha, K. K., Leung, N. L., & Pahl, K. (1980). Cryopreservation of strawberry meristems and mass propagation of plantlets. Journal of the American Society for Horticultural Science, 105, 481-484.
Langis, R., Schnabel-Preikstas, B. J., Earle, E. D., & Steponkus, P. L. (1990). Cryopreservation of carnation shoot tips by vitrification. Cryobiology, 27, 657-658.
Lee, S. S., Chang, Y. S., & Noraswati, M. N. R. (2009). Utilization of macrofungi by some indigenous communities for food and medicine in Peninsular Malaysia.Forest Research Institute Malaysia. Forest Ecology and Management, 257, 2062–2065.
Martin, C., & González-Benito, M. E. (2005). Survival and genetic stability of Dendranthemagrandiflora Tzvelev shoot apices after cryopreservation by vitrification and encapsulation-dehydration. Cryobiology, 51, 281–289.
Niino, T., Sakai, A., & Yakuwa, H. (1990). Cryopreservation of in vitro grown shoot tips of apple and pear shoots. Plant Cells Tissues Organs Culture, 28, 261–266.
Núñez, M., & Ryvarden, L. (2001). East Asian polypores 2.Polyporaceae s. lato. Synopis Fungorum, 14, 170–522.
Panis, B., Piette, B., & Swennen, R. (2005). Droplet vitrification of apical meristems: a cryopreservation protocol applicable to all Musaceae. Plant Science, 168, 45–55.
Quatrano, R. S. (1968). Freeze preservation of cultured flax cells utilisingdimethylsulfoxide. Plant Physiology, 43, 2057-2061.
Rajnesh, S., Bart, P., Mary, T., & Anand, T. (2008). Cryopreservation of shoot-tips by droplet vitrification applicable to all taro (Colocasiaesculenta var. esculenta ) accessions. Plant Cell, Tissue and Organ Culture, 92(1), 107-111.
Ryvarden, L., & Johansen, I. (1980). A preliminary polypore flora of East Africa. Fungi flora. Oslo. 1-636
Sakai, A., & Engelmann, F. (2007). Vitrification, encapsulation-vitrification and droplet-vitrification: A review. CryoLetters, 28, 151-172.
Sakai, A., Kobayashi, S., & Oiyama, I. (1991). Survival by vitrification of nucellar cells of navel orange Citrus-sinensis-var-brasiliensis Tanaka cooled to minus 196˚C. Journal of Plant Physiology, 137, 465-470.
Sakai, A., Kobayashi, S., & Oiyama, I. (1990). Cryopreservation of nucellar cells of navel orange (Citrus sinensisOsb. Var. brasiliensisTanaka) by vitrification. Plant Cell Report, 9, 30-33.
Sakai, A. (1960). Survival of the twig of woody plants. Nature, 185, 393-394.
Sakai, A., Matsumoto, T., Hirai, D., & Niino, T. (2000). Newly developed encapsulation-dehydration protocol for plant cryopreservation.Cryo Letters, 21, 53-62.
Schafer-Mehuhr, A. (1996). Refinement of cryopreservation techniques for potato. Final report for the period September 1991-1993 August 1996.International Plant Genetic Resources Institute. Rome.
Singh, N. P., McCoy, M. T., Tice, R. R., & Schneider, E. L. (1988). A simple technique for quantitation of low levels of DNA damage in individual cells. Experimental Cell Research, 175, 184-191.
Vitrification of Dikaryotic Mycelial Cells from Lignosus rhinocerus
259Pertanika J. Trop. Agric. Sci. 36 (3): 249 - 260 (2013)
Storey, K. B., Storey, J. M., Brooks, S. P. J., Churchill, T. A., & Brooks, R. J. (1988). Turtles survive freezing during winter hibernation. Proceedings of National Academy of Sciences, USA, 85, 8350–8354.
Steponkus, P. L., Dowgert, M. F., & Gordon-Kamm, W. J. (1983). Destabilization of the plasma membrane of isolated plant protoplast during freezing–thaw cycle: the influence of cold acclimation. Cryobiology, 20, 448–465.
Tan, C. S., & Stalpers, J. A. (1996). Vitrification of fungi. In A. Cimerman and N. Gunde-Cimerman (Eds.), Biodiversity, International Biodiversity Seminar ECCO XIV meeting (pp. 189–193). ECCO, Ljubljana, Slovenia.
Torres-Bauza, L. J., & Riggsby, W. S. (1980). Protoplasts from Yeast and Mycelial Forms of Candida albicans. Journal of General Microbiology, 119, 341-349.
Ulrich, J. M., Finkle, B. J., Moore, P. H., Ginoza, H. (1979). Effect of a mixture of cryoprotectants in attaining liquid nitrogen survival of callus cultures of a tropical plant. Cryobiology, 16(6), 550–556.
Yamada, H., Sun, X. B., Matsumoto, T., Ra, K. S., Hirano, M., & Kiyohara, H. (1991). Purification of anti-ulcer polysaccharides from the roots of Bupleurum falcatum. Planta Medica, 57(6), 555-9.

Pertanika J. Trop. Agric. Sci. 36 (3): 261 - 274 (2013)
ISSN: 1511-3701 © Universiti Putra Malaysia Press
TROPICAL AGRICULTURAL SCIENCEJournal homepage: http://www.pertanika.upm.edu.my/
Article history:Received: 20 February 2012Accepted: 10 September 2012
ARTICLE INFO
E-mail address: [email protected] (O. A. Adeyemi)* Corresponding author
Feed Restriction and Realimentation on Performance and Carcass Characteristics of Growing Rabbits in a Humid Environment
O. A. Adeyemi*, O. O. Ajeboriogbon and S. A. AderinoyeDepartment of Animal Production and Health, College of Animal Science and Livestock Production, Federal University of Agriculture, P.M.B 2240 Abeokuta, Ogun State, Nigeria
ABSTRACT
The effects of feed restriction for three weeks followed by a four-week realimentation on performance and carcass characteristics were investigated in growing rabbits in a derived savannah vegetation zone of South West Nigeria. Thirty (30) growing rabbits of mixed breeds and sexes with an average weight range of 750 – 800g were randomly distributed into five restriction regimes which served as the study treatments. The rabbits were divided into five groups of six rabbits each. Each treatment was replicated three times with two rabbits per replicate. The experiment was carried out using the completely randomized design (CRD). The rabbits in Treatment 1 (T1) (control) were fed ad libitum, whereas those in Treatment 2 (T2) and Treatment 3 (T3) were restricted to 80% and 60% of ad libitum respectively throughout the 7-week study period. Meanwhile, the rabbits in Treatment 4 (T4) were restricted to 80% of ad libitum for three weeks and later fed ad libitum for the remaining three weeks, whereas those in Treatment 5 (T5) were restricted to 60% of ad libitum for three weeks and later fed ad libitum for the remaining four weeks. The trial lasted for 7 weeks after which the rabbits were starved overnight and slaughtered. Weight gain over the entire period, average daily gain and average daily feed intake over the 49 days of experimental period were significantly (P<0.05) influenced by the feeding regime employed. The least average daily weight gain over the entire period of the experiment was observed on the rabbits subjected to 60% of ad libitum feeding throughout the experimental duration. The rabbits in Treatment 4 (which were restricted to 80% of ad
libitum feeding for 3 weeks followed by 4 weeks of ad libitum feeding showed a consistent similarity in performance with the rabbits on ad libitum feeding (Control). Feed restriction regimes significantly influenced (P<0.05) dressed weight and dressing out
O. A. Adeyemi, O. O. Ajeboriogbon and S. A. Aderinoye
262 Pertanika J. Trop. Agric. Sci. 36 (3): 261 - 274 (2013)
percentage (DOP); however, there were no effects (P>0.05) on the forelimb, loin, hind limb and thoracic cage weights of the rabbit carcasses. In terms of overall performance, the rabbits in Treatment 4, however, required less feed to gain a unit weight as compared to the rabbits in other treatments. Based on the findings of this study, it was concluded that feed restriction did not significantly influence carcass yield and relative organs investigated. It is recommended that growing rabbits can be subjected to a three-week feed restriction of not more than 20% provided at least four weeks of ad libitum feeding is allowed for compensatory growth.
Keywords: Feed restriction, realimentation, rabbits,
performance, and carcass characteristics
INTRODUCTION
Interest in rabbit production has been on the increase in recent years. Rabbit occupies a unique niche in that it is a mini livestock that is easy to manage, highly prolific and has a short generation interval. The cost of feeding rabbits is however very high, a condition that also prevails for other Nigerian livestock species (Adeyemi et al., 2008). Currently, there has been an increased interest in studying feed restriction in rabbits as a means of reducing the cost of production. Growing rabbits usually have unlimited access to the feed and eat ad libitum. In a restricted feeding system, either the access of the animals to the feed is limited, or a fixed amount of feed is given. There are two
methods for restricting feed intake, namely, qualitative and quantitative. In a qualitative feed restriction, the total amount of feed distributed to each animal is the same, but the feed composition can be changed, such as by increasing the fibre level and reducing the digestible energy content (Feugier, 2002). Quantitative feed restriction can be achieved by limiting the time for access to the feeder or by reducing the quantity of feed distributed (Feugier, 2002; Szendrö et al., 2000).
Restricted rabbits are reported to have improved feed efficiency (Maertens and Peeters, 1988; Perrier and Ouhayoun, 1996; Tůmová et al., 2002, 2003). Improved digestibility of nutrients at restricted feeding period was found in rabbits by Ledin (1984a, b). Feed restriction also reduces carcass fat deposition. Limiting feed intake depresses growth during the period of restriction, but reduced growth can be later compensated by realimentation. This phenomenon of accelerated growth following a period of feed restriction is termed “compensatory growth” (Tumova et al., 2002).
Most of the restriction studies carried out in rabbits were conducted in temperate regions of the world, thus there is a need to investigate the situation in a tropical climate. The present study was carried out to investigate the effect of quantitative restriction with or without ad libitum feeding after a restriction period on the growth and carcass indices under a tropical environment.

Feed Restriction and Realimentation on Performance and Carcass Characteristics of Growing Rabbits
263Pertanika J. Trop. Agric. Sci. 36 (3): 261 - 274 (2013)
MATERIALS AND METHODS
Experimental Site
The experiment was carried out at the rabbitry unit of the Teaching and Research Farm, Directorate (TREFAD), Federal University of Agriculture, Abeokuta, Nigeria. The location lies within the rainforest vegetation zone of South West Nigeria with a mean annual rainfall of 1100 mm, a temperature of 34.70C, and a relative humidity of 82%. It is located in the region 70 m above sea level, with latitude 705’ to 708’N and longitude 3011.2’E (Federal University of Agriculture, Abeokuta, Meteorological Station).
Rabbit Management and Housing
Thirty (30) growing rabbits of mixed breeds (Chinchilla x Dutch x California White) and sexes (20 males and 10 females) with an average weight of 750-800 g were selected for this experiment from a larger pool of 80 rabbits in the weight classification of 700 to 900 g in such a manner to minimize variations in initial weights between replicate pens. The rabbits were housed two per cells, in which there were three groups made up of two groups of two males and one group of two females per treatment in single tier hutches that had been washed and properly disinfected. The hutches raised 90 cm above the floor were housed in an open sided house that allowed for flow through ventilation. The hutches made of wood and wire mesh were divided into pens with a dimension of 120 x 50 x 45 cm each. Two flat bottom 20 cm wide earthen pots with inner lips to prevent wastage were placed
in each pen, one serving as a feeder while the other one as a drinker. The rabbits were treated for endo and ectoparasites using Ivomec® at 1ml/50 kg live weight.
Experimental Design
The experiment was carried out as a completely randomized design with five treatments. Each treatment group was replicated three times with two rabbits housed in the same cell serving as a replicate. The treatments were as follows:
T1: ad libitum feeding
T2: 80% of ad libitum feeding for the entire feeding trial
T3: 60% of ad libitum feeding for the entire feeding trial
T4: 80% of ad libitum (0-3 weeks) and ad libitum for the remaining four (3-7) weeks
T5: 60% of ad libitum (0-3 weeks) and ad libitum for the remaining four (3-7) weeks
Ad libitum feed intake of rabbits of the same weight class had been previously determined in a preliminary study. Briefly, 20 rabbits were allowed to acclimate for 3 days on ad libitum feeding and allowed free access to water at all times. After the acclimation period, the rabbits were offered feed ad libitum for 21 days during which ad libitum feed intake for each week was established. It is this established weekly ad libitum feed intake that was utilized in the present study. The composition of the diet is shown in Table 1. The ingredient
O. A. Adeyemi, O. O. Ajeboriogbon and S. A. Aderinoye
264 Pertanika J. Trop. Agric. Sci. 36 (3): 261 - 274 (2013)
composition (%) of the diet was on as-fed basis. The diet was based on feed composition used for growing rabbits on the Federal University of Agriculture Abeokuta, Teaching and Research Farm, which was developed in line with the recommendations of Hall (2010) and Merck (2011). The major ingredients (i.e. maize, groundnut cake and soy bean meal) were milled through a screen mesh size of 3.5 mm in a hammer mill. Other ingredients were already in milled forms at the point of purchase. The various ingredients were individually weighed out in their milled form into a rotary feed mixer and mixed to get the experimental diet. The experimental feed was mixed in the research feed mill. The feed was fed in mash form.
DATA COLLECTION AND ANALYSIS
Feed Intake
The feed intake per replicate cage was determined by collecting the left-over feed from the feeders each morning at 08:00 hrs before feeding. The daily collection of the left-over feed from each replicate was stored in marked nylon bags and kept in airtight plastic containers. These were bulked together at the end of each week, weighed and subtracted from the addition of daily feed supplied to get the feed intake per replicate cage. The value obtained was divided by the number of rabbits in the pen (2) to get the feed consumption per rabbit per week. The daily intake was derived by dividing the weekly intake by 7. Feed and water were supplied on a daily basis after removing the left-over feed each morning.
TABLE 1 Composition of experimental diet (% as-fed)
Ingredient (%)Maize 47.50Groundnut cake 10.00Soybean meal 8.00Wheat offal 31.00Bone meal 3.00Salt 0.25Vitamin/mineral premix* 0.25Total 100.00Determined Analysis (% DM)Dry matter 89.45Protein 18.74
Ether extract 4.58
Crude FibreNDFADFADLAsh
15.6834.2920.54 3.31 4.25
Metabolisable Energy+ (KJ /Kg) 10.93*contains Vit. A 4000000IU; Vit. D. 800000IU; Vit. E 40000mg; Vit. K3 800mg; Vit. B1 1000mg; Vit. B2 6000mg; Vit.B6 5000mg; Vit.B12 25mg; Niacin 6000mg; Pantothenic acid 20000mg; Folic acid 200mg; Biotin 8mg; Manganese 300000mg; Iron 80000mg; Zinc 20000mg; Cobalt 80mg; Iodine 400mg; Selenium 40mg; Choline 800000mg+=Calculated
Feed intake (g) = Feed supplied - Feed left over No of rabbit in the replicate
Body Weight and Weight Gain
The rabbits in each replicate cage were weighed together at the beginning of the trial and weekly thereafter. The gain for each week was obtained by the value difference. The value obtained was divided by the number of rabbits in each replicate to get the weight gain per rabbit per week. From this, the weight gain per day was calculated.
Feed Restriction and Realimentation on Performance and Carcass Characteristics of Growing Rabbits
265Pertanika J. Trop. Agric. Sci. 36 (3): 261 - 274 (2013)
Average weight gain (g/rabbit)
=Final weight - Initial weightNo of rabbit in the replicate
/gAverage daily weight gain dayrabbit
gFinal weight initial weightrabbitAveragedaily weight gain day Noof rabbit inthereplicate x Noof days ontrial
æ ö÷ç ÷ç -÷ç ÷=ç ÷ç ÷ç ÷ç ÷÷çè ø
Feed Conversion Ratio (FCR) was determined as follows:
( )Average feed intake g/rabbitFeed conversion ratio=
No of rabbit in the replicate x No of days in trial( )
( )/Average Feed Intake g/rabbit
Feed conversion ratio=Average Daily Weight Gain g rabbit
Carcass Characteristics
Since there were two rabbits per replicate cage, one rabbit was taken from each replicate. This constituted 50% of the replicate and was thus used. The three selected rabbits were individually weighed and slaughtered after a 24-hour fast. The slaughtered animals were dressed by flaying, eviscerating and splitting according to Blasco and Ouhayoun (1993), as well as Blasco et al. (1993). The cut parts, namely, head, fore limb, thoracic cage, loin and hind limb, were dissected according to Blasco and Ouhayoun (1993) as described below:
The head was separated from the body by cutting it though the section between occiput and atlas vertebra.
The fore limb was separated by cutting it through section between the 7th and 8th thoracic vertebra following the prolongation of the rib when cutting the thoracic wall.
The thoracic cage was taken as a section between the last thoracic and the first lumber vertebra following the prolongation of the 12th rib when cutting the thoracic wall.
The loin section was between the 6th and 7th lumber vertebra cutting the abdominal wall transversely to the vertebral column.
The hind legs was separated by cutting it through the os coxae and posterior part of m. iliopsoas, m. psoas major and m. iliacus.
The paws were removed at the carpal and tarsal joints. The parts were weighed and recorded.
The dressed weight and dressing percentage were calculated as follows:
Dressed weight = Live Weight - Offal weight
where,
Offal weight = Gastro intetinal weight (GIT) + Internal Organs weight
Dressing out Percentage (DOP) % = (Dressed weight/Live weight) x 100
The weight of the internal organs, such as spleen, liver, kidney, lungs, heart and gastro intestinal tract, were also taken. The gastro intestinal tract was taken as the digestive tube from the point of decapitating the head to the anus comprising oesophagus, stomach, small intestine and the large intestine.
O. A. Adeyemi, O. O. Ajeboriogbon and S. A. Aderinoye
266 Pertanika J. Trop. Agric. Sci. 36 (3): 261 - 274 (2013)
Cost Analysis
The prevailing market prices of the feed ingredients at the time of the experiment were used to estimate the unit cost of the experimental diet. Feed cost per kilogramme and cost per kilogramme of weight gain were calculated. The percentage feed cost saving of rabbits on restriction compared to the ad libitum fed rabbits was also determined (at the time of the experiment, one hundred and fifty five Naira (^), Nigeria National Currency was equivalent to One United States Dollar (^ 155.00 = US$ 1.00).
Data Analysis
The experimental diet samples were subjected to proximate analysis according to the methods of AOAC (1995). The detergent components were determined by the procedure developed by Goering and Van Soest (1970). Metabolisable energy (ME) value of the test diet was calculated by the method of Wardeh (1981). All data collected were subjected to statistical analysis appropriate for a completely randomized design layout using Minitab Analytical Computer Package (Minitab Inc., 1999). Significant differences between the treatment means were determined using the Duncan’s Multiple Range Test (Steel & Torrie, 1990).
RESULTS AND DISCUSSION
The growth performance of rabbits subjected to varying dietary feeding regimes is presented in Table 2.
Final live weight, weight gain over the entire period, average daily gain and
average daily feed intake over the 49-day experimental period were significantly (P<0.05) influenced by the feeding regimes employed. The least average daily weight gain over the entire period of the experiment was observed on the rabbits subjected to 60% ad libitum feeding throughout the experimental duration.
The average daily weight gain of these rabbits which was on the most severe restriction was 25.72% less than the average weight gain on the control feed regimen. The rabbits in Treatment 4 (80% ad libitum feeding for 3 weeks followed by 4 weeks of ad libitum feeding) showed a consistent similarity in performance with the rabbits on ad libitum feeding (Control). In terms of overall performance, the rabbits in Treatment 4, however, required less feed to gain a unit weight compared to the rabbits in the other treatments.
The rabbits on the Control treatment required significantly (P<0.05) more quantity of feed to gain a unit weight, an indication that it is less efficient. The nature of average weight gain over the period of feed regimentation is presented in Fig.1. As expected, from Week 1 through Week 3 (end of the restriction period), the rabbits restricted to 80 and 60% of the ad libitum intake presented a lower live weight than those fed ad libitum.
The rabbits previously restricted but later reverted to ad libitum feeding showed a steep rise in average daily weight gain from Week 4 onwards. The average daily gains during restriction were 11.32 and 9.72 g/day for the rabbits fed 80 and 60% of the ad
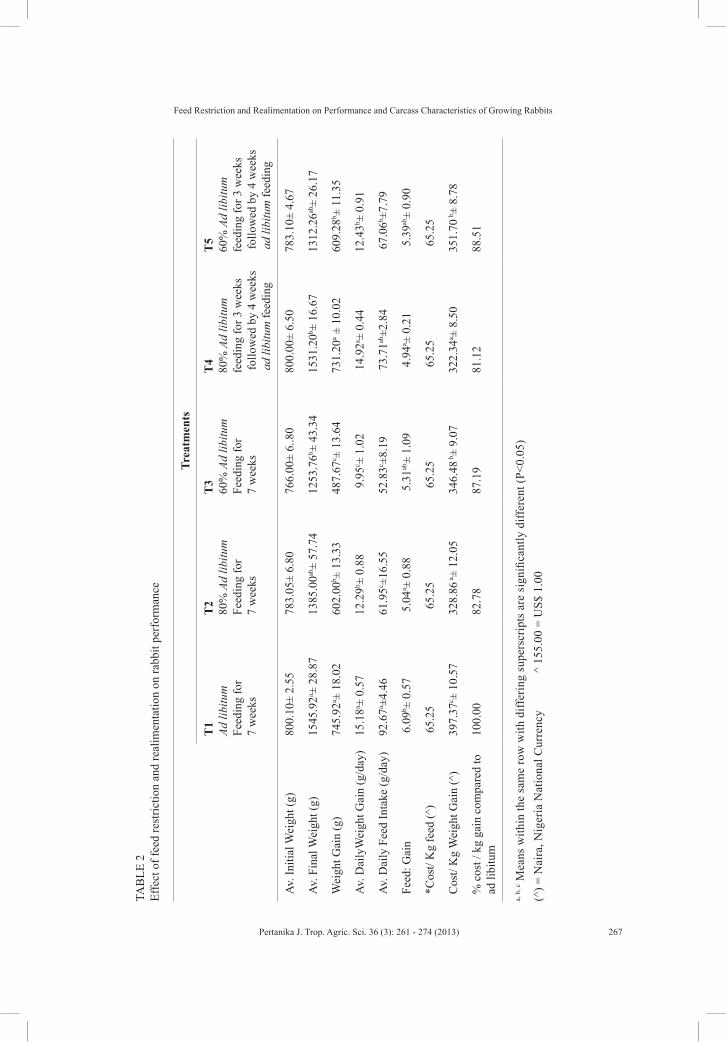
Feed Restriction and Realimentation on Performance and Carcass Characteristics of Growing Rabbits
267Pertanika J. Trop. Agric. Sci. 36 (3): 261 - 274 (2013)
TAB
LE 2
Ef
fect
of f
eed
rest
rictio
n an
d re
alim
enta
tion
on ra
bbit
perf
orm
ance
Trea
tmen
ts
T1
Ad li
bitu
m
Feed
ing
for
7 w
eeks
T2
80%
Ad
libitu
m
Feed
ing
for
7 w
eeks
T3
60%
Ad
libitu
m
Feed
ing
for
7 w
eeks
T4
80%
Ad
libitu
m
feed
ing
for 3
wee
ks fo
llow
ed b
y 4
wee
ks a
d lib
itum
feed
ing
T5
60%
Ad
libitu
m
feed
ing
for 3
wee
ks fo
llow
ed b
y 4
wee
ks a
d lib
itum
feed
ing
Av. I
nitia
l Wei
ght (
g)80
0.10
± 2.
5578
3.05
± 6.
8076
6.00
± 6.
.80
800.
00±
6.50
783.
10±
4.67
Av. F
inal
Wei
ght (
g)15
45.9
2a ± 2
8.87
1385
.00ab
± 57
.74
1253
.76b ±
43.
3415
31.2
0b ± 1
6.67
1312
.26ab
± 26
.17
Wei
ght G
ain
(g)
745.
92a ±
18.
0260
2.00
b ± 1
3.33
487.
67c ±
13.
6473
1.20
a ± 1
0.02
609.
28b ±
11.
35
Av. D
aily
Wei
ght G
ain
(g/d
ay)
15.1
8a ± 0
.57
12.2
9b ± 0
.88
9.9
5c ± 1
.02
14.
92a ±
0.4
412
.43b ±
0.9
1
Av. D
aily
Fee
d In
take
(g/d
ay)
92.6
7a ±4.
4661
.95c ±
16.5
552
.83c ±
8.19
73.
71ab
±2.8
4 6
7.06
b ±7.
79
Feed
: Gai
n
6.0
9b ± 0
.57
5.0
4a ± 0
.88
5.3
1ab±
1.09
4.9
4a ± 0
.21
5.3
9ab±
0.90
*Cos
t/ K
g fe
ed (^
) 6
5.25
65.
25 6
5.25
65.
25 6
5.25
Cos
t/ K
g W
eigh
t Gai
n (^
)39
7.37
c ± 1
0.57
328.
86 a±
12.0
534
6.48
b±
9.07
322.
34a ±
8.5
035
1.70
b±
8.78
% c
ost /
kg
gain
com
pare
d to
ad
libi
tum
100.
0082
.78
87.1
981
.12
88.5
1
a, b
, c M
eans
with
in th
e sa
me
row
with
diff
erin
g su
pers
crip
ts a
re s
igni
fican
tly d
iffer
ent (
P<0.
05)
(^) =
Nai
ra, N
iger
ia N
atio
nal C
urre
ncy
^
155
.00
= U
S$ 1
.00

O. A. Adeyemi, O. O. Ajeboriogbon and S. A. Aderinoye
268 Pertanika J. Trop. Agric. Sci. 36 (3): 261 - 274 (2013)
libitum intake; however, in the last 4 weeks when ad libitum feeding was restored, average daily weight gains of 17.62 and 14.47% were obtained, respectively. These results were in agreement with the report by Perrier (1998), where a reduced level of intake (50% and 70% of the ad libitum intake) provoked a reduction of live weight (-32.9 and –20.5%, respectively) at the end of the restriction period (35-56 days).
Foubert et al. (2008) reported that a restricted feeding (70% of the ad libitum level) resulted in a lower live weight (-8.8%) at the end of restriction period (32-53 days). Tumova et al. (2002) also reported that during the restriction period, weight gain in the restricted rabbits was about 60-70% lower than in the ad libitum fed rabbits.
The current results also confirm the results of Boisot et al. (2003), who observed that feed restriction (60% and 80% of the ad libitum level) elicited a lower live weight (respectively, -17.5 and -7%,) at the end of the restriction period (34-54 days).
The average daily feed intake for the entire period was significantly influenced by feeding strategy. The rabbits on continuous ad libitum feeding consumed significantly more feed than those in other feeding regimes. In addition, the rabbits on previously restricted but later ad libitum fed consumed significantly more feed than their continuously restricted counterparts. The feed intake pattern during the experiment is shown in Fig.2. The trend showed that the feed intake was consistently lower for
0
5
10
15
20
25
1 2 3 4 5 6 7
weeks
Treatment 1
Treatment 2
Treatment 3
Treatment 4
Treatment 5
Fig.1: Weight change trend of rabbits subjected to feed restriction
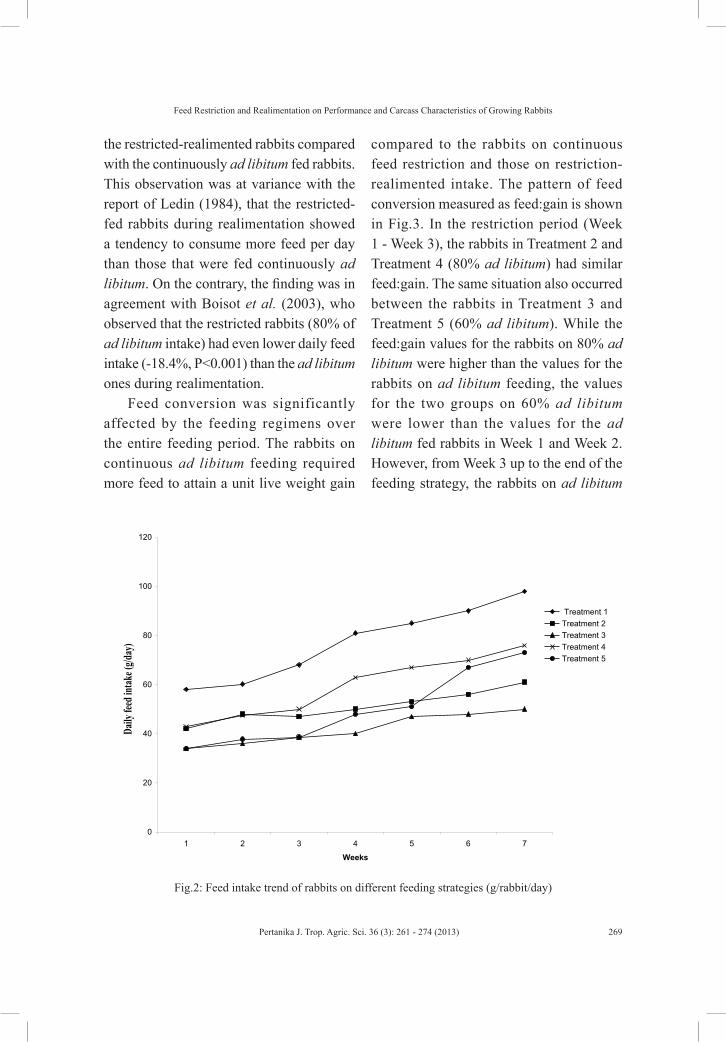
Feed Restriction and Realimentation on Performance and Carcass Characteristics of Growing Rabbits
269Pertanika J. Trop. Agric. Sci. 36 (3): 261 - 274 (2013)
the restricted-realimented rabbits compared with the continuously ad libitum fed rabbits. This observation was at variance with the report of Ledin (1984), that the restricted-fed rabbits during realimentation showed a tendency to consume more feed per day than those that were fed continuously ad libitum. On the contrary, the finding was in agreement with Boisot et al. (2003), who observed that the restricted rabbits (80% of ad libitum intake) had even lower daily feed intake (-18.4%, P<0.001) than the ad libitum ones during realimentation.
Feed conversion was significantly affected by the feeding regimens over the entire feeding period. The rabbits on continuous ad libitum feeding required more feed to attain a unit live weight gain
compared to the rabbits on continuous feed restriction and those on restriction-realimented intake. The pattern of feed conversion measured as feed:gain is shown in Fig.3. In the restriction period (Week 1 - Week 3), the rabbits in Treatment 2 and Treatment 4 (80% ad libitum) had similar feed:gain. The same situation also occurred between the rabbits in Treatment 3 and Treatment 5 (60% ad libitum). While the feed:gain values for the rabbits on 80% ad libitum were higher than the values for the rabbits on ad libitum feeding, the values for the two groups on 60% ad libitum were lower than the values for the ad libitum fed rabbits in Week 1 and Week 2. However, from Week 3 up to the end of the feeding strategy, the rabbits on ad libitum
Fig.2: Feed intake trend of rabbits on different feeding strategies (g/rabbit/day)
0
20
40
60
80
100
120
1 2 3 4 5 6 7
Weeks
Treatment 1Treatment 2Treatment 3Treatment 4Treatment 5

O. A. Adeyemi, O. O. Ajeboriogbon and S. A. Aderinoye
270 Pertanika J. Trop. Agric. Sci. 36 (3): 261 - 274 (2013)
feeding appeared to be less efficient as they required more feed to gain a unit weight. Similarly, improvements were noted in the feed conversion in the weight of the rabbits in Treatment 4 and Treatment 5 (80 and 60% ad libitum feeding during restriction followed by ad libitum feeding in the 4-week realimentation period). It was thus clear that during the realimentation (4-7 weeks), there was a favourable effect of feed restriction on feed conversion. This finding was in consonance with the previous reports of Boisot et al. (2003) and Foubert et al. (2008), in which significant favourable effects of feed restriction level were observed on feed conversion in the total fattening period.
The results were, however, at variance with that of Ledin (1984), who reported
that in the entire growth period, the feed conversion was similar for the restricted-realimented and continuously ad libitum animals because the differences in the feed conversion efficiency in both periods (restriction and realimentation) tended to cancel each other. Meanwhile, Perrier (1998) found significant differences, but just for animals having a level of 50% intake of ad libitum.
The effect of treatments on economy of production measured as cost per kilogram weight gain indicated that restricting the feed by 20 and 40% without realimentation (T2 and T3) resulted in a reduction of 17.24 and 12.81% respectively as compared with the ad libitum fed control group. For the rabbits subjected to realimentation after the restriction period of 3 weeks, the savings in
Fig.3: Feed conversion trend of rabbits on different feeding strategies (g feed: g weight)
0
1
2
3
4
5
6
7
1 2 3 4 5 6 7
Weeks
Treatment 1
Treatment 2
Treatment 3
Treatment 4
Treatment 5
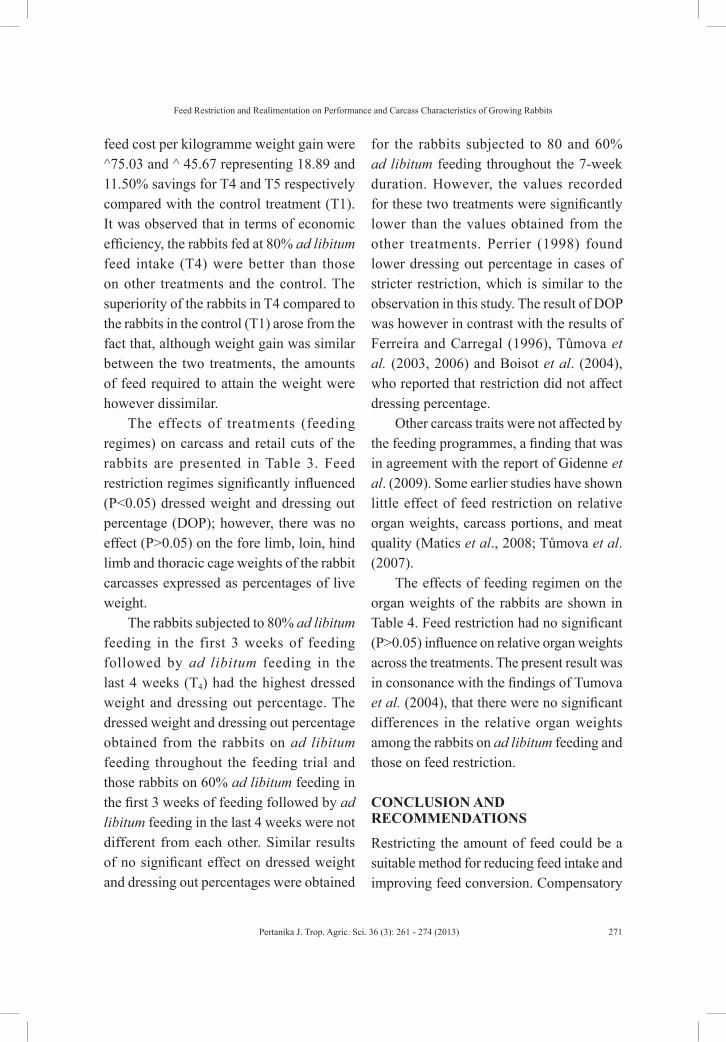
Feed Restriction and Realimentation on Performance and Carcass Characteristics of Growing Rabbits
271Pertanika J. Trop. Agric. Sci. 36 (3): 261 - 274 (2013)
feed cost per kilogramme weight gain were ^75.03 and ^ 45.67 representing 18.89 and 11.50% savings for T4 and T5 respectively compared with the control treatment (T1). It was observed that in terms of economic efficiency, the rabbits fed at 80% ad libitum feed intake (T4) were better than those on other treatments and the control. The superiority of the rabbits in T4 compared to the rabbits in the control (T1) arose from the fact that, although weight gain was similar between the two treatments, the amounts of feed required to attain the weight were however dissimilar.
The effects of treatments (feeding regimes) on carcass and retail cuts of the rabbits are presented in Table 3. Feed restriction regimes significantly influenced (P<0.05) dressed weight and dressing out percentage (DOP); however, there was no effect (P>0.05) on the fore limb, loin, hind limb and thoracic cage weights of the rabbit carcasses expressed as percentages of live weight.
The rabbits subjected to 80% ad libitum feeding in the first 3 weeks of feeding followed by ad libitum feeding in the last 4 weeks (T4) had the highest dressed weight and dressing out percentage. The dressed weight and dressing out percentage obtained from the rabbits on ad libitum feeding throughout the feeding trial and those rabbits on 60% ad libitum feeding in the first 3 weeks of feeding followed by ad libitum feeding in the last 4 weeks were not different from each other. Similar results of no significant effect on dressed weight and dressing out percentages were obtained
for the rabbits subjected to 80 and 60% ad libitum feeding throughout the 7-week duration. However, the values recorded for these two treatments were significantly lower than the values obtained from the other treatments. Perrier (1998) found lower dressing out percentage in cases of stricter restriction, which is similar to the observation in this study. The result of DOP was however in contrast with the results of Ferreira and Carregal (1996), Tůmova et al. (2003, 2006) and Boisot et al. (2004), who reported that restriction did not affect dressing percentage.
Other carcass traits were not affected by the feeding programmes, a finding that was in agreement with the report of Gidenne et al. (2009). Some earlier studies have shown little effect of feed restriction on relative organ weights, carcass portions, and meat quality (Matics et al., 2008; Tůmova et al. (2007).
The effects of feeding regimen on the organ weights of the rabbits are shown in Table 4. Feed restriction had no significant (P>0.05) influence on relative organ weights across the treatments. The present result was in consonance with the findings of Tumova et al. (2004), that there were no significant differences in the relative organ weights among the rabbits on ad libitum feeding and those on feed restriction.
CONCLUSION AND RECOMMENDATIONS
Restricting the amount of feed could be a suitable method for reducing feed intake and improving feed conversion. Compensatory
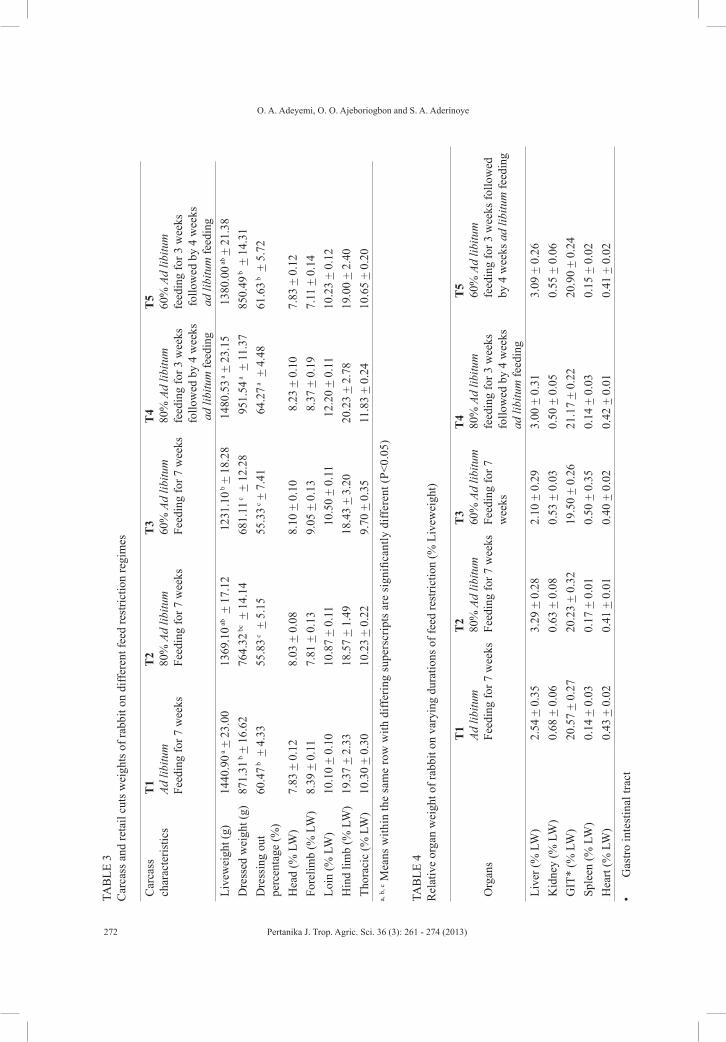
O. A. Adeyemi, O. O. Ajeboriogbon and S. A. Aderinoye
272 Pertanika J. Trop. Agric. Sci. 36 (3): 261 - 274 (2013)
TAB
LE 3
C
arca
ss a
nd re
tail
cuts
wei
ghts
of r
abbi
t on
diffe
rent
feed
rest
rictio
n re
gim
es
Car
cass
ch
arac
teris
tics
T1
Ad li
bitu
m
Feed
ing
for 7
wee
ks
T2
80%
Ad
libitu
m
Feed
ing
for 7
wee
ks
T3
60%
Ad
libitu
m
Feed
ing
for 7
wee
ks
T4
80%
Ad
libitu
m
feed
ing
for 3
wee
ksfo
llow
ed b
y 4
wee
ks a
d lib
itum
feed
ing
T5
60%
Ad
libitu
m
feed
ing
for 3
wee
ks fo
llow
ed b
y 4
wee
ks a
d lib
itum
feed
ing
Live
wei
ght (
g)14
40.9
0 a +
23.
0013
69.1
0 ab
+ 17
.12
1231
.10 b
+ 1
8.28
1480
.53 a
+ 2
3.15
1380
.00 a
b + 2
1.38
Dre
ssed
wei
ght (
g)87
1.31
b +
16.
6276
4.32
bc
+ 14
.14
681.
11 c +
12.
28
951.
54 a +
11.
3785
0.49
b +
14.
31D
ress
ing
out
perc
enta
ge (%
)60
.47 b
+ 4
.33
55.8
3 c +
5.1
5 55
.33 c
+ 7
.41
64
.27 a
+ 4
.48
61.6
3 b +
5.7
2
Hea
d (%
LW
)7.
83 +
0.1
28.
03 +
0.0
88.
10 +
0.1
0
8.2
3 +
0.10
7.83
+ 0
.12
Fore
limb
(% L
W)
8.39
+ 0
.11
7.81
+ 0
.13
9.05
+ 0
.13
8
.37
+ 0.
197.
11 +
0.1
4Lo
in (%
LW
)10
.10
+ 0.
1010
.87
+ 0.
11
10.5
0 +
0.11
12.
20 +
0.1
110
.23
+ 0.
12H
ind
limb
(% L
W)
19.3
7 +
2.33
18.5
7 +
1.49
18.4
3 +
3.20
20.2
3 +
2.78
19.0
0 +
2.40
Thor
acic
(% L
W)
10.3
0 +
0.30
10.2
3 +
0.22
9.70
+ 0
.35
11.8
3 +
0.24
10.6
5 +
0.20
a, b
, c M
eans
with
in th
e sa
me
row
with
diff
erin
g su
pers
crip
ts a
re s
igni
fican
tly d
iffer
ent (
P<0.
05)
TAB
LE 4
R
elat
ive
orga
n w
eigh
t of r
abbi
t on
vary
ing
dura
tions
of f
eed
rest
rictio
n (%
Liv
ewei
ght)
Org
ans
T1
Ad li
bitu
m
Feed
ing
for 7
wee
ks
T2
80%
Ad
libitu
m
Feed
ing
for 7
wee
ks
T3
60%
Ad
libitu
m
Feed
ing
for 7
w
eeks
T4
80%
Ad
libitu
m
feed
ing
for 3
wee
ks
follo
wed
by
4 w
eeks
ad
libi
tum
feed
ing
T5
60%
Ad
libitu
m
feed
ing
for 3
wee
ks fo
llow
ed
by 4
wee
ks a
d lib
itum
feed
ing
Live
r (%
LW
)2.
54 +
0.3
53.
29 +
0.2
82.
10 +
0.2
93.
00 +
0.3
13.
09 +
0.2
6K
idne
y (%
LW
)0.
68 +
0.0
60.
63 +
0.0
80.
53 +
0.0
30.
50 +
0.0
50.
55 +
0.0
6G
IT*
(% L
W)
20.5
7 +
0.27
20.2
3 +
0.32
19.5
0 +
0.26
21.1
7 +
0.22
20.9
0 +
0.24
Sple
en (%
LW
)0.
14 +
0.0
30.
17 +
0.0
10.
50 +
0.3
50.
14 +
0.0
30.
15 +
0.0
2H
eart
(% L
W)
0.43
+ 0
.02
0.41
+ 0
.01
0.40
+ 0
.02
0.42
+ 0
.01
0.41
+ 0
.02
• G
astro
inte
stin
al tr
act
Feed Restriction and Realimentation on Performance and Carcass Characteristics of Growing Rabbits
273Pertanika J. Trop. Agric. Sci. 36 (3): 261 - 274 (2013)
growth was observed in the rabbits subjected to restriction but later ad libitum fed. Body weight compensation was almost complete in the rabbits of T4, which was similar to the weight obtained on the control treatment (ad libitum feeding). Concerning the carcass traits, the observed decrease in dressing out percentage with increasing stiffness of restriction is an indication of the fact that feed restriction may have its own disadvantages except when realimentation is allowed for adequate period.
From the findings of this study, it is recommended that growing rabbits can be subjected to a three-week feed restriction of not more than 20% provided at least four weeks of ad libitum feeding is allowed for compensatory growth.
REFERENCESA. O. A. C. (1995). Official Methods of Analysis.
Association of Official Analytical Chemists (16th Edn.). Washington D.C.
Adeyemi, O. A., Sobayo, R. A., Aluko, F. A., & Oke, D. B. (2008). Utilisation of rumen filtrate fermented corn-cobs by weaner rabbits. Nig. J. Anim. Prod., 35(1), 69-75.
Blasco, A.,& Ouhayoun, J. (1993). Harmonization of criteria and terminology in rabbit meat research. Revised proposal. World Rabbit Sci., 4(2), 93-99.
Blasco A., Ouhayoun, J., & Masoero, G. (1993). Harmonization of criteria and terminology in rabbit meat research. World Rabbit Sci., 1, 3-10.
Boisot, P., Licois, D., & Gidenne, T. (2003). Feed restriction reduces the sanitary impact of an experimental reproduction of Epizootic Rabbit Enteropathy Syndrom (ERE), in the growing rabbit. 10ème Journées Recherche. Cunicoles Française. p. 267-270.
Boisot P., Duperray, J., Dugenetais, X., & Guyonvarch, A. (2004). Interest of hydric restriction times of 2 and 3 hours per day to induce feed restriction in growing rabbits. In Proc. 8th World Rabbit Congress, September7–10, Puebla, Mexico. 759–764.
Ferreira R. G., & Carregal, R. D. (1996). A note on carcass characteristics of rabbits fed on a restricted system. In Proc. 6th World Rabbit Congress, July 9–12, Toulouse, France. 163–165.
Feugier, A. (2002). Incidence d’un rationnement quantitatif sur la croissance, la digestion et l’état sanitaire du lapin. Ed. ISARA. 1- 41.
Foubert, C., Boisot, P., Duperray, J., & Guyonvarch, A. (2007). Interêt d’un accès limité à la mangeoire de 6h, 8h et 10 h pqr jour pour engendrer un rationnement alimentaire chez le lapin en engraissement. 12èmes Journées de la recherche Cunicole. 123-126.
Gidenne, T., Combes, S., Feugier, A., Jehl, A., Arveux, P., Boisot, P., Briens, C., Corrent, E., Fortune, H., Montessuy, S., & Verdelhan, S. (2009). Feed restriction strategy in the growing rabbit. 2. Impact on digestive health, growth and carcass characteristics. Animal, 3(4), 509–515.
Goering, H. K., & van Soest, P. J. (1970). Forage analysis (Apparatus, Reagents, Proceedings and some applications). Agric. Handbook No.379 ARS. USDA, Washington D. C.
Halls, A. E. (2010). Nutritional Requirements of Rabbits. Retrieved from http://www.nutrecocanada.com/docs/shur-gain---specialty/nutritional-requirements-of-rabbits
Ledin, I. (1984a). Effect of restricted feeding and realimentation on growth, carcass composition and organ growth during the first seven days of realimentation in rabbit. Acta Agric. Scand. 34, 54-66.
Ledin, I. (1984b). A note on the effect of different feeding levels on the rate of digesta passage in rabbits. Acta Agric. Scand., 34, 67-70.TA
BLE
3
Car
cass
and
reta
il cu
ts w
eigh
ts o
f rab
bit o
n di
ffere
nt fe
ed re
stric
tion
regi
mes
Car
cass
ch
arac
teris
tics
T1
Ad li
bitu
m
Feed
ing
for 7
wee
ks
T2
80%
Ad
libitu
m
Feed
ing
for 7
wee
ks
T3
60%
Ad
libitu
m
Feed
ing
for 7
wee
ks
T4
80%
Ad
libitu
m
feed
ing
for 3
wee
ksfo
llow
ed b
y 4
wee
ks a
d lib
itum
feed
ing
T5
60%
Ad
libitu
m
feed
ing
for 3
wee
ks fo
llow
ed b
y 4
wee
ks a
d lib
itum
feed
ing
Live
wei
ght (
g)14
40.9
0 a +
23.
0013
69.1
0 ab
+ 17
.12
1231
.10 b
+ 1
8.28
1480
.53 a
+ 2
3.15
1380
.00 a
b + 2
1.38
Dre
ssed
wei
ght (
g)87
1.31
b +
16.
6276
4.32
bc
+ 14
.14
681.
11 c +
12.
28
951.
54 a +
11.
3785
0.49
b +
14.
31D
ress
ing
out
perc
enta
ge (%
)60
.47 b
+ 4
.33
55.8
3 c +
5.1
5 55
.33 c
+ 7
.41
64
.27 a
+ 4
.48
61.6
3 b +
5.7
2
Hea
d (%
LW
)7.
83 +
0.1
28.
03 +
0.0
88.
10 +
0.1
0
8.2
3 +
0.10
7.83
+ 0
.12
Fore
limb
(% L
W)
8.39
+ 0
.11
7.81
+ 0
.13
9.05
+ 0
.13
8
.37
+ 0.
197.
11 +
0.1
4Lo
in (%
LW
)10
.10
+ 0.
1010
.87
+ 0.
11
10.5
0 +
0.11
12.
20 +
0.1
110
.23
+ 0.
12H
ind
limb
(% L
W)
19.3
7 +
2.33
18.5
7 +
1.49
18.4
3 +
3.20
20.2
3 +
2.78
19.0
0 +
2.40
Thor
acic
(% L
W)
10.3
0 +
0.30
10.2
3 +
0.22
9.70
+ 0
.35
11.8
3 +
0.24
10.6
5 +
0.20
a, b
, c M
eans
with
in th
e sa
me
row
with
diff
erin
g su
pers
crip
ts a
re s
igni
fican
tly d
iffer
ent (
P<0.
05)
TAB
LE 4
R
elat
ive
orga
n w
eigh
t of r
abbi
t on
vary
ing
dura
tions
of f
eed
rest
rictio
n (%
Liv
ewei
ght)
Org
ans
T1
Ad li
bitu
m
Feed
ing
for 7
wee
ks
T2
80%
Ad
libitu
m
Feed
ing
for 7
wee
ks
T3
60%
Ad
libitu
m
Feed
ing
for 7
w
eeks
T4
80%
Ad
libitu
m
feed
ing
for 3
wee
ks
follo
wed
by
4 w
eeks
ad
libi
tum
feed
ing
T5
60%
Ad
libitu
m
feed
ing
for 3
wee
ks fo
llow
ed
by 4
wee
ks a
d lib
itum
feed
ing
Live
r (%
LW
)2.
54 +
0.3
53.
29 +
0.2
82.
10 +
0.2
93.
00 +
0.3
13.
09 +
0.2
6K
idne
y (%
LW
)0.
68 +
0.0
60.
63 +
0.0
80.
53 +
0.0
30.
50 +
0.0
50.
55 +
0.0
6G
IT*
(% L
W)
20.5
7 +
0.27
20.2
3 +
0.32
19.5
0 +
0.26
21.1
7 +
0.22
20.9
0 +
0.24
Sple
en (%
LW
)0.
14 +
0.0
30.
17 +
0.0
10.
50 +
0.3
50.
14 +
0.0
30.
15 +
0.0
2H
eart
(% L
W)
0.43
+ 0
.02
0.41
+ 0
.01
0.40
+ 0
.02
0.42
+ 0
.01
0.41
+ 0
.02
• G
astro
inte
stin
al tr
act
O. A. Adeyemi, O. O. Ajeboriogbon and S. A. Aderinoye
274 Pertanika J. Trop. Agric. Sci. 36 (3): 261 - 274 (2013)
Maertens, L., & Peeters, J. E. (1988). Effect of a feed restriction after weaning on fattening performances and caecal traits of early weaned rabbits. 6. Arbeitstagung über Peltztiere, Kaninchen und Heimtier production und Krankenheit. Celle 2-4 Juni, 158-169.
Matics, Z. S., Dalle Zotte, A., Radnai, I., Kovács, M., Metzger, Z. S., & Szendrı, Z. S. (2008). Effect of restricted feeding after weaning on the productive and carcass traits of growing rabbits. In the Proceeding of 9th World Rabbit Congress – June 10-13, 2008 – Verona – Italy pp 741-745
Merck Manual (2011). Nutritional Requirements of Rabbits. Merck Sharp & Dohme Corp., a subsidiary of Merck & Co., Inc. Whitehouse Station, New Jersey, USA. Retrieved from http://www.merckvetmanual.com/mvm/index.jsp?cfile=htm/bc/171315.htm
Minitab Inc. (1999). Minitab Data Analysis System. Release 7.1 Standard Version Serial. Minitab Inc.
Perrier, G. (1998). Influence de deux niveaux et de deux durées de restriction alimentaire sur l’efficacité productive du lapin et les caractéristiques bouchères de la carcasse. 7ème Journées. Recherche. Cunicole Française, 179-182.
Perrier, G., & Ouyayoun, J. (1996). Growth and carcass traits of the rabbit: a comparative study of three modes of feed rationing during fattening. 6th World Rabbit Congress, 3, 225-231.
Steel, R. G. D., & Torrie, J. H. (1980). Principles and Procedures of Statistics (2nd Edn.). USA: McGraw Hill Book Co., Inc.
Szendrõ, Z. S., Mihálovics, G. Y., Milistis, G., Biró-Németh, E., & Radnai, I. (2000). Effect of reduction of feeding time on the performances and carcass quality of growing rabbits. 7th World Rabbit Congress, 6.
Tumova, E., Sk Ivan, M., Sk Ivanová, V., & Kacerovská, V. (2002). Effect of early feed
restriction on growth in broiler chickens, turkeys and rabbits. Czech Journal of Animal Science, 10, 418-428.
Tůmová, E., Skřivanová, V., & Skřivan, M. (2003). Effect of restricted feeding time and quantitative restriction in growing rabbits. Arch. Geflűgelkde, 67, 182 -190.
Tůmova E., Zita, L., & Štolc, L. (2006). Carcass quality in restricted and ad libitum fed rabbits. Czech J. Anim. Sci., 51(5), 214–219.
Tumová, E, Zita, L., Skrivanová, V., Fucíková, A., Skrivan, M., and Burešová, M. (2007). Digestibility of nutrients, organ development and blood picture in restricted and ad libitum fed broiler rabbits. Arch.Geflügelk., 71(1), S. 6–12.
Wardeh, M. F. (1981). Methods for estimating energy and protein utilization of feed. PhD Dissertation. Utah State University. Logan. US.
Pertanika J. Trop. Agric. Sci. 36 (3): 275 - 284 (2013)
ISSN: 1511-3701 © Universiti Putra Malaysia Press
TROPICAL AGRICULTURAL SCIENCEJournal homepage: http://www.pertanika.upm.edu.my/
Article history:Received: 18 May 2011Accepted: 2 November 2011
ARTICLE INFO
E-mail addresses: [email protected] (Chimbekujwo, I. B.) [email protected] (Bukar, A. M.), [email protected] (Channya, F. K.)* Corresponding author
Management of Root Knot Nematodes (Meloidogyne incognita) on Cowpea with Plant Extracts
Chimbekujwo, I. B.1*, Bukar, A. M.2 and Channya, F. K.3 1Department of Plant Sciences, Modibbo Adama University of Technology, P.M.B. 2076, Yola, Adamawa State, Nigeria2Department of Biological Sciences, Bama College of Education, Borno State, Nigeria3Department of Plant Sciences, Modibbo Adama University of Technology, Yola, Adamawa State, Nigeria
ABSTRACT
Screen house experiment was conducted to test the efficacies of leaf powder of neem (Azadirachta indica), kassod tree (Cassia siamea), eucalyptus (Eucalyptus gigantea) and locust bean tree (Parkia biglobosa) in the management of Meloidogyne incognita on cowpea yield. In this study, 50g of each of the leaf powder was separately mixed with 4 kg of soil in a 25-cm diameter plastic pot. Non-amended pots served as the control. Cowpea seeds were sown in each pot and each seedling was inoculated with about 3000 freshly hatched juveniles of Meloidogyne incognita two weeks after sowing. The experiment was laid out in a completely randomised design with five replications. The obtained data were analysed using ANOVA and means, while the significance values were separated using the Duncan multiple test. The result of the study showed that all the treatments significantly (p<0.001) reduced root galling and nematode population, as well as improved plant growth and yield of cowpeas. Although all treatments were effective in reducing root galls and nematode population, application of Azadirachta indica leaf powder gave the highest reduction in root galls (0.293) and nematode population (24), followed by Cassia siamea, Eucalyptus gigantea and Parkia biglobosa. The findings recorded root galls and nematode population of 28.25 and 37.34, 29 and 48, and 30 and 53.34 respectively as compared to the control treatment, which recorded root galls of 107.75 and nematode population of 189.34.
Keywords: Azadirachta indica, cowpea, Cassia
siamea, Eucalyptus gigantea, Parkia biglobosa and
Meloidogyne incognita
Chimbekujwo, I. B., Bukar, A. M. and Channya, F. K.
276 Pertanika J. Trop. Agric. Sci. 36 (3): 275 - 284 (2013)
INTRODUCTION
Cowpea (Vigna unguiculata (L.) Walp) is a dicotyledonous plant belonging to the Fabaceae family. It is the most important grain legume in West Africa, which provides a source of profitable revenue between 23 and 29% of the selling price (Langyintuo et al., 2000). It is also valued as the cheapest dietary and high quality vegetable protein of about 25-43% (Nielson et al., 1997), accounting for up to 80% of total protein intake in Nigeria (Rachie & Rawal, 1975). Meloidogyne spp is a major problem of cowpeas in most crop growing regions of the world (Caveness, 1992). Losses on cowpeas are attributable to Meloidogyne species in some West African countries, which have been put between 10% and 89% including total crop losses in some cases (Adesiyan et al., 1990). Iheukwumere et al. (1995) recognized Meloidogyne spp as one of the plant-parasitic nematodes of economic importance in legume production in Nigeria. The root knot nematode is estimated to cause losses ranging from 10% to 69% in Nigeria (Olowe, 2009). The symptoms of nematode infection include formation of root galls which results in growth reduction, nutrient and water uptake reduction, increased wilting, mineral deficiency, as well as weak and poor yielding plants. The use of synthetic nematicides is considered the most effective practical means of combating the menace of plant-parasitic nematodes in cowpeas (Adesiyan, 1992). However, chemical control of root knot nematodes leads to environmental hazards because of the high toxicity and persistence in the
soil ( Anastasiadis et al., 2008). As an alternative, organic soil amendment has been found to be cheaper, less harmful to man and effective in the management of plant-parasitic nematodes (Olabiyi et al., 2007). In view of this, the present investigation was undertaken to assess the nematicidal activity of four plant species, namely; Azadirachta indica, Cassia siamea, Eucalyptus gigantean and Parkia biglobosa, in the management of Meloidogyne spp in cowpeas.
MATERIALS AND METHODS
Soil Collection and Sterilization
Top soil of 0–30 cm depth was used for the experiment in this study. The soil was collected from the Biological Garden of Modibbo Adama University of Technology, Yola, in Adamawa state, Nigeria, located at latitude 9⁰ 14΄N and longitude 12⁰ 27΄E. The soil, composed of 55.6% sand, 19.4% silt, 25% clay, pH 6.8 and 0.98% organic matter, was steam-sterilized by heating with lighted firewood in a large aluminium pot to a temperature of 100oC and maintained for one hour. The soil was then allowed to cool and later stored in jute sacs to rest for six weeks to regain its stability.
Collection and Preparation of Leaves
Mature leaves of Azadirachta indica, Cassia siamea, Eucalyptus gigantea, Parkia biglobosa and Calotropis procera were used for the experiment. The leaves were separately collected from different plants at different locations within the premises of

Management of Root Knot Nematodes (Meloidogyne incognita) on Cowpea with Plant Extracts
277Pertanika J. Trop. Agric. Sci. 36 (3): 275 - 284 (2013)
Modibbo Adama University of Technology, Yola, and spread on polythene sheets in an open protected area for one week to dry. The dried leaves were ground separately to fine particles using a mortar and stored in a sealed container for use.
Amendment Applications Rate
The ground leaves were separately mixed with 4 kg of steam-sterilized soil at the rate of 50 g. The mixtures were transferred into 25-cm diameter perforated plastic pots.
Sowing of Seeds
Seeds of cowpeas, cv. “Kanannado”, were obtained from Monday market in Maiduguri, Borno, Nigeria. The seeds were sown into plastic pots filled with the mixture of steam-sterilized soil and ground leaves. Meanwhile, the control pots contained only steam-sterilized soil. Three seeds were sown per pot at a depth of 2 cm, but the seedlings were thinned to one per pot six days after emergence to ensure uniform plant vigour. The pots were watered regularly once a day, and the potted soil around the base of the plants was loosened from time to time with a hand fork to avoid compacting without disturbing the plant roots.
Collection of Root Knot Nematode Samples
The samples of root knot nematodes (Meloidogyne spp.) were collected from tomato plants under irrigation in various farms with the permission of the farmers at Lake Alau in Borno. The roots of the
diseased plants showing characteristic symptoms of 15 root knot nematodes were carefully uplifted with a trowel up to 15–20 cm depth from the rhizosphere of the diseased plants together with approximately 1 kg of soil . The samples were then placed in polythene bags and brought to the laboratory for analysis.
Identification of Root Knot Nematode Species
The root knot nematode species was identified on the basis of perineal pattern characteristics of mature female as described by Eisenback et al. (1981). A pure culture of root knot nematode, Meloidogyne incognita, was raised from a single egg mass obtained from a root knot nematode-infected tomato plant. The single egg mass was propagated on the tomato plant by inoculating the tomato seedlings grown in steam-sterilized soil. Further sub-cultures were made from the initial culture to increase the nematode population .
Preparation of Inoculum
Second-stage juvenile nematodes were used as the inoculum. Eggs of Meloidogyne incognita were collected from a pure culture and maintained on tomato roots using sodium hypochlorite technique (Hussey & Barker, 1973). The eggs were placed in the tap water in a Petri dish and incubated for 24 hours at room temperature for hatching. After hatching, the second-stage juveniles were collected and larval suspension was prepared in tap water.
Chimbekujwo, I. B., Bukar, A. M. and Channya, F. K.
278 Pertanika J. Trop. Agric. Sci. 36 (3): 275 - 284 (2013)
Inoculation Procedure
The cowpea plants were inoculated two weeks after planted in the pots. The population of about 3000 juvenile nematodes per plant was used. Four holes about 2 cm deep and 1 cm wide each were made in the soil around each seedling to expose the roots. The second-stage juvenile nematode suspension was applied into each hole with a syringe and the holes were filled with moist soil. Each treatment was replicated five times and the pots were laid out in a completely randomized experimental design in the screen house. The experiment was terminated sixty days after sowing.
Data Collection
Collection of data was carried out during harvest, whereby the shoot height was ascertained using a measuring tape, the numbers of seeds per plant were counted, and the fresh weight of shoots and grain yield per plant were determined using an electronic balance. Furthermore, the populations of nematodes in the soil and roots, as well as the number of galls and gall index were also identified.
Estimation of Nematode Population in Soil
The population of nematodes in the soil was determined using modified Baermann’s funnel extraction technique (Barker, 1985).
Assessment of Galling Index
The roots were rated for the amount of galls using a rating scheme described by Ogbuji (1981), as follows:
0 = 0 gall (no infection)
1 = 1 – 3 galls (rare infection)
2 = 4 – 10 galls (light infection)
3 = 11 - 30 galls (moderate infection)
4 = 31 - 100 galls (severe infection)
5 = > 100 galls (very severe infection)
Estimation of Nematode Population in Roots
The population of nematodes in the roots was determined using the maceration method followed by Baermann’s funnel technique (Southey, 1970). The reproduction rate of nematodes was calculated by using the formula, R= Pf/Pi, where Pf represents the final nematode population and Pi represents the initial nematode population (Oostenbrink, 1966).
Measurement Plant Height
The plant height was measured from the base of the plant to the tip of the top leaf on the main shoot. Measurements were taken from three plants in each treatment and the average height was calculated and expressed in cm.
Measurement of Shoot Weight
The weight of three randomly selected fresh shoots was measured on electronic balance and the average weight was taken as the shoot weight per plant.
Estimation of Number of Seeds per Plant
The total number of seeds produced in the three plant samples were counted, and the
Management of Root Knot Nematodes (Meloidogyne incognita) on Cowpea with Plant Extracts
279Pertanika J. Trop. Agric. Sci. 36 (3): 275 - 284 (2013)
average number was taken as the number of seeds per plant.
Estimation of Cowpea Grain Yield
After threshing, the grain produce obtained from each plant was cleaned and weighed in grams on electronic balance, and the average weight for each treatment was taken as the grain yield per plant.
RESULTS AND DISCUSSION
The results showed that all the treatments significantly (P<0.001) suppressed the development of Meloidogyne incognita population in the soil as compared to the control. The highest population of 733.34 was recorded in the control treatment, while the population dropped to as low as 213.34 in the soil treated with Azadirachta indica leaf powder, representing 70.91% of reduction over the control. This was followed by the leaf powder of Cassia siamea (306.67) with 58.18% reduction, Eucalyptus gigantean (320.00) with 56.36% reduction, and Parkia biglobosa (440.00) with 40.00% reduction as compared to the control (Fig.1). The highest population of M. incognita in the roots (189.34) was recorded in the control plants, while the lowest population (24.00) representing 87.32% reduction over the control was recorded in the plants grown in the soil amended with the leaf powder of Azadirachta indca. Likewise, this was followed by Cassia siamea (37.34) with 80.28% reduction, Eucalyptus gigantea (48.00) with 74.65% reduction, and Parkia biglobosa (53.34) with 71.83% reduction as compared to the control treatment (Fig. 2).
The reproductive capacity of the nematodes was also significantly (P<0.001) affected by the treatments imposed on the plants (Fig.3). The highest rate of reproduction of Meloidogyne incognita (1.041) was observed in the control plants, which was significantly different from other treatments. The highest reduction in the reproduction rate (0.293) representing 71.85% reduction as compared to the control was recorded in plants administered with the leaf powder of Azadirachtaindica. This was followed by Cassia siamea (0.422) with 59.46% reduction, Eucalyptus gigantea (0.443) with 57.47 % reduction, and Parkia biglobosa (0.605) with 41.88% reduction as compared to the control treatment. The number of root galls incited by Meloidogyne incognita on the roots of cowpeas peaked at 107.75 in the control (Fig.4), but ranged from as low as 19.50 in the Azadirachtaindica leaf powder treated plants to 30.00 in the Parkia biglobosa leaf powder treated plants. The plants treated with Azadirachta indica leaf powder had the highest reduction efficacy (81.9%), followed by Cassia siamea leaf powder (73.78%), Eucalyptusgigantea leaf powder (73.09%) and Parkia biglobosa leaf powder (72.16%). Fresh shoot weight, shoot height and number of leaves per plant were significantly (P<0.001) higher in the pots treated with Azadirachta indica, Parkiabiglobosa, Eucalyptus gigantea and Cassia siamea than in the control treatment. The lowest shoot weight (10.18g) was recorded in the control plants, whereas the highest fresh shoot weight (46.12g) representing 353.05% increase over the

Chimbekujwo, I. B., Bukar, A. M. and Channya, F. K.
280 Pertanika J. Trop. Agric. Sci. 36 (3): 275 - 284 (2013)
0
100
200
300
400
500
600
700
800
900
Population of M. incognia/kg of soil
% R
educ
tion
Popu
latio
n
050100
150
200
250
Population of M. incognita/root system
% R
educ
tion
Popu
latio
n
0
0,2
0,4
0,6
0,81
1,2
1,4
Reproduction Factor
Rep.
Fac
tor
020406080100
120
140
No. of galls/root system
% R
educ
tion
NO
. of g
alls
Fig.
1: T
he e
ffect
s of o
rgan
ic so
il am
endm
ents
on
the
popu
latio
n of
M. i
ncog
nita
in
the
rhiz
osph
ere
of c
owpe
aFi
g.2:
The
effe
cts o
f org
anic
soil
amen
dmen
ts o
n th
e po
pula
tion
of
M. i
ncog
nita
in th
e ro
ot sy
stem
of c
owpe
a
Fig.
3: T
he e
ffect
s of o
rgan
ic so
il am
endm
ents
on
M. i
ncog
nita
repr
oduc
tion
fact
or in
the
root
syst
em o
f cow
pea
Fig.
4: T
he e
ffect
s of o
rgan
ic so
il am
endm
ents
on
gall
form
atio
n in
M
. inc
ogni
ta-in
fect
ed ro
ot sy
stem
of c
owpe
a
Management of Root Knot Nematodes (Meloidogyne incognita) on Cowpea with Plant Extracts
281Pertanika J. Trop. Agric. Sci. 36 (3): 275 - 284 (2013)
control was recorded in the plants treated with the leaf powder of Azadirachta indica.
Meanwhile, the plants treated with the leaf powder of Cassia siamea, Eucalyptus gigantea and Parkia biglobosa recorded 208.35% (31.39g), 87.33% (19.07g), and 157.17% (26.18g) of shoot weight increase respectively over the control treatment (Table 1). The lowest shoot height (10.50cm) was noted in the control plants, while the maximum shoot height (49.87cm) representing 374.95% increase over the control was recorded in the plants treated with the leaf powder of Azadirachta indica. This was followed by Cassia siamea (45.34cm) with 331.81% increase, Eucalyptus gigantea (42.20cm) with 301.9% increase and Parkia biglobosa (36.00cm) with 242.86% increase over the control treatment (Table 1). The number of seeds per plant and grain yield per plant were significantly (P<0.001) higher in the plants treated with organic materials than in the control plants. The highest number of seed per plant (49.25) was obtained from the plants treated with the leaf powder of Azadirachta indica. This was followed by Cassia siamea (44.50), Eucalyptus gigantea (36.50) and Parkia biglobosa (28.75). The lowest number of seeds per plant (10.00)
was recorded in the control plants (Table 1). The lowest grain yield (2.26g) was recorded in the control plants, while the highest grain yield per plant (10.60g) representing 369.03% increase as compared to the control was recorded in the plants treated with the leaf powder of Azadirachta indica. The plants treated with the leaf powder of Cassia siamea recorded 9.58g representing 323.89% increase, while the plants treated with the leaf powder of Eucalyptus gigantea and Parkia biglobosa recorded 225.22% (7.35g) and 192.48% (6.61g) yield increase, respectively (see Table 1).
Means in the same column followed by the same letter do not differ statistically between themselves at 5% probability level, as indicated by Duncan multiple range tests.
Figures in parentheses indicate percentage increase as compared to the control treatment.
The results of this study showed that amending the soil with the leaf powder of A. indica, P. biglobosa, E. gigantea and C. siamea suppressed the population of M. incognita both in the soil and roots of cowpea plants with a concomitant increase in growth and yield of cowpeas. These results were in agreement with the previous findings of Ahmad et al. (2007) and Adegbite
TABLE 1 Effect of organic soil amendments on the growth and yield of Meloidogyne incognita-infected cowpea plant.
Treatments Fresh Shoot wt.(g) Shoot Height (cm) No. of seeds/ plant Grain yield/ plant (g)A. indica 46.12b (353.05) 49.87de (374.95) 49.25cd (392.5) 10.60cd (369.03)C. siamea 31.39fg (208.35) 45.34fg (331.81) 44.50cd (345.0) 9.58ef (323.89)E .gigantea 19.07jl (87.33) 42.20gh (301.9) 36.50ef (265.0) 7.35gh (225.22)P. biglobos 26.18 (157.17) 36.00 (242.86) 28.75 (187.5) 6.61 (192.48)Control 10.18m 10.50m 10.00i 2.26j

Chimbekujwo, I. B., Bukar, A. M. and Channya, F. K.
282 Pertanika J. Trop. Agric. Sci. 36 (3): 275 - 284 (2013)
(2011a), who reported that application of botanicals as soil amendment causes significant reduction in root knot nematode infestation which consequently leads to the increase in growth of different plants. The nematicidal potential of Azadirachta indica found in this study was supported by Yasmin et al.’s (2003) findings, which reported that fresh extracts of seeds, leaves and barks of neem inhibited the hatching of Meloidogyne incognita. Boiled water extract of fresh neem leaves was reported to be toxic to eggs and juveniles of M. incognita (Claudius et al., 2010). The neem constituents, namely, nimbin, salanin, thionemone, azadirachtin and various flavonoids, have been reported to have a nematicidal action (Akhtar and Malik, 2000).
The results of the present study also showed that the incorporation of Eucalyptus gigantea leaf powder significantly suppressed the development of Meloidogyne incognita population both in the soil and root systems of cowpea, reduced root gall formation, and improved the growth of cowpea plant. Similar findings were also reported by Shahnazdawar et al. (2007) that aqueous and ethanol extracts of different parts of Eucalyptus gigantean, namely, leaf, stem, bark and fruit showed a nematicidal effect against Meloidogyne javanica on mung bean and chick pea plants when used as soil amendment.
The findings of this study also showed that amending the soil with Cassia siamea leaf powder significantly reduced the development of Meloidogyne incognita population in the soil and root of cowpea,
reduced root knot disease and improved growth of cowpea plant. This result was in agreement with the findings of Bello et al. (2006), who reported that water extract of seed, leaf and bark of Cassia siamea significantly inhibited larval hatch of Meloidogyne incognita.
The results of this study also showed that amending the soil with P. biglobosa leaf powder significantly reduced nematode population, as well as improved plant growth and grain yield. This result was in agreement with the findings of Fatoki and Oyedunmade (1996), who reported the effective control of Meloidogyne incognita with chopped leaves of Parkia biglobosa. Olabiyi et al. (2007) also reported that the leaf extract of Parkia biglobosa effectively inhibited the hatching of M. incognita eggs.
CONCLUSION
In conclusion, the findings of this study showed that the leaf powder of Azadirachta indica, Parkia biglobosa, Eucalyptus gigantea and Cassia siamea has strong nematicidal properties. Their addition to the soil controls the population build up of Meloidogyne incognita, which results in better growth of cowpeas. This finding is very important from the point of view of controlling the root knot nematodes affecting cowpeas since the use of synthetic nematicides by subsistence farmers is plagued with several limitations, such as prohibitive cost, lack of technical expertise in their applications, and the environmental pollution they likely cause.
Management of Root Knot Nematodes (Meloidogyne incognita) on Cowpea with Plant Extracts
283Pertanika J. Trop. Agric. Sci. 36 (3): 275 - 284 (2013)
REFERENCESAdegbite, A. A. (2011a). Assessment of Yield Loss of
Cowpea (Vigna unguiculata L.) due to Root Knot Nematode, Meloidogyne incognita under Field Conditions. American Journal ofExperimental Agriculture, 1(3), 79-85.
Adesiyan, S. O., Caveness, F. E., Adeniji, M. O., & Fawole, B. (1990). Nematode Pests of tropical crops. Heinemann Educational Books (Nigeria) Limited.
Adesiyan, S. O. (1992). Chemical Control of nematode pests of some economic crops. In proceedings of the first regional symposium of the Biology and control of nematode pests of food crops in Africa University of Ibadan, Nigeria.
Ahmad, F., Rather, M. A., & Siddiqui, M.A. (2007). Impact of organic soil amendments and nematicides on Meloidogyne javanica infecting tomato. Indian Journal of Nematology, 37, 55-57.
Akhtar, M., & Malik, A. (2000). Role of organic soil amendments and soil organisms in the biological control of plant-parasitic nematodes: a review. Biores. Technol., 74, 35-47.
Anastasiadis, I. A., Giannakou, I. O., Prophetou-Athanasiadou, D. A., & Gowen, D. A. (2008). The combined effect of the application of a biocontrol agent Paecilomyces lilacinus, with various practices for the control of root-knot nematodes. Crop Protection, 27, 352-361.
Barker, K. R. (1985). Nematode extraction and bioassays. In K. R. Barker, C. C., Carter & J. N. Sasser (Eds.), An Advance Treatise on Meloidogyne (Vol. 2) (pp. 19-35). Methodology. North Carolina State University Graphics.
Bello, L. Y., Chindo, P. S., Marley, M. D., & Alegbejo, M. D. (2006). Effect of some plant extracts on egg hatching of Meloidogyne incognita. Archives of Phytopathology and Plant Protection, 39, 253-257.
Caveness, F. E. (1992). Nematological Researchat IITA. A summary of investigationconducted between 1969 and 1988. In J. Lowe (Ed). Plant health management Researchmonograph p. 17-19.
Claudius-Cole, A. O., Aminu, A. E., & Fawole, B. (2010). Evaluation of plant extracts in the management of rootknotnematode Meloidogyne incognita on cowpea [Vigna unguiculata (L) Walp] Mycopath, 8(2), 53-60.
Eisenback, J. D., Hirschmann, H., Sasser, J. N., & Trianttaphyllou, A.C. (1981).A Guide to the Four Most Common Species of Root Knot Nematodes (Meloidogyne species) with Pictorial Key. International Meloidogyne Project. Department of Plant Pathology, North Carolina University, Raleigh, N.C.
Fatoki, O. K., & Oyedunmade, E. E. A. (1996). Controlling effect of some plant leaves on the root knot nematode, Meloidogyne incognita attacking tomato. Nigerian Journal of Plant Protection, 16, 59 – 65.
Hussey, R. S., & Barker, K. R. (1973). A comparison of methods of collecting inocula of Meloidogyne spp including a new technique. Plant Disease Reporter, 57, 1025 – 1028.
Iheukwumere, C. C., Atiri, G. I., Fawole, B., & Dashiell, K. E. (1995). Evaluation of some commonly grown soybean cultivars for resistance to root-knot nematodes and soybean mosaic virus in Nigeria. Fitopatologia Brasileria, 20, 190-193.
Langyintuo, A. S., Lowenberg-De Boer, J., Faye, M., Lambert, D., Ibro, G., Moussa, B., Kergna, A., Kushwaha, S., Musa, S., & Ntoukam, G. (2000). Cowpea Supply and Demand in West and Central Africa. In the Proceedings of the Third world Cowpea Conference. International Institute of Tropical Agriculture (IITA), Ibadan, Nigeria. September 4-7, 2000. 2000: 1-35.
Chimbekujwo, I. B., Bukar, A. M. and Channya, F. K.
284 Pertanika J. Trop. Agric. Sci. 36 (3): 275 - 284 (2013)
Nielson, S. S., Ohler, T. A., & Mitchell, C. A. (1997). Cowpea leaves for human consumption. In B. B. Singh, D. R. Mohan Raj, K. E. Dashiell, & L. E. N. Jackaj (Eds), Advances in Cowpea Research. Co-publication IITA and JIRCAS, IITA, Nigeria.
Ogbuji, R. O. (1981). Infectivity of three Meloidogyne sp. on soyabean in Nigeria. Dertropenlandwrit, 88, 149-152.
Olabiyi, T. I., W. B. Akanbi, & Adepoju, I. O. (2007).Control of certain nematode pest with different organic manure on cowpea. American-Eurasian Journal of Agricultural and Environmental Sciences, 2(5), 523- 527.
Olowe, T. (2009). Cowpea Germplasm Resistant toMeloidogyne arenaria Race 1, Meloidogyne incognita Race 4 and Meloidogyne javanica. European Journal of Scientific Research, 28(3), 338-350.
Oostenbrink, M. (1966). Major characteristics of the relation between nematodes and plants. Meded. Landbouwhogesch. Wageningen, 66, 4 – 46.
Rachie, K. O., & Rawal, K. A. (1975). Integrated approaches to improving cowpea, Vigna unguiculata (L) Walp. Technical Bulletin 1975, p. 5.
Shahnazdawar, S., Younus, M., & Javidzaki, M. (2007). Use of Eucalyptus spp.in the control of Meloidogyne javanica root knot nematode. Pakistan Journal of Botany, 39(6), 2209-2214.
Southey, J. F. (1970). Laboratory methods for work with plant and soil nematodes. Ministry of Agriculture, Fisheries and Food. Technical Bulletin 2. Her Majesty’s Stationary Office.
Yasmin, L. Rashid, M. H. Nazim Uddin, M. Hossain, M. S. Hossain, M. E., & Ahmed M. U. (2003). Use of Neem Extract in Controlling Root-knot Nematode (Meloidogyne javanica) of Sweet-gourd. Plant Pathology Journal, 2, 161-168.
Pertanika J. Trop. Agric. Sci. 36 (3): 285 - 288 (2013)
ISSN: 1511-3701 © Universiti Putra Malaysia Press
TROPICAL AGRICULTURAL SCIENCEJournal homepage: http://www.pertanika.upm.edu.my/
Article history:Received: 14 June 2012Accepted: 28 August 2012
ARTICLE INFO
E-mail addresses: [email protected] (Sringam, S.) [email protected] (Suwanathada, P.), [email protected] (Sangkaew A.), [email protected] (Thuangsanthia, A.), [email protected] (Leingchareon, N.)* Corresponding author
Case Study
Electroejaculation in a Perineal Urethrostomy Goat
Sringam, S.1*, Suwanathada, P.1, Sangkaew A.1, Thuangsanthia, A.2 and Leingchareon, N.2
1Department of Veterinary Surgery and Theriogenology, Faculty of Veterinary Medicine, Khon Kaen University, Khon Kaen -40002, Thailand.2Embryo Transfer Technology Research Center, Department of Livestock Development, Pakchong, Nakhonratchasima -30130, Thailand
ABSTRACT
This report describes semen collection by electroejaculation (EE) method from an urethrostomy goat. The buck used in this study underwent the urethrostomy four months before being incapacitated. The semen was collected by EE two times at 30 min apart. Generally, all the semen characteristics were very poor. The semen volume, concentration, motility and viability of the first ejaculate were higher than those of the second ejaculation. EE was useful for semen collection from a genetically superior goat, incapacitated due to urethrostomy.
Keywords: Electroejaculation, urethrostomy, goat
INTRODUCTION
Semen collection is an essential step for utilizing the artificial insemination technology in farm animals. In collecting
the semen from the males, there are several methods used for various situations, such as artificial vagina (AV), electroejaculation (EE) and epididymal spermatozoa recovery (from the dead animals) (Memon et al., 1986; Ritar et al., 1992; Datta et al., 2009). Basically, the use of AV is considered as the best method for semen collection in domestic animals. However, the EE method has been employed successfully both in domestic and wildlife animals when

Sringam, S., Suwanathada, P., Sangkaew A., Thuangsanthia, A. and Leingchareon, N.
286 Pertanika J. Trop. Agric. Sci. 36 (3): 285 - 288 (2013)
the AV method is inapplicable. The EE method can be used for various purposes, such as in animals having problems with mounting due to musculoskeletal diseases or injury, animals outside their breeding season, or paralyzed animals due to spinal cord injury. This study reports a buck that was incapacitated and unable to serve the does after recovering from its perineal urethrostomy, despite having reasonably good libido. Therefore, the EE method was applied to collect the semen from this valuable buck.
CASE DESCRIPTION
Case History
A 30-month-old male Kalahali Red goat weighing 65 kg belonging to the Embryo Transfer Technology Research Centre, Department of Livestock Development, Nakhon Ratchasima, Thailand, was used in this study. It was fed with a commercial diet (16% protein, CP, Thailand) at approximately 600g/day and free access to dry Pangola grass, water and vitamin/mineral block. The goat semen was collected by using AV once a week to produce frozen semen and distributed to the farmers for 6 months. The post-thaw motility of frozen semen was at least 40%. During the last 4 months, the animal had developed a severe difficulty in urinating. After a complete physical examination, X-ray and ultrasonography, perineal urethrostomy without penile transection was performed at the Veterinary Teaching Hospital, the Faculty of Veterinary Medicine, Khon Kaen University, Thailand.
A new urethral opening was reconstructed at the perineal area of the animal.
Electroejaculation Procedure
After surgery, the buck urinated via the new urethral opening and had a good health. Although the buck regained its libido completely, semen collection with AV was not successful. Semen collection was conducted in February 2012, 4 months after the surgery. The buck was subjected to electroejaculation procedure as previously described by Sundararaman et al. (2007). Briefly, the buck was restrained in a lateral recumbency position, faeces were removed and the urethral opening was cleaned. A lubricated rectal probe (2.5 cm in diameter with three longitudinal electrodes) was inserted approximately 10 cm into the rectum with the electrodes facing down and then connected to an electro-ejaculator. By using the manual control knob of the instrument, the stimulation power was increased from 0 to 20 mA and held for 2 to 3 sec and brought to 0. This procedure was repeatedly performed after a short resting period, with increasing stimulation power by 20 mA in every attempt until ejaculation occurred. This buck was able to ejaculate when using the stimulation power at 40 mA. Semen was collected into a 15 ml sterile tube, which was immediately evaluated for appearance and volume. Equal volume of egg yolk tris (3.025 g tris (hydroxymethyl)-aminomethane, 1.7 g sodium citrate monohydrate, 1.25 g glucose, 100 mg benzylpenicillin, 100
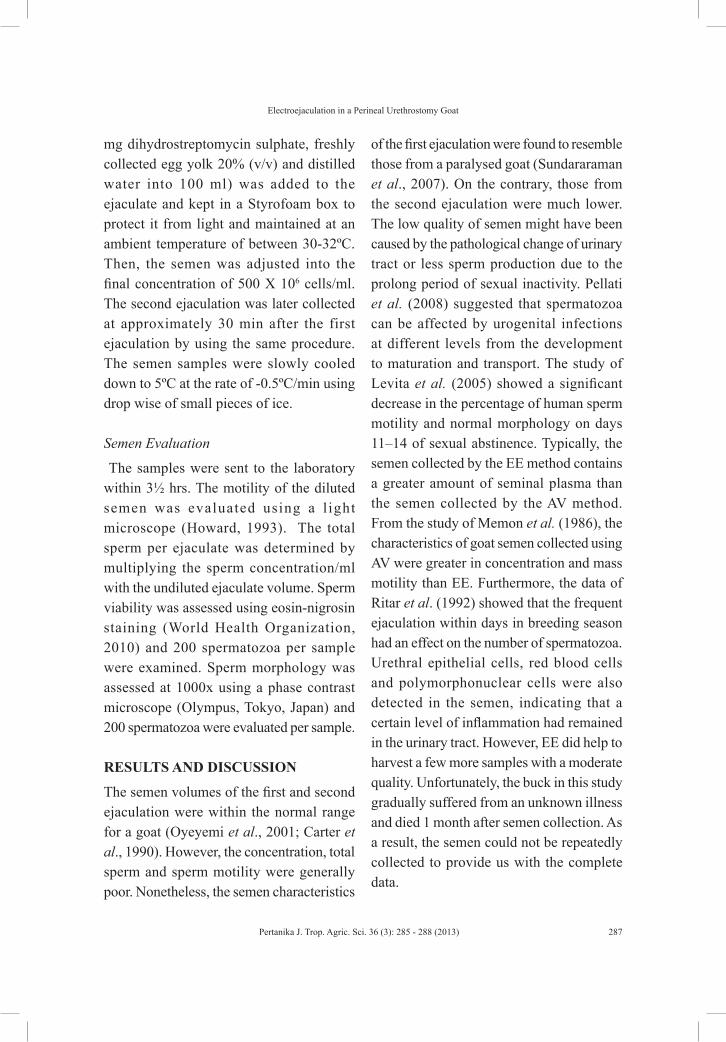
Electroejaculation in a Perineal Urethrostomy Goat
287Pertanika J. Trop. Agric. Sci. 36 (3): 285 - 288 (2013)
mg dihydrostreptomycin sulphate, freshly collected egg yolk 20% (v/v) and distilled water into 100 ml) was added to the ejaculate and kept in a Styrofoam box to protect it from light and maintained at an ambient temperature of between 30-32ºC. Then, the semen was adjusted into the final concentration of 500 X 106 cells/ml. The second ejaculation was later collected at approximately 30 min after the first ejaculation by using the same procedure. The semen samples were slowly cooled down to 5ºC at the rate of -0.5ºC/min using drop wise of small pieces of ice.
Semen Evaluation
The samples were sent to the laboratory within 3½ hrs. The motility of the diluted semen was evaluated using a l ight microscope (Howard, 1993). The total sperm per ejaculate was determined by multiplying the sperm concentration/ml with the undiluted ejaculate volume. Sperm viability was assessed using eosin-nigrosin staining (World Health Organization, 2010) and 200 spermatozoa per sample were examined. Sperm morphology was assessed at 1000x using a phase contrast microscope (Olympus, Tokyo, Japan) and 200 spermatozoa were evaluated per sample.
RESULTS AND DISCUSSION
The semen volumes of the first and second ejaculation were within the normal range for a goat (Oyeyemi et al., 2001; Carter et al., 1990). However, the concentration, total sperm and sperm motility were generally poor. Nonetheless, the semen characteristics
of the first ejaculation were found to resemble those from a paralysed goat (Sundararaman et al., 2007). On the contrary, those from the second ejaculation were much lower. The low quality of semen might have been caused by the pathological change of urinary tract or less sperm production due to the prolong period of sexual inactivity. Pellati et al. (2008) suggested that spermatozoa can be affected by urogenital infections at different levels from the development to maturation and transport. The study of Levita et al. (2005) showed a significant decrease in the percentage of human sperm motility and normal morphology on days 11–14 of sexual abstinence. Typically, the semen collected by the EE method contains a greater amount of seminal plasma than the semen collected by the AV method. From the study of Memon et al. (1986), the characteristics of goat semen collected using AV were greater in concentration and mass motility than EE. Furthermore, the data of Ritar et al. (1992) showed that the frequent ejaculation within days in breeding season had an effect on the number of spermatozoa. Urethral epithelial cells, red blood cells and polymorphonuclear cells were also detected in the semen, indicating that a certain level of inflammation had remained in the urinary tract. However, EE did help to harvest a few more samples with a moderate quality. Unfortunately, the buck in this study gradually suffered from an unknown illness and died 1 month after semen collection. As a result, the semen could not be repeatedly collected to provide us with the complete data.
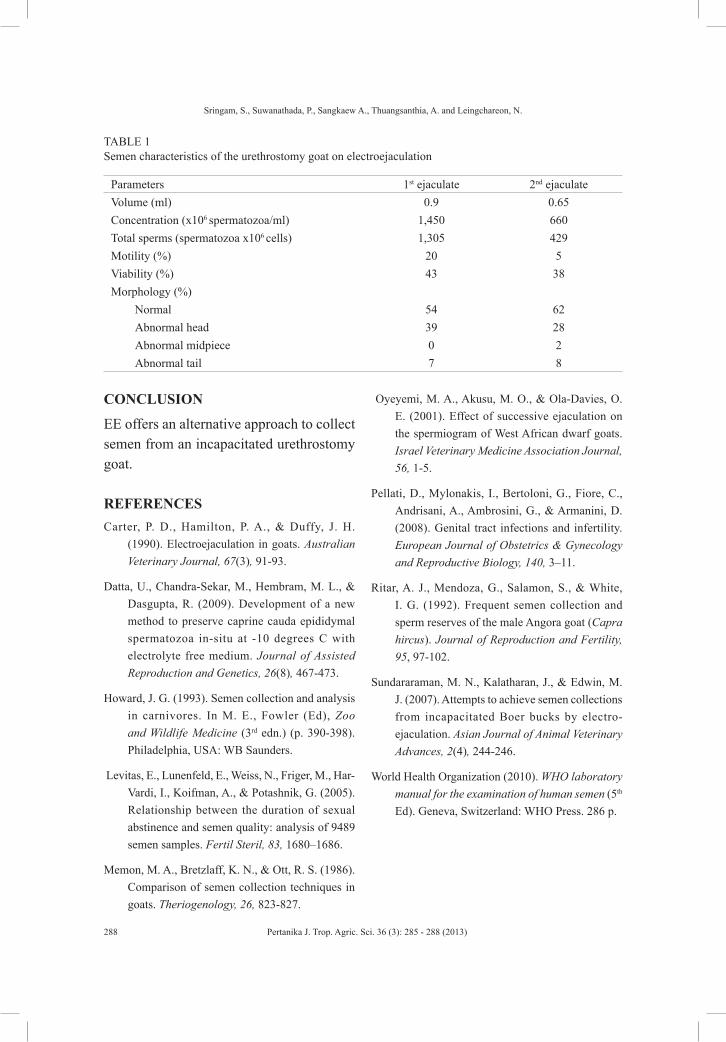
Sringam, S., Suwanathada, P., Sangkaew A., Thuangsanthia, A. and Leingchareon, N.
288 Pertanika J. Trop. Agric. Sci. 36 (3): 285 - 288 (2013)
CONCLUSION
EE offers an alternative approach to collect semen from an incapacitated urethrostomy goat.
REFERENCESCarter, P. D., Hamilton, P. A., & Duffy, J. H.
(1990). Electroejaculation in goats. Australian Veterinary Journal, 67(3), 91-93.
Datta, U., Chandra-Sekar, M., Hembram, M. L., & Dasgupta, R. (2009). Development of a new method to preserve caprine cauda epididymal spermatozoa in-situ at -10 degrees C with electrolyte free medium. Journal of Assisted Reproduction and Genetics, 26(8), 467-473.
Howard, J. G. (1993). Semen collection and analysis in carnivores. In M. E., Fowler (Ed), Zoo and Wildlife Medicine (3rd edn.) (p. 390-398). Philadelphia, USA: WB Saunders.
Levitas, E., Lunenfeld, E., Weiss, N., Friger, M., Har-Vardi, I., Koifman, A., & Potashnik, G. (2005). Relationship between the duration of sexual abstinence and semen quality: analysis of 9489 semen samples. Fertil Steril, 83, 1680–1686.
Memon, M. A., Bretzlaff, K. N., & Ott, R. S. (1986). Comparison of semen collection techniques in goats. Theriogenology, 26, 823-827.
Oyeyemi, M. A., Akusu, M. O., & Ola-Davies, O. E. (2001). Effect of successive ejaculation on the spermiogram of West African dwarf goats. Israel Veterinary Medicine Association Journal, 56, 1-5.
Pellati, D., Mylonakis, I., Bertoloni, G., Fiore, C., Andrisani, A., Ambrosini, G., & Armanini, D. (2008). Genital tract infections and infertility. European Journal of Obstetrics & Gynecology and Reproductive Biology, 140, 3–11.
Ritar, A. J., Mendoza, G., Salamon, S., & White, I. G. (1992). Frequent semen collection and sperm reserves of the male Angora goat (Capra hircus). Journal of Reproduction and Fertility, 95, 97-102.
Sundararaman, M. N., Kalatharan, J., & Edwin, M. J. (2007). Attempts to achieve semen collections from incapacitated Boer bucks by electro-ejaculation. Asian Journal of Animal Veterinary Advances, 2(4), 244-246.
World Health Organization (2010). WHO laboratory manual for the examination of human semen (5th Ed). Geneva, Switzerland: WHO Press. 286 p.
TABLE 1 Semen characteristics of the urethrostomy goat on electroejaculation
Parameters 1st ejaculate 2nd ejaculateVolume (ml) 0.9 0.65Concentration (x106 spermatozoa/ml) 1,450 660Total sperms (spermatozoa x106 cells) 1,305 429Motility (%) 20 5Viability (%) 43 38Morphology (%)
Normal 54 62Abnormal head 39 28Abnormal midpiece 0 2Abnormal tail 7 8

REFEREES FOR THE PERTANIKA JOURNAL OF TROPICAL AGRICULTURAL SCIENCE
VOL. 36(3) AUG. 2013
The Editorial Board of the Journal of Tropical Agricultural Science wishes to thank the following for acting as referees for manuscripts published in this issue of JTAS.
While every effort has been made to include a complete list of referees for the period stated above, however if any name(s) have been omitted unintentionally or spelt incorrectly, please notify the Chief Executive Editor, Pertanika Journals at [email protected].
Any inclusion or exclusion of name(s) on this page does not commit the Pertanika Editorial Office, nor the UPM Press or the University to provide any liability for whatsoever reason.
Special Acknowledgement
The JTAS Editorial Board gratefully acknowledges the assistance of Doreen Dillah, who served as the English language editor for this issue.
Anuchai Pinyopummin (Kasetsart University, Thailand)
Baharuddin Salleh (USM, Malaysia)
Dahlan Ismail (UPM, Malaysia)
Faizah Shaharom (UMT, Malaysia)
Hadi Hajarian (Razi University, Iran)
Jugah Kadir (UPM, Malaysia)
Mohd Zamri Saad (UPM, Malaysia)
Mojtaba Dashtizad (National Institute of Genetic Engineering and Biotechnology, Iran)
Najiah Musa@Zakaria (UMT, Malaysia)
UPM- Universiti Putra MalaysiaUM- Universiti MalayaUSM- Universiti Sains MalaysiaUMT- Universiti Malaysia Terengganu
Odunsi Adeyinka Adeniyi (Ladoke Akintola University of Technology, Nigeria)
Rajinder Singh (Malaysia Palm Oil Board, Malaysia)
Shaik Mohd Amin (UPM, Malaysia)
Sundararaman M. N. (Madras Veterinary College, India)
Tan Soon Guan (UPM, Malaysia)
Tan Yee How (UPM, Malaysia)
Yong Hoi Sen (UM, Malaysia)
Zary Shariman Yahaya (USM, Malaysia)

PertanikaOur goal is to bring high quality research to the widest possible audience
Journal of Tropical Agricultural Science
INSTRUCTIONS TO AUTHORS(Manuscript Preparation & Submission Guidelines)
Revised: February 2013
We aim for excellence, sustained by a responsible and professional approach to journal publishing. We value and support our authors in the research community.
Please read the guidelines and follow these instructions carefully; doing so will ensure that the publication of your manuscript is as rapid and efficient as possible. The Editorial Board reserves the right to return manuscripts that are not prepared in accordance with these guidelines.
About the JournalPertanika is an international peer-reviewed journal devoted to the publication of original papers, and it serves as a forum for practical approaches to improving quality in issues pertaining to tropical agriculture and its related fields. Pertanika began publication in 1978 as a Journal of Tropical Agricultural Science and became a leading agricultural journal in Malaysia. After 29 years as a multidisciplinary journal, the revamped Journal of Tropical Agricultural Science (JTAS) is now focusing on tropical agricultural research. Other Pertanika series include Journal of Science and Technology (JST) and Journal of Social Sciences and Humanities (JSSH).
JTAS is published in English and it is open to authors around the world regardless of the nationality. It is currently published four times a year, i.e. in February, May, August and November.
Goal of PertanikaOur goal is to bring the highest quality research to the widest possible audience.
Quality We aim for excellence, sustained by a responsible and professional approach to journal publishing. Submissions are guaranteed to receive a decision within 12 weeks. The elapsed time from submission to publication for the articles averages 5-6 months.
Indexing of PertanikaPertanika is now over 33 years old; this accumulated knowledge has resulted in Pertanika JTAS being indexed in SCOPUS (Elsevier), Thomson (ISI) Web of Knowledge (BIOSIS & CAB Abstracts), EBSCO, DOAJ, Google Scholar, CABI, AGRICOLA, ISC and MyAIS.
Future visionWe are continuously improving access to our journal archives, content, and research services. We have the drive to realise exciting new horizons that will benefit not only the academic community, but society itself. We also have views on the future of our journals. The emergence of the online medium as the predominant vehicle for the ‘consumption’ and distribution of much academic research will be the ultimate instrument in the dissemination of research news to our scientists and readers.
Aims and scope
Pertanika Journal of Tropical Agricultural Science aims to provide a forum for high quality research related to tropical agricultural research. Areas relevant to the scope of the journal include: agricultural biotechnology, biochemistry, biology, ecology, fisheries, forestry, food sciences, genetics, microbiology, pathology and management, physiology, plant and animal sciences, production of plants and animals of economic importance, and veterinary medicine.
Editorial StatementPertanika is the official journal of Universiti Putra Malaysia. The abbreviation for Pertanika Journal of Tropical Agricultural Science is Pertanika J. Trop. Agric. Sci.
Guidelines for AuthorsPublication policiesPertanika policy prohibits an author from submitting the same manuscript for concurrent consideration by two or more publications. It prohibits as well publication of any manuscript that has already been published either in whole or substantial part elsewhere. It also does not permit publication of manuscript that has been published in full in Proceedings. Please refer to Pertanika’s Code of Ethics for full details.
Editorial processAuthors are notified on receipt of a manuscript and upon the editorial decision regarding publication.
Manuscript review: Manuscripts deemed suitable for publication are sent to the Editorial Board members and/or other reviewers. We encourage authors to suggest the names of possible reviewers. Notification of the editorial decision is usually provided within to eight to ten weeks from the receipt of manuscript. Publication of solicited manuscripts is not guaranteed. In most cases, manuscripts are accepted conditionally, pending an author’s revision of the material.
Author approval: Authors are responsible for all statements in articles, including changes made by editors. The liaison author must be available for consultation with an editor of The Journal to answer questions during the editorial process and to approve the edited copy. Authors receive edited typescript (not galley proofs) for final approval. Changes cannot be made to the copy after the edited version has been approved.
Manuscript preparationPertanika accepts submission of mainly four types of manuscripts. Each manuscript is classified as regular or original articles, short communications, reviews, and proposals for special issues. Articles must be in English and they must be competently written and argued in clear and concise grammatical English. Acceptable English usage and syntax are expected. Do not use slang, jargon, or obscure abbreviations or phrasing. Metric measurement is preferred; equivalent English measurement may be included in parentheses. Always provide the complete form of an acronym/abbreviation the first time it is presented in the text. Contributors are strongly recommended to have the manuscript checked by a colleague with ample experience in writing English manuscripts or an English language editor.
Linguistically hopeless manuscripts will be rejected straightaway (e.g., when the language is so poor that one cannot be sure of what the authors really mean). This process, taken by authors before submission, will greatly facilitate reviewing, and thus publication if the content is acceptable.
The instructions for authors must be followed. Manuscripts not adhering to the instructions will be returned for revision without review. Authors should prepare manuscripts according to the guidelines of Pertanika.
1. Regular articleDefinition: Full-length original empirical investigations, consisting of introduction, materials and methods, results and discussion, conclusions. Original work must provide references and an explanation on research findings that contain new and significant findings.
Size: Should not exceed 5000 words or 8-10 printed pages (excluding the abstract, references, tables and/or figures). One printed page is roughly equivalent to 3 type-written pages.
2. Short communicationsDefinition: Significant new information to readers of the Journal in a short but complete form. It is suitable for the publication of technical advance, bioinformatics or insightful findings of plant and animal development and function.
Size: Should not exceed 2000 words or 4 printed pages, is intended for rapid publication. They are not intended for publishing preliminary results or to be a reduced version of Regular Papers or Rapid Papers.
3. Review articleDefinition: Critical evaluation of materials about current research that had already been published by organizing, integrating, and evaluating previously published materials. Re-analyses as meta-analysis and systemic reviews are encouraged. Review articles should aim to provide systemic overviews, evaluations and interpretations of research in a given field.
Size: Should not exceed 4000 words or 7-8 printed pages.
4. Special issuesDefinition: Usually papers from research presented at a conference, seminar, congress or a symposium.
Size: Should not exceed 5000 words or 8-10 printed pages.
5. OthersDefinition: Brief reports, case studies, comments, Letters to the Editor, and replies on previously published articles may be considered.
Size: Should not exceed 2000 words or up to 4 printed pages.
With few exceptions, original manuscripts should not exceed the recommended length of 6 printed pages (about 18 typed pages, double-spaced and in 12-point font, tables and figures included). Printing is expensive, and, for the Journal, postage doubles when an issue exceeds 80 pages. You can understand then that there is little room for flexibility.
Long articles reduce the Journal’s possibility to accept other high-quality contributions because of its 80-page restriction. We would like to publish as many good studies as possible, not only a few lengthy ones. (And, who reads overly long articles anyway?) Therefore, in our competition, short and concise manuscripts have a definite advantage.
FormatThe paper should be formatted in one column format with at least 4cm margins and 1.5 line spacing throughout. Authors are advised to use Times New Roman 12-point font. Be especially careful when you are inserting special characters, as those inserted in different fonts may be replaced by different characters when converted to PDF files. It is well known that ‘µ’ will be replaced by other characters when fonts such as ‘Symbol’ or ‘Mincho’ are used.
A maximum of eight keywords should be indicated below the abstract to describe the contents of the manuscript. Leave a blank line between each paragraph and between each entry in the list of bibliographic references. Tables should preferably be placed in the same electronic file as the text. Authors should consult a recent issue of the Journal for table layout.
Every page of the manuscript, including the title page, references, tables, etc. should be numbered. However, no reference should be made to page numbers in the text; if necessary, one may refer to sections. Underline words that should be in italics, and do not underline any other words.
We recommend that authors prepare the text as a Microsoft Word file.
1. Manuscripts in general should be organised in the following order:
o Page 1: Running title. (Not to exceed 60 characters, counting letters and spaces). This page should only contain the running title of your paper. The running title is an abbreviated title used as the running head on every page of the manuscript.
In addition, the Subject areas most relevant to the study must be indicated on this page. Select the appropriate subject areas from the Scope of the Journals provided in the Manuscript Submission Guide
o A list of number of black and white / colour figures and tables should also be indicated on this page. Figures submitted in color will be printed in colour. See “5. Figures & Photographs” for details.
o Page 2: Author(s) and Corresponding author information. This page should contain the full title of your paper with name(s) of all the authors, institutions and corresponding author’s name, institution and full address (Street address, telephone number (including extension), hand phone number, fax number and e-mail address) for editorial correspondence. The names of the authors must be abbreviated following the international naming convention. e.g. Salleh, A.B., Tan, S.G., or Sapuan, S.M.
Authors’ addresses. Multiple authors with different addresses must indicate their respective addresses separately by superscript numbers:
George Swan1 and Nayan Kanwal2 1Department of Biology, Faculty of Science, Duke University, Durham, North Carolina, USA. 2Office of the Deputy Vice Chancellor (R&I), Universiti Putra Malaysia, Serdang, Malaysia.
o Page 3: This page should repeat the full title of your paper with only the Abstract (the abstract should be less than 250 words for a Regular Paper and up to 100 words for a Short Communication). Keywords must also be provided on this page (Not more than eight keywords in alphabetical order).
o Page 4 and subsequent pages: This page should begin with the Introduction of your article and the rest of your paper should follow from page 5 onwards.
Abbreviations. Define alphabetically, other than abbreviations that can be used without definition. Words or phrases that are abbreviated in the introduction and following text should be written out in full the first time that they appear in the text, with each abbreviated form in parenthesis. Include the common name or scientific name, or both, of animal and plant materials.
Footnotes. Current addresses of authors if different from heading.
2. Text. Regular Papers should be prepared with the headings Introduction, Materials and Methods, Results and Discussion, Conclusions in this order. Short Communications should be prepared according to “8. Short Communications.” below.
3. Tables. All tables should be prepared in a form consistent with recent issues of Pertanika and should be numbered consecutively with Arabic numerals. Explanatory material should be given in the table legends and footnotes. Each table should be prepared on a separate page. (Note that when a manuscript is accepted for publication, tables must be submitted as data - .doc, .rtf, Excel or PowerPoint file- because tables submitted as image data cannot be edited for publication.)
4. Equations and Formulae. These must be set up clearly and should be typed triple spaced. Numbers identifying equations should be in square brackets and placed on the right margin of the text.
5. Figures & Photographs. Submit an original figure or photograph. Line drawings must be clear, with high black and white contrast. Each figure or photograph should be prepared on a separate sheet and numbered consecutively with Arabic numerals. Appropriate sized numbers, letters and symbols should be used, no smaller than 2 mm in size after reduction to single column width (85 mm), 1.5-column width (120 mm) or full 2-column width (175 mm). Failure to comply with these specifications will require new figures and delay in publication. For electronic figures, create your figures using applications that are capable of preparing high resolution TIFF files acceptable for publication. In general, we require 300 dpi or higher resolution for coloured and half-tone artwork and 1200 dpi or higher for line drawings to be submitted in separate electronic files.
For review, you may attach low-resolution figures, which are still clear enough for reviewing, to keep the file of the manuscript under 5 MB. Illustrations may be produced at no extra cost in colour at the discretion of the Publisher; the author could be charged Malaysian Ringgit 50 for each colour page.
6. References. Literature citations in the text should be made by name(s) of author(s) and year. For references with more than two authors, the name of the first author followed by ‘et al.’ should be used.
Swan and Kanwal (2007) reported that …The results have been interpreted (Kanwal et al., 2009).
o References should be listed in alphabetical order, by the authors’ last names. For the same author, or for the same set of authors, references should be arranged chronologically. If there is more than one publication in the same year for the same author(s), the letters ‘a’, ‘b’, etc., should be added to the year.
o When the authors are more than 11, list 5 authors and then et al.
o Do not use indentations in typing References. Use one line of space to separate each reference. The name of the journal should be written in full. For example:
Jalaludin, S. (1997a). Metabolizable energy of some local feeding stuff. Tumbuh, 1, 21-24.Jalaludin, S. (1997b). The use of different vegetable oil in chicken ration. Malayan Agriculturist, 11,
29-31.Tan, S. G., Omar, M. Y., Mahani, K. W., Rahani, M., & Selvaraj, O. S. (1994). Biochemical genetic
studies on wild populations of three species of green leafhoppers Nephotettix from Peninsular Malaysia. Biochemical Genetics, 32, 415 - 422.
o In case of citing an author(s) who has published more than one paper in the same year, the papers should be distinguished by addition of a small letter as shown above, e.g. Jalaludin (1997a); Jalaludin (1997b).
o Unpublished data and personal communications should not be cited as literature citations, but given in the text in parentheses. ‘In press’ articles that have been accepted for publication may be cited in References. Include in the citation the journal in which the ‘in press’ article will appear and the publication date, if a date is available.
7. Examples of other reference citations:
Monographs: Turner, H. N., & Yong, S. S. Y. (2006). Quantitative Genetics in Sheep Breeding. Ithaca: Cornell University Press.
Chapter in Book: Kanwal, N .D. S. (1992). Role of plantation crops in Papua New Guinea economy. In Angela R. McLean (Ed.), Introduction of livestock in the Enga province PNG (p. 221-250). United Kingdom: Oxford Press.
8. Proceedings: Kanwal, N. D. S. (2001). Assessing the visual impact of degraded land management with landscape design software. In Kanwal, N. D. S., & Lecoustre, P. (Eds.), International forum for Urban Landscape Technologies (p. 117-127). Lullier, Geneva, Switzerland: CIRAD Press.

9. Short Communications should include Introduction, Materials and Methods, Results and Discussion, Conclusions in this order. Headings should only be inserted for Materials and Methods. The abstract should be up to 100 words, as stated above. Short Communications must be 5 printed pages or less, including all references, figures and tables. References should be less than 30. A 5 page paper is usually approximately 3000 words plus four figures or tables (if each figure or table is less than 1/4 page).
*Authors should state the total number of words (including the Abstract) in the cover letter. Manuscripts that do not fulfill these criteria will be rejected as Short Communications without review.
STYLE OF THE MANUSCRIPTManuscripts should follow the style of the latest version of the Publication Manual of the American Psychological Association (APA). The journal uses American or British spelling and authors may follow the latest edition of the Oxford Advanced Learner’s Dictionary for British spellings.
SUBMISSION OF MANUSCRIPTSAll articles should be submitted electronically using the ScholarOne web-based system. ScholarOne, a Thomson Reuters product provides comprehensive workflow management systems for scholarly journals. For more information, go to our web page and click “Online Submission”.
Alternatively, you may submit the electronic files (cover letter, manuscript, and the Manuscript Submission Kit comprising Declaration and Referral forms) via email directly to the Chief Executive Editor. If the files are too large to email, mail a CD containing the files. The Manuscript Submission Guide and Submission Kit are available from the Pertanika’s home page at http://www.pertanika.upm.edu.my/home.php or from the Executive Editor’s office upon request.
All articles submitted to the journal must comply with these instructions. Failure to do so will result in return of the manuscript and possible delay in publication.
Please do not submit manuscripts to the editor-in-chief or to any other office directly. All manuscripts must be submitted through the chief executive editor’s office to be properly acknowledged and rapidly processed at the address below:
Dr. Nayan KANWALChief Executive Editor Pertanika Journals, UPM PressOffice of the Deputy Vice Chancellor (R&I)IDEA Tower II, UPM-MTDC Technology CentreUniversiti Putra Malaysia43400 UPM, Serdang, Selangor Malaysia
E-mail: [email protected]; [email protected]: + 603-8947 1622.or visit our website at http://www.pertanika.upm.edu.my/home.php for further information.
Authors should retain copies of submitted manuscripts and correspondence, as materials cannot be returned. Authors are required to inform the Chief Executive Editor of any change of address which occurs whilst their papers are in the process of publication.
Cover letter
All submissions must be accompanied by a cover letter detailing what you are submitting. Papers are accepted for publication in the journal on the understanding that the article is original and the content has not been published or submitted for publication elsewhere. This must be stated in the cover letter.
The cover letter must also contain an acknowledgement that all authors have contributed significantly, and that all authors are in agreement with the content of the manuscript.
The cover letter of the paper should contain (i) the title; (ii) the full names of the authors; (iii) the addresses of the institutions at which the work was carried out together with (iv) the full postal and email address, plus facsimile and telephone numbers of the author to whom correspondence about the manuscript should be sent. The present address of any author, if different from that where the work was carried out, should be supplied in a footnote.
As articles are double-blind reviewed, material that might identify authorship of the paper should be placed on a cover sheet.
Peer reviewPertanika follows a double-blind peer-review process. Peer reviewers are experts chosen by journal editors to provide written assessment of the strengths and weaknesses of written research, with the aim of improving the reporting of research and identifying the most appropriate and highest quality material for the journal.
In the peer-review process, three referees independently evaluate the scientific quality of the submitted manuscripts. Authors are encouraged to indicate in the Referral form using the Manuscript Submission Kit the names of three potential reviewers, but the editors will make the final choice. The editors are not, however, bound by these suggestions.
Manuscripts should be written so that they are intelligible to the professional reader who is not a specialist in the particular field. They should be written in a clear, concise, direct style. Where contributions are judged as acceptable for publication on the basis of content, the Editor reserves the right to modify the typescripts to eliminate ambiguity and repetition and improve communication between author and reader. If extensive alterations are required, the manuscript will be returned to the author for revision.
The Journal’s review processWhat happens to a manuscript once it is submitted to Pertanika? Typically, there are seven steps to the editorial review process:
1. The executive editor and the editorial board examine the paper to determine whether it is appropriate for the journal and should be reviewed. If not appropriate, the manuscript is rejected outright and the author is informed.
2. The executive editor sends the article-identifying information having been removed, to three reviewers. Typically, one of these is from the Journal’s editorial board. Others are specialists in the subject matter represented by the article. The executive editor asks them to complete the review in three weeks and encloses two forms: (a) referral form B and (b) reviewer’s comment form along with reviewer’s guidelines. Comments to authors are about the appropriateness and adequacy of the theoretical or conceptual framework, literature review, method, results and discussion, and conclusions. Reviewers often include suggestions for strengthening of the manuscript. Comments to the editor are in the nature of the significance of the work and its potential contribution to the literature.
3. The executive editor, in consultation with the editor-in-chief, examines the reviews and decides whether to reject the manuscript, invite the author(s) to revise and resubmit the manuscript, or seek additional reviews. Final acceptance or rejection rests with the Editorial Board, who reserves the right to refuse any material for publication. In rare instances, the manuscript is accepted with almost no revision. Almost without exception, reviewers’ comments (to the author) are forwarded to the author. If a revision is indicated, the editor provides guidelines for attending to the reviewers’ suggestions and perhaps additional advice about revising the manuscript.
4. The authors decide whether and how to address the reviewers’ comments and criticisms and the editor’s concerns. The authors submit a revised version of the paper to the executive editor along with specific information describing how they have answered’ the concerns of the reviewers and the editor.
5. The executive editor sends the revised paper out for review. Typically, at least one of the original reviewers will be asked to examine the article.
6. When the reviewers have completed their work, the executive editor in consultation with the editorial board and the editor-in-chief examine their comments and decide whether the paper is ready to be published, needs another round of revisions, or should be rejected.
7. If the decision is to accept, the paper is sent to that Press and the article should appear in print in approximately three months. The Publisher ensures that the paper adheres to the correct style (in-text citations, the reference list, and tables are typical areas of concern, clarity, and grammar). The authors are asked to respond to any queries by the Publisher. Following these corrections, page proofs are mailed to the corresponding authors for their final approval. At this point, only essential changes are accepted. Finally, the article appears in the pages of the Journal and is posted on-line.
English language editingPertanika emphasizes on the linguistic accuracy of every manuscript published. Thus all authors are required to get their manuscripts edited by professional English language editors. Author(s) must provide a certificate confirming that their manuscripts have been adequately edited. A proof from a recognised editing service should be submitted together with the cover letter at the time of submitting a manuscript to Pertanika. All costs will be borne by the author(s).
This step, taken by authors before submission, will greatly facilitate reviewing, and thus publication if the content is acceptable.
Author material archive policyAuthors who require the return of any submitted material that is rejected for publication in the journal should indicate on the cover letter. If no indication is given, that author’s material should be returned, the Editorial Office will dispose of all hardcopy and electronic material.

CopyrightAuthors publishing the Journal will be asked to sign a declaration form. In signing the form, it is assumed that authors have obtained permission to use any copyrighted or previously published material. All authors must read and agree to the conditions outlined in the form, and must sign the form or agree that the corresponding author can sign on their behalf. Articles cannot be published until a signed form has been received.
Lag time A decision on acceptance or rejection of a manuscript is reached in 3 to 4 months (average 14 weeks). The elapsed time from submission to publication for the articles averages 5-6 months.
Hardcopies of the Journals and off printsUnder the Journal’s open access initiative, authors can choose to download free material (via PDF link) from any of the journal issues from Pertanika’s website. Under “Browse Journals” you will see a link entitled “Current Issues” or “Archives”. Here you will get access to all back-issues from 1978 onwards.
The corresponding author for all articles will receive one complimentary hardcopy of the journal in which his/her articles is published. In addition, 20 off prints of the full text of their article will also be provided. Additional copies of the journals may be purchased by writing to the executive editor.


Pertanika began publication in 1978 as the
Journal of Tropical Agricultural Science (JTAS).
In 1992, a decision was made to streamline
Pertanika into 3 journals. i.e.,
1. Journal of Tropical Agricultural Science (JTAS) 2. Journal of Science and Technology (JST) 3. Journal of Social Sciences and Humanities (JSSH)
PROFILE: Pertanika publishes original academic
articles rapidly. It is fully committed to the
Open Access Initiative and provides free access
to all articles as soon as they are published.
QUALITY: Articles submitted to Pertanika
undergo rigid originality checks. Our double-
blind peer review procedures are fair and open.
AUTHOR SERVICES: We ensure that your work
reaches the widest possible audience in print
and online rapidly. Submissions are through
ScholarOne system by Thomson Reuters.
The Journal accepts articles as regular, short
communication or review papers.
The article should include the following:
An abstract of not more than 300 words; Up to 8 related keywords; Name(s), Institutional affiliation(s) and
email(s) of each author. The maximum length of your article
must not exceed: o approximately 6000 words or 27 pages,
including abstract, diagrams tables and references for full research papers,
o 2000 words for short communication papers, or
o 4000 words for review papers
References should be listed in APA style.
You may submit your articles at any time of the
year. The journal is now accepting papers for
its 2013-14 issues.
For guidance on the submission process, or for any questions regarding submissions, you may contact the Chief Executive Editor at: [email protected]
BACKGROUND
BENEFITS TO AUTHORS
………………………………………………………………………
Call for Papers 2013-14 now accepting submissions… ……………………………………………………………..………
About the Journal
An international multidisciplinary peer-reviewed leading Malaysian journal.
Publishes articles in English quarterly. i.e., February, May, August and November.
The elapsed time from submission to publication for the articles averages 5 to 6 months. A decision on acceptance of a manuscript is reached in 3 to 4 months (average 14 weeks).
Indexed in SCOPUS (Elsevier), Thomson (BIOSIS), EBSCO, DOAJ, Agricola, CABI, Google Scholar, MyAIS & ISC.
Scope of Journal Pertanika JTAS aims to provide a forum for high-quality
research related to tropical agricultural research dealing with issues of worldwide relevance.
Refer to our website for detailed scope areas. http://www.pertanika.upm.edu.my/scope.php
Format for Paper Submission Articles should include the following:
o problem formulation o conceptual framework o methodology/ approach o research design (if applicable) o statistical analysis (if applicable) o main findings o overall contribution o conclusions & suggestion for further research o acknowledgements (if applicable)
Rapid research publication… Pertanika is the resource to support you in strengthening your research.
……………………………………………………………………
Journal’s profile: http://www.pertanika.upm.edu.my/
SUBMISSION GUIDELINES
SUBMISSION DEADLINE
CONTACT US View current issue Submit your manuscript to http://mc.manuscriptcentral.com/upm-jtas
View journal archives
Having trouble viewing this email? Click here to view online | View in a Mobile Device


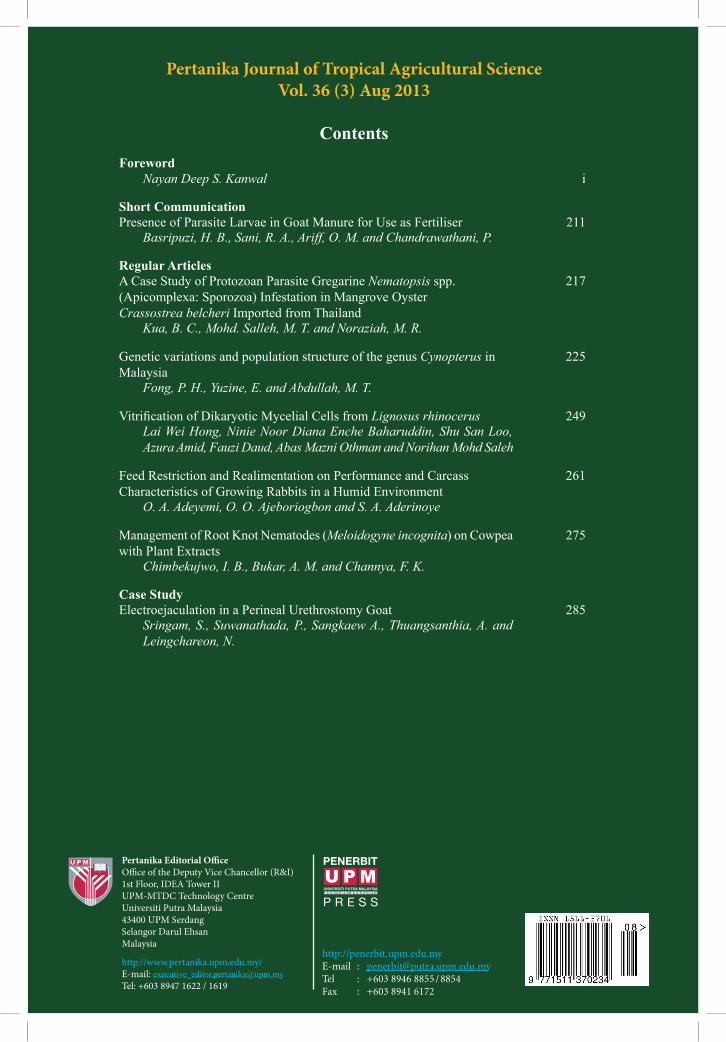
Vol. 36 (3) Aug. 2013
VOL. 36 (3) AUG. 2013
Pertanika Journal of Tropical Agricultural ScienceVol. 36 (3) Aug 2013
Contents
Pertanika JTAS
Pertanika Editorial O�ceO�ce of the Deputy Vice Chancellor (R&I) 1st Floor, IDEA Tower II UPM-MTDC Technology CentreUniversiti Putra Malaysia43400 UPM SerdangSelangor Darul EhsanMalaysia
http://www.pertanika.upm.edu.my/E-mail: [email protected]: +603 8947 1622 / 1619
Foreword
Nayan Deep S. Kanwal i
Short CommunicationPresence of Parasite Larvae in Goat Manure for Use as Fertiliser 211
Basripuzi, H. B., Sani, R. A., Ariff, O. M. and Chandrawathani, P.
Regular ArticlesA Case Study of Protozoan Parasite Gregarine Nematopsis spp. (Apicomplexa: Sporozoa) Infestation in Mangrove Oyster Crassostrea belcheri Imported from Thailand
217
Kua, B. C., Mohd. Salleh, M. T. and Noraziah, M. R.
Genetic variations and population structure of the genus Cynopterus in Malaysia
225
Fong, P. H., Yuzine, E. and Abdullah, M. T.
Lignosus rhinocerus 249Lai Wei Hong, Ninie Noor Diana Enche Baharuddin, Shu San Loo, Azura Amid, Fauzi Daud, Abas Mazni Othman and Norihan Mohd Saleh
Feed Restriction and Realimentation on Performance and Carcass Characteristics of Growing Rabbits in a Humid Environment
261
O. A. Adeyemi, O. O. Ajeboriogbon and S. A. Aderinoye
Management of Root Knot Nematodes (Meloidogyne incognita) on Cowpea with Plant Extracts
275
Chimbekujwo, I. B., Bukar, A. M. and Channya, F. K.
Case StudyElectroejaculation in a Perineal Urethrostomy Goat 285
Sringam, S., Suwanathada, P., Sangkaew A., Thuangsanthia, A. and Leingchareon, N.