Journal of Information Technology and Applications - JITA
76
Journal of Information Technology and Applications Exchange of Information and Knowledge in Research VOLUME 5 NUMBER 1 BANJA LUKA, JUNE 2015 (1-76) ISSN 2232-9625 (Print) ISSN 2233-0194 (Online) UDC 004 (BANJA LUKA)
-
Upload
khangminh22 -
Category
Documents
-
view
0 -
download
0
Transcript of Journal of Information Technology and Applications - JITA

Journalof InformationTechnologyand Applications
Exchange of Information
and Knowledge in Research
VO
LU
ME
5 N
UM
BE
R 1
BA
NJA
LU
KA
, JU
NE
20
15
(1-76
) ISS
N 2
23
2-9
62
5 (P
rint) IS
SN
22
33
-0
19
4 (O
nlin
e) U
DC
00
4
(BANJA LUKA)

Full-text available free of charge at http://www.jita-au.com
THE AIM AND SCOPE
The aim and scope of the Journal of Information Technology and Applications (JITA) is:
• to provide international dissemination of contributions in fi eld of Information Technology,
• to promote exchange of information and knowledge in research work and
• to explore the new developments and inventions related to the use of Information
Technology towards the structuring of an Information Society.
JITA provides a medium for exchanging research results and achievements accomplished by
the scientifi c community from academia and industry.
By the decision of the Ministry of Education and Culture of the Republic of Srpska, no.:
07.030-053-160-4/10 from 3/3/2010, the journal „Journal of Information Technology and
Applications“ Banja Luka is registered in the Registry of public organs under the number 591.
Printed by Markos, Banja Luka in 300 copies two times a year.
Indexed in: LICENSE AGREEMENT, 3.22.12. EBSCO Publishing Inc., Current Abstracts
Printed on acid-free paper
ebscohost.com
indexcopernicus.com
citefactor.org/contact
scholar.google.com
doisrpska.nub.rs
crossref.org
road.issn.org

CONTENTS
Editorial ........................................................................................................................................................................................4
Simulation of Processes in Traction Electric Actuators of Autonomous Vehicles..........................................5YU. M. INKOV, E.V. SACHKOVA, YA. A. KOROBANOVA, T.N. FADEIKIN
Automatic Temperature Regulation System of Locomotive Traction Induction MotorsWith Power Losses Minimization .........................................................................................................................................13A.S. KOSMODAMIANSKIY, V.I. VOROBIEV, A.A. PUGACHEV
A new Approach to Computer Analysis of Queuing Systems Without Programming ......................................25ZORAN Ž. AVRAMOVIĆ, RADOMIR Z. RADOJIČIĆ, SAŠA D. MIRKOVIĆ
The Perspective of High-Temperature Superconductivity Eltctrical Equipment Applicationfor Traction Power Supply and the Problems of Electromagnetic Compatibility .........................................33M.P. BADJOR, YU. M. INKOV
Safety and Risk Management .................................................................................................................................................42V.M. LISENKOV, P.F. BESTEMYANOV
Water treeing in extruded cable insulation as Rehbinder electrical effect ...................................................55IZ. B. PESHKOV, M. YU. SHUVALOV, V.L. OVSIENKO
Control Systems for Automated Vessel Piloting Through Local Stationary Obstacles ..............................61DOVGOBROD GEORGY MOISEEVICH, KLYACHKO LEV MIKHAYLOVICH
Prospects of High Technologies in the Remote Diagnosis of the Track .............................................................65LIEVIN, BORIS A., NEDORCHUK, BORIS L.
Instructions for Authors .....................................................................................................................................................72
UDC 004 ISSN 2232-9625 (PRINT)
ISSN 2233-0194 (ONLINE)
VOLUME 5 NUMBER 1 BANJA LUKA, JUNE 2015 (1-76)

EDITORS:
GORDANARADIĆ, PhDEDITOR-IN-CHIEF
ZORANAVRAMOVIĆ, PhD
DUŠANSTARČEVIĆ, PhD
EDITORIAL
Dear Readers,
According to the signed Agreement on the sctienfi tic cooperation between PanEuropean University Apeiron and Moscow State University of Railway Engi-neering (MIIT), the JITA Editorial Board made a decision that academician Inkov Yuri M. will be guest editor for this issue.
Inkov Yuri M., Doctor of Sciences Habil., Professor, Honoured Scientist of Rus-sian Federation, Honorary Worker of Higher Professional Education of the Rus-sian Federation, Honorary Railwayman, Honorary Worker of Transport of Russia, member of International Academy of Electrotechnical Sciences, Russian Engineer-ing Academy, Serbian Academy of Engineering, IEEE, Chief Scientifi c Secretary of the Academy of Electrotechnical Sciences of the Russian Federation, professor of the Moscow State University of Railway Engineering (MIIT).
Inkov Yuri M. published more than 200 scientifi c papers, more than 120 patents for inventions, 15 monographs, textbooks and manuals for students of higher edu-cational institutions. He is a research consultant and an author of over 30 articles of the Great Soviet Encyclopaedia (3rd edition), a member of the Editorial Board, the author of the articles and scientifi c supervisor of sections “Power and Information Electronics” and “Electrical Transport Systems and Space Equipment”. He is a co-author of the “Encyclopaedia of Electric Engineering”, a unique scientifi c -practical work in the fi eld of electric engineering and electrical power engineering.
4 Journal of Information Technology and Applications www.jita-au.com

SIMULATION OF PROCESSES IN TRACTION ELECTRIC ACTUATORS OF AUTONOMOUS VEHICLES JITA 5(2015) 1:5-12
SIMULATION OF PROCESSES IN TRACTION ELECTRIC ACTUATORS OF AUTONOMOUS VEHICLES
Yu. M. Inkov1, E.V. Sachkova2, Ya. A. Korobanova3, T.N. Fadeikin4 1D. Sc. Habil., professor
2PhD, associated professor3post-graduate student4post-graduate student
MSURE (MIIT)
Contribution to the state of the art
DOI: 10.7251/JIT1501005I UDC: 629.424
Abstract: At the stage of construction of traction electric drives of electric power systems (EPS) the analysis of electromagnetic and energy processes in various operational and emergency modes is needed. The calculation of complex multi-electromechanical systems of modern vehicles is only possible by computer simulation. The programming of such complex systems by traditional methods is practically impossible, or is a time-consuming process. The use of universal modeling systems is the only possible way of modeling of multi-component systems. In this article we deal with the mathematical model of the synchronous generator of autonomous vehicle in computer-aided design (CAD) OrCAD 10.0 (Pspice). The software package OrCAD 10.0 (Pspice) is one of the most versatile in the fi eld of simulation of electrical circuits with a large number of components. OrCAD libraries contain proven by the time mathematical models of practical application of electric power components and it is continuously ever-growing. At the end of the article the characteristics for different modes of operation of a synchronous generator are summarized.
Keywords: traction electric drive, autonomous locomotive, marine engine, mathematical model, energy processes, electromechanical system, synchronous generator, the hysteresis loop.
In traction electric drives of modern vehicles, in-cluding autonomous locomotives of railways, ships and vessels regardless of the type of driving (traction) engine as a primary power source the synchronous generators are applied, which are geared by diesel en-gines or turbines.
Th e analysis of electromagnetic and energy pro-cesses in electric drives of such vehicles, including comparative analysis, is worth while carrying out on mathematical models of traction electric drives, which allows to enter in the analyzed system the parameters of its components with any required ac-curacy. Th ese system parameters are: the source of power, converters and regulators of parameters of en-ergy transmitted from the source to electric engines and the engine themselves.
Th e most suitable for the simulation of electro-magnetic and energy processes in complex multi-electromechanical systems, which also include trac-tion electric drives, is a software package OrCAD 10.0. Th is is allows to perform multivariate calcula-tions of electromagnetic and energy processes in such systems during reasonable time.
Using the specifi ed software package the system under analysis is divided into interconnected indi-vidual modules that are managed by a specifi c algo-rithm.
June 2015 Journal of Information Technology and Applications 5

JITA 5(2015) 1:5-12 YU. M. INKOV D., E.V. SACHKOVA, YA. A. KOROBANOVA, T.N. FADEIKIN:
СГ – synchronous generator (power source)ИЭЭ – power sourceУПРЭЭ – converting and electric energy regulating deviceПЭД – drive motorsУУЗД – control, protection, and diagnostics device
Figure 1. The power circuit structure of the of electric equipment of traction electric drive of autonomous vehicle: 1 – synchronous
generator (power source); 2 - converting and electric energy regulating device; 3 - drive motors; 4 - control, protection, and
diagnostics device.
In particular, the traction electric drive of the au-tonomous vehicle, as electromechanical system, can be represented by the structure, shown in Figure 1 and including four modules 1-4.
Mathematical models should be drawn up for each of the modules of the analyzed system, depending on the purpose of the analysis. Th e given algorithm defi nes the interaction of the mentioned models and allows ob-taining of the required solution of the problem.
In this paper the mathematical model of the input module of the analyzed system - synchronous gener-ator type SGDM - 5000 - 8 - OM4, used in traction motor drives of ship vehicles is regarded.
Th e building of the model of a synchronous gen-erator is started with the creation of the model of the magnetic core.
Th e model of the magnetic core is based on the template created on the basis of the model Giles-Atherton [6, 7]. Th e initial data for the model are:
1. Th e size of the gap, Gap [centimeters];2. the cross-section area of the core, Area [square
centimeters];
3. the length of the median line of the core, Path [centimeters];
4. the duty factor of the core, Pack (dimension-less).
In addition, to construct a model of the core it is necessary to set the hysteresis loop for the core mate-rial (Figure 2).
Figure 2. The hysteresis loop for the core material
For Figure 2 the following symbols are accepted:Hc [Oersted] - the electromagnetic fi eld strength
of the core when induction equals to zero;• Br [Gauss] - induction in the core when the
electromagnetic fi eld strength equals to zero;• Hm [Oersted] - the electromagnetic fi eld
strength of the core when induction equals to the saturation induction;
• Bm [Gauss] – the saturation induction.
In addition to that, the value of initial magnetiza-tion (Initial Perm) is set.
Th e initial information is entered in the Model Editor in table of Hysteresis Curve and Parameters. Th e information in the table of Hysteresis Curve is entered in the form of:
• (0, Br);• (Hc, 0);• (Hm, Bm).
Th e attempt to construct a more accurate hystere-sis loop for more points does not give positive results, because only the fi rst three pairs of numbers listed in the table are consider in the Model Editor.
In the version OrCAD 9.2 is used the 2nd level (LEVEL = 2) of core model, and in version OrCAD 10.0 - the 2nd (LEVEL = 2) or the 3rd (LEVEL = 3).
6 Journal of Information Technology and Applications www.jita-au.com
SIMULATION OF PROCESSES IN TRACTION ELECTRIC ACTUATORS OF AUTONOMOUS VEHICLES JITA 5(2015) 1:5-12
For the third level we introduce the following as-sumptions [7]:
1. the loop is static, its shape does not depend on the frequency variation of the electromagnetic fi eld strength H;
2. the saturation induction Bm for the model of the magnetic core is defi ned as the asymptote of the hysteresis loop. Th e manufacturers of the magnetic core typically defi ne saturation as point on the hys-teresis loop, above which a decrease of penetrability in the core begins to limit its application. If the val-ues Bm are taken directly from the reference tables of manufacturers cores, the core model will work with a low value of the value Bm. Taking into account the diff erent defi nitions of the saturation induction, it is not recommended to use values of Bm from the reference data; instead of it, it is used the values Bm, which was defi ned directly on the hysteresis loop;
3. Th e model of the air gap may be incorrect at low operating frequencies (typically <100 Hz). Ob-tained in this case error is caused by the 0,001Ω resis-tor introduced in series with the inductor of core. To improve the accuracy of the modelling of air gap one of the following conditions should be met: winding resistance is greater than or equals to 0.1Ω; the in-ductive component of the impedance (ZL) is greater or equals to 0.1 Ω. Th e verifi cation showed, that in this case these conditions are hold true.
Th e value of inductive impedance component is cal-culated by the formula as ,
where - angular frequency; Leq - equivalent inductance.
When replacing the Leq on an equivalent expression, we obtain:
,
where - magnetic permeability; A - area; n - num-ber of windings; L - length;
Th e results of the calculation circuit, comprising a core, in which saturation induction Bm is greater than 106 G, may diff er from the results of simulation of real cores [7].
In case of convergence problems appearing while modelling of core with very high saturation induc-tion and very low coercive force the core should be replaced by the ideal core, which model provides the calculation of the saturation induction at infi nite and zero coercive force.
In [5] we analyzed the problems of modifi cation PSpice-model of the magnetic core for defi ning its parameters by reference characteristics; also we pro-posed modifi cation PSpice-model to account the magnetic properties of materials.
MS - saturation magnetization (magnetization saturation) [ampere / meter] = 4,903,089.039498;
A - shape parameter of no hysteresis magnetiza-tion curve (thermal energy parameter) [ampere/me-ter] = 48.64212819596;
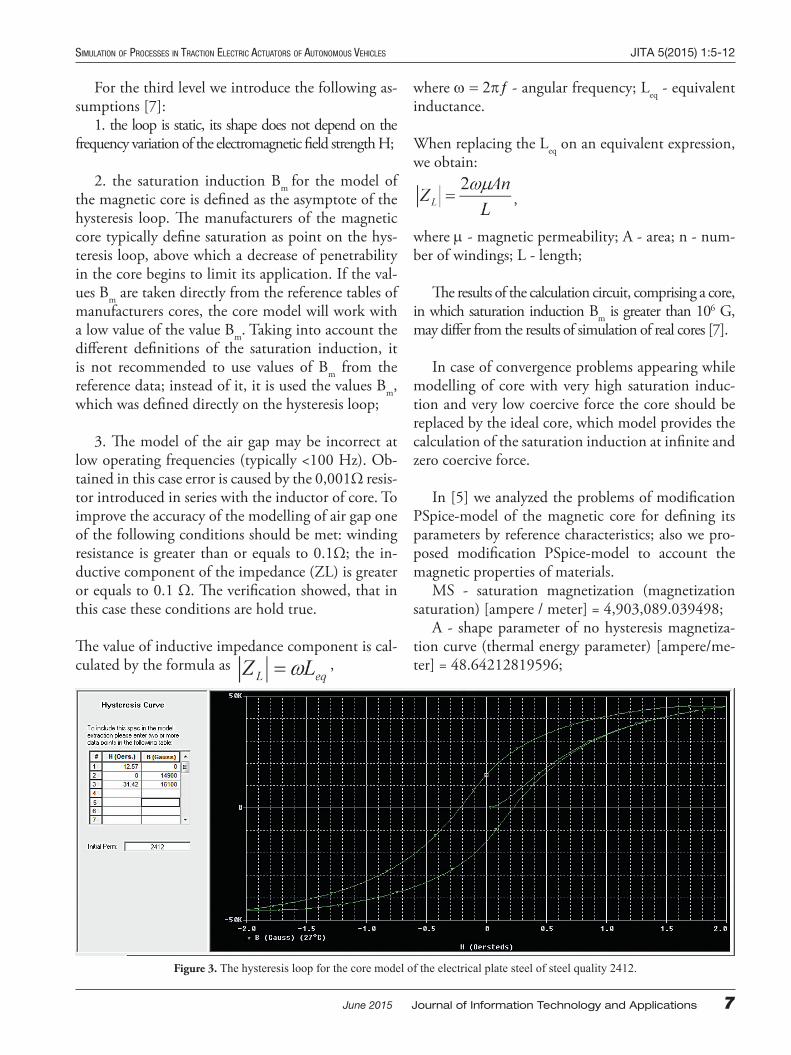
Figure 3. The hysteresis loop for the core model of the electrical plate steel of steel quality 2412.
June 2015 Journal of Information Technology and Applications 7

JITA 5(2015) 1:5-12 YU. M. INKOV D., E.V. SACHKOVA, YA. A. KOROBANOVA, T.N. FADEIKIN:
C – the constant value of elastic displacement of domain edges (domain fl exing parameter) = 0,01001;
K - the constant value of mobility of domain (domain anisotropy parameter) [amperes / meter] = 19.8446694766.
Hysteresis loop for the constructed model of the core is shown in Figure 3.
Now we develop a model of the specifi c magnetic core. Its parameters, according to the task: GAP = 0,968 cm, AREA = 143,184 cm2, PATH = 101,9 cm, PACK = 1. As the core material the electrical plate steel of qual-ity 2412 was used. Th e values of Br, Hc, Hm and Bm are taken from the passport. So, Hc = 12,57 Oe, Br = 1,49 * 104 G, Hm = 31,42 Oe, Bm = 1,6 * 104 G. According to these data we calculated the required characteristics of the model.
Th e next step will be the modelling of a synchro-nous generator operating in short circuit and idling modes. Th e electric diagram of such generator is shown in Figure 4.
Figure 4. The electric diagram of a synchronous generator
Th e scheme of the developed model is shown in Figure 5.
Th e vehicles EPS are complex systems consisting of several diesel or turbo-generators and dozens or even hundreds of asynchronous motors, dozens of static loads. Th e most advisable way to carry out the study of such systems is by using models of synchro-nous generators in the phase coordinates. However, the presence of variable coeffi cients in the equations of these elements causes considerable computational diffi culties which at solving of the given tasks by the traditional research methods are non-defi ned. Cur-rently the objectives of the study of transients in EPS are solved by using the models of synchronous gen-erators written in the axes d, q. Th e presentation of
synchronous generators mathematical models in this form in case of applying the program PSpice a/d is decisive. Th e program PSpice a/d generates the com-munication equations between the electric machines models recorded in this way, and they are compiled automatically, without the researcher intervention. Moreover, generated in this way models easily inte-grate into the available in libraries DesignLab com-ponents.
Th e type of the diff erential equations of AC elec-trical machines is diff erent depending on the choice of the voltage vector direction, the fl ux linkages, the initial mode (generator or motor). Th e transients study method by using the PSpice program is suit-able for any form of diff erential equations.
Th e three-phase synchronous generator with sa-lient-pole rotor is analysed. Th e generator has a sym-metrical three-phase winding on the stator. Th e fi eld coil and the damper winding are located on the ro-tor. Th e damper winding is intended primarily for damping of the rotor fl uctuations, the improvement of the conditions of pulling into synchronism and prevention from overvoltage in the stator windings under unbalanced load conditions. Th e system of diff erential equations describing electromagnetic and electromechanical transient processes in a synchro-nous generator includes the equation of the equilib-rium v oltage of all electrical circuits in the stator and rotor and the equation of rotor operation.
8 Journal of Information Technology and Applications www.jita-au.com

SIMULATION OF PROCESSES IN TRACTION ELECTRIC ACTUATORS OF AUTONOMOUS VEHICLES JITA 5(2015) 1:5-12
·
·
·
·
·
·
·
·
·
· · · · · ·
·
Using the above system of the synchronous gen-erator diff erential equations with variable coeffi cients all the main processes of the synchronous generator can be modelled.
In this diagram a three-phase network is modelled by the sinusoidal voltage sources U1, U2, U3. Th e voltage amplitude is 3642 V, the magnitude of the DC component equals to 0, and the frequency is 50 Hz. Th e shift between the phases is by 120 electrical degrees. Th e inductors L1, L2, L3 simulate the fi lters protecting against the interference in the network. Th e wire resistance is modelled by using resistors r1, r2, r3, r4, r5. Th e resistor r6 simulates the idle mode, and the resistor r7 simulates the short circuit mode. Th e inductors L4, L5, L6, L7, L8 simulate the actual
June 2015 Journal of Information Technology and Applications 9

JITA 5(2015) 1:5-12 YU. M. INKOV D., E.V. SACHKOVA, YA. A. KOROBANOVA, T.N. FADEIKIN:
generator operation. Th e number of windings is taken from the passport data of the synchronous generator SGDM - 5000 - 8 - OM4 type. Element K2 simulates the core operation which model is described above.
Figure 5. The diagram of model a synchronous generator
Figure 6 shows the power in the idle mode, and Figure 7 shows the power in the short circuit mode.
Figure 6. Power in the idle mode
Figure 7. Power in the short circuit mode
Th e oscillograph records demonstrate clearly that in the idle mode the energy is not released. Th is fact confi rms the adequacy of the model. It also proves that the regulation quality is at a high level.
Finally, the last stage of the simulation is the analysis the synchronous generator processes in the real load mode. According to the calculations, the load is simulated by the current source I1. Th e complete diagram of a synchronous generator model is shown in Figure 8.
10 Journal of Information Technology and Applications www.jita-au.com
SIMULATION OF PROCESSES IN TRACTION ELECTRIC ACTUATORS OF AUTONOMOUS VEHICLES JITA 5(2015) 1:5-12
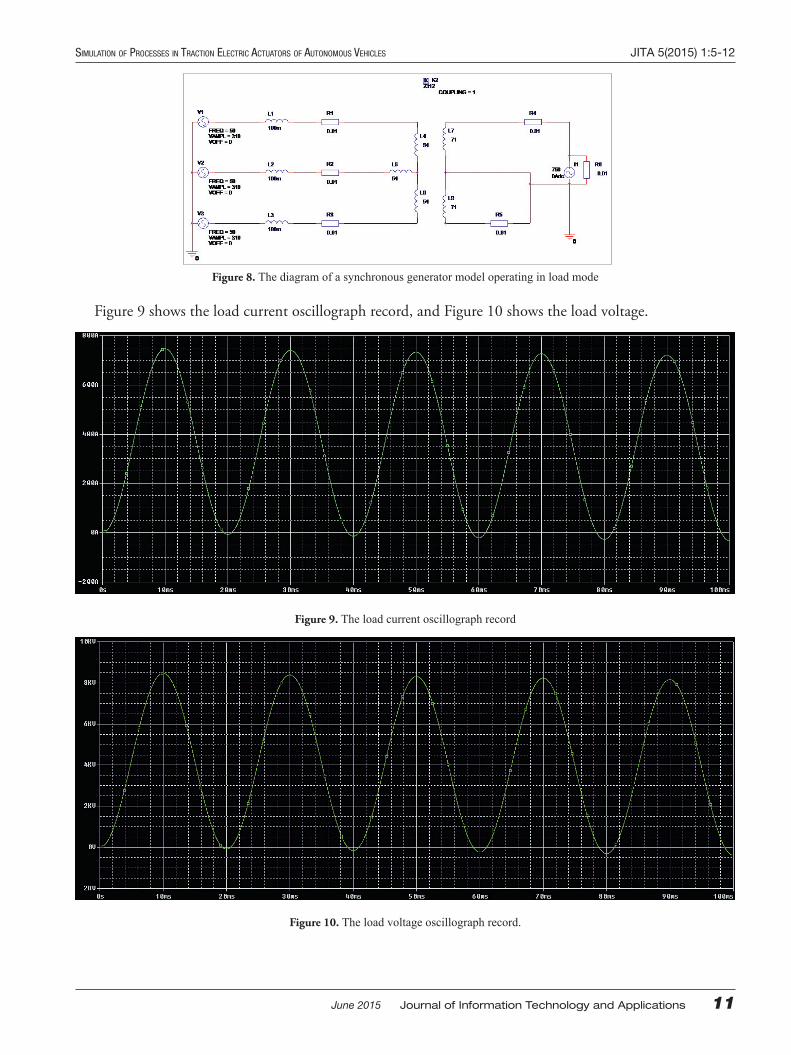
Figure 8. The diagram of a synchronous generator model operating in load mode
Figure 9 shows the load current oscillograph record, and Figure 10 shows the load voltage.
Figure 9. The load current oscillograph record
Figure 10. The load voltage oscillograph record.
June 2015 Journal of Information Technology and Applications 11

JITA 5(2015) 1:5-12 YU. M. INKOV D., E.V. SACHKOVA, YA. A. KOROBANOVA, T.N. FADEIKIN:
Th e proposed model of a synchronous generator for autonomous locomotive takes into account the actual characteristics of electrical steel of core and allows to obtain the necessary characteristics of the
generator in a wide range of loads. Th e model can be used for analyze of electromechanical processes in autonomous traction electric locomotives and deter-mining of the energy effi ciency of electric drives.
BIBLIOGRAPHY
[1] Boskobovich, V.Yu., Koroleva, T.N., Pavlova, V.A. (2001). Electric power installation and vehicle power electronics. SPb.: Elmore.
[2] Boskobovich, V.Yu. (2008). Modeling of the electric propulsion devices with the use of OrCAD systems. SPb.: Litera.[3] Kopylov, I.P. (2006). Electric machines. M.: Higher school.[4] Merkuryev, G.V., Shargin, Yu. M. (2006). Stability of power systems. Calculations: SPb.: NOU. “The training centre
of power engineering”.[5] Nedoluzhko, I., Kayukov, D. (2005). The Modifi cation of the PSpice Magnetic Core Model. Power Electronics. № 1.
SPb.: Finestreet, pp. 116-119.[6] PSpice Reference Guide, Product version 9.2., Cadence Design System, Inc. 360 p.[7] PSpice A/D Reference Guide, Product version 10.0, Cadence Design System Inc. 426 p.[8] Tokarev, L.N., Komarov, V.M., Vasin, I.M., Popel, G.V. (2010). Marine power systems. SPb.: VMII.[9] Tokarev, L.N. (2006). Marine electrical engineering and electrical mechanics. SPb.: Beresta. [10] Vasin, I.M., Tokarev, L.N., (2008). Physical processes in electrical machines and systems. Mathematical description
and calculation. SPb.: Litera.
Submitted: April 30, 2015.Accepted: May 8, 2015.
12 Journal of Information Technology and Applications www.jita-au.com

AUTOMATIC TEMPERATURE REGULATION SYSTEM OF LOCOMOTIVE TRACTION INDUCTION MOTORS WITH POWER LOSSES MINIMIZATION JITA 5(2015) 1:13-24
AUTOMATIC TEMPERATURE REGULATION SYSTEM OF LOCOMOTIVE TRACTION INDUCTION MOTORS WITH
POWER LOSSES MINIMIZATION
A.S. Kosmodamianskiy1, V.I. Vorobiev2, A.A. Pugachev2
1Russian Open Transport Academy (MSUT branch), 2Bryansk State Technical [email protected]
Contribution to the state of the art
DOI: 10.7251/JIT1501013K UDC: 629.424:621.313.333
Abstract: The air cooling systems are shown to be used to provide required temperature condition of traction induction motors on locomotives. The automatic temperature regulation system is developed for its using to solve such a task. Results of experimental investigation showed that the AO63-4 induction motor stator end winding on the side opposite to air supply is the most heated part of the induction motor. Based on the results of the research, it was used an aperiodic second-order transfer function for approximation of the thermal transient curves. The design of an induction motor control system maintaining operating mode with minimum of the stator current are considered. It is shown that the modes of minimum of the stator current and minimum of power losses are quite close to each other. The MatLab simulation results taking typical nonlinearities and iron power losses in an induction motor and conduction and commutation power losses in semiconductors of frequency converter into account are presented. It is shown that as a result of application of the suggested system the power losses reduction may be led up to 20 % relatively to classical scalar control.
Key words: induction motor, locomotive, automatic system, equivalent circuit, power losses minimization.
INTRODUCTION
Application of induction motors as traction and auxiliary means of rolling stock has become popular due to their relative simplicity, high reliability, effi -ciency, satisfactory design, compactness and perfor-mance characteristics. However, the induction motor quality indicators for rated operating conditions do not coincide with those of real operation in response to the variety of factors.
Analyzing the results of researches [6] one can conclude that many failures and malfunctions are directly or indirectly related to or caused by exten-sive heating of the diff erent motor parts involved in machine operation. Th at is why the accurate track of motor thermal state and adequate response of the motor control system to abnormal situations are very important.
Except causing failures and damages, the tem-perature of induction motor windings is known to aff ect the operating modes of the electric drive, par-ticularly static mechanical characteristics and it also violates the settings of optimal control systems on any quality indicator [4]. Th is is particularly criti-cal in traction electric drives, where except meet-ing strict requirements on the energy and mass and dimensions, the drive must provide a prescribed driving force to ensure the required quality of the transition process.
It follows from the survey carried out that for im-plementation of traction forces of the electric drive with power losses minimization it is necessary to consider fully a temperature condition of the trac-tion induction motor and take measures to prevent it from extreme or often overheating.
June 2015 Journal of Information Technology and Applications 13
JITA 5(2015) 1:13-24 A.S. Kosmodamianskiy, V.I. Vorobiev, A.A. Pugachev:
To provide the required temperature condition of traction motors on locomotives air cooling systems are used. In [7], in particular, it is noted that cooling regulation of traction electric motors allows reduc-ing the cooling air fl ow through the drive motor by 25% when outdoor temperature is below 18 °C. Th e greatest eff ect in solving the problem of increasing effi ciency of cooling systems can be achieved if cool-ing systems of traction motors will be equipped with a controlled drive fans, allowing continuous and au-tomatic change of cooling air fl ow depending on the temperature of the heated parts of the equipment, its current load and temperature of cooling air.
AUTOMATIC TEMPERATURE REGULATION SYSTEM OF
LOCOMOTIVE TRACTION INDUCTION MOTORS
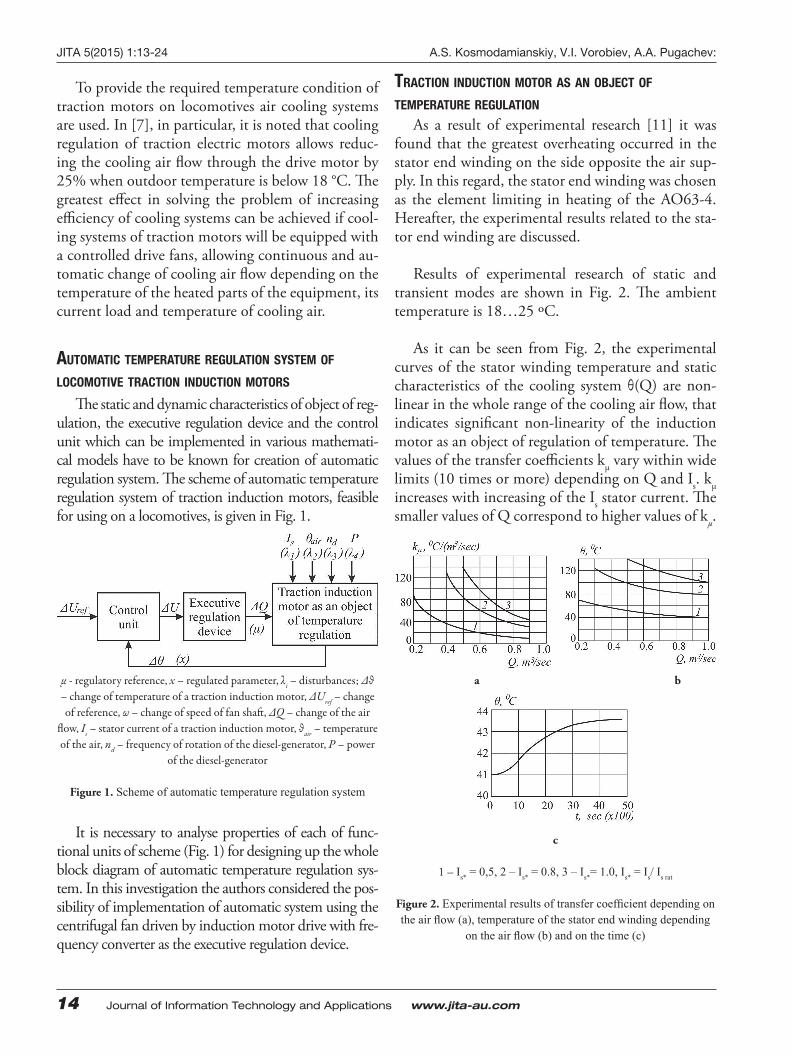
Th e static and dynamic characteristics of object of reg-ulation, the executive regulation device and the control unit which can be implemented in various mathemati-cal models have to be known for creation of automatic regulation system. Th e scheme of automatic temperature regulation system of traction induction motors, feasible for using on a locomotives, is given in Fig. 1.
μ - regulatory reference, х – regulated parameter, λi – disturbances; Δθ – change of temperature of a traction induction motor, ΔUref – change of reference, ω – change of speed of fan shaft , ΔQ – change of the air
fl ow, Is – stator current of a traction induction motor, θair – temperature of the air, nd – frequency of rotation of the diesel-generator, Р – power
of the diesel-generator
Figure 1. Scheme of automatic temperature regulation system
It is necessary to analyse properties of each of func-tional units of scheme (Fig. 1) for designing up the whole block diagram of automatic temperature regulation sys-tem. In this investigation the authors considered the pos-sibility of implementation of automatic system using the centrifugal fan driven by induction motor drive with fre-quency converter as the executive regulation device.
TRACTION INDUCTION MOTOR AS AN OBJECT OF
TEMPERATURE REGULATION
As a result of experimental research [11] it was found that the greatest overheating occurred in the stator end winding on the side opposite the air sup-ply. In this regard, the stator end winding was chosen as the element limiting in heating of the AO63-4. Hereafter, the experimental results related to the sta-tor end winding are discussed.
Results of experimental research of static and transient modes are shown in Fig. 2. Th e ambient temperature is 18…25 ºC.
As it can be seen from Fig. 2, the experimental curves of the stator winding temperature and static characteristics of the cooling system θ(Q) are non-linear in the whole range of the cooling air fl ow, that indicates signifi cant non-linearity of the induction motor as an object of regulation of temperature. Th e values of the transfer coeffi cients kμ vary within wide limits (10 times or more) depending on Q and Is. kμ increases with increasing of the Is stator current. Th e smaller values of Q correspond to higher values of kμ.
a b
c
1 – Is* = 0,5, 2 – Is* = 0.8, 3 – Is*= 1.0, Is* = Is/ Is rat
Figure 2. Experimental results of transfer coeffi cient depending on the air fl ow (a), temperature of the stator end winding depending
on the air fl ow (b) and on the time (c)
14 Journal of Information Technology and Applications www.jita-au.com

AUTOMATIC TEMPERATURE REGULATION SYSTEM OF LOCOMOTIVE TRACTION INDUCTION MOTORS WITH POWER LOSSES MINIMIZATION JITA 5(2015) 1:13-24
It is shown in [7] that the design of the automatic regulation system needs just determination of the dynamic characteristics and parameters of the cool-ing system of the traction electric motors only on the regulatory reference with all possible changes of disturbances. For the design of regulation system it requires an experimental curves presented in the form of mathematical functions, written as a transfer functions.
Based on the results of the research, for approxi-mating the thermal transient it was decided to use the following type of transfer function:
where kμ determined by Fig. 2,a, Т1, Т2 denote the time constants.
To determine time constants Oldenberg and Sar-torius methods and Orman interpolation method have been used. Parameter values of the transfer functions (1) are summarized in Table 1.
Table 1. Parameters of transfer function (1)
BaselineT
1,
sec
T2,
sec
kμ, ºС/
(m3/
sec)
Q = 0,91 m3/sec, I* = 1, us* = 1, fs* =1 958 169 42
Q = 0,91 m3/sec, I* = 0.5, us* = 1, fs* =1 821 152 12
Q = 0,51 m3/sec, I* = 1 us* = 1, fs* =1 969 271 130
Q = 0,51 m3/sec, I* = 0.5, us* = 1, fs* =1 659 101 25
Q = 0,51 m3/sec, I* = 0.5, us* = 0.23, fs* =0.35 659 101 25
Q = 0,51 m3/sec, I* = 1, us* = 0.23, fs* =0.35 969 271 130
Here subscript * denotes the relative value of some parameter, i.e. us* = us/ us rat, fs* = fs/ fs rat, where us denotes the stator voltage, fs
denotes frequency of the stator current, subscript rat denotes the rated value of some parameter
Analysis of the results comparison of the tran-sients curves obtained during the experiment with the curves obtained in the simulation of the transfer function (1) (parameters of transfer function defi ned in Table 1) showed high results convergence.
Centrifugal fan as an executive device of auto-matic temperature regulation systemTh e important condition for correct design of
system control of cooling fan electric drive is pre-cise identifi cation of fan parameters as a mechanical load for electric motor. Th e main parameter of fan, in terms of electric drive, is relation between TL load torque and the ω rotor speed: TL = f(ω) called a me-chanical characteristic. Th e kind of this function as well a relation between the T motor torque and the rotor speed determine the initial energy effi ciency of electric drive.
Th e mechanical characteristic of the fan can be written as follow:
where TL0 is an idling load, H0 is a static air pressure, Hs is an air pressure under closed latch, i.e. air fl ow Q = 0, CH is a empirical coeffi cient, η(ω, Hs) is a fan effi ciency.
Relation between the H air pressure and the ω ro-tor speed can be described as follow:
where c is an empirical coeffi cient.
Equations (2), (3) contain the main parameters of fan, including effi ciency change, and allow to take it into account in the further researches as a load torque for induction motor.
Induction motor drive as a regulation device of automatic temperature regulation systemTh e correct mathematical model of the induction
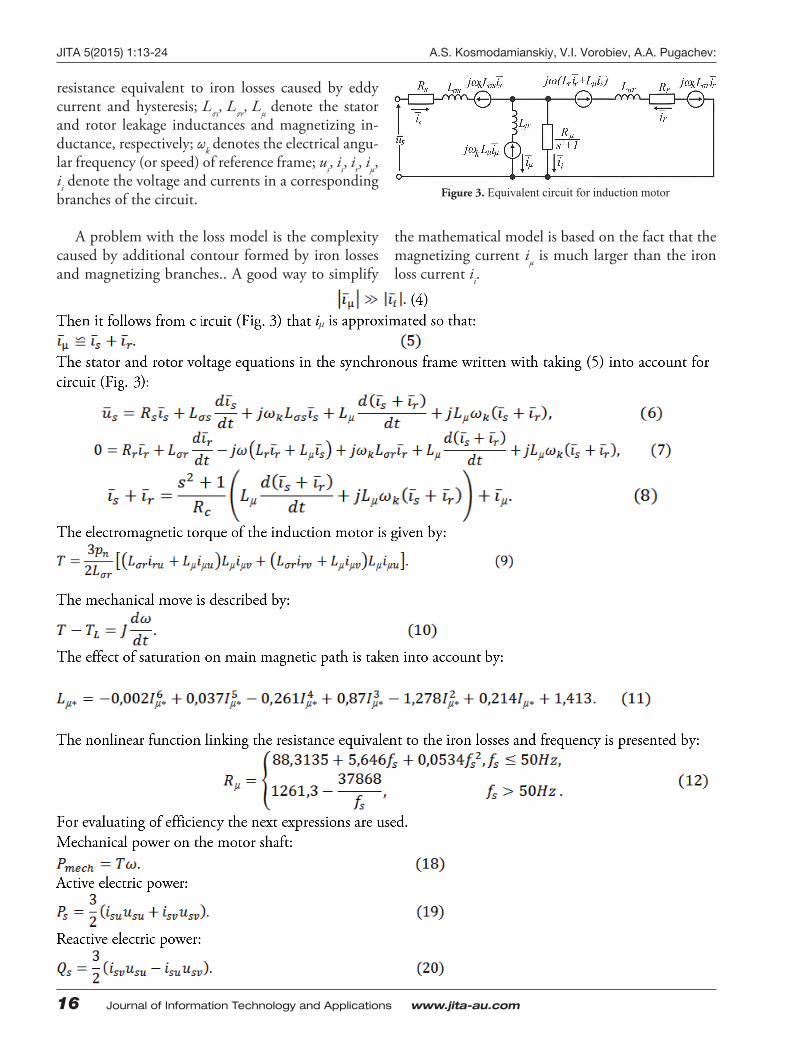
motor taking all possible losses, and also nonlinear-ity caused by features of work in various modes into account is necessary for synthesis of control system of electric drive of automatic temperature regulation system. It is obvious that the greatest diffi culties are presented by the accounting of losses in iron [1, 10]. Th e equivalent circuit for induction motor with sta-tor and rotor iron losses is shown in Fig. 3.
In Fig. 3 and further in the article Rs, Rr denote the stator and the rotor resistances; Rμ denotes the
June 2015 Journal of Information Technology and Applications 15
JITA 5(2015) 1:13-24 A.S. Kosmodamianskiy, V.I. Vorobiev, A.A. Pugachev:
resistance equivalent to iron losses caused by eddy current and hysteresis; Lσs, Lσr, Lμ denote the stator and rotor leakage inductances and magnetizing in-ductance, respectively; ωk denotes the electrical angu-lar frequency (or speed) of reference frame; us, is, ir, iμ, ii denote the voltage and currents in a corresponding branches of the circuit.
A problem with the loss model is the complexity caused by additional contour formed by iron losses and magnetizing branches.. A good way to simplify
the mathematical model is based on the fact that the magnetizing current iμ is much larger than the iron loss current ii.
μ
Figure 3. Equivalent circuit for induction motor
16 Journal of Information Technology and Applications www.jita-au.com

AUTOMATIC TEMPERATURE REGULATION SYSTEM OF LOCOMOTIVE TRACTION INDUCTION MOTORS WITH POWER LOSSES MINIMIZATION JITA 5(2015) 1:13-24
Control system of induction motor drive Th e most common features of electric drives of
cooling fans for locomotives traction electric equip-ments and motors are highlighted from the survey of operation modes of the auxuliary drives and ma-chines. It can be listed as follows:
- shifting of speed to its lower values causes con-siderable reducing of load torque and mechan-ical power on the motor shaft;
- the long period of time of operation mode with permanent speed and load torque;
- the absence of reverse mode; - the restricted range of speed change; - the absence of overloads, the value of overload
may be determined in advance; - the start-up time is not limited, the start is
prefered to have a small start-up time for re-stricting dinamic overloads.
For all these reasons, the strict requires in tran-sient modes to closed-loop system control of cooling fan electric drive are not applied. For restricting the dinamic overloads it is wisely to put not a steplike reference signal but a ramped one.
It is obvious that the scalar control system thor-
oughly satisfi es all features mentioned above. Th e scalar control system of induction motor are shown in Fig. 4.
Figure 4. The scalar control system of induction motor
Th e voltage source inverter of frequency converter is presented as the next transfer functions of frequen-cy and voltage:
where kfc is the gain and τfc is the time constant.
kf and ku coeffi cients provide the proportional rela-tionship between fs frequency of stator current and Us stator voltage.
June 2015 Journal of Information Technology and Applications 17

JITA 5(2015) 1:13-24 A.S. Kosmodamianskiy, V.I. Vorobiev, A.A. Pugachev:
Th e equation of the speed PI-controller:
where ksp is the gain and τsp is the time constant.
Th e unit in Fig. 4 named Comp takes a function of compensation of voltage drop over the stator resis-tance. Two cases of such compensation are applied: IR-compensation and IZ-compensation.
Expression for voltage augment in case of IR-compensation:
Expression for voltage augment in case of IZ-com-pensation:
Controller of temperature as a control unit Controller of temperature working on a signal of
mismatch of the reference and feedback is used as a control unit of automatic temperature regulation system. Th e type and parameters of the controller in-fl uence on a steady state and transient mode. It needs to fi nd a correct point where transient time, error of regulation, variability, etc. have a satisfying values. In this work P- and PI-controller of temperature are presented and discussed:
Simulation of automatic temperature regula-tion systemSimulation of automatic temperature regulation
system was carried out by using of Matlab Simulink. Th e object of temperature regulation was simulated by transfer function (1) with parameters presented in Table 1. Th e centrifugal fan was described by (2), (3). Th e induction motor was presented in accordance to (6) – (10), the nonlinearity are implemented by (11) – (17). Th e energy equations of an induction motor are included by (18) – (26). Th e scalar control sys-tem was implemented by (27) – (31). Th e equations
of (32), (33) were used to simulate the control unit in various confi gurations of automatic temperature regulation system.
Th e results of simulation of transient modes of automatic temperature regulation system are shown in Fig. 5.
1 – WCU(р) = 3, 2 – WCU(р) = 10, 3 – WCU(р) = (р+0.0008)/р.a – Is* = 1.0, Q = 0.91 m3/sec, us* = 1, fs* = 1,b – I s* = 0.5, Q = 0.91 m3/sec, us* = 1, fs* = 1,
c – I s* = 1.0, Q = 0.51 m3/sec, us* = 0.23, fs* = 0.35, d – I s* = 0.5, Q = 0.51 m3/sec, us* = 0.23, fs* = 0.35
Figure 5. The temperature change of the stator winding of the
traction induction motor
a
b
c
d
18 Journal of Information Technology and Applications www.jita-au.com
AUTOMATIC TEMPERATURE REGULATION SYSTEM OF LOCOMOTIVE TRACTION INDUCTION MOTORS WITH POWER LOSSES MINIMIZATION JITA 5(2015) 1:13-24
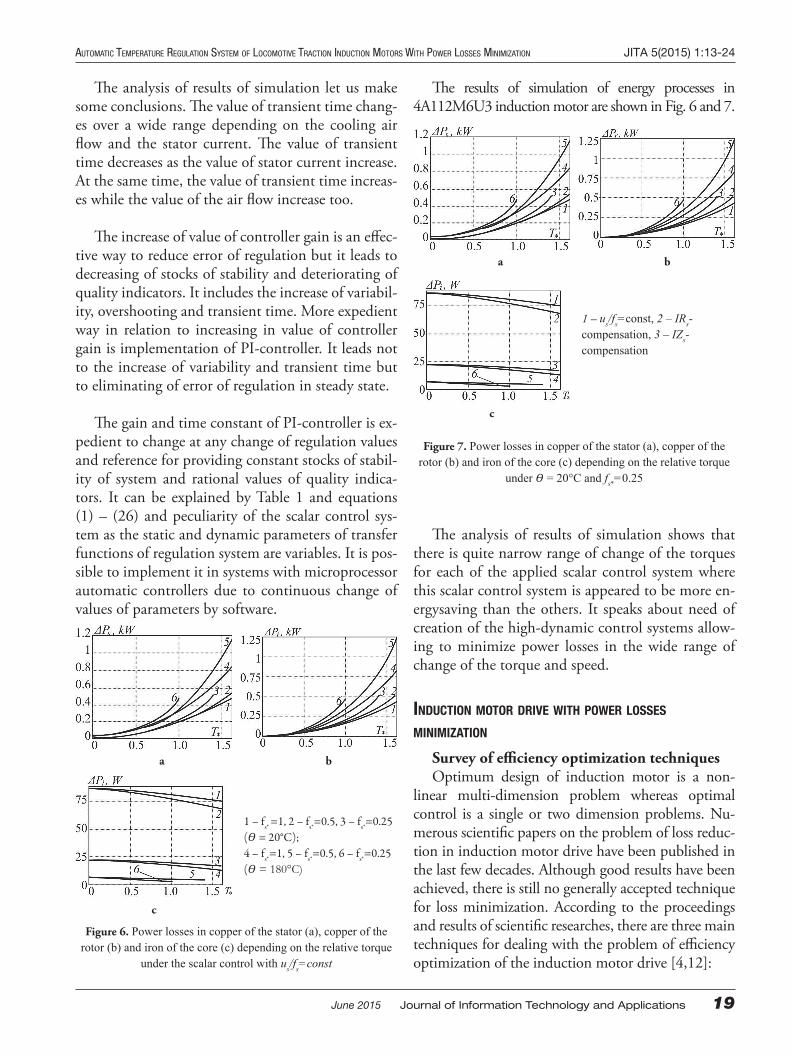
Th e analysis of results of simulation let us make some conclusions. Th e value of transient time chang-es over a wide range depending on the cooling air fl ow and the stator current. Th e value of transient time decreases as the value of stator current increase. At the same time, the value of transient time increas-es while the value of the air fl ow increase too.
Th e increase of value of controller gain is an eff ec-tive way to reduce error of regulation but it leads to decreasing of stocks of stability and deteriorating of quality indicators. It includes the increase of variabil-ity, overshooting and transient time. More expedient way in relation to increasing in value of controller gain is implementation of PI-controller. It leads not to the increase of variability and transient time but to eliminating of error of regulation in steady state.
Th e gain and time constant of PI-controller is ex-pedient to change at any change of regulation values and reference for providing constant stocks of stabil-ity of system and rational values of quality indica-tors. It can be explained by Table 1 and equations (1) – (26) and peculiarity of the scalar control sys-tem as the static and dynamic parameters of transfer functions of regulation system are variables. It is pos-sible to implement it in systems with microprocessor automatic controllers due to continuous change of values of parameters by software.
1 – fs* =1, 2 – fs*=0.5, 3 – fs*=0.25 (𝛳 = 20°C); 4 – fs*=1, 5 – fs*=0.5, 6 – fs*=0.25 (𝛳 = 180°C)
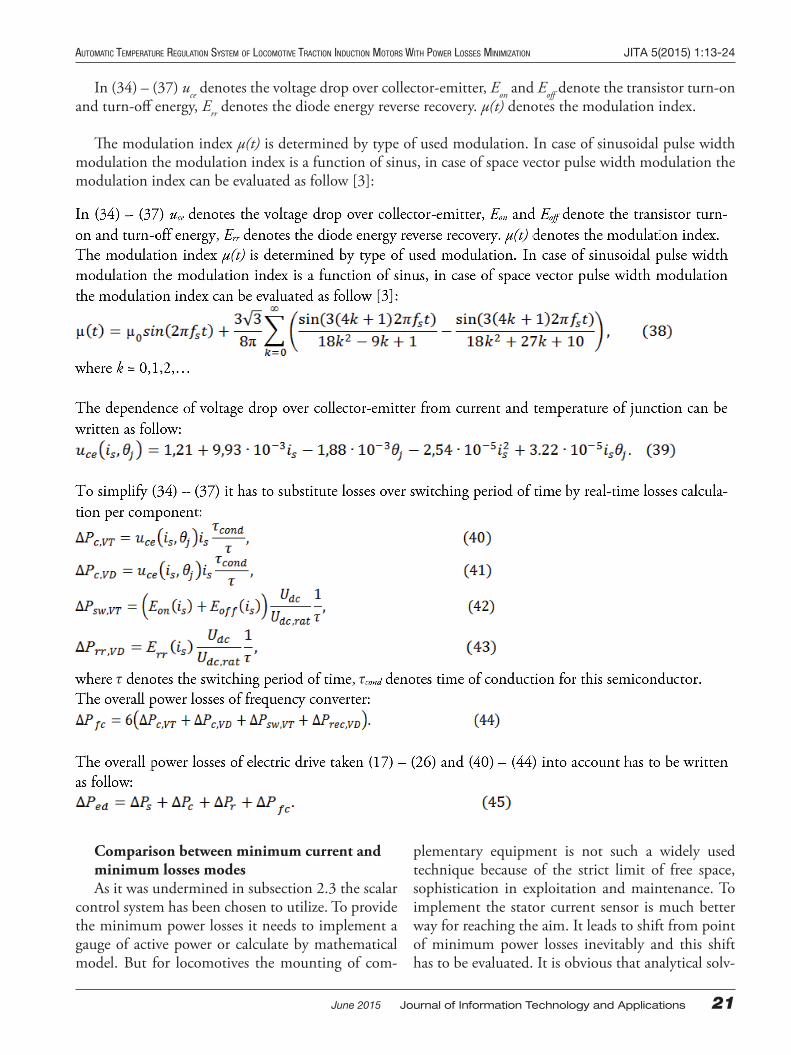
Th e results of simulation of energy processes in 4A112M6U3 induction motor are shown in Fig. 6 and 7.
1 – us/fs=const, 2 – IRs-compensation, 3 – IZs- compensation
Figure 7. Power losses in copper of the stator (a), copper of the rotor (b) and iron of the core (c) depending on the relative torque
under 𝛳 = 20°C and fs*=0.25
Th e analysis of results of simulation shows that there is quite narrow range of change of the torques for each of the applied scalar control system where this scalar control system is appeared to be more en-ergysaving than the others. It speaks about need of creation of the high-dynamic control systems allow-ing to minimize power losses in the wide range of change of the torque and speed.
INDUCTION MOTOR DRIVE WITH POWER LOSSES
MINIMIZATION
Survey of effi ciency optimization techniquesOptimum design of induction motor is a non-
linear multi-dimension problem whereas optimal control is a single or two dimension problems. Nu-merous scientifi c papers on the problem of loss reduc-tion in induction motor drive have been published in the last few decades. Although good results have been achieved, there is still no generally accepted technique for loss minimization. According to the proceedings and results of scientifi c researches, there are three main techniques for dealing with the problem of effi ciency optimization of the induction motor drive [4,12]:
a b
a b
c
c
Figure 6. Power losses in copper of the stator (a), copper of the rotor (b) and iron of the core (c) depending on the relative torque
under the scalar control with us/fs=const
June 2015 Journal of Information Technology and Applications 19

JITA 5(2015) 1:13-24 A.S. Kosmodamianskiy, V.I. Vorobiev, A.A. Pugachev:
- simple state control; - loss model control; - search control.
Th e simple state control is based on the control of one of the variables in the drive [2]. Th is variable must be measured or estimated and its value is used in the feedback control of the drive, with the aim of running the motor by predefi ned reference. Th is technique is simple, but gives good results only for a narrow set of operation conditions. Also, it is sensi-tive to parameter changes in the drive due to tem-perature changes and magnetic circuit saturation.
Th e loss model control are fast because the opti-mal control is calculated directly from the loss model [13]. Th e main disadvantage of this technique is that the power loss simulation and calculation of the op-timal operating conditions is very complex and it is also highly sensitive to parameter variations in the drive.
Th e search control uses the on-line procedure for effi ciency optimization [8]. Th e on-line effi ciency op-timization control on the basis of search changes one of variables in steps until the measured input power settles down to the lowest value is very attractive. Search technique has an important advantage com-pared to other techniques. It is absolutely insensitive to parameter changes while eff ects of the parameter variations caused by temperature and saturation are very expressed in two other techniques. Also there is an signifi cant drawback in its use: convergence of con-trolled variable to its optimal value sometimes can be
too slow, and it never reaches the value of minimal losses then in small steps oscillates around it.
Th ere are some hybrid techniques that combine peculiarities and advantages of three techniques mentioned above [1, 9, 5], but, nevertheless, it can be classifi ed by presented ones.
As a result of survey carried out and features of electric drives of cooling fans, it has been concluded that the search control with indirect power losses minimization is worth to be applied. Th e variable controlled to reach the optimization point is the sta-tor voltage, the variable choosen to be minimized is the stator current. Th e next subsections is presented to prove proximity of minimum current and mini-mum losses modes.
Overall power losses model of induction mo-tor driveBesides the induction motor taken part in energy
conversion, it is also voltage source inverter of fre-quency converter takes its place in electrical energy conversion. As a rule of thumb, it used to be elimi-nated from considering as a source of power losses due to a values of losses slightly compared to values of induction motor one. But now, since the comput-er technology made a huge step forward, it is not so onerous and tremendous to extract the equations of power losses in frequency converter.
Th e average power losses of frequency converter over switching period of time are determined by fol-low equations [9]:
20 Journal of Information Technology and Applications www.jita-au.com
AUTOMATIC TEMPERATURE REGULATION SYSTEM OF LOCOMOTIVE TRACTION INDUCTION MOTORS WITH POWER LOSSES MINIMIZATION JITA 5(2015) 1:13-24
In (34) – (37) uce denotes the voltage drop over collector-emitter, Eon and Eoff denote the transistor turn-on and turn-off energy, Err denotes the diode energy reverse recovery. μ(t) denotes the modulation index.
Th e modulation index μ(t) is determined by type of used modulation. In case of sinusoidal pulse width modulation the modulation index is a function of sinus, in case of space vector pulse width modulation the modulation index can be evaluated as follow [3]:
τ ττττ
Comparison between minimum current and minimum losses modes As it was undermined in subsection 2.3 the scalar
control system has been chosen to utilize. To provide the minimum power losses it needs to implement a gauge of active power or calculate by mathematical model. But for locomotives the mounting of com-
plementary equipment is not such a widely used technique because of the strict limit of free space, sophistication in exploitation and maintenance. To implement the stator current sensor is much better way for reaching the aim. It leads to shift from point of minimum power losses inevitably and this shift has to be evaluated. It is obvious that analytical solv-
June 2015 Journal of Information Technology and Applications 21

JITA 5(2015) 1:13-24 A.S. Kosmodamianskiy, V.I. Vorobiev, A.A. Pugachev:
ing this problem is very complex task. Th e numerical methods has been utilized to get the relationship be-tween power losses under the diff erent modes. Math-ematically, this task for the scalar control system can be written as follow:
where s = ω0 – ω, sopt denotes its optimal value in terms of losses minimization.
Table 2 contains the most important results of the numerical investigation for 4A112M6U3 induction motor. IGBT module of SKiiP 11HEB066V1 was used as a voltage source inverter.
Th e quantity comparison of overall power loss-es in electric drive between minimum current and minimum losses modes shows its almost thoroughly coincidence. So, the maximum mismatch in overall power losses under two considered modes for 0.2≤ T*≤1.5 and 0.25≤ ω* ≤1.25 equals to 8%.
Table 2. Comparison between minimum current and minimum losses modes
mode ω*ΔP
ed, W
T*=0.2 T*=0.4 T*=0.6 T*=0.8 T*=1.0 T*=1.2
minimum
power
losses
1.25 138.1 243.1 361.6 499.3 653.4 839.5
1 116.3 212.3 324.9 458.3 615 793.5
0.75 96.1 184.2 292.1 422.7 576.5 753
0.5 77.2 159.2 263.5 491.5 543.2 718
0.25 61.9 138.5 239.8 365.7 515.5 689.5
minimum
current
1.25 146.2 246.3 362.3 499.1 659.5 841
1 120.1 213.2 324.4 459 616 796.5
0.75 97.3 184.2 292.3 423.8 579 777.5
0.5 77.8 159.5 264.5 393.7 597 724
0.25 62.1 139.4 241.8 369.1 521 691.2
Implementation of power losses minimizationTh e developed control system of induction mo-
tor are shown in Fig. 8, a. Th e control system may be divided into two subsystems: the common scalar control system having closed loop with speed feed-back (Fig. 4) and the control system providing the minimum current mode.
a
bFigure 8. The scalar control system of induction motor with power losses minimization (a) and technique of searching for minimum
of the stator current (b)
Th e essence of the control system providing the minimum current mode is the next. If a steady state of the operation can be found, the search control sys-tem is enabled, until the stator current reaches the minimum. It is used an external, periodical test sig-nal, triangular shape wave, that determines the in-creases or the decreases of the additional voltage con-trol signal. Once the minimum point was reached, the system operates in this new steady state, until a change in the stator current is detected.
Th e search technique uses as manipulated variable the γ1 voltage and as test signal the γ2 triangular volt-age in order to change the stator voltage:
It is applied that the γ2 test signal has the ampli-tude ΔUs,max and the τγ period then the position of the
22 Journal of Information Technology and Applications www.jita-au.com

AUTOMATIC TEMPERATURE REGULATION SYSTEM OF LOCOMOTIVE TRACTION INDUCTION MOTORS WITH POWER LOSSES MINIMIZATION JITA 5(2015) 1:13-24
current operating point (1, 2 or 3 in Fig. 8, b) rela-tive to the minimum point can be determined by the variation of the ΔIs stator current due to the +ΔUs,max test signal in the fi rst τγ /2 half of period so that:
- if ΔIs > 0 then the slip is s < sopt (point 1);- if ΔIs < 0 then the slip is s > sopt (point 2); - if ΔIs = 0 then the slip is s = sopt (point 3).
In order to make the induction motor to operate close to minimum point it needs to choose the ramp sign of the manipulated variable (γ1= εt, where ε is an empirical coeffi cient) so that:
- if ΔIs increases then γ1 has to decrease the stator voltage:
- if ΔIs decreases then γ1 has to increase the stator voltage:
- if ΔIs ≈ 0 then the signal is γ ≈ 0.
Simulation of induction motor driveSimulation of the drive was carried out in MatLab
as follows. At the fi rst interval of time the soft start of the induction motor to the referenced speed was car-ried out. Th e system of the stator current minimiza-tion is disconnected. After completion of transition processes the search control technique is added to classical system of scalar control and starts register-ing the direction of change of the stator current in the fi rst half of period of a test signal. Depending on change of the stator current the system of its mini-mization begins developing the γ1 manipulated signal directed on reduction of the current. When change of the current becomes less than a hysteresis of the relay regulator (Fig. 8, a), the test signal is discon-nected until owing to various reasons (change of the load torque, temperature of windings, etc.), not de-pending on change of a reference speed, slip will not deviate the optimum value that will cause the corre-sponding increase in the current and, consequently, in the power losses.
Th e results of simulation are shown in Fig. 9. Th e stator current are presented in synchronous frame so that its frequency in Fig. 9 is null.
Figure 9. The stator current (a),
overall power losses (b) and additional stator voltage (c)
Th e analysis of results shows operability of the de-veloped control system. So, with speed twice reduced relative to the rated and load torque one and a half times exceeded relative to the rated, for ensuring the minimum stator current it is necessary to increase the stator voltage. It leads to a simultaneous reduc-tion of power losses (about 20%). Th e stator current decreases approximately by 15...20%. Speed after shutdown of system of the current stator minimiza-tion comes back to the value before inclusion of the system. Oscillations of speed under the search con-trol system are insignifi cant and do not exceed 0.5%.
CONCLUSIONS
Th e developed automatic temperature regula-tion system of traction induction motors consists of control unit implemented by P- or PI-controller, ex-ecutive regulation device implemented by induction motor drive with the centrifugal fan. Th e developed and constructed physical model of both traction and auxiliary drive of locomotive allows to investigate the thermal and electromechanical and control process-es. Th e developed control system of the induction motor with the stator current minimization provides also power losses minimization. Th e minimization mode is feasible under the steady state. Th e control system gives the greatest eff ect under lowered speed and/or the lowered or raised load torques due to reg-ulation in necessary limits of the stator current by means of change of the stator voltage. Reduction of both power losses and the stator current can reach
a b
c
June 2015 Journal of Information Technology and Applications 23

JITA 5(2015) 1:13-24 A.S. Kosmodamianskiy, V.I. Vorobiev, A.A. Pugachev:
20% of initial value depending on the providing speed and torque.
Acknowledgements
Th e reported study was supported by Russian Foundation for Basic Research (RFBR), research project No. 14-08-31274.
REFERENCES
[1] Aissa, K., Eddine, K.D. (2009). Vector control using series iron loss model of induction motors and power loss mini-mization, World academy of science, engineering, and technology, 52,. – P. 142 – 148.
[2] Benbouzid, M.E.H., Nait Said, N.S. (1998). An effi ciency optimization controller for induction motor drives, IEEE Power Engineering Review, Vol. 18, Issue 5, pp. 63 –64.
[3] Bierhoff, M.H. [et al.] (2004). Semiconductor losses in voltage source and current source IGBT converters based on analytical derivation, Power Electronics Specialists Conference,. PESC 04. 2004 IEEE 35th Annual, Volume 4, pp. 2636 – 2642.
[4] Blamisa, B., Vukosavic, S.N. (2013). Effi ciency optimization of induction motor drive, Naučno-stručni simpozijum Energetska efi kasnost, ENEF 2013, Banja Luka, 22. – 23. Nov. 2013.
[5] Blanuša, B., Marić, P., Dokić, B. (2010). New hybrid model for effi ciency optimization of induction motor drives, in Proceedings of 52nd International Symposium ELMAR-2010, pp. 313–317.
[6] Kosmodamianskiy, A.S., Vorobiev, V.I., Pugachev, A.A. (2011). The temperature effect on the performance of a traction asynchronous motor, Russian Electrical Engineering, 2011, Vol. 82, No. 8, pp. 443 – 448.
[7] Kosmodamianskiy, A.S. (2002). Theoretical bases and development of locomotives traction electric motors tempera-ture control system, thesis, doctor in engineering – Moscow, – 306 p.
[8] Kosmodamianskiy, A.S., Vorobiev, V.I., Pugachev, A.A. (2012). Induction motor drives with minimal power losses, Russian Electrical Engineering, Vol. 83, No. 12, pp. 667 – 671.
[9] Kosmodamianskiy, A.S., Klyachko, L.M., Vorobiev, V.I., Pugachev, A.A. (2014). Control system of a tractive drive with temperature control of thermally loaded elements, Russian Electrical Engineering, Vol. 85, No. 8, pp. 513 – 518.
[10] Lim, S., Nam, K. (2004). Loss-minimising control scheme for induction motors IEEE Proc.-Electr. Power Appl. Vol. 151. No. 4, July 2004. – p. 386 – 397.
[11] Pugachev, A., Fedyaeva, G. (2015). Defi nition of the transfer function of asynchronous motor as an object of tempera-ture control, Applied Mechanics and Materials. 2015.–vol. 698. – pp. 124 – 130.
[12] Thanga Raj, C., Srivastava, S. P., Pramod, A. (2009). Energy effi cient control of three-phase induction motor, a review, International Journal of Computer and Electrical Engineering, Vol. 1, No. 1, April 2009. – pp. 61 – 70.
[13] Vukosavic, S.N., Levi, E. (2003). Robust DSP-based effi ciency optimization of variable speed induction motor drive, IEEE Transaction of Ind. Electronics, Vol. 50,No. 3,pp. 560-570, 2003.
Submitted: April 30, 2015.Accepted: May 8, 2015.
24 Journal of Information Technology and Applications www.jita-au.com

A NEW APPROACH TO COMPUTER ANALYSIS OF QUEUING SYSTEMS WITHOUT PROGRAMMING JITA 5(2015) 1:25-32
A NEW APPROACH TO COMPUTER ANALYSIS OF QUEUING SYSTEMS WITHOUT PROGRAMMING
Zoran Ž. Avramović, Radomir Z. Radojičić, Saša D. MirkovićUniversity of Belgrade, [email protected]
Contribution to the state of the art
DOI: 10.7251/JIT1501025A UDC: 662.62:519.245
Abstract. The paper presents original object oriented programming system ARS for modelling and simulation queuing systems. Programming system was developed in programming language C++. It establishes connection with intrinsic, but also with other Windows programming packages, in a simple way, through object oriented environment. Basic characteristics and possibilities of programming system, as well as comparative analysis of simulators: mathematical model (analytical solution) - GPSS/H - ARS, on the example of closed queuing network in the paper is given. The signifi cant application for computer performance evaluation is reported.
Keywords: simulation, queuing system, programming system, computer performance evaluation.
INTRODUCTION
Since the invention of computer the growing im-portance is attached to virtual experiments on the computer. In view that the subject of attention in the research activities are more and more frequently the complex systems, where the mathematical or statis-tical analyses are either too complex or do not give results, the computer simulation has been obtaining a growing importance [6,7].
Th e methodological approach to modelling is di-rectly related to the language choice for the system simulation. Th e experience in development of the theory and practice of simulation indicates that the most effi cient means of the simulation models pro-gramming are the specialised simulation languages.
ARS is a simulation system which, in a simple way, by defi ned graphical models, creates the model (specifying a sequence of activities and precisioning the operations performed by their implementation over the attributes of the model objects).
Th e philosophy of the ARS programming system
is based on the object approach to the modelling and simulation process.
THE CONCEPT OF THE SYSTEM
Th e ARS has been conceived as a general pro-gramming system intended for stochastic modelling and to processes oriented discrete simulation. It has been accomplished on an object approach, establish-ing a close, natural relationship between the analysed system and the simulation model - alleviating the modelling and simulation process to the user.
Th e ARS programming system enables the mod-elling and simulation of single- and multiphase of queuing systems, either single- or multi-channel ones (with equivalent or non-equivalent servers). It is also possible to model and simulate both open and closed networks, but also the queuing networks with and without the feedback.
Th e motive for development and implementation of this system is the authors’ wish to expand and im-prove the capabilities of modern simulation languag-es and simplify their use and application.
June 2015 Journal of Information Technology and Applications 25

JITA 5(2015) 1:25-32 Zoran Ž. Avramović, Radomir Z. Radojičić, Saša D. Mirković:
BASIC CHARACTERISTICS OF THE SYSTEM
Th e ARS programming system represents an ob-ject approach to the simulation modelling, which enables a simple modelling procedure, a high detail level of real processes, updating and use of the results in all steps of operation. It is enough to have a ba-sic knowledge on the computer operation for its use. Th e users’ requests to model the systems and laws of their functioning as truly as possible for the re-quirements of various investigations, are met by ARS through the fl exible graphic environment available and a wide range of basic and derived “objects”.
Th e basic elements present in modelling by the ARS programming system are static and dynamic objects (transactions). Any change in the object sta-tus results from the occurrence of an event, which may represent either starting or ending an activity.
Th e static objects direct, hold, update and partly control the dynamic objects, or change their param-eters’ values. One of the basic static objects in ARS is a server, representing the object by which the activity duration or delay is modelled.
Th e dynamic objects are created in input points of the model by the basic object for generation of objects, or defi ned by an initial state of the system. Th ese objects are moved through the model bearing their characteristics - transaction parameters. As long as they are present in the model, the dynamic objects are in interaction with other objects in various forms.
During the simulation, it is possible to achieve the interaction and communication, in all variants, between static and dynamic objects (either directly or indirectly), with a possibility of using additional variables and functions from a wide range of the of-fered ones, as well as those derived there from.
Th e objects may be basic and derived. Th e ba-sic objects are defi ned in advance and they cannot change their intended function, but their specifi ed parameters can be changed.
Th e ARS programming system incorporates a capacity of modelling the queuing system by user through the application of off ered or independently
designed objects. By designing of the own objects of an arbitrary complexity and through the defi nition of their parameters, it becomes possible for the user to better imitate the computer system functioning so that the desired level of detailing in an accessible way is obtained.
THE MODELLING AND SIMULATION
Th e model of the queuing system in ARS is a se-ries of static objects through which the transactions pass during the simulation [8].
Th e simulation of queuing system operation in the ARS system is performed by a simple proce-dure: after creating a graphic model of the system and defi ning the work load and system resources pa-rameters, the interactive simulation is activated and implemented [1,2]. During the simulation and on its completion, the user has at disposal (current and fi nal) simulation results - statistic indicators of basic and derived performances of the queuing model.
Th e user has at disposal a large number of dif-ferent probability distributions of arrivals of open network transactions, various distributions of service time and standard scheduling algorithms (FCFS, LCFS, PRI, RSS, and RR).
Th e modelling is implemented with the graphic editor’s support, by simply creating a state-transition diagram, using the off ered objects, and on the basis of already created models in the form of the derived objects. It would be possible to use either the mouse or develop a model by means of the keyboard.
Th e visual monitoring of the transactions fl ow in all stages of creation and modelling, as well as in the phase of simulation, represents an important innovation in re-lation to the program packets of similar nature.
Th e monitoring and analysis of the transient re-sponse and steady state are achieved by storing and erasing the selected statistic indicators, dynamic ob-jects and their attributes. When detecting the steady state (by monitoring the steadiness of relevant, pre-selected indicators of system performances), it is pos-sible to automatically stop the simulation.
26 Journal of Information Technology and Applications www.jita-au.com
A NEW APPROACH TO COMPUTER ANALYSIS OF QUEUING SYSTEMS WITHOUT PROGRAMMING JITA 5(2015) 1:25-32
By building a more detailed model and defi ning the derived objects based on the requirements, creat-ing the own functions of distributions on the basis functions, by defi nition of users’ functions to be used during the simulation, and based on the appearance of working environment, the adjustment of the sys-tem is made according to the users’ requirements.
WORKING ENVIRONMENT
Th e ARS programming system communicates and uses, in a very fl exible way, both internal and other Windows program packets having the required inter-relation with it. Th e system is furnished with the original program packet for a curve-fi tting, rep-resenting an important supplementary characteristic. Th e use of a wide set of approximate functions and deriving of conclusions on the basis of numerical processing and graphical presentation of simulation results brings an advantage over the existing program packets of a similar application.
Th e user has in front of him a possibility of a dia-logue with the computer in all steps of modelling and simulation.
Th e interactive simulation enables the experi-menting during which, in randomly selected mo-ments, or after the meeting of a particular condition, an arbitrary object in the system can be approached, watched and its current status monitored, the val-ues of some variables can be changed, the status of the system also can be changed by introducing tak-ing out or updating of the object parameters or even modify the initial diagram and continue the simula-tion thereafter.
A particular advantage of the interactive opera-tion is shown in detecting, locating and correcting of errors.
Th e system comprises a standard HELP giving the required information in all steps of model elabo-ration and in all stages of simulation. Th ere is also a possibility of a multi-media presentation of the pro-gramming system, with an animation and accompa-nying vocal presentations, supplementing the basic elements of the simulation system. Programming
system was developed in programming language C++ [9,12].
SIMPLE QUEUING MODEL OF THE CLOSED NETWORK (THE
COMPARATIVE ANALYSIS)
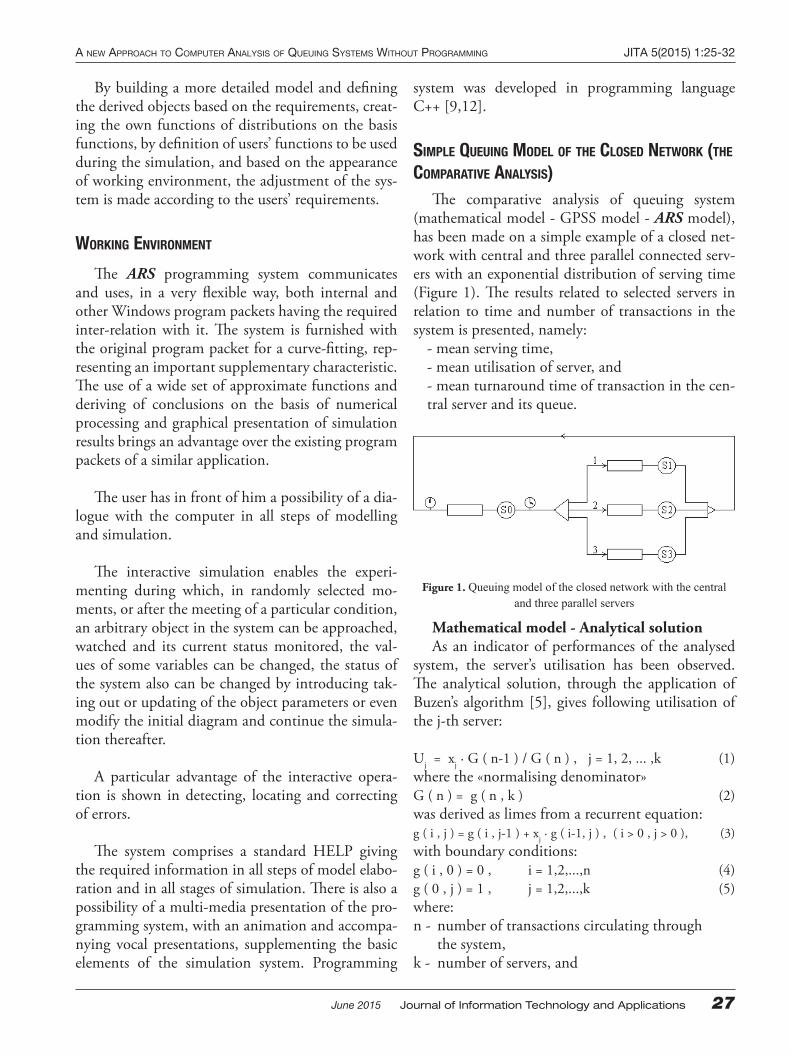
Th e comparative analysis of queuing system (mathematical model - GPSS model - ARS model), has been made on a simple example of a closed net-work with central and three parallel connected serv-ers with an exponential distribution of serving time (Figure 1). Th e results related to selected servers in relation to time and number of transactions in the system is presented, namely:
- mean serving time,- mean utilisation of server, and- mean turnaround time of transaction in the cen-tral server and its queue.
Figure 1. Queuing model of the closed network with the central and three parallel servers
Mathematical model - Analytical solutionAs an indicator of performances of the analysed
system, the server’s utilisation has been observed. Th e analytical solution, through the application of Buzen’s algorithm [5], gives following utilisation of the j-th server:
Uj = xj · G ( n-1 ) / G ( n ) , j = 1, 2, ... ,k (1)where the «normalising denominator»G ( n ) = g ( n , k ) (2)was derived as limes from a recurrent equation:g ( i , j ) = g ( i , j-1 ) + xj · g ( i-1, j ) , ( i > 0 , j > 0 ), (3)with boundary conditions:g ( i , 0 ) = 0 , i = 1,2,...,n (4)g ( 0 , j ) = 1 , j = 1,2,...,k (5)where:n - number of transactions circulating through the system,k - number of servers, and
June 2015 Journal of Information Technology and Applications 27

JITA 5(2015) 1:25-32 Zoran Ž. Avramović, Radomir Z. Radojičić, Saša D. Mirković:
xj - normalised request for the j-th server.
Simulation model in GPSS/H languageTh e listing of the program implemented in the
simulation language GPSS/H is elementary [3,4,11].
Simulation model in the ARS programming systemTh e queuing model of the implemented solution
of the closed network, in the programming system ARS is shown in Figure 1. Th e basic static objects used in this network:
Chronoscope (Object for time measur-ing - punctual measuring of small time particles)Queue (Object for waiting for serving; fi nite queue; n-queue capacity)
Server (Variable delay object for serving or processing)
Collector (Merging point. Object for putting the transactions together)
Distributor (Branching point. Object for probabilistic branching of transac-tions)
Table 1. The server’s basic parameters
ServerServer’sname
Meanserving
timeS0 Central 5 ms
S1 First parallel 25 ms
S2 Second parallel 25 ms
S3 Third parallel 10 ms
Table 2. The probabilistic branching element’s basic parameters
Channel Probability of transfer
1 2/11
2 2/11
3 7/11
Review and analysis of the resultsFigure 2 shows the mean serving time of serving
by the fi rst parallel server in relation to the number of transactions in the model. Th e comparison with the value from Table 1 shows that the ARS program-ming system gives a lower and more stable relative error of serving time dispersion. For the illustra-tion, we should mention that the mean relative er-ror in the concrete case is: for ARS 2.35%, and for GPSS/H 4.37%.
Figure 2. Mean serving time for the fi rst parallel server in relation to the number of transactions in the model
Th e results showing the dependence of the central server’s utilisation from the number of transactions in the model (Figure 3) indicate that the ARS pro-gramming system is signifi cantly more convergent to results obtained by the analytical method from the mathematical model. In the case in question the relative error mean value for ARS is 3.28%, and for GPSS/H 5.91% (whereas their maximum values are 7.68% for ARS and 18.10% for GPSS/H).
Figure 3. Utilisation of the central server in relation to the number of transactions in the model (A.S. - Analytical solution)
28 Journal of Information Technology and Applications www.jita-au.com

A NEW APPROACH TO COMPUTER ANALYSIS OF QUEUING SYSTEMS WITHOUT PROGRAMMING JITA 5(2015) 1:25-32
Of a particular interest are the results obtained by observation of the central server utilisation in relation to the simulation time. It is not diffi cult to notice in Figure 4 that utilisation off ered by the ARS program-ming system, during the transient regime of simula-tion, has an unstable value which, as the simulation continues, converts into steady, close to the theoretical one. As the opposed to this, GPSS/H demonstrates, for the same parameter, a higher dispersion during the entire period under consideration. It has been found that during the whole period under consideration, the mean value of a relative error for the ARS program-ming system is 3.01%, and for GPSS/H 3.61%.
Figure 4. The simulator behavior in the transient time (on an example of the central server utilization) (for 4 transactions in the
model)
Th e mean time of transactions’ holding in the central server and its queue (Figure 5), and the mean time of transactions’ queuing at the central server (Figure 6), in relation to the number of transactions in the model, for the programming system ARS and GPSS/H have approximately same law of change.
Figure 6. Turnaround time in the central server’s queue in relation to the number of transactions in the model
Th e ARS programming system, using the own least-squares curve-fi tting program, has established the approximate function for the mean time of trans-actions’ queuing in relation to the number of trans-actions in the model:Tq [ms] = a· ln(1+n) + b / ln(1+n) + c · √n + d / √n + e / n + f, n=1,2,... (6)
Values of coeffi cients in equation are:a = -341.63, b = -38541.22, c = 640.82, d = 1048.67, e = 38190.69, f = 18087.80. (7)
For the found approximate dependence, the correla-tion coeffi cient is 0.991.
SIMULATION MODEL OF THE COMPUTER SYSTEM
Th e simulation analysis of the computer system model functioning has been made on the example of a closed multi-processor multi-processes network (Figure 7) with three processors, two disks, paging storage consisting of 512 pages, fi ve priority queues for the processor, three priority queues for storage allocation and ten processes moving through the model, respecting the dependence of the processes activities (as shown in Figure 8). Th e attributes of all processes are presented in a tabular form (Table 3).
Figure 5. Turnaround time in the central server and its queue in relation to the number of transactions in the model
June 2015 Journal of Information Technology and Applications 29

JITA 5(2015) 1:25-32 Zoran Ž. Avramović, Radomir Z. Radojičić, Saša D. Mirković:
Figure 7. Queuing model of the multi-processor multi-processes computer system
Legend:
SR - State of rest (10) P - Processors (3)
RP - Request for the processes DP - Decreasing of priority
SQ - Storage queue (3) IP - Increasing of priorities
F - Filter CM - Clearing of memory
SO - Storage occupation D - Disks (2)
PQ - Processor queue (5) BE - Branching elements (3)
Table 3. Dynamic objects (processes) of the system with attributes and initial values
Pro-cess
A1 A2 A3 A4 A5 A6 A7 A8 A9 A10 A11
1 18 5 5 5 0.01 0 1000 1.00 10 2 0
2 32 4 3 4 0.02 0 2000 0.50 20 5 0
3 40 3 2 4 0.05 0 3000 0.00 20 8 0
4 46 3 2 4 0.05 0 4000 0.50 5 10 0
5 74 3 1 4 0.10 0 5000 0.50 10 50 0
6 88 3 1 4 0.10 0 6000 0.00 40 40 0
7 92 3 1 4 0.10 4 7000 0.30 50 60 0
8 144 3 1 4 0.20 2 8000 0.50 100 15 0
9 166 3 1 4 0.30 2 9000 1.00 200 17 0
10 200 3 1 4 0.40 3 10000 0.80 250 30 0
Legend: A1 - number of pages, A2 - current priority, A3 - the lowest priority, A4 - the highest priority, A5 - probability of
transfer to the state of rest, A6 - request for process, A7 - mean turnaround time of the state of rest, A8 - probability of transfer to the fi rst disk, A9 - mean time serving for disk, A10 - mean time of serving for the processor, A11 - remaining processing time
(established after the interruption of the process due to the lapse of the processor time quantum)
Figure 8. Tree presenting the dependence of processes by presence in the storage (when a process is active, all preceding ones must be
stored)
Th e static objects in this network and their basic parameters are (serving times by all servers are the exponentially distributed):SR: Multi-channel server (10 channels). It obtains the mean serving time through its attribute process (A7). While receiving the request from object RP, object SR releases the requested processes, in case they are served within it.RP: Th e object for events generation and updating of variable systems, transaction attributes and object parameters. It generates the event to object SR for re-lease to the fi rst process and the process determined by attribute A6 of the current process.SQ: A multiple queuing for storage. It consists of three queues. Th e highest priority queue comprises the processes with more than 100 pages, the me-dium priority - processes with the number of pages between 50 and 100 and the lowest priority - other processes.F: Th e object letting in the transactions when the condition required is met. If the coming process re-quires more pages than available at the moment, it is on admitted until the required number of pages is available.SO: By processing through this object, the value of the variable SR (the number of pages available in the storage, the global variable of the system) decreases by the number of pages of the current process.PQ: Five queues accepting the processes by their pri-ority attribute.P: Multi-channel server with three processors. Th e mean serving time is obtained from the process at-tribute (A10). Th e upper limit of the serving time is specifi ed - the processor time quantum. (Th e remain-ing serving time is recorded in attribute A11 of the process, and the process is released. If on the process occupation attribute A11 is other than zero, this val-ue is added to the current serving time).
30 Journal of Information Technology and Applications www.jita-au.com
A NEW APPROACH TO COMPUTER ANALYSIS OF QUEUING SYSTEMS WITHOUT PROGRAMMING JITA 5(2015) 1:25-32
BE1: Th e process is forwarded to the fi rst branch if attribute A11 is more than zero.BE2: Th e branching is implemented according to the leaving probability (the fi rst branch is approached with the probability given by attribute A5).DP: It decreases the priority to the process by 1 (if it is higher than the minimum value for that process).CM: Th e storage is clear. Variable SR increases by the number of required pages for the current process.BE3: Divides the processes according to probabili-ties obtained from attribute A8 of the current process (disk D1 is approached with the probability given by attribute A8).D1 and D2: Servers with mean serving time accord-ing to attribute A9 of the process.IP: It increases the priority to the process (if it is low-er than the maximum value for that process).
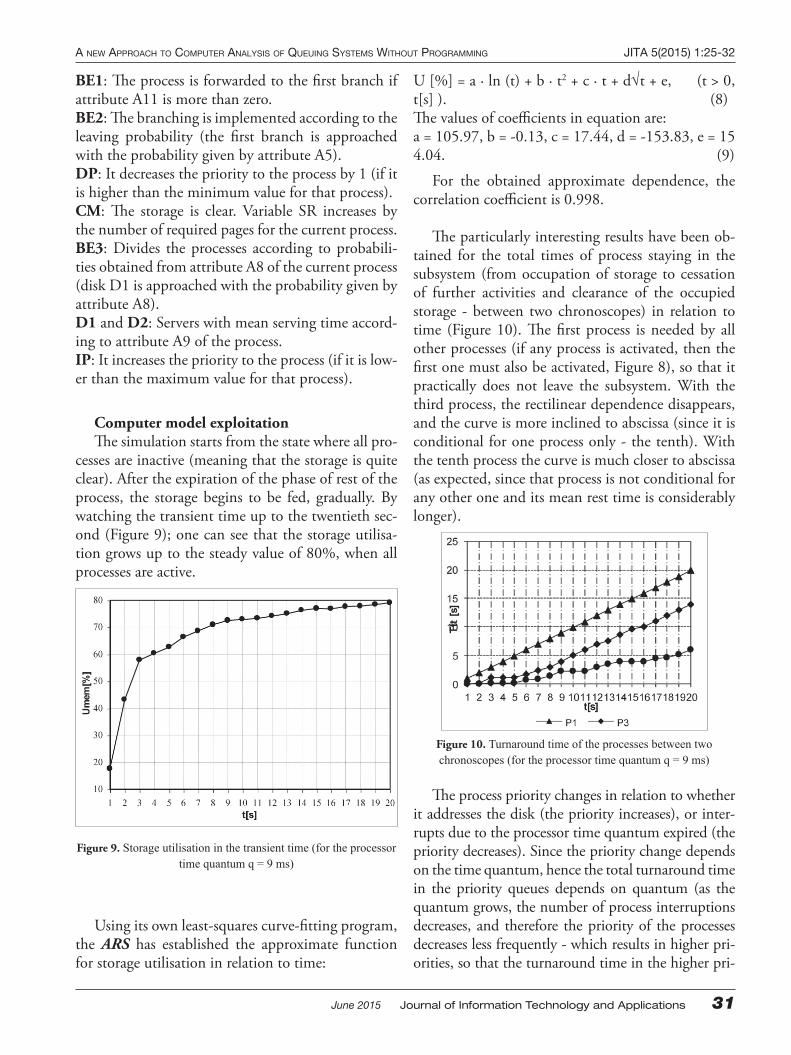
Computer model exploitationTh e simulation starts from the state where all pro-
cesses are inactive (meaning that the storage is quite clear). After the expiration of the phase of rest of the process, the storage begins to be fed, gradually. By watching the transient time up to the twentieth sec-ond (Figure 9); one can see that the storage utilisa-tion grows up to the steady value of 80%, when all processes are active.
Figure 9. Storage utilisation in the transient time (for the processor time quantum q = 9 ms)
Using its own least-squares curve-fi tting program, the ARS has established the approximate function for storage utilisation in relation to time:
U [%] = a · ln (t) + b · t2 + c · t + d√t + e, (t > 0, t[s] ). (8)Th e values of coeffi cients in equation are:a = 105.97, b = -0.13, c = 17.44, d = -153.83, e = 154.04. (9)
For the obtained approximate dependence, the correlation coeffi cient is 0.998.
Th e particularly interesting results have been ob-tained for the total times of process staying in the subsystem (from occupation of storage to cessation of further activities and clearance of the occupied storage - between two chronoscopes) in relation to time (Figure 10). Th e fi rst process is needed by all other processes (if any process is activated, then the fi rst one must also be activated, Figure 8), so that it practically does not leave the subsystem. With the third process, the rectilinear dependence disappears, and the curve is more inclined to abscissa (since it is conditional for one process only - the tenth). With the tenth process the curve is much closer to abscissa (as expected, since that process is not conditional for any other one and its mean rest time is considerably longer).
Figure 10. Turnaround time of the processes between two chronoscopes (for the processor time quantum q = 9 ms)
Th e process priority changes in relation to whether it addresses the disk (the priority increases), or inter-rupts due to the processor time quantum expired (the priority decreases). Since the priority change depends on the time quantum, hence the total turnaround time in the priority queues depends on quantum (as the quantum grows, the number of process interruptions decreases, and therefore the priority of the processes decreases less frequently - which results in higher pri-orities, so that the turnaround time in the higher pri-
June 2015 Journal of Information Technology and Applications 31

JITA 5(2015) 1:25-32 Zoran Ž. Avramović, Radomir Z. Radojičić, Saša D. Mirković:
ority queues is longer). Figure 11 shows that the total turnaround time in priority 4 queue is signifi cantly longer than turnaround time in priority 1 queue with the longer quantum of the processor time.
Figure 11. Total queuing times for the processor in relation to the processor time quantum
CONCLUSION
Th e paper presents the original programming sys-tem ARS for simulation of the queuing system. Th e
presented programming system is applicable for the simulation of open and closed queuing networks of an arbitrary complexity. It enables a simple modelling, interactive simulation, adequate presentation and nu-merical processing of results, arbitrary adjustment of working environment and system resources and other advantages, aiming at a more effi cient designing.
Th e programming system off ers to the user a pos-sibility of introducing his own objects, enabling a more successful modelling of complex systems. Th e own system for numerical processing of the simula-tion results is an effi cient tool for collecting the sta-tistic indicators of the relevant system performances. Th e interactive simulation and a possibility of chang-ing the structure of the analysed of queuing system makes a basis for a successful detection and removal of errors found during the modelling.
Considering the before specifi ed properties of the ARS programming system, we are of the opin-ion that it represents an adequate tool in the fi eld of modelling the discrete queuing systems.
REFERENCES
[1] Avramović, Z.Ž., Radojičić, R.Z., “ARS - new programming system for computer performance analysis” (in Serbian), ETRAN, Budva, 1996, 47-50.
[2] Avramović, Z.Ž., Radojičić, R.Z., Savkić, D.S., “The modelling and simulation operation of a railway station in the ARS programming system” (in Serbian), JUŽEL, Niš, 1996, 31-34.
[3] Avramović, Z.Ž., Radojičić, R.Z., Savkić, D.S., “Basic characteristics of object oriented programming system ARS for simulation queuing systems” (in Serbian), YuInfo, Brezovica, 1996, 107.
[4] Banks, J., Carson, J. S., Sy, J.N., Getting Started with GPSS/H, Wolverine Software Corporation, Annadale, 1989.[5] Buzen, J.P., “Computational algorithms for closed queuing networks with exponential servers”, Comm. ACM, 16 (1973)
527-531.[6] Gordon, G., System Simulation, Prentice-Hall, Englewood Cliffs, Nj, 1978.[7] Graham, R.L., Knuth, D.E., Patashnik, O., Concrete mathematics: a foundation for computer science, Addison-Wesley
Publishing Company, 1988.[8] Kleinrock, L., Queuing theory, Volume I: Theory, John Wiley & Sons, Nj, 1975.[9] Nutaro, J. J. (2011). Building software for simulation: theory and algorithms, with applications in C++. John Wiley &
Sons.[10] Pritsker, A.A.B., Introduction to Simulation and SLAM II, Systems Publishing Corporation, West Lafayette, Indiana,
1984.[11] Schriber, T.J., Simulation using GPSS, John Wiley, 1974.[12] Varga, A. (2001, June). The OMNeT++ discrete event simulation system. In Proceedings of the European simulation
multiconference (ESM’2001) (Vol. 9, No. S 185, p. 65). sn.
Submitted: April 4, 2015.Accepted: May 29, 2015.
32 Journal of Information Technology and Applications www.jita-au.com

THE PERSPECTIVE OF HIGH-TEMPERATURE SUPERCONDUCTIVITY ELTCTRICAL EQUIPMENT APPLICATION
FOR TRACTION POWER SUPPLY AND THE PROBLEMS OF ELECTROMAGNETIC COMPATIBILITY JITA 5(2015) 1:33-54
THE PERSPECTIVE OF HIGH-TEMPERATURE SUPERCONDUCTIVITY ELTCTRICAL EQUIPMENT
APPLICATION FOR TRACTION POWER SUPPLY AND THE PROBLEMS OF ELECTROMAGNETIC COMPATIBILITY
M.P. Badjor, Yu. M. InkovD. Sc. Habil., professors
MSURE (MIIT)
Case stydy
DOI: 10.7251/JIT1501033B UDC: 621.31.027.2
ANNOTATION
EMC analysis of superconducting and traditional electrical equipment, study of the laws of the electro-magnetic interaction, the nature of the mutual infl uence of the parameters and operation of electrical equipment, as well as search of protection and types of arrangement of electrical equipment, in which interference will not cause disruption to the interacting elements.
Th e analysis of the world tendencies in the devel-opment of the electrical engineering and power engi-neering, including the ones for the electrifi ed transport, shows that one of the important tendencies in the near-est future will be the employment of the high-current applied superconductivity. It is well-known, that the new opportunities are opened by the ready for the mass production high-temperature superconductors of the second generation, capable of operating at temperatures up to the temperature of the liquid nitrogen, which is a hundred times more economical than the helium tem-peratures. As it is estimated, after the introduction of the high-temperature superconductors of the second gener-ation the cost of the high-temperature superconducting wires will be comparable to the cost of the resistance wires. Th is means that in the nearest future the develop-ment of the new superconducting electrical equipment will be started, which will excel the conventional elec-trical equipment at physical, technical and commercial
characteristics. Consequently, nowadays it is becoming more and more challenging the scientifi c research of the development, testing of models and production proto-types of various electrical equipment on the basis of the high-temperature superconducting materials, including cable power lines, transformers, electric motors, reac-tors and energy storage units.
Th e introduction and employment of the super-conducting technologies and new high-temperature superconducting electrical equipment in locomotive and stationary energetic will enable to improve the traction electrical equipment safety and effi ciency, to reduce the capital and maintenance costs, to pro-vide the energy saving.
Th e problem of the superconducting electrical equip-ment employment on the transport objects is closely con-nected with the necessary solution of the parallel scien-tifi c, technological and design problems. One of them is the problem of the analysis of the electromagnetic interaction of the superconducting electrical equipment external fi elds with other types of equipment and with the conventional equipment as well. Th is problem is of special importance for the perspective transport vehicles, which size is more or less limited and where it is diffi cult to apply the easiest protection means from the external magnetic fi elds (EMF) – distance protection.
June 2015 Journal of Information Technology and Applications 33
JITA 5(2015) 1:33-54 M.P. Badjor, Yu. M. Inkov:
Th e advantages of the superconducting electrical equipment can be clearly seen at the increased capac-ity, that’s why it is more reasonable to produce power (traction) equipment as superconducting and auxil-iary equipment for providing transport vehicle needs (electric motors for compressors, ventilators, pumps and the electric drive control units & etc.) can be produced non- superconducting but conventional.
Th e problem of the electromagnetic compatibility, including the transport systems, was investigated in the terms of the conventional sources (static semicon-ducting converters, electrical machines, switchgear & etc.) and interference receptors (means of communi-cation and information). Th e perspective of the im-provement of transport means energy and technical-economic properties due to the application of the superconducting electrical equipment brings about a new aspect of the electromagnetic compatibility – the problem of the electromagnetic compatibility of superconducting and conventional electrical equip-ment. One of the basic questions to be investigated in the framework of the electromagnetic compatibility of superconducting and conventional electrical equip-ment is the study of the laws of the electromagnetic interaction, the nature of the mutual infl uence of the parameters and operation of electrical equipment, as well as the search of protection and types of arrange-ment of electrical equipment, in which interference will not cause disruption to the interacting elements.
At DC railway substations in the years to come a wide variety of superconducting electrical equipment will be applied, including non-resistance smoothing inductors, produced on the basis of high-temperature superconductivity, which will considerably increase the energy and technical properties of the substation smoothing equipment.
For the analysis and improvement of the electro-magnetic and ecological conditions the methods of electromagnetic compatibility of superconducting and conventional electrical equipment in the linear focus has been worked out, which allows to analyse in general the impact of the conventional electrical equipment electromagnetic fi elds on the diff erential and integral properties of the superconducting elec-trical equipment.
Th e biggest part of the auxiliary conventional electrical equipment consists of the electrical ma-chines and electromagnetic devices with a close air gap ferromagnetic wire, which considerably compli-cates the theoretical investigation of the impact of the superconducting electrical equipment external magnetic fi elds on the technical characteristics of the auxiliary generators and electric drive motors with an electric drive control system. Th e superconduct-ing coil is supposed to be the source of the external electric fi elds; it is also the main element of the su-perconducting electrical equipment.
Th e investigation of the electromagnetic cou-pling of superconducting and conventional electrical equipment requires the development of the math-ematical apparatus of analysis. At the initial stage of investigation it is worth while applying the analytical image of coupling, based on the range of assumptions allowing analysing in general the impact of each pa-rameter of the coupling elements. Th e apparatus of numerical procedures of magnetic fi eld calculations can be applied for such type of analysis.
Th e theoretical investigations of the dependencies of the electromagnetic coupling of the superconduct-ing and conventional electrical equipment for the defi ning the conditions of their joint usage includes mathematical physics methods for the solution of the boundary problems, numerical procedures of mag-netic fi eld calculations on the basis of the secondary source concept, applied with the help of the iteration methods, numerical procedures of extremal prob-lems solution.
Th e produced analysis of the transient operation mode of the superconducting electrical equipment as a part of the traction power supply and a perspective transport vehicle demonstrates that the process time is long enough independently of the type of the trans-port vehicle, its application, capacity, running condi-tions & etc. It gives the opportunity to employ the approximation for the analysis of the impact of the superconducting electrical equipment external mag-netic fi elds on the conventional electrical equipment. Th e given approximation is based on the assumption of the superconducting electrical equipment external magnetic fi elds, as the fi eld of constant current.
34 Journal of Information Technology and Applications www.jita-au.com

THE PERSPECTIVE OF HIGH-TEMPERATURE SUPERCONDUCTIVITY ELTCTRICAL EQUIPMENT APPLICATION
FOR TRACTION POWER SUPPLY AND THE PROBLEMS OF ELECTROMAGNETIC COMPATIBILITY JITA 5(2015) 1:33-54
Th e three-dimensional non-linear numerical model of the electromagnetic coupling of the super-conducting and conventional electrical equipment is worked out. It is based on the assumption of the ferromagnetic wire magnetization fi eld as the fi eld of the equivalent secondary sources of the surface and volume fi ctitious magnetic charges. Th e model enables to calculate the induction of the resultant magnetic fi eld (the fi eld of primary sources – current in the coils – and ferromagnetic wire magnetization fi elds) in the arbitrary point of the unlimited compu-tational domain. Th is is very comfortable while ana-lysing the coupling of several sources of the external magnetic fi elds and several sources under their infl u-ence. Th e model enables to calculate the induction in the air gap of the conventional electric equipment and its integral parameters at the non-linear charac-teristics of ferromagnetic wire, the longitudinal size limits and arbitrary space orientation of the conven-tional electric equipment.
According to [2], the standing wave of the trans-mitting antenna (waveguide) presents to be a com-plex of the continuously changing positive and negative charges with a wave length l. Th ese charges polarize the environment causing the appearance of volume positive and negative charges, which follow each other along the waveguide from the source to the receiver.
In the system of ETL the complex of the con-tinuously changing positive and negative charges spaciously remind the eddy-current toroids and move along the waveguide. Th e fi gure 1 represents this process. Th e toroid inner diameter is close to the wire diameter and the outer diameter is defi ned by the frequency, voltage magnitude and charge density inside the eddy, or, in other words, the amperage of the electric induction current.
Each of the moving volume charges possesses its own magnetic fi eld as shown on the fi gure 1a and the polar extensions of these dynamic magnets in the current nodes are similar. Th e fi gure 1b illustrates the toroids 1, 2 and 3, which represent the increase of volume charges (the increas e of current antinode) and corresponding magnetic fi elds as the blind cur-rent and the transmitted power grow.
Figure 1. The models of charge and magnetic fi elds movement along the conductor resonance single-conductor ETL
Th e toroids surface 1, 2, 3 &etc. may be present-ed as the complex of “equipotential” magnetic power lines.
Th ese magnetic fi elds pack each volume charge but, on the other hand, provide the movement along the wire due to mutual repulsion of the magnetic poles and the repulsion of the whole pack from the energy source.
Th e generating of such toroid eddies of opposite charges with inherent magnetic fi elds provides ac-cording to Tesla [3], permanent energy transmission from the source to the receiver.
Consequently, in the case of ETL we deal with dilatational waves which move not across the wire section but along it without entering it. It can be concluded, that wire resistance and its section are not important for ETL, and as its conductor it may serve thin steel wire or cable in insulation sleeve or fi xed on the high-voltage insulators, as Tesla did [3].
Th e principle of local variable degree of unknown search fi eld quantization is suggested for the im-provement of the process of the iterative search of secondary fi eld sources density distribution, which allows reducing the calculation time and the neces-sary ECM memory while preserving the accuracy of calculations. Th is principle is employed to construct the computer procedures for the systems with a great volume of ferromagnetic material and a close air gap.
Th e effi cient protection measure of the conven-tional electric equipment from the electromagnetic coupling with superconducting electric equipment is electromagnetic screens [1].
a b
June 2015 Journal of Information Technology and Applications 35
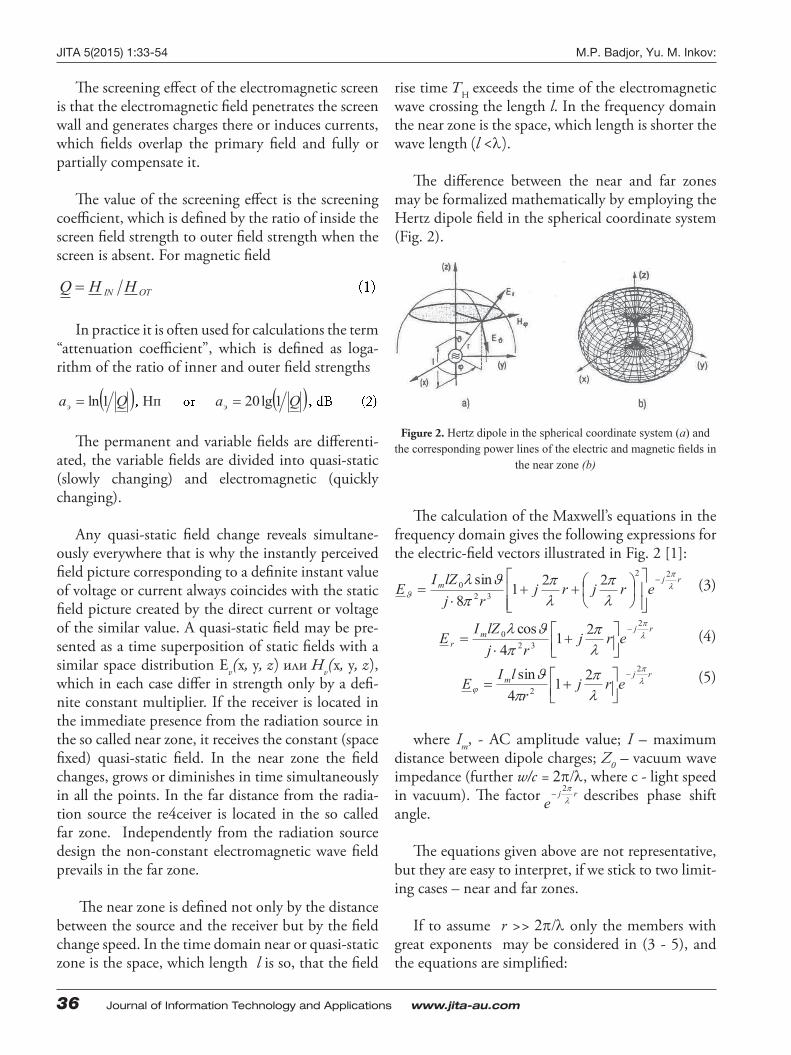
JITA 5(2015) 1:33-54 M.P. Badjor, Yu. M. Inkov:
Th e screening eff ect of the electromagnetic screen is that the electromagnetic fi eld penetrates the screen wall and generates charges there or induces currents, which fi elds overlap the primary fi eld and fully or partially compensate it.
Th e value of the screening eff ect is the screening coeffi cient, which is defi ned by the ratio of inside the screen fi eld strength to outer fi eld strength when the screen is absent. For magnetic fi eld
In practice it is often used for calculations the term “attenuation coeffi cient”, which is defi ned as loga-rithm of the ratio of inner and outer fi eld strengths
Th e permanent and variable fi elds are diff erenti-ated, the variable fi elds are divided into quasi-static (slowly changing) and electromagnetic (quickly changing).
Any quasi-static fi eld change reveals simultane-ously everywhere that is why the instantly perceived fi eld picture corresponding to a defi nite instant value of voltage or current always coincides with the static fi eld picture created by the direct current or voltage of the similar value. A quasi-static fi eld may be pre-sented as a time superposition of static fi elds with a similar space distribution Еv(х, у, z) или Hv(х, у, z), which in each case diff er in strength only by a defi -nite constant multiplier. If the receiver is located in the immediate presence from the radiation source in the so called near zone, it receives the constant (space fi xed) quasi-static fi eld. In the near zone the fi eld changes, grows or diminishes in time simultaneously in all the points. In the far distance from the radia-tion source the re4ceiver is located in the so called far zone. Independently from the radiation source design the non-constant electromagnetic wave fi eld prevails in the far zone.
Th e near zone is defi ned not only by the distance between the source and the receiver but by the fi eld change speed. In the time domain near or quasi-static zone is the space, which length l is so, that the fi eld
rise time TН exceeds the time of the electromagnetic wave crossing the length l. In the frequency domain the near zone is the space, which length is shorter the wave length (l <).
Th e diff erence between the near and far zones may be formalized mathematically by employing the Hertz dipole fi eld in the spherical coordinate system (Fig. 2).
Figure 2. Hertz dipole in the spherical coordinate system (a) and the corresponding power lines of the electric and magnetic fi elds in
the near zone (b)
Th e calculation of the Maxwell’s equations in the frequency domain gives the following expressions for the electric-fi eld vectors illustrated in Fig. 2 [1]:
where Im, - AC amplitude value; I – maximum distance between dipole charges; Z0 – vacuum wave impedance (further w/c = , where c - light speed in vacuum). Th e factor describes phase shift angle.
Th e equations given above are not representative, but they are easy to interpret, if we stick to two limit-ing cases – near and far zones.
If to assume r >> only the members with great exponents may be considered in (3 - 5), and the equations are simplifi ed:
OTIN HHQ
Qаэ 1ln Нп Qаэ 1lg20
rjm erjrjrj
lZIE22
320 2218sin
rjmr erj
rjlZIE
2
320 214cos
rjm erjrlIE
2
2
214sin
rje
2
(3)
(4)
(5)
36 Journal of Information Technology and Applications www.jita-au.com

THE PERSPECTIVE OF HIGH-TEMPERATURE SUPERCONDUCTIVITY ELTCTRICAL EQUIPMENT APPLICATION
FOR TRACTION POWER SUPPLY AND THE PROBLEMS OF ELECTROMAGNETIC COMPATIBILITY JITA 5(2015) 1:33-54
Due to diff erent exponent у, the component r of rE may be neglected in comparison to E , so that
fi nally only the vector E and H are left. Th ese
vectors are perpendicular to each other and the direc-tion of the wave propagation. Th ey oscillate in-phase and their attitude in time and space is constant:
000 ZHE (9)
Th e active impedance Z0 is called the wave im-pedance of vacuum.
In the immediate proximity of the antenna (r >> ) (near zone) both the second and the third members of (3-5) are signifi cantly less than one, and these equations are simplifi ed:
According to [1] it may be deduced the ratio HE
EZrjZHE 00 2 (13)
Th e impedance EZ0 is being capacitive
jwCZc 1 at r >> or >>1
00 ZZ E (14)
Th e specifi c energy in the near zone of the high-impedance (electric) fi eld has the prevailing electric nature, i.e.
For the fi eld in the proximity of a small circuit with current (FitzGerald dipole), structurally dual equations will be got in the coordinate system J and j, the calculation of which produces the active wave impedance for the far zone из Z0 = 377 Ω, and for the near zone:
Th e wave impedance HZ0 of the loop antenna
near zone is of the inductive character (r >> or >>1), and
It is the characteristics of the low resistance fi eld, i.e. the magnetic fi eld in the proximity to the loop antenna. Th e specifi c energy in the near zone is of the magnetic nature:
In the far zone the vectors of the electric and mag-netic fi eld strength are directed at the right angle to each other and to the propagation direction. While the electric fi eld in the near zone remains transversal, then the magnetic fi eld contains the additional rH .
If the condition l<<. is not satisfi ed, then it is necessary to use not the dipole equation but the equation of electric long lines.
Figure 3 illustrates the examples of quasi-static fi elds in the near zone.
(6)
(7)
(8)
(10)
(11)
(12)
rjm erjrj
lZIE
22
320 28sin
rjmr erj
rjlZIE
2
320 24cos
rjm erjrrlIH
2
2
24sin
rjm erj
lZIE2
320
8sin
rjmr e
rjlZIE
2
320
4cos
rjm errlIH
2
24sin
2
21)()( Erwrw эл
rjZZ H 200
00 ZZ H
2
21)()( Hrwrw М
June 2015 Journal of Information Technology and Applications 37
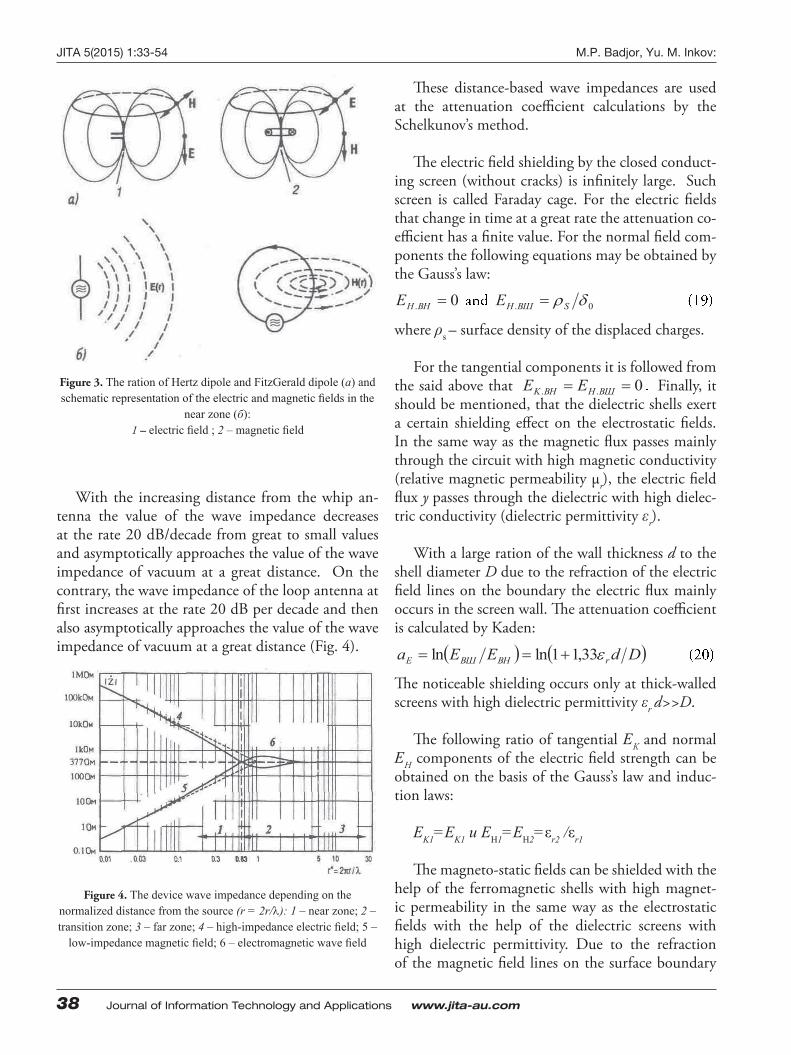
JITA 5(2015) 1:33-54 M.P. Badjor, Yu. M. Inkov:
Figure 3. The ration of Hertz dipole and FitzGerald dipole (а) and schematic representation of the electric and magnetic fi elds in the
near zone (б): 1 – electric fi eld ; 2 – magnetic fi eld
With the increasing distance from the whip an-tenna the value of the wave impedance decreases at the rate 20 dB/decade from great to small values and asymptotically approaches the value of the wave impedance of vacuum at a great distance. On the contrary, the wave impedance of the loop antenna at fi rst increases at the rate 20 dB per decade and then also asymptotically approaches the value of the wave impedance of vacuum at a great distance (Fig. 4).
Th ese distance-based wave impedances are used at the attenuation coeffi cient calculations by the Schelkunov’s method.
Th e electric fi eld shielding by the closed conduct-ing screen (without cracks) is infi nitely large. Such screen is called Faraday cage. For the electric fi elds that change in time at a great rate the attenuation co-effi cient has a fi nite value. For the normal fi eld com-ponents the following equations may be obtained by the Gauss’s law:
where ρs – surface density of the displaced charges.
For the tangential components it is followed from the said above that Finally, it should be mentioned, that the dielectric shells exert a certain shielding eff ect on the electrostatic fi elds. In the same way as the magnetic fl ux passes mainly through the circuit with high magnetic conductivity (relative magnetic permeability μr), the electric fi eld fl ux y passes through the dielectric with high dielec-tric conductivity (dielectric permittivity εr).
With a large ration of the wall thickness d to the shell diameter D due to the refraction of the electric fi eld lines on the boundary the electric fl ux mainly occurs in the screen wall. Th e attenuation coeffi cient is calculated by Kaden:
Th e noticeable shielding occurs only at thick-walled screens with high dielectric permittivity εr d>>D.
Th e following ratio of tangential ЕK and normal ЕH components of the electric fi eld strength can be obtained on the basis of the Gauss’s law and induc-tion laws:
ЕK1=ЕK1 и ЕН1=ЕН2=εr2 /εr1
Th e magneto-static fi elds can be shielded with the help of the ferromagnetic shells with high magnet-ic permeability in the same way as the electrostatic fi elds with the help of the dielectric screens with high dielectric permittivity. Due to the refraction of the magnetic fi eld lines on the surface boundary
Figure 4. The device wave impedance depending on the normalized distance from the source (r = 2r/): 1 – near zone; 2 – transition zone; 3 – far zone; 4 – high-impedance electric fi eld; 5 –
low-impedance magnetic fi eld; 6 – electromagnetic wave fi eld
0.ВННE 0. SВШНE
DdEEa rВНВШE 33,11lnln
0.. ВШНВHK EE
38 Journal of Information Technology and Applications www.jita-au.com

THE PERSPECTIVE OF HIGH-TEMPERATURE SUPERCONDUCTIVITY ELTCTRICAL EQUIPMENT APPLICATION
FOR TRACTION POWER SUPPLY AND THE PROBLEMS OF ELECTROMAGNETIC COMPATIBILITY JITA 5(2015) 1:33-54
of the thick-walled screens from the materials with high magnetic permeability the magnetic fl ux mainly passes in the screen wall.
Th e attenuation coeffi cient is calculated in the following way:
In the absence of currents in the screen the fol-lowing ratio of normal and tangential components of the magnetic fi eld strength on the screen surface can be obtained due to the Gauss’s law and fl ux continu-ity law
Th e shielding of the quasi-static electric alternat-ing fi elds works in the same way as of the electrostatic fi elds due to the redistribution of charges. However, if in the electrostatic fi eld the attenuation coeffi cient is infi nitely large, then in the alternating fi eld the frequency growth causes a phase shift, which defi nes the fi nal value of the attenuation coeffi cient. Th is eff ect becomes noticeable at very high frequencies. Actually the attenuation coeffi cient is supposed to be infi nitely large at the quasi-static fi elds. Th e same boundary conditions are used as for the electrostatic fi eld. Th e actual screens, for example the device cases, have gaps, cracks. If the separate screen walls are not connected to each other electrically, then the diff er-ence of potential arises and the screen has almost no eff ect. Th e shielding elements should be connected together while shielding from electrostatic fi elds.
Th e electromagnetic impact is possible through the cracks between the screen elements. Th is impact can be reduced by using labyrinth seals. At high fre-quencies, the screen elements should have numerous galvanic contacts for the currents aff ecting the equi-potential bonding could follow the shortest path. While the fully closed metal screen provides fi eld ab-sence inside it without screen grounding, the appli-cation of the shadow eff ect of three separate shield-ing sheets requires their grounding.
Th e harmful eff ects of gaps in the closed screens can reduce the role of the screen to the shielding ef-
fect of a single screen elements plate. Th e higher the screen material conductivity is, the more are the cur-rents in the screen at the similar induction electric fi eld strength, and the higher is the attenuation co-effi cient. As the static magnetic fi eld cannot induct currents, the non-ferromagnetic shells for constant magnetic fi elds (f = 0) have no shielding eff ect. On the other hand, the attenuation coeffi cient of quasi-static magnetic fi eld tends to infi nity with the fre-quency increase. Th is tendency has a limit on the fre-quencies where, along with the quasi-static magnetic fi eld the magnetic fi eld of displaced currents (elec-tromagnetic waves) must also be taken into account. With increasing frequency we can no longer ignore the eff ect of displacement currents. Th e impact of the displaced currents can’t be ignored any longer due to the frequency increase.
To manufacture the screens it is used the mate-rials, which have high conductivity for the existing fi elds fl uxes and which are able to create an oppos-ing magnetic fi eld due to the induction. Th e screen from good conductive metals and ferromagnetic ma-terials are used most frequently. Th e comparison of the characteristics of the two screens with the same thickness and made of iron and copper explains the features of their shielding action (Fig. 5).
Figure 5. The ration of attenuation coeffi cient as of the magnetic fi eld of the cylindrical screen from frequency f: 1 – for iron screen (г0= 5 m, d0= 0,1 mm, = 7 o 106 Cm/m, μr =200); 2 – for copper
screen (г0= 5 m, dy= 0,1 mm, σ =58 o 106 Cm/m, μr =1)
DdHHa rВНВШH 33,11lnln
21 KK HH 1221 rrHH HH
June 2015 Journal of Information Technology and Applications 39

JITA 5(2015) 1:33-54 M.P. Badjor, Yu. M. Inkov:
In the range up to 100 kHz, the penetration depth of the electromagnetic fi eld is greater than the thickness of the screen wall, and a material with high conductivity has a higher attenuation coeffi cient. Th e shielding eff ect here is based only on the screen attenuation, which acts as a shorted turn.
Th e analytical calculation of the shielding eff ect of electromagnetic screens requires the solution of Maxwell’s equations for the areas inside and outside of the screen, and also in its wall. Th e result of the so-lution is the values of the shielding coeffi cient or at-tenuation coeffi cient. Th is method provides a deeper, beyond the known approximation formulae, under-standing of the principle of electromagnetic screens and the screen operation becomes available for accu-rate quantitative assessment. However, this method is mathematically intensive, with approximate for-mulae the screens calculation is possible with the help of a grid method. Th e attenuation graphs for the cabin with an edge length2 m calculated by this method are presented in Fig.6.
Figure 6. The attenuation coeffi cients of the measuring cabin with an edge length of 2m and copper foil screen thickness of 0.1 mm.
It should be noted that the spherical screens in practice are very rare; more often the question arises whether it is possible to calculate the shielding ef-fect of the rectangular screening cabin. Taking into account the signifi cant diffi culties, it should not be tried to calculate the attenuation coeffi cient of the fi elds in the rectangular cabin accurately and analyti-cally but it should be replaced with the sphere the radius r0 of which equals to half of the length of the cabin edges. Due to the edge eff ect the shielding ef-fect near the cabin corners is weaker as the current in the screen wall should pass the longer way, which results in a high active and inductive voltage drop
along the wall. Th e edge eff ect can be smoothed by the rounding of corners and increasing the wall thickness near the corners.
Th e attenuation coeffi cient for the quasi-static magnetic fi elds theoretically reaches high values, however, in practice due to the door gaps, lattice ventilation widows, power supply input & etc. it is limited.
Th e method of calculation of the shielding ef-fect of multilayer cylindrical and fl at ferromagnetic (magneto static) screens in the linear approximation is based on the recurrence relations, which allows calculating the magnetic fi eld induction in the fi eld behind the screen for an arbitrary number of layers of the screen. Multilayer cylindrical screens provide a higher ratio of the shielding eff ect than single-layer screens of similar thickness with practically a very slight increase in the weight and dimensions. Th e cylindrical screens are more eff ective than the fl at ones. Flat multilayer and single-layer screens of equal thickness provide almost the same shielding eff ect.
Th e principles of the numerical calculation of the ferromagnetic screen with a complex shape are based on the fact that the screen can be represented as a set of discrete elements. Th e size and position of each element are defi ned on the basis of the condition of minimization of the magnetic fi eld energy in the giv-en volume (shielded area), due to this there arises a possibility to synthesize a complex shape screen. Th e active screens synthesizing method is based on the gradient methods for solving extremal problems and allows to calculate the geometrical dimensions and the space position of axisymmetric shielding coils with rectangular cross section for superconducting coils of the similar geometry, while maintaining the predetermined intensity of the entire system.
Th e areas of numerical modelling are identifi ed and the nonlinear numerical models are worked out, what allows analyzing the interaction of the con-ventional and superconducting electrical equipment electric fi eld sources with the unlimited area of the magnetic fi eld distribution and the lack of symmetry of the fi eld distribution in space. Th e algorithm and software package are developed to determine the ef-
40 Journal of Information Technology and Applications www.jita-au.com

THE PERSPECTIVE OF HIGH-TEMPERATURE SUPERCONDUCTIVITY ELTCTRICAL EQUIPMENT APPLICATION
FOR TRACTION POWER SUPPLY AND THE PROBLEMS OF ELECTROMAGNETIC COMPATIBILITY JITA 5(2015) 1:33-54
fect of electromagnetic fi elds on the integral param-eters of conventional and superconducting electrical equipment. Th ere have been conducted the research and the defi nition of the parameters and sizes of the superconducting inductive reactors of the smooth-ing fi lters for traction substations, which minimize the space occupied and ensure the best application of superconducting material at a given power intensity.
Th e obtained results can be considered as the basis of the research area related to electromagnetic com-patibility of power superconducting and convention-al electrical equipment for traction power supply and perspective vehicles.
REFERENCES: [1] Badjor, M.P. (2002(. Electromagnetic compatibility. Manual for Higher educational institutions. - M.: Transpot, 640 p.[2] Strebkov, D.S. (2005). High-temperature quasi-superconductivity of the conductors for capacitive currents. Scientifi c
papers of RAAS №4, P.56-58.[3] Tesla, N. (1999). World System of wireless Transmission of Energy. Telegraph and Telephone Age, October 16.1927.
Published in a book: Nikola Tesla. Selected works. Articles. Beograd, p. 280.
Submitted: April 30, 2015.Accepted: May 8, 2015.
June 2015 Journal of Information Technology and Applications 41

JITA 5(2015) 1:42-54 V.M. Lisenkov, P.F. Bestemyanov:
SAFETY AND RISK MANAGEMENT
V.M. Lisenkov, P.F. BestemyanovD. Sc. Habil., professors
MSURE (MIIT)
Case stydy
DOI: 10.7251/JIT1501042L UDC: 331.45/.46:656.2
Abstract: The article is devoted to the problem of creating a system of security and risk management. Formulated in relation to the process of movement of trains: - factor of safety of the train - the probability of traversing the trains on a particular route without transfer of its movement in a dangerous condition; - a measure of risk of the transfer movement of the train in a dangerous state - transition probability of motion in a dangerous state when the movement of trains on a given route.
The objectives of security and risk management are: to provide values of their indicators are not worse than normative, namely, the values of the performance security shall be not less than the normative, and the values of indicators of risk - not more than normative. Proposed functional framework and organizational structure for the management of safety and risks.
Keywords: safety index, a measure of risk, a dangerous condition, standard indicators of safety and risk.
SAFETY AND RISK INDEX
Safety and risk management gain particular sig-nifi cance when managing responsible technological processes (RTP), which lack of security leads to great fi nancial losses and loss of life.
RTP is distinguished by two groups of states – danger-ous (DS) and non-hazardous (NS). Transitions of RTP states from NS to DS are accompanied by the emergence of damaging factors whose impact on the external environ-ment objects and RTP objects causes loss and damage.
With this consideration in mind we can formu-late the following defi nition of security RTP - this characteristic of RTP not to move from NS to DS during some estimated time. Transitions of RTP into DS are random events, so the measure of safety, that would numerically estimate the security, must be a probabilistic observation. Th us, safety indicator – is the probability that the RTP won’t turn from of NS to DS for the estimated time. Obviously, the larger the indicator, the higher is safety.
Practically, it is important to know what the mini-mum level of safety should be, for losses and dam-ages not to exceed to an estimated level. Th is mini-mum level of safety normalizes and the actual levels of safety should not be smaller.
Th e word risk, according to the norms of the Rus-sian language [1, 2], means the possibility of occur-rence of an unwanted event. In this case, when con-sidering RTP, the undesirable event is the transition of RTP into a dangerous sate. With this consider-ation in mind, linguistically correct is the following defi nition of risk transition of RTP from DS: risk transition of RTP into DS - is the ability to turn into RTP from NS into DS.
Taking into account that the transition of RTP into DS is random, risk index as well as safety index, should be of probabilistic nature, that is: risk rate transition of RTP from NS into DS – is the prob-ability of transition of RTP from NS into DS.
42 Journal of Information Technology and Applications www.jita-au.com

SAFETY AND RISK MANAGEMENT JITA 5(2015) 1:42-54
Obviously, the larger the risk transitions of RTP into DS, the lower is safety. Th erefore, in this case the maximum value of risk index is limited. Such index value is called normative.
Transitions of RTP into DS occur under the in-fl uence of dangerous destabilizing factors (DDF) in the form of dangerous hardware failures, dangerous errors in software and dangerous mistakes of the per-sonnel. DDF events are random and undesirable. Th erefore, on the analogy of the above indexes for RTP, it is possible to formulate a number of addi-tional indexes to assess the safety and risks of the in-dividual components of RTP – technical equipment of specifi c functionality, software and personnel:
- safety index of technical equipment is the probability that the technical equipment won’t have any dangerous failures during estimated time;
- risk index of dangerous failure is the probabil-ity of occurrence of a dangerous failure during the estimated time.
In the study [3] there are other types of index-es, including other types of RTP, for example, train movement.
With regard to the train movement:
- safety index of the train movement is the probability of a train going on a certain route without transition of its movement into a dan-gerous state;
- risk index of the train transition into a danger-ous state is the probability of transition of train movement into DS when going on a sched-uled route.
Since the transition of trains in the DS ends with loss and damage, it is possible to use the following indexes:
- risk index of losing Mi during train movement is the probability of losing Mi due to the transi-tion of movement into the DS on a scheduled route;
- risk index of damaging Ni during train move-ment is the probability of damaging Ni due to the transition of train movement into the DS
on a scheduled route.Th e study shows all possible safety indexes and
calculations in respect to the transportation process and trains movement.
In the future, in order to reduce the text instead of “probability of transition RTP and NS into DS” there will be used - the transition probability of RTP into DS.
OBJECTIVES AND MANAGEMENT PROCESSES.
Th e objectives of the safety and risk management of RTP are: to provide the index values just as well as the standard, that is the index values of safety should not be less than the standard, and the values of risk indexes should not be more than the standard. At that there should be observed resource limits.
With regard to this RTP as the train movement on a scheduled route, the purpose of safety manage-ment is to ensure the safety index movement is not lower than the standard value. As for the risk man-agement purposes, they provide safety index move-ment does not exceeding the standard values.
Process safety and risk management consists of changing their indexes until you reach the purpose of management. Th us special techniques are used: endurance, structural, parry CRF.
To implement the safety and risk management process of RTP there must be the complex of func-tionally related hardware, software and personnel, which are capable of implementing the above meth-ods.
Safety and risk management is possible only for certain standard values of safety and risk of RTP as a whole and its individual functional components. At the stage of design and production of technical equipment, these standard values should be provided and confi rmed by a safety certifi cate. In the process of operation of RTP there should be monitored the actual values and risks. If the actual values are worse than the standard, there should be developed and implemented measures for the elimination of this situation.
June 2015 Journal of Information Technology and Applications 43

JITA 5(2015) 1:42-54 V.M. Lisenkov, P.F. Bestemyanov:
In order to do this effi ciently, it must be based on well-developed:
- regulatory framework; - functional baseline; - organizational structure; - legal and regulatory framework; - technological base; - scientifi c methodological basis; - personnel framework; - conceptual framework.
Th e more perfect the listed frameworks are, the smaller amount of resources will be required to achieve safety and risk management.
Features of construction of these frameworks are discussed below.
THE LEGAL FRAMEWORK OF SAFETY AND RISK
MANAGEMENT.
Legislative framework consists of three Federal Laws of the Russian Federation
- «Consumer rights protection» - «Technical Regulation» - «Railway transport in the Russian Federation».
Th e fi rst two laws form the legal framework of safety management systems and risk of RTP for any functional purpose, the third forms the legal frame-work of safety and risk management only on the rail-ways.
In the «Consumer rights protection» it is claimed: «Th is law regulates relations between consumers and employers , sets out the rights of consumers to purchase goods (work, services) of good quality, the safety of their life and health ... ».
Th us, according to this law, the services for pas-sengers and cargo must be safe especially to the con-sumers of these services, i.e. concerning passengers and not those who provide these services, i.e. rail-ways.
According to the Federal Law about “Technical Regulation”: “regulates relations arising in: devel-opment, accepting, application and enforcement of
mandatory requirements for products or related pro-cesses of design (including research), manufacturing, construction, installation, commissioning “. Accord-ing to Article 7 of the Law, mandatory requirements include requirements of mechanical, thermal, radia-tion security, etc.
According to this law, “the harm risk degree” should be taken into account in determining the characteristics and parameters of technical means.
In addition, and in accordance with the Federal Law about “Consumer Rights Protection”, the man-datory requirement is the requirement of products and services safety.”
According to the Federal Law about “Railway Transport in the Russian Federation” the manda-tory requirement is the requirement to ensure the absence of “unacceptable risk” accidents occurrence and health injury of citizens, environmental damage, and property of individuals or legal entities.
Th us, according to the Federal Law about “Con-sumer Rights Protection”, “Railway Transport in the Russian Federation”, “Technical Regulation”, which form the legal framework of safety and risk manage-ment, the mandatory are:
- security requirement of products and services in regard to passengers, the environment, the goods transported, the transport system;
- quantitative (probabilistic) requirement of “risk level” of harm to consumers of transport servic-es and the environment and to ensure that this “level” is not more than the “acceptable” value, i.e. not more than the standard value.
FUNCTIONAL BASELINE MANAGEMENT
Th e functional baseline below refers to a set of functions that must be performed in the manage-ment process to achieve the most eff ective security and risk management. Th ese features include:
- specifi cation and justifi cation of a complete range of safety and risk performance; in solv-ing certain problems there can only be used a part of the indexes;
44 Journal of Information Technology and Applications www.jita-au.com

SAFETY AND RISK MANAGEMENT JITA 5(2015) 1:42-54
- task of harmonized between each other nor-mative values of the indexes of transport safety in general, traffi c safety, safety of hardware op-eration and software, operators, as well as the standard values of all types of risks. Depending on the solvable problem operation it may be required knowledge of the standard values of the indexes;
- specifi cation of the parameters and character-istics of hardware and software, as well as the professional characteristics of operators, which provide normative values of their safety and risk performance;
- development of classifi ers of dangerous desta-bilizing factors on the basis of analyzing the causes of the transition into dangerous states and on the basis of special methods of identifi -cation of dangerous hardware failures;
- frequency response analysis of CRF; - specifi cation of safety indexes and risks of
complex devices via the CRF probability, for example, by the method of event tree analysis;
- effi ciency analysis of ensuring methods of stan-dard values of safety and risks;
- provision of given safety parameters and char-acteristics indexes at all stages of their life cy-cles;
- certifi cation of technical means in terms of the safety of operation;
- licensing of the company performance in view of its ability to produce hardware with planned safety indexes of functioning (presence of the required technological base, personnel, meth-odological support, etc.);
- control of the use of certifi ed equipment; - a statistical analysis of operational safety index-
es of trains movement, operation of technical equipment and operators, the identifi cation of the CRF and their occurrence;
- forecasting possible changes in safety and risks indexes due to changes in operating conditions of technical equipment, production technol-ogy, etc .;
- programs development of preventive opera-tional measures aimed at preventing the CRF and the transition into dangerous states;
- development of long-term programs of pro-viding normative safety and risks values.
If at least one of these functions won’t be accom-plished during the performance, the process of safety and risk management won’t be as eff ective as pos-sible. But there may be cases where the accomplish-ment of all these functions is not necessary.
ORGANIZATIONAL STRUCTURE OF CONTROL FACILITIES.
For performance of all listed above functions it is necessary to have a set of the organizations, en-terprises of the technical means and the personnel, which are in a functional interrelation, which it is possible to call a control system of safety and risks. Th e system has to possess a certain organizational structure. Th e modern System has the three-level hi-erarchical structure including:
- federal, - branch and - corporate (separate corporations, organiza-
tions, enterprises, companies, etc.) levels.
Th e Federal Assembly, the President and the Gov-ernment of the Russian Federation refer to the Fed-eral hierarchical level. According to the Federal law “On technical regulation” they have to:
- adopt the laws of the Russian Federation relat-ing to area of safety of production and services, including safety of rail transportation;
- accept the technical regulations in the form of Federal laws of the Russian Federation, de-crees of the Russian President and resolutions of the Government of the Russian Federation defi ning the relations between all participants of transportation process arising at safety of transportations and freights.
To the branch hierarchical level of System refer the following:
- the ministries, the state committees, agencies the main function of which is assistance to execution of the main functions of bodies of federal level at management of safety;
- the state control (supervision) authorities for observance of requirements of technical regu-lations;
- national authority of the Russian Federation on standardization, technical committees on standardization;
June 2015 Journal of Information Technology and Applications 45

JITA 5(2015) 1:42-54 V.M. Lisenkov, P.F. Bestemyanov:
- body for certifi cation, test laboratories (cen-ters);
- body for accreditation of participants of trans-portation process.
Governing bodies of branch level have no right to publish normative documents of Federal level in the fi eld of management of safety, obligatory for execu-tion.
Th e main function of structural components of System of corporate level (corporations, the compa-nies, the enterprises, etc.) is ensuring standard values of indicators of safety and risks at various stages of life cycles of technical means and the personnel by selection of the corresponding characteristics and pa-rameters of technical means and the personnel.
Th e functional and organizational structure of System of each organization is defi ned by its concrete functions at safety of transportations.
Th us, the control system of safety and risks is the centralized state control system for traffi c safety of trains as the state establishes standard indicators of safety and risks and exercises the supervision of ap-plication only of the technical means certifi ed on in-dicators of safety.
REGULATORY LEGAL BASE OF SYSTEM
Part of process of management of safety and risks is technical regulation, i.e. legal regulation of the re-lations in the fi eld of establishment, applications and executions of obligatory requirements to production or to related design processes (including researches, productions, constructions, installation, adjustment, operation of storage, transportation, realization and utilization, and also in the fi eld of establishment and application on a voluntary basis of requirements to production, design processes, including researches, productions, constructions, installation, adjustment, operation, storage, transportation, to realization and utilization, performance of work or rendering servic-es and legal regulation of the relations in the fi eld of an assessment of compliance of production to obliga-tory requirements).
Th e regulatory legal base of technical regulation is formed by:
- technical regulations; - national standards; - sets of rules.
Th e technical regulations – the document which is accepted by the international treaty of the Russian Federation ratifi ed in the order established by the legislation of the Russian Federation, or the intergov-ernmental agreement concluded in the order estab-lished by the legislation of the Russian Federation, either the Federal law, or the decree of the President of the Russian Federation, or the resolution of the government of the Russian Federation. It establishes requirements to objects of technical regulation (to production, including buildings, structures and con-structions or to the design processes connected with requirements to production (including researches), productions, constructions, installation, adjustment, operation, storage, transportation, realization and utilization obligatory for application and execution.
Technical regulations are accepted for: - protection of life and health of citizens, prop-
erty of natural or legal entities, state or munici-pal property;
- environmental protections, life and health of animals and plants;
- preventions of the actions misleading consumers.
Adoption of technical regulations in other pur-poses isn’t allowed.
Technical regulations taking into account the de-gree of risk of harm establish minimum necessary re-quirements ensuring mechanical safety electric, ther-mal, biological, safety of radiations and other types of safety.
Th e technical regulations have to contain require-ments to characteristics of production, production processes, etc., but shouldn’t contain the require-ments to designs and execution, except for the cases if due to the lack of requirements to a design and execution taking into account degree of risk of harm the achievement of the purpose of adoption of tech-nical regulations formulated above isn’t provided.
46 Journal of Information Technology and Applications www.jita-au.com
SAFETY AND RISK MANAGEMENT JITA 5(2015) 1:42-54
Th e words “taking into account degree of risk of harm” assume knowledge of value of an indicator of risk at which admissible losses and damages at trans-portation process aren’t provided.
Technical regulations are subdivided on: - all-technical technical regulations and - special technical regulations
Th ey diff er in that the requirements of the general technical regulations are obligatory for application and observance concerning any kinds of production, production processes, etc., and the requirements of special technical regulations consider technological and other features of separate types of production, production processes, etc.
Th e general technical regulations, for example concerning safe operation and utilization of cars and the equipment, fi re safety, electromagnetic compat-ibility, etc.
Technical the regulations have to contain a list and (or) the description of objects of technical regu-lation, the requirement to these objects and rules of their identifi cation for application of technical regu-lations.
Th e documentary certifi cate of compliance of production and (or) other objects of technical regu-lation to the requirements of technical regulations, provisions of standards and sets of rules is called as compliance confi rmation.
Forms of confi rmation of compliance are subdi-vided into voluntary and obligatory confi rmation of compliance.
Voluntary confi rmation of compliance is carried out in the form of voluntary certifi cation.
Obligatory confi rmation of compliance is carried out in the forms of: adoption of the declaration on compliance (compliance declaring); obligatory certi-fi cation.
Voluntary confi rmation of compliance is carried out at the initiative of the applicant on terms of the
contract between the applicant and certifi cation body. It can be carried out for establishment of com-pliance to the national standards, standards of the or-ganizations, to the sets of rules, systems of voluntary certifi cation, to the conditions of contracts.
Th e certifi cate of conformity on the objects, which passed voluntary certifi cation, gives out body for certifi cation.
Obligatory confi rmation of compliance is carried out only in the cases established by the correspond-ing technical regulations and is exclusive on compli-ance to requirements of technical regulations.
Production released in the territory of the Russian Federation can only be object of obligatory confi r-mation of compliance.
Forms and schemes of obligatory confi rmation of compliance can be established only by technical regulations taking into account degree of risk of im-possibility of achievement of the objectives of techni-cal regulations.
Declaring of compliance is carried out on one of the following schemes:
- adoption of the declaration on compliance on the basis of own proofs;
- adoption of the declaration on compliance on the basis of own proofs, the evidence obtained with participation of body for certifi cation and (or) the accredited test laboratory (center).
Obligatory certifi cation is carried out by the body for certifi cation accredited in the order established by the Government of the Russian Federation.
Th e body for certifi cation attracts the test labora-tories accredited in the order established by the Gov-ernment of the Russian Federation on a contractual basis for carrying out researches (tests) and measure-ments; exercises control of objects of certifi cation if such control is provided by the corresponding scheme of obligatory certifi cation and the contract.
Th e state control (supervision) for observance of requirements of technical regulations is exercised
June 2015 Journal of Information Technology and Applications 47

JITA 5(2015) 1:42-54 V.M. Lisenkov, P.F. Bestemyanov:
concerning production and other objects of techni-cal regulation.
Concerning production the state control (super-vision) of observance of requirements of technical regulations is exercised only at a stage of the address of production.
Th e national standard – the document in which for voluntary repeated use the characteristics of pro-duction, rules of their implementation and the char-acteristic of processes of design are established (in-cluding researches, productions, constructions, in-stallation, adjustment, operation, storage, realization and utilization, performance of work and services).
Th e purposes of standardization are: - the increase of level of life safety and health of
citizens, property of natural and legal entities, the state or municipal property, objects taking into account the risk of emergency situations of natural and technogenic character, increase of the level of ecological safety, safety of life and health of animals and plants;
- ensuring competitiveness and quality of pro-duction (works, services), unities of measure-ments, rational use of resources, interchange-ability of technical means (cars and equipment, their components, components and materials), technical and information compatibility, com-parability of results of researches (tests) and measurements, technical and economic data, carrying out analysis of characteristics of pro-duction (works, services), executions of the state orders, voluntary confi rmation of com-pliance of production (works, services);
- assistance to observance of requirements of technical regulations;
- creation of systems of classifi cation and cod-ing of technical and economic and social infor-mation, systems of cataloguing of production (works, services) systems of ensuring quality of production (works, services), systems of search and data transmission, assistance to work on unifi cation.
Develops and approves national standards nation-al authority on standardization.
Provisions of the national standard have advisory nature, except for those a case when on it links in technical regulations take place.
Th e set of rules documents of standardization which contains technical rules and (or) the description of processes of design (including researches, produc-tions, constructions, installation, adjustment, opera-tion, storage, transportation, realization, utilization of production and which is applied on a voluntary basis).
Development and the approval of sets of rules are carried out by federal executive authorities within their powers.
TECHNICAL BASE OF SYSTEM
Th e technical base of a control system of safety is formed by the technical means of two main groups diff ering in a functional purpose:
- technical means of safety of train service and - the technical means intended for the analysis
of the actual and predicted traffi c safety and functioning of the technical means infl uencing traffi c safety.
Special systems of safety of train service, for exam-ple, of system of automatic lock-out, the automatic locomotive alarm system, etc. treat the fi rst group.
Th e automated systems treat the second group: - collection of information about dangerous
failures of hardware and the reasons of their emergence; about dangerous errors of software and the personnel, about the reasons of their emergence; about transitions of the movement to dangerous states, about losses and damages;
- transfers of this information in the device of calculation of the actual values of indicators;
- calculation of the actual (operational) values of indicators of safety of functioning of techni-cal means and personnel, and also traffi c safety indicators in general;
- estimates of residual safe resources of technical means;
- calculation of expected values of indicators of traffi c safety of trains and functioning of tech-nical means;
48 Journal of Information Technology and Applications www.jita-au.com

SAFETY AND RISK MANAGEMENT JITA 5(2015) 1:42-54
- formations of operational recommendations about prevention of decrease in the actual in-dicators of safety are lower than standard level.
Without the developed technical base of System its eff ective functioning, i.e. eff ective management of safety and risks isn’t possible.
NORMALIZING PRINCIPLES OF SAFETY INDEXES
Normalizing of safety indexes is the process of set-ting their normalized values (standards). Normalized value of safety indicator – limited value, for instance, min allowed value of traffi c safety indicator P(S0), max allowed value of loss risk indicator Q(Mi) and damage risk indicator Q(Ni).
It is possible to use two principles in setting nor-malized values of safety indexes. First principle is based on economic and second one – on social approach to normalizing task solution. According to the fi rst prin-ciple normalized values of safety indexes are set on the basis of economic expediency evaluation while the sec-ond principle is based on estimation of public opinion about necessary level of safe transportation.
According to the 1st principle the resource level for normalizing of indexes can be limited or not.
As a rule, traffi c safety improving is concerned with investment and that is why economic expedien-cy of traffi c safety improving projects is determined according various evaluation methods of investment projects [4].
Investment project’s effi ciency is characterized by a rating system:
- commercial effi ciency, which considers fi nan-cial implications of project implementation for its direct participants;
- budget effi ciency, which considers fi nancial implications of project implementation for federal, regional or sectorial budgets;
- economical effi ciency, considering costs and eff ects which are concerned with project im-plementation and which come out of project participants’ direct fi nancial interests and al-low cost measurement.
Future costs and eff ects’ estimation for effi ciency determination of investment project is carried out within calculated period which duration is called “time horizon”. Time horizon is measured by a num-ber of calculated intervals each of which can be equal to a month, a quarter or a year.
It is recommended to compare diff erent variations of traffi c safety improving by using such indexes as net present value (integral eff ect), profi tability index, internal rate of return, pay-off period, etc.
During transportation process implementation it is convenient to use a formula of net present value for safety indexes’ optimization task solution in eco-nomic context:
where T - time horizon equal to calculated period number on which writing-off of technical resource occurred;t - calculated interval;Rt - results, taken out on t-calculated interval;Зt - costs, born on the same interval;E - discount rate, equal to acceptable for investor rate of return on equity.
Discounting is understood as reduction of timely asynchronical costs, results, eff ects to their values for any one time moment, for instance primary moment (t=0).
Following from formula (1), for increasing value of Эинм it is necessary, in particular, to decrease costs Зt . In general costs are determined as investment costs K and current costs C, that is
З = K + C ; (2)discounted investment costs’ amount
T
ttE
KK0
t )1(1 (3)
for Kt - investment costs for t - interval;discounted current costs’ amount
T
ttE
CC0
t )1(1 (4)
T
ttинт E
ЗRЭ0
t )1(1)( , (1)
June 2015 Journal of Information Technology and Applications 49
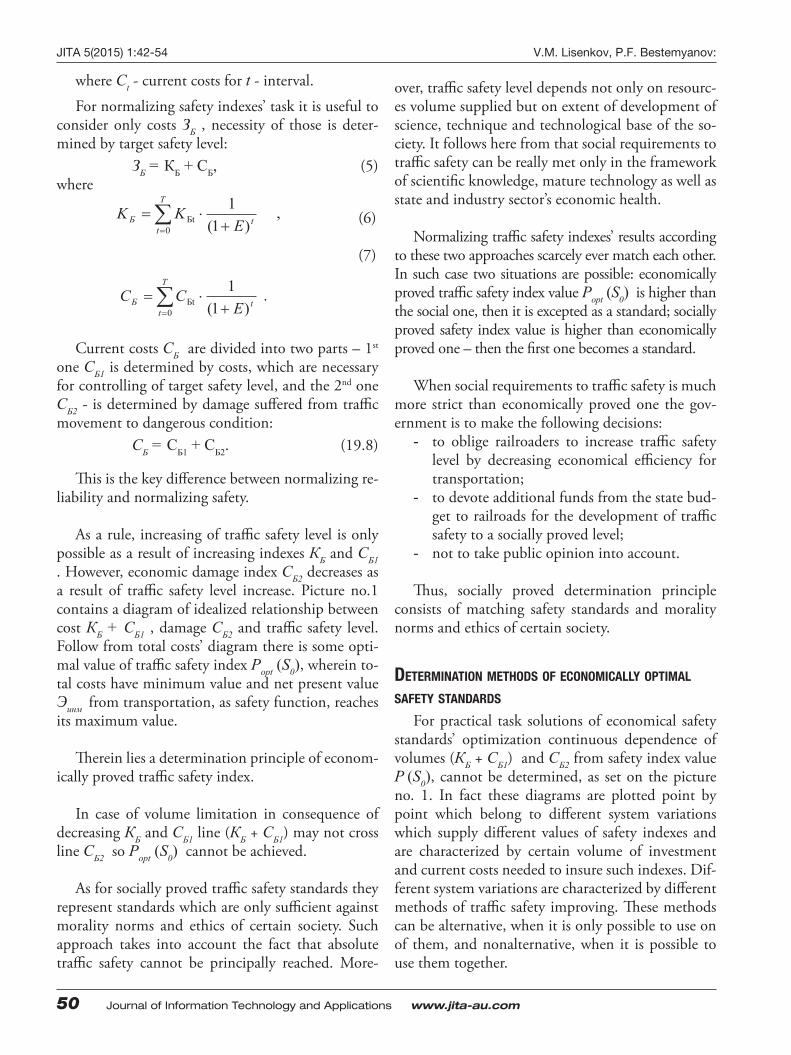
JITA 5(2015) 1:42-54 V.M. Lisenkov, P.F. Bestemyanov:
where Ct - current costs for t - interval.
For normalizing safety indexes’ task it is useful to consider only costs ЗБ , necessity of those is deter-mined by target safety level:
ЗБ = КБ + СБ, (5)where
(6)
(7)
Current costs СБ are divided into two parts – 1st one СБ1 is determined by costs, which are necessary for controlling of target safety level, and the 2nd one СБ2 - is determined by damage suff ered from traffi c movement to dangerous condition:
СБ = СБ1 + СБ2. (19.8)
Th is is the key diff erence between normalizing re-liability and normalizing safety.
As a rule, increasing of traffi c safety level is only possible as a result of increasing indexes КБ and СБ1 . However, economic damage index СБ2 decreases as a result of traffi c safety level increase. Picture no.1 contains a diagram of idealized relationship between cost КБ + СБ1 , damage СБ2 and traffi c safety level. Follow from total costs’ diagram there is some opti-mal value of traffi c safety index Рopt (S0), wherein to-tal costs have minimum value and net present value Эинм from transportation, as safety function, reaches its maximum value.
Th erein lies a determination principle of econom-ically proved traffi c safety index.
In case of volume limitation in consequence of decreasing КБ and СБ1 line (КБ + СБ1) may not cross line СБ2 so Рopt (S0) cannot be achieved.
As for socially proved traffi c safety standards they represent standards which are only suffi cient against morality norms and ethics of certain society. Such approach takes into account the fact that absolute traffi c safety cannot be principally reached. More-
over, traffi c safety level depends not only on resourc-es volume supplied but on extent of development of science, technique and technological base of the so-ciety. It follows here from that social requirements to traffi c safety can be really met only in the framework of scientifi c knowledge, mature technology as well as state and industry sector’s economic health.
Normalizing traffi c safety indexes’ results according to these two approaches scarcely ever match each other. In such case two situations are possible: economically proved traffi c safety index value Рopt (S0) is higher than the social one, then it is excepted as a standard; socially proved safety index value is higher than economically proved one – then the fi rst one becomes a standard.
When social requirements to traffi c safety is much more strict than economically proved one the gov-ernment is to make the following decisions:
- to oblige railroaders to increase traffi c safety level by decreasing economical effi ciency for transportation;
- to devote additional funds from the state bud-get to railroads for the development of traffi c safety to a socially proved level;
- not to take public opinion into account.
Th us, socially proved determination principle consists of matching safety standards and morality norms and ethics of certain society.
DETERMINATION METHODS OF ECONOMICALLY OPTIMAL
SAFETY STANDARDS
For practical task solutions of economical safety standards’ optimization continuous dependence of volumes (КБ + СБ1) and СБ2 from safety index value Р (S0), cannot be determined, as set on the picture no. 1. In fact these diagrams are plotted point by point which belong to diff erent system variations which supply diff erent values of safety indexes and are characterized by certain volume of investment and current costs needed to insure such indexes. Dif-ferent system variations are characterized by diff erent methods of traffi c safety improving. Th ese methods can be alternative, when it is only possible to use on of them, and nonalternative, when it is possible to use them together.
T
ttБ E
KK0
Бt )1(1 ,
T
ttБ E
CC0
Бt )1(1 .
50 Journal of Information Technology and Applications www.jita-au.com
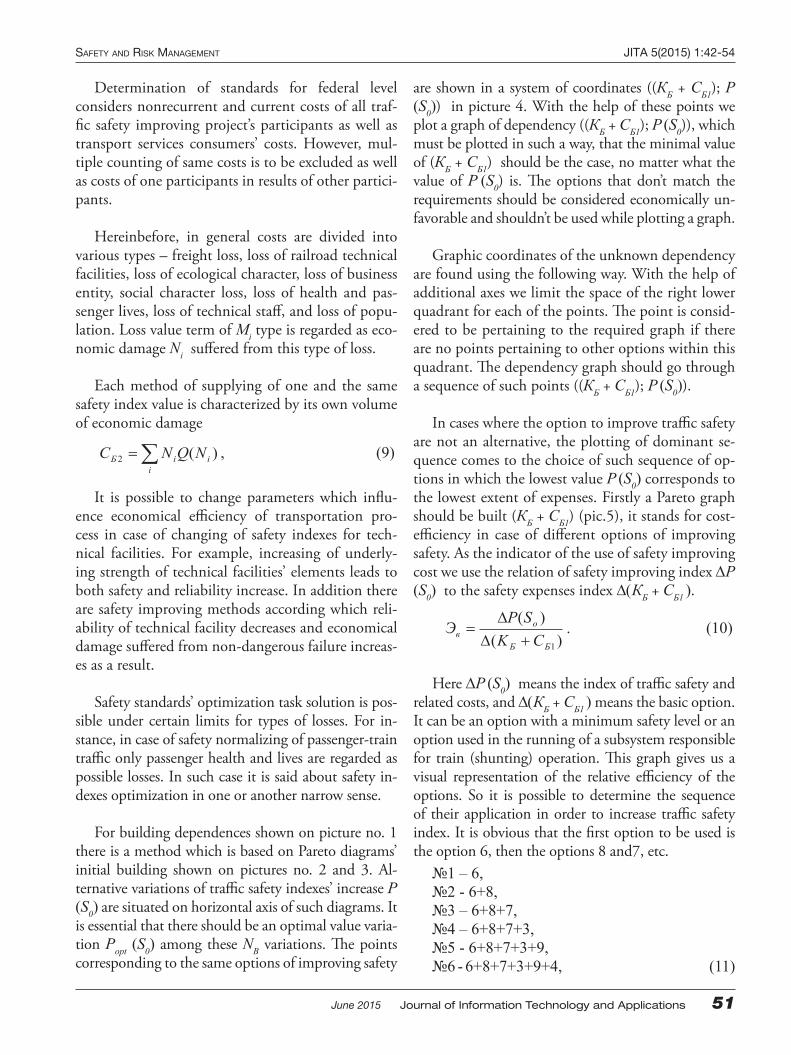
SAFETY AND RISK MANAGEMENT JITA 5(2015) 1:42-54
Determination of standards for federal level considers nonrecurrent and current costs of all traf-fi c safety improving project’s participants as well as transport services consumers’ costs. However, mul-tiple counting of same costs is to be excluded as well as costs of one participants in results of other partici-pants.
Hereinbefore, in general costs are divided into various types – freight loss, loss of railroad technical facilities, loss of ecological character, loss of business entity, social character loss, loss of health and pas-senger lives, loss of technical staff , and loss of popu-lation. Loss value term of Mi type is regarded as eco-nomic damage Ni suff ered from this type of loss.
Each method of supplying of one and the same safety index value is characterized by its own volume of economic damage
It is possible to change parameters which infl u-ence economical effi ciency of transportation pro-cess in case of changing of safety indexes for tech-nical facilities. For example, increasing of underly-ing strength of technical facilities’ elements leads to both safety and reliability increase. In addition there are safety improving methods according which reli-ability of technical facility decreases and economical damage suff ered from non-dangerous failure increas-es as a result.
Safety standards’ optimization task solution is pos-sible under certain limits for types of losses. For in-stance, in case of safety normalizing of passenger-train traffi c only passenger health and lives are regarded as possible losses. In such case it is said about safety in-dexes optimization in one or another narrow sense.
For building dependences shown on picture no. 1 there is a method which is based on Pareto diagrams’ initial building shown on pictures no. 2 and 3. Al-ternative variations of traffi c safety indexes’ increase Р (S0) are situated on horizontal axis of such diagrams. It is essential that there should be an optimal value varia-tion Рopt (S0) among these NB variations. Th e points corresponding to the same options of improving safety
are shown in a system of coordinates ((КБ + СБ1); Р (S0)) in picture 4. With the help of these points we plot a graph of dependency ((КБ + СБ1); Р (S0)), which must be plotted in such a way, that the minimal value of (КБ + СБ1) should be the case, no matter what the value of Р (S0) is. Th e options that don’t match the requirements should be considered economically un-favorable and shouldn’t be used while plotting a graph.
Graphic coordinates of the unknown dependency are found using the following way. With the help of additional axes we limit the space of the right lower quadrant for each of the points. Th e point is consid-ered to be pertaining to the required graph if there are no points pertaining to other options within this quadrant. Th e dependency graph should go through a sequence of such points ((КБ + СБ1); Р (S0)).
In cases where the option to improve traffi c safety are not an alternative, the plotting of dominant se-quence comes to the choice of such sequence of op-tions in which the lowest value Р (S0) corresponds to the lowest extent of expenses. Firstly a Pareto graph should be built (КБ + СБ1) (pic.5), it stands for cost-effi ciency in case of diff erent options of improving safety. As the indicator of the use of safety improving cost we use the relation of safety improving index Р (S0) to the safety expenses index КБ + СБ1 ).
Here Р (S0) means the index of traffi c safety and related costs, and КБ + СБ1 ) means the basic option. It can be an option with a minimum safety level or an option used in the running of a subsystem responsible for train (shunting) operation. Th is graph gives us a visual representation of the relative effi ciency of the options. So it is possible to determine the sequence of their application in order to increase traffi c safety index. It is obvious that the fi rst option to be used is the option 6, then the options 8 and7, etc.
№1 – 6,№2 - 6+8,№3 – 6+8+7,№4 – 6+8+7+3,№5 - 6+8+7+3+9,№6 - 6+8+7+3+9+4, (11)
i
iiБ NQNC )(2 , (9)
)(
)(
1ББ
oв CK
SPЭ . (10)
June 2015 Journal of Information Technology and Applications 51
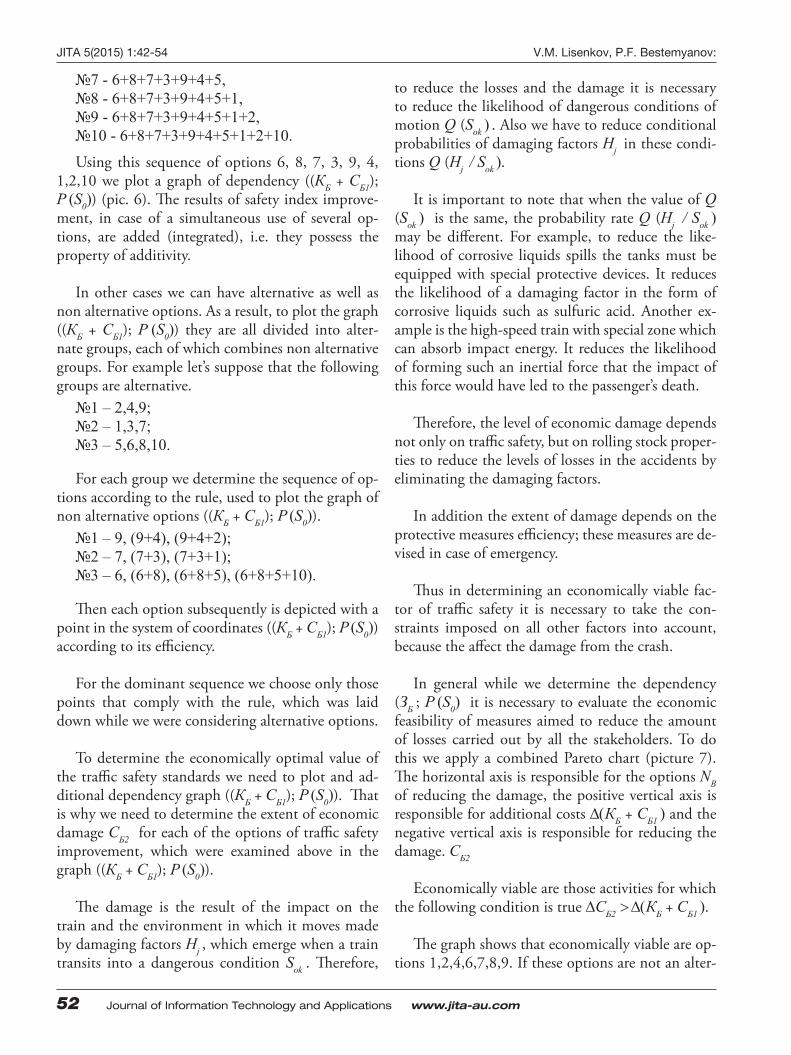
JITA 5(2015) 1:42-54 V.M. Lisenkov, P.F. Bestemyanov:
№7 - 6+8+7+3+9+4+5,№8 - 6+8+7+3+9+4+5+1,№9 - 6+8+7+3+9+4+5+1+2,№10 - 6+8+7+3+9+4+5+1+2+10.Using this sequence of options 6, 8, 7, 3, 9, 4,
1,2,10 we plot a graph of dependency ((КБ + СБ1); Р (S0)) (pic. 6). Th e results of safety index improve-ment, in case of a simultaneous use of several op-tions, are added (integrated), i.e. they possess the property of additivity.
In other cases we can have alternative as well as non alternative options. As a result, to plot the graph ((КБ + СБ1); Р (S0)) they are all divided into alter-nate groups, each of which combines non alternative groups. For example let’s suppose that the following groups are alternative.
№1 – 2,4,9;№2 – 1,3,7;№3 – 5,6,8,10.
For each group we determine the sequence of op-tions according to the rule, used to plot the graph of non alternative options ((КБ + СБ1); Р (S0)).
№1 – 9, (9+4), (9+4+2);№2 – 7, (7+3), (7+3+1);№3 – 6, (6+8), (6+8+5), (6+8+5+10).
Th en each option subsequently is depicted with a point in the system of coordinates ((КБ + СБ1); Р (S0)) according to its effi ciency.
For the dominant sequence we choose only those points that comply with the rule, which was laid down while we were considering alternative options.
To determine the economically optimal value of the traffi c safety standards we need to plot and ad-ditional dependency graph ((КБ + СБ1); Р (S0)). Th at is why we need to determine the extent of economic damage СБ2 for each of the options of traffi c safety improvement, which were examined above in the graph ((КБ + СБ1); Р (S0)).
Th e damage is the result of the impact on the train and the environment in which it moves made by damaging factors Hj , which emerge when a train transits into a dangerous condition Sok . Th erefore,
to reduce the losses and the damage it is necessary to reduce the likelihood of dangerous conditions of motion Q (Sok ) . Also we have to reduce conditional probabilities of damaging factors Hj in these condi-tions Q (Hj / Sok ).
It is important to note that when the value of Q (Sok ) is the same, the probability rate Q (Hj / Sok ) may be diff erent. For example, to reduce the like-lihood of corrosive liquids spills the tanks must be equipped with special protective devices. It reduces the likelihood of a damaging factor in the form of corrosive liquids such as sulfuric acid. Another ex-ample is the high-speed train with special zone which can absorb impact energy. It reduces the likelihood of forming such an inertial force that the impact of this force would have led to the passenger’s death.
Th erefore, the level of economic damage depends not only on traffi c safety, but on rolling stock proper-ties to reduce the levels of losses in the accidents by eliminating the damaging factors.
In addition the extent of damage depends on the protective measures effi ciency; these measures are de-vised in case of emergency.
Th us in determining an economically viable fac-tor of traffi c safety it is necessary to take the con-straints imposed on all other factors into account, because the aff ect the damage from the crash.
In general while we determine the dependency (ЗБ ; Р (S0) it is necessary to evaluate the economic feasibility of measures aimed to reduce the amount of losses carried out by all the stakeholders. To do this we apply a combined Pareto chart (picture 7). Th e horizontal axis is responsible for the options NB of reducing the damage, the positive vertical axis is responsible for additional costs КБ + СБ1 ) and the negative vertical axis is responsible for reducing the damage. СБ2
Economically viable are those activities for which the following condition is true СБ2 КБ + СБ1 ).
Th e graph shows that economically viable are op-tions 1,2,4,6,7,8,9. If these options are not an alter-
52 Journal of Information Technology and Applications www.jita-au.com
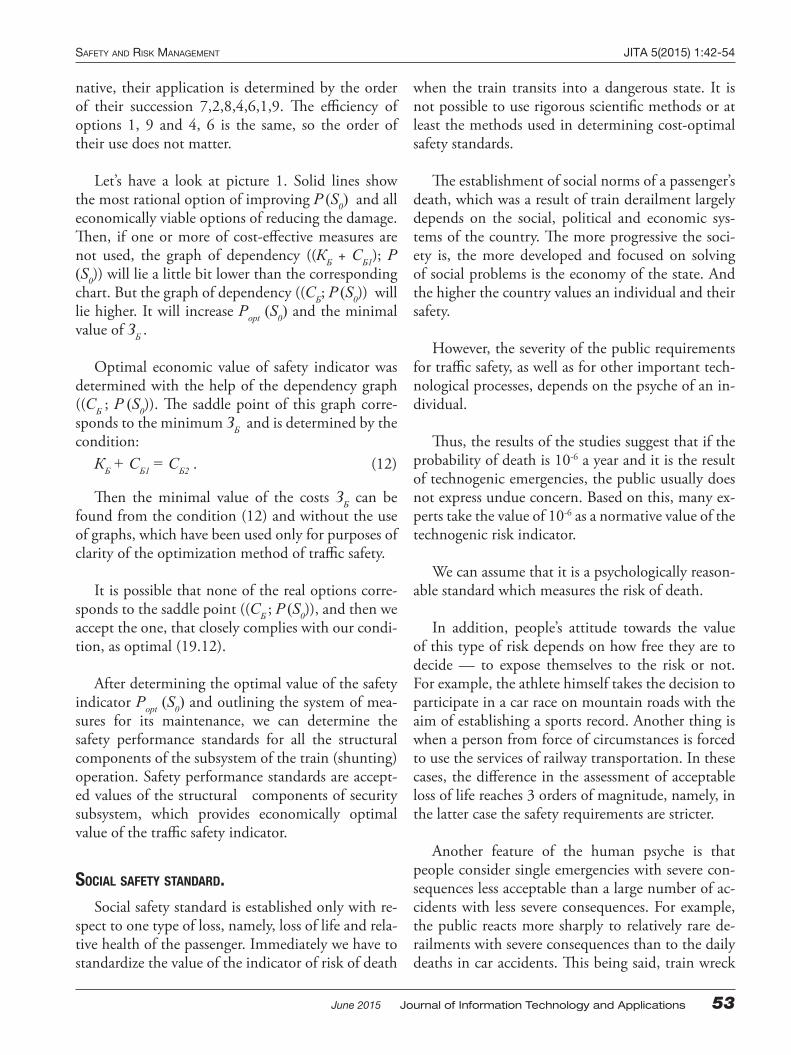
SAFETY AND RISK MANAGEMENT JITA 5(2015) 1:42-54
native, their application is determined by the order of their succession 7,2,8,4,6,1,9. Th e effi ciency of options 1, 9 and 4, 6 is the same, so the order of their use does not matter.
Let’s have a look at picture 1. Solid lines show the most rational option of improving Р (S0) and all economically viable options of reducing the damage. Th en, if one or more of cost-eff ective measures are not used, the graph of dependency ((КБ + СБ1); Р (S0)) will lie a little bit lower than the corresponding chart. But the graph of dependency ((СБ; Р (S0)) will lie higher. It will increase Рopt (S0) and the minimal value of ЗБ .
Optimal economic value of safety indicator was determined with the help of the dependency graph ((СБ ; Р (S0)). Th e saddle point of this graph corre-sponds to the minimum ЗБ and is determined by the condition:КБ + СБ1 = СБ2 . (12)
Th en the minimal value of the costs ЗБ can be found from the condition (12) and without the use of graphs, which have been used only for purposes of clarity of the optimization method of traffi c safety.
It is possible that none of the real options corre-sponds to the saddle point ((СБ ; Р (S0)), and then we accept the one, that closely complies with our condi-tion, as optimal (19.12).
After determining the optimal value of the safety indicator Рopt (S0) and outlining the system of mea-sures for its maintenance, we can determine the safety performance standards for all the structural components of the subsystem of the train (shunting) operation. Safety performance standards are accept-ed values of the structural components of security subsystem, which provides economically optimal value of the traffi c safety indicator.
SOCIAL SAFETY STANDARD.
Social safety standard is established only with re-spect to one type of loss, namely, loss of life and rela-tive health of the passenger. Immediately we have to standardize the value of the indicator of risk of death
when the train transits into a dangerous state. It is not possible to use rigorous scientifi c methods or at least the methods used in determining cost-optimal safety standards.
Th e establishment of social norms of a passenger’s death, which was a result of train derailment largely depends on the social, political and economic sys-tems of the country. Th e more progressive the soci-ety is, the more developed and focused on solving of social problems is the economy of the state. And the higher the country values an individual and their safety.
However, the severity of the public requirements for traffi c safety, as well as for other important tech-nological processes, depends on the psyche of an in-dividual.
Th us, the results of the studies suggest that if the probability of death is 10-6 a year and it is the result of technogenic emergencies, the public usually does not express undue concern. Based on this, many ex-perts take the value of 10-6 as a normative value of the technogenic risk indicator.
We can assume that it is a psychologically reason-able standard which measures the risk of death.
In addition, people’s attitude towards the value of this type of risk depends on how free they are to decide — to expose themselves to the risk or not. For example, the athlete himself takes the decision to participate in a car race on mountain roads with the aim of establishing a sports record. Another thing is when a person from force of circumstances is forced to use the services of railway transportation. In these cases, the diff erence in the assessment of acceptable loss of life reaches 3 orders of magnitude, namely, in the latter case the safety requirements are stricter.
Another feature of the human psyche is that people consider single emergencies with severe con-sequences less acceptable than a large number of ac-cidents with less severe consequences. For example, the public reacts more sharply to relatively rare de-railments with severe consequences than to the daily deaths in car accidents. Th is being said, train wreck
June 2015 Journal of Information Technology and Applications 53

JITA 5(2015) 1:42-54 V.M. Lisenkov, P.F. Bestemyanov:
is considered to be a truly extraordinary event, and car accidents are considered to be everyday phenom-ena, an inevitable attribute of modern city life. At the same time we know that the automobile safety is substantially lower than the train safety.
Th us, the establishment of social norms of risk of death indicator as the passenger travel by train, we should take into account the real state of the society as well as the state of overall security of the individual in society. We should also take into account the cur-rent state of train safety.
If the social norm of the risk of death of the pas-senger is more strict than economically feasible, then it should underlie the safety standards of structural components, which are parts of train and shunting operation. To do this we use the methods discussed above to determine the most economically rational option of implementing of a subsystem, which can provide the risk of death standard. Th e safety val-ues of structural components of such a system are accepted as normative.
Submitted: April 30, 2015.Accepted: May 8, 2015.
54 Journal of Information Technology and Applications www.jita-au.com

WATER TREEING IN EXTRUDED CABLE INSULATION AS REHBINDER ELECTRICAL EFFECT JITA 5(2015) 1:55-60
WATER TREEING IN EXTRUDED CABLE INSULATION AS REHBINDER ELECTRICAL EFFECT
Iz. B. Peshkov1, M. Yu. Shuvalov2, V.L. Ovsienko3
1D. Sc. Habil., professor, 2D. Sc. Habil., 3Ph. D.,JSC VNIIKP
Case stydy
DOI: 10.7251/JIT1501055P UDC: 621.315:66.017
Abstract: The paper contains systematic comparison of signs and properties of the water treeing phenomenon (the basic mechanism of degradation of medium voltage electric cable extrudered insulation which develops under combined action of electric stress and water) and Rehbinder Effect – the reduction of mechanical strength of solids due to physical and chemical action of liquid medium.
The analysis of the published data permits to distinguish 13 indications of the Rehbinder Effect. The authors show successively the direct analogy of the water treeing and the Rehbinder Effect using the above mentioned indications, including decrease of work of the development of new surfaces in the course of destruction, chemical specifi city, role of material defects, two-stage destruction nature, etc. The analogy obtained is accepted as a working hypothesis which permits to bring certain order into theoretical and experimental studies of the water treeing.
Key words: water treeing, Rehbinder Effect, destruction, medium, defects.
Today XLPE cables are the basic types of 10-500 kV AC power cables. Th ese cables are used for feed-ing cities and energy-intensive manufacturing facili-ties, as well as for carrying energy from electric power stations. Polymer cable insulation operates under the exposure to high electric stresses; therefore polyethyl-ene insulation of medium and high-voltage cable has to meet strict electric strength and reliability require-ments over the operation period of several decades.
However if there are cavities and microimpuri-ties in the polymer insulation, then in the course of operation degradation known as treeing begin to develop within the insulation material. Treeing may be caused both by contaminants in the original poly-ethylene and imperfection of cable manufacturing process.
In the long run treeing leads to cable failure in operation. Th erefore the investigation of tree initia-
tion and development is of paramount importance. Th e main form of electrical insulation breakdown is associated with dendric tree-like growth known as electrical trees (ET). Th e main factors of ET growth are electric stress and temperature. Ageing known as water treeing [3, 8, 7] occur in the insulation under the simultaneous exposure to electric fi eld and water diff usion into the insulation from the environment.
Electrical and water trees (WTs) tend to grow from the defects of the cable insulating system. ETs initiate slowly but grow quickly. On the contrary, WTs initiate quickly but grow relatively slowly. In medium voltage cables WTs form the basic mecha-nism of degradation of extruded insulation.
Despite the dramatic progress achieved over the recent 20-30 years in the fi eld of development of more reliable dielectric materials and their processing into high-performance products, WTs still remain
June 2015 Journal of Information Technology and Applications 55
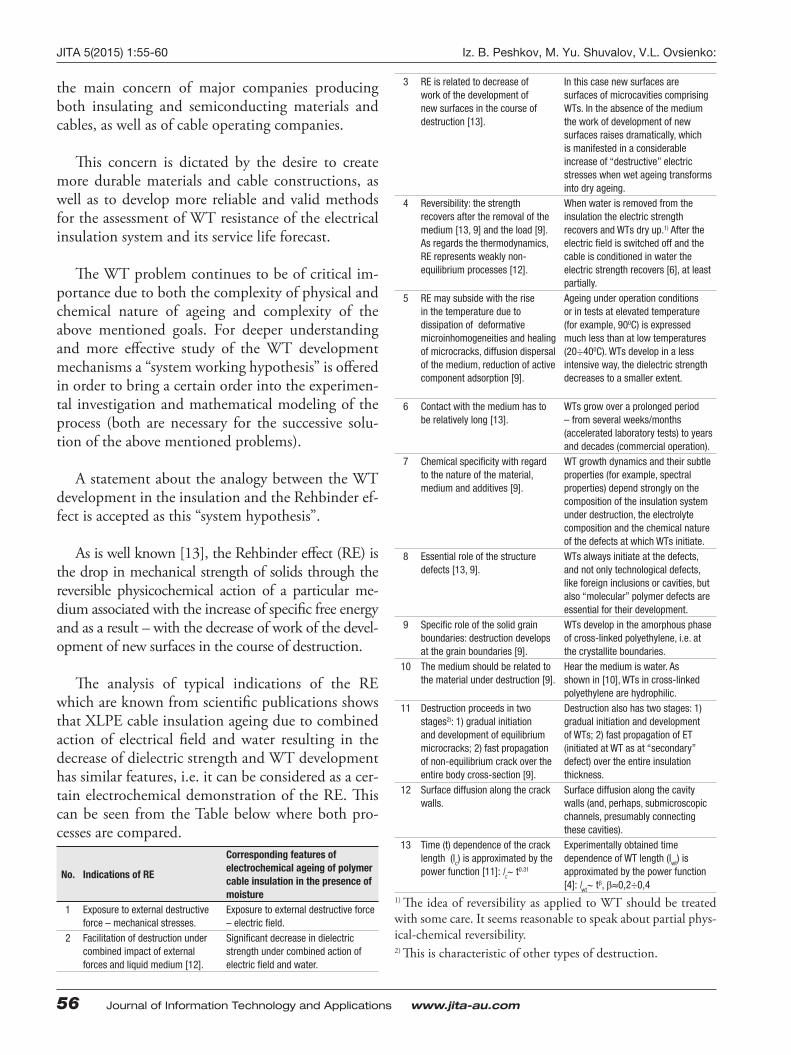
JITA 5(2015) 1:55-60 Iz. B. Peshkov, M. Yu. Shuvalov, V.L. Ovsienko:
the main concern of major companies producing both insulating and semiconducting materials and cables, as well as of cable operating companies.
Th is concern is dictated by the desire to create more durable materials and cable constructions, as well as to develop more reliable and valid methods for the assessment of WT resistance of the electrical insulation system and its service life forecast.
Th e WT problem continues to be of critical im-portance due to both the complexity of physical and chemical nature of ageing and complexity of the above mentioned goals. For deeper understanding and more eff ective study of the WT development mechanisms a “system working hypothesis” is off ered in order to bring a certain order into the experimen-tal investigation and mathematical modeling of the process (both are necessary for the successive solu-tion of the above mentioned problems).
A statement about the analogy between the WT development in the insulation and the Rehbinder ef-fect is accepted as this “system hypothesis”.
As is well known [13], the Rehbinder eff ect (RE) is the drop in mechanical strength of solids through the reversible physicochemical action of a particular me-dium associated with the increase of specifi c free energy and as a result – with the decrease of work of the devel-opment of new surfaces in the course of destruction.
Th e analysis of typical indications of the RE which are known from scientifi c publications shows that XLPE cable insul ation ageing due to combined action of electrical fi eld and water resulting in the decrease of dielectric strength and WT development has similar features, i.e. it can be considered as a cer-tain electrochemical demonstration of the RE. Th is can be seen from the Table below where both pro-cesses are compared.
No. Indications of RE
Corresponding features of
electrochemical ageing of polymer
cable insulation in the presence of
moisture
1 Exposure to external destructive force – mechanical stresses.
Exposure to external destructive force – electric fi eld.
2 Facilitation of destruction under combined impact of external forces and liquid medium [12].
Signifi cant decrease in dielectric strength under combined action of electric fi eld and water.
3 RE is related to decrease of work of the development of new surfaces in the course of destruction [13].
In this case new surfaces are surfaces of microcavities comprising WTs. In the absence of the medium the work of development of new surfaces raises dramatically, which is manifested in a considerable increase of “destructive” electric stresses when wet ageing transforms into dry ageing.
4 Reversibility: the strength recovers after the removal of the medium [13, 9] and the load [9]. As regards the thermodynamics, RE represents weakly non-equilibrium processes [12].
When water is removed from the insulation the electric strength recovers and WTs dry up.1) After the electric fi eld is switched off and the cable is conditioned in water the electric strength recovers [6], at least partially.
5 RE may subside with the rise in the temperature due to dissipation of deformative microinhomogeneities and healing of microcracks, diffusion dispersal of the medium, reduction of active component adsorption [9].
Ageing under operation conditions or in tests at elevated temperature (for example, 900C) is expressed much less than at low temperatures (20÷400C). WTs develop in a less intensive way, the dielectric strength decreases to a smaller extent.
6 Contact with the medium has to be relatively long [13].
WTs grow over a prolonged period – from several weeks/months (accelerated laboratory tests) to years and decades (commercial operation).
7 Chemical specifi city with regard to the nature of the material, medium and additives [9].
WT growth dynamics and their subtle properties (for example, spectral properties) depend strongly on the composition of the insulation system under destruction, the electrolyte composition and the chemical nature of the defects at which WTs initiate.
8 Essential role of the structure defects [13, 9].
WTs always initiate at the defects, and not only technological defects, like foreign inclusions or cavities, but also “molecular” polymer defects are essential for their development.
9 Specifi c role of the solid grain boundaries: destruction develops at the grain boundaries [9].
WTs develop in the amorphous phase of cross-linked polyethylene, i.e. at the crystallite boundaries.
10 The medium should be related to the material under destruction [9].
Hear the medium is water. As shown in [10], WTs in cross-linked polyethylene are hydrophilic.
11 Destruction proceeds in two stages2): 1) gradual initiation and development of equilibrium microcracks; 2) fast propagation of non-equilibrium crack over the entire body cross-section [9].
Destruction also has two stages: 1) gradual initiation and development of WTs; 2) fast propagation of ET (initiated at WT as at “secondary” defect) over the entire insulation thickness.
12 Surface diffusion along the crack walls.
Surface diffusion along the cavity walls (and, perhaps, submicroscopic channels, presumably connecting these cavities).
13 Time (t) dependence of the crack length (lc) is approximated by the power function [11]: lc~ t0.31
Experimentally obtained time dependence of WT length (lwt) is approximated by the power function [4]: lwt~ tβ, β≈0,2÷0,4
1) Th e idea of reversibility as applied to WT should be treated with some care. It seems reasonable to speak about partial phys-ical-chemical reversibility.2) Th is is characteristic of other types of destruction.
56 Journal of Information Technology and Applications www.jita-au.com

WATER TREEING IN EXTRUDED CABLE INSULATION AS REHBINDER ELECTRICAL EFFECT JITA 5(2015) 1:55-60
Below we deal with a variety of experimental data which illustrate the typical features of the RE in respect to the electrochemical ageing of extruded cross-linked polyethylene cable insulation with refer-ence to the processes described in the Table.
Dielectric strength reduction due to ageing (item 2).
Accelerated ageing tests of full-scale specimens of medium-voltage cable are being conducted in VNIIKP at present; the tests comply with the norms of CENELEC (HD 605, HD 620). Th e electric strength data obtained by now and averaged over some manufacturing plants are given in Fig. 1 versus
test duration.
Figure 1. Dependence of dielectric strength (Ebr) of full-scale 10 kV cable specimens on time (t) of accelerated electrochemical ageing tests carried out in accordance with CENELEC norms
Signifi cant increase in the work of development of new surfaces in the absence of active medium which is represented by a sharp increase of destruc-tive electric stresses (item 3).
WTs initiate even at electric stresses (E) equal to 2-3 kV/mm and probably at lower stresses. At the same time the electrical ageing at moderate tempera-tures in the absence of moisture in the insulation is registered only at E values within tens of kV/mm. Th is is confi rmed by the experimental data given in [14].
Specimens of 1 mm thickness cut out of 110 kV cable insulation were aged at a temperature of 400C and E=23 kV/mm. Examination of the specimens af-ter 5000 hours of ageing revealed no signs of ageing.
In addition test of a full-scale specimen of a 110 kV cable as carried out at continuously applied voltage, with E=13 kV/mm at the inner screen and constant heating, the conductor temperature was 1300C. Th e breakdown occurred after 23800 hours of testing, whereupon the insulation was examined using the FTIR spectropho-tometry, thermal analysis, video microscopy and other techniques which revealed some signs of thermal ageing and no signs of electrical ageing.
If exposure to water had been “included” into the performed tests one could have with certainty ex-pected mass initiation of WTs and most likely early failures of the test specimens.
Reversibility (item 4) – this property requires ad-ditional analysis.
Weakening of the RE with the rise of temperature (item 5) is illustrated by two length histograms of WTs revealed in two diff erent parts of the same cable after 12 years of operation (Fig. 2 a, b). Th e diff erence between the parts lies in the following: due to the outer source of heat one part of the cable was heated to a higher tem-perature which prevented WT growth. As a result the mean sizes of the trees exhibit two-fold diff erence.
Figure 2a. Histogram of “bow-tie” water tree lengths and approximating density of type 1 maximum value distribution (detailed description of this distribution is given, e.g., in [5]).
The trees were revealed in the cable specimen after 12 years of operation at moderate temperature
June 2015 Journal of Information Technology and Applications 57

JITA 5(2015) 1:55-60 Iz. B. Peshkov, M. Yu. Shuvalov, V.L. Ovsienko:
Figure 2b. Histogram of bow-tie water tree lengths and approximating probability density. The trees were found in another specimen of the same cable: the specimen was taken from a cable
line section that was in operation at elevated temperature
Th is phenomenon also requires additional con-sideration.
Chemical specifi city (item 7). Th ere are many scientifi c papers which show the dependence of the WT growth rate on the chemical composition of insulating and semiconducting compounds, for example, [3, 8], and electrolyte composition [2]. Consideration must be given to the diff erences in the chemical nature of WT which are resulting from the diff erences in the composition of the defects that give rise to treeing.
Such chemical “individuality” of some WTs is demonstrated in Fig. 3. Optical contrast of the trees against the surrounding dielectric is resulting from the primary absorption.
Role of defects (item 8). On the whole it is safe to say that there is a positive correlation between the sizes of defects and trees; large WTs growing at large defects are shown in Fig. 4 a, b, c. However this correlation is not strict: while examining cables that failed in op-eration one could sometimes come across large trees growing from small inclusions. Th e WT growth rate seems to be dependent on a variety of defect character-istics: its form and dielectric constant (and hence local increase of electric stress), hydrophilic property and water solubility of substances comprising the defect, their chemical activity, compatibility of the defect and the surrounding polymer. A large WT growing from a small-size defect is shown in Fig. 4 d.
Figure 3. Bow-tie water trees possessing intrinsic optical absorption in different spectral regions. The distinctions are caused by the difference in the chemical nature of the defects at which the
trees grew.
Figure 4a. Water tree growing from the hydrophilic cellulose material fi ber. Stained with methylene blue.
Figure 4b. Vented water tree growing from the semicon
screen protrusion. Stained with methylene blue.
Figure 4c. Bow-tie water tree growing from a foreign inclusion in the insulation bulk. Stained with methylene blue.
Figure 4d. Bow-tie water tree of 1.5 mm length growing from a small inclusion. In this case the image
contrast is provided with the help of the so-called Reihnberg illumination (color
variant of the dark fi eld microscopic method) – “optical staining” based on
the use of light fi lters instead of staining the insulation slices containing water
trees (see photo in Fig. 4a-c and Fig. 6) with a special staining agent.
58 Journal of Information Technology and Applications www.jita-au.com

WATER TREEING IN EXTRUDED CABLE INSULATION AS REHBINDER ELECTRICAL EFFECT JITA 5(2015) 1:55-60
WT development in the amorphous phase of the material (item 9). Comparative investigation with the aid of a polarizing and a phase-contrast micro-scope shows that WTs, as well as other types of deg-radation of amorphous-crystalline polymers, develop practically in the amorphous phase of the material.
Indeed, as may be seen in Fig. 5 a, b, birefrin-gence, determined by the dielectric crystalline phase organization, undergoes no changes inside the WT as compared with the intact insulation, and as a re-sult the WT is practically invisible in the polarization contrast and at the same time it is perfectly visible in the phase contrast. It means that the crystalline phase of the polyethylene inside the WT remains intact. It is fair to say that this simple proof of the crys-talline phase intactness is eff ective only for “young” and relatively small WTs. Large WTs often scatter light in such a way that they introduce an amplitude contrast into the optical image which does not dis-appear when the polarizer and the analyzer are in a crossed position. Nevertheless this diffi culty may be overcome by using the special technique of video-enhanced polarization microscopy [1].
Two-stage cable destruction (item 11). In case of the electrochemical ageing of the extruded power cable insulation the failure condition is achieved in the following way. At fi rst WTs are developing over a long period of time; then as their dimensions and the extent of polymer degradation within the WT reach some critical level (enter a certain critical region),
electrical trees originate at the water trees as second-ary defects and rather quickly they grow through the entire insulating layer causing a breakdown. Photos of WTs at which electrical trees began to grow are shown in Fig. 6.
Fig. 6. Electrical trees (1) growing from water trees (2), stained with methylene blue
Th erefore on the basis of both our own and for-eign test data we may say that there is a rather close analogy between the Rehbinder eff ect and the WT development. However this analogy cannot be ab-solutely full for variety of reasons, including the fol-lowing:
- RE in its traditional meaning refers to me-chanical destruction phenomena while WT growth is an electrochemical process;
- RE covers a wide spectrum of phenomena [12] and thus it cannot be determined comprehen-sively;
- RE suggests that no chemical reactions [11] oc-cur in the degredated material or a “moderate” chemical interaction takes place [12]. At the same time it is known [10] that the WT de-velopment is accompanied by local oxidation of the dielectric. Th erefore the electrochemical ageing of the extruded power cable insulation should be viewed as only partly reversible pro-cess (in the sense that was mentioned earlier – after the moisture is removed the WTs dry up and the cable dielectric strength recovers). With respect to thermodynamics it is proper to regard the WT growth as a relatively weakly non-equilibrium process [14].
Figure 5a. Bow-tie water tree. The photomicrograph was obtained with the use of the phase contrast method.
Fig. 5b. The same as in Fig. 5a but polarization contrast is used
instead of phase contrast. The water tree is practically invisible.
June 2015 Journal of Information Technology and Applications 59

JITA 5(2015) 1:55-60 Iz. B. Peshkov, M. Yu. Shuvalov, V.L. Ovsienko:
REFERENCES[1] Allen, R.D., Allen N.S. (1983) Video-enhanced Microscopy with a Computer Frame Memory. Journal of Microscopy,
Vol. 129, pt 1, January 1983. p.p. 3-17.[2] Bamji S., Bulinski A., Densley J. at al. (1984) Water Treeng in Polymeric Insulation. CIGRE, 1984, Paper 15-07, 7 p.p.[3] Bostrom, J.O., Campus, A., Hampton, R.N., Heikalla, P., Jager, K.M. et al. (2005) Copolymer compounds of cross-
linked polyethylene (SuperCOPO) for medium voltage power cables. Cables and Wires, № 5 (294), 2005, p.p. 7-22 (in Russian).
[4] Gototh H., Okamato T., Suzuki S., Tanaka T. (1984) Method for Estimation of the Remaining Life-time of 6.6 kV XLPE Cables after their First Failure in Service. IEEE Transactions. Vol. PAS-103, №9, 1984, p.p. 2428-2434.
[5] Gumbel, E. (1965) Statistics of extremes. : “Mir”, 1965 – 450 p.p. (in Russian).[6] Katz C., Fryszczyn B. (1985) Recovery of Dielectric Strength in Cables Containing Water Trees. International Confer-
ence on Properties and Applications of Dielectric Materials, Xian, China, June 24-29, 1985. Vol. 2, p.p. 526-530.[7] Leppanen, J., Chamov, A.V. (2005) Insulating technology for medium-voltage cables of improved reliability. Cables
and Wires, № 5 (294), 2005, p.p. 32-34 (in Russian).[8] Mendelsohn, A., Aarts, M. (2005) Global experience of using water-tree retardant cross-linked polyethylene insulation
for long-life medium-voltage cables. Cables and Wires, № 5 (294), 2005, p.p. 23-29 (in Russian).[9] Rehbinder, P.A. (1979). Surface phenomena in disperse systems. Selecta M.: “Nauka”, 1979 (in Russian).[10] Ross, R., Geurts, V.S.M., Smit, J.J. et al. (1990) The Hydrophilic Nature of Water Trees. IEEE International Symposium
on Electrical Insulation. Toronto, Canada, June 3-6, 1990. p.p. 169-172.[11] Shchukin, D.E., Summ, B.D. (1969) Role of processes of adsorption-active medium distribution over the surface of
solids in the effect of strength reduction through adsorption. Collected works. Surface diffusion and diffl uence. Ed. by Prof. Ya.E. Geguzin. M.: “Nauka”, 1969, p.p. 161-187 (in Russian).
[12] Shchukin. E.D. (1976) Reduction of surface energy and change in mechanical properties of solids under environmental exposure. “Physical-chemical mechanics of materials”, 1976, v. 12, №1, p.p. 3-21 (in Russian).
[13] Shchukin, E.D., Pertsev, A.V., Amelina, E.A. (1992) Colloid chemistry. M.: “Vyshaya shkola”, 1992 (in Russian).[14] Shuvalov, M.Yu. (2000) Investigation of high voltage cables, development of improved methods of electrical design and
microdiagnostics. Doct. of Sc. M.: JSC VNIIKP, 2000, 342 p (in Russian).
Submitted: April 30, 2015.Accepted: May 8, 2015.
60 Journal of Information Technology and Applications www.jita-au.com

CONTROL SYSTEMS FOR AUTOMATED VESSEL PILOTING THROUGH LOCAL STATIONARY OBSTACLES JITA 5(2015) 1:61-64
CONTROL SYSTEMS FOR AUTOMATED VESSEL PILOTING THROUGH LOCAL STATIONARY OBSTACLES
Dovgobrod Georgy Moiseevich1, Klyachko Lev Mikhaylovich2
1Ph.D. (Engineering), 2D.Sc.(Shipbuilding)OJSC “Central Scientifi c Research Institute “Kurs”, Moscow, Russian Federation,
e-mail: [email protected]
Case stydy
DOI: 10.7251/JIT1501061M UDC: 656.61.052
Abstract: To reduce the “human factor” component in the causes of accidents during pilot age of vessels along areas of fairways with local stationary obstacles we propose a device which provides: a) real-time presentation on a graphical display of information on current and predicted positions of a vessel with regard to a stationary obstacle; b) automated or semi-automated piloting of a vessel in to a straight path for safe passage of an obstacle. Specifi ed device will allow reducing the risk of accidents while piloting a vessel along diffi cult parts of fairways.
Key words: control systems, navigation, microcontroller.
Each year, in Saint-Petersburg a number of vessel collision events with bridge piers takes place during the passage o f cargo ship caravans along the Neva [1]. In order to reduce the “human factor” compo-nent in the causes of accidents during pilot age of vessels along areas of the fairways with local station-ary obstacles a device for vessel piloting (DVP) has been developed in OJSC “CSRI “Kurs”. DVP is de-signed for:
a. Delivery of information to navigator on cur-rent and predicted positions of a vessel with re-gard to a local stationary obstacle (for example, piers of a bridge);
b. Automated or semi-automated piloting of a vessel into a straight path for safe passage of an obstacle.
STRUCTURAL DIAGRAM OF A DEVICE FOR VESSEL PILOTING
(DVP)
Th e following designations are used below:Dv – a tuple of a vessel geometrical parameters Dv
- {d, lb, lst} where d is a vessel hull beam, lb, lst are dis-
tances from bow and stern to a vessel center of mass respectively.
Tpr - one-dimensional (linear) array of tuples of parameters of preset straight-line motion paths in the vicinity of a j-th obstacle Tprj= {ɸpr, λpr, ɸpr, lpr, L,}j, where ɸpr, λpr are the latitude and the longitude of an initial point, lpr is the length of a preset path, L is the length of a maneuvering area in front of an obstacle.
Structural diagram of a DVP is presented in Fig-ure 1. Connections shown dashed may be absent in a simplifi ed version of a device. Units of a DVP gear are designed to fulfi ll the following functions. Graphical screen 1 displays on a screen in visual form symbolic representations of current and projected positions of a vessel with regard to an obstacle. Control unit 2 is used to control DVP operation. Angular speed sen-sor (ASS) 3 measures angular speed of a vessel hull turning rate in horizontal plane w. Heading sensor 4 measures the current heading of a vessel ɸh. Global positioning system (GPS) receiver 5 measures current velocity vector of longitudinal vessel movement Vv
June 2015 Journal of Information Technology and Applications 61

JITA 5(2015) 1:61-64 Dovgobrod Georgy Moiseevich, Klyachko Lev Mikhaylovich:
and the vessel current coordinates fv, lv. Microcon-troller 6 performs calculations of the following values with period (See Figure 2): xvl, xvr coordinates of the current projection of a vessel hull and of its center of mass xcm on oX axis in the local coordinates system XOY, xl
p, xr
p coordinates of predicted over time Dt position of a vessel hull projection and of its cen-ter of mass onto OX axis, the current distance to an obstacle L, obstacle approach speed Vap.. It displays on a graphical screen in a visual form current and predicted geometric parameters of the mutual po-sition of the vessel and the obstacle Xv, Xv
p, L, Vap..
It stores the vessel motion actual parameters Tac in permanent memory. It estimates Vv, fv, lv in case of short-term signals from SNS receiver drop out. Rud-der feedback 7 measures the current rudder position Digital interface 8 is used to enter the coordinates of the obstacles Sob, of preset motion paths in the vi-cinity of obstacles Tpr, of vessel geometric parameters Dv, of prediction time Dt, and to feed the actual path and other vessel motion parameters Tac into a PC for further analysis. Interface with the steering gear actua-tor 9 is used to transfer rudder defl ection calculated value dpr into the actuator. Permanent memory 10 is used for storage of: coordinates of obstacles Sob, preset motion paths in the vicinity of obstacles Tpr, vessel geometric parameters Dv, prediction time Dt, actual path and other vessel motion parameters Tac.
Figure 1. Structural diagram of a vessel piloting device
DVP OPERATION DESCRIPTION
Let us consider geometric layout of a vessel enter-ing a preset path for passing an obstacle presented in Figure 2. XOY is a local system of coordinates con-nected with defi nite stationary obstacle. OY axis has a direction of a preset motion path in the vicinity of
an obstacle. OX axis is perpendicular to OY axis. Th e origin of coordinates “O” lies at the initial point of a preset path for passing through an obstacle {fpr, lpr}.
Figure 2. Geometric layout of a vessel entering a preset path of passing through an obstacle
Along the entire length of a ship fairway serviced by DVP when a vessel is in motion DVP operates in one of the two modes: a) next obstacle approach state and b) piloting state. In the state of next obstacle approach DVP monitors the current distance from a vessel to the next obstacle and when a vessel enters the vicinity of an obstacle passes into “piloting state” mode. By “the vicinity of an obstacle” we mean a part of water area near an obstacle suffi cient for entering a preset path for passing an obstacle. After the state of piloting has set in a navigator may choose one of the three modes to pilot a vessel into a preset path to pass obstacles and to move along this path:
3. Manual control without an advisor.4. Manual control with an advisor.5. Automatic control.
In manual control modes a navigator uses dis-played on a screen information on a preset path, on current and predicted vessel position, on an obstacle position and pilots a vessel into a preset path to pass an obstacle. In manual control mode with an advisor the screen displays a recommended value of rudder defl ection. In this case to control a vessel motion it is enough for a navigator to match the images of the current rudder position with a recommended one with the help of rudder control gear. When passing an obstacle a navigator uses information presented on the screen in order to counteract vessel deviation
62 Journal of Information Technology and Applications www.jita-au.com
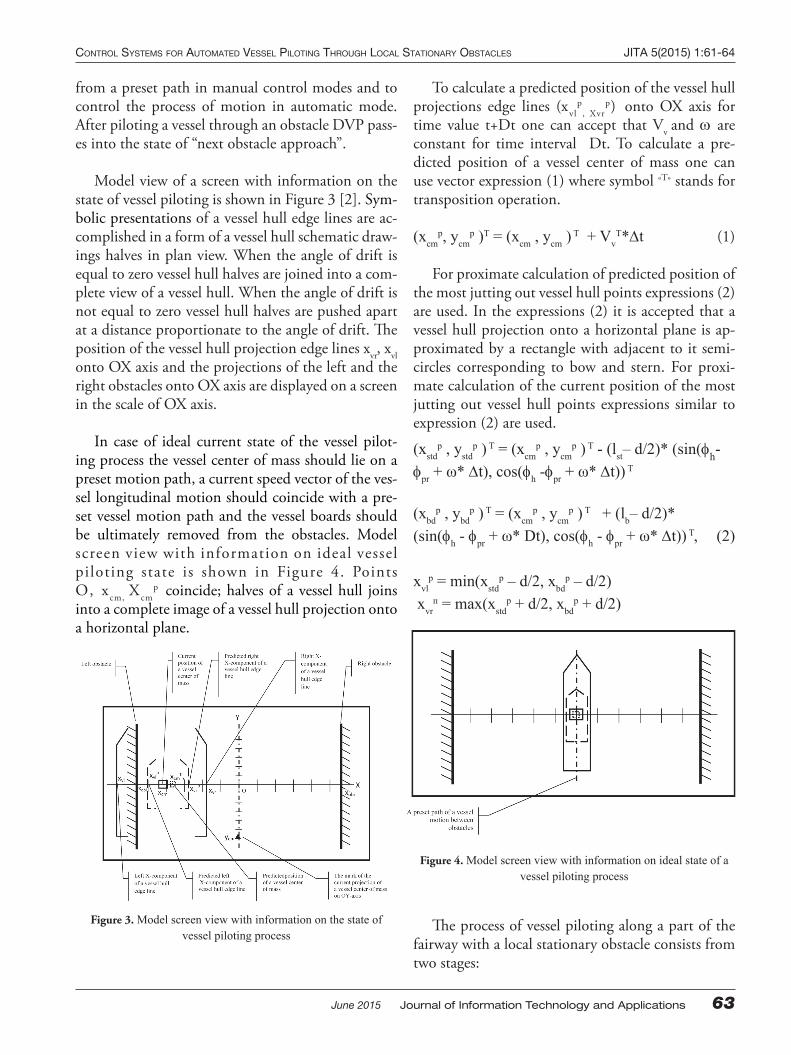
CONTROL SYSTEMS FOR AUTOMATED VESSEL PILOTING THROUGH LOCAL STATIONARY OBSTACLES JITA 5(2015) 1:61-64
from a preset path in manual control modes and to control the process of motion in automatic mode. After piloting a vessel through an obstacle DVP pass-es into the state of “next obstacle approach”.
Model view of a screen with information on the state of vessel piloting is shown in Figure 3 [2]. Sym-bolic presentations of a vessel hull edge lines are ac-complished in a form of a vessel hull schematic draw-ings halves in plan view. When the angle of drift is equal to zero vessel hull halves are joined into a com-plete view of a vessel hull. When the angle of drift is not equal to zero vessel hull halves are pushed apart at a distance proportionate to the angle of drift. Th e position of the vessel hull projection edge lines xvr, xvl onto OX axis and the projections of the left and the right obstacles onto OX axis are displayed on a screen in the scale of OX axis.
In case of ideal current state of the vessel pilot-ing process the vessel center of mass should lie on a preset motion path, a current speed vector of the ves-sel longitudinal motion should coincide with a pre-set vessel motion path and the vessel boards should be ultimately removed from the obstacles. Model screen view with information on ideal vessel piloting state is shown in Figure 4. Points O, xcm, Xcm
p coincide; halves of a vessel hull joins into a complete image of a vessel hull projection onto a horizontal plane.
Figure 3. Model screen view with information on the state of vessel piloting process
To calculate a predicted position of the vessel hull projections edge lines (xvl
p, Xvr
p) onto OX axis for time value t+Dt one can accept that Vv and are constant for time interval Dt. To calculate a pre-dicted position of a vessel center of mass one can use vector expression (1) where symbol «T» stands for transposition operation.
(xcmp, ycm
p )T = (xcm , ycm ) T + VvT*t (1)
For proximate calculation of predicted position of the most jutting out vessel hull points expressions (2) are used. In the expressions (2) it is accepted that a vessel hull projection onto a horizontal plane is ap-proximated by a rectangle with adjacent to it semi-circles corresponding to bow and stern. For proxi-mate calculation of the current position of the most jutting out vessel hull points expressions similar to expression (2) are used.
(xstdp , ystd
p ) T = (xcmp , ycm
p ) T - (lst– d/2)* (sin(h- pr + ω* t), cos(h -pr + ω* t)) T
(xbdp , ybd
p ) T = (xcmp , ycm
p ) T + (lb– d/2)*(sin(h - pr + ω* Dt), cos(h - pr + ω* t)) T, (2)
xvlp = min(xstd
p – d/2, xbdp – d/2)
xvrп = max(xstd
p + d/2, xbdp + d/2)
Figure 4. Model screen view with information on ideal state of a vessel piloting process
Th e process of vessel piloting along a part of the fairway with a local stationary obstacle consists from two stages:
June 2015 Journal of Information Technology and Applications 63
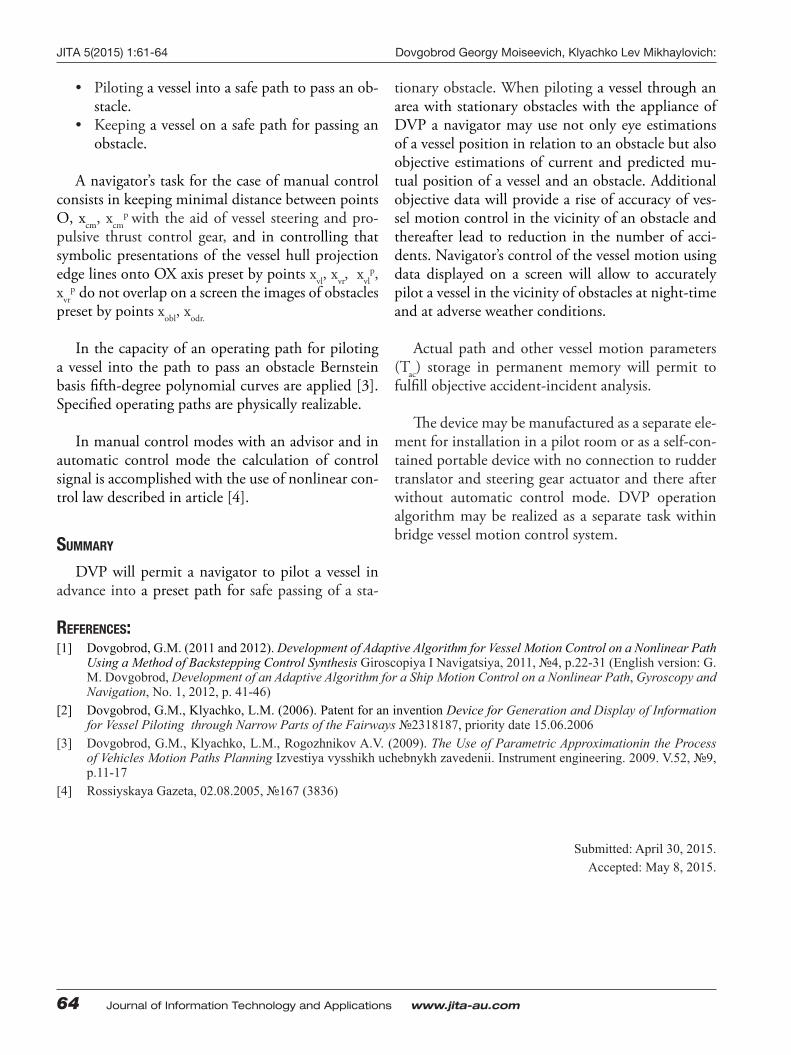
JITA 5(2015) 1:61-64 Dovgobrod Georgy Moiseevich, Klyachko Lev Mikhaylovich:
• Piloting a vessel into a safe path to pass an ob-stacle.
• Keeping a vessel on a safe path for passing an obstacle.
A navigator’s task for the case of manual control consists in keeping minimal distance between points O, xcm, xcm
p with the aid of vessel steering and pro-pulsive thrust control gear, and in controlling that symbolic presentations of the vessel hull projection edge lines onto OX axis preset by points xvl, xvr, xvl
p, xvr
p do not overlap on a screen the images of obstacles preset by points xobl, xodr.
In the capacity of an operating path for piloting a vessel into the path to pass an obstacle Bernstein basis fi fth-degree polynomial curves are applied [3]. Specifi ed operating paths are physically realizable.
In manual control modes with an advisor and in automatic control mode the calculation of control signal is accomplished with the use of nonlinear con-trol law described in article [4].
SUMMARY
DVP will permit a navigator to pilot a vessel in advance into a preset path for safe passing of a sta-
tionary obstacle. When piloting a vessel through an area with stationary obstacles with the appliance of DVP a navigator may use not only eye estimations of a vessel position in relation to an obstacle but also objective estimations of current and predicted mu-tual position of a vessel and an obstacle. Additional objective data will provide a rise of accuracy of ves-sel motion control in the vicinity of an obstacle and thereafter lead to reduction in the number of acci-dents. Navigator’s control of the vessel motion using data displayed on a screen will allow to accurately pilot a vessel in the vicinity of obstacles at night-time and at adverse weather conditions.
Actual path and other vessel motion parameters (Tac) storage in permanent memory will permit to fulfi ll objective accident-incident analysis.
Th e device may be manufactured as a separate ele-ment for installation in a pilot room or as a self-con-tained portable device with no connection to rudder translator and steering gear actuator and there after without automatic control mode. DVP operation algorithm may be realized as a separate task within bridge vessel motion control system.
REFERENCES:[1] Dovgobrod, G.M. (2011 and 2012). Development of Adaptive Algorithm for Vessel Motion Control on a Nonlinear Path
Using a Method of Backstepping Control Synthesis Giroscopiya I Navigatsiya, 2011, №4, p.22-31 (English version: G. М. Dovgobrod, Development of an Adaptive Algorithm for a Ship Motion Control on a Nonlinear Path, Gyroscopy and Navigation, No. 1, 2012, p. 41-46)
[2] Dovgobrod, G.M., Klyachko, L.M. (2006). Patent for an invention Device for Generation and Display of Information for Vessel Piloting through Narrow Parts of the Fairways №2318187, priority date 15.06.2006
[3] Dovgobrod, G.M., Klyachko, L.M., Rogozhnikov A.V. (2009). The Use of Parametric Approximationin the Process of Vehicles Motion Paths Planning Izvestiya vysshikh uchebnykh zavedenii. Instrument engineering. 2009. V.52, №9, p.11-17
[4] Rossiyskaya Gazeta, 02.08.2005, №167 (3836)
Submitted: April 30, 2015.Accepted: May 8, 2015.
64 Journal of Information Technology and Applications www.jita-au.com

PROSPECTS OF HIGH TECHNOLOGIES IN THE REMOTE DIAGNOSIS OF THE TRACK JITA 5(2015) 1:65-71
PROSPECTS OF HIGH TECHNOLOGIES IN THE REMOTE DIAGNOSIS OF THE TRACK
Lievin, Boris A.1, Nedorchuk, Boris L.1professor, rector
Moscow State University of Railway Engineering (MIIT), Moscow, Russia
Case stydy
DOI: 10.7251/JIT1501065L UDC: 656.2:62
Abstract: The article assesses trends of development of devices for control and diagnostics of railway tracks, highlights the growing importance of advanced technologies that make use of more sophisticated methods of remote monitoring of the technical condition and ensure safe operation of railroad bed. In particular, the authors analyze in detail the results of their own developments, with an emphasis on options for optical control with the use of aircraft and video recording, signifi cantly expanding the possibilities of monitoring and quality of observations, and at the same time forecast (considering experimental data and economic factors) promising areas of engineering research.
Keywords: railway, track monitoring, remote diagnostics, aerial photography, optical sensors, polarization of refl ected light, infrared technology, satellite communications.
INTRODUCTION
As we know, a number of immutable factors (pri-marily, the need to increase operating speeds on the railways, to achieve additional traffi c safety guar-antees with account for not only “uncreated” man-made threats) forces constantly to look for more ef-fi cient and reliable control devices in all respects of tracking of technical condition of the track, condi-tions of the right-of-way.
Th ere is a fairly defi nite picture of vectors of en-gineering research where high-tech solutions and projects claim to dominate. Some of them are imple-mented; others are likely to have diff erent degrees of readiness and experimental verifi cation.
VECTOR DISPOSITION
Th e general trend in the situation, from the very origins guided by enforcement promises, have re-mained the same for nearly two centuries: live vi-sual inspection with direct participation of a person
(track patrolman), as soon as the slightest opportu-nity appeared, was immediately supplemented by independent technical expertise, objective data of instruments and measurement, engineering analysis. Moreover, with the increasing complexity of track measuring equipment which was put on the track carts, placed in special cars, troubleshooting gradu-ally transformed from a contact to a non-contact one, using as instruments the most promising means of detection of defects, technological risks, direct threats to traffi c safety.
If we take into account methods of troubleshooting of the state of the track (railway complex elements), which have become known in recent years, then used and proposed methods can be grouped as follows.
1. Mechanical methods. Th ese include, for ex-ample, a system of rail structures diagnostics, created on the basis of micromechanical sensor elements [11]; a technique to assess dynamic eff ects of the vehicle on the track, built on the spectral analysis of the responses received to the shock pulse and in-
June 2015 Journal of Information Technology and Applications 65
JITA 5(2015) 1:65-71 Lievin, Boris A., Nedorchuk, Boris L.:
volving monitoring with the use of vibration sensors that convert mechanical vibrations recorded by them into electric signal [18, 14]; a method of continuous change of the vertical forces in the contact area of wheel and rail with dynamometric wheel sets, allow-ing to fi x deformation of a spoke or a disc, and thus the state of individual sections of the track [16].
2. Ultrasonic methods. An example where by multiple refl ection of the ultrasonic pulse from the boundaries of the control object by SAFT method imaging of defects in rail base blades is provided is shown in [2]; similar opportunities for ultrasonic in-spection are provided by examination of the surface of the rail in order to detect appearance of cracks and fractures during tracking the dynamics of the defect in order to prevent accidents on the road [e.g. 9].
3. Signal- reproducing means. Highlighting of that category by us is based on the fact that in the process of troubleshooting new narrowly functional, but very useful clips and repeaters of controlled data are off ered, including acceleration sensors used for inertial measurement of track irregularities [3], as well as angular movement sensors used for monitor-ing the state of the rail track [7].
4. Methods for diagnostics of ballast and sub-grade. In particular, this category refers to regis-tration of deformability degree of under-rail and under-sleeper grounds during load tests, which are carried out by mobile diagnostic complexes [1]; to monitoring of the roadbed and track superstructure on the basis of a three-level control system [17]; to analysis of the ballast layer with undersurface radars [10]; to organization of permanent automated posts for mode observations of deformations of high rail-way slopes using deep groundwater frames based on inclinometers PIN [15].
5. Methods of optical control, that fi x most clearly predominant trend towards the development of remote diagnostics of the railway track. In that case, the choice of technological combinations de-pends on methods of video recording of a controlled object and on capabilities of signal- transforming sys-tems, as well as on equipment carriers, monitoring means. Th e examples are: a) use of the eff ect of polar-
ization during refl ection of light in the visible range of the electromagnetic radiation from the surface of the rail head and further algorithmic processing of images, received from cameras [12, 4]; b) use of re-motely piloted aircrafts (RPA) or other types of air vehicles (including helicopters [6]) to conduct sur-veillance in a fl exible mode of diagnostic problems (in particular, we can cite an option of RPA with scanners, performing multispectral imagery in vis-ible and infrared ranges of the electromagnetic spec-trum; while devices of GPS / GLONASS system can be used as a surveying system, orienting to refl ect on the map local objects and identifying marks on the track and in the right-of-way [13, 8]).
Research intensity in each case is provided, of course, by its own means and methodological ap-proaches, but it is important to emphasize the de-sire to go beyond the usual technique, to denote ap-proaching to the current level of practical require-ments and technical process. From this point of view, in our opinion, the experience of participating in the development of two above mentioned types of opti-cal control is illustrative.
APPROACHES TO THE METHOD IMPLEMENTATION
In a professional community of transport special-ists each discussion on any scientifi c problem has a subtext of topics of risks, threats to safety on the roads. It is also always current for railways. Th ere-fore, the development of improved technical means of diagnosis of the railway track, including those that allow installation on aircrafts, remains a need, fi rst of all determined by this reason.
With regard to the same demand we consider, of course, a possibility of using fl uorescent polarization eff ect of refl ected light from the metal surface of the rail head for detecting traditional defects of rails, fas-teners, sleepers, monitoring ballast layer condition. Justifi ed by that basis, a non-contact method had passed through its own specifi c stages of develop-ment and experimental verifi cation before it could qualify for some kind of continuation.
Upon refl ection of the radiation of natural day-light, which is by its very nature non-polarized, from
66 Journal of Information Technology and Applications www.jita-au.com
PROSPECTS OF HIGH TECHNOLOGIES IN THE REMOTE DIAGNOSIS OF THE TRACK JITA 5(2015) 1:65-71
the boundary between two media (air-metal) its partial polarization occurs, which depends on the one hand, on the viewing angle, and on the other hand – on the optical properties of the contacting media. Th e change of polarization characteristics of the refl ected light car-ries information about the parameters of the surface. By tracking those changes, it is possible to determine the properties of the surface layer of metal. In our case, the objects of study are the rail heads, and as for nor-mal operation they should have almost perfectly fl at upper surface, all defects and foreign objects, diff erent in polarization characteristics of the smooth track sur-face will show an increased contrast in the images after processing by the method described below. Due to sig-nifi cant loads generated during the passage of trains, various defects appear on the surface of the rail heads. Consequently, the rays refl ected from the element ar-eas, receive diff erent polarization characteristics, thus allowing to detect local defects (chips, cracks, rail cor-rugation and so on).
In natural light variation of the electromagnetic fi eld vector is chaotic, because it is a set of many incoherent components. In this case, all directions of the electric fi eld are equally probable. Such light is called non-po-larized. If any direction of the vector is preferred then such a wave is recognized partially polarized.
Th ere are diff erent methods used for description of polarized light (Poincare sphere, Stokes vector, Jones vector, the quantum mechanical image). We have chosen the Stokes vector, as it makes it easier to analyze the passage of rays of light through optical systems.
Stokes vector is a set of four values, called Stokes parameters that characterize intensity and polariza-tion of light. Th ose parameters have the dimension of intensity; each of them corresponds not to the instantaneous intensity, but to the intensity, which is average in time required for measurement. Four parameters are the column vector
Th e fi rst parameter I is intensity. Parameters Q, U and V are consequently parameter of preferential horizontal polarization, parameter of preferential po-larization at the angle of 45 ° and parameter of pref-erential right-circular polarization. When a param-eter has a negative value, it means that polarization of orthogonal shape is preferential.
Th e proposed method consists of recording the refl ected light from the surface of the rails using pho-todetector equipped with a polarizing fi lter (like SLR camera). Th e railway track is processed fragment-wise, the size of each fragment is determined by the size of the matrix of the recording device, lens fo-cal length and the distance from which the survey is conducted.
To establish relations between the polarization characteristics of the electromagnetic wave before and after the fi lter, Mueller method is used. It is a matrix description of the interaction of the light beam and of an optical device through which light passes, and helps to calculate the result of such a process.
Since the removal or installation of the fi lter could cause displacement of the camera and violate the framing, as well as to improve the accuracy of the measurements, an improved method proposed in [5] is used, according to which for each part of the track a series of shots was made using diff erent orientation of the fi lter.
It should be noted, however, that any spatial vari-ations in the values of any of the Stokes parameters indicate as far as problems of shooting in the area of rail track are concerned, the presence of a surface fea-ture of the rail, which could potentially be a defect.
Simplifi ed, see their technical essence, experi-ments at the site of October Railway at Krestovsky Bridge in Moscow have shown a promising way to visualize defects using the eff ect of polarization of the refl ected light and optical control means.
ADVANTAGES OF AIR DIAGNOSTICS
Th e use of aerial reconnaissance methods to diag-nose the state of railway tracks is not a new idea [see.
IQUV
June 2015 Journal of Information Technology and Applications 67

JITA 5(2015) 1:65-71 Lievin, Boris A., Nedorchuk, Boris L.:
e.g., 6], although a restraining motive, which is present here, is quite understandable. Introduction of aerial photography on a regular basis is still very expensive in terms of conventional piloted aerial vehicles, airplanes and helicopters, their ties with airbases, maintenance, accounting for takeoff s and landings.
A possible alternative is a RPA, mentioned above within the fi fth classifi cation group (methods of optical control), which stands for remotely-piloted vehicle with scanners on board. Army prototypes (USA, Israel) have proven their eff ectiveness, and an increasing interest to them emerges in Russia, too.
Th e main advantages of RPA for diagnostics of railway tracks are:
- High effi ciency of use, ability to achieve a given stretch of track in a relatively short time, because the speed of RPA on the route can reach 200-250 km/h or more;
- Relatively low cost of operation of RPA as compared to other types of aircrafts, helicopters and airplanes;
- Use of RPA does not require intervals in timetable of trains, which are inevitable when using track-measur-ing cars;
- Route of RPA may be adjusted in accordance with the information received during fl ight and that route can deviate from the axis of the track at a consider-able distance;
- Control of RPA in fl ight if communication with them is conducted through satellite channels or spe-cially designed fi ber optic lines running along the track (it is possible to use another RPA as a booster converter) can be performed centrally from a single command post;
- Presence of infrared technology on board gives a pos-sibility to monitor the state of electrifi ed railways, identifying certain areas of high heating of electrical circuits due to bad contacts, as well as to remotely monitor transformer houses and other equipment;
- Infrared sensors allow monitoring twenty-four-hour a day without additional lighting;
- System based on RPA can be a supplement to existing and planned protection systems, including security systems switching on CCTV cameras.
Th e use of RPA will help to expand the search area and assess operational situation when alarm sig-nals are received from other sources.
Note, however, that engineering of such an ex-pensive system to solve specifi c tasks may not be ap-propriate. From this point of view other tasks should be anticipated, in addition to those, which regularly can be met on the railway. Th e fi rst is the observation of a possible crash site of trains, damage assessment and management of operations aimed at liquidation of consequences; then there is a task of regular fl y-by of railways to assess the track state in order to ensure safe traffi c.
Many of those ideas were taken into account during implementation of the project, carried out with the support of Russian Foundation for Ba-sic Research and JSC “Russian Railways” (grant №11-07-13112-ofi -m-2011-RR). It was called “Th e use of RPA to obtain images of railways and the right-of-way in order to ensure traffi c safety and prevent acts of terrorism” and provided an ostensible rationale for the very possibility of inspection from the air by means of optical imaging sensors, includ-ing multi-zone ones. And the threat detection can be carried out automatically, using mathematical meth-ods of pattern recognition, as well as in “live” mode by a human operator.
Demonstrated approach takes into account the need for the ability to see the heterogeneity of the environment (nature of the violations of the ground surface, the color of vegetation or snow, etc.), dynam-ics of weather conditions, illumination of controlled areas (especially in the presence of clouds, sunshine, provoking the formation of harsh shadows ,contrast-ing backgrounds). Neutralization of some negative related phenomena, especially at dusk and at night, does not rule out the involvement of special electro-optical devices: TV cameras, capable of working in low illumination, and infrared devices.
Another possibility is the use of RPA using opera-tional information for continuous observation of a designated section of the route in the loitering mode. Under this option it is possible to track an immediate moment of preparation of an act of unlawful interfer-ence into rail transport operation and to prevent the consequences of the derailment. To do this, images obtained in real time are to be forwarded to a central server, to be processed there, and at the moment of
68 Journal of Information Technology and Applications www.jita-au.com
PROSPECTS OF HIGH TECHNOLOGIES IN THE REMOTE DIAGNOSIS OF THE TRACK JITA 5(2015) 1:65-71
detection of moving objects on the tracks immediate communication with the security agencies is provided to take measures to counter the threat.
To solve the problem, it is possible to optimally choose a type of sensor that records the image. In good light conditions, it is possible to use a video camera, a high-speed optical camera or scanner with a line of sensors. It should be borne in mind that a video camera allows to get more frames per second than a photo camera. However, the photo camera produces an image with better resolution; its matrix has more points. As for a linear matrix scanner for image storage, it will need signifi cantly less memo-ry, because in this case there will be no duplication, when the same fragment of the railroad tracks is pres-ent on multiple frames. Another situation is inevita-ble: the image quality depends on the speed of fl ight of the equipment carriers.
To conduct aerial photography of railway tracks in winter at the experimental ring in Scherbinka, Moscow region, a remotely piloted aircraft of a heli-copter type of the video studio DT group was used. Th e selection of a helicopter-type RPA was justifi ed by its better handling in tight spaces and by signifi -cantly lower operating costs.
Aircraft RPA, having a much greater range and fl ight time, requires a developed ground infrastruc-ture (devices of takeoff and landing, maintenance facilities, etc.) and numerous personnel to operate them. Th is type of devices is available only to enti-ties (public and private) with signifi cant resources. In addition, in Russia there is now no legislative frame-work governing the operation and the permission of such aerial vehicles for fl ights.
Helicopter aerial vehicle of multi-rotor type – multicopter, used for shooting, allows to receive bird’s eye panorama photos and videos of good qual-ity. Aerial photography may relate to natural sites, monuments, documentary scenes, music videos, fes-tive events, sporting events and many other things. Th e use of this type of shooting during the research work was, apparently, the fi rst experience in the prac-tice of DT group, as well as any other contractors of such orders.
Control of the movement of RPA was carried out through radio channel. To get images an aircraft was fi tted with a camera Canon EOS 5D Mark II, which provides a remote control of the gate by a sep-arate desk and simultaneous transmission of signals through radio channel. Th e camera was mounted on gimbal suspension, from where picture was continu-ously transmitted to the screen of the control unit. In that case, the operator could focus the camera at the subject.
Power supply of electric engines of helicopters was carried out by storage batteries. Depending on the load the device was able to continuously stay aloft for up to fi fteen minutes and to gain a height of over 100 meters. Preparations for the shooting took less than 30 minutes.
Th e use of RPA of a helicopter type is a tempo-rary measure. Th is type of device fully satisfi es the requirements of experimental works as a technology demonstrator. For the monitoring system of railways RPA of an aircraft type are more preferable, as having much greater fl ying range and time of staying aloft.
ACCUMULATION OF ARGUMENTS AND FORECAST
A changing global environment, entry into the era of global electronic networks, nanotechnologies and nanomaterials, respectively change evaluation criteria of approaches, in force hitherto, to control of condition and safety of the railways. Risks, losses, economic benefi ts get a new price, and therefore the things that only recently seemed too expensive and low effi cient, now emerge in a diff erent coordinate system, have qualitatively diff erent projections into the future. And it is from this angle that it is nec-essary to assess the prospects for use of remote di-agnostics, suggesting their further development and reasonable claim to be promising ones.
It is important to emphasize, fi rst of all, that cer-tain priorities of remote (including air) diagnosis are not opposed to any traditional “terrestrial” methods of tracking of technical conditions of an operated railway lines and under-rail, under-sleeper grounds. In varying degrees, the collection of such informa-tion is equidirectional, is a controlling process, which
June 2015 Journal of Information Technology and Applications 69

JITA 5(2015) 1:65-71 Lievin, Boris A., Nedorchuk, Boris L.:
is complex in its aims, while none of the links can be taken out of the overall circuit. It is an axiom, which is clear for everybody.
Th e second fundamental point for the analyst: by isolating the interests of optical control and giving a special importance to them, it is impossible to be un-aware of the need to build arguments for its priorities and, therefore, a critical interpretation of the results of experimental works, experimental check of ideas, off ered by scientists and researchers, and of innova-tive solutions, should prevail. Designing of a trend is a considerable step in order to achieve at the end reliable, argued outcome.
In the context of existing materials we can con-fi dently say that there is a rational and justifi able compatibility of not only contact and contactless diagnostics of the track, but already of long range diagnostics as well which is carried out at consider-able distance from the earth’s surface with the help of specially designed aircrafts and optical electronic monitoring devices.
Experimental data accumulated by our experts (in particular, at the facilities of October Railway, the ex-perimental railway ring in Shcherbinka, Moscow re-gion), as well as the views of numerous aerial photo-graphs support this theses. Most often, pictures were taken in a densely populated area, which is typical for Western Europe and North America, and therefore it is certainly diffi cult to determine areas of risk or to assess the dynamics of accidents. However, there is an additional argument with regard to the Russian practice. After all, especially in the eastern part of the country railways are located mostly in uninhabited and inaccessible areas, and therefore, the use of RPA there is very productive and desirable considering many criteria, including purely economic ones.
CONCLUSION
Arguments, earlier put forward by researchers [8], and conclusions, summarized with their account en-able to select multiple areas that could become a ref-erence for RPA, tailored to remote diagnosis of the track and its safety.
It is necessary to use more purposefully the fact that operating costs of remotely piloted aircrafts are lower than costs of conventional aerial vehicles (air-planes, helicopters).
Railway-owned communication lines (they are laid along the rails) should be adapted for the needs of the fl ight control and receipt of information from RPA that will give additional savings for organiza-tion of monitoring control.
It is advisable to integrate aerial remote diagnos-tics to the relevant structures of railway companies, providing a certain cooperation (again, in order to reduce total costs) with the manufacturers and op-erators of RPA of this type.
In view of the emergence of optics, sensors, devic-es of a new generation, of increasingly sophisticated electronic means of communication and data pro-cessing there is a need for comprehensive approach to the design of models of remote monitoring of the technical condition of the railroad bed and safety of right-of-way, in view of achieving relevant goals and quality of diagnosis.
If high technologies will be fully in-demand at all levels of the system, being built in this way, its effi ciency is not long in coming. In the meantime, the innovative research needs more coordination and joint eff orts.
70 Journal of Information Technology and Applications www.jita-au.com

PROSPECTS OF HIGH TECHNOLOGIES IN THE REMOTE DIAGNOSIS OF THE TRACK JITA 5(2015) 1:65-71
REFERENCES
[1] Ashpiz, E.S., Zamuhovskiy, A. V. (2012). Substantiation of deformability standards, World of Transport and Transpor-tation Journal, 43 (5): p. 112-119.
[2] Bazulin, E.G. (2010). SAFT imaging of fl aws in the rail base blade with consideration of multiple refl ections of an ul-trasonic pulse from the boundaries of a test object, Russian Journal of Nondestructive Testing, 46 (2): p.63-67.
[3] Boronakhin, A.M., Gupalov, V.I., Mochalov, A.V. (2002). The method of inertial measurement of track irregularities, Patent of the Russian Federation №2242391 of 30.12.2002.
[4] Bugaev, A. S. et al. (2012). Contactless diagnostics of the rails: refl ected light polarization effect, World of Transport and Transportation Journal, 41(3): p. 82-88.
[5] Cremer F., de Jong W., Schutte K. (2002). Infrared polarization measurements and modeling applied to surface-laid antipersonnel landmines, Optical Engineering, 41(5): 1021-1032.
[6] Eyre-Walker R., Earp G. (2008). Application of Aerial Photography to Obtain Ideal Data for Condition Based Risk Management of Rail Networks, The 4th IET International Conference on Railway Condition Monitoring 18–20 June 2008, Conference Centre, Derby, UK.
[7] Khodorkovsky, Ya. I. et al. (1998). The method and device for monitoring of a rail track condition, Patent of the Russian Federation №2123445 of 20.12.1998.
[8] Lievin, B.A. et al. (2013). Distantly piloted aircrafts and the track security, World of Transport and Transportation Journal, 46(2): p. 152-157.
[9] Manual for ultrasonic testing of rails and welds (2006). Government of India, Ministry of Railways, Research Designs &Standards Organisation Lucknow- 226011. http://www.ecr.indianrailways.gov.in/uploads/fi les/1357555682170-usfd.pdf.
[10] Olhoeft G., Selig E. (2002). Ground Penetrating Radar Evaluation of Railway Track Substructure Conditions, Proceed-ings of SPIE, 4758: p.48.
[11] Podgornaya, L.N. (2010). Development and research of system of track diagnostics on micromechanical sensor ele-ments. Abstract from PhD (Tech.) Thesis, St.Petersburg.
[12] Razevig, V.V. et al. (2012). Using the effect of polarization of the refl ected light for contactless diagnostics of rails, Intelligent transportation systems: Proceedings of the II International scientifi c-practical conference “IntellektTrans 2012”, p. 379-386, St.Petersburg, Petersburg State Transport University.
[13] Razevig, V.V. et al. (2012). The use of RPAV to obtain images of railways and the right -of -way in order to ensure safety and prevent terrorist attacks, Intelligent transportation systems: Proceedings of the II International scientifi c-practical conference “IntellektTrans 2012”, p. 370-379, St. Petersburg, Petersburg State Transport University.
[14] Satov, M.D., Kvashnin, M. Ya., Kvashnin, N.M. (2010). Monitoring of the railway track, Industry of Kazakhstan, 62(5): p. 58-60.
[15] Savin, A. N. (2012). Automated posts to observe deformation of embankments, World of Transport and Transportation Journal, 44(6): p. 160-163.
[16] Shulman, Z. A. (2014). Continuous measurements of vertical forces of track and rolling stock interaction , World of Transport and Transportation Journal, 55(6): p.68-77.
[17] Zagirov, E.D., Igonkin, S.N. (2012). Monitoring of the permanent way and of the subgrade, World of Transport and Transportation Journal, 43(5): p. 124-128.
[18] Zamukhovskiy, A. V., Kvashnin, N. M., Zhangabylova, A. M. (2014). Control of vehicle’s dynamic impact on a track, World of Transport and Transportation Journal, 54( 5): p. 72-81.
Submitted: April 30, 2015.Accepted: May 8, 2015.
June 2015 Journal of Information Technology and Applications 71

INSTRUCTIONS FOR AUTHORS
Th e Journal of Information Technology and Appli-cation (JITA) publishes quality, original papers that contribute to the methodology of IT research as well as good examples of practical applications.
Authors are advised that adherence to the Instruc-tions to Authors will help speed up the refereeing and production stages for most papers.
• Language and presentation • Length of submissions • Submission • Contact details/biographies • Title of the paper• Abstract and keywords • Figures and tables • Sections • Footnotes • Special characters • Spelling • References • Proofs • PDF off print • Copyright and permissions • Final material • Correspondence • Publication ethics
LANGUAGE AND PRESENTATION
Manuscripts should be written in English. All authors should obtain assistance in the editing of their papers for correct spelling and use of English grammar. Manuscripts should have double spacing, with ample margins and pages should be numbered consecutively. Th e Editors reserve the right to make changes that may clarify or condense papers where this is considered desirable.
LENGTH OF SUBMISSIONS
Papers should not normally exceed 12 Journal pages (about 8000 words). However, in certain cir-cumstances (e.g., review papers) longer papers will be published.
SUBMISSION
Manuscripts must be submitted through the JITA online submission system.
Please read the instructions carefully before sub-mitting your manuscript and ensure the main article fi les do not contain any author identifi able informa-tion.
Although PDF is acceptable for initial submission original source (i.e. MS Word) fi les will be required for typesetting etc.
CONTACT DETAILS/BIOGRAPHIES
A separate fi le containing the names and addresses of the authors, and the name and full contact details (full postal address, telephone, fax and e-mail) of the author to whom correspondence is to be directed should be uploaded at the time of submission (you should select Contact details/Biographies as the fi le type). Th is fi le is not shown to reviewers. Th is fi le should also contain short biographies for each author (50 words maximum each) which will appear at the end of their paper.
Th e authors’ names and addresses must not ap-pear in the body of the manuscript, to preserve ano-nymity. Manuscripts containing author details of any kind will be returned for correction.
TITLE OF THE PAPER
Th e title of the paper should not be longer than 16 words.
ABSTRACT AND KEYWORDS
Th e fi rst page of the manuscript should contain a summary of not more than 200 words. Th is should be self-contained and understandable by the gener-al reader outside the context of the full paper. You should also add 3 to 6 keywords.
72 Journal of Information Technology and Applications www.jita-au.com
FIGURES AND TABLES
Figures which contain only textual rather than diagrammatic information should be designated Tables. Figures and tables should be numbered con-secutively as they appear in the text. All fi gures and tables should have a caption.
SECTIONS
Sections and subsections should be clearly diff er-entiated but should not be numbered.
FOOTNOTES
Papers must be written without the use of foot-notes.
SPECIAL CHARACTERS
Mathematical expressions and Greek or other symbols should be written clearly with ample spac-ing. Any unusual characters should be indicated on a separate sheet.
SPELLING
Spelling must be consistent with the Concise Ox-ford Dictionary.
REFERENCES
References in the text are indicated by the number in square brackets. If a referenced paper has three or more authors the reference should always appear as the fi rst author followed by et al. References are list-ed alphabetically. All document types, both printed and electronic, are in the same list. References to the same author are listed chronologically, with the old-est on top. Journal titles should not be abbreviated.
JournalAvramović ZŽ (1995) Method for evaluating
the strength of retarding steps on a marshalling yard hump. European Journal of Operational Research, 85(1), 504–514.
BookWalsham G (1993) Interpreting Information Sys-
tems in Organizations. Wiley, Chichester.
Contributed volume
Huberman AM and Miles MB (1994) Data Management and analysis methods. In Handbook of Qualitative Research (Denzin NK and Linkoln YS, Eds), pp 428-444, Sage, Th ousand Oaks, California.
Conference PaperHuberman AM and Miles MB (1994) Data
Management and analysis methods. In Handbook of Qualitative Research (Denzin NK and Linkoln YS, Eds), pp 428-444, Sage, Th ousand Oaks, California.
Unpublished reports/thesesNandhakumar JJ (1993) Th e practice of execu-
tive information systems development: and in-depth case study. PhD Th esis, Department of Engineering, University of Cambridge.
PROOFS
Proofs of papers will be sent to authors for check-ing. Alterations to diagrams should be avoided where possible. It will not be possible to accept major tex-tual changes at this stage. Proofs must be returned to the publishers within 48 hours of receipt by fax, fi rst-class post, airmail or courier. Failure to return the proof will result in the paper being delayed.
PDF OFFPRINT
Corresponding authors will receive a PDF of their article. Th is PDF off print is provided for personal use. It is the responsibility of the corresponding au-thor to pass the PDF off print onto co-authors (if rel-evant) and ensure that they are aware of the condi-tions pertaining to its use.
Th e PDF must not be placed on a publicly-available website for general viewing, or otherwise distributed without seeking our permission, as this would contravene our copyright policy and poten-tially damage the journal’s circulation. Please visit http://www.apeiron-journals.com/JITA/authors/rights_and_permissions.html to see our latest copyright policy.
June 2015 Journal of Information Technology and Applications 73

COPYRIGHT AND PERMISSIONS
Th e copyright of all material published in the Jour-nal is held by Paneuropean University APEIRON. Th e author must complete and return the copyright form enclosed with the proofs.
Authors may submit papers which have been published elsewhere in a foreign language, provided permission has been obtained from the original pub-lisher before submission.
Authors wishing to use material previously pub-lished in JITA should consult the publisher.
FINAL MATERIAL
All fi nal material must be submitted electronically in its original application format (MS Word is pre-ferred). Th e fi le must correspond exactly to the fi nal version of the manuscript.
CORRESPONDENCE
Business correspondence and enquiries relating to advertising, subscriptions, back numbers or reprints should be addressed to the relevant person at:
Paneuropean University APEIRONJournal JITAPere Krece 13, P.O.Box 5178102 Banja LukaBosnia and Hercegovina / RS
PUBLICATION ETHICS
We take an active interest in issues and develop-ments relating to publication ethics, such as plagia-rism, falsifi cation of data, fabrication of results and other areas of ethical misconduct. Please note that submitted manuscripts may be subject to checks us-ing the corresponding service, in order to detect in-stances of overlapping and similar text.


EDITORS
Gordana Radić, PhD, Editor-in-Chief (B&H)
Zoran Ž. Avramović, PhD, (B&H)
Dušan Starčević, PhD, (B&H)
EDITORIAL BOARD
Zdenka Babić, PhD, (B&H)
Leonid Avramovič Baranov, PhD, (Rusia)
Patricio Bulić, PhD, (Slovenia)
Valery Timofeevič Domansky, PhD, (Ukraina)
Hristo Hristov, PhD, (Bulgaria)
Emil Jovanov, PhD, (USA)
Petar Marić, PhD, (B&H)
Vojislav Mišić, PhD, (Canada)
Boško Nikolić, PhD, (Serbia)
Dragica Radosav, PhD, (Serbia)
Gjorgji Jovanchevski, PhD, (Macedonia)
Branko Latinović, PhD (B&H)
Vladimir Nikolajevič Mališ, PhD (Rusia)
Goran Đukanović, PhD (B&H)
Yidong Li, PhD (China)
EDITORIAL COUNCIL
Siniša Aleksić, APEIRON University, Director
Esad Jakupović, APEIRON University, Rector
TECHNICAL STAFF
Stojanka Radić, Lector
EDITOR ASSISTANTS
Sretko Bojić, APEIRON University
Gordan Ružić, ETF University of Belgrade
PUBLISHER
Paneuropean University APEIRON,
College of Information Technology
Banja Luka, Republic of Srpska, B&H
www.apeiron-uni.eu
Darko Uremović, Person Responsible for the Publisher
Aleksandra Vidović, Editor of University Publications