Nevada's Information Technology Career Cluster
219
Emsi Q4 2021 Data Set | www.economicmodeling.com 1 Nevada’s Information Technology Career Cluster
-
Upload
khangminh22 -
Category
Documents
-
view
3 -
download
0
Transcript of Nevada's Information Technology Career Cluster

Emsi Q4 2021 Data Set | www.economicmodeling.com 1
Nevada’s Information Technology Career Cluster

Emsi Q4 2021 Data Set | www.economicmodeling.com 2
Table of Contents Page
Index............................................................................................................................................................................
Occupation Analysis..............................................................................................................................................
Career Cluster Occupational Summary............................................................................................
Individual Occupation Analysis...........................................................................................................
Educational Program Analysis...........................................................................................................................
Career Cluster Educational Summary...............................................................................................
Individual Educational Program Analysis........................................................................................
Methodology............................................................................................................................................................
Data Sources.............................................................................................................................................................
Data Limitations......................................................................................................................................................
Appendices................................................................................................................................................................
Appendix A: Occupational Summary Table, Sorted by In-Demand Rank..........................
Appendix B: Program Summary Table, Sorted by 2020 Completions.................................
3
8
9
12
52
53
54
205
207
211
213
213
215

Emsi Q4 2021 Data Set | www.economicmodeling.com 3
Educational Programs Page
Accounting and Business/Management (52.0305)........................................................................... 183
Accounting and Computer Science (30.1601).................................................................................... 131
Accounting and Related Services, Other (52.0399).......................................................................... 185
Advertising (09.0903)................................................................................................................................... 72
Animation, Interactive Technology, Video Graphics, and Special Effects (10.0304)............ 74
Applied Economics (45.0602)................................................................................................................... 151Applied Mathematics, General (27.0301)............................................................................................. 126
Architectural and Building Sciences/Technology (04.0902).......................................................... 62
Area Studies, Other (05.0199)................................................................................................................... 67
Asian Studies/Civilization (05.0103)....................................................................................................... 64
Building Construction Technology/Technician (46.0415).............................................................. 155
Index
Occupations Page
Computer Network Architects (15-1241).............................................................................................. 32
Computer Network Support Specialists (15-1231)............................................................................ 26
Computer Occupations, All Other (15-1299)....................................................................................... 44
Computer Programmers (15-1251).......................................................................................................... 38
Computer Systems Analysts (15-1211)…............................................................................................... 20
Computer User Support Specialists (15-1232).................................................................................... 28Data Scientists and Mathematical Science Occupations, All Other (15-2098)....................... 51
Database Administrators and Architects (15-1245).......................................................................... 36
Information Security Analysts (15-1212)............................................................................................... 23
Market Research Analysts and Marketing Specialists (13-1161)….............................................. 12
Network and Computer Systems Administrators (15-1244)......................................................... 34Project Management Specialists and Business Operations Specialists, All Other (13-1198)…........................................................................................................................................................ 15
Software Developers and Software Quality Assurance Analysts and Testers (15-1256)… 40
Web Developers and Digital Interface Designers (15-1257)......................................................... 42

Emsi Q4 2021 Data Set | www.economicmodeling.com 4
Educational Programs Page
Business Administration and Management, General (52.0201).................................................. 172
Business Administration, Management and Operations, Other (52.0299).............................. 181
Business, Management, Marketing, and Related Support Services, Other (52.9999)......... 203
Business/Commerce, General (52.0101)............................................................................................... 170
Business/Offi ce Automation/Technology/Data Entry (52.0407)................................................. 187
Communication, General (09.0100)........................................................................................................ 68
Computer and Information Sciences and Support Services, Other (11.9999)....................... 106
Computer and Information Sciences, General (11.0101)............................................................... 75
Computer and Information Sciences, Other (11.0199)................................................................... 79Computer and Information Systems Security/Auditing/Information Assurance (11.1003)........................................................................................................................................................... 98
Computer Engineering Technology/Technician (15.1201)............................................................ 113
Computer Engineering, General (14.0901).......................................................................................... 107
Computer Graphics (11.0803)................................................................................................................... 91
Computer Programming, Specifi c Applications (11.0202)............................................................ 81
Computer Programming/Programmer, General (11.0201)........................................................... 80
Computer Science (11.0701)..................................................................................................................... 87
Computer Software and Media Applications, Other (11.0899)................................................... 92
Computer Support Specialist (11.1006)................................................................................................ 103
Computer Systems Analysis/Analyst (11.0501).................................................................................. 84
Computer Systems Networking and Telecommunications (11.0901)....................................... 94
Computer/Computer Systems Technology/Technician (15.1202)............................................. 114Computer/Information Technology Services Administration and Management, Other (11.1099)............................................................................................................................................................ 104
Criminal Justice/Law Enforcement Administration (43.0103)....................................................... 138
Criminal Justice/Safety Studies (43.0104)............................................................................................ 140
Crisis/Emergency/Disaster Management (43.0302)......................................................................... 145
Cyber/Computer Forensics and Counterterrorism (43.0403)....................................................... 146
Data Entry/Microcomputer Applications, General (11.0601)........................................................ 86
Data Modeling/Warehousing and Database Administration (11.0802)................................... 90

Emsi Q4 2021 Data Set | www.economicmodeling.com 5
Educational Programs Page
Data Processing and Data Processing Technology/Technician (11.0301)............................... 82
Design and Applied Arts, Other (50.0499)........................................................................................... 165
Design and Visual Communications, General (50.0401)................................................................ 161
Digital Arts (50.0102).................................................................................................................................... 159
E-Commerce/Electronic Commerce (52.0208)................................................................................... 178
Economics, General (45.0601)................................................................................................................... 149
Energy Systems Technology/Technician (15.1701).......................................................................... 115
Entrepreneurial and Small Business Operations, Other (52.0799).............................................. 191
Entrepreneurship/Entrepreneurial Studies (52.0701)...................................................................... 188
Environmental Control Technologies/Technicians, Other (15.0599)......................................... 110
Environmental Science (03.0104)............................................................................................................ 58
Environmental Studies (03.0103)............................................................................................................. 56
Environmental/Natural Resources Management and Policy, General (03.0201).................. 60
Fashion Merchandising (52.1902)........................................................................................................... 202
Game and Interactive Media Design (50.0411).................................................................................. 164
General Studies (24.0102).......................................................................................................................... 120
Geographic Information Science and Cartography (45.0702)..................................................... 154
Geography (45.0701).................................................................................................................................... 152
Geology/Earth Science, General (40.0601).......................................................................................... 136
German Studies (05.0125).......................................................................................................................... 66
Graphic Communications, General (10.0301)..................................................................................... 73
Graphic Design (50.0409)........................................................................................................................... 163
Health Information/Medical Records Administration/Administrator (51.0706).................... 166
Health Information/Medical Records Technology/Technician (51.0707)................................ 167
Health Services Administration (51.2211)............................................................................................ 168Heating, Air Conditioning, Ventilation and Refrigeration Maintenance Technology/Technician (47.0201)..................................................................................................................................... 157Homeland Security, Law Enforcement, Firefi ghting and Related Protective Services, Other (43.9999)............................................................................................................................................... 148
Information Science/Studies (11.0401)................................................................................................. 83

Emsi Q4 2021 Data Set | www.economicmodeling.com 6
Educational Programs Page
Information Technology (11.0103)......................................................................................................... 77
Information Technology Project Management (11.1005).............................................................. 101
International Business/Trade/Commerce (52.1101)......................................................................... 193
International/Globalization Studies (30.2001).................................................................................... 132
Latin American Studies (05.0107)............................................................................................................ 65
Liberal Arts and Sciences, General Studies and Humanities, Other (24.0199)....................... 122
Liberal Arts and Sciences/Liberal Studies (24.0101)......................................................................... 118
Logistics, Materials, and Supply Chain Management (52.0203).................................................. 174
Management Information Systems and Services, Other (52.1299)............................................ 196
Management Information Systems, General (52.1201).................................................................. 195
Manufacturing Engineering Technology/Technician (15.0613)................................................... 111
Marketing/Marketing Management, General (52.1401)................................................................ 198
Mass Communication/Media Studies (09.0102)................................................................................ 70
Mathematics, General (27.0101).............................................................................................................. 124
Multi-/Interdisciplinary Studies, General (30.0000).......................................................................... 128
Multi-/Interdisciplinary Studies, Other (30.9999).............................................................................. 134
Natural Resources/Conservation, General (03.0101)....................................................................... 54
Network and System Administration/Administrator (11.1001)................................................... 96
Non-Profi t/Public/Organizational Management (52.0206)........................................................... 177
Operations Management and Supervision (52.0205)...................................................................... 176
Project Management (52.0211)................................................................................................................ 179
Sales, Distribution, and Marketing Operations, General (52.1801)............................................ 200
Securities Services Administration/Management (43.0112)......................................................... 144
Security and Loss Prevention Services (43.0109).............................................................................. 142
Small Business Administration/Management (52.0703)................................................................ 190
Solar Energy Technology/Technician (15.1703)................................................................................. 116
Statistics, General (27.0501)...................................................................................................................... 127
System, Networking, and LAN/WAN Management/Manager (11.1002)................................. 97
Systems Science and Theory (30.0601)................................................................................................. 130

Emsi Q4 2021 Data Set | www.economicmodeling.com 7
Educational Programs Page
Telecommunications Technology/Technician (15.0305)................................................................ 109
Web Page, Digital/Multimedia and Information Resources Design (11.0801)...................... 89
Web/Multimedia Management and Webmaster (11.1004).......................................................... 100

Emsi Q4 2021 Data Set | www.economicmodeling.com 8
Information Technology Career Cluster
Occupation Analysis

Emsi Q4 2021 Data Set | www.economicmodeling.com 9
Information Technology Career Cluster Occupational Summary
40,039 6,372 $36.18
Jobs (2020) Total Program Completions (2020) Avg. Hourly Earnings (2020)
22,522 jobs below National average 4,093 Openings (2020) National Average: $43.83
InstitutionCompletions
(2020)Growth % YOY
(2020)College of Southern Nevada 2,136 4.0%University of Nevada-Las Vegas 1,318 9.7%
University of Nevada-Reno 1,047 1.4%
Truckee Meadows Community College 761 12.2%
Western Nevada College 460 1.1%
Great Basin College 146 6.6%
Advanced Training Institute 113 -11.0%
Nevada State College 111 7.8%
University of Phoenix-Nevada 71 -35.5%
Career College of Northern Nevada 68 -33.3%
Sierra Nevada University 62 26.5%Roseman University of Health Sciences 28 -34.9%DeVry University-Nevada 25 -40.5%Northwest Career College 20 300.0%Nevada Career Institute 4 Insf. DataCarrington College-Las Vegas 2 -77.8%Las Vegas College 0 -100.0%
2020 Program Completions
99 17Programs (2020) Institutions (2020)

Emsi Q4 2021 Data Set | www.economicmodeling.com 10
Information Technology Career Cluster Occupational Summary
Regional Trends
Region 2020 Jobs 2025 Jobs Change % Change
Nevada 40,039 44,912 4,873 12.2%
Las Vegas-Henderson-Paradise, NV
27,733 30,829 3,096 11.2%
Reno, NV 7,945 9,038 1,092 13.7%
United States 7,001,984 7,604,903 602,919 8.6%

Emsi Q4 2021 Data Set | www.economicmodeling.com 11
Demographics
Gender 2020 Jobs 2020 Percent
Males 25,234 63.0%
Females 14,804 37.0%
Age 2020 Jobs 2020 Percent
14-18 100 0.2%
19-24 2,181 5.4%
25-34 10,702 26.7%
35-44 11,146 27.8%
45-54 8,415 21.0%
55-64 5,779 14.4%
65+ 1,717 4.3%
Race/Ethnicity 2020 Jobs 2020 Percent
White 23,218 58.0%
Asian 6,511 16.3%
Hispanic or Latino 5,568 13.9%
Black or African American
3,011 7.5%
Two or More Races 1,284 3.2%
American Indian or Alaska Native
250 0.6%
Native Hawaiian or Other Pacifi c Islander
198 0.5%
Information Technology Career Cluster Occupational Summary
Gender
Age
Race/Ethnicity
63%
37%
0%
6%
27%
28%
21%
14%
4%
58%
16%
14%
8%
3% 1%
0%

Emsi Q4 2021 Data Set | www.economicmodeling.com 12
Market Research Analysts and Marketing Specialists (13-1161)
3,722 1,689 $29.40 23
Jobs (2020)Total Program
Completions (2020)
Avg. Hourly Earnings
(2020)
In-Demand Occupational
Rank
2,848 jobs below National
average504 Annual Openings National Average: $35.84 of 754 occupations
Typical Entry Level Education Work Experience Required Typical On-The-Job Training
Bachelor's degree None None
52.0201 52.1401 45.0601 09.0102 52.1101 05.0103 03.0104 03.0101
University of Nevada, Las Vegas
206 118 66 127 47 4
University of Nevada, Reno
156 175 81 33 43 7
College of Southern Nevada
336 1
Nevada State College
58 4
University of Phoenix, Nevada
47 1
Great Basin College 47
2020 Program Completions by Institution
CIP Code
0% 0% 1%1% 2%2%3%
3%
4%
21%
29%
34%
09.0100 52.1801 52.0299 51.2211 30.2001
College of Southern Nevada
17
Nevada State College
14
DeVry University-Nevada
5
Sierra Nevada University
2
Truckee Meadows Community College
3
Nevada Career Institute
4
CIP Code
Emsi Q4 2021 Data Set | www.economicmodeling.com 13
Educational Program Completions
CIP Code Program 2016 2017 2018 2019 2020
52.0201Business Administration and Management, General
1,006 1,007 1,028 993 918
52.1401 Marketing/Marketing Management, General 171 234 224 288 298
45.0601 Economics, General 49 63 60 136 147
09.0102 Mass Communication/Media Studies 93 110 121 104 127
52.1101 International Business/Trade/Commerce 86 75 93 67 88
03.0104 Environmental Science 28 48 52 58 55
09.0100 Communication, General 0 0 0 6 17
52.1801Sales, Distribution, and Marketing Operations, General
6 8 13 9 17
03.0101 Natural Resources/Conservation, General 3 5 3 5 7
52.0299Business Administration, Management and Operations, Other
35 25 18 14 5
05.0103 Asian Studies/Civilization 3 3 5 8 4
51.2211 Health Services Administration 0 0 0 0 4
30.2001 International/Globalization Studies 4 3 4 2 2
03.0103 Environmental Studies 9 15 5 1 0
05.0107 Latin American Studies 1 2 0 1 0
05.0125 German Studies 0 0 0 0 0
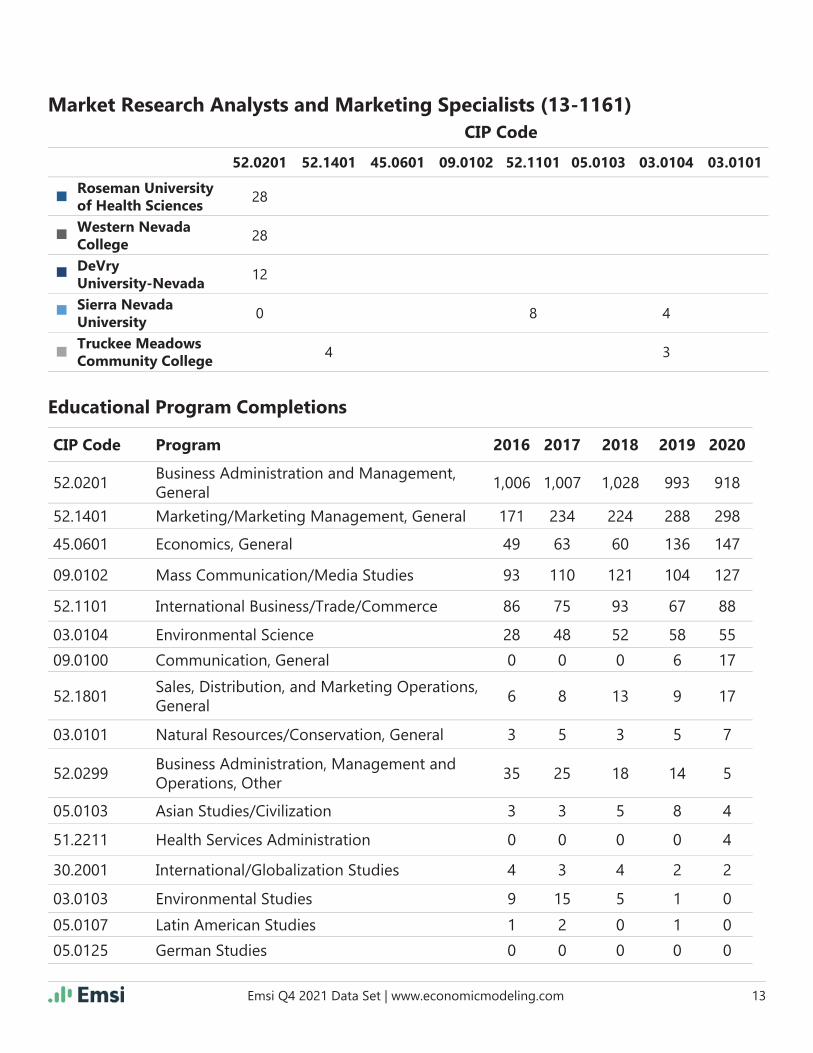
52.0201 52.1401 45.0601 09.0102 52.1101 05.0103 03.0104 03.0101
Roseman University of Health Sciences
28
Western Nevada College
28
DeVry University-Nevada
12
Sierra Nevada University
0 8 4
Truckee Meadows Community College
4 3
CIP Code
Market Research Analysts and Marketing Specialists (13-1161)

Emsi Q4 2021 Data Set | www.economicmodeling.com 14
Market Research Analysts and Marketing Specialists (13-1161)
CIP Code Program 2016 2017 2018 2019 2020
05.0199 Area Studies, Other 0 0 0 0 0
09.0903 Advertising 0 0 0 0 0
45.0602 Applied Economics 3 2 4 0 0
50.0499 Design and Applied Arts, Other 0 0 0 0 0

Emsi Q4 2021 Data Set | www.economicmodeling.com 15
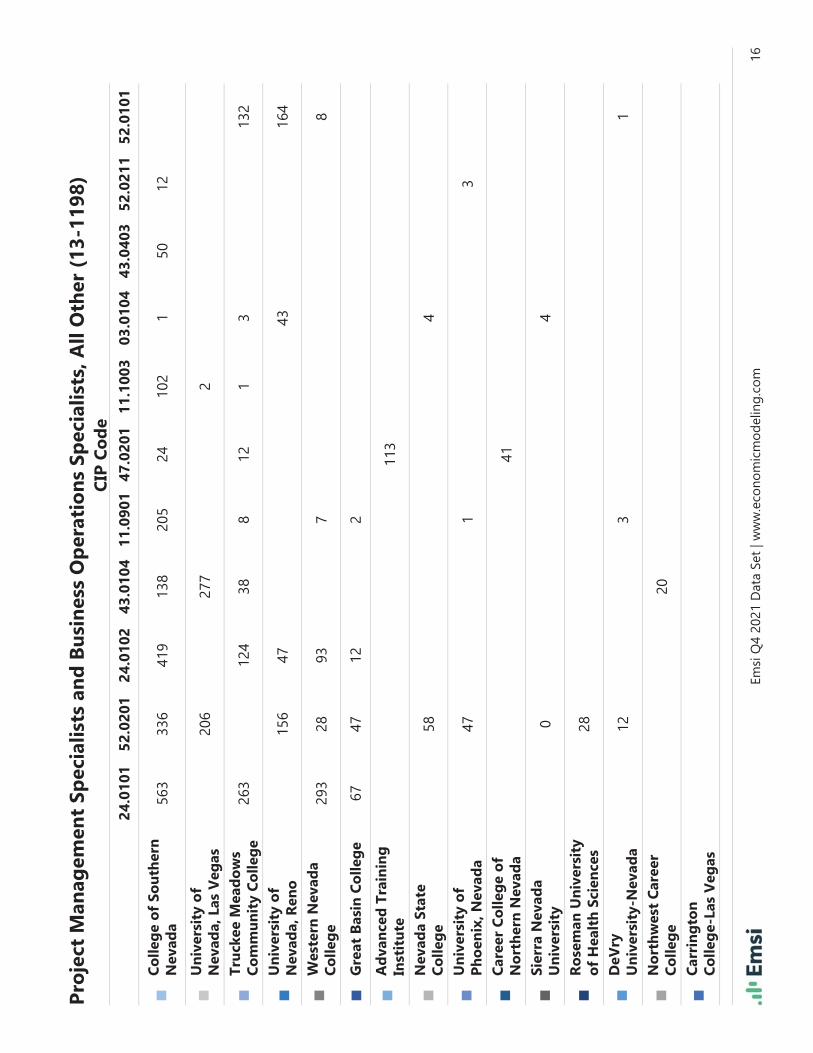
Project Management Specialists and Business Operations Specialists, All Other (13-1198)
12,636 4,513 $33.55 16
Jobs (2020)Total Program
Completions (2020)
Avg. Hourly Earnings
(2020)
In-Demand Occupational
Rank
1,412 jobs below National
average1,168 Annual Openings National Average: $40.62 of 754 occupations
Typical Entry Level Education Work Experience Required Typical On-The-Job Training
Bachelor's degree None None
2020 Program Completions by Institution
0% 0% 0% 1% 1%1%
1%
2%3%
3%
10%
10%
13%14%
41%
52.9999 15.1703 52.0799 24.0199 43.0109 52.0305
Truckee Meadows Community College
4 3
Nevada State College 5
University of Phoenix, Nevada 1
Sierra Nevada University 2
Carrington College-Las Vegas 2
CIP Code
Emsi
Q4
2021
Dat
a Se
t | w
ww
.eco
nom
icm
odel
ing.
com
16
24.0
101
52.0
201
24.0
102
43.0
104
11.0
901
47.0
201
11.1
003
03.0
104
43.0
403
52.0
211
52.0
101
Co
lleg
e o
f So
uth
ern
N
evad
a56
333
641
913
820
524
102
150
12
Un
iver
sity
of
Nev
ada,
Las
Veg
as20
627
72
Tru
ckee
Mea
do
ws
Co
mm
un
ity
Co
lleg
e26
312
438
812
13
132
Un
iver
sity
of
Nev
ada,
Ren
o15
647
4316
4
Wes
tern
Nev
ada
Co
lleg
e29
328
937
8
Gre
at B
asin
Co
lleg
e67
4712
2
Ad
van
ced
Tra
inin
g
Inst
itu
te11
3
Nev
ada
Stat
e C
olle
ge
584
Un
iver
sity
of
Ph
oen
ix, N
evad
a47
13
Car
eer
Co
lleg
e o
f N
ort
her
n N
evad
a41
Sier
ra N
evad
a U
niv
ersi
ty0
4
Ro
sem
an U
niv
ersi
ty
of
Hea
lth
Sci
ence
s28
DeV
ry
Un
iver
sity
-Nev
ada
123
1
No
rth
wes
t C
aree
r C
olle
ge
20
Car
rin
gto
n
Co
lleg
e-La
s V
egas
CIP
Co
de
Pro
ject
Man
agem
ent
Spec
ialis
ts a
nd
Bu
sin
ess
Op
erat
ion
s Sp
ecia
lists
, All
Oth
er (
13-1
198)

Emsi
Q4
2021
Dat
a Se
t | w
ww
.eco
nom
icm
odel
ing.
com
17
52.1
101
11.1
099
30.0
000
43.0
103
52.0
701
04.0
902
46.0
415
03.0
101
03.0
201
43.0
302
52.0
299
Un
iver
sity
of
Nev
ada,
Las
Veg
as47
4722
16
Tru
ckee
Mea
do
ws
Co
mm
un
ity
Co
lleg
e3
105
Un
iver
sity
of
Nev
ada,
Ren
o33
7
Wes
tern
Nev
ada
Co
lleg
e12
Gre
at B
asin
Co
lleg
e2
22
5
Nev
ada
Stat
e C
olle
ge
167
Un
iver
sity
of
Ph
oen
ix, N
evad
a8
Sier
ra N
evad
a U
niv
ersi
ty8
174
DeV
ry
Un
iver
sity
-Nev
ada
5
CIP
Co
de
Pro
ject
Man
agem
ent
Spec
ialis
ts a
nd
Bu
sin
ess
Op
erat
ion
s Sp
ecia
lists
, All
Oth
er (
13-1
198)

Emsi Q4 2021 Data Set | www.economicmodeling.com 18
Educational Program Completions
CIP Code Program 2016 2017 2018 2019 2020
24.0101 Liberal Arts and Sciences/Liberal Studies 1,105 1,208 1,121 1,243 1,186
52.0201Business Administration and Management, General
1,006 1,007 1,028 993 918
24.0102 General Studies 699 730 637 652 695
43.0104 Criminal Justice/Safety Studies 467 475 510 484 473
52.0101 Business/Commerce, General 263 297 303 293 305
11.0901Computer Systems Networking and Telecommunications
272 106 180 171 226
47.0201Heating, Air Conditioning, Ventilation and Refrigeration Maintenance Technology/Technician
224 175 227 214 190
11.1003Computer and Information Systems Security/Auditing/Information Assurance
63 48 113 98 105
52.1101 International Business/Trade/Commerce 86 75 93 67 88
03.0104 Environmental Science 28 48 52 58 55
43.0403Cyber/Computer Forensics and Counterterrorism
10 5 24 37 50
11.1099Computer/Information Technology Services Administration and Management, Other
25 15 30 29 49
30.0000 Multi-/Interdisciplinary Studies, General 41 39 36 28 33
43.0103Criminal Justice/Law Enforcement Administration
71 62 78 44 29
52.0701 Entrepreneurship/Entrepreneurial Studies 39 28 38 28 28
04.0902Architectural and Building Sciences/Technology
0 0 15 22 19
52.0211 Project Management 0 0 0 6 15
46.0415 Building Construction Technology/Technician 5 4 18 20 10
03.0101 Natural Resources/Conservation, General 3 5 3 5 7
03.0201Environmental/Natural Resources Management and Policy, General
5 3 6 3 5
Project Management Specialists and Business Operations Specialists, All Other (13-1198)
Emsi Q4 2021 Data Set | www.economicmodeling.com 19
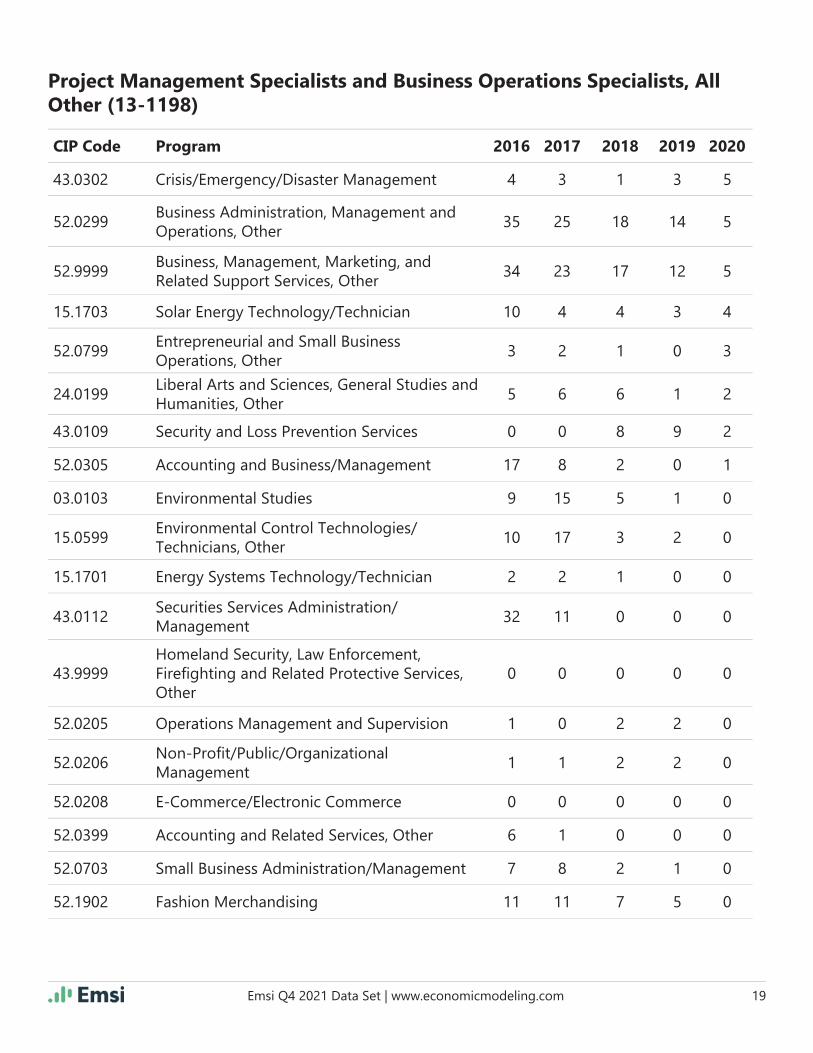
Project Management Specialists and Business Operations Specialists, All Other (13-1198)
CIP Code Program 2016 2017 2018 2019 2020
43.0302 Crisis/Emergency/Disaster Management 4 3 1 3 5
52.0299Business Administration, Management and Operations, Other
35 25 18 14 5
52.9999Business, Management, Marketing, and Related Support Services, Other
34 23 17 12 5
15.1703 Solar Energy Technology/Technician 10 4 4 3 4
52.0799Entrepreneurial and Small Business Operations, Other
3 2 1 0 3
24.0199Liberal Arts and Sciences, General Studies and Humanities, Other
5 6 6 1 2
43.0109 Security and Loss Prevention Services 0 0 8 9 2
52.0305 Accounting and Business/Management 17 8 2 0 1
03.0103 Environmental Studies 9 15 5 1 0
15.0599Environmental Control Technologies/Technicians, Other
10 17 3 2 0
15.1701 Energy Systems Technology/Technician 2 2 1 0 0
43.0112Securities Services Administration/Management
32 11 0 0 0
43.9999Homeland Security, Law Enforcement, Firefi ghting and Related Protective Services, Other
0 0 0 0 0
52.0205 Operations Management and Supervision 1 0 2 2 0
52.0206Non-Profi t/Public/Organizational Management
1 1 2 2 0
52.0208 E-Commerce/Electronic Commerce 0 0 0 0 0
52.0399 Accounting and Related Services, Other 6 1 0 0 0
52.0703 Small Business Administration/Management 7 8 2 1 0
52.1902 Fashion Merchandising 11 11 7 5 0
Emsi Q4 2021 Data Set | www.economicmodeling.com 20
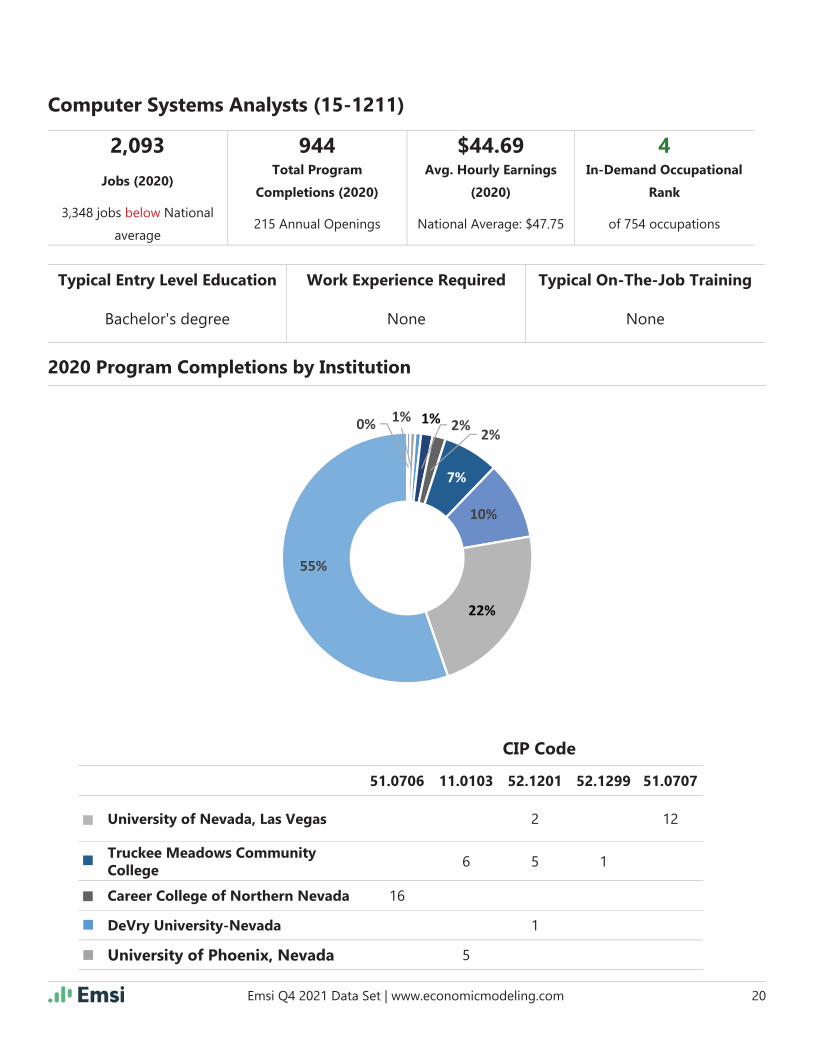
Computer Systems Analysts (15-1211)
2,093 944 $44.69 4
Jobs (2020)Total Program
Completions (2020)
Avg. Hourly Earnings
(2020)
In-Demand Occupational
Rank
3,348 jobs below National
average215 Annual Openings National Average: $47.75 of 754 occupations
Typical Entry Level Education Work Experience Required Typical On-The-Job Training
Bachelor's degree None None
51.0706 11.0103 52.1201 52.1299 51.0707
University of Nevada, Las Vegas 2 12
Truckee Meadows Community College
6 5 1
Career College of Northern Nevada 16
DeVry University-Nevada 1
University of Phoenix, Nevada 5
2020 Program Completions by Institution
CIP Code
0% 1% 1% 2% 2%
7%
10%
22%
55%

Emsi
Q4
2021
Dat
a Se
t | w
ww
.eco
nom
icm
odel
ing.
com
21
11.0
901
11.1
005
11.1
003
11.0
201
51.0
707
11.0
501
11.0
899
11.0
701
11.0
101
11.1
099
11.0
202
Co
lleg
e o
f So
uth
ern
N
evad
a20
517
410
224
121
4
Un
iver
sity
of
Nev
ada,
Las
Veg
as2
161
47
Un
iver
sity
of
Nev
ada,
Ren
o95
Tru
ckee
Mea
do
ws
Co
mm
un
ity
Co
lleg
e8
131
16
Car
eer
Co
lleg
e o
f N
ort
her
n N
evad
aW
este
rn N
evad
a C
olle
ge
77
DeV
ry
Un
iver
sity
-Nev
ada
33
Un
iver
sity
of
Ph
oen
ix, N
evad
a1
Gre
at B
asin
Co
lleg
e2
2
CIP
Co
de
Co
mp
ute
r Sy
stem
s A
nal
ysts
(15
-121
1)

Emsi Q4 2021 Data Set | www.economicmodeling.com 22
Educational Program Completions
CIP Code Program 2016 2017 2018 2019 2020
11.0901Computer Systems Networking and Telecommunications
272 106 180 171 226
11.1005 Information Technology Project Management 1 0 78 94 174
11.0701 Computer Science 104 95 113 119 161
11.0101 Computer and Information Sciences, General 115 110 125 144 133
11.1003Computer and Information Systems Security/Auditing/Information Assurance
63 48 113 98 105
11.1099Computer/Information Technology Services Administration and Management, Other
25 15 30 29 49
11.0201Computer Programming/Programmer, General
3 3 6 27 24
11.0202 Computer Programming, Specifi c Applications 10 12 20 11 16
51.0706Health Information/Medical Records Administration/Administrator
22 30 28 19 16
51.0707Health Information/Medical Records Technology/Technician
30 13 21 14 12
11.0103 Information Technology 54 63 36 3 11
52.1201 Management Information Systems, General 9 9 10 5 8
11.0501 Computer Systems Analysis/Analyst 7 8 3 4 4
11.0899Computer Software and Media Applications, Other
0 0 0 12 4
52.1299Management Information Systems and Services, Other
2 2 5 2 1
11.0199 Computer and Information Sciences, Other 24 20 0 0 0
11.9999Computer and Information Sciences and Sup-port Services, Other
0 0 0 0 0
15.1202Computer/Computer Systems Technology/Technician
0 0 0 0 0
30.0601 Systems Science and Theory 0 0 0 0 0
Computer Systems Analysts (15-1211)

Emsi Q4 2021 Data Set | www.economicmodeling.com 23
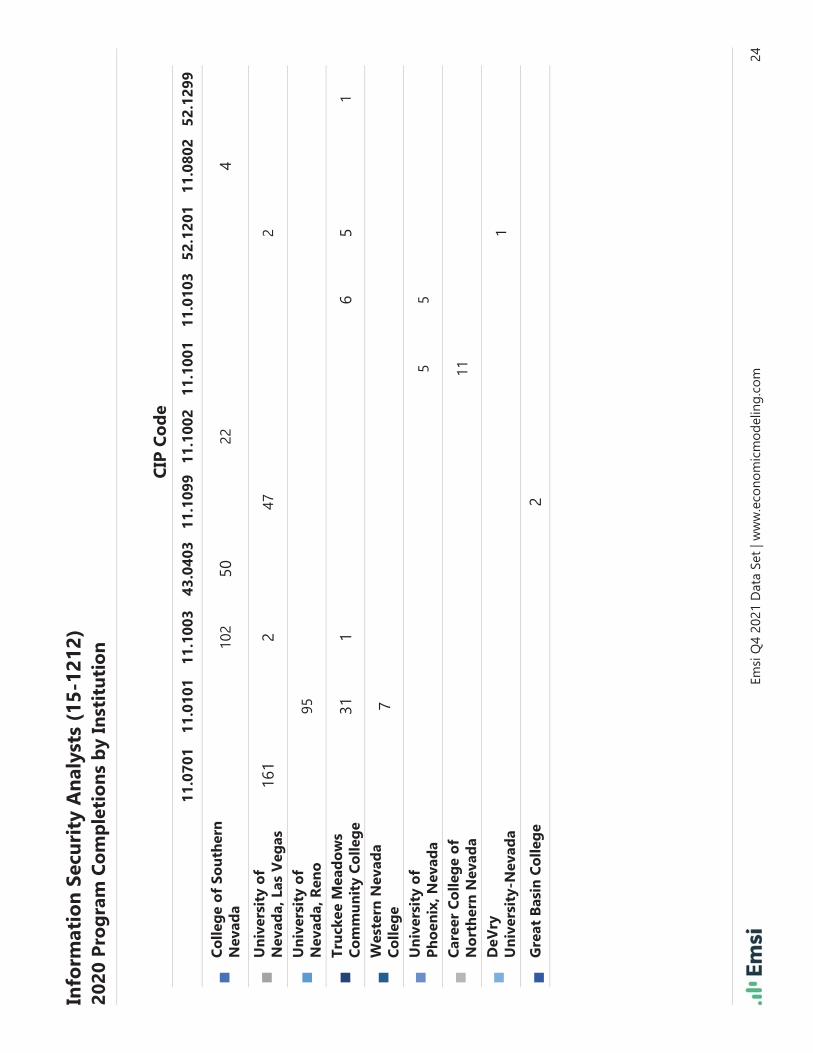
Information Security Analysts (15-1212)
602 1,433 $52.34 27
Jobs (2020)Total Program
Completions (2020)
Avg. Hourly Earnings
(2020)
In-Demand Occupational
Rank
702 jobs below National
average76 Annual Openings National Average: $51.72 of 754 occupations
Typical Entry Level Education Work Experience Required Typical On-The-Job Training
Bachelor's degree Less than 5 years None
43.0104 11.0901 11.0501
College of Southern Nevada 138 205 174
University of Nevada, Las Vegas 277
Truckee Meadows Community College
38 8
Northwest Career College 20
Western Nevada College 7
University of Phoenix, Nevada 1
DeVry University-Nevada 3
Great Basin College 2
CIP Code
49%
34%
7%6%
1%1% 1% 1% 0%
0%
Emsi
Q4
2021
Dat
a Se
t | w
ww
.eco
nom
icm
odel
ing.
com
24
11.0
701
11.0
101
11.1
003
43.0
403
11.1
099
11.1
002
11.1
001
11.0
103
52.1
201
11.0
802
52.1
299
Co
lleg
e o
f So
uth
ern
N
evad
a10
250
224
Un
iver
sity
of
Nev
ada,
Las
Veg
as16
12
472
Un
iver
sity
of
Nev
ada,
Ren
o95
Tru
ckee
Mea
do
ws
Co
mm
un
ity
Co
lleg
e31
16
51
Wes
tern
Nev
ada
Co
lleg
e7
Un
iver
sity
of
Ph
oen
ix, N
evad
a5
5
Car
eer
Co
lleg
e o
f N
ort
her
n N
evad
a11
DeV
ry
Un
iver
sity
-Nev
ada
1
Gre
at B
asin
Co
lleg
e2
CIP
Co
de
Info
rmat
ion
Sec
uri
ty A
nal
ysts
(15
-121
2)20
20 P
rog
ram
Co
mp
leti
on
s b
y In
stit
uti
on

Emsi Q4 2021 Data Set | www.economicmodeling.com 25
Educational Program Completions
CIP Code Program 2016 2017 2018 2019 2020
43.0104 Criminal Justice/Safety Studies 467 475 510 484 473
11.0901Computer Systems Networking and Telecommunications
272 106 180 171 226
11.1005 Information Technology Project Management 1 0 78 94 174
11.0701 Computer Science 104 95 113 119 161
11.0101 Computer and Information Sciences, General 115 110 125 144 133
11.1003Computer and Information Systems Security/Auditing/Information Assurance
63 48 113 98 105
43.0403Cyber/Computer Forensics and Counterterrorism
10 5 24 37 50
11.1099Computer/Information Technology Services Administration and Management, Other
25 15 30 29 49
11.1002System, Networking, and LAN/WAN Management/Manager
142 85 35 22 22
11.1001Network and System Administration/Administrator
28 20 23 31 16
11.0103 Information Technology 54 63 36 3 11
52.1201 Management Information Systems, General 9 9 10 5 8
11.0802Data Modeling/Warehousing and Database Administration
2 1 1 6 4
52.1299Management Information Systems and Services, Other
2 2 5 2 1
11.0199 Computer and Information Sciences, Other 24 20 0 0 0
11.0401 Information Science/Studies 0 1 0 0 0
11.9999Computer and Information Sciences and Sup-port Services, Other
0 0 0 0 0
43.9999Homeland Security, Law Enforcement, Firefi ghting and Related Protective Services, Other
0 0 0 0 0
Information Security Analysts (15-1212)

Emsi Q4 2021 Data Set | www.economicmodeling.com 26
Computer Network Support Specialists (15-1231)
1,512 763 $30.91 13
Jobs (2020)Total Program
Completions (2020)
Avg. Hourly Earnings
(2020)
In-Demand Occupational
Rank
225 jobs below National
average141 Annual Openings National Average: $34.37 of 754 occupations
Typical Entry Level Education Work Experience Required Typical On-The-Job Training
Associate's degree None None
CIP Code Program 2016 2017 2018 2019 2020
11.0901Computer Systems Networking and Telecommunications
272 106 180 171 226
11.0701 Computer Science 104 95 113 119 161
11.0101 Computer and Information Sciences, General 115 110 125 144 133
11.1003Computer and Information Systems Security/Auditing/Information Assurance
63 48 113 98 105
11.1099Computer/Information Technology Services Administration and Management, Other
25 15 30 29 49
11.0201Computer Programming/Programmer, General
3 3 6 27 24
11.1002System, Networking, and LAN/WAN Management/Manager
142 85 35 22 22
11.1001Network and System Administration/Administrator
28 20 23 31 16
51.0707Health Information/Medical Records Technology/Technician
30 13 21 14 12
11.0103 Information Technology 54 63 36 3 11
11.0501 Computer Systems Analysis/Analyst 7 8 3 4 4
11.0199 Computer and Information Sciences, Other 24 20 0 0 0
11.1006 Computer Support Specialist 0 0 0 0 0
11.9999Computer and Information Sciences and Support Services, Other
0 0 0 0 0
Educational Program Completions

Emsi
Q4
2021
Dat
a Se
t | w
ww
.eco
nom
icm
odel
ing.
com
27
11.0
901
11.0
701
11.0
101
11.1
003
11.1
099
11.0
201
11.1
002
11.1
001
51.0
707
11.0
103
11.0
501
Co
lleg
e o
f So
uth
ern
N
evad
a20
510
224
2212
1
Un
iver
sity
of
Nev
ada,
La
s V
egas
161
47
Un
iver
sity
of
Nev
ada,
R
eno
95
Tru
ckee
Mea
do
ws
Co
mm
un
ity
Co
lleg
e8
311
6
Wes
tern
Nev
ada
Co
lleg
e7
7
Un
iver
sity
of
Ph
oen
ix,
Nev
ada
12
55
Car
eer
Co
lleg
e o
f N
ort
her
n N
evad
a11
DeV
ry
Un
iver
sity
-Nev
ada
33
Gre
at B
asin
Co
lleg
e2
2
CIP
Co
de
Co
mp
ute
r N
etw
ork
Su
pp
ort
Sp
ecia
lists
(15
-123
1)1%
1%1%
2%2%
6%
12%
27%
48%
Emsi Q4 2021 Data Set | www.economicmodeling.com 28
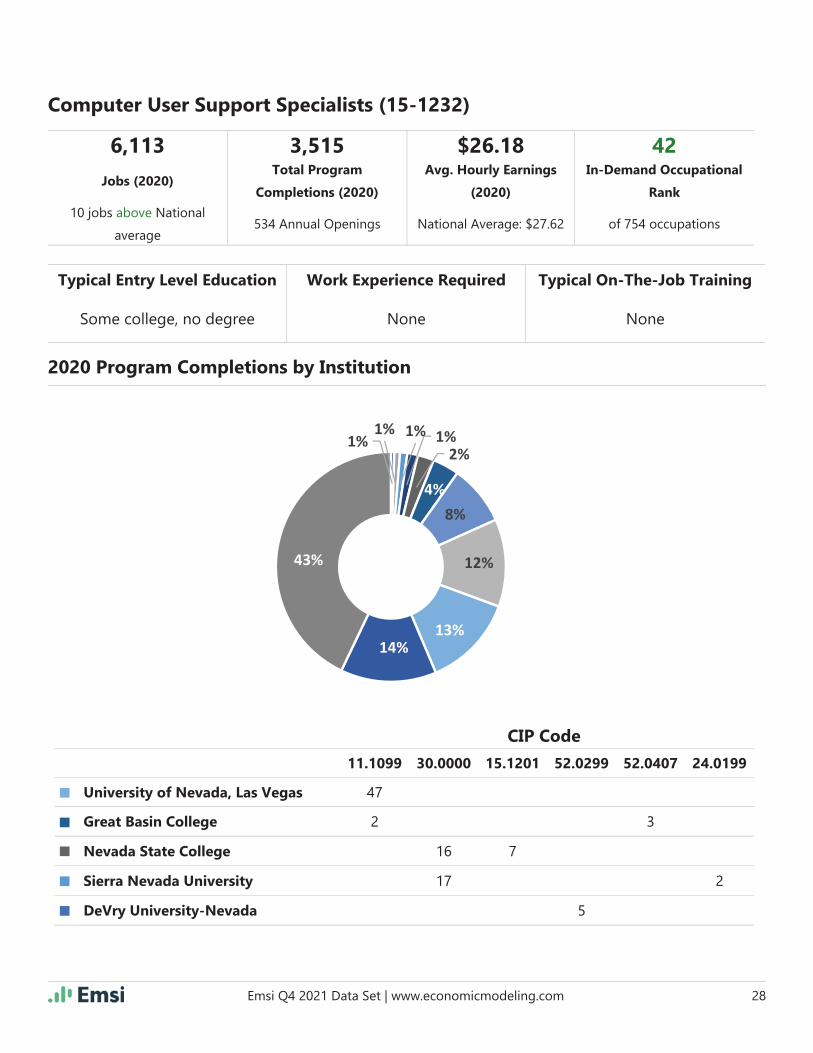
Computer User Support Specialists (15-1232)
6,113 3,515 $26.18 42
Jobs (2020)Total Program
Completions (2020)
Avg. Hourly Earnings
(2020)
In-Demand Occupational
Rank
10 jobs above National
average534 Annual Openings National Average: $27.62 of 754 occupations
Typical Entry Level Education Work Experience Required Typical On-The-Job Training
Some college, no degree None None
11.1099 30.0000 15.1201 52.0299 52.0407 24.0199
University of Nevada, Las Vegas 47
Great Basin College 2 3
Nevada State College 16 7
Sierra Nevada University 17 2
DeVry University-Nevada 5
2020 Program Completions by Institution
CIP Code
1%1% 1% 1%
2%
4%8%
12%
13%14%
43%
Emsi
Q4
2021
Dat
a Se
t | w
ww
.eco
nom
icm
odel
ing.
com
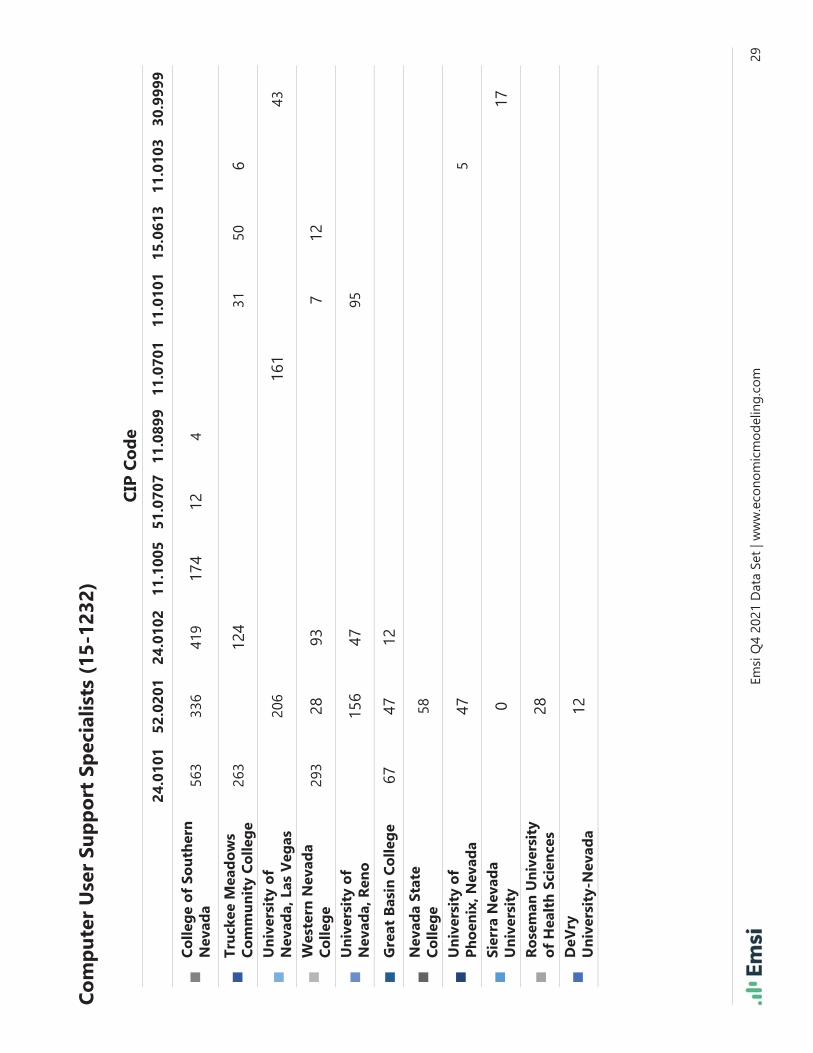
29
24.0
101
52.0
201
24.0
102
11.1
005
51.0
707
11.0
899
11.0
701
11.0
101
15.0
613
11.0
103
30.9
999
Co
lleg
e o
f So
uth
ern
N
evad
a56
333
641
917
412
4
Tru
ckee
Mea
do
ws
Co
mm
un
ity
Co
lleg
e26
312
431
506
Un
iver
sity
of
Nev
ada,
Las
Veg
as20
616
143
Wes
tern
Nev
ada
Co
lleg
e29
328
937
12
Un
iver
sity
of
Nev
ada,
Ren
o15
647
95
Gre
at B
asin
Co
lleg
e67
4712
Nev
ada
Stat
e C
olle
ge
58
Un
iver
sity
of
Ph
oen
ix, N
evad
a47
5
Sier
ra N
evad
a U
niv
ersi
ty0
17
Ro
sem
an U
niv
ersi
ty
of
Hea
lth
Sci
ence
s28
DeV
ry
Un
iver
sity
-Nev
ada
12
CIP
Co
de
Co
mp
ute
r U
ser
Sup
po
rt S
pec
ialis
ts (
15-1
232)
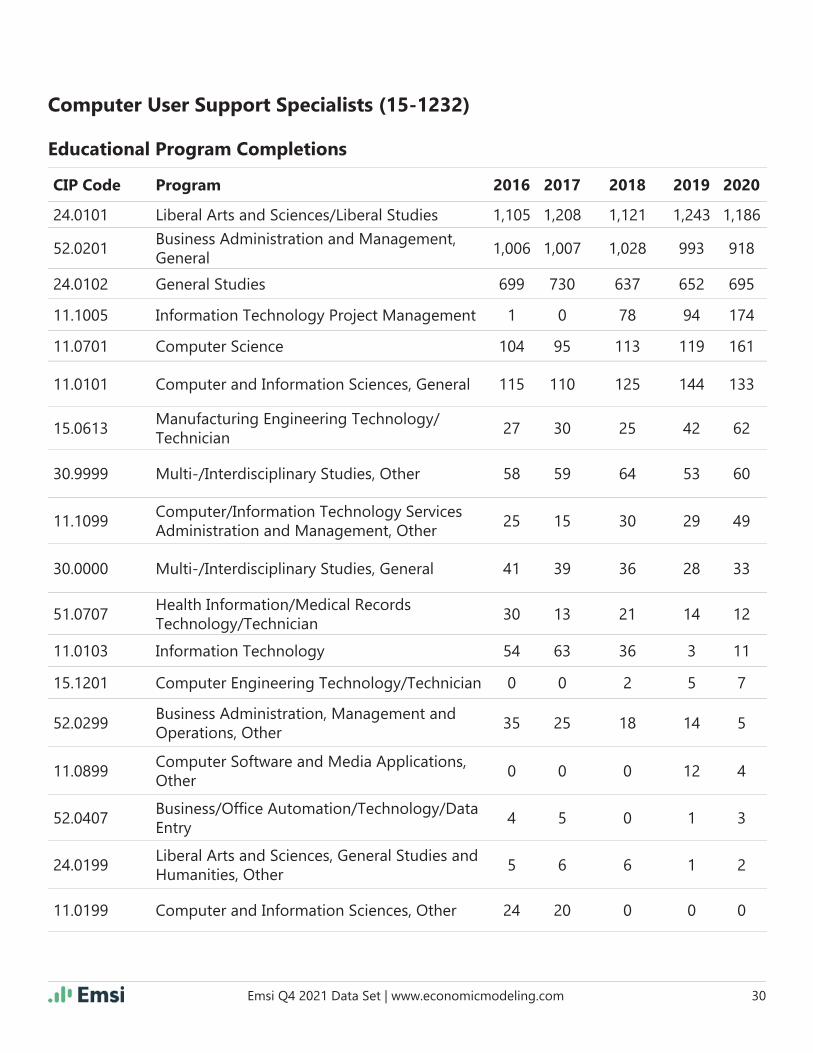
Emsi Q4 2021 Data Set | www.economicmodeling.com 30
Educational Program Completions
CIP Code Program 2016 2017 2018 2019 2020
24.0101 Liberal Arts and Sciences/Liberal Studies 1,105 1,208 1,121 1,243 1,186
52.0201Business Administration and Management, General
1,006 1,007 1,028 993 918
24.0102 General Studies 699 730 637 652 695
11.1005 Information Technology Project Management 1 0 78 94 174
11.0701 Computer Science 104 95 113 119 161
11.0101 Computer and Information Sciences, General 115 110 125 144 133
15.0613Manufacturing Engineering Technology/Technician
27 30 25 42 62
30.9999 Multi-/Interdisciplinary Studies, Other 58 59 64 53 60
11.1099Computer/Information Technology Services Administration and Management, Other
25 15 30 29 49
30.0000 Multi-/Interdisciplinary Studies, General 41 39 36 28 33
51.0707Health Information/Medical Records Technology/Technician
30 13 21 14 12
11.0103 Information Technology 54 63 36 3 11
15.1201 Computer Engineering Technology/Technician 0 0 2 5 7
52.0299Business Administration, Management and Operations, Other
35 25 18 14 5
11.0899Computer Software and Media Applications, Other
0 0 0 12 4
52.0407Business/Offi ce Automation/Technology/Data Entry
4 5 0 1 3
24.0199Liberal Arts and Sciences, General Studies and Humanities, Other
5 6 6 1 2
11.0199 Computer and Information Sciences, Other 24 20 0 0 0
Computer User Support Specialists (15-1232)
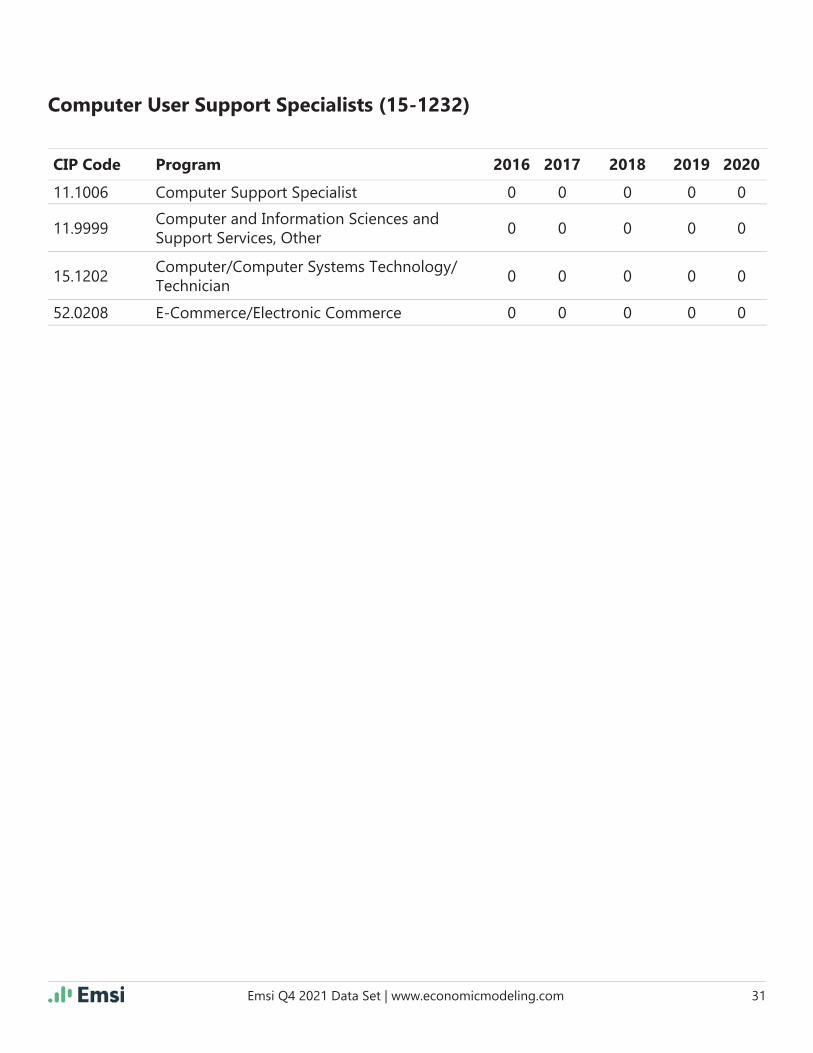
Emsi Q4 2021 Data Set | www.economicmodeling.com 31
Computer User Support Specialists (15-1232)
CIP Code Program 2016 2017 2018 2019 2020
11.1006 Computer Support Specialist 0 0 0 0 0
11.9999Computer and Information Sciences and Support Services, Other
0 0 0 0 0
15.1202Computer/Computer Systems Technology/Technician
0 0 0 0 0
52.0208 E-Commerce/Electronic Commerce 0 0 0 0 0
Emsi Q4 2021 Data Set | www.economicmodeling.com 32
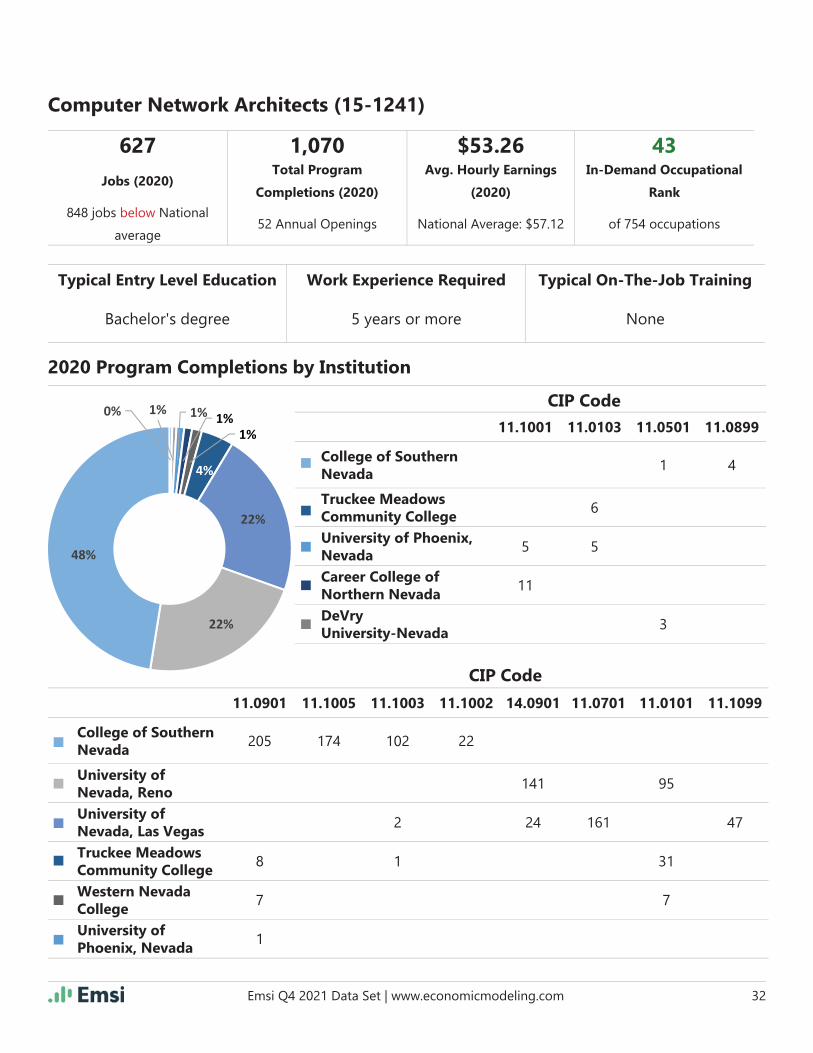
Computer Network Architects (15-1241)
627 1,070 $53.26 43
Jobs (2020)Total Program
Completions (2020)
Avg. Hourly Earnings
(2020)
In-Demand Occupational
Rank
848 jobs below National
average52 Annual Openings National Average: $57.12 of 754 occupations
Typical Entry Level Education Work Experience Required Typical On-The-Job Training
Bachelor's degree 5 years or more None
11.0901 11.1005 11.1003 11.1002 14.0901 11.0701 11.0101 11.1099
College of Southern Nevada
205 174 102 22
University of Nevada, Reno
141 95
University of Nevada, Las Vegas
2 24 161 47
Truckee Meadows Community College
8 1 31
Western Nevada College
7 7
University of Phoenix, Nevada
1
2020 Program Completions by Institution
CIP Code
11.1001 11.0103 11.0501 11.0899
College of Southern Nevada
1 4
Truckee Meadows Community College
6
University of Phoenix, Nevada
5 5
Career College of Northern Nevada
11
DeVry University-Nevada
3
CIP Code0% 1% 1% 1%1%
4%
22%
22%
48%

Emsi Q4 2021 Data Set | www.economicmodeling.com 33
Educational Program Completions
CIP Code Program 2016 2017 2018 2019 2020
11.0901Computer Systems Networking and Telecommunications
272 106 180 171 226
11.1005 Information Technology Project Management 1 0 78 94 174
14.0901 Computer Engineering, General 82 108 171 152 165
11.0701 Computer Science 104 95 113 119 161
11.0101 Computer and Information Sciences, General 115 110 125 144 133
11.1003Computer and Information Systems Security/Auditing/Information Assurance
63 48 113 98 105
11.1099Computer/Information Technology Services Administration and Management, Other
25 15 30 29 49
11.1002System, Networking, and LAN/WAN Management/Manager
142 85 35 22 22
11.1001Network and System Administration/Administrator
28 20 23 31 16
11.0103 Information Technology 54 63 36 3 11
11.0501 Computer Systems Analysis/Analyst 7 8 3 4 4
11.0899Computer Software and Media Applications, Other
0 0 0 12 4
11.0199 Computer and Information Sciences, Other 24 20 0 0 0
11.9999Computer and Information Sciences and Support Services, Other
0 0 0 0 0
15.0305 Telecommunications Technology/Technician 0 2 0 2 0
11.0901 11.1005 11.1003 11.1002 14.0901 11.0701 11.0101 11.1099
DeVry University-Nevada 3
Great Basin College 2 2
CIP Code
Computer Network Architects (15-1241)

Emsi Q4 2021 Data Set | www.economicmodeling.com 34
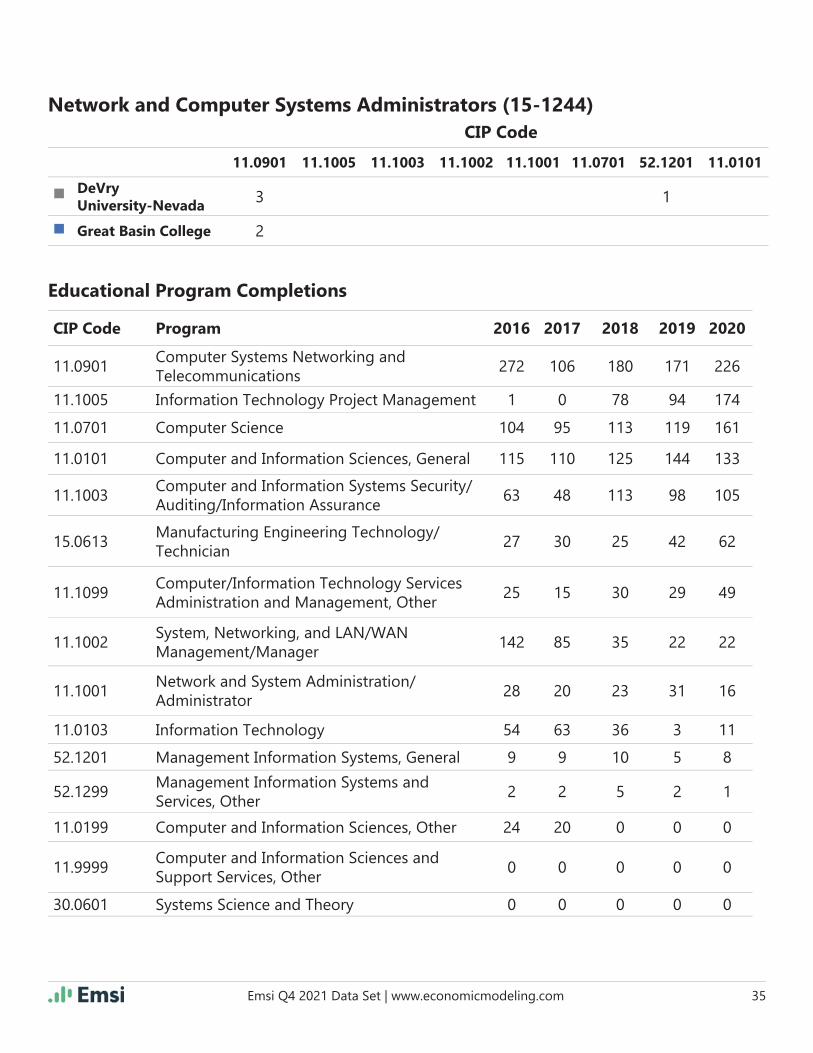
Network and Computer Systems Administrators (15-1244)
1,494 968 $41.59 8
Jobs (2020)Total Program
Completions (2020)
Avg. Hourly Earnings
(2020)
In-Demand Occupational
Rank
1,672 jobs below National
average140 Annual Openings National Average: $42.90 of 754 occupations
Typical Entry Level Education Work Experience Required Typical On-The-Job Training
Bachelor's degree None None
11.0901 11.1005 11.1003 11.1002 11.1001 11.0701 52.1201 11.0101
College of Southern Nevada
205 174 102 22 11
University of Nevada, Las Vegas
2 161 2
Truckee Meadows Community College
8 1 5 31
University of Nevada, Reno
95
University of Phoenix, Nevada
1 5
Western Nevada College
7 7
2020 Program Completions by Institution
CIP Code
15.0613 11.1099 11.0103 52.1299
Truckee Meadows Community College
50 6 1
University of Phoenix, Nevada
47 5
Western Nevada College
12
Great Basin College 2
CIP Code0% 0%
3% 6%
10%
11%
17%
53%
Emsi Q4 2021 Data Set | www.economicmodeling.com 35
Educational Program Completions
CIP Code Program 2016 2017 2018 2019 2020
11.0901Computer Systems Networking and Telecommunications
272 106 180 171 226
11.1005 Information Technology Project Management 1 0 78 94 174
11.0701 Computer Science 104 95 113 119 161
11.0101 Computer and Information Sciences, General 115 110 125 144 133
11.1003Computer and Information Systems Security/Auditing/Information Assurance
63 48 113 98 105
15.0613Manufacturing Engineering Technology/Technician
27 30 25 42 62
11.1099Computer/Information Technology Services Administration and Management, Other
25 15 30 29 49
11.1002System, Networking, and LAN/WAN Management/Manager
142 85 35 22 22
11.1001Network and System Administration/Administrator
28 20 23 31 16
11.0103 Information Technology 54 63 36 3 11
52.1201 Management Information Systems, General 9 9 10 5 8
52.1299Management Information Systems and Services, Other
2 2 5 2 1
11.0199 Computer and Information Sciences, Other 24 20 0 0 0
11.9999Computer and Information Sciences and Support Services, Other
0 0 0 0 0
30.0601 Systems Science and Theory 0 0 0 0 0
11.0901 11.1005 11.1003 11.1002 11.1001 11.0701 52.1201 11.0101
DeVry University-Nevada 3 1
Great Basin College 2
CIP Code
Network and Computer Systems Administrators (15-1244)

Emsi Q4 2021 Data Set | www.economicmodeling.com 36
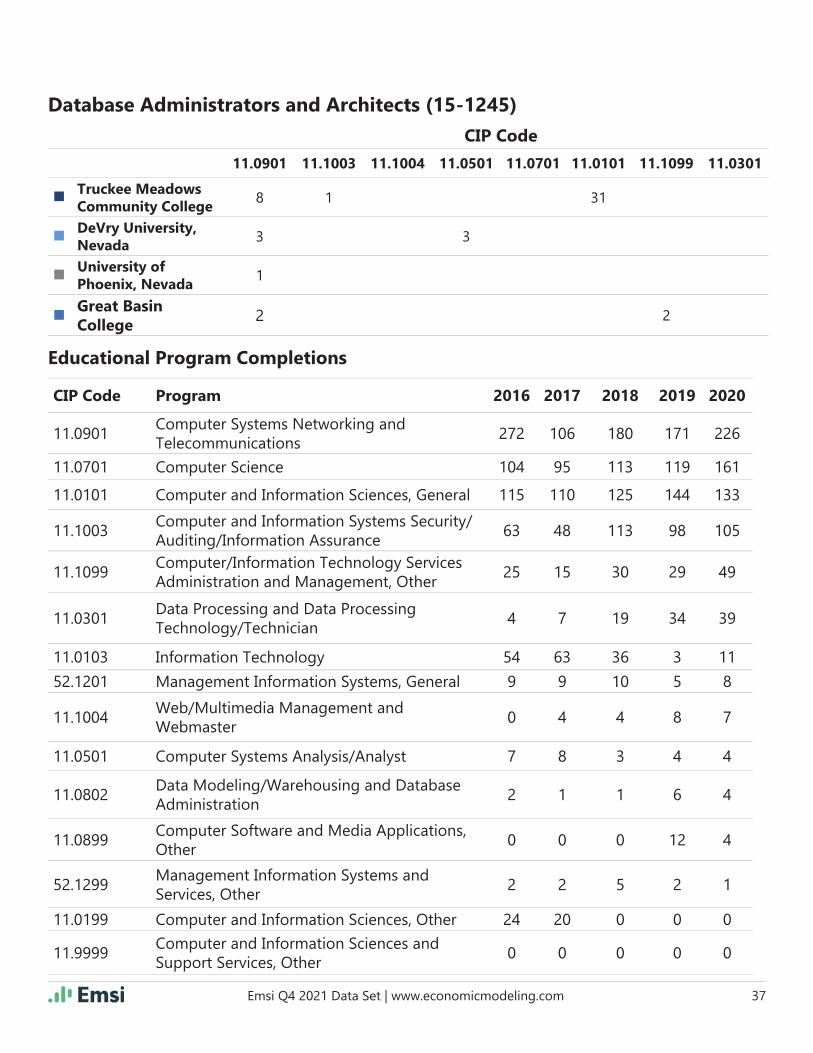
Database Administrators and Architects (15-1245)
741 752 $45.68 95
Jobs (2020)Total Program
Completions (2020)
Avg. Hourly Earnings
(2020)
In-Demand Occupational
Rank
493 jobs below National
average71 Annual Openings National Average: $48.64 of 754 occupations
Typical Entry Level Education Work Experience Required Typical On-The-Job Training
Bachelor's degree None None
11.0901 11.1003 11.1004 11.0501 11.0701 11.0101 11.1099 11.0301
College of Southern Nevada
205 102 7 1
University of Nevada, Las Vegas
2 161
Western Nevada College
7 7 47 39
University of Nevada, Reno
95
2020 Program Completions by Institution
CIP Code
11.0103 52.1201 11.0802 11.0899 52.1299
College of Southern Nevada 4 4
University of Nevada, Las Vegas
2
Truckee Meadows Community College
6 5 1
DeVry University, Nevada 1
University of Phoenix, Nevada
5
CIP Code
0% 1% 1%
7%
13%
13%
22%
43%
Emsi Q4 2021 Data Set | www.economicmodeling.com 37
Educational Program Completions
CIP Code Program 2016 2017 2018 2019 2020
11.0901Computer Systems Networking and Telecommunications
272 106 180 171 226
11.0701 Computer Science 104 95 113 119 161
11.0101 Computer and Information Sciences, General 115 110 125 144 133
11.1003Computer and Information Systems Security/Auditing/Information Assurance
63 48 113 98 105
11.1099Computer/Information Technology Services Administration and Management, Other
25 15 30 29 49
11.0301Data Processing and Data Processing Technology/Technician
4 7 19 34 39
11.0103 Information Technology 54 63 36 3 11
52.1201 Management Information Systems, General 9 9 10 5 8
11.1004Web/Multimedia Management and Webmaster
0 4 4 8 7
11.0501 Computer Systems Analysis/Analyst 7 8 3 4 4
11.0802Data Modeling/Warehousing and Database Administration
2 1 1 6 4
11.0899Computer Software and Media Applications, Other
0 0 0 12 4
52.1299Management Information Systems and Services, Other
2 2 5 2 1
11.0199 Computer and Information Sciences, Other 24 20 0 0 0
11.9999Computer and Information Sciences and Support Services, Other
0 0 0 0 0
Database Administrators and Architects (15-1245)
11.0901 11.1003 11.1004 11.0501 11.0701 11.0101 11.1099 11.0301
Truckee Meadows Community College
8 1 31
DeVry University, Nevada
3 3
University of Phoenix, Nevada
1
Great Basin College
2 2
CIP Code

Emsi Q4 2021 Data Set | www.economicmodeling.com 38
Computer Programmers (15-1251)
1,181 636 $42.97 117
Jobs (2020)Total Program
Completions (2020)
Avg. Hourly Earnings
(2020)
In-Demand Occupational
Rank
566 jobs below National
average85 Annual Openings National Average: $45.88 of 754 occupations
Typical Entry Level Education Work Experience Required Typical On-The-Job Training
Bachelor's degree None None
11.0901 11.1003 11.1004 11.0501 11.0802 11.0899 11.0701 11.0101
College of Southern Nevada
205 102 7 1 4 4
University of Nevada, Las Vegas
2 161
University of Nevada, Reno
95
Truckee Meadows Community College 8 1 31
Western Nevada College
7 7
DeVry University-Nevada
3 3
2020 Program Completions by Institution
CIP Code
11.1099 11.0301 11.0103 52.1201 52.1299
University of Nevada, Las Vegas
47 39 2
Truckee Meadows Community College
6 5 1
DeVry University-Nevada
1
University of Phoenix, Nevada
5
Great Basin College
2
CIP Code0% 1% 1% 2%
7%
13%
33%
43%

Emsi Q4 2021 Data Set | www.economicmodeling.com 39
Educational Program Completions
CIP Code Program 2016 2017 2018 2019 2020
11.0901Computer Systems Networking and Telecommunications
272 106 180 171 226
11.0701 Computer Science 104 95 113 119 161
11.0101 Computer and Information Sciences, General 115 110 125 144 133
11.1003Computer and Information Systems Security/Auditing/Information Assurance
63 48 113 98 105
11.1099Computer/Information Technology Services Administration and Management, Other
25 15 30 29 49
11.0301Data Processing and Data Processing Technology/Technician
4 7 19 34 39
11.0103 Information Technology 54 63 36 3 11
52.1201 Management Information Systems, General 9 9 10 5 8
11.1004Web/Multimedia Management and Webmaster
0 4 4 8 7
11.0501 Computer Systems Analysis/Analyst 7 8 3 4 4
11.0802Data Modeling/Warehousing and Database Administration
2 1 1 6 4
11.0899Computer Software and Media Applications, Other
0 0 0 12 4
52.1299Management Information Systems and Services, Other
2 2 5 2 1
11.0199 Computer and Information Sciences, Other 24 20 0 0 0
11.9999Computer and Information Sciences and Support Services, Other
0 0 0 0 0
11.0901 11.1003 11.1004 11.0501 11.0802 11.0899 11.0701 11.0101
University of Phoenix, Nevada 1
Great Basin College 2
CIP Code
Computer Programmers (15-1251)

Emsi Q4 2021 Data Set | www.economicmodeling.com 40
Software Developers and Software Quality Assurance Analysts and Testers (15-1256)
5,770 629 $47.35 1
Jobs (2020)Total Program
Completions (2020)
Avg. Hourly Earnings
(2020)
In-Demand Occupational
Rank
7,997 jobs below National
average747 Annual Openings National Average: $54.87 of 754 occupations
Typical Entry Level Education Work Experience Required Typical On-The-Job Training
Bachelor's degree None None
14.0901 11.0101 11.0701 11.1099 15.0613 11.0202 11.0103 11.0501
University of Nevada, Reno
141 95
University of Nevada, Las Vegas
24 161 47
Truckee Meadows Community College
31 50 16 6
College of Southern Nevada
1
Western Nevada College
7 12
University of Phoenix, Nevada
5
2020 Program Completions by Institution
CIP Code
11.0201 11.0899
College of Southern Nevada 24 4
CIP Code0% 0% 1%
3%5%
16%
37%
38%

Emsi Q4 2021 Data Set | www.economicmodeling.com 41
Educational Program Completions
CIP Code Program 2016 2017 2018 2019 2020
14.0901 Computer Engineering, General 82 108 171 152 165
11.0701 Computer Science 104 95 113 119 161
11.0101 Computer and Information Sciences, General 115 110 125 144 133
15.0613Manufacturing Engineering Technology/Technician
27 30 25 42 62
11.1099Computer/Information Technology Services Administration and Management, Other
25 15 30 29 49
11.0201Computer Programming/Programmer, General
3 3 6 27 24
11.0202 Computer Programming, Specifi c Applications 10 12 20 11 16
11.0103 Information Technology 54 63 36 3 11
11.0501 Computer Systems Analysis/Analyst 7 8 3 4 4
11.0899Computer Software and Media Applications, Other
0 0 0 12 4
11.0199 Computer and Information Sciences, Other 24 20 0 0 0
11.0401 Information Science/Studies 0 1 0 0 0
11.9999Computer and Information Sciences and Support Services, Other
0 0 0 0 0
30.0601 Systems Science and Theory 0 0 0 0 0
50.0411 Game and Interactive Media Design 15 24 11 12 0
52.0208 E-Commerce/Electronic Commerce 0 0 0 0 0
14.0901 11.0101 11.0701 11.1099 15.0613 11.0202 11.0103 11.0501
DeVry University, Nevada
3
Great Basin College 2
CIP Code
Software Developers and Software Quality Assurance Analysts and Testers (15-1256)
Emsi Q4 2021 Data Set | www.economicmodeling.com 42
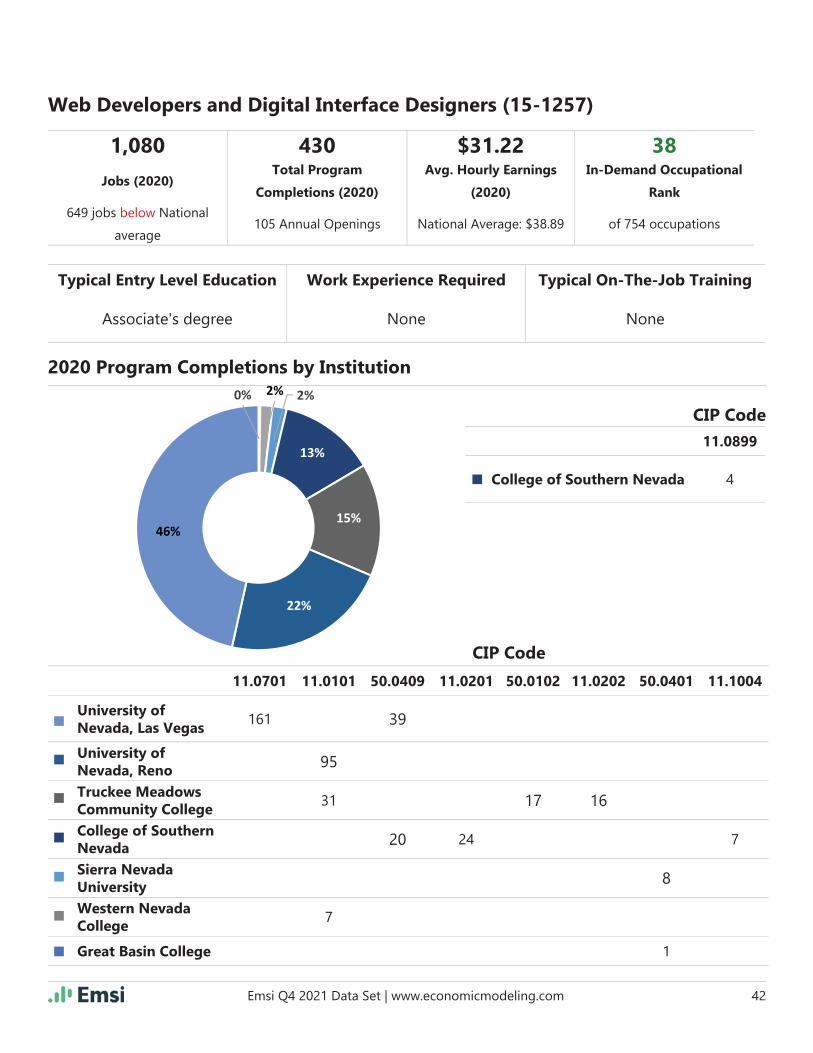
Web Developers and Digital Interface Designers (15-1257)
1,080 430 $31.22 38
Jobs (2020)Total Program
Completions (2020)
Avg. Hourly Earnings
(2020)
In-Demand Occupational
Rank
649 jobs below National
average105 Annual Openings National Average: $38.89 of 754 occupations
Typical Entry Level Education Work Experience Required Typical On-The-Job Training
Associate's degree None None
11.0701 11.0101 50.0409 11.0201 50.0102 11.0202 50.0401 11.1004
University of Nevada, Las Vegas
161 39
University of Nevada, Reno 95
Truckee Meadows Community College
31 17 16
College of Southern Nevada 20 24 7
Sierra Nevada University 8
Western Nevada College
7
Great Basin College 1
2020 Program Completions by Institution
CIP Code
11.0899
College of Southern Nevada 4
CIP Code0% 2% 2%
13%
15%
22%
46%

Emsi Q4 2021 Data Set | www.economicmodeling.com 43
Educational Program Completions
CIP Code Program 2016 2017 2018 2019 2020
11.0701 Computer Science 104 95 113 119 161
11.0101 Computer and Information Sciences, General 115 110 125 144 133
50.0409 Graphic Design 55 63 79 69 59
11.0201Computer Programming/Programmer, General
3 3 6 27 24
50.0102 Digital Arts 0 0 0 5 17
11.0202 Computer Programming, Specifi c Applications 10 12 20 11 16
50.0401 Design and Visual Communications, General 3 7 3 6 9
11.1004Web/Multimedia Management and Webmaster
0 4 4 8 7
11.0899Computer Software and Media Applications, Other
0 0 0 12 4
10.0301 Graphic Communications, General 0 0 0 0 0
11.0199 Computer and Information Sciences, Other 24 20 0 0 0
11.0801Web Page, Digital/Multimedia and Information Resources Design
12 5 8 1 0
11.9999Computer and Information Sciences and Support Services, Other
0 0 0 0 0
50.0499 Design and Applied Arts, Other 0 0 0 0 0
Web Developers and Digital Interface Designers (15-1257)

Emsi Q4 2021 Data Set | www.economicmodeling.com 44
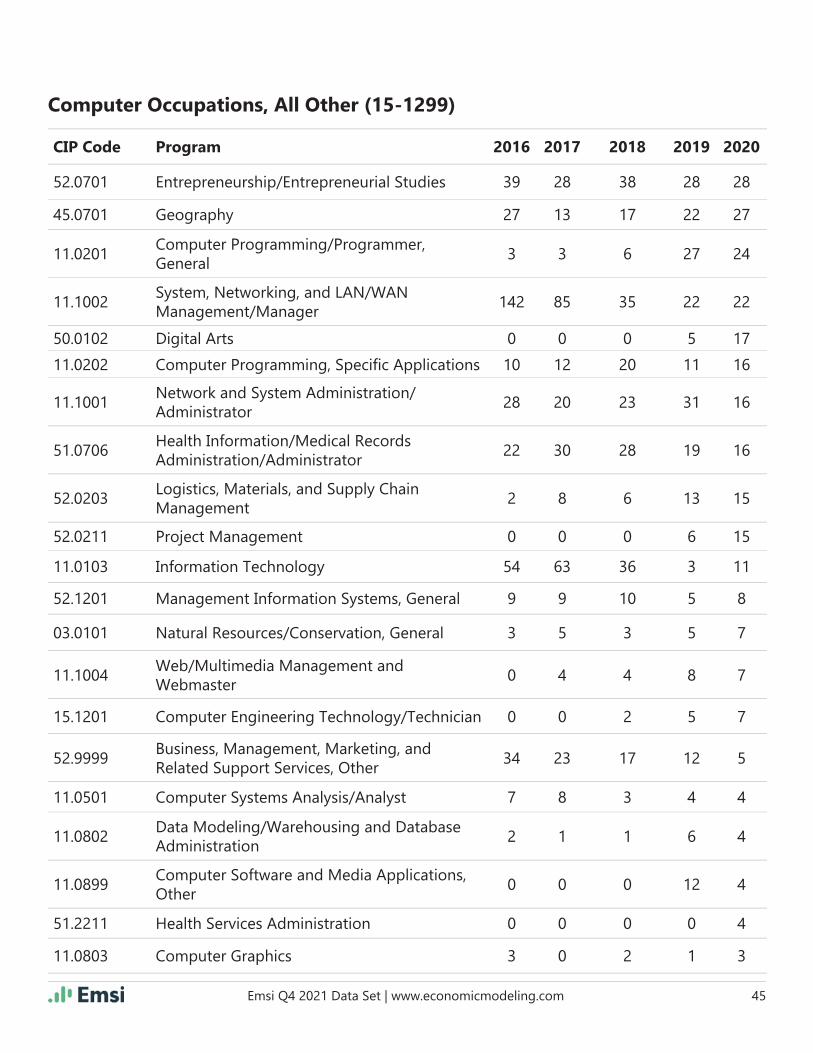
Computer Occupations, All Other (15-1299)
2,261 2,175 $37.63 13
Jobs (2020)Total Program
Completions (2020)
Avg. Hourly Earnings
(2020)
In-Demand Occupational
Rank
1,427 jobs below National
average226 Annual Openings National Average: $46.07 of 754 occupations
Typical Entry Level Education Work Experience Required Typical On-The-Job Training
Bachelor's degree NoneModerate-term on-the-job
training
CIP Code Program 2016 2017 2018 2019 2020
52.0101 Business/Commerce, General 263 297 303 293 305
52.1401 Marketing/Marketing Management, General 171 234 224 288 298
11.0901Computer Systems Networking and Telecommunications
272 106 180 171 226
11.1005 Information Technology Project Management 1 0 78 94 174
14.0901 Computer Engineering, General 82 108 171 152 165
11.0701 Computer Science 104 95 113 119 161
11.0101 Computer and Information Sciences, General 115 110 125 144 133
11.1003Computer and Information Systems Security/Auditing/Information Assurance
63 48 113 98 105
52.1101 International Business/Trade/Commerce 86 75 93 67 88
40.0601 Geology/Earth Science, General 53 56 52 48 59
03.0104 Environmental Science 28 48 52 58 55
43.0403Cyber/Computer Forensics and Counterterrorism
10 5 24 37 50
11.1099Computer/Information Technology Services Administration and Management, Other
25 15 30 29 49
11.0301Data Processing and Data Processing Technology/Technician
4 7 19 34 39
Educational Program Completions
Emsi Q4 2021 Data Set | www.economicmodeling.com 45
CIP Code Program 2016 2017 2018 2019 2020
52.0701 Entrepreneurship/Entrepreneurial Studies 39 28 38 28 28
45.0701 Geography 27 13 17 22 27
11.0201Computer Programming/Programmer, General
3 3 6 27 24
11.1002System, Networking, and LAN/WAN Management/Manager
142 85 35 22 22
50.0102 Digital Arts 0 0 0 5 17
11.0202 Computer Programming, Specifi c Applications 10 12 20 11 16
11.1001Network and System Administration/Administrator
28 20 23 31 16
51.0706Health Information/Medical Records Administration/Administrator
22 30 28 19 16
52.0203Logistics, Materials, and Supply Chain Management
2 8 6 13 15
52.0211 Project Management 0 0 0 6 15
11.0103 Information Technology 54 63 36 3 11
52.1201 Management Information Systems, General 9 9 10 5 8
03.0101 Natural Resources/Conservation, General 3 5 3 5 7
11.1004Web/Multimedia Management and Webmaster
0 4 4 8 7
15.1201 Computer Engineering Technology/Technician 0 0 2 5 7
52.9999Business, Management, Marketing, and Related Support Services, Other
34 23 17 12 5
11.0501 Computer Systems Analysis/Analyst 7 8 3 4 4
11.0802Data Modeling/Warehousing and Database Administration
2 1 1 6 4
11.0899Computer Software and Media Applications, Other
0 0 0 12 4
51.2211 Health Services Administration 0 0 0 0 4
11.0803 Computer Graphics 3 0 2 1 3
Computer Occupations, All Other (15-1299)

Emsi Q4 2021 Data Set | www.economicmodeling.com 46
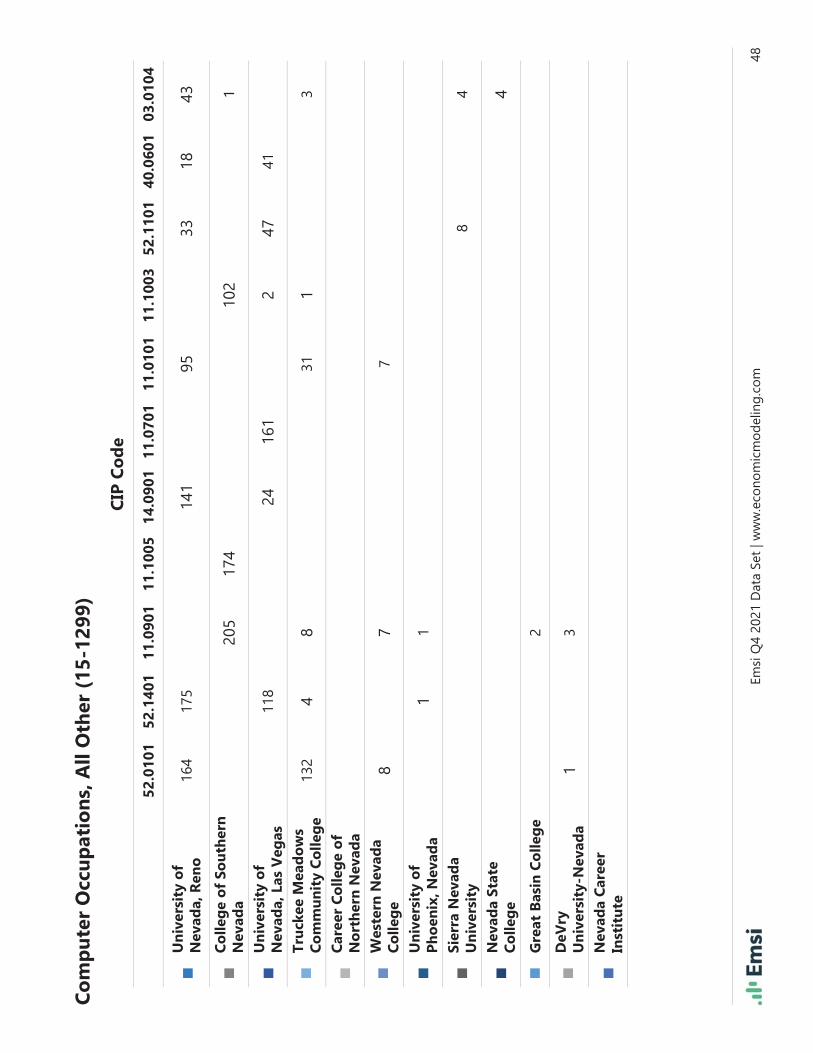
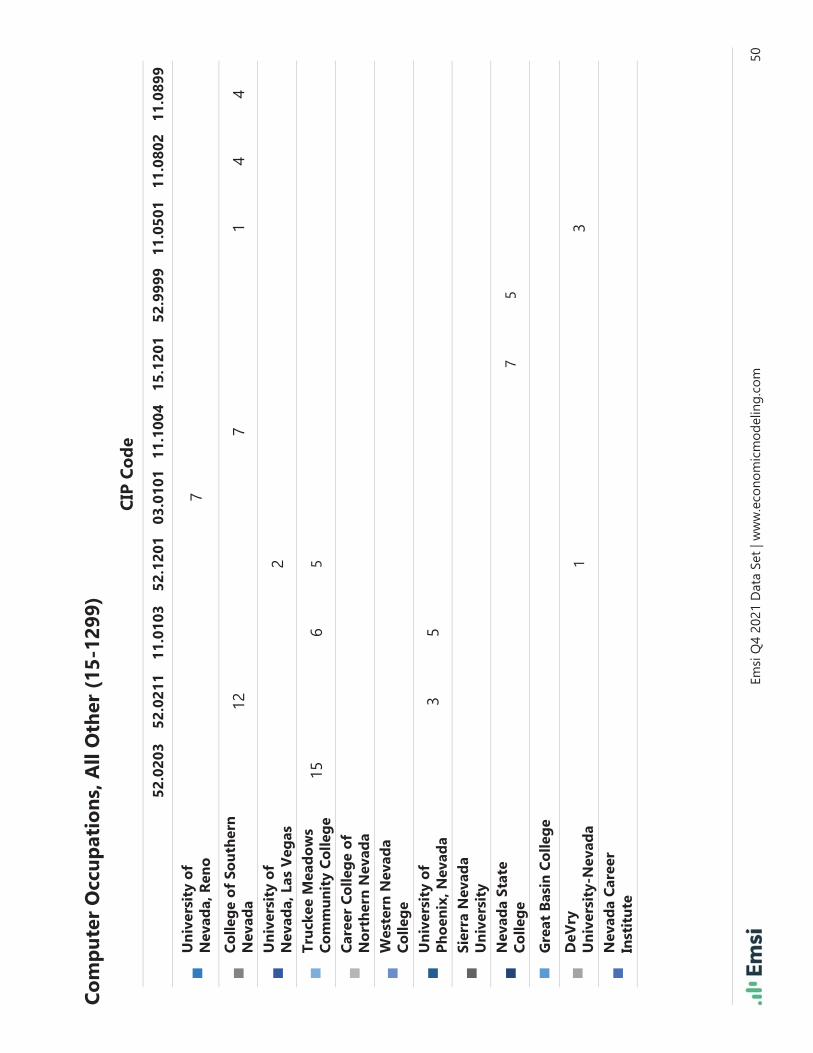
Computer Occupations, All Other (15-1299)
CIP Code Program 2016 2017 2018 2019 2020
52.0407Business/Offi ce Automation/Technology/Data Entry
4 5 0 1 3
52.0799Entrepreneurial and Small Business Operations, Other
3 2 1 0 3
52.0305 Accounting and Business/Management 17 8 2 0 1
52.1299Management Information Systems and Services, Other
2 2 5 2 1
03.0103 Environmental Studies 9 15 5 1 0
09.0903 Advertising 0 0 0 0 0
10.0304Animation, Interactive Technology, Video Graphics, and Special Effects
5 10 2 2 0
11.0199 Computer and Information Sciences, Other 24 20 0 0 0
11.0401 Information Science/Studies 0 1 0 0 0
11.0601Data Entry/Microcomputer Applications, General
3 1 0 2 0
11.0801Web Page, Digital/Multimedia and Information Resources Design
12 5 8 1 0
11.9999Computer and Information Sciences and Support Services, Other
0 0 0 0 0
15.1202Computer/Computer Systems Technology/Technician
0 0 0 0 0
30.0601 Systems Science and Theory 0 0 0 0 0
30.1601 Accounting and Computer Science 0 0 0 0 0
45.0702Geographic Information Science and Cartography
0 0 0 0 0
50.0411 Game and Interactive Media Design 15 24 11 12 0
52.0208 E-Commerce/Electronic Commerce 0 0 0 0 0
52.0399 Accounting and Related Services, Other 6 1 0 0 0
52.0703 Small Business Administration/Management 7 8 2 1 0

Emsi
Q4
2021
Dat
a Se
t | w
ww
.eco
nom
icm
odel
ing.
com
47
CIP
Co
de
Co
mp
ute
r O
ccu
pat
ion
s, A
ll O
ther
(15
-129
9)20
20 P
rog
ram
Co
mp
leti
on
s b
y In
stit
uti
on
0%0%
1%1%
1%1%
1%1%
11%
23%
28%
32% 51
.221
111
.080
352
.040
752
.079
952
.030
552
.129
9
Tru
ckee
Mea
do
ws
Co
mm
un
ity
Co
lleg
e3
1
Un
iver
sity
of
Ph
oen
ix, N
evad
a1
Gre
at B
asin
Co
lleg
e3
3
Nev
ada
Car
eer
Inst
itu
te4
Emsi
Q4
2021
Dat
a Se
t | w
ww
.eco
nom
icm
odel
ing.
com
48
Co
mp
ute
r O
ccu
pat
ion
s, A
ll O
ther
(15
-129
9)
CIP
Co
de
52.0
101
52.1
401
11.0
901
11.1
005
14.0
901
11.0
701
11.0
101
11.1
003
52.1
101
40.0
601
03.0
104
Un
iver
sity
of
N
evad
a, R
eno
164
175
141
9533
1843
Co
lleg
e o
f So
uth
ern
N
evad
a20
517
410
21
Un
iver
sity
of
Nev
ada,
Las
Veg
as11
824
161
247
41
Tru
ckee
Mea
do
ws
Co
mm
un
ity
Co
lleg
e13
24
831
13
Car
eer
Co
lleg
e o
f N
ort
her
n N
evad
aW
este
rn N
evad
a C
olle
ge
87
7
Un
iver
sity
of
Ph
oen
ix, N
evad
a1
1
Sier
ra N
evad
a U
niv
ersi
ty8
4
Nev
ada
Stat
e C
olle
ge
4
Gre
at B
asin
Co
lleg
e2
DeV
ry
Un
iver
sity
-Nev
ada
13
Nev
ada
Car
eer
Inst
itu
te

Emsi
Q4
2021
Dat
a Se
t | w
ww
.eco
nom
icm
odel
ing.
com
49
Co
mp
ute
r O
ccu
pat
ion
s, A
ll O
ther
(15
-129
9)
CIP
Co
de
43.0
403
11.1
099
11.0
301
52.0
701
45.0
701
11.0
201
11.1
002
50.0
102
11.0
202
11.1
001
51.0
706
Un
iver
sity
of
N
evad
a, R
eno
27
Co
lleg
e o
f So
uth
ern
N
evad
a50
2422
Un
iver
sity
of
Nev
ada,
Las
Veg
as47
3922
Tru
ckee
Mea
do
ws
Co
mm
un
ity
Co
lleg
e17
16
Car
eer
Co
lleg
e o
f N
ort
her
n N
evad
a11
16
Wes
tern
Nev
ada
Co
lleg
eU
niv
ersi
ty o
f P
ho
enix
, Nev
ada
5
Sier
ra N
evad
a U
niv
ersi
ty4
Nev
ada
Stat
e C
olle
ge
Gre
at B
asin
Co
lleg
e2
2
DeV
ry
Un
iver
sity
-Nev
ada
Nev
ada
Car
eer
Inst
itu
te
Emsi
Q4
2021
Dat
a Se
t | w
ww
.eco
nom
icm
odel
ing.
com
50
Co
mp
ute
r O
ccu
pat
ion
s, A
ll O
ther
(15
-129
9)
CIP
Co
de
52.0
203
52.0
211
11.0
103
52.1
201
03.0
101
11.1
004
15.1
201
52.9
999
11.0
501
11.0
802
11.0
899
Un
iver
sity
of
N
evad
a, R
eno
7
Co
lleg
e o
f So
uth
ern
N
evad
a12
71
44
Un
iver
sity
of
Nev
ada,
Las
Veg
as2
Tru
ckee
Mea
do
ws
Co
mm
un
ity
Co
lleg
e15
65
Car
eer
Co
lleg
e o
f N
ort
her
n N
evad
aW
este
rn N
evad
a C
olle
ge
Un
iver
sity
of
Ph
oen
ix, N
evad
a3
5
Sier
ra N
evad
a U
niv
ersi
tyN
evad
a St
ate
Co
lleg
e7
5
Gre
at B
asin
Co
lleg
e
DeV
ry
Un
iver
sity
-Nev
ada
13
Nev
ada
Car
eer
Inst
itu
te

Emsi Q4 2021 Data Set | www.economicmodeling.com 51
Data Scientists and Mathematical Science Occupations, All Other (15-2098)
207 105 $54.67 104
Jobs (2020)Total Program
Completions (2020)
Avg. Hourly Earnings
(2020)
In-Demand Occupational
Rank
345 jobs below National
average30 Annual Openings National Average: $49.98 of 754 occupations
Educational Program Completions
CIP Code Program 2016 2017 2018 2019 2020
27.0101 Mathematics, General 70 80 87 85 105
27.0301 Applied Mathematics, General 0 0 0 0 0
27.0501 Statistics, General 0 0 0 0 0
2020 Program Completions by Institution
27.0101
University of Nevada, Reno 60
University of Nevada, Las Vegas
37
Truckee Meadows Community College
7
College of Southern Nevada 1
CIP Code
Typical Entry Level Education Work Experience Required Typical On-The-Job Training
Bachelor's degree None None
1%
7%
35%57%

Emsi Q4 2021 Data Set | www.economicmodeling.com 52
Information Technology Career ClusterEducational Programs

Emsi Q4 2021 Data Set | www.economicmodeling.com 53
Information Technology Career Cluster Educational Program Summary
InstitutionCompletions
(2020)Growth %
YOY (2020)Market Share
(2020)IPEDS Tuition & Fees (2020)
College of Southern Nevada 2,136 4.0% 33.5% $3,878
University of Nevada-Las Vegas 1,318 9.7% 20.7% $8,465
University of Nevada-Reno 1,047 1.4% 16.4% $8,695
Truckee Meadows Community College 761 12.2% 11.9% $2,862
Western Nevada College 460 1.1% 7.2% $3,548
Great Basin College 146 6.6% 2.3% $3,593
Advanced Training Institute 113 (11.0%) 1.8% N/A
Nevada State College 111 7.8% 1.7% $6,075
University of Phoenix-Nevada 71 (35.5%) 1.1% $9,552
Career College of Northern Nevada 68 (33.3%) 1.1% N/A
Sierra Nevada University 62 26.5% 1.0% $35,508
Roseman University of Health Sciences 28 (34.9%) 0.4% $36,533
DeVry University-Nevada 25 (40.5%) 0.4% $15,368
Northwest Career College 20 300.0% 0.3% N/A
Nevada Career Institute 4 Insf. Data 0.1% N/A
Carrington College-Las Vegas 2 (77.8%) 0.0% N/A
607,216 7.1% $48,567 20,061 6,372
Jobs (2020)% Change
(2020-2025)Median Annual
EarningsAvg. Monthly Postings
(2021)Program
Completions
6% below National average
Nation: 3.3% Nation: $53,95535,424 Avg. Monthly
Hires (2021)72,370 Annual
Openings
2020 Program Completions
2020 Completions
% Change (2012-2020)
Distance Offered Programs 2,854 13.4%
Non-Distance Offered Programs 3,518 23.2%
All Programs 6,372 18.6%
Job Postings Summary
240,731 4 : 1Unique Postings
(Jan 2021 - Dec 2021)Posting Intensity
(Jan 2021 - Dec 2021)
1,244,072 Total Postings Regional Average: 5 : 1
Emsi Q4 2021 Data Set | www.economicmodeling.com 54
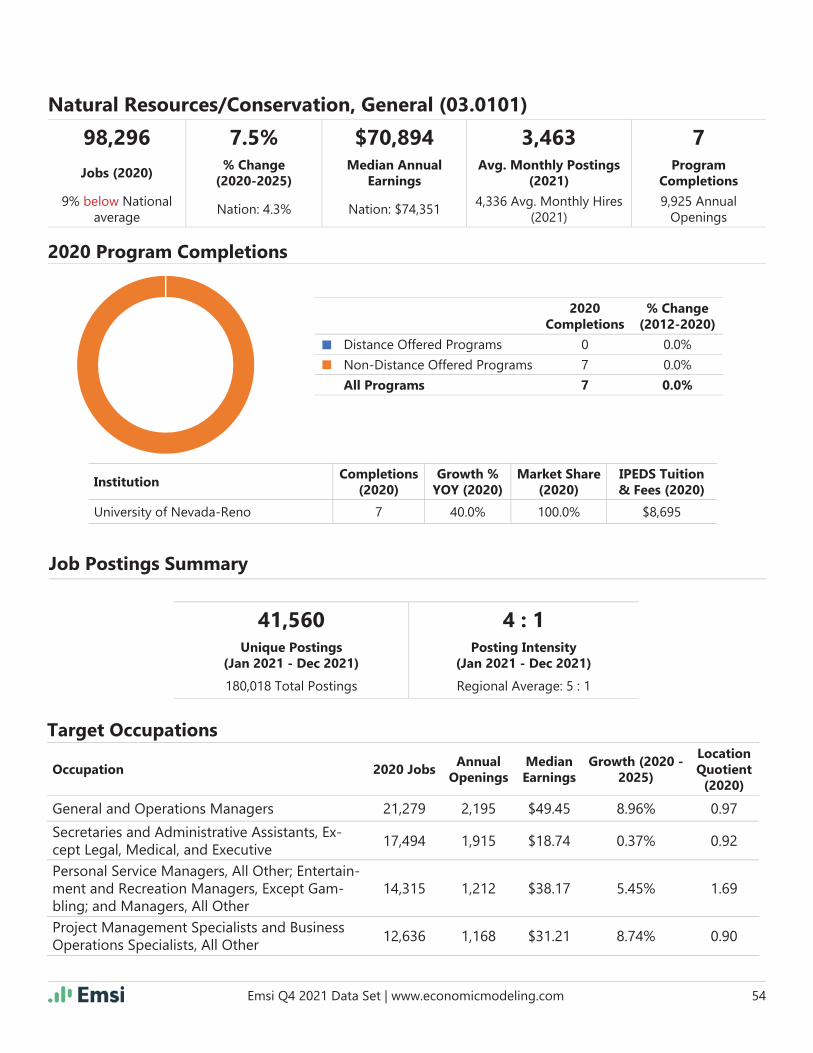
InstitutionCompletions
(2020)Growth %
YOY (2020)Market Share
(2020)IPEDS Tuition & Fees (2020)
University of Nevada-Reno 7 40.0% 100.0% $8,695
98,296 7.5% $70,894 3,463 7
Jobs (2020)% Change
(2020-2025)Median Annual
EarningsAvg. Monthly Postings
(2021)Program
Completions
9% below National average
Nation: 4.3% Nation: $74,3514,336 Avg. Monthly Hires
(2021)9,925 Annual
Openings
Occupation 2020 JobsAnnual
OpeningsMedian Earnings
Growth (2020 - 2025)
Location Quotient
(2020)
General and Operations Managers 21,279 2,195 $49.45 8.96% 0.97
Secretaries and Administrative Assistants, Ex-cept Legal, Medical, and Executive
17,494 1,915 $18.74 0.37% 0.92
Personal Service Managers, All Other; Entertain-ment and Recreation Managers, Except Gam-bling; and Managers, All Other
14,315 1,212 $38.17 5.45% 1.69
Project Management Specialists and Business Operations Specialists, All Other
12,636 1,168 $31.21 8.74% 0.90
2020 Program Completions
2020 Completions
% Change (2012-2020)
Distance Offered Programs 0 0.0%
Non-Distance Offered Programs 7 0.0%
All Programs 7 0.0%
Target Occupations
Job Postings Summary
Natural Resources/Conservation, General (03.0101)
41,560 4 : 1Unique Postings
(Jan 2021 - Dec 2021)Posting Intensity
(Jan 2021 - Dec 2021)
180,018 Total Postings Regional Average: 5 : 1
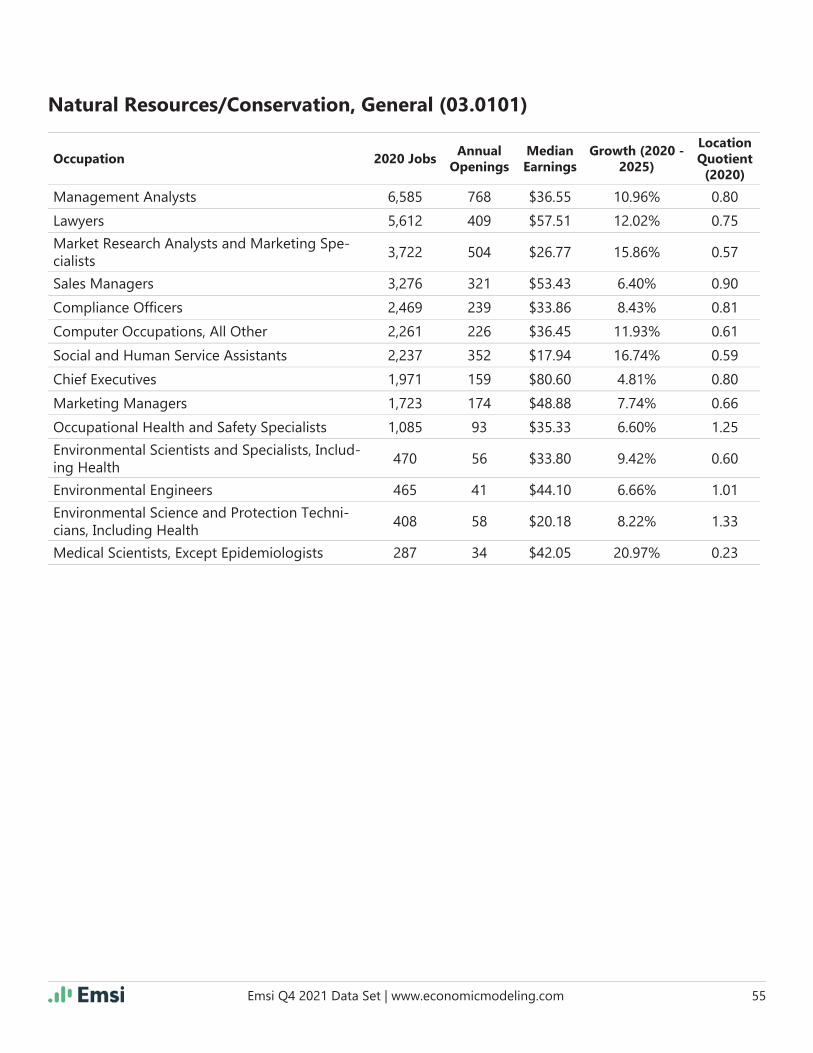
Emsi Q4 2021 Data Set | www.economicmodeling.com 55
Natural Resources/Conservation, General (03.0101)
Occupation 2020 JobsAnnual
OpeningsMedian Earnings
Growth (2020 - 2025)
Location Quotient
(2020)
Management Analysts 6,585 768 $36.55 10.96% 0.80
Lawyers 5,612 409 $57.51 12.02% 0.75
Market Research Analysts and Marketing Spe-cialists
3,722 504 $26.77 15.86% 0.57
Sales Managers 3,276 321 $53.43 6.40% 0.90
Compliance Offi cers 2,469 239 $33.86 8.43% 0.81
Computer Occupations, All Other 2,261 226 $36.45 11.93% 0.61
Social and Human Service Assistants 2,237 352 $17.94 16.74% 0.59
Chief Executives 1,971 159 $80.60 4.81% 0.80
Marketing Managers 1,723 174 $48.88 7.74% 0.66
Occupational Health and Safety Specialists 1,085 93 $35.33 6.60% 1.25
Environmental Scientists and Specialists, Includ-ing Health
470 56 $33.80 9.42% 0.60
Environmental Engineers 465 41 $44.10 6.66% 1.01
Environmental Science and Protection Techni-cians, Including Health
408 58 $20.18 8.22% 1.33
Medical Scientists, Except Epidemiologists 287 34 $42.05 20.97% 0.23
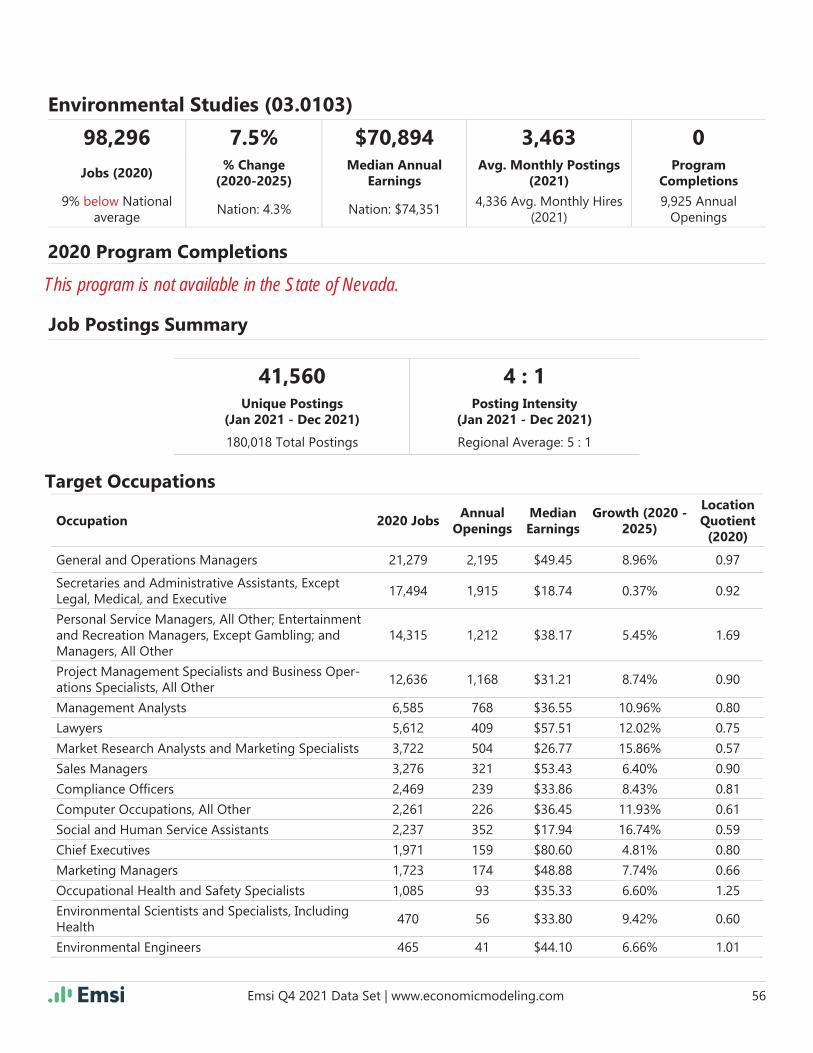
Emsi Q4 2021 Data Set | www.economicmodeling.com 56
98,296 7.5% $70,894 3,463 0
Jobs (2020)% Change
(2020-2025)Median Annual
EarningsAvg. Monthly Postings
(2021)Program
Completions
9% below National average
Nation: 4.3% Nation: $74,3514,336 Avg. Monthly Hires
(2021)9,925 Annual
Openings
Occupation 2020 JobsAnnual
OpeningsMedian Earnings
Growth (2020 - 2025)
Location Quotient
(2020)
General and Operations Managers 21,279 2,195 $49.45 8.96% 0.97
Secretaries and Administrative Assistants, Except Legal, Medical, and Executive
17,494 1,915 $18.74 0.37% 0.92
Personal Service Managers, All Other; Entertainment and Recreation Managers, Except Gambling; and Managers, All Other
14,315 1,212 $38.17 5.45% 1.69
Project Management Specialists and Business Oper-ations Specialists, All Other
12,636 1,168 $31.21 8.74% 0.90
Management Analysts 6,585 768 $36.55 10.96% 0.80
Lawyers 5,612 409 $57.51 12.02% 0.75
Market Research Analysts and Marketing Specialists 3,722 504 $26.77 15.86% 0.57
Sales Managers 3,276 321 $53.43 6.40% 0.90
Compliance Offi cers 2,469 239 $33.86 8.43% 0.81
Computer Occupations, All Other 2,261 226 $36.45 11.93% 0.61
Social and Human Service Assistants 2,237 352 $17.94 16.74% 0.59
Chief Executives 1,971 159 $80.60 4.81% 0.80
Marketing Managers 1,723 174 $48.88 7.74% 0.66
Occupational Health and Safety Specialists 1,085 93 $35.33 6.60% 1.25
Environmental Scientists and Specialists, Including Health
470 56 $33.80 9.42% 0.60
Environmental Engineers 465 41 $44.10 6.66% 1.01
2020 Program Completions
Target Occupations
Job Postings Summary
Environmental Studies (03.0103)
This program is not available in the State of Nevada.
41,560 4 : 1Unique Postings
(Jan 2021 - Dec 2021)Posting Intensity
(Jan 2021 - Dec 2021)
180,018 Total Postings Regional Average: 5 : 1
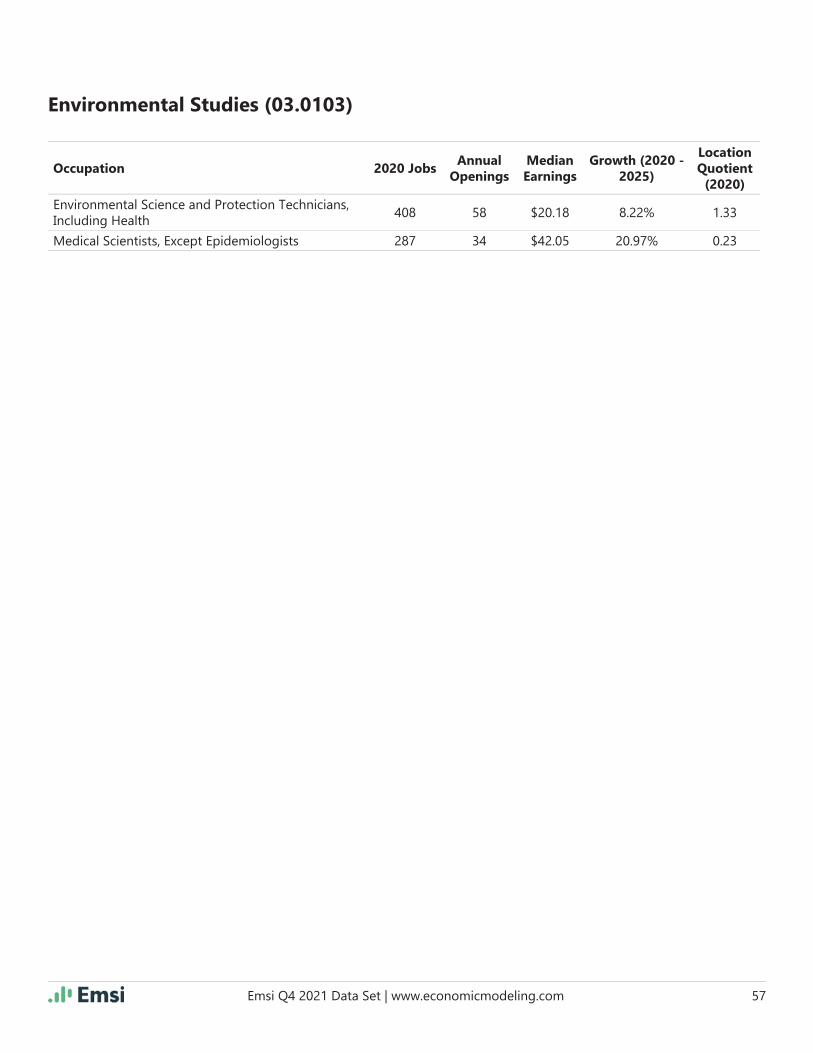
Emsi Q4 2021 Data Set | www.economicmodeling.com 57
Environmental Studies (03.0103)
Occupation 2020 JobsAnnual
OpeningsMedian Earnings
Growth (2020 - 2025)
Location Quotient
(2020)
Environmental Science and Protection Technicians, Including Health
408 58 $20.18 8.22% 1.33
Medical Scientists, Except Epidemiologists 287 34 $42.05 20.97% 0.23

Emsi Q4 2021 Data Set | www.economicmodeling.com 58
InstitutionCompletions
(2020)Growth %
YOY (2020)Market Share
(2020)IPEDS Tuition & Fees (2020)
University of Nevada-Reno 43 (4.4%) 78.2% $8,695
Sierra Nevada University 4 (33.3%) 7.3% $35,508
Nevada State College 4 0.0% 7.3% $6,075
Truckee Meadows Community College 3 0.0% 5.5% $2,862
College of Southern Nevada 1 Insf. Data 1.8% $3,878
98,296 7.5% $70,894 3,463 55
Jobs (2020)% Change
(2020-2025)Median Annual
EarningsAvg. Monthly Postings
(2021)Program
Completions
9% below National average
Nation: 4.3% Nation: $74,3514,336 Avg. Monthly Hires
(2021)9,925 Annual
Openings
Occupation 2020 JobsAnnual
OpeningsMedian Earnings
Growth (2020 - 2025)
Location Quotient
(2020)
General and Operations Managers 21,279 2,195 $49.45 8.96% 0.97
Secretaries and Administrative Assistants, Ex-cept Legal, Medical, and Executive
17,494 1,915 $18.74 0.37% 0.92
2020 Program Completions
2020 Completions
% Change (2012-2020)
Distance Offered Programs 0 0.0%
Non-Distance Offered Programs 55 205.6%
All Programs 55 205.6%
Target Occupations
Job Postings Summary
Environmental Science (03.0104)
41,560 4 : 1Unique Postings
(Jan 2021 - Dec 2021)Posting Intensity
(Jan 2021 - Dec 2021)
180,018 Total Postings Regional Average: 5 : 1

Emsi Q4 2021 Data Set | www.economicmodeling.com 59
Occupation 2020 JobsAnnual
OpeningsMedian Earnings
Growth (2020 - 2025)
Location Quotient
(2020)
Personal Service Managers, All Other; Entertain-ment and Recreation Managers, Except Gam-bling; and Managers, All Other
14,315 1,212 $38.17 5.45% 1.69
Project Management Specialists and Business Operations Specialists, All Other
12,636 1,168 $31.21 8.74% 0.90
Management Analysts 6,585 768 $36.55 10.96% 0.80
Lawyers 5,612 409 $57.51 12.02% 0.75
Market Research Analysts and Marketing Spe-cialists
3,722 504 $26.77 15.86% 0.57
Sales Managers 3,276 321 $53.43 6.40% 0.90
Compliance Offi cers 2,469 239 $33.86 8.43% 0.81
Computer Occupations, All Other 2,261 226 $36.45 11.93% 0.61
Social and Human Service Assistants 2,237 352 $17.94 16.74% 0.59
Chief Executives 1,971 159 $80.60 4.81% 0.80
Marketing Managers 1,723 174 $48.88 7.74% 0.66
Occupational Health and Safety Specialists 1,085 93 $35.33 6.60% 1.25
Environmental Scientists and Specialists, Includ-ing Health
470 56 $33.80 9.42% 0.60
Environmental Engineers 465 41 $44.10 6.66% 1.01
Environmental Science and Protection Techni-cians, Including Health
408 58 $20.18 8.22% 1.33
Medical Scientists, Except Epidemiologists 287 34 $42.05 20.97% 0.23
Medical Scientists, Except Epidemiologists 287 34 $42.05 20.97% 0.23
Environmental Science (03.0104)
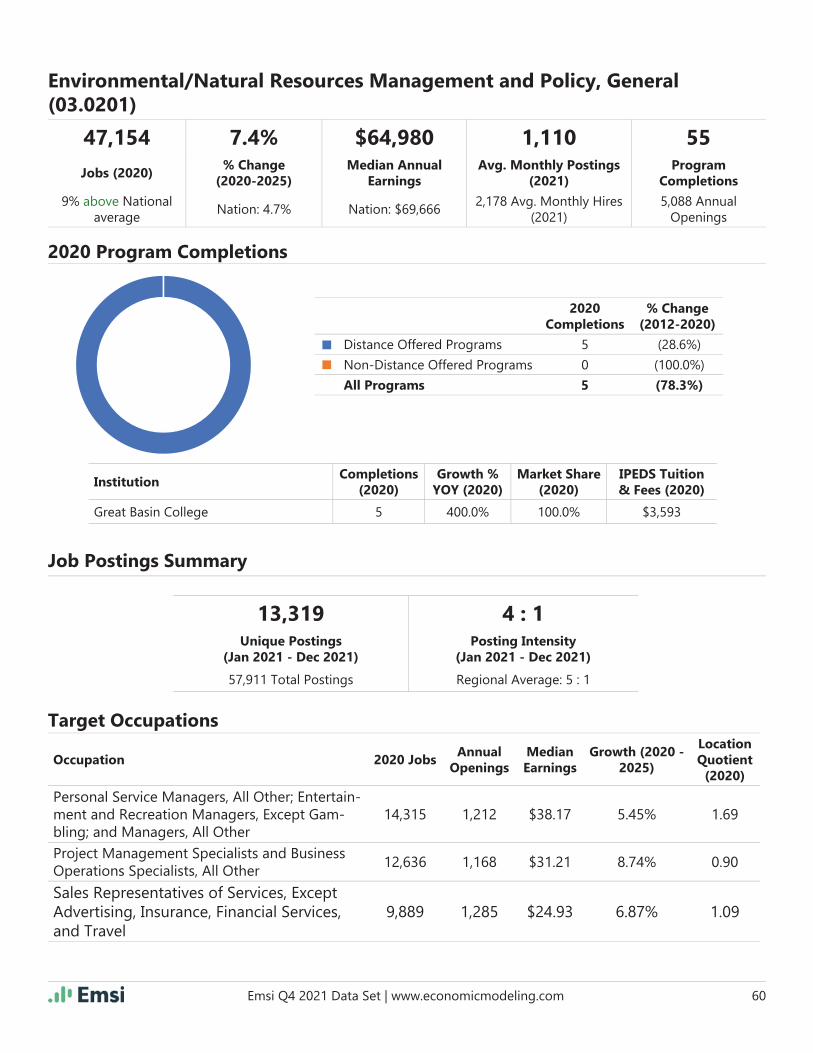
Emsi Q4 2021 Data Set | www.economicmodeling.com 60
InstitutionCompletions
(2020)Growth %
YOY (2020)Market Share
(2020)IPEDS Tuition & Fees (2020)
Great Basin College 5 400.0% 100.0% $3,593
47,154 7.4% $64,980 1,110 55
Jobs (2020)% Change
(2020-2025)Median Annual
EarningsAvg. Monthly Postings
(2021)Program
Completions
9% above National average
Nation: 4.7% Nation: $69,6662,178 Avg. Monthly Hires
(2021)5,088 Annual
Openings
Occupation 2020 JobsAnnual
OpeningsMedian Earnings
Growth (2020 - 2025)
Location Quotient
(2020)
Personal Service Managers, All Other; Entertain-ment and Recreation Managers, Except Gam-bling; and Managers, All Other
14,315 1,212 $38.17 5.45% 1.69
Project Management Specialists and Business Operations Specialists, All Other
12,636 1,168 $31.21 8.74% 0.90
Sales Representatives of Services, Except Advertising, Insurance, Financial Services, and Travel
9,889 1,285 $24.93 6.87% 1.09
2020 Program Completions
2020 Completions
% Change (2012-2020)
Distance Offered Programs 5 (28.6%)
Non-Distance Offered Programs 0 (100.0%)
All Programs 5 (78.3%)
Target Occupations
Job Postings Summary
Environmental/Natural Resources Management and Policy, General (03.0201)
13,319 4 : 1Unique Postings
(Jan 2021 - Dec 2021)Posting Intensity
(Jan 2021 - Dec 2021)
57,911 Total Postings Regional Average: 5 : 1

Emsi Q4 2021 Data Set | www.economicmodeling.com 61
Occupation 2020 JobsAnnual
OpeningsMedian Earnings
Growth (2020 - 2025)
Location Quotient
(2020)
First-Line Supervisors of Transportation and Material Moving Workers, Except Aircraft Cargo Handling Supervisors
3,833 546 $26.12 14.44% 0.87
Chief Executives 1,971 159 $80.60 4.81% 0.80Lifeguards, Ski Patrol, and Other Recre-ational Protective Service Workers
1,562 413 $11.13 5.80% 1.48
First-Line Supervisors of Firefi ghting and Prevention Workers
768 55 $41.22 2.85% 1.26
Forest and Conservation Technicians 621 82 $18.29 3.01% 1.90Environmental Scientists and Specialists, Including Health
470 56 $33.80 9.42% 0.60
Natural Sciences Managers 355 32 $52.48 8.58% 0.48Legislators 195 19 $78.82 8.67% 0.37Foresters 148 15 $30.88 3.98% 1.45Conservation Scientists 141 16 $34.72 9.45% 0.63Fire Inspectors and Investigators 116 12 $44.58 (0.13%) 0.86Forest Fire Inspectors and Prevention Spe-cialists
57 7 $9.90 11.93% 1.68
Fish and Game Wardens 46 5 $29.79 6.15% 0.69Forest and Conservation Workers 31 6 $14.58 9.69% 0.22
Environmental/Natural Resources Management and Policy, General (03.0201)
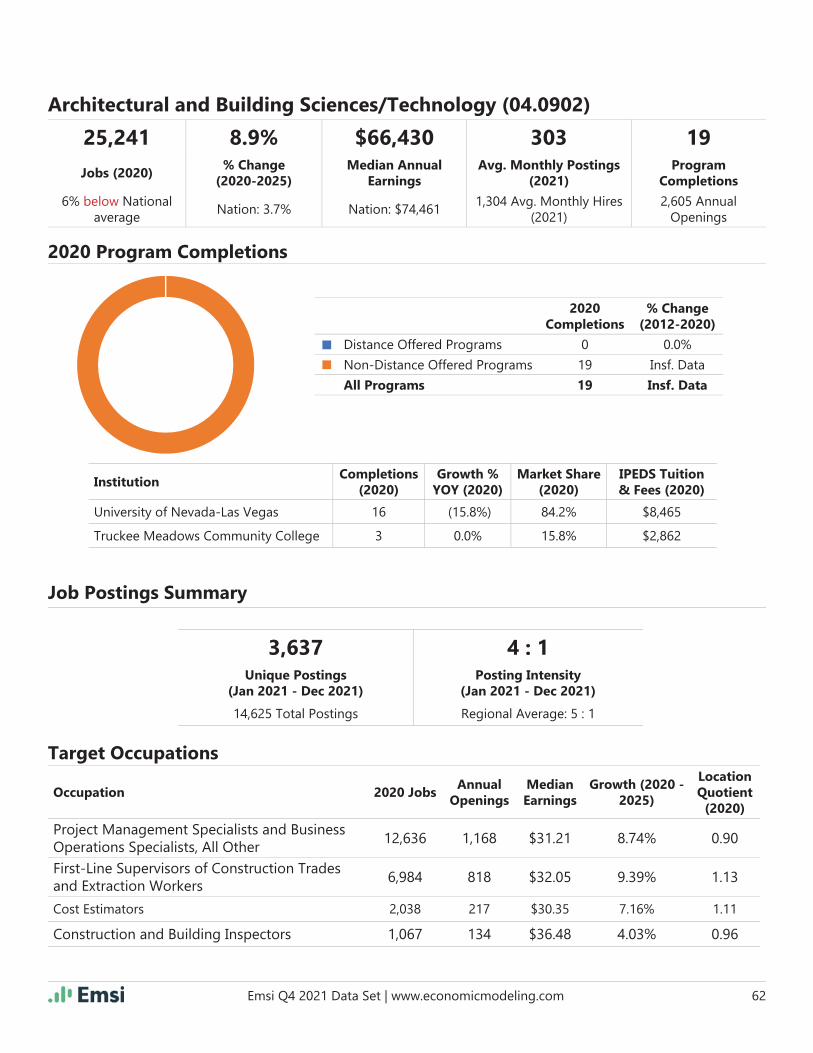
Emsi Q4 2021 Data Set | www.economicmodeling.com 62
InstitutionCompletions
(2020)Growth %
YOY (2020)Market Share
(2020)IPEDS Tuition & Fees (2020)
University of Nevada-Las Vegas 16 (15.8%) 84.2% $8,465
Truckee Meadows Community College 3 0.0% 15.8% $2,862
25,241 8.9% $66,430 303 19
Jobs (2020)% Change
(2020-2025)Median Annual
EarningsAvg. Monthly Postings
(2021)Program
Completions
6% below National average
Nation: 3.7% Nation: $74,4611,304 Avg. Monthly Hires
(2021)2,605 Annual
Openings
Occupation 2020 JobsAnnual
OpeningsMedian Earnings
Growth (2020 - 2025)
Location Quotient
(2020)
Project Management Specialists and Business Operations Specialists, All Other
12,636 1,168 $31.21 8.74% 0.90
First-Line Supervisors of Construction Trades and Extraction Workers
6,984 818 $32.05 9.39% 1.13
Cost Estimators 2,038 217 $30.35 7.16% 1.11
Construction and Building Inspectors 1,067 134 $36.48 4.03% 0.96
2020 Program Completions
2020 Completions
% Change (2012-2020)
Distance Offered Programs 0 0.0%
Non-Distance Offered Programs 19 Insf. Data
All Programs 19 Insf. Data
Target Occupations
Job Postings Summary
Architectural and Building Sciences/Technology (04.0902)
3,637 4 : 1Unique Postings
(Jan 2021 - Dec 2021)Posting Intensity
(Jan 2021 - Dec 2021)
14,625 Total Postings Regional Average: 5 : 1

Emsi Q4 2021 Data Set | www.economicmodeling.com 63
Occupation 2020 JobsAnnual
OpeningsMedian Earnings
Growth (2020 - 2025)
Location Quotient
(2020)
Architectural and Civil Drafters 1,036 113 $25.41 5.85% 1.15
Architectural and Engineering Managers 949 96 $60.35 13.93% 0.53
Architects, Except Landscape and Naval 532 59 $35.43 17.67% 0.46
Architectural and Building Sciences/Technology (04.0902)

Emsi Q4 2021 Data Set | www.economicmodeling.com 64
InstitutionCompletions
(2020)Growth %
YOY (2020)Market Share
(2020)IPEDS Tuition & Fees (2020)
University of Nevada-Las Vegas 4 (50.0%) 100.0% $8,465
5,195 15.6% $53,761 241 4
Jobs (2020)% Change
(2020-2025)Median Annual
EarningsAvg. Monthly Postings
(2021)Program
Completions
35% below National average
Nation: 11.6% Nation: $62,812308 Avg. Monthly Hires
(2021)697 Annual Openings
Occupation 2020 JobsAnnual
OpeningsMedian Earnings
Growth (2020 - 2025)
Location Quotient
(2020)
Market Research Analysts and Marketing Spe-cialists
3,722 504 $26.77 15.86% 0.57
Interpreters and Translators 866 119 $12.94 18.44% 1.08
Anthropologists and Archeologists 403 42 $30.22 6.83% 4.88
Social Science Research Assistants 128 20 $24.86 14.41% 0.33
Museum Technicians and Conservators 44 8 $19.96 25.39% 0.36
Historians 23 3 $28.70 14.30% 0.60
Geographers <10 Insf. Data Insf. Data Insf. Data Insf. Data
2020 Program Completions
2020 Completions
% Change (2012-2020)
Distance Offered Programs 0 0.0%
Non-Distance Offered Programs 4 (42.9%)
All Programs 4 (42.9%)
Target Occupations
Job Postings Summary
Asian Studies/Civilization (05.0103)
2,893 5 : 1Unique Postings
(Jan 2021 - Dec 2021)Posting Intensity
(Jan 2021 - Dec 2021)
14,116 Total Postings Regional Average: 5 : 1
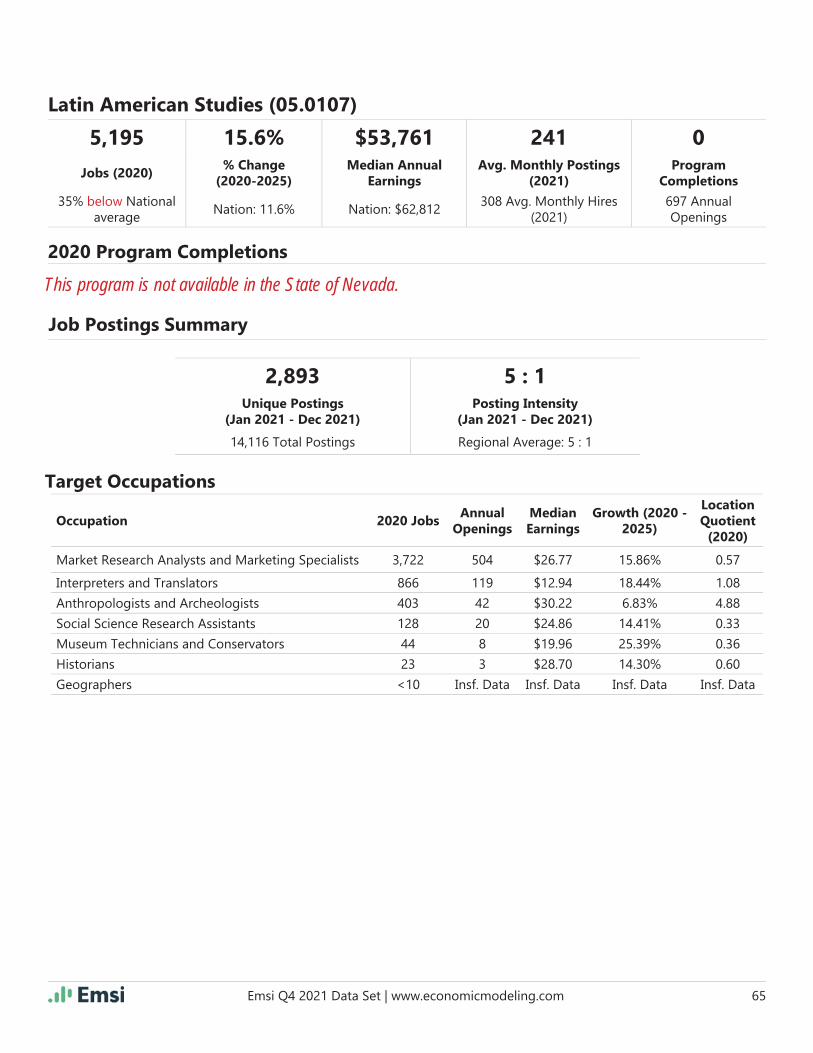
Emsi Q4 2021 Data Set | www.economicmodeling.com 65
5,195 15.6% $53,761 241 0
Jobs (2020)% Change
(2020-2025)Median Annual
EarningsAvg. Monthly Postings
(2021)Program
Completions
35% below National average
Nation: 11.6% Nation: $62,812308 Avg. Monthly Hires
(2021)697 Annual Openings
Occupation 2020 JobsAnnual
OpeningsMedian Earnings
Growth (2020 - 2025)
Location Quotient
(2020)
Market Research Analysts and Marketing Specialists 3,722 504 $26.77 15.86% 0.57
Interpreters and Translators 866 119 $12.94 18.44% 1.08
Anthropologists and Archeologists 403 42 $30.22 6.83% 4.88
Social Science Research Assistants 128 20 $24.86 14.41% 0.33
Museum Technicians and Conservators 44 8 $19.96 25.39% 0.36
Historians 23 3 $28.70 14.30% 0.60
Geographers <10 Insf. Data Insf. Data Insf. Data Insf. Data
2020 Program Completions
Target Occupations
Job Postings Summary
Latin American Studies (05.0107)
This program is not available in the State of Nevada.
2,893 5 : 1Unique Postings
(Jan 2021 - Dec 2021)Posting Intensity
(Jan 2021 - Dec 2021)
14,116 Total Postings Regional Average: 5 : 1
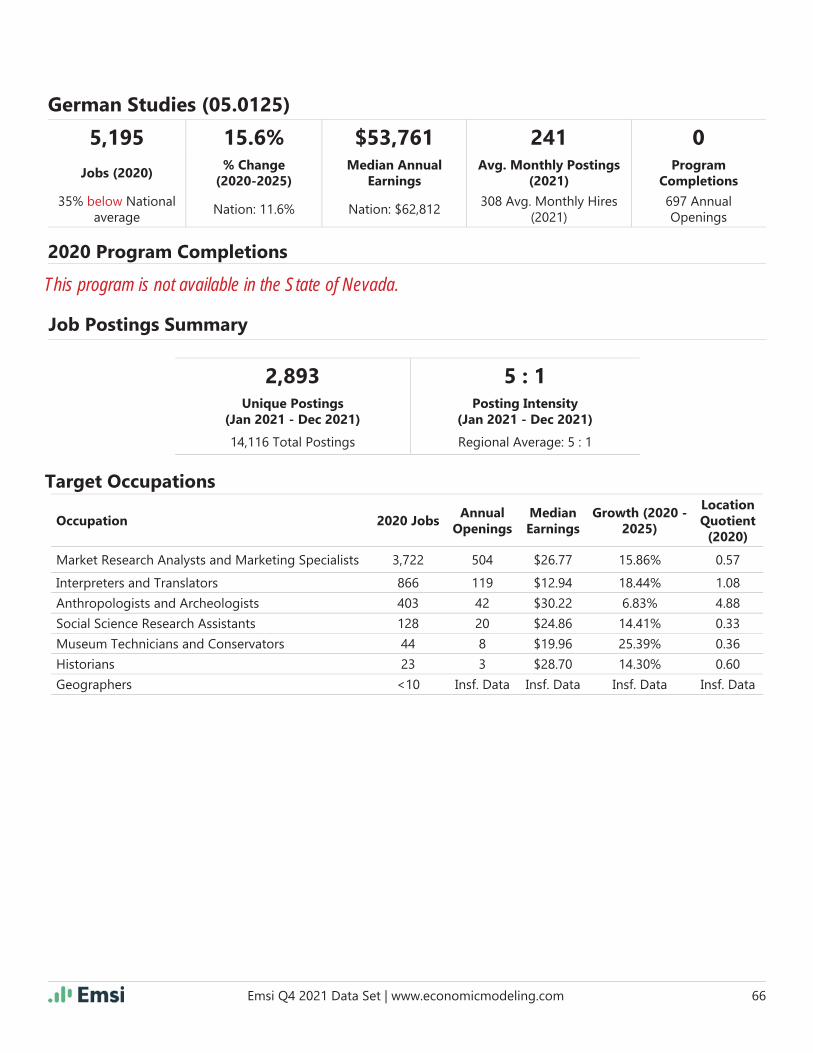
Emsi Q4 2021 Data Set | www.economicmodeling.com 66
5,195 15.6% $53,761 241 0
Jobs (2020)% Change
(2020-2025)Median Annual
EarningsAvg. Monthly Postings
(2021)Program
Completions
35% below National average
Nation: 11.6% Nation: $62,812308 Avg. Monthly Hires
(2021)697 Annual Openings
Occupation 2020 JobsAnnual
OpeningsMedian Earnings
Growth (2020 - 2025)
Location Quotient
(2020)
Market Research Analysts and Marketing Specialists 3,722 504 $26.77 15.86% 0.57
Interpreters and Translators 866 119 $12.94 18.44% 1.08
Anthropologists and Archeologists 403 42 $30.22 6.83% 4.88
Social Science Research Assistants 128 20 $24.86 14.41% 0.33
Museum Technicians and Conservators 44 8 $19.96 25.39% 0.36
Historians 23 3 $28.70 14.30% 0.60
Geographers <10 Insf. Data Insf. Data Insf. Data Insf. Data
2020 Program Completions
Target Occupations
Job Postings Summary
German Studies (05.0125)
This program is not available in the State of Nevada.
2,893 5 : 1Unique Postings
(Jan 2021 - Dec 2021)Posting Intensity
(Jan 2021 - Dec 2021)
14,116 Total Postings Regional Average: 5 : 1

Emsi Q4 2021 Data Set | www.economicmodeling.com 67
5,195 15.6% $53,761 241 0
Jobs (2020)% Change
(2020-2025)Median Annual
EarningsAvg. Monthly Postings
(2021)Program
Completions
35% below National average
Nation: 11.6% Nation: $62,812308 Avg. Monthly Hires
(2021)697 Annual Openings
Occupation 2020 JobsAnnual
OpeningsMedian Earnings
Growth (2020 - 2025)
Location Quotient
(2020)
Market Research Analysts and Marketing Specialists 3,722 504 $26.77 15.86% 0.57
Interpreters and Translators 866 119 $12.94 18.44% 1.08
Anthropologists and Archeologists 403 42 $30.22 6.83% 4.88
Social Science Research Assistants 128 20 $24.86 14.41% 0.33
Museum Technicians and Conservators 44 8 $19.96 25.39% 0.36
Historians 23 3 $28.70 14.30% 0.60
Geographers <10 Insf. Data Insf. Data Insf. Data Insf. Data
2020 Program Completions
Target Occupations
Job Postings Summary
Area Studies, Other (05.0199)
This program is not available in the State of Nevada.
2,893 5 : 1Unique Postings
(Jan 2021 - Dec 2021)Posting Intensity
(Jan 2021 - Dec 2021)
14,116 Total Postings Regional Average: 5 : 1

Emsi Q4 2021 Data Set | www.economicmodeling.com 68
InstitutionCompletions
(2020)Growth %
YOY (2020)Market Share
(2020)IPEDS Tuition & Fees (2020)
Nevada State College 14 133.3% 82.4% $6,075
Truckee Meadows Community College 3 Insf. Data 17.6% $2,862
12,063 6.6% $60,899 708 17
Jobs (2020)% Change
(2020-2025)Median Annual
EarningsAvg. Monthly Postings
(2021)Program
Completions
32% below National average
Nation: 7.9% Nation: $72,490580 Avg. Monthly Hires
(2021)1,362 Annual
Openings
Occupation 2020 JobsAnnual
OpeningsMedian Earnings
Growth (2020 - 2025)
Location Quotient
(2020)
Market Research Analysts and Marketing Spe-cialists
3,722 504 $26.77 15.86% 0.57
Marketing Managers 1,723 174 $48.88 7.74% 0.66
Public Relations Specialists 1,369 144 $27.82 6.07% 0.57
Writers and Authors 1,298 143 $20.67 6.35% 1.12
Producers and Directors 838 78 $32.71 0.01% 0.67
2020 Program Completions
2020 Completions
% Change (2012-2020)
Distance Offered Programs 0 0.0%
Non-Distance Offered Programs 17 Insf. Data
All Programs 17 Insf. Data
Target Occupations
Job Postings Summary
Communication, General (09.0100)
8,501 4 : 1Unique Postings
(Jan 2021 - Dec 2021)Posting Intensity
(Jan 2021 - Dec 2021)
34,361 Total Postings Regional Average: 5 : 1
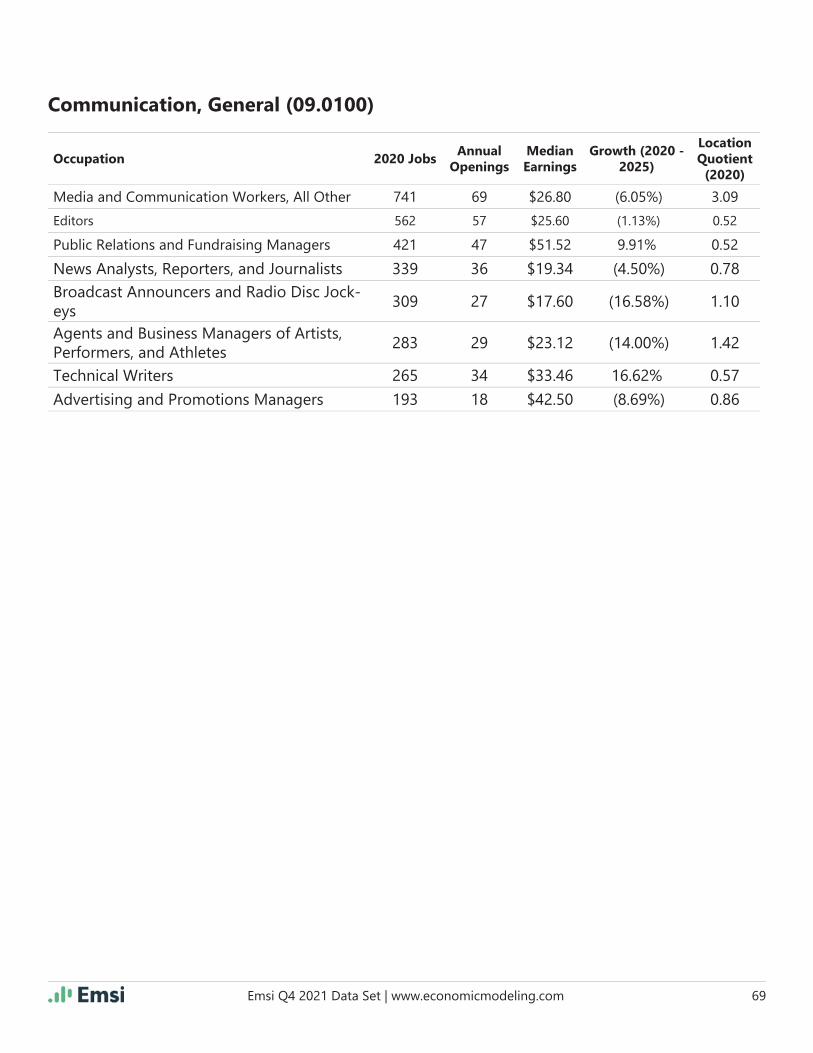
Emsi Q4 2021 Data Set | www.economicmodeling.com 69
Occupation 2020 JobsAnnual
OpeningsMedian Earnings
Growth (2020 - 2025)
Location Quotient
(2020)
Media and Communication Workers, All Other 741 69 $26.80 (6.05%) 3.09
Editors 562 57 $25.60 (1.13%) 0.52
Public Relations and Fundraising Managers 421 47 $51.52 9.91% 0.52
News Analysts, Reporters, and Journalists 339 36 $19.34 (4.50%) 0.78Broadcast Announcers and Radio Disc Jock-eys
309 27 $17.60 (16.58%) 1.10
Agents and Business Managers of Artists, Performers, and Athletes
283 29 $23.12 (14.00%) 1.42
Technical Writers 265 34 $33.46 16.62% 0.57
Advertising and Promotions Managers 193 18 $42.50 (8.69%) 0.86
Communication, General (09.0100)

Emsi Q4 2021 Data Set | www.economicmodeling.com 70
InstitutionCompletions
(2020)Growth %
YOY (2020)Market Share
(2020)IPEDS Tuition & Fees (2020)
University of Nevada, Las Vegas 127 22.1% 100.0% $8,465
11,647 7.5% $61,105 34,746 127
Jobs (2020)% Change
(2020-2025)Median Annual
EarningsAvg. Monthly Postings
(2021)Program
Completions
36% below National average
Nation: 7.7% Nation: $72,241567 Avg. Monthly Hires
(2021)1,346 Annual
Openings
Occupation 2020 JobsAnnual
OpeningsMedian Earnings
Growth (2020 - 2025)
Location Quotient
(2020)
Market Research Analysts and Marketing Spe-cialists
3,722 504 $26.77 15.86% 0.57
Marketing Managers 1,723 174 $48.88 7.74% 0.66
Public Relations Specialists 1,369 144 $27.82 6.07% 0.57
Writers and Authors 1,298 143 $20.67 6.35% 1.12
Producers and Directors 838 78 $32.71 0.01% 0.67
Advertising Sales Agents 634 80 $22.85 (3.80%) 0.61
Editors 562 57 $25.60 (1.13%) 0.52
2020 Program Completions
2020 Completions
% Change (2012-2020)
Distance Offered Programs 0 0.0%
Non-Distance Offered Programs 127 58.8%
All Programs 127 58.8%
Target Occupations
Job Postings Summary
Mass Communication/Media Studies (09.0102)
8,535 4 : 1Unique Postings
(Jan 2021 - Dec 2021)Posting Intensity
(Jan 2021 - Dec 2021)
34,746 Total Postings Regional Average: 5 : 1

Emsi Q4 2021 Data Set | www.economicmodeling.com 71
Mass Communication/Media Studies (09.0102)
Occupation 2020 JobsAnnual
OpeningsMedian Earnings
Growth (2020 - 2025)
Location Quotient
(2020)
Public Relations and Fundraising Managers 421 47 $51.52 9.91% 0.52
News Analysts, Reporters, and Journalists 339 36 $19.34 (4.50%) 0.78
Agents and Business Managers of Artists, Per-formers, and Athletes
283 29 $23.12 (14.00%) 1.42
Technical Writers 265 34 $33.46 16.62% 0.57
Advertising and Promotions Managers 193 18 $42.50 (8.69%) 0.86

Emsi Q4 2021 Data Set | www.economicmodeling.com 72
9,790 9.8% $57,016 858 0
Jobs (2020)% Change
(2020-2025)Median Annual
EarningsAvg. Monthly Postings
(2021)Program
Completions
35% below National average
Nation: 7.7% Nation: $67,407441 Avg. Monthly Hires
(2021)1,138 Annual
Openings
Occupation 2020 JobsAnnual
OpeningsMedian Earnings
Growth (2020 - 2025)
Location Quotient
(2020)
Market Research Analysts and Marketing Specialists 3,722 504 $26.77 15.86% 0.57
Computer Occupations, All Other 2,261 226 $36.45 11.93% 0.61
Graphic Designers 1,681 166 $23.63 3.40% 0.73
Writers and Authors 1,298 143 $20.67 6.35% 1.12
Advertising Sales Agents 634 80 $22.85 (3.80%) 0.61
Advertising and Promotions Managers 193 18 $42.50 (8.69%) 0.86
2020 Program Completions
Target Occupations
Job Postings Summary
Advertising (09.0903)
This program is not available in the State of Nevada.
10,295 4 : 1Unique Postings
(Jan 2021 - Dec 2021)Posting Intensity
(Jan 2021 - Dec 2021)
40,287 Total Postings Regional Average: 5 : 1
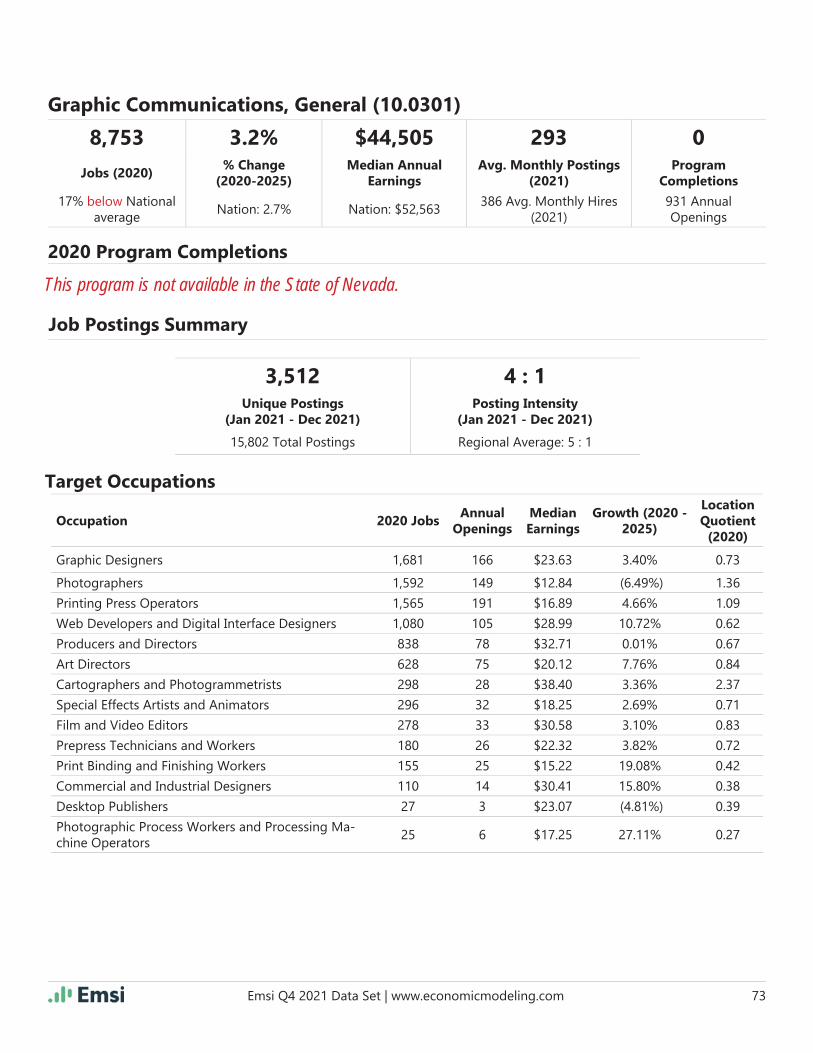
Emsi Q4 2021 Data Set | www.economicmodeling.com 73
8,753 3.2% $44,505 293 0
Jobs (2020)% Change
(2020-2025)Median Annual
EarningsAvg. Monthly Postings
(2021)Program
Completions
17% below National average
Nation: 2.7% Nation: $52,563386 Avg. Monthly Hires
(2021)931 Annual Openings
Occupation 2020 JobsAnnual
OpeningsMedian Earnings
Growth (2020 - 2025)
Location Quotient
(2020)
Graphic Designers 1,681 166 $23.63 3.40% 0.73
Photographers 1,592 149 $12.84 (6.49%) 1.36
Printing Press Operators 1,565 191 $16.89 4.66% 1.09
Web Developers and Digital Interface Designers 1,080 105 $28.99 10.72% 0.62
Producers and Directors 838 78 $32.71 0.01% 0.67
Art Directors 628 75 $20.12 7.76% 0.84
Cartographers and Photogrammetrists 298 28 $38.40 3.36% 2.37
Special Effects Artists and Animators 296 32 $18.25 2.69% 0.71
Film and Video Editors 278 33 $30.58 3.10% 0.83
Prepress Technicians and Workers 180 26 $22.32 3.82% 0.72
Print Binding and Finishing Workers 155 25 $15.22 19.08% 0.42
Commercial and Industrial Designers 110 14 $30.41 15.80% 0.38
Desktop Publishers 27 3 $23.07 (4.81%) 0.39
Photographic Process Workers and Processing Ma-chine Operators
25 6 $17.25 27.11% 0.27
2020 Program Completions
Target Occupations
Job Postings Summary
Graphic Communications, General (10.0301)
This program is not available in the State of Nevada.
3,512 4 : 1Unique Postings
(Jan 2021 - Dec 2021)Posting Intensity
(Jan 2021 - Dec 2021)
15,802 Total Postings Regional Average: 5 : 1

Emsi Q4 2021 Data Set | www.economicmodeling.com 74
4,866 7.9% $59,503 607 0
Jobs (2020)% Change
(2020-2025)Median Annual
EarningsAvg. Monthly Postings
(2021)Program
Completions
32% below National average
Nation: 5.4% Nation: $72,366167 Avg. Monthly Hires
(2021)500 Annual Openings
Occupation 2020 JobsAnnual
OpeningsMedian Earnings
Growth (2020 - 2025)
Location Quotient
(2020)
Computer Occupations, All Other 2,261 226 $36.45 11.93% 0.61
Graphic Designers 1,681 166 $23.63 3.40% 0.73
Art Directors 628 75 $20.12 7.76% 0.84
Special Effects Artists and Animators 296 32 $18.25 2.69% 0.71
2020 Program Completions
Target Occupations
Job Postings Summary
Animation, Interactive Technology, Video Graphics, and Special Effects (10.0304)
This program is not available in the State of Nevada.
7,289 4 : 1Unique Postings
(Jan 2021 - Dec 2021)Posting Intensity
(Jan 2021 - Dec 2021)
25,653 Total Postings Regional Average: 5 : 1

Emsi Q4 2021 Data Set | www.economicmodeling.com 75
InstitutionCompletions
(2020)Growth %
YOY (2020)Market Share
(2020)IPEDS Tuition & Fees (2020)
University of Nevada-Reno 95 (7.8%) 71.4% $8,695
Truckee Meadows Community College 31 10.7% 23.3% $2,862
Western Nevada College 7 16.7% 5.3% $3,548
26,743 12.7% $75,071 2,082 133
Jobs (2020)% Change
(2020-2025)Median Annual
EarningsAvg. Monthly Postings
(2021)Program
Completions
44% below National average
Nation: 8.3% Nation: $92,8261,146 Avg. Monthly Hires
(2021)2,741 Annual
Openings
Occupation 2020 JobsAnnual
OpeningsMedian Earnings
Growth (2020 - 2025)
Location Quotient
(2020)
Computer User Support Specialists 6,113 534 $24.14 6.33% 1.00
Software Developers and Software Quality As-surance Analysts and Testers
5,770 747 $44.71 24.66% 0.42
Computer Occupations, All Other 2,261 226 $36.45 11.93% 0.61
Computer and Information Systems Managers 2,093 218 $56.84 13.31% 0.49
2020 Program Completions
2020 Completions
% Change (2012-2020)
Distance Offered Programs 7 Insf. Data
Non-Distance Offered Programs 126 68.0%
All Programs 133 77.3%
Target Occupations
Job Postings Summary
Computer and Information Sciences, General (11.0101)
24,978 4 : 1Unique Postings
(Jan 2021 - Dec 2021)Posting Intensity
(Jan 2021 - Dec 2021)
103,953 Total Postings Regional Average: 5 : 1

Emsi Q4 2021 Data Set | www.economicmodeling.com 76
Occupation 2020 JobsAnnual
OpeningsMedian Earnings
Growth (2020 - 2025)
Location Quotient
(2020)
Computer Systems Analysts 2,093 215 $42.25 14.41% 0.38
Computer Network Support Specialists 1,512 141 $30.02 9.24% 0.87
Network and Computer Systems Administrators 1,494 140 $39.85 12.85% 0.47
Computer Programmers 1,181 85 $41.45 0.89% 0.68
Data Entry Keyers 1,115 125 $15.42 (1.72%) 0.77
Web Developers and Digital Interface Designers 1,080 105 $28.99 10.72% 0.62
Database Administrators and Architects 741 71 $44.43 10.03% 0.60
Computer Network Architects 627 52 $46.85 10.36% 0.43
Information Security Analysts 602 76 $43.07 23.70% 0.46
Computer and Information Research Scientists 61 8 $51.27 26.25% 0.21
Computer and Information Sciences, General (11.0101)

Emsi Q4 2021 Data Set | www.economicmodeling.com 77
InstitutionCompletions
(2020)Growth %
YOY (2020)Market Share
(2020)IPEDS Tuition & Fees (2020)
Truckee Meadows Community College 6 500.0% 54.5% $2,862
University of Phoenix-Nevada 5 150.0% 45.5% $9,552
25,663 12.8% $75,784 1,970 11
Jobs (2020)% Change
(2020-2025)Median Annual
EarningsAvg. Monthly Postings
(2021)Program
Completions
44% below National average
Nation: 8.3% Nation: $93,6191,106 Avg. Monthly Hires
(2021)2,637 Annual
Openings
Occupation 2020 JobsAnnual
OpeningsMedian Earnings
Growth (2020 - 2025)
Location Quotient
(2020)
Computer User Support Specialists 6,113 534 $24.14 6.33% 1.00
Software Developers and Software Quality Assur-ance Analysts and Testers
5,770 747 $44.71 24.66% 0.42
Computer Occupations, All Other 2,261 226 $36.45 11.93% 0.61
Computer and Information Systems Managers 2,093 218 $56.84 13.31% 0.49
Computer Systems Analysts 2,093 215 $42.25 14.41% 0.38
2020 Program Completions
2020 Completions
% Change (2012-2020)
Distance Offered Programs 0 0.0%
Non-Distance Offered Programs 11 (87.9%)
All Programs 11 (87.9%)
Target Occupations
Job Postings Summary
Information Technology (11.0103)
23,641 4 : 1Unique Postings
(Jan 2021 - Dec 2021)Posting Intensity
(Jan 2021 - Dec 2021)
98,809 Total Postings Regional Average: 5 : 1
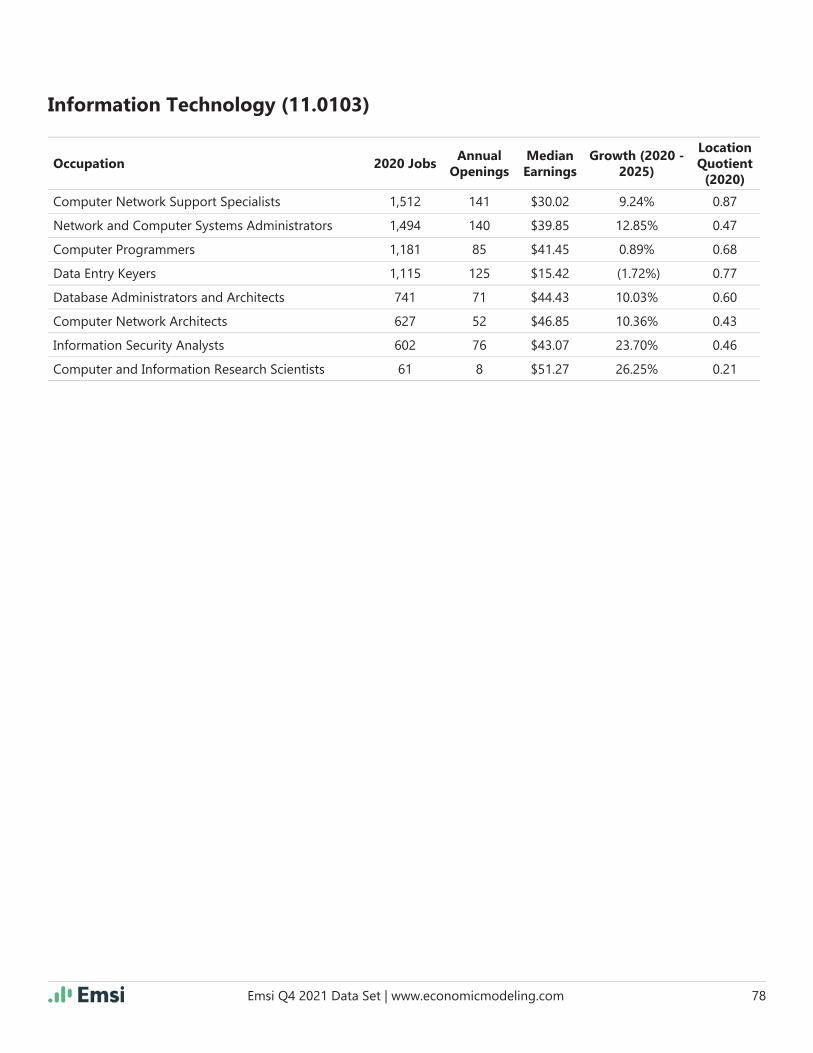
Emsi Q4 2021 Data Set | www.economicmodeling.com 78
Information Technology (11.0103)
Occupation 2020 JobsAnnual
OpeningsMedian Earnings
Growth (2020 - 2025)
Location Quotient
(2020)
Computer Network Support Specialists 1,512 141 $30.02 9.24% 0.87
Network and Computer Systems Administrators 1,494 140 $39.85 12.85% 0.47
Computer Programmers 1,181 85 $41.45 0.89% 0.68
Data Entry Keyers 1,115 125 $15.42 (1.72%) 0.77
Database Administrators and Architects 741 71 $44.43 10.03% 0.60
Computer Network Architects 627 52 $46.85 10.36% 0.43
Information Security Analysts 602 76 $43.07 23.70% 0.46
Computer and Information Research Scientists 61 8 $51.27 26.25% 0.21

Emsi Q4 2021 Data Set | www.economicmodeling.com 79
26,743 12.7% $75,071 2,082 0
Jobs (2020)% Change
(2020-2025)Median Annual
EarningsAvg. Monthly Postings
(2021)Program
Completions
44% below National average
Nation: 8.3% Nation: $92,8261,146 Avg. Monthly Hires
(2021)2,741 Annual
Openings
Occupation 2020 JobsAnnual
OpeningsMedian Earnings
Growth (2020 - 2025)
Location Quotient
(2020)
Computer User Support Specialists 6,113 534 $24.14 6.33% 1.00
Software Developers and Software Quality Assur-ance Analysts and Testers
5,770 747 $44.71 24.66% 0.42
Computer Occupations, All Other 2,261 226 $36.45 11.93% 0.61
Computer and Information Systems Managers 2,093 218 $56.84 13.31% 0.49
Computer Systems Analysts 2,093 215 $42.25 14.41% 0.38
Computer Network Support Specialists 1,512 141 $30.02 9.24% 0.87
Network and Computer Systems Administrators 1,494 140 $39.85 12.85% 0.47
Computer Programmers 1,181 85 $41.45 0.89% 0.68
Data Entry Keyers 1,115 125 $15.42 (1.72%) 0.77
Web Developers and Digital Interface Designers 1,080 105 $28.99 10.72% 0.62
Database Administrators and Architects 741 71 $44.43 10.03% 0.60
Computer Network Architects 627 52 $46.85 10.36% 0.43
Information Security Analysts 602 76 $43.07 23.70% 0.46
Computer and Information Research Scientists 61 8 $51.27 26.25% 0.21
2020 Program Completions
Target Occupations
Job Postings Summary
Computer and Information Sciences, Other (11.0199)
This program is not available in the State of Nevada.
24,978 4 : 1Unique Postings
(Jan 2021 - Dec 2021)Posting Intensity
(Jan 2021 - Dec 2021)
103,953 Total Postings Regional Average: 5 : 1
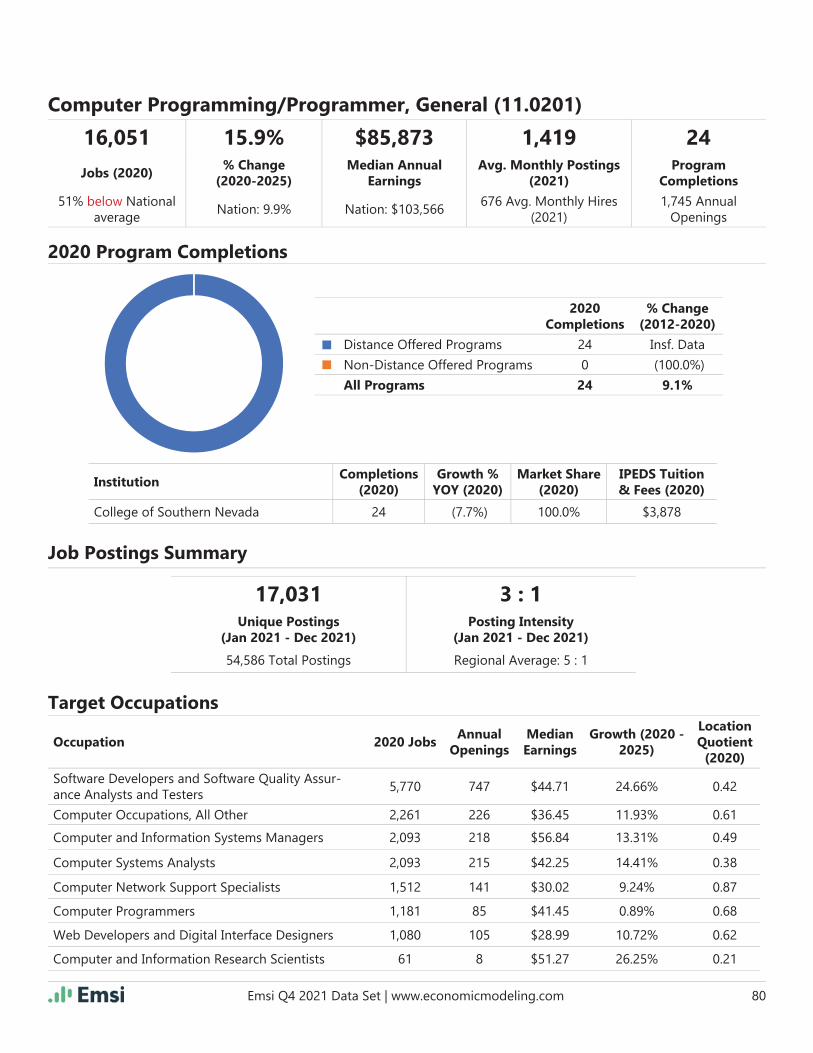
Emsi Q4 2021 Data Set | www.economicmodeling.com 80
InstitutionCompletions
(2020)Growth %
YOY (2020)Market Share
(2020)IPEDS Tuition & Fees (2020)
College of Southern Nevada 24 (7.7%) 100.0% $3,878
16,051 15.9% $85,873 1,419 24
Jobs (2020)% Change
(2020-2025)Median Annual
EarningsAvg. Monthly Postings
(2021)Program
Completions
51% below National average
Nation: 9.9% Nation: $103,566676 Avg. Monthly Hires
(2021)1,745 Annual
Openings
Occupation 2020 JobsAnnual
OpeningsMedian Earnings
Growth (2020 - 2025)
Location Quotient
(2020)
Software Developers and Software Quality Assur-ance Analysts and Testers
5,770 747 $44.71 24.66% 0.42
Computer Occupations, All Other 2,261 226 $36.45 11.93% 0.61
Computer and Information Systems Managers 2,093 218 $56.84 13.31% 0.49
Computer Systems Analysts 2,093 215 $42.25 14.41% 0.38
Computer Network Support Specialists 1,512 141 $30.02 9.24% 0.87
Computer Programmers 1,181 85 $41.45 0.89% 0.68
Web Developers and Digital Interface Designers 1,080 105 $28.99 10.72% 0.62
Computer and Information Research Scientists 61 8 $51.27 26.25% 0.21
2020 Program Completions
2020 Completions
% Change (2012-2020)
Distance Offered Programs 24 Insf. Data
Non-Distance Offered Programs 0 (100.0%)
All Programs 24 9.1%
Target Occupations
Job Postings Summary
Computer Programming/Programmer, General (11.0201)
17,031 3 : 1Unique Postings
(Jan 2021 - Dec 2021)Posting Intensity
(Jan 2021 - Dec 2021)
54,586 Total Postings Regional Average: 5 : 1

Emsi Q4 2021 Data Set | www.economicmodeling.com 81
InstitutionCompletions
(2020)Growth %
YOY (2020)Market Share
(2020)IPEDS Tuition & Fees (2020)
Truckee Meadows Community College 16 45.5% 100.0% $2,862
14,539 16.6% $90,068 1,400 16
Jobs (2020)% Change
(2020-2025)Median Annual
EarningsAvg. Monthly Postings
(2021)Program
Completions
53% below National average
Nation: 10.2% Nation: $105,937622 Avg. Monthly Hires
(2021)1,603
Annual Openings
Occupation 2020 JobsAnnual
OpeningsMedian Earnings
Growth (2020 - 2025)
Location Quotient
(2020)
Software Developers and Software Quality Assur-ance Analysts and Testers
5,770 747 $44.71 24.66% 0.42
Computer Occupations, All Other 2,261 226 $36.45 11.93% 0.61
Computer and Information Systems Managers 2,093 218 $56.84 13.31% 0.49
Computer Systems Analysts 2,093 215 $42.25 14.41% 0.38
Computer Programmers 1,181 85 $41.45 0.89% 0.68
Web Developers and Digital Interface Designers 1,080 105 $28.99 10.72% 0.62
Computer and Information Research Scientists 61 8 $51.27 26.25% 0.21
2020 Program Completions
2020 Completions
% Change (2012-2020)
Distance Offered Programs 0 0.0%
Non-Distance Offered Programs 16 220.0%
All Programs 16 220.0%
Target Occupations
Job Postings Summary
Computer Programming, Specifi c Applications (11.0202)
16,797 3 : 1Unique Postings
(Jan 2021 - Dec 2021)Posting Intensity
(Jan 2021 - Dec 2021)
53,610 Total Postings Regional Average: 5 : 1
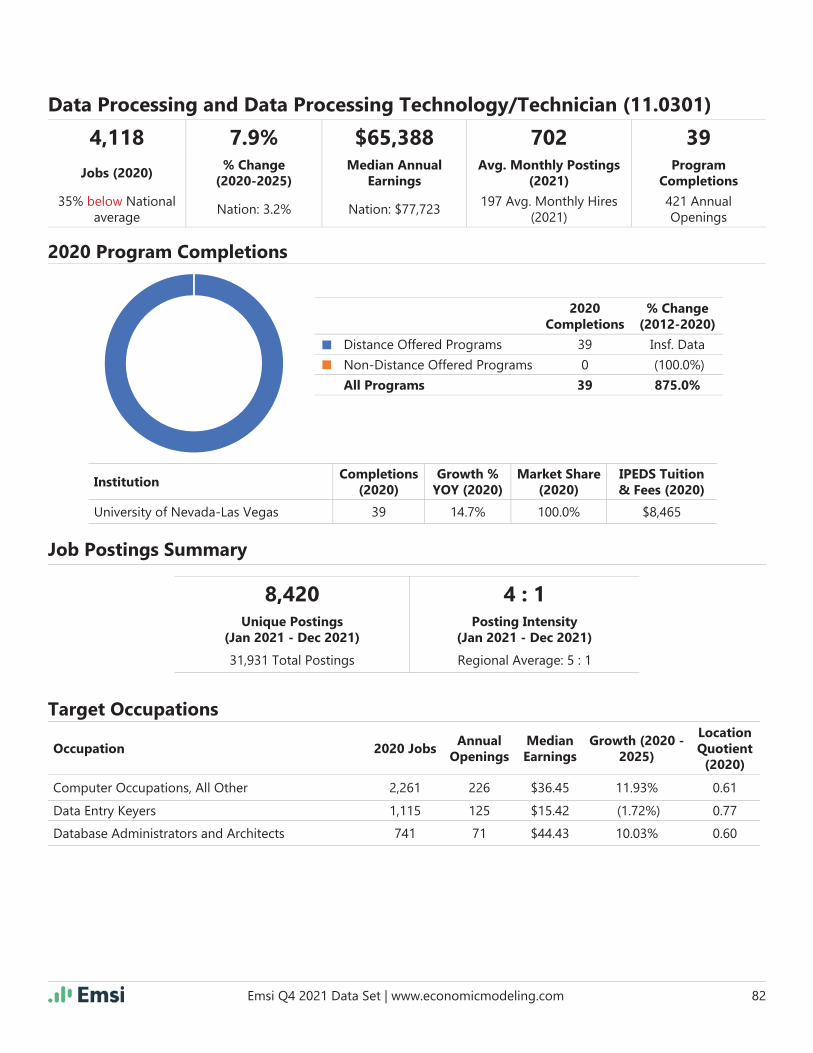
Emsi Q4 2021 Data Set | www.economicmodeling.com 82
InstitutionCompletions
(2020)Growth %
YOY (2020)Market Share
(2020)IPEDS Tuition & Fees (2020)
University of Nevada-Las Vegas 39 14.7% 100.0% $8,465
4,118 7.9% $65,388 702 39
Jobs (2020)% Change
(2020-2025)Median Annual
EarningsAvg. Monthly Postings
(2021)Program
Completions
35% below National average
Nation: 3.2% Nation: $77,723197 Avg. Monthly Hires
(2021)421 Annual Openings
Occupation 2020 JobsAnnual
OpeningsMedian Earnings
Growth (2020 - 2025)
Location Quotient
(2020)
Computer Occupations, All Other 2,261 226 $36.45 11.93% 0.61
Data Entry Keyers 1,115 125 $15.42 (1.72%) 0.77
Database Administrators and Architects 741 71 $44.43 10.03% 0.60
2020 Program Completions
2020 Completions
% Change (2012-2020)
Distance Offered Programs 39 Insf. Data
Non-Distance Offered Programs 0 (100.0%)
All Programs 39 875.0%
Target Occupations
Job Postings Summary
Data Processing and Data Processing Technology/Technician (11.0301)
8,420 4 : 1Unique Postings
(Jan 2021 - Dec 2021)Posting Intensity
(Jan 2021 - Dec 2021)
31,931 Total Postings Regional Average: 5 : 1
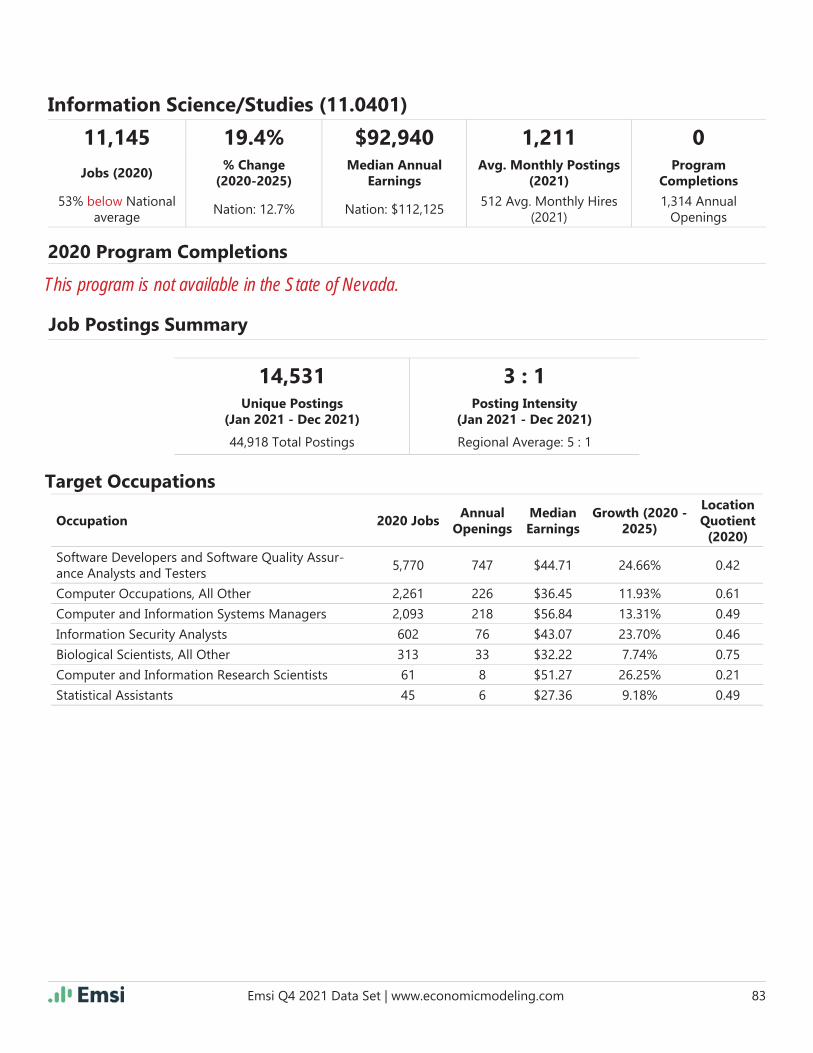
Emsi Q4 2021 Data Set | www.economicmodeling.com 83
11,145 19.4% $92,940 1,211 0
Jobs (2020)% Change
(2020-2025)Median Annual
EarningsAvg. Monthly Postings
(2021)Program
Completions
53% below National average
Nation: 12.7% Nation: $112,125512 Avg. Monthly Hires
(2021)1,314 Annual
Openings
Occupation 2020 JobsAnnual
OpeningsMedian Earnings
Growth (2020 - 2025)
Location Quotient
(2020)
Software Developers and Software Quality Assur-ance Analysts and Testers
5,770 747 $44.71 24.66% 0.42
Computer Occupations, All Other 2,261 226 $36.45 11.93% 0.61
Computer and Information Systems Managers 2,093 218 $56.84 13.31% 0.49
Information Security Analysts 602 76 $43.07 23.70% 0.46
Biological Scientists, All Other 313 33 $32.22 7.74% 0.75
Computer and Information Research Scientists 61 8 $51.27 26.25% 0.21
Statistical Assistants 45 6 $27.36 9.18% 0.49
2020 Program Completions
Target Occupations
Job Postings Summary
Information Science/Studies (11.0401)
This program is not available in the State of Nevada.
14,531 3 : 1Unique Postings
(Jan 2021 - Dec 2021)Posting Intensity
(Jan 2021 - Dec 2021)
44,918 Total Postings Regional Average: 5 : 1
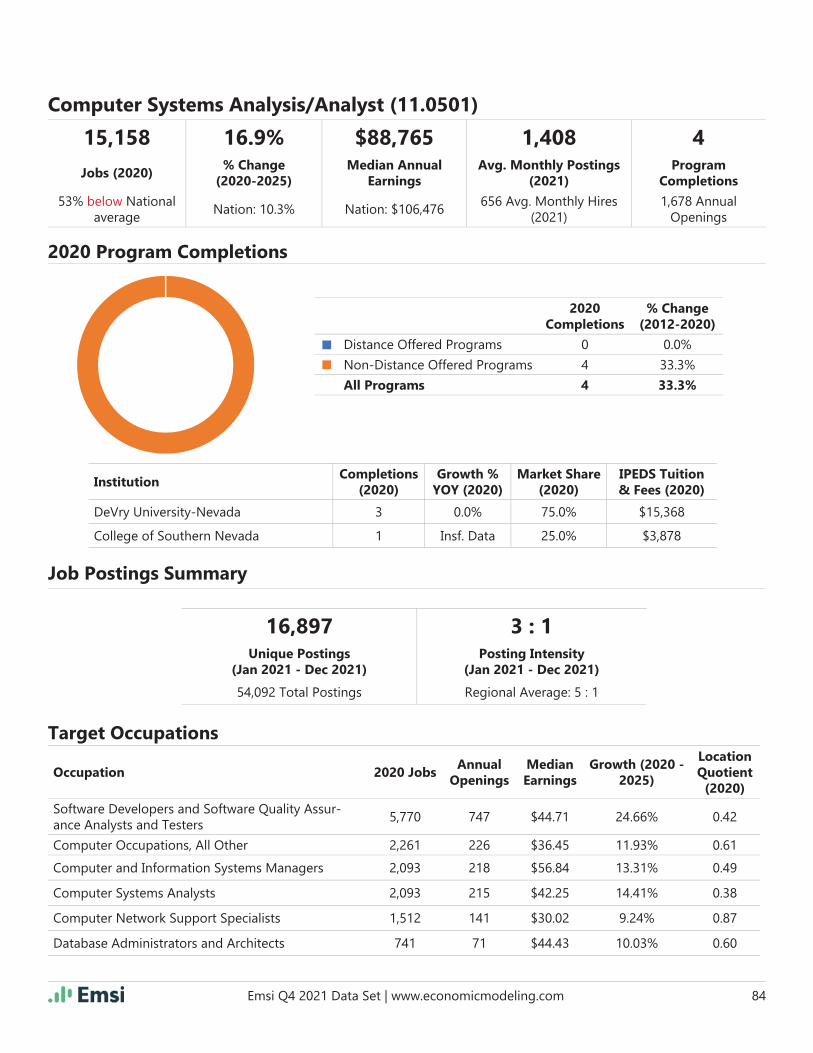
Emsi Q4 2021 Data Set | www.economicmodeling.com 84
InstitutionCompletions
(2020)Growth %
YOY (2020)Market Share
(2020)IPEDS Tuition & Fees (2020)
DeVry University-Nevada 3 0.0% 75.0% $15,368
College of Southern Nevada 1 Insf. Data 25.0% $3,878
15,158 16.9% $88,765 1,408 4
Jobs (2020)% Change
(2020-2025)Median Annual
EarningsAvg. Monthly Postings
(2021)Program
Completions
53% below National average
Nation: 10.3% Nation: $106,476656 Avg. Monthly Hires
(2021)1,678 Annual
Openings
Occupation 2020 JobsAnnual
OpeningsMedian Earnings
Growth (2020 - 2025)
Location Quotient
(2020)
Software Developers and Software Quality Assur-ance Analysts and Testers
5,770 747 $44.71 24.66% 0.42
Computer Occupations, All Other 2,261 226 $36.45 11.93% 0.61
Computer and Information Systems Managers 2,093 218 $56.84 13.31% 0.49
Computer Systems Analysts 2,093 215 $42.25 14.41% 0.38
Computer Network Support Specialists 1,512 141 $30.02 9.24% 0.87
Database Administrators and Architects 741 71 $44.43 10.03% 0.60
2020 Program Completions
2020 Completions
% Change (2012-2020)
Distance Offered Programs 0 0.0%
Non-Distance Offered Programs 4 33.3%
All Programs 4 33.3%
Target Occupations
Job Postings Summary
Computer Systems Analysis/Analyst (11.0501)
16,897 3 : 1Unique Postings
(Jan 2021 - Dec 2021)Posting Intensity
(Jan 2021 - Dec 2021)
54,092 Total Postings Regional Average: 5 : 1
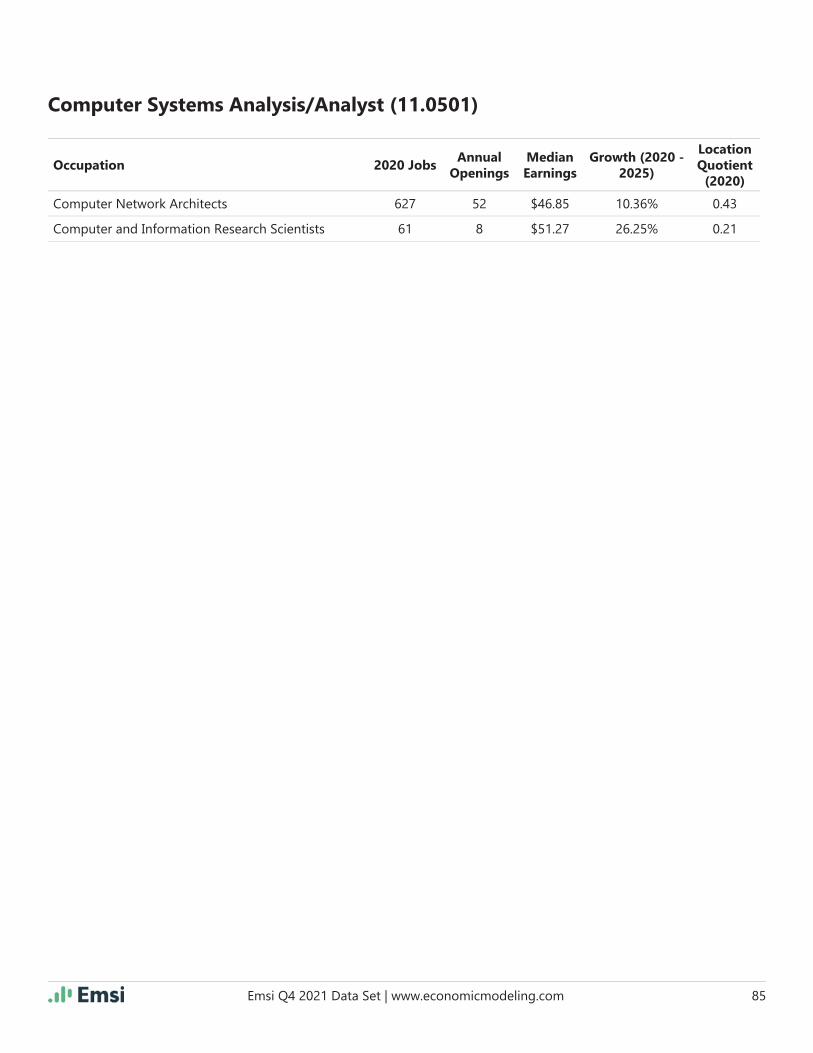
Emsi Q4 2021 Data Set | www.economicmodeling.com 85
Computer Systems Analysis/Analyst (11.0501)
Occupation 2020 JobsAnnual
OpeningsMedian Earnings
Growth (2020 - 2025)
Location Quotient
(2020)
Computer Network Architects 627 52 $46.85 10.36% 0.43
Computer and Information Research Scientists 61 8 $51.27 26.25% 0.21
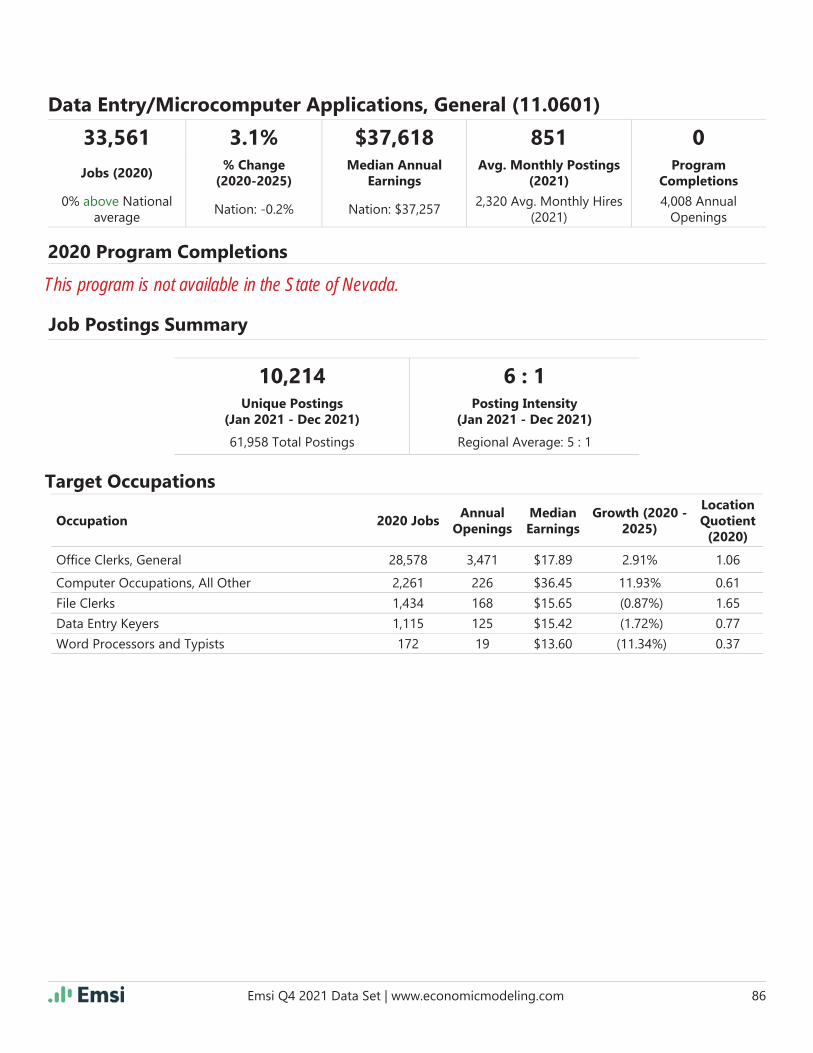
Emsi Q4 2021 Data Set | www.economicmodeling.com 86
33,561 3.1% $37,618 851 0
Jobs (2020)% Change
(2020-2025)Median Annual
EarningsAvg. Monthly Postings
(2021)Program
Completions
0% above National average
Nation: -0.2% Nation: $37,2572,320 Avg. Monthly Hires
(2021)4,008 Annual
Openings
Occupation 2020 JobsAnnual
OpeningsMedian Earnings
Growth (2020 - 2025)
Location Quotient
(2020)
Offi ce Clerks, General 28,578 3,471 $17.89 2.91% 1.06
Computer Occupations, All Other 2,261 226 $36.45 11.93% 0.61
File Clerks 1,434 168 $15.65 (0.87%) 1.65
Data Entry Keyers 1,115 125 $15.42 (1.72%) 0.77
Word Processors and Typists 172 19 $13.60 (11.34%) 0.37
2020 Program Completions
Target Occupations
Job Postings Summary
Data Entry/Microcomputer Applications, General (11.0601)
This program is not available in the State of Nevada.
10,214 6 : 1Unique Postings
(Jan 2021 - Dec 2021)Posting Intensity
(Jan 2021 - Dec 2021)
61,958 Total Postings Regional Average: 5 : 1

Emsi Q4 2021 Data Set | www.economicmodeling.com 87
InstitutionCompletions
(2020)Growth %
YOY (2020)Market Share
(2020)IPEDS Tuition & Fees (2020)
University of Nevada-Las Vegas 161 35.3% 100.0% $8,465
26,089 13.4% $77,314 2,045 161
Jobs (2020)% Change
(2020-2025)Median Annual
EarningsAvg. Monthly Postings
(2021)Program
Completions
44% below National average
Nation: 8.9% Nation: $94,9561,077 Avg. Monthly Hires
(2021)2,668 Annual
Openings
Occupation 2020 JobsAnnual
OpeningsMedian Earnings
Growth (2020 - 2025)
Location Quotient
(2020)
Computer User Support Specialists 6,113 534 $24.14 6.33% 1.00
Software Developers and Software Quality Assur-ance Analysts and Testers
5,770 747 $44.71 24.66% 0.42
Computer Occupations, All Other 2,261 226 $36.45 11.93% 0.61
Computer and Information Systems Managers 2,093 218 $56.84 13.31% 0.49
Computer Systems Analysts 2,093 215 $42.25 14.41% 0.38
Computer Network Support Specialists 1,512 141 $30.02 9.24% 0.87
Network and Computer Systems Administrators 1,494 140 $39.85 12.85% 0.47
2020 Program Completions
2020 Completions
% Change (2012-2020)
Distance Offered Programs 0 0.0%
Non-Distance Offered Programs 161 59.4%
All Programs 161 59.4%
Target Occupations
Job Postings Summary
Graphic Communications, General (11.0701)
24,535 4 : 1Unique Postings
(Jan 2021 - Dec 2021)Posting Intensity
(Jan 2021 - Dec 2021)
99,570 Total Postings Regional Average: 5 : 1
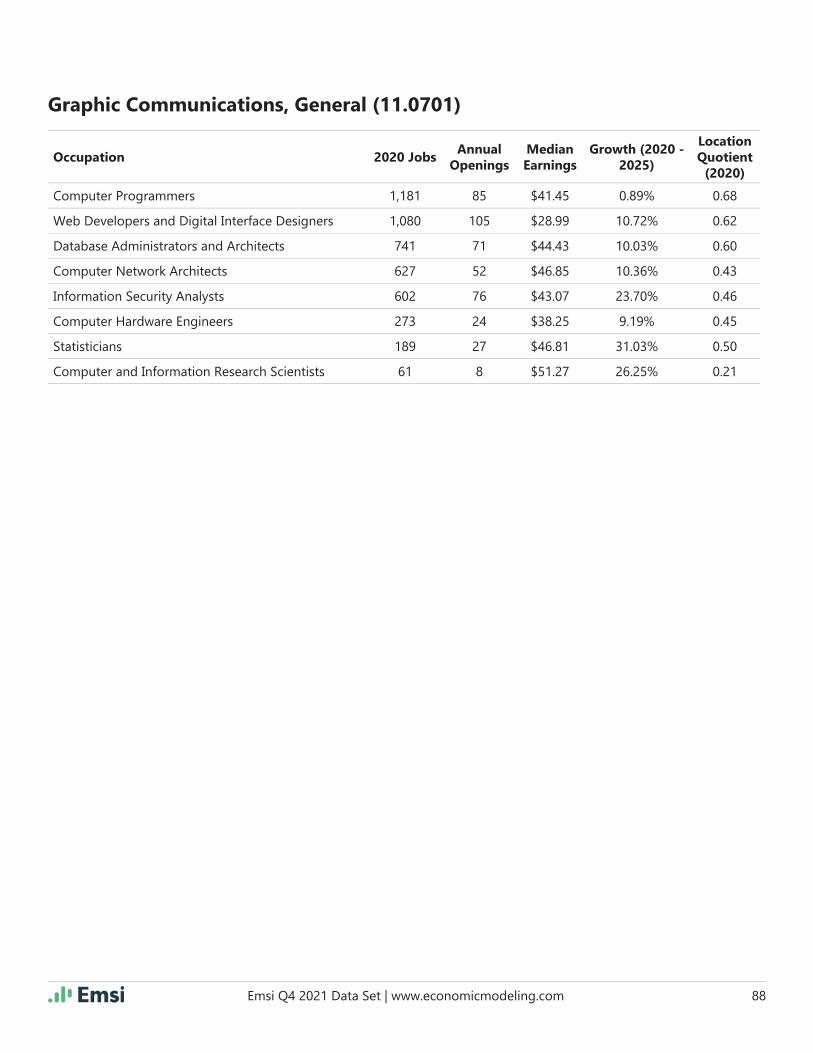
Emsi Q4 2021 Data Set | www.economicmodeling.com 88
Graphic Communications, General (11.0701)
Occupation 2020 JobsAnnual
OpeningsMedian Earnings
Growth (2020 - 2025)
Location Quotient
(2020)
Computer Programmers 1,181 85 $41.45 0.89% 0.68
Web Developers and Digital Interface Designers 1,080 105 $28.99 10.72% 0.62
Database Administrators and Architects 741 71 $44.43 10.03% 0.60
Computer Network Architects 627 52 $46.85 10.36% 0.43
Information Security Analysts 602 76 $43.07 23.70% 0.46
Computer Hardware Engineers 273 24 $38.25 9.19% 0.45
Statisticians 189 27 $46.81 31.03% 0.50
Computer and Information Research Scientists 61 8 $51.27 26.25% 0.21

Emsi Q4 2021 Data Set | www.economicmodeling.com 89
6,500 7.1% $65,636 758 0
Jobs (2020)% Change
(2020-2025)Median Annual
EarningsAvg. Monthly Postings
(2021)Program
Completions
34% below National average
Nation: 4.4% Nation: $75,926229 Avg. Monthly Hires
(2021)614 Annual Openings
Occupation 2020 JobsAnnual
OpeningsMedian Earnings
Growth (2020 - 2025)
Location Quotient
(2020)
Computer Occupations, All Other 2,261 226 $36.45 11.93% 0.61
Graphic Designers 1,681 166 $23.63 3.40% 0.73
Computer Programmers 1,181 85 $41.45 0.89% 0.68
Web Developers and Digital Interface Designers 1,080 105 $28.99 10.72% 0.62
Special Effects Artists and Animators 296 32 $18.25 2.69% 0.71
2020 Program Completions
Target Occupations
Job Postings Summary
Web Page, Digital/Multimedia and Information Resources Design (11.0801)
This program is not available in the State of Nevada.
9,096 4 : 1Unique Postings
(Jan 2021 - Dec 2021)Posting Intensity
(Jan 2021 - Dec 2021)
33,559 Total Postings Regional Average: 5 : 1
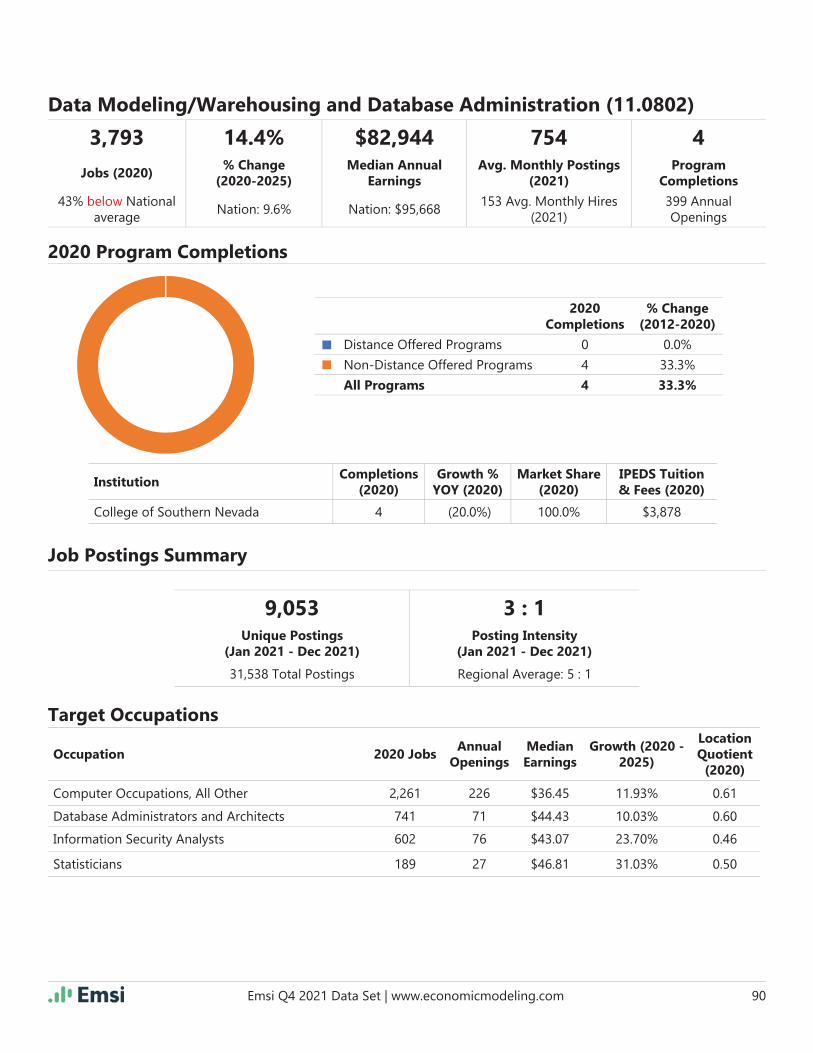
Emsi Q4 2021 Data Set | www.economicmodeling.com 90
InstitutionCompletions
(2020)Growth %
YOY (2020)Market Share
(2020)IPEDS Tuition & Fees (2020)
College of Southern Nevada 4 (20.0%) 100.0% $3,878
3,793 14.4% $82,944 754 4
Jobs (2020)% Change
(2020-2025)Median Annual
EarningsAvg. Monthly Postings
(2021)Program
Completions
43% below National average
Nation: 9.6% Nation: $95,668153 Avg. Monthly Hires
(2021)399 Annual Openings
Occupation 2020 JobsAnnual
OpeningsMedian Earnings
Growth (2020 - 2025)
Location Quotient
(2020)
Computer Occupations, All Other 2,261 226 $36.45 11.93% 0.61
Database Administrators and Architects 741 71 $44.43 10.03% 0.60
Information Security Analysts 602 76 $43.07 23.70% 0.46
Statisticians 189 27 $46.81 31.03% 0.50
2020 Program Completions
2020 Completions
% Change (2012-2020)
Distance Offered Programs 0 0.0%
Non-Distance Offered Programs 4 33.3%
All Programs 4 33.3%
Target Occupations
Job Postings Summary
Data Modeling/Warehousing and Database Administration (11.0802)
9,053 3 : 1Unique Postings
(Jan 2021 - Dec 2021)Posting Intensity
(Jan 2021 - Dec 2021)
31,538 Total Postings Regional Average: 5 : 1

Emsi Q4 2021 Data Set | www.economicmodeling.com 91
InstitutionCompletions
(2020)Growth %
YOY (2020)Market Share
(2020)IPEDS Tuition & Fees (2020)
Great Basin College 3 200.0% 100.0% $3,593
6,048 6.5% $65,100 654 3
Jobs (2020)% Change
(2020-2025)Median Annual
EarningsAvg. Monthly Postings
(2021)Program
Completions
32% below National average
Nation: 3.8% Nation: $76,190202 Avg. Monthly Hires
(2021)585 Annual Openings
Occupation 2020 JobsAnnual
OpeningsMedian Earnings
Growth (2020 - 2025)
Location Quotient
(2020)
Computer Occupations, All Other 2,261 226 $36.45 11.93% 0.61
Graphic Designers 1,681 166 $23.63 3.40% 0.73
Computer Programmers 1,181 85 $41.45 0.89% 0.68
Art Directors 628 75 $20.12 7.76% 0.84
Special Effects Artists and Animators 296 32 $18.25 2.69% 0.71
2020 Program Completions
2020 Completions
% Change (2012-2020)
Distance Offered Programs 3 Insf. Data
Non-Distance Offered Programs 0 (100.0%)
All Programs 3 (86.4%)
Target Occupations
Job Postings Summary
Computer Graphics (11.0803)
7,845 4 : 1Unique Postings
(Jan 2021 - Dec 2021)Posting Intensity
(Jan 2021 - Dec 2021)
28,704 Total Postings Regional Average: 5 : 1
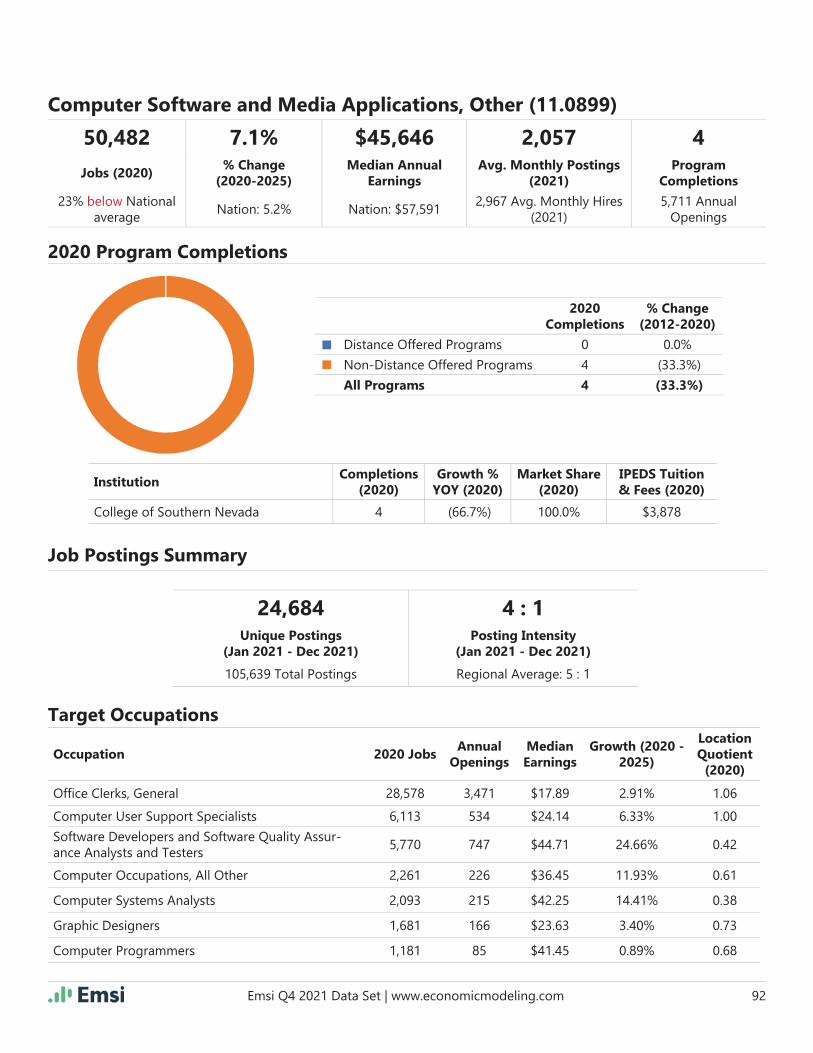
Emsi Q4 2021 Data Set | www.economicmodeling.com 92
InstitutionCompletions
(2020)Growth %
YOY (2020)Market Share
(2020)IPEDS Tuition & Fees (2020)
College of Southern Nevada 4 (66.7%) 100.0% $3,878
50,482 7.1% $45,646 2,057 4
Jobs (2020)% Change
(2020-2025)Median Annual
EarningsAvg. Monthly Postings
(2021)Program
Completions
23% below National average
Nation: 5.2% Nation: $57,5912,967 Avg. Monthly Hires
(2021)5,711 Annual
Openings
Occupation 2020 JobsAnnual
OpeningsMedian Earnings
Growth (2020 - 2025)
Location Quotient
(2020)
Offi ce Clerks, General 28,578 3,471 $17.89 2.91% 1.06
Computer User Support Specialists 6,113 534 $24.14 6.33% 1.00
Software Developers and Software Quality Assur-ance Analysts and Testers
5,770 747 $44.71 24.66% 0.42
Computer Occupations, All Other 2,261 226 $36.45 11.93% 0.61
Computer Systems Analysts 2,093 215 $42.25 14.41% 0.38
Graphic Designers 1,681 166 $23.63 3.40% 0.73
Computer Programmers 1,181 85 $41.45 0.89% 0.68
2020 Program Completions
2020 Completions
% Change (2012-2020)
Distance Offered Programs 0 0.0%
Non-Distance Offered Programs 4 (33.3%)
All Programs 4 (33.3%)
Target Occupations
Job Postings Summary
Computer Software and Media Applications, Other (11.0899)
24,684 4 : 1Unique Postings
(Jan 2021 - Dec 2021)Posting Intensity
(Jan 2021 - Dec 2021)
105,639 Total Postings Regional Average: 5 : 1
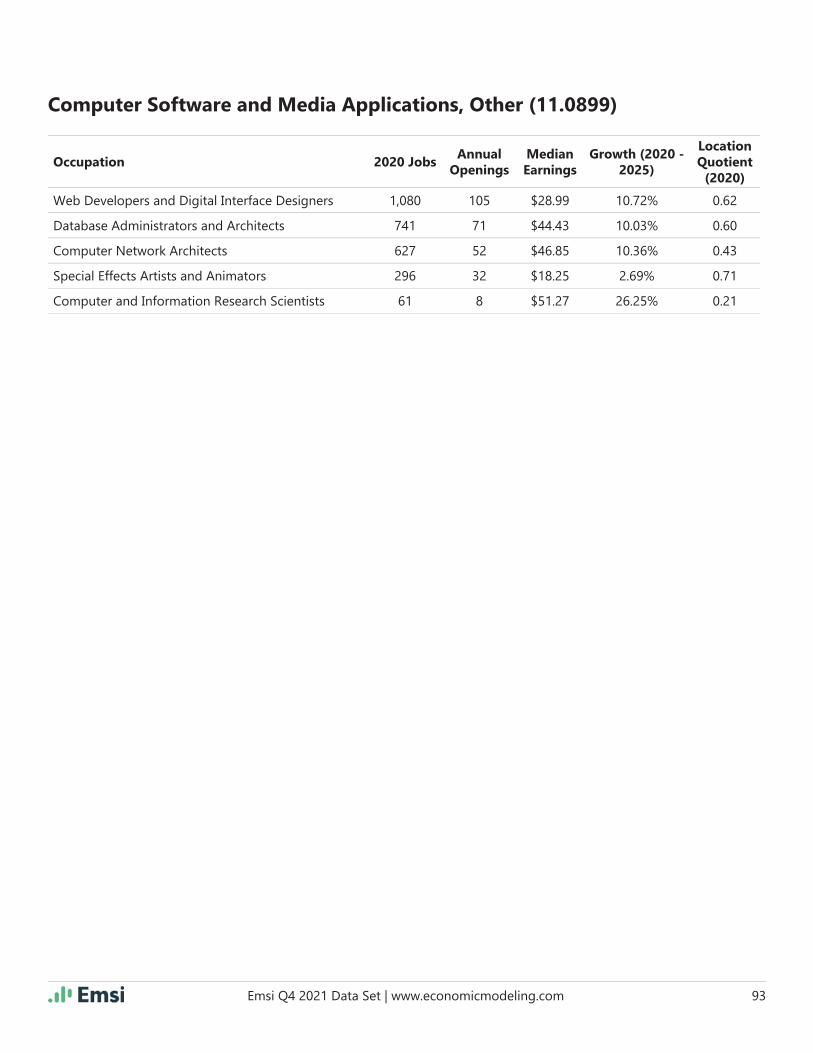
Emsi Q4 2021 Data Set | www.economicmodeling.com 93
Computer Software and Media Applications, Other (11.0899)
Occupation 2020 JobsAnnual
OpeningsMedian Earnings
Growth (2020 - 2025)
Location Quotient
(2020)
Web Developers and Digital Interface Designers 1,080 105 $28.99 10.72% 0.62
Database Administrators and Architects 741 71 $44.43 10.03% 0.60
Computer Network Architects 627 52 $46.85 10.36% 0.43
Special Effects Artists and Animators 296 32 $18.25 2.69% 0.71
Computer and Information Research Scientists 61 8 $51.27 26.25% 0.21

Emsi Q4 2021 Data Set | www.economicmodeling.com 94
InstitutionCompletions
(2020)Growth %
YOY (2020)Market Share
(2020)IPEDS Tuition & Fees (2020)
College of Southern Nevada 205 40.4% 90.7% $3,878
Truckee Meadows Community College 8 0.0% 3.5% $2,862
Western Nevada College 7 (22.2%) 3.1% $3,548
DeVry University-Nevada 3 0.0% 1.3% $15,368
Great Basin College 2 (60.0%) 0.9% $3,593
University of Phoenix-Nevada 1 Insf. Data 0.4% $9,552
25,301 10.3% $75,414 1,186 226
Jobs (2020)% Change
(2020-2025)Median Annual
EarningsAvg. Monthly Postings
(2021)Program
Completions
34% below National average
Nation: 5.6% Nation: $90,369970 Avg. Monthly Hires
(2021)2,400 Annual
Openings
Occupation 2020 JobsAnnual
OpeningsMedian Earnings
Growth (2020 - 2025)
Location Quotient
(2020)
Project Management Specialists and Business Oper-ations Specialists, All Other
12,636 1,168 $31.21 8.74% 0.90
Computer Occupations, All Other 2,261 226 $36.45 11.93% 0.61
2020 Program Completions
2020 Completions
% Change (2012-2020)
Distance Offered Programs 5 400.0%
Non-Distance Offered Programs 221 82.6%
All Programs 226 85.2%
Target Occupations
Job Postings Summary
Computer Systems Networking and Telecommunications (11.0901)
14,231 4 : 1Unique Postings
(Jan 2021 - Dec 2021)Posting Intensity
(Jan 2021 - Dec 2021)
52,400 Total Postings Regional Average: 5 : 1

Emsi Q4 2021 Data Set | www.economicmodeling.com 95
Computer Systems Networking and Telecommunications (11.0901)
Occupation 2020 JobsAnnual
OpeningsMedian Earnings
Growth (2020 - 2025)
Location Quotient
(2020)
Computer and Information Systems Managers 2,093 218 $56.84 13.31% 0.49
Computer Systems Analysts 2,093 215 $42.25 14.41% 0.38
Computer Network Support Specialists 1,512 141 $30.02 9.24% 0.87
Network and Computer Systems Administrators 1,494 140 $39.85 12.85% 0.47
Computer Programmers 1,181 85 $41.45 0.89% 0.68
Database Administrators and Architects 741 71 $44.43 10.03% 0.60
Computer Network Architects 627 52 $46.85 10.36% 0.43
Information Security Analysts 602 76 $43.07 23.70% 0.46
Computer and Information Research Scientists 61 8 $51.27 26.25% 0.21
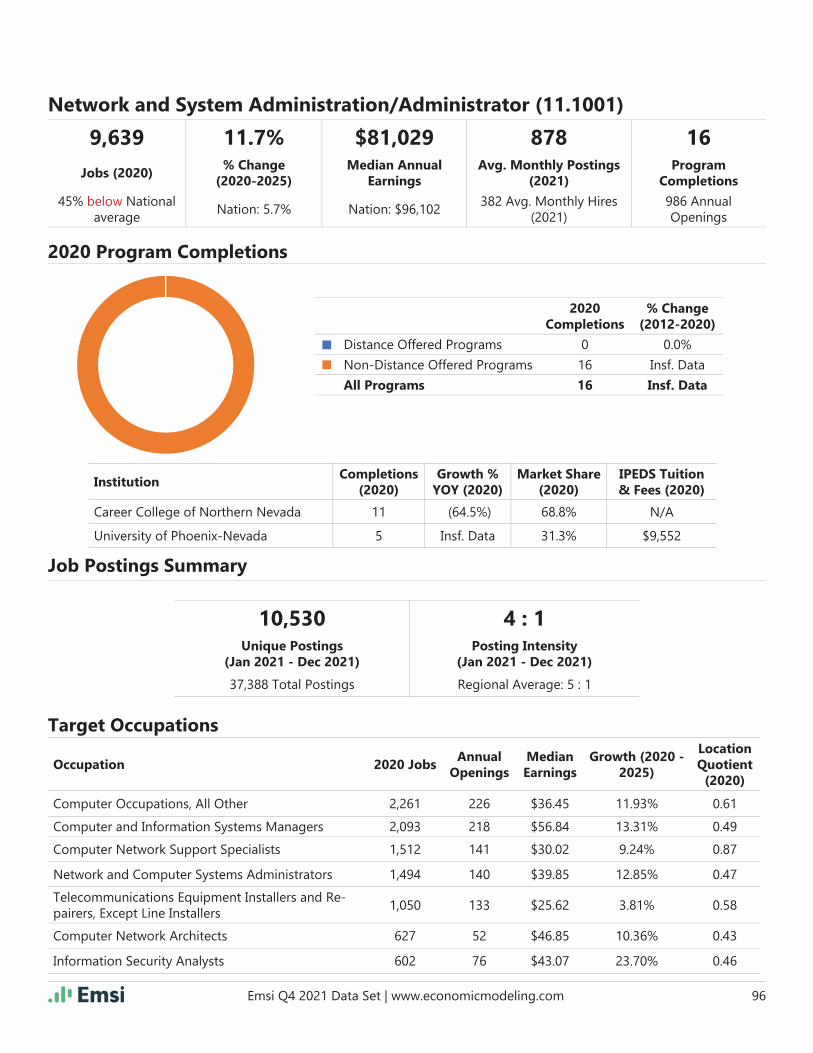
Emsi Q4 2021 Data Set | www.economicmodeling.com 96
InstitutionCompletions
(2020)Growth %
YOY (2020)Market Share
(2020)IPEDS Tuition & Fees (2020)
Career College of Northern Nevada 11 (64.5%) 68.8% N/A
University of Phoenix-Nevada 5 Insf. Data 31.3% $9,552
9,639 11.7% $81,029 878 16
Jobs (2020)% Change
(2020-2025)Median Annual
EarningsAvg. Monthly Postings
(2021)Program
Completions
45% below National average
Nation: 5.7% Nation: $96,102382 Avg. Monthly Hires
(2021)986 Annual Openings
Occupation 2020 JobsAnnual
OpeningsMedian Earnings
Growth (2020 - 2025)
Location Quotient
(2020)
Computer Occupations, All Other 2,261 226 $36.45 11.93% 0.61
Computer and Information Systems Managers 2,093 218 $56.84 13.31% 0.49
Computer Network Support Specialists 1,512 141 $30.02 9.24% 0.87
Network and Computer Systems Administrators 1,494 140 $39.85 12.85% 0.47
Telecommunications Equipment Installers and Re-pairers, Except Line Installers
1,050 133 $25.62 3.81% 0.58
Computer Network Architects 627 52 $46.85 10.36% 0.43
Information Security Analysts 602 76 $43.07 23.70% 0.46
2020 Program Completions
2020 Completions
% Change (2012-2020)
Distance Offered Programs 0 0.0%
Non-Distance Offered Programs 16 Insf. Data
All Programs 16 Insf. Data
Target Occupations
Job Postings Summary
Network and System Administration/Administrator (11.1001)
10,530 4 : 1Unique Postings
(Jan 2021 - Dec 2021)Posting Intensity
(Jan 2021 - Dec 2021)
37,388 Total Postings Regional Average: 5 : 1
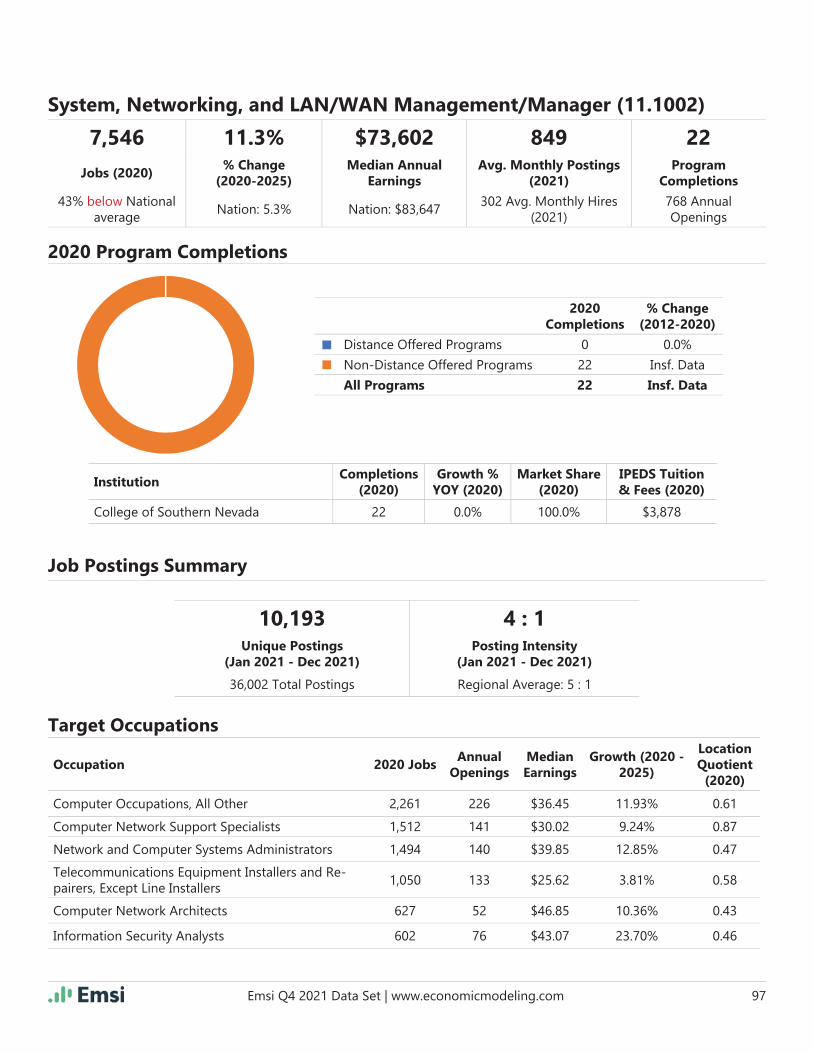
Emsi Q4 2021 Data Set | www.economicmodeling.com 97
InstitutionCompletions
(2020)Growth %
YOY (2020)Market Share
(2020)IPEDS Tuition & Fees (2020)
College of Southern Nevada 22 0.0% 100.0% $3,878
7,546 11.3% $73,602 849 22
Jobs (2020)% Change
(2020-2025)Median Annual
EarningsAvg. Monthly Postings
(2021)Program
Completions
43% below National average
Nation: 5.3% Nation: $83,647302 Avg. Monthly Hires
(2021)768 Annual Openings
Occupation 2020 JobsAnnual
OpeningsMedian Earnings
Growth (2020 - 2025)
Location Quotient
(2020)
Computer Occupations, All Other 2,261 226 $36.45 11.93% 0.61
Computer Network Support Specialists 1,512 141 $30.02 9.24% 0.87
Network and Computer Systems Administrators 1,494 140 $39.85 12.85% 0.47
Telecommunications Equipment Installers and Re-pairers, Except Line Installers
1,050 133 $25.62 3.81% 0.58
Computer Network Architects 627 52 $46.85 10.36% 0.43
Information Security Analysts 602 76 $43.07 23.70% 0.46
2020 Program Completions
2020 Completions
% Change (2012-2020)
Distance Offered Programs 0 0.0%
Non-Distance Offered Programs 22 Insf. Data
All Programs 22 Insf. Data
Target Occupations
Job Postings Summary
System, Networking, and LAN/WAN Management/Manager (11.1002)
10,193 4 : 1Unique Postings
(Jan 2021 - Dec 2021)Posting Intensity
(Jan 2021 - Dec 2021)
36,002 Total Postings Regional Average: 5 : 1

Emsi Q4 2021 Data Set | www.economicmodeling.com 98
InstitutionCompletions
(2020)Growth %
YOY (2020)Market Share
(2020)IPEDS Tuition & Fees (2020)
College of Southern Nevada 102 5.2% 97.1% $3,878
University of Nevada-Las Vegas 2 Insf. Data 1.9% $8,465
Truckee Meadows Community College 1 0.0% 1.0% $2,862
24,247 10.8% $74,929 1,142 105
Jobs (2020)% Change
(2020-2025)Median Annual
EarningsAvg. Monthly Postings
(2021)Program
Completions
34% below National average
Nation: 6.0% Nation: $90,254942 Avg. Monthly Hires
(2021)2,333 Annual
Openings
Occupation 2020 JobsAnnual
OpeningsMedian Earnings
Growth (2020 - 2025)
Location Quotient
(2020)
Project Management Specialists and Business Oper-ations Specialists, All Other
12,636 1,168 $31.21 8.74% 0.90
Computer Occupations, All Other 2,261 226 $36.45 11.93% 0.61
Computer and Information Systems Managers 2,093 218 $56.84 13.31% 0.49
Computer Systems Analysts 2,093 215 $42.25 14.41% 0.38
2020 Program Completions
2020 Completions
% Change (2012-2020)
Distance Offered Programs 2 Insf. Data
Non-Distance Offered Programs 103 543.8%
All Programs 105 556.3%
Target Occupations
Job Postings Summary
Computer and Information Systems Security/Auditing/Information Assurance (11.1003)
13,705 4 : 1Unique Postings
(Jan 2021 - Dec 2021)Posting Intensity
(Jan 2021 - Dec 2021)
49,123 Total Postings Regional Average: 5 : 1
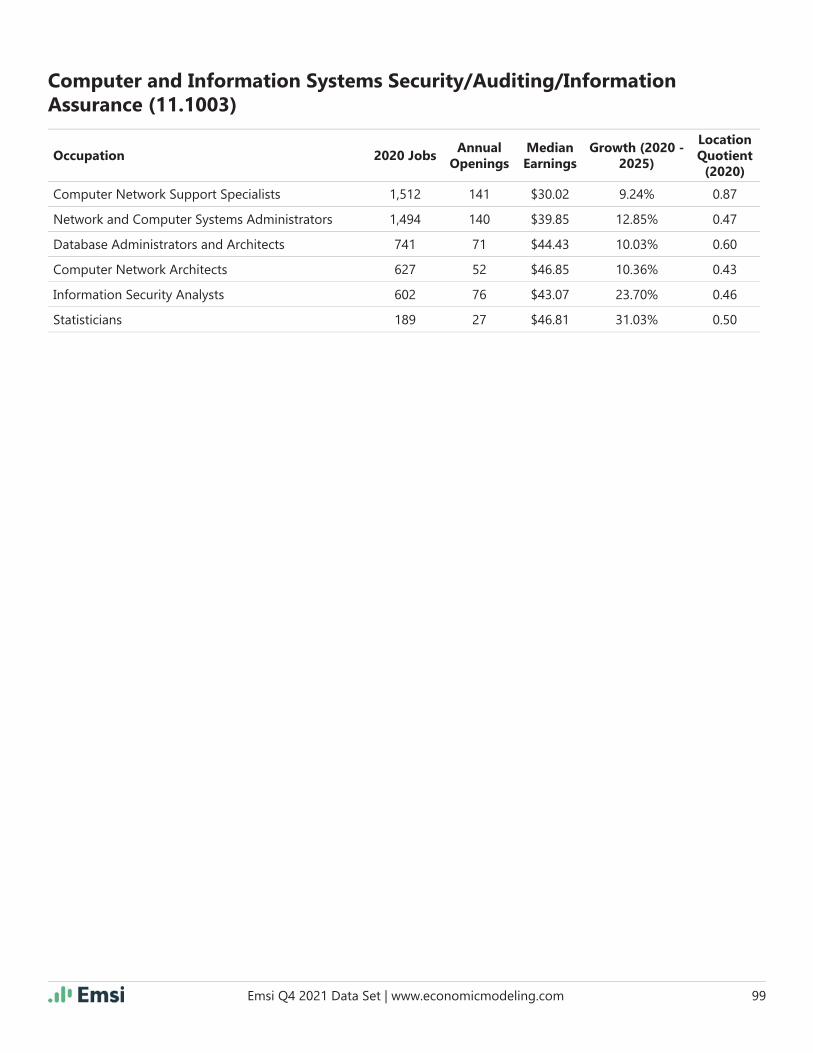
Emsi Q4 2021 Data Set | www.economicmodeling.com 99
Computer and Information Systems Security/Auditing/Information Assurance (11.1003)
Occupation 2020 JobsAnnual
OpeningsMedian Earnings
Growth (2020 - 2025)
Location Quotient
(2020)
Computer Network Support Specialists 1,512 141 $30.02 9.24% 0.87
Network and Computer Systems Administrators 1,494 140 $39.85 12.85% 0.47
Database Administrators and Architects 741 71 $44.43 10.03% 0.60
Computer Network Architects 627 52 $46.85 10.36% 0.43
Information Security Analysts 602 76 $43.07 23.70% 0.46
Statisticians 189 27 $46.81 31.03% 0.50

Emsi Q4 2021 Data Set | www.economicmodeling.com 100
InstitutionCompletions
(2020)Growth %
YOY (2020)Market Share
(2020)IPEDS Tuition & Fees (2020)
College of Southern Nevada 7 (12.5%) 100.0% $3,878
4,083 11.3% $75,346 748 7
Jobs (2020)% Change
(2020-2025)Median Annual
EarningsAvg. Monthly Postings
(2021)Program
Completions
39% below National average
Nation: 7.2% Nation: $88,207150 Avg. Monthly Hires
(2021)402 Annual Openings
Occupation 2020 JobsAnnual
OpeningsMedian Earnings
Growth (2020 - 2025)
Location Quotient
(2020)
Computer Occupations, All Other 2,261 226 $36.45 11.93% 0.61
Web Developers and Digital Interface Designers 1,080 105 $28.99 10.72% 0.62
Database Administrators and Architects 741 71 $44.43 10.03% 0.60
2020 Program Completions
2020 Completions
% Change (2012-2020)
Distance Offered Programs 7 600.0%
Non-Distance Offered Programs 0 0.0%
All Programs 7 600.0%
Target Occupations
Job Postings Summary
Web/Multimedia Management and Webmaster (11.1004)
8,972 4 : 1Unique Postings
(Jan 2021 - Dec 2021)Posting Intensity
(Jan 2021 - Dec 2021)
32,040 Total Postings Regional Average: 5 : 1

Emsi Q4 2021 Data Set | www.economicmodeling.com 101
InstitutionCompletions
(2020)Growth %
YOY (2020)Market Share
(2020)IPEDS Tuition & Fees (2020)
College of Southern Nevada 174 85.1% 100.0% $3,878
30,713 7.8% $74,512 2,007 174
Jobs (2020)% Change
(2020-2025)Median Annual
EarningsAvg. Monthly Postings
(2021)Program
Completions
13% below National average
Nation: 5.4% Nation: $85,5211,049 Avg. Monthly Hires
(2021)2,796 Annual
Openings
Occupation 2020 JobsAnnual
OpeningsMedian Earnings
Growth (2020 - 2025)
Location Quotient
(2020)
Personal Service Managers, All Other; Entertainment and Recreation Managers, Except Gambling; and Managers, All Other
14,315 1,212 $38.17 5.45% 1.69
Computer User Support Specialists 6,113 534 $24.14 6.33% 1.00
Computer Occupations, All Other 2,261 226 $36.45 11.93% 0.61
Computer and Information Systems Managers 2,093 218 $56.84 13.31% 0.49
Computer Systems Analysts 2,093 215 $42.25 14.41% 0.38
Network and Computer Systems Administrators 1,494 140 $39.85 12.85% 0.47
2020 Program Completions
2020 Completions
% Change (2012-2020)
Distance Offered Programs 0 0.0%
Non-Distance Offered Programs 174 Insf. Data
All Programs 174 Insf. Data
Target Occupations
Job Postings Summary
Information Technology Project Management (11.1005)
24,086 4 : 1Unique Postings
(Jan 2021 - Dec 2021)Posting Intensity
(Jan 2021 - Dec 2021)
107,752 Total Postings Regional Average: 5 : 1
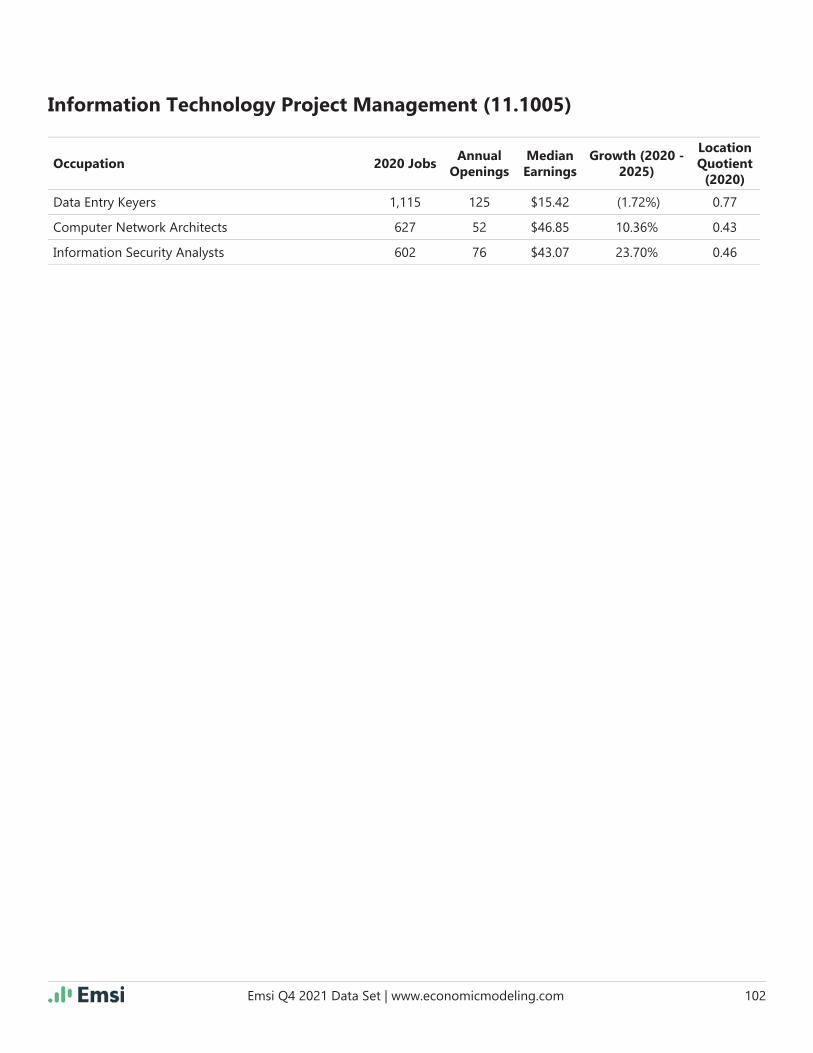
Emsi Q4 2021 Data Set | www.economicmodeling.com 102
Information Technology Project Management (11.1005)
Occupation 2020 JobsAnnual
OpeningsMedian Earnings
Growth (2020 - 2025)
Location Quotient
(2020)
Data Entry Keyers 1,115 125 $15.42 (1.72%) 0.77
Computer Network Architects 627 52 $46.85 10.36% 0.43
Information Security Analysts 602 76 $43.07 23.70% 0.46
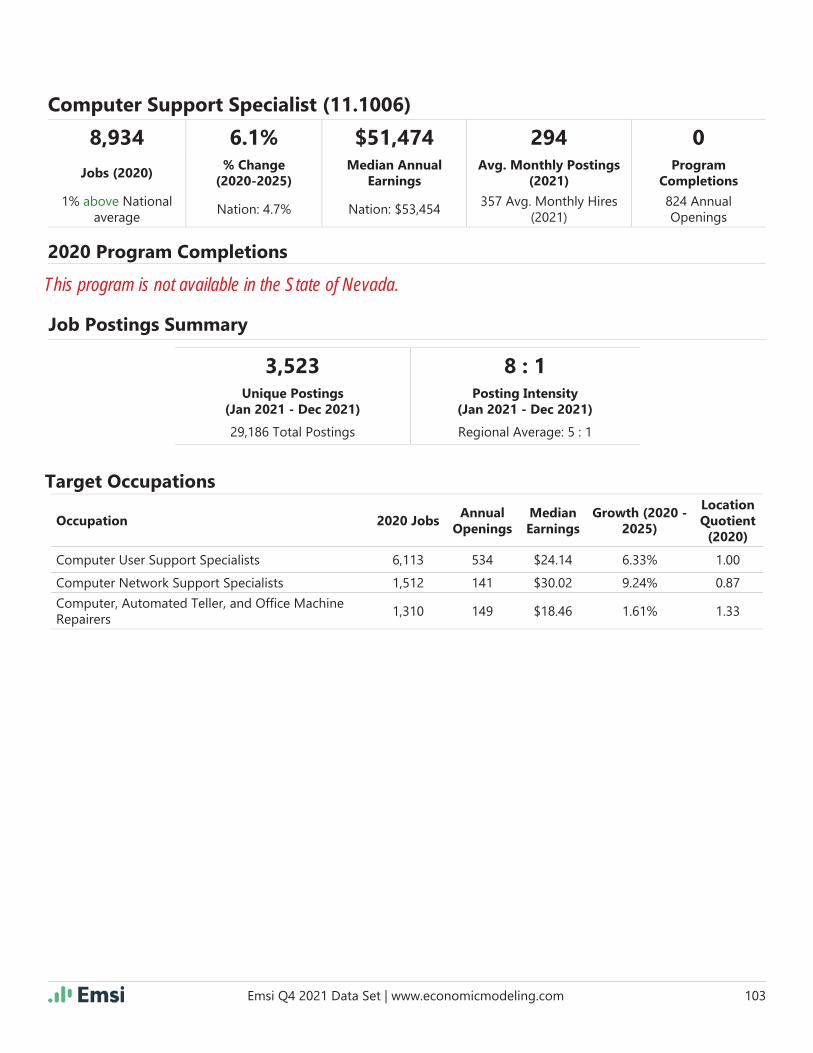
Emsi Q4 2021 Data Set | www.economicmodeling.com 103
8,934 6.1% $51,474 294 0
Jobs (2020)% Change
(2020-2025)Median Annual
EarningsAvg. Monthly Postings
(2021)Program
Completions
1% above National average
Nation: 4.7% Nation: $53,454357 Avg. Monthly Hires
(2021)824 Annual Openings
Occupation 2020 JobsAnnual
OpeningsMedian Earnings
Growth (2020 - 2025)
Location Quotient
(2020)
Computer User Support Specialists 6,113 534 $24.14 6.33% 1.00
Computer Network Support Specialists 1,512 141 $30.02 9.24% 0.87
Computer, Automated Teller, and Offi ce Machine Repairers
1,310 149 $18.46 1.61% 1.33
2020 Program Completions
Target Occupations
Job Postings Summary
Computer Support Specialist (11.1006)
This program is not available in the State of Nevada.
3,523 8 : 1Unique Postings
(Jan 2021 - Dec 2021)Posting Intensity
(Jan 2021 - Dec 2021)
29,186 Total Postings Regional Average: 5 : 1

Emsi Q4 2021 Data Set | www.economicmodeling.com 104
InstitutionCompletions
(2020)Growth %
YOY (2020)Market Share
(2020)IPEDS Tuition & Fees (2020)
University of Nevada-Las Vegas 47 74.1% 95.9% $8,465
Great Basin College 2 0.0% 4.1% $3,593
37,183 11.8% $72,621 1,969 49
Jobs (2020)% Change
(2020-2025)Median Annual
EarningsAvg. Monthly Postings
(2021)Program
Completions
36% below National average
Nation: 8.0% Nation: $90,5731,514 Avg. Monthly Hires
(2021)3,680 Annual
Openings
Occupation 2020 JobsAnnual
OpeningsMedian Earnings
Growth (2020 - 2025)
Location Quotient
(2020)
Project Management Specialists and Business Oper-ations Specialists, All Other
12,636 1,168 $31.21 8.74% 0.90
Computer User Support Specialists 6,113 534 $24.14 6.33% 1.00
Software Developers and Software Quality Assur-ance Analysts and Testers
5,770 747 $44.71 24.66% 0.42
Computer Occupations, All Other 2,261 226 $36.45 11.93% 0.61
Computer and Information Systems Managers 2,093 218 $56.84 13.31% 0.49
2020 Program Completions
2020 Completions
% Change (2012-2020)
Distance Offered Programs 2 (33.3%)
Non-Distance Offered Programs 47 Insf. Data
All Programs 49 1533.3%
Target Occupations
Job Postings Summary
Computer/Information Technology Services Administration and Management, Other (11.1099)
23,627 4 : 1Unique Postings
(Jan 2021 - Dec 2021)Posting Intensity
(Jan 2021 - Dec 2021)
97,097 Total Postings Regional Average: 5 : 1
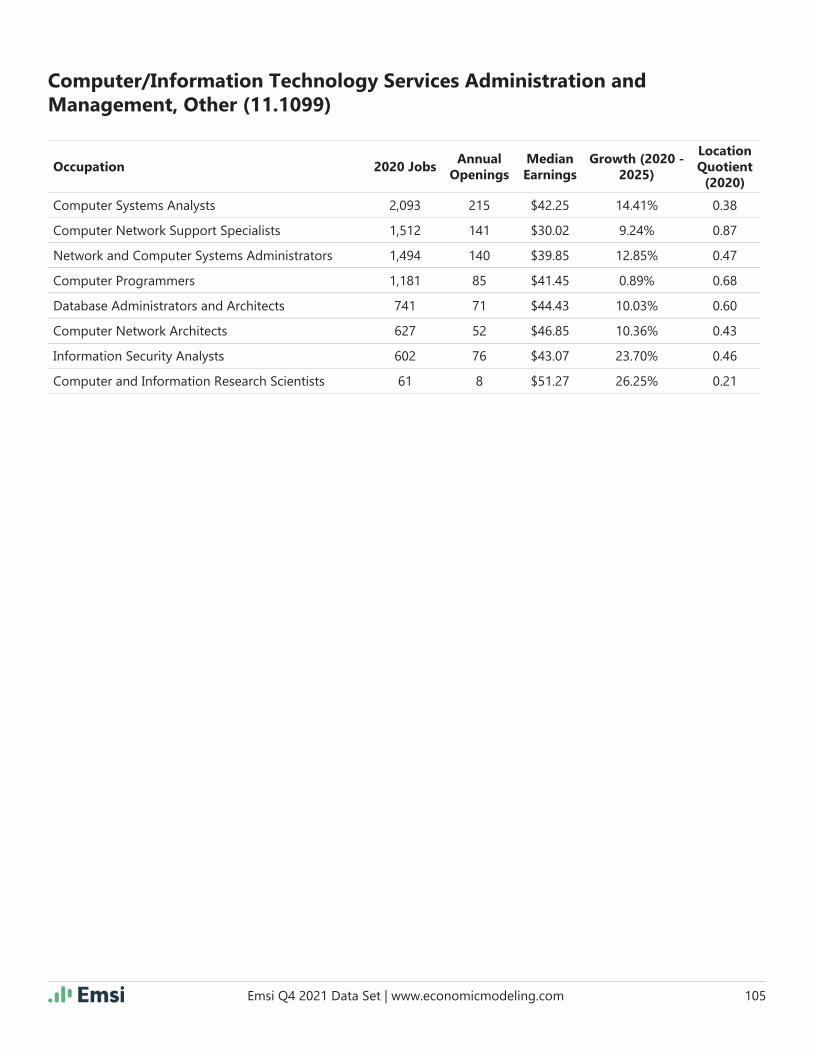
Emsi Q4 2021 Data Set | www.economicmodeling.com 105
Computer/Information Technology Services Administration and Management, Other (11.1099)
Occupation 2020 JobsAnnual
OpeningsMedian Earnings
Growth (2020 - 2025)
Location Quotient
(2020)
Computer Systems Analysts 2,093 215 $42.25 14.41% 0.38
Computer Network Support Specialists 1,512 141 $30.02 9.24% 0.87
Network and Computer Systems Administrators 1,494 140 $39.85 12.85% 0.47
Computer Programmers 1,181 85 $41.45 0.89% 0.68
Database Administrators and Architects 741 71 $44.43 10.03% 0.60
Computer Network Architects 627 52 $46.85 10.36% 0.43
Information Security Analysts 602 76 $43.07 23.70% 0.46
Computer and Information Research Scientists 61 8 $51.27 26.25% 0.21
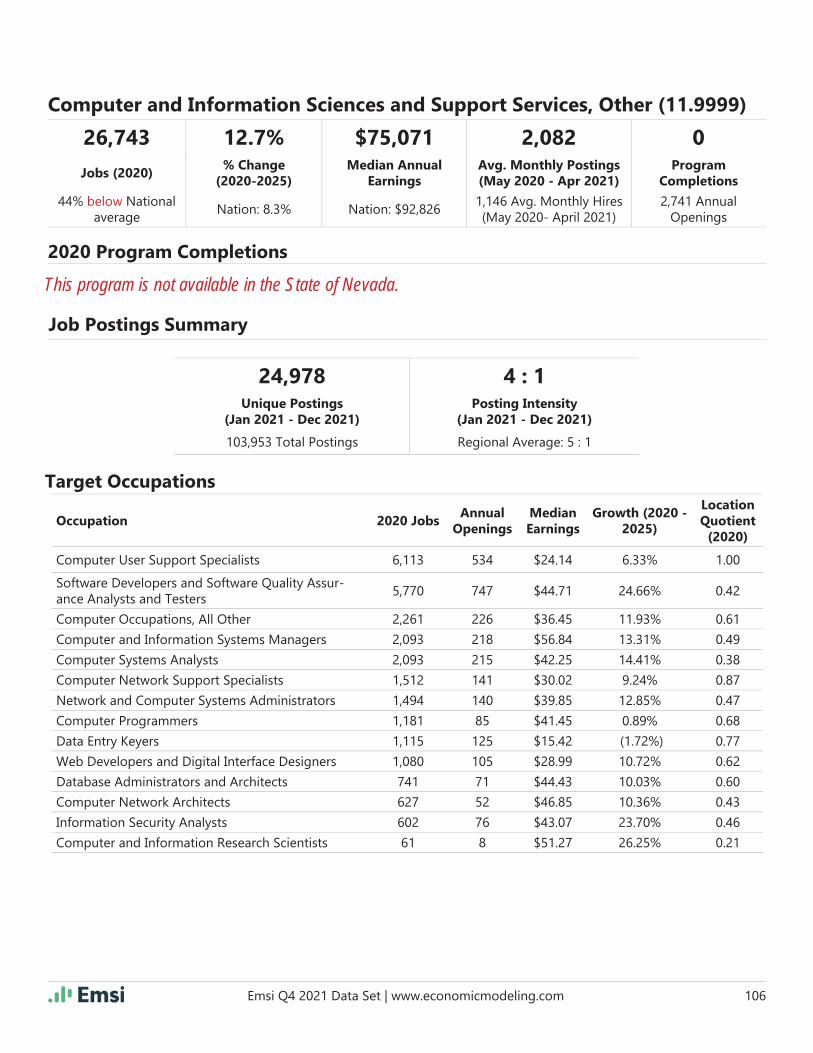
Emsi Q4 2021 Data Set | www.economicmodeling.com 106
26,743 12.7% $75,071 2,082 0
Jobs (2020)% Change
(2020-2025)Median Annual
EarningsAvg. Monthly Postings (May 2020 - Apr 2021)
Program Completions
44% below National average
Nation: 8.3% Nation: $92,8261,146 Avg. Monthly Hires (May 2020- April 2021)
2,741 Annual Openings
Occupation 2020 JobsAnnual
OpeningsMedian Earnings
Growth (2020 - 2025)
Location Quotient
(2020)
Computer User Support Specialists 6,113 534 $24.14 6.33% 1.00
Software Developers and Software Quality Assur-ance Analysts and Testers
5,770 747 $44.71 24.66% 0.42
Computer Occupations, All Other 2,261 226 $36.45 11.93% 0.61
Computer and Information Systems Managers 2,093 218 $56.84 13.31% 0.49
Computer Systems Analysts 2,093 215 $42.25 14.41% 0.38
Computer Network Support Specialists 1,512 141 $30.02 9.24% 0.87
Network and Computer Systems Administrators 1,494 140 $39.85 12.85% 0.47
Computer Programmers 1,181 85 $41.45 0.89% 0.68
Data Entry Keyers 1,115 125 $15.42 (1.72%) 0.77
Web Developers and Digital Interface Designers 1,080 105 $28.99 10.72% 0.62
Database Administrators and Architects 741 71 $44.43 10.03% 0.60
Computer Network Architects 627 52 $46.85 10.36% 0.43
Information Security Analysts 602 76 $43.07 23.70% 0.46
Computer and Information Research Scientists 61 8 $51.27 26.25% 0.21
2020 Program Completions
Target Occupations
Job Postings Summary
Computer and Information Sciences and Support Services, Other (11.9999)
This program is not available in the State of Nevada.
24,978 4 : 1Unique Postings
(Jan 2021 - Dec 2021)Posting Intensity
(Jan 2021 - Dec 2021)
103,953 Total Postings Regional Average: 5 : 1
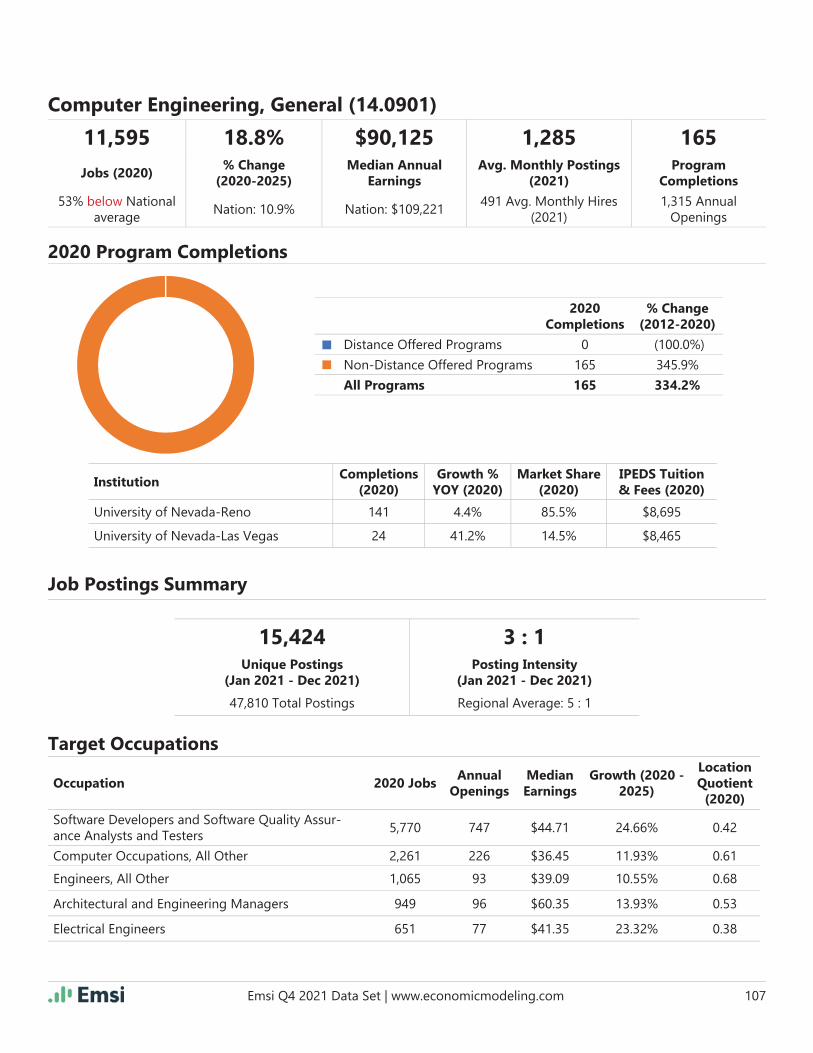
Emsi Q4 2021 Data Set | www.economicmodeling.com 107
InstitutionCompletions
(2020)Growth %
YOY (2020)Market Share
(2020)IPEDS Tuition & Fees (2020)
University of Nevada-Reno 141 4.4% 85.5% $8,695
University of Nevada-Las Vegas 24 41.2% 14.5% $8,465
11,595 18.8% $90,125 1,285 165
Jobs (2020)% Change
(2020-2025)Median Annual
EarningsAvg. Monthly Postings
(2021)Program
Completions
53% below National average
Nation: 10.9% Nation: $109,221491 Avg. Monthly Hires
(2021)1,315 Annual
Openings
Occupation 2020 JobsAnnual
OpeningsMedian Earnings
Growth (2020 - 2025)
Location Quotient
(2020)
Software Developers and Software Quality Assur-ance Analysts and Testers
5,770 747 $44.71 24.66% 0.42
Computer Occupations, All Other 2,261 226 $36.45 11.93% 0.61
Engineers, All Other 1,065 93 $39.09 10.55% 0.68
Architectural and Engineering Managers 949 96 $60.35 13.93% 0.53
Electrical Engineers 651 77 $41.35 23.32% 0.38
2020 Program Completions
2020 Completions
% Change (2012-2020)
Distance Offered Programs 0 (100.0%)
Non-Distance Offered Programs 165 345.9%
All Programs 165 334.2%
Target Occupations
Job Postings Summary
Computer Engineering, General (14.0901)
15,424 3 : 1Unique Postings
(Jan 2021 - Dec 2021)Posting Intensity
(Jan 2021 - Dec 2021)
47,810 Total Postings Regional Average: 5 : 1

Emsi Q4 2021 Data Set | www.economicmodeling.com 108
Computer Engineering, General (14.0901)
Occupation 2020 JobsAnnual
OpeningsMedian Earnings
Growth (2020 - 2025)
Location Quotient
(2020)
Computer Network Architects 627 52 $46.85 10.36% 0.43
Computer Hardware Engineers 273 24 $38.25 9.19% 0.45

Emsi Q4 2021 Data Set | www.economicmodeling.com 109
4,425 6.7% $60,046 168 0
Jobs (2020)% Change
(2020-2025)Median Annual
EarningsAvg. Monthly Postings
(2021)Program
Completions
20% below National average
Nation: 0.3% Nation: $71,255210 Avg. Monthly Hires
(2021)505 Annual Openings
Occupation 2020 JobsAnnual
OpeningsMedian Earnings
Growth (2020 - 2025)
Location Quotient
(2020)
Electrical and Electronic Engineering Technologists and Technicians
1,419 170 $33.35 11.30% 1.31
Telecommunications Line Installers and Repairers 1,329 151 $18.41 2.24% 1.15
Telecommunications Equipment Installers and Re-pairers, Except Line Installers
1,050 133 $25.62 3.81% 0.58
Computer Network Architects 627 52 $46.85 10.36% 0.43
2020 Program Completions
Target Occupations
Job Postings Summary
Telecommunications Technology/Technician (15.0305)
This program is not available in the State of Nevada.
2,013 4 : 1Unique Postings
(Jan 2021 - Dec 2021)Posting Intensity
(Jan 2021 - Dec 2021)
8,632 Total Postings Regional Average: 5 : 1

Emsi Q4 2021 Data Set | www.economicmodeling.com 110
41,549 8.0% $70,023 1,226 0
Jobs (2020)% Change
(2020-2025)Median Annual
EarningsAvg. Monthly Postings
(2021)Program
Completions
8% above National average
Nation: 4.2% Nation: $76,5471,767 Avg. Monthly Hires
(2021)4,105 Annual
Openings
Occupation 2020 JobsAnnual
OpeningsMedian Earnings
Growth (2020 - 2025)
Location Quotient
(2020)
Personal Service Managers, All Other; Entertainment and Recreation Managers, Except Gambling; and Managers, All Other
14,315 1,212 $38.17 5.45% 1.69
Project Management Specialists and Business Oper-ations Specialists, All Other
12,636 1,168 $31.21 8.74% 0.90
First-Line Supervisors of Construction Trades and Extraction Workers
6,984 818 $32.05 9.39% 1.13
Installation, Maintenance, and Repair Workers, All Other
2,166 246 $22.90 4.40% 1.27
Sales Representatives, Wholesale and Manufactur-ing, Technical and Scientifi c Products
1,691 215 $42.08 12.15% 0.63
Architectural and Engineering Managers 949 96 $60.35 13.93% 0.53
Industrial Production Managers 907 101 $47.19 18.99% 0.56
Miscellaneous Construction and Related Workers 706 90 $18.90 3.40% 2.05
Calibration Technologists and Technicians and Engineering Technologists and Technicians, Except Drafters, All Other
446 61 $35.30 18.06% 0.50
Power Plant Operators 428 41 $42.85 (5.96%) 1.34
Solar Photovoltaic Installers 226 42 $22.55 28.83% 1.65
Plant and System Operators, All Other 71 9 $29.66 8.05% 0.49
Wind Turbine Service Technicians 27 6 $24.86 47.92% 0.36
2020 Program Completions
Target Occupations
Job Postings Summary
Environmental Control Technologies/Technicians, Other (15.0599)
This program is not available in the State of Nevada.
14,712 4 : 1Unique Postings
(Jan 2021 - Dec 2021)Posting Intensity
(Jan 2021 - Dec 2021)
64,281 Total Postings Regional Average: 5 : 1

Emsi Q4 2021 Data Set | www.economicmodeling.com 111
InstitutionCompletions
(2020)Growth %
YOY (2020)Market Share
(2020)IPEDS Tuition & Fees (2020)
Truckee Meadows Community College 50 138.1% 80.6% $2,862
Western Nevada College 12 (42.9%) 19.4% $3,548
111,081 8.8% $72,748 4,852 62
Jobs (2020)% Change
(2020-2025)Median Annual
EarningsAvg. Monthly Postings
(2021)Program
Completions
11% below National average
Nation: 5.7% Nation: $77,3704,979 Avg. Monthly Hires
(2021)11,617 Annual
Openings
Occupation 2020 JobsAnnual
OpeningsMedian Earnings
Growth (2020 - 2025)
Location Quotient
(2020)
General and Operations Managers 21,279 2,195 $49.45 8.96% 0.97
Maintenance and Repair Workers, General 14,904 1,562 $21.86 4.19% 1.12
Personal Service Managers, All Other; Entertainment and Recreation Managers, Except Gambling; and Managers, All Other
14,315 1,212 $38.17 5.45% 1.69
Sales Representatives, Wholesale and Manufactur-ing, Except Technical and Scientifi c Products
8,154 939 $29.03 7.31% 0.68
2020 Program Completions
2020 Completions
% Change (2012-2020)
Distance Offered Programs 0 0.0%
Non-Distance Offered Programs 62 3000.0%
All Programs 62 3000.0%
Target Occupations
Job Postings Summary
Manufacturing Engineering Technology/Technician (15.0613)
58,226 5 : 1Unique Postings
(Jan 2021 - Dec 2021)Posting Intensity
(Jan 2021 - Dec 2021)
265,084 Total Postings Regional Average: 5 : 1

Emsi Q4 2021 Data Set | www.economicmodeling.com 112
Manufacturing Engineering Technology/Technician (15.0613)
Occupation 2020 JobsAnnual
OpeningsMedian Earnings
Growth (2020 - 2025)
Location Quotient
(2020)
Electricians 7,937 963 $30.24 7.51% 1.19
Management Analysts 6,585 768 $36.55 10.96% 0.80
Computer User Support Specialists 6,113 534 $24.14 6.33% 1.00
Software Developers and Software Quality Assur-ance Analysts and Testers
5,770 747 $44.71 24.66% 0.42
Construction Managers 5,005 485 $39.03 11.07% 1.20
First-Line Supervisors of Mechanics, Installers, and Repairers
4,327 449 $34.50 6.58% 0.97
First-Line Supervisors of Production and Operating Workers
3,834 476 $28.74 11.00% 0.70
Sales Managers 3,276 321 $53.43 6.40% 0.90
Chief Executives 1,971 159 $80.60 4.81% 0.80
Network and Computer Systems Administrators 1,494 140 $39.85 12.85% 0.47
Electrical and Electronic Engineering Technologists and Technicians
1,419 170 $33.35 11.30% 1.31
Engineers, All Other 1,065 93 $39.09 10.55% 0.68
Mechanical Engineers 996 106 $43.42 21.33% 0.37
Architectural and Engineering Managers 949 96 $60.35 13.93% 0.53
Industrial Production Managers 907 101 $47.19 18.99% 0.56
Industrial Engineers 781 102 $43.19 29.91% 0.30
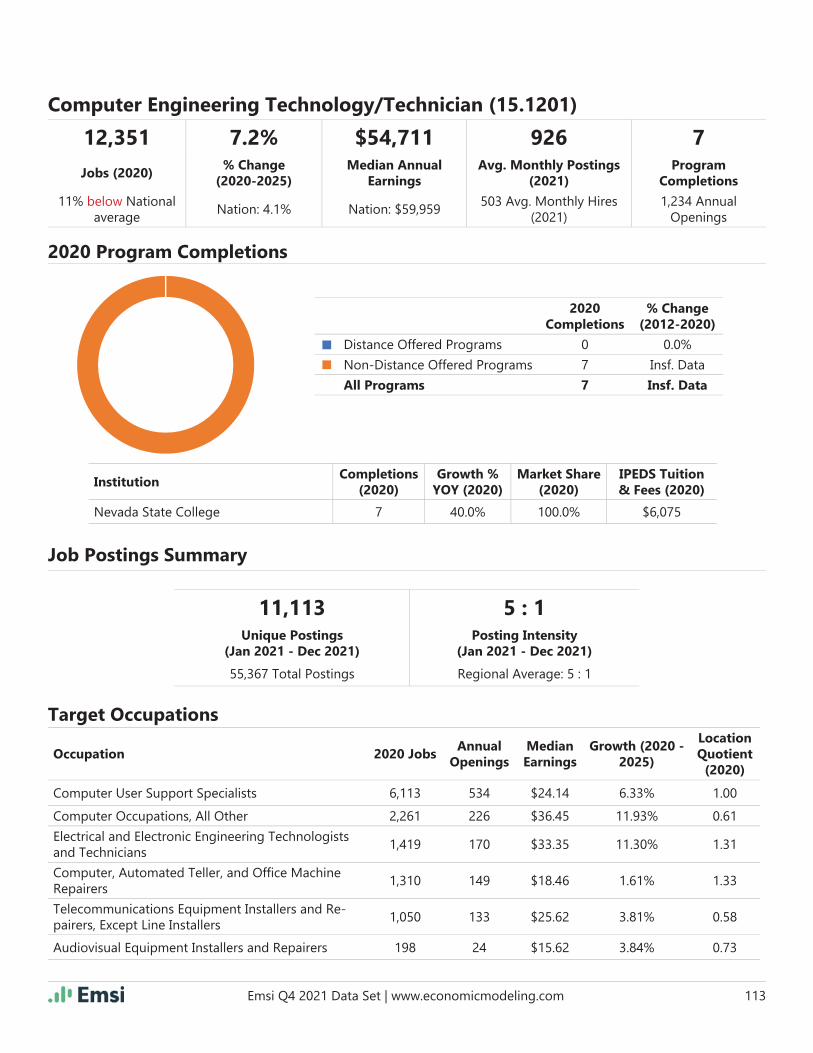
Emsi Q4 2021 Data Set | www.economicmodeling.com 113
InstitutionCompletions
(2020)Growth %
YOY (2020)Market Share
(2020)IPEDS Tuition & Fees (2020)
Nevada State College 7 40.0% 100.0% $6,075
12,351 7.2% $54,711 926 7
Jobs (2020)% Change
(2020-2025)Median Annual
EarningsAvg. Monthly Postings
(2021)Program
Completions
11% below National average
Nation: 4.1% Nation: $59,959503 Avg. Monthly Hires
(2021)1,234 Annual
Openings
Occupation 2020 JobsAnnual
OpeningsMedian Earnings
Growth (2020 - 2025)
Location Quotient
(2020)
Computer User Support Specialists 6,113 534 $24.14 6.33% 1.00
Computer Occupations, All Other 2,261 226 $36.45 11.93% 0.61
Electrical and Electronic Engineering Technologists and Technicians
1,419 170 $33.35 11.30% 1.31
Computer, Automated Teller, and Offi ce Machine Repairers
1,310 149 $18.46 1.61% 1.33
Telecommunications Equipment Installers and Re-pairers, Except Line Installers
1,050 133 $25.62 3.81% 0.58
Audiovisual Equipment Installers and Repairers 198 24 $15.62 3.84% 0.73
2020 Program Completions
2020 Completions
% Change (2012-2020)
Distance Offered Programs 0 0.0%
Non-Distance Offered Programs 7 Insf. Data
All Programs 7 Insf. Data
Target Occupations
Job Postings Summary
Computer Engineering Technology/Technician (15.1201)
11,113 5 : 1Unique Postings
(Jan 2021 - Dec 2021)Posting Intensity
(Jan 2021 - Dec 2021)
55,367 Total Postings Regional Average: 5 : 1

Emsi Q4 2021 Data Set | www.economicmodeling.com 114
14,444 8.2% $58,929 1,057 0
Jobs (2020)% Change
(2020-2025)Median Annual
EarningsAvg. Monthly Postings
(2021)Program
Completions
25% below National average
Nation: 4.4% Nation: $68,636584 Avg. Monthly Hires
(2021)1,449 Annual
Openings
Occupation 2020 JobsAnnual
OpeningsMedian Earnings
Growth (2020 - 2025)
Location Quotient
(2020)
Computer User Support Specialists 6,113 534 $24.14 6.33% 1.00
Computer Occupations, All Other 2,261 226 $36.45 11.93% 0.61
Computer Systems Analysts 2,093 215 $42.25 14.41% 0.38
Electrical and Electronic Engineering Technologists and Technicians
1,419 170 $33.35 11.30% 1.31
Computer, Automated Teller, and Offi ce Machine Repairers
1,310 149 $18.46 1.61% 1.33
Telecommunications Equipment Installers and Re-pairers, Except Line Installers
1,050 133 $25.62 3.81% 0.58
Audiovisual Equipment Installers and Repairers 198 24 $15.62 3.84% 0.73
2020 Program Completions
Target Occupations
Job Postings Summary
Computer/Computer Systems Technology/Technician (15.1202)
This program is not available in the State of Nevada.
12,688 5 : 1Unique Postings
(Jan 2021 - Dec 2021)Posting Intensity
(Jan 2021 - Dec 2021)
60,340 Total Postings Regional Average: 5 : 1
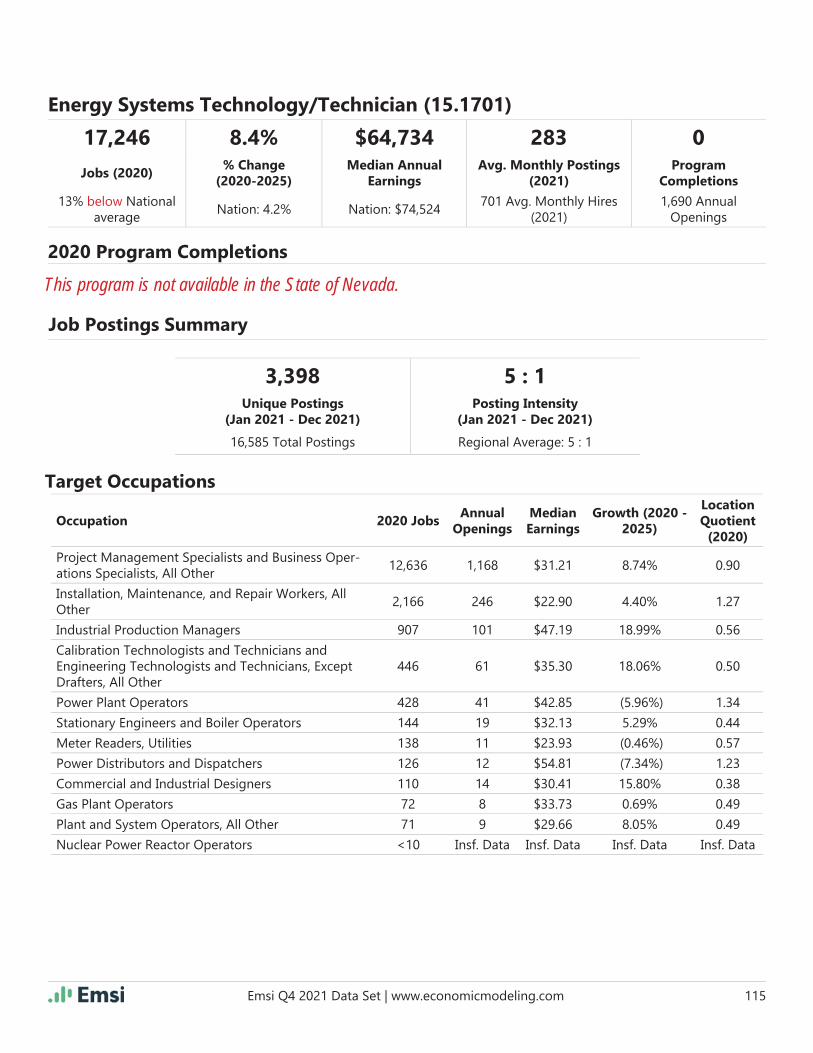
Emsi Q4 2021 Data Set | www.economicmodeling.com 115
17,246 8.4% $64,734 283 0
Jobs (2020)% Change
(2020-2025)Median Annual
EarningsAvg. Monthly Postings
(2021)Program
Completions
13% below National average
Nation: 4.2% Nation: $74,524701 Avg. Monthly Hires
(2021)1,690 Annual
Openings
Occupation 2020 JobsAnnual
OpeningsMedian Earnings
Growth (2020 - 2025)
Location Quotient
(2020)
Project Management Specialists and Business Oper-ations Specialists, All Other
12,636 1,168 $31.21 8.74% 0.90
Installation, Maintenance, and Repair Workers, All Other
2,166 246 $22.90 4.40% 1.27
Industrial Production Managers 907 101 $47.19 18.99% 0.56
Calibration Technologists and Technicians and Engineering Technologists and Technicians, Except Drafters, All Other
446 61 $35.30 18.06% 0.50
Power Plant Operators 428 41 $42.85 (5.96%) 1.34
Stationary Engineers and Boiler Operators 144 19 $32.13 5.29% 0.44
Meter Readers, Utilities 138 11 $23.93 (0.46%) 0.57
Power Distributors and Dispatchers 126 12 $54.81 (7.34%) 1.23
Commercial and Industrial Designers 110 14 $30.41 15.80% 0.38
Gas Plant Operators 72 8 $33.73 0.69% 0.49
Plant and System Operators, All Other 71 9 $29.66 8.05% 0.49
Nuclear Power Reactor Operators <10 Insf. Data Insf. Data Insf. Data Insf. Data
2020 Program Completions
Target Occupations
Job Postings Summary
Energy Systems Technology/Technician (15.1701)
This program is not available in the State of Nevada.
3,398 5 : 1Unique Postings
(Jan 2021 - Dec 2021)Posting Intensity
(Jan 2021 - Dec 2021)
16,585 Total Postings Regional Average: 5 : 1

Emsi Q4 2021 Data Set | www.economicmodeling.com 116
InstitutionCompletions
(2020)Growth %
YOY (2020)Market Share
(2020)IPEDS Tuition & Fees (2020)
Truckee Meadows Community College 4 33.3% 100.0% $2,862
23,753 9.5% $65,869 372 4
Jobs (2020)% Change
(2020-2025)Median Annual
EarningsAvg. Monthly Postings
(2021)Program
Completions
8% below National average
Nation: 4.2% Nation: $74,5601,233 Avg. Monthly Hires
(2021)2,486 Annual
Openings
Occupation 2020 JobsAnnual
OpeningsMedian Earnings
Growth (2020 - 2025)
Location Quotient
(2020)
Project Management Specialists and Business Oper-ations Specialists, All Other
12,636 1,168 $31.21 8.74% 0.90
First-Line Supervisors of Construction Trades and Extraction Workers
6,984 818 $32.05 9.39% 1.13
Sales Representatives, Wholesale and Manufactur-ing, Technical and Scientifi c Products
1,691 215 $42.08 12.15% 0.63
Engineers, All Other 1,065 93 $39.09 10.55% 0.68
Miscellaneous Construction and Related Workers 706 90 $18.90 3.40% 2.05
2020 Program Completions
2020 Completions
% Change (2012-2020)
Distance Offered Programs 0 0.0%
Non-Distance Offered Programs 4 Insf. Data
All Programs 4 Insf. Data
Target Occupations
Job Postings Summary
Solar Energy Technology/Technician (15.1703)
4,458 4 : 1Unique Postings
(Jan 2021 - Dec 2021)Posting Intensity
(Jan 2021 - Dec 2021)
19,364 Total Postings Regional Average: 5 : 1

Emsi Q4 2021 Data Set | www.economicmodeling.com 117
Solar Energy Technology/Technician (15.1703)
Occupation 2020 JobsAnnual
OpeningsMedian Earnings
Growth (2020 - 2025)
Location Quotient
(2020)
Calibration Technologists and Technicians and Engineering Technologists and Technicians, Except Drafters, All Other
446 61 $35.30 18.06% 0.50
Solar Photovoltaic Installers 226 42 $22.55 28.83% 1.65

Emsi Q4 2021 Data Set | www.economicmodeling.com 118
InstitutionCompletions
(2020)Growth %
YOY (2020)Market Share
(2020)IPEDS Tuition & Fees (2020)
College of Southern Nevada 563 (0.7%) 47.5% $3,878
Western Nevada College 293 (12.0%) 24.7% $3,548
Truckee Meadows Community College 263 (6.1%) 22.2% $2,862
Great Basin College 67 6.3% 5.6% $3,593
199,966 6.2% $46,569 7,055 1,186
Jobs (2020)% Change
(2020-2025)Median Annual
EarningsAvg. Monthly Postings
(2021)Program
Completions
5% below National average
Nation: 2.1% Nation: $50,93811,342 Avg. Monthly
Hires (2021)23,855 Annual
Openings
Occupation 2020 JobsAnnual
OpeningsMedian Earnings
Growth (2020 - 2025)
Location Quotient
(2020)
Retail Salespersons 41,491 6,053 $12.64 2.60% 1.19
Customer Service Representatives 28,551 4,255 $16.03 8.87% 1.09
General and Operations Managers 21,279 2,195 $49.45 8.96% 0.97
Secretaries and Administrative Assistants, Except Legal, Medical, and Executive
17,494 1,915 $18.74 0.37% 0.92
2020 Program Completions
2020 Completions
% Change (2012-2020)
Distance Offered Programs 1,186 32.5%
Non-Distance Offered Programs 0 0.0%
All Programs 1,186 32.5%
Target Occupations
Job Postings Summary
Liberal Arts and Sciences/Liberal Studies (24.0101)
84,660 5 : 1Unique Postings
(Jan 2021 - Dec 2021)Posting Intensity
(Jan 2021 - Dec 2021)
464,018 Total Postings Regional Average: 5 : 1

Emsi Q4 2021 Data Set | www.economicmodeling.com 119
Liberal Arts and Sciences/Liberal Studies (24.0101)
Occupation 2020 JobsAnnual
OpeningsMedian Earnings
Growth (2020 - 2025)
Location Quotient
(2020)
Personal Service Managers, All Other; Entertainment and Recreation Managers, Except Gambling; and Managers, All Other
14,315 1,212 $38.17 5.45% 1.69
Project Management Specialists and Business Oper-ations Specialists, All Other
12,636 1,168 $31.21 8.74% 0.90
First-Line Supervisors of Offi ce and Administrative Support Workers
11,554 1,238 $24.99 3.70% 0.87
Postsecondary Teachers 8,204 1,014 $30.37 11.03% 0.51
Sales Representatives, Wholesale and Manufactur-ing, Except Technical and Scientifi c Products
8,154 939 $29.03 7.31% 0.68
Computer User Support Specialists 6,113 534 $24.14 6.33% 1.00
Real Estate Sales Agents 5,993 607 $27.36 6.24% 1.54
Financial Managers 5,646 544 $49.56 10.99% 0.91
Human Resources Specialists 4,583 535 $25.69 9.34% 0.72
Sales Managers 3,276 321 $53.43 6.40% 0.90
Tutors and Teachers and Instructors, All Other 2,933 439 $23.19 13.88% 0.78
Social and Human Service Assistants 2,237 352 $17.94 16.74% 0.59
Chief Executives 1,971 159 $80.60 4.81% 0.80
Executive Secretaries and Executive Administrative Assistants
1,813 203 $31.10 0.18% 0.38
Marketing Managers 1,723 174 $48.88 7.74% 0.66

Emsi Q4 2021 Data Set | www.economicmodeling.com 120
InstitutionCompletions
(2020)Growth %
YOY (2020)Market Share
(2020)IPEDS Tuition & Fees (2020)
College of Southern Nevada 419 1.9% 60.3% $3,878
Truckee Meadows Community College 124 21.6% 17.8% $2,862
Western Nevada College 93 86.0% 13.4% $3,548
University of Nevada-Reno 47 (37.3%) 6.8% $8,695
Great Basin College 12 (14.3%) 1.7% $3,593
199,966 6.2% $46,569 7,055 695
Jobs (2020)% Change
(2020-2025)Median Annual
EarningsAvg. Monthly Postings
(2021)Program
Completions
5% below National average
Nation: 2.1% Nation: $50,93811,342 Avg. Monthly
Hires (2021)23,855 Annual
Openings
Occupation 2020 JobsAnnual
OpeningsMedian Earnings
Growth (2020 - 2025)
Location Quotient
(2020)
Retail Salespersons 41,491 6,053 $12.64 2.60% 1.19
Customer Service Representatives 28,551 4,255 $16.03 8.87% 1.09
General and Operations Managers 21,279 2,195 $49.45 8.96% 0.97
2020 Program Completions
2020 Completions
% Change (2012-2020)
Distance Offered Programs 648 55.4%
Non-Distance Offered Programs 47 (69.9%)
All Programs 695 21.3%
Target Occupations
Job Postings Summary
General Studies (24.0102)
84,660 5 : 1Unique Postings
(Jan 2021 - Dec 2021)Posting Intensity
(Jan 2021 - Dec 2021)
464,018 Total Postings Regional Average: 5 : 1

Emsi Q4 2021 Data Set | www.economicmodeling.com 121
General Studies (24.0102)
Occupation 2020 JobsAnnual
OpeningsMedian Earnings
Growth (2020 - 2025)
Location Quotient
(2020)
Secretaries and Administrative Assistants, Except Legal, Medical, and Executive
17,494 1,915 $18.74 0.37% 0.92
Personal Service Managers, All Other; Entertainment and Recreation Managers, Except Gambling; and Managers, All Other
14,315 1,212 $38.17 5.45% 1.69
Project Management Specialists and Business Oper-ations Specialists, All Other
12,636 1,168 $31.21 8.74% 0.90
First-Line Supervisors of Offi ce and Administrative Support Workers
11,554 1,238 $24.99 3.70% 0.87
Postsecondary Teachers 8,204 1,014 $30.37 11.03% 0.51
Sales Representatives, Wholesale and Manufactur-ing, Except Technical and Scientifi c Products
8,154 939 $29.03 7.31% 0.68
Computer User Support Specialists 6,113 534 $24.14 6.33% 1.00
Real Estate Sales Agents 5,993 607 $27.36 6.24% 1.54
Financial Managers 5,646 544 $49.56 10.99% 0.91
Human Resources Specialists 4,583 535 $25.69 9.34% 0.72
Sales Managers 3,276 321 $53.43 6.40% 0.90
Tutors and Teachers and Instructors, All Other 2,933 439 $23.19 13.88% 0.78
Social and Human Service Assistants 2,237 352 $17.94 16.74% 0.59
Chief Executives 1,971 159 $80.60 4.81% 0.80
Executive Secretaries and Executive Administrative Assistants
1,813 203 $31.10 0.18% 0.38
Marketing Managers 1,723 174 $48.88 7.74% 0.66

Emsi Q4 2021 Data Set | www.economicmodeling.com 122
InstitutionCompletions
(2020)Growth %
YOY (2020)Market Share
(2020)IPEDS Tuition & Fees (2020)
Sierra Nevada University 2 100.0% 100.0% $35,508
195,383 6.1% $46,364 6,701 2
Jobs (2020)% Change
(2020-2025)Median Annual
EarningsAvg. Monthly Postings
(2021)Program
Completions
4% below National average
Nation: 2.0% Nation: $50,34311,030 Avg. Monthly
Hires (2021)23,320 Annual
Openings
Occupation 2020 JobsAnnual
OpeningsMedian Earnings
Growth (2020 - 2025)
Location Quotient
(2020)
Retail Salespersons 41,491 6,053 $12.64 2.60% 1.19
Customer Service Representatives 28,551 4,255 $16.03 8.87% 1.09
General and Operations Managers 21,279 2,195 $49.45 8.96% 0.97
Secretaries and Administrative Assistants, Except Legal, Medical, and Executive
17,494 1,915 $18.74 0.37% 0.92
Personal Service Managers, All Other; Entertainment and Recreation Managers, Except Gambling; and Managers, All Other
14,315 1,212 $38.17 5.45% 1.69
Project Management Specialists and Business Oper-ations Specialists, All Other
12,636 1,168 $31.21 8.74% 0.90
2020 Program Completions
2020 Completions
% Change (2012-2020)
Distance Offered Programs 0 0.0%
Non-Distance Offered Programs 2 (60.0%)
All Programs 2 (60.0%)
Target Occupations
Job Postings Summary
Liberal Arts and Sciences, General Studies and Humanities, Other (24.0199)
80,410 6 : 1Unique Postings
(Jan 2021 - Dec 2021)Posting Intensity
(Jan 2021 - Dec 2021)
446,054 Total Postings Regional Average: 5 : 1

Emsi Q4 2021 Data Set | www.economicmodeling.com 123
Liberal Arts and Sciences, General Studies and Humanities, Other (24.0199)
Occupation 2020 JobsAnnual
OpeningsMedian Earnings
Growth (2020 - 2025)
Location Quotient
(2020)
First-Line Supervisors of Offi ce and Administrative Support Workers
11,554 1,238 $24.99 3.70% 0.87
Postsecondary Teachers 8,204 1,014 $30.37 11.03% 0.51
Sales Representatives, Wholesale and Manufactur-ing, Except Technical and Scientifi c Products
8,154 939 $29.03 7.31% 0.68
Computer User Support Specialists 6,113 534 $24.14 6.33% 1.00
Real Estate Sales Agents 5,993 607 $27.36 6.24% 1.54
Financial Managers 5,646 544 $49.56 10.99% 0.91
Sales Managers 3,276 321 $53.43 6.40% 0.90
Tutors and Teachers and Instructors, All Other 2,933 439 $23.19 13.88% 0.78
Social and Human Service Assistants 2,237 352 $17.94 16.74% 0.59
Chief Executives 1,971 159 $80.60 4.81% 0.80
Executive Secretaries and Executive Administrative Assistants
1,813 203 $31.10 0.18% 0.38
Marketing Managers 1,723 174 $48.88 7.74% 0.66
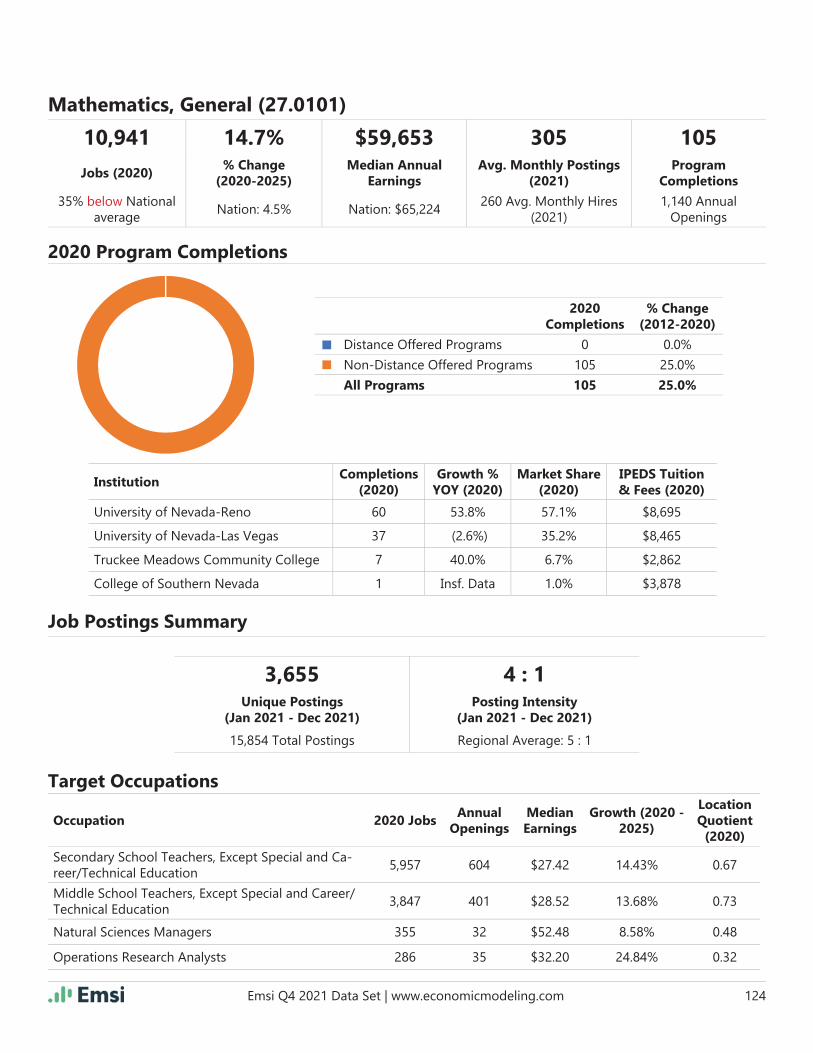
Emsi Q4 2021 Data Set | www.economicmodeling.com 124
InstitutionCompletions
(2020)Growth %
YOY (2020)Market Share
(2020)IPEDS Tuition & Fees (2020)
University of Nevada-Reno 60 53.8% 57.1% $8,695
University of Nevada-Las Vegas 37 (2.6%) 35.2% $8,465
Truckee Meadows Community College 7 40.0% 6.7% $2,862
College of Southern Nevada 1 Insf. Data 1.0% $3,878
10,941 14.7% $59,653 305 105
Jobs (2020)% Change
(2020-2025)Median Annual
EarningsAvg. Monthly Postings
(2021)Program
Completions
35% below National average
Nation: 4.5% Nation: $65,224260 Avg. Monthly Hires
(2021)1,140 Annual
Openings
Occupation 2020 JobsAnnual
OpeningsMedian Earnings
Growth (2020 - 2025)
Location Quotient
(2020)
Secondary School Teachers, Except Special and Ca-reer/Technical Education
5,957 604 $27.42 14.43% 0.67
Middle School Teachers, Except Special and Career/Technical Education
3,847 401 $28.52 13.68% 0.73
Natural Sciences Managers 355 32 $52.48 8.58% 0.48
Operations Research Analysts 286 35 $32.20 24.84% 0.32
2020 Program Completions
2020 Completions
% Change (2012-2020)
Distance Offered Programs 0 0.0%
Non-Distance Offered Programs 105 25.0%
All Programs 105 25.0%
Target Occupations
Job Postings Summary
Mathematics, General (27.0101)
3,655 4 : 1Unique Postings
(Jan 2021 - Dec 2021)Posting Intensity
(Jan 2021 - Dec 2021)
15,854 Total Postings Regional Average: 5 : 1

Emsi Q4 2021 Data Set | www.economicmodeling.com 125
Mathematics, General (27.0101)
Occupation 2020 JobsAnnual
OpeningsMedian Earnings
Growth (2020 - 2025)
Location Quotient
(2020)
Data Scientists and Mathematical Science Occupa-tions, All Other
207 30 $51.05 28.05% 0.38
Statisticians 189 27 $46.81 31.03% 0.50
Mathematicians 55 4 $35.23 (9.27%) 1.96
Statistical Assistants 45 6 $27.36 9.18% 0.49
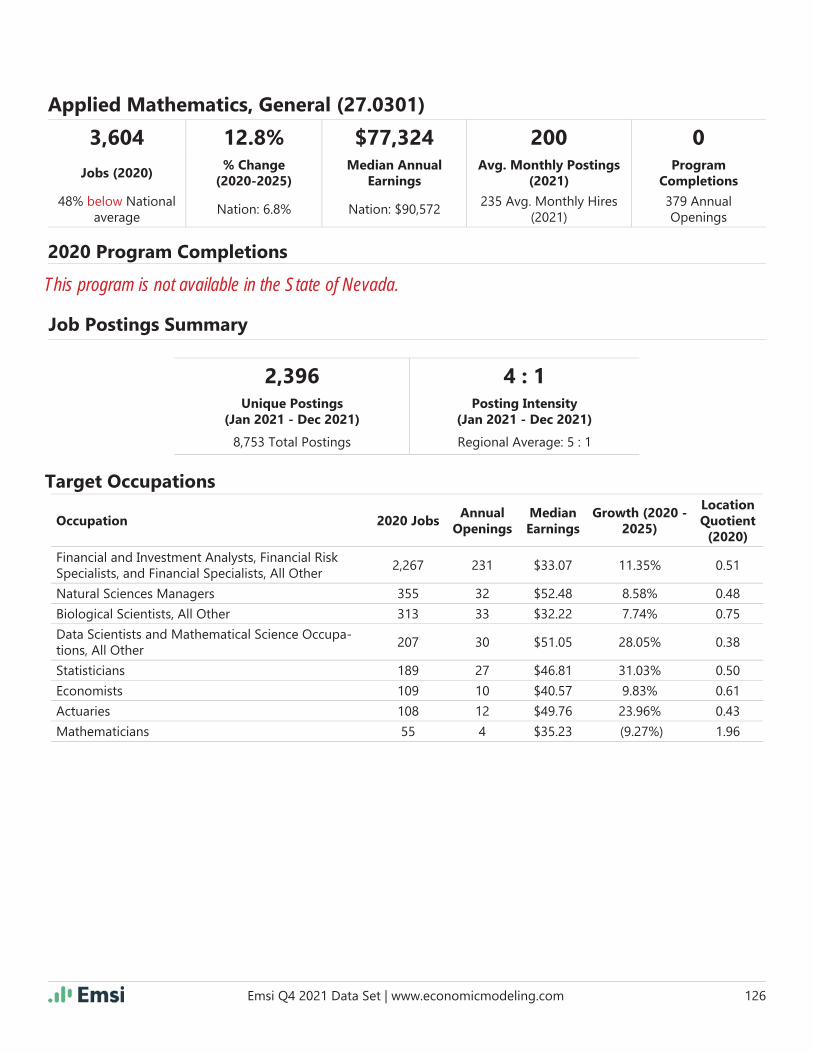
Emsi Q4 2021 Data Set | www.economicmodeling.com 126
3,604 12.8% $77,324 200 0
Jobs (2020)% Change
(2020-2025)Median Annual
EarningsAvg. Monthly Postings
(2021)Program
Completions
48% below National average
Nation: 6.8% Nation: $90,572235 Avg. Monthly Hires
(2021)379 Annual Openings
Occupation 2020 JobsAnnual
OpeningsMedian Earnings
Growth (2020 - 2025)
Location Quotient
(2020)
Financial and Investment Analysts, Financial Risk Specialists, and Financial Specialists, All Other
2,267 231 $33.07 11.35% 0.51
Natural Sciences Managers 355 32 $52.48 8.58% 0.48
Biological Scientists, All Other 313 33 $32.22 7.74% 0.75
Data Scientists and Mathematical Science Occupa-tions, All Other
207 30 $51.05 28.05% 0.38
Statisticians 189 27 $46.81 31.03% 0.50
Economists 109 10 $40.57 9.83% 0.61
Actuaries 108 12 $49.76 23.96% 0.43
Mathematicians 55 4 $35.23 (9.27%) 1.96
2020 Program Completions
Target Occupations
Job Postings Summary
Applied Mathematics, General (27.0301)
This program is not available in the State of Nevada.
2,396 4 : 1Unique Postings
(Jan 2021 - Dec 2021)Posting Intensity
(Jan 2021 - Dec 2021)
8,753 Total Postings Regional Average: 5 : 1

Emsi Q4 2021 Data Set | www.economicmodeling.com 127
1,044 17.1% $100,443 70 0
Jobs (2020)% Change
(2020-2025)Median Annual
EarningsAvg. Monthly Postings
(2021)Program
Completions
51% below National average
Nation: 11.0% Nation: $106,07847 Avg. Monthly Hires
(2021)120 Annual Openings
Occupation 2020 JobsAnnual
OpeningsMedian Earnings
Growth (2020 - 2025)
Location Quotient
(2020)
Natural Sciences Managers 355 32 $52.48 8.58% 0.48
Data Scientists and Mathematical Science Occupa-tions, All Other
207 30 $51.05 28.05% 0.38
Statisticians 189 27 $46.81 31.03% 0.50
Actuaries 108 12 $49.76 23.96% 0.43
Survey Researchers 84 10 $25.22 8.93% 0.75
Mathematicians 55 4 $35.23 (9.27%) 1.96
Statistical Assistants 45 6 $27.36 9.18% 0.49
2020 Program Completions
Target Occupations
Job Postings Summary
Statistics, General (27.0501)
This program is not available in the State of Nevada.
838 4 : 1Unique Postings
(Jan 2021 - Dec 2021)Posting Intensity
(Jan 2021 - Dec 2021)
3,130 Total Postings Regional Average: 5 : 1

Emsi Q4 2021 Data Set | www.economicmodeling.com 128
InstitutionCompletions
(2020)Growth %
YOY (2020)Market Share
(2020)IPEDS Tuition & Fees (2020)
Sierra Nevada University 17 (10.5%) 51.5% $35,508
Nevada State College 16 77.8% 48.5% $6,075
199,966 6.2% $46,569 7,055 33
Jobs (2020)% Change
(2020-2025)Median Annual
EarningsAvg. Monthly Postings
(2021)Program
Completions
5% below National average
Nation: 2.1% Nation: $50,93811,342 Avg. Monthly
Hires (2021)23,855 Annual
Openings
Occupation 2020 JobsAnnual
OpeningsMedian Earnings
Growth (2020 - 2025)
Location Quotient
(2020)
Retail Salespersons 41,491 6,053 $12.64 2.60% 1.19
Customer Service Representatives 28,551 4,255 $16.03 8.87% 1.09
General and Operations Managers 21,279 2,195 $49.45 8.96% 0.97
Secretaries and Administrative Assistants, Except Legal, Medical, and Executive
17,494 1,915 $18.74 0.37% 0.92
Personal Service Managers, All Other; Entertainment and Recreation Managers, Except Gambling; and Managers, All Other
14,315 1,212 $38.17 5.45% 1.69
2020 Program Completions
2020 Completions
% Change (2012-2020)
Distance Offered Programs 0 0.0%
Non-Distance Offered Programs 33 230.0%
All Programs 33 230.0%
Target Occupations
Job Postings Summary
Multi-/Interdisciplinary Studies, General (30.0000)
84,660 5 : 1Unique Postings
(Jan 2021 - Dec 2021)Posting Intensity
(Jan 2021 - Dec 2021)
464,018 Total Postings Regional Average: 5 : 1

Emsi Q4 2021 Data Set | www.economicmodeling.com 129
Multi-/Interdisciplinary Studies, General (30.0000)
Occupation 2020 JobsAnnual
OpeningsMedian Earnings
Growth (2020 - 2025)
Location Quotient
(2020)
Project Management Specialists and Business Oper-ations Specialists, All Other
12,636 1,168 $31.21 8.74% 0.90
First-Line Supervisors of Offi ce and Administrative Support Workers
11,554 1,238 $24.99 3.70% 0.87
Postsecondary Teachers 8,204 1,014 $30.37 11.03% 0.51
Sales Representatives, Wholesale and Manufactur-ing, Except Technical and Scientifi c Products
8,154 939 $29.03 7.31% 0.68
Computer User Support Specialists 6,113 534 $24.14 6.33% 1.00
Real Estate Sales Agents 5,993 607 $27.36 6.24% 1.54
Financial Managers 5,646 544 $49.56 10.99% 0.91
Human Resources Specialists 4,583 535 $25.69 9.34% 0.72
Sales Managers 3,276 321 $53.43 6.40% 0.90
Tutors and Teachers and Instructors, All Other 2,933 439 $23.19 13.88% 0.78
Social and Human Service Assistants 2,237 352 $17.94 16.74% 0.59
Chief Executives 1,971 159 $80.60 4.81% 0.80
Executive Secretaries and Executive Administrative Assistants
1,813 203 $31.10 0.18% 0.38
Marketing Managers 1,723 174 $48.88 7.74% 0.66

Emsi Q4 2021 Data Set | www.economicmodeling.com 130
15,725 17.2% $93,456 1,426 0
Jobs (2020)% Change
(2020-2025)Median Annual
EarningsAvg. Monthly Postings
(2021)Program
Completions
53% below National average
Nation: 9.6% Nation: $107,730652 Avg. Monthly Hires
(2021)1,734 Annual
Openings
Occupation 2020 JobsAnnual
OpeningsMedian Earnings
Growth (2020 - 2025)
Location Quotient
(2020)
Software Developers and Software Quality Assur-ance Analysts and Testers
5,770 747 $44.71 24.66% 0.42
Computer Occupations, All Other 2,261 226 $36.45 11.93% 0.61
Computer and Information Systems Managers 2,093 218 $56.84 13.31% 0.49
Computer Systems Analysts 2,093 215 $42.25 14.41% 0.38
Network and Computer Systems Administrators 1,494 140 $39.85 12.85% 0.47
Engineers, All Other 1,065 93 $39.09 10.55% 0.68
Architectural and Engineering Managers 949 96 $60.35 13.93% 0.53
2020 Program Completions
Target Occupations
Job Postings Summary
Systems Science and Theory (30.0601)
This program is not available in the State of Nevada.
17,117 3 : 1Unique Postings
(Jan 2021 - Dec 2021)Posting Intensity
(Jan 2021 - Dec 2021)
54,552 Total Postings Regional Average: 5 : 1

Emsi Q4 2021 Data Set | www.economicmodeling.com 131
11,395 8.8% $65,492 841 0
Jobs (2020)% Change
(2020-2025)Median Annual
EarningsAvg. Monthly Postings
(2021)Program
Completions
31% below National average
Nation: 4.8% Nation: $76,781495 Avg. Monthly Hires
(2021)1,197 Annual
Openings
Occupation 2020 JobsAnnual
OpeningsMedian Earnings
Growth (2020 - 2025)
Location Quotient
(2020)
Accountants and Auditors 9,134 971 $30.63 8.05% 0.72
Computer Occupations, All Other 2,261 226 $36.45 11.93% 0.61
2020 Program Completions
Target Occupations
Job Postings Summary
Accounting and Computer Science (30.1601)
This program is not available in the State of Nevada.
10,095 4 : 1Unique Postings
(Jan 2021 - Dec 2021)Posting Intensity
(Jan 2021 - Dec 2021)
35,716 Total Postings Regional Average: 5 : 1

Emsi Q4 2021 Data Set | www.economicmodeling.com 132
InstitutionCompletions
(2020)Growth %
YOY (2020)Market Share
(2020)IPEDS Tuition & Fees (2020)
Sierra Nevada University 2 0.0% 100.0% $35,508
18,744 7.4% $72,761 976 2
Jobs (2020)% Change
(2020-2025)Median Annual
EarningsAvg. Monthly Postings
(2021)Program
Completions
15% above National average
Nation: 7.6% Nation: $71,570623 Avg. Monthly Hires
(2021)1,789 Annual
Openings
Occupation 2020 JobsAnnual
OpeningsMedian Earnings
Growth (2020 - 2025)
Location Quotient
(2020)
Personal Service Managers, All Other; Entertainment and Recreation Managers, Except Gambling; and Managers, All Other
14,315 1,212 $38.17 5.45% 1.69
Market Research Analysts and Marketing Specialists 3,722 504 $26.77 15.86% 0.57
News Analysts, Reporters, and Journalists 339 36 $19.34 (4.50%) 0.78
Legislators 195 19 $78.82 8.67% 0.37
Economists 109 10 $40.57 9.83% 0.61
Political Scientists 31 4 $53.89 19.97% 0.41
2020 Program Completions
2020 Completions
% Change (2012-2020)
Distance Offered Programs 0 0.0%
Non-Distance Offered Programs 2 Insf. Data
All Programs 2 Insf. Data
Target Occupations
Job Postings Summary
International/Globalization Studies (30.2001)
11,717 4 : 1Unique Postings
(Jan 2021 - Dec 2021)Posting Intensity
(Jan 2021 - Dec 2021)
50,051 Total Postings Regional Average: 5 : 1

Emsi Q4 2021 Data Set | www.economicmodeling.com 133
International/Globalization Studies (30.2001)
Occupation 2020 JobsAnnual
OpeningsMedian Earnings
Growth (2020 - 2025)
Location Quotient
(2020)
Historians 23 3 $28.70 14.30% 0.60
Sociologists <10 Insf. Data Insf. Data Insf. Data Insf. Data

Emsi Q4 2021 Data Set | www.economicmodeling.com 134
InstitutionCompletions
(2020)Growth %
YOY (2020)Market Share
(2020)IPEDS Tuition & Fees (2020)
University of Nevada-Las Vegas 43 (10.4%) 71.7% $8,465
Sierra Nevada University 17 240.0% 28.3% $35,508
177,826 5.4% $43,344 8,177 60
Jobs (2020)% Change
(2020-2025)Median Annual
EarningsAvg. Monthly Postings
(2021)Program
Completions
2% above National average
Nation: 1.3% Nation: $45,02610,492 Avg. Monthly
Hires (2021)21,578 Annual
Openings
Occupation 2020 JobsAnnual
OpeningsMedian Earnings
Growth (2020 - 2025)
Location Quotient
(2020)
Retail Salespersons 41,491 6,053 $12.64 2.60% 1.19
Customer Service Representatives 28,551 4,255 $16.03 8.87% 1.09
General and Operations Managers 21,279 2,195 $49.45 8.96% 0.97
Secretaries and Administrative Assistants, Except Legal, Medical, and Executive
17,494 1,915 $18.74 0.37% 0.92
Personal Service Managers, All Other; Entertainment and Recreation Managers, Except Gambling; and Managers, All Other
14,315 1,212 $38.17 5.45% 1.69
First-Line Supervisors of Retail Sales Workers 13,082 1,463 $19.78 2.63% 1.11
2020 Program Completions
2020 Completions
% Change (2012-2020)
Distance Offered Programs 43 Insf. Data
Non-Distance Offered Programs 17 (71.2%)
All Programs 60 1.7%
Target Occupations
Job Postings Summary
Multi-/Interdisciplinary Studies, Other (30.9999)
98,126 5 : 1Unique Postings
(Jan 2021 - Dec 2021)Posting Intensity
(Jan 2021 - Dec 2021)
520,501 Total Postings Regional Average: 5 : 1

Emsi Q4 2021 Data Set | www.economicmodeling.com 135
Multi-/Interdisciplinary Studies, Other (30.9999)
Occupation 2020 JobsAnnual
OpeningsMedian Earnings
Growth (2020 - 2025)
Location Quotient
(2020)
First-Line Supervisors of Offi ce and Administrative Support Workers
11,554 1,238 $24.99 3.70% 0.87
Sales Representatives, Wholesale and Manufactur-ing, Except Technical and Scientifi c Products
8,154 939 $29.03 7.31% 0.68
Management Analysts 6,585 768 $36.55 10.96% 0.80
Computer User Support Specialists 6,113 534 $24.14 6.33% 1.00
Sales Managers 3,276 321 $53.43 6.40% 0.90
Social and Human Service Assistants 2,237 352 $17.94 16.74% 0.59
Chief Executives 1,971 159 $80.60 4.81% 0.80
Marketing Managers 1,723 174 $48.88 7.74% 0.66
Unclassifi ed Occupation 0 0 $0.00 0.00% 0.00
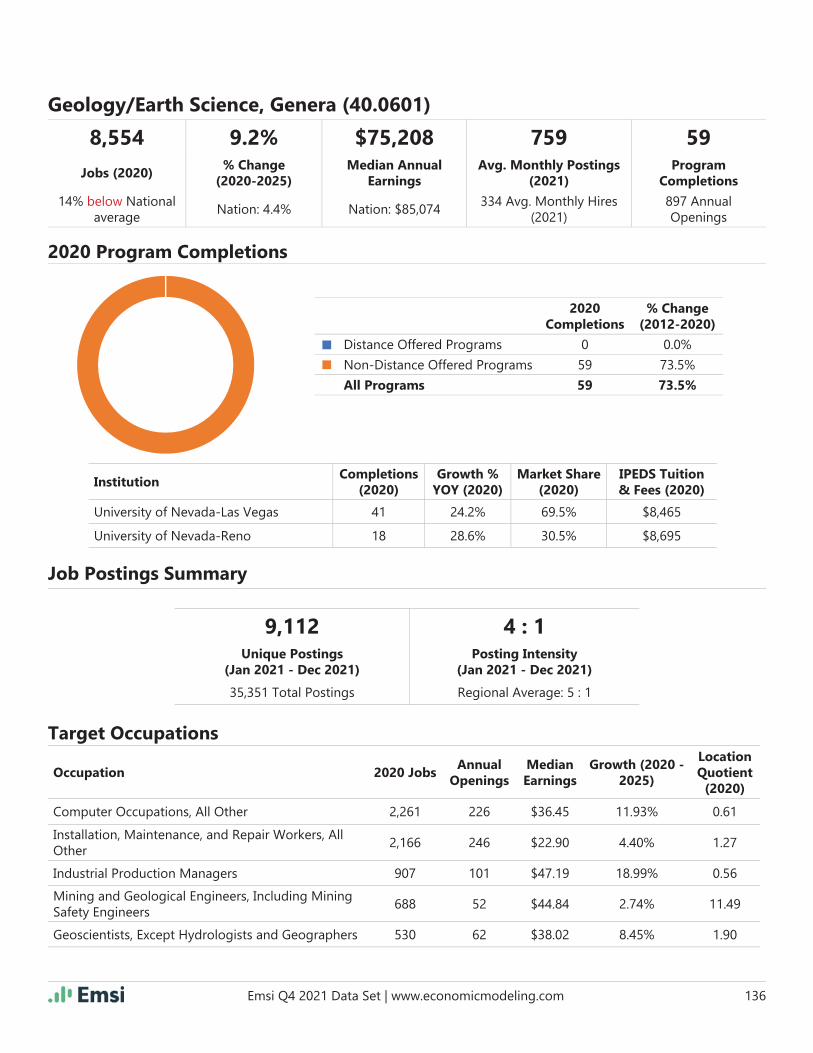
Emsi Q4 2021 Data Set | www.economicmodeling.com 136
InstitutionCompletions
(2020)Growth %
YOY (2020)Market Share
(2020)IPEDS Tuition & Fees (2020)
University of Nevada-Las Vegas 41 24.2% 69.5% $8,465
University of Nevada-Reno 18 28.6% 30.5% $8,695
8,554 9.2% $75,208 759 59
Jobs (2020)% Change
(2020-2025)Median Annual
EarningsAvg. Monthly Postings
(2021)Program
Completions
14% below National average
Nation: 4.4% Nation: $85,074334 Avg. Monthly Hires
(2021)897 Annual Openings
Occupation 2020 JobsAnnual
OpeningsMedian Earnings
Growth (2020 - 2025)
Location Quotient
(2020)
Computer Occupations, All Other 2,261 226 $36.45 11.93% 0.61
Installation, Maintenance, and Repair Workers, All Other
2,166 246 $22.90 4.40% 1.27
Industrial Production Managers 907 101 $47.19 18.99% 0.56
Mining and Geological Engineers, Including Mining Safety Engineers
688 52 $44.84 2.74% 11.49
Geoscientists, Except Hydrologists and Geographers 530 62 $38.02 8.45% 1.90
2020 Program Completions
2020 Completions
% Change (2012-2020)
Distance Offered Programs 0 0.0%
Non-Distance Offered Programs 59 73.5%
All Programs 59 73.5%
Target Occupations
Job Postings Summary
Geology/Earth Science, Genera (40.0601)
9,112 4 : 1Unique Postings
(Jan 2021 - Dec 2021)Posting Intensity
(Jan 2021 - Dec 2021)
35,351 Total Postings Regional Average: 5 : 1

Emsi Q4 2021 Data Set | www.economicmodeling.com 137
Geology/Earth Science, Genera (40.0601)
Occupation 2020 JobsAnnual
OpeningsMedian Earnings
Growth (2020 - 2025)
Location Quotient
(2020)
Surveyors 472 50 $39.68 8.75% 1.15
Environmental Engineers 465 41 $44.10 6.66% 1.01
Natural Sciences Managers 355 32 $52.48 8.58% 0.48
Hydrologists 141 16 $43.72 5.33% 2.16
Conservation Scientists 141 16 $34.72 9.45% 0.63
Atmospheric and Space Scientists 131 13 $47.95 5.45% 1.02
Geological and Hydrologic Technicians 125 20 $24.22 15.61% 0.82
Petroleum Engineers 108 14 $66.61 27.94% 0.39
Soil and Plant Scientists 64 9 $40.83 14.10% 0.41

Emsi Q4 2021 Data Set | www.economicmodeling.com 138
InstitutionCompletions
(2020)Growth %
YOY (2020)Market Share
(2020)IPEDS Tuition & Fees (2020)
Western Nevada College 12 33.3% 41.4% $3,548
University of Phoenix-Nevada 8 (52.9%) 27.6% $9,552
Nevada State College 7 (41.7%) 24.1% $6,075
Great Basin College 2 (60.0%) 6.9% $3,593
35,709 6.5% $73,006 856 29
Jobs (2020)% Change
(2020-2025)Median Annual
EarningsAvg. Monthly Postings
(2021)Program
Completions
9% above National average
Nation: 4.3% Nation: $74,7691,071 Avg. Monthly Hires
(2021)3,154 Annual
Openings
Occupation 2020 JobsAnnual
OpeningsMedian Earnings
Growth (2020 - 2025)
Location Quotient
(2020)
Personal Service Managers, All Other; Entertainment and Recreation Managers, Except Gambling; and Managers, All Other
14,315 1,212 $38.17 5.45% 1.69
Project Management Specialists and Business Oper-ations Specialists, All Other
12,636 1,168 $31.21 8.74% 0.90
Police and Sheriffs Patrol Offi cers 5,722 502 $35.55 4.84% 0.91
2020 Program Completions
2020 Completions
% Change (2012-2020)
Distance Offered Programs 14 (72.5%)
Non-Distance Offered Programs 15 (85.4%)
All Programs 29 (81.2%)
Target Occupations
Job Postings Summary
Criminal Justice/Law Enforcement Administration (43.0103)
10,270 4 : 1Unique Postings
(Jan 2021 - Dec 2021)Posting Intensity
(Jan 2021 - Dec 2021)
42,964 Total Postings Regional Average: 5 : 1

Emsi Q4 2021 Data Set | www.economicmodeling.com 139
Criminal Justice/Law Enforcement Administration (43.0103)
Occupation 2020 JobsAnnual
OpeningsMedian Earnings
Growth (2020 - 2025)
Location Quotient
(2020)
First-Line Supervisors of Police and Detectives 1,047 78 $52.21 4.94% 0.89
Detectives and Criminal Investigators 690 61 $39.10 6.56% 0.67
Labor Relations Specialists 686 67 $29.93 0.76% 1.09
Public Safety Telecommunicators 534 59 $26.15 7.50% 0.63
Emergency Management Directors 79 8 $39.94 6.47% 0.61
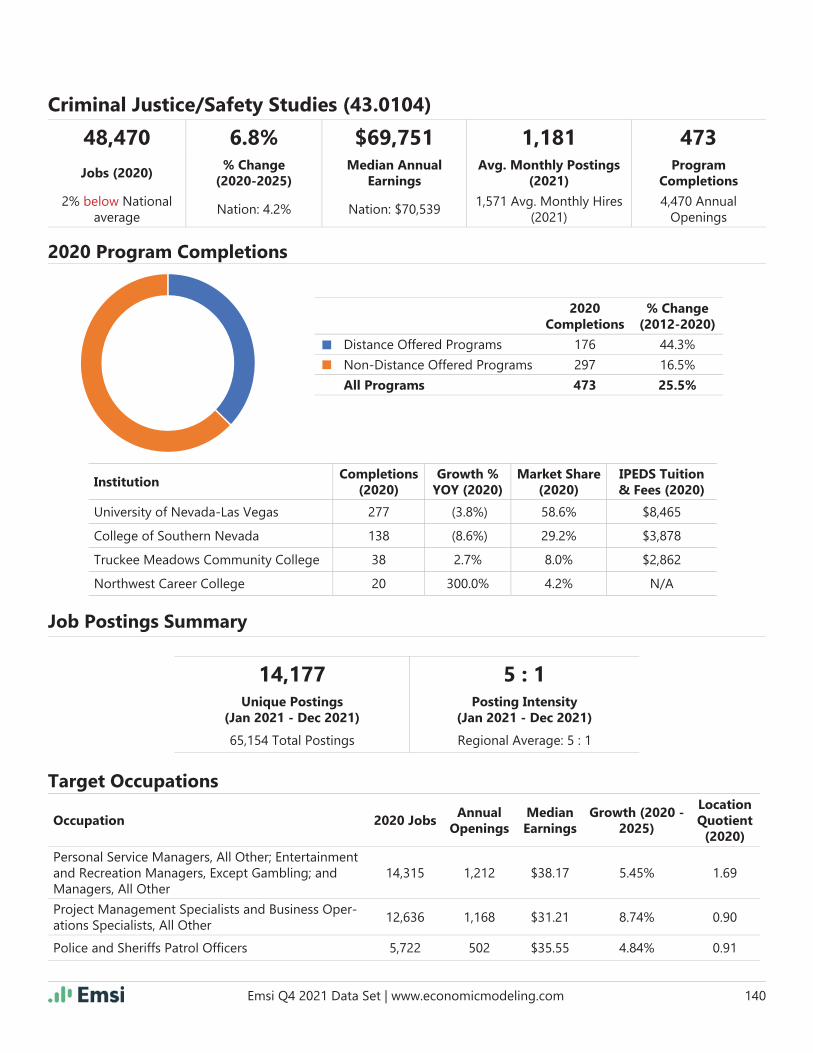
Emsi Q4 2021 Data Set | www.economicmodeling.com 140
InstitutionCompletions
(2020)Growth %
YOY (2020)Market Share
(2020)IPEDS Tuition & Fees (2020)
University of Nevada-Las Vegas 277 (3.8%) 58.6% $8,465
College of Southern Nevada 138 (8.6%) 29.2% $3,878
Truckee Meadows Community College 38 2.7% 8.0% $2,862
Northwest Career College 20 300.0% 4.2% N/A
48,470 6.8% $69,751 1,181 473
Jobs (2020)% Change
(2020-2025)Median Annual
EarningsAvg. Monthly Postings
(2021)Program
Completions
2% below National average
Nation: 4.2% Nation: $70,5391,571 Avg. Monthly Hires
(2021)4,470 Annual
Openings
Occupation 2020 JobsAnnual
OpeningsMedian Earnings
Growth (2020 - 2025)
Location Quotient
(2020)
Personal Service Managers, All Other; Entertainment and Recreation Managers, Except Gambling; and Managers, All Other
14,315 1,212 $38.17 5.45% 1.69
Project Management Specialists and Business Oper-ations Specialists, All Other
12,636 1,168 $31.21 8.74% 0.90
Police and Sheriffs Patrol Offi cers 5,722 502 $35.55 4.84% 0.91
2020 Program Completions
2020 Completions
% Change (2012-2020)
Distance Offered Programs 176 44.3%
Non-Distance Offered Programs 297 16.5%
All Programs 473 25.5%
Target Occupations
Job Postings Summary
Criminal Justice/Safety Studies (43.0104)
14,177 5 : 1Unique Postings
(Jan 2021 - Dec 2021)Posting Intensity
(Jan 2021 - Dec 2021)
65,154 Total Postings Regional Average: 5 : 1

Emsi Q4 2021 Data Set | www.economicmodeling.com 141
Criminal Justice/Safety Studies (43.0104)
Occupation 2020 JobsAnnual
OpeningsMedian Earnings
Growth (2020 - 2025)
Location Quotient
(2020)
Child, Family, and School Social Workers 3,255 382 $24.82 10.76% 1.09
Correctional Offi cers and Jailers 2,891 270 $28.87 (0.55%) 0.80
Compliance Offi cers 2,469 239 $33.86 8.43% 0.81
Financial and Investment Analysts, Financial Risk Specialists, and Financial Specialists, All Other
2,267 231 $33.07 11.35% 0.51
First-Line Supervisors of Police and Detectives 1,047 78 $52.21 4.94% 0.89
Probation Offi cers and Correctional Treatment Spe-cialists
935 87 $30.26 4.08% 1.17
Detectives and Criminal Investigators 690 61 $39.10 6.56% 0.67
Information Security Analysts 602 76 $43.07 23.70% 0.46
Public Safety Telecommunicators 534 59 $26.15 7.50% 0.63
First-Line Supervisors of Correctional Offi cers 477 41 $37.44 1.58% 1.00
Private Detectives and Investigators 237 29 $26.23 10.33% 0.65
Bailiffs 187 18 $29.91 1.76% 1.10
Fire Inspectors and Investigators 116 12 $44.58 (0.13%) 0.86
Emergency Management Directors 79 8 $39.94 6.47% 0.61
Transit and Railroad Police 11 1 $36.14 7.07% 0.23

Emsi Q4 2021 Data Set | www.economicmodeling.com 142
InstitutionCompletions
(2020)Growth %
YOY (2020)Market Share
(2020)IPEDS Tuition & Fees (2020)
Carrington College-Las Vegas 2 (77.8%) 100.0% N/A
50,105 5.1% $46,120 1,306 2
Jobs (2020)% Change
(2020-2025)Median Annual
EarningsAvg. Monthly Postings
(2021)Program
Completions
47% above National average
Nation: 5.7% Nation: $55,9182,738 Avg. Monthly Hires
(2021)5,670 Annual
Openings
Occupation 2020 JobsAnnual
OpeningsMedian Earnings
Growth (2020 - 2025)
Location Quotient
(2020)
Security Guards 20,031 2,734 $14.93 2.33% 2.06
Personal Service Managers, All Other; Entertainment and Recreation Managers, Except Gambling; and Managers, All Other
14,315 1,212 $38.17 5.45% 1.69
Project Management Specialists and Business Oper-ations Specialists, All Other
12,636 1,168 $31.21 8.74% 0.90
Transportation Security Screeners 1,310 131 $19.59 5.83% 2.72
School Bus Monitors and Protective Service Workers, All Other
1,224 350 $19.45 11.97% 0.96
2020 Program Completions
2020 Completions
% Change (2012-2020)
Distance Offered Programs 0 0.0%
Non-Distance Offered Programs 2 Insf. Data
All Programs 2 Insf. Data
Target Occupations
Job Postings Summary
Security and Loss Prevention Services (43.0109)
15,672 5 : 1Unique Postings
(Jan 2021 - Dec 2021)Posting Intensity
(Jan 2021 - Dec 2021)
78,764 Total Postings Regional Average: 5 : 1
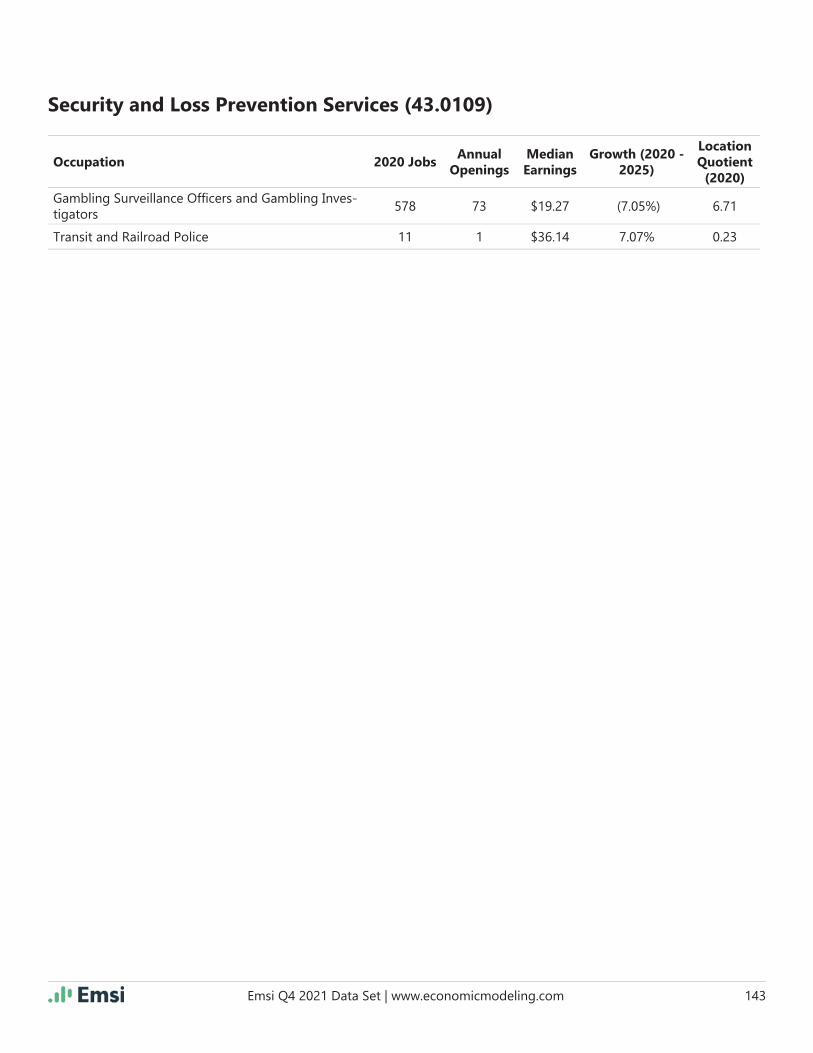
Emsi Q4 2021 Data Set | www.economicmodeling.com 143
Security and Loss Prevention Services (43.0109)
Occupation 2020 JobsAnnual
OpeningsMedian Earnings
Growth (2020 - 2025)
Location Quotient
(2020)
Gambling Surveillance Offi cers and Gambling Inves-tigators
578 73 $19.27 (7.05%) 6.71
Transit and Railroad Police 11 1 $36.14 7.07% 0.23
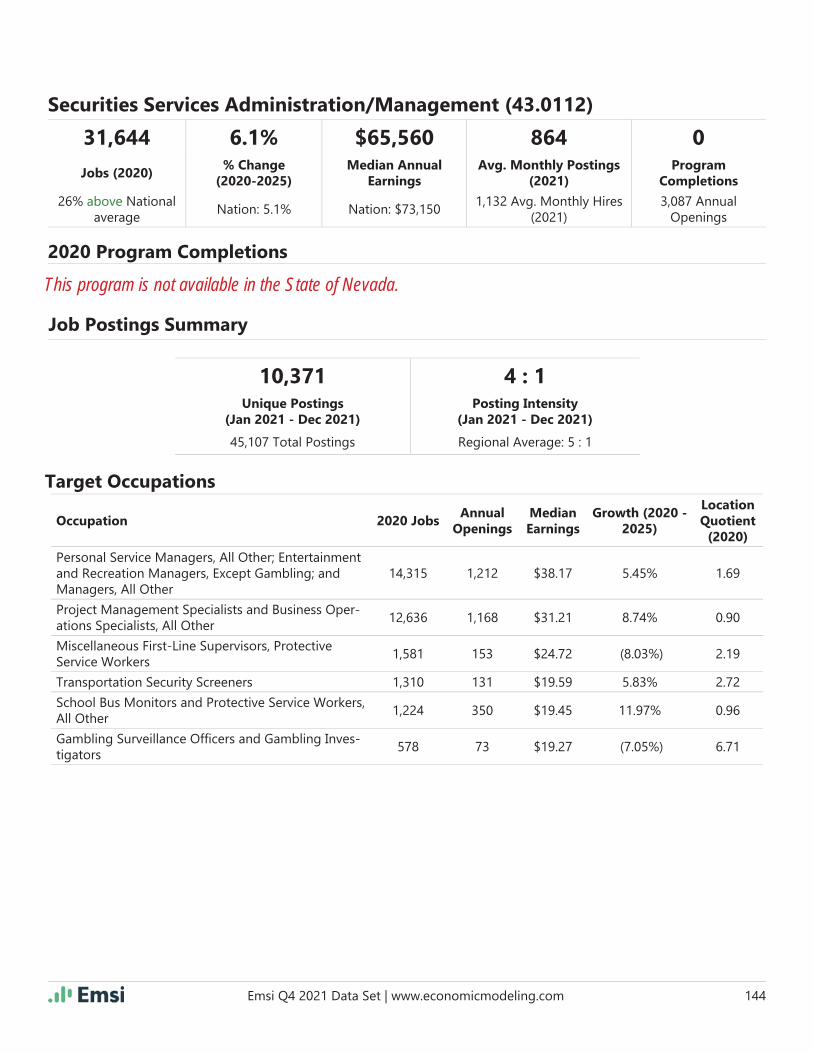
Emsi Q4 2021 Data Set | www.economicmodeling.com 144
31,644 6.1% $65,560 864 0
Jobs (2020)% Change
(2020-2025)Median Annual
EarningsAvg. Monthly Postings
(2021)Program
Completions
26% above National average
Nation: 5.1% Nation: $73,1501,132 Avg. Monthly Hires
(2021)3,087 Annual
Openings
Occupation 2020 JobsAnnual
OpeningsMedian Earnings
Growth (2020 - 2025)
Location Quotient
(2020)
Personal Service Managers, All Other; Entertainment and Recreation Managers, Except Gambling; and Managers, All Other
14,315 1,212 $38.17 5.45% 1.69
Project Management Specialists and Business Oper-ations Specialists, All Other
12,636 1,168 $31.21 8.74% 0.90
Miscellaneous First-Line Supervisors, Protective Service Workers
1,581 153 $24.72 (8.03%) 2.19
Transportation Security Screeners 1,310 131 $19.59 5.83% 2.72
School Bus Monitors and Protective Service Workers, All Other
1,224 350 $19.45 11.97% 0.96
Gambling Surveillance Offi cers and Gambling Inves-tigators
578 73 $19.27 (7.05%) 6.71
2020 Program Completions
Target Occupations
Job Postings Summary
Securities Services Administration/Management (43.0112)
This program is not available in the State of Nevada.
10,371 4 : 1Unique Postings
(Jan 2021 - Dec 2021)Posting Intensity
(Jan 2021 - Dec 2021)
45,107 Total Postings Regional Average: 5 : 1

Emsi Q4 2021 Data Set | www.economicmodeling.com 145
InstitutionCompletions
(2020)Growth %
YOY (2020)Market Share
(2020)IPEDS Tuition & Fees (2020)
Truckee Meadows Community College 5 66.7% 100.0% $2,862
28,845 6.8% $73,665 809 5
Jobs (2020)% Change
(2020-2025)Median Annual
EarningsAvg. Monthly Postings
(2021)Program
Completions
18% above National average
Nation: 5.0% Nation: $79,548901 Avg. Monthly Hires
(2021)2,521 Annual
Openings
Occupation 2020 JobsAnnual
OpeningsMedian Earnings
Growth (2020 - 2025)
Location Quotient
(2020)
Personal Service Managers, All Other; Entertainment and Recreation Managers, Except Gambling; and Managers, All Other
14,315 1,212 $38.17 5.45% 1.69
Project Management Specialists and Business Oper-ations Specialists, All Other
12,636 1,168 $31.21 8.74% 0.90
First-Line Supervisors of Police and Detectives 1,047 78 $52.21 4.94% 0.89
First-Line Supervisors of Firefi ghting and Prevention Workers
768 55 $41.22 2.85% 1.26
Emergency Management Directors 79 8 $39.94 6.47% 0.61
2020 Program Completions
2020 Completions
% Change (2012-2020)
Distance Offered Programs 5 Insf. Data
Non-Distance Offered Programs 0 (100.0%)
All Programs 5 150.0%
Target Occupations
Job Postings Summary
Crisis/Emergency/Disaster Management (43.0302)
9,703 4 : 1Unique Postings
(Jan 2021 - Dec 2021)Posting Intensity
(Jan 2021 - Dec 2021)
39,840 Total Postings Regional Average: 5 : 1

Emsi Q4 2021 Data Set | www.economicmodeling.com 146
InstitutionCompletions
(2020)Growth %
YOY (2020)Market Share
(2020)IPEDS Tuition & Fees (2020)
College of Southern Nevada 50 42.9% 100.0% $3,878
31,243 7.7% $72,377 1,482 50
Jobs (2020)% Change
(2020-2025)Median Annual
EarningsAvg. Monthly Postings
(2021)Program
Completions
7% above National average
Nation: 5.8% Nation: $81,5001,019 Avg. Monthly Hires
(2021)2,839 Annual
Openings
Occupation 2020 JobsAnnual
OpeningsMedian Earnings
Growth (2020 - 2025)
Location Quotient
(2020)
Personal Service Managers, All Other; Entertainment and Recreation Managers, Except Gambling; and Managers, All Other
14,315 1,212 $38.17 5.45% 1.69
Project Management Specialists and Business Oper-ations Specialists, All Other
12,636 1,168 $31.21 8.74% 0.90
Computer Occupations, All Other 2,261 226 $36.45 11.93% 0.61
Detectives and Criminal Investigators 690 61 $39.10 6.56% 0.67
Information Security Analysts 602 76 $43.07 23.70% 0.46
Forensic Science Technicians 424 60 $30.82 8.10% 2.52
2020 Program Completions
2020 Completions
% Change (2012-2020)
Distance Offered Programs 0 0.0%
Non-Distance Offered Programs 50 4900.0%
All Programs 50 4900.0%
Target Occupations
Job Postings Summary
Cyber/Computer Forensics and Counterterrorism (43.0403)
17,785 4 : 1Unique Postings
(Jan 2021 - Dec 2021)Posting Intensity
(Jan 2021 - Dec 2021)
75,579 Total Postings Regional Average: 5 : 1
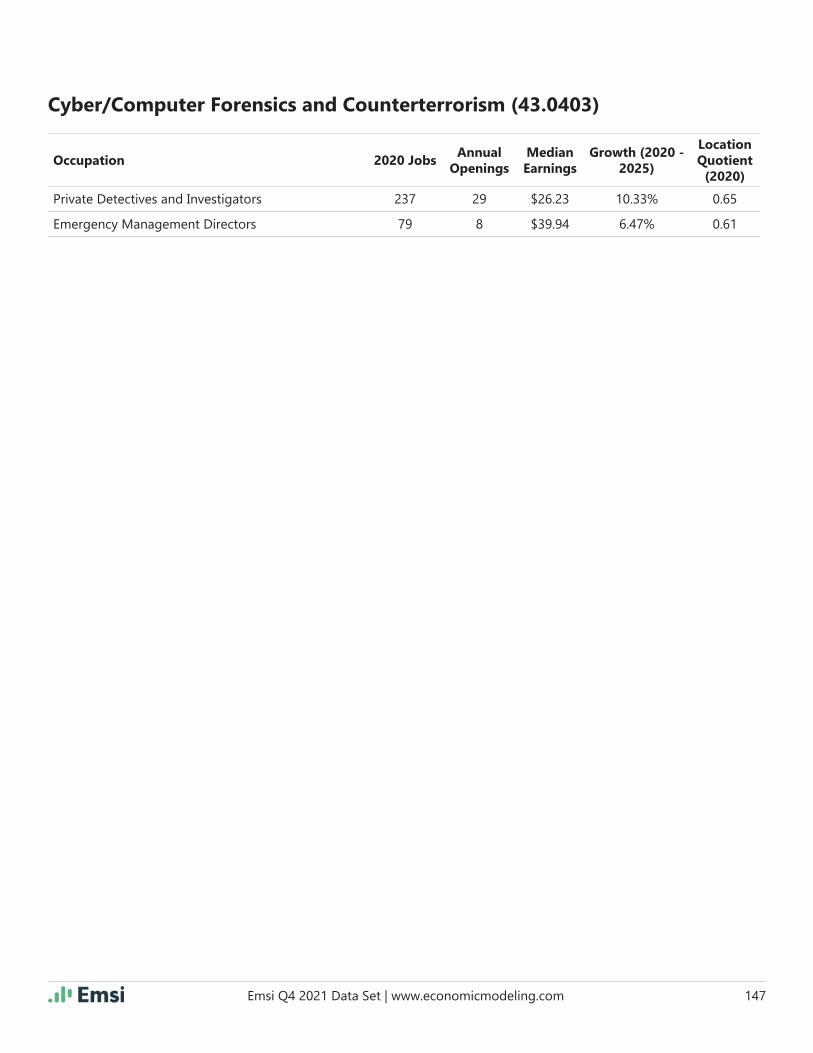
Emsi Q4 2021 Data Set | www.economicmodeling.com 147
Cyber/Computer Forensics and Counterterrorism (43.0403)
Occupation 2020 JobsAnnual
OpeningsMedian Earnings
Growth (2020 - 2025)
Location Quotient
(2020)
Private Detectives and Investigators 237 29 $26.23 10.33% 0.65
Emergency Management Directors 79 8 $39.94 6.47% 0.61

Emsi Q4 2021 Data Set | www.economicmodeling.com 148
35,498 6.5% $70,944 990 0
Jobs (2020)% Change
(2020-2025)Median Annual
EarningsAvg. Monthly Postings
(2021)Program
Completions
14% above National average
Nation: 5.2% Nation: $78,0191,142 Avg. Monthly Hires
(2021)3,181 Annual
Openings
Occupation 2020 JobsAnnual
OpeningsMedian Earnings
Growth (2020 - 2025)
Location Quotient
(2020)
Personal Service Managers, All Other; Entertainment and Recreation Managers, Except Gambling; and Managers, All Other
14,315 1,212 $38.17 5.45% 1.69
Project Management Specialists and Business Oper-ations Specialists, All Other
12,636 1,168 $31.21 8.74% 0.90
Compliance Offi cers 2,469 239 $33.86 8.43% 0.81
Miscellaneous First-Line Supervisors, Protective Service Workers
1,581 153 $24.72 (8.03%) 2.19
Transportation Security Screeners 1,310 131 $19.59 5.83% 2.72
First-Line Supervisors of Police and Detectives 1,047 78 $52.21 4.94% 0.89
First-Line Supervisors of Firefi ghting and Prevention Workers
768 55 $41.22 2.85% 1.26
Detectives and Criminal Investigators 690 61 $39.10 6.56% 0.67
Information Security Analysts 602 76 $43.07 23.70% 0.46
Emergency Management Directors 79 8 $39.94 6.47% 0.61
2020 Program Completions
Target Occupations
Job Postings Summary
Homeland Security, Law Enforcement, Firefi ghting and Related Protective Services, Other (43.9999)
This program is not available in the State of Nevada.
11,879 4 : 1Unique Postings
(Jan 2021 - Dec 2021)Posting Intensity
(Jan 2021 - Dec 2021)
50,404 Total Postings Regional Average: 5 : 1

Emsi Q4 2021 Data Set | www.economicmodeling.com 149
InstitutionCompletions
(2020)Growth %
YOY (2020)Market Share
(2020)IPEDS Tuition & Fees (2020)
University of Nevada-Reno 81 9.5% 55.1% $8,695
University of Nevada-Las Vegas 66 6.5% 44.9% $8,465
18,829 7.7% $72,327 962 147
Jobs (2020)% Change
(2020-2025)Median Annual
EarningsAvg. Monthly Postings
(2021)Program
Completions
14% above National average
Nation: 7.8% Nation: $71,848638 Avg. Monthly Hires
(2021)1,812 Annual
Openings
Occupation 2020 JobsAnnual
OpeningsMedian Earnings
Growth (2020 - 2025)
Location Quotient
(2020)
Personal Service Managers, All Other; Entertainment and Recreation Managers, Except Gambling; and Managers, All Other
14,315 1,212 $38.17 5.45% 1.69
Market Research Analysts and Marketing Specialists 3,722 504 $26.77 15.86% 0.57
Environmental Scientists and Specialists, Including Health
470 56 $33.80 9.42% 0.60
Social Science Research Assistants 128 20 $24.86 14.41% 0.33
2020 Program Completions
2020 Completions
% Change (2012-2020)
Distance Offered Programs 0 0.0%
Non-Distance Offered Programs 147 157.9%
All Programs 147 157.9%
Target Occupations
Job Postings Summary
Economics, General (45.0601)
11,548 4 : 1Unique Postings
(Jan 2021 - Dec 2021)Posting Intensity
(Jan 2021 - Dec 2021)
49,369 Total Postings Regional Average: 5 : 1

Emsi Q4 2021 Data Set | www.economicmodeling.com 150
Economics, General (45.0601)
Occupation 2020 JobsAnnual
OpeningsMedian Earnings
Growth (2020 - 2025)
Location Quotient
(2020)
Economists 109 10 $40.57 9.83% 0.61
Survey Researchers 84 10 $25.22 8.93% 0.75
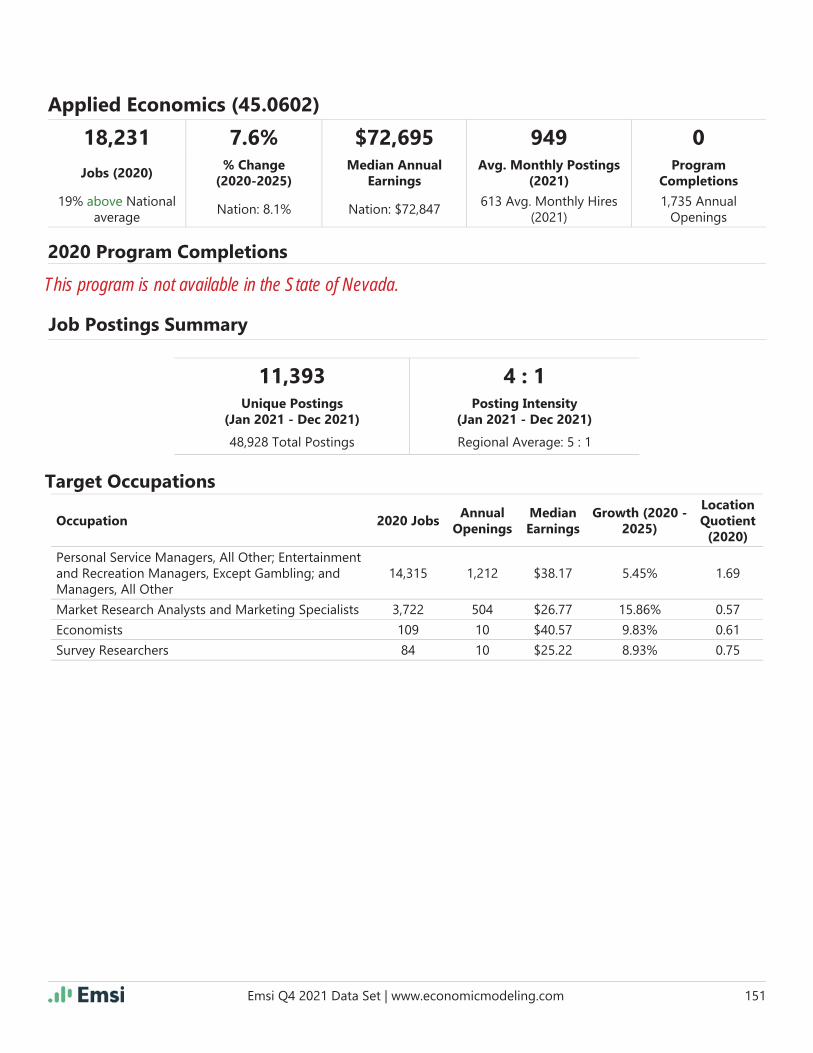
Emsi Q4 2021 Data Set | www.economicmodeling.com 151
18,231 7.6% $72,695 949 0
Jobs (2020)% Change
(2020-2025)Median Annual
EarningsAvg. Monthly Postings
(2021)Program
Completions
19% above National average
Nation: 8.1% Nation: $72,847613 Avg. Monthly Hires
(2021)1,735 Annual
Openings
Occupation 2020 JobsAnnual
OpeningsMedian Earnings
Growth (2020 - 2025)
Location Quotient
(2020)
Personal Service Managers, All Other; Entertainment and Recreation Managers, Except Gambling; and Managers, All Other
14,315 1,212 $38.17 5.45% 1.69
Market Research Analysts and Marketing Specialists 3,722 504 $26.77 15.86% 0.57
Economists 109 10 $40.57 9.83% 0.61
Survey Researchers 84 10 $25.22 8.93% 0.75
2020 Program Completions
Target Occupations
Job Postings Summary
Applied Economics (45.0602)
This program is not available in the State of Nevada.
11,393 4 : 1Unique Postings
(Jan 2021 - Dec 2021)Posting Intensity
(Jan 2021 - Dec 2021)
48,928 Total Postings Regional Average: 5 : 1

Emsi Q4 2021 Data Set | www.economicmodeling.com 152
InstitutionCompletions
(2020)Growth %
YOY (2020)Market Share
(2020)IPEDS Tuition & Fees (2020)
University of Nevada-Reno 27 22.7% 100.0% $8,695
19,390 6.4% $75,607 1,327 27
Jobs (2020)% Change
(2020-2025)Median Annual
EarningsAvg. Monthly Postings
(2021)Program
Completions
25% above National average
Nation: 5.2% Nation: $78,040558 Avg. Monthly Hires
(2021)1,768 Annual
Openings
Occupation 2020 JobsAnnual
OpeningsMedian Earnings
Growth (2020 - 2025)
Location Quotient
(2020)
Personal Service Managers, All Other; Entertainment and Recreation Managers, Except Gambling; and Managers, All Other
14,315 1,212 $38.17 5.45% 1.69
Computer Occupations, All Other 2,261 226 $36.45 11.93% 0.61
Civil Engineering Technologists and Technicians 814 84 $25.72 4.54% 1.26
Environmental Scientists and Specialists, Including Health
470 56 $33.80 9.42% 0.60
Surveying and Mapping Technicians 436 59 $26.43 5.53% 0.84
Cartographers and Photogrammetrists 298 28 $38.40 3.36% 2.37
2020 Program Completions
2020 Completions
% Change (2012-2020)
Distance Offered Programs 0 0.0%
Non-Distance Offered Programs 27 68.8%
All Programs 27 68.8%
Target Occupations
Job Postings Summary
Geography (45.0701)
15,918 4 : 1Unique Postings
(Jan 2021 - Dec 2021)Posting Intensity
(Jan 2021 - Dec 2021)
59,500 Total Postings Regional Average: 5 : 1
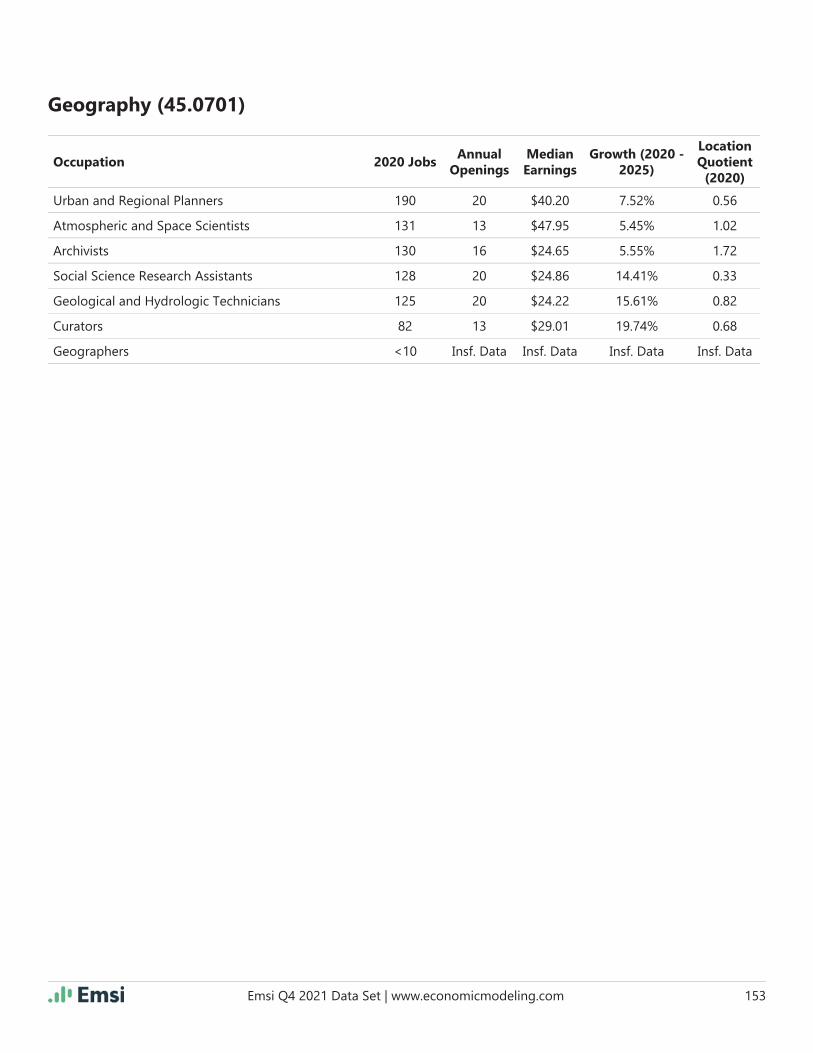
Emsi Q4 2021 Data Set | www.economicmodeling.com 153
Geography (45.0701)
Occupation 2020 JobsAnnual
OpeningsMedian Earnings
Growth (2020 - 2025)
Location Quotient
(2020)
Urban and Regional Planners 190 20 $40.20 7.52% 0.56
Atmospheric and Space Scientists 131 13 $47.95 5.45% 1.02
Archivists 130 16 $24.65 5.55% 1.72
Social Science Research Assistants 128 20 $24.86 14.41% 0.33
Geological and Hydrologic Technicians 125 20 $24.22 15.61% 0.82
Curators 82 13 $29.01 19.74% 0.68
Geographers <10 Insf. Data Insf. Data Insf. Data Insf. Data

Emsi Q4 2021 Data Set | www.economicmodeling.com 154
18,290 6.4% $76,786 1,346 0
Jobs (2020)% Change
(2020-2025)Median Annual
EarningsAvg. Monthly Postings
(2021)Program
Completions
30% above National average
Nation: 5.3% Nation: $81,258538 Avg. Monthly Hires
(2021)1,647 Annual
Openings
Occupation 2020 JobsAnnual
OpeningsMedian Earnings
Growth (2020 - 2025)
Location Quotient
(2020)
Personal Service Managers, All Other; Entertainment and Recreation Managers, Except Gambling; and Managers, All Other
14,315 1,212 $38.17 5.45% 1.69
Computer Occupations, All Other 2,261 226 $36.45 11.93% 0.61
Life, Physical, and Social Science Technicians, All Other
569 81 $22.00 7.91% 0.89
Surveying and Mapping Technicians 436 59 $26.43 5.53% 0.84
Cartographers and Photogrammetrists 298 28 $38.40 3.36% 2.37
Physical Scientists, All Other 212 21 $35.99 9.38% 0.87
Urban and Regional Planners 190 20 $40.20 7.52% 0.56
Geographers <10 Insf. Data Insf. Data Insf. Data Insf. Data
2020 Program Completions
Target Occupations
Job Postings Summary
Geographic Information Science and Cartography (45.0702)
This program is not available in the State of Nevada.
16,149 4 : 1Unique Postings
(Jan 2021 - Dec 2021)Posting Intensity
(Jan 2021 - Dec 2021)
61,259 Total Postings Regional Average: 5 : 1

Emsi Q4 2021 Data Set | www.economicmodeling.com 155
InstitutionCompletions
(2020)Growth %
YOY (2020)Market Share
(2020)IPEDS Tuition & Fees (2020)
Truckee Meadows Community College 10 (33.3%) 100.0% $2,862
95,282 7.3% $50,278 1,315 10
Jobs (2020)% Change
(2020-2025)Median Annual
EarningsAvg. Monthly Postings (Dec 2020 - Nov 2021)
Program Completions
20% above National average
Nation: 3.5% Nation: $50,0846,347 Avg. Monthly Hires
(Dec 2020 - Nov 2021)10,228 Annual
Openings
Occupation 2020 JobsAnnual
OpeningsMedian Earnings
Growth (2020 - 2025)
Location Quotient
(2020)
Carpenters 15,039 1,527 $24.48 3.80% 1.58
Maintenance and Repair Workers, General 14,904 1,562 $21.86 4.19% 1.12
Construction Laborers 13,427 1,641 $17.24 10.24% 1.09
Project Management Specialists and Business Oper-ations Specialists, All Other
12,636 1,168 $31.21 8.74% 0.90
First-Line Supervisors of Construction Trades and Extraction Workers
6,984 818 $32.05 9.39% 1.13
Operating Engineers and Other Construction Equip-ment Operators
5,062 604 $24.59 6.02% 1.36
2020 Program Completions
2020 Completions
% Change (2012-2020)
Distance Offered Programs 0 0.0%
Non-Distance Offered Programs 10 Insf. Data
All Programs 10 Insf. Data
Target Occupations
Job Postings Summary
Building Construction Technology/Technician (46.0415)
15,783 4 : 1Unique Postings
(Jan 2021 - Dec 2021)Posting Intensity
(Jan 2021 - Dec 2021)
69,195 Total Postings Regional Average: 5 : 1

Emsi Q4 2021 Data Set | www.economicmodeling.com 156
Building Construction Technology/Technician (46.0415)
Occupation 2020 JobsAnnual
OpeningsMedian Earnings
Growth (2020 - 2025)
Location Quotient
(2020)
Construction Managers 5,005 485 $39.03 11.07% 1.20
Painters, Construction and Maintenance 4,390 491 $19.11 10.63% 1.22
Drywall and Ceiling Tile Installers 3,074 303 $20.64 7.23% 2.72
Cement Masons and Concrete Finishers 2,630 290 $24.52 8.21% 1.44
Roofers 2,147 253 $20.29 8.89% 1.44
Cost Estimators 2,038 217 $30.35 7.16% 1.11
Sheet Metal Workers 1,559 180 $23.42 9.51% 1.26
Carpet Installers 1,385 116 $26.88 (2.88%) 4.45
Construction and Building Inspectors 1,067 134 $36.48 4.03% 0.96
Tile and Stone Setters 1,025 108 $22.38 8.73% 1.92
Civil Engineering Technologists and Technicians 814 84 $25.72 4.54% 1.26
Glaziers 787 95 $19.37 6.16% 1.55
Insulation Workers, Floor, Ceiling, and Wall 451 53 $17.69 10.26% 1.48
Floor Layers, Except Carpet, Wood, and Hard Tiles 255 30 $25.36 13.07% 1.10
Career/Technical Education Teachers, Secondary School
229 28 $29.48 23.77% 0.35
Insulation Workers, Mechanical 133 20 $24.45 23.81% 0.50
Paperhangers 132 11 $15.42 (1.53%) 2.99
Terrazzo Workers and Finishers 58 5 $25.59 (0.90%) 1.96
Floor Sanders and Finishers 52 6 $20.95 8.70% 0.75

Emsi Q4 2021 Data Set | www.economicmodeling.com 157
InstitutionCompletions
(2020)Growth %
YOY (2020)Market Share
(2020)IPEDS Tuition & Fees (2020)
Advanced Training Institute 113 (11.0%) 59.5% N/A
Career College of Northern Nevada 41 (21.2%) 21.6% N/A
College of Southern Nevada 24 26.3% 12.6% $3,878
Truckee Meadows Community College 12 (25.0%) 6.3% $2,862
46,405 7.1% $55,105 984 190
Jobs (2020)% Change
(2020-2025)Median Annual
EarningsAvg. Monthly Postings
(2021)Program
Completions
4% above National average
Nation: 4.1% Nation: $55,3622,358 Avg. Monthly Hires
(2021)4,984 Annual
Openings
Occupation 2020 JobsAnnual
OpeningsMedian Earnings
Growth (2020 - 2025)
Location Quotient
(2020)
Maintenance and Repair Workers, General 14,904 1,562 $21.86 4.19% 1.12
Project Management Specialists and Business Oper-ations Specialists, All Other
12,636 1,168 $31.21 8.74% 0.90
Plumbers, Pipefi tters, and Steamfi tters 5,024 652 $26.30 11.15% 1.16
2020 Program Completions
2020 Completions
% Change (2012-2020)
Distance Offered Programs 0 0.0%
Non-Distance Offered Programs 190 (39.3%)
All Programs 190 (39.3%)
Target Occupations
Job Postings Summary
Heating, Air Conditioning, Ventilation and Refrigeration Maintenance Technology/Technician (47.0201)
11,810 5 : 1Unique Postings
(Jan 2021 - Dec 2021)Posting Intensity
(Jan 2021 - Dec 2021)
57,554 Total Postings Regional Average: 5 : 1

Emsi Q4 2021 Data Set | www.economicmodeling.com 158
Heating, Air Conditioning, Ventilation and Refrigeration Maintenance Technology/Technician (47.0201)
Occupation 2020 JobsAnnual
OpeningsMedian Earnings
Growth (2020 - 2025)
Location Quotient
(2020)
First-Line Supervisors of Mechanics, Installers, and Repairers
4,327 449 $34.50 6.58% 0.97
Heating, Air Conditioning, and Refrigeration Me-chanics and Installers
3,361 412 $26.33 11.44% 0.96
Sheet Metal Workers 1,559 180 $23.42 9.51% 1.26
Helpers--Installation, Maintenance, and Repair Workers
1,071 156 $17.81 7.40% 1.29
Construction and Building Inspectors 1,067 134 $36.48 4.03% 0.96
Pipelayers 990 104 $24.14 1.11% 2.89
Miscellaneous Construction and Related Workers 706 90 $18.90 3.40% 2.05
Electrical and Electronics Repairers, Commercial and Industrial Equipment
520 53 $32.02 10.65% 0.87
Home Appliance Repairers 240 24 $17.94 (2.64%) 0.74

Emsi Q4 2021 Data Set | www.economicmodeling.com 159
InstitutionCompletions
(2020)Growth %
YOY (2020)Market Share
(2020)IPEDS Tuition & Fees (2020)
Truckee Meadows Community College 17 240.0% 100.0% $2,862
8,908 5.6% $49,034 797 17
Jobs (2020)% Change
(2020-2025)Median Annual
EarningsAvg. Monthly Postings
(2021)Program
Completions
19% below National average
Nation: 5.3% Nation: $66,955300 Avg. Monthly Hires
(2021)917 Annual Openings
Occupation 2020 JobsAnnual
OpeningsMedian Earnings
Growth (2020 - 2025)
Location Quotient
(2020)
Computer Occupations, All Other 2,261 226 $36.45 11.93% 0.61
Graphic Designers 1,681 166 $23.63 3.40% 0.73
Photographers 1,592 149 $12.84 (6.49%) 1.36
Web Developers and Digital Interface Designers 1,080 105 $28.99 10.72% 0.62
Artists and Related Workers, All Other 697 77 $14.62 3.75% 4.48
Art Directors 628 75 $20.12 7.76% 0.84
Fine Artists, Including Painters, Sculptors, and Illus-trators
535 70 $9.75 11.97% 1.11
2020 Program Completions
2020 Completions
% Change (2012-2020)
Distance Offered Programs 0 0.0%
Non-Distance Offered Programs 17 Insf. Data
All Programs 17 Insf. Data
Target Occupations
Job Postings Summary
Digital Arts (50.0102)
9,561 4 : 1Unique Postings
(Jan 2021 - Dec 2021)Posting Intensity
(Jan 2021 - Dec 2021)
35,897 Total Postings Regional Average: 5 : 1
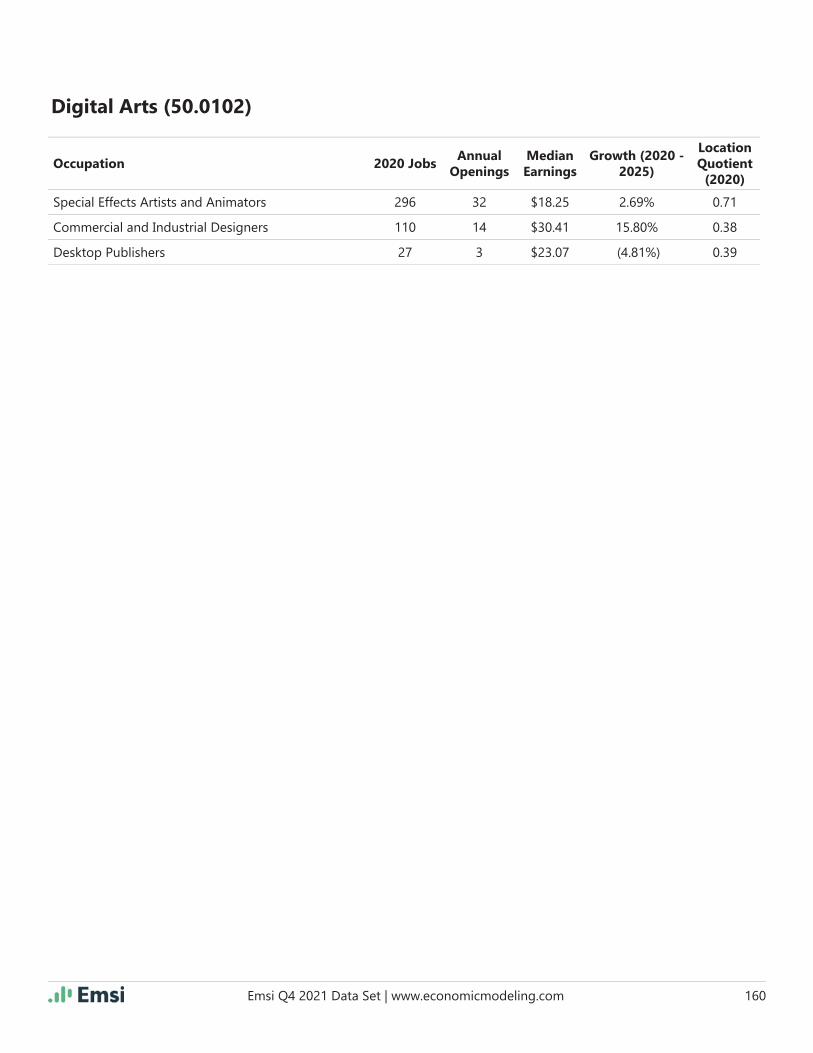
Emsi Q4 2021 Data Set | www.economicmodeling.com 160
Digital Arts (50.0102)
Occupation 2020 JobsAnnual
OpeningsMedian Earnings
Growth (2020 - 2025)
Location Quotient
(2020)
Special Effects Artists and Animators 296 32 $18.25 2.69% 0.71
Commercial and Industrial Designers 110 14 $30.41 15.80% 0.38
Desktop Publishers 27 3 $23.07 (4.81%) 0.39
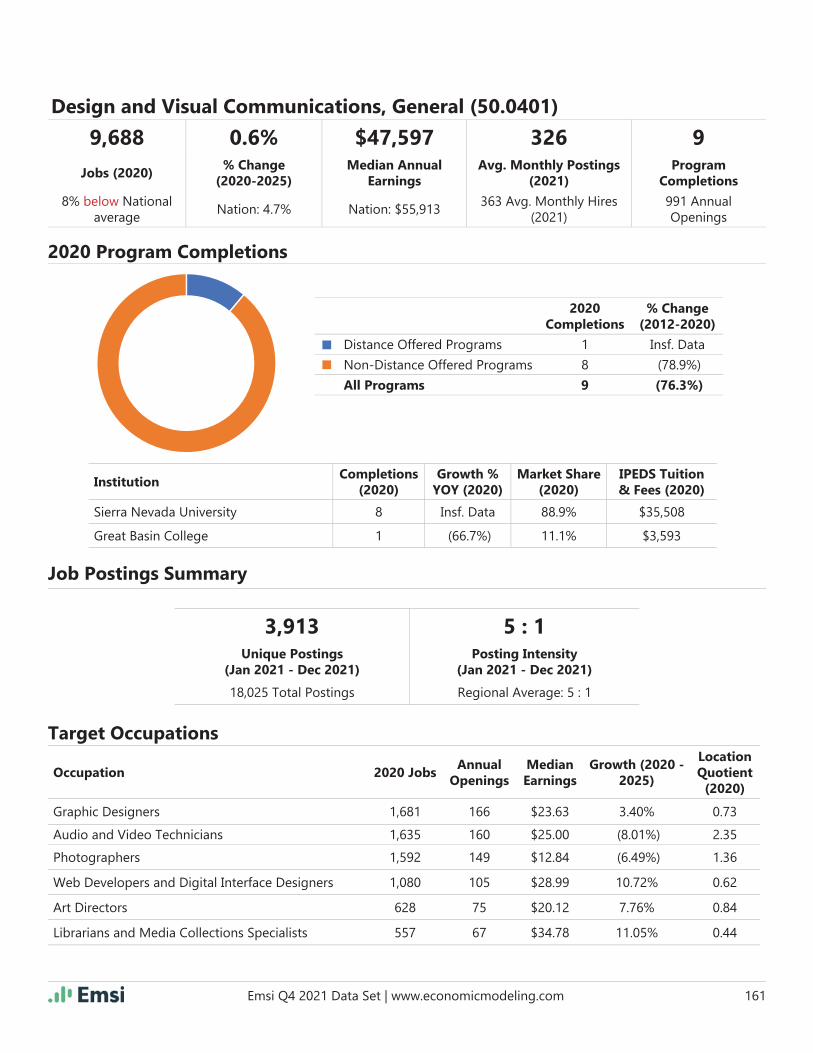
Emsi Q4 2021 Data Set | www.economicmodeling.com 161
InstitutionCompletions
(2020)Growth %
YOY (2020)Market Share
(2020)IPEDS Tuition & Fees (2020)
Sierra Nevada University 8 Insf. Data 88.9% $35,508
Great Basin College 1 (66.7%) 11.1% $3,593
9,688 0.6% $47,597 326 9
Jobs (2020)% Change
(2020-2025)Median Annual
EarningsAvg. Monthly Postings
(2021)Program
Completions
8% below National average
Nation: 4.7% Nation: $55,913363 Avg. Monthly Hires
(2021)991 Annual Openings
Occupation 2020 JobsAnnual
OpeningsMedian Earnings
Growth (2020 - 2025)
Location Quotient
(2020)
Graphic Designers 1,681 166 $23.63 3.40% 0.73
Audio and Video Technicians 1,635 160 $25.00 (8.01%) 2.35
Photographers 1,592 149 $12.84 (6.49%) 1.36
Web Developers and Digital Interface Designers 1,080 105 $28.99 10.72% 0.62
Art Directors 628 75 $20.12 7.76% 0.84
Librarians and Media Collections Specialists 557 67 $34.78 11.05% 0.44
2020 Program Completions
2020 Completions
% Change (2012-2020)
Distance Offered Programs 1 Insf. Data
Non-Distance Offered Programs 8 (78.9%)
All Programs 9 (76.3%)
Target Occupations
Job Postings Summary
Design and Visual Communications, General (50.0401)
3,913 5 : 1Unique Postings
(Jan 2021 - Dec 2021)Posting Intensity
(Jan 2021 - Dec 2021)
18,025 Total Postings Regional Average: 5 : 1
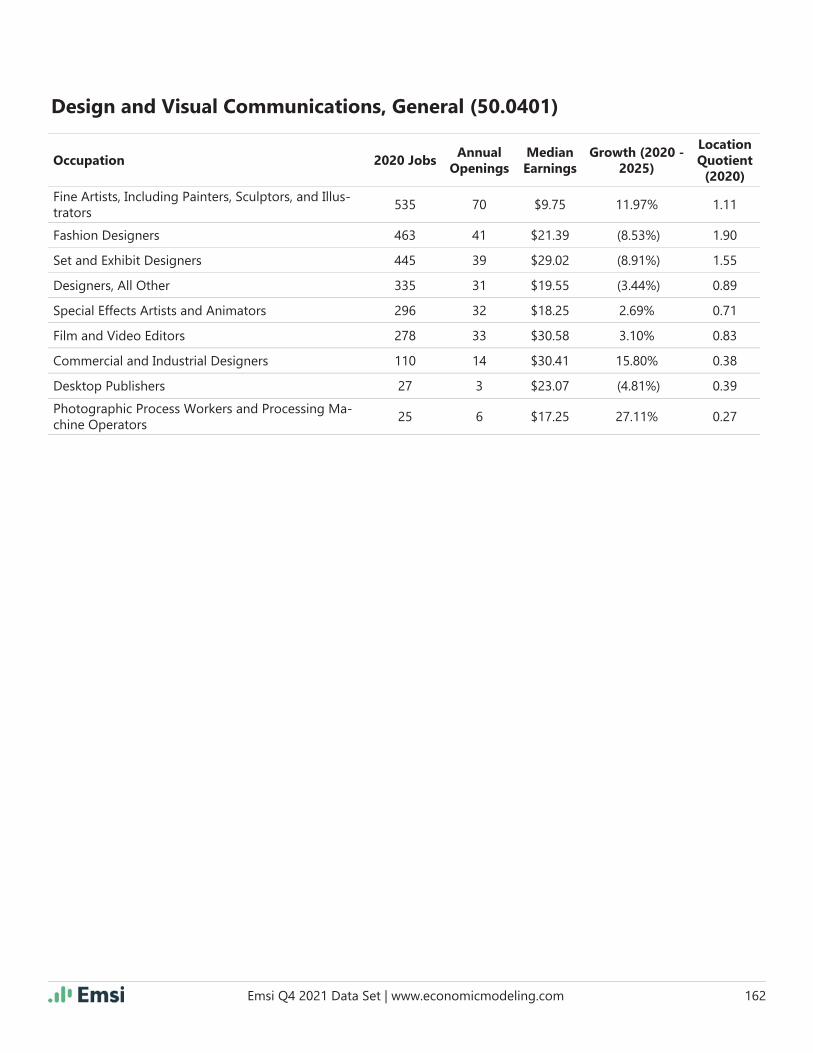
Emsi Q4 2021 Data Set | www.economicmodeling.com 162
Design and Visual Communications, General (50.0401)
Occupation 2020 JobsAnnual
OpeningsMedian Earnings
Growth (2020 - 2025)
Location Quotient
(2020)
Fine Artists, Including Painters, Sculptors, and Illus-trators
535 70 $9.75 11.97% 1.11
Fashion Designers 463 41 $21.39 (8.53%) 1.90
Set and Exhibit Designers 445 39 $29.02 (8.91%) 1.55
Designers, All Other 335 31 $19.55 (3.44%) 0.89
Special Effects Artists and Animators 296 32 $18.25 2.69% 0.71
Film and Video Editors 278 33 $30.58 3.10% 0.83
Commercial and Industrial Designers 110 14 $30.41 15.80% 0.38
Desktop Publishers 27 3 $23.07 (4.81%) 0.39
Photographic Process Workers and Processing Ma-chine Operators
25 6 $17.25 27.11% 0.27

Emsi Q4 2021 Data Set | www.economicmodeling.com 163
InstitutionCompletions
(2020)Growth %
YOY (2020)Market Share
(2020)IPEDS Tuition & Fees (2020)
University of Nevada-Las Vegas 39 (11.4%) 66.1% $8,465
College of Southern Nevada 20 0.0% 33.9% $3,878
4,409 5.8% $47,270 174 59
Jobs (2020)% Change
(2020-2025)Median Annual
EarningsAvg. Monthly Postings
(2021)Program
Completions
18% below National average
Nation: 4.8% Nation: $59,499160 Avg. Monthly Hires
(2021)459 Annual Openings
Occupation 2020 JobsAnnual
OpeningsMedian Earnings
Growth (2020 - 2025)
Location Quotient
(2020)
Graphic Designers 1,681 166 $23.63 3.40% 0.73
Web Developers and Digital Interface Designers 1,080 105 $28.99 10.72% 0.62
Artists and Related Workers, All Other 697 77 $14.62 3.75% 4.48
Art Directors 628 75 $20.12 7.76% 0.84
Special Effects Artists and Animators 296 32 $18.25 2.69% 0.71
Desktop Publishers 27 3 $23.07 (4.81%) 0.39
2020 Program Completions
2020 Completions
% Change (2012-2020)
Distance Offered Programs 0 0.0%
Non-Distance Offered Programs 59 (10.6%)
All Programs 59 (10.6%)
Target Occupations
Job Postings Summary
Graphic Design (50.0409)
2,087 4 : 1Unique Postings
(Jan 2021 - Dec 2021)Posting Intensity
(Jan 2021 - Dec 2021)
9,326 Total Postings Regional Average: 5 : 1

Emsi Q4 2021 Data Set | www.economicmodeling.com 164
10,636 17.0% $76,777 1,122 0
Jobs (2020)% Change
(2020-2025)Median Annual
EarningsAvg. Monthly Postings
(2021)Program
Completions
49% below National average
Nation: 12.3% Nation: $98,933470 Avg. Monthly Hires
(2021)1,246 Annual
Openings
Occupation 2020 JobsAnnual
OpeningsMedian Earnings
Growth (2020 - 2025)
Location Quotient
(2020)
Software Developers and Software Quality Assur-ance Analysts and Testers
5,770 747 $44.71 24.66% 0.42
Computer Occupations, All Other 2,261 226 $36.45 11.93% 0.61
Graphic Designers 1,681 166 $23.63 3.40% 0.73
Art Directors 628 75 $20.12 7.76% 0.84
Special Effects Artists and Animators 296 32 $18.25 2.69% 0.71
2020 Program Completions
Target Occupations
Job Postings Summary
Game and Interactive Media Design (50.0411)
This program is not available in the State of Nevada.
13,464 3 : 1Unique Postings
(Jan 2021 - Dec 2021)Posting Intensity
(Jan 2021 - Dec 2021)
42,469 Total Postings Regional Average: 5 : 1
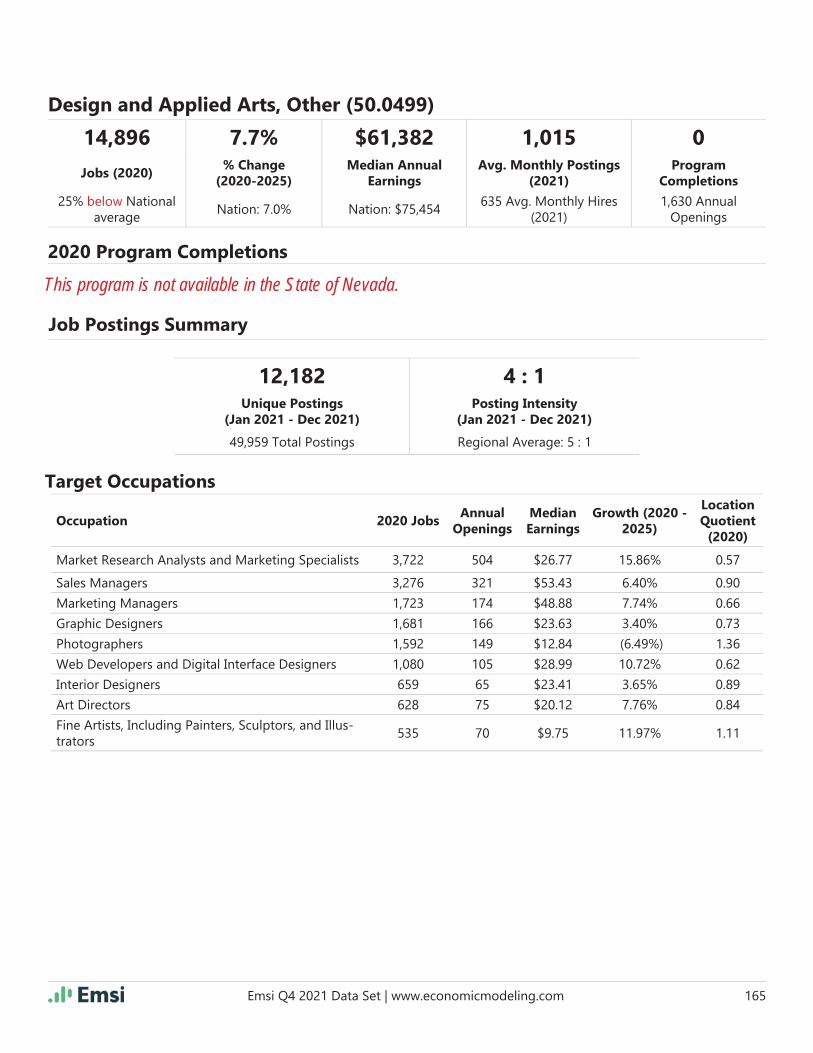
Emsi Q4 2021 Data Set | www.economicmodeling.com 165
14,896 7.7% $61,382 1,015 0
Jobs (2020)% Change
(2020-2025)Median Annual
EarningsAvg. Monthly Postings
(2021)Program
Completions
25% below National average
Nation: 7.0% Nation: $75,454635 Avg. Monthly Hires
(2021)1,630 Annual
Openings
Occupation 2020 JobsAnnual
OpeningsMedian Earnings
Growth (2020 - 2025)
Location Quotient
(2020)
Market Research Analysts and Marketing Specialists 3,722 504 $26.77 15.86% 0.57
Sales Managers 3,276 321 $53.43 6.40% 0.90
Marketing Managers 1,723 174 $48.88 7.74% 0.66
Graphic Designers 1,681 166 $23.63 3.40% 0.73
Photographers 1,592 149 $12.84 (6.49%) 1.36
Web Developers and Digital Interface Designers 1,080 105 $28.99 10.72% 0.62
Interior Designers 659 65 $23.41 3.65% 0.89
Art Directors 628 75 $20.12 7.76% 0.84
Fine Artists, Including Painters, Sculptors, and Illus-trators
535 70 $9.75 11.97% 1.11
2020 Program Completions
Target Occupations
Job Postings Summary
Design and Applied Arts, Other (50.0499)
This program is not available in the State of Nevada.
12,182 4 : 1Unique Postings
(Jan 2021 - Dec 2021)Posting Intensity
(Jan 2021 - Dec 2021)
49,959 Total Postings Regional Average: 5 : 1
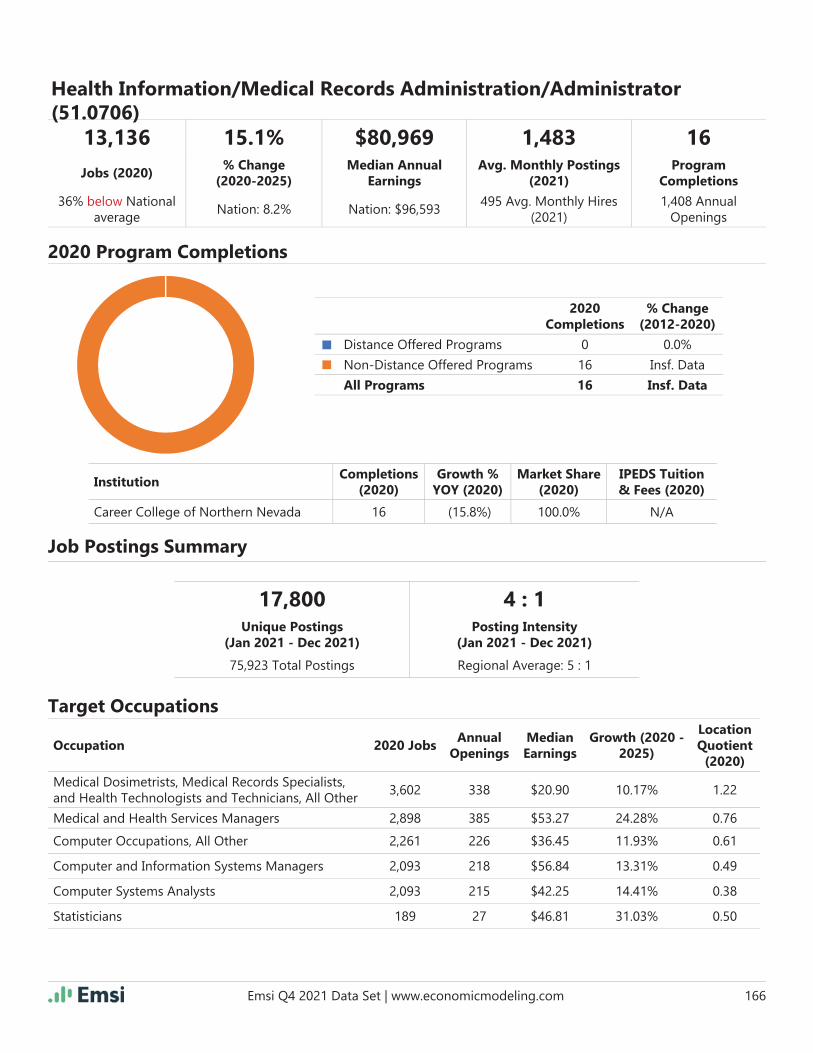
Emsi Q4 2021 Data Set | www.economicmodeling.com 166
InstitutionCompletions
(2020)Growth %
YOY (2020)Market Share
(2020)IPEDS Tuition & Fees (2020)
Career College of Northern Nevada 16 (15.8%) 100.0% N/A
13,136 15.1% $80,969 1,483 16
Jobs (2020)% Change
(2020-2025)Median Annual
EarningsAvg. Monthly Postings
(2021)Program
Completions
36% below National average
Nation: 8.2% Nation: $96,593495 Avg. Monthly Hires
(2021)1,408 Annual
Openings
Occupation 2020 JobsAnnual
OpeningsMedian Earnings
Growth (2020 - 2025)
Location Quotient
(2020)
Medical Dosimetrists, Medical Records Specialists, and Health Technologists and Technicians, All Other
3,602 338 $20.90 10.17% 1.22
Medical and Health Services Managers 2,898 385 $53.27 24.28% 0.76
Computer Occupations, All Other 2,261 226 $36.45 11.93% 0.61
Computer and Information Systems Managers 2,093 218 $56.84 13.31% 0.49
Computer Systems Analysts 2,093 215 $42.25 14.41% 0.38
Statisticians 189 27 $46.81 31.03% 0.50
2020 Program Completions
2020 Completions
% Change (2012-2020)
Distance Offered Programs 0 0.0%
Non-Distance Offered Programs 16 Insf. Data
All Programs 16 Insf. Data
Target Occupations
Job Postings Summary
Health Information/Medical Records Administration/Administrator (51.0706)
17,800 4 : 1Unique Postings
(Jan 2021 - Dec 2021)Posting Intensity
(Jan 2021 - Dec 2021)
75,923 Total Postings Regional Average: 5 : 1
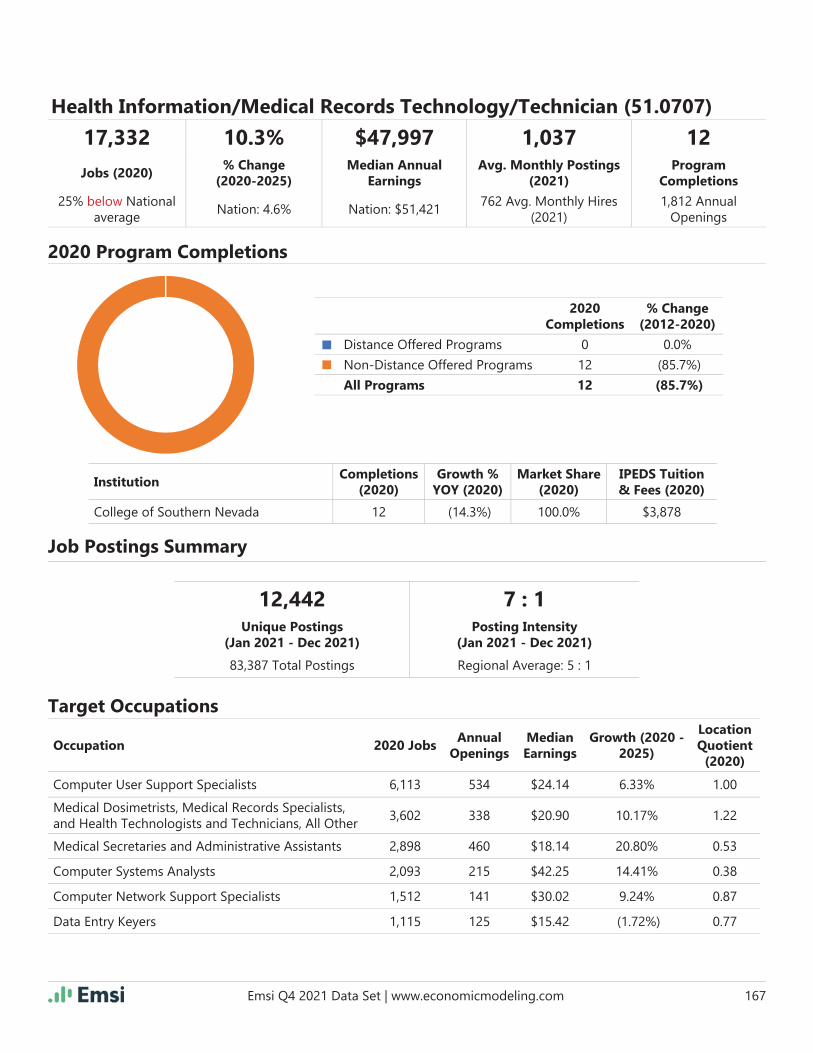
Emsi Q4 2021 Data Set | www.economicmodeling.com 167
InstitutionCompletions
(2020)Growth %
YOY (2020)Market Share
(2020)IPEDS Tuition & Fees (2020)
College of Southern Nevada 12 (14.3%) 100.0% $3,878
17,332 10.3% $47,997 1,037 12
Jobs (2020)% Change
(2020-2025)Median Annual
EarningsAvg. Monthly Postings
(2021)Program
Completions
25% below National average
Nation: 4.6% Nation: $51,421762 Avg. Monthly Hires
(2021)1,812 Annual
Openings
Occupation 2020 JobsAnnual
OpeningsMedian Earnings
Growth (2020 - 2025)
Location Quotient
(2020)
Computer User Support Specialists 6,113 534 $24.14 6.33% 1.00
Medical Dosimetrists, Medical Records Specialists, and Health Technologists and Technicians, All Other
3,602 338 $20.90 10.17% 1.22
Medical Secretaries and Administrative Assistants 2,898 460 $18.14 20.80% 0.53
Computer Systems Analysts 2,093 215 $42.25 14.41% 0.38
Computer Network Support Specialists 1,512 141 $30.02 9.24% 0.87
Data Entry Keyers 1,115 125 $15.42 (1.72%) 0.77
2020 Program Completions
2020 Completions
% Change (2012-2020)
Distance Offered Programs 0 0.0%
Non-Distance Offered Programs 12 (85.7%)
All Programs 12 (85.7%)
Target Occupations
Job Postings Summary
Health Information/Medical Records Technology/Technician (51.0707)
12,442 7 : 1Unique Postings
(Jan 2021 - Dec 2021)Posting Intensity
(Jan 2021 - Dec 2021)
83,387 Total Postings Regional Average: 5 : 1

Emsi Q4 2021 Data Set | www.economicmodeling.com 168
InstitutionCompletions
(2020)Growth %
YOY (2020)Market Share
(2020)IPEDS Tuition & Fees (2020)
Nevada Career Institute 4 Insf. Data 100.0% N/A
25,636 14.3% $66,852 2,023 4
Jobs (2020)% Change
(2020-2025)Median Annual
EarningsAvg. Monthly Postings
(2021)Program
Completions
37% below National average
Nation: 8.1% Nation: $70,4671,262 Avg. Monthly Hires
(2021)3,145 Annual
Openings
Occupation 2020 JobsAnnual
OpeningsMedian Earnings
Growth (2020 - 2025)
Location Quotient
(2020)
Management Analysts 6,585 768 $36.55 10.96% 0.80
Market Research Analysts and Marketing Specialists 3,722 504 $26.77 15.86% 0.57
Medical and Health Services Managers 2,898 385 $53.27 24.28% 0.76
Medical Secretaries and Administrative Assistants 2,898 460 $18.14 20.80% 0.53
Financial and Investment Analysts, Financial Risk Specialists, and Financial Specialists, All Other
2,267 231 $33.07 11.35% 0.51
Computer Occupations, All Other 2,261 226 $36.45 11.93% 0.61
Public Relations Specialists 1,369 144 $27.82 6.07% 0.57
2020 Program Completions
2020 Completions
% Change (2012-2020)
Distance Offered Programs 0 0.0%
Non-Distance Offered Programs 4 Insf. Data
All Programs 4 Insf. Data
Target Occupations
Job Postings Summary
Health Services Administration (51.2211)
24,280 5 : 1Unique Postings
(Jan 2021 - Dec 2021)Posting Intensity
(Jan 2021 - Dec 2021)
110,666 Total Postings Regional Average: 5 : 1

Emsi Q4 2021 Data Set | www.economicmodeling.com 169
Health Services Administration (51.2211)
Occupation 2020 JobsAnnual
OpeningsMedian Earnings
Growth (2020 - 2025)
Location Quotient
(2020)
Healthcare Social Workers 1,157 146 $30.84 14.55% 0.72
Human Resources Managers 1,140 113 $49.21 8.23% 0.73
Eligibility Interviewers, Government Programs 463 52 $23.93 9.63% 0.36
Health Education Specialists 359 51 $25.93 15.25% 0.66
Community Health Workers 321 47 $23.52 17.62% 0.56
Legislators 195 19 $78.82 8.67% 0.37

Emsi Q4 2021 Data Set | www.economicmodeling.com 170
InstitutionCompletions
(2020)Growth %
YOY (2020)Market Share
(2020)IPEDS Tuition & Fees (2020)
University of Nevada-Reno 164 (4.7%) 53.8% $8,695
Truckee Meadows Community College 132 16.8% 43.3% $2,862
Western Nevada College 8 166.7% 2.6% $3,548
DeVry University-Nevada 1 0.0% 0.3% $15,368
75,484 8.6% $82,086 2,872 305
Jobs (2020)% Change
(2020-2025)Median Annual
EarningsAvg. Monthly Postings
(2021)Program
Completions
2% below National average
Nation: 5.3% Nation: $90,0383,179 Avg. Monthly Hires
(2021)7,422 Annual
Openings
Occupation 2020 JobsAnnual
OpeningsMedian Earnings
Growth (2020 - 2025)
Location Quotient
(2020)
General and Operations Managers 21,279 2,195 $49.45 8.96% 0.97
Personal Service Managers, All Other; Entertainment and Recreation Managers, Except Gambling; and Managers, All Other
14,315 1,212 $38.17 5.45% 1.69
Project Management Specialists and Business Oper-ations Specialists, All Other
12,636 1,168 $31.21 8.74% 0.90
2020 Program Completions
2020 Completions
% Change (2012-2020)
Distance Offered Programs 140 23.9%
Non-Distance Offered Programs 165 38.7%
All Programs 305 31.5%
Target Occupations
Job Postings Summary
Business/Commerce, General (52.0101)
34,467 4 : 1Unique Postings
(Jan 2021 - Dec 2021)Posting Intensity
(Jan 2021 - Dec 2021)
147,231 Total Postings Regional Average: 5 : 1
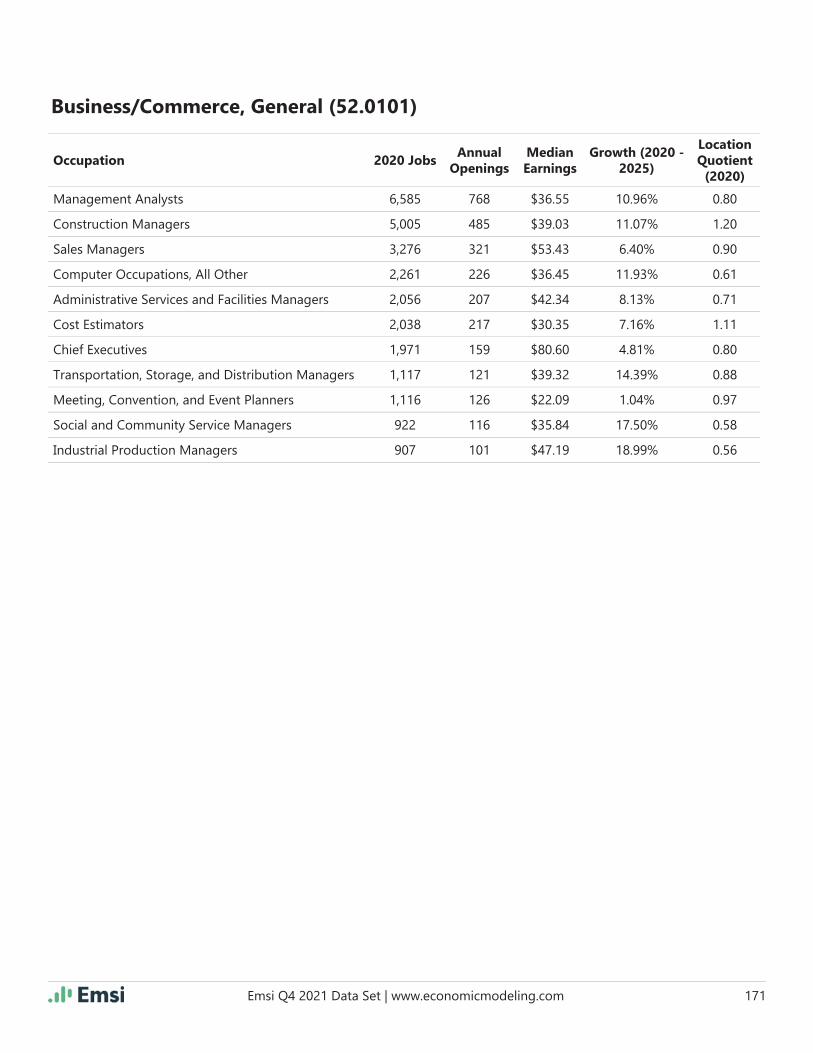
Emsi Q4 2021 Data Set | www.economicmodeling.com 171
Business/Commerce, General (52.0101)
Occupation 2020 JobsAnnual
OpeningsMedian Earnings
Growth (2020 - 2025)
Location Quotient
(2020)
Management Analysts 6,585 768 $36.55 10.96% 0.80
Construction Managers 5,005 485 $39.03 11.07% 1.20
Sales Managers 3,276 321 $53.43 6.40% 0.90
Computer Occupations, All Other 2,261 226 $36.45 11.93% 0.61
Administrative Services and Facilities Managers 2,056 207 $42.34 8.13% 0.71
Cost Estimators 2,038 217 $30.35 7.16% 1.11
Chief Executives 1,971 159 $80.60 4.81% 0.80
Transportation, Storage, and Distribution Managers 1,117 121 $39.32 14.39% 0.88
Meeting, Convention, and Event Planners 1,116 126 $22.09 1.04% 0.97
Social and Community Service Managers 922 116 $35.84 17.50% 0.58
Industrial Production Managers 907 101 $47.19 18.99% 0.56

Emsi Q4 2021 Data Set | www.economicmodeling.com 172
InstitutionCompletions
(2020)Growth %
YOY (2020)Market Share
(2020)IPEDS Tuition & Fees (2020)
College of Southern Nevada 336 (17.2%) 36.6% $3,878
University of Nevada-Las Vegas 206 (2.4%) 22.4% $8,465
University of Nevada-Reno 156 13.0% 17.0% $8,695
Nevada State College 58 11.5% 6.3% $6,075
University of Phoenix-Nevada 47 (38.2%) 5.1% $9,552
Great Basin College 47 38.2% 5.1% $3,593
Western Nevada College 28 64.7% 3.1% $3,548
Roseman University of Health Sciences 28 (34.9%) 3.1% $36,533
DeVry University-Nevada 12 (25.0%) 1.3% $15,368
173,052 7.0% $82,086 6,920 918
Jobs (2020)% Change
(2020-2025)Median Annual
EarningsAvg. Monthly Postings
(2021)Program
Completions
8% below National average
Nation: 3.1% Nation: $90,0389,048 Avg. Monthly Hires
(2021)19,226 Annual
Openings
2020 Program Completions
2020 Completions
% Change (2012-2020)
Distance Offered Programs 512 (32.6%)
Non-Distance Offered Programs 406 32.2%
All Programs 918 (14.0%)
Job Postings Summary
Business Administration and Management, General (52.0201)
83,038 5 : 1Unique Postings
(Jan 2021 - Dec 2021)Posting Intensity
(Jan 2021 - Dec 2021)
430,524 Total Postings Regional Average: 5 : 1

Emsi Q4 2021 Data Set | www.economicmodeling.com 173
Business Administration and Management, General (52.0201)
Occupation 2020 JobsAnnual
OpeningsMedian Earnings
Growth (2020 - 2025)
Location Quotient
(2020)
Customer Service Representatives 28,551 4,255 $16.03 8.87% 1.09
General and Operations Managers 21,279 2,195 $49.45 8.96% 0.97
Secretaries and Administrative Assistants, Except Legal, Medical, and Executive
17,494 1,915 $18.74 0.37% 0.92
Personal Service Managers, All Other; Entertainment and Recreation Managers, Except Gambling; and Managers, All Other
14,315 1,212 $38.17 5.45% 1.69
First-Line Supervisors of Retail Sales Workers 13,082 1,463 $19.78 2.63% 1.11
Project Management Specialists and Business Oper-ations Specialists, All Other
12,636 1,168 $31.21 8.74% 0.90
First-Line Supervisors of Offi ce and Administrative Support Workers
11,554 1,238 $24.99 3.70% 0.87
Accountants and Auditors 9,134 971 $30.63 8.05% 0.72
Sales Representatives, Wholesale and Manufactur-ing, Except Technical and Scientifi c Products
8,154 939 $29.03 7.31% 0.68
Management Analysts 6,585 768 $36.55 10.96% 0.80
Computer User Support Specialists 6,113 534 $24.14 6.33% 1.00
Financial Managers 5,646 544 $49.56 10.99% 0.91
Human Resources Specialists 4,583 535 $25.69 9.34% 0.72
Market Research Analysts and Marketing Specialists 3,722 504 $26.77 15.86% 0.57
Sales Managers 3,276 321 $53.43 6.40% 0.90
Computer and Information Systems Managers 2,093 218 $56.84 13.31% 0.49
Chief Executives 1,971 159 $80.60 4.81% 0.80
Marketing Managers 1,723 174 $48.88 7.74% 0.66
Human Resources Managers 1,140 113 $49.21 8.23% 0.73
Target Occupations

Emsi Q4 2021 Data Set | www.economicmodeling.com 174
InstitutionCompletions
(2020)Growth %
YOY (2020)Market Share
(2020)IPEDS Tuition & Fees (2020)
Truckee Meadows Community College 15 15.4% 100.0% $2,862
21,618 8.7% $78,238 1,569 15
Jobs (2020)% Change
(2020-2025)Median Annual
EarningsAvg. Monthly Postings
(2021)Program
Completions
10% above National average
Nation: 6.0% Nation: $88,604663 Avg. Monthly Hires
(2021)2,031 Annual
Openings
Occupation 2020 JobsAnnual
OpeningsMedian Earnings
Growth (2020 - 2025)
Location Quotient
(2020)
Personal Service Managers, All Other; Entertainment and Recreation Managers, Except Gambling; and Managers, All Other
14,315 1,212 $38.17 5.45% 1.69
Computer Occupations, All Other 2,261 226 $36.45 11.93% 0.61
Transportation, Storage, and Distribution Managers 1,117 121 $39.32 14.39% 0.88
Cargo and Freight Agents 1,001 133 $14.37 14.57% 1.12
Logisticians 917 136 $29.61 25.75% 0.48
Industrial Production Managers 907 101 $47.19 18.99% 0.56
Electronics Engineers, Except Computer 663 60 $49.67 11.69% 0.58
2020 Program Completions
2020 Completions
% Change (2012-2020)
Distance Offered Programs 11 Insf. Data
Non-Distance Offered Programs 4 (20.0%)
All Programs 15 200.0%
Target Occupations
Job Postings Summary
Logistics, Materials, and Supply Chain Management (52.0203)
18,827 4 : 1Unique Postings
(Jan 2021 - Dec 2021)Posting Intensity
(Jan 2021 - Dec 2021)
80,915 Total Postings Regional Average: 5 : 1
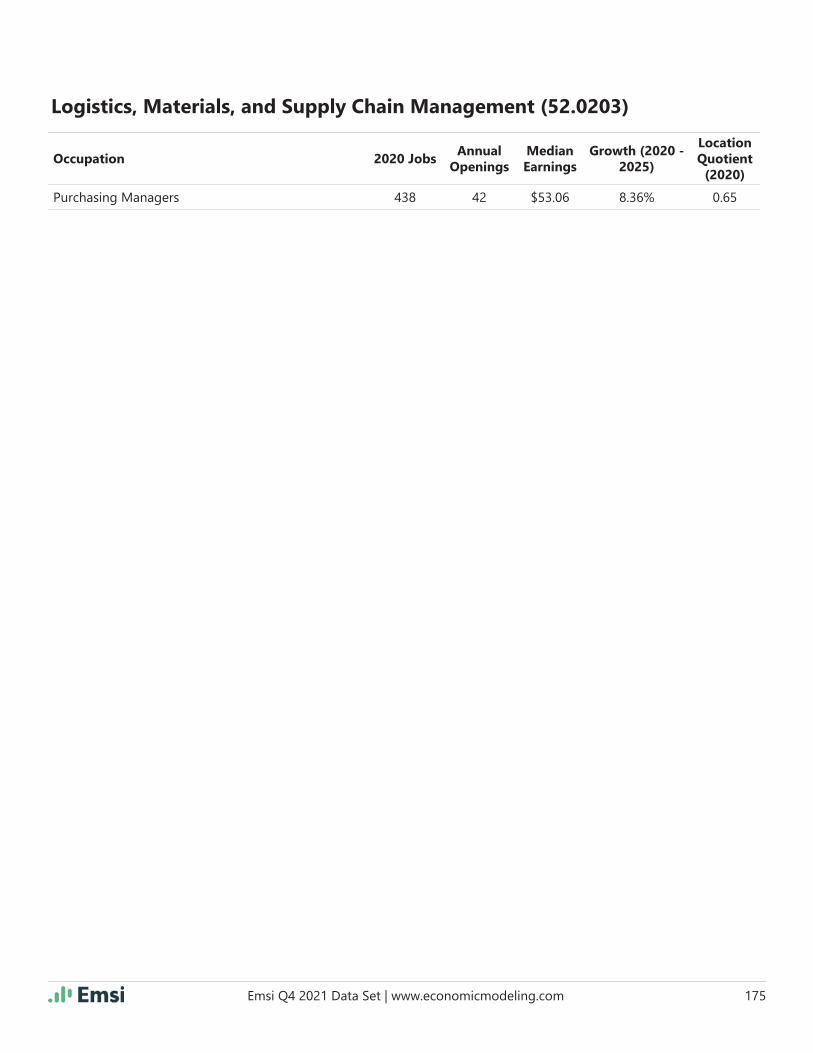
Emsi Q4 2021 Data Set | www.economicmodeling.com 175
Logistics, Materials, and Supply Chain Management (52.0203)
Occupation 2020 JobsAnnual
OpeningsMedian Earnings
Growth (2020 - 2025)
Location Quotient
(2020)
Purchasing Managers 438 42 $53.06 8.36% 0.65

Emsi Q4 2021 Data Set | www.economicmodeling.com 176
74,994 9.0% $79,975 2,190 0
Jobs (2020)% Change
(2020-2025)Median Annual
EarningsAvg. Monthly Postings
(2021)Program
Completions
5% below National average
Nation: 5.4% Nation: $86,5823,200 Avg. Monthly Hires
(2021)7,553 Annual
Openings
Occupation 2020 JobsAnnual
OpeningsMedian Earnings
Growth (2020 - 2025)
Location Quotient
(2020)
General and Operations Managers 21,279 2,195 $49.45 8.96% 0.97
Personal Service Managers, All Other; Entertainment and Recreation Managers, Except Gambling; and Managers, All Other
14,315 1,212 $38.17 5.45% 1.69
Project Management Specialists and Business Oper-ations Specialists, All Other
12,636 1,168 $31.21 8.74% 0.90
Management Analysts 6,585 768 $36.55 10.96% 0.80
Construction Managers 5,005 485 $39.03 11.07% 1.20
First-Line Supervisors of Mechanics, Installers, and Repairers
4,327 449 $34.50 6.58% 0.97
First-Line Supervisors of Production and Operating Workers
3,834 476 $28.74 11.00% 0.70
Computer and Information Systems Managers 2,093 218 $56.84 13.31% 0.49
Transportation, Storage, and Distribution Managers 1,117 121 $39.32 14.39% 0.88
Logisticians 917 136 $29.61 25.75% 0.48
Industrial Production Managers 907 101 $47.19 18.99% 0.56
Labor Relations Specialists 686 67 $29.93 0.76% 1.09
Life, Physical, and Social Science Technicians, All Other
569 81 $22.00 7.91% 0.89
Purchasing Managers 438 42 $53.06 8.36% 0.65
Operations Research Analysts 286 35 $32.20 24.84% 0.32
2020 Program Completions
Target Occupations
Job Postings Summary
Operations Management and Supervision (52.0205)
This program is not available in the State of Nevada.
26,283 5 : 1Unique Postings
(Jan 2021 - Dec 2021)Posting Intensity
(Jan 2021 - Dec 2021)
124,628 Total Postings Regional Average: 5 : 1

Emsi Q4 2021 Data Set | www.economicmodeling.com 177
52,285 8.1% $83,426 1,404 0
Jobs (2020)% Change
(2020-2025)Median Annual
EarningsAvg. Monthly Postings
(2021)Program
Completions
2% above National average
Nation: 5.3% Nation: $89,4342,131 Avg. Monthly Hires
(2021)4,993 Annual
Openings
Occupation 2020 JobsAnnual
OpeningsMedian Earnings
Growth (2020 - 2025)
Location Quotient
(2020)
General and Operations Managers 21,279 2,195 $49.45 8.96% 0.97
Personal Service Managers, All Other; Entertainment and Recreation Managers, Except Gambling; and Managers, All Other
14,315 1,212 $38.17 5.45% 1.69
Project Management Specialists and Business Oper-ations Specialists, All Other
12,636 1,168 $31.21 8.74% 0.90
Chief Executives 1,971 159 $80.60 4.81% 0.80
Social and Community Service Managers 922 116 $35.84 17.50% 0.58
Fundraisers 454 61 $28.35 16.70% 0.48
Public Relations and Fundraising Managers 421 47 $51.52 9.91% 0.52
Operations Research Analysts 286 35 $32.20 24.84% 0.32
2020 Program Completions
Target Occupations
Job Postings Summary
Non-Profi t/Public/Organizational Management (52.0206)
This program is not available in the State of Nevada.
16,850 5 : 1Unique Postings
(Jan 2021 - Dec 2021)Posting Intensity
(Jan 2021 - Dec 2021)
78,893 Total Postings Regional Average: 5 : 1

Emsi Q4 2021 Data Set | www.economicmodeling.com 178
75,971 8.0% $65,627 3,031 0
Jobs (2020)% Change
(2020-2025)Median Annual
EarningsAvg. Monthly Postings
(2021)Program
Completions
14% below National average
Nation: 5.2% Nation: $75,9243,561 Avg. Monthly Hires
(2021)7,891 Annual
Openings
Occupation 2020 JobsAnnual
OpeningsMedian Earnings
Growth (2020 - 2025)
Location Quotient
(2020)
General and Operations Managers 21,279 2,195 $49.45 8.96% 0.97
First-Line Supervisors of Retail Sales Workers 13,082 1,463 $19.78 2.63% 1.11
Project Management Specialists and Business Oper-ations Specialists, All Other
12,636 1,168 $31.21 8.74% 0.90
First-Line Supervisors of Offi ce and Administrative Support Workers
11,554 1,238 $24.99 3.70% 0.87
Computer User Support Specialists 6,113 534 $24.14 6.33% 1.00
Software Developers and Software Quality Assur-ance Analysts and Testers
5,770 747 $44.71 24.66% 0.42
Sales Managers 3,276 321 $53.43 6.40% 0.90
Computer Occupations, All Other 2,261 226 $36.45 11.93% 0.61
2020 Program Completions
Target Occupations
Job Postings Summary
E-Commerce/Electronic Commerce (52.0208)
This program is not available in the State of Nevada.
36,368 5 : 1Unique Postings
(Jan 2021 - Dec 2021)Posting Intensity
(Jan 2021 - Dec 2021)
166,375 Total Postings Regional Average: 5 : 1

Emsi Q4 2021 Data Set | www.economicmodeling.com 179
InstitutionCompletions
(2020)Growth %
YOY (2020)Market Share
(2020)IPEDS Tuition & Fees (2020)
College of Southern Nevada 12 Insf. Data 80.0% $3,878
University of Phoenix-Nevada 3 (50.0%) 20.0% $9,552
74,523 8.8% $83,960 3,131 15
Jobs (2020)% Change
(2020-2025)Median Annual
EarningsAvg. Monthly Postings
(2021)Program
Completions
7% below National average
Nation: 5.9% Nation: $95,2403,164 Avg. Monthly Hires
(2021)7,342 Annual
Openings
Occupation 2020 JobsAnnual
OpeningsMedian Earnings
Growth (2020 - 2025)
Location Quotient
(2020)
General and Operations Managers 21,279 2,195 $49.45 8.96% 0.97
Personal Service Managers, All Other; Entertainment and Recreation Managers, Except Gambling; and Managers, All Other
14,315 1,212 $38.17 5.45% 1.69
Project Management Specialists and Business Oper-ations Specialists, All Other
12,636 1,168 $31.21 8.74% 0.90
Management Analysts 6,585 768 $36.55 10.96% 0.80
Financial Managers 5,646 544 $49.56 10.99% 0.91
2020 Program Completions
2020 Completions
% Change (2012-2020)
Distance Offered Programs 12 Insf. Data
Non-Distance Offered Programs 3 Insf. Data
All Programs 15 Insf. Data
Target Occupations
Job Postings Summary
Project Management (52.0211)
37,575 4 : 1Unique Postings
(Jan 2021 - Dec 2021)Posting Intensity
(Jan 2021 - Dec 2021)
152,669 Total Postings Regional Average: 5 : 1

Emsi Q4 2021 Data Set | www.economicmodeling.com 180
Project Management (52.0211)
Occupation 2020 JobsAnnual
OpeningsMedian Earnings
Growth (2020 - 2025)
Location Quotient
(2020)
Sales Managers 3,276 321 $53.43 6.40% 0.90
Financial and Investment Analysts, Financial Risk Specialists, and Financial Specialists, All Other
2,267 231 $33.07 11.35% 0.51
Computer Occupations, All Other 2,261 226 $36.45 11.93% 0.61
Administrative Services and Facilities Managers 2,056 207 $42.34 8.13% 0.71
Marketing Managers 1,723 174 $48.88 7.74% 0.66
Human Resources Managers 1,140 113 $49.21 8.23% 0.73
Logisticians 917 136 $29.61 25.75% 0.48
Public Relations and Fundraising Managers 421 47 $51.52 9.91% 0.52
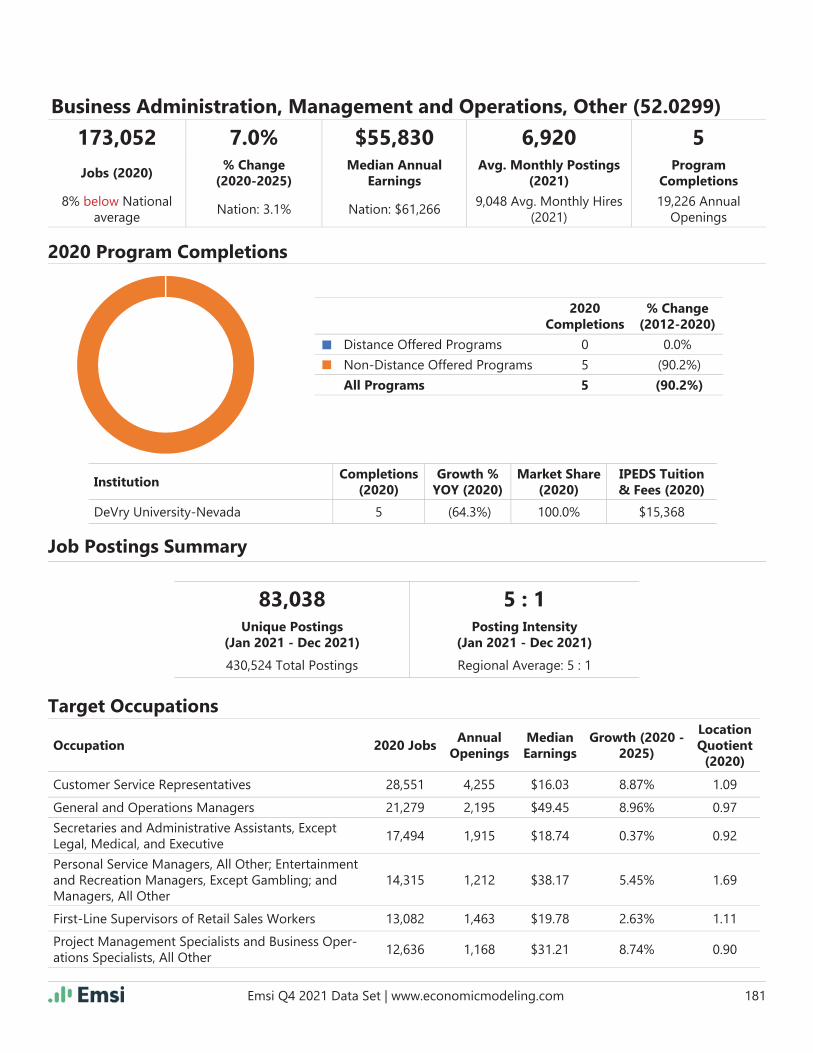
Emsi Q4 2021 Data Set | www.economicmodeling.com 181
InstitutionCompletions
(2020)Growth %
YOY (2020)Market Share
(2020)IPEDS Tuition & Fees (2020)
DeVry University-Nevada 5 (64.3%) 100.0% $15,368
173,052 7.0% $55,830 6,920 5
Jobs (2020)% Change
(2020-2025)Median Annual
EarningsAvg. Monthly Postings
(2021)Program
Completions
8% below National average
Nation: 3.1% Nation: $61,2669,048 Avg. Monthly Hires
(2021)19,226 Annual
Openings
Occupation 2020 JobsAnnual
OpeningsMedian Earnings
Growth (2020 - 2025)
Location Quotient
(2020)
Customer Service Representatives 28,551 4,255 $16.03 8.87% 1.09
General and Operations Managers 21,279 2,195 $49.45 8.96% 0.97
Secretaries and Administrative Assistants, Except Legal, Medical, and Executive
17,494 1,915 $18.74 0.37% 0.92
Personal Service Managers, All Other; Entertainment and Recreation Managers, Except Gambling; and Managers, All Other
14,315 1,212 $38.17 5.45% 1.69
First-Line Supervisors of Retail Sales Workers 13,082 1,463 $19.78 2.63% 1.11
Project Management Specialists and Business Oper-ations Specialists, All Other
12,636 1,168 $31.21 8.74% 0.90
2020 Program Completions
2020 Completions
% Change (2012-2020)
Distance Offered Programs 0 0.0%
Non-Distance Offered Programs 5 (90.2%)
All Programs 5 (90.2%)
Target Occupations
Job Postings Summary
Business Administration, Management and Operations, Other (52.0299)
83,038 5 : 1Unique Postings
(Jan 2021 - Dec 2021)Posting Intensity
(Jan 2021 - Dec 2021)
430,524 Total Postings Regional Average: 5 : 1

Emsi Q4 2021 Data Set | www.economicmodeling.com 182
Business Administration, Management and Operations, Other (52.0299)
Occupation 2020 JobsAnnual
OpeningsMedian Earnings
Growth (2020 - 2025)
Location Quotient
(2020)
First-Line Supervisors of Offi ce and Administrative Support Workers
11,554 1,238 $24.99 3.70% 0.87
Accountants and Auditors 9,134 971 $30.63 8.05% 0.72
Sales Representatives, Wholesale and Manufactur-ing, Except Technical and Scientifi c Products
8,154 939 $29.03 7.31% 0.68
Management Analysts 6,585 768 $36.55 10.96% 0.80
Computer User Support Specialists 6,113 534 $24.14 6.33% 1.00
Financial Managers 5,646 544 $49.56 10.99% 0.91
Human Resources Specialists 4,583 535 $25.69 9.34% 0.72
Market Research Analysts and Marketing Specialists 3,722 504 $26.77 15.86% 0.57
Sales Managers 3,276 321 $53.43 6.40% 0.90
Computer and Information Systems Managers 2,093 218 $56.84 13.31% 0.49
Chief Executives 1,971 159 $80.60 4.81% 0.80
Marketing Managers 1,723 174 $48.88 7.74% 0.66
Human Resources Managers 1,140 113 $49.21 8.23% 0.73

Emsi Q4 2021 Data Set | www.economicmodeling.com 183
InstitutionCompletions
(2020)Growth %
YOY (2020)Market Share
(2020)IPEDS Tuition & Fees (2020)
University of Phoenix-Nevada 1 Insf. Data 100.0% $9,552
141,955 6.3% $60,101 4,184 1
Jobs (2020)% Change
(2020-2025)Median Annual
EarningsAvg. Monthly Postings
(2021)Program
Completions
10% below National average
Nation: 2.7% Nation: $65,1827,218 Avg. Monthly Hires
(2021)15,050 Annual
Openings
Occupation 2020 JobsAnnual
OpeningsMedian Earnings
Growth (2020 - 2025)
Location Quotient
(2020)
Offi ce Clerks, General 28,578 3,471 $17.89 2.91% 1.06
General and Operations Managers 21,279 2,195 $49.45 8.96% 0.97
Personal Service Managers, All Other; Entertainment and Recreation Managers, Except Gambling; and Managers, All Other
14,315 1,212 $38.17 5.45% 1.69
Project Management Specialists and Business Oper-ations Specialists, All Other
12,636 1,168 $31.21 8.74% 0.90
First-Line Supervisors of Offi ce and Administrative Support Workers
11,554 1,238 $24.99 3.70% 0.87
Bookkeeping, Accounting, and Auditing Clerks 11,208 1,333 $19.65 3.49% 0.78
2020 Program Completions
2020 Completions
% Change (2012-2020)
Distance Offered Programs 0 (100.0%)
Non-Distance Offered Programs 1 Insf. Data
All Programs 1 (95.8%)
Target Occupations
Job Postings Summary
Accounting and Business/Management (52.0305)
50,208 5 : 1Unique Postings
(Jan 2021 - Dec 2021)Posting Intensity
(Jan 2021 - Dec 2021)
230,680 Total Postings Regional Average: 5 : 1

Emsi Q4 2021 Data Set | www.economicmodeling.com 184
Accounting and Business/Management (52.0305)
Occupation 2020 JobsAnnual
OpeningsMedian Earnings
Growth (2020 - 2025)
Location Quotient
(2020)
Accountants and Auditors 9,134 971 $30.63 8.05% 0.72
Management Analysts 6,585 768 $36.55 10.96% 0.80
Financial Managers 5,646 544 $49.56 10.99% 0.91
Sales Managers 3,276 321 $53.43 6.40% 0.90
Financial and Investment Analysts, Financial Risk Specialists, and Financial Specialists, All Other
2,267 231 $33.07 11.35% 0.51
Computer Occupations, All Other 2,261 226 $36.45 11.93% 0.61
Administrative Services and Facilities Managers 2,056 207 $42.34 8.13% 0.71
Cost Estimators 2,038 217 $30.35 7.16% 1.11
Chief Executives 1,971 159 $80.60 4.81% 0.80
Executive Secretaries and Executive Administrative Assistants
1,813 203 $31.10 0.18% 0.38
Transportation, Storage, and Distribution Managers 1,117 121 $39.32 14.39% 0.88
Payroll and Timekeeping Clerks 1,037 107 $22.61 (2.50%) 0.86
Tax Preparers 1,033 134 $22.45 7.61% 1.29
Purchasing Managers 438 42 $53.06 8.36% 0.65
Brokerage Clerks 327 38 $22.29 1.36% 0.80
Budget Analysts 310 30 $33.77 7.96% 0.65
Agents and Business Managers of Artists, Perform-ers, and Athletes
283 29 $23.12 (14.00%) 1.42
Tax Examiners and Collectors, and Revenue Agents 282 27 $28.23 5.12% 0.56
Credit Analysts 274 29 $37.01 9.21% 0.42
Financial Examiners 193 24 $27.02 21.33% 0.30
Statistical Assistants 45 6 $27.36 9.18% 0.49
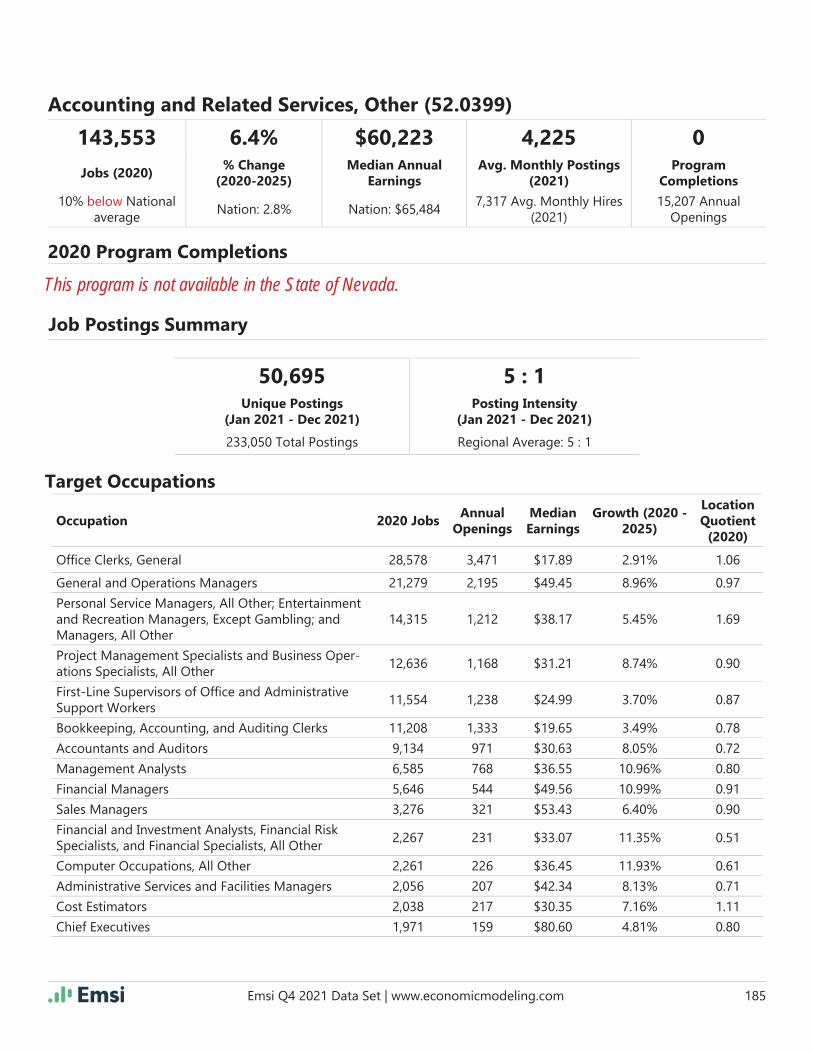
Emsi Q4 2021 Data Set | www.economicmodeling.com 185
143,553 6.4% $60,223 4,225 0
Jobs (2020)% Change
(2020-2025)Median Annual
EarningsAvg. Monthly Postings
(2021)Program
Completions
10% below National average
Nation: 2.8% Nation: $65,4847,317 Avg. Monthly Hires
(2021)15,207 Annual
Openings
Occupation 2020 JobsAnnual
OpeningsMedian Earnings
Growth (2020 - 2025)
Location Quotient
(2020)
Offi ce Clerks, General 28,578 3,471 $17.89 2.91% 1.06
General and Operations Managers 21,279 2,195 $49.45 8.96% 0.97
Personal Service Managers, All Other; Entertainment and Recreation Managers, Except Gambling; and Managers, All Other
14,315 1,212 $38.17 5.45% 1.69
Project Management Specialists and Business Oper-ations Specialists, All Other
12,636 1,168 $31.21 8.74% 0.90
First-Line Supervisors of Offi ce and Administrative Support Workers
11,554 1,238 $24.99 3.70% 0.87
Bookkeeping, Accounting, and Auditing Clerks 11,208 1,333 $19.65 3.49% 0.78
Accountants and Auditors 9,134 971 $30.63 8.05% 0.72
Management Analysts 6,585 768 $36.55 10.96% 0.80
Financial Managers 5,646 544 $49.56 10.99% 0.91
Sales Managers 3,276 321 $53.43 6.40% 0.90
Financial and Investment Analysts, Financial Risk Specialists, and Financial Specialists, All Other
2,267 231 $33.07 11.35% 0.51
Computer Occupations, All Other 2,261 226 $36.45 11.93% 0.61
Administrative Services and Facilities Managers 2,056 207 $42.34 8.13% 0.71
Cost Estimators 2,038 217 $30.35 7.16% 1.11
Chief Executives 1,971 159 $80.60 4.81% 0.80
2020 Program Completions
Target Occupations
Job Postings Summary
Accounting and Related Services, Other (52.0399)
This program is not available in the State of Nevada.
50,695 5 : 1Unique Postings
(Jan 2021 - Dec 2021)Posting Intensity
(Jan 2021 - Dec 2021)
233,050 Total Postings Regional Average: 5 : 1

Emsi Q4 2021 Data Set | www.economicmodeling.com 186
Accounting and Related Services, Other (52.0399)
Occupation 2020 JobsAnnual
OpeningsMedian Earnings
Growth (2020 - 2025)
Location Quotient
(2020)
Executive Secretaries and Executive Administrative Assistants
1,813 203 $31.10 0.18% 0.38
Personal Financial Advisors 1,597 157 $32.37 11.20% 0.65
Transportation, Storage, and Distribution Managers 1,117 121 $39.32 14.39% 0.88
Payroll and Timekeeping Clerks 1,037 107 $22.61 (2.50%) 0.86
Tax Preparers 1,033 134 $22.45 7.61% 1.29
Purchasing Managers 438 42 $53.06 8.36% 0.65
Brokerage Clerks 327 38 $22.29 1.36% 0.80
Budget Analysts 310 30 $33.77 7.96% 0.65
Agents and Business Managers of Artists, Perform-ers, and Athletes
283 29 $23.12 (14.00%) 1.42
Tax Examiners and Collectors, and Revenue Agents 282 27 $28.23 5.12% 0.56
Credit Analysts 274 29 $37.01 9.21% 0.42
Financial Examiners 193 24 $27.02 21.33% 0.30
Statistical Assistants 45 6 $27.36 9.18% 0.49
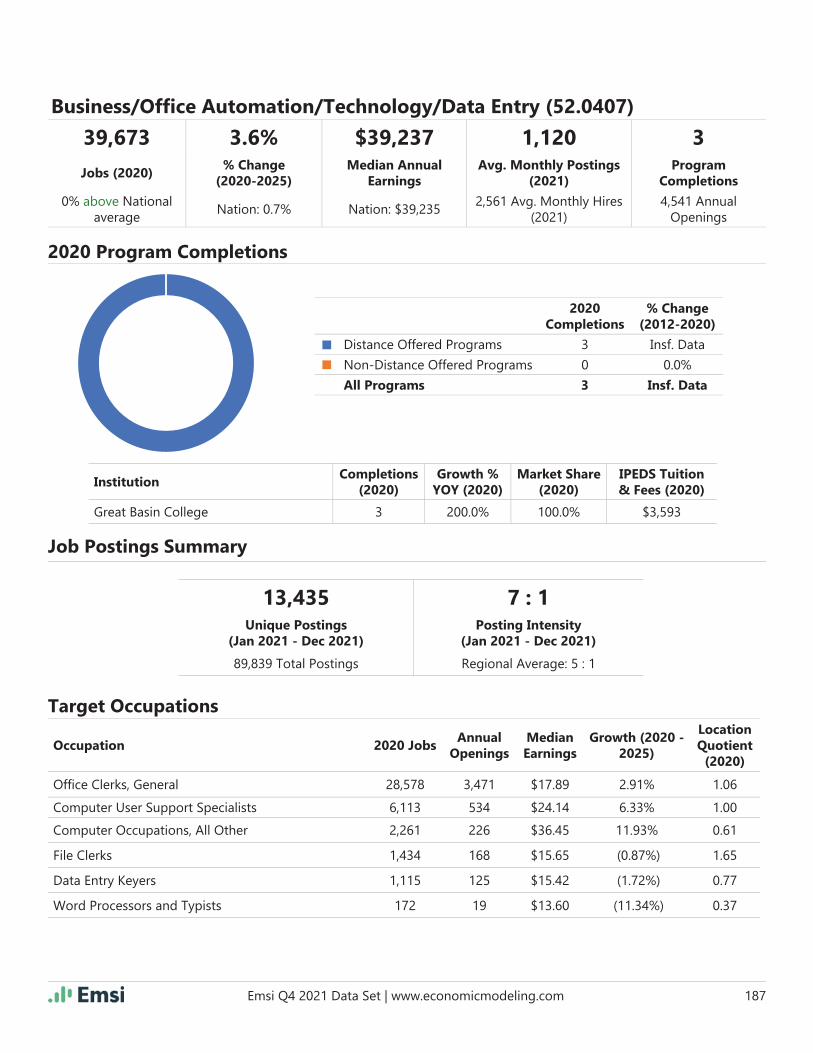
Emsi Q4 2021 Data Set | www.economicmodeling.com 187
InstitutionCompletions
(2020)Growth %
YOY (2020)Market Share
(2020)IPEDS Tuition & Fees (2020)
Great Basin College 3 200.0% 100.0% $3,593
39,673 3.6% $39,237 1,120 3
Jobs (2020)% Change
(2020-2025)Median Annual
EarningsAvg. Monthly Postings
(2021)Program
Completions
0% above National average
Nation: 0.7% Nation: $39,2352,561 Avg. Monthly Hires
(2021)4,541 Annual
Openings
Occupation 2020 JobsAnnual
OpeningsMedian Earnings
Growth (2020 - 2025)
Location Quotient
(2020)
Offi ce Clerks, General 28,578 3,471 $17.89 2.91% 1.06
Computer User Support Specialists 6,113 534 $24.14 6.33% 1.00
Computer Occupations, All Other 2,261 226 $36.45 11.93% 0.61
File Clerks 1,434 168 $15.65 (0.87%) 1.65
Data Entry Keyers 1,115 125 $15.42 (1.72%) 0.77
Word Processors and Typists 172 19 $13.60 (11.34%) 0.37
2020 Program Completions
2020 Completions
% Change (2012-2020)
Distance Offered Programs 3 Insf. Data
Non-Distance Offered Programs 0 0.0%
All Programs 3 Insf. Data
Target Occupations
Job Postings Summary
Business/Offi ce Automation/Technology/Data Entry (52.0407)
13,435 7 : 1Unique Postings
(Jan 2021 - Dec 2021)Posting Intensity
(Jan 2021 - Dec 2021)
89,839 Total Postings Regional Average: 5 : 1

Emsi Q4 2021 Data Set | www.economicmodeling.com 188
InstitutionCompletions
(2020)Growth %
YOY (2020)Market Share
(2020)IPEDS Tuition & Fees (2020)
University of Nevada-Las Vegas 22 4.8% 78.6% $8,465
Sierra Nevada University 4 33.3% 14.3% $35,508
Great Basin College 2 (50.0%) 7.1% $3,593
55,184 8.1% $82,254 1,913 28
Jobs (2020)% Change
(2020-2025)Median Annual
EarningsAvg. Monthly Postings
(2021)Program
Completions
1% below National average
Nation: 5.1% Nation: $89,5122,319 Avg. Monthly Hires
(2021)5,252 Annual
Openings
Occupation 2020 JobsAnnual
OpeningsMedian Earnings
Growth (2020 - 2025)
Location Quotient
(2020)
General and Operations Managers 21,279 2,195 $49.45 8.96% 0.97
Personal Service Managers, All Other; Entertainment and Recreation Managers, Except Gambling; and Managers, All Other
14,315 1,212 $38.17 5.45% 1.69
Project Management Specialists and Business Oper-ations Specialists, All Other
12,636 1,168 $31.21 8.74% 0.90
Financial and Investment Analysts, Financial Risk Specialists, and Financial Specialists, All Other
2,267 231 $33.07 11.35% 0.51
2020 Program Completions
2020 Completions
% Change (2012-2020)
Distance Offered Programs 2 0.0%
Non-Distance Offered Programs 26 (3.7%)
All Programs 28 (3.4%)
Target Occupations
Job Postings Summary
Entrepreneurship/Entrepreneurial Studies (52.0701)
22,959 4 : 1Unique Postings
(Jan 2021 - Dec 2021)Posting Intensity
(Jan 2021 - Dec 2021)
97,392 Total Postings Regional Average: 5 : 1

Emsi Q4 2021 Data Set | www.economicmodeling.com 189
Entrepreneurship/Entrepreneurial Studies (52.0701)
Occupation 2020 JobsAnnual
OpeningsMedian Earnings
Growth (2020 - 2025)
Location Quotient
(2020)
Computer Occupations, All Other 2,261 226 $36.45 11.93% 0.61
Chief Executives 1,971 159 $80.60 4.81% 0.80
Fundraisers 454 61 $28.35 16.70% 0.48

Emsi Q4 2021 Data Set | www.economicmodeling.com 190
64,471 7.2% $74,701 2,028 0
Jobs (2020)% Change
(2020-2025)Median Annual
EarningsAvg. Monthly Postings
(2021)Program
Completions
1% below National average
Nation: 4.0% Nation: $79,8612,710 Avg. Monthly Hires
(2021)6,259 Annual
Openings
Occupation 2020 JobsAnnual
OpeningsMedian Earnings
Growth (2020 - 2025)
Location Quotient
(2020)
General and Operations Managers 21,279 2,195 $49.45 8.96% 0.97
Personal Service Managers, All Other; Entertainment and Recreation Managers, Except Gambling; and Managers, All Other
14,315 1,212 $38.17 5.45% 1.69
Project Management Specialists and Business Oper-ations Specialists, All Other
12,636 1,168 $31.21 8.74% 0.90
First-Line Supervisors of Offi ce and Administrative Support Workers
11,554 1,238 $24.99 3.70% 0.87
Computer Occupations, All Other 2,261 226 $36.45 11.93% 0.61
Chief Executives 1,971 159 $80.60 4.81% 0.80
Fundraisers 454 61 $28.35 16.70% 0.48
2020 Program Completions
Target Occupations
Job Postings Summary
Small Business Administration/Management (52.0703)
This program is not available in the State of Nevada.
24,339 4 : 1Unique Postings
(Jan 2021 - Dec 2021)Posting Intensity
(Jan 2021 - Dec 2021)
108,549 Total Postings Regional Average: 5 : 1

Emsi Q4 2021 Data Set | www.economicmodeling.com 191
InstitutionCompletions
(2020)Growth %
YOY (2020)Market Share
(2020)IPEDS Tuition & Fees (2020)
Truckee Meadows Community College 3 Insf. Data 100.0% $2,862
66,738 7.4% $74,414 2,157 3
Jobs (2020)% Change
(2020-2025)Median Annual
EarningsAvg. Monthly Postings
(2021)Program
Completions
4% below National average
Nation: 4.1% Nation: $80,1882,892 Avg. Monthly Hires
(2021)6,490 Annual
Openings
Occupation 2020 JobsAnnual
OpeningsMedian Earnings
Growth (2020 - 2025)
Location Quotient
(2020)
General and Operations Managers 21,279 2,195 $49.45 8.96% 0.97
Personal Service Managers, All Other; Entertainment and Recreation Managers, Except Gambling; and Managers, All Other
14,315 1,212 $38.17 5.45% 1.69
Project Management Specialists and Business Oper-ations Specialists, All Other
12,636 1,168 $31.21 8.74% 0.90
First-Line Supervisors of Offi ce and Administrative Support Workers
11,554 1,238 $24.99 3.70% 0.87
Financial and Investment Analysts, Financial Risk Specialists, and Financial Specialists, All Other
2,267 231 $33.07 11.35% 0.51
2020 Program Completions
2020 Completions
% Change (2012-2020)
Distance Offered Programs 3 Insf. Data
Non-Distance Offered Programs 0 0.0%
All Programs 3 Insf. Data
Target Occupations
Job Postings Summary
Entrepreneurial and Small Business Operations, Other (52.0799)
25,878 4 : 1Unique Postings
(Jan 2021 - Dec 2021)Posting Intensity
(Jan 2021 - Dec 2021)
114,079 Total Postings Regional Average: 5 : 1

Emsi Q4 2021 Data Set | www.economicmodeling.com 192
Entrepreneurial and Small Business Operations, Other (52.0799)
Occupation 2020 JobsAnnual
OpeningsMedian Earnings
Growth (2020 - 2025)
Location Quotient
(2020)
Computer Occupations, All Other 2,261 226 $36.45 11.93% 0.61
Chief Executives 1,971 159 $80.60 4.81% 0.80
Fundraisers 454 61 $28.35 16.70% 0.48
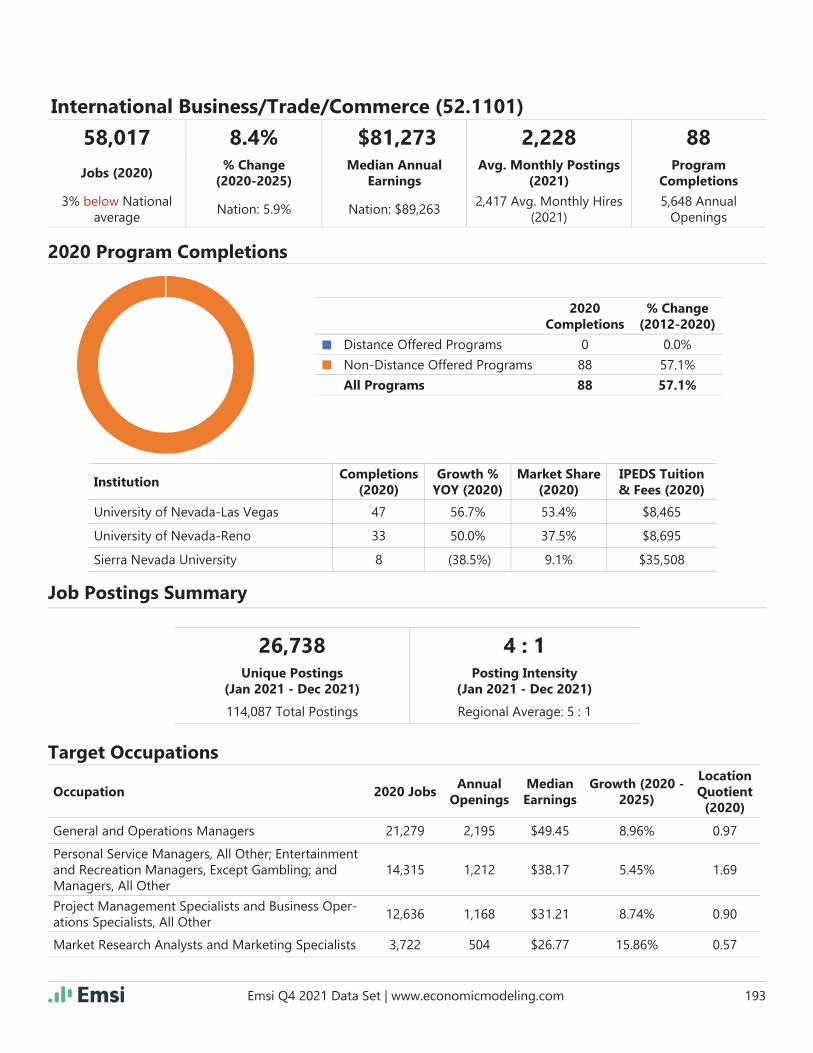
Emsi Q4 2021 Data Set | www.economicmodeling.com 193
InstitutionCompletions
(2020)Growth %
YOY (2020)Market Share
(2020)IPEDS Tuition & Fees (2020)
University of Nevada-Las Vegas 47 56.7% 53.4% $8,465
University of Nevada-Reno 33 50.0% 37.5% $8,695
Sierra Nevada University 8 (38.5%) 9.1% $35,508
58,017 8.4% $81,273 2,228 88
Jobs (2020)% Change
(2020-2025)Median Annual
EarningsAvg. Monthly Postings
(2021)Program
Completions
3% below National average
Nation: 5.9% Nation: $89,2632,417 Avg. Monthly Hires
(2021)5,648 Annual
Openings
Occupation 2020 JobsAnnual
OpeningsMedian Earnings
Growth (2020 - 2025)
Location Quotient
(2020)
General and Operations Managers 21,279 2,195 $49.45 8.96% 0.97
Personal Service Managers, All Other; Entertainment and Recreation Managers, Except Gambling; and Managers, All Other
14,315 1,212 $38.17 5.45% 1.69
Project Management Specialists and Business Oper-ations Specialists, All Other
12,636 1,168 $31.21 8.74% 0.90
Market Research Analysts and Marketing Specialists 3,722 504 $26.77 15.86% 0.57
2020 Program Completions
2020 Completions
% Change (2012-2020)
Distance Offered Programs 0 0.0%
Non-Distance Offered Programs 88 57.1%
All Programs 88 57.1%
Target Occupations
Job Postings Summary
International Business/Trade/Commerce (52.1101)
26,738 4 : 1Unique Postings
(Jan 2021 - Dec 2021)Posting Intensity
(Jan 2021 - Dec 2021)
114,087 Total Postings Regional Average: 5 : 1
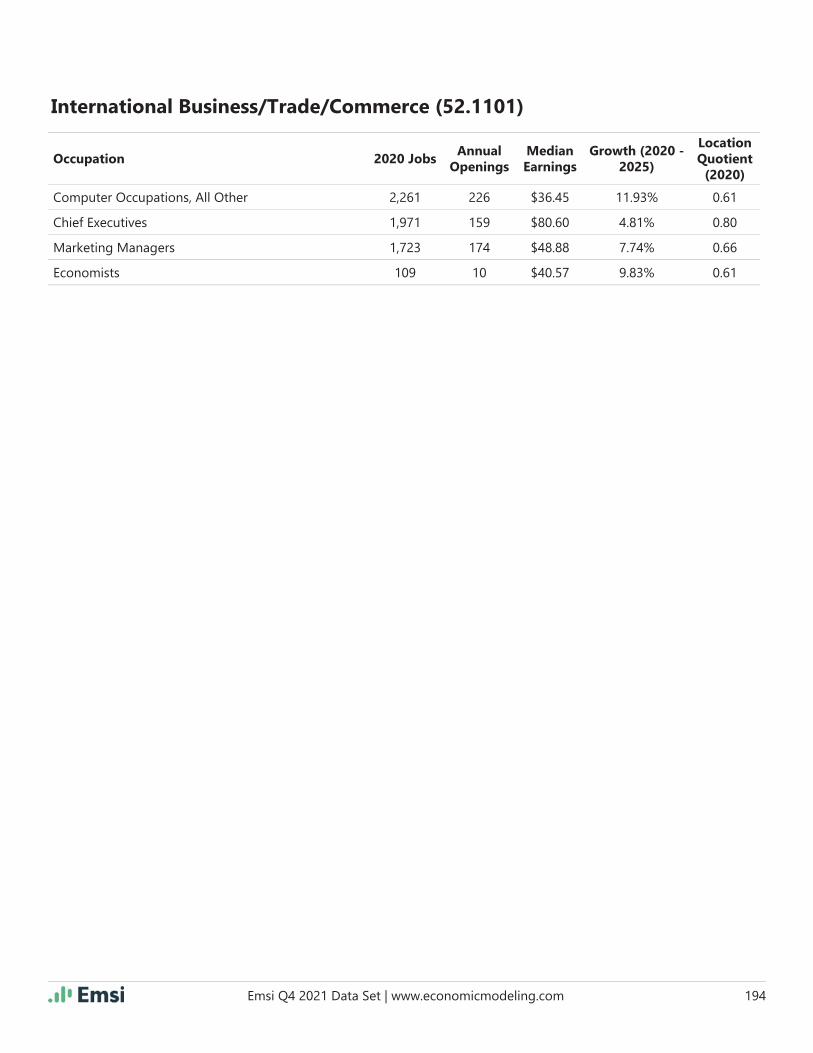
Emsi Q4 2021 Data Set | www.economicmodeling.com 194
International Business/Trade/Commerce (52.1101)
Occupation 2020 JobsAnnual
OpeningsMedian Earnings
Growth (2020 - 2025)
Location Quotient
(2020)
Computer Occupations, All Other 2,261 226 $36.45 11.93% 0.61
Chief Executives 1,971 159 $80.60 4.81% 0.80
Marketing Managers 1,723 174 $48.88 7.74% 0.66
Economists 109 10 $40.57 9.83% 0.61

Emsi Q4 2021 Data Set | www.economicmodeling.com 195
InstitutionCompletions
(2020)Growth %
YOY (2020)Market Share
(2020)IPEDS Tuition & Fees (2020)
Truckee Meadows Community College 5 150.0% 62.5% $2,862
University of Nevada-Las Vegas 2 100.0% 25.0% $8,465
DeVry University-Nevada 1 (50.0%) 12.5% $15,368
17,337 11.9% $85,124 1,258 8
Jobs (2020)% Change
(2020-2025)Median Annual
EarningsAvg. Monthly Postings
(2021)Program
Completions
42% below National average
Nation: 6.5% Nation: $96,689651 Avg. Monthly Hires
(2021)1,834 Annual
Openings
Occupation 2020 JobsAnnual
OpeningsMedian Earnings
Growth (2020 - 2025)
Location Quotient
(2020)
General and Operations Managers 21,279 2,195 $49.45 8.96% 0.97
Personal Service Managers, All Other; Entertainment and Recreation Managers, Except Gambling; and Managers, All Other
14,315 1,212 $38.17 5.45% 1.69
Project Management Specialists and Business Oper-ations Specialists, All Other
12,636 1,168 $31.21 8.74% 0.90
Market Research Analysts and Marketing Specialists 3,722 504 $26.77 15.86% 0.57
2020 Program Completions
2020 Completions
% Change (2012-2020)
Distance Offered Programs 0 0.0%
Non-Distance Offered Programs 8 (90.7%)
All Programs 8 (90.7%)
Target Occupations
Job Postings Summary
Management Information Systems, General (52.1201)
15,090 4 : 1Unique Postings
(Jan 2021 - Dec 2021)Posting Intensity
(Jan 2021 - Dec 2021)
54,441 Total Postings Regional Average: 5 : 1

Emsi Q4 2021 Data Set | www.economicmodeling.com 196
InstitutionCompletions
(2020)Growth %
YOY (2020)Market Share
(2020)IPEDS Tuition & Fees (2020)
Truckee Meadows Community College 1 (50.0%) 100.0% $2,862
17,337 11.9% $85,124 1,258 1
Jobs (2020)% Change
(2020-2025)Median Annual
EarningsAvg. Monthly Postings
(2021)Program
Completions
42% below National average
Nation: 6.5% Nation: $96,689651 Avg. Monthly Hires
(2021)1,834 Annual
Openings
Occupation 2020 JobsAnnual
OpeningsMedian Earnings
Growth (2020 - 2025)
Location Quotient
(2020)
Management Analysts 6,585 768 $36.55 10.96% 0.80
Computer Occupations, All Other 2,261 226 $36.45 11.93% 0.61
Computer and Information Systems Managers 2,093 218 $56.84 13.31% 0.49
Computer Systems Analysts 2,093 215 $42.25 14.41% 0.38
Network and Computer Systems Administrators 1,494 140 $39.85 12.85% 0.47
Computer Programmers 1,181 85 $41.45 0.89% 0.68
Database Administrators and Architects 741 71 $44.43 10.03% 0.60
Information Security Analysts 602 76 $43.07 23.70% 0.46
2020 Program Completions
2020 Completions
% Change (2012-2020)
Distance Offered Programs 0 0.0%
Non-Distance Offered Programs 1 (80.0%)
All Programs 1 (80.0%)
Target Occupations
Job Postings Summary
Management Information Systems and Services, Other (52.1299)
15,090 4 : 1Unique Postings
(Jan 2021 - Dec 2021)Posting Intensity
(Jan 2021 - Dec 2021)
54,441 Total Postings Regional Average: 5 : 1
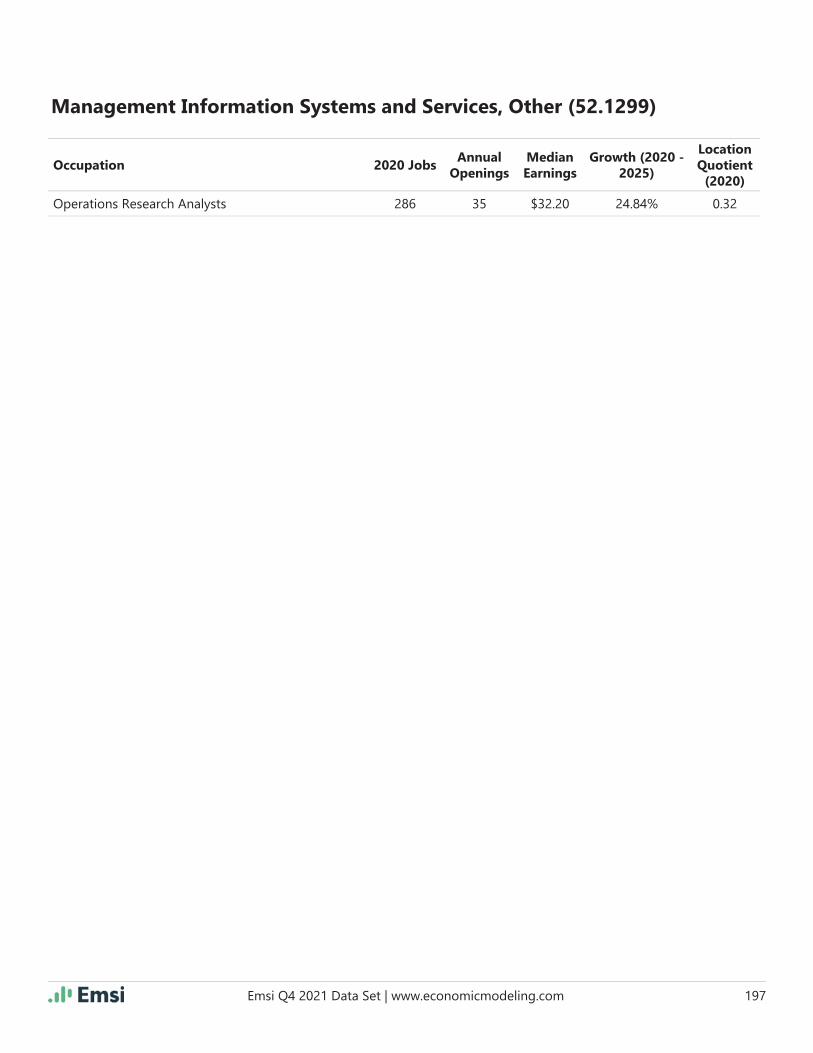
Emsi Q4 2021 Data Set | www.economicmodeling.com 197
Management Information Systems and Services, Other (52.1299)
Occupation 2020 JobsAnnual
OpeningsMedian Earnings
Growth (2020 - 2025)
Location Quotient
(2020)
Operations Research Analysts 286 35 $32.20 24.84% 0.32

Emsi Q4 2021 Data Set | www.economicmodeling.com 198
InstitutionCompletions
(2020)Growth %
YOY (2020)Market Share
(2020)IPEDS Tuition & Fees (2020)
University of Nevada-Reno 175 (6.4%) 58.7% $8,695
University of Nevada-Las Vegas 118 22.9% 39.6% $8,465
Truckee Meadows Community College 4 300.0% 1.3% $2,862
University of Phoenix-Nevada 1 (75.0%) 0.3% $9,552
18,194 7.1% $59,126 1,477 298
Jobs (2020)% Change
(2020-2025)Median Annual
EarningsAvg. Monthly Postings
(2021)Program
Completions
22% below National average
Nation: 7.3% Nation: $76,641976 Avg. Monthly Hires
(2021)2,073 Annual
Openings
Occupation 2020 JobsAnnual
OpeningsMedian Earnings
Growth (2020 - 2025)
Location Quotient
(2020)
Market Research Analysts and Marketing Specialists 3,722 504 $26.77 15.86% 0.57
Interviewers, Except Eligibility and Loan 3,712 459 $15.82 (0.98%) 2.21
Sales Managers 3,276 321 $53.43 6.40% 0.90
Computer Occupations, All Other 2,261 226 $36.45 11.93% 0.61
Marketing Managers 1,723 174 $48.88 7.74% 0.66
2020 Program Completions
2020 Completions
% Change (2012-2020)
Distance Offered Programs 4 100.0%
Non-Distance Offered Programs 294 101.4%
All Programs 298 101.4%
Target Occupations
Job Postings Summary
Marketing/Marketing Management, General (52.1401)
17,723 4 : 1Unique Postings
(Jan 2021 - Dec 2021)Posting Intensity
(Jan 2021 - Dec 2021)
65,869 Total Postings Regional Average: 5 : 1
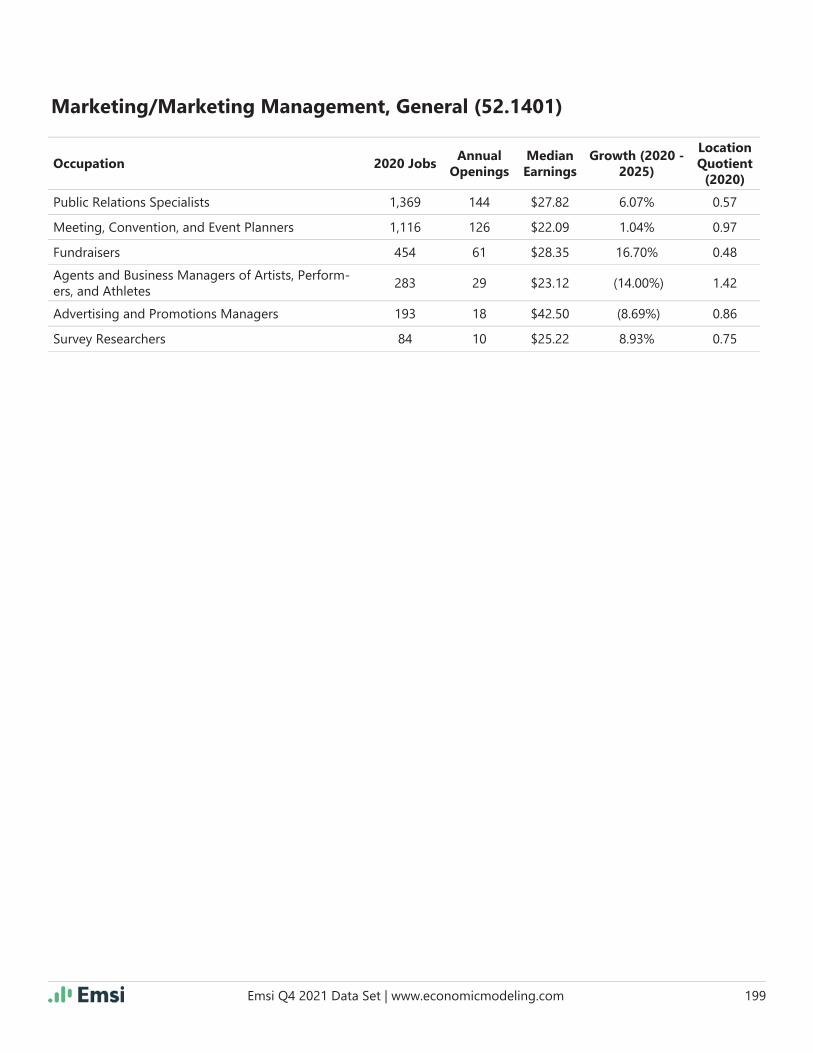
Emsi Q4 2021 Data Set | www.economicmodeling.com 199
Marketing/Marketing Management, General (52.1401)
Occupation 2020 JobsAnnual
OpeningsMedian Earnings
Growth (2020 - 2025)
Location Quotient
(2020)
Public Relations Specialists 1,369 144 $27.82 6.07% 0.57
Meeting, Convention, and Event Planners 1,116 126 $22.09 1.04% 0.97
Fundraisers 454 61 $28.35 16.70% 0.48
Agents and Business Managers of Artists, Perform-ers, and Athletes
283 29 $23.12 (14.00%) 1.42
Advertising and Promotions Managers 193 18 $42.50 (8.69%) 0.86
Survey Researchers 84 10 $25.22 8.93% 0.75

Emsi Q4 2021 Data Set | www.economicmodeling.com 200
InstitutionCompletions
(2020)Growth %
YOY (2020)Market Share
(2020)IPEDS Tuition & Fees (2020)
College of Southern Nevada 17 88.9% 100.0% $3,878
57,379 6.2% $48,393 3,253 17
Jobs (2020)% Change
(2020-2025)Median Annual
EarningsAvg. Monthly Postings
(2021)Program
Completions
12% below National average
Nation: 3.1% Nation: $55,8402,795 Avg. Monthly Hires
(2021)6,645 Annual
Openings
Occupation 2020 JobsAnnual
OpeningsMedian Earnings
Growth (2020 - 2025)
Location Quotient
(2020)
First-Line Supervisors of Retail Sales Workers 13,082 1,463 $19.78 2.63% 1.11
Sales Representatives, Wholesale and Manufactur-ing, Except Technical and Scientifi c Products
8,154 939 $29.03 7.31% 0.68
Real Estate Sales Agents 5,993 607 $27.36 6.24% 1.54
Insurance Sales Agents 4,812 531 $20.10 7.86% 0.78
Market Research Analysts and Marketing Specialists 3,722 504 $26.77 15.86% 0.57
Telemarketers 3,605 557 $11.96 1.04% 3.37
Securities, Commodities, and Financial Services Sales Agents
3,365 343 $23.24 6.70% 0.80
2020 Program Completions
2020 Completions
% Change (2012-2020)
Distance Offered Programs 0 0.0%
Non-Distance Offered Programs 17 466.7%
All Programs 17 466.7%
Target Occupations
Job Postings Summary
Sales, Distribution, and Marketing Operations, General (52.1801)
39,041 5 : 1Unique Postings
(Jan 2021 - Dec 2021)Posting Intensity
(Jan 2021 - Dec 2021)
184,842 Total Postings Regional Average: 5 : 1

Emsi Q4 2021 Data Set | www.economicmodeling.com 201
Sales, Distribution, and Marketing Operations, General (52.1801)
Occupation 2020 JobsAnnual
OpeningsMedian Earnings
Growth (2020 - 2025)
Location Quotient
(2020)
Sales Managers 3,276 321 $53.43 6.40% 0.90
Buyers and Purchasing Agents 3,126 326 $26.71 3.16% 0.79
Driver/Sales Workers 2,635 417 $12.41 19.94% 0.67
First-Line Supervisors of Non-Retail Sales Workers 2,471 242 $27.64 3.36% 0.82
Sales Representatives, Wholesale and Manufactur-ing, Technical and Scientifi c Products
1,691 215 $42.08 12.15% 0.63
Door-to-Door Sales Workers, News and Street Ven-dors, and Related Workers
641 76 $11.46 (15.26%) 1.22
Advertising Sales Agents 634 80 $22.85 (3.80%) 0.61
Sales Engineers 172 24 $46.58 14.55% 0.29
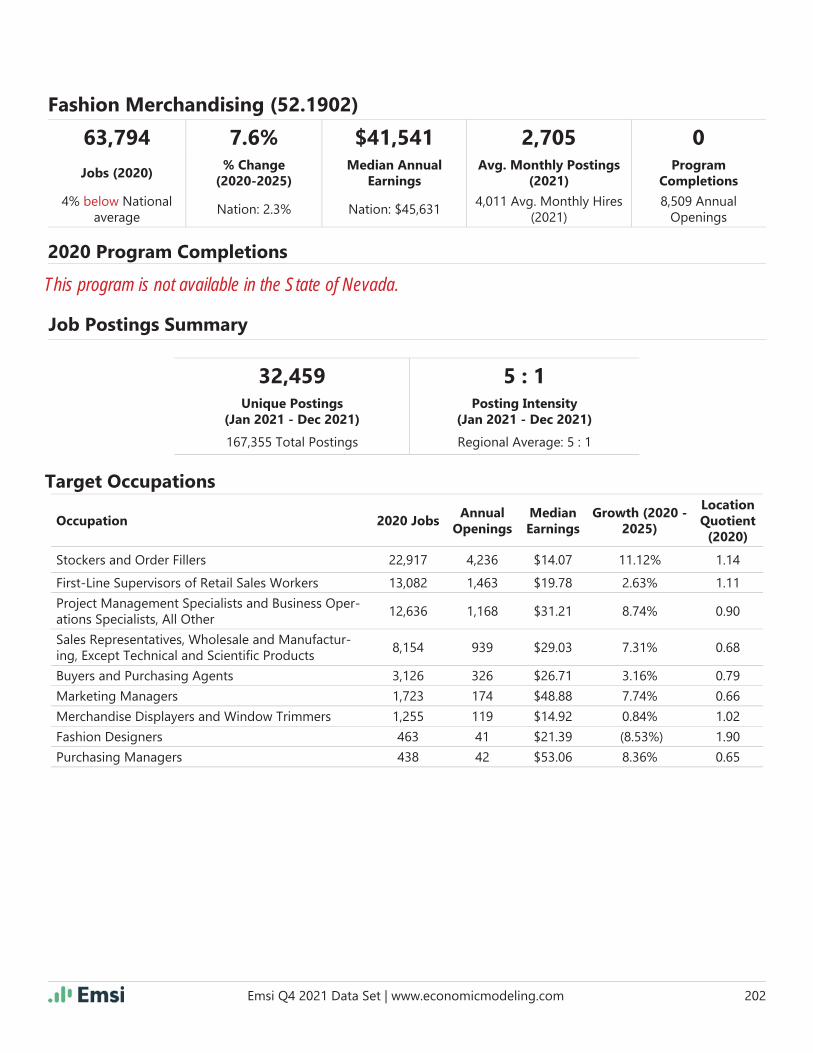
Emsi Q4 2021 Data Set | www.economicmodeling.com 202
63,794 7.6% $41,541 2,705 0
Jobs (2020)% Change
(2020-2025)Median Annual
EarningsAvg. Monthly Postings
(2021)Program
Completions
4% below National average
Nation: 2.3% Nation: $45,6314,011 Avg. Monthly Hires
(2021)8,509 Annual
Openings
Occupation 2020 JobsAnnual
OpeningsMedian Earnings
Growth (2020 - 2025)
Location Quotient
(2020)
Stockers and Order Fillers 22,917 4,236 $14.07 11.12% 1.14
First-Line Supervisors of Retail Sales Workers 13,082 1,463 $19.78 2.63% 1.11
Project Management Specialists and Business Oper-ations Specialists, All Other
12,636 1,168 $31.21 8.74% 0.90
Sales Representatives, Wholesale and Manufactur-ing, Except Technical and Scientifi c Products
8,154 939 $29.03 7.31% 0.68
Buyers and Purchasing Agents 3,126 326 $26.71 3.16% 0.79
Marketing Managers 1,723 174 $48.88 7.74% 0.66
Merchandise Displayers and Window Trimmers 1,255 119 $14.92 0.84% 1.02
Fashion Designers 463 41 $21.39 (8.53%) 1.90
Purchasing Managers 438 42 $53.06 8.36% 0.65
2020 Program Completions
Target Occupations
Job Postings Summary
Fashion Merchandising (52.1902)
This program is not available in the State of Nevada.
32,459 5 : 1Unique Postings
(Jan 2021 - Dec 2021)Posting Intensity
(Jan 2021 - Dec 2021)
167,355 Total Postings Regional Average: 5 : 1

Emsi Q4 2021 Data Set | www.economicmodeling.com 203
InstitutionCompletions
(2020)Growth %
YOY (2020)Market Share
(2020)IPEDS Tuition & Fees (2020)
Nevada State College 5 (44.4%) 100.0% $6,075
118,150 6.5% $62,531 3,434 5
Jobs (2020)% Change
(2020-2025)Median Annual
EarningsAvg. Monthly Postings
(2021)Program
Completions
4% below National average
Nation: 3.0% Nation: $66,9975,932 Avg. Monthly Hires
(2021)12,404 Annual
Openings
Occupation 2020 JobsAnnual
OpeningsMedian Earnings
Growth (2020 - 2025)
Location Quotient
(2020)
Offi ce Clerks, General 28,578 3,471 $17.89 2.91% 1.06
General and Operations Managers 21,279 2,195 $49.45 8.96% 0.97
Personal Service Managers, All Other; Entertainment and Recreation Managers, Except Gambling; and Managers, All Other
14,315 1,212 $38.17 5.45% 1.69
Project Management Specialists and Business Oper-ations Specialists, All Other
12,636 1,168 $31.21 8.74% 0.90
First-Line Supervisors of Offi ce and Administrative Support Workers
11,554 1,238 $24.99 3.70% 0.87
Management Analysts 6,585 768 $36.55 10.96% 0.80
2020 Program Completions
2020 Completions
% Change (2012-2020)
Distance Offered Programs 0 (100.0%)
Non-Distance Offered Programs 5 Insf. Data
All Programs 5 (83.3%)
Target Occupations
Job Postings Summary
Business, Management, Marketing, and Related Support Services, Other (52.9999)
41,209 5 : 1Unique Postings
(Jan 2021 - Dec 2021)Posting Intensity
(Jan 2021 - Dec 2021)
186,419 Total Postings Regional Average: 5 : 1
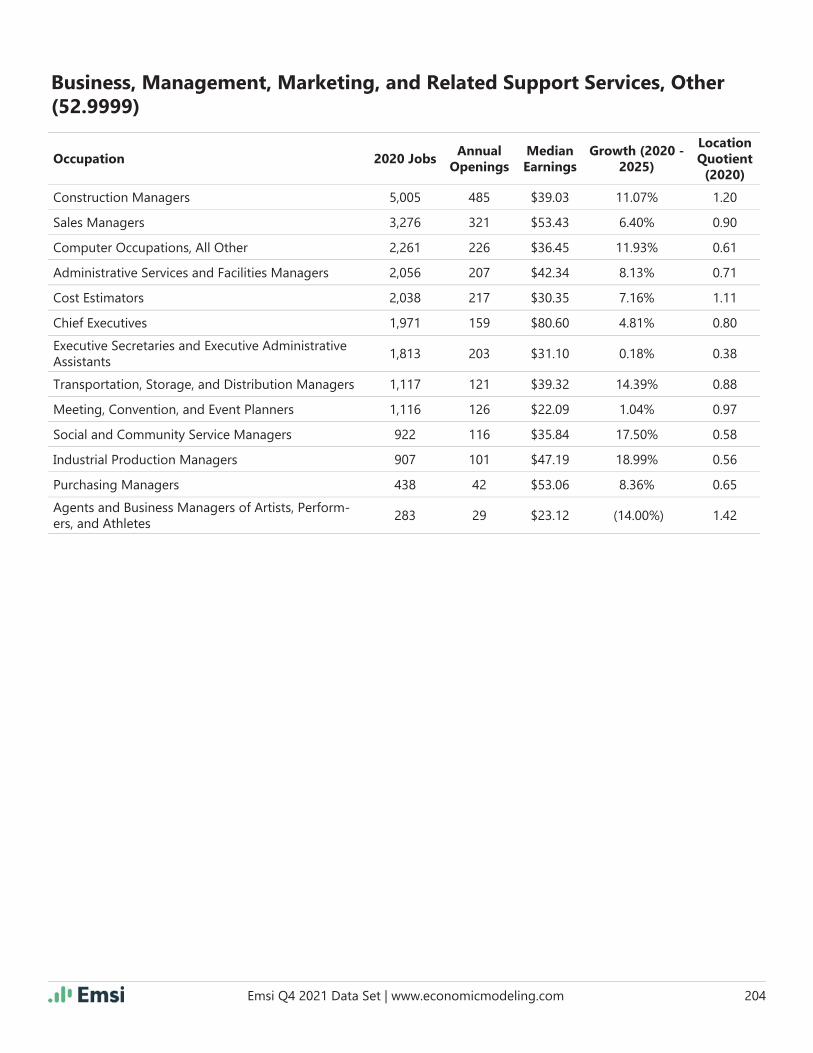
Emsi Q4 2021 Data Set | www.economicmodeling.com 204
Business, Management, Marketing, and Related Support Services, Other (52.9999)
Occupation 2020 JobsAnnual
OpeningsMedian Earnings
Growth (2020 - 2025)
Location Quotient
(2020)
Construction Managers 5,005 485 $39.03 11.07% 1.20
Sales Managers 3,276 321 $53.43 6.40% 0.90
Computer Occupations, All Other 2,261 226 $36.45 11.93% 0.61
Administrative Services and Facilities Managers 2,056 207 $42.34 8.13% 0.71
Cost Estimators 2,038 217 $30.35 7.16% 1.11
Chief Executives 1,971 159 $80.60 4.81% 0.80
Executive Secretaries and Executive Administrative Assistants
1,813 203 $31.10 0.18% 0.38
Transportation, Storage, and Distribution Managers 1,117 121 $39.32 14.39% 0.88
Meeting, Convention, and Event Planners 1,116 126 $22.09 1.04% 0.97
Social and Community Service Managers 922 116 $35.84 17.50% 0.58
Industrial Production Managers 907 101 $47.19 18.99% 0.56
Purchasing Managers 438 42 $53.06 8.36% 0.65
Agents and Business Managers of Artists, Perform-ers, and Athletes
283 29 $23.12 (14.00%) 1.42
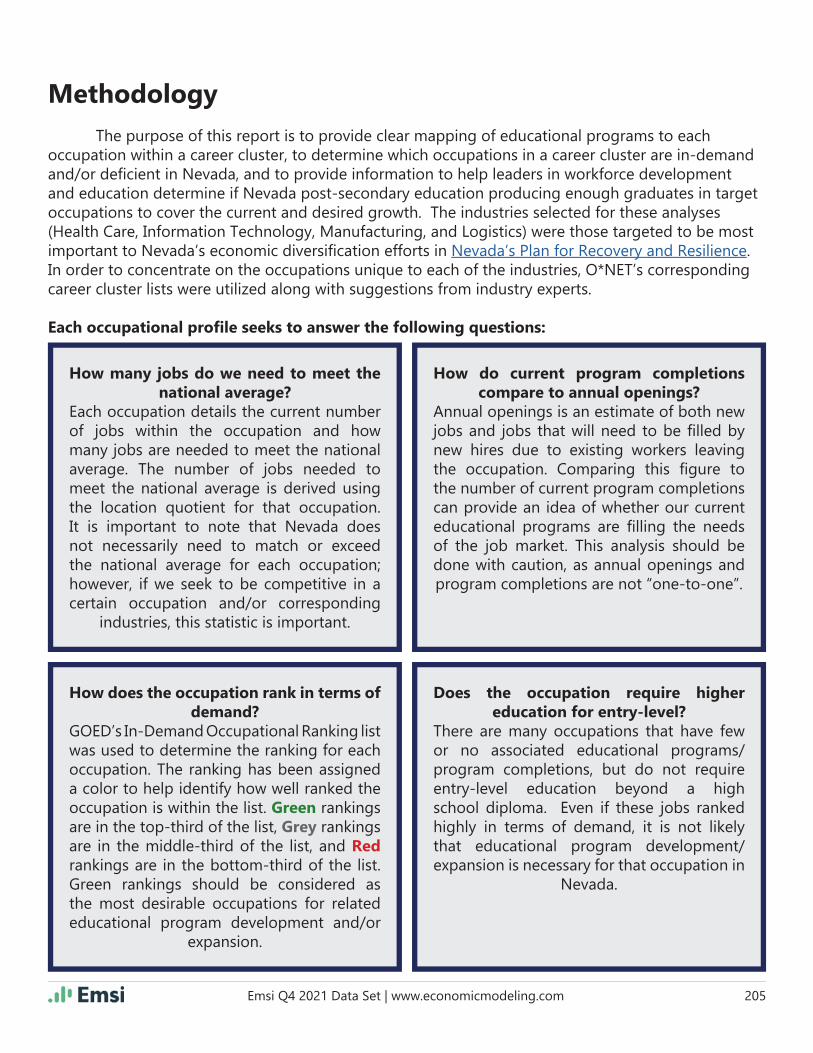
Emsi Q4 2021 Data Set | www.economicmodeling.com 205
How many jobs do we need to meet the national average?
Each occupation details the current number of jobs within the occupation and how many jobs are needed to meet the national average. The number of jobs needed to meet the national average is derived using the location quotient for that occupation. It is important to note that Nevada does not necessarily need to match or exceed the national average for each occupation; however, if we seek to be competitive in a certain occupation and/or corresponding
industries, this statistic is important.
How do current program completions compare to annual openings?
Annual openings is an estimate of both new jobs and jobs that will need to be fi lled by new hires due to existing workers leaving the occupation. Comparing this fi gure to the number of current program completions can provide an idea of whether our current educational programs are fi lling the needs of the job market. This analysis should be done with caution, as annual openings and program completions are not “one-to-one”.
How does the occupation rank in terms of demand?
GOED’s In-Demand Occupational Ranking list was used to determine the ranking for each occupation. The ranking has been assigned a color to help identify how well ranked the occupation is within the list. Green rankings are in the top-third of the list, Grey rankings are in the middle-third of the list, and Redrankings are in the bottom-third of the list. Green rankings should be considered as the most desirable occupations for related educational program development and/or
expansion.
Does the occupation require higher education for entry-level?
There are many occupations that have few or no associated educational programs/program completions, but do not require entry-level education beyond a high school diploma. Even if these jobs ranked highly in terms of demand, it is not likely that educational program development/expansion is necessary for that occupation in
Nevada.
Methodology The purpose of this report is to provide clear mapping of educational programs to each occupation within a career cluster, to determine which occupations in a career cluster are in-demand and/or defi cient in Nevada, and to provide information to help leaders in workforce development and education determine if Nevada post-secondary education producing enough graduates in target occupations to cover the current and desired growth. The industries selected for these analyses (Health Care, Information Technology, Manufacturing, and Logistics) were those targeted to be most important to Nevada’s economic diversifi cation efforts in Nevada’s Plan for Recovery and Resilience. In order to concentrate on the occupations unique to each of the industries, O*NET’s corresponding career cluster lists were utilized along with suggestions from industry experts.
Each occupational profi le seeks to answer the following questions:

Emsi Q4 2021 Data Set | www.economicmodeling.com 206
Is this analysis enough?
The information listed in the occupational summary is helpful in determining whether educational workforce development programs are adequately producing enough graduates and completers to staff an occupation. However, this information does not determine whether we need more educational programs or not. Educational programs are not one-to-one with occupations, because one program can be relevant for many occupations. Because of this fact, the occupational data is not the whole story. To adequately examine occupational-education mapping, analysis must be conducted on the program side as well.
Each educational program profi le seeks to answer the following questions:
How do jobs related to this program compete with other jobs in the economy?Consider the number of current jobs that are mapped to the program and how that number compares to the national average. Confi rm if the occupations are projected to grow and if companies are actively hiring (number of job postings). Compare the average wage to the national average - is
this wage reasonable?
How are these programs distributed regionally?
Determine where the programs are located. Is a program located only in the North, but growth is expected in the South or in rural areas? If growth is expected in an area without a program, is distance education for
the program offered?
How many occupations does this program map to, and what is the cumulative demand in the economy for more
educational programs in this fi eld?Consider the total annual openings, projected growth, and annual job postings for all the occupations. It may be helpful to exclude occupations that require only a high-school
diploma or less for entry-level positions.
What are employers in the fi eld saying?Examining the data is important, but local employer testimonies are just as important. Do local employers prefer a specifi c degree for a specifi c occupation? Are they struggling to fi nd local candidates with
proper credentials?
Along with expert opinion and employer input, considering each of these questions on both the occupation and education side should provide an adequate analysis to aid workforce development and educational leaders in determining which in-demand occupations in the career cluster if Nevada higher education is producing enough graduates in target occupations to cover the current and desired growth.

Emsi Q4 2021 Data Set | www.economicmodeling.com 207
Data SourcesEmsi
Emsi provides the best mix of Labor Market Information (LMI) for professionals in higher education, economic development, workforce development, talent acquisition, and site selection. Their data, which covers more than 99% of the workforce, is compiled from a wide variety of government sources, job postings, and online profi les and resumes. Emsi data is used to solve a variety of problems, including: aligning education programs with regional needs, equipping students with career visions, to understand regional economic and workforce activity, and connecting the right talent to the right job.
Occupational Employment Statistics (OES)The Occupational Employment Statistics (OES) program estimates employment and wages for most occupations by industry and sector at the national, the state, the metropolitan statistical area (MSA), and the non-MSA levels in all 50 states and the District of Columbia. OES accounts for 1.1 million establishments and 57 percent of national employment, including railroad, but excluding military, agriculture, fi shing, forestry, private households, self-employment, and others.
How Emsi Incorporates OESOES is our primary source of occupation data, but we compensate for OES’s general weaknesses and lack of valid historical data by utilizing stronger, more accurate industry employment counts from the Quarterly Census of Employment and Wages (QCEW), County Business Patterns (CBP), and American Community Survey (ACS), among others. We then apply regionalized, OES-based staffi ng patterns to the industry data to show the distribution of jobs by occupation within an industry sector.
Emsi gathers occupation earnings data from the OES program. We use unsuppression techniques to fi ll in missing values as appropriate, and then build a time series of OES data to report and present historical occupation earnings.
Integrated Post-secondary Education Data System (IPEDS)IPEDS is a system of interrelated surveys conducted annually by the U.S. Department’s National Center for Education Statistics (NCES). IPEDS gathers information from every college, university, and technical and vocational institution that participates in the federal student fi nancial aid programs. The Higher Education Act of 1965, as amended, requires that institutions that participate in federal student aid programs report data on enrollments, program completions, graduation rates, faculty and staff, fi nances, institutional prices, and student fi nancial aid. Many institutions that do not receive federal funding also participate and report their data to IPEDS voluntarily.
Emsi uses IPEDS data to provide information about postsecondary institutions, especially in regard to college completions by program type and demographic (race and gender). Completions include degrees (associate’s, bachelor’s, master’s, doctoral), certifi cates, and any other formal award.
In addition, Emsi uses the Classifi cation of Instructional Programs (CIP) system to create

Emsi Q4 2021 Data Set | www.economicmodeling.com 208
program-to-occupation crosswalks, which map programs of study to occupations and reveal one measure of education supply and demand.
Job Posting Analytics (JPA)JPA is data collected from hundreds of millions of job postings created by employers. JPA can help measure the demand for talent in a given region. It is more granular than traditional LMI, provid-ing details about the labor market (e.g. specifi c skills requested by employers) that LMI simply can’t. Another of JPA’s strengths is that it has virtually no time lag, since job postings are live; hence it is also sometimes known as “real-time labor market data.” The number of postings may be either higher or lower than the number of actual hires. Postings might outnumber hires when a company is trying hard to fi nd talent, or postings may be signifi cantly fewer than hires because certain types of jobs (e.g., roofers, welders, and other blue-collar jobs) aren’t typically advertised online. When this hap-pens, Emsi deduplicates the postings as much as possible and then provide a realistic ratio of unique postings to hires.
In-Demand Occupation Analysis
The In-Demand Occupation Ranking List is a product developed by the Nevada Governor’s Offi ce of Economic Development (GOED).
Several factors are utilized to create the occupational ranking:Target Sector Approach - To focus the rankings on GOED’s target industries, staffi ng patterns were utilized on the culmination of the Aerospace and Defense, Health Care, Information Technology, Manufacturing, Logistics & Operations, Mining, Natural Resource Technologies and Tourism & Gaming industries. This approach is the fi rst step in creating staffi ng demand estimates by occupation for these target sectors.
STEM Scores - In 2013, Brookings developed a comprehensive scoring system to determine the level of STEM knowledge needed to be employed in each occupation. The report defi nes STEM occupations in two ways: High-STEM in any one fi eld: The occupation must have a knowledge score of at least 1.5 standard deviations above the mean in at least one STEM fi eld. Super-STEM or high-STEM across fi elds: The occupation’s combined STEM score—the sum of the scores from each fi eld—must be at least 1.5 standard deviations above the mean score. Since this report was developed prior to the current 2018 Standard Occupational Classifi cation (SOC) system, adjustments were conducted in house to bring the scores up to date.
Location quotient (LQ) - LQ is a way of quantifying how concentrated a particular industry, cluster, occupation, or demographic group is in a region as compared state or county containing that region or to the nation. It can reveal what makes a particular region “unique.” For the majority of occupations, the LQ was calculated using the target sector employment. If an occupation had 200 employees or less, the LQ for all persons employed in the occupation (not just within the GOED sectors), also known as the “economy LQ” was used instead. This approach helps normalize the smaller occupations within the target sectors.
Job Postings - Using Emsi’s Job Posting Analytics (see the defi nition above for a detailed description), unique postings from the most recent one-year period at the time the ranking list was developed (May 2020 - April 2021) were collected for each occupation.
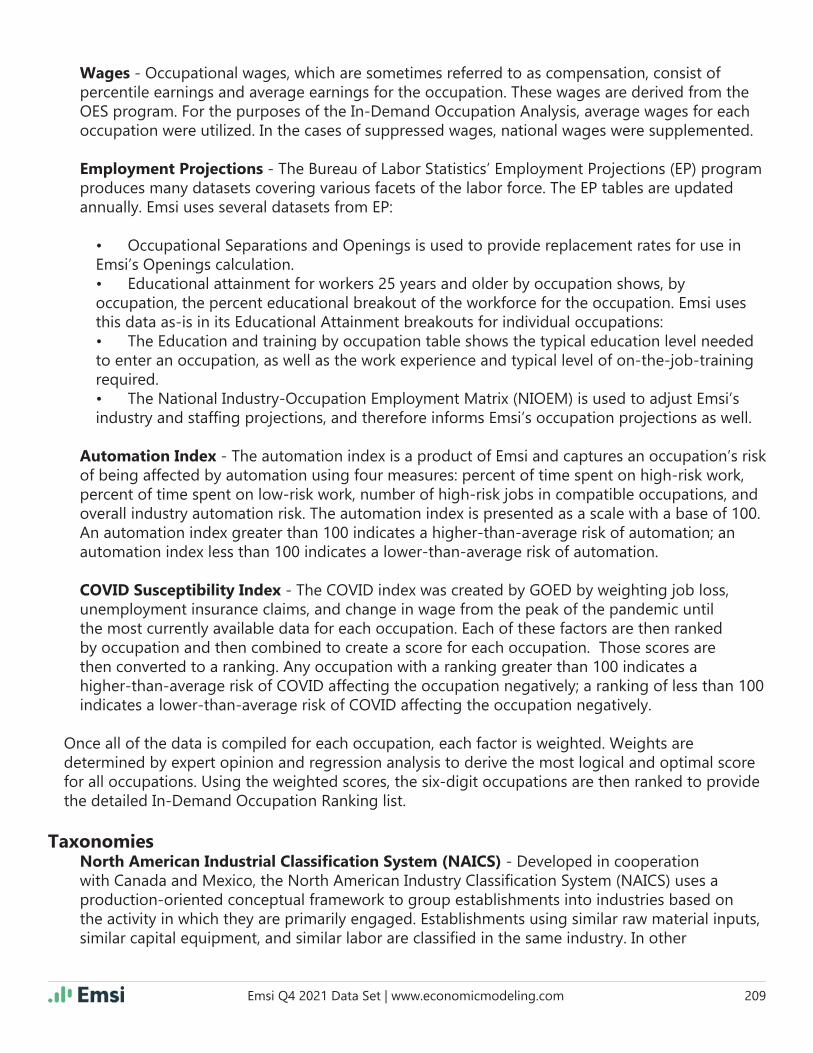
Emsi Q4 2021 Data Set | www.economicmodeling.com 209
Wages - Occupational wages, which are sometimes referred to as compensation, consist of percentile earnings and average earnings for the occupation. These wages are derived from the OES program. For the purposes of the In-Demand Occupation Analysis, average wages for each occupation were utilized. In the cases of suppressed wages, national wages were supplemented.
Employment Projections - The Bureau of Labor Statistics’ Employment Projections (EP) program produces many datasets covering various facets of the labor force. The EP tables are updated annually. Emsi uses several datasets from EP:
• Occupational Separations and Openings is used to provide replacement rates for use in Emsi’s Openings calculation.• Educational attainment for workers 25 years and older by occupation shows, by occupation, the percent educational breakout of the workforce for the occupation. Emsi uses this data as-is in its Educational Attainment breakouts for individual occupations:• The Education and training by occupation table shows the typical education level needed to enter an occupation, as well as the work experience and typical level of on-the-job-training required.• The National Industry-Occupation Employment Matrix (NIOEM) is used to adjust Emsi’s industry and staffi ng projections, and therefore informs Emsi’s occupation projections as well.
Automation Index - The automation index is a product of Emsi and captures an occupation’s risk of being affected by automation using four measures: percent of time spent on high-risk work, percent of time spent on low-risk work, number of high-risk jobs in compatible occupations, and overall industry automation risk. The automation index is presented as a scale with a base of 100. An automation index greater than 100 indicates a higher-than-average risk of automation; an automation index less than 100 indicates a lower-than-average risk of automation.
COVID Susceptibility Index - The COVID index was created by GOED by weighting job loss, unemployment insurance claims, and change in wage from the peak of the pandemic until the most currently available data for each occupation. Each of these factors are then ranked by occupation and then combined to create a score for each occupation. Those scores are then converted to a ranking. Any occupation with a ranking greater than 100 indicates a higher-than-average risk of COVID affecting the occupation negatively; a ranking of less than 100 indicates a lower-than-average risk of COVID affecting the occupation negatively.
Once all of the data is compiled for each occupation, each factor is weighted. Weights are determined by expert opinion and regression analysis to derive the most logical and optimal score for all occupations. Using the weighted scores, the six-digit occupations are then ranked to provide the detailed In-Demand Occupation Ranking list.
TaxonomiesNorth American Industrial Classifi cation System (NAICS) - Developed in cooperation with Canada and Mexico, the North American Industry Classifi cation System (NAICS) uses a production-oriented conceptual framework to group establishments into industries based on the activity in which they are primarily engaged. Establishments using similar raw material inputs, similar capital equipment, and similar labor are classifi ed in the same industry. In other

Emsi Q4 2021 Data Set | www.economicmodeling.com 210
words, establishments that do similar things in similar ways are classifi ed together. NAICS was introduced in 1997 and is periodically revised to refl ect changes in the industrial structure of the U.S. and North American economy.
Classifi cation of Instructional Programs (CIP) - The Classifi cation of Instructional Programs (CIP) is a taxonomy of academic programs developed by the US Department of Education. Colleges and universities across the country assign CIP codes to their academic programs. CIP codes are also often assigned to courses, certifi cates, and degrees.
Standard Occupational Classifi cation (SOC) System - The 2018 Standard Occupational Classifi cation (SOC) system is a federal statistical standard used by federal agencies to classify workers into occupational categories for the purpose of collecting, calculating, or disseminating data. All workers are classifi ed into one of 867 detailed occupations according to their occupational defi nition. To facilitate classifi cation, detailed occupations are combined to form 459 broad occupations, 98 minor groups, and 23 major groups. Detailed occupations in the SOC with similar job duties, and in some cases skills, education, and/or training, are grouped together.

Emsi Q4 2021 Data Set | www.economicmodeling.com 211
Data Limitations
Occupational Employment Statistics (OES)
OES is merely a survey and is not based on administrative records like Quarterly Census of Employment and Wages (QCEW) from the BLS; because of this, OES’s fi gures aren’t as comprehensive as most industry data.
Not all metropolitan and non-metropolitan areas have information for all occupations. Only 57 percent of employment is covered in the OES survey (compared to the 95 percent of wage-and-salary jobs captured by QCEW), which excludes all industries under NAICS 11 (agriculture, forestry, fi shing, and hunting) except for logging, support activities for crop production, and support activities for animal production.
The OES survey takes up to three years to complete, so the BLS states that it is less useful for measuring change in job counts or wages over time. An apparent increase in wages, for example, could just as likely be due to different businesses responding to the survey in one year, changes in the occupational, industrial, and geographical classifi cation systems, changes to collection or estimation methods, or changes to other methodologies in the survey.
Integrated Post-secondary Education Data System (IPEDS)
Institutions self-report their information to IPEDS, so the possibility of error exists, particularly in regard to the reported programs of study.
There is about a year lag between when IPEDS collects its data and when it is released. IPEDS is not comprehensive of all education and training programs (e.g. MakerSquare and other non-traditional education and training programs are not included in this data).
Programs that are offered online are fl agged as such, but their enrollments and completions cannot be split out to show number of brick-and-mortar completions vs. number of online completions.
The CIP taxonomy is not intuitively organized; its classifi cations do not necessarily match up with the exact names of majors, and similar programs may not be found within the same six, four, or even two-digit series.
Job Posting Analytics (JPA)
The number of postings may be either higher or lower than the number of actual hires. Postings might outnumber hires when a company is trying hard to fi nd talent, or postings may be signifi cantly fewer than hires because certain types of jobs (e.g., roofers, welders, and other blue-collar jobs) aren’t typically advertised online. When this happens, Emsi deduplicate the postings as much as possible and then provide a realistic ratio of unique postings to hires.

Emsi Q4 2021 Data Set | www.economicmodeling.com 212
In-Demand Occupation Analysis
GOED’s In-Demand Occupation Analysis is developed to inform lawmakers, educational institutions, workforce development agencies, and students what occupations are needed to continue economic diversifi cation while also considering job postings, existing industry employment projections, STEM scores, job openings, wages, automation risk and COVID risk. This multi-variate approach is an effort to mitigate bias inherent to any one data series and, as such, the occupations presented as most in-demand may not align with private agencies, national reports, or other states.

Emsi Q4 2021 Data Set | www.economicmodeling.com 213
SOC Description2020 Jobs
Jobs Above
or Below National Average
Total 2020 Program
Completions
Annual Openings
Avg. Hourly
Earnings
In-Demand Occupational
Rank
15-1256 Software De-velopers and Software Qual-ity Assurance Analysts and Testers
5,770 (7,997) 629 747 $47.35 1
15-1211 Computer Sys-tems Analysts
2,093 (3,348) 944 215 $44.69 4
15-1244 Network and Computer Sys-tems Adminis-trators
1,494 (1,672) 968 140 $41.59 8
15-1299 Computer Oc-cupations, All Other
2,261 (1,427) 2,175 226 $37.63 13
13-1198 Project Man-agement Spe-cialists and Business Oper-ations Special-ists, All Other
12,636 (1,412) 4,513 1,168 $33.55 16
13-1161 Market Re-search Analysts and Marketing Specialists
3,722 (2,848) 1689 504 $29.40 23
15-1212 Information Se-curity Analysts
602 (702) 1,433 76 $52.34 27
15-1257 Web Develop-ers and Digital Interface De-signers
1,080 (649) 430 105 $31.22 38
15-1232 Computer User Support Spe-cialists
6,113 10 3,515 534 $26.18 42
15-1241 Computer Net-work Architects
627 (848) 1,070 52 $53.26 43
Appendix A: Occupational Summary Table, Sorted by In-Demand Occupational Rank
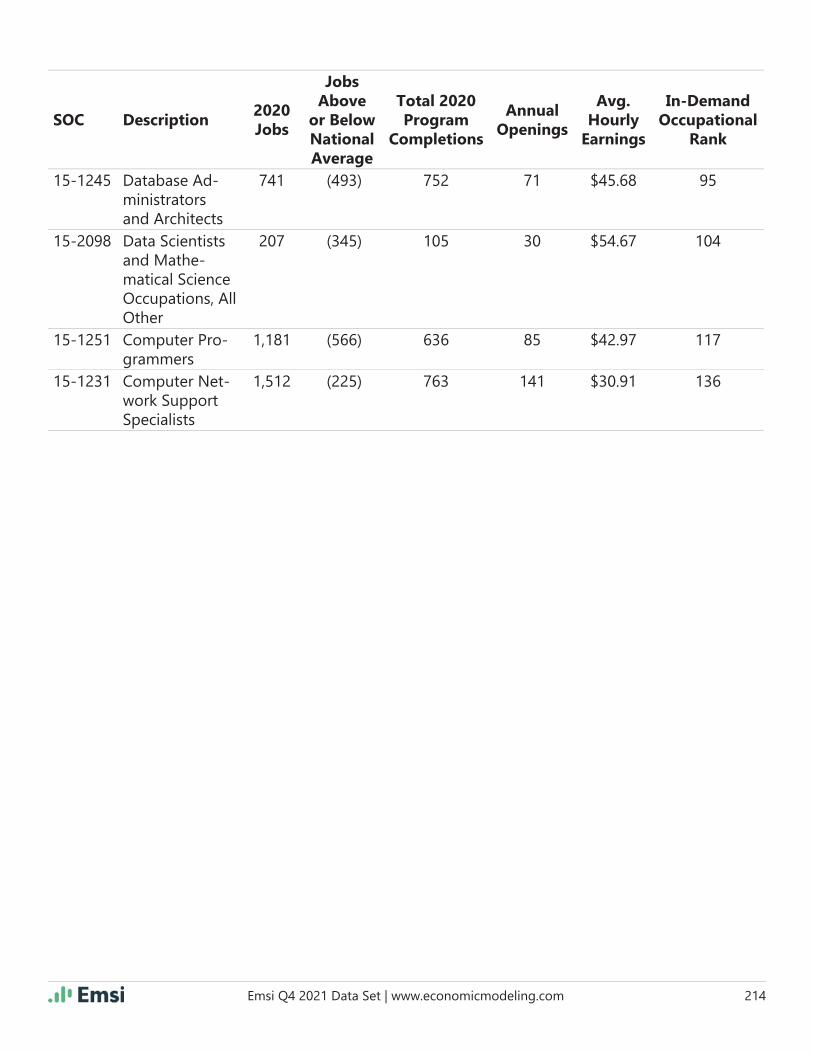
Emsi Q4 2021 Data Set | www.economicmodeling.com 214
SOC Description2020 Jobs
Jobs Above
or Below National Average
Total 2020 Program
Completions
Annual Openings
Avg. Hourly
Earnings
In-Demand Occupational
Rank
15-1245 Database Ad-ministrators and Architects
741 (493) 752 71 $45.68 95
15-2098 Data Scientists and Mathe-matical Science Occupations, All Other
207 (345) 105 30 $54.67 104
15-1251 Computer Pro-grammers
1,181 (566) 636 85 $42.97 117
15-1231 Computer Net-work Support Specialists
1,512 (225) 763 141 $30.91 136

Emsi Q4 2021 Data Set | www.economicmodeling.com 215
CIP Code
Program 2016 2017 2018 2019 2020
24.0101 Liberal Arts and Sciences/Liberal Studies
1,105 1,208 1,121 1,243 1,186
52.0201 Business Administration and Management, General
1,006 1,007 1,028 993 918
24.0102 General Studies 699 730 637 652 69543.0104 Criminal Justice/Safety Studies 467 475 510 484 47352.0101 Business/Commerce, General 263 297 303 293 30552.1401 Marketing/Marketing Manage-
ment, General171 234 224 288 298
11.0901 Computer Systems Networking and Telecommunications
272 106 180 171 226
47.0201 Heating, Air Conditioning, Ven-tilation and Refrigeration Main-tenance Technology/Technician
224 175 227 214 190
11.1005 Information Technology Project Management
1 0 78 94 174
14.0901 Computer Engineering, General 82 108 171 152 16511.0701 Computer Science 104 95 113 119 16145.0601 Economics, General 49 63 60 136 14711.0101 Computer and Information Sci-
ences, General115 110 125 144 133
09.0102 Mass Communication/Media Studies
93 110 121 104 127
11.1003 Computer and Information Systems Security/Auditing/In-formation Assurance
63 48 113 98 105
27.0101 Mathematics, General 70 80 87 85 10552.1101 International Business/Trade/
Commerce86 75 93 67 88
15.0613 Manufacturing Engineering Technology/Technician
27 30 25 42 62
30.9999 Multi-/Interdisciplinary Studies, Other
58 59 64 53 60
40.0601 Geology/Earth Science, General 53 56 52 48 5950.0409 Graphic Design 55 63 79 69 5903.0104 Environmental Science 28 48 52 58 55
Appendix B: Program Summary Table, Sorted by 2020 Completions
Program Completions
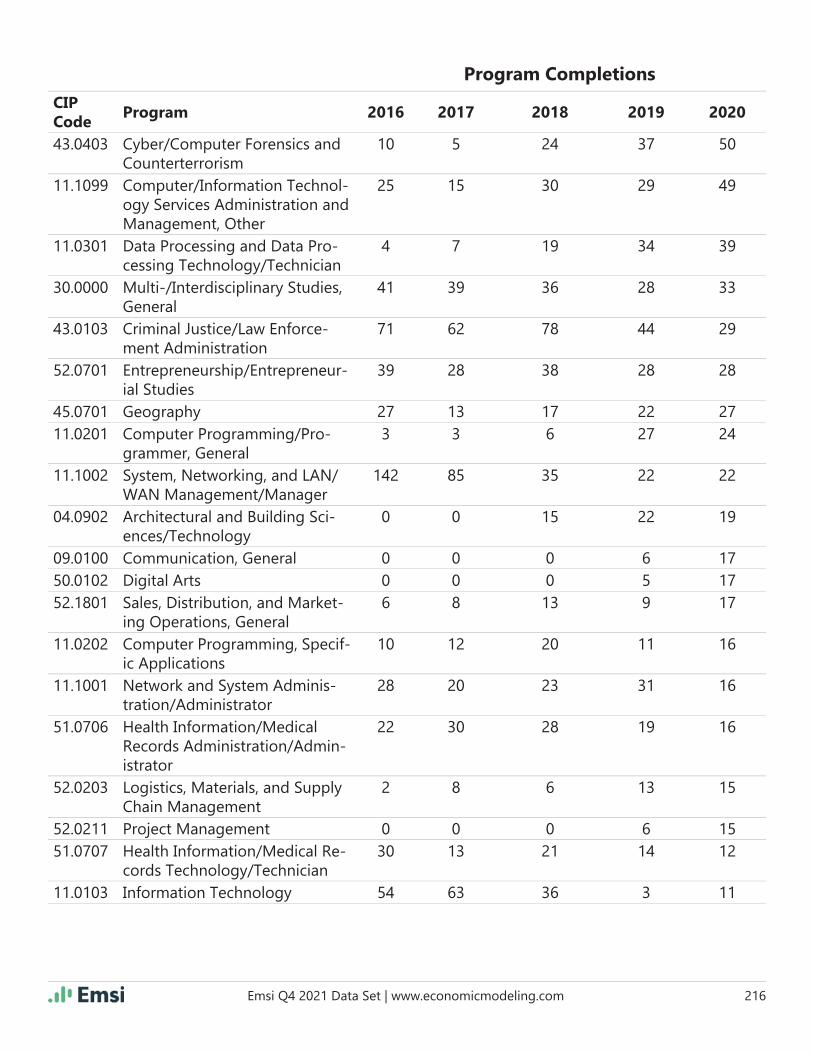
Emsi Q4 2021 Data Set | www.economicmodeling.com 216
CIP Code
Program 2016 2017 2018 2019 2020
43.0403 Cyber/Computer Forensics and Counterterrorism
10 5 24 37 50
11.1099 Computer/Information Technol-ogy Services Administration and Management, Other
25 15 30 29 49
11.0301 Data Processing and Data Pro-cessing Technology/Technician
4 7 19 34 39
30.0000 Multi-/Interdisciplinary Studies, General
41 39 36 28 33
43.0103 Criminal Justice/Law Enforce-ment Administration
71 62 78 44 29
52.0701 Entrepreneurship/Entrepreneur-ial Studies
39 28 38 28 28
45.0701 Geography 27 13 17 22 2711.0201 Computer Programming/Pro-
grammer, General3 3 6 27 24
11.1002 System, Networking, and LAN/WAN Management/Manager
142 85 35 22 22
04.0902 Architectural and Building Sci-ences/Technology
0 0 15 22 19
09.0100 Communication, General 0 0 0 6 1750.0102 Digital Arts 0 0 0 5 1752.1801 Sales, Distribution, and Market-
ing Operations, General6 8 13 9 17
11.0202 Computer Programming, Specif-ic Applications
10 12 20 11 16
11.1001 Network and System Adminis-tration/Administrator
28 20 23 31 16
51.0706 Health Information/Medical Records Administration/Admin-istrator
22 30 28 19 16
52.0203 Logistics, Materials, and Supply Chain Management
2 8 6 13 15
52.0211 Project Management 0 0 0 6 1551.0707 Health Information/Medical Re-
cords Technology/Technician30 13 21 14 12
11.0103 Information Technology 54 63 36 3 11
Program Completions

Emsi Q4 2021 Data Set | www.economicmodeling.com 217
CIP Code
Program 2016 2017 2018 2019 2020
46.0415 Building Construction Technolo-gy/Technician
5 4 18 20 10
50.0401 Design and Visual Communica-tions, General
3 7 3 6 9
52.1201 Management Information Sys-tems, General
9 9 10 5 8
03.0101 Natural Resources/Conserva-tion, General
3 5 3 5 7
11.1004 Web/Multimedia Management and Webmaster
0 4 4 8 7
15.1201 Computer Engineering Technol-ogy/Technician
0 0 2 5 7
03.0201 Environmental/Natural Resourc-es Management and Policy, General
5 3 6 3 5
43.0302 Crisis/Emergency/Disaster Man-agement
4 3 1 3 5
52.0299 Business Administration, Man-agement and Operations, Other
35 25 18 14 5
52.9999 Business, Management, Market-ing, and Related Support Ser-vices, Other
34 23 17 12 5
05.0103 Asian Studies/Civilization 3 3 5 8 411.0501 Computer Systems Analysis/
Analyst7 8 3 4 4
11.0802 Data Modeling/Warehousing and Database Administration
2 1 1 6 4
11.0899 Computer Software and Media Applications, Other
0 0 0 12 4
15.1703 Solar Energy Technology/Tech-nician
10 4 4 3 4
51.2211 Health Services Administration 0 0 0 0 411.0803 Computer Graphics 3 0 2 1 352.0407 Business/Offi ce Automation/
Technology/Data Entry4 5 0 1 3
52.0799 Entrepreneurial and Small Busi-ness Operations, Other
3 2 1 0 3
Program Completions

Emsi Q4 2021 Data Set | www.economicmodeling.com 218
CIP Code
Program 2016 2017 2018 2019 2020
24.0199 Liberal Arts and Sciences, Gen-eral Studies and Humanities, Other
5 6 6 1 2
30.2001 International/Globalization Studies
4 3 4 2 2
43.0109 Security and Loss Prevention Services
0 0 8 9 2
52.0305 Accounting and Business/Man-agement
17 8 2 0 1
52.1299 Management Information Sys-tems and Services, Other
2 2 5 2 1
03.0103 Environmental Studies 9 15 5 1 005.0107 Latin American Studies 1 2 0 1 005.0125 German Studies 0 0 0 0 005.0199 Area Studies, Other 0 0 0 0 009.0903 Advertising 0 0 0 0 010.0301 Graphic Communications, Gen-
eral0 0 0 0 0
10.0304 Animation, Interactive Technol-ogy, Video Graphics, and Spe-cial Effects
5 10 2 2 0
11.0199 Computer and Information Sci-ences, Other
24 20 0 0 0
11.0401 Information Science/Studies 0 1 0 0 011.0601 Data Entry/Microcomputer Ap-
plications, General3 1 0 2 0
11.0801 Web Page, Digital/Multime-dia and Information Resources Design
12 5 8 1 0
11.1006 Computer Support Specialist 0 0 0 0 011.9999 Computer and Information
Sciences and Support Services, Other
0 0 0 0 0
15.0305 Telecommunications Technolo-gy/Technician
0 2 0 2 0
15.0599 Environmental Control Technol-ogies/Technicians, Other
10 17 3 2 0
Program Completions

Emsi Q4 2021 Data Set | www.economicmodeling.com 219
CIP Code
Program 2016 2017 2018 2019 2020
15.1202 Computer/Computer Systems Technology/Technician
0 0 0 0 0
15.1701 Energy Systems Technology/Technician
2 2 1 0 0
27.0301 Applied Mathematics, General 0 0 0 0 027.0501 Statistics, General 0 0 0 0 030.0601 Systems Science and Theory 0 0 0 0 030.1601 Accounting and Computer Sci-
ence0 0 0 0 0
43.0112 Securities Services Administra-tion/Management
32 11 0 0 0
43.9999 Homeland Security, Law En-forcement, Firefi ghting and Re-lated Protective Services, Other
0 0 0 0 0
45.0602 Applied Economics 3 2 4 0 045.0702 Geographic Information Science
and Cartography0 0 0 0 0
50.0411 Game and Interactive Media Design
15 24 11 12 0
50.0499 Design and Applied Arts, Other 0 0 0 0 052.0205 Operations Management and
Supervision1 0 2 2 0
52.0206 Non-Profi t/Public/Organization-al Management
1 1 2 2 0
52.0208 E-Commerce/Electronic Com-merce
0 0 0 0 0
52.0399 Accounting and Related Ser-vices, Other
6 1 0 0 0
52.0703 Small Business Administration/Management
7 8 2 1 0
52.1902 Fashion Merchandising 11 11 7 5 0
Program Completions