Journal of Chromatography Vol. 479 Np. 1 September 22, 1989
232
VOL .'479 NO.1 SEPTEMBER 22, 1989 EDITORS R. W. Giese (Boston, MA) J. K. Haken (Kensington, N.S.W.) K. Macek (Prague) L. R. Snyder (Orinda, CA) EDITOR, SYMPOSIUM VOLUMES . E. Heftmann (Orinda, CAl EDITORIAL BOA RD D . W . Arm strong (Rolla, MO ) W . A . Aue (Halifax) P. Bocek (Brno) A. A Boul ton (S askatoon ) , P. W. Carr (Minnea polis, MN ) N, H, C. Cooke (San Ramon, CAl V. A. Davankov (Moscow) Z. Deyl (Prague) S. Dilli (Kensi ngton, N.SW.) H. Engelhardt (Saarbru cken) F, Erni (Basle) M. B. Evans (Hatf ield) J. L Glajch (N, Bill erica, MA) G, A . Gu io chon (Knoxv ille, TN ) P. R. Haddad (K ensington , NSW,) I. M . Hais (Hradec Kralove ) W. S. Hancoc k. (San Francisco, CAl S, Hjerten (Uppsala) , Cs. Horvath ( New Haven, CT) J, F, K, Huber (Vien na) K -P, Hupe (Waldbronn) T. W . Hu tchens ( Houston, TX) J, Janak (Brno) P. Jand era ( Pardu bice) B. L Karger (Bosto n, MA) E. sz. Kovats (L ausan ne) A . J . P. Martin (Ca mbridge) L. W. McLaug hlin (Ch estnut Hill, MA) R. P. Patienc e (Sunbury-on- Thames) J. D. Pearson (Kalamazoo, MI ) H, Poppe (Amste rdam) F, E. Regni er (West Lafayette, IN ) P. G, Rig hetti ( Milan) P. Sch oen makers ( Eindhoven ) G, Schom bu rg ( Mulheim/ Ruh r) R. Schwarzenbach (Dubendorf} R, E. Sho up (West Lafayette, IN ) A. M. Siouff (Ma rseille) D. J , Str ydom (Boston, MA) K, K, Ung er (Mainz ) J. T. Watson (East Lansinq . M I) B, D, wesrerlund (Uppsala) EDITORS , BIBLIOGRAPH Y SECTION Z, Deyl (Prague) ,J, Janak (Brno), V, Schwarz ( Prag ue ), K, M acek ( Prag ue) ELSEVIER
-
Upload
khangminh22 -
Category
Documents
-
view
0 -
download
0
Transcript of Journal of Chromatography Vol. 479 Np. 1 September 22, 1989

VOL .'479 NO.1 SEPTEMBER 22, 1989
EDITORSR. W. Giese (Boston, MA)J. K. Haken (Kensington, N.S.W.)K. Macek (Prague)L. R. Snyder (Orinda, CA)
EDITOR, SYMPOSIUM VOLUMES. E. Heftmann (Orinda, CA l
EDITORIAL BOA RDD. W . Arm strong ( Rolla, MO )W . A . Aue (Halifax)P. Bocek (Brno)A. A Boul ton (S askatoon ) ,P. W. Carr (Minnea po lis, MN )N, H, C. Cooke (San Ramon, CAlV. A. Davankov (Moscow)Z. Deyl ( Prague)S. Dill i (Kensi ngton, N.SW.)H. Engel hard t (Saa rbru cken)F, Erni ( Basle)M . B . Evans ( Hatf ield)J . L Gla jc h ( N, Bill erica, M A)G, A . Gu iochon ( Knoxv i lle, TN )P. R. Haddad (K ensington , NSW,)I. M . Hais (Hradec Kralove )W . S. Hancoc k. (San Francisco, CAlS, Hjerten (Uppsa la) ,Cs. Hor vath (New Haven, CT )J , F, K, Hub er (Vien na)K - P, Hup e (W ald bronn)T. W . Hu tchens ( Houston, TX)J , Janak (Brno)P. Jand era ( Pardu bice)B. L Karg er ( Bosto n, MA)E. sz. Kovats (L ausan ne)A . J . P. Martin (Ca mbridge)L. W. McLaughlin (Ch estnut Hill, MA)R. P. Pati enc e (S unbury -on- Thames)J . D. Pearson ( Kalamazoo, MI )H, Poppe (Amste rdam)F, E. Regnier (West Lafayett e, IN )P. G, Rig hetti (Milan)P. Sch oen makers ( Eindhoven )G, Schom bu rg (Mulheim/ Ruh r)R. Schwarzenbac h ( Du bendo rf}R, E. Sho up (West Lafayett e, IN )A. M . Sio uff (Ma rsei lle)D. J , Strydom ( Bosto n, MA)K, K, Ung er (Mainz )J . T. Watson (East Lansinq . M I)B, D, wesrerlund ( Uppsala)
EDITORS , BIBLIOGRAPHY SECTIONZ, Deyl ( Prague) , J , Janak ( Brno), V, Schwarz ( Prag ue ), K, M acek ( Prag ue)
ELSEVIER

JOURN~LOFCHROMATOGRAPHY
Scope. Th e Journal of Chromatograp h y publ ishes papers on all aspects of chromat ography, electrophoresisand related methods. Contrib ut ion s consist ma inly of research papers dealing wi th chromatog raphic theo ry. instrumental development and their applicat ions. Th e section Biomedical Applications. w hich is underseparate edi tors hip, deal s w ith the following aspects: developme nts in and app licat ion s of chromatographic and electr ophoret ic techniqu es related to cl inica l diagnosis or alterat ions during med ical treatment;screen ing and pro f il ing of bod y f lu ids or t issues w it h special reference to metabolic d isorders; results frombasic med ical research w ith d irect consequences in cl inica l pract ice; drug level mon itoring and pharrnacokinetic stud ies; cli nic al to xicology; analytica l studies in occupat ion al med ic ine.
Submission of Papers , Papers in English, French and Germ an may be submi tted. in thr ee copies. Manuscr ipts should be submitte d to : Th e Editor of J ournal of Chroma tography , P.O. Box 681 , 1000 AR Amsterdam. The Neth erlands. or to : The Editor of Journal of Chromato graphy. Biomedical Applications, P.O.Box 681 , 1000 AR Am sterdam, Th e Neth erland s. Review art ic les are inv ited or proposed by lett er to theEditors. An outl ine of the proposed rev iew shou ld fir st be forwarded to th e Editors for preli minary discussion prio r to preparat ion . Sub mission of an art icle is understo od to imply that th e art ic le is original andunpubl ished and is not being considered for publicat ion elsewhere. For copyright regu lati ons, see below .
Subscription Orders. Subscript io n orders should be sent to : Elsevier Sc ience Publ ishers B.V., P.O. Box211 , 1000 AE Am sterdam. Th e Neth erland s, Tel. 5803911, Telex 185 82 ESPA NL . The Journal of Chro matograph y and th e Biomedical Applicat ion s sect ion can be subscribed to separately.
Publication. Th e Journal of Chromato graph y ( inc l. Biomedical Applications ) has 37 volumes in 198 9. Thesubscript ion prices for 1989 are:
J. Chromatogr. + Bio med. Appl. (Vols. 461 -497 ) :Ofl. 6475.00 plu s Of l. 999.00 (p.p.h.) (to tal ca. USS 3428.50 )
J. Chromatogr. only (Vo ls. 461 -486 ) :Ofl. 5200.00 pl us Ofl. 702.00 (p.p.h.) (to ta l ca. USS 2707.25 )
Biomed. Appl. only (Vols. 487 -497 ) :Ofl. 2200.00 plu s Ofl. 297 .00 (p.p.h.) (t ot al ca. USS 1145.50 ).
Our p.p.h . (postage, package and hand ling ) charge inc ludes surface de live ry of all issues, except to subscribers in Ar gentina. Au stral ia, Brasil, Canada, Ch ina, Hong Kong , Ind ia, Israel, M alaysia, M exico, NewZealand. Pakistan , Sing apor e. South Africa, South Korea, Taiw an, Thailand and th e U.S.A. who receive allissues by air del ivery (S.A. L. - Surface A ir Lift ed ) at no extra cost. For J apan , air delivery requi res 50%add iti ona l charge; for all other countrie s airma il and S.A.L. charges are availabl e upon requ est. Back vo lumes of the Journ al of Chr omatograph y (Vols. 1-460 )are available at Df l. 19 5.00 (plus postage) . Claimsfor missi ng issues w ill be hon oured, free of charge. wit hin thr ee months after pu bli cation of the issue.Customers in th e U.S.A. and Canada wi sh ing inf ormat ion on th is and other Elsevier journ als, please contactJournal Information Cent er, Elsevier Scien ce Publ ishing Co. Inc.• 655 Av enue of the Americas, New York.NY 10010. Tel. (2 12) 633 -37 50.
Abstracts /Contents Lists pu blished in An alyt ical Ab stract s, ASCA. Biochemical Ab stract s, Biolo g icalAbstract s. Chemical Ab stract s, Chemical Tit les. Chro mato graph y Ab stract s, Clini cal Chemi stry Loo kou t,Curr ent Content s/Physical , Chemical & Earth Sciences, Cur rent Con tent s/L ife Scien ces, Deep -Sea Research/ Part B: Oceanographic Lit erature Review , Excerpta M ed ica, Ind ex M edicu s, Mass SpectrometryBullet in , PASCAL-CNRS, Pharmaceutical Ab stract s, Referativnyi Zhurnal, Sc ience Citation Ind ex andTrends in Biotechnology.
See inside back cover for Publ icat ion Sch edul e, In fo rmat ion fo r Authors and informa t ion on Ad vert isements.
© ELSEVIER SCIENCE PU BLISHERS BV . - 1989 002 1-9673/89 / S0350
Al l rig hts reserved . No part of th is pub l ic at io n may be repr oduced . stor ed in a retrieval sys tem or tran smitted in an y fo rm or by any means .
elect roni c . mechan ical. photocop y ing , record ing or otherwise. w it hout the pr ior w ritt en permission of the publisher, Elsevier Scienc e Publishers8 .V.. P.O. Bo x 330, 100 0 AH Am sterdam, The Netherland s.
Upon accept ance of an article by th e journ al. the author (s) w ill be asked to transfer copyright of the art icle to the publisher. The transfer will ensureth e w idest possib le disseminat ion of info rmat ion .
Submission of an article for publ icat ion entail s th e authors' irrevocable and exclu sive authoriza tio n of the pu bli sher to collect any sums orconsiderat ions for co pying or reproduction payable by th ird part ies (as ment ion ed in arti c le 17 paragraph 2 of the Dutch Copyright Act of 1912and the Royal Decree of June 20. 1974 (S. 351) pursuant to art ic le 16 b of the Dut ch Copyright Act of 19 12 ) and/o r to act in or out of Court in
co nnect ion therewith .Special regulations for readers in the U .S .A . Th is journ al has been reg istered wi th th e Copyrig ht Clearance Center, Inc. Consent is given forco py ing of articles for person al or internal use, or for the personal use of specif ic c lients. This consent is gi ven on th e condit ion that the copier paysthrough the Center th e per-copy fee stated in the code on the first page of each art icle for copying beyond that permit ted by Sections 107 or 108 ofthe U.S. Co pyright Law . The app rop riate fee shou ld be forw arded w ith a copy of the first pag e of th e artic le to the Copyr ight Clearance Center.Inc.. 27 Congress Street, Salem. MA 01970, U.S.A . If no code appears in an art icle , the author has not given broad consent to copy and permissionto copy must be obtained di rectly from the aut ho r. All art icle s pub lished pr ior to 198 0 may be copied for a per-co py fee of USS2.25. also payablethrough the Center. This consent do es not exten d to othe r kind s of copying . suc h as for ge neral di stri but ion. resale. advertisin g and promot ion
purposes. or for creatin g new co llective wo rks. Special written permission must be ob taine d from thb pub li sher for such copyi ngNo responsibil it y is assume d by the Publisher for any injury and /or damage to persons or prop erty as a matter of produ ct s liabil ity. negl ige nce orother w ise. or from any use or operati on of any methods. prod uct s, instruct ions or ideas contained in the materials herein . Because of rapid
advan ces in the medi cal sciences. th e Publisher recom mend s that in dependen t veri fication of diag noses and dr ug dosages shou ld be made .Although all advertising material is expe cted to co nform to ethica l (med ical) standards. inclu sion III th is publi cation doe s no t const itute a
gua rantee or endo rsemen t of the quality or value of such prod uct or of th e claims made of it by its manufactur er.This issue is prin ted on acid -f ree paper.
Printed in The Neth erlands •

VOL. 479, NO. I JOURNAL OF CHROMATOGRAPHY
CONTENTS
SEPTEMBER 22, 1989
(Abstracts/Contents Lists published in Analytical Abstracts, ASCA, Biochemical Abstracts, Biological Abstracts, Chemical Abstracts, Chemical Titles, Chromatography Abstracts, Current Contents/ Physical, Chemical & Earth Sciences, Current Contents/ Life Sciences, Deep-Sea Research/Part B: Oceanographic LiteratureReview, Excerpta Medica, Index Medicus, Mass Spectrometry Bulletin, PASCAL-CNRS, ReferativnyiZhurnal and Science Citation Index)
Obituary: M. J. E. Golay (1902-1989)by Cs. Horvath (New Haven, CT, U.S.A.)
Mobile phase effects on aromatic hydroxyl compounds with an aminopropyl column and interpretation by the Snyder modelby L. D. Olsen and R. J. Hurtubise (Laramie, WY, U.S.A.) (Received June 6th, 1989). 5
Gas chromatography of pure and surface-modified precipitated calcium carbonateby T. Ahsan, B. A. Colenutt and K. S. W. Sing (Uxbridge, U.K.) (Received May 30th, 1989) 17
Kinetic analysis of the carboxypeptidase A hydrolysis of oligopeptides by reversed-phase high-performance liquid chromatographyby M. A. Serra, F. X. Aviles, E. Giralt and C. M. Cuchillo (Barcelona, Spain) (Received June7th, 1989) 27
Reversed-phase high-performance liquid chromatographic separation of some indole and quinolinealkaloids from Cinchonaby A. Hermans-Lokkerbol, T. van der Leer and R. Verpoorte (Leiden, The Netherlands)(Received June 21st, 1989) . . . . . . . . . . . . . . . . . . . . . . . . . 39
Multilayer coil planet centrifuge for analytical high-speed counter-current chromatography'by H. Oka, F. Oka and Y. Ito (Bethesda, MD, U.S.A.) (Received May 30th, 1989) 53
Capillary gas chromatography-mass spectrometry and identification of substituted carboxylic acidsin lipids extracted from a 4000-year-old Nubian burialby F. O. Giilacar, A. Buchs and A. Susini (Geneva, Switzerland) (Received June 19th, 1989) 61
Comparison of the use of mass spectrometry and methylene unit values in the determination of thestereochemistry of estranediol, the major urinary metabolite of 19-nortestosterone in thehorseby E. Houghton, A. Ginn, P. Teale, M. C. Dumasia and J. Copsey (Newmarket, U.K.)(Received May 23rd, 1989) 73
High-performance size-exclusion chromatography of poly- and oligoethylene terephthalate using amixture of hexafiuoroisopropanol and chloroform as the mobile phaseby N. Chikazumi, Y. Mukoyama and H. Sugitani (Ibaraki, Japan) (Received June 9th, 1989) 85
Application of high-performance liquid chromatography with spectrophotometric and electrochem-ical d,etection to the analysis of alkylenebis(dithiocarbamates) and their metabolitesby V. Bardarov, Chr. Zaikov and M. Mitewa (Sofia, Bulgaria) (Received April 24th, 1989) 97
Quantification and characterization of the trifluoroacetic anhydride derivatives of N,N'-ethylenebisstearamide and N,N'-ethylenebisoleamideby P. A. Metz, F. L. Morse and T. W. Theyson (Williamsport, PA, U.S.A.) (Received May26th, 1989) .... . . . . . . . . . . . . . . . . . . . . . . . . . . . . . . 107
Selective determination of benzo[a]pyrene in petroleum-based products using multi-column liquidchromatographyby P. R.' Fielden and A. J. Packham (Manchester, U.K.) (Received June 5th, 1989) 117
Chromatographic determination of amines in biological fluids with special reference to the biologicalmonitoring of isocyanates and amines. 1. Determination of 1,6-hexamethylenediamine usingglass capillary gas chromatography and thermionic specific detectionby G. Skarping, M. Dalene, T. Brorson, J. F. Sandstrom, C. Sango and A. Tiljander (Lund,Sweden) (Received June 2nd, 1989) . . . . . . . . . . . . . . . . . . . . . :. . 125
(Continued overleaf)

Contents (continued)
Chromatographic determination of amines in biological fluids with special reference to the biologicalmonitoring of isocyanates and amines. II. Determination of 2,4- and 2,6-toluenediamineusing glass capillary gas chromatography and selected ion monitoringby J. F. Sandstrom, G. Skarping and M. Dalene (Lund, Sweden) (Received June 2nd, 1989) 135
Chromatographic determination of amines in biological fluids with special reference to the biologicalmonitoring of isocyanates and amines. III. Determination of 4,4-'methylenedianiline in hydrolysed human urine using derivatization and capillary gas chromatography with selectedion monitoringby A. Tiljander, G. Skarping and M. Dalene (Lund, Sweden) (Received June 9th, 1989) 145
High-sensitivity high-performance liquid chromatographic analysis of diquat and paraquat withconfirmationby V. A. Simon and A. Taylor (Jacksonville, FL, U.S.A.) (Received May 5th, 1989) . . . 153
Notes
Optimization of size-exclusion separation of proteins on a Superose columnby P. L. Dubin and J. M. Principi (Indianapolis, IN, U.S.A.) (Received June 7th, 1989) 159
Gas chromatographic retention indices of tear gases on capillary columnsby B. R. Gandhe, R. C. Malhotra and P. K. Gutch (Gwalior, India) (Received June 14th,1989) . . . . . . . . . . . . . . . . . . . . . . . . . 165
Use of a stop-flow technique to study on-column decomposition in supercritical fluid chromatographyby M. B. Evans and M. S. Smith (Hatfield, U.K.) and J. M. Oxford (Ware, U.K.) (ReceivedJune 13th, 1989) . . . . . .. . . . . . .. 170
Gas chromatographic separation of diastereomeric dicarbamate derivatives of y- and b-Iactonesby K:-H. Engel (Berlin, FR.G.), R. A. Flath (Albany, CA, U.S.A.) and W. Albrecht andR. Tressl (Berlin, FR.G.) (Received June 7th, 1989) . . . . . 176
Liquid chromatographic analysis of bromination reactions of metal trifluoroacetylacetonatesby T. J. Cardwell and T. H. Lorman (Bundoora, Australia) (Received July 4th, 1989) 181
High-performance liquid chromatographic analysis of Solanum steroidal alkaloidsby S. F. Osman (Philadelphia, PA, U.S.A.) and S. L. Sinden (Beltsville, MD, U.S.A.) (Re-ceived July 4th, 1989) . " . . . . . 189
Determination of hydrogen sulphide by porous-layer open-tubular column gas chromatography-mass spectrometryby S. Jacobsson and O. Falk (Solna, Sweden) (Received June 8th, 1989) . . . . . . . . 194
Supercritical fluid extraction of s-triazine herbicides from sedimentby V. Janda (Prague, Czechoslovakia) and G. Steenbeke and P. Sandra (Ghent, Belgium)(Received June 12th, 1989) 200
High-performance liquid chromatography of metribuzin and non-polar metabolites extracted fromleaf tissuesby H. A. Norman, C. F. Mischke and J. B. St. John (Beltsville, MD, U.S.A.) (Received June6th, 1989) . . . . . . . . . . . . . . . . . . . . . . . . . . . . . 206
Separation of cationic technetium-99m amine complexes on porous graphitic carbonby M. F Emery and C. K. Lim (Harrow, U.K.) (Received June 12th, 1989) 212
Letter to the Editor
Reduced variation in retention times of biogenic amines by temperature control in liquid chromatography with electrochemical detectionby D. L. Palazzolo and S. K. Quadri (Manhattan, KS, U.S.A.) (Received July 3rd, 1989) 216
***********************************************+******************************************* *: In articles with more than one author, the name of the author to whom correspondence should be addressed is indicated in the :: articleheadingby a 6-pointcd asterisk (*) :
* *******************************************************************************************

JOURNAL OF CHROMATOGRAPHY
VOL. 479 (1989)

JOURNALof
CHROMATOGRAPHYINTERNATIONAL JOURNAL ON CHROMATOGRAPHY,
ELECTROPHORESIS AND RELATED METHODS
EDITORSR. W. GI ESE (Boston, MA). J. K. HAKEN (Kensington, N.S.w.), K. MACEK (Prague),
L. R. SNYDER (Orinda, CAl
EDITOR, SYMPOSIUM VOLUMESE. HEFTMANN (Orinda, CAl
EDITORIAL BOARD
D. A. Armstrong (Rolla, MO), W. A. Aue (Halifax), P. Bocek (Brno). A. A. Boulton(Saskatoon), P. W. Carr (Minneapolis, MN), N. C. H. Cooke (San Ramon, CAl, V. A.Davankov (Moscow), Z. Deyl (Prague), S. Dilli (Kensington, N.S.w.), H. Engelhardt(Saarbrucken). F. Erni (Basle), M. B. Evans (Hatfield), J. L. Glajch (Wilmington), DE,G. A. Guiochon (Knoxville, TN), P. R. Haddad (Kensington, N.S.w.), I. M. Hais (Hradec Kralove). W. Hancock (San Francisco, CA). S. Hjerten (Uppsala). Cs. Horvath(New Haven, CT), J. F. K. Huber (Vienna), K.-P. Hupe (Waldbronn), T. W. Hutchens(Houston, TX), J. Janak (Brno), P. Jandera (Pardubice), B. L. Karger (Boston, MA), E.sz. Kovats (Lausanne), A. J. P. Martin (Cambridge), L. W. McLaughlin (Chestnut Hill,MA), R. P. Patience (Sunbury-on-Thames). J. D. Pearson (Kalamazoo, MI), H. Poppe(Amsterdam), F. E. Regnier (West Lafayette, IN), P. G. Righetti (Milan), P. Schoenmakers (Eindhoven). G. Schomburg (Muhlheirn/Ruhr). R. Schwarzenbach (Dubendorf), R. E. Shoup (West Lafayette, IN), A. M. Siouffi (Marseille). D. J. Strydom (Boston, MA), K. K. Unger (Mainz), J. T. Watson (East Lansing, MI), B. D. Westerlund
(Uppsala)
EDITORS, BIBLIOGRAPHY SECTIONZ. Deyl (Prague). J. Janak (Brno). V. Schwarz (Prague), K. Macek (Prague)
ELSEVIERAMSTERDAM - OXFORD - NEW YORK - TOKYO
J. Chromatogr., Vol. 479 (1989)

© ELSEVIER SCIENCE PUBLISHERS B.V. -1989 0021-9673/89/$03.50
All rights reserved. No part of this publication may be reproduced, stored in a retrieval system or transmitted in any form or by any means,electronic, mechanical, photocopying, recording or otherwise, without the prior written permission of the publisher, Elsevier Science Publishers
B.V., P.O. Box 330, 1000 AH Amsterdam, The Netherlands.Upon acceptance of an article by the journal, the author(s) will be asked to transfer copyright of the article to the publisher. The transfer will ensure
the widest possible dissemination of information.Submission of an article for publication entails the authors' irrevocable and exclusive authorization of the publisher to collect any sums orconsiderations for copying or reproduction payable by third parties (as mentioned in article 17 paragraph 2 of the Dutch Copyright Act of 1912and the Royal Decree of June 20,1974 (S. 351) pursuant to article 16 b of the Dutch Copyright Act of 1912) and/or to act in or out of Court in.
connection therewith.Special regulations for readers in the U.S.A. This journal has been registered with the Copyright Clearance Center, Inc. Consent is given forcopying of articles for personal or internal use, or forthe personal use of specific clients. This consent is given on the condition that the copier paysthrough the Center the per-copy fee stated in the code on the first page of each article for copying beyond that permitted by Sections 107 or 108 ofthe U.S. Copyright Law. The appropriate fee should be forwarded with a copy of the first page of the article to the Copyright Clearance Center,Inc., 27 Congress Street, Salem, MA 01970, U.S.A. If no code appears in an article, the author has not given broad consent to copy and permissionto copy must be obtained directly from the author. All articles published prior to 1980 may be copied for a per-copy fee of US$ 2.25, also payablethrough the Center. This consent does not extend to other kinds of copying, such as for general distribution, resale, advertising and promotion
purposes, or for creating new collective works. Special written permission must be obtained from the publisher for such copying.No responsibility is assumed by the Publisher for any injury and/or damage to persons or property as a matter of products liability, negligence orotherwise, or from any use or operation of any methods, products, instructions or ideas contained in the materials herein. Because of rapid
advances in the medical sciences, the Publisher recommends that independent verification of diagnoses and drug dosages should be made.Although all advertising material is expected to conform to ethical (medical) standards, inclusion in this publication does not constitute a
guarantee or endorsement of the quality or value of such product or of the claims made of it by its manufacturer.This issue is printed on acid-free paper.
Printed in The Netherlands

Journal of Chromatography, 479 (1989) 1-3Elsevier Science Publishers B.V., Amsterdam - Printed in The Netherlands
CHROM. 21 818
Obituary
M. J . E. Golay (1902-1989)
Marcel J. E. Golay, one of the leading scientists in chromatography, died at theage of86 on April 27, 1989. As with some other prominent figures who laid down thefoundation of modern chromatography, his training was not in chemistry but in otherfields. Golay was an electrical engineer/physicist with excellent mathematical skillsand an uncanny insight into the physical phenomena underlying the subject of hisinqui ry. Beyond that he was a distinguished inventor and innovator. To chrornatographers he is best known as the father of capillary columns, which are often referredto as Golay columns. In the middle of the 1950s, as the meteoric growth of gas
0021-9673/89/$03 .50 © 1989 Elsevier Science Publishers B.V.

2 OBITUARY
chromatography commenced, Golay concluded, after analyzing the disadvantages ofpacked columns, that open tubes with a retentive wall would require less pressuredrop for a theoretical plate than comparable packed columns, and therefore wouldoffer great advantages in gas chromatography. First, at fixed pressure drop the use ofa comparatively long open tubular column would yield higher efficiency than thatobtainable with a packed column. Alternatively, an open tubular column can beoperated at a lower mean pressure of the carrier gas than a packed column chosen asthe suitable reference, so that the concomitantly higher diffusivity results in increasedefficiency. Indeed, Golay correctly perceived that the anfractuous flow field in apacked bed is associated with low mass to momentum transfer efficiency and opentubes offer a superior choice. It did not take much time for Golay to reduce thisconcept to practice in 1956, and to present a complete mathematical treatment ofaxial dispersion in laminar flow through open ducts with circular cross section and aretentive inner wall. It amounted to the Golay equation that first expressed rigorouslythe various plate height contributions in open tubular columns.
The introduction of open tubular columns, however , imposed a challenge oninstrument design because, for practical reasons, the tube diameter has to be small:not greater than 0.5 mm. As a result the flow-rate of the carrier gas and the loadingcapacity of the column, which is adversely affected also by the typically low phaseratio, in such columns were much smaller than with the packed columns of thosedays . Thus open tubular columns required detectors with very small dead and sensingvolumes, novel sampling techniques and a much more demanding construction thanthat of the usual gas chromatographs that were built for use with packed columns ofrather large dimensions. Fortuitously, the flame ionization detector was invented atabout the same time as the capillary column; the match was perfect and a new generation of gas chromatographs was born. Golay's columns were called capillary columns because of their small inner diameter. He always emphasized, however, that it isnot the size but the openness of the column, i.e., the absence of anastomosis, that isthe distinguishing feature of capillary columns. Indeed , the Golay equation is just asapplicable to a 3 ft. I.D. oil pipeline as to a 10 mm I.D . capillary column. For thisreason the term "open tubular columns" appeared to be more appropriate, and nowit is frequently used in the literature. Since then a variety of other columns of capillarydimensions, e.g., packed capillaries, have been developed, so that the term opentubular column has gained a new significance.
Yet, Golay's work has to be also viewed as the starting point of the miniaturization of chromatographic instrumentation. Today we are witnessing an increasinguse of capillary columns in liquid chromatography and in fact open tubes are widelyemployed in analytical instruments such as those for capillary electrophoresis or flowinjection analysis .
Capillary columns have changed gas chromatography and with time capillarycolumns have also undergone changes. Golay recognized the major shortcoming ofhis columns, the low phase ratio that results in low loading capacity and low eluiteconcentrations in the effluent, and he proposed in 1960 to make columns with aporous layer at the inner wall. Shortly thereafter support-coated open tubular columns were introduced and thus columns with higher loading capacity became available . In the last decade glass and fused-silica capillaries have largely replaced themetal tubes used previously, and these columns, with sophisticated surface treatment

OBITUARY 3
and novel stationary phases, manifest the final triumph of Golay's original concept.M: J. E. Golay was born on May 3, 1902 in Neuchatel, Switzerland. He studied
electrical engineering at the Eidgenossische Technische Hochschule in Zurich andgraduated in 1924. Subsequently he came to the U.S.A. and was employed by BellTelephone Laboratories until 1928. Then he left for the University of Chicago wherehe received a Ph.D. in Physics in 1931. After.graduation Dr. Golay joined the U.S.Signal Corps Engineering Laboratories in Fort Monmouth, NJ. At this large andprestigious center of research on electronics and communications he mainly workedwith defense-oriented systems and made significant (unpublished) contributions tothe war effort. At the end of his tenure with the U.S. Signal Corps he was ChiefScientist of the Components Division and then retired in 1955. After his retirementDr. Golay devoted himself to consulting work with the Philco Corporation in thefield of information theory and with The Perkin-Elmer Corporation in the field ofscientific instrumentation. He was Professor at the Technische Hogeschool in Eindhoven, The Netherlands, in 1961-1962. From 1963 until his decease he had beenSenior Research Scientist at Perkin-Elmer.
Dr. Golay authored close to 100 scientific papers and over 40 patents. Hereceived numerous awards, among them the Harry Diamond Award of the Instituteof Radio Engineers (1950), the American Chemical Society Award in Chemical Instrumentation (1961), the Distinguished Achievement Award of the Instrument Society of America (1962), the J. Hamilton Award of the American Society of NavalEngineers (1972), the Chromatography Anniversary Medal of the Academy ofSciences of the U.S.S.R. (1979), the American Chemical Society Award in Chromatography (1981), and the S. Dal Nogare Award in Chromatography of the DelawareValley Chromatography Forum (1982). The Ecole Polytechnique Federale of Lausanne, Switzerland, conferred an honorary doctorate on him in 1977.
He crossed many interdisciplinary lines and made numerous major scientificand technical contributions in addition to the invention of capillary columns forchromatography. In the field of radio communications he has been known for theso-called Golay delay line. In information theory and pattern recognition he introduced several powerful code systems and novel approaches to signal processing.He applied his experience in this field to analytical chemistry and developed elegantmethods for processing analytical signals to reduce noise and improve resolution. Inanalytical instrumentation his work in infrared spectroscopy, which included theinvention of the Golay detector, is well known.
Until his death Dr. Golay was active scientifically. His recent research interestwas focussed on bandspreading under conditions of potential significance in highspeed liquid chromatography. Very recently his attention had turned again to opentubular columns and he became interested in the effect of turbulence. Indeed a logicalfurther development of his original concept would lead to the use of open tubes withturbulent flow: a continuation that offers an even higher mass-to-momentum transferefficiency, and if practicable, could provide higher speed of analysis and columnefficiency. The community of chromatographers owes a great deal to Marcel Golay;through his accomplishments he will be remembered by generations to come.
New Haven, CT (U.S.A.) CSABA HORVATH

Journal oj Chromatography, 479 (1989) 5-16Elsevier Science Publishers B.Y., Amsterdam - Printed in The Netherlands
CHROM. 21 671
MOBILE PHASE EFFECTS ON AROMATIC HYDROXYL COMPOUNDSWITH AN AMINOPROPYL COLUMN AND INTERPRETAnON BY THESNYDER MODEL
L. D. OLSEN and R. J. HURTUBISE*
Department a/Chemistry, University 0/ Wyoming, P.O. Box 3838, Laramie, WY 82071 (U.S.A.)
(First received April 17th, 1989, revised manuscript received June 6th, 1989)
SUMMARY
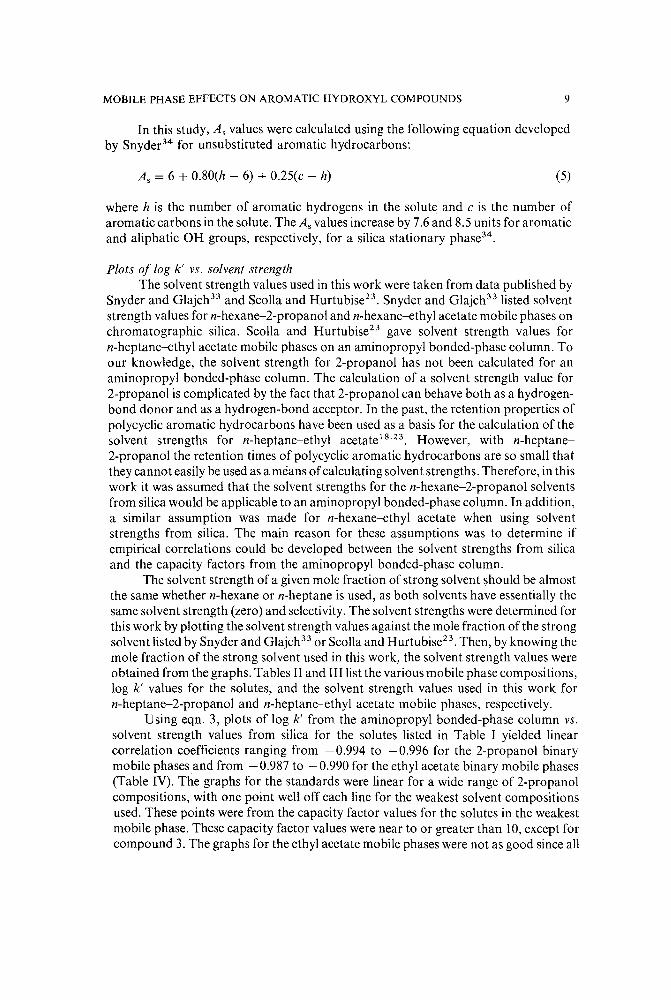
The Snyder chromatographic model was employed to correlate and interpret theretention data of hydroxyl aromatics on a high-performance aminopropyl bondedphase column. Several n-heptane-2-propanol and n-heptane-ethyl acetate mobilephases were used to obtain the retention data. Plots of the logarithm of the capacityfactor (log k') vs. solvent strength and log k' vs. log (mole fraction of the strong solvent)showed good linearity for all the hydroxyl aromatics studied. Because a value of thesolvent strength for 2-propanol on the aminopropyl bonded-phase was not available,the solvent strength for 2-propanol on silica was used in an empirical fashion. Theslopes from the plots of log k' vs. solvent strength for ethyl acetate from anaminopropyl bonded-phase column were used to obtain experimental areas of thesolutes. The experimental molecular areas were compared with calculated values, andthe results showed that the localization of the solutes and the polarity of the mobilephases were important considerations. The results also indicated that the n-heptaneethyl acetate data correlated very well with the Snyder model.
INTRODUCTION
Reversed- and normal-phase high-performance liquid chromatography (HPLC)can provide information on highly complex mixtures. As retention and selectivity aredependent on specific functional group-stationary phase interactions, normal-phaseHPLC offers some advantages in separating functional classes and isomers I.
Normal-phase HPLC has been found to be very useful in separating coal-derivedliquids because frequently coal liquids are not soluble in the water-based solvents oftenused in reversed-phase HPLC2
•
A number of models have been developed to explain the roles of the solvent,solute and stationary phase in normal-phase HPLC 3- 16 . Ifa given model is capable ofdescribing the retention of solutes, then the model can be used to predict retention forsimilar chromatographic systems. In addition, mobile phases that would provide thebest resolution and selectivity could then be predicted from the model.
Scott and co-workers'Pv'P have considered solute-mobile phase and solute-
0021-9673/89/$03.50 © 1989 Elsevier Science Publishers B.Y.

6 L. D. OLSEN, R. J. HURTUBISE
stationary phase interactions for silica gel. The Snyder adsorption model is based ondisplacement of solvent molecules by solute molecules from the stationary phasesurface'':". The model of Soczewinski and co-workers":" is similar to that developed bySnyder. The Hennion et al.14 approach for aminopropyl-bonded silica containselements from the Snyder, Soczewinski and Scott models. Snyder and co-workers'S!"have reviewed the first three models and all four models were summarized by Snyderand Schunk!", Hydrogen bonding and other interactions were used by Chang andco-workers-Y'" to explain the retention behavior on an aminopropyl bonded-phasecolumn.
The models developed by Snyder and Soczewinski have been used to describea number of interactions in several chromatographic systems. The approaches ofSnyder and Soczewinski were used by Hurtubise et al.19 to explain some of theretention characteristics of alkylphenols on an aminopropyl bonded-phase columnand by Hussain et al.2 0 to interpret retention results for alkylphenols on a cyanopropylbonded-phase column and a silica column. Some of the interactions of polar soluteson a silica column and a nitrophenyl bonded-phase column were described byRuckmick and Hurtubise2 1
•2 2 using the Snyder approach. Scolla and Hurtubise'P
concluded that elements of the Snyder model could describe the retention behavior ofaromatic nitrogen compounds on an aminopropyl bonded-phase column. Olsen andHurtubise/" used the Snyder concepts to characterize the retention properties ofseveral aromatic hydroxyl compounds on a silica stationary phase. Snyder2 5 foundthat the behavior of diastereomers on a silica column could be evaluated by his model.In addition, Snyder and Schunk!" employed the Snyder model to characterize anamino bonded-phase column. Hammers et at.26 concluded that an amino bondedphase column behaved like partially deactivated silica gel. Weiser et al.2 7 reachedsimilar conclusions for a cyanopropyl bonded-phase column. Smith and Cooperr"applied Snyder's concepts to amino, cyano, and diol bonded-phase columns todescribe solute retention with several different mobile phase systems.
In this study, aromatic hydroxyl compounds were investigated on an aminopropyl bonded-phase column using different solvent compositions of n-heptane-2propanol and n-heptane-ethyl acetate. The data were interpreted with the Snyderdisplacement model. The compounds studied were selected on the basis of similar sizeand structure but differing acidities, polarities and hydrogen-bonding abilities.
EXPERIMENTAL
The equipment, experimental conditions and procedures have been reportedpreviously'"'. However, there were a fewdifferences, and these are indicated as follows.The detector was set at 254 nm. The columns used were 30 cm x 3.9 mm J.D.prepacked ,uBondapak NH 2 columns obtained from Waters Assoc. (Milford, MA,U.S.A.). The ,uBondapak NH 2 columns contained aminopropyl groups chemicallybonded to irregular-shaped 1O-,um porous silica. The compositions of the n-heptane-2propanol mobile phases were 99:1, 98:2, 97:3, 96:4, 95:5, 94:6, 93:7, 92:8, 91:9, 90:10and 89:11 (vjv), and those of the n-heptane-ethyl acetate mobile phases were 85:15,82:18, 80:20, 77:23, 75:25, 73:27, 70:30, 65:35, 60:40, 55:45 and 50:50 (vjv). TableI gives the names, structures and pKa values of the compounds investigated.

MOBILE PHASE EFFECTS ON AROMATIC HYDROXYL COMPOUNDS 7
TABLE I
COMPOUNDS STUDIED ON AN AMINOPROPYL COLUMN AND THEIR pKa VALUES
No. Compound Structure pK"
OH
I-Naphthol 06 9J"
::::,... I ~
ev
OH
2 2-Naphthol ::::,... I ~ 9.6"
OH
3 1,2,3,4-Tetrahydro-l-naphthol cO 15.7b
OH
4 5,6,7,8-Tetrahydro-I-naphthol cO 10J"
5 1-Naphthalenernethanol 06 15.3b
::::,... ~
oS~"6 1-Naphthaleneethanol ::::,... I ~ 15.2b
7 2-NaphthalenernethanolevCH,oH
15.3b
::::,... ~
8 2-NaphthaleneethanolevCH2CH20H
15.2b
::::,... ~
a From ref. 29.b Calculated from information in ref. 30.

8
RESULTS AND DISCUSSION
L. D. OLSEN, R. 1. HURTUBISE
Theoretical considerationsThe following equation is fundamental to the Snyder model:
(1)
where the subscripts m and a refer to the mobile phase and adsorbed phase,respectively. The adsorption of a solute molecule, X, causes the displacement ofn solvent molecules, S. The solvent strength of a non-localizing binary mobile phase ona bonded-phase column can be calculated with eqn. 2 according to Snyder andSchunk 'f and Snyder:" if the adsorbent activity, a', is known
(2)
where GAil is the solvent strength of the binary eluent, GA and Gil are the solvent strengthsof the pure weak and strong solvent, respectively, Nil is the mole fraction of solventBand nb is the relative molecular area of a molecule of solvent B. The Gil term can varywith Nil owing to restricted-access delocalization of the strong solvent on silica andalumina according to Snyder and Schunk!" and Snyder/ '. However, restricted-accessdelocalization should be minimal for aminopropyl bonded-phases because of theflexible nature of the bonded functional group in the stationary phase!", Therefore, Gilin eqn. 2 should be a constant for an aminopropyl bonded-phase according to Snyderand Schunk!" and SnyderV.
Snyder!" has shown that the retention of a solute will vary in a binary mobilephase of two different compositions according to the following equation:
(3)
where k'! is the capacity factor of the solute in mobile phase I of solvent strength Glandk'z is the capacity factor of the solute in the second mobile phase of solvent strength G2.Ifmobile phase I is n-heptane then G1 is zero. The a' term is defined arbitrarily as beingequal to unity for the aminopropyl bonded-phase column". The slope oflog k'z )IS. G2 isequal to a'A s; hence experimental As values can be obtained from the slope. If thesolutes are polar, they can localize and site-competition delocalization can occur on anaminopropyl bonded-phase column owing to the exposed nature of the functionalgroup. Thus, the experimental As values will be larger than expected!8,33.
Another equation that can be derived from the Snyder approach is
log k' = log k~ - (As/nb) log Xs (4)
where As is the molecular area of the solute, nbis the strong solvent molecular area, k' isthe capacity factor of the solute eluted in the binary mobile phase, k~ is the capacityfactor of the solute eluted in the pure strong solvent, and Xs is the mole fraction of thestrong solvent in the binary mobile phase!", In the derivation of eqn. 4, it is assumedthat the I - Nil term in the logarithmic expression in eqn. 2 is small and Gil does notvary with Nil. Eqn. 4 has been shown to be valid if very polar binary mobile phases arebeing used!7,25.
MOBILE PHASE EFFECTS ON AROMATIC HYDROXYL COMPOUNDS 9
In this study, As values were calculated using the following equation developedby Snyderl" for unsubstituted aromatic hydrocarbons:
As = 6 + O.80(h - 6) + 0.25(c - h) (5)
where h is the number of aromatic hydrogens in the solute and c is the number ofaromatic carbons in the solute. The As values increase by 7.6 and 8.5 units for aromaticand aliphatic OH groups, respectively, for a silica stationary phase:".
Plots of log k' vs. solvent strengthThe solvent strength values used in this work were taken from data published by
Snyder and Glajch" and Scolla and Hurtubise'". Snyder and Glajch" listed solventstrength values for n-hexane-2-propanol and n-hexane-ethyl acetate mobile phases onchromatographic silica. Scolla and Hurtubise-? gave solvent strength values forn-heptane-ethyl acetate mobile phases on an aminopropyl bonded-phase column. Toour knowledge, the solvent strength for 2-propanol has not been calculated for anaminopropyl bonded-phase column. The calculation of a solvent strength value for2-propanol is complicated by the fact that 2-propanol can behave both as a hydrogenbond donor and as a hydrogen-bond acceptor. In the past, the retention properties ofpolycyclic aromatic hydrocarbons have been used as a basis for the calculation of thesolvent strengths for n-heptane-ethyl acetate 1 8
.2 3
. However, with n-heptane2-propanol the retention times of polycyclic aromatic hydrocarbons are so small thatthey cannot easily be used as a means ofcalculating solvent strengths. Therefore, in thiswork it was assumed that the solvent strengths for the n-hexane-2-propanol solventsfrom silica would be applicable to an aminopropyl bonded-phase column. In addition,a similar assumption was made for n-hexane-ethyl acetate when using solventstrengths from silica. The main reason for these assumptions was to determine ifempirical correlations could be developed between the solvent strengths from silicaand the capacity factors from the aminopropyl bonded-phase column.
The solvent strength of a given mole fraction of strong solvent should be almostthe same whether n-hexane or n-heptane is used, as both solvents have essentially thesame solvent strength (zero) and selectivity. The solvent strengths were determined forthis work by plotting the solvent strength values against the mole fraction of the strongsolvent listed by Snyder and Glajch" or Scolla and Hurtubise2 3
. Then, by knowing themole fraction of the strong solvent used in this work, the solvent strength values wereobtained from the graphs. Tables II and III list the various mobile phase compositions,log k' values for the solutes, and the solvent strength values used in this work forn-heptane-2-propanol and n-heptane-ethyl acetate mobile phases, respectively.
Using eqn. 3, plots of log k' from the aminopropyl bonded-phase column vs.solvent strength values from silica for the solutes listed in Table I yielded linearcorrelation coefficients ranging from -0.994 to -0.996 for the 2-propanol binarymobile phases and from -0.987 to -0.990 for the ethyl acetate binary mobile phases(Table IV). The graphs for the standards were linear for a wide range of 2-propanolcompositions, with one point well off each line for the weakest solvent compositionsused. These points were from the capacity factor values for the solutes in the weakestmobile phase. These capacity factor values were near to or greater than 10, except forcompound 3. The graphs for the ethyl acetate mobile phases were not as good since all

10 L. D. OLSEN, R. J. HURTUBISE
TABLE II
LOG k' VALUES FOR THE MODEL COMPOUNDS ON AN AMINOPROPYL BONDED-PHASE COLUMNWITH n-HEPTANE-2-PROPANOL MOBILE PHASES (25°C)
Compound Mole fraction 2-propanolNo.
0.019 0.038 0.056 0.074 0.094 0.109 0.126 0.143 0.159 0.175 0.191(99.'1r (98:2) (97:3) (96:4) (95:5) (94:6) (93:7) (92:8) (91:9) (90.10) (89:JJ )
I 1.263 0.916 0.738 0.597 0.497 0.418 0.321 0.280 0.222 0.169 0.1252 1.360 0.998 0.788 0.651 0.559 0.456 0.385 0.316 0.258 0.203 0.1553 0.642 0.368 0.222 0.109 0.000 -0.07 -0.12 -0.19 -0.24 -0.28 -0.324 0.874 0.564 0.402 0.280 0.182 0.109 0.040 -0.02 -0.09 -0.12 -0.185 1.000 0.711 0.541 0.418 0.331 0.246 0.168 0.109 0.058 0.020 -0.026 0.940 0.637 0.463 0.340 0.258 0.155 0.093 0.040 0.010 -0.07 -0.127 1.045 0.738 0.564 0.441 0.350 0.246 0.183 0.125 0.076 0.020 -0.028 0.947 0.651 0.484 0.350 0.280 0.169 0.109 0.040 0.000 -0.07 -0.09Log X, -1.721 -1.420 -1.252 -1.131 -1.036 -0.962 -0.900 -0.845 -0.799 -0.757 -0.719BAB
b 0.308 0.322 0.338 0.348 0.360 0.370 0.378 0.387 0.393 0.401 0.406
a n-Heptane-2-propanol composition (v/v) in parentheses.b Solvent strength values on silica taken from information in ref. 33.
of the graphs had a slight curvature. However, the lowest correlation coefficient was- 0.987, which indicated that they were approximately linear. The slopes, interceptsand correlation coefficients obtained for these log k' values from the aminopropylbonded-phase column vs. solvent strength values from silica are given in Table IV.These results are strictly empirical and at present have no firm theoretical basis.
TABLE III
LOG k' VALUES FOR MODEL COMPOUNDS ON AN AMINOPROPYL BONDED-PHASE COLUMN WITHn-HEPTANE-ETHYL ACETATE MOBILE PHASES (2YC)
Compound Mole fraction ethyl acetateNo.
0.209 0.248 0.273 0.309 0.333 0.357 0.391 0.447 0.500 0.551 0.600(85:15)" (82:18) (80:20) (77"23) (75:25) (73:27) (70:30) (65:35) (60:40) (55:45) (50:50)
I 0.787 0.679 0.612 0.522 0.468 0.422 0.369 0.258 0.179 0.111 0.0452 0.888 0.780 0.701 0.615 0.561 0.506 0.449 0.340 0.260 0.179 0.1243 0.655 0.554 0.481 0.401 0.344 0.294 0.248 0.140 0.064 0.000 -0.084 0.455 0.344 0.276 0.199 0.130 0.083 0.037 -0.08 -0.13 -0.21 -0.285 0.910 0.797 0.721 0.630 0.572 0.519 0.456 0.336 0.260 0.173 0.1116 1.015 0.906 0.820 0.739 0.678 0.624 0.567 0.449 0.365 0.288 0.2307 0.390 0.845 0.770 0.680 0.621 0.566 0.508 0.389 0.305 0.223 0.1648 1.005 0.892 0.812 0.724 0.669 0.615 0.554 0.435 0.352 0.270 0.212Log X, -0.680 -0.605 -0.564 -0.510 -0.478 -0.447 -0.408 -0.350 -0.301 -0.259 -0.222
BABb 0.321 0.330 0.337 0.343 0.348 0.355 0.363 0.377 0.389 0.402 0.413
BABc 0.054 0.060 0.063 0.068 0.070 0.073 0.076 0.080 0.083 0.086 0.090
a n-Heptane--ethyl acetate composition (v/v) in parentheses.b Solvent strength values on silica taken from information in ref. 33.c Solvent strength values on an aminopropyl bonded-phase column taken from information in ref. 23.
MOBILE PHASE EFFECTS ON AROMATIC HYDROXYL COMPOUNDS II
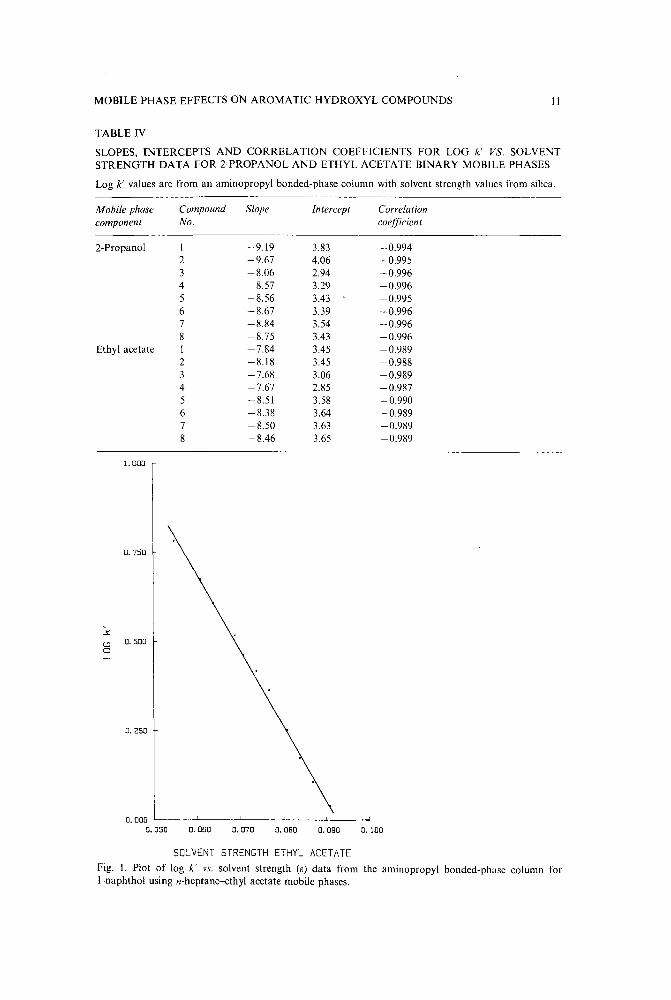
TABLE IV
SLOPES, INTERCEPTS AND CORRELATION COEFFICIENTS FOR LOG k' VS. SOLVENTSTRENGTH DATA FOR 2-PROPANOL AND ETHYL ACETATE BINARY MOBILE PHASES
Log k' values are from an aminopropyl bonded-phase column with solvent strength values from silica.
Mobile phasecomponent
2-Propanol
Ethyl acetate
Compound Slope Intercept CorrelationNo. coefficient
1 -9.19 3.83 -0.9942 -9.67 4.06 -0.9953 -8.06 2.94 -0.9964 -8.57 3.29 -0.9965 -8.56 3.43 -0.9956 -8.67 3.39 -0.9967 -8.84 3.54 -0.9968 -8.75 3.43 -0.996I -7.84 3.45 -0.9892 -8.18 3.45 -0.9883 -7.68 3.06 -0.9894 -7.67 2.85 -0.9875 -8.51 3.58 -0.9906 -8.38 3.64 -0.9897 -8.50 3.63 -0.9898 -8.46 3.65 -0.989
I. 000
0.750
0.500
0.250
0.1000.0900.0800.0700.060
O. 000 '--__-'-__~__--J..____'____l
0.050
SOLVENT STRENGTH ETHYL ACETATEFig. l. Plot of log k' vs. solvent strength (e) data from the aminopropyl bonded-phase column forl-naphthol using n-heptane-ethyl acetate mobile phases.

12 L. D. OLSEN, R. J. HURTUBISE
TABLE V
SLOPES, INTERCEPTS AND CORRELATION COEFFICIENTS FOR LOG k' VS. SOLVENTSTRENGTH FOR n-HEPTANE-ETHYL ACETATE MOBILE PHASES
Log k' and solvent strength values are from an aminopropy1 bonded-phase column.
Compound Slope Intercept CorrelationNo. coefficient
I -20.66 1.92 -0.9982 -21.45 2.06 -0.9993 -20.21 1.76 -0.9984 -20.24 1.56 -0.9985 -22.40 2.14 -0.9986 -22.07 2.22 -0.9987 -22.40 2.19 -0.9998 -22.27 2.22 -0.998
However, the results can be used in a practical fashion to predict the retention ofhydroxyl aromatics.
If the solvent strength values for n-heptane-ethyl acetate mobile phases from anaminopropyl bonded-phase column from Scolla and Hurtubisee ' were used, plots oflog k' vs. solvent strength yielded excellent correlation coefficients ranging from- 0.998 to - 0.999 (Fig. 1). The results for the slopes, intercepts and correlationcoefficients are given in Table V. The main reason why the correlation coefficients arebetter in Table V than in Table IV is that the solvent strength data for an aminopropylbonded-phase column were used rather than solvent strength values from silica. Use of
TABLE VI
SLOPES, INTERCEPTS AND CORRELATION COEFFICIENTS FOR LOG k' VS. LOG (MOLEFRACTION) PLOTS FOR 2-PROPANOL AND ETHYL ACETATE BINARY MOBILE PHASES
Mobile phasecomponent
2-Propanol
Ethyl acetate
Compound Slope Intercept CorrelationNo. coefficien t
I -1.13 -0.68 -1.002 -1.19 -0.70 -1.003 -0.96 -1.00 -0.9994 -1.04 -0.90 -0.9995 -1.01 -0.73 -0.9996 -1.05 -0.85 -0.9997 -1.07 -0.78 -1.008 -1.05 -0.84 -0.9991 -1.63 -0.31 -1.002 -1.69 -0.25 -1.003 -1.59 -0.42 -0.9994 -1.60 -0.62 -0.9995 -1.77 -0.28 -1.006 -1.74 -0.16 -1.007 -1.77 -0.23 -1.008 -1.76 -0.18 -1.00
MOBILE PHASE EFFECTS ON AROMATIC HYDROXYL COMPOUNDS 13
the solvent strength values from an aminopropyl bonded-phase column has a strongtheoretical basis9 ,1 8 .
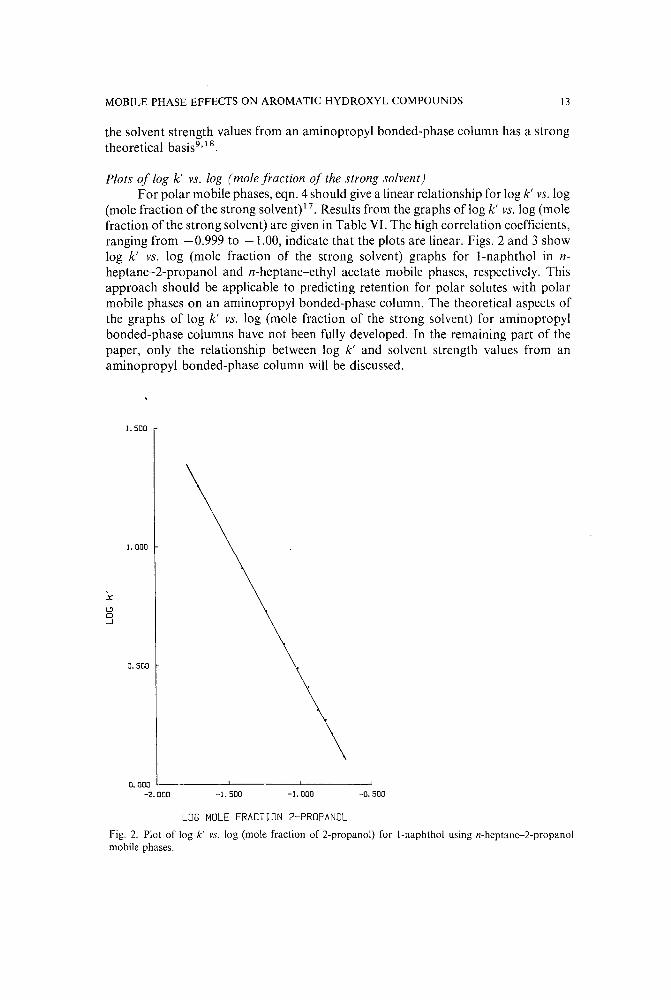
Plots of log k' vs. log (mole fraction of the strong solvent)For polar mobile phases, eqn. 4 should give a linear relationship for log k' vs. log
(mole fraction of the strong solvent)!" Results from the graphs of log k' vs. log (molefraction of the strong solvent) are given in Table VI. The high correlation coefficients,ranging from -0.999 to -1.00, indicate that the plots are linear. Figs. 2 and 3 showlog k' vs. log (mole fraction of the strong solvent) graphs for l-naphthol in nheptane-2-propanol and n-heptane-ethyl acetate mobile phases, respectively. Thisapproach should be applicable to predicting retention for polar solutes with polarmobile phases on an aminopropyl bonded-phase column. The theoretical aspects ofthe graphs of log k' vs. log (mole fraction of the strong solvent) for amino propylbonded-phase columns have not been fully developed. In the remaining part of thepaper, only the relationship between log k' and solvent strength values from anaminopropyl bonded-phase column will be discussed.
1.500
I. 000
:x:L:)0....J
0.500
-0.500-I. 000-I. 500
0.000 L- ---' ---'- -'
-2.000
LOG MOLE FRACTION 2-PROPANOL
Fig. 2. Plot of log k' vs. log (mole fraction of 2-propanol) for l-naphthol using n-heptane-2-propanolmobile phases.

14
oX
'-'o---'
I. 000
0.750
0.500
0.250
L. D. OLSEN, R. J. HURTUBISE
-0.500 -0.250
LOG MOLE FRACTION ETHYL ACETATE
Fig. 3. Plot of log k' vs. log (mole fraction of ethyl acetate) for I-naphthol using n-heptane-ethyl acetatemobile phases.
Theoretical interpretationsSnyder and Schunk!". in comparing aminopropyl bonded-phase and silica
columns, noted that retention on an aminopropyl bonded-phase column is generallylower. This means that the solutes and the solvents do not localize as strongly on anaminopropyl bonded-phase column. Also, the solvent strength values willdiffer on thetwo types ofcolumns as restricted-access delocalization is minimal on an aminopropylbonded-phase columrr'" and therefore the solvent strength values will not be as largeon the aminopropyl column. This is supported by the solvent strength data reported inTable III for the n-heptane-ethyl acetate mobile phases and other data reported in theliteraturet'".
Owing to the polar nature of the solutes (see Table I), localization and hydrogenbonding of these solutes to the stationary phase are expected. If localization orhydrogen bonding does occur, the experimental As values will be larger than thecalculated As values 2 5
,3 2 , 3 3 . Other factors to consider are interactions among solventand solute molecules and their effects on solvent strength. Snyder? has shown that withan aminopropyl bonded-phase column the contribution of molecular interactions tosolvent strength should be reduced by about half in comparison with silica.
The slopes in Table V are equal to a'As.according to eqn. 3; a' will be arbitrarily

MOBILE PHASE EFFECTS ON AROMATIC HYDROXYL COMPOUNDS 15
TABLE VII
CALCULATED AND EXPERIMENTAL As VALUES USING LOG k' VS. SOLVENT STRENGTHDATA FOR n-HEPTANE-ETHYL ACETATE MOBILE PHASES
Log k' and solvent strength values are from an aminopropyl bonded-phase column.
Compound No. A, (calc.) A, (exptl.) LlA,
I 15.7 20.7 -5.02 15.7 21.4 -5.73 18.1 20.2 -2.14 17.2 20.2 -3.15 17.5 22.4 -4.96 18.4 22.1 -3.77 17.5 22.4 -4.98 18.4 22.3 -3.9
assumed to have a value of unity'", Using this information, the slopes in Table V andeqns. 3 and 5, the experimental and calculated As values can be determined. Table VIIcontains a list of the calculated A" experimental As and LIAs (calculated As-experimental As) values from plots of log k' from the aminopropyl bonded-phasecolumn vs. solvent strength values from an aminopropyl bonded-phase column for then-heptane-ethyl acetate mobile phases. In Table VII, all of the experimental As valuesare larger than the calculated As values, which indicates that site-competitiondelocalization is occurringf!". It is expected that the compounds with the smaller pKa
values would donate a proton more readily and therefore more strongly localize orhydrogen bond with the stationary phase and have larger LIAs values. However, if theLIAs values are compared with the pKa values in Table I, no pattern appears to standout. This indicates that other factors are more important than pKa values. This is notsurprising, given the overall complexity of the chromatographic interactions.
CONCLUSIONS
The linearity for plots of log k' vs. solvent strength and log k' vs. log (molefraction of the strong solvent) for both the aminopropyl bonded-phase column andearlier results with a silica columrr'" would be useful for predicting the retention ofhydroxyl aromatics. Because a solvent strength value for 2-propanol is not availablefor the aminopropyl bonded-phase column, it was not possible to correlate then-heptane-2-propanol retention data directly with the Snyder model. However, thelinear plots acquired for log k' vs. solvent strength for ethyl acetate from anamino propyl bonded-phase column and the relatively large As (exptl.) values for theaminopropyl bonded-phase column showed that the Snyder model readily describedthe retention characteristics of the hydroxyl aromatics for this chromatographicsystem. Similar conclusions were reached for the n-heptane-ethyl acetate mobilephases on a silica columrr'",
16
ACKNOWLEDGEMENTS
L. D. OLSEN, R. J. HURTUBISE
Financial support for this project was provided by the US, Department ofEnergy under contract No, DE-AC22-83PC600l5, Partial support was provided toLD.O, by the Patricia Roberts Harris Fellowship program through the University ofWyoming.
REFERENCES
L. R. Snyder and J. J. Kirkland, Introduction to Modern Liquid Chromatography, Wiley-Interscience,New York, 2nd ed., 1979.
2 R. S,.Brown and L. T. Taylor, Anal. Chem., 55 (1983) 723.3 E. Soczewinski, Anal. Chem., 41 (1969) 179.4 E. Soczewinski and G. Matysik, J. Chromatogr., 48 (1970) 57.5 E. Soczewinski, J. Chromatogr., 130 (1977) 23.6 E. Soczewinski and T. Dzido, Chromatographia, 22 (1986) 25.7 E. Soczewinski, J. Chromatogr., 388 (1987) 91.8 L. R. Snyder and H. Poppe, J. Chromatogr., 184 (1980) 363.9 L. R, Snyder, in Cs. Horvath (Editor), High-Performance Liquid Chromatography-Advances and
Perspectives, Vol. 3, Academic Press, New York, 1983, pp. 157-223.10 R. P. W. Scott and P, Kucera, J. Chromatogr., 112 (1975) 425.I I R. P. W. Scott, J. Chromatogr., 122 (1976) 35.12 R. P. W. Scott and P. Kucera, J. Chromatogr., 149 (1978) 93.13 R. P. W. Scott and P. Kucera, J. Chromatogr., 171 (1979) 37.14 M. C. Hennion, C. Picard, C. Cornbellas, M. Caude and R. Rosset, J. Chromatogr., 210 (1981) 211.15 C. A. Chang and C. S. Huang, Anal. Chem., 57 (1985) 997.16 C. A. Chang and L. T. Tan, J. Liq. Chromatogr., 8 (1985) 995.17 L. R. Snyder, Anal. Chem., 46 (1974) 1384.18 L. R. Snyder and T. C. Schunk, Anal. Chem., 54 (1982) 1764.19 R. J. Hurtubise, A. Hussain and H. F. Silver, Anal. Chem., 53 (1981) 1993.20 A. Hussain, R. J. Hurtubise and H. F. Silver, J. Chromatogr., 252 (1982) 21.21 S. C. Ruckmick and R. J. Hurtubise, J. Chromatogr., 360 (1986) 343.22 S. C. Ruckmick and R. J. Hurtubise, J. Chromatogr., 361 (1986) 47.23 P. L. Seolla and R. J. Hurtubise, J. Chromatogr., 405 (1987) 107.24 L. D. Olsen and R. J. Hurtubise, J. Chromatogr., 474 (1989) 347.25 L. R. Snyder, J. Chromatogr., 245 (1982) 165.26 W. E. Hammers, M, C. Spanjer and C. L. de Ligny, J. Chromatogr., 174 (1979) 291.27 E. L. Weiser, A. W. Salotto, S. M. Flach and L. R. Snyder, J.Chromatogr., 303 (1984) I.28 P. L. Smith and W. T. Cooper, J. Chromatogr., 410 (1987) 249.29 G. Kortum, W. Vogeland and K. Andrussow, Dissociation Constants of Organic Acids in Aqueous
Solutions, Butterworths, London, 196I.30 D. D. Perrin, B. Dempsey and E. P. Serjeant, p K; Prediction for Organic Acids and Bases, Chapman
& Hall, New York, 1981.31 L. R. Snyder, Principles of Adsorption Chromatography, Marcel Dekker, New York, 1968, p. 208.32 L. R. Snyder, J. Chromatogr., 255 (1983) 3.33 L. R. Snyder and J. L. Glajch, J. Chromatogr., 248 (1982) 165.34 L. R. Snyder, Principles ofAdsorption Chromatography, Marcel Dekker, New York, 1968, pp. 199-200.

Journal of Chromatography, 479 (1989) 17-25Elsevier Science Publishers B.Y., Amsterdam - Printed in The Netherlands
CHROM. 21655
GAS CHROMATOGRAPHY OF PURE AND SURFACE-MODIFIED PRECIPITATED CALCIUM CARBONATE
T. AHSAN, B. A. COLENUTT* and K. S. W. SING
Department of Chemistry, Brunei University, Uxbridge, Middx UB8 3PH (U.K.)
(First received March 21st, 1989; revised manuscript received May 30th, 1989)
SUMMARY
Precipitated calcium carbonates, either pure or coated with stearic acid, arematerials of major industrial importance. Gas chromatographic measurements ofspecific retention volumes have been used to derive isosteric heats of adsorption forvarious hydrocarbons on both pure and modified calcium carbonate samples.Significant differences in the heats of adsorption and peak skew ratios have beenobserved with the different samples. The results are explained by the presence ofexposed polar cationic species at the surface of pure calcium carbonate. Modificationby stearate coating masks these sites and so reduces specific interaction. Gaschromatography is shown to be a valuable tool for probing the nature of the calciumcarbonate surface.
INTRODUCTION
Finely divided calcium carbonate is extensively used as a filler or extender inmany industries, the rubber and plastics industry being particularly important':Precipitated calcium carbonate is produced on the industrial scale by passing a streamof carbon dioxide through a suspension of calcium hydroxide. The solid product maybe given a stearate coating as part of the production process. A stearate coating makesthe material more easily wetted and so improves the incorporation and dispersioncharacteristics2
.
It is thought that strong filler-polymer interactions are required for goodreinforcement", but although stearate coated calcium carbonate is readily dispersible ithas a reduced degree of reinforcement. However, the lack of understanding of calciumcarbonate reinforcement may be partially attributed to a lack of fundamentalknowledge about the properties and surface characteristics exhibited by the pure andmodified surfaces. It is in probing and elucidating the surface properties of calciumcarbonates that gas chromatography (GC) may be a valuable tool. GC providesa unique means of studying the adsorption characteristics of surfaces at low coverage".We have already reported that GC can be used as a convenient and effective techniqueto assess adsorbent-adsorbate interaction parameters such as heats of adsorption oncalcium carbonate at low surface coverage provided that certain conditions such asstringent drying of the carrier gas and careful adsorbent conditioning are fulfilled5
.
0021-9673/89/$03.50 © 1989 Elsevier Science Publishers B.Y.

18 T. AHSAN, B. A. COLENUTT, K. S. W. SING
There are few accounts in the literature of previous GC studies of calcium carbonate.These have revealed the existence of polar sites at the surface'<". In a recent study"a comparison was made of the entropy and heats of adsorption of some saturatedhydrocarbons on pure and stearate coated calcium carbonate. To date little has beenreported on the characterization of the surface and particularly its behaviour towardsmolecular probes of varying polarity.
Here we report the isosteric heats of adsorption of various hydrocarbonmolecular probes on the surfaces of pure and modified calcium carbonates andcompare the nature of the surfaces with those of other solid adsorbents such asgraphitized thermal carbon black (GTCB) and silica gel using data from the literature.
EXPERIMENTAL
Gas chromatographyComprehensive experimental detail and the necessary precautions have been
described and discussed previously", Thus to obtain reproducible and reliable data it isvital to remove all water from the carrier gas and to recondition the columns afterinjections have been made. This prevents build-up ofadsorbed substances which mightmodify the surface during the study and is particularly vital in dealing with uncoatedcalcium carbonate.
Gas chromatography measurements were made on a Pye Model 104 gaschromatograph equipped with a flame ionization detector. Calcium carbonateparticles were packed in 50 em x 3 mm J.D. glass columns. Vapour samples of thehydrocarbon molecular probes were introduced into the nitrogen carrier gas stream bymeans of a Hamilton gas-tight l-ml syringe. Each injection was equivalent to between1 and 50 nmol of the compound. The hydrocarbons (Aldrich) were of high purity(better than 99%) and gave a single peak in the chromatogram. Sequences ofinjectionswere made until retention volumes were reproducible to within 2% for at least fourconsecutive injections. Injections were made over a range of oven temperaturesbetween 70 and 190°C.
Preparation of calcium carbonateThe finely divided calcium carbonate was prepared by a precipitation process
starting from granular calcium carbonate. The raw calcium carbonate (AnalaR grade,BDH) was heated to 1l00°C and the resulting calcium oxide was added to water toproduce a 0.9 M suspension. Calcium carbonate was precipitated by passing 40%carbon dioxide in air at a flow-rate of 200 Ijh with continous stirring. This wascontinued until a pH of? was reached when the product was filtered and dried at 115°Cfor 16 h.
One sample (acetone washed) of the colloidal calcium carbonate collected at pH7 was mixed with an equivalent volume ofacetone, filtered and washed three times withmore acetone. This product was also dried at 115°C for 16 h.
A further sample (Calgon treated) of the colloidal calcium carbonate was mixedwith a 500 ppm (wjv) aqueous solution ofCalgon S (sodium hexametaphosphate) andstirred for 10 min. The calcium carbonate was filtered and dried as described above.
A final sample (stearate coated) of the calcium carbonate was coated with 2.6%(wjw) of stearic acid by a proprietary method and once again dried at 115°C for 16 h.

GC OF CALCIUM CARBONATE
TABLE I
SURFACE AREA OF CALCIUM CARBONATE SAMPLES
19
Type of sample
Pure uncoated materialAcetone washed500 ppm Calgon S impurity2.5% (wjw) Ammonium stearate
BET surfacearea (m 2 jg)
29.434.144.230.0
The treatments with acetone and Calgon S were intended to reduce Ostwaldripening and so prevent aggregation. These products would be expected to have highersurface areas than the other two samples. The BET nitrogen surface areas of thesamples were measured and are given in Table 1.
RESULTS AND DISCUSSION
When the precautions described previously" are adopted it is possible todetermine values of specific retention volume, Vg, from the expression
where tR and to are the retention times at the peak maxima of the hydrocarbon andmethane, respectively, Fe is the corrected carrier gas flow-rate, Tis the absolute columntemperature and w is the mass of calcium carbonate.
The values of Vg are independent of any variables such as sample size. Underthese conditions the isosteric heats of adsorption at low or essentially zero coverage,s". can be calculated using the equation
st _ R dOn Vg)
q - d(l/1)
where R is the universal gas constant.Fig. I shows examples of the linear plots which were obtained when log Vg was
plotted against liT. The heats of adsorption for the hydrocarbon probes on the fourcalcium carbonate samples calculated from the plots are given in Table II.
Comparisons can be made between the heats ofadsorption in Table II and thosereported for the same hydrocarbon molecular probes on GTCB9 and macroporoussilica".
Fig. 2 shows the plots of heat of adsorption against carbon number for theadsorption of a range of normal alkanes on various adsorbents. From this it is possibleto compare the magnitude ofthe non-specific adsorbent-adsorbate interactions. It canbe seen that the increase in the interaction energy is linear with the carbon number in allcases. The position of the plot for GTCB may be explained by its non-specific surface

20 T. AHSAN, B. A. COLENUTT, K. S. W. SING
TABLE II
ISOSTERIC HEATS OF ADSORPTION (kljmol) OF VARIOUS HYDROCARBONS ON CALCIUMCARBONATES
Adsorbate Adsorbent
Unmodified Acetone Calgon S Stearatewashed treated coated
n-Hexane 36.4 35.5 37.3 35.3n-Heptane 44.1 40.5 43.2 41.1n-Octane 52.6 46.5 49.3 47.7Cyclohexane 32.1 33.4 33.4But-I-ene 46.9 41.1 34.7Hex-I-ene 53.7 51.4 52.3 42.6Hept-I-ene 60.3 56.9 58.5 47.0Benzene 64.3Toluene 68.0 42.4
and the surface density of the carbon atoms", The plots for calcium carbonate andmacroporous silica start at a nearly common point at a carbon number of six but theindividual slopes are very different. The greater slope for the calcium carbonatesamples may be explained by the presence of cationic sites at the surface which undergospecific polarization interactions-" with adsorbate molecules. Since the polarizability
00
-0·5
-1-0
-1·5
oV
C
B
A
2·20 2-30 2·40 2·50
1/ T ,103
(K-1 )
Fig. I. Plots oflog V. against IjTfor hydrocarbons on pure calcium carbonate. (A) n-hexane; (B) n-heptane;(C) n-octane; (D) hex-I-ene; (E) hept-I-ene. Circles and squares indicate measurements made on differentoccasions on the same adsorbent after reconditioning.

GC OF CALCIUM CARBONATE
/55 /
//
50 /0;-
j0 45 /.;x:
...1 /IT
40 //
/35
305 7 8
Number of carbon atoms/n c
21
Fig. 2. Heats of adsorption of n-alkanes against carbon number for various adsorbents. 0 = Unmodified;o = Calgon treated; 0 = stearate coated; --------- = GTCB: = macroporous silica".
of the hydrocarbons increases with increasing molecular weight, an enhancement ofthis interaction energy for the higher hydrocarbons in the homologous series would beexpected and this is observed. Furthermore, the strongest interaction is apparent withthe pure calcium carbonate surface as would be expected if the surface modificationinvolves masking or reaction at the exposed cationic sites.
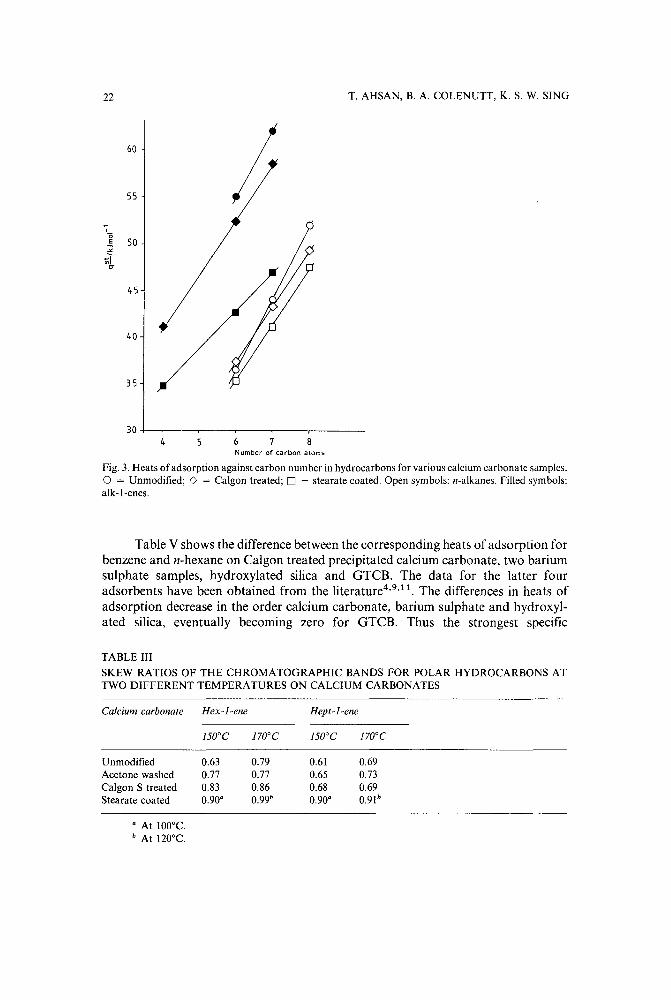
Fig. 3 shows the plots of heat of adsorption against carbon number for thenormal alkanes and certain alkenes on various calcium carbonates. It can be seen thatthe corresponding plots for the alkanes and alkenes are nearly parallel for theunmodified and Calgon-treated calcium carbonates, but that this is not the case withthe stearate coated sample. The greater rate of increase in heats of adsorption for thealkenes are due to the contribution made by the specific interactions between thez-bonds of the alkene molecules and the polar cationic sites on the surface of the purecalcium carbonate.
The skew ratios (the ratio of the horizontal distances at halfpeak height from theperpendicular at the peak maximum to the leading and trailing edges) were calculatedfrom the chromatographic bands observed with unsaturated hydrocarbons on calciumcarbonate samples at two different temperatures. The values are given inTable III.Theskew ratios of the bands increase and approach unity, representing a completelysymmetrical peak, as the high energy cationic sites are progressively masked as a resultof the different treatments given to the calcium carbonate surfaces. The effect becomesmost pronounced in the case of the stearate-coated sample where the coating hasevidently played an important role in masking the polar catonic sites. This conclusionis supported by the calculated differences between the corresponding heats ofadsorption of unsaturated and saturated C6 and C7 hydrocarbons on the calciumcarbonate samples given in Table IV. The smallest difference, reflecting the leastcontribution by specific interactions, is given by the stearate coated sample.
22
60
55
.,'0.; 50'"...1e-
45
40
35
304 5 6 7 8
Number of carbon atoms
T. AHSAN, B. A. COLENUTT, K. S. W. SING
Fig. 3. Heats of adsorption against carbon number in hydrocarbons for various calcium carbonate samples.o = Unmodified; 0 = Calgon treated; 0 = stearate coated. Open symbols: n-alkanes. Filled symbols:alk-I-enes.
Table V shows the difference between the corresponding heats of adsorption forbenzene and n-hexane on Calgon treated precipitated calcium carbonate, two bariumsulphate samples, hydroxylated silica and GTCB. The data for the latter fouradsorbents have been obtained from the literature 4
,9 , l1 . The differences in heats ofadsorption decrease in the order calcium carbonate, barium sulphate and hydroxylated silica, eventually becoming zero for GTCB. Thus the strongest specific
TABLE III
SKEW RATIOS OF THE CHROMATOGRAPHIC BANDS FOR POLAR HYDROCARBONS ATTWO DIFFERENT TEMPERATURES ON CALCIUM CARBONATES
Calcium carbonate Hex-I-ene Hept-I-ene
i50 aC tnrc i50 aC rsrc
Unmodified 0.63 0.79 0.61 0.69Acetone washed 0.77 0.77 0.65 0.73Calgon S treated 0.83 0.86 0.68 0.69Stearate coated 0.90· 0.99b 0.90· 0.91 b
a At lOoac.b At l20 ae.
GC OF CALCIUM CARBONATE 23
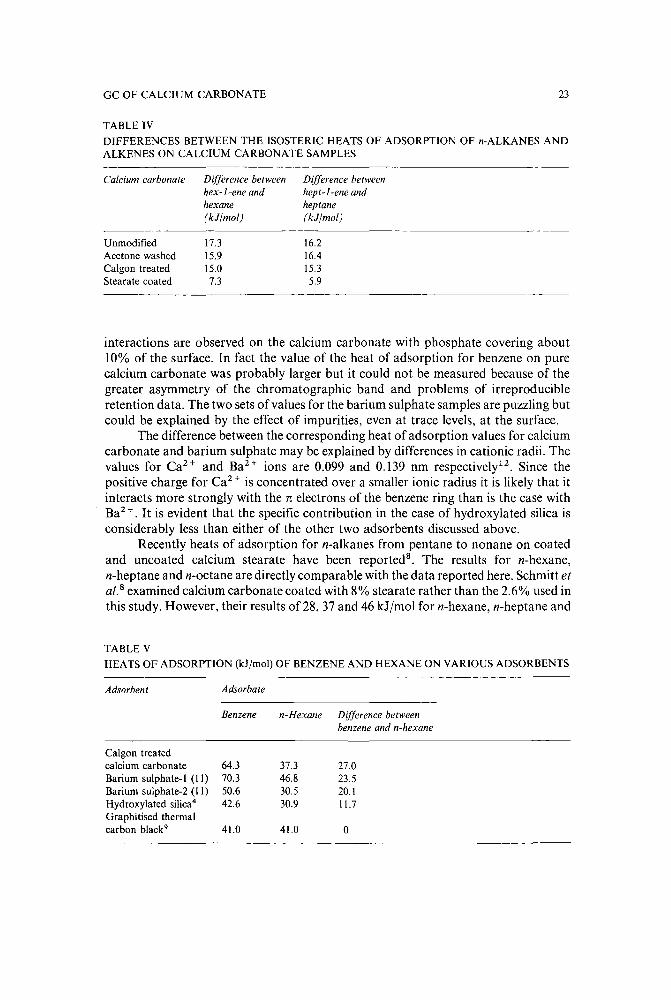
TABLE IV
DIFFERENCES BETWEEN THE ISOSTERIC HEATS OF ADSORPTION OF n-ALKANES ANDALKENES ON CALCIUM CARBONATE SAMPLES
Calcium carbonate
UnmodifiedAcetone washedCalgon treatedStearate coated
Difference betweenhex-I-ene andhexane(k Jlmol)
17.315.915.07.3
Difference betweenhept-I-ene andheptane(kJimoi)
16.216.415.35.9
interactions are observed on the calcium carbonate with phosphate covering about10% of the surface. In fact the value of the heat of adsorption for benzene on purecalcium carbonate was probably larger but it could not be measured because of thegreater asymmetry of the chromatographic band and problems of irreproducibleretention data. The two sets of values for the barium sulphate samples are puzzling butcould be explained by the effect of impurities, even at trace levels, at the surface.
The difference between the corresponding heat of adsorption values for calciumcarbonate and barium sulphate may be explained by differences in cationic radii. Thevalues for Ca 2 + and BaH ions are 0.099 and 0.139 nm respectively'<. Since thepositive charge for Ca 2 + is concentrated over a smaller ionic radius it is likely that itinteracts more strongly with the 11: electrons of the benzene ring than is the case withBaH. It is evident that the specific contribution in the case of hydroxy1ated silica isconsiderably less than either of the other two adsorbents discussed above.
Recently heats of adsorption for n-alkanes from pentane to nonane on coatedand uncoated calcium stearate have been reported", The results for n-hexane,n-heptane and n-octane are directly comparable with the data reported here. Schmitt etal.8 examined calcium carbonate coated with 8% stearate rather than the 2.6% used inthis study. However, their results of28, 37 and 46 kllmol for n-hexane, n-heptane and
TABLE VHEATS OF ADSORPTION (k.I/mol) OF BENZENE AND HEXANE ON VARIOUS ADSORBENTS
Adsorbent Adsorbate
Benzene n-Hexane Difference betweenbenzene and n-hexane
Calgon treatedcalcium carbonate 64.3 37.3 27.0Barium sulphate-I (II) 70.3 46.8 23.5Barium sulphate-2 (II) 50.6 30.5 20.1Hydroxylated silica4 42.6 30.9 11.7Graphitised thermalcarbon black? 41.0 41.0 0

24 T. AHSAN, B. A. COLENUTT, K. S. W. SING
n-octane, respectively, are within a few kilojoules of the values we report here despitethe difference in the degree of surface coating.
The effect of modifying surfaces with essentially non-volatile or chemicallybound liquids has been demonstrated for the silica-polyethylene glycol system 13 andcomparisons can be made with the coating of calcium carbonate. Papirer et al.13 hasshown that the heats of adsorption are related to the degree of surface coverage,effectively ranging from the heat of adsorption onto the solid to the heat of solutioninto the coating liquid. On that basis we would expect the heat of adsorption measuredin the calcium carbonate-stearic acid system to vary with the degree of coating and thedifferences between the two sets of results might be explained in this way.
However, the calcium carbonate surface is clearly heterogeneous and treatmentwith stearic acid is unlikely to result in a uniform coating. Stearate will concentrate atthe high energy sites and the effect of various degrees of coating cannot be predictedwith confidence. Thus the apparent differences in the heats of adsorption for calciumcarbonates with differing surface coatings is significant. The industrial scale production of calcium carbonate generally involves a stearate coating in the range2.5-3.0%, a range which has developed for empirical reasons. The observation that anincrease in loading produces relatively little change in the heat of adsorption indicatesthat although 2.6% may not be the optimum loading it has virtually eliminated theinfluence of the high energy cationic sites and increased loadings above that levelwould have relatively little effect.
So far as uncoated calcium carbonates are concerned there is poor agreementbetween the values of heats of adsorption we report here and those of Schmitt et al.8.
Their values of 11, 15 and 17 kJ Imol for n-hexane, n-heptane and n-octane,respectively, are remarkably low, being less than half of the values of the corresponding heats of condensation. Such values are similar to those we obtained inexperiments before taking all the precautions we eventually found to be necessary",There may be problems with water adsorption from the carrie! gas and, equallyimportant, if columns are not repeatedly reconditioned between injections, traceamounts of hydrocarbon probe may adsorb at polar cationic sites modifying thesurface during the analysis. This results in variable retention volumes and poorlinearity of the plots oflog Vg against liT. Hence it is possible that Schmitt et al. were infact studying a modified calcium carbonate surface rather than the uncoated onewhich was assumed. In such circumstances the nature of the surface would probably bechanging during the determinations so that reliable results would be difficult toachieve. The relatively good agreement between our two sets of results for coatedcalcium carbonate suggests that there are no fundamental differences of chromatographic technique which could account for the differences in the uncoated calciumcarbonate.
CONCLUSIONS
Gas chromatographic measurements of the specific retention volumes forvarious hydrocarbons have provided a means of characterizing the surfaces ofdifferent precipitated calcium carbonate samples. For each homologous series thederived values of isosteric heat of adsorption at very low surface coverage show a lineardependency on carbon number. For a given hydrocarbon the highest value of heat of

GC OF CALCIUM CARBONATE 25
adsorption has been obtained with the pure calcium carbonate sample and the lowestwith a stearate coated sample. The differences may be explained by the presence ofexposed polar cationic sites on the surface of the pure material giving rise to specificinteractions. These cations are masked by the stearate coating and there is thus lessspecific interaction in this case. There is some evidence that a coating of 2.6% stearateis sufficient to mask all of the cationic sites and that higher loadings have little effect.
The magnitude of the specific adsorbent-adsorbate interaction has beenestimated as the difference between the corresponding values for unsaturated andsaturated linear hydrocarbons. The pure sample again gives the highest value of heat ofadsorption. The effect is further emphasized by the calculation of skew ratios for thevarious band since the value approaches unity, a symmetrical peak, on the stearatemodified sample but is much lower on other samples.
ACKNOWLEDGEMENTS
We wish to thank the Scienceand Engineering Research Council (SERC) for theprovision of a research studentship (to T.A.) and ICI Chemicals and Polymer Limitedfor financial assistance. In addition we thank Roger Rothon and David Harrison fortheir help and advice.
REFERENCES
H. S. Katz and J. V. Milewski (Editors), Handbook of Fillers and Reinforcement for Plastics, VanNostrand-Reinhold, New York, 1978.
2 E. Suito, M. Arakawa and T. Arakawa, Bull. Inst. Chem., Kyoto Univ., 33 (1975) I.3 E. M. Dannenburg, Rubber Chem. Technol., 55 (1982) 872.4 A. V. Kiselev and Y. I. Yashin, Gas Adsorption Chromatography. Plenum, New York, 1969, Ch. 4.5 T. Ahsan, B. A. Colenutt and K. S. W. Sing, J. Chromatogr., 464 (1989) 416.6 H. P. Schreiber, M. R. Werlheimer and M. Lambla, J. Appl. Polym. Sci., 27 (1982) 2269.7 E. Papirer, J. Schultz and C. Turchi, Eur. Polym. J., 20 (1984) 1155.8 P. Schmitt, E. Koerper, J. Schultz and E. Papirer, Chromatographia, 25 (1988) 786.9 O. G. Eisen, A. V. Kiselev, A. E. Pitt, S. A. Rang and K. D. Shcherbakova, Chromatographia, 4 (1971)
448.10 R. M. Barrer, J. Colloid Interface Sci., 21 (1966) 415.II L. D. Belyakova, A. V. Kiselev and G. A. Soloyan, Chromatographia, 3 (1970) 254.12 P. W. Atkins, Physical Chemistry, Academic Press, New York, 1978.13 E. Papirer, H. Balard, Y. Rahmani, A. P. Legrand, L. Facchini and H. Hommel, Chromatographia, 23
(1987) 639.


Journal of Chromatography; 479 (1989) 27-37Elsevier Science Publishers B.V., Amsterdam - Printed in The Netherlands
CHROM. 21 673
KINETIC ANALYSIS OF THE CARBOXYPEPTIDASE A HYDROLYSIS OFOLIGOPEPTIDES BY REVERSED-PHASE HIGH-PERFORMANCE LIQUIDCHROMATOGRAPHY
M. A. SERRA
Departament de Bioquimica i Biologia Molecular, Facultat de Ciencies, Universitat Autonoma de Barcelona,08193 Bellaterra (Barcelona) (Spain)
F. X. AVILES
Departament de Bioquimica i Biologia Molecular, Facultat de Ciencies, and Institut de Biologia Fonamental"Vicent Villar Palasi", Universitat Autonoma de Barcelona, 08193 Bellaterra (Barcelona) (Spain)
E. GIRALT
Departament de Quimica Organica, Facultat de Quimica, Universitat de Barcelona, Marti i Franques 1,08028Barcelona (Spain)
and
C. M. CUCHILLO*
Departament de Bioquimica i Biologia Molecular, Facultat de Ciencies, and Institut de Biologia Fonamental"Vicent Villar Palasi", Universitat Autonoma de Barcelona, 08193 Bellaterra (Barcelona) (Spain)
(First received March 13th, 1989; revised manuscript received June 7th, 1989)
SUMMARY
A reversed-phase high-performance liquid chromatographic (HPLC)-basedmethod was developed to fol1owthe time course of the hydrolytic action of pancreaticcarboxypeptidase A on oligopeptide substrates of the general formula benzoyl(glycylkL-Phe, n being in the range 1-5. The proposed procedure is sensitive at thenanomolar level of substrate, but also allows the kinetics of substrate hydrolysis to beinvestigated over a wide range of concentrations. The prior quenching of thecarboxypeptidase activity and the use of isocratic conditions for the rapid separationof the substrates and their products (in less than 8 min for the slowest one), allow theautomation of the procedure, which could become an easy and versatile alternative tothe commonly used spectrophotometric methods. A comparative evaluation of the useof a spectrophotometric method to measure carboxypeptidase A activity on the samesubstrates indicated that the latter is not valid for long oligopeptides (n ?: 2) atconcentrations higher than 5 mM owing to an interference of a physico-chemicalnature. For benzoylglycyl-t-Phe (n = 1), the apparent kinetic parameters werecalculated by means of the HPLC method and by a wel1 established spectrophotometric procedure, and both yielded similar values.
0021-9673/89/$03.50 © 1989 Elsevier Science Publishers B.V.

28
INTRODUCTION
M. A. SERRA et al..
Pancreatic carboxypeptidase A (CPA, peptidyl-r.-amino acid hydrolase, E.C.3.4.17.1) catalyses the cleavage of the terminal bond of peptides and proteins with anaromatic or branched-aliphatic amino acid at the Csterminus". The enzymic propertiesof CPA are usually studied by measuring the hydrolysis of synthetic dipeptidederivatives, either by continuous methods (spectrophotometric'r:", fluorimetric ' andconductimetric") or by discontinuous spectrophotometric procedures7-9. A modifiedninhydrin method for the determination of the C-terminal amino acid released duringthe hydrolysis"? is the only one described for the analysis of the CPA-catalysedcleavage oflonger oligopeptides such as those of the general formula benzoyl(GlY)n-LPhe, n being 1_51 1
. As this procedure requires large amounts of substrate and is alsosubject to interference from other ninhydrin positive substances 1 2
, we becameinterested in finding an alternative procedure to quantify the CPA kinetics for thehydrolysis of the above-mentioned oligopeptides, which could be useful in a range ofconcentrations from 50 p.M to 50 mM. Our aim is to use these substrates and analyticalprocedures to characterize further the enzymic properties of porcine CPA and itszymogens, which have been extensively studied in our laboratory'Pv'".
In an initial attempt, an spectrophotometric assay was used to follow thedecrease in absorbance in the peptide UV band. This had to be performed in the regionof220 nm for oligopeptides with n ~ 2, thus making necessary the use of very thin cells(0.1 mm optical path). Under these conditions we found an interference, ofa physico-chemical nature, with the measurement of the enzymic activity that made itscorrect determination very difficult. Several tests were carried out in order to identifyand to eliminate this interference, none of which was successful.
Because of these problems, we decided to develop a semi-automated methodbased on the instantaneous quenching of the action of CPA on peptide substrates byaddition of trifluoroacetic acid (TFA), followed by separation and quantification ofthe components of the reaction mixture by reversed-phase high-performance liquidchromatography (HPLC). This method provides reliable kinetic measurements fora wide range of substrate sizes and concentrations in comparison with controlspectrophotometric assays carried out at low substrate concentrations. The feasibilityof this procedure is illustrated by the determination of the apparent kinetic parametersfor the CPA hydrolysis ofbenzoylglycyl-L-Phe (BGP) by both spectrophotometric andHPLC methods. The results are also compared with those given in the literature.
EXPERIMENTAL
ApparatusA Waters Assoc. (Milford, MA, U.S.A.) HPLC system, with a WISP 710B
automatic injector, a Model M730 data module and an Altex Ultrasphere C 18 ODS(particle size 5 /lm) column (4.5 em x 4.6 mm J.D.) was used. A double-beam HitachiModel 220 thermostated spectrophotometer was used to calculate peptide and proteinconcentrations and to record CPA activity.
ChemicalsAll chemicals were of analytical-reagent grade. Tris (Trizma-base) (Sigma),

KINETIC ANALYSIS OF OLIGOPEPTIDE HYDROLYSIS 29
sodium chloride (Merck) and zinc chloride (Panreac, Spain) were used for bufferpreparation. Dithizone (Merck) and carbon tetrachloride (Merck) were used for metalextraction. Norganic-filtered Millipore water, HPLC-grade acetonitrile (Carlo Erba)and TFA (Aldrich) were used for all HPLC experiments.
EnzymesPorcine pancreatic CPA a was obtained from partial tryptic activation of
pro-carboxypeptidase A (PCPA) by the method described previouslyl3. The enzymeconcentration was calculated spectrophotometrically using A~§oo = 19.6 Imol- 1 cm- 1
(ref. 2).
Oligopeptide substrates and productsHippuric acid (BG), BGP, N-(2-furanacryloyl)-L-phenyalanyl-L-Phe (FAPP)
(Sigma), benzoylglycyl-Gly (BG2) and benzoyl(glycyl)z-Gly (BG3) (Bachem) wereused without further purification. Benzoyltglycylu-Gly (BG5) and benzoyl(glycyl)s-LPhe (BG5P) were synthesized by the procedure of Spilburg et al.t" with minormodifications. The same method was adapted to the preparation of benzoyltglycylj-L-Phe (BG2P) and benzoyltglycyljj-r-Phe (BG3P) via reaction of L-Phe with theN-hydroxysuccinimido esters of BG2 and BG3, respectively.
All the synthesized compounds were purified by recrystallization (ethanolwater) until chromatographic homogeneity [thin-layer chromatography on silica gelplates using chloroform-methanol-water (83:15:2) as solvent] and characterized byinfrared and lH (200 MHz) and l3C (50 MHz) NMR spectroscopy. The amino acidcomposition and concentration of the above oligopeptides in solution were checked byamino acid analysis following a dabsyl chloride-Hl-lC method 1 7.
Buffer preparation and metal extractionA 50 mM Tris-HCI-0.5 M NaCI buffer (pH 7.5) was used for enzymic
experiments. Zinc chloride up to I IlM was always added before carrying out any CPAactivity measurement in order to preserve the enzyme integrityll. When indicated,buffer and oligopeptide solutions were extracted with dithizone dissolved in carbontetrachloride in order to remove metal ions 11.
Spectrophotometric-based kinetic analysisBGP hydrolysis was measured by following the decrease in absorbance in the
region of280 nm, according to the method of Whitaker et al.' For BGP, BG2P, BG3Pand BG5P hydrolysis at low concentrations (less than I mM), the decrease inabsorbance at 220 nm was recorded. Changes in the molar absorptivities (zls) werecalculated from absorbance values when substrate hydrolysis was completed. For allfour substrates, 2-mm optical-path cells (Hellma) with a reaction volume of 0.5 mlwere employed and 50-100 nM enzyme concentrations were used. This allowedstraight progress curves to be obtained for the first 3-5 min of the reaction (less than ca.10% hydrolysis), from which initial velocities were calculated. Demountable microcells (Hellma) ofO.1-mm optical path with a volume of 50 III were used to determine thekinetics of hydrolysis of BGP, BG2P, BG3P and BG5P at higher concentrations(greater than 1 mM) at 220 nm by the following procedure: the substrate solution wasplaced in an eppendorftube and the reaction was initiated by the addition of 5-10 III of

30 M. A. SERRA et al.
CPA to complete a reaction volume of 60 Ill, which was immediately mixed in a vortexstirrer; 50 III of the reaction mixture were transferred to the cell, which was closed andplaced immediately in the spectrophotometer cellcompartment. In this way recordingscould begin less than 30 s from mixing. Initial velocities were calculated as describedabove. All experiments were performed at 25°C. Assay of FAPP hydrolysis by CPAwas performed as described by Peterson et al,",
HPLC-based kinetic analysisAll HPLC analyses were carried out using isocratic elution at a flow-rate of 0.5
nil/min with different water-acetonitrile proportions in 0.1% TFA, according to thesubstrate being analysed, and monitored at 280 nm. Solvents were previouslydegassed. An automatic injector and a plotter with integrating built-in capabilitieswere always employed for the quantitative determination of the chromatographicpeak areas of both peptide substrates and their products. The samples for the kineticdeterminations were prepared as follows: 300 III of each substrate (BGP, BG3P orBG5P) concentration were placed in an eppendorf tube and 10 III of CPA (finalconcentration around 50 nM) were added to initiate the reaction; sample aliquots of 45III were withdrawn at fixed time intervals (0.5 min) for 3 min (less than ca. 10%hydrolysis) and the reaction was quenched by adding 5 III ofTFA (final concentration0.1-1 % TFA, depending on the substrate employed). Samples from the kineticexperiments were kept frozen (- 20°C) if not analysed immediately. Standards ofknown concentrations of the different peptide substrates and products were analysedand used as references to calculate, by interpolation, the amount of each product asa function of the integration of the peak area corresponding to the sample.
Calculation of kinetic parametersA linear regression program was used for the calculation of the apparent kinetic
parameters, K; and V, from v versus vlS plots, where Km is the Michaelis-Mentenconstant, V the maximum velocity, v the initial velocity and S the substrateconcentration. These parameters were refined by a non-linear regression procedure.'".
RESULTS AND DISCUSSION
Fig. I shows that the difference spectra for BGP, BG2P, BG3P and BG5P aftertheir complete hydrolysis by CPA have a strong negative absortion band at 220 nm.BGP also exhibits two other cleavage-sensitive bands at 254 and 280 nm. Because theinitial absorbances were higher than 1.8, even when using 2-mm optical-path cells,Ol-mm optical-path cells had to be used in order to follow the reaction at 220 nm atsubstrate concentrations above I mM for BG2P, BG3P and BG5P.
In order to check the stability of the assayed oligopeptide substrates (BGP,BG2P, BG3P)a in the absence of enzyme, the UV absorbance at different wavelengthswas recorded for some time. Surprisingly, a sigmoidal perturbation of the absorbancesin the 220-270 nm range was apparent in the first 8 min after placing the sample in thecell (Fig. 2). This effect was noticeable for oligopeptide concentrations above 4-5 mM.Although the decrease in absorbance accounts for less than 5% of the absolute initial
a BG5P could not be tested because of its low solubility at concentrations higher than 5 mM.
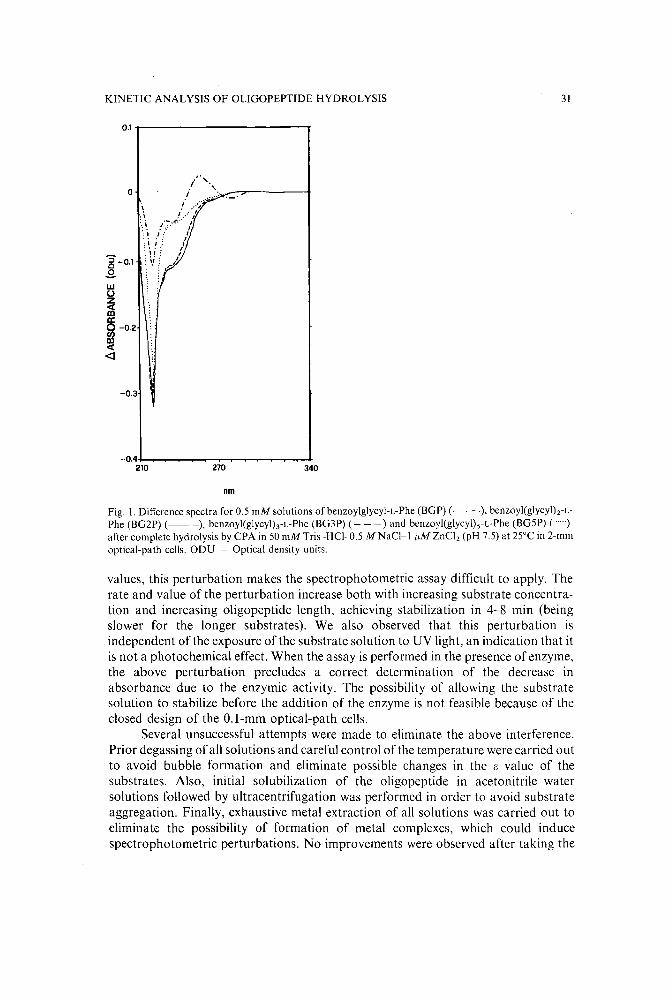
KINETIC ANALYSIS OF OLIGOPEPTIDE HYDROLYSIS 31
0.1-r------------,.
.",I "
i .._-",-----f..... '-
\ /,;,/..;/,:1 t : ,
~ i ; f "
\\i!.,/
o
~-0.1.swo
~a:~ -0.2
«<I
-0.3
nm
Fig. I. Difference spectra for 0.5 mM solutions ofbenzoylglycyl-L-Phe (BGP) (. -. - .), bcnzoylrglycyllj-tPhe (BG2P) (--), benzoylrglycyljj-t-Phe (Bmp) ( - - - ) and benzoyltglycylje-t-Phe (BG5P) C·)after complete hydrolysis by CPA in 50 mM Tris-HCI-0.5 M NaCl-l 11M ZnCI 2 (pH 7.5) at 25°C in 2-mmoptical-path cells. ODU = Optical density units.
values, this perturbation makes the spectrophotometric assay difficult to apply. Therate and value of the perturbation increase both with increasing substrate concentration and increasing oligopeptide length, achieving stabilization in 4-8 min (beingslower for the longer substrates). We also observed that this perturbation isindependent of the exposure of the substrate solution to UV light, an indication that itis not a photochemical effect. When the assay is performed in the presence of enzyme,the above perturbation precludes a correct determination of the decrease inabsorbance due to the enzymic activity. The possibility of allowing the substratesolution to stabilize before the addition of the enzyme is not feasible because of theclosed design of the O.l-mm optical-path cells.
Several unsuccessful attempts were made to eliminate the above interference.Prior degassing of all solutions and careful control of the temperature were carried outto avoid bubble formation and eliminate possible changes in the f, value of thesubstrates. Also, initial solubilization of the oligopeptide in acetonitrile-watersolutions followed by ultracentrifugation was performed in order to avoid substrateaggregation. Finally, exhaustive metal extraction of all solutions was carried out toeliminate the possibility of formation of metal complexes, which could inducespectrophotometric perturbations. No improvements were observed after taking the
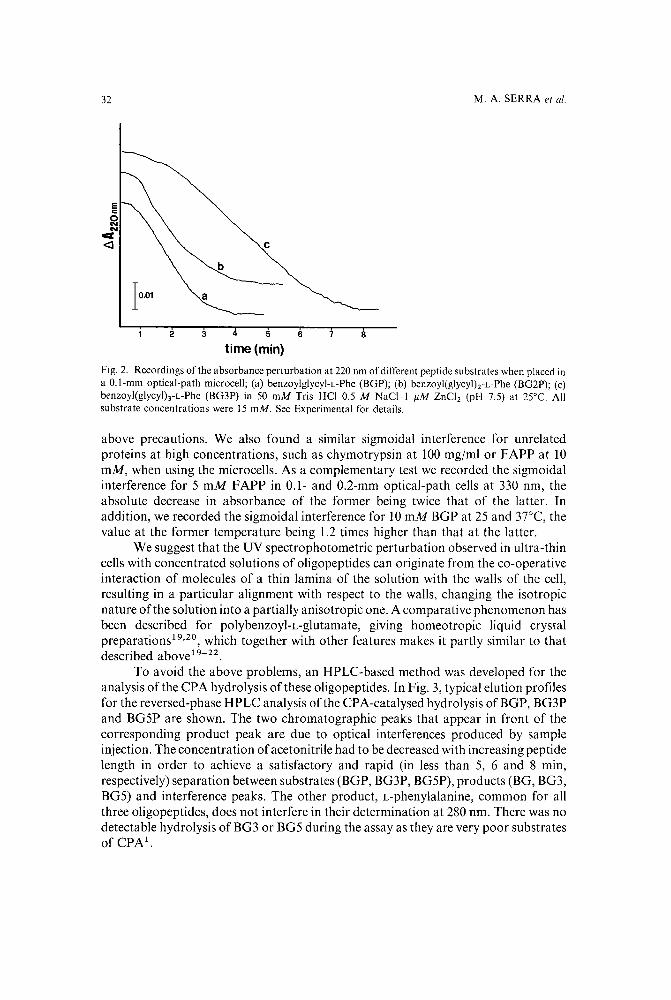
32
e'"2
NCI:<l
10.01
2 3 4 5 6 8
M. A. SERRA et al.
time (min)
Fig. 2. Recordings of the absorbance perturbation at 220 nm of different peptide substrates when placed ina O.l-mm optical-path microcell; (a) benzoylglycyl-L-Phe (BGP); (b) benzoyt(glycyljj-t-Phe (BG2P); (c)benzoylrglycyljj-t-Phe (BG3P) in 50 mM Tris-HCI-0.5 M NaCI-l pM ZnCl 2 (pH 7.5) at 25°C. Allsubstrate concentrations were 15 mM. See Experimental for details.
above precautions. We also found a similar sigmoidal interference for unrelatedproteins at high concentrations, such as chymotrypsin at 100 mgjml or FAPP at 10mM, when using the microcells. As a complementary test we recorded the sigmoidalinterference for 5 mM FAPP in 0.1- and 0.2-mm optical-path cells at 330 nm, theabsolute decrease in absorbance of the former being twice that of the latter. Inaddition, we recorded the sigmoidal interference for 10 mM BGP at 25 and 37°C, thevalue at the former temperature being 1.2 times higher than that at the latter.
We suggest that the UV spectrophotometric perturbation observed in ultra-thincells with concentrated solutions of oligopeptides can originate from the co-operativeinteraction of molecules of a thin lamina of the solution with the walls of the cell,resulting in a particular alignment with respect to the walls, changing the isotropicnature of the solution into a partially anisotropic one. A comparative phenomenon hasbeen described for polybenzoyl-L-glutamate, giving homeotropic liquid crystalpreparations'P'?", which together with other features makes it partly similar to thatdescribed above l 9- 22 .
To avoid the above problems, an HPLC-based method was developed for theanalysis of the CPA hydrolysis of these oligopeptides. In Fig. 3, typical elution profilesfor the reversed-phase HPLC analysis of the CPA-catalysed hydrolysis ofBGP, BG3Pand BG5P are shown. The two chromatographic peaks that appear in front of thecorresponding product peak are due to optical interferences produced by sampleinjection. The concentration of acetonitrile had to be decreased with increasing peptidelength in order to achieve a satisfactory and rapid (in less than 5, 6 and 8 min,respectively) separation between substrates (BGP, BG3P, BG5P), products (BG, BG3,BG5) and interference peaks. The other product, L-phenylalanine, common for allthree oligopeptides, does not interfere in their determination at 280 nm. There was nodetectable hydrolysis ofBG3 or BG5 during the assay as they are very poor substratesof CPA l
.

KINETIC ANALYSIS OF OLlOOPEPTlDE HYDROLYSIS 33
0.05
Ec:::oCDN
c(
o
A B 4.78 C 6.86
BG5PBG3P
3.93
1.76
1.41 BGP
1.521.55BG
1.78
1.82
BG3BG5
~~ '-- "-- :----I!I\. \.-
o 4 0 5 0
time (min)Fig. 3. Reversed-phase HPLC profiles ofTFA-quenched samples of CPA-hydrolysed solutions of 0.5 mMof (A) benzoylglycyl-t-Phe (BOP), (B) benzoyliglycyljj-t-Phe (B03P) and (C) benzoyltglycylle-t-Phe(B05P). Elution was carried outwith 32%, 25% and 23% acetonitrile in water, respectively, in 0.1% TFA.CPA concentration, 57 nM; final TFA concentration in quenched samples, I% for BOP and 0.1% for B03Pand B05P.
The hydrolysis rate could be measured by following either the decrease in thepeak of the substrate or the increase in the peak of the product. We adopted the latterapproach because more accurate results were obtained and also the precision waslower when the peak of the substrate was used, especially at high concentrations. Thecalibration graphs for BG, BG3 and BG5 (with correlation coefficients from 0.997 to0.999) that were used to calculate the corresponding amounts of products formed fromthe integration areas of the peaks are shown in Fig. 4. Chromatographic runs werealways performed in duplicate over the range 0-0.1 absorbance and showed goodreproducibility. Under the assay conditions described, unperturbed and well definedchromatographic elution profiles were obtained with 20-,u1 injection volumes; samplescan be injected directly up to substrate concentrations of 15 mM. Above thisconcentration it is necessary to dilute the samples for kinetic determinations. In orderto test concentrations of substrate below 0.1 mM, the injection volume and/or thesensitivity of the HPLC detector have to be increased. The CPA concentrations used inthis work (ca.50 nM) can be reduced approximately 250-fold employing the sameprocedure.
The linearity of the peptide hydrolysis rate as a function of the enzymeconcentration in the range used (20-200 nM), as determined by the HPLC method,was tested and yielded good results (correlation coefficients between 0.9903 and0.9989). The proportionality between substrate concentration and integration areasbefore and after the addition of TFA was also verified for BGP, BG3P and BG5P,

34 M. A. SERRA et al.
t~
C030D::D.
U.o(J)
~20
o~zc:(Z
1
2 3 4 5
PEAK INTEGRATION AREAS(arbitrary units)
Fig. 4. Calibration graphs for hippuric acid (BG) (.), bcnzoyhglycyljj-Gly (BG3) (0) and benzoyl(glycylu-Gly (BG5) (/',) as a function of peak-integration areas ofHPLC elution profiles. and nanomoles ofeach eluted product. Correlation coefficients, 0.9980, 0.9969 and 0.9985, respectively. HPLC conditions asin Fig. 3. Products were in 50 mMTris-HCI---D.5 M NaCI-1 11M ZnCl 2 (pH 7.5) at 25°C. All measurementswere made in duplicate.
together with the efficiency of TFA in quenching the enzymic activity (data notshown). It is very important to note that the concentration of TFA added forquenching had to be carefully selected in order to avoid substrate aggregation at verylow pH values. A final value of0.1% TFA can be generally used for all the oligopeptidesubstrates analysed over a wide range of concentrations (we tested up to 50 mM forBGP and BG3P and up to 5 mM for BG5P), although at low BGP concentrationshigher TFA values can also be used (up to 1%).
The results for the quantification of the hydrolysis of the above-mentionedsubstrates by CPA employing both spectrophotometric and HPLC methods aresummarized in Table I. It is seen that the initial velocities obtained with the twomethods are in good agreement, although the spectrophotometric-derived values areslightly higher, probably owing to an underestimation of the substrates LJe values'".
In Fig. 5, typical progress curves for the CPA-catalysed hydrolysis ofBGP in theconcentration range 0.5-6.5 mM, as obtained from HPLC data, are shown. Theapparent kinetic parameters calculated by both the HPLC and the spectrophotometricmethods are given in Table II, and agree well with those in the literature for bovineCPA 3,10. This determination was restricted to the first part of the v-S curve for BGPand assuming Michaelis-Menten kinetics. A more complete kinetic analysis would bemore complicated because anomalies at higher concentrations have been reported 3,1 o.
The method described in this work shows comparable sensitivity and speed tothe HPLC method recently proposed by Galdes et aI. 24 for the analysis of reactionmixtures of the CPA-catalysed hydrolysis of dansylated dipeptides and depsipeptides

KINETIC ANALYSIS OF OLIGOPEPTIDE HYDROLYSIS 35
TABLE I
COMPARISON OF THE CPA-CATALYSED HYDROLYSIS OF OLIGOPEPTIDES AS DETERMINED BY THE SPECTROPHOTOMETRIC AND HPLC METHODS
All assays were performed in duplicate at 0.5 mM of oligopeptide concentration in 50 mM Tris-HCI-0.5M NaCI-I /lM ZnCI2 (pH 7.5) at 25°e. CPA concentration, 57 nM. Specific activities are given in urnolmin - 1 nmol " 1. Values are not significantly different for to.9 5 (bounderies of the central interval of theStudent t value).
Substrate Specific activity
Spectrophotometric method" HPLC method"
BGPBG3PBG5P
1.0900.5631.773
0.958'0.432"1.597"
a Specific activities calculated from spectrophotometric data using ,1£280 = 0.0721 mmol" 1 ern- 1 forbenzoylglycyl-i.-Phe (BGP), ,1£220 = 1.281mmol " 1 em - 1 for benzoyltglycyljj-t-Phe (BG3P) and ,1£220 ~
1.53 I mmol "! cm -I for benzoyltglycylj.-t-Phe (BG5P).b Specific activities calculated from HPLC data at different proportions of solvent A (water-O.I %
TFA) and solvent B (acetonitrile-u.l Ss TFA): 68:32 (BGP), 75:25 (BG3P) and 77:23 (BG5P).c Withdrawn aliquots were quenched by adding TFA up to 1%." Withdrawn aliquots were quenched by adding TFA up to 0.1%.
in order to identify reaction intermediates in cryokinetic studies. It is also comparableto the method proposed by Grimwood et al.2 5 for the quantification of carboxypeptidase N following the hydrolysis of furanacryloyl derivatives of Ala-Lys orAla-Arg. In both instances the analysis is performed at fixed and low substrateconcentrations. In this present work we use different peptide substrates for the
31. ( ) 2time minFig. 5. HPLC-determined progress curves for the CPA-catalysed hydrolysis ofbenzoylglycyl-L-Phe (BGP)at (a) 0.65, (b) 1.62,(c) 3.23, (d) 4.85 and (e) 6.47 mM, in 50 mMTris-HCI-o.5 MNaCI-I /lMZnCl z (pH 7.5)at 2Ye. CPA concentration, 56 nM; final TFA concentration in quenched aliquots, 1%. Correlationcoefficients were 0.9925, 0.9949,0.9948,0.9978 and 0.9988, respectively. HPLC conditions as in Fig. 3. Allmeasurements were made in duplicate.
20
CJ1D
5
15

36 M. A. SERRA et al.
TABLE II
APPARENT KINETIC PARAMETERS FOR THE CPA-CATALYSED HYDROLYSIS OF BGPDETERMINED BY THE SPECTROPHOTOMETRIC AND HPLC METHODS
Benzoylglycyl-L-Phe (BGP) range of concentrations analysed, 0.5-6.5 mM. All measurements were carriedout in duplicate in 50 mMTris-HCI-o.5 MNaCI-I /lMZnCI 2 (pH 7.5) at 2SOC. CPA concentration, 56 nM.Parameter values are not significantly ditTerent for to.95' Confidence limits for each parameter are alsoindicated.
Kinetic parameter
s; (mM)V Cflmol min- 1 nmol- 1)
Spectrophotometric method"
1.68 ± 0.023.15 ± 0.01
HPLC method"
1.39 ± 0.042.95 ± 0.03
a According to the method described by Whitaker et a13 .
b HPLC eluent, water-acetonitrile (68:32), both in 0.1% TFA. Withdrawn aliquots were quenched byadding TF A up to a final concentration of 1%.
determination of the CPA activity. Also, different conditions for its quenching (TFAinstead of either hydrochloric or phosphoric acid) are applied in order to increase boththe solubility of the peptide substrates and products (particularly when working withlong oligopeptides) and the lifetime of the column. The more comprehensive design ofour method, which is intended to be used in kinetic studies covering a wide range ofsubstrate sizes (dipeptides to hexapeptides) and concentrations, required a carefulselection ofchromatographic conditions for their analysis. It is also interesting that theuse of a very short HPLC column (and very cheap, as it is commercially available asa guard column) shortens the time that would be required to separate longoligopeptides and products in an HPLC column of standard length.
To summarize, we have developed a sensitive and flexible method for theanalysis of the CPA kinetic properties with oligopeptides as substrates by means of anisocratic reversed-phase HPLC separation of quenched samples. The method can beautomated and allows the sequential analysis of multiple samples by the use of anautosampler. This technique combines reproducibility together with accuracy andrequires short times and small amounts to complete the analysis. Using oligopeptidesubstrates of the general formula benzoyhglycylj.-t-Phe, n being 1-5, their hydrolysisproducts can be detected at the nanomole level. The practical CPA concentrationrange is from 0.2 nM to 0.2 J.lM. The range of peptide substrate concentrations that canbe determined by the HPLC method described is very wide and the method is clearlymuch more convenient than currently used spectrophotometric procedures, particularly at high concentrations (no limit when combined with accurate dilutions prior tothe HPLC analysis).
The application of this method can facilitate more detailed studies on thecomplex kinetic behaviour that was observed for CPA with N-benzoylated peptidederivatives either in solution or in crystals'{r'", and to provide further informationabout the configuration of the active site in several subsites 2 6
-2 8
, which could moreeasily accommodate longer substrates. It has already been described for bovine CPA insolution that non-Michaelis-Menten kinetics apparently disappear when longersubstrates are employed-v '", a fact that could be confirmed by the method describedhere. The proposed method can also be used in enzymological studies of carboxypeptidases in the presence of different salts and solvents, a field of growinginterest2 4 , 2 9 .
KINETIC ANALYSIS OF OLIGOPEPTIDE HYDROLYSIS
ACKNOWLEDGEMENTS
37
This work was partially supported by grants PR84-0385, PB85-0097 andBT86-18 from the Comisi6n Interministerial de Ciencia y Tecnologia (CICYT), Spain.M.A.S. is a recipient of a pre-doctoral fellowship from the Plan de Formaci6n delPersonal Investigador (PFPI), Ministerio de Educaci6n y Ciencia (MEC), Spain.
REFERENCES
S. P. Blackburn, Enzyme Structure and Function, Vol. 3, Enzymology, Marcel Dekker, New York, 1976,Ch. 4, p. 183.
2 J. E. Folk and E. W. Schirmer, J. Bioi. Chem., 238 (1963) 3884.3 J. R. Whitaker, F. Menger and M. L. Bender, Biochemistry, 5 (1966) 386.4 L. M. Peterson, B. Holmquist and J. L. Bethune, Anal. Biochem., 125 (1982) 420.5 M. Roth and A. Rohner, cu« Chim. Acta, 135 (1983) 65.6 A. A. Baykov and E. B. Kostenko, Anal. Biochem., 134 (1983) 330.7 H. U. Bergmeyer (Editor), Methods ofEnzymatic Analysis, Vol. 2, Academic Press, New York, 2nd ed.,
1970.8 K. S. Brown, W. D. Kingsbury, N. M. Hall, G. L. Dunn and C. Gilvarg, Anal. Biochem., 161 (1987) 219.9 J. E. Snoke and H. Neurath, J. Bioi. Chem., 181 (1949) 789.
IO R. C. Davies, J. F. Riordan, D. S. Auld and B. L. Vallee, Biochemistry, 7 (1968) 1090.II D. S. Auld and B. L. Vallee, Biochemistry, 9 (1970) 602.12 S. Visser and H. S. Rollema, Anal. Biochem., 153 (1986) 235.13 M. Vilanova, J. Vendrell, M. T. Lopez, C. M. CuchiIlo and F. X. Aviles, Biochem. J., 229 (1985) 605.14 F. X. Aviles, J. Vendrell, F. J. Burgos, F. Soriano and E. Mendez, Biochem. Biophys. Res. Commun., 130
(1985) 97.15 J. M. Sanchez-Ruiz, J. L. Lopez-Lacomba, P. L. Mateo, M. Vilanova, M. A. Serra and F. X. Aviles, Eur.
J. Biochem., 176 (1988) 225.16 C. A. Spilburg, J. L. Bethune and B. L. Vallee, Biochemistry, 16 (1977) 1142.17 J. Vendrell and F. X. Aviles, J. Chromatogr., 358 (1986) 401.18 SAS User's Guide Statistics, SAS Institute, Cary, NC, 5th ed., 1985, pp. 575-606.19 W. G. Miller, Annu. Rev. Phys. Chem., 29 (1978) 519.20 D. B. Dul're, in A. Ciferri, W. R. Krigbaum and R. B. Meyer (Editors), Polymer Liquid Crystals,
Academic Press, New York, 1982, Ch. 7, pp. 166-199.21 P. J. Flory, Proc. R. Soc., London, Ser. A, 234 (1956) 60.22 C. Robinson, Trans. Faraday Soc., 52 (1956) 571.23 A. Tsai, R. Kauten and G. Palmer, Anal. Biochem., 151 (1985) 131.24 A. Galdes, D. S. Auld and B. L. Vallee, Biochemistry, 25 (1986) 646.25 B. G. Grimwood, A. L. Tarentino and T. H. Plummer, Jr., Anal. Biochem., 170 (1988) 264.26 N. Abramowitz, 1. Schechter and A. Berger, Biochem. Biophys. Res. Commun., 29 (1967) 862.27 B. L. Vallee, J. F. Riordan, J. L. Bethune, T. L. Coombs, D. S. Auld and M. Sokolovsky, Biochemistry,
7 (1968) 3547.28 D. C. Rees and W. N. Lipscomb, J. Mol. Bioi., 160 (1982) 475.29 A. C. Williams and D. S. Auld, Biochemistry, 25 (1986) 94.


Journal of Chromatography, 479 (1989) 39-51Elsevier Science Publishers B.V., Amsterdam - Printed in The Netherlands
CHROM. 21 729
REVERSED-PHASE HIGH-PERFORMANCE LIQUID CHROMATOGRAPHIC SEPARATION OF SOME INDOLE AND QUINOLINE ALKALOIDSFROM CINCHONA
A. HERMANS-LOKKERBOL*, T. VAN DER LEER and R. VERPOORTE
Centre jor Bio-Pharmaceutical Sciences, Department oj Pharmacognosy, University of Leiden, GorlaeusLaboratories, P.O. Box 9502, 2300 RA Leiden (The Netherlands)
(First received March 6th, 1989; revised manuscript received June 21st, 1989)
SUMMARY
A high-performance liquid chromatographic method was developed for theseparation of corynantheal, quinamine, cinchonamine, cinchonine, cinchonidine, quinidine and quinine. The eluent consists of 0.1 M potassium phosphate buffer (pH3.Q)-acetonitrile (85:15) to which is subsequently added 5 mM hexylamine, 85%phosphoric acid to give pH 3.0 and 2% (vjv) tetrahydrofuran. It proved necessary todevelop another reversed-phase eluent, namely 1 M sodium acetate buffer-acetonitrile-tetrahydrofuran (80:20:5) (pH 5.5-6.0) for the separation of cinchoninone,quinidinone, cinchonine, cinchonidine, quinine and quinidine because of the epimerization of cinchoninone and quinidinone at one of the asymmetric carbon atomsduring the chromatographic run. Both eluents were used in combination with a LiChrosorb RP-8 Select B column.
INTRODUCTION
The importance of and demand for the products of the Cinchona tree, viz.quinine (Q) and quinidine (Qd), as well as the non-methoxylated analogues cinchonidine (Cd) and cinchonine (C), is well known. The production of these quinolinealkaloids by means of plant cell cultures is under investigation in our laboratory. Thefundamental knowledge of the biosynthesis of the Cinchona alkaloids in plant cellcultures still displays several gaps. Corynantheal (CorAL) is thought to be a keyproduct in the biosynthetic pathway.
To investigate its conversion into the quinolines and to determine the activitiesof the enzymes involved, a high-performance liquid chromatographic (HPLC) systemsuitable for the separation of CorAL, cinchonamine (CAm), quinamine (QAm), Cd,C, Q and Qd had to be developed (see Fig. 1). As we also wanted to elucidate theenzymatic reaction of cinchoni(di)none (C-on) into C and Cd and of quini(di)none(Q-on) into Q and Qd, a system for the separation of these compounds was alsorequired. It would be convenient to have one system for both assays. Therefore, theemphasis here was to analyse the end-products of the biosynthesis pathway in addition to the intermediates leading to these end-products.
0021-9673/89/$03.50 © 1989 Elsevier Science Publishers B.V.

40 A. HERMANS-LOKKERBOL et al.
Secotcco n in
~l,,;~,)J,)J ~H2H
Tryptamine
H
OH
Quinamine
H
E
RCinchonamine
R
I~H'"
H""CH,OOC '" 0
St ric tc si dine
H
HCinchonaminal
\
OCH,
R
CHOCorynantheal
/
Cinchophyllines
CH30
R= H Cinchonidinone
R=OCHJR,HR =OCHJ Guinidincne
11 II
R
H
R
H
HO --·I····~". 'N"
H H
"'I '"'" N'
R=H Cinchonidine
R=OCH3 Quinine
R =H Cinchonine
R =OCH] QUinidine
Fig. I. Biosynthesis of Cinchona alkaloids.
So far some work has been done on the HPLC separation of Cinchona alkaloids ': However, in none of these systems was attention paid to the separation of theindole alkaloids CorAL, QAm and CAm in combination with the quinoline alkaloids,
In view of the procedures used to extract the compounds of interest of the
HPLC OF CINCHONA ALKALOIDS 41
biomass, a reversed-phase (RP) HPLC system was to be preferred, with dihydroquinine (HQ) as the internal standard. HQ is preferred because its extraction propertiesare the same as those of the alkaloids to be separated. Strong bases, such as thequinoline alkaloids, usually show poor peak shapes in the reversed-phase HPLCmode. Hexylamine, as a long-chain molecule with an alkaline end-group, can beadded to the eluent to improve the shape of the peaks of the eluted alkaloids, owing toits capacity to mask the free silanol groups of the column material".
EXPERIMENTAL
ApparatusThe HPLC system consisted of a high-pressure pump (Model 2150; LKB.
Bromma, Sweden), a 100-.u1 loop injector (U6K; Waters Assoc., Milford, MA,U.S.A.), a 275-nm UV detector (2158 Uvicord SD; LKB) and a flat-bed recorder(BD41; Kipp, Delft, The Netherlands). A 25 em x 4 mm I.D. RP-8 Select B columnof LiChrosorb (5 .urn) (Merck, Darmstadt, F.R.G.) was used. The flow-rate wasadjusted to 1.5 mljmin for all analyses.
AlkaloidsCinchonine, cinchonidine, quinine and quinidine were obtained from Fluka
(Buchs, Switzerland) and cinchoninone and quinidinone from ACF Chemiefarma(Maarssen, The Netherlands). Quinamine and cinchonamine were obtained fromplant material and corynantheal by semisynthesis by Dr. G. Massiot (Laboratoire dePharmacognosie, Faculte de Pharmacie, Reims, France).
ChemicalsAnalytical-reagent grade materials were used unless indicated otherwise and all
water used was deionized and filtered.Acetonitrile and methanol were freshly distilled before use. Tetrahydrofuran
was of extra-pure quality (Merck), I A-dioxane and acetic acid were of Baker grade(Baker, Deventer, The Netherlands), phosphoric acid was 85% (Merck), hexylaminewas of "for synthesis' quality (Merck) and KH2P04 was obtained from Baker.
EluentsThe eluent described by McCall ey3 and used as a basis for developing a new
system was prepared as follows: 0.1 M KH2P04 solution was acidified with 0.1 MH 3P04 to pH 3.0 and 850 ml of this buffer were mixed with 150 ml of acetonitrile.Eluent A was prepared from this solution by the addition of 5 mM hexylamine,acidification to pH 3.0 with 85% H 3P04 and subsequent addition of 2% (vjv)tetrahydrofuran. The eluents were filtered and degassed before use.
RESULTS AND DISCUSSION
McCall ey3 compared the performances of six different RP columns related tothe separation of the major Cinchona alkaloids; two of these (.uBondapak CIS andLiChrosorb RP-8 Select B) gave good results without the use of a long-chain amine.We chose the LiChrosorb RP-8 Select B column and the eluent he described as astarting point for the development of a suitable system for our assays.
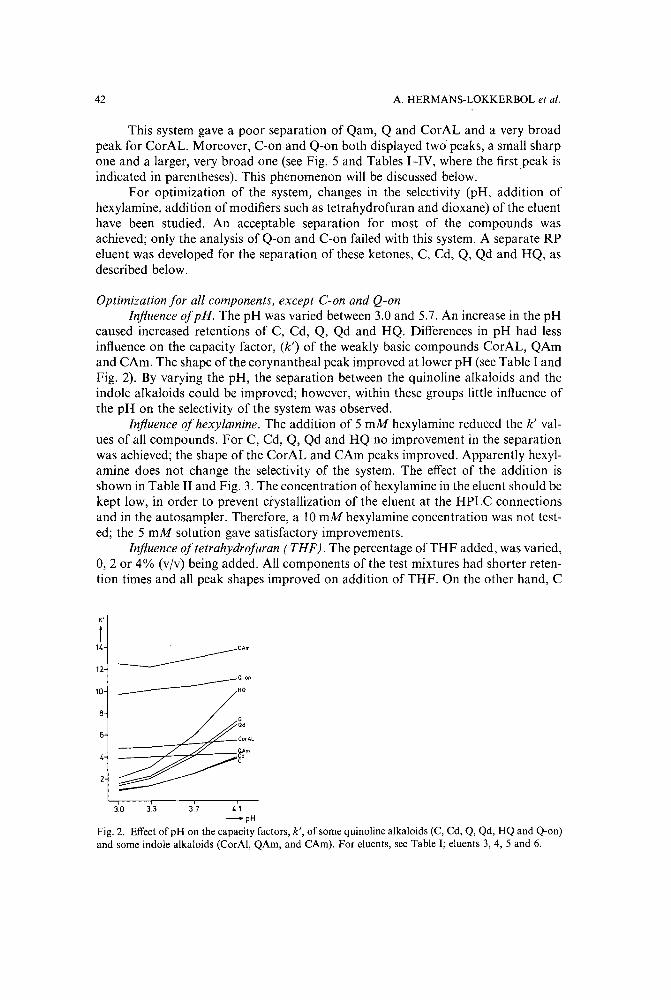
42 A. HERMANS-LOKKERBOL et at.
114
This system gave a poor separation of Qam, Q and CorAL and a very broadpeak for CorAL. Moreover, Coon and Q-on both displayed two peaks, a small sharpone and a larger, very broad one (see Fig. 5 and Tables I-IV, where the first peak isindicated in parentheses). This phenomenon will be discussed below.
For optimization of the system, changes in the selectivity (pH, addition ofhexylamine, addition of modifiers such as tetrahydrofuran and dioxane) of the eluenthave been studied. An acceptable separation for most of the compounds wasachieved; only the analysis of Q-on and Coon failed with this system. A separate RPeluent was developed for the separation of these ketones, C, Cd, Q, Qd and HQ, asdescribed below.
Optimization for all components, except C-on and Q-onInfluence ofpH. The pH was varied between 3.0 and 5.7. An increase in the pH
caused increased retentions of C, Cd, Q, Qd and HQ. Differences in pH had lessinfluence on the capacity factor, (k') of the weakly basic compounds CorAL, QAmand CAm. The shape of the corynantheal peak improved at lower pH (see Table I andFig. 2). By varying the pH, the separation between the quinoline alkaloids and theindole alkaloids could be improved; however, within these groups little influence ofthe pH on the selectivity of the system was observed.
Influence ofhexylamine. The addition of 5 mM hexylamine reduced the k' values of all compounds. For C, Cd, Q, Qd and HQ no improvement in the separationwas achieved; the shape of the CorAL and CAm peaks improved. Apparently hexylamine does not change the selectivity of the system. The effect of the addition isshown in Table II and Fig. 3. The concentration ofhexylamine in the eluent should bekept low, in order to prevent crystallization of the eluent at the HPLC connectionsand in the autosampler. Therefore, a 10 mM hexylamine concentration was not tested; the 5 mM solution gave satisfactory improvements.
Influence oftetrahydrofuran (THF). The percentage ofTHF added, was varied,0,2 or 4% (vjv) being added. All components of the test mixtures had shorter retention times and all peak shapes improved on addition of THF. On the other hand, C
"___________cAm
12
10
6
____Q-OO
___ /HQ
QQd
___---:;,.L--:::::::.;r--CorAL
30 33 37 4.1-pH
Fig. 2. Effect of pH on the capacity factors, k', of some quinoline alkaloids (C, Cd, Q, Qd, HQ and Q-on)and some indole alkaloids (CorAl, QAm, and CAm). For eluents, see Table I; eluents 3, 4, 5 and 6.
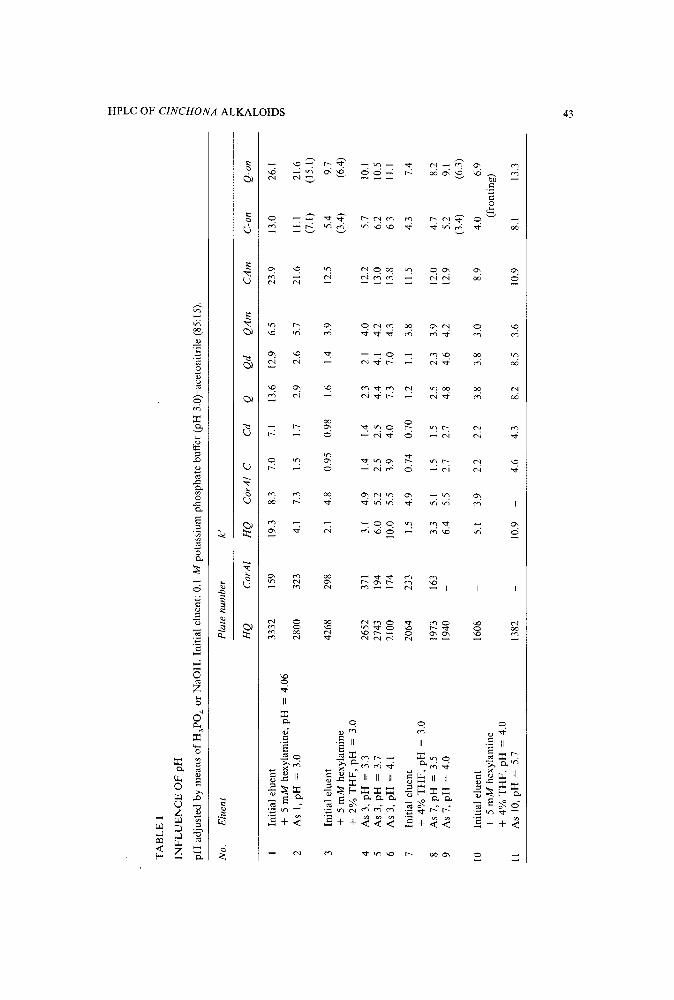
::c: -e t"" o 0 ."
TA
BL
EI
QIN
FL
UE
NC
EO
Fp
H:<; ("
)
pHad
just
edby
mea
nsof
H3P0
4or
NaO
H.
Init
ial
elue
nt:
0.1
Mpo
tass
ium
phos
phat
ebu
ffer
(pH
3.0)
-ace
toni
tril
e(8
5:15
).~ ~
No.
Elu
ent
Pla
tenu
mbe
rk'
;> t""
HQ
Cor
Al
HQ
Cor
Al
CC
dQ
Qd
QA
mC
Am
C-o
nQ
-on
~ ;> r- 0In
itia
lel
uent
3332
159
19.3
8.3
7.0
7.1
13.6
12.9
6.5
23.9
13.0
26.1
S+
5m
Mhe
xyla
min
e,pH
=4.
06V
J
2A
sI,
pH=
3.0
2800
323
4.1
7.3
1.5
1.7
2.9
2.6
5.7
21.6
11.1
21.6
(7.1
)(1
5.1)
3In
itia
lel
uent
4268
298
2.1
4.8
0.95
0.98
1.6
1.4
3.9
12.5
5.4
9.7
+5
mM
hexy
lam
ine
(3.4
)(6
.4)
+2%
TH
F,
pH=
3.0
4A
s3,
pH=
3.3
2652
371
3.1
4.9
1.4
1.4
2.3
2.1
4.0
12.2
5.7
10.1
5A
s3,
pH=
3.7
2743
194
6.0
5.2
2.5
2.5
4.4
4.1
4.2
13.0
6.2
10.5
6A
s3,
pH=
4.1
2100
174
10.0
5.5
3.9
4.0
7.3
7.0
4.3
13.8
6.3
Il.l
7In
itia
lel
uent
2064
233
1.5
4.9
0.74
0.70
1.2
l.l
3.8
11.5
4.3
7.4
+4
%T
HF
,pH
=3.
08
As
7,pH
=3.
519
7316
33.
35.
11.
51.
52.
52.
33.
912
.04.
78.
29
As
7,pH
=4.
019
406.
45.
52.
72.
74.
84.
64.
212
.95.
29.
1(3
.4)
(6.3
)
10In
itia
lel
uent
1608
5.1
3.9
2.2
2.2
3.8
3.8
3.0
8.9
4.0
6.9
+5
mM
hexy
lam
ine
(fro
ntin
g)+
4%
TH
F,
pH
=4.
0II
As
10,
pH=
5.7
1382
10.9
4.6
4.3
8.2
8.5
3.6
10.9
8.1
13.3
..,. w

TA
BL
EII
INF
LU
EN
CE
OF
HE
XY
LA
MIN
E
Init
ial
elue
nt:
0.1
Mpo
tass
ium
phos
phat
ebu
ffer
(pH
3.0)
-ace
toni
tril
e(8
5:IS
).
-4 -4
Pla
tenu
mbe
rN
o.E
luen
t
HQ
Init
ial
elue
nt19
40+
4%T
HF
,pH
=4.
02
As
I,+
5m
Mhe
xyla
min
e,16
08pH
=4.
0
3In
itia
lel
uent
,pH
=3.
013
57
4A
s3,
+5
mM
hexy
lam
ine
2800
Cor
Al
245
323
k' HQ
Cor
Al
CC
dQ
Qd
QA
mC
Am
C-o
nQ
-on
6.4
5.5
2.7
2.7
4.8
4.6
4.2
12.9
5.2
9.1
(3.4
)(6
.3)
5.1
3.9
2.2
2.2
3.8
3.8
3.0
8.9
4.0
6.9
(fro
ntin
g)
4.3
10.3
1.6
1.7
3.1
2.8
30.2
14.0
27.4
?>(9
.3)
(19.
0)4.
17.
31.
51.
72.
92.
65.
721
.611
.121
.6::c m
(7.4
)(1
5.1)
:;0 ~ ;.. Z f/J r-. 0 ~ ~ m :;0 1;0 0 r- 2- "-

HPLC OF CINCHONA ALKALOIDS 45
-Ha-a-adc~Cd
A 32 B
"130
28
26
24
22CAm
20
18
16
14
16
"1
14
12 \
10 ~
~:~~n CorAL
6 a0HQ4 Qd~CorAl
~aAm--C,Cd
o o-mM hexylamine_mM hexylamine
Fig. 3. Influence of hexylamine on the retention of quinoline alkaloids (C, Cd, Q, Qd, HQ, Q-on) andindole alkaloids (CorAL, QAm, CAm). For eluents, see Table II; for A eluents I and 2 and for B eluents 3and 4.
and Cd now had almost identical k' values, and also for Q and Qd there was atendency to co-elute, especially at the 4% THF level. The peak shapes of CorAL andCAm improved and the shorter analysis time, acquired by the lower k' of the lastcompound, CAm (17 vs 28.5 min), was an additional advantage. Results are given inTable III.
Influence ofdioxane and pyridine. Modifiers other than THF were studied. Addition of 1,4-dioxane (2%, v/v) to the eluent resulted in only a slight improvement inpeak shape. Retention times were shortened, but overall THF gave better results.Addition of pyridine to the eluent (1 mM pyridine; the pH was readjusted to 3.37 withH 3P04 ) did not improve the performance. Results are given in Table IV.
From these results, an eluent containing 5 mM hexylamine and 2% (vfv-)--'IHFat pH 3.0 was selected as the most suitable for the assay of CorAL, QAm, CAm, C,Cd, Q and Qd (eluent A; see Fig. 4). A disadvantage is that eluents containing hexylamine crystallize very easily at the HPLC connections, causing problems, especially inautosamplers. Nevertheless, the advantage of better peak shapes prevailed over thisinconvenience.
Optimization for all quinoline alkaloids (C-on, Qi-on, C, Cd, Q, Qd, HQ)Eluent A was not suitable for the assay of the ketones (Q-on and C-on). Both
Q-on and C-on gave two peaks in this solvent (see Fig. 5; in Tables I-IV the first of

TA
BL
EII
I
INF
LU
EN
CE
OF
TH
F
Init
ial
elue
nt:
0.1
Mpo
tass
ium
phos
phat
ebu
ffer
(pH
3.0)
-ace
toni
tril
e(8
5:15
).
.j>.
0\
No.
Elu
ent
Init
ial
elue
nt+
5m
Mhe
xyla
min
e,pH
=3.
02
AsI,
+2
%T
HF
3In
itia
lel
uent
,pH
=3.
0
4A
s3,
+2%
TH
F
5A
s3,
+4%
TH
F
Pla
tenu
mbe
rk'
HQ
Cor
Al
HQ
Cor
Al
CC
dQ
Qd
QA
mC
Am
Cro
nQ
i-on
2800
323
4.1
7.3
1.5
1.7
2.9
2.6
5.7
21.6
11.1
21.6
(7.4
)(l
5.!
)42
6829
82.
14.
80.
950.
981.
61.
43.
912
.55.
49.
7(3
.4)
(6.4
)
1357
245
4.3
10.3
1.6
1.7
3.1
2.8
30.2
14.0
27.4
(9.3
)(1
9.0)
;l>13
2623
62.
56.
91.
11.
11.
81.
718
.!7.
413
.5::r:
(4.8
)(9
.1)
tTl
2064
233
1.5
4.9
0.74
0.70
1.2
1.1
3.8
11.5
4.3
7.4
~ a::(2
.8)
(5.0
);l> Z C
/J t-- 0 ~ ~ tTl~ tl:
l0 r- ~ I:l :-
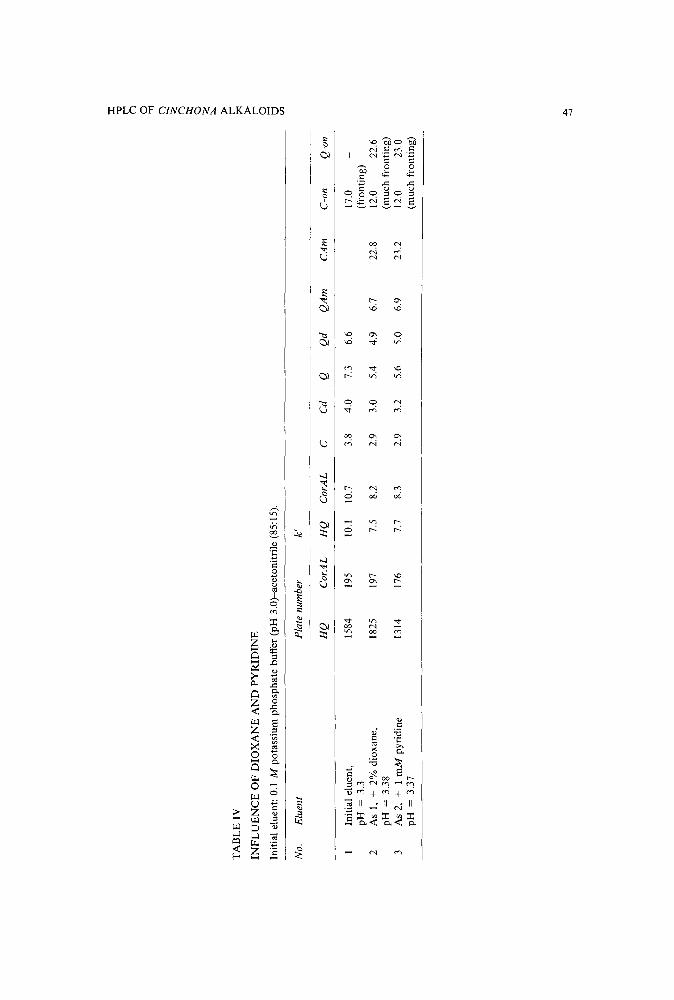
TA
BL
EIV
INF
LU
EN
CE
OF
DIO
XA
NE
AN
DP
YR
IDIN
E
Init
ial
elue
nt:
0.1
Mpo
tass
ium
phos
phat
ebu
ffer
(pH
3.o)
-ace
toni
tril
e(8
5:15
).
::r: "t:I r o o -n n ~ ~ ~ ;J> r ~ ;J> r o a (/)
No.
Elu
ent
Init
ial
elue
nt,
pH=
3.3
2A
s1,
+2%
diox
ane,
pH=
3.38
3A
s2,
+1
mM
pyri
dine
pH=
3.37
Pla
tenu
mbe
rk'
HQ
Co
rAL
HQ
Co
rAL
CC
dQ
Qd
QA
mC
Am
C-o
nQ
ron
1584
195
10.1
10.7
3.8
4.0
7.3
6.6
17.0
(fro
ntin
g)18
2519
77.
58.
22.
93.
05.
44.
96.
722
.812
.022
.6(m
uch
fron
ting
)13
1417
67.
78.
32.
93.
25.
65.
06.
923
.212
.023
.0(m
uch
fron
ting
)
.j:>
.
-'
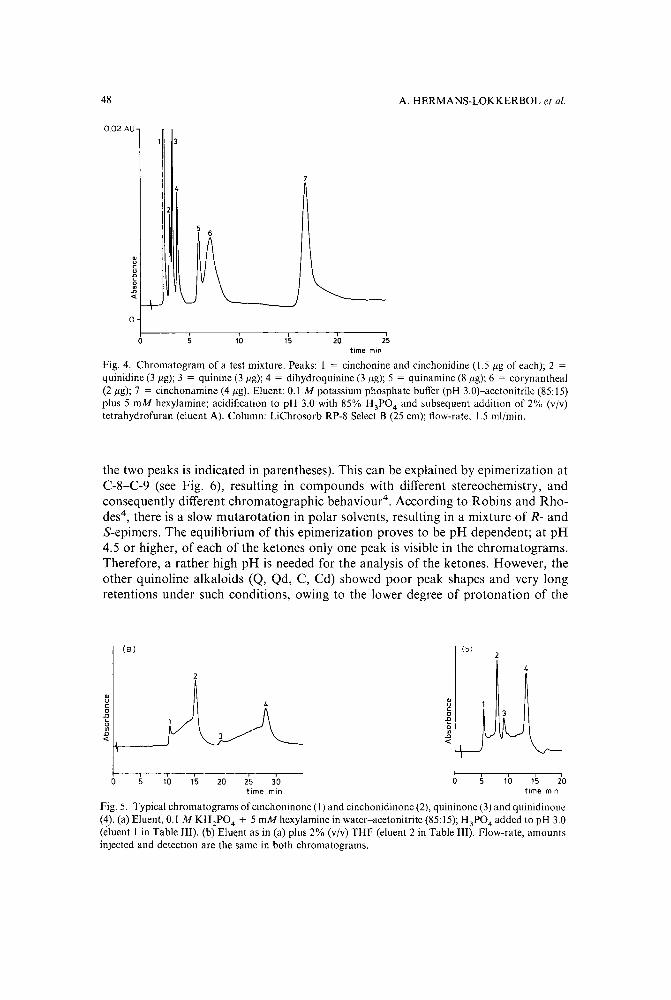
48
0.02 AU
~uc:o"5on"..o
o
5 6
10 15 20time min
25
A. HERMANS-LOKKERBOL et al.
Fig. 4. Chromatogram of a test mixture. Peaks: I = cinchonine and cinchonidine (1.5 /lg of each); 2 =
quinidine (3 /lg); 3 = quinine (3 /lg); 4 = dihydroquinine (3 /lg); 5 = quinamine (8 /lg); 6 = corynantheal(2 /lg); 7 = cinchonamine (4 /lg). Eluent: 0.1 M potassium phosphate buffer (pH 3.0)-acetonitrile (85:15)plus 5 mM hexylamine; acidification to pH 3.0 with 85% H3P04 and subsequent addition of 2% (v/v)tetrahydrofuran (eluent A). Column: LiChrosorb RP-8 Select B (25 em); flow-rate, 1.5 nil/min.
the two peaks is indicated in parentheses). This can be explained by epimerization atC-8-C-9 (see Fig. 6), resulting in compounds with different stereochemistry, andconsequently different chromatographic behaviour". According to Robins and Rhodes", there is a slow mutarotation in polar solvents, resulting in a mixture of R- andS-epimers. The equilibrium of this epimerization proves to be pH dependent; at pH4.5 or higher, of each of the ketones only one peak is visible in the chromatograms.Therefore, a rather high pH is needed for the analysis of the ketones. However, theother quinoline alkaloids (Q, Qd, C, Cd) showed poor peak shapes and very longretentions under such conditions, owing to the lower degree of protonation of the
~
oco~o
'".0..
o
(8)
5 10 15 20 25 30time min
~oco.0
<;on.0«
o
(b)
10 15 20time min
Fig. 5. Typical chromatograms of cinchoninone (I) and cinchonidinone (2), quininone (3) and quinidinone('!). (a) Eluent, 0.1 M KH 2P04 + 5 mM hexylamine in water-acetonitrite (85:15);H3P04 added to pH 3.0(eluent I in Table III). (b) Eluent as in (a) plus 2% (v/v) THF (eluent 2 in Table Ill). Flow-rate, amountsinjected and detection are the same in both chromatograms.

HPLC OF CINCHONA ALKALOIDS 49
H H H
R
R= H Cinch6nidinone
Fig. 6. Epimerization of C-on and Q-on.
R= OCH3 Oulnldinone
alkaloids at higher pH. As is known from previous investigations", alkaloids willform ion pairs when acetate is the counter ion. In an HPLC eluent based on acetatebuffer strong ion-pair formation is observed, even at higher pH; in phosphate bufferthe alkaloids do not give rise to ion pairs extractable with non-polar solvents", i.e.,they will elute more rapidly than the alkaloid-acetate ion pairs. For acetate-basedsolvents a much higher concentration of acetonitrile is needed to ensure reasonableretention of the now less polar compounds.
At this time only the ketones were tested together with C, Cd, Q, Qd and HQ; aswe already developed an HPLC system for the separation of CorAL, QAm and CAmin combination with these five alkaloids, their chromatographic behaviour in eluentsbased on an acetate buffer was not investigated.
Several acetate buffer eluents were tested (see Tables V and VI). The first was a0.1 M acetate buffer (pH 5.5) mixed with an equal volume of methanol. The pH ofthis eluent after the addition of methanol was 6.4. The performance in this eluent waspoor, with no separation between C and Cd or between Q and Qd, and severe tailingof all compounds. By varying the chromatographic parameters. attempts were madeto find the optimum in separation quality. When methanol was replaced with acetonitrile as the organic part of the eluent in comparable volume ratios, the k' valuesdecreased considerably owing to the higher eluotropic strength of acetonitrile (eluentswith the same eluotropic strength were not compared). It is noteworthy that in acetatebuffer-acetonitrile the sequence of elution is Cd-C-Q-Qd-HQ, whereas with methanol the sequence is C-Cd-Qd-Q-HQ (the same inversion in the retention of thestereoisomers was noted when phosphate buffer was used instead of acetate buffer).
Another variation was the acidity of the eluent: the pH was varied between 4.1and 6.7, by adding 10 M sodium hydroxide solution or acetic acid; in the latter
TABLE V
ACETATE BUFFER-METHANOL ELUENTS
Eluent k'
C Cd Q Qd HQ C-on Q-on
0.1 M sodium acetate (pH 5.5)+ methanol (l:l), pH = 6.4 5.5 5.5 9.0 7.8 11.\ 12.3
As above + acetic acid to pH 5.5 3.8 4.0 6.7 5.8 8.8 5.2 8.9

50 A. HERMANS-LOKKERBOL et al.
TABLE VI
ACETATE BUFFER-ACETONITRILE ELUENTS
Eluent k'
No. Composition C Cd Q Qd HQ C-on Qron
0.1 M acetate (pH 5.5) 2.1 1.9 2.2 2.4 2.7 3.9 4.9+ CH 3CN (1:1), pH = 6.7
2 I + acetic acid to pH 5.5 1.1 1.1 1.3 1.4 1.6 1.7 2.23 2 + water to H20-CH 3CN (2:1), pH 5.05 2.5 2.3 3.2 3.5 4.0 3.2 4.54 3 + water to HP-CH3CN (3:1), 6.1 5.8 8.7 9.7 11.7 8.6 13.9
NaOH to pH 5.55 4 + acetic acid to pH 5.05 5.8 5.3 8.7 9.3 11.4 7.4 12.56 5 + 1% (v/v) THF 4.7 4.4 7.0 7.4 9.5 5.8 9.57 6 + water to H20-CH 3CN (4:1), 9.6 9.1 15.8 16.3 22.0 12.1
pH 4.98 7 + acetic acid to pH 4.1 5.8 5.8 9.7 9.7 13.6 9.1 16.09 8 + THF to 5% (v/v), pH 4.15 2.5 2.5 3.7 3.7 4.8 3.2 5.1
IO 9 + NaOH to pH 4.9 3.3 3.1 5.1 5.2 6.4 3.9 6.311 IO + NaOH to pH 5.5 4.1 3.7 6.0 6.5 7.8 5.4 8.412 II + NaOH to pH 6.0 4.6 4.1 6.7 7.1 8.7 7.3 11.2
instance not only the [HA]:[Ac-] ratio changed, but also the sum. In alI instances alower pH coincided with lower k' values.
The water to organic solvent ratio was varied between I: I and 4:I. The morewater the eluent contained, the more alI the compounds were retained. For example,in an eluent containing acetate buffer and acetonitrile, with 1% (vjv) THF added anda final pH of 5.0, the k' values of all compounds tested increased by a factor of 2 ormore when the water to acetonitrile ratio was changed from 3:I to 4:I.
The addition of THF to the eluent resulted in an improvement in the elutionpattern; the peaks shapes were better and the retention times shorter. However, as inthe phosphate buffer eluents, here also C and Cd had the same k' values and Q andQd showed a tendency to co-elute when 5% THF was present. An increase in theTHF content from I to 5% (vjv) in an eluent containing acetate buffer-acetonitrile(4:1) at pH 4.1 resulted in a 2-3-fold decrease in k' values. The same occurred with aneluent of pH 4.9.
Instead of THF, other organic modifiers from diverse classes in Snyder's c1assification" were tested. Both I and 5% (vjv) additions to the eluent ofmethoxyethanol,1,4-dioxane and acetone were tried, but none gave satisfactory results; addition ofchloroform, mixed with methanol to increase its solubility, gave no improvement.
When the column was situated in a water-jacket at 3YC, only a slight improvement in the separation was observed.
In spite of all these variations, no eluent could be found that fulfilled satisfactorily all the requirements stated above. The best eluent proved to be I M acetatebuffer-acetonitrile (80:20) with pH between 5.5 and 6.0, to which 5% (vjv) THF wasadded. With this system C-on can be determined in the presence of C and Cd. However, C-on cannot be determined in combination with both Q and Qd; at pH 5.5 itelutes shortly before Q, without sufficient separation, and at pH 6.0 it elutes shortlyafter Qd. .

HPLC OF CINCHONA ALKALOIDS 5\
For long-term satisfactory HPLC performance a lower molarity of the eluent isdesired.
ACKNOWLEDGEMENTS
We thank Dr. G. Massiot for the kind gift of corynantheal and ACF Chemiefarma for supplying cinchinone and quinidinone.
REFERENCES
I R. Verpoorte, J. Schripsema and T. van der Leer, in A. Brossi (Editor), The Alkaloids, Vol. 34, Aca-demic Press, San Diego, 1988, Ch. 6, p. 37\; and references cited therein.
2 D. V. McCalley, Chromatographia, 17 (\983) 264.3 D. V. McCalley, J. Chromatogr., 357 (1986) 221.4 R. J. Robins and M. J. C. Rhodes, Phytochemistry, 26 (1987) 551.5 A. Hermans-Lokkerbol and R. Verpoorte, Planta Med., 4 (1986) 229.6 L. R. Snyder, J. Chromatogr. Sci., 16 (\978) 223.

Journal of Chromatography. 479 (1989) 53- 60Elsevier Science Publishers B.V., Amsterdam - Printed in The Netherlands
CHROM. 21654
MULTILAYER COIL PLANET CENT RIFUGE FOR ANALYTICAL HIGHSPEED COUNTER-CU R RENT CHROMATOGRAPHY
HISAO OK A", FUMIE OKA and YOICHIRO ITO*
Laboratory 0/ Technical Development , National Heart , Lung, and Blood Institute, National Institutes 4Health , Building 10, Room 5D-12, Bethesda. MD 20892 ( U.S.A)
(First received March 20th, 1989, revised manuscript received May 30th, 1989)
SUMMA RY
A compact portable model of a high- speed counter-current chromatographenables efficient analytical separa tions of microgram sample quantities within 10 min .A series of preliminary experiments was conducted to study retention of the sta tionary phase of various two-phase solvent systems in shor t coils with different helicaldiam eters. Under the optimal experimenta l conditions, analytical cap ab ility of theappa ra tus was successfully demonstrat ed in separation offlavonoids from a crude seabucktho rn ethanol extract in a multilayer coil with a tot al capacity of 8 m\.
INTR OD UCTION
Counter-current chromatography (Ccq has many desirable features for performing analytical separa tions because it eliminates various complications such assample loss, tailing of solute peak s, contamina tion, etc., all arising from the use ofsolid suppo rts". Never theless, the method has been used almost exclusively for preparat ive purposes mainl y du e to its long sepa ration times required . Ad vent of highspeed CCC in early 1980s, however, rema rka bly improved the CCC technology tosho rten the separation time from days to a few hou rs ' :":'. Recent development of ananalytical coil planet centrifuge with a 5-cm revolu tion rad ius further reduced thesepa ra tion time, thus providing a powerful tool for analyses of various natural products" .
Thi s paper introduces a new coil planet centrifuge with a 2.5-cm revolutionradius which can be operated at the maximum speed of 4000 rpm. Performance of theapparatus was evaluated in term s of retention of the sta tiona ry phase of severaltwo-phase solvent systems, and the analytica l cap ability of the meth od was demonstrated in sepa ra tion of microgram qu antities of flavonoids from a crude eth an olextract of sea buckthorn (Hippophae rhamn oides) using a two-phase solvent systemcomposed of chloroform-meth an ol- water (4:3:2, v/v/v) .
Q Visiting Scientist from Aichi Prefectur al Institute of Public Health , Nagoya, Japan.
0021-9673/89/$03.50 © 1989 Elsevier Science Publishers B.V.
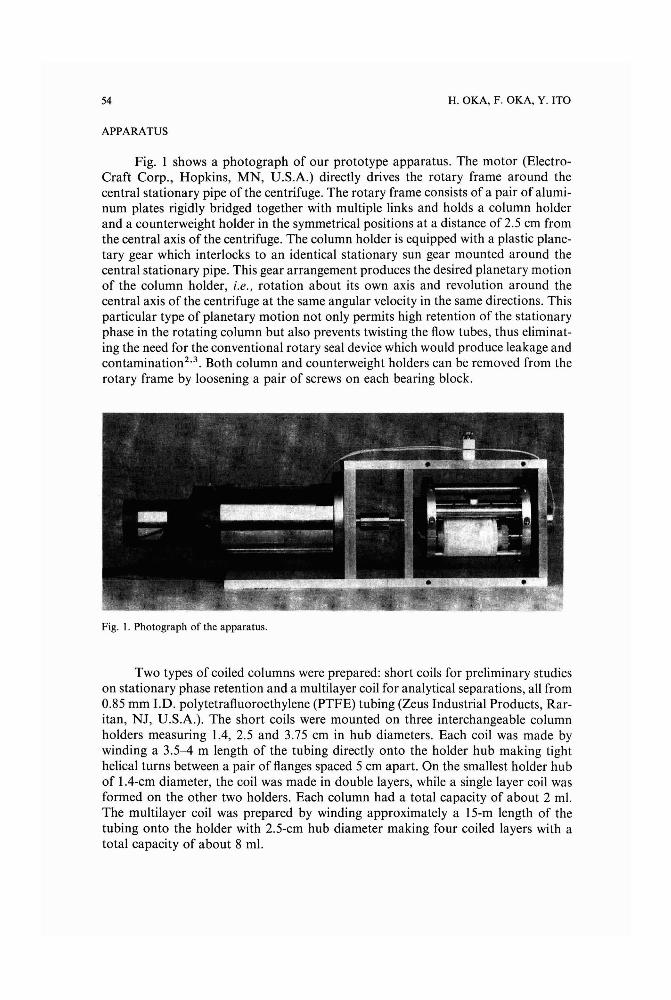
54
APPARATUS
H. aKA, F. aKA, Y. ITO
Fig. I shows a photograph of our prototype apparatus . The motor (ElectroCraft Corp., Hopkins, MN, U.S.A.) directly drives the rotary frame around thecentral stationary pipe of the centrifuge. The rotary frame cons ists of a pair of aluminum plates rigidly bridged together with multiple links and holds a column holderand a counterweight holder in the symmetrical positions at a distance of 2.5 em fromthe central axis of the centrifuge. The column holder is equipped with a plastic planetary gear which interlocks to an identical stationary sun gear mounted around thecentral stationary pipe . This gear arrangement produces the desired planetary motionof the column holder, i.e., rotation about its own axis and revolution around thecentral axis of the centrifuge at the same angular velocity in the same directions. Thi sparticular type of planetary motion not only permits high retention of the stationaryphase in the rotating column but also prevents twisting the flow tubes, thus eliminating the need for the conventional rotary seal device which would produce leakage andcontaminationv' . Both column and counterweight holders can be removed from therotary frame by loosening a pair of screws on each bearing block .
Fig. I. Photograph of the apparatus.
Two types of coiled columns were prepared: short coils for preliminary studieson stationary phase retention and a multilayer coil for analytical separations, all from0.85 mm to. polytetrafluoroethylene (PTFE) tubing (Zeus Industrial Products, Raritan, NJ , U.S.A.) . The short coils were mounted on three interchangeable columnholders measuring lA, 2.5 and 3.75 em in hub diameters. Each coil was made bywinding a 3.5-4 m length of the tubing directly onto the holder hub making tighthelical turns between a pair of flanges spaced 5 em apart. On the smallest holder hubof IA-cm diameter, the coil was made in double layers, while a single layer coil wasformed on the other two holders. Each column had a total capacity of about 2 ml.The multilayer coil was prepared by winding approximately a 15-m length of thetubing onto the holder with 2.5-cm hub diameter making four coiled layers with atotal capacity of about 8 ml.
COIL PLANET CENTRIFUGE FOR HIGH-SPEED CCC 55
Each terminal of these coils was connected to a PTFE flow tube of 0.45 mm J.D.and 0.5-mm wall thickness in the following manner: approximately a l-cm length ofthe flow tube was inserted into the column terminal, and a piece of copper wire with0.7-mm diameter was wound over the junction to limit heat expansion of the tubing.Then, heat was applied with a heat gun until the whole joint became transparent andfused together. The joint thus formed generally holds a pressure up to severalhundred p.s.i. A pair of flow tubes from the coiled column first passes through thecenter hole of the column holder shaft, then forms an arch to reach the opening of theyoke mounted on the left end of the rotary frame and finally enters the opening of thecentral stationary pipe to exit the centrifuge. At the top of the centrifuge, these flowtubes are tightly supported with a silicone-rubber-padded clamp. These flow tubeswere lubricated with silicone grease and protected with a sheath of Tygon tubing ateach supported portion to prevent direct contact with metal parts. If these cautionsare followed, the flow tubes can maintain their integrity for many months of operation.
EXPERIMENTAL
ReagentsOrganic solvents used for preparation of the two-phase solvent systems include
n-hexane, ethyl acetate, methanol, chloroform, acetic acid and n-butanol. Amongthose, n-hexane, acetic acid and n-butanol were of reagent grade and obtained fromPolyscience (Warrington, PA, U.S.A.), MalJinckrodt (Paris, KY, U.S.A) and TediaCompany (Fairfield, OH, U.S.A.), respectively. All other solvents were glass-distilledchromatographic grade and purchased from Burdick and Jackson Labs. (Muskegon,MI, U.S.A.). Dried powder of sea buckthorn ethanol extract used as the test samplewas obtained from China by the courtesy of Professor Tian You Zhang at BeijingInstitute of New Technology Application, Beijing, China.
Preparation of two-phase solvent systems and sample solutionThe folJowing six volatile two-phase solvent systems were prepared for prelimi
nary studies on stationary phase retention in short coils: n-hexane-water, n-hexaneethyl acetate-methanol-water (1: I: 1:1), chloroform-water, chloroform-acetic acidwater (2:2:1), n-butanol-water, n-butanol-acetic acid-water (4:1:5). The two-phasesolvent system composed of chloroform-methanol-water (4:3:2) was prepared for theanalytical separation of the sea buckthorn ethanol extract with the multilayer coil.Each solvent system was thoroughly equilibrated in a separatory funnel at roomtemperature by repeated shaking and degassing by opening the stopcock and twophases separated before use.
The sample solution for the analytical separation was prepared by dissolving 30mg of the sea buckthorn extract dried powder in I ml of the lower non-aqueous phaseof the above solvent system used for separation.
Procedures for preliminary studies on stationary phase retention in short coilsFor each experiment, the short coil was first entirely filled with the stationary
phase. Then, the apparatus was run at the desired revolutional speed while the mobilephase was continuously eluted through the coil at a flow-rate of 60 ml/h, In order to

56 H. OKA, F. OKA, y. ITO
provide a uniform flow, a 20-ml capacity glass syringe was driven by a multi-speedtransmission syringe driver (Harvard Apparatus, Millis, MA, U.S.A.). The effluentfrom the outlet of the column was collected into a 5-ml capacity graduated cylinder.After 3 ml were eluted, the results were recorded by simply observing the amount ofupper and lower phases comprising the total volume of the effluent.Then, the apparatus was stopped and the column flushed by allowing nitrogen gas to push out thecontents. The experiments were performed by varying the experimental conditionssuch as revolutional speed (2000, 2500, 3000, 3500, 4000 rpm), elution modes (head totailor tail to head) and the use of upper and lower phases as the mobile phase. Thehead-tail elution modes were changed by altering the direction of the planetary motion.
Construction ofphase distribution diagramFrom the volume of the stationary phase eluted from the column, V., the per
centage retention of the stationary phase relative to the total column capacity wascomputed according to the expression 1OO( Vc + Vr - Vs) / Vc , where Vc and Vrare thetotal column capacity and the dead space volume in the flow tubes, respectively.Using these retention data obtained from the suitable elution mode, a set of phasedistribution diagrams was prepared by plotting the percentage retention of the stationary phase against the applied revolution speed in rpm.
Procedure for analytical separation offlavonoids from sea buckthorn ethanol extractwith the multilayer coil
The column was first entirely filled with the upper aqueous stationary phase.Then, the coil planet centrifuge was rotated at the optimum speed of 3500 rpm, whilethe mobile phase was pumped into the head of the column at a flow-rate of 120 ml/hby a Shimadzu Model 6A HPLC pump (Shimadzu Corporation, Kyoto, Japan).After a steady state hydrodynamic equilibrium was reached, 4 pi of the sample solution containing 120 pg of the sample were injected into the head of the coil with amicrosyringe via a Rheodyne Model 7152 syringe loading sample injector. Effluentfrom the outlet of the column was continuously monitored by the absorbance at 254nm using a Shimadzu Model SPD-6A detector equipped with a preparative flow cellto record the elution curve with a Pharmacia 482 recorder (Pharmacia, Uppsala,Sweden).
The lower non-aqueous phase used as the mobile phase tends to produce microdroplets upon a slight fall of the ambient temperature. When this phenomenon occursin the detector cell, the recording of the elution curve is disturbed by an intensivenoise. In order to prevent this detrimental effect, the effluent from the column wasfirst passed through a narrow PTFE tube (3 m x 0.45 mm J.D.) which was immersedinto a water-bath heated at 40°C before entering the detector. A similar narrow tubewas applied at the outlet of the detector to prevent sudden pressure drop which wouldgenerate gas bubbles from the mobile phase.
RESULTS AND DISCUSSION
The results of the preliminary studies on stationary phase retention in shortcoils are summarized in Fig. 2 where a set of phase distribution diagrams are arranged

COIL PLANET CENTRIFUGE FOR HIGH-SPEED CCC 57
Hexane System Chloroform System n-Butanol System
He....,. Hexane I Chloroform Chloroform 2 n-Butanol n-Butanol 4
Water EthylAcetate 1 Water AceticAcid2 Wale, Acetic Acid 1Methanol 1 Water 1 Water 5Wale, I
;,...., ....,...- ....... ... .................-....._.__.i->:/
------ / ~------_.-_..
............-----_... r:":'----- --------
...------------_....
..--_................-. ...."..............----
---,/~_.....
/...---
~,0
100
HOLDERDIAMETER ((3)
1.40cm (0.28) ~ 50zo~1oow
w Gi~ 2.55cm (0.51) ~ 50:I: rn~ <~ 11:1000.. 0:::J W
3.85cm (0.77) ~ 50...J
W...Jiiio::!:
3000 40002000 3000 40002000 3000 40002000 3000 40002000 3000 40002000 3000 4000
»>: ------ ......-....------- ....---.r:: ..-_ ....------
.r::" ->: ....------------_..---...._-- ---- --- ------ ..----- .> -0
2000
100
"#.;- 50oi=i5 100I-w0:W 50rn<:I:0.. 100a::W0..0..::J 50
1.40cm (0.28)W...J
iiio::!:W
~ 2.55cm (0.51):I:0..
0:W
~o...J
3.85cm 10.77)
RPM
Fig. 2. Phase distribution diagrams of six volatile two-phase solvent systems obtained from short coilsmounted on the present apparatus. --, head to tail elution; - - -, tail to head elution. Flow-rate: 60 ml/h,
according to the applied two-phase solvent systems and the choice of the mobilephase.
Each column contains retention curves obtained from the same solvent systemindicated at the top. These columns are placed from left to right in the order ofhydrophobicity of the major organic solvent, i.e., n-hexane, chloroform and n-butanol. In each solvent group, the left column shows the binary solvent system with ahigh interfacial tension, while the right column shows ternary or quaternary solventsystem containing one or two additional solvents to moderate the interfacial tension.
These diagrams are also divided into upper and lower panels according to thechoice of the mobile phase as indicated in the left margin: the upper panel wasobtained by the upper phase mobile and the lower panel by the lower phase mobile.Each mobile phase group consists of three rows each obtained from a different helical
58 H. aKA, F. aKA, Y. ITO
diameter or f3 value of the coil as indicated on the left. Here, parameter f3 indicates theratio of the rotation radius (distance from the holder axis to the coil) to the revolutionradius (distance from the holder axis to the central axis of the centrifuge). As statedelsewhere", the f3 value plays an important role in retention of the stationary phase inthe rotating coil. Each diagram contains a single retention curve determined at fivedifferent rpms: the solid line indicates the head to tail elution mode and the brokenline, the tail to head elution mode.
In all phase distribution diagrams obtained from the n-hexane systems, excellent retention of the lower phase is obtained by the tail to head elution of the upperphase (the upper panel) or by the head to tail elution of the lower phase (the lowerpanel). This phase distribution pattern indicates an ideal hydrodynamic trend that theupper phase distributes toward the head and the lower phase toward the tail, regardless of the applied f3 value. The above results clearly indicate that these hexane solventsystems can be retained in a multilayer coil with the full range of f3 values from 0.28 to0.77.
In the chloroform solvent systems with moderate hydrophobicity, the binarysystem shows retention curves similar to those observed in the n-hexane solvent systems. However, the chloroform-acetic acid-water system displays a quite differentphase distribution pattern which is largely affected by f3 values. In this ternary chloroform system, the largest f3 value of 0.77 produces satisfactory retention of around50% at 4000 rpm as shown by the broken line with the upper phase mobile (the thirdrow in the upper panel) or the solid line with the lower phase mobile (the third row inthe lower panel) according to the typical hydrodynamic trend similar to that in thebinary chloroform system. However, at the smaller f3 values of 0.51 to 0.28, thehydrodynamic trend of the ternary chloroform system is completely reversed as indicated by the solid lines in the upper phase mobile (first and second rows in the upperpanel) and the broken lines in the lower phase mobile (first and second rows in thelower panel). At the transitional f3 value of 0.51, the retention level becomes lowest inboth mobile phase groups. The large difference in retention between these two chloroform systems may be caused by an addition of a large proportion of acetic acid whichlowered the interfacial tension between the two phases.
The hydrophilic n-butanol solvent systems show somewhat similar retentionbehavior to the ternary chloroform system. The ternary n-butanol system showssubstantially lower retention level due to its reduced interfacial tension by the addition of acetic acid.
The above results provide useful information for the design of the multilayercoil with respect to the solvent systems to be used for the separation. A large capacitymultilayer coil with full f3 values ranging from 0.28 to 0.77 can be used for varioushexane systems and some chloroform systems containing a small amount of a modifier. On the other hand, the multilayer coil with the f3 value around 0.77 can yieldsatisfactory retention to all solvent systems except for the ternary n-butanol system,while the column capacity is limited to several milliliters. In the light of the aboveexperimental results, a multilayer coil with the f3 value ranging from 0.51 to 0.77 wasselected for performing analytical separations.
Using a multilayer coil consisting of four coiled layers with a total capacity ofabout 8 ml, analytical capability of the present apparatus was evaluated in separationof f1avonoids in the crude ethanol extract of sea buckthorn with a two-phase solvent

COIL PLANET CENTRIFUGE FOR HIGH-SPEED CCC
4.0B
59
0.01
0.04
_ 0.03Ec
~UJ
~ 0.02<{eocr:o(fJaJ<{
A3.0
Ec
55~
'"ocro 2.0.c(;
'".a<l:
1.0
o 2 4 6 810TIME (min)
o 5 10 15Time (min)
Fig. 3. Chromatograms of flavonoids in the crude sea buckthorn ethanol extract by the present apparatus(A) and by the existing analytical CCC centrifuge (B). The experimental conditions were as follows: (A)Coil planet centrifuge with 2.5-cm revolution radius; column, multilayer coil, 0.85 mm J.D. and 8-mlcapacity with fJ = 0.51-0.77; solvent system, chloroform-methanol-water (4:3:2, vlvlv]; mobile phase,lower phase; flow-rate, 2 rnl/rnin; sample size, 120 j.i.g; revolution, 3500 rpm. (B) Coil planet centrifuge with6.35-cm revolution radius; column, multilayer coil, 0.85 mm J.D. and 43 ml capacity with fJ = 0.4-0.75;solvent system and mobile phase as in (A); flow-rate, 5 ml/min; sample size, 3 mg; revolution, 1800 rpm.
system composed of chloroform-methanol-water (4:3:2, v/v/v). Separation was performed with the lower non-aqueous mobile phase in the head to tail elution mode at aflow-rate of 2 ml/min under a coil rotation of 3500 rpm. Fig. 3A shows a chromatogram offlavonoids in a 120-flgquantity of the crude extract obtained by the presentmethod by on-line UV monitoring of the effluent at 254 nm. Five peaks, includingisorhamnetin (1) and quercetin (2) were well resolved and eluted within 8 min.
Fig. 3B shows a similar chromatogram obtained by Zhang et al" which represents the most efficient analytical CCC separations ever achieved in the past. In ananalytical column with a 40-ml total capacity, mounted on a high-speed CCC centrifuge with a 6.35-cm revolution radius, a 3-mg quantity of the same sample wasseparated at a flow-rate of 5 ml/min at 1800 rpm of coil rotation under otherwiseidentical conditions. In this experiment, on-line UV monitoring of the effluent produced an intensive noise in recording due to a thermolabile nature of the chloroformmobile phase and, therefore, the elution curve was manually drawn following thespectrophotometric analysis of each fraction.
The present apparatus further improved the analytical capability of CCC byreducing the sample size by less than 1/20 and shortening the separation time without
60 H. OKA, F. OKA, Y. ITO
significantly affecting the peak resolution. In addition, the method permits on-lineUV monitoring of the effluent by a minor modification of the conventional LC detection system as described elsewhere7
.
ACKNOWLEDGEMENTS
We are deeply indebted to Biomedical Engineering and InstrumentationBranch, National Institutes of Health, Bethesda, MD, U.S.A., for engineering andfabrication of the instrument.
REFERENCES
I Y. Ito, in N. B. Mandava and Y. Ito (Editors), Countercurrent Chromatography, Theory and Practice,Marcel Dekker, New York, 1988, Ch. 3, pp. 79-442.
2 Y. Ito, CRC c-u. Rev. Anal. Chem., 17 (1986) 65.3 Y. Ito, J. Sandlin and W. G. Bowers, J. Chromatogr., 244 (1982) 247.4 Y. Ito and Y. W. Lee, J. Chromatogr., 391 (1987) 290.5 Y. Ito, J. Chromatogr., 301 (1984) 387.6 T. Y. Zhang, R. Xiao, Z. Y. Xiao, L. K. Pannell and Y. Ito, J. Chromatogr., 445 (1988) 199.7 H. Oka and Y. Ito, J. Chromatogr., 475 (1989) 229.

Journal of Chromatography, 479 (1989) 61-72Elsevier Science Publishers B.V., Amsterdam - Printed in The Netherlands
CHROM. 21 719
CAPILLARY GAS CHROMATOGRAPHY-MASS SPECTROMETRY ANDIDENTIFICATION OF SUBSTITUTED CARBOXYLIC ACIDS IN LIPIDS EXTRACTED FROM A 4000-YEAR-OLD NUBIAN BURIAL
FAZIL O. GOLA<;AR* and ARMAND BUCHS
Laboratory for Mass Spectrometry, University of Geneva. 16 Boulevard d'Yvoy, 1211 Geneva 4 (Switzerland)
and
ALBERTO SUSINI
Department of Anthropology, University of Geneva, 12 Rue Gustave Revillod, 1227 Carouge-Geneva (Switzerland)
(First received April 10th, 1989; revised manuscript received June 19th, 1989)
SUMMARY
Polar carboxylic acid fractions of lipids extracted from samples from a 4000year-old Nubian mummy were investigated by capillary gas chromatography-massspectrometry. They contain series of lX,w-dicarboxy, monohydroxy, dihydroxy andketo fatty acids, some of which were found for the first time outside the syntheticlaboratory. Their chromatographic and mass spectrometric characteristic propertiesare reported.
INTRODUCTION
During an investigation of the extractable lipids from diverse parts of a 4000year-old Nubian burial belonging to the Ancient Kerma ' civilization, the substitutedfatty acids in the polar acid fractions were examined by gas chromatography-massspectrometry (GC-MS). In addition to a homologous series of CrC l 8 lX,w-dicarboxylic aliphatic acids and diverse C I 6-C ZO mid-chain vicinal dihydroxy fatty acids, weidentified several homologous series of C7-C 18 monohydroxy fatty acids containingevery positional isomer except the 4-hydroxy acids, and a series of all keto fatty acidsexcluding the IX-, f3-, (w - 2)- and (w - 3)-oxo positional isomers. Moreover, a homologous series of n-alkylsuccinic acids with alkyl substituents ranging from C I I to C l 6
were also found in the extract from inside of the skull. We report here the GCretention characteristics of these compounds on an OV-73 coated capillary columnand their mass spectrometric fragmentation patterns.
0021-9673/89/$03.50 © 1989 Elsevier Science Publishers BY

62
EXPERIMENTAL
F. O. GULA<;:AR, A. BUCHS, A. SUSINI
Samples, extraction and preparationThe mummy, ofa 40-50-year-old male, was found in a necropolis at Kerma in
Upper Nubia (Sudan) excavated in 1983.Samples of skin and concretions from the inside of the skull and of the thorax
were extracted by homogenizing the tissue with chloroform-methanol (2:1) and theextracts were kept in a refrigerator until analysis. The extracted lipids were separatedinto various classes using chromatographic procedures that have already been described for geological/:" or biological" organic material. Briefly, the lipids were firstseparated into neutral and acidic fractions by chromatography on a silica gel column(200 x 12 mm J.D., 70-230 mesh, 10% potassium hydroxide). The acidic fraction wasesterified with 14% boron trifluoride in methanol and the resulting methyl esters wereseparated by flash chromatography' on a second silica gel column (300 x 6 mm J.D.,70-230 mesh, nitrogen pressure 0.3-0.5 bar). After the elution of the monocarboxylicfatty acid methyl esters with 50 ml of hexane-methylene chloride (3:1), the polarcarboxylic acid methyl esters were eluted with 50 ml of methylene chloride-ethylacetate (9:1). Before the GC-MS analyses were performed, the polar acid fractionwas trimethylsilylated at 70-90°C for 15 min with bis(trimethylsilyl)trifluoroacetamide containing 1% of trimethylchlorosilane (Fluka, Buchs, Switzerland).
GC-MS analysesThe equipment used was a Finnigan 4000 quadrupole mass spectrometer
equipped with the SuperIncos data system and coupled to a Carlo Erba 5300 MegaSeries gas chromatograph. Analyses were performed with laboratory made glass capillary columns (Duran, 25 m x 0.32 mm J.D.), coated with OV-73 (Alltech). Aftersplitless injection at 60°C, the GC oven was heated to 130°C at 10°Cjmin and then to280°C at 4°Cjmin. The detailed GC and MS conditions have been described elsewhere''. Equivalent chain lengths (ECL) of the unbranched «.co-dicarboxylic aciddimethyl esters were first determined by coinjection of a sample with a standardmixture of n-alkanoic acid methyl esters and found to be equal to (n + 3) + 0.33(± 0.04) where n is the number of carbon atoms in the free diacid. The ECL values ofthe other polar acids were calculated on the basis of their retention times relative tothose of the a,w-dicarboxylic acids which were present in all samples from the mummy.
RESULTS AND DISCUSSION
Fig. 1 shows the reconstructed total ion chromatogram (TIC) of the methylated and trimethylsilylated polar acid fraction separated from white concretions foundinside the mummy's thorax. The early eluting part of the chromatogram is dominatedby regularly spaced peaks arising from the saturated straight-chain a,w-dicarboxylicacid dimethyl esters (CrC1s) identified on the basis of their mass spectra. The compounds of this series exhibit in their mass spectra" and intense m]z 98 peak which wasused for their detection by mass fragmentography 7
•
Between two successive homologues of the a,w-dicarboxylic acids, the TICshows a very complex pattern, especially in the late-eluting part, as exemplified by the

GC-MS OF CARBOXYLIC ACIDS IN LIPIDS
100 644
'C9
1257
RICCa ClO
Cll\ l008 \ B1B 1115
1372729
C12 C14 C16C7 t Cn ~l90B It 1062 15 \
9B21214
[18
~600 800 1000 1200 1400 1600 1800 SCAN
20:00 26:40 33:20 40:00 46:40 53:20 60:00 TIME
63
Fig. 1. Reconstructed total ion chromatogram of the esterified and trimethylsilylated polar acid fractionfrom the thorax extract (peaks marked C, represent a,w-dicarboxylic acids with n = number of carbonatoms in the free acid).
partial TIC in Fig. 2. A close examination of the mass spectra showed that most of thepeaks appearing as single chromatographic peaks on this trace are in fact due toseveral coeluting components. Almost all components of this chromatogram wereidentified by comparison of their mass spectra and retention times with those ofauthentic analogues, with published spectra of lower homologues or by the interpretation of their mass spectra, as shown in Tables I and II.
Ox.ofatty acidsThe major oxo fatty acids included a homologous series of 4-oxo fatty acids in
the Cll-C1 8 range with the C1 6 homologue being the most abundant. They arecharacterized by a major McLafferty rearrangement ion at mlz 130 and a secondary

64
100
1115
1105
11441214
1199
1186 1225
1257
F. O. OOLA<;AR, A. BUCHS, A. SUSTNT
1372
1357
110036:40
115038:20
120040:00
125041:40
130043:20
135045:00
1400 SCAN46:40 TIME
Fig. 2. Detail of part of the reconstructed total ion chromatogram of Fig. I.
TABLE 1
KETO ACIDS FOUND IN LIPIDS EXTRACTED FROM THE MUMMY
See Experimental for OC-MS conditions.
Compound Chain ECL Fragment" Other peaks"length (n)
4-0xo 8-20 (n+ 1)+0.61 98, 130 115, (M-31),(M-87)5-0xo 9-20 (11+ 1)+0.65 144 112,129,(M - 31),(M - 101)6-0xo 12-18 (n+ 1)+0.79 158 126,143,(M - 31),(M - 115)7-0xo 12-18 (n+ 1)+0.82 172 (M -114),(M - 31)8-0xo 13-18 (11+ 1)+0.84 186 (M -128),(M - 31)9-0xo 16-18 (11+ 1)+0.86 200 (M -142), (M - 31)
10-Oxo 16-18 (11+ 1)+0.87 214 (M -156),(M - 31)II-Oxo 16-18 (11+ 1)+0.88 228 (M -170)12-0xo 16-18 (n + 1)+ 0.89 242 (M -184)13-0xo 18 (11+ 1)+0.90 256 (M -198)(w-I)-Oxo 8 (11 + 2)+ 0.07 58 71,(M - 89),(M - 57),(M - 3I)(w-I)-Oxo to 18 (11 + 2)+ 0.16 58 71,(M - 89),(M - 57),(M - 31)
a m]z of ion(s) used for fragmentographic detection.b m]z of other diagnostic ions, not necessarily major ones.
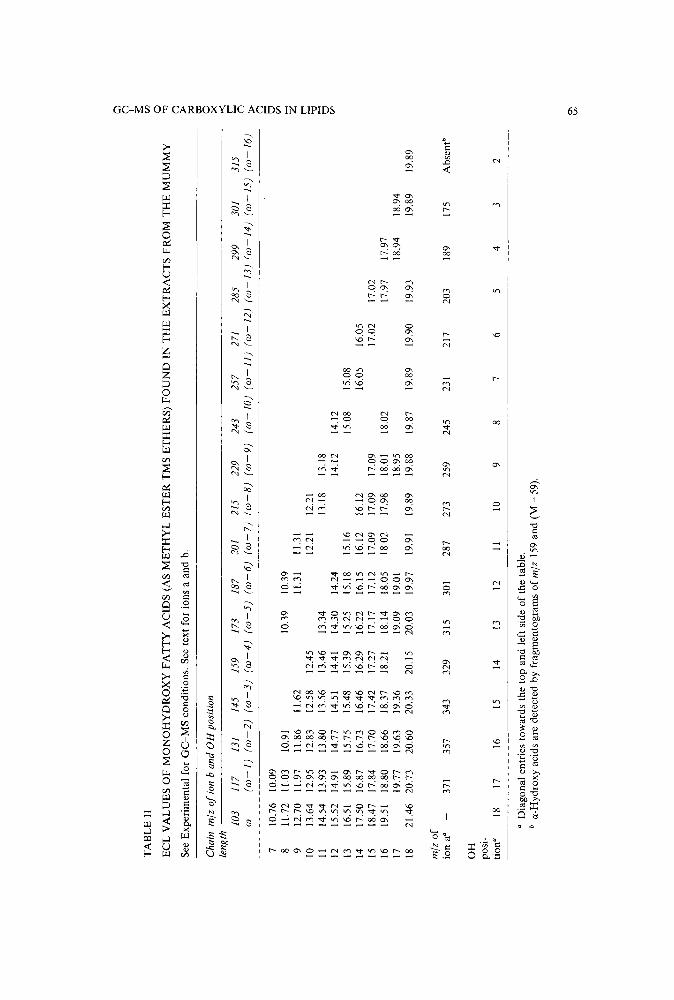
a <;'1 ~T
AB
LE
IIC
/J 0E
CL
VA
LU
ES
OF
MO
NO
HY
DR
OX
YF
AT
TY
AC
IDS
(AS
ME
TH
YL
ES
TE
RT
MS
ET
HE
RS
)F
OU
ND
INT
HE
EX
TR
AC
TS
FR
OM
TH
EM
UM
MY
'Tl o
See
Exp
erim
enta
lfo
rG
C-M
Sco
ndit
ions
.Se
ete
xtfo
rio
nsa
and
b.:J> ;:e co
Cha
inm
lzo
fion
ba
nd
OH
posi
tion
0 ;Xle
ngth
-<10
311
713
114
515
917
318
720
121
522
924
325
727
128
529
930
131
5l" (=)
co(w
-l)
(w-2
)(w
-3)
(w-4
)(w
-5)
(w-6
)(w
-7)
(w-8
)(w
-9)
(w-l
O)
(w
-ll)
(w-1
2)
(w-1
3)
(w-1
4)
(w-1
5)
(w-1
6)
:J> o7
10.7
610
.09
6 C/J
811
.72
/1.0
310
.91
10.3
910
.39
Z9
12.7
011
.97
11.8
611
.62
11.3
111
.31
1013
.64
12.9
512
.83
12.5
812
.45
12.2
112
.21
l" ::a11
14.5
413
.93
13.8
013
.56
13.4
613
.34
13.1
813
.18
612
15.5
214
.91
14.7
714
.51
14.4
114
.30
14.2
414
.12
14.1
2C
/J
1316
.51
15.8
915
.75
15.4
815
.39
15.2
515
.18
15.1
615
.08
15.0
814
17.5
016
.87
16.7
316
.46
16.2
916
.22
16.1
516
.12
16.1
216
.05
16.0
515
18.4
717
.84
17.7
017
.42
17.2
717
.17
17.1
217
.09
17.0
917
.09
17.0
217
.02
1619
.51
18.8
018
.66
18.3
718
.21
18.1
418
.05
18.0
217
.98
18.0
118
.02
17.9
717
.97
1719
.77
19.6
319
.36
19.0
919
.01
18.9
518
.94
18.9
418
21.4
620
.73
20.6
020
.33
20.1
520
.03
19.9
719
.91
19.8
919
.88
19.8
719
.89
19.9
019
.93
19.8
919
.89
m]z
ofio
na"
-37
135
734
332
931
530
128
727
325
924
523
121
720
318
917
5A
bsen
t"
OH
posi
-tio
na18
1716
1514
1312
1110
98
76
54
32
aD
iago
nal
entr
ies
tow
ards
the
top
and
left
side
of
the
tabl
e.b
a-H
ydro
xyac
ids
are
dete
cted
byfr
agm
ento
gram
so
fm
]z15
9an
d(M
-59
).
0\
VI
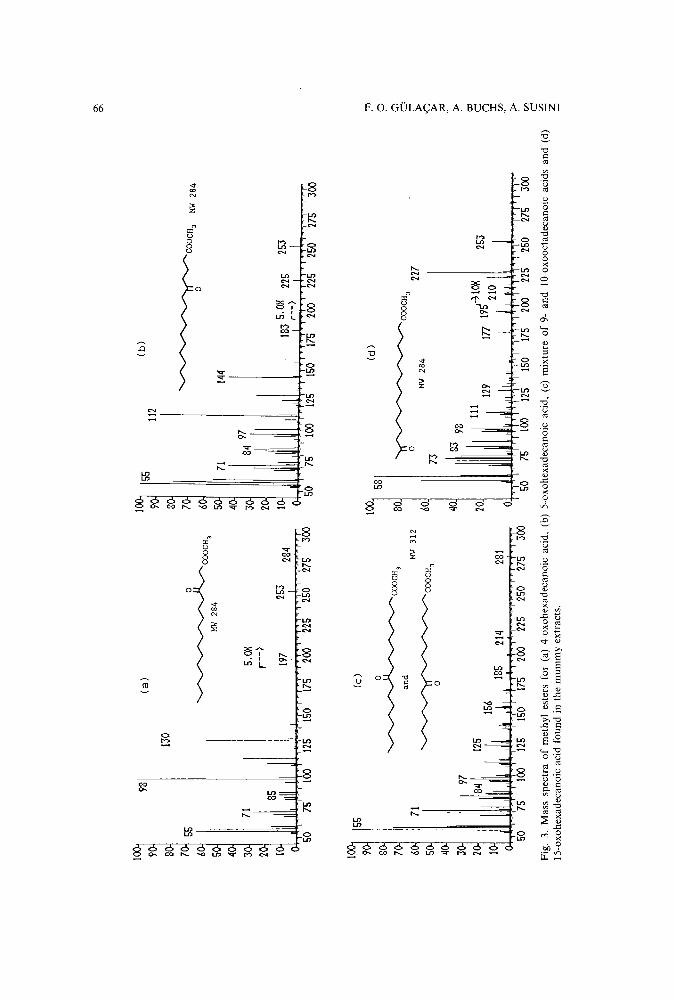
a,
a,
(a)
5075
100
125
150
175
200
225
250
275
300
MIl
284
150
175
200
225
250
275
300
(b)
~COOCH3
o
144
112
8497
71
55
50
284
253
5.0X
r--)
197
~M
il28
4C
OO
CH
3
55(e
)
100
58'
(d)
0
~COOCH3
80~COOCH3
an
d71
MIl
312
022
760
MIl
284
~COOCH3
730
40
I,III~II
JI:'129
9712
520
{71
VfI
I25
317
719
~tl\
I18
521
428
1III
,111
111111
,,11111
1,,1111
11,1111
11111
"lill
i,,h
ili1
,il',I
II,
''I
'I
"I
'I
',
'i
'I
'I
'I'
,I
'I
5075
100
125
150
175
200
225
250
275
300
5075
100
125
150
175
200
225
250
275
300
Fig.
3.M
ass
spec
tra
ofm
ethy
les
ters
for
(a)
4-ox
ohex
adec
anoi
cac
id,
(b)
5-ox
ohex
adec
anoi
cac
id,
(c)
mix
ture
of
9-an
dIO
-oxo
octa
deca
noic
acid
san
d(d
)l5
-oxo
hexa
deca
noic
acid
foun
din
the
mum
my
extr
acts
.
~ 9 o c: r ;J>
<l
;J> ?' ?> tc C o :I: Y'
;J>
(/) C u: 3

GC-MS OF CARBOXYLIC ACIDS IN LIPIDS 67
fragment at m]z 98 (130 - CH30H), and also by the a-cleavage ions at m]z 115 andmlz 197 (M - 87), as shown in the mass spectrum of the 4-oxohexadecanoic acidillustrated in Fig. 3a. Thus, 4-oxo fatty acids may also be detected by the m[z 98 massfragmentogram as they are chromatographically well separated from the dicarboxylicacids. The 4-oxo acids are accompanied by smaller amounts of the corresponding5-oxo isomers which are characterized by a similar fragmentation pattern [McLafferty ion at m]z 144, m]z 112 (144 - CH30H) and a-cleavage ions at m]z 129 and mlz(M -101)] (Fig. 3b). They elute just after the 4-oxo isomers as only partially resolvedpeaks. The other prominent oxo-acids identified were coe1uting mixtures of 9- andlO-oxo isomers of hexadecanoic and octadecanoic acids. The mass spectra of theseisomers are also characterized by the same fragments as those produced from the 4and 5-oxo isomers, but these fragments, although of diagnostic value, are not themajor ones (Fig. 3c).
Another relatively important homologous series of keto acids is the one withthe oxo function on C-( OJ-I). These acids have much higher ECL values than thoseof the mid-chain keto acids of the same chain length and their mass spectra arecharacterized by an intense m]z 58 ion from McLafferty rearrangement (Fig. 3d).Finally, minor or trace amounts of keto fatty acid positional isomers with the ketofunction located between C-6 and C-(OJ - 4) were observed on the mass fragmentograms of the corresponding McLafferty rearrangement ions, as shown in Table 1.
Oxo fatty acids with the keto function at a given position show a constantincrease in their ECL value with increasing carbon number, except when the functionis on the (OJ-I) carbon atom. Thus, a 4-oxo fatty acid methyl ester will elute (on theGC time scale) at a position corresponding to 61% of the distance between the elutionpositions of the n-fatty acid methyl esters with one and two more carbon atoms,respectively (Table I). If we call this a "constant increment", then the (OJ -l)-oxo fattyacids show a slightly "positive increment" of their ECL with increasing carbon number.
Monohydroxy fatty acidsThe mass spectra of the two large peaks (i.e., 1115 and 1257) in the chroma
togram in Fig. 2 showed that they are produced by unresolved isomers of monohydroxypalmitic and monohydroxystearic acids, respectively. The mass spectra ofmonohydroxy fatty acid TMS ether methyl ester derivatives are characterized byintense fragments from a-cleavage to the OTMS group, specific to the position of theoriginal hydroxy group'':", except for a- and OJ-hydroxy acids which do not show iona:
The other characteristic ions which are common to all spectra are m]z 73(TMS group), the (a - 29) ion produced by the loss of CHO from ion a after migration of the TMS group to the carboxylic carbonyl group and the (a- 32) ion

68 F. O. OOLA<;AR, A. BUCHS, A. SUS1Nl
([a - CH 30H] "). Table II gives the ECL values of all the monohydroxy acids foundin the mummy samples and the mlz values of the ions a and b used for their detection.The m-hydroxy acids which do not exhibit ion a were detected by the (M - 47) ions".Every positional isomer of the monohydroxy acids in the range C7-C 18 , except the 4and 5-hydroxy isomers, was present. The a- and f3-hydroxy isomers having the samecarbon number coelute in the entire carbon number range but the contribution of thea-hydroxy acids may be calculated through the abundance of the (M - 59)+ ion,present in their mass spectra". The other positional isomers are all resolved for theacids with less than 13 carbon atoms. Acids with longer chains show either coelutionor only partial resolution of the isomers bearing the hydroxyl group on carbon atomsa- to (m- 6) positions. ECLs of homologous acids in the series with the hydroxysubstituent on a given carbon atom (from the carboxylic carbon side) clearly exhibit a"negative increment" with increasing chain length (Table II, diagonal entries). Twohigher a-hydroxy acid homologues, C2 2 and C2 3 (not shown in Table II), were alsofound in significant amounts in all the extracts.
Dihydroxy fatty acidsBoth the large peaks at 1357 and 1372 in the TIC in Fig. 2 show almost
identical mass spectra (Fig. 4a); they were identified as the threo and erythro isomers
OTMS
~COOCH3OTMS
MIl 474
(a)
259 332
5.0Xr--)
450
443
400350300250
21!5
200
187
15010050
orMS
~COOCH3OTMS
MIl 474
187
50 100 150 200 250 300 350 400 450Fig. 4. Mass spectra of methyl ester TMS ethers for (a) 9,IO-dihydroxyoctadecanoic acid and (b) 11,12dihydroxyoctadecanoic acid found in the mummy extracts.
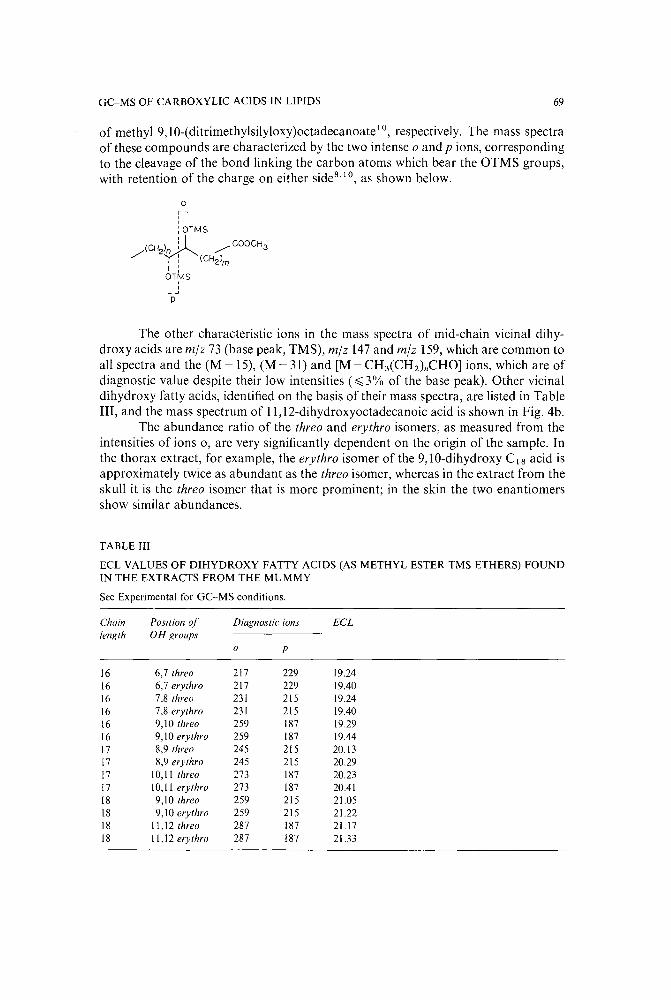
GC-MS OF CARBOXYLIC ACIDS IN LIPIDS 69
of methyl 9,10-(ditrimethylsilyloxy)octadecanoateIO, respectively. The mass spectraof these compounds are characterized by the two intense 0 and p ions, correspondingto the cleavage of the bond linking the carbon atoms which bear the OTMS groups,with retention of the charge on either sides.lo, as shown below.
or--,: OTMS
(CH0: ...--COOCH3.-/ 2n »:
: (CH2)m
OTMS,_Jp
The other characteristic ions in the mass spectra of mid-chain vicinal dihydroxy acids are m]z 73 (base peak, TMS), m]z 147 and m]z 159, which are common toal1 spectra and the (M -15), (M - 31) and [M - CH3(CH2)nCHO] ions, which are ofdiagnostic value despite their low intensities (~3% of the base peak). Other vicinaldihydroxy fatty acids, identified on the basis of their mass spectra, are listed in TableIII, and the mass spectrum of 11,12-dihydroxyoctadecanoic acid is shown in Fig. 4b.
The abundance ratio of the threo and erythro isomers, as measured from theintensities of ions 0, are very significantly dependent on the origin of the sample. Inthe thorax extract, for example, the erythro isomer of the 9,10-dihydroxy CIS acid isapproximately twice as abundant as the threo isomer, whereas in the extract from theskul1 it is the threo isomer that is more prominent; in the skin the two enantiomersshow similar abundances.
TABLE III
ECL VALUES OF DIHYDROXY FATTY ACIDS (AS METHYL ESTER TMS ETHERS) FOUNDIN THE EXTRACTS FROM THE MUMMY
See Experimental for GC-MS conditions.
Chain Position of Diagnostic ions ECLlength OH groups
0 p
16 6,7 threo 217 229 [9.24[6 6,7 erythro 2[7 229 [9.40[6 7,8 threo 23[ 215 [9.24[6 7,8 erythro 23[ 215 19.40[6 9,10 threo 259 [87 [9.2916 9,10 erythro 259 [87 [9.4417 8,9 threo 245 2[5 20.[3[7 8,9 erythro 245 2[5 20.2917 10,1 [ threo 273 187 20.23[7 10,II erythro 273 187 20.4[[8 9,10 threo 259 215 21.05[8 9,10 erythro 259 215 21.2218 [[,12 threo 287 [87 21.1718 ll,12erythro 287 [87 21.33

70 F. O. GULA<;AR, A. BUCHS, A. SUSINI
~COOCH,
MW 328 COOCH,
255 297
50 75 100 125 150 175 200 225 250 275 300Fig. 5. Mass spectrum of the methyl ester of n-tridecylsuccinic acid found in the extract from the skull.
Alkylsuccinic acidsThe mass spectrum of a relatively intense peak eluting at an ECL value of
18.84 in the TIC of the skull extract is shown in Fig. 5. The major ions at m]z 146 and114 can be interpreted as originating from an alkyl-substituted succinic acid dimethylester by a McLafferty rearrangement and a subsequent loss of CH 30H:
R~C'~.:J [ ------
OCH 3
COOCH 3
+0OH Icoe", -c"'O<. mj' '"
COOCH3
m/z 146
Indeed, a comparison of the spectrum in Fig. 5 with that of methyl n-dodecylsuccinate ll confirms the unknown compound as being a C13-alkyl-substituted
succinic acid. A search for the occurrence of other homologues in the extract bymeans of m]z 146 and 114 fragmentograms indicated the presence of Cll
(ECL= 16.88), C1 2 - (17.86), C14 - (19.82), C1 S- (20.79) and Cw (21.79) alkylatedanalogues. The evolution of the ECL values suggests that the alkyl substituent islinear. These compounds could not be detected in the skin or thorax samples.
DISCUSSION
Most of the substituted fatty acids founds in the extracts from the mummy arenormally not found in human or animal tissues. They are obviously produced by postmortem transformations of the original fatty acids. As will be reported elsewhere1 2
,
other lipid compounds such as the sterols, the bile acids and, more particularly, theunsubstituted monocarboxylic acids also showed more or less intense modifications.The last group included only saturated fatty acids (indicating a complete disappearance of the unsaturated fatty acids normallyfound in human tissues), comprising iso-

GC-MS OF CARBOXYLIC ACIDS IN LIPIDS 71
and anteiso-methyl-branched homologues in the C l3-C 19 range. This suggests a bacterial reworking of the original carboxylic acids. The relative abundances of the diverse substituted acids reported here suggest that most of them are produced byoxidation of the double bond of an unsaturated fatty acid originally present in thebody. Thus, in the a,w-dicarboxylic acid series, the most abundant compound is theC9 homologue; in the mid-chain monohydroxy or keto acid series, those with 18 and16 carbon atoms and the oxo function on C-9 and C-IO are the most abundant. In thedihydroxy fatty acid series, 9,1O-dihydroxy acids, presumably produced by dihydroxylation of the double bonds of oleic and palmitoleic acids, are major compounds.
Among the acids reported here, the complete series of isomeric monohydroxyand keto acids have never been reported in natural samples, although recently theyhave been detected in aerosols in the C6-C15 range, with maxima at C9 or C 11
9, l3 .
The lOvoxo- and 10-hydroxy CIS and C16 acids have been reported in the adipocerefrom human bodies having been immersed in the sea for 3-6 months 14,15, but positional isomers and other homologues were not mentioned.
Mid-chain vicinal dihydroxy acids are well known compounds which are routinely prepared from unsaturated fatty acids in order to determine the position andthe geometry of the double bonds'Pi'" in the original compounds. However, to ourknowledge, they have never been reported as occurring in samples from outside thelaboratory. As we already pointed out, in the mummy samples they are obviouslyproduced through dihydroxylation of the double bond in a suitable precursor. It isinteresting that the enantiomeric composition of these acids is dependent on theirorigin. Two possibilities may explain this: (i) the original unsaturated precursor acidshad the same double bond geometry but different mechanisms of dihydroxylationwere operative, or (ii) the mechanism of formation was the same but the ratio of thecis- to trans-unsaturated acids in diverse parts of the body was different.
The mass spectrometric fragmentation patterns of the n-alkylsuccinic acidshave been interpreted by using spectra obtained from methyl and ethyl esters ofsynthetic n-dodecylsuccinic acid 11. The only report on the occurrence of this type ofcompound in a natural sample concerns Green River oil shale, a 60 million-year-oldsediment, in which a homologous series with an alkyl substituent ranging from C13 toC29 (CIS and C2Smembers absent) was detected!" The fact that in the mummy theyoccur only in the skull extract and that only the C l3 alkyl-substituted homologue is ofsignificant abundance, must have either a biochemical or a diagenetic significance,but at present we have no explanation.
ACKNOWLEDGEMENTS
This work was supported in part by the Fonds National Suisse de la Recherche Scientifique (Grant No. 2000-5.222). We thank Mrs. O. Vaucher for valuabletechnical assistance.
REFERENCES
1 M. Klohn, A. Susini and C. A. Baud, Am. 1. Phys. Anthropol., 75 (1988) 232.2 Y. A. Mendoza, F. O. Gulacar and A. Buchs, Chern. Ceol., 62 (1987) 307.3 Y. A. Mendoza, F. O. Giilacar, Z.-L. Hu and A. Buchs, Int. J. Environ. Anal. Chem., 31 (1987) 107.

72 F. O. GOLAGAR, A. BUCHS, A. SUSINI
4 Z.-L. Hu, Y. A. Mendoza, A. Buchs and F. O. Giilacar, Lipids, 23 (.1988) 679.5 W. C. Still, M. Kahn and A. Mitra, J. Org. Chem., 43 (.1978) 2923.6 G. Eglinton, D. H. Hunneman and K. Douraghi-Zadeh, Tetrahedron, 24 (1968) 5929.7 K. Kawamura and R. Ishiwatari, Geochim. Cosmochim. Acta, 48 (1984) 251.8 G. Eglinton, D. H. Hunneman and A. McCormick, Org. Mass Spcctrom., I (1968) 593.9 K. Kawamura and R. B. Gagosian, J. Chromatogr., 438 (1988) 309.
10 J. J. Boon, J. W. de Leeuw, G. J. v.d. Hoek and J. H. Vosjan, J. Bacteriol., 129 (1977) 1183.II R. Ryhage and E. Stenhagen, Ark. Kemi, 23 (1964) 177.12 F. O. Gulacar, A. Susini and M. Klohn, J. Lipid Res., in press.13 K. Kawamura and R. B. Gagosian, J. Chromatogr., 438 (1988) 29914 T. Takatori and A. Yamaoka, Forensic Sci., 9 (1977) 73.15 T. Takatori and A. Yamaoka, Forensic Sci., 10 (1977) 117.16 N. J. Jensen and M. L. Gross, Mass Spectrom. Rev., 7 (1987) 497.17 A. G. Douglas, M. Blumer, G. Eglinton and K. Douraghi-Zadeh, Tetrahedron, 27 (1971) 1071.

Journal of Chromatography, 479 (1989) 73-83Elsevier Science Publishers B.V., Amsterdam - Printed in The Netherlands
CHROM. 21 645
COMPARISON OF THE USE OF MASS SPECTROMETRY AND METHYLENE UNIT VALUES IN THE DETERMINAnON OF THE STEREOCHEMISTRY OF ESTRANEDlOL, THE MAJOR URINARY METABOLITE OF 19NORTESTOSTERONE IN THE HORSE
EDWARD HOUGHTON*, ANNETTE GINN, PHILIP TEALE, MINOO C. DUMASIA and JOHNCOPSEY"
Horseracing Forensic Laboratory Ltd., P.O. Box 15, Snailwell Road, Newmarket, Suffolk CB8 TDT (U.K.)
(First received June 2nd, 1988; revised manuscript received May 23rd, 1989)
SUMMARY
The stereochemistry of an isomer of 5-estrane-3, l71X-diol, the major metaboliteof 19-nortestosterone in horse urine has been established by the use of methylene unit(MU) values. The empirical MU values of the bis-trimethylsilyl (TMS) derivatives ofthe eight available isomers of 5-androstane-3, l7-diol and four isomers of 5-estrane3,17fJ-diol were determined by capillary gas chromatography using three differentcolumns. From this data the theoretical MU values for the bis-TMS derivatives of thefour 5-estrane-3, l71X-diol isomers were predicted. Comparison of the experimentallydetermined MU value of the urinary metabolite with those of the theoretical valuesestablished the correct stereochemistry of the steriod. This method has been comparedwith the use of gas chromatography-mass spectrometry in the determination of thestereochemistry of unknown metabolites.
INTRODUCTION
Studies related to the metabolism of 19-nortestosterone (estr-4-en-17fJ-ol-3one), 1, in the horse have demonstrated that an isomer ofestrane-3,17-diol, 2, is themajor urinary metabolite excreted as a glucuronic acid conjugate.'. Initial studiesdemonstrated that the hydroxyl function at the 17- position of this major metabolitehad an o-configuration", a minor estrane-3, l7-diol metabolite was also isolated witha 17fJ-OHconfiguration. Due to the unavailability of the isomers of estrane-3, l71X-diolas reference steroids it was not possible to determine the stereochemistry at the 3- and5- positions of the major metabolite by a direct comparison of gas chromatographic(GC) retention time data.
Gas chromatographic-mass spectrometric (GC-MS) studies" have showndifferences in the relative intensities of some of the fragment ions in the mass spectra of
a Present address: Philips Scientific, York Street, Cambridge, CBI 2PX, U.K.
0021-9673/89/$03.50 © 1989 Elsevier Science Publishers B.V.

74
o~1
19-Nortestosterone
OH
HoJff
2Estrane-3, 17 -diol
E. HOUGHTON et al.
the trimethylsilyl (TMS) derivatives of the four isomeric So:-androstanediols andconsiderable differences in the mass spectrum of SfJ-androstane-30:, 17fJ-diol bis-TMSwhen compared to the mass spectra of derivatives of the So-series. To investigatewhether GC-MS could be used in determining the stereochemistry of the estrane3,170:-diol metabolite a study of the mass spectra of the TMS derivatives of the eightisomers of androstane-3, 17-diol and the four isomers of estrane-3, 17fJ-diol has beenundertaken and the results are reported in this paper.
It has been demonstrated that the retention behaviour of a steroid on GCanalysis is a property of the steroid nucleus and additive contributions due to thesubstituent groups attached to the nucleus". Thus changes brought about bya chemical reaction or a stereochemical change in structurally related compoundsalters the retention time by a constant factor provided there is no interference fromneighbouring groups".
Using the same series of twelve reference steroids, the additive contributions tothe MU values ' due to changes in the steroid nucleus and stereochemistry have beenused to predict the MU values of the four isomers of estrane-Ll Zx-diol bis-TMSderivatives. The MU value of the TMS derivative of the estrane-3, 170:-diol metabolitewas compared with these predicted values and the stereochemistry at the 3- andS-positions has been established.
EXPERIMENTAL
Solvents and chemicalsThe even numbered hydrocarbons n-C 16-n-C 32 , N,O-bis(trimethylsilyl) acet
amide (BSA), trimethylchlorosilane (TMCS), So:-androstane-30:,17fJ-diol, So:-androstane-3fJ,17fJ-diol, SfJ-androstane-30:,17fJ-diol, SfJ-androstane-3fJ,17fJ-diol and undecane were obtained from Sigma (Poole, U.K.). So:-Androstane-30:,170:-diol, So:-androstane-Sfi.l Ze-diol, SfJ-androstane-30:,170:-diol, SfJ-androstane-3fJ,170:-diol and So:estrane-3fJ,17fJ-diol were obtained from the M.R.C. Steroid Reference collection.So:-Estrane-30:,17fJ-diol, SfJ-estrane-30:,17fJ-diol and SfJ-estrane-3fJ, 17fJ-diol were giftsfrom Organon (Oss, The Netherlands).

STEREOCHEMISTRY OF ESTRANEDIOL 75
Isolation and purification of urinary metabolitesThe administration of 19-nortestosterone to cross-bred gelded ponies, the
collection of urine and the determination of urinary excretion have been reportedpreviously'.
For one animal, 70% of the administered dose was excreted in the first 24 h. Themetabolites were isolated from this urine (900 ml) by lyophilisation, enzyme hydrolysisof the residue reconstituted in acetate buffer, pH 4.5 and solvent extraction.Purification by repeated chromatography on Kieselgel H 1 yielded a fraction which,following derivatisation and GC-MS analysis, was shown to contain two isomers ofestrane-3,17-diol.
Derivatisation of steroidsThe reference steroids (5-10 flg) were treated with BSA (50 fll) and TMCS (25 fll)
and heated at 60°C for 2 h. The excessderivatisation reagents were removed in a streamof nitrogen at 40°C and the residue dissolved in undecane (100 fll) for analysis by GCand GC-MS. Aliquots of the purified fraction containing the estranediol metaboliteswere similarly derivatised.
Gas chromatographyGC was carried out using a Hewlett-Packard 5890A gas chromatograph with
a HP3392A integrator. The steroid derivatives were analysed on three differentcolumns, a 1701 (OV-1701), a BP5 (SE-S4) and a BPI (SE-30) (25 m x 0.3 mm 1.0.);the columns were purchased from S.G.E.
The analysis was carried out in the splitless injection mode with undecane assolvent. The initial temperature of 150°C was ramped to 300°C at 5°C/min; hydrogenwas used as carrier gas (linear gas velocity approximately 40 cm/s).
The steroid derivatives were individually coinjected with the even numberedhydrocarbon mixture n-C l 6-n-C32 in undecane. For each analysis a plot of retentiontime (min) vs. carbon number of the hydrocarbons was obtained and the methyleneunit (MU) values for the steroids determined from linear regression analysis. To checkthe reproducibility of the injections replicate analysis (n= 7) of the bis-TMS derivativeof 5fJ-androstane-3fJ, 17fJ-diol with the hydrocarbon mixture were made.
Capillarv column GC-MSMass spectra were obtained on the Hewlett-Packard 5970 mass selective detector
interfaced to a HP 5890A gas chromatograph. A bonded polydimethylsiloxanefused-silica column (18 m x 0.25 mm 1.0.) was used with helium as carrier gas.Splitless injections were made in undecane at 150°C, the oven temperature was rampedto 180°C at 10°C/min then to 280°C at 5°C/min; mass spectra were recorded over therange mjz 100-500.
RESULTS AND DISCUSSION
The relative intensities of the relevant ions in the mass spectra of the bis-TMSderivatives of the eight isomers of androstane-3, 17-diol are shown in Table I. The massspectra were similar in that they showed molecular ions (M;, mlz 436) with fragmentions a mjz 421 [M - 15r+-; mjz 346 [M - 90]";; m]z 331 [M - (90 + 15W; mlz 256[M - (90 + 90)];; mlz 241 [M - (90 + 90 + 15]+ and mjz 129 (O-ring fragment).

TA
BL
EI
MA
SS
SP
EC
TR
AL
DA
TA
FO
RT
HE
TM
SD
ER
IVA
TIV
ES
OF
TH
EE
IGH
TA
ND
RO
ST
AN
E-3
,17
-DIO
LIS
OM
ER
S
And
rost
aned
iol
isom
erR
elat
ive
inte
nsit
ies
(%)
--.J
0'.
Mol
ecul
ario
nM
+'
Fra
gmen
tio
ns(m
]:43
6)[M
-1
5r
(m]z
421)
[M-9
0Jt
(mlz
346)
[M-(
90
+1
5)r
[M-(
90
+9
0)j
t[M
-(9
0+
90
+1
5)r
m]z
215
m]z
129
(m]z
331)
(m]z
256)
(m]z
241)
5o:-
A-3
/J,1
7,B
-dio
l29
7054
3735
7037
lOa
5,B
-A-3
,B,1
7,B
-dio
l14
1852
2710
067
4097
5o:-
A-3o
:,17
,B-d
iol
2418
3545
65lO
a47
655,
B-A-
3o:,
17,B
-dio
l9
1545
10lO
a65
3852
5o:-
A-3
,B,1
7o:-
diol
3480
6040
4077
26lO
a5,
B-A
-3,B
,17o
:-di
ol8
5030
lOa
5426
625o
:-A
-3o:
,17o
:-di
ol29
2046
5670
100
4367
5,B
-A-3
o:,1
7o:-
diol
62
3912
100
6234
40
tTl ::c 0 c o ::c ...., 0 Z ~ ~
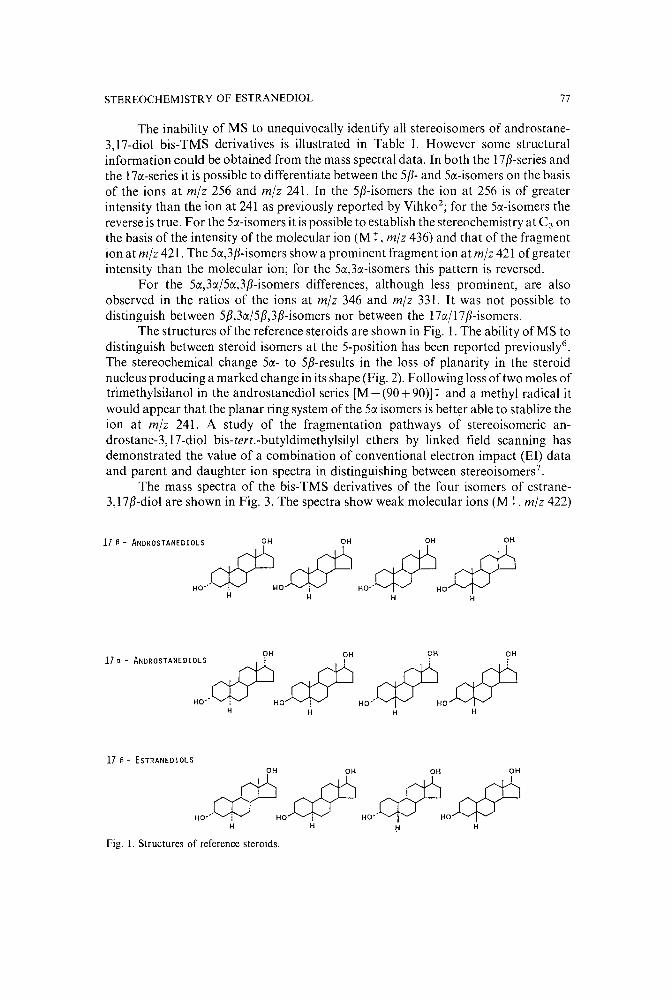
STEREOCHEMISTRY OF ESTRANEDIOL 77
The inability of MS to unequivocally identify all stereoisomers of androstane3,17-diol bis-TMS derivatives is illustrated in Table 1. However some structuralinformation could be obtained from the mass spectral data. Inboth the 17f)-seriesandthe 17a-series it is possible to differentiate between the 5f)-and 5a-isomers on the basisof the ions at m]z 256 and mjz 241. In the 5f)-isomers the ion at 256 is of greaterintensity than the ion at 241 as previously reported by Vihk0 2
; for the 5a-isomers thereverse is true. For the 5a-isomers it is possible to establish the stereochemistry at Co onthe basis of the intensity of the molecular ion (M ;- , m]z 436) and that of the fragmention at mlz 421. The 5a,3f)-isomers show a prominent fragment ion at m]z 421 of greaterintensity than the molecular ion; for the 5a,3a-isomers this pattern is reversed.
For the 5a,3a/5a,3f)-isomers differences, although less prominent, are alsoobserved in the ratios of the ions at mjz 346 and mlz 331. It was not possible todistinguish between 5f),3a/5f),3f)-isomers nor between the 17a/17f)-isomers.
The structures of the reference steroids are shown in Fig. 1. The ability ofMS todistinguish between steroid isomers at the 5-position has been reported previously".The stereochemical change 5a- to 5f)-results in the loss of planarity in the steroidnucleus producing a marked change in its shape (Fig. 2). Following loss of two moles oftrimethylsilanol in the androstanediol series [M - (90+90)];- and a methyl radical itwould appear that the planar ring system of the 5a isomers is better able to stablize theion at m]z 241. A study of the fragmentation pathways of stereoisomeric androstane-3,17-diol bis-tert.-butyldimethylsilyl ethers by linked field scanning hasdemonstrated the value of a combination of conventional electron impact (EI) dataand parent and daughter ion spectra in distinguishing between stereo isomers 7
.
The mass spectra of the bis-TMS derivatives of the four isomers of estrane3,17f)-diol are shown in Fig. 3. The spectra show weak molecular ions (M;-. m]z 422)
OH OH OH oH
17' - ,,""""'""""~ ! i i
'0- i "O~"oqSb"O~H H H H
17 ~ - ESTRANED I OLS
"o/c#"O~"OC#"O~H H H H
Fig. 1. Structures of reference steroids.
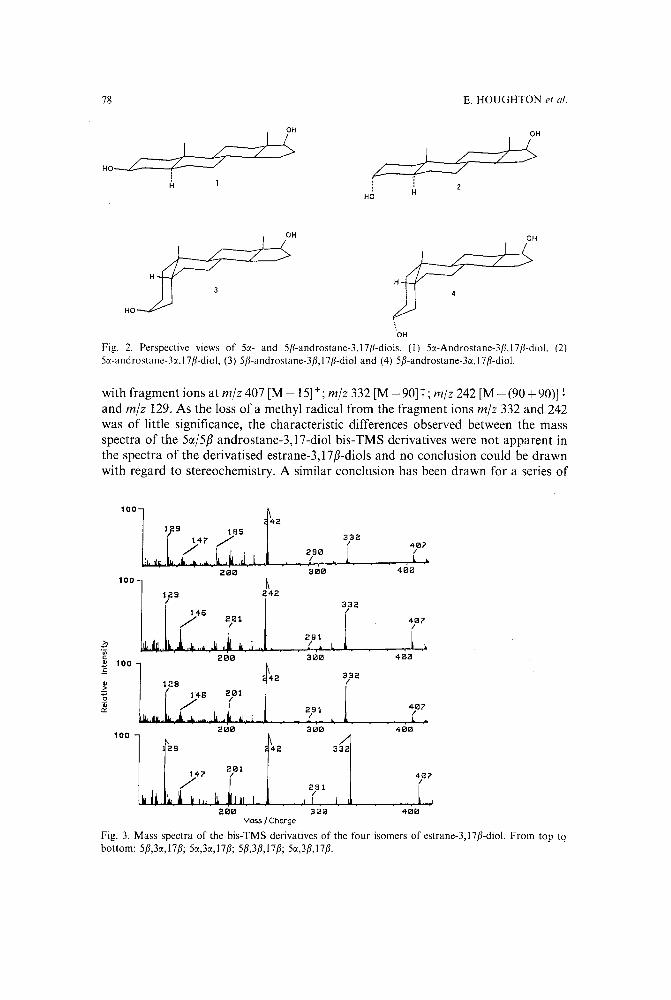
78
Ho_L----<C-----/
Ho
E. HOUGHTON et al.
OH
HO
OH
·OH
Fig. 2. Perspective views of Sa- and S(i-androstane-3.17(i-diols. (I) Sa-Androstane-3(i.I7(i-dio!, (2)Sa-androstanc-3()(.J 7fJ-diol. (3) S(i-alldrostanc-3fJ, 17fJ-diol and (4) SfJ-androstane-3a, 17fJ-diol.
with fragment ions ei m]: 407 [M-15]+; m]z 332 [M -90]:; m]z 242 [M-(90+90)]:and mlz 129. As the loss of a methyl radical from the fragment ions m]z 332 and 242was of little significance, the characteristic differences observed between the massspectra of the 5a/5fJ androstane-3,17-diol bis-TMS derivatives were not apparent inthe spectra of the derivatised estrane-3, 17fJ-diols and no conclusion could be drawnwith regard to stereochemistry. A similar conclusion has been drawn for a series of
100
332I
290I
2ell 31l1l100
129I 332
I
291;:;- I·in
301lcs 100.£ 332
" I>:;:;oGi
291a::I
31le100 /1
332
3'1'1Mass! Charge
Fig. 3. Mass spectra of the bis-TMS derivatives of the four isomers of estrane-3, 17fJ-diol. From top tobottom: SfJ,3a,17fJ; Sa,3a,17fJ; SfJ,3fJ,17fJ; Sa,3fJ,17fJ.

STEREOCHEMISTRY OF ESTRANEDIOL 79
5rx/5f3 androstanetriols where mass spectra of the TMS derivatives were dominated byrearrangement ions". The mass spectrum (Fig. 4) of the bis-TMS derivative of themajor estrane-3,17-diol metabolite was similar to those of the estrane-3, 17f3-diolisomers (Fig. 3) and stereochemical distinction on the basis ofMS was impossible. Onthe basis of relative intensities of the ions, the spectrum was different to that reportedpreviously 1
, presumably due to the use of a different instrument. MS analysis of theTMS derivatives of androstane-3,17-diol and estrane-J, 17f3-diol isomers thereforefailed to provide sufficient characteristic information to unequivocally determine thestereochemistry of the metabolite.
100
.~
'"c2..5
Q;a:
129/ 42
291I
200 300Mass/Charge
32
407I
400
Fig. 4. Mass spectrum of the bis-TMS derivative of the most abundant isomer of estrane-3, 17-diol isolatedfrom horse urine following administration of 19-nortestosterone.
Although it is known that GC can separate stereoisomers, the determination ofthe stereochemistry of the metabolite on the basis of a direct comparison of retentiontime data was not possible due to the unavailability of the estrane-3, 17rx-diol isomers asreference steroids. An indirect approach was therefore adopted which depended uponthe prediction of the MU values of the estrane-3,17rx-diol bis-TMS derivatives anda comparison of these predicted values with the experimentally determined values forthe metabolites. The TMS derivatives of the reference steroids were analysed on threedifferent columns. As reported previously the 17f3-isomers had longer retention timesthan the 17rx-isomers9
.
To determine MU values a typical GC chromatogram, obtained for coinjectionof the bis-TMS derivative of 5f3-androstane-3f3, 17f3-diol and the hydrocarbon mixture,is shown in Fig. 5. A plot of the retention time (min) vs. carbon number gave a linearrelationship over the range n-C 16-n-C 2 8 (correlation coefficient, 0.9997) (Fig. 6). TheMU value 25.71 for 5f3-androstane-3f3,17f3-diol bis-TMS was determined from linearregression analysis. Reanalysis of this mixture (n = 6) gave the following MU values forthis steroid derivative, 25.70, 25.71, 25.71, 25.71, 25.71 and 25.71. The MU values,determined for the TMS derivatives of the eight isomers of androstane-3, 17-diol andfour isomers of estrane-3, 17f3-diol on the three different columns are shown in Table II.The MU values of the derivatised estrane-3, 17-diol metabolites are shown in Table III.
MU values allow retention indices to be determined under temperatureprogrammed conditions and can be regarded, for practical purposes, to be equivalentto the Kovats retention indices. Based upon the concept that the paper chromatographic mobility of a compound results from the additive contributions of itscomponents-", it has been shown that the logarithm ofthe retention time of a steroid ismade up of the additive contributions of the substituents together with that of thenucleus 3
,1l , 12 . For the TMS derivatives of the eight isomers of androstanediol and

80
Retention Time (min)
C2622.79
C28
25.84
E. HOUGHTON et al.
Fig. S. Capillary column gas chromatogram for coinjection of the hydrocarbons n-C 16-n-C 3 2 with thebis-TMS derivative of Sf1-androstane-3fJ,I7f1-diol* (column BPS).
32
28
24
~
.s,5 20
Q)
Ei=c0:;:;c:Q)
16Q;0:
12
8
1400 1800 2200 2600 3000
Carbon Number
Fig. 6. Plot of retention time vs. carbon number for hydrocarbons n-C I 6-n-C 32 (column BPS; correlationcoefficient, 0.9996 n-C 16-n-C2 S ; regression equation y = S8.6x + 1269).

STEREOCHEMISTRY OF ESTRANEDIOL
TABLE II
MU VALUES FOR THE REFERENCE STEROIDS ON THREE COLUMNS
A = Androstanediol; E = estranediol.
81
Steroid
5a-A-3a,17a5a-A-3/3,17a5/3-A-3a,17a5/3-A-3f3,17a
5a-A-3a, 17f35a-A-3(3,17f35fJ-A-3a,17[15(3-A-3/3,17f3
5a-E-3a,17(35a-E-3[i,17/35(3-E-3a, 17f35(3-E-3(3, 17f3
MU values
1701 BP5 BPI
24.98 24.89 24.7426.29 26.12 25.9724.84 24.63 24.4524.92 24.86 24.69
26.12 25.80 25.7026.80 26.64 26.4926.04 25.81 25.7025.74 25.71 25.60
25.03 25.02 24.9125.87 25.73 25.5825.66 25.50 25.3725.47 25.44 25.32
TABLE III
MU VALUES FOR THE URINARY ESTRANE-3,17 DIOL METABOLITES OF 19-NORTESTOSTERONE IN THE HORSE
MajormetaboliteMinor metabolite
1701
25.3825.86
BP5
25.1125.84
BPI
25.1325.56
four isomers of estrane-3, 17/i-diol this principle has been used to calculate thecontributions to the MU values of the stereochemical change (17j3-0H to 17a-OH) andalso a change in the steroid nucleus (androstane to estrane).
For isomers of androstane-3,17/i-diol and androstane-3,17a-diol having thesame stereochemistry at the 3- and 5- positions, subtraction of the MU values gives thecontribution to the retention behaviour of the stereochemical change from 17/i-OH to17a-OH (Table IV). Subtraction of these contributions from the MU values of the
TABLE IV
CONTRIBUTION TO THE MU VALUES FOR THE CONVERSION 17(3-0H TO 17a-OH
A = Androstanediol.
Column
1701 BP5 BPI
(5a-A-3a,17(3) --> (5a-A-3a,17a) 1.14 0.91 0.96(5a-A-3(3,17(3) --> (5a-A-3f3,17a) 0.51 0.52 0.52(5(3-A-3a,17/3) --> (5(3-A-3a,17a) 1.20 1.18 1.25(5(3-A-3fJ, 17fJ) --> (5(3-A-3f3,17a) 0.82 0.85 0.91

82 E. HOUGHTON et al.
TABLE V
CALCULATED MU VALUES FOR THE FOUR ESTRANE-3,17a-DlOL ISOMERS
Column
1701 BP5 BPI
5a-Estrane-3a.17a-diol 23.89 24.11 23.955a-Estrane-3{J,17a-diol 25.36 25.21 25.065{J-Estrane-3a,17a-diol 24.26 24.32 24.125fJ-Estrane-3fJ, 17a-diol 24.65 24.59 24.41
TMS derivatives of the isomers of estrane-3, 17fJ-diol having the correspondingstereochemistries at the 3- and 5- positions gives the predicted MU values for theisomers of estrane-3, 17a-diol-bis-TMS derivatives (Table V).
The contribution of the C-IO methyl group can be obtained by subtracting theMU values of the TMS derivatives of the estrane-3,1 7P-diol isomers from those of theandrostane-3,1 7P-diol isomers having the same stereochemistries at the 3- and5-positions (Table VI). Subtraction of this contribution from the MU values of theTMS derivatives of isomers of androstane-3,17a-diol having the correspondingstereochemistries at the 3- and 5-positions again gave the predicted MU values shownin Table V. In predicting the MU values of the TMS derivatives of the estrane3,17a-diol isomers the assumption is made that the contribution due to the change instereochemistry at the 17-position is independent of the presence/absence of the methylgroup at C-lO or, this is equivalent to stating the contribution due to thepresence/absence of the methyl group at C-lO is independent of the stereochemistry atC-17. This assumption is thus dependent upon the non-interaction of the methyl groupat C-IO with the hydroxy function at C-17; due to the remoteness of the two groups anysuch interaction is improbable. The non-interaction of the methyl group at C-IO withsubstituents at C-17 has been demonstrated for a series of 4-en-3-one steroids forwhich, irrespective of the substituent at C-17 the contribution to retention time data ofthis methyl group was constant.'.
The above assumption can only be applied when the steroid 3,17-diols have thesame stereochemistry at the 3- and 5-positions. The fact that the contributions to MU
VALUES VI
CONTRIBUTION TO THE MU VALUES FOR THE C lO METHYL GROUP
A = Androstanediol; E = estranediol.
Column
1701 BP5 BPi
(5a-A-3a,17fJ) .... (5a-E-3a,17fJ) 1.09 0.78 0.79(5a-A-3fJ, 17fJ) .... (5a-E-3fJ,17fJ) 0.93 0.91 0.91(5fJ-A-3a,17fJ) .... (5fJ-E-3a,17fJ) 0.38 0.31 0.33(5fJ-A-3fJ,17fJ) .... (5fJ-E-3fJ,17fJ) 0.27 0.27 0.28

STEREOCHEMISTRY OF ESTRANEDIOL 83
values of the 17{3-0H to 17a-OH conversion (Table IV) and the methyl group at C-IO(Table VI) are not constant for different isomers demonstrates their dependence uponthe stereochemistry at these positions. The predicted MU values for the TMSderivatives of the four estrane-3,17a-diol isomers are shown in Table V. Comparisonof the experimentally determined MU values on the three columns for the majorestrane-3,17a-diol metabolite (Table III) with the predicted MU values (Table V)established the configurations at the 3- and 5-positions to be {3 and a, respectively. Thisconfiguration was later confirmed by custom synthesis of 5a-estrane-3{3,1 7a-diol andcomparison of retention time data with that of the metabolite. Comparison of the MUvalues of the TMS derivative of the minor metabolite with those of the referencesteroids confirmed the configuration to be 5a,3{3,17{3.
CONCLUSIONS
The value of GC-MS in the identification of a variety of steroids, isolated frombiological samples, and their derivatives has been well documented over the past twodecades. On the basis of MS alone it is not normally possible to differentiate betweensteroid stereoisomers. However, stereoisomers of most steroids can be resolved bycapillary GC and thus the combination ofGC-MS can yield full structure elucidationprovided the appropriate reference steroids are available for direct comparison of massspectral and retention time data. In determining the stereochemistry of estrane3,17a-diol alternative approaches had to be considered as it was not possible to obtainthe four isomers of estrane-3,17a-diol as reference steroids.
The results demonstrate that MU values can be used for the elucidation of thestereochemistry of steroid isomers when the appropriate reference compounds areunavailable.
REFERENCES
I E. Houghton, Xenobiotica, 7 (1977) 683.2 R. Vihko, Acta Endocrinol., Suppl., 109 (1966) 1.3 B. A. Knights and G. H. Thomas, Anal. Chem., 34 (1962) 1046.4 R. B. Clayton, Biochemistry, 1 (1962) 357.5 E. C. Horning, K. B. Eik-Nes and E. C. Horning, Monographs on Endocrinology, Vol. 2. Gas Phase
Chromatography of Steroids, Springer-Verlag, Berlin, Heidelberg, New York, 1968.6 M. Friedrnann-Spiteller and G. Spiteller, Fortschr. Chem. Forsch., 12 (1969) 440.7 S. J. Gaskell, A. w. Pike and D. S. Millington, Biomed. Mass Spectrom., 6 (1979) 78.8 H. Grote and G. Spiteller, Biomed. Mass Spectrom .. 4 (1977) 216.<) R. J. Heitzmann and G. H. Thomas. Biochem. J., 96 (1965) 22 p,
to E. C. Bate-Smith and R. G. Westall, Biochim. Biophys. Acta, 4 (1950) 427.11 B. A. Knights and G. H. Thomas, Chem. Ind., (1963) 43.12 J. Chamberlain, B. A. Knights and G. H. Thomas, J. Endocrinol., 26 (1963) 367.

Journal of Chromatography, 479 (1989) 85-95Elsevier Science Publishers B.V., Amsterdam - Printed in The Netherlands
CHROM. 21675
HIGH-PERFORMANCE SIZE-EXCLUSION CHROMATOGRAPHY OFPOLY- AND OLIGOETHYLENE TEREPHTHALATE USING A MIXTUREOF HEXAFLUOROISOPROPANOL AND CHLOROFORM AS THE MOBILE PHASE
NOBUTOSHI CHIKAZUMI*·a, YOSHIYUKI MUKOYAMA and HATUO SUGITANI
Ibaraki Research Laboratory, Hitachi Chemical Co.. Ltd.. 4-13-1 Higashichou Hitachi. lbaraki 317 (Japan)
(First received February 27th, 1989; revised manuscript received June 9th, 1989)
SUMMARY
Solvent systems using a mixture of hexafluoroisopropanol (HFIP) and chloroform (CHCI 3) were developed for the analysis of polyethylene terephthalate (PET) andits oligomers by high-performance size-exclusion chromatography (SEC) at roomtemperature (25°C). The molecular weight distribution of PET and PET film weredetermined using HFIP-CHCI 3 (I :9) and the SEC calibration graph of polystyrenes,which are insoluble in HFIP. These mixed solvents also had considerable advantageswith regard to cost reduction and safety in comparison with HFIP alone.
INTRODUCTION
Size-exclusion chromatography (SEC), also known as gel permeation chromatography (GPC), can be used to separate polymers with respect of their molecular sizein solution using appropriate calibration graphs based on their elution volumes. SECcolumns packed with spherical particles of styrene-divinylbenzene copolymer! havebeen indispensable for the analysis of organic polymeric materials using highperformance liquid chromatography (HPLC) with organic solvents.
The selection of solvents is one of the most important problems in the use of SECanalysis for measuring molecular weight distributions (MWD) of organic materials.With a column packed with styrene-divinylbenzene copolymer, SEC eluents such astetrahydrofuran (THF), chloroform and toluene have generally been used at roomtemperature. However, for the analysis of polymers that are insoluble in these commonsolvents, SEC eluents such as N,N-dimethylformamide, m-cresol and a-dichlorobenzene have been used at high temperatures.
In SEC measurements of polyethylene terephthalate (PET)2-4 and polyamides(e.g., nylonj>:", various difficulties have been encountered in dissolving thesepolymers in polar solvents such as m-cresol, a-chlorophenol and phenol-tetrachloroethane. In addition, the exposure of PET to high temperatures in these solvents duringthe course of the SEC measurement causes undesirable degradation of the polymer.
a Present address: Research and Development Division, Hitachi Chemical Co., Ltd., P.O. Box 233,Shinjuku-Mitsui Bldg. No. I-I, 2-Chome, Nishishinjuku, Shinjuku-ku, Tokyo 163, Japan.
0021-9673/89/$03.50 © 1989 Elsevier Science Publishers B.V.

86 N. CHIKAZUMI, Y. MUKOYAMA, H. SUGITANI
The solvent hexafluoroisopropanol (HFIP)8,9 is known to dissolve PET andpolyamides at room temperature. However, polystyrenes, usually used for preparingSEC calibration graphs to determine the MWD of polymers, are insoluble in HFIPalone. Further, as HFIP is expensive and irritating to the skin and eyes, it is preferableto reduce the amount of HFIP used in any industrial analytical method.
Several attempts have been made to apply SEC to PET and polyamides usingsolvents mixed with HFIP, such as HFIP-toluene1 0
, HFIP-pentafluorophenol 1 1 andHFIP-methylene chloride'F"!". This paper describes an effective mixed solvent systemconsisting of a mixture of HFIP and chloroform which permits the successful SECmeasurement of various kinds of PET samples at room temperature.
EXPERIMENTAL
Samples and solventsPET samples with different degrees ofpolymerization [Pn = 150,110,52,35 and
5 (data given by the manufacturer)], two kinds of PET oligomers and PET film wereobtained from the Industrial Plant Engineering Office of Hitachi. Epoxy resins,polyester resins and narrow-MWD polystyrene standards were obtained from Shell,NBS, Tosoh and Pressure Chemical, respectively.
THF and chloroform for SEC solvents were obtained from Wako and HFIPfrom Hidoras Chemical and DuPont. All the SEC solvents were degassed by ultrasonictreatment.
Test of solubility of PET and polystyreneHFIP-chloroform mixed solvents in the ratios 0.5:9.5, 1:9,2:8,3:7,4:6 and 1:1
(v/v) were prepared to determine the solubility of three kinds of PET samples withdifferent degrees of polymerization (P; = 150,52 and 5) and two kinds of polystyrenestandards (molecular weights 4.98 . 105 and 2.8 . 103
) . The HFIP-chloroform mixedsolvents were added to PET samples and polystyrenes to give a concentration of0.2%(w/v). The vials containing the solutions were tightly sealed and kept at roomtemperature (25°C) for one night. The solubility of the samples was also measured inthe same manner by using HFIP-THF (1:9 and 1:1).
Preparation of SEC columnsAll the packing materials and SEC columns used in this study (Gelpack) were
made by Hitachi Chemical.GL-S300HC-l series columns with HFIP-CHCI3 (1:9) mixed solvent. Porous
spherical particles of styrene-divinylbenzene copolymer with an exclusion limit (Mli m )
of 1 . 103 were packed in a 500 x 8 mm J.D. stainless-steel column with a slurryprepared by using HFIP-CHCI 3 (1:9) (designation: GL-S3l0HC-I).
GL-S320HC-l (Mlim 5 . 103) , GL-S330HC-l (Mlim 2' 104
) and GL-S340HC-l(M1im 7 . 104
) columns were prepared using HFIP-CHCI 3 (1:9) in the same manner asdescribed above. A GL-S300MHC-l column (mixed gel of M lim 7 . 104
, 5 . 105 ,
4 . 106 and 5 . 107) was prepared for measuring the MWD of PET and PET film,
because its calibration graph was linear.GL-S300HC-5 series columns with HFIP-CHCI3 (1:1) mixed solvent. GL
S350HC-5 (Mlim 5 . 105) and GL-S360HC-5 (M1im 4 . 106
) columns were prepared asdescribed above except that HFIP-CHCI 3 (I: I) was used.

HPSEC OF POLY- AND OLIGOETHYLENE TEREPHTHALATE 87
GL-A100 series columns with THF solvent. GL-AllO (M1im 1 . 103) , GL-AI20
(MUm 5· 103) , GL-AI30 (MUm 2· 104
) , GL-AI40 (MUm 7· 104) , GL-AI50 (M1im
5 . 105) , GL-AI60 (MUm 4· 106) and GL-AIOOM (mixed gel of M 1im7· 104,5. 105
,
4 . 106 and 5 . 107) columns were prepared by packing the particles in 500 x 8 mm
I.D. stainless-steel columns as described above except that THF was used as thesolvent.
SEC and mass spectrometryA Hitachi 635 high-performance liquid chromatograph with a UV detector set at
254 nm and a Hitachi 635A high-performance liquid chromatograph with a UVdetector set at 250 nm, both instruments also with a refractive index detector, wereused. All SEC experiments were carried out at room temperature (25°C).
For column protection, a column packed with HFIP-CHCI 3 (1:9) should beused with the same solvent as the SEC eluent, and the same rule should be followedwith the HFIP-CHCI3 (1:1) and THF columns. SEC experiments using THF assolvent were carried out under the same analytical condition as for the HFIP-CHCI 3
systems.The number of theoretical plates (N) was determined by using 0.1% or 0.2%
(w/v) benzene with UV detection at 254 or 250 nm at a flow-rate of 1.0 ml/min andcalculated using the equation N = 5.54 (VR/ W)2, where VR is the retention volume andWis the peak width at half-height. The height equivalent to a theoretical plate (HETP)is expressed by L/N, where L is the column length and N is the number of theoreticalplates. The column pressure drop (P) was measured at a flow-rate of 1.0 ml/min. M 1imwas determined from a calibration graph for polystyrene, obtained using the THFsolvent column.
The number-average molecular weight (Mn) , the weight-average molecularweight (Mw), the Z-average molecular weight (Mz ) and the polydispersion index (D) ofPET samples were calculated from the following equations: M; = LHdL(HdMJ, M';= L(HiMJ/LHi, M; = L(HiM?)/L(HiMJ and D = Mw/M n,where Hi is peak heightand M, is molecular weight obtained from the calibration graph for polystyrenestandards using HFIP-CHCI3 (1:9).
The peaks collected from the SEC fractions of PET samples and oligomerspresent in PET films were identified using a Hitachi M-60 mass spectrometer.
RESULTS
Test of solubility of PET and polystyreneThe results of the solubility tests on the samples are given in Table 1. With
HFIP-CHCI 3 mixed solvents, PET samples (P; = 5 and P n = 52) were soluble in thesolvents with ratios of 1:9 or higher, while the PET sample (P; = 150) was soluble insolvents with ratios of 4:6 or higher. On the other hand, the polystyrene standard oflower molecular weight (2.8 . 103
) was soluble in the solvents at all ratios, while thestandard of higher molecular weight (4.98· 105
) did not dissolve in HFIP-CHCI 3 withratios of 4:6 and 1:1. Unfortunately, we could not find an HFIP-CHCI 3 mixture witha ratio in which all the PET samples and polystyrenes were soluble.
None of the PET samples, even that with Pn = 5, were soluble in the HFIP-THFsolvents at the ratios tested. It was evident that HFIP-THF solvents are unsuitable forSEC measurements of PET samples.

88 N. CHIKAZUMI, Y. MUKOYAMA, H. SUGITANI
TABLE I
TEST OF SQLUBILITY OF PET AND POLYSTYRENE AT A CONCENTRATION OF 0.2% (w/v)
Solvent Mixture ratio PET PS(v]v)
P; = 5 P; = 52 P; = 150 2.8 . 103 4.98 . 105
HFIP-CHCI 3 0.5:9.5 la I I sa S1:9 S S I S S2:8 S S I S S3:7 S S I S S4:6 S S S S II: I S S S S I
HFIP-THF 1:9 I I I S SI: I I I I I I
a I = Insoluble; S = soluble.
In accordance with these results, HFIP-CHCI 3 (I :9) and (I: I) were selected for.SEC measurements of PET samples.
1 • 105
(A)
3'3.7' 10'
21 . 10'
4
2.8' 10'
5
01 20 40 60Elution Volume (mil
337 ·10'
2 (B)
1 • 1054
~I 1·10'.,(
o 20 40 60Elution Volume (mil
Fig. I. Chromatograms of polystyrene standards of molecular weights 1.0' 105,1.0' 104,2.8' 103 and 3.7102 using (A) HFIP-CHCI 3 (1:9) or (B) THF as the mobile phase. HPLC instrument, Hitachi 635A;
columns, (A) Gelpack GL-S310HC-l + GL-S320HC-1 + GL-S330HC-I, (B) Gelpack GL-AIIO+ GL-AI20 + GL-AI30; all three columns, 500 x 8 mm 1.0.; flow-rate, 1.0 rnl/rnin; detector, UV (250nm); column temperature, 25°C.
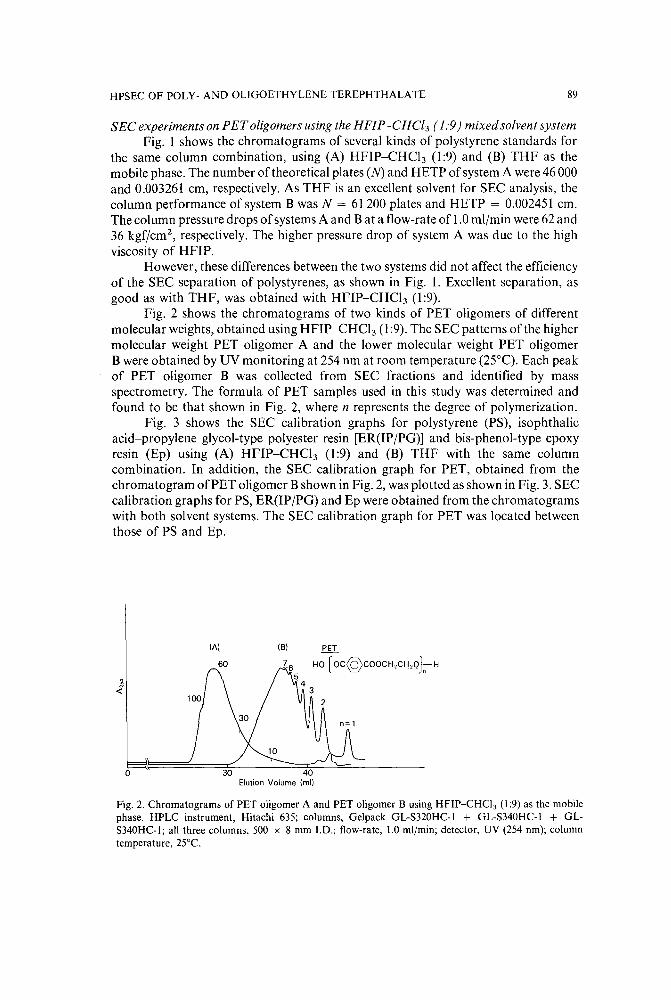
HPSEC OF POLY- AND OLIGOETHYLENE TEREPHTHALATE 89
SEC experiments on PEToligomers using the HFIP-CHCI3 ( 1:9) mixedsolvent systemFig. I shows the chromatograms of several kinds of polystyrene standards for
the same column combination, using (A) HFIP-CHCI3 (1:9) and (B) THF as themobile phase. The number of theoretical plates (N) and HETP ofsystem A were 46 000and 0.003261 em, respectively. As THF is an excellent solvent for SEC analysis, thecolumn performance of system B was N = 61 200 plates and HETP = 0.002451 em.The column pressure drops ofsystems A and B at a flow-rate of 1.0 ml/min were 62 and36 kgf/crrr', respectively. The higher pressure drop of system A was due to the highviscosity of HFIP.
However, these differences between the two systems did not affect the efficiencyof the SEC separation of polystyrenes, as shown in Fig. 1. Excellent separation, asgood as with THF, was obtained with HFIP-CHCI 3 (1:9).
Fig. 2 shows the chromatograms of two kinds of PET oligomers of differentmolecular weights, obtained using HFIP-CHCI3 (1:9). The SEC patterns of the highermolecular weight PET oligomer A and the lower molecular weight PET oligomerB were obtained by UV monitoring at 254 nm at room temperature (25°C). Each peakof PET oligomer B was collected from SEC fractions and identified by massspectrometry. The formula of PET samples used in this study was determined andfound to be that shown in Fig. 2, where n represents the degree of polymerization.
Fig. 3 shows the SEC calibration graphs for polystyrene (PS), isophthalicacid-propylene glycol-type polyester resin [ER(IP/PG)] and bis-phenol-type epoxyresin (Ep) using (A) HFIP-CHCI 3 (1:9) and (B) THF with the same columncombination. In addition, the SEC calibration graph for PET, obtained from thechromatogram ofPET oligomer B shown in Fig. 2, was plotted as shown in Fig. 3. SECcalibration graphs for PS, ER(lP/PG) and Ep were obtained from the chromatogramswith both solvent systems. The SEC calibration graph for PET was located betweenthose of PS and Ep.
40Elution Volume (mil
o
(AI (8) PET
HofOC@COOCH2CH2Qt-H
Fig. 2. Chromatograms of PET oligomer A and PET oligomer Busing HFIP-CHCI 3 (1:9) as the mobilephase. HPLC instrument, Hitachi 635; columns, Gelpack GL-S320HC-1 + GL-S340HC-1 + GLS340HC-I; all three columns, 500 x 8 mm I.D.; flow-rate, 1.0 ml/min; detector, UV (254 nm); columntemperature, 25°C.
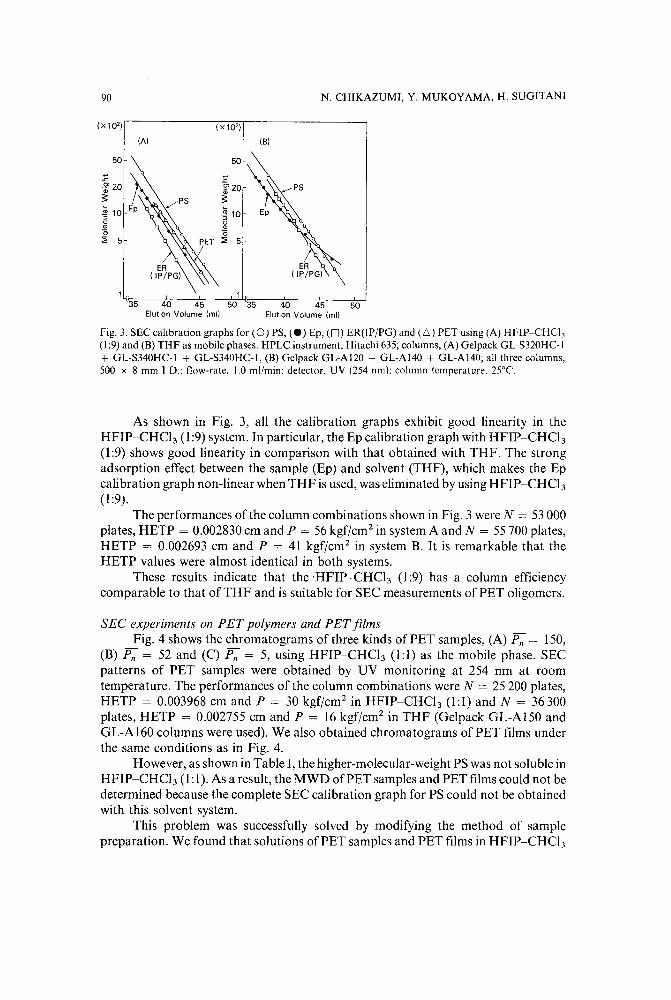
90
(xlO')
(A)
N. CHIKAZUMI, Y. MUKOYAMA, H. SUGITANI
(xl0')
(8)
~ 10o'"o:;; 5
50 35 40 45 50Elution Volume (mil
Fig. 3. SEC calibration graphs for (0) PS, (e) Ep, (D) ER(IPjPG) and (6) PET using (A) HFIP-CHCI 3
(1:9) and (B) THF as mobile phases. HPLC instrument, Hitachi 635; columns, (A) Gelpack GL-S320HC-l+ GL-S340HC-I + GL-S340HC-l, (B) Gelpack GL-AI20 + GL-AI40 + GL-AI40; all three columns,500 x 8 mm J.D.: flow-rate. 1.0 mllmin: detector. UV (254 nrn): column temperature. 25°C.
As shown in Fig. 3, all the calibration graphs exhibit good linearity in theHFIP-CHCI 3 (1:9) system. In particular, the Ep calibration graph with HFIP-CHCl3
(1:9) shows good linearity in comparison with that obtained with THF. The strongadsorption effect between the sample (Ep) and solvent (THF), which makes the Epcalibration graph non-linear when THF is used, was eliminated by using HFIP-CHCI 3
(1:9).The performances of the column combinations shown in Fig. 3 were N = 53000
plates, HETP = 0.002830 em and P = 56 kgf/cm? in system A and N = 55700 plates,HETP = 0.002693 em and P = 41 kgf/cm? in system B. It is remarkable that theHETP values were almost identical in both systems.
These results indicate that the 'HFIP-CHCI3 (1:9) has a column efficiencycomparable to that ofTHF and is suitable for SEC measurements of PET oligomers.
SEC experiments on PET polymers and PET/UrnsFig. 4 shows the chromatograms of three kinds of PET samples, (A) Pn = 150,
(B) Pn = 52 and (C) Pn = 5, using HFIP-CHCI 3 (1:1) as the mobile phase. SECpatterns of PET samples were obtained by UV monitoring at 254 nm at roomtemperature. The performances of the column combinations were N = 25200 plates,HETP = 0.003968 em and P = 30 kgf/cm" in HFIP-CHCh (1:1) and N = 36300plates, HETP = 0.002755 cm and P = 16 kgf'/cm? in THF (Gelpack GL-AI50 andGL-AI60 columns were used). We also obtained chromatograms of PET films underthe same conditions as in Fig. 4.
However, as shown in Table I, the higher-molecular-weight PS was not soluble inHFIP-CHCI 3 (1:1). As a result, the MWD of PET samples and PET films could not bedetermined because the complete SEC calibration graph for PS could not be obtainedwith this solvent system.
This problem was successfully solved by modifying the method of samplepreparation. We found that solutions of PET samples and PET films in HFTP-CHCI,

HPSEC OF POLY- AND OLIGOETHYLENE TEREPHTHALATE
IA)
91
a 10
Fig. 4. Chromatograms of PET samples (A) P;:= 150,(B) P;:= 52 and (C) P;:= 5 using HFIP-CHCI 3 (1:1)as the mobile phase. HPLC instrument, Hitachi 635; columns, Gelpack GL-S350HC-5 + GL-S360HC-5;column dimensions, 500 x 8 mm J.D. x 2; flow-rate, 1.0 ml/min; detector, UV (254 nm); columntemperature, 25°C.
(1:1) could be diluted with CHCh to produce HFIP-CHCI3 (1:9) with no polymerprecipitation. Injection of these sample solutions into the HPLC instrument caused noproblems in operation with HFIP~CHCl3 (1:9).
Table II shows the SEC measurements of five PET samples (P; =. 150, 110, 52,35 and 5) using HFIP-CHC13(1:9). The column used for measuring the MWD of PETwas Gelpack GL-S300MHC-l, which gave an almost linear calibration graph forpolystyrene. The performances of this column were N = 16300 plates, HETP= 0.003067 em and P = 11 kgf/crrr' with HFIP~CHC13 (1:9) and N = 18200 plates,HETP = 0.002747 em and P = 7 kgf/cm? with THF (Gelpack GL-AI00M columnwas used).
From the degree of polymerization (Pn) , the number-average molecular weightsof PET samples (P; = 150, 110, 52, 35 and 5) were calculated to be 28948,21248,10054, 6773 and 983, respectively, from the formula shown in Fig. 2. These M; datacalculated from the degree of polymerization (Pn) were in good agreement with theSEC results for M; shown in Table TT.
TABLE II
SEC MEASUREMENT OF PET SAMPLES USNG HFIP-CHCl3 (1:9)
SEC conditions: column, Gelpack GL-S300MHC-I (500 x 8 mm J.D.); eluent, HFIP-CHC1 3 (1:9);flow-rate, 1.0 nil/min; detector, UV (250 nrn); column temperature, 25°C; HPLC instrument, Hitachi 635A.
PET sample u, M w M, D
P;:= 150 2.70 . 104 6.88 . 104 1.19 . 105 2.55
P;:=IIO 2.31 . 104 5.43' 104 9.78· 104 2.35
P;:= 52 1.11 . 104 2.76 . 104 4.76 . 104 2.48
Pn = 35 6.83 . 103 1.41 . 104 2.33 . 104 2.06
Pn = 5 5.82· 102 8.90 . 102 1.55 . 103 1.53

92 N. CHIKAZUMI, Y. MUKOYAMA, H. SUGITANI
These results show that the SEC analysis of all kinds of PET samples and PETfilms is possible if HFIP-CHCI3 (l :9) is used and that the MWD of these polymers canbe determined from the SEC calibration graphs for PS.
SEC experiments on oligomers present in PET filmsOligomers present in the PET samples or PET films can be analysed by SEC
measurement of their CHCh extracts, using THF as the solvent. The CHCh extractsof the PET sample (P; = 5) and the PET film were dissolved in THF after removingCHCI 3 ·
Fig. 5 shows the chromatograms ofoligomers present in the CHCI 3 extract of thePET sample (P; = 5)and oligomers present in the CHCI 3 extract of the PET film usingTHF. The peak of each SEC fraction was collected and identified by massspectrometry. The formula of each oligomer was determined and is shown in Fig. 5.
2
n=l
3
HO--[oC@COOCH2CH20;;-H 4
(A) 56
o 20 I
30I
40 ml
IIIJ:
9-J:
91C=O g.:G~=o ~
<;H2 CSJ ¢H2 T 9yH2 c-o 0 c-o o-o9 <> CH21 CSJ
o~ yH2 ¢H2 o=~o CH2 0 '
o=c 6 o-c 0 '1.n 0 ¢H 2 G
I n=4 Iln=3 'Y CH2 N
III n=2 VI n= 1 o=c-b 6v J:
IV(B)
o 20 30Elution Volume (mil
Fig. 5. Chromatograms of oligomers present in PET and PET film using THF as mobile phase. Samples: (A)CHC13 extract of PET sample (P; = 5); (B) CHCl 3 extract of PET film. HPLC instrument, Hitachi 635A;columns, Gelpack GL-AIIO + GL-AI20 + GL-A130; all three columns, 500 x 8 mm J.D.; flow-rate, 1.0ml/rnin; detector, UV (250 nm); column temperature, 25°C.

HPSEC OF POLY- AND OLIGOETHYLENE TEREPHTHALATE 93
III
o
(A) (8)
o 20
Fig. 6. Chromatograms of PET film using HFIP-CHCI3 (1:9) as the mobile phase. Samples: (A) PET film;(B) CHCI, extract of PET film. HPLC instrument, Hitachi 635A; columns, Gelpack GL-S310HC-I+ GL-S320HC-1 + GL-S330HC-I; all three columns, 500 x 8 mm I.D.; flow-rate, 1.0 ml/min; detector,UV (250 nm); column temperature, 25°C.
Although this method is effective for identifying the oligomers, it isdoubtful thatthese chromatograms accurately reflect the amount of such oligomers because it wasdifficult to extract all of the oligomers by the extraction process used. SEC analysis ofthe PET film oligomer using HFIP-CHCh (1:9) was tried in order to overcome thisdisadvantage.
Fig. 6 shows the chromatograms of PET film and the CHCh extract of PET filmusing HFIP-CHC13 (l :9).The fractions of the main peaks were collected and identifiedby mass spectrometry by the same method as with THF. The main oligomer peak ofthe PET film and the CHCl3 extract of the PET film shown in Fig. 6 was identified asthe same cyclic oligomer as peak III in Fig. 5.
DISCUSSION
Even at high temperatures, PET samples and PET films cannot be dissolved inmost of the common SEC solvents such as THF, chloroform, toluene, dimethylformamide, dimethyl sulfoxide, anisole, 2-nitropropane, ethyl acetate, 1,1,2-trichloroethane, 1,1,2,2-tetrachloroethane, 1,2,4-trichlorobenzene and acetonitrile. Onlya fewpolar solvents can dissolve PET, viz., trifluoroacetic acid, m-cresol, phenol-tetrachloroethane, o-chlorophenol, nitrobenzene, HFIP and hexafluoroacetone. Of thesesolvents, m-cresol has been the most commonly used for the SEC analysis of PET attemperatures of IIO-l35 ee. However, there is ample evidence that PET is degraded inm-cresol by acid-catalyzed hydrolysis. Further. SEC analysis must be carried out at

94 N. CHIKAZUMI. Y. MUKOYAMA. H. SUGITANI
high temperature to reduce the high viscosity of m-cresol. The operation of HPLCunder this condition is not easy and it lacks safety, reproducibility and reliability.
Paschke et 01. 16 reported that SEC of PET using nitrobenzene-tetrachloroethane (0.5:99.5) at room temperature minimizes polymer degradation and distribution equilibration. However, in this instance, PET was first dissolved in purenitrobenzene at 180-200°C and then diluted with tetrachloroethane, whereas thesamples in our study, in which we used the HFIP-CHCI 3 to dissolve PET, wereprepared under mild conditions at room temperature.
SEC experiments using HFIP alone have been carried out with PET I I,
polytetramethyleneterephthalate!", polyamide 65 and polyamide 1210. However, theSEC measurement of these polymers in HFIP had the serious disadvantage thatpolystyrenes, usually used for preparing a calibration graph to determine the MWD ofpolymers, are insoluble in HFIP.
In our study, we found that the solutions of PET samples in HFIP-CHCI 3 (1:1)could be diluted with CHCh to give HFIP-CHCI 3 (1:9) with no polymer precipitation.We confirmed that this new method of sample preparation could be applied to PETfilms. The MWD of PET film calculated from the calibration graph for PS under thesame analytical conditions as for Table II gave M; = 2.33' 104, M'; = 5.64' 104, M;= 1.02 . 105 and D = 2.42.
We also found that the MWD ofPET samples prepared in HFIP-CHCI 3 (1:9) bythe dilution method described above showed little difference from the MWD of thosedissolved in undiluted HFIP-CHCl3 (1:1). For example, the MWDs of the PETsample with Pn = 150using HFIP-CHCh (1:9)were M« = 2.70' 104,M'; = 6.88' 104,
M z = 1.19' 105 and D = 2.55 when the sample was dissolved and diluted so as to giveHFIP-CHCh (1:9), and M« = 2.55 . 104, M'; = 6.62 . 104, M, = 1.16' 105 andD = 2.60 when the sample was dissolved in HFIP-CHCI 3 (1:1). This problem is beingstudied further and will be the subject of a subsequent paper.
Several SEC experiments using mixed solvents of HFIP with other compoundshave been attempted, e.g., HFIP-methylene chloride (30:70)12-14 and HFIP-pentafluoropropanol (1:1)II for PET and HFIP-toluene (20:80)1° for polyamide 12. Inthese studies, a refractive index detector, a UV detector and a laser low-angle lightscattering photometerS,11 were used as SEC detectors. For the detector with theHFIP-CHCh systems, it has been our experience that a UV detector is to be peferredbecause of its high sensitivity, high resolution and stability of the baseline.
As HFIP is expensive and irritating to the skin and eyes, the HFIP-CHCI 3
system has a considerable advantage in diluting the HFIP with CHCI 3 , which is muchcheaper and safer than HFIP. Moreover, as the HFIP-CHCI 3 system can be separatedinto two phases at low temperature (below 10°C), HFIP-CHCI3 waste solvent can beeasily recovered by cooling and redistillation. We were able to re-use the HFIP-CHCI 3
solvent as the SEC eluent several times by applying this method.
CONCLUSIONS
HFIP-CHCI 3 mixed solvent columns packed with styrene-divinylbenzenecopolymer have been developed for SEC measurements of PET, PET film and theiroligomers at room temperature. In comparison with THF, HFIP-CHCI 3 (1:9) and(1:1) showed sufficient column efficiency. Especially in HFIP-CHCI 3 (1:9), the
HPSEC OF POLY- AND OLIGOETHYLENE TEREPHTHALATE 95
polystyrenes usually used for preparing calibration graphs were soluble and the MWDof PET samples and PET films could be determined. The direct SEC analysis ofoligomers present in PET film was also possible with this solvent system.
ACKNOWLEDGEMENTS
The authors gratefully acknowledge helpful discussions with and valuableadvice from Professor Takahisa Ohta, University of Tokyo, and also thank themembers of the Industrial Plant Engineering Office of Hitachi, who kindly suppliedthe PET samples and offered valuable advice on the analytical conditions for thisstudy.
REFERENCES
1 1. C. Moore, J. Polym. Sci., Part A2, (1964) 835.2 E, L. Lawton and D. M. Cates, Polym. Prepr. Am. Chem. Soc. Div. Polym. Chem., 9 (1968) 851.3 R. S. Montserrat, J. P. Selga and V. P. Co1omer, Afinidad, 38 (1982) 379.4 N. A. Borshch and N. G. Mal-tseva, Zh. Anal. Khim., 41 (1986) 916.5 H. Schorn, R. Kosfeld and M. Hess, J. Chromatogr., 282 (1983) 579.6 R. Panaris and G. Pallas, Polym. Lett., 8 (1970) 441.7 D. J. Goedhart, J. B. Hussem and B. P. M. Smeets, J. Chromatogr. Sci., 13 (1980) 203.8 M. Ladika and Z. Mihalic, Kem. Ind., 32 (1983) 433.9 K. F. Purcell, J. A. Stikeleather and S. D. Brunk, J. Mol. Spectrosc., 32 (1969) 202.
10 M. Sakai and T. Ogawa, Bunseki Kagaku, 32 (1983) 258.11 S. Berkowitz, J. Appl. Polym. Sci., 29 (1984) 4353.12 B. L. Neff and J. R. Overton, J. Liq. Chromatogr., 7 (1984) 1537.13 J. R. Overton and H. L. Browning, Jr., ACS Symp. Ser., No. 245 (1984) 219.14 J. R. Overton and H. L. Browning, Jr., Org. Coat. Appl. Polym. Sci. Prepr., 48 (1983) 940.15 E. L. Slagowski, R. C. Gebauer and G. J. Gaesser, J. Appl. Polym. Sci., 21 (1977) 2293.16 E. E. Paschke, B. A. Bidlingmeyer and J. G. Berkmann, J. Polym. Sci., 15 (1977) 983.

Journal of Chromatography, 479 (l989) 97-105Elsevier Science Publishers B.V., Amsterdam - Printed in The Netherlands
CHROM. 21 658
APPLICAnON OF HIGH-PERFORMANCE LIQUID CHROMATOGRAPHYWITH SPECTROPHOTOMETRIC AND ELECTROCHEMICAL DETECTIONTO THE ANALYSIS OF ALKYLENEBIS(DITHIOCARBAMATES) ANDTHEIR METABOLITES
V. BARDAROV and Chr. ZAIKOV
Institute of Hygiene and Occupational Health. 1431 Sofia (Bulgaria)
and
M. MITEWA*
Department of Chemistry, University of Sofia, 1126 Sofia (Bulgaria)
(First received June 8th, 1988; revised manuscript received April 24th, 1989)
SUMMARY
The application of high-performance liquid chromatography with spectrophotometric or electrochemical detection was demonstrated for the determination ofsome alkylenebis(dithiocarbamates) (ABDTCs) and some of their degradationproducts and metabolites, especially alkylenethiourea, for toxicological investigation.First the ABDTCs were dissolved in the presence of EDTA and antioxidant, followedby ion-exchange chromatography with electrochemical detection (0.1-20 ng injected)or UV detection (20-5000 ng injected). Then normal-phase chromatography with UVdetection was performed to determine ethylene- and propylenethioureas (0.1-1000 nginjected). The above-mentioned compounds were determined in technical products,air, blood, tissues, etc.
INTRODUCTION
Alkylenebis(dithiocarbamates) (ABDTCs), being metal (M+ or M2+) orammonium salts of propylene- or ethylenebis(dithiocarbamic) acids (1-7) exhibitfungicidal activity. The M+ salts are water-soluble, having a high toxicity andshort-lived fungicidal action and are not widely used. In contrast, the ABDTCs ofsome bivalent metal ions, being polymeric products, are practically insoluble, havea low toxicity (LD so = 4000-9000 mg/kg) and durable fungicidal action and arewidely used in agricultural practice. However, they are unstable compounds,undergoing degradation to alkylenethioureas", the latter being some ofthe metabolitesas well". It has been shown that compounds of this type exhibit a high degree ofcarcinogenicity, mutagenicity and teratogenicity'<". For that reason, the applicationof this type of fungicides in practice requires convenient methods for their determination as well as that of their degradation (metabolite) products. However, their analysisis hampered by their low solubility, low stability and polymeric structure. Compounds
0021-9673/89/$03.50 © 1989 Elsevier Science Publishers B.V.

98
S
IICH2NH-C-S-M+
ICH2NH-C-S-M+
IIS
1 M+ = Na" (Nabam)2 M+ = NH: (Amobam)
V. BARDAROV, Chr. ZAIKOV, M. MTTEWA
S
IIR-CHNH-C-S-
I M2 +
H-CHNH-C-S -
IIS
3 R = H; M = Zn (Zineb)4 R = H; M = Mn and Zn (Mankozeb)5 R = H; M = Mn (Maneb)6 R = H; M = mixture of Zn, Cu, Mn, Fe (Cufram)7 R = CH 3 ; M = Zn (Propineb)
1-7 are typical representatives of ABDTCs, 3-7 being the most frequently usedfungicides in agricultural practice.
The methods developed for their determination, mainly volumetric, have lowselectivity", A number of them are indirect, based either on spectrophotometric, gaschromatographic (GC) or thin-layer chromatographic (TLC) determinations of thereaction products, liberated after reduction (in an acidic medium) by carbondisulphide'<!", ethylenediamine or propylenediamine'{r' ". These determinations arenot specific (they are not direct), and some are rather time-consuming. Somehigh-performance liquid chromatographic (HPLC) methods have also been describedfor the analysis of ABDTCs after extractive alkylatiou'V'" and for alkylenethioureaafter derivatization15-17, as well as direct HPLC methods with spectrophotometric1 8
, 1 9 or electrochemical'V'? detection and a TLC merhod".The aim of the present work was to apply HPLC for direct determination of the
anionic part of these compounds (bis-dithiocarbamates) and their degradationproducts and metabolites (mainly alkylenethiourea) for toxicological investigations.
EXPERIMENTAL
Apparatus and chemicalsThe HPLC equipment consisted of a Series 4 solvent delivery system (Perkin
Elmer, Norwalk, CT, U.S.A.), equipped with a Model 550 SE UV-VIS spectrometer(Perkin-Elmer) used as an UV detector with an 8-Jll flow cell, an LC-95 UV detector
S
IIRCHNHC-S-
IHCHNHC -s-
IIS
RCHNH~
I c=oRCHNH ~ HCHNH/
I "'c=sHCHNH/ ~ RCHNH",
x_ I C H2
HCHNH/
ETU ( R = H)
Metabolic degradation of ABDTCs according to Vogeler et al."; X = unidentified product.
HPLC OF ALKYLENEBIS(DITHIOCARBAMATES) 99
with a 4,5-J.lI flow cell or an electrochemical detector Model LC-4B with a glassycarbon working electrode (Bioanalytical Systems, West Lafayette, IN, U.S.A.), aninjector Model 7125 with a 20-J.llloop (Rheodyne, Cotati, CA, U.S.A.) and a ModelR-IOO recorder (Perkin-Elmer). The UV spectra were recorded on a Lambda-5UV-VIS spectrometer (Perkin-Elmer). A precise pH meter "Radelkis", Type OP-207(Metrimpex, Budapest, Hungary) and an ultrasonic bath Model RK-IOO Sonorex(Bandelin, Berlin, F.R.G.) were used in the course of the sample and mobile phasepreparation.
All solvents used, anhydrous methanol and ethanol, pentane, heptane andwater, were of HPLC grade and all other chemicals, NaCI04 , EDTA disodium salt,dipotassium phosphate, sodium dihydrogenphosphate and ascorbic acid, were ofanalytical-reagent grade.
Water- and methanol-extracted zinc propylenebis(dithiocarbamate) (ZnPBDTC)n, supplied by Agria (Plovdiv, Bulgaria), Zineb (Zn-EBDTC), supplied byBayer (F.R.G.), propylenethiourea (PTU), synthesized according to McKay andHattonP and twice recrystallized from heptane-ethanol and ethylenethiourea (ETU)(2-imidazolidinethione), supplied by Aldrich (Milwaukee, WI, U.S.A.), were used asstandard substances.
All solutions were degassed by helium purging, and thermostatted at ambienttemperature in capped flasks.
HPLC proceduresIon-exchange HPLC (HPIEC) was performed using a 250 mm x 4.6 mm
Partisil SAX IO-J.lm (Whatman) column. The mobile phase was I g EDTA, 0.150 molCI04 and 0.05 mol phosphate per litre water, pH 6.8, at a flow-rate of 2 ml/min. UVdetection was used for concentrations higher than 1 J.lg/ml (285 nm), and electrochemical detection (ED) for the concentration range I ng/ml-I J.lg/ml at a glassy carbonworking electrode potential of 0.80 V; the reference electrode was 1 M CI- /Ag/AgCl.
Normal-phase HPLC was performed using a PE 250 mm x 4.6 mm Si-60IO-J.lm, a 125 mm x 4 mm LiChrosorb Si 100 5-J.lm, a 250 mm x 4 mm LiChrosorbCN 5-J.lm or a 125 mm x 4 mm LiChrosorb 5-J.lm RP-8 column. The mobile phase:comprised 6--8% (v/v) of methanol and ethanol in pentane at a flow-rate of 3 ml/min(overpressure 50 kPa helium in the mobile phase container to prevent flowfluctuations). UV detection was performed at 235 nm.
The hydrodynamic voltammogram of PBDTC 2- was obtained by injection of
aliquots equivalent to 500 ng (Zn-PBDTC)n in the mobile phase (see above) ata flow-rate of 2 ml/min,
All solutions of (Zn-PBDTC)n and (Zn-EBDTC)n were obtained by dissolutionin the mobile phase (presence of EDTA) and adding ascorbic acid as an antioxidant indegassed water.
The determination of (Zn-PBDTC)n in air in the course of measurement of theinhalatory toxicity of (Zn-PBDTC)n (technical product) to experimental animals wascarried out by aspiration of 20 I of the assay air through a I3-mm-diameter polymericl.5-J.lm polyvinyl acetate (PVA) fibre FPP-15 filter (U.S.S.R.), held in a filter holder.The latter was connected to a syringe and washed with 2.0 ml of methanol. After thatthe filter was removed and sonicated for 15min in a capped sample tube with 5.0 ml of0.1% EDTA and 0.1% ascorbic acid in degassed water. Aliquote of both solutions,
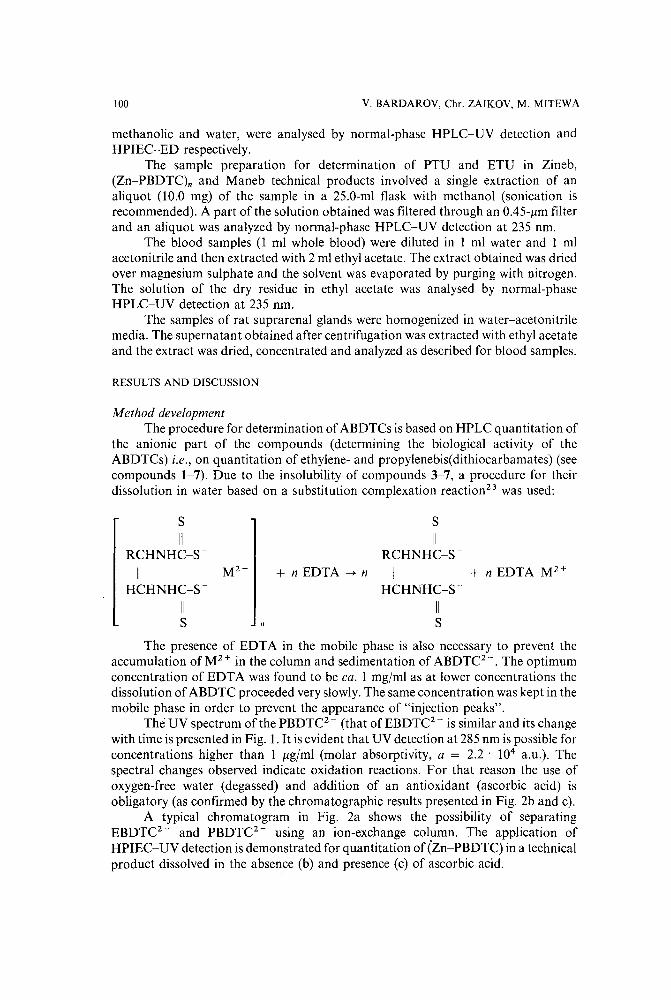
100 V. BARDAROV, Chr. ZAIKOV, M. MITEW A
methanolic and water, were analysed by normal-phase HPLC-UV detection andHPIEC-ED respectively.
The sample preparation for determination of PTU and ETU in Zineb,(Zn-PBDTC)n and Maneb technical products involved a single extraction of analiquot (10.0 mg) of the sample in a 25.0-ml flask with methanol (sonication isrecommended). A part of the solution obtained was filtered through an 0.45-J1m filterand an aliquot was analyzed by normal-phase HPLC-UV detection at 235 nm.
The blood samples (1 ml whole blood) were diluted in 1 ml water and I mlacetonitrile and then extracted with 2 ml ethyl acetate. The extract obtained was driedover magnesium sulphate and the solvent was evaporated by purging with nitrogen.The solution of the dry residue in ethyl acetate was analysed by normal-phaseHPLC-UV detection at 235 nm.
The samples of rat suprarenal glands were homogenized in water-acetonitrilemedia. The supernatant obtained after centrifugation was extracted with ethyl acetateand the extract was dried, concentrated and analyzed as described for blood samples.
RESULTS AND DISCUSSION
Method developmentThe procedure for determination of ABDTCs is based on HPLC quantitation of
the anionic part of the compounds (determining the biological activity of theABDTCs) i.e., on quantitation of ethylene- and propylenebis(dithiocarbamates) (seecompounds 1-7). Due to the insolubility of compounds 3-7, a procedure for theirdissolution in water based on a substitution complexation reaction" was used:
S
IIRCHNHC-S-
I M2 +
HCHNHC-S-
IIS
S
IIRCHNHC-S-
+ n EDTA ~ n I + n EDTA-M 2 +
HCHNHC-S-
IIS
The presence of EDTA in the mobile phase is also necessary to prevent theaccumulation of M 2 + in the column and sedimentation of ABDTC2
". The optimumconcentration of EDTA was found to be ca. 1 mg/ml as at lower concentrations thedissolution of ABDTC proceeded very slowly. The same concentration was kept in themobile phase in order to prevent the appearance of "injection peaks".
The UV spectrum of the PBDTC2- (that ofEBDTC2
- is similar and its changewith time is presented in Fig. 1. It is evident that UV detection at 285 nm is possible forconcentrations higher than 1 J1g/ml (molar absorptivity, a = 2.2' 104 a.u.). Thespectral changes observed indicate oxidation reactions. For that reason the use ofoxygen-free water (degassed) and addition of an antioxidant (ascorbic acid) isobligatory (as confirmed by the chromatographic results presented in Fig. 2b and c).
A typical chromatogram in Fig. 2a shows the possibility of separatingEBDTC2
- and PBDTC2- using an ion-exchange column. The application of
HPIEC-UV detection is demonstrated for quantitation of (Zn-PBDTC) in a technicalproduct dissolved in the absence (b) and presence (c) of ascorbic acid.
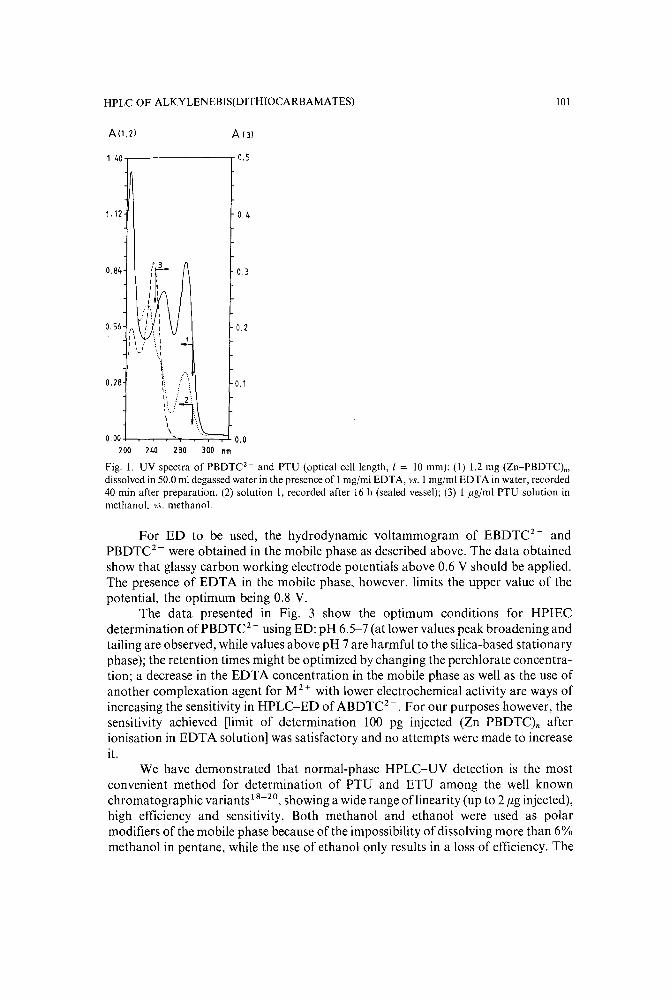
HPLC OF ALKYLENEBIS(DITHTOCARBAMATES) 101
A (1,2) A (3)
1,40-r-------, 0,5
0,84
1. 12
r~3"I'I I,
ill0,56 1\ "
,\ 'I \ I
, J, v
I,0,28
0,4
0,3
0,2
0.1
0,00 0.0200 240 280 300 nm
Fig. 1. UV spectra of PBDTC2 - and PTU (optical cell length, I = 10 mm): (I) 1.2 mg (Zn-PBDTC).,dissolved in 50,0 ml degassed water in the presence of I mg/rnl EDTA, vs. I mg/rnl EDTA in water, recorded40 min after preparation, (2) solution I, recorded after 16 h (sealed vessel); (3) 1 /lg/ml PTU solution inmethanol. vs, methanol.
For ED to be used, the hydrodynamic voltammogram of EBDTC2- and
PBDTC2- were obtained in the mobile phase as described above. The data obtained
show that glassy carbon working electrode potentials above 0.6 V should be applied.The presence of EDTA in the mobile phase, however, limits the upper value of thepotential, the optimum being 0.8 V.
The data presented in Fig. 3 show the optimum conditions for HPIECdetermination ofPBDTC2
- using ED: pH 6.5-7 (at lower values peak broadening andtailing are observed, while values above pH 7 are harmful to the silica-based stationaryphase); the retention times might be optimized by changing the perchlorate concentration; a decrease in the EDTA concentration in the mobile phase as well as the use ofanother complexation agent for M 2 + with lower electrochemical activity are ways ofincreasing the sensitivity in HPLC-ED of ABDTC2
- . For our purposes however, thesensitivity achieved [limit of determination 100 pg injected (Zn-PBDTC)n afterionisation in EDTA solution] was satisfactory and no attempts were made to increaseit.
We have demonstrated that normal-phase HPLC-UV detection is the mostconvenient method for determination of PTU and ETU among the well knownchromatographic variants 18-20, showing a wide range oflinearity (up to 2 /lg injected),high efficiency and sensitivity. Both methanol and ethanol were used as polarmodifiers of the mobile phase because of the impossibility of dissolving more than 6%methanol in pentane, while the use of ethanol only results in a loss of efficiency. The

102
AA
a
EBDTC 2PBore2- /
\
AA
b
PBDTC2; equivalent to84% IZn-PBDTC)nin the sample
V. BARDAROV, Chr. ZAIKOV, M. MITEWA
c
PBDTC2; equil'llent to91% IZn-PBDTC) nin the sample
o 2 4 8 min 0 2 4 6 min 0 2 4 6 min
Fig. 2. Chromatograms of solutions ofZineb and (Zn-PBDTCln- Column: 250mm x 4.6 mm SAX, IO11m.Mobile phase: I g EDTA, 0.150 mol CIO~ and 0.05 mol phosphate per litre water, pH 6.8, flow-rate2 ml/min. UV detection at 235 nm. (a) Equal amounts of Zineb and (Zn-PBDTCl,,, dissolved in the mobilephase in presence of AA; (b) 2.0 mg of (Zn-PBDTCl., dissolved in 100.0 ml of mobile phase, 10 IIIinjectedIOmin after preparation; (c) 2.0 mg of the same (Zn-PBDTCl. as used for (a), dissolved in 100.0ml of mobilephase containing 100 mg ascorbic acid (AA).
4 10 min
Fig. 3. HPlEC-ED ofPBDTC2- and changes in its retention with acidity and perchlorate concentration in
the mobile phase. Column: 250mm x 4.6mm SAX, 1011m. The mobile phase contains I gil EDTA; pH andperchlorate concentrations as shown. ECD at 0.8 V on glassy carbon working electrode (I M CI- IAgiAgClreference electrode).
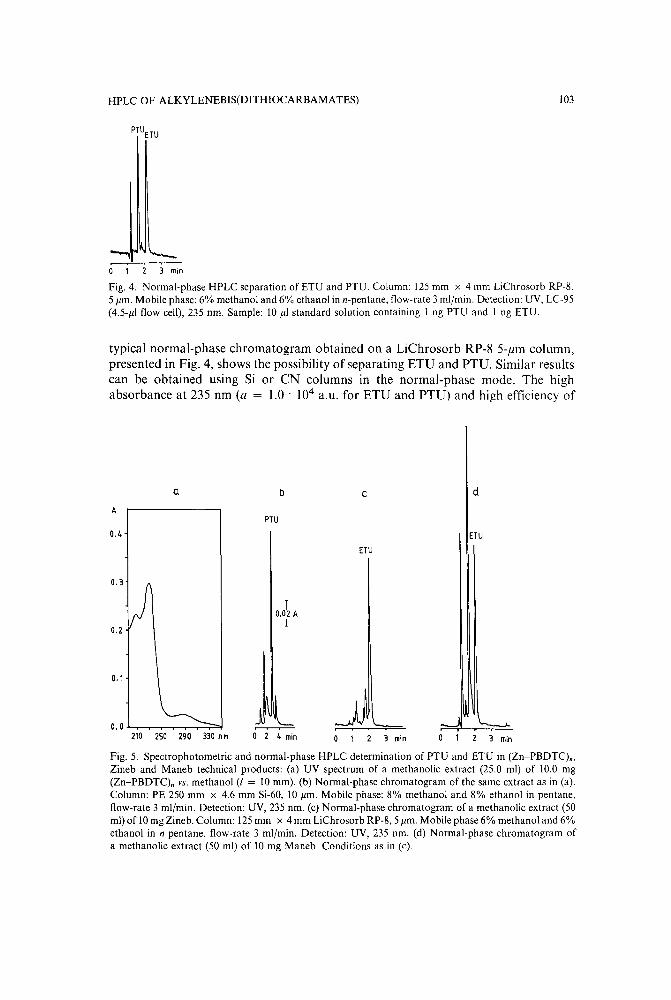
HPLC OF ALKYLENEBIS(DITHIOCARBAMATES) 103
o 1 3 min
Fig. 4. Normal-phase HPLC separation of ETU and PTU. Column: 125mm x 4 mm LiChrosorb RP-8,5/lm. Mobile phase: 6% methanol and 6% ethanol in n-pentane, flow-rate 3 nil/min. Detection: UV, LC-95(4.5-/llflow cell), 235 nm. Sample: 10 /ll standard solution containing I ng PTU and I ng ETU.
typical normal-phase chromatogram obtained on a LiChrosorb RP-8 5-flm column,presented in Fig. 4, shows the possibility of separating ETU and PTU. Similar resultscan be obtained using Si or CN columns in the normal-phase mode. The highabsorbance at 235 nm (a = 1.0 . 104 a.u. for ETU and PTU) and high efficiency of
3 min3 min
,.......,......o 2 4 min210 250 290 330 nm
a b c d
APTU
0.4 ETU
ETU
0.3
0.0~ A1
0.2
0.1
Fig. 5. Spectrophotometric and normal-phase HPLC determination of PTU and ETU in (Zn-PBDTCln,Zineb and Maneb technical products: (a) UV spectrum of a methanolic extract (25.0 ml) of 10.0 mg(Zn-PBDTC)n vs. methanol (I = 10 mm). (b) Normal-phase chromatogram of the same extract as in (a).Column: PE 250 mm x 4.6 mm Si-60, 10 /lm. Mobile phase: 8% methanol and 8% ethanol in pentane,flow-rate 3 ml/min. Detection: UV, 235 nm. (c) Normal-phase chromatogram of a methanolic extract (50ml) of 10mg Zineb. Column: 125mm x 4 mm LiChrosorb RP-8, 5/lm. Mobile phase 6% methanol and 6%ethanol in n-pentane, flow-rate 3 ml/rnin. Detection: UV, 235 nm. (d) Normal-phase chromatogram ofa methanolic extract (50 ml) of 10 mg Maneb. Conditions as in (c).

104 V. BARDAROV, Chr. ZAIKOV, M. MITEWA
normal-phase HPLC of the compounds allow a highly sensitive determination to beachieved (100 pg injected for PTU and ETU when an LC-95 UV detector is used).
ApplicationsThe applications of the procedure developed for determination of PTU in
a methanolic extract from a technical product (Zn-PBDTC)n is shown in Fig. 5b (theUV spectrum of the extract is shown on Fig. 5a). The appearance of several peaks inthe chromatogram obtained with UV detection at 235 nm shows unequivocally thatthe absorbance at this wavelength is due to different compounds and selectivedetermination of PTU is possible only by means of HPLC. In Fig. 5c andd chromatograms of methanolic extracts of Zineb and Maneb, obtained in the sameway, are represented. The other peaks observed are due to impurities, formed in thecourse of prolonged storage of the samples (more than 4 years).
The determinations of (Zn-PBDTC)n and PTU by means of HPIEC-ED andnormal-phase HPLC-UV detection, respectively, in air in the course of measurementof the inhalatory toxicity of the (Zn-PBDTC)n technical product to experimentalanimals are demonstrated in Fig. 6. The high reproducibility of the HPLC
,10 mino 2 4 6 min
a ba b
PTU in air
0.026 mg/m3
IZn-PBDTCl n in air0.9 mg/m3
PTU
0.57}Jg/ml
T TI
0.001A 0.5 nA
1 1
PTU
0.08}'g/g
I
Fig. 6. Determination of (Zn-PBDTC), and PTU in air from a camera for inhalatory experiments withexperimental animals. (a) Normal-phase chromatogram of the methanolic extract from the sampling filterafter aspiration of 201 air. Conditions as in Fig. 5b. (b) Ion-exchange chromatogram of the extract of thesame filter as in (a) in mobile phase in the presence of antioxidant (ascorbic acid). Conditions as in Fig. 2.
Fig. 7. Determination of PTU in biological samples. (a) Normal-phase chromatogram of a blood samplefrom a rat, given a dose of 60 mg/kg PTU daily for I month. Column: 125mm x 4 mm LiChrosorb Si 100,5 /lm. Mobile phase: 5% methanol and 5% ethanol in pentane, flow-rate 2 ml/min. Detection: UV, 235 nm.Sample preparation as described in the text. (b) Normal-phase chromatogram ofa suprarenal gland samplefrom a rat, dosed as in (a). Conditions as in (a). Sample preparation as described in the text.

HPLC OF ALKYLENEBIS(DTTHIOCARBAMATES) 105
determination was confirmed when the sample solution from a separate air sample wasinjected five times in 3 h [coefficient of variation C.V. = 4.6% for PTU and 8.3% for(Zn-PBDTC)n). A considerably lower reproducibility was obtained in the course ofmeasurement of the air concentrations of PTU and (Zn-PBDTC)n [four determinations daily, C.V. 20-40% for PTU and (Zn-PBDTC)n), which is connected mainly withinconsistent dosage of (Zn-PBDTC)n in the air.
Chromatograms of rat blood and rat suprarenal gland samples for determination ofPTU are presented in Fig. 7. The recoveries from the procedures described are93-97% (six determinations) for blood samples, where a known amount (5.00 /lg/ml)ofPTU was added, and 61-75% (three determinations) for suprarenal gland samples,where 1.0 /lg PTU per gram sample was added before homogenization.
REFERENCES
I J. F. Seiler, Mutat. Res., 26 (1974) 189.2 K. Vogeler, Ph. Dreze, A. Rapp, St. H. Steffan and H. Ullemeyer, Pflanzenschutz-Nachr., 30 (1977) 72.3 J. R. M. Innes, M. Valerio, B. Ulland, A. J. Pallotta, L. Petrucelli, R. R. Bates, H. L. Falk, J. J. Gart, M.
Klein, I. Mitchel and J. Peters, J. Natl. Cancer Inst., 42 (1969) 1101.4 K. S. Khera, Teratology, 7 (1973) 243.5 D. G. Clarke, H. Baum, E. L. Stanley and W. F. Haster, Anal. Chern., 23 (1951) 1842.6 British Standard, BS 5202 Part II, 1983; Anal. Abstr., 46 (1984) 6-30.7 G. E. Keppel, J. Assoc. Off. Anal. Chern., 54 (1971) 528.8 T. E. Cullen, Anal. Chern., 23 (1951) 1842.9 H. A. McLeod and K. A. McCulley, J. Assoc. Off Anal. Chern., 52 (1969) 1226.
10 Report of the Panel on the Determination Dithiocarbamate Residues, Analyst (London), 106 (1981)782.
II M. Uno, y. Onji, M. Nozawa, H. Nakahira and K. Tangawa, Shokuhin Eiseigaku Zasshi, 24 (1983) 201.12 K. K. Mazumbar, N. Samajpati and I. Chakrabarti, Indian J. Exp. Bioi., 20 (1982) 865.13 K. H. Gustafsson and Ch. H. Fahlgren, J. Agrie. Food Chern., 31 (1983) 461.14 K. H. Gustafsson and R. A. Thompson, J. Agrie. Food Chern., 29 (1981) 729.15 R. M. Smith, C. Madaher, W. G. Salt and N. A. Smart, Chrornatographia, 19 (1984) 411.16 R. R. King, J. Agrie. Food Chern., 25 (1977) 73.17 S. Lembo, G. Marzillo and C. Sgambati, J. Chrornatogr., 267 (1983) 427.18 F. J. Lawrence, F. Iverson, H. B. Hanekamp, P. Bos and R. W. Frei, J. Chrornatogr., 212 (1981) 245.19 J. C. Van Damme, M. Galoux and J. Verdier, J. Chrornatogr., 206 (1981) 125.20 H. B. Hanekamp, P. Bos and R. W. Frei, J. Chrornatogr., 186 (1979) 489.21 G. Czegledi-Janko and A. Hollo, J. Chrornatogr., 31 (1967) 89.22 A. F. McKay and W. G. Hatton, J. Arn. Chern. Soc., 78 (1956) 1618.23 J. Pflugmacher and W. Ebing, Z. Lebensm-Unters-Forsch., 179 (1980) 349.


Journal of Chromatography, 479 (1989) 107-116Elsevier Science Publishers B.V., Amsterdam - Printed in The Netherlands
CHROM. 21 650
QUANTIFICATION AND CHARACTERIZATION OF THE TRIFLUOROACETIC ANHYDRIDE DERIVATIVES OF N,N'-ETHYLENEBISSTEARAMIDE AND N,N'-ETHYLENEBISOLEAMIDE
P. A. METZ*, F. L. MORSE and T. W. THEYSON
LONZA Inc., Research and Development Laboratories, 3500 Trenton Avenue, Williamsport, PA 17701(U.S.A.)
(First received March 1st, 1989; revised manuscript received May 26th, 1989)
SUMMARY
An analytical technique for the measurement of low levels (0.1-3.0%) ofN,N'-ethylenebisstearamide (EBS) and N,N'-ethylenebisoleamide (EBO) in polymericmatrices has been developed. The method involves reaction of the secondarybis-amides with trifluoroacetic anhydride (TFAA) followed by high-performanceliquid chromatographic (gel permeation chromatographic) separation and quantification of the N-trifluoroacyl derivatives. The method is linear in ranges typical ofpolymer compounding applications and offers a direct measurement ofEBS and EBOwithout the need for prior extraction. The TFAA derivatives were isolated andcharacterized by infrared and direct-probe mass spectrometry.
INTRODUCTION
Trifluoroacetic anhydride (TFAA) is a powerful electrophilic acylating reagentthat has been shown to react with primary and secondary amines":", amino acids",amides ' and polyamides", as well as a number of other nucleophiles", Historically,TFAA derivatizations have been employed in gas-liquid chromatography (GC) toimprove the volatility and chromatographic behavior of otherwise non-volatile ordifficult to separate compounds", Recently, TFAA has been employed as a derivatization reagent for gel permeation chromatography (GPC) of polymers such aspolyamides9
-11 and polyurethanesV. N-Trifluoroacylation of these polymers im
proves their solubility in common GPC solvents allowing characterization of thepolymer based upon the chromatographic distribution of the TFAA analogue.
N,N'-Ethylenebisstearamide (EBS) and N,N'-ethylenebisoleamide (EBO) arehigh-melting aliphatic amides that are used as additives in a variety of polymers,functioning as lubricants, mold release agents and slip agents. EBS is widely used inacrylonitrile-butadiene-styrene (ABS) and other styrene co-polymers13. EBO hasshown utility as a slip agent and a dispersant for other additives including flameretardants, pigment and colorants in polyolefins!". In addition, numerous patentshave been issued for the application of EBS and EBO in a varity of thermoplastics,including polyurethane elastomers, polyacetals, nylons and acrylates. For these
0021-9673/89/$03.50 © 1989 Elsevier Science Publishers B.V.
108 P. A. METZ, F. L. MORSE, T. W. THEYSON
applications, compounders require accurate quantitation of additive loadings,particularly where low levels of additives are used. Large variations in polymerperformance are known to occur with relatively small differences in additive loadings.
This paper describes an analytical derivatization-GPC procedure for themeasurement oflow levels (0.1-3.0%) ofEBS and EBO in polymer compounds. Thederivatization procedure involves reaction of EBS and EBO with TFAA followed byGPC analysis of the N-trifluoroacyl derivatives. In addition, qualitative data arepresented on the isolated TFAA derivatives, confirming the N-trifluoroacylationreaction.
EXPERIMENTAL
ReagentsEBS and EBO were prepared in-house and are commercially available. ABS,
styrene-acrylonitrile (SAN) and low-density polyethylene (LOPE) were obtainedfrom commercial sources. Reagent-grade TFAA, trichloroacetic anhydride and aceticanhydride were purchased from Aldrich (Milwaukee, WI, U.S.A.). High-performanceliquid chromatography (HPLC) grade chloroform, dichloromethane, carbon tetrachloride and tetrahydrofuran (THF) were obtained from J. T. Baker (Philipsburg, NJ,U.S.A.). ACS reagent-grade heptane was purchased from EM Science (Cherry Hill,NJ, U.S.A.). All other incidental chemicals were ACS reagent grade.
ApparatusThe HPLC system used for the GPC separation of EBS-TFAA and EBO-TFAA
derivatives consisted of a Model 510 pump (Waters Assoc., Milford, MA, U.S.A.),a Model 7125 injector equipped with a 100-plloop (Rheodyne, Cotati, CA, U.S.A.)and a Model LC-lOO column oven, maintained at 60 ± 1°C (Perkin-ElmerCorporation, Norwalk, CT, U.S.A.). Separations were performed at a flow-rate of 1.0ml/min, with THF as the mobile phase. The gel permeation column set consisted oftwo pStyragel® 100 A and two pStyragel 500 A columns (Waters). Detection wasperformed with a Model 410 differential refractive index detector (Waters), with theinternal temperature maintained at 50 ± 1°C. Chromatographic recording, integration and data handling were performed with a Model 4270/Chromatation ATsystem (Spectra-Physics, Santa Clara, CA, U.S.A.).
GC separations of the TFAA derivatives of EBS and EBO were performed ona Model 5890 GC system (Hewlett-Packard, Palo Alto, CA, U.S.A.). The gaschromatograph was equipped with a 3.5 m x 0.53 mm J.D. SPB-5 (dr 1.0 pm)fused-silica column (Supelco, Bellefonte, PA, U.S.A.). Split injections (5: I) of 1.0 piwere performed with helium as the carrier gas at 65 csa!«. The column inlet temperaturewas 300°C. The flame ionization detector was set at 325°C. The column temperatureprogram was from 280 to 320°C at 5°C/min with a final hold time of 5 min.
For identification of the Nstrifluoroacyl derivatives a Model 4021 gas chromatograph-mass spectrometer was used (Finnigan, Sunnyvale, CA, U.S.A.). The gaschromatograph was equipped with a 12m x 0.20 mm J.D. cross-linked methyl silicone(dr 0.33 pm) fused-silica column (Hewlett-Packard). Split injections (20: I) of 1.0 piwere performed with helium as the carrier gas at 40 cm/s. The column inlet was set at300°C and the column temperature program was from 280 to 320°C at SOC/minwith

QUANTIFICATION OF TFAA DERIVATIVES OF EBS AND EBO 109
a hold time of 15 min. Direct-probe mass spectral (MS) sampling was performed withballistic heating from 50 to 300°C. In all experiments the mass spectrometer was usedin the electron-impact (EI) mode with the ionization energy set at 70 eV. The scan ratewas one scan per 3 s over a mass range of 35-950 a.m.u.
Infrared (IR) spectra were recorded on a Model 281 IR spectrophotometer(Perkin-Elmer) using a thin film preparation on a thallium bromide window (ModelKRS-5; Foxboro Company, North Haven, CT, U.S.A.).
SAN and LDPE were compounded in a Model EPL-V3302 BrabenderPlasticorder (C.W. Brabender, Hackensack, NJ, U.S.A.) equipped with a No.6 rollerhead and roller blades. LFPE was pelletized in a 3/4-in. single screw extruder. ABS waspowder blended with EBS and melt blended in an Instron Model 1123 universal testinginstrument (Instron Corp., Canton, MA, U.S.A.) equipped with a Model 3210capillary rheometer.
ProcedureTFAA derivatization ofEBS in SAN was performed by transferring 5.000 g (±
5 mg) of SAN containing between 0.3 and 3.0% EBS into a 100-ml pressure-tightreaction vessel (Model 3-3110, Supelco). To the reaction vessel were added 50.00 ml ofchloroform and 2.00 ml of TFAA. The vessel was sealed and heated on a hot plate(l15°C) for 1.5 h. After reaction, the sample was cooled to ambient temperature,diluted ten-fold in THF and chromatographed by GPC with THF as the mobile phaseat 1.0 ml/rnin. Multi-level calibrations were performed by following the sameprocedure with the addition of 15.0 (± 0.5), 75.0 (± 0.5) and 150.0 mg (± 0.5 mg) ofEBS to each of three reaction vessels containing 5.000 g SAN with no additives.
TFAA derivatization ofEBS in ABS was performed as described above for SANsamples. Multilevel calibrations were carried out in the same manner, with the sameEBS standard levels.
TFAA derivatization of EBO in LDPE was performed by transferring 1.000g (± 5 mg) of LDPE containing between 0.2 and 0.5% EBO to a 100-ml pressure tightreaction vessel. To the vessel were added 30.00 ml ofchloroform plus 2.00 ml ofTFAA.The vessel was sealed and heated for 1.5 h on a hot plate (l15°C). After reaction, thesample was cooled to ambient temperature, during which time the LDPE precipitated.The resulting mixture was centrifuged at 3070 g for 10 min (Model HN-SII;International Equipment Company, Needram Heights, MA, U.S.A.). The lighterpolyethylene gel separated from the reaction mixture and migrated to the top of thevessel. A 10-ml luer lock syringe, with a 3-in. No. 17 gauge needle, was used topenetrate the LDPE layer and collect the chloroform layer for HPLC analysis. Thecollected portion was chromatographed directly by GPC without further dilution.Multilevel calibrations of EBO in LDPE were performed by following the sameprocedure as above with the addition of 2.00 (± 0.05), 3.50 (± 0.05) and 5.00 mg (±0.05 mg) ofEBO to each of the reaction vessels containing 1.000 g LDPE containing noadditives.
TFAA derivatives of EBS and EBO were prepared for the purpose of isolationand identification by reacting 0.150 g (± 5 mg) of the bis-amide with 2 ml TFAA in 50ml of chloroform in a 100-ml reaction vessel. The mixture was heated for 1.5 h at115°C, and then dried under a stream of high-purity nitrogen. The EBS-TFAAderivative was recrystallized twice from scrupulously dried diethyl ether. The

110 P. A. METZ, F. L. MORSE, T. W. THEYSON
EBO-TFAA formed a yellow oil that would not recrystallize. The latter was analyzedwithout further purification. The derivatives were stored over desiccant prior to GC,IR and GC-MS analysis.
RESULTS AND DISCUSSION
HPLC analysis ofEBS and EBO in polymer compounds is made difficult by thefact that neither the polymers nor the aforementioned additives is readily soluble inroutine HPLC solvents. GC analysis is limited by both the solubility and volatility ofthe fatty secondary amides and the polymer matrix. Edwards 15 has reported an HPLCmethod for the analysis of amide slip agents in polyethylene and polyethylene-vinylacetate copolymers. However, the slip agents reported were the more soluble primaryamides. The latter were readily.extracted from resin granules and thin film strips withmethanol. Additives in polyolefins have also been analyzed by capillary GC withon-column injection of dichloromethane-methanol (1:1) extracts!". In-house procedures for separation and analysis of the less soluble secondary bis-amides, EBS andEBO, in various polymer compounds historically involved high temperature Soxhletextractions (6-24 h), followed by total nitrogen (Kjeldahl) analysis. These methods aretime consuming, require significant amounts of sample handling and lack specificityand sensitivity. This lab has also investigated dispersive IR and Fourier transform(FT)-IR analysis of polymer thin film for EBS and EBO using reflectance andattenuated total reflectance accessories. While IR spectroscopy shows promise forhigher levels of these additives (1-5%)in a limited number of polymer compounds, itdoes not represent a universal analytical approach. Furthermore, IR techniques havebeen hampered by the ability to prepare and/or reproduce thin films. Differentialscanning calorimetry (DSC) has also been investigated. Preliminary results indicatethat subtle changes in the polymer glass transition state may be correlated to additiveloading levels.
TFAA derivatization of EBS and EBO in polymer compounds followed byHPLC (GPC) analysis of the N-trifluoroacyl derivatives allows direct measurement oflow levels of these additives without the need for extraction.
Eqn. I shows the reaction of TFAA with EBS/EBO:
H HR-C-N-CH2-CHz-N-C-R' + 2(F3CCOho --->
II IIo 0
R-C-N-CH2-CHz-N-C-R' + 2F3CCOOH
II I I IIo c=o O=C 0
I ICH 3 CF 3
(I)
Although both N- and O-trifluoroacetylation reactions have been reported? andEBS/EBO derivatization may proceed through the enolic intermediate, no evidence ofO-trifluoroacetylation has been found. Other anhydrides were also tested for theirability to derivatize EBS and EBO. Trichloroacetic anhydride, chioro acetic anhydrideand acetic anhydride, respectively, were less reactive towards the secondary bisamides. The latter two anhydrides did not react with EBS or EBO in polymer matrices.TFAA not only reacts with the secondary bis-amides, but significantly enhancespolymer solubility in the reaction media.
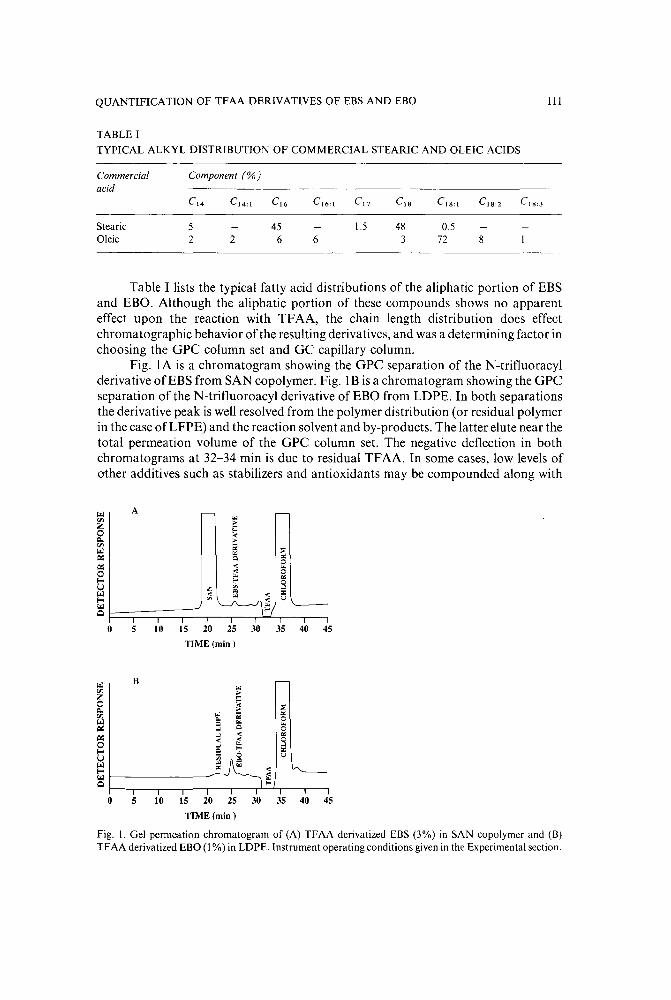
QUANTIFICATION OF TFAA DERIVATIVES OF EBS AND EBO
TABLE ITYPICAL ALKYL DISTRIBUTION OF COMMERCIAL STEARIC AND OLEIC ACIDS
111
Table I lists the typical fatty acid distributions of the aliphatic portion of EBSand EBO. Although the aliphatic portion of these compounds shows no apparenteffect upon the reaction with TFAA, the chain length distribution does effectchromatographic behavior of the resulting derivatives, and was a determining factor inchoosing the GPC column set and GC capillary column.
Fig. lA is a chromatogram showing the GPC separation of the N-trifluoracylderivative ofEBS from SAN copolymer. Fig. lB is a chromatogram showing the GPCseparation of the N-trifluoroacyl derivative of EBO from LDPE. In both separationsthe derivative peak is well resolved from the polymer distribution (or residual polymerin the case ofLFPE) and the reaction solvent and by-products. The latter elute near thetotal permeation volume of the GPC column set. The negative deflection in bothchromatograms at 32-34 min is due to residual TFAA. In some cases, low levels ofother additives such as stabilizers and antioxidants may be compounded along with
'"A - -
'" '"z ..;:0 -e
Q. ..v: Oi :;0'" '"c:.: Q "0c:.: -e ...0 -e 0...
"f- .,.'=<c z '"'" :;:
'" -c '" -ef- '" ,,'" u
'" ~~
\~IQ
0 5 10 15 20 25 30 35 40 45
TIME (min )
'"B
'"'" ..Z ;:0 ~ :;0Q.u: '" Oi ".. 0
'" Q '" ...c:.: -l Q 0c:.: -l -e ".., <:: 00 ;, -lf- Q
.,.:I:
U :;; 0 o
'" '"'" " '" -ef-
'" <::Q ...
0 5 10 15 20 25 30 35 40 45
TlME(minl
Fig. I. Gel permeation chromatogram of (A) TFAA derivatized EBS (3%) in SAN copolymer and (B)TFAA derivatized EBO (I %) in LDPE. Instrument operating conditions given in the Experimental section.

112 P. A. METZ, F. L. MORSE, T. W. THEYSON
TABLE II
LINEAR RANGES AND MINIMUM DETECTION LIMITS FOR EBS AND EBO DERIVATIVES
Sample Working range (% wiw) Linearity, R 2 MDL"
EBS in SAN 0.3-3.0 0.9999 omEBS in ABS 0.3-3.0 0.9996 0.02EBO in LDPE 0.2--0.5 0.9989 0.05
a MDL = Minimum detection limit, based on a signal-to-noise ratio of 2:I.
EBS or EBO. Such components may present a problem in quantitation ofEBS or EBOif they fall in the same molecular-weight range as the respective TFAA derivatives. Inthis study, the EBS and EBO derivatives were sufficiently resolved from any otherinterferences to allow for good quantitation. Preliminary results obtained in thislaboratory for complex polymer blends indicate that quantitation by the method ofstandard addition may be used where additives of similar molecular weight interferewith EBS or EBO measurement. Also, changing data handling from peak area to peakheight improves quantitation when EBS and EBO derivatives are not completelyresolved from interfering peaks.
Table II lists the linear ranges and minimum detection limits for EBS and EBOcompounded in three polymers, ABS, SAN and LDPE. The secondary bis-amide/polymer combinations and the corresponding working ranges are consistent withspecific plastic applications. EBS and EBO response linearity are based on a threepoint standardization. The minimum detection limits have been obtained experimentally and represent that quantity of analyte that produces a signal equal to twicethe baseline noise.
Table III lists the precision and accuracy of the method for EBS and EBOmeasurement in the respective polymer matrices. The standard deviation is less than2% relative for both standards and samples (n = 5 determinations). Good agreementwas found between the measured level and the actual compounded amounts of EBSand EBO. The accuracy of the determination is largely dependent upon the method ofstandardization. A multipoint external standard calibration of the secondary bisamide in the polymer matrix was found to give the best results.
Fig. 2 shows the effect of the polymer matrix upon the standardization of EBS inSAN. It is evident that the polymer matrix affects the standardization, decreasing the
TABLE III
PRECISION AND ACCURACY FOR EBS AND EBO USING TFAA DERIVATIZATION METHOD
Sample R.S.D. a (%) Accuracy
Standards Samples % Compounded % Found
EBS in SAN 1.42 1.88 2.00 2.08EBS in ABS 1.69 1.98 1.00 0.96EBO in LDPE 1.35 2.00 0.40 0.41
a R.S.D. = Relative standard deviation (n = 5).

QUANTIFICATION OF TFAA DERIVATIVES OF EBS AND EBO 113
320
~ 2603!Z 200;;loU 140..:~Cl::-e 80
20 -t-''T-.---.----.-.--.--,---,,-,----r---.--.-----.-.--,0.2 0.6 1.4 1.8 2.2 2.6 3
EBS (%)
Fig. 2. Comparison of SAN copolymer matrix (D) and non-matrix (+) three-point calibration ofTFAA-derivatized EBS (range 0.3-3.0%).
slope of the standard curve. This trend was consistent, regardless of the secondarybis-amide or polymer matrix studied. Table IV lists calibration data for polymermatrix and non-matrix standardization ofEBS and EBO in the three polymers studied.The response is always greater for the analyte in the matrix-free environment.However, the polymer matrix does not appear to affect the linearity of response asevidenced by the correlation coefficients shown. These results indicate that improvedaccuracy may be expected when standards are prepared in the polymer matrix in whichthey intend to be measured. However, it may be possible to apply a calculatedcorrection factor to non-matrix standardization results based on the differencesbetween the two calibration curves.
As noted previously, TFAA addition to chloroform greatly improved thesolubility of otherwise insoluble or very slow to dissolve polymers. Hence, somecontroversy arose as to whether EBS and EBO were in fact derivatized, or perhapsmore readily dissolved with the aid of TFAA. Four pieces of evidence indicate theformation of bis-amide -N-trifluoroacyl derivatives: IR spectral data, melting pointdata, MS analysis and GC analysis.
Fig. 3 shows IR spectra of EBO and the isolate from the reaction of EBO withTFAA, respectively. Strong bands at 3350crrr ' (N-H stretching vibrations) and 1565cnr' (N-H bending vibrations) characteristic of secondary amides were not present inthe TFAA derivative isolate spectrum. Furthermore, the shift of the amide band in thederivative spectrum from 1640 to 1720 cm' is consistent with the formation of
TABLE IV
EFFECT OF POLYMER MATRIX ON EXTERNAL STANDARDIZATION
Sample
EBS in SANEBS in ABSEBO in LOPE
Slope" y Intercept R2
Matrix Non-matrix Matrix Non-matrix Matrix Non-matrix
4.97 . 10-6 3.63 . 10-7 0.010 0.002 0.9999 1.00001.23 . 10-5 9.48' 10-6 0.190 0.001 0.9996 0.99992.3 . 10- 7 1.37 . 10-8 0.001 0.001 0.9989 0.9997
a Slope based on a three-point external standardization.

114
100
zo 60....[IJ[IJs[IJ
Z~c:.:::Eo-<
20
P. A. METZ, F. L. MORSE, T. W. THEYSON
4000 3500 3000 2500 2000 1800 1600 1400 1200 1000 800 600
WAVENUMBER (eM')
Fig. 3. Infrared spectrum of (--) EBO and (---------) the isolate from the reaction of EBO with TFAA.
a tertiary amide and with the addition of an electron withdrawing group to thenitrogen. Analogous IR spectral differences between EBS and the EBS/TFAA isolatewere observed. These results are consistent with those published previously for theN-trifluoroacyl derivatives of polyarnides 'P.
The EBS and EBO derivative isolates also displayed different melting rangesthan their respective starting materials. The EBS derivative isolate displayed a meltingrange of 61-69°C. The EBS starting material melts between 140 and 145°C.Recrystallization of the EBS-TFAA isolate was performed in scrupulously driedsolvents since the N-trifluoroacyl derivatives favor hydrolysis back to the secondaryamide. The EBO starting material had a melting range of 110-1 17°C, the EBO-TFAAderivative isolate was a liquid at room temperature. Repeated attempts to recrystallizethis isolate, even under cryogenic conditions ( - 72°C), were unsuccessful. Decreasedmelting ranges are consistent with the formation of tertiary amide derivatives, due toloss of available protons for inter-molecular bonding.
Fig. 4 and 5 are direct-probe EI mass spectra (DP-EI-MS) of EBS and theEBS-TFAA derivative isolate, respectively. The molecular ion (M +) at mjz = 784(Fig. 5) represents the derivatized bis-amide with two stearate groups making up thealiphatic portion of the molecule. As shown in Table I, the aliphatic portion ofEBS isderived form a complex distribution of fatty acids. Although the molecular ionsthroughout the probe profile were weak (< 0.1% total ion current), M + ions of mlz= 770, 756, 742 and 728 representing other possible combinations of fatty amidederivatized species were found in other MS runs. Molecular ions and high-molecularweight fragments were als quite weak in the DP-EI-MS of the EBS starting material.However, some common low-molecular-weight fragments tm]: = 43,57,71,84 and98) were found in both this spectra and the EBS/TFAA derivative isolate spectra.These data indicate that the isolate is likely a derivative of the EBS starting material.No clear assignment could be made for fragments associated with the trifluoracylfragment. Similar DP- ElMS results were obtained for the EBO-TFAA derivative, withweak M+ ions of mjz = 780, 778, 766, 754, 752 and 750 being observed.

QUANTIFICATION OF TFAA DERIVATIVES OF EBS AND EBO 115
166.6 43
> 50.0 57Eo--- 7300 86
;Z~Eo-- 284 297 369 325;Z
50 100 156 200 250 366-~ 100.6 , 56.6X
;,-~....;l~ 56.6
566~
340 353 368 381 J9'j
35el 400 450 500 556 660
M/ZFig. 4. Direct-probe EI (70 eV) mass spectrum obtained by analysis of underivatized EBS. Instrumentoperating conditions given in the Experimental section.
166.6 4357
56.6 7198
335 350 364 377 392 405 423 691 614
300
600
273 235 361 322
256
550
518 532 545 560 574
450 500
156 200
449 473 499
133 154 168 186 193
469,500. ex
100
84
50
350
56.9
59.0
199.9
199.6
784643 668
650 700 ?S9
M/Z000 859
Fig. 5. Direct-probe EI (70 eV) mass spectrum obtained by the analysis ofTFAA derivatized EBS, showingthe weak molecular ion im}z 784) for the distearate bis-amide derivative. Instrument operating conditionsgiven in the Experimental section.

116 P. A. METZ, F. L. MORSE, T. W. THEYSON
GC-EI-MS analysis of both the EBO-TFAA and EBS-TFAA derivatives wasunsuccessful, presumably because not enough material was ionized to producea strong mass spectrum. In either case, no molecular ions were observed for theN-trifluoroacyl derivatives. A softer ionization mechanism, such as chemical ionization (CI) or fast atom bombardment (FAB) may have given improved results,especially with respect to generating stronger molecular ions. However, thesetechniques were not available during this study. The use of ammonia reagent gas indesorption CI-MS has been reported to be a useful technique for obtaining strongpseudo molecular ions (M + NH 4 ) in high-molecular-weight compounds containinglong chain aliphatic functions 1
? This technique may be successful for MS analysis ofthe TFAA derivatives.
The TF AA derivatives of EBS and EBO have also been analyzed by GC ona short non-polar stationary phase column (3.5 m, SPB-5) with high carrier gasflow-rate (65 cm/s). This fact alone supports the formation of the N-trifluoroacylderivative, since EBS and EBO are themselves not sufficiently volatile to undergo Gc.While TF AA derivatization of EBS or EBO followed by GC would not be applicableto polymer analysis, it may be an attractive approach for product characterization.The TFAA derivatives are readily formed at room temperature and the GC separationmay be fine-tuned to give a distinct "finger print" of the final product distribution. Animportant consideration in the GC technique is the removal of excess TFAA andtrifluoroacetic acid by evaporation or neutralization prior to GC analysis. Residualacid and anhydride are highly corrosive and may damage stainless steel surfaces on theGC injector and detector, and may also depolymerize the stationary phase.
ACKNOWLEDGEMENTS
The authors wish to thank Bucknell University for the use of their MS facilitiesand Peter Findise for his expert assistance with MS studies.
REFERENCES
I W. J. A. VandenHeuvel, W. L. Gardner and E. C. Horning, Anal. Chem., 36 (1964) 1550.2 W. J. Irvine and M. J. Saxby, J. Chromatogr., 70 (1972) 141.3 R. A. Morrisette and W. E. Link, J. Gas Chromatogr., 3 (1965) 67.4 M. Hasegawa and I. Matsubara, Anal. Chem., 63 (1975) 308.5 G. P. Slater, J. Chromatogr., 64 (1972) 166.6 H. S. Schuttenberg and R. C. R. C. Schultz, Angew. Chem., Int. Ed. Engl., 15 (1976) 777.7 D. R. Knapp, Analytical Derivatization Reactions, Wiley-Interscience, New York, 1979, p. 687.8 W. J. A. VandenHeuvel, J. Sjovall and E. C. Horning, Biochim. Biophys. Acta, 48 (1961) 596.9 E. Jacobi, H. Schutlenberg and Schultz, Makromol. Chem., I (1980) 397.
10 K. Weisskopf, Polymer, 24 (1983) 72.I I K. Weisskopf, Polymer, 26 (1985) 1187.12 E. Bragini, E. Gattiglia, E. Pedemonte and S. Russo, Makromol. Chem., 184 (1983) 1213.I3 L. L. Blyler, Jr., Soc. Plast. Eng. (Tech. Pap.), 20 (1974) 33.14 T. E. Breuer, N. B. Martin and H. Tomilson, ANTEC Conference Proceedings, Washington, DC, April
29-May 2, 1985.15 D. H. Edwards, J. High Resolut. Chromatogr. Chromatogr. Commun., 5 (1982) 161.16 G. diPasquale, L. GiambeIli, A. Suffientini and R. PaieIla, J. High Resolut. Chromatogr. Chromatogr.
Commun., 8 (1985) 618.17 P. A. Metz, D. R. Omstead, L. Kaplan, J. A. Liesch, R. A. Stearns and W. J. A. VandenHeuvel, J.
Chromatogr., 441 (1988) 31.

Journal of Chromatography, 479 (1989) 117-124Elsevier Science Publishers B.Y., Amsterdam - Printed in The Netherlands
CHROM. 21 659
SELECTIVE DETERMINATION OF BENZO[a]PYRENE IN PETROLEUMBASED PRODUCTS USING MULTI-COLUMN LIQUID CHROMATOGRAPHY
P. R. FIELDEN' and A. 1. PACKHAM
Department of Instrumentation and Analytical Science, U.M.I.S.T., P.O. Box 88, Manchester M60 lQD(U.K.)
(First received April 24th, 1989; revised manuscript received 1une 5th, 1989)
SUMMARY
A method is presented to enable the rapid on-line determination of benzo[a]pyrene in petroleum-based products such as diesel oil and aviation fuel. A columnswitching technique is employed to achieve the necessary resolution due to the complex sample matrix. Fluorescence detection is employed to further increase the selectivity towards the polynuclear aromatic hydrocarbons. A cyclodextrin bonded phasecolumn was used to give the initial fractionation. The fraction of interest was thenheart cut onto a reversed-phase CIS analytical column and separated using gradientelution. This technique removes, with the exception of dilution and filtration, anynecessary pre-analytical step.
INTRODUCTION
Polynuclear aromatic hydrocarbons (PAHs) are common environmental pollutants derived from both natural and man-made combustion of a variety of carbonbased materials. The carcinogenic nature of some of the group members, notablybenzo[a]pyrene, has been well documentedv? as have both selective and general analytical techniques/r'. The determination of these compounds in petroleum products,and especially diesel oils, causes significant analytical problems due to the complexnature of the matrix. Diesel oil is a complex mixture of hydrocarbons with a boilingrange of between 180 and 360°C. Between 15 and 30% has an aromatic nature, whilethe remainder is essentially aliphatic".
Multi-column techniques have been used to overcome the non-availability ofhighly efficient columns capable of resolving petroleum products. However, toachieve a final fraction of suitable complexity, incompatible techniques such as normal- and reversed-phase or size-exclusion and reversed-phase chromatography needto be used. The solvent-exchange procedures that are therefore necessary are complexand result in long analysis times and analyte loss or degradation. Sonnefeld et al."have reported an on-line normal-rreversed-phase technique using a gas-dried intermediary diamine exchange column. May and Wise6 have proposed a similar technique.
0021-9673/89/$03.50 © 1989 Elsevier Science Publishers B.Y.

118 P. R. FIELDEN, A. J. PACKHAM
although the solvent exchange was achieved using off-line solvent evaporation. Theunique selectivity of the cyclodextrin bonded phases has been used to resolve thesolvent incompatibility problem. The chromatographic technique involves fractionating an oil sample on a y-cyclodextrin column. The fraction obtained from this columnthat contains benzo[a]pyrene is then passed directly to the head of a C18 columnrather than to the detector. The fraction can then be eluted from this column and theanalyte determined at a later time.
The cyclodextrins are torus-shaped polymers consisting of a-l,4 D-glucosideoligosaccharides. The external surface is ringed by hydroxyl groups giving a hydrophilic environment. The internal environment is hydrophobic and responsible for theselective nature of the column by the formation of inclusion complexes with molecules of the correct size and charge distribution 7
. Three cyclodextrins have beensuccessfully bound to a 5-,um spherical silica base. These have been named a-, [3- andy-cyclodextrins and consist of six, seven and eight glucose monomers, respectively.The internal diameters are 0.57, 0.78 and 0.95 nm, respectively, and in all three casesthe torus is about 0.78 nm deep". The size of benzo[a]pyrene, across the wide axis, isapproximately 0.88 nm suggesting that only the [3- and j-cyclodextrins will be able toform inclusion complexes. This has been confirmed" and benzo[a]pyrene has beenshown to form a 2:1 analyte-eavity complex. In a recent study by Olsson et al" theretention of a range of PARs by monomeric and polymeric C18 bonded phases andby the [3-cyclodextrin bonded phase were compared. While the resolving power of thecyclodextrin phase was not found to be as high as that of conventional reversedphases, the authors did suggest that the cyclodextrin-bonded phases may offer significant advantages where the separation of PARs of different molecular weights isrequired. In this study only the v-cyclodextrin bonded phase was used.
The cyclodextrins are a relatively new group of bonded phases and have beenused successfully for the separation of a number of chiral compounds such as benzo[a]- and benzo[e]pyrene, dansyl D- and L-Ieucine7, and ortho; para- and meta-nitroanilines 7 . [3- and y-bonded phases have been used by Armstrong et al. l l to resolvemixtures of PARs. These separations have been achieved due to the ability of thephase to form an inclusion complex. The stability of the complex depends on thecharge distribution, and the shape and size of the molecule forming the complex.There must be a hydrophobic region within the molecule that is the correct size toenter the cavity; the complex stability may be enhanced by the presence of externalpolar groups that are able to interact with the secondary hydroxyls. If the analyte istoo large it will be unable to enter the cavity and no inclusion-derived retention willoccur, although retention may still be observed due to an ionic interaction mechanism. In this mode the column acts as a high-density diol column. If the analyte is toosmall it will enter the cavity, but the stability of the complex is poor and the retentionwill be low. It is also possible to use non-polar solvents such as hexane with thesephases; in this case no inclusion occurs and retention is due purely to external adsorption.
EXPERIMENTAL
MaterialsBenzo[a]pyrene was obtained from BDR (Poole, U.K.). Chromatographic sol
vents were also obtained from BDH and were of HiPerSolv grade. The water used in
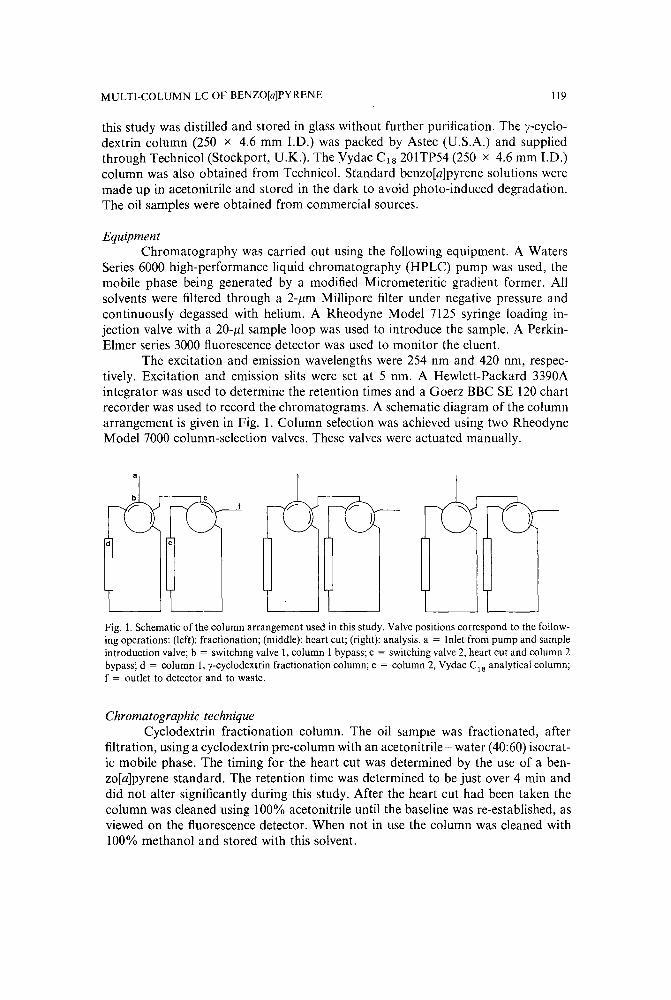
MULTI-COLUMN LC OF BENZO[a]PYRENE 119
this study was distilled and stored in glass without further purification. The y-cyclodextrin column (250 x 4.6 mm J.D.) was packed by Astec (U.S.A.) and suppliedthrough Technicol (Stockport, U.K.). The Vydac C1 8 20lTP54 (250 x 4.6 mm LD.)column was also obtained from Technicol. Standard benzo[a]pyrene solutions weremade up in acetonitrile and stored in the dark to avoid photo-induced degradation.The oil samples were obtained from commercial sources.
EquipmentChromatography was carried out using the following equipment. A Waters
Series 6000 high-performance liquid chromatography (HPLC) pump was used, themobile phase being generated by a modified Micrometeritic gradient former. Allsolvents were filtered through a 2-pm Millipore filter under negative pressure andcontinuously degassed with helium. A Rheodyne Model 7125 syringe loading injection valve with a 20-pl sample loop was used to introduce the sample. A PerkinElmer series 3000 fluorescence detector was used to monitor the eluent.
The excitation and emission wavelengths were 254 nm and 420 nm, respectively. Excitation and emission slits were set at 5 nm. A Hewlett-Packard 3390Aintegrator was used to determine the retention times and a Goerz BBC SE 120 chartrecorder was used to record the chromatograms. A schematic diagram of the columnarrangement is given in Fig. 1. Column selection was achieved using two RheodyneModel 7000 column-selection valves. These valves were actuated manually.
Fig.!. Schematic of the column arrangement used in this study. Valve positions correspond to the following operations: (left): fractionation; (middle): heart cut; (right): analysis. a = Inlet from pump and sampleintroduction valve; b = switching valve 1, column 1 bypass; c = switching valve 2, heart cut and column 2bypass; d = column I, y-cyc1odextrin fractionation column; e = column 2, Vydac CIS analytical column;f = outlet to detector and to waste.
Chromatographic techniqueCyclodextrin fractionation column. The oil sample was fractionated, after
filtration, using a cyclodextrin pre-column with an acetonitrile - water (40:60) isocratic mobile phase. The timing for the heart cut was determined by the use of a benzo[a]pyrene standard. The retention time was determined to be just over 4 min anddid not alter significantly during this study. After the heart cut had been taken thecolumn was cleaned using 100% acetonitrile until the baseline was re-established, asviewed on the fluorescence detector. When not in use the column was cleaned with100% methanol and stored with this solvent.
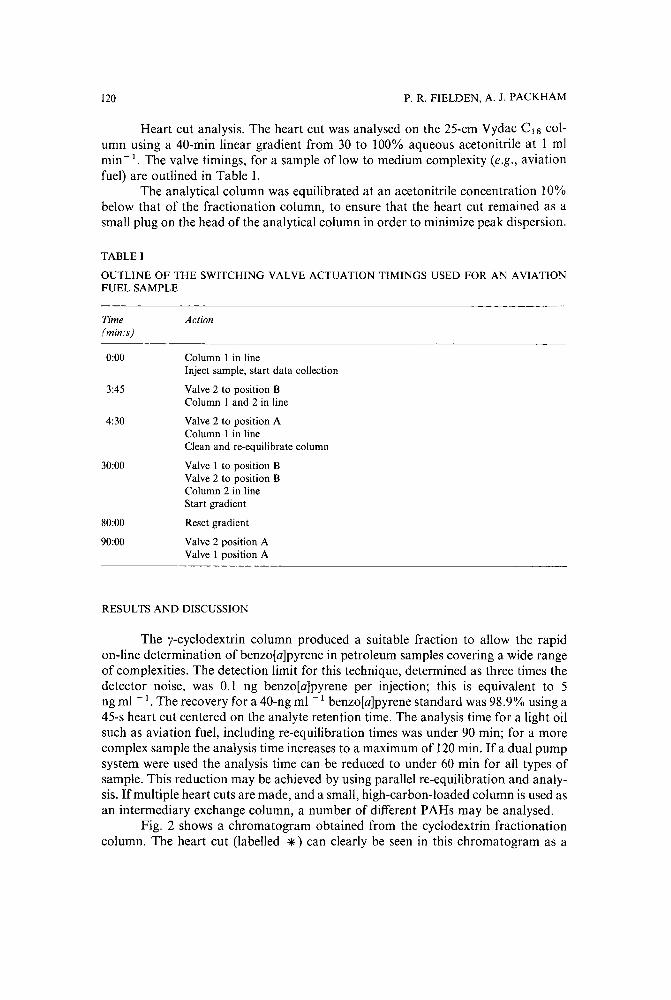
120 P. R. FIELDEN, A. J. PACKHAM
Heart cut analysis. The heart cut was analysed on the 25-cm Vydac C1 S column using a 40-min linear gradient from 30 to 100% aqueous acetonitrile at 1 mlmin -1. The valve timings, for a sample of low to medium complexity (e.g., aviationfuel) are outlined in Table I.
The analytical column was equilibrated at an acetonitrile concentration 10%below that of the fractionation column, to ensure that the heart cut remained as asmall plug on the head of the analytical column in order to minimize peak dispersion.
TABLE I
OUTLINE OF THE SWITCHING VALVE ACTUATION TIMINGS USED FOR AN AVIATIONFUEL SAMPLE
Time(min:s)
0:00
3:45
4:30
30:00
80:00
90:00
Action
Column I in lineInject sample, start data collection
Valve 2 to position BColumn I and 2 in line
Valve 2 to position AColumn I in lineClean and re-equilibrate column
Valve I to position BValve 2 to position BColumn 2 in lineStart gradient
Reset gradient
Valve 2 position AValve I position A
RESULTS AND DISCUSSION
The y-cyclodextrin column produced a suitable fraction to allow the rapidon-line determination of benzo[a]pyrene in petroleum samples covering a wide rangeof complexities. The detection limit for this technique, determined as three times thedetector noise, was 0.1 ng benzo[a]pyrene per injection; this is equivalent to 5ng ml -1. The recovery for a 40-ng ml -1 benzo[a]pyrene standard was 98.9% using a45-s heart cut centered on the analyte retention time. The analysis time for a light oilsuch as aviation fuel, including re-equilibration times was under 90 min; for a morecomplex sample the analysis time increases to a maximum of 120 min. If a dual pumpsystem were used the analysis time can be reduced to under 60 min for all types ofsample. This reduction may be achieved by using parallel re-equilibration and analysis. If multiple heart cuts are made, and a small, high-carbon-loaded column is used asan intermediary exchange column, a number of different PAHs may be analysed.
Fig. 2 shows a chromatogram obtained from the cyclodextrin fractionationcolumn. The heart cut (labelled *) can clearly be seen in this chromatogram as a

MULTI-COLUMN LC OF BENZO[ajPYRENE
DETECTORRESPONSE
121
It
5 10 min
Fig. 2. Chromatogram showing a 45-s heart cut (marked *) taken from a sample of aviation fuel fractioned on a y-cydodextrin column. The mobile phase was acetonitrile - water (40:60), flow-rate 1 mlmin-I.
vacancy in the detector signal output, the rapid drop in fluorescence is due to solventeluting from the bottom of the CiS column. The length of the heart cut influences thesensitivity of the analysis. A reduced heart-cut time will decrease the amount ofbenzo[a]pyrene that can be transferred to the second column but also decreases theamount of interfering substances present in the fraction. The timing and length of theheart cut was not optimized in this study, however, it would be expected that optimization of this parameter would result in a reduced minimum level of detection. Thisreduction could also be achieved using further fractionation columns especially whenhighly complex samples are to be analysed. The time of the heart cut is limited by thenecessity to introduce the sample as a small plug on the head of the second column.Failure to do this leads to poor sample resolution when the final analysis is carriedout. The mobile phase used to elute the benzo[a]pyrene fraction from the cyclodextrincolumn was acetonitrile-water (40:60). At this acetonitrile concentration, the organicmodifier enters the cyclodextrin cavity in preference to the analyte. This has the effectof reducing inclusion formation for benzo[a]pyrene to a minimum and allowing it toelute in less than 4.5 min. The vast majority of interfering components are morestrongly retained on the column by a mechanism, that is as yet, not fully understood.The use of lower acetonitrile concentrations would cause strong retention of benzo[a]pyrene and probably produce a fraction of similar complexity. However, this
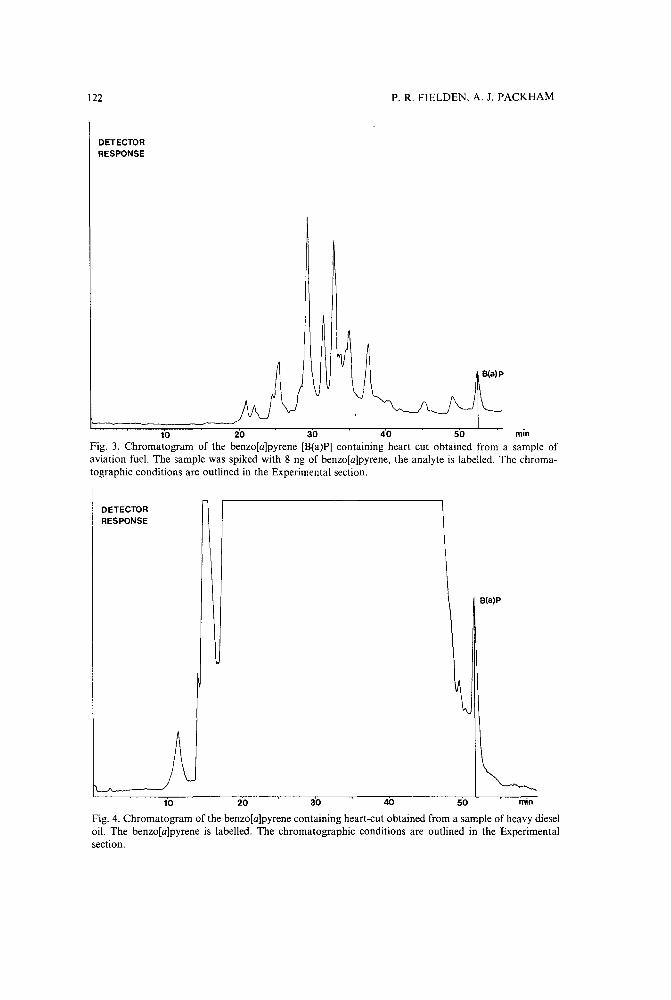
122
DETECTORRESPONSE
P. R. FIELDEN, A. J. PACKHAM
B(a)p
10 20 30 40 50 minFig. 3. Chromatogram of the benzo[a]pyrene [B(a)P] containing heart cut obtained from a sample ofaviation fuel. The sample was spiked with 8 ng of benzo[a]pyrene, the analyte is labelled. The chromatographic conditions are outlined in the Experimental section.
DETECTORRESPONSE
B(a)P
\
A10 20 30 40 50 min
Fig. 4. Chromatogram of the benzo[a]pyrene containing heart-cut obtained from a sample of heavy dieseloil. The benzo[a]pyrene is labelled. The chromatographic conditions are outlined in the Experimentalsection.

MULTI-COLUMN LC OF BENZO[a]PYRENE 123
would lengthen the analysis time and as the efficiency of these columns is relativelylow, the heart-cut time would have to be increased significantly to maintain the highrecovery. The long heart cut time, in addition to the lower acetonitrile concentrations,would mean that the sample would not be introduced as a small plug on the head ofthe second column and so the final resolution would be decreased.
Fig. 3 shows the final analytical chromatogram of an aviation fuel spiked withbenzo[a]pyrene, so that the final injection contained 8 ng of the analyte. The analytepeak is baseline resolved from all interfering components suggesting that there hasbeen a high degree of fractionation in the cyclodextrin column. This high degree ofresolution allows very low levels of benzo[a]pyrene to be assayed.
Fig. 4 shows the final chromatogram of a heavy diesel oil. Although the benzo[a]pyrene has not been fully resolved, due to the far higher sample complexity, it isclearly visible and quantitation may be carried out precisely. The resolution of thissample may be improved by the incorporation of a further fractionation stage toreduce the fraction complexity without adversely affecting the recovery of benzo[a]pyrene.
The method described in this paper can be used to give both quantitative andqualitative information about the amount of benzo[a]pyrene in various petroleumproducts. Significant advantages over off-line and other on-line techniques areachieved. In particular the system increases operator safety due to the reduced environment contamination and sample handling, and sample loss due to the reducedpossible adsorption or volatization of the sample. The removal of any pre-analysisstep, such as solid phase or solvent-solvent extraction significantly reduces the analysis time and analyst hours required for the determination. The sensivity is high due tothe resolution of the sample and the almost complete transfer of the benzo[a]pyrene inthe fraction to the analytical column. This highlights the advantages that multicolumn techniques have over conventional methods. The selectivity towards the chosen analyte is high while the time spent resolving it from interferences is reduced. Thelimitation of this method lies in its cost and complexity, although this must be offsetagainst the reduced analysis time and increased operator safety.
ACKNOWLEDGEMENTS
A. J. P. is in receipt of a Science and Engineering Research Council CASEaward, co-sponsored by Esso Petroleum Company Ltd. (Esso Research Centre,Abingdon, U.K.). We are also indebted to Technicol for the supply of columns usedin this study.
REFERENCES
1 D. Hoffman and C. E. Wynder, Chemical Carcinogens, ACS Monograph Series No. 173, AmericanChemical Society, Washington, DC, 1976.
2 R. D. Harvey (Editor), Polycyclic Aromatic Hydrocarbons and Carcinogenesis, ACS Monograph SeriesNo. 283, American Chemical Society, Washington, DC, 1985.
3 M. L. Lee, M. V. Novotny and K. D. Bartle, Analytical Chemistry of Polycyclic Aromatic Compounds,Academic Press, New York, 1981.
4 D. J. Cookson, C. J. Rix, I. M. Show and B. E. Smith, J. Chromatogr., 312 (1984) 237.5 W. J. Sonnefeld, W. H. Zoller. W. E. May and S. A. Wise. Anal. Chem., 54 (1982) 723.

124 P. R. FIELDEN, A. J. PACKHAM
6 W. E. May and S. A. Wise, Anal. Chem., 56 (1984) 225.7 Cyclobond Handbook, Advanced Separation Technologies, Whippany, NJ.8 R. Woodberry, S. Ransom and C. Fu-Ming, Anal. Chem., 60 (1988) 2621.9 M. Olsson, L. C. Sander and S. A. Wise, J. Chrornatogr., 477 (1989) 277.
10 D. W. Armstrong, D. Wade, A. Alak, W. L. Hinze, T. E. Riehl and K. H. Bui, Anal. Chem., 57 (1985)234.
II D. W. Armstrong, A. Alak, D. Wade, W. L. Hinze and T. E. Riehl, J. Liq. Chrornatogr., 8 (1985) 261.

Journal of Chromatography, 479 ,(989) 125-133Elsevier Science Publishers B.Y., Amsterdam - Printed in The Netherlands
CHROM. 21 663
CHROMATOGRAPHIC DETERMINATION OF AMINES IN BIOLOGICALFLUIDS WITH SPECIAL REFERENCE TO THE BIOLOGICAL MONITORING OF ISOCYANATES AND AMINES
I. DETERMINATION OF 1,6-HEXAMETHYLENEDIAMINE USING GLASSCAPILLARY GAS CHROMATOGRAPHY AND THERMIONIC SPECIFICDETECTION
G. SKARPING*, M. DALENE, T. BRORSON, J. F. SANDSTROM, C. SANGO and A. TlLJANDER
Department of Occupational and Environmental Medicine, University Hospital, S-22185 Lund (Sweden)
(First received March 21st, 1989; revised manuscript received June 2nd, (989)
SUMMARY
A capillary gas chromatographic method with thermionic specific detection wasdeveloped for the analysis of 1,6-hexamethylenediamine (HDA) (CA. No. 124-09-4)in aqueous solution, human urine and plasma. The method is based on a derivatizationprocedure with ethyl chloroformate (CA. No. 541-41-3) in a two-phase system, whereHDA-diurethane is formed. The overall recovery was found to be 95 ± 5% fora concentration of 100 p,g HDA/l of urine, 98 ± 5% for 1000 p,g/l. In plasma therecovery was 106 ± 4% for 500p,g/l. The minimum detectable concentration in plasmaand urine was found to be less than 10p,g/l. The use of heptafluoro butyric anhydride asa derivatization reagent is also discussed.
INTRODUCTION
Aliphatic diamines are industrially used as chelating agents and chemicalreagents. 1,6-Hexamethylenediamine (HDA) is used for the manufacture of urethanecoatings and of polyamides, e.g. Nylon-66, also in paints and as a curing agent forepoxy resins. HDA is moderately toxic'<", and has been associated with healthhazards in the work environmenr':",
Analogous endogenous diamines, e.g., putrescine (l,4-diaminobutane) andcadaverine (1,5- diaminopentane), are known to have important roles in cell growthand differentiation. HDA has been identified in humans, as one in a series ofmetabolites of the cell-differentiating agent hexamethylenebisacetamide (HMBA)6-9.Rosenberg and Savolainen'? have proposed that analysis of HDA in urine may beused as a test for occupational exposure to 1,6-hexamethylenediisocyanate (HDI).
The occurrence of diamines in working atmospheres, and the biochemicalinterest in di- and polyamines, has necessitated development of a series of analyticalmethods, including high-performance liquid chromatography (HPLC)11-14, gas
0021-9673/89/$03.50 © 1989 Elsevier Science Publishers B.Y.

126 G. SKARPTNG et al.
chromatography (GC)15, ion-exchange and ion-pair chromatographv'P'!" and thinlayer chromatography1~, Monitoring of HDI in air using impinger flasks containingacidic aqueous solutions, where HDA is formed, was described by Dalene15. Theamine was derivatized to the corresponding amide by reaction with a perfluoro fattyacid anhydride. Capillary GC with electron-capture (ECD) and thermionic specificdetection (TSD) was used for quantitation.
A possibility for biological monitoring of exposure to HDI and HDA would bevaluable, and the aim of this study was to develop an highly sensitive analytical methodfor the determination of HDA in biological fluids.
EXPERIMENTAL
ApparatusA Varian 3500 gas chromatograph equipped with a Varian thermionic specific
detector and a Varian 8035 automatic on-column injector was employed. The injectorwas cooled with liquid nitrogen. The injector starting temperature was 105°C for 5 s,and thereafter the temperature was increased with 150°C/min to a final temperature of280°C, where it was kept for 7 min. Column parameters as in Fig. 2.
A Varian 3700 gas chromatograph equipped with a Varian thermionic specificdetector and a Grob-type cold on-column injector with a water cooling system,designed and manufactured at our laboratories, was also used. Typical settings for thedetector were: bead heating current, 3.10 A; bias voltage, - 3.9 V, detectortemperature, no°c; gas flow-rates; 3 ml/rnin of hydrogen, 175 ml/min of air and 20ml/min of nitrogen as the make-up gas.
A Shimadzu GC-MS QPIOOO EI/CI quadrupole mass spectrometer connectedto a Shimadzu GC 9A gas chromatograph was used.
Chromatograms were recorded on Servogor Model 310 linear recorders, andShimadzu C-R3A integrators were used for peak evaluation. An Heidolph VV 2001Rota-vapor, rotating evaporator (Heidolph Elektro, Kelheim, F.R.G.) connected toan aspiration pump was used for evaporation, and a Sigma 3E-l centrifuge (Sigma,Harz, F.R.G.) was employed for phase separation.
A Reacti-Vap™ Evaporator (Pierce) was used for evaporation oftoluene samplesolutions containing the carbamate derivative of HDA.
For enrichment and evaporation of solvent containing heptafluorobutyricanhydride (HFBA) derivatives, a vacuum desiccator connected to an aspirating pumpwas used. The apparatus was supplied with an electrically heated oven, designed andmanufactured at our laboratory.
ColumnsFused-silica capillary columns with chemically bonded stationary phases,
CP-Sil® 8 CB (Chrompack, Middelburg, The Netherlands), 12 m x 0.32 mm J.D.,with a film thickness of 0.2 jlm, and DB-5 (J & W Scientific, Folsom, CA, U.S.A.), 30m x 0.24 mm J.D., with a film thickness of 0.5 jlm were used.
ChemicalsChemicals used were HDA, ethyl chloroformate, isobutyl chloroformate and
toluene from Janssen (Beerse, Belgium). Trifluoroacetic anhydride (TFAA), penta-

DETERMINATION OF AMINES IN BIOLOGICAL FLUIDS. 1. 127
fluoropropionic anhydride (PFPA) and heptafluorobutyric anhydride (HFBA) werefrom Pierce (Rockford, IL, U.S.A.), di-n-butylamine (DBA) and 1,4-butanediamine(BDA) from Fluka (Buchs, Switzerland), HCl, NaOH, NH 3 and K2HP04 fromMerck (Darmstadt, F.R.G.).
StandardsSynthesis of1,6-hexamethylenediurethane and 1,4-butanediurethane. To 250 ml of
a solution of toluene containing ca. 5 g of HDA or BDA were added 25 ml of 30%(w/w) ammonia and 5 g of sodium hydroxide dissolved in 250 ml of distilled water.Ethyl chloroformate (20 ml) was added dropwise with stirring, and the mixture wasstirred for 10min. The organic layer was separated and shaken four times with 200-mlportions of 0.1 M HCl, to remove unreacted amine and partially reacted aminourethane. The toluene solution was then washed four times with 200-ml portions ofwater, and evaporated to dryness to remove the remaining ethyl chloroformatereagent. After recrystallization from ethyl acetate the derivatives were stored in andesiccator.
Standards and internal standards were identified by GC-mass spectrometry(MS), and the purity was tested using TSD and flame ionization detection (FID). Thepurity was also examined by elemental analysis, and was found to be better than 99%.
Synthesis ofthe isobutyl chloroformate derivative ofDBA. To 250 ml of a toluenesolution containing ca. 5 g of DBA, 25 ml of 30% (w/w) ammonia and 5 g of sodiumhydroxide, dissolved in 250 ml of distilled water, were added. Isobutyl chloroformatewas added dropwise to the solution with continuous stirring, and the mixture wasstirred for 10min. The organic layer was separated and shaken four times with 200-mlportions of 0.1 M HCl to remove unreacted amine. The toluene solution was thenwashed four times with 200-ml portions of water, and evaporated to dryness to removethe remaining ethyl chloroformate reagent. The residue was redissolved in ethylacetate and eluted through a silica column (60 mm x 20 mm J.D.). The recrystallization from ethyl acetate was performed at - 10°C.
Synthesis of1,6-hexamethylenebisheptafluorobutyramide. After recrystallizationofHDA from toluene, 0.2 g(I.6mmol) of the amine and 1.6g (4 mmol) ofHFBA weredissolved in ethyl acetate, and the solution was heated to 150°C for 10 min. Aftercooling to room temperature, the excess of reagent and liberated acids were extractedwith aIM phosphate buffer solution pH 7.0. The organic phase was eluted througha silica column (60 mm x 20 mm J.D.) with ethyl acetate, followed by evaporation ofthe ethyl acetate solution to dryness; ca. 500 mg (80%) of the amine were obtained.
ProcedurePreparation ofstandard solutions. Standard solutions of the derivatives of HDA
were prepared by dissolving accurately weighed amounts of each derivative (ca. 60mg/100 ml) in toluene. The solutions were then further diluted in toluene toappropriate concentrations. Standard solutions of HDA were prepared in acidicaqueous solutions.
Sampling and storing of urine samples. Urine samples were acidified by theaddition of 5 ml of aqueous 6 M HCl solution per ca. 100 ml of urine. The urinesamples were stored in a refrigerator.

128 G. SKARPING et al.
Work-up procedureWith chloroformates as the derivatization agents. A 2-ml urine or plasma sample
was added to 3 ml of6 MHC!. The mixture was heated at 100°Covernigh (hydrolysis).A 2-ml aliquot was transferred to a test-tube where 1 ml of 3% (w/w) aqueous NH 3 ,
3 ml of 5 MNaOH and 2 ml of toluene were added. The mixture was shaken and 100IIIof ethylchloroformate were added. The mixture was then shaken for 15 min at roomtemperature. A l-ml aliquot of the toluene layer was evaporated to dryness by usinga flow of nitrogen (30°C). A I-ml volume of a toluene solution, containing an internalstandard comprising the isobutyl chloroformate derivative of di-n-butylamine at theappropriate concentration, was added to the dry residue. The toluene layer wasanalysed by Gc. The same procedure was used for aqueous samples where thehydrolysis step can be eliminated.
With anhydrides as the derivatization agents. A 2-ml urine sample was added to3 ml of 6 M HC!. The mixture was heated at 100°C overnight. A 2-ml aliquot wastransferred to a test-tube where 4 ml saturated NaOH and 3 ml toluene were added.The mixture was shaken for 5 min at room temperature. A 2-ml volume of the organiclayer was transferred to a new lO-ml test-tube where 20 III of HFBA were added. Thesolution was immediately shaken vigorously for 5 min on a Vortex mixer. The excessofHFBA and the acid formed were removed by shaking with 2 ml of I M phosphatebuffer solution (pH 7.5). The toluene layer containing the amide formed was thentransferred to a new test-tube, ready for injection on the chromatographic system. Thesame procedure was used for aqueous samples where the hydrolysis step can beeliminated.
Internal standard. The internal standards used were I,4-butane diurethane, theisobutyl chloroformate derivative of di-n-butylamine (1 ng/Ill) and the HFBAderivative of 1,4-butanediamine (1 ng/Ill). A solution of toluene containing the internalstandard was added to the dry residue from the work-up procedure before the GCanalysis.
RESULTS AND DISCUSSION
Storage and treatment of samplesHDA-spiked urine samples were found to be stable after the acidification. No
noticeable change in sample composition occurred even after storage in darkness atroom temperature for several weeks.
The mixture was heated at 100°C overnight in order to hydrolyse the sample;a shorter time of hydrolysis was shown to result in lower recovery of HDA. Howeverurinary elimination of compounds originating from exposure to HDI or HDA wiIlrisea mixture of several metabolites and conjugates, of which free HDA probablyconsitutes a minor portion. The hydrolysis reaction obviously influences thepossibility of separately determining these compounds, and consequently the methoddescribed only gives the sum offree HDA and hydrolysable HDA conjugates. Sampleclean-up using a silica gel cartridge has been described as efficient!". However, ourattempts to perform this and other similar procedures were unsuccessful due to severelosses (ca. 50%).
Work-up procedureChloroformates as reagents. Parameters for the derivatization of amines have

DETERMINATION OF AMINES IN BIOLOGICAL FLUIDS. 1. 129
been studied in some detail!". In general, the derivatization reaction in a two-phasesystem, with an appropriate pH in the aqueous phase, will be faster than that ina single-phase system. The choice of pH depends on the basicity of the amineconsidered. For the reaction to occur at a reasonable rate at room temperatureunprotonated amines must be present. For the two-phase derivatization of piperazine.'? (pKa = 9.8) we found that with a phosphate buffer solution (pH 10) thereaction is quantitative in less than 5 min, with ammonia as a catalyst. However, thisprocedure gave unsatisfactory results for the very basic diamine HDA (pKa = 11.9),whereas the reaction is quantitative only at pH> 12. The recovery for two-phasederivatization of HDA in urine (ca. 2 ng/JlI) is quantitative, for ammonia concentrations higher than 1% (w/w) (Fig. 1). We found that the use of 3% ammonia issuitable, since the ammonia concentration in water solutions tend to decrease duringstorage. The amount of ethyl chloroformate added is not critical when using ammonia.The plot of the amount of ethyl chloroformate added versus recovery in Fig. 1 isvirtually horizontal in the range 10-150 Jll. It was also observed, for the system withoutammonia, that the recovery decreased when the amount of ethyl chloroformate addedwas increased.
It should also be noted that the consumption of the reagent due to hydrolysis inthe standard procedure is not critical if the reagent is added directly to the two phasesystem. This was established by adding the HDA-containing urine hydrolysate to thetwo-phase reaction mixture at different times. The same quantitative results werefound for 0-1 min, whereafter the recovery decreased, and after 3 min only ca. 50%recovery was obtained. Injection of chloroformate reagents influences the detectorsensitivity as described previously!". The evaporation step is essential to remove excessof reagent. The procedure is time consuming, when a Rota-vapor is used, as onlya single sample Canbe evaporated. Evaporation by a flow ofnitrogen simplifies routineanalyses as nine samples can be treated simultaneously.
Anhydrides as reagents. The two-phase derivatization of aromatic diamines wasrecently studied?". However the two-phase derivatization procedure was originally
91II
Ii Ii
.. ----50
15010050O+---.--.----~-.,...-~-.,...
o
Ethylchloroformate (~I)
Fig. I. The recovery of HDA-diurethane with variable amounts of the derivatization reagent (ethylchloroformate) and different concentrations of ammonia: 0.0 (o), 0.5 (C), 1.0 (D) and 5.0% (x).

130 G. SKARPING et al.
developed for aqueous solutions, and has not yet successfully been used for urinesamples containing aliphatic diamines. For urine samples the recoveries were low (lessthan 50%), and varied greatly, giving poor reproducibility. The derivatizationprocedure was therefore performed in toluene after extraction of aqueous urinehydrolysates.
The excess of reagent was efficiently removed from the organic phase byextraction with aIM phosphate buffer (pH 7.5) solution. For urine samples, usingGC-TSD, the chromatograms of the derivatives showed a more complex picturecompared to the corresponding chloroformate derivatives. Further work-up by liquidextraction, membrane extraction or by the use of extraction columns may be necessary.
ChromatographyThe chromatographic behaviour of both the urethane and amide derivatives is
excellent. The use of an apolar stationary phase with relatively low film thickness is
A
115°C
I Io 1.
B
IS
25 °C/min
5
IS
115°C
I Io 1
Fig. 2.
25 °C/min
5
280°C
I8 min
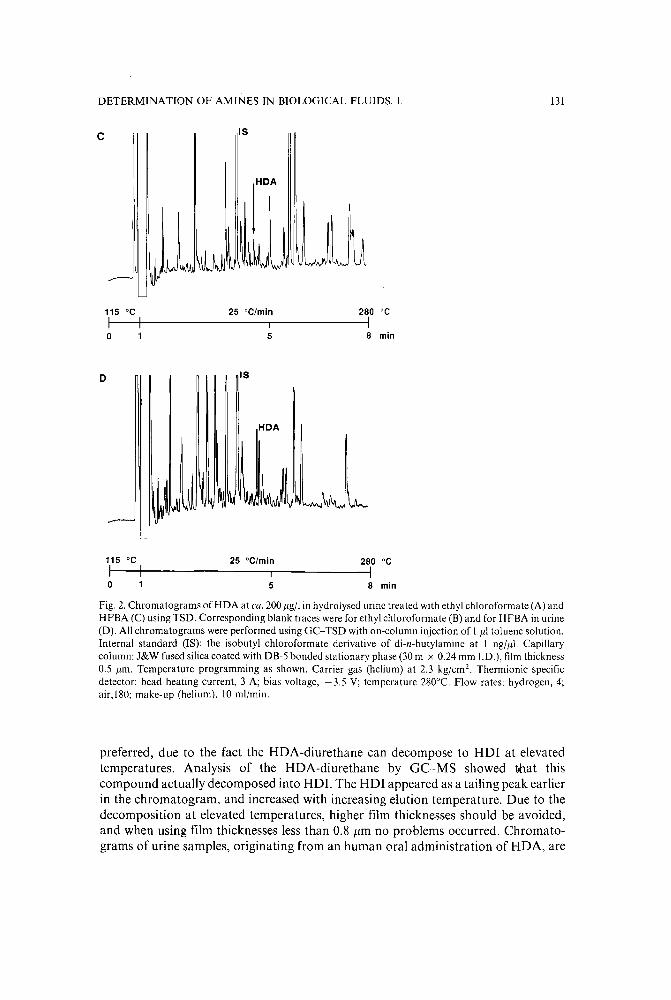
DETERMINATION OF AMINES IN BIOLOGICAL FLUIDS. 1. 131
c IS
115 'C
Io
D
25 'C/min
5
IS
HDA
280 'C
I8 min
115 'C
I Io 1
25 'C/min
5
Fig. 2. Chromatograms of HDA at ca. 200 Ilg/I in hydrolysed urine treated with ethyl chloroformate (A) andHFBA (C) using TSD. Corresponding blank traces were for ethyl chloroformate (B) and for HFBA in urine(D). All chromatograms were performed using GC-TSD with on-column injection of I III toluene solution.Internal standard (IS): the isobutyl chloroformate derivative of di-n-butylamine at I ng/Ill. Capillarycolumn: J&W fused silica coated with DB-5 bonded stationary phase (30 m x 0.24 mm 1.D.), film thickness0.5 tIm. Temperature programming as shown. Carrier gas (helium) at 2.3 kg/ern". Thermionic specificdetector: bead heating current, 3 A; bias voltage, - 3.5 V; temperature 280°C. Flow-rates: hydrogen, 4;air, 180: make-up (helium), 10 ml/rnin.
preferred, due to the fact the HOA-diurethane can decompose to HOI at elevatedtemperatures. Analysis of the HOA-diurethane by GC-MS showed lihat thiscompound actuaUy decomposed into HOI. The HOI appeared as a tailing peak earlierin the chromatogram, and increased with increasing elution temperature. Due to thedecomposition at elevated temperatures, higher film thicknesses should be avoided,and when using film thicknesses less than 0.8 J1m no problems occurred. Chromatograms of urine samples, originating from an human oral administration of HOA, are

132 G. SKARPING et al.
shown in Fig. 2, and for urine matrixes it is evident that the chloroformate procedure isa better choice than the anhydride procedure. No interfering peaks disturb theevaluation of the chromatogram.
Quantitative analysisRecovery. The recovery was studied by spiking aqueous solutions, hydrolysed
human urine and blood plasma, and performing the derivatization procedures asdescribed above. Peak heights were compared to those of standards by usingGC-TSD. With ethyl chloroformate as the reagent, the recovery for human urine was95 ± 5% (n = 7) for a concentration oflOO iig ofHDA per litre and 98 ± 5% (n = 7) for1000 flgjl and for plasma 106 ± 4% (n = 6) for 500 flgjl at a 95% degree of confidence.
Calibration graphs. Fig. 3 shows the calibration graph for HDA derivatives ofethyl chloroformate obtained by GC-TSD. Different amounts of HDA were added tourine and the work-up procedure was as described above. For each HDA concentration, two determinations with duplicate injections were made. No significantdifference between plotted peak heights or peak area ratios, relative to the internalstandard, was observed. The concentration range investigated, 10-350 flgjl urine, gavea correlation coefficient of0.9998 for a plot of the area ratio for six concentrations. Nonoticeable differences were found between aqueous solutions and human urine.
Precision. When analysing substances present in complicated matrices such asurine and plasma, the addition ofan internal standard to the sample before the analysisis strongly recommended. In this study, the internal standard chosen behaves similarlyto the HDA derivatives in the chromatographic system. The overall precision, usingthe ethyl chloroformate work-up procedure and the di-n-butylamine derivative as theinternal standard, was very good. The overall precision with the work-up procedureand GC analysis was about 6% (n = 6) for 100 flgjl HDA-spiked urine, and 2% (n = 5)for 1000 flgjl with duplicate samples and injections. The overall precision (R.S.D.) forurine samples was 5% (n = 8) at a concentration of 100 flgjl, and 3% at a concentrationof 1000 flgjl.
Detection limit. Using GC-TSD the responses for the derivatives of HDAinvestigated were in the same range. In acidic aqueous air sampling solutions, wherethe chromatograms appear to be virtually free from interfering peaks, the detectionlimits were less than 10 pg injected amount, which corrsponds to a concentration of 10
3..'"::l~ 2
~0
~
'"~
""'".,Q.
400100 200 300
HDA in urine (ng/ml)
0..=---...,----,-----,----,o
Fig. 3. Calibration graph for HDA in humane urine.

DETERMINATION OF AMINES IN BIOLOGICAL FLUIDS. I. 133
f.lg/l of sampling solution. The same detection limit was found for the ethylchloroformate derivative in biological fluids. The detection limit can be furtherlowered by dissolving the dry residue in a smaller volume, and an enrichment factor ofup to 50 is possible. The detection limit for the HFBA derivatization procedure, whenused for biological samples such as urine, is considerable higher due to the interferingpeaks (Fig. 2).
CONCLULIONS
The chromatographic behaviour of both the urethane and amide derivatives isexcellent, and the choice of reagent is principally affected by the matrix and by thedetection system used. For urine hydrolysates, the two-phase derivatization with ethylchloroformate is preferable as the work-up procedure is performed in one step. Themethod presented offers enhanced possibilities to determine endogenous and exogenous aliphatic diamines at low concentrations (Jig/l range) in biological fluids. Themethod is also applicable to the determination of HOI in air using the impingertechnique and an acidic aqueous sampling solution.
ACKNOWLEDGEMENTS
The authors are indebted to Professor Staffan Skerfving, head of the Department of Occupational and Environmental Medicine (University of Lund), for valuablediscussions and great interest in this work. We also gratefully acknowledge the skilfultechnical assistance of Anneli Pamark and the Swedish Work Environment Fund forfinancial support. We thank Dr. Jan Buijten, Chrompack, for supplying dedicatedcapillary columns and Dr. Mats Malmberg, Synthelec, Lund, for synthesis ofderivatives.
REFERENCES
I O. 1. Dashiell and G. 1. Kennedy, J. Appl. Toxicol., 4 (\984) 320.2 F. R. Johannsen, G. J. Levinskas, R. Ben-Dyke and G. K. Hogan, Fund. Appl. Toxicol., 9 (\987) 504.3 C. A. Manen, R. D. Hood and J. Farina, Teratology, 28 (\983) 237-242.4 R. R. Beard and J. T. Noe, Patty's Industrial Hygiene and Toxicology, Wiley-Interscience, New York,
1981, p. 3135.5 M. Sittig, Handbook of Toxic and Hazardous Chemicals and Carcinogens, Noyes Publications, Park
Ridge, NJ, 1985.6 E. Meilhoc, M-J. Moutin and H. B. Osborne, Biochem. J., 238 (\986) 701.7 P. S. Callery,M. J. Egorin, 1. A. Geelhaar and M. S. B. Nayar, Cancer Res., 46 (1986) 4900.8 B. A. Conley, P. S. Callery, M. J. Egorin, B. Subramanyam, 1. A. Geelhaar and S. Pan, Proc. Annu.
Meeting Am. Assoc. Cancer Res., 28 (1987) 311.9 M. J. Egorin, E. G. Zuhowski, M. S. B. Nayar and P. S. Callery, J. Chromatogr., 415 (1987) 148.
10 C. Rosenberg and H. Savolainen, Analyst (London), III (1986) 1069.II N. D. Brown, M. P. Strickler and J. M. Whaun, J. Chromatogr., 245 (1982) 101.12 T. Saaden and T. Greibrokk, J. Chromatogr., 247 (\982) Ill.13 H. M. 1. J. Joosten and C. Olieman, J. Chromatogr., 356 (1986) 311.14 Y. Nishikawa, J. Chromatogr., 392 (1987) 349.15 M. Dalene, Doctoral thesis. Lund University, Lund. 1987.16 C. W. Gehrke, K. C. Kuo, R. 1. Ellis and T. P. Waalkes, J. Chromatogr., 143 (1977) 345.17 N. Sayem-el-Daher, R. E. Simard, 1. L'Heureux and A. G. Roberge, J. Chromatogr., 256 (\983)
313-321.18 A. Shirahata, Y. Takeda, M. Kawase and K. Sarnejina, J. Chromatogr., 262 (1983) 451.19 G. Skarping, T. Bellander and 1. Mathiasson, J. Chromatogr., 370 (1986) 245.20 1. Renman and-G. Skarping, in preparation.


Journal of Chromatography, 479 (1989) 135-143Elsevier Science Publishers B.Y., Amsterdam - Printed in The Netherlands
CHROM. 21 664
CHROMATOGRAPHIC DETERMINATION OF AMINES IN BIOLOGICALFLUIDS WITH SPECIAL REFERENCE TO THE BIOLOGICAL MONITORING OF ISOCY ANATES AND AMINES
II. DETERMINATION OF 2,4- AND 2,6-TOLUENEDIAMINE USING GLASSCAPILLARY GAS CHROMATOGRAPHY AND SELECTED ION MONITORING
1. F. SANDSTROM, G. SKARPING* and M. DALENE
Department of Occupational and Environmental Medicine. University Hospital. S-22185 Lund (Sweden)
(First received March 21st, 1989; revised manuscript received June 2nd, 1989)
SUMMARY
A capillary gas chromatographic method, using selected ion monitoring in theelectron impact mode, was developed for the analysis of 2,4- and 2,6-toluenediamine(TDA), (CA. Nos. 95-80-7 and 823-40-5)in aqueous solutions and human urine. Themethod is based on basic extraction of TDA from 2 ml of hydrolysed urine intotoluene. The TDA was derivatized to an amide using a perfluorofatty anhydride.Three anhydrides were investigated, trifluoroacetic anhydride, TF AA (CA. No.407-25-0), pentafluoropropionic anhydride, PFPA (CA. No. 356-42-3) and heptafluorobutyric anhydride, HFBA (CA. No. 336-59-4). Trideuterated 2,4- and 2,6TDA, (C2H3C6H3(NH2)z), were synthesized and used as internal standards. Themolecular ions of TDA-amides (mjz=314, 414 and 514) and the trideuterated TDA(mjz=317, 417 and 517) were monitored. The correlation coefficient was 0.999 for2,4-TDA and 0.998 for 2,6-TDA (0.3-8 flgjl) for the monitoring of molecular ions, andthe correlation coefficient was 0.999 for 2,4-TDA and 0.998 for 2,6-TDA (0.3-8 flgjl)for the monitoring of mlz = 295 and 298 fragments of TDA-PFPA and trideuteratedTDA-PFPA. The detection limit ofTDA in human urine was ca. 0.1 flgjl. Hydrolysedurine from an exposed worker was found to contain 4 flg ofTDAjl, with a workroomatmosphere of 1-10 flgjm 3 TD!. The overall recovery for PFPA derivatives was foundto be 96 ± 4 for 2,4- and 106 ± 5% for 2,6-TDA from water and 100 ± 4 and 109± 6% from urine.
INTRODUCTION
Quantification of isocyanates and amines in trace levels in air has been of greatinterest for many years due to their possible environmental and occupational hazards.Toluene diisocyanate (TDI) is one of the main components in the manufacture ofpolyurethane foams and coatings. The related aromatic amine, toluenediamine
0021-9673/89/$03.50 © 1989 Elsevier Science Publishers B.V.

136 J. F. SANDSTROM, G. SKARPING, M. DALENE
(TDA), is used as an intermediate in polyurethane foam production, in elastomerproduction and in dyes. TDA has also been detected in urine hydrolysate afteroccupational exposure to TDP.
The analysis ofaromatic amines in human body fluids is ofgreat interest in orderto develop analytical methods for the biological monitoring of exposure to thesecompounds'<".
Several analytical techniques have been used for the determination of aromaticamines in air and in biological fluids. The methods most frequently employed areliquid chromatography (LC) with ultraviolet (UV)6-10 and electrochemical (ED)10-14detection, and gas chromatography (GC) with electron-capture15-17 and thermionicspecific detection (TSD)16,17 or selected ion monitoring (SIM)l.
Glass capillary GC and TSD of toluenediamines has been investigated at ourlaboratories. The adsorptive behaviours of the aromatic amines and the correspondingderivatives have been studied17-20.
In this work we present a method for the determination of TDA in the low j1g/1level in human urine using capillary GC and SIM in order to investigate the exposureto TDI during manufacture ofpolyurethanes. The choice ofderivatization reagent andthe internal standard is discussed in some detail.
EXPERIMENTAL
ApparatusA Varian 3500 (Varian Associates, Walnut Creek, CA, U.S.A.) gas chromato
graph equipped with a Varian thermionic specific detector and a Varian 8035automatic on-column injector was employed. The injector starting temperature was120°C for 5 s and thereafter the temperature was increased at 150°C/min to 250°C,where it was kept for 7 min. The injector was cooled with air or liquid nitrogen. Thecolumn was held isothermal at 115°C for I min and then increased at 15°Cjmin to270°C, where it was held for I min. The carrier gas, helium at a flow-rate of 3 ml/rnin,was dried over molecular sieve 5A and deoxygenated using an "indicating Oxytrap"(Chrompack, Middelburg, The Netherlands).
A Shimadzu GC-MS QP1000 EI/CI (Shimadzu, Kyoto, Japan) quadrupolemass spectrometer connected to a Shimadzu GC-9A gas chromatograph, equippedwith a Shimadzu autosampler (AOC-9), was used for identification and quantitativeanalysis. An Hamilton 70lRN syringe, point style 5 needle, with a conical point andsidehole to minimize the septum coring was used. The autosampler was used inconnection with a Shimadzu split/splitless injection system (SPL-G9). The capillarycolumn outlet was mounted directly in the ion source. The starting temperature of thecolumn oven was 95°C for 2 min. It was then raised at 20°Cjmin to 260°C, where it waskept for 2 min. The split exit valve was kept closed for I min after the injection. Thetemperatures of the ion source and the interface were 250°C. The capillar inlet pressurewas 0.2 kg/em" for capillary columns with an J.D. of 0.32 mm and 0.5 kg/em" in thecase of0.24 mm J.D. The pressure of the ion source was ca. 1.5' 10-5and 1.0' 10-5Torr.
The instrument was used in the electron impact (EI) mode (20 and 70 eV) and setas follows: the molecular ions (M +) of the three derivatives were monitored atm]z = 314 (toluenediamine trifluoroacetyl derivative, TDA-TFA), mlz 414 (toluenediamine pentafluoropropionyl derivative, TDA-PFP) and m]z 514 (toJuenediamine

DETERMINAnON OF AMINES IN BIOLOGICAL FLUIDS. II. 137
heptafluorobutyryl derivative, TDA-HFB). The molecular ions of trideuteratedderivatives ofTDA were monitored at mlz » 317, 417 and 517.The ion source filamentwas turned on after ca. 5 min and off after ca. 8 min. Ten measurements were made persecond (rate 4). The tuning of the instrument (auto tune) was performed usinga standard sample inlet system and nonafluorotributylamine as a calibrant, allaccording to a standard procedure (70 eV). The resolution was optimized and nofurther centring was necessary.
For enrichment and evaporation of solvent, a vacuum desiccator connected toan aspirating pump was employed. The apparatus was equipped with an electricallyheated oven, designed and manufactured at our laboratory.
To centrifuge the samples a Sigma 3£-1 (Harz, F.R.G.) centrifuge was used.
ColumnsFour types of fused-silica capillary columns with chemically bonded stationary
phases were used: Nordion'" (Helsinki, Finland) NB-54 (25 m x 0.32 mm I.D.), withfilm thickness of 0.50 {lm, Chrompack (Middelburg, The Netherlands) CP-Sil 8 CB (25m x 0.32 mm I.D.) with film thickness of 1.2 {lm, and CP-Sil 8 CB (25 m x 0.25 mmI.D.) with a film thickness of 0.12 {lm and J & W Scientific (Folsom, CA, U.S.A.)DB-5 (30 m x 0.243 mm I.D.), with a film thickness of 0.25 {lm.
ChemicalsChemicals used were 2,4- and 2,6-TDA from Fluka (Buchs, Switzerland),
heptafluorobutyric anhydride (HFBA), pentafluoropropionic anhydride (PFPA) andtrifluoroacetic anhydride (TFAA) from Pierce (Rockford, IL, U.S.A.), toluene fromLab-Scan (Dublin, Ireland), nonafluorotributylamine, HCl, NaOH and K2HP04
from Merck (Darmstadt, F.R.G.), trideuterated 2,4- and 2,6-TDA from Synthelec(Lund, Sweden) and ethanol from Kemetyl (Stockholm, Sweden).
SamplingA 5-ml volume of 6 M HCl was added to ca. 100 ml of urine. The acidic urine
samples were stored in a refrigerator. The samples were stable for at least 3 monthswithout noticeable degradation.
Synthesis ofperfluorofatty anhydride derivatives of TDAA 2-g amount ofTDA was dissolved in ca. 90 ml of toluene. The perfluorofatty
anhydride (PFPA, TFAA or HFBA, ca. 12g) was added gradually to the solution withstirring, and the mixture was allowed to stand with continuous stirring for 5 min. Themolar ratio between the perfluorofatty anhydride and TDA was 2.2:1 (w/w). Thereaction mixture was gradually heated to ca. 90°C and then extracted with1 M phosphate buffer (pH 7.5) in order to remove excess of the reagent and acidformed. The organic phase was separated and evaporated to dryness using a rotatingevaporator connected to an aspirating pump (temperature of the water-bath was keptat 30°C). The residue was recrystallized from ethanol-water (87:13, v/v), whereafterthe TDA derivative was filtered off (Mesh G4), washed with cold distilled water anddried in a vacuum desiccator.

138 1. F. SANDSTROM, G. SKARPING, M. DALENE
Preparation of standard solutionsStandard solutions of TDA in toluene were prepared by using the work-up
procedure. The completeness of the reaction was checked by GC-TSD, and comparedwith solutions containing the synthesized standard. Standard solutions of TDAderivatives were prepared by dissolving the 2,4- and 2,6-TDA derivatives in tolueneand further dilution to appropriate concentrations. Standard solutions of TDA andtrideuterated TDA were prepared by dissolving the amines in 0.1 M HCI and thenfurther dilution in aqueous solutions such as acidified human urine. Amine standardsin acidic solutions (0.1 MHCI) or acidified human urine were stable for at least 3 weeksat room temperature.
Work-up procedureTo a 2-ml urine sample, 3 ml of 6 M HCI, containing the trideuterated TDA as
internal standard (ca. 100 ,ug/I), were added. The acidified sample was then hydrolysedat 100°C overnight. A 2-ml aliquot of the acidified sample was transferred toa test-tube. A 4-ml volume of saturated NaOH and 3 ml of toluene were added. Themixture was then shaken for ca. 10min and centrifuged (1500g) for 5min. A 2-ml volumeof the organic layer was transferred to a new test tube and 20 ,ul of anhydride reagen t wereadded. The mixture was immediately shaken vigorously for ca. 10 min. The excess ofanhydride reagent and acid formed were removed by extraction with 2 ml ofI M phosphate buffer solution (pH 7.5). A I-ml volume of the toluene layer containingthe amide formed was then transferred to a new test-tube. The samples were enriched byevaporation of the toluene solution in a vacuum desiccator at controlled temperature(30°C). The dry residue was finally diluted in 50 ,ul of toluene and then analysed.
The same procedure was used for aqueous samples but in this case the hydrolysisstep was omitted.
RESULTS AND DISCUSSION
StandardsStandards of perfluorofatty anhydride derivatives of 2,4-TDA, 2,6-TDA,
trideuterated 2,4- and 2,6-TDA were identified by GC-mass spectrometry (MS) andthe purity was checked by GC-TSD and elemental analysis. The purity was found tobe better than 99%. The isotopic purity was checked for all the fragments investigated.The ratios of the mass fragment m/z=41 7 to that ofm/z =414 of the 2,4- and 2,6-TDAamide derivatives were <0.3%. The ratios of the mass fragment m/z=414 to that ofm/z=417 of the trideuterated 2,4- and 2,6-TDA amide derivatives were <0.3%.
Internal standardThe determinations with GC-MS were performed using a trideuterated TDA as
the internal standard. The three hydrogen atoms at the methyl group were exchangedto deuterium. There are several advantages of using deuterium labelled substances asinternal standards. The chemical, physical and chromatographic properties of thetrideuterated TDA are similar to those ofTDA. The behaviour oftrideuterated TDAis similar to that of TDA during storage and the work-up procedure. TrideuteratedTDA is not naturally present in the sample and no interferences have been found forthe mass fragments monitored. The similar fragmentation patterns of TDA andtrideuterated TDA are favourable for easier calibration of the mass spectrometer.

DETERMINATION OF AMINES IN BIOLOGICAL FLUIDS. II. 139
Work-up procedureGC-TSD was used to optimize the work-up conditions. The concentrations of
the two aromatic amines studied were ca. 180j1g/1 in urine. The isobutyl chloroformatederivative of di-n-butylamine was used as the internal standard. The internal standarddiluted in toluene was added after the evaporation step. The procedure was studied bycomparison of standard solutions of the derivatives in toluene and the dissolvedresidue after the enrichment step. The basic properties of the aromatic amine, TDA,determine the choice of extraction solution. The conditions of extraction of TDA inurine into toluene were optimized by variation of the pH and ionic strength. The use of5 MNaOH saturated with NaCI gave a recovery ofless than 70%. However the use ofsaturated NaOH yielded ca. 100% recovery. For aqueous test solutions a two-phasederivatization system can also be employed.
The enrichment step was studied. Evaporation of the solvent with a gentle flowof nitrogen gave losses of about 70-80%. No losses and excellent reproducibility werefound in the evaporation step, when a vacuum desiccator connected to an aspiratingpump equipped with an electrically heated oven was used.
ChromatographyTFAA, PFPA and HFBA derivatives of 2,4- and 2,6-TDA were studied. All
compounds showed excellent chromatographic behaviour using GC-MS. Howeverbaseline separation of the isomers was not complete for the HFBA derivatives and theisomers of the TFAA derivatives showed somewhat broader peaks. However baselineseparation of the 2,4- and 2,6-TDA PFPA derivatives was found for all capillarycolumns tested, no endogenous peaks from the urine extracts interfered in the analysis.
DetectionTSD. The limit of detection for the PFPA derivative of TDA with GC-TSD is
ca. 10 j1g/1. An aqueous solution of TDA can be further enriched, giving detectionlimits ofless than 0.5 j1g/1, and several j11 of the solvent can be injected onto the column.The molar sensitivity for all the derivatives of TDA studied was virtually the same.However, when analysing urine samples considerable interferences were found, andca. 50 j1g/1 can be quantitatively analysed without a further clean-up step.
Mass-selective detection. GC-MS and SIM was used for the determination ofTDA-amides in the low j1g/1 range. A 1-4 j11 volume of the sample solution (toluene)was injected into the chromatographic system. This amount may damage andcontaminate the ion source and the high vacuum system. These problems wereeliminated when the filament was switched off during the entrance of the solvent andswitched on during the chromatography. Several hundreds of analyses were hencepossible.
Several mass fragments were suitable for quantitative analysis. Mass spectrawere obtained for the purpose of identification, and to choose the suitable fragmentions for quantitative analysis. Fig. I shows mass spectra of the derivatives of PFPA.The molecular ions (M+) at m/z=4l4 and 417 and fragment ions (M+ -C2Fs) atm]z = 295 and 298 are suitable for quantitation of TDA. The molecular ions werehowever chosen due to the sensitivity, the matrix and the relatively more significantinformation. An ionization voltage of 20 eV was chosen due to the better signal-tonoise ratio.
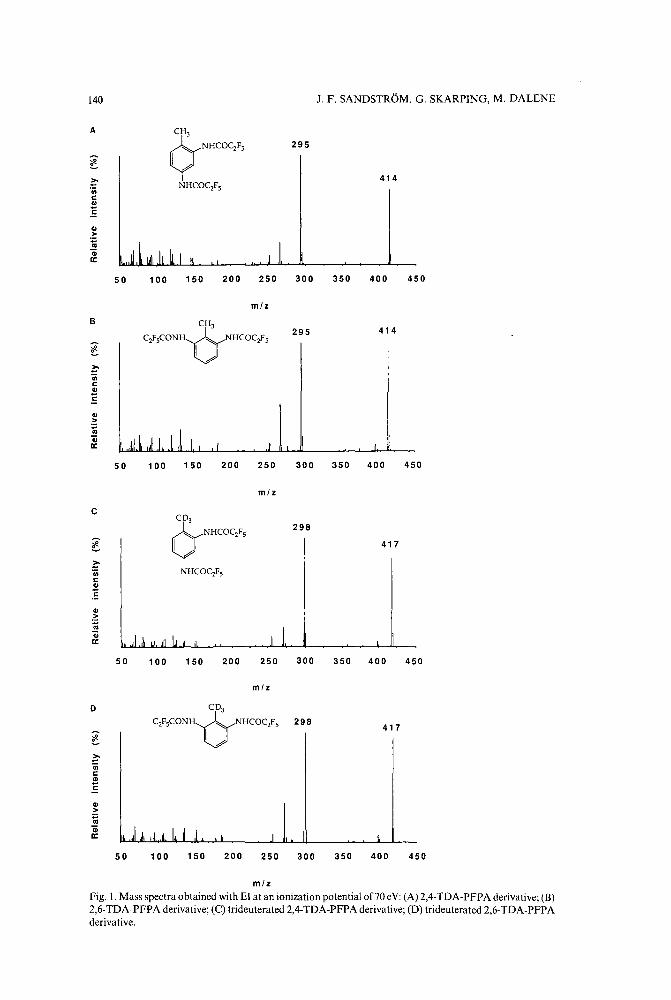
140
A CH 3
~NHCOC2FS
YNHCOC2FS
295
J. F. SANDSTROM, G. SKARP1NG, M. DALENE
414
50 100 150 200 250
m/z
300 350 400 450
B
~u;c:.,E.,.~OJQiII:
295 414
50 100 150 200 250
m/z
300 350 400 450
c
.,ZOJQiII:
CD3
~NHCOC2Fs
yNHCOC2Fs
298
417
50 100 150 200 250
m/z
300 350 400 450
o
~u;c:.,E
298417
.,ZOJQiII: J ,I, ,.I.d. 1., ~ .I h J
50 100 150 200 250 300 350 400 450
m/z
Fig. 1.Mass spectra obtained with E1at an ionization potential of70eV: (A) 2,4-TDA-PFPA derivative; (B)2,6-TDA-PFPA derivative; (C) trideuterated 2,4-TDA-PFPA derivative; (D) trideuterated 2,6-TDA-PFPAderivative.
DETERMINATION OF AMINES IN BIOLOGICAL FLUIDS. II. 141
Quantitative analysisCalibration graphs. Human urine was spiked with 2,4- and 2,6-TDA and the
work-up procedure was performed. For each concentration two determinations withduplicate injections were made. The average values of the peak area ratio betweenTDA (m/z=414 and 295) and trideuterated TDA (m/z=417 and 298) were plotted.The calibration graphs were linear and passed through the origin. The calibrationgraph using SIM of the molecular ions for the concentration range 0.3-8 J1.g/l (peakarea ratio 0-0.3) gave a correlation coefficient of 0.999 (n = 9) for 2,4-TDA and 0.998(n = 9) for 2,6-TDA. The correlation coefficients using SIM of the (M + - ClF5) ionswere 0.999 (n=9) for 2,4-TDA and 0.998 (n=9) for 2,6-TDA. No noticeabledifferences were found for peak height measurements when using HFBA as thederivatization reagent.
Recovery and precision. The overall recovery was studied for ten spiked urinesamples containing ca. 145 J1.g/l of the two TDA isomers using GC-TSD. The urineswere worked up according to the procedure, but without the presence oftrideuteratedTDA as the internal standard. Comparison was made by analysing the amidestandards in toluene. The overall recoveries for 2,4- and 2,6-TDA was found to be 100± 4 and 109 ± 6% (n= 10).The recoveries for TDA-spiked urine in the hydrolysis stepstudied by using GC-SIM 15J1.g/l) were 100 ± 4% (n= 10)for both 2,4- and 2,6-TDA.The values are given with a 95% confidence range.
An enrichment step using a vacuum desiccator connected to an aspirating pumpwas employed to increase the detection limit. Twentyfive samples were simultaneouslyevaporated within an hour. No carryover and no artefact were found during thisprocedure. More than a 40-fold enrichment ofthe sample was possible. The recovery inthe enrichment procedure and 20-fold enrichment was found to be 100 ± 3 (n= 10)for2,4-TDA and 104±4% for 2,6-TDA (n= 10). The overall recovery for aqueoussolutions was similar. The values are given with a 95% confidence range.
The usefulness of a trideuterated internal standard is demonstrated by the highprecision in the GC-SIM analysis at the low J1.g/llevel. Ten different spiked urines atca. 2 J1.g/l and ten different spiked urines at ca. 15 J1.g/l were analysed. The relativestandard deviations for the ten samples for TFAA, PFPA and HFBA derivatives weredetermined. The samples were enriched ten times and the mean values for duplicateinjections for both the peak area and peak height ratio were measured by monitoringthe molecular ions and the ratio between the amine and internal standard variedbetween 2 and 5% (Table I). The values in the table are given with a 95% confidencerange.
Detection limitThe detection limit, according to Miller and Miller 2 1
, for TDA in human urinewith GC-MS using the EI mode was ca. 0.1 J1.g/l for PFPA derivatives. The sampleswere treated according to the work-up procedure and with a 40-fold enrichment (thedry residue was dissolved in 25 J1.l of toluene).
ApplicationsThe method is applicable to the monitoring of isocyanates and amines in air,
collected in an impinger flask containing 10 ml of diluted hydrochloric acid. Thepotential of the method is illustrated by the high selectivity and sensitivity, less than

142 J. F. SANDSTROM, G. SKARPING, M. DALENE
TABLE I
PRECISION IN THE GC-SIM ANALYSIS OF 2,4- AND 2,6-TDA IN HYDROLYSED HUMANURINE AS THEIR PERFLUOROFATTY ANHYDRIDE DERIVATIVES
Injected volume: I Jll. Internal standard (IS): trideuterated TDA. An autoinjector was used for splitlessinjections. Ten different urine samples spiked with 2,4- and 2,6-TDA with duplicate injections weredetermined. Values are relative standard deviations ("!o) in peak area and peak height, respectively. TFAA= trifluoroacetic anhydride derivative (M+ at m/z=314); PFPA = pentafluoropropionic anhydridederivative (M + at m/z = 414) and HFBA = heptafluorobutyric anhydride derivative (M + at mlz= 514).
Amine Cone. (Jlg/l) TFAA PFPA HFBA
DDa IS· DD IS DD IS
2,4-TDA 14.4 7,10 3,3 19,20 3, 4 17, 17 3,32.2 17, 19 4,3 17, 17 2,3 13, 14 4,5
2,6-TDA 14.5 15, 19 4,4 6,6 2,2 6,6 2,22.2 5,7 4, 5 12,12 2, 3 9, 9 4, 4
a Direct determination without internal standard.• The ratio between the amine and the internal standard.
1/500 of the present Swedish threshold limit value (TLV) (40 j1g/m3) with a sampling
time of 15 min and with a flow-rate of Ll/rnin.Urine from a worker exposed to TDI at a flexibe foam factory was analysed, the
workroom atmosphere containing 1-10 j1g/m3. The work-up procedure was per
formed and the sample was enriched 20 times and analysed with GC-SIM. Thecorresponding diamines ofTDI, 2,4- and 2,6-TDA were found in the hydrolysed urine(ca. 4 j1g/I). The chromatograms are shown in Fig. 2.
41
2
3
BO°C 290°C (30°C/min) 230°C 290°C (30°C/min)
Iii i I Iii I8 9 min 8 9 min
Fig. 2. SIM of hydrolysed urine samples using the EI mode (20 eV). (A) The molecular ion of theTDA-PFPA derivative (m/z=414) from a worker exposed to TDI, with an air concentration of 1-10 Jlg/mJ
The peaks correspond to a concentration of ea. 4 Jlg/I in hydrolysed urine of 2,4- and 2,6-TDA. (B) Themolecular ion of the TDA-PFPA derivative (m]z= 414) from a non-exposed subject. (C) The molecular ionof the trideuterated TDA-PFPA derivative (mlz = 417) used as the internal standard. Peaks: I = PFPAderivative of 2,6-TDA; 2 = PFPA derivative of 2,4-TDA; 3 = PFPA derivative of trideuterated 2,6-TDA;4 = PFPA derivative of trideuterated 2,4-TDA. Column: J&W fused silica coated with DB-5 bondedstationary phase (30 m x 0.243 mm I.D.), film thickness 0.25 Jlm. Inlet pressure of the carrier gas (helium):0.5 kgjcm '. Splitless injection (I min) of 1 JlI toluene. Temperature programming: isothermal at 95°C (2min), increased at lOoCjmin to 110°C, then at 30°Cjmin to a final temperature of 300°C.
DETERMINAnON OF AMINES IN BIOLOGICAL FLUIDS. II.
CONCLUSIONS
143
A GC-SIM method is demonstrated for determination of TDA in hydrolysedhuman urine. Due to the high selectivity and sensitivity no special clean-up procedureis necessary. Several samples can be worked up simultaneously. The use oftrideuterated 2,4- and 2,6-TDA results in accurate and precise determinations. Thecombination of high-resolution chromatography and selective detection is demonstrated to be appropriate for the analysis of TDA in biological matrices.
ACKNOWLEDGEMENTS
We are indebted to Professor Staffan Skerfving, head of the department ofOccupational and Environmental Medicine, for his interest in this work. We alsogratefully acknowledge the Swedish Work Environment Fund (AMFO-88-0l61) forfinancial support.
REFERENCES
1 C. Rosenberg and H. Savo1ainen. J. Chromatogr.. 367 (1986) 385-392.2 Bioassay of2,4-Diaminotoluenejor Possible Carcinogenicity, Technical Report Series no. 162, CAS No.
95-80-7, National Cancer Institue, Bethesda, MD, 1979.3 Bioassay of2,6-Diaminotoluene Dihydrochloridefor Possible Carcinogenicity, Technical Report Series no.
200, CAS No, 15481-70-6, National Cancer Institue, Bethesda, MD, 1980.4 B. B. Furlong, R. P. Weaver and J. A. Goldstein, Carcinogenesis, 8 (1987) 247-251.5 P. H. Grantham, L. Mohan, T. Benjamin, P. P. Roller, J. R. Miller and E. K. Weisburger, J. Environ
Pathol. Toxicol., 3 (1980) 149-166.6 C. Sango, J. Liq. Chromatogr., 2 (1979) 763.7 S. Sardas, A. E. Karakaya and B. Sener, Gazi Univ. Eczacilik Fak. Derg., 3 (1985) 89-94.8 R. C. Snyder, W. C. Brumley, C. V. Breder and T. Fazio, J. Assoc. OJI Anal. Chern., 65 (1982)
1388-1394.9 E. H. Nieminen, L. H. Saarinen and J. T. Laaksalo, J. Liq. Chromatogr., 6 (1983) 453-469.
10 M. Dalene, L. Mathiasson, G. Skarping, C. Sango and 1. F. Sandstrom, J. Chromatogr., 435 (1988)469-481.
11 C. J. Warwick, D. A. Bagon and C. 1. Purnell, Analyst (London), 106 (1981) 676-685.12 D. A. Bagon and C. J. Purnell, 1. Chromatogr., 190 (1980) 175-182.13 D. A. Bagon, C. J. Warwick and R. H. Brown, Am. Ind. Hyg. Assoc. J., 45 (1984) 39-43.14 M. S. Varney and M. R. Preston, J. Chromatogr., 348 (1985) 265-274.15 T. Hirayama, M. Ono, K. Uchiyama, M. Nohara and S. Fukui, J. Assoc. OJI Anal. Chern., 68 (1985)
746-748.16 C. Rosenberg and H. Savolainen, J. Chromatogr., 323 (1985) 429-433.17 G. Skarping, L. Renman and M. Dalene, J. Chromatogr., 270 (1983) 207-218.18 G. Skarping, C. Sango and B. E. F. Smith, J. Chromatogr., 208 (1981) 313-321.19 G. Skarping, L. Renrnan, C. Sango, L. Mathiasson and M. Dalene,J. Chromatogr.. 346 (1985) 191-204.20 L. Renman and G. Skarping, in preparation.21 J. C. Miller and J. N. Miller, Statistics For Analytical Chemistry, Ellis Horwood, Chichester, 19S4.


Journal a/Chromatography, 479 (1989) 145-152Elsevier Science Publishers B.Y., Amsterdam - Printed in The Netherlands
CHROM. 21 672
CHROMATOGRAPHIC DETERMINATION OF AMINES IN BIOLOGICALFLUIDS WITH SPECIAL REFERENCE TO THE BIOLOGICAL MONITORING OF ISOCYANATES AND AMINES
III. DETERMINATION OF 4,4'-METHYLENEDIANILINE IN HYDROLYSEDHUMAN URINE USING DERIVATIZATION AND CAPILLARY GASCHROMATOGRAPHY WITH SELECTED ION MONITORING
A. TILJANDER, O. SKARPINO* and M. DALENE
Department 0/ Occupational and Environmental Medicine, University Hospital, S-221 85 Lund (Sweden)
(First received March 28th, [989; revised manuscript received June 9th, 1989)
SUMMARY
A method is presented for the determination of 4,4'-methylenedianiline inhydrolysed human urine, based on a derivatization procedure with pentafluoropropionic anhydride and capillary gas chromatographic determination with selectedion monitoring. Dideuterated 4,4'-methylenedianiline was used as an internalstandard. The ratio of the molecular ion of the 4,4'-methylenedianiline amidederivative (mjz 490) and the dideuterated 4,4'-methylenedianiline amide derivative(mjz 492) was used for quantitative analysis. The calibration graph was linear in theinvestigated range (5-30 j.tgjl in urine) with a correlation coefficient of 0.998. Theprecision was 3.4% for urine samples containing 26 j.tgjl and the detection limit was2 j.tgjl. The overall recovery for urine samples containing liS j.tgjlwas 96 ± 5%. Urinesamples from eight skin-exposed epoxy resin workers were examined and 4,4'methylenedianiline was found in the concentration range 2-600 j.tgjl.
INTRODUCTION
4,4'-Methylenedianiline (MDA) is a commercially important diamine used as anintermediate in the preparation of epoxy resins, polyurethanes, rubber chemicals andpolymers. By far the largest application for MDA is as an intermediate forisocyanates'P.
MDA has been reported to be hepatoxic in dogs", rats4, S and humans'': 7. It has
shown to be mutagenic in the Ames test in the presence of an S9 metabolic activationsystem", MDA has also been reported to be carcinogenic in rats and mice". MDA isabsorbed readily through the skin!", which causes problems when handling MDA.The determination of MDA in biological fluids from occupationally exposedpersons 11,12 is therefore of major importance. The hydrolysis of authentic urine andthe possible metabolites N-acetyl-MDA and N,N'-diacetyl-MDA has been describ-
0021-9673/89/$03.50 © 1989 Elsevier Science Publishers B.Y.
146 A. TlLJANDER, G. SKARPTNG, M. DALENE
ed11,13. The capillary gas chromatographic (GC) trace determination ofMDA has metwith considerable difficulties owing to the easy oxidation and adsorbtion of MDA inthe analytical system14, which makes the use of a derivatization procedure necessary.Anhydrides have been reported as derivatization reagents for GC determinations ofMDA 11,12,14-17. Several techniques have been developed for the determination ofMDA in matrices such as air sampling solutions I 5,16,18, blood!" and urine1J,ll,ly,lU.
The detection methods used in GC methods are thermionic specific detection (TSD),electron-capture detection (ECD) and selected ion monitoring (SIM). For thedetermination of MDA in urine, detection limits in the range 5-10 flg/llJ.12,19 havebeen reported. 4,4'Methylenebis-2-chloroaniline11 and 4,4'-ethylenedianiline(EDA)12,17 have been used as internal standards for GC-SIM.
In this paper, a GC-SIM method is described for biological monitoring ofMDA, at low flg/llevels, in human urine using dideuterated MDA WH 2]MDA) as aninternal standard.
EXPERIMENTAL
EquipmentThe analyses were performed on a Shimadzu (Kyoto, Japan) QPIOOO EI/CI
quadrupole mass spectrometer. The mass spectrometer was connected to a ShimadzuGC-9A gas chromatograph equipped with an SPL-G9 split-splitless injection systemand a Shimadzu AOC-9. The carrier gas was helium and the inlet pressure was 0.5kg/ern", The injector temperature was 280°C. The split exit valve was closed for I minafter injection. The oven temperature was isothermal at 100°C for 2 min, thenincreased at 30°Cjmin to 300°C, the final temperature being maintained for 2 min. Thequadrupole mass-selective detector was operated in the electron-impact (EI) mode at70 eV using SIM at m]z 490 and 492. The interface temperature was 250°C and the ionsource temperature 300°C. The filament of the ion source was on between 7.5 and 10min after the injection into the GC column. Five measurements were made per second.The mass spectrometer was calibrated with tris(nonafluorobutyl)amine according tothe standard procedure.
The high-performance liquid chromatography (HPLC) system consisted ofa Waters 600 multi solvent delivery system (Millipore-Waters, Milford, MA, U.S.A.),a Waters 712 WISP with variable injection volume, a Waters 490 programmablemulti-wavelength detector and a Shimadzu C-R3A integrator.
A Varian (Walnut Creek, CA, U.S.A.) 3500 gas chromatograph equipped witha Varian thermionic specific detector and a Varian 8035 automatic on-column injectorwas employed. For separation of phases, a Model 3E-l centrifuge (Sigma, Harz,F.R.G.) was used. For enrichment and evaporation, a vacuum desiccator connected toan aspirating pump was employed. The vacuum desiccator was equipped with anelectrically heated oven, designed and manufactured in our laboratory.
ColumnsFused-silica capillary columns, with chemically bonded apolar stationary
phases, were tested: Chrompack (Middelburg, The Netherlands) CP-Sil 8 CB (25m x 0.32 mm J.D.) with film thicknesses of 1.2, 0.50 and 0.25 flm and CP-SiI8 CB (25m x 0.25 mm J.D.) with film thickness of 0.12 flm; Nordion (Helsinki, Finland) NB-54
DETERMINATION OF AMINES IN BIOLOGICAL FLUIDS. Ill. 147
(25 m x 0.32 mm 1.0.) with film thicknesses of 1.0, 0.50 and 0.25 {lm; andJ & W Scientific (Folsom, CA, U.S.A.) DB-5 (30 m x 0.25 mm I.D.) with a filmthickness of 0.25 {lm.
The HPLC column was made of stainless steel (25 cm x 3 mm 1.0.) and waspacked with Nucleosil CIS particles (5 {lm) (Marcherey-Nagel, Duren, F.R.G.).
ChemicalsMDA, EDA and 2,4-toluenediamine (2,4-TDA) were obtained from Aldrich
(Beerse, Belgium). The rzHz]MDA [CzHz(C6H4NHzh hydrochloride] was synthesized at Synthelec (Lund, Sweden). Trifluoroacetic anhydride (TFAA), pentafluoropropionic anhydride (PFPA) and heptafluorobutyric anhydride (HFBA) were obtained from Pierce (Rockford, IL, U.S.A.), toluene and acetonitrile of HPLC gradefrom Lab-Scan (Dublin, Ireland), tris(nonafluorobutyl)amine, sodium hydroxide,hydrochloric acid, potassium dihydrogenphosphate and dipotassium hydrogenphosphate (anhydrous) from Merck (Darmstadt, F.R.G;) and ethanol from Kemetyl(Stockholm, Sweden).
Synthesis of MDA amide derivativesA 17.5-g amount ofPFPA was added to a solution containing 5.0 g ofMDA and
90 ml of toluene. The mixture was slowly heated to 70°C, then cooled and evaporatedto dryness on a rotating evaporator. The residue was recrystallized from ethanolwater (7: I) and the crystals were filtered and washed with the same mixture. Thecrystals obtained were dried in a vacuum desiccator. The HFBA derivative of MDAwas synthesized in a similar manner.
Preparation of standard solutionsStock solutions ofMDA and [ZHz]MDA were prepared in 0.1 M HCl at the I gil
level and diluted with 0.1 MHCl to the appropriate concentrations. A stock solution ofMDA-PFPA derivative was prepared in ethanol at the I gil level and was diluted withtoluene to the desired concentrations. The solutions were stable for more than 10weeks without any noticeable degradation when stored in a refrigerator.
SamplingA 2-ml volume of 6 M HCl per 100 ml of urine was added to the urine samples.
The acidified urine samples were stored in a refrigerator until analysis.
Work-up procedureA 0.8-ml urine sample was placed in a 10-ml test-tube fitted with a PTFE cap and
1.2 ml of6 MHCI and 0.1 ml of 0.5 mg/l [ZHz]MDA solution were added. The test-tubewas heated at 95-100°C for 2 h and then cooled to room temperature. Toluene (3 rnl)and 4 ml of saturated aqueous NaOH solution were added and the mixture was shakenfor 10 min and then centrifuged at 1500 g for 10 min. A 2-ml volume of the organicphase was separated and transferred to a new test-tube, 20 {ll ofPFPA were added andthe solution was shaken for 5 min. Then, 2 ml of I M aqueous phosphate buffer (pH7.5) were added and the mixture was shaken for 10 min. A I-ml volume of the organicphase was transferred to a new test-tube and evaporated to dryness in a vacuumdesiccator at 30°C. The dry residue was dissolved in 0.1 ml of toluene and 1 {llof thissolution was injected into the GC-mass spectrometric (GC-MS) system.

148
RESULTS AND DISCUSSION
A. TILJANDER, G. SKARPING, M. DALENE
StandardThe identity of the MDA-PFPA derivative was confirmed by GC-MS and the
purity was determined using both HPLC-UV detection (A = 245 nm) and capillaryGC-TSD. The purity was found to be better than 99%. The purity was furtherexamined by elemental analysis and the experimental carbon, hydrogen and nitrogenpercentages were found to differ by less than 0.2% from the calculated values.
Isotopic purityThe ratio of the mass fragment of mlz 492 to m]z 490 of the MDA-PFPA
derivative was 3%, as expected from the naturally occurring isotopes in theMDA-PFPA derivative. The ratio of the mass fragment of m]z 490 to mjz 492 of the[2H2]MDA-PFPA derivative was 6% as a result of the remaining parent material.
Work-up procedureHydrolysis. Urine samples from workers exposed to MDA were hydrolysed
under weakly acidic, strongly acidic and strongly basic conditions. The optimumconditions were 2 h at 95-100°C under strongly acidic conditions 13
.
Extraction of MDA. The recovery was almost completely independent ofwhether 5 M NaOH or saturated NaOH was added to the hydrolysed urine sample.The foaming tendency was found to be less pronounced when saturated NaOH wasused.
Derivatization. Three derivatization reagents, TFAA, PFPA and HFBA, weretested. The recoveries for the derivatization reactions were ca. 100%. Excess reagentand liberated acid were removed by extraction with 1 M phosphate buffer (pH 7.5)without any measurable losses of the MDA amide derivative.
Enrichment. The components of interest were enriched lO-fold. The removal ofthe remaining excess of reagent and the volatile impurities present in the sampleincreased the lifetime of the capillary column. The opportunities to enrich the samplefurther are obvious and the possibility of choosing an optimum solvent for thesubsequent GC analysis is also feasible.
ChromatographyCapillary columns with an apolar stationary phase with a film thickness in the
range 0.12-1.2 /lm were tested. Of the three derivatives tested, the MDA-PFPAderivative showed the best column performance. The elution temperature was 300°C.No endogenous peaks from the urine extracts interfered in the analysis. The necessityto achieve an appropriate vacuum in the MS system defined the chromatographicsystem. A relative long capillary column, (20-30 m) ofI.D. 0.25 mm was used to avoida sub-atmospheric inlet pressure. The pressure in the ion source was ca. 2 . 10-5 Torr.The column oven was maximally temperature programmed at 30°C/min owing to thebetter signal-to-noise ratio obtained. More than 1000chromatographic analysis weremade without any noticeable column degradation.
Internal standardEDA, 2,4-TDA and [2H2]MDA were tested. EDA and 2,4-TDA gave unsatis-

DETERMINATION OF AMINES IN BIOLOGICAL FLUIDS. III. 149
factory precision. [zHz]MDA was found to be the best choice on the basis of the similarfragmentation pattern and chemical performance, and it is not expected to appear ina workplace environment.
Mass spectraFor the purpose of identifying and selecting suitable fragment ions for
quantitative analysis, mass spectra of the PFPA derivatives of MDA andeHz]MDA were obtained (Fig. 1).The fragmentation patterns for the two isotopes arevery similar. Typical fragmentations were found 16.17 and the most abundant peakswere the molecular ions.
DetectionThermionic specific detection. The molar sensitivity using GC-TSD is similar for
the three derivatives of MDA investigated. The detection limit was ca. 40 fmole ofMDA-PFPA derivative injected. Interfering peaks occur in the chromatograms fromthe urine samples, giving a practical detection limit of ca. 600 j1gjl.The efficient use ofa GC-TSD method for urine samples demands a more complete sample clean-up ora more selective derivatization procedure.
Selected-ion monitoring. The molecular ion was chosen owing to the sensitivityand the more significant information provided. The sensitivities of the PFPA and
F~">V~J'F;343
252 328
A
><E-<HenZOJE-<ZH
100
80
60
40
20 369
490
491
/
500450400350300250m/z
200100 150
o-!'-'o.LJL.........yL.Jl>.U...1...>..+"""'-..L>.......,...~_ ........__--.._-lllL..JL,.'--.L-_~__.,----L-.h....,
50
330BdO
~~ 492
,;- 100E-< (C 7H 4D) +NHCO Fd! - 254 - ~'F;Hen 80 \z'" 134E-< 60 371zH 133 \ 493OJ 40 -, 345
/:> (C 7H 3D 2 ) +NHCO 330H
ll~254
E-< 20 371<t:HOJ 00:
50 100 150 200 250 300 350 400 450 500m/z
Fig. I. Mass spectra obtained in the EI mode at an ionization potential ono eV: (A) MDA-PFPA derivative;(B) [2H2]MDA-PFPA derivative.

150 A. T1LJANDER, G. SKARPING, M. DALENE
HFBA derivatives of MDA were about the same. However, the MDA-TFAAderivative was 10-20 times less sensitive. In this study, the detection limit was set by theinstrument as no interfering peaks were found. Obviously for urine samples a lowerdetection limit can be obtained with further enrichment. However, the concentrationof the internal standard influences the detection limit as [2H2]MDA unfortunatelycontains 6% of MDA.
Quantitative analysisRecovery. The overall recovery was studied for seven urine samples containing
115 j.lg/I of MDA using an HPLC-UV system. The recovery was 96 ± 5% (95%confidence and n = 7).
Calibration graph. Seven different concentrations of MDA in urine wereprepared, including a blank, according to the work-up procedure. For eachconcentration three determinations with duplicate injections were made by GC-MS.The calibration graph (Fig. 2) for the investigated concentration range of 5-30 j.lg/I ofMDA in urine was linear and gave a correlation coefficient of 0.998 (n = 7;y = 0.0158x+ 0.0108). Correction for the contribution of MDA from the [2H2]MDA internalstandard was made by subtraction of a value of 0.06. Each point on the graphrepresented the corrected average value of the ratio of the peak area of theMDA-PFPA derivative to that of the [2H2]MDA-PFPA derivative.
Detection limit. The detection limit, defined as the urine sample concentrationgiving a signal equal to the blank signal plus three standard deviations'", was 2 j.lg/I ofMDA. No interfering peaks appeared when urine samples from ten persons wereexamined.
Accuracy and precision. Eight urine samples containing 26 j.lg/I of MDA wereanalysed. The relative standard deviation of the MDA peak area was 35%. Therelative standard deviation of the peak area ratio of MDA to [2H2]MDA was 3.4%.
0.6
0.5
o o.&~ 0.3c:l
~ 0.2
0.1
10 15 20 25 30
MDA 1n uri ne (uq/ l)
Fig. 2. Calibration graph for MDA in urine: ratio between the peak areas of the MDA-PFPA derivative andthe [2H21MDA-PFPA derivative from the worked-up urine versus the concentration ofMDA in the originalurine sample. Column, CP-SiI8 CB (25 m x 0.25 mm J.D.) with a film thickness of 0.25 Jim; inlet pressure ofcarrier gas (helium), 0.5 kg/em"; I-Jil splitless injection; temperature programme, isothermal at 100°C for2 min, increased at 30°C/min to a final temperature of 300°C, then isothermal for 2 min.
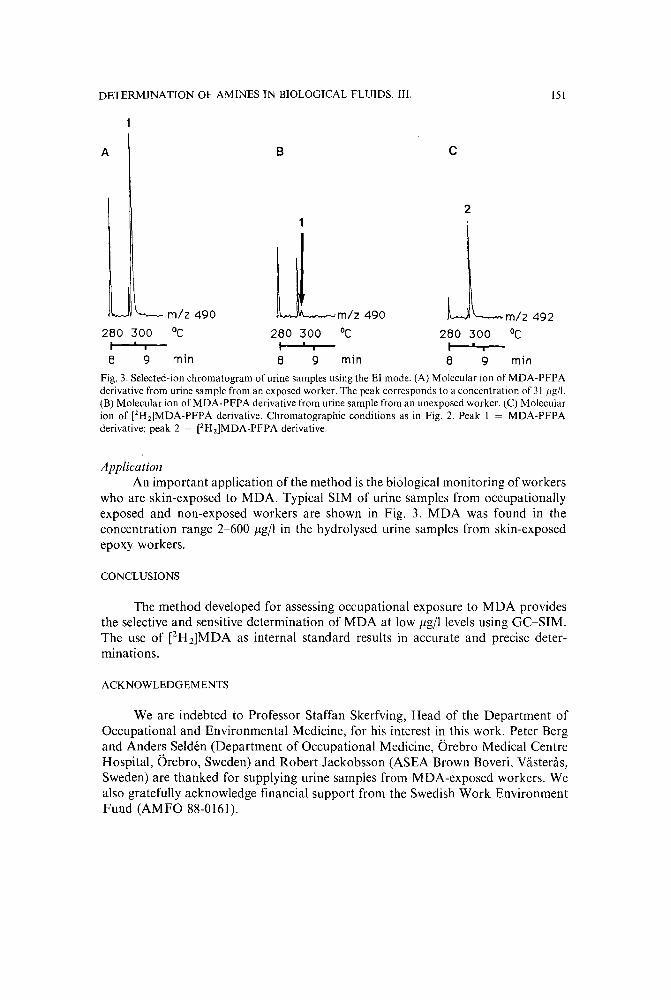
DETERMINATION OF AMINES IN BIOLOGICAL FLUIDS. Ill. lSI
A B c
21
min
m/z 492
°c280 300I 'i
8 9min
)",""..JV\..,_-,mlz 490
°c280 300I I i
8 9min
m/z 490
°c280 300I 'i
8 9Fig. 3. Selected-ion chromatogram of urine samples using the EI mode. (A) Molecular ion of MDA-PFPAderivative from urine sample from an exposed worker. The peak corresponds to a concentration of 31 Ilgll.(B) Molecular ion of MDA-PFPA derivative from urine sample from an unexposed worker. (C) Molecularion of [2H21MDA-PFPA derivative. Chromatographic conditions as in Fig. 2. Peak I = MDA-PFPAderivative; peak 2 = [2H2]MDA-PFPA derivative.
ApplicationAn important application of the method is the biological monitoring of workers
who are skin-exposed to MDA. Typical SIM of urine samples from occupationallyexposed and non-exposed workers are shown in Fig. 3. MDA was found in theconcentration range 2-600 j1g/1 in the hydrolysed urine samples from skin-exposedepoxy workers.
CONCLUSIONS
The method developed for assessing occupational exposure to MDA providesthe selective and sensitive determination of MDA at low j1g/1 levels using GC-SIM.The use of [ZHz]MDA as internal standard results in accurate and precise determinations.
ACKNOWLEDGEMENTS
We are indebted to Professor Staffan Skerfving, Head of the Department ofOccupational and Environmental Medicine, for his interest in this work. Peter Bergand Anders Selden (Department of Occupational Medicine, Orebro Medical CentreHospital, Orebro, Sweden) and Robert Jackobsson (ASEA Brown Boveri, Vasteras,Sweden) are thanked for supplying urine samples from MDA-exposed workers. Wealso gratefully acknowledge financial support from the Swedish Work EnvironmentFund (AMFO 88-0161).
152
REFERENCES
A. TILJANDER, G. SKARPING, M. DALENE
Evaluation of the carcinogenic Risk of Chemicals to Humans, World Health Organization (fARCMonographs, Vol. 39), International Agency for Research on Cancer, Lyon, 1986, p. 347.
2 M. Grayson (Editor), Kirk-Othmer Encyclopedia of Chemical Technology, Vol. 2, Wiley-Interscience,Toronto, 1978, p. 338.
3 W. B. Deichmann, W. E. MacDonald, M. Coplan, F. Woods and E. Blum, Toxicology, 11 (1978) 185.4 S. Fukushima, M. Shibata, T. Hibino, T. Yoshimura, M. Hirose and N.lto, Toxicol. Appl. Pharmacol.,
48 (1979) 145.5 G. Pludro, K. Karlowski, M. Mankowska, H. Woggon and W-J. Uhde, Acta Pol. Pharm., 26 (1969) 352.6 D. B. McGill and J. D. Motto, N. Engl. J. Med., 291 (1974) 278.7 H. Kopelman, P. J. Scheuer and R. Williams, Q. J. Med., 35 (1966) 553.8 K. Tanaka, T. Ino, T. Sawahata, S. Marui, H. Igaki and H. Yashima, Mutation Res., 143 (1985) II.9 E. K. Weisburger, A. S. K. Murthy, H. S. Lilja and J. C. Lamb, IV, J. Natl. Cancer Inst., 72 (1984) 1457.
10 S. R. Cohen, Arch. Dermatol., 121 (1985) 1022.II J. Cocker, W. Gristwood and H. K. Wilson, Br. J. Ind. Med., 43 (1986) 620.12 J. Cocker, 1. C. Brown, H. K. Wilson and K. Rollins, J. Anal. Toxicol., 12 (1988) 9.13 A. Tiljander, G. Skarping and C. Sango, in preparation.14 G. Skarping, 1. Renman and M. Dalene, J. Chromatogr., 270 (1983) 207.15 G. Skarping, C. Sango and B. E. F. Smith, J. Chromatogr., 208 (1981) 313.16 G. Skarping, 1. Renman and B. E. F. Smith. J. Chromatogr.. 267 (1983) 315.17 M. Tortoreto, P. Catalani, M. Bianchi, C. Blonda, C. Pantarotto and S. Paglialunga, J. Chromatogr.,
262 (1983) 367.18 R. M. Riggin, C. C. Howard, D. R. Scott and R. 1. Hedgecoke, J. Chromatogr. Sci., 21 (1983) 321.19 C. Rosenberg and H. Savolainen, J. Chromatogr., 358 (1986) 385.20 P. Trippel-Schulte, J. Zeiske and A. Kettrup, Chromatographia, 22 (1986) 138.21 J. C. Miller and J. N. Miller, Statistics for Analytical Chemists, Ellis Horwood, Chichester, 1984.

Journal of Chromatography, 479 (1989) 153-158Elsevier Science Publishers B.V., Amsterdam - Printed in The Netherlands
CHROM. 21 660
HIGH-SENSITIVITY HIGH-PERFORMANCE LIQUID CHROMATOGRAPHIC ANALYSIS OF DIQUAT AND PARAQUAT WITH CONFIRMATIONa
VERNE A. SIMON* and ANNE TAYLOR
Department of Health and Rehabilitative Services, State of Florida, 1217 Pearl Street, Jacksonville, FL32202 (U.S.A.)
(First received June 20th, 1988; revised manuscript received May 5th, 1989)
SUMMARY
An isocratic high-performance liquid chromatographic (HPLC) assay for diquat and paraquat in well water is presented. This assay is a more rapid and sensitiveversion of our previously published method. A novel post-column reaction is used toconfirm diquat and paraquat. Concentrations of0.1-10 Ilgjkg ofdiquat and paraquatas the di-cations can be determined on 100-ml sample aliquots. Other HPLC methodsare less sensitive and require larger volumes. Separation is achieved by solid-phaseextraction on small (100 mg) bare silica columns. Chromatography is also carried outon bare silica. Both the mobile phase and the solid-phase extraction eluent are aqueous acidic solutions containing tetramethylammonium and ammonium ions.
INTRODUCTION
Paraquat and diquat are general herbicides for both terrestrial and aquaticplants. Both are double quaternary ammonium ions. Both paraquat and diquat aretoxic to man, the former being implicated in many deaths". Paraquat is structurallyrelated to l-methyl-4-phenyl-I,2,3,6-tetrahydropyridine (MPTP), a compoundknown to produce Parkinsonism in man", and paraquat has been shown to causeParkinsonism in the leopard frog, Rana pipiens Schreber, when injected peritoneally'.
Of published methods, those based on spectrophotometry'r" were neither sufficiently sensitive nor specific. Much of the chromatographic work on paraquat and/ordiquat has concerned clinical samples with limits of detection at or above 100 Ilg/kg7-9. Liquid chromatography'? and pyrolytic gas chromatographyl ' have been employed to study natural waters, but detection limits were 50 or 10 Ilg/kg, respectively.
A high-performance liquid chromatographic (HPLC) method, not yet publish-
a Presented at the 12th International Symposium on Column Liquid Chromatography, Washington,DC, June 19-24, 1988. The majority of the papers presented at this symposium have been published in J.Chromatogr., Vols. 458 and 459 (1988) and 461 and 465, No.1 (1989).

154 V. A. SIMON, A. TAYLOR
ed, has been developed for the United States Environmental Protection Agency(EPA) for diquat and paraquatl '. This is a HPLC method employing diode-arraydetection and has minimum detection limits of 0.44 /lg/kg for diquat and 0.80 /lg/kgfor paraquat using a 250-ml sample. The EPA method depends on UV-spectral scanning for qualitative confirmation.
An enzyme-linked immunosorbent assay (ELISA) has been reported l:' whichhas a detection limit of I or 0.1 /lg/kg depending on the matrix. The ELISA methodcannot be used for diquat and involves reagents not commercially available.
The present internally standardized isocratic HPLC method for diquat andparaquat is an improvement of our previously published work!", Samples are concentrated on smaller silica columns (100 mg) eluted with a smaller volume of an aqueoussolution containing tetramethylammonium and ammonium ions at low pH, andchromatographed on silica with a similar but more dilute mobile phase. Two independent modes of detection are used: direct UV absorption at optimized wavelengths andUV absorption following post-column reaction with sodium hydrosulfite (sodiumdithionite).
The present method achieves a ten-fold increase in sensitivity over our previousmethod. Thus both qualitative and quantitative confirmation is possible at a sensitivity which permits smaller sample size than any previous method.
EXPERIMENTAL
MaterialsDownstream from the Model 501 analytical pump (Waters, Milford, MA,
U.S.A.) was a Model LC600 autosampler (Perkin-Elmer, Norwalk, CT, U.S.A.). AnUptight guard column (Upchurch Scientific, Oak Harbor, WA, U.S.A.) was filledwith Perisorb A, bare silica. The column consisted of two 33 mm x 4.6 mm J.D.,3-/lm Perkin-Elmer bare silica cartridge columns in tandem. The column temperaturewas maintained by a Waters column oven and temperature control module.
Direct detection of analytes in the column effluent was provided by a diodearray detector, Model 235 (Perkin-Elmer). Following direct detection post-columnreagent was pumped via a T-connection into the effluent stream using a Model EI20pump (Eldex Labs., San Carlos, CA, U.S.A.). Following post-column reaction (PCR)analyte derivatives were detected using a Model 783 variable-wavelength detectorequipped with a tungsten lamp (ABI Analytical, Ramsey, NJ, U.S.A.).
Data were processed using an Omega-2 data station with an Epson EX-800printer (Perkin-Elmer).
A twelve-station Visiprep vacuum manifold (Supelco, Bellefonte, PA, U.S.A.)was used to process solid-phase extraction (SPE) columns. SPE columns were 100 mgbare silica by Lida (Bensenville, IL, U.S.A.).
Tetramethylammonium hydroxide pentahydrate, ammonium sulfate, ammonium hydroxide, sulfuric acid, sodium hydroxide and sodium hydrosulfite, all reagentgrade, were purchased from Fisher Scientific (Orlando, FL, U.S.A.). All membranefilters were purchased through Fisher Scientific.
Diquat dibromide (6,7-dihydrodipyrido]l ,2-a:2', I' -c]pyrazinediium dibromide)and paraquat dichloride (1,1'-dimethyl-4,4'-bipyridinium dichloride) were suppliedby the EPA (Research Triangle Park, NC, U.S.A.). Diethylparaquat diiodide (1,1'-

HPLC OF DIQUAT AND PARAQUAT 155
diethyl-4,4'-bipyridinium diiodide) was supplied by Chevron (San Francisco, CA,U.S.A.).
Standard solutions. Diquat dibromide and paraquat dichloride were dried toconstant weight at l lO'C. The salts were cooled over Drierite at atmospheric pressure. The weighing form of diquat dibromide was taken to be the monohydrate, andparaquat dichloride was taken to be the tetrahydrate". Stock solutions of each anaIyte, containing 100 ng/fll of the di-cations, were prepared in deionized water andstored at 4°C in plastic bottles.
Mobile phase. A solution of tetramethylammonium hydroxide pentahydrate(10.00 g) in 600 ml of water was adjusted to a pH between 2.5 and 5.0 by addition of50% sulfuric acid. Ammonium sulfate (30.00 g) was added, and the volume wasadjusted to II with water. The solution was adjusted to a pH of2.20 ± 0.02 with 50%sulfuric acid and filtered through a 0.45-flm Nylon filter (Fisher).
Post-column reagent. Sodium hydroxide (12.00 g) and sodium hydrosulfite (3.00g) were dissolved in water, diluted to II, and filtered through a 0.45-flm Metricel filter(Fisher Scientific). This solution must be prepared immediately before use.
Sodium hydro sulfite stored at atmospheric pressure over Drierite is usable forat least three months.
Solution A. Concentrated sulfuric acid (27.8 ml) was diluted to II to produce a IN solution.
Solution B. Concentrated ammonium hydroxide (4 ml) was diluted with waterto 200 m!.
Solution C (eluent). The eluent was prepared in the same way as the mobilephase except that 12.00 g rather than 10.00 g of tetramethylammonium hydroxidepentahydrate was used.
MethodsReservoirs of 60-ml capacity were attached to 100-mg silica columns, using 1.5
ern x 6.4 mm G.D. Tygon tubing. To facilitate insertion into silica columns, the edgeof the tubing was beveled, using scissors. The silica columns were inserted into atwelve-station vacuum manifold and pretreated by drawing through in series: solution A (2.5 ml), water (5 ml), solution B (2.5 ml) and water (5 ml).
Samples (20 or 100 ml) were fortified with diethylparaquat diiode (200 ng),which served as an internal standard. The samples were filtered at a dropwise ratethrough the silica columns. As soon as the columns became empty air flow wasdiscontinued.
A 3-mm diameter, 0.45-flm Nylon filter was attached to the inlet of the silicacolumn and a 3-ml polypropylene syringe was attached to the column outlet. Thesamples were gently eluted by forcing through with the syringe 500 fll of solution C inthe reverse direction 'from sample loading. The eluate was collected in a tared polypropylene centrifuge tube, and sufficient solution C was added to adjust the weight to0.50 ± 0.01 g. The tube was capped, vortex-mixed and stored at 4°C for later incjection.
Extracts were transferred to 0.8-ml glass vials and placed in the autosamplerprogrammed to inject 50 fll by overfilling a fixed loop. The mobile phase flow-rate wasset at 0.8 ml/min, producing a pressure of 34.4 bar. The column consisted of two 33mm x 4.6 mm LD., 3-flm bare silica cartridge columns, which were heated to 70°C ina column oven.
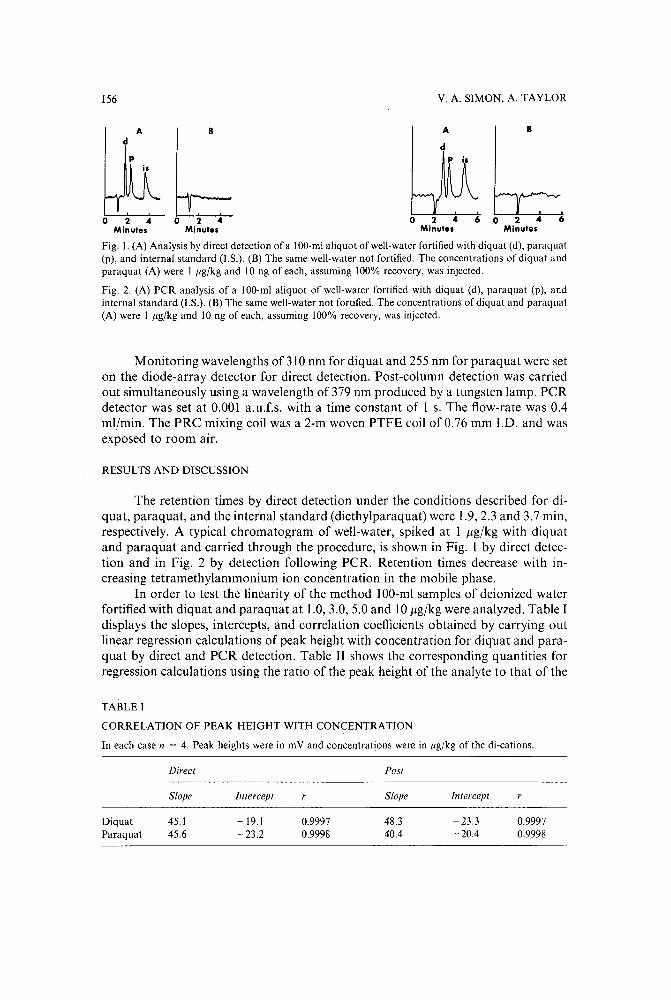
156 V. A. SIMON, A. TAYLOR
d
P
A B
o 2 4Minutes
A
dP is
B
2 4 6Minutes
Fig. I. (A) Analysis by direct detection of a 100-m]aliquot of well-water fortified with diquat (d), paraquat(p), and internal standard (I.S.). (B) The same well-water not fortified. The concentrations of diquat andparaquat (A) were I Jig/kg and 10 ng of each, assuming 100% recovery, was injected.
Fig. 2. (A) PCR analysis of a 100-ml aliquot of well-water fortified with diquat (d), paraquat (p), andinternal standard (I.S.). (B) The same well-water not fortified. The concentrations of diquat and paraquat(A) were I Jig/kg and 10 ng of each, assuming 100% recovery, was injected.
Monitoring wavelengths of 310 nm for diquat and 255 nm for paraquat were seton the diode-array detector for direct detection. Post-column detection was carriedout simultaneously using a wavelength of 379 nm produced by a tungsten lamp. PCRdetector was set at 0.001 a.u.f.s. with a time constant of I s. The flow-rate was 0.4ml/min. The PRC mixing coil was a 2-m woven PTFE coil of 0.76 mm 1.0. and wasexposed to room air.
RESULTS AND DISCUSSION
The retention times by direct detection under the conditions described for diquat, paraquat, and the internal standard (diethylparaquat) were 1.9,2.3 and 3.7 min,respectively. A typical chromatogram of well-water, spiked at I ,ug/kg with diquatand paraquat and carried through the procedure, is shown in Fig. 1 by direct detection and in Fig. 2 by detection following PCR. Retention times decrease with increasing tetramethylammonium ion concentration in the mobile phase.
In order to test the linearity of the method 100-ml samples of deionized waterfortified with diquat and paraquat at 1.0, 3.0, 5.0 and 10 ,ug/kgwere analyzed. Table Idisplays the slopes, intercepts, and correlation coefficients obtained by carrying outlinear regression calculations of peak height with concentration for diquat and paraquat by direct and PCR detection. Table II shows the corresponding quantities forregression calculations using the ratio of the peak height of the analyte to that of the
TABLE I
CORRELATION OF PEAK HEIGHT WITH CONCENTRATION
In each case n = 4. Peak heights were in mV and concentrations were in Jig/kg of the di-cations.
DiquatParaquat
Direct
Slope
45.145.6
Intercept
-19.1-23.2
0.99970.9998
Post
Slope
48.340.4
Intercept
-23.3- 20.4
r
0.99970.9998

HPLC OF DIQUAT AND PARAQUAT 157
TABLE II
CORRELATION OF ANALYTE TO INTERNAL STANDARD PEAK HEIGHT RATIO WITHCONCENTRATION
In each case n = 4. Concentrations were in fig/kg, as the di-cations.
DiquatParaquat
Direct
Slope
1.241.27
Intercept
0.8510.643
0.99470.9954
Post
Slope
1.190.998
Intercept
0.7830.619
0.99290.9944
internal standard versus concentration. Clearly the use of peak-height ratios leads tosmaller coefficients of correlation for both methods of detection. Analysts may wishto shorten analysis time by leaving out the internal standard.
In order to test the reproducibility of the method five 100-ml samples wereanalyzed at each of three concentrations, 0.1, 1 and 10 pgjkg. The coefficients ofvariation of peak height at each concentration are shown in Table III. The variabilityof peak height for direct detection is independent of concentration from 0.1 to 10pgjkg for both diquat and paraquat. Using PCR peak height variability is comparable to that for direct detection at 10 pgjkg but increases for diquat as the concentration drops to 1 pgjkg and for paraquat as the concentration drops to 0.1 pgjkg.
The average recovery ofdiquat over the 0.1-10 pgjkg range was 117 ± 14%based on single point calibration using direct UV absorbance. By PCR the averagediquat recovery was 119 ± 17% . Average paraquat recovery was 118 ± 12% bydirect detection and 113 ± 19% by PCR detection.
It is important that samples be collected in plastic bottles as diquat and paraquat are adsorbed to glass!". Analytes are no longer adsorbed onto glass once dissolved in eluent (solution C).
Elution ofSPE columns in the reverse direction is important in order to achievehigh sensitivity. This technique has not led to serious interference with diquat orparaquat in more than 300 well-water samples.
Applying the present method to 20-ml sample volumes permits detection ofdiquat and paraquat at 1 pgjkg by both detection methods (data not shown). Ourroutine well-water monitoring is done on 20-ml sample aliquots.
TABLE III
VARIABILITY OF PEAK HEIGHT AT A GIVEN CONCENTRATION
Five extractions were made for each concentration. C.V. = Coefficient of variation.
Cone. Direct detection: C. V. peak height (%)(fig/kg)
Detection/allowing PCR: C. V. peak height (%)
Diquat Paraquat Diquat Paraquat
0.1 3.7 6.5 15.2 19.81 7.5 6.1 11.9 4.6
to 4.1 6.1 4.1 5.9

158 V. A. SIMON, A. TAYLOR
A column temperature of 70°C was used to prevent excessive peak tailing. Thesilica columns tolerate the conditions of the assay well remaining usable for at least400 injections.
Those interested in adapting the present method to more complex matricesshould be aware that neither diquat nor paraquat are significantly eluted from silicaby methanol, acetonitrile, or tetrahydrofuran. Such solvents may be useful in sampleclean-up procedures.
Although a diode-array detector was used in the present method, it should bepointed out that the minimum requirement for all signals reported is a single timeprogrammable variable-wavelength detector. Thus confirmation is provided withoutthe need for the U'V-scanning capability used for confirmation by the proposed EPAmethod.
An improvement over our previously reported assay for diquat and paraquathas been presented, which allows lower detection limits (0.1 ,ug/kg versus 0.5 ,ug/kg)with smaller sample volumes (l00 versus 250 mI). No other assay offers such highsensitivity for both diquat and paraquat. A volume of20 ml sufficesfor detection at Ippb. The use of smaller sample volumes saves sample-preparation time, shipmentcosts, and storage space.
A unique PCR detection method, which compliments existing methods, allowsconfirmation of diquat and paraquat.
REFERENCES
I H. M. Hassan and C. S. Moody, Can. J. Physiol. Pharmacol., 60 (1982) 1367.2 J. A. Javitch, R. J. D' Amato, S. M. Strittmatter and S. H. Snyder, Proc. Natl. Acad. Sci. U.S.A., 82
(1985) 2177.3 A. Barbeau, L. Dallaire, N. T. Buu, J. Poirier and E. Rucinska, Life Sci., 37 (1985) 1529.4 H. Maruyama and M. Ide, J. Anal. Toxicol., 12 (1988) 33.5 D. R. Jarvie and M. J. Stewart, Clin. Chim. Acta, 94 (1979) 241.6 D. R. Jarvie, A. F. Fell and M. J. Stewart, Clin. Chim. Acta, 117 (1981) 153.7 A. Pryde and F. J. Darby, J. Chromatogr., 115 (1975) 107.8 J. J. Miller, E. Sanders and D. Webb, J. Anal. Toxicol., 3 (1979) 1.9 R. Gill, S. C. Qua and A. C. Moffat, J. Chromatogr., 255 (1983) 483.
10 I. Ahmad, J. Assoc. Off Anal. Chem., 66 (1983) 663.II A. J. Cannard and W. J. Criddle, Analyst, 100 (1975) 848.12 W. J. Bashe, Technology Applications Inc., Cincinatti, OH 45268, personal communication.13 J. VanEmon, B. Hammock and J. N. Seiber, Anal. Chem., 58 (1986) 1866.14 V. A. Simon, LC' GC, Mag. Liq. Gas Chromatogr., 5 (1987) 899.15 B. L. Worobey, Pestic. Sci., 18 (1987) 245.

Journal of Chromatography, 479 (1989) 159-164Elsevier Science Publishers B.Y., Amsterdam - Printed in The Netherlands
CHROM. 21 670
Note
Optimization of size-exclusion separation of proteins on a Superosecolumn
PAUL L. DUBIN" and JOSEPH M. PRINCIPI
Department of Chemistry, Indiana University-Purdue University at Indianapolis, 1125 East 38th Street,Indianapolis, IN 46205-2820 (U.S.A.)
(First received April 5th, 1989; revised manuscript received June 7th, 1989)
The chromatographic partition coefficient for size-exclusion chromatography(SEC) is obtained experimentally as
KSEC (1)
where Ve is the measured peak elution volume, Va is the column void volume orexclusion volume and Vt is the total column volume, i.e., the sum of Va and the porevolume, Vp ' Several treatments have appeared in which KSEC is related to thedimensions of the stationary pores and the macromolecular solutes':". However, themigration of proteins on SEC columns is in fact typically influenced by electrostaticand hydrophobic factors, as well as by steric effects":".
All aqueous SEC packings bear a discernible level of ionogenic groups whichcommonly produce a negative surface charge"; this stationary charge may interactwith regions of similar or opposite charge on the proteins, leading to repulsion orretention. Such coulomb interactions are evidently most prominent in low ionicstrength eluent, in the absence of screening by small ions, However, it is not at all clearthat these interactions can be totally suppressed by the addition of salt, for tworeasons. First, the reduction of protein solvation at high ionic strength may facilitatebinding via enhanced hydrophobic interactions. Second, if the protein's ionic groupsactually ion pair with those on the packing, as is indeed suggested by the commonreference to "ion-exchange" mechanisms", then the interaction between the stationaryphase and the protein may be so intimate that the ionic strength of the medium mightnot screen these interactions through the usual Debye-Hiickel square root dependence. Put differently, the proximity of the stationary phase and the proteinionophores in the binding mode might preclude the intervention of the bulkelectrolyte. Such considerations may be involved in the finding that protein retentionvolumes may display minima or maxima with increasing ionic strength for a number ofSEC packingsv!",
The role of the ionic strength (I) must primarily involve the effective distance ofelectrostatic forces, i.e., the Debye length (see, e.g., ref. 11), while the influence of pH
0021-9673/89/$03.50 © 1989 Elsevier Science Publishers B.Y.

160 NOTES
on retention depends on the pK values of solute and packing ionogens. Repulsiveforces should dominate at high pH, at which condition both packing and solute arenegatively charged; the situation is more complex in neutral or acidic media, in whichsome regions of the protein bear a charge opposite in sign to that of the stationaryphase. The net electrostatic force between the protein and the packing will then bequite sensitive to orientation and rotational freedom of the protein in the nearproximity of the stationary phase.
The co-existence of several separation mechanisms is of course frequentlyexploited to maximize peak resolution". In practise, this may involve the manipulationof solvent gradients with SEC packings that contain both hydrophobic and ionicsubstituents. Such mixed-mode chromatography however, vitiates the interpretationof retention volumes in terms of molecular dimensions. Furthermore, it is difficult toanalyze the mangnitude of non-steric effects, unless conditions for "ideal" behaviorcan be identified as a point of reference. The determination of solvent conditions thatcorrespond to "pure SEC" is therefore of practical and fundamental significance. Inthis report, we describe an empirical, but efficient procedure to identify such "ideal"conditions.
EXPERIMENTAL
Proteins obtained from Sigma (99+ % purity) were thyroglobulin (bovine)(mol.wt. 669 000 daltons, pI = 4.6); apoferritin (horse spleen) (467 000 daltons, pI =ca. 5.0); catalase (bovine liver) (232 000 daltons, pI = 5.6), bovine serum albumin(66 000 daltons, pI = 4.8), ovalbumin (44000 daltons, pI = 4.6), myoglobin (17 000daltons, pI = 7.3) and cytochrome c (12 400 daltons, pI = 10.6). All proteins gavea single symmetrical chromatographic peak. Corresponding Stokes radii, obtainedfrom a variety of references, were 85, 61, 52, 36, 28, 20 and 16 A, respectively. Bluedextran was obtained from Pharmacia.
A prepacked Superose 6 column (30 em x 1.00 em J.D., Pharmacia) witha molecular weight range of 5000-500 000 (globular proteins) was eluted with sodiumchloride-sodium phosphate buffer (9:1), at varying pH and ionic strengths, at 23 ±1°C using a Milton Roy minipump. A Rheodyne procolumn filter (0.2 flm) was placedin-line to protect the column from particulate matter. The column exclusion volumeand total permeable volume, as measured with blue dextran and deuterium oxide, were14.58 and 22.42 ml, respectively. At a typical flow-rate of 0.35 ml min -I the platecount, as measured by injection of 5% deuterium oxide, was 9000 m -I. Samples,containing typically 3.5 mg ml- I protein, were injected via a Rheodyne 7010 (200 fll)loop injector, after filtration through disposable nylon 0.45-flm syringe filter tips(National Scientific Co.). Detection was by refractive index (Waters Assoc., R401) orUV absorbance at 254 nm (Altex, Model 153).
RESULTS AND DISCUSSION
Geometric considerations suggest that, for solutes and pores with well definedsymmetrical geometries
KSEC = (1 - (X},1. (2)

NOTES 161
where a = Rlr; is the ratio of solute and pore sizes, and Adepends on pore geometry,i.e. A = 2forcylindrical pores and 3 for spherical pores 13
. Although direct methods failto reveal a uniform pore geometry for any gel packing!", data for neutralpolysaccharides on porous glass pac kings are well fit by eqn. 2 using A = 2 (ref. 15).Furthermore, these same results indicate that the effective cylindrical radius of thepores may be identified with the value from mercury porosimetry.
The evaluation of R is hardly straightforward: the macromolecular dimensionalparameter that controls elution in SEC is the subject of debate. For solutes ofnear-spherical symmetry, retention may be predicted, with equal accuracy, bya number of variables, including the Stokes radius and the viscosity radius". We haverecently shown, however, that neither of these parameters uniformly determines KSEC
for asymmetric macromolecules of varying shapes 1 7. For proteins, however, R may beidentified with dimensions determined by hydrodynamic and other techniques. In thiswork, the Stokes radius, Rs, is employed.
If electrostatic and hydrophobic effects influence the retention of proteins,deviations from a geometric relation such as eqn. 2 are expected. For a series ofglobular proteins with different isoelectric points, such as those studied here, with pIranging from 4.6 to 10.6, it is unlikely that these deviations could be uniform, becausethe charge states of the proteins studied vary widely at any chosen pH. Conversely,congruence of the data with eqn. 2 may be taken as indicating an absence of non-idealinteractions. The magnitude of the deviations from eqn. 2 may be quantitativelyparameterized by the regression coefficient of plots of KSEC vs. Rs; for this purpose it isnot necessary to assume a specific form for KSEC(Rs), i.e., a specific value for A.Optimization of solvent pH and ionic strength may then be guided by maximization ofthe regression coefficient.
Since the dependence of KSEC on I and pH is not known a priori, an empiricaloptimization procedure was used to identify the combination of I and pH corresponding to the largest value of the regression coefficient, presumably 1.00. A simplexmethod 18 was used to maximize the regression coefficient of KSEcCRs) in the I, pHcoordinate system, as shown in Fig. I. Fig. 2 illustrates the dependence of KSECon Rsatconditions far from the optimum, while Fig. 3 shows the results obtained at theoptimum conditions, I = 0.38, pH 5.5. As evident from the insert of Fig. 3, the dataconform rather well to eqn. 2, with A = 2. The result for thyroglobulin, not shown inthe insert, deviates slightly from the curve, and we suggest that this largest proteinmight sample an average pore size different from that "seen" by the others.
Our results differ from those of Waldmann-Meyer!? whose data for proteins onAgarose and Sephadex gels conformed to eqn. 3
KSEC = k - Rs/Rx cos e (3)
corresponding to conical pore geometry. (Here R; and eare the geometric parametersof the pore.) This difference could arise in several ways, including an actual differencein pore geometry between the packings used in the two studies, or distortion of the datain ref. 19 through protein-packing interactions. In addition, discerning between eqns.2 and 3 may require precision beyond that typically available.
We believe that Fig. 3 corresponds to pure size exclusion; therefore, under theconditions represented by the other vertices in Fig. I, some protein-stationary phase

162 NOTES
0.6
0.5
0.4
0.3
0.2
0.1
0.03 4
pH
Fig. 1. Simplex optimization of the regression coefficient, r, of plots of KSEC v.\'. Rs, for globular proteins ineluents of varying ionic strength, J, and pH, on Superose 6 column.
interactions take place. Such interactions are apparently difficult to suppress, eventhough the charge on Superose is presumably quite low in the pH range studied, andeven though the hydrophobicity parameter/? for this packing is low compared to othergels. It is also of interest to note that the optimal pH is below the isoelectric point ofmost of the proteins, so that the average protein net charge is opposite in sign to thecharge on the packing. This effect, which would be expected to lead to enhancedretention through coulombic attraction, is obviously outweighed by the reduction ofthe packing charge at the lower pH. Kopaciewicz and Regnier" also noted thesimultaneous effects of protein and packing charge for derivatized silica supports. and
1008060
D
IJ. IJ. IJ.
20
1.0
0.8
0.6
KSEC
0.4
0.2
0.00 40
R. .A-sFig. 2. KSEC v.\'. R s in mobile phase: (D) pH 6.04, J = 0.35 M; (6) pH 7.0, I = O.oI M.

0.7
o
163
10080
o
60
10 20 30R
40 SO 60s
40
0.9
K I/2SEC
0.8
20
NOTES
1.0
0.9
0.8
0.7
KSEC
0.6
0.5
0.4
OJ0
Rs ,A
Fig. 3. KSEC vs. Rs in optimized mobile phase, with pH 5.5, I = 0.38 M. Insert: data plotted according to eqn.2 (see text for explanation).
Mori and Kat02 1 similarly described the retention behavior of proteins on diolbonded porous glass. Both of theses packings would be expected to have considerablylarger surface charge densities than Superose.
Three semi-empirical treatments have dealt with electrostatic interactions inSEC2 2
-2 4
, all of them focussing on repulsive effects that lead to early elution. Thesethree approaches all relate the reduction in Ve to the dimensions of an electrical doublelayer, but the first tw02 2
•2 3 assign the effect to the potential around the solute, while the
third 2 4 emphasizes the double layer near the packing. While all three descriptions arecleary incomplete, the present results show the importance of the charge on thepacking.
CONCLUSIONS
An empirical optimization procedure leads to mobile phase conditions underwhich a number of globular proteins with differing isoelectric points, show a dependence of KSEC on Stokes radius in close agreement with that predicted from a simplegeometric model. It is suggested that these conditions correspond to "ideal" SEC, anddeviations therefrom to electrostatic interactions with the packing. Studies arecurrently underway to establish whether such "ideal" conditions exist for SECstationary phases that are more hydrophobic or more highly charged than Superose 6.
ACKNOWLEDGEMENT
Partial support by a grant from S. C. Johnson & Son is gratefully acknowledged.

164
REFERENCES
NOTES
I E. F. Cassasa, Macromolecules, 9 (1976) 182-185, and references cited therein.2 J. C. Giddings, E. Kucera, C. P. Russell and M. N. Meyers, J. Phys. Chem., 72 (1968) 4397--4408.3 M. E. Himmel and P. G. Squire, in P. L. Dubin (Editor), Aqueous Size-Exclusion Chromatography,
Elsevier, Amsterdam, 1988, Ch. 1.4 W. Kopaciewicz and F. E. Regnier, in M. T. W. Hearn, F. E. Regnier and C. T. Wehr (Editors),
High-Performance Liquid Chromatography of Proteins and Peptides, Academic Press, Orlando, FL,1983, pp. 151-159.
5 H. D. Crone, J. Chromatogr., 92 (1974) 127-135.6 G. Siepke, H. Miillner and U. Grau, Angew. Chem., Int. Ed. Engl., 25 (1986) 535-552.7 P. Roumeliotis, K. K. Unger, J. Kinkel, G. Brunner, R. Wieser and G. Tschank, in F. Lottspeich, A.
Henschen and K. P. Hupe (Editors), HPLC in Protein and Peptide Chemistry, Walter de Gruyter, Berlin,1981, pp. 72-82.
8 P. L. Dubin, in P. L. Dubin (Editor), Aqueous Size-Exclusion Chromatography, Elsevier, Amsterdam,1988, Ch. 3.
9 H. G. Barth, J. Chromatogr. Sci., 18 (1980) 409--429.10 E. Pfannkoch, K. C. Lu, F. E. Regnier and H. G. Barth, J. Chromatogr. Sci., 18 (1980) 430.II W. J. Moore, Basic Physical Chemistry, Prentice-Hall, Englewood Cliffs, NJ, 1983, p. 373.12 T. Andersson, M. Carlsson, L. Hagel, P.-A. Pernemalm and J.-C. Janson, J. Chromatogr., 326 (1985)
33--44.13 E. F. Cassasa, J. Phys. Chem., 75 (1971) 3929-3939.14 L. Hagel, in P. L. Dubin (Editor), Aqueous Size-Exclusion Chromatography, Elsevier, Amsterdam, 1988,
Ch.5.15 H. Waldmann-Meyer, J. Chromatogr., 350 (1985) 1-13.16 M. Potschka, J. Chromatogr., 441 (1988) 239-260.17 P. L. Dubin and J. M. Principi, Macromolecules, 22 (1989) 1891-1896.18 K. W. Burton and G. Nickless, Chemometrics and Intelligent Laboratory Systems, I (1987) 135~149.
19 H. Waldman-Meyer, J. Chromatogr., 410 (1987) 233-248.20 P. L. Dubin and J. M. Principi, Anal. Chem., 61 (1989) 780-781.21 S. Mori and M. Kato, J. Liq. Chromatogr., 10 (1987) 3113-3126.22 M. G. Styring, C. J. Davison, C. Price and C. Booth, J. Chem. Soc., Faraday Trans. 1, 80 (1984)
3051-3058.23 M. Potschka, Anal. Biochem., 162 (1987) 47-64.24 P. L. Dubin, C. M. Speck and J. I. Kaplan, Anal. Chem., 69 (1988) 895-900.
Journal of Chromatography, 479 (1989) 165-169Elsevier Science Publishers B.V., Amsterdam - Printed in The Netherlands
CHROM.21 704
Note
Gas chromatographic retention indices of tear gases on capillary columns
B. R. GANDHE*, R. C. MALHOTRA and P. K. GUTCH
Defence Research and Development Establishment, Tansen Road, Gwalior 474002 (India)
(First received March 6th, 1989; revised manuscript received June 14th, 1989)
Tear gas compounds (lacrimators) cause irritation of the eyes, nose, respiratorytract and skin with the consequent production of profuse tears and mucous. Onprolonged exposure individuals may suffer acute pain in the chest, difficulty in breathing and vomiting". Methods are required for their rapid and sensitive identification,and gas chromatography (GC) with a fused-silica capillary column is the method ofchoice due to its high resolution power and sensitivity.
The correlation of retention indices between an unknown and reference compound on two or more columns of different polarities is generally sufficient for identification purposes. The measurement of Kovats retention indices? is useful only whencompounds with similar retention behaviour are to be studied, as the column temperature in these measurements is held constant. Recently, temperature-programmedretention indices using Van den Dool and Kratz equation" have been found to beuseful for compounds of defence interest":",
In this paper we report temperature-programmed retention indices for severaltear gas compounds using Van den Dool's equation:'. GC of these compounds as aclass on a fused-silica capillary column and temperature-programmed retention indices for most of them have not previously been reported. Further, the measurementof retention indices on two columns with different polarities is shown to be applicablefor the identification of tear gases in air.
EXPERIMENTAL
StandardsC6-CS n-alkanes were purchased from BDH (Poole, U.K.) and C9-CZ4 n-al
kanes from Fluka (Buchs, Switzerland).
Tear gas compoundsChloroacetone (A-Stoff) was obtained from Fluka and methyl ethyl ketone,
benzyl chloride, benzyl bromide, ethyl cyanoacetate, benzoyl chloride and ethyl bromoacetate from BDH.
«i-Chloroacetophenone (CN) was prepared by chlorination of acetophenone".o-Chlorobenzylidene malononitrile (CS) was prepared by condensation of o-chlorobenzaldehyde with malononitrile".
0021-9673/89/$03.50 © 1989 Elsevier Science Publishers B.V.

166 NOTES
The purity of all the compounds was checked by GC before further use and wasfound to be > 99% in all instances. Further, CS and CN were characterized by IRand MS data (CS, M +. = m/z 188; CN, M +. = m/z 154.) Their melting points werein good agreements with literature values.
InstrumentationA Shimadzu Model GC-9APTF gas chromatograph equipped with a flame
ionization detector and a Chromatopak C-R3A data processor was used. Two fusedsilica capillary columns (30 m x 0.32 mm J.D.) with a 0.25-,um film of surface-bondedand cross-linked stationary phase were used: (a) DB-1701 (86% dimethyl-, 14% cyanopropylphenyl polysiloxane) and (b) DB-1 (100% dimethylpolysiloxane), suppliedby J & W Scientific (Folsom, CA, U.S.A.). The carrier gas was nitrogen at 1.25kgjcrrr' at the inlet. Hydrogen was supplied to the detector at 40 nil/min and air at 400ml/min. The column oven temperature was held at 600C for 2 min, increased at8°C/min up to 200°C. The injector block was kept at 210°C and the detector block at230°C. A splitless Grob-type injection system was used.
Measurement of retention indicesIn order to measure the retention indices, generally solutions containing several
tear gases in acetone together with n-alkane standards were injected on to the GCcolumn. The sample size in each instance was about 0.1 ,Ill.The amounts of individualtear gases and n-alkanes present were in the range IO~15 ng. The retention times wererecorded with an accuracy of up to 0.001 min with the help of the Shimadzu C-R3Adata processor.
In order to identify individual components in the mixture, an authentic sampleof each tear gas was injected separately and its retention time was compared with thatof the component in mixture.
Temperature-programmed retention indices for individual compounds werecalculated as described in literature".
RESULTS AND DISCUSSION
Temperature-programmed retention indices for tear gas compounds on twocapillary columns are given in Table J. The reliability of the retention indices dependson the accurate measurements of retention times and reproducible temperature programming and carrier gas flow-rates. The retention times were measured in up toO.OOl-min increments. The reproduciblity of the temperature programming was satisfactory. The flow-rate of the carrier gas and other chromatographic conditions weremaintained constant. The standard deviation of the retention index of any particularcompound was less than 0.8 (n = 5).
Errors arising from deterioration of the stationary phase can be avoided by useof bonded phases. Application of a small sample size (0.1 ,Ill) with nanogram levelconcentrations of the components helped in avoiding errors that generally arise fromoverloading of the column. The peaks were sharp and symmetrical even on polarphase. A typical chromatogram for some tear gas compounds obtained on theDB-1701 column is shown in Fig. 1.
As can be seen from the data in Table I. the retention indices on the polar

NOTES 167
TABLE I
TEMPERATURE-PROGRAMMED RETENTION INDICES OF TEAR GAS COMPOUNDS ONDB-I AND DB-l701 FUSED-SILICA CAPILLARY COLUMNS
Heating rate 8°C/min. Other GC conditions as described in the text.
Compound
Methyl ethyl ketoneChloroacetoneBromoacetoneEthyl bromoacetateBenzyl chlorideEthyl cyanoacetateBenzoyl chloridew-Chloroacetophenone (CN)o-Chlorobenzylidene malononitrile (CS)
a Mean ± S.D. (n = 5).
Retention index"
DB-f
721.6 ± 0.3850.6 ± 0.6876.5 ± 0.5986.5 ± 0.5
1002.2 ± 0.51026.7 ± 0.41038.5 ± 0.61229.8 ± 0.51487.6 ± 0.5
os-not
810.6 ± 0.2989.8 ± 0.4
1027.6 ± 0.41061.5 ± 0.61122.5 ± 0.41140.8 ± 0.41193.7 ± 0.71471.7 ± 0.81810.4 ± 0.5
89.0139.2151.175.0
120.3114.1155.2241.9322.8
stationary phase are higher than those on the non-polar phase. Further, the differencein the retention indices value on the polar and non-polar columns (.dl) is higher foraromatic compounds such as CS and CN than for aliphatic compounds such asbromoacetone. The large variations in the iJI values can be attributed to the differentchemical natures and physical properties of the tear gases studied.
-
2
3
4
I
5
I
4 8 12 16 20 24 28 32
MIN
Fig. I. Separation of tear gases on a DB-1701 fused-silica capillary column (30 m x 0.32 mm I.D., filmthickness 25 Itm). Chromatographic conditions are described in the text. Peaks: I = chloroacetophenone;2 = benzyl chloride; 3 = benzoyl chloride; 4 = CN; 5 = CS.
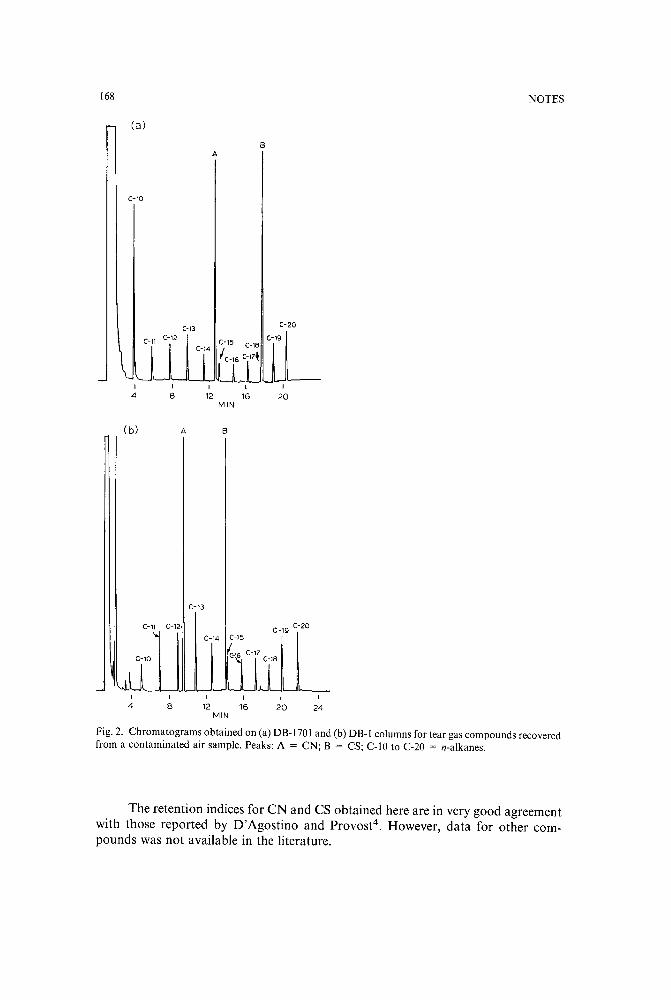
168 NOTES
(a)
BA
C-10
C-13 C-20
(-19
20MIN
(b) A B
(-13
e-n C-12, C-19 C-20... C-14 C-15
{,6 C-17
-Jl TO "! IT
2420I
BI
4I I
12 16MIN
Fig. 2. Chromatograms obtained on (a) DB-170l and (b) DB-I columns for tear gas compounds recoveredfrom a contaminated air sample. Peaks: A = CN; B = CS; C-IO to C-20 = n-alkanes.
The retention indices for CN and CS obtained here are in very good agreementwith those reported by D'Agostino and Provost", However, data for other compounds was not available in the literature.
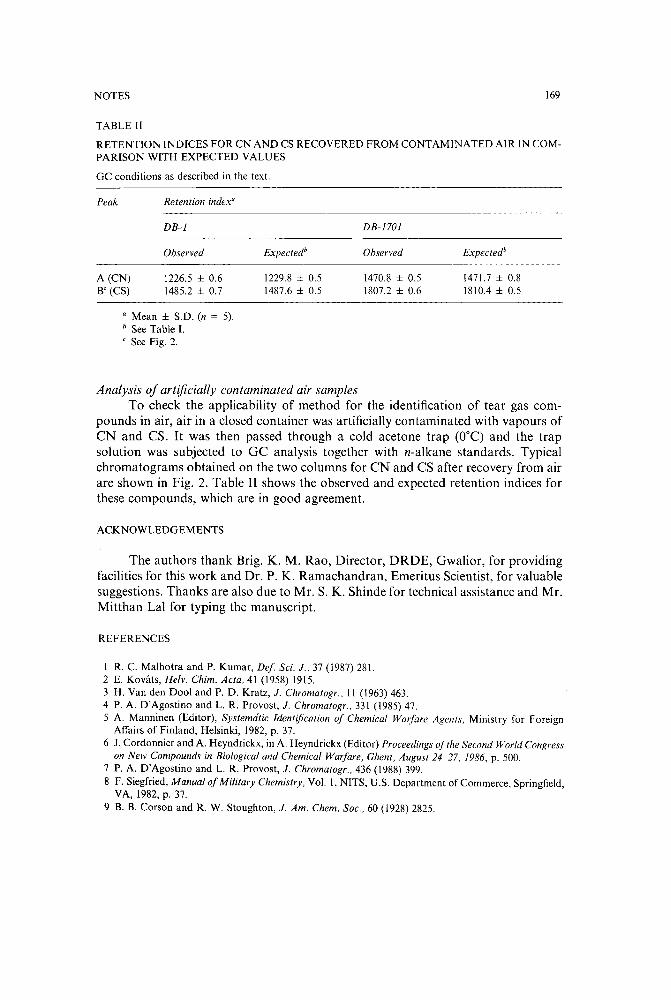
NOTES 169
TABLE II
RETENTION INDICES FOR CN AND CS RECOVERED FROM CONTAMINATED AIR IN COMPARISON WITH EXPECTED VALUES
GC conditions as described in the text.
Peak Retention index"
DB-l
Observed Expected"
DB-1701
Observed Expected"
A (CN)B' (CS)
1226.5 ± 0.61485.2 ± 0.7
1229.8 ± 0.51487.6 ± 0.5
1470.8 ± 0.51807.2 ± 0.6
1471.7 ± 0.81810.4 ± 0.5
a Mean ± S.D. (n = 5).b See Table I.c See Fig. 2.
Analysis of artificially contaminated air samplesTo check the applicability of method for the identification of tear gas com
pounds in air, air in a closed container was artificially contaminated with vapours ofCN and CS. It was then passed through a cold acetone trap (O°C) and the trapsolution was subjected to GC analysis together with n-alkane standards. Typicalchromatograms obtained on the two columns for CN and CS after recovery from airare shown in Fig. 2. Table II shows the observed and expected retention indices forthese compounds, which are in good agreement.
ACKNOWLEDGEMENTS
The authors thank Brig. K. M. Rao, Director, DRDE, Gwalior, for providingfacilities for this work and Dr. P. K. Ramachandran, Emeritus Scientist, for valuablesuggestions. Thanks are also due to Mr. S. K. Shinde for technical assistance and Mr.Mitthan Lal for typing the manuscript.
REFERENCES
I R. C. Malhotra and P. Kumar, De.f Sci. J., 37 (1987) 281.2 E. Kovats, Helv. Chim. Acta, 41 (1958) 1915.3 H. Van den Dool and P. D. Kratz, J. Chromatogr., II (1963) 463.4 P. A. D'Agostino and L. R. Provost, J. Chromatogr., 331 (1985) 47.5 A. Manninen (Editor), Systematic Identification of Chemical Warfare Agents, Ministry for Foreign
Affairs of Finland, Helsinki, 1982, p. 37.6 J. Cordonnier and A. Heyndrickx, in A. Heyndrickx (Editor) Proceedings ofthe Second World Congress
on New Compounds in Biological and Chemical Warfare, Ghent, August 24-27, 1986, p. 500.7 P. A. D'Agostino and L. R. Provost, J. Chromatogr., 436 (1988) 399.8 F. Siegfried, Manual of Military Chemistry, Vol. I, NITS, U.S. Department of Commerce, Springfield,
VA, 1982, p. 37.9 B. B. Corson and R. W. Stoughton, J. Am. Chem. Soc., 60 (1928) 2825.
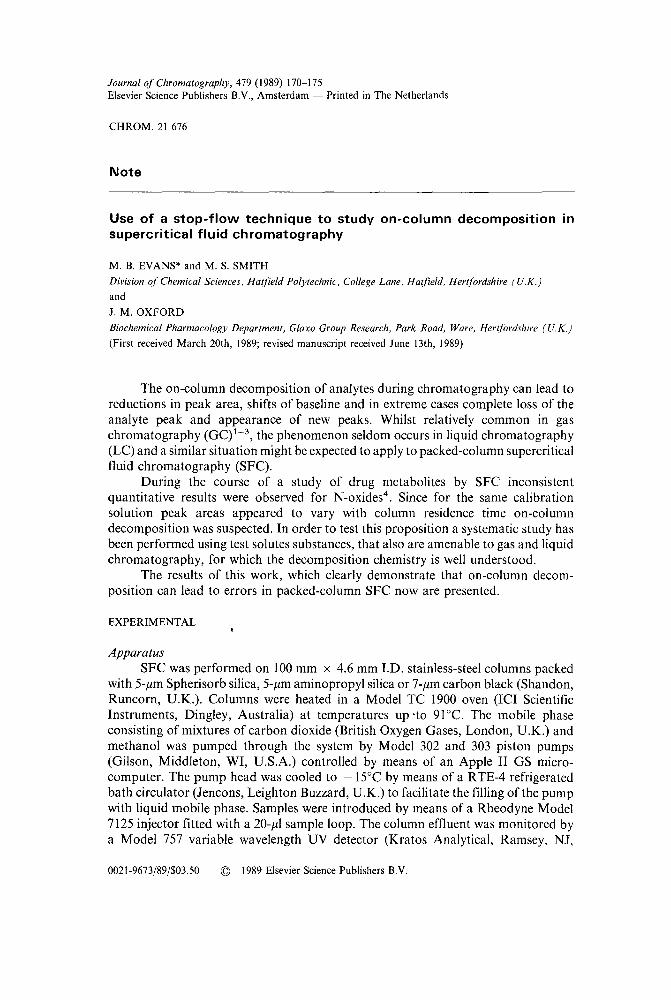
Journal of Chromatography, 479 (1989) 170-175Elsevier Science Publishers B.V., Amsterdam - Printed in The Netherlands
CHROM. 21 676
Note
Use of a stop-flow technique to study on-column decomposition insupercritical fluid chromatography
M. B. EVANS* and M. S. SMITH
Division of Chemical Sciences, Hatfield Polytechnic, College Lane, Hatfield, Hertfordshire (U.K.)
and
J. M. OXFORD
Biochemical Pharmacology Department, Glaxo Group Research, Park Road, Ware, Hertfordshire (U.K.)
(First received March 20th, 1989; revised manuscript received June 13th, 1989)
The on-column decomposition of analytes during chromatography can lead toreductions in peak area, shifts of baseline and in extreme cases complete loss of theanalyte peak and appearance of new peaks. Whilst relatively common in gaschromatography (GC)1-3, the phenomenon seldom occurs in liquid chromatography(LC) and a similar situation might be expected to apply to packed-column supercriticalfluid chromatography (SFC).
During the course of a study of drug metabolites by SFC inconsistentquantitative results were observed for Nsoxides''. Since for the same calibrationsolution peak areas appeared to vary with column residence time on-columndecomposition was suspected. In order to test this proposition a systematic study hasbeen performed using test solutes substances, that also are amenable to gas and liquidchromatography, for which the decomposition chemistry is well understood.
The results of this work, which clearly demonstrate that on-column decomposition can lead to errors in packed-column SFC now are presented.
EXPERIMENTAL
ApparatusSFC was performed on 100 mm x 4.6 mm LD. stainless-steel columns packed
with 5-,um Spherisorb silica, 5-,um aminopropyl silica or 7-,um carbon black (Shandon,Runcorn, U.K.). Columns were heated in a Model TC 1900 oven (ICI ScientificInstruments, Dingley, Australia) at temperatures up -to 91°C. The mobile phaseconsisting of mixtures of carbon dioxide (British Oxygen Gases, London, U.K.) andmethanol was pumped through the system by Model 302 and 303 piston pumps(Gilson, Middleton, WI, U.S.A.) controlled by means of an Apple II GS microcomputer. The pump head was cooled to -15°C by means of a RTE-4 refrigeratedbath circulator (Jencons, Leighton Buzzard, U.K.) to facilitate the filling of the pumpwith liquid mobile phase. Samples were introduced by means of a Rheodyne Model7125 injector fitted with a 20-,u1 sample loop. The column effluent was monitored bya Model 757 variable wavelength UV detector (Kratos Analytical, Ramsey. NJ.
0021-9673(89($03.50 © 1989 Elsevier Science Publishers B.V.

NOTES 171
U.S.A.) set at 254 nm. A Tescom back-pressure regulator (Tescom Instruments, ElkRiver, MI, U.S.A.) was used to maintain supercritical conditions.
The high-performance LC (HPLC) system consisted of Model PU 4015 pistonpump (Philips Analytical, Cambridge, U.K.), a Rheodyne Model 7125 injector fittedwith a 1O-J.L1 injector loop and a Model PU 4025 UV detector (Philips Analytical)operated at 254 nm. Chromatography was performed on 250 mm x 4.6 mm I.D.stainless-steel columns packed with lO-,um Partisil ODS-lor 5-,um Spherisorb silica(Phase Separations, Queensferry, U.K.). The columns were thermostated by means ofa Model TC 1900 oven (lCI Scientific Instruments).
The GC experiments were carried out on a Model 204 gas chromatograph(Philips Analytical) equipped for packed and capillary column operation withon-column injection and flame ionization detection. Chromatography was performedon 2 m x 4 mm I.D. glass columns packed with 10% (w/w) OV-I or PEG 20M on80-100 mesh Chromosorb P and a 10 m x 0.32 mm I.D. fused-silica capillary coatedwith PEG 20M, film thickness 0.5,um(Thames Chromatography, Maidenhead, U.K.).Nitrogen or helium was used as carrier gas with a Model 151/3G toggle valve (HokeInternational, Harrow, U.K.) in the gas line to enable stop-flow operation.
MaterialsHPLC-grade methanol and acetonitrile were obtained from BDH (Poole, U.K.)
whilst 2-phenylpropan-2-01, l-phenylpropan-z-ol, 2-phenylpropan-I-ol and propiophenone were obtained from Aldrich (Gillingham, U.K.).
RESULTS AND DISCUSSION
There is increasing evidence to suggest that SFC is appropriate for the assay ofthermally liable compounds'":", Normally such compounds are polar in nature andrequire the use of mobile phase with high percentages of polar modifiers, such asmethanol, which in turn necessitate operation at elevated temperatures to maintainsupercritical conditions. For instance, Cheuh and Prausnitz" have shown that fora carbon dioxide-methanol (80:20, v/v) mixture column temperatures in excess of75°C are necessary. At such temperatures on-column degradation of thermally liablecompounds is a possibility, especially with silica-based stationary phases, whereacid-catalysed elimination reactions can occur. In order to test this thesis a series ofphenylalkanols with primary, secondary and tertiary hydroxyl groups have beenexamined by stop-flow SFC and for comparison by GC and LC.
Rapid on-column reactions generally are associated with the appearance ofadditional peaks due to the fragmentation of molecules. On the other hand relativelyslow on-column reactions lead to apparently normal chromatograms but with reducedpeak areas which lead to unsuspected quantitative errors. Two techniques may be usedto detect on-column reactions which are not manifested by the appearance ofadditional peaks or baseline disturbance. The first involves the measurement of peakareas for a labile test substance relative to those of a stable internal standard for a rangeof column temperatures. Here reductions of retention and associated peak areas at thehigher temperatures can lead '10 uncertainties, also comparisons are complicated bydifferences in solute residence times. These limitations can be overcome by the secondmethod, stop-flow chromatography, which involves interuption of the elution process

172 NOTES
by stopping the mobile phase flow when the solutes are midway down the column. Theanalyte and internal standard thus trapped on the column continue to undergodynamic partition and or adsorption equilibria and any associated chemical reactions.Subsequent elution of the solutes by resumption of the mobile phase flow yieldsa chromatogram from which peak area measurements may be made to indicate theextent of analyte decomposition. The latter approach was preferred in the presentwork.
As test compounds were chosen a range ofphenyl propanols with increasing easeof dehydration due to the presence of primary (I), secondary (II) or tertiary (III)hydroxyl groups.
I II ill
In the presence ofacidic catalysts the alcohols undergo an E I reaction? followinginitial protonation to yield conjugated propenylbenzenes via a carbocation:
R-CH-CHI 3
OH
R- CH-CH31+o
/\H H
-H+R-CH=CH 2 - R-CH- CH3
+
Silica-based stationary phases, which are commonly used in chromatography,have acidic surfaces owing to the presence of silanol groups which could act as a sourceof protons"? for the initial step of the decomposition reaction.
In a preliminary experiment all three alcohols were studied by stop-flow SFCusing a silica column at 91°C with an input pressure of 141 bar. For each measurementthe mobile phase flow was stopped once the sample was judged to be half-way downthe column. Peak areas of test alcohol andpropiophenone(internal standard) weremeasured on the resumption of flow. Taking a normal chromatogram as a referencepoint the peak area ratios were used to calculate the relative reaction rates shown inFig. 1. As expected the tertiary alcohol displayed the greater rate of dehydration.Furthermore the results suggest that significant quantitative errors could arise exceptwhere high mobile phase flow-rates are employed. On-column decomposition of theprimary and secondary alcohols in contrast was insignificant.
Bonded phases with reduced silanol contents would be expected to be lesscatalytic and this is borne out in practice as iIlustrated by data obtained using an
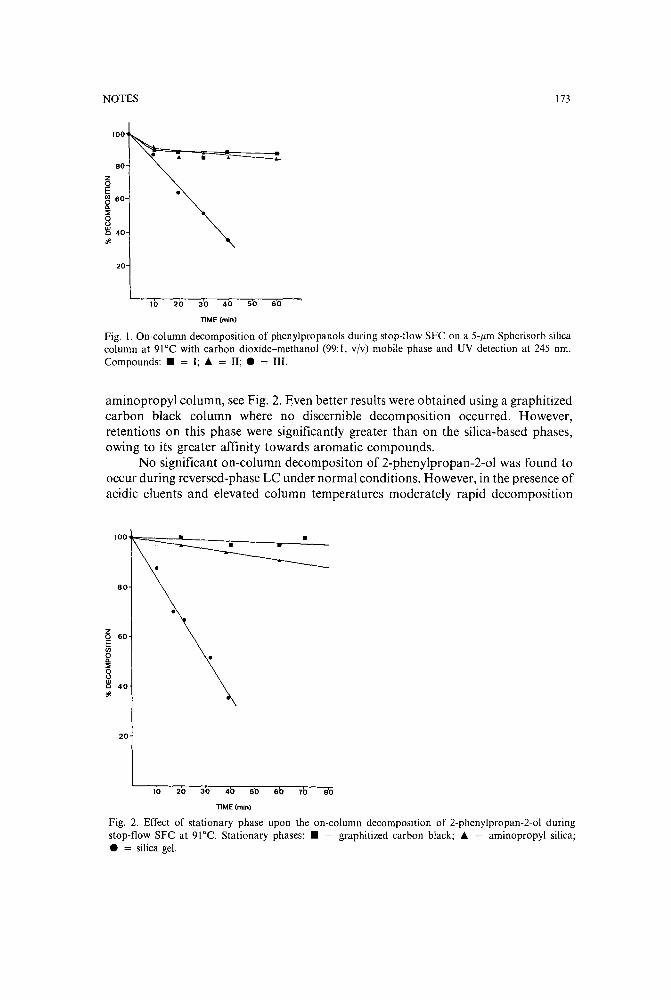
NOTES 173
100
• •80
zQI: •gj 60a.~0o~ 40'#.
20
10 20 30 40 50 60
TIME (min)
Fig. 1. On-column decomposition of phenylpropanols during stop-flow SFC on a 5-J.lrn Spherisorb silicacolumn at 91°C with carbon dioxide-methanol (99:1, v/v) mobile phase and UV detection at 245 nrn.Compounds: • = I; .. = II; • = III.
aminopropyl column, see Fig. 2. Even better results were obtained using a graphitizedcarbon black column where no discernible decomposition occurred. However,retentions on this phase were significantly greater than on the silica-based phases,owing to its greater affinity towards aromatic compounds.
No significant on-column decompositon of 2-phenylpropan-2-o1 was found tooccur during reversed-phase LC under normal conditions. However, in the presence ofacidic eluents and elevated column temperatures moderately rapid decomposition
1001\=:::::==::=-_. ....-_~_
80
•zg 60
'"0a.~
8wc 40'#.
20
10 20 30 40 50 6 80
TIME (min)
Fig. 2. Effect of stationary phase upon the on-column decomposition of 2-phenylpropan-2-o1 duringstop-flow SFC at 91°C. Stationary phases: • = graphitized carbon black; .. = aminopropyl silica;• = silica gel.
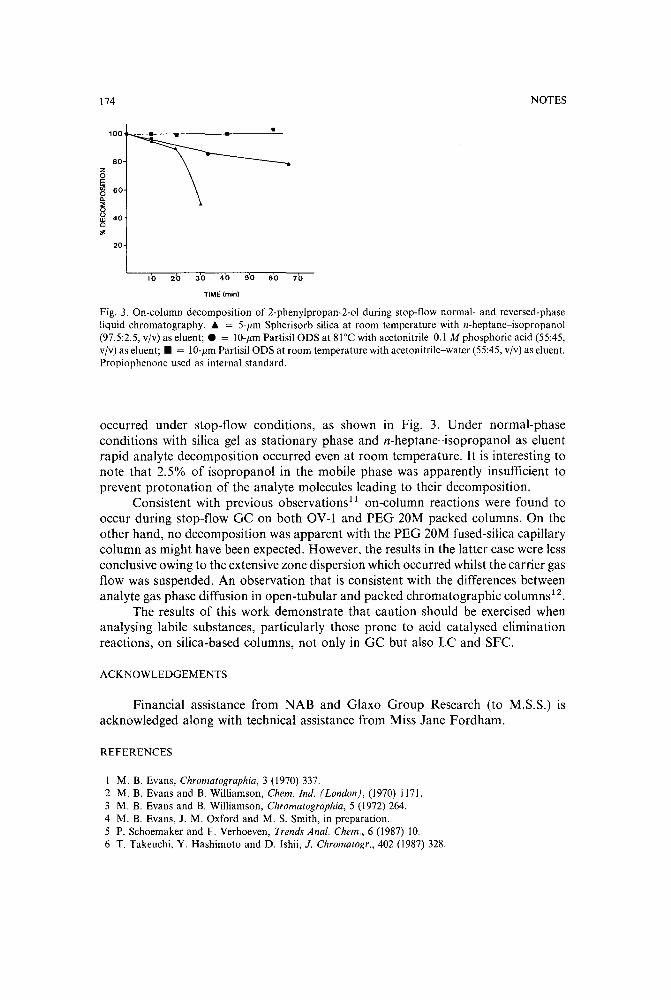
174 NOTES
100 •
60zQl::(/l 6000-::;;
8 40wCl
'" 20
10 20 30 40 50 60 70
TIME (min)
Fig. 3. On-column decomposition of 2-phenylpropan-2-o1 during stop-flow normal- and reversed-phaseliquid chromatography.... = 5-Jlm Spherisorb silica at room temperature with n-heptane-isopropanol(97.5:2.5, vjv) as eluent; • = IO-JlmPartisil ODS at 81'C with acetonitrile-o.1 M phosphoric acid (55:45,vjv) as eluent; • = 10-JlmPartisil ODS at room temperature with acetonitrile-water (55:45, vjv) as eluent.Propiophenone used as internal standard.
occurred under stop-flow conditions, as shown in Fig. 3. Under normal-phaseconditions with silica gel as stationary phase and n-heptane-isopropanol as eluentrapid analyte decomposition occurred even at room temperature. It is interesting tonote that 2.5% of isopropanol in the mobile phase was apparently insufficient toprevent protonation of the analyte molecules leading to their decomposition.
Consistent with previous observations!! on-column reactions were found tooccur during stop-flow GC on both OV-1 and PEG 20M packed columns. On theother hand, no decomposition was apparent with the PEG 20M fused-silica capillarycolumn as might have been expected. However, the results in the latter case were lessconclusive owing to the extensive zone dispersion which occurred whilst the carrier gasflow was suspended. An observation that is consistent with the differences betweenanalyte gas phase diffusion in open-tubular and packed chromatographic columnsP.
The results of this work demonstrate that caution should be exercised whenanalysing labile substances, particularly those prone to acid catalysed eliminationreactions, on silica-based columns, not only in GC but also LC and SFC.
ACKNOWLEDGEMENTS
Financial assistance from NAB and Glaxo Group Research (to M.S.S.) isacknowledged along with technical assistance from Miss Jane Fordham.
REFERENCES
I M. B. Evans, Chroma/agraphia, 3 (1970) 337.2 M. B. Evans and B. Williamson, Chern. Ind. (London), (1970) 117!.3 M. B. Evans and B. Williamson, Chroma/agraphia, 5 (1972) 264.4 M. B. Evans, J. M. Oxford and M. S. Smith, in preparation.5 P. Schoemaker and F. Verhoeven, Trends Anal. Chern., 6 (1987) 10.6 T. Takeuchi. Y. Hashimoto and D. Ishii, J. Chromatogr., 402 (1987) 328.

NOTES
7 Ph. Morin, M. elude and R. Rosser. 1. Chromatogr.. 407 (19g7j g7.g P. L. Cheuh and J. M. Prausnitz, AIChE J., 13 (1967) 1099.9 F. Carey and R. Sunbury, Advanced Organic Chemistry, Plenum, London, 2nd ed., 1984.
10 M. L. Hair and W. Hertt, J. Phys. Chem., 74 (1970) 91.I I M. B. Evans, Ph.D. Thesis, London University, 1967.12 R. M. Smith, Gas and Liquid Chromatography in Analytical Chemistry, Wiley, Chichester, 1988.
175

Journal of Chromatography, 479 (1989) 176-180Elsevier Science Publishers B.V., Amsterdam - Printed in The Netherlands
CHROM. 21 666
Note
Gas chromatographic separation of diastereomeric dicarbamate derivatives of y- and b-Iactones
K.-H. ENGEL*
Technische Universitiit Berlin, lnstitut fur Biotechnologie, Fachgebiet Chemisch-technische Analyse, Seestrasse 13, D-lOOO Berlin 65 (F.R.G.)
R. A. FLATH
Western Regional Research Center, USDA-ARS, 800 Buchanan Street, Albany, CA 94710 (U.S.A.)
and
W. ALBRECHT and R. TRESSL
Technische Universitiit Berlin, lnstitut fur Biotechnologie, Fachgebiet Chemisch-technische Analyse, Seestrasse 13, D-1000 Berlin 65 (F.R.G.).
(First received April 12th, 1989; revised manuscript received June 7th, 1989)
Lactones are an important group of chiral compounds playing significant rolesin several foods". In spite of their powerful contributions to overall flavourimpressions, the amounts of lactones in natural systems are mostly very low, andsensitive analytical techniques are required to determine their naturally occurringenantiomeric compositions. Recently a major breakthrough has been achieved bydirect capillary gas chromatographic (GC) separation of enantiomers of y-lactonesusing modified cyclodextrin as a chiral stationary phase". However, the conversioninto diastereomeric derivatives followed by separations on non-chiral (commonlyavailable) stationary phases is still a useful and easily applicable alternative forlaboratories with standard GC equipment.
The GC separation of diastereomeric ketals obtained by direct reaction withoptically pure 2,3-butanediol has been described for b-lactones3,4. In general theformation of diastereomeric derivatives of lactones requires an opening of the ring toobtain intermediates with reactive functional groups. Enantiomers of 4- and5-hydroxyalkanoic acid esters, derived from y- and b-lactones, were separated afterconversion into (R)-1-phenylethylcarbamates5
. Opening of the lactone ring to give4-hydroxyalkanoic acid isopropylesters and subsequent derivatization with (S)-Oacetyllactyl chloride" was applied to determine the configurations of v-deca- andv-dodecalactone in peach 7 and strawberry". The corresponding diastereomeric estersof (S)-tetrahydro-5-oxo-2-furancarboxylic acid have been used to investigate chiralb-lactones9
. Reactive functional groups can also be obtained by reduction of y- andb-lactones to l,4-and 1,5-diols, respectively. Separations of the corresponding diestersof (S)-O-acyllactic acids have been reported!",
This paper presents the capillary GC separation of diastereomeric dicarbamatesobtained by derivatization of 1,4- and 1,5-diols with (R)-( + )-l-phenylethyl isocyanate.
0021-9673/89/$03.50 © 1989 Elsevier Science Publishers B.V.

NOTES
EXPERIMENTAL
177
Chemicals(R)-( + )-I-Phenylethyl isocyanate (PEIC) and 4-dimethylaminopyridine
(DMAP) were obtained from Fluka (Neu-Ulm, F.R.G.). Racemic y- and b-Iactoneswere gifts from Haarman & Reimer (Holzminden, F.R.G.) and Firmenich (Geneva,Switzerland). All solvents were redistilled before use.
DerivatizationReduction ofy- and o-lactones to 1,4- and lS-diots. Lithium aluminium hydride
was added to a solution of lactones (in a typical experiment 0.5 fil of an equimolarmixture of CS-C ll y-Iactones) in 0.2 ml dry diethyl ether. After shaking at roomtemperature for 15min and addition of 1M HCI (1 m!) the mixture was extracted withchloroform (2 x 20 ml). The chloroform extracts were washed (1 ml NaHC0 3 , 1 mlwater) and dried with sodium sulphate. The solvent was evaporated and the residueredissolved in 200 fil diethyl ether.
Conversion into diastereomeric dicarbamates. After transferring the solution toa screw-capped reaction vial the diethyl ether was removed by using a stream ofnitrogen. The residue was dissolved in 25 fil toluene containing 1% DMAP. A 2 filvolume of (R)-( + )-PEIC was added and the mixture was kept at 60°C for 24 h. Afteraddition of 250 fil dichloromethane the solution was subjected to GC analysis.
Capillary GCCapillary GC separations were carried out on a 30 ill. x 0.32 mm J.D. DB 210
column (film tickness 0.25 fim; J&W Scientific) installed in a Carlo Erba FractovapSeries 2150 gas chromatograph, equipped with a split (1:25) and flame ionizationdetection (FID). Injector temperature: 230°C. Detector temperature: 275°C. Carriergas (hydrogen), 0.85 bar; flow-rate, u (225°C) = 55 cm/s. Temperature programmefrom 220 to 260°C at 1°C/min.
Capillary Gtl-rnass spectrometry (MS)A Finnigan MAT 4500 series quadrupole gas chromatograph-mass spec
trometer coupled with an Incos data system was used. The fused-silica column(described above) was inserted directly into the ion source. Ionization voltage: 70 eV.Ion source temperature: 180°C. Speed: 1 scan/so Mass range (m/z): 33-500.
RESULTS AND DISCUSSION
Diastereomeric dicarbamates were obtained from chiral y- and b-Iactones byreduction with lithium aluminium hydride and subsequent derivatization of the 1,4and 1,5-diols formed, with (R)-( + )-I-phenylethyl isocyanate (Fig. I). The GCseparation of diastereoisomers obtained by this procedure from an homologous seriesof racemic lactones is shown in Fig. 2.
Complete conversion into dicarbamates at moderate temperature was achievedby using DMAP as a catalyst 1
1. DMAP has also been employed to obtain carbamatediastereoisomers from the sterically hindered tertiary alcohol linalool'P. The presenceof water and/or traces of acid has to be avoided; they cause the reaction to yield only

178 NOTES
Fig. 1. Conversion of y-lactones into diastereomeric dicarbamates (R = from -CH 3 to -C 7H 15)'
a mixture of mono- and dicarbamates. Quantitative derivatization, however, isnecessary to prevent possible discrimination of enantiomers.
The identities of the derivatives were confirmed by GC-MS. Mass spectra of thedicarbamates were mainly characterized by fragmentations of the l-phenylethylcarbamoyloxy moieties of the molecules. The spectra obtained from an homologous
~ C7Ca Cg
1:(51clO
II:(R) c6cn
~ Cs
II ~ ~ lAJlAJ ----' "'--' \......---a to 20 30min
Q Cg C,O
Ca C1,
1:(51 C'2
II:(R)C7
C6
a 10 20 30min
Fig. 2. Gas chromatographic separation of di[(R)-I-phenylethyl]carbamates derived from racemicy-Iactones (a) and o-lactones (b); for conditions see Experimental.
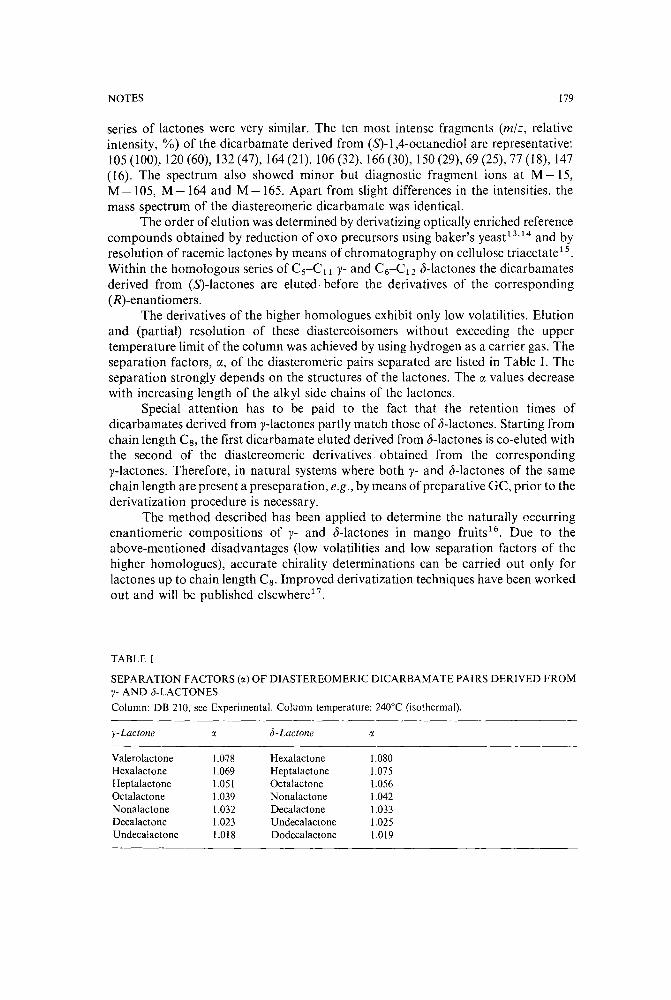
NOTES 179
series of lactones were very similar. The ten most intense fragments (rn/z, relativeintensity, %) of the dicarbamate derived from (S)-l,4-octanediol are representative:105 (100),120 (60),132 (47),164 (21), 106(32),166 (30),150 (29), 69 (25), 77 (18), 147(16). The spectrum also showed minor but diagnostic fragment ions at M-15,M-l05, M-164 and M-165. Apart from slight differences in the intensities, themass spectrum of the diastereomeric dicarbamate was identical.
The order of elution was determined by derivatizing optically enriched referencecompounds obtained by reduction of oxo precursors using baker's yeast 13
, 14 and byresolution of racemic lactones by means of chromatography on cellulose triacetate-",Within the homologous series of CS-C 1 l y- and C6-C12 b-lactones the dicarbamatesderived from (S)-lactones are eluted before the derivatives of the corresponding(R)-enantiomers.
The derivatives of the higher homologues exhibit only low volatilities. Elutionand (partial) resolution of these diastereoisomers without exceeding the uppertemperature limit of the column was achieved by using hydrogen as a carrier gas. Theseparation factors, iX, of the diasteromeric pairs separated are listed in Table I. Theseparation strongly depends on the structures of the lactones. The iX values decreasewith increasing length of the alkyl side chains of the lactones.
Special attention has to be paid to the fact that the retention times ofdicarbamates derived from y-lactones partly match those of b-lactones. Starting fromchain length Cs, the first dicarbamate eluted derived from b-lactones is co-eluted withthe second of the diastereomeric derivatives, obtained from the correspondingy-lactones. Therefore, in natural systems where both y- and b-lactones of the samechain length are present a preseparation, e.g., by means of preparative GC, prior to thederivatization procedure is necessary.
The method described has been applied to determine the naturally occurringenantiomeric compositions of y- and b-lactones in mango fruits l 6
. Due to theabove-mentioned disadvantages (low volatilities and low separation factors of thehigher homologues), accurate chirality determinations can be carried out only forlactones up to chain length Cs. Improved derivatization techniques have been workedout and will be published elsewhere!7.
TABLe I
SEPARATION FACTORS (IX) OF DIASTEREOMERIC DICARBAMATE PAIRS DERIVED FROMy- AND <I-LACTONES
Column: DB 210, see Experimental. Column temperature: 2400C (isothermal),
v-Lactone IX b-Lactone IX
Valero lactone 1.078 Hexalactone 1.080Hexalactone 1.069 Heptalactone 1.075Heptalactone 1.051 Octalactone 1.056Octalactone 1,039 Nonalactone 1,042Nonalactone 1,032 Decalactone 1,033Decalactone 1.023 Undecalactone 1.025Undecalactone 1.018 Dodecalactone 1.019

180
ACKNOWLEDGEMENT
NOTES
Financial support by a grant from the Deutsche Forschungsgemeinschaft, Bonn,F.R.G., is gratefully acknowledged by K.H.E.
REFERENCES
H. Maarse and C. A. Vissher (Editors), Volatile Compounds in Food -s-Qualitative Data, Supplement 4,TNO-CIVO, Zeist, The Netherlands 1987.
2 W. A. Konig, S. Lutz, C. Colberg, N. Schmidt, G. Wenz, E. v.d. Bey, A. Mosandl, C. Gunther and A.Kustermann, J. High Resolut. Chrornatogr. Chrornatogr. Cornrnun., I I (1988) 621.
3 G. Saucy, R. Borer, D. P. Trullinger, J. B. Jones and K. P. Lock, J. Org. Chern., 42 (1977) 3206.4 R. Tressl and K.-H. Engel, in P. Schreier (Editor), Analysis oj Volatiles, Walter de Gruyter, Berlin, New
York, 1984, p. 323.5 R. Tress1, K.-H. Engel, W. Albrecht and H. Bille-Abdullah, ACS Syrnp. Ser., 289 (1985) 43.6 A. Mosandl, M. Gessner, C. Gunther, W. Deger and G. Singer, J. High Resolut. Chromatogr.
Chromatogr. Cornrnun., 10 (1987) 67.7 M. Feuerbach, O. Frohlich and P. Schreier, J. Agric. Food Chern., 36 (1988) 1236.8 G. Krammer, O. Frohlich and P. Schreier, in P. Schreier (Editor), Bioflavour '87, Walter de Gruyter,
Berlin, New York, 1988, p. 89.9 M. Gessner, W. Deger and A. Mosandl, Z. Lebensm-Unters-Forsch., 186 (1988) 417.
10 W. Deger, M. Gessner, C. Gunther, G. Singer and A. Mosandl, J. Agric. Food Chern., 36 (1988) 1260.11 G. Holle, W. Steglich and H. Vorbruggen, Angew. Chern., 90 (1978) 602.12 A. A. Rudmann and J. R. Aldrich, J. Chrornatogr., 407 (1987) 324.13 M. Utaka, H. Watabu and A. Takeda, J. Org. Chern., 52 (1987) 4363.14 M. Gessner, C. Gunther and A. Mosandl, Z. Naturforsch. Teil C, 42 (1987) 1159.15 E. Francotte and D. Lohmann, Helv. Chirn. Acta, 70 (1987) 1569.16 R. Tressl, K.-H. Engel and W. Albrecht, in S. Nagy, J. A. Attaway and M. E. Rhodes (Editors),
Adulteration oj Fruit Juice Beverages, Marcel Dekker, New York, Bas1e, 1988, p. 67.17 K.-H. Engel, W. Albrecht and J. Heidlas, J. Agric. Food Chern., submitted for publication.

Journal ofChromatography, 479 (1989) 181-188Elsevier Science Publishers B.V., Amsterdam - Printed in The Netherlands
CHROM. 21 746
Note
Liquid chromatographic analysis of bromination reactions of metal trifluoroacetylacetonates
T. J. CARDWELL* and T. H. LORMAN
Analytical Chemistry Laboratories, Chemistry Department, La Trobe University, Bundoora, Victoria 3083( Australia)
(First received March 29th, 1989; revised manuscript received July 4th, 1989)
Many of the electrophilic substitution reactions investigated by Singh and Sahai 1 and Joshi and Pathak? and some of those studied by Collman et al.3,4 haveincluded trivalent metal j1-diketonates with unsymmetrical ligands. These octahedralmetal complexes display geometrical isomerism yet it is surprising that there is onlyone brief reference to this type of isomerism in these early investigations: isomers wereclaimed for the substituted products of the formylacetone chromium(III) chelate" butno supporting evidence was givens.
In two previous papers from these laboratories, it was demonstrated that gaschromatography (GC) was effective in separating the mono-, bi- and tri-substitutedproducts in the bromination of the trifluoroacetylacetonates of chromium and rhodium":". In the separation of the rhodium compounds, the chromatogram clearlyshowed the presence of geometrical isomers in the bi- and tri-brominated derivatives7
whereas the corresponding chromatogram for the chromium compounds showed thatisomers seemed to be present only in the mono-substituted derivative",
The geometrical isomers of cobalt(III) and chromium(III) chelates of trifluoroacetylacetone, benzoylacetylacetone and 2,2-dimethylhexane-3,5-dione have beenseparated by high-performance liquid chromatography (HPLC) in the adsorptionmode" and this technique has also been recommended for the analysis of electrophilicsubstitution reactions involving labile or thermally unstable metal j1-diketonates9
, Inthis paper, the effects of the presence of geometrical isomers in electrophilic substitution reactions is investigated and HPLC is applied to the separation of isomericforms of the products in the bromination of some trivalent metal trifluoroacetylacetonates.
EXPERIMENTAL
The trifluoroacetylacetonates of chromium(III), rhodium(III) and cobalt(II1)were prepared by the method of Fay and Piper!" and samples were purified by column chromatography on acid-washed alumina using chloroform as eluent. As thiseluent yields mixtures of isomers, the identities of the chelates were established by thepresence of molecular ions in their mass spectra, Highly pure samples of the meridional isomers were isolated (i) after several recrystallisations from benzene-hexane
0021-9673/89/$03.50 © 1989 Elsevier Science Publishers BY

182 NOTES
(50:50) followed by column chromatography on acid-washed alumina using hexanebenzene (20:80) as eluent'? or (ii) using preparative liquid chromatography withdichloromethane-hexane (20:80) as the mobile phase. The purity of the meridionalisomer was confirmed by HPLC and its identity (for rhodium and cobalt chelates)was established by NMR.
Bromination of the metal chelates was performed in chloroform at room temperature using a 4:1 mole ratio of bromine to metal complex. The reaction mixturewas analysed as follows: the solvent was rapidly removed in a stream of nitrogen, theresidue was washed successively with aqueous sodium bicarbonate, aqueous sodiumbisulphite and water, air-dried and then it was dissolved in hexane or the HPLCmobile phase to a concentration of 0.5-1.0%. The reaction time under these conditions is indicated in each of the figure legends.
HPLC was carried out by injecting 20 fll of sample solution into either an Altex420 chromatograph fitted with an Hitachi 100-10 variable-wavelength detector or aLaboratory Data Control system consisting of a Constametric JIG pump and anLDC UV monitor set at 254 nm. Two analytical columns were used; a Phase Separations 5-flm Spherisorb silica column (250 x 4.6 mm J.D.) and a 7-flm Zorbaxcolumn (150 x 4.6 mm J.D.), slurry-packed using isopropanol as slurry solvent at apressure of 4500 p.s.i. Preparative liquid chromatography of solutions containing100-500 mg complex in hexane was performed on a Waters Prep LC-system 500 usinga PrepPak-500 silica radical compression cartridge and a refractive index detector.Electron impact mass spectra of the chelates were recorded on a JEOL JMS D-I00mass spectrometer by direct insertion probe introduction of solid samples at 70 eV.NMR spectra were obtained on a JEOL JNM-FX200 Fourier transform NMR spectrometer and samples were made up in deuterochloroform with tetramethylsilane asinternal standard.
RESULTS AND DISCUSSION
Bromination of Crt tfa) 3·
Using dichloromethane-hexane (20:80), resolution of the geometrical isomersof chromium trifluoroacetylacetonate, Cr(tfah, was readily achieved by normalphase adsorption HPLC in good agreement with the previous results of Uden et al.8.
It was confirmed that the meridional (mer) isomer was eluted ahead of the facial (fac)isomer by injecting samples enriched in one isomer according to the method of Fayand Piper!". In the bromination ofa mixture of isomers ofCr(tfah, one would expecteach of the brominated products to display geometrical isomerism but the HPLCanalysis in Fig. IC indicates that there are more components in the reaction mixturethan could be explained simply by geometrical isomerism. The last two peaks, identified on the basis of their retention volumes (VR) of9.9 and 16.0 ern", are the geometrical isomers of the unreacted chromium chelate, Cr(tfah In a previous paper, theauthors used mass spectral evidence to identify the major peaks in the gas chromatogram of the above reaction mixture to be the mono-, bi- and tri-brominated derivatives ofCr(tfah, eluted in the order" Cntfa), < Cr(tfah(Brtfa) < Cr(tfa)(Brtfa)z <Cr(Brtfah, where Brtfa represents the brominated trifluoroacetylacetonate anion. Inan attempt to identify the components giving rise to the peaks in Fig. lC, samples ofthe individual GC peaks were collected in small quantities for analysis by HPLC.

NOTES
10
10
A
B
c
183
o
VR(cm3)
Fig. 1. Liquid chromatograms of samples of (A) the mono- and (B) the bi-brominated chromium trilluoroacetylacetonate, as collected by GC, and (C) of the reaction mixture of brominated Crttfa), sampledafter 45 min. Column: 5-ttm Spherisorb silica, 250 x 4.6 mm I.O.; mobile phase: dichloromethane-hexane(20:80) at 1cm' min -1. Peaks: 1 = mer-Cr(Brtfa)3; 2,3,4 = mer-Cr(Brtfa)2(tfa); 6 = fac-Cr(Brtfa)/tfa);5,7,8 = mer-Cr(Brtfa)(tfa)2; 9 = fac-Cr(Brtfa)(tfa)2; 10 = mer-Cr(tfa)3; II = fac-Cr(tfa)3'
The last eluting GC peak corresponds to the first LC peak (VR = 2.1 em3 in Fig.1) and hence its identity is the tri-brominated chromium chelate. The liquid chromatograms for the samples of mono- and bi-brominated chelates are shown in Figs. lAand lB. The last peak in Fig. lA (VR = 9.9 cm') is clearly due to traces of the merisomer of Crttfa), in the collected sample of the mono-brominated species. The latterappears to give rise to four major peaks with retention volumes ranging from 4.4 to8.6 ern" under these conditions yet only two components were observed in the gaschromatogram of this sample. Mass spectral data for collected fractions ofeach of thefour HPLC peaks are practically identical and the spectra show parent ions at m]z =
591 and 589 in an intensity ratio of 1:1, indicating that the four components corre-

184
IO
NOTES
o 10 15 20 25 30
Fig. 2. Liquid chromatogram of the bromination reaction mixture of Co/tfa), sampled after 90 min.Column: 'l-uxnZorbax silica, ISO x 4.6 mm J.D.; mobile phase: dichloromethane-hexane (8:92) at I cm 'min - 1. Peaks: I = mer-Co(Brtfa)3; 2,3,4 = mer-Co(Brtfa)2(tfa); 6 = .!ac-Co(Brtfa)2(tfa); 5,7,8 = mer-Co(Brtfa)(tfa)2; 9 = fac-Co(Brtfa)(tfa)2; 10 = mer-Cr(tfa)3'
spond to the mono-brominated species", For the bi-brominated chelate sample (Fig.lB), the peaks at VR = 2.1 and 4.5 cm ' arise from the tri- and mono-brominatedspecies, respectively, which are present as impurities; hence, there appears to be fourcomponents in the bi-brominated sample also although the fourth component (VR =
5.0 em.') is often difficult to detect in the chromatogram of the reaction mixturebecause of overlap with early eluting peaks attributed to the mono-brominated complex.
The peak area ratios of the four components for the bi-brominated chelate arerelatively constant for all reactions, regardless of the reaction time or the initialisomeric ratio of Cr(tfah; this is not unexpected as the bi-brominated species appearlate-in a reaction and by that stage, isomerisation would have occurred already so thatan equilibrium isomeric mixture would be observed. On the otherhand, brominationreactions of Crttfa), enriched with thefac isomer produce greater proportions of the
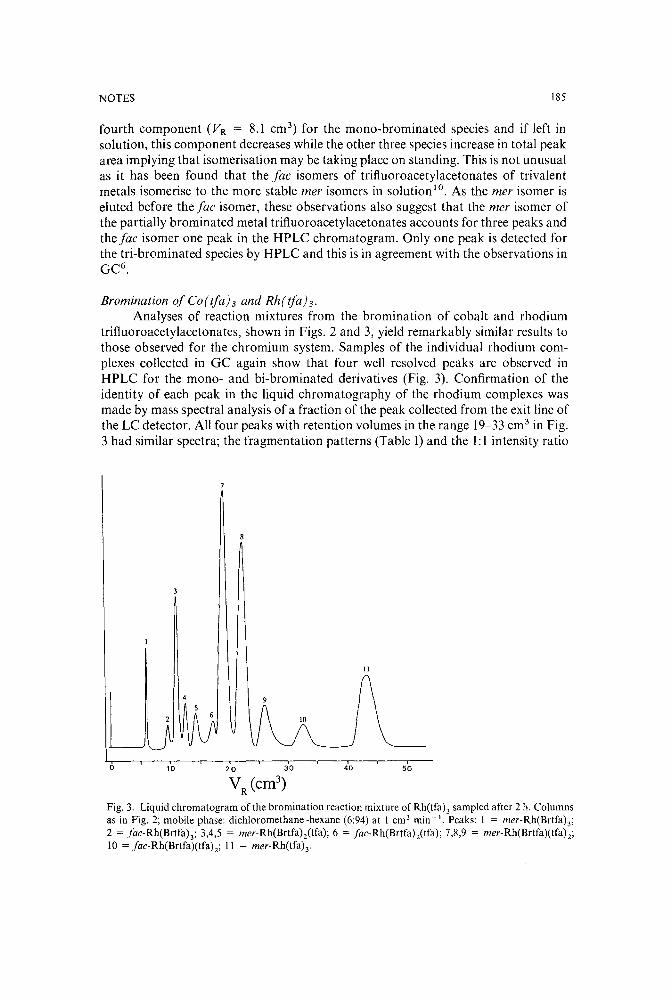
NOTES 185
fourth component (VR = 8.1 cm') for the mono-brorninated species and if left insolution, this component decreases while the other three species increase in total peakarea implying that isomerisation may be taking place on standing. This is not unusualas it has been found that the fac isomers of trifluoroacetylacetonates of trivalentmetals isomerise to the more stable mer isomers in solution!". As the mer isomer iseluted before the fac isomer, these observations also suggest that the mer isomer ofthe partially brominated metal trifluoroacetylacetonates accounts for three peaks andthe fac isomer one peak in the HPLC chromatogram. Only one peak is detected forthe tri-brominated species by HPLC and this is in agreement with the observations inGC6
.
Bromination of Co(tfa}, and Rht tfat «.
Analyses of reaction mixtures from the bromination of cobalt and rhodiumtrifluoroacetylacetonates, shown in Figs. 2 and 3, yield remarkably similar results tothose observed for the chromium system. Samples of the individual rhodium complexes collected in GC again show that four well resolved peaks are observed inHPLC for the mono- and bi-brominated derivatives (Fig. 3). Confirmation of theidentity of each peak in the liquid chromatography of the rhodium complexes wasmade by mass spectral analysis of a fraction of the peak collected from the exit line ofthe LC detector. All four peaks with retention volumes in the range 19-33 cm' in Fig.3 had similar spectra; the fragmentation patterns (Table I) and the 1:1 intensity ratio
11
o 10 40 50
Fig. 3. Liquid chromatogram of the bromination reaction mixture of Rhrtfa), sampled after 2 h. Columnsas in Fig. 2; mobile phase: dichloromethane-hexane (6:94) at 1 cm' min - '. Peaks: I = mer-Rh(Brtfa)3;2 = jac-Rh(Brtfa)3; 3,4,5 = mer-Rh(Brtfa)itfa); 6 = jac-Rh(Brtfa),(tfa); 7,8,9 = mer-Rh(Brtfa)(tfa)2;10 = jac-Rh(Brtfa)(tfa)2; 11 = mer-Rh(tfa)3'

186 NOTES
TABLE I
RELATIVE INTENSITIES OF FRAGMENT IONS IN THE MASS SPECTRA OF Rh(tfa)3 AND ITSBROMINATED DERIVATIVES
Ion
M+[M - (tfaj]"[M-(BrtfaW[M - (Brtfa) - CF 2] +
[M - (Brtfa) - CF 3]+[M - (Brtfa) - 2CF3]+[M~ (Brtfa) - (tfaj] +
[M-2(tfaW[M- 2(BrtfaW[M -2(tfa)-CF3] +[M- 2(Brtfa) - CF 3]+
Rh(tfa)3
50100
9
4
Rh(Brtfa) (tfa) 2 Rh(Brtfa ) 2 (tfa) Rh(Brtfa )3
38 43 4012 26
100 100 10015 6 128 23 1317 14 723 9
43 80
13 7
of the parent ions at m]e = 642 and 640 indicate that all components in this group ofLC peaks are mono-brominated species. The four peaks with VR = 11.0-17.2 cm' arebi-brominated species which give parent ions at m]e = 722, 720 and 718 in a ratio of1:2:1. The tri-brominated rhodium complex displays two isomers in GC and HPLC,the first eluting in each case being the mer isomer as shown later. The fac and merisomers of the tri-brominated complexes gave similar spectra with parent ions at m]e
= 802, 800, 798 and 796 in an intensity ratio of 1:3:3:I. Table I lists the data for themajor fragments in the mass spectra of brominated derivatives of Rh(tfah
As the HPLC results provide very strong evidence that there are three components for the mer isomer ofeach of the partially brominated chelates, it was of interestto carry out bromination reactions on the mer isomer only. Pure samples of the merisomers of Mttfa); were isolated by fractional recrystallisation!" or preparative LCand bromination reactions were performed as described above for mixtures of isomers. HPLC analysis of the rhodium reaction mixture yielded a similar chromatogramto that in Fig. 3 and the peak due to thefac isomer of the initial rhodium reactant wasabsent. In all three metal systems, four peaks and not three were observed for thepartially brominated chelates.
NMR spectroscopyIn order to characterize all of the components giving rise to the various liquid
chromatographic peaks by NMR spectroscopy, attempts were made to isolate sufficient quantities of each of the species. Although fractional recrystallization was foundto be suitable in the isolation of the chromium compounds", separation of the brominated rhodium chelates requires preparative LC using dichloromethane-hexane(10:90) and it was only possible to isolate mer-Rh(tfah and Rh(Brtfah(tfa). Twosamples of the bi-brominated derivative were isolated; analytical HPLC showed thatone of these samples contained only the first eluting component (VR = 11.0 cm', Fig.3) whereas the other sample contained the first three of the four components attributed to the bi-brominated complex.
1H NMR spectroscopy has been found to be extremely useful in the character-

NOTES 187
ization of the configurations of isomers of trivalent metal trifluoroacetylacetonates.The fac isomer of Rlutfa), was reported to give single resonances for the methyl andmethine protons at 2.36 and 5.99 ppm, respectively, whereas the mer isomer gavethree methyl resonances at 2.35-2.40 ppm and three methine resonances at 5.98-6.03ppm10,1l. The sample corresponding to the peak with VR = 6.1 cm' in Fig. 3 hasthree methyl group resonances at 2.72-2.75 ppm and no methine proton resonance;this is consistent with non-equivalent methyl groups in a mer configuration andbromination of all three chelate rings, as in Rh(Brtfah A mixture of the isomers ofthe tri-brominated complex shows four methyl groups resonances at 2.72-2.76 ppm.
The spectra of the two isolated samples of the bi-brominated rhodium chelatewere identical and had three methyl resonances at 2.30-2.32 ppm indicative of a merconfiguration and in each case, a single methine resonance was observed at 5.96 ppmarising from one unbrominated ligand. As there is no evidence of another methylresonance peak in the 1H NMR spectrum of the sample which displays three HPLCpeaks, this indicates that the mer isomer of this compound consists of three components and hence the fac isomer gives one HPLC peak. This supports the earliersuggestions of solution isomerisation for the mono-brominated species observed inthe HPLC monitoring of the bromination of Crttfa), initially enriched in the facisomer.
13C NMR spectra were also run on the above rhodium samples collected bypreparative LC. As these data confirm the assignment of mer configurations alreadyderived from the 1H NMR spectral data but provide no additional structural information, they are not presented in this paper. 1Hand 13CNMR spectra were bothunsuccessful in differentiating the individual components of the mer isomers of thepartially brominated chelates.
On the basis of the NMR and mass spectral data for the brominated rhodiumchelates and the close similarities of the elution profiles of bromination reactionmixtures of all three trifluoroacetylacetonates, it is concluded that the mer isomers ofthe partially brominated trifluoroacetylacetonates of chromium(IIT), rhodium(III)
TABLE II
CHROMATOGRAPHIC RETENTION DATA FOR METAL TRIFLUOROACETYLACETONATES AND THEIR BROMINATED DERIVATIVES
Column: 'l-utt: Zorbax silica, 150 x 4.6 mm I.D.; mobile phase: dichloromethane-hexane (10:90); columndead volume: 1.9 cm'. mer (1/2/3) = Three components of the mer partially brominated derivatives.
Capacity factors for individual componentsMetalcomplex
M(Brtfa),
M(Brtfa)2(tfa)
M(Brtfa)(tfa)2
M(tfa),
Isomer
merfacmer (1/2/3)facmer(l/2/3)facmerfac
M = Cr
1.95
2.65/2.95/3.254.34.1/4.6/5.27.257.8
12.95
M = Rh
1.21.92.05/2.3/2.63.153.6/4.05/4.76.057.95
12.7
M = Co
2.3
2.6/3.05/3.54.64.3/5.1/6.07.88.9
14.1
188 NOTES
and cobalt(III) consist of three components which are readily separated by normalphase HPLC. The chromatographic capacity factors for the parent metal chelates andtheir brominated derivatives have been determined under identical chromatographicconditions and the data are listed in Table II.
REFERENCES
1 P. R. Singh and R. Sahai, Indian J. Chem., 8 (1970) 178.2 K. C. Joshi and V. N. Pathak, J. Chern. Soc., Perkin Trans. I, (1973) 57.3 J. P. Collman, R. A. Moss, H. Maltz and C. Heindel, J. Am. Chern. Soc .. 83 (1961) 531.4 J. P. Collman, Angew. Chem., Int. Ed. Eng., 4 (1965) 132.5 J. P. Collman and E. T. Kittleman, J. Am. Chern. Soc., 83 (1961) 3529.6 T. J. Cardwell and T. H. Lorman, Inorg. Chim. Acta, 53 (1981) Ll03.7 T. J. Cardwell and T. H. Lorman, Inorg, Chim. Acta, 120 (1986) L5.8 P. C. Uden, I. E. Bigley and F. H. Walters, Anal. Chim. Acta, 100 (1978) 555.9 T. J. Cardwell and T. H. Lorman, Inorg. Chim. Acta, 85 (1984) 1.
10 R. Fay and T. Piper, J. Am. Chern. Soc., 85 (1962) 500.II R. C. Mehrotra, R. Bohra and D. P. Gaur, Metal {3-Diketonates and Allied Derivatives, Academic
Press, London, 1978.

Journal of Chromatography, 479 (1989) 189-193Elsevier Science Publishers B.V., Amsterdam - Printed in The Netherlands
CHROM. 21 741
Note
High-performance liquid chromatographic analysis of Solanum steroidal alkaloids
S. F. OSMAN*
Eastern Regional Research Center, Agricultural Research Service, U.S. Department ofAgriculture, 600 EastMermaid Lane, Philadelphia, PA 191/8 (U.S.A.)
and
S. L. SINDEN
Beltsville Agricultural Research Center, Agricultural Research Service, U.S. Department of Agriculture,Beltsville, MD 20705 (U.S.A.)
(First received April 24th, 1989; revised manuscript received July 4th, 1989)
Solanum species contain as major secondary metabolites, steroidal alkaloidsusually as glycosides (generally referred to as glycoalkaloids). Earlier interest centeredon the use of these compounds as starting material for synthetic production ofsteroidal hormones"; however, more recent interest has been on the role of thesecompounds in pest resistance and culinary quality ofedible Solanaceous crops such aspotato". In the development of new hybrid strains it is desireable to know the alkaloidcompositions of the wild species parents and their hybrids so that new alkaloids are notinadvertently introduced into our food crops. There are many methods that have beendescribed for glycoalkaloid analysis using high-performance liquid chromatography(HPLC)3-5 thin-layer chromatography (TLC)6 or gas chromatography (GC)7;however, all of these techniques have significant limitations which are mainly due tothe hydrophobic (aglycone)-hydrophilic (carbohydrate) dicotomous nature of theglycoalkaloid structure. HPLC has been particularly useful in the analysis of potatoglycoalkaloid mixtures. However, separations by HPLC depend, for the most part, onthe structure of the carbohydrate portion of the molecule. At this time onlyglycoalkaloids that have gross differences in aglycone structure can be separated byHPLC when they contain glycosidic units of similar polarity.
We have recently been examining the glycoalkaloid composition of some diseaseand pest resistant somatic hybrids obtained by protoplast fusion. The glycoalkaloidsin these hybrids have similar structures which we were unable to separate by availablemethods. For analysis of these hybrids, we have concentrated on analyzing theaglycones (i.e., steroidal alkaloids) rather than attempting to separate the glycoalkaloids in the mixture.
For the analysis of somatic hybrids between S. brevidens and S. tuberosum, theseparation of saturated from ,15 (5,6 unsaturated) alkaloids presented an especiallydifficult chromatographic challenge. Methods described for the analysis of thesteroidal alkaloids by GC 8
, HPLC9, l O and TLCll were of limited use because of poor
resolution and/or low sensitivity of detection. In this paper we describe a method for

190 NOTES
~"!: .w.; MeMa e
Me 0
HO ~
9, SOLASODINE
the separation and quantitation of Solanum steroidal alkaloids by reversed-phaseHPLC which is particularly useful for the separation of saturated from unsaturatedalkaloids.
EXPERIMENTAL
MaterialsSolanidine, demissidine, tomatidine and solasodine were purchased from Sigma
(St. Louis MO, U.S.A.), leptinidine (23-hydroxysolanidine), acetylleptinidine, 23-hydroxy- and 23-acetyldemissidine and 5-tomatidenol were isolated from plant tissue asthe glycosides and partially purified by ammonia precipitation. The glycosides werehydrolyzed in 1 M methanolic HCI. The individual aglycones were isolated bypreparative TLC on silica gel using appropriate solvent systemsl '. The purifiedaglycones were characterized by either gas chromatography- or direct probe-massspectrometry.
Alkaloid mixtures from Solanum hybrids were prepared by hydrolysis of theglycoalkaloid mixture with 1 M methanolic HCI.
All solvents were high-purity grade from Burdick & Jackson, (St. Louis, MO,U.S.A.).
Chromatographic procedureHPLC analyses were carried out on a Hewlett-Packard 1090 instrument fitted
with a Supelcosil LC-18-DB (5 Jlm) column (25 em x 4.6 mm J.D.) (Supelco,Bellefonte, PA, U.S.A.) and a Model 1037A refractive index (RI) detector (HewlettPackard). The mobile phase was acetonitrile -rnethanol-ethanolamine (60:40:0.001)and the flow-rate was 0.5 ml min'
RESULTS AND DISCUSSION
The HPLC chromatogram for the steroidal alkaloids shown in Fig. 1 is given inFig. 2. These nine steroidal alkaloids are the major aglycones of the Solanum
~e M{ ~ R
Me N ""Me
HO 1, SOLANIDINE, R=H, ,5
2, DEMISSIDINE,R=H
3, LEPTINIDINE, R=OH, ,5o
4, ACETYL LEPTINIDINE, R=o.8.CH3, ,55, 23-HYDROXYDEMISSIDINE,R=OH
?6, 23-ACETYLDEMISSIDINE, R=D-e-CH3
Me <------r--
~e '; /.~-JMe
Me 0 H
HO
7, TOMATIDINE
8,5-TOMATIDENOL, ,5
Fig. I. Structures of Solanum steroidal alkaloids. Me =. Methyl.

NOTES
~§: t::.'" 0~ ~
N
0: co ec
"- :; ';i
~6
'".... ~~
~ !£:
<:" v~~ ~
I-sx I 2X ITime (min)
Fig. 2. Reversed-phase HPLC of Solanum steroidal alkaloids. For conditions, see Experimental.
191
glycoalkaloids'f as well as glycoalkaloids that have only been found in experimentalhybridsl '. Other alkaloid aglycones have been reported 12, however, these rareaglycones were not available to us.
Although partial separation of demissidine and its ,15 analogue, solanidine hasbeen achieved by capillary GC 8
, other such analogues cannot be separated under thesame conditions. The alkaloids, as is the case observed with steroids in general,decompose at the high temperatures required in the GC analysis which adverselyeffects sensitivity, quantitation (we have been able to detect lower concentrations ofsolanidine which elutes at 240DC than tomatidine which elutes at 270DC) andresolution.
One objection to the use ofHPLC for analysis of the steroidal alkaloids has beenthe poor sensitivity of available detection devices. Generally, these compounds exhibitno appreciable absorption above 200 nm which limits the use of UV detection.Tomatidine and 5-tomatidenol have been separated by normal-phase HPLC with UVdetection; however, 210 f.1g of tomatidine was injected and base line separation was notachieved". Until recently, detectors were not sufficiently sensitive to use for the level ofdetection required in analysis of alkaloid extracts, however, RI detectors are nowavailable that can detect these compounds at concentration levels well below thatrequired in most, if not all, analyses. Using tomatidine as a representative alkaloid, wehave determined that one can detect quantities as low as 200 ng which is approximatelya thousand fold increase in sensitivity over that reported for UV detection without theproblem of UV variable response for different chromophores.
The HPLC analysis of the steroidal alkaloid fraction of a Solanum hybrid 14
(supplied to us by Dr. J. P. Helgeson, Agricultural Research Service, U.S. Departmentof Agriculture, University Wisconsin, U.S.A.) which contains ,15 and saturatedanalogues is shown in Fig. 3a. For comparison purposes, the GC for this same mixtureis shown in Fig. 3b. HPLC analysis of this mixture revealed two components (22 and24.5 min) which were not readily apparent by other chromatographic procedures. Itwas established by mass spectrometry on collected samples of these peaks that thecompounds are hydroxysolanidanes, the former being unsaturated and the latter thesaturated compound. However, on the basis of retention (see Fig. 2) and mass spectraldata, these compounds are not 23-hydroxysolanidine or 23-hydroxydemissidine. Thesuperior separation of the saturate/zl ' pairs compared to GC is evident.

192
(a)
(b)(2)
(1)
Time (min)
I50
NOTES
Time (min)
Fig. 3. Analysis of alkaloid fraction of S. brevidens x S. tuberosum hybrid. {a) HPLC chromatogram; (b) GCchromatogram. For conditions, see ref. 8.
The chromatogram of the tuber alkaloids of the commercial potato variety,Kahtadin, is shown in Fig. 4. Although there are some minor unidentified compoundsin this alkaloid extract, one alkaloid, solanidine represents at least 90% of the sample.
Of all the reported methods for separating Solanum steroid alkaloids, in ourestimation, this HPLC method provides the best separation of saturated and LIsanalogues (e.g., solanidine and demissidine). Chromatographic conditions can bevaried depending on the composition of the alkaloid mixture. On the basis ofpreliminary results we have for the separation of partially characterized dihydroxysteroidal alkaloids using a solvent mixture of acetonitrile-methanol (85:15) ata flow-rate of 0.5 ml min- t provides better resolution of the solvent peaks from the
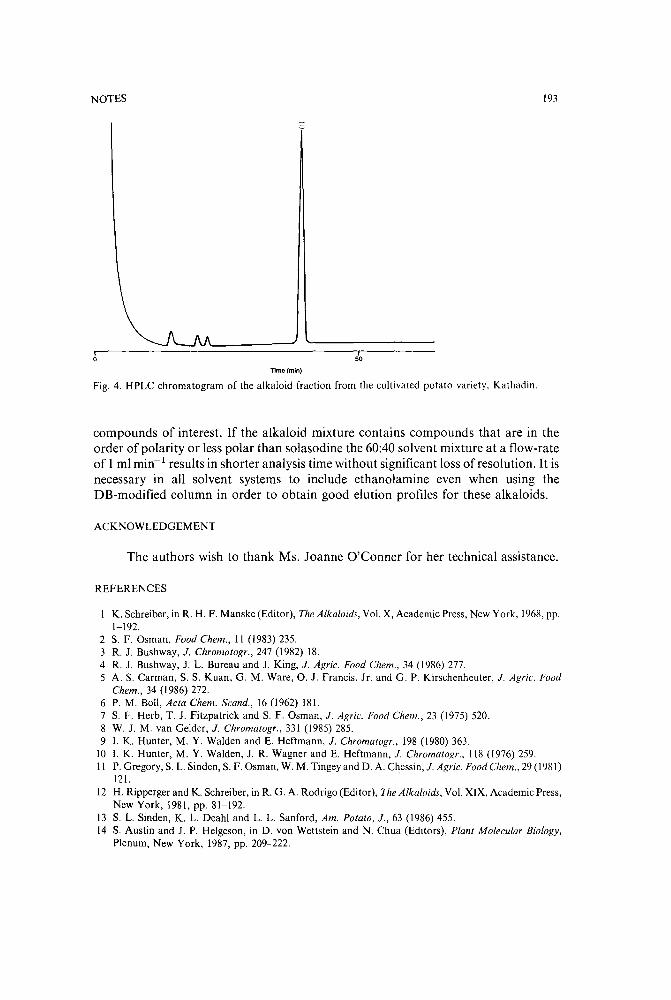
NOTES 193
r50
T1rne{min)
Fig. 4. HPLC chromatogram of the alkaloid fraction from the cultivated potato variety, Kathadin.
compounds of interest. If the alkaloid mixture contains compounds that are in theorder of polarity or less polar than solasodine the 60:40 solvent mixture at a flow-rateof I ml min' results in shorter analysis time without significant loss of resolution. It isnecessary in all solvent systems to include ethanolamine even when using theDB-modified column in order to obtain good elution profiles for these alkaloids.
ACKNOWLEDGEMENT
The authors wish to thank Ms. Joanne O'Conner for her technical assistance.
REFERENCES
K. Schreiber, in R. H. F. Manske (Editor), The Alkaloids, Vol. X, Academic Press, New York, 1968, pp.1-192.
2 S. F. Osman, Food Chern., 11 (1983) 235.3 R. J. Bushway, J. Chrornatogr., 247 (1982) 18.4 R. J. Bushway, 1. L. Bureau and J. King, J. Agric. Food Chern., 34 (1986) 277.5 A. S. Carman, S. S. Kuan, G. M. Ware, O. J. Francis, Jr. and G. P. Kirschenheuter, J. Agric. Food
Chern., 34 (1986) 272.6 P. M. Boll, Acta Chern. Scand., 16 (1962) 181.7 S. F. Herb, T. J. Fitzpatrick and S. F. Osman, J. Agric. Food Chern., 23 (1975) 520.8 W. J. M. van Gelder, J. Chromatogr., 331 (1985) 285.9 I. K. Hunter, M. Y. Walden and E. Heftrnann, J. Chromatogr., 198 (1980) 363.
10 I. K. Hunter, M. Y. Walden, 1. R. Wagner and E. Heftmann, J. Chromatogr., 118 (1976) 259.II P. Gregory, S. L. Sinden, S. F. Osman, W. M. Tingey and D. A. Chessin, J. Agric. Food Chern., 29 (1981)
121.12 H. Ripperger and K. Schreiber, in R. G. A. Rodrigo (Editor), The Alkaloids, Vol. XIX, Academic Press,
New York, 1981, pp. 81-192.13 S. L. Sinden, K. L. Deahl and L. L. Sanford, Arn. Potato, J., 63 (1986) 455.14 S. Austin and J. P. Helgeson, in D. von Wettstein and N. Chua (Editors), Plant Molecular Biology,
Plenum, New York, 1987, pp. 209-222.

Journal 0.[Chromatography, 479 (1989) 194-'-199Elsevier Science Publishers B.Y., Amsterdam - Printed in The Netherlands
CHROM. 21 674
Note
Determination of hydrogen sulphide by porous-layer open-tubularcolumn gas chromatography-mass spectrometry
SYEN JACOBSSON* and OLLE FALK
Kabi Pharma, Research and Development Department, Box 1828, S-171 26 Solna (Sweden)
(First received February 15th, 1989; revised manuscript received June 8th, 1989)
Numerous papers'r" have been published on the determination of volatilesulphur compounds such as hydrogen sulphide in various matrices as mouth air,petroleum gases, atmosphere samples and aqueous samples. Generally, volatilesulphur compounds are determined by gas chromatography. Gas chromatographicanalyses of, for example, hydrogen sulphide have mainly been carried out using packedcolumns. The separation of hydrogen sulphide is often performed on packingmaterials such as Porapak Q, Nor QS1-8. However, several other packing materialsand stationary phases have come into use, e.g., Carbopackz,9,10, Triton X_30511 ,1 Z,
Chromosorb P and 10213,14, Chromosil 33015, Tenax GC 16, polyphenyl ether 1z,17
and various methylsilicone phases 18-zo. The determination of hydrogen sulphide oncapillary columns has been performed with non-polar or medium-polarity siliconephases z1-z4. For capillary columns to retain hydrogen sulphide sufficiently to provideseparation from air components the columns have to be operated at sub-ambienttemperatures. Commonly used detection techniques are flame photometric andthermal conductivity detection, although mass spectrometry has also been used incombination with capillary columns.
Recently, porous-layer open-tubular (PLOT) columns with PoraPLOT Q deposited on the column wall have become commercially available. In this paper wedemonstrate the usefulness of such a column interfaced to a mass spectrometer for theheadspace analysis of hydrogen sulphide in liquid and solid samples.
EXPERIMENTAL
Gas standards of 10 ppm (standard grade A) and 992 ± 50 ppm hydrogensulphide were obtained from AGA '(Lidingo, Sweden). Sampling and injections werecarried out with gas-tight syringes.
A PLOT column 10 m x 0.32 mm I.D. with PoraPLOT Q deposited on thecolumn wall (Chrompak, Middelburg, The Netherlands) was either kept at 40°C ortemperature programmed, the linear flow velocity of the carrier gas (helium) being 40cmls at 40°C.
The gas chromatograph-mass spectrometer was a Shimadzu (Kyoto, Japan)QP-1000 in the selected ion monitoring (SIM) mode. The ion ofm]z 34, correspondingto the molecular ion ofHzS, was monitored. The electron-impact energy was 70 eVandthe ion source temperature was 250°C.
002 I-9673/89/$03.50 © 1989 Elsevier Science Publishers B.Y.

NOTES 195
To prevent particles from the column to entering and contaminating the ionsource, the PLOT column was connected to the ion source via deactivated fused silica.A piece of deactivated quartz-wool was placed in the low-volume connector betweenthe PLOT column and the fused silica.
For high hydrogen sulphide concentrations (amount of H 2S sampled> 2 ng),ordinary split injection could be used; however, for lower concentrations cryogenicfocusing of the headspace sample was necessary. In this work the cryogenic focusingsystem (Fig. I) was used throughout. A detailed description of a similar system hasbeen published elsewhere". Briefly, the hydrogen sulphide present in the headspacesample was injected into the dynamic headspace chamber and transferred to a coldtrap by a flow of helium (20 ml/min]. The cold trap was made of a deactivated fusedsilica (35 em x 0.25 mm J.D.). This fused-silica tube was placed inside aU-shapedglass tube (1.6 mm O.D. x 0.7 mm J.D.), which was suspended in a Dewar flaskcontaining liquid nitrogen. Around the glass tube a Kanthal A wire was coiled toachieve rapid heating on reinjection. With use of the cryogenic focusing techniquerelative large headspace volumes (1-10 ml) could be injected on to the capillary columnwithout the need for splitting.
SV I/t-:I+---.-.-_\.
Injection r'-r:::==J,--&':port -+ L.- -c+----1t----;>".......---MS
Cold trap
Fig. 1.Schematic diagram of the cold trap-reinjection interface. DHC = Dynamic headspace chamber usedas an injector; FC = flow controller; MS = mass spectrometer; NV = needle valve; SV = solenoid valve;V = Valco six-port valve.
Liquid samples were analysed by use of the static headspace method. Forquantitative determination, the standard additions technique was used. The samplewas equilibrated in a glass vial (9 m!) with a aluminium-coated silicone septum.A known volume of the hydrogen sulphide gas standard was added to the liquid phaseof the sample by means of a gas-tight syringe. The headspace of the equilibratedsample was examined by PLOT column gas chromatography-mass spectrometry. Asthe gaseous hydrogen sulphide was added to the liquid phase, the headspaceconcentration ofhydrogen sulphide incrased with time and reached equilibrium within60 min (Fig. 2). To simulate standard sample conditions, a liquid phase (N-acetylcysteine in water, 25 mg/ml) that had been heat treated at 120°C for 20 minutes prior tothe equilibrium study was used.
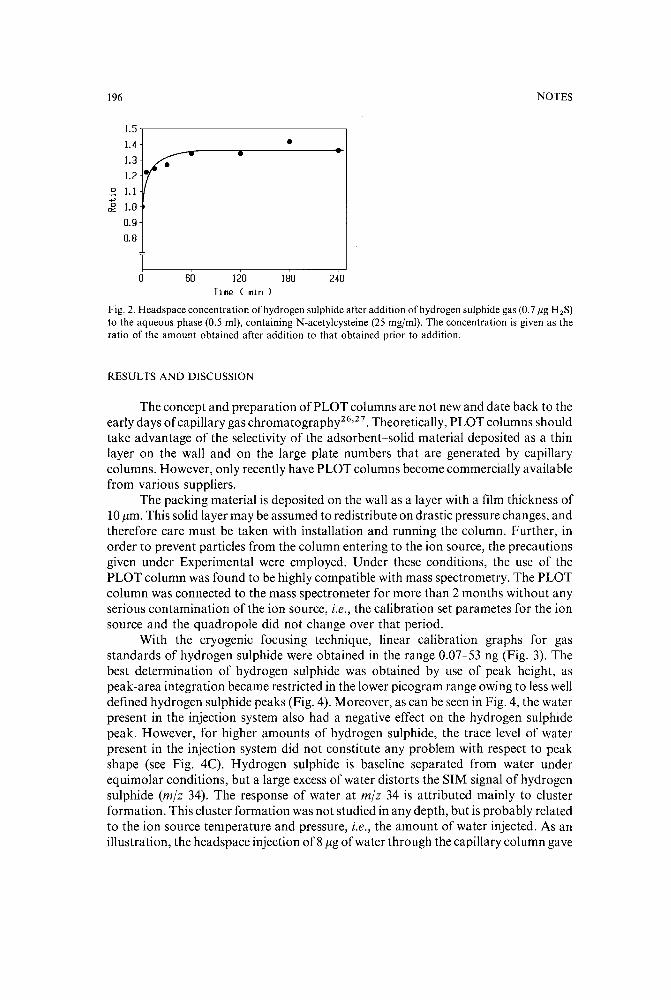
196 NOTES
1.5
1.4 •1.3 -r--- •1.2
0 I.1....,0 1.0~
0.90.8
0 60 120 180 240Time ( min)
Fig. 2. Headspace concentration of hydrogen sulphide after addition of hydrogen sulphide gas (0.7 J-Ig H2S)
to the aqueous phase (0.5 ml), containing N-acetylcysteine (25 mgrml). The concentration is given as theratio of the amount obtained after addition to that obtained prior to addition.
RESULTS AND DISCUSSION
The concept and preparation ofPLOT columns are not new and date back to theearly days ofcapillary gas chromatography''Pv 7. Theoretically, PLOT columns shouldtake advantage of the selectivity of the adsorbent-solid material deposited as a thinlayer on the wall and on the large plate numbers that are generated by capillarycolumns. However, only recently have PLOT columns become commercially availablefrom various suppliers.
The packing material is deposited on the wall as a layer with a film thickness of10flm. This solid layer may be assumed to redistribute on drastic pressure changes, andtherefore care must be taken with installation and running the column. Further, inorder to prevent particles from the column entering to the ion source, the precautionsgiven under Experimental were employed. Under these conditions, the use of thePLOT column was found to be highly compatible with mass spectrometry. The PLOTcolumn was connected to the mass spectrometer for more than 2 months without anyserious contamination of the ion source, i.e., the calibration set parametes for the ionsource and the quadropole did not change over that period.
With the cryogenic focusing technique, linear calibration graphs for gasstandards of hydrogen sulphide were obtained in the range 0.07-53 ng (Fig. 3). Thebest determination of hydrogen sulphide was obtained by use of peak height, aspeak-area integration became restricted in the lower picogram range owing to less welldefined hydrogen sulphide peaks (Fig. 4). Moreover, as can be seen in Fig. 4, the waterpresent in the injection system also had a negative effect on the hydrogen sulphidepeak. However, for higher amounts of hydrogen sulphide, the trace level of waterpresent in the injection system did not constitute any problem with respect to peakshape (see Fig. 4C). Hydrogen sulphide is baseline separated from water underequimolar conditions, but a large excess of water distorts the SIM signal of hydrogensulphide tm]: 34). The response of water at mjz 34 is attributed mainly to clusterformation. This cluster formation was not studied in any depth, but is probably relatedto the ion source temperature and pressure, i.e., the amount of water injected. As anillustration, the headspace injection of8 flg of water through the capillary column gave
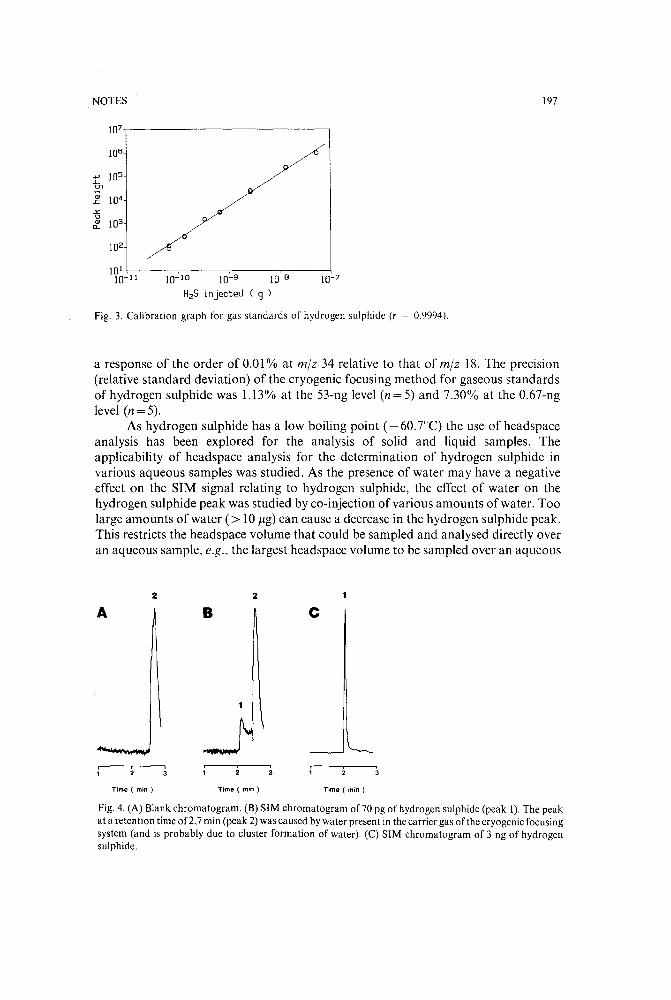
197
10- 10 10- 9 10-8 10-7
H2S injected ( 9 )
Fig. 3. Calibration graph for gas standards of hydrogen sulphide (r = 0.9994).
NOTES
107
106
-0-> 105L<:n
OJ 104L
-'"a103OJ
n,
102
101
10- 1 1
a response of the order of 0.01% at mlz 34 relative to that of m]z 18. The precision(relative standard deviation) of the cryogenic focusing method for gaseous standardsof hydrogen sulphide was 1.13% at the 53-ng level (n=5) and 7.30% at the 0.67-nglevel (n = 5).
As hydrogen sulphide has a low boiling point ( - 60.7°C) the use of headspaceanalysis has been explored for the analysis of solid and liquid samples. Theapplicability of headspace analysis for the determination of hydrogen sulphide invarious aqueous samples was studied. As the presence of water may have a negativeeffect on the SIM signal relating to hydrogen sulphide, the effect of water on thehydrogen sulphide peak was studied by co-injection of various amounts of water. Toolarge amounts of water (> 10 /lg) can cause a decrease in the hydrogen sulphide peak.This restricts the headspace volume that could be sampled and analysed directly overan aqueous sample, e.g., the largest headspace volume to be sampled over an aqueous
A2
B2
c
Time ( min) Time ( min) Time ( min)
Fig. 4. (A) Blank chromatogram. (B) SIM chromatogram of70 pg of hydrogen sulphide (peak I). The peakat a retention time 01'2.7 min (peak 2) was caused by water present in the carrier gas of the cryogenic focusingsystem (and is probably due to cluster formation of water). (C) SIM chromatogram of 3 ng of hydrogensulphide.

198
200000
ll!x:
ij 150000ll!
D...
•
NOTES
o 100 200 300 400 500 500 700H2S added ( ng )
Fig. 5. Standard addition calibration graph. Addition of gaseous hydrogen sulphide to an aqueous sample(1.0 ml) at 25°C.
solution at 25°C and analysed as such is ca. 400 fll. Further, this also calls for identicalprocedures in calibration and analysis of the aqueous sample in order to generatereliable quantitative results. The standard additions method fulfils this criterion. Byuse of the standard additions method, hydrogen sulphide could be quantitativelydetermined (Fig. 5).
The precision (relative standard deviation) of the headspace analysis methodwas 4.4% at a hydrogen sulphide concentration of 1.4 flgjml in an aqueous sample.The sample was repeatedly analysed five times. With the proposed method,concentrations of hydrogen sulphide in aqueous solutions in the low ngjml range canbe determined with a limit of detection of ca. 1 ngjml (Fig. 6). If greater sensitivity isneeded, however, an approach would be to use stripping analysis in combination withthe cryogenic focusing device. A prerequisiste of such a method, however, is that waterhas to be removed prior to the trap, e.g., by calcium chloride!", in order to preventplugging of the cold trap.
A2
B
Time ( min) Time ( min)
Fig. 6. (A) SIM chromatogram of 1.4 ng/ml of hydrogen sulphide (peak I) in an aqueous sample (peak2 = water). (B) SIM chromatogram of 1.6 fl~/ml of hydrogen sulphide in an aqueous sample. Theequilibrium temperature was 2SOC and the heac .pace volume sampled was 100 Ill.
NOTES 199
A distinct advantage with the PLOT column is that the sub-ambient columntemperatures that are generally needed for capillary column separations of manygaseous and highly volatile compounds can be circumvented. The combination ofa PLOT column separation and mass spectrometric detection also provides a highlyselective determination of hydrogen sulphide, with a sensitivity comparable to orbetter than that of flame photometric detection.
REFERENCES
1 C. N. Jones, Anal. Chem., 39 (1967) 1858.2 L. Giry, M. Chaigneau and L.-P. Ricard, Analusis, 6 (1978) 203.3 N. Kishima, Anal. Chem., 58 (1986) 1255.4 F. Andrawes, G. Holzer, E. Roedder, E. K. Gibson, Jr., and J. Oro, J. Chromatogr., 302 (1984) 181.5 T. L. C. de Souza, J. Chromatogr. Sci., 22 (1984) 470.6 L. Huber and H. Obbens, J. Chromatogr., 349 ([985) 465.7 P. P. Deprez, P. D. Franzm~'nn and H. R. Burton, J. Chromatogr., 362 ([986) 9.8 G. A. Cutter and T. J. Oatts, Anal. Chem., 59 (1987) 717.9 F. Mangani, F. Bruner and Penna, Anal. Chem., 55 (1983) 2[93.
10 P. G. Slater and L. Harling-Bowen, Analyst (London), [11 (1986) 1059.II A. H. H. Tameesh, A. O. Bender-and T. M. Sarkissian, J. Chromatogr., 321 ([985) 59.12 J. Macak, 1. Kubat, V. Dobal and\!. Mizera, J. Chromatogr., 286 (1984) 69.[3 W. K. AI-Thamir, J. High Resolut. ~hromatogr. Chromatogr. Commun., 8 (1985) 143.14 A. Tangerman, 1. Chromatogr., 366 (lf86) 205.15 C. Leek and L. E. Bagander, Anal. Chem., 60 ([988) 1680.16 K. J. Rygle, G. P. Feulmer and R. F. Scheideman, J. Chromatogr. Sci., 22 ([984) 514.[7 A. R. Blachette and A. D. Cooper, Anal. Chem., 48 (1976) 729.[8 H. J. Rath and 1. Wimmer, Chromatographia, 13 (1980) 513.19 A. Tangerman,M. T. Meuwese-Arends and J. H. M. van Tongeren, Clin. Chim. Acta, 130 ([983) 103.20 K. C. Campbell, M. L. Mirza, S. J. Thomson and G. Webb, Analyst (London), 110 (1985) 1039.21 S. O. Farwell, S. J. Gluck, W. L. Bamesberger, T. M. Schutte and D. F. Adams, Anal. Chem., 51 (1979)
609.22 J. Kangas, J. Chromatogr., 346 (1985) 405.23 M. Termonia, M. Guns and F. Gillard, Int. J. Environ. Anal. Chefn., 20 (1985) 69.24 J. W. de Leeuw, E. W. B. de Leer J. S. Sinninghe Damste and P. J. W. Schuyl, Anal. Chem., 58 (1986)
1852.25 A. Hagman and S. Jacobsson, J. Chromatogr., 395 (1987) 271.26 I. Halasz and Cs. Horvath, Nature (London), [97 ([963) 71.27 M. J. E. Golay, Anal. Chem., 40 (1968) 382.

Journal of Chromatography, 479 (1989) 200-205Elsevier Science Publishers B.V., Amsterdam - Printed in The Netherlands
CHROM. 21 689
Note
Supercritical fluid extraction of s-triazine herbicides from sediment"
V. JANDA-
Prague Institute ofChemical Technology, Department of Water Technology and Environmental Engineering,Suchbatarova 5, CS-16628 Prague 6 (Czechoslovakia)
and
G. STEENBEKE and P. SANDRA
University of Ghent, Laboratory of Organic Chemistry, Krijgslaan 281(S4), B-9000 Ghent (Bclgium )
(First received March 3rd, 1989; revised manuscript received June 12th, 1989)
Supercritical fluid extraction (SFE) is a very useful technique for the isolation oforganic compounds from a solid matrix. It has been used for the analysis of flavoursand fragrances from natural products 1
, toxic organics from resins", polycycliccompounds and polychlorinated biphenyls from environmental solids? and othercompounds (ref. 4 and references cited therein).
Carbon dioxide is mostly used as a supercritical fluid because of its low criticaltemperature (32°C) and pressure (73 bar), which allows SFE to be performed atrelatively low temperatures, avoiding thermal decomposition of analytes. Carbondioxide is a non-explosive and relatively inert gas at normal temperature and pressure,which simplifies subsequent concentration ofthe compounds isolated by SFE. It is alsopossible to couple SFE with capillary gas chromatography (GC)3,4. Complete transferof analytes from SFE directly into a capillary column is achieved by this on-linemodification and lower detection limits may be reached.
The aim of this work was to measure the recovery of s-triazine herbicides fromriver sediment by SFE. The compounds used are listed in Table 1.
TABLE I
s-TRIAZINE HERBICIDES STUDIED
Common name
SimazineAtrazinePropazineTerbutylazineCyanazine
Systematic name
2-Chloro-4,6-bisethylamino-s-triazine2-Chloro-4-ethylamino-6-isopropylamino-s-triazine2-Chloro-4,6-bisisopropylamino-s-triazine2-Chloro-4-ethylamino-6-tert.-butylamino-s-triazine2-Chloro-4-ethylamino-6-( I-cyano )isopropylamino-s-triazine
U Presented at the 10th International Symposium on Capillary Chromatography, Riva del Garda, May22-25, 1989.
0021-9673/89/$03.50 © 1989 Elsevier Science Publishers B.V.

NOTES
EXPERIMENTAL
201
Supercritical fluid extractionAll the SFEs were performed using a Varian 8500 syringe pump. The extractions
were performed at a pressure of carbon dioxide of230 bar and a temperature 48°C. Thedensity ofcarbon dioxide under these conditions is about 0.80 g/ml". The apparatus isshown schematically in Fig. 1. The cartridge for extraction of the sediment wasconstructed according to Fig. 2. The pressure of the supercritical carbon dioxide in thecartridge was maintained by means of a capillary fused-silica restrictor (30 cm x 25pm LD.). The time ofSFE was 30 min and during this period approximately 18 ml ofliquid carbon dioxide were pumped into the SFE system. The cartridge had an innervolume 0.57 ml and 500 mg of the sediment were extracted. The outlet of the restrictorwas immersed in methanol in the test-tube to trap the isolated compounds. Althoughthe test-tube was placed in the oven, losses of methanol during SFE were acceptablebecause it was cooled by carbon dioxide expansion from the restrictor (during SFE icewas precipitated on the outer wall of the test-tube from moisture in the oven). Thevolume of methanol in the test-tube was 1ml at the beginning of the SFE and decreasedto approximately 0.5 ml by stripping with gaseous carbon dioxide within the 30-minperiod. Venting of methanol vapour from the test-tube did not affect the recovery ofs-triazines as they are relatively non-volatile and evaporation of a solvent is a commonstep, e.g., for concentration of extracts from water". The decrease in the methanolvolume was corrected for by addition of an internal standard before chromatographicanalysis.
3r,I,,l·4,:,I 6
2:: 5,L _
11
3
4
5
5
11 9
12 10
Fig. I. Apparatus for SFE (not to scale). I = Pump for liquid carbon dioxide; 2 = oven; 3 = shut-offvalve; 4 = cartridge with sample of sediment (for details see Fig. 2); 5 = restrictor; 6 = test-tube withmethanol; 7 = fused-silica capillary (0.32 mm 1.0.) for venting gaseous carbon dioxide.
Fig. 2. Extraction cartridge. I = Stainless-steel capillary; 2 = tubing union; 3 = metal ferrule; 4 = femalenut; 5 = metal fitting; 6 = male nut; 7 = stainless-steel tubing; 8 = female nut; 9 = Vespel ferrule; 10 =
male nut; I I = stainless-steel frit; 12 = restrictor.
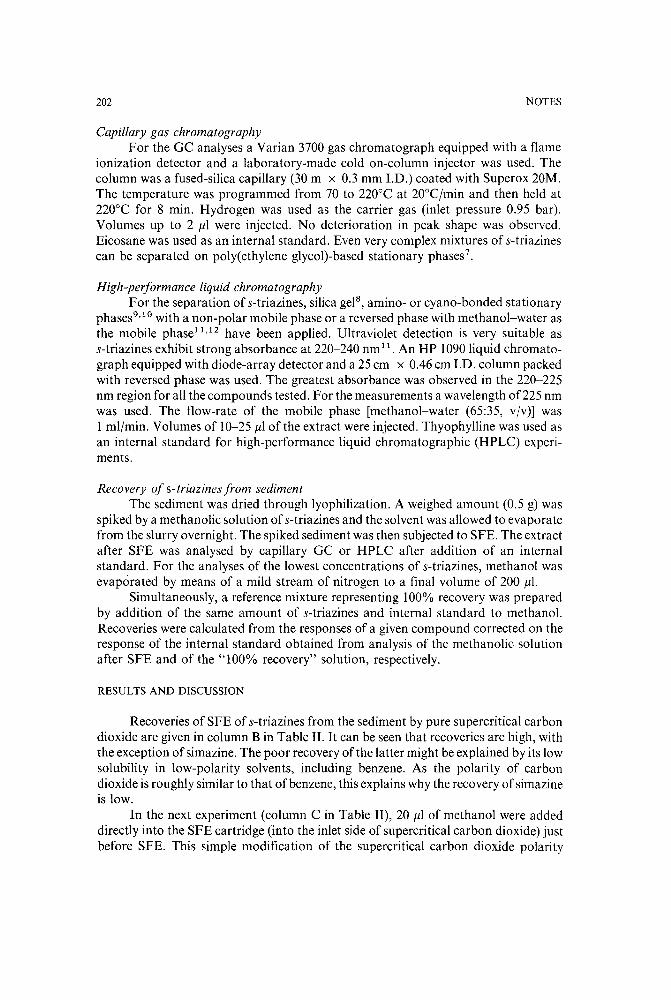
202 NOTES
Capillary gas chromatographyFor the GC analyses a Varian 3700 gas chromatograph equipped with a flame
ionization detector and a laboratory-made cold on-column injector was used. Thecolumn was a fused-silica capillary (30 m x 0.3 mm J.D.) coated with Superox 20M.The temperature was programmed from 70 to 220°C at 20°Cjmin and then held at220°C for 8 min. Hydrogen was used as the carrier gas (inlet pressure 0.95 bar).Volumes up to 2 III were injected. No deterioration in peak shape was observed.Eicosane was used as an internal standard. Even very complex mixtures of s-triazinescan be separated on poly(ethylene glycol)-based stationary phases7
•
High-performance liquid chromatographyFor the separation of s-triazines, silica gel", amino- or cyano-bonded stationary
phases't'? with a non-polar mobile phase or a reversed phase with methanol-water asthe mobile phase1 1
, 1 2 have been applied. Ultraviolet detection is very suitable ass-triazines exhibit strong absorbance at 220-240 nm!". An HP 1090 liquid chromatograph equipped with diode-array detector and a 25 em x 0.46 cm J.D. column packedwith reversed phase was used. The greatest absorbance was observed in the 220-225nm region for all the compounds tested. For the measurements a wavelength of225 nmwas used. The flow-rate of the mobile phase [methanol-water (65:35, vjv)] was1 mljmin. Volumes of 10-25 III of the extract were injected. Thyophylline was used asan internal standard for high-performance liquid chromatographic (HPLC) experiments.
Recovery of s-triazines from sedimentThe sediment was dried through lyophilization. A weighed amount (0.5 g) was
spiked by a methanolic solution ofs-triazines and the solvent was allowed to evaporatefrom the slurry overnight. The spiked sediment was then subjected to SF£. The extractafter SFE was analysed by capillary GC or HPLC after addition of an internalstandard. For the analyses of the lowest concentrations of s-triazines, methanol wasevaporated by means of a mild stream of nitrogen to a final volume of 200 Ill.
Simultaneously, a reference mixture representing 100% recovery was preparedby addition of the same amount of s-triazines and internal standard to methanol.Recoveries were calculated from the responses of a given compound corrected on theresponse of the internal standard obtained from analysis of the methanolic solutionafter SFE and of the "100% recovery" solution, respectively.
RESULTS AND DISCUSSION
Recoveries ofSFE of s-triazines from the sediment by pure supercritical carbondioxide are given in column B in Table II. It can be seen that recoveries are high, withthe exception of simazine. The poor recovery of the latter might be explained by its lowsolubility in low-polarity solvents, including benzene. As the polarity of carbondioxide is roughly similar to that of benzene, this explains why the recovery of simazineis low.
In the next experiment (column C in Table II), 20 III of methanol were addeddirectly into the SFE cartridge (into the inlet side of supercritical carbon dioxide) justbefore SFE. This simple modification of the supercritical carbon dioxide polarity
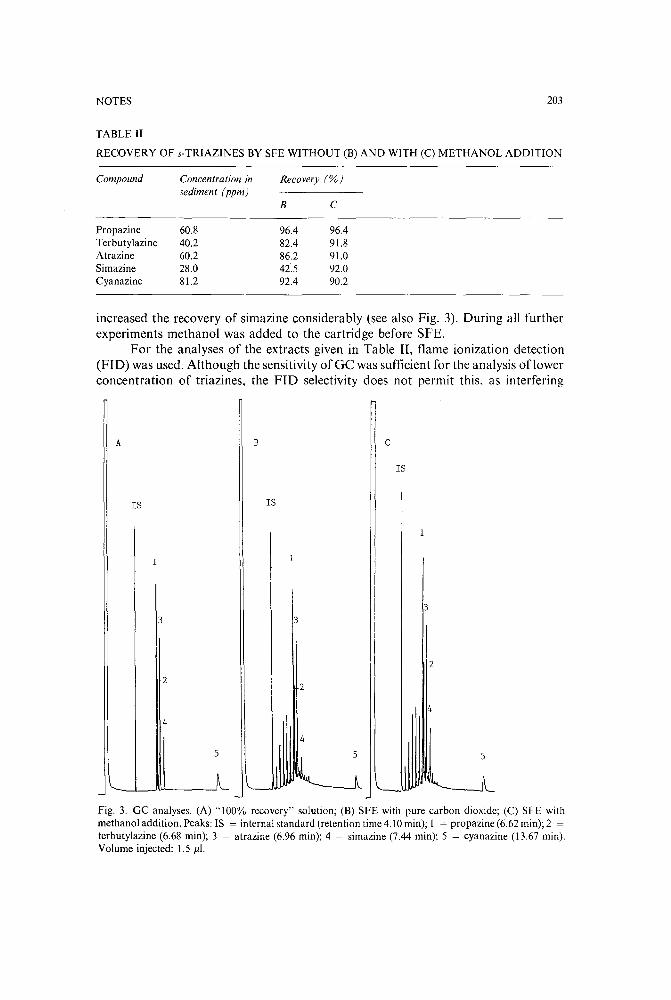
NOTES 203
TABLE II
RECOVERY OF s-TRIAZINES BY SFE WITHOUT (B) AND WITH (C) METHANOL ADDITION
Compound Concentration in Recovery (%)sediment (ppm)
B C
Propazine 60.8 96.4 96.4Terbutylazine 40.2 82.4 91.8Atrazine 60.2 86.2 91.0Simazine 28.0 42.5 92.0Cyanazine 81.2 92.4 90.2
increased the recovery of simazine considerably (see also Fig. 3). During all furtherexperiments methanol was added to the cartridge before SFE.
For the analyses of the extracts given in Table II, flame ionization detection(FID) was used. Although the sensitivity ofGC was sufficient for the analysis oflowerconcentration of triazines, the FTD selectivity does not permit this, as interfering
A
IS
B
IS
c
IS
33 3
2
22
4
4
4
5 5 5
Fig. 3. GC analyses. (A) "100% recovery" solution; (B) SFE with pure carbon dioxide; (C) SFE withmethanol addition. Peaks: IS = internal standard (retention time 4.10 min); I = propazine (6.62 min); 2 =terbutylazine (6.68 min); 3 = atrazine (6.96 min); 4 = simazine (7.44 min); 5 = cyanazine (13.67 min).Volume injected: 1.5 Ill.
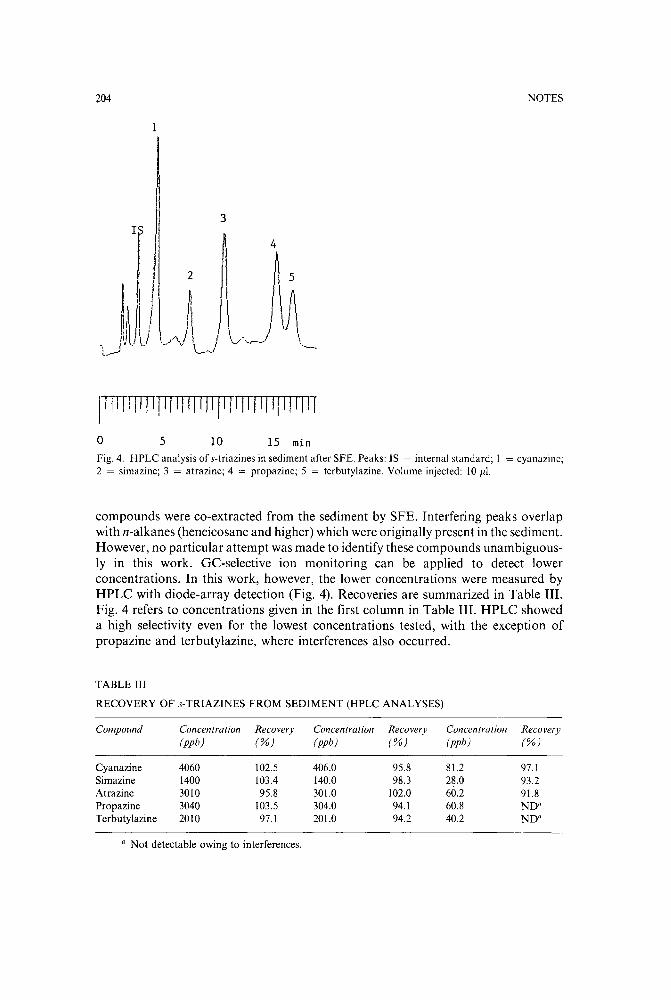
204
1
3
NOTES
4
I~ 5
I \ tl
\ / \) \\./-.,_.r__-/ "..
'-.
o 5 10 15 min
Fig. 4. HPLC analysis of s-triazines in sediment after SFE. Peaks: IS = internal standard; 1 = cyanazine;2 = simazine; 3 = atrazine; 4 = propazine; 5 = terbutylazine. Volume injected: 10 Ill.
compounds were co-extracted from the sediment by SFE. Interfering peaks overlapwith n-alkanes (heneicosane and higher) which were originally present in the sediment.However, no particular attempt was made to identify these compounds unambiguously in this work. GC-selective ion monitoring can be applied to detect lowerconcentrations. In this work, however, the lower concentrations were measured byHPLC with diode-array detection (Fig. 4). Recoveries are summarized in Table III.Fig. 4 refers to concentrations given in the first column in Table III. HPLC showeda high selectivity even for the lowest concentrations tested, with the exception ofpropazine and terbutylazine, where interferences also occurred.
TABLE III
RECOVERY OF s-TRIAZINES FROM SEDIMENT (HPLC ANALYSES)
Compound Concentration Recovery Concentration Recovery Concentration Recovery(ppb) (%) (ppb) (%) (ppb) (%)
Cyanazine 4060 102.5 406.0 95.8 81.2 97.1Simazine 1400 103.4 140.0 98.3 28.0 93.2Atrazine 3010 95.8 301.0 102.0 60.2 91.8Propazine 3040 103.5 304.0 94.1 60.8 ND"Terbutylazine 2010 97.1 201.0 94.2 40.2 ND"
a Not detectable owing to interferences.
NOTES
REFERENCES
205
I S. B. Hawthorne, M. S. Kreiger and D. J. Miller, Anal. Chem., 60 (1988) 472.2 J. H. Raymer and E. D. Pellizzari, Anal. Chem., 59 (1987) 1043.3 S. B. Hawthorne and D. J. Miller, J. Chromatogr., 403 (1987) 63.4 I. L. Davies, M. W. Raynor, 1. P. Kithinji, K. D. Bartle, P. T. Williams and G. E. Andrews, Anal. Chem.,
60 ([988) 683A.5 R. W. Bally and C. A. Cramers, in D. Ishii, K. Jinno and P. Sandra (Editors), Proc. 7th Int. Symp. on
Capillary Chromatography, University of Nagoya Press, Nagoya, 1986, p. 560.6 V. Janda, in P. Sandra and W. Bertsch (Editors), Proc. 6th Int. Symp. on Capillary Chromatography,
Hiithig, Heidelberg, 1985, p. 296.7 E. Matisova, J. Krupcik, O. Liska and N. Szentivanyi, J. Chromatogr., [69 (1979) 261.8 P. Dufek and V. Pacakova, J. Chromatogr., 187 (1980) 341.9 P. Dufek, V. Pacakova and E. Terafova, J. Chromatogr., 19[ (1980) 115.
10 E. Smolkova and V. Pacakova, Chromatographia, II (1978) 698.1[ H. Jork and B. Roth, J. Chromatogr., 144 ([977) 39.12 M. Pop[, Z. Voziiakova, V. Tatar and J. Strnadova, J. Chromatogr. Sci., 21 (1983) 39.

Journal of Chromatography, 479 (1989) 206-21 IElsevier Science Publishers B.V., Amsterdam - Printed in The Netherlands
CHROM. 21 680
Note
High-performance liquid chromatography of metribuzin and non-polarmetabolites extracted from leaf tissues
HELEN A. NORMAN', CHARLES F. MISCHKE and JUDITH B. St. JOHN
Weed Science Laboratory, U.S. Department of Agriculture, Agricultural Research Service, Building 001,Room 29, BARC-West, Beltsville, MD 20705 (U.S.A.)
(First received August Ist, 1988; revised manuscript received June 6th, 1989)
Metribuzin [4-amino-6-(l, l-dimethylethyl)-3-(methylthio)-1,2,4- triazin-5(4H)one] (Fig. I) is an asymmetric triazinone herbicide which effectively controls certaingrass and broadleaf weeds infesting soy bean, tomato and other crops. The rate ofmetabolism of metribuzin to less phytotoxic compounds is thought to determine therelative tolerance of different crop cultivars to metribuzin1-4. Frear et al.5 haveidentified two polar metabolites, the P-D-(N-glucoside) conjugate and the malonylP-D-(N-glucoside) conjugate, as the initial and major degradation products in tomato.
0
'"""'1""Ii' NH2(H3Ch C N/
N1 J Nl )SCH3"......:: SCH3
N N
Metrlbuzin DA
0 0
(H3ChCIi'NH Ii' NH2(H3Ch C N/
N1 ~ N
1 ~" 0 " 0N N
H H
DADK DKFig.!. Structure of metribuzin and non-polar metabolites.
In contrast, the major pathway of metabolism of metribuzin in soy beaninvolved an initial oxidation of the methylthio group to yield a reactive sulfoxideintermediate". This sulfoxide could then undergo peptide conjugation with homoglutathione or possibly degrade to non-polar metabolites, specifically the diketo (OK)and the deaminated diketo (OAOK) forms of metribuzin. Small amounts of thedeaminated (OA) form ofmetribuzin, OK and OAOK (Fig. I) were reported as plantmetabolites in sugar-cane", potato" and several weed species?'!", These non-polar
0021-9673/89/$03.50 © 1989 Elsevier Science Publishers B.Y.
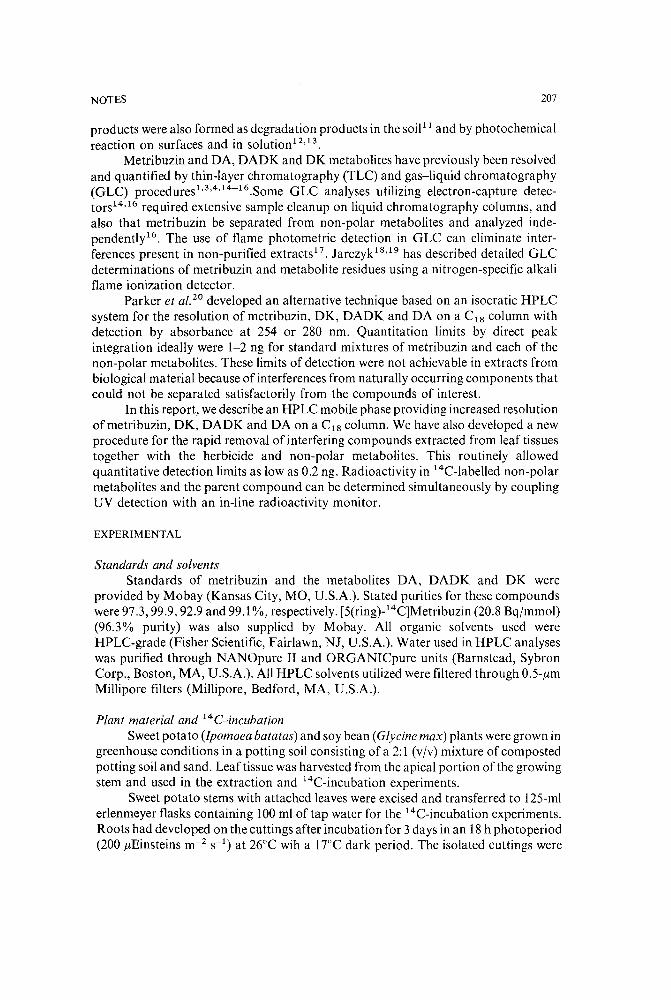
NOTES 207
products were also formed as degradation products in the soilI I and by photochemicalreaction on surfaces and in solution I2
, 13 .
Metribuzin and DA, DADK and DK metabolites have previously been resolvedand quantified by thin-layer chromatography (TLC) and gas-liquid chromatography(GLC) procedures l,3,4,14-16.Some GLC analyses utilizing electron-capture detectors l4, 16 required extensive sample cleanup on liquid chromatography columns, andalso that metribuzin be separated from non-polar metabolites and analyzed independently':". The use of flame photometric detection in GLC can eliminate interferences present in non-purified extracts!". Jarczyk'V'? has described detailed GLCdeterminations of metribuzin and metabolite residues using a nitrogen-specific alkaliflame ionization detector.
Parker et al.2 0 developed an alternative technique based on an isocratic HPLCsystem for the resolution ofmetribuzin, DK, DADK and DA on a CIS column withdetection by absorbance at 254 or 280 nm. Quantitation limits by direct peakintegration ideally were 1-2 ng for standard mixtures of metribuzin and each of thenon-polar metabolites. These limits of detection were not achievable in extracts frombiological material because of interferences from naturally occurring components thatcould not be separated satisfactorily from the compounds of interest.
In this report, wedescribe an HPLC mobile phase providing increased resolutionofmetribuzin, DK, DADK and DA on a CIS column. We have also developed a newprocedure for the rapid removal of interfering compounds extracted from leaf tissuestogether with the herbicide and non-polar metabolites. This routinely allowedquantitative detection limits as low as 0.2 ng. Radioactivity in 14C-Iabelled non-polarmetabolites and the parent compound can be determined simultaneously by couplingUV detection with an in-line radioactivity monitor.
EXPERIMENTAL
Standards and solventsStandards of metribuzin and the metabolites DA, DADK and DK were
provided by Mobay (Kansas City, MO, U.S.A.). Stated purities for these compoundswere 97.3, 99.9, 92.9 and 99.1%, respectively. [5(ring)-14C]Metribuzin (20.8 Bq/mmol)(96.3% purity) was also supplied by Mobay. All organic solvents used wereHPLC-grade (Fisher Scientific, Fairlawn, NJ, U.S.A.). Water used in HPLC analyseswas purified through NANOpure II and ORGANICpure units (Barnstead, SybronCorp., Boston, MA, U.S.A.). All HPLC solvents utilized were filtered through 0.5-j,lmMillipore filters (Millipore, Bedford, MA, U.S.A.).
Plant material and 14C-incubationSweet potato (Ipomoea batatas) and soy bean (Glycine max) plants were grown in
greenhouse conditions in a potting soil consisting of a 2:1 (vIv) mixture of compostedpotting soil and sand. Leaf tissue was harvested from the apical portion of the growingstem and used in the extraction and 14C-incubation experiments.
Sweet potato stems with attached leaves were excised and transferred to 125-mlerlenmeyer flasks containing 100 ml of tap water for the 14C-incubation experiments.Roots had developed on the cuttings after incubation for 3 days in an 18h photoperiod(200 j,lEinsteins m-2 S-I) at 26°C wih a 17°C dark period. The isolated cuttings were

208 NOTES
then incubated for 48 h in flasks containing 100ml of 5' 10-6 M metribuzin containing0.5 ,uCi [14C]metribuzin (20.8 Bqjmmol). At the end of the incubation period. cuttingswere rinsed with running water and placed in 100 ml of 5 . 10-0 M metribuzin for anadditional 72 h.
Sample preparationLeaf tissue (2.5 g fresh weight) was homogenized with 20 ml of methanol-water
(8:2, vjv) using a Polytron. Spiked samples were prepared by adding 2.5 ,ug each ofmetribuzin, DA, DADK and DK, dissolved in methanol to the homogenates. Anequivalent amount of methanol was added to blank samples. Homogenates werevaccum filtered, and then plant residue on the filter was rinsed with 20 ml ofmethanol-water (8:2, vjv) followed by 10 ml of methanol. Combined filtrates wereevaporated in vacuo. The sample was dispersed in 25 ml of chloroform and partitionedwith 20 ml of 0.1 M potassium chloride. The chloroform layer was recovered and theaqueous phase re-partitioned twice with chloroform. Combined chloroform fractionswere dried in vacuo at 35°C and the residue re-dissolved in 200-500,u1 of diethyl ether.This re-dissolved residue was then applied to a C18Sep-Pak cartridge (Waters Assoc.,Milford, MA, U.S.A.). Diethyl ether was evaporated by passing nitrogen gas throughthe Sep-Pak. Metribuzin and non-polar metabolites were then eluted with 20 ml ofacetonitrile-water (50:50, vjv). The eluate was dried in vacuo and the residue nextsolubilized in chloroform and applied to a silica Sep-Pak cartridge (Waters Assoc.).Metribuzin and non-polar metabolites were eluted from the Sep-Pak cartridge with 20ml of chloroform. The final extracts were dried and then re-dissolved in the mobilephase prior to HPLC analysis.
HPLC analysesHPLC analyses were conducted utilizing an ACS Model 351 solvent delivery
system (Applied Chromatography Systems, Luton, U.K.), a Rheodyne Model 7125syringe-loading sample injector with a 50-,ulloop and a 25 em x 4.6 mm J.D. BeckmanUltrasphere (5 ,urn) reversed-phase C18 column. The mobile phase was 0.05 M aceticacid-acetonitrile-methanol (67:28:5, vjvjv) delivered at a flow-rate of 0.9 ml min-i.Samples for injection (50 ,ul) were taken from final extracts dissolved in this mobilephase. Compounds were detected at 280 nm with a Linear UVIS 203 variablewavelength detector, and elution profiles were recorded and integrated by a HP 3390Aintegrator (Hewlett-Packard, Avondale, PA, U.S.A.). After injection of 20 samples,the column was cleaned with tetrahydrofuran at a flow-rate of I mljmin for 2 h toremove strongly retained contaminants. Radioactivity was determined after the peakswere first detected at 280 nm and then eluted through a Flo-One Beta (Model IC)HPLC radioactive flow detector (Radiomatic Instruments and Chemical Co., Tampa,FL, U.S.A.) with Flo-Scint III (Radiomatic Instruments and Chemical Co.) asscintillator mixed with the HPLC eluate by means of the Flo-One component pumpoperating at 4.5 mljmin. Under these conditions, the counting efficiency for 14C wasapproximately 80%.
TLC separation of metribuzin and metabolitesSilica gel HF plates (Analabs, Norwalk, CT, U.S.A.) were used for TLC of
[14C]metribuzin, DA, DADK and DK. Tissue extracts for TLC were first purified

NOTES 209
through CiS and silica Sep-Paks, then re-dissolved in ethanol and applied to plates,developed in benzene-chloroform-s-dioxane (4:3:3, vjvjV)l. Metribuzin, DA, DADKand DK standards were used for co-chromatography and detection by UV light. Theresolved compounds were scraped from the TLC plate and extracted from the silicawith 50% ethanol and counted for radioactivity using a Beckman LS 1801 liquidscintillation counter.
RESULTS AND DISCUSSION
Standards of metribuzin and the non-polar metabolites, DK, DADK and DA,were optimally resolved by reversed-phase HPLC separation utilizing 0.05 M aceticacid-acetonitrile-methanol (67:28:5, vjvjv) as the mobile phase (Fig. 2). Reproduciblequantitation by peak integration at 280 nm was recorded between 0.2 ng and 100ug ofthe standards. Parker et al.20 used reversed-phase separation with a mobile phaseconsisting of methanol-0.05 M acetic acid (62:38, vjv), delivered at 1 mljmin, toseparate these same compounds with detection limits of 1-2 ng at 280 nm.
25
MetrlbuzlnDADK
DK
5
Q)
oc...0
a<Jl.0 -J
-co:---~,.---------,'-o,.-------,~--~---c'-=----,-'
Ec:
oIX)
C\l
Retention Time (min)
Fig. 2. Reversed-phase HPLC separation of metribuzin and non-polar metabolite standards. Column:Beckman Ultrasphere (5 Jlm, 250 mm x 4.6 mm). Mobile phase: 0.05 M acetic acid-acetonitrile-methanol(67:28:5, v/v/v), 0.9 ml/rnin; detection by UV absorbance (280 nm).
Chromatograms of samples from sweet potato leaf extracts which were spikedwith a mixture of metribuzin and non-polar metabolite standards (2.5 flg per 2.5g tissue) before or after filtration through CiS and silica Sep-Paks are compared in Fig.3A and B, respectively. The peaks defined correspond to approximately 25 ng each ofmetribuzin, DK, DADK and DA. Without Sep-Pak purification (Fig. 3A), unidentified components eluted immediately before or concurrently with the compounds ofinterest and background signals were elevated. Successive elution of the extractsthrough CiS and silica Sep-Pak with the solvents described, removed most of theinterfering contaminants (Fig. 3B). The unidentified peaks remaining in samplesfiltered through Sep-Paks were also found in blank tissue extracts. They weresufficiently resolved from metribuzin, DK, DADK and DA to allow reproduciblequantitation of metribuzin and the metabolites to a limit of 0.2 ng. An equivalentchromatogram of samples from soy bean leaf extracts purified by Sep-Pak filtration isshown in Fig. 4. The recoveries of metribuzin and each of the non-polar metabolitesadded to the tissue extracts of both sweet potato and soy bean were 92-94%.
The excellent HPLC resolution allowed the direct determination of [14C]metri-
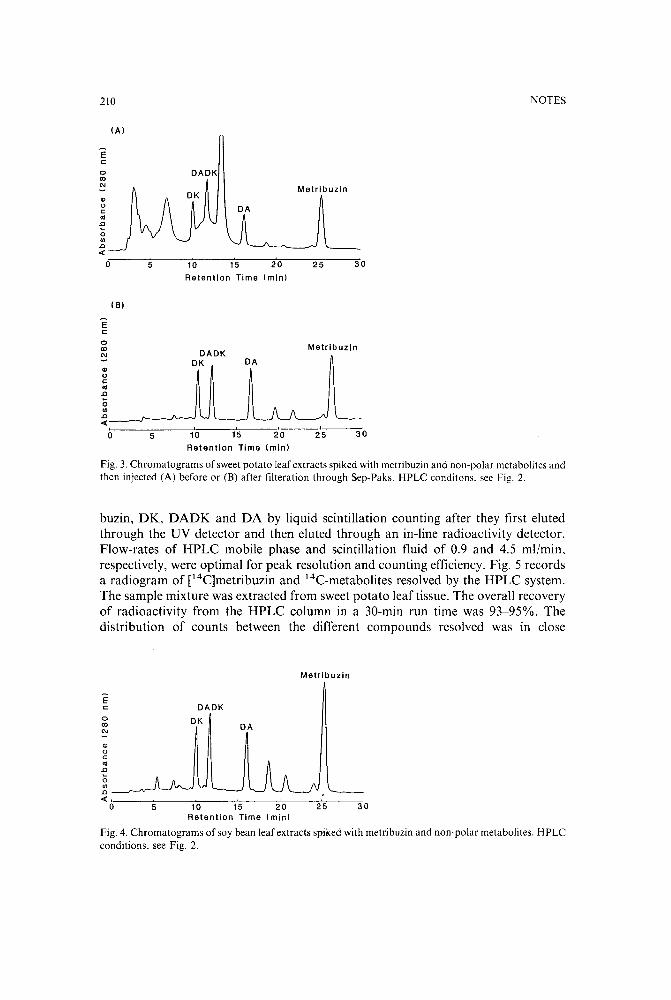
NOTES
30
25
25
Metrlbuzln
DADADK
DK
DADK
10 15 20
Retention Time (min)
1'0 1'5 2'0
Retention Time (min)
Fig. 3. Chromatograms of sweet potato leaf extracts spiked with metribuzin and non-polar metabolites andthen injected (A) before or (B) after filteration through Sep-Paks. HPLC conditons. see Fig. 2.
210
(Al
Ec0ex>
'".,0c
'".0<;Ul.0<{
0 5
(Bl
Ec0ex>
'".,0c
'".00Ul.0<{
,
0 5
buzin, OK, OAOK and OA by liquid scintillation counting after they first elutedthrough the UV detector and then eluted through an in-line radioactivity detector.Flow-rates of HPLC mobile phase and scintillation fluid of 0.9 and 4.5 mljmin,respectively, were optimal for peak resolution and counting efficiency. Fig. 5 recordsa radiogram of [14C]metribuzin and 14C-metabolites resolved by the HPLC system.The sample mixture was extracted from sweet potato leaf tissue. The overall recoveryof radioactivity from the HPLC column in a 30-min run time was 93-95%. Thedistribution of counts between the different compounds resolved was in close
Metrlbuzln
Ec
oex>
'"
DADKDK
DA
30255
.,oc
'".0o~ _..r-.Ar-..J \.....J ''''-.--'
-c0=-----7---~-----;'::---~--~-10 15 20
Retention Time (min)
Fig. 4. Chromatograms of soy bean leaf extracts spiked with metribuzin and non-polar metabolites. HPLCconditions, see Fig. 2.

NOTES
3500
3000
2500
~ 20000...o
1500
DA
Metribuzin
211
Retention Time (min)Fig. 5. Radiogram of 14C-metribuzin and 14C-metabolites extracted from sweet potato leaf tissue andresolved by HPLC. Conditions, see Fig. 2. Flow-rates: mobile phase, 0.9 mljmin, scintillation fluid, 4.5nil/min.
agreement with values determined in aliquots of the same sample mixture separated byTLC. Utilization of HPLC for resolution avoids possible losses during collection ofzones from TLC plates and allows simultaneous quantitation.
REFERENCES
I B. L. Mangeot, F. W. Slife and C. E. Rieck, Weed Sci., 27 (1979) 267.2 G. R. Stephenson, J. E. McLeod and S. C. Phatak, Weed Sci., 24 (1976) 161.3 S. W. Gawronski, L. C. Haderlie, R. H. Callihan and H. Gawronski, Weed Res., 26 (1986) 307.4 S. W. Gawronski, L. C. Haderlie and J. C. Stark, Weed Res., 27 (1987) 49.5 D. S. Frear, E. R. Mansager, H. W. Swanson and F. S. Tanaka, Pestic. Biochem. Physiol., 19(1983) 270.6 D. S. Frear, H. W. Swanson and E. R. Mansager, Pestic. Biochem. Physiol., 23 (1985) 56.7 M. W. Hilton, N. S. Nomura, W. L. Yauger and S. S. Kameda, J. Agric. Food Chem., 22 (1974) 578.8 R. H. Callihan, G. F. Stallknecht, R. B. Dwelle and M. Blicharczyk, Am. Potato J., 53 (1976) 253.9 T. G. Hargroder and R. L. Rogers, Weed Sci., 22 (1974) 238.
10 M. A. Mann and W. 1. McLeod, Can. J. Plant Sci., 58 (1978) 485.II M. S. Sharom and G. R. Stephenson, Weed Sci., 24 (1976) 153.12 P. Bartl, H. Parlar and K. Korte, Z. Naturforsch., 3[6 (1976) 1[22.13 B. E. Pape and M. J. Zabik, J. Agric. Food Chem., 20 (1972) 72.14 G. R. B. Webster, S. R. MacDonald and L. P. Sarna, J. Agric. Food Chem., 23 (1975) 74.15 G. R. B. Webster and G. J. Reimer, Pestic. Sci., 7 ([976) 292.16 J. S. Thornton and C. W. Stanley, J. Agric. Food Chem., 25 (1977) 380.17 F. G. von Stryk, J. Chromatogr., 56 (1971) 345.18 H. J. Jarczyk, Pflanzenschutz-Nachr. Bayer (Ger. Ed.), 31 (1978) 84.[9 H. J. Jarczyk, Pflanzenschutz-Nachr. Bayer (Ger. Ed.), 36 (1983) 63.20 C. E. Parker, G. H. Degen, E. O. Abusteit and F. T. Corbin, 1. Liq. Chromatogr., 6 (1983) 725.

Journal of Chromatography, 479 (1989) 212-215Elsevier Science Publishers B.Y., Amsterdam - Printed in The Netherlands
CHROM. 21 677
Note
Separation of cationic technetium-99m amine complexes on porousgraphitic carbon
M. F. EMERY
Division of Radioisotopes, MRC Clinical Research Centre, Watford Road, Harrow, Middlesex HAl 3UJ(o.x.,and
C. K. LIM"
Division of Clinical Cell Biology, MRC Clinical Research Centre, Watford Road, Harrow, Middlesex HAl3UJ (U.K.)
(First received April 17th, 1989; revised manuscript received June 12th, 1989)
Technetium-99m has almost ideal physical properties (half-life, tl; = 6.1 h,y energy 140 keY) for diagnostic imaging studies in nuclear medicine using singlephoton emission computer tomography (SPECT). It is readily available as sodiumpertechnetate (TcOi) from commercial generators. Analysis of technetium complexesevaluated as potential radiopharmaceuticals has mainly relied on paper chromatography'':" and instant thin-layer chromatography'<", although high-performanceliquid chromatography (HPLC) is increasingly being employed5-7.
Cationic technetium complexes of linear and macrocyclic amines have beensynthesised as possible imaging agents'<!", but so far only one HPLC method has beenreported for their analysis 15. This was because of the difficulties in eluting thesecompounds from silica-based reversed-phase columns15 and a styrene-divinyIbenzenebonded phase (Hamilton PRP-l) was suggested as an alternative. However, althoughsome degree of separation has been achieved with this system using PRP-l, furtherimprovement in resolution is required particularly between pertechnetate (TcOi) andthe complexes. This paper describes the complete separation of TcOi and themonocationic amine complexes dioxo(ethylenediamine)-, dioxo(l ,5,8,12-tetraazadodecane)- and trans-dioxo(l,4,8,II-tetraazacyclotetradecane)-technetium on a porousgraphitic carbon (PGC) column with acetonitrile in 1% trifluoroacetic acid as eluent.The system is suitable for monitoring the radiochemical purity of these potentialradiopharmaceuticals and for metabolism studies.
EXPERIMENTAL
Materials and reagentsEthylenediamine (en-) and stannous tartrate were from Sigma (Poole, U.K.).
1,5,8,12-Tetraazadodecane (ta) was from Aldrich (Gillingham, U.K.). 1,4,8,II-Tetraazacyclotetradecane or cyclam (eye) was from Lancaster Synthesis (Morecambe,U.K.).
0021-9673/89/$03.50 © 1989 Elsevier Science Publishers B.Y.

NOTES 213
Sodium pertechnetate (TcO;) was eluted from an Ultratechnekow FM generator (Mallinckrodt Diagnostia, The Netherlands). The eluate was diluted with isotonicsaline to give a working solution of 0.2-1 mCi/ml (7.4-37 Mllqjml).
Trifluoroacetic acid (TFA) and hydrochloric acid were AnalaR grade fromBDH. Acetonitrile was HPLC grade from Rathburn (Walkerburn, U.K.).
Preparation of technetium amine complexesStannous tartrate was used as the reductant. A saturated solution was made by
adding the solid to nitrogen purged 0.01 M HCl. The solution was filtered througha Millex GS 0.22-flm filter (Millipore, Harrow, U.K.) into a nitrogen-filled vial andconstantly purged with nitrogen. The ligand solutions (20-50 mM) were made up inwater. All reagents were freshly made before used.
The reaction was carried out in a capped vial by mixing 1 ml of ligand solution,1 ml of sodium pertechnetate working solution and 1 ml of filtered stannous tartratesolution. The mixture was shaken and allowed to stand at room temperature for 15-30min before injection into the liquid chromatograph. The complexes were stable for atleast 2 h.
High-performance liquid chromatographyA Varian Associates (Walnut Creek, CA, U.S.A.) Model 5000 liquid chromato
graph was used. The radiomatic detector was home made and consisted of a PTFEtubing wound around the outside of a 1.3-cm diameter plastic tube placed ina thallium-activated sodium iodide crystal well with the photomultiplier tube linked toa scintillation adoptor 288 and ratemeter 248 both from ESI Nuclear (Redhill, U.K.).The detector coil flow volume was 160 fll.
The separation was carried out on a 10 em x 4 mm PGC (7-flm sphericalparticles) column (Hypercarb; Shandon Southern Scientific, Runncorn, U.K.). Forthe separation of mixtures, step-wise elution was used. The column was eluted withacetonitrile-I % TFA (2:98, vIv) for 14min and then changed to acetonitrile-l % TFA(10:90, v/v) for the elution of the last peak (total time 20 min). For individualtechnetium amine complexes, isocratic elution with an appropriate mixture ofacetonitrile and 1% TFA was sufficient.
RESULTS AND DISCUSSION
PGC is a new packing material for reversed-phase chromatography'P-!". It ischemically stable to extreme pH and is free of silanol groups which are common tosilica-base reversed-phase materials. PGC is much more hydrophobic and retentivethan conventional Cs or CIS reversed-phase packings and is therefore ideal forseparating compounds which are difficult to retain on silica-based columns. Inaddition, PGC can interact electronically with solutes having lone pair electrons'Y'"because of the presence of the band of delocalised n-electrons. The above propertiessuggested the possibility of retaining and separating technetium amine complexes onPGC where silica-base materials have already failed 15.
The separation of a mixture containing [Tc02en2]+ , [Tc02ta]+ , [Tc02cyc] andTcO; is shown in Fig. 1. The elution order of the cationic species, [Tc02en2]+ <[Tc02tat < [Tc02cyc]+, is that expected for reversed-phase chromatography sincethe hydrophobicity of the compounds increased in that order.

214 NOTES
i20
io
i i10 15
Time (min)
Fig. I. Separation of technetium-99m amine complexes and pertechnetate on porous graphitic carbon.Mobile phase: acetonitrile-I % TFA (2:98, v/v) for 14 min, then 10:90(v/v) for 6 min; flow-rate, I nil/min.Detection: radiometric.
TFA was chosen as the aqueous component of the mobile phase for two reasons.Firstly, it forms ion pairs with the cationic technetium amine complexes but, unlikelong-chain ion-pairing agents, does not confer strong hydrophobicity on the soluteswhich may lead to excessive retention on the highly hydrophobic PGc. Secondly, TFAis an excellent competing agent for electronic interaction chromatography (EIC) onPGC, thus allowing the retention times of the anionic TcOi to be precisely controlledby simply adjusting the concentrations of TFA in the mobile phase!". Retention ofinorganic oxo-anions, including TcOi, on PGC has been shown to be exclusivelyelectronic interaction19. The PGC column is stable under the strongly acidic conditionused and no deterioration of column performance was observed after prolonged usagewith 1% TFA as eluent.
The ability of PGC to simultaneously separating cations and anions based ona combination of hydrophobic and electronic interactions is unique. It is anticipatedthat many novel applications will be developed by exploiting these chromatographicproperties. The method described here is well suited for checking the purity oftechnetium amine complexes and for studying the metabolism of these potentialradiopharmaceuticals. It is also well suited for the semi-preparative isolation ofindividual technetium amine complex with 0.9% NaCl instead of TFA as the majormobile phase component. After removal of acetonitrile by evaporation the preparation in saline can be used directly.
REFERENCES
I A. M. Zimmer, W. Majewski and S. M. Spies, Eur. 1. Nucl. Med., 7 (1982) 88.2 D. Webber, A. M. Zimmer and S. M. Spies, J. Nucl. Med. Technol., II (1983) 15.3 P. J. Robbins, Am. J. Hosp. Pharm., 40 (1983) 629.4 R. J. Kowalsky and J. R. Creekmore, J. Nucl. Med. Technol., 10 (1982) 15.5 A. D. Nunn, J. Chromatogr., 255 (1983) 91.6 G. M. Wilson and T. C. Pinkerton, Anal. Chem., 57 (1985) 246.7 G. J. de Groot, H. A. Das and C. L. de Ligny, Int. 1. Appl. Radiot. Isot., 36 (1985) 349.8 J. Simon, S. Zuckman, D. E. Troutner, W. A. Volkert and R. A. Holmes, Radiochem. Radioanal. Lett.,
47 (1981) Ill.9 J. R. Thornback and A. E. Theobald, Int. J. Appl. Radiot. Isot., 32 (1981) 833.

NOTES 215
IO S. Seifert, R. Muenze and B. Johannsen, Radiochem. Radioanal. Lett., 54 (1982) 153.I I P. Blauenstein, G. Pfeiffer, P. A. Schubiger, G. Anderegg, K. Zollinger, K. May, Z. Proso, E. lanovici
and P. Lerch, Int. J. Appl. Radiat Isot., 36 (1985) 3I5.12 W. A. Volkert, D. E. Troutner and R. A. Holmes, Int. J. Appl. Radiat. Isot., 33 (1982) 891.I3 D. E. Troutner, J. Simon, A. R. Ketring, W. Vokert and R. A. Holmes, J. Nucl. Med., 21 (1980) 443.14 M. E. Kastner, M. j. Lindsay and M. J. Clarke, Inorg. Chem., 21 (1982) 2037.15 T. J. Hoffman, W. A. Volkert, D. E. Troutner and R. A. Holmes, Int. J. Appl. Radiat.Lsot., 35 (1984)
223.16 M. T. Gilbert, J. H. Knox and B. Kaur, Chromatographia, 16 (1982) 138.17 J. H. Knox, B. Kaur and G. R. Millward, J. Chromatogr., 352 (1986) 3.18 B. J. Bassler, E. Garfunkel, R. A. Hartwick and R. Kaliszan, J. Chromatogr., 461 (1989) 139.19 C. K. Lim, Biomed. Chromatogr., 3 (1989) 92.
Journal of Chromatography, 479 (1989) 216-219Elsevier Science Publishers B.V., Amsterdam - Printed in The Netherlands
CHROM. 21 744
Letter to the Editor
Reduced variation in retention times of biogenic amines by temperaturecontrol in liquid chromatography with electrochemical detection
Sir,It is known that in high-performance liquid chromatography (HPLC) with
electrochemical detection (ED) large fluctuations in column temperature can affectretention times, peak heights and other separation characteristics. However,' inair-conditioned or centrally heated laboratories temperature fluctuations are smallduring a 24-h period. The effects of these relatively small temperature fluctuations onseparation characteristics have not been adequately investigated. The objectives of thisstudy were (1) to investigate the magnitudes of changes in retention times of biogenicamines when separations are performed in an air-conditioned laboratory and (2) todetermine if these changes can be reduced to acceptable levels by stabilizing thetemperatures of column and mobile phase with a simple system of heating jackets andtemperature controllers.
EXPERIMENTAL
Separations of dopamine (DA), norepinephrine (NE), 3,4-dihydroxybenzylamine (DHBA), and serotonin (5-HT) were performed using an LC-4A amperometricdetector, a Phase II, 5 11m, ODS, reversed-phase C t S column, and a glassy carbonworking electrode (Bioanalytical Systems, West Lafayette, IN, U.S.A.). The mobilephase (pH 3.0) included monochloroacetic acid (14.15 g/I), sodium hydroxide (4.675g/l), EDTA (250 mg/l), octanesulfonic acid (300 mgjl), 1.4% tetrahydrofuran, and 2%acetonitrile. The flow-rate of the mobile phase was 1.7 ml/min, the sensitivity of thedetector was 1 nA full scale, and the potential of the working electrode was 0.8 V withreference to a Ag/AgCl reference electrode.
The room, column and mobile phase temperatures were monitored with the helpof temperature probes (Yellow Springs Instrument, Yellow Spring, OH, U.S.A.). Inthe first part of the study, separations were performed without controlling thetemperature. In the second part, the temperatures of the column and mobile phasereservoir were maintained at 29.4-30.1 °C and 43.2-44.0°C, respectively, with the helpof custom-fitting heating jackets (Glas-Col, Terre Haute, IN, U.S.A.). The temperatures of the heating jackets on the column and mobile phase reservoir were controlledby Model 720 Lab Temperature Controllers (Dowty Electronics, Brandon, VT,U.S.A.).
RESULTS AND DISCUSSION
During a 24-h period, the temperature in the air-conditioned laboratoryfluctuated between 24.8 and 27SC (Fig. lA). This fluctuation caused the column
0021-9673/89/$03.50 © 1989 Elsevier Science Publishers B.V.

LETTER TO THE EDITOR 217
28A
- 27U
ti.E 26'"l-E00a: 25
240 400 800 1200 1600 2000 2400
TIME
B
27 28 29 30
Room Temp. ( C )
Fig.!. (A) Fluctuations in room temperature in an air-conditioned laboratory during a 24-h period. (B)Fluctuations in the temperature of analytical column in an air-conditioned laboratory. Open squares= temperature of the column was not stabilized; closed-squares = temperature of the column was stabilizedat 29.4-30.1°C with the help of a heating jacket and a temperature controller.
temperature to vary between 26.2 and 29.9°e (Fig. IB). The use of heating mantles onthe column and mobile phase reservoir stabilized the column temperature between29.4 and 30.1°e, although the room temperature continued to fluctutate as before.
When temperatures of the mobile phase and column were not controlled, thedifferences between the shortest and the longest retention times were 6.9%, 10.4%,14.5% and 15.8% for NE, DHBA, DA and 5-HT, respectively (Table IA). Bycontrast,when temperatures of the column and mobile phase reservoir were stabilized thevariability in retention times decreased to 0%, 4.1%,3.8% and 5.1% for NE, DHBA,DA and 5-HT, respectively (Table 18).
These results indicate that variations in the retention times of biogenic aminescan be reduced by stabilizing the temperatures of the column and mobile phase witha simple system of heating jackets and temperature controllers. When the columntemperature was maintained within a range of 0.7°e, the longest retention times forDA, DHBA and 5-HT were only 5% or less longer than the shortest retention times,and the variation in the retention time of NE was undetectable. This representsa substantial narrowing of the variability in retention times and leads to increasedconfidence in the identity of the compounds being separated.

218 D. L. PALAZZOLO, S. K. QUADRI
TABLE I
RETENTION TIMES OF BIOGENIC AMINES AND DHBA
A: Retention times were determined in an air-conditioned laboratory without stabilizing the temperatures ofanalytical column and mobile phase; the room and column temperatures fluctuated between 24.8 and 27.5°Cand between 26.2 and 29.9°C, respectively. B: Retention times were determined in the same laboratory butthe column and mobile phase temperatures were stabilized by a simple system of heating jackets; the roomtemperature fluctuated as before, but fluctuations in the column temperature were reduced to 0.7°C(between 29.4 and 30.1°C).
Trial Retention time (min)
A B
NE DHBA DA 5-HT NE DHBA DA 5-HT
1 3.1 5.3 8.7 26.4 3.0 5.0 8.1 24.62 3.1 5.1 8.3 25.2 3.0 5.0 8.0 24.23 3.1 5.2 8.2 25.0 3.0 5.0 8.0 23.84 3.1 5.0 8.1 24.5 3.0 5.0 8.0 23.65 3.1 5.1 8.2 24.6 3.0 5.0 8.0 24.06 3.1 5.2 8.2 25.2 3.0 5.1 8.0 24.47 3.1 5.1 8.1 24.8 3.0 5.0 8.0 23.88 3.0 5.0 7.8 23.3 3.0 5.0 7.9 23.89 2.9 4.8 7.7 22.8 3.0 4.9 7.8 23.8
10 2.9 4.8 7.6 22.8 3.0 5.0 8.0 23.4II 3.0 4.8 7.6 23.2 3.0 5.0 8.0 23.412 3.1 5.0 8.0 25.2 3.0 5.0 8.0 23.7
Range 0.2 0.5 1.1 3.6 0.0 0.2 0.3 1.2
The results indicate that temperature fluctuations during a 24-h period are rathersubstantial even in air-conditioned laboratories and lead to almost parallel changes incolumn temperatures and, consequently, to variations in retention times and annoyingdoubts and errors in identification ofcompounds. The temperature-controlling systemused in this study minimizes these hazards by maintaining variability in the columntemperature within a range of O.7°C. Even this small variability can be eliminated byusing a more sensitive temperature controller. On the whole, the temperaturecontrolling system used in this study is simpler and less expensive than ovens, glasscolumn jackets and cumbersome circulating water baths.
Another advantage of the system is that it permits preheating of the mobile phasejust before its entry into the column. This is considered essential for achievingmaximum efficiency in HPLC-ED, since it prevents formation of a temperaturegradient in the column and the consequent peak-splitting phenomenon'v'.
It has been shown that high column temperatures reduce retention times by asmuch as 40% and increase resolution by producing sharper and higher peaks", Thetemperature controlling system used in this study has the capacity to maintain columntemperature at higher levels of 50 or 60°C. The resultant increase in resolution anddecrease in run times would be especially useful when a large number of samples isbeing analyzed 3
. Excessive increases in column temperature, however, are notadvisable when the compounds being separated are thermally labile and when lowboiling solvents are used in the mobile phase.

LETTER TO THE EDITOR
ACKNOWLEDGEMENT
219
The work was approved as Kansas Agricultural Experiment Station contribution No.1 88-511-J.
Neuroendocrine Research Laboratory,Department of Anatomy and Physiology,VMS 228, Kansas State University,Manhattan, KS 66506 (U.S.A.)
D. L. PALAZZOLO
S. K. QUADR1*
1. R. E. Shoup, Curro Sep., 2 (1980) I.2 R. J. Perchalski and B. J. Wilder, Anal. Chem., 51 (1979) 774.3 F. Hefti, Curro Sep., 2 (1980) 13.
(First received April 24th, 1989; revised manuscript received July 3rd, 1989)

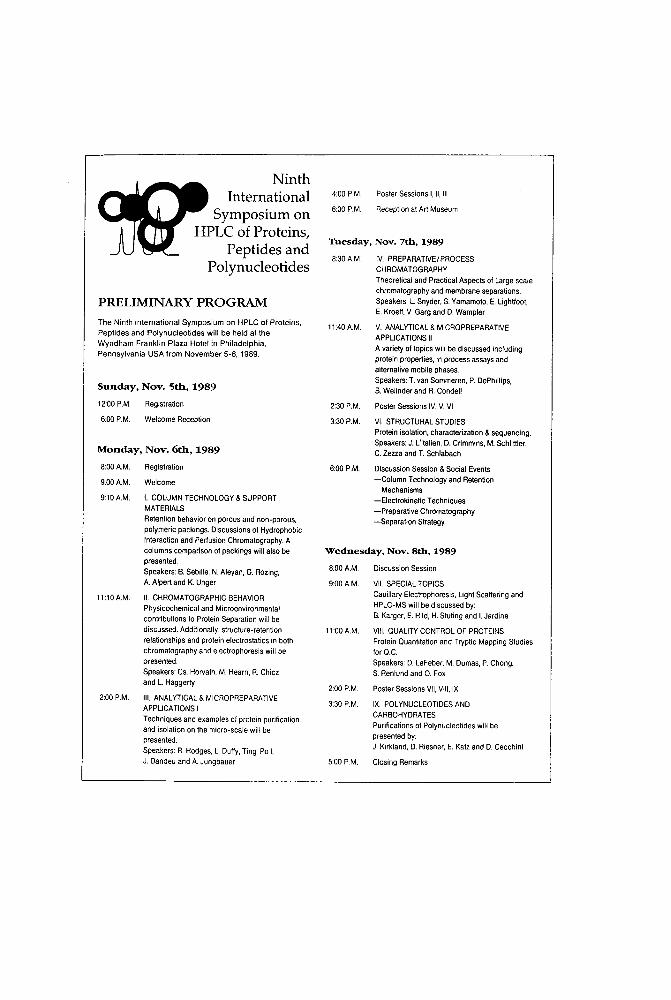
3:30P.M. VI. STRUCTURAL STUDIESProtein isolation, characterization &sequencing.Speakers: J. L'ifalien, D.Crimmins, M.Schlittier,C.Zezza andT.Schlabach
PosterSessions I, II,III
Reception atArt Museum
4:00P.M.
6:00P.M.
2:30P.M.
Tuesday, Nov. 7th, 1989
8:30AM. IV. PREPARATIVE/PROCESSCHROMATOGRAPHYTheoretical and Practical Aspects of Largescalechromatography andmembrane separations.Speakers: L.Snyder, S.Yamamoto, E.Lightioot,E.KroeN, V.GargandD.Wampler
11:40AM. V. ANALYTICAL & MICROPREPARATIVEAPPLICATIONS IIA variety of topicswill be discussed includingprotein properties, inprocess assays andallemativemobilephases.Speakers: T.vanSommeren, P.DePhillips,B.Wellnderand R.Condell
PosterSessions IV,V,VI
NinthInternational
Symposium onHPLC of Proteins,
Peptides andPolynuc1eotides
Sunday, Nov. 5th, 1989
The Ninth International Symposium on HPLC of Proteins,Peptides and Polynucleotides will be held at theWyndham Franklin Plaza Hotel in Philadelphia,Pennsylvania USA from November 5-8, 1989.
Monday, Nov. 6th, 1989
PRELIMINARY PROGRAM
12:00P.M. Registration
6:00P.M. Welcome Reception
8:00A.M. Registration
9:00AM. Welcome
9:10AM. I. COLUMN TECHNOLOGY & SUPPORTMATERIALSRetention behavior onporous andnon-porous,polymericpackings.Discussions of HydrophobicInteraction and Perfusion Chromatography. Acolumnscomparison of packingswill alsobepresented.Speakers: B.Sebille,N.Afeyan, G.Razing,A Alpertand K.Unger
11:10A.M. II. CHROMATOGRAPHIC BEHAVIORPhysicochemical andMicroenvironmentalcontributions to ProteinSeparation will bediscussed. Additionally, structure-retentionrelationships andproteinelectrostatics in bothchromatography andelectrophoresis will bepresented.Speakers: Cs.Horvath, M.Hearn, R.Chiczand L Haggerty
2:00P.M. III. ANALYTICAL & MICROPREPARATIVEAPPLICATIONS ITechniques andexamples of proteinpurificationandisolation onthemicro-scale will bepresented.Speakers: R.Hodges, L. Duffy, Ting-PoI,J.Dandeu and A.Jungbauer
6:00P.M. Discussion Session & SocialEvents-Column Technology and Retention
Mechanisms-Electrokinetic Techniques-Preparative Chromatography-Separation Strategy
Wednesday, Nov. 8th, 1989
8:00A.M. Discussion Session
9:00AM. VII. SPECIAL TOPICSCapillary Electrophoresis, LightScattering andHPLC-MS wili be discussed by:B.Karger, E.Hild,H.StutingandI.Jardine
11:00A.M. VIII. QUALITY CONTROL OFPROTEINSProtein Quantitation andTrypticMapping Studies10rQ.C.Speakers: D.LeFeber, M.Dumas, P.Chong,S.Renlund andO.Fox
2:00P.M. PosterSessions VII,VIII, IX
3:30P.M. IX. POLYNUCLEOTIDES ANDCARBOHYDRATESPurifications of Polynucleotides will bepresented by:J. Kirkland, D.Riesner, E.KatzandD.Cecchini
5:00 P.M. ClosingRemarks

JUftfOUR6fdI! Eml~ema{(ional Symposium on
Separradont Sclemlce anud BioftedU!oXogyBahia Mar Hotel &Yachting Center, Fort lauderdale. Florida
Janucuy 16-18. 1990Lois Ann Beaver, Chairman
AMONG THE FEATURED PARTICIPANTS ARE
• Mark D. Di.bner, Director, Biotechnology Information Division, Northcarolina Biotechnology Center, Research Triangle Park, OC
• catherine Fenselau, Professor & Chairman, Dept. Chemistry, University ofMaryland, Baltimore County, MD
• Georges Qliochon, Professor, Department of Chemistry, University ofTennessee and oak Ridge National Laboratory, TN
• Ralald R. RaIn, Vice President, Alan Patricof Associates, New York, NY• William S. Hancock, Senior SCientist, Medicinal & Analytical Chemistry
Department, Genentech, south san Francisco, CA• Csaba Horvath, Professor, Department of Chemical Engineering, Yale
University, New Haven, CT• E. N. Lightfoot, Jr., Professor, Department of Chemical Engineering,
University of Wisconsin, Madison, WI• Jay Olpin, Technical Director, Research & production, Cell SYstems,
Middletown, MD• Fred E. Regnier, Professor, Department of Biochemistry, Purdue University,
west Lafayette, IN• Richard O. ~lin III, Vice President for Biomedical Products, Biotronic
systems Corporation, Rockville, MD
POSTER SESSION
You are invited to sutmit an abstract to the SyDplsimn Manager forcoosideratioo for inclusioo in the program. llbstracts should be limited toate, single-spaced typed page, stating title, authors (indicate presenter),addresses, text & references. Include a caJp1ete address & telE!j;Oooe nmd:ler.
ABSTRACTS AND ALL CORRESPONDENCE SHOULD BE ADDRESSED TO
Mrs. Janet Cunningham. Synposium Manager. Barr EnterprisesP. O. Box 279, Walkersville, Maryland 21793 USA
Phone (301) 898-3772 • FAX (301) 898-5596

PUBLICATION SCHEDULE FOR 1989
Journal of Chromatography and Journal of Chromatography, Biomedical Applications
MONTH J F M A M J J A: S,
Journal of 461 463/2 464/2 466 468 471 473/2 476 478/1 The publicationChromatography 462 464/1 465/1 467/1 469 472/1 474/1 477/1 478/2 schedule for further
463/1 465/2 467/2 470/1 472/2 474/2 477/2 479/1 issues will be470/2 473/1 475 published later
Bibliography 486/1 486/2 486/3 486/4Section
Biomedical 487/1 487/2 488/1 489/1 490/1 491/1 491/2 492 493/2 495 IAppl ications 488/2 489/2 490/2 493/1 494
INFORMATION FOR AUTHORS
(Detailed Instructions to Authors were published in Vol. 478, pp. 453-456. A free reprint can be obtained byapplication to the publisher, Elsevier Science Publishers BV, P.O. Box 330, 1000 AH Amsterdam, TheNetherlands.)
Types of Contributions. The following types of papers are published in the Journal of Chromatographyand the section on Biomedical Applications: Regular research papers (Full-length papers), Notes, Reviewarticles and Letters to the Editor. Notes are usually descriptions of short investigations and reflect the samequality of research as Full-length papers, but should preferably not exceed six printed pages. Letters to theEditor can comment on (parts of) previously published articles, or they can report minor technical improvements of previously published procedures; they should preferably not exceed two printed pages. For reviewarticles, see inside front cover under Submission of Papers.
Submission, Every paper must be accompanied by a letter from the senior author, stating that he is submitting the paper for publication in the Journal of Chromatography. Please do not send a letter signed bythe director of the institute or the professor unless he is one of the authors.
Manuscripts, Manuscripts should be typed in double spacing on consecutively numbered pages of uniformsize. The manuscript should be preceded by a sheet of manuscript paper carrying the title of the paper andthe name and full postal address of the person to whom the proofs are to be sent. Authors of papers inFrench or German are requested to supply an English translation of the title of the paper. As a rule, papersshould be divided into sections, headed by a caption (e.g., Summary, Introduction, Experimental, Results,Discussion, etc.). All illustrations, photographs, tables, etc.. should be on separate sheets.
Introduction. Every paper must have a concise introduction mentioning what has been done before on thetopic described, and stating clearly what is new in the paper now submitted.
Summary. Full-length papers and Review articles should have a summary of 50-100 words which clearlyand briefly indicates what is new, different and significant. In the case of French or German articles anadditional summary in English, headed by an English translation of the title, should also be provided.(Notes and Letters to the Editor are published without a summary.)
Illustrations. The figures should be submitted in a form suitable for reproduction, drawn in Indian ink ondrawing or tracing paper. Each illustration should have a legend, all the legends being typed (with doublespacing) together on a separate sheet. If structures are given in the text, the original drawings should besupplied. Coloured illustrations are reproduced at the author's expense, the cost being determined by thenumber of pages and by the number of colours needed. The written permission of the author and publishermust be obtained for the use of any figure already published. Its source must be indicated in the legend.
References, References should be numbered in the order in which they are cited in the text, and listed innumerical sequence on a separate sheet at the end of the article. Please check a recent issue for the layoutof the reference list. Abbreviations for the titles of journals should follow the system used by ChemicalAbstracts. Articles not yet published should be given as "in press" (journal should be specified), "submitted for publication" (journal should be specified). "in preparation" or "personal communication".
Dispatch, Before sending the manuscript to the Editor please check that the envelope containsthree copies of the paper complete with references, legends and figures. One of the sets offigures must be the originals suitable for direct reproduction. Please also ensure that permission to publish has been obtained from your institute,
Proofs, One set of proofs will be sent to the author to be carefully checked for printer's errors. Correctionsmust be restricted to instances in which the proof is at variance with the manuscript. "Extra corrections"will be inserted at the author's expense.
Reprints, Fifty reprints of Full-length papers, Notes and Letters to the Editor will be supplied free of charge.Additional reprints can be ordered by the authors. An order form containing price quotations will be sent tothe authors together with the proofs of their article.
Advertisements. Advertisement rates are available from the publisher on request. The Editors of the journalaccept no responsibility for the contents of the advertisements.

The ideal combination:
BOOK,'S'OFTWARE-and DATABASE
BASIC GASCHROMATOGRAPHY· .MASS SPECTROMETRY:Principles and Techniques
GAS.CHROMATOGRAPHY·MASS SPECTROMETRY:A Knowledge Base
F.W. Karasek and R.E. Clement,Waterloo, Ont., Canada .
The book opens with the principles of bothGC and MS necessary to understand anddeal with the data generated in GC/MS analyses.
The focus then turns to the particular requirements created by a direct combinationof these two techniques into a single instrumentation system. The data generatedand their use are covered in detail. The roleof the computer and its specific software.especially in compound identification viamass spectral search techniques, receivesspecial attention.
Representative applications and resultsobtained with GC/MS-computer techniquesare presented. permitting extrapolation ofspec;iic applications tosimilar problems encountered by the reader. Instructional, informative and application-oriented, the material will be useful to a wide range of people.
Designed to be used independently, thebook is admirably complemented whenused in conjunction with the software.
1988 viii + 202pagesUS$ 79.00/ Dfl. 150.00ISBN 0-444~42760-0
F.A. Settle, Jr. and M.A. Pleva, .Lexington, vA, USA
This electronic module, though an independent source of current information onGC/MS, can also be used as a helpful supplement to the book.
.The module consists of a knowledge baseand a retrieval program allowing the information to be presented' in a user- friendlyformat. A number of special purpose files ,are included: an index, a glossary, and a list 'of keywords. The module is available for theIBM-PC and its compatibles as a set ofthree 51
/4" diskettes, reqUiring 128K RAMmemory and two disk drives.
It is useful as an introduction to the operation of instrument components. data systems and the interpretation of reSUltingdata. It aids workers requiring GC/MS analysis in the fields of medicine, pharmacy, environmental and forensic science and helpsto acquaint potential purchasers with the .;different types of equipment available, along ~with a guide to manufacturers and prices.
3 Diskettes + manual:US$ 144.75/ Dfl. 275.00ISBN0-444-42761-9
A brochure giving full details is available from...
ELSEVIER SCIENCE PUBLISHERSP.O. Box 211, 1000 AE Amsterdam, The Netherlands
, P.O. Box 882, Madison Square Station, New York, NY 10159, USA


![Argumentations and logic [1989]](https://static.fdokumen.com/doc/165x107/631eee640e3ac35f4f00659e/argumentations-and-logic-1989.jpg)