Journal of Business Valuation and Economic Loss Analysis A Methodology for Valuing Tiered Entities
39
Journal of Business Valuation and Economic Loss Analysis Volume 1, Issue 1 2006 Article 6 A Methodology for Valuing Tiered Entities Dennis A. Webb * Lari B. Masten † * Primus Valuations, [email protected] † Masten Valuation, [email protected] Copyright c 2006 The Berkeley Electronic Press. All rights reserved.
-
Upload
independent -
Category
Documents
-
view
2 -
download
0
Transcript of Journal of Business Valuation and Economic Loss Analysis A Methodology for Valuing Tiered Entities
Journal of Business Valuation andEconomic Loss Analysis
Volume1, Issue1 2006 Article 6
A Methodology for Valuing Tiered Entities
Dennis A. Webb∗ Lari B. Masten†
∗Primus Valuations, [email protected]†Masten Valuation, [email protected]
Copyright c©2006 The Berkeley Electronic Press. All rights reserved.
A Methodology for Valuing Tiered Entities∗
Dennis A. Webb and Lari B. Masten
Abstract
The conventional approach to valuing limited partnerships is the net asset value method; how-ever, when used to value interests in tiered entities, this approach can produce outlandish returns.The model failure occurs when its underlying assumptions are violated, and/or when the hypotheti-cal buyer’s expectations and the facts and circumstances of the case are not adequately represented.This article offers proof of the failure, an alternative approach to the entire process, and applica-tion via a case study taken from an actual assignment. The recommended process can be used forsimple to extremely complex tiered asset ownership fact patterns and structures.
KEYWORDS: tier, layer, discount, fractional interest, partnership, real estate, business valuation
∗This article was first presented at NACVA’s 13th Annual Consultants’ Conference (San Fran-cisco: June 2, 2006). Dennis A. Webb, ASA, MAI, MRICS, provides valuation and consultingservices involving real property-related business interests. He authored “Undivided Interests inReal Property: Partnerships and Cotenancies,” and teaches extensively on partnership and com-mon tenancy interest valuation. Mr. Webb received a B. S. in engineering from UCLA, with aminor in economics. He is past President of the Los Angeles Chapter of the American Societyof Appraisers, and a member of the Appraisal Institute and the Royal Institution of CharteredSurveyors. He can be reached at [email protected] and (949) 443-0800. Lari B. Masten,MSA, CPA/ABV, CVA, focuses her professional time on litigation support, goodwill impairmenttesting, business valuation and other consulting services as they apply to both public and privatecompanies. Ms. Masten received a Master of Science in Accounting from Texas Tech University.She is a contributing editor to National Litigation Consultant’s Review, a member of the NACVAnational instructors’ team, and is currently serving as Chair of NACVA’s Valuation CredentialingBoard. She can be reached at [email protected] and (303) 331-4430.
Introduction
The net asset value method is usually the method of choice when valuing an asset holding company. Revenue Ruling 59-60 §5(b) suggests that the appraiser place greatest weight on adjusted net worth when valuing a closely held investment or real estate holding company.
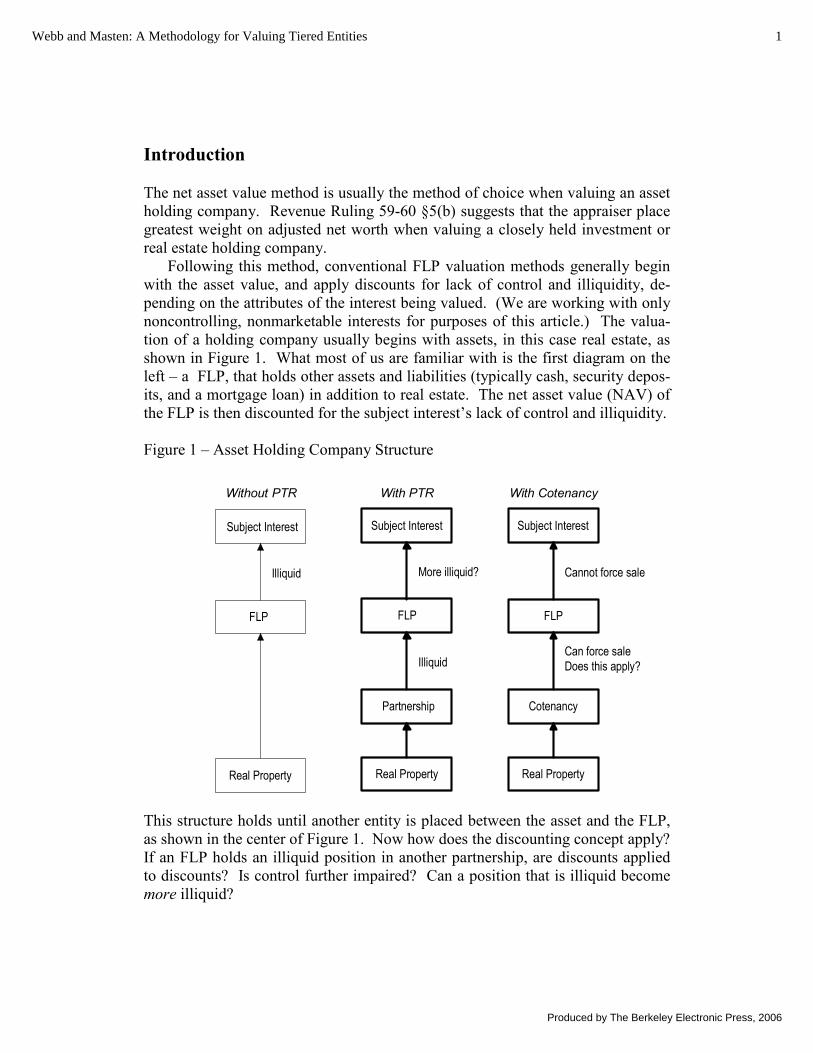
Following this method, conventional FLP valuation methods generally begin with the asset value, and apply discounts for lack of control and illiquidity, de-pending on the attributes of the interest being valued. (We are working with only noncontrolling, nonmarketable interests for purposes of this article.) The valua-tion of a holding company usually begins with assets, in this case real estate, as shown in Figure 1. What most of us are familiar with is the first diagram on the left – a FLP, that holds other assets and liabilities (typically cash, security depos-its, and a mortgage loan) in addition to real estate. The net asset value (NAV) of the FLP is then discounted for the subject interest’s lack of control and illiquidity.
Figure 1 – Asset Holding Company Structure
This structure holds until another entity is placed between the asset and the FLP, as shown in the center of Figure 1. Now how does the discounting concept apply? If an FLP holds an illiquid position in another partnership, are discounts applied to discounts? Is control further impaired? Can a position that is illiquid become more illiquid?
Subject Interest
FLP
Cotenancy
Real Property
Cannot force sale
Can force saleDoes this apply?Illiquid
More illiquid?
Subject Interest
FLP
Partnership
Real Property
Subject Interest
Real Property
Illiquid
Without PTR
FLP
With PTR With Cotenancy
1Webb and Masten: A Methodology for Valuing Tiered Entities
Produced by The Berkeley Electronic Press, 2006
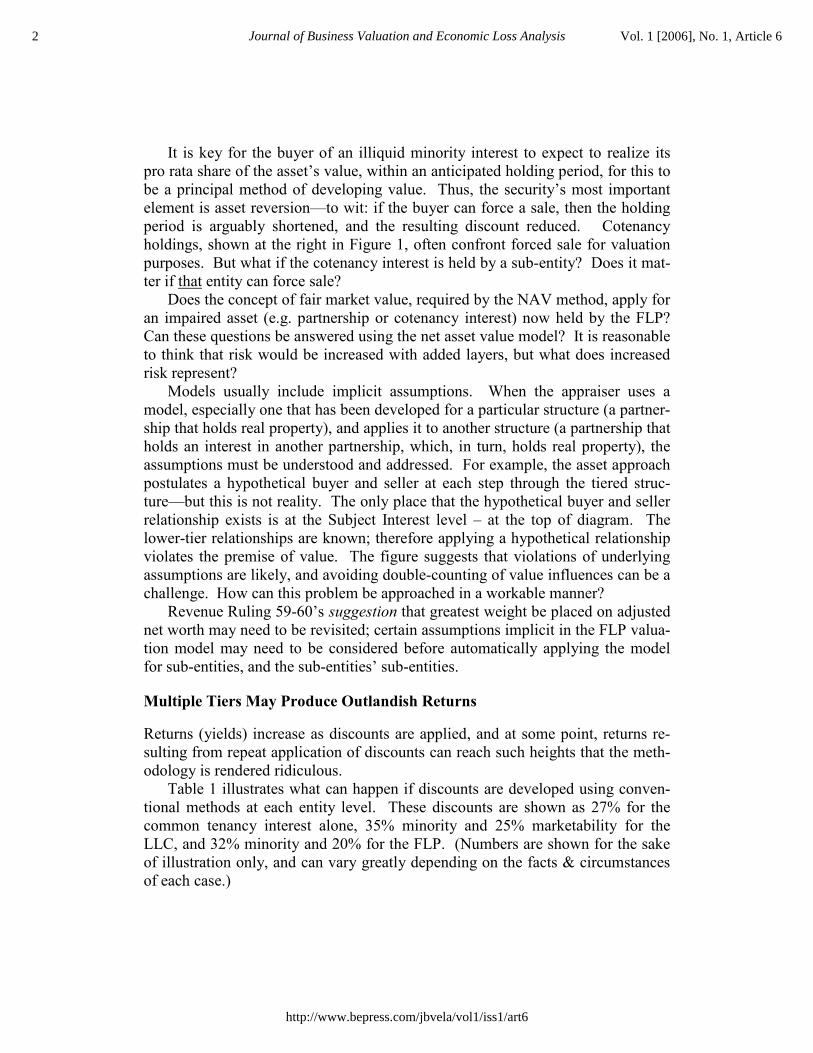
It is key for the buyer of an illiquid minority interest to expect to realize its pro rata share of the asset’s value, within an anticipated holding period, for this to be a principal method of developing value. Thus, the security’s most important element is asset reversion—to wit: if the buyer can force a sale, then the holding period is arguably shortened, and the resulting discount reduced. Cotenancy holdings, shown at the right in Figure 1, often confront forced sale for valuation purposes. But what if the cotenancy interest is held by a sub-entity? Does it mat-ter if that entity can force sale?
Does the concept of fair market value, required by the NAV method, apply for an impaired asset (e.g. partnership or cotenancy interest) now held by the FLP? Can these questions be answered using the net asset value model? It is reasonable to think that risk would be increased with added layers, but what does increased risk represent?
Models usually include implicit assumptions. When the appraiser uses a model, especially one that has been developed for a particular structure (a partner-ship that holds real property), and applies it to another structure (a partnership that holds an interest in another partnership, which, in turn, holds real property), the assumptions must be understood and addressed. For example, the asset approach postulates a hypothetical buyer and seller at each step through the tiered struc-ture—but this is not reality. The only place that the hypothetical buyer and seller relationship exists is at the Subject Interest level – at the top of diagram. The lower-tier relationships are known; therefore applying a hypothetical relationship violates the premise of value. The figure suggests that violations of underlying assumptions are likely, and avoiding double-counting of value influences can be a challenge. How can this problem be approached in a workable manner?
Revenue Ruling 59-60’s suggestion that greatest weight be placed on adjusted net worth may need to be revisited; certain assumptions implicit in the FLP valua-tion model may need to be considered before automatically applying the model for sub-entities, and the sub-entities’ sub-entities.
Multiple Tiers May Produce Outlandish Returns
Returns (yields) increase as discounts are applied, and at some point, returns re-sulting from repeat application of discounts can reach such heights that the meth-odology is rendered ridiculous.
Table 1 illustrates what can happen if discounts are developed using conven-tional methods at each entity level. These discounts are shown as 27% for the common tenancy interest alone, 35% minority and 25% marketability for the LLC, and 32% minority and 20% for the FLP. (Numbers are shown for the sake of illustration only, and can vary greatly depending on the facts & circumstances of each case.)
2 Journal of Business Valuation and Economic Loss Analysis Vol. 1 [2006], No. 1, Article 6
http://www.bepress.com/jbvela/vol1/iss1/art6
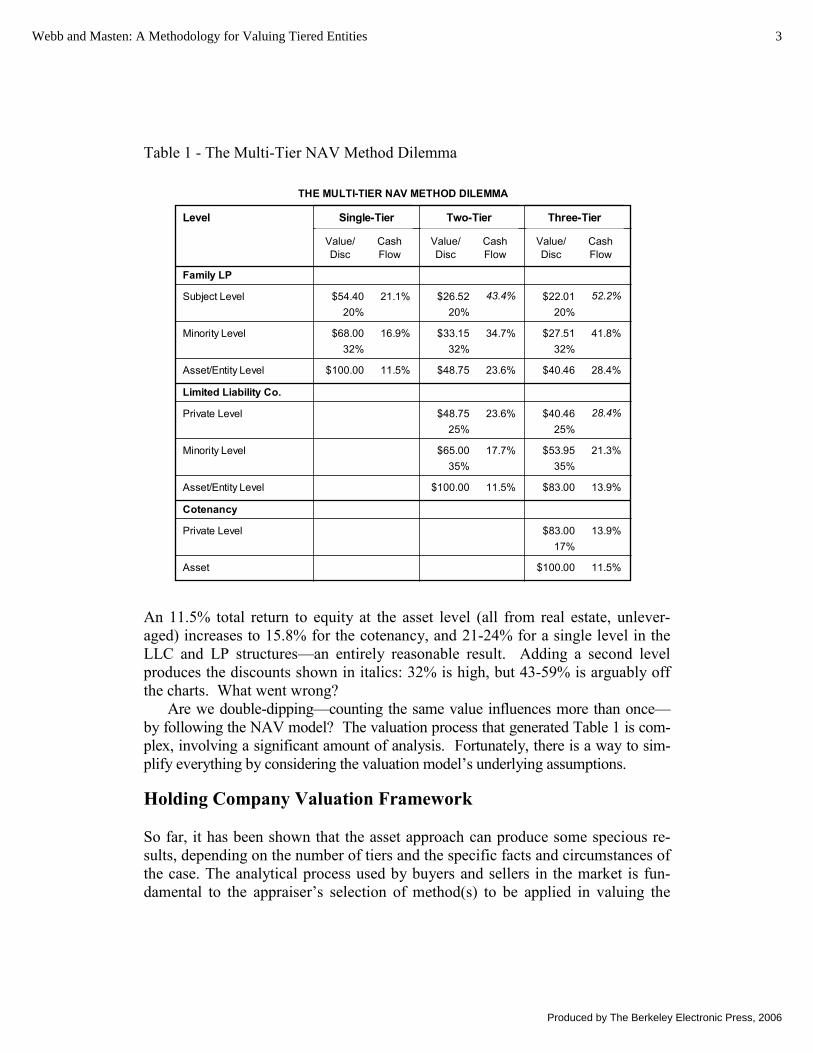
Table 1 - The Multi-Tier NAV Method Dilemma
THE MULTI-TIER NAV METHOD DILEMMA
Level Single-Tier Two-Tier Three-Tier
Value/Disc
CashFlow
Value/Disc
CashFlow
Value/Disc
CashFlow
Family LP
Subject Level $54.40 21.1% $26.52 43.4% $22.01 52.2%20% 20% 20%
Minority Level $68.00 16.9% $33.15 34.7% $27.51 41.8%32% 32% 32%
Asset/Entity Level $100.00 11.5% $48.75 23.6% $40.46 28.4%
Limited Liability Co.
Private Level $48.75 23.6% $40.46 28.4%25% 25%
Minority Level $65.00 17.7% $53.95 21.3%35% 35%
Asset/Entity Level $100.00 11.5% $83.00 13.9%
Cotenancy
Private Level $83.00 13.9%17%
Asset $100.00 11.5%
An 11.5% total return to equity at the asset level (all from real estate, unlever-aged) increases to 15.8% for the cotenancy, and 21-24% for a single level in the LLC and LP structures—an entirely reasonable result. Adding a second level produces the discounts shown in italics: 32% is high, but 43-59% is arguably off the charts. What went wrong?
Are we double-dipping—counting the same value influences more than once—by following the NAV model? The valuation process that generated Table 1 is com-plex, involving a significant amount of analysis. Fortunately, there is a way to sim-plify everything by considering the valuation model’s underlying assumptions.
Holding Company Valuation Framework
So far, it has been shown that the asset approach can produce some specious re-sults, depending on the number of tiers and the specific facts and circumstances of the case. The analytical process used by buyers and sellers in the market is fun-damental to the appraiser’s selection of method(s) to be applied in valuing the
3Webb and Masten: A Methodology for Valuing Tiered Entities
Produced by The Berkeley Electronic Press, 2006
Subject Interest. However, the valuation method can only be selected after con-sideration of the facts and the objectives of the hypothetical buyer of the subject interest.
The asset approach carries an implicit assumption that the buyer of a frac-tional interest, that is noncontrolling and illiquid, will realize its pro rata share of the underlying assets. The problem with the asset approach, as it is generally practiced, is that no allowance exists for the specific timing of this realization. This may not matter for a single tier, but with the introduction of several tiers, a review of the facts from this perspective can prove most enlightening. Address-ing time elements can make order out of a set of facts that are otherwise woefully difficult for the valuer to accommodate in the analysis.
The Asset Holding Timeline
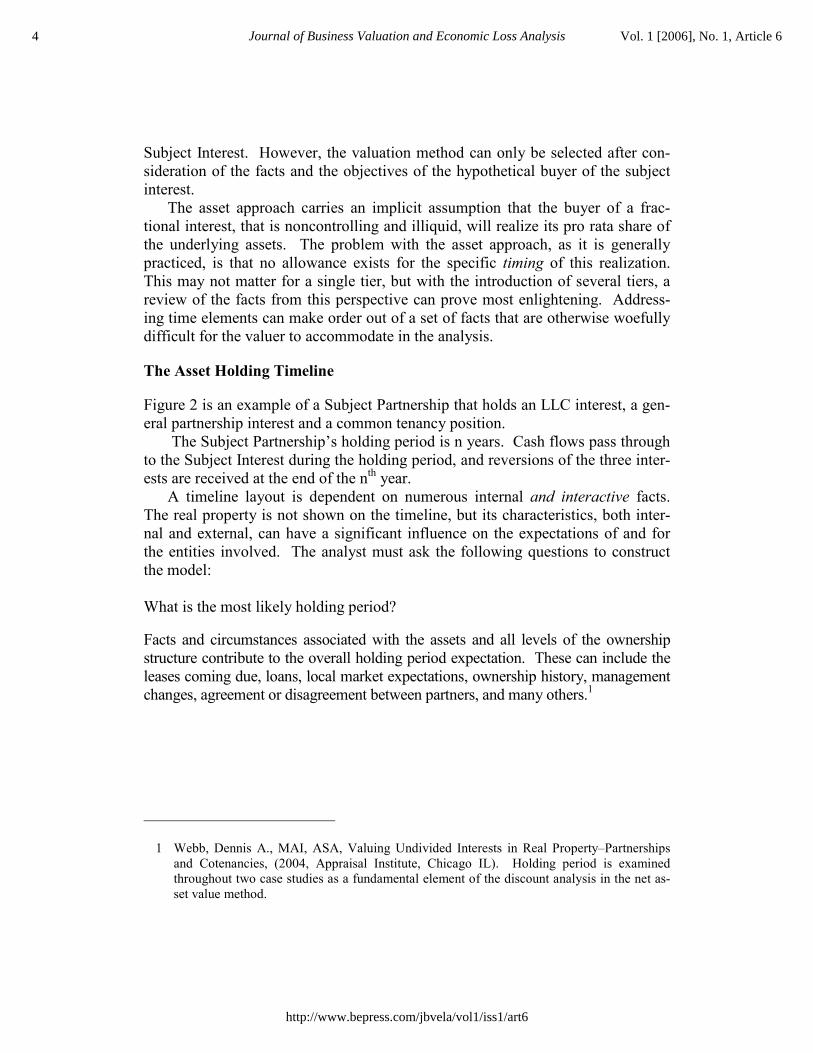
Figure 2 is an example of a Subject Partnership that holds an LLC interest, a gen-eral partnership interest and a common tenancy position.
The Subject Partnership’s holding period is n years. Cash flows pass through to the Subject Interest during the holding period, and reversions of the three inter-ests are received at the end of the nth year.
A timeline layout is dependent on numerous internal and interactive facts. The real property is not shown on the timeline, but its characteristics, both inter-nal and external, can have a significant influence on the expectations of and for the entities involved. The analyst must ask the following questions to construct the model:
What is the most likely holding period?
Facts and circumstances associated with the assets and all levels of the ownership structure contribute to the overall holding period expectation. These can include the leases coming due, loans, local market expectations, ownership history, management changes, agreement or disagreement between partners, and many others.1
1 Webb, Dennis A., MAI, ASA, Valuing Undivided Interests in Real Property–Partnerships and Cotenancies, (2004, Appraisal Institute, Chicago IL). Holding period is examined throughout two case studies as a fundamental element of the discount analysis in the net as-set value method.
4 Journal of Business Valuation and Economic Loss Analysis Vol. 1 [2006], No. 1, Article 6
http://www.bepress.com/jbvela/vol1/iss1/art6
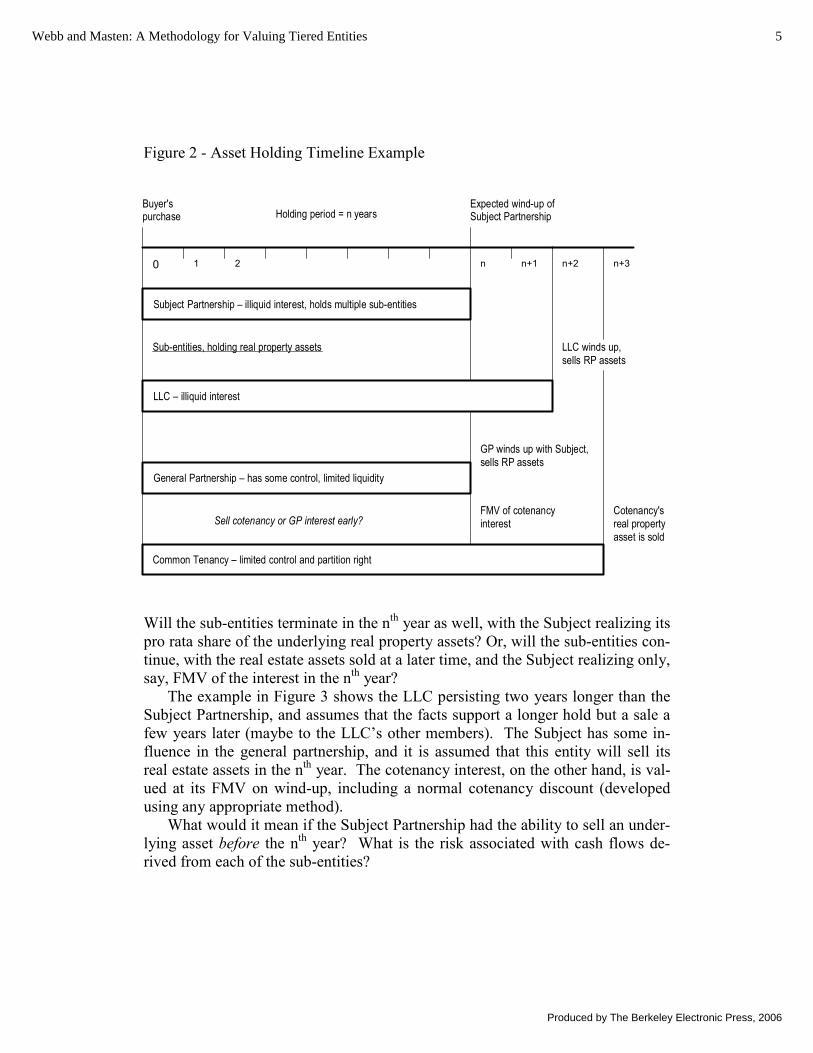
Figure 2 - Asset Holding Timeline Example
Subject Partnership – illiquid interest, holds multiple sub-entities
LLC – illiquid interest
General Partnership – has some control, limited liquidity
Common Tenancy – limited control and partition right
21 n n+1 n+20
Buyer'spurchase
Expected wind-up ofSubject PartnershipHolding period = n years
Sub-entities, holding real property assets
GP winds up with Subject,sells RP assets
FMV of cotenancyinterest
n+3
Sell cotenancy or GP interest early?
LLC winds up,sells RP assets
Cotenancy'sreal propertyasset is sold
Will the sub-entities terminate in the nth year as well, with the Subject realizing its pro rata share of the underlying real property assets? Or, will the sub-entities con-tinue, with the real estate assets sold at a later time, and the Subject realizing only, say, FMV of the interest in the nth year?
The example in Figure 3 shows the LLC persisting two years longer than the Subject Partnership, and assumes that the facts support a longer hold but a sale a few years later (maybe to the LLC’s other members). The Subject has some in-fluence in the general partnership, and it is assumed that this entity will sell its real estate assets in the nth year. The cotenancy interest, on the other hand, is val-ued at its FMV on wind-up, including a normal cotenancy discount (developed using any appropriate method).
What would it mean if the Subject Partnership had the ability to sell an under-lying asset before the nth year? What is the risk associated with cash flows de-rived from each of the sub-entities?
5Webb and Masten: A Methodology for Valuing Tiered Entities
Produced by The Berkeley Electronic Press, 2006
Tools for Real Estate Entity Valuation
Question 5 is obviously a leading question—risk is made explicit in the income approach, but valuers, and even the courts, sometimes are challenged by risk complexity and perceived uncertainty introduced into the analysis. These issues are very much simplified for real estate entities, since risk for a holding company begins with the asset—all returns for such entities have something to do with the real estate. This is very good news, since risk rates for both real property and mi-nority-level premia are readily extracted from published data.
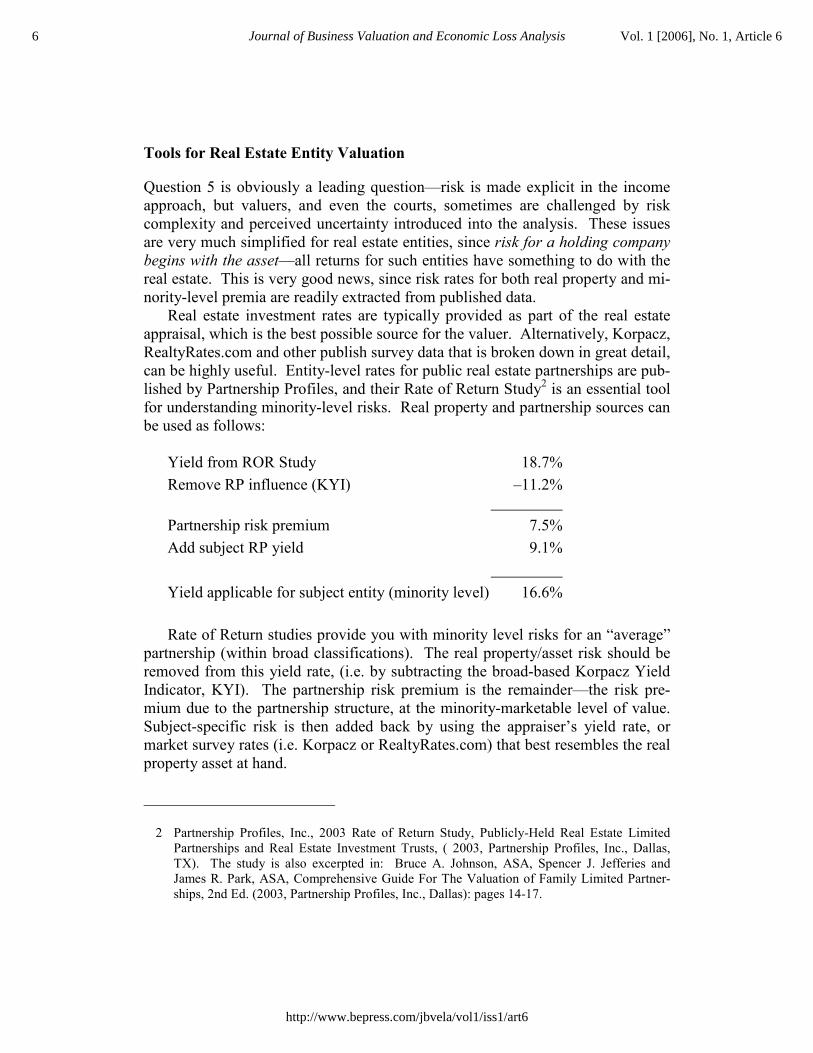
Real estate investment rates are typically provided as part of the real estate appraisal, which is the best possible source for the valuer. Alternatively, Korpacz, RealtyRates.com and other publish survey data that is broken down in great detail, can be highly useful. Entity-level rates for public real estate partnerships are pub-lished by Partnership Profiles, and their Rate of Return Study2 is an essential tool for understanding minority-level risks. Real property and partnership sources can be used as follows:
Yield from ROR Study 18.7% Remove RP influence (KYI) –11.2% Partnership risk premium 7.5% Add subject RP yield 9.1% Yield applicable for subject entity (minority level) 16.6%
Rate of Return studies provide you with minority level risks for an “average” partnership (within broad classifications). The real property/asset risk should be removed from this yield rate, (i.e. by subtracting the broad-based Korpacz Yield Indicator, KYI). The partnership risk premium is the remainder—the risk pre-mium due to the partnership structure, at the minority-marketable level of value. Subject-specific risk is then added back by using the appraiser’s yield rate, or market survey rates (i.e. Korpacz or RealtyRates.com) that best resembles the real property asset at hand.
2 Partnership Profiles, Inc., 2003 Rate of Return Study, Publicly-Held Real Estate Limited Partnerships and Real Estate Investment Trusts, ( 2003, Partnership Profiles, Inc., Dallas, TX). The study is also excerpted in: Bruce A. Johnson, ASA, Spencer J. Jefferies and James R. Park, ASA, Comprehensive Guide For The Valuation of Family Limited Partner-ships, 2nd Ed. (2003, Partnership Profiles, Inc., Dallas): pages 14-17.
6 Journal of Business Valuation and Economic Loss Analysis Vol. 1 [2006], No. 1, Article 6
http://www.bepress.com/jbvela/vol1/iss1/art6
*The “base” yield rate concluded in this example applies for a non-controlling but liquid interest; it needs further adjustment for specific risks posed by the en-tity structure and specific facts of the case, exacerbated by the interest’s illiquid-ity. Nonetheless, this yield rate usually represents most of the risk to the subject interest. CAPM it’s not.
Discounted Future Returns Method
With time elements and risk rates under control, there is no good reason for avoiding an otherwise complex valuation method. Multiple tiers create complexi-ties that are best understood, and analyzed, by breaking down its expected cash flows over time (the holding period), and assigning risks to cash flows (yield rates). While asset models incorporate an implicit reference to risk and holding period, income models can make both of these variables explicit. Since multi-tiered investments carry multiple, interrelated sources of risk, it would be most reasonable to use an income model for analysis. An income model is also the most likely method used in the market—by buyers and sellers of similarly com-plex investments.
The discounted future returns method applies an appropriate yield (or dis-count) rate to cash flows, and different rates can be used for cash flows carrying differing risks. Thus, the model provides a framework for breaking down com-plex structures, considering both and holding periods. It is the holding period analysis that provides us with a way of addressing and isolating specific elements of the multi-tiered ownership structure.
Once the facts & circumstances (agreements, personalities, real property leases, financing agreements, etc.) have been considered and a likely timeline constructed, converting it to a discounted cash flow model is straightforward. Each cash flow has an associated risk, as does each reversion. Cash flow risks may be exacerbated to one degree or another by the sub-entity structure, and re-versions usually carry additional uncertainties. These variations can be accom-modated in the yield rate buildup.
If a reversion involves the wind-up of a sub-entity, then the amount is the un-discounted net asset value of the entity realized in that year. If a reversion in-volves an interest in a sub-entity that does not wind up (the Subject entity termi-nates but the sub-entity continues to exist) interest reversions can be valued using income or asset approach techniques, as either approach will be valid. Of course, if there are more than two tiers to begin with, the above process may have to be repeated to value the reversion beginning at Subject wind-up.
7Webb and Masten: A Methodology for Valuing Tiered Entities
Produced by The Berkeley Electronic Press, 2006
The FLP Valuer’s Checklist
The valuer’s job is to gather facts, ask questions, and then apply the valuation arts. It is only after a thorough understanding of what, why and when is devel-oped, can the how of the valuation be determined.
This checklist does not describe exact processes, nor is it a restatement of Revenue Ruling 59-60 (which is applicable throughout). It does provide a con-ceptual outline of the steps that must be taken in order to develop a reasonable and defensible foundation for the valuation process, no matter how complex the entity structure. The accompanying case analysis and subsequent valuation report that would be prepared flows directly from this outline.
The assignment is to…
1. Purpose and use, standard and date of value
2. Required reliability of the value conclusion
3. The scope of the assignment
This step depends on the foregoing, the applicable valuation processes, and may have to be revised based on review of remaining facts & circumstances.
Just the facts…
4. History, distribution of ownership
5. Agreements
6. Assets, operations and forecasts
And the buyer’s expectations are…
7. Who is the hypothetical buyer?
8. What holding period scenarios are supported by the assets, by ownership facts & circumstances, and by the agreement? What are the intentions of the controlling parties?
9. What is the buyer’s expected investment cycle?
Only now can you select the valuation process…
Review approaches to value, select approaches based on everything above: Facts & circumstances of the case, purpose and use of the valuation, required reliability
8 Journal of Business Valuation and Economic Loss Analysis Vol. 1 [2006], No. 1, Article 6
http://www.bepress.com/jbvela/vol1/iss1/art6
of the value conclusion, entity structure, control and liquidity impairments, buyer’s expectations, and the available methods for analyzing risk. The compara-tive company approach is not generally usable for asset holding companies, but all methods should be reviewed regardless.
10. Asset accumulation approach
a. Value balance sheet items
b. Develop discounts for control and liquidity impairment
c. Apply discounts to NAV and conclude value
11. Income approach
a. Prepare a forecast at the underlying asset level
b. Normalize the forecast for entity influences and changed holding pe-riod expectations
c. Quantify risk at the underlying asset level
d. Quantify risk associated with control impairment
e. Quantify risk connected with liquidity impairment
f. Apply risk-adjusted yield (discount) rates to future cash flows
g. Calculate effective discounts
Conclusion
The valuation process for tiered entities does not introduce anything that is not considered by the appraiser for other types of holding company valuations. How-ever, it does point out the critical need to carefully examine the facts & circum-stances of the case. Arbitrary application of the net asset value method, as if each tier was separate from the other, ignores both the assumptions implicit in the method, and the viewpoint of the hypothetical buyer of the interest that the valua-tion is intended to model. A well-considered income model can be used to cut through the tiers and reflect the risk and holding period expectations of the buyer. It is a method that can keep the appraiser afloat when confronting complex and otherwise confounding multiple tiers.
9Webb and Masten: A Methodology for Valuing Tiered Entities
Produced by The Berkeley Electronic Press, 2006
Case Study
The R & B Walker Family Partnership was formed largely to hold an interest in an LLC and an undivided (cotenancy) interest in a skilled nursing facility. Entity ownership is partly interrelated, but outside parties are also involved. Two 49.9% interests in the R&B Walker Family Partnership are to be transferred into a trust.
The assignment is to…
1. Purpose and use, standard and date of value
The purpose of the valuation is to develop an opinion of the fair market value of the Partnership interests which are the subject of this report, as of the effective date of the valuation, for tax reporting use. The effective date of this valuation, the date for which value is concluded, is January 17, 2004, the date of formation of the Partnership.
2. Required reliability of the value conclusion
The gift tax purpose of the valuation will not allow summary or restricted reports, nor a limited valuation process.
3. The scope of the assignment
Must be adequate to produce a suitably reliable value conclusion. This step may have to be revised based on review of remaining facts & circumstances.
Just the facts…
4. History of the entity and its ownership
R & B Walker Family Partnership
The Ronald and Barbara Walker Family Partnership, L.P., was organized on January 17, 2004, generally to manage family assets. Its original partners included the Ronald Walker Trust, Ronald Walker and Barbara Walker. The General Partners are Ronald Walker and Barbara Walker. The assets of the Partnership were contributed upon in-ception by Ronald and Barbara Walker, and include the following:
Entity Type Interest Held
Trump-TAPA Properties (“TAPA”) Limited Liability Co. 5.00% Skilled Nursing Facility (“SNF”) Cotenancy 50.00%
10 Journal of Business Valuation and Economic Loss Analysis Vol. 1 [2006], No. 1, Article 6
http://www.bepress.com/jbvela/vol1/iss1/art6
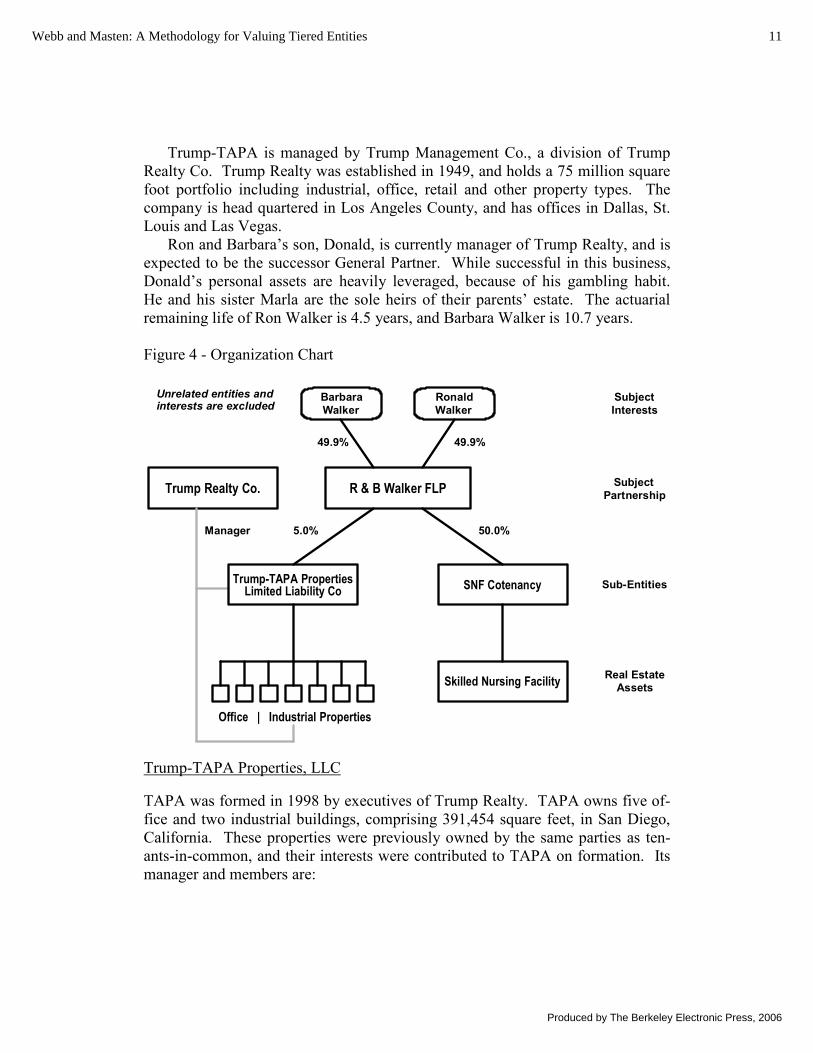
Trump-TAPA is managed by Trump Management Co., a division of Trump Realty Co. Trump Realty was established in 1949, and holds a 75 million square foot portfolio including industrial, office, retail and other property types. The company is head quartered in Los Angeles County, and has offices in Dallas, St. Louis and Las Vegas.
Ron and Barbara’s son, Donald, is currently manager of Trump Realty, and is expected to be the successor General Partner. While successful in this business, Donald’s personal assets are heavily leveraged, because of his gambling habit. He and his sister Marla are the sole heirs of their parents’ estate. The actuarial remaining life of Ron Walker is 4.5 years, and Barbara Walker is 10.7 years.
Figure 4 - Organization Chart
Unrelated entities andinterests are excluded
Trump Realty Co.
Manager
R & B Walker FLP
RonaldWalker
50.0%5.0%
49.9%49.9%
BarbaraWalker
SubjectInterests
SubjectPartnership
SNF Cotenancy
Skilled Nursing Facility
Trump-TAPA PropertiesLimited Liability Co
Office | Industrial Properties
Sub-Entities
Real EstateAssets
Trump-TAPA Properties, LLC
TAPA was formed in 1998 by executives of Trump Realty. TAPA owns five of-fice and two industrial buildings, comprising 391,454 square feet, in San Diego, California. These properties were previously owned by the same parties as ten-ants-in-common, and their interests were contributed to TAPA on formation. Its manager and members are:
11Webb and Masten: A Methodology for Valuing Tiered Entities
Produced by The Berkeley Electronic Press, 2006
Manager: Trump Realty Co.
Members: R & B Walker LP (subject) 5.00% David & Mable Walker 8.00% Trump Realty 30.00% Trump/Walker Spectrum 57.00%
Total 100.00%
Skilled Nursing Facility
This is a 50% cotenancy ownership of a 195-bed skilled nursing facility (land and building only) located in Cucamonga, California. The Finnerty Living Trust holds the other half-interest. Walker and Finnerty purchased the facility in 2000, and entered into a long-term lease with an operator.
5. Agreements
R&B Walker Family Partnership
The General Partners (or an appointed manager) have control over management of the assets; however, this control is compromised because a Limited Partner or Assignee may cause sale of up to 75% of assets and distribution of net proceeds. As a practical matter, this concerns only the SNF interest. The Partnership is scheduled to terminate no sooner than December 31, 2103 (99 years). The inter-est is not able to cause termination.
Limited Partner interests may be assigned to certain family members, and to anyone under state law. The Partnership retains the option to acquire any trans-ferred interest at its fair market value—this definition includes application of any discounts. The right of first refusal acts as an impediment to purchase by an out-sider, since any transfer could be blocked by such purchase. However, it does not act as a significant limitation on marketability, since any Limited Partner or As-signee can withdraw on 60-days’ notice, at fair market value. The interest sold and acquired under these provisions would be a Limited Partner interest, not an Assignee position.
Trump-TAPA Properties, LLC
The Manager has control over the assets, and is generally unrestricted in its ac-tions except for specified elements of control which are subject to majority vote. The LLC also has a 99-year remaining term. Trump Realty is the Manager and a
12 Journal of Business Valuation and Economic Loss Analysis Vol. 1 [2006], No. 1, Article 6
http://www.bepress.com/jbvela/vol1/iss1/art6
Member of the LLC, and it is unlikely that the Subject Partnership (R&B WFP) would be able to cause termination.
The LLC Member interest is generally illiquid, but may be assigned. The LLC and its other Members retain the option to acquire any transferred interest at the price and terms offered. The right of first refusal acts as an impediment to pur-chase by an outsider, since any transfer could be blocked by such purchase.
Skilled Nursing Facility
This interest is valued as a tenancy-in-common position, for which property rights are determined by state law. There is no operating agreement, but the property is operated under a long-term lease, discussed below.
6. Assets, operations and forecasts
Operations of asset holding companies are typically operations of the assets them-selves. Operating forecasts are based on the asset appraisals, with other entity revenues and expenses (if any) added, and changes in balance sheet items (typi-cally cash reserves, security deposits, accrued items and loans) forecast.3
Asset history should be summarized, with leases and other agreements reana-lyzed, since they may impact normalizing adjustments to the financial data of the entity (particularly for non-controlling positions) in ways that will not have been considered in the real estate appraisal. A good start on this analysis can often be obtained from the real estate appraiser.4
Trump-TAPA Properties LLC
TAPA owns five office and two industrial buildings, comprising 391,454 square feet, located in San Diego, California.
There are two major tenants, Viticultural Sciences and Alpo, which together oc-cupy 90% of the combined building space; the remaining 10% is occupied by three other tenants. The Viticultural Sciences leases run through 2013, and Alpo to 2005, with options through 2015. Rents are slightly below market. The forecast shows
3 Forecasts are often needed even if the asset method is to be used, because expressions of risk (discount/yield rates) are often needed, and cannot be developed by any other method.
4 Obtain agreements even if they are summarized in the real estate appraisal, as there are often conditions that do not impact market value for the 100% fee interest holder, but which will be important for the valuation.
13Webb and Masten: A Methodology for Valuing Tiered Entities
Produced by The Berkeley Electronic Press, 2006
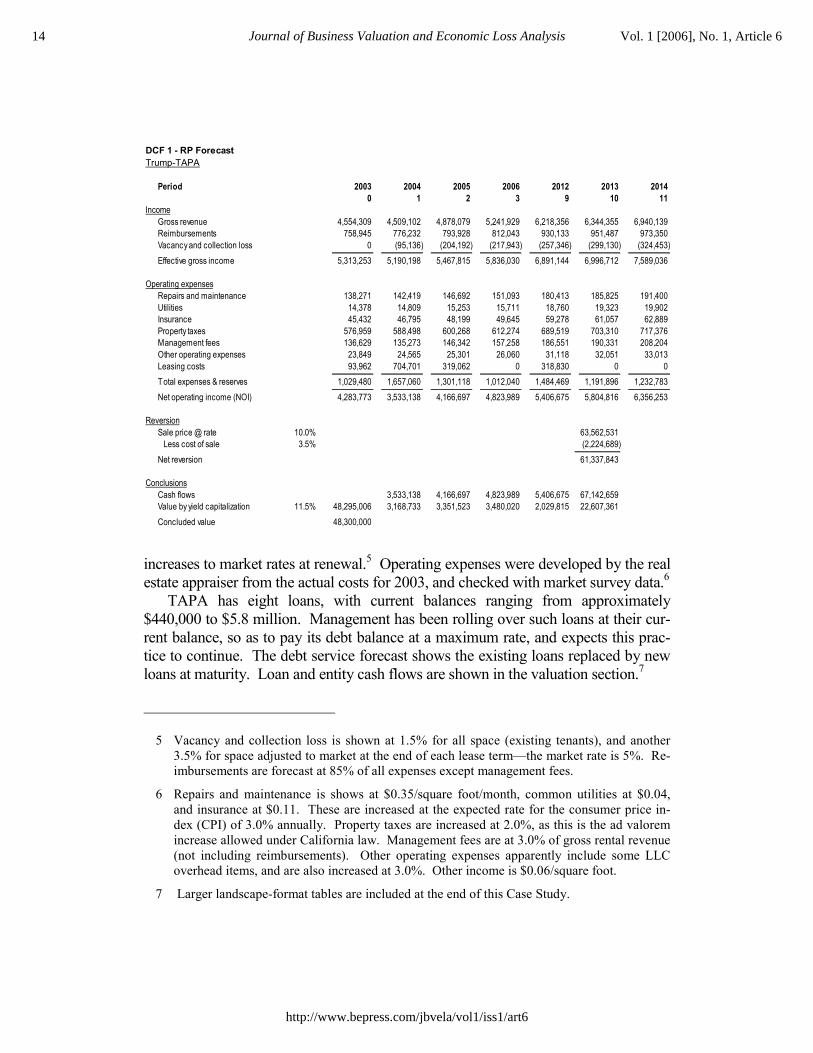
DCF 1 - RP ForecastTrump-TAPA
Period 2003 2004 2005 2006 2012 2013 20140 1 2 3 9 10 11
IncomeGross revenue 4,554,309 4,509,102 4,878,079 5,241,929 6,218,356 6,344,355 6,940,139Reimbursements 758,945 776,232 793,928 812,043 930,133 951,487 973,350Vacancy and collection loss 0 (95,136) (204,192) (217,943) (257,346) (299,130) (324,453)__________ __________ __________ __________ __________ __________ __________Effective gross income 5,313,253 5,190,198 5,467,815 5,836,030 6,891,144 6,996,712 7,589,036
Operating expensesRepairs and maintenance 138,271 142,419 146,692 151,093 180,413 185,825 191,400Utilities 14,378 14,809 15,253 15,711 18,760 19,323 19,902Insurance 45,432 46,795 48,199 49,645 59,278 61,057 62,889Property taxes 576,959 588,498 600,268 612,274 689,519 703,310 717,376Management fees 136,629 135,273 146,342 157,258 186,551 190,331 208,204Other operating expenses 23,849 24,565 25,301 26,060 31,118 32,051 33,013Leasing costs 93,962 704,701 319,062 0 318,830 0 0__________ __________ __________ __________ __________ __________ __________Total expenses & reserves 1,029,480 1,657,060 1,301,118 1,012,040 1,484,469 1,191,896 1,232,783__________ __________ __________ __________ __________ __________ __________Net operating income (NOI) 4,283,773 3,533,138 4,166,697 4,823,989 5,406,675 5,804,816 6,356,253
ReversionSale price @ rate 10.0% 63,562,531 Less cost of sale 3.5% (2,224,689)___________Net reversion 61,337,843
ConclusionsCash flows 3,533,138 4,166,697 4,823,989 5,406,675 67,142,659Value by yield capitalization 4 11.5% 48,295,006 3,168,733 3,351,523 3,480,020 2,029,815 22,607,361Concluded value -5 48,300,000
increases to market rates at renewal.5 Operating expenses were developed by the real estate appraiser from the actual costs for 2003, and checked with market survey data.6
TAPA has eight loans, with current balances ranging from approximately $440,000 to $5.8 million. Management has been rolling over such loans at their cur-rent balance, so as to pay its debt balance at a maximum rate, and expects this prac-tice to continue. The debt service forecast shows the existing loans replaced by new loans at maturity. Loan and entity cash flows are shown in the valuation section.7
5 Vacancy and collection loss is shown at 1.5% for all space (existing tenants), and another 3.5% for space adjusted to market at the end of each lease term—the market rate is 5%. Re-imbursements are forecast at 85% of all expenses except management fees.
6 Repairs and maintenance is shows at $0.35/square foot/month, common utilities at $0.04, and insurance at $0.11. These are increased at the expected rate for the consumer price in-dex (CPI) of 3.0% annually. Property taxes are increased at 2.0%, as this is the ad valorem increase allowed under California law. Management fees are at 3.0% of gross rental revenue (not including reimbursements). Other operating expenses apparently include some LLC overhead items, and are also increased at 3.0%. Other income is $0.06/square foot.
7 Larger landscape-format tables are included at the end of this Case Study.
14 Journal of Business Valuation and Economic Loss Analysis Vol. 1 [2006], No. 1, Article 6
http://www.bepress.com/jbvela/vol1/iss1/art6
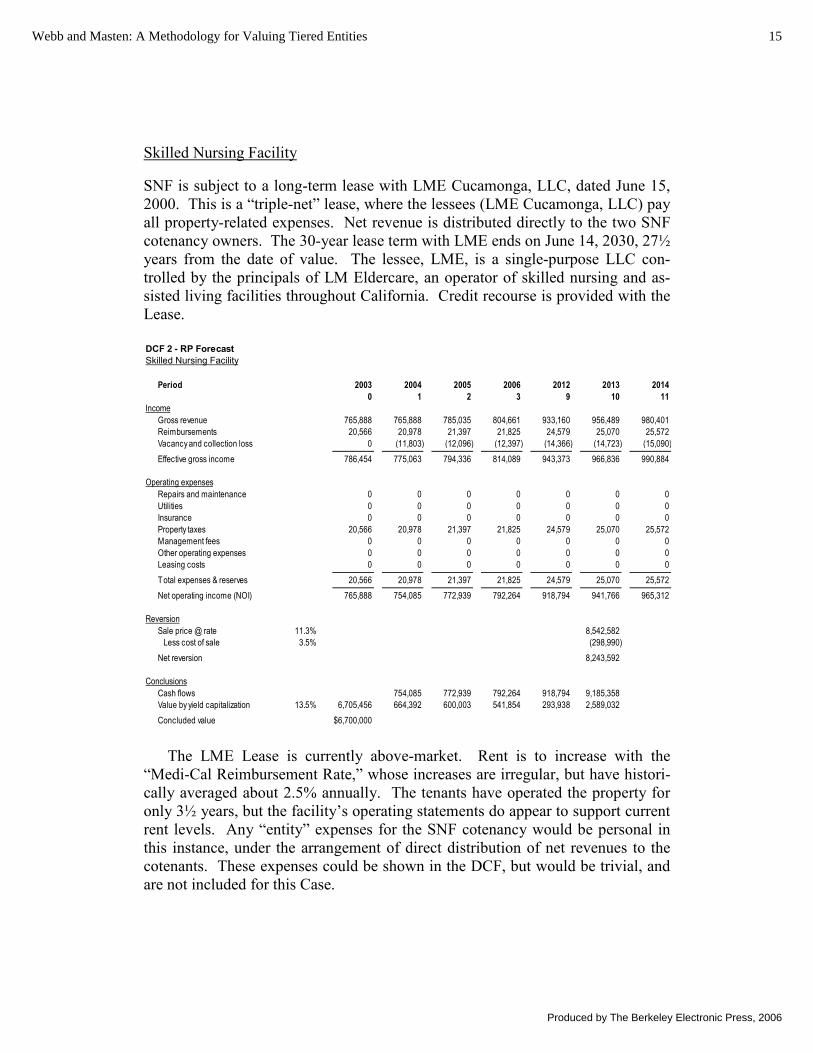
Skilled Nursing Facility
SNF is subject to a long-term lease with LME Cucamonga, LLC, dated June 15, 2000. This is a “triple-net” lease, where the lessees (LME Cucamonga, LLC) pay all property-related expenses. Net revenue is distributed directly to the two SNF cotenancy owners. The 30-year lease term with LME ends on June 14, 2030, 27½ years from the date of value. The lessee, LME, is a single-purpose LLC con-trolled by the principals of LM Eldercare, an operator of skilled nursing and as-sisted living facilities throughout California. Credit recourse is provided with the Lease.
DCF 2 - RP ForecastSkilled Nursing Facility
Period 2003 2004 2005 2006 2012 2013 20140 1 2 3 9 10 11
IncomeGross revenue 765,888 765,888 785,035 804,661 933,160 956,489 980,401Reimbursements 20,566 20,978 21,397 21,825 24,579 25,070 25,572Vacancy and collection loss 0 (11,803) (12,096) (12,397) (14,366) (14,723) (15,090)__________ __________ __________ __________ __________ __________ __________Effective gross income 786,454 775,063 794,336 814,089 943,373 966,836 990,884
Operating expensesRepairs and maintenance 0 0 0 0 0 0 0Utilities 0 0 0 0 0 0 0Insurance 0 0 0 0 0 0 0Property taxes 20,566 20,978 21,397 21,825 24,579 25,070 25,572Management fees 0 0 0 0 0 0 0Other operating expenses 0 0 0 0 0 0 0Leasing costs 0 0 0 0 0 0 0__________ __________ __________ __________ __________ __________ __________Total expenses & reserves 20,566 20,978 21,397 21,825 24,579 25,070 25,572__________ __________ __________ __________ __________ __________ __________Net operating income (NOI) 765,888 754,085 772,939 792,264 918,794 941,766 965,312
ReversionSale price @ rate 11.3% 8,542,582 Less cost of sale 3.5% (298,990)Net reversion 8,243,592
ConclusionsCash flows 754,085 772,939 792,264 918,794 9,185,358Value by yield capitalization 4 13.5% 6,705,456 664,392 600,003 541,854 293,938 2,589,032Concluded value -5 $6,700,000
The LME Lease is currently above-market. Rent is to increase with the “Medi-Cal Reimbursement Rate,” whose increases are irregular, but have histori-cally averaged about 2.5% annually. The tenants have operated the property for only 3½ years, but the facility’s operating statements do appear to support current rent levels. Any “entity” expenses for the SNF cotenancy would be personal in this instance, under the arrangement of direct distribution of net revenues to the cotenants. These expenses could be shown in the DCF, but would be trivial, and are not included for this Case.
15Webb and Masten: A Methodology for Valuing Tiered Entities
Produced by The Berkeley Electronic Press, 2006
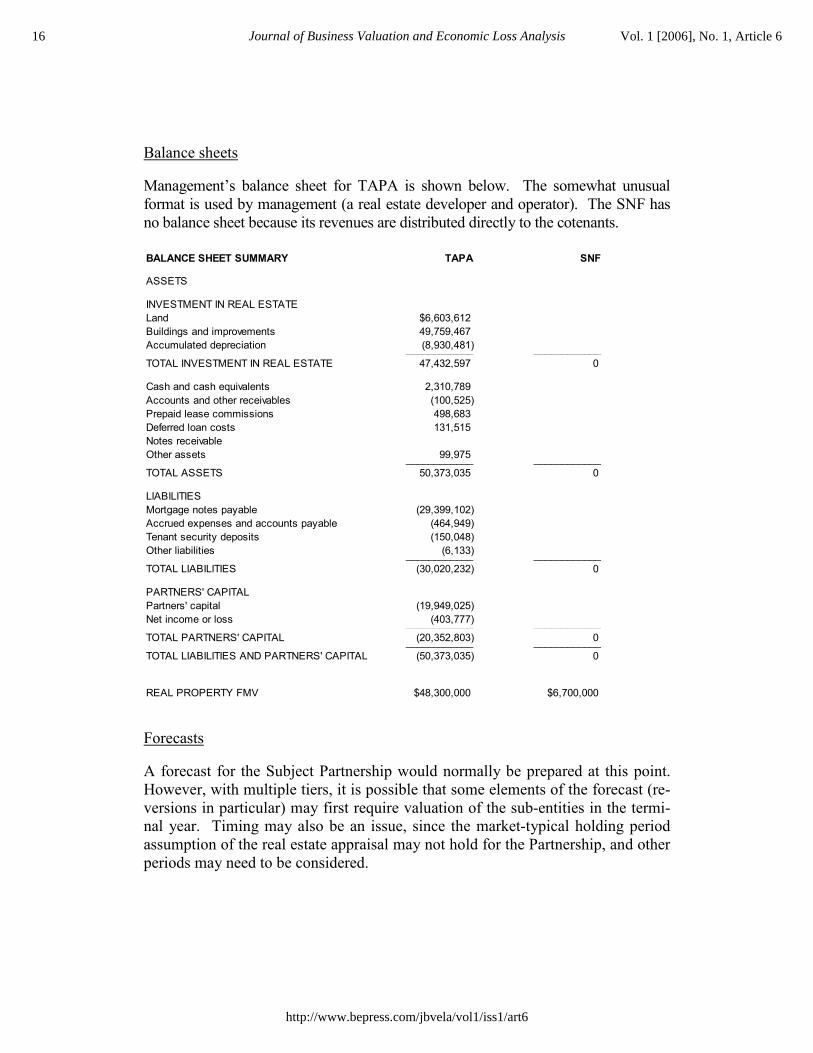
Balance sheets
Management’s balance sheet for TAPA is shown below. The somewhat unusual format is used by management (a real estate developer and operator). The SNF has no balance sheet because its revenues are distributed directly to the cotenants. BALANCE SHEET SUMMARY TAPA SNF
ASSETS
INVESTMENT IN REAL ESTATELand $6,603,612Buildings and improvements 49,759,467Accumulated depreciation (8,930,481)____________ ____________TOTAL INVESTMENT IN REAL ESTATE 47,432,597 0
Cash and cash equivalents 2,310,789Accounts and other receivables (100,525)Prepaid lease commissions 498,683Deferred loan costs 131,515Notes receivableOther assets 99,975____________ ____________TOTAL ASSETS 50,373,035 0
LIABILITIESMortgage notes payable (29,399,102)Accrued expenses and accounts payable (464,949)Tenant security deposits (150,048)Other liabilities (6,133)____________ ____________TOTAL LIABILITIES (30,020,232) 0
PARTNERS' CAPITALPartners' capital (19,949,025)Net income or loss (403,777)____________ ____________TOTAL PARTNERS' CAPITAL (20,352,803) 0____________ ____________TOTAL LIABILITIES AND PARTNERS' CAPITAL (50,373,035) 0
REAL PROPERTY FMV $48,300,000 $6,700,000
Forecasts
A forecast for the Subject Partnership would normally be prepared at this point. However, with multiple tiers, it is possible that some elements of the forecast (re-versions in particular) may first require valuation of the sub-entities in the termi-nal year. Timing may also be an issue, since the market-typical holding period assumption of the real estate appraisal may not hold for the Partnership, and other periods may need to be considered.
16 Journal of Business Valuation and Economic Loss Analysis Vol. 1 [2006], No. 1, Article 6
http://www.bepress.com/jbvela/vol1/iss1/art6
And the buyer’s expectations are…
7. Who is the hypothetical buyer?
One generally assumes that the hypothetical buyer is in the position of an inves-tor, although the facts may support the buyer’s using the property. In reality, other partners or cotenants would be the actual buyers, particularly when they have first refusal rights. Nonetheless, fair market value requires a hypothetical buyer (and seller). The objectives of this hypothetical buyer (cash flow, involve-ment with local real estate, expecting to hold for an agreed or understood term) are essential to understanding the buyer’s likely valuation model. The buyer’s in-vestment alternatives will direct the selection or weighting of the valuation ap-proaches, as well as determining relevant data sources.
In this case, the Subject Partnership holds interests in an entity (TAPA) that is managed by a privately-held real estate investment trust (REIT). A buyer of an interest in such an entity is typically the same one that would be a REIT or pub-licly-traded limited partnership (RELP) buyer. The going-in expectation would no doubt be to hold for an investment term. Interest in specific assets would be less than for a buyer of an interest in a small FLP, although the SNF facility may be investigated more closely.
8. What holding period scenarios are supported by the assets, by ownership facts
& circumstances, and by the agreement? What are the intentions of the con-trolling parties?
R & B Walker LP
The holding period is not fixed by any circumstance of the Partnership, except for its stated remaining term of 99 years. A typical investor holding period for the real property itself (fee interest) is about 10 years, although some use models of 5-10 or 7-10 years (based on investor survey data).
Actuarial remaining life of Ron Walker 4.5 years, and Barbara Walker 10.7 years; it is most likely that the Manager or General Partner will hold until these deaths take place. It is somewhat likely that Donald Walker would take advan-tage of any chance to raise cash, supported by his personal history. Thus, 10 years is selected for the R & B Walker LP as the buyer’s most reasonable expectation.
TAPA
The facts and circumstances have revealed no similar imperatives to sell at a par-ticular future point for TAPA. TAPA pays management fees to Trump Realty (a
17Webb and Masten: A Methodology for Valuing Tiered Entities
Produced by The Berkeley Electronic Press, 2006
disincentive for Trump to sell), who generally bases its sale decisions on real property markets and its development opportunities.
The above observation about the typical investor holding period of 10 years for real property fee interests still applies, but the other members will have held these properties longer than that, and another 10 years may be extreme by this view (particularly since all parties are older, the depreciation period is nearing its end, and leverage is declining. Yield rates are typically developed through obser-vation of investment markets that do not typically consider holding periods longer than 15 years. The Case, therefore, concludes five more years, beginning in year 10 and continuing through year 15, before TAPA’s assets are sold. It is very likely that refinancing of existing loans will be possible, although if it were not, then properties might be sold instead, shortening the period.
SNF Cotenancy
The Subject Interest does have the ability to cause the Partnership to sell its in-terest in the SNF, although a sale at fair market value would not necessarily be beneficial since the buyer would demand a discount for reason of the fractional position. Current ownership sees SNF as a long term investment, and forcing sale would be contrary to this objective. Thus, absent evidence to the contrary, one would expect resistance to a proposed sale.
The Case interprets the ability to cause sale as affecting the risk associated with the position held by the Subject Interest, a sort of emergency exit strategy. It does not reduce the holding period, because an early sale is inconsistent with an investment “going-in” strategy, and also because the financial incentive for such an action is limited (since sale of a fraction is typically made at a discount—the Subject Interest cannot force sale alone, as the cotenancy interest is held by the FLP).
Transfer of the Partnership’s interest in SNF is assumed at termination (as op-posed to a forced sale of the entire property), and the new buyer could in turn force a sale. A separate analysis concludes that the new buyer’s expected hold would be about three years.
18 Journal of Business Valuation and Economic Loss Analysis Vol. 1 [2006], No. 1, Article 6
http://www.bepress.com/jbvela/vol1/iss1/art6
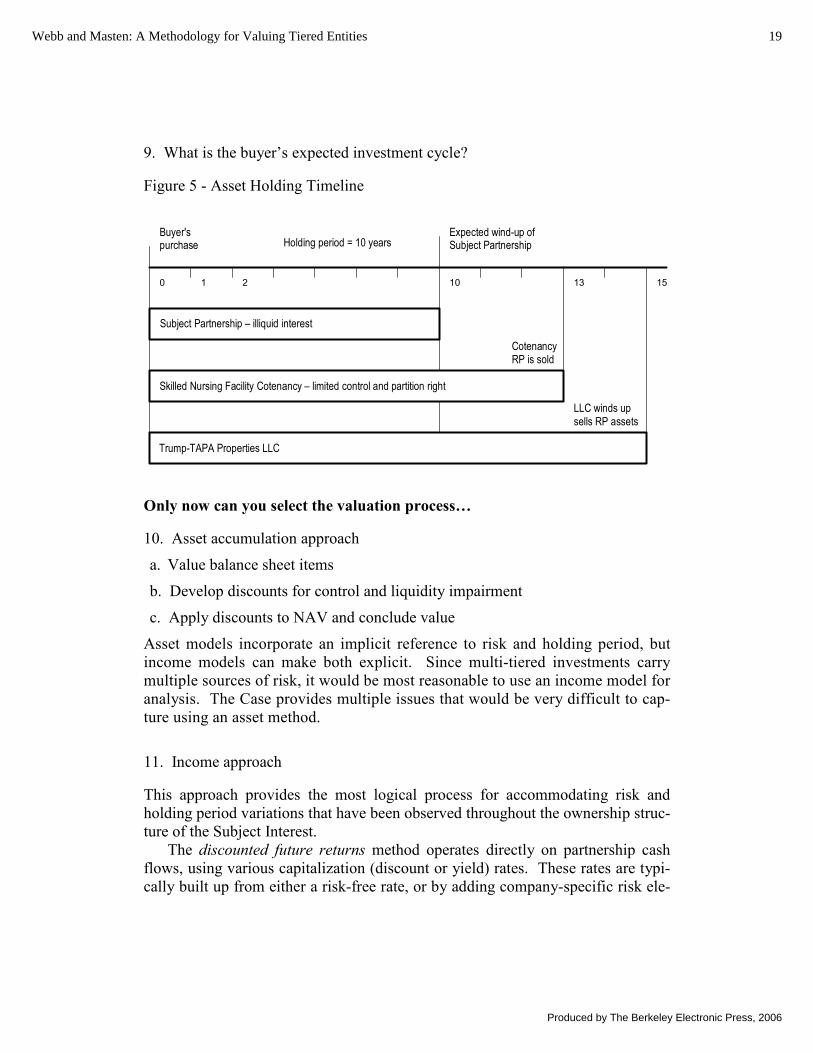
9. What is the buyer’s expected investment cycle?
Figure 5 - Asset Holding Timeline
Subject Partnership – illiquid interest
Trump-TAPA Properties LLC
21 100
Buyer'spurchase
Expected wind-up ofSubject PartnershipHolding period = 10 years
13
LLC winds upsells RP assets
CotenancyRP is sold
Skilled Nursing Facility Cotenancy – limited control and partition right
15
Only now can you select the valuation process…
10. Asset accumulation approach
a. Value balance sheet items
b. Develop discounts for control and liquidity impairment
c. Apply discounts to NAV and conclude value
Asset models incorporate an implicit reference to risk and holding period, but income models can make both explicit. Since multi-tiered investments carry multiple sources of risk, it would be most reasonable to use an income model for analysis. The Case provides multiple issues that would be very difficult to cap-ture using an asset method.
11. Income approach
This approach provides the most logical process for accommodating risk and holding period variations that have been observed throughout the ownership struc-ture of the Subject Interest.
The discounted future returns method operates directly on partnership cash flows, using various capitalization (discount or yield) rates. These rates are typi-cally built up from either a risk-free rate, or by adding company-specific risk ele-
19Webb and Masten: A Methodology for Valuing Tiered Entities
Produced by The Berkeley Electronic Press, 2006
ments to rates extracted from public real estate limited partnership (RELP) market trading data. However, rates for most real estate holding entities should be built-up from rates that reflect the risk of the underlying assets—the real property risk—rather than a risk-free rate, since a) the underlying real property represents a very large portion of the total entity risk, and b) real estate capital market data is readily available and relatively precise. An incremental partnership (control) risk can then be extracted from RELP trading data, and increments added to the build up for illiquidity and other subject-specific elements.
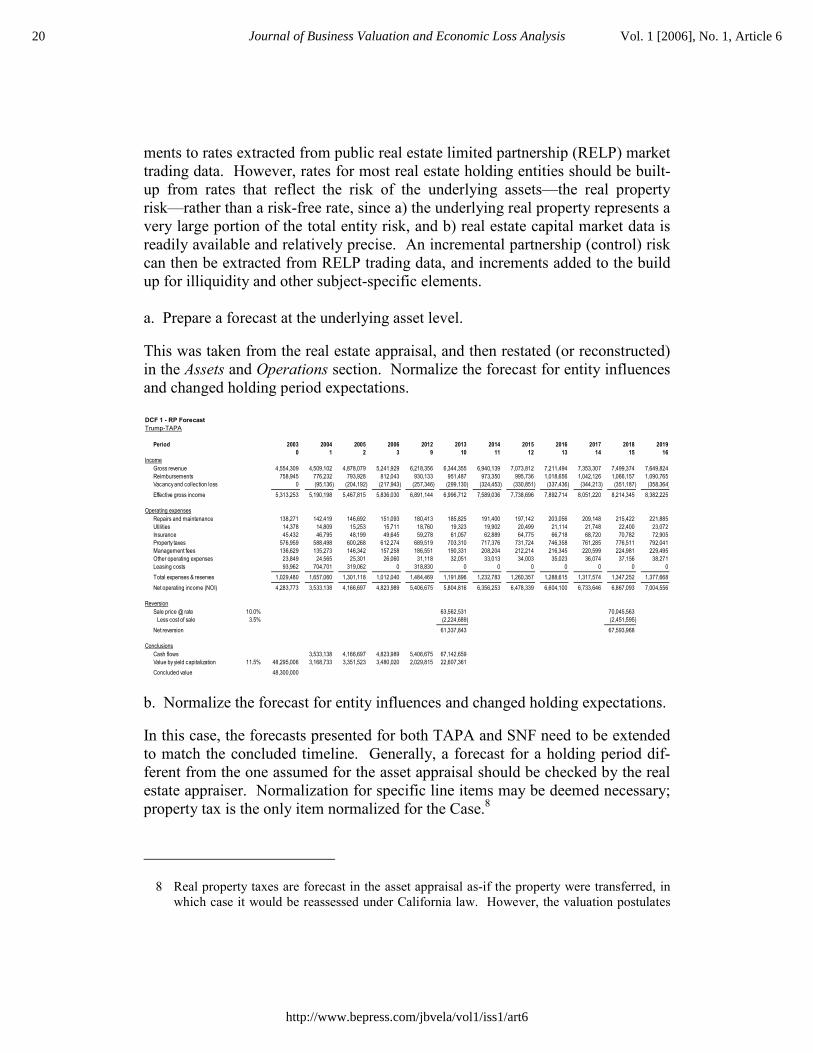
a. Prepare a forecast at the underlying asset level.
This was taken from the real estate appraisal, and then restated (or reconstructed) in the Assets and Operations section. Normalize the forecast for entity influences and changed holding period expectations.
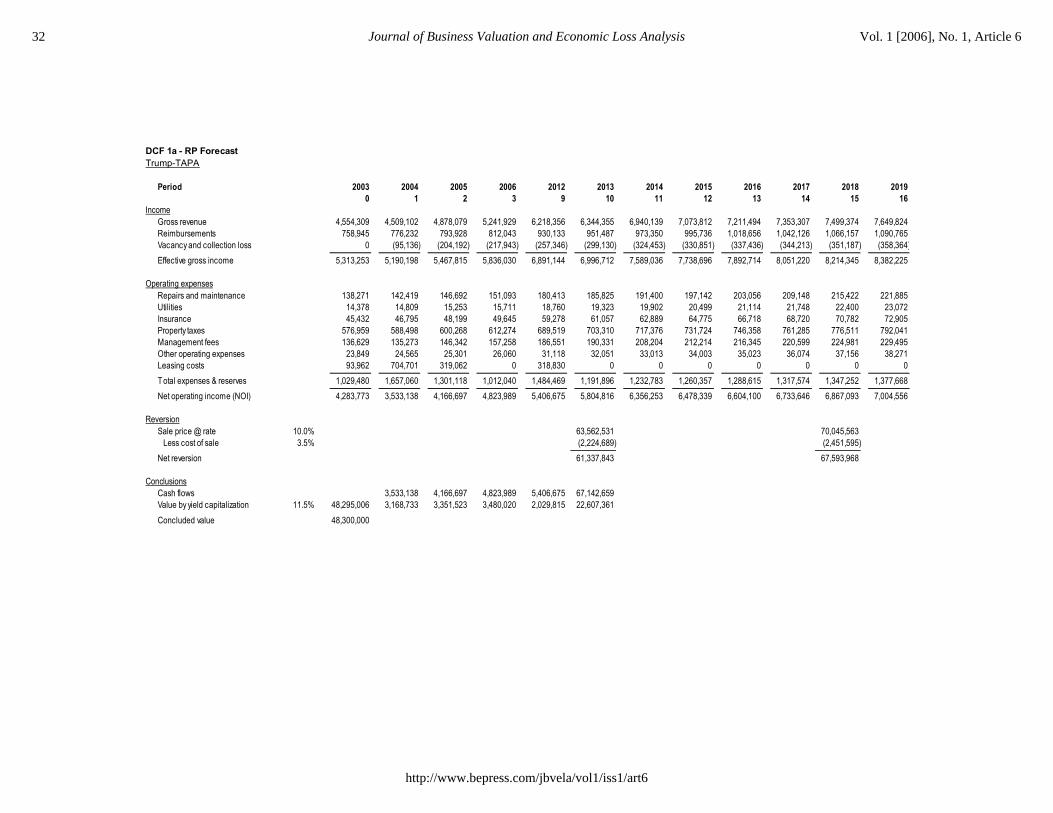
DCF 1 - RP ForecastTrump-TAPA
Period 2003 2004 2005 2006 2012 2013 2014 2015 2016 2017 2018 20190 1 2 3 9 10 11 12 13 14 15 16
IncomeGross revenue 4,554,309 4,509,102 4,878,079 5,241,929 6,218,356 6,344,355 6,940,139 7,073,812 7,211,494 7,353,307 7,499,374 7,649,824Reimbursements 758,945 776,232 793,928 812,043 930,133 951,487 973,350 995,736 1,018,656 1,042,126 1,066,157 1,090,765Vacancy and collection loss 0 (95,136) (204,192) (217,943) (257,346) (299,130) (324,453) (330,851) (337,436) (344,213) (351,187) (358,364)__________ __________ __________ __________ __________ __________ __________ __________ __________ __________ __________ __________Effective gross income 5,313,253 5,190,198 5,467,815 5,836,030 6,891,144 6,996,712 7,589,036 7,738,696 7,892,714 8,051,220 8,214,345 8,382,225
Operating expensesRepairs and maintenance 138,271 142,419 146,692 151,093 180,413 185,825 191,400 197,142 203,056 209,148 215,422 221,885Utilities 14,378 14,809 15,253 15,711 18,760 19,323 19,902 20,499 21,114 21,748 22,400 23,072Insurance 45,432 46,795 48,199 49,645 59,278 61,057 62,889 64,775 66,718 68,720 70,782 72,905Property taxes 576,959 588,498 600,268 612,274 689,519 703,310 717,376 731,724 746,358 761,285 776,511 792,041Management fees 136,629 135,273 146,342 157,258 186,551 190,331 208,204 212,214 216,345 220,599 224,981 229,495Other operating expenses 23,849 24,565 25,301 26,060 31,118 32,051 33,013 34,003 35,023 36,074 37,156 38,271Leasing costs 93,962 704,701 319,062 0 318,830 0 0 0 0 0 0 0__________ __________ __________ __________ __________ __________ __________ __________ __________ __________ __________ __________Total expenses & reserves 1,029,480 1,657,060 1,301,118 1,012,040 1,484,469 1,191,896 1,232,783 1,260,357 1,288,615 1,317,574 1,347,252 1,377,668__________ __________ __________ __________ __________ __________ __________ __________ __________ __________ __________ __________Net operating income (NOI) 4,283,773 3,533,138 4,166,697 4,823,989 5,406,675 5,804,816 6,356,253 6,478,339 6,604,100 6,733,646 6,867,093 7,004,556
ReversionSale price @ rate 10.0% 63,562,531 70,045,563 Less cost of sale 3.5% (2,224,689) (2,451,595)___________ ___________Net reversion 61,337,843 67,593,968
ConclusionsCash flows 3,533,138 4,166,697 4,823,989 5,406,675 67,142,659Value by yield capitalization 4 11.5% 48,295,006 3,168,733 3,351,523 3,480,020 2,029,815 22,607,361Concluded value -5 48,300,000
b. Normalize the forecast for entity influences and changed holding expectations.
In this case, the forecasts presented for both TAPA and SNF need to be extended to match the concluded timeline. Generally, a forecast for a holding period dif-ferent from the one assumed for the asset appraisal should be checked by the real estate appraiser. Normalization for specific line items may be deemed necessary; property tax is the only item normalized for the Case.8
8 Real property taxes are forecast in the asset appraisal as-if the property were transferred, in which case it would be reassessed under California law. However, the valuation postulates
20 Journal of Business Valuation and Economic Loss Analysis Vol. 1 [2006], No. 1, Article 6
http://www.bepress.com/jbvela/vol1/iss1/art6
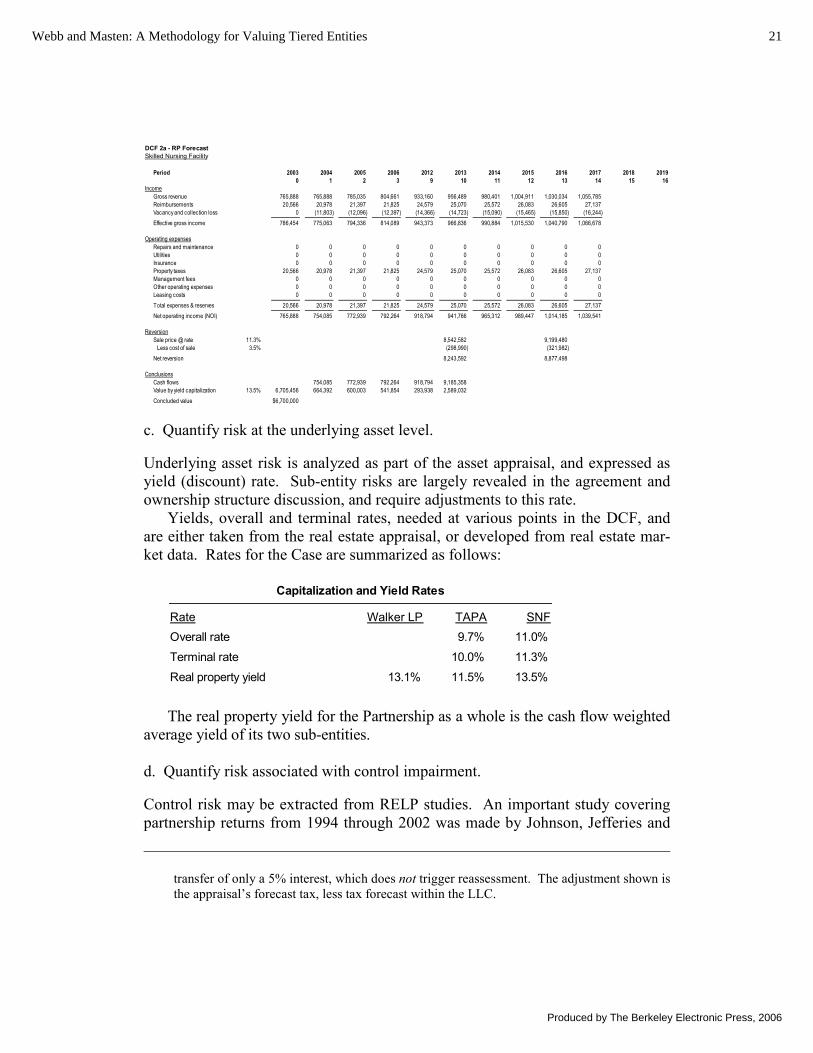
DCF 2a - RP ForecastSkilled Nursing Facility
Period 2003 2004 2005 2006 2012 2013 2014 2015 2016 2017 2018 20190 1 2 3 9 10 11 12 13 14 15 16
IncomeGross revenue 765,888 765,888 785,035 804,661 933,160 956,489 980,401 1,004,911 1,030,034 1,055,785Reimbursements 20,566 20,978 21,397 21,825 24,579 25,070 25,572 26,083 26,605 27,137Vacancy and collection loss 0 (11,803) (12,096) (12,397) (14,366) (14,723) (15,090) (15,465) (15,850) (16,244)__________ __________ __________ __________ __________ __________ __________ __________ __________ __________Effective gross income 786,454 775,063 794,336 814,089 943,373 966,836 990,884 1,015,530 1,040,790 1,066,678
Operating expensesRepairs and maintenance 0 0 0 0 0 0 0 0 0 0Utilities 0 0 0 0 0 0 0 0 0 0Insurance 0 0 0 0 0 0 0 0 0 0Property taxes 20,566 20,978 21,397 21,825 24,579 25,070 25,572 26,083 26,605 27,137Management fees 0 0 0 0 0 0 0 0 0 0Other operating expenses 0 0 0 0 0 0 0 0 0 0Leasing costs 0 0 0 0 0 0 0 0 0 0__________ __________ __________ __________ __________ __________ __________ __________ __________ __________Total expenses & reserves 20,566 20,978 21,397 21,825 24,579 25,070 25,572 26,083 26,605 27,137__________ __________ __________ __________ __________ __________ __________ __________ __________ __________Net operating income (NOI) 765,888 754,085 772,939 792,264 918,794 941,766 965,312 989,447 1,014,185 1,039,541
ReversionSale price @ rate 11.3% 8,542,582 9,199,480 Less cost of sale 3.5% (298,990) (321,982)Net reversion 8,243,592 8,877,498
ConclusionsCash flows 754,085 772,939 792,264 918,794 9,185,358Value by yield capitalization 4 13.5% 6,705,456 664,392 600,003 541,854 293,938 2,589,032Concluded value -5 $6,700,000
c. Quantify risk at the underlying asset level.
Underlying asset risk is analyzed as part of the asset appraisal, and expressed as yield (discount) rate. Sub-entity risks are largely revealed in the agreement and ownership structure discussion, and require adjustments to this rate.
Yields, overall and terminal rates, needed at various points in the DCF, and are either taken from the real estate appraisal, or developed from real estate mar-ket data. Rates for the Case are summarized as follows:
Capitalization and Yield Rates
Rate Walker LP TAPA SNFOverall rate 9.7% 11.0%
Terminal rate 10.0% 11.3%
Real property yield 13.1% 11.5% 13.5%
The real property yield for the Partnership as a whole is the cash flow weighted average yield of its two sub-entities.
d. Quantify risk associated with control impairment.
Control risk may be extracted from RELP studies. An important study covering partnership returns from 1994 through 2002 was made by Johnson, Jefferies and
transfer of only a 5% interest, which does not trigger reassessment. The adjustment shown is the appraisal’s forecast tax, less tax forecast within the LLC.
21Webb and Masten: A Methodology for Valuing Tiered Entities
Produced by The Berkeley Electronic Press, 2006
Park, (the “JJP Study”),9 and was used to assist in building up appropriate capi-talization rates for use in this Case. The JJP Study involves hundreds of partner-ships, and many thousands of transactions.
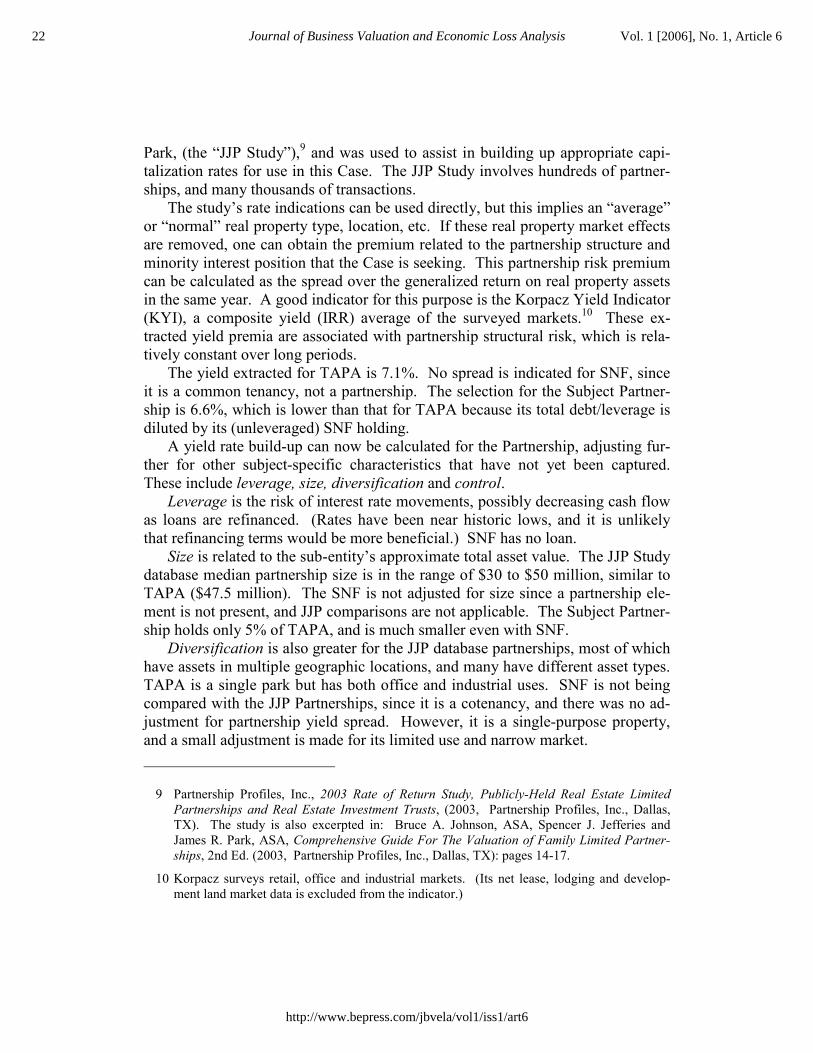
The study’s rate indications can be used directly, but this implies an “average” or “normal” real property type, location, etc. If these real property market effects are removed, one can obtain the premium related to the partnership structure and minority interest position that the Case is seeking. This partnership risk premium can be calculated as the spread over the generalized return on real property assets in the same year. A good indicator for this purpose is the Korpacz Yield Indicator (KYI), a composite yield (IRR) average of the surveyed markets.10 These ex-tracted yield premia are associated with partnership structural risk, which is rela-tively constant over long periods.
The yield extracted for TAPA is 7.1%. No spread is indicated for SNF, since it is a common tenancy, not a partnership. The selection for the Subject Partner-ship is 6.6%, which is lower than that for TAPA because its total debt/leverage is diluted by its (unleveraged) SNF holding.
A yield rate build-up can now be calculated for the Partnership, adjusting fur-ther for other subject-specific characteristics that have not yet been captured. These include leverage, size, diversification and control.
Leverage is the risk of interest rate movements, possibly decreasing cash flow as loans are refinanced. (Rates have been near historic lows, and it is unlikely that refinancing terms would be more beneficial.) SNF has no loan.
Size is related to the sub-entity’s approximate total asset value. The JJP Study database median partnership size is in the range of $30 to $50 million, similar to TAPA ($47.5 million). The SNF is not adjusted for size since a partnership ele-ment is not present, and JJP comparisons are not applicable. The Subject Partner-ship holds only 5% of TAPA, and is much smaller even with SNF.
Diversification is also greater for the JJP database partnerships, most of which have assets in multiple geographic locations, and many have different asset types. TAPA is a single park but has both office and industrial uses. SNF is not being compared with the JJP Partnerships, since it is a cotenancy, and there was no ad-justment for partnership yield spread. However, it is a single-purpose property, and a small adjustment is made for its limited use and narrow market.
9 Partnership Profiles, Inc., 2003 Rate of Return Study, Publicly-Held Real Estate Limited Partnerships and Real Estate Investment Trusts, (2003, Partnership Profiles, Inc., Dallas, TX). The study is also excerpted in: Bruce A. Johnson, ASA, Spencer J. Jefferies and James R. Park, ASA, Comprehensive Guide For The Valuation of Family Limited Partner-ships, 2nd Ed. (2003, Partnership Profiles, Inc., Dallas, TX): pages 14-17.
10 Korpacz surveys retail, office and industrial markets. (Its net lease, lodging and develop-ment land market data is excluded from the indicator.)
22 Journal of Business Valuation and Economic Loss Analysis Vol. 1 [2006], No. 1, Article 6
http://www.bepress.com/jbvela/vol1/iss1/art6
Yield Rate Build-Up
Description Walker LP TAPA SNF
Real property yield 13.1% 11.5% 13.5%
Yield spread over KYI 6.6% 7.1% NA
Other risk premia:
Leverage 0.2% 0.5% 0.0%
Size 0.5% 0.0% NA
Distribution trend 0.0% 0.2% 0.0%
Diversification 0.0% 0.3% 0.5%
Control adjustment -2.5% 2.0%
Minority-marketable yield 17.9% 19.6% 16.0%
Control is a negative adjustment, for reduced risk, because of the Subject Inter-est’s ability to force sale of some assets. It is not adjusted further for TAPA be-cause the interest held by the Partnership exhibits roughly the same level of control (almost none) as do interests in the JJP Study partnerships. Control for the SNF co-tenancy interest had not been adjusted for impairment in the first place, since it is not a partnership, so its yield is increased because of the need to obtain cooperation of the other cotenant(s) concerning any asset-related decisions. The interest has substantially more control than a limited partner (for which we adjusted about 7%) but less than 100% fee ownership for which no premium is applied.
One control aspect of cotenancy, other cotenants, concerns the uncontrolled transferability of the other cotenants’ interests, say by gift or bequest to their chil-dren, which exacerbate the expected partition process.
The foregoing rates apply at the date of value; in addition, the discounted cash flow analysis needs minority-level rates in year 10 for the sub-entities. Terminal yield rates are calculated by adjusting the above-developed (or “going-in”) yields:
Terminal Yield Rate Build-Up
Description TAPA SNFGoing-in yield 19.6% 16.0%
Real property spread 0.3% 0.3%Other risk premia:
Adjust for leverage (decline) -0.5% -0.0%Adjust for entity risk 0.5% 0.0%
Adjust for other cotenants 0.0% 2.0%
Terminal yield rate (minority-marketable) 19.9% 18.3%
23Webb and Masten: A Methodology for Valuing Tiered Entities
Produced by The Berkeley Electronic Press, 2006
The real property spread is the difference between the going-in and terminal real property capitalization rates.
Leverage is declining for TAPA, and the earlier adjusted increment, as well as some of the leverage effects incorporated in the minority increment (yield spread over KYI), are reduced accordingly. SNF has no leverage.
Entity risk refers to the interest’s lack of influence on the underlying entity structures, and chance that they may be altered by year 10. (TAPA and other Walker partnership structures have changed historically.)
Other cotenants refers to the greater likelihood that the Finnerty heirs will be the other cotenants near the terminal year.
e. Quantify risk associated with liquidity impairment
Both the Subject Partnership interests and the sub-entity interests are illiquid to varying degrees. For the Partnership, material risks are those that that would be avoided if the Subject Interest could exit at will (or at least with no longer a delay than is typical for minority holders of public limited partnership interests). For the sub-entity interests, material risks are those faced by hypothetical purchaser of those interests in the terminal year.
Holding period uncertainty is adjusted because specific holding periods are assumed for the model, but cannot be known with certainty. TAPA is the most restricted; the 5-year hold expected in the terminal year could be shorter or longer, although another 10 years seems unlikely. The SNF term is shorter because of the buyer’s ability to force sale, and the variability of the period is less than for TAPA, where the buyer has no such ability. The terminal year uncertainty pre-mium is, therefore, greater for TAPA than for SNF.
The term for the Walker Partnership is tied to the actuarial lives of the princi-pals and the intentions of their son Donald. The 10-year period could extend for many more years, or it could shorten. However, the ability to force sale of SNF may constrain the period, reducing risk somewhat.
Management is often adjusted for partnerships whose managers are apparently less able to deal with future problems than are the managers of public limited partnerships. The importance depends on what sort of decisions might be required during the holding period. There are effectively no management decisions re-quired for SNF under the lease agreement, and both TAPA and its properties are operated by managers who are arguably as capable as any in the industry. Thus, there is no adjustment for added management risk.
Due diligence becomes a risk issue when the costs of making a reasonable in-vestigation into the legal, asset and valuation issues presented by the investment. They may be onerous for smaller interests, or almost trivial for high value inter-ests. The Subject and both sub-entity interests are large, there are no confidential-
24 Journal of Business Valuation and Economic Loss Analysis Vol. 1 [2006], No. 1, Article 6
http://www.bepress.com/jbvela/vol1/iss1/art6
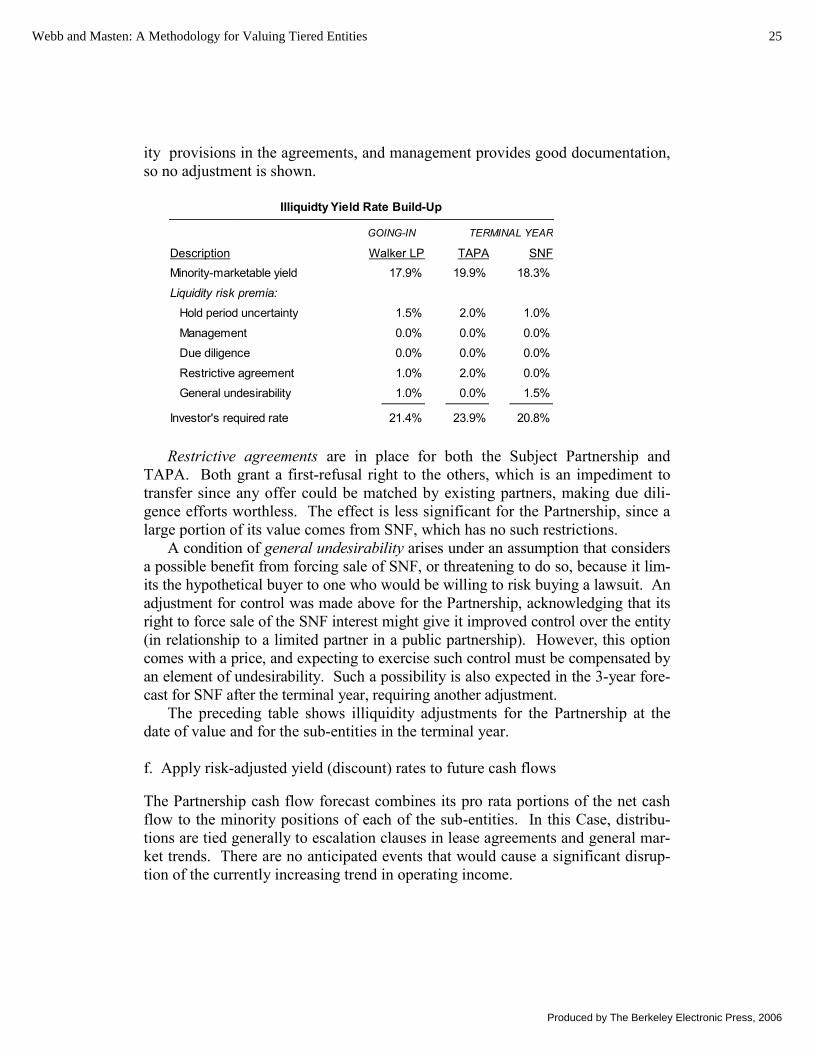
ity provisions in the agreements, and management provides good documentation, so no adjustment is shown.
Illiquidty Yield Rate Build-Up
GOING-IN TERMINAL YEAR
Description Walker LP TAPA SNFMinority-marketable yield 17.9% 19.9% 18.3%
Liquidity risk premia:
Hold period uncertainty 1.5% 2.0% 1.0%
Management 0.0% 0.0% 0.0%
Due diligence 0.0% 0.0% 0.0%
Restrictive agreement 1.0% 2.0% 0.0%
General undesirability 1.0% 0.0% 1.5%
Investor's required rate 21.4% 23.9% 20.8%
Restrictive agreements are in place for both the Subject Partnership and TAPA. Both grant a first-refusal right to the others, which is an impediment to transfer since any offer could be matched by existing partners, making due dili-gence efforts worthless. The effect is less significant for the Partnership, since a large portion of its value comes from SNF, which has no such restrictions.
A condition of general undesirability arises under an assumption that considers a possible benefit from forcing sale of SNF, or threatening to do so, because it lim-its the hypothetical buyer to one who would be willing to risk buying a lawsuit. An adjustment for control was made above for the Partnership, acknowledging that its right to force sale of the SNF interest might give it improved control over the entity (in relationship to a limited partner in a public partnership). However, this option comes with a price, and expecting to exercise such control must be compensated by an element of undesirability. Such a possibility is also expected in the 3-year fore-cast for SNF after the terminal year, requiring another adjustment.
The preceding table shows illiquidity adjustments for the Partnership at the date of value and for the sub-entities in the terminal year.
f. Apply risk-adjusted yield (discount) rates to future cash flows
The Partnership cash flow forecast combines its pro rata portions of the net cash flow to the minority positions of each of the sub-entities. In this Case, distribu-tions are tied generally to escalation clauses in lease agreements and general mar-ket trends. There are no anticipated events that would cause a significant disrup-tion of the currently increasing trend in operating income.
25Webb and Masten: A Methodology for Valuing Tiered Entities
Produced by The Berkeley Electronic Press, 2006
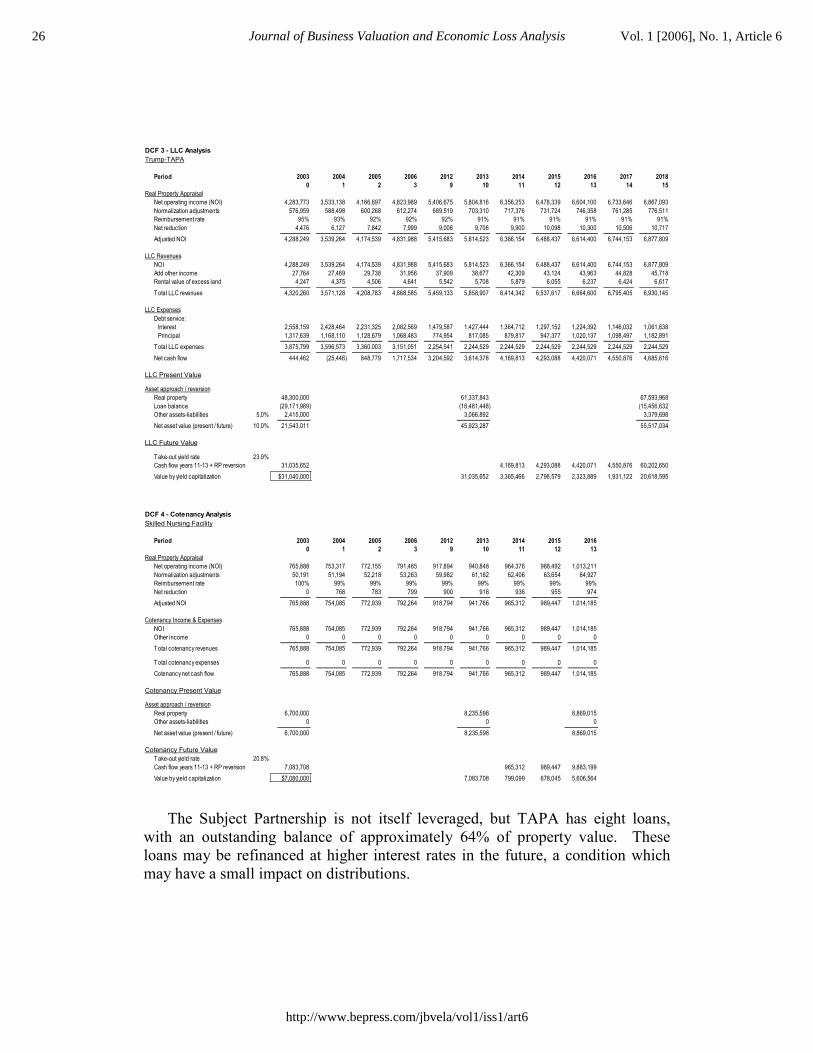
DCF 3 - LLC AnalysisTrump-TAPA
Period 2003 2004 2005 2006 2012 2013 2014 2015 2016 2017 20180 1 2 3 9 10 11 12 13 14 15
Real Property AppraisalNet operating income (NOI) 4,283,773 3,533,138 4,166,697 4,823,989 5,406,675 5,804,816 6,356,253 6,478,339 6,604,100 6,733,646 6,867,093Normalization adjustments 576,959 588,498 600,268 612,274 689,519 703,310 717,376 731,724 746,358 761,285 776,511Reimbursement rate 95% 93% 92% 92% 92% 91% 91% 91% 91% 91% 91%Net reduction 4,476 6,127 7,842 7,999 9,008 9,706 9,900 10,098 10,300 10,506 10,717__________ __________ __________ __________ __________ __________ __________ __________ __________ __________ __________Adjusted NOI 4,288,249 3,539,264 4,174,539 4,831,988 5,415,683 5,814,523 6,366,154 6,488,437 6,614,400 6,744,153 6,877,809
LLC RevenuesNOI 4,288,249 3,539,264 4,174,539 4,831,988 5,415,683 5,814,523 6,366,154 6,488,437 6,614,400 6,744,153 6,877,809Add other income 27,764 27,489 29,738 31,956 37,909 38,677 42,309 43,124 43,963 44,828 45,718Rental value of excess land 4,247 4,375 4,506 4,641 5,542 5,708 5,879 6,055 6,237 6,424 6,617__________ __________ __________ __________ __________ __________ __________ __________ __________ __________ __________Total LLC revenues 4,320,260 3,571,128 4,208,783 4,868,585 5,459,133 5,858,907 6,414,342 6,537,617 6,664,600 6,795,405 6,930,145
LLC ExpensesDebt service: Interest 2,558,159 2,428,464 2,231,325 2,082,569 1,479,587 1,427,444 1,364,712 1,297,152 1,224,392 1,146,032 1,061,638 Principal 1,317,639 1,168,110 1,128,679 1,068,483 774,954 817,085 879,817 947,377 1,020,137 1,098,497 1,182,891__________ __________ __________ __________ __________ __________ __________ __________ __________ __________ __________Total LLC expenses 3,875,799 3,596,573 3,360,003 3,151,051 2,254,541 2,244,529 2,244,529 2,244,529 2,244,529 2,244,529 2,244,529__________ __________ __________ __________ __________ __________ __________ __________ __________ __________ __________Net cash flow 444,462 (25,446) 848,779 1,717,534 3,204,592 3,614,378 4,169,813 4,293,088 4,420,071 4,550,876 4,685,616
LLC Present Value
Asset approach / reversionReal property 48,300,000 61,337,843 67,593,968Loan balance (29,171,989) (18,481,448) (15,456,632)Other assets-liabilities 5.0% 2,415,000 3,066,892 3,379,698___________ ___________ ___________Net asset value (present / future) 10.0% 21,543,011 45,923,287 55,517,034
LLC Future Value
Take-out yield rate 23.9%Cash flow years 11-13 + RP reversion 31,035,652 4,169,813 4,293,088 4,420,071 4,550,876 60,202,650Value by yield capitalization 4 $31,040,000 31,035,652 3,365,466 2,796,579 2,323,889 1,931,122 20,618,595
DCF 4 - Cotenancy AnalysisSkilled Nursing Facility
Period 2003 2004 2005 2006 2012 2013 2014 2015 20160 1 2 3 9 10 11 12 13
Real Property AppraisalNet operating income (NOI) 765,888 753,317 772,155 791,465 917,894 940,848 964,376 988,492 1,013,211Normalization adjustments 50,191 51,194 52,218 53,263 59,982 61,182 62,406 63,654 64,927Reimbursement rate 100% 99% 99% 99% 99% 99% 99% 99% 99%Net reduction 0 768 783 799 900 918 936 955 974__________ __________ __________ __________ __________ __________ __________ __________ __________Adjusted NOI 765,888 754,085 772,939 792,264 918,794 941,766 965,312 989,447 1,014,185
Cotenancy Income & ExpensesNOI 765,888 754,085 772,939 792,264 918,794 941,766 965,312 989,447 1,014,185Other income 0 0 0 0 0 0 0 0 0__________ __________ __________ __________ __________ __________ __________ __________ __________Total cotenancy revenues 765,888 754,085 772,939 792,264 918,794 941,766 965,312 989,447 1,014,185
Total cotenancy expenses 0 0 0 0 0 0 0 0 0__________ __________ __________ __________ __________ __________ __________ __________ __________Cotenancy net cash flow 765,888 754,085 772,939 792,264 918,794 941,766 965,312 989,447 1,014,185
Cotenancy Present Value
Asset approach / reversionReal property 6,700,000 8,235,598 8,869,015Other assets-liabilities 0 0 0___________ ___________ ___________Net asset value (present / future) 6,700,000 8,235,598 8,869,015
Cotenancy Future ValueTake-out yield rate 20.8%Cash flow years 11-13 + RP reversion 7,083,708 965,312 989,447 9,883,199Value by yield capitalization 4 $7,080,000 7,083,708 799,099 678,045 5,606,564
The Subject Partnership is not itself leveraged, but TAPA has eight loans, with an outstanding balance of approximately 64% of property value. These loans may be refinanced at higher interest rates in the future, a condition which may have a small impact on distributions.
26 Journal of Business Valuation and Economic Loss Analysis Vol. 1 [2006], No. 1, Article 6
http://www.bepress.com/jbvela/vol1/iss1/art6
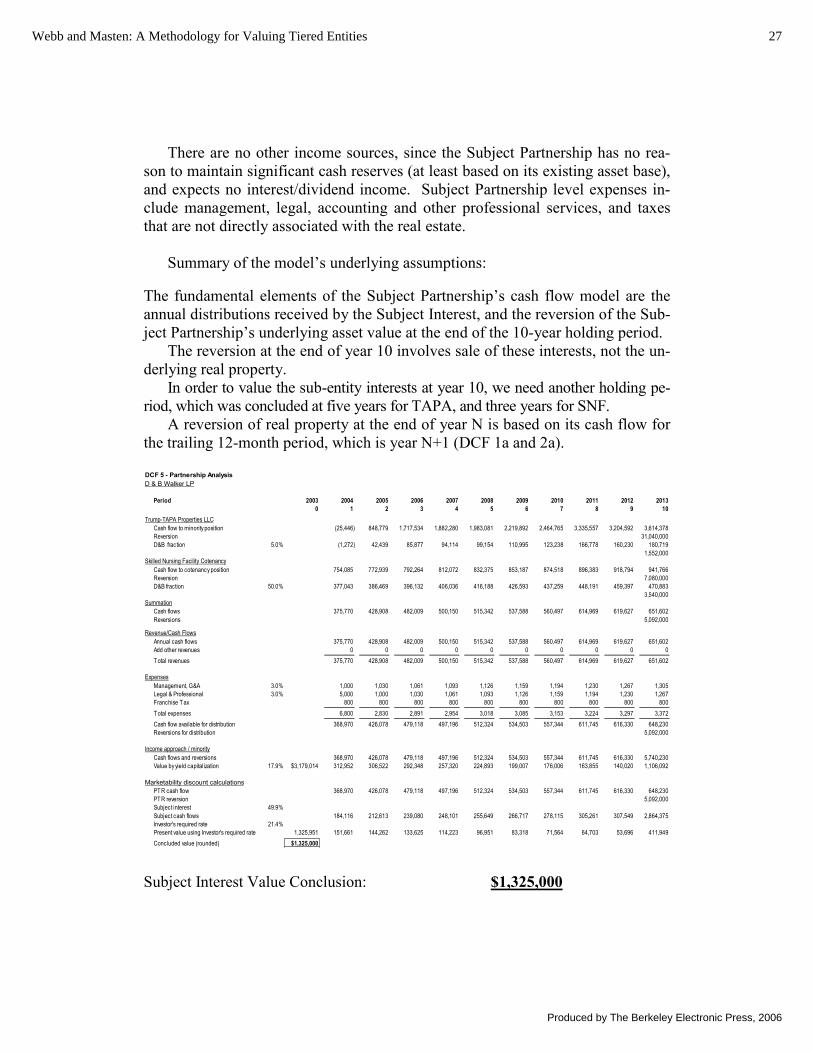
There are no other income sources, since the Subject Partnership has no rea-son to maintain significant cash reserves (at least based on its existing asset base), and expects no interest/dividend income. Subject Partnership level expenses in-clude management, legal, accounting and other professional services, and taxes that are not directly associated with the real estate.
Summary of the model’s underlying assumptions:
The fundamental elements of the Subject Partnership’s cash flow model are the annual distributions received by the Subject Interest, and the reversion of the Sub-ject Partnership’s underlying asset value at the end of the 10-year holding period.
The reversion at the end of year 10 involves sale of these interests, not the un-derlying real property.
In order to value the sub-entity interests at year 10, we need another holding pe-riod, which was concluded at five years for TAPA, and three years for SNF.
A reversion of real property at the end of year N is based on its cash flow for the trailing 12-month period, which is year N+1 (DCF 1a and 2a).
DCF 5 - Partnership AnalysisD & B Walker LP
Period 2003 2004 2005 2006 2007 2008 2009 2010 2011 2012 20130 1 2 3 4 5 6 7 8 9 10
Trump-TAPA Properties LLCCash flow to minority position (25,446) 848,779 1,717,534 1,882,280 1,983,081 2,219,892 2,464,765 3,335,557 3,204,592 3,614,378Reversion 31,040,000D&B fraction 5.0% (1,272) 42,439 85,877 94,114 99,154 110,995 123,238 166,778 160,230 180,719
1,552,000Skilled Nursing Facility Cotenancy
Cash flow to cotenancy position 754,085 772,939 792,264 812,072 832,375 853,187 874,518 896,383 918,794 941,766Reversion 7,080,000D&B fraction 50.0% 377,043 386,469 396,132 406,036 416,188 426,593 437,259 448,191 459,397 470,883
3,540,000Summation
Cash flows 375,770 428,908 482,009 500,150 515,342 537,588 560,497 614,969 619,627 651,602Reversions 5,092,000
Revenue/Cash FlowsAnnual cash flows 375,770 428,908 482,009 500,150 515,342 537,588 560,497 614,969 619,627 651,602Add other revenues 0 0 0 0 0 0 0 0 0 0__________ __________ __________ __________ __________ __________ __________ __________ __________ __________Total revenues 375,770 428,908 482,009 500,150 515,342 537,588 560,497 614,969 619,627 651,602
ExpensesManagement, G&A 3.0% 1,000 1,030 1,061 1,093 1,126 1,159 1,194 1,230 1,267 1,305Legal & Professional 3.0% 5,000 1,000 1,030 1,061 1,093 1,126 1,159 1,194 1,230 1,267Franchise Tax 800 800 800 800 800 800 800 800 800 800__________ __________ __________ __________ __________ __________ __________ __________ __________ __________Total expenses 6,800 2,830 2,891 2,954 3,018 3,085 3,153 3,224 3,297 3,372__________ __________ __________ __________ __________ __________ __________ __________ __________ __________Cash flow available for distribution 368,970 426,078 479,118 497,196 512,324 534,503 557,344 611,745 616,330 648,230Reversions for distribution 5,092,000
Income approach / minorityCash flows and reversions 368,970 426,078 479,118 497,196 512,324 534,503 557,344 611,745 616,330 5,740,230Value by yield capitalization 17.9% $3,179,014 312,952 306,522 292,348 257,320 224,893 199,007 176,006 163,855 140,020 1,106,092
Marketability discount calculationsPTR cash flow 368,970 426,078 479,118 497,196 512,324 534,503 557,344 611,745 616,330 648,230PTR reversion 5,092,000Subject interest 49.9%Subject cash flows 184,116 212,613 239,080 248,101 255,649 266,717 278,115 305,261 307,549 2,864,375Investor's required rate 21.4%Present value using Investor's required rate 1,325,951 151,661 144,262 133,625 114,223 96,951 83,318 71,564 64,703 53,696 411,949Concluded value (rounded) $1,325,000
Subject Interest Value Conclusion: $1,325,000
27Webb and Masten: A Methodology for Valuing Tiered Entities
Produced by The Berkeley Electronic Press, 2006
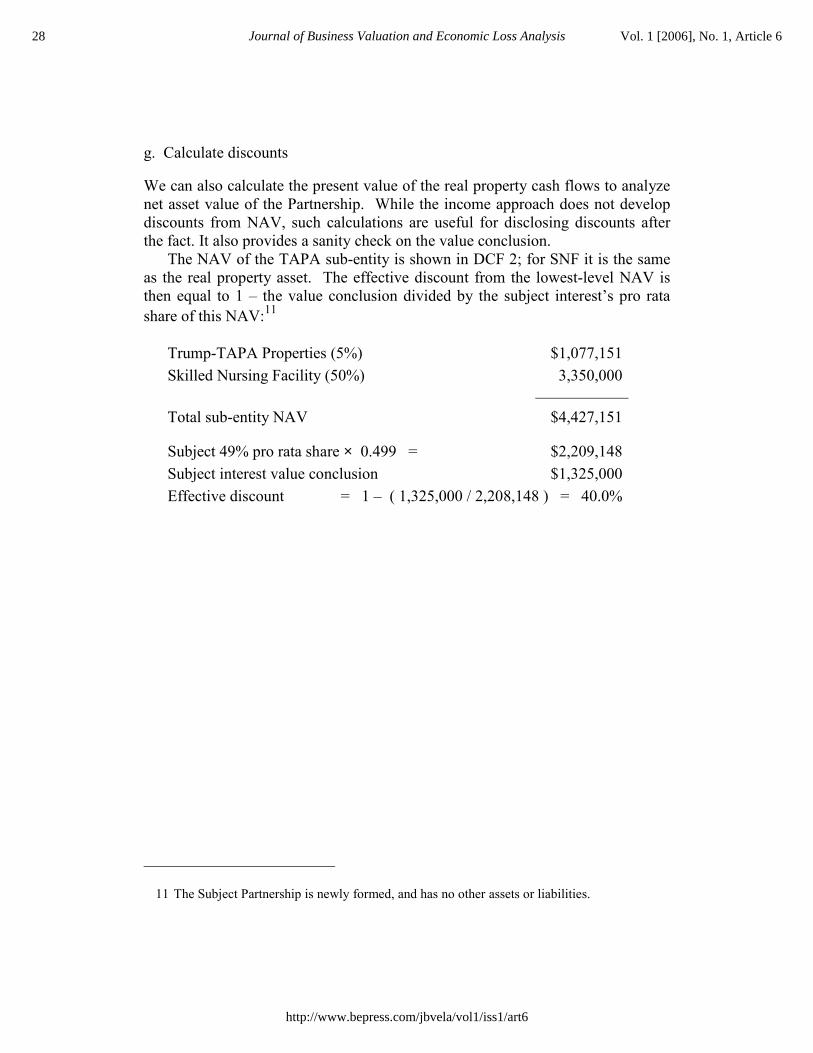
g. Calculate discounts
We can also calculate the present value of the real property cash flows to analyze net asset value of the Partnership. While the income approach does not develop discounts from NAV, such calculations are useful for disclosing discounts after the fact. It also provides a sanity check on the value conclusion.
The NAV of the TAPA sub-entity is shown in DCF 2; for SNF it is the same as the real property asset. The effective discount from the lowest-level NAV is then equal to 1 – the value conclusion divided by the subject interest’s pro rata share of this NAV:11
Trump-TAPA Properties (5%) $1,077,151 Skilled Nursing Facility (50%) 3,350,000
Total sub-entity NAV $4,427,151
Subject 49% pro rata share × 0.499 = $2,209,148Subject interest value conclusion $1,325,000 Effective discount = 1 – ( 1,325,000 / 2,208,148 ) = 40.0%
11 The Subject Partnership is newly formed, and has no other assets or liabilities.
28 Journal of Business Valuation and Economic Loss Analysis Vol. 1 [2006], No. 1, Article 6
http://www.bepress.com/jbvela/vol1/iss1/art6
Conclusions
Conventional FLP valuations rely on asset methods, where discrete discounts are ap-plied to net asset value. This model typically breaks down when applied to multi-tiered structures, producing outlandish returns to the interest being valued. The model failure occurs when the underlying assumptions of the asset method are violated, and/or when the hypothetical buyer’s expectations are not adequately represented.
This article demonstrates this failure, and provides guidance to the valuer re-garding alternative valuation approaches that can be applied in nearly all cases. In order to assure that the process adequately reflects the facts & circumstances of the case and the decision-making process of the hypothetical buyer and seller, the valuer should:
� Make a detailed investigation of the facts & circumstances present at each
level of the tiered structure and match the valuation process to the market;
� Determine a likely holding timeline for the FLP and all the sub-entities;
� Develop expressions of risk (yield rates) associated with assets first, then risk added through the entity structure (for control, liquidity and any other im-pairments); and
� Apply yield rates to expected cash flows over the concluded holding period(s) in a discounted future returns valuation model.
� Include a sanity check to the implied yield in order to determine if the opinion of value reflects a reasonable conclusion for both the buyer and the seller.
This article considers the implications of various sub-entity holding scenarios, and offers a FLP valuation checklist as a guide to setting up the assignment, un-covering the facts, identifying and modeling the buyer’s expectations, and apply-ing the valuation process. Use of the recommended checklist is demonstrated in conjunction with a case study taken from an actual assignment. The case shows how fact patterns can be turned into quantitative elements that are essential for making a convincing analysis.
The authors’ intention is to take the tears out of tiered entity valuations, by providing a logical and supportable process designed to make extremely complex tiered asset ownership structures and fact patterns amenable to conventional valuation analysis.
29Webb and Masten: A Methodology for Valuing Tiered Entities
Produced by The Berkeley Electronic Press, 2006
References
The Appraisal of Real Estate, 12th ed. (2001, Appraisal Institute, Chicago IL)
Johnson, Bruce A. and Spencer J. Jefferies. Comprehensive Guide For The Valua-tion of Family Limited Partnerships, (2001, Partnership Profiles, Inc., Dallas TX )
Mercer, Z. Christopher, ASA, CFA. Quantifying Marketability Discounts, (1997, Peabody Publishing, Memphis TN)
Pratt, Shannon P., DBA, CFA, FASA, et al. Valuing a Business, The Analysis and Appraisal of Closely Held Companies, 4th ed. (2000, Irwin Professional Publish-ing, Chicago IL)
Webb, Dennis A., MAI, ASA, Valuing Undivided Interests in Real Property–Partnerships and Cotenancies, (2004, Appraisal Institute, Chicago IL)
Partnership Profiles, Inc., Rate of Return Study, Publicly-Held Real Estate Limited Partnerships and Real Estate Investment Trusts, (Published annually, Partnership Profiles, Inc., Dallas TX). Other publications of Partnership Profiles may be found at www.partnershipprofiles.com
Korpacz Real Estate Investor Survey, PricewaterhouseCoopers (Published quar-terly, PWC, New York NY). www.pwcreval.com/
Investor Survey, RealtyRates.com, (Published quarterly, Robert G. Watts, Braden-ton Fl). www.realtyrates.com
Appendix
The Appendix includes a complete set of tables—larger-size copies of those that are included in the text.
30 Journal of Business Valuation and Economic Loss Analysis Vol. 1 [2006], No. 1, Article 6
http://www.bepress.com/jbvela/vol1/iss1/art6
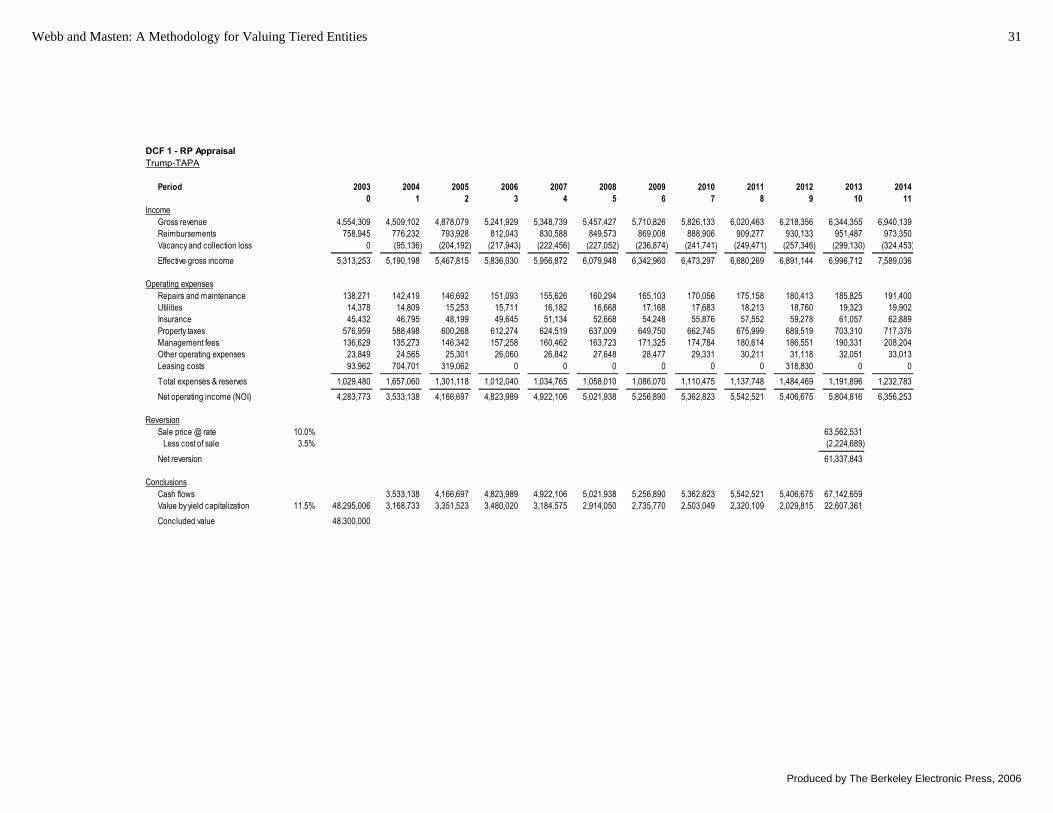
DCF 1 - RP AppraisalTrump-TAPA
Period 2003 2004 2005 2006 2007 2008 2009 2010 2011 2012 2013 20140 1 2 3 4 5 6 7 8 9 10 11
IncomeGross revenue 4,554,309 4,509,102 4,878,079 5,241,929 5,348,739 5,457,427 5,710,826 5,826,133 6,020,463 6,218,356 6,344,355 6,940,139Reimbursements 758,945 776,232 793,928 812,043 830,588 849,573 869,008 888,906 909,277 930,133 951,487 973,350Vacancy and collection loss 0 (95,136) (204,192) (217,943) (222,456) (227,052) (236,874) (241,741) (249,471) (257,346) (299,130) (324,453)__________ __________ __________ __________ __________ __________ __________ __________ __________ __________ __________ __________Effective gross income 5,313,253 5,190,198 5,467,815 5,836,030 5,956,872 6,079,948 6,342,960 6,473,297 6,680,269 6,891,144 6,996,712 7,589,036
Operating expensesRepairs and maintenance 138,271 142,419 146,692 151,093 155,626 160,294 165,103 170,056 175,158 180,413 185,825 191,400Utilities 14,378 14,809 15,253 15,711 16,182 16,668 17,168 17,683 18,213 18,760 19,323 19,902Insurance 45,432 46,795 48,199 49,645 51,134 52,668 54,248 55,876 57,552 59,278 61,057 62,889Property taxes 576,959 588,498 600,268 612,274 624,519 637,009 649,750 662,745 675,999 689,519 703,310 717,376Management fees 136,629 135,273 146,342 157,258 160,462 163,723 171,325 174,784 180,614 186,551 190,331 208,204Other operating expenses 23,849 24,565 25,301 26,060 26,842 27,648 28,477 29,331 30,211 31,118 32,051 33,013Leasing costs 93,962 704,701 319,062 0 0 0 0 0 0 318,830 0 0__________ __________ __________ __________ __________ __________ __________ __________ __________ __________ __________ __________Total expenses & reserves 1,029,480 1,657,060 1,301,118 1,012,040 1,034,765 1,058,010 1,086,070 1,110,475 1,137,748 1,484,469 1,191,896 1,232,783__________ __________ __________ __________ __________ __________ __________ __________ __________ __________ __________ __________Net operating income (NOI) 4,283,773 3,533,138 4,166,697 4,823,989 4,922,106 5,021,938 5,256,890 5,362,823 5,542,521 5,406,675 5,804,816 6,356,253
ReversionSale price @ rate 10.0% 63,562,531
Less cost of sale 3.5% (2,224,689)___________Net reversion 61,337,843
ConclusionsCash flows 3,533,138 4,166,697 4,823,989 4,922,106 5,021,938 5,256,890 5,362,823 5,542,521 5,406,675 67,142,659Value byyield capitalization 4 11.5% 48,295,006 3,168,733 3,351,523 3,480,020 3,184,575 2,914,050 2,735,770 2,503,049 2,320,109 2,029,815 22,607,361Concluded value -5 48,300,000
31Webb and Masten: A Methodology for Valuing Tiered Entities
Produced by The Berkeley Electronic Press, 2006
DCF 1a - RP ForecastTrump-TAPA
Period 2003 2004 2005 2006 2012 2013 2014 2015 2016 2017 2018 20190 1 2 3 9 10 11 12 13 14 15 16
IncomeGross revenue 4,554,309 4,509,102 4,878,079 5,241,929 6,218,356 6,344,355 6,940,139 7,073,812 7,211,494 7,353,307 7,499,374 7,649,824Reimbursements 758,945 776,232 793,928 812,043 930,133 951,487 973,350 995,736 1,018,656 1,042,126 1,066,157 1,090,765Vacancy and collection loss 0 (95,136) (204,192) (217,943) (257,346) (299,130) (324,453) (330,851) (337,436) (344,213) (351,187) (358,364)__________ __________ __________ __________ __________ __________ __________ __________ __________ __________ __________ __________Effective gross income 5,313,253 5,190,198 5,467,815 5,836,030 6,891,144 6,996,712 7,589,036 7,738,696 7,892,714 8,051,220 8,214,345 8,382,225
Operating expensesRepairs and maintenance 138,271 142,419 146,692 151,093 180,413 185,825 191,400 197,142 203,056 209,148 215,422 221,885Utilities 14,378 14,809 15,253 15,711 18,760 19,323 19,902 20,499 21,114 21,748 22,400 23,072Insurance 45,432 46,795 48,199 49,645 59,278 61,057 62,889 64,775 66,718 68,720 70,782 72,905Property taxes 576,959 588,498 600,268 612,274 689,519 703,310 717,376 731,724 746,358 761,285 776,511 792,041Management fees 136,629 135,273 146,342 157,258 186,551 190,331 208,204 212,214 216,345 220,599 224,981 229,495Other operating expenses 23,849 24,565 25,301 26,060 31,118 32,051 33,013 34,003 35,023 36,074 37,156 38,271Leasing costs 93,962 704,701 319,062 0 318,830 0 0 0 0 0 0 0__________ __________ __________ __________ __________ __________ __________ __________ __________ __________ __________ __________Total expenses & reserves 1,029,480 1,657,060 1,301,118 1,012,040 1,484,469 1,191,896 1,232,783 1,260,357 1,288,615 1,317,574 1,347,252 1,377,668__________ __________ __________ __________ __________ __________ __________ __________ __________ __________ __________ __________Net operating income (NOI) 4,283,773 3,533,138 4,166,697 4,823,989 5,406,675 5,804,816 6,356,253 6,478,339 6,604,100 6,733,646 6,867,093 7,004,556
ReversionSale price @ rate 10.0% 63,562,531 70,045,563
Less cost of sale 3.5% (2,224,689) (2,451,595)___________ ___________Net reversion 61,337,843 67,593,968
ConclusionsCash flows 3,533,138 4,166,697 4,823,989 5,406,675 67,142,659Value by yield capitalization 4 11.5% 48,295,006 3,168,733 3,351,523 3,480,020 2,029,815 22,607,361Concluded value -5 48,300,000
32 Journal of Business Valuation and Economic Loss Analysis Vol. 1 [2006], No. 1, Article 6
http://www.bepress.com/jbvela/vol1/iss1/art6
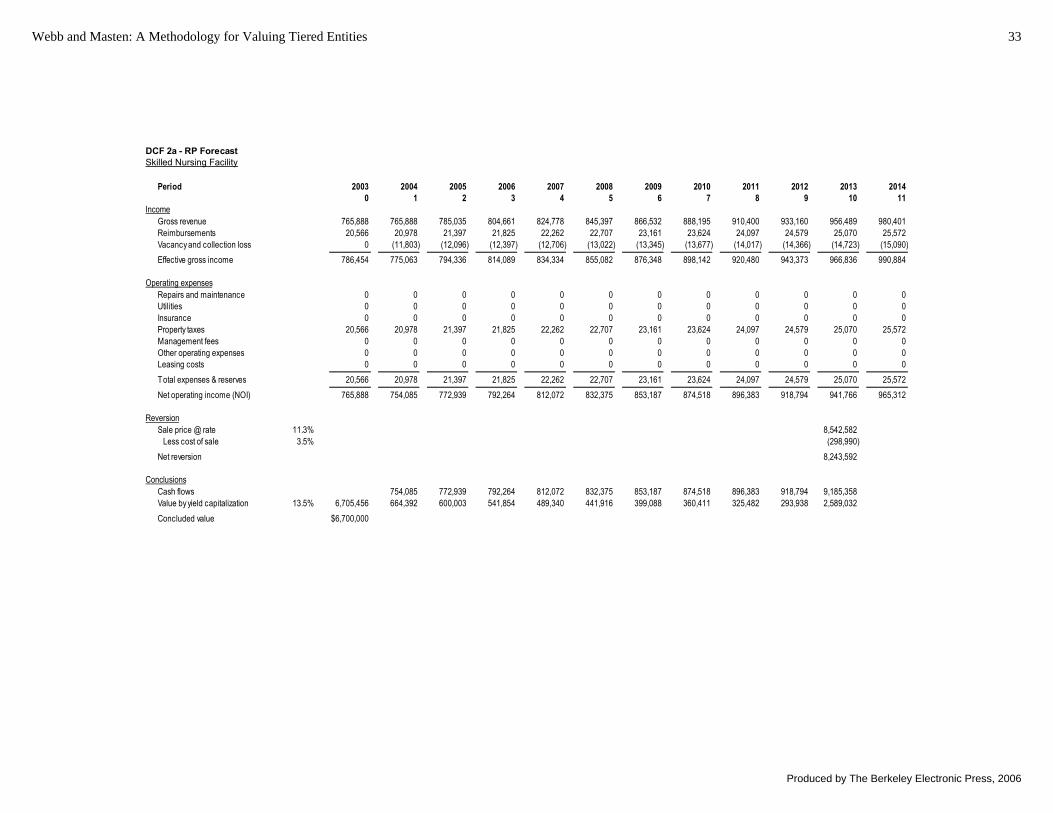
DCF 2a - RP ForecastSkilled Nursing Facility
Period 2003 2004 2005 2006 2007 2008 2009 2010 2011 2012 2013 20140 1 2 3 4 5 6 7 8 9 10 11
IncomeGross revenue 765,888 765,888 785,035 804,661 824,778 845,397 866,532 888,195 910,400 933,160 956,489 980,401Reimbursements 20,566 20,978 21,397 21,825 22,262 22,707 23,161 23,624 24,097 24,579 25,070 25,572Vacancyand collection loss 0 (11,803) (12,096) (12,397) (12,706) (13,022) (13,345) (13,677) (14,017) (14,366) (14,723) (15,090)__________ __________ __________ __________ __________ __________ __________ __________ __________ __________ __________ __________Effective gross income 786,454 775,063 794,336 814,089 834,334 855,082 876,348 898,142 920,480 943,373 966,836 990,884
Operating expensesRepairs and maintenance 0 0 0 0 0 0 0 0 0 0 0 0Utilities 0 0 0 0 0 0 0 0 0 0 0 0Insurance 0 0 0 0 0 0 0 0 0 0 0 0Property taxes 20,566 20,978 21,397 21,825 22,262 22,707 23,161 23,624 24,097 24,579 25,070 25,572Management fees 0 0 0 0 0 0 0 0 0 0 0 0Other operating expenses 0 0 0 0 0 0 0 0 0 0 0 0Leasing costs 0 0 0 0 0 0 0 0 0 0 0 0__________ __________ __________ __________ __________ __________ __________ __________ __________ __________ __________ __________Total expenses & reserves 20,566 20,978 21,397 21,825 22,262 22,707 23,161 23,624 24,097 24,579 25,070 25,572__________ __________ __________ __________ __________ __________ __________ __________ __________ __________ __________ __________Net operating income (NOI) 765,888 754,085 772,939 792,264 812,072 832,375 853,187 874,518 896,383 918,794 941,766 965,312
ReversionSale price @ rate 11.3% 8,542,582
Less cost of sale 3.5% (298,990)Net reversion 8,243,592
ConclusionsCash flows 754,085 772,939 792,264 812,072 832,375 853,187 874,518 896,383 918,794 9,185,358Value byyield capitalization 4 13.5% 6,705,456 664,392 600,003 541,854 489,340 441,916 399,088 360,411 325,482 293,938 2,589,032Concluded value -5 $6,700,000
33Webb and Masten: A Methodology for Valuing Tiered Entities
Produced by The Berkeley Electronic Press, 2006
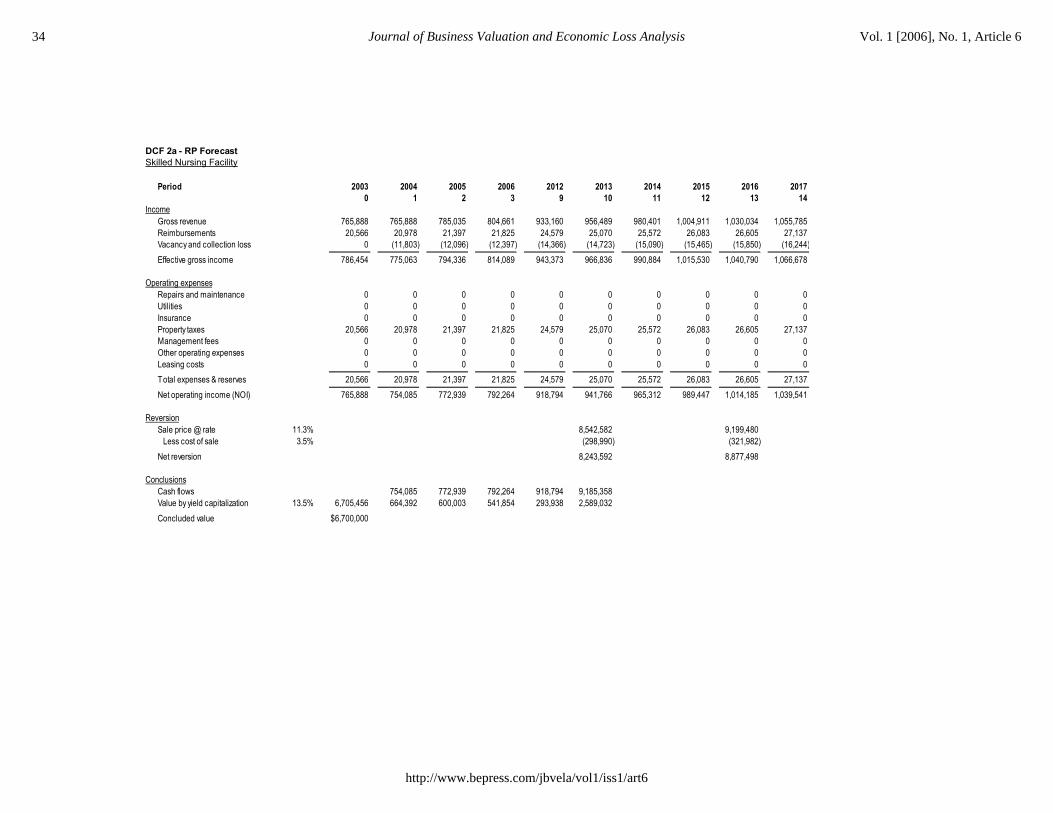
DCF 2a - RP ForecastSkilled Nursing Facility
Period 2003 2004 2005 2006 2012 2013 2014 2015 2016 20170 1 2 3 9 10 11 12 13 14
IncomeGross revenue 765,888 765,888 785,035 804,661 933,160 956,489 980,401 1,004,911 1,030,034 1,055,785Reimbursements 20,566 20,978 21,397 21,825 24,579 25,070 25,572 26,083 26,605 27,137Vacancy and collection loss 0 (11,803) (12,096) (12,397) (14,366) (14,723) (15,090) (15,465) (15,850) (16,244)__________ __________ __________ __________ __________ __________ __________ __________ __________ __________Effective gross income 786,454 775,063 794,336 814,089 943,373 966,836 990,884 1,015,530 1,040,790 1,066,678
Operating expensesRepairs and maintenance 0 0 0 0 0 0 0 0 0 0Utilities 0 0 0 0 0 0 0 0 0 0Insurance 0 0 0 0 0 0 0 0 0 0Property taxes 20,566 20,978 21,397 21,825 24,579 25,070 25,572 26,083 26,605 27,137Management fees 0 0 0 0 0 0 0 0 0 0Other operating expenses 0 0 0 0 0 0 0 0 0 0Leasing costs 0 0 0 0 0 0 0 0 0 0__________ __________ __________ __________ __________ __________ __________ __________ __________ __________Total expenses & reserves 20,566 20,978 21,397 21,825 24,579 25,070 25,572 26,083 26,605 27,137__________ __________ __________ __________ __________ __________ __________ __________ __________ __________Net operating income (NOI) 765,888 754,085 772,939 792,264 918,794 941,766 965,312 989,447 1,014,185 1,039,541
ReversionSale price @ rate 11.3% 8,542,582 9,199,480
Less cost of sale 3.5% (298,990) (321,982)Net reversion 8,243,592 8,877,498
ConclusionsCash flows 754,085 772,939 792,264 918,794 9,185,358Value by yield capitalization 4 13.5% 6,705,456 664,392 600,003 541,854 293,938 2,589,032Concluded value -5 $6,700,000
34 Journal of Business Valuation and Economic Loss Analysis Vol. 1 [2006], No. 1, Article 6
http://www.bepress.com/jbvela/vol1/iss1/art6
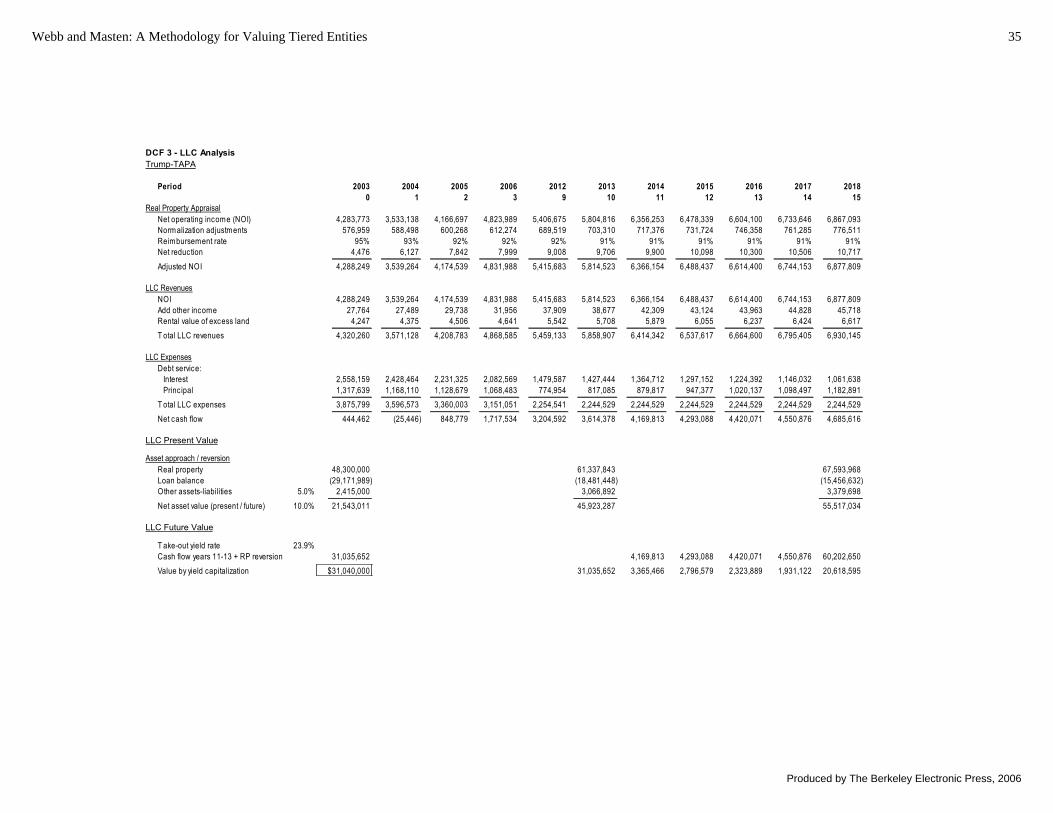
DCF 3 - LLC AnalysisTrump-TAPA
Period 2003 2004 2005 2006 2012 2013 2014 2015 2016 2017 20180 1 2 3 9 10 11 12 13 14 15
Real Property AppraisalNet operating income (NOI) 4,283,773 3,533,138 4,166,697 4,823,989 5,406,675 5,804,816 6,356,253 6,478,339 6,604,100 6,733,646 6,867,093Normalization adjustments 576,959 588,498 600,268 612,274 689,519 703,310 717,376 731,724 746,358 761,285 776,511Reimbursement rate 95% 93% 92% 92% 92% 91% 91% 91% 91% 91% 91%Net reduction 4,476 6,127 7,842 7,999 9,008 9,706 9,900 10,098 10,300 10,506 10,717__________ __________ __________ __________ __________ __________ __________ __________ __________ __________ __________Adjusted NOI 4,288,249 3,539,264 4,174,539 4,831,988 5,415,683 5,814,523 6,366,154 6,488,437 6,614,400 6,744,153 6,877,809
LLC RevenuesNOI 4,288,249 3,539,264 4,174,539 4,831,988 5,415,683 5,814,523 6,366,154 6,488,437 6,614,400 6,744,153 6,877,809Add other income 27,764 27,489 29,738 31,956 37,909 38,677 42,309 43,124 43,963 44,828 45,718Rental value of excess land 4,247 4,375 4,506 4,641 5,542 5,708 5,879 6,055 6,237 6,424 6,617__________ __________ __________ __________ __________ __________ __________ __________ __________ __________ __________T otal LLC revenues 4,320,260 3,571,128 4,208,783 4,868,585 5,459,133 5,858,907 6,414,342 6,537,617 6,664,600 6,795,405 6,930,145
LLC ExpensesDebt service:
Interest 2,558,159 2,428,464 2,231,325 2,082,569 1,479,587 1,427,444 1,364,712 1,297,152 1,224,392 1,146,032 1,061,638Princ ipal 1,317,639 1,168,110 1,128,679 1,068,483 774,954 817,085 879,817 947,377 1,020,137 1,098,497 1,182,891__________ __________ __________ __________ __________ __________ __________ __________ __________ __________ __________
T otal LLC expenses 3,875,799 3,596,573 3,360,003 3,151,051 2,254,541 2,244,529 2,244,529 2,244,529 2,244,529 2,244,529 2,244,529__________ __________ __________ __________ __________ __________ __________ __________ __________ __________ __________Net cash flow 444,462 (25,446) 848,779 1,717,534 3,204,592 3,614,378 4,169,813 4,293,088 4,420,071 4,550,876 4,685,616
LLC Present Value
Asset approach / reversionReal property 48,300,000 61,337,843 67,593,968Loan balance (29,171,989) (18,481,448) (15,456,632)Other assets-liabilities 5.0% 2,415,000 3,066,892 3,379,698___________ ___________ ___________Net asset value (present / future) 10.0% 21,543,011 45,923,287 55,517,034
LLC Future Value
T ake-out yield rate 23.9%Cash flow years 11-13 + RP reversion 31,035,652 4,169,813 4,293,088 4,420,071 4,550,876 60,202,650Value by yield capitalization 4 $31,040,000 31,035,652 3,365,466 2,796,579 2,323,889 1,931,122 20,618,595
35Webb and Masten: A Methodology for Valuing Tiered Entities
Produced by The Berkeley Electronic Press, 2006
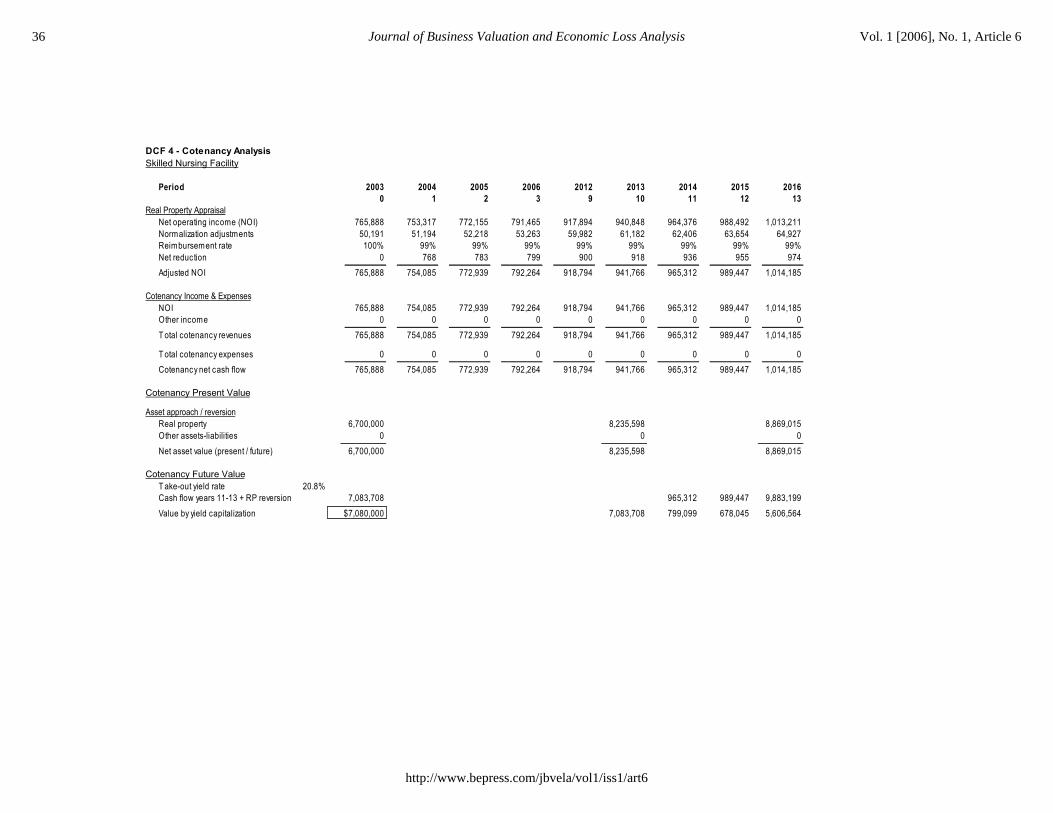
DCF 4 - Cotenancy AnalysisSkilled Nursing Facility
Period 2003 2004 2005 2006 2012 2013 2014 2015 20160 1 2 3 9 10 11 12 13
Real Property AppraisalNet operating income (NOI) 765,888 753,317 772,155 791,465 917,894 940,848 964,376 988,492 1,013,211Normalization adjustments 50,191 51,194 52,218 53,263 59,982 61,182 62,406 63,654 64,927Reimbursement rate 100% 99% 99% 99% 99% 99% 99% 99% 99%Net reduction 0 768 783 799 900 918 936 955 974__________ __________ __________ __________ __________ __________ __________ __________ __________Adjusted NOI 765,888 754,085 772,939 792,264 918,794 941,766 965,312 989,447 1,014,185
Cotenancy Income & ExpensesNOI 765,888 754,085 772,939 792,264 918,794 941,766 965,312 989,447 1,014,185Other income 0 0 0 0 0 0 0 0 0__________ __________ __________ __________ __________ __________ __________ __________ __________T otal cotenancy revenues 765,888 754,085 772,939 792,264 918,794 941,766 965,312 989,447 1,014,185
T otal cotenancy expenses 0 0 0 0 0 0 0 0 0__________ __________ __________ __________ __________ __________ __________ __________ __________Cotenancy net cash flow 765,888 754,085 772,939 792,264 918,794 941,766 965,312 989,447 1,014,185
Cotenancy Present Value
Asset approach / reversionReal property 6,700,000 8,235,598 8,869,015Other assets-liabilities 0 0 0___________ ___________ ___________Net asset value (present / future) 6,700,000 8,235,598 8,869,015
Cotenancy Future ValueT ake-out yield rate 20.8%Cash flow years 11-13 + RP reversion 7,083,708 965,312 989,447 9,883,199Value by yield capitalization 4 $7,080,000 7,083,708 799,099 678,045 5,606,564
36 Journal of Business Valuation and Economic Loss Analysis Vol. 1 [2006], No. 1, Article 6
http://www.bepress.com/jbvela/vol1/iss1/art6
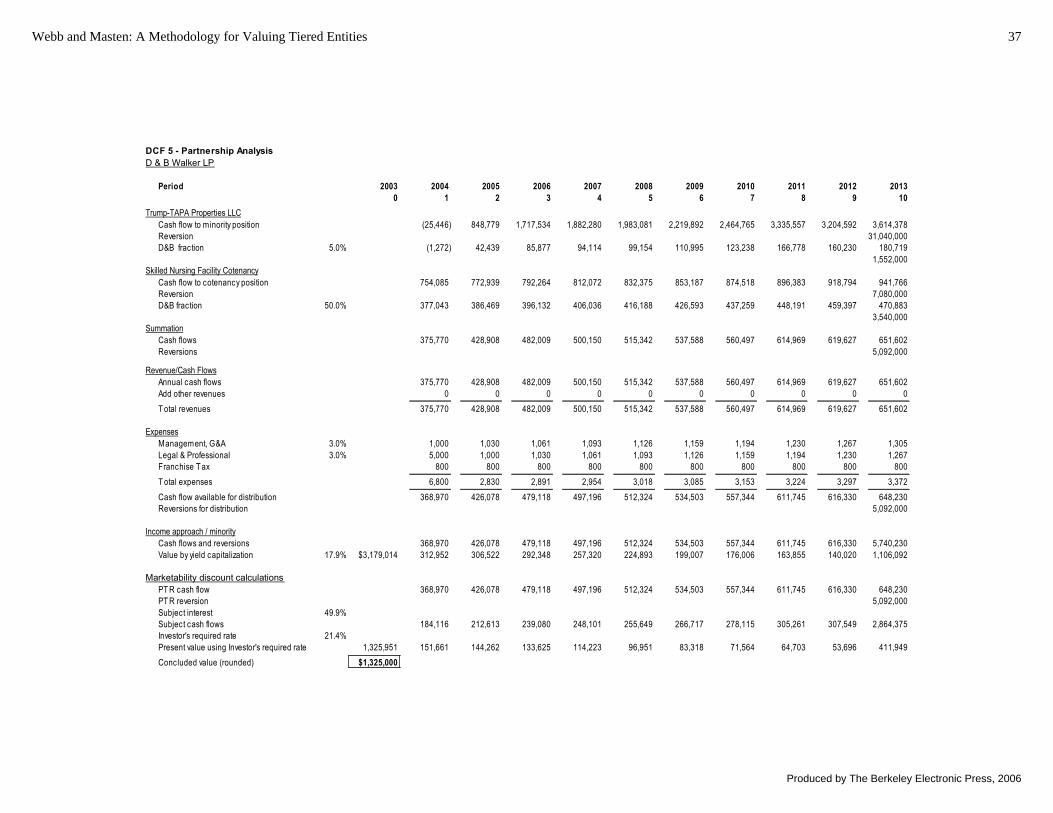
DCF 5 - Partnership AnalysisD & B Walker LP
Period 2003 2004 2005 2006 2007 2008 2009 2010 2011 2012 20130 1 2 3 4 5 6 7 8 9 10
Trump-TAPA Properties LLCCash flow to minority position (25,446) 848,779 1,717,534 1,882,280 1,983,081 2,219,892 2,464,765 3,335,557 3,204,592 3,614,378Reversion 31,040,000D&B fraction 5.0% (1,272) 42,439 85,877 94,114 99,154 110,995 123,238 166,778 160,230 180,719
1,552,000Skilled Nursing Facility Cotenancy
Cash flow to cotenancy position 754,085 772,939 792,264 812,072 832,375 853,187 874,518 896,383 918,794 941,766Reversion 7,080,000D&B fraction 50.0% 377,043 386,469 396,132 406,036 416,188 426,593 437,259 448,191 459,397 470,883
3,540,000Summation
Cash flows 375,770 428,908 482,009 500,150 515,342 537,588 560,497 614,969 619,627 651,602Reversions 5,092,000
Revenue/Cash FlowsAnnual cash flows 375,770 428,908 482,009 500,150 515,342 537,588 560,497 614,969 619,627 651,602Add other revenues 0 0 0 0 0 0 0 0 0 0__________ __________ __________ __________ __________ __________ __________ __________ __________ __________T otal revenues 375,770 428,908 482,009 500,150 515,342 537,588 560,497 614,969 619,627 651,602
ExpensesManagement, G&A 3.0% 1,000 1,030 1,061 1,093 1,126 1,159 1,194 1,230 1,267 1,305Legal & Professional 3.0% 5,000 1,000 1,030 1,061 1,093 1,126 1,159 1,194 1,230 1,267Franchise Tax 800 800 800 800 800 800 800 800 800 800__________ __________ __________ __________ __________ __________ __________ __________ __________ __________T otal expenses 6,800 2,830 2,891 2,954 3,018 3,085 3,153 3,224 3,297 3,372__________ __________ __________ __________ __________ __________ __________ __________ __________ __________Cash flow available for distribution 368,970 426,078 479,118 497,196 512,324 534,503 557,344 611,745 616,330 648,230Reversions for distribution 5,092,000
Income approach / minorityCash flows and reversions 368,970 426,078 479,118 497,196 512,324 534,503 557,344 611,745 616,330 5,740,230Value by yield capitalization 17.9% $3,179,014 312,952 306,522 292,348 257,320 224,893 199,007 176,006 163,855 140,020 1,106,092
Marketability discount calculationsPT R cash flow 368,970 426,078 479,118 497,196 512,324 534,503 557,344 611,745 616,330 648,230PT R reversion 5,092,000Subject interest 49.9%Subject cash flows 184,116 212,613 239,080 248,101 255,649 266,717 278,115 305,261 307,549 2,864,375Investor's required rate 21.4%Present value using Investor's required rate 1,325,951 151,661 144,262 133,625 114,223 96,951 83,318 71,564 64,703 53,696 411,949Concluded value (rounded) $1,325,000
37Webb and Masten: A Methodology for Valuing Tiered Entities
Produced by The Berkeley Electronic Press, 2006