Journal of Archaeological Science - National Institute of ...
14
Contents lists available at ScienceDirect Journal of Archaeological Science: Reports journal homepage: www.elsevier.com/locate/jasrep Remote sensing investigation of the Buddhist archaeological landscape around Sannati, India Ekta Gupta ⁎ , M.B. Rajani, Srikumar Menon National Institute of Advanced Studies, IISc Campus, Bangalore, India ARTICLEINFO Keywords: Sannati Stupa Crop-mark Soil-mark Landscape archaeology Kanaganahalli Remote sensing ABSTRACT In a country like India which has a long history of human occupancy and rich cultural heritage, identification of potential archaeological sites is essential before they get fully obliterated due to rapid urbanization, large-scale infrastructure development and mechanised agriculture activities. In this study, an important Buddhist site Sannati (which dates back to Maurya period, 3rd century BCE) and its surrounding, is investigated. Earlier investigations have uncovered a fortified mound, Vihara complex, habitation site and 3 stupa mounds in this region. The present study develops simple and cost-effective ways to identify potential buried archaeological sites and mounds using the knowledge of known sites and visual interpretation of remote sensing images of the region. This study has successfully located several archaeologically potential sites in the study area that now require archaeological investigation on ground. The developed approach can be applied to investigate other similar buried/undiscovered potential archaeological sites. 1. Introduction Archaeologists have been using field-walking methods for site pro- spections since the time archaeological studies began. Later during the mid-20th century CE, another method called aerial survey became popular. Presently, with the availability of high tech aerial and satellite products such as Hyperspectral images (Cavalli et al., 2007), RADAR (Chen et al., 2017; Tapete and Cigna, 2017) and LiDAR (Hesse, 2010) data and complex automated algorithm, site prospection has become possible even for the sites that are imperceptible on ground (Rowlands and Sarris, 2007). But complexities in data processing, high cost and unavailability of ready data, often restricts their use. Therefore, there is a need to make the best use of what is readily available and easily accessible. The present study is advocating a methodology that is ro- bust, simple, cost effective and can be easily adapted with little training. In India, early historic Buddhist sites (3rd Century BCE to 2rd Century CE) have been found from north, extending for thousands of square kilometres to central, east and further in the south to the States of Andhra Pradesh and Karnataka. One of these Buddhist sites has been discovered in Sannati, Karnataka. Ground surveys of Sannati by Seshadri (1965) (Rowlands and Sarris, 2007) threw up a large number of artefacts of Buddhist association, such as relief carvings on slabs, archaeological mounds as well as remains of stupas. The presence of artefacts of Early Historic periods and remnants of Buddhist structures led to a series of archaeological exploration and excavation in this re- gion (Poonacha, 2011a). Excavations by Sundara (1986–87) (Howell et al., 1995) and Howell (1986–1989) (Howell et al., 1995) revealed a habitation site and the remains of a brick stupa, respectively. Archae- ological investigations in this region so far have found a fortified mound (Ranamandala) (Poonacha, 2011b), one potential habitation site (Poonacha, 2011c) (labelled as SAN 8 in Howell's report (Howell et al., 1995)), Benagutti Vihara Complex (Indian Archaeology, 2003; Deshmanya, 2007) and three stupa mounds (Poonacha, 2011d) (see Fig.1 forlocationsofallthesesites).Inadditiontothesearchaeological structures, profound artistic richness on the slabs of Kanaganahalli stupa indicates that this site could have been a major stupa site and therefore, it could potentially be a part of a large cluster of stupas and other associated structures, similar to clusters in Nagarjunakonda, Sanchi, Sarnath and Lauriya Nandangarh. Thus, this entire region so- licits further archaeological investigation and it is also imperative to identify remains or their traces before they are lost to the fast-changing land use. With this background, the present study has been carried out with the hypothesis that with a site as important as Sannati and Kanaganahalli in the vicinity and the presence of the stupa mounds or mounds similar to that across the river as far as Sirival Village, the possibility of the presence of unidentified/undocumented Buddhist https://doi.org/10.1016/j.jasrep.2019.04.009 Received 5 June 2018; Received in revised form 28 March 2019; Accepted 9 April 2019 ⁎ Corresponding author. E-mail address: [email protected] (E. Gupta). Journal of Archaeological Science: Reports 25 (2019) 294–307 2352-409X/ © 2019 Elsevier Ltd. All rights reserved. T
-
Upload
khangminh22 -
Category
Documents
-
view
8 -
download
0
Transcript of Journal of Archaeological Science - National Institute of ...

Contents lists available at ScienceDirect
Journal of Archaeological Science: Reports
journal homepage: www.elsevier.com/locate/jasrep
Remote sensing investigation of the Buddhist archaeological landscapearound Sannati, IndiaEkta Gupta⁎, M.B. Rajani, Srikumar MenonNational Institute of Advanced Studies, IISc Campus, Bangalore, India
A R T I C L E I N F O
Keywords:SannatiStupaCrop-markSoil-markLandscape archaeologyKanaganahalliRemote sensing
A B S T R A C T
In a country like India which has a long history of human occupancy and rich cultural heritage, identification ofpotential archaeological sites is essential before they get fully obliterated due to rapid urbanization, large-scaleinfrastructure development and mechanised agriculture activities. In this study, an important Buddhist siteSannati (which dates back to Maurya period, 3rd century BCE) and its surrounding, is investigated. Earlierinvestigations have uncovered a fortified mound, Vihara complex, habitation site and 3 stupa mounds in thisregion. The present study develops simple and cost-effective ways to identify potential buried archaeologicalsites and mounds using the knowledge of known sites and visual interpretation of remote sensing images of theregion. This study has successfully located several archaeologically potential sites in the study area that nowrequire archaeological investigation on ground. The developed approach can be applied to investigate othersimilar buried/undiscovered potential archaeological sites.
1. Introduction
Archaeologists have been using field-walking methods for site pro-spections since the time archaeological studies began. Later during themid-20th century CE, another method called aerial survey becamepopular. Presently, with the availability of high tech aerial and satelliteproducts such as Hyperspectral images (Cavalli et al., 2007), RADAR(Chen et al., 2017; Tapete and Cigna, 2017) and LiDAR (Hesse, 2010)data and complex automated algorithm, site prospection has becomepossible even for the sites that are imperceptible on ground (Rowlandsand Sarris, 2007). But complexities in data processing, high cost andunavailability of ready data, often restricts their use. Therefore, there isa need to make the best use of what is readily available and easilyaccessible. The present study is advocating a methodology that is ro-bust, simple, cost effective and can be easily adapted with littletraining.
In India, early historic Buddhist sites (3rd Century BCE to 2rdCentury CE) have been found from north, extending for thousands ofsquare kilometres to central, east and further in the south to the Statesof Andhra Pradesh and Karnataka. One of these Buddhist sites has beendiscovered in Sannati, Karnataka. Ground surveys of Sannati bySeshadri (1965) (Rowlands and Sarris, 2007) threw up a large numberof artefacts of Buddhist association, such as relief carvings on slabs,archaeological mounds as well as remains of stupas. The presence of
artefacts of Early Historic periods and remnants of Buddhist structuresled to a series of archaeological exploration and excavation in this re-gion (Poonacha, 2011a). Excavations by Sundara (1986–87) (Howellet al., 1995) and Howell (1986–1989) (Howell et al., 1995) revealed ahabitation site and the remains of a brick stupa, respectively. Archae-ological investigations in this region so far have found a fortifiedmound (Ranamandala) (Poonacha, 2011b), one potential habitationsite (Poonacha, 2011c) (labelled as SAN 8 in Howell's report (Howellet al., 1995)), Benagutti Vihara Complex (Indian Archaeology, 2003;Deshmanya, 2007) and three stupa mounds (Poonacha, 2011d) (seeFig. 1 for locations of all these sites). In addition to these archaeologicalstructures, profound artistic richness on the slabs of Kanaganahallistupa indicates that this site could have been a major stupa site andtherefore, it could potentially be a part of a large cluster of stupas andother associated structures, similar to clusters in Nagarjunakonda,Sanchi, Sarnath and Lauriya Nandangarh. Thus, this entire region so-licits further archaeological investigation and it is also imperative toidentify remains or their traces before they are lost to the fast-changingland use.
With this background, the present study has been carried out withthe hypothesis that with a site as important as Sannati andKanaganahalli in the vicinity and the presence of the stupa mounds ormounds similar to that across the river as far as Sirival Village, thepossibility of the presence of unidentified/undocumented Buddhist
https://doi.org/10.1016/j.jasrep.2019.04.009Received 5 June 2018; Received in revised form 28 March 2019; Accepted 9 April 2019
⁎ Corresponding author.E-mail address: [email protected] (E. Gupta).
Journal of Archaeological Science: Reports 25 (2019) 294–307
2352-409X/ © 2019 Elsevier Ltd. All rights reserved.
T

archaeological features in the study area is quite high. The study hasbeen carried out using simple and easy to apply remote sensingmethods to identify buried sites and archaeological mounds.
2. Study area
The geographical extent chosen for this study was determined bytaking historical sites around the Sannati into consideration. The ex-treme coordinates of the study area are 16°52′10.54″N, 76°52′30.61″E,16°48′12.11″N, and 76°56′22.39″E covering an area of 51 sq. km.
2.1. Physical conditions
The extent includes regions on either side of river Bhima where theriver flowing in a southerly direction, makes a sharp turn and takes anortherly course (uttaravahini) and then turn to the east. The river alsoacts as a dividing line between the talukas1 of Chitapur and Shahpur.Sannati, Benagutti, Kanaganahalli and Anegutti are situated on the leftbank of Bhima in Chitapur. On the right bank lies Hasargundgi andSirival in Shahpur (ref Fig. 1).
The study area largely has Precambrian geological formation com-posed of Bhima group limestone and shales. This region is largelycovered with rich Black cotton soil (Vertisol). The climate in this regionvaries with seasons. January to February is winter season which isfollowed by hot and very dry summer from March to May. It receivesmonsoon rainfall from June to September with annual rainfall varyingfrom 50 to 60 cm (Karnataka Gazetteer, n.d.). The region is primarilyoccupied with agricultural land-use and pockets of small village set-tlements. A range of crops is grown in this region such as cotton, sun-flower, groundnut, jowar, rice, maize, wheat, etc. and have differentsowing and harvesting season (http://raitamitra.kar.nic.in/
statistics.html, n.d.). The land-use is more or less the same in the past50 years except addition of few more roads and canal.
2.2. Historical background
Sannati (also spelt Santi, Sanati, Sannathi or Sonthi) and its sur-roundings have been considered as one of the largest and oldestBuddhist centres of Karnataka (Chittaranjan, 2004a). Buddhist activityat this site can be traced back to the Maurya period (middle of 3rdcentury BCE) and the monastic community continued to expand overthe next six hundred years after which the centre seems to have beenabandoned. The region later came to prominence as a Sakta centrewhen a small temple, for goddess Chandralamba, at the site became animportant place of worship (Quintanilla, 2017). The only Major andSpecial Edicts of the Maurya Emperor Ashoka to be discovered inKarnataka are in Sannati (Talim, 2010). Hence the region is consideredsignificant (Chittaranjan, 2004b) as the possible southernmost outpostof the Maurya Empire.
2.3. Archaeological explorations and excavations
In a ground survey of the region (published in 1965), M. Seshadrinoticed a number of relief slabs in and around the precinct ofChandralamba temple depicting Buddha's birth, throne, footprints andthe Bodhi tree. These slabs are thought to have cladded the drum andother parts of Buddhist stupas that were constructed or enlarged andembellished during Satavahana rule in the region. Seshadri had alsoreported remains of a circular structure with highly decorated relief andAyaka pillars (which was later identified as Kanaganahalli Stupa) andtwo potential stupa mounds in the vicinity. In a subsequent investiga-tion of the site, M.S. Nagaraja Rao and his team identified remains ofstupas at various localities at Sannati. Since these records do notmention geographical coordinates of the identified stupas, it has notbeen possible to know which ones they are referring to. Following arethe sites explored and excavated by field archaeologists:
Fig. 1. a) Extent of Early Satavahanas (adapted from huntingtonarchive (n.d.)); b) major stupa sites in Andhra and Karnataka region (Shimada and Willis, 2016) c)study area.
1 Taluka is an administrative division in India comprising of a city or a townthat serves as its administrative center with additional a few towns and numberof villages.
E. Gupta, et al. Journal of Archaeological Science: Reports 25 (2019) 294–307
295
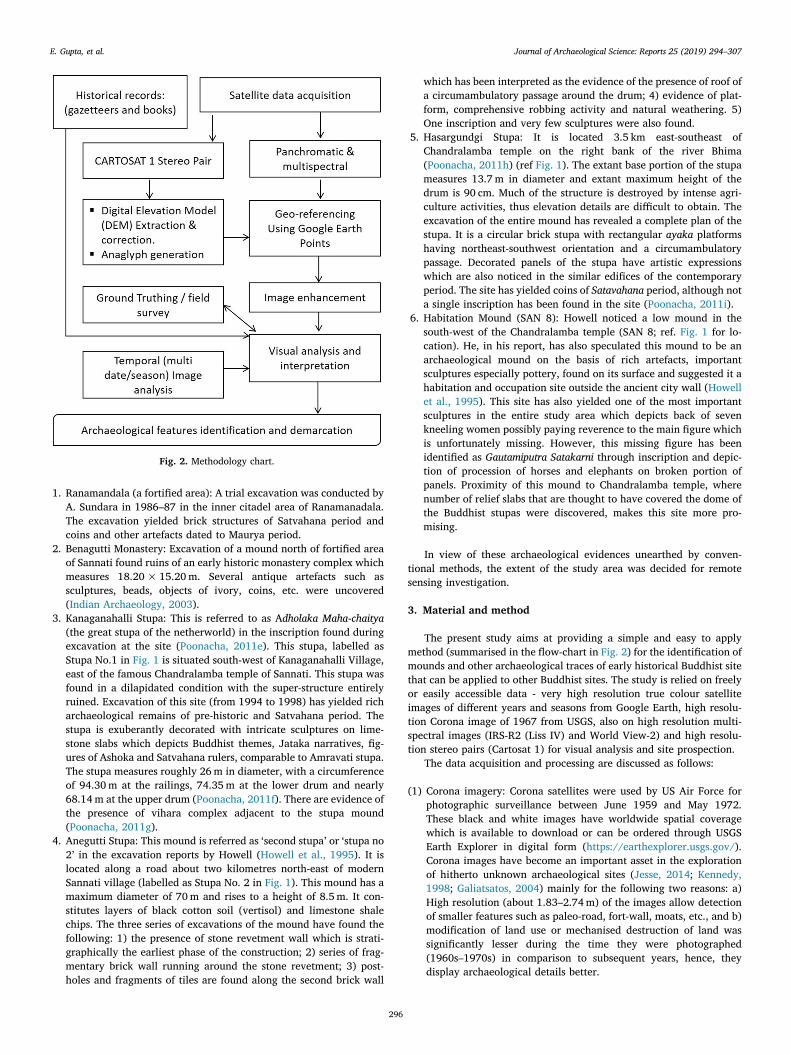
1. Ranamandala (a fortified area): A trial excavation was conducted byA. Sundara in 1986–87 in the inner citadel area of Ranamanadala.The excavation yielded brick structures of Satvahana period andcoins and other artefacts dated to Maurya period.
2. Benagutti Monastery: Excavation of a mound north of fortified areaof Sannati found ruins of an early historic monastery complex whichmeasures 18.20×15.20m. Several antique artefacts such assculptures, beads, objects of ivory, coins, etc. were uncovered(Indian Archaeology, 2003).
3. Kanaganahalli Stupa: This is referred to as Adholaka Maha-chaitya(the great stupa of the netherworld) in the inscription found duringexcavation at the site (Poonacha, 2011e). This stupa, labelled asStupa No.1 in Fig. 1 is situated south-west of Kanaganahalli Village,east of the famous Chandralamba temple of Sannati. This stupa wasfound in a dilapidated condition with the super-structure entirelyruined. Excavation of this site (from 1994 to 1998) has yielded richarchaeological remains of pre-historic and Satvahana period. Thestupa is exuberantly decorated with intricate sculptures on lime-stone slabs which depicts Buddhist themes, Jataka narratives, fig-ures of Ashoka and Satvahana rulers, comparable to Amravati stupa.The stupa measures roughly 26m in diameter, with a circumferenceof 94.30m at the railings, 74.35m at the lower drum and nearly68.14m at the upper drum (Poonacha, 2011f). There are evidence ofthe presence of vihara complex adjacent to the stupa mound(Poonacha, 2011g).
4. Anegutti Stupa: This mound is referred as ‘second stupa’ or ‘stupa no2’ in the excavation reports by Howell (Howell et al., 1995). It islocated along a road about two kilometres north-east of modernSannati village (labelled as Stupa No. 2 in Fig. 1). This mound has amaximum diameter of 70m and rises to a height of 8.5m. It con-stitutes layers of black cotton soil (vertisol) and limestone shalechips. The three series of excavations of the mound have found thefollowing: 1) the presence of stone revetment wall which is strati-graphically the earliest phase of the construction; 2) series of frag-mentary brick wall running around the stone revetment; 3) post-holes and fragments of tiles are found along the second brick wall
which has been interpreted as the evidence of the presence of roof ofa circumambulatory passage around the drum; 4) evidence of plat-form, comprehensive robbing activity and natural weathering. 5)One inscription and very few sculptures were also found.
5. Hasargundgi Stupa: It is located 3.5 km east-southeast ofChandralamba temple on the right bank of the river Bhima(Poonacha, 2011h) (ref Fig. 1). The extant base portion of the stupameasures 13.7 m in diameter and extant maximum height of thedrum is 90 cm. Much of the structure is destroyed by intense agri-culture activities, thus elevation details are difficult to obtain. Theexcavation of the entire mound has revealed a complete plan of thestupa. It is a circular brick stupa with rectangular ayaka platformshaving northeast-southwest orientation and a circumambulatorypassage. Decorated panels of the stupa have artistic expressionswhich are also noticed in the similar edifices of the contemporaryperiod. The site has yielded coins of Satavahana period, although nota single inscription has been found in the site (Poonacha, 2011i).
6. Habitation Mound (SAN 8): Howell noticed a low mound in thesouth-west of the Chandralamba temple (SAN 8; ref. Fig. 1 for lo-cation). He, in his report, has also speculated this mound to be anarchaeological mound on the basis of rich artefacts, importantsculptures especially pottery, found on its surface and suggested it ahabitation and occupation site outside the ancient city wall (Howellet al., 1995). This site has also yielded one of the most importantsculptures in the entire study area which depicts back of sevenkneeling women possibly paying reverence to the main figure whichis unfortunately missing. However, this missing figure has beenidentified as Gautamiputra Satakarni through inscription and depic-tion of procession of horses and elephants on broken portion ofpanels. Proximity of this mound to Chandralamba temple, wherenumber of relief slabs that are thought to have covered the dome ofthe Buddhist stupas were discovered, makes this site more pro-mising.
In view of these archaeological evidences unearthed by conven-tional methods, the extent of the study area was decided for remotesensing investigation.
3. Material and method
The present study aims at providing a simple and easy to applymethod (summarised in the flow-chart in Fig. 2) for the identification ofmounds and other archaeological traces of early historical Buddhist sitethat can be applied to other Buddhist sites. The study is relied on freelyor easily accessible data - very high resolution true colour satelliteimages of different years and seasons from Google Earth, high resolu-tion Corona image of 1967 from USGS, also on high resolution multi-spectral images (IRS-R2 (Liss IV) and World View-2) and high resolu-tion stereo pairs (Cartosat 1) for visual analysis and site prospection.
The data acquisition and processing are discussed as follows:
(1) Corona imagery: Corona satellites were used by US Air Force forphotographic surveillance between June 1959 and May 1972.These black and white images have worldwide spatial coveragewhich is available to download or can be ordered through USGSEarth Explorer in digital form (https://earthexplorer.usgs.gov/).Corona images have become an important asset in the explorationof hitherto unknown archaeological sites (Jesse, 2014; Kennedy,1998; Galiatsatos, 2004) mainly for the following two reasons: a)High resolution (about 1.83–2.74m) of the images allow detectionof smaller features such as paleo-road, fort-wall, moats, etc., and b)modification of land use or mechanised destruction of land wassignificantly lesser during the time they were photographed(1960s–1970s) in comparison to subsequent years, hence, theydisplay archaeological details better.
Fig. 2. Methodology chart.
E. Gupta, et al. Journal of Archaeological Science: Reports 25 (2019) 294–307
296

A Corona image of 1967 (Mission 1044-2) of the study area has beenused in the present study. The Corona image when downloaded coverseast-west and a north-south stretch of ~70 km and ~19.5 km respec-tively and includes only approximate coordinates of image corners,therefore, the image has a wide range of geospatial error. Thus, the firsttask was to georeference the imagery. A total of 15 ground controlpoints (GCP) were identified on Google Earth Pro by using the inter-section of the roads and other stable features that could be identified onCorona image. The study area lies at the corner of the image; therefore,more GCPs were identified over the study area to ensure higher accu-racy. First polynomial order transformation has been used along withnearest neighbour resampling method. The georeferenced image couldbe geospatially overlaid exactly on the other multispectral images of theregion. Image enhancement technique (min-max linear stretch) wasapplied for better visualisation and interpretation. While interpretingthe black and white Corona image it was difficult to distinguish be-tween soil-mark and crop-mark but from the knowledge of the regionand the appearance of the known features the marks on the moundsseem to be parch marks and marks on the levelled agricultural fieldsseem to be soil-mark.
(2) Survey of India (SOI) toposheet: The earliest available large-scaletoposheet (1: 25,000) for the study area is for the year 1989–90. Itwas collected from SOI office, Bangalore. The toposheet wasscanned and georeferenced using ground control points fromGoogle Earth portal with linear transformation type and nearestneighbour sampling method. The toposheet was overlaid with theacquired satellite data to trace the archaeological features.
(3) High-resolution multispectral data: IRS-R2 (LISS IV), IRS-P6 (LISSIV) and World View-2 (ref Table 1) data has been used for creating aFalse Color Composite image (which consist of a green, red andinfrared region of the spectrum).
(4) Stereo data: Cartosat 2 stereo data has been used to generate DEMand anaglyph image2 using the software Erdas Imagine. Since thestudy area has characteristics (such as flat terrain, no forest coverand no tall buildings) that minimises inaccuracy, a DEM of 5m gridspacing was created (Deo et al., 2016). The coordinates of DEMwere not sitting properly over other images; hence, it was geor-eferenced which requires careful identification of GCPs.
(5) Google Earth (GE)'s historical imagery: GE provides very high re-solution (~0.5m) imageries of different dates. The source and dateof the images available for the region surveyed in the present studyare listed in Table 1. However, there are images of few dates whichare not available for all the sites. The GE images give a good rangeof temporal and seasonal variations, which helps in the identifica-tion of subtle marks and patterns that may get highlighted undercertain seasonal conditions and provide an indication of the pre-sence of any archaeological feature on the surface (Parcak, 2009).
The processed images were chronologically arranged and carefullyanalysed with reference to the published archaeological records andmaps. Identification of the known archaeological sites provided inter-pretation keys for the identification of hitherto unknown/buried po-tential archaeological sites.
4. Results of remote sensing analysis and ground truthing
Remote sensing analysis was carried out following a thorough re-view of archaeological exploration and excavation already undertakenin this region. Corona images which predate excavation ofKanaganahalli, Anegutti and Hasargundgi stupa were analysed to un-derstand how stupa sites look before excavation. The known sites in allthe acquired images has been analysed to identify site-specific inter-pretation keys that led to investigation of potential stupa sites as well asother potential archaeological sites.
4.1. Identification of known stupa sites
4.1.1. Sites that are found in the form of mounds
(1) Kanaganahalli: The location of this excavated stupa is well knownand easily identifiable on very high-resolution satellite images. InCorona image (captured long before the excavation), the site looksas a white circular negative crop-mark of 60m diameter with a darkspot at its centre that suggests an archaeological mound collapsedfrom the centre (ref Fig. 3). The field report by M. Seshadri (1965)(Seshadri, 1965) contemporary to Corona image also mention aboutthis place as a building with circular basement with some relief andmissing superstructure. The distinct tone, texture, size and shape ofKanaganahalli stupa identified in pre-excavation Corona imageguided us to find out the other documented stupa sites and alsolocation of potential sites that are yet to be explored.
After excavation (completed in 2002), this mound was left open andis now has exposed ashlar slabs lying around its broken Anda (dome).Therefore, this stupa doesn't appear as a mound anymore. For the samereason, this stupa cannot be visualised in the anaglyph image as a raisedmound.
(2) Anegutti (Stupa No 2): Approximate location of this stupa mound ismarked in the published maps. However, to come down to the exactlocation, it is required to identify the feature on the satellite image.Identification of Kanaganahalli stupa in Corona image has helped usfinding out Anegutti stupa's location by using the same interpreta-tion keys. The mound appears similar to Stupa no. 1 in tone andtexture but without any dark spot at its centre, which suggest thatmound is intact (ref Fig. 3). The size of this stupa is larger thanStupa no.1. After pointing out this stupa in Corona image, it waseasy to identify it on GE images by referring the location, shape andsize. This stupa can be visualised as a distinct raised round moundthrough anaglyph image. Our field visits and observation has fur-ther confirmed its location.
(3) Stupa No. 3: This is very similar to Anegutti mound from outsideand has not been excavated by archaeologists. It is situated at
Table 1Satellite data acquired/used for the study.
Satellite/sensor Spatial resolution(m)
Date
Corona (1044-2) 1.83–2.74m 10.11.1967IRS-R2 (LISS-4); IRS-P6
(LISS-4)5.8 10.04.2013; 6.04.2007;
3.05.2009CARTOSAT-1 2.5 15.04.2011World View-2 0.5 22.2.2010; 29.03.2012
High-resolution images (~0.5 m) from Google Earth with sources and datesDigital Globe 31/12/2005Digital Globe 30/11/2009Digital Globe 11/04/2011Digital Globe 29/03/2012Digital Globe 21/05/2012CNES/Airbus 20/03/2014CNES/Airbus 28/10/2016Digital Globe 06/01/2017Digital Globe 06/04/2017Digital Globe 14/4/2017
2 Anaglyph images are used to perceive a landscape as three-dimensionalscene by using two images (stereoscopic images) of the same area captured atslightly different angles. These stereo pairs are filtered with two different colorsone for each eye, typically red and cyan. The landscape looks like an ex-aggerated 3D model.
E. Gupta, et al. Journal of Archaeological Science: Reports 25 (2019) 294–307
297

around 1.2 km north-east from Anegutti (ref Figs. 1 & 3). This isidentified as stupa by Howell and marked as Stupa No. 3 (Howellet al., 1995a). This stupa has also been identified using the ap-proximate location marked on Howell's map and from its shape,size, tone and texture which is similar to Anegutti stupa. This stupaalso distinctively visible as a raised round mound in the anaglyph
image. Remote sensing analysis has also brought to our notice that anewly constructed canal is incising the edges of this stupa. Thisencroachment can also be traced using recent years GE images (refFig. 4). This stupa with encroaching canal has also been observedon field.
Fig. 3. Corona image (a1, b1, c1) of Stupas before excavation/exploration and their corresponding recent high-resolution Google Earth image (a2, b2, c2).
Fig. 4. Site of Stupa No. 3; above are images from Google Earth showing the location of the canal (that has been dug recently) scraping the edge of stupa, below is aphoto taken at the site.
E. Gupta, et al. Journal of Archaeological Science: Reports 25 (2019) 294–307
298

While comparing the appearance of Stupa 2 and 3 on satelliteimages, we have found that Stupa 3 being situated on a single parcel ofagricultural land, away from the edges of the parcel, is clearly visible.While three land parcels are abutting Stupa 2 from all the sides andhence, making it less distinctively visible. However, recent canal con-struction on the edge of Stupa 3 has blurred its distinctive shape in therecent images. It is also observed that stupa mounds (stupa no 2 & 3)are more conspicuous when the fields around it have good vegetationgrowth or moister soil condition.
4.1.2. Sites that are found as low mound or as buried foundation
1) Hasargundgi Stupa: Location of this stupa was difficult to identify as
its structural remains on the surface are not visible. The marks werenot visible on Corona image. However, soil-mark (ref Fig. 5a, b & c)and negative crop-mark (ref Fig. 5d) identified near Hasargundgisettlement in the IRS P6 and GE historical images of different datesand years has been associated with the location marked in a contourmap of the stupa site published in an excavation report (Poonacha,2011) This association has been further confirmed by measuringdiameter of the stupa (30m) and the distance between nalla(rivulet) from the centre of the stupa in the contour map and com-paring it with that of the corresponding soil-mark in the FalseColour Infrared Image (ref Fig. 5a) which was the most conspicuousamong all the images. As the location of Hasargundgi stupa is le-velled by agricultural activity, the mound is neither visible on
Fig. 5. Soil-mark of Hasargundgi Stupa on IRS P6 image (a), Google Earth historical imageries (b, c & c); subtle crop-mark of the same stupa is visible on (d).
E. Gupta, et al. Journal of Archaeological Science: Reports 25 (2019) 294–307
299

anaglyph image nor perceivable on ground.
2) Benagutti Vihara: Visual analysis of all available satellite imagescouldn't yield any definite shape and pattern of crop-mark or soilmark in the Benagutti Vihara site. However, a mound is observed inthe anaglyph image and DEM on the location marked in the pub-lished documents (Howell et al., 1995a). The elevation profile of themound is given in the Fig. 7. The location of this mound was furthervisualised in Corona and other satellite images. Brighter tone in theCorona image and negative cropmark on other images was observedon that location. Although, the mark is neither distinctive nor of anydefinitive shape.
3) Habitation Mound (SAN 8): A search of archaeological traces usingsatellite images (Corona and DEM) of SAN 8 region was carried out.A distinctive negative soil-mark, bright in tone, near-circular inshape and more than 100m in diameter was detected (Latitude16°49′36.94″N and Longitude 76°55′3.37″E at the centre of theidentified feature) on Corona imagery (Fig. 6a). This could also belater observed in other images of different dates (both IRS P6 andGE, ref. Fig. 6b & c). On anaglyph image and DEM, a raised mound isfound in the same location which extends beyond the extent of thecrop-mark/soil-mark. The elevation profile of the mound is given inFig. 7. The soil mark on this site, though larger in size, has a strikingresemblance in shape and crop-mark (negative) with Hasargundgistupa and other potential stupas found in the vicinity.
4) An Early Historic mound (labelled as M in Fig. 1), located east ofSirival village, has got completely obliterated due to the extensivestone quarry in that area, hence, cannot be identified on any imageor on ground.
4.2. Identification of potential archaeological sites
Identification of known archaeological sites on satellite images hasprovided the main interpretation keys to explore unidentified stupa andother potential archaeological sites in the vicinity. Following are in-terpretation keys that are found to be associated with Buddhist ar-chaeological sites in the study area. These are mainly- bright tone, acircular shape, smooth texture, light-toned soil mark and negative crop-mark/parch mark. Bright tone can be attributed to shallow depth of soilover the buried archaeological site. The shallow soil above a buriedfeature get much drier than its surrounding deeper soil due to intenseheat during the summer. Shallow depth also discourages vegetationgrowth and hence leaves negative cropmark. In general, mounds areround in shape. In case of stupa, they form a very distinctive round
shape. The basement of stupa also forms a circular shape leaving somecircular marks of buried structure visible on ground. Following poten-tial sites have been traced from the image analysis and their coordinatesare listed along with the other known stupa sites in Table 2.
4.2.1. A cluster of possible stupas in the vicinity of Anegutti (Stupa No. 2)mound:
Visual analysis of Corona image of 1967 led to the identification ofother circular parch-marks/soil mark which are similar to the otheridentified known stupa mounds. All the acquired subsequent multi-spectral images of the different time periods from 2005 to 2017 wereanalysed (ref. Table 1) to assess the continuity of the traces of identifiedcrop-marks/soil-mark. The continuity of the traces has been observed,that indicated that these marks are not temporary. Through the visualanalysis, it is observed that summer is the best time to get the crop/parch/soil marks. Soil-marks of P1 and P2 on late summer images (refFig. 8e & f) are more conspicuous than any other available images ofdifferent season (this also corresponds to harvesting season). P3 is moredistinct in Fig. 8c when there are crops on field around the stupa mark.In Fig. 8a, P1 and P3 measures ~60m in diameter and are slightlysmaller than Anegutti mound. P1 has lighter and mixed tone whichsuggests that it is more damaged than P3. Parch-mark/soil-mark P2(100m in diameter) which forms a bright colour annulus shaped fea-ture, bigger than P1, P3 and Stupa No. 2, could be remnant of stonypaving of circumambulatory passage of a stupa. The toposheet andmulti-temporal images reveal that P3 has been gradually transformedfrom a mound to completely levelled plantation site and can be tracedas negative crop-mark (ref Fig. 8h.)
On ground survey, we have found abundance of shale chips over P3area (ref Fig. 9). These shales chips are very similar to the material withwhich Stupa no. 2 and 3 are covered. Howell suggests that the topportion of the dome of stupa no. 2 was covered with shale chips whichin the final period of destruction slumped down from the top andcovered the entire structure (Howell et al., 1995b). The presence of thismaterial in a circular form at P3 sites gives us good reasons to probefurther. There are no visible indications of other two identified sites P1& P2. Their absence can be attributed to heavy agricultural activitiesthat destroys the entire structure gradually and levelled the surface as itis happening in case of P3 and excavated stupa Hasargundgi. In Surveyof India toposheet (ref no. 56 D/13/SE; surveyed in 1989–90), Stupa No2, Stupa No 3, and P3 have been marked as stony waste (ref Fig. 8b).Out of these three stony waste features marked in the toposheet, twohave been found to be Stupas, which suggest that P3 could also be asimilar structure.
Spatial distribution of P1, P2 and P3 along with Stupa no 2 form a
Fig. 6. Soil-mark (a, b & c) on the location of SAN 8 “habitation mound”.
E. Gupta, et al. Journal of Archaeological Science: Reports 25 (2019) 294–307
300

square pattern. It has been observed in some of the famous Buddhistsites that stupas are arranged in a cluster, forming a definitive geo-metric shape. For example, stupas in Lauriya Nandagarh(Archaeological Survey Of India, 2019) are arranged in three rows, twoof which are parallel to each other and perpendicular to the third row.Such patterns in Buddhist sites support the possibility of cluster of 4stupas around Stupa no. 2. If this speculation is true, then P2 would bethe largest stupa in this region.
False calls: In IRS P6 - May 2009 image, two more circular markssimilar in size to Anegutti stupa were found in the vicinity of thiscluster, but their tone and texture were different from other identifiedstupa sites. These crop-marks were not observed in any other imageexcept the May 2012 image of GE. Presence of stacks of the gatheredcrop in the image of May 2012 led us to associate the mark with har-vesting season (ref. Fig. 10). It was later confirmed on the field visitwhere we could see a light colour solid circle on the field from the topof Anegutti hill which was found to be remnants of dried harvestedcrop. Such deceptive crop-marks/soil-marks can be misleading; hence,
one has to be cautious while interpreting and has to find supportiveevidence from multiple sources.
4.2.2. Other potential sitesA similar crop-mark/soil-mark is found along the left side of the
northerly bend of the river Bhima opposite to Anabi (Labelled as P4 inFig. 14). This soil-mark has a circular shape and diameter of around100m. Occurrence of this feature in the several available images (LISS4, Corona and GE May 2012) and its similarity with the crop/soil-markof known sites suggests presence of a buried structure (ref Fig. 11).
There is another crop-mark on the western end of Sirival village thatseems to be archaeologically potential (Labelled as P5 in Fig. 14). Thiscrop-mark did not catch our attention until we examined it in Coronaimage (Fig. 12a). In the monochromatic Corona image, this featureappears as a dark-toned square of ~160×160m, inside which there isa circular feature of brighter tone with a diameter of ~100m (refFig. 12a). This feature has been observed in all the historical images ofGE. The GE images show a progressive increase in area being quarriedfrom the south-eastern side in the year 2005 (~180m2) which hasexpanded to its north at present (~1500m2) (ref Fig. 12b and c).However, this scar is not observed in Corona image of 1967 (Fig. 12a).On field visit (which was for ground truthing and not an intensive ar-chaeological survey) no dressed stone or artefacts were observed on thesite but a substantial amount of stone quarrying was evident. Themound couldn't be approached due to the presence of dumped quarrydebris and wild vegetation over it. It is possible to think that the centralcircular mound might have formed from the heap of stone debris pro-duced due to stone quarrying, but the Corona image of the year 1967shows the mound clearly without any quarry scars. In addition, theearliest available GE image of the year 2005 also shows the same sizemound and a small trench of quarried stones which is too small(~180m2) to produce such a huge debris mound (~8900m2).
This analysis led us to contemplate the nature of this mound, howand when it was formed. Is it an ancient quarry site that had been usedto remove stones for the construction of the 8th–10th Centuries CE
Fig. 7. DEM and elevation profile of Benagutti mound and “habitation mound” SAN 8 created in Erdas Imagine.
Table 2List of documented stupa site and identified possible archaeological structureswith coordinates.
Stupa Location (point taken at the centre of the feature)
Latitude Longitude
Stupa no. 1 (Kanaganahalli) 16°50′7.79″N 76°56′3.83″EStupa no. 2 (Anegutti) 16°50′47.70″N 76°55′31.35″EStupa no. 3 16°51′22.87″N 76°55′52.96″EHasargundgi 16°48′42″N 76°54′43″EP1 16°50′50.34″N 76°55′28.65″EP2 16°50′52.68″N 76°55′33.61″EP3 16°50′50.37″N 76°55′34.87″EP4 16°51′15.11″N 76°54′37.52″EP5 16°49′37.47″N 76°55′2.79″E
E. Gupta, et al. Journal of Archaeological Science: Reports 25 (2019) 294–307
301

Rashtrakuta temples at Sirival? or does it hold any other archaeologicalimportance since it is located in Sirival - a place with the largest clusterof temples of Rashtrakutas period? (Patil and Balasubramanya, 2001a)This led us to further question why no historical structure, whether it beof Rashtrakuta period or later period, has been found in this particulararea, whereas, historical monuments are scattered all over the Sirivalvillage and even across the river (ref Fig. 13a). Another important ob-servation that has been made in the present study is the location of thisfeature. Through visual analysis, it is found that its location is quitecomparable with that of Hasargundgi Stupa i.e. both of them are si-tuated between the right bank of a river bend and village settlement (refFig. 13). While investigating whether Sirival has any association withBuddhism, it is found that archaeologists have recovered a slab withstupa carving of the early historic period at Sirival (Patil andBalasubramanya, 2001b). Absence of any historical structure (sub-sequent to Satavahana, including Rashtrakuta) over the identified fea-ture suggests that the mound might be older than Rashtrakuta periodand for some reason, people avoided building over it. However, it isdifficult to reach any conclusion without detailed field investigation.Therefore, a thorough field exploration on site is suggested for in-vestigating its archaeological potential.
5. Discussion
5.1. Remote sensing and site identification
The analysis of Corona image of 1967 to identify all the knownstupa sites and other archaeological mounds provided us interpretationkeys that helped us towards the identification of similar but unknownfeatures in the vicinity. The image has also pointed out a few unknownsites that looks similar to known mounds but at present they have gotcompletely levelled. However, analysis of other satellite images showspresence of spectral anomaly on their respective location. Investigationwas done to identify such spectral anomalies in the remaining studyarea. To avoid inclusion of false calls (wrong identification of a feature),
multiple images of different dates/seasons/years assisted in eliminatingthem. The confidence level to consider an identified site as a potentialarchaeological site becomes higher if there is a continuity in its pre-sence in the images of multiple dates and seasons.
The sequence of these images has also helped in tracing the gradualdestruction of archaeological mounds that has occurred in the recentyears as in case of P3, which is very important to understand how someof the sites would have been destroyed in the past. Seasonal landcoverconditions play a crucial role in the visibility of subtle crop/soil marksof buried features. In the present study, it is found that these marks arebetter discernible in the images obtained in the month of March, Apriland May (summer season) which is the time when fields are ploughed,and climatic condition is hot and dry. Patterns due to moisture varia-tion in soil is almost imperceptible from the ground but can be detectedas a subtle difference in colour of soil and vegetation on aerial photo-graphs or satellite image (Parcak, 2009) (Navalgund and Rajani, 2017).Raised mounds are found more conspicuous when the soil around themhas more moisture or good growth of crops or when the mound doesn'tshare boundaries with more than one field. In the present study, thisvariation has been an important key to identify the potential sites, ofwhich soil marks were the most useful.
The resolution of DEM was not good enough to visualise all themounds. It is found that DEM can be used to visualise features withdiameter approximately more than 100m. Mounds smaller than thatcan be visualised in 3D in Anaglyph. Mounds found on the location ofcrop/soil-mark suggest possibility of potential archaeological site.Because of levelling of the ground, none of the identified unknown sitesare found to be a mound. Summary of remote sensing analysis is givenin Table 3.
5.2. Limitations of the method used
The methodology used in this study is simple and can be easilyapplied to other similar Buddhist site but there are certain limitations. Itis found that there is inconsistency in the spectral anomalies observed
Fig. 8. Crop-mark/soil-mark of cluster of probable stupa sites in the vicinity of Anegutti mound (Stupa No 2). Image source a) Corona c) d) e) and f) Google EarthDigital Globe, h) Google Earth CNES/Airbus; b) part of the toposheet (ref no. 56 D/13/SE) pointing the location of mounds marked as stony waste.
E. Gupta, et al. Journal of Archaeological Science: Reports 25 (2019) 294–307
302

for the buried sites. Even the summer images, which are considered bestfor the identification of spectral anomalies, do not have consistency inthe presence of identified features. It is observed that an image thatshows one feature very clearly may not necessarily show the otherfeatures with that much clarity and sometimes few of them are foundcompletely missing. For instance, Hasargundgi stupa was not seen inCorona image, LISS IV images of April month but all or some of theother sites were found visible in these images. There could be multiplefactors for this inconsistency such as irrigation of the field, depth of soil,
tilling and ploughing of the soil, crop-type, etc. Therefore, it is essentialto have images of multiple dates.
Identified interpretation keys, though have been associated witharchaeological mounds or buried sites might sometime lead you towrong interpretation. Stacks of harvested crop (ref Fig. 10) could havebeen interpreted as potential sites if they had not been analysed inmultiple dates images. Therefore, one has to be aware of possibilities offinding such false calls.
Fig. 9. a) Location of P3 - Shale chips deposits creating white patches on the ground; b) close-up of the shale deposits found on the P3 site; c) close-up of the shaledeposits found all over the Stupa no.2; d) Stupa no.3, encroached by recent human activities –thick layer of the same shale chip material got exposed.
Fig. 10. Example of false call, two circular features (b, c) inside the yellow dotted circle are stack of harvested crop; corona image (a) doesn't show presence of anysuch marks as the image is captured in November which is not the harvesting season.
E. Gupta, et al. Journal of Archaeological Science: Reports 25 (2019) 294–307
303

Fig. 11. Soil-mark of possible stupa site (P4) on Corona (a), IRS P6 False colour image (b, c) and Google Earth image (d).
Fig. 12. Traces of possible archaeological site (P5) on Corona (a) and Google Earth images (b and c) and below are photos taken at site.
Fig. 13. (a) Distribution of historical structures at Sirival (in red triangle) with highlighted possible archaeological site (P5), ref. Fig. 10 for larger view; (b) image ofHasargundgi stupa site (ref Fig. 4 for larger view) comparable to P5 site in terms of its location between a bending rivulet and a village.
E. Gupta, et al. Journal of Archaeological Science: Reports 25 (2019) 294–307
304

5.3. Implication of the study
The study area has cultural remains from Middle Palaeolithic periodto 18th century. Most of the structural remains on the left bank of theriver are from early historic period (Maurya and Satavahana), on theright bank we find abundance of remains from the Rashtrakuta period.Some of the identified potential sites on the left bank (P1, P2, P3) arebeing associated to stupa structure because of their close proximity andresemblance to the known stupa sites. The reason for this associationhas already been discussed in detail in the result section.
Direct indication of the presence of archaeological structure on thenewly identified sites was not observed due to levelling and layering of
fields for agricultural purpose which changes the surface and topo-graphical profile significantly. Therefore, it is difficult to ascertain thetype and the purpose of the identified mounds and features.Nevertheless, the archaeological richness of the site, the evidence ac-quired through remote sensing analysis in the present study which arealso comparable to the evidence of buried foundation/structure ofknown sites are significant enough to highlight the identified sites forfurther detailed ground investigation.
6. Conclusion
The study has evolved a simple and robust methodology to identify
Fig. 14. Map of study area with known and newly identified sites.
E. Gupta, et al. Journal of Archaeological Science: Reports 25 (2019) 294–307
305

hitherto unknown mounds and buried sites in a Buddhist archaeologicallandscape which is experiencing land use change by modern agri-cultural activities. The study has found few more possible stupa sites.Systematic study of simple remote sensing data can explore buried re-lics, when no surface remnants are found, by identifying weak spectralanomalies of the earth surface. Detailed ground investigation and ex-cavation might suggest that the site was possibly a more importantBuddhist centre than what it was thought. This approach can be easilyapplied to investigate larger similar landscape before modern agri-culture or other development activities smother all the archaeologicalevidences. Also, such investigation would help us to know whether theexisting known stupa sites of early historic period extend beyond whatis yet known. The methodology can also be applied to search ashmounds that are mainly found in south Deccan and north Dharwadregion. Results of this study can also be developed to set criteria andrules to produce a sound algorithm for automation. Moreover, theadopted approach is considered as the first step to identify the ar-chaeological potential of a site which then can be referred to suggest ifthe site requires detailed investigation using more complex and costlytechniques such as LIDAR or ground explorations through trial ex-cavations.
Acknowledgement
We thank Karnataka Knowledge Commission whose funding(2015–2016) for investigating the site Sirival in the neighbourhoodprovided financial support for carrying out preliminary analysis of thepresent work. We extend our gratitude to Professor Ravi Korisetter foraccompanying us during the field visit and his guidance. We arethankful to the reviewers and the editors for their constructive com-ments and suggestions. We are grateful to Shailesh Nayak, Director,National Institute of Advanced Studies, Bangalore for the institutionalsupport and encouragement. I am thankful to Manipal Academy ofHigher Education for permitting this research as part of the PhD pro-gramme. We thank ISRO, for Satellite Data.
References
Archaeological Survey of India; Excavations - important - Bihar. Archaeological Survey ofIndia. (Retrieved January 18, 2019) (n.d.).
Cavalli, Rosa M., et al., 2007. Remote hyperspectral imagery as a support to
archaeological prospection. J. Cult. Herit. 8 (3), 272–283 July–September.Chen, Fulong, et al., 2017. An overview of satellite synthetic aperture radar remote
sensing in archaeology: from site detection to monitoring. J. Cult. Herit. 23(Supplement), 5–11 March.
Chittaranjan, H. (Ed.), 2004. Gulbarga District Gazetteer. Government of KarnatakaPublication, pp. 672–675.
Chittaranjan, H. (Ed.), 2004. Gulbarga District Gazetteer. Government of KarnatakaPublication, pp. 673.
Deo, Rinki, et al., 2016. Comparison of Tandem-X and Cartosat-1 Stereo Dems overDifferent Terrains of Indi. 2016 IEEE International Geoscience and Remote SensingSymposium (IGARSS), Beijing. pp. 6484–6487.
Deshmanya, Jayashree B., 2007. Buddhism in Karnataka with Special Reference to Artand Architecture. PhD Thesis. Karnataka University, pp. 285–287. http://hdl.handle.net/10603/104987.
Galiatsatos, Nikolaos, 2004. Assessment of the CORONA Series of Satellite Imagery forLandscape Archaeology: A Case Study From the Orontes Valley, Syria, DurhamTheses. Durham University(Available at Durham E-Theses Online: http://etheses.dur.ac.uk/281/).
Hesse, R., 2010. LiDAR-derived local relief models – a new tool for archaeological pro-spection. Archaeol. Prospect. 17, 67–72. https://doi.org/10.1002/arp.374.
Howell, J.R., et al., 1995. Excavations at Sannathi 1986–1989. New Delhi.Howell, J.R., et al., 1995a. Excavations at Sannathi 1986–1989. New Delhi. pp. 26.Howell, J.R., et al., 1995b. Excavations at Sannathi 1986–1989. New Delhi. pp. 25.http://raitamitra.kar.nic.in/statistics.html, Accessed date: 5 November 2018.huntingtonarchive.osu.edu/resources/images/maps/fullSize/15EarlySatavahanas.jpg
(retrieved on Feb 10, 2019) (n.d.).Indian Archaeology, 2003. 1997–98 – A Review. Archaeological Survey of India, Janpath,
New Delhi, pp. 77–93.Jesse, Casana, 2014. Regional-scale archaeological remote sensing in the age of big data:
automated site vs. brute method. Adv. Archaeol. Pract. 2 (3), 222–233.Karnataka Gazetteer https://www.karnataka.gov.in/Gazetteer/Downloads/Chapter-1-
1to48.pdf, Accessed date: 5 November 2018.Kennedy, David, 1998. Declassified satellite photographs and archaeology in the Middle
East: case studies from Turkey. Antiquity 72 (277), 553–561.Navalgund, R., Rajani, M.B., 25 Nov 2017. The science behind archaeological signatures
from space. Curr. Sci. 113 (10), 1859–1872.Parcak, S., 2009. Satellite Remote Sensing for Archaeology, 1st edn. Routledge 31 March.Patil, C.S., Balasubramanya, 2001a. Sirival: Its Monuments, Sculptures and Inscriptions.
Directorate of Archaeology and Museums, Mysore. pp. 1.Patil, C.S., Balasubramanya, 2001b. Sirival: Its Monuments, Sculptures and Inscriptions.
Directorate of Archaeology and Museums, Mysore. pp. 130.Poonacha, K.P., 2011. Excavations at Kanaganahalli (Sannati) Taluk Chitapur. In: Dist.
Gulbarga, Karnataka, pp. 26 New Delhi.Poonacha, K.P., 2011a. Excavations at Kanaganahalli (Sannati) Taluk Chitapur. Dist.
Gulbarga, Karnataka, New Delhi, pp. 7–25.Poonacha, K.P., 2011b. Excavations at Kanaganahalli (Sannati) Taluk Chitapur. Dist.
Gulbarga, Karnataka, New Delhi, pp. 16–21.Poonacha, K.P., 2011c. Excavations at Kanaganahalli (Sannati) Taluk Chitapur, Dist.
Gulbarga, Karnataka. New Delhi. pp. 7.Poonacha, K.P., 2011d. Excavations at Kanaganahalli (Sannati) Taluk Chitapur, Dist.
Gulbarga, Karnataka. New Delhi. pp. 10.Poonacha, K.P., 2011e. Excavations at Kanaganahalli (Sannati) Taluk Chitapur, Dist.
Gulbarga, Karnataka. Appendix-III, New Delhi. pp. 639.Poonacha, K.P., 2011f. Excavations at Kanaganahalli (Sannati) Taluk Chitapur, Dist.
Gulbarga, Karnataka. New Delhi. pp. 65.Poonacha, K.P., 2011g. Excavations at Kanaganahalli (Sannati) Taluk Chitapur, Dist.
Table 3Summary of remote sensing analysis.
Data Interpretation keys Remarks
Raised mounds Low mounds or buried sites
Corona • Very bright and lighttone• Circular shape• Shadow• Size varying roughlyfrom 50 to 70m
• Light tone- contrast is lesser thanof mounds and sometimes missing• Circular shape• Size varying roughly from 100mto ~130m
• Corona provides 50 years old information when the region was less affectedby modern agricultural activity and shows presence of a few features that wereexisting then but have completely gone by now.• Raised mounds are distinctively visible• Low mounds and buried sites were identified except Hasargundgi stupa site.
Multi-temporal & multispectralimages
• Lighter tone• Circular shape• Negative parch-mark
• Circular shape- usually irregular;annulus shape in case of P2.• Negative crop-mark and soil-mark
• Different years and months images in Google Earth were very helpful toexamine the continuity of identified features and hence, to eliminate false calls.• Google Earth historical images has also helped us to trace obliteration ofmounds and hence to understand the process of destruction.• Dry season (April–May) images were good in revealing buried features.
Anaglyph Anaglyph images have been found useful in identifying small mounds as theycannot be visualised on DEM.
DEM DEM were useful to visualise mounds larger than 100m. Mounds seen on DEMif found to be associated with crop/soil-mark and other identifiedinterpretation keys suggest possibility of potential archaeological sites. DEMhelped us to see the elevation profile of the mounds.
Toposheet Toposheet guided us to believe that P3 was a mound when the toposheet wassurveyed also that P3 has some similarity with Stupa no 2&3 as they all aremarked as stony waste.
E. Gupta, et al. Journal of Archaeological Science: Reports 25 (2019) 294–307
306

Gulbarga, Karnataka. New Delhi.Poonacha, K.P., 2011h. Excavations at Kanaganahalli (Sannati) Taluk Chitapur, Dist.
Gulbarga, Karnataka. New Delhi. pp. 11.Poonacha, K.P., 2011i. Excavations at Kanaganahalli (Sannati) Taluk Chitapur, Dist.
Gulbarga, Karnataka. New Delhi. pp. 21–22.Quintanilla, Sonya Rhie, 2017. Transformations of identity and the Buddha's infancy
narratives at Kanaganahalli. Arch. Asian Art 67 (1), 111–142. https://doi.org/10.1215/00666637-3788663.
Rowlands, Aled, Sarris, Apostolos, 2007. Detection of exposed and subsurface archae-ological remains using multi-sensor remote sensing. J. Archaeol. Sci. 34 (5), 795–803
May.Seshadri, M., 1965. Buddhist monuments at Sannati. Q. J. Mythic Soc. LV-I (1–4), 35–37
Bangalore.Shimada, A., Willis, M., 2016. Amravati: The Art of an Early Buddhist Monument in
Context. British Museum, London.Talim, Meena, 2010. Edicts of King Asoka: A New Vision. Aryan Books International, New
Delhi.Tapete, Deodato, Cigna, Francesca, 2017. Trends and perspectives of space-borne SAR
remote sensing for archaeological landscape and cultural heritage applications. J.Archaeol. Sci. Rep. 14, 716–726 August.
E. Gupta, et al. Journal of Archaeological Science: Reports 25 (2019) 294–307
307