ISSI March 2019 Platnick - International Space Science Institute
46
NASA Progress in Generating Multi-instrument Imager Cloud Data Records for Climate Analysis and Aerosol Interaction Studies International Space Science Institute (ISSI) Bern, Switzerland 4-8 March 2019 Steven Platnick 1 , Kerry Meyer 1 , Robert Holz 2 , Steven A. Ackerman 2 , Andy Heidinger 3,2 , Nandana Amarasinghe 4,1 , Galina Wind 4,1 , Chenxi Wang 5,1 , Benjamin Marchant 6,1 , Richard Frey 2 , et al. 1 NASA GSFC, 2 U. Wisc./CIMSS/SSEC, 3 STAR/NOAA, 4 SSAI, 5 U. MD/ESSIC, 6 USRA/GESTAR
-
Upload
khangminh22 -
Category
Documents
-
view
8 -
download
0
Transcript of ISSI March 2019 Platnick - International Space Science Institute

NASA Progress in Generating Multi-instrument Imager Cloud Data Records for Climate Analysis and Aerosol Interaction Studies
International Space Science Institute (ISSI)Bern, Switzerland4-8 March 2019
Steven Platnick1, Kerry Meyer1, Robert Holz2, Steven A. Ackerman2, Andy Heidinger3,2, Nandana Amarasinghe4,1, Galina Wind4,1, Chenxi Wang5,1, Benjamin Marchant6,1, Richard Frey2, et al.
1NASA GSFC, 2U. Wisc./CIMSS/SSEC, 3STAR/NOAA, 4SSAI, 5U. MD/ESSIC, 6USRA/GESTAR

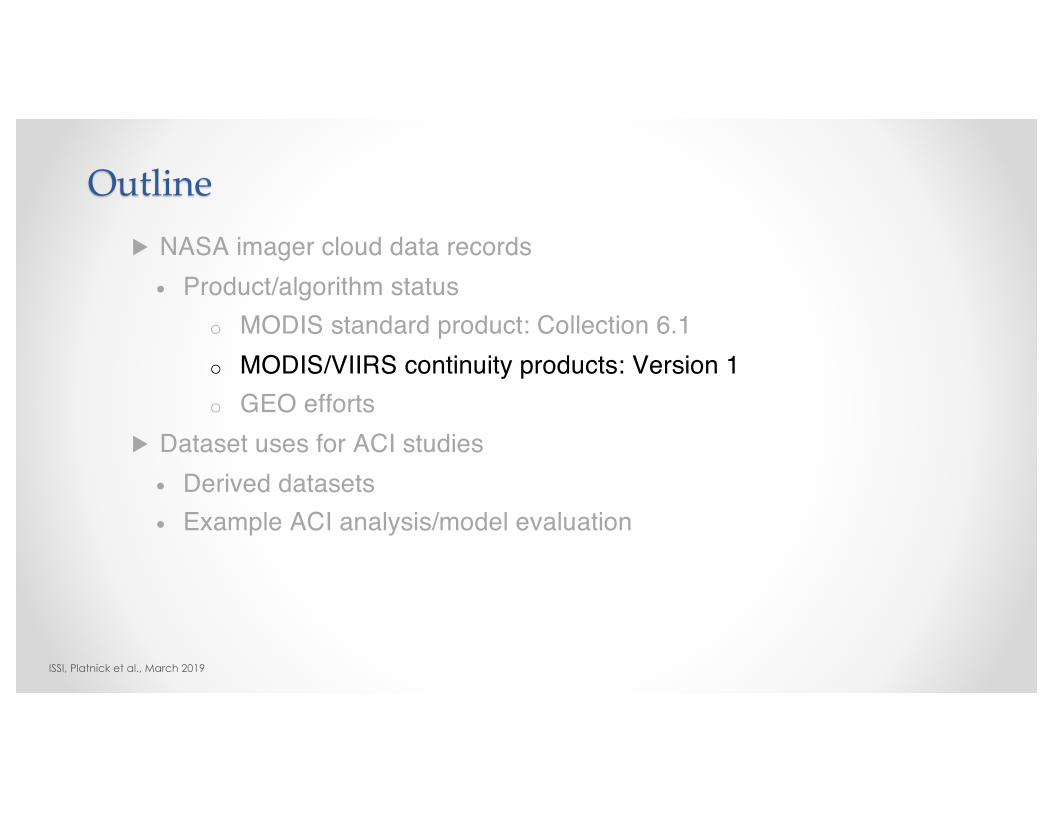
▶ NASA* imager cloud data records• Product/algorithm status
o MODIS standard product: Collection 6.1o MODIS/VIIRS continuity products: Version 1o GEO efforts
▶ Dataset uses for ACI studies • Derived datasets• Example ACI analysis/model evaluation
Outline
ISSI, Platnick et al., March 2019
* Independent product generated by NASA CERES team for use in radiation budget algorithm not discussed.

▶ NASA imager cloud data records• Product/algorithm status
o MODIS standard product: Collection 6.1o MODIS/VIIRS continuity products: Version 1o GEO efforts
▶ Dataset uses for ACI studies • Derived datasets• Example ACI analysis/model evaluation
Outline
ISSI, Platnick et al., March 2019

MODIS Atmosphere Team Collection History
Collection Start of Reprocessing MODIS Terra Start of Reprocessing MODIS Aqua6.1 Sept. 2017 (completed Dec. 2017) Dec. 2017 (completed March 2018)6.0 2014 20135.1 2008 20085.0 2005 20054 2002 20023 2001 20021 2000 –
ISSI, Platnick et al., March 2019

▶ L1B• C6.0: Aqua VNIR spatial “re-registration”, Terra VNIR/SWIR radiometric
corrections (RVS)• C6.1: Terra IR cross-talk corrections, further Aqua/Terra RVS corrections
▶ C6 L2 cloud properties• Cloud mask threshold updates, new 1km Cloud Top Product• Optical/microphysical: numerous updates
o New rad. transfer, ice particle models, phase algorithm, surface ancillary (C5 gap-filled land spectral surface albedo, variable wind speed ocean model). Additional error sources in pixel-level uncertainty calculations. Spectral cloud effective radius retrievals included explicitly. Processing of lower quality “partly cloudy” pixels + failed retrieval info.
C6.0/C6.1 Highlights
ISSI, Platnick et al., March 2019

0 90E 180 90W 0
-90
-45
0
45
90
0.0
15.0
30.0
0 90E 180 90W 0
-90
-45
0
45
90
0.0
15.0
30.0
[ Annual mean ]
AQUA ! (C51) LIQUID
JUL, 2002 to JUN, 2001
0 90E 180 90W 0
-90
-45
0
45
90
0.0
15.0
30.0
0 90E 180 90W 0
-90
-45
0
45
90
0.0
15.0
30.0
[ Annual mean ]
TERRA ! (C51) LIQUID
JUL, 2000 to JUN, 2001
0 90E 180 90W 0
-90
-45
0
45
90
-20.0
-10.0
0.0
10.0
20.0
0 90E 180 90W 0
-90
-45
0
45
90
-20.0
-10.0
0.0
10.0
20.0
[ %b0 (per decade) ]
AQUA ! (C51) anomaly (LIQUID) TREND (TOTAL)
Time Series, Monthly :JUL, 2002 to JUN, 2010
5% significance level
0 90E 180 90W 0
-90
-45
0
45
90
-20.0
-10.0
0.0
10.0
20.0
0 90E 180 90W 0
-90
-45
0
45
90
-20.0
-10.0
0.0
10.0
20.0
[ %b0 (per decade) ]
TERRA ! (C51) anomaly (LIQUID) TREND (TOTAL)
Time Series, Monthly :JUL, 2000 to JUN, 2010
5% significance level
C5.1 Cloud Optical Thickness (COT) annual mean, liq. water clouds
MODIS Terra MODIS Aqua
C5.1 COT trend (%/dec) July 2002-June 2010, 5% sig. level
30
0
15
30
0
15
20
-20
-10
10
0
20
-20
-10
10
0
ISSI, Platnick et al., March 2019
Climate Data Record Challenges: VNIR Calibration

0 90E 180 90W 0
-90
-45
0
45
90
0.0
15.0
30.0
0 90E 180 90W 0
-90
-45
0
45
90
0.0
15.0
30.0
[ Annual mean ]
AQUA ! (C51) LIQUID
JUL, 2002 to JUN, 2001
0 90E 180 90W 0
-90
-45
0
45
90
0.0
15.0
30.0
0 90E 180 90W 0
-90
-45
0
45
90
0.0
15.0
30.0
[ Annual mean ]
TERRA ! (C51) LIQUID
JUL, 2000 to JUN, 2001
0 90E 180 90W 0
-90
-45
0
45
90
-20.0
-10.0
0.0
10.0
20.0
0 90E 180 90W 0
-90
-45
0
45
90
-20.0
-10.0
0.0
10.0
20.0
[ %b0 (per decade) ]
AQUA ! (C51) anomaly (LIQUID) TREND (TOTAL)
Time Series, Monthly :JUL, 2002 to JUN, 2010
5% significance level
0 90E 180 90W 0
-90
-45
0
45
90
-20.0
-10.0
0.0
10.0
20.0
0 90E 180 90W 0
-90
-45
0
45
90
-20.0
-10.0
0.0
10.0
20.0
[ %b0 (per decade) ]
TERRA ! (C51) anomaly (LIQUID) TREND (TOTAL)
Time Series, Monthly :JUL, 2000 to JUN, 2010
5% significance level
30
0
15
30
0
15
20
-20
-10
10
0
20
-20
-10
10
0
C5.1 Cloud Optical Thickness (COT) annual mean, liq. water clouds
C6.1 COT trend (%/dec) July 2002-June 2017, 5% sig. level
MODIS Terra MODIS Aqua
ISSI, Platnick et al., March 2019
Climate Data Record Challenges: VNIR Calibration

18-yr time series, ±60° zonal mean
land
ocean
C5.1: -13%/dec
C5: -6%/dec
C6: -0.5%/dec
C6: -2%/decCO
TCO
T
influence of0.67 µm channelcalibration drift
0.86 µm drift
Terra MODIS Liquid water Cloud Optical Thickness (COT) Trends
ISSI, Platnick et al., March 2019
Climate Data Record Challenges: VNIR Calibration

AIRS & MODIS Ice COT Trend (2002-2016)
Brian Kahn (left fig. from Kahn et al., ACP, 2018)
AIRS% MODIS%AIRS (IR) MODIS MYD06 (VNIRS/SWIR)
COT Trend/14-yrs
ISSI, Platnick et al., March 2019

Cloud Fraction, Terra 18-yr time series, ±25° zonal mean over ocean
ocean C6.1: ~0.1%/dec
C5.1C6.0
Clou
d Fr
actio
n influence of IR crosstalk impacting 8.5 µm channel (primarily)
ISSI, Platnick et al., March 2019
Climate Data Record Challenges: IR Calibration
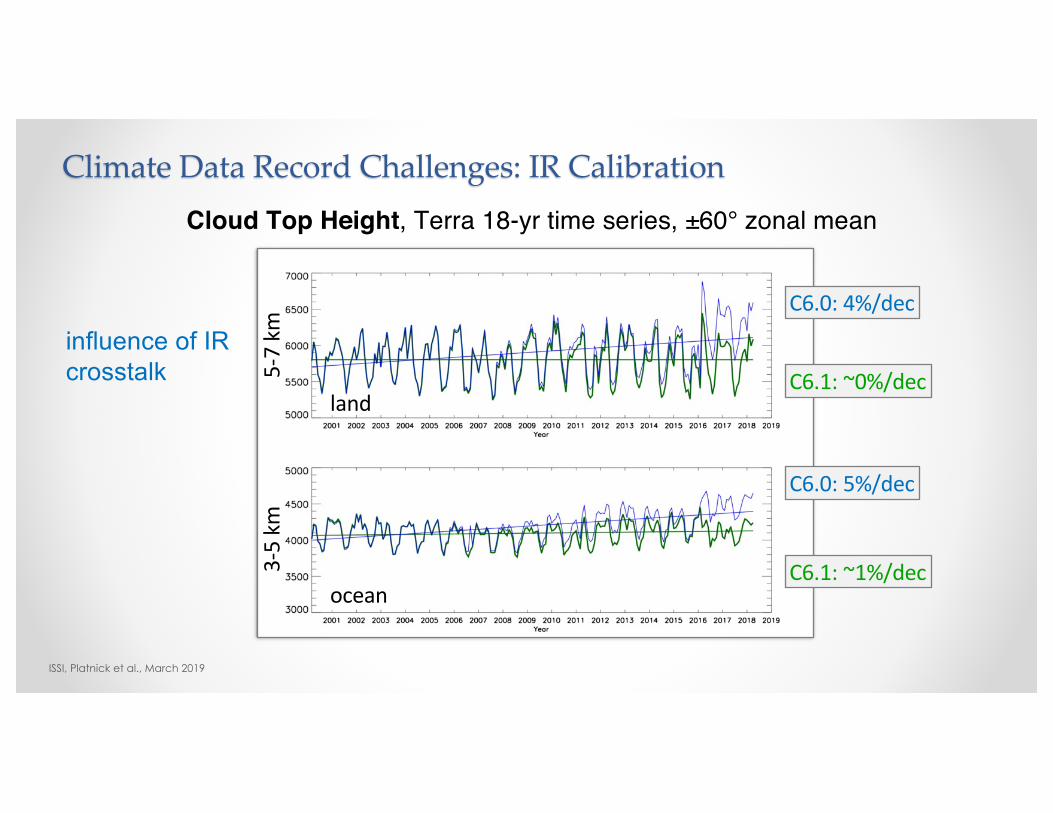
Cloud Top Height, Terra 18-yr time series, ±60° zonal mean
land
oceanC6.1: ~1%/dec
C6.1: ~0%/dec
C6.0: 4%/dec
C6.0: 5%/dec
influence of IR crosstalk 5-
7 km
3-5
km
ISSI, Platnick et al., March 2019
Climate Data Record Challenges: IR Calibration

ISSI, Platnick et al., March 2019
C6: Pixel-level Uncertainty Datasets
Error Sources: L1B calibration (scene-dependent), surface reflectance (land, ocean Cox-Munk wind vector), water cloud eff. variance, atmospheric correction (CTP, reanalysis state vector, O3), 3.7 µm emission (Tc, Tsfc) and solar irradiance, …
–1
central U.S. data granule, Aqua MODIS, 8 June 2014(Fig. 13, Platnick et al., 2017)

COT, CER_2.1 µm, CER_3.7 µm and uncertainties
MODIS CLDPROP (continuity product algorithm) prelim. retrieval,MYD021KM.A_2014033.2040.061_L1B, SE Pacific

WP derived from CER_2.1 & CER_3.7 µm retrievals
WP uncertainty
ISSI, Platnick et al., March 2019
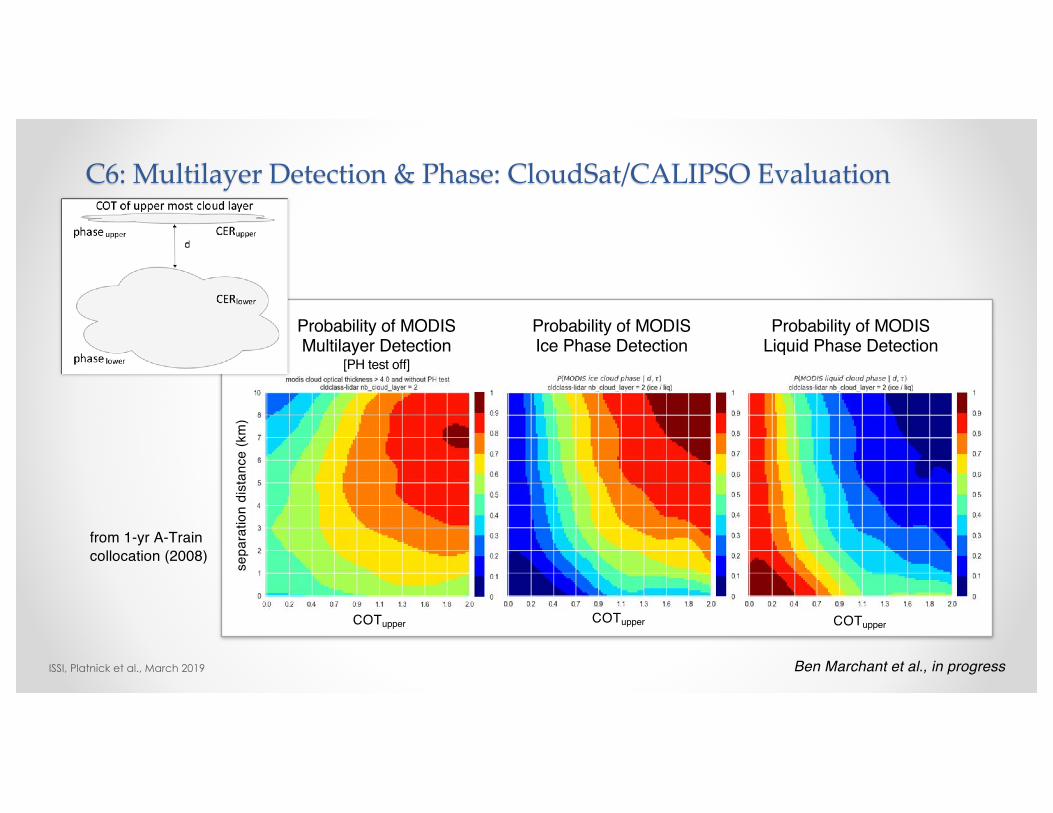
COTupper COTupperCOTupper
sepa
ratio
n di
stan
ce (k
m)
Probability of MODISIce Phase Detection
Probability of MODISLiquid Phase Detection
Probability of MODIS Multilayer Detection
[PH test off]
C6: Multilayer Detection & Phase: CloudSat/CALIPSO Evaluation
from 1-yr A-Train collocation (2008)
Ben Marchant et al., in progress

ISSI, Platnick et al., March 2019
Removing cloudy pixels flagged as Multilayer by
MODIS (COT> 4)
All MODIS ice cloud CER retrievals
CC Single Layer IceCC
Multilayer
CER2.1 µm
CER2.1 µm
Most CER artifacts associated with multilayer clouds have been removed
C6: Multilayer Impact on Ice CER2.1µm: CloudSat/CALIPSO Evaluation

ISSI, Platnick et al., March 2019
C6: Global MODIS Multilayer Detection Probability
B. Marchant et al., in progress

ISSI, Platnick et al., March 2019
ORACLES region browse imagery: modis-images.gsfc.nasa.gov/oracles/
25 July (206) 2017
K. Meyer et al. (2015)
Research Product: Simultaneous Cloud/Above-Cloud Absorbing Aerosol

ISSI, Platnick et al., March 2019K. Meyer et al. (2015)
Can’t calculation DRE without accurate cloud reflectance
Research Product: Simultaneous Cloud/Above-Cloud Absorbing Aerosol

ISSI, Platnick et al., March 2019
Fig. 3aFig. 2
Witte et al., GRL, 2018
• “Validation” efforts sometimes find positive retrieved CER biases. Explanations typically focus on retrieval algorithms and cloud heterogeneity. In situ uncertainty regarded as minor.
• CAPS suite (CDP + 2DC/CIP) biased low relative to Phase Doppler Interferometer (PDI) probe from three Sc aircraft campaigns (MACE, POST, VOCALS). No sig. bias wrt MODIS C6 (~0.2 µm).
• CAPS and PDI agree well in small CER conditions, but PDI typically measures larger CER than CAPS and PVM in the presence of broad DSDs, that are associated with larger CER.
Uncertainty: In Situ DSD/CER

ISSI, Platnick et al., March 2019
Fig. 3c,d
Witte et al., GRL, 2018
CER
PDI–
CER
CAPS
• “Validation” efforts sometimes find positive retrieved CER biases. Explanations typically focus on retrieval algorithms and cloud heterogeneity. In situ uncertainty regarded as minor.
• CAPS suite (CDP + 2DC/CIP) biased low relative to Phase Doppler Interferometer (PDI) probe from three Sc aircraft campaigns (MACE, POST, VOCALS). No sig. bias wrt MODIS C6 (~0.2 µm).
• CAPS and PDI agree well in small CER conditions, but PDI typically measures larger CER than CAPS and PVM in the presence of broad DSDs, that are associated with larger CER.
Uncertainty: In Situ DSD/CER

ISSI, Platnick et al., March 2019
Discrepancies between Holographic Detector for Clouds (HOLODEC) vs. CDP & 2DC
Fig. 3, Glienke et al., GRL, 2017
GOES-15/LaRC
deff≈ 44 µm (HOLODEC)deff≈ 26 µm (CDP)
Uncertainty: In Situ DSD/CER
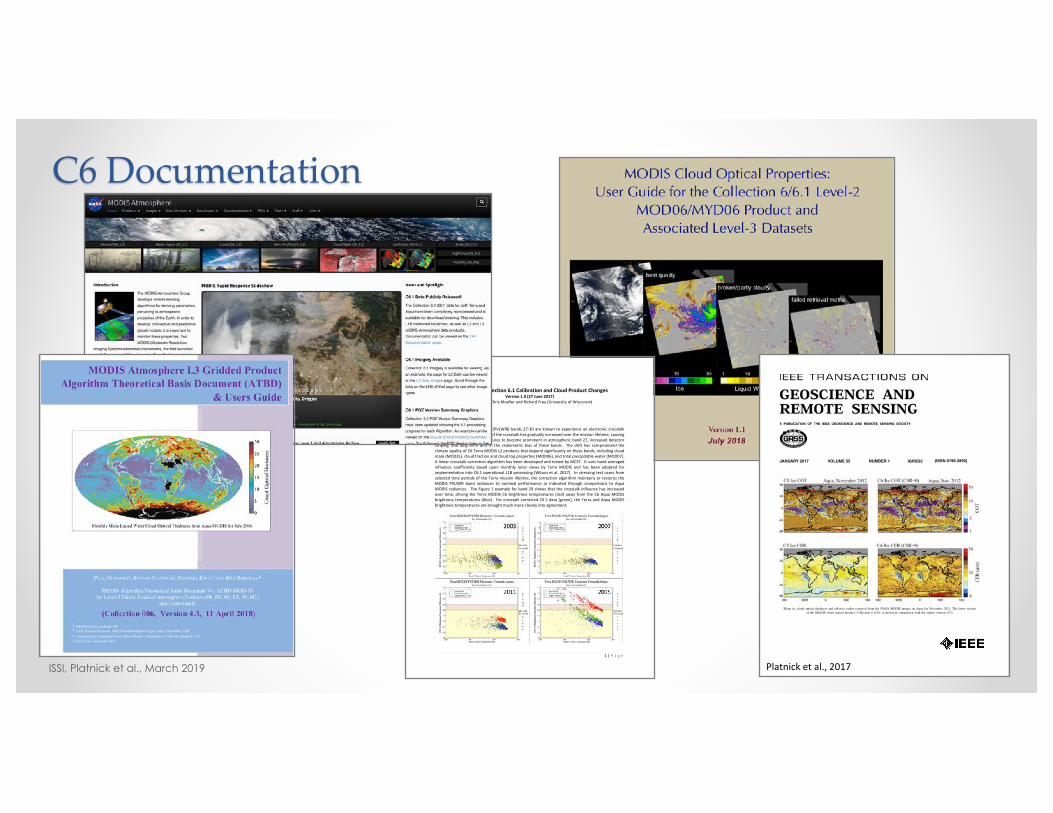
C6 Documentation
1 | P a g e
Terra MODIS Collection 6.1 Calibration and Cloud Product Changes Version 1.0 (27 June 2017)
Authored by Chris Moeller and Richard Frey (University of Wisconsin) Calibration (MOD021KM) The Terra MODIS Photovoltaic (PVLWIR) bands 27-30 are known to experience an electronic crosstalk contamination. The influence of the crosstalk has gradually increased over the mission lifetime, causing for example, earth surface features to become prominent in atmospheric band 27, increased detector striping, and long term drift in the radiometric bias of these bands. The drift has compromised the climate quality of C6 Terra MODIS L2 products that depend significantly on these bands, including cloud mask (MOD35), cloud fraction and cloud top properties (MOD06), and total precipitable water (MOD07). A linear crosstalk correction algorithm has been developed and tested by MCST. It uses band averaged influence coefficients based upon monthly lunar views by Terra MODIS and has been adopted for implementation into C6.1 operational L1B processing (Wilson et al. 2017). In stressing test cases from selected time periods of the Terra mission lifetime, the correction algorithm maintains or restores the MODIS PVLWIR band radiances to nominal performance as indicated through comparisons to Aqua MODIS radiances. The Figure 1 example for band 29 shows that the crosstalk influence has increased over time, driving the Terra MODIS C6 brightness temperatures (red) away from the C6 Aqua MODIS brightness temperatures (blue). For crosstalk corrected C6.1 data (green), the Terra and Aqua MODIS brightness temperatures are brought much more closely into agreement.
ISSI, Platnick et al., March 2019
JANUARY 2017 VOLUME 55 NUMBER 1 IGRSD2 (ISSN 0196-2892)
Mean ice cloud optical thickness and effective radius retrieved from the NASA MODIS imager on Aqua for November 2012. The latest versionof the MODIS cloud optical product, Collection 6 (C6), is shown in comparison with the earlier version (C5).
Platnick et al., 2017
▶ NASA imager cloud data records• Product/algorithm status
o MODIS standard product: Collection 6.1o MODIS/VIIRS continuity products: Version 1o GEO efforts
▶ Dataset uses for ACI studies • Derived datasets• Example ACI analysis/model evaluation
Outline
ISSI, Platnick et al., March 2019

▶ Direct continuity with MODIS cloud products not feasible• spectral channel differences, pixel size/sampling, relative radiometry
▶ Approach: apply common algorithms to both VIIRS and MODIS using common/near-common subset of spectral channels. • cloud mask and optical properties (MOD06/MOD35 Collection 6
heritage), cloud-top properties (NOAA GOES-R AWG heritage)▶ Status
• In production at U. Wisconsin SIPS• Public distribution from LAADS (ladsweb.modaps.eosdis.nasa.gov) imminent• Need user feedback!
MODIS/VIIRS continuity products
ISSI, Platnick et al., March 2019

MODIS vs. VIIRS Radiometry
VIIRS ChannelM5
(0.67µm)M7
(0.87µm)M8
(1.24µm)M10
(1.61µm)M11
(2.25µm)
Radiometric Adjustment
(Expected VIIRS TOC/Observed)
vs C6 0.94 0.96 0.98 0.98 0.97
vs C6.1 0.95 0.97 0.99 0.98 0.97
• Large COT biases in initial VIIRS implementation suggested relative radiometric biases between MODIS & VIIRS.
• Multiyear MODIS Aqua/VIIRS match files generated to assess relative radiometry using warm maritime clouds as reflectance target (account for bandpass, atmo. correction, etc.).
• Adjustments applied to VIIRS, final values consistent with aerosol team (Sayer et al., 2017).
ISSI, Platnick et al., March 2019

2013 2014 2015 2016 2017 20180.0
0.1
0.2
0.3
0.4
0.5
0.6
PF (I
CE)
VIIRS, AQUA & MYD08 (PF ICE and LIQUID) zonal avg [0, 50N][158E, 128W]DATA: APR, 2012 to OCT, 2018 :: AQUAV 1.0dev15, VIIRS 1.0dev18
2013 2014 2015 2016 2017 2018Year
0.0
0.1
0.2
0.3
0.4
0.5
0.6
PF (L
IQUI
D)
VIIRSMODIS AQUAMYD08
2013 2014 2015 2016 2017 20180.0
0.1
0.2
0.3
0.4
0.5
0.6
PF (I
CE)
VIIRS, AQUA & MYD08 (PF ICE and LIQUID) zonal avg [0, 50N][158E, 128W]DATA: APR, 2012 to OCT, 2018 :: AQUAV 1.0dev15, VIIRS 1.0dev18
2013 2014 2015 2016 2017 2018Year
0.0
0.1
0.2
0.3
0.4
0.5
0.6
PF (L
IQUI
D)
VIIRSMODIS AQUAMYD08 2013 2014 2015 2016 2017 2018
400
500
600
700
800
CTP
(hPa
)
VIIRS & AQUA (CTP and CTH) zonal avg [0, 50N][158E, 128W]
DATA: APR, 2012 to OCT, 2018 :: AQUAV 1.0dev15, VIIRS 1.0dev18
2013 2014 2015 2016 2017 2018Year
2
3
4
5
6
7
8
CTH
(km
)
VIIRSMODIS AQUAMYD08
2013 2014 2015 2016 2017 2018400
500
600
700
800
CTP
(hPa
)
VIIRS & AQUA (CTP and CTH) zonal avg [0, 50N][158E, 128W]
DATA: APR, 2012 to OCT, 2018 :: AQUAV 1.0dev15, VIIRS 1.0dev18
2013 2014 2015 2016 2017 2018Year
2
3
4
5
6
7
8
CTH
(km
)
VIIRSMODIS AQUAMYD08
6-yr Time Series, N. Pacific VIIRS continuity MODIS continuity MYD08
2013 2014 2015 2016 2017 20180.6
0.7
0.8
0.9
1.0
CF D
AY
VIIRS, AQUA & MYD08 (CF TOTAL & DAY) zonal avg [0, 50N][158E, 128W]
DATA: APR, 2012 to OCT, 2018 :: AQUAV 1.0dev15, VIIRS 1.0dev18
2013 2014 2015 2016 2017 2018Year
0.6
0.7
0.8
0.9
1.0
CF T
OTA
L
VIIRSMODIS AQUAMYD08Feb. 2014 VIIRS CLDMSK
CTP: 400-800 hPa
Phase Frac. liquid: 0-0.6
CTH: 2-8 km
Phase Frac. ice: 0-0.6
Cloud Fraction: 0.6-1.0

2013 2014 2015 2016 2017 201820
25
30
35
40
2.x µm
RE
(ICE)
(µm
)
VIIRS & AQUA ( 2.x µm RE LIQUID and ICE) zonal avg [0, 50N][158E, 128W]
DATA: APR, 2012 to OCT, 2018 :: AQUAV 1.0dev15, VIIRS 1.0dev18
2013 2014 2015 2016 2017 2018Year
14
15
16
17
18
19
20
2.x µm
RE
(LIQ
UID)
(µm
)
VIIRSMODIS AQUAMYD08
2013 2014 2015 2016 2017 20186
8
10
12
14
COT
(ICE)
VIIRS & AQUA (COT LIQUID and ICE) zonal avg [0, 50N][158E, 128W]
DATA: APR, 2012 to OCT, 2018 :: AQUAV 1.0dev15, VIIRS 1.0dev18
2013 2014 2015 2016 2017 2018Year
6
8
10
12
14CO
T (L
IQUI
D)
VIIRSMODIS AQUAMYD08
2013 2014 2015 2016 2017 20186
8
10
12
14
COT
(ICE)
VIIRS & AQUA (COT LIQUID and ICE) zonal avg [0, 50N][158E, 128W]
DATA: APR, 2012 to OCT, 2018 :: AQUAV 1.0dev15, VIIRS 1.0dev18
2013 2014 2015 2016 2017 2018Year
6
8
10
12
14
COT
(LIQ
UID)
VIIRSMODIS AQUAMYD08
6-yr Time Series, N. Pacific VIIRS continuity MODIS continuity MYD08
2013 2014 2015 2016 2017 20180.6
0.7
0.8
0.9
1.0
CF D
AY
VIIRS, AQUA & MYD08 (CF TOTAL & DAY) zonal avg [0, 50N][158E, 128W]
DATA: APR, 2012 to OCT, 2018 :: AQUAV 1.0dev15, VIIRS 1.0dev18
2013 2014 2015 2016 2017 2018Year
0.6
0.7
0.8
0.9
1.0
CF T
OTA
L
VIIRSMODIS AQUAMYD08Feb. 2014 VIIRS CLDMSK
COT liquid: 6-15
CER_2.x liquid: 14-20µm
COT ice: 6-15
CER_2.x ice: 20-40µm
Cloud Fraction: 0.6-1.0
CLD VIIRS
-90
-45
0
45
90CF
DAY
0.0
0.5
1.0
-90
-45
0
45
90
CTH
(km
)
0
7
14
0 90E 180 90W 0-90
-45
0
45
90
CTP
(hPa
)
202
601
1000
CLD VIIRS - CLD MODIS
CLD VIIRS - MYD08
-0.4
-0.2
0.0
0.2
0.4
-2.0
-1.0
0.0
1.0
2.0
0 90E 180 90W 0
0 90E 180 90W 0
-100
-50
0
50
100
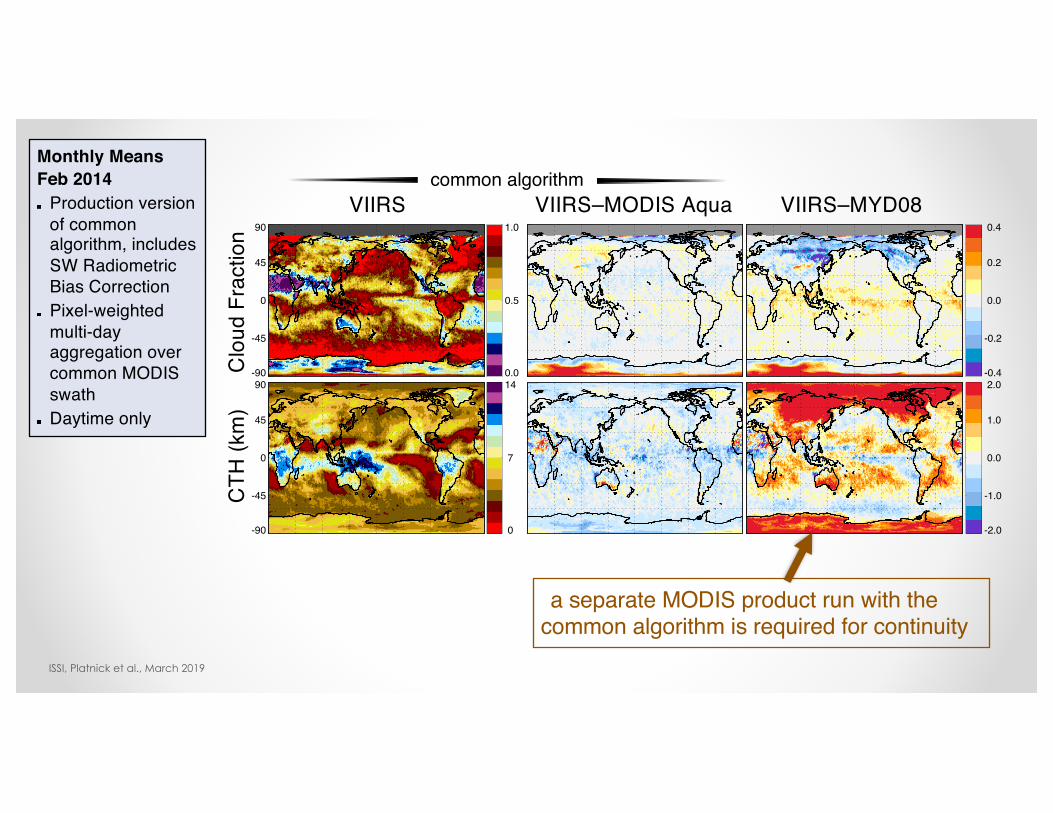
CF-DAY MEAN , CTH, CTP (AQUA 1.0dev15,VIIRS 1.0dev18)
All Monthly Averages are Pixel Weighted Monthly MeansFeb 2014
Production version of common algorithm, includes SW Radiometric Bias CorrectionPixel-weighted multi-day aggregation over common MODIS swathDaytime only
a separate MODIS product run with the common algorithm is required for continuity
CTH
(km
)C
loud
Fra
ctio
nVIIRS VIIRS–MODIS Aqua
common algorithmVIIRS–MYD08
ISSI, Platnick et al., March 2019

CLD VIIRS
-90
-45
0
45
90
CF M
EAN
TOT
0.0
0.5
1.0
0 90E 180 90W 0-90
-45
0
45
90CO
T IC
E
1 5 10 50
0 90E 180 90W 0-90
-45
0
45
90
COT
LIQ
1 5 10 50
CLD VIIRS - CLD MODIS
CLD VIIRS - MYD08
-0.2
-0.1
0.0
0.1
0.2
-6.0
-3.0
0.0
3.0
6.0
0 90E 180 90W 0
0 90E 180 90W 0
-6.0
-3.0
0.0
3.0
6.0
CF MEAN TOT, COT(Ice), COT(Liq) (AQUA 1.0dev15,VIIRS 1.0dev18)
All Monthly Averages are Pixel Weighted
CLD VIIRS
-90
-45
0
45
90
RF_1
.6 µ
m
0.0
0.5
1.0
-90
-45
0
45
90RF
_2.x
µm
0.0
0.5
1.0
0 90E 180 90W 0-90
-45
0
45
90
RF_3
.7 µ
m
0.0
0.5
1.0
CLD VIIRS - CLD MODIS
CLD VIIRS - MYD08
-0.2
-0.1
0.0
0.1
0.2
-0.2
-0.1
0.0
0.1
0.2
0 90E 180 90W 0
0 90E 180 90W 0
-0.2
-0.1
0.0
0.1
0.2
(RF-Liquid) (AQUA 1.0dev15,VIIRS 1.0dev18)All Monthly Averages are Pixel Weighted
(RF_LIQ_grid_npts=0 & RF_ICE_grid_npts=0) masked out from each RF_grid_nptsnum[idx]/deno[idx] where idx = where (RF_LIQ_grid_npts ge 0 & mask_day_grid_npts gt 0)
Monthly MeansFeb 2014
Production version of common algorithm, includes SW Radiometric Bias CorrectionPixel-weighted multi-day aggregation over common MODIS swathDaytime onlyHighest Quality (non-“Partly Cloudy” pixels)
CO
T liq
.R
etrie
val F
ract
ion
liq. VIIRS VIIRS–MODIS Aqua
common algorithmVIIRS–MYD08
ISSI, Platnick et al., March 2019

6.9
1.9
1.2
5.36.7
1.2: MODIS mean1.4: VIIRS mean
mean:MYD06 Population
CLDPROP Population
19 Feb. 2014 (N. Pacific)
pixel FOV, pixel growth affects retrievals and CSR population
ISSI, Platnick et al., March 2019

MODIS/VIIRS L2 Cloud Continuity Product Status
65 pp. w/references to C6.1 user guide sections as appropriate
CLDMSK_L2_VIIRS_SNPP VIIRS/SNPP Cloud Mask 6-Min Swath 750mCLDPROP_L2_VIIRS_SNPP VIIRS/SNPP Optical Cloud Properties 6-min Swath 750mCLDPROP_D3_VIIRS_SNPP VIIRS/SNPP Optical Cloud Properties Daily 1°CLDPROP_M3_VIIRS_SNPP VIIRS/SNPP Optical Cloud Properties Monthly 1°CLDMSK_L2_MODIS_AQUA MODIS/AQUA Cloud Mask 5-Min Swath 1kmCLDPROP_L2_MODIS_AQUA MODIS/AQUA Optical Cloud Properties 5-min Swath 1kmCLDPROP_D3_MODIS_AQUA MODIS/AQUA Optical Cloud Properties Daily 1°CLDPROP_M3_MODIS_AQUA MODIS/AQUA Optical Cloud Properties Monthly 1°
• Final version 1 code successfully delivered to SIPS Dec. 2018. Public release imminent.
• User guide draft completed• Filename convention
ISSI, Platnick et al., March 2019
EOS MODIS and SNPP VIIRS Cloud Properties: User Guide for the Climate Data Record Continuity Level-2 Cloud Top and Optical Properties Product
(CLDPROP)
Version 1 February 2019
CLOUD MASKING TEAM STEVEN A. ACKERMAN6, RICHARD FREY6
CLOUD TOP PROPERTY TEAM ANDREW HEIDINGER2, YUE LI6, ANDI WALTHER6
CLOUD OPTICAL PROPERTY TEAM STEVEN PLATNICK1, KERRY G. MEYER1, GALA WIND3,1, NANDANA AMARASINGHE3,1, CHENXI WANG4,1, BENJAMIN MARCHANT5,1
PRODUCT ASSESSMENT SUPPORT ROBERT E. HOLZ6, STEVEN DUTCHER6, PAUL HUBANKS7,1
1 Earth Sciences Division, NASA Goddard Space Flight Center, Greenbelt, MD 2 NOAA NESDIS/STAR/CIMSS, Madison, WI 3 Science Systems and Applications, Inc., Lanham, MD 4 Earth System Science Interdisciplinary Center, University of Maryland, College Park, MD 5 Goddard Earth Sciences Technology and Research, Universities Space Research Association, Columbia, MD 6 Cooperative Institute for Meteorological Satellite Studies, University of Wisconsin, Madison WI 7 ADNET Systems, Inc., Bethesda, MD

▶ NASA imager cloud data records• Product/algorithm status
o MODIS standard product: Collection 6.1o MODIS/VIIRS continuity products: Version 1o GEO efforts
▶ Dataset uses for ACI studies • Derived datasets• Example ACI analysis/model evaluation
Outline
ISSI, Platnick et al., March 2019

GSFC GEO Cloud Continuity Research Efforts
▶ Since VIIRS and ABI/AHI have similar spectral bands, a ‘seed’ effort was initiated by NASA to demonstrate porting VIIRS atmosphere algorithms to ABI/AHI. • Leverages U. Wisconsin SIPS capabilities for a limited research
study for both cloud and aerosol algorithm teams; cloud team also leveraging SEVIRI effort (SEV06) at ICARE.
• Initial cloud effort: 2km retrievals, cloud optical retrievals (AWG cloud mask & cloud-top), focused on AHI
• Includes discussions with NOAA STAR and how to work collaboratively on tasks that best leverage agency activities
ICWG-2, Oct. 2018

AHI preliminary NASA cloud
research products15-16 May 2016
ICWG-2, Oct. 2018

COT-liquid CER-liquid 2.24 µm
For overlap region defined by VZA ≤15°, ≤ 5 min (16 May 2016)
AHI
AHI
VIIRS VIIRS
AHI vs VIIRS Retrievals: contiguous cloudy pixels only
ICWG-2, Oct. 2018

J. Riedi, M. Patou, et al. AOGS Annual Mtg., 2017

ISSI, Platnick et al., March 2019
2019-22-02, North Pacific, GOES-17 2019-15-01, Hawaii, GOES-17

▶ NASA imager cloud data records• Product/algorithm status
o MODIS standard product: Collection 6.1o MODIS/VIIRS continuity products: Version 1o GEO efforts
▶ Dataset uses for ACI studies • Derived datasets• Example ACI analysis/model evaluation
Outline
ISSI, Platnick et al., March 2019

Droplet Concentration
Bennartz and Rausch, “Global and regional estimates of warm cloud droplet number concentration based on
13 years of AQUA-MODIS observations”, ACP, 2017
!" ~ $%
&'()*+,-.

Droplet Concentration
S. Zeng et al., “Study of global cloud droplet number concentration with A-Train satellites”, ACP, 2014
Bennartz-like algorithm
Yong Hu algorithm (lidar cloud-top depolarization ratio + passive CER).
Doesn’t rely on adiabatic assumption.
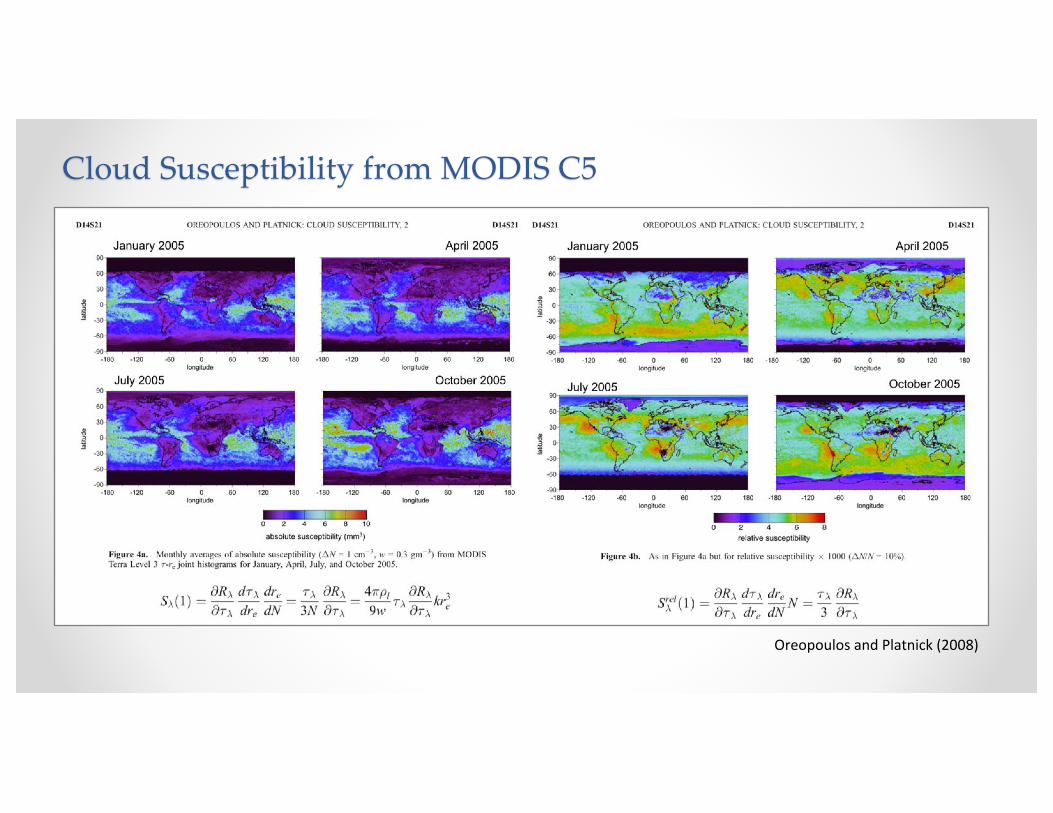
Cloud Susceptibility from MODIS C5
Oreopoulos and Platnick (2008)

▶ NASA imager cloud data records• Product/algorithm status
o MODIS standard product: Collection 6.1o MODIS/VIIRS continuity products: Version 1o GEO efforts
▶ Dataset uses for ACI studies • Derived datasets• Example ACI analysis/model evaluation
Outline
ISSI, Platnick et al., March 2019

0 1 2 3 4 5 60
1
2
3
4
5
6
7
0 1.3 3.6 9.4 23 60 1501100800
680
560
440
310
1800
CF: 84.09 RFO: 3.46CR1
0 1 2 3 4 5 60
1
2
3
4
5
6
7
0 1.3 3.6 9.4 23 60 1501100800
680
560
440
310
1800
CF: 96.69 RFO: 2.99CR2
0 1 2 3 4 5 60
1
2
3
4
5
6
7
0 1.3 3.6 9.4 23 60 1501100800
680
560
440
310
1800
CF: 89.30 RFO: 5.02CR3
0 1 2 3 4 5 60
1
2
3
4
5
6
7
0 1.3 3.6 9.4 23 60 1501100800
680
560
440
310
1800
CF: 92.49 RFO: 3.77CR4
0 1 2 3 4 5 60
1
2
3
4
5
6
7
0 1.3 3.6 9.4 23 60 1501100800
680
560
440
310
1800
Cloud optical thickness
Clo
ud to
p pr
essu
re(m
b)
CF: 86.71 RFO: 3.68CR5
0 1 2 3 4 5 60
1
2
3
4
5
6
7
0 1.3 3.6 9.4 23 60 1501100800
680
560
440
310
1800
CF: 82.24 RFO: 6.99CR6
0 1 2 3 4 5 60
1
2
3
4
5
6
7
0 1.3 3.6 9.4 23 60 1501100800
680
560
440
310
1800
CF: 95.27 RFO: 2.44CR7
0 1 2 3 4 5 60
1
2
3
4
5
6
7
0 1.3 3.6 9.4 23 60 1501100800
680
560
440
310
1800
CF: 86.19 RFO: 4.92CR8
0 1 2 3 4 5 60
1
2
3
4
5
6
7
0 1.3 3.6 9.4 23 60 1501100800
680
560
440
310
1800
CF: 88.86 RFO: 7.62CR9
0 1 2 3 4 5 60
1
2
3
4
5
6
7
0 1.3 3.6 9.4 23 60 1501100800
680
560
440
310
1800
CF: 68.49 RFO: 7.28CR10
0 1 2 3 4 5 60
1
2
3
4
5
6
7
0 1.3 3.6 9.4 23 60 1501100800
680
560
440
310
1800
CF: 51.04 RFO:10.36CR11
0 1 2 3 4 5 60
1
2
3
4
5
6
7
0 1.3 3.6 9.4 23 60 1501100800
680
560
440
310
1800
CF: 29.66 RFO:41.47CR12
0.1 0.2 0.4 0.8 1.5 3 6 10 15 20 25 35Cloud fraction (%)
Cloud Regimes (CRs) from MODIS C6
Oreopoulos et al. JGR (2017)
high
clo
uds
dom
inan
tm
id-le
vel
dom
inan
tLi
quid
/low
clo
uds
dom
inan
t
Relative Frequency of Occurrence of CRs
Variety of CRs can occur in same region =>consider AIE vs. CR

• Morning AOD: 1° grid from MODIS Terra C6 Dark Target or MERRA2, 12 years, 50°S-50°N
• Afternoon Cloud Parameters (Cx):Precip, CF, CTP, COT, CER, CRE
• dlnCx/dlnAOD at each grid cell by CR
• Only statistical sig. sensitivities used to calculate distribution
Lazaros Oreopoulos, Nayeong Cho, et al. (in progress)
ocean landCR ACI Example Regional Results
median/interquartiledistribution
yellow=no statist. sig.
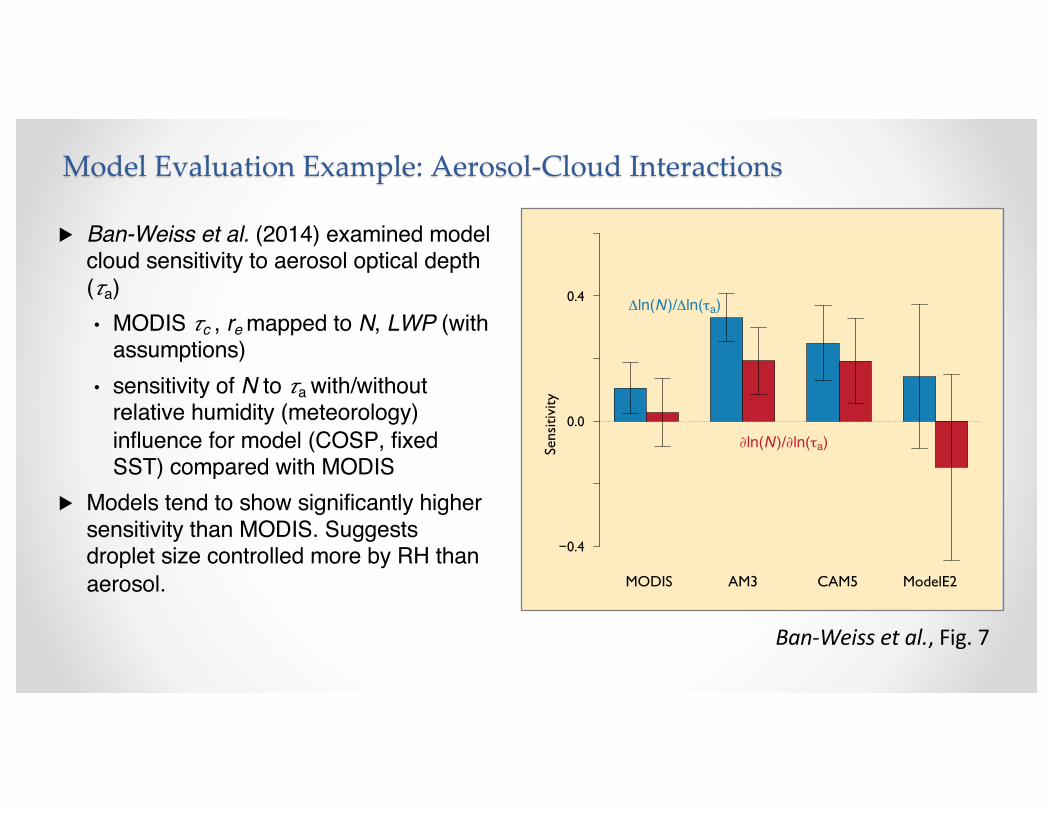
Model Evaluation Example: Aerosol-Cloud Interactions
▶ Ban-Weiss et al. (2014) examined model cloud sensitivity to aerosol optical depth (!a)• MODIS !c , re mapped to N, LWP (with
assumptions)• sensitivity of N to !a with/without
relative humidity (meteorology) influence for model (COSP, fixed SST) compared with MODIS
▶ Models tend to show significantly higher sensitivity than MODIS. Suggests droplet size controlled more by RH than aerosol.
Using proxies to pick apart correlations between aerosols and clouds
−0.4
0.0
0.4Δln(N )/Δln(τa)
∂ln(N )/∂ln(τa)
MODIS AM3 CAM5 ModelE2
Sens
itivi
ty
after Ban-Weiss et al. 2014, 10.1002/2014JD021722 Ban-Weiss et al., Fig. 7