JOB STRESS AMONG COLLEGE TEACHERS IN DOABA REGIONOF PUNJAB (INDIA) INTRODUCTION
13
International Journal of Advanced Research in Management and Social Sciences ISSN: 2278-6236 Vol. 2 | No. 3 | March 2013 www.garph.co.uk IJARMSS | 1 JOB STRESS AMONG COLLEGE TEACHERS IN DOABA REGIONOF PUNJAB (INDIA) Rupinder Kaur* Lalita Kumari** Aarti Sharma*** Abstract: Stress is a feeling that's created when we react to particular events. It's the body's way of rising to a challenge and preparing to meet a tough situation with focus, strength, stamina, and heightened alertness. Stress may be good or bad. Employee and Job efficiency depends upon the physical level and mental level of the employee. The aim of this study was to find out the factors that creates stress among college teachers in Doaba region of Punjab. The 60 respondents were selected by random cum convenient sampling method. Data was analyzed with the help of factor analysis and chi square test. The five factors are found that creates the job stress among college teachers in the Doaba region. The most important factor that creates stress is Salary and other benefits followed by working conditions, relations with colleagues, job security and work load So by improving these factors job stress can be reduced among college teachers. The results of this study may be helpful for college’s higher authorities to make HR policies for teachers. Keywords: Job Stress, College, Teachers, Gender, Punjab, India *Assistant Professor, Lyallpur Khalsa College, Jalandhar. **Research Scholar, Commerce & Business Management Department, Guru Nanak Dev University, Amritsar. ***Assistant Professor in Commerce, LRDAV College Jagraon
Transcript of JOB STRESS AMONG COLLEGE TEACHERS IN DOABA REGIONOF PUNJAB (INDIA) INTRODUCTION

International Journal of Advanced Research in
Management and Social Sciences ISSN: 2278-6236
Vol. 2 | No. 3 | March 2013 www.garph.co.uk IJARMSS | 1
JOB STRESS AMONG COLLEGE TEACHERS IN DOABA REGIONOF PUNJAB
(INDIA)
Rupinder Kaur*
Lalita Kumari**
Aarti Sharma***
Abstract: Stress is a feeling that's created when we react to particular events. It's the body's
way of rising to a challenge and preparing to meet a tough situation with focus, strength,
stamina, and heightened alertness. Stress may be good or bad. Employee and Job efficiency
depends upon the physical level and mental level of the employee. The aim of this study was
to find out the factors that creates stress among college teachers in Doaba region of Punjab.
The 60 respondents were selected by random cum convenient sampling method. Data was
analyzed with the help of factor analysis and chi square test. The five factors are found that
creates the job stress among college teachers in the Doaba region. The most important
factor that creates stress is Salary and other benefits followed by working conditions,
relations with colleagues, job security and work load So by improving these factors job stress
can be reduced among college teachers. The results of this study may be helpful for college’s
higher authorities to make HR policies for teachers.
Keywords: Job Stress, College, Teachers, Gender, Punjab, India
*Assistant Professor, Lyallpur Khalsa College, Jalandhar.
**Research Scholar, Commerce & Business Management Department, Guru Nanak Dev
University, Amritsar.
***Assistant Professor in Commerce, LRDAV College Jagraon

International Journal of Advanced Research in
Management and Social Sciences ISSN: 2278-6236
Vol. 2 | No. 3 | March 2013 www.garph.co.uk IJARMSS | 2
INTRODUCTION
Stress is an adverse reaction a person has to excessive pressures or other types of demands
placed upon them. Given an excess of pressure, stress can therefore happen to anyone, and
should not be seen as a weakness. Instead, an individual needs to be helped to deal with
these pressures. The concept of stress was first introduced in the life sciences by Selye Hans
in 1936. It was derived from the Latin word ‘stringere’; it meant the experience of physical
hardship, starvation, torture and pain. Selye Hans, 1974 defined stress as “the non-specific
response of the body to any demand placed upon it”. Many people still get confused about
pressure and stress, yet there’s a great deal of difference between the two. We all
experience pressure on a daily basis, and need it to motivate us and enable us to perform at
our best – ask any athlete or actor. However, if we experience too much pressure without
the opportunity to recover, we feel unable to cope and stress is the result. HSE defines
Claxton (1989) indicated that teaching is an occupation which is always demanding and
changing. Stress has physical and emotional effects on us and can create positive or
negative feelings. As a positive influence, stress can help compel us to action; it can result in
a new awareness and an exciting new perspective. As a negative influence, it can result in
feelings of distrust, rejection, anger, and depression, which in turn can lead to health
problems such as headaches, upset stomach, rashes, insomnia, ulcers, high blood pressure,
heart disease, and stroke. Stress is the “wear and tear” our bodies experience as we adjust
to our continually changing environment. According to Hans Selye, a pioneer researcher in
stress reaction, “stress is the human response to changes that occur as a part of daily living.”
“Stress comes from any situation or circumstance that requires behavioral adjustment. Any
change, either good or bad, is stressful, and whether it’s a positive or negative change, the
physiological response is the same” (Lazarus, 2000).
Stress reactions may result when people are exposed to risk factors at work. Reactions may
be emotional, behavioral, cognitive, and/or physiological in nature. When stress reactions
persist over a longer period of time, they may develop into more permanent, irreversible
health outcomes, such as chronic fatigue, musculoskeletal problems or cardiovascular
disease. Furthermore, it can also be deduced that there are two distinct types of stressors;
those which are found within the individual, which include personal values, attitudes and
self-concepts, and those that originate outside the individual, which include environmental

International Journal of Advanced Research in
Management and Social Sciences ISSN: 2278-6236
Vol. 2 | No. 3 | March 2013 www.garph.co.uk IJARMSS | 3
and work-related stressors. University Durham (1992) defined stress as a process of
behavioral, emotional, mental, and physical reactions caused by prolonged, increasing, or
new pressures that are significantly greater than the availability of coping strategies.
TABLE I COMPONENTS OF JOB STRESS IN THE VIEW OF VARIOUS RESEARCHERS
AUTHOR COMPONENT
Nema.G, Nagar D & Mandhanya Y (2000) 1.Excessive or high workload 2.unrealistic deadlines 3. Poor working relationships 4. Lack of control over work activities 5. Job insecurity 6. Lack of carrier opportunities 7. Multiple reporting
Northern Territory Govt. Report(2003) 1.Failure to inform about significant change 2.poor physical working environment 3.longer working hours.
Johnson et.al (2005) 1.psychological well being 2.physical health 3.job satisfaction
Park (2007) 1.low personal income 2. Low level of education 3.work more physically demanding and less satisfaction
Williams (2003) 1.uncertain job security 2.fear of lay-off
Harrington (2001) 1.health effects shift work causes 2.disruption of circadian rythm 3.reduction in quality and quantity of sleep, fatigue, anxiety, depression & increased neuroticism.
Gemmil & Heisler (1972) 1.Inseurity of job or promotion 2.ambiguity of supervisors evaluations. 3.too heavy work load, too less authority.
Evers, Tomic & Brouwers (2005) & Kokkinos, Panayiotou & Dazoglou (2005)
1.Disciplinary problems 2.apathy 3.overcrowdedd classrooms 4.unvoluntary transfers 5.inadequate salaries 6.lack of administrative support.
Krause (1994) 1.Lack of resources 2.lack of time 3.excessive meetings 4.large class sizes 5.lack of assistance6. lack of support
Kahan & Cooper (1993) 1.limited opportunities for development 2.insufficient performance feedback 3.inadequate assessment measures 4.biased control system 4.culture within organisation
Rutter, Hezberg & Paice (2002) 1.High self expectation 2.securing financial support for research 3.insufficient development 4. Inadequate salary 5. Slow progress on career advancement 6. Long meetings 7. Frequent interruptions.

International Journal of Advanced Research in
Management and Social Sciences ISSN: 2278-6236
Vol. 2 | No. 3 | March 2013 www.garph.co.uk IJARMSS | 4
RESEARCH METHODOLOGY
Sample unit and sample size: It was, for the purpose of this study, decided to select a
sample of 50 college teacher respondents from Doaba region of Punjab. A sample of 50
respondents was chosen through the convenience cum random sampling technique.
Research instrument: The study was conducted with pre structured questionnaire
(Annexure 1) Twenty three items were used for data collection regarding job stress. A five-
point scale with 1 being “strongly disagree” and being 5 “strongly agree” was used. Hence a
higher score indicated greater agreement with a statement than a lower score. To know the
satisfaction level of respondents fifty three number item was formulated. To facilitate
answering, the questions were developed in simple words.
Data analysis tools: The information collected from the survey has been analysed using
different techniques. The various statistical tools as factor analysis and Chi-Square test have
been used in the present study.
OBJECTIVES OF THE STUDY
The present study has been carried out with the following objectives:
1. To study the factors that cause Job Stress;
2. To study the relationship between Job stress and Gender;
3. To suggest some measures to reduce the level of job stress in colleges.
HYPOTHESIS FORMULATION
A study investigated stress, job satisfaction and organisational climate in 2500 medical
practitioners and auxiliary personnel in Germany. Job stress and dissatisfaction was
measured using a 12-item questionnaire developed from previous work by the authors.
Participants were randomly selected from national listings and 5000 were sent a
questionnaire. It was reported that female doctors perceived higher .levels of work stress
compared to their male counterparts, and that female auxiliary personnel reported lower
levels of stress compared to the male auxiliary personnel (Gardiner and Tiggemann, 1999).
An Australian cross-sectional study investigated stress, mental health, and leadership styles,
in 60 female and 60 male managers in male and female dominated industries. Male
dominated industries included academia, automotive industry, IT, accounting consultancies
and the timber industry. Female dominated industries included childhood education,
nursing and hair dressing. The female and male participants were not matched. Job stress

International Journal of Advanced Research in
Management and Social Sciences ISSN: 2278-6236
Vol. 2 | No. 3 | March 2013 www.garph.co.uk IJARMSS | 5
was measured using three scales from the Survey of Work Pressure and the GHQ was used
to measure mental health. Women reported overall higher levels of job stress than men, but
did not experience worse mental health. Female managers in male-dominated industries
reported the greatest level of pressure from discrimination. It is concluded that the gender
and the gender ratio of the industry influence stress, leadership style and mental health
among managers. The authors highlight that the findings need to be replicated, and due to
the small sample size there are limitations as to the ability to generalise to other male and
female dominated industries&dquo;. Davidson & Cooper &dquo; conducted a study
investigating occupational stress in managers in various work sectors within the UK. Initially,
60 female managers were interviewed, and then 696 female managers and 185 male
managers completed a stress questionnaire, based on the findings from the interviews and
previous research. Stress outcomes were measured using the GHQ, drug use and job
satisfaction. It was found that female managers reported higher levels of stress than male
managers, and they also experienced higher pressure levels than men from the work,
home/social and individual arenas (Davidson and Cooper, 1984). Davidson, Cooper &
Baldini, Davidson et al. (1995) studied stress in 126 female and 220 male graduate managers
using the OSI. The female participants reported significantly higher scores on the seven
subscales relating to sources of pressure compared to the male participants. The female
managers were also more at risk of physical and mental ill health and had lower job
satisfaction scores. The authors conclude that the female managers are under considerably
more pressure than their male counterparts managers are under considerably more
pressure than their male counterparts (Davidson et al., 1995).
H(0) College teachers perception about job stress is independent of gender.
DATA ANALYSIS AND INTERPRETATION
A total of 50 (Table 2) teacher respondent participated in the survey. Majority of
respondents were male employees (60%). Majority of the respondents were of age above
45 (52%) and most of them (40%) have been working for more than 10 years. 11%
respondents are working at salary up to 20,000. Majority of respondents have qualification
PG with NET and are assistant professors.

International Journal of Advanced Research in
Management and Social Sciences ISSN: 2278-6236
Vol. 2 | No. 3 | March 2013 www.garph.co.uk IJARMSS | 6
TABLE-2 DEMOGRAPHIC PROFILE OF RESPONDENT
AGE Frequency Percent
25-35 8 16
35-45 16 32
Above 45 26 52
Gender Frequency Percent
Male 30 60
Female 20 40
Salary Frequency Percent
10,000-20,000 11 22
20,000-30,000 19 38
Above 30,000 20 40
Tenure Frequency Percent
2-5 years 12 24
5-10 years 18 36
Above 10 years 20 40
Qualification Frequency Percent
PG with NET 30 60
Ph.D 20 40
Status of Employment Frequency Percent
Assistant professor 28 56
Associate professor 22 44
FACTOR ANALYSIS
KMO (Kaiser – Meyer- Olkin) measure of sampling adequacy: The KMO measure of sampling
adequacy is an index used to examine the appropriateness of the factor analysis. The values
between 0.5 to 1.0 indicate that factor analysis is suitable and appropriate.
The overall significance of correlation matrices is tested with Barlett’s test of Sphericity,
significant at 1% (p<0.000) that supports the validity of data. Table 3 shows KMO measure of
sampling adequacy and Barlett’s test of sphericity. Calculated value of KMO measure of
sampling adequacy is .588. This indicates that the sample is adequate for applying the factor
analysis. So factor analysis is applied to extract various factors using principle of component
analysis.
Table-3 KMO AND BARTLETT'S TEST
Kaiser-Meyer-Olkin Measure of Sampling Adequacy.
.588
Bartlett's Test of Sphericity
Approx. Chi-Square 433.002
Df 231
Sig. .000

International Journal of Advanced Research in
Management and Social Sciences ISSN: 2278-6236
Vol. 2 | No. 3 | March 2013 www.garph.co.uk IJARMSS | 7
Extraction of Factors: factors are extracted on the basis of Eigen value. Only those factors
which have Eigen values greater than 1 are retained, and other factors are not included. An
Eigen value represents the amount of variance associated with the factor. Total variance
explained is 67.388%.
TABLE-4 TOTAL VARIANCE EXPLAINED
Extraction Method: Principal Component Analysis.
From the table 4, five factors have been extracted and total variance explained by these
factors together is 67.388%, the remaining is due to the other factors which are beyond the
scope of the study. The results were obtained through orthogonal rotation with varimax
method and all factors loading greater than 0.4 (ignoring the sign) were retained.
NAMING OF FACTORS
Table 5 shows the factor loading on the various statements. This approach helps in
detecting the structure in the relationship between variable i.e to classify the variables. All
the variables have been given appropriate names according to the variables that have been
loaded on each factor. The names of the factors, the statement labels and factor loadings
are summarized below (Table-5)
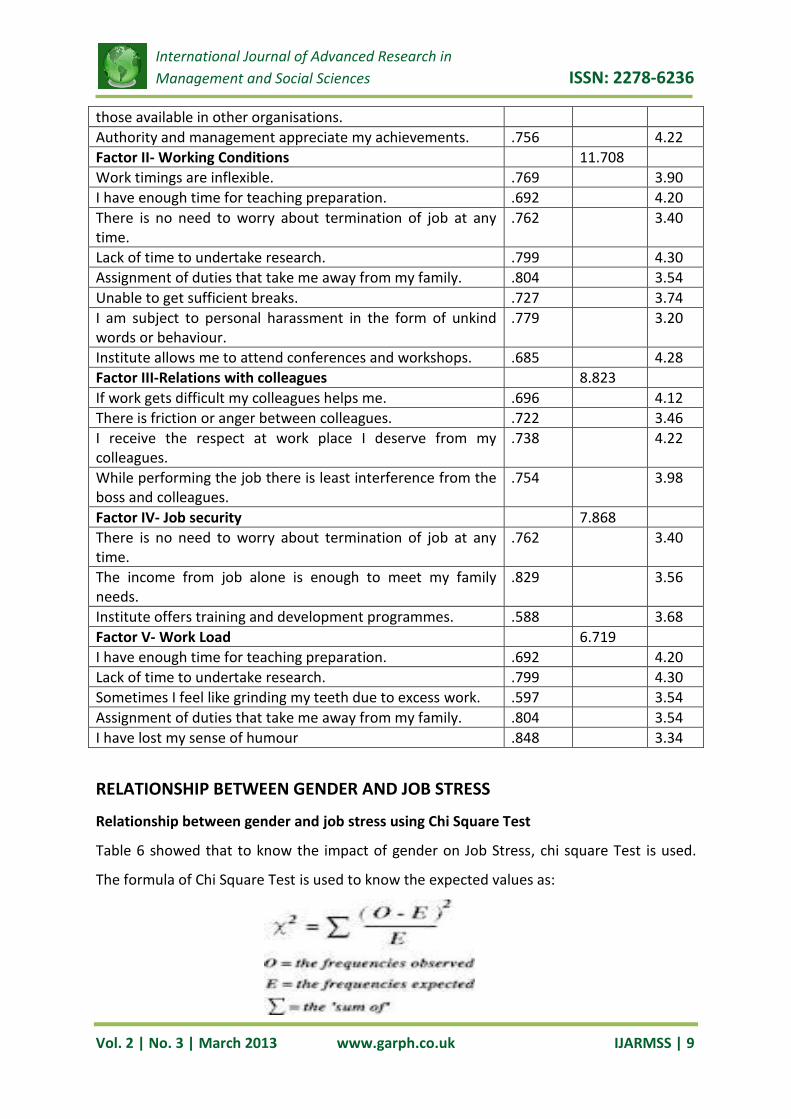
Salary and other benefits
It was clear from the table that most important factor as perceived by college teachers was
“Salary and other benefits”, consists of 8 statements with loading in the range of .685 to
.829. It accounts for 33.270% of the total variance. It has items related to gross emoluments
offered by the institute are commensurate with one’s responsibility, training and
experience, enough time for teaching preparation, lack of time to undertake research,
income alone is enough to meet family needs, performance appraisal and promotions are
based upon objective criteria and institute offers training and development opportunities.
Component Initial Eigenvalues Extraction Sums of Squared Loadings
Total % of Variance Cumulative % Total % of Variance Cumulative %
Factors
1 4.899 33.270 33.270 4.899 33.270 33.270
2 2.576 11.708 44.978 2.576 11.708 44.978
3 1.941 8.823 52.801 1.941 8.823 52.801
4 1.731 7.868 60.669 1.731 7.868 60.669
5 1.478 6.719 67.388 1.478 6.719 67.388

International Journal of Advanced Research in
Management and Social Sciences ISSN: 2278-6236
Vol. 2 | No. 3 | March 2013 www.garph.co.uk IJARMSS | 8
Working conditions
Factor two consist of eight items covering 11.708% of the total variance. The lowest loading
is .685 and highest variance is .804. The factor has been named as working conditions
offered by the organisation and it includes work timings are inflexible, sufficient time for
teaching preparation, lack of time to undertake research, unable to get sufficient breaks,
personal harassment and institute allow attending conferences and workshops.
Relations with colleagues
The factor includes four items. The factor loading from .696 to .754. The factor explains
8.823% of the total variance. The factor explains friction and anger between colleagues,
least interference from the job and colleagues and colleagues help in case of difficulty.
Job security
The factor includes three items. The factor loading ranges from .588 to .829 and
explains7.868% of total variance. Three statements constitute this factor namely no worry
about no worry about termination of job, income from job is sufficient to meet family needs
and institute offers training and development programmes.
Work load
This is the next important factor includes five items, which accounts for 6.719% of variance.
The lowest loading is .597 and highest is .848. The factor suggests enough time for teaching
preparation, lack of time to undertake research, lost sense of humour, grinding of teeth due
to excess work.
TABLE-5 NAMING OF FACTORS
Factor loading
% of variance
Mean
Factor I- Salary and other benefits 33.270
Gross Emoluments offered by the institute are commensurate with one’s responsibility, education, training and experience.
.700 3.20
I have enough time for teaching preparation. .692 4.20
Lack of time to undertake research. .799 4.30
The income from job alone is enough to meet my family needs.
.829 3.56
Institute allows me to attend conferences and workshops. .685 4.28
Institute offers training and development programmes. .588 3.68
Performance appraisal and promotions are based on objective criteria.
.661 3.84
Gross Emoluments and other benefits compare well with .819 3.70
International Journal of Advanced Research in
Management and Social Sciences ISSN: 2278-6236
Vol. 2 | No. 3 | March 2013 www.garph.co.uk IJARMSS | 9
those available in other organisations.
Authority and management appreciate my achievements. .756 4.22
Factor II- Working Conditions 11.708
Work timings are inflexible. .769 3.90
I have enough time for teaching preparation. .692 4.20
There is no need to worry about termination of job at any time.
.762 3.40
Lack of time to undertake research. .799 4.30
Assignment of duties that take me away from my family. .804 3.54
Unable to get sufficient breaks. .727 3.74
I am subject to personal harassment in the form of unkind words or behaviour.
.779 3.20
Institute allows me to attend conferences and workshops. .685 4.28
Factor III-Relations with colleagues 8.823
If work gets difficult my colleagues helps me. .696 4.12
There is friction or anger between colleagues. .722 3.46
I receive the respect at work place I deserve from my colleagues.
.738 4.22
While performing the job there is least interference from the boss and colleagues.
.754 3.98
Factor IV- Job security 7.868
There is no need to worry about termination of job at any time.
.762 3.40
The income from job alone is enough to meet my family needs.
.829 3.56
Institute offers training and development programmes. .588 3.68
Factor V- Work Load 6.719
I have enough time for teaching preparation. .692 4.20
Lack of time to undertake research. .799 4.30
Sometimes I feel like grinding my teeth due to excess work. .597 3.54
Assignment of duties that take me away from my family. .804 3.54
I have lost my sense of humour .848 3.34
RELATIONSHIP BETWEEN GENDER AND JOB STRESS
Relationship between gender and job stress using Chi Square Test
Table 6 showed that to know the impact of gender on Job Stress, chi square Test is used.
The formula of Chi Square Test is used to know the expected values as:

International Journal of Advanced Research in
Management and Social Sciences ISSN: 2278-6236
Vol. 2 | No. 3 | March 2013 www.garph.co.uk IJARMSS | 10
Calculation of Chi Square Test:
Level O significance =5% ; Degree of freedom= (r-1) (c-1) = (5-1)*(2-1) =4*1=4
Table Value=9.49 ; Calculated value= 2.1598 (see Table 7)
Decision: As the calculated value is less than the tabulated value our Null hypothesis is
accepted i.e. there is no significant relationship between Gender and job stress.
Table 6 Relationship between Gender and job stress
Gender Job stress
Male Female Total
Strongly agree 9(12) 4(5.2) 13
Agree 10(9.6) 6(6.4) 16
Neutral 5(4.8) 3(3.2) 8
Disagree 4(5.4) 5(3.6) 9
Strongly Disagree 2(2.4) 2(1.6) 4
Total 30 20 50
*significant value at 95% level of significance
Table 7 calculation of Chi Square value
Observed frequency (O) Expected Frequency(E) (O-E)2/E
9 12 .75
10 9.6 .017
5 4.8 .0083
4 5.4 .36
2 2.4 .067
4 5.2 .28
6 6.4 .025
3 3.2 .0125
5 3.6 .54
2 1.6 .1
Calculated Value 2.1598
DISCUSSION AND FINDINGS
Five factors have been found that creates job stress among the college teacher i.e. Salary
and other benefits, working conditions, Relations with colleagues, Job security and Work
load. Salary and other benefits carry maximum variance that means salary plays an
important role in one’s economic status if not satisfied it creates stress.
Null hypothesis that College teachers’ perception about job stress in independent of gender
has been accepted, there is no relationship between job stress and gender. It means male
and female has same perception about their job stress .One earning hand may not be able

International Journal of Advanced Research in
Management and Social Sciences ISSN: 2278-6236
Vol. 2 | No. 3 | March 2013 www.garph.co.uk IJARMSS | 11
to survive due to high cost of living similarly both male and female have to earn to fulfil their
desires. They both suffer from same kind of stress.
CONCLUSION
The most important factor that creates stress is Salary and other benefits followed by
working conditions, relations with colleagues, job security and work load So by improving
these factors job stress can be reduces among college teachers. A model can be formed with
the help of factors found in this study. The results of this study is consistent with which was
found by researcher in other countries.
RECOMMENDATIONS
Organisations must improve the salary structure according to cost of living.
Pension and other retirement benefits must be provided so that employees feel
secured.
Employee should be provided opportunities for career development and research.
LIMITATIONS AND SCOPE FOR FUTURE RESEARCH
The study has been confined to Doaba regions only and based on the subjective opinion of
the respondents and truth of the answers given by them cannot be assessed, so the findings
of the study cannot be generalized. Both the time and cost factors have been the
constraints while conducting of the study. The sample is small that may not represent the
whole universe. The future studies can be conducted on schools teachers and impact of job
stress on job satisfaction, performance and commitment.
Salary and other
benefits
Relations with
colleagues
working conditions
Job security Work load
Job stress

International Journal of Advanced Research in
Management and Social Sciences ISSN: 2278-6236
Vol. 2 | No. 3 | March 2013 www.garph.co.uk IJARMSS | 12
BIBLIOGRAPHY
1. A Study on Telecommunication Sector of Pakistan Journal of Business Studies
Quarterly 2011, Vol. 2, No. 3, pp. 50-56.
2. A.K. Srivastava (2008). Effect of Perceived Work Environment on Employees’ Job
Behaviour and Organizational Effectiveness. Journal of the Indian Academy of
Applied Psychology, Vol.34, No.1, 47-55.
3. Abirami.V.(2012), “ Levels of stress among college teachers with reference to
Coimbatore District”, Researchers world- Journal of Arts, Science and commerce.Vol-
III Issue-4(2) pp 93-104.
4. Davidson MJ, Cooper CL. Occupational stress in female managers: A comparative
study. Journal of Management Studies, 1984: 21: 185.
5. Davidson, MJ, Cooper CL, Baldini V. Occupational stress in female and male graduate
managers. Stress Medicine, 1995: 11: 157-175.
6. Durham, J. (1992) “Stress in teaching”. (2nd ed.) London: Routledge
7. Evers, W., Tomic, W., & Brouwers, A. (2005). “Does equity sensitivity moderate the
relationship between self-efficacy beliefs and teacher burnout?” Representative
Research in Social Psychology, 25, 35-46.
8. Gangadhar.M.Rao, V.S.P. Rao and Narayana.P (1997), “Organisational Behaviour”,
Konark Publishers Pvt. Limited New Delhi.
9. Gardiner M, Tiggemann M. Gender differences in leadership style, job stress and
mental health in male- and female-dominated industries. Journal of Occupational
and Organizational Psychology, 1999: 72: 301-315.
10. Gemmil, G.R., & Heisler, W, (1972), "Fatalism as a factor of managerial job
satisfaction, job strategy and mobility", Personnel Psychology, 25, pp 241- 250.
11. Harrington, J., (2001), "Health effects of shift work and extended hours of work."
Occupational and Environmental Medicine. 58 (1), pp.68-72.
12. Johnson, S., Cartwright, S., Ian, D , Taylor, P., Millet,C., (2005), “ The experience of
work-related stress across occupations”, Journal of Managerial Psychology, 20 (2),
pp. 178-187
13. Kahn, R. L., & Cooper, C. L. (1993). “Stress in the Dealing Room: High performers
under pressure”. Routledge: London and New York.

International Journal of Advanced Research in
Management and Social Sciences ISSN: 2278-6236
Vol. 2 | No. 3 | March 2013 www.garph.co.uk IJARMSS | 13
14. Khan. A, Shah.I.M, Khan.S, Gul.S, (2012), “The moderating effects of resources on
stress and Performance”, International Review of Social Sciences and Humanities,
Vol.2, No. 2,pp.21-29
15. Kokkinos, C.M., Panayiotou, G., & Dazoglou, A.M. (2005). “Correlates of teacher
appraisal of students behavior”. Psychology in the Schools, 42, 79-89.
16. Muhammad Mansoor. The Impact of Job Stress on Employee Job Satisfaction
17. Muthuvelayutham C, Mohanasundaram H(2012), “ A Study on the Impact of
Occupational Stress among Teachers on Job Satisfaction and Job Involvement – An
Empirical Study” European Journal of Social Sciences Vol.30 No.2, pp. 339-351
18. Nema. G, Nagar. D, Mandhanya.Y(2012) “A Study on the Causes of Work Related
Stress Among the College Teachers” Pacific Business review.
19. Park, J., (2007), 'Work place and job performance', Perspectives Statistics Canada
Catalogue no.75-001-XIE, pp. 1-13
20. Rehman.M, Irum.R, Ijaj. Z, Noor.U,Salma.U (2012), “Impact of job stress on Employee
Job satisfaction: A study of private colleges of Pakistan”, Journal of Business Studies,
Vol.3 No. 3 pp.50-56.
21. Rutter,H., Herzberg,J., & Paice, E. (2002). “Stress in Doctors and Dentist who teach.
Medical Education”, (36), 543-549.
22. Salami. S “ Job -related stress, personality, social support and burnout among college
of education lecturers”.
23. Williams, C., (2003), "Sources of workplace stress." Perspectives on Labour and
Income. Statistics Canada Catalogue no. 75-001-XIE, 4(6), pp.5-12.
24. http://www.businesslink.gov.uk
25. http://www.hse.gov.uk/stress/furtheradvice/wrs.htm