JOB SATISFACTION AS MEDIATOR IN THE RELATIONSHIP BE TWEEN WORK SPIRITUALITY AND PERFORMANCE: A CASE...
83
VOLUME NO. 4 (2014), ISSUE NO. 02 (FEBRUARY) ISSN 2231-4245 A Monthly Double-Blind Peer Reviewed (Refereed/Juried) Open Access International e-Journal - Included in the International Serial Directories Indexed & Listed at: Ulrich's Periodicals Directory ©, ProQuest, U.S.A., EBSCO Publishing, U.S.A., Cabell’s Directories of Publishing Opportunities, U.S.A., Open J-Gage, India [link of the same is duly available at Inflibnet of University Grants Commission (U.G.C.)], Index Copernicus Publishers Panel, Poland with IC Value of 5.09 & number of libraries all around the world. Circulated all over the world & Google has verified that scholars of more than 3130 Cities in 166 countries/territories are visiting our journal on regular basis. Ground Floor, Building No. 1041-C-1, Devi Bhawan Bazar, JAGADHRI – 135 003, Yamunanagar, Haryana, INDIA http://ijrcm.org.in/
-
Upload
independent -
Category
Documents
-
view
1 -
download
0
Transcript of JOB SATISFACTION AS MEDIATOR IN THE RELATIONSHIP BE TWEEN WORK SPIRITUALITY AND PERFORMANCE: A CASE...

VOLUME NO. 4 (2014), ISSUE NO. 02 (FEBRUARY) ISSN 2231-4245
A Monthly Double-Blind Peer Reviewed (Refereed/Juried) Open Access International e-Journal - Included in the International Serial Directories
Indexed & Listed at: Ulrich's Periodicals Directory ©, ProQuest, U.S.A., EBSCO Publishing, U.S.A., Cabell’s Directories of Publishing Opportunities, U.S.A.,
Open J-Gage, India [link of the same is duly available at Inflibnet of University Grants Commission (U.G.C.)], Index Copernicus Publishers Panel, Poland with IC Value of 5.09 & number of libraries all around the world.
Circulated all over the world & Google has verified that scholars of more than 3130 Cities in 166 countries/territories are visiting our journal on regular basis.
Ground Floor, Building No. 1041-C-1, Devi Bhawan Bazar, JAGADHRI – 135 003, Yamunanagar, Haryana, INDIA
http://ijrcm.org.in/

VOLUME NO. 4 (2014), ISSUE NO. 02 (FEBRUARY) ISSN 2231-4245
INTERNATIONAL JOURNAL OF RESEARCH IN COMMERCE, ECONOMICS & MANAGEMENT A Monthly Double-Blind Peer Reviewed (Refereed/Juried) Open Access International e-Journal - Included in the International Serial Directories
http://ijrcm.org.in/
ii
CONTENTS
Sr. No.
TITLE & NAME OF THE AUTHOR (S) Page No.
1. JOB SATISFACTION AS MEDIATOR IN THE RELATIONSHIP BETWEEN WORK
SPIRITUALITY AND PERFORMANCE: A CASE STUDY OF EMPLOYEE’S SHARIA
BANKING SECTOR IN SURAKARTA DISTRICT, INDONESIA
ACHMAD CHOERUDIN, TULUS HARYONO & MUHAMMAD CHOLIL
1
2. WOMEN ENTREPRENEURSHIP AND EMPOWERMENT: AN ANALYSIS FROM THE
PERSPECTIVE OF SMALL URBAN INDIA
DR. SUJIT ROY & DR. SAMITA MANNA
8
3. ERP APPLICATION IN INDIAN INDUSTRIES: AN ANALYSIS WITH RESPECT TO
MANUFACTURING UNITS IN PONDICHERRY
DR. D. ARAVAZHI IRISSAPPANE & S. YASODHA
13
4. INFLUENCE OF ADVERTISING IN MEDIA ON THE PERCEPTIONS OF YOUNG INDIAN
CONSUMERS WITH SPECIAL REFERENCE TO ORGANIZED FAST FOOD OUTLETS
DEEPAK ASHOKKUMAR & DR. S. SANKARANARAYANAN
20
5. NATURE BASED TOURISM AND PROTECTED AREA (PA) MANAGEMENT
U.N. SHUKLA & ALTAF AHMAD LONE
24
6. PRODUCTION TREND OF MAJOR AGRICULTURAL CROPS IN BANGLADESH
MD. RASHIDUL HASAN, M. S. RAHMAN & D. C. ACHARJEE
29
7. APPRAISAL OF SOCIAL MEDIA AS A STRATEGIC MARKETING TOOL
AAKRITI CHAUDHRY & ASHIMA SHARMA
33
8. A BRIEF ANALYSIS OF INDIA-JAPAN BILATERAL TRADE: A TRADE INTENSITY
APPROACH
P. SUNDAR RAJ & DR. B. AMBROSE
36
9. TALENT MANAGEMENT AS A NEVER-ENDING WAR FOR TALENT: AN ANALYSIS
DR. R. UMA DEVI
39
10. A STUDY ON HUMAN RESOURCE ACCOUNTING
DR. CIRAPPA. I. B & MUTTESHA. N
46
11. DETERMINANTS OF TOBACCO OUTPUT IN ZIMBABWE
DESMOND NDEDZU, VIMBAYI KETERO, TAMUKA MUKURA, TENDAI MAKOVA &
EDGAR MUHOYI
53
12. NATURAL RESOURCE ENDOWMENT AND ECONOMIC GROWTH IN AN OIL
EXPORTING COUNTRY: THE CASE OF NIGERIA
ALALADE S. A. & EJUMEDIA P. E.
59
13. CONSUMER BEHAVIOUR WITH REFERENCE TO HOME APPLIANCES IN TIRUVARUR
TOWN
R. AYYAPPAN & DR. P.ASOKAN
65
14. SELF HELP GROUP-BANK LINKAGE PROGRAMME AS AN INSTRUMENT OF ECONOMIC
UPLIFTMENT OF POOR WOMEN OF ASSAM: A CASE STUDY OF RAHA BLOCK OF
NAGAON DISTRICT
SUMIT DEY, LAKHIMI NATH & PRIYAM KALITA
68
15. HUMAN RESOURCE MANAGEMENT SCENARIO IN INDIA
THOTA AMRUTHA VALLI & T.RANGA VALLI
73
REQUEST FOR FEEDBACK & DISCLAIMER 76

VOLUME NO. 4 (2014), ISSUE NO. 02 (FEBRUARY) ISSN 2231-4245
INTERNATIONAL JOURNAL OF RESEARCH IN COMMERCE, ECONOMICS & MANAGEMENT A Monthly Double-Blind Peer Reviewed (Refereed/Juried) Open Access International e-Journal - Included in the International Serial Directories
http://ijrcm.org.in/
iii
CHIEF PATRON PROF. K. K. AGGARWAL
Chairman, Malaviya National Institute of Technology, Jaipur (An institute of National Importance & fully funded by Ministry of Human Resource Development, Government of India)
Chancellor, K. R. Mangalam University, Gurgaon
Chancellor, Lingaya’s University, Faridabad
Founder Vice-Chancellor (1998-2008), Guru Gobind Singh Indraprastha University, Delhi
Ex. Pro Vice-Chancellor, Guru Jambheshwar University, Hisar
FOUNDER PATRON LATE SH. RAM BHAJAN AGGARWAL
Former State Minister for Home & Tourism, Government of Haryana
Former Vice-President, Dadri Education Society, Charkhi Dadri
Former President, Chinar Syntex Ltd. (Textile Mills), Bhiwani
CO-ORDINATOR DR. BHAVET
Faculty, Shree Ram Institute of Business & Management, Urjani
ADVISORS DR. PRIYA RANJAN TRIVEDI
Chancellor, The Global Open University, Nagaland
PROF. M. S. SENAM RAJU Director A. C. D., School of Management Studies, I.G.N.O.U., New Delhi
PROF. M. N. SHARMA Chairman, M.B.A., HaryanaCollege of Technology & Management, Kaithal
PROF. S. L. MAHANDRU Principal (Retd.), MaharajaAgrasenCollege, Jagadhri
EDITOR PROF. R. K. SHARMA
Professor, Bharti Vidyapeeth University Institute of Management & Research, New Delhi
CO-EDITOR DR. SAMBHAV GARG
Faculty, Shree Ram Institute of Business & Management, Urjani
EDITORIAL ADVISORY BOARD DR. RAJESH MODI
Faculty, Yanbu Industrial College, Kingdom of Saudi Arabia
PROF. SIKANDER KUMAR Chairman, Department of Economics, HimachalPradeshUniversity, Shimla, Himachal Pradesh
PROF. SANJIV MITTAL UniversitySchool of Management Studies, GuruGobindSinghI. P. University, Delhi
PROF. RAJENDER GUPTA Convener, Board of Studies in Economics, University of Jammu, Jammu

VOLUME NO. 4 (2014), ISSUE NO. 02 (FEBRUARY) ISSN 2231-4245
INTERNATIONAL JOURNAL OF RESEARCH IN COMMERCE, ECONOMICS & MANAGEMENT A Monthly Double-Blind Peer Reviewed (Refereed/Juried) Open Access International e-Journal - Included in the International Serial Directories
http://ijrcm.org.in/
iv
PROF. NAWAB ALI KHAN Department of Commerce, Aligarh Muslim University, Aligarh, U.P.
PROF. S. P. TIWARI Head, Department of Economics & Rural Development, Dr. Ram Manohar Lohia Avadh University, Faizabad
DR. ANIL CHANDHOK Professor, Faculty of Management, Maharishi Markandeshwar University, Mullana, Ambala, Haryana
DR. ASHOK KUMAR CHAUHAN Reader, Department of Economics, KurukshetraUniversity, Kurukshetra
DR. SAMBHAVNA Faculty, I.I.T.M., Delhi
DR. MOHENDER KUMAR GUPTA Associate Professor, P.J.L.N.GovernmentCollege, Faridabad
DR. VIVEK CHAWLA Associate Professor, Kurukshetra University, Kurukshetra
DR. SHIVAKUMAR DEENE Asst. Professor, Dept. of Commerce, School of Business Studies, Central University of Karnataka, Gulbarga
ASSOCIATE EDITORS PROF. ABHAY BANSAL
Head, Department of Information Technology, Amity School of Engineering & Technology, Amity University, Noida
PARVEEN KHURANA Associate Professor, MukandLalNationalCollege, Yamuna Nagar
SHASHI KHURANA Associate Professor, S.M.S.KhalsaLubanaGirlsCollege, Barara, Ambala
SUNIL KUMAR KARWASRA Principal, AakashCollege of Education, ChanderKalan, Tohana, Fatehabad
DR. VIKAS CHOUDHARY Asst. Professor, N.I.T. (University), Kurukshetra
TECHNICAL ADVISOR AMITA
Faculty, Government M. S., Mohali
FINANCIAL ADVISORS DICKIN GOYAL
Advocate & Tax Adviser, Panchkula
NEENA Investment Consultant, Chambaghat, Solan, Himachal Pradesh
LEGAL ADVISORS JITENDER S. CHAHAL
Advocate, Punjab & Haryana High Court, Chandigarh U.T.
CHANDER BHUSHAN SHARMA Advocate & Consultant, District Courts, Yamunanagar at Jagadhri
SUPERINTENDENT SURENDER KUMAR POONIA

VOLUME NO. 4 (2014), ISSUE NO. 02 (FEBRUARY) ISSN 2231-4245
INTERNATIONAL JOURNAL OF RESEARCH IN COMMERCE, ECONOMICS & MANAGEMENT A Monthly Double-Blind Peer Reviewed (Refereed/Juried) Open Access International e-Journal - Included in the International Serial Directories
http://ijrcm.org.in/
v
CALL FOR MANUSCRIPTS We invite unpublished novel, original, empirical and high quality research work pertaining to recent developments & practices in the areas of
Computer Science & Applications; Commerce; Business; Finance; Marketing; Human Resource Management; General Management; Banking;
Economics; Tourism Administration & Management; Education; Law; Library & Information Science; Defence & Strategic Studies; Electronic Science;
Corporate Governance; Industrial Relations; and emerging paradigms in allied subjects like Accounting; Accounting Information Systems; Accounting
Theory & Practice; Auditing; Behavioral Accounting; Behavioral Economics; Corporate Finance; Cost Accounting; Econometrics; Economic
Development; Economic History; Financial Institutions & Markets; Financial Services; Fiscal Policy; Government & Non Profit Accounting; Industrial
Organization; International Economics & Trade; International Finance; Macro Economics; Micro Economics; Rural Economics; Co-operation;
Demography: Development Planning; Development Studies; Applied Economics; Development Economics; Business Economics; Monetary Policy; Public
Policy Economics; Real Estate; Regional Economics; Political Science; Continuing Education; Labour Welfare; Philosophy; Psychology; Sociology; Tax
Accounting; Advertising & Promotion Management; Management Information Systems (MIS); Business Law; Public Responsibility & Ethics;
Communication; Direct Marketing; E-Commerce; Global Business; Health Care Administration; Labour Relations & Human Resource Management;
Marketing Research; Marketing Theory & Applications; Non-Profit Organizations; Office Administration/Management; Operations Research/Statistics;
Organizational Behavior & Theory; Organizational Development; Production/Operations; International Relations; Human Rights & Duties; Public
Administration; Population Studies; Purchasing/Materials Management; Retailing; Sales/Selling; Services; Small Business Entrepreneurship; Strategic
Management Policy; Technology/Innovation; Tourism & Hospitality; Transportation Distribution; Algorithms; Artificial Intelligence; Compilers &
Translation; Computer Aided Design (CAD); Computer Aided Manufacturing; Computer Graphics; Computer Organization & Architecture; Database
Structures & Systems; Discrete Structures; Internet; Management Information Systems; Modeling & Simulation; Neural Systems/Neural Networks;
Numerical Analysis/Scientific Computing; Object Oriented Programming; Operating Systems; Programming Languages; Robotics; Symbolic & Formal
Logic; Web Design and emerging paradigms in allied subjects.
Anybody can submit the soft copy of unpublished novel; original; empirical and high quality research work/manuscript anytime in M.S. Word format
after preparing the same as per our GUIDELINES FOR SUBMISSION; at our email address i.e. [email protected] or online by clicking the link online
submission as given on our website (FOR ONLINE SUBMISSION, CLICK HERE).
GUIDELINES FOR SUBMISSION OF MANUSCRIPT
1. COVERING LETTER FOR SUBMISSION:
DATED: _____________
THE EDITOR
IJRCM
Subject: SUBMISSION OF MANUSCRIPT IN THE AREA OF.
(e.g. Finance/Marketing/HRM/General Management/Economics/Psychology/Law/Computer/IT/Engineering/Mathematics/other, please specify)
DEAR SIR/MADAM
Please find my submission of manuscript entitled ‘___________________________________________’ for possible publication in your journals.
I hereby affirm that the contents of this manuscript are original. Furthermore, it has neither been published elsewhere in any language fully or partly, nor is it
under review for publication elsewhere.
I affirm that all the author (s) have seen and agreed to the submitted version of the manuscript and their inclusion of name (s) as co-author (s).
Also, if my/our manuscript is accepted, I/We agree to comply with the formalities as given on the website of the journal & you are free to publish our
contribution in any of your journals.
NAME OF CORRESPONDING AUTHOR:
Designation:
Affiliation with full address, contact numbers & Pin Code:
Residential address with Pin Code:
Mobile Number (s):
Landline Number (s):
E-mail Address:
Alternate E-mail Address:
NOTES:
a) The whole manuscript is required to be in ONE MS WORD FILE only (pdf. version is liable to be rejected without any consideration), which will start from
the covering letter, inside the manuscript.
b) The sender is required to mentionthe following in the SUBJECT COLUMN of the mail:
New Manuscript for Review in the area of (Finance/Marketing/HRM/General Management/Economics/Psychology/Law/Computer/IT/
Engineering/Mathematics/other, please specify)
c) There is no need to give any text in the body of mail, except the cases where the author wishes to give any specific message w.r.t. to the manuscript.
d) The total size of the file containing the manuscript is required to be below 500 KB.
e) Abstract alone will not be considered for review, and the author is required to submit the complete manuscript in the first instance.
f) The journal gives acknowledgement w.r.t. the receipt of every email and in case of non-receipt of acknowledgment from the journal, w.r.t. the submission
of manuscript, within two days of submission, the corresponding author is required to demand for the same by sending separate mail to the journal.
2. MANUSCRIPT TITLE: The title of the paper should be in a 12 point Calibri Font. It should be bold typed, centered and fully capitalised.
3. AUTHOR NAME (S) & AFFILIATIONS: The author (s) full name, designation, affiliation (s), address, mobile/landline numbers, and email/alternate email
address should be in italic & 11-point Calibri Font. It must be centered underneath the title.
4. ABSTRACT: Abstract should be in fully italicized text, not exceeding 250 words. The abstract must be informative and explain the background, aims, methods,
results & conclusion in a single para. Abbreviations must be mentioned in full.
VOLUME NO. 4 (2014), ISSUE NO. 02 (FEBRUARY) ISSN 2231-4245
INTERNATIONAL JOURNAL OF RESEARCH IN COMMERCE, ECONOMICS & MANAGEMENT A Monthly Double-Blind Peer Reviewed (Refereed/Juried) Open Access International e-Journal - Included in the International Serial Directories
http://ijrcm.org.in/
vi
5. KEYWORDS: Abstract must be followed by a list of keywords, subject to the maximum of five. These should be arranged in alphabetic order separated by
commas and full stops at the end.
6. MANUSCRIPT: Manuscript must be in BRITISH ENGLISH prepared on a standard A4 size PORTRAIT SETTING PAPER. It must be prepared on a single space and
single column with 1” margin set for top, bottom, left and right. It should be typed in 8 point Calibri Font with page numbers at the bottom and centre of every
page. It should be free from grammatical, spelling and punctuation errors and must be thoroughly edited.
7. HEADINGS: All the headings should be in a 10 point Calibri Font. These must be bold-faced, aligned left and fully capitalised. Leave a blank line before each
heading.
8. SUB-HEADINGS: All the sub-headings should be in a 8 point Calibri Font. These must be bold-faced, aligned left and fully capitalised.
9. MAIN TEXT: The main text should follow the following sequence:
INTRODUCTION
REVIEW OF LITERATURE
NEED/IMPORTANCE OF THE STUDY
STATEMENT OF THE PROBLEM
OBJECTIVES
HYPOTHESES
RESEARCH METHODOLOGY
RESULTS & DISCUSSION
FINDINGS
RECOMMENDATIONS/SUGGESTIONS
CONCLUSIONS
SCOPE FOR FURTHER RESEARCH
ACKNOWLEDGMENTS
REFERENCES
APPENDIX/ANNEXURE
It should be in a 8 point Calibri Font, single spaced and justified. The manuscript should preferably not exceed 5000 WORDS.
10. FIGURES &TABLES: These should be simple, crystal clear, centered, separately numbered & self explained, and titles must be above the table/figure. Sources
of data should be mentioned below the table/figure. It should be ensured that the tables/figures are referred to from the main text.
11. EQUATIONS:These should be consecutively numbered in parentheses, horizontally centered with equation number placed at the right.
12. REFERENCES: The list of all references should be alphabetically arranged. The author (s) should mention only the actually utilised references in the preparation
of manuscript and they are supposed to follow Harvard Style of Referencing. The author (s) are supposed to follow the references as per the following:
• All works cited in the text (including sources for tables and figures) should be listed alphabetically.
• Use (ed.) for one editor, and (ed.s) for multiple editors.
• When listing two or more works by one author, use --- (20xx), such as after Kohl (1997), use --- (2001), etc, in chronologically ascending order.
• Indicate (opening and closing) page numbers for articles in journals and for chapters in books.
• The title of books and journals should be in italics. Double quotation marks are used for titles of journal articles, book chapters, dissertations, reports, working
papers, unpublished material, etc.
• For titles in a language other than English, provide an English translation in parentheses.
• The location of endnotes within the text should be indicated by superscript numbers.
PLEASE USE THE FOLLOWING FOR STYLE AND PUNCTUATION IN REFERENCES:
BOOKS
• Bowersox, Donald J., Closs, David J., (1996), "Logistical Management." Tata McGraw, Hill, New Delhi.
• Hunker, H.L. and A.J. Wright (1963), "Factors of Industrial Location in Ohio" Ohio State University, Nigeria.
CONTRIBUTIONS TO BOOKS
• Sharma T., Kwatra, G. (2008) Effectiveness of Social Advertising: A Study of Selected Campaigns, Corporate Social Responsibility, Edited by David Crowther &
Nicholas Capaldi, Ashgate Research Companion to Corporate Social Responsibility, Chapter 15, pp 287-303.
JOURNAL AND OTHER ARTICLES
• Schemenner, R.W., Huber, J.C. and Cook, R.L. (1987), "Geographic Differences and the Location of New Manufacturing Facilities," Journal of Urban Economics,
Vol. 21, No. 1, pp. 83-104.
CONFERENCE PAPERS
• Garg, Sambhav (2011): "Business Ethics" Paper presented at the Annual International Conference for the All India Management Association, New Delhi, India,
19–22 June.
UNPUBLISHED DISSERTATIONS AND THESES
• Kumar S. (2011): "Customer Value: A Comparative Study of Rural and Urban Customers," Thesis, Kurukshetra University, Kurukshetra.
ONLINE RESOURCES
• Always indicate the date that the source was accessed, as online resources are frequently updated or removed.
WEBSITES
• Garg, Bhavet (2011): Towards a New Natural Gas Policy, Political Weekly, Viewed on January 01, 2012 http://epw.in/user/viewabstract.jsp

VOLUME NO. 4 (2014), ISSUE NO. 02 (FEBRUARY) ISSN 2231-4245
INTERNATIONAL JOURNAL OF RESEARCH IN COMMERCE, ECONOMICS & MANAGEMENT A Monthly Double-Blind Peer Reviewed (Refereed/Juried) Open Access International e-Journal - Included in the International Serial Directories
http://ijrcm.org.in/
1
JOB SATISFACTION AS MEDIATOR IN THE RELATIONSHIP BETWEEN WORK SPIRITUALITY AND
PERFORMANCE: A CASE STUDY OF EMPLOYEE’S SHARIA BANKING SECTOR IN SURAKARTA DISTRICT,
INDONESIA
ACHMAD CHOERUDIN
STUDENT
FACULTY OF ECONOMICS & BUSINESS
SEBELAS MARET UNIVERSITY OF SURAKARTA
INDONESIA
TULUS HARYONO
PROFESSOR
FACULTY OF ECONOMICS & BUSINESS
SEBELAS MARET UNIVERSITY OF SURAKARTA
INDONESIA
MUHAMMAD CHOLIL
SR. LECTURER
FACULTY OF ECONOMICS & BUSINESS
SEBELAS MARET UNIVERSITY OF SURAKARTA
INDONESIA
ABSTRACT This study aims to investigate the relationship between works spirituality and performance mediated by job satisfaction. Conducted in sharia bank in Surakarta
District, Central Java, Indonesia. The data were collected through surveys to employees with proportional random and simple random sampling involved 175
employees as the respondents. Based on the number of the sample, the test to the sample validity and reliability showed the result was that the sample was valid
and reliable. The data analysis was carried out by using Structural Equation Model (SEM). The finding of the study show that: (1) there is a positive and significant
relation between relationship work spirituality and job satisfaction, (2) there is a positive and significant relation between relationship work spirituality and
performance, (3) there is a positive and significant relation between relationship job sataisfaction and performance and (4) there is a positive and significant
relation between relationship work spirituality and performance with job satisfaction as mediate.
KEYWORDS
Job satisfaction, work spirituality, performance.
INTRODUCTION he development of work spirituality has important to human behavior. Presently, work spirituality is developed to enhance the integrity and loyalty of
employees (Ashmos and Duchon, 2000). The life of employees is affected significantly by work spirituality (Othman, Abdullah and Ahmad, 2008). Work
spirituality has a strong relationship with work behavior like job satisfaction, performance, attitude, work ethics, morality and management behavior (Ali
and Ellahi, 2012; Javanmard, 2012; Hutson, 2000). One of the work behavioral is job satisfaction which is how much someone loves his job (Spector, 1999).
Judge, Thoresan, Bono, and Patton (2001) explained about the relationship between job satisfaction and performance in direct relation and reciprocity. The
knowledge of the researchers, there are inconcistency research that discusses the direct relationship and reciprocity between job satisfaction and performance
on a model research (Carmeli, 2003; Bhuian, Menguc and Borsboom, 2005; Othman et al., 2008), but these findings are not significant as researched by Sohi
(1996), as Wanous (1974) provides an explanation of the relationship of the theory of intrinsic and extrinsic job satisfaction with performance.
Individual job satisfaction will have an impact for performance in the work, as an attempt to create a company's effectiveness in the facing competition. Job
satisfaction and performance can minimize the level of turnover in company (Chawda and Guda, 2010). The issues of spirituality, job satisfaction and employee
performance occurred in sharia banking in Indonesia. Phenomena that occur in the company e.g. decreased performance of employees in one of the sharia
banking of 6.55% in 2010 due to a change in the management of human resources and has not been able to adapt to the new management system in sharia
banking. Employee performance declined from employees who have good value of 13,04% in 2009 to 6.5% in 2010. The performance assessment decreased
from 78,26% to 73,91%. Employee performance appraisal with a value of less good increased from 8.7% in 2009 to 19,57% in 2010 (Suryoadi and Ratnawati,
2010). Decrease in performance due to the dissatisfaction of employees in their work and declining work spirituality in the company, so that the research on the
relationship between work spirituality and performance mediated by job satisfaction to be important to look at these problems and provide solutions. Based on
the background, one research problem is taken about how the model of relationship between work spirituality and performance with job satisfaction as
mediated occurred in sharia bank. Additionally, it is not found so far for the model of relationship between work spirituality and performance mediated by job
satisfaction of employees using Structural Equation Model approach.
REVIEW OF LITERATURE Work spirituality is a distinct state that is characterised by cognitive, interpersonal, spiritual and mystical dimensions. Work spirituality involves: (a) engaging
work characterised by a profound feeling of well-being, a belief that one is engaged in meaningful work that has a higher purpose, an awareness of alignment
between one’s values and beliefs and one’s work, and a sense of being authentic; (b) a spiritual connection characterised by a sense of connection to something
larger than self; (c) a sense of community characterised by a feeling of connectedness to others and common purpose; and (d) a mystical or unitive experience
characterised by a positive state of energy or vitality, a sense of perfection, transcendence, and experiences of joy and bliss (Kinjerski and Skrypnek, 2006).
Job satisfaction as a pleasurable or positive emotional state resulting from the appraisal of one’s job or job experiences (Locke, 1976). In measuring job
satisfaction in our study, we will focus on the intrinsic and extrinsic job satisfaction. Intrinsic sources of satisfaction depend on the individual characteristics of
the person, such as the ability to use initiative, relations with supervisors, or the work that the person actually performs; these are symbolic or qualitative facets
of the job. Extrinsic sources of satisfaction are situational and depend on the environment, such as pay, promotion, or job security; these are financial and other
material rewards or advantages of a job.
T

VOLUME NO. 4 (2014), ISSUE NO. 02 (FEBRUARY) ISSN 2231-4245
INTERNATIONAL JOURNAL OF RESEARCH IN COMMERCE, ECONOMICS & MANAGEMENT A Monthly Double-Blind Peer Reviewed (Refereed/Juried) Open Access International e-Journal - Included in the International Serial Directories
http://ijrcm.org.in/
2
Performance represented behaviors employees engage in while at work which contribute to organizational goals (Campbell, 1990). These behaviors are formally
evaluated by an organization as part of an employees responsibilities. Researchers distinguish performance into two aspects: task performance and contextual
performance. (Aryee et al., 2004; Borman and Motowidlo, 1993). In our study, we will focus on task performance and contextual performance.
IMPORTANCE OF THE STUDY 1. This research contributes to the human resource management, particularly related to the use of quantitative models and empirical test on human
behaviour for work spirituality, job satisfaction and performance in sharia banking.
2. This research contributes to the future research through the proposed theoretical construction with the limitation that have not been empirically tested
yet and contribute to the thoughts for the managerial practices in an company and provides the result of the research for a new discourse for the
development of human resource management.
3. This research contributes to the implications for managerial practice, especially potential and the company's ability to improve the quality of human
resources in the competition and the progress of the company.
STATEMENT OF THE PROBLEMS 1. Does work spirituality have a direct relationship with job satisfaction?
2. Does work spirituality have a direct relationship with performance?
3. Does work job satisfaction have a direct relationship with performance?
4. Does work spirituality have a indirect relationship with performance mediated by job satisfaction?
OBJECTIVES OF THE STUDY 1. To test and analyze the direct relationship between work spirituality and job satisfaction.
2. To test and analyze the direct relationship between work spirituality with performance.
3. To test and analyze the direct relationship between job satisfaction with performance.
4. To test and analyze an indirect relationship between work spirituality towards performance mediated by job satisfaction.
HYPOTHESIS WORK SPIRITUALITY AND JOB SATISFACTION
East (2005) mentioning a strong correlation between work spirituality and job satisfaction. Yahyazadeh-Jeloudar and Lotfi-Goodarzi (2012) state that work
spirituality significantly will influence the job satisfaction that covers the work itself, attitude to supervisor, relationship with co-workers, work environment
condition but not significant when being correlated to salary. Work spirituality acts in controlling a clear achievement, brings an effect on and makes a short-
term and long-term goal with the capability of achieving the goal, even in a very difficult condition, particularly in job satisfaction. One of the dimensions is
framed as the meaning with its indicators goal and organization service (Yahyazadeh-Jeloudar and Lotfi-Goodarzi, 2012) and this finding is supported by Nur
(2003), Scott (2009), Chand and Koul (2012).
H1: Work spirituality has a positive relationship with job satisfaction.
WORK SPIRITUALITY AND PERFORMANCE
Work spirituality will impact the performance through the value of awareness, cognitive, interpersonal, spiritual and mystical dimensions, life essence, gift of
love in the employees’ life and transcendence in helping other in handling any work matters in workplace. Lynton and Thogersen (2009) saying that work
spirituality in praying and productivity can improve performance and job satisfaction (Alexander et al., 1993). This finding is supported by Neck and Milliman
(1994), Shaw (1999), Ayranci (2011), Javanmard (2012), Rastgar, Zarei, Davoudi and Farash (2012).
H2: Work spirituality has a positive relationship with performance.
JOB SATISFACTION AND PERFORMANCE
Brown and Reterson (1993) state that in the intrinsic value of work, job satisfaction is not consistent and has a weak correlation. However, this finding is not in
line with the findings of Christen et al (2006) observe that the correlation between the job satisfaction and work achievement is for one-direction correlation
causing job satisfaction to work achievement or vice versa (Law et al., 2001). Mutual relationship is that when satisfaction is extrinsic, it will address to work
performance, but when job satisfaction is intrinsic, the performance will lead to the relationship to job satisfaction. This finding is supported by Carmeli (2003),
Bhuian et al., (2005), and Othman et al., (2008), but the finding that not significant by Sohi (1996).
H3: Job satisfaction has a positive relationship with performance.
JOB SATISFACTION AS MEDIATOR IN RELATIONSHIP BETWEEN WORK SPIRITUALITY AND PERFORMANCE
Development of work spirituality to employees as required by the self-centred behaviour of individual work (Fry, 2003; Madlin, 1986). The behavior of work will
be established through the consciousness of work spirituality to achieve life needs of employees. In addition to providing a sense of job satisfaction as an
expression of employee behavior, work spirituality is also improving the performance of employees. An Individual performance will enhance with increasing
spirituality of someone that is mediated by job satisfaction. Model mediation is a causal model (Ross et al., 2004). The relationship of this mediation is to explain
why and how a process of cause and effect that happens (Baron and Kenny, 1986). This mediation models provide an explanation that work spirituality is not
related directly with performance with mediated by job satisfaction, as well as job satisfaction and performance of a person based on a feeling of pleasure and
sense of self as the embodiment of work spirituality which lead to intuitive abilities will increase (Vaughan, 1989).
H4: Work spirituality has a positive relationship with performance mediated by job satisfaction.
FIGURE 1. MODEL OF RESEARCH
Model of the research are:
Model (1) : Work spirituality – Job satisfaction.
Model (2) : Work spirituality – Performance.
Model (3) : Job satisfaction – Performance.
Model (4) : Work spirituality – Job satisfaction – Performance.
Job Satisfaction
(M)
Performance
(Y)
Work Spirituality
(X)
VOLUME NO. 4 (2014), ISSUE NO. 02 (FEBRUARY) ISSN 2231-4245
INTERNATIONAL JOURNAL OF RESEARCH IN COMMERCE, ECONOMICS & MANAGEMENT A Monthly Double-Blind Peer Reviewed (Refereed/Juried) Open Access International e-Journal - Included in the International Serial Directories
http://ijrcm.org.in/
3
RESEARCH METHODOLOGY POPULATION AND SAMPLES
This research is a survey conducted to 320 employees of sharia banking in Surakarta District, Central Java, Indonesia. According to Guilford and Flruchter (1973)
the number of sample allowed is 178 employees by referring to Hair et. al., (2009) in which the size of 100-200 samples for the technique of maximum likelihood
estimation, a technique of taking sample using the method of proportional and simple random sampling. Meanwhile, the data collection was done using
observation and the distribution of questionnaires at sharia bank.
MEASUREMENTS AND TESTING RESEARCH VARIABLES
Work spirituality is a capability of someone to implement and realize the spiritual sources, values and qualities through the ways of improving the daily functions
and prosperity (Kinjerski and Skrypnek, 2006). A research using Spiritual at Work Scale was developed by Kinjerski and Skrypnek (2006) consisting of 18 items of
question with the Likert Scale 1 to 5 including engaging work, sense of community, spiritual connection and mystical experience.
Job satisfaction is about the degree to love job (Spector, 1999). A research using Job Satisfaction Scale was developed by Weiss, Dawis, England and Lofquist
(1967) covering 18 items of question using Likert Scale 1 to 5 including intrinsic and extrinsic job satisfaction.
Performance is a measure an achievement in a job, including task performance by Wayne et al. (1997) and Hochwarter et al. (2006) and contextual performance
by Witt and Carlson (2006), Van Scotter and Motowidlo (1996) using LIkert Scale 1 to 5 is covering 14 items of question using Likert Scale 1 to 5.
ANALYSIS TECHNIQUE
The technique on the research analysis used Structural Equation Modelling (SEM), a statistical technique of multivariate by testing a series of causality
relationship between variables simultaneously (Hair et al., 2009).
RESULTS AND DISCUSSION RESULTS
The distribution result of the respondents based on the demography included male (56%) and female (44%). Based on the age, the respondents were between
21-30 years old (53%), 31-40 years old (33%) and above 40 years old (4%). Based on the marital status, it includes the married ones (70%) and unmarried ones
(30%). Based on work experience, it included those below 5 years (63%), between 6-10 years (16%) and above 10 years (21%). For the educational level, it was
dominated by the undergraduates (4%), Senior High School (10%), postgraduates (70%), and diploma (16%). For the employment status, 66% of them were
permanent employees and 34% were the contract ones. For the management level, it includes top management (0%), midlle management (70%) and lower
management (30%).
Confirmatory Factor Analysis (CFA) was used to test the construct validity in which each variable was scores above 0,5. The result of data management, loading
factor score in each item of questions was higher than 0,5 that shows the validity of the research instruments. The reliability test in this research was measured
using the composite reliability technique.
The result of the outlier data evaluation showed no single observed data showing that the value of mahalonobis d-squared was not more than the value of chi-
square table (α=0.001; df=82) at 99,637. This comparison showed no any multivariate outlier indication in the collected research data. It means that the
observed data was concentrated at the centroid points. Furthermore, the result of computerized AMOS program showed that the value of multivariate CR was
at 1,323 from -2,58 to 2,58 based on the standards. This indicates a normal distribution of the data observed through the research indicators of multivariate
data.
TABLE 1: THE TESTING RESULTS OF HYPOTESIS 1, 2 AND 3
Variable Correlation Estimate Standard of Estimate (SE) Critical Ratio (CR) t Critical Probability (p) Remarks
Work Spirituality Job Satisfaction 1,751 0,753 2,325 1,961 0,020 Significant
Work Spirituality Performance 1,573 0,563 2,279 1,961 0,005 Significant
Job Satisfaction Performance 0,491 0,142 3,463 1,961 0,000 Significant
(Source: managed data, 2014)
Hypothesis 1, SEM model resulted in the goodness of fit that index value: GFI=0,985, AGFI=0,961, NFI=0,954, RFI=0.567, IFI=1,002, TLI=1,004, RMSEA=0.000,
AIC=33,708, ECVI=0,194, and CFI=1, and the model is fit. Results obtained in this study, the value of CR=2,325 with a value of SE=0,753, because the value of CR >
± 1.96 and the coefficient of relationship between work spirituality and job satisfaction was positive (�1 = 1,751 > 0) shows that there is a positive and
significant relationship between work spirituality and job satisfaction. This hypothesis can be accepted at a significance level α=0.05.
Hypothesis 2, SEM model resulted in the goodness of fit that index value: GFI=0,981, AGFI=0,950, NFI=0,865, RFI=0,746, IFI=0.960, TLI=0,928, RMSEA=0,041,
AIC=36,370, ECVI=0,209 and CFI=0,968, and the model is fit. Results obtained in this study, the value of CR=2,279 with a value of SE=0,563, because the value of
CR > ± 1.96 and the coefficient of relationship between work spirituality and performance was positive (�2 = 1,573 > 0) shows that there is a positive and
significant relationship between work spirituality and performance. This hypothesis can be accepted at a significance level α=0.05.
Hypothesis 3, SEM model resulted in the goodness of fit that index value: GFI=0,975, AGFI=0,873, NFI=0,874, RFI=0,592, IFI=0,891, TLI=0,650, RMSEA=0,143,
AIC=25,119, ECVI=0,144 and CFI=0,889, and the model is fit. Results obtained in this study, the value of CR=3,463 with a value of SE=0,142, because the value of
CR > ± 1.96 and the coefficient of relationship between job satisfaction and performance was positive (�3 = 0,491 > 0) shows that there is a positive and
significant relationship between job satisfaction and job performance. Thus, the hypothesis can be accepted at a significance level α=0.05.
TABLE 2: THE TESTING RESULT OF HYPOTESIS 4
Independent Variable Mediate Variable Dependent Variable Direct Coefficient Indirect Coefficient Total Coefficient Remark
Work Spirituality Job Satisfaction Performance 1,573 1,604 x 0,112 = 0,1796 1,753 Partial Mediator
(Source: managed data, 2014)
Hypothesis 4, SEM model resulted in the goodness of fit that index value GFI=0,965, AGFI=0,929, NFI=0,876, RFI=0,807, IFI=0,959, TLI=0,933, RMSEA=0,050,
AIC= 61,748, ECVI=0,355, and CFI=0,957, so the model is fit. Work spirituality is associated positively with performance, both directly and indirectly, while job
satisfaction is able to properly mediate the relationship between work spirituality and performance. This is shown from the value of the coefficient of a direct
connection to spirituality and performance of 1,573, whereas the value of the coefficient of an indirect relationship between work spirituality and performance
of 0,1796. The total coefficients after mediated with the job satisfaction of 0.699, so this relationship can be accepted at a significance level α = 0.05.
DISCUSSION First, work spirituality has a positive and significant relationship with job satisfaction, shown between the estimation of the parameter variable is created
produces a value of CR=2,325. The value of CR=2,325 higher than significant level of 1,961 at 5%, and this hypothesis is accepted. The research result is
supported by Parasuman (1984), Nur (2003), East (2005), Scott (2009), Laila and Amjad (2011) as well as Chand and Koul (2012) that strong relationships
between work spirituality and job satisfaction.
The research result is supported by Malik, Danish and Usman (2010) that there is a positive relationship between work spirituality and job satisfaction, with such
confidence is sometimes intrapersonal skills, self control and identity are higher compared to interpersonal skills. Yahyazadeh-Jeloudar and Lotfi-Goodarzi (2012)
that work spirituality will deal significantly on job satisfaction include the work itself, the attitude to supervision, relationship with colleagues and working
environment conditions, but it is not significant when related to salaries or waging level employees. Work spirituality will be instrumental in the self-control to
achieve clear results, balancing objectives with the ability to achieve goals in all conditions, especially in job satisfaction. One of the dimensions in the definition
of the objectives and services is the charge indicators will exist within the company. Work spirituality will have an effect on interaction and reciprocity of

VOLUME NO. 4 (2014), ISSUE NO. 02 (FEBRUARY) ISSN 2231-4245
INTERNATIONAL JOURNAL OF RESEARCH IN COMMERCE, ECONOMICS & MANAGEMENT A Monthly Double-Blind Peer Reviewed (Refereed/Juried) Open Access International e-Journal - Included in the International Serial Directories
http://ijrcm.org.in/
4
individual cognition, emotion and behaviour, the tendency of a person to experience positive or negative feelings will affect someone's beliefs and thoughts
about the work.
Secondly, work spirituality has a positive and significant relationship with performance, an estimation of the parameters indicated variable formed produces a
value of CR=2,279. The value of CR=2,279 higher than significant level of 1,961 at 5%, and this hypothesis is accepted. Work spirituality will effect on
performance through values awareness, understanding the meaning of a truth of life, the meaning of life, the gift of love in the life of employees and a sense of
transedence that helps a person in the work place, it works in this case is the sharia banking.
These findings are supported by Lynton Thogersen (2009) and that person's work spirituality has five characteristics: (1) an employee who works hard, (2) the
employees love what do, (3) an employee who obtains the energy, the spirit of a work of passion, a sense of curiosity and using values, (4) an employee who has
a awareness and (5) an employee who has any respect in the cultured and do it well whereas spirituality in the form of prayer, supplication, the sense of self to
advance elements of productivity will improve performance and job satisfaction (Alexander et al., 1993). Employees have spirituality will show higher
performance compared to other employees (Isen and Baron, 1991; Shaw, 1999). Joshi (1997) that work spiritual and emotional maturity of a person are related
to each other in the process of conformity is associated with improved performance or otherwise. The research result is supported by Isen and Baron (1991),
Alexander et al. (1993), Neck and Milliman (1994), Joshi (1997), Shaw (1999), Ayranci (2011), Laila and Amjad (2011), Anjum and Ali (2011), Chin, Anatharaman
and Tong (2011), Javanmard (2012) and Rastgar et al. (2012).
Thirdly, job satisfaction has a positive and significant relationship with performance, because an estimation of the parameters indicated variable formed
produces a value of CR=3,463. The value of CR = 3,463 higher than significant level of 1,961 at 5%, and this hypothesis is accepted. The dominant dimension is
task performance, this shows that job satisfaction is going to help in the task of communication, efficiency and ability of employees in the company.
The research result is supported by Brown and Reterson (1993) that the intrinsic value of work, job satisfaction is inconsistent and has a weak relationship, but
this finding is contrary to the findings by Christen et al. (2006) that the positive relationship between job satisfaction and performance. The relationship between
job satisfaction and work achievement to direct relationships, leading to job satisfaction will influence the ability of the employee's work or accomplishments
might otherwise (Law et al., 2001).
Fourthly, work spirituality positively and significantly associated indirectly with performance. A positive coefficient indicated that work spirituality will give a
positive relationship indirectly to performance with job satisfaction as a mediator. The higher work spirituality of an employee, will have an impact on increasing
job satisfaction and performance of the employees. All the knowledge of researchers, this finding has not been researched by further researches before.
Such explanations as in the diagram below:
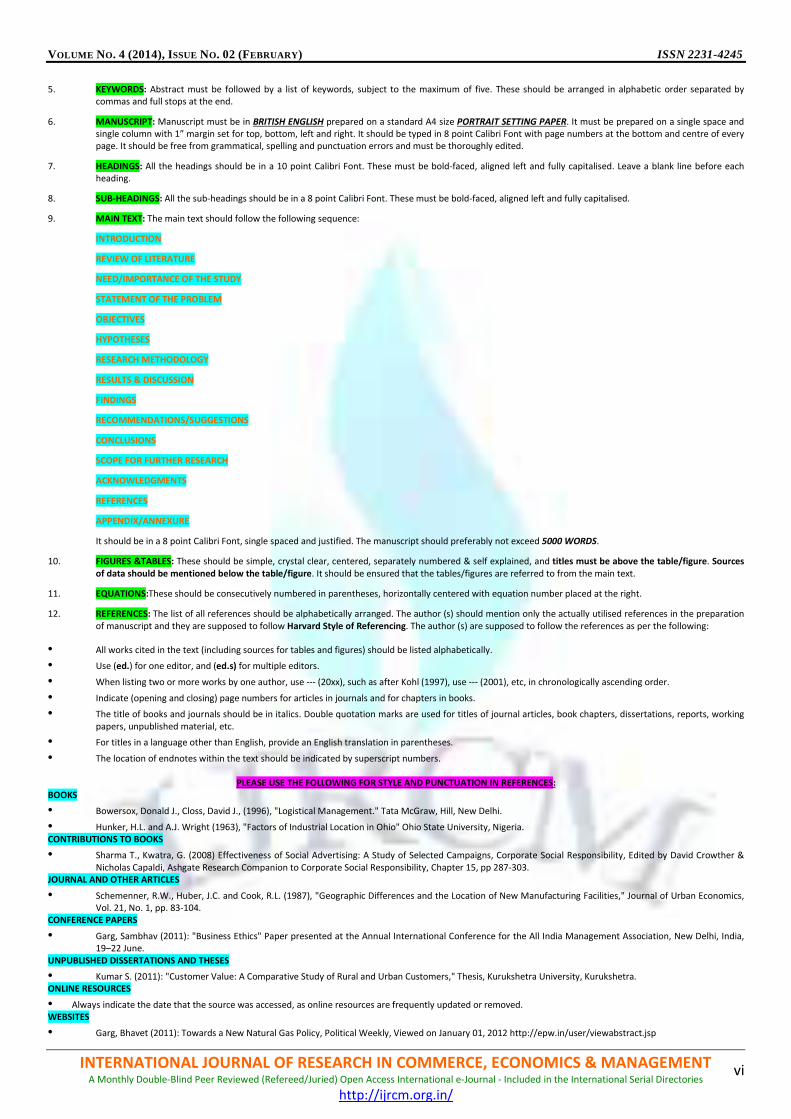
FIGURE 2: RELATIONSHIP OF MEDIATING: WORK SPIRITUALITY - JOB SATISFACTION - PERFORMANCE
Based on the results of testing, the relationships of variables in the model are obtained, the coefficient of relationship work spirituality and performance (a)
was 1,573, the coefficient of relationship work spirituality and job satisfaction (b) was 1,604, the coefficient of relationship job satisfaction and performance (d)
was 0,112, and the coefficient of relationship between work spirituality and performance with mediated by job satisfaction (c) was 1,753. The mediation is
partial mediation because if (c) and (d) the significant and (a) are also significant, the coefficient of (a) lower (down) than (b) and the independent variable is
able to affect directly the dependent variable without variable or involve with mediators (Sheng Wu, 2011; Hair et al., 2009). This idea was perfected by Zhao
et al. (2009) which does not rely on the test of the total effect of the variable X (work spirituality) to variable Y (performance) on causal models. This type of
mediation including the mediation of complementary variables influence there is mediation and direct influence both there and at that point in the same
direction. Mediator variable is based that job satisfaction is the psychological conditions of employees resulting from the reflection of a dynamic job (Cohrs et al.,
2006).
Variable mediation is the result of multiplication between the coefficients variable spirituality with job satisfaction of 1,604, the coefficients variable job
satisfaction with performance of 0,112 and the coefficient directly between spirituality with performance of 1,573 on the model of research and at the point
of the same direction. The value of the coefficient in direct and indirect variables were 1,573 and 1.753, thus strengthening the relationships variables after
mediated by job satisfaction..Zhao et al. (2009) mentioned the complementary indications that give this mediation a framework built in model theory research is
complete, so that identification of the mediator variables consistent with hypothesis theory framework, but worth noting for other possibilities in the direct
connection.
FINDINGS 1. Work spirituality has a positive and significant relationship with job satisfaction, can be accepted.
2. Work spirituality has a positive and significant relationship with performance, can be accepted.
3. Job satisfaction has a positive and significant relationship with performance, can be accepted.
4. Work spirituality has a positive and significant relationship with job performance are mediated by job satisfaction, can be accepted.
RECOMMENDATION AND SUGGESTION 1. For the practical implementation, it is necessary to give understanding for the employees about work spirituality role to improve the relationship between
job satisfaction and performance for the capability of work spirituality in controlling and managing work behaviour in company.
2. For the research appropriateness to the standard of statistics, it is essential to ensure the question indicators completeness in the questionnaires to avoid
the respondents’ hesitation. Additionally, the number of the analyzed samples must be sufficient based on the requirements of the statistical analysis.
CONCLUSION 1. Work spirituality has a positive and significant relationship with job satisfaction, this hypothesis can be accepted. This finding is supported by Parasuman
(1984), Nur (2003), East (2005), Scott (2009), Malik, Danish and Usman (2010), Laila and Amjad (2011), Yahyazadeh-Jeloudar and Lotfi-Goodarzi (2012),
Chand and Koul (2012).
2. Work spirituality has a positive and significant relationship with performance, this hypothesis can be accepted. This finding is supported by Isen and Baron
(1991), Alexander et al. (1993), Neck and Milliman (1994), Joshi (1997), Shaw (1999), Lynton and Thogersen (2009), Ayranci (2011), Laila and Amjad (2011),
Anjum and Ali (2011), Chin, Anatharaman and Tong (2011), Javanmard (2012) and Rastgar et al. (2012).
a: 1,573
Performance
(Y)
Work Spirituality
(X)
Job Satisfaction
(M)
d : 0,112 b : 1,604
c : 1,753

VOLUME NO. 4 (2014), ISSUE NO. 02 (FEBRUARY) ISSN 2231-4245
INTERNATIONAL JOURNAL OF RESEARCH IN COMMERCE, ECONOMICS & MANAGEMENT A Monthly Double-Blind Peer Reviewed (Refereed/Juried) Open Access International e-Journal - Included in the International Serial Directories
http://ijrcm.org.in/
5
3. Job satisfaction has a positive and significant relationship with performance, this hypothesis can be accepted. This finding is supported by Brown and
Reterson (1993), (Law et al., 2001) and Christen et al. (2006).
4. Work spirituality has a positive and significant relationship with job performance are mediated by job satisfaction, this hypothesis can be accepted. Search
all researchers, these findings, has not been examined by the researchers before, thus giving the new findings in the study.
LIMITATIONS 1. This research is based on a single survey instrument (single self report survey instrument) questionnaire.
2. This study uses the concept of work spirituality is relatively new in the research organization's behavior and condition of the understanding of different
respondents may give rise to difficulties in understanding the survey instrument.
3. Research is done on sharia banking employees so that in the process of capturing the response through the questionnaire is experiencing delays due to the
flurry of work hours and the limited human resources in the bank's influence on the collection of data, process data and research results of sports.
4. This research using a limited number of samples of employees, it required a larger number of samples.
SCOPE FOR FUTURE RESEARCH 1. To result in a relationship between independent variables and dependent ones in further research, a moderation variable as the one increasing the
relationship of both is necessary.
2. It involves the research respondents that had many activities and limitation in sharia bank. This, as a consequence, brought an effect on data gathering and
data management process.
3. Research is done on sharia banking when done on conventional banks or any other industry sector possible results will be different because cultural
factors, organization, work ethic, management companies and work environment.
REFFERENCES 1. Alexander, C.N., Swanson, G.C., Rainforth, M.V., Carlisle, T.W., Todd, C.C., Oates, R.M., (1993), ”Effects of the transcendental meditation program on stress
reduction, health, and employee development: A prospective study in two occupational settings”, Anxiety Stress Coping, Vol. 6, pp. 245-262.
2. Ali, Shah Taseema and Ellahi, Abida. (2012). “Workplace spirituality, emotional intelligence and job satisfaction: Pakistani manager in focus”. International
Conference on Management (ICM 2 rd
) Proceeding. 11-12 Juni 2012.
3. Anjum, Afifa., and Ali, Huma, (2011), “Effect of emotional intelligence and perceived work environment on perforamnce of bankers,” International Journal
of The Computer, The internet and Management. Vol. 19, No. 2, pp. 50-54.
4. Aryee, S., Chen, Z.X., and Budhwar, P.S. (2004), “ Exchange fairness and employee performance: An examination of the relationship between
organizational politics and procedural justice”, Organizational Behavior and Human Decision Processes, No. 94, pp. 1-14.
5. Ashmos, D.P., and D. Duchon, (2000), “Spirituality at work: A conceptualization and measure,” Journal of Management Inquiry. Vol. 9, No. 2, pp. 134-44.
6. Ayranci, E., (2011), “Effects of Top Turkish Managers’ Emotional and Spiritual Intelligences on their Organizations’ Financial Performance”, Business
Intelligence Journal, Vol. 4, No. 1.
7. Baron, Rueben M., and Kenny, David A., (1986), “The moderator-mediator variable distinction in social psychological research: conceptual, strategic, and
statistical considerations,” Journal of Personality and Social Psychology. Vol. 51, No. 6, pp. 1173-1182.
8. Bhuian, S.N., Menguc, B., and Borsboom, R. (2005), “Stressors and job outcomes in sales: a emphasic model versus a linear-quadartic interactive model,”
Journal of Business Research. Vol. 58, pp. 141-150.
9. Borman, W.C. and Motowidlo, S.J., (1993), “Expanding the Criterion Domain to Include Elements of Contextual Performance in N. Schmit and W.C. Borman
(Eds.), Personnel Selection in Organisations , Jossey-Bass, San Francisco, C.A.
10. Borman, W.C., and Motowidlo, S.J., (1997), “Task performance and contextual performance: the meaning for personal selection research”, Human
Performance, Vol. 10, No.2, pp. 199-209.
11. Brown, S.P., and Peterson, R.A., (1993), “Antecedents and consequences of salesperson job satisfaction: meta anaylisis and assessmentof casual effects,”
Journal of Marketing Research. Vol. 30, No. 1, pp. 63-77.
12. Campbell, J.P, (1990), “Modeling the performance prediction problem in industrial and organizational psychology”, Palo Alto.
13. Chand, Piar and Koul, Hemange. (2012), “Workplace spirituality, organizational emotional ownership and job satisfaction as moderators in coping with job
stress”. International Conference on Humanities, Economics and Geography, March 17-18: pp. 225-229.
14. Chawla, V., and Guda, S. (2010). “Individual spirituality at work and its relationship with job satisfaction, propensity to leave and job commitment: An
exploratory study among sales professionals”. Journal of Human Values, Vol. 16, No. 2, pp. 157–167.
15. Cohrs, J. Christopher, Andrea E. Abele, and Dorothea E. Dette, (2006), “Integrating situational and dispositional determinants of job satisfaction: Findings
from three samples of professionals”. The Journal of Psychology. Vol. 140, No. 4, pp. 363-395
16. East, T.J., (2005). “A grounded study on how spirituality in the workplace impacts a person’s job satisfaction”, (Doctoral dissertation, Capella University,
2005), Dissertation Abstracts International. 66 (3). 1070A. (UMI No. 316880).
17. Fry, L.W., (2003). “Toward a theory of spiritual leadership”, The Leadership Quarterly. Vol. 14, pp. 693-727.
18. Guilford and Flurchter, (1973). “Fundamental Statistics in Psychology Education”. New York: McGraw Hill.
19. Hair, J.F., Black, W.C., Babin, B.J., and Anderson, R.E. (2009), “Multivariate data analysis”. (7th ed.). Upper Saddle River, NJ: Prentice Hall.
20. Hochwarter, W.A., Witt, L.A., Treadway, D.C., and Ferris, G.R., (2006), “The interaction of social skill and organizational support on job performance”,
Journal of Applied Psychology, Vol. 91, No. 2, pp. 482- 489.
21. Hutson, S., (2000), “Why Religion Matters; The Fate of the Human Spirit in an Age of Disbelief”. New York: Harper & Row.
22. Isen, A. and Baron, R., (1991), “Positive affect as a factor in organizational behavior”, In LL Cummings and BM Staw (Eds.), Research in Organizational
Behaviour, pp. 1-53.
23. Javanmard, Habibollah. (2012), “The impact of spirituality on work performance,” Indian Journal of Science and Technology, Vol. 5, No. 1, pp. 1961-1966.
24. Joshi, M. (1997), “Emotion the term and meaning”, Sunday Review, January, Vol.5, No. 8.
25. Judge, Timothy A., Thoreson, Carl J., Bono, Joyce E., and Patton, Gregory K., (2001), “ The job satisfaction – job performance relationship: A qualitative and
quantitative review”. Psychological Bulletin. Vol. 127, No. 2, pp. 376-407.
26. Kinjerski, V., and Skrypnek, B. J.(2006), “Measuring the intangible: Development of the Spirit at Work Scale”. Best paper proceedings of the sixty-fifth
annual meeting of the Academy of Management (CD), ISSN 1543-8643, A1-A6.
27. Law, K., Wong, C., and Song, L., (2004), “The construct and criterion validity of emotional intelligence and its potential utility for management studies”.
Journal of Applied Psychology, Vol. 89, No. 3, pp. 483–496
28. Locke, E.A., (1976), “The nature causes and causes of job satisfaction”. In Dunnette, M.C. (Ed.). Handbook of industrial and organisational psychology .
Chicago, IL: Rand McNally.
29. Lynton, N. and Thogersen, K. H. (2009), “Spiritual intelligence leadership in the china laboratory”. Journal of International Business Ethics, Vol. 2, No. 1.
30. Madlin, N. (1986), “Religion and the Entrepreneurial Psyche”. Venture. Vol.8, No.16.
31. Malik, Mohammed Ehsan., Danish, Riswan Qaiser., and Usman, Ali. (2010), “Impact of spiritual consciousness on the job performance of banking
exceutives,” Interdisciplinary Journal of Contemporary Research in Business. Vol. 2, No. 1, pp.142-158.

VOLUME NO. 4 (2014), ISSUE NO. 02 (FEBRUARY) ISSN 2231-4245
INTERNATIONAL JOURNAL OF RESEARCH IN COMMERCE, ECONOMICS & MANAGEMENT A Monthly Double-Blind Peer Reviewed (Refereed/Juried) Open Access International e-Journal - Included in the International Serial Directories
http://ijrcm.org.in/
6
32. Neck, C and Milliman, J., (1994), “Thought Self-leadership Finding Spiritual Fulfillment in Organizational Life”, Journal of Managerial Psychology, Vol. 9,
No. 6, pp. 9-16.
33. Nur, Y. A., (2003), “Management by virtues: a comparative study of spirituality in the workplace and its impact on selected organizational outcomes”.
(Doctoral dissertation, Indiana Univeristy, 2003). Dissertation Abstract International, 64 (6), 2168A. (UMI No. 3094142).
34. Othman, Abdul Kadir, Abdullah, Hazman Shah and Ahmad, Jasmine, (2008), “Emotional intelligence, emotional labour and work effectiveness in service
organizations: a proposed model”, Vision–The Journal of Bussiness Perspective, Vol. 12, No. 1, pp.31-34.
35. Rastgar, Abbas Ali., Zarei, Azim., Davoudi, Seyed Mehdi Mousavi., and Fartash, Kiarash., (2012), “The link between workplace spirituality, organizational
citizenship behavior and job performance,” APJEM, Vol. 1, No. 6, pp. 51-67.
36. Rose, B.M., Holmbeck, G.N., Coakley, R.M., and Franks, E.A. (2004), “Mediator and moderator effects in developmental and behavioral pediatric
research,”Developmental and Behavioral Pediatrics. Vol. 25, pp. 58–67.
37. Scott, Ann. (2009), “Spirituality’s relationship to job satisfaction,” Research Paper Hodges University, pp. 1-13.
38. Shaw, J.D., (1999), “Job satisfaction and turnover inetentions: the moderating role positive effect”, Journal of Pschology, Vol. 139, pp. 242-244.
39. Sheng Wu, Hsueh. (2011), “How to model mediating and moderating effects”, CFDR Workshop Series. Center for Family and Demografhic Research.
40. Sohi, R.S. (1996), “The effects of environmental dynamism and heterogeny on salespeoples role perceptions, performance and job satisfaction,” European
Journal of Marketing. Vol. 30, No. 7, pp. 49-67.
41. Spector, P.E., (1997), “Job satisfaction”. Thousand Oaks, CA: Sage.
42. Suryoadi, Yeni and Ratnawati, Intan. (2011), “The Effect of Training and Compensation Satisfaction towards Employee Performance in PT. Bank Muamalat
Indonesia Cabang Semarang”. Report of Research, pp. 1-29.
43. Susan Tee Suan Chin, RN. Anantharaman and David Yoon Kin Tong, (2011), “The Roles of Emotional Intelligence and Spiritual Intelligence at the
Workplace”, Journal of Human Resources Management Research. IBIMA Publishing.
44. Van Scotter, J.R., and Motowidlo, S.J. (1996), “Interpersonal facilitation and job dedication as separate facets of contextual performance”, Journal of
Applied Psychology. Vol. 81, No. 5, pp. 525-531.
45. Vaughan, F.E., (1989), “Varieties of Intuitive Experience in Agor”, WH. (Ed.), Intuition in Organizations, Sage Publications. pp. 40-61.
46. Wanous, J.P., and Lawler, E.E.,III.(1974), “Measurement and meaning of job satisfaction,” Journal of Applied Psychology, Vol. 56,No. 2, pp. 95-105.
47. Wayne, S.J., Shore, L.M., and Liden, R.C., (1997), “Perceived organizational support and leader-member exchange: A social exchange perspective”,
Academy of Management Journal, Vol. 40, No. 1, pp. 82- 111.
48. Weiss, D.J., Dawis, R.V., England, G.W., and Lofquist, L.H., (1967), “Manual for the Minnesota Satisfaction Questionnaire”. Minneapolis: University
of Minnesota.
49. Witt, L.A., and Carlson, D.S. (2006), “The work- family interface and job performance: moderating eff ects of conscientiousness and perceived
organizational support,” Journal of Occupational Health Psychology, Vol. 11, No. 4, pp. 343- 357.
50. Yahyazadeh-Jeloudar, Soleiman dan Lotfi-Goodrasi, Fatemeh, (2012), “What is the relationship between spiritual intelligence and job satisfaction among
MA and BA teachers?”, International journal of Business and Sciences. Vol. 3, No. 8, pp. 299-303.
51. Zhao, Xinshu, Lynch, John G., and Chen, Qimei, (2009), “Reconsidering Baron and Kenny: myths and truths about mediaton analysis”, Journal of Consumer
Research, pp. 1-36.
APPENDIX TABLE 1: SAMPLE CHARACTERISTICS
No. Demographic Variables Explanation (%)
1. Sex Male (56%) and female (44%).
2. Age Between 21-30 years old (53%), 31-40 years old (33%) and above 40 years old (4%).
3. Marital Status The married ones (70%) and unmarried ones (30%).
4. Work Experinces Those below 5 years (63%), between 6-10 years (16%) and above 10 years (21%).
5. Education Level The undergraduates (4%), Senior High School (10%), postgraduates (70%), and diploma (16%).
6. Employment Status 66% of them were permanent employees and 34% were the contract ones.
7. Management Level Midlle management (70%) and lower management (30%).
(Sources: managed data, 2014)
TABLE 2: THE TESTING RESULTS OF GOODNESS OF FIT OF SEM MODEL
No. Goodness of Fit Index Model 1 Model 2 Model 3 Model 4 Remarks
1. Chi-square 7,705 10,370 9,119 25,748 Good
2. Probability 0,000 0,240 0,010 0,106 Good/Marginal
3. GFI (Goodness of Fit Index) 0,985 0,981 0,975 0,965 Good
4. AGFI (Adjusted Goodness of Fit Index) 0,981 0,950 0,864 0,929 Good
5. NFI (Normed Fit Index) 0,954 0,865 0,873 0,876 Good
6. RFI (Relative Fit Index) 0,567 0,746 0,592 0,807 Good
7. IFI (Incremental Fit Index) 1,002 0,960 0,891 0,959 Good
8. TLI (Tucker Lewis Index) 1,004 0,928 0,650 0,933 Good
9. CFI (Comparative Fit Index) 1,000 0,968 0,889 0,050 Good
10. RMSEA (The Root Mean Square Error of Approximation) 0,000 0,041 0,143 0,957 Good/Marginal
11. AIC (Akaikes Information Criterion) 33,708 36,370 25,119 61,748 Marginal
12. ECVI (Expected Cross Validation Index) 0,194 0,209 0,144 0,355 Good
(Sources: managed data, 2014)
TABLE 3: ESTIMATES FOR THE STRUCTURAL EQUATION MODELING
Parameter Model Estimate t Value Hypothesis
Work Spirituality Job Satisfaction (1) 1,604 *** Accepted
Work Spirituality Performance (2) 0,180 0,005 Accepted
Job Satisfaction Performance (3) 0,112 0,140 Accepted
Work Spirituality Job Satisfaction Performance (4) 1,753 0,106 Accepted
(Source: managed data, 2014)
VOLUME NO. 4 (2014), ISSUE NO. 02 (FEBRUARY) ISSN 2231-4245
INTERNATIONAL JOURNAL OF RESEARCH IN COMMERCE, ECONOMICS & MANAGEMENT A Monthly Double-Blind Peer Reviewed (Refereed/Juried) Open Access International e-Journal - Included in the International Serial Directories
http://ijrcm.org.in/
7
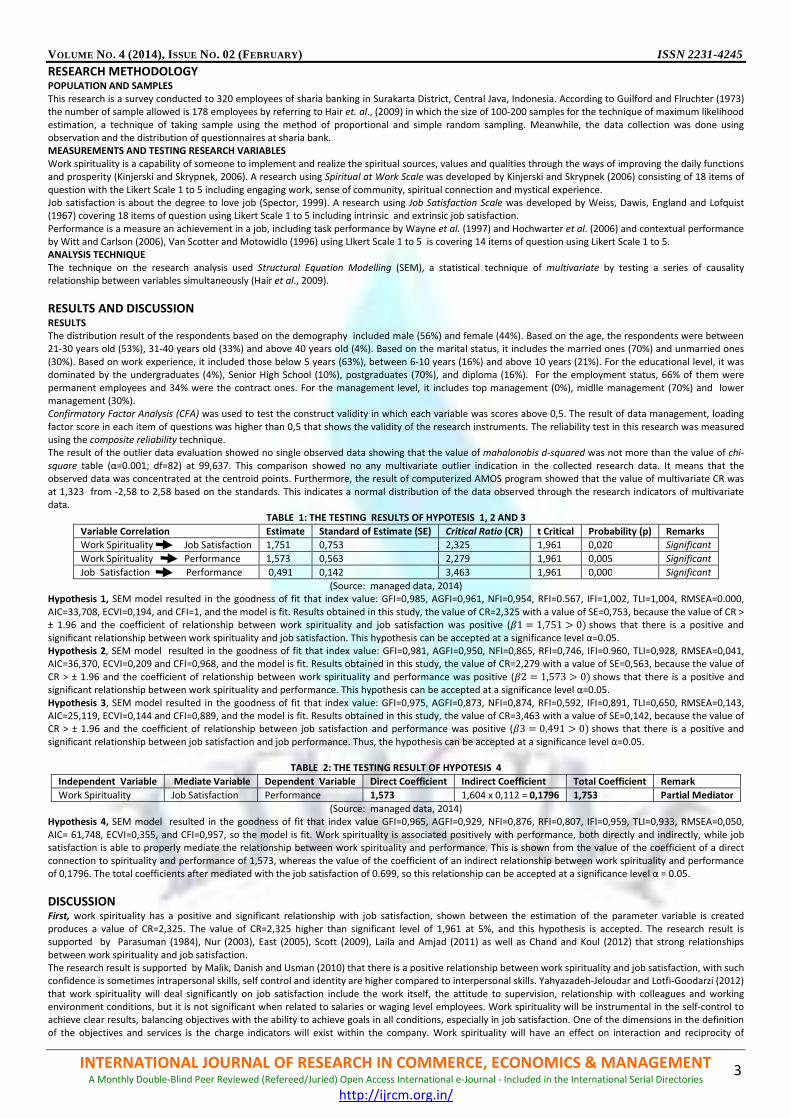
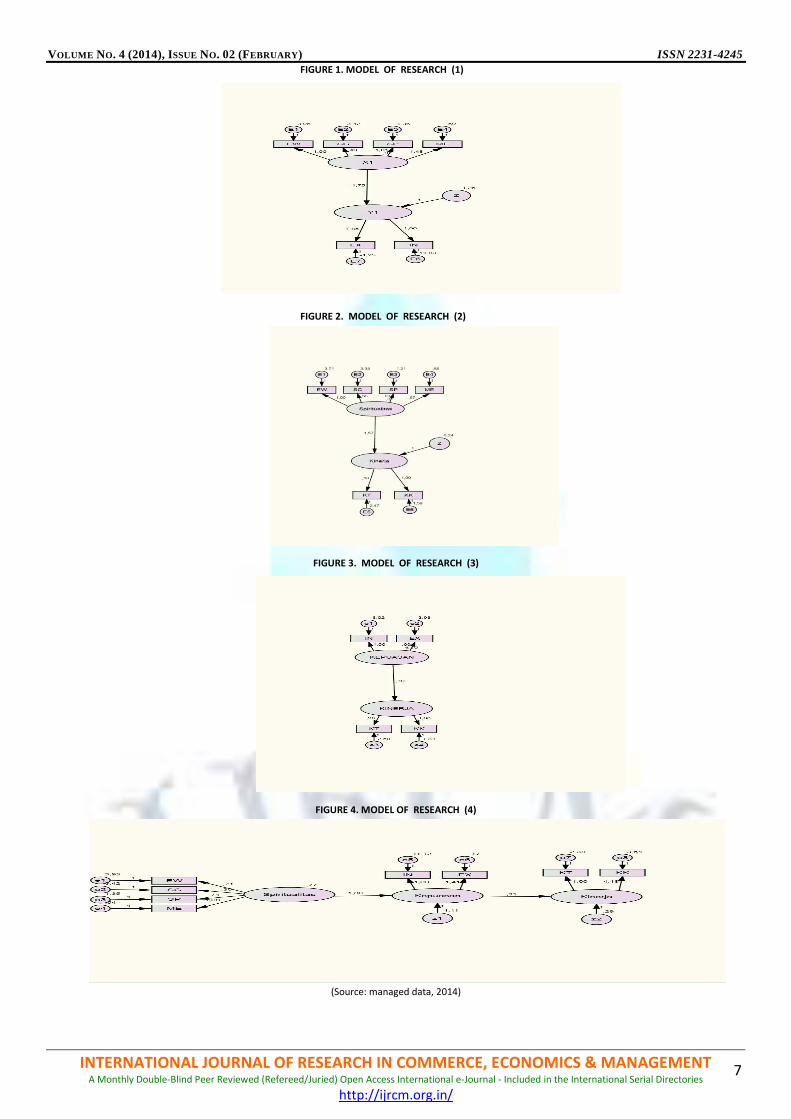
FIGURE 1. MODEL OF RESEARCH (1)
FIGURE 2. MODEL OF RESEARCH (2)
FIGURE 3. MODEL OF RESEARCH (3)
FIGURE 4. MODEL OF RESEARCH (4)
(Source: managed data, 2014)
VOLUME NO. 4 (2014), ISSUE NO. 02 (FEBRUARY) ISSN 2231-4245
INTERNATIONAL JOURNAL OF RESEARCH IN COMMERCE, ECONOMICS & MANAGEMENT A Monthly Double-Blind Peer Reviewed (Refereed/Juried) Open Access International e-Journal - Included in the International Serial Directories
http://ijrcm.org.in/
8
WOMEN ENTREPRENEURSHIP AND EMPOWERMENT: AN ANALYSIS FROM THE PERSPECTIVE OF SMALL
URBAN INDIA
DR. SUJIT ROY
CONSULTANT (HR, OD & ENTREPRENEURSHIP)
KOLKATA
DR. SAMITA MANNA
PROFESSOR
DEPARTMENT OF SOCIOLOGY
UNIVERSITY OF KALYANI
KALYANI
ABSTRACT Though entrepreneurship is very old, women entrepreneurship is a recent phenomenon in India. This study has been conducted to explore the issues of women
entrepreneurship and empowerment from the perspectives of thriving, evolving and prospering small urban India in this millennium beyond the peripherals of
metropolis through an intensive micro-level field study. The methodology of the study was based on the primary data collected through direct interviews with
women entrepreneurs by using an interview schedule with structured questionnaire and an attitude scale. The study has been to explore the levels of perceived
empowerment of women entrepreneurs as well as to ascertain the relationship between perceived empowerment and socio-demographic and family relational
factors. The study also tries to find the causal relationship between the business-organizational and socio-economic factors and empowerment level of women
entrepreneurs as also the cumulative effects of all factors on the levels of empowerment of women entrepreneurs. The result points to a poor level of perceived
empowerment of women entrepreneurs. The item analysis shows that women entrepreneurs have gotten their recognition and importance only in their families.
They have not thought that their business-life has enhanced their status in society. The study also shows that decisional level-in-family, financial management
level and social interaction level have caused significant influences on the levels of perceived empowerment of women entrepreneurs.
KEYWORDS Decisional level-in-family, empowerment, financial management level, social interaction level, women entrepreneurship.
INTRODUCTION omen entrepreneurship deals both with the position of women in society and with the role of entrepreneurship in the same society. Women
entrepreneurship has now achieved a special significance from the perspective of distribution of social power in today’s society. Women have not
only been exploited and discriminated economically but also subjugated socially, and at the end, they have been politically rendered to a ‘powerless
social category’ in the Indian society. ‘Women’s issues’ are thus perceived to be linked to the ‘social issues’ and these issues are specially focused on women’s
unequal access to the productive resources, decision-making bodies, education, employment opportunities, entrepreneurial endeavour and social justice.
‘Women in business’ has been a recent phenomenon in India. It is needless to say that women’s situation and gender roles are largely determined through
various institutions and processes of the society. The subordinate positioning of women in society in accordance with the constructed beliefs reveals that ‘males
were associated with stronger and more positive elements (such as public, culture, light, right etc.) and the females with the weaker and more negative one
(such as private, nature, dark etc., the other part of the pair) (Wiesner-Hanks, 2001).
The status of women in India has many facets, which makes one to go for ‘generalizations’ very difficult. This is mainly due to the existence of considerable
variation between regions, between rural and urban areas, between classes and finally, between religions, linguistics, tribal and caste groups. However, in a
nutshell, women share a common experience of ‘marginalization’. When a woman feels and perceives herself that she can accomplish any kind of work within
the society as man can, the woman is said to be empowered. Therefore, it is an internal process of women’s life. To be empowered, women must have a clear
perception regarding their own values and abilities, and they must be enriched in thoughts and ideas as per Khanum, 2001. According to Kabeer (1999),
empowerment entails a process of change, through which a person makes a choice. Choice necessarily implies the possibility of alternatives and the ability to
choose one among others.
At this juncture, the interactive inter-relations between entrepreneurship and perceived empowerment of women entrepreneurs draw our attention. The
present study has attempted to understand the issues of entrepreneurship of women business owners and their perceptions of empowerment from the
perspectives of thriving, evolving and prospering small urban India in this millennium beyond the peripherals of metropolis. The study has tried to connect the
micro-level reality of women empowerment with the issues of entrepreneurial activities from the perspective of socio-economic conditionality of women
entrepreneurs. It is an intensive micro-level field study of women entrepreneurs, which is exploratory as well as descriptive in nature.
LITERATURE REVIEW The individual- women entrepreneur(s) runs the core process of empowerment. They need to take charge of themselves and take steps for self-empowerment
as “the process by which the powerless gain greater control over the circumstances of their lives. It includes both control over resources (physical, human,
intellectual, financial) and over ideology (beliefs, values and attitudes). It means not only greater extrinsic control but also a growing intrinsic capability- greater
self-confidence and an inner transformation of one’s consciousness that enables one to overcome external barriers to accessing resources or changing
traditional ideology” (Sen and Batliwala, 2000). However, it is not possible for one person to empower another. People can only empower themselves (Korten,
1993).
In a general sense, empowerment can be defined as a process of carrying out more controlling power to face the questions on existing power, and have control
over the sources of power. Empowerment is a process and, at the same time, the result of process (Haider and Akhtar, 1999). Pillai (1995) has defined women
empowerment as an active, multi-dimensional process that enables women to realize their full identity and power in all spheres of life. Power is not a
commodity to be transacted nor can it be given away as aims. Power has to be acquired, and it needs to be exercised, sustained and preserved.
When a woman feels and perceives herself that she can accomplish any kind of work within the society as man can, the woman is said to be empowered.
Therefore, it is an internal process of women’s life. To be empowered, women must have a clear perception regarding their own values and abilities, and they
must be enriched in thoughts and ideas (Khanum, 2001). Empowerment is now increasingly seen as a process by which one can gain greater control over her
live. This means control over material assets, intellectual resources and ideology. It involves ‘power to, power with and power within’.
With reference to women, the power-relation that has to be involved includes their lives at multiple levels: family, community, market and the state.
Importantly, it involves, at the psychological level, women’s ability to assert them, because this power-relationship is constructed by the ‘gender roles’ assigned
to women, especially in a culture like India which resists women empowerment (Chandra, 2011).
W

VOLUME NO. 4 (2014), ISSUE NO. 02 (FEBRUARY) ISSN 2231-4245
INTERNATIONAL JOURNAL OF RESEARCH IN COMMERCE, ECONOMICS & MANAGEMENT A Monthly Double-Blind Peer Reviewed (Refereed/Juried) Open Access International e-Journal - Included in the International Serial Directories
http://ijrcm.org.in/
9
The word women empowerment essentially means that women have the power or capacity to regulate their day-to-day lives in the social, political and
economic terms- a power, which enables them to move from the periphery to the centre stage. Women will have to empower themselves ‘from below’ in order
to compel the society and the government to empower them ‘from above’ (Bhuyan, 2006).
According to Kabeer (1999), empowerment entails a process of change, through which a person makes a choice. Choice necessarily implies the possibility of
alternatives and the ability to choose one among others. The ability to exercise choice can be thought of three inter-related dimensions: resources (pre-
conditions), agency (process) and achievements (outcomes).
The status of women in India has been subject to many great changes over the last few millennia. In the present day, when women are showing their capabilities
in various walks of life, the entrepreneurial classes of women are playing an increasingly prominent role in various sectors of industrial growth and economic
development. Entrepreneurship among women has been gradually changing with the growing sensitivity of the roles, responsibilities and economic status of
women in the society in general and family in particular (Singh & Nagaich, 2011).
The more entrepreneurial activities of women, the more of individual wealth in the hands of women entrepreneurs, which results in social awareness and
‘social’ capital of women. Along with physical and finance capital, the term social capital here is used as the human equivalent of ‘nature capital’, based on the
insight that both ‘nature’ and ‘people’ provide some sort of ‘raw material’ which goes into production processes and ultimately serves accumulation. In this
conceptualization, human beings are perceived not only as a labour force, but also as an organisational potential resource, which can and will bring about social
change (Dietrich, 2007).
With growing awareness and self-consciousness, women entrepreneurs develop ‘individual identity’ and ‘self-esteem’ of their own and become ‘self-confident’.
By this process, women entrepreneurs expand their identity to larger identities or connect with others. ‘Connecting is empowerment’. Connecting with larger
groups in the society provide women entrepreneurs a higher degree of empowerment by going beyond the self and serving other individuals, groups and the
society, thus discharging her social responsibility.
This is the link between individual empowerment and social empowerment in the society. Such concern for others, called ‘extension motivation’ (Pareek, 1997),
along with internal locus of control is the basis of individual empowerment, and is considered a building block of social empowerment. So, empowerment
cannot be reduced to legal rights or economic bargaining power, because it has personal and cultural dimensions.
Therefore, it can now be said that entrepreneurship is not only organizational and economic, but also mental and social in nature. Thus, the reality of perceived
empowerment of women entrepreneurs due to entrepreneurial activities are both present and they reinforce each other.
OBJECTIVES The specific objectives of the study have been as follows:
i) To ascertain perceived empowerment levels of women entrepreneurs.
ii) To explore the relationship between perceived levels of empowerment of women entrepreneurs and socio-demographic and family relational factors
of their life.
iii) To examine the causal relationship between the business-organizational factors and perceptions of empowerment levels of women entrepreneurs.
iv) To find how far socio-economic and business conditinalities of women entrepreneurs have been able to influence and effect cumulatively on levels of
perception of empowerment of women entrepreneurs.
METHODOLOGY The present study was carried out in the Ranaghat municipal town area, a sub-divisional township in the district of Nadia of the state of West Bengal in India in
the month of May-June, 2012. Ranaghat railway junction station is an important junction of five railway connections of the Eastern Railways. Ranaghat
municipality is 150 years old. The researcher had found 119 business-firms, owned-and-managed by women entrepreneurs themselves, out of 358 women-
owned firms. The total business firms were 3041 in the area as per the municipal records.
The study was based on the primary data collected through direct interviews with women entrepreneurs by using an interview schedule with structured
questionnaire, including both open and close-ended questions, and an attitude scale of 5-point Likert scale with six items, prepared following the ‘Empowerment
Scale’ of Kabeer (2001), through complete enumeration survey. The questionnaire consisted of objective type questions covering the socio-demographic,
business-economic and legal-organizational factors of women entrepreneurial life, and subsequently the variables have been defined for the purpose of the
study. The item analysis has been used for more intensive in-depth study of attitudes and opinions of women entrepreneurs towards different dimensions of
social life. The data analyses have been done through SPSS.
RESULTS AND DISCUSSION The distributions of different socio-demographic, business-economic and legal-organizational variables of women entrepreneurial life have been projected in the
Table-1. Women have now been engaged in entrepreneurial endeavour with different ages and educational background. They have been mostly non-trained as
well as married, coming mostly from simple families. The families of women entrepreneurs have mostly supported them. However, the decisional level-in-family
has been mostly weak for women entrepreneurs. At the family level, the basic unit of society, women have still lesser degree of independence and they are
dependent on their male counterparts in taking major decisions in family-matters.
TABLE-1: DESCRIPTIVE STATISTICS AND DISTRIBUTION OF VARIABLES
Variable Valid N Mean SD CV (%)
Age
Education
Training
Marital Status
Family Type
Family Support Index
Decisional Level in Family
Business Years
Business Phase
Firm-Size
Business-type
Proprietorship of Business
Size & Scale of Business
Income Level
Financial Management Index
Business Networking Index
Institutional Interaction Index
Social Interaction Index
Perceived Empowerment Index
119
119
119
119
119
119
119
119
119
119
119
119
119
119
119
119
119
119
119
38.66
1.61
0.22
1.35
1.89
3.43
2.51
8.80
2.21
0.92
1.82
1.13
1.71
1.87
2.56
1.82
1.22
1.01
21.08
7.14
0.64
0.42
0.68
0.31
0.89
1.40
4.60
0.96
0.74
1.20
0.33
0.66
0.70
1.39
0.78
1.24
0.99
4.71
18.47
39.75
190.91
50.37
16.40
25.95
55.78
52.27
43.44
80.43
65.93
29.20
38.60
37.43
54.30
42.86
101.64
98.02
22.34
SD= Standard Deviation; CV= Co-efficient of Variation
(Source: Primary Data)

VOLUME NO. 4 (2014), ISSUE NO. 02 (FEBRUARY) ISSN 2231-4245
INTERNATIONAL JOURNAL OF RESEARCH IN COMMERCE, ECONOMICS & MANAGEMENT A Monthly Double-Blind Peer Reviewed (Refereed/Juried) Open Access International e-Journal - Included in the International Serial Directories
http://ijrcm.org.in/
10
There have been almost one-fourth women entrepreneurs, who have been new in business upto five years of experience. However, women entrepreneurs have
been mostly in stability phase of business and nearly one-third women have been single-handedly managing their businesses. While nearly sixty-three percent
women have been in trading business, the overwhelming eighty-seven percent women have sole ownership, with the majority of medium-sized firms with
middle income-group. Women entrepreneurs have been found to be mostly weak in financial management, business networking and social interaction.
The further analyses of interactive dimensions of different variables have revealed so many shades and intricacies of different issues on women
entrepreneurship and empowerment.
The overall average empowerment perceptions score has come out, after rounding-off, to 20 by adding the item-scores of the empowerment perception items.
It has indicated poor level of perceived empowerment of women entrepreneurs under study. Further, an item-wise analysis has shown that the following have
been the items with respect to which the empowerment perception levels of women entrepreneurs have been found weak:
a) You think that your business-life has enhanced your social status in society (Item-3).
b) Your family-members will support you if you join in politics (Item-5).
c) You are afraid to express/discuss your opinions to male entrepreneurs (Item-6).
The following have been the items with respect to which the empowerment levels of women entrepreneurs have been found strong:
a) Your family-members are supportive in your business-endeavours (Item-1).
b) You can take minor decisions regarding family-matters without consulting your father/husband/brother/son (Item-2).
c) Your opinions are taken in a serious manner in family-matters (Item-4).
The overall findings have revealed a ground reality about the perceived empowerment levels of women entrepreneurs. Women entrepreneurs have supports
from their family-members in carrying out their businesses. They have been taking minor decisions in family without consulting their male counterparts in
family. They have opined that their opinions have been considered seriously in family-matters. All these findings have pointed to the fact that women
entrepreneurs have gotten their recognition and importance only in their families - the smallest micro-level units of the society.
But, the contrasting picture of state of empowerment of women entrepreneurs has been revealed in the greater context of social life outside the family-life.
They have not thought that their business-life has enhanced their status in society. Not only that, they have been, in general, afraid and shy to express or discuss
their opinions to the male entrepreneurs. The most frustrating revelation has been that women entrepreneurs have no support and encouragement from their
family-members in their political adventurism. All these factors have indicated a poor level of perceived empowerment of women entrepreneurs.
Item-wise distribution of empowerment data of women entrepreneurs has been presented in the Table-2. It has been interesting to note that none of these
distributions, when plotted, has been flat. This has implied that there have been no contradictions in the perceived empowerment levels of women
entrepreneurs. It has revealed a truncated women empowerment level in our society. It has signified that women entrepreneurial culture has still been in
primitive and in evolving stage in our society.
TABLE-2: ITEM-WISE FREQUENCY DISTRIBUTION OF PERCEIVED EMPOWERMENT DATA
(Source: Primary Data)
The Table-3 has shown that the perceived empowerment levels of women entrepreneurs have been strong for only 31.90% respondents and it has been weak
for 68.10% women entrepreneurs.
It has been observed from the Table-3 that perceived empowerment level has been weak for almost two-third women entrepreneurs (68.10%) and it has been
strong for only 31.90% respondents.
TABLE-3: PERCEIVED EMPOWERMENT LEVEL-WISE DISTRIBUTION
N.B.: Figures in the parentheses indicate percentages.
(Source: Primary Data)
The analysis of correlation (Table-4) of perceived empowerment levels of women entrepreneurs with respect to different independent variables has revealed
that all variables have a bearing, either positive or negative, on empowerment levels of women entrepreneurs except family-type and proprietorship of
businesses.
Item No. Strongly Agree Agree Neither Agree Nor Disagree Disagree Strongly Disagree
1
2
3
4
5
6
54
47
16
39
5
7
41
48
29
56
12
13
16
15
32
12
4
34
5
6
23
9
11
36
3
3
19
3
87
29
Perceived Empowerment level No. of Women Entrepreneurs
Weak 81 (68.10)
Strong 38 (31.90)
Total 119 (100)

VOLUME NO. 4 (2014), ISSUE NO. 02 (FEBRUARY) ISSN 2231-4245
INTERNATIONAL JOURNAL OF RESEARCH IN COMMERCE, ECONOMICS & MANAGEMENT A Monthly Double-Blind Peer Reviewed (Refereed/Juried) Open Access International e-Journal - Included in the International Serial Directories
http://ijrcm.org.in/
11
TABLE-4: COEFFICIENTS OF CORRELATION
**Correlation is significant at the 0.01 level (2-tailed).
* Correlation is significant at the 0.05 level (2-tailed).
Dependent Variable: Perceived Empowerment level
(Source: Primary Data)
The factors of education, training, marital status, decisional level-in-family, business phase, firm size, business type, size and scale of businesses, income level,
financial management, business networking, institutional interaction and social interaction have been positively associated with perceived empowerment levels
of women entrepreneurs. All the above factors have influenced empowerment levels of women entrepreneurs in a directly proportional manner in that women
entrepreneur have perceived strong sense of empowerment with rising levels of the above factors.
It has also been revealed that the factors of age, family type, family support and business years have negative correlations with the perceived empowerment of
women entrepreneurs. The case of family support to women entrepreneurs has shown a peculiarity in that women entrepreneurs have shown strong sense of
empowerment with less support from family. With less family support, women entrepreneurs have to manage and operate businesses on their own way, thus
showing strongly empowered business women in social life.
The Table-5 has presented the regression analysis between the dependent/consequent variable- perception levels of empowerment of women entrepreneurs
and the independent/predictor variables to depict the causal effect of independent factors on the consequent factor of perceived empowerment levels of
women entrepreneurs. The factors of decisional level-in-family, financial management level and social interaction level have caused significant regressional
effects on the empowerment level of women entrepreneurs. A woman entrepreneur, who has taken different decisions in her family, has become very
conscious about her power-position not only in business environment but also in social life.
Financial management has also been found to be closely and causally tuned to the empowerment of women entrepreneurs. Women entrepreneurs have
become more confident with the hands-on experience of tackling the financial aspects of their businesses, which has made them more powerful in life. Social
interaction has also been found to cause an effect on perceived empowerment of women entrepreneurs. Interactions in different spheres of social life have
made women entrepreneurs’ conscious of their relative positions in society and made them feel more empowered in life.
MODEL SUMMARY
The R2 value (Co-efficient of Determination to measure the amount of variability in one variable that is explained by the other) of the Model (R
2 = .633) has
suggested that the predictor variables jointly contributed 63.30% towards the perceived empowerment of women entrepreneurs. This has meant that all these
independent variables have explained upto 63.30% of the total variation embedded with the consequent variable- empowerment level of women
entrepreneurs. The F value (F = 9.575) has also been found to be significant at 0.01 level of probability, which has indicated the effectiveness of the Model.
TABLE-5: REGRESSION ANALYSIS
Independent Variable β-value t-value Sig. t
(Constant) 12.489 3.600** .000
Age -.033 -.396 .693
Education .039 .446 .657
Training .133 1.324 .188
Marital Status .075 .936 .352
Family Type -.058 -.623 .534
Family Support Index -.066 -.800 .426
Decisional Level in Family .167 2.021* .046
Business-years -.093 -1.110 .270
Business Phase .119 1.568 .120
Firm-Size -.035 -.374 .709
Business-type -.018 -.229 .819
Proprietorship of Business -.015 -.225 .823
Size & Scale of Business .058 .603 .548
Income Level .156 1.357 .178
Financial Management Index .319 2.295* .024
Business Networking Index .095 1.036 .303
Institutional Interaction Index .012 .079 .937
Social Interaction Index .169 1.987* .050
** t is significant at the .01 level.
* t is significant at the .05 level.
Dependent Variable: Perceived Empowerment level
Independent Variable r-value
Age -.219*
Education .442**
Training .429**
Marital Status .234*
Family Type -.058
Family Support -.283**
Decisional Level in Family .489**
Business-years -.198*
Business Phase .183*
Firm-Size .270**
Business-type .290**
Proprietorship of Business .091
Size & Scale of Business .241**
Income Level .239**
Financial Management Index .692**
Business Networking Index .506**
Institutional Interaction Index .691**
Social Interaction Index .474**

VOLUME NO. 4 (2014), ISSUE NO. 02 (FEBRUARY) ISSN 2231-4245
INTERNATIONAL JOURNAL OF RESEARCH IN COMMERCE, ECONOMICS & MANAGEMENT A Monthly Double-Blind Peer Reviewed (Refereed/Juried) Open Access International e-Journal - Included in the International Serial Directories
http://ijrcm.org.in/
12
TABLE-5(CONTD.): MODEL SUMMARY
** Significant at .01 level
(Source: Primary Data)
CONCLUSION The study has showcased a microcosm of intricate relationship between perceived empowerment and entrepreneurship of businesswomen in a representative
way from the perspective of small urban India, which is thriving and prospering in this new millennium. Mere activities of women in economic sphere have not
ensured a meaningful perception of empowerment by women entrepreneurs. Entrepreneurial economic activities of women have already been playing a
significant role at the core level of social life i.e. the family. However, this entrepreneurial role of women, in general, has yet to be a significant determinant in
the lives of women entrepreneurs, particularly outside their families. Women entrepreneurs have been found not to discharge their societal role and
responsibilities with an empowered mind-set. However, with few significant emerging trends as asserted by a small number of women entrepreneurs, women
entrepreneurship has been pointing to an evolving, enriching and meaningful life of women entrepreneurs.
REFERENCES 1. Bhuyan, Dasarathi. (2006). Empowerment of Indian Women: A Challenge of 21
st Century. Orissa Review, January.
2. Chandra, Rakesh. (2011). Women Empowerment in India- Milestones & Challenges. University of Lucknow: Institute of Women’s Studies.
3. Dietrich, Gabriele. (2007). Loss of Socialist Vision and Options Before the Women’s Movement. In Roy Mukherjee, Sanchari (Ed.): Indian Women: Broken
Words, Distant Dreams. Kolkata: Levant Books.
4. Haider, R. and Akhtar, R. (1999). “The Role of NGO and Women’s Perception of Empowerment”. Empowerment, Vol. 6, pp.58-59.
5. Kabeer, Naila. (1999). Resources, Agency, Achievements: Reflections on the Measurement of Women’s Empowerment. Development and Change, Vol. 30.
Oxford: Blackwell Publishers Ltd.
6. Kabeer, Naila. (2001). “Reflections on the Measurement of Women’s Empowerment”. In ‘Discussing Women’s Empowerment- Theory and Practice’, Sida
Studies (3), Stockholm: Novum Grafiska AB.
7. Khanum, M.S. (2001). “Women with Extra Eyes: The Role of RMP in Women Empowerment in Rural Bangladesh”. Empowerment, Vol. 8, pp. 95-96.
8. Korten, David. (1993). Participatory Development as New Paradigm: The Transition of Development Professionalism. London: Zed Books.
9. Pareek, U. (1997). Instruments for Human Resource Development. New Delhi: Tata-McGraw Hill.
10. Pillai, J.K. (1995). Women and Empowerment. New Delhi: Gyan Publishing House.
11. Sen, Gita and Batliwala, Srilatha. (2000). Empowering Women for Reproductive Rights. In Presser, Harriet B. and Sen, Gita (Ed.): Women’s Empowerment
and Demographic Process: Moving Beyond Cairo. New Delhi: OUP. pp.18.
12. Singh, Rajeev and Nagaich, Promode. (2011). “Women Entrepreneurship: Analytical view with special reference to Jabalpur City”. Indian Journal of
Commerce & Management Studies, Vol -II, Issue-3, March.
13. Wiesner-Hank, Merry. (2001). Gender in History. Oxford: Blackwell Publishers.
Model R2 F Sig.
1 .633 9.575** .000
VOLUME NO. 4 (2014), ISSUE NO. 02 (FEBRUARY) ISSN 2231-4245
INTERNATIONAL JOURNAL OF RESEARCH IN COMMERCE, ECONOMICS & MANAGEMENT A Monthly Double-Blind Peer Reviewed (Refereed/Juried) Open Access International e-Journal - Included in the International Serial Directories
http://ijrcm.org.in/
13
ERP APPLICATION IN INDIAN INDUSTRIES: AN ANALYSIS WITH RESPECT TO MANUFACTURING UNITS IN
PONDICHERRY
DR. D. ARAVAZHI IRISSAPPANE
ASSOCIATE PROFESSOR
KANCHI MAMUNIVAR CENTRE FOR POST - GRADUATE STUDIES
PONDICHERRY
S. YASODHA
RESEARCH SCHOLAR
KANCHI MAMUNIVAR CENTRE FOR POST - GRADUATE STUDIES
PONDICHERRY
ABSTRACT This study examined the extent of ERP adoption and its benefits in Indian context. The two companies have been selected for this study, and the survey was
conducted in Hindustan Computer Limited and Sundaram Fasteners. Primary data was collected through interviews and structured questionnaires were
distributed among 79 respondents in both the companies. From the recent literatures we get the impression that many an author expects the introduction and
utilization of ERP results in fundamental changes and also it contains many case studies of an organizations and empirical research that have implemented ERP
systems successfully. This study found that the companies could not get any benefit from the present intensity of ERP adoption in Human Resource Management,
Field Service and Accounting Management. This study concludes that the extent of ERP adoption differ significantly between companies with different activities
but benefits from ERP adoption is similar and do not differ by nature of business of the companies in Indian Context.
JEL CODE
P42, P49.
KEYWORDS
ERP, ERP adoption, Functional areas.
INTRODUCTION RP(Enterprise Resource Planning) is a computer-based system that places company’s major activity areas under an umbrella. ERP system is a software
package of different modules and each module has a specific business process. Companies choose to adopt ERP for many reasons. From a technological
perspective, there is a need for a common platform and an integration of several information systems or simply a replacement of an existing IT
infrastructure, which enhances single-data entry and information consistency across the system. From an organizational perspective, ERP is attractive as it
promises to cut down operating costs, better data visibility and process improvement. From the strategic perspective, it is appealing because of cost reductions
gained through more efficient systems, improvements in productivity, decision-making, overall quality and support in business growth. An ERP system is
considered as one of the crucial IT innovations of the 1990s.
Enterprise Resource Planning (ERP) (Alexis Leon 2002) is an expanded effort to integrate marketing, financial, manufacturing and human resources in a single
system. Standardized record keeping permits information sharing throughout the organization. An ERP system helps the organization in sharing data and
knowledge between departments, reducing costs, and improving management effectiveness in business processes. Enterprises, instead of investing lots of
money in to small software applications are moving towards ERP solutions which can be more appropriate according to their day to day needs.
STATEMENT OF THE PROBLEM The basic idea of implementing an ERP solution is to get tangible business benefits that would improve the performance of the organization and achieve certain
business objectives. This could be in terms of inventory reduction, faster time to market, reducing manufacturing and order processing cycle times, etc. It is
amazing but true that not a single ERP implementation in India has reached the stability or maturity so far to deliver these business benefits in significant
manner. Most of them still seem to be in a half-backed stage where the organizations have been unable to respond to the stringent demands and discipline
required by the requires tremendous effort in enforcing change in management coupled with the inability of these firms to respond to that challenge have
further compounded their problems. So it has become critical to deliver value out of these implementations in a reasonably short time, so as to justify the large
investment involved. This brings us to a very basic question- how do we maximize the return on IT investment? What are the factors in an ERP implementation
that could maximize the Return on Investment (ROI)?
SCOPE OF THE STUDY Every Company must be competitive and have strategies to survive in the market and protect its shareholders. Those strategies are related to factors such as
effort and reduced cost and increase efficiency and productivity, expansion of the business and organizations frontiers, and dealing with the business
organizations as a leading and inter connected system. Thus, ERP is directly applied to reduced costs to provide product improvement and services with better
quality, to supply include services and convenience to customers and to allow the integration of suppliers and customers operations. In this context
the adoption of an ERP System can raise a series of organizational changes, the companies’ relationship with buyers, customers and suppliers and also its
product and services. Hence studying the subject you have a lot of course for many organizations interestly adopting ERP.
OBJECTIVES OF THE STUDY This study is aimed at fulfilling the following objectives
1. To evaluate the extent of ERP adoption in Indian Companies
2. To find out whether there is positive reaction among the Employees about Adoption of ERP in their organization.
3. To elicit whether Adoption of ERP is highly beneficial to the organization or not.
HYPOTHESIS For the present study, the following hypotheses have been framed:
1. There is no significant difference in ERP adoption between companies with different activities.
2. There is no significant difference in benefits from ERP adoption between companies with different activities
E

VOLUME NO. 4 (2014), ISSUE NO. 02 (FEBRUARY) ISSN 2231-4245
INTERNATIONAL JOURNAL OF RESEARCH IN COMMERCE, ECONOMICS & MANAGEMENT A Monthly Double-Blind Peer Reviewed (Refereed/Juried) Open Access International e-Journal - Included in the International Serial Directories
http://ijrcm.org.in/
14
3. Employees’ perception about ERP adoption and ERP benefits differ significantly by their social characteristics.
4. Adoption of ERP in Indian companies is highly extensive in all functional areas
5. Benefits from ERP adoption are not significantly related to the extent of ERP adoption in Indian companies.
METHODOLOGY To find out the extent of ERP adoption and its benefits in Indian context, this study uses survey method. Two companies, Hindustan Computer Limited (HCL) and
Sundaram Fasteners Limited are selected for the survey as only these two companies in this (Pondicherry) region have permitted the researcher to do the
survey. Between the companies, HCL is IT based company and Sundaram Fasteners limited is Non-IT based. The respondents are employees from these two
companies at clerical, supervisor and managerial level. A questionnaire with Likert type scale items for measuring the ERP adoption and ERP benefits is
prepared for the survey. The questionnaire includes 15 scale items for measuring ERP benefits and 35 scale items for measuring ERP adoption in the selected
companies. The questionnaires were distributed to employees of all cadres in both the companies in person by the researchers. The data collected from the
survey were analysed using various statistical techniques such as reliability analysis, factor analysis and multiple regression analysis.
LIMITATIONS OF THE STUDY
• The present study is limited to analyze two organizations due to time constraints also many firms have been lethargic to provide the information in order
to preserve management system and other activities.
• The data in the ERP applications is not integrated with other enterprise or division systems and does not include external intelligence.
REVIEW OF LITERATURE Christopher P. Holland et. al. (1999) this study demonstrates the organizational and technical complexity of ERP implementation in a multinational textile group
and identifies the factors that determines the total cost of the system. The case was compiled on the basis of material from two personal interviews with the key
informants of the global ERP project. Interview data were supplemented by documentary evidence collected over a three year period starting from the
European IT strategy review and through to the live implementation of the project. Documentary evidence included IT and business plans, internal company
presentations and briefings, consultancy reports and annual accounts. The firm was also operating in a turbulent market and involved in a series of mergers and
acquisitions which had led to massive cultural and structural changes including staff reductions throughout the firm. There was a feeling of unease amongst the
employees. Further it adds that in the European context, it was not viable for organization to retain national structures and systems, and the pattern of
organizational change outlined. The study concludes that the organization is undergoing a transformation which will reduce overheads and increase customer
responsiveness and customer service are various levels throughout the firm.
De Vaan and Barendrecht (2000) argued that the introduction and utilization of ERP will result in radical changes. Based on the empirical (Leeuwen, O.C. van
and P. Wemmenhove 2001) research they came to the conclusion that ERP does not nearly have such a large impact on the roles and the position of the
controller as suggested in literature. In general, introducing ERP causes a gradual evolution rather than a drastic revolution.The study identified that the
improvement in efficiency of daily activities, the more explicit focus on customers and the greater speed in providing information are regarded as major
advantages of ERP. It is also notifiable that it usually takes a lot of time and money to introduce and utilize ERP.
G. Colin Ash et. al. (2001) examined the state of e-business developments within ERP environments worldwide. Data were collected through structured
interviews. The findings were analyzed according to an established research framework from Business Process Change. The IT managers were interviewed to
obtain a basic insight into each organization’s of the use of Internet Technology (web, intranets, extranets, and e-mail). They were questioned about “the
benefits and barriers arising from extending their R/3 business processes on to the Internet”. Analysis of the findings from interviews of ten overseas SAP sites,
highlighted consideration of the environmental conditions and management of e-business change, when implementing e-business projects. The study was an
exploratory investigation into the benefits from extending enterprise wide business systems beyond the organization. The findings of the preliminary
investigation of local Australian SAP sites confirmed the existence of the three generic business-to-business models: (i) B2B- to support information processing
and communication, (ii) B2E – to support knowledge sharing, (iii) B2C- to support customer interaction on demand. This study suggests a rich field for future
research study regarding the sues of e-ERP projects.
Kai Reimers (2002) conducted a study to identify the crucial ERP implementation process and context variables which warrant closer attention in the study of IT-
enabled organizational change in a SAP R/3 user companies in China. The study had adopted an in-depth questionnaire survey and collected information from
both IT managers of foreign controlled company and a Chinese Company. It applied statistical tools like Correlation analysis, Product moment correlation co-
efficient, Spearman correlation, Least-square Regression etc. It concludes that (i) centralized decision making in the steering committee may lead to some delay
in the decision making process thus causing schedule and possible budget overruns. (ii) Seniority-base decision making enables senior management to
unilaterally change some project parameters. (iii) Modern management system may simply be more compatible with the philosophy underpinning an ERP
system which enables decentralized decision making.
Fiona Fui – Hoon Nah (2003) covered the management, social and organizational issues involved in ERP implementations. An ERP system is a multi-module
application software package system that integrates key business and management process across an enterprise. It serves as a backbone for the enterprise and
helps to manage the important aspects of a business, including procurement, order tracking, material management, product planning, manufacturing, human
resources, and financial management. The study listed for important attributes of ERP, It facilitates to
• Automate, standardize and integrate an organization’s business process
• Share common data and practices across the entire enterprise
• Generate and access information in real-time.
Morley et. al. (2004) identified the role and magnitude of ten dimensions of service quality as antecedents of satisfaction and dissatisfaction in a B2B service
environment from the perspective of the customer. The results of this study indicated that some dimensions of service quality are associated with satisfaction:
some are more aligned with dissatisfaction. The most important dimensions are responsiveness and understanding the customer.
Ashok Soni (2005) provided an overview into the future direction of enterprise systems and related applications. The applications will cover areas such as
advanced planning and scheduling systems, customer relationship management systems, supplier relationship systems and the impact of technologies.
V.K. Jain et. al (2013) evaluated the perception of executives working in the area of supply chain management and ERP towards the role of ERP on improving
supply chain effectiveness. The study is conducted on about 20 executives working with the automobile, tyre manufacturing and pharmaceutical firms and
found that the ERP implementation positively contributes towards some parameters of supply chain effectiveness.
ANALYSIS AND INTREPRETATION In many industries in India, the ERP system is adopted, to change, i.e. modernize, the way the organization operates. An attempt has been made to empirically
analyze the employees’ perception on the installation of ERP in two leading organizations in Pondicherry. Hindustan Computer Limited (HCL) and Sundaram
Fasteners that have adopted ERP system to get an aerial view of the extent of ERP adoption and its benefits in Indian companies.
INTERNAL CONSISTENCY (RELIABILITY) OF SCALES ITEMS
The internal consistency of scale items in the questionnaire that measures the extent of ERP adoption and its benefits in selected companies (HCL and
Sundaram) in Pondicherry region were tested using Reliability Analysis with ‘Cronbach Alpha Coefficient’. As this reliability analysis (T.R. Bhatti 2005) with
Cronbach Alpha Coefficient is being widely used by many researchers for evaluating the success of the implementation of ERP systems in firms. It measures,
how well the items making up the scale ‘go together’; and how consistent they are with each other. For scale items measuring certain concept to be consistent
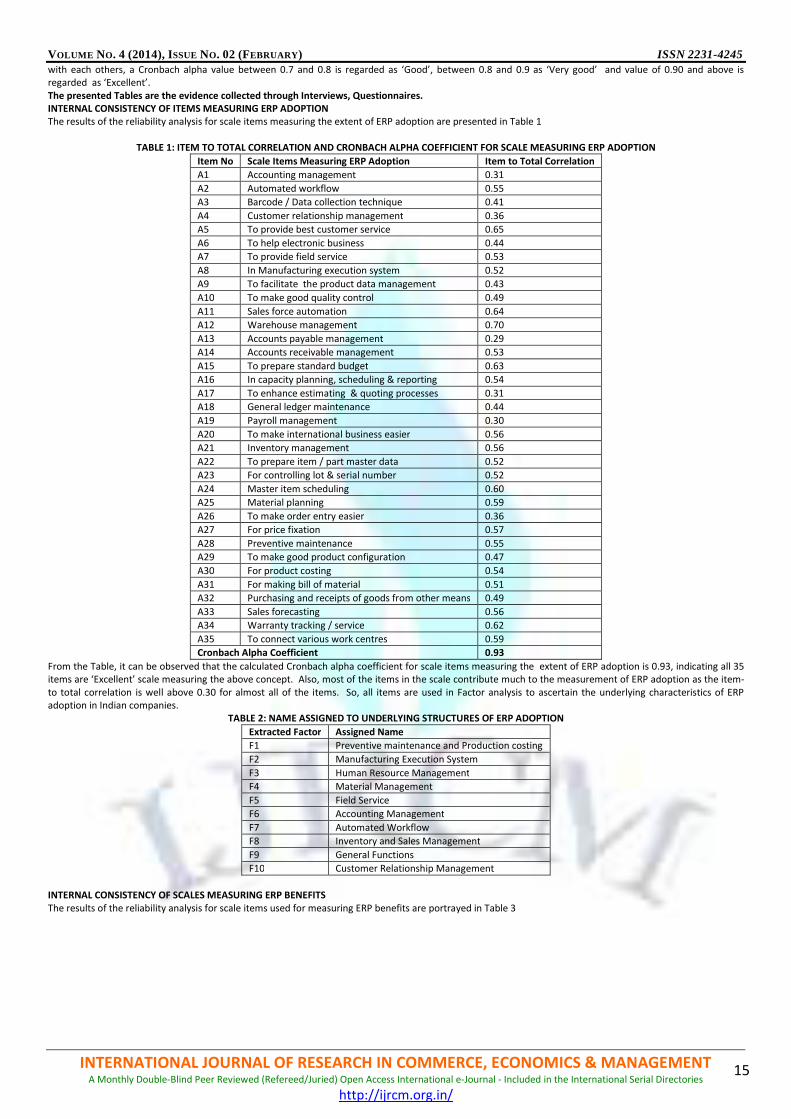
VOLUME NO. 4 (2014), ISSUE NO. 02 (FEBRUARY) ISSN 2231-4245
INTERNATIONAL JOURNAL OF RESEARCH IN COMMERCE, ECONOMICS & MANAGEMENT A Monthly Double-Blind Peer Reviewed (Refereed/Juried) Open Access International e-Journal - Included in the International Serial Directories
http://ijrcm.org.in/
15
with each others, a Cronbach alpha value between 0.7 and 0.8 is regarded as ‘Good’, between 0.8 and 0.9 as ‘Very good’ and value of 0.90 and above is
regarded as ‘Excellent’.
The presented Tables are the evidence collected through Interviews, Questionnaires.
INTERNAL CONSISTENCY OF ITEMS MEASURING ERP ADOPTION
The results of the reliability analysis for scale items measuring the extent of ERP adoption are presented in Table 1
TABLE 1: ITEM TO TOTAL CORRELATION AND CRONBACH ALPHA COEFFICIENT FOR SCALE MEASURING ERP ADOPTION
Item No Scale Items Measuring ERP Adoption Item to Total Correlation
A1 Accounting management 0.31
A2 Automated workflow 0.55
A3 Barcode / Data collection technique 0.41
A4 Customer relationship management 0.36
A5 To provide best customer service 0.65
A6 To help electronic business 0.44
A7 To provide field service 0.53
A8 In Manufacturing execution system 0.52
A9 To facilitate the product data management 0.43
A10 To make good quality control 0.49
A11 Sales force automation 0.64
A12 Warehouse management 0.70
A13 Accounts payable management 0.29
A14 Accounts receivable management 0.53
A15 To prepare standard budget 0.63
A16 In capacity planning, scheduling & reporting 0.54
A17 To enhance estimating & quoting processes 0.31
A18 General ledger maintenance 0.44
A19 Payroll management 0.30
A20 To make international business easier 0.56
A21 Inventory management 0.56
A22 To prepare item / part master data 0.52
A23 For controlling lot & serial number 0.52
A24 Master item scheduling 0.60
A25 Material planning 0.59
A26 To make order entry easier 0.36
A27 For price fixation 0.57
A28 Preventive maintenance 0.55
A29 To make good product configuration 0.47
A30 For product costing 0.54
A31 For making bill of material 0.51
A32 Purchasing and receipts of goods from other means 0.49
A33 Sales forecasting 0.56
A34 Warranty tracking / service 0.62
A35 To connect various work centres 0.59
Cronbach Alpha Coefficient 0.93
From the Table, it can be observed that the calculated Cronbach alpha coefficient for scale items measuring the extent of ERP adoption is 0.93, indicating all 35
items are ‘Excellent’ scale measuring the above concept. Also, most of the items in the scale contribute much to the measurement of ERP adoption as the item-
to total correlation is well above 0.30 for almost all of the items. So, all items are used in Factor analysis to ascertain the underlying characteristics of ERP
adoption in Indian companies.
TABLE 2: NAME ASSIGNED TO UNDERLYING STRUCTURES OF ERP ADOPTION
Extracted Factor Assigned Name
F1 Preventive maintenance and Production costing
F2 Manufacturing Execution System
F3 Human Resource Management
F4 Material Management
F5 Field Service
F6 Accounting Management
F7 Automated Workflow
F8 Inventory and Sales Management
F9 General Functions
F10 Customer Relationship Management
INTERNAL CONSISTENCY OF SCALES MEASURING ERP BENEFITS
The results of the reliability analysis for scale items used for measuring ERP benefits are portrayed in Table 3
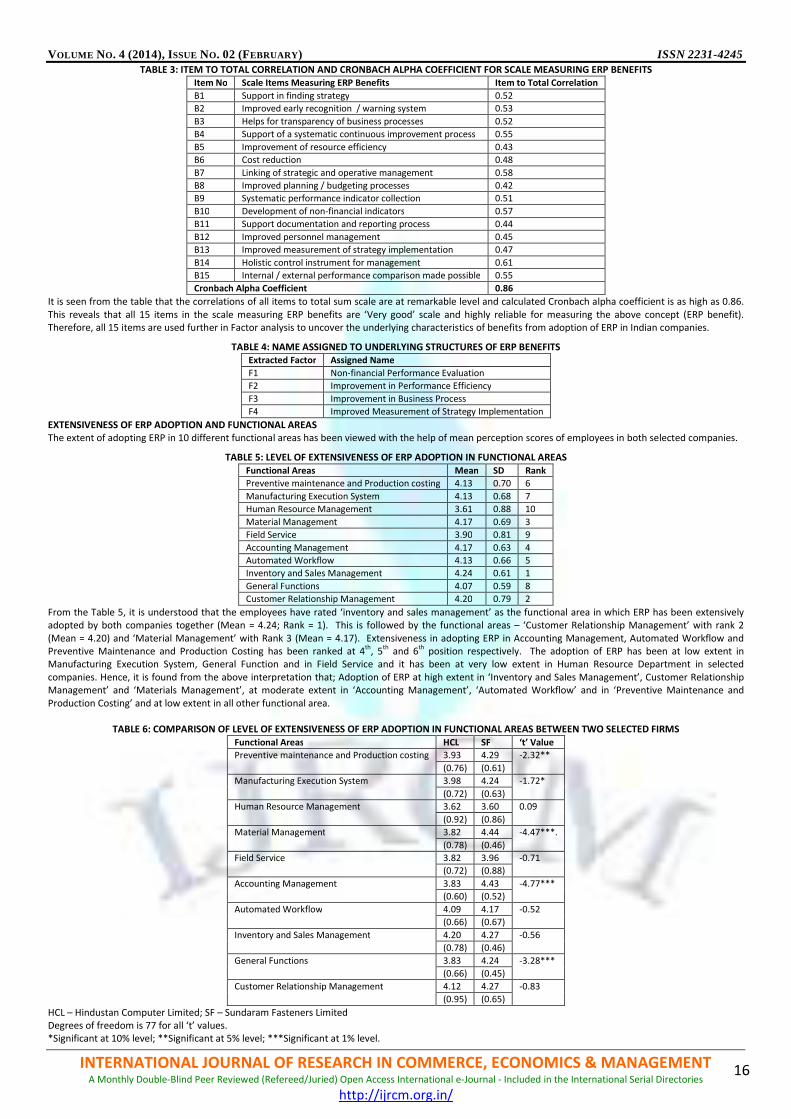
VOLUME NO. 4 (2014), ISSUE NO. 02 (FEBRUARY) ISSN 2231-4245
INTERNATIONAL JOURNAL OF RESEARCH IN COMMERCE, ECONOMICS & MANAGEMENT A Monthly Double-Blind Peer Reviewed (Refereed/Juried) Open Access International e-Journal - Included in the International Serial Directories
http://ijrcm.org.in/
16
TABLE 3: ITEM TO TOTAL CORRELATION AND CRONBACH ALPHA COEFFICIENT FOR SCALE MEASURING ERP BENEFITS
Item No Scale Items Measuring ERP Benefits Item to Total Correlation
B1 Support in finding strategy 0.52
B2 Improved early recognition / warning system 0.53
B3 Helps for transparency of business processes 0.52
B4 Support of a systematic continuous improvement process 0.55
B5 Improvement of resource efficiency 0.43
B6 Cost reduction 0.48
B7 Linking of strategic and operative management 0.58
B8 Improved planning / budgeting processes 0.42
B9 Systematic performance indicator collection 0.51
B10 Development of non-financial indicators 0.57
B11 Support documentation and reporting process 0.44
B12 Improved personnel management 0.45
B13 Improved measurement of strategy implementation 0.47
B14 Holistic control instrument for management 0.61
B15 Internal / external performance comparison made possible 0.55
Cronbach Alpha Coefficient 0.86
It is seen from the table that the correlations of all items to total sum scale are at remarkable level and calculated Cronbach alpha coefficient is as high as 0.86.
This reveals that all 15 items in the scale measuring ERP benefits are ‘Very good’ scale and highly reliable for measuring the above concept (ERP benefit).
Therefore, all 15 items are used further in Factor analysis to uncover the underlying characteristics of benefits from adoption of ERP in Indian companies.
TABLE 4: NAME ASSIGNED TO UNDERLYING STRUCTURES OF ERP BENEFITS
Extracted Factor Assigned Name
F1 Non-financial Performance Evaluation
F2 Improvement in Performance Efficiency
F3 Improvement in Business Process
F4 Improved Measurement of Strategy Implementation
EXTENSIVENESS OF ERP ADOPTION AND FUNCTIONAL AREAS
The extent of adopting ERP in 10 different functional areas has been viewed with the help of mean perception scores of employees in both selected companies.
TABLE 5: LEVEL OF EXTENSIVENESS OF ERP ADOPTION IN FUNCTIONAL AREAS
Functional Areas Mean SD Rank
Preventive maintenance and Production costing 4.13 0.70 6
Manufacturing Execution System 4.13 0.68 7
Human Resource Management 3.61 0.88 10
Material Management 4.17 0.69 3
Field Service 3.90 0.81 9
Accounting Management 4.17 0.63 4
Automated Workflow 4.13 0.66 5
Inventory and Sales Management 4.24 0.61 1
General Functions 4.07 0.59 8
Customer Relationship Management 4.20 0.79 2
From the Table 5, it is understood that the employees have rated ‘inventory and sales management’ as the functional area in which ERP has been extensively
adopted by both companies together (Mean = 4.24; Rank = 1). This is followed by the functional areas – ‘Customer Relationship Management’ with rank 2
(Mean = 4.20) and ‘Material Management’ with Rank 3 (Mean = 4.17). Extensiveness in adopting ERP in Accounting Management, Automated Workflow and
Preventive Maintenance and Production Costing has been ranked at 4th
, 5th
and 6th
position respectively. The adoption of ERP has been at low extent in
Manufacturing Execution System, General Function and in Field Service and it has been at very low extent in Human Resource Department in selected
companies. Hence, it is found from the above interpretation that; Adoption of ERP at high extent in ‘Inventory and Sales Management’, Customer Relationship
Management’ and ‘Materials Management’, at moderate extent in ‘Accounting Management’, ‘Automated Workflow’ and in ‘Preventive Maintenance and
Production Costing’ and at low extent in all other functional area.
TABLE 6: COMPARISON OF LEVEL OF EXTENSIVENESS OF ERP ADOPTION IN FUNCTIONAL AREAS BETWEEN TWO SELECTED FIRMS
Functional Areas HCL SF ‘t’ Value
Preventive maintenance and Production costing 3.93 4.29 -2.32**
(0.76) (0.61)
Manufacturing Execution System 3.98 4.24 -1.72*
(0.72) (0.63)
Human Resource Management 3.62 3.60 0.09
(0.92) (0.86)
Material Management 3.82 4.44 -4.47***.
(0.78) (0.46)
Field Service 3.82 3.96 -0.71
(0.72) (0.88)
Accounting Management 3.83 4.43 -4.77***
(0.60) (0.52)
Automated Workflow 4.09 4.17 -0.52
(0.66) (0.67)
Inventory and Sales Management 4.20 4.27 -0.56
(0.78) (0.46)
General Functions 3.83 4.24 -3.28***
(0.66) (0.45)
Customer Relationship Management 4.12 4.27 -0.83
(0.95) (0.65)
HCL – Hindustan Computer Limited; SF – Sundaram Fasteners Limited
Degrees of freedom is 77 for all ‘t’ values.
*Significant at 10% level; **Significant at 5% level; ***Significant at 1% level.

VOLUME NO. 4 (2014), ISSUE NO. 02 (FEBRUARY) ISSN 2231-4245
INTERNATIONAL JOURNAL OF RESEARCH IN COMMERCE, ECONOMICS & MANAGEMENT A Monthly Double-Blind Peer Reviewed (Refereed/Juried) Open Access International e-Journal - Included in the International Serial Directories
http://ijrcm.org.in/
17
The results of ‘t’ test showing the significant difference in level of extensiveness of ERP Adoption in 10 functional areas between HCL and SF have been
presented in Table 1. It can be observed from the results that the level of extensiveness in ERP adoption is significantly higher in Sundaram Fasteners Limited
(Mean Scores are comparatively higher) than that of in Hindustan Computer Limited in the following functional areas – Preventive Maintenance and Production
Costing (t value = -2.32, p < 0.05), Manufacturing Execution System (t value = -1.72, p < 0.10), Materials Management (t value = -4.47, p < 0.01), Accounting
Management (t value = -4.77, p < 0.01) and in General functions (t value = -3.28, p < 0.01). Since two firms are distinct in nature of business, that is one is IT
firms (HCL) and other one is Non-IT firm, the above difference in various functional areas can be attributed to type of business. In other words, it can be
interpreted that the ERP adoption in IT firm is significantly less compared to that of in Non-IT firm.
Extensiveness of the ERP adoption in 10 major functional areas in the selected organizations as has been perceived by the employees is analysed with respect to
employees’ various social characteristics in order to know whether all employees, irrespective of their personal attributes have given same viewpoint or
different viewpoint as this would lead the researcher to arrive at strong conclusion about extensiveness of ERP adoption in these organization.
EXTENT OF BENEFITS FROM ERP ADOPTION
The extent of benefits from ERP adoption in the 10 different functional areas have been analysed using the opinion scores of the employees of these
organizations.
TABLE 7: EXTENT OF BENEFITS FROM ERP ADOPTION IN SELECTED COMPANIES
Benefits From ERP Mean SD Rank
Non-financial Performance Evaluation 3.81 0.61 3
Improvement in Performance Efficiency 3.99 0.65 1
Improvement in Business Process 3.75 0.71 4
Improved Measurement of Strategy Implementation 3.85 0.62 2
Table 7 presents the extent of benefits from ERP adoption in the sample companies. The table discloses that among the four major benefits, ‘improvement in
performance efficiency’ is ranked first with mean score of 3.99 followed by ‘improved measurement of strategy implementation’ (Mean = 3.85; Rank = 2) and
‘Non-financial performance evaluation (Mean = 3.81, Rank = 3). Improvement in business process is ranked 4 with mean score of 3.75. The above results
indicate that the primary benefits from ERP are “Improvement in Performance Efficiency” and next “Improvement Measurement of Strategy Implementation”.
Non-financial performance evaluation and Improvement in business process are considered to be additional benefits from ERP adoption. Comparison of mean
perception between employees of two companies, as has been presented in Table 8, reveals that their level of opinion about extent of benefits is almost similar
in both companies.
Only in respect of ‘Improved measurement of strategy implementation’ two employee groups differ significantly in their perception (t value = 1.81, p < 0.10).
This may be due to the fact that two selected firms are distinct in nature in respect of their activities. With regard to all other benefits as well as to Total
Benefits from ERP, the employee groups from both companies have perceived in a similar manner.
TABLE 8: COMPARISON OF EXTENT OF BENEFITS FROM ERP ADOPTION BETWEEN THE TWO FIRMS
Benefits From ERP HCL SF ‘t’ Value
Non-financial Performance Evaluation 3.84 3.78 0.42
(0.71) (0.52)
Improvement in Performance Efficiency 4.00 3.99 0.10
(0.75) (0.57)
Improvement in Business Process 3.81 3.71 0.61
(0.79) (0.64)
Improved Measurement of Strategy Implementation 3.99 3.74 1.81*
(0.60) (0.61)
Total Benefits from ERP 3.91 3.80 0.95
(0.62) (0.36)
Degrees of freedom is 77 for all ‘t’ values.
*Significant at 10% level.
Therefore, it is found from the above results that the extent of benefits from ERP adoption is same in both the companies irrespective of their distinct nature of
business. The extent of benefits from ERP as has been perceived by employee groups with different job status (Clerks, Supervisor and Manager) from selected
companies have been compared using one way Analysis of Variance (F test) in order to know whether the responses about extent of benefits is consistent
among employees of all job status.
RELATIONSHIP BETWEEN “EXTENSIVENESS OF ERP ADOPTION AND ERP BENEFITS”
The effect the Extensiveness of ERP adoption on the extent of benefits from ERP adoption has been analysed. In this regard, multiple regression technique is
used. The ERP benefits are treated as dependent variable and 10 functional areas are considered as independent variables.
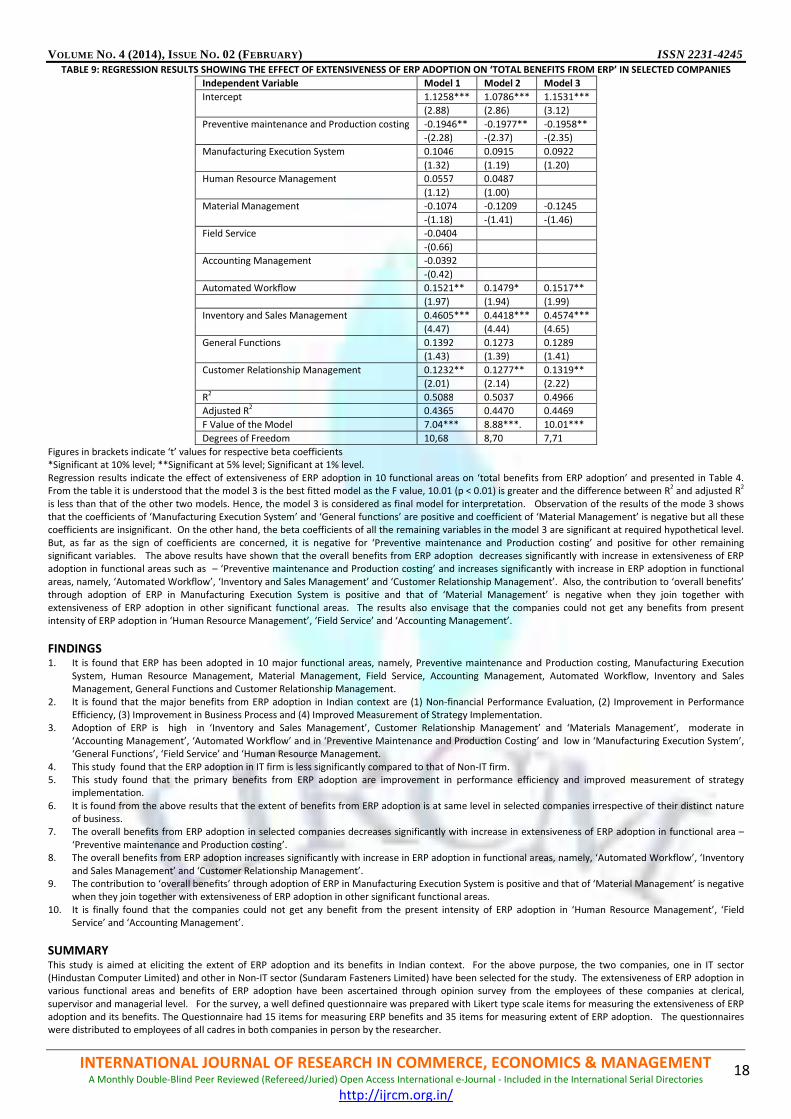
VOLUME NO. 4 (2014), ISSUE NO. 02 (FEBRUARY) ISSN 2231-4245
INTERNATIONAL JOURNAL OF RESEARCH IN COMMERCE, ECONOMICS & MANAGEMENT A Monthly Double-Blind Peer Reviewed (Refereed/Juried) Open Access International e-Journal - Included in the International Serial Directories
http://ijrcm.org.in/
18
TABLE 9: REGRESSION RESULTS SHOWING THE EFFECT OF EXTENSIVENESS OF ERP ADOPTION ON ‘TOTAL BENEFITS FROM ERP’ IN SELECTED COMPANIES
Independent Variable Model 1 Model 2 Model 3
Intercept 1.1258*** 1.0786*** 1.1531***
(2.88) (2.86) (3.12)
Preventive maintenance and Production costing -0.1946** -0.1977** -0.1958**
-(2.28) -(2.37) -(2.35)
Manufacturing Execution System 0.1046 0.0915 0.0922
(1.32) (1.19) (1.20)
Human Resource Management 0.0557 0.0487
(1.12) (1.00)
Material Management -0.1074 -0.1209 -0.1245
-(1.18) -(1.41) -(1.46)
Field Service -0.0404
-(0.66)
Accounting Management -0.0392
-(0.42)
Automated Workflow 0.1521** 0.1479* 0.1517**
(1.97) (1.94) (1.99)
Inventory and Sales Management 0.4605*** 0.4418*** 0.4574***
(4.47) (4.44) (4.65)
General Functions 0.1392 0.1273 0.1289
(1.43) (1.39) (1.41)
Customer Relationship Management 0.1232** 0.1277** 0.1319**
(2.01) (2.14) (2.22)
R2 0.5088 0.5037 0.4966
Adjusted R2 0.4365 0.4470 0.4469
F Value of the Model 7.04*** 8.88***. 10.01***
Degrees of Freedom 10,68 8,70 7,71
Figures in brackets indicate ‘t’ values for respective beta coefficients
*Significant at 10% level; **Significant at 5% level; Significant at 1% level.
Regression results indicate the effect of extensiveness of ERP adoption in 10 functional areas on ‘total benefits from ERP adoption’ and presented in Table 4.
From the table it is understood that the model 3 is the best fitted model as the F value, 10.01 (p < 0.01) is greater and the difference between R2 and adjusted R
2
is less than that of the other two models. Hence, the model 3 is considered as final model for interpretation. Observation of the results of the mode 3 shows
that the coefficients of ‘Manufacturing Execution System’ and ‘General functions’ are positive and coefficient of ‘Material Management’ is negative but all these
coefficients are insignificant. On the other hand, the beta coefficients of all the remaining variables in the model 3 are significant at required hypothetical level.
But, as far as the sign of coefficients are concerned, it is negative for ‘Preventive maintenance and Production costing’ and positive for other remaining
significant variables. The above results have shown that the overall benefits from ERP adoption decreases significantly with increase in extensiveness of ERP
adoption in functional areas such as – ‘Preventive maintenance and Production costing’ and increases significantly with increase in ERP adoption in functional
areas, namely, ‘Automated Workflow’, ‘Inventory and Sales Management’ and ‘Customer Relationship Management’. Also, the contribution to ‘overall benefits’
through adoption of ERP in Manufacturing Execution System is positive and that of ‘Material Management’ is negative when they join together with
extensiveness of ERP adoption in other significant functional areas. The results also envisage that the companies could not get any benefits from present
intensity of ERP adoption in ‘Human Resource Management’, ‘Field Service’ and ‘Accounting Management’.
FINDINGS 1. It is found that ERP has been adopted in 10 major functional areas, namely, Preventive maintenance and Production costing, Manufacturing Execution
System, Human Resource Management, Material Management, Field Service, Accounting Management, Automated Workflow, Inventory and Sales
Management, General Functions and Customer Relationship Management.
2. It is found that the major benefits from ERP adoption in Indian context are (1) Non-financial Performance Evaluation, (2) Improvement in Performance
Efficiency, (3) Improvement in Business Process and (4) Improved Measurement of Strategy Implementation.
3. Adoption of ERP is high in ‘Inventory and Sales Management’, Customer Relationship Management’ and ‘Materials Management’, moderate in
‘Accounting Management’, ‘Automated Workflow’ and in ‘Preventive Maintenance and Production Costing’ and low in ‘Manufacturing Execution System’,
‘General Functions’, ‘Field Service’ and ‘Human Resource Management.
4. This study found that the ERP adoption in IT firm is less significantly compared to that of Non-IT firm.
5. This study found that the primary benefits from ERP adoption are improvement in performance efficiency and improved measurement of strategy
implementation.
6. It is found from the above results that the extent of benefits from ERP adoption is at same level in selected companies irrespective of their distinct nature
of business.
7. The overall benefits from ERP adoption in selected companies decreases significantly with increase in extensiveness of ERP adoption in functional area –
‘Preventive maintenance and Production costing’.
8. The overall benefits from ERP adoption increases significantly with increase in ERP adoption in functional areas, namely, ‘Automated Workflow’, ‘Inventory
and Sales Management’ and ‘Customer Relationship Management’.
9. The contribution to ‘overall benefits’ through adoption of ERP in Manufacturing Execution System is positive and that of ‘Material Management’ is negative
when they join together with extensiveness of ERP adoption in other significant functional areas.
10. It is finally found that the companies could not get any benefit from the present intensity of ERP adoption in ‘Human Resource Management’, ‘Field
Service’ and ‘Accounting Management’.
SUMMARY This study is aimed at eliciting the extent of ERP adoption and its benefits in Indian context. For the above purpose, the two companies, one in IT sector
(Hindustan Computer Limited) and other in Non-IT sector (Sundaram Fasteners Limited) have been selected for the study. The extensiveness of ERP adoption in
various functional areas and benefits of ERP adoption have been ascertained through opinion survey from the employees of these companies at clerical,
supervisor and managerial level. For the survey, a well defined questionnaire was prepared with Likert type scale items for measuring the extensiveness of ERP
adoption and its benefits. The Questionnaire had 15 items for measuring ERP benefits and 35 items for measuring extent of ERP adoption. The questionnaires
were distributed to employees of all cadres in both companies in person by the researcher.

VOLUME NO. 4 (2014), ISSUE NO. 02 (FEBRUARY) ISSN 2231-4245
INTERNATIONAL JOURNAL OF RESEARCH IN COMMERCE, ECONOMICS & MANAGEMENT A Monthly Double-Blind Peer Reviewed (Refereed/Juried) Open Access International e-Journal - Included in the International Serial Directories
http://ijrcm.org.in/
19
The data collected from the survey were tested using reliability analysis to know the reliability of scale items used in the questionnaire. It is found from the
analysis that scale items measuring both ERP adoption and ERP benefits are consistent with each other and reliable measures. After ascertaining that the scale
items are reliable, the study administered factor analysis on the data to find out underlying dimensions of ERP adoption and ERP benefits in the selected
companies. The underlying dimensions that are uncovered from data measuring ERP adoption were given appropriate names and are considered as major
functional areas of ERP adoption. Similarly, the underlying dimensions of ERP benefits were identified with suitable name and considered as major benefits from
ERP adoption in the selected companies. The mean perception scores of the respondents for each major functional areas and each major benefit are compared
by firms as well as by respondents’ (employees’) job status, job experience, education and age to known consistency of the ERP adoption and ERP benefits.
Finally, the relationship between extensiveness of ERP adoption in major functional areas and major benefits have been analysed using Multiple regression
technique.
CONCLUSION This study concludes that the extent of ERP adoption differ significantly between companies with different activities but benefits from ERP adoption is similar
and do not differ by nature of business of the companies in Indian context. All the employees irrespective of their job status, job experience, education and age
are consistent in agreeing that the ERP adoption in 10 major functional areas, namely Preventive maintenance and Production costing, Manufacturing Execution
System, Human Resource Management, Material Management, Field Service, Accounting Management, Automated Workflow, Inventory and Sales
Management, General Functions and Customer Relationship Management has benefited their companies in improving Non-financial Performance Evaluation,
Performance Efficiency, Business Process and Measurement of Strategy Implementation. It is further concluded from the study that the extent of ERP adoption
in ‘Automated Workflow’, ‘Inventory and Sales Management’ and ‘Customer Relationship Management’ play a significant role in improving the overall efficiency
of the companies under study. This study further envisaged that though the extent of ERP adoption is high in ‘Human Resource Management’, ‘Field Service’
and ‘Accounting Management’ it has failed to bring any benefit to the companies under study.
REFERENCES 1. Alexis Leon (2002), Enterprise Resource Planning, TATA McGrew-Hill Publications, New Delhi,
2. Ashok Soni (2005), Enterprise Systems and Applications: The Future – A panel Discussion, POMS OM Frontiers: Winds of Change.
3. Bhatti, T.R. (2005), Critical Success Factors For The implementation of Enterprise Resource Planning (ERP: Empirical Validation, The Second International
Conference on Innovation in Information.
4. Christopher P. Holland and Ben Light (1999), Global Enterprise Resource Planning Implementation, Proceedings of the 32nd
Hawaii International
Conference on System Sciences.
5. Colin Ash, G. and Janice, M. Burn, (2001), E-ERP: A Comprehensive Approach to E-Business, IRMA International Conference, pp. 112-116.
6. De Vaan M.J.M. and Barendrecht, R.A (2000), ERP-wereld verander tingrijpend, Tijdschrift Voor Inkoop & Logistic, November, Vol. 103, pp. 462-468.
7. Fiona Fui-Hoon Nah, (2003), Enterprise Resource Planning and its Implementations, International Journal of Human-Computer Interaction, Vol.16, Issue
No.1, pp. 1-3.
8. Jain, V.K. and Bhakar, S.S. (2013), Role of ERP in Improving Supply Chain Effectiveness: A Perpetual Study, ICFAI Journal of Supply Chain Management,
Vol. 3, No.2.
9. Kai Reimers, (2002) Implementing ERP systems in China, 35th Hawaii International Conference on System Sciences.
10. Leeuwen, O.C. van and Wemmenhove, P. (2001), Trends in Finance & Control, Maandblad voor Accountancy en Dedrijfseconomie, Vol. 78, pp. 435-444.
11. Morley and Roy Ph.D., (2004),Customer based antecedents of satisfaction an dissatisfaction in business to business services, The University of Western
Ontario (Canada), pp. 225.
12. Rosemann. M, (1999), ERP Software: characteristics and consequences, 7th European Conference on Information Systems.

VOLUME NO. 4 (2014), ISSUE NO. 02 (FEBRUARY) ISSN 2231-4245
INTERNATIONAL JOURNAL OF RESEARCH IN COMMERCE, ECONOMICS & MANAGEMENT A Monthly Double-Blind Peer Reviewed (Refereed/Juried) Open Access International e-Journal - Included in the International Serial Directories
http://ijrcm.org.in/
20
INFLUENCE OF ADVERTISING IN MEDIA ON THE PERCEPTIONS OF YOUNG INDIAN CONSUMERS WITH
SPECIAL REFERENCE TO ORGANIZED FAST FOOD OUTLETS
DEEPAK ASHOKKUMAR
RESEARCH SCHOLAR
SCHOOL OF MANAGEMENT
BHARATHIAR UNIVERSITY
COIMBATORE
DR. S. SANKARANARAYANAN
ASSOCIATE PROFESSOR
SCHOOL OF MANAGEMENT
BHARATHIAR UNIVERSITY
COIMBATORE
ABSTRACT The young Indian consumers are unique in terms of their population size and characteristics. According to Government of India’s youth portal, the current
percentage of population under 25 years of age in India is 51% and the percentage under 35 years of age is about 66%. The researcher attempts to analyse the
influence of advertising in media on the perceptions of Indian youth with special reference to organized fast food outlets. The present study has considered the
following media carrying advertisements of organized fast food companies, namely: newspaper, magazine, television, radio, internet, mobile phone,
pamphlet/brochure, hoarding and banner. The sample consisted of 320 respondents in the age group of 15 to 24 years living in Mumbai city. Multistage
sampling technique was adopted to select the required sample respondents. A structured questionnaire was used for collecting the data. Structural equation
modeling was used for analyzing the influence of advertising in media upon the consumer perceptions. Television, newspaper and banner advertisements were
found to have significant influence upon the perceptions of youth.
KEYWORDS
Advertising media, Consumer perceptions, Fast food, Young consumers, Youth.
INTRODUCTION usiness organisations all around the world use advertising to disseminate the information about their products and services to their target customers.
The ability of advertising and other promotional methods to deliver carefully prepared messages to target audiences has given them a major role in the
marketing programs of most organizations (Belch and Belch, 2003). The messages transmitted by the advertisers are sensed, selected and attended by
the consumers. Further, these external sources of information are interpreted and given meaning from the consumer’s perspective. These are nothing but
‘perceptions’, the process by which an individual receives, selects, organizes and interprets information to create a meaningful picture of the world (Harrell,
1986). Once an individual selects and attends to a stimulus in the form of advertisement, the perceptual process comes into play thereby organizing,
categorizing and interpreting the incoming information. From the marketer’s and retailer’s point of view, it is important to understand how the target customers
interpret the advertisement transmitted by them. It is a challenging task for the marketers to measure or influence consumers’ perceptions since these are
highly individualistic in nature. Things can get more challenging and daunting when the customers to be focused and targeted are young. Having grown up in an
even more media saturated, brand conscious world than their parents, the youth respond to advertising differently and prefer to encounter marketing messages
in different places or from different sources (Khermouch and Green, 2001). Many companies are recognizing that the most global segment of all the consumer
segments is the youth of the world, as they show amazing similarities in tastes, interests, language and attitudes (Parmar, 2002). The multinational organizations
realize the fact that one of their major marketing challenges is to tap into the youth segment which shell out huge amounts of money on different products and
services. In the Asian region, youth from India deserve special attention due to the enormity of their size. When compared to the previous generation, the
contemporary Indian youth are experimentative, daring, financially more secure and more educated with a modern outlook (Nair, 2010). The young consumers
are going to be big spenders from now on. Much of the retail boom is already being driven by them. Consumption of items like sports shoes, apparels and cell
phones are shooing up because of them (Ramaswamy and Namakumari, 2009). Among the different products and service offerings, fast food has received
significant attention and interest from the Indian youth. The fast food sector is gaining acceptance primarily from Indian youth and is becoming part of their
lifestyle (Goyal and Singh, 2007). By the year 2016, the Indian fast food market is forecasted to have a value of 18567.7 million U.S. dollars, an increase of 63.9%
since 2011 (Marketline, 2012). This indicates huge opportunities for fast food companies of both national and international origins. There is no wonder that the
number of organized fast food outlets are increasing rapidly on a pan India basis. In such a case, there is likely to be intense competition among different fast
food brands to gain the attention and patronage of young Indian consumers. In order to encounter this competition, the fast food companies resort to
advertising to position their products and services in the minds of consumers. This could be the reason why, almost all the organized fast food players frequently
telecast colorful advertisements in the television medium while making effective use of other advertising media as well. There is no doubt that these
organizations shell out huge amounts of money in coming up with these advertisements in different media. Now, the major question in focus is whether these
advertisements are able to capture the attention, interest and thereby influence the perceptions of young consumers in a successful manner. As in several
aspects of life, it is the perception that matters in a marketing context in which brand names and company names trigger association and images. Perception is
unique to each individual and it is not just objective reality. Different individuals may have their own version of brand description based on their perception
(Rameshkumar, 2011). Hence, this study is an attempt to investigate the influence of advertising in media on the perceptions of young Indian consumers with
special reference to organized fast food outlets.
STATEMENT OF PROBLEM Advertising research has shown that the context surrounding the advertisement has many effects on consumer’s perceptions of and reactions to the advertising
content (Dahlen and Edenius, 2007). Creative and innovative advertisements may serve the purpose of capturing the attention of its target consumers; but they
are still costly. Apart from this, it is quiet a difficult task to gain the attention of young consumers. Youth of the present era very well realize the fact that
advertisements are strategies employed by organizations to sell their products and services. Only a handful of advertisements with creative themes manage to
enjoy the attention of these youngsters. The present age of globalization also sets up the stage for intense competition among different organizations to gain the
market share. Too many advertisements of the same product or service category under different brand names in the same medium result in information
overload. Such a situation may result in confusing the customer rather than aiding him/her in the buying decision making process. Different advertising media
vehicles carry advertisements sponsored by fast food companies. Only those advertisements with the potential to hook the youth upon their innovative themes
B

VOLUME NO. 4 (2014), ISSUE NO. 02 (FEBRUARY) ISSN 2231-4245
INTERNATIONAL JOURNAL OF RESEARCH IN COMMERCE, ECONOMICS & MANAGEMENT A Monthly Double-Blind Peer Reviewed (Refereed/Juried) Open Access International e-Journal - Included in the International Serial Directories
http://ijrcm.org.in/
21
manage to stand apart distinctively from the clutter. An advertisement is considered to be effective when it manages to get the attention of its target consumers
and also is successful enough to influence their perceptions towards the concerned products and services. When this influence occurs at the perceptual level of
a consumer there is a high probability that he or she will purchase/experience the concerned product or service. The current study attempts to address the
research problem pertaining to the extent of influence of advertisements on perceptions of youth.
LITERATURE REVIEW Earlier researchers (Pollay et al. 1993) have reported that younger audiences think of advertising as an information source more than do older audiences.
Coulter et al. (2001) found that feeling good about an advertisement made the respondents feel good about the advertised offering. It was also revealed that
the entertainment aspect of advertising could lead to increased trust in advertisers, manufacturers and retailers. On the other hand, the researchers also
indicated that due to its prevelant, intrusive and repetitive nature, advertising might be perceived as a powerful negative force as well. Kim et al. (2010)
attempted to investigate the consumer perceptions on web advertisements and motivating factors to purchase from online shopping. They opined that
consumer’s perceptions of the attributes of web advertisements would tend to influence their intention to purchase from online shopping sites. Dean (1999)
found that complete product information was rarely available to consumers especially when viewing advertisements. Product cues in advertising are important
to consumers in making inferences, reducing uncertainty and forming product preferences. If there is an abundance of cues, only a few will be fully processed
due to the limited capacity of the human processing system. Bacher (2003) was of the opinion that sponsored marketing communications including advertising
had the potential to reorganize the way in which the consumer perceives and appreciates the brand. But the same author reported that current practice of
marketing communications and advertising simply cannot, has not and will not routinely cause such necessary mental reorganizations. Most of the previous
studies on fast food advertising focused upon the influence of the advertisements on children’s fast food consumption and the resultant obesity (Andreyeva et
al. 2011; Henderson and Kelly, 2005). Apart from this, studies on fast food mainly focused upon consumption patterns and characteristics of fast food
consumers (Goyal and Singh (2007); Oyewole (2007)). Studies specific to the perception of fast food advertisements and its influence on youth are lacking.
Hence, the current study attempts to address this research gap by focusing upon the influence of fast food advertisements on the perceptions of young Indian
consumers.
RESEARCH METHODOLOGY POPULATION AND SAMPLING FRAME
The population for the study comprised of young consumers in the age group of 15-24 years in the city of Mumbai, India. The sampling frame for the present
study included youth visiting the organized fast food outlets in the study area. Four brands of fast food outlets were considered namely Mc Donald’s, Kentucky
Fried Chicken (KFC), Pizza Hut and Dominos. These fast food chains were considered due to their immense popularity among young consumers and the
occurrence of high footfalls in their fast food outlets. The sampling frame comprised of total 1974 respondents (total footfall of young consumers visiting all the
outlets considered for the study (approximately) in a day as per the information given by the outlet service personnel).
SAMPLE SIZE AND SAMPLING TECHNIQUE
A sample size of 306 was determined by using the Krejcie and Morgan (1970) sample size table. To be on the safer side, 320 respondents were contacted. Out of
320 responses, 312 were found to be usable. Multistage sampling technique was used to select the required number of sample respondents. In the first stage,
the study area was selected as the city of Mumbai by purposive sampling. In the second stage, each of the four organized fast food outlet chains (Mc Donald’s,
Kentucky Fried Chicken (KFC), Pizza Hut and Domino’s) were classified as different strata. Following this, the number of outlets to be considered from each
stratum were calculated in proportion to the total number of outlets. Each outlet was selected using lottery method. In the third stage, the number of
respondents to be involved in the study were calculated in proportion to the total number of footfalls occurring in all the outlets. Purposive sampling was used
to select the respondents coming out of the outlets.
DATA COLLECTION
The researcher designed a structured questionnaire by adopting items for measuring perceptions from the studies of Oyewole (2007) and Makgosa and
Mabalane(2011). Further the researcher sought the opinion of the respondents regarding the influence of advertising in media sources of information using 5
point Likert scales (Very high- 5, High- 4 , Neutral – 3, Low – 2, Very low- 1).
CONTACT METHOD
Intercept method was used to collect the primary data from the respondents coming out of the selected fast food outlets and willing to take part in the survey.
DATA ANALYSIS
Principal components factor analysis and structural equation modelling was applied to analyse the primary data by using SPSS 18.0. and AMOS.
RESULTS AND DISCUSSION PROFILE OF RESPONDENTS
The respondents comprised of 51.92 % of males and 48.08% of females. The mean age of the respondents was 22 years. 81% of the respondents were college
students. 19% of the respondents were employed. The mean monthly household income of the respondents was Rs. 32,245.
FACTORS UNDERLYING PERCEPTIONS OF YOUTH TOWARDS ORGANISED FAST FOOD OUTLETS
Previous researchers have conducted studies to identify the factors underlying perceptions of respondents towards fast food outlets (Oyewole (2007); Makgosa
and Mabalane (2011); Lee and Ulgado (1997); Goyal and Singh (2007)). Results of these studies highlighted the emergence of hygiene, empathy, comfort of
facilities, availability, nutritional value, unique experience, price, reliability, social outing, nutritional awareness, food taste, variety, seating space and ambience
as factors underlying the perceptions. The present study used principal components factor analysis with varimax rotation to identify the factors underlying the
perceptions of respondents. Six resultant factors emerged in the study namely - Hygiene and reliability, Health consciousness, Courteousness, Unique
experience, Comfort and Convenience and Price as shown in Table 1.
INFLUENCE OF ADVERTISING IN VARIOUS MEDIA ON PERCEPTIONS OF YOUTH TOWARDS FAST FOOD OUTLETS
Structural equation modelling was used to study the influence of advertising in various media on perceptions of youth. The undesirable condition of
multicollinearity was verified for the independent variables before the conduct of structural equation modelling. Drawing inferences from structural equation
modelling might be a problem if the independent variables have high correlations among each other.
TABLE 1: PERCEPTIONS OF RESPONDENTS TOWARDS ORGANISED FAST FOOD OUTLETS: SIX FACTORS SOLUTION
Factors Reliability (Cronbach’s α)
Hygiene and reliability 0.719
Health consciousness 0.726
Courteousness 0.722
Unique experience 0.811
Comfort and Convenience 0.809
Price 0.814
The presence of high correlations among independent variables may lead to inflated squared multiple correlations (R2) in regression analysis. High correlation
values lying above 0.8 or 0.9 are to be scanned for detecting the presence of multicollinearity. It was found out that none of the correlation estimates exceeded
the value of 0.8 as highlighted in table 2 indicating the absence of multicollinearity within the predictor variables. The advertisements in media sources formed

VOLUME NO. 4 (2014), ISSUE NO. 02 (FEBRUARY) ISSN 2231-4245
INTERNATIONAL JOURNAL OF RESEARCH IN COMMERCE, ECONOMICS & MANAGEMENT A Monthly Double-Blind Peer Reviewed (Refereed/Juried) Open Access International e-Journal - Included in the International Serial Directories
http://ijrcm.org.in/
22
the exogenous variables (independent variables) namely: Television, newspaper, magazine, internet, pamphlets, hoardings, banners, FM Radio and mobile
phones. The perception of youth towards relevant attributes of fast food outlets namely: ‘hygiene and reliability’, ‘health consciousness’, ‘courteousness’,
‘unique experience’, ‘comfort and convenience’ and ‘price’ formed the endogenous variables (dependent variables). Statistical tests for goodness of fit for the
models were also carried out by analyzing the values of Chi-square, GFI, AGFI and RMSEA. All these values were found lying within the acceptable range for the
relevant models indicating goodness of fit (Table 3).
TABLE 2: BIVARIATE CORRELATIONS AMONG PREDICTOR VARIABLES FOR CHECKING MULTICOLLINEARITY
Independent Variables Television Newspaper Magazines Internet Pamphlet Hoardings Banners FM Radio Mobile phones
Television 1.00 -0.56 -0.78 -0.31 -0.117 0.122 0.153 0.05 0.043
Newspaper -0.56 1.00 0.761 0.605 0.687 0.242 0.169 0.12 0.395
Magazines -0.78 0.761 1.00 0.564 0.677 0.173 0.149 0.08 0.286
Internet -0.31 0.605 0.564 1.00 0.633 0.383 0.315 0.14 0.556
Pamphlets -0.12 .687 0.677 0.633 1.00 0.241 0.233 0.08 0.310
Hoardings 0.122 0.242 0.173 0.383 0.241 1.00 0.743 0.27 0.368
Banners 0.153 0.169 0.149 0.315 0.233 0.743 1.00 0.29 0.314
FM Radio 0.055 0.116 .085 0.145 0.087 0.275 0.296 1.00 0.312
Mobile phones 0.043 0.395 0.286 0.556 0.310 0.368 0.314 0.31 1.00
TABLE 3: GOODNESS OF FIT STATISTICS FOR THE MODEL
Parameters Obtained values Cut-Off values
Chi-Square 40.083(p =0.077) P > 0.05
GFI 0.967 > 0.90
AGFI 0.918 >0.90
RMSEA 0.044 < 0.05
Table 4 highlights the standardised regression coefficients (β) signifying the influence of media advertisements on perceptions. It is observed that Television
advertisements (β = 0.142, t-value = 3.354, p<0.05) and Banner advertisements (β = 0.225, t-value = 3.568, p<0.01) had a significant and positive influence upon
the perceptions of youth in terms of ‘hygiene and reliability’ associated with fast food outlets. This indicates that television advertisements and banners
highlighted messages related to hygiene and reliability of organized fast food outlets which influenced the perceptions of youth in a positive direction. The
media advertisements explained for a variation of 5.1% (R2) within the dependent variable ‘hygiene and reliability’.
TABLE 4: INFLUENCE OF ADVERTISING IN MEDIA ON PERCEPTIONS OF RESPONDENTS TOWARDS ORGANISED FAST FOOD OUTLETS
Independent variables - Advertising in
media
Dependent variables –Standardised Coefficients
Hygiene &
Reliability
Comfort &
convenience
Courteousn
ess
Health Unique
experience
Price
Television Advertisements .142* .159* .089 .060 .236** .040
Newspaper Advertisements -.002 .159 .047 -.501** -.142 -.378**
Magazine Advertisements
-.043 -.034 -.108 .091 -.168 .221*
Internet Advertisements
.073 -.055 .061 .040 -.062 .218*
Pamphlet Advertisements
-.044 -.029 .015 -.128 -.029 -.111
Hoardings -.179 -.235** -.092 .013 -.014 .138
Banner Advertisements
.225** .266** .171 .013 .113 -.196
FM Radio Advertisements
-.004 .092 -.086 .068 -.054 -.018
Mobile phone Advertisements
-.008 .001 -.024 -.016 -.048 .028
R2
0.051 0.083 0.034 0.261 0.215 0.089
* Significant at 0.05 level, ** Significant at 0.01 level, *** Significant at 0.001 level
Television advertisements (β = 0.159, t-value = 3.894, p<0.05) and Banner advertisements (β = 0.266, t-value =4.368, p<0.01) were also found to be significantly
and positively influencing the perceptions of youth with respect to ‘comfort and convenience’ offered in fast food outlets. The predictor variables explained for
a variation of 8.3% (R2) within the dependent variable ‘comfort and convenience’. Further television advertisements (β = 0.236, t-value = 6.321, p<0.01) had a
significant and positive influence upon the ‘unique experience’ offered in fast food outlets. Fast food organizations of both national and international origins
aggressively target the young consumers with their colourful advertisements. These advertisements mainly showcase the fast food outlets as a place of ultimate
recreation offering a treat comprising of colourful aesthetics, visual images, pleasant music and delicious fast food dishes. Television advertising makes effective
usage of audio and video messages to such an extent that youth easily perceive the fast food outlets and cafes as destinations of ‘unique experience’. The
predictor variables explain a variation of 21.5% within the dependent variable.
Newspaper advertisements (β = -0.501, t-value = -8.509, p<0.01) had a significant negative influence upon the perception of youngsters with respect to health
related aspects of fast food items. This could be implying that newspaper advertisements highlighted minimal contents related to health aspects, nutritional
value and calorie contents of fast food. The media sources of information contributed to a variation of 26.1% within the dependent variable ‘health
consciousness’.
Moreover the perceptions of youngsters towards prices of fast food items are negatively influenced by referring to newspaper advertisements (β = -0.327, t-
value = -0.022, p<0.01). It appears as if the prices of fast food highlighted in these newspaper advertisements were perceived to be high by the Indian youth. On
the other hand magazines and internet had positive significant influence upon perceptions related to price. The advertising sources contributed to a variation of
8.9% within the dependent variable. On the other hand advertisements placed in magazine and internet media significantly and positively influenced the price
related perceptions of youth.
Advertising in media such as FM Radio, mobile phones and pamphlets were found to have no significant influence upon the perceptions of young consumers. It
could also be observed that the predictor variables (advertising in media sources) on the whole contributed to a maximum variation of 26.1% (R2
Value) within
the dependent variable ‘health consciousness’ followed by variation of 21.5% within the dependent variable ‘unique experience’. This indicates that exposure to
different media advertisements considered for the present study resulted in maximum variation and influence upon the perceptions of youth related to health
and unique experience associated with organised fast food outlets. More and more fast food companies are trying to portray their fast food dishes as healthy
options for the consumers owing to the increasing discussion and research activities at the global level relevant to the harmful health effects of fast food
consumption.

VOLUME NO. 4 (2014), ISSUE NO. 02 (FEBRUARY) ISSN 2231-4245
INTERNATIONAL JOURNAL OF RESEARCH IN COMMERCE, ECONOMICS & MANAGEMENT A Monthly Double-Blind Peer Reviewed (Refereed/Juried) Open Access International e-Journal - Included in the International Serial Directories
http://ijrcm.org.in/
23
MANAGERIAL IMPLICATIONS Fast food companies may have to use advertising themes focussed upon ‘hygiene and reliability of outlets’, ‘health consciousness of youth’, ‘courteousness of
service personnel’, ‘unique experience associated with the outlets’, ‘comfort and convenience of the outlets’ and ‘prices of fast food dishes’. Organised fast
food restaurants can make effective use of television and banner advertisements, since these were found to have significant and positive influence upon
perceptions of youth related to ‘hygiene and reliability’, ‘comfort and convenience’ and ‘unique experience’ associated with fast food outlets. Creative and
innovative advertisement themes telecasted or displayed through television and banners are bound to gain the interest of youngsters. None of the media
vehicles were found to be influencing the perceptions related to ‘courteousness of service personnel’. Hence, fast food companies may try to incorporate
themes related to this perceptual aspect in their advertisements. The advertisements carried in media vehicles other than television and banners namely
newspaper, pamphlets, hoardings, FM radio and mobile phones were found to have either negative or absolutely no significant influence upon the perceptions
of youth. Hence fast food companies may take steps to understand the shortcomings (if any) and suitability of these media vehicles to make effective usage of
them.
CONCLUSION, LIMITATIONS AND AVENUES FOR FUTURE RESEARCH From the present study, it is concluded that advertisements in media possessed significant influence upon the perceptions of youth towards organised fast food
outlets. Despite of this influence, the concerned organisations may attempt to come up with advertisements which stand out and attract attention. Only such
unique advertising strategies can help in countering the clutter of advertisements in media. The present study was conducted among youth belonging to the city
of Mumbai, India. Hence the generalization of results to young consumers belonging to other geographical areas should be done with caution because of vast
cultural diversity in these markets. Further studies could be conducted among Indian youth with special focus on service offers other than organised fast food
outlets such as education, fitness centres, and beauty parlours/saloons to name a few. Such initiatives could benefit the national and international marketers in
tailoring their marketing strategies to focus and serve the youth consumer segment in an effective and efficient manner.
REFERENCES 1. Andreyeva T. , Kelly I.R. and Harris J.L. (2011) , Exposure to food advertising on television: Associations with children’s fast food and soft drink consumption
and obesity, Economics and human biology ,9, pp221-233
2. Bacher W.M.W (2003), How advertising affects consumers? , Journal of Advertising research,43, pp230-234
3. Belch G.E. and Belch M.E. (2003), Advertising and Promotion: An integrated marketing communications perspective, Tata McGraw Hill publishing, 6th
Edition, p5
4. Coulter R.A., Zaltman G. and Coulter K.S. (2001), Interpreting consumer perceptions of advertising :An application of Zaltman Metaphor Elicitation
Technique, Journal of Advertising, 30:4, pp 1-21
5. Dahlen M. and Edenius M. (2007), When is advertising advertising? Comparing responses to non-traditional and traditional advertising media, Journal of
Current issues and Research in Advertising, 29:1,pp 33-42
6. Dean D.H. (1999), Brand endorsement, popularity and event sponsorship as advertising cues affecting consumer pre- purchase attitudes, Journal of
Advertising, 28:3, PP1-12
7. Goyal A. and Singh N.P. (2007) , Consumer perception about fast food in India: an exploratory study, British food journal, Vol.109 , No.2, pp 182-195
8. Harrell .G (1986), Consumer Behaviour, (San Diego: Harcourt Brace Jovanovich), p66
9. Henderson V.R. and Kelly B. (2005) Food advertising in the age of obesity: Content analysis of food advertising on general market and African American
television, Journal of nutritional education behaviour, 37, pp 191- 196
10. Khermouch .G and Green.J (2001), “ Buzz Marketing”, Businessweek, pp50-56
11. Kim J.U, Jinkim W. and Park S.C. (2010), Consumer perceptions on web advertisements and motivating factors to purchase in the online shopping,
Computers in Human behaviour, 26, pp 1208-1222
12. Krejice R.V. and Morgan D.W. (1970), Determining sample size for research, Educational and Psychological measurement, pp607-610
13. Lee, M., & Ulgado, F.M. (1997). Consumer evaluations of fast- food services: a crossnational comparison. The journal of services marketing, 11(1), 39-52.
14. Makgosa, R. & Mabalane, N. (2011). Fast food purchase behavior in Botswana: An exploratory study. Indian journal of Marketing, 27(7), 23-30
15. Marketline (2012), Fast food in India, www.marketlineinfo.com, Informa business
16. Nair, S.R. (2010), Consumer behaviour in Indian perspective: Texts and cases, 2nd
edition, Himalaya publishing house, Mumbai
17. Oyewole, P. (2007). Fast food marketing and the African American Consumers. Journal of International Consumer Marketing, 19(4), 75-108
18. Parmar .A (2002), Global youth united, Marketing News, pp49
19. Pollay, Richard.W and Mittal.B (1993), Here’s the beef: Factors, Determinants and segments in the consumer criticism of advertising, Journal of Marketing,
57, pp 99-114
20. Ramaswamy V.S. and Namakumari S. (2009) , Marketing Management-Global perspective Indian context, 4th
edition, pp 292
21. Rameshkumar S. (2011), Consumer behaviour and brands, concepts and cases, Pearson publication, Noida

VOLUME NO. 4 (2014), ISSUE NO. 02 (FEBRUARY) ISSN 2231-4245
INTERNATIONAL JOURNAL OF RESEARCH IN COMMERCE, ECONOMICS & MANAGEMENT A Monthly Double-Blind Peer Reviewed (Refereed/Juried) Open Access International e-Journal - Included in the International Serial Directories
http://ijrcm.org.in/
24
NATURE BASED TOURISM AND PROTECTED AREA (PA) MANAGEMENT
U.N. SHUKLA
READER
INSTITUTE OF TOURISM & HOTEL MANAGEMENT
DR. B. R. AMBEDKAR UNIVERSITY
AGRA
ALTAF AHMAD LONE
ASST. PROFESSOR
DEPARTMENT OF TOURISM STUDIES
CENTRAL UNIVERSITY OF KASHMIR
KASHMIR
ABSTRACT This study analyzes the keen behind the involvement of visitors in nature-based tourism and identifies the associated protected area (PA) management regimes,
including the social and cultural consequences of it on local communities. Nature-based tourism (NBT), also known as ecotourism, is a faster growing area in the
tourism sector. It can prove as a complementary factor of development for both rural and well established urban-based tourism industries as well. The protected
area network in India has grown steadily. As of May, 2008, India has 97 NPs covering 38199.47km2 and 508 WLSs covering 118,236.94 km
2 representing 1.16%
and 3.60% respectively of the country‘s geographical area (National Wildlife Database Cell, 2008). The areas are adopted in-situ and ex-situ conservation
strategies for conservation of populations of many endangered species, especially rhino, birds, bears, elephant and tigers etc. and also ecology of the area being
maintained, despite high biotic pressures and random disturbances at the sites by mass tourism. However, in spite of being hubs of population conservation and
ecological integrity, they also bring about several management challenges. The most difficult assessed challenge facing by PA managers was the anger among
locals against the bans on their access for biomass and required revenue from the PA for biodiversity conservation.
JEL CODE
L83
KEYWORDS Management, Nature Based Tourism, Protected area.
INTRODUCTION rotected areas bring tremendous cultural, ecological, spiritual, and scientific benefits to society. They are critical to preserving global biodiversity and
stemming the extinction crisis. Today there are more than 100,000 protected areas worldwide comprising about 12 percent of the Earth’s surface
(Lopoukhine, 2008; Chape, et al. 2003). .A protected area is “an area of land and/or sea especially dedicated to the protection and maintenance of
biological diversity, and of natural and associated cultural resources, and managed through legal or other effective means” (IUCN, 1994). Protected areas are
hubs of diversity conservation and species habitat protection. They provide the natural environment for healthy outdoor recreational activities and safeguarding
of living for the tourists. Visit to such areas not only provide the opportunity to access the nature but also the sense of love and education about the wild
species. Protected areas such as national parks and reserves form the front line in the campaign to conserve biodiversity (Chape, et al. 2003). India is unique in
richness of bio diversity due to diversity of physiographic and climatic conditions. India ranks as the sixth among the 12-mega bio diversity countries of the
world. Moreover, out of 18 unique `biodiversity hot-spots' two are located in India-North-Eastern Himalayas and Western Ghats. (Mandal, 2003). The protected
area network in India has grown steadily. As of May 2008, India has 97 NPs covering 38199.47km2
and 508 WLSs covering 118,236.94 km2 representing 1.16%
and 3.60% respectively of the country‘s geographical area (NWDC, 2008).
Balmford, et al. (2009) find increasing visitors to protected areas (PAs) in 15 of 20 countries, with rapid increases in less-wealthy countries tied to international
tourist visitation. India, being an emerging economy with increasing mobility and disposable income also witnesses a great number of nature based tourists. The
28 tiger reserves alone receive >1 million visitors a year (Tiger Task Force, 2005). Yet, India’s 590 PAs cover <5% of total land area, are small (average size <300
km2), highly fragmented, and surrounded by high densities of people (Rodgers et al. 2003; Karanth & DeFries, 2010). Several research findings suggests that
nature-based tourism is beneficial for local promotion and protected area management, and provides participation of locals in management and promotes
conservation (Mansourian, 2008; Scherl & Emerton, 2008). Other communities in the vicinity of parks have been economically and socially promoted (Shukla &
Lone, 2012; Kumar Vijay, 2009; Spiteri & Nepal 2008). Further, some researchers observed no benefits and involvement of locals in PA management strategies
(Glasson, 1992 cited by Glasson et al, 1995; Fennell, 1999; Bandyopadhyay & Tembo, 2010) and also leakage of tourist benefits occurs outside the local
community (Boora, 2005).
The negative impacts of tourism had been identified by many past researchers, either in the form of sensitive ecological or wild species disturbance or the
physical environment of the PAs (Croall, 1995; Keefe, 1995; Frederico Neto, 2003). Others find tourism-generated revenues may be insufficient to sustain PA
conservation and management efforts (Karanth & DeFries, 2010). Perceptions of management practices also affect people’s attitudes (Ormsby and Kaplin, 2005;
Allendorf, 2007). For example, conflicts with managers due to resource extraction, strict rules on forest resources use, and access (Heinen and Shrivastava, 2009;
Shibia, 2010), rude behavior (Ormsby and Kaplin, 2005), or harassment by park rangers (Infield and Namara, 2001) generate negative attitudes toward protected
areas (Macura, et al, 2011).
MATERIAL AND METHODS STUDY SITES
We opted the 02 Protected Areas (Keoladeo & Ranthambore National Parks) of Rajasthan state, in India to observe the nature-based tourism and management
activities of them (Figure 1). The PAs were chosen as research sites because of their rich wildlife attractions and great rush of tourists, as both of them fall in the
India’s famous tourist ‘Golden Triangle’. Also the ease of accessibility to these areas was taken into concern. The data of visitor arrivals were collected from the
forest departments of the study sites. The average tourist numbers for both sites during 2007-08, was 1, 26, 697 (ranging from 94,284 in Keoladeo to 159,110 in
Ranthambore). Both PAs fall within the range of great tourism influence from the nearby core tourism centres and distance from these centres is given in (Table
1). The selected PAs differ in history of establishment, size, types of attractions, management practices and wild ecosystem and habitats (Table 1). The collected
data depended on the co-operation showed by the authorities to access the maintained records and the permissions to the PAs.
P

VOLUME NO. 4 (2014), ISSUE NO. 02 (FEBRUARY) ISSN 2231-4245
INTERNATIONAL JOURNAL OF RESEARCH IN COMMERCE, ECONOMICS & MANAGEMENT A Monthly Double-Blind Peer Reviewed (Refereed/Juried) Open Access International e-Journal - Included in the International Serial Directories
http://ijrcm.org.in/
25
FIGURE I: LOCATION OF TWO SELECTED PROTECTED AREAS IN INDIA INDICATED BY RED MARK AND OTHER PAS ARE IN MARKED GREY
SURVEYS AND INTERVIEWS
An interview instrument (questionnaire) was designed to collect the relevant information about the tourism activities and management regimes governing
nature-based tourism in both PAs. The instrument was designed using a semi-structured format with both open- and closed-ended questions. Further, the
instrument was modified into two different designs (one for management and other for private service providers) by altered queries according to need of
achievement.
Field visits were made to various locations in the PAs to get a first hand impression of the field situation and requirements and to draw the views of the staff
posted at various camps/chowkies and also collect official records on visitors (numbers, domestic vs. foreign, seasonality) and gate fees. Also, semi structured
interviews of managers or owners of 103/115 (89%) tourist facilities around 02 PAs were taken from May 2009 to February 2010 period on regular intervals. We
visited all facilities within 10 km of the PAs. Questions to facilities covered transportation, relationship with park management, employment, and other
opportunities provided to locals.
RESULTS AND DISCUSSION NATURE BASED TOURISM TRENDS
Nature-based tourism in India is comparatively cheaper than European destinations, e.g., tiger watching in the Kanha National Park and in Bandhavgah National
Park (both in Madhya Pradesh) either government or private facilities can provide a 10 day visit with ground costs between Aus. $20 to $ 100 per day (Valentine,
1983). The comparison of tourist arrivals for (Ranthambore & Keoladeo) were made after collected the official records of them from the respective forest
departments for 2002 to 2008 period (Table 1). On comparison of total tourists’ arrivals during 2007-08, Keoladeo comparatively witnessed the lesser number
(94284) of tourists than Ranthambore (159,110) respectively (Table 1). Furthermore, during (2002-08) period, Keoladeo witnessed the least number of tourists
for 2002-03 year (when Siberian cranes went locally extinct in this year, annual growth rate falls −35% against the previous year). The average tourists (67%) for
Keoladeo during (2002-08 yrs) are largely domestic. Although, for 2007–08 year, domestic tourists for Keoladeo comprised more than 64% of them and
surprisingly Ranthambore witnessed only about 42% domestic visitors for the same period (Table 1).
TOURISM OPPORTUNITIES AND PERFORMANCE
We interviewed 89% (103/115) hotel, resort and paying guest owners within 10 km range of both selected PAs in India. We found most of the representatives to
be co-operative (since only 11% of owners or managers could not be located and 3% declined interviews). Most facilities are privately owned, and often run by
individuals (ranging from 95% in Keoladeo to 93% in Ranthambore respectively).
TABLE I: CHARACTERISTICS OF 02 SELECTED PROTECTED AREAS IN INDIA
Protected
area
PA size
km2
Year
established as
National park
Habitat Closest tourist
centres/cities
Tourist
numbers
2007–2008
Annual
growth
rate for
2002–2008a
Average
growth
rate for
2002–2008b
Indian
tourists
2007–
2008
Ranthambore 392 1980 Tropical dry forest, open scrub Jaipur (145 km) 159,110 14.2% 17.0% 42%
Keoladeo 28.73 1981 dry grassland, woodlands,
swamps and wetlands
Agra (50 km)
Jaipur (180 km)
94284
2.41% 8.5% 64%
Sources: Tourist arrivals were collected from the forest Departments of selected PAs. aAnnual growth rate is calculated as {ln (2007–2008) − ln (2002–2003)}/Number of years × 100}.
bAverage growth rate is averaged for every year from 2002–2008. For Keoladeo the data was available from 2000–2008. Data for both PAs were available from
2002–2008.
Many of the facilities in both PAs are established after 2000 (Ranthambore 40% and Keoladeo 44%) and almost 96% of resorts and guest houses are located
outside the Keoladeo on the northern urban side of the park within 5 km range of park boundaries and large about (98%) facilities in Ranthambore are outside
the PA as well. In additional the inside facilities in both PAs are run by the respective forest departments. At both sites, the facilities vary in class of amenities
and charges accordingly (i.e; Rs. 60 in Dharamshalas to 40,500 in luxurious Oberio hotel) with an average beds capacity of ‘33%’ ranging from (6–130) beds in
Ranthambore (Table 2). Also, large number of facilities has recently grown around both PAs. Both PAs are located in urban areas and therefore, facilities around
them have developed very fast for past 10 years and consequently the average tourists’ arrivals.

VOLUME NO. 4 (2014), ISSUE NO. 02 (FEBRUARY) ISSN 2231-4245
INTERNATIONAL JOURNAL OF RESEARCH IN COMMERCE, ECONOMICS & MANAGEMENT A Monthly Double-Blind Peer Reviewed (Refereed/Juried) Open Access International e-Journal - Included in the International Serial Directories
http://ijrcm.org.in/
26
The facilities offer employment between 1 to 150 people, along with the guest house stays, which comparatively provide employment to fewer people.
Percentage local of total employees in and around these PAs varied from 86% in Keoladeo to 81% in Ranthambore (Table 2). Most of employees were hesitant to
discuss wages and salaries offered, therefore, collected salary range for both PAs was not available. Majority of the locals were posted on low graded jobs
(gardening, sweeping, security etc.) and most of the high class posts were occupied by outsiders. The availability of jobs in both PAs is highly seasonal and
therefore, the depended income of locals get affected due to seasonal impacts (October to April, peak tourist season in both PAs). The charges of rooms also
varied in PAs according to the offered facilities. The price/person/day ranged from Rs 60 in (Dharamshalas) to Rs 40,500 in (Oberio hotel) for Ranthambore and
Rs 100 (Guest houses) to Rs 7,500 in (Bagh Palace, Achnera Road) for Keoladeo (Table 2). However, the majority of the accommodation units in and around both
areas fall under the range of Rs 500-1500 charges. Many of the hotels/resorts purchase food produces directly from the local markets, but for some expensive
hotels the food and drink items are supplied by contractors. In Keoladeo food produces for hotels like “Hotel Ashok- ITDC” and “Hotel Saras RTDC” is supplied by
contractors, who in turn make purchases from the city market. Other hotels generally make purchases direct from the city.
TABLE II: CHARACTERISTICS OF TOURIST RESORTS AND GUEST HOUSES IN 02 SELECTED PROTECTED AREAS
Protected area (Queries)# Ranthambore Keoladeo
Total tourist facilities 61 54
Interviewed (% age) 88% 90%
Private ownership 93% 95%
Distance to PA (range in km) 0-10 0-5
Year established 1930-2009 1976-2008
Resorts built post 2000 40% 44%
Resorts outside PAs 98% 96%
Local employees (range) 81% 86%
Bed capacity (range) 10-130 6-100
Price in Rs (range) 60-40500 100-7500
Bore well use ≈ 95% ≈ 92%
Waste disposal Burn, recycle Burn, bury, Recycle
Conflicts with FD (yes) 12% 18%
FD rules fair (yes) 82% 76%
Seen wildlife offences (yes) 37% 8%
FD takes action (yes) 56% 88%
Support FD for emergency
(yes)
22% 32%
# According to Karant & DeFries, 2010
FD = Forest Department
The facilities rely on local resources, particularly water. Water resources were often underground bore wells; approx. 95% facilities in Ranthambore and approx.
92% in Keoladeo use this form of water source and municipal water supply was found another alternative source of water supply (Table 2). Further, both these
PAs are located in areas of acute water shortage and high temperatures zone (40–50◦C) in summer months. Also, the ground water of these areas is not pure
enough for drinking; therefore, almost all facilities in PAs supplied the distilled water bottles to visitors. In Keoladeo, the severe water scarcity during recent
years due to lesser monsoon and lack of any sufficient alternative water resource made the most of migratory birds away of it and proportionally the shortage in
tourist arrivals.
Ecotourism can provide resources for environmental conservation and management and an incentive for the conservation and sustainable use of public and
private land (Allcock et al., 1994; Eagles, 2002). The changing pattern of land use is one of the common impacts of tourism on destinations. The proper
maintenance of land use around the PAs is an important job for nature conservation, with precious habitats and rare species whose long term existence depends
on the forms of land use around the existing areas.
Tourism development in the study areas have resulted the change in land use along with the sharp increase in prices around them. The outside
industrialists/traders purchase the land from local people and bring outsiders for key posts, which fallout the decline in employment opportunities for the locals
(Jabar-Din-Khan (RTD employee), pers. comm., 2012). Few other facilities in both PAs are located inside the highly ecologically sensitive wildlife habitats
(personal observations, 2012). Proper planning and management to mitigate these rapid land use changes in areas surrounding these PAs is needed to maintain
ecological connectivity and functionality of these landscapes.
Opinions of tourists and private facility owners on the main reasons which are leading the development of tourism in both PAs were collected by asking an
appropriate question during the interviews. The found reasons have mentioned below as per the recorded number of frequencies, (1) sightings of tigers in
Ranthambore, and migratory birds and pythons in Keoladeo, (2) motivation from nature and desire for change in routine life, (3) opportunities for adventure,
stay with wild species, safaris, boating, etc., (4) location/accessibility in urban centers, (5) improvement in accommodations units, (6) increase in income and
economic growth of middle class population.
TOURISM AND PARK MANAGEMENT
We examined the attitudes of tourist facilities towards the forest department in both PAs to understand their interrelationship. We find minimal conflict
between locals and authorities in Keoladeo as comparison to the initial years of its creation as National Park, (ban on entries of surrounding people, cattle and
buffalo, which lead to the death of 9 people in police firing, Earle, 1987). Forest department rules were considered fair (ranging between 76% in Keoladeo and
82% of responses in Ranthambore (Table 2). Wildlife offences of lesser impacts such as grazing, fuel wood, and non timber forest product collection, were
observed in both PAs. Forest departments in both PAs were found taking action against such reported offences. Locals in both areas are supporting the forest
department during emergencies such as fires and trekking out the wildlife culprits by providing the secret information about them (Table 2). In Keoladeo the
locals have been made active in eradication of an invasive plant species Prosofilis juliflora for 2007-2010 to protect the park during the dried seasons. The rules
governing entry of people and vehicles vary across the PAs. For example, in Keoaldeo private vehicles are allowed to enter the park till the barrier point (1km
from main gate). During 2009-10, more than 350 vehicles have entered the park on a typical high season day (December 25, 2009; Forest Deptt. KNP, 2010) and
in Ranthambore, routine entered vehicles are regulated by the forest department. The department had divided the park into 8 zones and in each zone 8 vehicles
(4 six seater gypsies, 4 twenty or sixteen seater canter) are allowed to enter during each (morning & afternoon) shifts. The tourist road network and zone system
in the Ranthambore is meant for the vehicular traffic control, while in Keoaldeo the park is divided into the sections/blocks to do the same activity. In keoladeo,
tourists viewed wildlife from cycles /rickshaws / electra-van and boats (08 boats, capacity 50 people), however during the recent water shortage in park, boat
journeys have been stopped for all years from 2002-2009 except 2004-2005 when the wetland got sufficient amount of water due to good monsoon (Keoladeo
Forest Department, 2009). In Ranthambore the main reason of tourists was to get the glimpse of tigers from the vehicles and therefore, nearly all tourists were
participating in “tiger shows”. One such incident was noticed during a visit to the park, when a tigress passed through middle of the vehicles on the main road, a
great number of visitors were watching her and a considerable amount of flash photography took place (Shukla & Lone, pers. Obs., 2012).
In both PAs tourists visited the religious temples and shrines located inside. On religious days roads inside Ranthambore are clogged with vehicles, people
walking on foot and large amounts of garbage (Karanth & DeFries, 2010). Earlier, in Keoladeo a considerable number of devotees were visited the three temples
daily. Now, the management reduced the practice for Tuesdays and Saturdays in a week, when the number of devotees touches a maximum. Apart from this,

VOLUME NO. 4 (2014), ISSUE NO. 02 (FEBRUARY) ISSN 2231-4245
INTERNATIONAL JOURNAL OF RESEARCH IN COMMERCE, ECONOMICS & MANAGEMENT A Monthly Double-Blind Peer Reviewed (Refereed/Juried) Open Access International e-Journal - Included in the International Serial Directories
http://ijrcm.org.in/
27
devotees use the Aghapur road while going for their parikrama and some devotees visit the Syed Baba Majaar inside the park. In addition to these, around 300
people come to the park for daily morning walk.
For 2002-2008 periods, the annual average tourism revenue for Keoladeo was Rs 85, 16,577.14, ranges from Rs 44, 16,070 for (2002) to Rs 1, 01, 00,735 for
(2005) years (Directorate of KNP, 2009). Major source of revenue collection in Keoladeo (about 95%) is in the form of entrance fees and rest comes from the
vehicular charges. However, in Ranthambore the case is completely reverse, where vehicles are found the major of revenue collection. Out of Rs 524/person/trip
for a domestic tourist, Rs 330 are the vehicular charges. In both PAs, the tourism revenue can potentially support the conservation and management of parks
after implementing it with caution. Entry fees vary in these PAs, for example; Rs 25 for Indian (adult) nationals, Rs 5 (student) and Rs 200 for international
visitors in Keoladeo. In Ranthambore the entry charges for all tourists categories were just double than Keoladeo. In both PAs, during interactions the officials,
suggested that the entry fee be enhanced for the foreign tourists, while private stakeholders (guides, drivers, hoteliers, travel agents etc.) suggested that the
trend should be reverse for the domestic visitors, as they hesitate to pay the high entry and vehicle fees (Rickshaws in Keoladeo), which forced them to stay
away. The forest departments in both PAs are managing the revenue generated from the tourism.
CONCLUSION Most studies of nature-based tourism conclude that countries fail to collect the full potential income from such visitors (e.g. Brockelman, 1988). The other side
of this issue is the tendency for societies to undervalue the worth of national parks and other protected areas (Valentine, 1989). However, less-wealthy countries
are experiencing growth in international tourism (Balmford et al. 2009). India, being an emerging economy and an increase in income and economic growth of
middle class population along with a vast diversity in opportunities of natural protected areas (national parks, biosphere reserves, wetlands, coral reefs and
mangroves etc.) support nature based tourism in protected areas.
The annually analysed tourist data for 02 PAs suggests that both the PAs are witnessed the greater sum of (both domestic & international) tourists. The
majorities (avg. 67%) of the tourists in Keoladeo national park were domestic, that proves the increasing interest of Indian tourists and great future for the
natural tourism in India. Also the management planning and practices in these areas are good enough to control the mass tourism. However, the concept of
carrying capacities in both areas has not yet been scientifically determined and all types of managerial functions are controlling by basic management,
sometimes with the help of local people.
However, the large amount of revenue made from the all tourism activities is quite enough to direct for the support of conservation and park management,
however, the extra efforts in these PAs are required to implement it with caution. The most of the tourism offering facilities are privately owned and newly
developed and approx. 97% of them are within 10 km range of the PA boundaries. The very less portion of the total population around the destinations is
engaged with the tourism related activities. Even the National Ecotourism Plan has acknowledged the participation of the local community for the development
and sustainability of ecotourism (Macura, et al, 2011). The availability of jobs in both PAs is highly seasonal and therefore, the depended income of locals get
affected due to seasonal impacts (October to April, peak tourist season in both PAs). Sustainable tourism development in these areas is unlikely to occur unless
the management local communities work together to make it happen. Like other PAs, the sustainability of these areas are well depended on the issue of local
people involvement in management projects. Therefore, in both areas the extra efforts from management are required to take the support of locals for long run
sustainability of these areas.
Wildlife habitat and species around the world are facing a crisis. It is estimated that global warming may cause the extinction of 15–37% of species by 2050
(Hundal, 2004). The corresponding natural area management, increase in tourism development, land use changes and local people interest in study PAs require
the attention of government authorities, private stakeholders along with the participation of local communities for the welfare of existing wild species and
surrounding inhabitants.
REFERENCES 1. Allcock, A., Jones, B., Lane, S. and Grant, J., (1994), “National Ecotourism Strategy”. Canberra, ACT: Commonwealth Department of Tourism.
2. Allendorf, T. D. (2007), “Residents’ attitudes toward three protected areas in southwestern Nepal”, Biological Conservation Vol. 16, pp. 2087-2102.
3. Balmford, A., Beresford J., Green J., Naidoo R., Walpole M., Manica A. (2009), “A global perspective on trends in nature-based tourism”, Plos Biol Vol., 7,
pp. 1–6.
4. Bandyopadhyay, S., Tembo G. (2010), “Household consumption and natural resource management around national parks in Zambia”, J Nat Resour Policy
Res, Vol. 2, pp. 39–55.
5. Boora, S.S. (2005), “Ecotourism and Environmental Sustainability in India”, Bulletin of the National Institute of Ecology”, Vol. 15, pp. 249-258.
6. Brockelman, W. (1988), Nature conservation, 179-237 in A. Arkhabhirama, D. Phantumvanit, J. Elkington and P. Ingkasuwan, eds, Thailand natural
resources profile, Oxford University Press, Singapore
7. Chape, S., S. Blyth, L. Fish, and M. Spalding (eds.). (2003), United Nation’s list of protected areas, IUCN, Gland Switzerland and UNEP-WCMC, Cambridge,
UK.
8. Croall, J. (1995), “Preserve or Destroy: Tourism and the Environment”, Calouste Gulbenkian Foundation, London.
9. Eagles, Paul F.J. (2002), “Trends in Park Tourism: Economics, Finance and Management”, Journal of sustainable tourism, Vol. 10, No. 2, pp. 132-153
10. Earle, S. (1987), “A sanctuary for birds”, The India Magazine, Vol. 7, pp. 60-69.
11. Fennell, D. A. (1999), “Ecotourism: An Introduction”, London: Routledge.
12. Frederico Neto. (2003), “A new approach to sustainable tourism development: Moving beyond environmental protection”, Natural Resources Forum, Vol.
27, pp. 212–222
13. Glasson, J., Godfrey, K. B. & Goodey, B. (1995), “Towards Visitors Impacts Management: Visitor Impacts, Carrying Capacity and Management Responses in
Europe's Historic Towns and Cities”, Avebury: Ashgate Publishing Ltd.
14. Heinen, J. T., and R. J. Shrivastava. (2009), “An analysis of conservation attitudes and awareness around Kaziranga National Park, Assam, India: implications
for conservation and development”, Population & Environment, Vol. 30, pp. 261-274.
15. Hundal, Swardeep S. (2004), “Wildlife Conservation Strategies and Management in India: An Overview”, edited by, T.D. Hooper, Proceedings of the Species
at Risk Pathways to Recovery Conference, Victoria, B.C. Organizing Committee, Victoria, B.C.
16. Infield, M., and A. Namara. (2001), “Community attitudes and behaviour towards conservation: an assessment of a community conservation programme
around Lake Mburo National Park, Uganda”, Oryx, Vol. 35, pp. 48-60.
17. IUCN. (1994), “Protected Area Management Categories”, Gland, WCPA.
18. Karanth Krithi K. & DeFries Ruth. (2010), “Nature-based tourism in Indian protected areas: New challenges for park management”, Conservation Letters 00
(2010), pp. 1–13
19. Keefe, J. (1995), “Water fights”, Tourism in Focus, Vol. 17, pp. 8-9.
20. Kumar Vivay. (2009), “Impact assessment of ecotourism on visitors and villagers in Satpuda National Park, Madeya Pradesh”, Journal of Tropical Forestry,
Vol. 25, No, I & II, pp. 62-65.
21. Lopoukhine Nikita (Nik). (2008), “Protected Areas — For Life’s Sake”, Secretariat of the Convention on Biological Diversity (2008). Protected Areas in
Today’s World: Their Values and Benefits for the Welfare of the Planet. Montreal, Technical Series no. 36, i-vii + 96 pages. Pp. 1-3
22. Macura Biljana, Zorondo-Rodríguez Francisco, Grau-Satorras Mar, Demps Kathryn, Laval Marie, Garcia Claude A., and Reyes-García Victoria. (2011), “Local
Community Attitudes toward Forests Outside Protected Areas in India: Impact of Legal Awareness, Trust, and Participation”, Ecology and Society, Vol. 16,
No, 3, pp. 10.

VOLUME NO. 4 (2014), ISSUE NO. 02 (FEBRUARY) ISSN 2231-4245
INTERNATIONAL JOURNAL OF RESEARCH IN COMMERCE, ECONOMICS & MANAGEMENT A Monthly Double-Blind Peer Reviewed (Refereed/Juried) Open Access International e-Journal - Included in the International Serial Directories
http://ijrcm.org.in/
28
23. Mandal Maitreyi. (2003): Protected Area Management in India: A Perspective. Pp. 1-8. http://www.aseandiversity.info/Abstract/52001719.pdf. Paper
submitted for the XII World Forestry Congress at Quebec, Canada, September 21-28, 2003
24. Mansourian Stephanie, Higgins-Zogib Liza, Dudley Nigel and Stolton Sue Poverty and Protected Areas. (2008), “Protected Areas in Today’s World: Their
Values and Benefits for the Welfare of the Planet”, Secretariat of the Convention on Biological Diversity. Technical Series no. 36, 18-28 pages.
25. National Wildlife Database Cell (NWDC). (May, 2008): List of Existing Wildlife Sanctuary, Viewed on Aug 03, 2010 http://oldwww.wii.gov.in/nwdc/
list_existing_wlcs.pdf.
26. Ormsby, A., and B. A. Kaplin. (2005), A framework for understanding community resident perceptions of Masoala National Park, Madagascar.
Environmental Conservation, Vol. 32, pp. 156-164. Viewed on Aug 10, 2010 http://dx.doi.org/10.1017/S0376892905002146
27. Rodgers, A., Hartley D., Bashir S. (2003), Community approaches to conservation: some comparison of Africa and India. Pages 324–382 in V.K. Saberwal &
M. Rangarajan, editors. Battles over nature: science and politics of conservation. Permanent Black, New Delhi.
28. Scherl Lea M. and Emerton Lucy. (2008), “Protected Areas. Contributing to Poverty Reduction, Protected Areas in Today’s World: Their Values and Benefits
for the Welfare of the Planet, Secretariat of the Convention on Biological Diversity. Technical Series no. 36, 4-17 pages.
29. Shibia, M. G. (2010), “Determinants of attitudes and perceptions on resource use and management of Marsabit National Reserve, Kenya”, Journal of
Human Ecology, Vol. 30, pp. 55-62.
30. Shukla. U.N & Lone. A.A. (2012), Ecotourism and local communities: impacts and opportunities, Sustainable tourism issues and challenges; Macmillan
publishers, Chapter 1, pp. 69-83.
31. Spiteri, A., Nepal S.K. (2008), “Evaluating local benefits from conservation in Nepal’s Annapurna Conservation Area”, Environ Manage, Vol. 42, pp. 391–401.
32. Tiger Task Force. (2005), “The Report of Tiger Task Force: Joining the Dots”, Project Tiger, Union Ministry of Forests, Government of India, New Delhi.
33. Valentine, P.S. (1983), “Conservation burning bright: progress in Indian national parks - the state of Madhya Pradesh”, Habitat Australia, Vol. 11, No, 3, pp.
8-11
34. Valentine, P.S. (1989), How much is a park worth: economic and social benefits of nature conservation, Proceedings fourth South Pacific conference on
nature conservation and protected areas, Port Vila, Vanuatu, 4-12 September, South Pacific Regional Environment Program, Noumea

VOLUME NO. 4 (2014), ISSUE NO. 02 (FEBRUARY) ISSN 2231-4245
INTERNATIONAL JOURNAL OF RESEARCH IN COMMERCE, ECONOMICS & MANAGEMENT A Monthly Double-Blind Peer Reviewed (Refereed/Juried) Open Access International e-Journal - Included in the International Serial Directories
http://ijrcm.org.in/
29
PRODUCTION TREND OF MAJOR AGRICULTURAL CROPS IN BANGLADESH
MD. RASHIDUL HASAN
ASST. PROFESSOR
DEPARTMENT OF AGRIBUSINESS & MARKETING
SHER-E BANGLA AGRICULTURAL UNIVERSITY
DHAKA
M. S. RAHMAN
ASST. PROFESSOR
DEPARTMENT OF MANAGEMENT & FINANCE
SHER-E BANGLA AGRICULTURAL UNIVERSITY
DHAKA
D. C. ACHARJEE
ASST. PROFESSOR
DEPARTMENT OF AGRICULTURAL MARKETING & BUSINESS MANAGEMENT
SYLHET AGRICULTURAL UNIVERSITY
SYLHET
ABSTRACT The study use secondary data from Bangladesh Bureau of Statistics to capture the production trend of major crops in Bangladesh during 1990-2010. The findings
of the study suggested that except pulses and oilseed production of different crops increased during the period. Positive and significant growth of production
achieved during 1990-2010 for most of the crops. Among all the crops highest positive growth rate was achieved by Maize (37.9%). Negative production growth
rate was found for different pulses and oilseed. Further steps need to be taken to increase the production all the crops to solve the food shortage problem in the
country.
JEL CLASSIFICATION
Q110
KEYWORDS
Trend analysis, production, growth rate.
INTRODUCTION griculture is the most prominent sector in Bangladesh. There are four subsectors in agricultural sector. These are crops and horticulture, animal farming,
forest and related services and fishing. The growth rate of crops and horticulture, animal farming, forest and related services and fishing were 15.89,
12.13, 9.09 and 10.04 percent respectively (BBS, 2009). But most of the farmers of Bangladesh are poor. As a result they generally rely on subsistence
farming. In a subsistence agrarian economy of Bangladesh, domestic food production has an important role to play in the quest for food security (Begum and luc,
2010). The productivity in the agricultural sector is critically important if agricultural production is to increase at a sufficiently rapid rate to meet escalating
demands for food (Hayami and Ruttan, 1985; Mellor, 1976). Major food items in Bangladesh are rice, wheat, pulses, potato, vegetables and fish. These food
items contribute almost 85% of the total calorie and protein intake. Rice and wheat alone contribute to 71% and 53% of the total per capita calorie and protein
intake respectively (BBS, 2008). Bangladesh has pursued for decades a strategic goal of self-sufficiency in cereal production. Whatever progress been made
would be difficult to sustain it due to high vulnerability of climatic shocks and the growing pressure of population on scarce natural resources thus, yet food
security has not been achieved. Reducing the food insecurity problem at national level requires that the food production system be efficient. To formulate the
policy regarding food production it is essential to know the long term trend of production. Keeping this in view the present study was undertaken to know the
long term production trend and growth rate of major agricultural crops in Bangladesh.
METHODOLOGY The study employed time series data on the production of various crop during the period of 1990 to 2010 in Bangladesh. The data were elicited from the various
issues of BBS (Bangladesh Bureau of Statistics). In order to gain some perspective on the growth rate of production of major agricultural crops time series data
for 20 years were used for a trend analysis.
The compound growth rates of production of different crops were worked out by fitting a semi-log trend equation (1) of the following form:
btaLn(y)orey bta +== + ---------------------------------------------------- [1]
Where, Y defines the time series data of production; ‘t’ is the trend term (time) and ‘a’ is the constant coefficient. The slope coefficient ‘b’ measures the relative
change in Y for a given absolute change in the value of explanatory variable ‘t’. If we multiply the relative change in Y by 100, we will get percentage change or
growth rate in Y for an absolute change in variable ‘t’.
RESULT AND DISCUSSION PRODUCTION OF MAJOR CEREAL CROPS
Rice, wheat and maize are the major cereal crops in Bangladesh. Because of population and income growth, the demand for cereal foods (especially for rice) is
expected to rise by over 1.5% per annum for the next few decades (Hossain et al., 2009). Rice is the main food item in Bangladesh. It is evident from the figure 1
that production of aman and boro rice was increasing year by year while the production of aus rice decreased from 2487 thousand MT to 1709 thousand MT
during the study period. The production of wheat was also declined during 1990-2010. Growth rate of wheat production was found to be negative. Among the
cereal crops the highest and the most impressive growth occurred in the production of maize due to high yielding varieties and rapid expansion of poultry
industries in the country. Aman and boro rice were also registered positive and significant growth rate during 1990-2010 (Table 1).
A

VOLUME NO. 4 (2014), ISSUE NO. 02 (FEBRUARY) ISSN 2231-4245
INTERNATIONAL JOURNAL OF RESEARCH IN COMMERCE, ECONOMICS & MANAGEMENT A Monthly Double-Blind Peer Reviewed (Refereed/Juried) Open Access International e-Journal - Included in the International Serial Directories
http://ijrcm.org.in/
30
Source: Various issues of BBS
TABLE 1: GROWTH RATE OF PRODUCTION OF DIFFERENT CROPS DURING 1990 TO 2010
Crops name Growth rate (%) Crops name Growth rate (%)
Aus rice -1.7*** Ginger 2.8**
Aman rice 1.1*** Turmeric 5.9***
Boro rice 6.0*** Pointed gourd 7.6***
Wheat -1.2ns
Cauliflower 4.5***
Maize 37.9*** Cabbage 5.8***
Lentil -4.0*** Tomato 3.37***
Mungbean -3.1*** Brinjal 4.6***
Chikpea -15.1*** Okra 6.6***
Vetch -4.5*** Bitter gourd 3.9***
Mustard -0.8** Banana 2.1***
Sesame -3.34*** Pine apple 2.6***
Ground nut 0.01 ns
Guava 1.12***
Onion 10.2*** Mango 7.35***
Garlic 7.4*** Jackfruit 2.58***
Chilli 7.2*** -- --
Note : ‘***’ and ‘**’ indicate significant at 1% and 5% level respectively, ns = Not significant
PRODUCTION OF DIFFERENT PULSES
Pulses are the major sources of protein. There are different types of pulses are grown in Bangladesh. It is evident from the figure 2 that production of different
pulses was continued decreased from year to year. . The production of chikpea was decreased from more than 70 thousand MT to only 5.74 thousand MT in
2010. Similar type of scenario are observed for other types of pulses. Despite the adoption of improved technology of pulses, the production registered negative
growth rates during 1990-2010 in Bangladesh (Table 1). This may be due for an uphill battle in terms of profitability over the same period and as such its land
coverage continuously fell.
Source: Various issues of BBS
0
2000
4000
6000
8000
10000
12000
14000
16000
18000
20000
19
89
-90
19
90
-91
19
91
-92
19
92
-93
19
93
-94
19
94
-95
19
95
-96
19
96
-97
19
97
-98
19
98
-99
19
99
-00
20
00
-01
20
01
-02
20
02
-03
20
03
-04
20
04
-05
20
05
-06
20
06
-07
20
07
-08
20
08
-09
20
09
-10
Pro
du
ctio
n (
Th
ou
san
d M
T)
Figure 1: Trend of cereal crop production during 1990 to 2010
Aus rice
Aman rice
Boro rice
Wheat
Maize
0
20
40
60
80
100
120
140
160
180
200
19
89
-90
19
90
-91
19
91
-92
19
92
-93
19
93
-94
19
94
-95
19
95
-96
19
96
-97
19
97
-98
19
98
-99
19
99
-00
20
00
-01
20
01
-02
20
02
-03
20
03
-04
20
04
-05
20
05
-06
20
06
-07
20
07
-08
20
08
-09
20
09
-10
Pro
du
ctio
n (
Th
ou
san
d M
T)
Figure 2: Trend of different pulses production during 1990-2010
Lentil
Mung bean
Chikpea
Vetch

VOLUME NO. 4 (2014), ISSUE NO. 02 (FEBRUARY) ISSN 2231-4245
INTERNATIONAL JOURNAL OF RESEARCH IN COMMERCE, ECONOMICS & MANAGEMENT A Monthly Double-Blind Peer Reviewed (Refereed/Juried) Open Access International e-Journal - Included in the International Serial Directories
http://ijrcm.org.in/
31
PRODUCTION OF DIFFERENT OILSEEDS
Different oilseeds like mustard, groundnut etc. are grown in Bangladesh although the production of all the oilseeds is decreasing over the period. It is revealed
from the following figure that the production of mustard was decreased over the period from about 217 thousand MT to 151 thousand MT. Production of
sesame decreased from 49 thousand MT to 32 thousand MT during 1990 to 2010. On the other hand production of groundnut increased to some extent during
1990 to 2010. Growth rate of mustard and sesame was found to be negative while the growth rate of ground nut was positive but not significant.
Source: Various issues of BBS
PRODUCTION OF DIFFERENT SPICES
Bangladesh produces different types of spices. It is revealed from the figure 4 that the production of onion was more or less static up to 2002-2003, after that
the production was jumped to more than double due to more area coverage and adoption of high yielding varieties. The production of chilies was almost
doubled during 1990-2010. The production of garlic was 39 thousand MT in the year 1990 and it was increased up to 164 thousand MT in 2010. Production of
other spices also increased from 1990 to 2010. Bangladesh achieved a steady growth in production of all types of spices crops. The highest growth rates were
observed for onion followed by garlic and chili (Table 1). This may be due to fiscal incentives government gave to spice producers through concessional credit
scheme.
Source: Various issues of BBS
PRODUCTION TREND OF DIFFERENT VEGETABLES
Different types of vegetables are grown in Bangladesh during winter and summer season. Among the vegetables brinjal, cabbage, tomato and cauliflower are
the major. Bangladesh has high potential for export vegetables (Hoq et al., 2012). Most vegetables are considered as high value crops in Bangladesh. A plenty of
vegetables are exported every year to UK, Europe and Middle East countries for ethnic people. It is clear from the following figure that production of all the
major vegetables are increased during 1990 to 2010. Production of brinjal was increased from 181 thousand MT to 341 thousand MT during 1990 to 2010.
Production of all other major vegetables also increased up to 2/3 times from 1990 to 2010. Table 1 reveals that the production of major vegetables namely
brinjal, cauliflower, cabbage, okra, bitter gourd, tomato and pointed gourd registered highly positive growth rates during 1990-2010.
Source: Various issues of BBS
0
50
100
150
200
250
300
19
89
-90
19
90
-91
19
91
-92
19
92
-93
19
93
-94
19
94
-95
19
95
-96
19
96
-97
19
97
-98
19
98
-99
19
99
-00
20
00
-01
20
01
-02
20
02
-03
20
03
-04
20
04
-05
20
05
-06
20
06
-07
20
07
-08
20
08
-09
20
09
-10
Pro
du
ctio
n (
Th
ou
san
d M
T)
Figure 3: Trend of different oilseed production during 1990 to 2010
Mustard
Sesame
Ground nut
0
200
400
600
800
1000
19
89
-90
19
90
-91
19
91
-92
19
92
-93
19
93
-94
19
94
-95
19
95
-96
19
96
-97
19
97
-98
19
98
-99
19
99
-00
20
00
-01
20
01
-02
20
02
-03
20
03
-04
20
04
-05
20
05
-06
20
06
-07
20
07
-08
20
08
-09
20
09
-10P
rod
uct
ion
(T
ho
usa
nd
MT
)
Figure 4: Production trend of different spices during 1990 to 2010
Onion
Garlic
Chilli
Ginger
Turmeric
0
50
100
150
200
250
300
350
400
450
19
89
-90
19
90
-91
19
91
-92
19
92
-93
19
93
-94
19
94
-95
19
95
-96
19
96
-97
19
97
-98
19
98
-99
19
99
-00
20
00
-01
20
01
-02
20
02
-03
20
03
-04
20
04
-05
20
05
-06
20
06
-07
20
07
-08
20
08
-09
20
09
-10P
rod
uct
ion
(T
ho
usa
nd
MT
)
Figure 5: Production trend of different vegetables during 1990 to 2010
Pointed gourd
Cauliflower
Cabbage
Tomato
Brinjal
Okra
Bitter gourd

VOLUME NO. 4 (2014), ISSUE NO. 02 (FEBRUARY) ISSN 2231-4245
INTERNATIONAL JOURNAL OF RESEARCH IN COMMERCE, ECONOMICS & MANAGEMENT A Monthly Double-Blind Peer Reviewed (Refereed/Juried) Open Access International e-Journal - Included in the International Serial Directories
http://ijrcm.org.in/
32
PRODUCTION OF DIFFERENT FRUITS
The land of Bangladesh is suitable for growing different fruits. Banana, mango, pineapple, jackfruit and guava are the major fruits of Bangladesh. Among the
different fruits banana is grown all the year round while the other fruits are seasonal. Growth rate of banana production is significantly positive during 1990-
2010. Production of banana increased from 637 thousand MT to 818 thousand MT from 1990 to 2010. Production of mango was 187 thousand MT in 2002 and it
was increased up to 828 thousand MT in 2009. Growth rate of all the major fruits registered positive and significant growth during 1990-2010. Among all the
fruits mango registered highest 7.35% growth in production followed by pineapple (2.60%).
Source: Various issues of BBS
CONCLUSION The study found that different type of cereals and non cereals crops are grown in Bangladesh. Trend analysis suggested that except pulses and few other crops
production of all the crops are increasing over the period. This may be due to adoption of HYV varieties and better crop management technologies. Production
of pulses decreases over the period due to poor adoption of high yielding varieties. Steps need to be taken to increase the production of pulses and other crops
further more to solve the problem of food shortage in the country. Government may introduce credit schemes to support the poor farmers to grow different
types of crops.
REFERENCES 1. BBS. (2008), “Statistical year book of Bangladesh”. Statistical Division, Ministry of planning, Government of the Peoples Republic of Bangladesh, Dhaka.
2. BBS. (2009), “Statistical year book of Bangladesh”. Statistical Division, Ministry of planning, Government of the Peoples Republic of Bangladesh, Dhaka.
3. BBS. (2010), “Statistical year book of Bangladesh”. Statistical Division, Ministry of planning, Government of the Peoples Republic of Bangladesh, Dhaka.
4. Begum, M. E. A. and Luc D’Haese. (2010), “Supply and demand situations for major crops and food items in Bangladesh”. J. Bangladesh Agril. Univ,. Vol. 8,
No 1, pp. 91–102.
5. Hayami, Y., and Ruttan, V.W. (1985), “Agricultural development: an international perspective”. Revised edition, Baltimore and London: The Johns Hopkins
University Press.
6. Hoq, M.S., S. K. Raha and N. Sultana. (2012), “Value addition in vegetables production, processing and export from Bangladesh”, Bangladesh J. Agril. Res.
Vol. 37, No 3, pp. 377-388.
7. Hossain, M., M. Asaduzzaman, M. A. S. Mandal, U , K , Deb and S. Jones. (2009), “Rice technologies: Strategic choices and policy options”, BIDS policy brief
prepared for the national conference on “Market volatility, vulnerability and food security: strategic issues and policy options” organized by BIDS and DFID,
Dhaka.
8. Mellor, J.W. (1976). The New Economics of Growth, Ithaca, NY: Cornell University Press.
0
200
400
600
800
1000
1200
19
89
-90
19
90
-91
19
91
-92
19
92
-93
19
93
-94
19
94
-95
19
95
-96
19
96
-97
19
97
-98
19
98
-99
19
99
-00
20
00
-01
20
01
-02
20
02
-03
20
03
-04
20
04
-05
20
05
-06
20
06
-07
20
07
-08
20
08
-09
20
09
-10
Pro
du
ctio
n (
Th
ou
san
d M
T)
Figure 6: Trend of different fruits production during 1990 to 2010
Banana
Pine apple
Guava
Mango
Jackfruit

VOLUME NO. 4 (2014), ISSUE NO. 02 (FEBRUARY) ISSN 2231-4245
INTERNATIONAL JOURNAL OF RESEARCH IN COMMERCE, ECONOMICS & MANAGEMENT A Monthly Double-Blind Peer Reviewed (Refereed/Juried) Open Access International e-Journal - Included in the International Serial Directories
http://ijrcm.org.in/
33
APPRAISAL OF SOCIAL MEDIA AS A STRATEGIC MARKETING TOOL
AAKRITI CHAUDHRY
ASST. PROFESSOR
GARGI COLLEGE
UNIVERSITY OF DELHI
NEW DELHI
ASHIMA SHARMA
ASST. PROFESSOR
GARGI COLLGE
UNIVERSITY OF DELHI
NEW DELHI
ABSTRACT In this technology driven era, marketers understand that they need to keep pace with changes taking place or risk being outdated. Social media as a marketing
tool is garnering huge attention. In the present scenario it is not possible to devise a marketing strategy without including social networks. Social media has
become an essential element in marketing mix in general and promotion mix in particular. It has made it possible for one person to communicate with thousands
of other people about the products or services that are available in the market and the companies that are providing it. Social media has magnified consumer to
consumer communication in the marketplace. Companies have realised that a properly executed social media marketing campaign can take a company to new
heights.
KEYWORDS
Promotion mix, social media, social media marketing.
INTRODUCTION rganisations use integrated marketing communication as a means of communicating with their target market. Integrated marketing communication is an
approach used by organisations to achieve their marketing campaign objectives through a well coordinated use of different promotional methods-
advertising, personal selling, public relations, publicity, direct marketing, and sales promotion -that are intended to reinforce each other. It leads to a
unified customer focused message. However, the methods used to communicate with the customers have undergone a significant change with the rise of social
media which can be more appropriately referred to as consumer generated media
Social media is now an integral part of the lives of millions of people by allowing them to connect and communicate with others online. Over the last decade
social media forums have grown exponentially. These forums offer marketers inexpensive ways to create and execute marketing campaigns.
DEFINITION OF SOCIAL MEDIA The meaning of the term social media can be derived from the words social which means interaction amongst individuals in a community or group and media
which means communication of information or ideas through various channels. Taken together social media refers to a platform for communication which is
generated and sustained by interactions among individuals through a specific medium.
Social media is creating sharing and exchanging of ideas information experiences and perspectives among people in virtual communities. Andreas Kaplan and
Michael Haenlein define social media as "a group of Internet-based applications that build on the ideological and technological foundations of Web 2.0, and that
allow the creation and exchange of user-generated content."[1]
The Universal McCann report (2008) refers to social media as “online applications, platforms and media which aim to facilitate interaction, collaboration, and the
sharing of content”. [2]
In simple words social media enables people with no knowledge of coding to post unique content and share it with the world
immediately.
Social media is a broad term which can encompass a wide range of forms such as social networking websites (Facebook, Google plus), video sharing sites
(YouTube), photo sharing sites (Instagram, Flickr), business networking sites (LinkedIn), micro-blogging sites(Twitter),company sponsored websites/blogs(P&G’s
Vocalpoint), social bookmarking sites (Reditt)
SOCIAL MEDIA’S ROLE IN THE PROMOTION MIX Recent years have seen a remarkable increase in the growth and popularity of social media networks. A significant number of people with access to internet
participate actively on social networks. According to a new eMarketer report, Worldwide Social Network Users: 2013 Forecast and Comparative Estimates, “ the
number of social network users in India is expected to cross 100 million users and reach more than 127 million users by end of 2013The total number of social
media users will more than double and reach close to 283 million users by 2017.” [3]
For businesses social media is an opportunity that transcends the traditional middlemen and helps them connects directly with customers. This is the reason
why nearly every business from giants like Starbucks and IBM to the local boutiques are exploring social media marketing. According to Constant Contract’s 2011
Small Business Attitudes & outlook survey, 73% of small businesses and organisations have started using social media marketing and 62% of those not using it
expect to start marketing through social media within the next 12 months.[4]
Just like email and websites first empowered businesses, social media is the next
marketing wave.
Social media has become synonymous with business marketing. Social media performs two interrelated functions in the marketplace. Firstly, it facilitates
interaction between the company and its prospective customers. Social media platforms such as blogs, Facebook, Twitter are used by companies to interact with
the customers. It enables the companies to reach a wider consumer base at a very less cost. Social media tools can be used to promote online conversations and
create buzz about the company’s products or services as a result creating an easily recognizable brand name. It can also be effectively used by companies to
understand the needs of the consumer. They can get instant feedback from the consumers about the product and modifications can be made therein. According
to CompTIA’s social business-trends and opportunity study, 61 % of the respondents feel that social media leads to better communication with the consumers. [5]
Secondly, social media facilitates interaction of consumers with one another. It is an extension of traditional word of mouth communication but the magnitude
with which it is done has amplified. Before the existence of social media an unsatisfied customer could tell ten people but with social media the consumer has
the means to tell ten million people in a matter of minutes.
Consumers around the world have adopted new digital technologies and have incorporated it in their day to day life. They are no longer passive recipients of
pushed information and are not satisfied with advertising and promotional information as the primary source of learning about new product and services rather
O

VOLUME NO. 4 (2014), ISSUE NO. 02 (FEBRUARY) ISSN 2231-4245
INTERNATIONAL JOURNAL OF RESEARCH IN COMMERCE, ECONOMICS & MANAGEMENT A Monthly Double-Blind Peer Reviewed (Refereed/Juried) Open Access International e-Journal - Included in the International Serial Directories
http://ijrcm.org.in/
34
they have become informed participants in the buying process.Social media plays a major role in influencing consumers buying decision in the marketplace. It
has an effect on the awareness level of the consumers, acquisition of information by the consumers, their opinions, attitudes and beliefs and also on their
purchase and post purchase behaviour communication and evaluation. They want to use social media to share amongst themselves their personal experiences
about products, services and brands to provide a more “real” view of their buying experience.
[6]
The figure shows the classic purchase funnel. The expectation to trial to sharing the actual experience is now a part of every purchase process. People are
turning to people like themselves for the information they need to make better purchase decisions.
According to a study on social media usage by The Nielsen Company and AbsolutData, nearly 40 million Indians are using online reviews to inform purchase
decisions– 67 percent of Indians who are on the web use online reviews to help them make purchases. Adrian Terron, Vice President, Global communications
and Marketing - India Region, The Nielsen Company says, “For the estimated 30 million online Indians who use social media, 78 per cent spend more than 15
minutes during each occasion. The activities performed also cover a wide spectrum that goes beyond status updates, sharing content and being in touch with
family and friends, into a host of activities that fulfil other purposes like entertainment, discussions on products and services with other like-minded
consumers”[7]
REASONS CONSUMERS HAVE ADOPTED SOCIAL MEDIA Human beings are social creatures. They have an innate desire to interact and connect with other individuals and belong to a community. It is this desire that has
led to the emergence of online forums, blogs, and chat rooms and is the most essential reason that consumers have adopted social media.
Social media has empowered consumers to share and collaborate more effectively and efficiently. Firefox browser is a notable example of a project that has
been developed and managed by online communities.
Moreover, there has been a shift of power from the corporate organisations to consumers. Quirky (http://www.quirky.com), founded by Ben Kaufman, is an
online crowd sourcing company that uses the talent of online consumers to contribute content. The company brings products to the marketplace through
interaction between the online global community and Quirky’s product design staff. Any person can become an inventor by submitting their ideas. Once an idea
is submitted other members of the Quirky community evaluate it and choose their favourites which are eventually designed, manufactured and sold by the
company. Inventors who submit ideas that are then created and people who contribute to those ideas share in royalties based on product sales. This approach
has worked for the company as the company has been able to raise $79 million in Series D funding from GE as well as its venture investors Andreessen Horowitz,
Norwest Venture Partners, RRE and Kleiner Perkins Caufield & Byers.[8]
It is important for companies to understand that consumers are using each other to decide what they should buy, when they should buy it, how they should buy
it and from whom they should buy it. This phenomenon is known as groundswell, a social trend in which people use technologies to get the things they need
from each other, rather than from traditional institutions like corporations
TRADITIONAL MARKETING V/S SOCIAL MEDIA MARKETING
Traditionally the aim of marketing was to use the resources that the organisation had in finding new prospects and converting them into customers. Retaining
existing customers was at the bottom of the funnel. In the past, the best a company could do after turning a prospect into a customer was to provide superior
customer service and hope for these consumers to come back and buy more of the company’s product. But social media has changed the game. Social media
marketing lays importance on existing customers and reminds them to come back and make a purchase. Word of mouth promotion becomes possible with
simultaneously thousands of people by just clicking the like, share and tweet button.
VOLUME NO. 4 (2014), ISSUE NO. 02 (FEBRUARY) ISSN 2231-4245
INTERNATIONAL JOURNAL OF RESEARCH IN COMMERCE, ECONOMICS & MANAGEMENT A Monthly Double-Blind Peer Reviewed (Refereed/Juried) Open Access International e-Journal - Included in the International Serial Directories
http://ijrcm.org.in/
35
DRAWBACKS OF SOCIAL MEDIA With low entry barriers and numerous tools to utilize, social media offers huge opportunities for organisations to reach customers and create brand
awareness.However as a marketing tool it is not entirely risk free. Organisations followers on the social media platforms are free to post their comments on these platforms which might expose the organisation to negative
publicity. Unsatisfied customers or competitors from the same industry are able to post unfavourable or offensive pictures, posts or videos. The organisation
also cannot ignore negative feedback.
Hackers also pose threat to business organisations. They may take over a company’s page or feed and share forged information which can go viral quickly.
Business organisations need to manage the social media platforms efficiently so as to respond immediately and neutralize harmful posts.
CONCLUSION In the recent decade social media has gained huge attention. Due to its easy way of use, speed and reach, social media became the trendsetter in topics that
range from environment to politics and technology.
The transition to social media is a n opportunity for marketers to create impactful personalised and relevant marketing messages that are not just effective but
more cost efficient and scalable. However, social media should not be seen as a replacement of other promotion mix elements like advertising in a newspaper or
on television, attending networking events, or sending direct mail. For a marketing strategy to be effective social media platforms have to be combined with
other promotion mix elements.
REFERENCES 1. Wikipedia, viewed on 5
th January 2014 http://en.wikipedia.org/wiki/Social_media
2. Perdue, D.J (2010), “Social Media Marketing: Gaining a Competitive Advantage by Reaching the Masses”, viewed on 12th
January, 2014 http://digitalco
mmons.liberty.edu/cgi/viewcontent.cgi?article=1135&context=honors
3. Social Network Users Statistics India 2013 till 2017 – Maturing growth next five years, viewed on 7th
Jnauary,2014 http://socialmediacases.blogspot.in/2013
/07/social-network-users-statistics-india.html
4. Why Social Media Marketing?, viewed on 7th
January, 2014 http://www.socialquickstarter.com/content/1-why_social_media_marketing
5. Five benefits of Social Media Marketing, viewed on 8th
January, 2014 http://revmediamarketing.com/five-benefits-of-social-media-marketing/
6. Evans, Dave., Mckee, Jake., “Social Media Marketing-the new generation of business engagement.” Wiley Publishing, Inc, chapter 1
7. Banka, Dipali (2011): “All about the Social Bandwagon”, viewed on 10th
January, http://imrbint.com/downloads/Impact_feature.pdf
8. Gannes, Liz (2013): “ Quirky raises $79 M, including $30 M from GE to make connected home gadgets” viewed on 12th
January http://allthingsd.com/
20131113/quirky-funding/
9. Mangold, Glynn. W., Faulds, J. David., (2009), “Social media: the new hybrid element of the promotion mix”, Business Horizons, Volume 52, Issue 4
10. Neti, Sisira (2011), “Social media and its role in Marketing”, International Journal of enterprise computing and Business Systems, Volume 1, Issue 2

VOLUME NO. 4 (2014), ISSUE NO. 02 (FEBRUARY) ISSN 2231-4245
INTERNATIONAL JOURNAL OF RESEARCH IN COMMERCE, ECONOMICS & MANAGEMENT A Monthly Double-Blind Peer Reviewed (Refereed/Juried) Open Access International e-Journal - Included in the International Serial Directories
http://ijrcm.org.in/
36
A BRIEF ANALYSIS OF INDIA-JAPAN BILATERAL TRADE: A TRADE INTENSITY APPROACH
P. SUNDAR RAJ
ASST. PROFESSOR
ECONOMICS WING
DDE
ANNAMALAI UNIVERSITY
ANNAMALAINAGAR
DR. B. AMBROSE
ASST. PROFESSOR
ECONOMICS WING
DDE
ANNAMALAI UNIVERSITY
ANNAMALAINAGAR
ABSTRACT Bilateral trade between India and Japan have maintained over a period of time. But the volume of trade between them is at a low level, relative to the size of
their economies. This paper is an attempt to measure strength and nature of bilateral trading relationship between India and Japan. Several statistical indices can
be used to measure trade relations between two nations. This paper has used one such index such as trade intensity. Trade intensity indices have been calculated
for the period from 2001to 2011. Both countries` bilateral trade relationship described in terms of intensity indices helps to identify how intensively the countries
are trading with each other. Thus, this study found that intensity between two countries is low. However, from the analysis made it is obvious that both countries
have much trade potential to reap between them.
KEYWORDS bilateral trade, trade intensity approach.
INTRODUCTION ndia and Japan have maintained diplomatic relations and enjoyed cordial relations based on trade and economic and technical cooperation. After the
World War II, the focus of Japan's economic relations with India switched from the prewar import of cotton to the import of iron ore. Relations developed
steadily as Japan's trade increased with India. Moreover, India and Japan have traditionally enjoyed cordial and friendly relations and the feelings of Indian
people towards Japan have been good. Hence the author has shown interest in studying the bilateral trade intensity between these two countries.
A BRIEF NOTE ON BILATERAL TRADE BETWEEN INDIA - JAPAN The proliferation of free trade agreements (FTAs) has been a key trend in the global trade community since the early 1990s. As of 31 July 2010, 474 Regional
Trade Agreements (RTAs) 1
have been notified to the World Trade Organization (WTO) and 283 agreements were in force. FTA is the single most important form
of RTA. 2 Recently, there has been active persuasion by both India and Japan to conclude free trade agreement between them. Though Japan has been always a
promoter of multilateral agreements, of late due to the emergence of different FTAs initiated by the United States, Japan has felt an acute need for its own
treaty with different countries to protect its market share in world trade. India, in the process of increasing its market share has been also keen in making FTAs
within the Asian region.
According to Barro et al, Economic growth take place when “liberalization of trade through policy induced measures by reducing and then eliminating tariff and
non-tariff barriers promotes efficiency of allocation of resources to productive uses, exploitation of scale economies, encourages competition, increases factor
productivity and increases trade flows, thereby, promoting economic growth”. 3 However, reality seems to be different from theoretical predictions. “In spite of
instituting various measures of trade liberalization in many countries, still there remain some country-specific barriers, which impede the growth of world
trade.” 4 Elizondo and Krugman is of the view that trade flows are adversely affected when infrastructure development are concentrated on only some
developed pockets of the country. 5 Further, large government size,
6 weak and inefficient institutions in home country
7 and political lobbying
8 have been
identified to constraint trade flows between countries. Based on the above the author tends to believe that decreasing tariff may promote trade between the
countries. On this idea the author has made a hypothesis that as tariff decreases, trade intensity tent to increase between India and Japan.
METHODOLOGY This study analyzes the trade relation between India and Japan. Data was collected from UN COMTRADE statistics database for the period from 2001 to 2011.
The simple technique called trade intensity index developed by K. Kojima 9 has been used. This trade intensity index has been used to measure the share of one
country`s trade with other country as a proportion of the latter`s share of world trade.
Trade Intensity: We can think of the trade intensity index as a uniform export share. In other words, the statistic tells us whether or not a region exports more
(as a percentage) to a given destination than the world does on average. It is interpreted in much the same way as an export share. It does not suffer from any
‘size’ bias, so we can compare the statistic across regions, and over time when exports are growing rapidly.
Definition: The trade intensity statistic is the ratio of two export shares. The numerator is the share of the destination of interest in the exports of the region
under study. The denominator is the share of the destination of interest in the exports of the world as a whole.
Range of values: The value of Trade intensity index ranges from 0 to 1 (0 to 100 when multiplied with 100). If the value is 0, it implies no trade relationship
between partner countries. On the other hand, if the value is 1 indicates high trade relations. If import intensity index is more (or less) than 100, it indicates that
country India is importing more (or less) from country Japan than might be expected from that country’s share in total world trade. In export too, if the value is 0
it implies export link between these two countries is negligible and if the value is nearer to 100 that indicates that performance is significant and if it exceeds 100
it indicates that India is exporting more to country Japan than might be expected from that country’s share in world trade.
Limitations: The limitation of the study is that the trade intensity indices have limited application for measuring bilateral potential trade between nations.
MATHEMATICAL DEFINITION The Export intensity index between India with respect to Japan (XIIijt) is shown as follows:
XIIijt = [Xij / Xi] / [Mj / (Mw- Mi)] * 100............................................. (1)
I

VOLUME NO. 4 (2014), ISSUE NO. 02 (FEBRUARY) ISSN 2231-4245
INTERNATIONAL JOURNAL OF RESEARCH IN COMMERCE, ECONOMICS & MANAGEMENT A Monthly Double-Blind Peer Reviewed (Refereed/Juried) Open Access International e-Journal - Included in the International Serial Directories
http://ijrcm.org.in/
37
Where:
XIIijt = Export intensity index of trade of India with Japan:
Xij = Exports of India to Japan.
Xi= Total Exports of India.
Mj = Total Imports of Japan.
Mw = Total World Imports.
Mi = Total Imports of India.
t = 2001 to 2011.
Import intensity index (MIIijt) can also be measured in the similar way:
MIIijt= [Mij / Mi] / [Xj / (Xw- Xi)] * 100.............................................. (2)
Where:
MIIijt = Import intensity index of trade of India with Japan:
Mij = Imports of India from Japan.
Mi = Total Imports of India.
Xj= Total Exports of Japan.
Xw = Total World Exports.
Xi = Total Exports of India.
t = 2001 to 2011.
The Export Intensity index between Japan with respect to India (XIIjit) is shown as follows:
XIIjit = [Xji / Xj ] / [Mi / (Mw- Mj)] * 100....................................................(3)
Where:
XIIjit = Export intensity index of trade Japan with India.
Xji = Exports of Japan to India.
Xj = Total Exports of Japan.
Mi = Total Imports of India.
Mw = Total World imports.
Mj = Total Imports of Japan.
t = 2001 to 2011.
Import intensity index (MIIjit) can also be measured in the similar way:
MIIjit = [Mji / Mj] / [Xi / (Xw- Xj)] * 100............................................. (4)
Where:
MIIjit = Import intensity index of trade of Japan with India.
Mji = Imports of Japan to India.
Mj = Total Imports of Japan.
Xi = Total Exports of India.
Xw = Total World Exports.
Xj = Total Exports of Japan.
t = 2001 to 2011.
In this analysis, if the intensities between two countries are well below 100, the author believes that the two countries have much trade potential to reap
between them. Bilateral trade relationships between India and Japan, which is described in terms of import and export intensity indices, helps to identify how
intensively the countries are trading with each other.
RESULT AND CONCLUSION OF THE STUDY The trends of export intensities and import intensities of both India and Japan are shown in Table 1. Export and import intensities of both India and Japan have
declined over the years. India’s export intensity with respect to Japan has declined significantly over the years, which may be seen from the fact that export
index has declined from 63.38 during 2001 to 38.76 during 2011. One can conclude from such a declining trend that India has not diversified its export basket
over the years to Japanese market, and it basically exported the same items, whose demands have been declining over the years. This shows that India`s
commodity concentration in export is more than in its import from Japan. In the import front also, trade intensity index has been maintained in a steady
manner. During 2001, import intensity index was 53.15, which has been maintained throughout the study period except for the year 2005 and 2010. However,
import intensity index is much less noticeable compared to the downslide in export intensity index. Steady trend in imports may be credited to the fact that
India is also a major importer of goods from Japan, and its importance has been growing in recent years (major imports include machinery, plant-related
products, transport equipment, and electronic machinery). India`s import intensity has declined during 2005, further this index show ups and downs. It indicates
that India`s import intensity has not drastically declined continuously from 2005 to 2011.
Japan`s export intensity index with respect to India was 52.17 during 2001, which marginally declined to 51.51 during 2011. On the other hand, its import index
was 57.17 during 2001 that too radically declined to 37.25 during 2011. These figures clearly indicate that Japan’s imports from India have declined much more
than its exports to India.
TABLE 1: TRADE INTENSITY INDEX BETWEEN INDIA AND JAPAN, 2001-2011
Year XIIijt MIIijt XIIjit MIIjit
2001 63.38 53.15 52.17 57.85
2002 69.02 56.93 55.88 63.43
2003 57.02 50.58 49.68 52.57
2004 49.83 47.74 47.41 45.64
2005 49.81 45.16 44.45 46.45
2006 48.31 49.07 48.12 45.53
2007 49.83 51.18 50.26 47.22
2008 42.02 49.88 49.32 39.75
2009 40.62 52.53 52.05 38.71
2010 47.14 45.5 44.88 44.96
2011 38.76 52.16 51.51 37.25
Source: Author’s Estimation.
XIIijt = India's Export Intensity Index with respect to Japan; MIIijt = India's Import Intensity Index with respect to Japan; XIIjit = Japan's Export Index with respect to
India; MIIjit = Japan's Import Intensity Index with respect to India; i = India; j =Japan; t= 2001 to 2011.
This may be due to the fact that Japan’s import items from India are basically composed of primary and intermediary goods (i.e., Traditionally, Japan has been
the second largest destination of Indian exports - such as gems, marine products, iron ore, and cotton yarn), whose demands are inelastic compared to its
exports items to India. Japan’s both import and export intensities are well below 100, which imply that it is trading much less with India than might be expected

VOLUME NO. 4 (2014), ISSUE NO. 02 (FEBRUARY) ISSN 2231-4245
INTERNATIONAL JOURNAL OF RESEARCH IN COMMERCE, ECONOMICS & MANAGEMENT A Monthly Double-Blind Peer Reviewed (Refereed/Juried) Open Access International e-Journal - Included in the International Serial Directories
http://ijrcm.org.in/
38
from Japan’s share in world trade. This implies Japan has much potential to increase its trade with India. In this study the author concludes that the overall trade
intensity whether its export (or) import, the intensity has declined over the period of study. However, the author feels that both India and Japan do have
substantial potential to increase their trade between them.
REFERENCES 1. World Trade Organisation, “Trade in a globalized World”, World Trade Report, 2008
2. World Trade Organization, RTA Gateway, 2011
3. Barro, R., and Sala-I-Martin, X.1995. Economic Growth. New York: McGraw-Hill
4. Kalirajan, K. 1999, Stochastic Varying Coefficients Gravity Model: An Application in Trade Analysis. Journal of Applied Statistics, 26: 185–194
5. Elizondom, R.L., and Krugman, P. 1992. ‘Trade Policy and Third World Metropolis’. NBER Working paper No. 4238. Washington, DC: National Bureau of
economic Research.
6. Rodrik, D., 1998. “Why Do More Open Countries Have Large Governments?” Journal of Political Economy 106 (5): 758–879
7. Wilson, J.S., Mann, C.L., and Otsuki, T. 2004. “The Potential Benefit of Trade Facilitation : A Global Perspective”. World Bank Policy Research Working Paper
3224, February. Washington, DC: The World Bank
8. Gawande, K., and Krishna, P. 2001. The Political Economy of Trade Policy: Empirical Approaches. Working papers, Economics Department. Providence, RI:
Brown University.
9. Kojima, K. (1964), "The Pattern of International Trade among Advanced Countries", Hitotsuboshi Journal of Economics, Vol.5(1) June. UN Comtrade
statistics database.
ANNEXURE TABLE2: BILATERAL TRADE BETWEEN INDIA AND JAPAN (Unit: US Dollar thousand)
year
India`s export
to Japan
Japan`s import
from World
India`s export
to world
India`s import
from Japan
Japan`s export
to world
India`s import
from world
World export World import
2001 1551244 349300362 43878489 1788176 403363609 50671106 6118895777 6312854542
2002 1786977 337608873 50097958 2139663 416715260 57453469 6419966502 6589876543
2003 1709802 383451985 59360659 2333143 471995905 72430524 7470780287 7663653043
2004 1847648 455253850 75904200 2962042 565761077 98981129 9101232948 9417813893
2005 2455239 515866388 100352637 3678528 594940866 140861667 10389054464 10642419338
2006 2804220 579063945 121200606 4743469 646725059 178212440 12042919050 12270185808
2007 3263389 622243336 145898053 5832826 714327036 218645294 13849310780 14080126378
2008 3624209 762533921 181860898 7784411 781412163 315712106 15989372712 16393518947
2009 3215709 551984751 176765036 6688836 580718734 266401553 12327153144 12591039320
2010 4805077 692620567 220408496 8265086 769839386 350029387 15055401572 15325394862
2011 5592608 855380474 301483250 11218263 823183759 462402791 17999547615 18333981514
Sources: ITC calculations based on UN COMTRADE statistics.
VOLUME NO. 4 (2014), ISSUE NO. 02 (FEBRUARY) ISSN 2231-4245
INTERNATIONAL JOURNAL OF RESEARCH IN COMMERCE, ECONOMICS & MANAGEMENT A Monthly Double-Blind Peer Reviewed (Refereed/Juried) Open Access International e-Journal - Included in the International Serial Directories
http://ijrcm.org.in/
39
TALENT MANAGEMENT AS A NEVER-ENDING WAR FOR TALENT: AN ANALYSIS
DR. R. UMA DEVI
ASST. PROFESSOR
DEPARTMENT OF COMMERCE
DR. S. R. K. GOVT. ARTS COLLEGE
YANAM
ABSTRACT Human capital is a precious and scarce resource and management of it is considered as a tough and crucial job for Human Resource Personnel. Nowadays the
organizational environment has become global, complex, dynamic, highly competitive and extremely volatile and due to these factors long run survival of
corporate entities became difficult. To overcome such problems, the enterprises have to adopt sound personnel policies and strategies for the smooth operation
of the organization as talented employee occupies a key role in the achievement of organizational goals. The organizations have to be global and systematic in
managing their human capital with a hope of gaining and sustaining a competitive advantage in future. Globally the Human Resource Professionals recognized
the importance of efficient and effective talent management practices for sound and healthy operation of an organization and making more investment into
talent development initiatives which currently is a challenge. By considering the human capital as an important component for the Nation’s growth, the Indian
Government has placed utmost importance for talent management prospects. Talent Management in organizations is not just limited to attracting the best
people from the industry but it is a continuous process that involves sourcing, hiring, developing, retaining and promoting them while meeting the organization’s
requirements simultaneously. On the above backdrop, the present study is undertaken to analyze the talent management practices for the best of the
organisations in particular and the nation as a whole.
KEYWORDS Talent management, Global, Human resource, Human capital, recruitment, organization.
1. INTRODUCTION alent management is the additional management processes and opportunities that are made available to people in the organization who are considered
to be ‘talent’.”
Today’s global economy has created a more complex and dynamic environment in which most firms must learn to compete effectively to achieve
sustainable growth. Despite millions of unemployed workers, there is an acute shortage of talent. Talent management not at all a new concept, but its
importance has recognized globally due to the dynamic environmental conditions at present. Talent management is a tailor-made system and every organization
has its own talent management system that suits their organization and environment. One of the most critical challenges for any organization is finding,
recruiting, and retaining talented individuals. Global business strategy needs alignment of people and talent management strategies.
There is a strategic imperative for organisations to manage talent. Changing demographic patterns mean that more people are approaching retirement than
entering the workforce. Younger generations have different needs and are renegotiating the psychological contracts with their employer. They are quick to
move if their organization is not meeting their expectations. Retaining and developing key people in the organization will be a critical success factor in the next
five years. Senior managers report talent management as a strategic priority, yet over half of line managers are resistant to talent management processes. The
strategies that can be used to determine the employee competency level of success include incorporating behavioral based questions that are designed to elicit
examples from candidates about their previous work history and how they behaved in the previous job situations. Another significant strategy of ensuring the
best fit is through competency-based management which can be described as the organization understanding its needs and who best fits with the organizations
and then aiming to deliver the right outcomes by determining the value behaviors. As a selection tool, this strategy helps with recruitment of employees who
possess the requisite skills and behavior and to identify the long-term high potential employees.
1.1 TALENT MANAGEMENT SYSTEM AS A PROCESS
Talent management is a continuous process and consists of various steps which are as follows:
Establish Development Plans for All Employees: Targeted career development for all levels of employee incorporating performance assessment, succession
management and learning initiatives is essential in managing talent efficiently.
Build a Foundation of Competencies: Establishing the competencies - the knowledge, skills and behaviours that are used to develop people in an
organization is a critical step for the success of any talent management approach; use of these competencies will also enable an organization to build job
profiles that can guide career development, training and performance improvement.
Integrate Career Development Planning into Performance Management: Performance management should be more than an assessment of job
performance and it is an opportunity to engage employees in their work and to establish goals. For best results, work plans should contain activities that
help employees to develop the skills needed to meet both individual and organizational goals.
Build Internal Talent Pools: The identification and retention of high performing and high potential public sector employees should continue to be a high
priority in today’s challenging environment; the private sector suffered considerable loss of capability during and immediately following the Global
Financial Crisis when entire business units were abolished with little or no attempt to retain proven or promising staff.
Leverage the Power of Informal Learning: For most employees, learning on the job from one’s peers is the most effective method of learning; creating the
appropriate structures and providing the right tools can facilitate this more efficiently and produce greater benefits for the employee and the organization.
Talent management strategies are holistic in nature and aim at supporting such practices which improve the communication of goals and performance
expectations across different levels in an organization. For many organizations talent management is a major strategic issue and they view it as a critical factor
for providing them with a competitive advantage in the competitive war for talent. Effective management of talent requires a thorough diagnosis of the
employee attitudes and also the organizational culture. The tools which help in attracting and retaining the best of talent in an organization are: pay, benefits,
learning and development and a proper work environment which can be group centric or individual and the benefits can be tangible or intangible. Talent
Management is managing the ability, competency and power of employees within an organization. The concept is not restricted to recruiting the right candidate
at the right time but it extends to exploring the hidden and unusual qualities of employees and developing and nurturing them to get the desired results. Hiring
the best talent from the industry may be a big concern for the organizations today but retaining them and most importantly, transitioning them according to the
culture of the organization and getting the best out of them is a much bigger concern. With a relatively young population and a highly educated workforce, India
has much to offer multinational companies that plan to build or expand their operations in the country.
2. REVIEW OF LITERATURE Today’s global economy has created a more complex and dynamic environment in which most organizations have to compete effectively to achieve sustainable
growth. Workforces around the world have become larger, increasingly diverse, more educated, and more mobile. This global environment has not only changed
the way business is conducted, it has also created the need for organizations to manage their workforces in a global context. As a consequence, the notion of a
T

VOLUME NO. 4 (2014), ISSUE NO. 02 (FEBRUARY) ISSN 2231-4245
INTERNATIONAL JOURNAL OF RESEARCH IN COMMERCE, ECONOMICS & MANAGEMENT A Monthly Double-Blind Peer Reviewed (Refereed/Juried) Open Access International e-Journal - Included in the International Serial Directories
http://ijrcm.org.in/
40
‘‘global workforce’’ has received extensive discussion recently. One of the major topics of this discussion has been around talent management. Most of the
research in the area of talent management so far has been premised on the idea of talent shortages, reflecting the robust economic conditions at present.
Campbell and Roland Smith (2010) define talent management as ‘an organization’s efforts to attract, develop, and retain skilled and valuable employees’. The
goal of talent management is to develop or recruit people with the requisite ‘capabilities and commitment needed for current and future organizational success.
They add that an organization’s talent pool, particularly its managerial talent, is often referred to as ‘the leadership pipeline’. The latter is managed through
‘various systems and processes to help the organization source, reward, evaluate, develop, and move employees into various functions and roles’. A report of
Cornerstone on demand argues that in today’s challenging fiscal environment improved talent management is not optional but essential if it is to play its part in
enhancing efficiency, reducing operational risks and lowering costs. It also states that a greater focus on managing talent can help public sector employers
deliver improved training at a lower cost, better develop and engage their people, and plan more effectively for the leadership and talent needs of the future.
Talent management solution integrates the needs of the management, executives and employees into one system and unifies information across all the major
HR processes like performance management, recruitment and selection, learning and development, succession planning and career development. According to a
survey report of the Economist Intelligence Unit (2006) and Development Dimensions International (DDI), maximum CEO’s from across different industries
globally spend their major chunk of time in recruiting, performance management, talent management, succession planning, mentoring and retention. Kirkland
(2007) opines that the challenges faced by profit and non-profit organizations are enormous and one of the most critical challenges for any organization is
finding, recruiting, and retaining talented individuals. Karthikeyan (2007) views that the emphasis has been laid on initiatives that can be put in place to help
organization to retain and nurture the talent. Despite the companies allocate great sums of money to talent management systems, many still struggles to fill key
positions, limiting their potential for growth in the process. Athey (2008) finds that despite millions of unemployed workers, there is an acute shortage of talent
globally. Cliffe (1998) finds that many companies mismanage talent development tasks. Through employee value proposition, management can attract and
retain the talent. Globally, fewer and fewer managers and professionals are ready to fill these leadership roles, and companies worldwide find themselves
competing for a smaller pool of talent. Murty (2008) found that the current challenge for IT industry is to match its supply and demand position, and retaining
the experienced persons in the organizations depends upon a number of factors in addition to pay and perquisites.
McCauley & Wakefield (2006) says that businesses must have the ability to identify the most talented individuals, provide them with the necessary training and
experience, and retain valuable employees on a long term basis. Heinen & O‘Neill (2004) views that managing talent cannot be completed within a quarter or a
year, because it involves integrated planning and is not merely the responsibility of the Human Resources Department, but other factors are included in
managing talent. Guthridge, Komm, & Lawson (2006) find that nearly half of the executives interviewed expressed concern that the senior leadership of their
organizations does not align talent management strategies with business strategies. Gakovic & Yardley (2007) opine that global business strategy needs
alignment of people and talent management strategies. Initially, identify the senior business manager with talent specialists. Next steps were to expand the
talent pool, beyond a senior business manager level, implement development programs for future leaders according to levels of experience and seniority in an
organization, and ensure the company had a customized solution to retain its talent through the employee value proposition. Roer Martin and Mihnea
Moldoveanu (2003) define that Talent = Capacity to learn + capacity to think + capacity to relate + capacity to act accordingly and the values of the organization.
Abbasi & Hollman (2000) point out that one of the issues facing organizations is an ability to foster a workforce that creates organizational capabilities. Many
human resource development academicians and practitioners have suggested and used training and development as a means of accomplishing this critical task.
Collings & Mellahi (2009) view that in the past year or two there have been numerous examples of organizations downsizing operations and reducing their
workforces as a result of global economic and financial conditions. Thus for many organizations there now seems to be a talent surplus with unemployment
increasing across many countries and too many qualified people chasing too few jobs. Regardless of economic and workforce conditions, however, organizations
large and small, public and private, have come to the realization that in order to gain and sustain a global competitive advantage they must manage their
workforces effectively. And to do so they must confront the reality of Global Talent Management (GTM) and its many challenges and develop human resource
management activities to meet those challenges. Coy and Ewing (2007) notice that there is considerable evidence that organization worldwide face formidable
talent challenges. The ability to attract, develop, and retain a needed supply of critical talent is a challenge facing all organizations.
Boudreau (2007), Ramstad (2005), Cappelli (2008), Collings & Mellahi (2009) and Lewis & Heckman (2006) also suggest that organizations face greater
competition for talent worldwide and face challenging times in attracting, retaining, and developing people they need. So even though there is currently a global
economic slowdown, there are major structural conditions in place to ensure that competition for talent worldwide will continue to be a significant challenge.
More specifically, organizations are and will continue to be searching for individuals who can effectively manage through the complex, challenging, changing,
and often ambiguous global environment. In other words, most companies worldwide, regardless of size, are confronting and/or will soon confront many GTM
challenges, if left unmet, will impact their global business strategies, both in the near term and longer term.
3. DATABASE AND METHODOLOGY Talent management is concerned with delivering business success by understanding what an organization actually means by talent and how it can achieve the
long term organizational goals. It aims at ensuring that the organizations value natural talents and understand the obstructions to an effective performance.
Nowadays it’s a global challenge faced by almost all countries in the world. As human capital is a precious and diversified resource, it’s a highly difficult task to
manage the talent. However talent management is a major strategic issue for many organizations and considered as a critical factor for providing with a
competitive advantage in the competitive war for talent.
3.1 OBJECTIVES OF THE STUDY
In India talent management Practices play a vital role in the economic development of the economy through the development of organizations. Though it is an
important concept, very few studies have undertaken in this area. Hence to have a study on the untapped areas of the study, the present study has been
undertaken. The objective of the present study is to analyze the significance of Talent Management as a crucial function of HR Professionals in organizations for
their sound performance. It also highlights the challenges, benefits, dimensions and perspectives of talent management. On the above backdrop, an attempt has
been made to have an in-depth knowledge of the emerging trends of talent management practices in India and study is entitled as ‘TALENT MANAGEMENT AS A
NEVER-ENDING WAR FOR TALENT: AN ANALYSIS’ . The following are some of the specific objectives of the study:
1. To study the concept and growth of Talent Management
2. To analyze the need of Talent Management
3. To evaluate the benefits of Talent Management
4. To analyze the Perspectives and Operational Dimensions of Talent Management
5. To assess the essential tools of Talent management Strategies.
6. To analyze the trends of Talent Management Practices in India
7. To evaluate the role of TMP in the development of organizations
8. Finally to analyze its role on the overall progress of the economy.
The data pertaining to the study has been analyzed and presented in tabular forms to make the findings meaningful and easily understandable. The present
study was based on two sources of data viz., primary data and secondary data. The primary data is the first hand information collected from the employees of
various organizations through direct interview method to know the importance of this concept. The secondary data related to present study is mainly collected
through secondary sources which include various periodicals, magazines and websites etc.
4. ANALYSIS In recent years, talent management has become a priority issue for organisations worldwide due to a shortage in skilled staff, particularly managers. Talent
management strategies facilitate the development of both individuals and organisations by identifying employees with talent and ensuring that they receive the

VOLUME NO. 4 (2014), ISSUE NO. 02 (FEBRUARY) ISSN 2231-4245
INTERNATIONAL JOURNAL OF RESEARCH IN COMMERCE, ECONOMICS & MANAGEMENT A Monthly Double-Blind Peer Reviewed (Refereed/Juried) Open Access International e-Journal - Included in the International Serial Directories
http://ijrcm.org.in/
41
support they require. A talent management strategy is a well planned and designed that contains a clear statement of what types of jobs and/or what part of the
organization a particular talent management approach is concerned with; reflect an understanding of where in the organization or outside it the right kinds of
people may be found for these jobs and when they will be required to fill them; and outline the ‘development outcomes’ which this talent management work is
designed to deliver in order to address current and potential future challenges.
Organizations which wish to attract the best of talents and retain employees across all levels must have an integrated approach to talent management.
According to Accenture High Performance Report, about 85 percent senior executives view talent management as a major competitive differentiator for
attracting and retaining skilled workforce and developing the highly talented leaders. Many Indian organizations have realized that it is the quality of people
which they employ, retain and develop will ensure their business profitability and provide them a competitive advantage. Talent management is concerned with
delivering business success by understanding what an organization actually means by talent and how it can achieve the long term organizational goals. It aims at
ensuring that the organizations value natural talents and understand the obstructions to an effective performance.
4. 1 TALENT MANAGEMENT STRATEGIES
Talent management solution integrates the needs of the management, executives and employees into one system and unifies information across all the major
HR processes like performance management, recruitment and selection, learning and development, succession planning and career development. According to a
survey report of May 2006 from the Economist Intelligence Unit (EIU) and Development Dimensions International (DDI), maximum CEO’s from across different
industries globally spend their major chunk of time in recruiting, performance management, talent management, succession planning, mentoring and retention.
Employers use a range of different approaches within their talent management strategies to develop employees including effective initial recruitment practices,
induction programmes, appropriate on the job training, continuing professional development, membership of professional bodies and attainment of career
related qualifications. Talent management strategies are holistic in nature and aim at supporting such practices which improve the communication of goals and
performance expectations across different levels in an organization. However, for many organizations talent management is a major strategic issue and they
view it as a critical factor for providing them with a competitive advantage in the competitive war for talent. These strategies can be categorized into the
following heads:
� Developing the existing talent pool
� Maximizing employee satisfaction
� Attracting talent visibility
� Planning in advance for succession
� Acting upon the performance reviewed
Essentials of successful Talent management strategies: To ensure that talent management strategies are successful, the following prerequisites are essential:
� Ensure the organization is committed to the long-term development of a talent management strategy.
� Have a clear definition of talent.
� Identify the skills of organization needs to develop in the next five to ten years.
� Link the talent management strategy with wider business objectives.
� Decision regarding the availability of talent management strategy to all or specific targeted groups.
� Involvement of all employees of the organization in the development of talent management strategy.
4.1.2 STRATEGIC CHALLENGES
Talent Management is managing the ability, competency and power of employees within an organization. The concept is not restricted to recruiting the right
candidate at the right time but it extends to exploring the hidden and unusual qualities of employees and developing and nurturing them to get the desired
results. Hiring the best talent from the industry may be a big concern for the organizations today but retaining them and most importantly, transitioning them
according to the culture of the organization and getting the best out of them is a much bigger concern. According to a report from CIPD’s 2006 Learning and
Development Survey, managing talent is not a very easy job and various factors influence the talent management strategies and policies of an organization. The
report highlights some of the major strategic challenges to talent management which are:
� A rise in the trends of globalization in the labor market.
� An increase in the virtual workplaces.
� Diverse workforce in terms of age, race, etc.
� Educated workforce carries independent notions about their style of work and career path.
Effective management of talent requires a thorough diagnosis of the employee attitudes and also the organizational culture. The tools which help in attracting
and retaining the best of talent in an organization are pay, benefits, learning and development and a proper work environment which can be group centric or
individual and the benefits can be tangible or intangible.
Pay: This is the most determining factor for retaining the talent pool in an organization which should be kept competitive. IT and ITES majors like Wipro
and Infosys implement variable pay for retaining the employees and extracting the best performance from them. Flexible benefits are another effective
tool for encouraging high performers.
Benefits: Benefits which provide social and futuristic security to the employees can serve as a major tool for retaining the best talent pool in an
organization. Many Indian organizations design and develop innovative benefit packages for retaining their talent.
Learning and Development: It enables the retention of the most competent and ambitious employees in the organization and at the same time provide a
competitive advantage by building the intellectual base in an organization. Many Indian companies are providing ample learning opportunities to its
employees for developing their leadership potential and also designing a Life Cycle Stage Development programme, which selects the employees with the
leadership potential and trains them in accordance with their level in the organization.
Organizational Culture: A healthy work environment boosts the morale and spirit of the employee and strengthens the bond of relationship between the
management and the employees. Work culture is influenced by the organizational communication system, feedback mechanism and the effective
implementation of recognition and rewards. Many Indian organizations have taken innovative initiatives for maximizing employee satisfaction and
improving the overall organizational productivity.
Talent Management illustrates managing the ability, competency and power of employees within an organization. The concept is not restricted to recruiting the
right candidate at the right time but it extends to exploring the hidden and unusual qualities of your employees and developing and nurturing them to get the
desired results. Hiring the best talent from the industry may be a big concern for the organizations today but retaining them and most importantly, transitioning
them according to the culture of the organization and getting the best out of them is a much bigger concern. Talent Management is not just limited to attracting
the best people from the industry but it is a continuous process that involves sourcing, hiring, developing, retaining and promoting them while meeting the
organization’s requirements simultaneously. Only hiring an employee does not solve the purpose but getting the things done from him is the main task.
Therefore, it can be said that talent management is a full-fledged process that not only controls the entry of an employee but also exit.
4.1.3 STRATEGIC PERSPECTIVES
It is clear that different organisations are seeking to achieve different things from their talent management systems, while all are seeking to achieve some form
of talent management. This reflects the strategic objective of the talent management system. This strategic perspective shapes the way in which the talent
management system is viewed, implemented, and put into operation, such that the same activity can result in a different action and/or outcome depending on
the perspective employed. The HR professionals have to consider various perspectives while formulating talent management strategy. Ashridge has
recommended Six Perspectives for the implementation of the best talent management system for successful human capital management.
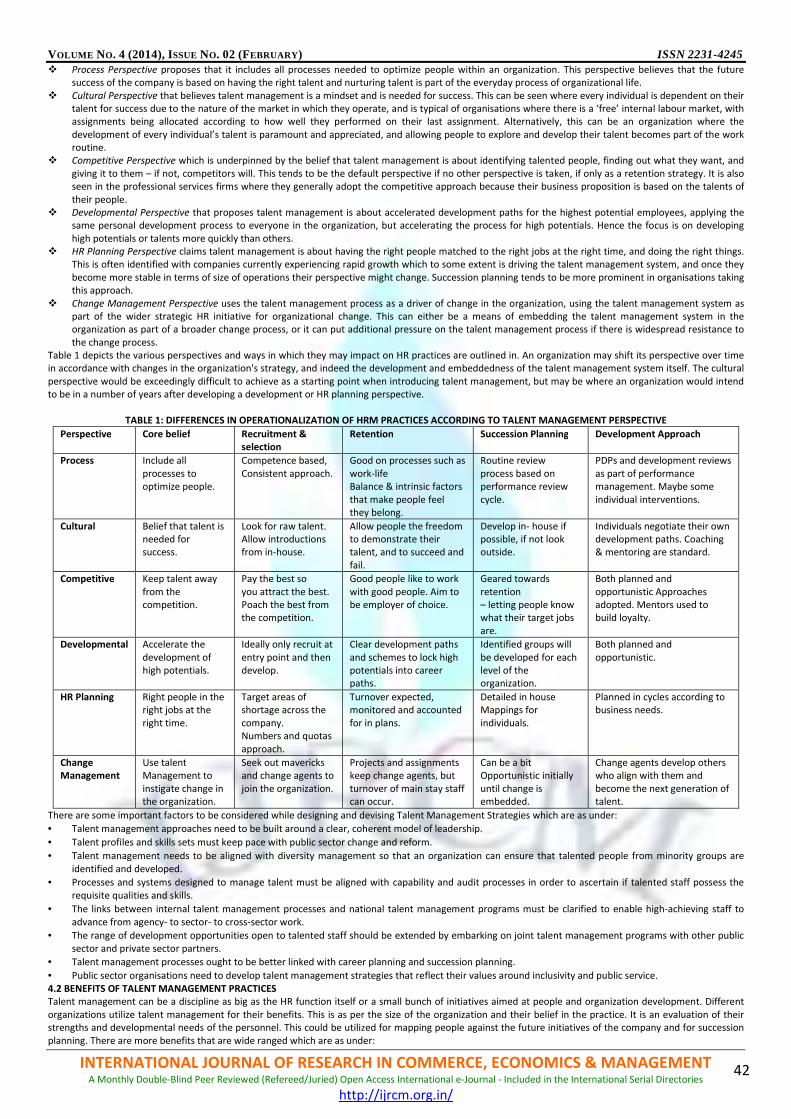
VOLUME NO. 4 (2014), ISSUE NO. 02 (FEBRUARY) ISSN 2231-4245
INTERNATIONAL JOURNAL OF RESEARCH IN COMMERCE, ECONOMICS & MANAGEMENT A Monthly Double-Blind Peer Reviewed (Refereed/Juried) Open Access International e-Journal - Included in the International Serial Directories
http://ijrcm.org.in/
42
� Process Perspective proposes that it includes all processes needed to optimize people within an organization. This perspective believes that the future
success of the company is based on having the right talent and nurturing talent is part of the everyday process of organizational life.
� Cultural Perspective that believes talent management is a mindset and is needed for success. This can be seen where every individual is dependent on their
talent for success due to the nature of the market in which they operate, and is typical of organisations where there is a ‘free’ internal labour market, with
assignments being allocated according to how well they performed on their last assignment. Alternatively, this can be an organization where the
development of every individual’s talent is paramount and appreciated, and allowing people to explore and develop their talent becomes part of the work
routine.
� Competitive Perspective which is underpinned by the belief that talent management is about identifying talented people, finding out what they want, and
giving it to them – if not, competitors will. This tends to be the default perspective if no other perspective is taken, if only as a retention strategy. It is also
seen in the professional services firms where they generally adopt the competitive approach because their business proposition is based on the talents of
their people.
� Developmental Perspective that proposes talent management is about accelerated development paths for the highest potential employees, applying the
same personal development process to everyone in the organization, but accelerating the process for high potentials. Hence the focus is on developing
high potentials or talents more quickly than others.
� HR Planning Perspective claims talent management is about having the right people matched to the right jobs at the right time, and doing the right things.
This is often identified with companies currently experiencing rapid growth which to some extent is driving the talent management system, and once they
become more stable in terms of size of operations their perspective might change. Succession planning tends to be more prominent in organisations taking
this approach.
� Change Management Perspective uses the talent management process as a driver of change in the organization, using the talent management system as
part of the wider strategic HR initiative for organizational change. This can either be a means of embedding the talent management system in the
organization as part of a broader change process, or it can put additional pressure on the talent management process if there is widespread resistance to
the change process.
Table 1 depicts the various perspectives and ways in which they may impact on HR practices are outlined in. An organization may shift its perspective over time
in accordance with changes in the organization's strategy, and indeed the development and embeddedness of the talent management system itself. The cultural
perspective would be exceedingly difficult to achieve as a starting point when introducing talent management, but may be where an organization would intend
to be in a number of years after developing a development or HR planning perspective.
TABLE 1: DIFFERENCES IN OPERATIONALIZATION OF HRM PRACTICES ACCORDING TO TALENT MANAGEMENT PERSPECTIVE
Perspective Core belief Recruitment &
selection
Retention Succession Planning Development Approach
Process Include all
processes to
optimize people.
Competence based,
Consistent approach.
Good on processes such as
work-life
Balance & intrinsic factors
that make people feel
they belong.
Routine review
process based on
performance review
cycle.
PDPs and development reviews
as part of performance
management. Maybe some
individual interventions.
Cultural Belief that talent is
needed for
success.
Look for raw talent.
Allow introductions
from in-house.
Allow people the freedom
to demonstrate their
talent, and to succeed and
fail.
Develop in- house if
possible, if not look
outside.
Individuals negotiate their own
development paths. Coaching
& mentoring are standard.
Competitive Keep talent away
from the
competition.
Pay the best so
you attract the best.
Poach the best from
the competition.
Good people like to work
with good people. Aim to
be employer of choice.
Geared towards
retention
– letting people know
what their target jobs
are.
Both planned and
opportunistic Approaches
adopted. Mentors used to
build loyalty.
Developmental Accelerate the
development of
high potentials.
Ideally only recruit at
entry point and then
develop.
Clear development paths
and schemes to lock high
potentials into career
paths.
Identified groups will
be developed for each
level of the
organization.
Both planned and
opportunistic.
HR Planning Right people in the
right jobs at the
right time.
Target areas of
shortage across the
company.
Numbers and quotas
approach.
Turnover expected,
monitored and accounted
for in plans.
Detailed in house
Mappings for
individuals.
Planned in cycles according to
business needs.
Change
Management
Use talent
Management to
instigate change in
the organization.
Seek out mavericks
and change agents to
join the organization.
Projects and assignments
keep change agents, but
turnover of main stay staff
can occur.
Can be a bit
Opportunistic initially
until change is
embedded.
Change agents develop others
who align with them and
become the next generation of
talent.
There are some important factors to be considered while designing and devising Talent Management Strategies which are as under:
• Talent management approaches need to be built around a clear, coherent model of leadership.
• Talent profiles and skills sets must keep pace with public sector change and reform.
• Talent management needs to be aligned with diversity management so that an organization can ensure that talented people from minority groups are
identified and developed.
• Processes and systems designed to manage talent must be aligned with capability and audit processes in order to ascertain if talented staff possess the
requisite qualities and skills.
• The links between internal talent management processes and national talent management programs must be clarified to enable high-achieving staff to
advance from agency- to sector- to cross-sector work.
• The range of development opportunities open to talented staff should be extended by embarking on joint talent management programs with other public
sector and private sector partners.
• Talent management processes ought to be better linked with career planning and succession planning.
• Public sector organisations need to develop talent management strategies that reflect their values around inclusivity and public service.
4.2 BENEFITS OF TALENT MANAGEMENT PRACTICES
Talent management can be a discipline as big as the HR function itself or a small bunch of initiatives aimed at people and organization development. Different
organizations utilize talent management for their benefits. This is as per the size of the organization and their belief in the practice. It is an evaluation of their
strengths and developmental needs of the personnel. This could be utilized for mapping people against the future initiatives of the company and for succession
planning. There are more benefits that are wide ranged which are as under:

VOLUME NO. 4 (2014), ISSUE NO. 02 (FEBRUARY) ISSN 2231-4245
INTERNATIONAL JOURNAL OF RESEARCH IN COMMERCE, ECONOMICS & MANAGEMENT A Monthly Double-Blind Peer Reviewed (Refereed/Juried) Open Access International e-Journal - Included in the International Serial Directories
http://ijrcm.org.in/
43
� Right Person in the right Job: Through a proper ascertainment of people skills and strengths, people decisions gain a strategic agenda. The skill or
competency mapping allows taking stock of skill inventories lying with the organization. This is especially important both from the perspective of the
organization as well as the employee because the right person is deployed in the right position and employee productivity are increased. Also since there is
a better alignment between an individual’s interests and his job profile, the job satisfaction is increased.
� Retaining the top talent: Despite changes in the global economy, attrition remains a major concern of organizations. Retaining top talent is important to
leadership and growth in the marketplace. Organisations that fail to retain their top talent are at the risk of losing out to competitors. The focus is now on
charting employee retention programs and strategies to recruit, develop, retain and engage quality people. Employee growth in a career has to be taken
care of, while succession planning is being performed those who are on the radar need to be kept in loop so that they know their performance is being
rewarded.
� Better Hiring: The quality of an organization is the quality of workforce it possesses. The best way to have talent at the top is have talent at the bottom.
Nowadays talent management programs and trainings, hiring assessments have become an integral aspect of HR processes.
� Understanding Employees Better: Employee assessments give deep insights to the management about their employees. Their development needs, career
aspirations, strengths and weaknesses, abilities, likes and dislikes. It is easier therefore to determine what motivates whom and this helps a lot Job
enrichment process.
� Better professional development decisions: When an organization gets to know who its high potential is, it becomes easier to invest in their professional
development. Since development calls for investment decisions towards learning, training and development of the individual either for growth, succession
planning, performance management etc, an organization remains bothered where to make this investment and talent management just make this easier
for them.
4.3 INTEGRATED TALENT MANAGEMENT PROGRAMME (ITMP)
Integrated Talent Management programme encompasses data, process, workflow management, security models, user portals, and reporting and analytics tools
across all technology applications required to run state-of-the-art talent management systems characterized by, and producing, high levels of alignment,
planning, decision-making and service delivery.
Essential approaches in achieving optimal talent management outcomes include:
• Assessing information about an organization’s directions, priorities, goals and objectives;
• Evaluating the results of regular employee surveys;
• Collating and considering information on employee demographics; and
• Analyzing departmental scan findings concerning the organization’s culture, leadership, management practices, work environment, decision-making and
other business processes and practices.
There are several critical factors in developing and implementing an effective ITMP such as;
• Active participation by senior executives;
• Accountability for the ITMP at the line manager level;
• A high level of departmental hr management support; and
• Effective organizational communication of the program.
There is a strategic imperative for organisations to manage talent. Changing demographic patterns mean that more people are approaching retirement than
entering the workforce. Younger generations have different needs and are renegotiating the psychological contracts with their employer. They are quick to
move if their organization is not meeting their expectations. Retaining and developing key people in the organization will be a critical success factor in the next
five years. Senior managers report talent management as a strategic priority, yet over half of line managers are resistant to talent management processes.
4.4 OPERATIONAL DIMENSIONS
While designing a Talent Management System, the organizations have to consider various operational dimensions in order to meet the strategic goal. These
dimensions are mainly categorized into three heads viz., defining, developing talent and structures and systems to support talent management. Basically there
are 18 dimensions which are common to all the organizations. But their application and approach differs from organization to organization.
FIGURE 1: OPERATIONAL DIMENSIONS OF TALENT MANAGEMENT
� Defining talent: Defining talent is how organisations decide to segment their workforce. By using a segmentation strategy for their talent, an organization is
not identifying the rest of the workforce as talentless. Talent management is about doing something additional or different with those people who are
defined as talent for the purpose of the organization – be it top performers, high potentials, senior managers suitable for director positions, or people
suitable for critical roles in the organization.
� Developing talent: Promotions, project work, management training schemes and management qualifications were the main development opportunities
offered and undertaken in organisations. Secondments, transfers and shadowing opportunities were offered by many organisations, but few managers had
personal experience of these development routes. Where the development of high potentials takes place in a highly supportive culture, the risks
associated with allocating stretching assignments or role transfers can be significantly mitigated.
� Structures and systems to support talent management: Performance management systems provide a good baseline for talent management systems on the
basis of performance, although many systems are not geared towards measuring an individual’s potential and future capability. The talent decision making
process rests between senior managers and line managers, with just under 30 per cent of organisations allowing individuals to contribute to the decision
themselves.
4.5 PROSPECTS OF TALENT MANAGEMENT IN INDIA
Many organizations already have identified and applied best practices for talent challenges in India with great success. A study by India’s Information Technology
Industry Association and NASSCOM reveal that the supply of skilled workers for offshore service and technical work will be exhausted by 2008 if India maintains
its 46 percent global share of this sector. India must produce an additional 500,000 graduates to staff, and ultimately manage its growing workforce in the next
five years. India is helping to reshape the world’s information technology industry and service sectors such as finance and telecom. It is also emerging as a vital
R&D partner for multinationals in pharmaceuticals, software, and microelectronics. India will become world’s largest export platform as well as the largest
domestic market for many products. India’s greatest impact on the global economy for the foreseeable future will not be through their products, but rather as
sources of skilled labor. While the U.S. still enjoys one of the world’s biggest supplies of degree-holding scientists and engineers on a per-capita basis, India is
producing millions of graduates in these fields each.
DEFINING
1. Size of talent pool
2. Entry criteria
3. Decision process
4. Permanency of decision
5. Recruitment as a source of talent
6. Transparency
DEVELOPING
7. Development path
8. Development focus
9. Support
10. Influence on career
11. Connected conversations
12. Organizational values
13. Risk
STRUCTURES AND SYSTEMS
14. Performance management
15. Talent management process
16. Use of technology
17. Systems flexibility
18. Ownership of talent

VOLUME NO. 4 (2014), ISSUE NO. 02 (FEBRUARY) ISSN 2231-4245
INTERNATIONAL JOURNAL OF RESEARCH IN COMMERCE, ECONOMICS & MANAGEMENT A Monthly Double-Blind Peer Reviewed (Refereed/Juried) Open Access International e-Journal - Included in the International Serial Directories
http://ijrcm.org.in/
44
Indian leaders are more sophisticated when it comes to talent management. Only a handful of Chinese organizations can talk about strategic approaches. The
disparity also exists in management development, the use of 360º and other multi rater tools, succession planning, and the adoption of leadership development
programs. Indian businesses face huge challenges in recruiting, retaining, and developing their workforces. But because India is a former British colony with an
established education system, and many Indians are fluent in English and open to international assignments, the cultural divide with the West is a boon to India.
India is one of the world’s most important suppliers of new talent. Each year, 2.5 million Indians graduate from college, and women are entering the workforce
in increasing numbers. Some 300,000 Indians are employed in Business Processing Outsourcing (BPO), where workers remotely handle everything from
insurance claims to tax statements for foreign corporations. This workforce is expected to reach 1.5 million by 2010. Organizations need to consider different
kinds of management structures to manage young leaders who are progressing quickly.
The management structure in India needs to include training and development. Because outsourcing is viewed as a cost-cutting measure, organizations overlook
development needs, and then blame cultural differences for problems that arise. Foreigners often insist on graduates of India’s elite schools, but this is a limited
talent pool. Foreign executives want to hire from a select few schools, such as the Indian Institutes of Management and the Indian Institutes of Technology. Most
outsourcing programs begin with easy, routine tasks that are best assigned to undergraduates. Women are increasingly important to the Indian workforce.
Recruiting women to work in call centers can dramatically increase the labor pool. In some industries, the percentage of female workers jumped from 10 percent
to 50 percent. But this isn’t happening at senior levels of the workforce. The McKinsey Global Institute produced a study contending that only 10-15 percent of
Indian graduates in most professional disciplines are suitable for employment by multinationals due to poor training, weak English skills, and other factors.
McKinsey also predicted that India will soon have huge labor shortages in fields with specialized skills like engineering.
5. CONCLUSION Globalization has spawned a global competition for talent. Many of the most pressing global challenges facing global firms today are directly related to human
capital challenges. Many Human Resource practitioners and HR consultants/ professionals are now recognizing this, especially for multinational enterprises. A
talent management strategy will improve organizational performance through better identifying, sourcing, developing, rewarding, motivating and retaining the
talent that keeps the firms ahead of competitors. The study enunciated that the factors driving the popularity of talent management today are: Scarcity of
talent, increasing complexity of the role of leadership and increased demands in technology. A rightly managed talent turns out to be a gold mine. Managements
need to realize its worth, extract it, polish it and utilize it. In all business climates, taking measures to retain valued employees saves money, preserves margins
leading to better business opportunities. If employees are positive about the talent management practices of the organization, they are more likely to have
confidence in the future of their organization. The resultant is a workforce that is more committed and engaged determined to outperform their competitors
and ensure a leadership position in the market for their organization.
Given the high level of interest in the concept of talent management over the past decade, it is somewhat paradoxical that it remains relatively poorly defined
and lacking in theoretical underpinning. Still the area of talent management is in its infancy and a significant degree of theoretical advancement is required. To
achieve success in business, the most important thing is to recognize the talent that can accompany in achieving the organizational goals. The process of talent
management is incomplete if management unable to fit the best talent of the industry at the place where he or she should be. Every organization requires the
best talent to survive and remain ahead in competition. Talent is the most important factor that drives an organization and takes it to a higher level, and
therefore, cannot be compromised at all. It won’t be exaggerating saying talent management as a never-ending war for talent!
By the study, it is clear that Talent Management System is integrated across all aspects of Human Resource Management. There are clear inter-dependencies
between talent management and recruitment, development, diversity, retention and succession planning practices. Best practices for developing Indian talent
also came up in every session with due importance of it. Several experts reported successful partnerships with the education systems to provide specialized
training to students before they enter the job market. The talent management system can be an effective tool for creating symbiotic relationship between talent
and the organization to dramatically accelerate performance improvements. Nurturing and retaining knowledge is a key to the success of any global sourcing
venture. Nurturing human capital is not an end in itself, but a route creating better value for all stakeholders - customers, shareholders, vendors and the
employees. The successful management of talent today gives organizations a vital edge. This indeed is a challenge to HR and effective talent management is an
important feather in the cap of any HR manager. Hence it can be concluded that Talent Management Practices plays a significant role in the acceleration of
sound growth of an organization which ultimately leads to the development of the economy as a whole.
REFERENCES 1. Athey, R. (2008). “It’s 2008: Do you know where your talent is? Why acquisition and retention strategies don’t work”. A Deloitte Research Study, Deloitte
Development LLC.
2. Bartlett, C., & Ghoshal, S. (2003, August). What is a global manager? Harvard Business Review.
3. Becker, B., & Huselid, M. A. (2006). Strategic human resource management: Where do we go from here? Journal of Management, 32: 898–925.
4. Becker, B., Huselid, M., & Beatty, R. (2009). The differentiated workforce: transforming talent into strategic impact. Boston: Harvard Business Review Press.
5. Beechler, S., & Woodward, I. C. (2009). The global war for talent. Journal of International Management, 15: 273–285.
6. Boudreau, J., & Ramstad, P. (2005). Talentship, talent segmentation, and sustainability: A new HR decision Science paradigm for a new strategy definition.
Human Resource Management, 42: 129–136.
7. Boudreau, J., & Ramstad, P. (2007). Beyond HR: The new science of human capital. Boston, MA: Harvard Business School Publishing.
8. Branham, L. (2005). Planning to become an employer of choice. Journal of Organizational Excellence, 24: 57–68.
9. Budhwar, P., Schuler, R., & Sparrow, P. (2009). International human resource management four-volume set. SAGE Publications Ltd.
10. Cappelli, P. (2008). Talent management for the twenty-first century. Harvard Business Review, March: 74–81.
11. CIPD, ‘Talent Management Factsheet” (August 2012)
12. Cliffe (1998). Human resource management and Fortune’s corporate reputation survey. Employee Responsibilities and Rights Journal, 10: 93–101.
13. Collings, D., & Mellahi, K. (2009). Strategic talent management: A review and research agenda. Human Resource Management Review, 19: 304–313.
14. Collings, D., Scullion, H., & Dowling, P. (2009). Global staffing: A review and thematic research agenda. The International Journal of Human Resource
Management, 20: 1251–1269.
15. Cornerstone On Demand, Making the Best of It: Why Tough Times Make Talent Management Essential in the Public Sector, Cornerstone OnDemand, Los
Angeles, California, 2011, 7 pp.
16. Corporate Leadership Council, Improving Talent Management Outcomes: 10 Talent management Insights for the Chief Human Resources Officer,
Corporate Leadership Council, Washington, DC, 2007, 39 pp.
17. Coy, P., & Ewing, E. (2007). Where are all the workers? Business Week: April 9: 28–31.
18. Daniels, J., Radebaugh, L., & Sullivan, D. (2007). International business: Environment and operations. Upper Saddle River, NJ: Pearson/Prentice-Hall.
19. “Developing an Integrated Talent Management Program: A Human Resource Management Framework”, The Government, St John’s, Newfoundland and
Labrador, 2008, 15 pp.
20. Dr. Eddie Blass (2007) Executive summary on “Talent Management- Maximizing talent for Business Performance”
21. Dr. John Sullivan (2012) Bold and Outrageous HR and Talent Management Practices
22. Executive summary on “Managing and developing Talent in China and India” - www.ddiworld.com/locations
23. Gupta, A., & Govindarajan, V. (2002). Cultivating a global mindset. The Academy of Management Executive, 16: 116–126.
24. Guthridge, M., & Komm, A. (2008). Why multinationals struggle to manage talent. The McKinsey Quarterly, 1–5.
25. Guthridge, M., Komm, A., & Lawson, E. (2008). Making talent management a strategic priority. The McKinsey Quarterly, January: 49–59.

VOLUME NO. 4 (2014), ISSUE NO. 02 (FEBRUARY) ISSN 2231-4245
INTERNATIONAL JOURNAL OF RESEARCH IN COMMERCE, ECONOMICS & MANAGEMENT A Monthly Double-Blind Peer Reviewed (Refereed/Juried) Open Access International e-Journal - Included in the International Serial Directories
http://ijrcm.org.in/
45
26. Hannon, J., & Milkovich, G. (1996). The effect of human resource reputation signals on share prices: An event study. Human Resource Management, 35:
405–424.
27. Henkens, K., Remery, & Schippers, J. (2008). Shortages in an ageing labour market: An analysis of employers’ behavior. International Journal of Human
Resources Management, 19: 1314–1329.
28. Improving Talent Management Outcomes: 10 Talent Management Insights for the Chief Human Resources Officer, Corporate Leadership Council,
Washington, DC, 2007, 39 pp.
29. Integrated Talent Management—The Evolution, , Melbourne, 2009,17pp.
30. Karthikeyan (2007). Employer’s attitude, practices and policies towards older workers. Human Resource Management Journal, 16: 313–330.
31. Kirkland (2007). The human resource management issues during an acquisition: The target irm’s top management team and key managers. International
Journal of Human Resource management, 17: 1307–1320.
32. Lewis, R., & Heckman, R. (2006). Talent management: A critical review. Human Resource Management Review, 16: 139–154.
33. Making the Best of It: Why Tough Times Make Talent Management Essential in the Public Sector, Cornerstone On Demand, Los Angeles, California, 2011, 7
pp.
34. Marion Devine and Marcus Powell, ‘Talent Management in the Public Sector’, The Ashridge Journal, Autumn 2008, pp. 19–24.
35. Matthewman. J and Matignon, F. (2005) Human capital reporting: an internal perspective. Chartered Institute of Personnel and Development, London.
36. Mc Cauley (2006). Examining the link between skill shortages, training composition and productivity levels in the construction industry: Evidence from
Northern Ireland. International Journal of Human Resource Management, 17: 265–279.
37. McKinsey & Company (2001) The war on talent, McKinsey & Company Inc, USA. Available:http://autoassembly.mckinsey.com/html/downloads/articles/
War_For_Talent.pdf (Accessed 3/10/12)
38. Michael Campbell and Roland Smith, High-Potential Talent: A View from Inside the Leadership Pipeline, Center for Creative Leadership, Greensboro, North
Carolina, USA, 2010, 29 pp.
39. Roer Martin (2003). Regional strategy and the demise of globalization. Journal of International Management, 9: 409–417.
40. SylviaVorhauser-Smith "Into India: Talent Management Essentials in a Land of Optimism".
41. Talent Management in the Public Sector , APS Human Capital Matters, Issue 1, February 2013, [email protected]
VOLUME NO. 4 (2014), ISSUE NO. 02 (FEBRUARY) ISSN 2231-4245
INTERNATIONAL JOURNAL OF RESEARCH IN COMMERCE, ECONOMICS & MANAGEMENT A Monthly Double-Blind Peer Reviewed (Refereed/Juried) Open Access International e-Journal - Included in the International Serial Directories
http://ijrcm.org.in/
46
A STUDY ON HUMAN RESOURCE ACCOUNTING
DR. CIRAPPA. I. B
ASST. PROFESSOR
DOS IN COMMERCE
DAVANGERE UNIVERSITY
DAVANGERE
MUTTESHA. N
RESEARCH SCHOLAR
DOS IN COMMERCE
DAVANGERE UNIVERSITY
DAVANGERE
ABSTRACT Human resource accounting has very high significance not only for the management, but also for analyst and even for employees. It helps management in better
utilization, planning management of human resources in the organization while for analyst, Even today, when a good deal of work has been done in this field, it is
very much unfortunate that there is not only set pattern or generally accepted method either for valuation of human resource or for their recording in books of
accounts or for the disclosure of information by means of different statements. In the present paper conclusions are drawn from literature whose goal was to put
information on intangibles into financial and non-financial frameworks. The analysis primarily focuses on two concepts: The human resource management
oriented concept called Human Resource Cost Accounting (HRCA) and Human Resources Value Accounting (HRVA) and the strategic management oriented
concept called Balanced Scorecard (BSC).Measurement of the investment in human resources will help to evaluate the charges in human resource investment
over a period of time. This paper aims at analyzing the application of Human Resource Accounting in large scale industries.
KEYWORDS Human Resource Accounting, Human Capital, Intellectual Capital, Lev and Schwartz model, Human assets, Human Efficiency.
INTRODUCTION uman Resource Accounting is one of the latest concepts adopted by Indian companies in recent times. Most of the enterprises which follow Human
Resource Accounting spare a separate section in their annual reports for a detailed account of their human resources. Human asset reporting in India
usually includes a profile of human assets, the compensation pattern, training and development, human asset productivity, human asset value, and the
total wealth of the organization.
The concept of human resource accounting can be basically examined from two dimensions: (i) the investment in human resources; and (ii) the value of human
resources. The expenditure incurred for creating, increasing, and updating the human resource quality is known as investment in human resources. Such
investment yields fruitful results like higher productivity and higher income to the organisation. The yield that the investment in human resources generates will
be considered as the basis of human resource value. The
OBJECTIVES The objectives of this paper include the followings:
1. Development of the Concept of HRA
2. Concept of HRA
3. Importance in Human Resources
4. Investment in Human Resources
5. Methods of human resource accounting
6. Efficient use of Human Resource
7. Calculating the Market Value of Assets
8. Human Capital.
METHODOLOGY This study carried out by using the secondary data from internet, journals, articles, text books, etc.
DEVELOPMENT OF THE CONCEPT OF HUMAN RESOURCE ACCOUNTING “Human Resource Accounting” is the offshoot of various research studies conducted in the areas of accounting and finance. Human resource is an asset whose
value gets appreciated over the period of time provided placed, applied and developed in the right direction. Till the recent past, organizations took few efforts
to assign monetary value to human resource in its accounting practice. Behavioural scientists initiated efforts to develop appropriate methodology for finding
out the value of human resource to the organization. They were against the conventional accounting practice for its failure to value the human resource of an
organization along with physical resources. The traditional concept suggested that expenditure on human resource is treated as a charge against revenue as it
does not create any physical asset. At present there is a change in this concept and the expenses incurred on any asset (as human resources) should be treated
as capital expenditure as it yields benefits which can be derived for a long period of time and could be measured in monetary terms.
The following are the reasons why Human Resources Accounting has been receiving so much attention in the recent years.
Firstly, there is genuine need for reliable and complete management of human resources. Secondly, a traditional framework of Accounting is in the process to
include a much broader set of measurement than was possible in the past. The people are the most important assets of an organization but the value of this
asset yet to appear in financial statements. It does not get included in management information systems too. Conventional accounting of human resources took
note of all expenses of Human capital formation which does not seem to be correct or meeting the actual needs.
Human Resource Accounting is the measurement of the cost and value of people to the organization. It involves measuring costs incurred by the organizations
to recruit, select, hire, train and develop employees and judge their economic value to the organization.
H

VOLUME NO. 4 (2014), ISSUE NO. 02 (FEBRUARY) ISSN 2231-4245
INTERNATIONAL JOURNAL OF RESEARCH IN COMMERCE, ECONOMICS & MANAGEMENT A Monthly Double-Blind Peer Reviewed (Refereed/Juried) Open Access International e-Journal - Included in the International Serial Directories
http://ijrcm.org.in/
47
CONCEPT OF HRA The concept of human resource accounting can be better understood if one goes through some of the important definitions given by the competent authors in
the accounting field.
1. The American Accounting Society Committee on Human Resource Accounting defines it as follows: “Human Resource Accounting is the process of
identifying and measuring data about human resources and communicating this information to interested parties.” In simple terms, it is an extension of the
accounting principles of matching costs and revenues and of organizing data to communicate relevant information in financial terms.
2. Mr. Woodruff Jr. Vice President of R. G. Batty Corporation defines it as follows:
“Human Resource Accounting is an attempt to identify and report investments made in human resources of an organization that are presently not
accounted for in conventional accounting practice. Basically it is an information system that tells the management what changes over time are occurring to
the human resources of the business.”
3. M.N. Baker defines Human Resource Accounting as follows:
"Human resource accounting is the term applied by the accountancy profession to quantify the cost and value of employees to their employing
organization"
4. Another management consultant Stephen Knauf has defined HRA as: "The measurement of quantification of human organization inputs such as
recruitment, training, experience and commitment"
Thus, human resources accounting may be defined as, “a process of accounting which identifies, quantifies and measures human resources for the use of
management to cope up with the changes in its quantum and quality so that equilibrium could be achieved in between the required resources and the provided
human resources”
IMPORTANCE OF HUMAN RESOURCE ACCOUNTING Human Resource Accounting provides useful information to the management, financial analysts and employees as stated below:
1. Human Resource Accounting helps the management in the Employment, locating and utilization of human resources.
2. It helps in deciding the transfers, promotion, training and retrenchment of human resources.
3. It provides a basis for planning of physical assets vis-à-vis human resources.
4. It assists in evaluating the expenditure incurred for imparting further education and training in employees in terms of the benefits derived by the firm.
5. It helps to identify the causes of high labour turnover at various levels and taking preventive measures to contain it.
6. It helps in locating the real cause for low return on investment, like improper or under-utilization of physical assets or human resource or both.
7. It helps in understanding and assessing the inner strength of an organization and helps the management to steer the company well through most adverse
and unfavourable circumstances.
8. It provides valuable information for persons interested in making long term investment in the firm.
9. It helps employees in improving their performance and bargaining power. It makes each of them to understand his contribution towards the betterment of
the firm vis-à-vis the expenditure incurred by the firm on him.
There is much debate as to whether the human resources of an organization can be considered as an asset and treated accordingly in the accounting system.
There are two schools of thought. One says that human resource is an asset and the other does not agree with this. Now let us see what is an asset? Asset is
anything which is owned by the entity to derive service in future and should have legally enforceable claim.
As such there is no guarantee of deriving benefits from the existing human resources in future and has no sales value like other assets. Therefore, legally, human
resource is not an asset claims one school of thought. Besides, company law also does not consider it as an asset.
But the other school is of the opinion that the "human resource is an asset". This school of thought puts forth two contentions in favour of its opinion as follows:
1. There is a legal ownership on the "human resource" which could in practice prevent him from joining the other organizations unless properly relieved by
complying with some formalities like giving advance notice of resignation, etc.
2. Uncertainty of deriving benefits is a common problem to all assets, not only with the human resources. Deriving future benefit may be a big question mark
in other assets too due to many factors. „Obsolescence‟ may be the one.
3. Generally, an asset needs maintenance and development support from the organization so as to derive benefits over a long period of time. Similarly,
human resources as an asset also is in need of training and development in order to maintain the service potential for the employer.
4. R.L. Woodruf Junior observed that treating people as assets and accounting them is logical and satisfactory to the expectation of the future economic
benefits.
The above analysis supports the view that the human resource is an asset as they are valuable resources to an organization and investments in such asset will
help organization to improve.
NOW, WHAT IS AN INVESTMENT? Any resource pressed into service for producing goods and services is called investments. Thus, investment refers to expenditure on new plant and machinery,
capital equipments, physical construction of new buildings together with any change in the stock of goods produced. There are two basic determinants of
investment.
(i) The expected rate of profit which the business hopes to realize from investment, and
(ii) The rate of interest.
The level of investment is guided by the level of expected profits. Firms will invest, only if it is profitable. Further an important cost associated with investment is
the cost of borrowing capital, which is the rate of interest. Of these two, the expected rate of profit is more influential than the rate of interest.
ASPECTS/METHODS OF HUMAN RESOURCE ACCOUNTING
METHODS
HUMAN RESOURCE COST ACCOUNTING (HRCA)
HUMAN RESOURCE VALUE ACCOUNTING (HRVA)

VOLUME NO. 4 (2014), ISSUE NO. 02 (FEBRUARY) ISSN 2231-4245
INTERNATIONAL JOURNAL OF RESEARCH IN COMMERCE, ECONOMICS & MANAGEMENT A Monthly Double-Blind Peer Reviewed (Refereed/Juried) Open Access International e-Journal - Included in the International Serial Directories
http://ijrcm.org.in/
48
HUMAN RESOURCE COST ACCOUNTING DEFINITION
• It is the measurement and reporting of the costs incurred to acquire and develop people as organisational resources.
HRCA INCLUDES accounting for the costs of-
→personnel acmvimes and funcmons such as recruitment, selecmon, placement and training.
→developing people as human assets. Also called ‘HUMAN ASSET ACCOUNTING’
APPROACHES OF HUMAN RESOURCE COST ACCOUNTING
• Historical Cost Approach
• Replacement Cost Approach
• Opportunity Cost Approach
HISTORICAL COST APPROACH
� The actual cost incurred on recruiting, selecting, training, placing and developing the human resources of an
� Enterprise are capitalised and written off over the expected useful life of human resources.
� Any amount spent on training and developing human resource increases its efficiency, hence capitalised.
� The amortization of human resource assets is done in the same way as that of other physical assets.
� If the asset is liquidated prematurely then its underwritten off amount is charged to revenue account.
� On the other hand, if it has a longer life than expected, its amortization is rescheduled.
REPLACEMENT COST APPROACH
� The cost of replacing employees is used as the measure of company’s human resources.
� The human resources of a company are to be valued on the assumption as to what it will cost the concern if existing human resources are required to be
replaced with other persons of equivalent experience and talent.
� In this the cost of recruiting, selecting, training, etc. of new employees to reach the level of competence of existing employees are measured.
OPPORTUNITY COST APPROACH
� It is based on economic concept of opportunity cost which removes the deficiency in replacement cost approach.
� Measured through a competitive bidding process within the entity.
STEPS
� The entity is divided into investment centres.
� The investment centre managers bid for scarce employees they need within the entity.
� The maximum bid price may be obtained by the capitalization of the excess profits generated by the employee.
1) THE LEV AND SCHWARTZ MODEL
This model was developed in 1971.It determining the value of human capital embodied in a person of age t is the present value of his remaining future earning
from employment in the form of salaries, wages, etc.
2) FLAMHOLTZ MODEL (1971)
This method determined an individual’s value to an organisation by the services he is expected to render to the organisation during the period he is likely to
remain with the organisation in various position or services states. The present value of human resource may be derived by discounting the realisable value of
expected future services at a specified rate.
Steps to be followed:
� Estimation of period.
� Identification of position or services.
� Estimation of probable period.
� Calculate the expected services.
� Calculation of present value at a predetermined rate.
3) GILES AND ROBINSON’S HUMAN ASSEST MULTIPLIER METHOD
This method is developed in 1972 & it was sponsored by ICMA and IPM. The valuation of human resource should be made in the same way as other business
assets on a GOING CONCERN BASIS.
4) HERMANSON’S MODEL
Roger H. Hermanson has suggested two models for the measurement of human resources. These are:-
HUMAN RESOURCE VALUE ACCOUNTING
THE LEV AND
SCHWARTZ MODEL
HERMON’S MODELUNPURCHASED GOODWILLADJUSTED DISCOUNTED FUTURE WAGE
FLAMHOLTZ MODEL (1971) JAGGI AND LAU MODEL
GILES AND ROBINSON’S HUMAN ASSET MULTIPLIER METHOD
MORSE NET BENEFIT MODEL (1973)

VOLUME NO. 4 (2014), ISSUE NO. 02 (FEBRUARY) ISSN 2231-4245
INTERNATIONAL JOURNAL OF RESEARCH IN COMMERCE, ECONOMICS & MANAGEMENT A Monthly Double-Blind Peer Reviewed (Refereed/Juried) Open Access International e-Journal - Included in the International Serial Directories
http://ijrcm.org.in/
49
o UNPURCHASED GOODWILL MODEL
HR is calculated by capitalising earnings in excess of normal earnings for the industry or the group of companies of which the firm is a part.
o ADJUSTED DISCOUNTED FUTURE WAGE MODEL
This model uses compensation as a surrogate measure of a person’s value to the firm. Compensation means the present value of
future stream of wages and salaries to employees of the firm. The discounted future wage stream is adjusted by an “efficiency ratio” which is the weighted
average of the ratio of return on investment of the given firm to all the firms in the economy for a specified period, usually five years. The weights are
assigned in the reverse order, i.e. 5 to the current year
5) JAGGI AND LAU MODEL
The valuation is on a group basis rather on individual basis. GROUP means a homogeneous group of employees who may not be necessarily working in the same
department. It might be difficult to predict an individual’s future period stay and chances of promotion, but on a group basis, it is easier to ascertain the future
period of services, chances of promotion and those who are likely to leave the firm during each of the forthcoming period. It assumed that the pattern of
movement is likely to remain constant overtime and the probabilities determined for one period can be extended to future periods.
6) MORSE NET BENEFIT MODEL (1973)
Calculation is on the basis of the present value of net benefits derived by the organisation from the expected future services of its employees.
Steps to be followed:
� Determination of the gross value of future services.
� Determination of the cost.
� Calculation of “net benefit” to the organisation on account of human resources by subtracting (ii) from (i).
� Calculation of the present value of the net benefits by discounting at predetermined rate of discount.
7) COMPETITIVE BIDDING MODEL
Curtis H Johns (1967) have advocated this model considering the value of individual employees in alternative uses compile that the employees have value only
when they cab be used alternatively or only when they can be put to alternative uses. To assess the value of employees, five proponent of the model have
suggested the competitive bidding amongst the managers of profit or investment centre. The highest of the bid price quoted by the divisional manager is used as
the value of that employees. In the same manner the value of other employees who are scares and whose services required by the other divisions also are
ascertain. John’s opinion that only when employment in one division devices on employees talent to another in the employee scares.
REVIEW OF LITERATURE 1. To measure human value as a part of the goodwill, HRA was introduced in the accounting literature in the 1960s (Flamholtz, 1985). In 1968 Brummet,
Flamholtz & Pyle used the term “human resource accounting” for the first time. In 1973 the American Accounting Association’s Committee on Human
Resource Accounting defined HRA as “the process of identifying and measuring data about human resources and communicating this information to
interested parties. It provides information about human resource costs and values, serves to facilitate to decision making, and motivates decision makers
to adopt a human resource perspective (Sackmann et al., 1989,). Research to examine the way in which human resource variables affect the efficiency of
firms could be performed in a number of ways including analyzing the association between different aspects of human resources and firm performance
(Bassi & McMurrer, 1998; Boudreau & Ramstad, 1997; Grojer, 1998). Looking at different proposals (Conner, 1991), the resource theory considers human
resources in a more explicit way. This theory considers that the competitive position of a firm depends on its specific and not duplicated assets. The most
specific (and not duplicated) asset that an enterprise has is its personnel. It takes advantage of their interdependent knowledge. That would explain why
some firms are more productive than others. With the same technology, a solid human resource team makes all the difference (Archel, 1995). There are
two reasons for including human resources in accounting. First, people are a valuable resource to a firm so long as they perform services that can be
quantified. Second, the value of a person as a resource depends on how he is employed. So management style will also influence the human resource
value (Ripoll and Labatut, 1994).
2. Research into true human research accounting began in 1960s by Rensis Likert (Bowers, 1973). Likert defends long-term planning by strong pressure on
human resources’ qualitative variables, resulting in greater benefits in the long run. Support for the idea of accounting for human resource values can be
found much earlier (Sacmann et. al., 1989). In 1965, Cronbach & Glaser (1965) and Naylor & Shine (1965) developed models for estimating the financial
utility of personal selection. To embrace both HRA and UA (Utility Analysis), Grojer & Johanson (1996) use the concept Human Resource Costing and
Accounting (HRCA). Grojer & Johanson (1996) express the management orientation of HRA even more clearly in the assertion that HRA concerns the
management of human resources. Roslender (1997) proposes a societal approach to the subject. He uses the term human worth accounting. Assets from
an accounting perspective are normally well, but too narrowly, defined when compared with emerging knowledge-based theories (Grant, 1996; Haanes &
Lowendahl, 1997). Because of poor measurement and inadequate reporting, human resources run in the risk of being undervalued internally by managers
and externally by capital markets (Hanson, 1997). There are many studies suggest a business community with a much more reluctant standpoint (Johanson
et al, 1998). One recent survey on the attitudes of members of the European Accounting Association toward HRCA showed that it is becoming more
important for accounting research and business practice, at least in East Europe and the Scandinavian countries. An interest in HRCA in Finland started
several years ago from a return on investment perspective. Guy Ahonen. Johanson (1999) propose that decision making and learning by investors and
managers are influenced when managers hold positive attitudes towards HRCA. The American SEC has declared that there is no evidence of an information
interest from a capital market point of view, not even for non financial HRCA information. In a recent literature survey (Johanson et al, 1998) on experience
using HRCA and the balance scorecard (BSC) some 2000 articles and books written in seven languages were looked at. When it comes to the BSC, of which
HRCA in some organizations is an explicit part, Human Resource Accounting there is no lack of company enthusiasm and good intentions on how to use the
BSC in the future - Johanson et al, 1998. Equity investors’ necessity for information on human resources has been investigated extensively whereas studies
of lenders are missing (Epstein & Freedman, 1994; Eccles & Mavrinac, 1995; Mavrinac& Siesfeld, 1997). One of the techniques showing a greater capacity
to stimulate efficiency is based on the idea that an employee who is induced to get to know his job better is more productive and quicker on the job
(Asociacion Espandola de Contabilidad y Administracion (AECA) 1994). No party that is referred to human resource is considered in the different balance
sheet models, and only in the profit and loss account are the costs most directly related to them, such as salaries and staff welfare expenses( including
pensions) (fourth directive of Comunidad Economica Europea 1978).
3. HUMAN RESOURCE ACCOUNTING (HRA) DISCLOSURE OF BANGLADESHI COMPANIES AND ITS ASSOCIATION WITH CORPORATE CHARACTERISTICS: Syed
Abdulla Al Mamun School of Management Asian Institute of Technology (AIT) Bangkok, Thailand. This study reports the relationship between corporate
characteristics and Human Resource Disclosure (HRAD) level in fifty five randomly selected companies of Bangladesh. The relationships were determined
using a HRAD Index (HRADI) under a number of hypotheses. The results of the study show that companies averagely disclose 25% of the total HRAD items.
In this study, HRAD has been found significantly related with the size of the company, category of the company (financial or non-financial) and profitability.
However, HDAD had no influence on the age of companies.
4. APPLICATION OF HUMAN RESOURCE ACCOUNTING IN HEAVY INDUSTRIES: Shalini Sharma1* and R.K. Shukla2. Since the beginning of globalization of
business and services, Human elements are becoming more important input for the success of any corporate enterprise. It helps the management to frame
policies for human resources. Human Resource Accounting is a process of identifying and measuring data about human resources. Measurement of the
investment inhuman resources will help to evaluate the charges in human resource investment over a period of time. This paper aims at analyzing the
application of Human Resource Accounting in heavy industries covering the period from 2001-2010 with the case study of The Hindustan Copper Limited, a
public sector undertaking. The case study helps to analyze that the value of production per employee is increasing or decreasing.

VOLUME NO. 4 (2014), ISSUE NO. 02 (FEBRUARY) ISSN 2231-4245
INTERNATIONAL JOURNAL OF RESEARCH IN COMMERCE, ECONOMICS & MANAGEMENT A Monthly Double-Blind Peer Reviewed (Refereed/Juried) Open Access International e-Journal - Included in the International Serial Directories
http://ijrcm.org.in/
50
5. HUMAN RESOURCE COSTING AND ACCOUNTING VERSUS THE BALANCED SCORECARD: A LITERATURE SURVEY OF EXPERIENCE WITH THE CONCEPTS: 1.
Ulf Johanson, Gunilla Eklöv, Mikael Holmgren, Maria Mårtensson. In the present paper conclusions are drawn from literature whose goal was to put
information on intangibles into financial and non-financial frameworks. The analysis primarily focuses on two concepts: The human resource management
oriented concept called Human Resource Costing and accounting (HRCA) and the strategic management oriented concept called Balanced Scorecard (BSC).
Despite numerous articles and books on theoretic views and models to capture intangibles in a tangible way, little is known about the outcome of HRCA
and BSC. Theoretical elaboration about possible effects is not rare, but investigations are scarce when it comes to financial attempts and almost non-
existent with respect to nonfinancial models. HRCA and BSC have largely been developed and applied to internal managerial purposes, though they appear
to be used occasionally for external marketing.The future of HRCA may well be to link it to the BSC. To date, HRCA suffers from not being grounded in
business strategy. Linking HRCA to BSC would solve this problem and, conversely, the BSC would have the option to utilise measures that have already
been developed within the HRCA framework. This effort of combining HRCA and BSC appears to already exist when reviewing some of the recent
literature. The question of standards is presently being pushed. However, is it possible to agree upon a standard? For what purpose and which standard?
6. HUMAN RESOURCE ACCOUNTING AND INTERNATIONAL DEVELOPMENTS: IMPLICATIONS FOR MEASUREMENT OF HUMAN CAPITAL: Maria L. Bullen
Clayton State University, Kel-Ann Eyler Wesleyan College. Human Resource Accounting (HRA) involves accounting for expenditures related to human
resources as assets as opposed to traditional accounting which treats these costs as expenses that reduce profit. Interest and contributions to growth in
HRA have been evident in a number of countries. The strong growth of international financial reporting standards (IFRS) is an indication that the
environment for international financial accounting is one that potentially encourages the consideration of alternative measurement and reporting
standards and lends support to the possibility that future financial reports may include non-traditional measurements such as the value of human
resources using HRA methods.
7. HUMAN RESOURCE ACCOUNTING: R Parameswaran, K Jothi. Human Resource Accounting is one of the latest concepts adopted by Indian companies in
recent times. Most of the enterprises which follow Human Resource Accounting spare a separate section in their annual reports for a detailed account of
their human resources. Human asset reporting in India usually includes a profile of human assets, the compensation pattern, training and development,
human asset productivity, human asset value, and the total wealth of the organization. The concept of human resource accounting can be basically
examined from two dimensions: (i) the investment in human resources; and (ii) the value of human resources. The expenditure incurred for creating,
increasing, and updating the human resource quality is known as investment in human resources. Such investment yields fruitful results like higher
productivity and higher income to the organisation. The yield that the investment in human resources generates will be considered as the basis of human
resource value. The American Accounting Association defines human resource accounting as “measuring data of human resources and communicating the
information to the interested parties”. It has rightly pointed out that human resource accounting would measure all the data relating to the people of an
organization, and this data when reported to either the shareholders, or managers, or government, or any other agency, will be helpful in making the
relevant decisions.
8. AN ANALYTICAL STUDY OF HUMAN RESOURCEACCOUNTING PRACTICES –AN INDIAN EXPERIENCE: Mamta Ratti (Professor, Swami Devi Dyal Institute of
Management Studies, Barwala, Panchkula, India). Human resource accounting has very high significance not only for the management, but also for analyst
and even for employees. It helps management in better utilization, planning management of human resources in the organization while for analyst, Even
today, when a good deal of work has been done in this field, it is very much unfortunate that there is not only set pattern or generally accepted method
either for valuation of human resource or for their recording in books of accounts or for the disclosure of information by means of different statements.
The study focuses on the calculation of the value of human resources at different levels of organization & to determine the human resource efficiency
quotient. Fifteen Companies are examined for the measurement of human resource measurement. The present study based on the primary data related to
the measurement of human resources. The incorporation of the value of HR is very expensive and not easy to calculate the value of HR and if they calculate
it, then the value will not indicate the true position of human resource.
9. APPLICATION OF HUMAN RESOURCE ACCOUNTING IN HEAVY INDUSTRIES: Shalini Sharma1* and R.K. Shukla: Since the beginning of globalization of
business and services, Human elements are becoming more important input for the success of any corporate enterprise. It helps the management to frame
policies for human resources. Human Resource Accounting is a process of identifying and measuring data about human resources. Measurement of the
investment in human resources will help to evaluate the charges in human resource investment over a period of time. This paper aims at analyzing the
application of Human Resource Accounting in heavy industries covering the period from 2001-2010 with the case study of The Hindustan Copper Limited, a
public sector undertaking. The case study helps to analyze that the value of production per employee is increasing or decreasing.
HUMAN CAPITAL INVESTMENT HUMAN CAPITAL STRUCTURE
Just like financial capital structure, which consist of various types of capital, the human capital structure consist of various types of employees employed in an
organization. The types of employees may be executives, supervisory, artisans, clerical and skilled-staff or semi-skilled staff. The composition and proportion of
various types of employees play an important role in the development of an organization.
People are the greatest asset the only real difference between one organization and the other is the performance of the people. The survival, development and
performance of an organization depends heavily upon the quality of manpower, Right from Alfred marshal a century ago, down to the management Guru Peter
Drucker, focusing attention knowledge workers and knowledge industries come out clear message that “Knowledge” is the key to development. We are in the
knowledge era where the new wealth of matrons is tied directly up with the creation, transformation and capitalization of knowledge.
Knowledge based industries especially in the science and technology based units are expanding faster than many other industries and contribute towards the
transformation of a country’s economic infrastructure. As there is greater demand for knowledge based products the role of knowledge in achieving competitive
advantage has become a very important matter in all sections of management. Knowledge, a primary competitive factor in business, which is non-traditional and
intangible, and its accumulation, transformation and valuation lie at the heart of intellectual capital management. A recent study estimates that 50 to 90 percent
of the value created by a firm comes from the management of intellectual capital and not from management of traditional physical assets. know-how,
capabilities, skills, and expertise of the human members of the organization. It is that knowledge that each individual has and which can be put to productive
use.
HUMAN CAPITAL AND ITS ELEMENTS
The world is shrinking in all major respects, people, goods, capital and information are moving around the to be as never before. Companies are trying to
become global players just to survive. Companies like Colgate even proclaim “We want to build a common corporate culture. We want them all to be collators”,
while trying to bridge the cultural gap between domestic employees and those in global operations for serving business interests.
With the concepts of the liberalization, privatization and globalization being applied all over the countries in the world, the need has arisen to go in for quality
products and quality service. Each organization has to compete with one another to improve the quality and device cost reduction measures to exist in the
industry. That could be done only with the development of human capital. If Japan and other East Asian countries like Korea and Taiwan have recorded rapid
economic growth, it is because of their investment in human capital, which cannot be easily measured and which differs from one to another. Basically, when we
talk of human capital it refers to the human knowledge, their inner capabilities and creativity qualities. These are to be tapped from the employees. With all the
development of technology it cannot be fully utilized to its full potential without knowledge and skill. The capabilities of the human capital in relation to the
needs of the organization should be improved with the creation of a climate in which the flower of human knowledge, skill, capabilities and creativity can bloom.
How do we develop our human capital and put it to optimum use is the challenge that the present day corporate sector faces. Technological improvements,
business strategies, quality concerns etc., will all have to be implemented through people (human capital only). So it is people who make all the difference.
People and their development are quite central to meeting the needs of globalization and liberalization. The human capital available in the organization should

VOLUME NO. 4 (2014), ISSUE NO. 02 (FEBRUARY) ISSN 2231-4245
INTERNATIONAL JOURNAL OF RESEARCH IN COMMERCE, ECONOMICS & MANAGEMENT A Monthly Double-Blind Peer Reviewed (Refereed/Juried) Open Access International e-Journal - Included in the International Serial Directories
http://ijrcm.org.in/
51
be rightly assessed and should be further developed through motivation training and perception to the needs of the organization. Only then, the organizational
goals can be achieved and more so, it can continue to be market contribution in the field of competition. With the arrival of micro-electronic technology, work
processes have changed. The computer technology offers greater precision but demands different skills. The owners (personnel) of these new skills are both
technically educated and trained on the job.
It is the human capital, which should be rightly invented for the qualitative improvement of human beings who are considered the most valuable asset of an
organization. Human capital refers to the basic skill, capabilities, the perception know-ho and expertise. Every individual has certain skills and understanding.
The education one has undergone should help him to develop knowledge in general. Till one gets basic employment he is no keen on planning his future and
there is uncertainty. This is normal most of the cases except one, who makes his planning as to what he should be even when he takes his education.
As one is placed in an organization in some position, he starts to look for elevation. The organization too would tap his basic skill and capabilities and divert them
to achieve the goals of the organization and in the process it attempts to develop his basic skill through proper training, motivation and direction. The human
capital is rightly put through for the personnel in the organization for effective functioning, right decision making and career development. In all these it creates
value to the organization and makes it more stable in the competitive environment.
The basic elements of human capital are projected as under:
� Know-how
� Education
� Vocational qualification
� Work related knowledge
� Occupational assessments
� Psychometric assessments
� Work related competencies
� Entrepreneurial innovativeness, proactive and reactive abilities.
� Changeability.
(Source: SMAC, 1998)
1. Know-how: This is one of the major elements as it relates to the process of the means to get the end results. It answers the question what is what and how to
do it and the functions involved in general.
2. Education: This is a basic factor which makes one to understand the various aspects of the job or work allotted. This is also a motivating facts for career
advancement.
3. Vocational qualification: This element refers to the practical knowledge a person gets through vocational education and training certain sphere of activity.
4. Work-related knowledge: It is one‟s knowledge in the particular field of work which he has gained through such work being allotted to him. His earlier work
experience in that particular job or work will be of additional value.
5. Occupational assessment: A good analysis of the job will motivate one to study the nature of work or occupation. This will enable one to plan is future career
depending upon the value of assessment.
6. Psychometric approach: This approach tries to measure the ability, i.e., intelligence in terms of quantity or how much intelligence a person has. In other
words, this approach tries to determine and measure qualitatively the factos that make up intelligence. To day Psychometric testing is used to discover usually
able youngsters, who may benefit from enriched or alerted learning. Each person score is compared with standardized norms, standards obtained from the
scores of a large, representative sample of children of the same age who took the test while it was in the process of preparation. Besides providing standardized
norms, test developers must devise techniques to try to ensure that the tests are valid (that they measure the abilities may claim to measure) and reliable that
the results are reasonably consistent from are time to another. These are rigorous criteria, but tests can be meaningful and useful only if they are both valid and
reliable.
7. Work related competencies: This relates to the knowledge one processes with regard to the work he is allotted or involved in. This includes the nature of the
job, his or her practical knowledge and experience in that line of activity, the training one has undergone in that line or work, is aptitude towards the work etc.
8. Entrepreneurial innovativeness, proactive and reactive abilities: It is the entrepreneurial skill and force with which one involves himself in his work. The
aptitude in the particular sphere of activity should motivate him for innovative approach. That should make one to act so when there is some adverse result.
Innovativeness is based on the constant bent of mind on research in the work field.
9. Changeability: The competitiveness among the enterprises drive them making various changes in the organization. As the organizations look or changes, the
employees would be driven for challenging tasks with many changes being made in the organizational structure. It may even salt in positional change. One
should be capable of adjusting himself to the changing organizational setup and changing situations.
These are all the elements of human capital. To tap these qualities highly and develop them would be the task of Human resource development.
MEASURES TO EVALUATE HUMAN CAPITAL In an enterprise the following indicators are being applied as measures evaluate the human capital:
i) Reputation of company employees with head hunters.
ii) Years of experience in profession.
iii) Rookie ratio (percentage of employees with less than 2 years experience)
iv) Employee satisfaction.
v) Employee participation.
vi) Proportion of employees making new innovative plans and suggestions.
vii) Value added per employee.
viii) Value added per salary rupee.
The accounting and reporting of intellectual capital will face the following problems.
i) The need for better tools to manage investment in people, skills and technological capabilities.
ii) The need to be able to measure, over the long run, the returns of investment in people‟s skills, information bases and the organizational technological
capabilities.
HUMAN CAPITAL INVESTMENT The Human Capital acts as a building block for the organizational (structural) capital of the firm. So, when the enterprise looks for making the Human Capital
more effective and beneficial, it has to focus on the effectiveness of investing in training, research and development outcome and returns to technological
infrastructure spending. The investment in human capital should be properly planned keeping in mind the future expansion and development programmes as
the organizational goal. Already it is seen that the organization required personnel who have to be rightly used for achieving its long project objectives. So, these
personnel need proper motivation and encouragement through job analysis, training and research development. Lines of activities are to be thought about for
making the employee to be more innovative. They must conduct themselves so to be a suggestive body to the organization.
VOLUME NO. 4 (2014), ISSUE NO. 02 (FEBRUARY) ISSN 2231-4245
INTERNATIONAL JOURNAL OF RESEARCH IN COMMERCE, ECONOMICS & MANAGEMENT A Monthly Double-Blind Peer Reviewed (Refereed/Juried) Open Access International e-Journal - Included in the International Serial Directories
http://ijrcm.org.in/
52
FINDINGS Cost per employee
� Human capital investment ratio.
� The amount of wealth created by each employee.
� The profit created by each employee..
� Methods of calculation of human resource accounting.
� Approaches to determine the human resource value.
CONCLUSION Human Resource Accounting Information of an organization is very important factor to decision makers in the era of knowledge based economy. As a result,
each organization takes serious attempt to disclose its HRA information to insiders and outsider decision makers. In fact, it is becoming an integral part of
management report. This study initiates to reveal the relationship between corporate attributes and HRAD of listed companies in Bangladesh. Its results shows
that company size significantly associated with HRAI, which leads the conclusion that larger companies with higher market value discloses more HRA information
than smaller companies. The possible reason for the result could be that large companies in DSE are motivated to disclose more HRA information in their annual
report to uphold their market value. In addition, the results also find the financial companies are disclosing HRA information than non financial companies and
company’s profitability positively influences companies to report the information in their annual report. The importance of people an as productive resource has
been ignored by the accounting profession. A team of competent devoted and motivated persons can convert a sick concern into successful one but on the
contrary incompetent and unmotivated personnel may squander away the existing resources leading to bankruptcy. Hence, the more valid treatment of human
resources development expenditure yielding future benefits is to capitalize such expenditure.
REFERENCES 1. Andrikopoulos, A. (2005). Using intellectual capital statements to determine value drivers and priorities for organizational change: a portfolio selection
approach. Knowledge Management Research & Practice 3 (3), 166.
2. Bhat, V.P. (2000, January 13). India: Towards transparency and uniformity. Business line. Chennai, 1.
3. Boedker, C., Mouristan, J. & Guthrie, J. (2008). Enhanced business reporting: international trends and possible policy directions. Journal of Human Resource
Costing & Accounting, 12 (1), 14.
4. Bras, F. A. & Rodrigues, L.L. (2007). Accounting for firms’ training programs: An exploratory study, 11 (3), 229.
5. Brummet, R.L., Flamholtz, E.G. & Pyle, W.C. (1968a, April). Human resource measurement: A challenge for accountants. Accounting Review, 217- 224.
6. Brummet, R.L., Flamholtz, E.G. & Pyle, W.C. (1968b, March). Accounting for human resources. Michigan Business Review, 20-25.
7. Brummet, R.L., Flamholtz, E.G. & Pyle, W.C. (1969, August). Human Resource Accounting: A tool to increase managerial effectiveness. Management
Accounting, 12-15.
8. Bullen, M.L. (2007). Human resource accounting: A useful tool for measurement and management in organizations. Leadership and Organizational
Management Journal. 85-103.
9. Das Gupta, N.(1985), “Human Resource Accounting”, Sultan Chand & Sons, New Delhi.
10. Human Resource Accounting – A Study Material of Company Secretarial Practices in India.
11. Kothari, C.R.(1990), Research Methodology; Methods and Techniques, Wishwa Prakashan, New Delhi.
12. Mouritsen, J. (1998) Driving growth: economic value added versus intellectual capital. Forthcoming in Management Accounting Research.
13. Mouritsen, J. (1999) Intellectual capital: the logic of an ‘economy of creativity’. Work in progress presented at the EIASM workshop on intangibles in
Brussels February, 1999.
14. Naylor, J. C. and Shine, L.C. (1965) A table for determining the increase in mean criterion score obtained by using a selection device. Journal of Industrial
Psychology, 3, pp 33-42.
15. Neimark, M. K. (1992) The hidden dimensions of annual reports. Marcus Wiener, New York, NYO’ Connor, M. A. (1998) Rethinking corporate financial
disclosure of human resource values for the knowledge based economy. Journal of Labour and Employment Law, Vol 1, no 2.
16. OECD (1992) Technology and the economy. The key relationships. The Technology/Economy Programme, Paris. Ogan, P. (1988) Assessing the impact of
human resource accounting information on managerial decisions: a field experiment. Personnel Review, Vol 17, No 3, pp 29-35.
17. Oliver, J. and Flamholtz, E. (1978) Human resource replacement cost numbers, cognitive information processing and personnel decisions. A laboratory
experiment. Journal of Business Finance and Accounting, Vol5, No 2, pp 137-157.
18. Porwal, L.S. (2001), “Accounting Theory” Tata McGraw Hill Company, New Delhi.
19. Rao, Prabhakar D,(1986), “Human Resource Accounting” Inter India Publication, New Delhi.
20. Sharma, R.K., Gupta Shashi K.(2009), “Management Accounting”, Kalyani Publishers, New Delhi.

VOLUME NO. 4 (2014), ISSUE NO. 02 (FEBRUARY) ISSN 2231-4245
INTERNATIONAL JOURNAL OF RESEARCH IN COMMERCE, ECONOMICS & MANAGEMENT A Monthly Double-Blind Peer Reviewed (Refereed/Juried) Open Access International e-Journal - Included in the International Serial Directories
http://ijrcm.org.in/
53
DETERMINANTS OF TOBACCO OUTPUT IN ZIMBABWE
DESMOND NDEDZU
LECTURER
ECONOMICS DEPARTMENT
UNIVERSITY OF ZIMBABWE
ZIMBABWE
VIMBAYI KETERO
STUDENT
UNIVERSITY OF ZIMBABWE
ZIMBABWE
TAMUKA MUKURA
LECTURER
ECONOMICS DEPARTMENT
UNIVERSITY OF ZIMBABWE
ZIMBABWE
TENDAI MAKOVA
LECTURER
ECONOMICS DEPARTMENT
UNIVERSITY OF ZIMBABWE
ZIMBABWE
EDGAR MUHOYI
LECTURER
ECONOMICS DEPARTMENT
UNIVERSITY OF ZIMBABWE
ZIMBABWE
ABSTRACT The study attempts to model the determinants of tobacco output in Zimbabwe over the period 1980 to 2012. An Ordinary Least Squares estimation technique is
adopted and some necessary statistical and econometric specification tests are performed. The findings reveal that acreage is a positive determinant of tobacco
output while the number of growers and the price of a substitute crop (soya beans) have a negative effect on tobacco output. Although these variables are
significant, their influence on tobacco output is minimal as depicted by the elasticities estimates which are less than one. Tobacco prices and rainfall have an
insignificant effect on output at the 5% level of significance. The study recommends the expansion of acreage and irrigation facilities in order to boost tobacco
output.
KEYWORDS Acreage, Ordinary Least Square (OLS), rainfall level, tobacco output.
INTRODUCTION obacco is an important commodity in Zimbabwe, employing 30% of the population and about a third of the people employed in the agriculture sector
(Leaver, 2004). The crop contributes about 20% of total export revenue, making it the second largest export contributor after minerals that account for
25% of total export revenue (NKC Independent Economist, 2010). Quite recently the number of tobacco growers has increased considerably from 48 000
in 2008 to 56 656 in 2011. A huge number of unregistered growers also exist in the midst of the registered ones (Tobacco Industry and Marketing Board (TIMB),
2012). These growers and their families depend on tobacco farming as a source of income. The crop is generally labour intensive in Zimbabwe, requiring human
labour for nursing the seeds, transplanting, weeding, spraying, harvesting and drying.
Having been grown in Zimbabwe for more than 100 years now, tobacco output appears to be sensitive to world commodity price developments due to shocks in
both supply and demand. International tobacco prices have been on the rise from US 8 cents per kilo in 1980 to US 65 cents per kilo in 1990. The price further
increased to US 1.69 dollars in 2000 and further increased to US 2.27 dollars in 2002 and thereafter the trend reversed and the price fell to US 1.61 dollars as at
year 2005. From the year 2006 the price took a positive trend to reach a maximum of US 3.21 dollars in 2008 after which it gradually declined to reach US2.78 in
2011.
Figure 1 shows annual tobacco output and price comparisons between 2000 and 2011. The data presented in figure 2 depictss a negative correlation between
the price of tobacco and the output produced particularly for the periods 2000-2002 and 2008-2011. The same relationship is not so well pronouced over the
period 2003-2007, possibly disqualifying the prediction of the Cobb-webb model of agricultural production which envisage output to respond the price changes
with a lag. From the figure, in years where the price is increasing output is declining and the reverse holds. Agricultural economic theory predicts a positive
relationship between price and quantity produced and supplied. This would therefore suggest that other factors, both exogenous and endogenous could be the
significant drivers of tobacco output. For instance, Jerie and Ndabaningi (2011) found that rainfall level, which is an exogenous component, is very important for
successful tobacco production.
T

VOLUME NO. 4 (2014), ISSUE NO. 02 (FEBRUARY) ISSN 2231-4245
INTERNATIONAL JOURNAL OF RESEARCH IN COMMERCE, ECONOMICS & MANAGEMENT A Monthly Double-Blind Peer Reviewed (Refereed/Juried) Open Access International e-Journal - Included in the International Serial Directories
http://ijrcm.org.in/
54
FIGURE 1: ANNUAL OUTPUT AND PRICE COMPARISON 2000-2011
Source: TIMB Annual Statistics (2012)
Figure 2 shows tobacco trends in output and acreage for the period 1980-2010. In the 1980s tobacco yield averaged 2.05kg/ha and this increased to 2.36 kg/ha
in the 1990s and thereafter the yield drastically declined to an average 1.65 kg/ha in the new millennium. The area planted took a similar trend to that of yield
between 1980 and the year 2000. However, yield drastically declined between 2005 and 2008 as output fell by a larger proportion relative to area under the
crop. Some schools of thought attribute the poor performance of tobacco between 2000 and 2008 to the government’s Fast Track Land Reform Programme
(FTLRP) of 2000 which substantially reversed landholding patterns between the white minority large scale commercial farmers and the majority black indigenous
peasant farmers. Consequently, experienced and well resourced white tobacco farmers were replaced by inexperienced and poorly resourced but eager
indigenous farmers.
FIGURE 2: TRENDS IN OUTPUT AND HECTARE FROM 1980-2010
Source: TIMB Annual Statistics (2012)
REVIEW OF LITERATURE The greatest challenge facing developing countries today is improving agricultural production to eliminate hunger and poverty (Nhemachena, 2003; Parry, 1978;
Parry, 1981; Youdeowe, Ezdina and Onazi, 1986). Tobacco production has the potential to meet these two goals through enhancing farmers’ incomes and
wealth. However, to address this challenge it is important to first of all understand the various factors that influence crop production. Most studies on the
determinants of crop production tend to agree that rainfall and acreage [(Igwe and Esonwune (2011), Olujenyo (2004), Jerie and Ndabaningi (2011), Harashima
(2008), Mohammad et al (2007)], are strong variables that influence crop output. The World Meteorological Organisation (WMO) report on Zimbabwe (2007)
also reports that rainfall is by far the most important variable that affects crop production. This is particularly likely, especially in communal areas of Zimbabwe
where rainfall is exceptionally variable in the absence of dam and irrigation facilities. However most of these studies tend to generalise rainfall as the important
determinant of crop production, thereby ignoring the “rainfall level” which is particularly important for successful tobacco production. For instance, tobacco
requires about 20mm to 30mm of rainfall after every two weeks (Jerie and Ndabaningi, 2011). This translates to rainfall of between 450mm to 800mm per
cropping season. Extreme rainfall variability in the absence of supportive dam and irrigation facilities may result in reduced crop yield.
A compilation of studies by the Food and Agricultural Organisation (FAO) in 2003 regarding tobacco production in most producing countries revealed that in
China 40% of variations in tobacco output from 1970 to 1999 were attributed to the total land under cultivation. In the same compilation, a study on Brazil’s
tobacco industry also shows that tobacco output is influenced by acreage as well as labour costs. The results show that 0.8% of discrepancies in tobacco output
are influenced by total land area under cultivation. Mohammad, et al. (2007) in their study for Pakistan found that crop acreage is significantly influenced by the
price of the crop and the prices of other competing crops while rainfall and irrigation were found to only have a positive effect on crop output in the short run.
Their study used acreage as a proxy for agricultural output, hence implicitly assuming that farmers can increase their output by utilising more land. This is a weak
proxy since output and acreage may not be positively correlated as output may depend on a whole array of other factors, both exogenous and endogenous
In trying to model the price elasticity of tobacco output in Zimbabwe, Leaver (2004) highlighted some of the factors that determine tobacco output in Zimbabwe.
Using time series data for 1938-2000 and applying the Nerlovian model to verify the supply response of tobacco output, results indicate that current tobacco
0
50000
100000
150000
200000
250000
300000
1980
1982
1984
1986
1988
1990
1992
1994
1996
1998
2000
2004
2008
(ha)
/(kg
/ha)
/(to
nnes
)
Area harvested (ha) Yield (kg/ha) Production (tonne)
236,946,295
202,535, 209
165,835,001
81, 806,414
68,901,129 73,376, 990
55,466,689
73, 039,015
48, 775, 178 58,570, 652
123,407,239 132, 431, 905
1.69
1.75
2. 27
2. 25
2.00
1.61
2. 00
2. 32
3.21 2. 98
2.88 2. 73
-
0.50
1.00
1.50
2.00
2.50
3.00
3.50
-
50,000,000
100,000,000
150,000,000
200,000,000
250,000,000
2000 2001 2002 2003 2004 2005 2006 2007 2008 2009 2010 2011
USD/KG
MASS (KG)
YEAR
ANNUAL PRODUCTION AND PRICE COMPARISON SINCE 2000
MASS SOLD (USC/KG)

VOLUME NO. 4 (2014), ISSUE NO. 02 (FEBRUARY) ISSN 2231-4245
INTERNATIONAL JOURNAL OF RESEARCH IN COMMERCE, ECONOMICS & MANAGEMENT A Monthly Double-Blind Peer Reviewed (Refereed/Juried) Open Access International e-Journal - Included in the International Serial Directories
http://ijrcm.org.in/
55
output and market prices were positively related to the next season’s tobacco at the 1% level of significance. Rainfall and sales quota were both found to have a
negative influence on tobacco output. Leaver ignored the effects of acreage on output which is a key factor of production in agriculture. Quite recently,
Pfumayaramba (2011) investigates tobacco output response to output itself, tobacco prices, prices of other crops as well as production costs in Zimbabwe using
time series data for the period 1980 to 2010. Results show that except for the price of competing crops, own tobacco price and quantity have positive influence
on tobacco output whilst production costs and price of other crops are negatively related to tobacco output. These results are consistent to those by Leaver
(2004). Both studies did not make an attempt to assess the influence of “the rainfall level” as well as the “number of farmers” on overall tobacco output. The
FTLRP brought a substantial increase in the number of farmers participating in tobacco production. These farmers are spread over small farm sizes, a situation
found to enhance farmer productivity in some countries due to the popularised inverse farm size-productivity relationship (Berry and Cline 1979, Carter 1984,
Cornia 1985)
SIGNIFICANCE OF THE STUDY Zimbabwe underwent an economic recession in the last decade to December 2008 such that overall agricultural output was severely depressed. Tobacco, which
is one of the country’s major income earner and employer was also severely affected. Examining and re-examining the factors that influence tobacco output in
an effort to formulate policies that promote increases in tobacco output is key to the successful turnaround of the Zimbabwean economy. Apart from the
already established determinants of tobacco output by previous scholars, this study attempts to access the “rainfall level” and two key variables (number of
growers and acreage) which were grossly transformed by the FTLRP of the year 2000.
STATEMENT OF PROBLEM The Zimbabwean economy is agro-based with tobacco as the major agricultural export crop and employer. Tobacco output is therefore directly linked to GDP
and hence economic growth. The tobacco industry experienced a decline in output from 236 000 tonnes in year 2000 to 48 000 tonnes in 2008 (TIMB, 2011). In
other periods output has been fluctuating and currently production is below the nation’s full potential. This production instability has culminated in a decrease
in the country’s exports, income and GDP. A decrease in income negatively affects the welfare of the nation since 30% of the population is employed in the
tobacco sector. The reduction in income also affects the country’s saving and investment levels. Researching on factors that determine tobacco output, which is
one of the prime drivers of economic growth in Zimbabwe, is therefore key to addressing an array of economic challenges.
OBJECTIVES OF THE STUDY The overall objective of the study is to determine the factors that influence tobacco output in Zimbabwe. Specific objectives are;
� To establish the effect of “rainfall level” on tobacco output.
� To determine if acreage influences output.
� To investigate the relationsgip between output and the number of growers
� To determine if the price of tobacco influences tobacco output.
� To establish the effect of yield on output
� To establis whether the price of a substitute crop affects tobacco output
RESEARCH METHODOLOGY The Ordinary Least Squares (OLS) regression methodology is widely used because it produces estimators which are best, linear, unbiased and efficient (BLUE). It
is also relatively easy to compute when compared to other regression methodologies. This methodology is applied on an extended and log-linearised Cobb-
Douglas production function of the form
βα KALQ = where L and K are the factors of production representing labour and capital,
Q is output, α and
β are parameters representing the marginal productivities of labour and capital respectively and A is a constant. This conventional production function is
modified to incorporate other agricultural factors of production as explained in the Cobb Web and Barnum-Squire models. A log model is estimated after
linearising the tobacco production function. The tobacco output function is therefore as follows:
tttttttt RLVLALPSLPTLGLQ µβββββββ +++++++= −− 654131210 ………. (1)
Where tLQ is the logarithm of total tobacco output in tonnes produced in year t, tLG
is the logarithm of the total number of tobacco growers in year t,
1−tLPT is the one period lag of the logarithm of tobacco prices, 1−tLPS
represents the one-period lagged log of prices of competing crops (Soya beans),
tLA is the log of acreage in year t, tLV
is the log of the yield per hectare in year t, tR is a dummy variable for rainfall level in year t. The dummy takes the
value 0 in years with rainfall below 450 millimetres or above 800 millimetres and 1 in years with rainfall level within the optimal range for tobacco production,
610 ,..., βββ are parameters to be estimated and
µt is a random error term.
Tobacco output is measured by the actual total of flue-cured tobacco output delivered to the auction floors. Because data on actual tobacco output delivered to
the auction floors is readily and accurately available, we use delivered tonnage to proxy total tobacco output. This is based on the assumption that all output
produced is sold.
Tobacco price is the average price for tobacco offered at the auction floors. To account for both the pre and post dollarisation periods and for uniformity, prices
are in American dollars as recorded and provided by the TIMB. The average price of soya beans is used as a proxy for the price of competing crops. The average
price is in US dollars after having converted Zimbabwean dollar values into US dollars using the official exchange rate as provided by the Reserve bank of
Zimbabwe (RBZ). The prices are valued through indirect quoting due to the inflationary conditions which prevailed before dollarisation in 2009. Soya is grown in
similar geographical regions as tobacco. It is also very sensitive to rainfall patterns as it requires neither too much nor too little rain just like tobacco and this
authenticates soya bean price as a better proxy for competing crops. Prices are lagged by one period since farmers’ output decisions are usually based on prices
that prevailed in the previous farming season.
After the FTLRP in year 2000, land holdings were restructured to smaller units. This resulted in an increase in the number of participants in commercial
agriculture. To capture the effect of the agrarian transformation on tobacco output, the total number of tobacco registered growers for a particular season is
included to be an explanatory variable. Also, to assess this inverse farm size- productivity relationship we take acreage to represent a measure of farm size and
regress it against output.
Yield measures the efficiency with which farmers use available resources to produce a given level of output. This is essential as it captures knowledge and
technological aspects of production. We take yield to mean total tobacco output per every hectare planted.
ESTIMATION PROCEDURE
The E-views econometric software is used is our analysis and a general to specific modelling approach is adopted. This approach requires diagnostic tests to be
performed in order to ensure the effectiveness of the technique. These tests involve testing for multi-collinearity, stationarity, variable significance, normality
and the goodness of fit. These tests are carried out to authenticate the assumptions of the Classical Linear Regression Model (CLRM) as well as to ensure that the

VOLUME NO. 4 (2014), ISSUE NO. 02 (FEBRUARY) ISSN 2231-4245
INTERNATIONAL JOURNAL OF RESEARCH IN COMMERCE, ECONOMICS & MANAGEMENT A Monthly Double-Blind Peer Reviewed (Refereed/Juried) Open Access International e-Journal - Included in the International Serial Directories
http://ijrcm.org.in/
56
results obtained are BLUE. To detect high collinearity between variables a correlation matrix is first constructed. Secondly to avoid the risk of spurious regression
caused by non stationary data, Augmented Dick Fuller unit root tests are carried out to test for stationarity, or the lack of it. Thirdly, non stationary variables are
differenced to make them stationary. Fourthly, the tobacco output function is estimated using the OLS method and any insignificant and unimportant variables
are dropped, and finally, model diagnostic tests are performed.
The presence of autocorrelation results in an overestimated coefficient of determination and renders the F-test and t-tests invalid (Gujarati, 1995). The Durbin
Watson (DW) statistic is used to test for autocorrelation which requires the statistic to have a value around two in the absence of autocorrelation. The t- statistic
test is also performed to ensure that exogenous variables are relevant. The inclusion of irrelevant variables inflates the variances of the coefficients. A huge
variance reduces the efficiency of estimated parameters. Because the CLRM requires the error term to be normally distributed about the mean (Gujarati, 1995),
the Jarque Bera statistic of skewness and kurtosis measures are computed to check for the normality of residuals. The goodness of fit test is also computed to
verify if the model is correctly specified. The coefficient of determination (R2) and the F-statistic are used to test for model specification bias.
RESULTS & DISCUSSION Table 1 shows minimum variability in most of the variables except for LGt, LPTt-1 and LPSt-1 which have relatively huge standard deviation scores. Most variables
are negatively skewed as indicated by the negative values of skewness, implying that higher values of variables were observed at the beginning of the period
under consideration except for soya beans prices and the number of growers which are positively skewed.
TABLE 1: SUMMARY OF DESCRIPTIVE STATISTICS
LAt LGt LPSt-1 LPTt-1 LQTt LVt Rt
Mean 11.07 8.50 -1.15 -0.11 11.77 7.56 0.73
Median 11.06 7.98 -1.11 0.52 11.74 7.61 1.00
Maximum 11.43 10.94 3.03 1.17 2.47 7.93 1.00
Minimum 10.55 7.04 -4.61 -2.53 10.70 6.67 0.00
Std. Dev. 0.22 1.32 1.17 1.18 0.42 0.31 0.45
Skewness -0.27 0.48 0.55 -0.77 -0.29 -1.30 -1.02
Kurtosis 2.33 1.70 7.98 2.11 2.55 4.21 2.04
Jarque-Bera 1.03 3.57 35.84 4.33 0.74 11.37 6.99
Probability 0.60 0.17 0.00 0.11 0.69 0.00 0.03
Observations 33 33 33 33 33 33 33
Normality of variables is tested by kurtosis and the Jarque-Bera (JB) statistics which should be close to 3 and 2 respectively to accept the null hypothesis of
normality. All variables are normally distributed except for LPSt-1 which has a value of 7.98 for kurtosis and 35.84 for the JB statistic. Despite the failure of LPSt-1
to satisfy the assumption of normality, we can still proceed to include it in the model. Green (2003) postulates that the assumption of normality is often viewed
as an unnecessary and possibly inappropriate addition to the regression model. Gujarati (2004) also emphasized that regression analysis can still be carried out
regardless of the normality of a variable.
TABLE 2: MULTI-COLLINEARITY TESTS USING PAIR WISE METHOD (CORRELATION MATRIX)
LGt LPTt-1 LPSt-1 LAt LVt Rt
LGt 1
LPTt-1 0.764687 1
LPSt-1 -0.021583 -0.264396 1
LAt 0.182486 0.582975 -0.320664 1
LVt -0.618429 -0.226929 -0.044868 0.347784 1
Rt 0.275542 0.199792 -0.182219 0.081553 -0.064645 1
The correlation matrix depicts the linear relationships amongst exogenous variables. High colleniarity between variable, as depicted by values greater than 0.8,
would result in the problem of multi-collinearity in exogenous variables. The results in the matrix have values below 0.8, implying that all the variables can be
included in the regression model as potential explanatory variables
TABLE 3: AUGMENTED DICK-FULLER UNIT ROOT TEST RESULTS
Variable ADF Statistic Order of Integration
dLQt -3.242113*** I (1)
dLGt -2.922017**
I (1)
dLPt-1 -4.231370*** I (1)
LPSt-1 -4.959449*** I (0)
dLAt -4.079628** I (1)
dLVt -4.526110*** I (1)
Rt -4.727048*** I (0)
*** indicating stationary at 1% (all levels),**stationary at 5% and d indicating change
Unit Root Test results suggest that the stationarity properties of the variables do not warrant the use of co-integration since the variables are not integrated of
the same order. Only two variables (Rt and LPSt-1) are stationary in levels while the rest became stationary after first differencing.
TABLE 4: OLS REGRESSION RESULTS
Variable Coefficient t-statistic p-value
C -0.092978 -1.966931 0.0604
dLAt 0.709920 4.593067 0.0001
dLPTt-1 0.060996 0.729945 0.4722
LPSt-1 -0.055781 -2.752054 0.0109
dLVt 0.513521 4.272621 0.0002
dLGt -0.300366 -2.779258 0.0102
Rt -0.078609 1.472435 0.1534
R-squared 0.811080 S.E. of regression 0.124352
Adjusted R-squared 0.765739 F-statistic 17.88847
Durbin Watson stat 1.877130 Prob (F-statistic) 0.000000
Dependant Variable: dLQt, d shows change

VOLUME NO. 4 (2014), ISSUE NO. 02 (FEBRUARY) ISSN 2231-4245
INTERNATIONAL JOURNAL OF RESEARCH IN COMMERCE, ECONOMICS & MANAGEMENT A Monthly Double-Blind Peer Reviewed (Refereed/Juried) Open Access International e-Journal - Included in the International Serial Directories
http://ijrcm.org.in/
57
A summary of the regression results is given in the table 4. A Durbin Watson (DW) statistic value of 1.877 (which is approximately equal to two) indicates the
absence of autocorrelation, a crucial requirement of the CLRM. The coefficient of determination (R-squared) indicates that about 81% of the variations in
tobacco output are explained by the combined variation in the exogenous variables in the model. The F-test shows that the overall regression is significant at 1%
level of significance as indicated by a low probability value of the F-statistic (0) and the greater value of the F-statistic (17.89). On the basis of these statistical
results, we conclude that the model is correctly specified and is of a “good fit”.
Total area under tobacco is significant at the 1% level of significance. It positively influences tobacco output as shown by the positive coefficient, conforming to
apriori expectations. However considering a coefficient of 0.71 which is less than one, the increase is only marginal. A 10% percent increase in acreage is
expected to yield 7.1% increase in tobacco output. This shows that tobacco output is inelastic to changes in acreage. The results are in line with those found by
Igwe (2011) which had an elasticity of 0.44.
The estimation found yield to be a significant variable in influencing tobacco output at 1%. Yield is positively related to output, that is, output increases as yield
increases. From the results, a percentage increase in yield would culminate into a 0.5% increase in output. The adoption of technology to improve yields has
positive although minimal effects on overall tobacco output.
The price of soya (a substitute crop) is significant at the 5% level of significance and is inversely related to tobacco output. An increase in the price of soya would
result in a decline in tobacco output. The result also reveals that output is inelastic to relative changes in the price of soya, as indicated by a price elasticity of
0.05. A study by Pfumayaramba (2011) also established tobacco output to be price inelastic and negatively related to output.
The number of growers is negative and significantly related to output at the 5% level of significance. A 1 percent increase in the number of tobacco registered
growers would result in a 0.3 percent decline in tobacco output. The negative relationship is not in line with our priori expectations. We conclude that new
tobacco farmers are less productive when compared to the former large scale commercial farmers. Their low productivity may be attributed to the lack of the
technical knowledge which is essential for successful tobacco farming and possibly the lack of the necessary farming equipment
The results show no evidence of a significant influence of previous season tobacco prices on current tobacco output. However, Leaver (2004) and Pfumayaramba
(2011) found past prices to be significant in influencing output. We attribute the difference in results to the differing time periods considered in the studies as
well as data inconsistencies in the new millennium due to the volatile economic environment that was experienced during that time.
Rainfall level has no influence on tobacco output at 10% level of significance as revealed by the results. We conclude that most tobacco farmers tend to
supplement low rainfall with irrigation water and that rainfall levels have generally been on the downside with extreme cases in which droughts have occurred.
SUMMARY AND POLICY RECOMMENDATIONS The study sought to determine the factors that influence tobacco output in Zimbabwe by employing an OLS methodology on time series data from 1980 to 2012.
ADF tests were done to avert the possibility of spurious regression and test results showed that all variables are stationary at 1st
difference with the exception of
the price of soya and rainfall level which were stationary at levels.
Acreage, yield, number of growers and the price of soya are found to be the significant determinants of tobacco output while rainfall level and previous season
tobacco prices are insignificant. We conclude that most tobacco farmers tend to supplement low rainfall with irrigation water and that rainfall levels have
generally been on the downside with extreme cases in which droughts have occurred. We also conclude that new tobacco farmers are less productive when
compared to the former large scale commercial farmers. Their low productivity is attributed to the lack of the technical knowledge which is essential for
successful tobacco farming and possibly to the lack of the necessary farming equipment.
Some policy implications can be drawn from the study results. Policy makers should consider incentives that promote land utilisation since tobacco output is
positively related to acreage. The setting and enforcement of a “minimum acreage” for farmers to be registered as growers should also be considered. There is
need to construct more dams and irrigation facilities in order to counter the adverse effects of droughts and “below optimal” rainfall levels in tobacco farming.
Agricultural institutions such as AGRITEX have to be adequately funded in order for them to implement government agricultural policy through the provision of
technical and extension services. The smooth functioning of these institutions assists in the timely and proficient delivery of farmer education on the optimum
methods of production.
REFERENCES 1. Alemu, Z.G., Oosthuizen, K. and VanSchalkwyk, H.D. (2003), “Grain-Supply Response in Etheopia: An Error-Correction Approach,” Agrekon, Vol. 42, No 4.
2. Barnum, Howard N. and Squire, L. (1979), “An Econometric Application of the Theory of the Farm-Household,” Journal of Development Economics, Vol. 6,
pp. 79-102.
3. Bautista.R.M et al (2002), Macroeconomic Policy Reforms and Agriculture: Toward Equitable Growth in Zimbabwe, IFRP Research Report 128, Library of
Congress Publications.
4. Berry, R.A. and W.R. Cline (1979), “Agrarian Structure and Productivity in Developing Countries.” Baltimore, Johns Hopkins University Press
5. Cafiero. C, (2003), Agricultural Policies in Developing Countries, NAPC Working Paper GCP/SYR?006/ITA, Damascus
6. Carter, M.R (1984), “Identification of the Inverse Relationship Between Farm Size and Productivity: An Empirical Analysis of Peasant Agricultural Production”
Oxford Economic Papers, New Series, Vol. 36, No. 1, pp. 131-145
7. Cornia, G.A. (1985), “Farm Size, Land Yields and the Agricultural Production Function: An Analysis for Fifteen Developing Countries,” World Development
Vol. 13, No.4, pp. 513-534.
8. Food and Agriculture Organization of the United Nations, (2003), “Issues in the Global Tobacco Economy: Selected Case Studies,” Rome, FAO Publications.
9. Greene, W.H., (2003), “Econometric Analysis,” 5th
Edition, New Jersey, Prentice Hall.
10. Igwe, K. and Esonwune, C. (2007), “Determinants of Agricultural Output: Implication on Government Funding of Agricultural Sector in Abia State, Nigeria,”
Journal of Economics and Sustainable Development, Vol.2, No. 4.
11. Jerie, S., and Ndabaningi, T. (2011), “The Impact of Rainfall Variability on Rain-Fed Tobacco in Manicaland Province of Zimbabwe,” Journal of Sustainable
Development in Africa, Vol. 13. No. 1, ISSN: 1520-5509
12. Leaver, R. (2004), “Measuring the Supply Response Function of Tobacco in Zimbabwe,” Agrekon, Vol.43, No. 1, pp. 29-49
13. Mohammad, et al (2007), Price and Non-Price Factors Affecting Acreage Response of Wheat in Different Agro-Ecological Zones in Punjab: A Co-Integration
Analysis, Pak. J. Agri. Sci., Vol. 44, No.2
14. Mudege, N. (2008), “An Ethnography of Knowledge: The Production of Knowledge in Mupfurudzi Resettlement Scheme,” Zimbabwe, Brill.
15. Nhemachena, M.R. (2007), “Assessment of the Economic Impacts of Climate Change on Agriculture in Zimbabwe: A Ricardian Approach,” NPSS 4292 Vol. 1,
No. 1.
16. NKC Independent Economists, (2010), “The Role of Burley Tobacco in Selected African Economies and the Expected Impact of a Decline in the Crop’s
Production, Western Cape.
17. Olujenyo F.O. (2004): “The Determinants of Agricultural Production and Profitability in Akoko Land, Ondo-State, Nigeria,” Thesis, Adekunle Ajasin
University, Ondo.
18. Parry, M.L. (1978), “Climate change, Agriculture and Settlement,” Folkestone, UK, William Dawson and Sons.
19. … (1981), “Climatic Change and the Agricultural Frontier: A Research Strategy,” In: Climate and History, pp. 319-336, Cambridge, Cambridge University
Press.
20. Pfumayaramba, T. (2011), “Analysis of Flue-cured Tobacco Supply Elasticity in Zimbabwe 1980-2010: An Error Correction Model Approach,” AARES Working
Paper 55, Melbourne.
21. Reserve Bank Of Zimbabwe, (2009), Annual Publications.

VOLUME NO. 4 (2014), ISSUE NO. 02 (FEBRUARY) ISSN 2231-4245
INTERNATIONAL JOURNAL OF RESEARCH IN COMMERCE, ECONOMICS & MANAGEMENT A Monthly Double-Blind Peer Reviewed (Refereed/Juried) Open Access International e-Journal - Included in the International Serial Directories
http://ijrcm.org.in/
58
22. Rukuni, M. (1994), “The Prime Movers of Zimbabwe’s Agricultural Revolution. In Zimbabwe Agricultural Revolution,” (ed.s) Rukuni. M and Eicher C.K,
Harare, University of Zimbabwe Press.
23. (2006), “The Evolution of Agricultural Policy: 1890–1990,” In: Rukuni, M, Tawonezvi, P, Eicher, CK, Munyuki-Hungwe, M & Matondi, P (eds). Zimbabwe’s
Agricultural Revolution Revisited. Harare, University of Zimbabwe Publications
24. Tobacco Industries and Marketing Board (TIMB) (2012), Annual Statistical Report
25. Townsend, T. (1994): “Dynamic Acreage Response and Error Correction Model for Maize and Tobacco in Zimbabwe,” Occasional Paper No. 7 of the
International Association of Agricultural Economics.
26. World Meteorological Organisation. (2007), “Climatology.” Retrieved from www.wmo.ch/pages/prog
27. Youdewe, P., Ezdinma, F.O.C., and Onazi, O., (1986), “Introduction to Tropical Agriculture.” England, Longman.
28. Zimbabwe Tobacco Association (2001), Annual Report.

VOLUME NO. 4 (2014), ISSUE NO. 02 (FEBRUARY) ISSN 2231-4245
INTERNATIONAL JOURNAL OF RESEARCH IN COMMERCE, ECONOMICS & MANAGEMENT A Monthly Double-Blind Peer Reviewed (Refereed/Juried) Open Access International e-Journal - Included in the International Serial Directories
http://ijrcm.org.in/
59
NATURAL RESOURCE ENDOWMENT AND ECONOMIC GROWTH IN AN OIL EXPORTING COUNTRY: THE
CASE OF NIGERIA
ALALADE S. A.
LECTURER
BABCOCK UNIVERSITY
ILISHAN-REMO
EJUMEDIA P. E.
STUDENT
DEPARTMENT OF ECONOMICS
UNIVERSITY OF LAGOS
AKOKA
ABSTRACT The question of whether natural resource endowment in a country is necessary or sufficient for economic growth has been an issue of debate since the
contribution of Sach and warners (1995). Thus, this study examines the long-run impact of natural resource (oil) endowment on economic growth in Nigeria. The
result indicates that the variables are inter-related, and that they have long-run relationship. We therefore proceed to estimate the long-run impact of oil
resource endowment on economic growth using the fully modified ordinary least square (OLS), because the conventional OLS can yield results that are biased and
inconsistent. The result showed that net oil export has a positive and significant impact on economic growth in Nigeria in the long-run. The implication of this is
that even though it seems that a resource curse exists in Nigeria now, in the long-run, oil resource “curse” can be converted into resource “blessings”. However,
when oil resource endowment is measured with oil export, it was observed that although the coefficient had positive relationship with economic growth, it was
not statistically significant implying that there is neither a resource “curse” or “blessing” in Nigeria in the long-run. Overall, we conclude that that good
governance is necessary to achieve economic growth in the long-run.
KEYWORDS natural resources, economic growth, oil exporting countries.
1. OVERVIEW he question of whether natural resource endowment in a country is necessary or sufficient for economic growth has been an issue of debate for a long
time. Writers such as (Lederman & Maloney, 2007) posit that natural resource in a country can be combined with capital and labour to achieve higher
economic growth (resource blessing). Thus, it is expected that countries with natural resource endowment should experience higher economic growth
than countries with less resource endowment. But, Jean (1876; 1962), and Sachs and Warner (1995; 1997) assert that while access to natural resource through
foreign trade is important for a country to achieve higher level of economic growth, possession and production of natural resource is not crucial.
Accordingly, other authors, such as De Long and Williamson (1994); Collier and Hoeffler (2005); Moene and Torvik (2006); and Ross (2012) establish that natural
resource endowment can create distortion in the economy. This distortions serve as a channel through which natural resource affect an economy negatively and
it is usually manifested through the stimulation of extensive rent seeking behavior among oil producing firms which would lead to corruption and make
government undertake worse economic policies; raise the stake in the struggle for control of government; and encourage politicians to put more effort into
maintaining political power. It may also lead to over expansion of the size of government arising from revenue generated from export (Willebald, 2010; Alonso &
Garcimartin, 2004).
Further, natural resource endowment can stimulate conflict within society as different groups and political parties fight for their share of either the resource or
resource “money”. It can also destroy a nation’s tax system as government’s revenue generating interest will be diverted more to income from resource export
proceeds. It can as well lead to Dutch Disease Syndrome – a situation in which revenue from natural resource export leads to appreciation of the exchange rate
thereby making output of the manufacturing sector less competitive in international markets. These negative effects have been described in the literature as
“resource curse” (Sachs & Warner 1995; 1997 & 2001, Gylfason et al. 1999).
Nigeria is richly endowed with huge natural resources (natural gas, tin, ore, coal, oil, limestone niobium, lead, zinc, arable land and water), but depends largely
on the oil resource. This is because of the lucrative nature of crude oil coupled with the fact that the country is bless with huge oil reserve, and also a major
producer of oil. Despite this, the country has been experiencing sluggish economic growth and rising unemployment rate as compared to some countries that
have less oil reserves.
Available data indicate that the current rates of unemployment of about 21 percent is far higher now than in the period before the oil boom in the early 1970s (
WDI, 2011). Several studies have examined the impact of resource endowment on economic growth in Nigeria. However, most of the studies in this area have
been theoretical (Mähler, 2010) (Onigbinde 2008). It is against this backdrop that this study empirically examines the impact of resource endowment on
economic growth in Nigeria. Specifically, the study examines: (1) if there exists a long-run relationship between oil resource endowment and economic growth
in Nigeria (2) if the resource curse exist in Nigeria in the long-run.
Following this introduction, section two treats the empirical literature review, some stylized facts on oil resource is analyzed in section three. Section four treats
the theoretical framework and methodology, the empirical result and discussion is treated in section five while section six treats the policy recommendations
and conclusion.
2. EMPIRICAL LITERATURE REVIEW The earlier study by Sachs and Warner (1997) establishes that countries with natural resource endowment achieve slower growth than countries that are less
endowed during 1970 to 1990 periods. They attributed the reason for this to the Dutch Disease Syndrome, which occurs mostly through exchange rate
appreciation and the de-industrialization that follow discoveries and booms in natural resources. According to this view, labour from manufacturing sectors is
move towards natural resource and service sectors, this movement will cause the country’s manufacturing sector to contract as it diminish long run labor
productivity and industrial growth (Sachs & Warner, 1997). Collier and Goderis (2007) explore six different channels by which the resource curse can manifest
namely; (a) Dutch Disease effects, (b) institutions´ conformation, (c) conflict of interests and political economy, (d) excessive public debt, (e) income inequality
and (f) commodity price volatility. Regarding institutional channels, conflict of interests and political economy, author like Van der Ploeg (2007) state that
institutions generated by natural resource-abundance come from previous institutional weaknesses, that is when weak institutions exist before the boom of
natural resources affects the economy, the effect is negative and vice versa.
T
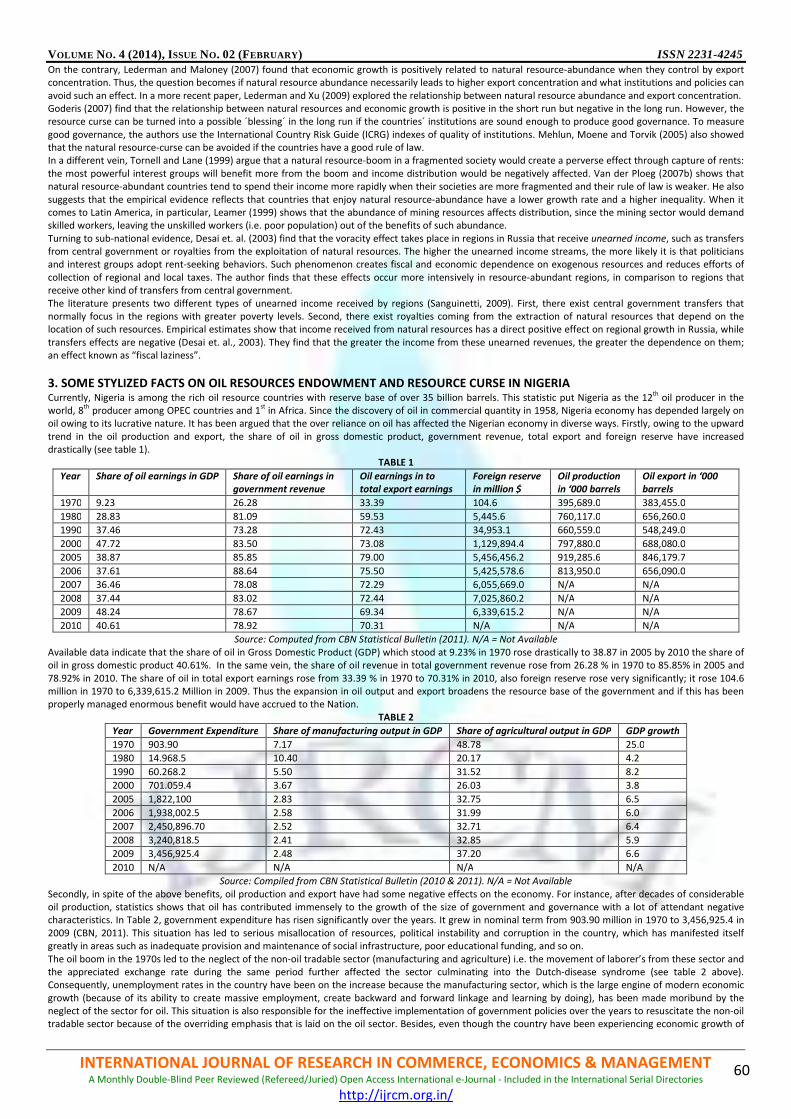
VOLUME NO. 4 (2014), ISSUE NO. 02 (FEBRUARY) ISSN 2231-4245
INTERNATIONAL JOURNAL OF RESEARCH IN COMMERCE, ECONOMICS & MANAGEMENT A Monthly Double-Blind Peer Reviewed (Refereed/Juried) Open Access International e-Journal - Included in the International Serial Directories
http://ijrcm.org.in/
60
On the contrary, Lederman and Maloney (2007) found that economic growth is positively related to natural resource-abundance when they control by export
concentration. Thus, the question becomes if natural resource abundance necessarily leads to higher export concentration and what institutions and policies can
avoid such an effect. In a more recent paper, Lederman and Xu (2009) explored the relationship between natural resource abundance and export concentration.
Goderis (2007) find that the relationship between natural resources and economic growth is positive in the short run but negative in the long run. However, the
resource curse can be turned into a possible ´blessing´ in the long run if the countries´ institutions are sound enough to produce good governance. To measure
good governance, the authors use the International Country Risk Guide (ICRG) indexes of quality of institutions. Mehlun, Moene and Torvik (2005) also showed
that the natural resource-curse can be avoided if the countries have a good rule of law.
In a different vein, Tornell and Lane (1999) argue that a natural resource-boom in a fragmented society would create a perverse effect through capture of rents:
the most powerful interest groups will benefit more from the boom and income distribution would be negatively affected. Van der Ploeg (2007b) shows that
natural resource-abundant countries tend to spend their income more rapidly when their societies are more fragmented and their rule of law is weaker. He also
suggests that the empirical evidence reflects that countries that enjoy natural resource-abundance have a lower growth rate and a higher inequality. When it
comes to Latin America, in particular, Leamer (1999) shows that the abundance of mining resources affects distribution, since the mining sector would demand
skilled workers, leaving the unskilled workers (i.e. poor population) out of the benefits of such abundance.
Turning to sub-national evidence, Desai et. al. (2003) find that the voracity effect takes place in regions in Russia that receive unearned income, such as transfers
from central government or royalties from the exploitation of natural resources. The higher the unearned income streams, the more likely it is that politicians
and interest groups adopt rent-seeking behaviors. Such phenomenon creates fiscal and economic dependence on exogenous resources and reduces efforts of
collection of regional and local taxes. The author finds that these effects occur more intensively in resource-abundant regions, in comparison to regions that
receive other kind of transfers from central government.
The literature presents two different types of unearned income received by regions (Sanguinetti, 2009). First, there exist central government transfers that
normally focus in the regions with greater poverty levels. Second, there exist royalties coming from the extraction of natural resources that depend on the
location of such resources. Empirical estimates show that income received from natural resources has a direct positive effect on regional growth in Russia, while
transfers effects are negative (Desai et. al., 2003). They find that the greater the income from these unearned revenues, the greater the dependence on them;
an effect known as “fiscal laziness”.
3. SOME STYLIZED FACTS ON OIL RESOURCES ENDOWMENT AND RESOURCE CURSE IN NIGERIA Currently, Nigeria is among the rich oil resource countries with reserve base of over 35 billion barrels. This statistic put Nigeria as the 12
th oil producer in the
world, 8th
producer among OPEC countries and 1st in Africa. Since the discovery of oil in commercial quantity in 1958, Nigeria economy has depended largely on
oil owing to its lucrative nature. It has been argued that the over reliance on oil has affected the Nigerian economy in diverse ways. Firstly, owing to the upward
trend in the oil production and export, the share of oil in gross domestic product, government revenue, total export and foreign reserve have increased
drastically (see table 1).
TABLE 1
Year Share of oil earnings in GDP Share of oil earnings in
government revenue
Oil earnings in to
total export earnings
Foreign reserve
in million $
Oil production
in ‘000 barrels
Oil export in ‘000
barrels
1970 9.23 26.28 33.39 104.6 395,689.0 383,455.0
1980 28.83 81.09 59.53 5,445.6 760,117.0 656,260.0
1990 37.46 73.28 72.43 34,953.1 660,559.0 548,249.0
2000 47.72 83.50 73.08 1,129,894.4 797,880.0 688,080.0
2005 38.87 85.85 79.00 5,456,456.2 919,285.6 846,179.7
2006 37.61 88.64 75.50 5,425,578.6 813,950.0 656,090.0
2007 36.46 78.08 72.29 6,055,669.0 N/A N/A
2008 37.44 83.02 72.44 7,025,860.2 N/A N/A
2009 48.24 78.67 69.34 6,339,615.2 N/A N/A
2010 40.61 78.92 70.31 N/A N/A N/A
Source: Computed from CBN Statistical Bulletin (2011). N/A = Not Available
Available data indicate that the share of oil in Gross Domestic Product (GDP) which stood at 9.23% in 1970 rose drastically to 38.87 in 2005 by 2010 the share of
oil in gross domestic product 40.61%. In the same vein, the share of oil revenue in total government revenue rose from 26.28 % in 1970 to 85.85% in 2005 and
78.92% in 2010. The share of oil in total export earnings rose from 33.39 % in 1970 to 70.31% in 2010, also foreign reserve rose very significantly; it rose 104.6
million in 1970 to 6,339,615.2 Million in 2009. Thus the expansion in oil output and export broadens the resource base of the government and if this has been
properly managed enormous benefit would have accrued to the Nation.
TABLE 2
Year Government Expenditure Share of manufacturing output in GDP Share of agricultural output in GDP GDP growth
1970 903.90 7.17 48.78 25.0
1980 14.968.5 10.40 20.17 4.2
1990 60.268.2 5.50 31.52 8.2
2000 701.059.4 3.67 26.03 3.8
2005 1,822,100 2.83 32.75 6.5
2006 1,938,002.5 2.58 31.99 6.0
2007 2,450,896.70 2.52 32.71 6.4
2008 3,240,818.5 2.41 32.85 5.9
2009 3,456,925.4 2.48 37.20 6.6
2010 N/A N/A N/A N/A
Source: Compiled from CBN Statistical Bulletin (2010 & 2011). N/A = Not Available
Secondly, in spite of the above benefits, oil production and export have had some negative effects on the economy. For instance, after decades of considerable
oil production, statistics shows that oil has contributed immensely to the growth of the size of government and governance with a lot of attendant negative
characteristics. In Table 2, government expenditure has risen significantly over the years. It grew in nominal term from 903.90 million in 1970 to 3,456,925.4 in
2009 (CBN, 2011). This situation has led to serious misallocation of resources, political instability and corruption in the country, which has manifested itself
greatly in areas such as inadequate provision and maintenance of social infrastructure, poor educational funding, and so on.
The oil boom in the 1970s led to the neglect of the non-oil tradable sector (manufacturing and agriculture) i.e. the movement of laborer’s from these sector and
the appreciated exchange rate during the same period further affected the sector culminating into the Dutch-disease syndrome (see table 2 above).
Consequently, unemployment rates in the country have been on the increase because the manufacturing sector, which is the large engine of modern economic
growth (because of its ability to create massive employment, create backward and forward linkage and learning by doing), has been made moribund by the
neglect of the sector for oil. This situation is also responsible for the ineffective implementation of government policies over the years to resuscitate the non-oil
tradable sector because of the overriding emphasis that is laid on the oil sector. Besides, even though the country have been experiencing economic growth of

VOLUME NO. 4 (2014), ISSUE NO. 02 (FEBRUARY) ISSN 2231-4245
INTERNATIONAL JOURNAL OF RESEARCH IN COMMERCE, ECONOMICS & MANAGEMENT A Monthly Double-Blind Peer Reviewed (Refereed/Juried) Open Access International e-Journal - Included in the International Serial Directories
http://ijrcm.org.in/
61
about 6 percent as shown in table 2 above, (CBN, 2010), available data show that unemployment rates in Nigeria have been increasing over the years. In fact,
the current unemployment rate exceeds that of the oil boom in the early 70s (see figure 1 below). This is because of the capital intensive nature of the oil sector.
Source: World Development Indicator (2011).
Furthermore, instead of serving as input such as capital and labour, oil endowment has served as a stimulant for internal conflict in Nigeria (Mähler, 2010). No
wonder that the civil and legal (Movement for the Actualization of the Sovereign State of Biafra (MASSOB), Movement of the Survival of the Ogoni People
(MOSSOP), Ijaw National Congress (INC), the Militant in Niger Delta and the Armed Boko-Haram in the North) agitations in all parts of the country is evidence to
back up this argument as each group fight for either the resource or share of the “oil money”.
4. THEORETICAL FRAMEWORK AND METHODOLOGY This study is anchored on the augmented Solow growth accounting model by Jorgenson (1966 & 2000). According to the theory, economic growth is determined
by three factors; physical, human capital and technological progress. The model tries attempts to reduce empirically the proportion of growth attributed to the
unexplained residual named technological progress. In developing the model for this study, we augment the model to include oil resource endowment. Thus,
using the Cobb-Douglas Production Function, the relationship is specify as follows:
NY AK Lα β θ= ….…………………………….…………… (1)
From equation 1 above, A = technological progress, Y = output, K = capital, L = number of workers, N = oil resource endowment. Β = is a parameter that lies
between zero and one. Transforming equation 1 above in linear form yields equation 2
ln ln ln lnLnY A K L N= + α + β + θ………………………… (2)
Taking the log of difference of each variable in equation 2 produces the growth rate of the variable. Thus equation 3 becomes;
y A K L N
y NA K L• •• • •
θα β= + + +
……………….........................… (3)
Equation 3 above implies that the growth rate of output equals the rate of technical change plus α times growth rate of per capital, plus β times the growth rate
of labour input per worker and plus θ times the per capital oil resource growth rate. From equation 3 above, AA
•
= Technological change in the economy. It
captures other factors such as improvement in management methods and ways of organizing production that raises the productivity capacity of factories that
leads to increase output other than capital, labour and oil resource endowment.
4.1 MODEL SPECIFICATION
Following the theoretical above, we specify a regression model that expresses growth of output per worker as a function of technological progress, growth of
per capita, per capita oil resource growth and growth rate of labour input per worker. Thus the model for the study is written as follows;
( , , , )Gy F Gk Gh Gnr A=…………………………………………………. (4)
Where;
Gy = Growth of per capita income
Gk = Growth of Physical capita
Gl = Growth of human capita measured with numbers of workers within the working age
Gnr = Growth rate of per capita Natural resource
A = technological change
From the discussion in the theoretical framework above, we Follow the endogenous growth model and assume A (Technological change) is determined within
the country by economic factors as follows
A=F (INF, FSD, SGEGDP COR)…………………….……….…..…… (5)
Where; FSD = Financial sector development measured as broad Money supply divided by gross domestic product, INF = inflation rate, COR = Corruption a proxy
for governance, SGEGDP = Share of government expenditure in gross domestic product. Incorporating equation 5 into 4 and expressing in empirical form yields
equation 6;
2 3 4 5
6 7 t
G y G k G h G nr C O R IN F
F SD SG E G D P e1= α + β + β + β + β + β
+ β + β +………………………….. (6)
0
5
10
15
20
25
Un
em
plo
ym
en
t ra
te
year
Figure 1: Trend of unemployment in Nigeria 1970 -2010
UN

VOLUME NO. 4 (2014), ISSUE NO. 02 (FEBRUARY) ISSN 2231-4245
INTERNATIONAL JOURNAL OF RESEARCH IN COMMERCE, ECONOMICS & MANAGEMENT A Monthly Double-Blind Peer Reviewed (Refereed/Juried) Open Access International e-Journal - Included in the International Serial Directories
http://ijrcm.org.in/
62
Since there are no universal measures of oil resource endowment, we utilized two indicators of oil resource endowment commonly used in the literature
namely; oil export and net oil export. Thus equation 7 becomes:
1 2 3 4 5
6 7 1
1 2 3 4 5
6 7 2
Gy Gk GL GOILP COR INF
FSD SGEGDP U
Gy Gk GL GNOILP COR INF
FSD SGEGDP U
= α + β + β + β + β + β+β + β +
= α + β + β + β + β + β+β + β +
………………….…… (7)
Where; OILP = Oil Production, GNOILE = Net Oil Export. All other variables remain as defined above. U1 & U2 = stochastic disturbance term. On Apriori, we expect
the coefficient of oil resource endowment to be positive and statistically significant in explaining economic growth (resource blessing), if otherwise, we conclude
that there exist “resource curse” however, if the coefficient is either positive or negative but not statistically significant, then there is neither a curse nor a
blessing. The coefficient of corruption and inflation is expected to be inversely related to GDP, while the coefficient of financial sector development, physical
capital, labour force and government expenditure is expected to be positively related to GDP.
4.2 TIME SERIES PROPERTIES OF THE VARIABLES
Inference from economic variables are based on the assumptions that the variables are stationary (i.e mean reverting), this assumption is often violated in most
time series variables. Thus the use of ordinary least square (OLS) can lead to “erroneous” conclusion (Granger & Newbold, 1974). Therefore, there is need to
examine whether the variables in our model are stationary. If the variable(s) is/are not stationary, then the variables contain unit root (mean and variance vary
over time). In order to examine whether the variables are stationary we employ the Augmented Dickey Fuller (ADF) test by Dickey and Fuller (1979). The test
involves the estimation of the following forms of regression equations with intercept and trend (t) in the series.
1 11
m
t t t tt
Y Y Y− −=
∆ = α + βτ + δ + ∆ + ε∑………………………………….... (8)
Where Δ = difference operator, α represent the drift, t represent deterministic trend and m is a lag length large enough to ensure that ε is a white noise
Process. The lag length is based on Schwarz Bayesian Information Criteria (SBIC). In the equation above, the co-efficient of interest is δ. If δ is equal one (1) i.e. δ
= 1, the series have unit root, if δ < 1, the series does not possess unit root, the possibility of δ > 1 is ruled out. The estimated ADF-statistic of the variable of
interest is compared with the Dickey and Fuller critical values. If the ADF-statistic is significantly more negative than the ADF-critical value then the hypothesis
that the variable of interest have unit root is rejected.
If the variables are stationary after taking the first difference, i.e. integrated of order one I(1), there is need to examine if co-integration exist among the
variables since differencing of the variables takes the variables from long run to short run relationship. The variables are said to be co-integrated if a linear
combination of these variables are stationary. If the variables are co-integrated we can say that there exists a long run stable relationship between the variables
in the model. That is, any deviation from the equilibrium will get automatically corrected and the variable will revert back to its long run equilibrium level. To test
for the possibility of a co-integrating relationship we employed the Johansen multivariate co-integration technique by Johansen 1988; Johansen and Julius
(1990). This is because of its superiority over the Engle-Granger (1987) two stage techniques. Once presence of co-integration is established, we estimate the
long-run coefficient of the variable. To do this, we employed the fully modified ordinary least square (FM-OLS) technique as propounded by Phillips and Hansen
(1990) this technique is superior than the conventional OLS because of its ability to resolve the possible problem of endogeneity in the model as the estimates
obtained using the conventional OLS is likely to be dependent on the stochastic disturbance term due to dynamism in the model as a result estimates will be
biased and inconsistent. Thus the result obtained from the FM-OLS is more robust and reliable.
4.3 DATA USED AND SOURCE
Data used for this study spans from 1970 to 2010 and they include; economic growth proxy with gross domestic product a rise in GDP represent growth and
vice-versa, physical capital is measured with gross fixed capital formation, labour force is measured with labour force participation rate, corruption, financial
sector development is measured with broad money supply (M2) divided by gross domestic product, and government expenditure as ratio of government to
gross domestic product. Specifically the data on corruption is extracted from the International Financial Statistics and the World Bank data files, data on the
indicators of natural resource endowment (oil export and net oil export), gross fixed capital formation are obtained from the Central Bank Nigeria (CBN)
statistical bulletin, financial sector development and ratio of government expenditure to GDP are computed from CBN Statistical bulletin and the National
Bureau of Statistics respectively.
5. EMPIRICAL RESULTS AND INTERPRETATION As earlier discussed, in order to avoid result that will give erroneous conclusion, we begin our analysis by first examining the time series properties of the
variables in the model. This is done using the standard Augmented Dickey Fuller (ADF) test. We include intercept and trend term in carrying out the test. The
result is summarized in table 1 below;
TABLE 1: RESULT OF UNIT ROOT TEST (ADF)
Variables Level First difference Order of integration
Critical Value Critical Value
LOGGDP -1.8322 -5.0049** I(1)
LOGOILEXP -1.5430 -5.2651** I(1)
LOGM2GDP -2.8022 -4.2923** I(1)
LOGNETOILEXP -2.5426 -6.7512** I(1)
LOGLF -0.5966 -4.4849** I(1)
LOGGFCF -2.5932 -4.3479** I(1)
LOGCPI -1.4531 -4.2699** I(1)
COR -3.1742 -8.3441** I(1)
LOGSEGDP -3.4676 -7.0609** I(1)
Critical values at 5% -3.5298
Note: ** denote significant at 5%
The unit root result displayed in table 1 above show that all the variables possess unit root (that is, not stationary) at level. However, after taking their first
difference, they all became stationary. This is because the ADF calculated statistics for all the variables is more negative than the ADF-critical value at 5% Thus it
can be concluded that the variables are integrated of order 1, that is I(1). Thus, we proceed to carrying out co-integration test.

VOLUME NO. 4 (2014), ISSUE NO. 02 (FEBRUARY) ISSN 2231-4245
INTERNATIONAL JOURNAL OF RESEARCH IN COMMERCE, ECONOMICS & MANAGEMENT A Monthly Double-Blind Peer Reviewed (Refereed/Juried) Open Access International e-Journal - Included in the International Serial Directories
http://ijrcm.org.in/
63
TABLE 2: JOHANSEN CO-INTEGRATION TEST
H0 H1 Trace Statistics 5% critical value H0 H1 Max Statistics 5% critical value
n ≤ 0 n > 0 309.09** 197.37 n ≤ 0 n > 0 79.92** 58.43
n ≤ 1 n > 1 229.17** 159.52 n ≤ 1 n > 1 66.84** 52.36
n ≤ 2 n > 2 162.33** 125.62 n ≤ 2 n > 2 55.42** 46.23
n ≤ 3 n > 3 106.90** 95.75 n ≤ 3 n > 3 34.61 40.08
n ≤ 4 n > 4 72.29** 69.81 n ≤ 4 n > 4 28.11 33.88
n ≤ 5 n > 5 44.18 47.85 n ≤ 5 n > 5 20.59 27.58
n ≤ 6 n > 6 23.59 29.79 n ≤ 6 n > 6 11.61 21.13
n ≤ 7 n > 7 11.97 15.49 n ≤ 7 n > 7 10.31 14.26
n ≤ 8 n > 8 1.68 3.84 n ≤ 8 n > 8 1.66 3.84
Note: n represents number of co-integrating vectors. And ** denotes rejection of the null hypothesis at the 5% level.
The Johansen multivariate co-integration test by Johansen (1988) and Johansen and Julius (1990) is employed to carry out the co-integration test. We allow for
intercept (no trend) in the co-integration equation. The co-integration result shown in table 2 above reveals that the hypothesis of no co-integration, H0, among
the variables can be rejected. The implication of this is that there exists a long-run relationship between the variables used in the model. It also implies that an
Error Correction Model can be estimated using the model. However, since our interest is to examine the long-run relationship among the variables, we did not
consider estimating the error correction model.
LONG-RUN ESTIMATES
Having shown that a long-run relationship exists between the variables in the model, we proceed to estimate the long-run impact of the regressors on the
regressand using FM-OLS. This technique is employed because the conventional OLS result can give result that is not reliable in the long-run (i.e. inconsistent and
biased). The result is displayed in table 3 below;
TABLE 3: LONG-RUN RESULT
Variable Model 1 Model 2
LOGLF 3.7285
(0.0001)*
4.3116
(0.0001)*
LOGGFCF 0.2506
(0.0001)*
0.3527
(0.0000)*
LOGCPI 0.2021
(0.0215)**
0.2139
(0.0214)**
COR -0.0035
(0.9455)
0.0101
(0.8510)
LOGM2GDP -0.1622
(0.1005)
-0.2367
(0.0466)*
LOGNETOILEXP 0.1806
(0.0037)*
SGEGDP 0.0164
(0.0027)*
0.0202
(0.0007)*
LOGOILEXP 0.0331
(0.5380)
C -5.1053
(0.0261)*
-6.4206
(0.0148)
R-squared 0.99 0.99
S.E of Regression 0.1195 0.1353
Long-run Variance 0.0082 0.0088
Durbin-Watson Stat 1.73 1.659
Note: value in parenthesis represent prob. Value; * and ** represent 5 and 10 percent significant level respectively.
The result in model 1 shows that five of the variables (LF, GFCF, COR, NETOILEXP, SGEXP) conform to our apriori expectation. But only four of these variables are
statistically significant in explaining the regressor. Specifically, a 1% increase in labour force participation, gross fixed capital formation, net oil export and
government expenditure is expected to increase the growth of the economy by 3.72, .25, .18 and .0.02% respectively in the long-run, while an increase in
corruption is expected to decrease economic growth by 0.35% in the long-run. While two of the variables CPI and financial sector development do not behave
well in the long-run, however, only the coefficient of CPI is statistically significant at 5%.
In model two, labour force participation, gross fixed capital formation, government expenditure and oil export have the expected relationship with the regressor
in the long-run, however, except for oil export the other three variables are statistically significant in explaining the regressor in the long-run. Specifically 1%
increase labour force participation rate is expected to increase economic growth by 4.31%. In the same vein 1% increase in gross fixed capital formation,
government expenditure and oil export bring about increase in economic growth by 0.35, 0.02 and 0.03% respectively in the long-run. But the coefficient of
natural resource measured with oil export although had it expected sign is not statistical significant in the long-run. The coefficient of the other three (CPI, COR,
M2GDP) did not conform to the apriori expectation. However, consumer price index and financial sector development measured with the ratio of broad money
supply to gross domestic product are statistically significant at 5% while corruption is not significant.
6. POLICY IMPLICATION AND CONCLUSION The empirical result displayed above indicates that in the long-run the coefficient of oil resource endowment proxy with net oil export is positive and statistically
significant implying that oil resource can be combine with capital and labour to achieve economic growth in Nigeria in the long-run “resource blessing”. The
implication of this is that even though it seems that a resource curse exist in Nigeria now, in the long-run, oil resource curse can be converted into resource
blessings. The possible explanation for this is that in the long-run, owing to increase level of education and exposure of the Nigerian citizens, there will be high
demand by the citizens for good governance. The implication of good governance is that effort will be made to ensure that oil proceed is effectively and
efficiently utilize and the manufacturing sector will be able to play its role of massive employment, forward and backward linkage and learning by doing.
However, when oil resource endowment is measured with oil export, it was observed that although the coefficient had positive relationship with economic
growth it was not statistically significant implying that there is neither a resource “curse” or “blessing” in Nigeria in the long-run. The study investigates the
long-run impact of oil resource on economic growth in Nigeria. Using co-integration and fully modified Ordinary Least square Techniques, the study reveals that
a long run relationship exists between the variables in the model. The result show that the measurement of oil resource matters. Specifically, the result show
that of the seven variables in model 1, five conform to our apriori expectation in model 1, while the other two variables did not behave well. In model 2, four of
the variables behave well while the other three did not.

VOLUME NO. 4 (2014), ISSUE NO. 02 (FEBRUARY) ISSN 2231-4245
INTERNATIONAL JOURNAL OF RESEARCH IN COMMERCE, ECONOMICS & MANAGEMENT A Monthly Double-Blind Peer Reviewed (Refereed/Juried) Open Access International e-Journal - Included in the International Serial Directories
http://ijrcm.org.in/
64
REFERENCES 1. Collier, P. & Goderis, B. (2007), Commodity Prices, Growth and the Natural Resource Curse: Reconciling a Conundrum, the Centre for the Study of African
Economies Working Paper Series.
2. Collier, P. & Hoffler, A. (2002), Greed and Grievance in African Civil Wars, Quarterly Journal of Economics
3. De Long, J.B. & Williamson, J.G. (1994), “Natural Resources and Convergence, in the Nineteenth and Twentieth Century’s,” unpublished paper, Harvard
University
4. Dickey, D. & Fuller, W. (1981), Likelihood Ratio Statistics for Autoregressive Time Series with a Unit Root, Econometrica, vol.49, http://dx.doi.org/
10.2307/1912517
5. Gylfason, T. (2000), Resources, Agriculture and Economic Growth in Economies in Transition. Kyklos, vol. 53.
6. Jean, A. (1962), The Six Books of a Commonwealth [Les six livres de la republique], Trans. Robert Knolles, ed. K. D. McRae [Cambridge: Harvard University
Press].
7. Johansen, S. & Juselius, K. (1990), Maximum Likelihood Estimation and Inferences on Co-Integration with Applications to the Demand for Money, Oxford
Bulletin of Economics and Statistics, vol. 52, http://dx.doi.org/10.1111/j.1468-0084.1990.mp52002003.x
8. Johansen, S. & Juselius, K. (1992), Tests Structural Hypotheses in a Multivariate Co-Integration Analysis of the PP and UIP for UK. Journal of Econometrics,
vol. 53, http://dx.doi.org/10.1016/0304-4076(92)90086-7
9. Leamer, E. Maul, H. Rodriguez, S. & Schott, P. (1999), Does Natural Resource Abundance Increase Latin American Income Inequality? Journal of
Development Economics, Vol. 59
10. Lederman, D. & Maloney, W. (2007), Trade Structure and Growth, In D. Lederman & W. Maloney (Eds.), Natural resources: Neither curse or destiny.
Washington, D.C.: Palo Alto, CA: Stanford Economics and Finance, an imprint of Stanford University Press. Madrid, Spain, unpublished (available by request
to [email protected]).
11. Mähler, A. (2010), Nigeria: A Prime Example of the Resource Curse? Revisiting the Oil-Violence Link in the Niger Delta.
12. Mehlum H, Moene K, & Torvik R. (2006), Institutions and the Resource Curse. Economic Journal 116(508):1–20
13. Pesaran, M., Hashem, M. & Shin, Y. (1998), An Autoregressive Distributed Lag Modeling Approach to Co-Integration Analysis. In Econometrics and
Economic Theory in the 20th Century: The Ragnar Frisch Centennial Symposium, edited. By Steinar Strom, Cambridge, Massachusetts, Cambridge
University Press.
14. Sachs, J. & Warner, A. (2001), “The Curse of Natural Resources”. European Economic Review 45, pp. 827-838.
15. Sachs, J. D. & Warner, A. M. (1995), Natural Resource Abundance and Economic Growth, NBER Working Paper 5398, National Bureau of Economic Research
16. Sala-i-Martin, X. & Subramanian, A. (2003), ‘Addressing the Natural Resource Curse: An Illustration from Nigeria’, NBER Working Paper No. 9804.
17. Tornell, A. & Lane, P. R. (1999), The Voracity Effect. American Economic Review, 89(1), 22-46.
18. Van der Ploeg, F. & Poelhekke, S. (2010), ‘The Pungent Smell of ‘Red Herrings’: Subsoil Assets, Rents, Volatility and the Resource Curse’, Journal of
Environmental Economics and Management, 60(1), 44-55.
19. Willebald, H. (2010), “Abundance of Natural Resources and Economic Development: Literature Review”. Preliminary Notes PhD Thesis, Departamento de
Historia Económica e Instituciones, Universidad Carlos III,

VOLUME NO. 4 (2014), ISSUE NO. 02 (FEBRUARY) ISSN 2231-4245
INTERNATIONAL JOURNAL OF RESEARCH IN COMMERCE, ECONOMICS & MANAGEMENT A Monthly Double-Blind Peer Reviewed (Refereed/Juried) Open Access International e-Journal - Included in the International Serial Directories
http://ijrcm.org.in/
65
CONSUMER BEHAVIOUR WITH REFERENCE TO HOME APPLIANCES IN TIRUVARUR TOWN
R. AYYAPPAN
RESEARCH SCHOLAR
P.G. & RESEARCH DEPARTMENT OF COMMERCE
THIRU.VI.KA. GOVERNMENT ARTS COLLEGE
TIRUVARUR
DR. P.ASOKAN
ASSOCIATE PROFESSOR
P.G. & RESEARCH DEPARTMENT OF COMMERCE
THIRU.VI.KA. GOVERNMENT ARTS COLLEGE
TIRUVARUR
ABSTRACT The present study Consumer behaviour – A study with reference to home appliances is aimed analyzing the role of consumers involving pre-purchase activities
and making the final decision. Consumer behaviour is the corner stone of marketing strategy. Business units aiming at increasing sales must understand the
behaviour of consumers. The study is based on survey method. The primary data were collected from the respondents using an interview schedule. The study was
a stupendous task because of large number of households. A sample of 150 respondents possessing Indian made home-appliances covered in the study was
selected, by using convenience sampling method. The convenience sampling is one of the non-probability sampling methods. The reason of using this method
was the non-availability of the list of universe. The study was conducted in Tiruvarur Town. In a competitive economic system, the success of the business units
depends on an accurate knowledge of the consumers. An understanding of consumer behaviour is essential in Marketing planning and programmes and one of
the most important keys to successful marketing. The increase in population, the increase in the diversity of population and the ever expending choices and
freedom, and the study of consumer behaviour are must for the marketing function.
KEYWORDS home Appliances, Tiruvarur Town.
INTRODUCTION he study of consumer behaviour is not altogether a recent activity. While it has blossomed in to a much studied science only during the last decades, it
finds mention in the earliest treatise THE WEALTH OF NATIONS by Adam Smith in 1776. The effects of sociology and psychology and anthropology
besides economics, on the behaviour of consumers were recognized and the science of consumer behaviour took root. Marketing and consumer
behaviour are so closely related that the study of consumer behaviour can be said to be the first step in refined marketing. Consumer behaviour study and
consumer research are important allies of the marketer.
IMPORTANCE OF THE STUDY A purchase is rarely the result of s single motive. Every business man needs to know why consumers purchase certain products or why they do not purchase
others. The present study Consumer behaviour – A study with reference to home appliances is aimed analyzing the role of consumers involving pre-purchase
activities and making the final decision. Consumer behaviour is the corner stone of marketing strategy. Business units aiming at increasing sales must
understand the behaviour of consumers.
OBJECTIVES OF THE STUDY 1. To study the general theoretical concepts of consumer behaviour.
2. To study the factors influencing the purchase of home appliances.
3. To study the relationship between income and Brand consciousness.
4. To know the awareness of consumers towards advertising, messages, after sales services and consumer legislation.
RESEARCH METHODOLOGY The study is based on survey method. The primary data were collected from the respondents using an interview schedule. The study was a stupendous task
because of large number of households. A sample of 150 respondents possessing Indian made home-appliances covered in the study was selected, by using
convenience sampling method. The convenience sampling is one of the non-probability sampling methods. The reason of using this method was the non-
availability of the list of universe. The study was conducted in Tiruvarur Town.
HOME APPLIANCES COVERED 1. Air - conditioner
2. Grinder
3. Pressure cooker
4. Refrigerator
5. Mixie
6. Washing machine
LIMITATIONS OF THE STUDY 1. The study was confined only to Tiruvarur Town
2. Owing to constraints of time and resources more number of home appliances and more information such as brand loyalty, order of purchase could not be
included.
3. The findings are drawn only on the basis of information supplied by the respondents.
T
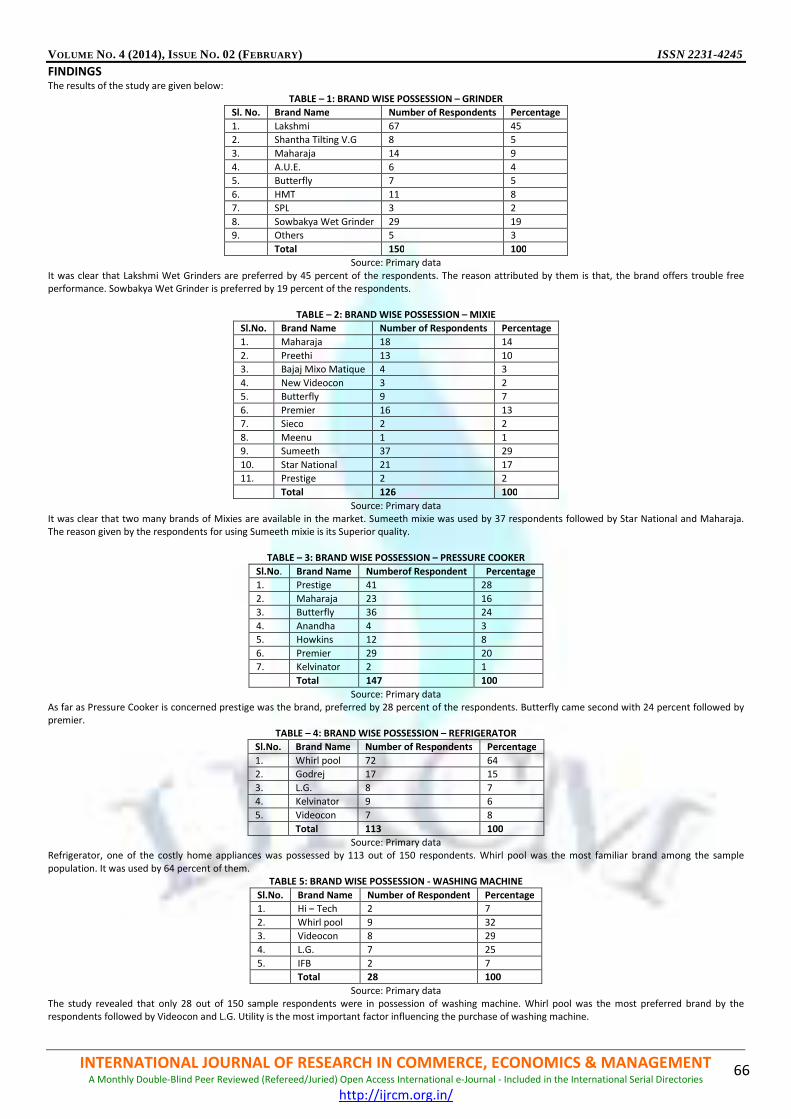
VOLUME NO. 4 (2014), ISSUE NO. 02 (FEBRUARY) ISSN 2231-4245
INTERNATIONAL JOURNAL OF RESEARCH IN COMMERCE, ECONOMICS & MANAGEMENT A Monthly Double-Blind Peer Reviewed (Refereed/Juried) Open Access International e-Journal - Included in the International Serial Directories
http://ijrcm.org.in/
66
FINDINGS The results of the study are given below:
TABLE – 1: BRAND WISE POSSESSION – GRINDER
Sl. No. Brand Name Number of Respondents Percentage
1. Lakshmi 67 45
2. Shantha Tilting V.G 8 5
3. Maharaja 14 9
4. A.U.E. 6 4
5. Butterfly 7 5
6. HMT 11 8
7. SPL 3 2
8. Sowbakya Wet Grinder 29 19
9. Others 5 3
Total 150 100
Source: Primary data
It was clear that Lakshmi Wet Grinders are preferred by 45 percent of the respondents. The reason attributed by them is that, the brand offers trouble free
performance. Sowbakya Wet Grinder is preferred by 19 percent of the respondents.
TABLE – 2: BRAND WISE POSSESSION – MIXIE
Sl.No. Brand Name Number of Respondents Percentage
1. Maharaja 18 14
2. Preethi 13 10
3. Bajaj Mixo Matique 4 3
4. New Videocon 3 2
5. Butterfly 9 7
6. Premier 16 13
7. Sieco 2 2
8. Meenu 1 1
9. Sumeeth 37 29
10. Star National 21 17
11. Prestige 2 2
Total 126 100
Source: Primary data
It was clear that two many brands of Mixies are available in the market. Sumeeth mixie was used by 37 respondents followed by Star National and Maharaja.
The reason given by the respondents for using Sumeeth mixie is its Superior quality.
TABLE – 3: BRAND WISE POSSESSION – PRESSURE COOKER
Sl.No. Brand Name Numberof Respondent Percentage
1. Prestige 41 28
2. Maharaja 23 16
3. Butterfly 36 24
4. Anandha 4 3
5. Howkins 12 8
6. Premier 29 20
7. Kelvinator 2 1
Total 147 100
Source: Primary data
As far as Pressure Cooker is concerned prestige was the brand, preferred by 28 percent of the respondents. Butterfly came second with 24 percent followed by
premier.
TABLE – 4: BRAND WISE POSSESSION – REFRIGERATOR
Sl.No. Brand Name Number of Respondents Percentage
1. Whirl pool 72 64
2. Godrej 17 15
3. L.G. 8 7
4. Kelvinator 9 6
5. Videocon 7 8
Total 113 100
Source: Primary data
Refrigerator, one of the costly home appliances was possessed by 113 out of 150 respondents. Whirl pool was the most familiar brand among the sample
population. It was used by 64 percent of them.
TABLE 5: BRAND WISE POSSESSION - WASHING MACHINE
Sl.No. Brand Name Number of Respondent Percentage
1. Hi – Tech 2 7
2. Whirl pool 9 32
3. Videocon 8 29
4. L.G. 7 25
5. IFB 2 7
Total 28 100
Source: Primary data
The study revealed that only 28 out of 150 sample respondents were in possession of washing machine. Whirl pool was the most preferred brand by the
respondents followed by Videocon and L.G. Utility is the most important factor influencing the purchase of washing machine.
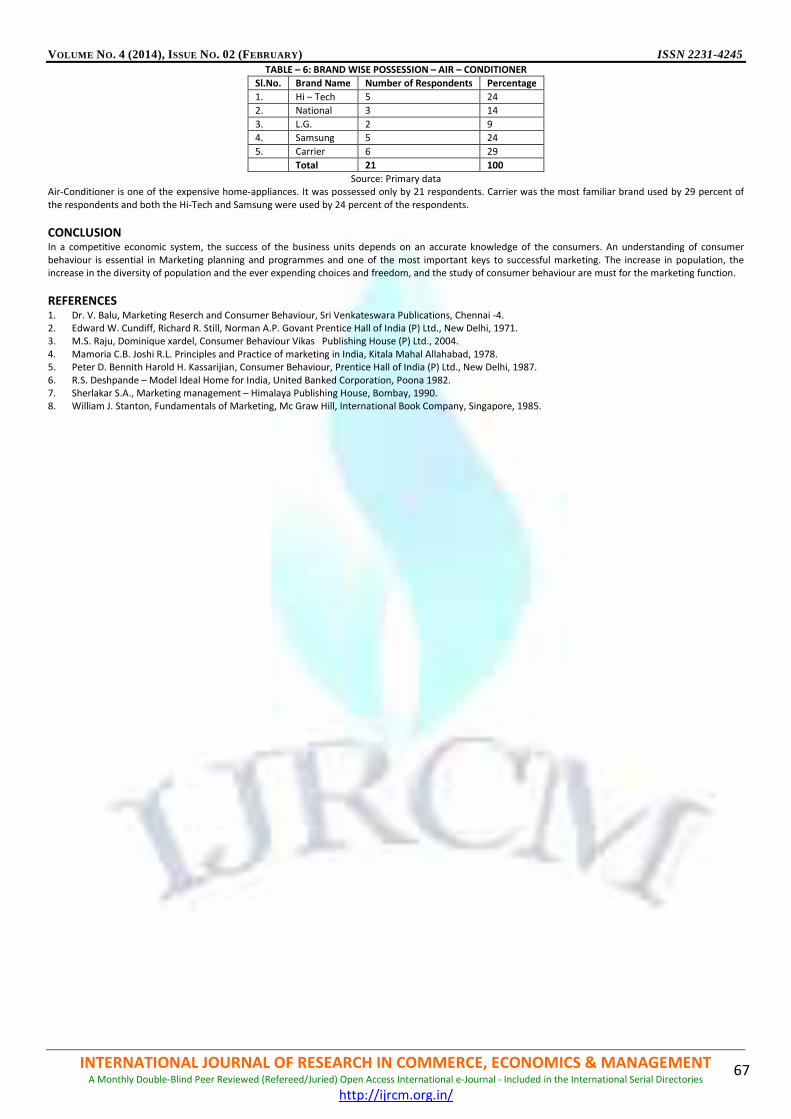
VOLUME NO. 4 (2014), ISSUE NO. 02 (FEBRUARY) ISSN 2231-4245
INTERNATIONAL JOURNAL OF RESEARCH IN COMMERCE, ECONOMICS & MANAGEMENT A Monthly Double-Blind Peer Reviewed (Refereed/Juried) Open Access International e-Journal - Included in the International Serial Directories
http://ijrcm.org.in/
67
TABLE – 6: BRAND WISE POSSESSION – AIR – CONDITIONER
Sl.No. Brand Name Number of Respondents Percentage
1. Hi – Tech 5 24
2. National 3 14
3. L.G. 2 9
4. Samsung 5 24
5. Carrier 6 29
Total 21 100
Source: Primary data
Air-Conditioner is one of the expensive home-appliances. It was possessed only by 21 respondents. Carrier was the most familiar brand used by 29 percent of
the respondents and both the Hi-Tech and Samsung were used by 24 percent of the respondents.
CONCLUSION In a competitive economic system, the success of the business units depends on an accurate knowledge of the consumers. An understanding of consumer
behaviour is essential in Marketing planning and programmes and one of the most important keys to successful marketing. The increase in population, the
increase in the diversity of population and the ever expending choices and freedom, and the study of consumer behaviour are must for the marketing function.
REFERENCES 1. Dr. V. Balu, Marketing Reserch and Consumer Behaviour, Sri Venkateswara Publications, Chennai -4.
2. Edward W. Cundiff, Richard R. Still, Norman A.P. Govant Prentice Hall of India (P) Ltd., New Delhi, 1971.
3. M.S. Raju, Dominique xardel, Consumer Behaviour Vikas Publishing House (P) Ltd., 2004.
4. Mamoria C.B. Joshi R.L. Principles and Practice of marketing in India, Kitala Mahal Allahabad, 1978.
5. Peter D. Bennith Harold H. Kassarijian, Consumer Behaviour, Prentice Hall of India (P) Ltd., New Delhi, 1987.
6. R.S. Deshpande – Model Ideal Home for India, United Banked Corporation, Poona 1982.
7. Sherlakar S.A., Marketing management – Himalaya Publishing House, Bombay, 1990.
8. William J. Stanton, Fundamentals of Marketing, Mc Graw Hill, International Book Company, Singapore, 1985.
VOLUME NO. 4 (2014), ISSUE NO. 02 (FEBRUARY) ISSN 2231-4245
INTERNATIONAL JOURNAL OF RESEARCH IN COMMERCE, ECONOMICS & MANAGEMENT A Monthly Double-Blind Peer Reviewed (Refereed/Juried) Open Access International e-Journal - Included in the International Serial Directories
http://ijrcm.org.in/
68
SELF HELP GROUP-BANK LINKAGE PROGRAMME AS AN INSTRUMENT OF ECONOMIC UPLIFTMENT OF
POOR WOMEN OF ASSAM: A CASE STUDY OF RAHA BLOCK OF NAGAON DISTRICT
SUMIT DEY
RESEARCH SCHOLAR
ASSAM UNIVERSITY
SILCHAR
LAKHIMI NATH
RESEARCH SCHOLAR
ASSAM UNIVERSITY
SILCHAR
PRIYAM KALITA
STUDENT
SONARI COMMERCE COLLEGE
SONARI
ABSTRACT
Indian society has always placed a very respectable position to the women. Ensuring gender equality in different socio economic sphere has always remained the
top priority of policy makers. Notions of women empowerment and their security can always be observed in the manifestos of all the political parties. Despite
this, the present socio economic status of women in India is very miserable. Except the women belonging to the high class group, the entire class of poor women
is surviving in the worst possible socio economic condition. In this context the Self Help Group (SHG) -bank linkage programme as launched by NABARD in 1992
can became a very effective tool of uplifting the socio economic status of poor women. There are enough evidences across the globe to show, how the SHG- bank
linkage programme through its functioning can provide productive employment opportunity, safe credit facility, saving opportunity and thereby can eradicate
poverty. However this programme had started quite late in Assam in compare to other states of the country. Therefore in order to access the success of this
particular programme in Assam , an attempt is going to be made to study the pre and post economic condition of women SHG member of Raha block of Nagaon
district .
KEYWORDS
Empowerment, SHGs, Employment.
I. INTRODUCTION ost women across the globe rely on the informal work sector for an income. If women were empowered to do more and be more, the possibility for
economic growth becomes apparent. Empowering women in developing countries is essential to reduce global poverty since women represent most of
the world’s poor population. All round development and harmonious growth of a nation would be possible only when women are considered as equal
partners in progress with men. Emancipation of women is a pre-requisite for nation's economic development and social upliftment. Poverty is the main obstacle
for the improvement of the women. The role of women and the need to empower them are central to human development programmes including poverty
alleviation. In spite of various programs relating to poverty alleviation has been started, it was observed that micro credit system through SHGs bank linkage
programme plays a very important role for the empowerment of woman in rural areas, especially from the poor families could be benefited. Rapid progress in
SHG formation has now turned into an empowerment movement among women across the country. Economic empowerment results in women’s ability to
influence or make decision, increased self confidence, better status and role in household etc. The empowerment of women through SHGs would give benefit
not only to the individual women but also for the family and community as a whole through collective action for development.
Self Help Group( SHG) is a small, autonomous, non political group of people living near each other and sharing common concerns, who come together voluntarily
to work jointly for their personal, social and economic development. They agree to save regularly and convert their savings into a Common Fund known as the
Group Corpus. The members of the group agree to use this common fund and such other funds that they may receive as a group through a common
management. The main objective of SHG formation is to improve poor people’s access to microfinance. One of the major causes of persistent poverty in the
backward regions of countries like India is that the poor people are not considered as credit worthy and as a result they have extremely limited access to the
formal financial services. Micro-finance programmes are important channels for providing small credit to the rural poor in order to alleviate poverty. Micro-
financing programmes through Self-Help Groups (SHGs), introduced in several parts of India, have the potential to minimize the problem of inadequate access of
the poor to the banking services.
Since women empowerment is critical to the socio-economic progress of the country, investing in women’s capacity building and empowering them to exercise
their choices is not only valuable itself but is also the surest way to contribute to economic growth and overall development. Empowerment of women has now
become a key issue in the Government’s Five-Year Plans-by organizing women into SHGs to make the beginning of a major process of empowering women. In
the same way, the agenda of SHGs is ‘Empowerment’ and shift from dormant masses of the rural women to vibrant masses by bringing more income in the
hands and control of women so that they can lead a better social life.
In the North- east region of India, the SHG- Bank linkage programme started in 1997-98. Since then the number of SHGs linked to the banks have increased
considerably especially during the last few years. The growth rate of SHGs linked to banks has been nearly 200 percent in the North-east from 2001-02 onwards
compared to only 50 percent for all India. In north-east India, the state Assam is the leader in the area of the number of SHGs linked to banks and amount of
bank loan received. However, the distribution of SHGs over Assam is skewed. Therefore in order to access the success of this particular programme in Assam, an
attempt is going to be made to study the SHGs bank linkage programme for the upliftment of poor women of Raha block of Nagaon district.
II. OBJECTIVES The main objectives of the study are as follows-
• To know the socio economic status of women SHG members of Raha block of Nagaon district.
• To highlight the impact of SHG-bank linkage programme in economic upliftment of women of Raha block of Nagaon district
• To identify the impact of SHG- BL programme on political knowledge of women SHG members of Raha block of Nagaon district.
• To identify the economic activities undertaken by the group members of SHG.
M

VOLUME NO. 4 (2014), ISSUE NO. 02 (FEBRUARY) ISSN 2231-4245
INTERNATIONAL JOURNAL OF RESEARCH IN COMMERCE, ECONOMICS & MANAGEMENT A Monthly Double-Blind Peer Reviewed (Refereed/Juried) Open Access International e-Journal - Included in the International Serial Directories
http://ijrcm.org.in/
69
III. PROFILE OF THE STUDY AREA The geographical area selected for study is the Nagaon district of Assam. Nagaon is one of the 29 districts of Assam. As per census 2011, Nagaon had a
population of 2,823,768 of which male and female were 1,439,112 and 1,384,656 respectively. Average literacy rate of Nagaon in 2011 were 72.37. If things are
looked out at gender wise, male and female literacy rate were 76.51 and 68.07 respectively. Sex Ratio in urban region of Nagaon district is 964 as per 2011
census data. As per 2011 census, 86.91 % population of Nagaon districts lives in rural areas of villages. In rural areas of Nagaon district, sex ratio is 962 females
per 1000 males. Literacy rate in rural areas of Nagaon district is 69.96 % as per census data 2011. Gender wise, male and female literacy stood at 74.22 and
65.52 percent respectively. As per HDR of Assam- 2003, the position of Nagaon in HDI ranking is 14 out of 23 districts of the state and its GDI rank is 22 which is
very much low. Our study area Raha block is one of the 18 blocks of Nagaon district. Raha is situated at about 22 km west of Nagaon district and it was an
important Chowki during the Ahom Days. Raha is a small town situated on National Highway 37 connecting Guwahati and Nagaon. Today, Raha is an important
trade centre for agricultural products such as paddy, jute and mustard. An important institution here is the Fishery Training College - the first of its kind in
Nagaon.
IV. STATEMENT OF THE PROBLEM Nagaon district is one of the most backward district of Assam. It is thickly populated and the overall literacy rate is also significantly low than the national and
state average. Further the area is absolutely backward in terms of Industrialization. Therefore the SHGs-BL programme in this particular area has a very high
prospect through providing gainful self employment opportunity to the poor especially to the women . SHGs - BL programme although started quite late in
Assam in compare to the other parts of the country but in recent years it has taken the momentum Therefore in order to evaluate the success of this
programme in Assam, one of its backward district has been selected as the area of the study.
V. METHODOLOGY 5.1 SAMPLE AND SAMPLING TECHNIQUE
Out of the seventeen gram panchyats (GPs) of Raha Development Block, Amtola, Ranthali, Chaparmukh, Raha, Hatbor, Amsoi has been purposively selected as
the study area. The logic behind this is, out of the selected GPs the first three are comparatively backward in terms of financial and economic infrastructure
whereas the rest three are relatively developed in terms of the same. A sample of 24 SHGs, four from each of the six GPs has been randomly selected.
Information on 120 women members (that is 5 members from each SHGs) has been collected. Thus the study is based on multi stage sampling.
5.2 METHODS OF DATA COLLECTION
The study is mainly based on primary data. The macro data about the SHGs of the area has been collected from the block officials of Raha development block
and the field data on the women members of the selected SHGs has been collected through survey method using personal interview schedule.
5.3 DESIGN OF THE STUDY
The data collected for the selected 24 SHGs are represented and interpreted through statistical tables and Pie charts. The study is essentially a descriptive one. It
aims at describing the role played by SHGs - BL programme in women empowerment through providing them financial security.
VI. FINDINGS AND DISCUSSION 6.1 SOCIO ECONOMIC STATUS OF THE RESPONDENTS
� 6.1.1. Distribution of the respondents on the basis of Age Group
Table 1 represents the distribution of the respondents on the basis of age group. This section is included in order to show the impact of SHGs-BL programme on
the women of different age group. It is clear from the table that majority (42.50%) of the respondents are from the age group of 30-40, followed by 30% in the
age group of 40-50 and 21.67% in the age group of 40-50. However it can be noticed from the table that SHGs -BL programme is not very much popular among
the women in the age group of below 20 and above 50. It is a matter of concern that SHGs- BL programme is unable to target the section of senior women,
because this section of the women are mostly financially insecure.
TABLE 1: DISTRIBUTION OF THE RESPONDENTS ON THE BASIS OF AGE
.
Source: Field Survey by the authors
� 6.1.2. Marital status of the women
Married women, many often in the poor are subjected to domestic violence and they are mostly dominated by their husband in terms of financial matters (Dey
et.al 2013). In this context SHGs -BL programme can play a greater role in economic empowerment of these women by providing them the opportunity to
participate in economic activities. Further this may reduce the frequency of domestic violence against them, because if they could earn, they will be treated as
an asset to the family. However, apart from the married women, this programme is also important to the widow and divorced women, because these women in
some societies particularly in the poor society are considered as burden to the family. Therefore these women should come out to avail the benefit of this
programme.
TABLE 2: MARITAL STATUS OF THE WOMEN
Marital Status No. of respondents Percentage
Married 91 75.83
Unmarried 22 18.34
Widow and divorced 7 5.83
Total 120 100
Source: Field survey by the author
From table 2 it appears that SHGs -BL programme is playing a great role towards economic upliftment of married women. Most of the respondents (75.83%) are
married and 18.34% of the respondents are yet to get married. However to assess the success of this particular programme among the widow and divorced
women a separate study is needed.
� 6.1.3.Distribution of the respondents on the basis of Educational attainment
Most probably the most important benefit of SHG-BL programme is that both illiterate and literate women can participate in the programme. The illiterate and
mere literate women , who are generally excluded from formal line can take the opportunity of becoming a member of SHG and thereby can become an
economic agent.
Age group No of respondents Percentage (%)
Below 20 04 3.33%
20-30 26 21.67%
30-40 51 42.50%
40-50 36 30%
50-60 3 2.50%
Total 120 100

VOLUME NO. 4 (2014), ISSUE NO. 02 (FEBRUARY) ISSN 2231-4245
INTERNATIONAL JOURNAL OF RESEARCH IN COMMERCE, ECONOMICS & MANAGEMENT A Monthly Double-Blind Peer Reviewed (Refereed/Juried) Open Access International e-Journal - Included in the International Serial Directories
http://ijrcm.org.in/
70
TABLE 3: EDUCATIONAL ATTAINMENT OF THE RESPONDENTS
Educational Attainment No of Respondents Percentage
Illiterate 4 3.33%
Primary 29 24.16%
High school(v to x) 79 65.83%
Higher secondary 8 6.68%
Degree -- --
Total 120 100
Source: Field Survey by the author
It can be seen from the above table that majority (65.83 %) of the respondents are high school level educated. 3.33% of the respondents are illiterate and 24.16
% have completed just primary level of education. It shows that educational attainment is not a barrier to join SHGs.
VII. IMPACT OF SHGS-BL PROGRAMME ON ECONOMIC UPLIFTMENT OF THE RESPONDENTS Since the main objective of this paper is to identify the role played by SHG- BL programme in economic upliftment of poor women, so we will basically judge
the effectiveness of this programme under the following heads-
7.1 INCOME
Economic upliftment of poor is possible through increasing their income level. Alternatively speaking, income generation is the only way to break the vicious
circle of poverty. As an instrument of economic upliftment, the success of SHG –BL programme can be realized only when it can raise the income level of the
poor women.
TABLE 4: IMPACT OF SHGS-BL PROGRAMME ON INCOME LEVEL OF THE RESPONDENT
The above table clearly reveals that SHGs have brought much improvement in the income level of the respondents. Majority (72.5%) of the respondents are of
the opinion that they have enjoyed increase in their income level after joining SHGs. However 27.5% of respondents revealed that they are waiting to realize the
impact of SHG-BL programme on their income level.
7.2 SAVING
Income generation schemes are definitely the way to economic upliftment of poor , but it doesn't provide the guarantee of sustainable economic upliftment.
SHGs- BL programme as we have seen above , can bring a positive impact on the income level of poor and thereby economic upliftment of them but to have
sustainable economic upliftment , it must have a positive impact on the saving level of the respondents. This is because economic upliftment in true sense will
occur when increase in income can provide them financial security over time and saving is the only way to ensure this. The impact of the SHG –BL programme on
the saving pattern of the women SHG members is shown in Table 5.
TABLE 5: CHANGE IN THE SAVING PATTERN OF RESPONDENTS
Note: The 3.33% of the members in post SHGs period are saving both in the group account as well as in their personal saving account.
The table represents the saving behaviour of the respondent both pre SHGs and post SHGs period. It appears from table 5 that none of the respondents had any
kind of saving in the pre SHG period. However after joining in SHG, all the respondent members as part of the mandatory saving of the group are saving in the
group account of the SHGs. Thus SHGs formation has 100 % positive impact in the saving habit of the respondents. But the mandatory saving of the group
members can not actually help in their economic upliftment, this is because the group members save a very marginal amount in the group account. Only 3.33%
the members along with saving in mandatory saving of the group, are also saving in their individual bank account. Thus analyzing the saving behaviour of the
respondents, it appears that SHGs- BL programme yet has not been able to yield the desired result in sustainable economic upliftment of poor women of the
study area.
7.3 CREDIT
Economic upliftment of the poor is also possible through providing them cheap and safe credit facilities. It is established by various researches that financial
inclusion of the poor will provide them productive employment opportunities and thereby can improve their economic condition. Further institutional credit is
the way to protect the financially excluded women from the clutches of village moneylenders, who often exploit the poor by charging exorbitant rates of interest
and manipulating their accounts. As a part of the financial inclusion strategy of the country, SHGs- BL programme is playing a major role in institutionalizing rural
credit by providing access to cheap and safe credit facilities to the excluded group, as after joining the SHGs, members now can meet their marginal credit
requirement from the group account of the SHGs.
TABLE 6: FREQUENCY OF TAKING LOAN FROM SHG ACCOUNT
No of time taken loan from SHG account No of Respondent
Once 31
Twice 50
Thrice 27
Four times 4
More than Four 2
None 6
Total 120
Source: Field Survey by the authors.
Opinion No. of Respondents Percentage
Yes 87 72.5%
Yet to be realized 33 27.5%
Total 120 100
PARTICULARS PRE-SHG POST-SHG
Number Percentage Number Percentage
In the SHG 0 0 120 100
Personal account in Banks 0 0 4 3.33%
No saving 120 100 _ _
Total 120 100 120 100

VOLUME NO. 4 (2014), ISSUE NO. 02 (FEBRUARY
INTERNATIONAL JOURNAL OF RESEARCH IN COMA Monthly Double-Blind Peer Reviewed (Refereed
In the above chart we can see that altogether 95% of the members are taking the loan are benefited from SHGs. 42% of the members have taken loan twice
while 26% have taken credit only once and 5% of the members have not taken credit yet.
VIII. IMPACT ON POLITICAL KNOWLEDGE SHGs-BL programme can definitely improve the political knowledge of the group members. Various formal meetings organized at the bl
meetings within the group will help the group members to acquire knowledge about different government s
benefits.
From the above chart we can easily comment that SHGs
respondents are of the opinion that their political knowledge on different government scheme has improved after joining SHGs.
IX. TYPES OF ECONOMIC ACTIVITIES PERFORMEDSHGs of this particular area are engaged in different types of economic activities.
time business, whereas some others are doing their business seasonally or part time. We observed four types of full time econ
poultry , weaving and goattery etc. and the part time activities include “Pitha making
of festivals like Bihu, Puja etc.
TABLE 6: DISTRIBUTIO
Nature of the economic activity
Full time Business
Part time and self employed
Both part time and Full time Business
In the above table we can see that most of the SHGs are engaged in full time economic activity while only four SHGs are engag
time groups become active in the time of festivals only, while the full time groups conduct their operation throughout the year. Among the full time
Frequency of taking loan from SHGs
Once Twice
Impact on Political knowledge
EBRUARY)
INTERNATIONAL JOURNAL OF RESEARCH IN COMMERCE, ECONOMICS Refereed/Juried) Open Access International e-Journal - Included in the International Serial Directories
http://ijrcm.org.in/
Source: Field survey by the authors
that altogether 95% of the members are taking the loan are benefited from SHGs. 42% of the members have taken loan twice
while 26% have taken credit only once and 5% of the members have not taken credit yet.
BL programme can definitely improve the political knowledge of the group members. Various formal meetings organized at the bl
meetings within the group will help the group members to acquire knowledge about different government scheme and thereby enable them to avail the
Source: Field survey by the authors
From the above chart we can easily comment that SHGs- BL programme has radically improved the awareness level of the respondents. As 94% of the
he opinion that their political knowledge on different government scheme has improved after joining SHGs.
TIVITIES PERFORMED BY THE RESPONDENTS SHGs of this particular area are engaged in different types of economic activities. However an important finding is that some women SHGs are engaged in full
time business, whereas some others are doing their business seasonally or part time. We observed four types of full time econ
oattery etc. and the part time activities include “Pitha making”, toy making etc. The part time SHGs members are generally active in time
TABLE 6: DISTRIBUTION OF THE SHGS ON THE BASIS OF TYPES OF ECONOMIC ACTIVITIES
Nature of the economic activity Economic activities No of SHGs
Weaving 7
Poultry 4
Goattery 3
Piggery 3
Saree Selling 3
Part time and self employed Pitha making , Pickle making 4
Both part time and Full time Business Gift coupon games, Pitha making 16
Source: Field Survey by the authors
In the above table we can see that most of the SHGs are engaged in full time economic activity while only four SHGs are engag
e in the time of festivals only, while the full time groups conduct their operation throughout the year. Among the full time
26%
42%
22%
3% 2% 5%
Frequency of taking loan from SHGs
account
Twice Thrice Four times More than Four None
94%
6%
Impact on Political knowledge
Improved Not improved
ISSN 2231-4245
MERCE, ECONOMICS & MANAGEMENT Included in the International Serial Directories
71
that altogether 95% of the members are taking the loan are benefited from SHGs. 42% of the members have taken loan twice
BL programme can definitely improve the political knowledge of the group members. Various formal meetings organized at the block level and informal
cheme and thereby enable them to avail the
BL programme has radically improved the awareness level of the respondents. As 94% of the
he opinion that their political knowledge on different government scheme has improved after joining SHGs.
However an important finding is that some women SHGs are engaged in full
time business, whereas some others are doing their business seasonally or part time. We observed four types of full time economic activities which are piggery,
toy making etc. The part time SHGs members are generally active in time
ONOMIC ACTIVITIES
No of SHGs
In the above table we can see that most of the SHGs are engaged in full time economic activity while only four SHGs are engaged in part time business. The part
e in the time of festivals only, while the full time groups conduct their operation throughout the year. Among the full time groups,
Frequency of taking loan from SHGs
None
VOLUME NO. 4 (2014), ISSUE NO. 02 (FEBRUARY) ISSN 2231-4245
INTERNATIONAL JOURNAL OF RESEARCH IN COMMERCE, ECONOMICS & MANAGEMENT A Monthly Double-Blind Peer Reviewed (Refereed/Juried) Open Access International e-Journal - Included in the International Serial Directories
http://ijrcm.org.in/
72
weaving is the most popular activity. However among the 24 SHGs, 16 SHGs are doing both part time and full time business. These groups organize various
types of gift coupon games in the time of Bihu, Deepawali etc.
X. SUGGESTIONS � The educated unemployed women should also participate in the programme.
� Senior women should be encouraged to participate in the programme.
� SHGs should extend the area of their business.
� The group members should be made understand that SHGs are not only the means of taking easy loan; rather it is the opportunity to improve their
economic condition.
� The group members should collectively utilize the benefits of different government scheme.
� The government should provide proper initiatives for the success of SHGs- BL programme in the prescribed area.
XI. CONCLUSION From the above discussion, it appears that the SHGs-BL programme if implemented and utilize properly, it can change the shape of rural economy of India. But
in our study area, the desired benefit of the scheme is yet to realize. Since the programme is able to achieve some sort of success in terms of income generation
of the rural poor but it has failed to enhance the income of the respondent to the extent which enable them to think for saving. However, we can not deny the
success of this programme in the study specially when we consider the widespread poverty, illiteracy and unemployment among the women of the area.
REFERENCES 1. Bass, P. & Srivastava, P. (2005). Exploring Possibilities: Microfinance and Rural Credit Access for the Poor in India. Economic and PoliticaL Weekly.40 (17).
2. Chandrasekhar, H.M. & Lokesh, M.U. (2009): Role of SHGs in socio-economic change of vulnerable poor. International NGO Journal. 4 (4), 127-131
3. Dasgupta, R. (2001): Working and Impact of Rural Self-Help Groups and other Forms of Micro Financing: An Informal Journey through Self-Help Groups.
Indian Journal of Agricultural Economics. 56(3), 370-386.
4. Dey.S & Borkakoty .N.(2013): Shg- Bank linkage programme and Financial security of women_ A case study of Sapekhati development block of Sivasagar
district, published in proceeding volume , Amguri college journal
5. Dhavamani, P. (2010). Empowerment of Rural Women through Self Help Groups in Sattur Taluk of Virudhunagar District. Journal for Bloomers of
Research. 2(2), 191-195.
6. Satish, P. (2000). Some Issues in the formation of Self Help Groups. Indian Journal of Agricultural Economics. 56(3), July- September, Mumbai
VOLUME NO. 4 (2014), ISSUE NO. 02 (FEBRUARY) ISSN 2231-4245
INTERNATIONAL JOURNAL OF RESEARCH IN COMMERCE, ECONOMICS & MANAGEMENT A Monthly Double-Blind Peer Reviewed (Refereed/Juried) Open Access International e-Journal - Included in the International Serial Directories
http://ijrcm.org.in/
73
HUMAN RESOURCE MANAGEMENT SCENARIO IN INDIA
THOTA AMRUTHA VALLI
RESEARCH SCHOLAR
DEPARTMENT OF HRM
ANDRA UNIVERSITY
VISAKHAPATNAM
T.RANGA VALLI
STUDENT
DEPARTMENT OF HRM
ANDRA UNIVERSITY
VISAKHAPATNAM
ABSTRACT The human resource management is a proactive central strategic management activity which is different from conventional personnel management. So now a
day’s Human resource is considered as the backbone of any economic enterprise. In recent years the economist has added “Human resource” besides land, capital
and technology as the key factor for building and developing the nation. The HRM is a growing concept. Indian economic scenario is undergoing a basic structural
change affecting all walks of life. Physical, behavioral and psychological differences among individuals have increased with rapid changes taking place in the
management process of the organizations. These have implications in the design of recruitment, selection, training and development, compensation, programme,
performance appraisal, employee discipline, promotion and transfers etc., are becoming difficult for implementation due to poor understanding of personnel
management by the employees so it represent a new model of HRM has been focused on the HR policies and practices followed in company related to HRP
Recruitment, Performance Appraisal, HRA, DA, Labor Welfare Measures. The success of the company is purely based on the Human Resource Policies and
Practices.
KEYWORDS Human Resources management, Human resource, Personnel management, Human Resource Management trends.
INTRODUCTION he origin of the function is a rose in those organizations which introduced 'welfare management' practices and also in those that adopted the principles
of 'scientific management. Since 1990 due to liberalized government policies, Indian scenario began to change. Human resource is a relatively modern
management term having been coined in the 1960s. Business scenario growing importance of Human Resources Management in both business and
public life. The business climate brought in the wake of liberalization, globalization, changing technologies, growth in Knowledge and advances in information
technology is offering managers a complex and challenging situation (Davis, 1995). Indian organizations are tending to become competitive to meet globally
relevant standards. The growing emphasis on privatization has warranted a new focus in terms of result orientation, long-term strategies, consumer focus, and
initiative. The HRM has emerged and evolved as one of the most important areas of organizational Science and practice. It has not been developed in isolation,
but rather in the Context of industrial change and economic development. The uniqueness of the Human Resources approach requires a totally different type of
attention from managers. The HR has characteristics that provide the greatest challenge as well as opportunity. A company‘s HR is fragile with delicate
relationships, along with unpredictable contributions and permanency is uncertain (Guest, 1991).
Human resource became one of crucial driver for development and change. As the viewpoint of management towards its employees began to change, role and
contribution of human resource as a talent pool also become so vital that most of the organizations started to focus their vision and mission statements on the
people who work for them. With the boom in the technology sector in 2000, newer and newer ways of attracting, recruiting and managing tenant in the
companies also started to emerge.
Human Resource Management as a function of management has come a long way. The traditional version of HRM, Personnel management is a concept that can
be appropriately related to the old model of organization, is bureaucratic in character, with less suppleness, and higher degree of centralization and
formalization, i.e., adherence to rules and regulation. HRM, on the other hand refers to the overall philosophy about the organization and how people should be
managed and is not merely limited to certain specific functions. HRM focuses on congruence and commitment instead of compliance and control. The scope of
HRM is indeed, very vast and wide. It includes all activities starting from manpower planning till employee leaves the organization. This study painstakingly
attempts to bestow the concept of, Objectives of HRM and trends along with the Challenges in HRM.
OBJECTIVES OF HRM The primary objective of HRM is to ensure the availability of right people for right jobs so as the organizational goals are achieves effectively. This primary
objective can further be divided into the following sub-objectives:
• To help the organization to attain its goals effectively and efficiently by providing competent and motivated employees.
• To utilize the available human resources effectively.
• To increase to the fullest the employee’s job satisfaction and self- actualization.
• To develop and maintain the quality of work life which makes employment in the organization a desirable personal and social situation.
• To help to maintain ethical policies and behavior inside and outside the organization.
• To establish and maintain cordial relations between employees and management.
• To reconcile individual/ group goals with organizational goals.
HUMAN RESOURCE MANAGEMENT TRENDS In organizations, it is important to determine both current and future organizational requirements for both core employees and the contingent workforce in
terms of their skills/technical abilities, competencies, flexibility etc. The analysis requires consideration of the internal and external factors that can have an
effect on the resourcing, development, motivation and retention of employees and other workers. The external factors are those largely out-with the control of
the organization and include issues such as the economic climate, current and future trends of the labor market e.g. skills, education level, government
investment into industries etc. On the Emerging Trends of Human Resource Management (With Special Focus on Information Technology Industry) other hand
internal influences are broadly within the control of the organization to predict, determine and monitor, for example the organizational culture underpinned by
management behaviors (or style), environmental climate and the approach to ethical and corporate social responsibilities. In order to know the business
T

VOLUME NO. 4 (2014), ISSUE NO. 02 (FEBRUARY) ISSN 2231-4245
INTERNATIONAL JOURNAL OF RESEARCH IN COMMERCE, ECONOMICS & MANAGEMENT A Monthly Double-Blind Peer Reviewed (Refereed/Juried) Open Access International e-Journal - Included in the International Serial Directories
http://ijrcm.org.in/
74
environment in which any organization operates three major trends should be considered: Demographics – It is the characteristics of a population/workforce,
for example, age, gender or social class. This type of trend may have an effect in relation to pension offerings, insurance packages etc.
Diversity – It refers to the variation within the population/workplace. Changes in society now mean that a larger proportion of organizations are made up of
"baby boomers" or older employees in comparison to thirty years ago. Advocates of "workplace diversity" simply advocate an employee base that is a mirror
reflection of the make-up of society insofar as race, gender, sexual orientation, etc. Skills and qualifications - As industries move from manual to more
managerial professions, so does the need for more highly skilled graduates. If the market is "tight" (i.e. not enough staff for the jobs), employers will have to
compete for employees by offering financial rewards, community investment, etc.
EMERGING HR TREND IN INDIA A look at the trends in managing people in this dynamic industry reflects that Attracting, Managing, Nurturing talent and Retaining people has emerged to be the
single most critical issue in lieu of the enormous opportunities spun off by the market. The new avatar of talent is the knowledge professional that is innovative,
business survey, quick on the uptake, has an instinctive ability to network, and possessing unbridled ambition. They are propelled by an urge to experiment, scan
new avenues that can spur their creativity. The knowledge professional will gravitate to an organization that is flexible, has strong values, a robust performance
ethic and provides challenging work on latest technology. This has led to companies proactively taking measures on three fronts. First, companies create an
organizational ambience where talent can bloom. Second, they put in place systems that help unleash their potential and third, they build a reward and
recognition mechanism that provides value for people.
EMERGING CHALLENGES IN HUMAN RESOURCE MANAGEMENT The propagation of technology and changes in the business environment has increased the importance of human resources in the modern world. The major
challenges facing human resources arise from this altitude of human resource activities to a core strategic function.
MAINTAINING PRODUCTIVE ORGANIZATION
There is a challenging task of maintaining a productive organization. Here, efforts may be made to take into account the emerging dimension related to the
imbalanced age structure of the human resources in the future. This necessitates adherence to a designed strategy for renewal of manpower in a phased
manner. The future age distribution of workforce can be assessed using a “manpower renewal forecast model”. Based on this diagnosis of potential manpower
problems, young blood may be inducted into the workforce where imbalanced age composition is likely to occur.
MANAGING TEAMS
Team building—activities aimed at improving the internal work and relationship processes of teams—requires attention to both task and interpersonal
relationships. In team building, organizations apply the principles of group dynamics to select complementary members, support more consistency, and manage
stages of group development, and establish constructive norms that promote high performance. Membership in teams is based on proficiency in areas that are
necessary for job achievement. Self-assurance is the key to team members' pledge to a common goal, shared responsibility, and group effort. Trust is built on six
interdependent factors: the honesty of the members; open communiqué; mutual admiration and support; justice and impartiality; capability and hard work; and
reward for joint effort. In addition, clear goals are a requirement for effective teamwork.
MANAGING DIVERSITY
Managing diversity means planning and implementing organizational systems and practices to manage people so that the potential advantages of diversity are
maximized while its potential disadvantages are minimized. The dimensions of workplace diversity include age, ethnicity, gender, physical abilities, race, sexual
orientation, educational background, geographic location, income, marital status, religious beliefs, parental status, and experience.
Diversity is going to be important issues for the H.R. manager as number of young workers in the work force is increasing, more women are joining the
workforce, increased mobility, common international careers and international experience is becoming a pre-requisite for managerial positions. Employees now
prefer high paying jobs in multinationals and other private sector concerns. The percentage of old employees is growing due to improved medical and health
care. With the growth of trade unions, employees have become more conscious of their right in the workplace. New workforce comprise worker, which have a
desire of higher degree of participation and avenues for self-fulfillment. Proportion of professional and technical employee will increase in relation to blue color
workers. Human resources will be treated as assets, which will appear in balance sheets of business organization in future.
ADAPTATION OF TECHNOLOGICAL CHANGES
There is a challenging task of adapting workplace to rapid technological changes which influence the nature of work and generate obsolescence. Accordingly, the
human resource managers will be required to perform the following tasks:
a) Maintain human resource competence through training and development programmes
b) Ensure a fit between technology and people for its optimal utilization through job design
c) Arrange alternative careers through training of employees displayed by technology
d) Update the new entrants to the workforce with the technology used at the job through a closer relationship between business and educational institutions; &
e) Increase the productivity of non-manufacturing jobs.
MANAGING GLOBALIZATION
Globalization requires organizations to move people, ideas, products and information around the world to meet local needs. It is one of the most theatrical
challenges facing as they enter the twenty-first century that is how to compete against foreign firms, both domestically and abroad. Lots of companies are
already being forced to think globally, something that doesn't come easily to firms long accustomed to doing business in a large and expanding domestic market
with negligible foreign competition. Feeble response to international competition may be resulting in upwards layoffs every year. Human resources can play a
critical role in a business's ability to compete head-to-head with foreign producer’s .New and important ingredients must be added to the mix when making
strategy: volatile political situations, contentious global trade issues, fluctuating exchange rates and unfamiliar cultures.
MANAGING CHANGE
Many organizations face an unpredictable environment in which change is almost constant. If they are to survive and prosper, they need to adapt to change
quickly and effectively. Human resources are almost always at the heart of an effective response system.
Change takes the shape of organizational restructuring, mergers and acquisitions, right sizing, implementing outsourcing, providing telecommuting opportunities
for employees. Focused change intervention increases productivity, improves organizational communications, improves process efficiency, improve quality, and
raises employee morale.
The challenges related to change for human resource management include:
• helping employees overcome resistance to change by convincing them about the bigger picture
• provide leadership for the change processes
• ensuring stability of systems and processes during the change process
• Equipping employees to deal with the changed realities.
CHANGING WORKFORCE PROFILE
Over the period of time Indian labor force has changed drastically, earlier it was employees who used to do such work which is job demand and expectation
based now the new HR employees has come up with more skills and higher expectations .To understand such Workforce The HR department needs to move
towards a more inclusive corporate culture and develop a deep understanding which includes demographics, skill sets, personality traits and employee
perspectives on the organization and culture. Now organizations are hiring more young groups then matured ones with the changing profile of employees their
expectations have also changed they expect better compensation and working facilities therefore these are challenge before HR department to have realistic job
preview so as to avoid unrealistic expectation and design a suitable retention strategy and develop quality of work life

VOLUME NO. 4 (2014), ISSUE NO. 02 (FEBRUARY) ISSN 2231-4245
INTERNATIONAL JOURNAL OF RESEARCH IN COMMERCE, ECONOMICS & MANAGEMENT A Monthly Double-Blind Peer Reviewed (Refereed/Juried) Open Access International e-Journal - Included in the International Serial Directories
http://ijrcm.org.in/
75
PROGRESS IN TECHNOLOGY
Several significant changes take place in technology almost every day. In order to make use of the latest technology, the appointment of right types of persons in
needed. "Information age" relates to computer-mediated information and networking. One of the implications of the increase in information and the ease, with
which it can be accessed, is a radical change in the role of middle level managers in managing human resource.
CONCLUSION The early part of the century saw a concern for improved efficiency through careful design of work. During the middle part of the century emphasis shifted to
the employee's productivity. Recent decades have focused on increased concern for the quality of working life, total quality management and worker's
participation in management. These three phases may be termed as welfare, development and empowerment.
Management of human resources is not the only task of personnel department. It is important activity of every manager. Every manager in the organization is
responsible for the recruitment, selection, development and maintenance of human resources of the people at work. The HRM department simply assists them
or guides them by training various policies and programme.
Thus, Human Resource Management should be linked with strategic goals and objectives in order to improve business performance and develop organizational
cultures that foster innovation and flexibility. The goals and objectives should be based on 3 H's of Heart, Head and Hand i.e., we should feel by Heart, think by
Head and implement by Hand.
REFERENCES 1. Ahuja.K.K(1998)Personnel Management, fourth revised edition, Kalyani Publishers, New Delhi
2. Ashwathapa K. (2005) ‘Human Resource Management’ Tata Mc Graw Hills, Fifth edition
3. Beardwell and Len Holde, (1996), Human Resource Management,Machmillian India Ltd., New Delhi
4. David A. Decenozo and Stephen P. Robbin (1986), Personnel / HumanResource Management, Third Edition, Prentic Hall of IndiaPrivate Limited, New Delhi,.
5. Gary Dessler(1999), Human Resource manage, Seventh Edition, Prentice–Hall of India Private Limited, New Delhi,
6. Geroge. T. Milkovich and John. W Bowdrean (2000), Human ResourceManagement, Fifth Edition, All India Traveller Book Seller, New Delhi.
7. Mamoria C.B and Gankar S.B (2005) ‘Personnel Management’ Himalaya Publishing House, Twenty Fifth editions.
8. Pareek, U and T.V.Rao, 1981, "Designing and Managing Human Resource Systems", Oxford and IBH Publishing Co., New Delhi.
9. Rao, T.V. and Abraham, E.A.," A Survey of HRD Practices in Indian Industry, in Rao, T.V. and Pereira, D.F., Recent Experiences in HRD, New Delhi, Oxford &
IBH, 1985.
VOLUME NO. 4 (2014), ISSUE NO. 02 (FEBRUARY) ISSN 2231-4245
INTERNATIONAL JOURNAL OF RESEARCH IN COMMERCE, ECONOMICS & MANAGEMENT A Monthly Double-Blind Peer Reviewed (Refereed/Juried) Open Access International e-Journal - Included in the International Serial Directories
http://ijrcm.org.in/
76
REQUEST FOR FEEDBACK
Dear Readers
At the very outset, International Journal of Research in Commerce, Economics & Management (IJRCM)
acknowledges & appreciates your efforts in showing interest in our present issue under your kind perusal.
I would like to request you tosupply your critical comments and suggestions about the material published
in this issue as well as on the journal as a whole, on our [email protected] for further
improvements in the interest of research.
If youhave any queries please feel free to contact us on our E-mail [email protected].
I am sure that your feedback and deliberations would make future issues better – a result of our joint
effort.
Looking forward an appropriate consideration.
With sincere regards
Thanking you profoundly
Academically yours
Sd/-
Co-ordinator
DISCLAIMER The information and opinions presented in the Journal reflect the views of the authors and not of the
Journal or its Editorial Board or the Publishers/Editors. Publication does not constitute endorsement by the
journal. Neither the Journal nor its publishers/Editors/Editorial Board nor anyone else involved in creating,
producing or delivering the journal or the materials contained therein, assumes any liability or
responsibility for the accuracy, completeness, or usefulness of any information provided in the journal, nor
shall they be liable for any direct, indirect, incidental, special, consequential or punitive damages arising
out of the use of information/material contained in the journal. The journal, nor its publishers/Editors/
Editorial Board, nor any other party involved in the preparation of material contained in the journal
represents or warrants that the information contained herein is in every respect accurate or complete, and
they are not responsible for any errors or omissions or for the results obtained from the use of such
material. Readers are encouraged to confirm the information contained herein with other sources. The
responsibility of the contents and the opinions expressed in this journal is exclusively of the author (s)
concerned.

VOLUME NO. 4 (2014), ISSUE NO. 02 (FEBRUARY) ISSN 2231-4245
INTERNATIONAL JOURNAL OF RESEARCH IN COMMERCE, ECONOMICS & MANAGEMENT A Monthly Double-Blind Peer Reviewed (Refereed/Juried) Open Access International e-Journal - Included in the International Serial Directories
http://ijrcm.org.in/
III