Work Flexibility, Job Satisfaction, and Job Performance among ...
Upload
independentCategory
view
1download
0
Job monitoring on the WLCG scope: Current status and new strategy
This article has been downloaded from IOPscience. Please scroll down to see the full text article.
2010 J. Phys.: Conf. Ser. 219 062002
(http://iopscience.iop.org/1742-6596/219/6/062002)
Download details:
IP Address: 137.138.252.98
The article was downloaded on 13/09/2013 at 14:32
Please note that terms and conditions apply.
View the table of contents for this issue, or go to the journal homepage for more
Home Search Collections Journals About Contact us My IOPscience
Job monitoring on the WLCG scope: Current status and new
strategy
Julia Andreeva1, Max Boehm
2, Sergey Belov
3, James Casey
1, Frantisek Dvorak
4,
Benjamin Gaidioz1, Edward Karavakis
1,5, Olga Kodolova
6, Lukasz Kokoszkiewicz
1,
Ales Krenek4, Elisa Lanciotti
1, Gerhild Maier
1, Milas Mulac
4, Daniele Filipe Rocha
Da Cuhna Rodrigues1, Ricardo Rocha
1, Pablo Saiz
1, Irina Sidorova
1, Jiri Sitera
4,
Elena Tikhonenko3, Kumar Vaibhav
7, Michal Vocu
4
1 CERN, European Organisation for Nuclear Research, Switzerland
2 EDS , an HP Company
3 JINR, Joint Institute of Nuclear Research, Dubna, Russia
4 CESNET, Prague, Czech Republic
5 School of Engineering and Design, Brunel University, Uxbridge, England
6 MSU, Moscow State University, Moscow, Russia
7Barc, Bhabha Atomic Research Centre, India
E-mail: [email protected]
Abstract. Job processing and data transfer are the main computing activities on the WLCG
infrastructure. Reliable monitoring of the job processing on the WLCG scope is a complicated
task due to the complexity of the infrastructure itself and the diversity of the currently used job
submission methods. The paper will describe current status and the new strategy for the job
monitoring on the WLCG scope, covering primary information sources, job status changes
publishing, transport mechanism and visualization.
1.Introduction
The Worldwide LHC Computing Grid (WLCG)[1] collaboration brings Grid infrastructures in Europe, the USA and Asia together to provide necessary resources for the LHC experiments preparing
for data taking later this year. The volume of data produced by the LHC will be hundred times greater
than in previous accelerators. 15 PetaBytes of data is expected to be generated every year. Access to
this data has to be provided to 7000 physicists all over the world. According to current estimation just for the first full year of running about 100K processors and 45 PetaBytes of disk storage are required.
17th International Conference on Computing in High Energy and Nuclear Physics (CHEP09) IOP PublishingJournal of Physics: Conference Series 219 (2010) 062002 doi:10.1088/1742-6596/219/6/062002
c© 2010 IOP Publishing Ltd 1
Considering the large amount of hardware resources distributed in more than 140 computing centres in
33 countries and the complexity of the heterogeneous distributed infrastructure it is a real challenge to
ensure good performance and high reliability . Reliable monitoring is one of the important conditions for the improvment of the quality of the WLCG infrastructure. At the same time, monitoring as such,
in particular job processing monitoring, is an important estimator of the performance and reliability of
the WLCG. Evidently, job monitoring is very much coupled with the site monitoring and monitoring of the Grid services. But these topics are out of scope of this paper. This paper mainly focuses on the
monitoring of job processing, in particular on job monitoring for the LHC experiments.
Job processing performed by the LHC experiments includes well organized production activity
carried out by groups of experts and chaotic user analysis. LHC experiments use various submission methods, execution backends and middleware flavours. More than 300K jobs are submitted daily to
the WLCG infrastructure and this number is steadily growing. Success of the job processing depends
on the health of the generic Grid services and on the quality of the services and software which are experiment-specific. All factors mentioned above explain the complexity of the job monitoring task.
The first part of this paper gives an overview of the current status of job monitoring on the WLCG
scope. Further chapters describe the new job monitoring strategy and current development. Several
examples of recent job monitoring applications focusing on the needs of different categories of users are presented in the paper. In the final part there are conclusions and outline for the future work.
2.Overview of the existing job monitoring applications In order to generate the physics tasks, to submit them and to follow their progress on the distributed
infrastructure, the LHC experiments developed the experiment-specific workload management
systems. These systems are normally used in the scope of a single LHC experiment. There can be different solutions used in a given experiment for analysis and production, or even several different
systems in a given experiment can be used for analysis. Naturally, the job monitoring task, its design,
implementation and level of complexity strongly depend on the workload management systems as
well as on the submission and execution backends. In case of ALICE and LHCb experiments, the job processing both for production and user analysis
is organized via central queue. This queue keeps track of the job progress. In this case the job
monitoring is a comparatively easy task. It is coupled with the experiment workload management systems, for example, Dirac[2] or AliEn[3] which provide job monitoring functionality. In ATLAS
and CMS the situation is much more complicated. CMS, for example, uses different systems for
analysis and production. Moreover, these systems are fully distributed. The CMS jobs are processed on several middleware platforms: gLite[4], ARC[5] and OSG[6]. Some of the job monitoring
applications available in ATLAS and CMS are coupled with workload management systems like
PANDA[7] monitoring in ATLAS or ProdAgent[8] monitoring in CMS. There is also a common job
monitoring solution used in all LHC experiments, the Experiment Dashboard[9] Job Monitoring. The CMS Dashboard provides the most advanced job monitoring functionality due to the fact that CMS
jobs and job submission systems are well instrumented to report the job monitoring information.
The solutions described above are working in the scope of a single experiment. They do not provide the overall cross-VO view of job processing on the WLCG infrastructure. The only system
which currently attempts to provide such a view is Imperial College Real Time Monitor (ICRTM)[10].
ICRTM connects to the MySQL databases of the distributed Logging and Bookkeeping
systems(LB)[11] and imports job status information to the central data repository. However, this information is not complete. Not all jobs processed on the WLCG infrastructure are submitted via
gLite WMSs and correspondingly not all of them are leaving a trace in LB systems. The comparison
of information in the CMS Dashboard with information in ICRTM central repository shows that some instances of the gLite WMS are not monitored by ICRTM. To conclude, a substantial fraction of
WLCG jobs escape ICRTM monitoring.
17th International Conference on Computing in High Energy and Nuclear Physics (CHEP09) IOP PublishingJournal of Physics: Conference Series 219 (2010) 062002 doi:10.1088/1742-6596/219/6/062002
2
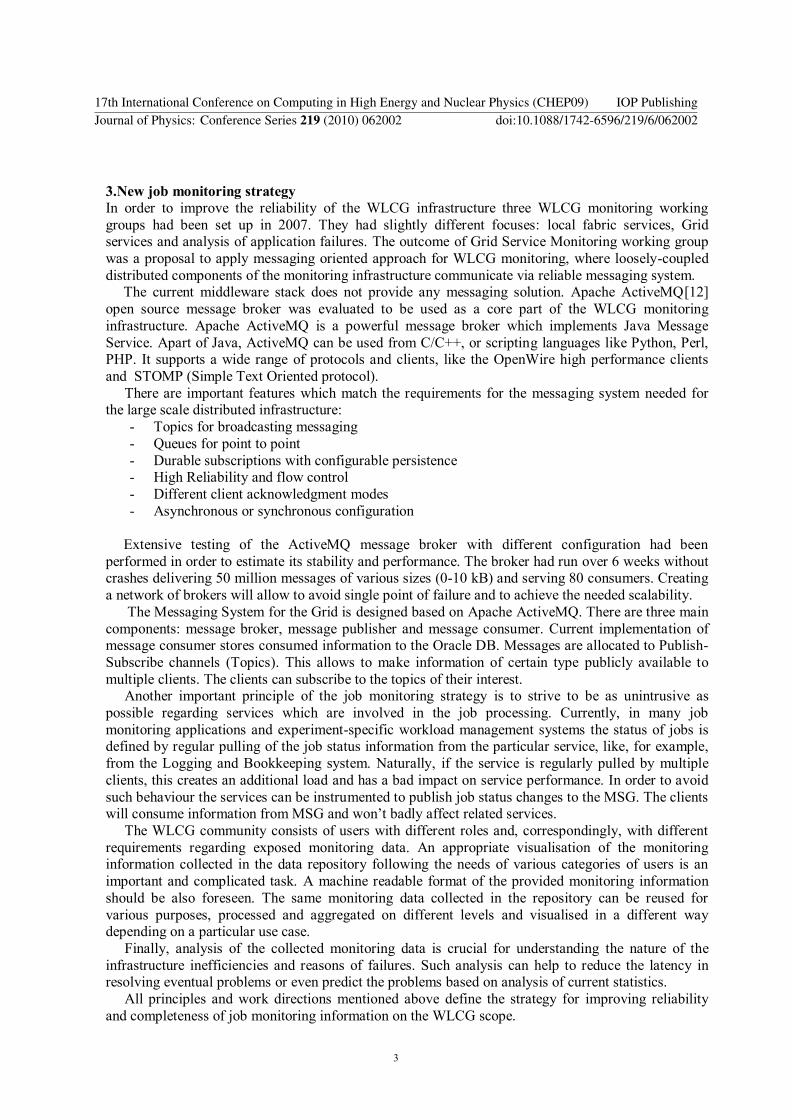
3.New job monitoring strategy
In order to improve the reliability of the WLCG infrastructure three WLCG monitoring working
groups had been set up in 2007. They had slightly different focuses: local fabric services, Grid services and analysis of application failures. The outcome of Grid Service Monitoring working group
was a proposal to apply messaging oriented approach for WLCG monitoring, where loosely-coupled
distributed components of the monitoring infrastructure communicate via reliable messaging system. The current middleware stack does not provide any messaging solution. Apache ActiveMQ[12]
open source message broker was evaluated to be used as a core part of the WLCG monitoring
infrastructure. Apache ActiveMQ is a powerful message broker which implements Java Message
Service. Apart of Java, ActiveMQ can be used from C/C++, or scripting languages like Python, Perl, PHP. It supports a wide range of protocols and clients, like the OpenWire high performance clients
and STOMP (Simple Text Oriented protocol).
There are important features which match the requirements for the messaging system needed for the large scale distributed infrastructure:
- Topics for broadcasting messaging
- Queues for point to point
- Durable subscriptions with configurable persistence - High Reliability and flow control
- Different client acknowledgment modes
- Asynchronous or synchronous configuration
Extensive testing of the ActiveMQ message broker with different configuration had been
performed in order to estimate its stability and performance. The broker had run over 6 weeks without crashes delivering 50 million messages of various sizes (0-10 kB) and serving 80 consumers. Creating
a network of brokers will allow to avoid single point of failure and to achieve the needed scalability.
The Messaging System for the Grid is designed based on Apache ActiveMQ. There are three main
components: message broker, message publisher and message consumer. Current implementation of message consumer stores consumed information to the Oracle DB. Messages are allocated to Publish-
Subscribe channels (Topics). This allows to make information of certain type publicly available to
multiple clients. The clients can subscribe to the topics of their interest. Another important principle of the job monitoring strategy is to strive to be as unintrusive as
possible regarding services which are involved in the job processing. Currently, in many job
monitoring applications and experiment-specific workload management systems the status of jobs is defined by regular pulling of the job status information from the particular service, like, for example,
from the Logging and Bookkeeping system. Naturally, if the service is regularly pulled by multiple
clients, this creates an additional load and has a bad impact on service performance. In order to avoid
such behaviour the services can be instrumented to publish job status changes to the MSG. The clients will consume information from MSG and won’t badly affect related services.
The WLCG community consists of users with different roles and, correspondingly, with different
requirements regarding exposed monitoring data. An appropriate visualisation of the monitoring information collected in the data repository following the needs of various categories of users is an
important and complicated task. A machine readable format of the provided monitoring information
should be also foreseen. The same monitoring data collected in the repository can be reused for
various purposes, processed and aggregated on different levels and visualised in a different way depending on a particular use case.
Finally, analysis of the collected monitoring data is crucial for understanding the nature of the
infrastructure inefficiencies and reasons of failures. Such analysis can help to reduce the latency in resolving eventual problems or even predict the problems based on analysis of current statistics.
All principles and work directions mentioned above define the strategy for improving reliability
and completeness of job monitoring information on the WLCG scope.
17th International Conference on Computing in High Energy and Nuclear Physics (CHEP09) IOP PublishingJournal of Physics: Conference Series 219 (2010) 062002 doi:10.1088/1742-6596/219/6/062002
3
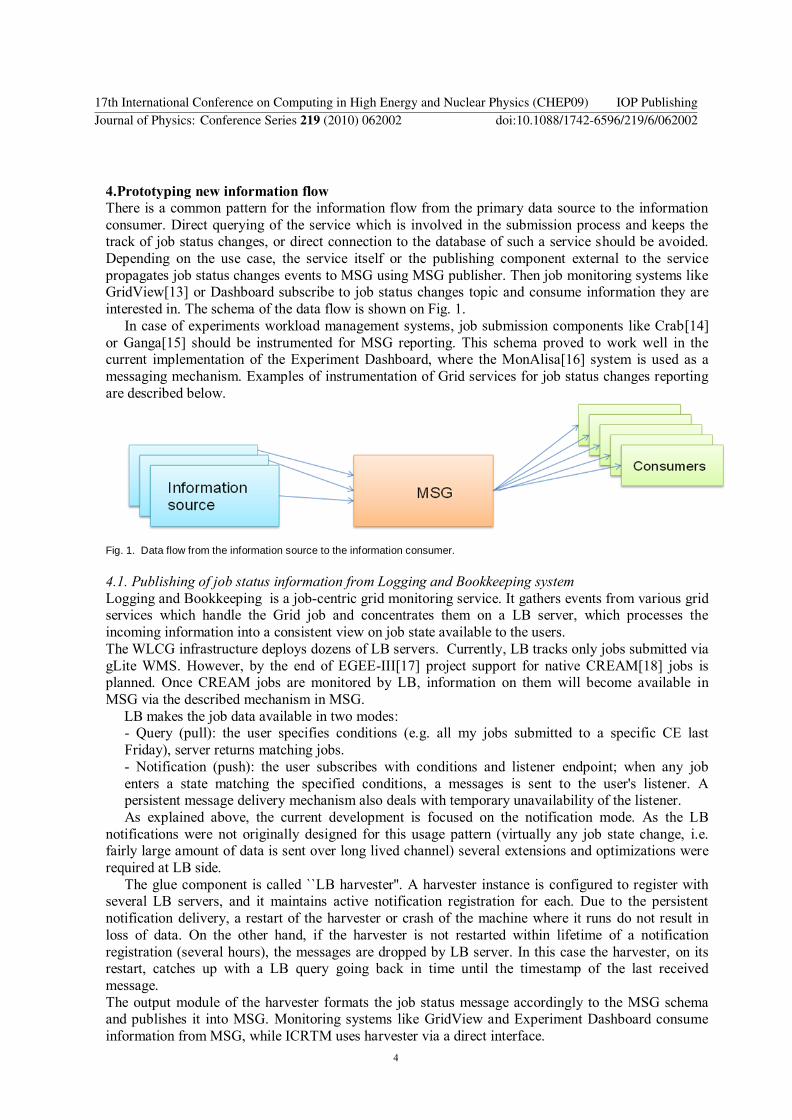
4.Prototyping new information flow
There is a common pattern for the information flow from the primary data source to the information
consumer. Direct querying of the service which is involved in the submission process and keeps the track of job status changes, or direct connection to the database of such a service should be avoided.
Depending on the use case, the service itself or the publishing component external to the service
propagates job status changes events to MSG using MSG publisher. Then job monitoring systems like GridView[13] or Dashboard subscribe to job status changes topic and consume information they are
interested in. The schema of the data flow is shown on Fig. 1.
In case of experiments workload management systems, job submission components like Crab[14]
or Ganga[15] should be instrumented for MSG reporting. This schema proved to work well in the current implementation of the Experiment Dashboard, where the MonAlisa[16] system is used as a
messaging mechanism. Examples of instrumentation of Grid services for job status changes reporting
are described below.
Fig. 1. Data flow from the information source to the information consumer.
4.1. Publishing of job status information from Logging and Bookkeeping system
Logging and Bookkeeping is a job-centric grid monitoring service. It gathers events from various grid services which handle the Grid job and concentrates them on a LB server, which processes the
incoming information into a consistent view on job state available to the users.
The WLCG infrastructure deploys dozens of LB servers. Currently, LB tracks only jobs submitted via
gLite WMS. However, by the end of EGEE-III[17] project support for native CREAM[18] jobs is planned. Once CREAM jobs are monitored by LB, information on them will become available in
MSG via the described mechanism in MSG.
LB makes the job data available in two modes: - Query (pull): the user specifies conditions (e.g. all my jobs submitted to a specific CE last
Friday), server returns matching jobs.
- Notification (push): the user subscribes with conditions and listener endpoint; when any job
enters a state matching the specified conditions, a messages is sent to the user's listener. A persistent message delivery mechanism also deals with temporary unavailability of the listener.
As explained above, the current development is focused on the notification mode. As the LB
notifications were not originally designed for this usage pattern (virtually any job state change, i.e. fairly large amount of data is sent over long lived channel) several extensions and optimizations were
required at LB side.
The glue component is called ``LB harvester''. A harvester instance is configured to register with several LB servers, and it maintains active notification registration for each. Due to the persistent
notification delivery, a restart of the harvester or crash of the machine where it runs do not result in
loss of data. On the other hand, if the harvester is not restarted within lifetime of a notification
registration (several hours), the messages are dropped by LB server. In this case the harvester, on its restart, catches up with a LB query going back in time until the timestamp of the last received
message.
The output module of the harvester formats the job status message accordingly to the MSG schema and publishes it into MSG. Monitoring systems like GridView and Experiment Dashboard consume
information from MSG, while ICRTM uses harvester via a direct interface.
17th International Conference on Computing in High Energy and Nuclear Physics (CHEP09) IOP PublishingJournal of Physics: Conference Series 219 (2010) 062002 doi:10.1088/1742-6596/219/6/062002
4
The whole harvester component is optimized for a fairly high throughput, being multi-threaded to
use multi-core machines. On the other hand, a single thread may serve multiple connections to avoid
unnecessary overhead. LB stress tests of the transport mechanism identified the network latency to be the first limiting factor -- with 6ms RTT we achieved corresponding 155 messages/s in a single stream
between 2.5 GHz machines. With 4 streams (still single harvester thread) 595 messages/s were
delivered, demonstrating almost linear scalability, while CPU load was still below 10%. Therefore, LB notifications and the harvester component are unlikely to become a bottleneck of the whole system.
In addition, in stability tests the whole chain (from LB to Dashboard and GridView via MSG)
was loaded with sustained stream of 600 jobs/h for several weeks without observing any problems.
Altogether the tests show readiness for production deployment. The LB harvester and the necessary modifications to the notification mechanism were developed as
part of LB release 2.0 which will be included in gLite 3.2. In order to speed up experimental
deployment limited support (namely in terms of performance) is also provided in LB release 1.9.2 in gLite 3.1.
4.2.Instrumentation of Condor-G
The specialized workload management system Condor [19] is used in many projects to organize distributed computations. Condor-G[20] , a job management part of Condor, is utilized on WLCG to
submit and keep track of jobs. On the WLCG infrastructure many jobs are submitted via Condor-G
without using gLite WMS. Currently there is no way to keep track of such jobs on a global scope. Only owners of the jobs can query Condor-G for job status.
In a collaboration between Condor and Experiment Dashboard development teams the publisher
component had been developed in order to enable job status changes publishing from Condor-G submission instance. Condor developers have added job logs parsing functionality to the Condor
standard libraries. It is a low-level facility to get detailed (and configurable) information on all job
events like submission, run, termination and any other status changes. The publisher of the job status
changes reads new events from standard Condor event logs, filters events in question, extracts essential attributes and publishes them to MSG. The publisher is run in Condor scheduler as Condor
job. In this case Condor itself will take care of publisher's operation. Dashboard collector consumes
job status change information which is published to MSG. During implementation, lots of reliability problems were solved: the client should be unique on
Condor host, it should never stop (except when Condor host is down), messages delivery should be
loss-free, and so on. Server side (special Dashboard collector) was readjusted to be more stable on different input data coming from Condor job monitoring tool.
Now the system is tested extensively to check its reliability and scalability. While testing some
minor problems were revealed and became subjects of correction. The complete chain from event log
reader, event publisher, MSG to Dashboard collector and database triggers successfully passed performed tests. Along with the tests and code optimization, work on preparing production distribution
of the monitoring tool for setup on Condor sites is in progress.
5.Recent job monitoring development Recent job monitoring development is focused on the needs of the LHC user community.
The Combined Computing Readiness Challenge run on the WLCG infrastructure in spring 2008
(CCRC08) was a good opportunity to validate the existing monitoring infrastructure. Several issues
were discovered and addressed during following months. One of the main outcome of the CCRC08 post-mortem analysis was the conclusion that the main monitoring source for the CCRC08 activities
were the experiment-specific systems, which performed quite well and provided necessary
functionality. One of the reported issues was the missing of propagation of information on how the LHC virtual organizations (VO) use a particular site, whether the site performs well regarding
activities of a given VO. Certainly, this information is available in the experiment-specific monitoring
systems, but users external to the VO are not familiar with them. Sometime access to the information
17th International Conference on Computing in High Energy and Nuclear Physics (CHEP09) IOP PublishingJournal of Physics: Conference Series 219 (2010) 062002 doi:10.1088/1742-6596/219/6/062002
5

is limited to the VO members. In addition, the variety of such systems even in the scope of a single
VO makes very difficult or even impossible cross-VO information correlation.
Another important direction of monitoring development is addressing the requirements of the physics community. Success of the distributed analysis is one of the key components of the overall
success of the LHC computing. Therefore, user-oriented monitoring of analysis jobs submitted to the
distributed infrastructure is a vital condition. Finally, identification of the underlying reasons of failures or inefficiencies is a complicated task.
The failures can be caused by the errors in the user code, by misbehaviour of the Grid services or by
misconfiguration of the site is an important and complicated task. Understanding the nature of failures
is necessary to cure a problem in a proper way. Naturally, it relates both to the monitoring of the jobs of the individual user or to the overall job processing at the site or on the global scope.
Below, in this chapter we will shortly introduce some of the recent applications which address
issues mentioned above.
5.1.Siteview
As mentioned in the introduction, site monitoring is out of the scope of this paper. Since job
processing is an important activity performed at the WLCG sites, we include a short description of the Siteview[21] functionality related to job monitoring. Another reason why short overview of Siteview
is included in the paper is its advanced visualization based on the GridMap[22] technology.
The Siteview application is composed of a Dashboard collector, central repository of the common monitoring metrics and GridMap visualization component. The Dashboard collector periodically reads
monitoring data from the experiment-specific monitoring systems and stores it in the common metrics
repository. The GridMap instance queries this repository and retrieves data to be displayed in a web page using GridMap technology. The system plays the role of the communication channel between the
LHC VOs using the WLCG sites and the support teams at the sites.
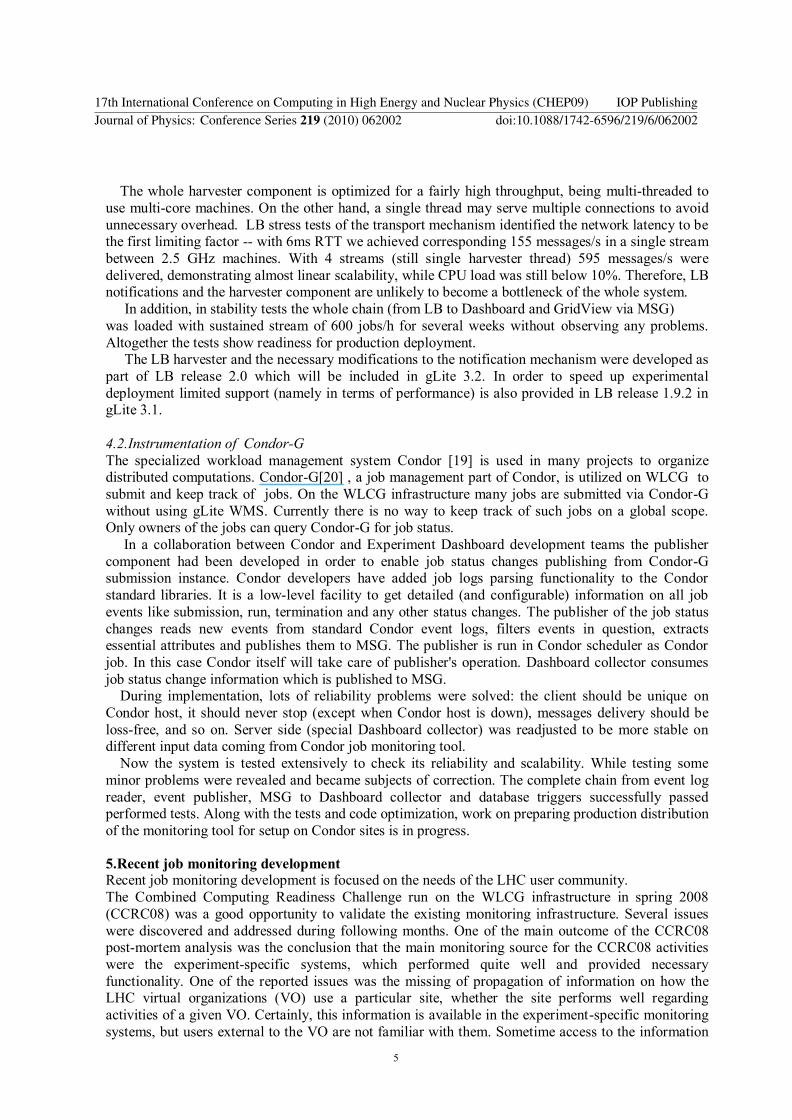
The user interface is shown in the Fig. 2. The GridMap shown on the UI is split in 4 main areas.
The first area shows the overall status of the site from the perspective of the particular VO. Three others represent main activities of the LHC VOs at the site - job processing, incoming and outgoing
transfer. The area relative to each of these activities is divided into rectangles which represent the VOs
supported by the site. The size of the rectangle is proportional to some metric representative of the importance of that activity, for example the metric chosen to set the size of the job processing
rectangle is the number of parallel jobs running at the site, and for data transfer is the average transfer
rate over the last hour. The color of the rectangle represents the status of the activity, the meaning of each colour being explained in the legend below the map. Moving the mouse on the map, a popup
window displays all the available information about a given activity. In case of job monitoring it
shows the number of jobs running in parallel, the number of jobs accomplished over last hour and the
last 24 hours, the success rate for the accomplished jobs. By clicking on the particular case corresponding to the job monitoring, user can get a submap, which shows how jobs of the VO are split
between various job processing activities: analysis, production, tests, etc... The main feature of the
GridMap visualization technique is that it provides transparent and intuitive navigation from the high level view to the very detailed information, which can be important for the debugging purposes. For
example, job monitoring submaps provide links to the primary information sources. Using GridMap
navigation one can get as deep as a log file of a particular job.
17th International Conference on Computing in High Energy and Nuclear Physics (CHEP09) IOP PublishingJournal of Physics: Conference Series 219 (2010) 062002 doi:10.1088/1742-6596/219/6/062002
6
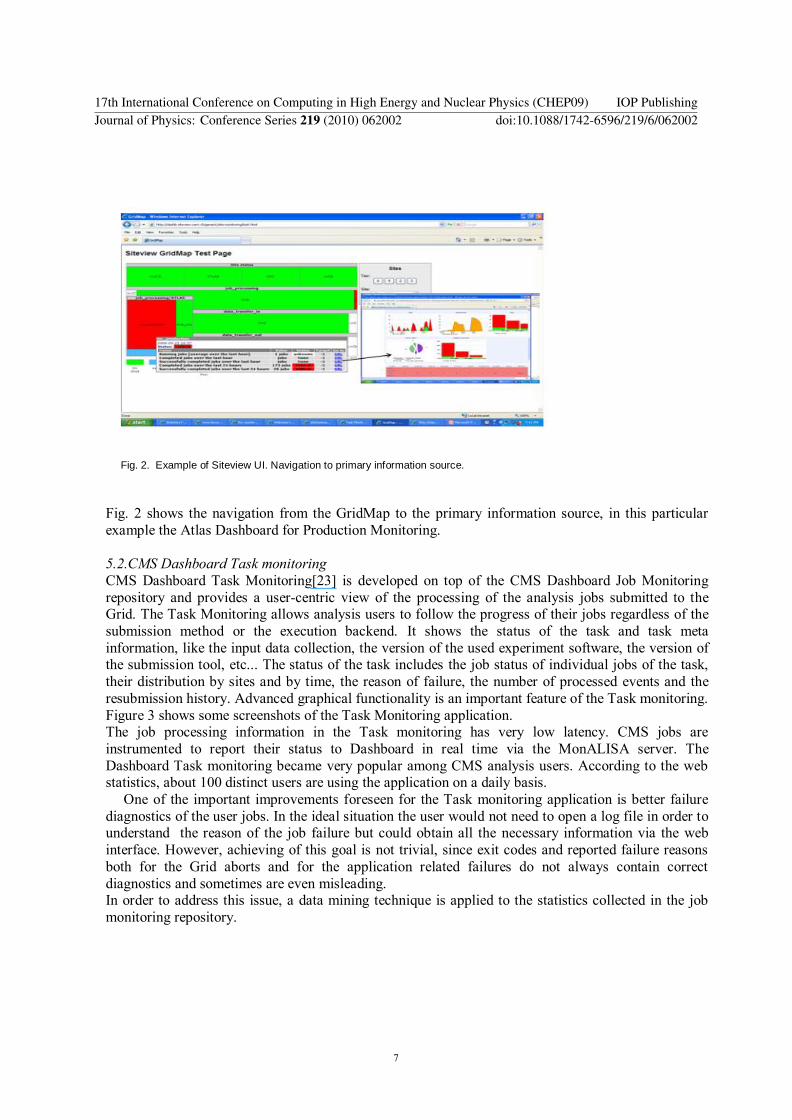
Fig. 2. Example of Siteview UI. Navigation to primary information source.
Fig. 2 shows the navigation from the GridMap to the primary information source, in this particular
example the Atlas Dashboard for Production Monitoring.
5.2.CMS Dashboard Task monitoring
CMS Dashboard Task Monitoring[23] is developed on top of the CMS Dashboard Job Monitoring
repository and provides a user-centric view of the processing of the analysis jobs submitted to the Grid. The Task Monitoring allows analysis users to follow the progress of their jobs regardless of the
submission method or the execution backend. It shows the status of the task and task meta
information, like the input data collection, the version of the used experiment software, the version of the submission tool, etc... The status of the task includes the job status of individual jobs of the task,
their distribution by sites and by time, the reason of failure, the number of processed events and the
resubmission history. Advanced graphical functionality is an important feature of the Task monitoring.
Figure 3 shows some screenshots of the Task Monitoring application. The job processing information in the Task monitoring has very low latency. CMS jobs are
instrumented to report their status to Dashboard in real time via the MonALISA server. The
Dashboard Task monitoring became very popular among CMS analysis users. According to the web statistics, about 100 distinct users are using the application on a daily basis.
One of the important improvements foreseen for the Task monitoring application is better failure
diagnostics of the user jobs. In the ideal situation the user would not need to open a log file in order to understand the reason of the job failure but could obtain all the necessary information via the web
interface. However, achieving of this goal is not trivial, since exit codes and reported failure reasons
both for the Grid aborts and for the application related failures do not always contain correct
diagnostics and sometimes are even misleading. In order to address this issue, a data mining technique is applied to the statistics collected in the job
monitoring repository.
17th International Conference on Computing in High Energy and Nuclear Physics (CHEP09) IOP PublishingJournal of Physics: Conference Series 219 (2010) 062002 doi:10.1088/1742-6596/219/6/062002
7
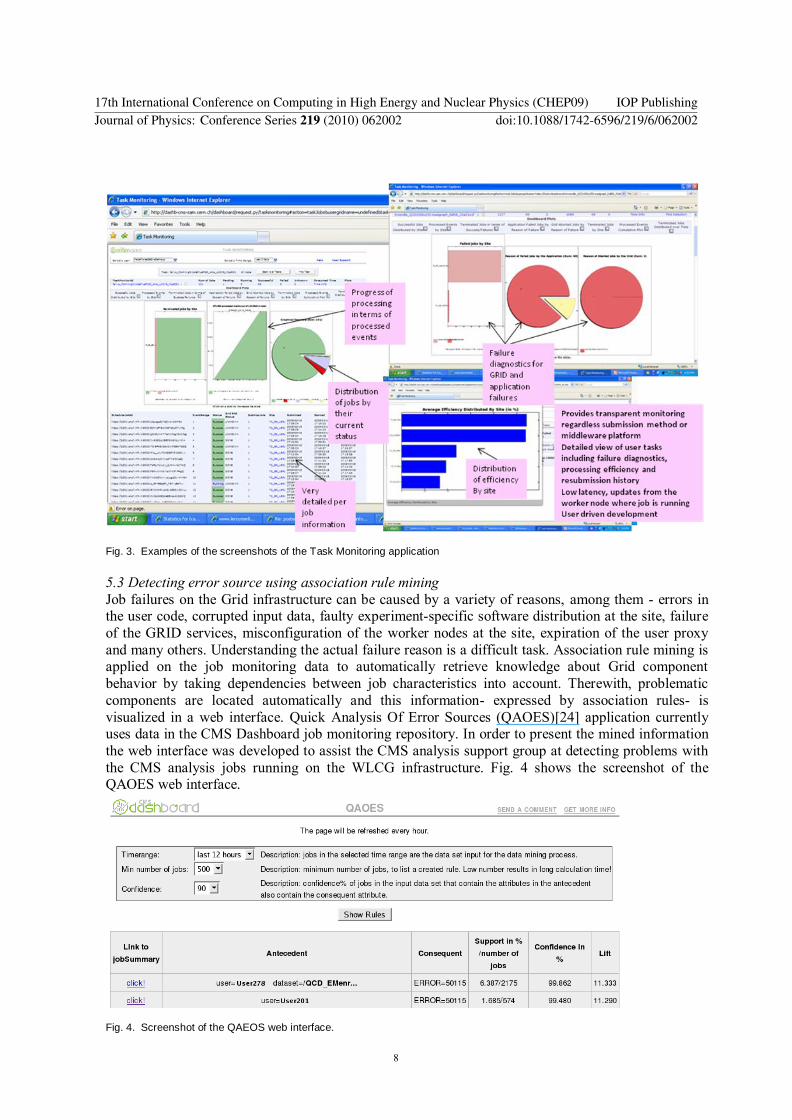
Fig. 3. Examples of the screenshots of the Task Monitoring application
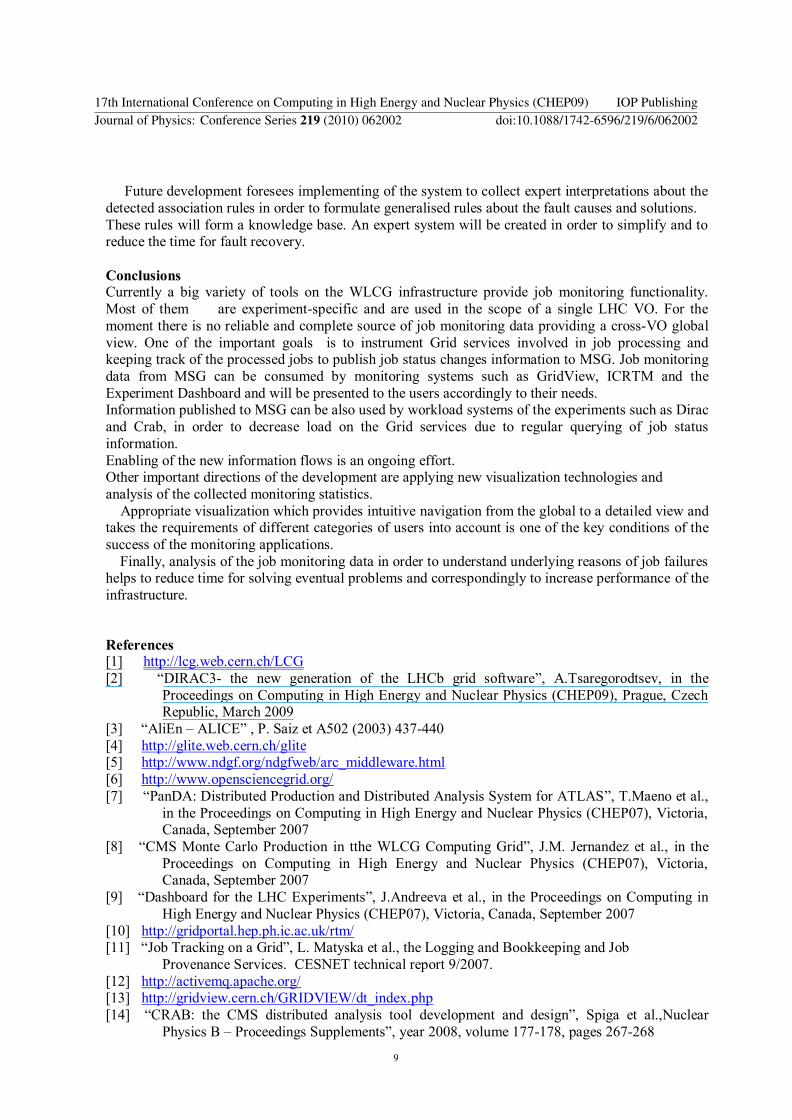
5.3 Detecting error source using association rule mining
Job failures on the Grid infrastructure can be caused by a variety of reasons, among them - errors in the user code, corrupted input data, faulty experiment-specific software distribution at the site, failure
of the GRID services, misconfiguration of the worker nodes at the site, expiration of the user proxy
and many others. Understanding the actual failure reason is a difficult task. Association rule mining is applied on the job monitoring data to automatically retrieve knowledge about Grid component
behavior by taking dependencies between job characteristics into account. Therewith, problematic
components are located automatically and this information- expressed by association rules- is
visualized in a web interface. Quick Analysis Of Error Sources (QAOES)[24] application currently uses data in the CMS Dashboard job monitoring repository. In order to present the mined information
the web interface was developed to assist the CMS analysis support group at detecting problems with
the CMS analysis jobs running on the WLCG infrastructure. Fig. 4 shows the screenshot of the QAOES web interface.
Fig. 4. Screenshot of the QAEOS web interface.
17th International Conference on Computing in High Energy and Nuclear Physics (CHEP09) IOP PublishingJournal of Physics: Conference Series 219 (2010) 062002 doi:10.1088/1742-6596/219/6/062002
8
Future development foresees implementing of the system to collect expert interpretations about the
detected association rules in order to formulate generalised rules about the fault causes and solutions.
These rules will form a knowledge base. An expert system will be created in order to simplify and to reduce the time for fault recovery.
Conclusions Currently a big variety of tools on the WLCG infrastructure provide job monitoring functionality.
Most of them are experiment-specific and are used in the scope of a single LHC VO. For the
moment there is no reliable and complete source of job monitoring data providing a cross-VO global
view. One of the important goals is to instrument Grid services involved in job processing and keeping track of the processed jobs to publish job status changes information to MSG. Job monitoring
data from MSG can be consumed by monitoring systems such as GridView, ICRTM and the
Experiment Dashboard and will be presented to the users accordingly to their needs. Information published to MSG can be also used by workload systems of the experiments such as Dirac
and Crab, in order to decrease load on the Grid services due to regular querying of job status
information.
Enabling of the new information flows is an ongoing effort. Other important directions of the development are applying new visualization technologies and
analysis of the collected monitoring statistics.
Appropriate visualization which provides intuitive navigation from the global to a detailed view and takes the requirements of different categories of users into account is one of the key conditions of the
success of the monitoring applications.
Finally, analysis of the job monitoring data in order to understand underlying reasons of job failures helps to reduce time for solving eventual problems and correspondingly to increase performance of the
infrastructure.
References [1] http://lcg.web.cern.ch/LCG
[2] “DIRAC3- the new generation of the LHCb grid software”, A.Tsaregorodtsev, in the
Proceedings on Computing in High Energy and Nuclear Physics (CHEP09), Prague, Czech Republic, March 2009
[3] “AliEn – ALICE” , P. Saiz et A502 (2003) 437-440
[4] http://glite.web.cern.ch/glite [5] http://www.ndgf.org/ndgfweb/arc_middleware.html
[6] http://www.opensciencegrid.org/
[7] “PanDA: Distributed Production and Distributed Analysis System for ATLAS”, T.Maeno et al.,
in the Proceedings on Computing in High Energy and Nuclear Physics (CHEP07), Victoria, Canada, September 2007
[8] “CMS Monte Carlo Production in tthe WLCG Computing Grid”, J.M. Jernandez et al., in the
Proceedings on Computing in High Energy and Nuclear Physics (CHEP07), Victoria, Canada, September 2007
[9] “Dashboard for the LHC Experiments”, J.Andreeva et al., in the Proceedings on Computing in
High Energy and Nuclear Physics (CHEP07), Victoria, Canada, September 2007
[10] http://gridportal.hep.ph.ic.ac.uk/rtm/ [11] “Job Tracking on a Grid”, L. Matyska et al., the Logging and Bookkeeping and Job
Provenance Services. CESNET technical report 9/2007.
[12] http://activemq.apache.org/ [13] http://gridview.cern.ch/GRIDVIEW/dt_index.php
[14] “CRAB: the CMS distributed analysis tool development and design”, Spiga et al.,Nuclear
Physics B – Proceedings Supplements”, year 2008, volume 177-178, pages 267-268
17th International Conference on Computing in High Energy and Nuclear Physics (CHEP09) IOP PublishingJournal of Physics: Conference Series 219 (2010) 062002 doi:10.1088/1742-6596/219/6/062002
9
[15] “Ganga: a tool for computational-task management and easy access to Grid resources”,
F.Brochu et al.,Computing Physics Communications
[16] http://monalisa.caltech.edu/monalisa.htm [17] http://public.eu-egee.org/
[18] “Using CREAM and CEMON for job submission and management of the gLite moddleware”.
M. Sgaravatto et al., in the Proceedings on Computing in High Energy and Nuclear Physics (CHEP09), Prague, Czech Republic, March 2009
[19] "Condor and the Grid", D.Thain, T.Tannenbaum, M.Livny, in Fran Berman, Anthony J.G. Hey,
Geoffrey Fox, editors, Grid Computing: Making The Global Infrastructure a Reality, John
Wiley, 2003 [20] "Condor-G: A Computation Management Agent for Multi-Institutional Grids", J.Frey,
T.Tannenbaum, I.Foster, M.Livny, S.Tuecke, Journal of Cluster Computing volume 5, pages
237-246, 2002 [20] [21] “Dashboard applications to monitor experiment activities at sites”,E.Lanciotti, P.Saiz et
al., in the Proceedings on Computing in High Energy and Nuclear Physics (CHEP09),
Prague, Czech Republic, March 2009
[22] “Visualization the State of the Grid with GridMaps”, M.Boehm and R.Kunli, Proceedings EGEE’07 conference, Budapest,2007
[23] “CMS Dashboard Task Monitoring: A User-centric monitoring view”, E.Karavakis et al, in the
Proceedings on Computing in High Energy and Nuclear Physics (CHEP09), Prague, Czech Republic, March 2009
[24] “Association Rule Mining on Grid Monitoring Data to Detect Error Sources”, G.Maier et al., in
the Proceedings on Computing in High Energy and Nuclear Physics (CHEP09), Prague, Czech Republic, March 2009
,
17th International Conference on Computing in High Energy and Nuclear Physics (CHEP09) IOP PublishingJournal of Physics: Conference Series 219 (2010) 062002 doi:10.1088/1742-6596/219/6/062002
10
Copyright © 2022 FDOKUMEN