a study on consumer buying behaviour towards packed fruit ...
1
JISC User Behaviour Observational Study
Scholarly digital use and information seeking behaviour
in business and economics
An evidenced-based study
CIBER
University College London http://www.ucl.ac.uk/infostudies/research/ciber/
October 2009

2
CIBER are: David Nicholas, Ian Rowlands, David Clark, Thomas
Nicholas and Hamid R. Jamali
© HEFCE, 2009. The Higher Education Funding Council for England (HEFCE), on behalf of the Joint
Information Systems Committee (JISC), permits the use of this publication under the terms of Creative
Commons Attribution-Non-Commercial-No Derivative Works 2.0 UK: England & Wales License
3
Table of Contents 1.0 General Aims ............................................................................................................... 9
2.0 Scope........................................................................................................................... 12
3.0 Literature review ...................................................................................................... 14
3.1 Main points arising from the literature ................................................................... 16
4.0 Results ........................................................................................................................ 17
4.1 Use and information seeking in respect to e-textbooks by business management
students and staff in the UK. ......................................................................................... 17
4.1.1 Introduction ...................................................................................................... 17
4.1.2 Results of log analysis ..................................................................................... 18
4.1.3. Questionnaire analysis (closed questions) ...................................................... 25
4.1.4 Questionnaire study (open ended questions) ................................................... 29
4.1.5 Focus groups .................................................................................................... 33
4.1.6 Main points arising from the project ................................................................ 35
4.2 Use and information seeking behaviour of UK academic economists (including
students) in connection with e-journals. ....................................................................... 37
4.2.1 ScienceDirect ................................................................................................... 37
4.2.1.1 Usage ........................................................................................................ 37
4.2.1.1.1 Use over time .................................................................................... 38
4.2.1.2 Information seeking behaviour ................................................................ 41
4.2.1.2.1 Journal content viewed ...................................................................... 44
4.2.1.3 Journals used ............................................................................................ 45
4.2.2 Oxford Journals (OJ)........................................................................................ 49
4.2.2.1 Usage......................................................................................................... 49
4.2.2.1.1 Use over time .................................................................................... 51
4.2.2.2 Information seeking behaviour ................................................................ 53
4.2.2.3 Journals used ............................................................................................. 55
4.2.3 Main points arising from the project ................................................................ 56
4.3 Use and information seeking behavior of international Economists in respect to e-
journals. . ....................................................................................................................... 58
4
4.3.1 Characteristic of population studied ................................................................ 58
4.3.2 Results .............................................................................................................. 59
4.3.2.1 Type of journal item viewed ..................................................................... 61
4.3.2.2 Type of journal content viewed ................................................................ 62
4.3.2.3 Type of article viewed (currency indicator) .............................................. 63
4.3.2.4 Age of article viewed ................................................................................ 64
4.3.2.5 Number of page views in a session or visit ............................................... 65
4.3.2.6 Other analyses (highlights of Table 24) .................................................... 66
4.3.2.7 Attitudinal data.......................................................................................... 66
4.3.3 Main points arising from the project ................................................................ 67
4.4 Use and information seeking behaviour of US students and faculty in respect to e-
journals. ........................................................................................................................ 69
4.4.1 Main points arising from the project ................................................................ 75
5.0 Conclusions ................................................................................................................ 77
5.1 E-book users............................................................................................................ 77
5.2 E-journal users ........................................................................................................ 78
6.0 References .................................................................................................................. 82
5
List of Tables Table 1: Research project specifications ........................................................................... 12
Table 2: JISC Business Observatory case study universities ranked by MyiLibrary e-book
use ............................................................................................................................. 21
Table 3: Use of JISC business titles by month for Cranfield (2008) ................................ 22
Table 4: Use of JISC business titles by month for LSE (2008) ........................................ 22
Table 5: Use of JISC business titles by month for Middlesex (2008) .............................. 23
Table 6: Summary of key economics usage metrics ......................................................... 39
Table 7: Use over time (percentage of monthly page views) ........................................... 40
Table 8: Use over time: (average day of the week percentage page views) ..................... 40
Table 9: Use over time (average hourly page views) ....................................................... 40
Table 10: Method of access and navigation (sessions) ..................................................... 43
Table 11: Content viewed (sessions) ................................................................................ 45
Table 12: Economics journal title use and scatter ............................................................ 46
Table 13: Economics top twenty journals ......................................................................... 47
Table 14: Journals featuring in the top five ranked lists of two or more institutions ....... 49
Table 15: Summary of key subject usage metrics ............................................................ 50
Table 16: Summary of usage metrics ................................................................................ 51
Table 17: Use over time (monthly percentage of page views) ......................................... 51
Table 18: Use over time: (average day of the week page views) ..................................... 52
Table 19: Use over time (average hourly page views) ..................................................... 52
Table 20: Use over time, Economics ................................................................................ 53
Table 21: Method of access and navigation (sessions) ..................................................... 54
Table 22: Content viewed (sessions) ................................................................................ 55
Table 23: Top Economics journals ................................................................................... 56
Table 24: Usage and information seeking characteristics of author users of ScienceDirect:
subject comparisons (percentages) ........................................................................... 60
Table 25: Method of navigation ........................................................................................ 75
6
List of Figures
Figure 1: Percentage share of subject usage for eight universities ................................... 21
Figure 2: Monthly use of Management Concepts & Practices by three universities ........ 24
Figure 3: Percentage share of e-book use for Liverpool across month – Media JISC
sponsored titles only ................................................................................................. 25
Figure 4: Frequency distribution of views by main subject category of journal. ............. 59
Figure 5: Percentage distribution of type of journal item viewed by subject. .................. 62
Figure 6: Percentage distribution of type of journal content viewed by subject grouping.
................................................................................................................................... 63
Figure 7: Percentage frequency views to articles in press. ............................................... 64
Figure 8: Age of journal content viewed .......................................................................... 65
Figure 9: Percentage of page views in a session (grouped). ............................................. 66
Figure 10: Number of page viewed by subject. ................................................................ 70
Figure 11: Percentage distribution of page views in a session by subject ........................ 71
Figure 12: Percentage distribution of session time by subject .......................................... 72
Figure 13: Average (median) page time by subject .......................................................... 72
Figure 14: Average view time (Median) in seconds, articles and abstracts by subject .... 73
Figure 15: Percentage distribution of article items item across subject ............................ 74
.
7
Executive Summary
The report covers the digital usage and information seeking behaviour of tens
of thousands of business/economics/management students, researchers and
academic staff. The intention was to inform and provide a context for the
small-scale but detailed observational and interview studies undertaken by
Middlesex University researchers. Much of the data were mined from
CIBER’s Virtual Scholar research programme and has not been previously
published in this form. New data was also obtained from the studies CIBER
are currently conducting, especially from the JISC national E-book
Observatory project and the RIN funded E-journals study. Log data, the main
source of information on usage and information seeking, covers a period of
more than five years and the questionnaire data represents more than 5000
people so this probably represents the biggest and most comprehensive usage
data set ever assembled on the subject. E-books and e-journals are covered
and usage at the three JISC case study institutions – LSE, Middlesex and
Cranfield, are highlighted A whole variety of analyses are featured including:
volume and, patterns of use (in terms of visits and page views), dwell time
(session and page times), type of content viewed (PDF, abstracts etc), number
of pages viewed in a session, methods of navigating towards content, age of
material viewed, and number of searches conducted, names of titles used,
user’s organization, age and gender, hardcopy v digital preferences,
viewing/reading behaviour.
The main findings are that Business/Economics students and academic staff
use and seeking information very much like their virtual colleagues in other
subject fields. That is they make characteristically short visits, which see
only a few pages and documents viewed; they like simple searching, use
Google and GoogleScholar and like browsing when they get to a website; they
appreciate searching off-site and outside the traditional (9-5) working day. E-
8
textbooks are mainly used for obtaining snippets of information and fact
finding. Power browsing of multiple e-text books is characteristic and there
appears to be very little extended reading of e-books. Students are the
majority users of digital information services, probably because there are
simply many more of them - there use however is much lighter as they tend
to view fewer pages. As with all subject fields, there are considerable
institutional differences between the usage and information seeking behavior
even within discipline, with those at research intensive institutions using the
databases more - although spending less time on a visit, and using less of the
functions on offer.
Economists/Business users are also distinctive in their use and information
seeking and their key characteristics in that: a) they are heavier users of e-
textbooks and e-books generally; b) they tend to search off campus and out of
office hours more (the fact that many are part-time and this provides part of
the explanation); c) their searches and visits are even more abbreviated than
the virtual scholar norm - they are the archetypal ‘bouncers’; d) Google and
GoogleScholar is even more popular, as to is abstract viewing; e) they had a
marked preference for current material.
Of the three case study institutions LSE was clearly the super-user both in
terms of e-books and e-jourmals, making more visits and viewing more pages.
We have found this elsewhere to be characteristic of top-rated research
driven universities1. However, abstract viewing was lowest at the LSE and
highest at Cranfield.
1 http://www.rin.ac.uk/use-ejournals
9
1.0 General Aims
The aim of this report is to inform and provide a context for the observational
element of the JISC funded User Behaviour Observational Study (Business
and Economics) which sought to ‘demonstrate the issues that real users
(students and researchers) face when navigating the Web and interacting
with scholarly resources’. This was undertaken by furnishing Business and
Economics digital usage and information seeking at a national and
international level.2 Something the literature review confirms has never been
done before. This was largely achieved through mining the Virtual Scholar
programme evidence base built up by the CIBER research group during the
past seven years3. The evidence base is formed from data from a four major
projects, which employed deep log and questionnaire methods, and the details
of these projects follow (summary data can be found in Table 1).
1. The JISC National E-books Observatory (November 2007 to March 2009)4.
The importance of this project for the Observatory is that: i) it covers
Business management; ii) it is probably the biggest study ever conducted
on the information seeking behaviour of UK university students and
certainly the biggest study of scholarly e-book use; iii) the data are very
current. Specifics:
a. Contributes detailed digital ‘footprints’ (logs) of students and staff
from 127 UK universities in respect to their use and information
seeking in connection with 5 e-business management textbooks on
the MyiLibrary system. These footprints include information on: a)
volume and duration of use; b) where use took place; c) book titles
used; d) date and time of searching; e) type of page viewed; f) where
the user arrived from (referrer link). The unique character of 2 http://www.jisc.ac.uk/whatwedo/programmes/inf11/userbehaviourbusandecon.asp 3 http://www.ucl.ac.uk/infostudies/research/ciber/ 4 http://www.jiscebooksproject.org/
10
business management usage and seeking is established through
comparisons with other subject fields. Diversity is also explored
through a number of individual university comparisons.
b. Provides tabulated questionnaire data from entry and exit surveys
for staff and students in the business management field at the 127
universities regarding: a) degree of e-book use; b) propensity to
buy/source from a library/surf the net, etc; c) screen/paper
preferences; d) session length; e) amount of text read (e.g. whole
chapter/book or skim); f) frequency of e-book use and whether it is
growing; g) frequency of use of library (physical / virtual) and
purposes of visit; h) satisfaction levels with hard copy provision; i)
off campus use of the digital library. Data are segmented by type of
university, age, gender and status (in regard to latter,
differentiating between staff and student behaviours)
c. Offers insights into the e-book behaviour and attitudes of business
students and faculty from an analysis of more than a thousand free
text comments furnished as part of the questionnaire surveys
mentioned above
2. Evaluating the usage and impact of e-journals in the UK. Funded by the
Research Information Network, 2008-20105
The importance of this project for the Observatory is that: i) it covered
Economics; ii) it is the biggest study conducted of the use of e-journals by
UK researchers and students; iii) the data are very current; iv)
institutional diversity was investigated. Details:
a) Part of this study furnished data on the use and information
seeking behaviour of 151 Economics journals on the ScienceDirect
and Oxford Journals databases.
5 Full report at http://www.rin.ac.uk/use-ejournals
11
b) It was a log based study and covered researchers (students and
staff) from 10 UK research institutions, mostly universities.
Comparative data for other representative subjects provided.
3. Authors as users. Funded by Elsevier; 2005-20066
The importance of this project for the Observatory is that it covered: a)
Economics authors (as defined by the user and the subject of the journals
used); b) a very wide range of information seeking characteristics covered.
Details:
a) Furnishes deep log analysis conducted over a period of 18 months of
30 international Economists
b) links demographic and attitudinal data obtained from a
questionnaire with usage data from ScienceDirect journals.
4. MaxData study7
The importance of this project for the Observatory is that it covered: i) a very
large population of students; b) a very large number of Economics/business e-
journals – over 1000. Details:
a) Includes an exploratory deep log analysis of Economics and
Business journal usage on OhioLINK, conducted as part of the
MaxData project funded by the US Institute of Museum and
Library Services. OhioLINK, the original “big deal”, provides a
single digital platform of nearly 6,000 full-text journal for more
than 600,000 people in the state of Ohio.
6 Unpublished report at http://www.ucl.ac.uk/infostudies/research/ciber/downloads/ 7 Full report at http://www.ucl.ac.uk/infostudies/research/ciber/downloads/
12
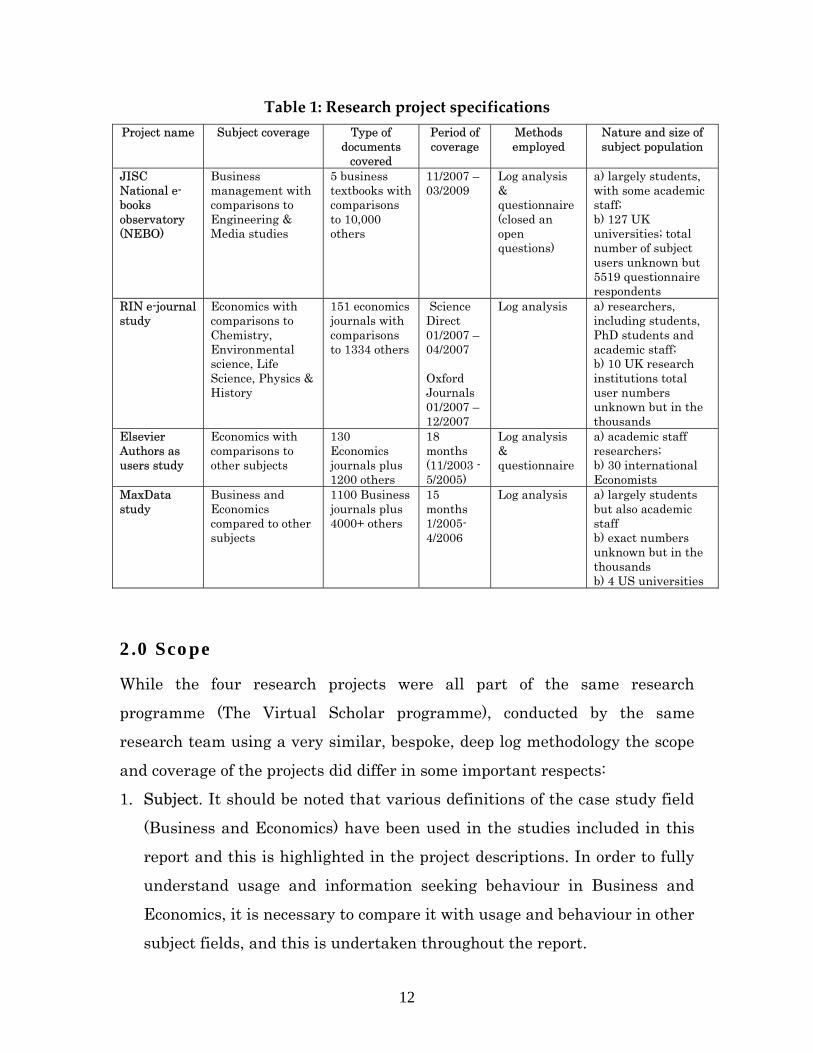
Table 1: Research project specifications Project name Subject coverage Type of
documents covered
Period of coverage
Methods employed
Nature and size of subject population
JISC National e-books observatory (NEBO)
Business management with comparisons to Engineering & Media studies
5 business textbooks with comparisons to 10,000 others
11/2007 – 03/2009
Log analysis & questionnaire (closed an open questions)
a) largely students, with some academic staff; b) 127 UK universities; total number of subject users unknown but 5519 questionnaire respondents
RIN e-journal study
Economics with comparisons to Chemistry, Environmental science, Life Science, Physics & History
151 economics journals with comparisons to 1334 others
Science Direct 01/2007 – 04/2007 Oxford Journals 01/2007 – 12/2007
Log analysis a) researchers, including students, PhD students and academic staff; b) 10 UK research institutions total user numbers unknown but in the thousands
Elsevier Authors as users study
Economics with comparisons to other subjects
130 Economics journals plus 1200 others
18 months (11/2003 - 5/2005)
Log analysis & questionnaire
a) academic staff researchers; b) 30 international Economists
MaxData study
Business and Economics compared to other subjects
1100 Business journals plus 4000+ others
15 months 1/2005-4/2006
Log analysis a) largely students but also academic staff b) exact numbers unknown but in the thousands b) 4 US universities
2.0 Scope
While the four research projects were all part of the same research
programme (The Virtual Scholar programme), conducted by the same
research team using a very similar, bespoke, deep log methodology the scope
and coverage of the projects did differ in some important respects:
1. Subject. It should be noted that various definitions of the case study field
(Business and Economics) have been used in the studies included in this
report and this is highlighted in the project descriptions. In order to fully
understand usage and information seeking behaviour in Business and
Economics, it is necessary to compare it with usage and behaviour in other
subject fields, and this is undertaken throughout the report.
13
2. User population. Students and researchers were the focus of the
Observational study. In the case of the log studies it was not always
possible to identify whether the user is a student, member of staff etc and
thus some of the data mined covers a wider user population and this is
highlighted in the project descriptions that follow.
3. Time period. Given the rate of change and volatility (churn) in the field it
was decided to only mine studies undertaken since 2005. Even so the
actual data drawn from the four projects encompasses different periods
from 2003 – 2009.
4. Country. The Observational strand of the project covers UK students and
researchers. The CIBER studies were more international in scope,
although the NEBO and RIN studies are exclusively UK. studies and this
is again pointed out in the project descriptions
14
3.0 Literature review
What is perhaps surprising given the size of the scholarly business and
economics community and their clear need for information is the fact that
there have been very few recent (2005 - ) studies of business/economics e-
journal usage, other than the CIBER studies reported here. One of the few is
a study by Evans and Peters (2005) that sought to discover how usage was
distributed over Emerald’s 108 Business and Management journals. These
titles attracted nearly 6.5 million ‘downloads’ in 2004, demonstrating how
popular journals are in the field. Around 10% of the titles accounted for
around 30% of use and around 47% accounted for 80% of use, which, in
relative terms, meant that use is quite well distributed over the Emerald
portfolio. Much higher levels of concentration exist in subjects like Physics
and the Life Sciences.
There is however a much more healthy literature on business/economics e-
books, which in itself is probably significant – business e-books are a
potentially important and exciting asset. Generally, the published literature
shows that business is among the most used subjects in terms of e-book
usage. A survey of a representative sample of 470 full-time American
students representing 250 colleges showed that 26.9% of respondents from
the (admittedly broad) subject category of “Business, Economics, Finance,
Engineering, Math” agreed with the statement “I use the library e-book
collection occasionally” (Primary Research Group Inc., 2009). Levine-Clark
(2007) found some subject differences in terms of frequency of use;
humanities (13.8 percent), business (13.3 percent) and social science (13
percent) faculty were the most frequent users of e-books; in contrast the
figure was just 11.8% for the science faculty. A study of NetLibrary usage
data for Auburn University Montgomery between 2000 and 2004 showed that
books in the subject “Business, Economics and Management” were the most
15
used titles with 1580 total accesses during the period. In total, 703 individual
business titles were used (Bailey, 2006).
A survey of 2084 students and staff at two Australian universities showed
that 62% respondents from business said they used e-books. (Borchert et al.,
2009). Dillon (2001a, b) at the University of Texas Austin examined usage
reports for electronic books and found that books on Economics and Business
received higher usage than e-books in most other subject areas. The study
also found that these results were consistent across the various collections.
Langston’s (2003) study concerned an electronic book pilot project in
cooperative collection building undertaken by the California State University
(CSU) system. Covering a total of 23,000 NetLibrary titles in two collections
(one leased and the other purchased), the study found that the most accessed
subject area in the leased collection was economics and business, which
accounted for 39% of all accesses.
An examination of NetLibrary usage reports for Simmons College over the
period (2001–2006) showed that the top six disciplines and subjects included
business, economics, and management (1,785 visits); general social sciences
(1,558); medicine (705); computer science (660); literature (559); and library
science and publishing (537) (Hernon et al., 2007). Finally, a study of e-book
usage statistics supplied by three e-book providers (including NetLibrary and
Ebrary) at the University of Idaho in 2008 showed that the highest usage of
e-books occurred in the category “Business/Economics”. 1186 titles in this
subject were used (total 3425 uses), which was equal to 17.4% of all titles in
the subject that the library held. It should also be noted that the library held
6836 titles in this subject category which was more than library’s holdings in
any other subject. (Hunter and Sprague, 2009)
16
3.1 Main points arising from the literature
• There is a clear consensus in the literature that business/economics
scholars are the biggest users of e-books, especially students
• Use of e-journals is a relatively under-researched area and hence the
importance of the present study
• Use of e-journals is relatively widely distributed over a large number of
titles
17
4.0 Results
4.1 Use and information seeking in respect to e-textbooks by
business management students and staff in the UK. JISC
National E-books Observatory (NEBO)8
4.1.1 Introduction
The general aims of the project were threefold:
1. To license a collection of e-books that are highly relevant to UK HE course
taught students in four discipline areas:
a. Business and Management Studies
b. Engineering
c. Medicine (not mental health or nursing)
d. Media Studies
2. To evaluate the use of the e-books though deep log analysis and the
impact of the free at the point of use materials upon publisher, aggregator
and library processes
3. To transfer knowledge acquired in the project to publishers, aggregators
and libraries to help stimulate an e-books market that has appropriate
business and licensing models
Data were collected on e-textbooks during the period November 2007 to
March 2009 for business management students and staff by three methods:
1) log analysis of titles on MyiLibrary platform; 2) questionnaires; 3) focus
groups. Data were collected from 127 UK universities in regard to general
digital use and information seeking as well as that regarding specific
8 Full report at: http://www.ucl.ac.uk/infostudies/research/ciber/downloads/
18
Business e-books that JISC provided for the purposes of Observatory. These
books were:
Blyton & Turnball, The Dynamics of Employee Relations, Palgrave Macmillan, 2004 (3rd ed.). Hannagan, Management Concepts & Practices, Pearson Education, 2004 (4th ed.). Hooley, Saunders & Piercy, Marketing Strategy & Competitive Positioning, Pearson Education, 2003 (3rd ed.). Pickton & Hudson Broderick, Integrated Marketing Communication, Pearson Education, 2004 (2nd ed.). Rollinson, Organisational Behaviour and Analysis: An Integrated Approach, Pearson Education, 2004 (3rd ed.).
4.1.2 Results of log analysis
Business e-books proved to be the most popular titles. Of the three subjects
covered (the two other subjects were Media studies and Engineering)
Business e-books received the highest volume of use. The five Business titles
(constituting 20% of the JISC e-books) accounted for 45% of page views; this
represented around 342,450 views. Their popularity could be put down to a
number of factors: a) the books were more attractive to university users; b)
the nature of business studies means that e-books are especially attractive,
and the literature suggests that this is the case; c) staff and librarians
promote them more; d) there were more students studying
Business/Management in the UK. In 2007/8 there were 40,425 students
compared to 34715 for Engineering and 8730 for media studies
The most popular JISC title was in fact a business title Organisational Behaviour and Analysis: an Integrated Approach, which attracted 82,787
page views in the 14 month survey period. The third, fourth and fifth most
used titles were also Business titles and all attracted more than 74,000
views. The book that increased its use most over the survey period was
19
Integrated Marketing Communication, its use increased from about 14% of
business use (December 2007) to 37% (May 2008).
Use was unusually strong in August. In relative terms Business e-book usage
was strongest in August 2008 when it accounted for 63% of all JISC e-book
use and was weakest between February and April 2008 and accounted for
less than 40% of views. Normally use of e-books are tied to teaching but
perhaps not so in the case of Business?
Business books were viewed for a relatively longer time. All e-book use is
relatively brief but relatively speaking Business e-textbooks obtained more
attention. Thus while most e-book pages were viewed for less than a minute a
higher proportion of Business pages (17%) were viewed for more than a
minute.
Business online sessions tended to feature a high number of page views and
lasted longer. Nearly a third (31%) of sessions recorded significant levels of
use with 11 or more pages being viewed. Sessions where Business titles only
were viewed were longer: 59% lasted more than 12 minutes compared to 51%
for sessions where Engineering and Media studies books were viewed. Fewer
Business sessions lasted under 30 seconds, which probably meant most users
were finding something of interest.
Cover pages, unexpectedly, were viewed for the longest time and perhaps this
was what we might call ‘dwell’ time, when users make relevant judgements
or trying to get a fix on things (orientation).
Much e-book use occurred off campus. A much higher proportion of Business
e-book sessions were conducted off-campus. Thus, while a third (32%) of UK
20
on-campus sessions viewed a Business title this was true of nearly two-thirds
(61%) of off campus (UK) and three quarters of overseas use.
Business users like using search to navigate towards e-book content. Thus
sessions viewing a Business title were about twice as likely to have used a
search expression. In general, those people using the search facility were
more likely to view more than one e-book in a session and were also more
likely to view more content pages in a session; the two tend to go hand in
hand, of course. Sessions using a search facility were more likely to view over
20 pages, and this could be due to the scatter gun approach of search.
Business users accessed e-books via virtual learning environments (VLE)
much more frequently than users from other subjects: 305 sessions arose
from a VLE as opposed to 74 for Engineering and just 50 for Media Studies.
It has to be said though accesses via VLE’s were low generally.
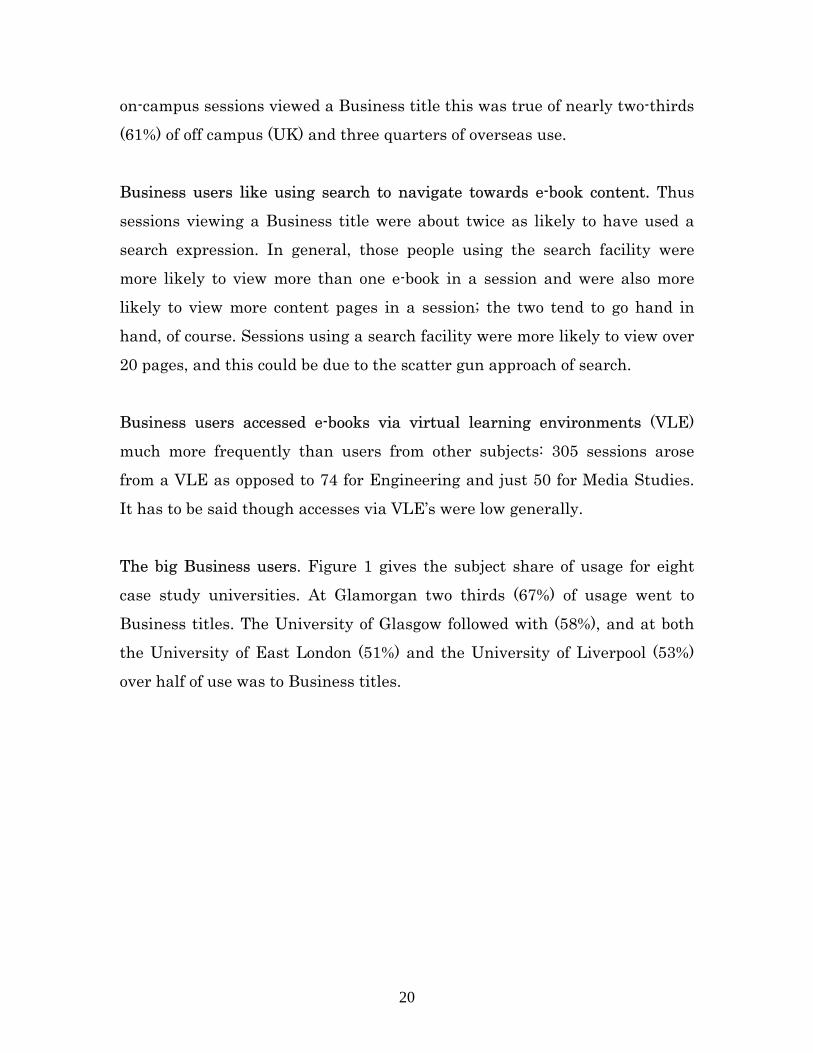
The big Business users. Figure 1 gives the subject share of usage for eight
case study universities. At Glamorgan two thirds (67%) of usage went to
Business titles. The University of Glasgow followed with (58%), and at both
the University of East London (51%) and the University of Liverpool (53%)
over half of use was to Business titles.
21
Figure 1: Percentage share of subject usage for eight universities
Univ of Glasgow
Univ College London
Univ of Birmingham
Cambridge Univ
Univ of Liverpool
Univ of East London
Univ of Glamorgan
Univ of East Anglia
100
90
80
70
60
50
40
30
20
10
0
Subject
Engineering
Business
Media
1651486817182111
58
1921
15
535167
30
263031
17
3031
12
59
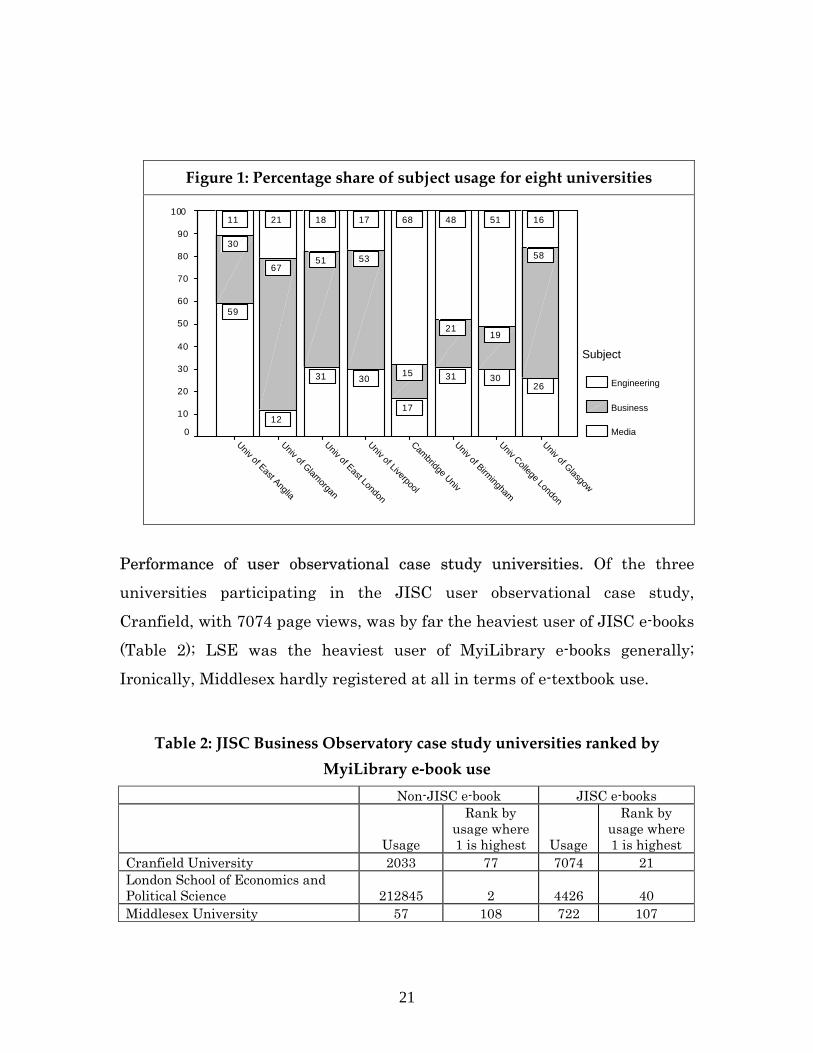
Performance of user observational case study universities. Of the three
universities participating in the JISC user observational case study,
Cranfield, with 7074 page views, was by far the heaviest user of JISC e-books
(Table 2); LSE was the heaviest user of MyiLibrary e-books generally;
Ironically, Middlesex hardly registered at all in terms of e-textbook use.
Table 2: JISC Business Observatory case study universities ranked by MyiLibrary e‐book use
Non-JISC e-book JISC e-books
Usage
Rank by usage where 1 is highest Usage
Rank by usage where 1 is highest
Cranfield University 2033 77 7074 21 London School of Economics and Political Science 212845 2 4426 40 Middlesex University 57 108 722 107
22
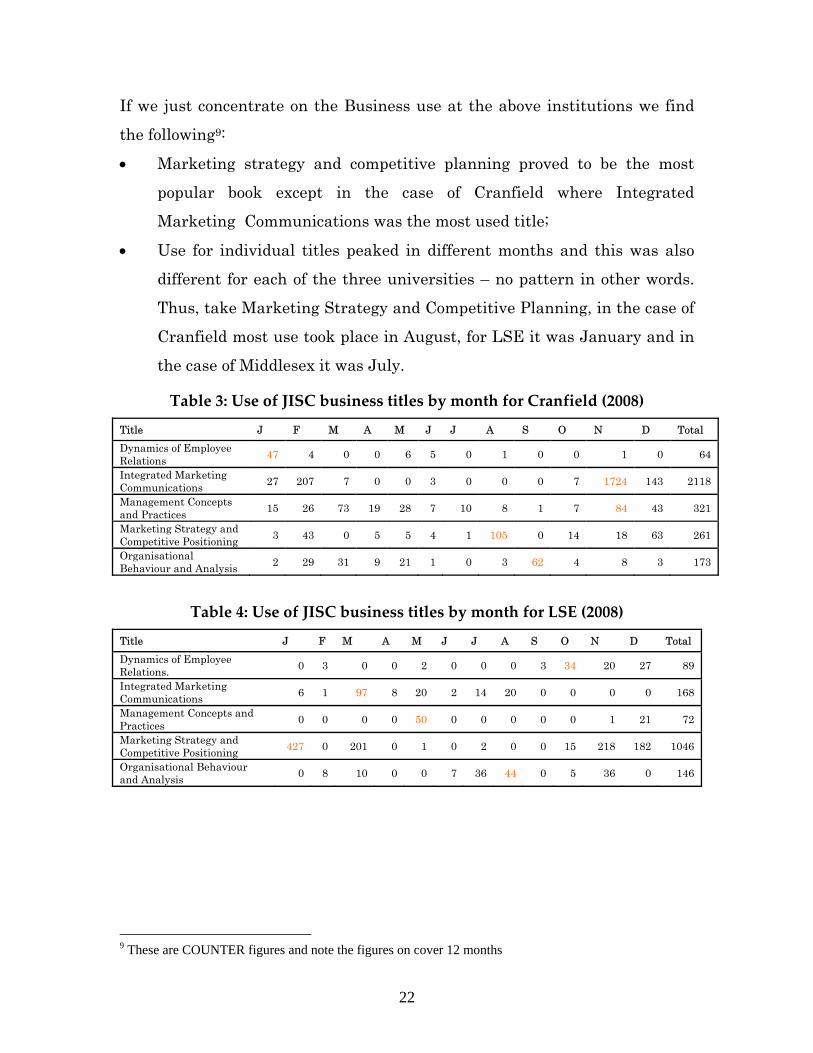
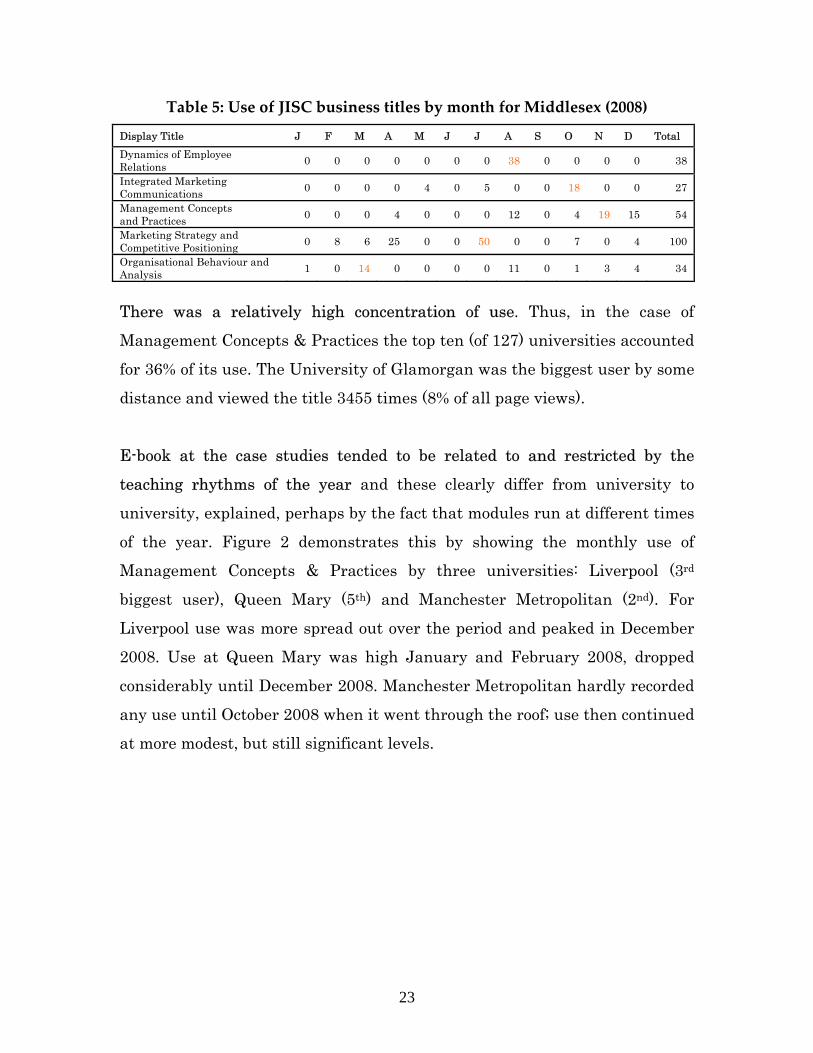
If we just concentrate on the Business use at the above institutions we find
the following9:
• Marketing strategy and competitive planning proved to be the most
popular book except in the case of Cranfield where Integrated
Marketing Communications was the most used title;
• Use for individual titles peaked in different months and this was also
different for each of the three universities – no pattern in other words.
Thus, take Marketing Strategy and Competitive Planning, in the case of
Cranfield most use took place in August, for LSE it was January and in
the case of Middlesex it was July.
Table 3: Use of JISC business titles by month for Cranfield (2008)
Title J F M A M J J A S O N D Total Dynamics of Employee Relations 47 4 0 0 6 5 0 1 0 0 1 0 64
Integrated Marketing Communications 27 207 7 0 0 3 0 0 0 7 1724 143 2118
Management Concepts and Practices 15 26 73 19 28 7 10 8 1 7 84 43 321
Marketing Strategy and Competitive Positioning 3 43 0 5 5 4 1 105 0 14 18 63 261
Organisational Behaviour and Analysis 2 29 31 9 21 1 0 3 62 4 8 3 173
Table 4: Use of JISC business titles by month for LSE (2008)
Title J F M A M J J A S O N D Total Dynamics of Employee Relations. 0 3 0 0 2 0 0 0 3 34 20 27 89
Integrated Marketing Communications 6 1 97 8 20 2 14 20 0 0 0 0 168
Management Concepts and Practices 0 0 0 0 50 0 0 0 0 0 1 21 72
Marketing Strategy and Competitive Positioning 427 0 201 0 1 0 2 0 0 15 218 182 1046
Organisational Behaviour and Analysis 0 8 10 0 0 7 36 44 0 5 36 0 146
9 These are COUNTER figures and note the figures on cover 12 months
23
Table 5: Use of JISC business titles by month for Middlesex (2008)
Display Title J F M A M J J A S O N D Total Dynamics of Employee Relations 0 0 0 0 0 0 0 38 0 0 0 0 38
Integrated Marketing Communications 0 0 0 0 4 0 5 0 0 18 0 0 27
Management Concepts and Practices 0 0 0 4 0 0 0 12 0 4 19 15 54
Marketing Strategy and Competitive Positioning 0 8 6 25 0 0 50 0 0 7 0 4 100
Organisational Behaviour and Analysis 1 0 14 0 0 0 0 11 0 1 3 4 34
There was a relatively high concentration of use. Thus, in the case of
Management Concepts & Practices the top ten (of 127) universities accounted
for 36% of its use. The University of Glamorgan was the biggest user by some
distance and viewed the title 3455 times (8% of all page views).
E-book at the case studies tended to be related to and restricted by the
teaching rhythms of the year and these clearly differ from university to
university, explained, perhaps by the fact that modules run at different times
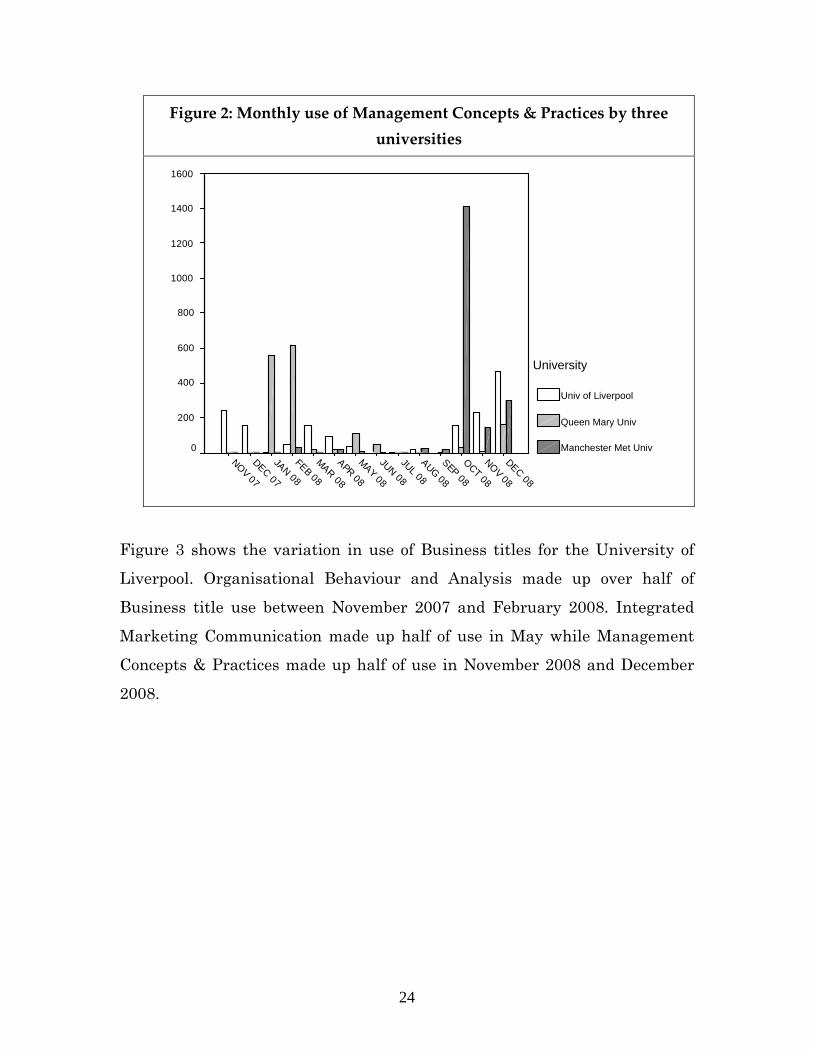
of the year. Figure 2 demonstrates this by showing the monthly use of
Management Concepts & Practices by three universities: Liverpool (3rd
biggest user), Queen Mary (5th) and Manchester Metropolitan (2nd). For
Liverpool use was more spread out over the period and peaked in December
2008. Use at Queen Mary was high January and February 2008, dropped
considerably until December 2008. Manchester Metropolitan hardly recorded
any use until October 2008 when it went through the roof; use then continued
at more modest, but still significant levels.
24
Figure 2: Monthly use of Management Concepts & Practices by three universities
DEC 08
NOV 08
OCT 08
SEP 08
AUG 08
JUL 08
JUN 08
MAY 08
APR 08
MAR 08
FEB 08
JAN 08
DEC 07
NOV 07
1600
1400
1200
1000
800
600
400
200
0
University
Univ of Liverpool
Queen Mary Univ
Manchester Met Univ
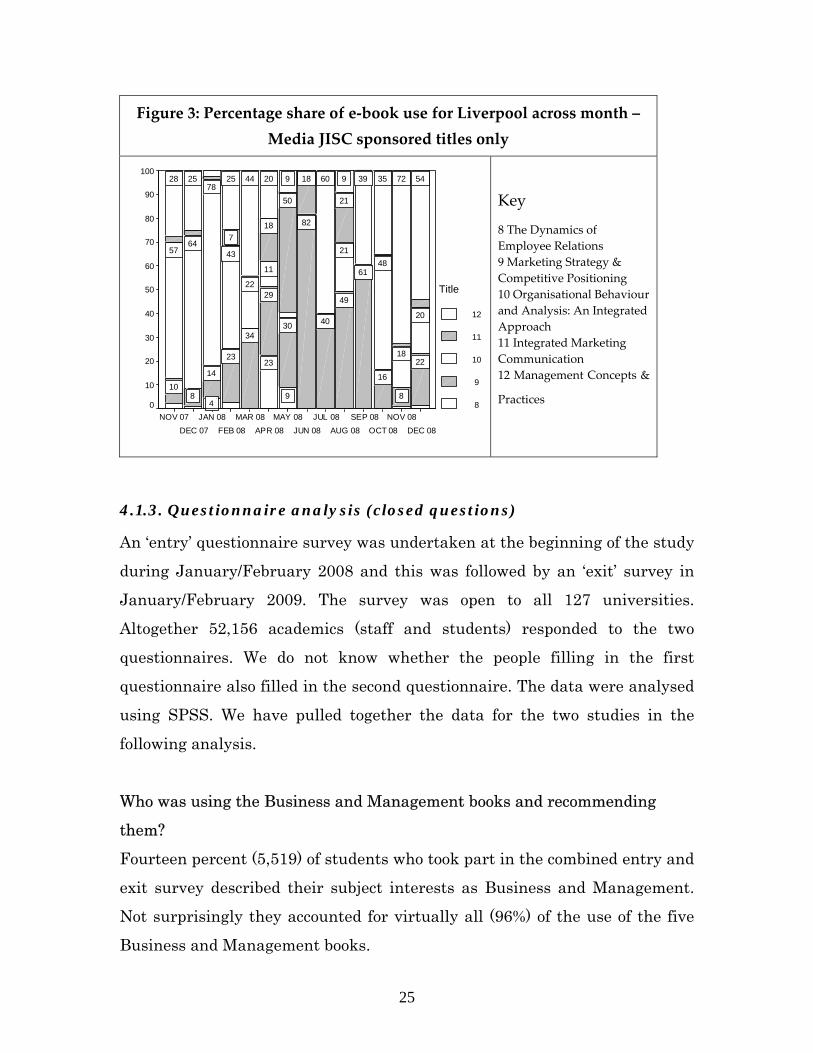
Figure 3 shows the variation in use of Business titles for the University of
Liverpool. Organisational Behaviour and Analysis made up over half of
Business title use between November 2007 and February 2008. Integrated
Marketing Communication made up half of use in May while Management
Concepts & Practices made up half of use in November 2008 and December
2008.
25
Figure 3: Percentage share of e‐book use for Liverpool across month – Media JISC sponsored titles only
DEC 08NOV 08
OCT 08SEP 08
AUG 08JUL 08
JUN 08MAY 08
APR 08MAR 08
FEB 08JAN 08
DEC 07NOV 07
100
90
80
70
60
50
40
30
20
10
0
Title
12
11
10
9
8
54723596092044252528
21
18
50
187
20
18
48
39
21
11
22
43
78
6457
22
8
16
61
49
40
82
30
29
34
23
14
810
9
23
4
Key
8 The Dynamics of Employee Relations 9 Marketing Strategy & Competitive Positioning 10 Organisational Behaviour and Analysis: An Integrated Approach 11 Integrated Marketing Communication 12 Management Concepts &
Practices
4.1.3. Questionnaire analysis (closed questions)
An ‘entry’ questionnaire survey was undertaken at the beginning of the study
during January/February 2008 and this was followed by an ‘exit’ survey in
January/February 2009. The survey was open to all 127 universities.
Altogether 52,156 academics (staff and students) responded to the two
questionnaires. We do not know whether the people filling in the first
questionnaire also filled in the second questionnaire. The data were analysed
using SPSS. We have pulled together the data for the two studies in the
following analysis.
Who was using the Business and Management books and recommending
them?
Fourteen percent (5,519) of students who took part in the combined entry and
exit survey described their subject interests as Business and Management.
Not surprisingly they accounted for virtually all (96%) of the use of the five
Business and Management books.
26
Ten percent (394) of the university staff who took part in the surveys
described their teaching interests as Business and Management.
Recommendations of the individual JISC Business titles from staff ranged
from 11.4% and 21.1%. (Individual title data follows). Ninety-nine percent of
the recommendations for the five Businesses and Management texts came
from staff describing their teaching interests as Business and Management.
Are Business and Management students and staff distinctive in their use of
e-books?
Sixty nine percent of the Business and Management students from the
surveys said they had used e-books against 68% for Engineering, 63% for
Media Studies and other subjects and 56% for Medicine. Not only were
Business students more likely to use e-books, their use of them was
increasing at a higher rate. Thus, take-up of e-books increased from 66.6% to
71.4% (a growth rate of nearly 5%) between the two surveys. In comparison
the growth figures for the other subjects were as follows:
• Engineering - growth rate 1.1%
• Media studies – growth rate 3.5%
• Medicine – growth rate minus 0.6%
• Other subjects – growth rate 2.9%
Interestingly, Business lecturers on the other hand used e-books less than
their academic colleagues from other subjects. Thus 59% had used e-books
while the figure for Media studies was 70%; only medical academics used
them less (53%). Business lecturers’ use of e-books, however, increased by
nearly 5% between the two surveys; even so this growth level was eclipsed by
that of medical staff (nearly 7%).
27
Individual university performance
The three JISC user observational case study institutions performed pretty
poorly in the questionnaire studies regarding response rates of business staff
and students: LSE (1 response), Cranfield (28) and Middlesex (2). This could
be due to the fact that the questionnaire was not promoted as much as at
other universities or academics in these universities were less interested in e-
books.
The Business and Management e-texts
In the exit survey 13.8% of business and management students (n=2,892)
said they had used one of the JISC business and management texts in e-book
form.10 The performance of the individual titles is as follows:
a) The Dynamics of Employee Relations
Used by 511 students in the entry survey and 572 in the exit survey. The
title was recommended by 11.4% of Business and Management staff with
6% strongly recommending it. Recommendations increased by 2.2%
between surveys, strong recommendations by 4.3%
b) Marketing Strategy and Competitive Positioning
Used by 559 students in entry survey and 870 in exit survey. The title was
recommended by 13.8% of Business and Management staff with 7.5%
strongly recommending it. Recommendations increased by 10% between
surveys, strong recommendations by 7.6%.
c) Organisational Behaviour and Analysis
This was the top book: used by 955 students in the entry survey and by
1,068 in exit survey. It was also the most strongly recommended e-book.
Thus, it was recommended by 21.1% of Business and Management staff
with 11.2% strongly recommending it. Recommendations increased by
6.8% between surveys, strong recommendations by 3.6%
d) Integrated Marketing and Communication 10 the entry survey did not ask this question
28
Used by 660 students in the entry survey and 737 in exit survey. It was
recommended by 16.2% Business and Management staff with 9.7%
strongly recommending it. Recommendations increased by 5% between
surveys, strong recommendations by 4.5%
e) Management Concepts and Practices
Used by 667 students in the entry survey and 740 in exit survey. It was
recommended by 16% of Business and Management staff with 8.6%
strongly recommending it. Recommendations increased by 0.7% between
surveys, strong recommendations by 2.9%
General e-book information seeking behaviour
Big users of e-books. Business and Management students were the most
frequent users of e-books with 19.4% reading more than 5 titles in the past
month as opposed to 19.2% for Engineering students, 15.9% for Media
Studies, 11.7% for Medicine and 15.2% for Others.
Time spent viewing e-books. Business and Management students shared
information seeking habits with the other subjects in terms of time spent
reading e-books with 39.2% of those from Business and Management and
other students saying they spent more than 20 minutes a time. Similarities
were shared across the scale with around 35% spending 11-20 minutes, with
down to 1.4% at less than 3 minutes.
Amount of e-book used. Business and Management students showed some
differences in terms of the proportion of e-books read. The whole book was
read by around 5% for both Business and Management and students from the
other subjects. For whole chapters however, Business and Management
students showed a higher proportion at 22.6% compared to 18.5% for other
student who, in turn, showed higher rates of reading one chapter or dipping
in and out of several.
29
Obtaining e-books. Business students were the least likely to have bought
their own copy of a textbook or to have obtained one from the open web. They
showed the strongest tendency of any of the subject groups to use library-
provided e-books. This tendency was noted before the National E-books
Observatory project took wing, so e-books appear to satisfy a real need. In
general terms business students were very frequent visitors to their
university digital library.
General demographics of Business students. Female students, perhaps
surprisingly, outnumbered men in Business studies, as in many other
subjects today, by a significant margin. As might be expected, given the
nature of the subject, Business studies courses contain a relatively high
proportion of part time students: to a much greater extent than the three
other subjects covered by the JISC Collections e-books experiment.
Hard-copy use. Business students were much more likely to be dissatisfied
with the level of print textbooks available to them. Whether this is a
perception (they are keen library users) or a more objective reality we cannot
say from the survey alone.
Location of access. As might be expected given the high proportion of part
time business students represented in the survey, business students prefer to
access their university’s digital offerings mostly or entirely from home.
4.1.4 Questionnaire study (open ended questions)
In the case of both the entry and exit questionnaires there was a catch-all,
open-ended question: “Is there anything that you want to add regarding
course texts, print or electronic, or about your university library?” There were
1,574 free text responses from Business staff and students of which 520
30
responses, due to ambiguity, could not be attributed to a specific or relevant
e-boo topic. 1,054 responses remained of which 481 originated from the entry
survey and 573 from the exit survey. The attraction of such data is that it is
given freely with prompting and direction and, possibly, provides a better
idea of what staff and students really think about e-books.
General impressions
61.4% of respondents offered positive opinions or experiences in regard to e-
books There was a significant improvement in positive e-book opinion
between the two surveys, from 58.1% - 63.7%. Of course, it is possible for a
respondent to offer both a positive and negative opinion at the same time (e.g.
“e-books are a great idea but using them is cumbersome…”) In fact, 7.4% of
respondents offered a mixed opinion and these people can be though of as
‘floating voters’ who, if their concerns were addressed could become positive
e-book users.
Examples of positive opinions proffered: • One citing academic outcomes: “The e-books service provided by my
university has been very useful and play crucial role on my studies.” • One on unblocking access: “The more e-books the better since more
students can use them at the same time!” • One on portability: “I now own a Sony portable reader - this has
revolutionised my reading habits. I find that being able to transport 160
e books in one devise invaluable. I read on trains and in cafes.”
• One on remote access and academic outcomes: “E-books are a VERY
good tool - you don’t have to worry about the availability of a certain
book and they are also useful to me as I have to travel for an hour to get
into Uni, so cutting out this journey to the library by accessing the book
online is extremely useful to me and gives me more study time.”
31
Examples of negative comments offered • One on printing difficulties: “e-books are a great idea but using them is
cumbersome and you can only print limited pages in many so limited
use and frustrating • Two on reading problems: “I find e-books really useful for core reading
when specific chapters are suggested but find it difficult to read whole
books on screen”. “I have noticed that most people find it very difficult to
read books and journals online. Most students tend to print the material
and then read it.
• One on their cumbersomeness “Accessing e-books although very
convenient (I can access at 3 am if I want to) is time consuming and
quiet fidgety. If I had the option I would much rather have a book in
hand.” The most common issues
The most common issues raised, receiving more than 50 responses, were in
rank order:
• Problems of getting hold of hard copies from library or other sources.
• Need for more e-book titles. A quarter of respondents mentioned this.
• Difficulties of access
• Difficulties of reading
• Preference for hard copy.
• Poor promotion.
Focus on access issues
Problems in accessing e-books accounted for 13.3% of comments. Those under
25 years in age tended to have less access worries. Thus just 11.7% of their
comments concerned access problems, whereas the figure for the 36-45 year
olds was 20.8%.
32
The following access aspects could be identified.
• Technical issues with software or hardware. E.g. “Do e-books work with
Macs - tried it with Safari and Firefox without success?” “My university
library provides e-books, but they only open in internet explorer,
whereas my default browser is Firefox. Making it compatible would be
great.” “I have often tried to access e-books through the university
online resources and have found some interesting titles; however when I
have attempted to read them, the internet explorer crashes and closes it
down, so i am unable to read them.”
• Problems with remote access. E.g. “Have never been successful at
accessing electronic print from home I cannot access the university e-
books from home”. “I can only use them at University. I would use them
a lot more if I could access at home.” I can't use my Athens password
because every time it says “there is a mistake in the Athens number" It
drives me potty when I am accessing e-books at home that you get
logged out of the system every 15minutes for security reasons.
• Timeouts. E.g. “I am not very satisfied with the electronic library
provided by my university.” “I have to log on myself each 5 mins, it is
not very convenient if I need to read and take note at the same time.” “I
noticed that when reading a chapter of an e-book on-line it timed out
and I had to reload the book and find where I was and this was an
inconvenience to me.”
• Printing restrictions. E.g. “I find the ability to only print 5 pages at a
time is very time consuming and frustrating. I realize it's for copyright
purposes, however, if it is intended to be used as a resource, it really
should be more user-friendly.” “While I like the idea of e-books, they are
not useful if you cannot print however much you want from them, and
are not user friendly to scroll through.”
33
• Limitations on multiple user access. E.g. “I have recently discovered
when using the electronic books that there is a limit as to how many
people can be accessing them at any one time. This can be rather
inconvenient when it has been set as a book/chapter to read for a
particular lecture.” “Not enough electronic copies!! Have to sit for hours
online until they are available.” “The availability of e-books is sporadic
and just like going into a standard library, if two users are trying to
access the same book at the same time on a network, it doesn't allow
access to the book for one of them, which is bad.”
• Interface issues. E.g. I use ebrary; I find the navigation clunky and
unintuitive. The technology needs to move into the 21st century! The
current form of electronic books offered by the university are HIGHLY
unuseable and impractical. Opening pages one by one is time consuming
and does not fit for intensive use
4.1.5 Focus groups
The purpose of the focus groups was to gain a deeper understanding of the
ways in which e-textbooks were used by students and academic staff in UK
Universities in order to enrich and enhance the log data collected from the
MyiLibrary site and reported in section 4.1.2. Separate focus groups of
students and academics staff (of between 2-8 people) were held at 10 of the
universities involved in the Observatory experiment. Just over 50 people
were interviewed in all. The relevant results of the focus groups for this study
are:
1. There was not much subject diversity, but the relatively low numbers
of people interviewed might be a factor in this.
2. E-textbooks were mainly used for obtaining snippets of information
and fact finding. There appeared to be very little extended reading of e-
books
34
3. Not unexpectedly high value was placed on the interactive features of
e-textbooks, and also on the facility to search for information.
4. Power browsing of multiple e-text books was characteristic, a function
of massive choice.
5. The e-book user was easily distracted and confused by the myriad
navigational routes and display options, and the ability to move out of
the e-book environment with ease and at will. It also has to be said
that the MyiLibrary interface is not a particularly intuitive one.
6. The most important reason for using e-books was convenience - of
transporting and accessing them.
7. E-books were used for a wide range of academic purposes and none
predominated suggesting that function (e.g. searching for quick facts)
or convenience may be more important than task.
8. The library catalogue/OPAC was the main means of accessing e-
textbooks. There was low use of Virtual Learning Environments but
higher use of e-reading lists as routes to e-books. Federated search
appears to be not much used and unimportant to students trying to
locate e-textbooks. The multiple routes to e-books confused students.
9. E-textbook content was mainly and equally accessed via search and
tables of contents. Advanced searching, as found to be universally the
case, and the expanding of the table of contents were almost never
used.
10. There was little sustained reading of the e-textbook online. The
preference was to print out material, of course something not made
easy by the e-book platforms.
11. Business students were more conscious of the currency (or otherwise)
of the e-textbooks, one student explaining that What I found was, in each and every new editions, we have more case studies which are very recent and relevant and up-to-date. So it’s nice to have up-to-date information in hand.
35
4.1.6 Main points arising from the project
• The results of this study confirms what we have found in the
literature that business students particularly are the major and most
significant users of e-books in that they view them more frequently,
spend longer viewing titles and undertake much busier and intensive
sessions. The most popular JISC title was in fact a business title,
attracting over 80,000views in 15months. The book that increased its
use most over the survey period was also a business title.
• There was a relatively high concentration of use in respect to the
JISC e-books. Thus, in the case of Management Concepts & Practices
the top ten (of 127) universities accounted for 36% of its use.
• Business students were the least likely to have bought their own
copy of a textbook or to have obtained one from the open web. They
showed the strongest tendency of any of the subject groups to use
library-provided e-books.
• A high proportion of e-book use came from the newer universities
(and this was true for other subjects too) Of the three universities
participating in the JISC user observational case study, Cranfield
was by far the heaviest user of JISC e-books – it has a big business
school.
• Use was unusually strong in August, which is unusual because much
e-textbook searching is tied to the rhythms of the teaching year.
Could be an indicator of project and postgraduate use.
• Business e-book users tend to search off campus (many were part-
time and this provides part of the explanation) and are more likely to
access the books via Virtual Learning Environments
• Business users liked using search to navigate towards e-book
content. The library catalogue/OPAC was the main means of

36
accessing e-textbooks. Federated search appears to be not much used
and unimportant to students trying to locate e-textbooks. Multiple
routes to e-books confused students.
• The e-book user was easily distracted and confused by the myriad
navigational routes and display options, and the ability to move out
of the e-book environment with ease and at will. Advanced searching
was hardly ever used though.
• E-textbooks were mainly used for obtaining snippets of information
and fact finding. Power browsing of multiple e-text books was
characteristic, a function of massive choice. There appeared to be
very little extended reading of e-books
• The most important reason for using e-books was convenience - of
transporting and accessing them.
• The main problems encountered were: a) lack of e-book titles. b)
access and navigation; c) reading electronic text; d) poor promotion.
37
4.2 Use and information seeking behaviour of UK academic
economists (including students) in connection with e-journals.
Research Information Network funded project ‘Evaluating the
usage and impact of e-journals in the UK’
The relevant aims of the study was to provide a detailed analysis of how
academic researchers in the UK have responded to the provision of scholarly
journals in digital form, and how this has shaped their information-seeking
behaviour and their use of such journals. The objectives were to: a)
investigate researchers’ behaviour, in terms of levels and patterns of usage,
content viewed, navigational preferences, and routes used to access e-journal
content; b) ascertain how researchers’ behaviours vary by subjects and
disciplines, and in relation to the universities and other institutions in which
they work. We shall focus on the study of use and information seeking
behaviour of 151 Economics journals from ScienceDirect and Oxford Journals
by UK researchers – lecturers, research staff and students. It was conducted
during 2007/8. It was a log based study and covered researchers from 10 UK
research-led institutions, mostly universities.
4.2.1 ScienceDirect
The following analyses examine use and information seeking behaviour from
an institutional perspective and demonstrate that even in the same field –
Economics, there are large differences in behaviour.
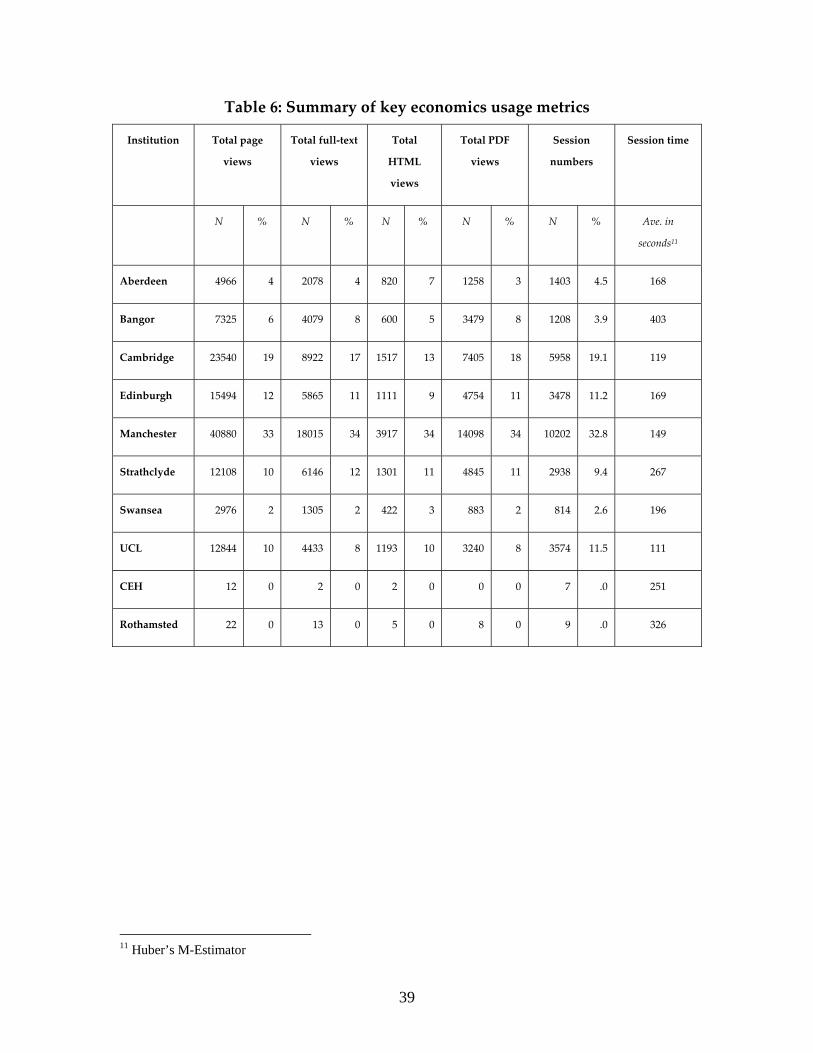
4.2.1.1 Usage (Table 6)
Economics followed a similar pattern to those of the scientific fields, with the
top institution (out of a possible 10) accounting for a third of all use.
Manchester proved the biggest user (it has a business school), accounting for
38
around a third of all use according to all the metrics. UCL was the only
institution to obtain a 5* ranking in the RAE (2001) but even so ranked only
around 4 in usage ranking terms. Cambridge conducted the shortest sessions,
119 seconds, and Bangor the longest ones (403 seconds), indicating that top
researchers spend very little time online.
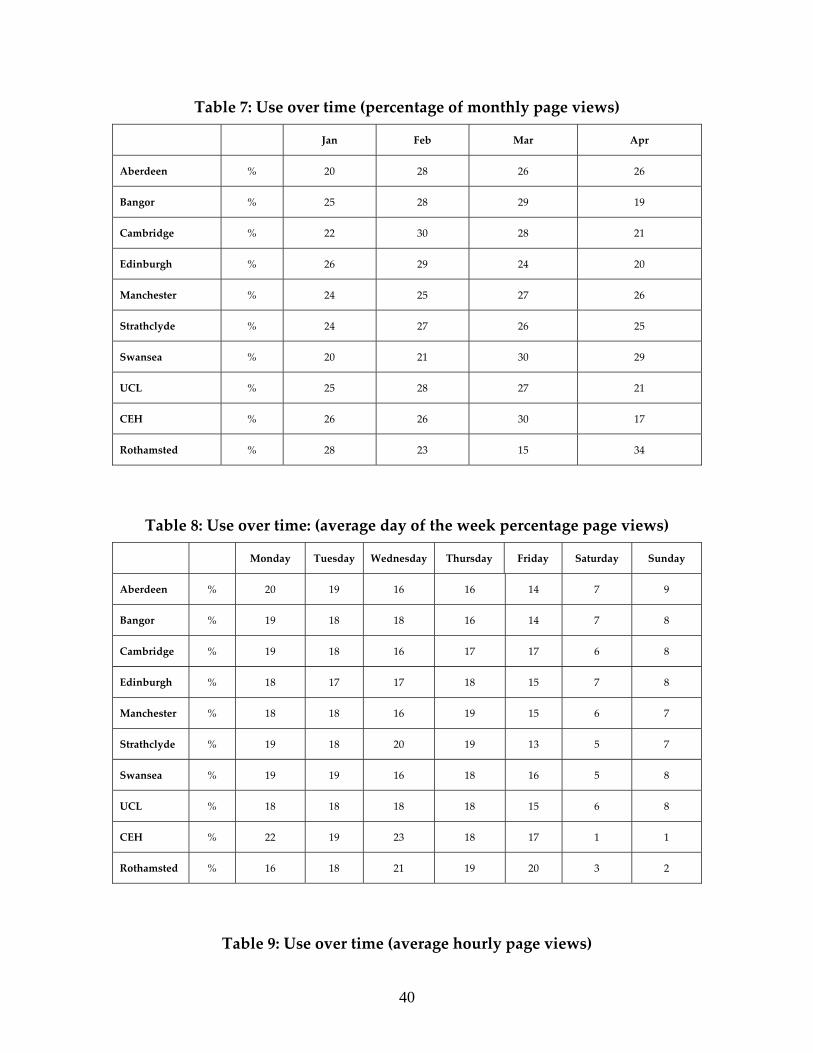
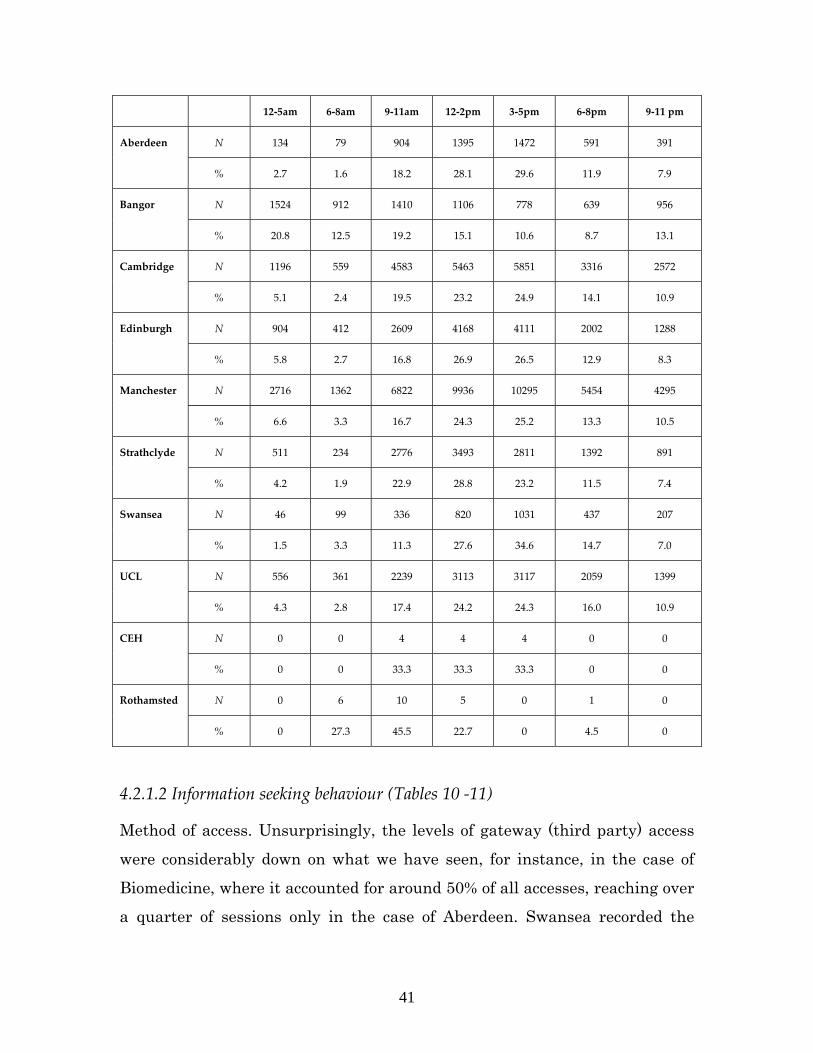
4.2.1.1.1 Use over time (Tables 7 ‐ 9) There was a greater variation between monthly use than we have previously
witnessed elsewhere and this often exceeded 10%. Usage then was quite
volatile. The busiest months proved to be February and March. A good deal of
use occurred over the weekends and, for Aberdeen, this accounted for 17% of
all use. Similarly much use occurred out of normal office hours; in fact, at
Bangor the figure exceeded 50%. This usage proved not to be mechanical or
robotic, perhaps a security guard, studying economics part-time? Economists
proved to be the group that searched most frequently out of hours.
39
Table 6: Summary of key economics usage metrics
Institution Total page
views
Total full‐text
views
Total
HTML
views
Total PDF
views
Session
numbers
Session time
N % N % N % N % N % Ave. in
seconds11
Aberdeen 4966 4 2078 4 820 7 1258 3 1403 4.5 168
Bangor 7325 6 4079 8 600 5 3479 8 1208 3.9 403
Cambridge 23540 19 8922 17 1517 13 7405 18 5958 19.1 119
Edinburgh 15494 12 5865 11 1111 9 4754 11 3478 11.2 169
Manchester 40880 33 18015 34 3917 34 14098 34 10202 32.8 149
Strathclyde 12108 10 6146 12 1301 11 4845 11 2938 9.4 267
Swansea 2976 2 1305 2 422 3 883 2 814 2.6 196
UCL 12844 10 4433 8 1193 10 3240 8 3574 11.5 111
CEH 12 0 2 0 2 0 0 0 7 .0 251
Rothamsted 22 0 13 0 5 0 8 0 9 .0 326
11 Huber’s M-Estimator
40
Table 7: Use over time (percentage of monthly page views)
Jan Feb Mar Apr
Aberdeen % 20 28 26 26
Bangor % 25 28 29 19
Cambridge % 22 30 28 21
Edinburgh % 26 29 24 20
Manchester % 24 25 27 26
Strathclyde % 24 27 26 25
Swansea % 20 21 30 29
UCL % 25 28 27 21
CEH % 26 26 30 17
Rothamsted % 28 23 15 34
Table 8: Use over time: (average day of the week percentage page views)
Monday Tuesday Wednesday Thursday Friday Saturday Sunday
Aberdeen % 20 19 16 16 14 7 9
Bangor % 19 18 18 16 14 7 8
Cambridge % 19 18 16 17 17 6 8
Edinburgh % 18 17 17 18 15 7 8
Manchester % 18 18 16 19 15 6 7
Strathclyde % 19 18 20 19 13 5 7
Swansea % 19 19 16 18 16 5 8
UCL % 18 18 18 18 15 6 8
CEH % 22 19 23 18 17 1 1
Rothamsted % 16 18 21 19 20 3 2
Table 9: Use over time (average hourly page views)
41
12‐5am 6‐8am 9‐11am 12‐2pm 3‐5pm 6‐8pm 9‐11 pm
Aberdeen N 134 79 904 1395 1472 591 391
% 2.7 1.6 18.2 28.1 29.6 11.9 7.9
Bangor N 1524 912 1410 1106 778 639 956
% 20.8 12.5 19.2 15.1 10.6 8.7 13.1
Cambridge N 1196 559 4583 5463 5851 3316 2572
% 5.1 2.4 19.5 23.2 24.9 14.1 10.9
Edinburgh N 904 412 2609 4168 4111 2002 1288
% 5.8 2.7 16.8 26.9 26.5 12.9 8.3
Manchester
N 2716 1362 6822 9936 10295 5454 4295
% 6.6 3.3 16.7 24.3 25.2 13.3 10.5
Strathclyde N 511 234 2776 3493 2811 1392 891
% 4.2 1.9 22.9 28.8 23.2 11.5 7.4
Swansea N 46 99 336 820 1031 437 207
% 1.5 3.3 11.3 27.6 34.6 14.7 7.0
UCL
N 556 361 2239 3113 3117 2059 1399
% 4.3 2.8 17.4 24.2 24.3 16.0 10.9
CEH
N 0 0 4 4 4 0 0
% 0 0 33.3 33.3 33.3 0 0
Rothamsted N 0 6 10 5 0 1 0
% 0 27.3 45.5 22.7 0 4.5 0
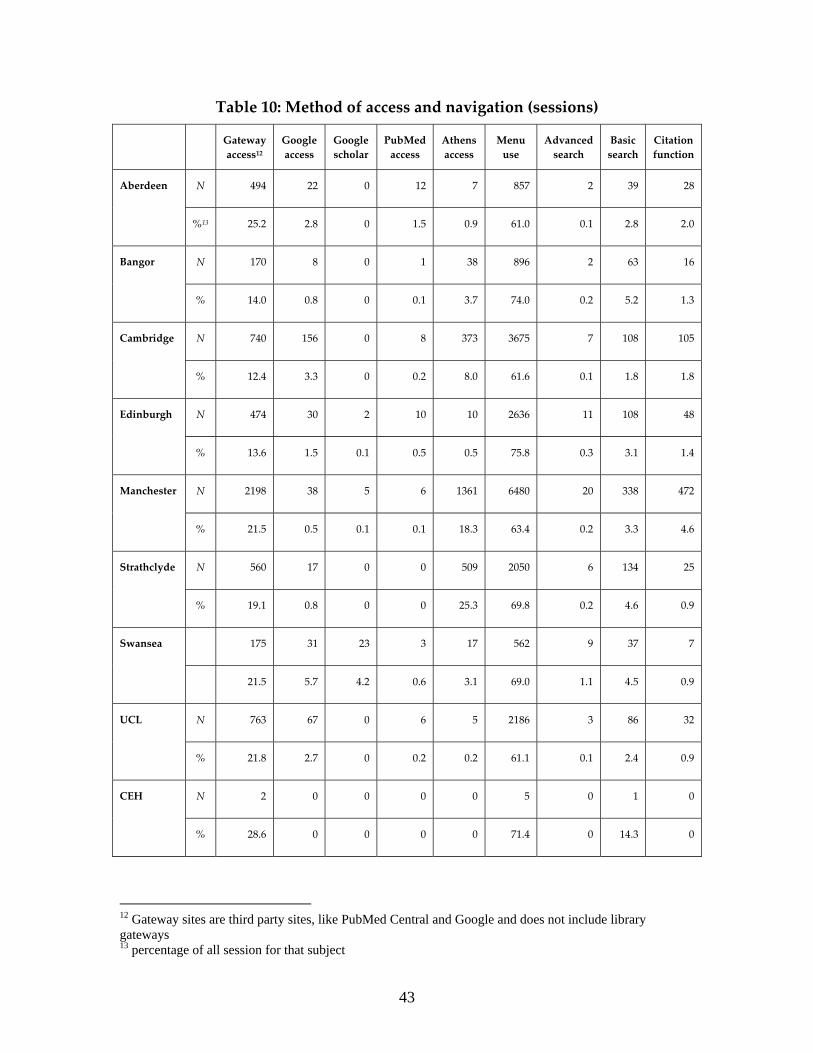
4.2.1.2 Information seeking behaviour (Tables 10 ‐11)
Method of access. Unsurprisingly, the levels of gateway (third party) access
were considerably down on what we have seen, for instance, in the case of
Biomedicine, where it accounted for around 50% of all accesses, reaching over
a quarter of sessions only in the case of Aberdeen. Swansea recorded the
42
greatest use of Google and GoogleScholar – used in 5% of all sessions - and
this might be explained by library training programmes.
Navigation. Menu (tables of contents and other lists) use was generally high,
and very high at Edinburgh where menus were viewed in three quarters of
all sessions. Economists are clearly browsers. Swansea used the advanced
search facility the most; Bangor recorded the highest levels of basic
searching, around 5% of sessions saw it employed; Manchester recorded the
greatest use of the citation facility, around 5% of all sessions saw it utilized;
Abstracts proved popular and at Aberdeen, Cambridge, Rothamsted and UCL
where they were viewed in more than one in three sessions.
43
Table 10: Method of access and navigation (sessions)
Gateway access12
Google access
Google scholar
PubMed access
Athens access
Menu use
Advanced search
Basic search
Citation function
Aberdeen N 494 22 0 12 7 857 2 39 28
%13 25.2 2.8 0 1.5 0.9 61.0 0.1 2.8 2.0
Bangor N 170 8 0 1 38 896 2 63 16
% 14.0 0.8 0 0.1 3.7 74.0 0.2 5.2 1.3
Cambridge N 740 156 0 8 373 3675 7 108 105
% 12.4 3.3 0 0.2 8.0 61.6 0.1 1.8 1.8
Edinburgh N 474 30 2 10 10 2636 11 108 48
% 13.6 1.5 0.1 0.5 0.5 75.8 0.3 3.1 1.4
Manchester
N 2198 38 5 6 1361 6480 20 338 472
% 21.5 0.5 0.1 0.1 18.3 63.4 0.2 3.3 4.6
Strathclyde N 560 17 0 0 509 2050 6 134 25
% 19.1 0.8 0 0 25.3 69.8 0.2 4.6 0.9
Swansea 175 31 23 3 17 562 9 37 7
21.5 5.7 4.2 0.6 3.1 69.0 1.1 4.5 0.9
UCL
N 763 67 0 6 5 2186 3 86 32
% 21.8 2.7 0 0.2 0.2 61.1 0.1 2.4 0.9
CEH
N 2 0 0 0 0 5 0 1 0
% 28.6 0 0 0 0 71.4 0 14.3 0
12 Gateway sites are third party sites, like PubMed Central and Google and does not include library gateways 13 percentage of all session for that subject
44
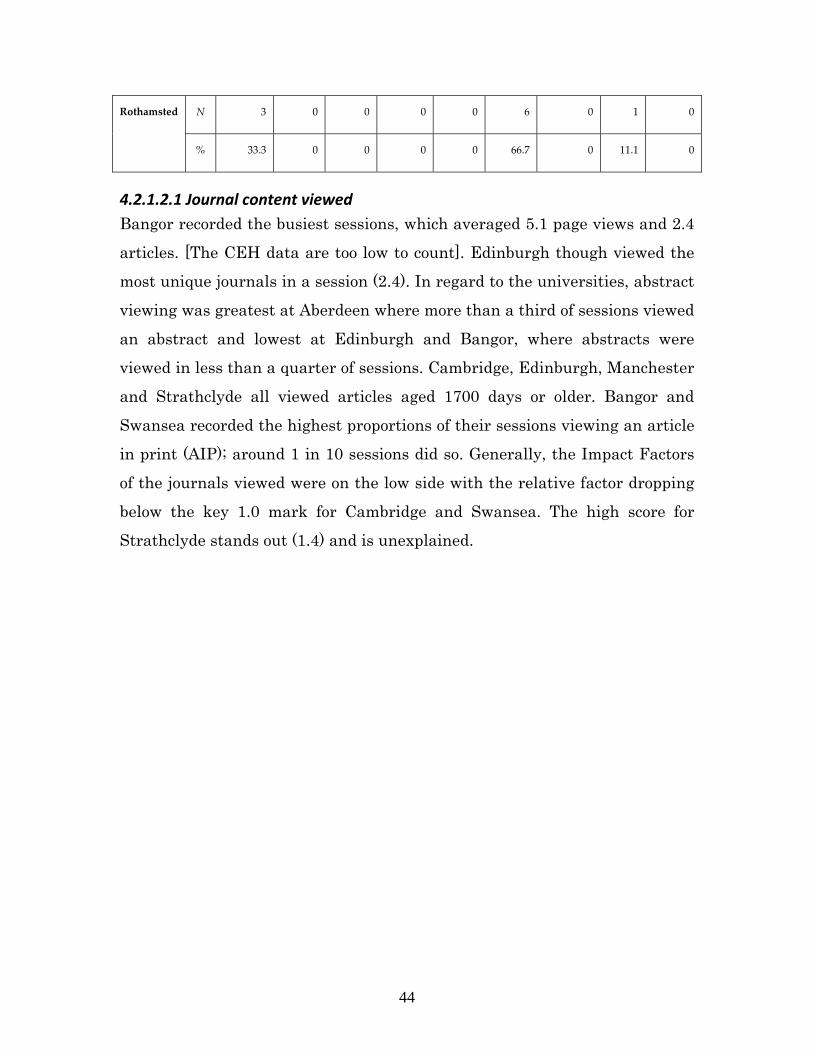
Rothamsted N 3 0 0 0 0 6 0 1 0
% 33.3 0 0 0 0 66.7 0 11.1 0
4.2.1.2.1 Journal content viewed Bangor recorded the busiest sessions, which averaged 5.1 page views and 2.4
articles. [The CEH data are too low to count]. Edinburgh though viewed the
most unique journals in a session (2.4). In regard to the universities, abstract
viewing was greatest at Aberdeen where more than a third of sessions viewed
an abstract and lowest at Edinburgh and Bangor, where abstracts were
viewed in less than a quarter of sessions. Cambridge, Edinburgh, Manchester
and Strathclyde all viewed articles aged 1700 days or older. Bangor and
Swansea recorded the highest proportions of their sessions viewing an article
in print (AIP); around 1 in 10 sessions did so. Generally, the Impact Factors
of the journals viewed were on the low side with the relative factor dropping
below the key 1.0 mark for Cambridge and Swansea. The high score for
Strathclyde stands out (1.4) and is unexplained.

45
Table 11: Content viewed (sessions)
Subject Volume Form Age/currency Impact
Ave. no. of pages viewed
Ave. no. of articles viewed
Ave. no. of journals viewed
% viewing
an abstract
Ave. age of article viewed (days)
Alerts
%
% viewing an AIP14
Ave. impact
factor of journal viewed
Relative impact factor
Aberdeen 3.9 1.6 1.4 35.9 1049 0.1 7.7 1.4 1.0
Bangor 5.1 2.4 1.4 24.3 1471 0 9.8 1.4 1.0
Cambridge 3.6 1.3 1.1 34.0 1756 0.1 4.5 1.3 0.9
Edinburgh 4.4 1.6 1.2 24.9 1736 0.1 5.9 1.4 1.1
Manchester 3.7 1.5 1.1 28.0 1746 0 5.1 1.5 1.0
Strathclyde 4.4 1.8 1.3 32.5 1731 0.1 8.9 2.0 1.4
Swansea 4.2 1.6 1.3 30.1 1431 0.2 9.8 1.2 0.8
UCL 3.3 1.0 1.1 33.4 1266 0 5.1 1.4 1.0
CEH 5.7 1.8 n/a 28.6 729 0 0 1.5 1.1
Rothamsted 5.3 3.6 n/a 44.4 1011 0 22.015 0.7 0.5
4.2.1.3 Journals used (Tables 12 ‐ 14)
High levels of concentration of use were found at Bangor where two thirds of
was accounted for by 5% of journals. There was quite a different picture at
Swansea where 5% of journals accounted for just 40% of use. Interestingly,
Evans and Peters (2005), using Emerald data for 108 journals showed that
5% of their journals accounted for 17% of use, quite a difference. Excluding
the laboratories, where figures were too small to be counted, the highest
articles in press – accepted manuscripts, uncorrected proofs and corrected proofs; 15 Based on just 4
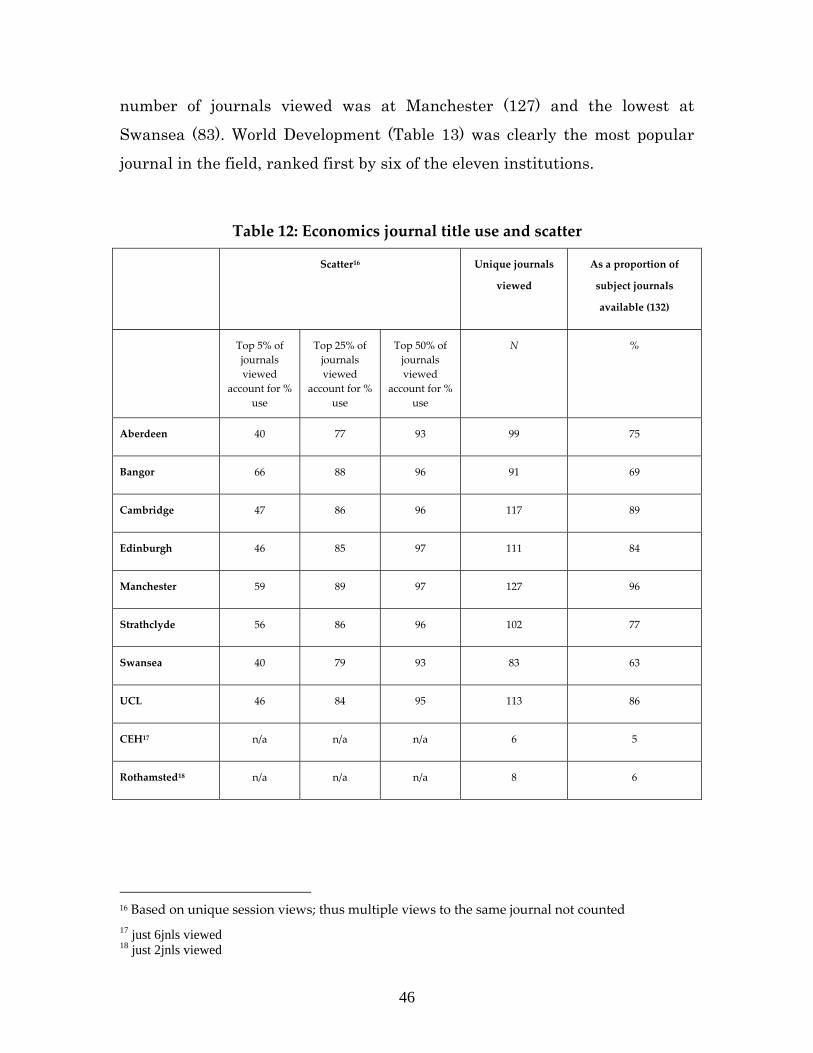
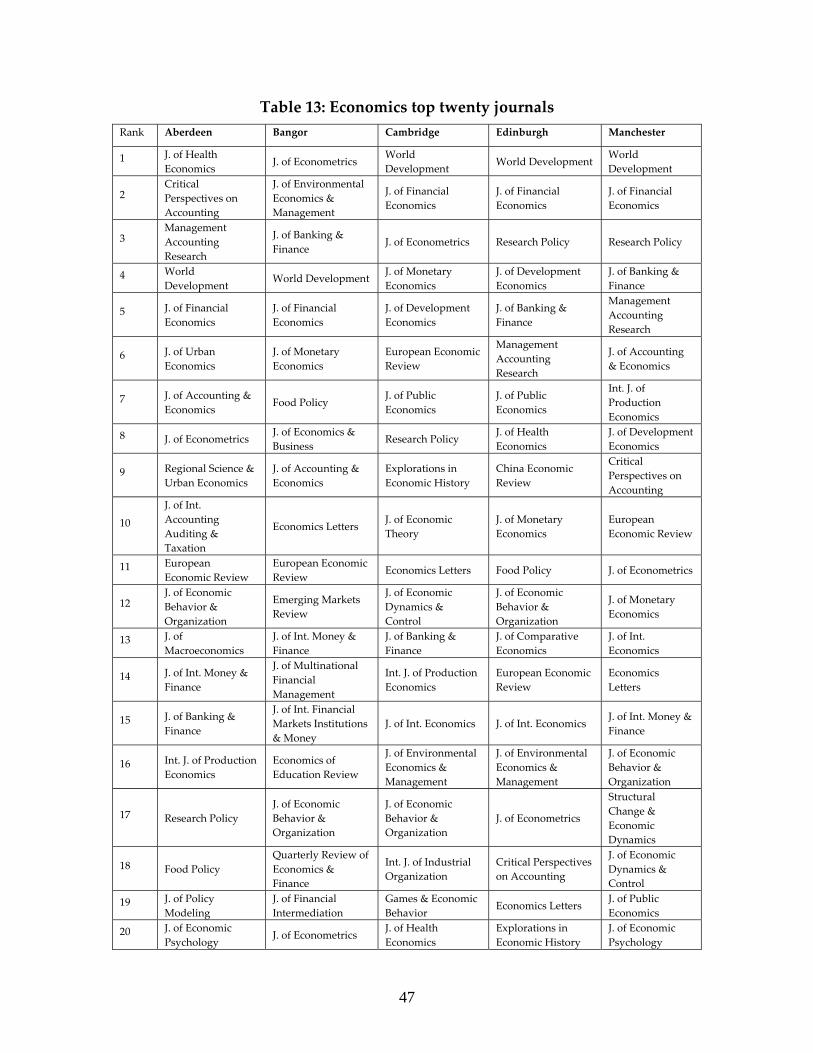
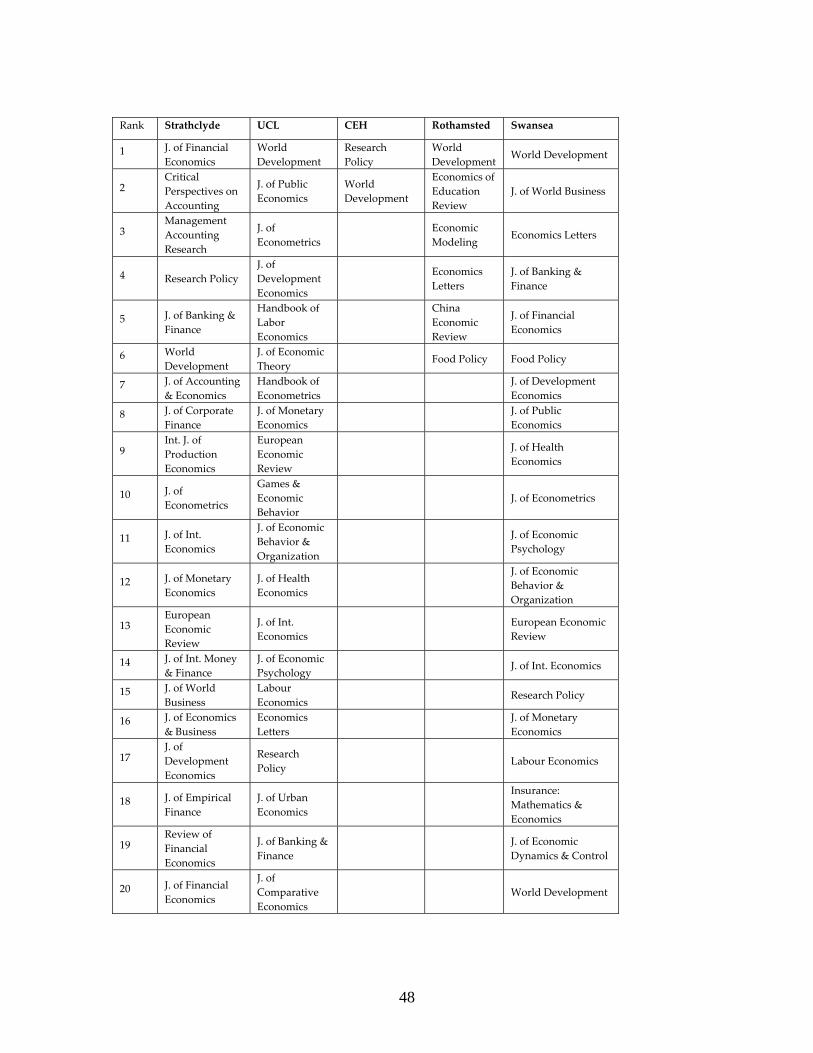
46
number of journals viewed was at Manchester (127) and the lowest at
Swansea (83). World Development (Table 13) was clearly the most popular
journal in the field, ranked first by six of the eleven institutions.
Table 12: Economics journal title use and scatter
Scatter16 Unique journals
viewed
As a proportion of
subject journals
available (132)
Top 5% of journals viewed
account for % use
Top 25% of journals viewed
account for % use
Top 50% of journals viewed
account for % use
N %
Aberdeen 40 77 93 99 75
Bangor 66 88 96 91 69
Cambridge 47 86 96 117 89
Edinburgh 46 85 97 111 84
Manchester 59 89 97 127 96
Strathclyde 56 86 96 102 77
Swansea 40 79 93 83 63
UCL 46 84 95 113 86
CEH17 n/a n/a n/a 6 5
Rothamsted18 n/a n/a n/a 8 6
16 Based on unique session views; thus multiple views to the same journal not counted 17 just 6jnls viewed 18 just 2jnls viewed
47
Table 13: Economics top twenty journals Rank Aberdeen Bangor Cambridge Edinburgh Manchester
1 J. of Health Economics J. of Econometrics
World Development World Development
World Development
2 Critical Perspectives on Accounting
J. of Environmental Economics & Management
J. of Financial Economics
J. of Financial Economics
J. of Financial Economics
3 Management Accounting Research
J. of Banking & Finance
J. of Econometrics Research Policy Research Policy
4 World Development
World Development J. of Monetary Economics
J. of Development Economics
J. of Banking & Finance
5 J. of Financial Economics
J. of Financial Economics
J. of Development Economics
J. of Banking & Finance
Management Accounting Research
6 J. of Urban Economics
J. of Monetary Economics
European Economic Review
Management Accounting Research
J. of Accounting & Economics
7 J. of Accounting & Economics
Food Policy J. of Public Economics
J. of Public Economics
Int. J. of Production Economics
8 J. of Econometrics J. of Economics & Business
Research Policy J. of Health Economics
J. of Development Economics
9 Regional Science & Urban Economics
J. of Accounting & Economics
Explorations in Economic History
China Economic Review
Critical Perspectives on Accounting
10
J. of Int. Accounting Auditing & Taxation
Economics Letters J. of Economic Theory
J. of Monetary Economics
European Economic Review
11 European Economic Review
European Economic Review
Economics Letters Food Policy J. of Econometrics
12 J. of Economic Behavior & Organization
Emerging Markets Review
J. of Economic Dynamics & Control
J. of Economic Behavior & Organization
J. of Monetary Economics
13 J. of Macroeconomics
J. of Int. Money & Finance
J. of Banking & Finance
J. of Comparative Economics
J. of Int. Economics
14 J. of Int. Money & Finance
J. of Multinational Financial Management
Int. J. of Production Economics
European Economic Review
Economics Letters
15 J. of Banking & Finance
J. of Int. Financial Markets Institutions & Money
J. of Int. Economics J. of Int. Economics J. of Int. Money & Finance
16 Int. J. of Production Economics
Economics of Education Review
J. of Environmental Economics & Management
J. of Environmental Economics & Management
J. of Economic Behavior & Organization
17 Research Policy J. of Economic Behavior & Organization
J. of Economic Behavior & Organization
J. of Econometrics
Structural Change & Economic Dynamics
18 Food Policy Quarterly Review of Economics & Finance
Int. J. of Industrial Organization
Critical Perspectives on Accounting
J. of Economic Dynamics & Control
19 J. of Policy Modeling
J. of Financial Intermediation
Games & Economic Behavior
Economics Letters J. of Public Economics
20 J. of Economic Psychology
J. of Econometrics J. of Health Economics
Explorations in Economic History
J. of Economic Psychology
48
Rank Strathclyde UCL CEH Rothamsted Swansea
1 J. of Financial Economics
World Development
Research Policy
World Development
World Development
2 Critical Perspectives on Accounting
J. of Public Economics
World Development
Economics of Education Review
J. of World Business
3 Management Accounting Research
J. of Econometrics
Economic Modeling
Economics Letters
4 Research Policy J. of Development Economics
Economics Letters
J. of Banking & Finance
5 J. of Banking & Finance
Handbook of Labor Economics
China Economic Review
J. of Financial Economics
6 World Development
J. of Economic Theory
Food Policy Food Policy
7 J. of Accounting & Economics
Handbook of Econometrics
J. of Development Economics
8 J. of Corporate Finance
J. of Monetary Economics
J. of Public Economics
9 Int. J. of Production Economics
European Economic Review
J. of Health Economics
10 J. of Econometrics
Games & Economic Behavior
J. of Econometrics
11 J. of Int. Economics
J. of Economic Behavior & Organization
J. of Economic Psychology
12 J. of Monetary Economics
J. of Health Economics
J. of Economic Behavior & Organization
13 European Economic Review
J. of Int. Economics
European Economic Review
14 J. of Int. Money & Finance
J. of Economic Psychology
J. of Int. Economics
15 J. of World Business
Labour Economics
Research Policy
16 J. of Economics & Business
Economics Letters
J. of Monetary Economics
17 J. of Development Economics
Research Policy
Labour Economics
18 J. of Empirical Finance
J. of Urban Economics
Insurance: Mathematics & Economics
19 Review of Financial Economics
J. of Banking & Finance
J. of Economic Dynamics & Control
20 J. of Financial Economics
J. of Comparative Economics
World Development
49
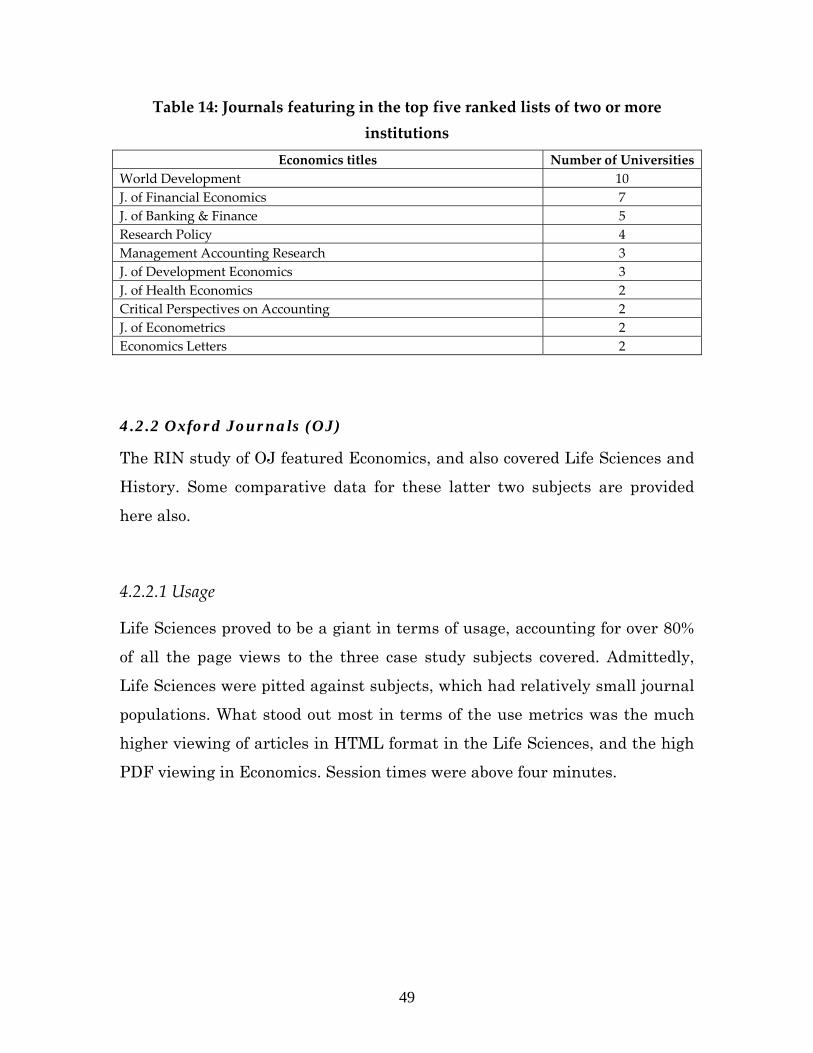
Table 14: Journals featuring in the top five ranked lists of two or more institutions
Economics titles Number of UniversitiesWorld Development 10 J. of Financial Economics 7 J. of Banking & Finance 5 Research Policy 4 Management Accounting Research 3 J. of Development Economics 3 J. of Health Economics 2 Critical Perspectives on Accounting 2 J. of Econometrics 2 Economics Letters 2
4.2.2 Oxford Journals (OJ)
The RIN study of OJ featured Economics, and also covered Life Sciences and
History. Some comparative data for these latter two subjects are provided
here also.
4.2.2.1 Usage
Life Sciences proved to be a giant in terms of usage, accounting for over 80%
of all the page views to the three case study subjects covered. Admittedly,
Life Sciences were pitted against subjects, which had relatively small journal
populations. What stood out most in terms of the use metrics was the much
higher viewing of articles in HTML format in the Life Sciences, and the high
PDF viewing in Economics. Session times were above four minutes.
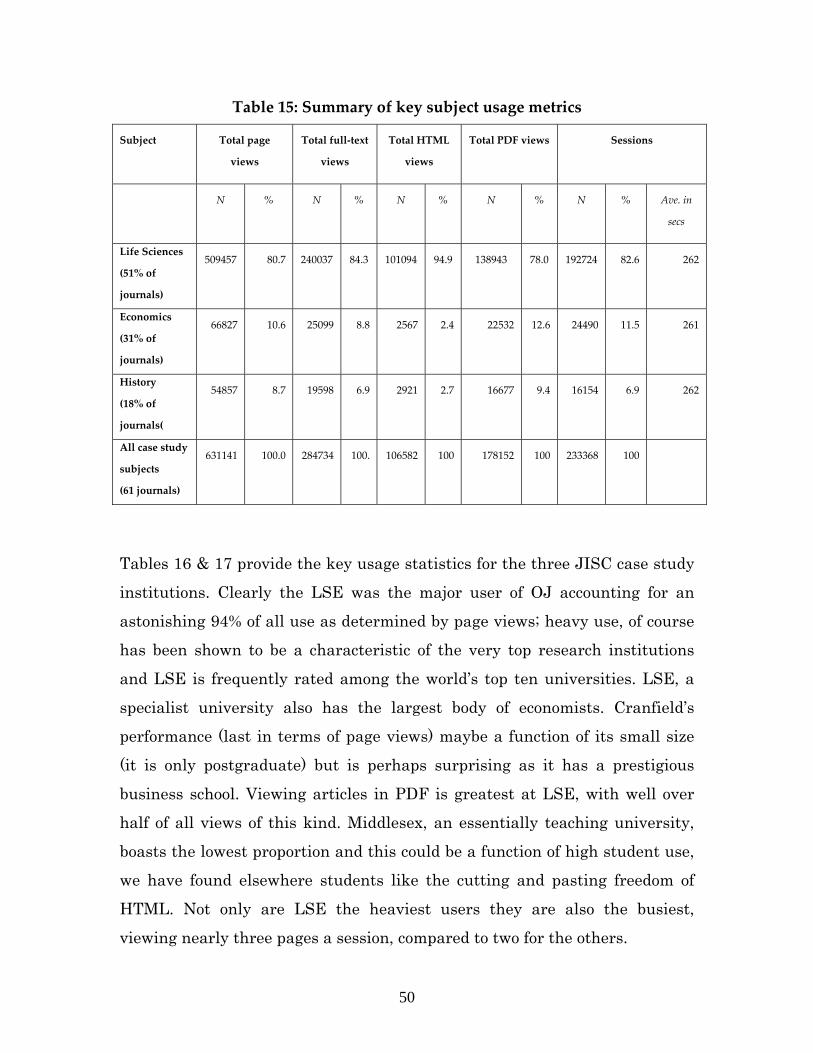
50
Table 15: Summary of key subject usage metrics
Subject Total page
views
Total full‐text
views
Total HTML
views
Total PDF views Sessions
N % N % N % N % N % Ave. in
secs
Life Sciences
(51% of
journals)
509457 80.7 240037 84.3 101094 94.9 138943 78.0 192724 82.6 262
Economics
(31% of
journals)
66827 10.6 25099 8.8 2567 2.4 22532 12.6 24490 11.5 261
History
(18% of
journals(
54857 8.7 19598 6.9 2921 2.7 16677 9.4 16154 6.9 262
All case study
subjects
(61 journals)
631141 100.0 284734 100. 106582 100 178152 100 233368 100
Tables 16 & 17 provide the key usage statistics for the three JISC case study
institutions. Clearly the LSE was the major user of OJ accounting for an
astonishing 94% of all use as determined by page views; heavy use, of course
has been shown to be a characteristic of the very top research institutions
and LSE is frequently rated among the world’s top ten universities. LSE, a
specialist university also has the largest body of economists. Cranfield’s
performance (last in terms of page views) maybe a function of its small size
(it is only postgraduate) but is perhaps surprising as it has a prestigious
business school. Viewing articles in PDF is greatest at LSE, with well over
half of all views of this kind. Middlesex, an essentially teaching university,
boasts the lowest proportion and this could be a function of high student use,
we have found elsewhere students like the cutting and pasting freedom of
HTML. Not only are LSE the heaviest users they are also the busiest,
viewing nearly three pages a session, compared to two for the others.
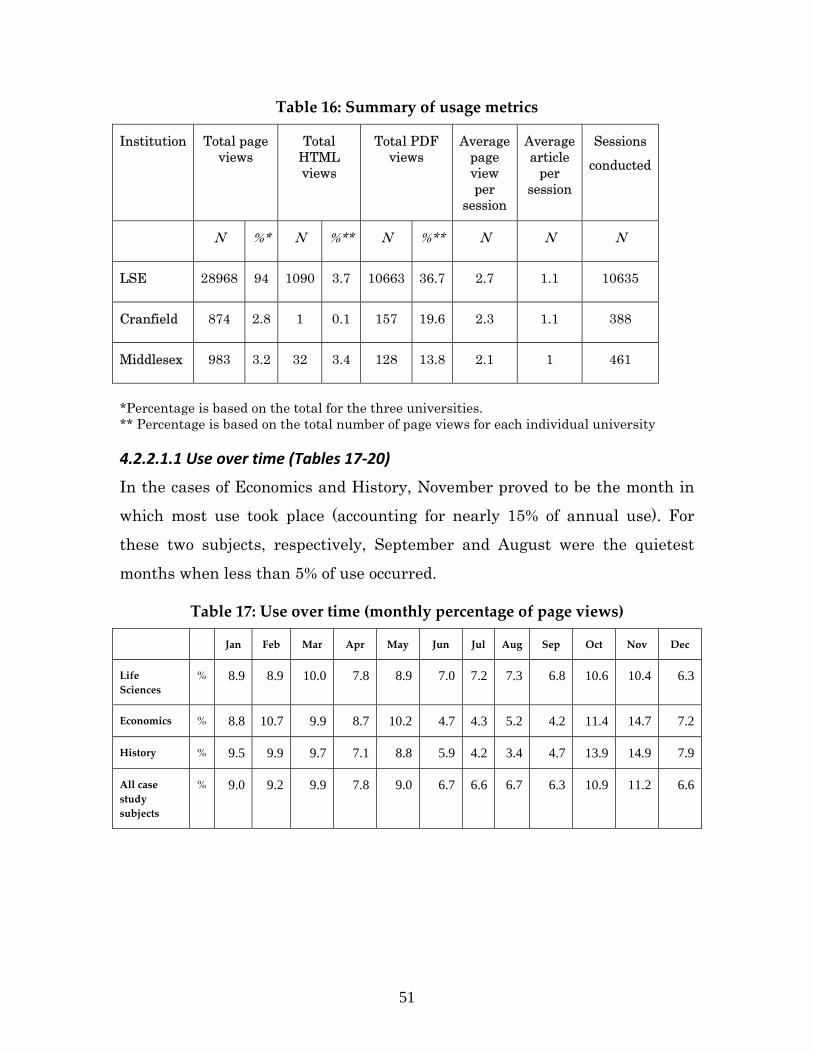
51
Table 16: Summary of usage metrics
Institution Total page views
Total HTML views
Total PDF views
Average page view per
session
Average article
per session
Sessions
conducted
N %* N %** N %** N N N
LSE 28968 94 1090 3.7 10663 36.7 2.7 1.1 10635
Cranfield 874 2.8 1 0.1 157 19.6 2.3 1.1 388
Middlesex 983 3.2 32 3.4 128 13.8 2.1 1 461
*Percentage is based on the total for the three universities. ** Percentage is based on the total number of page views for each individual university
4.2.2.1.1 Use over time (Tables 17‐20)
In the cases of Economics and History, November proved to be the month in
which most use took place (accounting for nearly 15% of annual use). For
these two subjects, respectively, September and August were the quietest
months when less than 5% of use occurred.
Table 17: Use over time (monthly percentage of page views)
Jan Feb Mar Apr May Jun Jul Aug Sep Oct Nov Dec
Life Sciences
% 8.9 8.9 10.0 7.8 8.9 7.0 7.2 7.3 6.8 10.6 10.4 6.3
Economics % 8.8 10.7 9.9 8.7 10.2 4.7 4.3 5.2 4.2 11.4 14.7 7.2
History % 9.5 9.9 9.7 7.1 8.8 5.9 4.2 3.4 4.7 13.9 14.9 7.9
All case study subjects
% 9.0 9.2 9.9 7.8 9.0 6.7 6.6 6.7 6.3 10.9 11.2 6.6
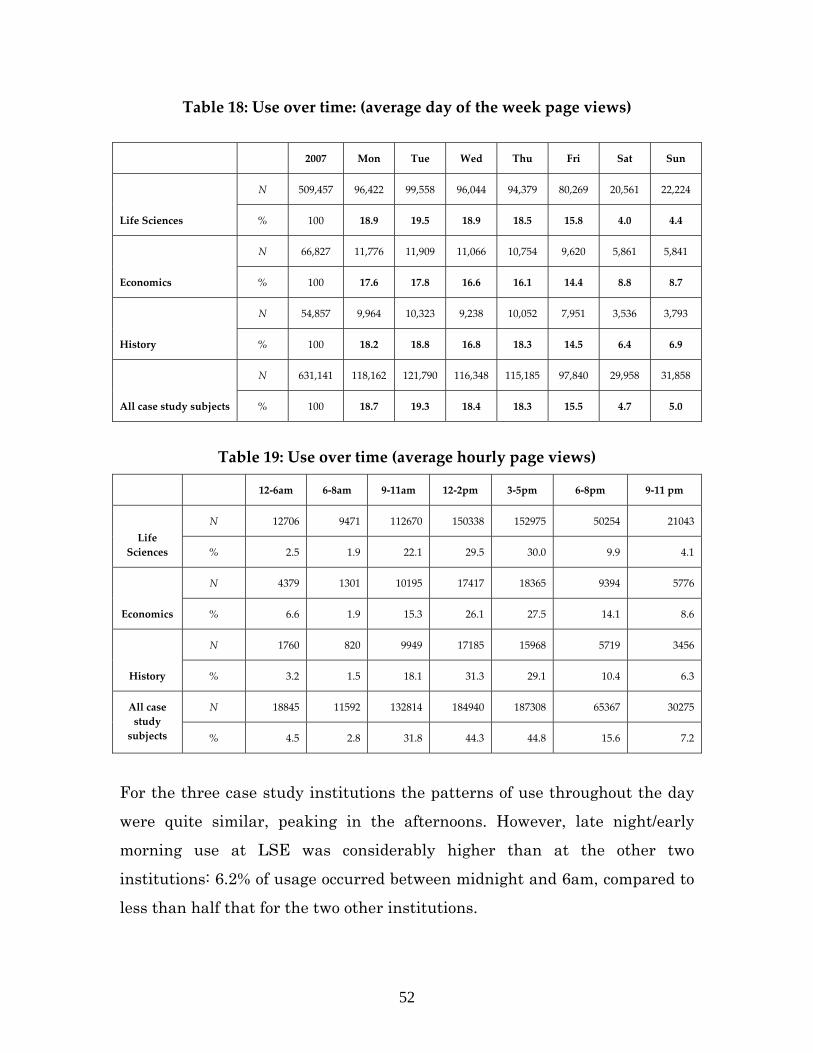
52
Table 18: Use over time: (average day of the week page views)
2007 Mon Tue Wed Thu Fri Sat Sun
Life Sciences
N 509,457 96,422 99,558 96,044 94,379 80,269 20,561 22,224
% 100 18.9 19.5 18.9 18.5 15.8 4.0 4.4
Economics
N 66,827 11,776 11,909 11,066 10,754 9,620 5,861 5,841
% 100 17.6 17.8 16.6 16.1 14.4 8.8 8.7
History
N 54,857 9,964 10,323 9,238 10,052 7,951 3,536 3,793
% 100 18.2 18.8 16.8 18.3 14.5 6.4 6.9
All case study subjects
N 631,141 118,162 121,790 116,348 115,185 97,840 29,958 31,858
% 100 18.7 19.3 18.4 18.3 15.5 4.7 5.0
Table 19: Use over time (average hourly page views)
12‐6am 6‐8am 9‐11am 12‐2pm 3‐5pm 6‐8pm 9‐11 pm
Life Sciences
N 12706 9471 112670 150338 152975 50254 21043
% 2.5 1.9 22.1 29.5 30.0 9.9 4.1
Economics
N 4379 1301 10195 17417 18365 9394 5776
% 6.6 1.9 15.3 26.1 27.5 14.1 8.6
History
N 1760 820 9949 17185 15968 5719 3456
% 3.2 1.5 18.1 31.3 29.1 10.4 6.3
All case study subjects
N 18845 11592 132814 184940 187308 65367 30275
% 4.5 2.8 31.8 44.3 44.8 15.6 7.2
For the three case study institutions the patterns of use throughout the day
were quite similar, peaking in the afternoons. However, late night/early
morning use at LSE was considerably higher than at the other two
institutions: 6.2% of usage occurred between midnight and 6am, compared to
less than half that for the two other institutions.
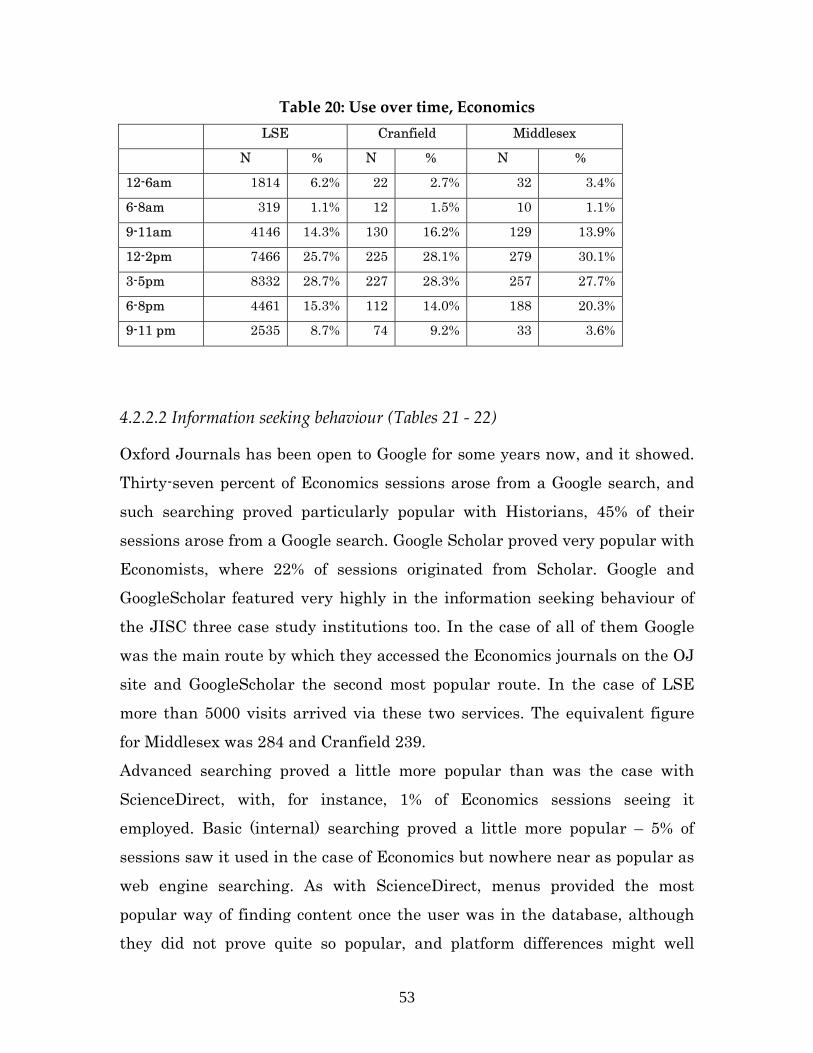
53
Table 20: Use over time, Economics LSE Cranfield Middlesex
N % N % N %
12-6am 1814 6.2% 22 2.7% 32 3.4%
6-8am 319 1.1% 12 1.5% 10 1.1%
9-11am 4146 14.3% 130 16.2% 129 13.9%
12-2pm 7466 25.7% 225 28.1% 279 30.1%
3-5pm 8332 28.7% 227 28.3% 257 27.7%
6-8pm 4461 15.3% 112 14.0% 188 20.3%
9-11 pm 2535 8.7% 74 9.2% 33 3.6%
4.2.2.2 Information seeking behaviour (Tables 21 ‐ 22)
Oxford Journals has been open to Google for some years now, and it showed.
Thirty-seven percent of Economics sessions arose from a Google search, and
such searching proved particularly popular with Historians, 45% of their
sessions arose from a Google search. Google Scholar proved very popular with
Economists, where 22% of sessions originated from Scholar. Google and
GoogleScholar featured very highly in the information seeking behaviour of
the JISC three case study institutions too. In the case of all of them Google
was the main route by which they accessed the Economics journals on the OJ
site and GoogleScholar the second most popular route. In the case of LSE
more than 5000 visits arrived via these two services. The equivalent figure
for Middlesex was 284 and Cranfield 239.
Advanced searching proved a little more popular than was the case with
ScienceDirect, with, for instance, 1% of Economics sessions seeing it
employed. Basic (internal) searching proved a little more popular – 5% of
sessions saw it used in the case of Economics but nowhere near as popular as
web engine searching. As with ScienceDirect, menus provided the most
popular way of finding content once the user was in the database, although
they did not prove quite so popular, and platform differences might well
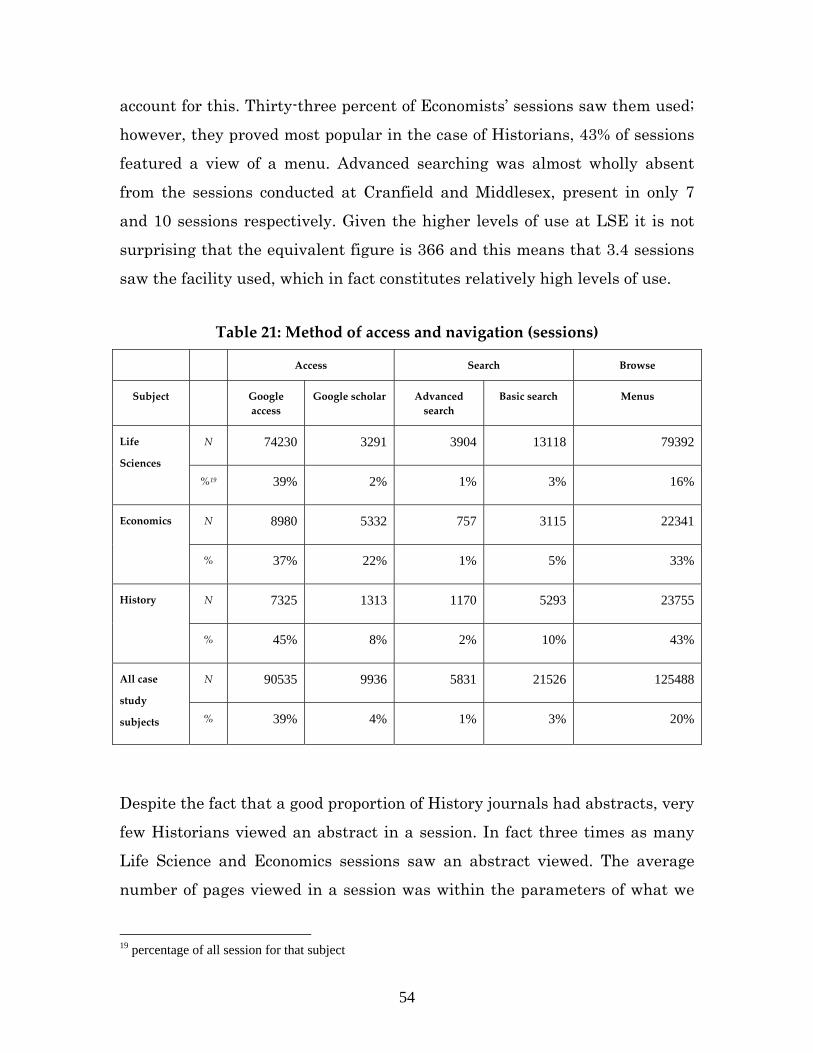
54
account for this. Thirty-three percent of Economists’ sessions saw them used;
however, they proved most popular in the case of Historians, 43% of sessions
featured a view of a menu. Advanced searching was almost wholly absent
from the sessions conducted at Cranfield and Middlesex, present in only 7
and 10 sessions respectively. Given the higher levels of use at LSE it is not
surprising that the equivalent figure is 366 and this means that 3.4 sessions
saw the facility used, which in fact constitutes relatively high levels of use.
Table 21: Method of access and navigation (sessions)
Access Search Browse
Subject Google access
Google scholar Advanced search
Basic search Menus
Life
Sciences
N 74230 3291 3904 13118 79392
%19 39% 2% 1% 3% 16%
Economics N 8980 5332 757 3115 22341
% 37% 22% 1% 5% 33%
History N 7325 1313 1170 5293 23755
% 45% 8% 2% 10% 43%
All case
study
subjects
N 90535 9936 5831 21526 125488
% 39% 4% 1% 3% 20%
Despite the fact that a good proportion of History journals had abstracts, very
few Historians viewed an abstract in a session. In fact three times as many
Life Science and Economics sessions saw an abstract viewed. The average
number of pages viewed in a session was within the parameters of what we
19 percentage of all session for that subject
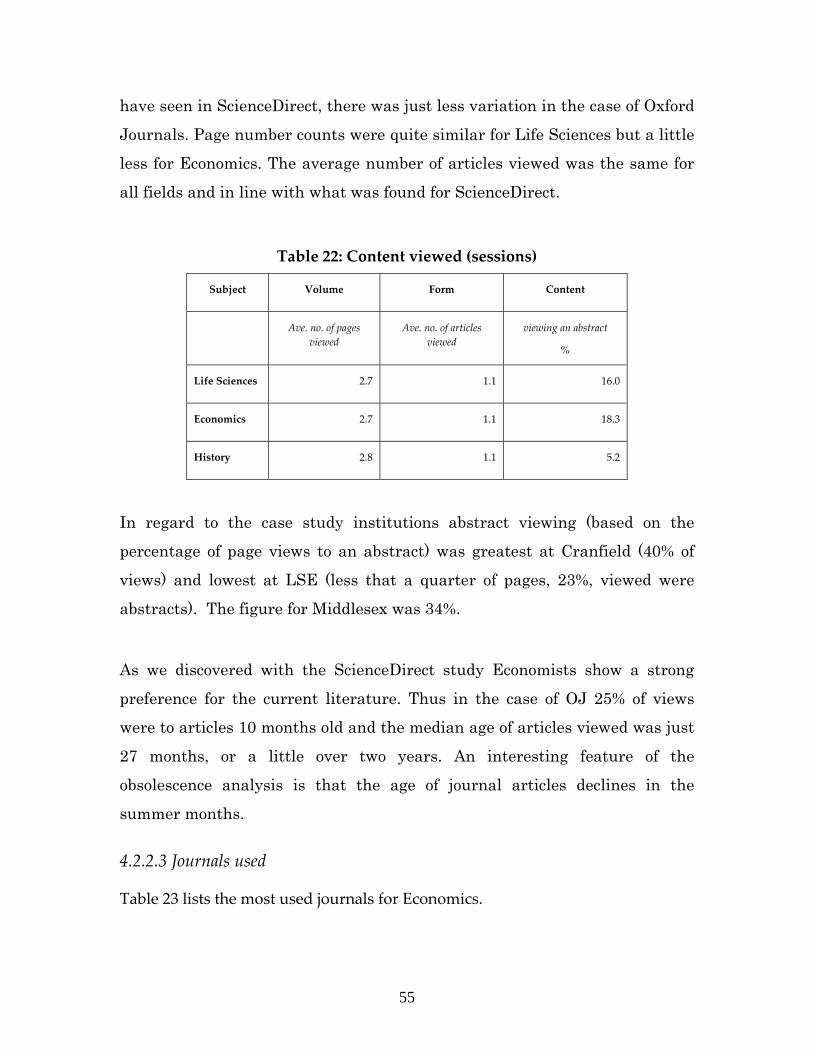
55
have seen in ScienceDirect, there was just less variation in the case of Oxford
Journals. Page number counts were quite similar for Life Sciences but a little
less for Economics. The average number of articles viewed was the same for
all fields and in line with what was found for ScienceDirect.
Table 22: Content viewed (sessions)
Subject Volume Form Content
Ave. no. of pages viewed
Ave. no. of articles viewed
viewing an abstract
%
Life Sciences 2.7 1.1 16.0
Economics 2.7 1.1 18.3
History 2.8 1.1 5.2
In regard to the case study institutions abstract viewing (based on the
percentage of page views to an abstract) was greatest at Cranfield (40% of
views) and lowest at LSE (less that a quarter of pages, 23%, viewed were
abstracts). The figure for Middlesex was 34%.
As we discovered with the ScienceDirect study Economists show a strong
preference for the current literature. Thus in the case of OJ 25% of views
were to articles 10 months old and the median age of articles viewed was just
27 months, or a little over two years. An interesting feature of the
obsolescence analysis is that the age of journal articles declines in the
summer months.
4.2.2.3 Journals used
Table 23 lists the most used journals for Economics.
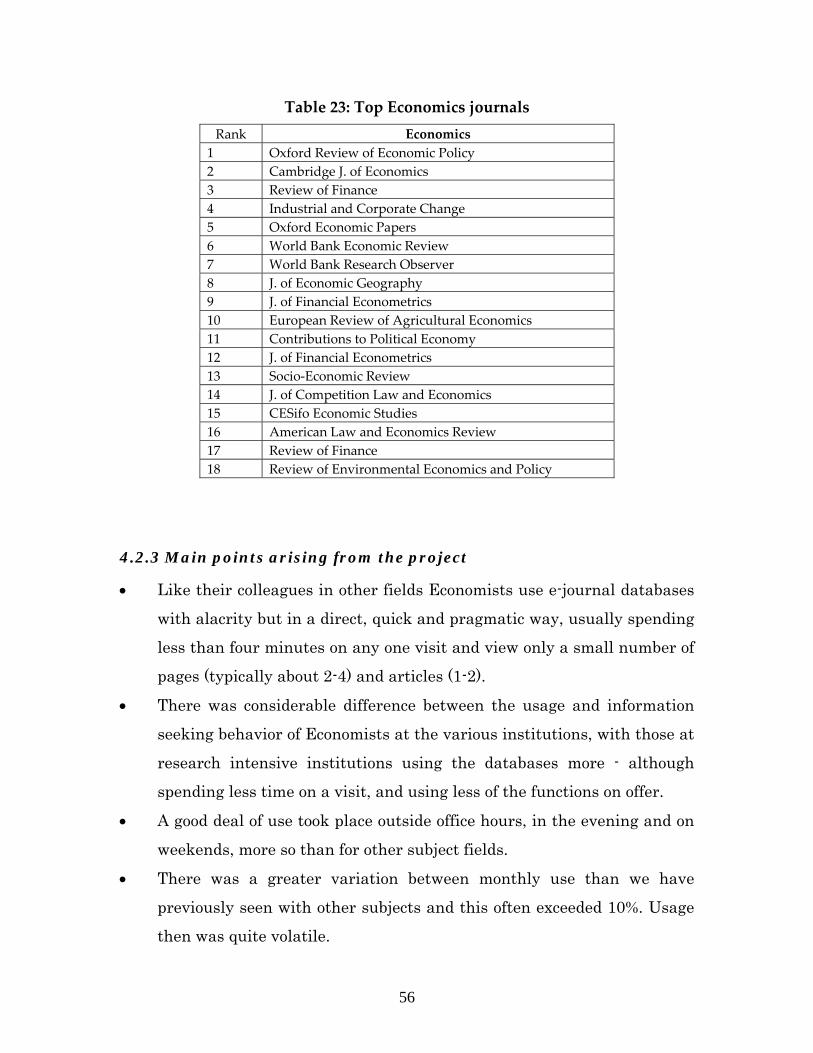
56
Table 23: Top Economics journals Rank Economics
1 Oxford Review of Economic Policy 2 Cambridge J. of Economics 3 Review of Finance 4 Industrial and Corporate Change 5 Oxford Economic Papers 6 World Bank Economic Review 7 World Bank Research Observer 8 J. of Economic Geography 9 J. of Financial Econometrics 10 European Review of Agricultural Economics 11 Contributions to Political Economy 12 J. of Financial Econometrics 13 Socio‐Economic Review 14 J. of Competition Law and Economics 15 CESifo Economic Studies 16 American Law and Economics Review 17 Review of Finance 18 Review of Environmental Economics and Policy
4.2.3 Main points arising from the project
• Like their colleagues in other fields Economists use e-journal databases
with alacrity but in a direct, quick and pragmatic way, usually spending
less than four minutes on any one visit and view only a small number of
pages (typically about 2-4) and articles (1-2).
• There was considerable difference between the usage and information
seeking behavior of Economists at the various institutions, with those at
research intensive institutions using the databases more - although
spending less time on a visit, and using less of the functions on offer.
• A good deal of use took place outside office hours, in the evening and on
weekends, more so than for other subject fields.
• There was a greater variation between monthly use than we have
previously seen with other subjects and this often exceeded 10%. Usage
then was quite volatile.
57
• Economists evidence a very strong preference for PDF displays.
• Economists proved to be among the biggest users of abstracts.
• Google and GoogleScholar searching proved very popular with
Economists, with, respectively, 37% and 22% of visits arriving by those
means. Browsing menus and lists provided the most popular way of
finding content once the user arrived at the e-journal database.
58
4.3 Use and information seeking behavior of international
Economists in respect to e-journals. Elsevier funded Authors as
users research project20.
The main aim of the research project was to provide a comprehensive (360
degree) understanding of the scholarly journal user (authors in this case) by
linking together data obtained about their attitudes towards scholarly
publishing issues and activities (e.g. open access, peer reviewing), obtained
through a questionnaire, with data about their use of ScienceDirect, obtained
through deep log analysis. This has never been undertaken before so the
analysis provides unique and rich insights into scholarly journal use and
seeking. Logs were collected for an eighteen month period (11/2003 - 5/2005)
and in all these authors conducted 16,865 sessions, which saw 110,029 pages
viewed.
4.3.1 Characteristic of population studied
More than 750 authors were studied and Figure 4 shows their subject
distribution. Economics accounted for approximately 2% (30 people) of the
sample.
20 http://www.ucl.ac.uk/infostudies/research/ciber/downloads/
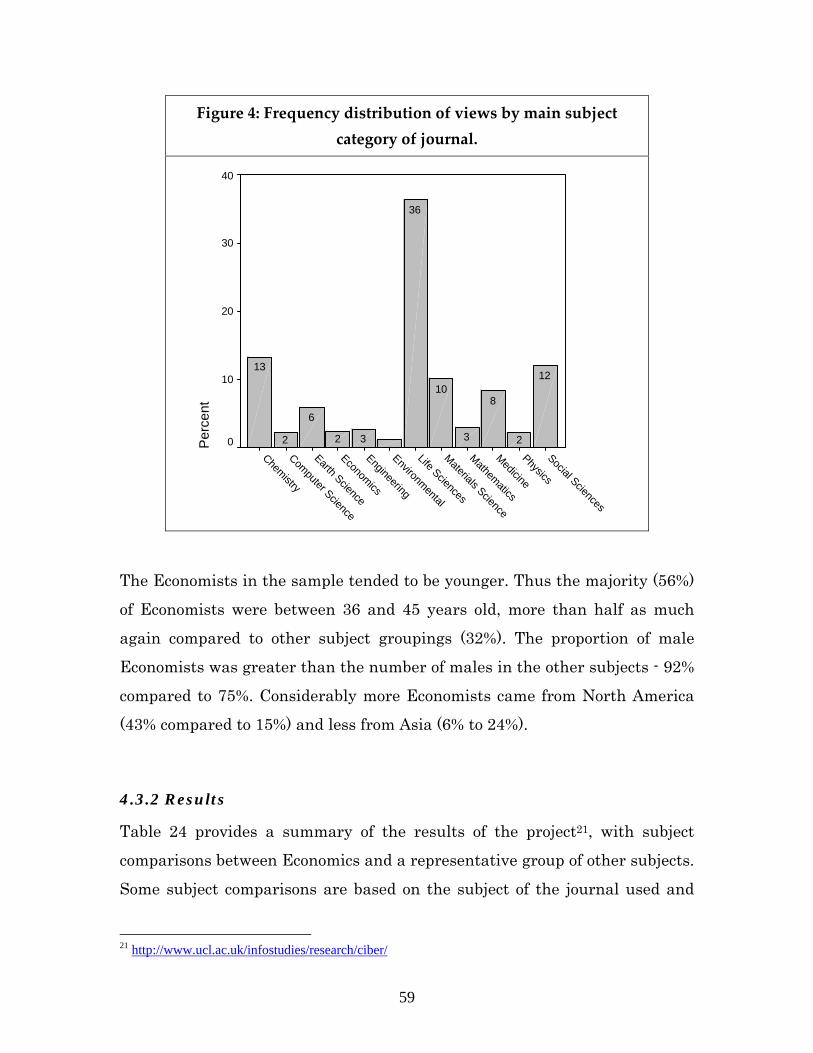
59
Figure 4: Frequency distribution of views by main subject category of journal.
Social Sciences
Physics
Medicine
Mathematics
Materials Science
Life Sciences
Environmental
Engineering
Economics
Earth Science
Computer Science
Chemistry
Per
cent
40
30
20
10
0
12
2
8
3
10
36
32
6
2
13
The Economists in the sample tended to be younger. Thus the majority (56%)
of Economists were between 36 and 45 years old, more than half as much
again compared to other subject groupings (32%). The proportion of male
Economists was greater than the number of males in the other subjects - 92%
compared to 75%. Considerably more Economists came from North America
(43% compared to 15%) and less from Asia (6% to 24%).
4.3.2 Results
Table 24 provides a summary of the results of the project21, with subject
comparisons between Economics and a representative group of other subjects.
Some subject comparisons are based on the subject of the journal used and
21 http://www.ucl.ac.uk/infostudies/research/ciber/
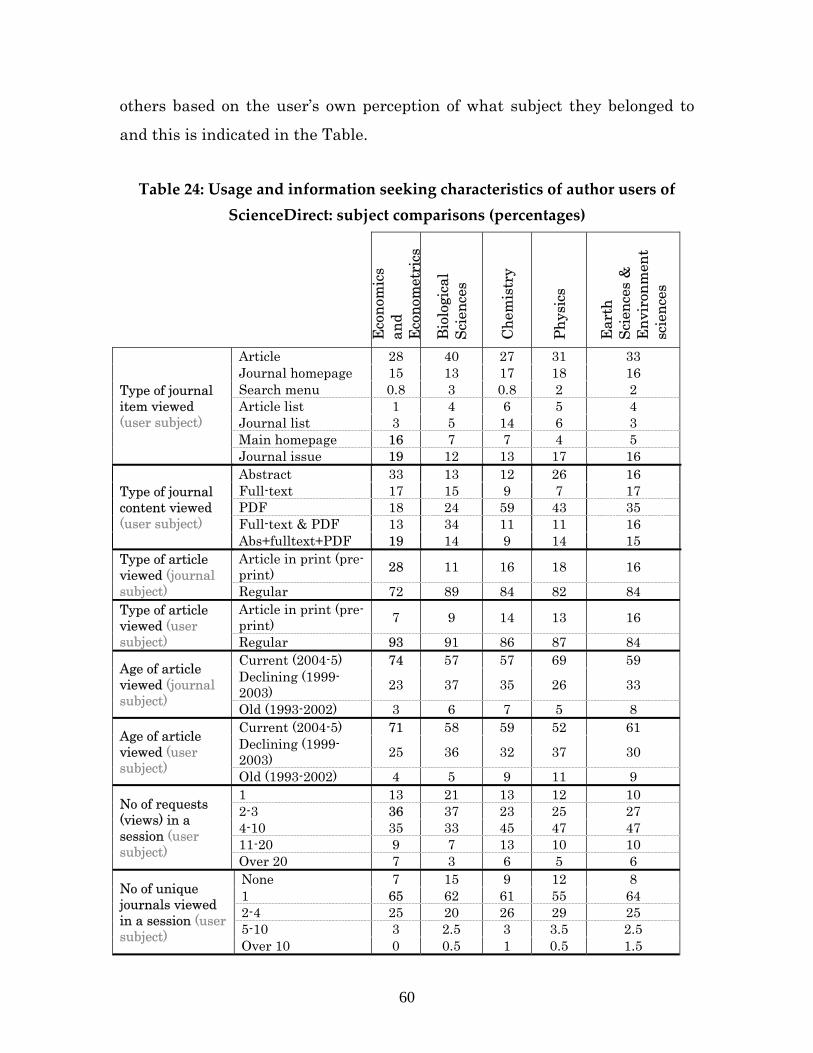
60
others based on the user’s own perception of what subject they belonged to
and this is indicated in the Table.
Table 24: Usage and information seeking characteristics of author users of
ScienceDirect: subject comparisons (percentages)
Eco
nom
ics
and
Eco
nom
etri
cs
Bio
logi
cal
Scie
nces
Che
mis
try
Phys
ics
Ear
th
Scie
nces
&
Env
iron
men
t sc
ienc
es
Type of journal item viewed (user subject)
Article 28 40 27 31 33 Journal homepage 15 13 17 18 16 Search menu 0.8 3 0.8 2 2 Article list 1 4 6 5 4 Journal list 3 5 14 6 3 Main homepage 16 7 7 4 5 Journal issue 19 12 13 17 16
Type of journal content viewed (user subject)
Abstract 33 13 12 26 16 Full-text 17 15 9 7 17 PDF 18 24 59 43 35 Full-text & PDF 13 34 11 11 16 Abs+fulltext+PDF 19 14 9 14 15
Type of article viewed (journal subject)
Article in print (pre-print) 28 11 16 18 16
Regular 72 89 84 82 84 Type of article viewed (user subject)
Article in print (pre-print) 7 9 14 13 16
Regular 93 91 86 87 84
Age of article viewed (journal subject)
Current (2004-5) 74 57 57 69 59 Declining (1999-2003) 23 37 35 26 33
Old (1993-2002) 3 6 7 5 8
Age of article viewed (user subject)
Current (2004-5) 71 58 59 52 61 Declining (1999-2003) 25 36 32 37 30
Old (1993-2002) 4 5 9 11 9
No of requests (views) in a session (user subject)
1 13 21 13 12 10 2-3 36 37 23 25 27 4-10 35 33 45 47 47 11-20 9 7 13 10 10 Over 20 7 3 6 5 6
No of unique journals viewed in a session (user subject)
None 7 15 9 12 8 1 65 62 61 55 64 2-4 25 20 26 29 25 5-10 3 2.5 3 3.5 2.5 Over 10 0 0.5 1 0.5 1.5
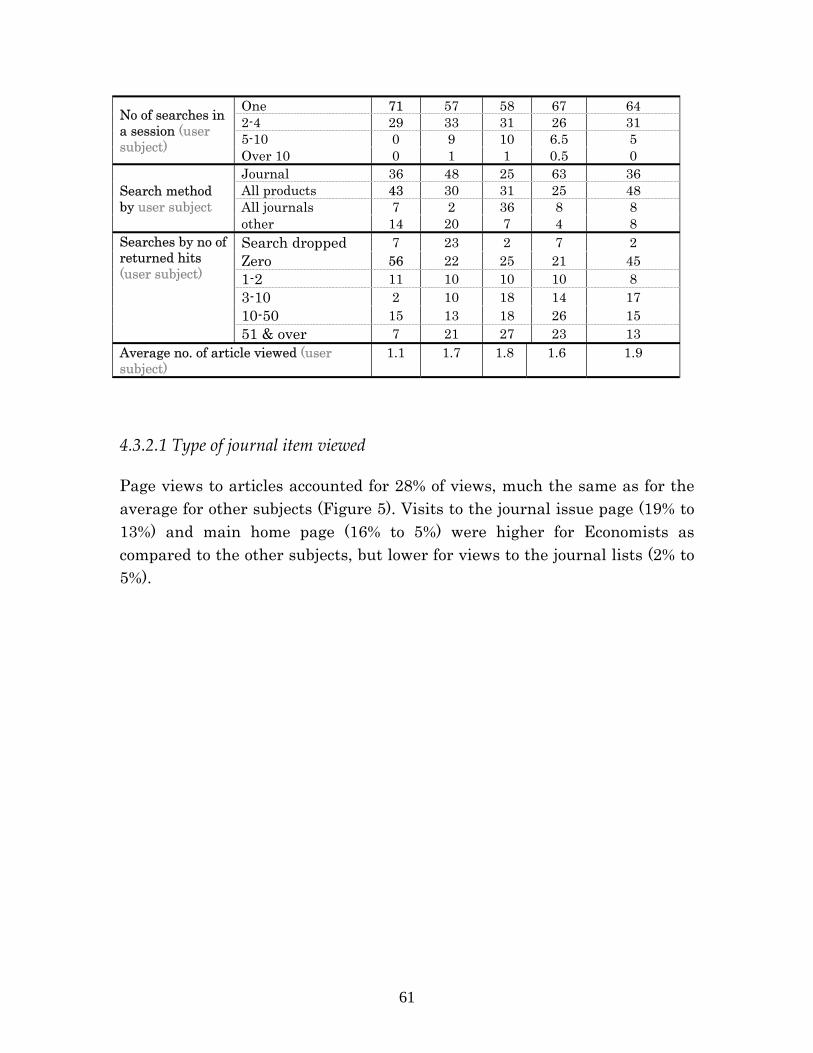
61
No of searches in a session (user subject)
One 71 57 58 67 64 2-4 29 33 31 26 31 5-10 0 9 10 6.5 5 Over 10 0 1 1 0.5 0
Search method by user subject
Journal 36 48 25 63 36 All products 43 30 31 25 48 All journals 7 2 36 8 8 other 14 20 7 4 8
Searches by no of returned hits (user subject)
Search dropped 7 23 2 7 2 Zero 56 22 25 21 45 1-2 11 10 10 10 8 3-10 2 10 18 14 17 10-50 15 13 18 26 15 51 & over 7 21 27 23 13
Average no. of article viewed (user subject)
1.1 1.7 1.8 1.6 1.9
4.3.2.1 Type of journal item viewed
Page views to articles accounted for 28% of views, much the same as for the average for other subjects (Figure 5). Visits to the journal issue page (19% to 13%) and main home page (16% to 5%) were higher for Economists as compared to the other subjects, but lower for views to the journal lists (2% to 5%).
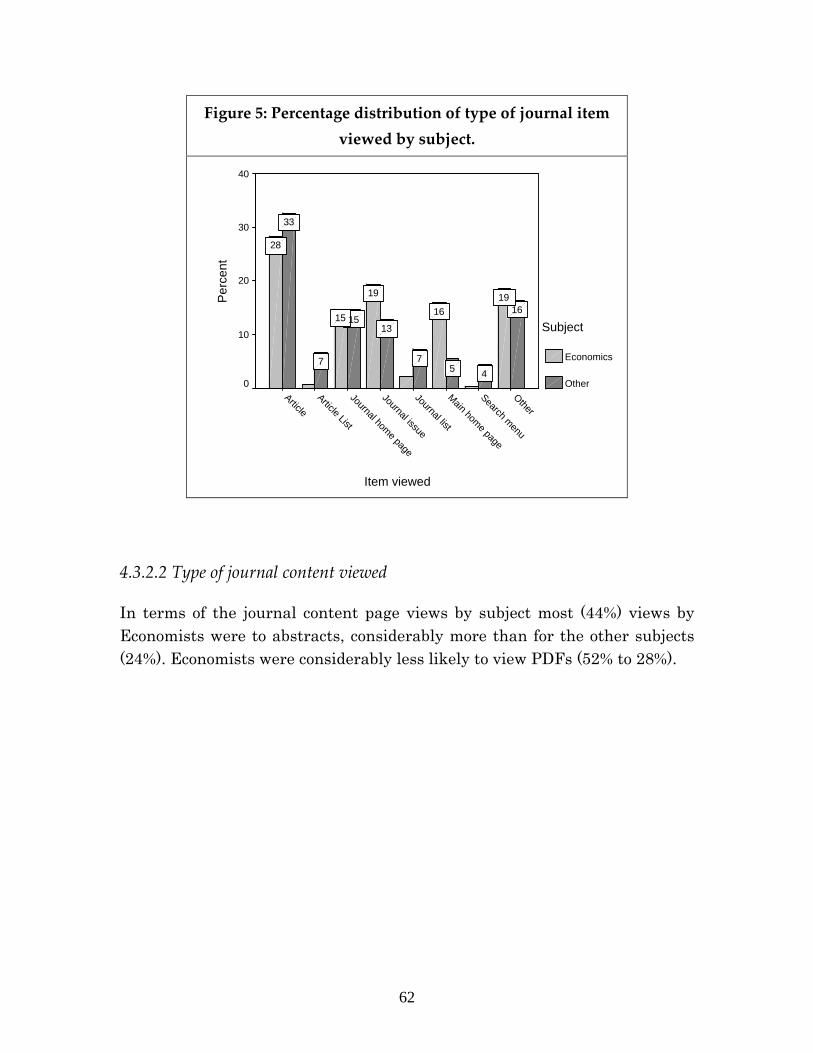
62
Figure 5: Percentage distribution of type of journal item viewed by subject.
Item viewed
OtherSearch menu
Main home page
Journal list
Journal issue
Journal home page
Article List
Article
Per
cent
40
30
20
10
0
Subject
Economics
Other
16
457
1315
7
33
1916
19
15
28
4.3.2.2 Type of journal content viewed
In terms of the journal content page views by subject most (44%) views by Economists were to abstracts, considerably more than for the other subjects (24%). Economists were considerably less likely to view PDFs (52% to 28%).
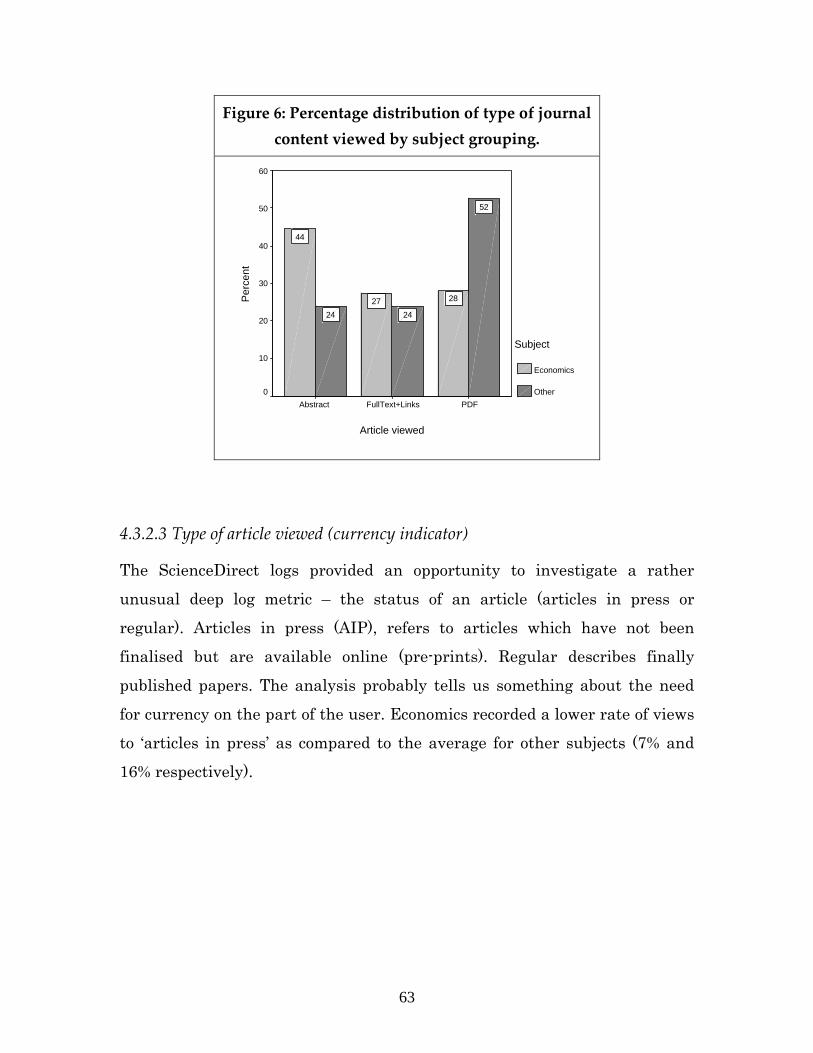
63
Figure 6: Percentage distribution of type of journal content viewed by subject grouping.
Article viewed
PDFFullText+LinksAbstract
Per
cent
60
50
40
30
20
10
0
Subject
Economics
Other
52
2424
2827
44
4.3.2.3 Type of article viewed (currency indicator)
The ScienceDirect logs provided an opportunity to investigate a rather
unusual deep log metric – the status of an article (articles in press or
regular). Articles in press (AIP), refers to articles which have not been
finalised but are available online (pre-prints). Regular describes finally
published papers. The analysis probably tells us something about the need
for currency on the part of the user. Economics recorded a lower rate of views
to ‘articles in press’ as compared to the average for other subjects (7% and
16% respectively).
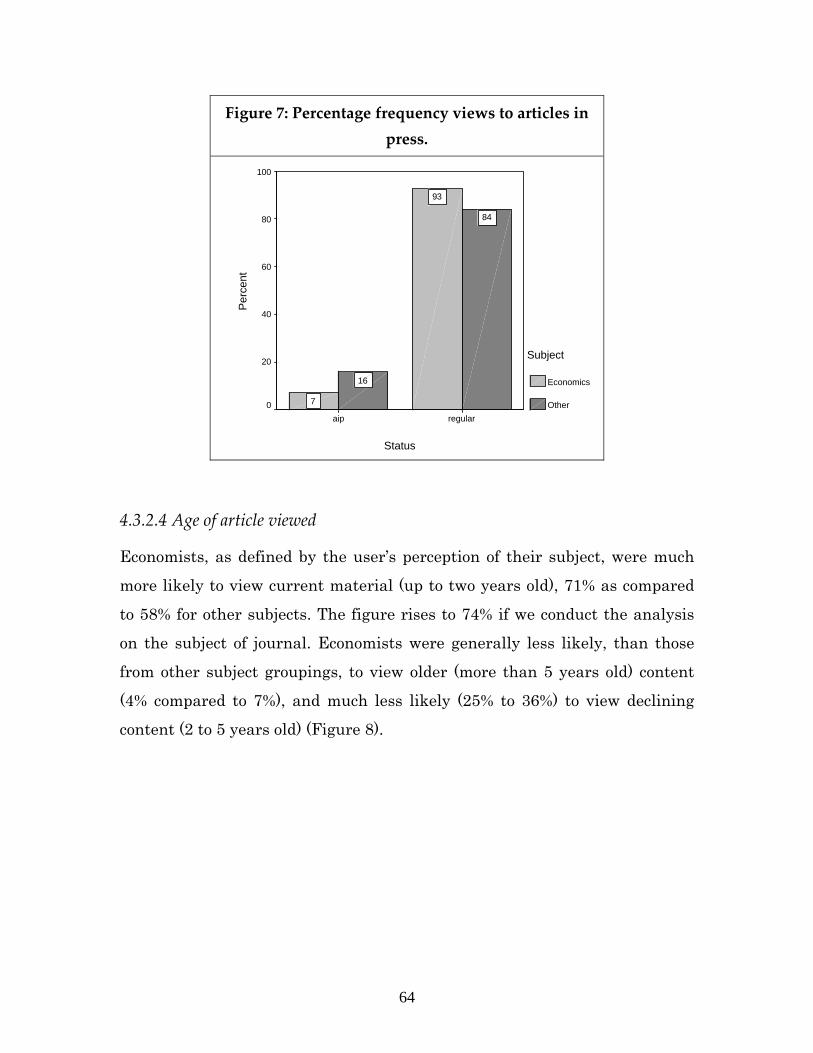
64
Figure 7: Percentage frequency views to articles in press.
Status
regularaip
Per
cent
100
80
60
40
20
0
Subject
Economics
Other
84
16
93
7
4.3.2.4 Age of article viewed
Economists, as defined by the user’s perception of their subject, were much
more likely to view current material (up to two years old), 71% as compared
to 58% for other subjects. The figure rises to 74% if we conduct the analysis
on the subject of journal. Economists were generally less likely, than those
from other subject groupings, to view older (more than 5 years old) content
(4% compared to 7%), and much less likely (25% to 36%) to view declining
content (2 to 5 years old) (Figure 8).
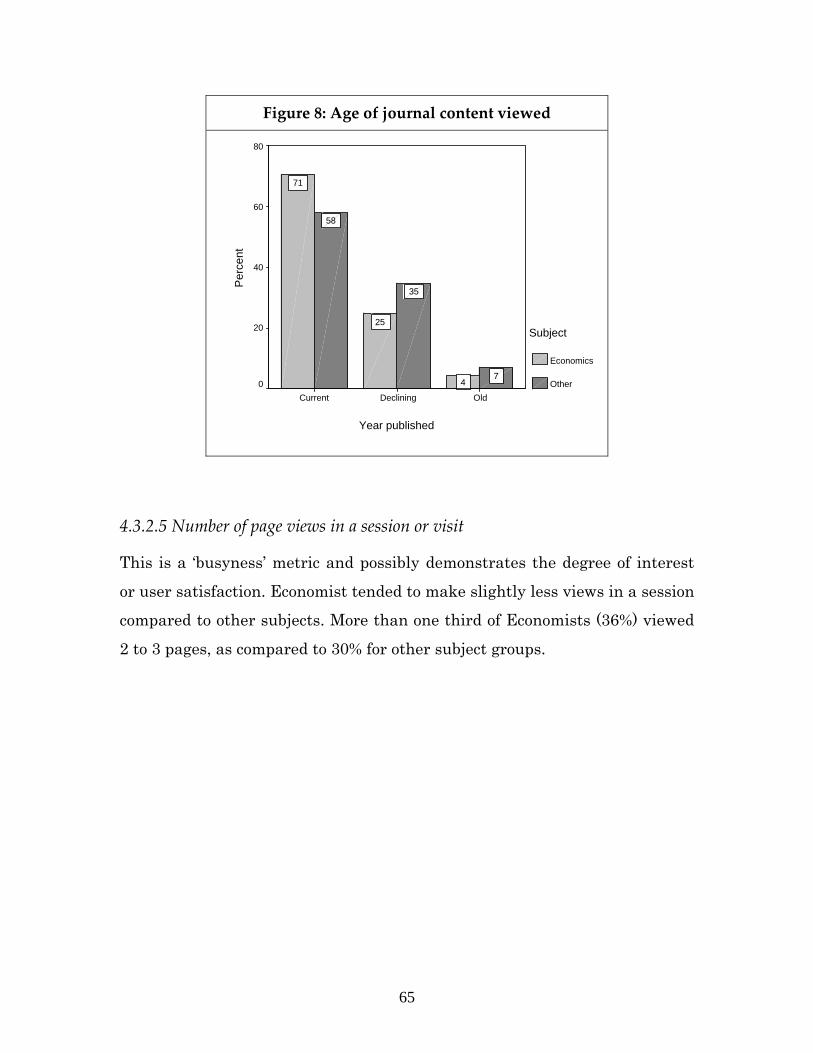
65
Figure 8: Age of journal content viewed
Year published
OldDecliningCurrent
Per
cent
80
60
40
20
0
Subject
Economics
Other7
35
58
4
25
71
4.3.2.5 Number of page views in a session or visit
This is a ‘busyness’ metric and possibly demonstrates the degree of interest
or user satisfaction. Economist tended to make slightly less views in a session
compared to other subjects. More than one third of Economists (36%) viewed
2 to 3 pages, as compared to 30% for other subject groups.
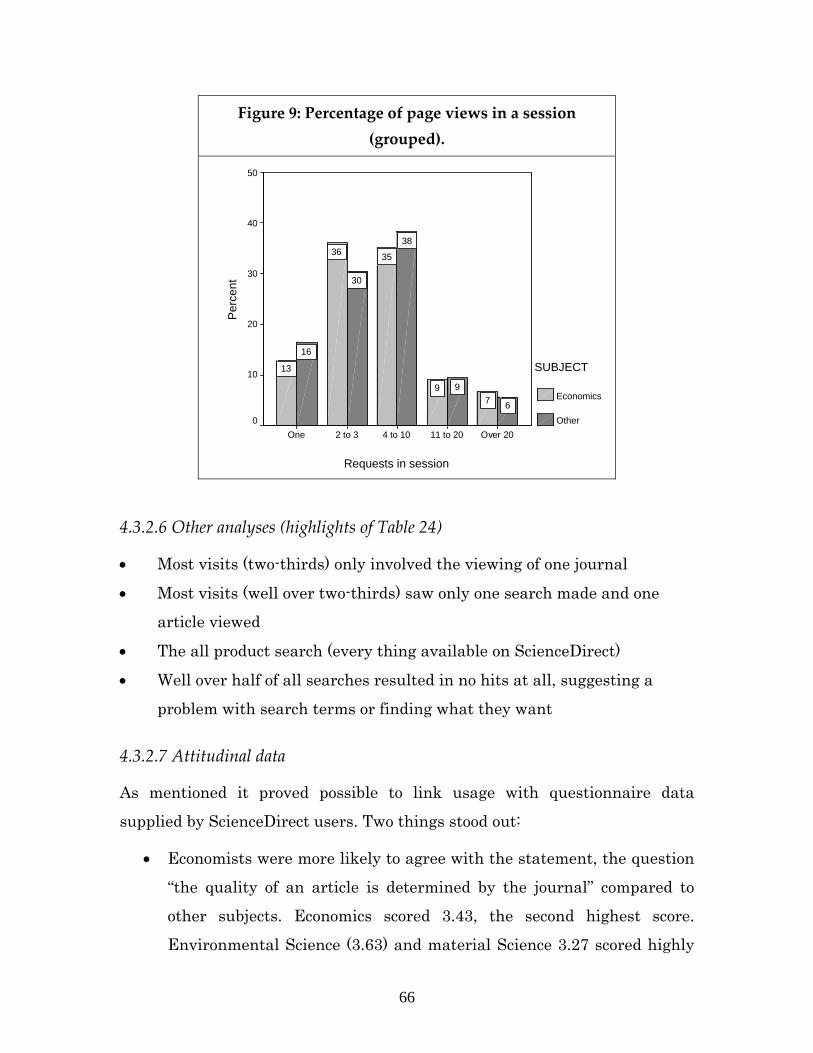
66
Figure 9: Percentage of page views in a session (grouped).
Requests in session
Over 2011 to 204 to 102 to 3One
Per
cent
50
40
30
20
10
0
SUBJECT
Economics
Other6
9
38
30
16
79
3536
13
4.3.2.6 Other analyses (highlights of Table 24)
• Most visits (two-thirds) only involved the viewing of one journal
• Most visits (well over two-thirds) saw only one search made and one
article viewed
• The all product search (every thing available on ScienceDirect)
• Well over half of all searches resulted in no hits at all, suggesting a
problem with search terms or finding what they want
4.3.2.7 Attitudinal data
As mentioned it proved possible to link usage with questionnaire data
supplied by ScienceDirect users. Two things stood out:
• Economists were more likely to agree with the statement, the question
“the quality of an article is determined by the journal” compared to
other subjects. Economics scored 3.43, the second highest score.
Environmental Science (3.63) and material Science 3.27 scored highly
67
by this question, while Mathematics (2.57), Social Science (2.73) and
Engineering (2.85) recorded low scores.
• Economists were more likely to agree with the statement “it is more
important to publish in a prestigious general journal, than a MORE
appropriate specialised journal” their score was 3.6. Those accessing
Computer Science (2.6), Physics (2.7) and Medicine (2.8) journals
tended to disagree with the statement.
4.3.3 Main points arising from the project
Economists recorded the:
• lowest percentage of page views to article lists and journal lists (they
appeared not to be general browsers, however they recorded the highest
number of views to journal issue pages (a case of focused browsing?);
• highest percentage of views to abstracts;
• highest percentage of views to articles in print (based on journal
subject), but also the lowest percentage of views to articles in print
viewed (based on user subject), something which suggests the two user
populations are differently;
• highest percentage of views (70-75%) to current articles (up to 2 years
old) and lowest views to old articles (aged over 5 years old);
• highest proportion of sessions viewing over 20 pages;
• highest proportion of sessions seeing just one search conducted and the
lowest number of sessions with 5 and over searches;
• highest proportion of searches with zero hits returned, suggesting a
problem with search terms or finding what they want, and the lowest
number of searches with 3-10 returned hits;
• lowest average number of articles viewed in a session.
In addition:
68
• most visits (two-thirds) only involved the viewing of one journal
• most visits (well over two-thirds) saw only one search made
• the all product search (every thing available on ScienceDirect) was
particularly popular
69
4.4 Use and information seeking behaviour of US students and
faculty in respect to e-journals. IMLS funded MaxData research
project22 23
The MaxData study, conducted with the University of Tennessee, sought to
develop and test methods, which would help university librarians, evaluate their
journal usage. The study, conducted during the period 2005‐2008, focused largely
on five American universities, a mixture of research and teaching, and large and
big ones. The fact that the study confined itself to US academics, staff and
students, means that the findings need to be treated with care. This is because we
have found quite big differences in information seeking behaviour between
scholars according to their nationality, even in the same discipline (Nicholas et al
2008). The study consisted of a deep log analysis of journal usage over a period
of 15 months on the OhioLINK platform by four Ohio Universities. Altogether
2,250,000 pages were viewed and 339,000 sessions conducted, demonstrating
how genuinely popular e‐journals are with the scholarly community.
OhioLINK covers all subject fields, including Business and Economics. As can
be seen from Figure 10 in usage terms Business is a medium size field.
22 http://www.ucl.ac.uk/infostudies/research/ciber/downloads/ 23 http://web.utk.edu/~tenopir/maxdata/index.htm
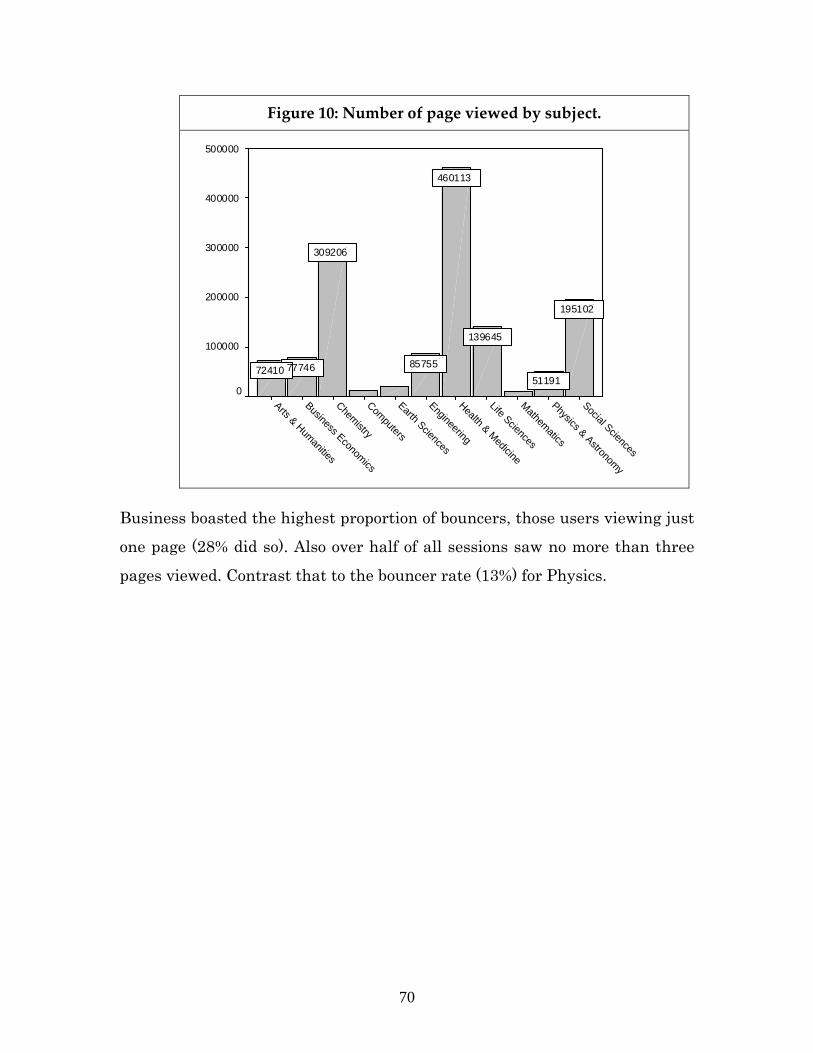
70
Figure 10: Number of page viewed by subject.
Social Sciences
Physics & Astronomy
Mathematics
Life Sciences
Health & Medicine
Engineering
Earth Sciences
Computers
Chemistry
Business Economics
Arts & Humanities
500000
400000
300000
200000
100000
0
195102
51191
139645
460113
85755
309206
7774672410
Business boasted the highest proportion of bouncers, those users viewing just
one page (28% did so). Also over half of all sessions saw no more than three
pages viewed. Contrast that to the bouncer rate (13%) for Physics.
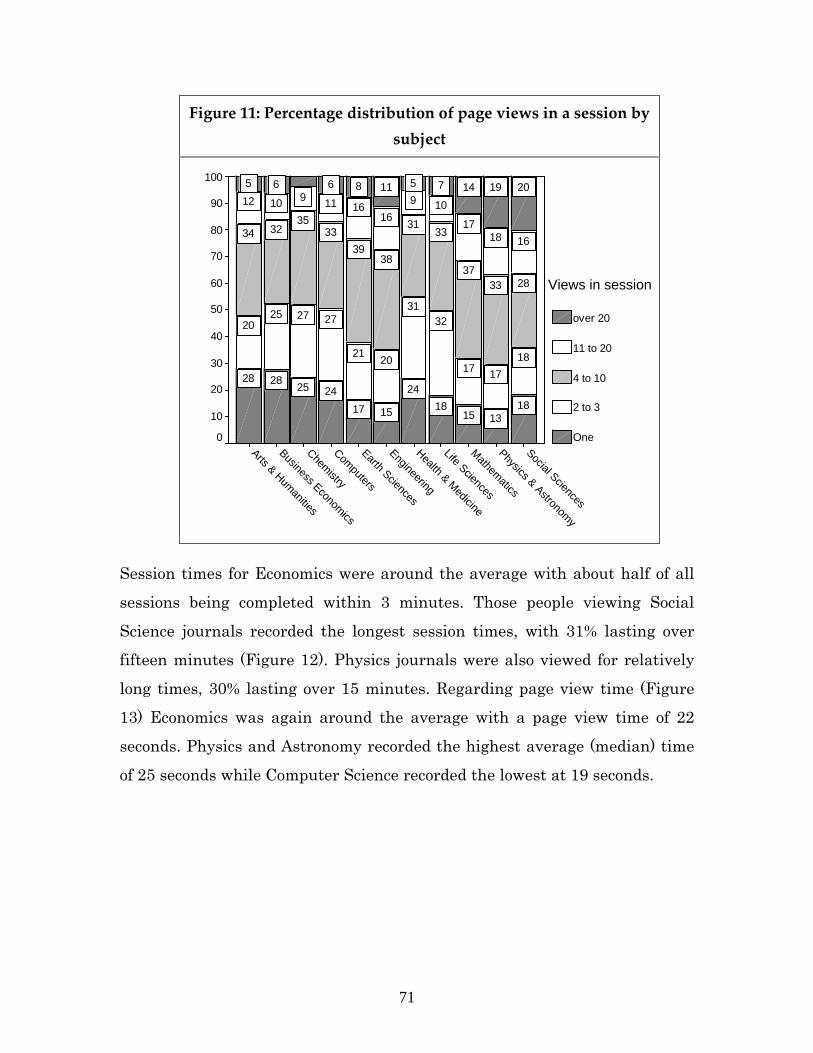
71
Figure 11: Percentage distribution of page views in a session by subject
Social Sciences
Physics & Astronomy
Mathematics
Life Sciences
Health & Medicine
Engineering
Earth Sciences
Computers
Chemistry
Business Economics
Arts & Humanities
100
90
80
70
60
50
40
30
20
10
0
Views in session
over 20
11 to 20
4 to 10
2 to 3
One
20191475118665
161817
10916
161191012
283337
3331
3839
3335
3234
181717
3231
2021
27272520
181315
1824
151724252828
Session times for Economics were around the average with about half of all
sessions being completed within 3 minutes. Those people viewing Social
Science journals recorded the longest session times, with 31% lasting over
fifteen minutes (Figure 12). Physics journals were also viewed for relatively
long times, 30% lasting over 15 minutes. Regarding page view time (Figure
13) Economics was again around the average with a page view time of 22
seconds. Physics and Astronomy recorded the highest average (median) time
of 25 seconds while Computer Science recorded the lowest at 19 seconds.
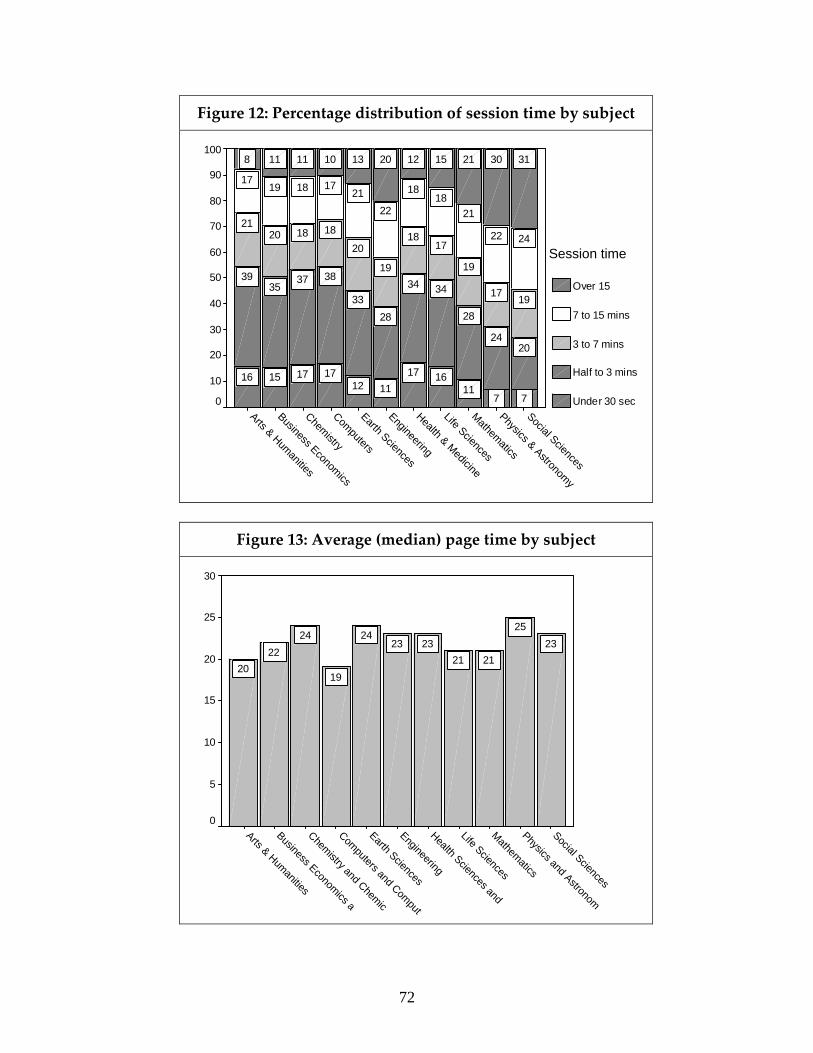
72
Figure 12: Percentage distribution of session time by subject
Social Sciences
Physics & Astronomy
Mathematics
Life Sciences
Health & Medicine
Engineering
Earth Sciences
Computers
Chemistry
Business Economics
Arts & Humanities
100
90
80
70
60
50
40
30
20
10
0
Session time
Over 15
7 to 15 mins
3 to 7 mins
Half to 3 mins
Under 30 sec
313021151220131011118
2422
2118
18
2221
17181917
1917
19
1718
19
20
18182021
2024
28
3434
2833
383735
39
7711
16171112
17171516
Figure 13: Average (median) page time by subject
Social Sciences
Physics and Astronom
Mathematics
Life Sciences
Health Sciences and
Engineering
Earth Sciences
Computers and Comput
Chemistry and Chemic
Business Economics a
Arts & Humanities
30
25
20
15
10
5
0
2325
21212323
24
19
2422
20
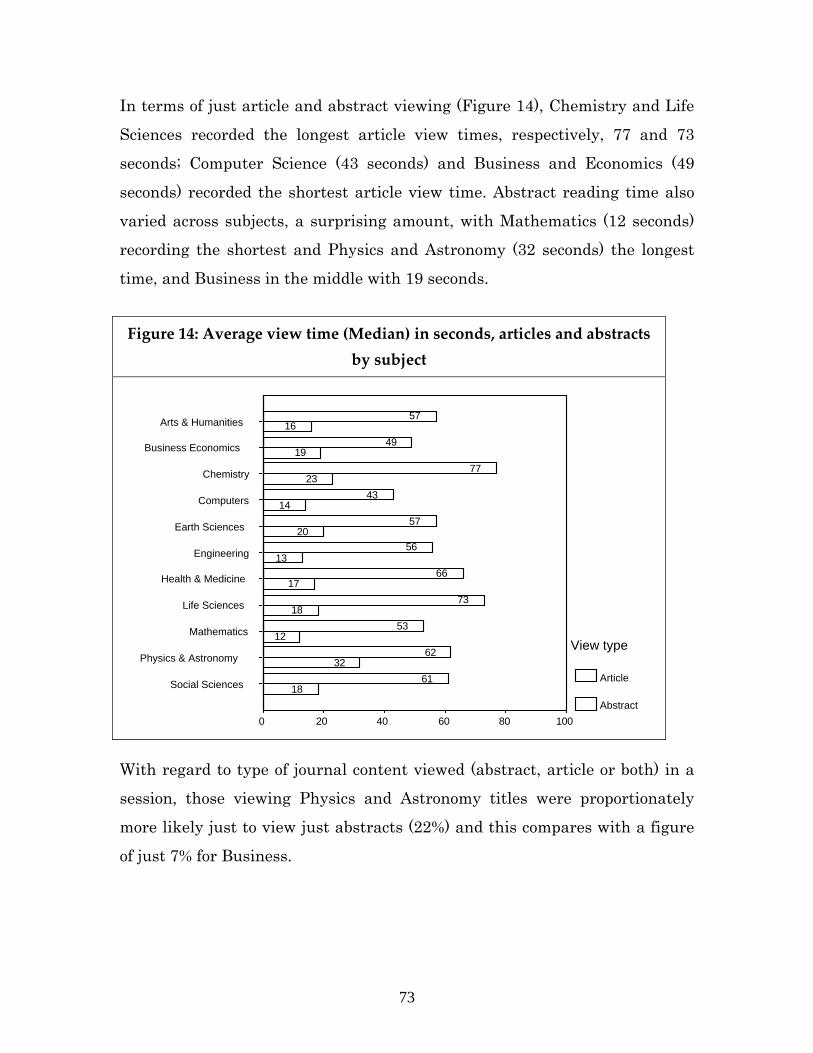
73
In terms of just article and abstract viewing (Figure 14), Chemistry and Life
Sciences recorded the longest article view times, respectively, 77 and 73
seconds; Computer Science (43 seconds) and Business and Economics (49
seconds) recorded the shortest article view time. Abstract reading time also
varied across subjects, a surprising amount, with Mathematics (12 seconds)
recording the shortest and Physics and Astronomy (32 seconds) the longest
time, and Business in the middle with 19 seconds.
Figure 14: Average view time (Median) in seconds, articles and abstracts
by subject
Arts & Humanities
Business Economics
Chemistry
Computers
Earth Sciences
Engineering
Health & Medicine
Life Sciences
Mathematics
Physics & Astronomy
Social Sciences
100806040200
View type
Article
Abstract18
32
12
18
17
13
20
14
23
19
16
61
62
53
73
66
56
57
43
77
49
57
With regard to type of journal content viewed (abstract, article or both) in a
session, those viewing Physics and Astronomy titles were proportionately
more likely just to view just abstracts (22%) and this compares with a figure
of just 7% for Business.
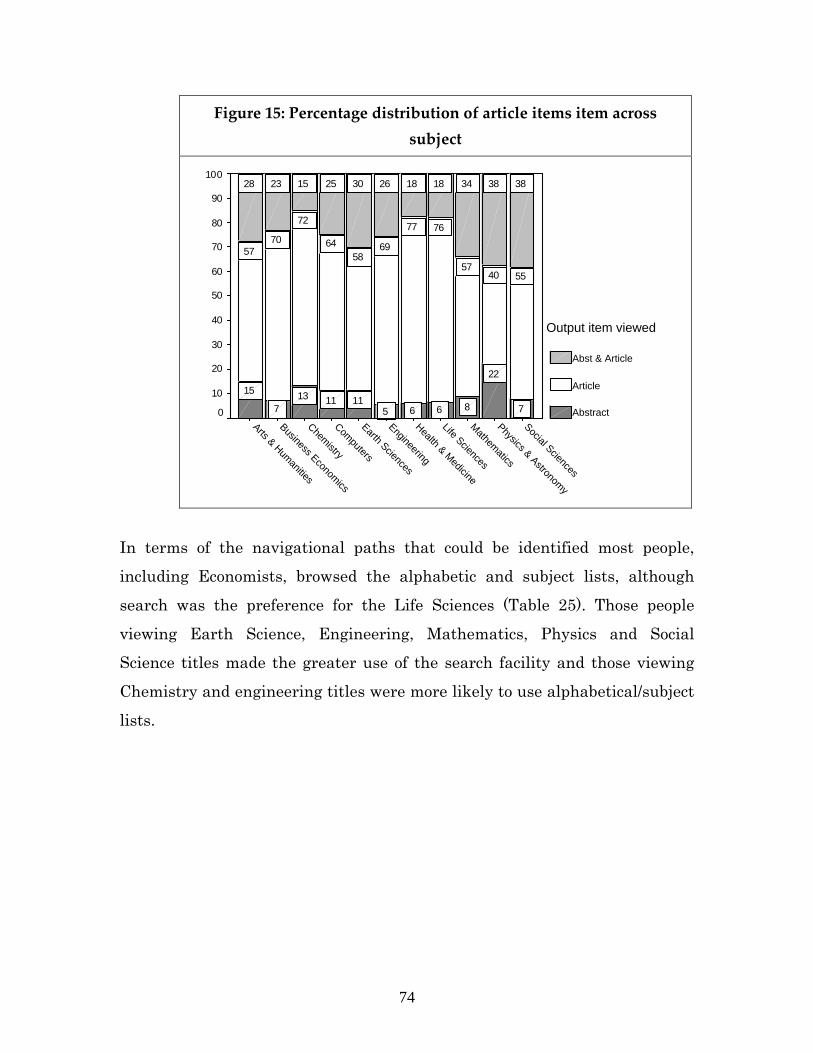
74
Figure 15: Percentage distribution of article items item across subject
Social Sciences
Physics & Astronomy
Mathematics
Life Sciences
Health & Medicine
Engineering
Earth Sciences
Computers
Chemistry
Business Economics
Arts & Humanities
100
90
80
70
60
50
40
30
20
10
0
Output item viewed
Abst & Article
Article
Abstract
3838341818263025152328
554057
7677
6958
64
72
7057
7
22
8665111113
7
15
In terms of the navigational paths that could be identified most people,
including Economists, browsed the alphabetic and subject lists, although
search was the preference for the Life Sciences (Table 25). Those people
viewing Earth Science, Engineering, Mathematics, Physics and Social
Science titles made the greater use of the search facility and those viewing
Chemistry and engineering titles were more likely to use alphabetical/subject
lists.
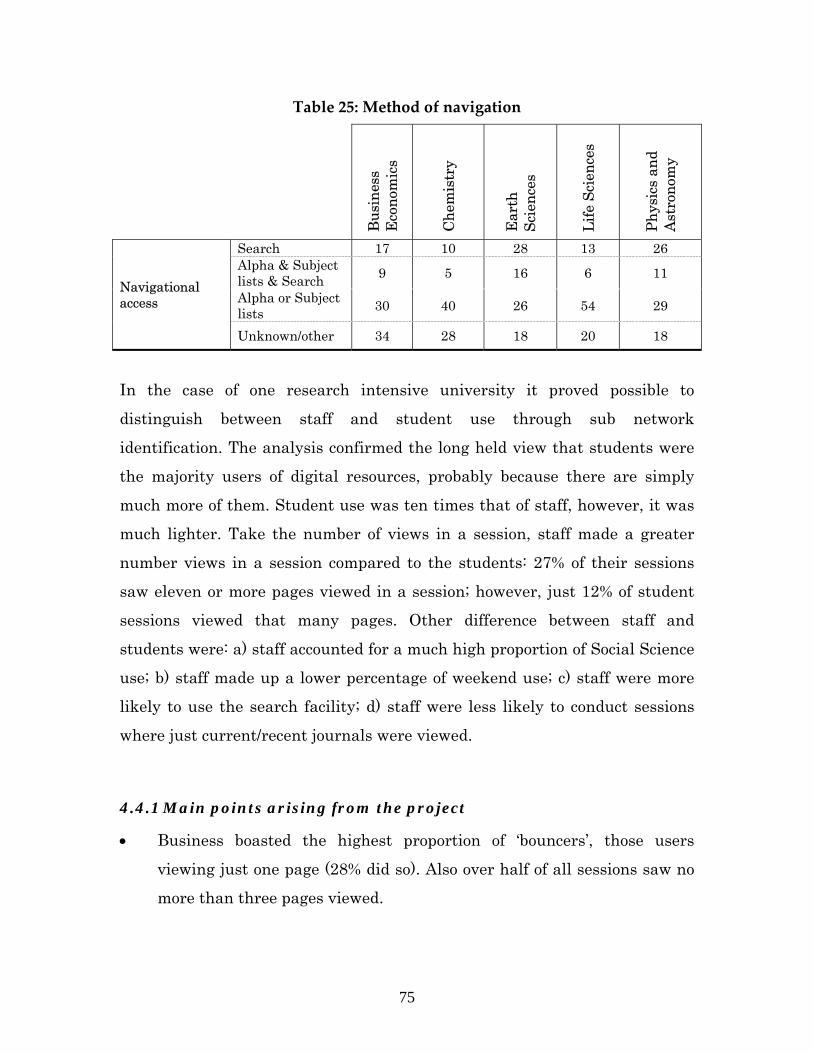
75
Table 25: Method of navigation
Bus
ines
s E
cono
mic
s
Che
mis
try
Ear
th
Scie
nces
Life
Sci
ence
s
Phys
ics
and
Ast
rono
my
Navigational access
Search 17 10 28 13 26 Alpha & Subject lists & Search 9 5 16 6 11
Alpha or Subject lists 30 40 26 54 29
Unknown/other 34 28 18 20 18
In the case of one research intensive university it proved possible to
distinguish between staff and student use through sub network
identification. The analysis confirmed the long held view that students were
the majority users of digital resources, probably because there are simply
much more of them. Student use was ten times that of staff, however, it was
much lighter. Take the number of views in a session, staff made a greater
number views in a session compared to the students: 27% of their sessions
saw eleven or more pages viewed in a session; however, just 12% of student
sessions viewed that many pages. Other difference between staff and
students were: a) staff accounted for a much high proportion of Social Science
use; b) staff made up a lower percentage of weekend use; c) staff were more
likely to use the search facility; d) staff were less likely to conduct sessions
where just current/recent journals were viewed.
4.4.1 Main points arising from the project
• Business boasted the highest proportion of ‘bouncers’, those users
viewing just one page (28% did so). Also over half of all sessions saw no
more than three pages viewed.
76
• Session times for Economics were around the average with about half of
all sessions being completed within 3 minutes. Page view time was
again around the average with a page view time of 22 seconds
• In terms of the navigational paths that could be identified most people,
including Economists, browsed the alphabetic and subject lists.
• Students were the majority users of OhioLINK, probably because there
are simply many more of them. Student use was ten times that of staff,
however, it was much lighter, they tended to view fewer pages
77
5.0 Conclusions
Business/Economics staff and students have traditionally been big and
important users of the published literature and therefore it is no surprise to
discover that they are big, strategic and pioneering users of today’s digital
scholarly literature. It is therefore puzzling that business/economic scholarly
users have been the subject of such little research here in the UK.
Essentially they use and seeking information very much like their virtual
colleagues. That is they make characteristically short visits, which see only a
few pages and documents viewed; they like using Google and GoogleScholar
and are browsers when they get to a website; they find abstracts very useful
(probably for browsing purposes) and like searching off-site and outside the
traditional (9-5) working day.
They are also distinctive in their use and information seeking and their key
characteristics are summed up below.
5.1 E-book users
Volume and pattern of use
• Business studies students are heavy users of e-textbooks and e-books
generally. Those students at the newer universities are especially
heavy users. Use also appears to be growing at a healthy rate.
Popularity could be put down to a number of factors: a) the books
were more attractive to university users; b) the nature of business
studies means that e-books are especially attractive; c) staff and
librarians promote them more.
• E-textbook searching is less tied to the rhythms of the teaching year
than other subjects and this could be because students have more
78
project work or because of the large postgraduate numbers in the
field.
Location of use
• Business e-book users tend to search off campus (the fact that many
are part-time and this provides part of the explanation)
Search and navigation
• Business users liked using search facilities to navigate towards e-
book content. The library catalogue/OPAC was the main means of
accessing e-textbooks.
• The e-book user was easily distracted and confused by the myriad
navigational routes and display options, and the ability to move out
of the e-book environment with ease and at will.
• As ever, advanced searching was hardly ever used though.
Nature of use and content viewed
• E-textbooks were mainly used for obtaining snippets of information
and fact finding. Power browsing of multiple e-text books was
characteristic, a function of massive choice. There appeared to be
very little extended reading of e-books
• The most important reason for using e-books was convenience - of
transporting and accessing them.
• Interactive features of e-textbooks were highly appreciated.
5.2 E-journal users
Users
• Students were the majority users, probably because there were simply
many more of them. Student use was ten times that of staff in the case
79
of the OhioLINK study, however, there use was much lighter as they
viewed fewer pages in a session.
Volume and pattern of use
• Economists used e-journal databases with alacrity but in a direct, quick
and pragmatic way, usually spending less than four minutes on any one
visit and view only a small number of pages (typically about 2-4) and
articles (1-2). Business boasted the highest proportion of ‘bouncers’,
those users viewing just one page (28% did so). Also over half of all
sessions saw no more than three pages viewed. Session times for
Economics were around the average with about half of all sessions being
completed within 3 minutes. Page view time was again around the
average with a page view time of 22 seconds.
• There is however a group of persistent users because Economists also
recorded the highest proportion of sessions viewing over 20 pages.
• There are differences between the usage and information seeking
behavior of Economists at the various institutions studies, with those at
research intensive institutions using the databases more - although
spending less time on a visit, and using less of the functions on offer.
• A good deal of use took place outside office hours, in the evening and on
weekends, more so than for other subject fields.
Searching and navigation
• Google and GoogleScholar searching proved very popular with
Economists, with, respectively, 37% and 22% of visits arriving by those
means.
• Browsing menus, contents pages and lists provided the most popular
way of finding content once the user arrived at the e-journal database.
• Recorded the highest proportion of sessions seeing just one search
conducted and the lowest number of sessions with 5 and over searches.
80
• Recorded the highest proportion of searches which returned zero hits,
suggesting there might be a problem with search terms or finding what
they want, and the lowest number of searches with 3-10 returned hits.
• Most visits (well over two-thirds) saw only one search made.
• In terms of the navigational paths that could be identified most people,
including Economists, browsed the alphabetic and subject lists.
Nature of use and content viewed
• Economists show a very strong preference for PDF displays.
• Economists proved to be among the biggest users of abstracts.
• Recorded the lowest average number of articles viewed in a session.
• Recorded the most visits (two-thirds) only involved the viewing of one
journal.
• The all-product search (every thing available on ScienceDirect) proved
particularly popular, again a manifestation of a browsing trait.
Currency/age
• Recorded the highest percentage of views to articles in print (based on
journal subject).
• Recorded the highest percentage of views (70-75%) to current articles
(up to 2 years old) and lowest views to old articles (aged over 5 years
old);
Finally the case study institutions – all with business schools or, in the case
of LSE, a major economics specialism, differed markedly, with:
1. LSE: a) best in terms of all MyiLibrary e-book use; b) biggest Oxford
Journals e-journal user, by miles; c) undertook the most searching of e-
journals in the early hours;
2. Cranfield: a) best performing in terms of JISC e-textbook use; b)
biggest user of abstracts;
81
3. Middlesex: a) appears to hardly use e-books at all, or if they do it must
be some other platform
82
6.0 References
Bailey, T. P. (2006) “Electronic Book Usage at a Master’s Level I University:
A Longitudinal Study”, The Journal of Academic Librarianship, 32 (1), 52–59.
Borchert, M., Hunter, A., Macdonald, D. And Tittel, C. (2009), A study on
student and staff awareness, acceptance and usage of e-books at two Queensland universities, Available at: http://eprints.usq.edu.au/4876/ (accessed 2
April 2009).
CIBER (2007) OhioLINK Deep Log study 2: case study of 4 universities,
UCL: Ciber.
Dillon, D. (2001a) “E-books: The University of Texas Experience, Part 1”,
Library Hi-Tech, 19 (2), 113–124.
Dillon, D. (2001b) “E-books: The University of Texas Experience, Part 2”,
Library Hi-Tech, 19 (4), 350-362.
Evans, P. and Peters, J. (2005) “Analysis of the dispersal of use for journals
Emerald Management Xtra (EMX)”, Interlending and Document Supply, 33
(3), 155-157.
Hernon, P., Hopper, R., Leach, M. R., Saunders, L. L. and Zhang, J. (2007)
“E-book Use by Students: Undergraduates in Economics, Literature, and
Nursing”, Journal of Academic Librarianship, 33 (1), 3-13.
83
Hunter, B. and Sprague, N. (2009) “Assessing e-books: Taking a closer look at
e-book statistics”, Library Collections, Acquisitions, & Technical Services, 32
(3-4), 150–157.
Langston, M. (2003), “The California State University E-Book Pilot Project:
Implications for Cooperative Collection Development”, Library Collections, Acquisitions, & Technical Services, 27 (1), 19–32.
Levine-Clark, M. (2007b) “Electronic books and the humanities: a survey at
the University of Denver”, Collection Building, 26 (1), 7-14.
Nicholas, D., Huntington, P. and Jamali, H.R. (2006) Authors as users A deep log analysis linking demographic and attitudinal data obtained from scholarly authors with their usage of ScienceDirect, UCL, CIBER.
Nicholas, D., Huntington, P., Jamali, H.R. (2008) “User diversity: as
demonstrated by deep log analysis”, Electronic Library, 26 (1), 21-38.
Nicholas, D., Rowlands, I. Jamali, H.R., Clark, D., Huntington, P. and Olle,
C. (2008) “UK scholarly e-book usage: a landmark survey”, Aslib Proceedings,
60 (4), 311-334.
Primary Research Group Inc. (2009) Survey of American College Students: Student Use of Library E-book Collections, ISBN #: 1-57440-113-0
Copyright © 2022 FDOKUMEN