a study on consumer buying behaviour towards packed fruit ...
Upload
khangminh22Category
view
2download
0
International Journal of Economic Research177
A Study on Consumer Behaviour with Reference to Indian Domestic Airlines in Pune
Anupama Tadamarla1, Mallika Srivastava2 and Krishna Murthy Inumula3
1Corresponding author, Faculty Member, IBS, Pune and Research Scholar, Symbiosis International University, Pune2Assistant Professor, SIBM, Symbiosis International University, Bangalore3Associate Professor, Symbiosis Institute of International Business (SIIB), Symbiosis International University, Pune
AbstrAct
It took many years to say the satisfying customers are the most important aspect for making sales and profits in the long run. In the competitive world customers are more attracted to the customers who are providing better service rather a better price. The service became more important factor as the increase of buying power of the consumer. This paper is to identify best service quality practices prevalent in the domestic civil aviation sector in India. Methodology followed is Qualitative research and Quantitative, Principal Component analysis. The quality service practices identified by the study will benefit the public sector and private sector to improve their overall customer value and thereby customer loyalty and profitability. The study is confined to only domestic airlines and will be conducted only in Pune metro.
Keywords: Service quality, Public sector Airlines, Private Airlines, Principal component Analysis.
IntroductIon1.
A country‘s transportation sector plays an integral role in the growth and development of an economy. According to the Indian Aerospace Industry Analysis report, in terms of passenger traffic, India is currently the ninth largest aviation market in the world. (Source: The International Air Transport Association (IATA) Press Release No.:57 on 16 October 2014) With regards to air cargo tonnage, India leads the South Asian region -consisting of Afghanistan, Bangladesh, Bhutan, India, the Maldives, Nepal, Pakistan and Sri Lanka. Currently, India has 128 airports - including 15 international airports. (Source: Nathan Economic Consulting India January Pvt. Ltd., India 24, 2012 submitted a report to The Ministry of Corporate Affairs, Govt. of India).
International Journal of Economic Research
ISSN : 0972-9380
available at http: www.serialsjournals.com
„ Serials Publications Pvt. Ltd.
Volume 14 • Number 15 (Part 4) • 2017
A Study on Consumer Behaviour with Reference to Indian Domestic Airlines in Pune

Anupama Tadamarla, Mallika Srivastava and Krishna Murthy Inumula
International Journal of Economic Research 178
The aviation sector has become the most important segment in the economic development of a nation. It plays a vital role in moving people or products from one place to another, either being domestic or international, especially when the distances involved are long. Indian aviation industry is one of the fastest growing sectors in the world. Till 1991, the only public airlines in India has enjoyed monopoly in its operations and businesses and therefore could dictate its own terms to its customers who have no other choice but to accept whatever have been available irrespective of quality of service, pricing, hospitality and comfort.
The scenario has changed following globalization and air space having open to competitions. The subsequent events have moved very fast as more and more new players entered with lot of advantages of being new operators as compared to the airlines which have been in operation since independence. Introduction of low cost carriers also change the perception that air travel is reserved only for the elites. As a result, the sector which is completely dominated by full-service airlines till a decade ago is now dominated by low cost carriers. In a way, low cost carriers address the rising aspirations of the Indian middle class couple with their high price sensitivity. Low cost carriers make air travel accessible to many and also boosted air cargo as well. In 2003 the introduction of a new type of airline service called low cost carriers (LCCs) or no-frills air service - by Air Deccan, reinvigorated India‘s civil aviation sector. The Indian aviation sector was exposed to intense competition with the advent of a low-cost airline - Air Deccan back in 2003. The success of Air Deccan spurred the entry of other LCCs like Spice Jet, Indigo, Go Air and subsequently low fare offerings from Jet airways and Kingfisher airlines (Sunil Patel, 2014).
According to the reports of Center for Asia Pacific Aviation India Pvt. Ltd (CAPA-Aviation News on 19-Jun-2015) the market shares of domestic airlines are IndiGo remained (19-Jun-2015) the largest domestic airline in May-2015, with a 38.9% market share and 2.8 million passengers. Overall traffic increased 20.6% to 322.3 million passengers. IndiGo maintained its market share lead over Jet Airways (18.3%), Air India (15.8%), SpiceJet (11.7%), GoAir (8.6%), JetLite (3.2%), Air Asia India (1.3%), Vistara (1.3%), Air Costa (0.9%) and Air Pegasus (0.1%).
Latest Market Share: (source DGCA)
Challenge in the domestic carriers markets in India is becoming tough as the customers’ needs and wants are growing in variety. In such an occasion, low cost carriers need to be aware of the latest shift and trend to be able to react on time. Thus, precise and timely information on a wide range of customer needs and expectations become critically important nowadays. Understanding and meeting customers’ expectations and subsequently being different from competitors are important in order to survive in the today’s world of globalization. It is imperative that low cost carriers’ measure and monitor service quality and satisfaction. The speed and intensity of change in service offerings has accelerated in recent years within the low cost airline industry (Atilgan et. al., 2008).
Low cost airline passengers not only consider the price but also the quality of service when selecting a flight (Jou, Lam, Hensher, Chen and Kou 2008). Quality of service is an important factor to develop

A Study on Consumer Behaviour with Reference to Indian Domestic Airlines in Pune
International Journal of Economic Research179
and maintain relationships with customers (Park, Robertson and Wu 2006). Passengers can assess and evaluate the quality of the airline through a comparison between experiences and their expectations on a number of attributes of the services (Gronroos 2007).The level of service quality has a direct impact on the satisfaction of air transport passengers (Saha, Theingi 2009). Quality of service has a positive influence on interest repeat purchase, recommend, and choose a better alternative in which three have a relationship with customer loyalty (Jones, Mothersbaugh, and Beatty2000). Service quality conditions influence a low cost carrier’s competitive advantage by retaining customer support, and with this comes market share. Delivering high quality service to customers is essential for low cost carrier survival, so low cost carriers need to understand what customers expect from their services. Service quality is one of the best models for evaluating customer’s expectations and perceptions. Service quality is a composite of various interactions between customers and airlines, With employees seeking to influence customers’ perceptions and the image of the carriers (Gursoy et. al., 2005; Ishaq, 2012). Service quality is a measure of how well the service level delivered matches customer expectations. Delivering quality service means conforming to customer expectations on a consistent basis (Parasuraman et. al., 1985). In 1988 Parasuraman, Zeithaml and Berry developed a generic instrument called SERVQUAL to measure service quality based on input from focus groups. It consists of five factors (tangibles, reliability, responsiveness, assurance and empathy) and contains a two-part, 22 scale items regarding expectations and performance. These five factors have been tested through numerous empirical studies in so various industries by many researchers (An & Noh, 2009) that it is also used in a variety of organizations. The SERVQUAL has been one of the most widely used and applied scales for the measurement of perceived service quality in recent years (Bigne et. al., 2003). Gronroos (1993) suggested that measuring passenger experiences in airline service quality is a theoretically valid way of measuring perceived quality. Understanding exactly what customers expect is the most crucial step in defining and delivering high quality service. The domestic carriers need to review its service strategy to increase customer satisfaction and subsequently customer loyalty. They should have strong commitment to service excellence as they also act as the ambassadors that carry the image of the nation.
LItErAturE rEVIEW2.
Ariffin et. al., (2010) revealed that caring and tangible was the only dimension that helped explained passengers’ satisfaction for low cost carriers. Although airlines needed to focus on the attributes that create competitive advantage such as low fare tickets, on time performance, schedule reliability, ease of booking procedures, after sale service, food on board, in flight entertainment and frequent updates about product developments, at the same time they must also ensure that their tangible, physical evidences or service environments of their offerings were being taken care of as perfectly as possible. Wong and Musa (2011) identified seven brand satisfaction dimensions which were tangibles, price, core service, reputation, publicity, word-of-mouth, and employee. The level of brand dissatisfaction was also higher for Malaysian Airlines compared with Air Asia though its brand image is Low Cost Carrier. Air Asia was perceived better than Malaysian Airlines in price, publicity, and word-of-mouth. On the other hand, Malaysian Airlines was perceived better in tangibles, core service, reputation, and employee. Aydin and Yildirim (2012) found that there was a significant relationship between airline firms’ preference and airline services preference. For THY (Turkish Air Lines) passengers, “safety” factor was found to be the most important to prefer this airline company. Riandarini et. al., (2015) indicated that there were differences in causality between customer loyalty models of FSA (Full Service Air Lines) with LFA (Low Fare Airlines).
Anupama Tadamarla, Mallika Srivastava and Krishna Murthy Inumula
International Journal of Economic Research 180
The quality of service and price together created satisfaction and encouraged the creation of a good image in the minds of passengers FSA and LFA. Quality of service had a greater influence on satisfaction than the price effect and the direct effect on the image quality of service was greater than its indirect effect through satisfaction. FSA found that customer satisfaction did not encourage loyalty, customer satisfaction LFA opposite effect on passenger loyalty. Johan et. al., (2014) found that perceived quality had the strong positive relationship with customer loyalty, and it was the most significant variable that affected customer loyalty. Mahmud et. al., (2013) showed that service quality influenced insignificantly toward customer’s satisfaction with a positive relationship and price influenced insignificantly toward customer’s satisfaction with a negative relationship, service quality influenced insignificantly toward customer’s loyalty with a negative relationship and price influenced significantly toward customer’s loyalty with a negative relationship. Customer satisfaction gave significant positive impact on customer loyalty. This implied that when customers felt satisfied then certainly they would also have a loyalty to the flight services industry. His research also recommended that the aviation services industries to maintain a consistent quality of service and continue to set the right price and fair, then the customers would certainly feel satisfied and be followed by loyalty to always use the services of the airline industry. Zangmo et. al., (2014) found that among the five SERVQUAL dimensions, passengers were most satisfied with the ‘assurance’ with ‘reliability’ being the least. Under the ‘tangibles’, passengers perception of in-flight entertainment services was low. Among the five items under ‘reliability’, airline website updating had the lowest level of satisfaction in passenger perception and a convenient flight schedule was the second lowest. Under the ‘responsibility’, efficiency of handling delayed flights was the lowest and promptness of responding to complaints was the second lowest. Understanding passengers’ specific needs was the lowest and giving individual attention to passengers is the second lowest perceived under the fifth dimension ‘empathy’. Passengers were most satisfied with employee’s appearance of neatness and tidiness, kindness and willingness to help. Further, passengers were more satisfied with safety, the image of the organization and the language skills of the employees. The results further showed that about 72% of respondents agreed that Drukair provides quality service, and they were satisfied. Furthermore, 77% of respondents agreed to be loyal customers in that they were willing to recommend Drukair to others and to say positive things about Drukair (Drukair Royal Bhutan Airlines).
stAtEMEnt oF tHE ProbLEM3.
Airlines industry is growing at a fast pace on one hand and other side the competition faced by the airlines to sustain in the market is getting difficult with the increase in fuel cost, airport taxes and along with more number of low cost carriers enter into this business makes it more difficult to run the business. The aviation industry has been identified as one of the more intangible service industries (Clemes et. al., 2008) and plays an important role in the global economy (Tiernan et. al., 2008).Customers become very choosy in selection of airlines because they know how to spend their hard earned money and they plan their trip, by exploring all the possibilities to get the best deal and they want to make sure every penny spent is worth it and get the best. Customers want best service at affordable rate with higher service quality, so issue comes up with it is low cost carriers; ultra-low cost carriers need to compete with hybrid and full service carriers. Therefore, the uphill tasks for domestic carriers are huge, so to maintain the quality and better service and keep their ticket cost low to attract customers is not an easy task they have in their hand.

A Study on Consumer Behaviour with Reference to Indian Domestic Airlines in Pune
International Journal of Economic Research181
obJEctIVEs oF tHE studY4.
The following are the specific objectives of the study.
1. To find out the most significant service quality dimensions and service quality perception of the passengers with different socio-demographic characteristics of the respondents. To achieve these purposes, the 5 - dimensional scale, suggested by Parasuraman et. al., (1988) will be applied to the airline travel sector i.e Indian Domestic Airlines (Full Service, Hybrid, Low cost and Ultra Low Cost carriers).
2. To test the demographic parameters with preference of Airlines.
MEtHodoLoGY5.
The study will be conducted among the travellers of Indian Domestic Airlines. The sampling unit of this research is voter belonging to Pune city. So the study can be regarded as special cases since one city is taken as sampling frame. Target sample size will be 242. For the purpose of the study the entire sample of respondents surveyed will be categorized i.e. stratified into classes with respect to the gender, age, education and type of airline. Stratified random sampling will be adopted to select the sample of 242 respondents. Based on the option chosen opted by the respondent they will be divided in to strata’s and from each stratum respondents were selected at random as respondents for the study. The respondents were interviewed and the data was collected using a well-structured interview schedule.
The first section of the questionnaire will include questions pertaining to the demographic profile of the respondents. The second section a structured questionnaire with a total of 27 questions were prepared regarding the services provided by airlines. The primary data was collected will show various facets of the respondents. Simple percentages were worked out to study general characteristics like age, gender, education, type of airline used. The sample respondents were asked to indicate the response levels on Strongly Agree, Agree, Neutral, Disagree and Strongly Agree. Likert scale was used to find the response Cronbach’s Alpha is calculated in checking the reliability of the data. Factor analysis is conducted for grouping the statements for political knowledge. To get with comprehensive results, the study proposed to adopt factor analysis and Principal Component Analysis (PCA) methods to analyze the data. The idea behind PCA and factor analysis is to reduce the dimensions of the observation, put the common variance together and come up with common factors and specific factors. In this paper, weighted average method is being used to know the most the most important and the least important variable in terms of preferred services.
rEsuLts And dIscussIon6.
Frome Table 1 Out of 242 respondents 148 i.e. 61% are male and remaining 94 i.e. only 39% are female.
More than half respondents i.e. 64% belong to the age group of less than 35 years, 26% belong to the age group of 35 to 45 years whereas only 10% are more than 45 and above respectively.
65% of the respondents are graduates, 28% are post graduates and only 7% (18 respondents) are under graduates which are not very significant portion of the overall population. Majority of the respondents are either students (39%) or employees (49%). Only 9% have their own business and the remaining are retired or have any other occupation.40% of the respondents belong to income group between `50, 000 to `1, 00,000 and next highest (26%) is the income group of `1, 00,000 to `1, 50,000. Only 15 out of 242
Anupama Tadamarla, Mallika Srivastava and Krishna Murthy Inumula
International Journal of Economic Research 182
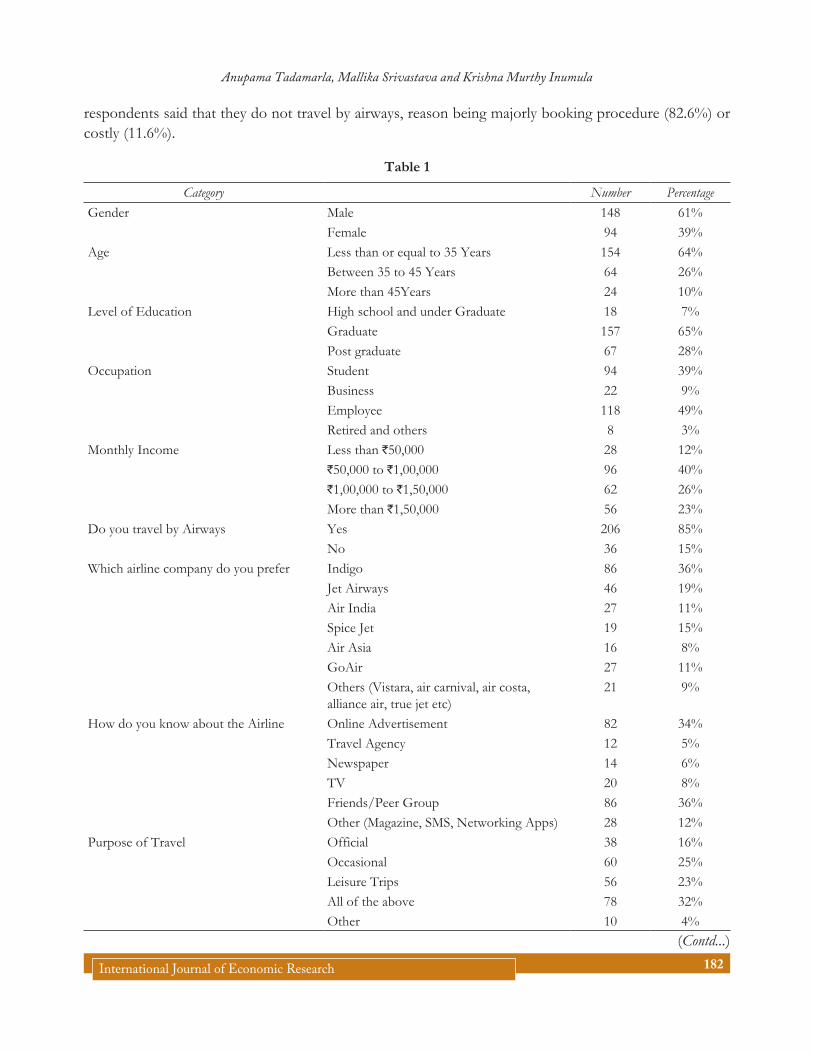
respondents said that they do not travel by airways, reason being majorly booking procedure (82.6%) or costly (11.6%).
table 1
Category Number PercentageGender Male 148 61%
Female 94 39%Age Less than or equal to 35 Years 154 64%
Between 35 to 45 Years 64 26%More than 45Years 24 10%
Level of Education High school and under Graduate 18 7%Graduate 157 65%Post graduate 67 28%
Occupation Student 94 39%Business 22 9%Employee 118 49%Retired and others 8 3%
Monthly Income Less than `50,000 28 12%`50,000 to `1,00,000 96 40%`1,00,000 to `1,50,000 62 26%More than `1,50,000 56 23%
Do you travel by Airways Yes 206 85%No 36 15%
Which airline company do you prefer Indigo 86 36%Jet Airways 46 19%Air India 27 11%Spice Jet 19 15%Air Asia 16 8%GoAir 27 11%Others (Vistara, air carnival, air costa, alliance air, true jet etc)
21 9%
How do you know about the Airline Online Advertisement 82 34%Travel Agency 12 5%Newspaper 14 6%TV 20 8%Friends/Peer Group 86 36%Other (Magazine, SMS, Networking Apps) 28 12%
Purpose of Travel Official 38 16%Occasional 60 25%Leisure Trips 56 23%All of the above 78 32%Other 10 4%
(Contd...)
A Study on Consumer Behaviour with Reference to Indian Domestic Airlines in Pune
International Journal of Economic Research183
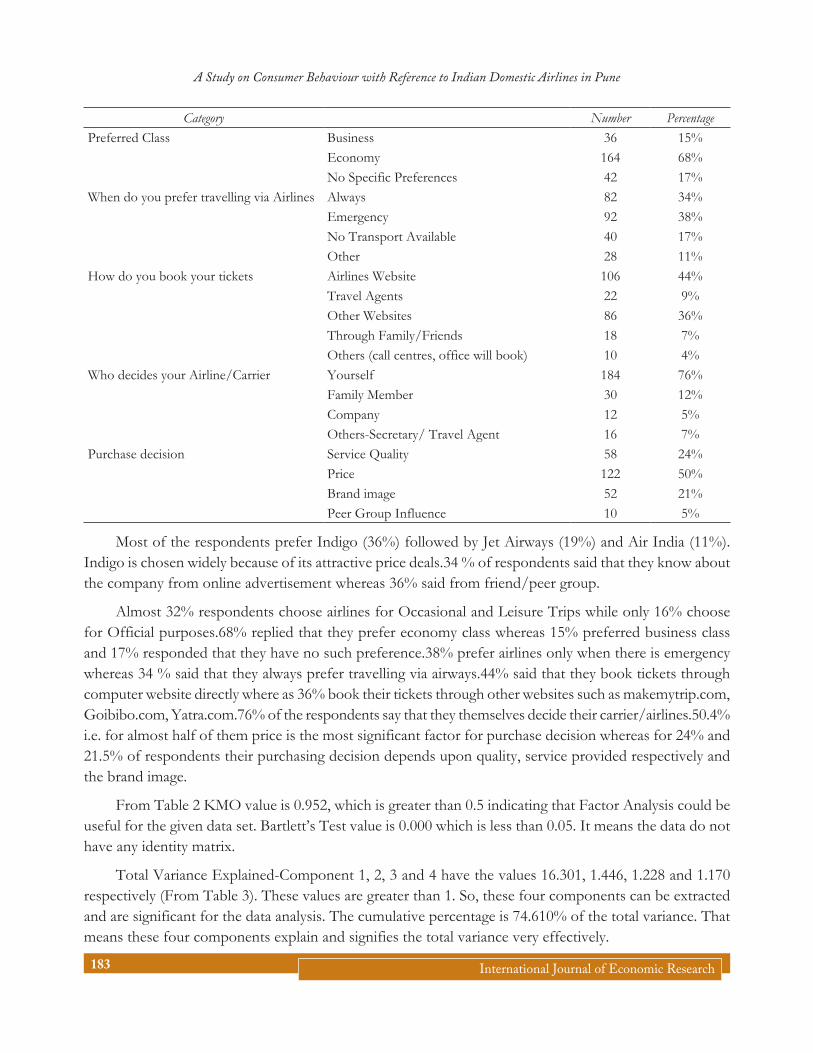
Category Number PercentagePreferred Class Business 36 15%
Economy 164 68%No Specific Preferences 42 17%
When do you prefer travelling via Airlines Always 82 34%Emergency 92 38%No Transport Available 40 17%Other 28 11%
How do you book your tickets Airlines Website 106 44%Travel Agents 22 9%Other Websites 86 36%Through Family/Friends 18 7%Others (call centres, office will book) 10 4%
Who decides your Airline/Carrier Yourself 184 76%Family Member 30 12%Company 12 5%Others-Secretary/ Travel Agent 16 7%
Purchase decision Service Quality 58 24%Price 122 50%Brand image 52 21%Peer Group Influence 10 5%
Most of the respondents prefer Indigo (36%) followed by Jet Airways (19%) and Air India (11%). Indigo is chosen widely because of its attractive price deals.34 % of respondents said that they know about the company from online advertisement whereas 36% said from friend/peer group.
Almost 32% respondents choose airlines for Occasional and Leisure Trips while only 16% choose for Official purposes.68% replied that they prefer economy class whereas 15% preferred business class and 17% responded that they have no such preference.38% prefer airlines only when there is emergency whereas 34 % said that they always prefer travelling via airways.44% said that they book tickets through computer website directly where as 36% book their tickets through other websites such as makemytrip.com, Goibibo.com, Yatra.com.76% of the respondents say that they themselves decide their carrier/airlines.50.4% i.e. for almost half of them price is the most significant factor for purchase decision whereas for 24% and 21.5% of respondents their purchasing decision depends upon quality, service provided respectively and the brand image.
From Table 2 KMO value is 0.952, which is greater than 0.5 indicating that Factor Analysis could be useful for the given data set. Bartlett’s Test value is 0.000 which is less than 0.05. It means the data do not have any identity matrix.
Total Variance Explained-Component 1, 2, 3 and 4 have the values 16.301, 1.446, 1.228 and 1.170 respectively (From Table 3). These values are greater than 1. So, these four components can be extracted and are significant for the data analysis. The cumulative percentage is 74.610% of the total variance. That means these four components explain and signifies the total variance very effectively.

Anupama Tadamarla, Mallika Srivastava and Krishna Murthy Inumula
International Journal of Economic Research 184
table 2 KMo and bartlett’s test
Kaiser-Meyer-Olkin Measure of Sampling Adequacy. .952Bartlett’s Test of Sphericity Approx. Chi-Square 3698.411
do 351Sig. .000
table 3 total Variance Explained
ComponentInitial Eigenvalues Extraction Sums of Squared Loadings Rotation Sums of Squared Loadings
Total % of Variance
Cumulative % Total % of
VarianceCumulative
% Total % of Variance
Cumulative %
1 16.301 60.373 60.373 16.301 60.373 60.373 15.864 58.754 58.7542 1.446 5.357 65.730 1.446 5.357 65.730 1.553 5.750 64.5043 1.228 4.547 70.277 1.228 4.547 70.277 1.395 5.167 69.6714 1.170 4.332 74.610 1.170 4.332 74.610 1.333 4.938 74.6105 .961 3.561 78.1706 .941 3.487 81.6577 .633 2.343 84.0018 .549 2.034 86.0349 .514 1.902 87.93710 .420 1.556 89.49311 .401 1.485 90.97712 .355 1.316 92.29313 .307 1.136 93.42914 .247 .916 94.34515 .225 .834 95.18016 .216 .799 95.97917 .206 .763 96.74218 .155 .574 97.31619 .140 .517 97.83420 .111 .410 98.24321 .106 .392 98.63622 .086 .318 98.95423 .080 .296 99.25024 .067 .248 99.49825 .050 .186 99.68426 .046 .172 99.85627 .039 .144 100.000
Extraction Method: Principal Component Analysis.
Factor 1 has the highest correlations-Employees are sincere and hold patience in resolving passengers’ problems = 0.935, Employees instils confidence to passengers = 0.922, Employees of the carrier have

A Study on Consumer Behaviour with Reference to Indian Domestic Airlines in Pune
International Journal of Economic Research185
knowledge to answer your questions = 0.918, the employees of the carriers are always courteous and understand your specific needs = 0.916So, from the above correlation significance we can name the component as ‘Behaviour of the Employees’.
Factor 2 Check in process is efficient in the carrier = 0.890,the flight departs and arrives on time from the above correlation significance, we can name the component as ‘Check in Efficiency’.
Factor 3 has the following correlation-Appearance, attitude and uniforms of employees are good = 0.769, the carrier provides quality food and beverages = 0.660, from the above correlation significance, we can name the component as ‘Hygienic factors’.
Factor 4 has the following correlation-The carrier has pre-flight services (early baggage check-in, email and sms reminder) = 0.746, the carrier has adequate in-flight entertainment (newspapers, magazines) = 0.695, from the above correlation significance, we can name the component as ‘Additional Services’.
After doing the factor analysis, (Table 4) it can be easily identified that the 4 factors which are significant for the turning around for Airlines are as follows: Behaviour of the Employees, Check in Efficiency Hygienic Factors, Additional factors like entertainment and pre booking reminders.
table 4 rotated component Matrixa
Component1 2 3 4
The carrier has clean and comfortable interiors. .812 .070 .209 –.056The carrier offers high seating comfort. .393 .302 –.128 .244The carrier has adequate in-flight entertainment (newspapers, magazines) .055 –.249 –.076 .695Appearance, attitude and uniforms of employees are good. .051 .079 .769 –.055The carrier provides quality food and beverages. .363 –.053 .660 .197The flight departs and arrives on time. .498 .440 –.445 .125Check in process is efficient in the carrier .041 .890 .066 –.054The carrier has pre-flight services (early baggage check-in, email and SMS reminder) .028 .256 .153 .746Information on ticket prices, flight schedule are easily available on time.] .866 .234 .075 .028Has easy, accurate and speedy reservation and ticketing facilities. .853 .329 .043 –.018The carriers have convenient flight schedules and enough frequencies. .888 .206 .073 .073The carriers have non-stop service to various destinations. .806 .225 –.008 .071The carrier offers onboard shopping with wide selection of products. .820 .086 .046 –.055The employees of the carriers are always courteous and understand your specific needs. .916 .086 .053 –.012The carrier has efficient baggage handling services both during check-in and delivery. .917 .133 .066 .020In case of delay carrier immediately makes an announcement and provides all necessary information (waiting time, receiving of food packets, hotel stay, rebook a flight).
.885 .087 .038 .104
It has proper remedial procedures for deployed or missing baggage. .869 .091 .015 .165Employees are sincere and hold patience in resolving passengers’ problems. .935 .062 .067 .107Employees are capable to respond to emergency situations. .901 –.079 .045 .111Employees of the carrier have knowledge to answer your questions. .918 –.014 .084 .125
(Contd...)

Anupama Tadamarla, Mallika Srivastava and Krishna Murthy Inumula
International Journal of Economic Research 186
Component1 2 3 4
Employees instil confidence to passengers. .922 .026 .040 .111The carrier makes you feel safe. .926 .078 .047 .057Probability of flight breakdowns is less. .912 .075 .096 .036The carrier provides seat preference. .891 .064 .047 .037The carrier provides meal preference. .873 –.009 .046 .092The carrier has facilities of pre order system. .905 –.004 .091 .037The carrier has a sound loyalty program to recognize you as a frequent customer. .641 .052 –.115 .225
Extraction Method: Principal Component Analysis. Rotation Method: Varimax with Kaiser Normalization. aRotation converged in 5 iterations.
From the study, it can be well concluded that there are various factors that play a major and vital role for the proper turn - around of the Airline Industry. The most important factor for the Airline Industry is how and what way the employees of a particular airline company behave when the customer is on board for a flight. This is quite understood because Employees represents the culture that is followed in the particular airline industry like any other industry.
Another important factor is the efficiency in Check in and Check out for the customer because that’s where most time of a customer is spent. It can also be concluded that Hygienic Factors also play a very vital role for airline industry. So, Proper hygiene and cleanliness is required to be maintained throughout the journey of the customers. Finally, Additional Factors which can be Pre Flight services such as email and SMS reminders and in-flight entertainment must also be taken care of for better customer satisfaction and customer delight.
referencesAn, M., & Noh, Y. (2009). Airline customer satisfaction and loyalty: impact of in –flight service quality. Service Business,
3: 293-307.
Atilgan, E., Akinci, S., and Aksoy, S. (2008). “Expectations and perceptions for airlines: The Sun Express case with the gaps model” Journal of Global Strategic Management, pp. 68-78.
Amir Mahmud, Kamaruzaman Jusoff and St. Hadijah, (2013) “The Effect of Service Quality and Price on Satisfaction and Loyalty of Customer of Commercial Flight Service Industry”, World Applied Sciences Journal, pp. 354 – 359
Azmi M. Ariffin, AliahHanim M. Salleh, Norzalita A. Aziz and AstutiAgustinaAsbudin, (2010), “Service Quality and Satisfaction for Low Cost Carriers”, International Review of Business Research Papers, pp. 47 - 56.
Berry, L.L., Parasuraman, A., &Zeithmal, V.A. (1988), The Service-Quality Puzzle. Business Horizons, 31(5): 35-43.
Bigne, J.E., Martinez, C., Miquel, M.J., &Andreu, L. (2003). Servqual Reliability and Validity in Travel Agencies. Annals of Tourism Research, 30(1): 258-262.
Clemes MD, Gan C, Kao T-H, Choong M (2008). An empirical analysis of customer satisfaction in international travel. Innov. Mark. 4(2): 49-62.
Dr. Sunil Patel., (2014) “Analysis of IndiGo’s profitability in the draining Indian Civil Aviation Industry”, (IJRMP) Vol. 3, Issue 6, pp. 34 – 40.
A Study on Consumer Behaviour with Reference to Indian Domestic Airlines in Pune
International Journal of Economic Research187
Grönroos, C., 2007, “Service Management and Marketing: Customer Management in Service Competition”, 3rd Edition, John Wiley & Sons Ltd., England, p. 483
Gronroos, C. (1993).Quality comes to service. In E. E. Scheuing, & W. F. Christopher (Eds.),
The service quality handbook (pp. 17–24). New York: AMACOM.
Gursoy, D., Chen, M.H., & Kim, H.Y.(2005). The US airlines relative positioning based on attributes of service quality. Tourism Management, 26: 57–67.
Jones, M.A., Mothersbaugh, D.L., Beatty, S.E. (2000), “Switching Barriers and Repurchase Intentions in Services”, Journal of Retailing76, 259-274.
Jou, R.C., Lam, S.H., Hensher, D.A., Chen, C.C., Kuo, C.W. (2008), “The effect of service quality and price on international airline competition”, Transportation Research Part E 44, 580-592.
Kenan Aydin and SedaYildirim,(2012) “The Measurement of Service Quality with SERVQUAL for Different Domestic Airline Firms in Turkey”, Serbian Journal of Management, pp. 210 - 230.
KeeMun, Wong and Ghazali, Musa, (2011) “Branding Satisfaction in the Airline Industry: A Comparative Study of Malaysia Airlines and Air Asia”,African Journal of Business Management. 5(8), pp. 3410 - 3423
MohdRemieMohd Johan, Noor Anida Zaria Mohd Noor, NurhidayahBahar,Liu Mei Yan and Low Hwei Ping,(2014) “Factors Affecting Customer Loyalty Towards Airlines Industry in Malaysia: An Exploratory Analysis”, Interdisciplinary Journal of Contemporary Research in Business, 6(6), pp. 12 - 23.
MelamZangmo, WasinLiampreecha and SujindaChemsripong,(2014) “The Influence of Passenger Perceived Service Quality on Passenger Satisfaction and Loyalty: Case of Drukair Royal Bhutan Airlines”, International Journal of Technical Research and Applications, 2(8), pp. 66 - 74.
Parasuraman, A., Zeithaml, V.A., & Berry, L.L. (1985), A Conceptual Model of Service Quality and Its Implications for Future Research. Journal of Marketing, 49(4): 41-55.
Park, J.W., Robertson, R., Wu, C.L. (2006), “Modeling the Impact of Airline Service Quality and Marketing Variables on Passengers Future Behavioral Intentions”, Transportation Planning and Technology, 29,359-381.
Reni HeviandriRiandarini, UjangSumarwan, Lilik Noor Yuliati and Kirbrandoko, (2015) “Comparison of Power Influence Factors Shaping Loyalty Indonesian Domestic Airlines”, European Journal of Business and Management,, 7(11), pp. 120 - 131.
Saha, G.C., Theingi. (2009), “Service quality, satisfaction, and behavioral intentions, A study of low-cost airline carriers in Thailand”, Managing Service Quality 19,350-372.
Tiernan S, Rhoades DL, Waguespack B (Jr) (2008). Airline service quality: Exploratory analysis of consumer perceptions and operational performance in the USA and EU. Manag. Serv. Qual. 18(3): 212-224.

Copyright © 2022 FDOKUMEN