
Jersey Central Power and Light Phase II ... - NJ.gov
455
Task Report – For Review Purposes Only i 6/30/2011 Jersey Central Power and Light Phase II Comprehensive Management Audit June 2011
-
Upload
khangminh22 -
Category
Documents
-
view
1 -
download
0
Transcript of Jersey Central Power and Light Phase II ... - NJ.gov

Task Report – For Review Purposes Only i
6/30/2011
Jersey Central Power and Light
Phase II Comprehensive Management Audit
June 2011


Final Report i
6/20/2011
Table of Contents
VII. EXECUTIVE MANAGEMENT AND CORPORATE GOVERNANCE ........................ 123
A. Executive Management ............................................................................................................................ 123
Background & Perspective ...................................................................................................................... 123
Organizational Structure and Planning ............................................................................................ 123
Management and Administrative Communications and Controls ............................................... 127
Findings & Conclusions ........................................................................................................................... 128
Recommendations .................................................................................................................................... 129
B. Corporate Governance ............................................................................................................................. 130
Background & Perspective ...................................................................................................................... 130
Findings & Conclusions ........................................................................................................................... 135
Recommendations .................................................................................................................................... 142
C. Organization Structure ............................................................................................................................. 143
D. Human Resources ..................................................................................................................................... 143
Background & Perspective ...................................................................................................................... 143
Organization and Staffing .................................................................................................................. 143
HR Steering Committee ..................................................................................................................... 147
HR Technology .................................................................................................................................... 148
Performance Management ................................................................................................................. 149
Compensation and Benefits ............................................................................................................... 153
Recruiting and Staffing ....................................................................................................................... 156
Safety ..................................................................................................................................................... 157
Data and Statistics ............................................................................................................................... 160
Employee Diversity ............................................................................................................................. 164
Data and Statistics ............................................................................................................................... 166
Findings & Conclusions ........................................................................................................................... 172
Recommendations .................................................................................................................................... 180
E. Strategic Planning ...................................................................................................................................... 182
Background & Perspective ...................................................................................................................... 182
Findings & Conclusions ........................................................................................................................... 183
Recommendations .................................................................................................................................... 184

ii Final Report
6/20/2011
Table of Contents (continued)
F. External Relations ...................................................................................................................................... 185
Background & Perspective ....................................................................................................................... 185
Findings & Conclusions ............................................................................................................................ 189
Recommendations ..................................................................................................................................... 190
VIII. FINANCE AND ACCOUNTING .................................................................................... 193
A. Finance......................................................................................................................................................... 193
Background & Perspective ....................................................................................................................... 193
Overview................................................................................................................................................ 194
Financing and Debt Management ...................................................................................................... 195
Credit ...................................................................................................................................................... 196
Investments ........................................................................................................................................... 200
Pension and Other Post-Retirement Benefits (OPEB) Plans........................................................ 205
Tax Treatment ...................................................................................................................................... 206
Findings & Conclusions ............................................................................................................................ 207
Recommendations ..................................................................................................................................... 209
B. Cash Management ...................................................................................................................................... 210
Background & Perspective ....................................................................................................................... 210
Overview................................................................................................................................................ 210
Cash Management Methodologies ..................................................................................................... 211
Cash Receipts ........................................................................................................................................ 212
Cash Disbursements ............................................................................................................................ 213
Banking .................................................................................................................................................. 215
Money Pool ........................................................................................................................................... 216
Financial Performance Measurements .............................................................................................. 219
Write-Offs ............................................................................................................................................. 220
Cost of Capital ...................................................................................................................................... 221
Findings & Conclusions ............................................................................................................................ 222
Recommendations ..................................................................................................................................... 224

Final Report iii
6/20/2011
Table of Contents (continued)
C. Accounting and Property Records .......................................................................................................... 225
Background & Perspective ...................................................................................................................... 225
Overview ............................................................................................................................................... 225
Accounts Payable ................................................................................................................................. 228
Accounts Receivable ........................................................................................................................... 231
Payroll Functions ................................................................................................................................. 233
Budget Processes ................................................................................................................................. 235
Property Accounting ........................................................................................................................... 244
Internal Auditing.................................................................................................................................. 245
Findings & Conclusions ........................................................................................................................... 253
Recommendations .................................................................................................................................... 257
IX. ELECTRIC OPERATIONS ................................................................................................. 259
A. Transmission and Distribution ................................................................................................................ 259
Background & Perspective ...................................................................................................................... 259
Organizational Structure .......................................................................................................................... 264
JCP&L ................................................................................................................................................... 264
FirstEnergy Utilities ............................................................................................................................ 268
Performance Management ....................................................................................................................... 272
Asset Management .................................................................................................................................... 276
Distribution Planning .......................................................................................................................... 276
Capital Management ............................................................................................................................ 276
Standards ............................................................................................................................................... 277
Operations and Maintenance ............................................................................................................. 278
Performance Measures........................................................................................................................ 278
Support Applications .......................................................................................................................... 278
Planned Maintenance .......................................................................................................................... 280
FEU/JCP&L Storm Process ............................................................................................................. 282
O&M Support Applications............................................................................................................... 287

iv Final Report
6/20/2011
Table of Contents (continued)
Capital Program ......................................................................................................................................... 290
System Forecasting ............................................................................................................................... 290
Distribution Forecasting...................................................................................................................... 291
Capital Program Planning and Budgeting ......................................................................................... 292
Support Applications ........................................................................................................................... 294
Work Management System ....................................................................................................................... 298
Workforce ................................................................................................................................................... 300
Findings & Conclusions ............................................................................................................................ 302
Service Levels ........................................................................................................................................ 302
Costs ....................................................................................................................................................... 312
Management Processes ........................................................................................................................ 324
Support Applications ........................................................................................................................... 334
Recommendations ..................................................................................................................................... 338
B. Extensions and Upgrades .......................................................................................................................... 346
Background ................................................................................................................................................. 346
Findings & Conclusions ............................................................................................................................ 349
Recommendations ..................................................................................................................................... 365
C. Contractor Performance ........................................................................................................................... 366
Underground Locate Services .................................................................................................................. 366
Background ........................................................................................................................................... 366
Findings & Conclusions ...................................................................................................................... 367
Recommendation ................................................................................................................................. 377
Installation of New and Replacement Lines and Services ................................................................... 377
Background ........................................................................................................................................... 377
Findings & Conclusions ...................................................................................................................... 378
Recommendations ................................................................................................................................ 386
X. CUSTOMER SERVICE ......................................................................................................... 387
A. Background & Perspective ....................................................................................................................... 387

Final Report v
6/20/2011
Table of Contents (continued)
Organization .............................................................................................................................................. 388
Performance Management ....................................................................................................................... 391
Residential Bill Changes ........................................................................................................................... 392
FEU Customer Services ........................................................................................................................... 394
Human Services Programs ................................................................................................................. 395
Regulatory Complaint Handling Process ......................................................................................... 396
Customer Support ..................................................................................................................................... 398
Non-Regulatory Complaint Handling Process ................................................................................ 398
Customer Contact Centers ...................................................................................................................... 399
Meter Reading............................................................................................................................................ 402
Credit and Collections .............................................................................................................................. 403
Meter Replacement Program ................................................................................................................... 404
IDER Direct Load Control Program ..................................................................................................... 405
Economic Development .......................................................................................................................... 406
B. Findings & Conclusions ........................................................................................................................... 407
Customer Satisfaction ............................................................................................................................... 408
Contact Center and Field Service ........................................................................................................... 411
Revenue Operations ................................................................................................................................. 419
Economic Development .......................................................................................................................... 430
C. Recommendations ..................................................................................................................................... 430
XI. CLEAN ENERGY ................................................................................................................ 433
A. Background ................................................................................................................................................ 433
Program Funding ...................................................................................................................................... 434
Utility Managed and Administered Programs ....................................................................................... 435
New Jersey Comfort Partners Program ........................................................................................... 435
CleanPower Choice Program ............................................................................................................. 436
B. Findings & Conclusions ........................................................................................................................... 437
C. Recommendations ..................................................................................................................................... 439

vi Final Report
6/20/2011
Table of Contents (continued)
XII. SUPPORT SERVICES ........................................................................................................ 441
A. Risk Management ....................................................................................................................................... 441
Background & Perspective ....................................................................................................................... 441
Enterprise Risk Management – Integrated Framework.................................................................. 441
Organization and Staffing ................................................................................................................... 442
Corporate Risk ...................................................................................................................................... 444
Insurance ............................................................................................................................................... 445
Findings & Conclusions ............................................................................................................................ 448
Recommendations ..................................................................................................................................... 449
B. Legal Services .............................................................................................................................................. 451
Background & Perspective ....................................................................................................................... 451
Organization and Staffing ................................................................................................................... 451
Operating Expenses ............................................................................................................................. 459
Findings & Conclusions ............................................................................................................................ 462
Law ......................................................................................................................................................... 462
Claims ..................................................................................................................................................... 465
Recommendations ..................................................................................................................................... 467
C. Facilities and Property Management ....................................................................................................... 469
Background and Perspective .................................................................................................................... 469
Organization and Staffing ................................................................................................................... 469
Budgeted and Actual expenses ........................................................................................................... 471
Major JCP&L facilities, changes, and reporting. .............................................................................. 472
Maintenance and Repair ...................................................................................................................... 473
Findings and Conclusions......................................................................................................................... 474
Recommendations ..................................................................................................................................... 475
D. Supply Chain .............................................................................................................................................. 476
Background & Perspective ....................................................................................................................... 476
FE Supply Chain .................................................................................................................................. 476
JCP&L Stores ........................................................................................................................................ 480

Final Report vii
6/20/2011
Table of Contents (continued)
Findings & Conclusions ........................................................................................................................... 480
Recommendations .................................................................................................................................... 484
E. Fleet Management ..................................................................................................................................... 487
Background & Perspective ...................................................................................................................... 487
Findings & Conclusions ........................................................................................................................... 493
Recommendations .................................................................................................................................... 501
F. Information Technology........................................................................................................................... 503
Background & Perspective ...................................................................................................................... 503
Mission, Goals, and Objectives ......................................................................................................... 503
Organization and Staffing .................................................................................................................. 504
Other Processes and Systems ............................................................................................................ 512
Staffing Levels ...................................................................................................................................... 515
IT Configuration .................................................................................................................................. 515
Operating Expenses and Capital Expenditures .............................................................................. 515
Findings & Conclusions ........................................................................................................................... 518
Recommendations .................................................................................................................................... 529
G. Records Management ............................................................................................................................... 532
Background & Perspective ...................................................................................................................... 532
Organization and Staffing .................................................................................................................. 532
Other Major Processes and Systems ................................................................................................. 537
Findings & Conclusions ........................................................................................................................... 538
Recommendations .................................................................................................................................... 539

viii Final Report
6/20/2011
Table of Exhibits
VII. EXECUTIVE MANAGEMENT AND CORPORATE GOVERNANCE ........................ 123
Exhibit VII-1 FirstEnergy Organization as of June 30, 2010 ...................................................... 124
Exhibit VII-2 FirstEnergy Utilities Organization as of June 30, 2010 ...................................... 125
Exhibit VII-3 Jersey Central Power & Light Organization as of June 30, 2010 ...................... 126
Exhibit VII-4 JCP&L Human Resources Organization as of July 31, 2010.............................. 145
Exhibit VII-5 FirstEnergy Human Resources Organization as of July 31, 2010 ...................... 147
Exhibit VII-6 Average Annual Training Spending (Actual) Per Employee 2005 to 2009 ..... 152
Exhibit VII-7 OSHA Incident Rate 2005 to 2010 ........................................................................ 161
Exhibit VII-8 FirstEnergy OSHA Incident Rate Compared to EEI Benchmarks 2005 to 2009 ............................................................................................................... 161
Exhibit VII-9 Lost-Time Rate 2005 to 2010 .................................................................................. 162
Exhibit VII-10 FirstEnergy Lost-Time Rate Compared to EEI Benchmarks 2005 to 2009 .... 162
Exhibit VII-11 DART Rate 2005 to 2010 ........................................................................................ 163
Exhibit VII-12 FirstEnergy DART Rate Compared to EEI Benchmarks 2005 to 2009 .......... 163
Exhibit VII-13 Motor Vehicle Incident Rate 2005 to 2010 ........................................................... 164
Exhibit VII-14 Diversity Composition of JCP&L Employees by EEO Category as of September 5, 2009 ..................................................................................................... 166
Exhibit VII-15 Workforce Utilization as of July 1, 2009 ................................................................ 168
Exhibit VII-16 Female and Minority Representation 2005 to 2009 ............................................. 169
Exhibit VII-17 External Employment Complaints and Court Filings 2005 to 2009 ................. 171
Exhibit VII-18 JCP&L Safety Statistics Compared to FE 2005 to 2009 ..................................... 174
Exhibit VII-19 Minority and Female Results for PSI 2006 to 2010 ............................................. 177
Exhibit VII-20 IBEW SCU-3 Grievances 2005 to 2009 ................................................................ 179
Exhibit VII-21 External Relations Organization as of June 30, 2010 .......................................... 185
VIII. FINANCE AND ACCOUNTING .................................................................................... 193
Exhibit VIII-1 Finance Organizations as of June 30, 2010 ........................................................... 194
Exhibit VIII-2 JCP&L Long-Term Debt & Equity 2005 to 2009 ................................................ 195
Exhibit VIII-3 JCP&L Credit Ratings 2005 to 2009 ...................................................................... 197
Exhibit VIII-4 Equivalent Credit Ratings 2005 to 2009 ................................................................ 197
Exhibit VIII-5 Peer Comparison Average of Three Years 2007 to 2009 .................................... 199
Exhibit VIII-6 Nuclear Decommissioning Trusts as of December 31, 2009 ............................. 202
Exhibit VIII-7 NDT Eligible Investments as of December 31, 2009 ......................................... 204

Final Report ix
6/20/2011
Table of Exhibits (continued)
Exhibit VIII-8 Pension and OPEB Investments as of December 31, 2009 .............................. 206
Exhibit VIII-9 Cash Management Organizations as of June 30, 2010 ....................................... 211
Exhibit VIII-10 Cash Management Flow Diagram as of June 30, 2010 ....................................... 213
Exhibit VIII-11 Payment Approval Levels as of December 31, 2009 .......................................... 214
Exhibit VIII-12 Cash and Cash Equivalents 2005 to 2009 ............................................................. 215
Exhibit VIII-13 Utility Money Pool Monthly Balances Outstanding January 31, 2008 to June 30, 2010 .............................................................................................. 218
Exhibit VIII-14 Financial Performance Measurements 2005 to 2009 .......................................... 219
Exhibit VIII-15 Net Write-Offs of Customer Accounts (Thousands of Dollars) 2005 to 2009 .............................................................................................................. 220
Exhibit VIII-16 Weighted Average Cost of Capital 2005 to 2009 ................................................. 221
Exhibit VIII-17 Long-Term Debt and Equity Percentages 2005 to 2009 .................................... 221
Exhibit VIII-18 Finance Organizations as of June 30, 2010 .......................................................... 227
Exhibit VIII-19 FE Invoice Processing Statistics as of June 30, 2010 .......................................... 230
Exhibit VIII-21 Typical Budget Schedule as of June 30, 2010 ....................................................... 237
Exhibit VIII-22 Budget and Forecast Process as of June 30, 2010 ............................................... 238
Exhibit VIII-23 JCP&L O&M Budget Variances 2005 to 2009 ($ Millions) ............................... 240
Exhibit VIII-24 Governing Approval Amounts as of June 30, 2010 ............................................ 241
Exhibit VIII-25 JCP&L Capital Expenditures’ Budget Variance 2005 to 2009 ($ Million) ....... 242
Exhibit VIII-26 Asset Values Not Unitized as of December 31, 2009 ......................................... 245
Exhibit VIII-27 Internal Audit Professional Certifications as of December 31, 2009 ............... 248
Exhibit VIII-28 Audit Reports Issued 2005 to 2009 ....................................................................... 251
Exhibit VIII-29 Performance Metrics Summary 2009 .................................................................... 252
IX. ELECTRIC OPERATIONS ................................................................................................. 259
Exhibit IX-1 Jersey Central Power & Light New Jersey Service Territories as of July 2010 ............................................................................................................... 260
Exhibit IX-2 Typical Electric Supply System 2010 ..................................................................... 261
Exhibit IX-3 Typical Transmission Structures 2010................................................................... 261
Exhibit IX-4 Energy Flow Through a Typical Substation 2010 ............................................... 262
Exhibit IX-5 Major Components of a Typical Substation 2010 ............................................... 262
Exhibit IX-6 Typical Distribution Equipment 2010................................................................... 263

x Final Report
6/20/2011
Table of Exhibits (continued)
Exhibit IX-7 Jersey Central Power & Light T&D Organization as of June 30, 2010 ........... 264
Exhibit IX-8 Jersey Central Power & Light Engineering, Transmission, Distribution, and Claims Organization as of June 30, 2010 ....................................................... 265
Exhibit IX-9 Jersey Central Power & Light RDO and Substation Organization as of June 30, 2010 ......................................................................................................... 266
Exhibit IX-10 Jersey Central Power & Light Fleet, Stores, Facilities, Meter Services, and Forestry Organization as of June 30, 2010 ............................................................ 267
Exhibit IX-11 FirstEnergy Utilities’ T&D Organization as of June 30, 2010 ........................... 268
Exhibit IX-12 FirstEnergy Utilities’ Operations Organization as of June 30, 2010 ................. 269
Exhibit IX-13 FirstEnergy Utilities’ Support Organization as of June 30, 2010 ....................... 270
Exhibit IX-14 2010 FE Utilities’ KPI Goals January, 2010.......................................................... 273
Exhibit IX-15 Table of Contents from the 2009 JCP&L Annual System Performance Report June 2010 ....................................................................................................... 274
Exhibit IX-16 Example JCP&L Monthly Performance Report May 2010 ................................ 275
Exhibit IX-17 Information Technology Applications Used For Asset Management Activities July 2010 .................................................................................................... 279
Exhibit IX-18 Information Technology Applications Used For Asset Management Activities July 2010 .................................................................................................... 280
Exhibit IX-19 JCP&L Storm Categories July 2010 ........................................................................ 285
Exhibit IX-20 Major Storm Activity 2005 to 2009 as of December 31, 2009 ........................... 286
Exhibit IX-21 Operations and Maintenance Support Applications July 2010 .......................... 288
Exhibit IX-22 Operations and Maintenance Support Applications July 2010 .......................... 289
Exhibit IX-23 Operations and Maintenance Support Applications July 2010 .......................... 290
Exhibit IX-24 JCP&L Service Territory Statistics 2005 to 2009.................................................. 291
Exhibit IX-25 Capital Program Support Applications July 2010 ................................................. 295
Exhibit IX-26 Capital Program Support Applications July 2010 ................................................. 296
Exhibit IX-27 Capital Program Support Applications July 2010 ................................................. 297
Exhibit IX-28 Capital Program Support Applications July 2010 ................................................. 298
Exhibit IX-29 Generic Work Management System 2010 ............................................................. 299
Exhibit IX-30 JCP&L Work Management System 2010 .............................................................. 300
Exhibit IX-31 Jersey Central Power & Light T&D Staffing Trends 2005 to 2009 ................... 301
Exhibit IX-32 Jersey Central Power & Light SAIFI 2005 to 2009 .............................................. 302

Final Report xi
6/20/2011
Table of Exhibits (continued)
Exhibit IX-33 JCP&L Distribution, Substation, Sub-Transmission, and Transmission SAIFI 2005 to 2009 .................................................................................................. 303
Exhibit IX-34 JCP&L Power Quality (PQ) Complaints 2005 to 2009 ...................................... 303
Exhibit IX-35 Jersey Central Power & Light Neutral-to-Earth/Stray-Voltage Complaints 2005 to 2009 ........................................................................................ 304
Exhibit IX-36 JCP&L Adaptive Relaying 2005 to 2009 ............................................................... 304
Exhibit IX-37 Jersey Central Power & Light CAIDI and SAIDI 2005 to 2009 ...................... 305
Exhibit IX-38 Customers Experiencing Interruptions 2005 to 2009 ......................................... 306
Exhibit IX-39 Percent of Customers Experiencing Multiple Interruptions 2005 to 2009 ..... 307
Exhibit IX-40 Jersey Central Power & Light Transmission Outage Frequency (TOF) 2008 to 2009 .............................................................................................................. 308
Exhibit IX-41 JCP&L Estimated Time of Restoration (ETR) 2007 to 2009............................ 308
Exhibit IX-42 JCP&L Outage Causes 2005 to 2009 .................................................................... 309
Exhibit IX-43 Distribution Miles Trimmed Earlier and Later Than Four-Year Cycle 2009 .. 310
Exhibit IX-44 JCP&L Customer Hours of Outages by Equipment Causes 2009 ................... 311
Exhibit IX-45 Energy Losses Unaccounted For 2005 to 2009 ................................................... 312
Exhibit IX-46 Transmission Expense per Mile of Transmission 2005 to 2009 ....................... 313
Exhibit IX-47 Distribution Expense per Circuit Mile of Distribution 2005 to 2009 .............. 314
Exhibit IX-48 Net Utility Plant in Service per Customer 2005 to 2009 .................................... 315
Exhibit IX-49 Gross Additions to Utility Plant (Less Nuclear Fuel) 2005 to 2009 ................. 316
Exhibit IX-50 JCP&L T&D Capital Expenditures 2005 to 2009 ............................................... 317
Exhibit IX-51 Jersey Central Power & Light Capital Program 2007 to 2010 ........................... 318
Exhibit IX-52 JCP&L T&D Operations and Maintenance Expenses 2005 to 2009 ............... 319
Exhibit IX-53 Actual Variance from Estimated Project Costs 2007 to 2009 ........................... 320
Exhibit IX-54 Deviation of Actual from Scheduled Project Completion Dates 2007 to 2009 .............................................................................................................. 321
Exhibit IX-55 JCP&L 2010 Transmission Vegetation Management Award Evaluation as of December 31, 2010 ......................................................................................... 323
Exhibit IX-56 Example JCP&L Schedule Adherence Report 2010 ........................................... 326
Exhibit IX-57 JCP&L Distribution Circuit and Pole Inspections 2005 to 2009 ...................... 328
Exhibit IX-58 JCP&L Transmission Aerial and Ground-Line Inspections 2005 to 2009 ...... 329
Exhibit IX-59 JCP&L Substation Inspections 2005 to 2009 ....................................................... 330

xii Final Report
6/20/2011
Table of Exhibits (continued)
Exhibit IX-60 JCP&L High-Priority Repeating Circuits 2005 to 2009 ....................................... 331
Exhibit IX-61 JCP&L Staffing Trends 2005–2009 ........................................................................ 334
Exhibit IX-62 Jersey Central Power & Light T&D Applications July 2010 .............................. 335
Exhibit IX-63 JCP&L Radio Upgrade Initiative 2010 ................................................................... 336
Exhibit IX-64 Work Management Initiative Scope 2010 .............................................................. 336
Exhibit IX-65 Applications Integration Diagram for the Work Management Initiative 2010 ............................................................................................................ 337
Exhibit IX-66 Projected JCP&L Payback Period for the Work Management Initiative 2010 ............................................................................................................ 337
Exhibit IX-67 Distribution Circuit Design Criteria ....................................................................... 342
Exhibit IX-68 Circuit Diagram Legend ........................................................................................... 343
Exhibit IX-69 13 kV Distribution Circuit ....................................................................................... 344
Exhibit IX-70 34 kV Distribution Circuit ....................................................................................... 344
Exhibit IX-71 BPU Proposed Rules Governing Smart Growth Policy 2004 ............................ 346
Exhibit IX-72 BPU-Adopted Rules Governing Smart Growth Policy 2004 ............................. 347
Exhibit IX-73 BPU Secretary's Letter Addressing Court Case Concerning Growth Policy as of March 24, 2010 ................................................................................................. 348
Exhibit IX-74 JCP&L Employees Responsible for Application of the Smart Growth Rules as of July 2010 ............................................................................................................ 349
Exhibit IX-75 Jersey Central Power & Light Work Management Process July 2010 ............... 350
Exhibit IX-76 CREWS Smart Growth Requirements July 2010 ................................................. 351
Exhibit IX-77 CREWS Smart Growth Determination as of July 2010 ...................................... 352
Exhibit IX-78 CREWS’ Smart Growth Billing for Designated Growth Areas as of July 2010 ................................................................................................................ 353
Exhibit IX-79 CREWS Smart Growth Billing for Designated Non-Growth Areas as of July 2010 ................................................................................................................ 354
Exhibit IX-80 CREWSDOC Smart Growth Contract Creation Procedures as of July 2010 ................................................................................................................ 355
Exhibit IX-81 CREWS Smart Growth Charge Category July 2010 ............................................ 356
Exhibit IX-82 State of New Jersey Economic Indicators 2003 to 2009..................................... 358
Exhibit IX-83 Monthly CIAC + DEP Dollars Collected for New Extensions January 2004 to March 2010 .................................................................................................. 359

Final Report xiii
6/20/2011
Table of Exhibits (continued)
Exhibit IX-84 Annual CIAC + DEP Dollars Collected for Non-Growth and Growth New Extension Jobs January 2004 to March 2010 ............................................. 360
Exhibit IX-85 Annual Refundable Deposit Dollars Collected for New Extensions 2004 to 2009 .............................................................................................................. 361
Exhibit IX-86 Job Scope for New Extension Jobs 2003 to 2009 ............................................... 362
Exhibit IX-87 Monthly CIAC + DEP Dollars Collected for JCP&L Upgrade Jobs January 2004 to March 2010 ................................................................................................. 363
Exhibit IX-88 DEP as Percent of DEP + CIAC for Upgrade Jobs in Non-Growth and Growth Areas 2005 to 2009 ................................................................................... 364
Exhibit IX-89 Upgrade Job Scope for Growth and Non-Growth Areas 2005 to 2009 ......... 365
Exhibit IX-90 Table of Contents from BPU One-Call Damage Prevention System as of July 2010 ............................................................................................................... 367
Exhibit IX-91 JCP&L Underground Locates Organization as of July 2010 ............................. 368
Exhibit IX-92 JCP&L Underground Locates Process as of July 2010 ...................................... 369
Exhibit IX-93 General Conditions Section from JCP&L Specifications for Contract Locating as of December 31, 2008 ........................................................................ 370
Exhibit IX-94 JCP&L Underground Locates Activity January 2005 to April 2010 ................. 371
Exhibit IX-95 Jersey Central Power & Light Contract Cost per Underground Locate Ticket 2005 to 2009 .................................................................................................. 372
Exhibit IX-96 Jersey Central Power and Light Avoided Cost of Screened Locate Ticket 2005 to 2009 .............................................................................................................. 373
Exhibit IX-97 Example Daily Performance Metrics Used for JCP&L Locates Contractor as of July 2010 ........................................................................................................... 373
Exhibit IX-98 Monthly Performance Metrics Used for JCP&L Locates Contractor as of October 2010 ............................................................................................................ 374
Exhibit IX-99 Percent of Total Locates Completed on Time January 2009 – April 2010 ..... 375
Exhibit IX-100 Jersey Central Power and Light Dig-in Claims 2004 to 2008 ............................ 376
Exhibit IX-101 Header from 2006 Audit of JCP&L Locates Contractor as of July 2010 ........ 377
Exhibit IX-102 Deliverables from FirstEnergy Team Formed to Develop Field Coordinator Reference Guide as of July 2010 ..................................................... 378
Exhibit IX-103 Organizations Responsible for Monitoring of JCP&L Contractor Performance as of July 2010 ................................................................................... 379
Exhibit IX-104 Criteria Used to Determine Whether Project Performed In-House or Via Contract as of July 2010 .......................................................................................... 380

xiv Final Report
6/20/2011
Table of Exhibits (continued)
Exhibit IX-105 Table of Contents from FirstEnergy Field Coordinator Reference Guide as of July 2010 ............................................................................................................ 381
Exhibit IX-106 Summary of Roles and Responsibilities of JCP&L / FE Field Coordinators as of July 2010........................................................................................................... 381
Exhibit IX-107 Application of Field Coordinator Methods to In-House Projects as of July 2010 ................................................................................................................ 382
Exhibit IX-108 Distribution, Transmission and Substation Contract Labor March, 2005 to December, 2009 ........................................................................................................ 382
Exhibit IX-109 Overview of JCP&L Project Monitoring as of July 2010 .................................... 383
Exhibit IX-110 Portion of Typical "Earned Value" Schedule as of July 2010............................. 384
Exhibit IX-111 Portion of Typical Primavera Schedule as of July 2010 ...................................... 384
Exhibit IX-112 Select Extract from Contractor Evaluation Form July 2010 .............................. 385
Exhibit IX-113 Rating Criteria Used for Contractor Evaluation Form as of July 2010 ............. 386
X. CUSTOMER SERVICE ......................................................................................................... 387
Exhibit X-1 Customer Numbers 2005 to 2009 .......................................................................... 387
Exhibit X-2 Sales by Volume by Customer Class 2005 to 2009 .............................................. 388
Exhibit X-3 Customer Service & Energy Efficiency Organization as of June 30, 2010 ...... 389
Exhibit X-4 JCP&L Recent Customer Service Organizational Changes August 29, 2010 .. 390
Exhibit X-5 JCP&L Customer Service Organization as of August 30, 2010 ......................... 390
Exhibit X-6 Sample CustomerFirst Scorecard as of April 30, 2010 ....................................... 391
Exhibit X-7 Typical Residential Service (RS Rate) Summer Bill Changes Non-Shopper at 952 kWh per Month 2005 to 2009 ..................................................................... 392
Exhibit X-8 Typical Residential Service (RS Rate) Summer Bill Changes RS Summary 2005 to 2009 ............................................................................................................... 394
Exhibit X-9 Low-Income Assistance Program and Participation Rates 2005 to 2009 ......... 396
Exhibit X-10 Formal BPU Complaint Trends 2005 to 2009 ...................................................... 398
Exhibit X-11 Inbound and Outbound Call Volume 2005 to 2009 ............................................ 399
Exhibit X-12 Staffing – Contact Center/CSR Turnover Rates 2005 to 2009 .......................... 400
Exhibit X-13 Meter Replacement 2005 to 2009 ........................................................................... 405
Exhibit X-14 Economic Development 2005 to 2009 .................................................................. 407
Exhibit X-15 Customer Service Costs per Customer 2005 to 2009 .......................................... 408

Final Report xv
6/20/2011
Table of Exhibits (continued)
Exhibit X-16 J.D. Power and Associates 2009 Electric Utility Residential Customer Satisfaction StudySM Customer Satisfaction Index Ranking – East Region: Large Segment ........................................................................................................... 409
Exhibit X-17 Complaints 2005 to 2009 ........................................................................................ 410
Exhibit X-18 Billing Disputes 2005 to 2009 ................................................................................. 411
Exhibit X-19 New Jersey Regulatory Customer Service Standards Reported 2005 to 2009 . 412
Exhibit X-20 Call Trends by Operating Company – ASA 2005 to 2009 ................................. 413
Exhibit X-21 Call Trends by Operating Company – AHT 2005 to 2009 ................................ 414
Exhibit X-22 Percent Calls Answered Trend 2005 to 2009 ....................................................... 415
Exhibit X-23 Call Volume/Self-Service Trends 2005 to 2009 .................................................. 416
Exhibit X-24 Service Call Trends 2005 to 2009........................................................................... 417
Exhibit X-25 Customer First Field Service Tracking Report – Overall Issue Resolution 2005 to 2009 .......................................................................................... 418
Exhibit X-26 2009 Monthly Service Calls Completed as of December 31, 2009 ................... 418
Exhibit X-27 Average Response Time by Service Request in Days & Total Requests 2005 to 2009 .............................................................................................................. 419
Exhibit X-28 Meters Not Read 2005 to 2009 .............................................................................. 420
Exhibit X-29 Meter-Reading Error Rate 2005 to 2009............................................................... 421
Exhibit X-30 Billing Exception Rates Trend 2005 to 2009 ....................................................... 422
Exhibit X-31 Theft of Service 2005 to 2009 ................................................................................ 423
Exhibit X-32 Mail vs. Electronic Volumes History 2005 to 2015 as of April 2010 ............... 424
Exhibit X-33 Net Write-Offs 2005 to 2009 ................................................................................. 425
Exhibit X-34 Accounts Receivable Aging 2005 to 2009 ............................................................ 426
Exhibit X-35 Customers in Arrears 2005 to 2009 ....................................................................... 427
Exhibit X-36 Customers Terminated for Non-Payment 2005 to 2009 .................................... 428
Exhibit X-37 Collection Agencies – Collected Year-to-Date 2006 to 2009 ............................ 429
Exhibit X-38 Customer Service Performance Levels Achieved Previously as of December 31, 2009 .................................................................................................. 430
XI. CLEAN ENERGY ................................................................................................................ 433
Exhibit XI-1 Comfort Partners Program Spending Levels as of April 21, 2010 .................... 438
Exhibit XI-2 Comfort Partners Program Spending Levels as of August 18, 2010 ................ 438

xvi Final Report
6/20/2011
Table of Exhibits (continued)
Exhibit XI-3 Comfort Partners Program Spending Levels Compared to Original as of December 31, 2010 ................................................................................................... 439
XII. SUPPORT SERVICES ........................................................................................................ 441
Exhibit XII-1 Risk Management and Claims Organization ......................................................... 443
Exhibit XII-2 Risk Management Expenses – Five Year............................................................... 444
Exhibit XII-3 Insurance Premium Expenses 2005 to 2009 ......................................................... 445
Exhibit XII-4 Total Claims for JCP&L 2005 to 2009 ................................................................... 447
Exhibit XII-5 JCP&L Claims against Other Parties 2005 to 2009.............................................. 447
Exhibit XII-6 SERVECO Legal Organization as of June 30, 2010 ............................................ 451
Exhibit XII-7 Use of External Counsel Firms by JCP&L as of June 30, 2010 ......................... 453
Exhibit XII-8 JCP&L Legal Cases 2005 to 2010 (Through July 6, 2010) .................................. 458
Exhibit XII-9 JCP&L Receivable Claims 2005 to 2010 (Through July 6, 2010)....................... 459
Exhibit XII-10 JCP&L Legal Expenses 2005 to 2009 .................................................................... 460
Exhibit XII-11 JCP&L Off-Budget Legal Expenses 2005 to 2009 .............................................. 461
Exhibit XII-12 2009 Legal Client Satisfaction Survey .................................................................... 463
Exhibit XII-13 2009 Outside Legal Firm Survey ............................................................................. 464
Exhibit XII-14 Real Estate and Facilities Organization 2006 to 2010 as of December 31, 2010 ................................................................................................... 470
Exhibit XII-15 JCP&L Facilities/Property Management Capital & O & M Expenses 2005 to 2009 ............................................................................................................... 471
Exhibit XII-16 Facility Inventory (Owned and Leased) as of December 31, 2009 .................... 472
Exhibit XII-17 Supply Chain as of July 8, 2010 ............................................................................... 476
Exhibit XII-18 Procurement Authority Limits as of December 31, 2010 ................................... 479
Exhibit XII-19 Support Services as of July 8, 2010 ......................................................................... 480
Exhibit XII-20 JCP&L Inventory Metrics 2005 to 2009 ................................................................ 482
Exhibit XII-21 Supply Chain Utility Support Staffing 2005 to 2009 ............................................ 483
Exhibit XII-22 FEU Fleet Services as of December 31, 2009 ...................................................... 488
Exhibit XII-23 Operations Support Services as of December 31, 2009 ...................................... 489
Exhibit XII-24 JCP&L Fleet Services Employees by Classification 2005 to 2009 ..................... 490
Exhibit XII-25 JCP&L Fleet Trends by Asset Class 2005 to 2009 ............................................... 490
Exhibit XII-26 FEU Asset Class Definitions as of December 31, 2009 ...................................... 491

Final Report xvii
6/20/2011
Table of Exhibits (continued)
Exhibit XII-27 Fleet Services O&M costs 2005 to 2009 ............................................................... 492
Exhibit XII-28 FEU Fleet Availability as of December 31, 2009 ................................................ 493
Exhibit XII-29 JCP&L Fleet Costs per Unit and per MRF 2005 to 2009 ................................. 494
Exhibit XII-30 Fleet Services Cost Component Trends 2005 to 2009 ....................................... 495
Exhibit XII-31 FE Vehicle Replacement Criteria as of December 31, 2009 .............................. 496
Exhibit XII-32 Average & Quantity as of July 2010 ...................................................................... 498
Exhibit XII-33 Vehicles with Fifty or Fewer Miles of Use as of December 31, 2009 .............. 499
Exhibit XII-34 Hours and Dollars Charged to Vehicle Breakdown in CREWS 2005 to 2009 .............................................................................................................. 500
Exhibit XII-35 VP Shared Services Administration & CIO Organization as of June 30, 2010 ............................................................................................................. 504
Exhibit XII-36 JCP&L Regional Field Operations Organization as of June 30, 2010 .............. 505
Exhibit XII-37 Energy Delivery & Financial Systems (Business Systems) Organization as of June 30, 2010 ................................................................................................... 508
Exhibit XII-39 JCP&L BCP Tests 2009 to 2010 ............................................................................ 512
Exhibit XII-40 IT Staffing Levels by Year 2005 to 2010 .............................................................. 515
Exhibit XII-41 IT Operating Expenses by Year 2005 to 2010 ..................................................... 516
Exhibit XII-42 IT Capital Expenditures by Year 2005 to 2010 ................................................... 517
Exhibit XII-43 % of IT Time by Type of Activity July 2009 to December 2009...................... 520
Exhibit XII-44 Key High-Level IT Performance Metrics 2005 to 2009 ..................................... 523
Exhibit XII-45 SERVECO Records & Information Compliance Department as of June 30, 2010 ............................................................................................................. 532
Exhibit XII-46 Percentage of FE and JCP&L Organizational Units Using Records Management Program as of June 30, 2010 ........................................................... 538

xviii Final Report
6/20/2011
Table of Findings
VII. EXECUTIVE MANAGEMENT AND CORPORATE GOVERNANCE ........................ 123
Finding VII-1 In general, the FE/JCP&L organization adequately supports ratepayer and corporate objectives, although there is no formal organizational review and evaluation process. .................................................................................................... 128
Finding VII-2 Administrative controls and procedures are adequate, and procedures are periodically reviewed and improved, if and as necessary. ................................... 128
Finding VII-3 The review, selection, and composition of the FirstEnergy and JCP&L Board of Directors are appropriate, although some policies should be updated. ................................................................................................................. 135
Finding VII-4 FirstEnergy has developed a thorough and substantive Code of Ethics. This code could be further communicated to vendors and contractors to assure understanding and alignment. ...................................................................... 137
Finding VII-5 Board compensation is proper and committees are appropriately structured, although committee rotation should be further investigated.............................. 139
Finding VII-6 The Audit Committee and Corporate Governance Committee properly perform their oversight roles for FirstEnergy and Jersey Central Power & Light, although the responsibility for oversight of risk management could be further clarified. ......................................................................................................... 140
Finding VII-7 The relationship between the Board of Directors and Internal Auditing is appropriate, although reporting relationships should be further clarified. ....... 140
Finding VII-8 The Board exerts proper control over external auditors; however, FirstEnergy has no plans to rebid outside audit services. ................................... 141
Finding VII-9 FirstEnergy and Jersey Central Power & Light have adequately complied with Sarbanes-Oxley/NYSE requirements and have established good internal controls, although outside counsel is not required to report wrongdoing up to the Board of Directors. ............................................................ 141
Finding VII-10 SERVECO and JCP&L’s HR roles are appropriately defined and serve the needs to JCP&L. ........................................................................................................ 172
Finding VII-11 JCP&L has a highly effective workforce planning process for replacing workers in key job categories. .................................................................................. 172
Finding VII-12 JCP&L workforce planning does not sufficiently address changes in work and workforce requirements in the future. ............................................................ 173
Finding VII-13 JCP&L’s employee and executive compensation is within acceptable market ranges. ............................................................................................................ 173
Finding VII-14 JCP&L’s employee benefits are comparable to benchmark utilities. ................. 174
Finding VII-15 JCP&L’s safety performance is below that of FE as a whole. ............................ 174

Final Report xix
6/20/2011
Table of Findings (continued)
Finding VII-16 JCP&L had an employee fatality in 2009. ............................................................. 174
Finding VII-17 In most job categories, JCP&L’s workforce composition reflects the diversity of the New Jersey labor pool. ................................................................. 176
Finding VII-18 JCP&L has implemented an effective program for attracting and training young people for linemen and substation positions. ........................................... 176
Finding VII-19 JCP&L appears to place appropriate emphasis on hiring and promoting minorities, but it could do more to attract women. ............................................ 177
Finding VII-20 JCP&L’s affirmative action plan provides only a limited narrative describing JCP&L’s actions and plans for hiring and promoting women and minorities............................................................................................................ 178
Finding VII-21 The number of Union grievances increased significantly in 2008 and 2009. .. 179
Finding VII-22 JCP&L is improving labor relations. ..................................................................... 179
Finding VII-23 FE/JCP&L has a robust, substantive strategic planning process. .................... 183
Finding VII-24 External relations functions are adequately staffed with capable personnel, but there is no external relations strategy that incorporates and integrates all external relations functions. .................................................................................... 189
Finding VII-25 Public programs are well thought-out but could be expanded. ......................... 189
Finding VII-26 Interfaces with government and regulatory agencies are appropriate, although in some cases, reporting could be more robust. .................................. 190
VIII. FINANCE AND ACCOUNTING .................................................................................... 193
Finding VIII-1 JCP&L’s credit standing and financial performance have not been adversely affected by the financing and debt management practices of FirstEnergy and its affiliates. ........................................................................................................ 207
Finding VIII-2 Credit rating provisions in BGS contracts could impact JCP&L’s liquidity if JCP&L’s ratings were to go below investment grade. ......................................... 207
Finding VIII-3 The tax methodology applied to JCP&L is reasonable, and tax considerations have not played an inappropriate role in JCP&L’s investment decisions. .................................................................................................................... 208
Finding VIII-4 JCP&L’s pension plan is funded appropriately. ................................................... 208
Finding VIII-5 Cash management methodologies are efficient and adequately safeguard JCP&L’s assets. ......................................................................................................... 222
Finding VIII-6 FirstEnergy’s centralized money pool arrangement provides JCP&L with an effective method of managing cash resources on a short-term basis. ......... 222

xx Final Report
6/20/2011
Table of Findings (continued)
Finding VIII-7 Approval for JCP&L’s participation in the Utility Money Pool expires at the end of 2011................................................................................................................. 222
Finding VIII-8 Cash disbursements are managed in an efficient, cost-effective manner. ......... 222
Finding VIII-9 JCP&L’s financial performance measurements reflect a general improvement in financial condition. ...................................................................... 223
Finding VIII-10 Write-offs did not have a material adverse effect on JCP&L. ............................ 223
Finding VIII-11 JCP&L’s increased cost of capital over the past five years has not negatively affected its financial condition. ............................................................. 223
Finding VIII-12 The accounts payable function is effective and efficient..................................... 253
Finding VIII-13 The process for receiving and securing accounts receivable operates in a safe and efficient manner. ........................................................................................ 253
Finding VIII-14 The payroll function is sufficiently independent and accountable, and payroll processing is achieved effectively and efficiently. ................................... 253
Finding VIII-15 The operating budget process is efficient and effective. ..................................... 253
Finding VIII-16 JCP&L and FirstEnergy Utilities use a different system than the rest of the organization to develop their capital budgets. ................................................ 254
Finding VIII-17 JCP&L’s work order procedures, corporate accounting manual, and property records are maintained in accordance with generally accepted accounting practices. ................................................................................................. 254
Finding VIII-18 JCP&L’s assets are not unitized in a timely manner. ........................................... 255
Finding VIII-19 The Internal Audit function is not independent from FE’s Finance organization. ............................................................................................................... 255
Finding VIII-20 There is adequate planning and coverage of audit activities based on risk management assessment techniques. ...................................................................... 256
Finding VIII-21 The Internal Audit resources appear adequate for the tasks covered. .............. 256
Finding VIII-22 FE’s fraud training program has not been offered to JCP&L employees. ....... 256
IX. ELECTRIC OPERATIONS ................................................................................................ 259
Finding IX-1 There is a generally positive trend in the System Average Interruption Frequency Index (SAIFI) reliability metric, and power quality complaints have decreased. .......................................................................................................... 302
Finding IX-2 There has been a generally positive trend in the Customer Average Interruption Duration Index (CAIDI) and SAIDI reliability metrics except for upticks in 2009. ................................................................................................... 305

Final Report xxi
6/20/2011
Table of Findings (continued)
Finding IX-3 JCP&L has made progress in reducing the number of customers experiencing multiple interruptions but does not include this important measurement in its monthly performance report. ............................................... 306
Finding IX-4 JCP&L transmission reliability, as measured by transmission outage frequency, deteriorated from 2008 to 2009 overall but particularly on the 230, 345, and 500 kV circuits................................................................................. 307
Finding IX-5 The accuracy of the estimated time of restoration given to customers reporting an outage has improved from 53.5% in 2007 to 94.4% in 2009. ..... 308
Finding IX-6 Tree incidents are the largest cause of outages and this outage category had a large increase in 2009, possibly due to the deferral of trimming on circuits following inspection to the next standard four-year cycle. ................... 309
Finding IX-7 JCP&L has deferred distribution vegetation management where based on inspection, circuit conditions permitted trimming to be deferred. ................... 310
Finding IX-8 JCP&L is experimenting with a new approach to distribution vegetation management, with a large shift from O&M to capital spending. ...................... 310
Finding IX-9 Overhead primary conductor is the leading equipment cause of customer outages. ..................................................................................................... 311
Finding IX-10 JCP&L has reduced its unaccounted-for energy losses from 2005 to 2009. ... 312
Finding IX-11 Transmission O&M expense per mile of transmission steadily decreased from 2005 to 2009. ................................................................................................... 312
Finding IX-12 Distribution O&M expense per mile of distribution increased from 2005 to 2007 but then decreased in 2009 to a level below 2005. .................................... 313
Finding IX-13 Net utility plant in service per customer has been increasing. ........................... 314
Finding IX-14 T&D-related capital spending decreased from 2005 to 2009 and the reductions in capacity-system reinforcement and condition/reliability improvements may affect reliability in the future. ............................................... 316
Finding IX-15 For the years 2007 through 2009, JCP&L received and expended significantly less capital than requested. ................................................................ 317
Finding IX-16 JCP&L has significantly decreased its budgeted and actual T&D O&M expenditures in 2008 and 2009, which may adversely affect customer service and reliability in the future. ........................................................................ 319
Finding IX-17 Capital project estimate variances are significant. ................................................ 320
Finding IX-18 Capital project schedule performance deteriorated in 2009 from 2007 and 2008 levels. ............................................................................................... 320

xxii Final Report
6/20/2011
Table of Findings (continued)
Finding IX-19 JCP&L focuses capital project management more on cash flow and current year capital budget compliance than on traditional individual project budget and schedule achievement. ....................................................................................... 322
Finding IX-20 JCP&L does not track the number and value of change orders by project or in total, which reduces its ability to manage and control projects. ............... 322
Finding IX-21 FirstEnergy Utilities does not always award JCP&L transmission corridor vegetation management contracts to the lowest bidder. ..................................... 322
Finding IX-22 FEU and JCP&L have an appropriate blend of centralization and decentralization in the Transmission and Distribution organization. ............... 324
Finding IX-23 FirstEnergy, FirstEnergy Utilities, and JCP&L have a highly developed performance management program. ...................................................................... 324
Finding IX-24 FEU and JCP&L have a rigorous capital program planning and budgeting process. ..................................................................................................... 324
Finding IX-25 JCP&L measures schedule adherence rather than actual vs. estimated hours of crew productivity. ................................................................................................. 325
Finding IX-26 FirstEnergy Utilities does not measure and report causes of crew downtime well. ........................................................................................................... 326
Finding IX-27 Asset management at FEU and JCP&L is well-developed and has achieved reductions in equipment-related failures. ............................................................... 327
Finding IX-28 JCP&L generally stays current with planned equipment maintenance.............. 327
Finding IX-29 Some high-priority circuits repeat as high-priority circuits in subsequent years after improvement programs have been completed. ................................. 331
Finding IX-30 Although tree incidents are a leading cause of outages, vegetation management is not organizationally grouped with the Engineering section and reports to a separate Director. ......................................................................... 332
Finding IX-31 JCP&L has a sound storm preparation and restoration process. ....................... 332
Finding IX-32 JCP&L uses industry-standard crew sizes. ............................................................ 332
Finding IX-33 FirstEnergy Utilities has current engineering and construction standards manuals. .................................................................................................... 333
Finding IX-34 T&D staffing levels at JCP&L are being maintained through the replacement of retiring workers but the economics of employee versus contractors have not been re-evaluated recently. ................................................. 333
Finding IX-35 FEU and JCP&L use an integrated suite of operations applications to fully support the T&D work process. ............................................................................. 334

Final Report xxiii
6/20/2011
Table of Findings (continued)
Finding IX-36 JCP&L will have a more modern work management process after the completion of the Radio Upgrade Initiative in Quarter 4, 2011 and the implementation of the FEU/JCP&L Work Management Initiative between November 2011 and October 2012. ...................................................................... 335
Finding IX-37 JCP&L has made progress in implementing distribution automation to improve reliability, but it should consider doing more. ...................................... 338
Finding IX-38 Jersey Central Power & Light has incorporated smart growth policies into its day-to-day business processes. .......................................................................... 349
Finding IX-39 The implementation of smart growth policies in 2005 decreased the average monthly level of new extension work activity within Jersey Central Power & Light by 31.3% or $400,476. ................................................................................... 357
Finding IX-40 JCP&L complied with smart growth rules by collecting CIAC for the total cost of new extensions in designated non-growth areas. ................................... 359
Finding IX-41 Up to $13.5 million of the $20.9 million collected as CIAC for new extensions in non-growth areas between 2005 and 2009 might have been collected as refundable DEP if the jobs had been processed as though they were in growth areas. ............................................................................................... 360
Finding IX-42 The average annual scope of work for new extension jobs in growth areas has decreased 11.8% (7.5 Hrs/WR) and in non-growth areas 41.9% (20.2 Hrs/WR) since the implementation of smart growth rules. .............................. 361
Finding IX-43 The smart growth policy increased the level of upgrade activity within JCP&L after its implementation. ............................................................................ 362
Finding IX-44 Jersey Central Power & Light complied with smart growth rules for upgrades requested by customers. ......................................................................... 363
Finding IX-45 The scope of work for jobs completed by JCP&L to upgrade facilities to customers was similar between growth and non-growth areas and demonstrated comparable trends. .......................................................................... 364
Finding IX-46 FirstEnergy, including Jersey Central Power & Light, has centralized the responsibility for processing requests from excavators to mark underground facilities in all the service territories of its subsidiaries. .............. 367
Finding IX-47 Jersey Central Power & Light/FirstEnergy has a defined process for completing requests from excavators to mark the location of underground electrical facilities. ..................................................................................................... 369
Finding IX-48 Jersey Central Power & Light has written contract specifications for vendors providing FirstEnergy with underground locating services. ............... 369

xxiv Final Report
6/20/2011
Table of Findings (continued)
Finding IX-49 The locates activity from New Jersey One Call for Jersey Central Power & Light peaked during 2006. ........................................................................................ 370
Finding IX-50 Jersey Central Power & Light's annual contract locate costs ranged from $9.78 to $11.65 per ticket over the last five years. ................................................ 371
Finding IX-51 The FirstEnergy / Jersey Central Power and Light ticket screening process has resulted in approximately $811,112 of avoided cost from 2005 through 2009. ............................................................................................................. 372
Finding IX-52 Jersey Central Power & Light/FirstEnergy monitors the performance of the locates contractor on both a daily and monthly basis. ......................................... 373
Finding IX-53 Jersey Central Power & Light completed 98.4% of 2009 location requests within three business days. ....................................................................................... 374
Finding IX-54 Jersey Central Power and Light has invoiced its underground locates contractor $630,923 for 271 dig-in claims during 2007, 2008 and 2009. .......... 375
Finding IX-55 Jersey Central Power & Light/FirstEnergy has not performed an audit of its locates contractor since 2006. ............................................................................ 376
Finding IX-56 Jersey Central Power & Light/FirstEnergy have specific organizations that are responsible for the oversight of contractor performance regarding the installation of transmission, substation, and distribution facilities..................... 378
Finding IX-57 Jersey Central Power & Light has a formalized process for determining whether a project is to be completed in-house or via contract labor. ............... 379
Finding IX-58 Jersey Central Power & Light / FirstEnergy has a defined process for the oversight of transmission, substation, and distribution construction contractors. ................................................................................................................. 380
Finding IX-59 Jersey Central Power & Light supervisors are expected to use the field coordinator process for transmission, distribution, and substation projects completed by in-house crews. ................................................................................. 381
Finding IX-60 Jersey Central Power and Light has reduced its distribution, transmission and substation contract labor work force, excluding tree trimming, from a yearly monthly average peak of 172 FTEs in 2005 to 9 FTEs in 2009. ............ 382
Finding IX-61 Jersey Central Power & Light has a formalized process to monitor the performance of contractors and in-house crews that are installing transmission, substation, and distribution facilities. ............................................. 383

Final Report xxv
6/20/2011
Table of Findings (continued)
X. CUSTOMER SERVICE ......................................................................................................... 387
Finding X-1 Total customer service costs per customer have increased at a rate that is slightly below the inflation rate. ............................................................................. 407
Finding X-2 According to the J. D. Power and Associates 2009 survey, the JCP&L Customer Satisfaction Index ranking is slightly below the average of other large eastern utilities. ................................................................................................ 408
Finding X-3 After decreasing from 2005 to 2007, the number of annual complaints has increased by 23% since 2007. ................................................................................. 409
Finding X-4 Three different units handle complaints relevant to JCP&L. ............................ 411
Finding X-5 The regulatory customer service standards reported to the BPU—average speed of answer, average time to reach a CSR, and percentage of calls handled by a CSR—have all deteriorated in recent years. .................................. 411
Finding X-6 The FEU average speed of answer is slower and the average hold time is longer for NJ customers than the average experienced by Ohio and Pennsylvania customers. .......................................................................................... 412
Finding X-7 The percentage of calls answered by the Reading contact center and the contract contact center that serve JCP&L customers has declined and falls below that of the Ohio call center. ........................................................................ 414
Finding X-8 It appears that the NCO contract contact center may be a higher cost than the Reading contact center.Error! Reference source not found. ....................... 415
Finding X-9 FirstEnergy Utilities has steadily improved the percentage of calls handled by the integrated voice response system. .............................................................. 415
Finding X-10 The percentage of service calls completed on the day requested has declined over the last five years, and it dropped precipitously after the field service customer satisfaction survey was suspended. ....................................................... 416
Finding X-11 Field service order response time has improved from 2005 to 2009. .............. 419
Finding X-12 The rate of meters not read improved from 2005 through 2008, but reversed to a relatively high 9.7% in 2009. ........................................................... 419
Finding X-13 FirstEnergy Utility’s last examination of AMI in 2007 did not consider societal and customer benefits. ............................................................................... 420
Finding X-14 The meter-reading error rate has improved steadily since 2005. ....................... 421
Finding X-15 FirstEnergy Utilities and JCP&L have not completed a meter reading reroute since 1994. ................................................................................................... 421
Finding X-16 FirstEnergy Utilities has significantly reduced the billing exception rate. ........ 422

xxvi Final Report
6/20/2011
Table of Findings (continued)
Finding X-17 The Rates Department has a strong influence on customer service and JCP&L’s financial success but it does not report to JCP&L. ............................. 422
Finding X-18 Theft-of-service activity has been increasing. ....................................................... 423
Finding X-19 FirstEnergy Utilities has made steady progress in increasing the percentage of electronic payments. ............................................................................................. 424
Finding X-20 Net write-offs for uncollectible accounts have steadily increased since 2006, and accounts receivable aging has deteriorated as well. ............................ 424
Finding X-21 As write-offs and slow payment have increased, the number of terminations for non-payment have also increased. .................................................................... 427
Finding X-22 The accounts and amounts submitted to collection agencies have increased over the last five years, but the percentage collected has decreased. ................. 428
Finding X-23 The New Jersey economic development function is more closely aligned with JCP&L functions than the FEU corporate-level functions. ...................... 430
XI. CLEAN ENERGY ................................................................................................................ 433
Finding XI-1 JCP&L is responsible for only a limited segment of the Clean Energy programs. .................................................................................................................... 437
Finding XI-2 The Comfort Partners Program and the CleanPower Choice Program were reduced as a result of the Governor’s issuance of Executive Order 14, although additional funding was later found. ........................................................ 437
Finding XI-3 JCP&L is appropriately managing its remaining responsibilities involving the Clean Energy programs. .................................................................................... 439
XII. SUPPORT SERVICES ........................................................................................................ 441
Finding XII-1 FirstEnergy/JCP&L has a robust risk management program, although the program can be better summarized and documented. ........................................ 448
Finding XII-2 The status and reporting relationship of CRO is appropriate. ........................... 449
Finding XII-3 Insurance processes and coverage are appropriate, although analyses should be periodically documented. .................................................................................... 449
Finding XII-4 The Legal Department’s performance objectives are vague and its key performance indicators (KPIs) in support of the Legal Department’s mission and objectives have not been fully developed. ....................................... 462

Final Report xxvii
6/20/2011
Table of Findings (continued)
Finding XII-5 Unlike other FE states, JCP&L has relied extensively, for a long period of time, on one external counsel firm for its state regulatory work in New Jersey and pays significantly for that firm’s activities. ......................................... 464
Finding XII-6 No formal written policies or procedures documentation exists for the Claims groups in OH, PA, or NJ. .......................................................................... 465
Finding XII-7 The in-house system supporting the Claims function could not provide all the information requested by Schumaker & Company during this audit. ....... 465
Finding XII-8 No formal reporting to JCP&L’s senior management regarding claims is currently being provided. ........................................................................................ 466
Finding XII-9 FE/JCP&L Real Estate and facilities organization properly maintains its buildings and properties by using simple, straightforward methodologies for managing its repair and upgrade workloads. .................................................. 474
Finding XII-10 There are no formal facilities forecasting or planning methodologies or techniques in place. .................................................................................................. 474
Finding XII-11 The corporate FE Supply Chain organization has a good procurement performance measurement and management program. ..................................... 480
Finding XII-12 In 2009, the Supply Chain unit for Utilities had almost 100% compliance with the policies for terms and conditions, supplier diversity, use of the Playbook, and purchase order structure. ............................................................... 481
Finding XII-13 The Supply Chain organization is making progress in converting manual processes to electronic processes. .......................................................................... 481
Finding XII-14 There are generally appropriate inventory performance measures for the JCP&L central storerooms. ..................................................................................... 481
Finding XII-15 JCP&L’s total inventory has dropped dramatically from 2005 to 2009, but that reduction has not been fast enough to maintain the turn ratios because the volume of issues has also decreased dramatically. ........................................ 482
Finding XII-16 Although the fill rate is an important measurement for the central stores, it does not measure the impact of unavailable materials on the field crews. ...... 482
Finding XII-17 Supply Chain staffing for Utility Support has dropped from 16 in 2006 to 9 in 2009, raising a concern about the capacity for ongoing support of JCP&L and the other operating companies. ....................................................... 482
Finding XII-18 The Supply Chain organization participated in 22 benchmarking studies and related reports in 2005 and 2006 but has not since. ............................................ 483
Finding XII-19 The Supply Chain organization does not actively participate in standards committees. ............................................................................................................... 483

xxviii Final Report
6/20/2011
Table of Findings (continued)
Finding XII-20 Despite a program to consolidate the three central storerooms in Ohio, there is currently no planned warehouse consolidation for JCP&L. ................. 483
Finding XII-21 There are limited programs for vendor restocking of work center storerooms, and FE has not outsourced much of the logistics and warehousing functions for JCP&L. ........................................................................ 484
Finding XII-22 FirstEnergy Utilities’ Fleet Services has developed an orderly and industry-typical set of policies and procedures for fleet management. ............................. 493
Finding XII-23 JCP&L fleet availability is better than the FEU opco average. .......................... 493
Finding XII-24 The recent fleet cost trend is favorable. ................................................................. 494
Finding XII-25 FirstEnergy Utilities and JCP&L do not follow their own vehicle replacement guidelines and the average fleet age is relatively old, which might result in excessive field-force work delays attributable to vehicle and equipment problems. ................................................................................................ 496
Finding XII-26 All fleet preventive maintenance is calendar based rather than the better practice of triggering preventive maintenance on a combination of mileage or engine hours of use and calendar time. ............................................................. 501
Finding XII-27 FirstEnergy Utilities does not track fuel usage by vehicle. .................................. 501
Finding XII-28 FirstEnergy has not conducted a full lease-versus-buy analysis for vehicles and equipment since 2004. ....................................................................................... 501
Finding XII-29 The FE IT organization, led by the CIO, reports up through the CFO organization at a lower level than in many organizations.................................... 518
Finding XII-30 The FE strategic planning process is improving but the plan does not specifically address the direction in which IT is going. ....................................... 518
Finding XII-31 The IT organization has amassed a large body of documentation associated with its policies and procedures. ............................................................................. 520
Finding XII-32 The IT organization has a very limited PMO in place. ........................................ 521
Finding XII-33 The FE IT organization does not sufficiently emphasize the certification of its staff. ................................................................................................................... 522
Finding XII-34 The key IT performance metrics currently in use are limited in nature and are not kept in a consolidated dashboard for reporting across the IT organization. ............................................................................................................... 523
Finding XII-35 IT controls have been incorporated into day-to-day activities. .......................... 524
Finding XII-36 No formal service level agreements exist between IT and JCP&L or other FE entities. ................................................................................................................. 525

Final Report xxix
6/20/2011
Table of Findings (continued)
Finding XII-37 The IT organization has a robust disaster recovery program, even though it did not begin developing a formal plan until 2004. ............................................. 525
Finding XII-38 IT vulnerability assessments and penetration testing are routinely performed. ................................................................................................................. 527
Finding XII-39 The IT organization uses ALTIRIS software, but doesn’t use the software’s wake-up capability. ................................................................................................... 528
Finding XII-40 Although FE has developed an outstanding records management program, it is not being fully utilized by all FE and JCP&L groups. ................................. 538

xxx Final Report
6/20/2011
Table of Recommendations
VII. EXECUTIVE MANAGEMENT AND CORPORATE GOVERNANCE ........................ 123
Recommendation VII-1 Develop a periodic organizational review process. (Refer to Finding VII-1) ......................................................................................... 129
Recommendation VII-2 Regularly review and update corporate governance policies. (Refer to Finding VII-3) ......................................................................... 142
Recommendation VII-3 Periodically send out letters to all vendors and contractors informing them of FE’s Code of Conduct. (Refer to Finding VII-4) ......................................................................................... 142
Recommendation VII-4 More routinelyrotate directors through committees. (Refer to Finding VII-5) ......................................................................................... 142
Recommendation VII-5 Review and update the Audit Committee charter to specify that the Audit Committee is responsible for oversight of all risk management. (Refer to Finding VII-6) ................................................ 142
Recommendation VII-6 Update the Audit Committee charter to state that the Director of Internal Auditing functionally reports to the Audit Committee and uses FE for logistical support. (Refer to Finding VII-7) ........... 143
Recommendation VII-7 Periodically rebid external audit services. (Refer to Finding VII-8) ......................................................................................... 143
Recommendation VII-8 Require all outside counsel to report wrongdoing up through the Board, as is now required from outside counsel practicing before the SEC. (Refer to Finding VII-9) ........................................................ 143
Recommendation VII-9 Continue to strengthen employee safety programs. (Refer to Finding VII-15 and Finding VII-16) .................................................... 180
Recommendation VII-10 Develop a strategic workforce plan. (Refer to Finding VII-11 and Finding VII-12) ....................................................................................... 181
Recommendation VII-11 Strengthen efforts to attract women to managerial and technical jobs. (Refer to Finding VII-17, Finding VII-18, and Finding VII-19) ....................................................................................... 181
Recommendation VII-12 Strengthen the narrative in the affirmative action plan describing JCP&L’s actions and plans for hiring and promoting women and minorities. (Refer to Finding VII-20) .................................................. 181
Recommendation VII-13 Develop a comprehensive and integrated external relations/communications strategy. (Refer to Finding VII-24, Finding VII-25, and Finding VII-26) ................................................... 190

Final Report xxxi
6/20/2011
Table of Recommendations (continued)
VIII. FINANCE AND ACCOUNTING .................................................................................... 193
Recommendation VIII-1 Explore the advisability of ring-fencing JCP&L’s operations from FE. (Refer to Finding VIII-2) ............................................................. 209
Recommendation VIII-2 Seek an extension of approval to participate in the Utility Money Pool. (Refer to Finding VIII-7) ............................................................ 224
Recommendation VIII-3 Study and evaluate combining FirstEnergy’s capital budget systems and databases. (Refer to Finding VIII-16) .......................... 257
Recommendation VIII-4 Provide the resources or effort to reduce the backlog of assets in Account 106. (Refer to Finding VIII-18) .......................................... 257
Recommendation VIII-5 In conjunction with the FE/Allegheny Energy merger integration process, identify and implement the most efficient organizational design to effectively and independently perform the Internal Audit function. (Refer to Finding VIII-19) ....................................... 257
Recommendation VIII-6 Provide the fraud training program to JCP&L employees. (Refer to Finding VIII-22) .................................................................... 258
IX. ELECTRIC OPERATIONS ................................................................................................. 259
Recommendation IX-1 Monitor recent capital and/or O&M expenditure reductions to ensure that customer service and reliability levels do not significantly deteriorate and maintain established state wide standards. (Refer to Finding IX-2, Finding IX-4, Finding IX-11, Finding IX-12, Finding IX-14, Finding IX-15, and Finding IX-16) ................................................................................ 338
Recommendation IX-2 Complete deferred trimming of the distribution corridors in 2011 consistent with the four-year vegetation management cycle. (Refer to Finding IX-6 and Finding IX-7) .......................................... 339
Recommendation IX-3 In conjunction with the FE/Allegheny Energy merger integration process, identify and implement the most efficient organizational design to effectively perform distribution vegetation managemen including considering reorganize distribution vegetation management under the JCP&L Engineering Services group. (Refer to Finding IX-30) ....................................................................... 339

xxxii Final Report
6/20/2011
Table of Recommendations (continued)
Recommendation IX-4 Upon completionof the first full program cycle, evaluate the experimental corridor widening program (which has resulted in an increased portion of the expenditures for distribution tree trimming being allocated to capital) and adjust as appropriate. (Refer to Finding IX-8) .......................................................................... 339
Recommendation IX-5 Award transmission vegetation management contracts to the lowest qualified bidder, and adequately document cases where exceptions are made. (Refer to Finding IX-21) ................................. 340
Recommendation IX-6 Revise capital program and project management to include a focus on managing individual projects according to their schedules and budgets. (Refer to Finding IX-17, Finding IX-18, and Finding IX-19) ......................................................................................... 340
Recommendation IX-7 Begin tracking and reporting the aggregate volume and value of change orders by project and by time period. (Refer to Finding IX-20) ......................................................................................... 340
Recommendation IX-8 Begin tracking and reporting actual versus estimated hours by work order and by time period. (Refer to Finding IX-25) ............... 340
Recommendation IX-9 Improve the delay reporting to reduce crew downtime and improve schedule adherence. (Refer to Finding IX-26) ................... 341
Recommendation IX-10 Modify the high-priority circuit program to include a focus on the number of repeat high-priority circuits. (Refer to Finding IX-29) ......................................................................................... 341
Recommendation IX-11 Re-evaluate the T&D employee and contractor labor allocation. (Refer to Finding IX-34) ........................................................................ 341
Recommendation IX-12 Include as a component of the analysis of the highest priority circuits the age, size, and type of overhead conductor to determine if these factors are the key contributors to the unreliability of a particular circuit and if conductor replacement would be cost-effective to address customer hours of outages on such circuits. (Refer to Finding IX-9) ........................................... 341
Recommendation IX-13 In conjunction with the high priority circuit program, consider adding CEMI measurements and targets to the internal reliability performance measures to enhance customer satisfaction and further improve reliability. (Refer to Finding IX-3) .......................... 342

Final Report xxxiii
6/20/2011
Table of Recommendations (continued)
Recommendation IX-14 JCP&L should provide documentation that its distribution planning criteria includes requirements consistent with the PJ Downes’ reports for tie and recloser schemes for new and substantially reconfigured circuits, which, over time, will allow for increasing levels of automation with respect to the Company’s response to outages. (Refer to Finding IX-37) ................................. 342
Recommendation IX-15 Determine the root cause(s) of the claims against JCP&L’s underground locates contractor and develop a plan to minimize the causes. (Refer to Finding IX-54) .................................................. 377
Recommendation IX-16 Perform periodic audits of the contractor(s) that are providing JCP&L with underground locates services. (Refer to Finding IX-55) ........................................................................................ 377
X. CUSTOMER SERVICE ......................................................................................................... 387
Recommendation X-1 Maintain or achieve customer service performance levels that result in overall customer satisfaction, making improvements where cost-effective. (Refer to Finding X-3, Finding X-5, Finding X-6, Finding X-7, and Finding X-10) ................................... 430
Recommendation X-2 In conjunction with the FE/ Allegheny Energy merger integration process, identify and implement the most efficient organizational design to effectively perform customer complaint management processes. (Refer to Finding X-4) ............................... 431
Recommendation X-3 In conjunction with the FE/Allegheny Energy merger integration process and then periodically thereafter, review and evaluate the use of call center resources, both internal and through contractors, in which these periodic reviews consider cost-effectiveness, as well as other relevant factors, including quality, experience, labor pool diversification, and disaster recovery. Changes resulting from these reviews should be incorporated over time, as necessary. (Refer to Finding X-8) ....................................................... 431
Recommendation X-4 Re-evaluate AMR, AMI, and communication devices for inside meters to reduce estimated meter reads and to lower meter- reading costs. (Refer to Finding X-12 and Finding X-13) .............. 431
Recommendation X-5 Complete the JCP&L meter reading rerouting process within six months. (Refer to Finding X-15) ......................................................... 432

xxxiv Final Report
6/20/2011
Table of Recommendations (continued)
Recommendation X-6 In conjuction with the FE/Allegheny Energy reorganization merger integration process, identify and implement the most efficient organizational design to effectively perform the economic development function, including New Jersey. (Refer to Finding X-23) ...................................................................................... 432
XI. CLEAN ENERGY ................................................................................................................ 433
XII. SUPPORT SERVICES ........................................................................................................ 441
Recommendation XII-1 Conduct periodic, formal risk management studies. (Refer to Finding XII-1) ......................................................................................... 449
Recommendation XII-2 Conduct periodic, formal insurance studies. (Refer to Finding XII-3) ......................................................................................... 449
Recommendation XII-3 Strengthen Legal Department objectives and associated KPIs, including responding to survey results. (Refer to Finding XII-4) ......................................................................................... 467
Recommendation XII-4 Perform a cost/benefit analysis to determine whether state regulatory work should be performed primarily internally or externally in the future, and incorporate the development of RFPs into this decision-making process. (Refer to Finding XII-5) ......................................................................................... 467
Recommendation XII-5 Establish formal written Claims function documentation for all FE groups managing claims. (Refer to Finding XII-6) .................... 468
Recommendation XII-6 Perform an investigation and resulting cost/benefit analysis to see if FE’s claims system should be replaced. (Refer to Finding XII-7) ......................................................................................... 468
Recommendation XII-7 Begin providing formal reports to JCP&L senior management regarding claims and legal cases activities. (Refer to Finding XII-8) ......................................................................................... 468
Recommendation XII-8 Develop a Facilities Master Plan. (Refer to Finding XII-10) ............ 475
Recommendation XII-9 Improve JCP&L turnover rate to 2.1, the level already achieved in 2005. (Refer to Finding XII-15) ...................................................... 484
Recommendation XII-10 Improve the JCP&L central storeroom fill rate to 94%, the level already achieved by FEU/Ohio Edison. (Refer to Finding XII-15) ....................................................................................... 484

Final Report xxxv
6/20/2011
Table of Recommendations (continued)
Recommendation XII-11 Measure the amount and cost of field crew lost time due to material availability (stock out) problems. (Refer to Finding XII-16) ...................................................................................... 484
Recommendation XII-12 Monitor the effect of FE Supply Chain staffing reductions on JCP&L and address adverse impacts as appropriate. (Refer to Finding XII-17) ...................................................................................... 485
Recommendation XII-13 Resume Supply Chain participation in benchmarking programs by 2012. (Refer to Finding XII-18) .................................................... 485
Recommendation XII-14 Consider adding Supply Chain staff to standards committees. (Refer to Finding XII-19) ...................................................................... 485
Recommendation XII-15 Accelerate the consideration of consolidating the two JCP&L regional storerooms. (Refer to Finding XII-20) ............................... 485
Recommendation XII-16 Investigate the possibility of vendor resupply of JCP&L central and work center storerooms and/or additional outsourcing of logistics and warehousing functions. (Refer to Finding XII-21) .... 486
Recommendation XII-17 Reinstate JCP&L fleet replacements and catch up to both the FEU fleet replacement guidelines and the fleet replacement strategy within five years, if practicable and cost beneficial. (Refer to Finding XII-25) ...................................................................... 501
Recommendation XII-18 Accelerate the implementation of scheduling preventive maintenance through a combination of mileage or engine hours of use and elapsed calendar time, if feasible and cost beneficial. (Refer to Finding XII-26) ...................................................................... 502
Recommendation XII-19 Implement the tracking of fuel usage by vehicle and add fuel use efficiency to the evaluations of individual vehicle and class-of-equipment performance and cost, if feasible and cost beneficial. (Refer to Finding XII-27) ...................................................................... 502
Recommendation XII-20 Conduct a thorough lease-versus-buy analysis before resuming the acquisition of vehicles and equipment for JCP&L. (Refer to Finding XII-28) ...................................................................................... 502
Recommendation XII-21 In conjunction with the FE/Allegheny Energy merger integration process, and regularly thereafter, identify and implement the most efficient organizational design to effectively perform the IT function across FE. (Refer to Finding XII-29) .................................. 529

xxxvi Final Report
6/20/2011
Table of Recommendations (continued)
Recommendation XII-22 Incorporate technology direction into IT’s strategic planning process. (Refer to Finding XII-30) ....................................................... 529
Recommendation XII-23 Expand the PMO to take on additional responsibilities. (Refer to Finding XII-32) ....................................................................................... 529
Recommendation XII-24 Expand FirstEnergy’s commitment to project management by incorporating all IT employees who are responsible for project delivery into a PMP certification program and closely monitor implementation of this program, whereby all appropriate staff achieve PMP certification to ensure timely progress is made. (Refer to Finding XII-33) ...................................................................... 530
Recommendation XII-25 Implement a relevant IT dashboard. (Refer to Finding XII-34) ...... 530
Recommendation XII-26 Expedite completion of SLAs with all major client groups. (Refer to Finding XII-36) ...................................................................... 531
Recommendation XII-27 Transition to the use of the remote management software’s wake-up capability. (Refer to Finding XII-39) .................................... 531
Recommendation XII-28 Take and enforce a more aggressive posture with regard to having departments follow FE’s records management program. (Refer to Finding XII-40) ....................................................................................... 539

Final Report 123
6/20/2011
VII. Executive Management and Corporate Governance
This chapter is divided into two sections as follows;
♦ Executive Management ♦ Corporate Governance
A. Executive Management
This section addresses FirstEnergy’s organizational structure and planning as well as management and administrative communications and control.
Background & Perspective
Organizational Structure and Planning
FirstEnergy Corp. (FirstEnergy or FE) is a diversified energy company (public utility holding company) with subsidiaries and affiliates involved in the generation, transmission, and distribution of electricity as well as energy management and other energy-related services. Included in the corporate structure are seven electric utility operating companies, including Jersey Central Power & Light (JCP&L), serving 4.5 million customers in Ohio, Pennsylvania, and New Jersey. FirstEnergy’s generation companies own or operate almost 14,000 megawatts of nuclear and fossil capacity.
FirstEnergy’s primary revenue is derived from its principal business: holding all of the outstanding common stock of its eight principal electric utility operating subsidiaries (including JCP&L) and of its generating and marketing subsidiary, FirstEnergy Solutions Corp. (FES). FirstEnergy also holds all of the common stock of its other direct subsidiaries: FirstEnergy Properties, Inc.; FirstEnergy Ventures Corp. (FEV); FirstEnergy Nuclear Operating Company (FENOC); FELHC, Inc.; FirstEnergy Facilities Services Group, LLC; FirstEnergy Fiber Holdings Corp.; GPU Power Inc.; GPU Nuclear Inc.; MARBEL Energy Corporation; and FirstEnergy Service Company (SERVECO).
FES owns and operates its fossil and hydroelectric generating facilities through its subsidiary, FirstEnergy Generation Corp. (FGCO). FES owns and operates FE’s nuclear generating facilities through its subsidiary, FirstEnergy Nuclear Generation Corp. (NGC). SERVECO provides legal, financial, and other support services for all FirstEnergy subsidiaries.

124 Final Report
6/20/2011
The FirstEnergy organization is led by its President & Chief Executive Officer (CEO) as shown in Exhibit VII-1. (See Chapter III – Affiliate Relationships & Cost Allocation Methodologies for further discussion about all of FirstEnergy’s subsidiaries and their relationships to JCP&L.)
Exhibit VII-1 FirstEnergy Organization
as of June 30, 2010
Source: Information Response 54
Reporting to the President and Chief Executive Officer are the three main areas of electric utilities (FirstEnergy Utilities), generation (FENOC and FirstEnergy Generation), and support services (human resources, finance, strategic planning, operations, and legal).
Akron, OH 13,602
FirstEnergyPresident & CEO
FirstEnergy
Akron, OH
FirstEnergyExcutive Assistant - CEO
Akron, OH 7,253
FirstEnergy UtilitiesSenior Vice President & President
FirstEnergy Utilities
Akron, OH 316
FirstEenrgy Service CompanyExecutive Vice President & General Counsel
Akron, OH 2,030
FirstEnergy GenerationEVP & President
FirstEnergy Generation
Akron, OH 1,211
FirstEnergy Service CompanyExecutive Vice President & Chief Financial Officer
Finance, Strategic Planning & Operations
Akron, OH 2,652
FirstEnergy Nuclear Operating CompanyPresident & Chief Nuclear Officer
FirstEnergy Nuclear Operating Company
Akron, OH 137
FirstEnergy Service CompanySenior Vice President
Human Resources

Final Report 125
6/20/2011
Exhibit VII-2 shows the organization for FirstEnergy Utilities.
Exhibit VII-2 FirstEnergy Utilities Organization
as of June 30, 2010
Source: Information Response 54
Functions that broadly support all of the electric utility companies fall under the Vice Presidents. Utility Support includes the functional areas of transmission planning, protections, and operation; distribution engineering, operations, and support; asset, project, and vegetation management; and general workforce development and performance and process improvement. Customer service and energy efficiency also include economic development, customer contact centers, revenue operations, and grid and meter technology. The electric utility companies, including JCP&L, report to the Vice President of Utility Operations.
Akron, OH 7,253
FirstEnergy UtilitiesSVP & President
FirstEnergy Utilities
Akron, OH
FirstEnergy UtilitiesExcutive Assistant, Sr Mgmt
Energy Delivery& Customer Services
Akron, OH 31
FirstEnergy UtilitiesVice President & Chief FERC Compliance Officer
FERC Policy & Compliance
Akron, OH 681
FirstEnergy UtilitiesVice PresidentUtility Support
Akron, OH 855
FirstEnergy UtilitiesVice President
Customer Service & Energy Efficiency
Akron, OH 5,684
FirstEnergy UtilitiesVice President
Utility Operations

126 Final Report
6/20/2011
Exhibit VII-3 shows the organizational structure of JCP&L.
Exhibit VII-3 Jersey Central Power & Light Organization
as of June 30, 2010
Source: Information Response 54
Reporting to the President of JCP&L are the support functions of New Jersey commodity sourcing (two business analysts, one engineer, and three operators) and JCP&L human resources (HR) (four HR representatives, two safety representatives, and one business analyst). The JCP&L organization is primarily focused on New Jersey operations. Also reporting to the President of JCP&L are three operation directors (operations and operations support) and a Vice President of External Affairs.
Operations Services includes engineering and two regional claims units. Two general managers are in charge of regional operating services for the North and Central regions. Each region has seven operation centers with managers in charge of each one. Operations centers include line and substation maintenance/repair and technical support.
Red Bank, NJ 1,426
JCP&LPresident
JCP&L
Red Bank, NJ
JCP&LExcutive Assistant, VP
Red Bank, NJ
JCP&LExecutive Assistant, VP
Reading, PA 7
JCP&LManager
ED Commodity Sourcing, NJ
Red Bank, NJ 8
JCP&LManager
Human Resources
Red Bank, NJ 750
JCP&LDirector
Operations Services
Red Bank, NJ 240
JCP&LDirector
Operations Support
Red Bank, NJ 193
JCP&LDirector
Operations Support
Red Bank, NJ 226
JCP&LVice PresidentExternal Affairs

Final Report 127
6/20/2011
One operations support section is in charge of dispatching and related support as well as underground substation maintenance, relay, testing, etc. The other operations support director is in charge of Fleet activities, stores and stores facilities, meter testing, and forestry.
The Vice President of External Affairs is in charge of a Director of Customer Services, whose responsibilities include meter reading and revenue operations. The Vice President of External Affairs also oversees the area managers, whose responsibilities include contact with local publics and government agencies.
FE/JCP&L has no department charters with position descriptions serving to describe the roles of various departments and employees. There is no formal process for evaluating/analyzing the organization, although FE/JCP&L has an ongoing program for developing goals and objectives as well as management coaching and feedback. (See the Strategic Planning chapter). Instead, organizational changes are made on a case-by-case basis, usually as part of the budgeting process, with any changes approved by senior management. There have been no major organizational changes at FE/JCP&L in the past five years.
Management and Administrative Communications and Controls
The highest level of governing administrative controls at FirstEnergy is documented in the Business Controls Manual. This manual establishes programmatic level controls and corporate responsibilities for FirstEnergy programs. These business practices have been developed as corporate-wide policies and procedures, replacing the general orders, corporate references, and other rules from predecessor companies. The Vice-President of Corporate Affairs and Community Development is responsible for developing, reviewing, updating, and otherwise maintaining these business practices.
Business practices generally describe the standards of business conduct and accountability for all FirstEnergy employees. They include a description of the applicable organization and the responsibilities of the departments. Procedural direction is also provided. The President and CEO of FirstEnergy and the Senior Vice President and General Counsel must approve new business practices and revisions to existing business practices. New business practices and revisions to existing business practices must be submitted by a member of senior management for consideration. Supervisors are responsible for disseminating business practices to employees. Business practices apply to all FirstEnergy employees including all of those at JCP&L. They undergo a review every five years and FirstEnergy indicated that a review is currently underway.
There is a sub-tending set of administrative controls called Corporate Policies, which fall under the responsibilities of the Vice-President, Corporate Secretary, and Chief Ethics Officer. There is no formal governing process for these documents, nor is there a central repository of all policies. Key policies are maintained for all important human resources areas such as employment and staffing, equal employment opportunity (EEO) and affirmative action, employee relations, health and safety, and compensation.

128 Final Report
6/20/2011
There is an Executive Leadership Team (ELT) that includes senior management of FirstEnergy Utilities (FEU) and all utility companies (including the President of JCP&L). Team members meet 10 times per year to review and discuss important issues facing FEU. Topics include customer service, energy efficiency, operations and maintenance (O&M) and capital budgets, operational issues (e.g., transmission, vegetation, facilities), human resources issues, regulatory commitments, and specific programs (e.g., JCP&L Smart Grid, Work Management Initiative), among other topics. The ELT also tracks and addresses progress on performance measures. (See the Strategic Planning Chapter.)
For JCP&L, monthly meetings and reporting are done via operational performance reports and operational performance report meetings. These lengthy reports cover all aspects of JCP&L operations, including reporting and analysis of Occupational Safety & Health Administration (OSHA)/safety, financial/expenditures, reliability, vegetation management, customer services, productivity, staffing/absenteeism, corrective and planned maintenance, among many other topics. There are also summaries to track performance metrics. (See also the Strategic Planning chapter.)
Findings & Conclusions
Finding VII-1 In general, the FE/JCP&L organization adequately supports ratepayer and corporate objectives, although there is no formal organizational review and evaluation process.
The FE/JCP&L organization has held steady over the past five years with only minor changes, often related to eliminating positions through the budgeting process. An emphasis on centralizing core services and promoting best practices throughout the organization is appropriate. At the support service company level, spans of control and layers of management were reasonable. At the JCP&L organization, however, spans of control were often wide and many positions were identified in the organizational charts as open.
There are no written charters to fully describe the roles and interrelationships of various FE/JCP&L departments. Likewise, there are no documented processes, criteria, or procedures for evaluating the efficiency and effectiveness of the organization. Organizational changes are not a part of the strategic process and are justified by managers mainly through the budgeting process. There are no requirements to periodically review the organization, nor is there any documented criteria that would define triggers for evaluating the organization or specific organizational units.
Finding VII-2 Administrative controls and procedures are adequate, and procedures are periodically reviewed and improved, if and as necessary.
Procedures are adequately documented and follow similar formats. Procedures are clearly written and are readily available to employees. All procedures are approved by senior management, and each procedure undergoes review as requested and/or periodically. A formal review of procedures was being conducted as the audit was underway.

Final Report 129
6/20/2011
Recommendations
Recommendation VII-1 Develop a periodic organizational review process. (Refer to Finding VII-1)
Periodically (at least every five years), FE/JCP&L should examine the organization to ensure that it is meeting all corporate goals and objectives (customer services, efficiencies, etc.). This process can be incorporated into the annual business planning process. Criteria for review can include spans of control, grouping of like functions, management layering, impact of management training and development, efficiency and performance criteria, level of support required from other organizational units, and lines of reporting and communications requirements. (This is not meant to be an inclusive list.) If these reviews come through management meetings/discussions and committee work, the results should be documented. FE/JCP&L should develop department charters and define conditions that would trigger an organizational review (e.g., a major change of business process, the application of new technology, difficulty in responding to a major or systematic problem or issue, major changes in regulatory requirements). It should also stipulate a required review of additional, new control points for the evaluation of material weaknesses.
The upcoming merger/integration of Allegheny would provide a good point to conduct this review (beyond changes to match Allegheny with the rest of the FE organization).

130 Final Report
6/20/2011
B. Corporate Governance
This section addresses FirstEnergy’s (FE) and Jersey Central Power & Light’s (JCP&L) corporate governance policies, practices, and procedures. It also reviews FE/JCP&L’s adherence to the Sarbanes-Oxley Act of 2002 (SOX). Specifically this section reviews the makeup and activities of the FirstEnergy and JCP&L Board of Directors and FE committees, board interfaces with external auditors, and actions to comply with both the Sarbanes-Oxley Act of 2002 and New York Stock Exchange (NYSE) requirements.
Background & Perspective
Publicly traded companies have long been subject to financial and disclosure laws and regulations (e.g., the Securities Exchange Act of 1934 and the Foreign Corrupt Practices Act, which among other stipulations required companies to have internal controls). The financial and public business community at large has been active in strengthening corporate governance principles through efforts such as the National Commission on Fraudulent Financial Reporting (Treadway Commission/Report) and the General Accounting Office. In 1998, the NYSE and the National Association of Securities Dealers (NASD) sponsored a committee (known as the Blue Ribbon Committee) that developed recommendations to improve audit committees’ effectiveness. Subsequently, the NYSE, the NASD, and the Securities and Exchange Commission (SEC) revised listing standards and developed new rules concerning the corporate governance roles of the audit committees.
Nevertheless, subsequent events surrounding several spectacular company collapses (e.g., Enron in 2001 and WorldCom and Global Crossing in 2002) and the allegations of misdeeds by corporate executives, independent auditors, and other market participants undermined investor confidence in the U.S. financial markets. In response, Congress passed, and the President signed into law, the Sarbanes-Oxley (SOX) Act of 2002, which effected sweeping corporate disclosure and financial reporting reform. This act directed the SEC to enact new rules to meet its intent. The SEC took and considered comments from interested parties and published the new rules in 2003.
The most applicable sections of SOX as they apply to large, publicly traded corporations involve:
♦ Strengthening auditor independence
♦ Increasing the roles and responsibilities of the corporate auditing committees
♦ Requiring senior management to certify and otherwise be generally held responsible for the accuracy of financial statements
♦ Increasing the disclosure and transparency of financial information in quarterly and annual reports
♦ Enhancing corporate internal controls (to include the establishment of a code of ethics)

Final Report 131
6/20/2011
In light of the recent economic difficulties precipitated by the Wall Street/real estate crash, several bills have been introduced in Congress that feature additional elements of business ethics and governance. Features include an independent director as Chairman of the Board (i.e., the Chairman and CEO cannot be the same person), claw back of executive payments in cases of fraud, formation of a Risk Management Board Committee, no severance payments for executives terminated for cause, disclosure of specific bonus targets for senior executives, no “golden parachute” for management of acquired companies as a part of merger agreements, and shareholder votes and limits on executive compensation, among others.
The Board of Directors, whose members are elected and accountable to shareholders, is the focal point of the corporate governance system. The FirstEnergy Board of Directors provides general governance for FirstEnergy and its subsidiaries. Each subsidiary, including JCP&L, has its own Board of Directors. The Board size and composition is not specifically set but rather determined by resolution of the Board majority. This evaluation and determination is conducted annually by the Corporate Governance Committee, which makes its recommendations to the Board as a whole. The Board is not divided into classes; all members stand for re-election annually. Currently, the Board’s five standing committees are:
♦ Audit Committee – responsible for overseeing and reviewing the integrity of FirstEnergy’s financial statements, including the financial statements of JCP&L; complying with legal, risk management, and regulatory requirements; overseeing the independent auditor’s qualifications and independence; performing the internal audit and independent auditor functions; managing the systems of internal control with respect to the accuracy of financial records; adhering to FE policies; and complying with legal and regulatory requirements.
♦ Corporate Governance Committee – develops and reviews corporate governance principles applicable to FirstEnergy, identifies and recommends Board candidates, and oversees the evaluation of the Board and management. The duty to oversee the evaluation of management was delegated to the Compensation Committee.
♦ Compensation Committee – oversees the compensation of certain senior-level officers at FirstEnergy, including the Chief Executive Officer, other non-CEO executive officers, the Chairman of the Board if he or she is not the CEO, and other individuals named in FE’s annual proxy statement; reviews, discusses, and endorses a compensation philosophy that supports competitive pay for performance and is consistent with the corporate strategy; assists the Board in establishing appropriate incentive compensation and equity-based plans for FE executive officers; administers such plans in order to attract, retain, and motivate skilled and talented executives and to align such plans with corporate and business unit performance, business strategies, and growth in shareholder value; reviews and discusses with First Energy management disclosures in the Compensation Discussion and Analysis included in FE’s annual report and proxy statement; and produces the Compensation Committee Report included in FE’s annual report and proxy statement.
♦ Finance Committee – reviews FirstEnergy’s capital structure policies, long- and short-term debt levels, dividend policy, issuance of securities, exposure to interest rate fluctuation, share

132 Final Report
6/20/2011
repurchase programs, and other financial matters deemed appropriate by the Board; approves terms of sales of FE securities and other major financial transactions when powers are delegated by the full Board; reviews FE financial forecasts, operations and maintenance budgets, and capital budgets; reviews FE’s pension fund investments, employee savings plans, and corporate insurance coverage.
♦ Nuclear Committee – reviews the safety, reliability, and quality of nuclear operations; reviews the effectiveness of management systems to self-identify problems and potential problems for prompt and complete corrective actions; reviews FirstEnergy’s nuclear operational and business plans; and undertakes studies, as the Board of Directors deems appropriate, concerning FE’s nuclear activities.
Corporate governance is a major responsibility of both the Corporate Governance Committee and the Audit Committee. The Audit Committee oversees compliance with many aspects of SOX. It also manages the relationships with internal and external auditors. Both committees are composed entirely of outside directors. The Audit Committee is composed of three or more directors (currently, in 2010, four directors), all of whom must be familiar with FE’s financial statements and related control processes (financially literate). One member must have (in the Board’s business judgment) accounting or financial management expertise. (This determination process is performed annually by the Board.) This committee has full access to FE’s and JCP&L’s senior management, outside auditors, and internal auditors. It also has authority and funding to retain independent legal, accounting, or any other outside expertise as needed. This committee’s basic functions are to oversee and review the integrity of FirstEnergy’s financial statements, including JCP&L’s financial statements, and the independent auditors’ qualifications; the independence and performance of the internal audit function; the adequacy of FE’s internal controls and corporate compliance structure, including computerized information system controls and security; adherence to corporate policies and review processes, including FirstEnergy’s Code of Business Conduct; and general discussion of FE’s policies with respect to risk assessment and risk management.
The Corporate Governance Committee consists of three or more independent directors (currently, in 2010, four outside directors). This committee is responsible for reviewing corporate governance policies and Board committee charters. It is charged with assessing (annually) Board and Board committee size, composition, and membership qualifications and with evaluating the effectiveness of the Board and the Board committees. The Corporate Governance Committee has full access to senior management and funding authority to retain outside expertise if needed.
Practices for director selection are discussed in FE’s proxy statements. The Corporate Governance Committee is responsible for identifying and recommending qualified director candidates to the full Board. This committee annually considers candidates in light of anticipated vacancies (e.g., upcoming retirements) and the size and composition of the Board in light of operating requirements (e.g., increased size of the corporation due to acquisitions). Director candidates are typically identified through other directors or by senior management; however, the committee is empowered to retain a search firm for this purpose, as necessary. Shareholders may also nominate director candidates, which

Final Report 133
6/20/2011
will be evaluated by the committee using the same requirements and processes as for Board/management-nominated directors.
All FE/JCP&L independent directors are compensated for their service, whereas management (non-independent) directors receive no additional financial consideration beyond their employee compensation.
Stated criteria/qualifications (generally) for director candidates include demonstrating or attaining:
♦ Integrity, honesty, and accountability, with a willingness to express independent thought
♦ Successful leadership experience and stature in an individual’s primary field, with a background that demonstrates an understanding of business affairs as well as the complexities of a large, publically held company
♦ Ability to think strategically and make decisions with a forward-looking focus
♦ Ability to assimilate relevant information on a broad range of complex topics
♦ Being a team player, with a willingness to ask tough questions in a constructive manner that adds to the decision-making process of the Board
♦ Independence
♦ Ability to devote necessary time to meet director responsibilities
As a whole, the Board seeks a mix of directors with diversity, age, background and training, business or administrative skills and experience, dedication and commitment, business judgment, analytical skills, problem-solving abilities, and familiarity with the regulatory environment.
The JCP&L Board of Directors consists of five members, two of which are outside directors. Directors include the Senior Vice-President and President of FirstEnergy Utilities, the FirstEnergy Vice President of Utility Operations, the President of JCP&L, and two outside directors with experience in consumer affairs and industry. One of JCP&L’s outside directors is also a director for the parent company, FirstEnergy. The JCP&L Board has no committees. The JCP&L Board of Directors derive their authority from the bylaws of Jersey Central Power & Light. JCP&L directors conduct regular meetings eight times a year in addition to occasional special meetings. Meetings are conducted via telephone call unless otherwise stated in the Notice of Meetings.
The Director of Internal Auditing reports to both the Chief Financial Officer (CFO) and the FE Board Audit Committee. Annually, the CFO reviews the performance and evaluation of the Director of Internal Auditing with the Chairman of the Audit Committee. The Director of Internal Auditing cannot be replaced without consultation with the Chairman of the Audit Committee.
FirstEnergy does not rebid audit services, but the Audit Committee does interview and approve new external audit partners, which are assigned every five years (as per SOX requirements). The Audit Committee also reviews and approves the assignment of other PricewaterhouseCoopers (PwC) key staff

134 Final Report
6/20/2011
to the audit engagements. PwC is not currently performing any non-audit work, but the Audit Committee is reviewing that policy in light of allowing PwC to perform audit-related work that does not result in any conflicts of interest and is in line with SOX requirements.
SOX requires quarterly certification to ensure that internal controls over financial reporting are operating effectively, that significant changes to internal controls or other factors that could affect internal controls are disclosed, and that significant deficiencies and material weaknesses are identified and corrected.
FirstEnergy has documented processes for assessing internal controls, and annual reviews of these processes are conducted. Any internal control deficiencies are identified and corrective actions are defined, implemented, and tracked. Process owners in the affected areas are assigned to conduct control testing to determine the operating effectiveness of key financial reporting controls and to provide input on changes, remediation status, and deficiencies. Internal Auditing conducts quality reviews of all testing performed by process owners to confirm it was conducted properly and adequately, in accordance with the defined test plans. Internal Auditing also ensures that additional testing is performed over new areas and existing areas that undergo changes in people, processes, or technology. The status of these tests and associated corrective actions are reported regularly to the FE Board Audit Committee and the FE Board.
All personnel responsible for SOX compliance testing are given annual training in their duties, with training completions tracked and logged. FirstEnergy reports its compliance with SOX internal control requirements through its 10-K and 10-Q reports and specifically states that:
♦ It is the responsibility of management to establish and maintain an adequate internal control structure as well as procedures for financial reporting.
♦ An assessment of the effectiveness of the internal control structure and of the procedures for financial reporting has been conducted.
FirstEnergy’s external auditor also reviews and makes comment on the adequacy on FE’s internal controls. PricewaterhouseCoopers submits an annual letter to FirstEnergy (as directed by New York Stock Exchange rules) discussing its internal quality control procedures, the results of its most recent quality control reviews of FE, and any steps it has taken to address any issues. Any material issues raised by governmental investigations of PwC and/or its employees within the preceding five years and any actions PwC has taken to address these issues are also addressed. This letter includes a statement that lead audit and quality review partners on each public audit client will be rotated every five years, that no client constitutes a material element of a partner’s earnings, and that evaluation and compensation practices prohibit compensation for selling non-audit services to audit clients.
The JCP&L Board addresses issues concerning:
♦ Environmental issues ♦ Operations

Final Report 135
6/20/2011
♦ Financial status ♦ Major events (e.g., Tinton Falls substation failure and impacts of storms/hurricanes) ♦ Local consumer topics (e.g., consumer choice on energy supply and Smart Meter Program)
The FirstEnergy Board receives detailed information prior to meetings on issues coming before it. Likewise, important information is summarized and tracked via a structured dashboard matrix. Topics include regulatory updates, ethics activities, SOX updates, and the status of internal audit recommendations.
The FE Board also monitors FirstEnergy’s corporate governance via specific criteria, comparing FE’s practices with Standard and Poor’s (S&P) 500 and utilities group companies. Factors evaluated include Board of Director makeup and practices, charter/bylaws, executive and director compensation practices, ownership/stock rules, director education, Audit Committee makeup and practices, among other items.
Findings & Conclusions
Finding VII-3 The review, selection, and composition of the FirstEnergy and JCP&L Board of Directors are appropriate, although some policies should be updated.
As noted earlier, JCP&L has its own Board of Directors that includes two outside directors (one who also sits on the FE Board), which adds another level of oversight. The JCP&L Board meets at least eight times annually and addresses topics specific to JCP&L, including company-specific financial information (e.g., net income status, budget variances, and short- and long-term debt issuances and obligations), key operational issues (e.g., safety, labor, reliability, relations, and issues with the New Jersey Board of Public Utilities (NJBPU) and status of major projects), and environmental issues (e.g., related to facilities, manufacturing gas plants expenses, and natural resource damage claims). All work is performed by the Board as a whole; there are no committees.
FirstEnergy’s Board consists of 11 directors, of which 10 are outside directors (the President & CEO of FirstEnergy is the only management director and he does not sit in on any committees). One of the FirstEnergy independent directors is also an independent director of JCP&L. The Board has a good mix of senior management experience that encompasses finance and accounting, utilities and nuclear generation, academics, human resources, and general business. Four directors have a strong background in finance and accounting. Ten directors are over 60 years old (one is over 70). The remaining two directors (one of whom is the President & CEO of FirstEnergy) are 59 years old. Tenure on the Board ranges from three years up to 22 years, with the average tenure being over 11 years. All independent directors are assigned to two committees. No directors serve on more than three other outside boards.
As mentioned earlier, two of JCP&L’s directors are independent, with one director (experience in human resources) also serving on the FE Board. The other independent director has experience in government and consumer services (New Jersey Division of Consumer Services) and has been on the JCP&L Board since 1983.

136 Final Report
6/20/2011
Although FirstEnergy has retirement guidelines for its directors, no such policy exists for JCP&L. Neither of JCP&L’s independent directors is scheduled to retire.
What constitutes independence in a director is specifically documented in the corporate governance policies and includes commercial/business/charitable relationships with First Energy, relationships with major suppliers to FirstEnergy, and any immediate family members who have such relationships. Corporate Governance Policies also require the Board to adhere to the definition of an independent director as promulgated (changed/updated) from time to time by the New York Stock Exchange (NYSE) The Corporate Governance Committee and the Board make specific determinations on any possible conflicts and such conflicts are disclosed in FE’s financial statements (proxy statement).
In addition to the FE Code of Business Conduct and Conflicts of Interest policy, directors are further bound by an additional, documented “Board of Director’s Code of Ethics and Business Conduct.” This code further defines conflicts of interest as they would apply to directors (third-party relationships, compensation, gifts/gratuities, personal use of company assets, and company loans) and requires directors to immediately disclose any potential conflicts of interest to the Corporate Governance Committee. This code also specifically tasks directors to oversee ethical behavior by FE management and employees and to encourage ethical behavior and reporting of unethical conduct. Finally, FirstEnergy has a documented Related Person Transaction policy that specifically defines a person related to a director or other person who is in a position of exercising control over FE decisions, stipulates how that person should be identified, and compiles relevant information, management review, approvals (Corporate Governance Committee), and appropriate disclosures.
Board policies specifically encourage Board training and continuing education programs, which may include internal strategy meetings, third-party presentations, and externally offered programs;. Board training topics are diverse and all FE Board members have made good use of training opportunities.
The Board is required to have FirstEnergy evaluate and, if necessary, recommend replacement of the Chief Ethics Officer and the Director of Internal Auditing. Executive sessions for directors are required at least six times in each calendar year, but in practice, the Board meets in executive session in most meetings.
Although the Board has not adopted a specific policy or philosophy on whether the roles of the CEO and Chairman should be separate, the FE Board Chairman is currently an independent director. Having an independent director serving as the chairman of the Board helps ensure the independence of the Board of Directors and is a good governance practice.
The Board does not believe in establishing term limits. Independent directors are required to resign and retire from the Board on the date they turn 72 years old, although the Board can extend a Board member’s service beyond that time if it feels doing so is in FirstEnergy’s best overall interest.
Board independence is defined in the corporate governance policies, and all Board members are required to annually update a Director’s Questionnaire to reaffirm their independence and lack of any

Final Report 137
6/20/2011
conflicts of interest. Likewise, FE officers are required to annually update an Officer’s Questionnaire. The Chairman of the Board is an independent director.
Although a majority of FE directors reside in Ohio, there is geographic diversity. Three directors come from the East Coast near JCP&L’s service territory.
With the upcoming Allegheny merger, the Board of Directors has decided to increase its total numbers to 13 by appointing two additional independent directors who are currently serving on the Allegheny Board.
Finding VII-4 FirstEnergy has developed a thorough and substantive Code of Ethics. This code could be further communicated to vendors and contractors to assure understanding and alignment.
FirstEnergy/JCP&L’s Code of Ethics is primarily defined in three documents: a business practice on “Ethics, Business Conduct, and Employee Concerns Line”; a corporate policy on “Code of Business Conduct”; and a policy defining the “Corporate Compliance Program.” The business practice on Ethics and Business Conduct succinctly states that ethical conduct applies to all employees as well as dealings with outside publics (regulators, government, customers, and suppliers). Authority and responsibility for maintaining these standards are vested with a designated Chief Ethics Officer who is a member of the Senior Management Committee. These stated responsibilities include:
♦ Establishing procedures to monitor and oversee compliance with ethics and business conduct standards
♦ Ensuring appropriate action is taken on reports of ethics and business conduct violations
♦ Developing ethics training programs
♦ Making appropriate changes to ethics and compliance policies in response to violations and potential legal and regulatory changes.
FirstEnergy’s Code of Business Conduct code is a more specific document with a cover statement by the President & Chief Executive Officer stating corporate-wide commitment to ethical conduct. This document lays out basic rules of employee conduct with examples on how to address common situations and how to go about reporting ethical violations without fear of retaliation. Specific areas include dealing with customers, suppliers, and political activities, among others. FirstEnergy’s code is reviewed annually by the Internal Audit Department and the Board of Directors.
The FirstEnergy Corporate Compliance Program further defines FirstEnergy’s ethics programs and policies by cross-referencing policies and practices to organizational guidelines from the United States’ Sentencing Guidelines Manual, which is prepared by the U.S. Sentencing Commission.
The Code of Business Conduct is distributed to each FirstEnergy employee, and all employees (non-bargaining) must undergo ethics training when first hired and acknowledge annually their compliance

138 Final Report
6/20/2011
with the code. Biennially, all employees must also take a refresher ethics course online and pass a written test with at least an 80 percent score. Training for each employee is documented and maintained on a LOTUS Notes system. In addition, supervisors and managers must undergo an additional ethics training course when they are hired/promoted to that level.
FirstEnergy uses a variety of ethics training courses including courses on ethical decision making, state regulatory codes of conduct, and FirstEnergy code of conduct as well as several courses on human resources topics (e.g., harassment and discrimination) and Sarbanes-Oxley compliance. Training on the state regulatory codes of conduct is conducted biennially for new hires and affected employees. Compliance and ethics training is conducted by a third-party vendor for all non-bargaining unit personnel or, in some cases, just supervisors (Ethics) and specific departments (Compliance). These courses are conducted on an as-needed basis, although a refresher course is conducted annually for all non-bargaining employees and contractors.
Potential ethics violations can be communicated up to the Chief Ethics Officer through local management, the Legal Department, or the Human Resources Department or by contacting the Employee Concerns Line. The Employee Concerns Line is a toll-free, 24-hour-a-day number maintained by an independent and outside entity. Employees using this hotline are assured of anonymity and can get updated actions taken by FirstEnergy on their report.
Follow-up investigations of ethics violations are the responsibility of the Ethics and Compliance Lead/Manager who reports to the Director of Internal Auditing. His duties include, among others, “managing ethics investigations to ensure that all issues are identified, researched, supported with all relevant and objective factual information, reviewed, and reported.” Allegations, whether they come through the hotline or by other means (e.g., internal auditing) are documented and maintained in an investigations log. This log includes investigation responsibility and a summary of each investigation’s result. All investigations are reviewed by the Director of Internal Auditing and the Chief Ethics Officer, and both individuals must agree to the resolution before the issue is closed out. Results of investigations are reviewed by the Board Audit Committee. All allegations are investigated (assigned out by the Chief Ethics Officer), usually within FE, although investigations will be contracted out to independent sources if specific expertise is required or if the nature of the allegation is deemed sensitive. Fraud is also explicitly addressed by Internal Auditing in developing its annual audit plan.
FirstEnergy has embarked on additional ethics training in the area of fraud. Approximately 150 FE employees have been through this training (none at JCP&L), and there are plans to roll out such training throughout FE.
The Board Audit Committee reviews ethics and fraud at each of its meetings. Important information and statistics are summarized in a dashboard and a detailed presentation is made annually. This annual review includes analysis of ethics/fraud trends, if any.
Annually, the Chief Ethics Officer provides the Board of Directors with a corporate ethics program update. This documentation includes an update of FirstEnergy’s Corporate Compliance Program,

Final Report 139
6/20/2011
noting responsibilities, key policies, communications, and training opportunities presented (e.g., interactive training, onboard training, and fraud training).
FirstEnergy has stated that it expects all vendors and contractors to adhere to ethical standards as outlined in the FE code. Standard contract provisions do include sections on employee obligations regarding gifts and gratuities/conflicts of interest, and a personal statement of compliance with FE ethics-related policies is signed annually by contractors with access to FirstEnergy systems. But no routine communications are made to all vendors and contractors regarding these expectations.
Finding VII-5 Board compensation is proper and committees are appropriately structured, although committee rotation should be further investigated.
FirstEnergy has analyzed annual surveys of Board of Director compensation over the past two years. This information has been provided by Hewitt & Associates (Hewitt), an outside company that specializes in these types of studies. This analysis includes retainer fees, meeting fees, stock-based long-term incentives, and insurance, among other items. The competitive benchmark used in this study compared practices in director compensation for a peer group of energy services companies as well as a general industry group of 130 companies.
In January 2010, FE board compensation was increased to the following levels (changes from 2009 noted in parenthesis):
♦ Annual cash board retainer – $60,000 (up from $40,000)
♦ Equity compensation – $86,000 (paid in the form of common stock)
♦ Cash board meeting fee – $1,500 per meeting (includes corporate office or facility visit and attendance at industry meeting or training at FirstEnergy’s request)
♦ Cash committee meeting fee – $1,500
♦ Committee chairperson retainer – $10,000 (up from $5,000 except the Nuclear Committee Chairman retainer, which remained the same); $15,000 for Audit Committee chairman.
♦ Committee member fee (Audit Committee members only) – $5,000
♦ Chairman of the Board additional cash retainer – $125,000
Equity and cash retainers and chairperson retainers are paid quarterly, while meeting fees are paid monthly. One of FirstEnergy’s independent directors also serves as an independent director on the Board of JCP&L for an additional cash retainer of $15,000 and $1,000 per meeting attended ($26,000 in 2009). Total director compensation for 2009 varied from approximately $165,000 to approximately $350,000 (approximately $200,000 on average). Almost all of this compensation came in the form of fees/cash and stock awards.
FirstEnergy has stated that the purpose of the director compensation is to link its personal interests to its long-term financial success. As such, within five years of joining the Board, each director must own

140 Final Report
6/20/2011
shares of FE common stock with an aggregate value of at least five times the annual equity retainer. Only non-employee directors receive compensation for their service on the Board.
These new levels will put FE director net total compensation at 3.4% above the median of blended peer group companies ($187,500 versus $181,369) from the Hewitt survey.
Directors are provided other benefits such as deferral of up to 100% of their cash retainer into cash or stock accounts, as defined in the Deferred Compensation Plan for Directors. Other benefits include limited use of corporate assets (e.g., corporate aircraft) and other perquisites valued in total of less than $10,000 per director. Independent directors do not receive any pension benefits. All forms of director compensation are listed in FE’s annual proxy statement.
Each director serves on two committees and each committee has four independent directors. Although Board policies state that consideration should be given to rotating committee members, this recommendation is not required. In practice, there is little rotation of committee assignments. For example, the four members of the Audit Committee have served in this post for tenures ranging from five to nine years, with the last change coming in 2005.
Finding VII-6 The Audit Committee and Corporate Governance Committee properly perform their oversight roles for FirstEnergy and Jersey Central Power & Light, although the responsibility for oversight of risk management could be further clarified.
Internal Auditing makes quarterly presentations to the Board Audit Committee. This demonstration includes a dashboard (summary matrix) on total recommendations, the number of recommendations implemented , and the number of open recommendations; a listing of significant and other findings; and a summary of recommendations by type (including internal control).
The Chief Risk Officer reports to the Audit Committee at each meeting, and it appears that the Audit Committee is responsible for oversight of risk management. The Audit Committee charter, however, provides for the committee to generally discuss FE policies only with respect to risk assessment and risk management.
The Board Corporate Governance Committee provides further oversight by tracking FE corporate governance practices and policies, reviewing the performance of the Board as a whole, and vetting candidates for directorships.
Finding VII-7 The relationship between the Board of Directors and Internal Auditing is appropriate, although reporting relationships should be further clarified.
The Director of Internal Auditing reports to both the FE Board Audit Committee and the FE Executive Vice President & Chief Financial Officer. The distinction in this dual-reporting relationship is not stated in corporate governance policies or in the Audit Committee charter. The Audit Committee

Final Report 141
6/20/2011
Chairman does meet with the Director of Internal Auditing at each committee meeting and gives input to and approves the Director of Internal Auditing’s performance evaluation.
A plan is under review to periodically move high-performing employees into Internal Auditing for training purposes. This will help ensure that Internal Auditing is viewed as a career-enhancing experience, thereby attracting capable employees to this function, enhancing the function’s independence, and serving to further expand ethical awareness throughout the organization.
Finding VII-8 The Board exerts proper control over external auditors; however, FirstEnergy has no plans to rebid outside audit services.
In accordance with the Audit Committee charter, there have been no fees paid to FirstEnergy’s external financial auditing firm for non-auditing services to FirstEnergy or any of its companies and subsidiaries. Non-auditing services include bookkeeping; financial systems design and implementation; appraisal, valuation, or actuarial services; internal auditing outsourcing services; and any broker, dealer, or legal services, among others. External auditing fees have remained stable over the past five years, averaging $6.5 million per year (2005 through 2007) and declining to less than $6.0 million the past two years (2008 and 2009).
The Board Audit Committee can approve the financial auditor’s performance of non-audit services only after considering the auditor’s independence in regard to the services provided. The external financial auditor performs normal auditing-related services for JCP&L, including financial statement assurance services and tax services.
As mentioned earlier, the Board Audit Committee meets frequently in closed session with PwC and reviews and approves partner rotations and assignment of key staff. FirstEnergy, however, has no plans to rebid external audit services.
Finding VII-9 FirstEnergy and Jersey Central Power & Light have adequately complied with Sarbanes-Oxley/NYSE requirements and have established good internal controls, although outside counsel is not required to report wrongdoing up to the Board of Directors.
The outside financial auditor regularly reports any material weaknesses in internal controls over financial reporting to the Audit Committee.
FirstEnergy has well-established internal processes for evaluating control points, identifying any material weaknesses, and implementing and tracking corrective actions. These processes include charts-listing process narratives to include control ID, control title, process description, scope, organizational unit covered, where preformed, whether the process is significant and a key control, and the process owner, among other information. Each process has a detailed narrative that includes a process flowchart, beginning and ending points of the process, significant systems involved, governing policies, third-party involvement, and recording and reporting, among other information and direction.

142 Final Report
6/20/2011
All personnel charged with performing SOX control testing are given appropriate training to accomplish their responsibilities. This training includes accessing and using the automated system for test conduction and includes modules for processes, work papers, selecting samples and sample size, and test rejection criteria (Internal Audit review), among other information.
SOX/SEC rules require outside counsel appearing and practicing before the SEC on FirstEnergy’s behalf be required to report wrongdoing/ethics concerns up through senior management to the Board Audit Committee. This requirement does not extend to other outside counsel, and FE does not have any policies in place requiring outside counsel (not appearing or practicing before the SEC) to report any observed wrongdoing/ethics concerns up through senior management to the Board of Directors.
Recommendations
Recommendation VII-2 Regularly review and update corporate governance policies. (Refer to Finding VII-3)
Update the Audit Committee charter to state that it is the Board’s position that the Chairman role should be filled by an independent director. Also evaluate the impact of not having a policy for retirement for JCP&L independent directors and make any changes, as necessary.
Recommendation VII-3 Periodically send out letters to all vendors and contractors informing them of FE’s Code of Conduct. (Refer to Finding VII-4)
Include within the body of this letter explicit language on FE’s expectations that vendor/contractor employees will abide by these standards when doing business with FE.
Recommendation VII-4 More routinelyrotate directors through committees. (Refer to Finding VII-5)
This rotation will give directors a broader view on FE operations and governance and help ensure fresh perspectives on each committee. Exceptions can be made for certain committee chairs where a very specific expertise is involved (e.g., Nuclear and Audit).
Recommendation VII-5 Review and update the Audit Committee charter to specify that the Audit Committee is responsible for oversight of all risk management. (Refer to Finding VII-6)
If this stipulation proves to result in work overload for the Audit Committee, establish a Risk Management Committee. Given the upcoming merger with two additional directors coming aboard and the further expansion of potential risk, now is the appropriate time to consider this change.

Final Report 143
6/20/2011
Recommendation VII-6 Update the Audit Committee charter to state that the Director of Internal Auditing functionally reports to the Audit Committee and uses FE for logistical support. (Refer to Finding VII-7)
Update other documents (e.g., position description) to reflect this change. Update the organizational chart to show a solid line between Internal Auditing and the Audit Committee and a dotted line between Internal Auditing and the CFO (or other report).
Recommendation VII-7 Periodically rebid external audit services. (Refer to Finding VII-8)
This formal process should be conducted periodically (e.g., every five years) and can coincide with the rotation of the audit partner. Competitive bidding can help ensure high-quality services (e.g., oversight) at the best overall value. It is also a way of encouraging fresh and more independent views/points of views.
Recommendation VII-8 Require all outside counsel to report wrongdoing up through the Board, as is now required from outside counsel practicing before the SEC. (Refer to Finding VII-9)
All outside counsel to FE/JCP&L (not just those practicing before the SEC) are in a position to detect fraud within the company, or to identify conditions that could lead to fraud. Outside counsel should view FE/JCP&L as their client (not the department or manager where they are performing work). As such, the Board of Directors should expect the same fraud reporting obligation from all outside counsel as required by attorneys practicing before the SEC. This expectation can be expressed in a letter to all outside counsel in a manner similar to Recommendation VII-3.
C. Organization Structure
Organizational structure issues have been addressed in each individual section to the extent that there are findings or recommendations in each area.
D. Human Resources
Background & Perspective
This section provides an overview of the Human Resources (HR) function as provided by SERVECO and JCP&L Human Resources.
Organization and Staffing
The Jersey Central Power & Light (JCP&L) Human Resources organization provides onsite HR support to JCP&L managers and employees. The Human Resources Manager reports directly to the JCP&L

144 Final Report
6/20/2011
President and has seven direct reports. The HR Manager is responsible for JCP&L HR and safety activities. She coordinates with SERVECO HR to disseminate FirstEnergy (FE) policy and information. In addition, she administers the performance management process for JCP&L and coordinates JCP&L Leadership Team meetings.
Direct reports include three advanced HR representatives. They perform high-level HR generalist functions supporting HR programs and initiatives, including recruiting, testing, and hiring of bargaining-unit employees, benefits open enrollment, investigations, EEO compliance and affirmative action plan development, and monitoring of medical case management. In addition, they provide HR support services for managers and employees.
One of the advanced HR representatives is assigned to northern New Jersey locations. Her specific functions include coaching, training, EEO investigations, and preparation of the JCP&L equal employment opportunity (EEO)/affirmative action plan. In addition, she coordinates new supervisor training with SERVECO HR. She also coordinates medical case management and Family Medical Leave (FML) applications. She also conducts open enrollment meetings during the annual benefits program.
A second advanced HR representative performs similar duties for central New Jersey locations. In addition, she represents JCP&L on the Monmouth County Workforce Investment Board and Disabilities Committee.
A third advanced HR representative supports workforce planning and performs recordkeeping for corporate Human Resources. In addition, she helps create and manage the HR budget. She also does work similar to the other advanced HR representatives. Another of her tasks is to perform EEI testing and bargaining recruitment, including recruiting for the Power Systems Institute (PSI) program (described in Finding VII-18).
An associate HR representative supports recruiting, testing, and hiring of bargaining-unit employees, including the Power Systems Institute program’s line workers and substation electricians. She also administers JCP&L’s drug and alcohol random testing program. In addition, she conducts employee orientations, maintains HR files, conducts EEI testing, and administers the flu shot program.
An assistant business analyst provides data for HR reporting, including the HR scorecard data, the discipline log, and safety recordkeeping. She also conducts discipline process tracking, processes invoices, maintains central New Jersey HR files, assists with commercial drivers license files, administers the flu shot program, and logs United Way pledges.
The remaining two staff members are a senior safety representative and an advanced safety representative. These employees are responsible for implementing safety programs, consulting on safe work practices, conducting accident investigations, and participating in corporate safety analysis and planning.

Final Report 145
6/20/2011
The advanced safety representative maintains New Jersey Commercial Driver License (CDL) files, coordinates first aid training, conducts safety programs/meetings, field audits, and safety orientations, and assists with safety investigations.
The senior safety representative maintains central New Jersey CDL files, conducts safety training for both internal and external groups, participates as part of mutual assistance during storms, and assists with safety investigations. He also researches and distributes safety-related materials to field employees.
The JCP&L Human Resources organization is shown in Exhibit VII-4.
Exhibit VII-4 JCP&L Human Resources Organization
as of July 31, 2010
Source: Information Response 54
Although the JCP&L HR Manger reports to the JCP&L President, the JCP&L HR organization is very much a part of FirstEnergy Service Company (SERVECO) HR, which is responsible for policy, strategy, common systems, and company-wide HR initiatives. JCP&L HR is responsible for implementation of these corporate initiatives and direct support of local management and employees.
The SERVECO HR organization is lead by a Senior Vice President (SVP) who reports to the President and CEO of FirstEnergy Corp. Reporting to the SVP of HR is a Vice President with a staff of 50 who are responsible for operational HR. Their functions include benefits and compliance, corporate human resources, labor relations, and health and absence management and safety.
Also reporting to the SVP of HR is a director of compensation, retirement programs, and succession planning. Within her 42-person organization, one team member is responsible for employee
Morristown, NJ 1,426
JCP&LPresident, JCP&L
JCP&L
Morristown, NJ 8
JCP&LMgr, Human Resources
CO-JCP&L-Human Resources
Morristown, NJ
JCP&LAdv Representative
CO-JCP&L-Human Resources
Morristown, NJ
JCP&LAssoc Representative
CO-JCP&L-Human Resources
Red Bank, NJ
JCP&LAdv Representative
CO-JCP&L-Human Resources
Red Bank, NJ
JCP&LAdv HR Representative
CO-JCP&L-Human Resources
Morristown, NJ
JCP&LAdv Safety Representative
CO-JCP&L-Human Resources
Red Bank, NJ
JCP&LSr Safety Representative
CO-JCP&L-Human Resources
Red Bank, NJ
JCP&LAsst Business Analyst
CO-JCP&L-Human Resources

146 Final Report
6/20/2011
compensation, human resources information system (HRIS), and payroll. This group also includes a supervisor of retirement programs, a manager of executive compensation, and a senior consultant for pension and executive compensation.
SERVECO HR also has a 13-person group that is responsible for learning and development. This group is led by a director. Reporting to her is a manager of learning and development and ten learning and development specialists. These individuals are responsible for developing the learning and development strategy and all have design, development, and delivery experience. In addition, the group performs some facilitation for other groups and new teams, including communications work and group interventions.
A director of workforce planning and HR service delivery also reports to the HR SVP. She has an organization of 30 individuals who are primarily responsible for the recruitment and hiring of non-bargaining-unit employees and for workforce planning.

Final Report 147
6/20/2011
The FirstEnergy Service Company’s Human Resources organization is shown in Exhibit VII-5.
Exhibit VII-5 FirstEnergy Human Resources Organization
as of July 31, 2010
Source: Information Response 54
HR Steering Committee
A FirstEnergy HR Steering Committee provides operating management oversight of HR initiatives and assures alignment to business strategies. In addition, this group provides content review and input on training content.
The HR Steering Committee is composed of nine key individuals:
♦ SVP, Human Resources ♦ Executive Vice President (EVP) and Chief Financial Officer (CFO) ♦ SVP and President, FE Utilities
Akron, OH 13,602
FirstEnergy CorpPresident & CEOPresident & CEO
Akron, OH 138
SERVECOSVP, Human ResourcesHuman Resources-FE Svcs
Akron, OH
SERVECOExcutive Development Advisor
Human Resources-FE Svcs
Akron, OH 13
SERVECODir, Learning & Development
Learning & Development-FE Svcs
Akron, OH 7
SERVECOMgr, Learning & Development
Learning & Development
Akron, OH
SERVECOSr Learning & Dev Spec
Learning & Development-FE Svcs
Akron, OH
SERVECOSr Learning & Dev Spec
Learning & Development-FE Svcs
Akron, OH
SERVECOStaff Learning & Dev Spec
Learning & Development-FE Svcs
Akron, OH
SERVECOAdv Learning & Dev Spec
Learning & Development-FE Svcs
Akron, OH
SERVECOAdv Learning & Dev Spec
Learning & Development-FE Svcs
Akron, OH
SERVECOExecutive Assistant
Learning & Development-FE Svcs
Akron, OH 42
SERVECODir, Comp Retmnt Prgms & Succession Pln
Comensation-Pension-Exec Comp
Akron, OH 28
SERVECOMgrm Emp Compensation, HRIS & Payroll
Emp Compensation, HRIS & Payroll
Akron, OH 9
SERVECOSupv, Retirement Programs
Exec Benefits & Capital Accumulation
Akron, OH 2
SERVECOMgr, Excutive Compensation
Excutive Compensation
Akron, OH
SERVECOExecutive Assistant
Compensation-Pension-Exec Comp
Akron, OH
SERVECOSr Consultant
Compensation-Pension-Exec Comp
Akron, OH 30
SERVECODir, Workforce Plng & HR Svc Delivery
Workforce Plng & HR Svc Delivery
Akron, OH 13
SERVECOMgr, Recruiting
Recruiting
Akron, OH 1
SERVECOHR Service Delivery Lead
HR Service Delivery-Shared Services
Akron, OH 6
SERVECOHR Service Delivery Lead
HR Service Delivery-FENOC
Akron, OH 3
SERVECOHR Service Delivery Lead
Strategic Planning & Operations
Akron, OH 2
SERVECOHR Service Delivery Lead
Energy Delivery & Customer Service
Akron, OH 2
SERVECOHR Service Delivery LeadHR Service Delivery-Fossil
Akron, OH
SERVECOExcutive Assistant
Workforce Plng & HR Svc Delivery
Akron, OH
SERVECOSr HR Representative
Workforce Plng & HR Svc Delivery
Akron, OH 49
SERVECOVP Human Resources
Human Resources
Akron, OH 21
SERVECOMgr, Emp Ben & Compliance
Employee Benefits, & Compliance
Akron, OH 5
SERVECOMgr, Corporate
Human Resources
Akron, OH
SERVECOExecutive Assistant, VP
Human Resources
Akron, OH 9
SERVECODir, Labor Relations & Safety
Labor Relations
Akron, OH 7
SERVECOManager
Labor Relations
Akron, OH 7
SERVECOConsultant
Safety
Akron, OH
SERVECOExecutive Assistant
Akron, OH 5
SERVECOHealth & Absence Mgmt Lead
Health & Absence Mgmt
Akron, OH
SERVECOExcutive Assistant, Sr Mgmt
Human Resources-FE Svcs

148 Final Report
6/20/2011
♦ President and CNO ♦ Vice President (VP), Fossil ♦ EVP and President, FE Generation ♦ Director, Learning & Development ♦ President, FirstEnergy Solutions ♦ EVP and General Counsel
HR Technology
SERVECO’s HR technology platform is the SAP enterprise resource planning (ERP) system’s human capital management (HCM) version 6.0. This system manages the human resources information system’s (HRIS) master data, including benefits. This system is a comprehensive, integrated human resources management solution that helps executives and human resources professionals forecast, plan, and hire the best talent as well as cultivate the skills of and train their workforce.
SERVECO uses three SAP HCM modules (in addition to SAP payroll).
♦ SAP E-Recruiting: This application is a fully web-enabled, end-to-end recruiting solution that accelerates and streamlines the recruiting process. Recruiters can take advantage of this talent pool to quickly find the staff they need, while collaborating closely with hiring managers throughout the hiring process. Applicant tracking and reporting functions help organize the processing of job applications and monitor the effectiveness of the recruiting organization. A collaboration platform links SAP e-recruiting to external systems such as job boards, recruiting service providers, and a company’s internal systems.
♦ SAP Enterprise Learning: This application integrates functionality for back-office enterprise resource planning, with functionality for both learning management systems (LMSs) and learning content management systems (LCMSs) in a single offering. It provides a comprehensive, blended learning environment for all individuals who address training needs. SAP enterprise learning supports traditional classroom training, virtual learning events, web-based training, and computer-based training as well as collaboration features. It is fully integrated with the SAP ERP HCM solution.
♦ The Cross Application Time Sheet (CATS): This application allows employees or administrators to track employee working times. Time data is recorded (e.g., with information referring to orders and cost centers) and can be transferred to corresponding applications and components of the SAP business suite.
SERVECO performs an upgrade or patch project every 24 months. The next upgrade or patch is scheduled to begin in 2012.
SERVECO has a four-year HR process improvement and technology enhancement plan (2010–2013). 2010 efforts focused on strengthening learning management, payroll process improvements, e-

Final Report 149
6/20/2011
recruiting, employee on-boarding, open-enrollment enhancements, and workforce planning enhancements. The learning management, payroll, and e-recruiting projects extend into 2011.
2011 will also bring new technology to the performance management process. SERVECO will implement new SAP technology including SAP EhP4, SAP human capital management (HCM), SAP employee and manager self-service (ESS & MSS) and SAP business warehouse (BW).
Subsequent years will bring technology support for compensation budgeting and market pricing, talent management, and succession planning.
Performance Management
FirstEnergy and its operating companies participate in a common performance management program. All full-time regular and part-time employees who are not represented by a labor union are eligible for the Employee Rewards Program.
The performance management process provides guidance and tools to help supervisors establish clear expectations for employees. This process helps supervisors more systematically measure and improve employee productivity and job performance that is aimed at establishing and enhancing a relationship of trust, understanding, and cooperation. This process is management’s primary tool for planning, monitoring, and evaluating performance.
Objectives of the Performance Management Process
♦ Link corporate, department, group, and employee accountabilities and priorities.
♦ Provide clear—mutually understood—performance objectives, critical success factors (competencies), performance measures, and development plans.
♦ Promote ongoing feedback and encourage thorough documentation of progress and results.
♦ Link performance to compensation.
To ensure consistent administration, supervisors are trained to establish job objectives and help employees create developmental plans.
The performance management process is an ongoing cycle and includes four steps:
1. Set objectives.
2. Create development plans.
3. Conduct mid-year review.
4. Conduct year-end review.
These steps are intended to include ongoing communication and feedback.

150 Final Report
6/20/2011
Objective Setting
Objective setting takes place in the beginning of each year. It begins with a discussion between the employee and supervisor to establish a mutual understanding of the major accountabilities and expected results for successful performance on the job. The objectives are intended to be relevant to corporate and departmental goals, within the employee’s control to achieve, and measurable in terms of quantity, quality, cost, and timeliness.
Critical Success Factors (CSFs)
Critical success factors (CSFs) are defined as competencies that encompass the knowledge, skills, and behaviors that distinguish performers. The CSFs were designed to ensure alignment with FirstEnergy’s mission, vision, and values. Performance appraisals reflect how an employee’s performance measures up against the CSFs required for that position’s level. The supervisor and employee discuss and agree upon the specific CSFs that are required to successfully perform the job.
Development Plans
Development plans generally address identified critical success factors as well as job- and performance-related skills. Action plans to improve job performance or to enhance the employee’s professional development are discussed with the employee. The supervisor then works with the employee to determine action plans with specific activities and mutually agreed-upon target dates.
The employee and supervisor determine the most effective way to provide the required development, taking into consideration available resources, including time, money, availability, and expertise. A variety of development activities can be considered that generally fall under three categories: experience; education/training; and professional/community involvement. They may include the following:
♦ On-the-job or external coaching and counseling ♦ Expanding job assignments ♦ Acting as project lead ♦ Rotating assignments ♦ Facilitating training sessions or meetings ♦ Participating on task forces or teams ♦ Preparing and making presentations ♦ Education/training ♦ Attending corporate-offered training ♦ Attending classes at universities or other learning institutions ♦ Performing writing assignments ♦ Attending seminars, workshops, or conferences ♦ Taking self-study courses ♦ Reading job-related books or periodicals/listening to tapes or CDs ♦ Professional/community involvement

Final Report 151
6/20/2011
♦ Joining and becoming active in technical/professional associations ♦ Serving on external boards and committees
The Employee’s Role
Employees are expected to meet or exceed the standards of performance agreed upon with their supervisor. In addition, employees are expected to track accomplishments, participate in performance discussions, advise their immediate supervisor when problems or obstacles occur, and ask for additional feedback as needed. Employees are also expected to take ownership of their developmental needs by initiating and implementing the action plans drafted in partnership with their supervisor.
Ongoing Feedback and Coaching
Supervisors are expected to provide feedback and coaching on an ongoing basis throughout the performance year by discussing problems, opportunities for enhanced performance, and changes that are occurring. Supervisors are expected to provide guidance and support, identify development needs, and recognize achievement.
Mid-Year and Year-End Reviews
During the mid-year and year-end reviews, the manager and employee discuss the performance results against the major objectives, the critical success factors, and the development plans. Results are documented on specified forms.
At a minimum, formal reviews are completed at mid-year and at year-end. Additional formal reviews may be completed at management’s discretion. A formal closeout review is completed any time an employee transfers to a different area.
During the formal review, the employee and supervisor will meet to discuss:
♦ Results and accomplishments as measured against the established objectives and critical success factors
♦ Accomplishments of the development plan
♦ Contributing circumstances that affected performance
♦ Action plans to begin the next performance-review cycle
Employee Development
The amount of money JCP&L has invested in training and development for its employees has remained stable over the last three years, in spite of the economic downturn. The per-employee training expenditure per JCP&L employee for 2005–2009 is provided in Exhibit VII-6.

152 Final Report
6/20/2011
Exhibit VII-6 Average Annual Training Spending (Actual) Per Employee
2005 to 2009
Avg. Training Spend per Employee
2005 $882.06
2006 $970.09
2007 $1,288.26
2008 $1,766.78
2009 $1,228.35 Source: Information Response 65
In 2008, the increase in JCP&L’s workforce development training dollars was attributable to the opening of a new training location in New Jersey and the start of a new Power Systems Institute (PSI) training class in New Jersey. (See Finding VII-18 for a discussion of the Power Systems Institute.)
Talent Talks
The Talent Talks initiative is designed to identify the levels of employee performance and potential in order to determine activities that will prepare FirstEnergy’s future leaders. Top performers, solid performers, as well as those in need of improvement are discussed in terms of their potential for development. Through discussions with the Leadership Team, developmental opportunities are identified to grow the necessary skills. For management, Talent Talks provide a foundation for succession planning at the business units (including JCP&L). These discussions help leaders at all levels better assess talent, discuss the capability of employees, identify high performers, and ensure that talent is being developed.
Talent Profile
Talent profiles are created in an online template by each employee to record his or her credentials, career aspirations, and future job interests. Employee managers also access the system to record their views on employee strengths and growth needs. Talent profiles are intended to be discussed during performance management discussions and used to create development plans. Employees are responsible for their own development, with input from their managers.
Leadership NJ
Annually, an employee (or two) is selected to participate in year-long Leadership New Jersey seminar sessions. These meetings are intended to educate the participant on the various facets of New Jersey, such as education, social services, criminal justice, politics, government, environment, etc. The

Final Report 153
6/20/2011
participant interacts and networks with individuals statewide in learning about the fabric of the state and how his or her leadership can effect positive change.
MBA Program/Educational Assistance
JCP&L has partnered with Georgian Court University to provide opportunities for employees to obtain their MBAs, while using JCP&L’s Educational Assistance Program.
Compensation and Benefits
FirstEnergy provides a competitive Total Compensation Program, which is intended to help attract, retain, and reward employees whose performance, contribution, and behaviors drive FE’s success. The goal of this program is to provide the basis for sound and consistent compensation administration across FirstEnergy. All active, non-represented employees are eligible to participate.
FirstEnergy’s program (including the plans and policies) is designed to provide the flexibility to accommodate the individual needs of all FE business units. The program’s intents are to encourage desired performance, contribution, behaviors, and results and to deliver rewards in a nondiscriminatory manner that can be easily understood and administered by management while fostering equity and consistency.
Pay Philosophy and Benchmarking
FE’s compensation philosophy targets total compensation at or above the 50th percentile with those of other utility companies that are similar in size and revenue scope. FirstEnergy supports a pay-for-performance philosophy in base and variable pay to reward individual, business unit, and corporate results.
FirstEnergy benchmarks standard rates (base pay), short-term incentive targets, long-term incentive targets, and total compensation at the utility industry’s median (50th) percentile. The standard rate structure, short-term incentive targets, and long-term incentive targets are benchmarked annually to ensure competitiveness with FirstEnergy’s peer group and alignment with FE’s compensation philosophy.
The standard rate of non-bargaining jobs is determined through market pricing. Market pricing provides a reliable and sound method to establish standard rates that are consistent with those of other comparable companies. Employees have the ability to achieve increased compensation through their individual performance. To encourage pay for performance, a salary range encompassing 80% to 120% of the standard rate is used. All employees should be compensated within this range. Employees performing the full scope of their job should be compensated within a range of 90% to 105% of the standard rate. The high end of this range is applicable for employees with sustained exceptional performance. Employees not yet performing the full scope of the job are paid at the lower end of the range.

154 Final Report
6/20/2011
In 2010, the average range position for JCP&L executives and management ranged from 93 to 107.6 percent. The average range position indicates how incumbents in JCP&L’s executive and management jobs are paid relative to the standard rate. (100% is equal to the standard rate.)
Annually, FirstEnergy participates in numerous compensation surveys from various major consulting companies to obtain current utility and non-utility market data. Some of the major consulting firms with which FirstEnergy participates include Towers Watson, Hewitt, Mercer, Hay Group, Culpepper, and World-at-Work.
Pay for Performance
FirstEnergy is committed to pay for performance. All employees, including bargaining-unit employees, participate in a short-term incentive. A represented employee may receive up to 6% based on key performance indicator (KPI) results.
KPIs are set by FE and vary by operating unit. All employees have two corporate (FE) financial goals and one operational goal:
1. Achieve earnings-per-share (EPS) guidance (normalized).
2. Achieve reduced net debt balance levels.
3. Drive energy delivery safety performance as measured by the Occupational Safety & Health Administration (OSHA) incident rate.
All New Jersey regional employees have the following five additional operational goals:
1. Achieve distribution System Average Interruption Duration Index (SAIDI) goals to meet state reliability requirements.
2. Achieve local JCP&L OSHA incident rate.
3. Achieve local motor vehicle accident rate (MVAR).
4. Achieve FE Utilities’ operating margin goal.
5. Achieve transmission outage frequency (TOF) goals to meet reliability requirements.
In addition, represented employees in New Jersey have an individual “triple play” goal with four components:
1. Achieve zero OSHA safety incidents.
2. Achieve zero MVAR incidents.
3. Attain perfect attendance.
4. Achieve call-out response for a stretch payout.

Final Report 155
6/20/2011
Executive Compensation
An executive compensation plan is offered to the top 37 executives in FE. At JCP&L, only the President is eligible for this plan. A key element of the executive compensation plan is the Long-Term Incentive Program (LTIP). This is an equity-based program designed to reward executives for achievement of FirstEnergy goals that are intended to increase shareholder value. The LTIP provides preferred shares and restricted stock units. Restricted stock units are distributed on an annual payout based on a three-year cycle. Average performance of the EPS, corporate safety, and operational KPIs forms the basis of this payout. The program also offers a deferred compensation option.
Employee Benefits
FirstEnergy offers a comprehensive employee benefit program. The benefits are similar for represented and non-represented employees, although some differences in coverage and employee contribution exist as a result of the collective bargaining agreement. The benefit program for all employees includes:
♦ Medical (PPO) options ♦ Prescription drug options ♦ Dental and vision options ♦ Group life insurance ♦ Flexible spending accounts ♦ Long-term care ♦ Home and auto insurance ♦ Financial planning
Employee Wellness
The following is list of actions taken to improve the health and wellness of JCP&L employees:
♦ Annual flu shots ♦ Health education through newsletters ♦ Health fairs and biometric screenings—under consideration for 2010/2011 ♦ 100% coverage under health care plans for preventive services ♦ Globalfit discount program on fitness center memberships and exercise equipment ♦ Know Your Numbers awareness education—scheduled for Fall 2010 (postponed to 2011) ♦ Medical providers’ websites on health and wellness ♦ Employee Assistance Program (EAP) services ♦ Smoking-cessation programs through medical vendors ♦ Disease management program ♦ Weight-loss programs through medical vendors ♦ Free diabetic supplies for participation in disease management program ♦ Onsite physical therapist education regarding body mechanics and injury prevention

156 Final Report
6/20/2011
Retiree Health Care Benefits
Eligible retirees have health care, vision, dental, and prescription drug plans available to them.
As with compensation, SERVECO benchmarks it benefits programs using data provided by national benefits consulting organizations such as AON and Hewitt. SERVECO participates in a number of benefits surveys throughout the year and keeps up to date on benefit trends and regulations on a regular basis.
Recruiting and Staffing
Recruiting and staffing for JCP&L’s represented employees is done by JCP&L HR representatives in New Jersey. Non-represented staffing is performed by SERVECO HR.
In general, the recruitment process begins when the business unit identifies a position to be filled. If the position is a new one, the process will start in compensation with job specification and market pay analysis. Once the job is defined and the pay range determined, the recruiter consults with the hiring manager to agree on process and timeline. The recruiting process is supported in the SAP e-recruiting module (implemented in 2009). The recruiter then begins sourcing. Depending on the position, the posting may be limited to internal or expanded to external sources. The recruiter performs high-level screening for basic qualifications. Qualified applicants are forwarded to the hiring manager for review and the interview process is arranged. Most recruitment is done by SERVECO HR. FE does not rely heavily on executive search firms.
On-Boarding Process
SERVECO has recently implemented a new employee on-boarding process that is designed to rapidly integrate the new hire into his or her position. This program replaces much of the traditional orientation process that was spent completing benefit forms. The new process provides greater standardization and more complete information about FirstEnergy. It is also intended to make better use of the new employee’s time, reduce turnover for new hires and the corresponding cost of attrition.
The program begins at the time a prospective employee accepts a position with FirstEnergy. Key elements include online forms and benefits enrollment using the New Employee Hub website for pre-start activities. More significantly, the program provides a connection plan to ensure the employee makes a smooth start. Hiring supervisors follow a Supervisor Connection Plan for pre-start, first-day, first-week, first-month, and close-out actions to be taken for new employees. A peer advisor is also assigned who follows the Peer Advisor Connection Plan with new employees. All new employees attend a central on-boarding session. At this point, the employee is made aware of the connection plan and his or her role. To measure the effectiveness of the on-boarding process, SERVECO (through an external vendor) conducts a survey of the new employee. Survey results, along with connection plan reports, are reviewed by SERVECO learning and development staff.

Final Report 157
6/20/2011
Safety
This section provides an overview of JCP&L’s safety programs and performance.
Safety Personnel
The administration of the overall safety process is managed by a combination of centralized (i.e., shared support across the regions) and decentralized (i.e., local safety representatives who report directly to regional management) resources.
The Corporate Health & Safety Department (SERVECO) is responsible for constructing industry-specific policies/programs (relative to safety), maintaining compliance to regulatory/consensus standard(s), developing and maintaining a safety-specific database and resources, and approving specific personal protective equipment (PPE). In addition, this department oversees the maintenance of the OSHA 300 Log and is responsible for managing all contacts with OSHA.
Within FE, there is also an Energy Delivery Safety Department. This group is responsible for developing strategic measures related to the implementation of policy and programs that are devised by the Corporate Health & Safety Department (SERVECO). Once implemented, the department is further responsible for assessing and enforcing implementation through various audits and applications.
The regional safety departments, including JCP&L in New Jersey, are responsible for overseeing compliance with all programs and policies. This oversight includes federal (both regulatory and consensus), corporate, and local compliance. They maintain the OSHA 300 Log for JCP&L and support the accident/incident investigation process.
In New Jersey, JCP&L has two safety professionals. The senior safety representative (see Exhibit VII-4) has an extensive background in workplace safety. His certifications include:
♦ Certified Utility Safety Administrator (CUSA) – National Safety Council ♦ OSHA 30 Certification ♦ Medic First-Aid Instructor ♦ Defensive Driving Instructor – National Safety Council ♦ Certified NJ Fire Level 2 Instructor ♦ Licensed NJ Fire Inspector
In addition, he is active in many safety-related professional groups, including:
♦ New Jersey Utility Association Safety and Health Committee and past Chairperson ♦ Board of Trustees – New Jersey State Safety Council and member of Executive Board ♦ Member of the New Jersey Emergency Preparedness Association Training Committee and
Conference Safety Officer ♦ Member of the Federal Safety and Health, Southern, and Northern Safety Committees

158 Final Report
6/20/2011
Safety Committees
FirstEnergy has an All Hands’ Safety Committee led by the corporate (SERVECO) Health & Safety Department. The committee is composed of safety representatives from Energy Delivery (ED), Fossil Generation, and Nuclear. The group meets three times per year to discuss common issues and concerns, including OSHA investigations, OSHA regulation, new programs and processes, and other safety-related issues.
There is also a Union/Management Safety Committee (ED leadership). This group meets quarterly and is attended by two regional Presidents (committee sponsors), management representatives from each operating company, Union leadership (representing each local), a representative from Workforce Development, and select representatives from corporate Health and Safety (SERVECO) and Energy Delivery Safety. It addresses common issues in the regions and works to devise universal solutions (if applicable).
Corporate Health & Safety also holds a monthly safety conference call with regional safety representatives. Regional safety representatives share information and discuss recent events, lessons learned that are specific to accident investigations (i.e., root cause, methods to prevent recurrence, tracking/trending, etc.), and other common issues across the region.
There are also Regional Safety Committees in each region including one for JCP&L. The Executive Safety Committee is chaired by JCP&L’s President and is attended by his direct reports, safety representatives, and Union leadership. The agenda focuses on safety issues that are specific to JCP&L. In addition, there is a Departmental Safety Committee that is chaired by the regional safety representative and attended by executive management and regional supervision.
Safety Programs
SERVECO maintains a health and safety database that is a repository of most safety-specific electronic applications, including health and safety programs, the accident/incident investigation application, the lessons learned application, and the peer review assessment application.
SERVECO also maintains the Accident Prevention Handbook (APH) database. This central repository houses all APH articles, the rationale and support documentation behind each article’s question and answer application, and the education schedule.
FirstEnergy health and safety and the operating companies have implemented a series of programs and processes that are compliant with all federal, state, and local regulations. At JCP&L, a number of initiatives have been implemented to improve FE’s safety performance.
The Safety Training Observation Program (STOP®) is intended to give managers and supervisors the tools they need to eliminate injuries and occupational illnesses. This goal is accomplished by observing people as they work, talking to them to reinforce their safe work practices, and addressing at-risk behaviors.

Final Report 159
6/20/2011
The STOP® program contributes to workplace safety in a number of ways. It:
♦ Helps modify behavior by observing people as they work ♦ Allows supervisors to talk to people to encourage safe work practices and to eliminate at-risk
behaviors ♦ Helps reduce injuries and modify employees’ behavior by reinforcing safe work practices and
eliminating at-risk behaviors ♦ Reduces costs related to incidents and injuries ♦ Develops communication skills ♦ Raises overall safety awareness ♦ Increases communication throughout the organization regarding safety-related behaviors ♦ Sharpens observational skills ♦ Develops safety leadership skills ♦ Communicates management’s commitment to safety
FE has also collaborated with Behavioral Science Technology (BST). FE began a pilot with its Met-Ed and JCP&L operating companies, assessing the safety culture at each operating company. BST offers a methodology, which is customized for each operating company based on an assessment that includes the results of surveys given to all employees and feedback from numerous focus groups.
The intent of the BST “Leading with Safety Initiative” undertaken at JCP&L is to change the safety culture. The process begins with a survey to assess the current safety culture, including 360-degree surveys for all levels of management.
At JCP&L, over 90% of the employees participated in this culture survey. This assessment work is seen as critical for understanding how employees currently view safety. The findings help focus BST and JCP&L on specific areas for improvement. The goal is to help JCP&L continue to build and sustain a healthy safety culture.
The behavioral safety program being piloted in New Jersey involves:
1. Employee engagement and field safety assessments focusing on “at risk” behaviors and employee exposures. A JCP&L management team is presently conducting these assessments and identifying exposure risks as well as providing positive feedback.
2. Collaborative accident fact-finding meetings between management and local unions to determine the root cause of an accident and to develop lessons learned for all employees.
3. Developing a JCP&L methodology to include local union representatives in the field safety assessments in 2011.
In addition, there are workshops and coaching session for general managers, managers, and supervisors. Workshop's to date have focused on the subjects of credibility and positive feedback. Senior leadership receives coaching on an on-going basis. There is also a feedback engine accessible via the internet for employees to continue contact with their BST coaches.

160 Final Report
6/20/2011
The Jersey Accident Reduction Initiative (JARI) was implemented at JCP&L in October 2007, when it was observed that some employees were having repeated accidents and committing repeated unsafe acts. JARI used employee accident records from January 1, 2003 to identify individual employees who would benefit from the JARI focus. It then provided those employees’ supervisors with a tool for focusing extra safety attention on them.
A review of the career accident history of all personnel was conducted. From this review, individuals were selected to be enrolled in the initiative on one of two levels (tiers).
♦ Tier 1 – consists of employees who have had at least one preventable OSHA recordable accident in the last year.
♦ Tier 2 – consists of employees with at least one OSHA recordable accident and one or more incidents, including preventable motor vehicle collisions and minor injury in the past four years.
Employees participating in JARI attend a safety awareness training session. This class was designed to make the employee understand the importance of working accident free. It was facilitated by the JCP&L Safety Department and focused on safety behavior, family, and relationships.
These employees are also subject to increased attention from their supervisor. JARI provides information to the supervisor on which employees have historically displayed evidence of unsafe behavior (e.g., in the form of reported accidents). From this information, the supervisor will perform more frequent safety observations (using the STOP techniques discussed above) on these individuals. Furthermore, documentation in the form of the JARI Safety Observation Report is maintained for these employees. The department manager will review the JARI Safety Observation Report and a copy is then sent to the JCP&L Safety Department.
All JARI participants have completed the program and follow-up activities are handled by the local supervisors.
Data and Statistics
An incident rate is the number of recordable injuries and illnesses (as required on the OSHA 300 Log) occurring among a given number of full-time workers (usually 100) over a given period of time (usually one year). The OSHA recordable incident rate for JCP&L is shown in Exhibit VII-7.

Final Report 161
6/20/2011
Exhibit VII-7 OSHA Incident Rate
2005 to 2010
Year OSHA Rate
2005 3.87 2006 2.77 2007 2.33 2008 2.25 2009 1.73 2010 1.74
Source: Information Response 861 and February 17, 2011 update
FirstEnergy participates in industry safety-statistics surveys conducted by the Edison Electric Institute (EEI). For the purposes of benchmarking, FE does not report JCP&L data separately to EEI. Exhibit VII-8 provides the FE ranking for recordable incident rate compared to other utilities that have participated in the EEI survey.
Exhibit VII-8 FirstEnergy OSHA Incident Rate Compared to EEI Benchmarks
2005 to 2009
Year FE Rate Rank
Among All
Reporting Utilities
Number of Utilities Reporting
Rank Among Group 2 Utilities
Number of Utilities Reporting in Group
2
2005 2.14 7 47 2 8 2006 1.68 9 41 3 9 2007 1.46 7 49 3 10 2008 1.76 15 48 5 11 2009 1.33 9 52 3 10
Source: Information Response 561
The lost-time case rate considers only incidents in which work time was lost. It is calculated in a manner similar to the incident rate and indicates how many employees lost time per 100 employees on FE’s payroll. The lost-time rate for JCP&L is shown in Exhibit VII-9.

162 Final Report
6/20/2011
Exhibit VII-9 Lost-Time Rate
2005 to 2010
Year Lost-Time Rate
2005 0.85 2006 1.04 2007 0.41 2008 0.41 2009 0.42
2010 (full year) 0.60
Source: Information Response 909
Again, for the purposes of benchmarking, FE does not report JCP&L data separately to EEI. Exhibit VII-10 provides the FE ranking for the lost-time rate compared to other utilities that have participated in the EEI survey.
Exhibit VII-10 FirstEnergy Lost-Time Rate Compared to EEI Benchmarks
2005 to 2009
Year FE Rate Rank Among
All Reporting Utilities
Number of Utilities Reporting
Rank Among Group 2 Utilities
Number of Utilities Reporting in Group
2
2005 0.63 21 47 2 8 2006 0.41 11 41 4 9 2007 0.30 6 49 2 10 2008 0.38 16 48 5 11 2009 0.30 9 52 2 10
Source: Information Response 561
The DART rate refers to the total days away and restricted time cases. It too is calculated the same way as the Incident rate but only using the cases with days away and restricted duty days. The DART rate for JCP&L is shown in
Exhibit VII-11.

Final Report 163
6/20/2011
Exhibit VII-11 DART Rate 2005 to 2010
Year DART Rate
2005 2.63 2006 1.87 2007 1.65 2008 1.50 2009 1.18 2010 1.43
Source: Information Response 861 and February 17, 2011 update
Again, for the purposes of benchmarking, FE does not report JCP&L data separately to EEI. Exhibit VII-12 provides the FE ranking for the DART rate compared to other utilities that have participated in the EEI survey.
Exhibit VII-12 FirstEnergy DART Rate Compared to EEI Benchmarks
2005 to 2009
Year FE Rate Rank Among
All Reporting Utilities
Number of Utilities Reporting
Rank Among Group 2 Utilities
Number of Utilities Reporting in Group
2
2005 1.37 17 47 3 9 2006 1.03 10 41 4 9 2007 1.05 10 49 4 10 2008 1.17 19 48 6 11 2009 0.88 15 52 3 10
Source: Information Response 561
The motor vehicle incident (MVI) rate reflects the number of incidents (crashes) involving corporate vehicles per million miles driven. The motor vehicle accident (or crash) rate for JCP&L is shown in Exhibit VII-13.

164 Final Report
6/20/2011
Exhibit VII-13 Motor Vehicle Incident Rate
2005 to 2010
Year Motor Vehicle
Crash Rate
2005 4.47 2006 6.42 2007 6.71 2008 5.91 2009 6.75 2010 5.94
Source: Information Response 861 and February 17, 2011 update
Safety Survey
A 2009 employee survey assessed employees’ perceptions of JCP&L’s commitment to safety. This survey is part of an initiative to change JCP&L’s safety culture to prevent future injuries. In March 2010, survey results were shared with the JCP&L Leadership Team, Union officials, and employees. This survey was part of a larger process aimed at identifying opportunities to make the workplace safer. Coaching sessions with the Leadership Team, managers, and supervisors are part of the overall plan. Changes to workplace practices, such as the daily safety hotline, are evolving with input from employees.
Employee Diversity
This section provides a discussion of JCP&L employee EEO, affirmative action, and diversity activities.
Recruitment, Selection, and Promotion
SERVECO HR reported to Schumaker & Company that diversity and affirmative action is always a consideration in the consultation meeting. Job openings where females and minorities are considered to be underrepresented get special attention in the recruitment process, especially if the underutilization is particularly high. Emphasis is on assuring a diverse pool of candidates for all positions, regardless of utilization level. Like many companies, in recent years, FirstEnergy has done less external recruiting and has had fewer open positions to fill. This tendency has led to fewer opportunities to correct for underutilization.
FirstEnergy also tracks female and minority successors for director and above.
The following initiatives are being pursued to increase the number of women and minority candidates for employment at JCP&L:

Final Report 165
6/20/2011
♦ Urban League and Morristown Neighborhood House clients were invited to Power Systems Institute (PSI) orientation to encourage participation in the line-worker training program.
♦ JCP&L provides office space to the Urban League at 300 Madison Ave., Morristown, New Jersey.
♦ Engineers provide “role model” presentations to Hispanic/Latino middle school students. The volunteers’ goal is to share their cultural backgrounds, educational experiences, and professional careers to which students can relate.
♦ JCP&L hosted visits to the Phillipsburg, NJ, PSI training facility for inner-city Newark students to expose them to jobs in its industry and to its PSI program.
♦ An HR representative is a member of the Workforce Investment Board for Monmouth County and sits on the Services for People with Disabilities Committee to explore opportunities to hire those with disabilities and to gain a greater understanding of disabilities in the workplace.
♦ An HR representative presented role model presentations to high school female students through the Urban League.
♦ An HR representative participated in Chamber of Commerce, Women in Business sessions.
♦ Employees participated in Vocational Technical High School open house sessions to showcase careers in the utility industry to male and female students.
♦ The Employee Volunteer Council created opportunities for employees to volunteer and collect women’s business clothing for a Dress for Success organization that provides support for women who are entering the workforce.
♦ JCP&L provides a venue for the Hispanic Engineers Event, where Leadership Team employees present educational business sessions.
♦ Employees participate in annual Martin Luther King Day events.
Office of Federal Contract Compliance Programs Compliance
The Office of Federal Contract Compliance Programs (OFCCP) has not conducted any audits of JCP&L or FE in the last five years.

166 Final Report
6/20/2011
Data and Statistics
Workforce Composition
Exhibit VII-14 details JCP&L’s workforce composition by gender and race as of September 5, 2009 based on data from the SERVECO’s HRIS system.
Exhibit VII-14 Diversity Composition of JCP&L Employees by EEO Category
as of September 5, 2009
Number of Employees
Percentage of Employees
Source: Information Response 860
The data for Exhibit VII-14 was extracted from FE’s human resources information system software, SAP, for the corresponding payroll period, August 23–September 5, 2009. This Excel file, which was submitted to Schumaker & Company, however, does not exactly match the JCP&L EEO-1 reports that
Job CategoriesOverall Totals White
Black or African American
Other Minorities White
Black or African
American Other
MinoritiesExecutive/Senior Officials and Managers 4 4 0 0 0 0 0First/Mid-level Officials & Managers 173 110 12 11 30 3 7Technicians 95 46 6 12 24 5 2Professionals 160 89 9 16 39 6 1Sales Workers 0 0 0 0 0 0 0Administrative Support Workers 305 118 16 5 122 33 11Craft Workers 631 536 38 37 14 5 1Operatives 79 59 12 4 3 0 1Laborers and Helpers 1 0 1 0 0 0 0Service Workers 6 3 1 0 1 1 0
Total 1,454 965 95 85 233 53 23
FemaleMale
Job CategoriesOverall Totals White
Black or African American
Other Minorities White
Black or African
American Other
MinoritiesExecutive/Senior Officials and Managers 0.3% 100.0% 0.0% 0.0% 0.0% 0.0% 0.0%First/Mid-level Officials & Managers 11.9% 63.6% 6.9% 6.4% 17.3% 1.7% 4.0%Technicians 6.5% 48.4% 6.3% 12.6% 25.3% 5.3% 2.1%Professionals 11.0% 55.6% 5.6% 10.0% 24.4% 3.8% 0.6%Sales Workers 0.0% 0.0% 0.0% 0.0% 0.0% 0.0% 0.0%Administrative Support Workers 21.0% 38.7% 5.2% 1.6% 40.0% 10.8% 3.6%Craft Workers 43.4% 84.9% 6.0% 5.9% 2.2% 0.8% 0.2%Operatives 5.4% 74.7% 15.2% 5.1% 3.8% 0.0% 1.3%Laborers and Helpers 0.1% 0.0% 100.0% 0.0% 0.0% 0.0% 0.0%Service Workers 0.4% 50.0% 16.7% 0.0% 16.7% 16.7% 0.0%
Total 100.0% 66.4% 6.5% 5.8% 16.0% 3.6% 1.6%
FemaleMale

Final Report 167
6/20/2011
were completed on the Equal Employment Opportunity Commission (EEOC) website and submitted in PDF format as part of Schumaker & Company’s data request. The Excel file used to create Exhibit VII-14 provides a picture of employee data at a point in time and may not reflect the employee changes made daily. FE does not report EEO-1 data for JCP&L as a whole (and is not required to do so). For each JCP&L location, it issues an individual report (as required). SERVECO cannot replicate the EEO-1 reports in an Excel file. The EEO files are compiled using a text file, extracted from SAP, in accordance with EEOC guidelines. The text files are written in code that cannot be translated into Excel in any legible or translatable format. Nonetheless, the exhibits provide a sufficiently reliable summary of JCP&L’s workforce.

168 Final Report
6/20/2011
Workforce Utilization
In 2009, JCP&L had two job categories where minorities were underutilized and seven where women were underutilized. The information in Exhibit VII-15 summarizes JCP&L’s minority and female employment and workforce availability data from its 2009 affirmative action plan. The exhibit indicates the categories in which minorities and females are underutilized based on workforce availability data from the appropriate recruitment area.
Exhibit VII-15 Workforce Utilization
as of July 1, 2009
Source: Information Response 401
Job CategoriesOverall Totals
JCP&L Number
JCP&L Percent
Goal Number
Goal Percent Underutilized?
Managers 46 8 17.39 7.25 15.77 NoSupervisors 120 22 18.33 19.38 16.15 NoSr. Professional - Engineering 28 5 17.86 7.18 25.65 YesProfessional - Engineering 15 11 73.33 3.34 22.27 NoSr. Professional - Business 32 4 12.50 5.69 17.79 YesProfessional - Business 12 4 33.33 2.28 19.08 NoSr. Technician - Engineering 80 14 17.50 13.59 17.00 NoTechnician - Engineering 9 1 11.11 1.18 13.19 NoSr. Technician - Other 62 16 25.81 13.34 21.52 NoTechnician - Other 11 2 18.18 1.96 17.86 NoSr. Clerical 127 43 33.86 32.98 25.97 NoClerical 3 0 0.00 0.33 11.26 NoMeter Readers 184 22 11.96 31.52 17.14 NoSr. Craft 523 67 12.81 66.42 12.70 NoEntry Craft 110 13 11.82 16.36 14.88 NoOperatives 76 17 22.37 11.71 15.42 NoLaborers 1 1 100.00 0.00 0.00 NoService Workers -Other 7 3 42.86 1.99 28.47 No
Total 1,446 253 0.17 236.50 0.16
Job CategoriesOverall Totals
JCP&L Number
JCP&L Percent
Goal Number
Goal Percent Underutilized?
Managers 46 9 19.57 10.91 23.73 YesSupervisors 120 30 25.00 21.46 17.89 NoSr. Professional - Engineering 28 2 7.14 2.87 10.27 NoProfessional - Engineering 15 2 13.30 1.23 8.27 NoSr. Professional - Business 32 13 40.63 16.85 52.66 YesProfessional - Business 12 10 83.33 7.25 60.49 NoSr. Technician - Engineering 80 25 31.25 22.83 28.55 NoTechnician - Engineering 9 5 55.56 2.61 29.09 NoSr. Technician - Other 62 12 19.35 22.69 36.60 YesTechnician - Other 11 2 18.18 5.55 50.49 YesSr. Clerical 127 119 93.70 106.10 83.55 NoClerical 3 2 66.67 1.92 64.27 NoMeter Readers 184 46 25.00 101.18 54.99 YesSr. Craft 523 7 1.34 23.85 4.56 YesEntry Craft 110 12 10.91 11.69 10.63 NoOperatives 76 4 5.26 13.10 17.25 YesLaborers 1 0 0.00 0.00 0.00 NoService Workers -Other 7 2 28.57 1.50 28.47 No
Total 1,446 302 0.21 373.59 0.26
Female
Minority

Final Report 169
6/20/2011
Affirmative Action Performance
Exhibit VII-16 provides a summary of minority and female employment and the areas of underutilization at JCP&L for the years 2005 to 2009.
Exhibit VII-16 Female and Minority Representation
2005 to 2009
Source: Information Response 401
Employment Complaints
Any JCP&L employee who believes that he or she has experienced or witnessed harassment as defined in FE’s discriminatory or sexual harassment policies is instructed to report the situation as soon as possible, but within 180 days of the incident, to any of the following employees as determined by the individual to be appropriate: the individual’s immediate supervisor; a higher-level supervisor in the individual’s section or department; the local human resources representative; or the Manager, Benefits & Compliance in the Human Resources Department. FirstEnergy will conduct a thorough investigation of the situation in accordance with its internal discrimination complaint procedure.1
For complaints of discrimination other than harassment, employees are encouraged to first discuss the issue with their immediate supervisor. If the employee does not believe that the matter can be freely discussed with the immediate supervisor, or the issue remains unresolved, he or she may proceed to the complaint procedure. To initiate the complaint procedure, the employee completes a complaint form, which is available from the local human resources representative, the HR Intranet site, or the compliance area of Human Resources. The completed complaint form is to be returned to the local human resources representative or the Manager, Benefits & Compliance as soon as possible, but within 180 days of the incident.
A human resources representative will conduct a fact-finding investigation of the allegations made. If inappropriate behavior has occurred, Human Resources and functional management will determine
1 Employees also have a legal right to file a complaint with the State of New Jersey or Federal EEOC without participating in JCP&L’s employment complaint process.
YearTotal Number of Employees
Number of Female
Employees
Percentage of Female
Employees
Number of Job
Categories Underutilized for Females
Number of Minority
Employees
Percentage of Minority
Employees
Number of Job
Categories Underutilized for Minorities
2005 1,378 230 16.69% N/A 216 15.67% N/A2006 1,412 285 20.18% 3 229 16.22% 12006 1,419 295 20.79% 5 251 17.69% 22008 1,447 308 21.29% 5 256 17.69% 32009 1,446 302 20.89% 7 252 17.43% 2

170 Final Report
6/20/2011
what steps will be taken to address the conduct. The individual filing the complaint will be informed of the determination made, generally within 30 days of receipt. Complaints that are particularly complex, however, may take longer.
Employees whose issues are not resolved through the internal complaint process may file complaints with a number of Sate of New Jersey agencies or the Federal Equal Employment Opportunity Commission. They may also seek remediation through the courts. Exhibit VII-17 details all formal complaints filed with external authorities by JCP&L from 2005 through 2010.

Final Report 171
6/20/2011
Exhibit VII-17 External Employment Complaints and Court Filings
2005 to 2009
2009 Agency/Court Nature of Claims Status/Disposition
EEOC Disability complaint Pending
New Jersey Dept. of Labor (DOL)
Retaliation complaint Pending
EEOC Sex/Disability complaint EEOC dismissal and issuance of right-to-sue letter2
2008
Agency/Court Nature of Claims Status/Disposition EEOC Race/Disability complaint EEOC dismissal and issuance of right-
to-sue letter
2007
Agency/Court Nature of Claims Status/Disposition EEOC Disability complaint Complaint withdrawn
EEOC Sex complaint EEOC dismissal and issuance of right-to-sue letter
2006
Agency/Court Nature of Claims Status/Disposition EEOC Sex/Age complaint No reasonable cause
Superior Court of NJ Disability/Race complaint Pending as to disability; dismissed on summary judgment as to race
2005
Agency/Court Nature of Claims Status/Disposition NJ Division on Civil Rights (DCR)
Disability complaint Complaint withdrawn
EEOC Sex/Retaliation complaint No violation
Source: Information Response 411
2 The EEOC will issue a right-to-sue letter even if it finds there is no reasonable cause to believe that the charge is true. The EEOC may dismiss a charge and issue a right-to-sue letter in any of the following situations: • The EEOC determines it does not have jurisdiction over the charge, 29 C.F.R. § 1601.18(a)(2003). • The EEOC closes the file where the charging party does not cooperate or cannot be located, 29 C.F.R. § 1601.18(b), (c)(2003). • The charging party requests a right-to-sue letter before the EEOC completes its investigation. (If less than 180 days after filing of
charge, EEOC must determine that the investigation cannot be completed within 180 days.) • The EEOC determines there is no reasonable cause, 29 C.F.R. 1601.19(a)(2003). • The EEOC has found reasonable cause, conciliation has failed, and the EEOC (or the Department of Justice for governmental
respondents) has decided not to litigate.

172 Final Report
6/20/2011
Findings & Conclusions
Finding VII-10 SERVECO and JCP&L’s HR roles are appropriately defined and serve the needs to JCP&L.
A key area of concern for Schumaker & Company is the degree to which operating companies in affiliate relationships have appropriate HR resources to support the specific needs of the operating company. In some case, we have seen all Human Resources being provided through corporate shared services that leave the operating companies with insufficient support.
JCP&L’s HR function appears to benefit from the resources provided by the larger SERVECO HR organization. There appears to be an appropriate focus on policy, governance, and major programs at the SERVECO level that produces standardization and efficiencies across FE.
At the same time, in New Jersey, the JCP&L HR organization appears to be appropriately staffed to deliver services to JCP&L. Managers in New Jersey appear to receive effective support from HR and have direct access to local HR resources.
Finding VII-11 JCP&L has a highly effective workforce planning process for replacing workers in key job categories.
In 2008, FE developed a workforce analytics (WFA) tool based on a business intelligence solution provided by Cognos. This tool enables FE to track and forecast workforce attrition. Workforce planners in corporate Energy Delivery and throughout FirstEnergy have access to the WFA to monitor and analyze actual attrition by year, business unit, job group, location, etc. WFA pulls active employee and attrition data from the SAP business warehouse. Attrition data is available by retirement, voluntary attrition, and involuntary attrition.
Retirement probabilities are based on data supplied by Hewitt. These probabilities are provided by age, length of service, gender, and bargaining unit. FE’s 2002–2006 actual attrition data is used as the current base. Early-out programs in the last couple of years have required the use of older data.
Workforce planners also use WFA data as a base reference to forecast future years’ attrition by business unit and job group. The WFA attrition forecasts are based on probabilities (i.e., risk) of employees leaving FE. These probabilities are calculated using five years of FE actual attrition and are broken out by age, gender, and bargaining vs. non-bargaining-unit employees. The WFA applies the probabilities to FE’s active workforce and generates future attrition forecasts. Business units reference the forecast data and then apply human intelligence to finalize their attrition forecasts. Attrition forecasts are used by SERVECO Human Resources to anticipate and prepare for future talent gaps, to recruit by job groups, and to conduct both on-boarding and succession planning.
In 2009, FE focused on standardizing and driving consistency throughout the workforce planning process and on enhancing the integration with the business services’ headcount budgeting process.

Final Report 173
6/20/2011
Throughout 2010, SERVECO HR has planned and implemented the Workforce Planning Enhancement project to identify and respond to critical business-unit needs and to implement IT solutions for more effective and efficient analysis and forecasting. Major enhancements include:
♦ Enabling workforce planners more efficient access to active employee demographics and internal transfer data via ad hoc queries of the SAP business warehouse (BW)
♦ Implementing SAP’s business planning and consolidation (BPC) for business units to enter annual staffing plans with attrition and to hire forecasts by month and job group. BPC enables automated reports reflecting the impact on headcounts and payroll cost, comparison to budget forecasts in order to evaluate consistency, and automated daily upload into the WFA.
Finding VII-12 JCP&L workforce planning does not sufficiently address changes in work and workforce requirements in the future.
SERVECO’s staffing strategy process includes an important job analysis component. The job analysis provides an overview of the common activities associated with a given job group and provides direction if the job description needs updating with new knowledge and skill requirements.
Schumaker & Company appreciates the effort to keep the knowledge and skill requirements for critical job groups current. Given the rapidly changing nature of technology, this is an important and often lacking element of workforce planning. That said, we find FE’s workforce planning to remain largely oriented toward workforce replacement rather than strategic workforce management.
The focus on retention and workforce replenishment suggests that the workforce of the future will be much the same as the current workforce. Additional consideration could be given to changing needs of the organization, the rapid and disruptive nature of technological change, and the resulting need for redesigned jobs.
Finding VII-13 JCP&L’s employee and executive compensation is within acceptable market ranges.
As discussed extensively above, FE’s pay philosophy is to target pay at the 50th percentile in its utility peer group. The pay range is 80% to 120% of the standard rate. FirstEnergy is committed to pay for performance. High-performing employees can achieve 120% of market. On average, FE is paying about 100% of the 50th percentile of market. New hires keep the average close to this figure.
FE benchmarks standard rates (base pay), short-term incentive targets, long-term incentive targets, and total compensation at the utility industry’s median (50th percentile). The standard rate structure, short-term incentive targets, and long-term incentive targets are benchmarked annually to ensure competitiveness with FE’s peer group and alignment with FE’s compensation philosophy. In addition, FirstEnergy uses market pricing for all non-bargaining jobs.

174 Final Report
6/20/2011
The above pay strategy and statements regarding actual pay levels suggest FE maintains a competitive pay structure that is consistent with industry standards.
Finding VII-14 JCP&L’s employee benefits are comparable to benchmark utilities.
As discussed above, SERVECO benchmarks benefits to general industry via Hewitt Benefits Consulting. In addition, SERVECO participates in numerous benefits surveys throughout the year and keeps up to date on benefit trends and regulations on a regular basis.
FirstEnergy aims to offer a competitive benefits package. At the same time, it has implemented a number of cost-control initiatives, including plan design changes and employee cost sharing. FE is self-insured on health care (so costs have direct impact) and is working on efforts to control usage. FE implemented a higher cost for spouses with access to subsidized coverage elsewhere (working 32 hours and have health insurance available). To be covered by an FE plan, these spouses now pay $200 per month. FirstEnergy has also made a commitment to wellness education and prevention and is providing education and promotions, preventative screenings, and vaccinations.
Finding VII-15 JCP&L’s safety performance is below that of FE as a whole.
Exhibit VII-8, Exhibit VII-10, and Exhibit VII-12 suggest that FE’s safety performance consistently ranks in the top half and often in the top quartile of utilities reporting in the EEI safety survey. These exhibits suggest that FE’s safety performance has improved during the five-year period. At the same time, Exhibit VII-7, Exhibit VII-9, and
Exhibit VII-11 suggest that JCP&L’s safety performance has improved as well. Nonetheless, it should be noted that JCP&L’s safety performance consistently lags behind that of FE as a whole. Exhibit VII-18 compares JCP&L’s and FE’s safety statistics for the years 2005 to 2009.
Exhibit VII-18 JCP&L Safety Statistics Compared to FE
2005 to 2009
2005 2006 2007 2008 2009 FE JCP&L FE JCP&L FE JCP&L FE JCP&L FE JCP&L
Incident Rate 2.14 3.87 1.68 2.77 1.46 2.33 1.76 2.25 1.33 1.73 Lost-Time Rate 0.63 0.85 0.41 1.04 0.30 0.41 0.38 0.41 0.30 0.42 DART Rate 1.37 2.63 1.03 1.87 1.05 1.65 1.17 1.50 0.88 1.18
Source: Information Response 561, 861, and 909
Finding VII-16 JCP&L had an employee fatality in 2009.
On August 11, 2009, an employee climbed on an energized breaker mistakenly thinking it was the de-energized breaker in which he was working. The employee suffered a fatal arc flash. The company

Final Report 175
6/20/2011
reports that the de-energized box was properly marked and barricaded. The reason for employee’s mistake is unknown.
On January 8, 2010, OSHA issued a three part citation against JCP&L. Each of the items in the citation were classified as “serious.” JCP&L contested the citation.
JCP&L and OSHA reached a tentative settlement relating to this event. Two of the original three citations were withdrawn and the third was reclassified as an “unclassified” violation with a total proposed penalty of $5,000. The tentative settlement also provides that none of the actions by JCP&L is an admission of wrongdoing or an admission that the conditions described in the remaining citation were the cause of any accident, incident, or injury.
The “unclassified” violation reiterates the facts of the incident stating that an employee was fatally injured when he came in contact with energized parts. The citation notes that the law requires an employer to ensure that employees do not approach or take conductive objects close to energized parts.
The final order of the administrative law judge was issued on January 6, 2011. The judge affirmed the settlement agreement. The judge agreed that JCP&L had abated all conditions in the citation, had conducted additional employee training and will continue to comply with the Occupational Safety and Health Act.
As a result of FirstEnergy’s and OSHA’s investigations, JCP&L has implemented three actions in an effort to prevent future recurrences.
1. An incident command system (ICS) within the substation organization was instituted. Bill Stevenson of the JCP&L Safety Department developed the ICS process and reviewed it with all management employees, who in turn reviewed it with all their staff members. The ICS is a standardized, on-scene, all-hazards incident management system that has applicability for managing any safety-compromising event. ICS is flexible and can be used for incidents of any type, scope, and complexity. It also identifies the single person in charge.
2. The demarcation or barrier system was reviewed with all substation employees. The instructional program explained the process of installing a barrier system, when to install it, and how to complete the installation. In addition, a checklist was provided to each substation employee to assist him or her in completing the task
3. A job-briefing refresher/training class was conducted with substation employees, which included reviews of the documentation forms. Leaders receive feedback, both positive and negative, as to how well their job briefings are conducted.

176 Final Report
6/20/2011
Finding VII-17 In most job categories, JCP&L’s workforce composition reflects the diversity of the New Jersey labor pool.
As shown in Exhibit VII-15, JCP&L’s workforce is underutilized in two job categories for minorities and seven for women. For minorities, JCP&L’s most significant underutilization is in Senior Professionals – Engineering. For women, the underutilization is broader and is most notable in technical job categories.
As noted above, limited hiring over the last few years has limited the opportunities to address these areas of underutilization. Also, Exhibit VII-16 suggests that the number of job categories experiencing underutilization has remained relatively stable (down one for minorities, up two for women). During periods of downsizing and limited hiring, it is often the lower-seniority employees who leave. This may include women and minorities hired to address underutilization. As such, the relatively low underutilization in difficult economic times suggests an acceptable level of performance by JCP&L.
Finding VII-18 JCP&L has implemented an effective program for attracting and training young people for linemen and substation positions.
FirstEnergy’s Power Systems Institute partnerships exist with two colleges in the state of New Jersey: Brookdale Community College and Raritan Valley Community College. Students completing the PSI program earn an Associate of Applied Science degree in Electric Utility Technology. Two programs are available: line worker and substation electrician. The intention of the program is to prepare individuals for a career as a line worker or substation electrician in the electric utility industry.
The program is twenty-one months in duration (four semesters). Students are enrolled full-time, five days a week. A lockstep concept is used to ensure that each student completes the program within the approximately two-year period. Students attend academic classes at the college two and a half days a week. The college curriculum includes both general and technical courses. The remaining two and a half days are spent in hands-on skills training, conducted by FE instructors. The FE training has been awarded credit hours and is, therefore, a requirement of the degree. Following the second semester, students are required to participate in a 10-week credited and compensated summer field experience.
A student must be accepted into the PSI program by FE. This acceptance is accomplished through a selection process that includes technical evaluation, college placement testing, background check, physical abilities testing, ability to obtain a Department of Transportation Medical Examiner’s certificate (as part of the CDL requirements), and successful completion and placement at climbing school.
FE pays the cost of tuition, textbooks, college fees, and flame-retardant clothing for all students enrolled in the program. Students must maintain a minimum 2.5 grade point average (GPA) and a C average in the FE training classes in order to receive this financial coverage. The student signs an agreement, with the understanding that he or she will accept a job offer (if one is made) and will remain with the JCP&L organization in his or her chosen profession for a three-year time period.

Final Report 177
6/20/2011
The information presented in Exhibit VII-19 identifies the number of graduates and hires from a diversity perspective for the past five years (2006–2010).
Exhibit VII-19 Minority and Female Results for PSI
2006 to 2010
2006 2007 2008 2009 2010 Min. Fem. Min. Fem. Min. Fem. Min. Fem. Min. Fem.
Graduates 1 0 4 1 4 0 6 0 7 0 Hires 0 0 4 1 3 0 4 0 4 0 Summer Program 4 1 4 0 6 0 8 0 5 0
Source: Information Response 799
The summer field experience, which is not a separate initiative, takes place midway through the program and is completed by all qualifying freshmen as part of the degree requirements. Following the second semester, students are required to participate in a 10-week credited and compensated summer field experience. Thus, the number of summer students in one year will be reflected in the number of graduates in the following year.
Finding VII-19 JCP&L appears to place appropriate emphasis on hiring and promoting minorities, but it could do more to attract women.
When hiring and promotion opportunities exist, JCP&L will place an emphasis on women and minorities in job categories where these groups are underrepresented. Consideration is given to these issues in consultation meeting between HR representatives and hiring managers. In addition, FE has started partnering with diverse professional organizations to help ensure a diverse candidate pool.
At JCP&L, special emphasis has been placed on attracting qualified minority engineers through a number of outreach initiatives. In addition, the PSI program is designed to bring women and minorities into noted important craft/technical jobs.
Unfortunately, as Exhibit VII-16 suggests, attaching females continues to be a challenge. Women are underrepresented in managerial and technical positions. As also noted in Exhibit VII-16, the difference between employment levels of women and placement goals is relatively significant in a number of categories. For example, in the technician job category, the placement goal is 50.49% while the actual employment level of women is 18.1%. (Although in fairness, it should be recognized that the category contains only 11 positions, making for relatively few hiring opportunities.)
Also, as noted in Exhibit VII-19, no women have participated in the otherwise excellent PSI program for three years.

178 Final Report
6/20/2011
Finding VII-20 JCP&L’s affirmative action plan provides only a limited narrative describing JCP&L’s actions and plans for hiring and promoting women and minorities.
JCP&L has submitted to Schumaker & Company affirmative action plans for 2005, 2006, 2007, 2008, and 2009 that appear to fully meet OFCCP requirements. Nonetheless, these affirmative action plans fail to provide depth in understanding JCP&L’s efforts to attract, hire, train, and promote women and minorities.
Schumaker & Company requested a description of all efforts related to increasing the pool of qualified women and minority candidates. JCP&L responded with a list of places to which it faxes job openings and a list of diversity-related organizations and agencies it works with. This response is similar to but not the same as the lists of similar activities in the affirmative action plan.
Schumaker & Company again asked for a list of sources used for identifying diverse candidates for job pools. JCP&L’s response to this request was a list, by year, of action-oriented programs to support diversity in hiring and promotion. This list differed from the prior list and the affirmative action plan.
In our interview with the JCP&L HR manager, we learned of additional efforts to support diversity at JCP&L. This time, Schumaker & Company asked for a summary of initiatives, such as the Hispanic Engineers’ Conference and the relationship with the Urban League, that are being used to increase the number of women and minority candidates for employment at JCP&L. JCP&L’s response to this request was a more in-depth list of its involvement in groups that help promote careers at JCP&L to women and minorities. Again, this list differed from the prior list and the affirmative action plan.
In addition, it is difficult to ascertain from the affirmative action plans what the hiring goals were for a given year and specific goal attainment. Schumaker & Company made a separate request for hiring and promotion data for women and minorities that shows the number of opportunities and women and minority placement. This data is presented by EEOC job categories (as requested) but not by the job categories used in the affirmative action plan. Thus, it is not directly relatable to affirmative action plan goals. In addition, it is not clear how many promotion and hiring opportunities existed. Knowing the number of opportunities is essential for understanding the actual level of performance in this area.
Finally, the affirmative action plan makes only a brief reference to the PSI program (described in Finding VII-18). This program was described to Schumaker & Company as an important strategy for filling key high-skilled jobs (linemen and substations). Emphasis is placed on recruiting women and minorities to this program and placing them in these high-paying jobs that are not traditionally held by minorities or especially women.
The totality of information presented by JCP&L suggests there is significant activity related to promoting and hiring women and minorities. Unfortunately, such activity is not addressed comprehensively in the affirmative action plan narrative or anywhere else for that matter.

Final Report 179
6/20/2011
Finding VII-21 The number of Union grievances increased significantly in 2008 and 2009.
JCP&L experienced a significant increase in Union grievances in 2008 and 2009. In most cases, these were related to overtime concerns. Exhibit VII-20 details the total number of grievances and the number of overtime grievances for the years 2005–2009.
Exhibit VII-20 IBEW SCU-3 Grievances
2005 to 2009
Year Overtime-
Related Grievances
All Other Grievances Total
2005 62 101 163
2006 94 167 261 2007 85 76 161 2008 156 106 262 2009 269 110 379
Source: Information Response 62
Grievances filed by the International Brotherhood of Electrical Workers (IBEW), System Council U-3 (SCU-3) increased 38% in 2008 and another 31% in 2009. A two-year increase of 58% in the grievance rate indicates a possible deterioration of management/Union relations.
JCP&L reports that the grievance spike is related to the express service technician position. JCP&L wishes to assign qualified employees to this work assignment on straight time, while the Union argues that only employees classified as express service technicians can be assigned this work.
Although the significant increase in grievances is a cause for concern, it is narrowly focused and does not appear to be indicative of an overall worsening of management/Union relations. JCP&L reports that it had been working to resolve the issues, and as of September 30, 2010, the Union had filed only 40 grievances with just 12 related to overtime.
Finding VII-22 JCP&L is improving labor relations.
Despite the increase in grievances, both the IBEW SCU-3 President and the JCP&L labor relations representative reported an improving relationship between the Union and JCP&L. The settlement of longstanding issues and litigation related to JCP&L’s call-out procedures is also seen as contributing to improved relations between the Union and JCP&L. System Council U-3 (Union) filed a grievance challenging JCP&L’s 2002 call-out procedure that required bargaining-unit employees to respond to emergency power outages. On May 20, 2004, an arbitration panel found that the call-out procedure violated the parties’ collective bargaining agreement. At the conclusion of the June 1, 2005 hearing, the

180 Final Report
6/20/2011
arbitrator decided to hear no testimony on damages and closed the proceedings. On September 9, 2005, the arbitrator issued his opinion and awarded approximately $16 million to the Union. JCP&L appealed this award by filing a complaint in federal court in New Jersey, which initiated the process to vacate the award.
On February 6, 2006, the federal court granted the Union’s motion and dismissed JCP&L’s appeal, making clear, however, that JCP&L’s appeal may be refiled once the damages award has been more formalized. The parties met multiple times and finalized the damages amounts with Arbitrator Restaino providing final rulings on damages at a September 7, 2007 hearing. Arbitrator Restaino issued a final order identifying individual damages amounts on October 31, 2007. The award appeal process was initiated. The Union filed a motion with the federal court to confirm the award and JCP&L filed its answer and counterclaim to vacate the award on December 31, 2007. On February 25, 2009, the federal district court denied JCP&L’s motion to vacate the Restaino arbitration decision and granted the Union’s motion to confirm the award. JCP&L filed a notice of appeal to the Third Circuit and a motion to stay enforcement of the judgment on March 6, 2009. The parties participated in the federal court’s mediation program and private settlement discussions were held.
The parties reached a tentative agreement on a global settlement package, which included an agreed-upon settlement payment and an extension of the collective bargaining agreement (CBA). The U.S. District Court approved and implemented the parties’ global settlement and the proceeds were distributed.
JCP&L and the Union have signed a three-year contract extension effective July 25, 2010. This contract extension was approved as part of the settlement agreement. In addition, it is seen as having been achieved within the context of improved relations.
FE has also included a new labor relations module in its supervisor training program that is designed to strengthen knowledge of the collective bargaining agreement and the roles and responsibilities of supervisors related to effective labor relations.
Recommendations
Recommendation VII-9 Continue to strengthen employee safety programs. (Refer to Finding VII-15 and Finding VII-16)
JCP&L has implemented a number of significant safety initiatives (as discussed above). These initiatives reflect a serious commitment to employee safety. Nonetheless, it is imperative that JCP&L continue this commitment, even as the memory of the employee fatality fades. Complacency is the most serious threat to employee safety.
Safety is a corporate goal for JCP&L. Its targets are for an OSHA incident rate of less than 38 OSHA recordable incidents and less than 33 OSHA recordable motor vehicle incidents for 2010. Safety is also a major component of the incentive compensation pay for all JCP&L employees.

Final Report 181
6/20/2011
Schumaker & Company encourages the ongoing evaluation of safety efforts and continued commitment and strengthening of these efforts. While the goals for 2010 reflect improvement, we believe JCP&L should strive to be the best performing unit of FE. In addition, we recommend that JCP&L’s safety performance be benchmarked against comparable utilities independent of FE. These numbers should be reported to all employees in the form of a safety scorecard with the annual safety statistics that are reported for bonus pay-out calculations.
Recommendation VII-10 Develop a strategic workforce plan. (Refer to Finding VII-11 and Finding VII-12)
The workforce planning process at FE is by far the most sophisticated that Schumaker & Company has seen, and it is not a stretch to describe as a best practice. In addition, the job analysis work described in Finding VII-12 also appears effective.
There is an opportunity to integrate these two initiatives or perhaps do workforce-of-the-future forecasting that can be integrated into the workforce planning process. Schumaker & Company believes that jobs will change significantly in coming years (as discussed in Finding VII-12) and that preparing for this potentiality is an important enhancement to FE’s highly effective workforce planning process.
Recommendation VII-11 Strengthen efforts to attract women to managerial and technical jobs. (Refer to Finding VII-17, Finding VII-18, and Finding VII-19)
As discussed, women are underutilized in seven job categories and the level of employment is significantly lower than the placement goal for most of the categories. More can and should be done to attach women to management and technical positions. These efforts should be specifically described in the affirmative action plan.
Recommendation VII-12 Strengthen the narrative in the affirmative action plan describing JCP&L’s actions and plans for hiring and promoting women and minorities. (Refer to Finding VII-20)
The trend these days is to outsource the preparation of the affirmative action plan and to use largely generic content in its narrative portion. Schumaker & Company would like to see a plan that more fully describes JCP&L’s intent and specific activities related to increasing opportunities for women and minorities. This recommendation is especially true when the varying responses to our inquires regarding JCP&L’s effort in this area are noted, as described in Finding VII-20.

182 Final Report
6/20/2011
E. Strategic Planning
This section presents the strategic planning processes for FirstEnergy (FE) and Jersey Central Power & Light (JCP&L).
Background & Perspective
FirstEnergy Utilities (FEU) does its long-range planning through a three-year business plan. The Executive Leadership Team (ELT) is the governing body that sets policies, provides oversight to FE Utilities, and maintains responsibility for the development of the business plan. Members of this team include the Senior Vice President & President, FE Utilities and all of his direct report vice presidents, including all regional presidents and utility company presidents (JCP&L among them).
The business plan starts with a defined vision and mission as follows: FE Utilities’ vision is to be “an industry-leading performer committed to safety, customer satisfaction, reliability, and financial performance; driven by leadership, skills, diversity, and character of its employees.” FE Utilities’ stated mission is to provide “safe and reliable electric service at a reasonable cost by optimizing the resources, skills, and diversity of our work force.” Defined focus areas include those mentioned in FEU’s vision statement as well as regulatory compliance (federal and state). Each focus area has sub-tending objective statements.
Multiple quantitative performance metrics are then defined for each focus/objective area except for regulatory compliance. These metrics include three years of actual performance and three years of looking forward at target performance. Each focus area also has defined fundamental strategies and risks to meet performance metrics, with additional fundamental strategies identified for cross-focus impact areas (Work Management Initiative and Employees). Emerging strategies and risks that will impact FE Utilities over the three-year planning period are also defined. Finally, key events that will drive the business plan are identified on a quarterly schedule.
Key planning assumptions are defined by year for the next three years. The basic elements of this plan haven’t changed significantly over the past five years although goals, strategies, and targets get refined each year. Metrics for each utility company are determined in ELT meetings based on historical performance and corporate positions on what can be accomplished going forward.
Capital monies are also planned and tracked via an annual Capital Portfolio Planning (CPP) process that incorporates items set out in the business plan. Capital planning is integrated to the business plan via an FEU Capital Portfolio Development calendar. Events on this calendar include an annual Executive Council summer strategy retreat (early summer) and a FE Board of Directors’ strategy meeting in the fall, prior to approving the business plans in December.
The Board of Directors’ annual strategic planning retreats are conducted offsite over a three-day period. The first portion of these retreats involves senior management making presentations on what they deem

Final Report 183
6/20/2011
as important issues facing the corporation going forward. The remainder of the time is spent in private director discussions on a wide range of topics (including what-if analysis) related to FirstEnergy’s strategic direction. These meetings are highly confidential. Agendas are produced ahead of time, but no meeting minutes are maintained. The results of these meetings are communicated to senior management for inclusion in business planning and budgeting.
JCP&L does not have a sub-tending business plan to the FE three-year business plan, but business plan metrics are broken down by operating utility with targets going out for the next three years. These targets include safety, reliability, operational, and customer service metrics. Five-year historical actual figures are also maintained by utility company.
Although JCP&L, like other utility and service companies, has numerous metrics to gauge performance in support of the three-year business plan, these metrics are not broken down below the company level (e.g., by departments) nor are they directly related to performance pay. FE has developed an incentive compensation plan that rewards the overall performance of FirstEnergy. The specifics of this plan vary slightly between utility companies and service companies. In the case of JCP&L, however, targets and stretch targets are set for broad-based financial targets (apply to all FE employees); safety, reliability, and financial targets (apply to all business unit employees); and specific safety, reliability, and operational targets (specific to JCP&L employees).
The primary means of tracking operations and performance in JCP&L is through monthly Operational Performance Reports (OPR) and monthly OPR meetings between the President of JCP&L and his direct reports. JCP&L’s President uses these reports as the basis of reporting up through the ELT. These reports are detailed and lengthy and include summaries of all JCP&L responsible metrics (23 metrics in the areas of safety operations, reliability/operations, customer satisfaction, financial performance, and employee workforce). Summaries include current and previous status (color-coded from excellent performance down to performance improvement needed) and values. Each is followed by details for each metric on monthly actual to target, definitions of ranking criteria (color codes), monthly analysis of results, a Gap Closure Plan, and any other related information.
Findings & Conclusions
Finding VII-23 FE/JCP&L has a robust, substantive strategic planning process.
FirstEnergy’s strategic direction is documented in a three-year business plan that is reviewed and updated annually. This plan includes a mission and vision statement as well as supporting objectives and strategies. Specific performance targets are also defined and quantified as appropriate.
Senior management is closely involved in the process at levels all the way down through the operating companies. The Board of Directors annually takes a three-day offsite retreat to specifically address the strategic direction of FirstEnergy and its companies. An Executive Leadership Team committee, consisting of senior management, meets periodically to develop planning guidelines and performance

184 Final Report
6/20/2011
measures, to review progress to plan, and to develop corrective actions. The ELT is involved in providing feedback to the Board of Directors through regular Board meetings and the Board retreat.
Incentive compensation plans are established for managers and employees that are largely based on overall corporate performance to strategic plan. (Some incentives are based on business unit targets.) FirstEnergy has stated a preference for motivating employees to work together for FE’s overall good as opposed to sub-optimizing performance incentives. This incentive structure is appropriate given FE’s corporate philosophy.
Operating utilities, including JCP&L, are integrated into the planning process. The President of JCP&L serves on the ELT and provides input to the three-year business plan. JCP&L has specific performance metrics it must achieve in support of the three-year business plan. These metrics are tracked and reviewed monthly in a structured and detailed report, which is reviewed between JCP&L’s President and his managers as well as being part of ELT meetings.
Recommendations
None

Final Report 185
6/20/2011
F. External Relations
This section addresses FirstEnergy’s (FE) and Jersey Central Power & Light Company’s (JCP&L) external relations activities for the public and regulatory areas.
Background & Perspective
The organization of FE/JCP&L’s external relations function is shown in Exhibit VII-21.
Exhibit VII-21 External Relations Organization
as of June 30, 2010
Source: Information Responses 54 and 203
Much of the external relations functions are handled out of the FirstEnergy Service Company (SERVECO) organization. Rates and regulatory affairs, state government affairs, public relations and outreach programs, external communications services, public affairs and outreach programs, and community involvement programs are all coordinated through the Executive Vice President (EVP) & General Counsel through personnel based in both New Jersey and Ohio. Within the JCP&L organization, an External Relations Department mainly addresses municipal relationships through area managers.
The Government Affairs Department is headed by a Senior Vice President (SVP). Reporting to the SVP are a Vice President (VP) of External Affairs and a director, who are in charge of state government affairs for New Jersey. Reporting to the VP of External Affairs are FE-wide functions, including the federal government affairs, public relations, public outreach, and communications services (employee, executive, advertising, nuclear, production print, and graphic services) functions. Public outreach is
Akron, OH 13,602
FirstEnergyPresident & CEO
Akron, OH 7,253
SERVECOSenior Vice President & President
FirstEnergy Utilities
Akron, OH 5,684
SERVECOVice President
Utility Operations
Red Bank, NJ 1,426
JCP&LPresident
Red Bank, NJ 226
JCP&LVice PresidentExternal Affairs
Akron, OH 316
SERVECOExecutive Vice President & General Counsel
Akron, OH 55
SERVECOVice President
Rates & Regulatory Affairs
Akron, OH 7
SERVECOVice President
Corporate Affairs & Community Involvement
Akron, OH 94
SERVECOSenior Vice PresidentGovernmental Affairs

186 Final Report
6/20/2011
responsible for outreach to important target audiences in Ohio, and there is no equivalent position for New Jersey.
The Director of Federal Government Affairs is a registered federal lobbyist and is responsible for serving as the primary liaison between FirstEnergy and the executive, legislative, and administrative agencies, members of Congress, the House and Senate, and their staff members. The director monitors activity at the federal level and provides FirstEnergy and its subsidiaries information and status on relevant legislative actions and concerns. The director also coordinates with various departments within the FE organization to arrange meetings with and to present FirstEnergy’s position before the House/Senate and their staff members.
JCP&L uses lobbyists and consultants to assist with its external affairs activities. Over the past three years, 10 of these firms have provided these services, which have totaled roughly $550,000 per year. Recently, the Vice President of External Affairs has taken over responsibilities for state government affairs, federal government affairs, and communications.
The Director of State Government Affairs for New Jersey is responsible for monitoring legislative issues of interest to FirstEnergy and JCP&L. Responsibilities include managing relationships with state legislators, the Governor’s office and staff, the executive branch, and other key public policy officials. This oversight includes working with FE/JCP&L management to develop and communicate corporate policies and positions to responsible outside publics and providing feedback on legislative issues and concerns.
Area managers, who report directly to the JCP&L Vice President of External Relations, are responsible for carrying out the following responsibilities in their locally assigned areas:
♦ Development and maintenance of favorable relationships with local elected and public officials, customers, and the general public
♦ Response to inquiries from the news media regarding regional corporate issues or coordination of responses with FE corporate staff on corporate or industry issues
♦ Preparation and coordination of community contact programs (e.g., disseminating information to the community, soliciting feedback from residents, and attending community gatherings and forums)
FirstEnergy/JCP&L’s corporate communications and external relations plan is documented in the 2010 External Communications Plan. This plan lays out important FE objectives, initiatives, strategy, and tactics for communicating and publicizing FirstEnergy’s position on key issues. Included in the plan are overall objectives, which include promoting FirstEnergy’s commitment to high standards of operations, financial strength, and environmental stewardship, among others. Such promotion is accomplished through publicity and news stories in local, regional, national, and trade news media outlets (both directly and working with other departments). This plan also includes brief discussions of tactics to

Final Report 187
6/20/2011
achieve these objectives, including news releases, fact sheets, guest editorials/letters to the editors, editorial board visits, media advisors/media tours, reporter visits, media interviews, and media visits.
In 2010 (through November 30), the Communications Department distributed and placed 89 news releases on a variety of topics (e.g., storm restoration and energy efficiency programs) and made editorial board visits to 10 different FE area newspapers (including the New Jersey Star Ledger). All of this was in addition to other FE-wide communication efforts. In New Jersey, stories have been placed in local media regarding issues related to the FE/Allegheny merger, service, energy efficiency goals, outages, rate decreases, and new electric generation prices, among other topics.
Budget and actual expenses for external affairs are tracked only for the Corporate Communications group. They varied between $15 million and $20 million in years 2005 through 2007 before declining to slightly over $11 million for 2008 and 2009. Costs for the Regional External Affairs group were not budgeted for or tracked separately prior to 2010, so this information is not available.
The External Relations group named a task force to examine means of exploring new social media (i.e., online techniques and practices to share information, opinions, insight, experience, and perspectives) technologies to enhance FE’s communications. The task force has presented its findings and FirstEnergy is considering implementing its recommendations.
There are no specific procedures or business practices documentation specific to external affairs. Reporting to and from FE’s Vice President of External Affairs is informal; there is no written periodic reporting.
FirstEnergy outreach programs in New Jersey include senior assistance and low-income programs as follows:
♦ Jersey Statewide Heating Assistance and Referral for Energy Services (NJ Shares) – a non-profit corporation (JCP&L is a founding member and has a seat on the Board) organized to provide cash assistance to individuals and families in New Jersey who are in need of temporary help in paying their utility bills; funding is provided by JCP&L customers, corporate employees, and FE shareholders. Funds are administered and distributed by community-based organizations.
♦ Gatekeeper Program – JCP&L field personnel are designated to recognize and report customers who may be in some form of distress (e.g., economic difficulty, physical and/or mental impairment, and poor property condition). These customers are referred to the appropriate human service agencies and programs.
♦ Comfort Partners Program – energy education and conservation program for low-income customers; this program includes the installation of energy-efficient measures in low-income homes.
JCP&L also participates in statewide programs, including the Low Income Home Energy Assistance Program (LIHEAP) and the Universal Service Fund (USF).

188 Final Report
6/20/2011
FirstEnergy has Educational Advisory Councils in Ohio, Pennsylvania, and New Jersey. (Individual state councils combined into a single council in 2010.) The FirstEnergy Educational Advisory Council (FEAC) consists of educators who assist FE/JCP&L in selecting and evaluating educational resources and programs that are provided to schools and youth groups throughout the JCP&L service territory.
Employee Community Involvement Teams (ECITs) have been in place at JCP&L since 2008 (now being rolled out in other states). Their presence helps establish and coordinate local corporate-sponsored and employee-driven community involvement activities.
Contributions made on behalf of JCP&L are done through the FE Foundation. This philanthropy generally consists of a large number of smaller contributions to charitable, educational, and community groups throughout the JCP&L service territory. It totaled $605,197 in 2008 and $149,845 in 2009. Contributions declined over the past two years because economic conditions resulted in an erosion of FE Foundation’s asset base. As a result, the FirstEnergy Foundation Board decided to suspend all discretionary grants beyond what had been pledged for the remainder of the year (2009). The grant suspension affected all states.
FirstEnergy’s stated giving guidelines and priorities are to:
♦ Help ensure the health and safety of the community ♦ Promote economic development ♦ Support employee involvement and investment
Grants, sponsorships, dues, and charitable contributions for non-profit, tax-exempt organizations all come through the FE Foundation. This effort falls under the Vice President of Corporate Affairs and Community Involvement who also serves as the President of the FirstEnergy Foundation. The Foundation has three trustees that form the Contributions Committee, which reviews and determines the eligibility of applications. Corporate contributions focus on gifts to civic organizations to support special events, community festivals, or other activities that may provide public benefits to FirstEnergy. They also encompass corporate memberships (e.g., chambers of commerce and economic development corporations) and gifts/grants made to organizations representing culture and art, education, and health and human services, among others. Contributions are broken out by operating company (e.g., JCP&L) and the Contributions Committee solicits and relies on recommendations from the regional presidents and area managers. All major gifts (over $10,000) and total budgets are approved by the Contributions Committee. The FE Foundation also has a matching gifts program for employees.
In addition to grants from the FE Foundation, FirstEnergy makes monetary contributions to non-profit and civic organizations in the form of corporate contributions. These contributions typically support fundraising dinners and community events.
Contribution requests can be made by managers/employees through the budgeting cycle/process up through the area managers and regional president, although all contributions are coordinated and

Final Report 189
6/20/2011
budgeted through the corporate level. Organizations that have requested contributions are tracked through a Lotus Notes database system that is also used for budgeting and reporting contributions.
The Corporate Affairs and Community Involvement Department is also responsible for encouraging and assisting employee involvement in community initiatives (e.g., volunteering for United Way campaigns, serving as community liaisons, and establishing and managing state educational advisory panels and Employee Community Involvement Teams).
In 2010, major issues at the state legislative level included legislation on community net metering (A.915 in Assembly, S-463 in Senate) and JCP&L’s compliance with the final version of the state’s Energy Master Plan. There are no major issues at the county and municipal level. Issues with the New Jersey Board of Public Utilities (NJBPU) include the Allegheny merger, basic generation service, the Energy Master Plan, smart growth, the Clean Energy Program, and many others. The status of NJBPU matters is reported on weekly by the Rate Department.
JCP&L is a member of the New Jersey Business & Industry Association (NJBIA), a statewide employer/business advocacy association. JCP&L also participates in the Employers Legislative Committee (ELC), an affiliate of NJBIA that is another avenue for interfacing with legislators. ELCs meet monthly to speak with legislators, cabinet members, and local officials on important legislative and regulatory issues affecting employers. Finally, JCP&L also participates in the New Jersey Utilities Association (NJUA), which through its policy committees and the association at large provides a forum for information, ideas, and guidance on topics of interest to the state’s utilities.
Findings & Conclusions
Finding VII-24 External relations functions are adequately staffed with capable personnel, but there is no external relations strategy that incorporates and integrates all external relations functions.
External relations at FE/JCP&L is an informal effort. Strategic planning efforts are conducted in external communications, but the plan is summary in detail and follow-up actions, programs, reporting, and feedback are not formally maintained. Contributions and grants are well documented, but there are no other strategic planning documents that incorporate state, federal, local, and community publics. Although contacts and presentations are made to various groups, these contacts are not systematically maintained in a format that can be tracked and analyzed. Finally, total external relations expenses are not budgeted for and tracked separately.
Finding VII-25 Public programs are well thought-out but could be expanded.
The strategy and process for contributions and grants are well thought-out and explicit. Management of this process is ongoing and explicit: The FE Foundation’s Contributions Committee meets quarterly to review fund strategies and performance, and numerous reports are developed from the Foundation and

190 Final Report
6/20/2011
Corporate Contributions Tracking System (FACCTS) to track outlays and pertinent information about all recipients.
Community activities and involvement as well as corporate citizenship activities are encouraged, but there are no specific programs to track this involvement.
Finding VII-26 Interfaces with government and regulatory agencies are appropriate, although in some cases, reporting could be more robust.
Periodic presentations are made to legislative bodies. These presentations are attended by senior-level FE and JCP&L management and include a wide variety of topics and information. Ongoing contacts are maintained with key legislators and their staff, with contact information documented and periodically updated. Legislative contacts and issues (current and anticipated) are documented and reported weekly. Municipal and county contact lists are documented and updated throughout the year as needed, although area manager contacts are not documented and there are no programs to consistently perform outreach to community groups.
Interfaces at the federal level are neither documented nor reported upon in a formal, periodic manner. Likewise, although there is weekly reporting on the status of NJBPU matters prepared by the Rate Department, there is no formal reporting for functions associated with NJBPU (non-rate) relations, the FE Political Action Committee, and government affairs responsible for labor and management groups.
Recommendations
Recommendation VII-13 Develop a comprehensive and integrated external relations/communications strategy. (Refer to Finding VII-24, Finding VII-25, and Finding VII-26)
FE/JCP&L should develop an integrated external relations strategy and supporting programs, analysis, and reporting that will further their ability to interact with and support all of their stakeholders. Some suggested strategies could include (but not be limited to):
♦ Outreach Contact Program – Identify all regulatory, legislative, local government, local community groups, etc. and develop a program of regular contact. Information on issues, concerns, follow-up actions, etc. should be documented and analyzed. Periodic surveying of these groups can be included.
♦ Capital Investment Strategy – Define various means of communicating to states, local communities, and other key constituencies the need for and value of capital investment projects. Emphasis can be linked to the effect of capital investment in improving the reliability goals already developed by FE/JCP&L.
♦ Communications Strategy – Clearly define programs that will support the tactics, goals, and strategy outlined in the External Communications Plan. Make this document more robust and link it to

Final Report 191
6/20/2011
other external strategies. Include communication strategies to regulatory bodies and other key stakeholders (not just media).
♦ Contributions Strategy – More specifically, link contributions and grants to other departmental strategies (e.g., human resource future-skill needs to educational/training grants).
♦ Corporate Citizen Strategy – Develop a formal, specific program to promote FE/JCP&L management to give speeches, participate in local events, and serve on local boards.
Expenses for all external relations activities and programs should be tracked.
Variations of these and other external relations strategies have been successfully used by other utilities.


Final Report 193
6/20/2011
VIII. Finance and Accounting
This chapter discusses finance and accounting activities of Jersey Central Power & Light Company (JCP&L) and FirstEnergy (FE).
A. Finance
This section provides an overview of Jersey Central Power & Light’s finances, with an emphasis on how those finances impact it as a regulated utility operation in New Jersey. Specifically, Schumaker & Company completed the following:
♦ A review of direct and indirect effects of the financing of JCP&L, FE, and all JCP&L affiliates.
♦ A review and assessment of the financial performance of JCP&L, FE, and all affiliates, including the effects of affiliate interrelationships on individual company performance.
♦ An assessment of the effects of FE and its affiliates’ activities on JCP&L’s creditworthiness.
♦ A review of the debt management policies for JCP&L, FE, and all affiliates, identifying any real or perceived encumbrance of utility assets for non-utility purposes and determining the extent of any negative effects that have resulted from business diversification.
♦ An evaluation of the investment decisions of JCP&L, FE, and affiliate companies with respect to the degree to which tax considerations may have outweighed other investment criteria (e.g., safety) in making decisions and an assessment of the effect of FE’s financing on JCP&L.
♦ An evaluation of the methods that JCP&L, FE, and its affiliates have used to determine and allocate consolidated income taxes over the past eight years and an evaluation of any other tax treatments allowed by the IRS.
♦ An assessment of the degree to which the historical and projected tax benefits from diversified activities have been and are projected to be realized as a result of JCP&L’s taxable income and a provision of the chief beneficiaries’ identities.
Background & Perspective
This Background & Perspective section is divided into six segments:
♦ Overview ♦ Financing and Debt Management ♦ Credit ♦ Investments ♦ Pension and Other Post-Retirement Benefits (OPEB) Plans ♦ Tax Treatment

194 Final Report
6/20/2011
Overview
JCP&L’s financing functions are conducted by the Treasury organization of its parent organization, FirstEnergy (FE), in which the Treasury employees are FE Service Company (SERVECO) employees. FE is a diversified energy company headquartered in Akron, OH. It holds all of the outstanding common stock of JCP&L and, either directly or indirectly, the outstanding stock of seven other electric operating subsidiaries. Decisions concerning the areas of debt, credit ratings, investments, and pension obligations are managed by the Treasury Department (highlighted in gray). These decisions report up through the Vice President (VP) & Treasurer, through the Executive Vice President (EVP) & Chief Financial Officer (CFO), to the President & Chief Executive Officer (CEO). The organizations that provide these functions are shown in Exhibit VIII-1.
Exhibit VIII-1 Finance Organizations
as of June 30, 2010
Source: Information Response 54. The highlighted boxes show the location and reporting responsibilities of the groups that manage the financing functions concerning JCP&L and FE. The organizations that are not shaded are the other Finance Departments that report directly to the EVP & CFO that are not directly involved in financing activities.
Akron, OH 1210
SERVECOExecutive Vice President & Chief Financial Officer
Finance, Strategic Planning, & Operations
SERVECOExecutive AssistantSenior Management
Akron, OH 5
SERVECOVice President
Investor Relations
Akron, OH 17
SERVECOVice President & Chief Risk Officer
Corporate Risk
Akron, OH 24
SERVECODirector
Internal Auditing
Akron, OH 23
SERVECODirector
Business Performance
Akron, OH 268
SERVECOVice President & Chief Accounting Officer
Controller's Department
Akron, OH 5
SERVECODirector
Business Development
Akron, OH 37
SERVECOVice President & Treasurer-FirstEnergy
Treasury
Akron, OH
SERVECOExecutive Assistant
Akron, OH 3
SERVECODirector
Investment Management
Akron, OH 9
SERVECOAssistant Treasurer
Akron, OH 21
SERVECOAssistant Treasurer
Liquidity/Cash Management
Akron, OH 822
SERVECOVice President -Shared Services Administration
& Chief Information Officer

Final Report 195
6/20/2011
The Treasury Department is managed by the Vice President & Treasurer with three direct reports – two Assistant Treasurers and a Director of Investment Management. The responsibilities of the Assistant Treasurer – Treasury, with a staff of 11, include cash operations and finance. The responsibilities of the Assistant Treasurer – Cash Liquidity & Management, with a staff of 22, include planning, budgets, capital, and finance. The responsibilities of the Director of Investment Management, with a staff of 4, include management of the pension, nuclear decommissioning trusts and savings plans.
Financing and Debt Management
Debt and equity outstanding at the end of each of the last five years (2005 to 2009) is shown in Exhibit VIII-2.
Exhibit VIII-2 JCP&L Long-Term Debt & Equity
2005 to 2009
Source: Information Response 91
JCP&L’s long-term debt consisted of unsecured notes as well as 2002 and 2006 series transition bonds totaling $1.84 billion at the end of 2009. Interest rates ranged from 4.80% to 7.35%, with maturities ranging from 2010 to 2036.

196 Final Report
6/20/2011
The 2002 Series Transition Bonds shown are from a June 2002 $320 million bond sale. On February 6, 2002, in Docket No. EF99080615, JCP&L received a bondable stranded costs rate order (financing order) from the New Jersey Board of Public Utilities (NJBPU). This order authorized the issuance of $320 million of transition bonds to securitize the recovery of bondable stranded costs associated with the previously divested Oyster Creek Nuclear Generating Station plus upfront transaction costs. The financing order was issued in accordance with the Electric Discount and Energy Competition Act, which was enacted by the State of New Jersey in February 1999. JCP&L formed JCP&L Transition Funding, LLC (a Delaware limited liability company) on February 24, 2000 for the purpose of issuing these bonds. JCP&L Transition Funding is a wholly-owned subsidiary of JCP&L and, in June 2002, sold all ($320 million) of the transition bonds. The balance amount of these bonds remaining as of the end of 2009 was $190 million.
The 2006 Series Transition Bonds shown are the result of a $182 million bond sale in August 2006. On June 8, 2006, in Docket No. ER03020133, JCP&L received a bondable stranded costs rate order from the NJBPU. This order authorized the issuance of transition bonds to securitize the recovery of bondable stranded costs associated with JCP&L’s deferred basic generation service (BGS) net of tax account balance at July 31, 2003 plus upfront transaction costs. JCP&L Transition Funding II, LLC (another Delaware limited liability company and wholly-owned subsidiary of JCP&L) was formed on March 29, 2004. In August 2006, Transition Funding II sold $182 million of transition bonds to securitize the recovery of deferred costs associated with JCP&L’s supply of BGS. At the end of 2009, the balance of these transition bonds was $150 million.
JCP&L did not purchase and does not own any of the transition bonds that are included as long-term debt on FirstEnergy’s and JCP&L’s consolidated balance sheets. The transition bonds are the sole obligation of JCP&L Transition Funding and JCP&L Transition Funding II and are collateralized by each corporation’s assets, which consist primarily of bondable transition property.
Credit
FirstEnergy and its affiliates maintain credit relations with and receive credit ratings from three nationally recognized statistical rating organizations (NRSRO) , as designated by the U.S. Securities and Exchange Commission. These three NRSROs, most commonly referred to as credit rating agencies, are Standard & Poor’s (S&P), Moody’s Investors Service Inc. (Moody’s), and Fitch Ratings, Ltd. (Fitch). The credit ratings assigned to JCP&L for the past five years are shown in Exhibit VIII-3.

Final Report 197
6/20/2011
Exhibit VIII-3 JCP&L Credit Ratings
2005 to 2009
Year
Corporate Credit
Issuer
Issuer Default
Senior Secured
Senior Unsecured
Preferred Stock
S&P Moody’s Fitch S&P Moody’s Fitch S&P Moody’s Fitch S&P Moody’s Fitch
2005 BBB Baa2 BBB- BBB+ Baa1 BBB+ BB+ BA1 BBB
2006 BBB Baa2 BBB- BBB+ Baa1 A-
2007 BBB Baa2 BBB Baa2
2008 BBB Baa2 BBB Baa2
2009 BBB Baa2 BBB Baa2
Source: Information Response 93
Equivalent credit rating categories for the three credit rating companies in Exhibit VIII-3 are shown in Exhibit VIII-4.
Exhibit VIII-4 Equivalent Credit Ratings
2005 to 2009
Equivalent Credit Ratings Credit Risk S&P (1) Moody’s (2) Fitch (1)
Investment Grade Highest Quality AAA Aaa AAA
High Quality (Very Strong) AA Aa AA Upper Medium Grade (Strong) A A A
Medium Grade BBB Baa BBB
Not Investment Grade Lower Medium Grade (Somewhat Speculative) BB Ba BB
Low Grade (Speculative) B B B Poor Quality (May Default) CCC Caa CCC
Most Speculative CC Ca CC No Interest Being Paid Or Bankruptcy Petition Filed C C C
In Default D C D
(1) The ratings from AA to CC by S&P and Fitch may be modified by the addition of a plus or minus sign to show relative standing within the category.
(2) The ratings from Aa to Ca by Moody’s may be modified by the addition of a 1, 2, or 3 to show relative standing within the category. Source: Credit rating agency information
The ratings for JCP&L are based on the consolidated credit profile of its parent, FirstEnergy Corp. For the past five years, JCP&L and FE have received investment grade credit ratings at the Medium Grade

198 Final Report
6/20/2011
(as shown in Exhibit VIII-3). The corporate credit ratings for FirstEnergy and its affiliates are based on FE’s transformation from an integrated electric utility holding company to a model that encompasses regulated electric transmission and distribution (T&D) operations as well as unregulated merchant electric generation and marketing activities. In its March 25, 2010 report, S&P indicated that the proposed merger with Allegheny Energy Inc. is expected to result in a slightly weaker business risk profile for FE and its affiliates. Other rationales given by Moody’s on November 18, 2009 for JCP&L’s ratings are:
♦ The regulated nature of JCP&L’s cash flow – benefitting from a monopoly in its service area and deriving its entire revenue base through regulated activities
♦ The stability and predictability of JCP&L’s consolidated financial metrics indicate a strong Baa rating according to Moody’s methodology.
♦ The presence of a reasonably constructive regulatory environment – JCP&L’s regulatory risk profile is considered to be average to slightly above average for U.S. electric utilities.
♦ The significance of JCP&L’s capital expenditure requirements – continuing to invest in its aging infrastructure in an effort to improve electric service reliability
Credit ratings are relative measures of risk. An analysis by S&P on March 23, 2010, comparing FE to four similar companies in the energy sector and using averages over the past three fiscal years (2007 to 2009), is shown in Exhibit VIII-5.

Final Report 199
6/20/2011
Exhibit VIII-5 Peer Comparison
Average of Three Years 2007 to 2009
Rating/Ratio
FE
Exelon
Corporation
Public Service Enterprise Group, Inc.
Constellation Energy
Group, Inc.
Allegheny
Energy, Inc.
S&P Credit Rating 3/23/10 BBB-/Stable BBB/Stable BBB/Stable BBB-/Stable BBB-/Stable
Adjusted Ratios3
EBIT1 Interest Coverage (x) 2.5 5.8 5.8 2.4 3.2
FFO2 Interest Coverage (x) 3.1 6.1 5.4 3.4 3.8
FFO2/Debt (%) 15.2 23.1 26.6 16.6 18.5
Discretionary Cash Flow/Debt (%) (5.5) 3.1 0.6 (8.2) (6.6)
Net Cash Flow/CAPEX4 (%) 69.9 111.3 99.5 53.9 73.4
Total Debt/Debt Plus Equity (%) 65.7 60.7 52.1 56.9 60.1
Return on Common Equity (%) 13.2 24.6 18.6 25.1 13.7
Common Dividend Payout Ratio – Unadjusted (%) 53.5 47.9 46.5 21.0 19.0
1 EBIT = Earnings Before Interest and Taxes 2 FFO = Funds From Operations 3 Adjustments to company-reported financial results made by Standard & Poor’s analysts 4 CAPEX = Capital Expenditures Source: Information Response 94, Attachment 28
In S&P’s analysis of the average of the past three fiscal years (2007 to 2009), FirstEnergy compares most favorably with Constellation Energy and Allegheny Energy, both of which have similar BBB- credit ratings with “Stable” outlooks. The other two energy companies, Exelon and the Public Service Enterprise Group, have stronger financial ratios and slightly higher credit ratings (BBB). S&P states that the outlook for FE and its subsidiaries is stable based on their projection that the proposed merger with Allegheny Energy will be approved in a timely manner by the regulators, “without a material change to the anticipated financial profile of the combined entity.” S&P also indicates that delays in the merger process, significant distractions from merger activities affecting operating performance, or changes in the financial basis of the proposed merger based on modified terms of approval might cause a lowering of the ratings. S&P states that an increase in the credit ratings could occur if financial performance “markedly exceeds expectations.” A credit-rating uptick might also occur if “credit metrics fall comfortably in the ‘significant’ category (20%- 30% FFO to debt and debt-to-capital below 50%)” and if this level of financial performance is maintained.
On February 11, 2010, S&P downgraded the senior unsecured debt of FirstEnergy to BB+. Pursuant to the requirements of a pre-existing NJBPU order, on February 17, 2010, JCP&L filed a plan addressing

200 Final Report
6/20/2011
the mitigation of any effect from this recent S&P downgrade of FE’s debt. This plan was to provide an “assessment of present and future liquidity necessary to assure JCP&L’s continued payment to BGS suppliers.” Subsequently, the public hearing to address the plan was held, and on March 17, 2010, NJBPU determined that JCP&L had ample resources available to continue uninterrupted payments to BGS suppliers. The NJBPU also concluded that there were no concerns with JCP&L’s liquidity, and therefore, no further action was required.
Investments
JCP&L controls no long-term investments. All long-term investments are consolidated and managed by FirstEnergy and include trusts, funds, and pensions and savings plans. All of these investments are managed by outside professional investment managers. Significant long-term investments on JCP&L’s balance sheet include a nuclear decommissioning trust (NDT) and a spent nuclear fuel trust. At the end of 2009, the balance in the NDT was $167 million, and the balance in the spent nuclear fuel trust was $200 million.
The Investment Committee has the fiduciary responsibility for certain FE investments held in trusts (e.g., pension, savings plan, nuclear decommissioning trusts, health care plan, non-qualified plans). This committee meets quarterly and sometimes more often. (In 2008, they met more often because of the financial turmoil in the countryand, in 2009, this committee met 17 times.) This committee must consist of at least five members, all of whom are appointed by FE’s CFO, and must include representatives from the Legal, Human Resources, and Risk Management departments. As of July 30, 2010, the members of this committee included:
♦ VP & Treasurer (Chairman) ♦ Director, Business Development ♦ Assistant Controller, FEU ♦ Assistant Treasurer ♦ Director, Corporate Enterprise Risk Management ♦ VP, Legal ♦ Director, Compensation, Retirement Programs, and Succession Planning
As of July 30, 2100, the responsibilities of this committee included:
♦ Reviewing and monitoring the custody and safekeeping of the assets
♦ Obtaining and reviewing information that may affect the investment objectives and policies for the assets, including:
- Tax obligations - Actuarial assumptions - Funding levels - Accumulated benefit obligations - Benefits to be paid - Expected contributions

Final Report 201
6/20/2011
- Anticipated investment time horizons - Other liquidity needs
♦ Establishing and monitoring compliance with investment objectives and policies
♦ Selecting, appointing, contracting with, monitoring performance, and terminating the services of trustees, custodians, investment managers, advisors, consultants, and other investment-related service providers
♦ Reviewing the reasonableness of expenses paid for custody and investment management services
♦ Reviewing the allocation among asset classes and investment managers and monitoring the investment performance of the assets
♦ Investing assets and monitoring the performance of such investments in situations where an investment manager has not been selected by this committee
♦ Reporting on the status and investment of the assets at least annually to FE’s CEO and CFO and to the Finance Committee
Schumaker & Company consultants were informed that FirstEnergy doesn’t “churn” fund managers. Rather, it tends to keep them for an extended period of time. In the August 31, 2009 meeting, however, the committee approved the hiring of a new investment advisor to counsel its activities. That advisor’s lengthy investment experience, independence, expertise with alternative investments, macroeconomic research knowledge, proven track record for strategic analysis, and the advisor being available exclusively to FE’s Investment Committee were the reasons stated for the hiring. At subsequent meetings in 2010, the Investment Committee approved the termination of several of its active equity managers at the recommendation of its recently hired investment advisor, with proceeds to be allocated to new investment managers recommended by the advisor.
Nuclear Decommissioning Trust
A nuclear decommissioning trust has been established for every nuclear plant unit owned or partially owned by an FE subsidiary. The purpose of these trusts is to segregate and invest monies for funding the nuclear plant decommissioning costs of each nuclear plant. FirstEnergy’s NDTs are shown in Exhibit VIII-6.

202 Final Report
6/20/2011
Exhibit VIII-6 Nuclear Decommissioning Trusts
as of December 31, 2009
Operating Company
Nuclear Generating Plants
Davis-Besse Perry Beaver Valley
Unit 1 Beaver Valley
Unit 2 Three Mile
Island Unit 2 FENOC1 X X X X
OE2 X X
TE3 X
Met-Ed4 X
Penelec5 X
JCP&L X
1 FirstEnergy Nuclear Operating Company 2 Ohio Edison Company 3 Toledo Edison Company 4 Metropolitan Edison Company 5 Pennsylvania Electric Company Source: Information Response 82 and Interview 153
The Investment Management Department oversees management of the NDT trusts. Contributions to these trusts are determined by the Rate Department and mandates from the state utility commissions.
JCP&L has a 25% ownership interest in Three Mile Island Unit 2 (TMI-2). This unit, damaged in an accident in 1979, is jointly owned by JCP&L and two affiliates: 1) Metropolitan Edison Company (Met-Ed) with a 50% interest and 2) Pennsylvania Electric Company (Penelec) with the final 25% interest. This unit has not operated since the accident, and its operating license has been converted to a “possession only” one.
The estimated cost to decommission this unit is $868 million, as determined by a site-specific decommissioning cost study, Decommissioning Cost Analysis for Three Mile Island Unit 2, dated January 2009 and escalated to 2009 dollars. At the end of 2009, the amount accumulated in the three NDTs concerning TMI-2 was $577 million. Of this amount, JCP&L’s share was $167 million. At the end of June 2010, FirstEnergy has $571 million in this trust, with future estimated earnings to be approximately $400 million. The costs to decommission TMI-2 were evaluated for three decommissioning scenarios:
♦ Delayed DECON – defer decommissioning until the spent fuel has been removed from the site, assuming that the decontamination and dismantling activities at TMI-2 are synchronized with the adjacent unit such that the licenses for both units are terminated concurrently.

Final Report 203
6/20/2011
♦ Custodial SAFSTOR – assuming that Three Mile Island Unit 1 (TMI-1), owned and operated by Exelon, is placed into long-term storage and that TMI-2 remains in storage until such time that decommissioning activities can be coordinated with TMI-1.
♦ Hardened SAFSTOR – assuming that TMI-1 is promptly decommissioned when it ceases operations in 2034 and that the TMI-2 reactor building is reconfigured for long-term passive storage; that TMI-2’s site structures and facilities, with the exception of the reactor building, are decontaminated and dismantled; that the reactor building and its contents are secured and that the site is reconfigured for monitored surveillance; and that decontamination and final dismantling of the reactor building is deferred for approximately 100 years (from Unit 1 shutdown).
Regardless of the scenario or the timing of the decommissioning activities, the cost estimates assume the eventual removal of all the contaminated and activated plant components and structural materials, such that the facility operator may then have unrestricted use of the site with no further requirement for a license.
Through mid-2010, this trust was being funded by JCP&L ratepayers. On February 19, 2010, JCP&L filed a request with the NJBPU to reduce the nuclear decommissioning cost charge to zero by June 1, 2010. JCP&L was to collect $1.2 million from rate payers in 2010, with no additional rate payer–funded collections anticipated, but retains the right to request recovery in the future if estimates / assumptions change.
Eligible investments for JCP&L’s NDT are shown in Exhibit VIII-7.

204 Final Report
6/20/2011
Exhibit VIII-7 NDT Eligible Investments
as of December 31, 2009
Investment Category
Asset Allocation Type of Investment Target Actual
Fixed Income
45% 49% U.S. treasury bills, notes, and bonds
U.S. Government Agency obligations
Obligations of state and local governments not in default as to principal or interest
Obligations of U.S. corporations not in default as to principal or interest
Mortgage-backed obligations (Collateralized Mortgage Obligations {CMOs}, etc.) not in default as to principal or interest Interest Only or Principal Only mortgage-backed obligations are not permitted in the portfolio.
Asset-backed securities
Time or demand deposits in a bank or an insured credit union located in the U.S.
Other money market instruments
Equities 55% 51% Common stock traded on U.S. stock exchanges
No direct investments in FirstEnergy Corp. (FE) stock other than index strategies that have FE as part of the index
Derivative contract, financial instrument, or other transaction (including, without limitation, any equity swap) as may be necessary to implement any hedging transaction
Source: Information Response 462
Spent Nuclear Fuel Trust
In 1983 or 1984, the Department of Energy (DOE) imposed a one-time fee (based on kilowatt hours (kWh) generated over the life of a nuclear plant at that time (through 1983) multiplied by 1 mil) toward the cost of disposing spent nuclear fuel at the Yucca Mountain Repository in Nevada. Yucca Mountain was the United States’ designated deep geological repository storage facility for spent nuclear reactor fuel and other radioactive waste. It is located between the Mojave Desert and the Great Basin Deserts in the US state of Nevada.
On March 3, 2010, the Department of Energy filed a motion with the Nuclear Regulatory Commission to withdraw with prejudice the license application for a high-level nuclear waste repository at Yucca Mountain. The U.S. Government’s Blue Ribbon Commission on America’s Nuclear Future is to conduct a comprehensive review of policies for managing the backend of the nuclear fuel cycle. Based on this review, it will provide recommendations for developing a safe, long-term solution to managing the United States’ used nuclear fuel and nuclear waste.

Final Report 205
6/20/2011
This liability (consisting of the cost to dispose of spent nuclear fuel as estimated in 1983)continues to grow, however, at the 13-week Treasury bill rate until such time as Yucca Mountain (or its designated replacement) becomes operational and the spent fuel can be transferred there. The nuclear fuel disposal trust that covers this liability is currently overfunded by approximately $15 million. This fund is taxable and, therefore, invested in tax-free municipal bonds. The JCP&L balance in this fund, including accrued interest, as of the end of 2009 was $200 million. It is being funded by JCP&L ratepayers. The regulatory liability for this fund is set by the Nuclear Regulatory Commission (NRC).
JCP&L owned 25% of the TMI-1 nuclear plant and 100% of the Oyster Creek nuclear plant (and owned corresponding percentages of their spent nuclear fuel). When the Oyster Creek and TMI-1 nuclear generating stations were sold to an Exelon affiliate (AmerGen Energy, LLC) prior to the merger between GPU and FirstEnergy, JCP&L retained a spent nuclear fuel obligation to the DOE.
Pension and Other Post-Retirement Benefits (OPEB) Plans
JCP&L’s pension and OPEB plans are consolidated with the rest of FE’s plans. They are administered by the Investment Management Department with guidance and oversight provided by its Investment Committee. FirstEnergy provides a noncontributory qualified defined benefit pension plan that substantially covers all of its employees. FE also provides non-qualified pension plans that cover certain employees. These plans extend defined benefits based on years of service and compensation levels. FE’s funding policy is based on actuarial computations using the projected unit credit method. Due to a large ($500 million) voluntary contribution in 2009, it is estimated that no additional cash contributions will be required before 2012.
FirstEnergy provides noncontributory life insurance to retired employees as well as optional contributory insurance. Subsidized health care benefits are also available upon retirement to employees, their dependents, and under certain circumstances, their survivors. Pension and OPEB costs are affected by employee demographics (including age, compensation levels, and employment periods), the level of contributions made to the plans, and earnings on plan assets.
Pension and OPEB investments measured at fair market value as of the end of 2009 are shown in Exhibit VIII-8.

206 Final Report
6/20/2011
Exhibit VIII-8 Pension and OPEB Investments
as of December 31, 2009
Assets
Pension Investments OPEB Investments Asset Value ($ millions)
Asset Allocation (%)
Asset Value ($ millions)
Asset Allocation (%)
Short-Term Securities 337 7 19 4 Common and Preferred
Stocks 1,572 36 225 47
Mutual Funds 159 4 12 3 Bonds 1,928 44 208 44
Real Estate/Other Assets 383 9 11 2 Total 4,379 100 475 100
Source: Information Response 82, Attachment 5
At the end of 2009, FE’s pension fund was funded at an 82% level, leaving a pension benefit liability on the balance sheet of approximately $1 billion. This level was an increase in funding percentage from 2008, which was approximately 80% funded. Nevertheless, it was not as high a funding percentage as that at the end of 2007, which reported a 111% pension funding. The primary reason for the reduction in funding percentage from 12/31/2007 to 12/31/2009, according to FE management, was losses in plan asset value experienced in 2008.
Tax Treatment
JCP&L, along with FirstEnergy Solutions Corporation (FES) and the other FE utility companies, is party to an Intercompany Income Tax Allocation Agreement. This agreement is effective for taxable years ending on or after January 1, 2002, with FE and its other subsidiaries providing for the allocation of consolidated tax liabilities. In accordance with Code Section 1552(b) and Section 1.1552-1(c)(2) of the Internal Revenue Code of 1986, the consolidated tax liability (other than AMT and its related credits) is allocated among all the participants of this agreement in the same percentage of the total consolidated tax as if computed for each participant on a separate return basis. Any tax benefits are allocated to participants who had items of deduction, loss, or credit for which the tax benefit amount is attributable. JCP&L’s federal income tax rate has been 35%, the same as for the other FE utilities, FES, and FE, for the past three years. According to the FirstEnergy Tax Department, JCP&L’s rate would be no different if it were a standalone utility. JCP&L’s taxes are calculated based only on JCP&L’s book income.
Net tax benefits attributable to FE, excluding those benefits derived from interest expense associated with the acquisition indebtedness of FE’s merger with GPU, are allocated to FE’s subsidiaries that have taxable income. This allocation is accounted for as a capital contribution to the recipient company.

Final Report 207
6/20/2011
Findings & Conclusions
Finding VIII-1 JCP&L’s credit standing and financial performance have not been adversely affected by the financing and debt management practices of FirstEnergy and its affiliates.
The credit ratings for JCP&L are based on the consolidated credit profile of its parent company. JCP&L has received an investment-grade credit rating from all three major credit rating companies for the past five years (2005 to 2009). According to these credit rating companies, the corporate credit ratings for FirstEnergy and its affiliates are based on FE’s transformation from an integrated electric utility holding company to a model that encompasses both regulated electric T&D operations and unregulated merchant electric generation and marketing activities.
Positive reasons supporting JCP&L’s investment-grade rating include the regulated nature of its cash flow, the stability and predictability of its cash flow, the presence of a reasonably constructive regulatory environment, and continued investment in its infrastructure to improve electric service reliability. A recent financial evaluation by one of the credit rating agencies indicates that JCP&L’s financial performance and risk measurements over the past three years are comparable to a peer panel of other electric utilities. JCP&L’s assets have not been encumbered for non-utility purposes, nor has JCP&L experienced any negative effects from its parent’s or affiliates’ debt management policies.
Finding VIII-2 Credit rating provisions in BGS contracts could impact JCP&L’s liquidity if JCP&L’s ratings were to go below investment grade.
Each year, the four New Jersey electric distribution companies (EDCs) – Public Service Gas & Electric Company (PSE&G), Atlantic City Electric Company (ACE), JCP&L, and Rockland Electric Company (RECO) – have procured their electric supply to serve their basic generation service (BGS) customers through a statewide auction process held in February of each year. BGS refers to the service of customers who are not served by a third-party supplier or competitive retailer. In other jurisdictions, this type of service is sometimes referred to as standard offer service, default service, or provider of last resort service.
The auction process has consisted of two auctions that are held concurrently, one for larger customers on an hourly price plan (BGS-CIEP) and one for smaller commercial and residential customers on a fixed-price plan (BGS-FP). The two contracts have non-reciprocating credit terms for margining, which means that JCP&L does not have to post margin to a supplier to cover any market price exposure. In Article 9 of the contract, however, JCP&L would be required to prepay 50% of its previous month’s payable to the supplier if two out of the three credit ratings for JCP&L were to fall below investment grade. In the event that JCP&L had only had two ratings, then only one would have to fall below investment grade.
Currently, JCP&L’s credit ratings are above investment grade, and therefore, it is not required to prepay. If JCP&L is required to prepay, the prepay amount will be disclosed on FirstEnergy’s

208 Final Report
6/20/2011
Enterprise Risk Management group’s monthly liquidity impact report. The amount varies from month to month based on demand. On average, over a one-year period, the amount is approximately $57 million.
After S&P downgraded the senior unsecured debt of FE to BB+ in February 2010, JCP&L filed (in compliance with the requirements of an NJBPU order) a plan to assess the present and future liquidity necessary to assure its continued payment to BGS suppliers. After a public hearing to address the plan was held in March 2010, the NJBPU determined that JCP&L had ample resources available to continue uninterrupted payments to BGS suppliers. It also concluded that there were no concerns with JCP&L’s liquidity and no further action required.
Finding VIII-3 The tax methodology applied to JCP&L is reasonable, and tax considerations have not played an inappropriate role in JCP&L’s investment decisions.
Although JCP&L’s financial operations are combined with the other FE companies in consolidated financial statements and for purposes of filing a consolidated federal tax return, JCP&L’s income taxes are computed based on JCP&L’s financial results alone. JCP&L’s allocated share of consolidated income taxes is the same as it would be if JCP&L were a standalone utility company. JCP&L’s federal income tax rate, as well as the rates of the other FE utility companies, has been 35% of book income for the past three years. The only tax consideration impacting investment decisions concerns whether the income from an investment is taxable or not, thereby affecting the return on that investment.
Finding VIII-4 JCP&L’s pension plan is funded appropriately.
JCP&L’s pension plan is consolidated with that of FirstEnergy and the other affiliated companies. The pension plan is administered by the Investment Management Department, overseen by the Investment Committee. Day-to-day operations are handled by outside professional investment managers and consultants. Although required to meet only quarterly, the Investment Committee has met many more times since the onset of investment markets’ economic problems in an effort to safeguard FE’s pension plan assets. The committee has taken an active role in monitoring the performance of its professional investment advisors and managers and has made adjustments, including terminating managers and hiring new professional advisors when required. Although the funded ratio (actuarial value of assets divided by actuarial accrued liabilities) has fallen since 2007, FE has taken action, with the insertion of $500 million in 2009, to keep this ratio above 80%.

Final Report 209
6/20/2011
Recommendations
Recommendation VIII-1 Explore the advisability of ring-fencing JCP&L’s operations from FE. (Refer to Finding VIII-2)
JCP&L would be required to prepay 50% of its previous month’s payable to its basic generation service (BGS) electricity supplier if two out of the three JCP&L credit ratings were to fall below investment grade. Currently, JCP&L’s credit ratings are above investment grade and prepayment is not required. If JCP&L is required to prepay, the annual amount could approximate $57 million. The credit ratings for JCP&L are based on the consolidated credit profile of its parent company, FirstEnergy. In the first quarter of 2010, one of the three credit agencies rating JCP&L and FE downgraded FE’s senior unsecured debt to below investment grade. As a result, the specter is raised that JCP&L’s credit could also be affected.
Ring-fencing involves an effort to wall off certain elements or subsidiaries of a corporation to protect its assets from creditors in a bankruptcy situation or, in this case, to protect an investment-grade credit rating. Generally, ring-fencing is a defensive or survival move. It comes with a cost and can restrict the way businesses operate. It is a strategy that JCP&L should consider and evaluate, however, based on the possibility of being saddled with an adverse credit rating.

210 Final Report
6/20/2011
B. Cash Management
This section, which provides an evaluation of Jersey Central Power & Light’s cash management methodologies and processes, includes an analysis of cash forecasting, diversification of investments, and the cost of capital.
Background & Perspective
This background and perspective section is divided into five segments:
♦ Overview ♦ Cash management methodologies ♦ Financial performance measurements ♦ Write-offs ♦ Cost of capital
Overview
JCP&L’s cash management functions are conducted by treasury groups of its parent organization, FirstEnergy. These groups are located within the FE Service Company (SERVECO). FirstEnergy is a diversified energy company based in Ohio that holds all of the outstanding common stock of JCP&L and, either directly or indirectly, the outstanding stock of seven other electric operating subsidiaries. Decisions concerning cash receipts, cash processing, banking relations, short-term borrowings, and cash disbursement are made by treasury groups that report up through the Vice President & Treasurer to the Executive Vice President & Chief Financial Officer and ultimately to the President & Chief Executive Officer. The organizations that provide these functions are shown in Exhibit VIII-9.

Final Report 211
6/20/2011
Exhibit VIII-9 Cash Management Organizations
as of June 30, 2010
Note: The organization blocks that are shaded are the groups that provide cash management functions for JCP&L and other FE entities. Source: Information Response 54
Cash Management Methodologies
Cash Forecasting
All cash management functions for JCP&L and all of the other FE subsidiaries are centralized in several groups that report to the FE Treasurer. Under this reporting hierarchy, cash operations reports to Treasury’s Assistant Treasurer and cash forecasting reports to the Assistant Treasurer for Liquidity,
Akron, OH 1210
SERVECOExecutive Vice President & Chief Financial Officer
Finance, Strategic Planning, & Operations
SERVECOExecutive AssistantSenior Management
Akron, OH 5
SERVECOVice President
Investor Relations
Akron, OH 17
SERVECOVice President & Chief Risk Officer
Corporate Risk
Akron, OH 24
SERVECODirector
Internal Auditing
Akron, OH 23
SERVECODirector
Business Performance
Akron, OH 268
SERVECOVice President & Chief Accounting Officer
Controller's Department
Akron, OH 5
SERVECODirector
Business Development
Akron, OH 37
SERVECOVice President & Treasurer-FirstEnergy
Treasury
Akron, OH
SERVECOExecutive Assistant
Akron, OH 3
SERVECODirector
Investment Management
Akron, OH 9
SERVECOAssistant Treasurer
Akron, OH 21
SERVECOAssistant Treasurer
Liquidity/Cash Management
Akron, OH 822
SERVECOVice President -Shared Services Administration
& Chief Information Officer

212 Final Report
6/20/2011
Cash Management. FE uses the personal computer–based multi-integrated decision analysis system (MIDAS) to forecast financial statements, including income statements, balance sheets, and cash flow statements down to the entity level. MIDAS was developed to integrate decision analysis capabilities into a utility simulation model by, or under the direction of, the Electric Power Research Institute (EPRI). It is now owned by Ventyx, a large software, data, and advisory services provider to the energy, utilities, and communications industries. FE uses MIDAS to produce multi-year financial statements based on data and assumptions provided by its business units.
Cash forecasts are prepared annually from information generated from the annual budget process. The annual budget numbers are, in turn, allocated by month to produce a monthly cash forecast. Actual cash results as well as cash-flow forecast updates obtained from various business units are introduced every month to the forecast. These figures are used to explain variances from forecasted results and to ensure that the most current and accurate information is contained within the forecast. The monthly forecasts are used to establish a daily forecast of receipts and disbursements. Every day, cash operations performs a validity check of all receipts and disbursements against the daily forecast. Unreasonable differences are identified for further investigation. A cash forecast for each entity, including JCP&L, is generated from the corporate cash forecasts.
Cash Collections and Disbursements
All cash collections and cash disbursements functions for JCP&L, along with the functions of the other FE utility companies, are consolidated by personnel in SERVECO departments.
Cash Receipts
The cash receipts function has been centralized for FE and its subsidiaries since the mid 1980s. General Public Utilities (GPU) also used a centralized remittance processing center at the time of the FE/GPU merger in 2001. The current central remittance center (CRC) has been in operation since 2004. During early 2008, a limited investigation of the concept of opening a New Jersey satellite remittance processing center was conducted with the aim of achieving accelerated remittance. It was determined that this concept was not economically advantageous.
Remittance volume is approximately 56% mail and 44% electronic. JCP&L also uses payment agents and has some walk-in payments. Deposits are made to the bank the same day they are received, and FE has next-day availability of funds (depending on from what banks the checks are drawn). For remittance processing of paper checks, data is sent to FE’s banks electronically using the accounts receivable conversion (ARC) process or the image cash letter (ICL) or Check 21 process. Under this latter process, an image of the payment check is sent to the bank electronically. JCP&L’s daily cash position is tracked on Excel spreadsheets, along with the other subsidiaries. For electronic payments, two banks are used as depositories of JCP&L customer payments. A graphic description of the cash and information flow for paper check and electronic remittances is show in Exhibit VIII-10.

Final Report 213
6/20/2011
Exhibit VIII-10 Cash Management Flow Diagram
as of June 30, 2010
Source: Information Response 99, Attachment 2
Remittance processing was the responsibility of the Customer Service Department until November 2008. At that time, ARC and ICL technology were implemented and it came under Treasury. Upon implementation of this technology in October 2009, the CRC went back under the control of the Customer Service Department. As of the time of our audit investigation, FE had determined that having the CRC under Customer Service rather than Treasury allowed greater flexibility for alternative or emergency uses of CRC staff.
Cash Disbursements
The SERVECO Accounts Payable Department, located in Johnstown, PA, handles all payables, including expense reports and invoices, for JCP&L, FE, and other affiliates. Invoices are sent to the department that is responsible for buying the service or product. This department is where source documents are faxed/scanned into SAP’s accounts payable module using CommonStore, an IBM tool. If some vendors send their invoices directly to Accounts Payable, those invoices will be forwarded to the responsible department to initiate the payment process. Accounts Payable is also responsible for initiating electronic payments through the JPMorgan Order-to-Pay network.
The forms in which requests for payment can be received at Accounts Payable include:
♦ Electronic invoice presentment and payment (EIPP) transactions (with or without accompanying purchase orders)
♦ Service entry sheet transactions

214 Final Report
6/20/2011
♦ Evaluated receipt settlement (ERS) transactions (purchase order but no invoice)
♦ Paper invoices for product-related purchases
♦ Expense reports
♦ Check requests
♦ Recurring transactions (with or without accompanying purchase orders)
♦ Consignment transactions
♦ Purchase card (P-card) transactions
♦ Electronic data interchange (EDI)
♦ Ancillary systems – feeds from internal (payroll garnishments, worker’s compensation, etc.) and external (telecommunications vendor invoices, freight/logistics, and contingent/temporary labor) systems
FirstEnergy’s standard terms are 2% 10 days, net 45 days, although alternative terms can be negotiated. Payments are made daily. After reviewing a proposed payment report, the report is sent to Treasury at roughly 3:30 P.M. for review and approval. By 5:00 P.M. a check-processing run is completed. Payments can be made electronically or via paper the next day, with a date of one day later. Any checks requiring special handling are printed in Johnstown, PA and sent to the appropriate FE employee via intercompany mail. Any other paper checks are printed in Akron, OH and mailed. Any electronic payments are sent via EIPP (which is preferred, with no bank involvement by FE) or automated clearing house (ACH)/wire transfer (files sent to bank). The Accounts Payable function also supports Treasury in its escheats process approximately twice annually.
Payment approval levels by position type and dollar amount of transaction are shown in Exhibit VIII-11.
Exhibit VIII-11 Payment Approval Levels as of December 31, 2009
Position Approval Level
Executive Officers as listed in FE’s 10-K $10,000,000 Vice President $1,000,000 Department Director $500,000 Department Manager $50,000 Department Supervisor $10,000
Source: Information Response 103

Final Report 215
6/20/2011
Banking
JCP&L does not maintain its own bank accounts. JCP&L and its affiliates participate in a centralized cash management function within the SERVECO organization. All receipts and disbursements for FE and its subsidiaries flow through SERVECO bank accounts. JCP&L’s receipts and disbursements as well as its bank accounts are comingled along with the receipts/disbursements and bank balances of other FE companies. The cash balances of each participant FE utility, however, are tracked and accounted for separately to ensure that each company’s cash is used only for its own purposes or in accordance with the terms of the FirstEnergy Intersystem Utility Money Pool (Utility Money Pool), which is discussed in the next section of this chapter. Bank account balances are monitored daily using banking systems and electronic bank statement imports into SAP, FE’s integrated enterprise resource planning (ERP) system. JCP&L and the other participants use four banks for cash receipt and disbursement functions. These banks are:
♦ JP Morgan Chase – main concentration and disbursement bank as well as depository for a portion of JCP&L customer receipts
♦ Bank of America – depository for JCP&L customer payments received from preauthorized direct debit
♦ Wachovia/Wells Fargo – depository for JCP&L customer check payments received at remittance that are ARC (accounts receivable conversion) eligible
♦ FirstMerit – ACH disbursement (payroll direct deposit)
JCP&L has maintained a relatively small balance in cash and temporary investments on its books over the past five years. The balance of cash and cash equivalents reported by JCP&L on its Form 10-Qs and 10-Ks for the period spanning 2005 through 2009 are shown in Exhibit VIII-12.
Exhibit VIII-12 Cash and Cash Equivalents
2005 to 2009
Balance at 2009 2008 2007 2006 2005
1st Quarter $4,213 $39,900 $46,486 $102,901 $40,900 2nd Quarter $138,131 $232,001 $87,150 $94,650 $411,586 3rd Quarter $931 $37,900 $76,530 $58,229 $571,299 4th Quarter $26,875 $66,209 $93,858 $40,900 $102,284
Source: Information Response 98

216 Final Report
6/20/2011
Money Pool
SERVECO administers a Utility Money Pool, in which JCP&L is an authorized participant, and tracks all the daily receipt and disbursement activity for each of the pool participants. The Utility Money Pool is set up to coordinate and provide for short-term cash and working capital requirements for the companies that participate in it. It allows companies to lend or borrow, on a short-term basis, from the money pool based on corporate-specific fund availability. FirstEnergy does not use commercial paper but maintains a $2.75 billion revolving credit facility as well as four utility-operating corporate-receivable financing facilities, all of which are available sources of liquidity to the Utility Money Pool.
Twenty-six banks participate in the revolving credit facility, with Citibank serving as the administrator. Usually, participants will have drawn down less than 50% of the available funds at any one time. The month of June is typically the peak demand for funds. The interest rate charged is the one-month London Interbank Offered Rate (LIBOR) plus 42.5 basis points. JCP&L’s borrowing limit from the facility is $425 million.
The money pool is designed to provide participating companies with the least expensive source of short-term borrowing and with a secure and easily accessible investment vehicle. The money pool provides cost savings by using available internal funds prior to obtaining outside funds through a more costly external source. External short-term investments made on behalf of the Utility Money Pool or by any individual company within the Utility Money Pool follow FE’s short-term investment policy.
On December 17, 2009, JCP&L was granted an extension of time by the New Jersey Board of Public Utilities (NJBPU) through December 31, 2011 to participate in the Utility Money Pool. By means of previous orders, the NJBPU had allowed JCP&L to participate in this money pool through December 31, 2009. Provisions of this latest order stated that JCP&L:
♦ Cannot borrow money from a bank or issue commercial paper to lend to the money pool
♦ Cannot borrow from the money pool if it could obtain funds at lower cost from a bank or by issuing commercial paper
♦ Require that its Chief Financial Officer or Treasurer, or designee, make money pool–related short-term financing decisions based on the best interest of JCP&L’s ratepayers
♦ Can deposit in the money pool only funds that it would have available for investment in short-term money markets or other short-term investments
♦ Cannot borrow any sum from the money pool for a period longer than 364 days
♦ Cannot have its borrowing exceed the limitation on unsecured indebtedness that had been contained in its certification of incorporation (Basically, it cannot change JCP&L’s money pool borrowing limitation.)

Final Report 217
6/20/2011
♦ Must file quarterly comparative statements with the NJBPU indicting the interest rate imposed for borrowing/investing with the money pool and the prevailing market rate at the time for similarly situated utilities
♦ Must comply with the requirements of New Jersey Administrative Code (N.J.A.C.) 14:4-4A.7 (f), (g), and (h) and the provisions of all other applicable statutes, regulations, and orders. In addition to the provisions listed above, this code mandates that:
- The Board of Directors approves the money pool participation.
- Participation in the money pool is restricted to:
• the public utility holding company
• other electric or gas public utilities within the public utility holding company system
• subsidiary companies providing electric or gas utility service outside of New Jersey that are certified or classified as electric or gas utilities by the public utility commission of the state where service is provided
• any other subsidiary in the public utility holding company system;
- A subsidiary company in the public utility holding company system that is not a public utility or an out-of-state utility is prohibited from borrowing from the money pool.
- All borrowers in the money pool have, at a minimum, investment-grade credit ratings from all applicable nationally recognized statistical rating organizations (NRSROs).
- The fees for administering the money pool must be cost-based and subject to review by the Board for ratemaking purposes.
- All money pool transactions must be recorded in a separate general ledger account within the electric or gas public utility’s books of account on an aggregate monthly basis.
JCP&L was a net borrower from the Utility Money Pool in 2008, but for 2009 and the first half of 2010, it has lent money to the Utility Money Pool for more months than it has borrowed. The average month-end amount borrowed in 2008, when every month was negative (i.e., JCP&L was a borrower), was approximately $137 million. In 2009, when the month-end balance for only four months was negative, the average monthly investment was approximately $42 million. This trend has continued through the first six months of 2010, with JCP&L being an investor for four months and a borrower for two months. During this timeframe, an average month-end investment in the Utility Money Pool of approximately $33 million has been recorded. The Utility Money Pool monthly balances outstanding for the 30 months ending June 30, 2010, including interest rates used either for money borrowed or lent (invested), are shown in Exhibit VIII-13.

218 Final Report
6/20/2011
Exhibit VIII-13 Utility Money Pool Monthly Balances Outstanding
January 31, 2008 to June 30, 2010
Source: Information Response 472

Final Report 219
6/20/2011
Financial Performance Measurements
JCP&L’s financial performance, as measured using standard financial ratios, is shown in Exhibit VIII-14.
Exhibit VIII-14 Financial Performance Measurements
2005 to 2009
Measurement
Years Ended December 31 % Change 2005 2006 2007 2008 2009
Current Ratio 0.38 0.60 0.92 0.81 1.32 247.4%
Debt-Equity Ratio 0.37 0.43 0.53 0.57 0.70 89.2%
Interest Coverage Ratio 4.89 5.00 4.42 4.36 3.39 –30.7%
Earnings-to-Fixed-Charge Ratio 4.44 4.28 3.91 3.91 3.18 –28.4%
Operating Margin 14.92% 15.13% 12.94% 12.51% 13.04% –12.6%
Net Profit Margin 7.03% 7.15% 5.74% 5.39% 5.70% –18.9%
Return on Assets 2.41% 2.55% 2.63% 2.81% 2.63% 9.1%
Return on Equity 5.73% 5.84% 6.03% 6.35% 6.55% 14.3%
Revenue per Employee $1,838 $1,842 $2,189 $2,362 $2,090 13.7%
Source: Information Response 86
The Current Ratio is a liquidity ratio indicating the number of times current assets will pay off current liabilities. It is calculated by dividing current assets by current liabilities. The Debt-Equity Ratio measures a company’s financial leverage and is calculated by dividing long-term debt and other long-term obligations by stockholder’s equity. The Interest Coverage Ratio focuses on the number of times interest expense is covered by operating profits. It is calculated by dividing earnings before interest and taxes (EBIT) by interest expense. The Earnings-to-Fixed-Charge Ratio is a broader measurement of debt-paying ability. It is calculated by dividing earnings by fixed charges (both as defined in Regulation S-K and as prescribed by the Securities and Exchange Commission (SEC)). Operating Margin is a measurement of a company’s gross operating profitability. It is calculated by dividing operating income by revenues. Net Profit Margin is an indication of how effective a company is at cost control. It is calculated by dividing net income by revenues. Return on Assets is a measure of a company’s profitability. It is calculated by dividing net income by total assets. Return on Equity measures how well a company is using investors’ capital to produce profits. It is calculated by dividing 12-month earnings on common stock by the average of 13 months of stockholder’s equity. Revenue per Employee is a measurement of management efficiency. It is calculated by dividing revenues by the number of employees. The relevance to JCP&L of these performance measurements over this five-year period are discussed in Finding VIII-9.

220 Final Report
6/20/2011
Write-Offs
JCP&L experienced no write-offs of assets in the five years ended December 31, 2009. There were, however, some write-offs of consumer receivables. The net write-offs of consumer accounts for the five-year period ending December 31, 2009 for JCP&L compared to its utility affiliates are shown in Exhibit VIII-15.
Exhibit VIII-15 Net Write-Offs of Customer Accounts
(Thousands of Dollars) 2005 to 2009
2005
2006
2007
2008
2009
% Change
JCP&L 6,693 5,045 8,524 10,961 11,627 73.7% Cleveland Electric 8,477 8,220 11,302 8,988 9,703 14.5% Met-Ed 8,959 7,269 9,835 9,770 9,204 2.7% Ohio Edison 13,433 13,158 15,115 33,747 14,443 7.5% Penelec 9,069 6,855 8,247 8,494 7,012 –22.7% Penn Power 2,726 2,097 2,688 2,893 2,808 3.0% Toledo Edison 3,829 5,072 6,289 5,325 7,791 103.5% Total 53,186 47,716 62,000 80,178 62,588 17.7%
Source: Information Response 105
Reasons given by FE management for the significant increase in JCP&L’s write-offs of customer accounts over the past five years, as compared to most of the other FE utility companies, included the increase in JCP&L revenue during this period as well as the overall decline in economic activity in New Jersey as compared to Ohio and Pennsylvania. Changes in amounts of write-offs of accounts can generally be correlated to changes in revenue. Over this five-year period, from 2005 through 2009, JCP&L’s revenue increased by over 23%, which should account for a relatively similar increase in write-off amounts. However, also during this period, the unemployment rate of New Jersey increased by 104% compared to 76% for Ohio and 62% for Pennsylvania, and the number of bankruptcy filings in New Jersey increased by 155.8% compared to 99.5% for Ohio and 52.8% for Pennsylvania. Both of these measurements indicate the relative adverse differences between the economy of New Jersey and that of Ohio and Pennsylvania, which would be reflected in differences in the change in write-off amounts among these states. JCP&L’s net write-offs as a percent of revenues for this five-year period were lower than the Ohio operating companies (Cleveland Illuminating Company, Ohio Edison, and Toledo Edison), the Pennsylvania operating companies (Penn Power, Met-Ed, and Penelec), and the average of all FirstEnergy utility companies.

Final Report 221
6/20/2011
Cost of Capital
JCP&L’s cost of capitalization (cost of capital) is calculated each quarter based on the weighted-average cost of long-term debt and preferred stock and the cost of equity. The cost of equity is the return on equity (ROE), which is calculated by dividing 12 months of earnings on common stock by the average of 13 months of stockholder’s equity. JCP&L’s cost of capital for each quarter for the past five years is shown in Exhibit VIII-16.
Exhibit VIII-16 Weighted Average Cost of Capital
2005 to 2009
Quarters Ended
Years % Change 2005–2009 2005 2006 2007 2008 2009
March 31 4.30% 6.28% 6.02% 5.94% 6.25% 45.3%
June 30 4.66% 5.97% 6.18% 5.85% 6.27% 34.5%
September 30 5.18% 5.97% 6.21% 5.88% 6.08% 17.4%
December 31 5.83% 5.91% 5.98% 6.18% 6.38% 9.4%
Source: Information Response 97
The relationship between the balance amounts of long-term debt and equity at JCP&L that were used to calculate the weighted-average cost of capital at the end of each quarter is shown in Exhibit VIII-17.
Exhibit VIII-17 Long-Term Debt and Equity Percentages
2005 to 2009
2005 2006 2007 2008 2009
Quarter Ended
% Debt
% Equity
% Debt
% Equity
% Debt
% Equity
% Debt
% Equity
% Debt
% Equity
March 31 28.4 71.6 26.7 73.3 29.7 70.3 34.7 65.3 42.1 57.9
June 30 27.1 72.9 27.2 72.8 34.2 68.8 35.1 64.9 41.8 58.2
September 30 26.8 73.2 29.7 70.3 34.6 65.4 34.6 65.4 41.4 58.6
December 31 26.8 73.2 30.0 70.0 34.5 65.5 36.4 63.6 41.3 58.7
Source: Information Response 97

222 Final Report
6/20/2011
Findings & Conclusions
Finding VIII-5 Cash management methodologies are efficient and adequately safeguard JCP&L’s assets.
The centralized cash functions performed for JCP&L and its affiliates provide an effective and efficient way to manage cash. At the same time, they provide transparency of activities and segregation of entity cash balances. Cash forecasts are automated and integrated into JCP&L’s financial forecasting, budgeting, and cash management functions. Remittance processing is performed in an efficient manner, and cash collections are deposited in financial institutions in a minimum timeframe. JCP&L generally has access to its cash funds within one day of receipt of payments. The consolidation of the remittance processing function into a single center is cost-effective and allows for maximum efficiency of operation.
Finding VIII-6 FirstEnergy’s centralized money pool arrangement provides JCP&L with an effective method of managing cash resources on a short-term basis.
By participating in a centralized money pool with other FE subsidiaries, JCP&L is able to borrow or lend money in a cost-effective manner. The contractual arrangement that governs JCP&L’s participation in this centralized money pool provides safeguards to protect JCP&L’s assets. It also ensures both the least cost in borrowing funds and a competitive rate for investing funds. JCP&L receives the same rate other FE subsidiaries receive in borrowing or investing on a monthly basis. Quarterly reports are sent to the NJBPU. They provide information on interest rates imposed for borrowing or investing funds compared to the prevailing market rates at the time. JCP&L is in compliance with all provisions of the NJBPU Board Order concerning its Money Pool participation.
Finding VIII-7 Approval for JCP&L’s participation in the Utility Money Pool expires at the end of 2011.
On December 17, 2009, the New Jersey Board of Public Utilities (NJBPU) granted JCP&L an extension of time to participate in the Utility Money Pool. This extension expires December 31, 2011. This was the latest of several extensions of approval that have been granted by the Board. Without Board approval, JCP&L will have to drop out of the Utility Money Pool and utilize other, possibly more expensive, means of fulfilling short-term financing requirements.
Finding VIII-8 Cash disbursements are managed in an efficient, cost-effective manner.
FirstEnergy’s Accounts Payable Department handles the accounts payable and cash disbursements functions for JCP&L and all the other FE subsidiaries in a consolidated operation. The accounts payable function is automated using SAP’s accounts payable module and a number of automated payable and disbursement systems. Invoices are received in a variety of ways and are automated as much as possible. The review, approval, and disbursement functions are likewise automated and

Final Report 223
6/20/2011
operate efficiently. The consolidation of these functions for all of FE’s subsidiaries helps to ensure that they are performed in a cost-effective manner.
Finding VIII-9 JCP&L’s financial performance measurements reflect a general improvement in financial condition.
Most of JCP&L’s profitability measurements (return on assets, return on equity, and revenue per employee) have shown steady increases over the past five years. Other profitability measurements (operating margin and net profit margin) have shown increases since the low economic point of the latest recession (2007–2008). The current ratio, a liquidity measurement, has also shown improvement over the past five years. The only negative effects showed up on the debt coverage ratios, which indicate an increase in debt over this same time period. Overall, however, JCP&L’s financial condition has generally improved over the past five years. The decrease in JCP&L’s net income (8.4%) is explained primarily by the decrease in revenues (7.7%). The use of JCP&L’s income by JCP&L or FE (through dividend payments) does not seem to be a factor that influences the financial performance measurements.
Finding VIII-10 Write-offs did not have a material adverse effect on JCP&L.
JCP&L did not experience any write-offs (other than customer accounts) in the past five years. The effect of write-offs experienced by JCP&L’s affiliate utility companies was limited to their operations. Although JCP&L’s customer account write-offs did increase significantly (75%) in the past five years, in 2009, they still amount to less than one-half of 1% of electric sales revenues. JCP&L’s cash flow was not materially impacted by customer account write-offs.
Finding VIII-11 JCP&L’s increased cost of capital over the past five years has not negatively affected its financial condition.
JCP&L’s cost of capital calculations show a steady increase in the cost of capital from 2005 to the end of 2009. In 2005, JCP&L’s cost of capital ranged from 4.32% in the first quarter to 5.83% by the end of the year. In 2009, its cost of capital ranged from a low of 6.08% to 6.38% by the end of the year. This increase is the direct result of an increase in JCP&L’s return on equity, which is offset somewhat by a shifting of the capitalization relationship from equity to long-term debt. ROE is used as the cost of equity in JCP&L’s cost-of-capital calculations. The increase in ROE is a positive measurement, generally indicating improved profitability and company management.

224 Final Report
6/20/2011
Recommendations
Recommendation VIII-2 Seek an extension of approval to participate in the Utility Money Pool. (Refer to Finding VIII-7)
Approval by the NJBPU for JCP&L to participate in FE’s Utility Money Pool expires December 31, 2011. Participation in the Utility Money Pool has proven to be an efficient and cost effective means for JCP&L to satisfy its short-term funding requirements. The approval by the Board includes a number of provisions that safeguard the rate-payers from any negative possibilities. JCP&L should continue their involvement in the Utility Money Pool, and should petition the NJBPU for a multi-year extension of their approval to do so.

Final Report 225
6/20/2011
C. Accounting and Property Records
This section provides a review of the accounting and property records operations of Jersey Central Power & Light that impact its regulated utility operations in New Jersey. This focused review will include an evaluation of resources and processes used in the accounts payable, accounts receivable, and payroll functions. It will also assess work order procedures, the corporate accounting manual, and property records supporting JCP&L’s operations. The tasks accomplished in this assessment include:
♦ An evaluation of the processing, recording, authorization, and accountability of the accounts payable function among all levels of affiliate management
♦ A review of the processes for receiving and securing accounts receivable
♦ A review of the independence, processing, and accountability of the payroll function, including the time and resources spent by employees on payroll
♦ An evaluation of the budget reporting, tracking, revision, and analysis performed
♦ An evaluation of work order procedures, the corporate accounting manual, and property records
Background & Perspective
This Background & Perspective section is divided into seven segments:
♦ Overview ♦ Accounts Payable ♦ Accounts Receivable ♦ Payroll Functions ♦ Budget Processes ♦ Property Accounting ♦ Internal Auditing
Overview
JCP&L’s general accounting functions are conducted by FirstEnergy Service Company (SERVECO) Controller’s Department employees. Accounting functions are performed by the Controller’s Department within the following functional areas:
♦ General accounting services ♦ Property accounting services ♦ Accounts payable ♦ Financial reporting ♦ Accounting strategy and compliance

226 Final Report
6/20/2011
♦ Tax services ♦ Business services for FirstEnergy Generation ♦ Business services for FirstEnergy Utilities
Software systems used to support these functional areas include:
♦ SAP – an integrated enterprise resource planning (ERP) system
♦ PowerPlant – a fixed asset management system
♦ Contractor Verification System (CVS) – used for fossil and nuclear generation
♦ ABP (revenue manager, preprocessor, write-offs, operational data store (ODS), archiving)
♦ FuelWorx/Aligne – used for fuel accounting
♦ ZaiNet/Aligne – commodity sales
♦ Customer Request Work Scheduling System (CREWS) – transmission and distribution (T &D) work management system
♦ PowerOn – issues orders for outages
♦ JP Morgan Order-to-Pay Network – third-party electronic invoice presentment and payment
♦ IBM® CommonStore for SAP – used for archiving and viewing documents
♦ PowerTax – used to record monthly taxes
Decisions concerning the general accounting functions of accounts payable, accounts receivable, payroll, property accounting, and work order processing are managed by the Controller’s Department, either in Johnstown, PA, Akron, OH, Reading, PA, or Morristown, NJ. These general accounting functions report up through the Vice President (VP) & Chief Accounting Officer (CAO), through the Executive Vice President (EVP) & Chief Financial Officer (CFO), to the President & Chief Executive Officer (CEO). The organizations that provide these functions are shown in Exhibit VIII-18.

Final Report 227
6/20/2011
Exhibit VIII-18 Finance Organizations
as of June 30, 2010
Source: Information Response 54 and Company Update
Akron, OH 1209
SERVECOExecutive Vice President & Chief Financial Officer
Finance, Strategic Planning, & Operations
SERVECOExecutive AssistantSenior Management
Akron, OH 5
SERVECOVice President
Investor Relations
Akron, OH 17
SERVECOVice President & Chief Risk Officer
Corporate Risk
Akron, OH 24
SERVECODirector
Internal Auditing
Akron, OH 23
SERVECODirector
Business Performance
Akron, OH 267
SERVECOVice President & Chief Accounting Officer
Controller's Department
Akron, OH
SERVECOExecutive Assistant
Akron, OH/Reading, PA/M 81
SERVECOAssistant ControllerFirstEnergy Utilities
Akron, OH/Reading, PA 59
SERVECOAssistant Controller
Corporate Accounting
Akron, OH 25
SERVECOVice President
Tax
Akron, OH 98
SERVECOAssistant Controller
FirstEnergy Generation
Akron, OH 5
SERVECODirector
Business Development
Akron, OH 37
SERVECOVice President & Treasurer - FirstEnergy
Treasury
Akron, OH
SERVECOExecutive Assistant
Akron, OH 3
SERVECODirector
Investment Management
Akron, OH 9
SERVECOAssistant Treasurer
Akron, OH 21
SERVECOAssistant Treasurer
Liquidity/Cash Management
Akron, OH 822
SERVECOVice President -Shared Services Administration
& Chief Information Officer

228 Final Report
6/20/2011
Other functions discussed in this chapter are handled by the cash remittance center (CRC) or the Human Resources (HR) Department.
Accounts Payable
The Accounts Payable Department is responsible for all accounts payable functions for FirstEnergy and its affiliates, including JCP&L. Invoices are normally routed through the originating department that is responsible for buying or authorizing the service or product acquired. The originating department is responsible for faxing all source documents to images into SAP’s accounts payable module, using CommonStore, an IBM tool. If vendors mistakenly send invoices directly to Accounts Payable (A/P) that should be entered in the field, they will be forward to the originating department. In addition to invoices, Accounts Payable is also responsible for processing all electronic invoices and payments through JP Morgan Order-to-Pay Network.
Invoices are received at Accounts Payable in various formats, including:
♦ Electronic invoice presentment and payment (EIPP) transactions (with or without a purchase order) are received using JP Morgan’s Order-to-Pay Network, which allows suppliers to pass invoices electronically to FE. If a service purchase order (PO) is associated, the invoice is passed automatically to the inbox of the person previously identified in the system on the PO. The SAP workflow allows for receipt and subsequent approval of the invoice. If no PO is associated, then the supplier is supposed to put the receiver’s ID into the system for transfer to his or her inbox. In the event that no ID is input, the invoice is passed automatically to A/P’s inbox for rerouting. As of June 30, 2010, FE had approximately 74,000 EIPP invoice transactions, or 17.5% of its total invoice transactions (and increasing). An EIPP transaction also results in electronic payment. Invoices not received via JP Morgan may also be paid electronically. Any time a vendor is paid electronically, that vendor has already received an e-mail notification two days prior that indicated payment was forthcoming. If an EIPP is used for product-related purchases, a three-way match (material receipt, PO, invoice) is performed.
♦ Service entry sheet transactions are paper invoices sent to field locations. They require a fax number for documents to be sent in, followed by workflow approvals through SAP.
♦ Evaluated receipt settlement (ERS) transactions (PO but no invoice from supplier) are product-related purchases that require a two-way match (material receipt and PO), whereas EIPP transactions that happen to be product-related purchases require a three-way match (material receipt, PO, invoice). FE buyers encourage use of ERS rather than EIPP for product-related purchases, although in a few cases, paper invoices, rather than EIPP or ERS, are used.
♦ Paper invoices for product-related purchases also require a three-way match. Approximately 5,600 paper invoices as of June 2010 YTD have been processed (1% to 2%) versus 122,000 for ERS transactions (29%).
♦ Expense reports (no PO/no invoice) use SAP’s online reporting process in which employees input expenses online. Then, if receipts are required, a fax number for the trip is provided to

Final Report 229
6/20/2011
the employees. When the employee faxes the receipts, SAP automatically matches them to the trip. Workflow dictates that a transaction won’t go to an employee’s supervisor for approval until receipts have been attached. It is up to the employee’s supervisor to confirm that receipts match what has been entered into SAP because A/P verifies receipts only for FE officers. Employees are typically reimbursed electronically. (The Internal Audit group audits employee expense reports every other year.)
♦ Check requests (no PO/no invoice) are used for such transactions as contribution to charitable organizations. If such organizations are not already set up as a vendor in SAP, the newly established vendor requires A/P review, including W-9 supplier verification.
♦ Recurring transactions (no PO) encompass such transactions such as Board of Directors’ (BOD) fees or Power System Institute (PSI) stipends.
♦ Recurring transactions (PO) occur for items like medical services at plants.
♦ Consignment transactions refer to vendor storing items (like poles) at FE sites. When poles are used, invoicing occurs automatically.
♦ Purchasing card (P-Card) transactions (Treasury)
♦ Electronic Data Interchange (EDI) happens for only one vendor.
♦ Ancillary systems include automatic feeds from:
- Internal FE systems
• Payroll garnishments (HR) • Worker’s compensation (HR) • Customer deposit refunds • Fleet leased vehicles • Forestry vegetation management system (VMS) • Real estate lease payments • Contractor verification system at plants, usually dealing with outages
- External systems
• Telecommunications vendor invoices (twice weekly) • Freight/logistics • Contingent/temporary labor
Invoice processing statistics for the Account Payable Department for the first six months of 2010 are shown in Exhibit VIII-19.

230 Final Report
6/20/2011
Exhibit VIII-19 FE Invoice Processing Statistics
as of June 30, 2010
Source: Information Response 503
This schedule indicates that 424,281 invoices were processed during the first six months of 2010, an average of 70,714 invoices per month, or 4,420 per Accounts Payable employee per month. Of these invoices, 1.3% were processed manually and 98.7% were processed automatically—either online (29.7%) or via some form of electronic commerce (69.0%).

Final Report 231
6/20/2011
Accounts Receivable
The central remittance center (CRC) is the initiation point for customer accounts receivable (A/R) functions. The CMC in Akron, OH processes customer remittances for JCP&L and all of the other FE utility and non-utility subsidiaries. It is one of the two largest remittance processing centers in the Akron area. The CRC has a three-hour battery backup that allows it to make a clean shutdown in the event of a power outage. Although the CRC does not have generator backup, it does have two power feeds from different substations. There has never been a power outage at the CRC longer than 1.5 hours.
In the event of a disaster at the CRC, remittance processing can be moved to suburban Charlotte, NC to run on Disaster Recovery Services (DRS) facilities, or remittance processing trucks can be brought to Akron. In either case, operations are supposed to be able to begin again within 48 hours. Testing of this process is performed annually, although the CRC has not had to use it in production. DRS has pledged not to serve another customer from the same geographic area as FE or, if it does, to have sufficient resources to serve both simultaneously.
The CRC was the responsibility of the Customer Service Department until November 2008, when it came under the control of the Treasury Department during the implementation of the accounts receivable conversion (ARC) and image cash letter (ICL) technologies. ARC allows the CRC to transmit personal (residential) checks and payment coupons to the bank electronically. ICL provides the means to electronically transmit an image of business checks and payment coupons to the bank. Upon implementation of this technology, responsibility for the CRC reverted to the Customer Service Department in October 2009, allowing for more flexible use of the CRC staff.
At the CRC, incoming mail is delivered via a courier service five times each evening (Monday through Friday) at 8:00 P.M., 10:00 P.M., midnight, 2:45 A.M., and 4:30 A.M. Incoming mail goes through a four-step process.
CRC First Step
Mail sorting equipment (OPEX Model 30) at the loading dock is used to sort “singles” (clean mail containing one document and one check, with no metal included, in a standard envelope and addressed to one of the utility companies processed at the CRC) from all other types of mail (“multiples”). Mail is sorted into four separate job categories: Ohio Edison (OE), Cleveland Electric Illuminating (CEI)/Toledo Edison (TE), FE Solutions (FES) (with the CRC essentially functioning as a lockbox), and Shared Services (SS) for all other mail.
Mail in these four categories is not commingled because of banking contractual requirements. Approximately 75% to 80% of all envelopes fall into the singles category. Any singles are processed using OPEX equipment. The OPEX Corporation manufactures high-speed mailroom automation and document imaging equipment. Any multiples are sent to a group that hand opens the mail, puts the documents into the proper order, and processes them using different equipment. OE, CEI/TE, and

232 Final Report
6/20/2011
companies in the SS category are charged for the CRC’s services based on their number of customers (JCP&L has approximately 24% of all utility customers), while the CRC charges FES based on the number of pieces of mail processed.
Approximately 100,000 envelopes (on average) are processed each evening, with Mondays and Wednesdays being the highest-volume days and Tuesdays the lowest-volume. Hours for processing mail payments (operations) are primarily 8:00 P.M. to 6:00 A.M., with control group functions (balancing, electronic payments via website, clarification work list, and escheat functions (less than $5,000 annually)) handled during daytime hours. The CRC receives approximately $35,000 to $40,000 in cash payments each year. Next year, the CRC will likely need to upgrade its Type 30 OPEX sorter equipment to Type 40 to be able to handle the introduction of intelligent bar codes by the post office.
CRC Second Step
Singles mail is machine-processed further using OPEX Model 150 equipment (which can handle 30,000 pieces of mail per hour). During such processing, envelopes are ripped off and thrown away, any further multiples are removed, and singles are further segmented by the following categories for electronic deposit:
♦ ARC processing ♦ ICL processing ♦ Remittances that cannot be electronically deposited
In the last case, paper checks are sent via courier to the Treasury Department, which deposits these checks into the local Chase bank. Virtually all of FE’s deposits are processed electronically. Typically, the only deposits that cannot be made electronically are foreign and unreadable checks.
In 1999, FE began a process of “read and keep” imaging of documents. Approximately 70% of all payments are from residential customers, and 30% of payments are from business customers. These percentages are reversed, however, when measuring the dollar amount of payments, with roughly 70% of the value of payments coming from business accounts and 30% of the value of payments coming from residential customers.
CRC Third Step
After all data, such as images of documents and checks, scan lines, and magnetic ink character recognition (MICR) codes, has been captured, the clarification work list is examined and any problems are addressed before a batch can be processed for deposit and customer account application. This step includes making all necessary corrections to amount entry, implementing scan line fixes, and ensuring that batches are balanced. Usually, more than 80% of all items processed are considered “kills” (the payment amount received equals the payment coupon amount) and do not require this step.

Final Report 233
6/20/2011
CRC Fourth Step
Files (by job/batch/sequence) are then sent to FE’s servers (located in a secure location within the CRC facility), where additional files are created to send to banks for check deposit data and to the customer service system for application of payments to customer accounts. Documents are kept for two days and checks for five days before being destroyed. Paper checks not yet destroyed are kept under lock and key at the CRC. An outside bonded vendor comes to the CRC twice a week to remove and destroy all checks and payment documents.
Payroll Functions
Payroll functions for JCP&L, as well as for all other FE subsidiaries, are the responsibility of the SERVECO Human Resources Department. This functional area is managed by the Employee Compensation, Human Resources Information System (HRIS), & Payroll Department and reports up through the Director, Compensation, Retirement Programs, & Succession Planning to the Senior Vice President (SVP), Human Resources.
SERVECO and affiliate companies use SAP’s Human Resources module as part of the SAP-integrated ERP or financial system. This approach ensures that: 1) transactions between affiliates are recorded in separate books and records; 2) intercompany transactions and related billings are structured so that non-regulated activities are not subsidized by regulated affiliates; and 3) adequate audit trails exist on the books and records.
Additional HR systems or modules used are:
♦ Cross Application Time Sheet (CATS) – an SAP module that is used to maintain time
♦ Customer Request Work Scheduling System (CREWS) – a work management system used by Energy Delivery that feeds time data to CATS
♦ FieldNet – a work management system used by Meter Services that also feeds time data to CATS
These systems provide the technical means for FE to process the payrolls of SERVECO and its affiliates, including JCP&L; to capture time and accounting distribution; to file federal, state, and local payroll tax returns; to maintain employee payroll records; and to generate checks, direct deposit statements, and employee W-2 forms. These systems, modules, and processes interface with FE’s inter-company billing, accounts payable, and general ledger processes and systems.
Time Entry
All employees are required to complete a timesheet, recording hours worked and accounting codes for time charges. Time recorded in the SAP HR/Payroll process is stored in CATS. Time is entered for hourly, non-exempt, and part-time employees in the appropriate timesheet system (CATS, CREWS, or FieldNet) or is recorded on a paper timesheet and then input to one of these systems by a timekeeper.

234 Final Report
6/20/2011
Employee time is reviewed by the timekeeper/time coordinator for appropriate hours and accounting charges. Time is transferred from CREWS and FieldNet to CATS.
Time for exempt, salaried, full-time employees is also entered in the appropriate timesheet system (CATS, CREWS, FieldNet) or is recorded on a paper timesheet and then input to one of these systems by a timekeeper. If one of these employees is unavailable, a timekeeper/time coordinator has the authority to enter a timesheet for that worker. Even if no timesheet is entered, such an employee will receive his or her biweekly salary; however, he or she will have to enter a timesheet for cost distribution of that period’s time in a subsequent period as a prior-period correction.
Time is transferred from CATS to the SAP HR module, thereby updating each employee’s quotas for hours taken for vacation, personal absences, sick days, etc. The Time Evaluation function is executed to evaluate the time transferred from CATS to the HR module as a means of creating payroll wage types for processing. Time data is transferred to SAP modules: controlling (CO); plant maintenance (PM), which updates service orders; and project system (PS).
Payroll Transaction Processing
This function is composed of two SAP processes (gross payroll processing and net payroll processing) and uses time-reporting data to process payroll and distribute costs. The consolidation and starting point for the payroll calculation process is gross payroll processing, which derives applicable gross balance data from master data and the time input/evaluation process. It is followed by net payroll processing, which is the output phase of the payroll operation.
The net payroll processing component processes deductions, taxes, and benefits for employees during a payroll run. The processing is based on wage types entered in the SAP HR master data as well as wage types that are calculated in the gross payroll processing component. A results cluster containing wage types and amounts for all employees in a payroll run is generated and serves as the basis for all output from the payroll system. This output is used to drive subsequent payroll processes, such as disbursement (checks and direct deposits), third-party remittances, statutory reporting, and posting of results to the accounting component.
At the completion of each weekly or biweekly payroll process, a report of each employee’s time charges is sent to his or her supervisor via Lotus Notes e-mail and the SAP workflow inbox. Supervisory personnel are required to review and approve time and accounting information that is entered into SAP for their employees. Corrections for missing and/or incorrect time charges will appear in a subsequent time approval report as a prior-period correction for review and approval.

Final Report 235
6/20/2011
Budget Processes
JCP&L’s budget processes for both operating and capital budgets are managed on a consolidated basis by several financial departments in the Controller’s and Treasury Departments that report to FE’s Executive Vice President (EVP) and Chief Financial Officer (CFO). At FirstEnergy, these processes are referred to as the integrated business planning (IBP) process.
Operating Budget
Development of the business plan and operating budget starts in early spring, and planning assumptions are distributed to all of the budget units in late summer. From an executive retreat in the summer come perceived corporate needs and strategies to achieve or address these needs. These needs and strategies are addressed in the business plan and operating budget. The budget process is usually completed by the end of the calendar year and occasionally by January of the budget year. The business plan has been either a three- or five-year plan. Lately, it has been a three-year plan. The first year of the business plan will become the operating budget. The budget data developed is entered in SAP’s budget module. The time required to input the entire budget data is approximately five days, with three days required for revisions to the budget.
The corporate budget calendar for both the operating and capital budgets developed by FE governs the timing of the budget processes for all of subsidiaries, including JCP&L and its budget units. The draft 2010 business planning calendar is shown in Exhibit VIII-20.

236 Final Report
6/20/2011
Exhibit VIII-20
Draft 2010 Business Planning Calendar As of June 30, 2010
Business units complete draft business plan write-ups. July 31
Executive leadership reviews five-year enterprise capital. Aug 3 & 6
Draft business plans including financials and capital plans approved and signed by business unit (BU) leadership. Aug 7
Business unit leaders review plans with FE’s President and CEO. Aug 10–Sept 4
Approve business plans including financials and capital plans. by Sept 8
Business units enter detailed 2010 budget financial data in conformance with approved assumptions (including capital) and business plans. Aug 17–Sept 14
IBP Department conducts 2010 budget close and processing. Sept 21–25
IBP publishes forecast to the Operational Leadership Council (OLC) and other business unit leadership as appropriate for review, adjustment if needed, and approval. Oct 6
Executive Council and OLC review budget and forecast at financial performance review (FPR) meeting Oct 21
Dates are tentative based on IBP management review and the Capital Management Group (CMG) finalization. Source: Information Response 117
Budget guidelines providing instructions on preparing the budget and assumptions to be used are distributed to all budget units. They help provide for consistency of input throughout the FE corporate structure. In addition to assumptions, these guidelines provide definitions and accounts to be included in budgeting for all types of labor, overhead, and various other-than-labor (OTL) expense accounts. Guidelines are included for both the operating and capital budgets. A typical budget time schedule is shown in Exhibit VIII-21.

Final Report 237
6/20/2011
Exhibit VIII-21 Typical Budget Schedule
as of June 30, 2010
Source: Information Response 119 ECCS=Enterprise Controlling – Consolidation System BI=Business intelligence

238 Final Report
6/20/2011
An overview of FE’s budget and forecast process is shown in Exhibit VIII-22.
Exhibit VIII-22 Budget and Forecast Process
as of June 30, 2010
Source: Information Response 119
At the JCP&L level, the operating (and capital) budget process starts in the March or April time period. JCP&L uses the guidelines and templates that have been developed by FE to ensure consistency of input. JCP&L usually completes the budget templates in August to develop a preliminary budget. JCP&L’s Business Services Department inputs the budget data into SAP after receiving approval from JCP&L management. The primary difference between the business plan and the operating budget is the level of detail.
Monthly, a financial performance report is prepared to present actual performance against the budget and reforecast and to explain the variances. The variance analysis conducted will compare actual results to the most recent forecast. There is no specific threshold for actual versus budget variances, as FE generally attempts to investigate and explain all relevant differences – variance thresholds are subjective in mature and depend on the account, risk, and the variance relative to management’s expectations. If budgets need to be adjusted or revised, they will be—either monthly for the operating companies or quarterly for FirstEnergy Utilities (FEU) and FirstEnergy. Actual results are compared against the revised budget numbers or targets, not the original budget. The original budget will be shown only in external reports, not in internal management reports.

Final Report 239
6/20/2011
At the JCP&L level, there are no hard and fast rules or thresholds for variance amounts. Actual results are compared to the most recent forecast. A monthly analysis is prepared for the President of JCP&L and the cost center managers. This document is the agenda for the JCP&L monthly performance review meeting. JCP&L management who typically attend this monthly review meeting are:
♦ President ♦ Vice President and Area Managers ♦ Director Operations, plus:
- General Managers - Lines Managers - Engineering Manager - Engineering Supervisors - Director, Operations Support - Substation General Managers - Substation Managers - Regional Dispatch Office (RDO) Managers
♦ Director Operations Support Services, plus: - Stores Managers - Forestry Manager
♦ Director, Business Services - Business Services Analyst IV
♦ Director Human Resources ♦ Director Customer Support ♦ Director Meter Reading and Revenue Operations
The financial performance section of the JCP&L monthly performance review report includes information on monthly and year-to-date (YTD) comparisons of actual operations and maintenance (O&M) expenses and capital expenditures (CapEx) compared to the latest forecast. Schedules show forecast, actual, variances, and trends and identify degrees of variance to highlight strengths and areas of concern. This report and the JCP&L meeting provide input for JCP&L’s portion of FE’s Executive Leadership Team (ELT) Performance Report, which includes analysis and gap-closure ideas and recommendations.
FirstEnergy’s monthly ELT Performance Report is prepared by the tenth workday of the month. This report consists of monthly financial, operational, safety, and environmental actual results compared to the budget. Data is provided by company and is consolidated for all of FEU operating companies. This report also includes some, but not all, of the key performance indicators (KPIs) measured by JCP&L and FE.
The monthly ELT Performance Report meeting is a video conference that is attended by the operating company presidents and FEU’s corporate management and is run by the Assistant Controller, FEU or the SVP & President, FEU. During this meeting, the monthly operating results reported in the ELT

240 Final Report
6/20/2011
Performance Report are reviewed. The meeting lasts approximately four hours, and no minutes are taken or saved.
JCP&L revises its operating budget by executing a reforecast after the third month of the year. This reforecast consists of three months of actual results plus nine months of estimates. At the end of six months, a six-plus-six reforecast is generated, and a nine-plus-three reforecast is developed after the ninth month of the year. As events dictate, reforecasts can be generated more often. Last year (2009), for example, there was a four-plus-eight reforecast. The original budget always remains the budget and the official document against which actual results are measured, as submitted to the Board of Directors for its review. Actual results compared against the reforecast results are used internally for corporate management. Topside changes in the business plan or the operating budget can be done using the multi-integrated decision analysis system (MIDAS). This system is used to assemble and model long-term financial forecasts.
A schedule depicting JCP&L’s O&M (or operating) budget variances for the past five years is shown in Exhibit VIII-23.
Exhibit VIII-23 JCP&L O&M Budget Variances
2005 to 2009 ($ Millions)
Note: Minor differences due to rounding Source: Information Response 116
Capital Budget
FirstEnergy’s capital budget development process is driven by the receipt of the system health reports, usually in the fall, from the operating companies and the plants. These reports of equipment and plant condition provide the basis for capital projects to be defined and for cost and benefits to be estimated. The capital requirements for different operating entities are not mixed; there is no trade-off of capital needs between generation and utilities, or among utilities. Proposed capital projects are prioritized, with safety and reliability given higher priority than proposed projects that add economic value.
The FE Board of Directors’ Finance Committee recommends the annual capital budget to the full BOD for approval in December. Major projects are separately identified, and new projects with a cumulative cost of $50 million are approved individually. Emergent projects that were not included in the approved
Actual Budget Amount % Actual Budget Amount % Actual Budget Amount % Actual Budget Amount % Actual Budget Amount %Revenue 2,688.1 2,431.5 256.6 10.6% 2,766.5 2,747.6 17.8 0.6% 3,342.6 3,319.6 23.1 0.7% 3,561.3 3,639.2 (77.9) -2.1% 3,076.2 3,565.6 (489.4) -13.7%
Operating Expenses 2,199.1 2,020.2 179.0 8.9% 2,257.8 2,236.6 21.2 0.9% 2,814.8 2,816.3 (1.5) -0.1% 3,033.9 3,105.4 (71.5) -2.3% 2,596.4 3,050.7 (454.2) -14.9%
Operating Margin 489.0 411.4 77.6 18.9% 507.7 511.1 (3.4) -0.7% 527.9 503.3 24.6 4.9% 527.4 533.8 (6.4) -1.2% 479.7 514.9 (35.2) -6.8%
Income Before Taxes 318.3 232.2 86.2 37.1% 336.3 333.9 2.4 0.7% 335.2 303.2 32.0 10.6% 335.2 334.5 0.1 0.0% 279.3 305.6 (26.3) -8.6%
Net Income 182.5 136.5 46.0 33.7% 189.6 195.8 (6.2) -3.2% 186.1 170.6 15.5 9.1% 187.0 188.9 (1.9) -1.0% 170.5 174.5 (4.0) -2.3%
2008
Description
2009VarianceVarianceVarianceVarianceVariance
2005 2006 2007

Final Report 241
6/20/2011
annual capital budget and which exceed $50 million, either individually or cumulatively, must be approved by the Finance Committee. Any proposed changes of $50 million or more to an approved capital project must be reapproved by the Finance Committee. A schedule depicting the approval limits governing FE’s spending for capital projects and other major financial activities is shown in Exhibit VIII-24.
Exhibit VIII-24 Governing Approval Amounts
as of June 30, 2010
Source: Information Response 329, Appendix 6.1a
JCP&L’s business units develop their own long-term forecasts. Operating forecasts are from three to five years, and capital forecasts are for five years. Business units classify capital projects in one of four ways:
♦ Mandatory – non-discretionary investment required by law, regulatory order, or duty to serve customers (e.g., new business), or required to meet externally driven regulatory commitment. These projects are “must spend” investments.
♦ Maintain – discretionary investment to support and sustain existing infrastructure at existing performance levels. Specific operational performance and financial tracking support these projects. These projects are “should spend to maintain operations” investments.

242 Final Report
6/20/2011
♦ Improvement – discretionary investment to improve existing infrastructure or performance levels beyond the existing business plan’s key performance metric commitments. Improvement in specific operational performance or financial benchmark targets supports these projects. These projects are “may spend to improve operations” investments.
♦ Value Add – discretionary, non-recurring investment for a defined initiative that improves or expands existing infrastructure or creates new business opportunities and drives improved economic value. These projects are “may spend based on economics” investments.
For the past four or five years, FEU has had a series of challenge sessions to review and evaluate proposed capital projects of JCP&L and the other FE utilities. There are typically three capital project challenge sessions or evaluation rounds, as described below:
♦ Round 1 takes place in the April/May timeframe and is the session in which the operating companies build and present their proposed capital portfolio. Participants in this session include company presidents, key managers (especially the engineering managers), and staff engineers to present the projects. Projects are rated 1, 2, or 3, with 1 being those ranked the highest and consisting of those projects that are ready to be presented to higher management. Projects rated 2 and 3 are either not acceptable or require some additional work or justification. Questions raised about the projects presented in this round generate action items to be addressed and discussed in Round 2. In the 2011 (for the 2011 budget year) Round 1 challenge session, JCP&L had 64 FEU projects and 65 transmission projects.
♦ Round 2 takes place in June with the same attendees as Round 1. In this session, the final project estimates are prepared and the focus is on projects that required follow-up or had action items to be addressed. Projects that were awarded a numerical rating of 1 are not addressed in Round 2. At the end of this round, the operating company needs to be comfortable with its capital proposal.
♦ Round 3 is the final session and combines O&M and capital projects. This round will include higher FEU management as well as FirstEnergy’s EVP & CFO, VP – Utility Support and the Senior Vice President & President, FE Utilities.
JCP&L’s capital budget actual expenditures compared to budget are shown in Exhibit VIII-25.
Exhibit VIII-25 JCP&L Capital Expenditures’ Budget Variance
2005 to 2009 ($ Million)
Source: Information Response 116, Attachment 2
Actual Budget Amount % Actual Budget Amount % Actual Budget Amount % Actual Budget Amount % Actual Budget Amount %
CapEx 204.9 179.2 25.7 14.3% 159.7 176.0 (16.3) -9.3% 194.4 192.0 2.4 1.3% 176.6 173.1 3.5 2.0% 170.6 160.2 10.4 6.5%
Variance
Description
2005 2006 2007 2008 2009
Variance Variance Variance Variance

Final Report 243
6/20/2011
FirstEnergy is using a SAP capital evaluation module, xRPM (run by the Corporate Budget & Planning group), as the central repository for capital project information. FE’s goal is to include all FE business unit capital portfolios in xRPM, although only a small portion of the FEU portfolio is currently in the module. Business units document their capital projects and blankets in xRPM for planning purposes, and these portfolios will automatically roll up to an enterprise view of capital portfolios. xRPM is used to facilitate the review and approval of the business unit and enterprise five-year capital portfolios. This module has been customized over the past three years and was just finalized last year (2009). There are a number of questions that are asked of each proposed capital project, and based on the answers, the proposed projects are ranked.
Rather than use xRPM, all of the entities in FEU, including JCP&L, use the request for project approval (RPA) system, a Lotus Notes application, to initiate, plan, track, and manage the approval process for capital projects. RPA does not electronically interface with SAP, CREWS, or other systems; however, it enables correlation to the cost collectors, work requests, accounting, and other data in those systems. FEU’s engineering and project management personnel are the principal source of information housed in the database, although Business Services users access RPA for reporting and analysis of out-year capital forecasts and as a reference on the status and approval of capital projects. Capital budget data from this database must then be manually loaded into SAP. Each operating company ranks its own capital projects,utilizing Energy Delivery’s capital allocation tool (ECAT).
ECAT is used to calculate a benefit-to-cost metric and to support the prioritization of capital projects for each of the operating companies. ECAT enables each operating company to rank proposed projects based on their benefit-to-cost ratio and to estimate the reliability impact of these proposed projects. Acknowledging that there will be some outages on an electric system due to unforeseen events, the model attempts to rank proposed projects by how cost-effectively they reduce the potential for outages by adding capacity, system flexibility, or automation, as examples. In a theoretical situation where two enhancements were proposed, the model looks at how much investment is needed in each case to improve overall performance. The project that provides the largest improvement in reliability for the dollars invested is given priority over the other project. Where a potential criteria violation has been identified, ECAT can be used to choose the most beneficial way to solve the situation. This Excel-based model uses templates for consistent data input from Engineering personnel regarding project details and benefits. The financial parameters in ECAT are refreshed on an annual basis, and results are validated through each operating company’s capital challenge process. ECAT is used only for specific capital projects; high-volume, repetitive capital work (i.e., blanket projects) is not modeled.
FirstEnergy Utilities’ capital planning management believes that xRPM is too limited and not practical for use by the FEU operating companies. Each iteration of xRPM is limited to approximately 70 projects, while FEU has over 600 projects to rank. Additionally, FEU believes that xRPM misses labor costs and lacks needed functionality.
There are no major changes planned for xRPM for capital project evaluation. FirstEnergy hoped to have FEU fully involved this year but decided to hold off (because of the proposed merger with Allegheny Power). Currently, 15 FEU staff members have been trained in xRPM. FE management

244 Final Report
6/20/2011
believes that including FEU in xRPM would provide FEU and FE an overall enterprise view of all capital projects. SAP currently gives management access to the enterprise view of all capital projects.
FirstEnergy Utilities reports on approximately 600 capital projects, worth $450 million in “direct view” costs (direct labor, material, etc.) and $725 million to $730 million in “settled view” costs (supervision, administrative and general (A&G), stores, handling, etc.). Reporting is done in both views – direct for FE management and settled for corporate management. Almost all projects are for a one-year duration, but specific projects can be multi-year in duration. Analysis is by cost category. Variance thresholds are not used as reporting criteria; all variances are reported. Variance percentages tend to be small, generally less than 10%.
Property Accounting
Property Accounting for JCP&L and all of FE’s subsidiaries is handled by FE’s Property Accounting Department, reporting through the Assistant Controller in the Corporate Accounting Department and the VP, Controller & CAO to the EVP & CFO. The Property Accounting Department staff is located in Reading, PA and Akron, OH.
This department is responsible for accounting and reporting of all property, plant, and equipment (PP&E) assets of JCP&L and the other FE subsidiaries. PP&E consist of all tangible non-current fixed assets such as real estate, plant, and equipment and all intangible non-current assets such as software. The Property Accounting function includes identifying, capturing, and capitalizing all costs incurred in acquiring PP&E, including the cost of preparing the asset for its intended use and related overheads such as supervision, engineering, and financing. Additional costs for additions and improvements incurred after an asset is installed are also captured and included in the cost of the asset. This function also encompasses calculating and recording depreciation over the useful life of the asset as well as accounting for asset retirement after the asset is removed from service.
The responsibility for unitizing JCP&L assets rests with FEU’s Business Services Department for New Jersey. Assets are targeted to be unitized within nine months of being placed in service, although management has indicated that they are usually unitized within three months. Assets that have not been unitized are included in an aging report and their progress is monitored. Management’s primary purpose for the unitization process is quality control for the classification of assets, which drives depreciation expense. Depreciation of an asset begins as soon as it is placed in service. Slight depreciation differences that could occur if the asset has not been placed in the correct account are immaterial and of no apparent concern to management.
The Property Accounting function uses the PowerPlant system, an asset management system that provides capitalized interest for projects, maintains depreciation rates, calculates monthly depreciation expense, and provides for various asset-related reporting requirements. PowerPlant, rather than SAP’s asset module, is used because it is more flexible in creating asset-related information, it provides more detailed reporting, it allows for greater detail concerning depreciation, it allows the use of Federal

Final Report 245
6/20/2011
Energy Regulatory Commission (FERC) Account 106 (Non-Unitized Assets), it provides a seamless interface with the PowerTax system, and it provides as-built and auto-unitization features.
A PowerPlant upgrade, which should be implemented in the first quarter of 2011, will provide an auto-unitization feature and will allow FE to eliminate the broad use of blanket projects. This upgraded version will require additional work on the front end of the unitization process, but less work will be required at the end of the unitization process. Following the implementation of this upgraded version, it is estimated that as much as 85% to 90% of all assets will be unitized automatically.
JCP&L’s aging report showing the value of assets not unitized as of the end of 2009 compared to the other FE utilities is shown in Exhibit VIII-26.
Exhibit VIII-26 Asset Values Not Unitized
as of December 31, 2009
Source: Information Response 744
Internal Auditing
Reporting Responsibility
Internal audit responsibility for JCP&L and all of FE’s operations and subsidiaries rests with the SERVECO Internal Audit Department. The Internal Audit Director reports directly to the Audit Committee of the BOD and administratively to FE’s EVP & CFO. Organizational charts show a direct line to the EVP & CFO. The Chair of the Audit Committee provides feedback to the CFO on the
$ % of Total $ % of Total $ % of Total $ % of Total $ % of Total
ATCO 12,376,705 6.86% 114,101 1.34% 10,568 0.21% 154,130 6.62% 12,655,504 6.45%
CEI 31,244,151 17.33% 0.00% 0.00% 0.00% 31,244,151 15.93%
JCP&L 40,579,834 22.50% 7,387,750 86.90% 4,978,930 99.90% 1,950,700 83.82% 54,897,216 27.99%
Met-Ed 14,795,076 8.20% 97,740 1.15% (104,787) -2.10% (128,513) -5.52% 14,659,516 7.47%
OE 26,032,056 14.44% 582,290 6.85% 115,910 2.33% 504,098 21.66% 27,234,354 13.89%
Penelec 39,561,538 21.94% 150,656 1.77% (34,519) -0.69% (141,874) -6.10% 39,535,801 20.16%
Penn Power 6,761,491 3.75% 177,721 2.09% 45,333 0.91% (8,473) -0.36% 6,976,072 3.56%
TE 8,972,377 4.98% (8,693) -0.10% (27,485) -0.55% (2,813) -0.12% 8,933,386 4.55%
Total 180,323,228 100.00% 8,501,565 100.00% 4,983,950 100.00% 2,327,255 100.00% 196,136,001 100.00%
TotalCompany
Up to 6 Months 7 to 9 Months 10 to 12 Months Over 12 MonthsMonths in GL 106 Account

246 Final Report
6/20/2011
Internal Audit Director’s performance evaluation and compensation. The Audit Committee Chair provides performance evaluation input to the CFO and then reviews the draft performance evaluation before it is finalized. He also sits down privately with the Internal Audit Director on various occasions and can discuss his performance evaluation (although this is not always done). The Audit Committee Chair views the Internal Audit Director as reporting functionally to him. The Internal Audit Director cannot be fired without approval of the BOD’s Audit Committee. Practice Advisory 1110-2 from the Institute of Internal Auditors (IIA)suggests that a company’s Chief Audit Executive (CAE) should report administravely to the company’s Chief Executive Officer (CEO). Although Practice Advisories are not mandatory, they are recommended and endorsed. First Energy’s Internal Auditing Department underwent quality assurance reviews in 2004 and 2009 and received a rating of “Generally Conforms”, the highest level of compliance with the IIA’s International Standards for the Professional Practice of Internal Auditing.
Internal Audit is involved in a total of nine planned meetings with the Audit Committee and Board of Directors—five Audit Committee meetings plus four earnings calls meetings (quarterly to discuss the 10Qs and 10K). The Internal Audit Director sets the agenda for the five meetings with the Audit Committee along with the BOD Chair. The timing and primary subjects covered in each of these Audit Committee meetings is: February – financial review, Sarbanes-Oxley (SOX) 404 issues, financial performance dashboard, ethics; May – results of the prior year and the first quarter; July – risk and compliance (laws & regulations); September – PricewaterhouseCoopers (PwC) outside auditors, discussions mainly involving IT and purchasing; and December – audit plan, code of conduct review.
Audit Planning
Audit planning meetings are held with business units to discuss their areas and to solicit audit concerns. From these meetings will come potential projects that are entered and tracked in the audit planning, tracking, and reporting (APTR) system. APTR is a project management tool that is used for annual planning and tracking of audits. This Access database, which can be downloaded into Excel, contains the audit universe. Also kept in APTR are actual projects, including audit findings, conclusions, and recommendations. Audit work papers are kept in a different database, the TeamMate software package. In the September to November time period, the Internal Audit group reviews these topics and performs a risk assessment of each topic, based on:
♦ Risk ranking (high, medium, or low) with help from the Enterprise Risk Management group for identifying FE’s risks and business units’ business plans
♦ Customer interest
♦ Value to the corporation
Risks are ranked using a formal risk assessment, considering: 1) Compliance Risk – required by federal and state laws; 2) Fraud Risk Assessment – selected after considering SOX controls, guidance on fraud from the American Institute of Certified Public Accountants (AICPA), emerging risk areas, and the

Final Report 247
6/20/2011
history of fraud within the company; and 3) General Risk – after discussion with senior management of areas they would like audited.
Based on this risk assessment, an audit plan is developed and sent to the BOD Audit Committee for approval. Approximately 55% to 60% of all audits are based on requests, either planned or unplanned (those identified after the audit plan has been approved). At the end of each year, a results report is sent to the BOD Audit Committee, in which each project is shown as completed, in progress, deferred, or dropped. The BOD Audit Committee also receives a copy of all reports, summaries, and any open recommendations.
Audit Plan Execution
Audit steps include:
♦ Research into the audit topic ♦ Assignment of staff at the beginning of each year to audits, by quarter ♦ Engagement planning using a risk-assessment template, including identification of business
assessment risk, specific risk, and associated controls ♦ Risk ranking, both inherent (before controls in place) and residual (after controls in place) ♦ Developing individual audit plans
- Brainstorming by team - Developing audit agreement, including purpose, scope, objectives, and milestones - Holding entrance conference
♦ Execution of audit plan steps
Upon completion of fieldwork, the audit team discusses issues and how to correct them. Internal Audit would rather have issues corrected during the fieldwork, if possible. Recommendations and action plans are drafted and discussed, with business unit management receiving acceptance and developing action plan due dates. The draft audit report is developed and reviewed with the Internal Audit Manager and the Internal Audit Director (sometimes multiple times) before being provided to business unit management. If the audit is of a financial nature, the SOX team may also review the audit report. After a review of the draft audit report by business unit management, the final report will be issued with any necessary changes. If business unit management doesn’t agree with the audit recommendations or action plan steps, Internal Audit attempts to determine why and provide alternatives, making note of this effort in the final report.
Audit issues and recommendations are entered and tracked in both the TeamMate and APTR systems. Audit reports are sent to the business unit SVP, CFO, Controller, Legal Department (in selected situations), the supervisor who is responsible for action plan steps, and the BOD Audit Committee. A typical audit takes approximately 25 to 35 hours from start of developing the individual audit plan to final report. The lead auditor is responsible for audit follow-up. Open and past-due recommendations are provided to the BOD Audit Committee five times throughout the year.

248 Final Report
6/20/2011
Staffing
The internal audit staff is located in Akron, OH or Reading, PA and in addition to the Internal Audit Director consists of 22 internal auditors. The average number of years of experience at FE for this group is almost 19, with an average of over 12 years of auditing experience. All auditors have earned one or more undergraduate college degrees, and seven have earned graduate degrees. Almost all have, or are pursuing, professional certifications. Professional certifications and audit staff holding or working toward certification are shown in Exhibit VIII-27.
Exhibit VIII-27 Internal Audit Professional Certifications
as of December 31, 2009
Professional Certifications
Number of Internal Auditors Holding Certification Pursuing Certification
Certified Public Accountant (CPA) 5 1 Certified Internal Auditor (CIA) 11 1 Certified Fraud Examiner (CFE) 1 2 Certified Information Systems Auditor (CISA) 7 1 Certified Polygram Examiner (CPE) 1 Certified Forester (CF) 1 Certified Tree Expert (CTE) 1
Note: Internal auditors may hold multiple certificates.
Source: Information Response 474
For work assignments, the auditors are not segregated based on functional areas (i.e., as information technology (IT), financial, or operational audits). Their backgrounds, training, and experience include public accounting, economics, information technology, investigations, and general business.
The goal is to have each audit staff perform four to six audits annually and for audit managers to perform two to three audits. This equates to approximately 1.5 audits per auditor per quarter. There is a limited budget for outsourcing audits. Outside internal audit assistance is used occasionally in three types of instances: 1) as audit staff augmentation – FE has contracted with three or four local firms to provide assistance as needed, working under Internal Audit’s direction; 2) on outsourced audits – audits of contracts, system interface audits, and validations of code-of-conduct responses conducted; and 3) for added expertise – generally with one of the remaining three international CPA firms out of the Big Four (excluding their external auditors); such work can take the form of training or consulting engagements.
Recently, FirstEnergy has initiated a professional accounting rotation program, whereby an accountant will rotate into Internal Audit from the Finance and Accounting Departments for a two-year stint to gain more and varied exposure. It is possible that Internal Audit will be implementing a similar rotation program, especially after the career development model in the Finance, Strategic Planning & Operations

Final Report 249
6/20/2011
organization is fully implemented. The hope is that by rotating auditors throughout the corporation, the audit staff’s professional experience will be enhanced.
Ethics Auditing
FirstEnergy has a separate Ethics Auditing work group that is staffed by an ethics auditor with a CFE certificate and a background in criminal investigation and fraud examination. He is supported by several auditors who are pursuing their own CFE designations. FE requires all non-union employees to complete an Annual Certification of Compliance, declaring whether they have any knowledge of impropriety regarding FE’s operations. FE’s conservative interpretation of the Weingarten Rule (requiring union representation to be present to review bargaining unit personnel questionnaires) effectively limits the audience for the questionnaires to the non-bargaining unit employees. The questionnaires are sent out to approximately 8,000 employees. The ethics auditor receives back disclosures on approximately 1,500 of these certificates annually. Disclosures can be as insignificant as indicating that the employee is a member of the local water authority board, or they can be as significant as revealing observed or suspected fraudulent behavior. As the questionnaire has been refined over the years, the questions have become more focused and Internal Audit has received a greater number of disclosure responses. The responses are completed online and are stored in a Lotus Notes database. If the employee does not have access to a computer, the questionnaire can be completed in hard copy.
FirstEnergy has a 24/7 hotline or employee concern telephone line operated by an outside third party. Communication is anonymous, and response is available to the caller if he or she calls back in 30 days. The Internal Audit Director and the Chief Ethics Officer review all calls and assign the disposition of each. It is estimated that this line will receive 60 to 70 calls per year, maybe one-third of which involve ethics. The others are generally Human Resources (HR)-related. Approximately 20% of the ethics calls have some substance to them. All calls are referred to the ethics auditor. The ethics calls are further referred to the Legal Department and the HR calls are referred to the Human Resources Department. Every quarter, the Internal Audit Director, the Chief Ethics Officer, and the ethics auditor review all the calls that have come through to determine if they were handled correctly. A record of all investigations is recorded in the investigative reports log, which is maintained by the Chief Ethics Officer. In 2009, there were 50 to 60 investigations. The Chief Ethics Officer will meet with the BOD in July and December to discuss ethics issues.
A fraud training program, “Take the Mystery out of Employee Fraud,” referred to as “Fraud 101,” was initially developed by the ethics auditor as a diagnostic audit tool. It has been expanded into a fraud training program in response to a perceived need. Demand for this program has been fairly high, with the last few training sessions being attended by approximately 150 participants. This program had not been offered to JCP&L employees as of the date of our interview with the ethics auditor. The BOD Audit Committee supports rolling out this training for more employees.
An ethics audit of JCP&L’s Smart Program (an energy efficiency program) concluded that $9.7 million in expenditures were fraudulent. This audit started in July 2006, with the report being finalized in February 2007.

250 Final Report
6/20/2011
A fraud risk assessment is conducted annually as part of the engagement risk-assessment process. This 60-page document was built with information derived from: 1) SOX; 2) management concerns; 3) prior fraud/risk experience; and 4) emerging pressures regarding incentives for fraud. Approximately 50 schemes have been identified in terms of financial statement effects, misappropriations, and general employee corruption. The possibility of fraudulent activity has been assigned based on the impact of the fraud and the likelihood of occurrence in terms of two numbers. Using numerical scores has resulted in ranking fraud risk higher in 2011 than in 2010, when a number score was not used.
SOX Controls
SOX functions for JCP&L and all of the FE operating companies and entities are managed by the Internal Audit Department. The SOX process at FE is a self-assessment that is performed by SOX liaisons in the business units. Internal Audit maintains continuous involvement with the SOX liaisons throughout the year. A SOX Steering Committee that meets five times a year provides overall guidance for the SOX program. Meetings typically discuss current SOX functions, scheduling, testing, hours of effort spent, and SOX issues. A presentation developed for each meeting presents root-cause analysis of SOX issues identified. The SOX Steering Committee membership includes:
♦ VP, Shared Services, Admin & CIO ♦ Director, Compensation, Retirement Programs, & Succession Plan ♦ Assistant Controller – FirstEnergy Generation (FEG) ♦ VP, Controller & CAO ♦ Director, Internal Auditing ♦ Assistant Controller – FEU & Controller – JCP&L ♦ Assistant Controller
There is also a meeting with FE’s external auditors at the end of the year and continuous involvement or meetings throughout the year. Another related oversight group, the Disclosure Committee, meets four times per year, although it can meet more often. There are approximately 20 members on this committee, including the Controller, representatives from Legal and the business units, and the Chief Ethics Officer. This committee will discuss risk factors in the 10Q and 10K, including contingencies, liabilities, appropriate disclosures, regulatory requirements, and FE’s position on whether financial information is fairly presented.
A training program on SOX testing is presented annually to the SOX testers. Testers have access to SERTUS, which stores training material and SOX work papers.
Audit Results
The number of audits conducted and reports issued by the Internal Audit Department for all of the FE operating companies and entities, including JCP&L, has increased over the past five years. The number of internal audit reports issued by year is shown in Exhibit VIII-28.

Final Report 251
6/20/2011
Exhibit VIII-28 Audit Reports Issued
2005 to 2009
Source: Information Response 123
In a presentation given to FirstEnergy’s BOD in May 2010, the Internal Audit Department reflected on its performance against the goals it set for itself in 2009. For all the metrics listed, the Internal Audit Department achieved its results, as shown in Exhibit VIII-29.
0
20
40
60
80
100
120
2005 2006 2007 2008 2009
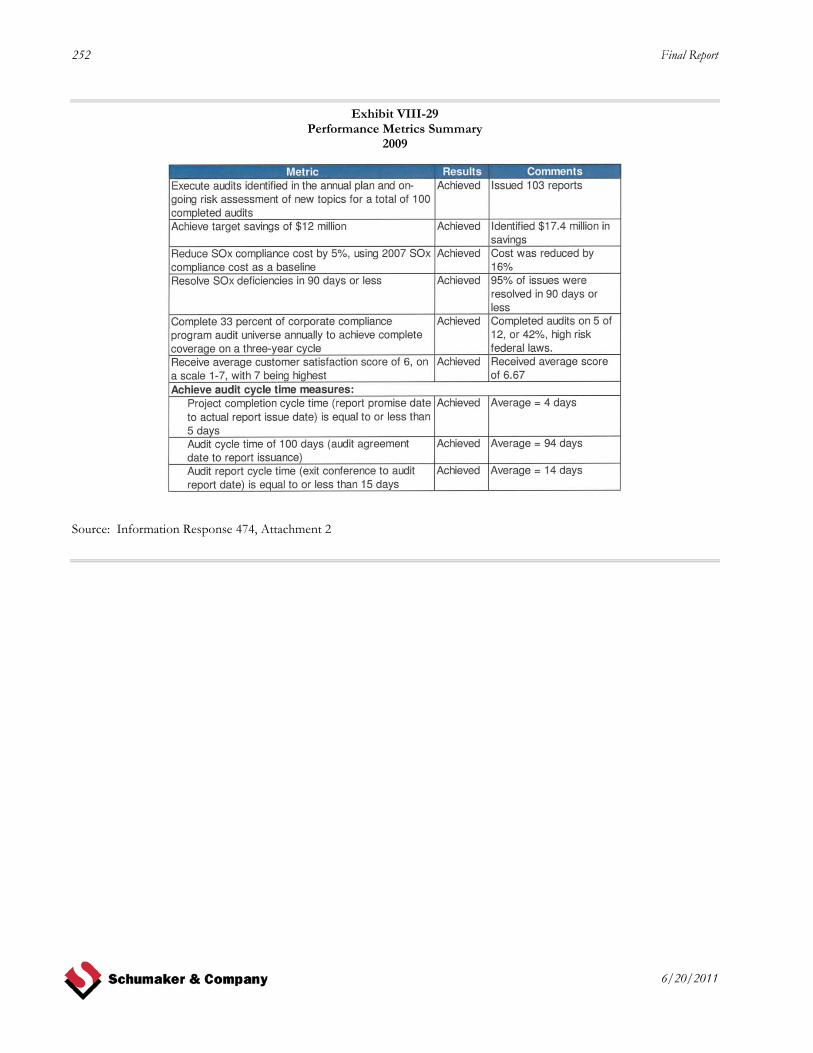
252 Final Report
6/20/2011
Exhibit VIII-29 Performance Metrics Summary
2009
Source: Information Response 474, Attachment 2

Final Report 253
6/20/2011
Findings & Conclusions
Finding VIII-12 The accounts payable function is effective and efficient.
JCP&L’s accounts payable function is consolidated at the FE corporate level within the SERVECO organization. This consolidated function is highly automated, thereby minimizing paperwork and manual processing. Using modern business processes and systems, such as JP Morgan’s Order-to-Pay electronic invoice presentment and payment Network and evaluated receipt settlement allows the accounts payable function to maximize the speed and certainty of processing payables and payments. In the first six months of 2010, approximately 99% of all invoices were processed electronically, at an average rate of over 200 invoices processed per Accounts Payable employee per day.
Finding VIII-13 The process for receiving and securing accounts receivable operates in a safe and efficient manner.
The accounts receivable function that services JCP&L rate payers as well as those of the other FE subsidiaries is consolidated into a single remittance processing center that is connected electronically to customer service, billing, and banking or cash management systems. Use of modern remittance-processing hardware and software, such as the accounts receivable conversion and image cash letters technology, allows payments from JCP&L customers to be recorded quickly and accounts to be updated with minimal delay. Transfer of funds from receipt to the outside banking system is achieved electronically, helping to ensure security of funds and facilitates as well as JCP&L’s quick access to and use of funds.
Finding VIII-14 The payroll function is sufficiently independent and accountable, and payroll processing is achieved effectively and efficiently.
JCP&L’s payroll function is consolidated at the corporate FE level within the SERVECO organization and the standardization of processes, practices, and systems allows for efficiencies and cost savings. Time entry has been pushed down to the individual employee level, using automated systems whenever possible. Time and account charge review and approval are likewise automated and speed the process of payroll processing while minimizing opportunities for manual errors. The payroll function is located in the Human Resources Department, thus reducing the opportunity for misunderstandings and delays attributable to the transfer of personnel data among departments. The payroll function is adequately explained and documented in a series of desk and employee manuals and procedures.
Finding VIII-15 The operating budget process is efficient and effective.
The budget process for JCP&L is managed and controlled by the overall plans and policies of its parent company. Budget schedules and assumptions are dictated by the FirstEnergy Budget Planning Department. Certain plans and directions guide the budget development process so that the end resultant budget conforms to the standards and goals of the larger corporate body. System automation is sufficient to not only allow an efficient budget-entry process but also promote efficiency in the

254 Final Report
6/20/2011
revision and comparison processes (basically, making it easy to revise or reforecast budgets and make comparisons between actual results and both budgets and prior-year actuals). From 2005 to 2009, JCP&L’s O&M budget process became more accurate, with over-spend variances seen in 2005 either decreasing (as in 2007) or becoming under-spend variances (as in 2006, 2008, and 2009).
Finding VIII-16 JCP&L and FirstEnergy Utilities use a different system than the rest of the organization to develop their capital budgets.
JCP&L and the other utility companies in FirstEnergy Utilities use a different system to rank their proposed capital projects than the other operating units in FirstEnergy use. FE’s stated goal was to use xRPM, the SAP capital evaluation module run by its Budget & Planning group, as the central repository for all capital project information for all FE entities. The module has been implemented and modified over the past three years so that it could serve this purpose as well as provide FE with a standard, integrated capital planning and evaluation system. All of the entities in FEU, including JCP&L, however, continue to use an older database system, RPA, a Lotus Notes application, to initiate, plan, track, and manage the approval process for their capital projects. RPA does not electronically interface with SAP, CREWS, or other systems. Capital budget data from this database must then be loaded into SAP using Excel templates. FEU capital management doesn’t believe that xRPM provides the functionality needed for the management of its capital projects. This continued use of separate systems may make it more difficult for FE to compare proposed capital expenditures from all its entities, recognizing that the goals and associated capital project evaluation criteria may be different among the FE business units. This limitation promotes the continued use of database silos for capital projects, making it more difficult to automatically roll up capital projects to an enterprise view of capital portfolios. This barrier, in turn, can prevent the optimum use of available funds across the FE spectrum of capital opportunities.
Finding VIII-17 JCP&L’s work order procedures, corporate accounting manual, and property records are maintained in accordance with generally accepted accounting practices.
JCP&L’s work order, property record, and general accounting functions are centralized under the management of SERVECO long with those of all the other FE operating companies and entities. The consolidation of responsibility for these processes under one financial organization allows JCP&L to take advantage of the cost benefits that can be realized from economies of scale. It also ensures that all functions are standardized and operated in accordance with generally accepted accounting practices and the requirements of various federal and state regulatory authorities. Automation benefits are realized through the use of SAP (FE’s integrated ERP system), PowerPlant (the property accounting system that is favored by the majority of utility companies in the U.S.), and the other common accounting modules and systems interfaced with SAP. SAP is an integrated accounting system that allows costs to be accumulated via a work order management process and ensures that the transactions of FE’s various entities and operating companies are recorded in separate books, intra-company transactions between and among FE’s affiliates are properly separated, and appropriate audit trails of transactions exist.

Final Report 255
6/20/2011
Finding VIII-18 JCP&L’s assets are not unitized in a timely manner.
After construction has been completed and assets are ready to be placed in service, those assets are transferred from GL Account 107 (Construction Work in Progress) to Account 106 (Completed Construction Not Classified). At this point in the process, depreciation will start and analysis of the project can begin. After analysis of the project is completed, assets are unitized and transferred to Account 101 (Electric Plant in Service Classified). The unitization process ensures that assets are assigned to the proper asset groups and depreciation rates.
In interviews, SERVECO management stated that unitization usually occurs within three months of assets being placed in service, although the stated goal across FEU is to unitize assets within none months of being placed in service. Assets that are eligible to be unitized but have not been (they are still in Account 106) are monitored and reported on a GL 106 Vintage Bucket Detail Report. A review of this report indicates that as of the end of 2009, JCP&L had almost $55 million of assets in this category. This figure represented approximately 28% of the total Account 106 balance for all of the FE utility companies. Looking at the categories of time subsequent to six months, JCP&L’s percentage of assets in the account is even greater, between 83.8% and 99.9% of the total, depending on the time category.
The delays in unitizing assets did not improve any in 2010 by the time Schumaker auditors had completed their field work, with an August 2010 GL 106 Vintage Bucket Detail Report showing JCP&L with a balance of assets in the 106 Account of almost $59 million, approximately 29% of the total for all of the FE utilities. As of the end of 2010, the balance of assets in Account 106 longer than nine months had been decreased to zero. As was the case at the end of 2009, the percentage of total assets attributed to JCP&L was larger the longer assets remained in this account. JCP&L’s percentage of total Account 106 assets was approximately 74% of assets in this account for more than six months.
Finding VIII-19 The Internal Audit function is not independent from FE’s Finance organization.
The Director, Internal Audit has a direct report responsibility to the Chair of the BOD Audit Committee and an indirect reporting responsibility (for administrative matters) to the EVP & CFO. However, the organizational charts don’t indicate this type of relationship. Rather, they indicate a direct reporting relationship to the EVP & CFO. The Chair of the BOD Audit Committee views the Internal Audit Director as reporting functionally to him. He stated that he provides feedback to the CFO regarding the Internal Audit Director’s performance evaluation and compensation. He also reviews the draft performance evaluation (presumably developed by the CFO or his office) before it is finalized. The Chair also sits down privately with the Internal Audit Director on various occasions and has stated that the Director’s performance evaluation can be discussed (although this is not always done). Because the Director’s performance evaluation is developed by the CFO, who certainly has more access to the Director, Internal Audit (the Director’s contact with the Chair of the Audit Committee seems to be limited to Board of Directors’ meetings), however, it appears that he may not be independent from the CFO’s influence. It also appears that way on the organizational chart.

256 Final Report
6/20/2011
Finding VIII-20 There is adequate planning and coverage of audit activities based on risk management assessment techniques.
Internal Audit employs adequate practices and tools in determining areas to audit. FE relies on risk ranking, customer interest, and perceived value to the corporation in developing its annual audit plan. Risks are ranked using a formal risk assessment, considering federal and state requirements, perceived fraud risk, SOX controls and test results, guidance on fraud from the AICPA, emerging risk areas, the history of fraud in FirstEnergy, and general risk—following discussion with senior management of areas they would like audited. Audit coverage has been distributed fairly among business area (FEU, FE Generation, SERVECO/corporate support services, and SOX controls) and by audit objective (compliance, financial, ethics, and operational).
Finding VIII-21 The Internal Audit resources appear adequate for the tasks covered.
The Internal Audit staff consisting of 22 professional auditors has adequate experience, background, and training to competently carry out its assignments. As a group, the Internal Audit staff members hold 27 professional certificates and are pursuing an additional five. In addition to its normal public accounting, internal auditing, and information systems expertise, the Internal Audit Department contains fraud investigation experience and capabilities not normally seen in an internal audit group. This department uses information systems, applications, and databases that allow it to operate in an efficient and effective manner.
Finding VIII-22 FE’s fraud training program has not been offered to JCP&L employees.
The Ethics Auditor in FE’s Internal Audit Department developed a fraud training program to present to FE’s employees to alert them to the possibilities of fraud existing in their business activities and to help them identify it if it does exist. This program has been well received by FE’s management and the BOD. At the time of our fieldwork in 2010 this program had not been offered yet to JCP&L’s employees.

Final Report 257
6/20/2011
Recommendations
Recommendation VIII-3 Study and evaluate combining FirstEnergy’s capital budget systems and databases. (Refer to Finding VIII-16)
Using two separate processes and systems to evaluate capital budget projects could make it more difficult for FE to optimize its available capital funds. All capital projects should be judged using a consistent and standardized evaluation methodology. Otherwise, capital investment decisions could be made without adequate information on available alternative uses for limited capital funds. FE should evaluate which budget system makes the most business sense and make changes to the current systems and processes, as necessary, over a reasonable period of time. This evaluation should include modifying its existing SAP capital evaluation module, xRPM, so that it includes the functionality needed for the FEU projects, and developing or purchasing another system that will allow inclusion of all capital portfolios and enable a true enterprise-wide evaluation of capital budget projects.
Recommendation VIII-4 Provide the resources or effort to reduce the backlog of assets in Account 106. (Refer to Finding VIII-18)
The backlog of JCP&L assets in Account 106, Completed Construction Not Classified, should be reduced and not allowed to reach the level it was at the end of 2009 ($55 million) or August 2010 ($58 million). Until projects are analyzed, assets cannot be placed in their proper accounts and any assets being replaced may not be retired. The upgrade of PowerPlant is supposed to include an automatic unitization function that may solve this problem on an ongoing basis. The upgrade, however, will not be able to eliminate the current backlog. Sufficient resources should be introduced to this problem to eliminate the backlog and to ensure that the unitization process is accomplished in a timely manner (closer to three months than to one year).
Recommendation VIII-5 In conjunction with the FE/Allegheny Energy merger integration process, identify and implement the most efficient organizational design to effectively and independently perform the Internal Audit function. (Refer to Finding VIII-19)
The Director, Internal Audit reports only administratively to the CFO. It appears, however, that the CFO’s office has more than administrative authority over the Director. The organizational charts do not represent a dotted-line or non-direct reporting relationship to the CFO. In addition, the CFO or his office is responsible for initiating the Director’s personnel evaluation, even if the Chair of the Audit Committee reviews it. The Director’s contact with the Chair of the Audit Committee is infrequent, usually occurring only at the Board of Directors’ meetings. The meetings between the Chair of the Audit Committee and the Director, Internal Audit should be increased so that effective management of this function can be enhanced. Consideration should be given to having all administrative functions not undertaken by the Chair of the Audit Committee be performed by a group outside the CFO organization.

258 Final Report
6/20/2011
Recommendation VIII-6 Provide the fraud training program to JCP&L employees. (Refer to Finding VIII-22)
FE’s fraud training program titled “Take the Mystery out of Employee Fraud” should be provided to JCP&L employees. This program was developed to meet a perceived need for information in this area and has been well received by management and the BOD. At the time of our fieldwork in 2010, however, this program had not been offered to JCP&L employees, although it had been provided to a number of the other FE companies and JCP&L affiliates.

Final Report 259
6/20/2011
IX. Electric Operations
This chapter covers activities associated with the electric system operations and maintenance.
A. Transmission and Distribution
This section addresses the transmission and distribution (T&D) of electricity to Jersey Central Power & Light (JCP&L) customers.
Background & Perspective
JCP&L has two non-contiguous service territories, the Northern and Central Regions in New Jersey, as shown in Exhibit IX-1.
Exhibit IX-1 Jersey Central Power & Light New Jersey Service Territories
as of July 2010
Source: http://www.firstenergycorp.com/outages/outages.do?state_code=NJ and modified by Schumaker & Company

260 Final Report
6/20/2011
The transmission and distribution facilities are two components of a typical electric supply system, as shown in Exhibit IX-2. In early 2000, New Jersey restructured its electric supply system and JCP&L does not provide any generation to end-use customers directly who are served by Basic Generation suppliers or by other electric generation suppliers. JCP&L’s affiliate, FirstEnergy Solutions (FES), sells FirstEnergy-owned generation into the PJM Interconnection3
(PJM) market and to end-use customers.
Exhibit IX-2 Typical Electric Supply System
2010
Source: http://upload.wikimedia.org/wikipedia/commons/4/41/Electricity_grid_simple-_North_America.svg
The transmission system delivers bulk energy electricity at high voltages to transmission substations and transmission voltage-level customers. Typical transmission structures are much larger than sub-transmission and distribution structures. Exhibit IX-3 provides a comparison of the structures. The main components of transmission are structures, insulators, and conductors.
3 PJM Interconnection is a regional transmission organization (RTO) that coordinates the movement of wholesale electricity in all or parts of Delaware, Illinois, Indiana, Kentucky, Maryland, Michigan, New Jersey, North Carolina, Ohio, Pennsylvania, Tennessee, Virginia, West Virginia and the District of Columbia.

Final Report 261
6/20/2011
Exhibit IX-3 Typical Transmission Structures
2010
Source: http://www.osha.gov/SLTC/etools/electric_power/illustrated_glossary/transmission_lines.html#Overhead
Substations transform voltages from one level to another. A typical substation and the power flow through that substation are shown in Exhibit IX-4.
Exhibit IX-4 Energy Flow Through a Typical Substation
2010
Note: Cutout switches are also know as disconnect switches
Source: http://www.osha.gov/SLTC/etools/electric_power/illustrated_glossary/substation.html
Exhibit IX-5 shows that substations contain numerous pieces of equipment.

262 Final Report
6/20/2011
Exhibit IX-5 Major Components of a Typical Substation
2010
Source: http://www.osha.gov/SLTC/etools/electric_power/illustrated_glossary/substation.html
Distribution circuits run from distribution substations either overhead on poles or underground through conduits or direct buried (no conduits) to serve customers. Services from distribution circuits connect to the customers’ electrical systems. An electric meter measures the consumption of electricity and, for larger customers, the demand (consumption of electricity in a given period) at the end of the service. Exhibit IX-6 shows typical overhead distribution components.
Exhibit IX-6 Typical Distribution Equipment
2010
Source: http://www.osha.gov/SLTC/etools/electric_power/illustrated_glossary/distribution_system.html and http://www.osha.gov/SLTC/etools/electric_power/illustrated_glossary/distribution_system/distribution_transformers.html

Final Report 263
6/20/2011
The JCP&L transmission system is controlled by a transmission dispatch office in Reading, Pennsylvania, and the distribution system is controlled by distribution regional dispatch offices (RDOs) in the Northern and Central Regions. JCP&L serves 1,099,417 customers with 18 miles of 500 kilovolt (KV) transmission lines, 446 pole miles of 230 KV transmission lines, 138 pole miles of 115 KV transmission lines, 26 transmission substations, 303 distribution substations, 30 combination transmission and distribution substations, 11,999 overhead distribution circuit miles, 6,960 underground distribution circuit miles, and 192,278 streetlights.
This Background and Perspective section is divided into seven subsections:
♦ Organizational Structure
♦ Performance Management
♦ Asset Management
♦ Operations and Maintenance
♦ Capital Program
♦ Workforce
♦ Operations Support Systems
Organizational Structure
The FirstEnergy Utilities (FEU) business unit, which includes JCP&L has a hybrid centralized/decentralized organizational structure for T&D operations. In general, personnel who are responsible for T&D construction and maintenance activities are physically located in the New Jersey service territory. On the other hand, transmission and substation planning and engineering responsibilities are centralized in the FE Service Company (SERVECO) in Akron, OH and Reading, PA. All distribution system Planning and Engineering is decentralized. It is the responsibility of JCP&L and is located in New Jersey. JCP&L distribution system planning and engineering, however, is supported by centralized SERVECO staff functions. Bulk power dispatch operations, planning, and engineering for transmission and substations as well as contract services for transmission patrols and vegetation management are centralized for all of FEU and are provided to JCP&L as affiliate services. Both the centralized SERVECO functions and the decentralized JCP&L functions are organizational units within FEU.
JCP&L
The physical delivery of electricity to JCP&L customers is primarily the responsibility of three directors who report to the JCP&L President, as shown in Exhibit IX-7.

264 Final Report
6/20/2011
Exhibit IX-7 Jersey Central Power & Light T&D Organization
as of June 30, 2010
Source: Information Response 54 and Interview 124
The Director of Operations Services manages the engineering, transmission, and distribution lines and the claims functions, as presented in Exhibit IX-8.
Exhibit IX-8 Jersey Central Power & Light Engineering, Transmission, Distribution, and Claims Organization
as of June 30, 2010
Source: Information Response 54-449 and Interviews 30 and 128
JCP&L Engineering Services (Engineering) is responsible for the JCP&L distribution electric system’s planning and engineering. Transmission planning and engineering is done by FEU. JCP&L Engineering performs all distribution lines capacity and protection planning and engineering, except for simple line extensions, which are done by layout technicians in the Lines Department. One Engineering
Red Bank, NJ 1,425
JCP&LPresident JCP&L
JCP&L
Red Bank, NJ 6
JCP&LManager
Commodity Sourcing-NJ
Red Bank, NJ 7
JCP&LManager
Human Resources
Red Bank, NJ
JCP&LExecutive Assistant
Vice President
Morristown, NJ 749
JCP&LDirector
Operation Services
Morristown, NJ 239
JCP&LDirector
Operations Support
Morristown, NJ 192
JCP&LDirector
Operations Support
Red Bank, NJ 225
JCP&LVice PresidentExternal Affairs
Morristown, NJ 749
JCP&LDirector
Operation Services
Morristown, NJ 151
JCP&LManager
Engineering Services
Morristown, NJ 3
JCP&LClaims Manager
Energy Distribution
Red Bank, NJ 2
JCP&LClaims Manager
Energy Distribution
Morristown, NJ
JCP&LAdministrative Assistant
Operations
Morristown, NJ 315
JCP&LGeneral Manager
Operations 1
Morristown, NJ 272
JCP&LGeneral Manager
Operations 2

Final Report 265
6/20/2011
section addresses all new business. JCP&L Engineering manages corporate equipment reliability programs (transformers, capacitors, poles, etc.) and performs the bulk of the capital program planning and budgeting as well as large project management. It also has units that oversee joint-use poles, rights of ways, storm response, mapping, and drafting.
The two JCP&L Regional Operations Services (Lines) business units are responsible for the construction and planned and corrective maintenance (CM) of all transmission and distribution lines and of all related equipment in the two regions in the JCP&L service territory. In addition to construction and maintenance crews, the Lines organizations include the trouble technicians (“express technicians”) who are the JCP&L first responders. Trouble technicians are available 24/7 throughout the service territory. Almost all line construction and maintenance work is performed by employee crews. Only pole and underground cable inspections, transmission patrols, and state Department of Transportation (DOT) road projects are routinely contracted. Planner schedulers undertake month-ahead scheduling with more detailed weekly schedules. The Claims function is covered in the Risk Management chapter.
The first Director of Operations Support manages the North and Central regional distribution operations (RDO) dispatch centers and substation organizations, as displayed in Exhibit IX-9.
Exhibit IX-9 Jersey Central Power & Light RDO and Substation Organization
as of June 30, 2010
Source: Information Response 54 and Interview 32
The RDO dispatch centers operate the sub-transmission and distribution (34.5 kV and below) system. There are two centers now, one in each region. Transmission operations are performed by the transmission regional dispatch center in Reading, Pennsylvania. The FEU transmission dispatch center and the JCP&L RDOs are staffed 24/7. 99% of the JCP&L substations have remote terminal units (RTUs) that send data to the RDO regarding electric system status. The RDOs are able to remotely operate some equipment. The RDOs manage customer outages, trouble orders, streetlight repair orders, and the storm restoration process.
Morristown, NJ 239
JCP&LDirector
Operations Support
Morristown, NJ 27
JCP&LManager
Distribution
Red Bank, NJ 28
JCP&LManager
Dispatching
Morristown, NJ
JCP&LAdministrative Assistant
Operations Support
Morristown, NJ 179
JCP&LGeneral Manager
Operations Support 2
Morristown, NJ 1
JCP&LGeneral Manager
Operations Support 3

266 Final Report
6/20/2011
While transmission substation planning and engineering is done by FEU, the JCP&L Engineering organization is responsible for distribution planning, the physical operation of the substations is the responsibility of the Dispatching group, and the JCP&L Substation organization handles the maintenance and construction of all transmission and distribution substations in its territory. It performs the planned maintenance as specified and keeps detailed records of substation performance and maintenance. Corrective maintenance identified by planned maintenance or equipment failure is also performed by this group. Normally, all transmission and distribution substation construction and maintenance work is performed by employees. Only below-grade civil work (e.g., conduit installation) is contracted. Because New Jersey is fairly well-developed, most substation construction work involves breaker and transformer capacity additions and reliability-related equipment replacements rather than new substation construction.
Exhibit IX-10 shows the organization of the second Director of Operations Support, who manages the Fleet, Stores, Facilities, Meter Services, and Forestry functions for both regions. On August 29, 2010, Meter Reading was transferred into this organization as well. Please see the Customer Services chapter for a discussion of Meter Reading.
Exhibit IX-10 Jersey Central Power & Light Fleet, Stores, Facilities, Meter Services, and Forestry Organization
as of June 30, 2010
Source: Information Response 54 and Interview 31
The JCP&L Meter Services Department installs, replaces, and maintains all meters in the service territory. It performs all New Jersey Board of Public Utilities (BPU) required meter replacements and tests. Both customers with high-voltage primary service and large-use customers have digital meters that communicate with the FEU’s MV90 system (meter data acquisition and management) via land lines or wireless communications. All large meters with current transformers (CTs) and potential transformers
Morristown, NJ 192
JCP&LDirector
Operations Support
Redbannk, NJ 58
JCP&LManager
Regional Fleet Services
Morristown, NJ 23
JCP&LManager
Support Services
Red Bank, NJ 18
JCP&LManager
Support Services
Morristown, NJ 80
JCP&LManager
Meter Services
Morristown, NJ
JCP&LSenior Distribution Specialist
Operations Support
Morristown, NJ 7
JCP&LManager
Foresty Services

Final Report 267
6/20/2011
(PTs) are retested and double checked 30 days after installation.4
The Forestry Department is responsible for vegetation management for all sub-transmission and distribution (34.5 kV and lower) corridors. An FEU centralized unit is responsible for vegetation management on the transmission line corridors in JCP&L’s territory. Distribution vegetation management is contracted to tree-trimming companies and is managed by a staff of six employee and three contract foresters. In addition to their regular trimming cycle work, tree-trimming contractors are also required to provide storm response assistance. JCP&L procedures call for a four-year tree-trimming cycle, as prescribed by the BPU code, on all circuits with intra-cycle trimming as needed. JCP&L is in the midst of an experimental capital program to enlarge parts of the distribution corridors and to remove danger trees in the lockout zone (line exposure from substation breaker to the first-down line recloser or fuse-protective device) and for all three-phase circuits.
A centralized FEU unit tests and supplies all meters and related equipment to JCP&L from the FirstEnergy warehouse and meter test facility in Bethel, Pennsylvania. JCP&L, however, performs customer-requested BPU meter tests in Morristown, New Jersey under the BPU’s supervision. The customer pays a small fee to have the meter tested with BPU oversight. Normally, all removed meters are returned to the Bethel facility for testing and disposition.
In addition to the three directors with T&D responsibility, a Director of Business Services is a member of the JCP&L President’s leadership team but reports directly to the FirstEnergy (FE) Assistant Controller. Until 2008, this position reported directly to the JCP&L President. The Business Services unit, with a staff of 11, is located in New Jersey and provides O&M budgeting and cost control services to the JCP&L President’s organization. This business unit is the focal point for the O&M budgeting and reporting processes and assists with capital budgeting for blanket orders based on history. This unit’s scope of responsibility is limited to the President’s direct reports. It does not do budgeting or reporting for the New Jersey Rates Department nor does it perform FE-centralized services like information technology that charge JCP&L. The Business Services unit prepares the Monthly Operating Report and reviews the JCP&L income statement with the President on a monthly basis. The President, however, is not responsible for the income statement results. His responsibilities encompass only the cost performance of his cost centers. Business Services does budget for non-consumptive revenue (not based on consumption rates), such as pole rentals, late payment fees, and engineering and construction charges for customer-requested non-tariff work (e.g., undergrounding on an overhead line).
FirstEnergy Utilities
JCP&L’s T&D functions receive governance, staff support, and some centralized services from the FirstEnergy Utilities (FEU) business unit. The FirstEnergy Senior Vice President/FEU President has four executive direct reports as shown in Exhibit IX-11.
4 CTs and PTs reduce high-voltage services to a lower level for the meter. The customer is served at the higher voltage but it is metered at a lower voltage and computations are used to translate the lower-voltage metered consumption to the higher voltage actually delivered.

268 Final Report
6/20/2011
Exhibit IX-11 FirstEnergy Utilities’ T&D Organization
as of June 30, 2010
Source: Information Response 54 and Interview 82 Note: FERC is the Federal Energy Regulatory Commission
The Vice Presidents (VPs) of Utility Operations and Support have T&D responsibilities. The VP of Federal Energy Regulatory Commission (FERC) policy addresses corporate-wide FERC issues (see the Affiliate Relations chapter). The Vice President of Customer Service and Energy Efficiency’s responsibilities are covered in the Customer Services chapter.
The Vice President of Utility Operations has the Presidents of JCP&L, Ohio Edison, Cleveland Electric Illuminating Company, Toledo Edison, and Pennsylvania Operations (which has three Pennsylvania operating companies (opcos)) reporting to him. Exhibit IX-12 displays the FirstEnergy Utilities’ Operations organization.
Akron, OH 7,252
FirstEnergy UtilitiesSenior Vice President &
PresidentFirstEnergy Utilities
Akron, OH
FirstEnergy UtilitiesExecutive Assistant
Energy Delivery & Customer Svcs
Akron, OH 30
FirstEnergy UtilitiesVice President & Chief FERC
Compliance OfficerFERC Policy & Compliance
Akron, OH 680
FirstEnergy UtilitiesVice PresidentUtility Support
Akron, OH 854
FirstEnergy UtilitiesVice President
Customer Service & Energy Effciency
Akron, OH 5,683
FirstEnergy UtilitiesVice President
Utility Operations

Final Report 269
6/20/2011
Exhibit IX-12 FirstEnergy Utilities’ Operations Organization
as of June 30, 2010
Source: Information Response 54 and Interview 81
The two special assignment positions are the utility operations safety directors. See the Human Resources chapter for a discussion of safety. This FEU Utility Operations Vice President regularly sees a roll-up view of the FEU operating companies’ income statements and can drill down into JCP&L and the other opcos. The Vice President has profit and loss responsibility but holds direct control over only a portion of the expenses. He has no direct control over rates and revenue. The Vice President sees costs in two views. The first is the view of direct costs from his direct report cost centers. The second is the “fully loaded” or “settled view” that includes overheads on direct costs and shared services allocations. This Vice President has no direct involvement in shared services budgeting or allocations, but he could influence costs for opco projects, such as IT projects specifically for FEU.
The Vice President of Utility Support has centralized line responsibility for transmission planning, protection, engineering, and dispatch. His group also performs substation engineering for all FEU opcos. In addition, his staff is responsible for virtually all other T&D functions performed by JCP&L and the other FEU opcos. Exhibit IX-13 presents the FirstEnergy Utilities’ Utility Support organization.
Akron, OH 5,683
FirstEnergyVice President
Utility Operations
Akron, OH 1,390
FirstEnergyPresident
Ohio Edison
Cleveland, OH 931
FirstEnergyPresident
Illuminating CO
Toledo, OH 382
FirstEnergyPresident
Toledo Edison
Red Bank, NJ 1,425
FirstEnergyPresident
JCP&L
Akron, OH
FirstEnergySpecial AsignmentUtility Operations
Reading, PA 1,548
FirstEnergyPresident
Pennsylvania Operations
Akron, OH
FirstEnergySpecial Assignment
Utility Operations

270 Final Report
6/20/2011
Exhibit IX-13 FirstEnergy Utilities’ Support Organization
as of June 30, 2010
Source: Information Response 54 and Interview 73
Transmission Operations Services operates the transmission dispatch centers. The center controlling the JCP&L transmission system is located in Reading, Pennsylvania.
Transmission Planning and Protection is the centralized organizational unit for all FEU transmission and substation planning and protection. It models all systems every year. Currently, all work is done by in-house employees. This unit does not engineer or estimate projects. Rather, it develops conceptual projects for detailed engineering and estimating by the counterpart central transmission and substation engineering units and for construction by the opcos. Presently, this unit is dealing with much planning uncertainty attributable to demand response programs, new generators, energy efficiency, and the economy. New Jersey generation connection requests first go through a PJM process. This unit will plan the connection to the transmission system in the JCP&L territory if it is approved. It will also plan any PJM-requested transmission congestion relief or transmission efficiency projects for JCP&L. Much of the JCP&L bulk power transmission and substation work is related to PJM requirements.
Transmission and Substation Design is the centralized unit for all FEU transmission and substation engineering design work. It has about 100 projects in process for JCP&L. The scope of its responsibilities includes transmission siting, rights of way, and surveying. Most work is done in-house, but approximately one-half of substation and 15% to 20% of transmission design is contracted. In-house billable hours are approximately 80% capital and 20% operations and maintenance (O&M). Design standards for transmission and substations are incorporated into the computer aided design
Akron, OH 680
FirstEnergyVice PresidentUtility Support
Akron, OH
FirstEnergyExcutive Assistant, Vice President
Utility Support
Akron, OH 75
FirstEnergyDirector
Transmission Operation
Akron, OH 39
FirstEnergyDirector
Transmission Planing & Protection
Akron, OH 35
FirstEnergyDirector
Operation Services
Akron, OH 247
FirstEnergyDirector
Workforce Development
Akron, OH 78
FirstEnergyDirector
Transmission & Substation Design
Akron, OH 111
FirstEnergyDirector
Operations Support
Akron, OH 20
FirstEnergyDirector
Asset Management
Akron, OH 9
FirstEnergyDirector
Performance & Process Improvement
Akron, OH 56
FirstEnergyDirector
Transmission Assets & Vegetation Management
Akron, OH
FirstEnergySpecial Assignment
Utility Support

Final Report 271
6/20/2011
(CAD) system in a manner similar to compatible units in distribution design. This unit receives conceptual work packages from the Planning group, designs and estimates the projects, and turns them over to the opco project management units for implementation. (The FEU Asset and Project Management group may help opcos with large projects or in times of peak workloads.)
The Asset and Project Management unit has four main functions: asset management, project management, Primavera scheduling, and capital program planning and budgeting. The Asset Management section develops asset management programs and processes, such as ad hoc lifespans of equipment analyses and the five-year circuit inspection program. The Project Management group undertakes major project management, primarily on the bulk power system. Examples include a 500 kilovolt (kV) transformer replacement, 230 kV line extension, and a 345 kV station upgrade. This group will also assist the opcos with projects, usually on the 34.5 kV sub-transmission system. The Project Management unit also provides central staff assistance for the project management processes, organization, and staffing. There is no hard cutoff between corporate and opco projects; however, corporate tends to do bulk power and opcos tend to do distribution. Permitting issues in NJ lead to more projects being locally managed. The three-person Primavera scheduling and project controls group supports FEU’s standard Primavera scheduling tool. FirstEnergy Utilities does not use any other scheduling tool, including MS Project. Primavera is generally used for projects over $100,000 and of longer duration. The T&D work management system, CREWS, handles smaller, shorter-duration jobs well. The Capital Program Planning and Budgeting function drives the calendar and process.
The Transmission Assets and Vegetation Management unit has centralized line responsibility for transmission corridor vegetation management and provides staff support to the opcos for transmission and substation maintenance. Transmission vegetation management work is contracted but is supervised by a staff of foresters. This group also provides some distribution vegetation management staff support to the opcos. The Substation Maintenance unit has a supervisor and four commissioning engineers deployed to New Jersey who inspect and accept substation construction work and perform root-cause failure analysis. The Transmission Maintenance group manages the centralized, contracted transmission aerial and ground inspections and the pole inspection contracts. It also provides staff support to the opco transmission crews.
Operations Services provides T&D staff support in four areas: reliability and outage management, distribution standards and joint use, distribution planning and protection and regulatory reporting. The Reliability & Outage Management Section is responsible for the development and promotion of effective strategies and procedures associated with the operations of the Regional Dispatching Offices (RDO) and are responsible for system enhancements and data management practices of the PowerOn Outage Management System (OMS). The Reliability & Outage Management Section also compiles and distributes the monthly Energy Delivery Reliability Report. The Standards and Joint Use group provides purchasing specification and field guidance for the selection of distribution material, selection of construction standards and joint use of FE facilities by communication and other utilities. In addition, the Standards group provides detailed engineering practices, reviews industry trends and shares best practices with JCP&L. The Joint Use function also includes the development and coordination of joint

272 Final Report
6/20/2011
use contracts for pole attachments and oversight of billing practices. Much of the activity in Joint Use is related to pole, vault and conduit rental by schools, telecommunication companies and hospitals. Joint use activities also include the dissemination of pole attachment requirements to attaching companies. The group manages a “call before you dig” ticket screening operation that validates the dig area against JCP&L known boundaries. Distribution Planning and Protection (DPP) is responsible to develop, document and promote consistent policies and procedures associated with distribution system planning, protection, automation, power quality, reactive support and retail distributed generation. DPP is responsible for system enhancements and data management practices associated with related tools including the GIS mapping system, CYME planning and protection system analyses tool, PQView power quality analyses program and Load Forecasting Demand Management System (LFDMS) distribution load forecasting model. They also facilitate and administer the retail distributed generation process for connecting customer solar, wind and gas generation to the distribution system. Regulatory Reporting supports JCP&L by facilitating the completion of JCP&L’s Annual System Performance Report; supporting the completion of various data requests; providing input to proposed new or modified state regulations; and compiling internal status reports.Electric Delivery Operations Support provides centralized service depots for transformer repair, rubber goods, and meters. It also provides centralized Fleet Services staff support. (See the Fleet Management chapter for a discussion of fleet services.)
The Performance and Process Improvement unit is primarily engaged in the Work Management Initiative (WMI). (See the Operations Support System section below). Six of the eight staff members are deployed to the WMI team. One of the remaining staff is working on the redesign of the Energy Delivery web portal and the eighth staff member is working on a root-cause analysis of an outage event in Metropolitan Edison. The director of the unit has been assigned to the Allegheny Power merger team on a substantially full-time basis.
Performance Management
FirstEnergy has a cascading performance management program that flows from corporate to the business units (including FEU) to the operating companies (including JCP&L). Key performance indicators (KPIs) are developed for each level, and targets are set for achievement each year. (See the Human Resources chapter for a discussion of the integration of performance management and incentive compensation.) Exhibit IX-14 shows the high-level corporate, business unit (FEU), and local (JCP&L) KPIs for 2010.

Final Report 273
6/20/2011
Exhibit IX-14 2010 FE Utilities’ KPI Goals
January, 2010
Source: Information Response 609 Notes: STIP is Short-Term Incentive Plan, OSHA is the Occupational and Safety Agency, TOF is the Transmission Outage Frequency, SAIDI is the System Average Interruption Duration Index, CS is Customer Service, EE is Energy Efficiency, and ASA is Average Speed of Answer
The KPIs cover financial, safety, reliability, and customer service performance. The local targets are consistent for all FEU opcos, including JCP&L, except for the reliability target, the System Average Interruption Duration Index (SAIDI). SAIDI targets are set for each opco according to past performance and the state regulatory service quality index (SQI) requirements or guidelines. JCP&L’s SAIDI target for 2010 is the third most stringent of the seven FEU opcos. Only Toledo Edison and Ohio Edison have higher targets for improved reliability.
JCP&L submits an Annual System Performance Report to the BPU in compliance with state requirements. The report is focused on reliability and provides information on reliability metrics, interruptions by cause, reliability management programs, staffing, training, major storm events, and the storm response process. The table of contents for the 2009 report is given in Exhibit IX-15.

274 Final Report
6/20/2011
Exhibit IX-15 Table of Contents from the 2009 JCP&L Annual System Performance Report
June 2010
Source: Information Response 132
All FEU opcos, including JCP&L, have a Monthly Operations Performance Report prepared by Business Services. An example of the summary page of this report is reproduced in Exhibit IX-16.

Final Report 275
6/20/2011
Exhibit IX-16 Example JCP&L Monthly Performance Report
May 2010
Source: Information Response 142 Note: CAIDI is Customer Average Interruption Duration Index
Following the summary page are individual pages on each metric that cover detailed performance information, analysis and performance gap identification, gap closure plans, and related information. The report is reviewed monthly in a detailed (approximately six hours) video conference with the JCP&L executives and managers. It is also reviewed monthly with the FEU executives and managers. The JCP&L President also holds a weekly teleconference with management staff to address important and emerging issues.

276 Final Report
6/20/2011
Asset Management
Asset management at FEU/JCP&L is focused on individual assets/pieces of equipment or categories of equipment. The FEU/JCP&L asset management goal is to provide the intended level of service performance consistent with the design at the lowest lifecycle cost over the true economic life of the piece of equipment. Asset management at FEU/JCP&L incorporates a lifecycle approach that begins at equipment specification and continues through retirement. The major processes involved include capacity planning, design and construction standards and equipment specification development, inspection and testing, rehabilitation and corrective or repair maintenance, and capital management.
The goal of asset optimization implies balancing between potentially conflicting demands. For example, while most operating personnel would prefer trouble-free equipment, the cost of acquisition—if in fact such equipment could be designed and manufactured—would be prohibitive. Likewise, buying solely on the basis of initial cost considerations may result in a false economy when the lifecycle costs are considered. Equipment ratings, standards development, equipment application, and maintenance and repair techniques, however, have evolved over time and are based on the collective experience of the utility industry, including that of its equipment manufacturers. Those cumulative experiences are incorporated in the asset management strategy at FEU/JCP&L, the elements of which are outlined below.
Distribution Planning
The planning criteria include, among other things, assumptions regarding environmental conditions, loading, or duty cycle capabilities, and allowances for uncertainty in operating environment, materials, and design margins. Planning criteria are intended to consider credible in-service situations but are not used to establish operating guidelines. For example, while transformer-planning criteria provide for normal loss of life (NLOL) loading on peak or during contingencies, it is not intended that transformers be routinely run to NLOL levels before capacity relief is provided. That relief might be provided in the form of a new source or it might come from operational load transfers, phase balancing, or circuit reconfigurations to name a few. Thus, capacity addition or replacement decisions are driven by the assessment of operational data, forecasted load growth projections, equipment condition reports, and repair/rehabilitation cost history, among other considerations. The existence of peak load data, operating performance, and condition assessment is critical to ensure compliance with the limitations set by the planning guidelines, general industry practices and standards, and/or manufacturer recommendations. The ongoing analysis of this data is essential to the achievement of optimal lifecycle and lifecycle cost whether in the use of transformer or other pieces of major electrical equipment.
Capital Management
Projects typically fall into the category of new business (customer driven), capacity (resolution of potential system loading issues), mandatory (safety, regulatory, or legal entity driven), condition

Final Report 277
6/20/2011
replacement (equipment capability driven), and reliability (operating performance driven). Several or all of these drivers may, in fact, precipitate the initiation, planning, and implementation of projects.
The capital management process seeks to stimulate the development of alternative solutions to the identified problem(s), which are then evaluated using risk-adjusted economic evaluation tools. These tools, in turn, lead to a selection of the most economically attractive solutions to the identified problem. The development of alternatives requires input from the other processes such as planning criteria standards, operating experience, and risk assessments. Accordingly, the focus of the capital management process is to select the solution that creates the most economic value within a reasonable period of time.
The focus of this process is the selection and authorization of capital projects into the budget for the next three years. The process, however, requires that O&M costs and capital solutions receive equal consideration, and the project that creates more economic value, all else being equal, is the preferred solution. The focus of the process is the normal additions, replacements, and upgrades necessary to ensure that customer demands are met. Although FE/JCP&L use a three-year planning horizon, which can be adjusted as conditions change, hard budgets are set for only the following year. Proposed projects are reviewed annually to create a portfolio for the following year’s budget. In addition, emergent projects are reviewed throughout the year if events arise that create a need for projects not defined in the previous budget cycle.
Standards
Standards cover material and major electrical equipment design parameters, design and installation requirements, operating capabilities and performance, repair or refurbishment, and replacement. Standards have evolved over the history of the industry from the collective body of experience of utilities, manufacturers, and researchers. Some are national in scope and application, while some are local. The test of a standard’s relevance is the cumulative experience derived from its application. Thus, standards are rarely absolute and generally change over time as experience is gained.
The empirical nature of many of these standards has necessarily driven a conservative approach to setting them. Conservative assumptions and judgments, modified by experience and scientific inquiry, have resulted in many different approaches to setting similar standards across the industry. Different assumptions of risk are implicit in those standards. However, the effectiveness of those standards must be measured by the operating performance of the assets to which they are applied and by the costs associated with their application and the resulting performance.
Standards provide improved lead times, consistency of equipment ratings and types, repeatability in the work, and increased flexibility across geographic boundaries and time. Standards also provide for increased operational flexibility in the form of equipment margins, outside assistance in emergencies, a common support process, and work methods across the entire organization.

278 Final Report
6/20/2011
Operations and Maintenance
Operations and maintenance practices are designed to ensure that equipment performs as designed throughout its lifecycle and that diagnostic testing is used to drive reliable service performance. Many of these practices are designed to be diagnostic in nature to ensure that incipient problems are identified before failures occur. The varying costs of upgrades, refurbishment, or repair (that may be viable responses to the results of diagnostic testing) are inputs to the capital management process that is used to compare other viable alternatives, such as replacement or elimination.
Inspection and test reports must be analyzed on a timely basis to be useful, and operational judgment must be exercised as to remedial or corrective actions. Trended results over time give an understanding of the aging mechanisms and/or operational wear and tear and are used to determine the appropriate corrective actions. In some cases, experience and/or economic considerations dictate the necessity of replacing or eliminating the equipment instead of refurbishing it. These results are inputs into the planning and operational decision-making processes.
Performance Measures
None of the above outlined processes stands on its own or operates in isolation. Each relevant organizational unit within FEU/JCP&L has one or more roles to play in each of these processes. The integration of the people involved in these processes helps to ensure that environmental factors, operating history, and cumulative experience are factored into the decision-making process so that optimization of lifecycle and lifecycle costs can occur.
Reliability is one of the most significant performance indicators in FEU/JCP&L’s set of operational performance measures. Today, virtually every person within FEU/JCP&L has significant performance-incentive goals related to the improvement of reliability at both the regional and corporate levels. This linked accountability is a key component of the asset management program because it creates and maintains the impetus for the integration of the processes described above.
Support Applications
Asset management requires that large amounts of data be processed in order to make effective decisions. Information technology tools (applications) have to be used to process that data. The primary applications FEU/JCP&L employees use for distribution, transmission, and substation asset management activities are given in Exhibit IX-17 and Exhibit IX-18.

Final Report 279
6/20/2011
Exhibit IX-17 Information Technology Applications Used For Asset Management Activities
July 2010
Source: Information Response 516 and Schumaker & Company Analysis
Distribution
Transm
ission
Substation
Planning C
riteria
Capital
Managem
ent
Mat/E
quip Standards
O&
M
Practices
Performance
Managem
ent
SAP
Enterprise software used for customer service, accounting, financial, and asset tracking processes. http://www.sap.com/solutions/business-suite/index.epx
CREWS (Customer
Request Work Scheduling)
An in-house-developed application used to design jobs based on standards, schedule work, and input time charges.
CRC (Circuit
Reliability Coordinator)
Specialized version of GIS View used in the reliability improvement process. http://www.gatekeeper.com/products.html
CYME
The CYMDIST distribution analysis program is designed for planning studies and simulating the behavior of electrical distribution networks under different operating conditions and scenarios. http://www.cyme.com/software/cymdist/
IVMS (Internet
Vegetation Management
System)
In-house-developed web-based application used to for vegetation management.
LFDMS (Load Forecast
Data Management
System)
In-house-developed application used to forecast substation and circuit loadings.
M5Application used to track the maintenance performed on the transportation fleet. http://www.assetworks.com/fleetfocus
Assets Activities Supported
ASSET MANAGEMENT
Application DescriptionApplication

280 Final Report
6/20/2011
Exhibit IX-18 Information Technology Applications Used For Asset Management Activities
July 2010
Source: Information Response 516 and Schumaker & Company Analysis
Planned Maintenance
The JCP&L T&D planned maintenance programs are described in the Annual System Performance Report:
♦ Vegetation Management – T&D circuit corridors are maintained with tree-trimming and brush and shrub control on a four-year cycle in compliance with the BPU’s and FEU’s vegetation
Distribution
Transm
ission
Substation
Planning C
riteria
Capital
Managem
ent
Mat/E
quip Standards
O&
M
Practices
Performance
Managem
ent
TARA (Transmission Adequacy and
Reliability Assessment)
Software used for identifying and analyzing transmission bottlenecks and how generating resources compete for these transmission resources. http://power-gem.com/index_files/Page624.htm
K71Software utilized to determine transformer impedances for inclusion in power flow and short circuit modeling databases.
K03Software utilized to determine the ratings of specific circuit terminal components and the overall circuit rating.
SuperHarm
SuperHarm enables the development of a computer model of a power system to explore variations on system loads and configurations, along with the resulting impact on system frequency response and distortion levels. http://www.pqsoft.com/SuperHarm/index.htm
PSLF (Positive
Sequence Load Flow)
A suite of analytical tools that can simulate large-scale power systems up to 60,000 buses. http://www.gepower.com/prod_serv/products/utility_software/en/ge_pslf/index.htm
VSAT (Voltage Security
Assessment Tool)
A highly automated steady-state analysis tool designed for comprehensive voltage security assessment. The software includes flexible specification of voltage security criteria and is designed to handle a large number of contingencies, power transfers, and scenarios. http://www.dsatools.com/html/prod_vsat.php
Assets Activities Supported
ASSET MANAGEMENT
Application DescriptionApplication

Final Report 281
6/20/2011
management standards. In 2009, 3,780 miles of distribution corridor and 120 miles of transmission corridor were inspected and trimmed, as necessary.
♦ Distribution Capacitors – There are 4,729 capacitor banks. Capacitors are used to supply reactive power and to provide voltage support to the power system. The capacitor maintenance program includes acceptance inspections of new installations, annual field inspections, and diagnostic inspections.
♦ Distribution Line Reclosers – There are 1,076 reclosers. Reclosers are self-contained devices that sense and interrupt fault current on a distribution circuit. They temporarily disconnect a section of the faulted distribution line to allow the fault to clear and then automatically reconnect that section of the line. Reclosure is set at between two and 180 seconds and from one to four repetitions for each device. Successful recloser operation prevents a substation breaker operation and protects the rest of the line from service interruption. The planned maintenance program for reclosers includes acceptance tests for new installations, biannual field inspections and counter readings, and shop inspection and maintenance of each device after a specified number of operations.
♦ Distribution Circuits and Equipment – All sub-transmission and distribution (34.5 kV and below) circuits are visually inspected to ensure compliance with the National Electric Safety Code and to identify any preventive or corrective maintenance required.
♦ Transmission and Distribution Poles – There are approximately 430,000 wood poles. All wood poles are inspected and treated as necessary on a ten-year inspection cycle. All Priority One poles are reinforced or replaced, as soon as practicable, generally within 90 days of discovery. A Priority One pole is defined as a wood pole that is determined to have internal and/or external decay or damage that considerably affects its strength.
♦ Transmission Aerial Patrols – Two aerial patrols are conducted each year on all transmission lines (115 kV and higher).
♦ Substations General – Monthly visual inspections are conducted of all 325 substations.
♦ Substation Protective Relays – There are 769 relays. Protective relays testing is typically done on a four-year cycle for PJM (100 kV and above) relays while all others are inspected on a five-year cycle.
♦ Substation Transformers – Periodic testing of substation transformers includes dissolved gas analysis, Doble power factor testing, dielectric and physical oil testing, transformer turns ratio, and combustible gas at prescribed periodicities. The planned maintenance program for transformers also includes annual infrared thermography analysis for abnormal heat generation.
♦ Substation Batteries – Batteries provide DC control power to substation equipment. Batteries are inspected and maintained 12 times per year. Annual impedance or voltage resistance tests are also performed.

282 Final Report
6/20/2011
♦ Substation Circuit Breakers – Testing is performed at intervals determined for the specific characteristics of each breaker. Tests include infrared testing, Doble power factor testing, dielectric oil, online timing, moisture, and high-potential and contact-resistance testing.
♦ Substation Underground Duct Systems – Testing is performed at intervals determined for the specific characteristics of each duct system. Tests include oil screen tests, dielectric tests, manhole inspections, vault inspections, and oil switch inspections.
♦ Highest-Priority Circuits – Circuits are ranked based on the average minutes of interruption per customer on each circuit. Area reliability teams analyze the worst-performing circuits and develop plans to improve their performance with better circuit design, equipment, or tree trimming. The 47 highest-priority circuits were analyzed and improved in 2009.
JCP&L reported 100% completion of all planned equipment maintenance in 2009. Corrective maintenance orders or, if necessary, replacement construction work orders are written for any maintenance problems discovered during planned maintenance that cannot be resolved immediately during the planned maintenance.
The Annual System Performance Report also discusses JCP&L’s power quality program, stray voltage program, and adaptive relay strategy. The power quality program and stray voltage program respond to complaints from customers. Each complaint is assigned to the appropriate unit for response. It is then analyzed and solutions are developed.
FEU/JCP&L Storm Process
JCP&L follows the FEU standard storm process. The strategic objectives of that process are as follows.
♦ Preparedness – to ensure that all personnel having restoration responsibilities understand strategic objectives and are trained in detailed procedures using a plan that is continuously updated to reflect organizational changes and lessons learned from previous storms.
♦ Anticipation – to predict potential damage to the transmission and distribution system. Quick response to customer outages is enhanced on advance warning. Monitoring weather conditions to predict potential system damage is essential.
♦ Assessment – Every storm leaves a footprint of damage within FirstEnergy’s system. The objective is to quickly and accurately assess damage within that footprint and restore customers’ service in a timely and safe manner. Coincident with this objective is the early isolation of hazards from public contact.
♦ Management – to respond to and manage all electric system disturbances, restoring service as quickly and safely as possible, effectively using all available resources.
♦ Communications – to establish mechanisms for communicating the status of the restoration effort to customers, governmental bodies, the news media, and corporate management. In June 2004,

Final Report 283
6/20/2011
JCP&L and Board staff also entered into a memorandum of understanding in which JCP&L agreed to improve communication with Board staff during emergency events.
JCP&L uses the following aid, systems, and facilities in its restoration efforts:
♦ Mutual Assistance – JCP&L participates in the Mid-Atlantic Mutual Assistance (MAMA) organization. Operating personnel from the other FirstEnergy companies are available and willing to travel to New Jersey to assist in any emergency and storm restoration activities. RDOs throughout FirstEnergy coordinate all restoration activities, and they all use the same manual of operations. Training is provided annually to ensure compliance with the storm process. As a member of MAMA, JCP&L also has access to operating personnel from neighboring utilities when they are available. In addition, as a member of the Edison Electric Institute, JCP&L has access to operating personnel from utilities and contractors throughout the United States and Canada. JCP&L is also a member of the New York Mutual Assistance and the Great Lakes Mutual Assistance organizations.
♦ PowerOn – All FirstEnergy operating companies use the same outage management system (OMS) in concert with the same storm process. This consistency allows additional RDO dispatchers to be brought into the affected area to provide assistance. It also enables support efforts to be conducted from remote locations.
♦ E-Plan – An electronic Lotus Notes–based directory has been developed that contains information to be used during restoration activities. Information such as practices, maps, weather, and hotels, etc. are contained in this database.
♦ Command Trailers – There are two emergency command trailers available for immediate deployment. These trailers, one 40 feet and the other 48 feet, are constantly maintained and equipped to ensure 24-hour availability. They consist of conference rooms, individual workstations, and storage areas. The trailers are equipped with diesel-powered generators, satellite and cellular phones, as well as a satellite-uplink TV so that they can operate remotely. There are numerous staging sites throughout New Jersey, which are all listed in the previously mentioned E-Plan. Each trailer is also equipped with fax machines, printers, LAN connections, and corporate radios. The command trailers’ intended use is for restoration activities associated with any system emergency or mutual assistance request that requires them to be placed into service.
♦ Remote Storm Rooms – In the event of a catastrophic event or an attack, JCP&L has the ability to relocate restoration activities to another area when local offices are incapacitated.
♦ Customer Care Outage Website – The customer care website has a Current System Outage Map. This technology provides timely emergency and storm restoration information to JCP&L customers. Customers can access service territory maps to view outage locations and the number of customers affected as well as area-specific messaging about restoration activities.
♦ Voice-Enabled Interactive Voice Response (IVR) – Customers who contact the call center can use FirstEnergy’s voice-enabled IVR system. This technology recognizes and responds to verbal

284 Final Report
6/20/2011
commands. Callers can navigate to access the services they need by simply speaking their selection. This service is offered 24/7. The IVR system reduces the amount of time customer service representatives need to spend on the phone, which frees them up to provide enhanced customer service to those customers who require one-on-one assistance. This system also has reverse IVR messaging capabilities, which are used to give customers callback notification during outage events or advanced notice by way of a recorded message when specific reliability improvements (e.g., cable replacements and tree trimming) are scheduled for their neighborhood and community.
♦ Internal Meteorological Support – This decision-based support service addresses the specific weather concerns of FirstEnergy. Because information from routine intelligence streams (National Weather Service, The Weather Channel, etc.) does not address specific weather concerns, the internal meteorological support provides FirstEnergy with a value-added service to remain knowledgeable of impending weather events. The support service consists primarily of real-time monitoring, forecasting, and post-event analysis products for weather phenomena of concern to FirstEnergy. Information is conveyed to weather-sensitive FirstEnergy business units and personnel through a blend of automated and manual methods, including web, e-mail, and pager. Participation in pre-storm conference calls occurs on an as-needed basis before and during significant weather events. Occasionally, short three-minute video clips depicting expected weather threats and impacts accompany e-mail alerts. Internal weather support capitalizes on the use of a full suite of cutting-edge, freely available software and data from the meteorological community—including the ability to run a high-resolution (2.5 mile) model over the FirstEnergy domain. The services are provided by two degreed meteorologists possessing a combined 35 years of experience in operational forecasting, research, programming, data analysis, outreach, and project management for the military, private, public, domestic, and international community.
Storm Categorization
At JCP&L, storms are categorized based on their actual or estimated severity so that internal and/or external resources may be mobilized. The PowerOn OMS can be used as the source of the estimated restoration times. If conditions change, the category can be upgraded or downgraded as appropriate. The storm categories are shown in Exhibit IX-19.

Final Report 285
6/20/2011
Exhibit IX-19 JCP&L Storm Categories
July 2010
Source: Information Response 146
Major and Minor Storms
JCP&L is subject to both major and minor storms. A major storm event is defined as “a sustained interruption of electric service beyond the control of the electric distribution company, which may include, but is not limited to, thunderstorms, tornadoes, hurricanes, heat waves or snow, and ice storms, which affect at least 10% of the customers in an operating area.” In addition, the regulation provides that “when one operating area experiences a major event, the major event shall be deemed to extend to those other operating areas which are providing assistance to the affected area.” Major storm events are not included in reported reliability.
Exhibit IX-20 shows the major storm activity from 2005 through 2009.

286 Final Report
6/20/2011
Exhibit IX-20 Major Storm Activity
2005 to 2009 as of December 31, 2009
Source: Information Response 770
In 2009, JCP&L experienced two major storm events.
February 11–15, 2009 Major Storm Event
Beginning on February 11, 2009, severe windstorms swept through the JCP&L service area, resulting in extensive damage to the electrical distribution system. The high winds, with gusts measuring more than 60 miles per hour, caused falling trees and branches to take down power lines in JCP&L’s Northern and Central Regions. Severe winds uprooted and tore branches from trees, resulting in broken poles and cross-arms, downed conductors, and blown fuses. In many cases, forestry work, line work, and service work were needed at the same location to achieve restoration. Some customers experienced multiple outages due to additional faults from later wind-related events. Approximately 99,900 JCP&L customers were affected by this event. JCP&L restored 90% of all customers impacted by this event within 12 hours. All customers were restored as of 1:10 A.M. on Sunday February 15, 2009. This storm was classified as a major event, with 15% of the customers in JCP&L’s Northern Region affected. JCP&L’s Central Region provided crews to assist the Northern Region and saw 4.86% of its customers affected by the event.
July 17–August 3, 2009 Major Storm Event
Five successive waves of violent weather storms affecting over 118,000 customers struck the JCP&L service territory beginning on the evening of July 17. This continuous series of weather events maintained a pattern of severe damage and outages for customers followed by periods of infrastructure rebuilding that did not allow sufficient time between waves to fully recover and return to normal work schedules. JCP&L continued to experience volatile weather throughout a 17-day period, ending on August 3. During this period, there were numerous storms and severe weather alerts, which included a
YearMajor
Storms **
Customer Outage Minutes
2009 2 47,266,8202008 6 169,135,2612007 2 70,782,1022006 3 135,379,0502005 1 22,483,316
** A "Major Storm" is equivalent to a "Major Event" as defined under N.J.A.C. 14: 5-1.2.

Final Report 287
6/20/2011
confirmed tornado in Wantage Township, New Jersey and a National Weather Service tornado warning with a report of a funnel cloud along the Route 78 corridor in Hunterdon and Somerset counties. The severe weather included thousands of lightning strikes throughout the JCP&L service territory as well as winds in excess of 100 miles per hour during the tornado.
This weather event resulted in over 1,462 cases of trouble affecting a total of 118,369 customers throughout JCP&L. Crews were on a 16-hour work and eight-hour rest rotation for a majority of this period, and outside assistance was requested and obtained for four of the storms. The line crews to assist restoration efforts were obtained from Con-Edison and Met-Ed, and contractor support was provided by Sussex Rural Electric, JBL Electric, TRI-M, Henkel’s & McCoy, Riggs Distribution, M. J. Electric, and Matrix electrical contractors. Resources were also shared between JCP&L’s Northern and Central Regions for all events.
The effects of the severe winds and lightning during this prolonged event included uprooted trees, broken branches and limbs, approximately 260 damaged poles (and associated hardware such as cross-arms), 840 damaged primary conductors, and 870 damaged services. Such destruction caused approximately 700 line fuses to operate due to lightning strikes or other temporary faults. In many cases, multiple crews were required to achieve safe, prompt repairs. In these cases, forestry work, equipment replacement, line work, and service work were needed at the same location to restore service to all customers. In some instances, customers experienced multiple outages due to the number of severe weather fronts that came through JCP&L’s service territory over this time period.
This storm sequence was classified as a major event, with 12.5% of the customers in JCP&L’s Northern Region and 9.7% of customers in JCP&L’s Central Region affected. For the period of the storms, a total of 118,396 customers were affected, which is 10.9% of all JCP&L customers.
Although a minor storm event is not defined by the BPU in its regulations as contained in the New Jersey Administrative Code, JCP&L informally classifies any day with more than 40 outages in either JCP&L region (Northern or Central) as a minor storm event. A review of the minor storm activity for JCP&L from 2005 through 2009 reveals that the number of minor storm days, the number of outages, and the customer outage minutes have declined over the four-year period. This tendency likely reflects improved overall system reliability that reduces the number of outages due to storms and therefore reduces the number of days with 40 outages or more, which are classified as minor storm days.
O&M Support Applications
Tremendous amounts of data are generated each day from the daily work that field crews perform to operate and maintain the system assets and to restore service outages. FEU/ JCP&L employs a number of information technology applications to assist its workers in processing daily work. Exhibit IX-21, Exhibit IX-22, and Exhibit IX-23 present a list of the applications used in the daily operations and maintenance of the JCP&L electrical assets.

288 Final Report
6/20/2011
Exhibit IX-21 Operations and Maintenance Support Applications
July 2010
Source: Information Response 516 and Schumaker & Company Analysis
Distribution
Transm
ission
Substation
Planned M
aintenance
Storm Process
(Service R
estoration)
SAP
Enterprise software used for customer service, accounting, financial, and asset tracking processes. http://www.sap.com/solutions/business-suite/index.epx
CREWS (Customer
Request Work Scheduling)
An in-house-developed application used to design jobs based on standards, schedule work, and input time charges.
Click
Application to assist in preparing monthly, weekly plans and schedules. http://www.clicksoftware.com/solutions-service-chain-optimization-shift-scheduling-software.htm
PrimaveraSoftware used to schedule and manage large projects. http://www.oracle.com/us/products/applications/042374.htm
CTApplication used to track large financial commitments for projects
EDOAApplication used by the RDO to manage switching and tagging requests.
OCRSApplication used to track overtime.
SycloApplication providing the ability to send work to mobile data terminal in field vehicles. http://www.syclo.com/
GIS Design
Application used by Engineers and Layout Technicians to design and layout new jobs. http://usa.autodesk.com/adsk/servlet/pc/index?id=15174834&siteID=123112
MPATApplication used to maintain the data within the GIS system
GIS ViewApplication used to make GIS data available to authorized users. http://www.gatekeeper.com/products.html
KorTerra
A set of robust software applications that increase office and field efficiency through automating the receipt and dispatch of locate tickets. http://www.korterra.com/
AssetsActivities
Supported
Operation & Maintenance
Application DescriptionApplication

Final Report 289
6/20/2011
Exhibit IX-22 Operations and Maintenance Support Applications
July 2010
Source: Information Response 516 and Schumaker & Company Analysis
Distribution
Transm
ission
Substation
Planned M
aintenance
Storm Process
(Service R
estoration)
Mapframe
Application making GIS Maps and data available on laptops. http://www.gepower.com/prod_serv/products/gis_software_2010/en/mapframe_mob_solutions.htm
AMFM ADMIN
Software used to interface GIS data with CYME and PowerOn applications.
PowerOn
Primary application used for outage management and service restoration. http://www.gepower.com/prod_serv/products/scada_software/en/poweron.htm
PowerOn Remote
Scaled-down version of PowerOn used during major events. http://www.gepower.com/prod_serv/products/scada_software/en/poweron.htm
MDSI
Application used to dispatch service restoration jobs direct to field vehicles. http://www.ventyx.com/solutions/mobile-workforce-management.asp
IVR (Interactive
Voice Response)
Application used to process high volumes of customer calls during major storm events.
ByPass
Application providing the ability to route high volumes of customer calls directly to PowerOn Outage Management during major events.
IVMS (Internet
Vegetation Management
In-house-developed web-based application used to for vegetation management.
PERTApplication used to track PCB (Polychlorinated biphenyls) events and associated equipment repairs.
AssetsActivities
Supported
Operation & Maintenance
Application DescriptionApplication

290 Final Report
6/20/2011
Exhibit IX-23 Operations and Maintenance Support Applications
July 2010
Source: Information Response 516 and Schumaker & Company Analysis
Capital Program
System Forecasting
FEU’s most-probable peak forecast is developed using a monthly peak regression model with monthly class sales as the independent variables. The monthly peak forecast is developed using historical data from 2002 forward. The annual peak forecast is defined by the highest monthly peaks for each year. Historically, the uncertainty range around the peak is not a normal distribution or a bell-shaped curve. That is because of the uncertainty caused by weather sensitivity.
The JCP&L summer peak is very weather-sensitive due to the combination of relatively low industrial sales in the sales mix, high residential air-conditioning saturation, and the warm summer climate of New Jersey. In the last FirstEnergy residential appliance survey in 2005, 70% of all residential customers use central air-conditioners (estimated 706,000 units in 2010) and some add room air-conditioners (estimated 660,000 units in 2010). Residential air-conditioning load alone represents 40% of the JCP&L
Distribution
Transm
ission
Substation
Planned M
aintenance
Storm Process
(Service R
estoration)
Mapframe
Application making GIS Maps and data available on laptops. http://www.gepower.com/prod_serv/products/gis_software_2010/en/mapframe_mob_solutions.htm
AMFM ADMIN
Software used to interface GIS data with CYME and PowerOn applications.
Cascade Office
Application used to track health of substation assets. http://digitalinspections.com/
Cascade Patrol &
Field
Application used to schedule substation inspections and capture resulting data. http://digitalinspections.com/
M5Application used to track the maintenance performed on the transportation fleet. http://www.assetworks.com/fleetfocus
AssetsActivities
Supported
Operation & Maintenance
Application DescriptionApplication

Final Report 291
6/20/2011
peak. Add the other residential weather-sensitive loads (pool pumps, etc.) and the residential weather-sensitive load approaches 60% of the entire JCP&L peak.
Metered studies have shown that air-conditioning load during normal summer peaks has very little diversity, with each unit running on average between 50 and 55 minutes during the peak hour. As a result, most of the connected load is realized at the time of the peak. Even during conditions of record temperature and humidity, residential air-conditioning cannot add much more load. Therefore, the high side of peak uncertainty is constrained. Conversely, a significant portion of the residential air-conditioning load is discretionary, meaning it is used only during very uncomfortable weather. During mild summers, much of the residential load is not realized because of customers’ resistance to using air-conditioning. That means that the low side of the uncertainty range is much greater than the high side.
The JCP&L service territory is in a slow growth period. Exhibit IX-24 shows the trends in JCP&L customers.
Exhibit IX-24 JCP&L Service Territory Statistics
2005 to 2009
Source: Information Response 135 and Schumaker & Company Analysis
Total net new customers added from 2005 to 2009 were 23,100, or a simple average annual growth rate of 0.5%.
Distribution Forecasting
The Load Forecasting Data Management System (LFDMS) application is used to model future substation loading based on historical load data, expected spot loads, and overall average growth rates for a given area. Peak load data for each transformer and circuit are obtained from the monthly substation inspections and real-time system control and data acquisition (SCADA) values. Each transformer and circuit on the distribution system has defined attributes, such as transformer nameplate and heat run capacity, circuit exit conductor thermal ratings, and circuit breaker ratings. Distribution circuit forecasts are derived using the most recent circuit peak, applying known spot loads coming onto
2005 2006 2007 2008 2009Number Residential Customers 950,622 958,986 963,484 967,653 969,897 Number Commercial Customers 117,365 118,636 119,618 120,602 121,297 Number Industrial Customers 2,640 2,592 2,587 2,551 2,529
Total Customers 1,072,632 1,082,220 1,087,696 1,092,814 1,095,732 Percent Change from Previous Year 0.9% 0.5% 0.5% 0.3%
New Business Commercial/Ind Install Counts YTD 2,489 2,345 2,425 1,713 New Business Residential Install Counts YTD 9,266 5,954 2,712 3,981
New Business Install Counts YTD 5,354 11,755 8,299 5,137 5,694 Percent Change from Previous Year 119.6% -29.4% -38.1% 10.8%

292 Final Report
6/20/2011
the system and average overall growth rates. This information is then reviewed, weather adjusted, and verified using economic factors in combination with the local distribution planner’s knowledge. The load forecasts are evaluated and potential equipment thermal overloads are identified. The local planning engineer will then determine if areas of concern can be alleviated through a variety of tools, including load transfers, load balancing, reconductoring, or other capital infrastructure upgrades.
Capital Program Planning and Budgeting
JCP&L spends between $150 and $200 million per year on approximately 100 to 150 T&D-related capital projects and programs. FE currently has a three-year capital planning horizon with strong emphasis on the next year. The request for project approval (RPA) is the basic capital project planning document. RPAs are tracked in a Lotus Notes database. A June executive conference with the FirstEnergy CEO and business unit heads, including those from FEU and Finance, is a key capital planning date. FEU develops a preliminary next-year capital-spend projection prior to this date and conducts two corporate challenge reviews of JCP&L’s proposed capital program prior to this meeting. That way, the FEU capital needs for the coming year are reasonably well-defined.
The T&D capital planning portion of the capital budget is driven by the FEU Asset and Project Management group. This group manages the process and calendar to blend with the overall FE corporate capital planning process. The FEU T&D capital planning process, however, has been developed specifically for T&D needs. Each FEU opco, including JCP&L, develops its own T&D capital program within the FEU process. The criteria that the T&D capital budget is designed to meet are: state reliability standards; North American Electric Reliability Corporation (NERC) criteria; FEU planning criteria; relocation requirements; new business; and state meter-replacement program requirements.
FEU and JCP&L develop a bottom-up capital program. Although it may be influenced by general corporate guidance on capital spending (e.g., “the same as last year”), JCP&L does not simply work toward spending a top-down capital allocation wisely, as many other companies do. While there is top-down guidance, FEU and JCP&L prepare to defend the bottom-up developed capital budget and request capital above the guidance if necessary.
The JCP&L capital program is a mix of specific projects, each over $50,000, and blankets for programs of smaller projects, such as new business, street lighting, and storms.
One of JCP&L’s T&D capital budgeting tools is to build up from available employee labor and to calculate the amount of capital work it can accomplish in the coming year. The projected productive hours of the planned workforce for the coming year are first allocated between O&M and capital. The capital productive hours are then turned into estimated capital spending based on historical and projected overhead rates and materials usage. The employee capital resource capacity is later balanced against the proposed total capital budget. FEU and JCP&L first assure all available employee capacity will be used and then program contract labor to make up any shortfall.

Final Report 293
6/20/2011
All proposed projects are ranked using a C (highest), B, A (lowest) ranking system. A secondary ranking within the CBA system ranks the projects as high, medium, or low within each letter. The highest ranked projects are C High and the lowest are A Low. Another project ranking system, ECAT, is available but not universally used. It is used for some specific projects but is not considered a corporate requirement. ECAT scoring is not used for blankets, bulk transmission projects, or mandatory projects. The FE corporate ranking tool, SAP’s XRPM, is also not used by FEU.
There are three capital program challenge sessions at each opco. The FE/FEU corporate challenge group includes Asset and Project Management staff, Business Services representatives, and various FEU T&D staff representatives. In general, bulk power transmission and substation capital projects are developed by the centralized FEU staff but each project is included in the relevant opco’s budget, including JCP&L’s.
Within JCP&L, the T&D capital plan and budget development is facilitated by the Engineering Services unit. Such development begins with a JCP&L internal process prior to the first corporate challenge. Projects are proposed and are then reviewed and refined in three or four iterations prior to the first corporate challenge in the March/April timeframe. The internal review and ranking process includes all JCP&L interested parties and works to develop a consensus among them, which is usually achieved. The JCP&L President, however, can make the final decision on the proposed JCP&L capital program if necessary.
At the first two corporate challenge rounds in March/April and June, individual planning engineers present and defend their proposed projects and programs. The projects and programs are adjusted in a consensus-building process. Because the process covers several months, conditions change over time and new projects or programs may be identified that have higher priorities than prior identified projects and programs. The project and program priority list is continually adjusted to reflect current and projected conditions. By the second corporate challenge session, projects and programs are ranked according to the CBA ranking system and, for JCP&L, the ECAT system.
FEU’s capital allocation tool, ECAT, is used to calculate a benefit-to-cost metric and to support the prioritization of capital projects. ECAT enables each operating company to rank proposed projects based on their benefit-to-cost ratio and to estimate the reliability impact of these proposed projects. Acknowledging that there will be some outages on an electric system due to unforeseen events, the model attempts to rank proposed projects by how cost-effectively they reduce the potential for outages by adding capacity, system flexibility, or automation, as examples. In a theoretical situation where two enhancements were proposed, the model looks at how much investment is needed in each case to improve overall performance. The project that provides the largest improvement in reliability for the dollars invested is given priority over the other project. Where a potential criteria violation has been identified, ECAT can be used to choose the most beneficial way to solve the situation. ECAT is a Microsoft Excel–based model that uses templates for consistent data input from Engineering personnel regarding project details and benefits. The financial parameters in ECAT are refreshed on an annual basis and results are validated through each operating company’s capital challenge process. ECAT is

294 Final Report
6/20/2011
used only for specific capital projects; high-volume, repetitive capital work (i.e., blanket projects) is not modeled.
After the third corporate challenge round, JCP&L’s proposed capital program is consolidated into the FEU composite proposed program and is presented to FE corporate. FE corporate makes final decisions about the total capital spend for the coming year and its allocation among business units. FEU receives a capital spending allocation that it then allocates among the opcos. The opcos, including JCP&L, make any adjustments necessary to fit the final capital plan within the capital spending allocation.
Counting the preliminary internal rounds, the three corporate challenge sessions, and the dry run prior to the third corporate challenge, the JCP&L capital program is formally reviewed at least seven times.
Smaller capital projects are implemented by the relevant work groups (e.g., lines, substations, and meters) using the day-to-day work management tools, such as CREWS. Specific projects larger than $50,000 dollars receive special treatment. These larger projects are scheduled by Engineering Services using the Primavera scheduling tool in a standard FEU scheduling format. These projects are also assigned a project manager and a field coordinator to assure that all project components (e.g., design, permitting, and construction) are completed on time and on budget.
Support Applications
The capital program is driven by defined projects and programs that address new business and the capacity and reliability of the electrical system to serve customers. A number of FEU/JCP&L applications are used to determine the need for the capital projects. Exhibit IX-25, Exhibit IX-26, Exhibit IX-27, and Exhibit IX-28 provide overviews of the applications used to determine the need for projects and to assist with their timely completion.

Final Report 295
6/20/2011
Exhibit IX-25 Capital Program Support Applications
July 2010
Source: Information Response 516 and Schumaker & Company Analysis
D
istribution
Transm
ission
Substation
System
Forecasting (Projects)
Distribution
Forecasting (Projects)
Planning &
Budgeting
Project C
ompletion
SAP
Enterprise software used for customer service, accounting, financial, and asset tracking processes. http://www.sap.com/solutions/business-suite/index.epx
CREWS (Customer
Request Work Scheduling)
An in-house-developed application used to design jobs based on standards, schedule work, and input time charges.
Click
Application to assist in preparing monthly, weekly plans and schedules. http://www.clicksoftware.com/solutions-service-chain-optimization-shift-scheduling-software.htm
PrimaveraSoftware used to schedule and manage large projects. http://www.oracle.com/us/products/applications/042374.htm
CTApplication used to track large financial commitments for projects
EDOAApplication used by the RDO to manage switching and tagging requests.
Assets
Capital Program
Application DescriptionApplication
Activities Supported

296 Final Report
6/20/2011
Exhibit IX-26 Capital Program Support Applications
July 2010
Source: Information Response 516 and Schumaker & Company Analysis
Distribution
Transm
ission
Substation
System
Forecasting (Projects)
Distribution
Forecasting (Projects)
Planning &
Budgeting
Project C
ompletion
GIS Design
Application used by engineers and layout technicians to design and layout new jobs. http://usa.autodesk.com/adsk/servlet/pc/index?id=15174834&siteID=123112
MPAT Application used to maintain the data within the GIS system.
CRC (Circuit
Reliability
Specialized version of GIS View used in the reliability improvement process. http://www.gatekeeper.com/products.html
LTS2005 FALLS
Applications used to evaluated lightning's impact on reliability. http://www.vaisala.com/en/products/thunderstormandlightningdetectionsystems/Pages/FALLS.aspx and http://www.vaisala.com/en/services/servicecontracts/Pages/LTS2005maintenance.aspx
CYME
The CYMDIST Distribution Analysis program is designed for planning studies and simulating the behavior of electrical distribution networks under different operating conditions and scenarios. http://www.cyme.com/software/cymdist/
AMFM ADMIN
Software used to interface GIS data with CYME and PowerOn applications.
LFDMS (Load Forecast
Data Management
System)
In-house-developed application used to forecast substation and circuit loadings.
FLIR
Application to assist in analyzing results of infrared inspections of substation equipment. http://www.flir.com/thermography/eurasia/en/content/?id=11378
DTAApplication to assist in analyzing results of Doble tests of substation equipment. http://www.doble.com/products/doble_test_assist
f h l
TOA4Application to assist in analysis of testing of oil in substation equipment. http://www.deltaxresearch.com/toa.htm
Assets
Capital Program
Application DescriptionApplication
Activities Supported

Final Report 297
6/20/2011
Exhibit IX-27 Capital Program Support Applications
July 2010
Source: Information Response 516 and Schumaker & Company Analysis
Distribution
Transm
ission
Substation
System
Forecasting (Projects)
Distribution
Forecasting (Projects)
Planning &
Budgeting
Project C
ompletion
TARA (Transmission Adequacy and
Reliability Assessment)
Software used for identifying and analyzing transmission bottlenecks and how generating resources compete for these transmission resources. http://power-gem.com/index_files/Page624.htm
K71Software utilized to determine transformer impedances for inclusion in power flow and short circuit modeling databases.
K03Software utilized to determine the ratings of specific circuit terminal components and the overall circuit rating.
EMTP-RVEMTP-RV is a specialized software for the simulation and analysis of transients in power systems. http://www.cyme.com/software/emtp/
SuperHarm
SuperHarm enables the development of a computer model of a power system to explore variations on system loads and configurations, along with the resulting impact on system frequency response and distortion levels. http://www.pqsoft.com/SuperHarm/index.htm
PSLF (Positive
Sequence Load Flow)
A suite of analytical tools that can simulate large-scale power systems up to 60,000 buses. http://www.gepower.com/prod_serv/products/utility_software/en/ge_pslf/index.htm
Replay PlusSoftware to review events on the bulk power system.
Display Station
Software used to display data from digital fault recorders.
PTLoadEPRI software to determine thermal characteristics of a power transformer.
CYMTCCCYMTCC addresses time over-current protection for industrial, commercial and distribution power systems. http://www.cyme.com/software/cymtcc/
Assets
Capital Program
Application DescriptionApplication
Activities Supported

298 Final Report
6/20/2011
Exhibit IX-28 Capital Program Support Applications
July 2010
Source: Information Response 516 and Schumaker & Company Analysis
Work Management System
In addition to overall applications integration, utilities use a combination of processes and information technology to help them complete the work needed to not only provide reliable service to their customers but also maintain their assets. This combination of processes and technology is generally referenced as a work management system. Generic tasks needed to complete work can be grouped into categories as shown in the work management process in Exhibit IX-29.
Distribution
Transm
ission
Substation
System
Forecasting (Projects)
Distribution
Forecasting (Projects)
Planning &
Budgeting
Project C
ompletion
SEL (multiple)
Suite of software to assist in analyzing system events. http://www.selinc.com/softwaresolutions/
DFR Assistant
DFR Assistant™ software tools perform automated analysis and classification of digital fault recorder (DFR) files. http://www.tli-inc.com/dfra.html
CAPE (Computer-
Aided Protection
Engineering)
Software used by engineers responsible for protection of high-voltage transmission systems and distribution systems within electric power utilities. http://www.electrocon.com/capeintro.html
TR1625Application that communicates with digital fault recorders (DFRs).
RSSApplication to manage relay setting of protective equipment
RTSApplication to assist in mamagement of the relay testing program
VSAT (Voltage Security
Assessment Tool)
A highly automated steady-state analysis tool designed for comprehensive voltage security assessment. The software includes flexible specification of voltage security criteria and is designed to handle a large number of contingencies, power transfers, and scenarios. http://www.dsatools.com/html/prod_vsat.php
Assets
Capital Program
Application DescriptionApplication
Activities Supported

Final Report 299
6/20/2011
Exhibit IX-29 Generic Work Management System
2010
Source: Schumaker & Company Analysis
The FEU/JCP&L work management system is shown in Exhibit IX-30.
Category Description
Identify The acknowledgement that a specific project (job) needs to be completed. Jobs can be initiated by customers, internal as a result of analyses, external forces such as weather, etc.
Design The translation of the work previously identified into labor, material, and equipment resources required for completion. Very simple and/or repetitive jobs generally do not need the design phase.
Prioritize / Schedule The matching of available labor, material, and equipment resources to complete the highest-priority work as soon as possible.
Perform The application of labor using materials and equipment to complete the work.Report The completion of the the documentation requirements associated with the job. Requirements can include
but are not limited to: labor hours, material items, transportation, results of inspections, etc.Evaluate The analysis of the data collected in the report phase to determine if improvements can be make to the work
management process.

300 Final Report
6/20/2011
Exhibit IX-30 JCP&L Work Management System
2010
Source: Information Response 157
Workforce
While the total number of JCP&L employees declined from 1,418 to 1,411 over the five-year period from 2005 to 2009, the total number of T&D engineering, lines, and substations employees increased from 876 to 888. Staffing trends are shown in Exhibit IX-31.

Final Report 301
6/20/2011
Exhibit IX-31 Jersey Central Power & Light T&D Staffing Trends
2005 to 2009
Source: Information Responses 132 and 135
The FEU/JCP&L T&D staffing strategy prefers employees over contractors for electrical system work. Contractors are used for peak workload demands (which have not occurred during the recent economic downturn), Department of Transportation road projects, specialized work, helicopter transmission line
2005 2006 2007 2008 2009
Engr+Lines+Sub 62% 63% 63% 61% 63%
0%
25%
50%
75%
100%
Perc
ent
Tota
l Em
ploy
ees

302 Final Report
6/20/2011
construction, below-grade civil (non-electric) conduit installations, one-call locate mark-outs, and some planned maintenance programs, including vegetation management and pole inspections.
Findings & Conclusions
Service Levels
Finding IX-1 There is a generally positive trend in the System Average Interruption Frequency Index (SAIFI) reliability metric, and power quality complaints have decreased.
The SAIFI has improved (fewer interruptions is better) from 2006 through 2009, as shown in Exhibit IX-32 .
Exhibit IX-32 Jersey Central Power & Light SAIFI
2005 to 2009
Source: Information Response 132, Attachment 1
JCP&L improved SAIFI in each of the system subcategories of distribution, substations, and sub-transmission from 2005 to 2009. Transmission stayed the same for the period spanning 2005 through 2009, as shown in Exhibit IX-33.

Final Report 303
6/20/2011
Exhibit IX-33 JCP&L Distribution, Substation, Sub-Transmission, and Transmission SAIFI
2005 to 2009
Source: Information Response 519, Attachment 1 and Schumaker & Company Analysis
In addition, Exhibit IX-34 shows that the number of power quality complaints per 1,000 customers served has significantly decreased from 2005 to 2009.
Exhibit IX-34 JCP&L Power Quality (PQ) Complaints
2005 to 2009
Source: Information Response 519, Attachment 8 and Schumaker & Company Analysis
Similarly, neutral-to-earth/stray-voltage complaints have decreased from 21 in 2005 to six in 2009, as displayed in Exhibit IX-35.

304 Final Report
6/20/2011
Exhibit IX-35 Jersey Central Power & Light Neutral-to-Earth/Stray-Voltage Complaints
2005 to 2009
Source: Information Response 519, Attachment 9 and Schumaker & Company Analysis
One of the possible reasons for improved SAIFI numbers may be the increase in adaptive relays installed at substations. Exhibit IX-36 shows that adaptive relays have been installed at 229 of the 274 substations since 2005.
Exhibit IX-36 JCP&L Adaptive Relaying
2005 to 2009
Source: Information Response 519, Attachment 10 and Schumaker & Company Analysis
The JCP&L adaptive relaying strategy allows the RDO to place adaptive relays in either the normal “fuse sacrifice” or storm condition “fuse save” mode. The normal fuse sacrifice mode allows fuses to fail and limit the number of customers to those downstream from the fuse. The fuse save mode, which is used during storm wind and lightning temporary faults, prevents larger numbers of sustained outages in favor of more frequent but momentary outages.

Final Report 305
6/20/2011
Finding IX-2 There has been a generally positive trend in the Customer Average Interruption Duration Index (CAIDI) and SAIDI reliability metrics except for upticks in 2009.
Exhibit IX-37 shows the trends in CAIDI and SAIDI.
Exhibit IX-37 Jersey Central Power & Light CAIDI and SAIDI
2005 to 2009
Source: Information Response 132
Both indexes improved (with fewer interruption minutes being better) from 2005 to 2008, but they experienced a slight degradation in 2009. SAIDI is the product of SAIFI and CAIDI. The CAIDI portion of the SAIDI metric caused the SAIDI to worsen because the SAIFI portion was better in 2009. That is, the length of time to restore customers, rather than the frequency of interruptions, caused the overall reliability metric of SAIDI to deteriorate slightly in 2009.

306 Final Report
6/20/2011
Finding IX-3 JCP&L has made progress in reducing the number of customers experiencing multiple interruptions but does not include this important measurement in its monthly performance report.
While reducing the total number of interruptions (SAIFI) increases the level of overall reliability, some customers still experience multiple outages in a system with improved reliability. Customers experiencing multiple interruptions (CEMI) is an indication of potential customer dissatisfaction. Tracking and reporting CEMI can assist utilities in identifying problems and in improving performance in this important area. The measurement is not required by BPU reliability regulations and JCP&L does not include this measurement in its current monthly performance.
Exhibit IX-38 gives the annual JCP&L customers interrupted both as the actual number of customers and as a percent of total customers for 2005–2009.
Exhibit IX-38 Customers Experiencing Interruptions
2005 to 2009
Source: Information Response 774 and Schumaker & Company Analysis
The percent of customers interrupted has decreased from 64.1% to 55.9% from 2005 to 2009. This tendency is consistent with JCP&L’s generally improving reliability.
The percent of customers interrupted for one to more than five times is shown in Exhibit IX-39.
665,815
2005 2006 2007 2008 2009
Percent Customers Interrupted 64.1% 83.7% 60.6% 57.3% 55.9%
0.0%
20.0%
40.0%
60.0%
80.0%
100.0%
Per
cent
Tot
al C
usto
mer
sIn
terr
upte
d
White box on the bar gives actual customers interrupted
665,815
908,348
663,722
629,989
612,584

Final Report 307
6/20/2011
Exhibit IX-39 Percent of Customers Experiencing Multiple Interruptions
2005 to 2009
Source: Information Response 774 and Schumaker & Company Analysis
While the number of customers experiencing one and two interruptions increased, this could be because customers experiencing three and more interruptions decreased. For example, reductions in the number of customers experiencing three interruptions may increase the number experiencing only two interruptions, even while decreasing the overall number of interruptions. Multiple interruptions, however, can be a source of high customer dissatisfaction. Therefore, it is a good practice to continue to call attention to this important area with regular monitoring CEMI metrics and the development of performance-improvement initiatives.
Finding IX-4 JCP&L transmission reliability, as measured by transmission outage frequency, deteriorated from 2008 to 2009 overall but particularly on the 230, 345, and 500 kV circuits.
Transmission outage frequency (TOF), shown in Exhibit IX-40, is the measure of the average number of transmission circuit outages per circuit. TOF for JCP&L was not available before 2008.

308 Final Report
6/20/2011
Exhibit IX-40 Jersey Central Power & Light Transmission Outage Frequency (TOF)
2008 to 2009
Source: Information Response 136
TOF remained the same for the lower voltages but increased for the higher, 69 kV to 500 kV, voltages. Two years of data is insufficient to establish or determine a trend and draw firm conclusions on transmission reliability.
Finding IX-5 The accuracy of the estimated time of restoration given to customers reporting an outage has improved from 53.5% in 2007 to 94.4% in 2009.
JCP&L provides inquiring customers who are experiencing an outage with an estimated time of restoration and then measures the accuracy of such estimates. Exhibit IX-41 shows the JCP&L estimated time of restoration (ETR) accuracy for the years 2007–2009.
Exhibit IX-41 JCP&L Estimated Time of Restoration (ETR)
2007 to 2009
Source: Information Response 515
ETR has improved each year and is approaching 100%.

Final Report 309
6/20/2011
Finding IX-6 Tree incidents are the largest cause of outages and this outage category had a large increase in 2009, possibly due to the deferral of trimming on circuits following inspection to the next standard four-year cycle.
The trends in JCP&L outage causes for 2005–2009 are shown in Exhibit IX-42.
Exhibit IX-42 JCP&L Outage Causes
2005 to 2009
Note: JCP&L classifies tree outages as “preventable” and “non-preventable.” This analysis combines the two categories to include all outages caused by trees. Source: Information Response 132
All categories of outage causes decreased from 2005 to 2009 except tree-related outages. It should be noted, however, that the category “Trees” shown in Exhibit 0-43 includes both “Preventable” and “Non-Preventable” tree-related outages. JCP&L’s Annual System Performance Report (“ASPR”) indicates that preventable tree-related outages have decreased significantly since 2005 while non-preventable incidents have increased. JCP&L is addressing this increase in the non-preventable outages by focusing on tree removal and corridor expansion.

310 Final Report
6/20/2011
As shown in Exhibit IX-43, in 2009, 1,153 miles of distribution circuits were trimmed later than the four-year cycle. According to JCP&L management, these circuits represented the most reliable circuits on the JCP&L distribution system for which trimming was deferred to levelize the workload across the four-year vegetation management cycle. Conversely, only 40 miles were trimmed earlier than the four-year cycle.
Exhibit IX-43 Distribution Miles Trimmed Earlier and Later Than Four-Year Cycle
2009
Source: Information Response 519 and Schumaker & Company Analysis
This lack of adherence to the four-year tree-trimming cycle may have contributed to the increase in tree-related outages in 2009.
Finding IX-7 JCP&L has deferred distribution vegetation management where based on inspection, circuit conditions permitted trimming to be deferred.
According to JCP&L management, in an effort to levelize the amount of trimming required each year in conjunction with JCP&L’s program to widen the corridor, JCP&L deferred a substantial amount of distribution vegetation management mileage in 2009 and 2010. Continued deferral of scheduled distribution vegetation management will likely adversely impact system reliability.
Finding IX-8 JCP&L is experimenting with a new approach to distribution vegetation management, with a large shift from O&M to capital spending.
From 2005 to 2009, capital expenditures increased by almost $9 million while O&M expenditures decreased by $11 million. Total distribution vegetation management expenditures averaged $15.9 million per year over the period but ranged from $12.9 million in 2006 to $18.3 million in 2008. The proportion of capital expenditures as a percent of total expenditures increased from 2% in 2005 to 58% in 2009.
JCP&L explained the shift in strategy as follows: “The shift from O&M to Capital in 2009 is attributed to focusing tree trimming spending on expanding the horizontal and vertical width of the corridor. This focus is in response to a desire to improve reliability as well as to minimize physical damage to electrical distribution facilities from tree-caused outages. These tree-related outages (categorized as “Non-Preventable” Trees in the ASPR) were attributed to overhanging branches above and adjacent to conductors and dead or defective trees falling from outside the distribution corridor. Portions of a
Miles1,152.9
39.8
1,192.7
2009 Substation Circuits Trimmed Later Than The Four-Year Cycle2009 Substation Circuits Trimmed Earlier Than The Four-Year Cycle
Total Miles Trimmed Off Cycle

Final Report 311
6/20/2011
circuit that experience high customer interruption minutes due to these vegetation-caused outages are targeted to receive a visual inspection and tree trimming which includes, if necessary, the removal of certain healthy limbs, which overhang primary conductors. Additionally, off corridor trees that are dying or significantly declining were targeted for removal.” JCP&L understands that capitalizing this tree work is in accordance with generally accepted accounting principles (GAAP) because the work performed exceeds the scope of the current forestry practice and provides the benefits of extending the life and improving the value of the distribution assets.
The reallocation of spending from O&M to capital in vegetation management is a result of increasing the horizontal and vertical corridors where JCP&L distribution facilities exist. Such reallocation, however, may have merit as an alternative approach to vegetation management.
Finding IX-9 Overhead primary conductor is the leading equipment cause of customer outages.
Exhibit IX-44 shows the customer hours for equipment caused outages by the type of equipment.
Exhibit IX-44 JCP&L Customer Hours of Outages by Equipment Causes
2009
Source: Information Response 519 and Schumaker & Company Analysis
Over 40% of the customer outage hours in 2009 were attributable to overhead primary conductor. Numerous miles of small primary conductor at JCP&L, like other utilities, have been in service for a long time and may be causing outages because of age-related deterioration. For example, an old and brittle, small overhead conductor can be more susceptible to tree-related outages because it may break more easily than a larger, newer conductor.

312 Final Report
6/20/2011
Finding IX-10 JCP&L has reduced its unaccounted-for energy losses from 2005 to 2009.
Exhibit IX-45 shows the trend in energy losses unaccounted for from 2005 to 2009.
Exhibit IX-45 Energy Losses Unaccounted For
2005 to 2009
Source: Consultant Analysis of JCP&L FERC Form 1 Reports
The percentage unaccounted for has decreased from 5.9% in 2005 to 5.1% in 2009. This tendency is likely attributable to improvements in metering and actual reductions in energy losses from improved T&D infrastructure.
It is interesting to note that the total megawatt hours (MWh) delivered fell from 24.7 million in 2005 to 19.5 million in 2009, despite a slight increase in the number of customers during the period.
Costs
Finding IX-11 Transmission O&M expense per mile of transmission steadily decreased from 2005 to 2009.
Exhibit IX-46 shows the annual transmission O&M expense per mile for 2005 through 2009.

Final Report 313
6/20/2011
Exhibit IX-46 Transmission Expense per Mile of Transmission
2005 to 2009
Source: Consultant Analysis of JCP&L FERC Form 1 Reports
The transmission O&M expense per mile steadily decreased from $14,333 in 2005 to $11,692 in 2009. As was the case with the Distribution vegetation program, the O&M reduction in the Transmission program is attributable to increased capital spending for expanding horizontal corridors.
Finding IX-12 Distribution O&M expense per mile of distribution increased from 2005 to 2007 but then decreased in 2009 to a level below 2005.
Exhibit IX-47 shows the 2005–2009 annual distribution O&M expense per circuit mile.
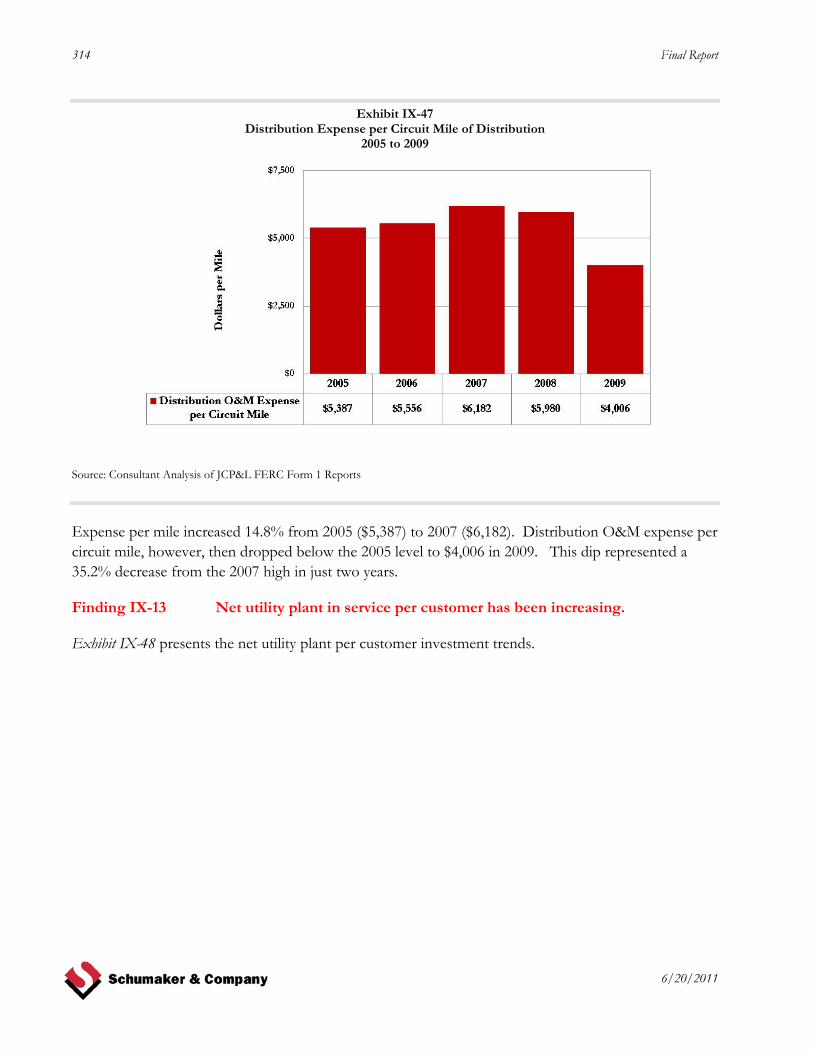
314 Final Report
6/20/2011
Exhibit IX-47 Distribution Expense per Circuit Mile of Distribution
2005 to 2009
Source: Consultant Analysis of JCP&L FERC Form 1 Reports
Expense per mile increased 14.8% from 2005 ($5,387) to 2007 ($6,182). Distribution O&M expense per circuit mile, however, then dropped below the 2005 level to $4,006 in 2009. This dip represented a 35.2% decrease from the 2007 high in just two years.
Finding IX-13 Net utility plant in service per customer has been increasing.
Exhibit IX-48 presents the net utility plant per customer investment trends.

Final Report 315
6/20/2011
Exhibit IX-48 Net Utility Plant in Service per Customer
2005 to 2009
Source: Consultant Analysis of JCP&L FERC Form One Reports
After decreasing to $2,074 in 2006, the net utility plant in service per customer increased to $2,377 in 2009. This tendency indicates that JCP&L is continuing to invest in its utility plant serving New Jersey customers.
JCP&L’s gross additions to utility plant (less nuclear fuel), however, declined from 2005 to 2009 as shown in Exhibit IX-49.

316 Final Report
6/20/2011
Exhibit IX-49 Gross Additions to Utility Plant (Less Nuclear Fuel)
2005 to 2009
Source: Consultant Analysis of JCP&L FERC Form 1 Reports
While JCP&L continued to invest in utility plant from 2005 to 2009, it did so at a slower rate. The amount per year declined from $209 million in 2005 to $166 million in 2009, possibly reflected the decline in general economic conditions over that period.
Finding IX-14 T&D-related capital spending decreased from 2005 to 2009 and the reductions in capacity-system reinforcement and condition/reliability improvements may affect reliability in the future.
The trends in T&D capital expenditures by category are shown in Exhibit IX-50.

Final Report 317
6/20/2011
Exhibit IX-50 JCP&L T&D Capital Expenditures
2005 to 2009
Source: Information Response 151
The reductions in capacity-system reinforcement and condition/reliability improvements could affect future reliability. The JCP&L system is continuing to age and a reduced level of infrastructure replacements and reinforcements could lead to a reduction in reliability in the future.
Finding IX-15 For the years 2007 through 2009, JCP&L received and expended significantly less capital than requested.
Exhibit IX-51 shows a profile of JCP&L’s capital program for 2007 through 2010.
Capital Categories 2005 2006 2007 2008 2009 Pct Change 05-09Capacity-New Load 17,968,170 20,944,258 33,224,610 22,701,386 13,546,537 -24.6%Capacity-Sys Reinforcement 35,830,781 22,417,920 31,694,551 32,004,194 12,288,641 -65.7%Condition/Reliability Improvements 48,099,712 35,858,062 43,029,910 27,553,069 29,453,341 -38.8%Failures 28,286,671 25,279,859 19,012,162 26,219,522 30,097,149 6.4%Meter 3,980,458 4,401,121 4,052,374 5,101,136 6,258,961 57.2%New Business 43,733,717 32,803,156 33,568,699 29,592,087 38,360,411 -12.3%Regulatory Required 7,130,890 3,236,751 7,665,731 4,292,192 1,343,750 -81.2%Relocations-Highway 2,548,075 492,098 2,808,234 1,423,480 3,069,417 20.5%Relocations-Other 1,113,979 1,294,511 1,214,291 1,299,043 1,351,091 21.3%Storms 4,613,932 5,176,512 2,514,613 11,451,035 9,011,142 95.3%Street Lighting 4,198,312 3,926,353 6,907,121 4,557,890 5,718,744 36.2%Tools & Equipment 1,268,704 871,969 1,537,452 570,276 1,133,492 -10.7%Forestry 1,939,092 989,365 966,457 4,342,616 17,644,954 810.0%Grand Total (T&D) 200,712,493 157,691,935 188,196,206 171,107,927 169,277,631 -15.7%

318 Final Report
6/20/2011
Exhibit IX-51 Jersey Central Power & Light Capital Program
2007 to 2010
Source: Information Response 757 and Schumaker & Company Analysis
Year2007
2008
2009
2010 March forecast increased due to Capital storm expenditures andadditional internal labor working on capital activities, offset byincreased attrition estimate
March forecast increased due to forestry budget forecast additions andforecast for Economic Stimulus refunds
June forecast reduced due to salary reductions, increased forecastattrition and reduced overtime forecast.
Forecast increased due to increased capital storm work.
September forecast increased due to emergent projects, capital stormexpenditures and additional internal labor working on capital activities
Primary Driver of Changes during the YearPrimary Driver of Budget DifferencesAvailable financial resources.
Deferral of IT/Communication related projects and bulk transmission build-out project funding.Revised load forecast lead to deferral of projects and program as well as funding level for blankets.
Increased labor costs and additional funding of storm blankets.
September forecast increased due to salary restoration, additionalinternal labor working on Capital activities and changes to SAP activityprices (price of an hour of labor moving to Capital)
April forecast increased due to increased capitalization of internal laborand additional forestry capitalizationJune forecast increased due to emergent projects offset by activity pricereduction

Final Report 319
6/20/2011
The difference between the carefully developed, bottom-up proposed capital budget and the actual capital expenditures was $18 million less, $27 million less, and $23 million less in the years 2007, 2008, and 2009, respectively. This decline amounts to 17% less actual capital spending from 2007 to 2009 than proposed; however, the final approved budget for 2010 was $29 million higher than proposed. According to JCP&L management, it would be unusal for JCP&L or any other subsidiary of FE to receive approval of 100% of the capital projects requested in its initial portfolio.
Finding IX-16 JCP&L has significantly decreased its budgeted and actual T&D O&M expenditures in 2008 and 2009, which may adversely affect customer service and reliability in the future.
Exhibit IX-52 shows the trends in budget and actual T&D O&M expenditures from 2005 to 2009.
Exhibit IX-52 JCP&L T&D Operations and Maintenance Expenses
2005 to 2009
Source: Information Response 137
JCP&L T&D O&M spending was $43 million, or 29.8% lower, in 2009 than 2007. Continued O&M spending at reduced levels could lead to future reductions in customer service or reliability. In four of the five years encompassing 2005 through 2009, JCP&L under-spent its O&M budget. According to JCP&L management, JCP&L looks at the combined O&M and capital spending for purposes of planned maintenance work.

320 Final Report
6/20/2011
Finding IX-17 Capital project estimate variances are significant.
Schumaker & Company requested the estimated and actual costs for 219 significant projects completed in 2007, 2008, and 2009. Exhibit IX-53 gives the results of the analysis of these projects and the actual variances from estimates by number of jobs and by dollars.
Exhibit IX-53 Actual Variance from Estimated Project Costs
2007 to 2009
Source: Information Response 831 and Schumaker & Company Analysis
Less variance is better. The amount of actual to estimated variance decreased from 2005 to 2009, as demonstrated by more jobs and dollars closer to the center of the charts; that is, less variance. However, the amount of variance in both jobs and dollars in 2009 is still significant. Improving estimating accuracy and managing work to achieve reasonable estimates would continue to reduce the variance of actual costs to estimated costs.
Finding IX-18 Capital project schedule performance deteriorated in 2009 from 2007 and 2008 levels.
The deviation of the number of days between scheduled completion date and actual completion date is a measure of project scheduling effectiveness and the ability of crews to meet schedules. Effective
< -50%
-26% to -
50%
-11% to -
25%
-10% to
+10%
+11% to
+25%
+26% to
+50%
> +50%
% Jobs 24% 9% 11% 11% 6% 9% 30%
0%
20%
40%
60%
80%
Perc
ent o
f Job
s
Actual Cost Deviation from Estimate
2007 Total Jobs = 82
< -50%
-26% to -
50%
-11% to -
25%
-10% to
+10%
+11% to
+25%
+26% to
+50%
> +50%
% Jobs 7% 14% 12% 10% 5% 10% 43%
0%
20%
40%
60%
80%Pe
rcen
t of J
obs
Actual Cost Deviation from Estimate
2008 Total Jobs = 85
< -50%
-26% to -
50%
-11% to -
25%
-10% to
+10%
+11% to
+25%
+26% to
+50%
> +50%
% Jobs 6% 10% 12% 52% 4% 8% 10%
0%
20%
40%
60%
80%
Perc
ent o
f Job
s
Actual Cost Deviation from Estimate
2009 Total Jobs = 52
< -50%
-26% to -
50%
-11% to -
25%
-10% to
+10%
+11% to +25
%
+26% to +50
%
> +50
%
% Total $$ 6% 5% 8% 9% 17% 6% 48%
0%
20%
40%
60%
80%
Perc
ent o
f Tot
Cos
t
Actual Cost Deviation from Estimate
2007Total Actual Cost = $45.0 million
< -50%
-26% to -
50%
-11% to -
25%
-10% to
+10%
+11% to +25
%
+26% to +50
%
> +50
%
% Total $$ 1% 5% 34% 12% 6% 5% 36%
0%
20%
40%
60%
80%
Perc
ent o
f Tot
Cos
t
Actual Cost Deviation from Estimate
2008Total Actual Cost = $80.7 million
< -50%
-26% to -
50%
-11% to -
25%
-10% to
+10%
+11% to +25
%
+26% to +50
%
> +50
%
% Total $$ 3% 49% 12% 25% 5% 3% 2%
0%
20%
40%
60%
80%
Perc
ent o
f Tot
Cos
t
Actual Cost Deviation from Estimate
2009Total Actual Cost = $23.9 million

Final Report 321
6/20/2011
scheduling processes result in higher percentages of projects getting completed in a range (plus or minus) of days around zero deviation.
The results of Schumaker & Company analysis of scheduled and actual completion dates for 219 projects completed between 2007 and 2009 by number of jobs and actual cost dollars are given in Exhibit IX-54.
Exhibit IX-54 Deviation of Actual from Scheduled Project Completion Dates
2007 to 2009
Source: Information Response 831 and Schumaker & Company Analysis
The most effective scheduling during the analysis period occurred in 2008, when 69% of the projects representing 67% of the total actual dollars were completed within plus or minus 30 days of the scheduled completion date. Scheduling performance in 2009 decreased to 48% of the projects or 29% of the total actual dollars being completed during the plus or minus 30-day range. 58% of the actual 2009 project dollars (23% of the projects) were completed 31 to 90 days prior to the scheduled completion date.
< -180
-91 to -180
-31 to -90
-30 to
+30
+31 to
+90
+91 to
+180
> +180
% Jobs 7% 2% 12% 55% 13% 7% 2%
0%
20%
40%
60%
80%
Perc
ent o
f Job
s
Actual Days Deviation from Scheduled
2007 Total Jobs = 82
< -180
-91 to -180
-31 to -90
-30 to
+30
+31 to
+90
+91 to
+180
> +180
% Jobs 2% 5% 13% 69% 4% 4% 4%
0%
20%
40%
60%
80%
Perc
ent o
f Job
s
Actual Days Deviation from Scheduled
2008 Total Jobs = 85
< -180
-91 to -180
-31 to -90
-30 to
+30
+31 to
+90
+91 to
+180
> +180
% Jobs 8% 10% 23% 48% 8% 4% 0%
0%
20%
40%
60%
80%
Perc
ent o
f Job
s
Actual Days Deviation from Scheduled
2009 Total Jobs = 52
< -180
-91 to -180
-31 to -90
-30 to
+30
+31 to
+90
+91 to
+180
> +180
% Total $$ 3% 2% 17% 49% 19% 9% 1%
0%
20%
40%
60%
80%
Perc
ent o
f Tot
Cos
t
Actual Days Deviation from Scheduled
2007Total Actual Cost = $45.0 million
< -180
-91 to -180
-31 to -90
-30 to
+30
+31 to
+90
+91 to
+180
> +180
% Total $$ 1% 1% 3% 67% 12% 10% 5%
0%
20%
40%
60%
80%
Perc
ent o
f Tot
Cos
t
Actual Days Deviation from Scheduled
2008Total Actual Cost = $80.7 million
< -180
-91 to -180
-31 to -90
-30 to
+30
+31 to
+90
+91 to
+180
> +180
% Total $$ 1% 7% 58% 29% 5% 1% 0%
0%
20%
40%
60%
80%
Perc
ent o
f Tot
Cos
t
Actual Days Deviation from Scheduled
2009Total Actual Cost = $23.9 million

322 Final Report
6/20/2011
Finding IX-19 JCP&L focuses capital project management more on cash flow and current year capital budget compliance than on traditional individual project budget and schedule achievement.
JCP&L’s report for project schedule and budget performance reporting is the “Redline Project Report.” The report combines both schedule and budget variance information in dollar terms. That is, the expected expenditures by type per month versus the actual expenditures for the month. The report is for a calendar year rather than the full lifecycle of all projects included. While managing the capital program according to planned cash flow and budgeted expenditures in each calendar year, some projects are started and completed within a calendar year, but others start before the calendar year or are completed after the calendar year. Therefore, the report does not show the cumulative budget and schedule variances for all projects. The report’s focus is primarily on dollar expenditure variances for the calendar year. It does show actual hours versus budgeted hours by month, but it does not calculate a schedule variance. JCP&L has no other regular project schedule and budget variance reports.
Finding IX-20 JCP&L does not track the number and value of change orders by project or in total, which reduces its ability to manage and control projects.
JCP&L does not track the number and/or value of change orders by project or in total. While change orders cannot be completely avoided, they can result from deficiencies in project planning or design. Frequent change orders or change orders for a high percentage of a project’s cost indicate that the project was not fully scoped or properly designed prior to implementation. Tracking change order volume and value both by project and in total is a good control metric to ensure that projects are properly scoped, planned, and designed.
Finding IX-21 FirstEnergy Utilities does not always award JCP&L transmission corridor vegetation management contracts to the lowest bidder.
Exhibit IX-55 shows the 2010 transmission corridor vegetation management contract bids and awards.

Final Report 323
6/20/2011
Exhibit IX-55 JCP&L 2010 Transmission Vegetation Management Award Evaluation
as of December 31, 2010
Source: Information Response 750 and Schumaker & Company Analysis
The exhibit shows that it cost JCP&L $64,578 more for not awarding each bid corridor to the lowest bidder. FEU provides the following explanations on why it did not award each corridor to the lowest bidder:
♦ NEWTON TO PS TAP N2214 T2298 – Timing restrictions associated with federal threatened and endangered species limited the amount of work that could feasibly be accomplished by one vendor, which was otherwise awarded six contracts (i.e., Asplundh).
♦ STONEYBROOK TO WHIPPANY B1016 G943 J1024 Q1031 – Timing restrictions associated with federal threatened and endangered species limited the amount of work that could feasibly be accomplished by one vendor, which was otherwise awarded six contracts (i.e., Asplundh).
♦ WHIPPANY TO ROSELAND A941 – Timing restrictions associated with federal threatened and endangered species limited the amount of work that could feasibly be accomplished by one vendor, which was otherwise awarded four contracts (i.e., Lewis Tree).
♦ NEW PROSPECT TO SMITHBURG G1021 D2004 H2008 – The successful vendor (i.e., Aspen) is local to central New Jersey and uses specialty equipment that is necessary to complete this project. In addition, this corridor is geographically proximate to another corridor that was awarded to this vendor. The impact of timing restrictions associated with federal threatened and endangered species was considered as well.
♦ TAP TO FRENEAU K1025 H1022 – The low bidder for this corridor was an out-of-state vendor (i.e., KWR) for which the undertaking of a single small project was not practical because of the startup costs. Moreover, this vendor is a relatively small company and has been awarded
Miles Project Aspen Contractor #1 Contractor #2 Contractor #3 Contractor #4
Difference Award
minus Low Bid
3.20 EAST FLEMINGTON TO PS TAP Q2243 I2209 $71,815.00 $77,574.15 $114,533.00 $109,282.00 $02.10 NEWTON TO PS TAP N2214 T2298 $49,995.00 $37,031.10 NO BID $103,202.00 $12,9649.40 Z1040 WHIPPANY TO TRAYNOR $337,041.00 $225,278.00 NO BID $307,838.00 $04.50 SHONGUM LAKE TO ROUTE 46 G943 E1045 $102,743.00 $136,931.20 $104,267.00 $442,323.00 $03.30 STONEYBROOK TO WHIPPANY B1016 G943 J1024 Q1031 $81,775.00 $75,907.10 NO BID $208,850.00 $5,8681.80 WHIPPANY TO ROSELAND A941 $54,716.00 $56,280.10 $75,244.00 $99,960.00 $1,5647.40 SMITHBURG TO ENGLISHTOWN T5020 $134,500.00 $185,007.00 $160,105.20 $227,846.00 $338,550.00 $010.60 ENGLISHTOWN TO DEANS PSEG T5020 $331,218.00 $206,850.40 $427,948.00 $427,734.00 $04.60 ATLANTIC TO OCEAN VIEW X2024 Y2025 $191,183.00 $47,770.20 $50,426.00 $147,595.00 $02.60 EAST WINDSOR TO WINDSOR E2005 $39,016.00 $34,480.05 $53,747.00 $112,891.00 $06.10 LARRABEE TO NEW PROSPECT B1042 G1021D2004 H2008 $165,175.00 $220,280.00 $170,943.41 $243,997.00 $379,826.00 $05.70 NEW PROSPECT TO SMITHBURG G1021 D2004 H2008 $104,675.00 $82,241.00 $69,624.40 $165,557.00 $309,603.00 $35,0518.90 SMITHBURG TO EAST WINDSOR E2005 $145,937.00 $121,627.20 $169,175.00 $335,446.00 $02.00 TAP TO FRENEAU K1025 H1022 $45,000.00 $66,540.00 $66,702.20 $35,869.00 $159,777.00 $9,1316.00 ENGLISHTOWN TO DEEP RUN B2C3 $66,500.00 $109,420.00 $104,149.20 $114,828.00 $254,332.00 $0
78.20 All $515,850.00 $2,068,927.00 $1,591,253.91 1,783,437.00 3,737,209.00 $64,577.40

324 Final Report
6/20/2011
a large amount of work by other FirstEnergy operating companies. These factors, coupled with concerns about the impact of timing restrictions associated with federal threatened and endangered species, made an award to this vendor impractical for this bid package.
Management Processes
Finding IX-22 FEU and JCP&L have an appropriate blend of centralization and decentralization in the Transmission and Distribution organization.
All T&D line, substation, and meter physical workers are assigned to JCP&L. In addition, the types of Distribution Planning and Engineering functions that require local knowledge, such as distribution capacity planning and line extensions, are deployed to New Jersey and the JCP&L organization.
The FEU-centralized T&D functions take advantage of concentration of expertise and seem to provide good service to JCP&L. The centralized FEU Planning and Engineering functions are ones that are not as dependent upon local knowledge, such as transmission and substation planning and engineering. These are functions that can benefit from the economy of scale that FirstEnergy enjoys across three states and multiple operating companies.
The centralized staff support for JCP&L-provided T&D functions also appears to take advantage of cross-pollination opportunities across the FEU territories. FEU T&D policies, standards, processes, programs, and systems employed by JCP&L are generally current or leading-industry practices.
Finding IX-23 FirstEnergy, FirstEnergy Utilities, and JCP&L have a highly developed performance management program.
FirstEnergy performance management cascades appropriately from the corporate level through the business units, including FEU, to the operating companies, including JCP&L, to the individual work groups. FE, FEU, and JCP&L have developed appropriate KPIs for each organizational level and perform accurate and timely performance reporting. The planning process sets appropriate KPI targets and charters initiatives to achieve the targeted performance. Performance is regularly reviewed at all levels and action plans to address performance gaps or emerging issues are developed and implemented.
Finding IX-24 FEU and JCP&L have a rigorous capital program planning and budgeting process.
The capital program planning and budgeting process was covered in the Background section of this chapter. Some of the highlights of the process include:
♦ Bottom-up process with programs and projects developed and championed by experts close to the work
♦ Rigorous reviews with multiple iterations at successive organizational levels

Final Report 325
6/20/2011
♦ Use of CBA priority codes and ECAT scoring to more objectively rank and prioritize programs and projects
♦ Cross-pollination of successful programs and projects from other opcos
♦ Executive leadership and involvement in the capital program planning
♦ Strong link to achieving performance management reliability and customer service targets
Finding IX-25 JCP&L measures schedule adherence rather than actual vs. estimated hours of crew productivity.
FEU and JCP&L do measure schedule adherence, absenteeism, and overtime but not productivity. Productivity is usually expressed as a ratio of actual hours taken on a work order versus the estimated work hours. Schedule adherence is a good substitute for productivity measurement and is generally more acceptable to craft workers. With schedules set according to good estimates of hours required and the available workforce, adhering to the schedule will result in acceptable productivity.
FEU /JCP&L did not track schedule adherence prior to 2010 and developed the Work Management Schedule Adherence Dashboard in 2010 to address this deficiency. An example of the Schedule Adherence Dashboard is given in Exhibit IX-56.

326 Final Report
6/20/2011
Exhibit IX-56 Example JCP&L Schedule Adherence Report
2010
Source: Information Response 881
It is a preferred practice, however, to regularly measure and report actual hours spent on each capital or O&M work order and to compare the actual hours to the estimated hours in a productivity report. Variances in productivity for individual projects will help identify problem areas or estimating inaccuracies.
Finding IX-26 FirstEnergy Utilities does not measure and report causes of crew downtime well.
The CREWS work management system for line and substation workers has a delay code for vehicle and fleet problems. It does not have a delay code for problems caused by material shortages. The FieldNet work management system used by meter technicians does not have any delay reporting capability. A good practice with a work management system, particularly one based on schedule adherence, is to have delay codes capture causes of schedule delays that can be analyzed and improved over time.

Final Report 327
6/20/2011
Finding IX-27 Asset management at FEU and JCP&L is well-developed and has achieved reductions in equipment-related failures.
FEU and JCP&L have developed asset management programs for all major T&D equipment categories and they are working to achieve the proper balance of design specifications, planned maintenance, and replacements, as discussed in the Background section of this chapter. Some of the strong points of the asset management program are:
♦ Planned maintenance and replacement programs for all major equipment types
♦ Analysis of equipment failure trends at both the FEU and JCP&L levels
♦ Design, construction, and material standards that are based, in part, on past experience
♦ Equipment performance measurement and reporting
♦ Good asset management information technology support
Finding IX-28 JCP&L generally stays current with planned equipment maintenance.
JCP&L reported 100% compliance with its planned equipment maintenance schedules in its Annual System Performance Report. Data for several planned maintenance programs is presented below. Exhibit IX-57 shows the results of distribution circuit and pole inspections for 2005–2009. Transmission aerial and ground-line inspections are presented in Exhibit IX-58. Exhibit IX-59 provides substation inspections.

328 Final Report
6/20/2011
Exhibit IX-57 JCP&L Distribution Circuit and Pole Inspections
2005 to 2009
Source: Information Response 519 and Schumaker & Company Analysis
2005 2006 2007 2008 2009Total Number of Circuits
1,116 1,127 1,151 1,163 1,165
Number of Circuits Inspected
183 198 198 231 231
Number of CM Work Orders¹
104 145 181 270 305
2005 2006 2007 2008 2009Total Number of Poles
314,042 316,283 318,524 320,765 323,007
Number of Poles Inspected
40,087 42,310 40,656 53,156 19,388
Number of CM Work Orders
25 439 137 60 134
NOTE: Additionally, there are a number of poles, which are normally reinforced by the inspecting contractor on an annual basis that will not require the creation of a CM work order.
DISTRIBUTION CIRCUITS
NOTE: There are a number of circuits that either serve single customers or are normally fed underground that are not included for inspection under the Overhead Circuit Inspection Program¹ Emergency condition items are not included in these orders since they are called in and/or are taken care of immediately
DISTRIBUTION POLES

Final Report 329
6/20/2011
Exhibit IX-58 JCP&L Transmission Aerial and Ground-Line Inspections
2005 to 2009
Source: Information Response 519 and Schumaker & Company Analysis
Total Number of Miles
Total Number Of Miles
Inspected¹
Condition Items Found
Total Number Of
Poles
Total Number Of
Poles Inspected
Condition Items Found
2009 757 1514 611³ 1930 0² 0
2008 746 1492 58 1930 0² 0
2007 746 2238 57 1912 0² 0
2006 746 1492 18 1912 843 21
2005 733 1466 136 1912 1021 80
² Pole inspections on 10 year cycle. Next inspection dates 2015 & 2016³ Fall aerial inspection on the 230kv lines was a comprehensive inspection in lieu of routine inspection
JCP&L Transmission Aerial Inspections JCP&L Groundline Inspections
¹ Aerial patrols completed twice per year

330 Final Report
6/20/2011
Exhibit IX-59 JCP&L Substation Inspections
2005 to 2009
Source: Information Response 519 and Schumaker & Company Analysis Note: RFC is Reliability First Corporation
Equipment Inspection YearNumber of Corrective
Work Orders Generated from Inspections
2005 2,8962006 2,4372007 3,0282008 3,1042009 2,5992005 422006 492007 762008 522009 192005 2192006 2472007 2252008 2082009 1332005 1142006 622007 1362008 1482009 135
*Notes:
Critical (PJM / RFC) Relay Schemes
Infra-red Inspections
Battery
JCP&L
1) Notifications with no associated order have been included in these counts to accommodate the fact that if a notification was entered work was intended to be done regardless of there being an associated order.
2) There is a possiblity of duplicate notifications for the same work as there is no way to determine if a notification associated with a piece of equipment has been entered multiple times.
3) M2 notifications can be generated from more than just a preventative maintenance order. For example, these notifications can be generated by a person working in the field during storm restoration.
4) Items above counted as "infrared" are based on regional personnel placing the appropriate coding on the M2 notification to indicate that the noticed condition was, indeed, found during infrared testing.
Substation
General

Final Report 331
6/20/2011
Finding IX-29 Some high-priority circuits repeat as high-priority circuits in subsequent years after improvement programs have been completed.
Another JCP&L reliability program is to address high-priority circuits each year. While improvements are made to each identified high-priority circuit, some circuits repeat as high-priority within a short time. Twenty-two high-priority circuits repeated as high-priority twice in the five years spanning 2005–2009, as shown in Exhibit IX-60. In addition, seven repeated three times and two repeated four times.
Exhibit IX-60 JCP&L High-Priority Repeating Circuits
2005 to 2009
Source: Information Response 519

332 Final Report
6/20/2011
Finding IX-30 Although tree incidents are a leading cause of outages, vegetation management is not organizationally grouped with the Engineering section and reports to a separate Director.
All other reliability programs (transformers, poles, capacitors, etc.) are managed by specialists in JCP&L Engineering Services. Resources are allocated and reallocated among capital and maintenance programs to achieve the highest reliability possible. The management of the vegetation management program, however, does not report to the unit managing the other reliability programs. However according to JCP&L management, the Engineering and Forestry Sections do collaborate and work closely on reliability issues related to vegetation. They jointly discuss and develop scheduled and non-scheduled maintenance work plans, and direct the priority of the work to be performed. Vegetation management is organized in a support services organization along with fleet, stores, and facilities management. Vegetation management is a key reliability program and is related to equipment management programs more than it is to support services. For example, reliability tradeoffs should be made between hardening older, small conductor and increasing the vegetation management around such vulnerable conductor. Also, high-priority circuits may need more frequent or more aggressive vegetation management to prevent them from repeating as high-priority circuits.
Finding IX-31 JCP&L has a sound storm preparation and restoration process.
The storm preparation and restoration process was described in the Background section of this chapter. Some of the strong points of the process are:
♦ Detailed plans ♦ Regular training ♦ Well-developed internal communications ♦ Utilization of ancillary personnel to assist in storm restoration ♦ Good information technology support ♦ Strong customer communication
Finding IX-32 JCP&L uses industry-standard crew sizes.
JCP&L uses the following industry-typical crew sizes:
♦ Meter Services – Meter testers typically work by themselves as a one-person crew.
♦ Substations
- Utility Construction & Maintenance (UC&M) substation crews typically work in two-person crews.
- Test technicians typically work by themselves as a crew.
- Relay technician seniors and the relay technicians typically work by themselves, unless work is required on transmission class voltages.

Final Report 333
6/20/2011
- Relay technician juniors will typically work as a part of a two-man relay crew.
- A cable crew typically works as a two-person crew.
- UC&M inspector typically works by him- or herself as a one-person crew.
- UC&M apprentice typically works as a member of a two-person crew.
- UC&M second class typically works as a member of a two-person crew.
- UC&M tool repair technician typically works as a two-person crew.
- Utility technician typically works as a one-person crew.
♦ Overhead Line
- Typical overhead line crews are two- or three-person crews depending on the job requirements.
- Line Construction & Maintenance (LC&M) troubleshooters work independently.
♦ Under Ground (UG) Line – Typical UG crews are two- to four-person crews depending upon the job requirements.
Finding IX-33 FirstEnergy Utilities has current engineering and construction standards manuals.
The engineering and construction standards manuals used by FEU centralized services and JCP&L are current. The FEU T&D construction standards provide various drawings, tables, and technical information to design and build the most common overhead and underground facilities that will support the safe and reliable distribution of electricity. The construction standard drawings provide necessary dimensional detail as well as identification of approved material/ equipment.
The engineering practices are FEU documents that describe various FEU engineering policies, procedures, and practices in-depth so that regional Engineering Services personnel can complete technical studies/activities and appropriate forms, documentation, or contracts; determine/secure appropriate cost contributions; provide appropriate design considerations; or identify information or considerations that need to be reviewed with FEU customers.
Finding IX-34 T&D staffing levels at JCP&L are being maintained through the replacement of retiring workers but the economics of employee versus contractors have not been re-evaluated recently.
Exhibit IX-61 shows the trends in JCP&L staffing.

334 Final Report
6/20/2011
Exhibit IX-61 JCP&L Staffing Trends
2005–2009
Source: Information Response 132 and 135
The total number of engineering, lines, and substations personnel have increased from 876 to 888 from 2005–2009. FEU and JCP&L have implemented an innovative Power Systems Institute (PSI) program to train high-quality replacements for retiring line and substation workers. The PSI program is described in the Human Resources chapter. Engineering has also recruited and hired more employees than it has lost over the four-year period.
FEU and JCP&L are essentially maintaining the T&D employee workforce at status quo levels, and most T&D electrical work is done by employees. Only limited, specialized work is contracted, such as tree trimming, transmission-line construction, or maintenance using helicopters, pole inspections, and Department of Transportation road-move projects. FEU and JCP&L, however, have not re-evaluated the in-house versus contractor costs and benefits in recent years. It is possible that the economics of employees versus contractors have changed over time to the point that readjustment of the in-house and contractor labor mix may be justified.
Support Applications
Finding IX-35 FEU and JCP&L use an integrated suite of operations applications to fully support the T&D work process.
The support applications listed in Exhibit IX-17, Exhibit IX-18, Exhibit IX-21, Exhibit IX-22, Exhibit IX-25, Exhibit IX-26, Exhibit IX-27, and Exhibit IX-28 are not used in isolation. Most, if not all, use data from other applications or sources. This dependence between applications for data demands that all the applications that support distribution, transmission, and substation operations communicate with each other. Exhibit IX-62 indicates how FEU/JCP&L have integrated all the support applications.
Exhibit IX-17, Exhibit IX-18, Exhibit IX-21, Exhibit IX-22, Exhibit IX-25, Exhibit IX-26, Exhibit IX-27, and Exhibit IX-28 provided descriptions of the applications, including websites for third-party vendors.
Category 2005 2006 2007 2008 2009Bargaining Unit Employees 1,122 1,137 1,124 1,111 1,090Non-Bargaining Unit Employees 296 312 312 345 321
Total Employees (Calculation) 1,418 1,449 1,436 1,456 1,411
Engineering 136 135 155 153 148Lines 579 588 577 565 568Substations 161 183 178 170 172
Total Engineering, Lines and Substations 876 906 910 888 888
Percentage Engineering, Lines, and Substations of Total Employees 62% 63% 63% 61% 63%

Final Report 335
6/20/2011
Exhibit IX-62 Jersey Central Power & Light T&D Applications
July 2010
Source: Information Response 516
Finding IX-36 JCP&L will have a more modern work management process after the completion of the Radio Upgrade Initiative in Quarter 4, 2011 and the implementation of the FEU/JCP&L Work Management Initiative between November 2011 and October 2012.
Current radio coverage is weak in portions of JCP&L’s territory, due, at least in part, to geographic and topographical constraints and obstacles, making it difficult to communicate with field personnel. The upgraded radio system will enhance JCP&L’s ability to respond to customer requests and restore service during outages. Exhibit IX-63 provides details about the upgrade.

336 Final Report
6/20/2011
Exhibit IX-63 JCP&L Radio Upgrade Initiative
2010
Source: Interview 62 and Information Response 517
Exhibit IX-30 presents JCP&L’s current work management process. The existing process, while usable, does not use global position system (GPS) technology and only partially uses mobile data terminal technology. The planning and scheduling process being used does not include state-of-the-art technology tools. The FEU / JCP&L Work Management Initiative (WMI) addresses these deficiencies. The project scope and goals of the WMI are given in Exhibit IX-64.
Exhibit IX-64 Work Management Initiative Scope
2010
Source: Interview 176 and Information Response 518
The operations support applications affected by the WMI are shown in Exhibit IX-65.

Final Report 337
6/20/2011
Exhibit IX-65 Applications Integration Diagram for the Work Management Initiative
2010
Source: Interview 176 and Information Response 518
The forecast payback period for JCP&L for the Work Management Initiative is 2.89 years, as presented in Exhibit IX-66.
Exhibit IX-66 Projected JCP&L Payback Period for the Work Management Initiative
2010
Source: Interview 176 and Information Response 688 Note: NPV is net present value and IRR is internal rate of return

338 Final Report
6/20/2011
The net present value (NPV) of the project becomes positive in the fourth year and the internal rate of return (IRR) is 60% or more from 2015 through 2017.
Finding IX-37 JCP&L has made progress in implementing distribution automation to improve reliability, but it should consider doing more.
During our onsite interviews, Schumaker & Company questioned the extent to which JCP&L had implemented distribution automation—in particular load switching between circuits to minimize the impact of outages. We were given the impression that some automation had been done in response to the PJ Downes Associates’ report but that JCP&L has not had a systematic program to review its entire system in such a manner.
This impression was further confirmed in our review of JCP&L’s response to prior reviews in Chapter V – Recommendations and Review of Previous Analysis. JCP&L provided periodic reports to the BPU staff who reported on the actions and status of actions taken to respond to items agreed to in the PJ Downes Associates’ report. Schumaker & Company consultants reviewed this material and requested further backup documentation for selected items. JCP&L had already agreed to implement everything in the PJ Downes Associates’ report. All of the recommendations in the PJ Downes’ report have been implemented. Furthermore, the Booth Associates’ reports also contained several recommendations dealing with system sectionalizing and/or auto load transfer schemes, although these items were not necessarily contained in the memorandum of understanding or stipulation of settlement.
The PJ Downes Associates’ report, however, recommended a study to determine if proactive relaying could be reasonably and effectively installed to allow the automatic sectionalizing of network operations during faults at various substations along the New Jersey shore on 34.5 kV lines. JCP&L performed these studies and did make changes at certain substations along the New Jersey shore that had been affected by outages covered in the PJ Downes’ report. The rest of the JCP&L system, however, might benefit from such a review. This is addressed in Recommendation V-1 in Chapter V – Review of Previous Audits.
Recommendations
Recommendation IX-1 Monitor recent capital and/or O&M expenditure reductions to ensure that customer service and reliability levels do not significantly deteriorate and maintain established statewide standards. (Refer to Finding IX-2, Finding IX-4, Finding IX-11, Finding IX-12, Finding IX-14, Finding IX-15, and Finding IX-16)
While still good, JCP&L’s T&D reliability and customer service levels deteriorated in 2009. This deterioration paralleled reduced T&D capital and O&M spending. The spending reductions were in response to a downturn in the economy and the growth rate; however, most of the T&D expenditures are related to maintaining and replacing aging infrastructure rather than growth. FEU and JCP&L have developed good linkage between asset management programs and reliability and customer service.

Final Report 339
6/20/2011
JCP&L’s levels of capital and O&M spending should be determined by taking into account the established statewide standards as well as internal reliability improvement targets.
Recommendation IX-2 Complete deferred trimming of the distribution corridors in 2011 consistent with the four-year vegetation management cycle. (Refer to Finding IX-6 and Finding IX-7)
A specific area of emphasis for JCP&L’s potential increased T&D spending should be to catch up all deferred corridors in the next budget year consistent with the four-year vegetation management cycle. Tree-related incidents are the largest single cause of customer service interruptions. Deviation from planned maintenance cycles likely contributed to the high number of tree-related outage incidents.
Recommendation IX-3 In conjunction with the FE/Allegheny Energy merger integration process, identify and implement the most efficient organizational design to effectively perform distribution vegetation managemen including considering reorganize distribution vegetation management under the JCP&L Engineering Services group. (Refer to Finding IX-30)
Vegetation management works hand in hand with other reliability programs to produce the overall reliability result for JCP&L. There are tradeoffs between tree trimming and overhead plant hardening. Vegetation management is a high-impact and high-cost facet of reliability management. The vegetation management program should be integrated with the equipment reliability program, and the total program should be optimized for the best reliability possible for the dollars expended. Vegetation management should be included in JCP&L’s analysis and determination of the best allocation of available resources among all reliability programs to produce the best reliability result.
Recommendation IX-4 Upon completionof the first full program cycle, evaluate the experimental corridor widening program (which has resulted in an increased portion of the expenditures for distribution tree trimming being allocated to capital) and adjust as appropriate. (Refer to Finding IX-8)
Continued deferral of scheduled distribution vegetation management will likely adversely impact system reliability. JCP&L should establish evaluative criteria for the corridor widening program and, following a complete cycle of the corridor widening program, should conduct a thorough review of the corridor widening program against the evaluative criteria. Adjustments to the corridor widening program should be made based on the results of the evaluation.

340 Final Report
6/20/2011
Recommendation IX-5 Award transmission vegetation management contracts to the lowest qualified bidder, and adequately document cases where exceptions are made. (Refer to Finding IX-21)
Past performance of vegetation management contractors should be used as a factor in determining such contractors’ qualification to bid on future transmission vegetation management corridors. Once qualified contractors bid, however, the lowest bidder should be awarded each corridor. If that bidder refuses the work, it should be assigned to the next lowest bidder. FEU should not reassign work to higher bidders based on subjective evaluations after the fact. If the current process is allowing unqualified bidders to submit bids, the bidder qualification process should be revised to ensure that only qualified bidders submit bids on each corridor.
Recommendation IX-6 Revise capital program and project management to include a focus on managing individual projects according to their schedules and budgets. (Refer to Finding IX-17, Finding IX-18, and Finding IX-19)
While managing the capital program according to planned cash flow and budgeted expenditures in each calendar year is a good business practice, diminishing the importance of individual project schedule and budget performance is not. JCP&L should refocus its attention on achieving schedules and budgets on each individual project as well and implement changes as appropriate.
Recommendation IX-7 Begin tracking and reporting the aggregate volume and value of change orders by project and by time period. (Refer to Finding IX-20)
Change order rates are a good indicator of the quality and thoroughness of the scoping, design, estimating, and project management of each project. The number and relative value of change orders can be used as an evaluative criterion for a single project. The aggregate number and value of change orders, by cause, on completed projects over a month, quarter, or year is a good evaluative criterion of the performance of the design, estimating, and project management units. JCP&L should evaluate new mechanisms that track and report aggregate volume and value of change orders and implement them if cost effective.
Recommendation IX-8 Begin tracking and reporting actual versus estimated hours by work order and by time period. (Refer to Finding IX-25)
Managing to schedule adherence can be an effective work management technique; however, the ongoing analysis of actual work hours versus estimated hours by project and in the aggregate for projects completed in a month, quarter, or year is a good practice. Actual versus estimated work-hour analyses can provide insight into estimating problems as well as productivity problems. Significant variances should be analyzed and the root causes discovered and resolved. JCP&L should evaluate new

Final Report 341
6/20/2011
mechanisms that track and report actual versus estimated hours by project and implement them if cost effective.
Recommendation IX-9 Improve the delay reporting to reduce crew downtime and improve schedule adherence. (Refer to Finding IX-26)
Each work management system should include time-reporting codes for typical work delays, such as vehicle and equipment breakdowns, material shortages, and traffic management. Tracking crew downtime by cause can identify the recurring problems that reduce productivity and affect schedule adherence. Feedback can then be provided to the support services that will assist in redesigning processes to minimize crew delays.
Recommendation IX-10 Modify the high-priority circuit program to include a focus on the number of repeat high-priority circuits. (Refer to Finding IX-29)
The actions taken to resolve each identified high-priority circuit should be adequate to remove that circuit from the high-priority circuit program for at least five years. While there are unforeseen circumstances that may cause an occasional circuit to repeat more often, the program should be thorough enough that this tendency occurs much less in the future.
Recommendation IX-11 Re-evaluate the T&D employee and contractor labor allocation. (Refer to Finding IX-34)
JCP&L has practices in place to fully use employee resources before turning to contractors; however, the work load and employee/contractor economics are constantly evolving. Because FEU and JCP&L have not re-evaluated the employee/contractor balance in recent years, there may be opportunities to reduce total costs while maintaining core competencies. FEU and JCP&L should re-evaluate the employee/contractor labor allocation for each major work group. Particular attention should be paid to lower-skilled, routine work that can be easily contracted.
Recommendation IX-12 Include as a component of the analysis of the highest priority circuits the age, size, and type of overhead conductor to determine if these factors are the key contributors to the unreliability of a particular circuit and if conductor replacement would be cost-effective to address customer hours of outages on such circuits. (Refer to Finding IX-9)
The replacement of old, deteriorated overhead conductor will not normally be driven by capacity overload. Therefore, the age, size, and type of overhead conductor should be considered in JCP&L’s review of the highest priority circuits. If a determination is made that one of these factors is a key contributor to the unreliability of a particular circuit, then consideration should be given to replace the deteriorated conductor if it is cost beneficial. JCP&L does not have a formal overhead conductor

342 Final Report
6/20/2011
replacement program in its listing of proposed 2011 capital projects. If this study was performed in the past, a report on the results should be presented to the BPU staff.
Recommendation IX-13 In conjunction with the high priority circuit program, consider adding CEMI measurements and targets to the internal reliability performance measures to enhance customer satisfaction and further improve reliability. (Refer to Finding IX-3)
JCP&L should consider the establishment of CEMI measurements and targets, along with remediation programs and communication of plans with affected customers, creates a proactive approach to potential customer dissatisfaction caused by multiple interruptions. While the number of customers affected may be small compared to the total customer population, multiple interruptions can be a source of high dissatisfaction.
Recommendation IX-14 JCP&L should provide documentation that its distribution planning criteria includes requirements consistent with the PJ Downes’ reports for tie and recloser schemes for new and substantially reconfigured circuits, which, over time, will allow for increasing levels of automation with respect to the Company’s response to outages. (Refer to Finding IX-37)
Automatic service restoration to portions of circuits is well-suited for urban and suburban and, in some cases, rural circuits. The customer density and mix of urban, suburban, and rural circuits in its territory makes JCP&L a candidate for the potential application of increased distribution automation to enhance reliability. This recommendation was also made in our review of recommendation from prior audits in Chapter V – Recommendations and Review of Previous Analysis.
Some other utilities have extended the distribution load switching to a larger part of their distribution system. For instance, in the early 2000s, one utility took a serious look at the design of its distribution network with respect to the implementation of more network distribution automation. The primary distribution voltages that were candidates for the automation used were 13 kV and 34 kV. The current design criteria for these circuits are shown in Exhibit IX-67.
Exhibit IX-67 Distribution Circuit Design Criteria
Normal Operating Condition
Emergency Operating Condition
13 kV 7 MVA 11 MVA 34 kV 21 MVA 29 MVA
MVA = Mega Volt Ampere Source: Schumaker & Company 2007 Stratified Management Audit of PECO Energy

Final Report 343
6/20/2011
This utility has designed all of its distribution circuits such that they can be backfed from an adjacent distribution circuit in an emergency condition—defined as in the event of an outage. Before distribution automation, this design allowed the utility to restore service to all customers on an out-of-service 13 kV circuit by manually switching to two adjacent circuits. It also enabled the utility to restore service to all customers on an out-of-service 34 kV circuit by manually switching to three adjacent circuits, even during peak load conditions. Today, the utility’s distribution automation scheme provides automated switching and reduces the number of customers affected by an outage. This scheme is illustrated in Exhibit IX-69 and Exhibit IX-70, with Exhibit IX-68 providing a definition of the symbols that are used.
♦ 13 kV circuits are usually connected to an adjacent circuit from a different substation, through a normally open-tie recloser, as shown in Exhibit IX-69. The switching on the circuit in the event of a fault is such that, although a momentary circuit outage would be experienced, within approximately one minute the two distribution circuits would get automatically reconfigured to minimize the number of customers impacted by the sustained outage.
♦ 34 kV circuits are usually connected to more than one adjacent circuit through multiple, normally open-tie reclosers, as shown Exhibit IX-70. The switching on the circuit in the event of a fault is such that, although a momentary circuit outage would be experienced, within approximately one minute its multiple distribution circuits would get automatically reconfigured to minimize the number of customers impacted by the sustained outage.
Exhibit IX-68 Circuit Diagram Legend
Source: Schumaker & Company 2007 Stratified Management Audit of PECO Energy

344 Final Report
6/20/2011
Exhibit IX-69 13 kV Distribution Circuit
Note CB – Circuit Breaker Source: Schumaker & Company 2007 Stratified Management Audit of PECO Energy
Exhibit IX-70 34 kV Distribution Circuit
Source: Schumaker & Company 2007 Stratified Management Audit of PECO Energy

Final Report 345
6/20/2011
Using the circuit’s emergency rating, the load shifted to the adjacent circuit is carried for a period of time following the sustained outage. Once the fault is remedied, the circuits are reconfigured back to their normal operating conditions.
This distribution automation scheme is referred to as an automated loop scheme. The customers in the local area served by the automated loop see an improvement in reliability, while the widespread use of reclosers is an attractive investment to supplement other initiatives to improve system-wide reliability.
The entire JCP&L distribution system should be studied to identify areas where additional distribution automations along the above lines could be implemented. While this technology might not prove cost effective in some areas of the JCP&L distribution system, such a study would ensure that all cost effective areas are identified and scheduled for potential improvement.

346 Final Report
6/20/2011
B. Extensions and Upgrades
Background
On January 20, 2004, the New Jersey Board of Public Utilities (BPU) proposed rules to reflect the smart growth policy goals of the state, as shown in Exhibit IX-71. After extensive hearings and input from stakeholders, the Board of Public Utilities adopted the new rules on November 16, 2004. Exhibit IX-72 shows an image of the rules from the New Jersey Register. The effective date of the new rules was December 20, 2004, with March 20, 2005 being set as the operative date for utilities to begin using them. Jersey Central Power & Light (JCP&L) implemented the new rules on March 20, 2005.
On March 24, 2010, the BPU issued a Secretary's Letter to instruct utilities to process all extensions as if they were in designated growth areas. The board set forth this directive pending the initiation of a rule-making process in response to a December 30, 2009 court ruling. Exhibit IX-73 provides a copy of the Secretary's Letter. JCP&L began processing all jobs as if they were in designated growth areas on March 24, 2010.
Exhibit IX-71 BPU Proposed Rules Governing Smart Growth Policy
2004
Source: Information Response 160, Extract from 36_N_J_R__5928_a_.pdf, page 2

Final Report 347
6/20/2011
Exhibit IX-72 BPU-Adopted Rules Governing Smart Growth Policy
2004
Source: Information Response 160, Extract from 36_N_J_R__5928_a_.pdf, page 1

348 Final Report
6/20/2011
Exhibit IX-73 BPU Secretary's Letter Addressing Court Case Concerning Growth Policy
as of March 24, 2010
Source: http://www.nj.gov/dca/divisions/osg/docs/bpuletter032410.pdf

Final Report 349
6/20/2011
Findings & Conclusions
Business Processes
Finding IX-38 Jersey Central Power & Light has incorporated smart growth policies into its day-to-day business processes.
Schumaker & Company requested copies of policies and procedures concerning the smart growth classification of extension and upgrade jobs processed by Jersey Central Power & Life. Schumaekr & Company consultants conducted interviews and viewed a demonstration of JCP&L's design procedure within the organization's work management system.
Customer service design engineers and layout technicians (design engineers) in the Engineering and Line Shop organizations, as shown in Exhibit IX-74, determine the facilities that need to be installed. They also dictate the smart growth classification of extension and upgrade jobs requested by customers.
Exhibit IX-74 JCP&L Employees Responsible for Application of the Smart Growth Rules
as of July 2010
Source: Information Responses 54 and 160 and Interview 33
The main tool used by JCP&L design engineers is the Customer Request Work Scheduling System (CREWS) within the organization's overall work management process, as shown in Exhibit IX-75.

350 Final Report
6/20/2011
Exhibit IX-75 Jersey Central Power & Light Work Management Process
July 2010
Source: Information Response 157
JCP&L made changes to the CREWS software tool, created CREWS procedures, and trained design engineers to comply with the smart growth rules.
Exhibit IX-76 displays the CREWS’ smart growth requirements. The procedure used by design engineers to determine whether a job is in a designated growth or non-growth area is given in Exhibit IX-77. Smart growth billing procedures for Jersey Central Power & Light are shown in Exhibit IX-78 and Exhibit IX-79 respectively.
Design engineers use an in-house–developed Lotus Notes application named "CREWSDOC" to create contracts that must be signed by customers before work can be started. The procedure for using CREWSDOC is given in Exhibit IX-80.
Exhibit IX-81 provides the procedure used by design engineers to determine whether customer billing is to be based on fixed charges or time and material.

Final Report 351
6/20/2011
Exhibit IX-76 CREWS Smart Growth Requirements
July 2010
Source: Information Response 160, Attachment 1, page 1

352 Final Report
6/20/2011
Exhibit IX-77 CREWS Smart Growth Determination
as of July 2010
Source: Information Response 160, Attachment 1, pages 1 and 2

Final Report 353
6/20/2011
Exhibit IX-78 CREWS’ Smart Growth Billing for Designated Growth Areas
as of July 2010
Source: Information Response 160, Attachment 1, pages 2 and 3

354 Final Report
6/20/2011
Exhibit IX-79 CREWS Smart Growth Billing for Designated Non-Growth Areas
as of July 2010
Source: Information Response 160, Attachment 1, pages 2 and 3

Final Report 355
6/20/2011
Exhibit IX-80 CREWSDOC Smart Growth Contract Creation Procedures
as of July 2010
Source: Information Response 160, Attachment 1, pages 3 and 4

356 Final Report
6/20/2011
Exhibit IX-81 CREWS Smart Growth Charge Category
July 2010
Source: Information Response 160, Attachment 2

Final Report 357
6/20/2011
Performance Management
Schumaekr & Company consultants requested seven (7) years of smart growth data for the extension of new facilities and for the upgrade of existing facilities to serve customers. Very few jobs processed prior to March 20, 2005 were coded as growth (G) or non-growth (NG). Data for 2005 was assumed to be non-typical because of a work stoppage at Jersey Central Power and Light during the first quarter of the year and was deemed an adjustment period for customers to become accustomed to the new rules.
Schumaker & Company's analysis of the data is presented below in separate "New Extensions" and "Upgrades" categories.
New Extensions
Finding IX-39 The implementation of smart growth policies in 2005 decreased the average monthly level of new extension work activity within Jersey Central Power & Light by 31.3% or $400,476.
New extensions, particularly for new housing, are dependent on general economic conditions. Exhibit IX-82 indicates that the gross domestic product (GDP)5
5 / A state's gross domestic product is the total value of all the state's goods and services that are produced in a year.
for the state of New Jersey has steadily increased from 2003 through 2008 while building permits for privately owned housing have decreased annually from 2006 through 2009. The mortgage crisis explains the levels in 2009, 2008, and a portion of 2007. After the implementation of the smart growth rules in 2005, single-unit building permits in the state decreased by 5,151 in 2006 and another 4,047 in 2007. While multi-unit permits increased by 886 in 2006, they decreased by 4,886 between 2006 and 2007. The state trends can be assumed to apply to JCP&L's service territory.

358 Final Report
6/20/2011
Exhibit IX-82 State of New Jersey Economic Indicators
2003 to 2009
Source: http://www.bea.gov/regional/gsp/action.cfm and http://www.census.gov/const/www/permitsindex.html
Prior to March 2005, Jersey Central Power & Light customers paid a combination of non-refundable contribution in aid to construction (CIAC) and/or refundable deposit (DEP) for new extensions based on tariffs filed and approved by the BPU. Comparing total CIAC plus DEP dollars collected for new extensions prior to and after the implementation of the smart growth rules provides an indication of the impact these new rules had on customer extensions.
Exhibit IX-83 provides a profile of monthly CIAC plus DEP dollars collected for new extensions. Monthly average CIAC plus DEP dollars collected by JCP&L for new extensions decreased by 31.3% after smart growth rules went into effect. The monthly average for 2004 was $1,278,857 compared to the 2006–2009 monthly average of $878,381.

Final Report 359
6/20/2011
Exhibit IX-83 Monthly CIAC + DEP Dollars Collected for New Extensions
January 2004 to March 2010
Source: Information Response 162 and Schumaker & Company Analysis
Finding IX-40 JCP&L complied with smart growth rules by collecting CIAC for the total cost of new extensions in designated non-growth areas.
The smart growth rules mandated that New Jersey utilities collect the full cost of installing new extensions (CIAC) in designated non-growth areas from customers requesting such extensions. This rule was suspended on March 24, 2010 pending further BPU rule-making as shown in Exhibit IX-73.
The rules further mandated that utilities process new extensions in growth-designated areas in accordance with tariffs approved by the BPU. These tariffs, depending on the scope of the job, may allow JCP&L to collect a non-refundable reimbursement (CIAC) and/or a refundable reimbursement (DEP) for the job.
Exhibit IX-84 provides the annual level of CIAC and DEP collected for new extensions by JCP&L both before and after the implementation of the smart growth rule. Prior to March 20, 2005 new extension reimbursements were not coded as being in either a non-growth area (NG) or a growth area (G) and are combined together (ALL) on the chart. All of the reimbursements in NG areas after the implementation of the smart growth rules in 2005 were collected as CIAC.
0
500,000
1,000,000
1,500,000
2,000,000
2,500,000
Dol
lars
Month
New Extensions CIAC DEPMo Avg
Smart G
rowth
Rules
1,278,857
878,381
1,278,857 to 878,381 equals 31.3% decrease

360 Final Report
6/20/2011
Exhibit IX-84 Annual CIAC + DEP Dollars Collected for Non-Growth and Growth New Extension Jobs
January 2004 to March 2010
Source: Information Response 162 and Schumaker & Company Analysis
Finding IX-41 Up to $13.5 million of the $20.9 million collected as CIAC for new extensions in non-growth areas between 2005 and 2009 might have been collected as refundable DEP if the jobs had been processed as though they were in growth areas.
Exhibit IX-85 presents the annual levels of CIAC and DEP collections for new extensions in growth areas and the annual CIAC collections in non-growth areas for 2005–2009. 64.6% of the reimbursements collected in growth-designated areas from 2005 through 2009 were for DEP. Applying that 64.6% to the total CIAC collected $20,938,779 in non-growth areas yields $13,526,451. Naturally, $13.5 million is an approximation and the actual level would be dependent on the tariffs that would apply to each job.

Final Report 361
6/20/2011
Exhibit IX-85 Annual Refundable Deposit Dollars Collected for New Extensions
2004 to 2009
Source: Information Response 162 and Schumaker & Company Analysis
Finding IX-42 The average annual scope of work for new extension jobs in growth areas has decreased 11.8% (7.5 Hrs/WR) and in non-growth areas 41.9% (20.2 Hrs/WR) since the implementation of smart growth rules.
JCP&L uses compatible units to design new extension jobs. Compatible units pre-define materials required, labor hours needed to install the materials, and the accounting treatment (capitalized or expensed) of the materials and labor associated with the job. The evaluation of the estimated labor hours per job or work request (WR) is an indication of the scope of work performed.
Schumaker & Company requested and analyzed estimated new extension labor hours for billable growth (G) and non-growth (NG) jobs. Schumaekr & Company consultants also confirmed through an interview that JCP&L designers are trained in and strive to use the most efficient design for all jobs, regardless of the location. Exhibit IX-86 presents the results of this analysis. The numbers in white boxes on the chart’s bars provide the number of jobs (work requests) included in the calculation of average estimated hours per job.
Very few jobs were classified as growth or non-growth prior to March 2005. Clearly, the scope of work (materials plus labor) decreased after the implementation of the smart growth rules in 2005.
2005 2006 2007 2008 2009
CIAC - G 830,894 2,026,413 3,085,102 1,557,558 1,269,516DEP - G 1,134,825 3,940,095 4,164,112 3,282,932 3,487,548
0%
20%
40%
60%
80%
100%
64.6%

362 Final Report
6/20/2011
Exhibit IX-86 Job Scope for New Extension Jobs
2003 to 2009
Source: Information Response 162 2nd Supplement, Attachments 1 and 2, and Schumaker & Company Analysis
Upgrades
Finding IX-43 The smart growth policy increased the level of upgrade activity within JCP&L after its implementation.
Again, comparing total CIAC plus DEP dollars collected for upgrades prior to and after the implementation of the smart growth rules provides an indication of the impact the new rules had on customer decisions concerning upgrade jobs.
A view of monthly CIAC plus DEP dollars collected by month for upgrades is presented in Exhibit IX-87. Monthly average CIAC plus DEP dollars collected by JCP&L for new extensions decreased by 31.3% after smart growth rules went into effect. The monthly average for 2004 was $134,367 compared to $240,523 for 2006–2009, indicating an approximate increase of 79.0% in activity.
(1) (2) (1)-(2) (1)-(2)/(1))
2003-2004 2005-2009 Change from (1) % Change from (1)Growth 63.7 56.2 -7.5 -11.8%Non-Growth 48.2 28 -20.2 -41.9%
Average Annual Est Hrs / WR

Final Report 363
6/20/2011
One (1) job in a designated growth area in September 2007 accounted for $685,133 in CIAC of the $1,111,611 shown on the chart.
Exhibit IX-87 Monthly CIAC + DEP Dollars Collected for JCP&L Upgrade Jobs
January 2004 to March 2010
Source: Information Response 162 and Schumaker & Company Analysis
Finding IX-44 Jersey Central Power & Light complied with smart growth rules for upgrades requested by customers.
Smart growth rules mandate the collection of certain expenses as CIAC in non-growth areas that might be collected as reimbursable deposits in growth areas. Exhibit IX-88 provides the annual percentage comparisons between DEP and CIAC collected after the implementation of these rules. DEP as a percentage of DEP plus CIAC reimbursements for 2005–2009 was 20.2% higher in growth areas compared to non-growth areas. The higher percentage of CIAC collected for non-growth jobs indicates that JCP&L applied the rules appropriately. Because of the reduced level of upgrade activity in non-growth areas, the 20.2% in DEP percentages would equate to only a $155,356 shift from CIAC to DEP if the jobs in non-growth areas had been processed in the same way as growth area jobs.

364 Final Report
6/20/2011
Exhibit IX-88 DEP as Percent of DEP + CIAC for Upgrade Jobs in Non-Growth and Growth Areas
2005 to 2009
Source: Information Response 162 and Schumaker & Company Analysis
Finding IX-45 The scope of work for jobs completed by JCP&L to upgrade facilities to customers was similar between growth and non-growth areas and demonstrated comparable trends.
As discussed above, estimated hours per job (work request) is a good indication of the facilities installed on a job. Schumaker & Company analyzed the estimated hours per work request for all upgrade billable jobs coded as growth (G) or non-growth (NG) between 2003 and 2009. The results of this analysis are presented in Exhibit IX-89. Again, the number of work requests (jobs) for each calculation is shown in the white box on each bar.
There were no jobs coded with G or NG in 2003 and very few in 2004. The data for 2005 through 2009 demonstrate similar trends and characteristics for both growth and non-growth jobs, indicating there was very little difference in the scope of facilities installed.
Upgrades - Jobs
2005 2006 2007 2008 2009 2005 2006 2007 2008 2009
NG G
CIAC 91,454 745,250 631,756 1,080,97 616,736 176,656 877,169 1,819,09 242,771 159,950DEP 26,796 190,785 218,754 798,640 396,884 115,608 861,546 1,038,62 872,311 993,862
0%
20%
40%
60%
80%
100%
Mill
ions
of D
olla
rs
34.0%
54.2%

Final Report 365
6/20/2011
Exhibit IX-89 Upgrade Job Scope for Growth and Non-Growth Areas
2005 to 2009
Source: Information Response 162 2nd Supplement, Attachments 1 and 2, and Schumaker & Company Analysis
Recommendations
None

366 Final Report
6/20/2011
C. Contractor Performance
Underground Locate Services
Background
In 1974, Garden State Underground Plant Location Service (GSUPLS) was created by New Jersey Utilities as a voluntary organization of underground facility operators. In October 1994, the Underground Facility Protection Act was signed into law and the NJ Board of Public Utilities (BPU) was designated as the agency charged with overseeing and enforcing compliance with the "One Call Law." As of November 1999, The BPU designated One Call Systems, Inc. as the operator of the One-Call Damage Prevention System. One Call Concepts became the operator in February 2010. Exhibit IX-71 provides the Table of Contents page from the BPU document that implements the Underground Facility Protection Act.
Jersey Central Power & Light (JCP&L), as an operator of underground facilities in the State of New Jersey, is required by law to participate in and comply with the requirements of the One-Call Damage Prevention System.

Final Report 367
6/20/2011
Exhibit IX-90 Table of Contents from BPU One-Call Damage Prevention System
as of July 2010
Source: http://www.nj1-call.org/docs/UndergroundFacilitiesAct-LAW.pdf and Information Response 303
Findings & Conclusions
Organization
Finding IX-46 FirstEnergy, including Jersey Central Power & Light, has centralized the responsibility for processing requests from excavators to mark underground facilities in all the service territories of its subsidiaries.
Schumaekr & Company consultants requested organizational charts for department(s) responsible for the oversight of contractors that locate and mark underground facilities in accordance with New Jersey's One Call law. Responsibilities were confirmed through interviews.
FirstEnergy (FE) has subsidiary utilities that operate in New Jersey, Pennsylvania, and Ohio. All of these states require the subsidiaries to participate in marking the location of their underground facilities at the request of potential excavators. The FirstEnergy Joint Use organization, in collaboration with JCP&L Engineering, has the responsibility for processing requests for markings in Jersey Central Power & Light's territory. Exhibit IX-72 provides the organizational relationship between FirstEnergy and JCP&L for underground locating services.

368 Final Report
6/20/2011
Exhibit IX-91 JCP&L Underground Locates Organization
as of July 2010
Source: Information Response 302 and Interviews 72 and 134

Final Report 369
6/20/2011
Process
Finding IX-47 Jersey Central Power & Light/FirstEnergy has a defined process for completing requests from excavators to mark the location of underground electrical facilities.
Schumaker & Company interviewed Jersey Central Power & Light and FirstEnergy personnel to evaluate the process that FE organizations use to respond to requests from New Jersey One Call to mark its underground facilities.
FirstEnergy performs a preliminary screen of all calls requesting that the location of JCP&L underground electrical facilities be marked. The 92% of tickets that require field marking after screening are sent to the "Locates" contractor in New Jersey for field completion. Exhibit IX-74 presents the process used to locate and mark Jersey Central Power & Light underground facilities when requested through New Jersey One Call.
Exhibit IX-92 JCP&L Underground Locates Process
as of July 2010
Source: Interviews 72 and 134
Finding IX-48 Jersey Central Power & Light has written contract specifications for vendors providing FirstEnergy with underground locating services.
Schumaekr & Company consultants requested and reviewed a copy of the current contract for underground locating services to verify the tasks performed by the locates contractor. The contract has ten sections covering all aspects of the activities performed by the contractor. Exhibit IX-76 presents the "General Conditions" section of the contract.

370 Final Report
6/20/2011
Exhibit IX-93 General Conditions Section from JCP&L Specifications for Contract Locating
as of December 31, 2008
Source: Information Response 316
Performance Management
Finding IX-49 The locates activity from New Jersey One Call for Jersey Central Power & Light peaked during 2006.
Schumaekr & Company consultants requested and analyzed the number of monthly underground locates completed for the past five years. The yearly monthly average of locates that were completed peaked in 2006 at 18,375 per month. The average for 2009 was 16,235 per month, down 11.6% from the peak. Exhibit IX-77 shows the five (5) years of data provided by month.

Final Report 371
6/20/2011
Exhibit IX-94 JCP&L Underground Locates Activity
January 2005 to April 2010
Source: Information Response 304
Finding IX-50 Jersey Central Power & Light's annual contract locate costs ranged from $9.78 to $11.65 per ticket over the last five years.
Schumaker & Company requested and analyzed the annual contract expenses for Jersey Central Power & Light's underground locates services for the last five years. The annual unit cost peaked at $11.65 per ticket in 2007 and 2008. Unit cost increased at a 3.5% annual rate from 2005 through 2009. The 2009 unit cost was 4.0% lower than the 2007 - 2008 peak cost. There was a $0.47 difference between the 2008 and 2009 unit cost. Exhibit IX-78 gives a comparison of the cost per ticket over the last five years.

372 Final Report
6/20/2011
Exhibit IX-95 Jersey Central Power & Light Contract Cost per Underground Locate Ticket
2005 to 2009
Source: Information Responses 304 and 668
Finding IX-51 The FirstEnergy / Jersey Central Power and Light ticket screening process has resulted in approximately $811,112 of avoided cost from 2005 through 2009.
Interviews indicated that approximately eight percent (8%) of the tickets received from New Jersey One Call in 2009 did not have to be sent to the field for locating because the screening process in Exhibit IX-74 above indicates there are no company underground facilities near the address of the proposed excavation. The eight percent (8%) level in 2009 was a 60% improvement from the five percent (5%) level experienced in 2005. Annual avoided cost ranged from $118,065 in 2005 to $193,041 in 2008. Exhibit IX-96 shows the annual avoided cost for each year and the percentage of tickets that did not have to be sent to the field.

Final Report 373
6/20/2011
Exhibit IX-96 Jersey Central Power and Light Avoided Cost of Screened Locate Ticket
2005 to 2009
Source: Information Responses 304 and 668 and Interviews 63 and 72
Finding IX-52 Jersey Central Power & Light/FirstEnergy monitors the performance of the locates contractor on both a daily and monthly basis.
Schumaekr & Company consultants requested and reviewed a copy of the metrics used to monitor the performance of the underground locates contractor. FirstEnergy / Jersey Central Power & Light implemented a monthly scorecard in January 2009 to monitor performance of its underground locates contractors. Exhibit IX-80 provides an example of the report used to monitor daily production by the locates contractor. The monthly scorecard metrics used to monitor the performance of the locates contractor is shown in Exhibit IX-98.
Exhibit IX-97 Example Daily Performance Metrics Used for JCP&L Locates Contractor
as of July 2010
Source: Information Response 307
2005 2006 2007 2008 2009
Avoided Cost $118,064 $148,093 $169,333 $193,041 $182,581
$0
$50,000
$100,000
$150,000
$200,000
$250,000
Dol
lars
Percent of tickets that did not have to be sent to field given in boxes
5 %
6 % 7 %
7 % 8 %

374 Final Report
6/20/2011
Exhibit IX-98 Monthly Performance Metrics Used for JCP&L Locates Contractor
as of October 2010
Source: Information Response 307
Finding IX-53 Jersey Central Power & Light completed 98.4% of 2009 location requests within three business days.
A provision of the New Jersey One Call law is that underground facility operators should complete requests to mark their facilities within three (3) business days after the request is received by the operator. Schumaker & Company requested and reviewed data that JCP&L uses to monitor compliance with the BPU requirements.
Monthly compliance during 2009 was 98% for seven (7) months and 99% for five (5) months, for a monthly average of 98.4%. Compliance ranged from 92% to 98% in the first four months of 2010. The lower than expected level of 92% in April 2010 can be partially attributed to precipitation occurring on 19 of the 30 days during the month. Exhibit IX-84 summarizes the monthly compliance performance.

Final Report 375
6/20/2011
Exhibit IX-99 Percent of Total Locates Completed on Time
January 2009 – April 2010
Source: Information Response 307
Finding IX-54 Jersey Central Power and Light has invoiced its underground locates contractor $630,923 for 271 dig-in claims during 2007, 2008 and 2009.
Schumaekr & Company consultants requested and analyzed five (5) years of dig-in claims data. Exhibit IX-100 provides the dollar value and number of dig-in claims invoiced to Jersey Central Power and Light's underground locates contractor (Locates Cntr) and other excavators (Excavator) deemed to be liable for the repairs. Claims invoiced to the locates contractor peaked in 2007 at $364,140, the first year of the current locates contractor. Contractor claims for 2008 and 2009 continued to be at higher levels than the previous locates contractor.
Jan09 Feb09 Mar09 Apr09 May09 Jun09 Jul09 Aug09 Sep09 Oct09 Nov09 Dec09 Jan10 Feb10 Mar10 Apr10
Percent 98 99 98 98 98 99 99 99 99 98 98 98 98 97 97 92
90
92
94
96
98
100Pe
rcen
t Com
plia
nce
Average = 98.4

376 Final Report
6/20/2011
Exhibit IX-100 Jersey Central Power and Light Dig-in Claims
2004 to 2008
Source: Information Response 304
Finding IX-55 Jersey Central Power & Light/FirstEnergy has not performed an audit of its locates contractor since 2006.
Schumaekr & Company consultants requested a copy of all audits of underground locates contractors performed in the last five years. Only one audit that was performed in 2006 was provided. Exhibit IX-101 provides the header from the title page of that audit.

Final Report 377
6/20/2011
Exhibit IX-101 Header from 2006 Audit of JCP&L Locates Contractor
as of July 2010
Source: Information Response 306
Recommendation
Recommendation IX-15 Determine the root cause(s) of the claims against JCP&L’s underground locates contractor and develop a plan to minimize the causes. (Refer to Finding IX-54)
Determination of the root causes should reduce the contractors per unit charge for locates. A total elimination of contractor claims would have reduced the 2009 per unit ticket cost by $0.96 to $10.66 per locate. Reduction of the locates contractor's claims would also improve customer reliability and free up labor resources for other types of work.
Recommendation IX-16 Perform periodic audits of the contractor(s) that are providing JCP&L with underground locates services. (Refer to Finding IX-55)
The last audit of the locates contractor was performed in 2006. During the interim, Jersey Central Power & Light awarded the contract services to a different contractor. Even though contractor performance is monitored on a monthly basis, periodic audits would ensure that the contractor continues to perform in accordance with all Jersey Central / FirstEnergy specifications.
Installation of New and Replacement Lines and Services
Background
During 2007, FirstEnergy (FE) detected a need to create a field coordinator role. The responsibility of this role was to oversee contractors working in the field to install transmission, substation, and distribution facilities. FE also determined the need for a Field Coordinator Reference Guide. A team was formed to develop the guide. Team members were representatives from:
♦ FirstEnergy

378 Final Report
6/20/2011
♦ The Illuminating Company
♦ Jersey Central Power & Light
Exhibit IX-102 provides the deliverables expected from the team charged with developing the Field Coordinator Reference Guide.
Exhibit IX-102 Deliverables from FirstEnergy Team Formed to Develop Field Coordinator Reference Guide
as of July 2010
Source: Information Response 309
Findings & Conclusions
Organization
Finding IX-56 Jersey Central Power & Light/FirstEnergy have specific organizations that are responsible for the oversight of contractor performance regarding the installation of transmission, substation, and distribution facilities.
Organizational charts for department(s) responsible for the oversight of transmission, substation, and distribution contractors were requested by Schumaekr & Company consultants and subsequently confirmed in interviews. The FirstEnergy ED (Energy Delivery) Project Management organization is responsible for establishing policies, standards, and software tools for monitoring contractor performance. The Jersey Central Power & Light organization that is responsible for daily monitoring of substation, distribution, and transmission contractor performance is the Region Project and Portfolio Management team. Exhibit IX-103 shows the organizations that are responsible for monitoring contractor performance.

Final Report 379
6/20/2011
Exhibit IX-103 Organizations Responsible for Monitoring of JCP&L Contractor Performance
as of July 2010
Source: Information Response 308 and Interviews 88, 134, 184, and 193
Process
Finding IX-57 Jersey Central Power & Light has a formalized process for determining whether a project is to be completed in-house or via contract labor.
Schumaekr & Company consultants requested and reviewed the criteria used to determine whether a project is to be performed in-house or contracted out. Exhibit IX-104 provides the criteria applied when deciding whether a project is to be performed in-house or via contract forces.

380 Final Report
6/20/2011
Exhibit IX-104 Criteria Used to Determine Whether Project Performed In-House or Via Contract
as of July 2010
Source: Information Response 315
Finding IX-58 Jersey Central Power & Light / FirstEnergy has a defined process for the oversight of transmission, substation, and distribution construction contractors.
Schumaker & Company reviewed the written policies and procedures related to the oversight of contractors installing transmission, distribution, and substation facilities. In addition, we interviewed FirstEnergy and Jersey Central Power & Light personnel about the process. Exhibit IX-105 provides the table of contents of the reference guide used by field coordinators. A summary of the specific activities performed by the field coordinators is given in Exhibit IX-106.

Final Report 381
6/20/2011
Exhibit IX-105 Table of Contents from FirstEnergy Field Coordinator Reference Guide
as of July 2010
Source: Information Response 309
Exhibit IX-106
Summary of Roles and Responsibilities of JCP&L / FE Field Coordinators as of July 2010
Source: Information Response 309
Finding IX-59 Jersey Central Power & Light supervisors are expected to use the field coordinator process for transmission, distribution, and substation projects completed by in-house crews.
The expectations for in-house projects are provided in Exhibit IX-107.

382 Final Report
6/20/2011
Exhibit IX-107 Application of Field Coordinator Methods to In-House Projects
as of July 2010
Source: Information Response 304
Performance Management
Finding IX-60 Jersey Central Power and Light has reduced its distribution, transmission and substation contract labor work force, excluding tree trimming, from a yearly monthly average peak of 172 FTEs in 2005 to 9 FTEs in 2009.
Schumaekr & Company consultants requested and analyzed five (5) years of contract work force data. Interviews revealed that Jersey Central Power and Light made a decision to do as much work with internal company labor as possible by improving planning, scheduling and processes. Exhibit IX-108 shows the monthly average count of contract FTEs for 2005 through 2009. The number of contract FTEs peaked at 240 in August, 2005 and the lowest number of 6 occurred in March, 2009. The data demonstrates a continuous trend of reducing the reliance on contract labor with minimum reliance occurring during 2009 with a yearly monthly average of 9 FTEs per month.
Exhibit IX-108 Distribution, Transmission and Substation Contract Labor
March, 2005 to December, 2009
Source: Information Response 314

Final Report 383
6/20/2011
Finding IX-61 Jersey Central Power & Light has a formalized process to monitor the performance of contractors and in-house crews that are installing transmission, substation, and distribution facilities.
Schumaekr & Company consultants requested and reviewed documentation of the methods used to monitor the quality and performance of work performed by contractors that are installing electrical facilities. Interviews indicted that because of the precision and complexity involved, the "Earned Value" method is used only on large Jersey Central projects. Primavera software is used for scheduling and monitoring of FirstEnergy / Jersey Central Power & Light projects. Frequent meetings are held with contractors and each contractor is formally evaluated at the end of the project.
Exhibit IX-109 provides an overview of the various methods used. An example of an "Earned Value" schedule is presented in Exhibit IX-110. An extract from a typical Primavera schedule is shown in Exhibit IX-111. Exhibit IX-112 provides select portions from the contractor evaluation form. The rating criteria used in the contractor evaluation are given in Exhibit IX-113.
Exhibit IX-109 Overview of JCP&L Project Monitoring
as of July 2010
Source: Information Response 310

384 Final Report
6/20/2011
Exhibit IX-110 Portion of Typical "Earned Value" Schedule
as of July 2010
Source: Information Response 310
Exhibit IX-111
Portion of Typical Primavera Schedule as of July 2010
Source: Information Response 310

Final Report 385
6/20/2011
Exhibit IX-112 Select Extract from Contractor Evaluation Form
July 2010
Source: Information Response 310

386 Final Report
6/20/2011
Exhibit IX-113 Rating Criteria Used for Contractor Evaluation Form
as of July 2010
Source: Information Response 310
No separate evaluation of contractor schedule or budget performance was completed because Jersey Central Power and Light made a conscious decision in 2008 to construct their transmission, substation and distribution facilities with its in-house personnel supplemented when needed. Exhibit IX-108 indicates the downward trend in the use of contract personnel. The evaluation of project schedule and budget performance included in the Transmission and Distribution chapter includes any contract personnel used.
Recommendations
None

Final Report 387
6/20/2011
X. Customer Service
This chapter addresses the Customer Service function. The Customer Service function includes customer contact centers, meter reading, billing, collections, and revenue protection. The remittance processing function is covered in the Finance chapter.
A. Background & Perspective
Jersey Central Power & Light (JCP&L) transmits and distributes electricity to about 1.1 million residential, commercial, and industrial customers in 13 counties in central and northern New Jersey. The number of customers by type over the 2005 to 2009 period is shown in Exhibit X-1.
Exhibit X-1 Customer Numbers
2005 to 2009
Source: Information Response 135
JCP&L’s customer mix as of 2009 is 88.7% residential, 11.1% commercial, and just 0.2% industrial. The total number of customers grew by 2.2% from 2005 to 2009 (Exhibit X-1), a period of relatively slow growth.
While the customer base grew slightly from 2005 to 2009, the number of megawatt hours (MWH) of electricity sold decreased in total and for all customer classes except for Public Street and Highway Lighting, as shown in Exhibit X-2.
Residential Commercial Industrial Total
2005 950,622 117,365 2,640 1,070,627 2006 958,986 118,636 2,592 1,080,214 2007 963,484 119,618 2,587 1,085,689 2008 967,563 120,602 2,551 1,090,716 2009 969,897 121,297 2,529 1,093,723
-
200,000
400,000
600,000
800,000
1,000,000
1,200,000

388 Final Report
6/20/2011
Exhibit X-2 Sales by Volume by Customer Class
2005 to 2009
Source: FERC Form 1, pp. 304 and Schumaker & Company Analysis of Information Response 135
Organization
Customer Service is primarily a centralized organization within the FirstEnergy Utilities (FEU) business unit and JCP&L. The contact centers, collections, revenue protection, and remittance processing functions are centralized as part of the FEU Customer Services group. Only the Revenue Operations function of meter reading is decentralized and reports to the JCP&L organization. Like most JCP&L functions, however, meter reading receives staff support from the FEU Customer Services organization. For the purposes of this report, remittance processing is covered in the Finance chapter.
The FEU Customer Services function is organized under the FirstEnergy (FE) Senior Vice President, who is also the President of the FEU business unit. The FEU President reports to the FirstEnergy CEO. The Vice President of Customer Service and Energy Efficiency reports to the President of FEU. The Customer Service Departments reporting to the Vice President of Customer Service and Energy Efficiency are highlighted in Exhibit X-3.
Residential Small Commercial and Industrial
Large Commercial and Industrial
Public Street & Highway Lighting
Total Megawatt Hours Sold
2005 10,106,918 9,431,766 3,073,951 86,779 22,699,4142006 9,547,790 9,450,490 2,831,040 86,180 21,915,5002007 9,838,800 9,867,446 2,884,540 88,265 22,679,0512008 9,667,364 9,706,944 2,773,128 88,385 22,235,8212009 9,213,827 9,323,204 2,447,113 87,453 21,071,597
0
5,000,000
10,000,000
15,000,000
20,000,000
25,000,000
Residential
Small Commercial
and Industrial
Large Commercial
and Industrial
Public Street & Highway Lighting
Total Megawatt
Hours Sold
Compound Growth/Loss 2005-2009 -2.29% -0.29% -5.54% 0.19% -1.84%
-6.00%
-5.00%
-4.00%
-3.00%
-2.00%
-1.00%
0.00%
1.00%

Final Report 389
6/20/2011
Exhibit X-3 Customer Service & Energy Efficiency Organization
as of June 30, 2010
Source: Information Response 54
Until recently, there was a Customer Service function within JCP&L that fell under the JCP&L Vice President of External Affairs. The JCP&L Director of Customer Service oversaw meter reading and revenue operations (field collections and revenue protection) for both the North and Central regions. In all other states, the field collections and revenue protection functions reported to the centralized FEU Revenue Operations organization. On August 29, 2010, FEU and JCP&L reorganized to bring the New Jersey organization into alignment with the rest of FEU. The Revenue Operations field collection and revenue protection functions were centralized under FEU Revenue Operations. The field collectors and revenue protection personnel, however, are still deployed throughout JCP&L’s service territory. The meter readers now report to a JCP&L Operations Support group along with the Fleet, Stores, Facilities, Meters and Forestry groups. The former JCP&L Customer Service group was eliminated when its functions were transferred elsewhere on August 29, 2010. In addition, a Customer Support group serving major accounts, which was centralized under FEU Customer Services, was transferred to JCP&L and now reports to the Vice President of External Affairs. Exhibit X-4 summarizes these recent organizational changes.
Akron, OH 853
FirstEnergyVice President
Customer Service & Energy Efficiency
Akron, OH 498
FirstEnergyDirector
Customer Contact Centers
Akron, OH 145
FirstEnergyDirector
Customer Service
Akron, OH 148
FirstEnergyDirector
Revenue Operations
Akron, OH 5
FirstEnergyDirector
Grid & Meter Technology
Akron, OH 15
FirstEnergyManager
National Accounts & Portfolio Management
Akron, OH 7
FirstEnergyDirector
Economic Development
Akron, OH 9
FirstEnergyDirector
Regulated Commodity Sourcing
Akron, OH 8
FirstEnergyManager
Energy Efficiency Compalance & Performance
Akron, OH 1
FirstEnergySpecial Assignment
Energy Efficiency & Program Management

390 Final Report
6/20/2011
Exhibit X-4 JCP&L Recent Customer Service Organizational Changes
August 29, 2010
Unit Prior to Reorganization After Reorganization
Meter Reading Reported to a JCP&L Customer Service group
Reports to JCP&L Operations Support group with Fleet, Stores Facilities, Meters, and Forestry groups – the former Customer Service group was eliminated.
Revenue Operations Collectors and Revenue Protection Personnel
Reported to a JCP&L Customer Service group with the meter readers
Reports to the FEU Revenue Operations group in Akron like all other FEU operating companies (opcos)
Customer Support Major Account Specialists
JCP&L Customer Support reported to the FEU Customer Services organization
Reports to the JCP&L Vice President of External Affairs – the function reports to the local opco in all other FEU opcos as well.
Source: Interview 130
Exhibit X-5 shows the current JCP&L Customer Service organization.
Exhibit X-5 JCP&L Customer Service Organization
as of August 30, 2010
Source: Information Response 54 and Interview 130
These changes bring the JCP&L customer service function organization into general alignment with the other FE operating companies (opcos).
Redbank, NJ 1424
JCP&LPresident
Redbank, NJ 30
JCP&LVice PPresidentExternal Affairs
Morristown, NJ 22
JCP&LManager
Customer Support
Redbank, NJ 348
JCP&LDirector
Operations Support
Red Bank, NJ 155
JCP&LManager
Meter Reading

Final Report 391
6/20/2011
Performance Management
The FEU Customer Services group uses a “CustomerFirst” scorecard with the following metrics:
♦ Contact Center Survey Index (customer satisfaction survey results) ♦ Contact Center Average Speed of Answer ♦ Street Lighting Percentage of Orders Closed in Three Days ♦ Justified Complaints ♦ Blue Sky Estimated Time of Restoration Accuracy ♦ First Call Resolution Percentage ♦ Meter Reading Accuracy
For each metric, there is a target for the year, with year-to-date results reported monthly. See Exhibit X-6 for an example of a monthly report.
Exhibit X-6 Sample CustomerFirst Scorecard
as of April 30, 2010
Source: Information Response 187

392 Final Report
6/20/2011
Residential Bill Changes
Exhibit X-7 shows the changes in a typical residential summer monthly bill from 2005 to 2009. The Rider NGC is the non-utility generation charge applicable to all kWh usage of all full and delivery service customers. The Transitional Energy Facility Assessment (TEFA) rider is a temporary fee established by the energy tax reform statute.
Exhibit X-7 Typical Residential Service (RS Rate) Summer Bill Changes
Non-Shopper at 952 kWh per Month 2005 to 2009
Source: Information Response 424
Overall, the typical summer residential monthly bill increased by $64.82 per month, or 52% for the period. Of this increase, 78% was attributable to basic generation service cost increases. All of the largest dollar increases were also the largest percentage increases, except delivery.
The customer bill includes several riders and other charge components. Explanations of the riders and charges acronyms included in the customer’s bill are:
♦ The Basic Generation Service – Fixed Pricing (BGS-FP) rider is for kilowatt hour (kWh) usage for non-shopping (default service) customers. It reflects charges for energy, generation capacity, ancillary services, and related costs as determined in the BGS6
6 PJM Interconnection is a regional transmission organization (RTO) that coordinates the movement of wholesale electricity in all or parts of Delaware, Illinois, Indiana, Kentucky, Maryland, Michigan, New Jersey, North Carolina, Ohio, Pennsylvania, Tennessee, Virginia, West Virginia and the District of Columbia.
auctions.
2005 to 2009 Percent Difference
Generation 74.09%Transmission 30.16%Customer Charge 0.00%Rider NGC 42.22%Delivery 14.19%Sales+TEFA Tax 53.88%Total Bill 51.85%
0.10%10.10%20.10%30.10%40.10%50.10%60.10%70.10%80.10%
Axi
s Titl
e
2005 2009 2005 to 2009 Dollar Difference
Generation $66.38 $115.56 $49.18 Transmission $4.41 $5.74 $1.33 Customer Charge $2.06 $2.06 $0.00 Rider NGC $10.61 $15.09 $4.48 Delivery $31.65 $36.14 $4.49 Sales+TEFA Tax $9.91 $15.25 $5.34 Total Bill $125.02 $189.84 $64.82
$0.00 $20.00 $40.00 $60.00 $80.00
$100.00 $120.00 $140.00 $160.00 $180.00 $200.00

Final Report 393
6/20/2011
♦ The Transitional Energy Facility Assessment (TEFA) rider is a temporary fee established by the energy tax reform statute.
♦ The Societal Benefits Charge (SBC) rider includes the Nuclear Plant Decommissioning Costs (NDC) rider, the Demand Side Management (DSF) rider, the Manufactured Gas Plant Remediation Costs (RAC) rider, the Uncollectible Accounts Charge (UNC) rider, the Consumer Education Program Costs (CED) rider, and the Universal Service Fund (USF) Costs rider.
♦ The System Control Charge (SCC) rider is for Basic Generation Service (BGS) system control costs.
A new rider charge has since been added, Rider RGGI Recovery Charge (RRC), to recover costs associated with the Integrated Distributed Energy Resource (IDER) program.
Five-year trends through 2009 of the bill’s line item components (customer charge, commodity, delivery, each tax, etc.) for the median customer are provided in table format in Exhibit X-8. They show that the largest bill increases in dollar terms have been in:
♦ Rider BGS – $50.51 per month. The BGS rider is the generation charge for non-shopping customers using the BGS auction results for basic generation service.
♦ Rider non-utility generation charge (NGC) – $4.48 per month. The NGC rider is the non-utility generation charge applicable to all kWh usage of all full and delivery service customers.
♦ Distribution – $3.57 per month. A Phase II 2004 rate case, which followed a 2003 rate reduction in Phase I, resulted in distribution charge increases in 2005 and 2006.
♦ New Jersey Sales and Use Tax – $5.34 per month. Both the tax rate and the amount taxed went up.

394 Final Report
6/20/2011
Exhibit X-8 Typical Residential Service (RS Rate) Summer Bill Changes
RS Summary 2005 to 2009
Source: Information Response 424
The total Rider NGC, customer, and delivery charges, or the portion of the bill going to JCP&L as rates and cost offsets, increased from $44.32 to $53.29, or $8.97 from 2005 to 2009. This was a 20% increase that accounted for 14% of the total bill increase of $64.82. The Consumer Price Index published by the U.S. Department of Labor Bureau of Labor Statistics had average year-to-year increases of 3.2%, 2.8%, 3.8%, and –0.4% from 2006 through 2009. The compound cumulative increase in the Consumer Price Index (CPI) was 10% from 2005 to 2009, or a simple average of 2.5% per year.
FEU Customer Services
The FEU Customer Services organization reports to the FEU Vice President of Customer Service and Energy Efficiency. It encompasses a number of functions provided to JCP&L as affiliate services. They include:
♦ Human Services – administration of several human service social programs
♦ Compliance – administration and response to regulatory complaints; FEU Customer Services has two employees deployed in New Jersey who manage FirstEnergy’s response to complaints filed with the Board of Public Utilities (BPU).
♦ Customer information system support and internal controls
RS Summary Calculation 2005 2006 2007 2008 2009 2005 to 2009 Dollar Difference
2005 to 2009 Percent Difference
Generation Rider BGS 66.38$ 74.19$ 86.63$ 105.34$ 116.89$ 50.51$ 76.09%- BGS Tax -$ 0.42$ 0.90$ 0.10$ 1.33$ 1.33$ -
Total Generation 66.38$ 73.77$ 85.73$ 105.24$ 115.56$ 49.18$ 74.09%Transmission BGS Tax -$ 0.42$ 0.90$ 0.10$ 1.33$ 1.33$ -
+ Transmission Charge 4.41$ 4.41$ 4.41$ 4.41$ 4.41$ -$ 0.00%Total Transmission 4.41$ 4.83$ 5.31$ 4.51$ 5.74$ 1.33$ 30.16%
Customer Charge 2.06$ 2.06$ 2.06$ 2.06$ 2.06$ -$ 0.00%Rider NGC 10.61$ 10.22$ 15.09$ 15.09$ 15.09$ 4.48$ 42.22%Delivery Distribution 26.77$ 30.34$ 30.34$ 30.34$ 30.34$ 3.57$ 13.34%
+ Rider SBC 4.81$ 4.81$ 4.50$ 5.08$ 5.73$ 0.92$ 19.13%+ Rider SCC 0.07$ 0.07$ 0.07$ 0.07$ 0.07$ -$ 0.00%
Total Delivery 31.65$ 35.22$ 34.91$ 35.49$ 36.14$ 4.49$ 14.19%Sales+TEFA Tax TEFA Charge 2.83$ 2.83$ 2.83$ 2.83$ 2.83$ -$ 0.00%
+ NJ Sales Tax 7.08$ 73.74$ 10.22$ 11.57$ 12.42$ 5.34$ 75.42%Total Taxes 9.91$ 76.57$ 13.05$ 14.40$ 15.25$ 5.34$ 53.88%
Total Bill 125.02$ 202.67$ 156.15$ 176.79$ 189.84$ 64.82$ 51.85%

Final Report 395
6/20/2011
♦ Large customer billing and contracts – primarily for customers using the MV90 interval billing system (time-of-use pricing using frequently reported interval consumption data); also administers contracts with large customers, such as Fort Dix in New Jersey
♦ Remittance processing – covered in the Finance chapter in this report
Human Services Programs
FEU Customer Services administers several human services social programs for JCP&L. They include:
♦ Universal Service Fund (USF) – JCP&L collects funds for application at the direction of the state.
♦ New Jersey Shares – FirstEnergy shareholders match customer contributions.
♦ Lifeline – funded by the USF charge; assistance for disability as directed by the state
♦ Comfort Partners – funded by Clean Energy Rider; a weatherization program
♦ Low Income Home Energy Assistance Program (LIHEAP) – low-income assistance as directed by the state
Exhibit X-9 shows the participation trends for each of these programs.

396 Final Report
6/20/2011
Exhibit X-9 Low-Income Assistance Program and Participation Rates
2005 to 2009
Source: Information Response 165
The increasing use of the human services social programs likely reflects the deterioration in the economy and the increases in power bills in the JCP&L territory.
Regulatory Complaint Handling Process
The FEU Customer Services organization handles regulatory complaints for all FEU opcos. While this is an FEU-centralized program, two employees are deployed to New Jersey to handle customer complaints from the Board of Public Utilities (BPU). They report to the Manager of Compliance and Human Services in the Customer Service organization.
There is a separate organization and process for handling non-BPU complaints that are addressed directly to JCP&L or FE headquarters. These are called “executive” or “escalated” complaints, which are handled by a separate JCP&L organization as described below. There is one FEU-wide complaint database, however, that tracks all complaints. This approach is necessary because some complainants address their complaints to multiple parties: the BPU, the FE CEO, their legislative representatives, etc. Until 2004, all complaints were handled by the FEU BPU complaint staff.
The FEU complaint database is an internal web database that can be accessed by multiple parties with appropriate security clearances. This database is used to track each complaint from receipt to resolution.
Percent Participants USF
Percent Participants NJ SHARES
Percent Participants Lifeline
Percent Participants Comfort Partners
Percent Participants LIHEAP
2005 2.02% 0.05% 1.78% 0.19% 0.41%2006 2.19% 0.08% 1.74% 0.20% 0.29%2007 2.37% 0.10% 1.92% 0.20% 0.63%2008 2.93% 0.19% 2.59% 0.22% 0.84%2009 2.93% 0.19% 2.59% 0.22% 0.84%
0.00%
0.50%
1.00%
1.50%
2.00%
2.50%
3.00%

Final Report 397
6/20/2011
Complaints from the BPU originate from two sources. First, the BPU Customer Service group receives complaints on non-engineering matters, such as billing and collections. The BPU Customer Service group enters the complaint into an electronic data interchange (EDI) application on the web, which is used by the BPU and all New Jersey utilities. The second source of complaints is from the BPU Engineering organization. These complaints, which reflect topics such as reliability or power quality, are faxed to the FEU complaint personnel in NJ.
The FEU BPU complaint staff in New Jersey checks the EDI regularly and normally picks up new complaints within an hour of entry. They then enter them into the FEU complaint system. They also enter faxed complaints as received. The database is checked regularly for duplicate complaints, such as BPU and executive, and duplicates are identified and consolidated.
The FEU BPU complaint staff has established a network of subject matter experts (SMEs) throughout FEU and JCP&L to address BPU complaints in their areas of expertise. For example, there is always a senior customer service representative at the Contact Center who is assigned to address BPU complaints as they are received. The BPU complaint staff assigns each complaint to the appropriate SME as it comes in via e-mail or fax. Complex complaints requiring the involvement of multiple SMEs are coordinated by the complaint staff. Complaint response has been established as a well-known priority at FEU and JCP&L, and complaints are generally addressed in a timely fashion. The FirstEnergy BPU complaint staff, however, does monitor the time line on all complaints and assures timely resolution.
For collection complaints, which represent over half of the cases, the BPU complaint staff first calls the customer and tries to confirm that the prescribed process has been followed and that the customer understands the options available, including assistance that might be available from the human services social programs. In general, the customer has been informed of the optional payment terms and social services but is appealing to the BPU as a court of last resort.
The FEU BPU complaint staff reviews the complaint response provided by the field SMEs and communicates the result to the BPU via the EDI. Normally, the SME has communicated with the customer, but the staff assures that the customer is well-informed. If the field SME response is somehow unsatisfactory, the FEU BPU complaint staff has an escalation procedure available, but leveraging it is seldom required. The BPU staff may agree or disagree with FirstEnergy’s proposed resolution. If it disagrees, the case is kept open until resolution with the BPU is achieved.
Except for meter errors, FirstEnergy does not forgive any money owed to resolve complaints. Its position is that it would be unfair to paying customers to forgive amounts owed by non-paying customers. FirstEnergy Utilities does have a variety of payment plans available and the FEU BPU complaint staff has ample discretion to work out creative payment plans with both the BPU and customers.
Should the customer not be satisfied with the response to the complaint, he/she can request a formal hearing on the complaint for a $25 filing fee. Such a request sets in motion a litigation process that can take six months to a year and results in an Administrative Law Judge (ALJ) recommendation to the

398 Final Report
6/20/2011
commissioners on how to resolve the complaint. The commissioners can either accept the recommendation or issue an alternative order. The customer can dispute all charges related to the bill in a formal hearing and FirstEnergy cannot interrupt power until the formal hearing is resolved. Exhibit X-10 shows the formal BPU complaint trends from 2005 to 2009.
Exhibit X-10 Formal BPU Complaint Trends
2005 to 2009
Year Formal Complaints Docketed Resolved to Date Hearings Held
2005 4 4 2 2006 7 6 2 2007 4 4 2 2008 8 8 4 2009 14 9 4
Source: Information Response 747
It is likely that the increasing trend in formal BPU complaints is related to the deteriorating economic conditions during this period and the increasing power bills.
Customer Support
The JCP&L Customer Support group reports to the JCP&L Vice President of External Affairs. This group is primarily composed of customer account representatives. Approximately 20 customer service specialists support the largest 100 accounts. There is also an FEU National Accounts group reporting to the FEU Vice President of Customer Service and Energy Efficiency. The National Accounts group represents all FEU operating companies to the headquarters of organizations with multiple company owned stores across the FEU territory, such as, Wal-Mart and McDonalds. There is little overlap between the national accounts and the New Jersey large accounts.
Non-Regulatory Complaint Handling Process
Two members of the JCP&L Customer Support group handle non-BPU executive complaints. This group utilizes the FEU complaint database for complaint tracking and has a parallel process. Complaints are assigned to appropriate field SMEs for resolution. If the response is inadequate, there is a rarely used internal escalation process. The JCP&L complaint staff tracks the complaints to resolution. If the customer is not satisfied with the resolution offered, the customer still can complain to the BPU.

Final Report 399
6/20/2011
Customer Contact Centers
The Customer Contact function is divided between a contracted contact center for credit matters and an FEU employee-staffed contact center for all other matters. The FEU employee contact center that primarily serves New Jersey and Pennsylvania FirstEnergy customers is located in Reading, Pennsylvania. It is being integrated with the Akron contact center serving Ohio customers, and many customer matters from any FEU state can be resolved by either contact center. The credit contract contact center is located in Pennsylvania and is discussed in the Credit and Collections section below.
Exhibit X-11 shows the FEU inbound and outbound call volumes from 2005 through 2009.
Exhibit X-11 Inbound and Outbound Call Volume
2005 to 2009
Source: Information Responses 195 and 199. Note: The higher than forecasted call volume experienced in 2008 is attributed to the outage calls from Hurricane Ike.
Inbound and outbound calls both peaked in 2008. FEU contact centers also field web, e-mail, mail, and faxed inquiries.
FEU employee contact centers use a four-tier system for customer service representatives (CSRs). Tier-one CSRs answer the simplest calls, such as move in or out and outages. Tier-one calls represent approximately 40% of the total calls. Tier-two CSRs can take tier-one calls plus billing and 911. (The 911 dispatcher calls for electric-related emergencies.) Tier-two calls also represent about 40% of the call
Total
2005 9,729,5642006 9,459,0792007 9,893,1892008 11,160,5222009 10,562,224
8,500,000
9,000,000
9,500,000
10,000,000
10,500,000
11,000,000
11,500,000
FirstEnergy Inbound Calls
New Jersey Ohio Pennsylvania Total
2005 498,694 464,808 1,164,565 2,128,0672006 479,230 294,954 1,079,756 1,853,9402007 679,632 931,621 1,150,748 2,762,0012008 728,608 1,618,236 1,003,643 3,350,4872009 595,620 1,342,023 624,415 2,562,058
0
500,000
1,000,000
1,500,000
2,000,000
2,500,000
3,000,000
3,500,000
Outbound Credit Calls – All States

400 Final Report
6/20/2011
volume. Tier-three CSRs can answer tier-one and -two calls plus new services and commercial and industrial requests. Tier-four CSRs can answer all types of calls and add the capability to do complicated out-of-the-ordinary move-in and -out calls.
Training is incremental and appropriate for each tier. The FEU contact center training program for each tier is highly developed and structured. It involves classroom time, practice, quality reviews, and shadowing working CSRs. New CSRs are first trained for tier one. Based upon projected needs, additional CSRs are selected for training at higher levels. Trainees for each subsequent tier are selected from candidates in the prior tier based upon performance and potential. CSR movement through the tiers is part of the career progression path.
Exhibit X-12 shows the staffing statistics for the Reading contact center.
Exhibit X-12 Staffing – Contact Center/CSR Turnover Rates
2005 to 2009
Source: Information Response 197
Like most call centers, the FEU contact centers experience turnover of approximately 20% per year. The FEU employee contact centers have developed a temporary-contract employee strategy to handle peak load volumes and to replenish employee ranks that have thinned by attrition. Each year, temporary contract employees are hired in the March/April timeframe to ramp up capacity to the August/September peak work months. The temporaries are hired and trained in subsequent groups until the staffing level range meets the forecasted call volume. After the peak work months, in October/November, the temporaries are evaluated and some, approximately 30 to 40, are offered full-time positions and kept on. The rest are phased out as the workload declines into the fall and winter.
January Staff December Staff Employees Hired Employees Leaving
2005 412 463 112 662006 461 447 93 1072007 444 466 142 1172008 462 446 63 792009 438 408 42 71
050
100150200250300350400450500
Turnover
2005 16.02%2006 23.21%2007 26.35%2008 17.10%2009 16.21%
0.00%5.00%
10.00%15.00%20.00%25.00%30.00%

Final Report 401
6/20/2011
This strategy allows FEU to meet its peak workloads economically and to audition a large number of candidates to fill full-time regular employee positions.
The FEU employee contact centers employ the following technology:
♦ The FEU customer information system is the SAP Core Customer System (CCS) – version ECC 6.0. Current customer modules used include Customer Service, Contract Billing, Invoicing, SD Billing, Contract Accounts Receivable and Payable, Credit Management, and Collection Management. It was last upgraded in April 2010.
♦ There are two switches for phone calls, one at each contact center. The Reading switch is a Nortel Symposium.
♦ There is one interactive voice response (IVR) system, Intervoice, which was upgraded in 2009.
♦ Genesis is the computer/telephony interface. It distributes calls intelligently to the four tiers of CSRs according to the IVR information. If the hold time is over two minutes, the caller is offered virtual hold to be called back or he/she can stay on the line. Virtual hold is a separate technology product that was implemented in 2008.
♦ Reporting out of Genesis is done through a Cognos front-end that converges all statistics for reporting.
♦ A contract with Experion is used at the contact centers on service requests to validate the applicant’s name and social security number. Invalid results are routed to a higher-level CSR for further review.
♦ Web self-service is available, which basically duplicates the IVR self-service options.
♦ All tier-one calls are now virtual between contact centers, and all tier-one CSRs are trained for all states. Also, 32 CSRs in Ohio can perform New Jersey billing calls.
FEU contact center technology is modern and there are plans for further improvement:
♦ There are current projects to install the Genesis work force management (WFM) tool and the Genesis intelligent workload distribution (IWD) tool. WFM performs forecasting, planning, scheduling, and reporting. IWD assembles and distributes all CSR work, including faxes, e-mails, and letters as well as calls. CSRs will receive electronic assignment of batch work when they are not expecting calls. IWD will also route outage calls to the back-office workstations so staff will not have to relocate to the contact center.
♦ FEU is working toward proactive customer messaging, such as texts to customers to notify them of outages.
♦ FEU will add Internet chat capabilities (between customers and CSRs in the contact center) for web service.

402 Final Report
6/20/2011
FEU contact centers also have a highly developed, centralized quality assurance program. They use NICE as a quality monitoring system. NICE records audio on all calls and video of screens seen on a random sample basis. There are 13 quality monitor personnel. Four are in Reading but all 13 are virtual. Each quality monitor can review any customer service representative. The quality monitors are mostly experienced CSRs. Calls are evaluated by the quality monitoring staff and contact center supervisors. The evaluation form used for monitoring is determined by the call type (i.e., outage, high bill, new service, etc.). Coaching packages are created by the contact center supervisor. They include evaluations and any other pertinent information for discussion with the CSRs. Coaching packages are sent electronically to the CSRs for review prior to the scheduled coaching sessions. Coaching sessions are held weekly between the supervisor and customer service representatives. Quality scores are included in the CSRs’ performance reviews.
The contact centers use a risk-based quality monitoring program. CSRs must achieve a minimum quality score of 87 on each call monitored. Lower scores result in the CSR being quality-reviewed more often, and higher scores less often. Calls selected as samples favor video calls, if available, for better monitoring. All customer survey responses on calls are quality scored as are all regulatory complaints involving calls.
Meter Reading
Meter reading is a JCP&L function. There are approximately 120 meter readers, earning approximately $24 per hour or more, who are deployed among the six business offices. JCP&L has not implemented automated meter reading (AMR) or advanced metering infrastructure (AMI) and has no plans to do so. JCP&L does use handheld meter-reading devices, with the route and high/low-read edit data programmed in. These devices also have global position system (GPS) tracking but no wireless communications. As a result, the movements of the meter reader can be viewed after the fact but not in real time. JCP&L has a number of inside meters that require the meter reader to gain access to the premises. Lack of access causes estimated meter reads.
FirstEnergy’s official position on AMI is, “With full and timely cost recovery, FE supports the phased and targeted deployment of AMI as a mechanism to empower customers to manage power costs, facilitate demand response, and to improve customer service and operational performance.” However, FirstEnergy Utilities’ approach to AMI, to date, is to implement it only under regulatory order. For example, it is under an order in Pennsylvania to install AMI over the next 15 years to comply with Pennsylvania Act 129, which was passed in 2008. FEU maintains that its AMI studies have never shown an economic benefit to the customer. It has not studied AMI in conjunction with time-of-use pricing, however. Time-of-use pricing enabled by AMI may allow some customers to reduce their bills by switching some power use from higher on-peak prices to lower off-peak prices.

Final Report 403
6/20/2011
Credit and Collections
Most credit and collections work is outsourced by FEU. The exceptions are the field collection/revenue protection function and business offices. The field collectors and revenue protection personnel are physically deployed to the several opcos but report to a central Revenue Operations unit. There is a $20 field collection fee by tariff in New Jersey. FirstEnergy Utilities would prefer not to collect money in the field because doing so allows customers who can pay to wait until the last minute before service termination to pay. Moreover, it adds a risk of theft and harm to the collector in the field. New Jersey law, however, requires field acceptance of payments in lieu of disconnection, so field collectors accept payments in New Jersey. There are also four revenue protection employees in the JCP&L territory.
JCP&L maintains six business offices, which are deployed throughout its service territory. They are:
♦ Morristown – 90 Ridgedale Avenue, Morristown, NJ 07960 ♦ Hopatcong – 175 Center Street, Landing, NJ 07850 ♦ Phillipsburg – 400 Lincoln Street, Phillipsburg, NJ 08865 ♦ Allenhurst – 300 Main Street, Allenhurst, NJ 07711 ♦ Toms River – 25 Adafre Avenue, Toms River, NJ 08753 ♦ Old Bridge – 999 Englishtown Road, Old Bridge, NJ 08857
Business office functions include taking bill payments and reviewing proper identification for service applications. Back-office work includes canceling misreads and issuing letters to customers for access, scheduling, and work that is related directly to meter reading.
Customers with collection concerns (payment arrangements and disconnections for non-payments) may call FirstEnergy’s collection agency via a direct-link telephone in each business office lobby. Customers with service concerns (high bills, service requests, and disputes) may also call FirstEnergy’s contact center via a direct-link telephone. Business office hours of operation are 8:15 A.M. to 4:00 P.M., Monday through Friday.
New Jersey law requires JCP&L to have at least one business office. The BPU order in the FirstEnergy/General Public Utilities (GPU) merger required that JCP&L retain the existing six New Jersey business offices for a period of at least five years. It also mandated that JCP&L must seek approval to change the business-office structure.
The credit call center function is contracted out to NCO Group, Inc. (NCO). Credit calls were formerly handled by the regular employee contact centers. Credit calls were contracted out when both the FE and GPU call centers were centralized in Akron and Reading respectively, prior to the merger. Both companies were concerned that not enough CSRs would transfer in the centralization to be able to handle the total workload. In both cases, credit calls were selected to be outsourced, at least for a transition period, and the credit calls were not brought back in-house.

404 Final Report
6/20/2011
The credit call center contractor is paid by the hour for FEU-dedicated credit CSRs. FirstEnergy Utilities prescribes the training and performance reporting for the contract CSRs and the NCO uses FEU systems and procedures. FirstEnergy Utilities has prepared a 15-page policy on credit that is available to credit CSRs on CNET, FEU’s online policy and procedures manual. FirstEnergy Utilities reports that NCO customer service representative performance is as good as or better than employee contact center CSRs’.
For a period of belt tightening from 2009 through 2010, the FEU employee contact centers began to take some credit calls in an effort to reduce outsource staff rather than employees. (Some senior CSRs still had credit call skills.) FEU, however, expects to return to all outsourced credit calls by the end of 2010.
New Jersey final bills are due in 15 days. At day 51, the bills are referred to outside collection agencies. FirstEnergy Utilities uses three tiers of collection agencies. The first tier is called Final Bill and works the overdue bills for up to 60 days. At day 113, unpaid bills are referred to the second tier, called Primary. At day 478, they are referred to the third tier, called Secondary. The bills stay with the third-tier collection agencies until the statute of limitations runs out. There are at least two contractors at each tier and the work assigned is adjusted over time based on each contractor’s performance. FirstEnergy Utilities does no credit reporting, but the collection agencies do.
Meter Replacement Program
JCP&L has a meter replacement program that is designed to comply with BPU requirements. Exhibit X-13 shows the number of meter replacements for the years 2005 to 2009.

Final Report 405
6/20/2011
Exhibit X-13 Meter Replacement
2005 to 2009
Source: Information Response 173
IDER Direct Load Control Program
JCP&L has an Integrated Distributed Energy Resource (IDER) program in New Jersey. It is led by the Advanced Grid and Meter Technology group in the FEU Energy Efficiency organization. IDER is implemented and operated by a turnkey contractor that recruits the customers and installs the hardware. JCP&L selects the substations and feeders and monitors the program from the regional dispatch office (RDO). IDER is a direct load control program that is designed to reduce high-priced peak loads or to respond to generation shortfalls. The program was started in 2008 with eight megawatts of controllable air-conditioning load. It does not use advanced metering infrastructure. In the first iteration, subscribers to this Easy Green program had a wireless switch and temperature sensor installed. A current transformer (CT) monitors the air-conditioning load. When called upon, the system can cycle the air conditioner on and off, allowing no more than a six-degree increase in temperature at the sensor. The eight megawatts of direct-load control was achieved on three feeders out of a single substation with approximately 3,000 customer volunteers. The participating customers receive $25 for signing up and $25 annually for participating. In addition, their electric consumption may be reduced somewhat.
The first iteration of IDER, (the 8MW BPU-approved pilot program) was deemed successful. A second iteration of IDER, a 15MW expansion of the pilot program, was approved by the BPU in 2009. A third iteration, funded with a Department of Energy grant, will add an additional 15 megawatts of controllable load (bringing the total size of the program to 38MW) and will expand the controls to pool pumps and
Northern Jersey Central Jersey
2005 11,655 7,321 2006 9,392 15,631 2007 8,226 12,623 2008 15,315 11,363 2009 17,702 16,784
0 2,000 4,000 6,000 8,000
10,000 12,000 14,000 16,000 18,000 20,000

406 Final Report
6/20/2011
water heaters. Approximately 10,000 customers will be involved. The IDER system has been called upon several times in 2010 for load reductions of up to 11 megawatts.
Economic Development
The FirstEnergy Utilities’ economic development function reports to the FEU Vice President of Customer Service and Energy Efficiency. It is led by a director of economic development and has eight additional positions. One economic development professional is deployed to New Jersey. FEU Economic Development develops and implements business attraction, retention, and expansion programs. FirstEnergy Utilities’ economic development activities include trade show participation, software systems to assist development agencies, an economic development website featuring available buildings, and U.S. Department of Commerce economic development program participation.
The single New Jersey economic development professional is headquartered in the state capitol, Trenton, and the function has offices in Red Bank and Morristown. New Jersey Economic Development once had a staff of six. New Jersey economic development activities focus on working with governmental development agencies, such as the New Jersey Economic Development Authority, counties and municipalities, large developers, and relocation consultants. The focus of New Jersey economic development is on the pharma, biotech, and defense industries, all of which have strong presences in New Jersey. The New Jersey economic development professional works closely with the JCP&L area managers, new business engineers, and large customer support representatives.
New Jersey projects announced and influenced and net present value (NPV) peaked in 2007 and have since decreased. Exhibit X-14 shows the New Jersey economic development performance metrics tracked for the period spanning 2005 through 2009.

Final Report 407
6/20/2011
Exhibit X-14 Economic Development
2005 to 2009
Source: Information Response 528
The number of new qualified leads peaked in 2006 and has since decreased. The reduction in economic development activity is likely related to the overall decline in economic conditions and may be related to the increase in power bills.
B. Findings & Conclusions
Finding X-1 Total customer service costs per customer have increased at a rate that is slightly below the inflation rate.
Exhibit X-15 shows the total JCP&L customer service costs and costs per customer for 2005 through 2009.
NJ Projects Announced
& Influenced
Total (PA/NJ/OH) Projects Announced
& Influenced
NJ New Qualified
Leads
Total (PA/NJ/OH) New Qualified
Leads
2005 6 154 103 1,3182006 9 213 388 1,5002007 20 168 91 9052008 18 200 91 8892009 7 115 50 636
0
200
400
600
800
1,000
1,200
1,400
1,600
NJ NPV
Total (PA/NJ/OH) NPV
2005 $501,404 $17,324,239 2006 $3,639,731 $17,693,824 2007 $5,049,188 $24,570,571 2008 $1,479,591 $30,223,547 2009 $1,854,497 $5,501,834
$0
$5,000,000
$10,000,000
$15,000,000
$20,000,000
$25,000,000
$30,000,000
$35,000,000

408 Final Report
6/20/2011
Exhibit X-15 Customer Service Costs per Customer
2005 to 2009
Source: Consultant Analysis of FERC Form 1, pp. 304, 322, and 323
The total cost per customer increased by $10, from $116 to $126 per year, from 2005 to 2009, a 9% increase. Inflation increased approximately 10% during the same period.
Customer Satisfaction
Finding X-2 According to the J. D. Power and Associates 2009 survey, the JCP&L Customer Satisfaction Index ranking is slightly below the average of other large eastern utilities.
Exhibit X-16 shows that JCP&L’s 2009 overall Customer Satisfaction Index ranking of 581 is below the large segment eastern average of 593, and it is well below the leading company’s 649 index.
2005 2006 2007 2008 2009
Total Customer Accounts Expenses1 34,479,059$ 35,665,278$ 37,309,332$ 38,592,092$ 32,957,459$ -1.12%
Total Customer Service & Information Expenses2 89,771,676$ 86,181,162$ 85,130,769$ 98,281,349$ 104,874,573$ 3.96%Average Number of Customers per Month 1,067,246 1,077,948 1,085,244 1,089,980 1,093,885 0.62%Total Customer Service Cost per Customer 116$ 113$ 113$ 126$ 126$ 2.00%
1Includes: supervision, meter reading expenses, customer records and collection expenses, uncollectible accounts, misc. customer accounts expenses2Includes: supervision, customer assistance expenses, informational and instructional expenses, misc. customer service and information expenses
Compound Growth/Loss
2005-2009
Total Customer Service Cost per Customer
2005 $116 2006 $113 2007 $113 2008 $126 2009 $126
$105
$110
$115
$120
$125
$130

Final Report 409
6/20/2011
Exhibit X-16 J.D. Power and Associates
2009 Electric Utility Residential Customer Satisfaction StudySM Customer Satisfaction Index Ranking – East Region: Large Segment
Source: Information Response 189-8; J.D. Power and Associates 2009 Electric Utility Residential Customer Satisfaction StudySM
Finding X-3 After decreasing from 2005 to 2007, the number of annual complaints has increased by 23% since 2007.
Billing disputes followed the same pattern. The BPU Consumer Report Card overall issue resolution results, however, showed an improvement from 2007 to 2009. Exhibit X-17 shows the number of BPU and region (to FirstEnergy) complaints as a total, by year, from 2005 to 2009.
649 641 618 617 608 608 604 597 593 589 587 586 581 576 575 574 571 552500520540560580600620640660

410 Final Report
6/20/2011
Exhibit X-17 Complaints 2005 to 2009
Source: Information Response 167
Total complaints went from 2,066 in 2005 to 2,225 in 2009.
The two types of complaints accounting for the majority of the increases in complaints are collection and payment plans (complaints about collection efforts or deferred payment plans) and termination of service (complaints about collections resulting in field termination). This tendency likely reflects the economic condition changes from 2007 through 2009 and the increases in bills.
Exhibit X-18 shows the number of billing disputes from 2005 to 2009.
Billing Disputes
Collections & Payment Plans Competition Credit &
Deposits Damages Discontinuance/ Transfer Metering Other Other Payment
IssuesPersonnel Problems Rates Scheduling
DelaysService
ExtensionsService
Interruptions Service Quality Termination
2005 434 633 2 15 72 30 89 28 13 6 14 225 23 255 223 42006 314 628 1 2 69 0 71 57 15 18 26 234 18 261 253 02007 395 708 5 0 51 0 82 16 9 7 33 156 7 136 204 02008 349 935 6 86 61 22 83 13 22 8 27 118 9 179 122 1482009 393 989 5 68 53 46 72 22 8 2 24 158 4 84 138 159
0
100
200
300
400
500
600
700
800
900
1,000

Final Report 411
6/20/2011
Exhibit X-18 Billing Disputes
2005 to 2009
Source: Information Response 169
The number of billing disputes rose from 14,970 in 2007 to 20,251 in 2009, a 35% increase.
Finding X-4 Three different units handle complaints relevant to JCP&L.
The FEU Customer Service Compliance unit handles BPU complaints. The JCP&L Customer Support unit handles non-BPU complaints made to JCP&L executives. The Technology and Quality unit in the Contact Center handles coordinates responses to non-regulatory complaints made to FE executives. The three units use the same tracking system and some complaints overlap (i.e., the same complaint is made to the BPU and FE executives). Until 2004, one unit handled all types of complaints.
Contact Center and Field Service
Finding X-5 The regulatory customer service standards reported to the BPU—average speed of answer, average time to reach a CSR, and percentage of calls handled by a CSR—have all deteriorated in recent years.
Exhibit X-19 shows the three regulatory service standard results reported to the BPU for the years 2005 through 2009.
All Disputes
2005 28,166 2006 17,795 2007 14,970 2008 16,567 2009 20,251
0
5,000
10,000
15,000
20,000
25,000
30,000

412 Final Report
6/20/2011
Exhibit X-19 New Jersey Regulatory Customer Service Standards Reported
2005 to 2009
Source: Information Response 200
Average speed of answer has increased steadily from 30 seconds in 2006 to 66 seconds in 2009. Average time to reach a CSR has increased from 41 seconds in 2006 to 99 seconds in 2009. The percentage of calls handled by a CSR has decreased from 72% in 2006 to 67% in 2009.
Finding X-6 The FEU average speed of answer is slower and the average hold time is longer for NJ customers than the average experienced by Ohio and Pennsylvania customers.
Exhibit X-20 shows the average speed of answer for the three Ohio companies, the three Pennsylvania companies, and JCP&L/NJ.
Telephone Access –Average Speed of
Answer (ASA)
Avg. Time to Reach a Customer Service
Rep. (CSR)
2005 57 732006 30 412007 49 692008 47 702009 66 99
0
20
40
60
80
100
120Se
cond
s
Percentage of Calls Handled
by a CSR
2005 77.42%2006 72.00%2007 68.00%2008 67.00%2009 67.00%
60.00%62.00%64.00%66.00%68.00%70.00%72.00%74.00%76.00%78.00%80.00%

Final Report 413
6/20/2011
Exhibit X-20 Call Trends by Operating Company – ASA
2005 to 2009
Source: Information Response 202
In 2009, the JCP&L/NJ average speed of answer of 66 seconds was 20% higher than the Ohio and Pennsylvania companies’ average of 55 seconds.
Exhibit X-21 shows the average handle time (AHT) for the three Ohio companies, the three Pennsylvania companies, and JCP&L/NJ.
Cleveland Electric
Illuminating (CEI)
Ohio Edison (OE)
Toledo Edison (TE)
Pennsylvania (PA)
CEI, OE, TE, and PA
Combined Average
New Jersey (NJ) PA/NJ
2005 54 53 56 54 552006 34 34 25 31 272007 58 59 39 52 452008 43 43 44 43 43 472009 59 57 58 45 55 66
010203040506070
Seco
nds

414 Final Report
6/20/2011
Exhibit X-21 Call Trends by Operating Company – AHT
2005 to 2009
Source: Information Response 202
The 2009, JCP&L/NJ average handle time of 329 seconds was 5% higher than the other companies’ average.
Finding X-7 The percentage of calls answered by the Reading contact center and the contract contact center that serve JCP&L customers has declined and falls below that of the Ohio call center.
Exhibit X-22 shows the percent of calls answered trend for the Reading contact center, which primarily serves Pennsylvania and New Jersey customers, the NCO contract contact center, which serves all FEU customers, and the Ohio contact center, which primarily serves Ohio customers.
Cleveland Electric
Illuminating (CEI)
Ohio Edison (OE)
Toledo Edison (TE)
Pennsylvania (PA)
CEI, OE, TE, and PA
Combined Average
New Jersey (NJ) PA/NJ
2005 327 329 306 321 3992006 353 351 334 346 3412007 347 339 328 338 3412008 338 337 330 340 336 3282009 303 302 299 343 312 329
050
100150200250300350400450
Seco
nds

Final Report 415
6/20/2011
Exhibit X-22 Percent Calls Answered Trend
2005 to 2009
Source: Information Response 538
The percentage of calls answered for the PA/NJ contact center has declined from 99.45% in 2005 to 97.64% in 2009. The percentage of calls answered by the contracted credit contract contact center has declined from 96.17% in 2005 to 94.26% in 2009. Both of these contact centers that serve New Jersey trail the Ohio contact center percentage of calls answered, which improved from 95.60% in 2005 to 98.22% in 2009.
Finding X-8 It appears that the NCO contract contact center may be a higher cost than the Reading contact center.Error! Reference source not found.
A confidential information response from FE shows the expense (cost) per call is lower for the Reading Contact Center than the NCO Contact Center for 2009. FirstEnergy Utilities does not track the cost per call minute for its in-house and contract contact centers. Because the Reading center and the contract center handle different types of calls, the cost per call number may be misleading if NCO calls are typically longer. The higher cost per call for credit, however, calls into question whether in-house or contract call centers are, in fact, lower cost.
Finding X-9 FirstEnergy Utilities has steadily improved the percentage of calls handled by the integrated voice response system.
Exhibit X-23 shows the percentage of incoming calls that were IVR self-serve.
NCO Ohio PA/NJ
2005 96.17% 95.60% 99.45%2006 96.12% 97.99% 99.20%2007 92.25% 98.68% 98.37%2008 92.98% 99.38% 98.61%2009 94.26% 98.22% 97.64%
88.00%
90.00%
92.00%
94.00%
96.00%
98.00%
100.00%

416 Final Report
6/20/2011
Exhibit X-23 Call Volume/Self-Service Trends
2005 to 2009
Source: Information Response 644
The percentage of calls handled by the IVR system has increased from 20.8% in 2005 to 30.2% in 2009. It is generally much cheaper to resolve calls with self-service through the IVR system than to answer them with a live CSR.
Finding X-10 The percentage of service calls completed on the day requested has declined over the last five years, and it dropped precipitously after the field service customer satisfaction survey was suspended.
Exhibit X-24 shows the five-year trend in service calls completed on the day requested.
Calls Offered Calls Handled IVR Self-Serve
2005 10,024,051 9,729,564 2,020,400 2006 9,638,660 9,459,079 2,529,923 2007 10,175,236 9,893,189 2,833,516 2008 11,451,358 11,160,522 3,563,138 2009 10,869,866 10,562,224 3,186,046
-
2,000,000
4,000,000
6,000,000
8,000,000
10,000,000
12,000,000
14,000,000
% Self-Serve
2005 20.77%2006 26.75%2007 28.64%2008 31.93%2009 30.16%
0.00%
5.00%
10.00%
15.00%
20.00%
25.00%
30.00%
35.00%

Final Report 417
6/20/2011
Exhibit X-24 Service Call Trends
2005 to 2009
Source: Information Response 190
The annual percentage declined from 72.88% in 2005 to 54.20% in 2009.
From 2005 through June 2009, a New Jersey field service tracking study surveyed customers who had in-person contact with field service personnel. Exhibit X-25 shows the trend in overall issue resolution. (JCP&L addressed your issue or request.)
Service Calls Scheduled
Completed on Day Requested
2005 219,814 160,196 2006 194,876 156,429 2007 174,282 127,426 2008 162,665 110,800 2009 146,044 79,156
0
50,000
100,000
150,000
200,000
250,000
Completion Percentage
2005 72.88%2006 80.27%2007 73.11%2008 68.12%2009 54.20%
0.10%10.10%20.10%30.10%40.10%50.10%60.10%70.10%80.10%90.10%

418 Final Report
6/20/2011
Exhibit X-25 Customer First Field Service Tracking Report – Overall Issue Resolution
2005 to 2009
Source: Information Response 189
The percentage (higher is better) increased from 87.1% in 2005 to 89.5% in the second quarter of 2009. FirstEnergy Utilities suspended the survey after the second quarter of 2009 when the BPU no longer required it. Exhibit X-26 shows the monthly service calls completed rate for 2009.
Exhibit X-26 2009 Monthly Service Calls Completed
as of December 31, 2009
Source: Information Response 190
Overall Issue Resolution
2005 87.10%2006 87.80%2007 87.70%2008 85.20%2009 89.50%
83.00%84.00%85.00%86.00%87.00%88.00%89.00%90.00%
January February March April May June July August September October November December
2009 69.69% 65.38% 66.54% 71.85% 63.92% 64.78% 45.67% 46.51% 44.49% 36.79% 31.36% 32.50%
0.10%
10.10%
20.10%
30.10%
40.10%
50.10%
60.10%
70.10%
80.10%

Final Report 419
6/20/2011
The completion percentage dropped precipitously from 64.78% in June, the last month for the field service tracking study, to 32.5% in December.
Finding X-11 Field service order response time has improved from 2005 to 2009.
Exhibit X-27 shows the 2005 to 2009 trend in elapsed time, in days, to fulfill a service request by type.
Exhibit X-27 Average Response Time by Service Request in Days & Total Requests
2005 to 2009
Source: Information Response 193
The install response time has improved from 11 days in 2005 to seven days in 2009. This improvement may have been aided by the reduction in service requests from 13,713 in 2005 to 9,247 in 2009.
Revenue Operations
Finding X-12 The rate of meters not read improved from 2005 through 2008, but reversed to a relatively high 9.7% in 2009.
Exhibit X-28 shows the percentage of meters not read from 2005 through 2009.
Install Relocate Remove Upgrade
2005 11 11 4 9 2006 9 9 4 9 2007 11 11 4 8 2008 7 8 5 6 2009 7 7 5 6
0
2
4
6
8
10
12
Day
s
Total Requests
2005 13,713 2006 13,481 2007 11,513 2008 9,920 2009 9,247
0 2,000 4,000 6,000 8,000
10,000 12,000 14,000 16,000

420 Final Report
6/20/2011
Exhibit X-28 Meters Not Read
2005 to 2009
*Work Stoppage January 2005 to March 15, 2005 Source: Information Response 164
The percentage of meters not read got as low as 4.5% in 2008, but it more than doubled to 9.7% in 2009.
Finding X-13 FirstEnergy Utility’s last examination of AMI in 2007 did not consider societal and customer benefits.
FirstEnergy Utilities last examined AMI in 2007. FEU prepared an AMI case-study presentation for the Public Utilities Commission of Ohio’s Smart Metering Workshop. The business case looked at only hard costs and cost savings and did not consider societal and customer benefits, such as reduced consumption and power bills. Hard costs included deployment and operations and maintenance of the hardware and network. Cost savings included lower meter-reading costs, quicker outage restoration, reduced theft of service, and some avoided meter-reading capital costs. The case study concluded that installing AMI throughout the FEU Ohio territories would result in a negative net present value over 20 years. The case study did not consider customer and societal benefits, such as:
♦ Enabling time-of-use pricing ♦ Enabling participation in load management programs ♦ Improving consumption information that could assist customers in lowering power bills ♦ Eliminating monthly meter-reading intrusion ♦ Decreasing the number of estimated bills
Registers Total Not Read or Estimated
2005* 14,551,004 3,328,337 2006 14,649,017 1,151,536 2007 14,818,615 798,534 2008 14,930,861 677,404 2009 14,954,796 1,451,687
-
2,000,000
4,000,000
6,000,000
8,000,000
10,000,000
12,000,000
14,000,000
16,000,000
No Read Rate
2005* 22.9%2006 7.9%2007 5.4%2008 4.5%2009 9.7%
0.0%
5.0%
10.0%
15.0%
20.0%
25.0%

Final Report 421
6/20/2011
Considering societal and customer benefits in future AMI business cases may change the conclusions regarding the feasibility of AMI.
FirstEnergy did commission the Electric Power Research Institute (EPRI) in 2008 to "provide background on various methodologies relating to societal benefits in the context of Smart Metering initiatives". The study contains guidelines and considerations relating to the means by which to quantify the societal benefits associated with Smart Metering.
Finding X-14 The meter-reading error rate has improved steadily since 2005.
Exhibit X-29 shows the meter reading error rate from 2005 through 2009.
Exhibit X-29 Meter-Reading Error Rate
2005 to 2009
Source: Information Response 164
The number of errors per year has declined from 31,123 in 2005 to 8,055 in 2009, a reduction of 74%. This tendency has resulted in an error rate reduction from 0.28% in 2005 to 0.06% in 2009.
Finding X-15 FirstEnergy Utilities and JCP&L have not completed a meter reading reroute since 1994.
The last major meter reading reroute was in 1994, with adjustments since then for new or deleted meters. A reroute for all of JCP&L meter reading was begun in the fourth quarter of 2009 using the
Registers Total Registers Read Total Errors
2005* 14,551,004 11,222,667 31,123 2006 14,649,017 13,497,481 33,668 2007 14,818,615 13,971,431 16,840 2008 14,930,861 14,253,457 10,367 2009 14,954,796 13,503,109 8,055
1
10
100
1,000
10,000
100,000
1,000,000
10,000,000
100,000,000
Error Rate
2005* 0.28%2006 0.25%2007 0.12%2008 0.07%2009 0.06%
0.00%
0.05%
0.10%
0.15%
0.20%
0.25%
0.30%

422 Final Report
6/20/2011
Field Net system’s automated route control system feature. However, there is no definitive end date for the completion of this process. While JCP&L typically does not have dramatic changes in meter reading demands from year to year, not performing a complete reroute since 1994 has resulted in too long of a period between complete reroutes and it is likely that there are meter reading route inefficiencies that can be corrected by a complete meter reading rerouting.
Finding X-16 FirstEnergy Utilities has significantly reduced the billing exception rate.
Exhibit X-30 shows the reduction in total billing exceptions from 2005 to 2009.
Exhibit X-30 Billing Exception Rates Trend
2005 to 2009
Note: Work stoppage December 2004 – March 2005 Source: Information Response 166
The number of billing exceptions was reduced from 465,752 to 237,464 from 2005 to 2009, a 49% reduction. This tendency has resulted in a billing error rate reduction from 3.62% to 1.81%.
Finding X-17 The Rates Department has a strong influence on customer service and JCP&L’s financial success but it does not report to JCP&L.
Having the Rate Department report to FirstEnergy Corporate rather than the FE Utilities business unit may cause a conflict of interest. In general, employees who are physically deployed in New Jersey are JCP&L employees who report up to the JCP&L President. This is true for most of the customer service–related employees, with the exception of the revenue operations collectors and revenue protection personnel, who report to FEU Revenue Operations in Akron. A significant Rates
# of Bills # of Exceptions
2005 12,866,748 465,752 2006 12,999,768 369,258 2007 13,048,740 233,642 2008 13,110,576 250,350 2009 13,145,832 237,464
1 10
100 1,000
10,000 100,000
1,000,000 10,000,000
100,000,000
Rates
2005 3.62%2006 2.84%2007 1.79%2008 1.91%2009 1.81%
0.00%0.50%1.00%1.50%2.00%2.50%3.00%3.50%4.00%

Final Report 423
6/20/2011
Department contingent is deployed to New Jersey that is primarily responsible for FE’s relationship with the BPU and for FE’s rate case strategy. This New Jersey Rate Department, however, reports to the FE Rate Department and has neither a dotted- nor solid-line relationship with the JCP&L President’s organization. This arrangement runs counter to the Business Services New Jersey financial unit, which has a strong dotted-line relationship to the JCP&L President and is an integral part of his leadership team. The JCP&L organization does not participate in rate case strategy; it supports the Rate Department’s initiatives only as needed. Therefore, the JCP&L organization does not control the revenue side of the business. JCP&L profit and loss responsibility comes together only at the FE CEO level.
FirstEnergy Solutions (FES) sells power in New Jersey, both through the BGS auctions and to individual shopping customers. Some potential JCP&L initiatives that might reduce power consumption, such as smart grid and AMI with time-of-use rates, may be in conflict with FE’s corporate interest to sell as much power at the highest possible prices in New Jersey.
Finding X-18 Theft-of-service activity has been increasing.
Exhibit X-31 shows the level of theft-of-service activity from 2005 to 2009.
Exhibit X-31 Theft of Service
2005 to 2009
2005 2006 2007 2008 2009
Number of Leads 476 682 864 1249 1339 Cases Opened 150 209 455 697 617 Cases Closed 113 277 463 691 609 Ongoing 478 629 196 227 153 Lost Revenue Billed $ 286,492 $ 56,252 $ 687,776 $ 397,862 $ 399,452 Lost Revenue Collected $ 118,516 $ 260,583 $ 674,497 $ 536,842 $ 532,490
Source: Information Response 780 and Schumaker & Company Analysis
The number of leads increased from 476 to 1339 from 2005 to 2009. Lost revenue collected, however, peaked in 2007. The increase in theft-of-service activity and the decrease in lost revenue collected are likely attributable to the deteriorating economic conditions and the increasing power bills during this time period.

424 Final Report
6/20/2011
Finding X-19 FirstEnergy Utilities has made steady progress in increasing the percentage of electronic payments.
Electronic payments are much cheaper to receive and process than payments received by mail or at business offices. Exhibit X-32 shows the trends in payments received by mail and electronically from 2005 through 2009.
Exhibit X-32 Mail vs. Electronic Volumes History
2005 to 2015 as of April 2010
Source: Information Response 179, p. 4
From 2005 to 2009, electronic payment volume increased from 13.2% to 28.05% while mail payment volume decreased from 72.16% to 56.28%. At these rates of change, electronic payments would exceed mail payments in 2013.
Finding X-20 Net write-offs for uncollectible accounts have steadily increased since 2006, and accounts receivable aging has deteriorated as well.
Exhibit X-33 shows the net write-offs for 2005 to 2009.

Final Report 425
6/20/2011
Exhibit X-33 Net Write-Offs
2005 to 2009
Source: Information Response 182
Write-offs more than doubled from 2006 to 2009 to over $11 million per year.
The write-off experience was paralleled by a deterioration in accounts receivable aging as well. Exhibit X-34 shows the year-end aging experience from 2006 through 2009. 2005 numbers were not available.
Net Write-Offs
2005 $6,524,064 2006 $5,288,499 2007 $8,373,986 2008 $10,809,078 2009 $11,013,744
$0
$2,000,000
$4,000,000
$6,000,000
$8,000,000
$10,000,000
$12,000,000

426 Final Report
6/20/2011
Exhibit X-34 Accounts Receivable Aging
2005 to 2009
Note: 2005 data not available Source: Information Response 182
This deterioration in write-offs and accounts receivable aging likely reflects the economic condition changes during this period and the increases in power bills.
Exhibit X-35 shows the number and percentage of FEU and JCP&L customers in arrears, another way of looking at the deteriorating collections.
31-60 Days 61-90 Days 90-120 Days > 120 Days
2005 $- $- $- $-2006 $9,682,211 $5,371,219 $4,849,526 $6,449,408 2007 $11,816,829 $6,963,732 $4,604,119 $6,215,115 2008 $12,724,345 $7,691,277 $6,142,936 $8,064,922 2009 $14,173,695 $7,531,023 $6,110,101 $9,347,472
$0 $2,000,000 $4,000,000 $6,000,000 $8,000,000
$10,000,000 $12,000,000 $14,000,000 $16,000,000

Final Report 427
6/20/2011
Exhibit X-35 Customers in Arrears
2005 to 2009
Source: Information Response 536
Finding X-21 As write-offs and slow payment have increased, the number of terminations for non-payment have also increased.
Exhibit X-36 shows the number of customers terminated for non-payment from 2005 to 2009.
FE Customers Past Due
JCP&L Total Customers Past Due
2005 954,619 230,3432006 921,933 220,7812007 961,477 235,1132008 945,080 257,3972009 1,040,759 277,457
0
200,000
400,000
600,000
800,000
1,000,000
1,200,000
FE % Customers in Arrears
JCP&L Total % Customers in Arrears
2005 0.00% 0.00%2006 20.53% 20.41%2007 21.14% 21.62%2008 21.01% 23.56%2009 23.14% 25.33%
0.00%
5.00%
10.00%
15.00%
20.00%
25.00%
30.00%

428 Final Report
6/20/2011
Exhibit X-36 Customers Terminated for Non-Payment
2005 to 2009
Source: Information Response 185
The terminations increased from 2006 through 2008, with a decrease in 2009. The 2009 terminations, however, were still higher than the number in 2005.
Finding X-22 The accounts and amounts submitted to collection agencies have increased over the last five years, but the percentage collected has decreased.
Exhibit X-37 shows the number of accounts and the dollars submitted to the three tiers of collection agencies as well as the percentage of dollars collected from 2005 through 2009.
Non-Payment
2005 10,710 2006 10,153 2007 12,410 2008 15,642 2009 11,343
0 2,000 4,000 6,000 8,000
10,000 12,000 14,000 16,000 18,000

Final Report 429
6/20/2011
Exhibit X-37 Collection Agencies – Collected Year-to-Date
2006 to 2009
Source: Information Response 184
Across the board, the numbers have deteriorated over the last five years with the exception of a slight uptick in the percentage collected in 2009.
Vendor Totals
Final Bill Total
Primary Total
Secondary Total
2006 44,916 21,348 13,338 10,210 2007 48,443 21,501 15,588 11,337 2008 50,511 21,372 16,843 12,274 2009 55,592 23,699 19,852 12,035
0 10,000 20,000 30,000 40,000 50,000 60,000
Accounts Placed
Vendor Totals
Final Bill Total
Primary Total
Secondary Total
2006 $1,546,278 $728,057 $644,412 $123,677 2007 $1,705,970 $846,608 $511,696 $181,027 2008 $1,749,174 $984,142 $465,077 $176,361 2009 $2,098,966 $1,417,794 $527,422 $141,479
$0
$500,000
$1,000,000
$1,500,000
$2,000,000
$2,500,000
Amount Placed
Vendor Totals
Final Bill Total
Primary Total
Secondary Total
2006 8.08% 8.32% 11.30% 2.76%2007 7.14% 8.51% 7.04% 2.89%2008 5.99% 7.98% 4.64% 2.73%2009 6.28% 10.21% 4.41% 1.89%
0.10%2.10%4.10%6.10%8.10%
10.10%12.10%
Percent Collected

430 Final Report
6/20/2011
Economic Development
Finding X-23 The New Jersey economic development function is more closely aligned with JCP&L functions than the FEU corporate-level functions.
The New Jersey economic development function is focused on the JCP&L territories, and the day-to-day work is with New Jersey–based development agencies, developers, local governments, and the JCP&L area managers, new business engineers, and large customer support representatives. There is little FEU-level economic development that impacts New Jersey.
C. Recommendations
Recommendation X-1 Maintain or achieve customer service performance levels that result in overall customer satisfaction, making improvements where cost-effective. (Refer to Finding X-3, Finding X-5, Finding X-6, Finding X-7, and Finding X-10)
Several measures of customer service quality and responsiveness have deteriorated in recent years. FirstEnergy Utilities should develop a series of cost effective action plans to return customer service performance to former levels. Targets that have been achieved previously are summarized in Exhibit X-38.
Exhibit X-38 Customer Service Performance Levels Achieved Previously
as of December 31, 2009
Measurement Level Achieved Previously Year 2009
Performance Improvement
Gap
Total Complaints 1,809 2007 2,225 23% Average Speed of Answer 30 seconds 2006 66 seconds 120% Average Time to Reach a CSR 41 seconds 2006 99 seconds 141%
Average Handle Time 312 seconds 2009 OH and PA Company Average 329 5%
Percent Calls Answered 99.45% 2005 97.64% –2% Meters Not Read 4.5% 2008 9.7% 116%
Source: Information Requests 167, 200, 202, 538, 164

Final Report 431
6/20/2011
Recommendation X-2 In conjunction with the FE/ Allegheny Energy merger integration process, identify and implement the most efficient organizational design to effectively perform customer complaint management processes. (Refer to Finding X-4)
Responsibilities for complaint response are currently split among three organizations, the FEU Customer Service Compliance unit, the FEU Contact Center Technology and Quality unit, and the JCP&L Customer Support unit. All three units use the same complaint-tracking system. For the complaints that are JCP&L-specific made by JCP&L customers, JCP&L should have primary responsibility for their resolution. FEU-wide customer complaint reporting should continue to be done by the FEU Customer Service Compliance unit.
Recommendation X-3 In conjunction with the FE/Allegheny Energy merger integration process and then periodically thereafter, review and evaluate the use of call center resources, both internal and through contractors, in which these periodic reviews consider cost-effectiveness, as well as other relevant factors, including quality, experience, labor pool diversification, and disaster recovery. (Refer to Finding X-8)
FirstEnergy Utilities believes the contractor and employee call centers deliver comparable performance. However, it has not conducted a detailed cost comparison. FirstEnergy Utilities should conduct a detailed cost comparison with the involvement of Business Services and Supply Chain and it should project which alternative, contract or in-house, will be more cost-effective over the long term. Once the more cost-effective option has been determined, FEU should develop a thorough implementation plan and schedule to move the work to the lower-cost option from the higher-cost option within a reasonable timeframe.
Recommendation X-4 Re-evaluate AMR, AMI, and communication devices for inside meters to reduce estimated meter reads and to lower meter-reading costs. (Refer to Finding X-12 and Finding X-13)
Meter-reading costs are fairly high at JCP&L, with low-density customers and relatively high meter-reader wages. Unread meters were at a high of 9.7% in 2009, twice the rate in 2008. JCP&L should re-evaluate AMR and AMI technologies in light of these circumstances and should include societal and customer benefits in its re-evaluation. At a minimum, JCP&L should consider the costs and benefits of installing communication devices for inaccessible or hard-to-read meters and the associated upgrade to meter-reader handheld devices on those routes to receive the wirelessly reported reads.

432 Final Report
6/20/2011
Recommendation X-5 Complete the JCP&L meter reading rerouting process within six months. (Refer to Finding X-15)
The meter reading rerouting process has been ongoing for over one year with no scheduled completion date. FEU and JCP&L should devote adequate resources to the process to complete the rerouting within six months.
Recommendation X-6 In conjuction with the FE/Allegheny Energy reorganization merger integration process, identify and implement the most efficient organizational design to effectively perform the economic development function, including New Jersey. (Refer to Finding X-23)
The FEU-level economic development function can continue to provide staff support and represent FEU economic development on a national and regional basis. It can also continue to provide economic development programs for use in New Jersey and professional development assistance. The New Jersey–level economic development activities, however, are very state-specific and the economic development professional should be reorganized under JCP&L External Affairs with the area managers. Alternatively, the economic development function can be completely phased out and the function can be handled by the area managers. New Jersey economic development has already been reduced from six positions to one. The economic development activity has been declining since the 2006-2007 time period.
Therefore, FE should identify and implement the most effective organizational design.

Final Report 433
6/20/2011
XI. Clean Energy
Schumaker & Company will assess Jersey Central Power & Light’s (JCP&L’s) accounting controls relative to the New Jersey Clean Energy Program, which was established as part of the Electric Discount and Energy Competition Act (EDECA). Among the areas or issues to be addressed in this review are:
♦ Initiatives to reduce peak demand, conserve finite resources, and promote new technologies
♦ The utility’s participation in various programs like the Core Rebate Program, the Solar Renewable Energy Certificates, the New Jersey CleanPower Choice Program, Clean Energy Financing, and the SREC-only Pilot Program
No single solution can meet future energy needs. Instead, we need to consider multiple diverse energy technologies that don’t deplete our natural resources or destroy our environment. Renewable energy technologies like the movement of wind and water, the heat and light of the sun, heat in the ground, and the carbohydrates in plants are all natural energy sources that can supply our needs in a sustainable way. And because they are homegrown, they can also increase energy security and create jobs.
A. Background
On February 9, 1999, the Electric Discount and Energy Competition Act was signed into law. EDECA established requirements to advance energy efficiency and renewable energy in New Jersey through a societal benefits charge. EDECA further empowered the New Jersey Board of Public Utilities (NJBPU) to initiate a proceeding and cause to be undertaken. This comprehensive resource analysis (CRA) of energy programs is currently referred to as the comprehensive energy efficiency (EE) and renewable energy (RE) resource analysis. After notice, opportunity for public comment, public hearing, and consultation with the New Jersey Department of Environmental Protection (DEP), within eight months of initiating the proceeding and every four years thereafter, the NJBPU determines the appropriate level of funding for EE and Class I RE programs that provide environmental benefits above and beyond those provided by standard offer or similar programs in effect as of February 9, 1999. These programs are now called New Jersey’s Clean Energy Program (the NJCEP).
Initially, the programs developed at each New Jersey utility were administered by that particular utility. In 2007, however, the management and administration of these programs was transferred to the New Jersey Clean Energy Office. The exception was the Renewable Program, which had been transitioned in 2003. As a result, JCP&L’s management of the Clean Energy Programs, other than the Comfort Partners Program and limited promotional support for the CleanPower Choice Program, is the responsibility of the Office of Clean Energy (OCE). Therefore, with the exception of the Comfort Partners and CleanPower Choice Programs, JCP&L acts primarily as a conduit for the collection of the monies that are used in the execution of the NJCEP. Such funds are passed on to the NJCEP for the accumulation and application of the various programs managed and administered by the Clean Energy Program. With respect to the Comfort Partners and CleanPower Choice Programs, JCP&L manages

434 Final Report
6/20/2011
and administers them, although their actual execution is contracted to outside firms. JCP&L and the other New Jersey utilities submit written descriptions of these programs and continue to manage the program filings and budgets collectively, which are presented to the Board for approval.
Program Funding
By order dated April 27, 2007, Docket No. EO07030203, the Board directed the Office of Clean Energy to initiate a third comprehensive EE and RE resource analysis proceeding. It also mandated the scheduling of public hearings on program funding and funding allocations for the years 2009 through 2012. By order dated September 30, 2008, Docket No. EO07030203, the Board set funding levels of $245 million for 2009, $269 million for 2010, $320 million for 2011, and $379 million for 2012. The Board’s action to approve the 2009 programs and budgets was memorialized in an order dated January 8, 2009, Docket No. EO07030203. By order dated December 17, 2009, Docket No. EO07030203, the Board approved 2010 programs and budgets for the NJCEP as well as the compliance filings of Honeywell, TRC, the OCE, and six utilities.
In the 2010 budget order, as in previous orders, the Board made its approval contingent on appropriations. The Board stated that “[a]ny adjustments to the 2010 budget as a result of State appropriations, if necessary, will be considered by the Board and memorialized in a separate order.” On February 10, 2010, Governor Christie issued Executive Order 14 in which he declared a fiscal emergency in the State of New Jersey. Pursuant to NJSA 52:27B-26, the Governor ordered the Director of the Division of Budget and Accounting within Treasury to identify and place into reserve funds sufficient to ensure that the state budget would remain in balance. On that authority, Treasury identified and placed $158 million of funding from the societal benefits charge, located in the Clean Energy Trust Fund within Treasury, into reserve.
As a result of these actions and because those funds were previously a part of the NJCEP 2010 budget, the 2010 budgets had to be modified in order to implement Executive Order 14. In this order, the Board will consider proposed modifications to the 2010 programs and budgets that were previously approved by the Board. The Board’s action is consistent with its authority under NJSA 48:3-60(a)(3) as well as with the 2010 Budget Order.
The OCE prepared a straw proposal with revisions to the 2010 programs and budgets that was circulated for written comment. The Board also held a public hearing on this matter. Upon review of the comments and once additional information on actual expenses was received, the OCE prepared recommendations to the Board that modified the straw proposal. In light of the state’s fiscal emergency, the comments submitted, and the Board’s authority under EDECA, the Board found the OCE’s recommendations to be reasonable and ordered the implementation of the program changes as recommended by the OCE (Board of Public (BPU) Utilities Docket No. EO07030203).

Final Report 435
6/20/2011
Utility Managed and Administered Programs
The two remaining programs that continue to be administered by the utilities are:
New Jersey Comfort Partners Program
The Residential Low-Income Program, known as New Jersey Comfort Partners, is managed by Atlantic City Electric, JCP&L, New Jersey Natural Gas, Elizabethtown Gas, Public Service Electric & Gas, and South Jersey Gas. It is designed to improve energy affordability for low-income households through energy conservation. To achieve this objective, several market barriers must be overcome. They include:
♦ Lack of information on either how to improve efficiency or the benefits of efficiency
♦ Low-income customers’ lack of necessary capital to upgrade efficiency or even, in many cases, keep up with regular bills
♦ Low-income customers being the least likely target of market-based residential service providers owing to perceptions of less capital, credit risk, and/or high transaction costs
♦ Split incentives between renters and landlords
The program addresses these barriers through:
♦ The direct installation of all cost-effective energy efficiency measures
♦ Comprehensive, personalized customer energy education and counseling
♦ The installation of health and safety measures, as appropriate
The program is targeted toward participants in the Universal Service Fund. This target population is characterized by high-energy burdens based on their income. Program participation is prioritized by energy use, with the highest energy users being served first.
Electric and gas utilities with overlapping service territories jointly deliver efficiency, health and safety, and educational services so that customers receive both gas and electric efficiency measures simultaneously. The selection of program delivery contractors and program delivery costs is shared among the participating gas and electric utilities. The implementation vendor contracts were finalized in August 2009, with three (3) existing and two (2) new implementation contractors hired.
The utilities use the JCP&L web-based Comfort Partners System as the statewide platform to track all program participants, measures, and energy savings. This system is used by all utilities, BPU Clean Energy staff, multiple program delivery vendors, inspection vendors, and state WAP agencies.

436 Final Report
6/20/2011
A minimum of 15% of randomly selected treated homes are subject to verification and inspection by an independent contractor(s) hired by the utilities. Third-party quality-assurance process enhancements may also take place.
In order to achieve the reductions in the revised reduced budget for 2010, the utilities agreed that the Comfort Partners Program needed to make changes in the 2010 Program Plan. They also agreed to delay program evaluation until 2011, to possibly reduce the number of customers to be served, or at a minimum to reduce the number of homes receiving pilot measures, or higher-cost efficiency measures that could produce deeper energy savings. It is further noted that program spending allowance guidelines were increased in 2009 for the Comfort Partners Program to be consistent with other low-income state-weatherization programs using federal stimulus funds. In addition, the Comfort Partners’ contractor infrastructure was increased by two additional contractors in 2009.
To be consistent with other low-income state-weatherization programs using federal stimulus funds, deep energy savings reductions were pursued. Therefore, the goal of the Comfort Partners Program was a range from 5,442 to 7,800 participants, depending on average spending per home and contractor capability. The electric service customer goal was a range from 5,442 to 7,800. The gas service customer goal was a range from 5,249 to 7,225.
CleanPower Choice Program
Utilities support the Clean Energy Campaign for the CleanPower Choice Program. The CleanPower Choice program offers retail electric customers the option of selecting an energy product or products with higher levels of renewable energy than is required by the renewable portfolio standards.
The program is delivered through a collaborative utility and CleanPower marketer program that is hosted by the four investor-owned electric utilities. The utilities provide a delivery platform to enable enrollment and billing, with oversight by the Office of Clean Energy. The program is offered as an add-on subscription of CleanPower and is supplied by a qualified third-party CleanPower Marketer without interruption to customers’ basic electric service. The Office of Clean Energy plays a lead role in marketing the program to customers in cooperation with electric and gas utilities and CleanPower marketers.
The utilities have implemented the requirements of the August 19, 2008 Board Order in Docket No. EA07110885, “In the Matter of Account Look-up for the Third-Party Suppliers (TPSs) and CleanPower Marketers (CPMs).” Program tasks include:
♦ Implement the pilot of a Customer Account Look-up procedure allowing the provision of Electric Distribution Company (EDC) account numbers to requesting TPSs and CPMs for which a valid release form has been obtained.
♦ Track the cost of providing the Customer Account Look-up service during the first year of implementation and file that information with the Board.

Final Report 437
6/20/2011
♦ File required monthly, quarterly, and annual program information with the Board.
The 2010 budget for this program, as shown in Appendix B, is intended to reimburse utilities for expenses necessary to:
♦ Make or maintain the Information Technology changes required to support a line item on customer bills
♦ Develop and maintain systems to support electronic data interchange transactions with CleanPower Marketers
♦ Facilitate customer signup
B. Findings & Conclusions
Finding XI-1 JCP&L is responsible for only a limited segment of the Clean Energy programs.
There are several other Energy Efficiency and Renewable Energy programs associated with Clean Energy (see
As discussed above, JCP&L is responsible for only the Comfort Partners Program and the CleanPower Choice Program.
www.njcleanenergy.com), including the Core Rebate Program, the Solar Renewable Energy Certificates, the New Jersey CleanPower Choice Program, Clean Energy Financing, and the SREC–only Pilot Program. Each of these programs, with the exception of the New Jersey CleanPower Choice Program and Comfort Partners Program, is administered by the Office of Clean Energy. In 2009, the BPU required JCP&L to prepare a New Jersey CleanPower Choice Program brochure to be inserted into customers’ bills in the months of April and May 2009. In 2010, JCP&L was not required to prepare a bill stuffer for CleanPower.
Finding XI-2 The Comfort Partners Program and the CleanPower Choice Program were reduced as a result of the Governor’s issuance of Executive Order 14, although additional funding was later found.
The BPU’s Order in Docket No. EO07030203, dated April 21, 2010, approved the reduction in spending on the Comfort Partners Program by $1.9 million for the statewide Comfort Partners Program and by $0.3 million for JCP&L, as shown in Exhibit XI-1.

438 Final Report
6/20/2011
Exhibit XI-1 Comfort Partners Program Spending Levels
as of April 21, 2010
Statewide JCP&L
Revised Budget Approved 4/21/2010 $29,218,313.45 $3,343,256.68
Original Budget Approved 12/16/2009 31,123,620.38 $3,636,672.14
Reduction in Comfort Partners Program ($1,905,306.93) ($293,415.46)
Source: Information Response 914 REVISED
In July 2010, the utilities reported to the OCE that a combination of increases in the number of measures installed in each home treated, which were implemented to increase the level of savings per home, and a ramp-up in the number of contractors and homes treated had caused several utilities to approach their budget limits. The utilities indicated that the increase in expenses was unprecedented and occurred in a very short time period. As a result, not enough time was allowed for all of the utilities to modify the program so that they remained within their budget throughout the remainder of the year without suspending the program to new applicants. The utilities indicated to staff that approximately $3 million in additional funding would be required to keep the program operating through the end of the year. Such funding would also mitigate layoffs by the contractors that deliver the program and install the measures in low-income homes.
Subsequently, the OCE identified approximately $3 million in funds that were made available for reallocation to the Comfort Partners Program, with Board approval. The BPU provided that approval in its order dated August 18, 2010 in Docket No. EO07030203. The effect of the BPU’s decision was an increase in spending from the original budget by $1.1 million for the statewide Comfort Partners Program and by $0.7 million for JCP&L, as shown in Exhibit XI-2.
Exhibit XI-2 Comfort Partners Program Spending Levels
as of August 18, 2010
Statewide JCP&L
Revised Budget Approved 8/18/2010 $32,206,497.01 $4,313,256.68
Original Budget Approved 12/16/2009 31,123,620.38 3,636,672.14
Increase in Comfort Partners Program $1,082,876.63 $676,584.54
Source: Information Response 914 REVISED
The BPU’s decision increased spending even more when compared to its April 21, 2010 decision to cut Comfort Partners spending. As shown Exhibit XI-3, the BPU’s August 18, 2010 decision increased the

Final Report 439
6/20/2011
statewide Comfort Partners Program by almost $3 million and JCP&L’s allocated share of that spending by almost $1 million.
Exhibit XI-3 Comfort Partners Program Spending Levels
Compared to Original as of December 31, 2010
Statewide JCP&L
Revised Budget Approved 8/18/2010 $32,206,497.01 $4,313,256.68
Revised Budget Approved 4/21/2010 $29,218,313.45 $3,343,256.68
Increase in Comfort Partners Program $2,988,183.56 $970,000.00 Source: Information Response 914 REVISED
In short, the Comfort Partners Program was less affected by the Executive Order than perhaps other programs.
Finding XI-3 JCP&L is appropriately managing its remaining responsibilities involving the Clean Energy programs.
JCP&L’s responsibilities for support of the Comfort Partners Program and the CleanPower Choice Program are identified in the program description and budget document, which is submitted to the BPU on an annual basis. In addition to specifying budgets levels and targeted customer goals, the program includes a requirement to perform quality-assurance (QA) inspections on the work of the contractors used in the Comfort Partners Program.
The final 2010 JCP&L Comfort Partners production report shows that total JCP&L production for 2010 was 2,395 jobs. A total of 618 QA inspections were performed in 2010, which is over a 25% inspection rate (618 jobs/2,395 jobs) compared to a minimum of 15% or approximately 359 (15% × 2,395 jobs) that would be required per procedure for 2010.
C. Recommendations
None


Final Report 441
6/20/2011
XII. Support Services
This chapter provides discussions regarding the following Jersey Central Power & Light (JCP&L) support services, which are generally performed by FirstEnergy Service Company (SERVECO) staff:
♦ Risk management ♦ Legal services ♦ Facilities and property management ♦ Supply chain ♦ Fleet management ♦ Information technology ♦ Records management
A. Risk Management
This section addresses FirstEnergy’s (FE) and Jersey Central Power & Light Company’s (JCP&L) risk management activities. These activities include corporate risk management, insurance, and claims.
Background & Perspective
FirstEnergy has stated that managing the various risks inherent in the utility industry is critical. To that end, goals for all risk management groups are geared toward creating an environment whereby risks are quickly identified, properly understood, and effectively managed. This approach includes identifying events, issues, and circumstances that could harm FirstEnergy and prevent it from fully achieving its business objectives.
Enterprise Risk Management – Integrated Framework
In 2001, the Committee of Sponsoring Organizations (COSO) of the Treadway Commission (a private-sector organization dedicated to providing guidance to executive management on various governance issues) engaged PricewaterhouseCoopers (PwC) to develop a framework for management. The aim of this framework was to improve organizational enterprise risk management. The resulting report, Enterprise Risk Management – Integrated Framework (published in 2004), provides a more robust and extensive focus (beyond internal controls) on the broader subject of corporate risk management. This report lays out eight broad framework components to a comprehensive risk management program. They are:
♦ Internal environment – the tone the organizations set for how risk is viewed and addressed by managers and employees, including risk management philosophy and risk appetite, integrity and ethical values, and the environment in which they operate

442 Final Report
6/20/2011
♦ Objective setting – a process to set specific objectives and ensure that the chosen objectives support and align with the organization’s mission and appetite for risk
♦ Event identification – a process for identifying external and internal events affecting the achievement of an organization’s objectives, distinguishing between risks and opportunities; opportunities are channeled back to management’s strategy or objective-setting process.
♦ Risk assessment – a process for analyzing risks, considering likelihood and impact as a basis for how they should be managed; risks are assessed on an inherent (underlying/built-in) and residual basis.
♦ Risk response – developing a set of actions (e.g., avoiding, accepting, reducing, and sharing) to align risks with the organization’s risk tolerances/appetites
♦ Control activities – policies and procedures established and implemented to ensure that responses are effectively carried out
♦ Information and communication – relevant information is identified, captured, and communicated in a form and timeframe (up, down, and across an organization) that enable people to carry out their responsibilities
♦ Monitoring – ongoing management activities and/or separate evaluations that monitor risk and ensure that modifications are made as necessary
A company’s enterprise risk management can and should be tailored to its specific environment and needs.
Organization and Staffing
The Corporate Risk Management/Insurance and Claims functions are shown in Exhibit XII-1.

Final Report 443
6/20/2011
Exhibit XII-1 Risk Management and Claims Organization
Source: Information response 209 & 54.
The Risk Management and Insurance functions report directly to the Vice President Corporate Risk and Chief Risk Officer (CRO), who in turn reports directly to the Executive Vice President and Chief Financial Officer (CFO). The position of Chief Risk Officer and the implementation of an enterprise risk management approach have been in place at FE since November 2000. The Chief Risk Officer also has reporting responsibilities to the Chairman of the FE Board of Directors Audit Committee (see chapter on Executive Management and Corporate Governance). Reporting directly to the CRO are managers for Credit Risk and Insurance and a director for enterprise risk management.
The JCP&L Claims function is divided between North and Central districts, with each district’s claims staffed by a manager and five (total) claim representatives. The FE Claims group reports up through the legal organization to the Executive Vice President (EVP) and General Counsel. FE Claims consists of a manager and 13 employees, which include eight employees (located in Reading, PA) who process claims and three claim representatives/adjusters who manage claims and work with external counsel to resolve personal injury and property damage claims.
Expenses for the Risk Management/Insurance organization have been steady over the past five years as shown in Exhibit XII-2.
Akron, OH 13,602
FirstEnergyPresident & CEO
FirstEnergy Corporation
Akron, OH 1,211
SERVECOEVP & CFO
Finance, Strategic Planning & Operations
Akron, OH 18
SERVECOVice President & CRO
Corporate Risk
Akron, OH 5
SERVECOCorp Credit Risk Manager
Akron, OH 7
SERVECODirrector
Corp Enterprise Risk Mgmt
Akron, OH 2
SERVECOCorp Insurance Risk Mgr
Akron, OH 316
SERVECOExecutive Vice President & General Counsel
FirstEnergy
Akron, OH 46
SERVECOVice President
Legal
Akron, OH 26
SERVECOAssociate General Counsel
Trans/Comm/Litig/Envir/Labor/Corp
Akron, OH 14
SERVECODir, Claims
Claims
Akron, OH 7,253
SERVECOSenior Vice President & President
Firstenergy Utilities
Akron, OH 5,684
SERVECOVice President
Utility Operations
Morristown, NJ 1,426
JCP&LPresident
Morristown, NJ 750
JCP&LDirector
Operation Services
Morristown, NJ 4
JCP&LED Claims ManagerCO-JCP&L-N-Claims
Morristown, NJ 3
JCP&LEd Claims ManagerCO-JCP&L-C-Claims

444 Final Report
6/20/2011
Exhibit XII-2 Risk Management Expenses – Five Year
Source: Information Request 209 and 210 Total Head count shown in brackets
Labor accounts for most of the expenses and has remained fairly stable over the past five years.
FirstEnergy’s stated risk management goal is to manage its overall exposure to uncertainty to an acceptable level. This aim is accomplished by systematically identifying sources and types of risk exposures, measuring the level of risk, and designing control processes to manage these risks. Control processes can seek to avoid all or part of the risk, accept the risk with active management participation, or transfer the risk (e.g., insurance).
Corporate Risk
Corporate risk is addressed through two departments: Corporate Enterprise Risk and Corporate Credit Risk.
The Enterprise Risk Management (ERM) group works with business units to provide risk management consultation. It also develops and implements risk management analytical tools and models and conducts integrated business planning risk workshops. In addition, the ERM group develops risk tolerances and associated policies and provides risk reporting to both the Risk Policy Committee and the Audit Committee of the Board of Directors.
The Credit Risk Management (CRM) group works with business units on credit issues and managing associated risks. This task includes minimizing the impacts of credit defaults by wholesale power counterparties, customers, vendors, and other business partners. This group is specifically responsible for securing credit for FE to purchase wholesale power from other utilities/generating companies and for assisting other departments in understanding the credit quality of their vendors.
FirstEnergy has a documented corporate risk management policy that encompasses:
♦ Purpose and background, including key obligations of FE and how those obligations pertain to the risk profile
♦ Definition of types of risks and the corporate risk philosophy
♦ Specific roles and responsibilities for risk management within the FE organization, including the Risk Policy Committee and specific senior management and director levels
2005 2006 2007 2008 2009Budget 1,949,656 [16] 2,040,067 [17] 2,222,415 [19] 2,227,369 [20] 1,994,607 19]Actual 1,690,006 [16] 1,856,380 [16] 1,998,647 [19] 2,190,964 [20] 1,868,014 [17]Variance (259,650) (183,687) (223,768) (36,405) (126,593)

Final Report 445
6/20/2011
FirstEnergy has several documented policies for managing financial risk, including:
♦ Short-term investment – specific guidelines to maintain capital and liquidity while retaining relationships with financial institutions (e.g., banks). This policy defines appropriate short-term investment instruments, exposure limits in order to spread risk, appropriate custodial arrangements, and reporting and performance guidelines.
♦ Commodities – control requirements and framework around which the Regulated Commodity Sourcing groups assess, manage, and report risks associated with bulk power supply. The ERM and CRM groups are involved with defining and monitoring these processes. Details include hedging/derivative strategies and guidelines, ethical guidelines, and required level of approvals.
♦ Treasury interest rate – framework for protecting FE from interest rate fluctuations undertaken only in the context of hedging or protecting underlying financial exposures. Speculation (e.g., trading in interest rates, writing options, or taking active positions involving financial derivative instruments) is forbidden.
Insurance
The Insurance Risk Management (IRM) group is responsible for transferring property, liability, and some other financial exposures to insurance companies (via insurance policies). IRM supports operations by providing the certificates of insurance and surety bonds needed to meet contractual obligations. IRM also provides fire protection consulting on FE properties.
Insurance premium expenses charged to JCP&L are summarized in Exhibit XII-3.
Exhibit XII-3 Insurance Premium Expenses
2005 to 2009
Insurance Type 2005 2006 2007 2008 2009
Excess Liability $787,603 $807,007 $814,229 $769,219 $591,490 Excess Worker’s Comp $33,603 $34,584 $43,156 $38,030 $37,338 General Liability $32,558 $60,185 $50,094 $35,159 $54,679 Property $298,999 $301,447 $311,265 $280,166 $420,793 Boiler & Machinery $7,091 $7,277 $14,469 $13,898 $14,954 Surety Bonds $16,026 $29,201 $119,620 $104,318 $73,352 Total $1,175,880 $1,239,701 $1,352,833 $1,240,790 $1,192,606
Source: Information Response: 213 & 214 Note: Figures do not include one-time Nuclear Liability Refund (Oyster Creek) in 2008.
Overall premium costs have remained steady over the past five years. Individually, property insurance rates have shown the greatest increases with JCP&L attempting to hold down premium cost by

446 Final Report
6/20/2011
increasing deductible amounts. This escalation was offset by decreases in excess liability premium costs (also by increasing the deductible amount).
FirstEnergy conducts periodic benchmarking on insurance terms, deductibles, costs, etc. and uses this data as levels for various insurance policies and costs. FE’s informal goal is to place within the norm of the utility benchmark group, although other industry benchmarking numbers are analyzed and considered. Insurance broker contracts are bid out every three years and FirstEnergy makes considerable use of industry-owned mutual insurance funds (e.g., Nuclear Electric Insurance Limited, Aegis, and Energy Industry Mutual).
FirstEnergy has not conducted any formal insurance studies in the past five years. Instead, it has annually reviewed the Edison Electric Institute (EEI) benchmarking data on insurance as a guide for establishing insurance limits and deductibles and as a basis for evaluating carrier bids. The IRM group also conducts annual payback calculations and cost benefit analysis to determine optimal deductible and coverage limits. Annual presentations on insurance coverage and expenses are made to the Audit Committee of the FE Board of Directors for its review and approval.
Types of insurance (other than health insurance) directly charged to JCP&L include boiler and machinery, excess liability, excess worker’s compensation, property, general liability, and surety bonds. Excess liability and property insurance are layered and spread throughout multiple insurance companies, with no one company accounting for more than 25% exposure. Policy limits range from $35 million to $200 million. Excess worker’s compensation, boiler and machinery, and the first levels of excess liability and property insurance have deductibles. Policy limits, deductibles, and premiums have remained stable over the past five years.
Insurance coverage allocated to JCP&L includes directors’ and officers’ (D&O) liability, fiduciary liability, and commercial crime. These policies are all layered, with policy limits ranging from $10 million to $50 million. Deductibles apply to the first layer of each line of insurance. Policy limits and deductibles have remained constant over the past five years, with total premiums declining during that period.
JCP&L’s insurance-related loss control and prevention and its controls program and activities consist of onsite surveys by insurance company representatives who tour JCP&L facilities and provide recommendations to mitigate fire hazards. These documented surveys include assessing building changes since the last survey, reviewing the implementation of recommendations from previous surveys, undertaking a walkthrough with local management, and conducting an exit interview to discuss findings and future recommendations for improvement. Loss control surveys are periodically conducted at Northern and Central New Jersey headquarters and at Central New Jersey stores.
FirstEnergy is qualified to maintain self-insurance for motor vehicles and worker’s compensation in New Jersey. Annual applications are submitted and approved by the respective state (e.g., New Jersey). Insurance related to employees and benefits (e.g. Health Insurance) is handled by the Human Resources Department.

Final Report 447
6/20/2011
Claims against JCP&L are forwarded to the JCP&L Claims group where they are entered into a payable system. An investigation is then initiated by a claims representative. Based on the results of this investigation, the claim will either be paid of denied.
Claims against JCP&L have declined over the past five years as shown in Exhibit XII-4.
Exhibit XII-4 Total Claims for JCP&L
2005 to 2009
Year Received Closed/Denied Settled $ Paid
2005 2732 2400 541 366,130 2006 3156 2223 824 426,119 2007 2146 1856 269 423,646 2008 2333 1950 318 320,299 2009 1854 1599 245 287,129
Source: Information Response 215
When JCP&L equipment, facilities, or property are damaged by the negligence of third parties, the claim is identified and entered into the system. The FE Corporate Claims group is then responsible for billing and collecting these claims against outside parties.
Claims by JCP&L against other parties are shown in Exhibit XII-5.
Exhibit XII-5 JCP&L Claims against Other Parties
2005 to 2009
Year Received Amount Invoiced Amount Paid Balance Due
2009 1574 $5,272,930 $4,379,449 $755,507
2008 1543 $4,797,940 $4,102,806 $552,135
2007 1633 $5,353,731 $4,653,760 $503,961
2006 1540 $4,680,458 $4,121,681 $385,440
2005 1455 $4,578,905 $3,794,161 $641,046
Total 7745 $24,683,964 $21,051,857 $2,838,089
Source: Information Response 837
Claims received and amounts invoiced and paid have remained fairly steady over the past five years.

448 Final Report
6/20/2011
Findings & Conclusions
Finding XII-1 FirstEnergy/JCP&L has a robust risk management program, although the program can be better summarized and documented.
Quarterly risk assessment matrixes are maintained for the Financial group, fossil fleet, and major projects (e.g., Sammis Air Quality Control and DOE Smart Grid). These templates include information describing the specific risk, likelihood of occurrence (percent), consequences of occurrence, cost/schedule impacts, risk owners, and mitigation strategies.
There is an actively established Risk Policy Committee (RPC) with senior managers from all parts of the FE organization. In addition, there is an Investment Committee made up of senior managers in the Finance group that also addresses financial risks.
As mentioned earlier, the CRO makes quarterly presentations to the FE Board on enterprise risk management. These presentations include details on major risks and their implications to FirstEnergy, various exposures, and attendant corporate positions. They also include suggested strategies for mitigating identified top risks.
The RPC meets quarterly and is documented via agendas and meeting minutes. A wide range of topics are discussed and any member is encouraged to bring up additional matters for committee consideration. Topics include updates on major projects, financial risk activities (e.g., hedging), regulatory requirements (e.g., Ohio energy efficiency programs), policy update changes, commodity operations, and a variety of other topics. Draft business unit plans are reviewed by the committee and associated risks are identified and discussed. The RPC also ensures that all major risks are identified in these draft plans, including risks associated with workforce issues (e.g., demographics, talent development, and retention). Annually emerging risks the company may have to address are discussed. They include emerging legislation involving changes in environmental, human resources, state and federal regulatory, and nuclear security requirements. Presentations are also heard from other management committees (e.g., Investment Committee) to further identify potential risks. The RPC, through the Chief Risk Officer, reports quarterly to the FE Board Audit Committee.
In 2009, Internal Auditing, at the request of the CRO, performed two audits: one of key enterprise risk management reports and one to ensure that treasury and commodity contracts were properly loaded and retrievable from Filenet – FE’s standard system for records and document retention. Both audits found that controls were complete, accurate, and effective and that improvement recommendations had been made.
Although there is a considerable amount of effort devoted to risk management activities, there are no periodic reports or studies to pull all of these activities together.

Final Report 449
6/20/2011
Finding XII-2 The status and reporting relationship of CRO is appropriate.
The Chief Risk Officer is specifically identified in the FE organization and is a member of the senior management team (Vice President) that reports directly to the Executive Vice President & Chief Financial Officer (only two reporting levels down from the FE Chief Executive Officer). Furthermore, the Chief Risk Officer functionally reports to the Chairman of the FE Board Audit Committee. The CRO attends all Audit Committee meetings and most full Board meetings and cannot be removed from his position without the consent of the Chairman of the Audit Committee.
Finding XII-3 Insurance processes and coverage are appropriate, although analyses should be periodically documented.
The Insurance Department annually reviews benchmark statistics compiled by EEI on a number of insurance parameters, including departmental responsibilities, insurance placement (e.g., use of outside brokers/consultants), limits/deductibles, terms (e.g., multiyear, annual adjustments, and valuation basis), key markets (insurers), premium allocation, and breakdown features on specific types of insurance. The five most critical risk management issues and challenges are also summarized. Analysis is conducted annually on limits and deductibles, and major insurance coverage is competitively bid. These processes and analyses are not periodically documented in an insurance study.
As mentioned earlier, FE/JCP&L’s insurance coverage and costs have remained steady over the past several years and have fallen well within industry norms.
The Manager of Insurance makes an annual presentation of insurance coverage and cost to the FE Board of Directors.
Recommendations
Recommendation XII-1 Conduct periodic, formal risk management studies. (Refer to Finding XII-1)
Summarize and document, in written narrative format, all key assumptions, analyses, options considered, programs and actions taken, routine feedback mechanisms, and actual experience for all risks identified in FE’s Enterprise Risk Management Program. This report can follow the same major topic outline found in the COSO study (see the Background and Perspective section of this chapter). These studies can provide a historical basis for ensuring that FirstEnergy/JCP&L continue to maintain a strong risk management function.
Recommendation XII-2 Conduct periodic, formal insurance studies. (Refer to Finding XII-3)
Summarize and document, in written narrative format, all key assumptions, analyses, options considered, bid evaluations, and decisions concerning FirstEnergy/JCP&L insurance needs. Include discussions on

450 Final Report
6/20/2011
actual exposure experience and any changes from the last report. These studies can provide a historical basis for ensuring that all insurance needs are being properly met.

Final Report 451
6/20/2011
B. Legal Services
This section discusses Jersey Central Power & Light’s (JCP&L’s) legal function program, which is provided by the FirstEnergy (FE) Legal Department within the FE Service Company (SERVECO) organization.
Background & Perspective
Organization and Staffing
Exhibit XII-6 illustrates the FE SERVECO Legal organization.
Exhibit XII-6 SERVECO Legal Organization
as of June 30, 2010
Source: Information Response 54
Included in the Legal organization are both law and claims functions, as follows:
Akron, OH 48
SERVECOVice President
Legal
Akron, OH
SERVECOExcutive Assistant, VP
Legal
Akron, OH 5
SERVECOAssociate General Counsel
Federal Regulatory
Akron, OH
SERVECOExcutive AssistantFederal Regulatory
Akron, OH
SERVECOExcutive AssistantFederal Regulatory
Akron, OH
SERVECOAttorney II
Federal Regulatory-Other
Akron, OH
SERVECOSenior Attorney II
Federal Regulatory-NRC
Akron, OH
SERVECOAttorney VI
Federal Regulatory-Other
Akron, OH 12
SERVECOAssociate General Counsel
State Regulatory
Akron, OH
SERVECOExcutive Assistant
State Regulatory
Akron, OH
SERVECOExcutive Assistant
State Regulatory
Akron, OH
SERVECOAttorney V
State Regulatory-PA
Akron, OH
SERVECOSenior Attorney II
State Regulatory-OH
Akron, OH
SERVECOSenior Attorney
State Regulatory-NJ
Akron, OH
SERVECOSenior Attorney
State Regulatory-OH
Akron, OH
SERVECOAttorney V
State Regulatory-OH
Akron, OH
SERVECOAttorney V
State Regulatory-OH/FES
Akron, OH
SERVECOSenior Attorney
State Regulatory (Open)
Akron, OH
SERVECOSenior Attorney
State Regulatory (Open)
Akron, OH
SERVECOLegal SpecialistState Regulatory
Akron, OH
SERVECOAssociate Legal Specialist
State Regulatory
Akron, OH 26
SERVECOAssociate General Counsel
Trans/Comm/Litig/Envir/Labor/Corp
Akron, OH
SERVECOExcutive Assistant
Akron, OH
SERVECOExecutive Assistant
Akron, OH 13
SERVECODirectorClaims
Akron, OH
SERVECOExecutive Assistant
Reading, PA 6
SERVECOClaims Manager
Claims
Akron, OH
SERVECOAdvanced Claims Representative
Akron, OH
SERVECOClaims Representative
Akron, OH
SERVECOClaims Representative
Akron, OH
SERVECOSenior Administrative Assistant
Akron, OH
SERVECOSenior Administrative Assistant
Akron, OH
SERVECOSenior Attorney II
Mergers & Acquisitions
Akron, OH
SERVECOSenior Attorney IIEnvironmental Law
Akron, OH 7
SERVECOSenior Attorney
Akron, OH
SERVECOExecutive Assistant
Akron, OH
SERVECOAttorney VI
Contracts/SC
Akron, OH
SERVECOAttorney VI
Contracts/Special Projects
Akron, OH
SERVECOAttorney VI
Benefits/Employee Law
Akron, OH
SERVECOSenior AttorneyReal Estate/Tax
Akron, OH
SERVECOAttorney IV
Financing/Bankruptcy
Akron, OH
SERVECOLegal Specialist
Akron, OH
SERVECOSenior Attorney
Securities

452 Final Report
6/20/2011
♦ AGC-Federal Regulatory group (Federal Energy Regulatory Commission (FERC)/North American Electric Reliability Corporation (NERC))
♦ AGC-State Regulatory group (New Jersey Board of Public Utilities (NJBPU), Pennsylvania Public Utilities Commission (PaPUC), and Public Utilities Commission of Ohio (PUCO))
♦ AGC-Transactions/Commercial Litigation/Environment/Labor group, which includes contracts, real estate/tax assessments, employment/benefits law, financing/bankruptcy lawyers, plus the Claims group
♦ Senior Attorney (securities)
Time is reported on weekly timesheets by Legal employees. Time is either directly charged or allocated based on SERVECO allocations (as further discussed in Chapter III – Affiliate Relationships and Cost Allocation Methodologies).
Law
Within the Law Department, attorneys are classified based on their experience and their ability to function independently and strategically. These classes (from lowest to highest) are:
♦ Attorney I through VI ♦ Senior Attorney I and II ♦ Associate General Counsel (AGC)
The Legal Department’s philosophy is that FE attorneys lead and are in charge of all legal activities, even if that activity is conducted by external counsel firms. FE approaches projects with in-house counsel directing activities, whereby attorneys are the substantive lead of any engagement conducted with these firms. Although external attorneys may be performing many of the activities, management indicates that there is a considerable amount of communication to provide these firms with direction.
FE has two reasons for using external counsel firms:
♦ The need for specialty skills ♦ The benefit of supplemental resources to existing staff when workload is high

Final Report 453
6/20/2011
JCP&L typically uses external counsel firms for claims, employment/labor law, real estate (easements, zoning, tree trimming, etc.), and environmental legal work. Firms used by JCP&L are displayed in Exhibit XII-7.
Exhibit XII-7 Use of External Counsel Firms by JCP&L
as of June 30, 2010
Source: Information Response 324
JCP&L has 10 to 12 external counsel firms that are routinely used, approximately 80% of which are leveraged mostly for claims work.
Firm Typical Areas of CounselAkin Gump Strauss Hauer & Feld LLP Federal RegulatoryAlston & Bird LLP Federal RegulatoryCaruso Pope Edell Picini ClaimsChiumento McNally LLC ClaimsDalcortivo Law Offices BankruptcyDaniel F. Sahin PC ClaimsDavis Wright Tremaine LLP Federal RegulatoryDonald S. Mazzotta PC ClaimsDuane Morris LLP Commercial LitigationEvans, Osborne & Kreizman ClaimsGenova Burns Labor/EmploymentHarvey, Pennington, Cabot ClaimsHepler Broom ClaimsHoagland Longo Moran Dunst ClaimsHogan & Hartson LLP Federal RegulatoryHunton & Williams Federal RegulatoryKeller and Heckman LLP TaxLaw Firm of Russell R. Johnson III BankruptcyLaw Offices of John S. Brady ClaimsLevitan & Frieland PC ClaimsLowenstein Sandler ClaimsMcElroy Deutsch Mulvaney ClaimsReal EstateMitchell Mitchell Gallagher ClaimsMorgan, Lewis & Bockius LLP Federal Regulatory/State RegulatoryNewman Williams Mishkin ClaimsOgletree Deakins Nash Smoak Labor/EmploymentPeters & Wasilefski ClaimsPicillo Caruso PC ClaimsRiker Danzig Scherer Hyland State RegulatoryRoland & Schlegel LLC ClaimsRudolph & Kayal ClaimsRuprecht, Hart & Weeks LLP ClaimsSchenck Price Smith & King EnvironmentalSkadden, Arps, Slate, Meagher Federal RegulatorySquire Sanders and Dempsey FinancingWeiner Lesniak Claims/Labor/EmploymentWiley Malehorn & Sirota ClaimsWinston & Strawn Federal Regulatory

454 Final Report
6/20/2011
FE management asks external counsel firms to control costs and to be innovative in how they provide services. As a result, payments to external counsel are made in multiple ways, including:
♦ Project budgets ♦ Retainer/alternative billing ♦ Conventional hourly rates ♦ Fixed fees
Approximately 20% of external firms use a retainer/alternative billing methodology, although firms are required to provide hourly support so FirstEnergy can review over/under budget situations. Action is taken by FE management if charges are more than 20% over/under budget, a provision which FE refers to as the 20% rule. The organization also asks all external counsel firms to provide a discount from their published rates.
Systems used by all Legal Department groups include:
♦ Hummingbird DM (eDocs) (document management)
♦ TeamConnect (matter management)
♦ Concordance (litigation document management), plus Lotus Notes (e-mail system) for litigation holds as part of the e-Discovery process
Within the Legal Department there are also two regulatory groups, one focusing on state regulatory issues and the other focusing on federal regulatory issues.
Law – Federal Regulatory
The Federal Regulatory group includes an AGC, three other attorneys (a senior attorney focusing on Nuclear Regulatory Commission (NRC) issues and two other attorneys handling FERC/wholesale issues and supporting state regulatory issues, as necessary), and two executive assistants. Among the issues handled by the Federal Regulatory group are:
♦ PJM Interconnection (PJM)/Midwest Independent System Operator (MISO) legal matters
♦ FERC filings, such as market-based filings, transmission filings, and merger filings, like the one recently made
♦ Generation interconnection load issues
♦ Unregulated FE Solutions generation issues
♦ Federal compliance audits and issues
♦ Affiliates
♦ NRC mandatory reliability interactions

Final Report 455
6/20/2011
♦ Licensing filings and issues in which this group provides regulatory support to the FirstEnergy Nuclear Operating Company (FENOC), the primary FE contact with NRC on issues such as extending licenses with the NRC, NRC investigations, nuclear decommissioning trust (NDT) issues, etc.
Because FERC and NRC are located in Washington, D.C., most external counsel firms providing FE groups with federal regulatory expertise are also located in that geographic area. They include:
♦ Akin Gump Strauss Hauer & Feld, LLP (MISO) ♦ Alston & Bird, LLP (PJM) ♦ Morgan, Lewis & Bockius (nuclear) ♦ Skadden, Arps, Slate, Meagher & Flom (big transactions, such as mergers, RTO consolidations, etc.) ♦ Winston & Strawn, LLP (hydroelectric licensing/Part 1 Federal Power Act (FPA) requirements)
When looking for new firms to address non-routine issues, discussions occur between legal and business unit (BU) management. If the issues are significant enough, the Executive Vice President (EVP) & General Counsel and Vice President, Legal may also get involved. Routine filings are typically given to firms having existing relationships with the FE Legal groups. One of the growth areas is the mandatory FERC reliability standards. Because these standards are fairly new requirements, this group has been evaluating new external counsel firms and has been making its selections by performing the following informal steps:
♦ Having external firms make presentations ♦ Checking references with other utility organizations ♦ Evaluating fee arrangements ♦ Reviewing benchmarks
Systems used specifically by this group include:
♦ LegalEase (tracking of FERC filings)
♦ FERC Subscription eService (sending electronic copies of FERC issuances and decisions to a proceeding’s parties)
♦ MISO/PJM “exploder” lists
Formal communications with operational groups include:
♦ Quarterly meetings and ad hoc calls with FENOC management ♦ Regulated Commodity Sourcing and FirstEnergy Solutions (FES) management meetings ♦ Vice President Rates & Regulatory Affairs management meetings ♦ AGC attendance at Executive Reliability Committee and Financial Disclosure Committee
meetings

456 Final Report
6/20/2011
Law – State Regulatory
The State Regulatory group is primarily responsible for any legal work involving rate filings (OH, PA, NJ), customer complaints, and compliance (energy efficiency, others) for regulated operating companies. It also holds responsibility for FES’ compliance filings (renewable energy, retail offerings, etc.) in PA and OH. This group has nine attorneys (two positions currently open), two legal specialists, and two executive assistants. All employees are located in Akron, OH, except for an attorney, a legal specialist, and an executive assistant who are located in Reading, PA, and are focused on Pennsylvania activities. Every two weeks, staff meetings are held were various topics are discussed. During these meetings, when work exceeds what attorneys in the State Regulatory area can handle, the group may discuss workload as input to the decision by the AGC and/or Vice President, Legal as to whether inside counsel elsewhere in the Legal Department or outside counsel is to be used handle the overload. Regarding NJ work, FE/JCP&L has a relationship with Morgan, Lewis & Bockius (ML&B), who has longstanding background and experience with JCP&L and with how FE works. In fact, this relationship began even before JCP&L was part of the FE organization. Annually, the Legal Department has meetings with relationship partners from outside counsel firms to discuss issues such as fee increases and succession planning.
As part of its training and development efforts, the State Regulatory group leverages expertise from external counsel organizations to provide training and law change summaries, as requested by FE management, because these firms are often involved in proposed legislation changes.
Formal communications with other FE groups also exist.
♦ Attorneys work closely with the Rates and Regulatory Affairs groups, including the holding of regular meetings with these groups.
♦ Attorneys also work closely with the General Counsel, who came up through the State Regulatory group.
♦ Attorneys have frequent communications with Energy Delivery groups.
Claims
The SERVECO Claims group is in the Transactions/Commercial Litigation/Environmental/Labor group within the Legal Department organization. This group is led by a manager and 13 employees, including five employees in Akron (OH) and eight employees in Reading (PA). Three claims representatives (some organizations refer to these employees as claims adjusters) in Akron (OH) manage the claims and work with external counsel to resolve personal injury (PI) and property damage (PD) claims (although they are not responsible for collections of claims payments.) The Akron (OH) group primarily handles OH and Western PA claims, while the Reading (PA) group primarily handles NJ claims, although it is really a team approach where the groups can help each other, if necessary. The two groups in OH and PA somewhat mirror each other, with the PA group having three individuals

Final Report 457
6/20/2011
responsible for investigating and processing receivable claims and two individuals responsible for processing payable/litigation claims.
This group handles only corporate claims. It does not handle regional claims, which are primarily PD claims under $20,000. For NJ, such claims are handled by JCP&L staff in Morristown (NJ) and Red Bank (NJ). The corporate claims are PD claims over $20,000 and any other litigated PI claims. They do not include environmental or regulatory claims, which are handled by others. Specifically, NJ environmental claims mainly relate to manufactured gas plant site remediation issues and are handled by Schenck, Price, Smith & King, LLP, a NJ law firm. State regulatory claims before the NJ BPU are handled by Morgan, Lewis & Bockius LLP, with office in NJ. Both of these outside firms are under active management by the Legal organization. NJ employees handling regional claims do not report to this group. Rather, they report to JCP&L’s Director of Operations Services. Two Energy Delivery (ED) Claims Managers (one in northern NJ and one in central NJ) oversee claims representatives who are responsible for investigating and resolving claims.
The receivables claims (those claims where payments are due to an FE group by an outside party) are primarily related to collections on damage to JCP&L’s equipment, whereas payable claims (those claims where payments are due to an outside party by an FE group) are primarily related to over/under voltage. Although lawsuits may come directly to the corporate claims group, most claims start through the SERVECO customer service organization, which turns them over to the NJ-based claims group(s) within the JCP&L operations function. If the claim is a personal injury or large property damage one, the customer service organization creates a notification in C-Net to go directly to the corporate claims group. Currently, the most frequent type of “hot-button” claim is street lighting (trends are up), although previously “hot-button” claim types included stray voltage and temporomandibular joint (TMJ) claims. SERVECO management also indicates that the number of claims is often influenced by the occurrence of bad storms.
The number of invoiced receivables claims (including litigated matters) for JCP&L for the period spanning 1/1/05 through 7/06/10 totaled 8,414, with a total collection, to date (as of 7/06/10), of $22,961,032. The number of payable claims for JCP&L for the period spanning 1/1/05 through 7/06/10 totaled 13,338. Of that amount: (1) payable claims (non-lawsuit) for JCP&L amounted to 12,993, with a total payout of $1,930,475; and (2) 345 of the 13,388 payable claims turned into lawsuits, with a total payout of $5,220,730. Of the 345 lawsuits, 55 remained open (as of 7/06/10).
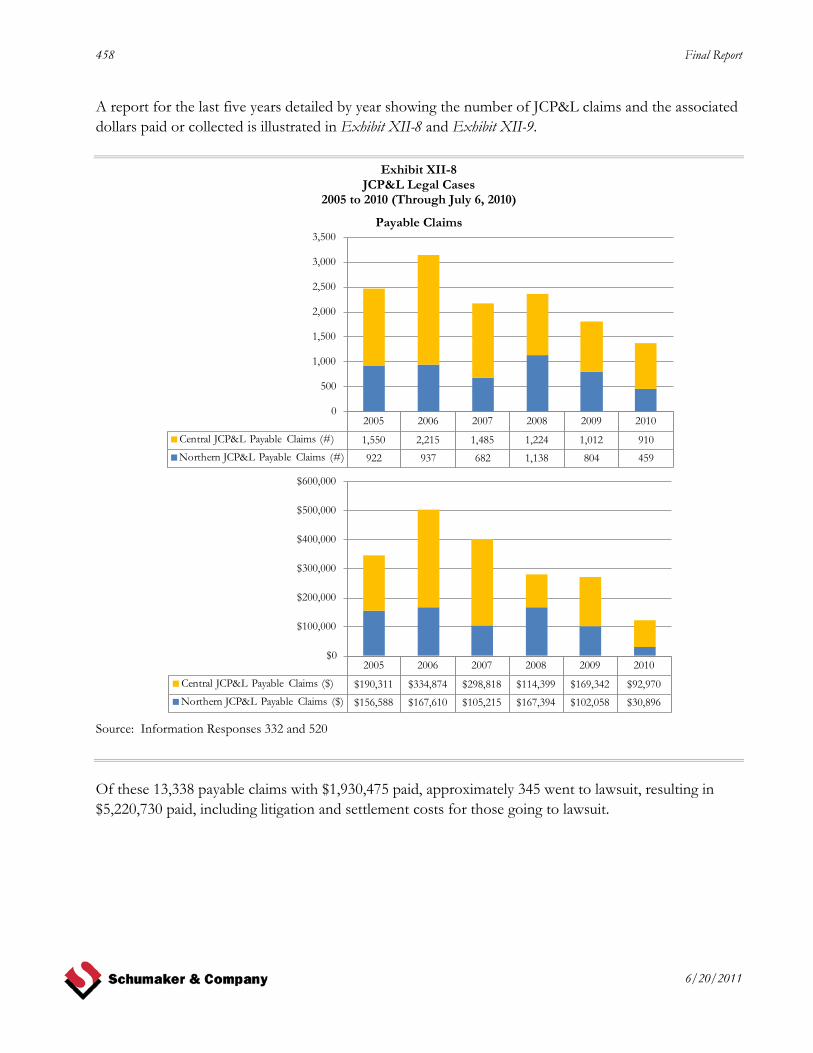
458 Final Report
6/20/2011
A report for the last five years detailed by year showing the number of JCP&L claims and the associated dollars paid or collected is illustrated in Exhibit XII-8 and Exhibit XII-9.
Exhibit XII-8 JCP&L Legal Cases
2005 to 2010 (Through July 6, 2010)
Payable Claims
Source: Information Responses 332 and 520
Of these 13,338 payable claims with $1,930,475 paid, approximately 345 went to lawsuit, resulting in $5,220,730 paid, including litigation and settlement costs for those going to lawsuit.
2005 2006 2007 2008 2009 2010
Central JCP&L Payable Claims (#) 1,550 2,215 1,485 1,224 1,012 910Northern JCP&L Payable Claims (#) 922 937 682 1,138 804 459
0
500
1,000
1,500
2,000
2,500
3,000
3,500
2005 2006 2007 2008 2009 2010
Central JCP&L Payable Claims ($) $190,311 $334,874 $298,818 $114,399 $169,342 $92,970Northern JCP&L Payable Claims ($) $156,588 $167,610 $105,215 $167,394 $102,058 $30,896
$0
$100,000
$200,000
$300,000
$400,000
$500,000
$600,000

Final Report 459
6/20/2011
Exhibit XII-9 JCP&L Receivable Claims
2005 to 2010 (Through July 6, 2010)
Source: Information Responses 332 and 520
Operating Expenses
The Legal Department’s budget, while taking into consideration all anticipated activities by the various business units, including those for JCP&L, is not specifically crafted by business unit (i.e., operating company). Therefore, budgeted external and internal legal costs for JCP&L were not available. Instead, Exhibit XII-10 illustrates actual costs that have been either directly charged to JCP&L or allocated by SERVECO.
2005 2006 2007 2008 2009 2010
JCP&L Receivable Claims (#) 1,455 1,540 1,633 1,543 1,574 669
0
200
400
600
800
1,000
1,200
1,400
1,600
1,800
2005 2006 2007 2008 2009 2010
JCP&L Receivable Claims ($) $3,794,161 $4,121,681 $4,653,759 $4,102,805 $4,379,449 $1,909,177
$0
$500,000
$1,000,000
$1,500,000
$2,000,000
$2,500,000
$3,000,000
$3,500,000
$4,000,000
$4,500,000
$5,000,000

460 Final Report
6/20/2011
Exhibit XII-10 JCP&L Legal Expenses
2005 to 2009
Source: Information Response 222
2005 2006 2007 2008 2009
External $4,872,168 $4,001,076 $3,248,582 $3,721,962 $3,345,837 Internal $749,565 $740,397 $723,438 $481,326 $390,161
$0
$1,000,000
$2,000,000
$3,000,000
$4,000,000
$5,000,000
$6,000,000
Internal External

Final Report 461
6/20/2011
Exhibit XII-11 illustrates JCP&L’s off-budget legal expenses relative to FE’s. Legal expenses that are paid out of another departments’ budget and/or are included in the expenses of a financing transaction are considered off-budget legal expenses. They are not included in legal expenses shown previously in Exhibit XII-10.
Exhibit XII-11 JCP&L Off-Budget Legal Expenses
2005 to 2009
Source: Information Response 328
2005 2006 2007 2008 2009
FE Off-Budget Legal Costs $4,491,979 $13,425,514 $1,341,976 $3,860,949 $4,381,840 JCP&L Portion of Off-Budget Legal Costs $303,382 $1,852,453 $816,924 $395,701 $1,261,385
$0
$2,000,000
$4,000,000
$6,000,000
$8,000,000
$10,000,000
$12,000,000
$14,000,000
$16,000,000

462 Final Report
6/20/2011
Findings & Conclusions
Law
Finding XII-4 The Legal Department’s performance objectives are vague and its key performance indicators (KPIs) in support of the Legal Department’s mission and objectives have not been fully developed.
The mission statement of the Legal Department is:
“The Legal Department will provide exceptional counsel that assures legal compliance and enables FirstEnergy to optimize business outcomes in all legal, regulatory, and commercial contexts.”
In support of this mission, the Legal Department’s 2010 performance objectives include:
♦ Providing exceptional counsel to the operating companies, FENOC, and FES in the accomplishment of regulatory, commercial, and compliance goals in partnership with other shared services departments
♦ Supporting HR and the business units in implementing the workforce plan, including providing legal support for reorganization and hiring activities, retention strategies, and benefit plan design and administration
♦ Providing timely and effective SEC compliance support
♦ Managing the Legal function to enhance capabilities and service value, to control costs (including outside counsel fees) especially in light of budget constraints, and to increase department employee engagement
♦ Being an effective partner and counselor to the BUs and other shared services departments in the accomplishment of their goals and objectives through exceptional advice delivered timely and efficiently
These performance objectives are somewhat vague as they do not include specific measurable
♦ Key activities
objectives regarding what is to be accomplished, nor do they specify how long it will take to complete these objectives. With regard to associated KPIs, according to Legal Department management, the question is always: “How do you measure success?” In past years, management used “bad,” “ok,” and “great” categories. In 2008, management evaluated all cases; however, in 2009, they evaluated approximately only 10 to 12 cases. In 2010, they are not formally performing any case evaluations, but they are evaluating individual lawyer performance, during which Legal management is focusing on:
♦ Client satisfaction ♦ Employee engagement ♦ Productivity

Final Report 463
6/20/2011
Among the tools that Legal Department management has used to measure success are the following:
♦ Annually, the Legal Department conducts client and outside law firm satisfaction surveys, including correlation analyses.
♦ Every other year, the Legal Department also conducts employee engagement studies as part of FE-wide efforts.
♦ Ongoing monthly actual-to-budget analyses are also performed.
Exhibit XII-12 displays FE’s 2009 client satisfaction survey regarding Legal’s performance, where FE in-house department clients evaluate the Legal Department’s performance.
Exhibit XII-12 2009 Legal Client Satisfaction Survey
Source: Information Response 326
When asked about those items on the left side of the graph, especially timeliness of response, readily accessible for calls or meetings, or proactively informed you about legal issues affecting your business and risk, the EVP & General Counsel indicated these areas always tend to score low. That is, according to SERVECO management, because attorneys can only do so much to prioritize their work and they do not specifically attempt to provide legal education to clients. The EVP & General Counsel also

464 Final Report
6/20/2011
indicated that she believes that the Legal Department has a good enough and robust dialogue with its clients, especially with Energy Delivery (ED) groups.
Exhibit XII-13 displays FE’s 2009 outside legal firm survey results, where Legal Department attorneys evaluate the outside counsel firms they use.
Exhibit XII-13 2009 Outside Legal Firm Survey
Source: Information Response 326
When asked about those items on the left side of the graph, especially proactively informed FirstEnergy attorneys about legal issues affecting FE’s business and risks, the EVP & General Counsel indicated that outside legal firms generally do not provide wide-ranging legal briefings. That is, according to SERVECO management, because they generally provide only information regarding the facts of specific cases, although some do provide blast e-mail messages too.
Finding XII-5 Unlike other FE states, JCP&L has relied extensively, for a long period of time, on one external counsel firm for its state regulatory work in New Jersey and pays significantly for that firm’s activities.
FE has not typically used requests for proposal (RFPs) to obtain external counsel legal work, but it has a listing of firms it typically uses. FE management indicates that they are continually reviewing JCP&L’s

Final Report 465
6/20/2011
need for legal work against the need for use of external counsel firms. For example, NJ has different restrictions than OH and PA, in that its state bar is more stringent and requires local counsel in some situations. In other states, this type of legal work is performed primarily by internal staff; however, unlike these FE states, JCP&L primarily uses outside counsel (Morgan, Lewis & Bockius LLP) for its state regulatory activities. This firm’s involvement with JCP&L predates both ML&B employment of key attorneys supporting JCP&L and FE’s acquisition of JCP&L. At this time, one of these key ML&B attorneys working in the state regulatory area is nearing retirement age, so JCP&L has started discussions with ML&B to develop potential succession plans for NJ’s state regulatory activities.
A fixed fee billing arrangement with Morgan, Lewis & Bockius for state regulatory work has been in place since November 2008. FE pays a monthly retainer, which covers all state regulatory work by ML&B’s New Jersey lawyers primarily for JCP&L, but it also includes some regulatory work for JCP&L’s affiliates in Pennsylvania and Ohio. The concept of state regulatory work is broadly defined, so that, for example, in addition to routine JCP&L regulatory matters, such concerns as work on Pennsylvania rate cases and work on Ohio re-regulation issues would be covered by the retainer. ML&B tracks accrued time at the discounted hourly rates. If, and to the extent that, ML&B’s time charges a specified amount in a year, ML&B would bill the excess time at its discounted hourly rates. Additionally, extraordinary matters, such as a full-scale JCP&L base rate case or merger proceedings, would fall outside the scope of the arrangement and would be billed separately on an hourly rate basis at FE’s discounted rates. In the last two years (2009 and 2010), JCP&L paid between $600,000 and $1 million annually. Although, in the past few years, JCP&L received more work than it paid for under this retainer mechanism, it is still paying a significant amount for legal assistance that might more efficiently be performed by internal attorneys. With key representatives from ML&B nearing retirement age, it is the ideal time for JCP&L to determine whether it should continue relying so heavily on external counsel for its NJ state regulatory work.
Claims
Finding XII-6 No formal written policies or procedures documentation exists for the Claims groups in OH, PA, or NJ.
The Claims function, although operating in OH, PA, or NJ, has no formal written policies or procedures in place. This lack of documentation makes it difficult for employees in all states to operate in a consistent manner to process claims.
Finding XII-7 The in-house system supporting the Claims function could not provide all the information requested by Schumaker & Company during this audit.
The system supporting the Claims function is an in-house–developed claims system that was instituted in the late 1980s. This application system captures, tracks, and reports FE claims and related lawsuit information, as provided by three subsystem modules:
♦ Receivable claims

466 Final Report
6/20/2011
♦ Payable claims ♦ Lawsuit and administrative maintenance
The receivable claims subsystem allows the Claims function to perform the following activities:
♦ Capture, verify, and send costs to the General Ledger (G/L) ♦ Generate claimant invoices ♦ Accept claimant payment and send payment/invoice information to G/L ♦ Work with outside counsel to obtain delinquent payments ♦ Establish payment contracts and schedules with claimant and receive claimant payments ♦ Generate reporting for Claims and Treasury departments and outside counsel and capture
attorney collection fees and expenses
The payable claims subsystem allows the Claims function to perform the following activities:
♦ Capture, investigate, negotiate, and issue payment to parties where FirstEnergy has damaged property or caused injury. Depending on the damage incurred, payments may be generated from Claims and/or Accounts Payable.
♦ Generate reporting for Claims and Treasury departments
The lawsuit and administrative maintenance subsystem allows the Claims function to perform the following activities:
♦ Capture, assist with the investigation and negotiation processes, assist legal counsel/court, track payments for incurred injury (payments issued by Damage Claims System (DCS) and/or Accounts Payable module in SAP)
♦ Track payments of invoices paid to the legal counsel
♦ Monitor case statute of time limitations
♦ Generate reporting for Claims and Legal departments
The SERVECO organization has not formally explored a more sophisticated system, although when asked about providing data by type of claim or having claim payments assigned to the year in which the claims were incurred, the Claims Director indicated that the system could not provide that data.
Finding XII-8 No formal reporting to JCP&L’s senior management regarding claims is currently being provided.
Although SERVECO’s Claims management indicates that it has extensive discussions with JCP&L management and staff, the service company provides no formal reporting to JCP&L’s senior management regarding the number or type of claims.

Final Report 467
6/20/2011
Recommendations
Recommendation XII-3 Strengthen Legal Department objectives and associated KPIs, including responding to survey results. (Refer to Finding XII-4)
The objectives in support of a group’s mission, such as that of the Legal Department, should support FE goals and objectives. They must also be specific and measurable with a timeframe for completion of these objectives, thereby allowing FE management to determine if Legal Department management is accountable in achieving its mission. The Legal Department should strengthen its objectives in future years to meet these criteria. In addition, specific KPIs should be developed that identify how the Legal Department is doing in regard to meeting its mission and objectives. As part of this response, Legal Department management should incorporate activities that address low scores in its survey results.
Recommendation XII-4 Perform a cost/benefit analysis to determine whether state regulatory work should be performed primarily internally or externally in the future, and incorporate the development of RFPs into this decision-making process. (Refer to Finding XII-5)
With key representatives from ML&B nearing retirement, it is the ideal time for JCP&L to determine whether it should continue relying so heavily on external counsel for its NJ state regulatory work. In other states, this type of legal work is performed primarily by internal staff. A cost/benefit analysis, including both quantitative and qualitative factors, should be performed to determine if it is the appropriate time to move in-house JCP&L’s legal work involving state regulatory issues and then provided to the BPU Audit Division. Although the AGC for state regulatory matters works closely with NJ external counsel, thereby developing an understanding of the NJ issues, considerable institutional knowledge will be leaving as ML&B attorneys retire and, given the amount of funds spent each month with ML&B attorneys, it may be more cost-effective to handle JCP&L’s work in-house and begin establishing FE’s own institutional knowledge of JCP&L’s issues.
As part of this effort, a request for qualifications (RFQ) (or RFQs) should also be used to identify potential new external sources for whatever legal work continues to be performed by external staff. Within utility legal organizations, the best practices for identifying external legal firms typically result from the periodic issuance of an RFQ. Such a strategy helps uncover potential candidates for inclusion in a prequalified list of external legal firms. A legal organization should periodically (at least every five years) develop such a prequalified list, which could vary in length by type of legal work. By implementing such a process, a legal organization not only formally identifies alternative legal firms it may not have considered in the past, but it also helps to ensure that it receives quality legal services at a reasonable cost by encouraging containment of costs by the firms used.
Such a process would not necessarily be limited to only JCP&L state regulatory work. Rather, the list might be a corporate-wide one to allow JCP&L, FE, and other subsidiaries the opportunity to take advantage of listed firms. If the process were limited to simply JCP&L state regulatory legal work, then

468 Final Report
6/20/2011
external legal firms would not necessarily put their most advantageous cost forward as a result of JCP&L’s relatively smaller size. Putting together a corporate-wide list that could be used by entities throughout the FE organization, however, it could benefit not only JCP&L but other entities as well. While FE believes that it has identified highly qualified counsel firms who are willing to represent JCP&L at extremely attractive rates, the use of a formal prequalified list would allow FE to open up the process to those whom it has not previously identified. Schumaker & Company also strongly believes that the use of such a list may make participants complacent. That is because inclusion on the list does not ensure continued work.
Recommendation XII-5 Establish formal written Claims function documentation for all FE groups managing claims. (Refer to Finding XII-6)
Formal written documentation should be developed for all FE groups managing claims to ensure that standardization of processing and managing claims activities is done.
Recommendation XII-6 Perform an investigation and resulting cost/benefit analysis to see if FE’s claims system should be replaced. (Refer to Finding XII-7)
Because the SERVECO organization has not formally explored replacement of its claims application system since that system’s implementation in the 1980s, a formal investigation and cost/benefit analysis should be performed. Assignment of claims payments to the year in which they were incurred is a very basic capability the system does not provide. Given its age, there are likely other capabilities it does not afford. A formal investigation and resulting cost/benefit analysis should be conducted to determine if replacement is warranted.
Recommendation XII-7 Begin providing formal reports to JCP&L senior management regarding claims and legal cases activities. (Refer to Finding XII-8)
While the use of verbal communications is useful to JCP&L senior management in understanding the impact of claims and legal cases on JCP&L’s operations, it is not a substitute for formal written reports that provide the level of detail JCP&L needs to fully understand these activities. The Legal Department should begin providing monthly formal reports to JCP&L senior management that detail this information and data.

Final Report 469
6/20/2011
C. Facilities and Property Management
This section addresses Jersey Central Power & Light Company’s (JCP&L) real estate and facilities activities.
Background and Perspective
Organization and Staffing
Real estate and facilities activities for FirstEnergy (FE) companies are coordinated out of the General Counsel organization, with utility companies each responsible for maintaining their own facilities. Exhibit XII-14 shows this organization for FE/JCP&L.

470 Final Report
6/20/2011
Exhibit XII-14 Real Estate and Facilities Organization
2006 to 2010 as of December 31, 2010
Source: Information Response 54
Real estate and facilities activities are coordinated by the Director of Real Estate and Facilities. Reporting to her are managers for Real Estate Services and Facilities Services. Reporting to the Manager of Facilities Services is a Supervisor responsible for facilities management in Pennsylvania and New Jersey. The FE facilities group is directly responsible for only FE corporate buildings. The current organization was created in 1997 and there have been no major organizational changes since that time.
JCP&L operations are responsible for their own facilities and maintenance but will use the FE facilities organization for assistance with analyzing and justifying (through the budgeting process) building and real estate purchase/expansion, leasing, usage, and sales/salvage. The Supervisor, Regional Facilities, in addition to administrative staff, has four building maintenance and six janitorial personnel. Staffing
Akron, OH 13,602
FirstEnergy OrganizationPresident & CEO FE
President & CEO, FE Corp
Akron, OH 316
FirstEnergy OrganizationEVP & General CounselEVP & General Counsel
Akron, OH 112
FirstEnergy OrganizationVP, Corp Sec & Chief Ethics Officer
Corp/Real Estate, Records Mgmt
Akron, OH 66
FirstEnergy OrganizationDir, Real Estate & Facilities
Real Estate & Facilities
Akron, OH
FirstEnergy OrganizationSr Admin Assistant
Real Estate & Facilities
Akron, OH 13
FirstEnergy OrganizationMgr, Real Estate Services
Real Estate
Akron, OH 51
FirstEnergy OrganizationMgr, Facility Services
General Facilities Mgt & Maint
Akron, OH 27
FirstEnergy OrganizationSupv, Facil Mgmt & Maint
Facility Mgmt-PA & NJ
Akron, OH 7,253
FirstEnergy OrganizationSVP & President, FE Utilities
FirstEnergy Utilities
Akron, OH 5,684
FirstEnergy OrganizationVP, Utility Operations
Utility Operations
Akron, OH 1,426
FirstEnergy OrganizationPresident, JCP&L
JCP&L
Akron, OH 193
FirstEnergy OrganizationDir, Ops Support
CO-JCP&L-Ops Support
Akron, OH 19
FirstEnergy OrganizationMgr, Support Svcs
CO-JCP&L-C-Stores/Facilities

Final Report 471
6/20/2011
levels for JCP&L facilities has slightly declined over the past five years, going from 21 employees in 2005 to 19 employees in 2009.
Budgeted and Actual expenses
Exhibit XII-15 shows the budgeted and actual expenses for JCP&L facilities capital and operations and maintenance for the past 5 years.
Exhibit XII-15 JCP&L Facilities/Property Management Capital & O & M Expenses
2005 to 2009
Source: Information Response 225
Facilities O&M budgeting is based on historical spending adjusted for any expected changes in spending during the facilities assessment in the budgeting process. Budgeted and actual operations and maintenance (O&M) have remained stable over the past 5 years, even declining by 20 percent in 2009. Capital expenditures have been higher than budgeted, particularly in 2008, when capital roof improvements were done at seven JCP&L facilities. JCP&L stated that the overruns came from bids coming in higher than expected and unanticipated breakdowns. The O&M positive variance in 2006 came from snowplowing expenses being less than anticipated in that year. Facilities expenses are estimated and broken out separately in each department’s operations budget.

472 Final Report
6/20/2011
Major JCP&L facilities, changes, and reporting.
Exhibit XII-16 shows a breakdown of major JCP&L land and facilities.
Exhibit XII-16 Facility Inventory (Owned and Leased)
as of December 31, 2009
’ Source: Information Response 732
JCP&L has stated that there are no anticipated real estate or facilities needs for JCP&L in the foreseeable future, nor are there any legal or regulatory issues or challenges that would affect the real estate/facilities area.
Decription/Use Address Municipality CountyGross Sq. Ft.
Assessed Value (Land &
Bldg) Annual Rent AgeOwned MGO 300 Madison Ave. Morristown, NJ 07960 Morris Twp Morris 201560 21000000 1961
Allenhurst 521/525 Main St Allenhurst, NJ 07711 Alenhurst Boro Monmouth 132,392 13,845,600 1959
Berkeley District Office Pinewald-Keswick Rd Bayvile, NJ 08721 Berkeley Twp Ocean 25,846 1,293,300 1978
Cookstown Service Ctr 214 Cookstown-New Egypt Rd Wrightstown, NJ 08562 North Hanover Twp Burlington 12,445 754,700 1957
Farmingdale Service Ctr & Sub Railroad Ave. Farmingdale, NJ 07727 Howel Twp Monmouth 39,928 5,948,900 1969
Notseparately
Freehold District Office 30 Rhea St Freehold, NJ 07728 Freehold Boro Monmouth 25,865 3,430,300 1966
Freneau Service Ctr Wilson Ave Monmouth, NJ 08772 Matawan Boro Monmouth 3,690 2,304,800
Lakewood Customer Ops Ctr 655 Squankum Rd Ocean, NJ 08701 Lakewood Twp Ocean 34,402 5,578,300 1901
Lakewood Garage 655 Squankum Rd Ocean, NJ 08701 Lakewood Twp Ocean 27,276 2,997,600 1951
Larrabee Service Ctr & Sub Randolph Road Ocean, NJ 07731 Howel Twp Monmouth 3,345 3,022,900 1988
Long Branch District Office 291 Monmouth Rd West Long Branch, NJ 07764 W Long Branch Bobo Monmouth 15,170 2,258,200 1962
Old Bridge District Office 1345 Englishtown Rd Old Bridge, NJ 08857 Old Bridge Twp Middlesex 21,801 1,300,000 1962
Point Pleasant District Office 405 New Jersey Ave Point Pleasant, NJ 08742 Point Pleasant Beach Boro Ocean 20,412 4,920,300 1956
Toms River Service Ctr 25 Adafre Ave Toms River, NJ 08753 Toms River Twp Ocean 13,842 679,400 2001
Union Beach Service Ctr 1500 Florence Ave Union Beach, NJ 07735 Union Beach Boro Monmouth 42,347 519,500 1956
Wall Service Ctr Monmouth, NJ 08772 Wal Twp Monmouth 17,365 1,488,000 1960
Boonton Customer Ops Ctr 46 Parsippany Blvd Boonton, NJ 07705 Parsippany-Troy Hils Morris 17,964 1,448,500 1955
Dover Region Head q trs-McFarlan 105 East McFarlan St Morris, NJ 07801 Dover Town Morris 33,577 1,315,000 1959
Dover Service Ctr-Richboynton Richboynton Rd Morris, NJ 07801 Dover Town Morris 21,668 1,328,000 1998
E. Hanover Service Ctr 150 N. Ridgedale Ave, NJ 07936 E Hanover Twp Morris 32,924 4,679,500 1998
Flemington District Office Rt 31 Flemington NJ 08822 Raritan Twp Hunterdon 18,492 2,305,700 1964
Hopatcong (Landing) Service Ctr 175 Center St Landing, NJ 07850 Hopatcong Boro Sussex 16,318 662,000 1965
Morris Park (Philipsburg) Svc Ctr 301 Red School Lane, NJ 08865 Lopatcong Twp Warren 5,503 1,305,900 1951
Morristown Service Ctr 10 Legion Place Morristown, NJ 07960 Morristown Town Morris 81,725 3,400,000 1907
Newton District Office 112 Hampton House Rd Newton, NJ 07860 Hampton Twp Sussex 19,547 1,102,000 1962
Phili p sbur g Service Ctr 400 Lincoln St Phili p sbur g , , NJ 08865 Phili p sbur g Town Warren 56,645 2,690,200 1947
Summit District Office 51 Chatham Rd Summit, NJ 07901 Summit City Union 23,763 2,750,000 1972
Washington Customer Ops Ctr 111 Kinnaman Ave. Washington, NJ 07882 Washington Twp Warren 19,142 100,800 1959
West Wharton Service Ctr West Dewey Ave Wharton, NJ 07885 Wharton Boro Morris 16,483 360,000 1960
Leased Wharton Material Distribution Ctr 98 North Main St Wharton NJ 07885 38,000 280,100Pub Affairs-Cap View (Trenton) 150 West State St. Trenton, NJ 08608 2,051 41,020Florham Sub Property Florham Park, NJ 4,800Allenhurst Walk In 300 Main St. Alenhurst NJ 07711 2,000 44,004Allenhurst Parking lot Allenhurst, NJ 07711 3,000Red Bank-Cust Svc 331 Newman Springs Red Bank, NJ 07701 11,200 376,250Red Bank-HQ 1 River Center 331 Newman S p rin g s Red Bank, NJ 07701 53,807 1,254,528
45,291Forked River Material Distrib Ctr 798 Rt 9 South Forked River, NJ 08731 Lacey Twp Ocean

Final Report 473
6/20/2011
The last significant facilities change was moving JCP&L headquarter functions from Allenhurst (JCP&L owned) to Red Bank, NJ (leased). In evaluating this move, JCP&L stated that facilities requirements were considered in arriving at the decision to move although no documentation or analysis was maintained. Options considered included renovating existing space, build on current owned property, build on new property, or lease. Cash flows were estimated for each scenario and Net Present Value numbers were determined (as well as the sale price of the Allenhurst facility to break even).
The move to Red Bank took place in 2004 with two floors leased: 28,669 square feet for FE Shared Services customer service functions (reduced to 17,500 square feet when the lease was renegotiated in 2010) and 52,934 square feet on another floor for JCP&L headquarters/corporate functions.
JCP&L has not conducted any planning studies or analysis to evaluate current utilization, future requirements, or disposition or leasing of excess land and office holdings. JCP&L plans to sell its former headquarters facility in Allenhurst, NJ, which is now vacant. JCP&L does not anticipate any additional real estate of facilities needs or additions in the foreseeable future.
JCP&L currently does not utilize any property or facility management manuals or procedures, there are no procedures or documented business practices specific to the facilities function, and there have been no internal audits of the JCP&L facility and property management function in the past 5 years.
Monthly reports are maintained up and down the Real Estate and Facilities Management chain that summarizes recent important events, payments, budgets, and status of ongoing issues.
Space standards have been developed and periodically reviewed that apply to all FirstEnergy offices, work stations, and office support areas. These standards include not only space/size criteria, but also various space amenities, e.g. floor and wall coverings, lighting and window treatment, furniture and chairs.
Maintenance and Repair
Maintenance and repair at JCP&L facilities are coordinated by supervisors responsible for Morristown Corporate facilities and Northern and Central Districts. Those building repairs and maintenance not included in lease agreements are handled by in-house personnel or contracted out depending on the type and complexity of the repair (e.g. roofing, plumbing, landscaping). Simple repairs are conducted by JCP&L staff at Morristown and Central Division. All services in Northern division are contracted out. In-house janitorial personnel are utilized in Central Division at 7 locations, with all other locations contracting out janitorial (not included as part of the leasing terms).
JCP&L facilities utilize a LOTUS based corrective work order system for identifying, scheduling, and documenting maintenance and repair. Terminals are located throughout all JCP&L properties. Repair requests will be routed to the responsible supervisor (Morristown or Northern/Central District) who will then assign JCP&L personnel to perform the work or arrange for contractors to come in. A Help desk is maintained to coordinate work orders and take emergency orders by phone. Contractor lists and

474 Final Report
6/20/2011
contact points are maintained at the Help Desk. There is also a Project Manager function responsible for coordinating/managing major repairs, such as roof replacements and building renovations. Bidding for all contracted work is conducted through the Contracts Group in Supply Chain with facilities supervisors assisting in identifying local bidders. When work orders are closed out, the requesting party is informed. Monthly reports are distributed to all facilities supervisors and ad-hoc reports are available tracking new work orders, open and aged work orders, and completed work orders.
The Help Desk also maintains equipment lists and planned maintenance schedules electronically in SAP. Each month, the system generates the planned maintenance to each facility’s supervisor. These PM tickets include the tools and specific activities to accomplish the work. When the work is completed, the ticket is closed out and reported back into the system.
Findings and Conclusions
Finding XII-9 FE/JCP&L Real Estate and facilities organization properly maintains its buildings and properties by using simple, straightforward methodologies for managing its repair and upgrade workloads.
Responsibilities for JCP&L buildings are clearly defined with Service Company personnel responsible for assisting in analysis and input to budgets, and supervisors located in New Jersey assigned to coordinate work for corporate and JCP&L land and buildings. Project managers (identified positions) are assigned to manage/coordinate contractors on larger projects. Monthly reporting is performed up through the Service Company officer level on JCP&L real estate and facilities activities and issues. Facilities supervisors interact with building supervisors to coordinate work and determine needs.
All contracts are negotiated and let through the Service Company’s Supply Chain Department. Planned maintenance and corrective maintenance work is handled through a straightforward, easy to use database system that has terminals throughout all JCP&L facilities and can be accessed by responsible JCP&L personnel. Facilities supervisors review, assign, schedule and follow up on all work and affected parties are notified when the work is completed. System work orders contain all necessary information and periodic reports are generated to track backlogs and progress. Planned/preventative work orders are automatically generated and tracked monthly.
Finding XII-10 There are no formal facilities forecasting or planning methodologies or techniques in place.
Facilities management and personnel interact and communicate with operations and JCP&L management on facilities needs on a case-by-case basis. Any planning or forecasting is informal and it is difficult to determine to what extent future needs are being properly addressed. Analysis in support of major facilities changes (e.g. move to Red Bank) is not maintained in any historical file.

Final Report 475
6/20/2011
Recommendations
Recommendation XII-8 Develop a Facilities Master Plan. (Refer to Finding XII-10)
Develop a strategic facilities planning process that defines changes in JCP&L’s business going forward and the necessary facilities changes that will best support these changes. Planning can go beyond space planning to consider changing technology, demographics, work content (e.g. employees skills, changes in contract versus in-house employees), among other topics. As part of this process, define analysis techniques for evaluating facilities needs and maintain a historical record of all major facilities analysis.
In particular, the plan should specifically address the excess space not currently in use at the main office in Morristown versus the need for leased space in Red Bank and other facilities.
A Strategic Facilities Plan or Facilities Master Plan will ensure this function is operated in the most cost-effective manner and best supports JCP&L operations.

476 Final Report
6/20/2011
D. Supply Chain
This section addresses the provisioning of materials and services to Jersey Central Power & Light Company (JCP&L).
Background & Perspective
The Supply Chain function at FirstEnergy (FE)/JCP&L is a hybrid organization structure. Procurement of, and logistics for, materials and services is centralized in the Supply Chain organization within the corporate FirstEnergy Service Company (SERVECO). The physical warehousing and distribution of materials and supplies in the field is decentralized to JCP&L.
FE Supply Chain
The centralized corporate Supply Chain organization is part of the Finance, Strategic Planning, and Operations group as shown in Exhibit XII-17. It reports to the Vice President, Shared Services Administration & Chief Information Officer.
Exhibit XII-17 Supply Chain
as of July 8, 2010
Source: Information Response 54 Supplemental Attachment 2
Akron, OH 1,211
SERVECOExecutive VP & CFO
Finance, Strategic Planning & Operations
Akron, OH 823
SERVECOVice President
Shared Services Admin & CIO
Akron, OH 184
SERVECODirector
Supply Chain
Akron, OH 19
SERVECODirector
Utility & Corporate Sourcing
Akron, OH 63
SERVECODirector
Generation Sourcing
Akron, OH 21
SERVECODirector
Strategy & Planning
Akron, OH 80
SERVECODirector
Operations & Logistics

Final Report 477
6/20/2011
The Supply Chain organization has four units:
♦ Utility and Corporate Sourcing provides procurement services for the FirstEnergy Utilities’ (FEU) business unit and corporate functions. There are separate groups for each area, meaning there is a dedicated group for FEU sourcing. The Utilities Sourcing unit has a manager and buyers.
♦ Generation Sourcing provides procurement services to the fossil and nuclear generation groups.
♦ Supply Chain Strategy and Planning provides assistance with major sourcing initiatives, supplier diversity, and supply chain information technology. It also operates a service center for purchase order creation with the proper legal terms and conditions.
♦ Operations and Logistics arranges for transportation of materials and supplies from vendors to the field and manages a specialized investment recovery function. Routine FEU investment recovery operations, such as for scrap cable, are handled by the FEU opco (operating companies) Stores functions. This FE centralized unit operates the nuclear and fossil generation storerooms, but it does not operate the Ohio, Pennsylvania, or JCP&L opco storerooms. This unit also manages the stock catalog and stock code numbers to reduce duplication.
Approximately three-quarters of the total supply chain materials spend is for inventoried items (i.e., items normally kept in stock at JCP&L warehouses). The other one-quarter of the materials spend is for non-stock items for specific projects or capital spares. In 2009, the FEU total spend for materials, equipment, and services was $450 million. The total spend for JCP&L was $73.8 million. JCP&L spend in 2009 for materials and equipment was $28.4 million and $45.4 million for services. Total FEU-specific supply chain expenses were $1.1 million in 2009, $400,000 below budget. JCP&L is charged 22.85% of the supply chain costs. Supply Chain utilizes the SAP supply chain modules for information processing.
Supply Chain prepared a 2010 Integrated Supply Plan for the FEU business unit. This plan includes an economic overview and its likely impact on FEU, market opportunities, expiring contracts, major sourcing initiatives, forecast spend and assumptions, and key strategies. The Supply Chain key strategies for FirstEnergy Utilities in 2010 are:
♦ Review and clarify specifications on materials and services for major projects
♦ Combine and leverage spend through vendor rationalization while enhancing supplier diversity
♦ Provide price stability on key commodities by eliminating variable pricing
♦ Procure across FE to maximize value
♦ Aggressively manage the entire supply chain
♦ Mitigate risk by assessing and standardizing contract content and by strategically evaluating the renewal of contracts

478 Final Report
6/20/2011
All Supply Chain procurements are done on standardized purchase orders, as the Supply Chain organization does not issue many long-form and/or individualized contracts. FE Supply Chain also has a purchasing card (P-Card) system that allows employees to purchase minor items at retail with a card that is like a credit or debit card. Total FirstEnergy P-Card spend in 2008 was $40 million. There are standard P-Cards, field force P-Cards for bargaining unit employees, and storm P-Cards issued only to supervisors and above for use during storms. The storm P-Cards have higher spending limits. In addition, Supply Chain staffs storm desks for emergency purchases during storms anywhere in the FE service territories. P-Card usage is closely controlled and audited extensively.
Most goods and services are procured through the Supply Chain organization. However, there is a category of “No Purchase Order” items that bypass the Supply Chain unit. No Purchase Order items include low-risk, one-time purchases for less than $10,000 that are impractical for the P-Card; utilities; energy transactions; charitable contributions; legal bills; tuition reimbursements; pole attachments; insurance premiums; and human resource benefits. The FE controller sets the No Purchase Order policy with Supply Chain review and concurrence. The FE Legal Department reviews No Purchase Order contracts but Supply Chain does not.
Typical services that do go through the Supply Chain procurement process include vegetation management, line construction/storm support, cable locating, flagging, pole inspections and transmission line inspections.
The Supply Chain organization operates on a “total cost of ownership” philosophy. That is, it makes procurement decisions in consultation with representatives of the eventual users and considers transportation costs, payment terms, escalation clauses, lead times, supplier diversity, spares costs, inventory costs, costs of installation, warrantees, repair costs, expected life, and other factors relevant to each purchase that affect the total cost of owning a particular item. One practical effect of this type of philosophy is to allow for standardization on one manufacturer’s brand of equipment. This standardization reduces the number of spare parts and the amount of training time needed. It also increases leverage with the selected manufacturer through a higher-volume, longer-term relationship.
Supply Chain utilizes a “Commodity Playbook Light” process for the procurement of services and commodity-based materials. The Commodity Playbook uses a combined Supply Chain and business unit client representative team working with a structured process/form to analyze the commodity purchase from multiple perspectives. Those viewpoints include historical spend, business unit needs, marketplace intelligence, market conditions, impact on the business unit, sourcing options, sourcing recommendations and timing, negotiating strategies, payment terms/discounts, sourcing action plans, documentation of the decision on the award, and contract execution checklists. The Playbook also includes a sourcing strategy checklist.
Supply Chain typically issues one- to three-year blanket purchase orders for a family of products, with options for negotiated renewals. However, Supply Chain strives to rebid all purchase orders approximately every six years, even if it is satisfied with the incumbent supplier. The department issues

Final Report 479
6/20/2011
single purchase orders for one-time specialized purchases. There is a requisition process with required approvals for unique purchases.
Procurement authority limits for both new purchase orders and releases against blanket purchase orders are shown in Exhibit XII-18
Exhibit XII-18 Procurement Authority Limits
as of December 31, 2010
Required Authority Procurement Limit
No Approval Necessary Purchase orders up to and including $10,000 Purchasing Associates Purchase orders up to and including $100,000 Buyers/Supervisors Purchase orders up to and including $1,000,000 Managers Purchase orders up to and including $2,000,000 Directors Purchase orders up to and including $5,000,000 Vice President Purchase orders over $5,000,000 (re-approval required at
each $5,000,000 increase) In addition: On commitments that are greater than $10,000,000 where prior approvals have not been obtained, notifications will be made by the business unit as follows:
Senior Vice President Greater than $10,000,000 Chief Financial Officer & Chief Operating Officer Greater than $15,000,000 Chief Executive Officer Greater than $25,000,000
Source: Information Response 246
The SAP computerized procurement system automatically controls for these approval limits.

480 Final Report
6/20/2011
JCP&L Stores
The JCP&L Stores function reports to the Manager of Support Services under the Director of Operations Support Services, as shown in Exhibit XII-19.
Exhibit XII-19 Support Services as of July 8, 2010
Source: Information Response 54
There are two JCP&L central storerooms, one in the North region and one in the Central region. These two storerooms resupply the 21 work centers in their respective regions. The work center inventories are kept by the work center operations units and are audited twice per year. The Stores organization makes decisions regarding maximum inventory levels and reorder points. Almost all ordering is released against corporate Supply Chain blanket purchase orders. The Stores function also supplies FEU standard electrical materials to transmission, distribution, and substation contractors.
Findings & Conclusions
Finding XII-11 The corporate FE Supply Chain organization has a good procurement performance measurement and management program.
The FirstEnergy Supply Chain organization has a comprehensive set of sourcing and procurement performance metrics. It also sets goals for improvement and measures performance against those goals. Supply Chain metrics include:
♦ Compliance with Supply Chain policies, including supplier diversity, purchase order standard structure, standard terms and conditions, and commodity playbook procurement procedures
♦ Utilization of electronic technology in the procurement and payment processes
Morristown, NJ 24
JCP&LManager
Stores and Facilities
Morristown, NJ
JCP&LSpecialist
Adv Material Control
Morristown, NJ
JCP&LSpecialist
Adv Material Control
Morristown, NJ 8
JCP&LSupervisor
Reg Storeroom
Morristown, NJ 12
JCP&LSupervisor
Reg Storeroom
Morristown, NJ
JCP&LSpecialist
Adv Distrubution

Final Report 481
6/20/2011
♦ Issuance of a Consolidated Scorecard that addresses progress against both corporate and Supply Chain objectives. Supply Chain 2009 objectives included:
- Reducing inventories
- Utilizing common processes and procedures
- Improving sourcing and logistics, including supplier diversity and electronic transactions
- Ensuring budget compliance
- Extending payment terms (improved cash management)
♦ Development of various spend analyses (by business unit, vendor, buyer, etc.)
♦ Use of various procurement and logistics process performance dashboards and reports (on-time delivery, expediting, open orders, contracts expiring, vendor insurance, requisition to purchase order elapsed time, etc.)
Finding XII-12 In 2009, the Supply Chain unit for Utilities had almost 100% compliance with the policies for terms and conditions, supplier diversity, use of the Playbook, and purchase order structure.
The only instances of missed full compliance for Supply Chain – Utilities in 2009 were 83% compliance with purchase order structure in the third quarter (which was still above the Supply Chain overall average of 63%) and 93% compliance with the Playbook in the fourth quarter (which was still above the Supply Chain overall average of 84%).
Finding XII-13 The Supply Chain organization is making progress in converting manual processes to electronic processes.
Overall, the Supply Chain function had 78% of invoices presented electronically in 2009 and paid 76% of them electronically. It has a goal to get to 89% in both categories by 2012. The Supply Chain Utilities unit made improvements from 2008 to 2009 in the percent of spend using electronic auctions and in the percentage of transactions issued electronically.
Finding XII-14 There are generally appropriate inventory performance measures for the JCP&L central storerooms.
The FirstEnergy Supply Chain organization measures and compares the following inventory performance metrics at JCP&L and the other FE opcos:
♦ Total inventory dollars by category (e.g., line, substation, and meter), which measures the total investment in inventory versus targeted inventory levels and per customer
♦ Turnover rate, which divides the total issues by the average inventory
♦ Fill rate, which is the percentage availability of items requested

482 Final Report
6/20/2011
Finding XII-15 JCP&L’s total inventory has dropped dramatically from 2005 to 2009, but that reduction has not been fast enough to maintain the turn ratios because the volume of issues has also decreased dramatically.
The turnover rate declined during the 2005–2009 period. The fill rate remained relatively constant, except for 2007, but at a fairly low level. The inventory levels for this timeframe are shown in Exhibit XII-20.
Exhibit XII-20 JCP&L Inventory Metrics
2005 to 2009
2005 2006 2007 2008 2009
Total Inventory Dollars 17,367,224 23,253,451 17,423,033 15,515,912 15,572,069
Turnover Rate7 2.10 1.12 2.05 1.38 1.07 Issues in Dollars 36,403,234 25,994,356 35,794,425 21,410,349 16,662,114
Fill Rate8 0.73 0.79 0.58 0.77 0.72 Source: Information Response 238 1-5
The JCP&L 2009 turnover rate of 1.07 was better than the FEU overall rate of 1.00. The JCP&L 2009 fill rate of 72%, however, was below the FEU opco average of 84%. Ohio Edison had a turnover rate of 1.90 and a fill rate of 94% for the year.
Finding XII-16 Although the fill rate is an important measurement for the central stores, it does not measure the impact of unavailable materials on the field crews.
Most field crew materials are actually issued from the work center storerooms, which are resupplied by the central storerooms. A stock out at the central storeroom may not mean a stock out at the work center. Likewise, having stock at the central warehouse but not at the work center may cause a delay for one or more field crews. Measuring fieldwork delays caused by materials would be a better measure of storeroom effectiveness.
Finding XII-17 Supply Chain staffing for Utility Support has dropped from 16 in 2006 to 9 in 2009, raising a concern about the capacity for ongoing support of JCP&L and the other operating companies.
The staffing totals are shown in Exhibit XII-21.
7 Total issues divided by average inventory 8 Percentage availability of items requested

Final Report 483
6/20/2011
Exhibit XII-21 Supply Chain Utility Support Staffing
2005 to 2009
2005 2006 2007 2008 2009
Staffing (Utility Support Staff Only) 16 17 18 14 9 Source: Information Response 236 Note: Four Inventory and Warehouse Support positions were transferred out of the Supply Chain unit in 2008, but still exist in the FEU organization.
This reduction in staffing creates a concern that the FirstEnergy opcos, including JCP&L, may not receive fully effective and efficient supply chain service because of a lack of resources. Central storeroom staffing at JCP&L was not similarly affected.
Finding XII-18 The Supply Chain organization participated in 22 benchmarking studies and related reports in 2005 and 2006 but has not since.
The Supply Chain function can be benchmarked across the utility industry and, to some extent, across other industries. Benchmarking opportunities are available for this function and FE would likely benefit from ongoing benchmarking participation.
Finding XII-19 The Supply Chain organization does not actively participate in standards committees.
Supply Chain buyers do not actively participate on committees for IT products. These committees are staffed with IT subject matter experts who conduct reviews and make recommendations to the IT Governance Committee, which is made up of senior management. The Supply Chain Director is a member of the IT Governance Committee, which approves standards. Supply Chain buyer linkage supports the standards and ensures compliance when issuing requests for proposal (RFPs) and when evaluating supplier responses.
Supply Chain buyers do not actively participate on committees for engineering design, construction, or materials. These committees are staffed with corporate or regional engineers who conduct reviews and submit specifications to the Supply Chain buyers. Supply Chain buyer linkage supports the standards and ensures compliance when issuing RFPs and when evaluating supplier responses.
Finding XII-20 Despite a program to consolidate the three central storerooms in Ohio, there is currently no planned warehouse consolidation for JCP&L.
FirstEnergy consolidated warehousing for the three Ohio operating companies and Penn Power in early 2010. FE plans to consider consolidation of warehousing in the eastern portion of the company,

484 Final Report
6/20/2011
including New Jersey. The scope and timing of warehousing changes have not yet been approved or determined.
Finding XII-21 There are limited programs for vendor restocking of work center storerooms, and FE has not outsourced much of the logistics and warehousing functions for JCP&L.
Given the volume of purchases for FE and JCP&L, opportunities may exist for vendors to restock JCP&L work center storerooms, perhaps even on a consignment (JCP&L does not own the inventory until issued) basis. This approach would avoid the double handling of materials passing through the central storerooms.
In addition, other utilities have outsourced all or portions of their logistics and warehousing to firms specializing in logistics and materials management. FE and JCP&L have not outsourced much of their logistics and warehousing functions. Outsourcing has the potential to reduce costs and improve service.
Recommendations
Recommendation XII-9 Improve JCP&L turnover rate to 2.1, the level already achieved in 2005. (Refer to Finding XII-15)
Although improving the turnover rate in a period of declining activity is challenging, JCP&L should be able to at least meet a success level previously achieved. JCP&L should review the stocked items, reorder points, and order quantities to further improve its inventory turnover rate.
Recommendation XII-10 Improve the JCP&L central storeroom fill rate to 94%, the level already achieved by FEU/Ohio Edison. (Refer to Finding XII-15)
While reviewing the stocked items, reorder points, and order quantities to improve the turnover rate, JCP&L should also make the necessary adjustments to improve the fill rate, at least to the level achieved by another FEU operating company, Ohio Edison. Adjustments to the order/receipt cycle times for replenishing some items may be required.
Recommendation XII-11 Measure the amount and cost of field crew lost time due to material availability (stock out) problems. (Refer to Finding XII-16)
Lost field crew time for any reason is expensive. Such lost time attributable to material availability problems is a controllable cost. The amount of crew time lost to material issues should be tracked and reported. Although it is impossible to eliminate all material delays, JCP&L should identify chronic problems through crew material delay reporting and correct them as quickly as possible.

Final Report 485
6/20/2011
The analysis and improvement of turnover rate, fill rate and crew lost time due to material availability (Recommendations 1, 2 and 3) should be conducted in concert to assure that improving the turnover rate does not materially impact fill rate and crew lost time negatively.
Recommendation XII-12 Monitor the effect of FE Supply Chain staffing reductions on JCP&L and address adverse impacts as appropriate. (Refer to Finding XII-17)
The FE Supply Chain organization has made strides in streamlining and automating its process. That process, however, still needs adequate expert supply chain human resources. FirstEnergy should monitor the supply chain service levels to JCP&L and make adjustments to Supply Chain staffing to maintain service levels as necessary. It should also make further productivity improvements, as practical, to continue providing good supply chain service to JCP&L.
Recommendation XII-13 Resume Supply Chain participation in benchmarking programs by 2012. (Refer to Finding XII-18)
A large part of the JCP&L cost structure is the procurement of materials and services. Furthermore, the cost of the Supply Chain and storeroom functions is a significant expense. FE and JCP&L can benefit from benchmarking and best practices lessons learned from others to improve the effectiveness of the procurement and materials management processes and to optimize the cost of providing those services. The FE Supply Chain organization should resume participation in procurement, logistics, and warehousing benchmarking programs to an extent appropriate to the scale of its operations by 2012.
Recommendation XII-14 Consider adding Supply Chain staff to standards committees. (Refer to Finding XII-19)
Other utilities include procurement professionals on equipment and materials standards committees. They bring a deep understanding of the procurement process to the committee and they benefit from their participation by learning from the committee how equipment and materials decisions impact operations. FirstEnergy should consider adding a Supply Chain professional to each standards committee that materially impacts JCP&L and the other FEU operating companies.
Recommendation XII-15 Accelerate the consideration of consolidating the two JCP&L regional storerooms. (Refer to Finding XII-20)
Consolidation of the two JCP&L regional storerooms into one may have significant cost, turnover, and fill rate benefits. FE Supply Chain logistics and JCP&L central stores should analyze the costs and benefits of regional storeroom consolidation as soon as practical.

486 Final Report
6/20/2011
Recommendation XII-16 Investigate the possibility of vendor resupply of JCP&L central and work center storerooms and/or additional outsourcing of logistics and warehousing functions. (Refer to Finding XII-21)
To reduce the total cost of supplying materials, utilities have formed strategic partnerships with major suppliers and specialized logistics companies to streamline the supply chain process. Some companies have gone so far as to outsource most of their process’s logistics and warehousing. The FE Supply Chain organization and JCP&L should investigate additional opportunities to partner with major suppliers and specialized logistics companies to provide more of the supply chain process at a potentially lower cost.

Final Report 487
6/20/2011
E. Fleet Management
This section addresses the provisioning and maintenance of Jersey Central Power & Light Company (JCP&L) owned and leased vehicles and equipment for the JCP&L field forces. It covers the JCP&L owned and leased vehicles and equipment used by transmission and distribution (T&D) line crews, substation mechanics, meter technicians, meter readers, and other field forces.
FirstEnergy (FE) no longer assigns personal vehicles to employees who are not regularly assigned to fieldwork. Only employees who are regularly assigned to fieldwork have the use of company-owned vehicles and equipment. For incidental use of personal vehicles on FE and JCP&L business, employees are reimbursed at the federally allowed mileage rate. For business trips over 160 miles, employees are asked to rent a vehicle.
All JCP&L bargaining unit employees except meter readers hired on or before April 1, 2005 utilize JCP&L owned or leased vehicles for field work. In the case of JCP&L bargaining unit represented meter readers, new meter readers are not assigned JCP&L owned or leased vehicles and are required to provide their own vehicles. This vehicle policy change was negotiated between JCP&L and the union as part of a collective bargaining agreement. The remaining meter-reading vehicles are being phased out as the meter readers with grandfathered JCP&L owned or leased vehicle use retire or transfer.
Background & Perspective
Fleet management is a hybrid FirstEnergy Utilities (FEU)/JCP&L organizational structure. Vehicle acquisition, policies, procedures, performance measurement, and systems are provided by an FEU-centralized Fleet Services unit for all FirstEnergy Utilities’ business unit operating companies (opcos), including JCP&L. The actual physical work of fleet management is performed by JCP&L Fleet Services employees who are deployed in the JCP&L service territories.

488 Final Report
6/20/2011
FirstEnergy Utilities’ Fleet Services is part of the Operations Support organization. This organization falls under the Vice President of Utility Support who reports to the FEU President as shown in Exhibit XII-22. The FEU Fleet Services organization is part of FirstEnergy Services Company (SERVECO).
Exhibit XII-22 FEU Fleet Services
as of December 31, 2009
Source: Information Response 54
The FEU Fleet Services organization holds a monthly conference call with all of the operating company Fleet Services managers. The aim of this call is to discuss developments and performance.
Akron, OH 7,253
SERVECOSenior Vice President & President
FirstEnergy Utilities
Akron, OH 681
SERVECOVice PresidentUtility Support
Akron, OH 112
SERVECODirector
ED-Operations Support
Akron, OH 8
SERVECOManager
Fleet Services
Akron, OH
SERVECOSenior Distribution Specialist
Fleet Services
Akron, OH
SERVECOAdv Distribution Specialist
Fleet Services
Akron, OH
SERVECOAdv Distribution Specialist
Fleet Services
Akron, OH
SERVECOAdv Distribution Specialist
Fleet Services
Akron, OH
SERVECOAdv Business Analyst
Fleet Services
Akron, OH
SERVECOAdv Distribution Specialist
Fleet Services
Akron, OH
SERVECOAssoc Administrative Assistant
Fleet Services

Final Report 489
6/20/2011
The physical work of JCP&L fleet management is performed by the Fleet Services organization in one of the two operations support services units. These units report to the JCP&L President as shown in Exhibit XII-23.
Exhibit XII-23 Operations Support Services
as of December 31, 2009
Source: Information Response 54
Morristown, NJ 1,425
JCP&LPresident
Morristown, NJ 192
JCP&LDirector
Opps Support
Morristown, NJ 58
JCP&LManager
Reg.Fleet Services
Morristown, NJ 14
JCP&LSupervisor
Reg Operations East
Morristown, NJ 8
JCP&LSupervisor
Reg Operations East
Morristown, NJ
JCP<ech 1/C (Vacant)
Fleet Services
Morristown, NJ 13
JCP&LSupervisor
Reg Operations East
Morristown, NJ 19
JCP&LSupervisor
Reg Operations East

490 Final Report
6/20/2011
The JCP&L Fleet Services workforce has remained relatively constant from 2005 to 2009, as shown in Exhibit XII-24.
Exhibit XII-24 JCP&L Fleet Services Employees
by Classification 2005 to 2009
2005 2006 2007 2008 2009
Auto Painter 3 3 3 3 3 Clerk Senior 5 5 5 5 5 Fleet Service Chief 4 3 4 4 4 Fleet Services Tech 1/C 40 44 42 41 39 Fleet Services Tech 2/C 2 2 1 1 1 General Utility Worker (Tool Rep – Transportation)
0 0 0 0 1
Manager 2 2 2 1 1 Supervisor 4 4 4 4 4 Total 60 63 61 59 58
Source: Information Response 256
Of the two net reductions in workforce over the period, from 60 to 58 employees, one was from the consolidation of the manager position from two regional managers to a single manager for both JCP&L regions. The other was a net reduction of one in craft and support worker positions.
Exhibit XII-25 shows the trends in the JCP&L fleet size by type of equipment, and Exhibit XII-26 explains the FEU fleet asset classifications.
Exhibit XII-25 JCP&L Fleet Trends by Asset Class
2005 to 2009
Asset Class 1 2 3 4 5 6 Total 1-6 7 8 9 Total 7-9 Total All
2005 331 228 55 217 77 31 939 330 65 50 445 1384 2006 293 243 54 219 76 31 916 323 63 50 436 1352 2007 283 264 55 226 88 21 937 322 65 48 435 1372 2008 220 288 54 219 88 22 891 322 64 50 436 1327 2009 206 290 50 227 88 22 883 321 63 50 434 1317 05-09 Change -125 62 -5 10 11 -9 -56 -9 -2 0 -11 -67
Source: Information Response 257

Final Report 491
6/20/2011
Exhibit XII-26 FEU Asset Class Definitions
as of December 31, 2009
Class Description
1 Light Duty <8500 gross vehicle weight (GVW ) Primarily downsize pickups, minivans, or passenger cars and units impacted by the EPACT
2 Medium Duty 8501–17,499 GVW Includes full-size pickups and vans, substation vehicles, small-stake body trucks, etc.
3 Heavy Duty >17,499 GVW Includes all heavy trucks other than aerial units, digger derricks, or crane trucks 4 Aerial Trucks Includes all man-lift capabilities regardless of size 5 Digger Derrick Trucks Includes all digger derricks 6 Crane Trucks Includes all trucks with mounted cranes; off-road cranes are included in construction equipment 7 Trailers Includes all trailers regardless of size 8 Construction Equipment Includes all backhoes, loaders, excavators, off-road cranes, dozers, etc.
9 Forklifts, Mowers, Misc. Includes all forklifts, riding sweepers, scrubbers, ATVs, mowers, and other miscellaneous equipment
Source: Information Response 257
The overall fleet size has been reduced by 67 units from 1,384 to 1,317 from 2005 to 2009. The biggest reductions were in Asset Class 1, light-duty vehicles (such as those assigned to meter readers whose JCP&L supplied vehicles are being phased out), with about half of those reductions offset by increases in Asset Class 2, medium-duty vehicles.
The ratio of fleet units per technician and support worker changed slightly from 1384:42 in 2005, or 33.0 vehicles per technician, to 1317:41 in 2009, or 32.1 vehicles per technician. This means that each technician had an average of about one fewer vehicle to maintain.
The JCP&L Fleet Services organization has 21 maintenance locations throughout the JCP&L service territory. The garages located in Dover and Farmingdale also have body shops. In addition to the garages that handle major repairs on the day shift, there are night-shift mechanics who report to the fieldwork centers. The night shift mechanics perform scheduled preventive maintenance and minor repairs when the field crews are off. In addition, the garages provide roadside minor repairs and towing for breakdowns in the field.
The JCP&L Fleet Services organization performs most work in-house, including some manufacturers’ warrantee work, such as on aerial trucks. The major categories of work that are contracted include hydraulic cylinders, windshields, upholstery, transmissions, and tire repair. Approximately 90% of spare parts and materials are covered by blanket purchase orders, and Fleet Services issues telephone releases against those blanket purchase orders to obtain the materials. The remaining 10% of the fleet purchases

492 Final Report
6/20/2011
are made with the FE credit card (P-Card) at local supply shops. JCP&L maintains 24 fueling locations. All FirstEnergy fuel is procured from one company at fixed prices.
FirstEnergy Utilities uses operations and maintenance (O&M) leases when it acquires new vehicles and has little capital spending for fleet. In 2008 and 2009, JCP&L capital expenditures for fleet were $393,000 and $123,000 respectively. There were no fleet capital expenditures from 2005 to 2007.
JCP&L Fleet Services O&M costs increased from 2005 to 2008, but they dropped below the 2005 level in 2009, as shown in Exhibit XII-27.
Exhibit XII-27 Fleet Services O&M costs
2005 to 2009
2005 2006 2007 2008 2009
Actual $16,572,853 $17,195,681 $17,711,561 $18,017,686 $15,199,466 Budget 16,248,358 16,567,589 17,448,203 17,749,976 14,944,118 Variance –2.00% –3.79% –1.51% –1.51% –1.71%
Source: Information Response 251
JCP&L Fleet Services’ actual costs run 1.5% to 3.8% over budget.
FirstEnergy Utilities and JCP&L Fleet Services use a maintenance repair weighting factor (MRF) for vehicles to normalize the maintenance work required by type of vehicle or equipment. As examples, an intermediate sedan has an MRF of 1.0 and a digger/derrick truck has an MRF of 7.5. MRFs have been established for all types of vehicles and equipment.
FirstEnergy Utilities and JCP&L have mechanic standard hours for preventive maintenance work but not for corrective work. FEU and JCP&L manage to “direct hours,” which is the percentage of mechanic time accounted for in M5. FEU and JCP&L track preventive maintenance jobs that are overdue, low utilization vehicles, and fleet units per mechanic, preventive maintenance orders per mechanic, and MRFs per mechanic.
JCP&L Fleet Services uses the FEU fleet management system M5 from Assetworks, which is common in the industry. FEU is currently using Release 2.1 and will upgrade to the current version 2.5 by the first quarter of 2011. Preventive maintenance schedules for each piece of equipment are entered into M5, as are all corrective repair work orders. Mechanic time is entered into M5 on the work order by the mechanic before the work order is completed. The invoices for the parts used are processed against the work order in M5 by a clerk before the work order is closed. M5 includes a fairly complete vehicle history.

Final Report 493
6/20/2011
Findings & Conclusions
Finding XII-22 FirstEnergy Utilities’ Fleet Services has developed an orderly and industry-typical set of policies and procedures for fleet management.
The standard policies, procedures, and processes followed by JCP&L and the other FEU opcos include:
♦ Vehicle Maintenance Work Flow
♦ New Vehicle Lease and Purchase Processing
♦ Lease Payments
♦ Vehicle Disposal
♦ Parts Ordering and Processing
♦ Mechanic Time Reporting
Finding XII-23 JCP&L fleet availability is better than the FEU opco average.
JCP&L vehicle availability is better than the FEU operating company (opco) average and all other FEU opcos, except Toledo Edison, as shown in Exhibit XII-28.
Exhibit XII-28 FEU Fleet Availability
as of December 31, 2009
Company
Total # of
Down Time Hours
Total # of
Vehicles
Total Available
Hours /Vehicle
Total Available Hours All Vehicles
YTD Avg. Down
Time % YTD Avg.
Availability %
Ohio Edison/Penn Power 6,378.5 1,091 170.0 185,470 3.4% 96.6% Toledo Edison 506.4 247 170.0 41,990 1.2% 98.8% The Illuminating Co 3,067.0 656 170.0 111,520 2.7% 97.3% Penelec 5,056.1 639 170.0 108,630 4.1% 95.9% Met Ed 2,511.6 529 170.0 89,930 2.7% 97.3% JCP&L 4,810.8 883 170.0 150,110 2.4% 97.6% Total FE Avg. & Totals 22,330.4 4,045 170.0 687,650 2.9% 97.1%
Source: Information Response 428

494 Final Report
6/20/2011
FirstEnergy Utilities defines downtime hours as the total hours that vehicles in Asset Classes 1–6 are not available between the hours of 7:30 A.M. to 4:00 P.M., Monday through Friday. The hours are calculated in the M5 fleet management system based on the open and completed dates and times of each work order.
Finding XII-24 The recent fleet cost trend is favorable.
Exhibit XII-29 shows that Fleet Services’ cost per unit and cost per MRF increased from 2005 to 2008 until decreasing in 2009 to approximately the 2005 level.
Exhibit XII-29 JCP&L Fleet Costs
per Unit and per MRF 2005 to 2009
Year Actual Costs Total Units Cost Per Unit Total MRF’s Cost Per MRF
2005 $16,488,932 1384 $11,913.97 4271.20 $3,860.49 2006 $17,198,863 1330 $12,931.48 3938.74 $4,366.59 2007 $17,712,852 1307 $13,552.30 3923.67 $4,514.36 2008 $17,629,210 1275 $13,826.83 3838.32 $4,592.95 2009 $15,082,387 1266 $11,913.42 3864.78 $3,902.52
Source: Information Response 266 Revised
JCP&L reduced its Fleet Services overtime cost from $652,039 in 2005 to $171,916 in 2009 (excluding overtime incurred for other FEU opcos).

Final Report 495
6/20/2011
Exhibit XII-30 shows that the major Fleet Services costs are fuel, labor, lease and rental costs, and materials and equipment.
Exhibit XII-30 Fleet Services Cost Component Trends
2005 to 2009
Category 2005 2006 2007 2008 2009
Fuel $2,196,611 $2,733,831 $2,967,592 $3,812,046 $3,439,713 General Business $263,128 $104,918 $114,366 $115,838 $51,523 Labor $5,646,827 $5,779,737 $5,576,162 $5,635,847 $4,913,158 Lease & Rental Costs $4,179,603 $4,475,510 $4,789,691 $4,517,317 $4,384,321 Materials & Equipment $3,334,990 $3,414,207 $3,774,367 $3,051,954 $1,935,678 Professional/Contractor – Other $421,259 $289,714 $141,622 $48,350 $37,041 Dues, Fees, Licenses, & Permits $446,514 $400,945 $349,053 $447,859 $320,953 Total $16,488,932 $17,198,862 $17,712,853 $17,629,211 $15,082,387
Source: Information Response 673
For the 2005–2009 period, fuel costs and lease and rental costs were the only categories to increase. All other cost categories decreased.

496 Final Report
6/20/2011
Finding XII-25 FirstEnergy Utilities and JCP&L do not follow their own vehicle replacement guidelines and the average fleet age is relatively old, which might result in excessive field-force work delays attributable to vehicle and equipment problems.
FirstEnergy Utilities’ current vehicle replacement guidelines are summarized below in Exhibit XII-31.
Exhibit XII-31 FE Vehicle Replacement Criteria
as of December 31, 2009
Asset Class Asset Class Description Vehicle Replacement Criteria
(Either Mileage or Age, or Both)
1 Light Duty <=8500 GVW >=100,000/10 yrs 2 Medium Duty 8501–17,499 GVW >=100,000/10 yrs 3 Heavy Duty >=17,500 GVW >=125,000/12 yrs 4 Aerial Trucks >=150,000/15 yrs 5 Digger Derrick Trucks >=150,000/15 yrs 6 Crane Trucks >=125,000/12 yrs 7 Trailers 15 yrs 8 Construction Equipment 15 yrs 9 Forklifts, Mower, Miscellaneous 15 yrs
Source: Information Response 267, Attachment 2
A fleet management consulting firm used by FEU recommends heavy-duty aerial truck replacement in years nine or 10. FEU’s replacement guidelines are longer than typical for the industry, with heavy-duty equipment replacement at 12 to 15 years. FEU and JCP&L, however, do not even follow these guidelines. FEU suspended adding new vehicles in 2009 and does not currently have a lease agreement in place to add new vehicles. However, a process to select a new lease vendor is underway and a lease agreement should be in place by the second quarter of 2011.
In 2008, FEU developed a vehicle lifecycle replacement strategy. The analysis and strategy reveals that:
♦ The FEU fleet includes 6,800 vehicles. Total vehicle replacements from 2004 through 2008 were 1,922. This figure equates to an average of 384 per year and an average 18-year replacement cycle (6,800 vehicles divided by 384 replacements per year). Of the 6,800 vehicles in the fleet, in 2008 approximately half qualified for replacement under existing guidelines.
♦ FEU’s average age of vehicles is 9.1 years, 3.2 years older than the industry average.
♦ Older vehicles have more problems than newer vehicles. Vehicles that are 10 to 12 years old had the most work orders opened during 2007 for no start (cannot get to the job), road call (breakdown on the job), and driver report of trouble when returned. It is likely that the oldest

Final Report 497
6/20/2011
vehicles are used as spares and have less utilization and, therefore, fewer opportunities for problems.
♦ FEU’s ownership costs of lease and license fees per vehicle of $5,219 are $1,285 lower than the industry average of $6,504. This lower cost of ownership, however, is almost exactly offset by higher operating costs per vehicle for labor, parts, and contract maintenance of $5,863 per vehicle. This figure is $1,262 higher than the industry average of $4,601.
♦ The study estimates/assumes 30,000 unproductive lost-time hours, worth $1.5 million per year, for vehicles seven years or older. This equates to 4.4 lost time-hours per vehicle per year, or, roughly just two crew hours per vehicle.
♦ Newer vehicles have advantages in lower emissions, better employee morale, and more safety features.
The vehicle lifecycle replacement strategy recommended replacing an average of 568 vehicles per year from 2009–2013, 218 per year more than the then current plan of 350 per year. The study showed the overall cash and O&M impact, but it did not calculate a discounted cash flow present value of the recommendation based on increased replacements and lower maintenance and downtime costs. FEU and JCP&L are not following the replacement strategy laid out in this document.

498 Final Report
6/20/2011
Exhibit XII-32 shows that JCP&L has the oldest vehicle fleet (Asset Classes 1–6) but that its construction equipment (Asset Class 8) is the second newest.
Exhibit XII-32 Average & Quantity
as of July 2010
Toledo Edison CEI
Ohio Edison
Penn Power Penelec Met Ed JCP&L
Asset Class Qty Avg Age Qty
Avg Age Qty
Avg Age Qty
Avg Age Qty
Avg Age Qty
Avg Age Qty
Avg Age
1-Light-Duty Vehicles <8501 GVW 7 12.4 48 8.9 128 5.6 21 5.7 153 9.9 189 8.7 198 12.3 2-Medium Trucks 8501–17,499 GVW 67 7.9 240 6.5 220 6.2 52 3.3 183 7.4 120 10.0 270 7.6 3-Heavy Trucks >17,499 GVW 12 17.5 24 10.6 60 14.8 6 8.0 24 14.4 27 13.0 48 11.6 4-Aerial Trucks 77 8.2 150 8.4 255 8.1 57 5.7 182 8.4 120 10.1 217 11.0 5-Digger Trucks 42 10.8 54 9.1 76 10.5 10 8.9 53 12.9 34 10.9 85 11.1 6-Crane Trucks 8 14.3 4 14.8 25 18.4 7 13.6 9 16.7 18 17.3 22 9.5 Total Qty & Avg. Age Rolling Stock 213 9.5 520 7.8 764 8.2 153 5.6 604 9.3 508 10.0 840 10.2 7-Trailers 95 18.3 224 18.7 345 18.9 67 18.0 326 19.9 202 19.4 314 13.4 8-Construction Equipment 27 12.7 48 16.5 63 21.2 7 9.4 47 19.0 22 18.1 61 12.6 9-Misc. Equipment – Forklifts, etc. 14 17.9 52 16.4 40 11.2 3 16.7 95 17.5 42 19.0 49 15.9 Total Qty Avg. Age Non-Rolling Stock 136 17.2 324 18.0 448 18.5 77 17.2 468 19.3 266 19.3 424 13.6 Total Qty & Avg. Age 349 12.5 844 11.7 1212 12.0 230 9.4 1072 13.6 774 13.2 1264 11.3
Source: Information Response 627
FEU and JCP&L have no designated spare vehicles, per se. JCP&L does, however, have vehicles for its full complement of field employees. Because of absences, training, and other reasons, a portion of the field workforce does not need its vehicles each day and those unused vehicles are used as spare vehicles, as needed, for reassignment to the other field forces where vehicles or equipment are unavailable.

Final Report 499
6/20/2011
Exhibit XII-33 shows the percentage of vehicles with 50 or fewer miles of use operated by the FEU operating company.
Exhibit XII-33 Vehicles with Fifty or Fewer Miles of Use
as of December 31, 2009
Company
Number of
Vehicles Fifty Miles or Fewer
Percentage Fifty or Fewer
Ohio Edison/Penn Power 1099 347 31.6% Cleveland Electric Illuminating 664 203 30.6% Toledo Edison 283 58 20.5% Penelec 639 86 13.5% Met Ed 533 114 21.4% JCP&L 883 296 33.5%
Source: Information Response 428
JCP&L has the highest percentage of vehicles with 50 or fewer miles of use, indicating that it might have more “de facto” spare vehicles.

500 Final Report
6/20/2011
The CREWS work management system used by T&D and substation field crews has a time category for “Vehicle Breakdown.” Exhibit XII-34 shows the 2005 to 2009 JCP&L hours and dollar charges to this time-delay category.
Exhibit XII-34 Hours and Dollars Charged to Vehicle Breakdown in CREWS
2005 to 2009
Year Hours Dollars
2005 Overtime 185.40 $10,197.00 Straight Time 1,489.95 $74,497.50
2005 Total 1,675.35 $84,694.50 2006 Overtime 198.03 $10,891.65
Straight Time 1,537.40 $76,870.00
2006 Total 1,735.43 $87,761.65 2007 Overtime 253.70 $13,953.50
Straight Time 1,428.60 $71,430.00
2007 Total 1,682.30 $85,383.50 2008 Overtime 217.40 $11,957.00
Straight Time 1,579.00 $78,950.00
2008 Total 1,796.40 $90,907.00 2009 Overtime 65.30 $3,591.50
Straight Time 1,342.70 $67,135.00 2009 Total 1,408.00 $70,726.50
Grand Total 8,297.48 $419,473.15
Source: Information Response 669
A high of 1,796 hours was charged in 2008, but the number dropped to 1,408 hours in 2009, the lowest in the five-year period. The wage cost in 2009 was nearly $71,000 associated with this delay code.
There is no comparable vehicle breakdown time code in FieldNET, the other major work management system, which is used by meter technicians, field collectors, and meter readers.
There were 1,581 JCP&L road-call work orders in 2009.

Final Report 501
6/20/2011
Finding XII-26 All fleet preventive maintenance is calendar based rather than the better practice of triggering preventive maintenance on a combination of mileage or engine hours of use and calendar time.
For example, oil changes could be scheduled at 6,000 miles or six months, whichever is first. Although FEU does track mileage and hours of use by vehicle and piece of equipment (hours per work order, not engine hours), such figures are not used to trigger preventive maintenance. Mileage and hours of use are tracked in the CREWS and FieldNET work management systems, and the data is transferred to M5.
Finding XII-27 FirstEnergy Utilities does not track fuel usage by vehicle.
Mileage and hours of use are reported for Asset Classes 1–6 and 8, the rolling stock, primarily through the CREWS and FieldNET work management systems. Although fuel usage is tracked in total, it is not tracked per vehicle. Fuel use per mile or per hour could be another diagnostic data point in evaluating the performance and cost of a particular vehicle or class of vehicles.
Finding XII-28 FirstEnergy has not conducted a full lease-versus-buy analysis for vehicles and equipment since 2004.
Although it is a moot point while new vehicle and equipment acquisitions are suspended, it has been six years since the last full lease-versus-buy analysis. During that time, economic and financial conditions have changed such that a new analysis may produce a different result than the 2004 decision, which was to use the operating lease structure through Bankers Leasing.
Recommendations
Recommendation XII-17 Reinstate JCP&L fleet replacements and catch up to both the FEU fleet replacement guidelines and the fleet replacement strategy within five years, if practicable and cost beneficial. (Refer to Finding XII-25)
The FEU fleet replacement guidelines are conservative and the fleet replacement strategy analysis was thorough and considered the total cost effectiveness of fleet and field crew labor costs. The guidelines and strategy are consistent with industry practices. FirstEnergy Utilities should re-implement the guidelines and strategy within five years to optimize the fleet and field crew labor costs, but only after performing a study that shows that the maintenance repair weighting factor is increasing and JCP&L’s fleet availability is dropping from 2009 levels.

502 Final Report
6/20/2011
Recommendation XII-18 Accelerate the implementation of scheduling preventive maintenance through a combination of mileage or engine hours of use and elapsed calendar time, if feasible and cost beneficial. (Refer to Finding XII-26)
FEU Fleet Services recognizes that using a combination of mileage or engine hours of use and elapsed calendar time is a superior practice in scheduling preventive maintenance. Such a practice should be implemented over time and FEU should consider tracking engine hours of use for vehicle and equipment categories, which would benefit materially from using engine hours as a trigger for preventive maintenance unless the cost and complexity of the required programming changes to CREWS are significant and outweigh the potential benefits.
Recommendation XII-19 Implement the tracking of fuel usage by vehicle and add fuel use efficiency to the evaluations of individual vehicle and class-of-equipment performance and cost, if feasible and cost beneficial. (Refer to Finding XII-27)
FirstEnergy Utilities and JCP&L generally keep good vehicle and equipment maintenance and performance history records. Adding fuel use efficiency information in a cost effective manner will further enable empirical analysis of performance and better repair or replace decisions, but only if a simple, cost effective tracking system can be installed or devised. Both FEU and JCP&L Fleet Services are quite capable of using this additional information.
Recommendation XII-20 Conduct a thorough lease-versus-buy analysis before resuming the acquisition of vehicles and equipment for JCP&L. (Refer to Finding XII-28)
As noted in Recommendation XII-17, JCP&L should resume the prescribed vehicle and equipment replacement program as soon as practical. Additionally, a new lease-versus-buy analysis should be conducted based on current and forecasted financial and economic conditions. That way, the lowest net present value cost on an after-tax basis can be identified for acquiring vehicles and equipment for JCP&L.

Final Report 503
6/20/2011
F. Information Technology
This section discusses JCP&L’s information technology function, which is managed by the FirstEnergy (FE) Information Technology (IT) group within the FE Service Company (SERVECO) organization.
Background & Perspective
Mission, Goals, and Objectives
The mission of the FirstEnergy Information Technology organization is to provide FirstEnergy with high-quality solutions to support effective business operations and to transform processes by focusing on the following strategic themes:
♦ Emerging technologies ♦ Continuous improvement ♦ Alignment with business operations ♦ Financial management ♦ Talent development ♦ Reliability/security
The organization’s goal is to deliver easy-to-use, reliable business systems and information with current and future technology that provide the highest value to FirstEnergy at a speed that keeps pace with FE’s changing business. Its values recognize the importance of IT employees in providing quality services to foster and drive leadership in technology through the following efforts:
♦ Teamwork ♦ Knowledgeable workforce ♦ Proactive communications ♦ Change leadership ♦ Accountability and ownership
IT is focusing on the following six key drivers to support implementation of its strategic vision:
♦ Ease of use ♦ Speed to market ♦ Flexible technology options ♦ Reliable solutions ♦ Enhanced value ♦ Skilled, flexible workforce
The organization’s objectives are designed to improve cross-functional development of the IT workforce to enhance skills that drive organizational efficiency. It accomplishes this aim by:

504 Final Report
6/20/2011
♦ Building sustainable regulatory compliance processes that are uniform across the business, thereby ensuring that all requirements are met
♦ Enabling greater functionality in FirstEnergy enterprise technologies that produce measurable productivity gains for the FE corporation
♦ Collaborating with the business to eliminate costly legacy assets and to reduce the amount of low-value activities while maintaining a high service level
♦ Improving the performance and reliability of the network infrastructure while positioning it for the future
Organization and Staffing
Exhibit XII-35 displays the five groups that report to the Vice President of Shared Services Administration & Chief Information Officer (CIO). Three of these groups are discussed in this section regarding FE’s information technology function, specifically IT Solutions, Infrastructure & Network, and Corporate Security & IT Compliance.
Exhibit XII-35 VP Shared Services Administration & CIO Organization
as of June 30, 2010
Source: Information Response 54 and Company Update
Akron, OH 822
SERVECOVice President
Shared Svcs Admin & CIO
Akron, OH 264
SERVECODirector
IT Solutions
Akron, OH
SERVECOExcutive Assistant
IT Solutions
Akron, OH 26
SERVECOManager
IT SAP, Supply Chain & HR
Akron, OH 48
SERVECOManager
IT BI Development & Support
Akron, OH 23
SERVECOManager
IT Enterprise Technologies & Tools
Akron, OH 128
SERVECODirector
Energy Delivery & Financial Systems
Akron, OH 19
SERVECODirector
IT Work Mgmt Program
Akron, OH 13
SERVECOManager
IT Business Intelligence Solutions
Akron, OH 336
SERVECODirector
Infrastructure & Network
Akron, OH
SERVECOExcutive Assistant
IT Operations
Reading, PA 190
SERVECOManager
Infrastructure-Network Field Ops
Akron, OH 35
SERVECOManager
System Operations
Akron, OH 49
SERVECOManager
Enterprise Systems
Akron, OH 56
SERVECODirector
Reliability Technologies
Akron, OH 183
SERVECODirector
Supply Chain & CPO
Akron, OH 18
SERVECODirector
Corporate Security & IT Compliance
Akron, OH 17
SERVECODirector
Flight Operations

Final Report 505
6/20/2011
Exhibit XII-36 displays the New Jersey Field Operations group supporting JCP&L employees.
Exhibit XII-36 JCP&L Regional Field Operations Organization
as of June 30, 2010
Source: Information Responses 54 and 321
IT Solutions
Included in the IT Solutions organization are the following groups:
♦ Energy Delivery & Financial Systems: This group is led by a director who has six managers as direct reports. Each of these six managers lead one of the following application development areas:
- Customer front office - Billing and revenue operations
Morristown, NJ 22
JCP&LSupervisor
IT Regional Field Ops
Morris Park Office, NJ
JCP&LNetwork Operations Specialist
Morristown, NJ 15
JCP&LSupervisor
Network Support
Larrabee, NJ
JCP&LCommunication Technician
Larrabee, NJ
JCP&LCommunication Technician
Larrabee, NJ
JCP&LCommunication Technician
Larrabee, NJ
JCP&LCommunication Technician
Larrabee, NJ
JCP&LCommunication Technician
Larrabee, NJ
JCP&LCommunication Technician
Freneau, NJ
JCP&LCommunication Technician
Freneau, NJ
JCP&LCommunication Technician
West Warton Office, NJ
JCP&LCommunication Technician
West Warton Offic, NJ
JCP&LCommunication Technician
West Warton Office, NJ
JCP&LCommunication Technician
Morristown, NJ
JCP&LCommunication Technician
Morris Park Office, NJ
JCP&LCommunication Technician
Morris Park Office, NJ
JCP&LCommunication Technician
Morris Park Office, NJ
JCP&LCommunication Technician
Red Bank, NJ
JCP&LIT Field Ops Specialist
Desktop Support
Red Bank, NJ
JCP&LIT Field Ops Specialist
Desktop Support
Morristown, NJ
JCP&LIT Field Ops Specialist
Desktop Support
Morristown, NJ
JCP&LProfessional Intern
Desktop Support
Morristown, NJ
JCP&LIT Field Ops Specialist
Desktop Support

506 Final Report
6/20/2011
- Finance - Energy delivery (ED) - FE Solutions (non-regulated) - FirstEnergy Nuclear Operating Company (FENOC) and generation
♦ IT Work Management Programs: A director leads a group of 19 employees on a special project that involves development and implementation of FE’s IT work management programs. This project, which is a special initiative for putting mobile units in trucks, is expected to last approximately four years. Currently, JCP&L uses PowerOn (outage management system) and AutoDesk (GIS); however, this initiative will add Click (scheduling) and Syclo (mobile) software with Panasonic Toughbook laptops. Started in 2009, the initiative was implemented at Cleveland Electric Illuminating (CEI) by August 2010. JCP&L implementation is not scheduled until sometime in 2012. In addition to newer technology, this initiative is expected to provide improved scheduling of work as well as turn-by-turn directions. JCP&L doesn’t currently use automatic meter reading (AMR) technology. With the Public Act 129 push in Pennsylvania, FE presently has a two-year plan for evaluating AMR in PA; however, there are no specific plans to implement AMR in OH or NJ, although FE may look at this possibility after PA is implemented.
♦ Enterprise Technologies & Tools: This group, led by a manager, is responsible for supporting development platforms, developing standards, assisting developers (as appropriate), web management, and support (including support of the web methods integration platform), and supporting the enterprise document management system, which is P8 (formerly FileNet) software. This group is currently performing a P8 upgrade project to improve reliability. Also underway is the implementation of Day CQ5 software for web management. This implementation began with non-regulated entities, after which a business case will be made in 2011 to determine whether regulated entities will be implementing.
♦ SAP, Supply Chain, & HR: This group, led by a manager, provides overall governance for SAP application modules, specifically the master schedule. It also supports the business unit (BU)/SERVECO relationships involving the FE Supply Chain and HR organizations.
♦ Business Intelligence Solutions Center: This group, led by a manager, is responsible for the Solutions Center strategy. It also interfaces with architects to act as a consultant to BUs before projects start in the Business Systems group. In addition, it promotes the use of SAP/business intelligence (BI)/middleware technical standards, the focal point for Applications Design Review (ADR) process, etc.
♦ Business Intelligence Development & Support: This group, led by a manager, is a result of the centralization of BI into one group. Recently, a three-year roadmap for this group was developed. The setting up of miscellaneous IT initiatives to improve technology performance, including their business cases, followed. The employees of this group support tools as well as dashboard reporting. In use are the SAP business warehouse (BW) and non-SAP BW (using Informatica), with Cognos as a front-end application for creating dashboard reports. Since

Final Report 507
6/20/2011
2008, the IT organization has been encouraging BU power users to develop their own Cognos dashboards and to move away from use of spreadsheets. As a result, this group sometimes provides training at user forums. This group also provides communications to the entire FE organization when IT changes occur, such as outages. A second function is the applications development and support of selected non-enterprise-wide applications using enterprise tools (Legal, Flight Operations, and selected other Shared Services organizations), plus Lotus Notes, one of the enterprise-wide tools. Most of these applications are off-the-shelf (OTS) software packages, although a few have been developed in-house. The group uses an agile methodology to develop its applications because speed to market is important. Group members must evaluate whether to move data and connect to it (faster results) or directly connect to data (faster development) when developing applications. Also part of this group is FE’s Resource & Program Management group, which consists of three employees who are responsible for:
- Project management office (PMO) activities, with responsibility for a project’s budgeting, resource planning, and other administrative standards
- Resource planning for the IT Solutions group, in which group members annually look at demand for skill sets (using HP PPM) and identify high-level gaps in resources. They then turn such matters over to individual IT managers to resolve. On a quarterly basis, the group provides ongoing support.
- Budgeting for the IT Solutions group (under the director’s management), including financial upfront development, plus monthly monitoring
One of these IT Solutions groups that interfaces substantially with JCP&L management and staff is the Energy Delivery & Financial Systems group (also referred to as the Business Systems group). This group is the point of contact with business units (BUs), including the energy delivery, call center, and financial/accounting areas. Such areas include:
♦ Front-office systems (call centers at two major locations in Reading, PA and Akron, OH and another smaller call center in Toledo, OH) (regulated only)
♦ FirstEnergy Solutions (FES) (unregulated retail supplier, not using SAP but ABP) (unregulated only)
♦ Energy delivery systems (outage management, work management, GIS, etc.) (regulated only)
♦ Customer, revenue, and billing systems (SAP, plus billing systems) (regulated only)
♦ Finance and corporate systems (SAP, budgets, etc.) (regulated and unregulated)
♦ Generation process support (fossil and nuclear plant operations) (unregulated only)

508 Final Report
6/20/2011
Exhibit XII-37 displays the Energy Delivery and Financial Systems (Business Systems) group.
Exhibit XII-37 Energy Delivery & Financial Systems (Business Systems) Organization
as of June 30, 2010
Source: Information Responses 54 and 580
Each group has an IT lead with supporting staff, which consist of both technical (development) and business (analytical/testing) employees working on projects who report to the lead. On major projects, there is also a business lead from the Operations group (not part of the IT organization) who is a seasoned employee responsible for providing resources to the team. If a problem exists with the Operations group providing resources, then that issue is escalated to the director to resolve with the BUs. The business units are also responsible for setting priorities.
Most major ED projects are managed by this group; however, the work management initiative has been established as a separate group that is managed by its own Director of Work Management Systems. Large projects are often handled in this way, especially if new technology is involved. Use of mobile devices in trucks is approximately 1.5 years away in NJ, as such usage is expected to start during the fourth quarter of 2011 and be fully implemented by 2012.
Exhibit XII-38 lists all major IT system/application initiatives that were underway when Schumaker & Company began fieldwork on this project, with an update as of mid-2010 as to each project’s status.
Akron, OH 133
SERVECODirector
Business Systems
Akron, OH 11
SERVECOManager
Generation Systems
Akron, OH 4
SERVECOLead
SAP Generation Systems
Akron, OH 5
SERVECOLead
Non-SAP Generation Systems
Akron, OH 12
SERVECOManager
Finance Systems
Akron, OH 11
SERVECOTeam Lead
Fl & Capital Portfolio
Akron, OH 40
SERVECOManager
Energy Delivery Systems
Akron, OH 13
SERVECOTeam Lead
Outage Management
Akron, OH 7
SERVECOTeam Lead
Asset & Work Management
Akron, OH 10
SERVECOTeam Lead
Device & Feild Metering
Akron, OH 1
SERVECOProject Manager
Energy Delivery Systems
Akron, OH
SERVECOProject Manager
Energy Delivery Systems
Akron, OH 35
SERVECOManager
Customer, Revenue, & Billing Systems
Akron, OH 15
SERVECOTeam Lead
Biling & Dereg Systems
Akron, OH 9
SERVECOTeam Lead
Revenue Operations
Akron, OH 4
SERVECOTeam Lead
FICA
Akron, OH 16
SERVECOManager
Front Office Sytems
Akron, OH 7
SERVECOTeam Lead
SAP Front Office
Akron, OH 6
SERVECOTeam Lead
Contact Center Technologies
Akron, OH
SERVECOGenesys Project Manager
Front Office Systems
Akron, OH 13
SERVECOManager
FES Systems
Akron, OH 6
SERVECOTeam Lead
FES Commodity Ops
Akron, OH 5
SERVECOTeam Lead
FES Finance & Retail

Final Report 509
6/20/2011
Exhibit XII-38
Major IT Initiatives as of June 30, 2010
Project Title Project Description Status
Critical Infrastructure Protection (CIP)
Implementation of all policies, procedures, and standards necessary to meet all requirements of the North American Electric Reliability Council’s (NERC’s) cyber security standards
Completed
Mobile Work Management Initiative (WMI)
Implementation of a scheduling/dispatching application that uses mobile data terminals for troubleshooters, line construction, substation construction, and supervision of outage and planned work
Initiated rollout of WMI system, with expected completion date of June 30, 2013; JCP&L is to deploy by late 2012
Call Center System Improvements
Implementation of enhanced functionality for call center monitoring, forecasting, scheduling, work load distribution, and routing
60% complete, with expected completion date of October 31, 2011
2009–2010 SAP Enhancement and Support
Upgrading the enterprise SAP systems, in which the upgrade package provides maintenance updates and provides additional functionality, including installation of ERP Enhancement Package 4, Support Package Stack 5, Netweaver Enhancement Package 1, Support Package Stack 5
Completed
Business Information Improvements
Providing standardization and improvements in reporting and data management
Various stages of completion
Mainframe Elimination/Migration
Retiring the current 9672-R15 mainframe hardware and applications
98% completed, with expected completion date of September 30, 2010
Network Transformation Improving the reliability and expanding the FirstEnergy IT network that supports voice, data, and video systems used throughout the corporation
60% completed, with expected completion date of December 31, 2012
Desk Personal Computer Operating System Upgrade to Microsoft Vista
Updating all PCs in fleet to Windows Vista operating system
98% completed, with expected completion date of October 31, 2010
Upgrade of the Corporate Document/Records Management System (FileNet/P8)
Upgrading the existing FileNet/P8 application from version 3.5 to 4.5.1.
90% completed (in final testing stages), with expected completion date of September 6, 2010
Source: Interview 118 and Information Responses 276, 518, and 579
The IT Solutions group uses multiple development environments, thereby allowing employees to move from development, to testing, and to user acceptance testing (done for major projects) before moving on to production. The application development methodology (ADM) online tool is used to assist in the management of IT projects. As shown below, Phase 2 Requirements Analysis has identified tasks specific to creating a testing strategy for projects. Phase 3 Design, Construct, and Test has tasks related

510 Final Report
6/20/2011
to the types of testing that may be performed depending on the requirements of the project (unit, integration, system, and user acceptance testing).
Infrastructure and Network
Included in the Infrastructure and Network organization are the following groups:
♦ Systems Operations: This group, led by a manager, is responsible for data center operations (Akron and Wadsworth, OH), satellite operations (Reading, PA), technical security operations (including intrusion and prevention implementation, with IT security having responsibility for direction), printing and inserting daily bills for all FE companies, disaster recovery plans (DRPs), and system network operating center (SNOC) 24/7 monitoring (Akron, OH) for the entire FE network. The server acquisition–associated guiding principles that IT uses in its data center include the following:
- Size assets to meet life expectancy during initial acquisition (i.e., UNIX servers are sized for five years and X86 servers are sized for four years).
- Develop/analyze new capacity requirements by working with application support staff and vendor architects.
- When replacing existing assets, analyze performance data provided via HP OpenView tool suite to understand existing application peak loads/utilizations.
- Use proactive HP OpenView alerts to handle the notification of potential server capacity issues in which server administrators are alerted to critical resources exceeding limits for a particular time period. These alerts can be reviewed to determine if there is an application issue or an infrastructure-related issue requiring a possible patch.
- On an exception basis, IT adds capacity (memory/CPU) to existing assets experiencing performance problems by evaluating FE’s options versus the expected remaining life of an asset. That process entails:
• Adding capacity to the current asset • Purchasing a new asset and cascading the legacy asset to other application requirements • Purchasing a new asset and retiring the legacy asset due to asset age
- These processes work with the multiple-year business planning process, which is described later in this document in Finding XII-30.
♦ Infrastructure/Network Field Operations: This group, led by a manager, has desktop support analysts (DSAs) who provide support to groups throughout the FE organization. (These employees do not assign IDs, passwords, or roles/responsibilities; the HR Department does.) There are approximately 6,000 laptops at FE, and roughly 488 in NJ. There are approximately 8,600 desktops at FE, and roughly 712 in NJ. Currently, FirstEnergy is using Vista SP2, MS Office 2003, and Lotus Notes but will be investigating the possibility of upgrades in future years. Presently, FE’s policy is to replace desktops every four years and laptops every three

Final Report 511
6/20/2011
years, although the organization is considering going to every five years for desktops. Activities for this group include:
- Configuration management (Akron, OH and Reading, PA) of desktop images and distribution, network/software patches, asset management, contract management, and client research and development (R&D) activities
- Voice operations (Akron, OH) supporting telephones and video conferencing –A high level of standardization exists within the FE organization. Typically, Verizon is used for cell telephones (only a few provider choices exist) unless coverage is not adequate (in which case AT&T is used). Pagers generally come from American Messaging, although occasionally local companies are used, if required.
- Messaging and collaboration (Akron, OH), including responsibility for e-mail (Lotus Notes/Domino), spam, etc.
- Central security administration (CSA) (Akron, OH) for user security provisioning and de-provisioning
- Datacom (Akron, OH) responsibility for the corporate data network, including synchronous optical networking (SONET) routers and switches, and break/fix implementation
- Six regional field operations (RFO) organizations (various OH, PA, and NJ locations), including 23 NJ employees – The employees of these organizations are typically of two types:
• Desktop analysts who provide virtual service desk (VSD) Level 1 support (24-hour coverage); desktop support and analysis Level 2 hands-on support for hardware, operating systems, office applications, but NOT business applications, VPN, Citrix, etc.; and occasionally support of the applications support team, when needed
• BU/communications technicians supporting circuits, carriers, equipment substations (supervisory control and data acquisition (SCADA) remote terminal units (RTUs)), communications huts, etc.
♦ Reliability Technologies: This group, led by a director, is responsible for the engineering and design of the network and integration with the network of energy management system (EMS) and generation management system (GMS) platforms, SCADA points, interconnects to PJM Interconnection (PJM), etc. FE has two control centers, one in Wadsworth (OH) and one in Reading (PA). The employees of this group are responsible for network engineering design, with subsequent implementation and support performed by the IT Infrastructure/Network Field Operations group. Major initiatives currently underway include a network transformation that addresses critical points, rollover, and fiber expansion and EMS/GMS reliability.
♦ Enterprise Systems: This group, led by a manager, is responsible for the design and deployment of various platforms used within the FE organization, including Windows/WMware (used for smaller applications) and Unix/AIX (used for SAP and Energy Delivery systems), SAP, and

512 Final Report
6/20/2011
storage. This group, which also has responsibility for FE’s Internet and Intranet, uses HP OpenView to monitor IT operations.
Corporate Security and IT Compliance
The Corporate Security and IT Compliance organization provides policies, procedures, and guidelines as well as strategic direction for all FE organizations except FENOC. In addition to its corporate security and IT compliance activities, this group also coordinates business continuity plan (BCP) activities, which according to SERVECO management goes hand-in-hand with DRP activities. Corporate-wide and departmental plans are currently in place. Initially, a task force (composed of Corporate Security/IT Compliance, HR, Legal, and Communications representatives and meeting regularly) was established to address training and communication areas. Subsequently, a steering committee (composed of executives from these same groups and meeting annually) was also established. Both BCP and DRP documents use the same tools, a combination of Strohl, MS Word, and Visio software. As part of training efforts, BCPs are often tested through regional dispatch office (RDO) drills and actual events, such as the following 2009 and 2010 JCP&L activities described in Exhibit XII-39.
Exhibit XII-39 JCP&L BCP Tests
2009 to 2010
Northern New Jersey (NNJ)
Central New Jersey (CNJ)
Black start drills (practicing those procedures necessary to bring the electric system back on-line after a total blackout) involving PJM system restoration training involving simulation of outages and restoration of customers
11/3/2010 3/3/2009, 11/18/2010, and 12/2/2010
Actual event (fire alarm) in which system operations were turned over to other JCP&L RDO
6/14/2010 3/21/2010, 3/22/2010, and 4/13/2010
Stress test – PowerOn disaster recovery failover plan and the production hardware environment
10/22/2009 10/22/2009
Source: Information Response 822
Other Processes and Systems
Governance
In 1999, an application development methodology (ADM) was developed primarily for use when implementing new applications, not upgrades, although modification projects may also use ADM steps. It was formalized as a means to provide sustainability and applicability for systems and applications. Then in 2000, four IT committees, specifically the ADM Committee, the Applications Design Review (ADR) Committee, the Architecture Review Board (ARB) Committee, and the IT Governance

Final Report 513
6/20/2011
Committee, were established to provide governance of IT architectures, processes, and services. Their respective responsibilities are as follows:
♦ The ADM Committee’s role (with at least one representative per IT director) is to provide guidance on changes to the ADM and associated processes, while ensuring any modifications do not compromise existing Sarbanes-Oxley (SOX) controls.
♦ The ADR Committee’s role (with 50 representatives from across the IT organization) is to conduct peer reviews of a project’s technical implementation strategies. The goals of such assessments are to promote adoption and to identify gaps related to the IT standard products, architectures, and services.
♦ The ARB Committee’s role (with 12 representatives, including one from the IT strategy team, one from the IT PMO, five representatives from a cross-section of IT, and five representatives from a cross-section of FE business units) is to ensure alignment of IT architecture with corporate goals and objectives.
♦ The IT Governance Committee’s role (with nine VPs or designated directors from FE business units, plus the CIO as facilitator) is to provide leadership in making business decisions that ensure the best use of IT to support corporate goals and objectives.
The ADR Committee functions as a step in the ADM (at the conclusion of the requirements analysis phase but prior to the design, construction, and test phases) in which committee members review the design and architecture of an application in progress, either online or via meetings, as appropriate. Only if escalation is necessary as a result of the ADR Committee’s inability to resolve conflicts does the ARB Committee meet. During such a meeting, the ARB Committee can grant an exception, change standards, etc. Only pivotal IT decisions go to the IT Governance Committee for review and approval. They can come from the ARB Committee or stem directly from the nature of the project. The IT Governance Committee, which meets quarterly, deals with issues, projects, policies, and budgets but not operational issues. The IT Governance Committee takes major decisions to the Senior Management Committee for approval. The CIO is a member of the Senior Management Committee of top executives, which meets quarterly for three to four hours and is led by the FE Chief Executive Officer (CEO). These activities initially applied to OH entities, which merged in 1997. They then extended to other FE entities (PA and NJ), when FirstEnergy was merged with General Public Utilities (GPU) in 2001.
The incorporation of SOX controls has transformed the IT organization, with the emphasis now on internal controls as opposed to audits. IT is asked to provide better information to BUs so they can test controls. Less emphasis is now placed on validation after the fact, because controls are now considered by IT management as a part of doing business in a timely manner. As a result, the level of documentation has increased, with reviews now being a way to look at continuous improvement.

514 Final Report
6/20/2011
Internal Audit
The Internal Audit (IA) organization regularly performs IT audits. From 2005 to 2009, this group executed 22 IT audits. In 2010, for example, an internal audit was underway regarding interfaces in customer systems. This audit also encompassed a review of change management activities versus FE’s chosen framework. On an annual basis, IT also reviews general IT controls and provides quarterly reports to IA.
Career Development
The IT organization uses a career development model (CDM), as do other FE organizations (as discussed further in Chapter IX – Human Resources). Individual positions are designated to a group, with levels and then proficiencies assigned to each group. That way, IT management can easily monitor progression. The CDM for IT employees is sometimes tied to an employee’s individual development plan (IDP), because IT tries to juggle company and employees wishes; however, there is no interaction with HR regarding IDPs, although the IDP template is an HR form.
The career development for IT employees is conducted through a combination of mentoring, on-the-job training (OJT), web-based training, classroom training, and knowledge sharing (teaming, train the trainer, etc.). Sometimes the IT organization goes to outside vendors for training, but that decision is dependent on whether the technology is project-based or inherent to the IT group.
The IT organization works in alignment with HR to recruit staff, including interns, using the Talent Talk program.

Final Report 515
6/20/2011
Staffing Levels
Exhibit XII-41 displays FirstEnergy’s staffing levels by year (2005 to 2010) for the IT/Corporate Security groups.
Exhibit XII-40 IT Staffing Levels by Year
2005 to 2010
Source: Information Responses 272 and 578
In 2009, for example, staffing reductions, a voluntary retirement program, and not back-filling attrition resulted in actual staffing levels being lower than the budgeted staffing levels. In most prior years, except 2006) actual levels were lower than budgeted staffing levels. Actual staffing levels for 2010 remained approximately the same as 2009.
IT Configuration
The current configuration of FE servers, workstations, and laptops that support FirstEnergy’s operations are all built from standard images according to internal build documentation. Subsequently, modifications are determined based on a security assessment that is performed monthly. During this assessment, the announced Microsoft security patches are reviewed to determine which of them will be applied and when. The IT organization has documentation detailing each patch as well as a complete inventory list for all servers, workstations, and laptops.
Operating Expenses and Capital Expenditures
Exhibit XII-41 displays FE’s operating expenses by year (2005 to 2010) for the IT/Corporate Security groups.
540 560 580 600 620 640 660 680 700 720 740
2005 2006 2007 2008 2009 2010(6 Months)
Actual Budget

516 Final Report
6/20/2011
Exhibit XII-41 IT Operating Expenses by Year
2005 to 2010
Source: Information Responses 271 and 578
$0
$20,000,000
$40,000,000
$60,000,000
$80,000,000
$100,000,000
$120,000,000
$140,000,000
2005 2006 2007 2008 2009 2010 (Actual 6 Months)
Budget Y/E Outlook
Actual Budget

Final Report 517
6/20/2011
Exhibit XII-42 displays FE’s capital expenditures by year (2005 to 2009) for the IT/Corporate Security groups.
Exhibit XII-42 IT Capital Expenditures by Year
2005 to 2010
Source: Information Responses 271 and 578
In recent years, the number of employees has gone down (as shown previously in Exhibit XII-40), as have operations and maintenance (O&M) expenses. At the same time, capital expenditures have gone up, because IT work was reallocated from O&M expenses to capital expenditures. Also, in 2008 and 2009, the economic downturn put IT (like other FE groups) under pressure to reduce costs and be a good steward of monies. Two examples of capital projects in recent years were SAP ($25 million) and credit and collections (although not so large). Both projects were completed in 2009. There has been another uptick in 2010 capital expenditures. The decline in staffing levels has been a result of attrition, FE voluntary retirement programs, and terminations.
$0 $10,000,000 $20,000,000 $30,000,000 $40,000,000 $50,000,000 $60,000,000 $70,000,000 $80,000,000 $90,000,000
$100,000,000
2005 2006 2007 2008 2009 2010 (Actual 6 Months)
Budget Y/E Outlook
Actual Budget

518 Final Report
6/20/2011
Findings & Conclusions
Finding XII-29 The FE IT organization, led by the CIO, reports up through the CFO organization at a lower level than in many organizations.
In today’s environment, with technology being a critical element for operating a business organization, not just its financial organization, other progressive companies have moved their IT organization out of the financial organization (where it was often located in the past). These organizations have also elevated the CIO position to one that reports directly to the Chief Executive Officer. At FirstEnergy, the IT organization remains in the Finance, Strategic Planning, and Operations group, reporting to the Executive Vice President (EVP) and Chief Financial Officer (CFO).
Finding XII-30 The FE strategic planning process is improving but the plan does not specifically address the direction in which IT is going.
The IT strategic plan is a multiple-year look obtained by meeting with BU management. After such a meeting the BUs approve a one-year outlook as part of the budgeting cycle (based on an assumed budget). Having a multiple-year plan allows IT to avoid the “all or nothing” way of addressing projects. (Maintenance work goes through the IT help desk and is spread throughout each of the groups.)
When the existing CIO came to FE in 2006, he has indicated that information technology was managed in a “here and now” mode supporting current operations, as follows:
♦ No plan existed to leverage technology. ♦ Technology, including SAP, was not being fully utilized. ♦ The IT organization was not a service organization. ♦ Duplicate organizations were frequently investigating the use of new technology.
The CIO spent the first six months visiting business units at all levels of the organization, noting a gap in the linkage between BUs and technology. Then in 2006, FE’s first five-year IT strategic plan was developed, with a focus on how to leverage SAP technology throughout the FE organization. In 2007, SAP upgrades were undertaken to expand new functionality. In 2008 and 2009, the CIO looked at staff alignment and eliminated duplication of interaction with BUs. The IT organization now has only three direct reports (excluding Supply Chain and Flight Operations) aligning solutions by technology or customer. Unlike in the past, issues crossing multiple areas now have one point of contact with whom to address issues. IT governance is a representation of both IT and BU organizations, and the CIO believes that communication is key to this relationship.
According to IT management, in recent years the philosophy has changed from “get it done” to “create value.” Over this timeframe, the FE organization has undertaken four to five major projects, with very little rework (only one to two weeks’ cleanup), because they no longer use the “big bang” implementation methodology. Rather, they implement bits and pieces throughout a major project. One example is the credit and collections project involving SAP and customer information system (CIS)

Final Report 519
6/20/2011
interaction. It was a two-year project, following an 18-month scope period. Within 12 months, the first component was implemented, followed by a call component, and a metrics to take actions component.
Little outsourcing is done, although staff augmentation in selected situations is conducted. When he first came into the FE IT organization, the CIO noted that employee skills were not sufficient. To that end, he began:
♦ Training – provided training from vendors to transfer knowledge and skills, using both classes (web-based classes) and shadowing of vendor personnel. FE recently converted to Windows Vista, for example, and used Microsoft to help during this transition.
♦ Internships – 77 interns have been hired over the last five years, with 34 having been converted to full-time (FT) employees.
In past few years, IT management indicates that the IT strategic plan was actually an activity-based plan. Now it is aligned with FirstEnergy’s objectives, a tendency which in turn drives the activities. The plan is updated annually. The latest plan was a three-year (2011–2012) one that was revised in March 2010. Schumaker & Company consultants agree that this plan is substantially better than simply having a list of projects to be undertaken in the next three years. The plan includes a discussion of FE’s corporate mission, vision, and values, FE’s business plan summary, a business environment description, a key initiative roadmap (schedule), common metrics, a workforce plan, and major risks and opportunities. Nevertheless, it does not include what direction IT believes FE should be going with respect to the technologies that will meet BU needs. Such are indicated by the list of key initiatives outlined in the plan. One document Schumaker & Company reviewed that did attempt to incorporate technology direction was the business intelligence (BI) roadmap; however, that document covers only a small part of the IT organization.
A linkage exists between IT’s annual plan and its five-year strategic plan, the latter of which is made visible to IT staff through individual development plans (IDPs). Among the metrics used are those that focus on safety, cost, and operational areas. An IDP begins with a review of the prior year’s results during the first quarter of a calendar year. Each individual development plan has “stretch” components but is based on both employee and management input for the creation of the actual IDP document, with metrics rolling up to the entire IT metrics. A mid-year review of progress against plan is conducted, during which areas for improvement and successes are discussed. At year-end a formal review is held, which can impact compensation. A merit program also exists at FE that incorporates the organization’s financial state as well as performance.
Exhibit XII-43 approximates the type of activity performed by the IT Solutions group. As can be seen, most work is project-related.

520 Final Report
6/20/2011
Exhibit XII-43 % of IT Time by Type of Activity
July 2009 to December 2009
Source: Information Response 282
Finding XII-31 The IT organization has amassed a large body of documentation associated with its policies and procedures.
The IT organization has a considerable number of policy and procedural documentation, including (but not limited to) the following:
♦ ADM procedures describing the steps required for IT projects, including IT committee descriptions – Such descriptions include the following five phases from initiation through post-implementation:
- Design (analyze) project - Requirements analysis - Design, construct (code), test - Implementation - Post-implementation
♦ Project management guidelines
♦ IT security policies, standards, and procedures that apply to the entire FE organization
♦ CIP policies, programs, and procedures in support of the reliable operation of FE’s bulk electric system
♦ Procedures used by the Network group in maintaining FE’s corporate network
Administration
Break/Fix
Enhancements
Maintenance
Operations
Project
R&D
Security Administration

Final Report 521
6/20/2011
♦ Procedures used by the Infrastructure group in supporting the operations of the corporate data centers as well as the EMS and GMS systems
♦ Change management and control procedures for tasks affecting IT-managed assets
♦ Procedures used by the IT PMO for capital projects
The IT organization regularly updates its IT policies and procedures. The primary triggers for updates are the following:
♦ Regulatory requirements – As the regulatory requirements change, FE is required to update its policies and procedures to meet the new stipulations. For example, CIP requirements from the North American Electric Reliability Corporation (NERC) have been revised two times, and each time the prescribed review cycles have changed.
♦ Technology changes – The introduction of technologies adopted by FE may require that the existing policies and procedures be updated.
♦ Self-contained update schedules – Many policies and procedures contain their own review cycles for reviewing and modifying, if applicable, any documentation.
Finding XII-32 The IT organization has a very limited PMO in place.
The IT organization has Version 1.0 project management guideline (PMG) documentation in place (last revised December 31, 2008) for the following topics:
♦ PMG Overview ♦ Project Initiation Guideline ♦ Project Plan and Scope Development ♦ Project Management Estimating Process ♦ Project Management Human Resource Management ♦ Project Scheduling ♦ Project Safety Planning ♦ Project Environmental Planning ♦ Project Risk Management Process ♦ Project Procurement Planning ♦ Project Contractor Management ♦ Project Quality Management ♦ Project Communications Management and Performance Support ♦ Project Reporting ♦ Project Change Control ♦ Project Closeout

522 Final Report
6/20/2011
The Resource and Program Management (R&PM) group performs the following basic project management office activities:
♦ Oversight progress against budget for capital projects, as 60% of projects are capital (new or enhanced applications) and 40% are non-capital break/fix projects:
- IT timelines
- Business cases (how they are done, including templates, and how to plan for resources)
♦ Training to new project managers
- One day in-house training by BI group (Project Tech Lead How-To Guide); the content of this training is focused primarily toward BI employees, not other IT project managers
- Two days general training by Human Resources (HR) group through outside vendor
Regarding PMO activities, the R&PM group does not have sufficient resources for rigorous oversight to ensure that standards included in the PMG documentation are actually being followed. Approximately three to four years ago (2006 to 2007), IT management made a conscious decision not to have the PMO enforce standards or ensure guidelines were being followed. Rather, it left these tasks up to other IT managers. The IT organization does have an ADM Topic Checklist tool that these other IT managers can use to guide employees through the ADM and assist them in determining what project tasks should be reviewed and executed. At a high level, this tool lists all ADM phases, outlines the topics within each phase, and provides a brief description of each topic.
PMO employees are generally part of bi-weekly staff meetings held by other IT directors or managers (for example, Director of ED & Financial Systems). They also take part in the bi-weekly staff meetings conducted by the Director of IT Solutions. During these meetings, which are held on Tuesdays, change management or project management activities can be discussed.
Finding XII-33 The FE IT organization does not sufficiently emphasize the certification of its staff.
According to IT management, certifications, while helpful to employees in performing their role, are not part of an employee’s individual development plan. Each IT employee is responsible for obtaining certification on his or her own, if he or she personally desires to do so. As such, there are approximately only 167 technical certifications (including multiple certifications by some employees) and three project management certifications within the IT organization. Encouraging employees to obtain project management and technical certifications helps both FE and its employees by increasing skill sets of employees to more effectively perform FirstEnergy’s IT work. They help IT managers validate that employees have the necessary skills, thereby allowing IT managers to focus not only on such skills but other workplace skills that IT staff need to work effectively.

Final Report 523
6/20/2011
Finding XII-34 The key IT performance metrics currently in use are limited in nature and are not kept in a consolidated dashboard for reporting across the IT organization.
Exhibit XII-44 illustrates the key high-level performance metrics IT formally tracks.
Exhibit XII-44 Key High-Level IT Performance Metrics
2005 to 2009
Source: Information Response 274
As shown, these metrics are fairly limited and are primarily related to the IT Network & Infrastructure group, not the IT Solutions or Corporate Security/IT Compliance groups. The only exception is the metric related to business and technical internships.
Any other metrics are monitored by only individual IT groups. For example, the Field Operations group monitors five metrics, some included in the list above in Exhibit XII-44 and some not. Those five metrics are:
♦ First call resolution: 74% 2010 target/78% actual year to date (YTD) (July) ♦ Abandoned calls: 4% 2010 target/4.6% actual YTD (July) (expects to meet by beginning of year
(BOY) 2011) ♦ Average speed of answer (ASA): 24 seconds 2010 target/27 seconds actual YTD (July) (expects
to meet by BOY 2011) ♦ Network reliability: 99% 2010 target/99%+ actual YTD (July) ♦ Time to respond for critical items (20 minutes): 98% 2010 target/97.5% actual YTD (July)
The IT organization does not have a formal program whereby individual group metrics (in addition to the key high-level performance metrics) are reported as a consolidated whole to senior management as part of an IT dashboard.

524 Final Report
6/20/2011
Finding XII-35 IT controls have been incorporated into day-to-day activities.
The controls associated with the IT organization are designed to support FirstEnergy’s SOX compliance. These controls are reviewed and tested annually or as needed by the IT SOX liaisons. In addition, the key controls are audited annually by FE’s Internal Audit Department and/or by FE’s external auditors (PricewaterhouseCoopers LLP). Each IT control is a self-contained document that consists of the following sections: control objectives, IT control mechanism, IT control process, IT change control log, and IT control review. The controls are broken into the following categories:
♦ IT entity level controls (ITELCs), with the CIO as the process owner, provide the “tone at the top” for the IT organization.
♦ IT general controls (ITGCs), with the Director of IT Operations and the Director of IT Solutions as process owners, are pervasive controls that cover multiple control objectives or cross-multiple platforms. They include:
- Change management controls for applications, databases, and infrastructure
- Security management controls for operating systems, databases, and applications
- Computer operations controls for backup and recovery and critical system monitoring
- Physical access to data center
♦ IT platform controls (ITPCs), with the Director of IT Operations and the Director of IT Solutions as process owners, are specific to a domain environment, plus any associated general controls, including:
- Security management - Server management - Mainframe backup and recovery - Batch scheduling/reporting
♦ IT exception controls (ITECs), with the Director of IT Operations and the Director of IT Solutions as process owners, are deviations from the ITGCs and ITPCs and rely on specific controls to mitigate risks in the exception area.
In addition to the annual key control reviews, two other types of control reviews are completed.
♦ Security configuration reviews are completed twice a year to ensure account access is appropriate for the servers and applicable databases.
♦ A quarterly review is conducted to ensure that access to the SOX applications is appropriate.
The process owners regularly certify the status of the controls for which they are responsible on the:
♦ Process Owner Input to (Q1, Q2, and Q3) (Year 20xx) Section 302 certification
♦ Process Owner Input to (Year 20xx) Section 404 certification

Final Report 525
6/20/2011
The IT controls are managed through a Lotus Notes database called “FirstEnergy IT Controls” and are accessible to the IT and Internal Audit organizations.
Finding XII-36 No formal service level agreements exist between IT and JCP&L or other FE entities.
IT does not have formal documented service level agreements (SLAs) with FirstEnergy’s operating companies. On a corporate basis, however, IT maintains reliability and performance targets that apply to all operating companies. (Refer to Finding XII-34 for Schumaker & Company concerns about IT performance metrics.)
A good SLA includes such topics such as the following:
♦ Introduction, including scope and objectives, definition of business partners (IT, SERVECO departments, regulated business units, and non-regulated business units), associated roles and responsibilities of business partners, governance committee roles and responsibilities, and corporate/executive roles and responsibilities
♦ A detailed listing of target metrics, including metric, metric calculation, goal, target, owner, responsible department, and explanation (if necessary), with the reporting structure and frequency identified
♦ Required management activities, such as:
- Identification of material variance and corrective actions
- Performance accountability for IT employees
- Methodology for revision of service levels
- Results of annual business performance surveys
♦ IT and business partner signatures
By implementing such an SLA, the IT organization is formally required to be accountable to BUs for its activities on their behalf.
Finding XII-37 The IT organization has a robust disaster recovery program, even though it did not begin developing a formal plan until 2004.
FirstEnergy began establishment of its disaster recovery plans at the end of year 2004, starting with its emergency management system (EMS) plan. The DRPs define the required actions in response to events or conditions of varying duration and severity that would activate the recovery plans. They also define the roles and responsibilities of responders. Of FE’s approximately 200 applications, approximately 20 are considered to be mission-critical and 60 to be business-critical. Mission-critical applications must have a return to operations (RTO) of less than one hour, while business-critical applications must have an RTO of zero to 48 hours. The FE DRP is composed of a master plan for

526 Final Report
6/20/2011
each of FE’s two main IT facilities, the primary data center referred to as the information system operations center (ISOC) and the second data center (SDC). This latter center is approximately 20 miles away from the ISOC and can act as a hot recovery site for ISOC operations. Each master plan provides an overall summary (structure, roles, responsibilities, and management of events) and a description of each of six tracks (including detailed steps for each track). Those six tracks are primarily:
♦ Track 0: infrastructure items that are needed for other applications to run and other items such as e-mail messaging
♦ Track 1: critical support systems, such as enterprise application integration (EAI) functions
♦ Track 2: applications recovery
♦ Track 3: enterprise systems, such as SAP, recovery
♦ Track 4: storage support, such as EMS and traffic management channel (TMC) products
♦ Track 5: off-site recovery, such as recovery of the cash remittance center (CRC) operations
Each track has a track lead who manages its update and execution. Included in FirstEnergy’s disaster recovery plans are worst case scenarios in which all affected facility-based plan recovery procedures would be executed if a formal disaster declaration (such as a complete data center not operational) were declared. Less serious situations, where individual hardware or software components are not operational, are also included. Each documented recovery procedure can also be used individually on a one-for-one basis without the need for a formal disaster declaration. One of IT’s philosophies is to use testing/quality assurance (QA) equipment as backup to production equipment, as needed.
The DRP program is made up of individual plans based on a standard template, which is then sequenced by application. Individual application plans include information such as the following:
♦ Contact information
♦ Overview information, including summary information, items in/out of scope, requirements, prerequisites, roles/responsibilities, etc.
♦ Procedures and steps
♦ Server location/purpose
♦ Network view diagram
♦ Revisions
♦ Testing table history
♦ Approvals (both IT and business unit representatives)
The annual draft revisions for these DRPs are first reviewed by IT infrastructure representatives before being sent out for review by business unit representatives. The DRPs are stored in a restricted network location that is accessible by assigned staff responsible for implementing the plans for a specific event.

Final Report 527
6/20/2011
Additionally, the disaster recovery plan is updated monthly and provided in total to each key IT employee in electronic form on a password-protected thumb drive.
Each year, all DRPs are tested either through desktop activities or full-fledged testing activities (if high-availability failover required). All mission-critical items are tested (either physically or via desktop exercises) at least annually, while business-critical items are tested at least once every three years. Other items are tested based on the cycle set as part of the annual review of the disaster recovery plan.
These plans also document what backup information is required and where the required backup information is located. The restoration requirements vary based on recovery strategies, although the methodology for restoration is documented. Any physical backups are copied to a separate physical site.
Each of FE’s two data centers is considered a hot site (Teir 1 facility) for the other one. They are approximately 15 miles away from each other, each in a different electric grid served by different substations, with each having dual feeds. Each has full generation backup capability.
Finding XII-38 IT vulnerability assessments and penetration testing are routinely performed.
The Cyber/IT Security area is responsible for cyber and physical security within the FE organization. Every other year an enterprise vulnerability assessment, which costs approximately $150,000, is performed by an outside vendor. Currently, that vendor is SecureState, which has done the assessment the last two times. This assessment project looks at all entry/exit points, including roughly 50,000 Internet protocol (IP) addresses, which encompass 1,000 Windows servers, 300 Unix servers, 10,000 workstations, and other devices. The scope of work typically includes:
♦ Internal network security assessment ♦ Internet vulnerability profiling ♦ Internet penetration testing ♦ Remote access security review (virtual private network (VPN)) ♦ Social engineering (not done in 2009 for cost purposes) ♦ Technical baseline/standards review ♦ Web application security attacks and leaking ♦ Oracle database (DB) ♦ Wireless connections ♦ Mobile device security, including laptop encryption ♦ Substation networks ♦ Firewall, intrusion prevention, and proxy server review
Ratings of extreme risk, high risk, medium risk, or low risk are given in total and by work area. In 2009 (May 21, 2009), the FE organization was scored by SecureState as having a medium risk in total, with individual work areas primarily low risk to medium risk but with a few high-risk areas. In 2009 (August 2009), the IA organization also reviewed SecureState’s activities to make sure the assessor performed a

528 Final Report
6/20/2011
complete external system vulnerability assessment and that mitigation plans were developed in response to any findings.
Every year, critical infrastructure protection (CIP) vulnerability assessments are performed by FirstEnergy and SecureState at all seven plants and 54 substations. This group was last in NJ on July 26–30, 2010 to perform assessments. New Jersey has 15 facilities (some involving substation collocation) and one plant (Yards Creek). Additionally, last year (2009) the Manager of Cyber Security & IT Compliance participated in a cyber simulation in New Jersey, referred to as Broken Wire/CIP Man, where various “what if” scenarios were discussed. In 2009, the primary topic dealt with what happens if a bad patch is installed by an unethical administrator.
In addition to these assessments, other activities such as the following occur:
♦ Online cyber security awareness training must be performed within two weeks of receiving network access as well as once annually in September of each year. Users can retake a test if they fail, but if they are CIP critical, then access is removed immediately. This computer-based training (CBT) was implemented by Global Learning Systems for roughly $100,000 in 2007. FE pays $50,000 annually but is now paying $40,000 to port it internally.
♦ Passwords, which must include alphabetic characters (upper and lower), numbers, and special character, are changed every 45 days, although CIP requires they be changed only once a year.
Finding XII-39 The IT organization uses ALTIRIS software, but doesn’t use the software’s wake-up capability.
Among the responsibilities of the Infrastructure/Network Field Operations group within the IT organization includes configuration management of desktop images and distribution, network/software patches, asset management, contract management, and client R&D activities. The group uses ALTIRIS software for remote management of workstations. While it has the capability to wake up powered-down machines to perform activities, FE currently does not use this capability.

Final Report 529
6/20/2011
Recommendations
Recommendation XII-21 In conjunction with the FE/Allegheny Energy merger integration process, and regularly thereafter, identify and implement the most efficient organizational design to effectively perform the IT function across FE. (Refer to Finding XII-29)
As FirstEnergy makes upcoming organization changes in the future, such as those that will occur due to the Allegheny Energy merger, the FE Service Company should investigate where to relocate the IT organization outside the financial organization to a location where it has a more corporate-wide impact. Not having the IT organization located within the financial organization helps ensure that the needs and requirements of all functions within an organization are given the appropriate priority when choosing what system additions or modifications to implement.
Recommendation XII-22 Incorporate technology direction into IT’s strategic planning process. (Refer to Finding XII-30)
While the IT organization has made great progress in developing its strategic plan, it still needs to incorporate what technology direction it generally wants to take going forward. In addition, it must list its key initiatives for the next three years. Individuals within the IT organization need to have the appropriate framework for identifying what technologies (hardware/software) should be chosen when evaluating options and making future decisions. It will also be extremely important if (and when) FE completes the merger of Allegheny Power into its operations.
Recommendation XII-23 Expand the PMO to take on additional responsibilities. (Refer to Finding XII-32)
PMO activities should not be primarily limited to oversight of capital projects’ progress against budget and training of new project managers. Rather, they should be expanded to develop and enforce the following of project management standards and to ensure that guidelines are being followed. Often, an IT PMO (and sometimes a corporate-wide PMO) is responsible for such activities as:
♦ Developing and communicating project management standards and guidelines
♦ Developing templates and checklists for use by project managers
♦ Establishing an IT/corporate-wide repository for project management documentation, including but not limited to project charters, project schedules, progress reports, and other documentation
♦ Reviewing all such project management documentation developed by project managers to ensure that standards and guidelines are being followed
♦ Managing resources for all IT projects
♦ Monitoring project management training and certification activities by employee

530 Final Report
6/20/2011
♦ Ensuring that formal quality assurance/testing activities are being performed by individuals other than those designing and developing code
FirstEnergy should perform a study to investigate what form its PMO should take. It should then implement that form in a timely manner.
Recommendation XII-24 Expand FirstEnergy’s commitment to project management by incorporating all IT employees who are responsible for project delivery into a PMP certification program and closely monitor implementation of this program, whereby all appropriate staff achieve PMP certification to ensure timely progress is made. (Refer to Finding XII-33)
For an organization the size and complexity of FE’s IT organization, few employees have project management certifications. Certification not only helps to ensure that individuals have been trained in appropriate project management practices, tools, and techniques, but it also helps to place appropriate emphasis by FE management on the importance of best practices with regard to project management. Emphasis on project management certification helps ensure standardization of project management implementation efforts. It also helps determine which employees are truly interested in furthering their position within the IT organization by obtaining their Project Management Professional (PMP) certification through the Project Management Institute. FirstEnergy indicates that it is committed to developing the skills of project managers, yet it does not require PMP certification. Inclusion of project management certification goals should be incorporated into the performance plans of appropriate employees. In addition to PMP certification, as part of its development of project managers, FE should also ensure that skill-based mentoring and exposure to a variety of on-the-job development experiences are included in this program.
Appropriate employees for inclusion in this program include not only project managers but also the directors and managers who have projects managers in their organization. That is because these individuals also need to understand project management philosophies, concepts, techniques, and tools.
Recommendation XII-25 Implement a relevant IT dashboard. (Refer to Finding XII-34)
The existing IT performance targets do not reflect an organized approach to effectively improving the IT organization’s performance. IT management, in conjunction with BUs, should determine what key metrics are relevant and then identify the particular targets against which results are measured. The key performance indicators (KPIs) for IT groups, as well as any success measures for individual IT employees, should be aligned so that they support the key IT performance targets included in an IT dashboard. Similarly, these key IT performance targets should support the IT strategic plan (described earlier in Finding XII-30 and Recommendation XII-22). Routinely (preferably monthly), dashboard results against targets, with explanations when targets are not achieved, should be published to all IT employees and major business partners. In the future, when a target is not achieved, a formal action plan should be

Final Report 531
6/20/2011
developed and a responsible person should be assigned to improve results and subsequently achieve the target.
Recommendation XII-26 Expedite completion of SLAs with all major client groups. (Refer to Finding XII-36)
To truly become “a valued business partner,” the IT organization must increase its client focus by interacting more frequently and effectively with its client groups. One of the ways the IT organization can begin to accomplish this aim is by establishing service level agreements with each of IT’s major client groups. These groups include both individual SERVECO departments and other BU groups, such as major JCP&L groups. Each major client group must be addressed through an SLA, which should also incorporate all major IT groups. These agreements, however, must not be developed and simply placed on a back shelf without further consideration. A mechanism must be developed that requires the IT organization to at least quarterly (if not monthly) provide feedback to the client groups as to how it is doing against the expectations included in the SLAs.
Recommendation XII-27 Transition to the use of the remote management software’s wake-up capability. (Refer to Finding XII-39)
The use of the ALTIRIS wake up capability can be limited by the hardware FE uses for its workstations, especially older types. As older workstations are replaced, the Infrastructure/Network Operations group should implement the software’s wake up capability, which would allow IT employees more flexibility when they could perform various configuration management activities.

532 Final Report
6/20/2011
G. Records Management
This section discusses Jersey Central Power & Light (JCP&L) Company’s records management program, which is managed by the FirstEnergy (FE) Records & Information Compliance Department (R&ICD) group within the FE Service Company (SERVECO) organization.
Background & Perspective
Organization and Staffing
Exhibit XII-45 illustrates the FE R&ICD group.
Exhibit XII-45 SERVECO Records & Information Compliance Department
as of June 30, 2010
Source: Information Response 54
Akron, OH 35
SERVECODirector
Records & Information Compliance
Akron, OH
SERVECOExecutive Assistant
Akron, OH 29
SERVECOManager
Enterprise Records Management
Akron, OH
SERVECOSupervisor
Nuclear Administration Services
Oak Harbor, OH 6
SERVECOSupervisor
Records Management-Davis Besse
North Perry, OH 5
SERVECOSupervisor
Records Management-Perry
Beaver Valley, PA 9
SERVECOSupervisor
Records Management-Beaver Valley
Akron, OH 4
SERVECOSupervisor
Records Management-Corporate
Akron, OH 3
SERVECOLead
Information Compliance

Final Report 533
6/20/2011
FE’s use of automated records management processes dates back to 1994. That automation included the use of bar coding for boxed paper records. Until the completion of the merger between FirstEnergy and GPU, Inc. (GPU) in 2001, records management was generally decentralized among business units. In 2002, as a merger synergy savings opportunity, a committee was formed to develop a business case for centralization of the organization’s records management functions to achieve cost savings and business process improvements. In 2003, the enterprise records management (ERM) program was established as a consolidated shared services organization that was extended in 2005 to its current state as the Records & Information Compliance Department. It is now the responsibility of the R&ICD to govern all of the organization’s policies, processes, and automation procedures associated with records management. Within FE, records are characterized as either “business” (based on a retention schedule) or “situational” (based on a litigation hold). Within the R&ICD organization, the Enterprise Records Management group manages business records, while the Information Compliance group manages situational records.
Enterprise Records Management
The ERM Manager is a Certified Records Manager (CRM) licensed by the Institute of Certified Records Managers™ (ICRM), an international certifying organization of and for professional records and information managers. The purpose of this organization is to create a standard designation by which persons involved in records and information management can be measured, accredited, and recognized in accord with the experience and knowledge criteria established by their peers.
Records are created within individual FE departments, all of which are responsible for following the R&ICD program guidelines. At a given point in time, as determined by the individual department, the records are prepared (including indexing) and released to R&ICD. Upon receipt of a department’s records, R&ICD is responsible for all records management functions. Such responsibilities include scanning, retrieval, both hard copy and electronic storage of records, management of legal holds, records retention, records management system maintenance, and records destruction. Among the documentation related to records management, FirstEnergy has a corporate policy (CP-104) for records retention, a business practice policy for confidential and proprietary information (BP-8.1), a business practice policy for records accuracy and management (BP-8.5), a litigation hold policy, and documentation for preparing, scanning, and retrieving FE records. Additionally, FE has electronic communications management, e-mail management, and electronic communications etiquette documentation in place.
Lifecycle and usefulness determines whether business records are turned over to the Enterprise Records Management (ERM) group or are kept in individual departments. Of those documents that are sent to the ERM group, some come from departments in paper form while others come in electronic form. In all cases, however, departments are able to input metadata electronically before sending files to the ERM group. Therefore, R&ICD management indicates that the group provides central governance but NOT necessarily central recordkeeping.

534 Final Report
6/20/2011
In 2005, enterprise-wide implementation of IBM/FileNet P8 as the records management tool began. FE has approximately 20 million records, of which 99% are paper or other physical types (such as microfiche). Going forward, however, all records sent to the ERM group are indexed using the P8 system, which provides users with 24/7 availability to search electronic documents using keyword searches. P8, the corporate-wide standard for FE’s records management system, is an integrated suite of software designed to provide enhanced management of electronic documents and records throughout their lifecycle. P8 applications in use include content manager (used primarily by individual departments for access, revision, and lookup of controlled documents), records manager (used primarily by the ERM group to facilitate the conversion of paper records to electronic format, thereby enabling record-releasing organizations to workflow electronic records directly to the system and providing 24/7 online user access to those records), and e-mail manager (used for accountability, search, and preservation of e-mail that is relevant to legal discovery requests).
Starting in July 2008, any new ERM users were required to use P8. If an individual department wants to use something else, it must go to IT and request a waiver. Infokeeper (IK), a separate application, allows users to perform data entry, record requests and retrievals, pickups and returns, and custom searches via a web server. Currently, InfoKeeper, which is also the bar-coding system, is not interfaced with P8; however, as part of the current P8 upgrade, it will be interfaced automatically in one to two years. Other systems include (a) Visual Corporate Keeper (VCK), a records management system for hard copy records such as paper, maps, microfilm, and microfiche that was developed to manage and maximize warehouse space, to reduce labor costs, and to allow records to be stored dynamically (they can be moved from one location to another with a simple barcode scan) and (b) WebSync, an automated connection between IK and VCK.
Before setting up its enterprise-wide system, FE benchmarked other utility organizations to see which ones controlled records on an enterprise-wide basis. According to R&ICD management, most had failed because they had not given enough attention to the nuclear organization. Therefore, to overcome this oversight, FirstEnergy’s ERM group is comprised of four sub-groups, three nuclear groups and one corporate group, although this latter group is responsible for all non-nuclear groups.
FE scans only active records from the historical records prior to 2005 (as a back file conversion), such as those used frequently by FirstEnergy Nuclear Operating Company (FENOC) employees. FE management considers it too costly to perform an entire back file conversion of all historical records.
Sometimes FE must retain hard copies as well as images, such as minutes and contracts. As a result, the R&ICD group must obtain legal interpretation if a group requests destruction of these records.
Information Compliance
When the Legal Department initiates a litigation hold on FE records, the Lead of the Information Compliance group activates and leads the Discovery Response team. The ERM Manager is also on the team. The team members meet to determine what information is to be held, including search criteria.

Final Report 535
6/20/2011
The Information Compliance Lead is also responsible for the search and collection of relevant e-mail, which must be collected from two sources: P8 and Lotus Notes, as follows:
♦ P8 Repository – includes all email messages (new, replies, and forwards) that were classified by Lotus Notes users. Classification criteria is applied as follows:
- Business information
• Long-term value: communications with other contracting parties regarding contract terms, contract disputes, and similar matters (15-year retention limit)
• Strategic value: information compiled in a final strategic document (e.g., a presentation, a business plan, transient information collected in an annual report/summary, a document that is one-of-a kind/unique in nature, or historical project information) (six-year retention limit)
• Near-term value: draft information ultimately compiled in a final strategic document (e.g., a presentation, a business plan, or a project working file) (three-year retention limit)
• Minor short-term value: routine communications among FE e-mail account holders (e.g., work schedules and status reports) (one-year retention limit)
- Personal information (no action-zero retention limit)
- Litigation hold (The system suspends destruction of user-classified email until released by the Legal Department.)
♦ Lotus Notes User Mailboxes – unclassified email messages or email received from external sources and not forwarded are not saved in the P8 Repository. Unlike other archiving systems, the e-mail manager system is not configured to archive all e-mail messages. That is, users can delete items in their inboxes that come from external sources. However, when a litigation hold is applicable, mailboxes are imaged and initially scanned for relevant messages. After this initial scan, no additional scans are done; users are responsible for classifying relevant messages.
The Information Compliance group is responsible for maintaining and updating information about litigation holds on a portal for both business and situational records. This group also performs audits of records management processes, not the Internal Audit (IA) Department. As a result, many nuclear quality assurance practices have been incorporated into the non-nuclear activities. As FE continues to manage numerous e-Discovery requests, changes in workforce, and the migration of corporate records into the P8 system, R&ICD management has stated the critical need for concurrence across records management activities and their customers to ensure success. Therefore, in the third quarter of 2009, the Information Compliance group performed a records management audit, which was titled “Records Storage Audit Report.” This audit was requested by the ERM group for the purposes of verifying that records management program activities were performed as a value service to the organization and aiding in the establishment of new procedures to effectively manage records management activities. Six findings identified program deficiencies and made recommendations for future improvement, although
536 Final Report
6/20/2011
the related issues were not in direct correlation with any noncompliance, nor was there any documented evidence to suggest that FE policies were not being followed.
♦ Issue 1 – Daily Procedure Steps: Daily performance of delivery, retrieval, and restocking of boxed records was not based on any written procedure or process.
♦ Issue 2 – Verification of Work Orders: Work orders that sit beyond a week as incomplete were filed in a pending folder within the storage room. No account or report, however, was produced to verify supervisory follow-up for any gaps in service resulting from open orders remaining pending for extended periods of time.
♦ Issue 3 – Records Center Safety: The records management function did not follow any standardized procedure to establish a safe environment while working in the Corporate Records Center (paper records storage). Department employees were usually alone in the Corporate Records Center and did what they felt was appropriate to safeguard themselves.
♦ Issue 4 – Records Center Storage Appearance: While the Corporate Records Center was considered effective in the safekeeping and preservation elements of records storage, box retrieval could be more efficient, with shelf signage that closely resembles the location system used on box barcodes.
♦ Issue 5 – Secure Disposal/Destructions: A concise destruction process was not available for the ERM group nor was a referable document for employees who are charged with final destruction. Once records have been placed on legal hold, not considering the retention period, clear communication must exist to ensure such records stay intact for the duration of the hold.
♦ Issue 6 – Notification of Litigation Hold: The audit did not reveal the existence of a list of known legal hold records held by the ERM group.
A follow-up audit in the second quarter of 2010, titled “Records Storage Audit Follow-Up Results,” was performed. All issues, except Issue 4, were or are in the process of being addressed. As an example, a “Delivery Guideline for Corporate Records” documentation was developed and at completion of our fieldwork was awaiting final review and approval by the Supervisor, Enterprise Records Management and approval by both the Manager, Enterprise Records Management and the Director, Records & Information Compliance. An initial judgment was made, however, that the proposed signage discussed in Issue 4 was unnecessary, because the personnel authorized to access the facility are fully knowledgeable about the shelving layout and identification. Since that initial judgment, management and staff have considered the likelihood of other, less knowledgeable personnel accessing the facility (e.g., in the event of an emergency or the potential use of temporary employees) and installed the recommended signage by the end of 2010.
Additionally, the R&ICD organization is in the process of developing an audit program for areas outside the records management group, although no audits of these areas have been developed to date.

Final Report 537
6/20/2011
Other Major Processes and Systems
Destruction of Records
Using P8, the ERM Manager periodically develops a listing of business records that are eligible for destruction. The ERM team reviews this listing to make sure none of the records are on the litigation hold list. An outside party is contacted to shred paper documents. For electronic records, items past their retention period are first flagged (only if they are not on the litigation hold list). The metadata is retained (P8 is Department of Defense (DoD) 5015.2 compliant). Then ERM group initiates a sweep process to be performed by the Information Technology (IT) organization. Two sweeps are required to delete items—one to identify and one to wipe out.
Disposal of Sensitive Records
A secure disposal program for safe discarding of sensitive information was established in July 2007. Approximately 1,000 locations at 156 facilities throughout the FE organization have bins for the disposal of sensitive information into locked containers. These bins are periodically picked up and shredded by an outside party (the same party that shreds business records that have gone past their retention period). Of these 156 facilities, 123 are serviced regularly and the remaining 33 are serviced annually or on a purge basis. The Information Compliance Lead has keys to these containers in the event that something that shouldn’t be placed in one accidentally is, although an Information Compliance team member personally assists in retrieving the desired item and doesn’t allow users to rummage through bins.
Training
The R&ICD group is also responsible for the provision of training for FE departments, as follows:
♦ Individual P8 training is done as requested.
♦ Records retention training, which is conducted biennially (every other year) for FE employees and contractors, provides guidance on the proper records management processes included in CP-104 and BP 8.5 policies.
♦ E-Discovery training, which started in 2009, is also done biennially.
♦ Secure disposal program training (as described in CP-804) was given to employees in 2007, when the program was started.
Benchmarking by Others
Since FE centralized the enterprise records management function and implemented its electronic records management technology, a number of utility, private sector, and government organizations (approximately 20 companies and two government entities) have benchmarked the FE process. Most of those contacts were made via group interviews on conference calls. In a few cases, specific information

538 Final Report
6/20/2011
was requested regarding organization, key success factors, change management, and lessons learned. The sample presentations listed below contain proprietary and confidential information.
♦ CCE benchmarking visit ♦ Key Bank benchmarking visit ♦ New Brunswick benchmarking visit
Findings & Conclusions
Finding XII-40 Although FE has developed an outstanding records management program, it is not being fully utilized by all FE and JCP&L groups.
Information gleaned from R&ICD’s knowledge of whether an FE user department has been set up to use P8 or sends hard copy (HC) to R&ICD shows that approximately 41% of FE user departments (380 of 917) may create records but do not send any documents to the R&ICD group. This tendency is illustrated in Exhibit XII-46. Similarly, approximately 44% (34 of 78) of JCP&L user departments also do not send any documents to the R&ICD group, a tendency that is also shown in Exhibit XII-46.
Exhibit XII-46 Percentage of FE and JCP&L Organizational Units Using Records Management Program
as of June 30, 2010
Total FE Organization JCP&L Organization Only
Source: Information Response 345
Additionally, a formal records retention schedule is in effect at FE; however, no controls are in place to make sure all departments use it. That is because FirstEnergy typically errs on the side of keeping too much information for too long a period of time. Nevertheless, a study was recently performed with the Legal organization to update FE’s retention schedule. Resulting from this study was a master schedule,
11.5%
15.5%
31.6%
41.4%
HC/P8 HC P8 Do Not Use
12.8%
35.9%
7.7%
43.6%
HC/P8 HC P8 Do Not Use

Final Report 539
6/20/2011
which is a reference for citations involving Federal Energy Regulatory Commission (FERC), Public Utilities Commission of Ohio (PUCO), Pennsylvania Public Utilities Commission (PaPUC), and New Jersey Board of Public Utilities (NJ BPU) requirements. This master schedule also ties record series (RS) numbers to the records retention schedule. As part of that study, approximately three RS numbers were noted where FE was keeping records too long. Various clarifications of items were also made.
Recommendations
Recommendation XII-28 Take and enforce a more aggressive posture with regard to having departments follow FE’s records management program. (Refer to Finding XII-40)
All FE departments should be following the organization’s records management program using P8. At this time, according to R&ICD’s data, roughly 59% of FE departments (56% of JCP&L departments) actively follow the program. Others may create records but they do not send any documents (neither electronic nor hard copy) to R&ICD. Given that a formal records management program has been in place for over five years, one would expect these percentages to be closer to 100%. The R&ICD organization should establish an implementation plan and schedule (no longer than two to four years) for having all FE departments actively involved.