3970.pdf - NJ.gov
277
-
Upload
khangminh22 -
Category
Documents
-
view
2 -
download
0
Transcript of 3970.pdf - NJ.gov


COMPREHENSIVE ANNUAL
FINANCIAL REPORT
of the
PASSAIC PUBLIC SCHOOLS
PASSAIC, NEW JERSEY
FOR THE FISCAL YEAR ENDED JUNE 30, 2020
Prepared by
School Business Administrator

PASSAIC PUBLIC SCHOOLS TABLE OF CONTENTS
INTRODUCTORY SECTION
Letter of Transmittal Organizational Charts Roster of Officials Consultants and Advisors Certificate ofExcellence
Independent Auditors' Report
FINANCIAL SECTION
REQUIRED SUPPLEMENTARY INFORMATION-PART I
Management's Discussion and Analysis
BASIC FINANCIAL STATEMENTS
A. District-Wide Financial Statements
A-1 Statement ofNet Position A-2 Statement of Activities
B. Fund Financial Statements
Governmental Funds
B-1 Balance Sheet B-2 Statement of Revenues, Expenditures and Changes in Fund Balances B-3 Reconciliation of the Statement of Revenues, Expenditures and Changes
In Fund Balances of Governmental Funds to the Statement of Activities
Proprietary Funds
B-4 Statement of Net Position B-5 Statement of Revenues, Expenses and Changes in Net Position B-6 Statement of Cash Flows
Fiduciary Funds
B-7 Statement of Fiduciary Net Position B-8 Statement of Changes in Fiduciary Net Position
Notes to the Financial Statements
REQUIRED SUPPLEMENTARY INFORMATION-PART II
C. Budgetary Comparison Schedules
C-1 Budgetary Comparison Schedule - General Fund C-1 A Budgetary Comparison Schedule C-2 Budgetary Comparison Schedule - Special Revenue Fund C-3 Budgetary Comparison Schedule- Note to Required Supplementmy
Information -
1-27 28-33 34 35 36
37-39
40-53
54 55
56 57
58
59 60 61
62 63
64-107
108-115 116-124 125-126
127

PASSAIC PUBLIC SCHOOLS TABLE OF CONTENTS
REQUIRED SUPPLEMENTARY INFORMATION- PART III
L. Schedules Related to Accounting and Reporting for Pensions and Other Postemployment Benefits
L-1
L-2
L-3
L-4 L-5
L-6
Required Supplementary Information- Schedule of the District's Proportionate Share of the Net Pension Liability- Public Employees Retirement System
Required Supplementary Information- Schedule of the District ContributionsPublic Employees Retirement System
Required Supplementary Information- Schedule of the District's Proportionate Share of the Net Pension Liability- Teachers Pension and Annuity Fund
Notes to Required Supplementary Information Required Supplementary Information- Schedule of Changes in the District's Proportionate Share of Total OPEB Liability
Notes to Required Supplementary Information
OTHER SUPPLEMENTARY INFORMATION
D. School Level Schedules
D-1 Combining Balance Sheet D-2 Blended Resource Fund- Schedule of Expenditures
Allocated by Resource Type - Actual D-3 Blended Resource Fund- Schedule of Blended Expenditures
Budget and Actual
E. Special Revenue Fund
E-1 Combining Schedule of Revenues and Expenditures, Special Revenue Fund- Budgetary Basis
E-1A-E-1 E Combining Schedule of Program Revenues and Expenditures -
Special Revenue Fund- Budgetary Basis E-2 Preschool Education Aid Schedule of Expenditures -
Budgetary Basis
F. Capital Projects Fund
F-1 Summary Schedule ofProject Expenditures F-2 Summary Schedule of Revenues, Expenditures and Changes in Fund Balance F-2a- Schedule of Project Revenues, Expenditures, Project Balance and
2e Project Status -Budgetary Basis
128
129
130 131
132 133
134
135-151
152-194
195
196-200
201
202 203
204-208

' PASSAIC PUBLIC SCHOOLS
TABLE OF CONTENTS
G. Proprietary Funds
G-1 G-2
G-3
Enterprise Fund
Statement of Net Position- Not Applicable Statement of Revenues, Expenses and Changes in Net Position Statement of Cash Flows- Not Applicable
H. Fiduciary Fund
H-1 H-2 H-3 H-4
Combining Statement of Agency Assets and Liabilities Combining Statement of Changes in Fiduciary Net Position- Not Applicable Student Activity Agency Fund Schedule of Receipts and Disbursements Payroll Agency Fund Schedule of Change in Assets and Liabilities
I. Long-Term Debt
I-1 I-2 I-3
J.
J-1 J-2 J-3 J-4 J-5 J-6 J-7 J-8 J-9 J-10 J-11 J-12 J-13 J-14 J-15 J-16 J-17 J-18 J-19 J-20
Schedule of Serial Bonds- Not Applicable Schedule of Capital Leases Payable- Not Applicable Budgetary Comparison Schedule Debt Service Fund- Not Applicable
STATISTICAL SECTION
Net Position by Component Changes in Net Position Fund Balances - Governmental Funds Changes in Fund Balances - Governmental Funds General Fund Other Local Revenue by Source Assessed Value and Actual Value of Taxable Propetiy Direct and Overlapping Property Tax Rates Principal Property Taxpayers Property Tax Levies and Collections Ratios of Outstanding Debt by Type Ratios ofNet General Bonded Debt Outstanding Direct and Overlapping Governmental Activities Debt Legal Debt Margin Information Demographic and Economic Statistics Principal Employers Full-Time Equivalent District Employees by Function/Program Operating Statistics School Building Information Schedule of Required Maintenance for School Facilities Schedule of Insurance
209
210 211
212 212 213 213
214 214 214
215 216-217 218 219 220 221 222 223 224 225 226 227 228 229 230 231 232 233-234 235 236-237

K.
K-1
K-2
K-3 K-4 K-5
K-6
K-7
K-7
K-8
PASSAIC PUBLIC SCHOOLS TABLE OF CONTENTS
SINGLE AUDIT SECTION
Report on Internal Control over Financial Reporting on Compliance and Other Matters Based on an Audit of Financial Statements Performed in Accordance with Government Auditing Standards
Report on Compliance for Each Major Federal and State Program; Report on Internal Control Over Compliance and Report on the Schedule of Expenditures of Federal Awards Required by the U.S. Uniform Guidance and Schedule of Expenditures of State Financial Assistance as Required by New Jersey OMB Circular 15-08
Schedule of Expenditures of Federal Awards, Schedule A Schedule of Expenditures of State Financial Assistance, Schedule B Notes to the Schedules ofExpenditures Federal Awards
and State Financial Assistance Schedule of Findings and Questioned Costs- Part 1-
Summary of Auditor's Results Schedule of Findings and Questioned Costs- Part 2 - Schedule of Financial Statement Findings
Schedule of Findings and Questioned Costs- Part 3 -Schedule of Federal and State Award Findings and Questioned Costs
Summary Schedule of PriorY ear Findings
238-239
240-242 243-244 245-246
247-248
249-250
251
252 253

TIJNITLJR(Q) JD) liJCCJr(Q) JRY ~JEC1LII (Q))N

Pablo Mufioz Superintendent of Schools
January 29, 2021
Honorable President Ms. Christina Schratz and Members of the Passaic Board of Education 663 Main A venue Passaic, New Jersey 07055
Dear President and Members of the Board of Education:
The Comprehensive Annual Financial Report (CAFR) of the Passaic Board of Education (District) for the fiscal year ended June 30, 2020 is hereby submitted by the district's Offices of the Superintendent of Schools and the School Business Administrator/Board Secretary. Responsibility for both the accuracy of the data and completeness and fairness of the presentation, including all disclosures, rests with the management of the district.
To the best of our knowledge and belief, the data presented in this report is accurate in all material respects and is reported in a manner designed to present fairly the financial position and results of operations of the various funds of the district. All disclosures necessary to enable the reader to gain an understanding of the district's financial activities have been included. The district's internal controls have been designed to provide reasonable, rather than absolute, assurance that the financial statements will be free from material misstatement. As management, we assert that to the best of our knowledge and belief; this financial report is complete and reliable in all material respects.
Phone: 973.470.5201 I Fax: 973 .860.2278 1663 Main Avenue, Passaic, NJ 07055 1 pmunoz@passaicschools. org
1

CAFR for the 2019-20 School Year
REPORT FORMAT
January 29,2021
The Comprehensive Annual Financial Report is presented in four sections: Introductory, Financial, Statistical, and Single Audit. The purpose of each section of the CAFR is as follows:
Introductory Section-This section includes this transmittal letter, the district's organizational chart, and a list of principal officials. This section is intended to familiarize the reader with the organizational structure of the school district, the nature and scope of the services it provides, and the specifics of its legal operating environment. It is primarily designed for the taxpayer.
Financial Section-This includes the independent auditor's report, the Management's Discussion and Analysis (MD&A), financial statements, notes to financial statements, and the combining and individual fund financial statements and schedules. It is primarily designed for oversight and legislative bodies.
Generally accepted accounting principles (GAAP) require that management provides a narrative introduction, overview, and analysis to accompany the financial statements in the form of Management's Discussion and Analysis (MD&A). This letter is designed to complement the MD&A and should be read in conjunction with it. The MD&A of the district can be found immediately following the report of the independent auditors.
Statistical Section-This includes selected financial and demographic information, generally presented on a multi-year basis. Unless otherwise noted, the information in these schedules is derived from the Comprehensive Annual Financial Reports for the relevant years.
Single Audit Section-The district is required to undergo an annual single audit in conformity with the provisions of the Title 2 U.S. Code of Federal Regulations Part 200, Uniform Administrative Requirements, Cost Principles, and Audit Requirements for Federal Awards (Uniform Guidance), and New Jersey Office of Management and Budget (OMB) Circular 15-08, "Single Audit Policy for Recipients of Federal Grants, State Grants, and State Aid."
This section includes independent auditor's reports on compliance and internal controls, schedules of expenditures for federal, state and local grants, notes to the schedules of expenditures of federal and state grants, schedule of findings and questioned costs, and a summary schedule of prior year audit findings.
2

CAFR for the 2019-20 School Year
REPORTING ENTITY AND ITS SERVICES
January 29, 2021
The district is an independent reporting entity within the criteria adopted by the Governmental Accounting Standards Board (GASB) as established by GASB Statement No. 14. All funds of the district are included in this report.
Organization of the Passaic Board of Education
The Passaic Board of Education is a Type II school district whose boundaries are coterminous with the City of Passaic in Passaic County, New Jersey.
The district's Board has nine (9) members that are elected for three (3) year overlapping terms. The members of the Board are residents of the City of Passaic. The Passaic Board of Education is annually organized on any day of the first or second week following the April school election.
All Passaic Board of Education meetings are public. The Board holds regularly scheduled public meetings once a month.
The district provides a full range of free public educational services to grade levels prekindergarten through grade 12 for residents of the City of Passaic. These educational services include general and career and technical education, as well as special programs to address the educational needs of children with disabilities. The district also provides programs for those children requiring academic remediation and for children with limited English language proficiency. The District is required to pass through to the charter schools a per-pupil allocation determined by the State of New Jersey. This pass-through amount is included in the District's annual operating budget.
Passaic Public Schools
The Passaic Public Schools has a diverse student body, with the ethnicity of students on October 11, 2019 being Hispanic/Latino 12,638 (93.18%); Black 559 (4.12%); Asian 252 (1.86%); Pacific Islander 12 (0.09%); White 97 (0.72%); American Indian 5 (0.04%) There were also a total of 6,579 (48.49%) female students and 6,988 (51.51 %) male students. There were also 1,688 special education students that represent 12.45% of the student population and 3,289 English Language Learners (ELLs) that represent 24.25% of the current student population.
The chart that follows reflects in-district eligibility for free and reduced-priced meals by grade-level compiled as of October 15, 2019, and as reported on the Application for State School Aid (ASSA). From the chart, one will note that most of our in-district students come from a low socio-economic background, with 10,920 of the student body eligible for free meals and 954 eligible for reduced-priced meals under the National School Breakfast & Lunch Program. The District was eligible for the Community Eligibility Provision (CEP), a federal program under the USDA's National School Lunch and School Breakfast Programs. It allows schools that predominantly serve low-income children to offer free breakfast and lunch to all students rather than collecting individual applications
3

CAFR for the 2019-20 School Year January 29, 2021
and limiting free and reduced-price lunches to income-eligible students. School eligibility for CEP is based on data from other federal programs, including the Supplemental Nutrition Assistance Program (SNAP) and the Temporary Assistance Program for Needy Families (TANF).
Total Free %Free and and Reduced
Grade Level In-District Onroll Free Lunch Reduced Lunch Reduced Eligible
Pre-K 3 year olds 581 450 44 494 85.0% Pre-K 4 year olds 622 467 46 513 82.5% Kindergarten 816 676 58 734 90.0% One 827 661 59 720 87.1% Two 791 652 61 713 90.1% Three 858 719 70 789 92.0% Four 830 684 65 749 90.2% Five 933 790 70 860 92.2% Six 941 759 75 834 88.6% Seven 927 748 73 821 88.6% Eight 916 723 65 788 86.0% Nine 753 600 50 650 86.3% Ten 771 599 69 668 86.6% Eleven 678 504 47 551 81.3% Twelve 640 458 35 493 77.0% SPED. Elementary 665 570 27 597 89.8% SPED Middle 525 459 20 479 91.2% SPED High 495 401 20 421 85.1% Total (PK-12) 13,569 10,920 954 11,874 87.5%
The number of children qualifying for free meals impacts both state aid (At-Risk component) and federal aid.
In the 2019-20 school year, the district operated seventeen (17) schools in twenty-one (21) locations; fourteen (14) owned and seven (7) leased. The district reported 13,569 pupils in-district and on roll (grades prekindergarten through grade 12) on October 15, 2019 for its 2020-21 Application for State School Aid (ASSA) student count.
4

CAFR for the 20I9-20 School Year Januaty 29, 2021
The following represents a listing of schools, grade configurations, and the enrollments taken from the Applications for State School Aid enrollment count on October 15, 2019, compared with the October 15, 2018 enrollment counts.
School Ownership 2018-19 Grade 2019-20 Grade Students on Roll Students on Roll October 15, 2018 October 15, 2019
Location Status Configuration Configuration ASSA Report ASSA Report
Sch.#I Owned Kindergarten- Kindergarten -
782 468 Grade 8, SPED Grade 8. SPED
Sch.#2 Leased Kindergarten-
N/A I98 0 Grade I, SPED
Sch.#3 Owned Pre-Kindergarten- Pre-Kindergarten-
843 804 Grade 8, SPED Grade 8, SPED
Sch. #5/ #5A Leased/Leased Kindergarten- Kindergarten-
46I 4I7 Grade 8, SPED Grade 8, SPED
Sch.#6 Owned Pre-Kindergarten- Pre-Kindergarten-
I095 I025 Grade 8, SPED Grade 8, SPED
Pre-Kindergarten Pre-Kindergarten Sch.#7 Owned and Kindergarten, and Kindergarten, 393 3I3
SPED SPED
Sch. #8/#8A Owned/Leased Pre-Kindergarten- Pre-Kindergarten-
578 660 Grade 8, SPED Grade 8, SPED
Sch. #9/ #9A Owned/Leased Grades I-8, SPED Kindergarten -
68I 8I2 Grade 8 SPED Sch.
Owned/Leased Pre-Kindergarten- Pre-Kindergarten-
905 775 #10/#IOA Grade 8, SPED Grade 8 SPED
Sch. #II Owned Kindergarten- Kindergarten-
II92 I003 Grade 8, SPED Grade 8 SPED
Passaic High Owned Grades 9-I2, SPED Grades 9-I2, SPED 2565 2364
Sch. Owned/Leased
Pre-Kindergarten, Pre-Kindergarten, 268 274
#I5/#I5A SPED SPED
Pre-Kindergarten Pre-Kindergarten,
Sch.#I6 Leased and Kindergarten, 46I 488 SPED
SPED
Sch.#I9 Owned Pre-Kindergarten & Pre-Kindergarten &
878 8II Grades 2-8, SPED Grades 2-8, SPED
Sch.#20 Owned Grades 2-8, SPED Grades 2-8, SPED 974 940
Sch.#2I Owned N/A Kindergarten -
0 733 Grade 8, SPED Passaic Preparatory Owned Grades 6-II, SPED Grades 6-I2, SPED 709 893 Ac.:=ulemv
Passaic Academy for
Owned Grades 6-II, SPED Grades 6-I2, SPED 7I5 789 Science & Fn lg
Total 13,698 13,569 Enrollment
5

CAFR for the 2019-20 School Year Januaty 29, 2021
Resident enrollment is the enrollment total utilized for state aid funding. This total includes all students counted on the roll/school district register, students in out-of-district placements, students in private schools, students on home instruction, less students enrolled in the early childhood education programs the last day preceding October 15 of each school year, and less students received. This count also includes students whose legal residence is in the City of Passaic and are receiving instruction while in state facilities.
The following represents the changes in the resident enrollment in the Passaic Public Schools over the last ten (1 0) years. The ten-year comparison of resident enrollment reflects an increase of 1 ,217 students.
ASSA Resident Enrollment Enrollment Applicable Reporting Date Enrollment Change# Change%
2020-21 October 15,2019 13,887 (124) -0.89% 2019-20 October 15, 2018 14,011 (27) -0.19% 2018-19 October 13, 2017 14,038 128 0.92% 2017-18 October 14, 2016 13,910 84 0.61% 2016-17 October 15, 2015 13,826 152 1.11% 2015-16 October 15, 2014 13,674 260 1.94% 2014-15 October 15, 2013 13,414 260 1.98% 2013-14 October 15, 2012 13,154 498 3.93% 2012-13 October 14, 2011 12,656 (14) -0.11% 2011-12 October 15, 2010 12,670 395 3.22%
District Factor Groupings
The Passaic Public Schools is classified an "A" district in the New Jersey Department of Education's District Factor Groupings (DFG). District Factor Grouping (DFG) is a system of ranking schools by socio-economic status. The group designations are based on information from census data and include the following: income, poverty, unemployment, percent of the population with no high school diploma, percent of the population with some college, occupations, and median family income.
There are eight DFG groupings: "A" designates the lowest socio-economic level, followed by B, CD, DE, FG, GH, I, and J. The DFG groupings are valuable for comparison of districts with similar profiles for purposes of state aid and assessment information.
6

CAFR for the 2019-20 School Year
City of Passaic
January 29, 2021
The City of Passaic is located in the southeastern portion of Passaic County, New Jersey. Its 3.2 square miles of land area contain mixed industrial, commercial, and residential land uses developed at a population density of 22,265 persons per square mile. According to the United States Census Bureau, Passaic has an estimated population of 69,703 in 2019 (2010 Census-69,781). Currently, Passaic is almost totally developed.
Passaic County
N
The City of Passaic is within Passaic County, 12 miles west of New York City. Passaic is situated on the Passaic River in a portion of lowlands between the First Watchung Mountains to the West and the low ridges on the westerly side of the Hackensack Meadows to the East.
7

CAFR for the 2019-20 School Year Januaty 29, 2021
The racial and ethnic demographics of the City of Passaic from the 2010 United States Census reflects a majority Hispanic/Latino population of 49,557 (71 %), a White population of 9,014 (13%), an African American population of 7,425 (11 %), and other population (inclusive of Native Americans, Asians, Pacific Islanders, and East Indians) of 3,785 (5%).
MAJOR INITIATIVES
The vision of the Passaic Public Schools is to become one of the best school systems in the state of New Jersey. During the 2019-2020, school year, the Passaic Public Schools continued its mission to provide an excellent education that prepares our students for college and to earn high paying jobs. The district has made an effort to focus on providing every student the opportunity to graduate from high school with a career certification and/or a minimum of fifteen college credits. Across grade levels, Passaic Public Schools sets rigorous goals and high expectations for all students.
The district uses the Theory of Action: An Aligned Instructional System, (Board Policy 6000a/6010a) to guide decision-making across the organization. The framework is comprised of six critical areas: curriculum, assessment, interventions, professional development, human resources, and student information systems. As it relates to instruction, the budget is developed with a clearly established relationship between the Theory of Action and improving the teaching and learning experience across our schools.
8

CAFR for the 2019-20 School Year January 29, 2021
Building Structures and Systems for Teaching and Learning
Over the last six years, the district has worked to realign the structures that define the school system.
New Schools
In September 2015, the district opened the Passaic Gifted and Talented Academy, School No. 20, to provide additional learning opportunities to support advanced studies for students in grades 2-8. Students apply to the school and are selected based on application requirements for Academics, Performing Arts, Physical Education, or Visual Arts. During specialized learning periods, students can choose math or language arts support, school play, specialized bands and choruses, Destination Imagination, National Junior Honor Society, Model United Nations, as well as other opportunities specific to each ofthe strands of study.
In September 2018, the district opened Passaic Academy of Science & Engineering (Science) and Passaic Preparatory Academy (Prep) in the former space of Lincoln Middle School. Both schools provide articulated learning experiences for students in grades 6-12. In the Science building, the district invested in renovating classroom space to include a maker space, physics lab, and renovation of laboratory and classroom space throughout the school. At Prep, classroom spaces and common spaces were renovated to support student learning and included the addition of a music lab and digital design lab spaces.
At the beginning of the 2019-2020 school year, the district opened Sonia Sotomayor School No. 21, a neighborhood school serving over 700 students in grades K-8. Preparations included a review of district zoning, analysis of district facilities, review of staffing needs, and district-wide special education and bilingual instructional program placement. As a result of the new classrooms provided by the new school, the district removed the temporary classroom units (TCUs) by contracting with appropriate vendors for removal, site remediation, and design of play spaces for future development.
District Realignment
In September 2018, the district realigned all district elementary schools to create PreK/Kindergarten to Grade 8 structures, providing students with social-emotional supports and minimizing student transitions between schools. In addition, the school schedules and staffing were adjusted to support transitions between content area teachers, allowing teachers to specialize and strengthen instruction in critical academic areas.
9

CAFR for the 2019-20 School Year
Early Childhood Education
January 29, 2021
Focus on Teaching and Learning
The Division of Early Childhood Education provides early learning environments that are developmentally appropriate and academically rigorous for the youngest learners in the City of Passaic. Our preschool program is a mixed delivery system, which includes in-district schools, private providers, and Head Start school sites. The classrooms are mixed age, consisting of three- and four-year old students and are taught by a P-3 certified teacher and a paraprofessional. The Division of Early Childhood Education staff also consist of school social workers, PIRT (Preschool Intervention and Referral Team), teacher coaches, and a CPIS (Community Parent Involvement Specialist). These staff members provide teachers with coaching on best instructional practices, interventions for students, and resources and support for the families of our students.
The curriculum used is High Scope, which emphasizes "active participatory learning." Active learning means students have direct, hands-on experiences with people, objects, events, and ideas. Children's interests and choices are at the heart of the curriculum. The assessment used is COR Advantage, which is both a valid and reliable child assessment that measures the developmental trajectories of our students. The learning domains are Approaches to Learning, Social and Emotional Developmental, Physical Development and Health, Language, Literacy and Communication, Mathematics, Creative Arts, Science and Technology, Social Studies, and English Language Learning.
Professional development is provided to all staff in order to ensure positive student outcomes. Professional development topics include ECERS-3, High Scope Curriculum, COR Assessment, family engagement, social-emotional learning, conflict resolution, and content-specific areas, such as math, science, and literacy.
Curriculum Development
Passaic Public Schools' continuous focus is in providing a viable curriculum across content areas and grade levels that are coherent and aligned. Revised curricula contain pacing as well as scope and sequence guides, unit plans, and aligned formative and surnrnative assessments. The process of curricula revision involves researching best educational practices and programs and the use of assessment data to guide changes. All curricula are aligned to New Jersey State Learning Standards (NJSLS) and reflect the district vision, mission, and focus and are approved annually by the Board of Education.
10

CAFR for the 2019-20 School Year
English Language Arts (ELA)
Januaty 29, 2021
In grades K-5, the NJSLS aligned curricula provide a clear guide for learning through the integration of reading and writing skills. Understanding by Design (UBD) is the curricular framework. Teachers align their instruction to the Reading and Writing Workshop model and use leveled readers to teach small group guided reading. In addition, teachers utilize Pearson's Reading Street series as a supporting resource. For kindergarten through grade 3, the district has partnered with Children's Literacy Initiative (CLI) to provide curriculum development support, professional development, and coaching around the literacy block to support teaching and learning. Chapter books are introduced to students in second grade. In grades 4-5, curricula have shifted to the use of core novels to support student development of critical thinking skills. Units are thematically designed and include project-based learning opportunities. Throughout the year, teachers receive ongoing professional development opportunities aligned to the curriculum. Additional standards-based opportunities for remediation and enrichment are offered to students during after school and summer school programs. During the 2019-2020 school year, curriculum revisions to Grades 4 and 5 were made to reflect our reading workshop initiative and partnership with CLI.
In grades 6-8, the ELA programs are aligned to the NJSLS and utilize the UBD framework and are structured around thematic units that include performance task learning opportunities. New novels were added to the classroom libraries. The novels represent the inclusivity needed in a 21st century classroom such as LGBTQ+, Special Needs, Persons of Colors, and race. In addition, the core and classroom library novels are complemented by nonfiction articles, poetry, short stories and plays. Many of the additional resources are accessed via our Houghton Mifflin Harcourt series, Collections. Students use Chromebooks in a 1:1 environment allowing them to compose their writing and interact with text in a digital environment. Moreover, standards-based opportunities for remediation and enrichment were offered to students enrolled in our afterschool, Saturday Academy, and summer school programs.
In grades 9-12, the ELA programs are aligned to the NJSLS and utilize the UBD framework and are structured around thematic units to support development of critical reading and writing skills. The programs of study support 25 credits in ELA coursework. In addition to the required grade specific courses, elective and advanced classes such as Journalism, Creative Writing, Dystopian Literature, Gothic Studies, Literature by African American Authors, Springboard English Language Composition Honors, English Literature and Composition Honors, and and Advanced Placement classes are offered. The high school ELA courses explore various genres of literature, such as novels, non-fiction texts, short stories, essays, dramas, and poetry. The exploration of text is designed to provide students with important skills of argumentation and literary analysis through close readings in historical, genre specific, and other contexts that provide greater understanding of the author's work. Students learn the essentials of correct and clear writing. Students refine their writing skills and learn the Modern Language Association (MLA) style, as well as, American Psychological Association (AP A) of formatting. Organization and study skills are also addressed. Students will present their writing orally in small groups or to the class at large. Additional standards-based opportunities for remediation and enrichment were offered to students during after-school and summer school programs.
11

CAFR for the 2019-20 School Year
Mathematics
January 29, 2021
The mathematics curricula in grades K-12 are aligned to the NJSLS and utilize the UBD framework. In grades K-2, students progress through a continuum starting with using numbers to represent quantities, addition and subtraction, and extending their understanding of a base-ten system. In grades 3-5, students use multiplication and division strategies, fractions, and measurement and data, to solve multi-step word problems, refine traditional algorithms, and extend place value understanding. In addition, students analyze and answer questions regarding data and compare the properties of two and three-dimensional shapes. In grades 3-7, the district has partnered with Math Solutions which provides our teachers professional development around content, mathematical best practices and support of implementation of Math Workshop in Grades 3 through 6. Additional standards-based opportunities for remediation and enrichment are offered to students during after school, summer school programs, and Saturday Enrichment courses. Students in K-5 used Dreambox Learning as a digital platform for intervention during the math block, for homework, and as part of the after-school program. Our district-wide goal for this school year is implementation of Number Sense Routines.
Curriculum work in grades 6 and 7 has centered on building a cohesive approach to pre-algebra. The curricula uses the Big Ideas Math program to support student learning around algebraic concepts. A 1 0-week Mathematics Saturday Academy was implemented to provide support for students in grades 6 through 8. Teachers continue to be provided monthly opportunities to attend additional professional development as well as receive job-embedded coaching. Students in Grades 6 through Algebra II use Imagine Learning as a digital platform for intervention during the math block. This program is also utilized in Saturday Academies for students as well as after-school programs. The Personal Financial Literacy standards under 21st Century Life and Career skills have been embedded in Grades 5 through 8.
Students in Algebra I and Algebra II classes are introduced to the fundamental concepts of descriptive and inferential statistics focusing on the major concepts and tools for collecting, analyzing, and drawing conclusions from data. Topics include visual representation of data, measures of central tendency, and measures of dispersion, probability, normal and bi-normal distribution, estimation and hypothesis testing, chi-square and F-distribution, as well as correlation and regression analysis. In Calculus, trigonometric and logarithmic functions are studied. Functions, derivatives and integrals are introduced and applied. Students can also participate in Advanced Placement Statistics, Advanced Placement Calculus, and Programming in Java. Additional standards-based opportunities for remediation and enrichment were offered to students during after school and summer school programs.
12

CAFR for the 2019-20 School Year
Science
January 29,2021
During the 2019-2020 school year, the K-12 science curricula were reviewed and revised for alignment to the Next Generation Science Standards (NGSS), also referred to as the NJSLSScience. At the elementary level, K-5 science classes use the discovery-based, hands-on science activities in the Full Option Science System/Delta Science Modules (FOSS/DSM) program. Since 2015, the district has contracted a refurbishing company to manage the K-5 science kits for a full-fidelity approach to the FOSS curricula. At the middle school level, grades 6-8, technology-based STEM activities are an integral part of the science curriculum; students utilize the Discovery Techbook. Students have the opportunity to utilize Chromebooks to research, use real-time data, and to share findings with one another. Explore Learning Gizmos were purchased for grades 3-8 students to use online simulations in order to explore science topics beyond the classroom. At the high school level, Passaic Academy for Science and Engineering continues to partner with Project Lead the Way (PLTW) to offer advanced, hands-on, Science, Technology, Engineering, and Mathematics (STEM) courses. Teachers utilize professional learning communities, to plan and implement common assessments. Additional STEM opportunities for enrichment were offered to students during Saturday enrichment programs and summer school.
Visual & Performing Arts
The Kindergarten-Grade 12 Visual & Performing Arts curricula programs are aligned to NJSLS as well as the National Art Standards using the UBD framework. In grades K- 12, all curricula are aligned to common themes and include project-based learning experiences that promote the artistic processes of creating, performing, presenting, producing, responding, and connecting. Visual and Performing Arts opportunities for enrichment and extended learning are offered to students during the Saturday enrichment programs and summer school. The launch of Modern Band Program will engage students to connect critical musical elements with high-interest genres students will develop skills in traditional rock band instruments. The diverse high school program offers three Advanced Placement courses, one Dual Enrollment course, and a variety of electives geared at exposing students to the various possibilities to express oneself. Media Arts and Dance Arts are offered at the Passaic Preparatory Academy as well as Passaic High School to support the growing interest to offer the five disciplines in the district. The Passaic Preparatory Academy offers Career and Technical Education programs in Digital Arts, Theatre Arts, and Music Technology.
Physical Education and Health
The K-12 Comprehensive physical and health education curricula are aligned to the NJSLS using the UBD framework. The following New Jersey Legislative Statutes related to the health and well-being of students have been added to the district health curriculum: Consent (N.J.S.A. 18A:35), Mental Health (N.J.S.A. 18A:35-4.39), New Jersey Safe Haven Infant Protection Act (N.J.S.A. 18A:35-4.40 & 18A:35-4.41), Sexting (N.J.S.A. 18A:35-4.33), and Sexual Abuse and Assault Awareness and Prevention Education (N.J.S.A 18A:35-4.5a.) Health Waves provides curricular materials for the instruction of health education in grades K-12. The physical education curriculum is differentiated across grade bands with an emphasis placed on skill development during the elementary grades, and a combination of both competitive and lifetime fitness activities in grades 6-12. Passaic High School provides the sports medicine pathway
13

CAFR for the 2019-20 School Year January 29, 2021
students the opportunity to obtain NASM Personal Training and CPRJAED certifications. The Passaic Gifted and Talented Academy offers a coaching and leadership elective course for the physical education strand students, and gymnastics and rock climbing electives for non-physical education strand students.
Social Studies
The K-12 Social Studies has been revised to align with the New Jersey Student Learning Standards-Social Studies (NJSLS-SS) and using the UBD framework. In grades K- 8, students and teachers utilize the Pearson MyWorld program to explore family, community, economics, culture, government, transportation, innovation, United States History, World History, and New Jersey state history. In addition, common assessments have been developed that align to NJSLSSS, New Jersey Student Learning Standards-English Language Arts (NJSLS-ELA), and Advanced Placement (AP) standards. The teachers have received training on these changes through professional development, grade level meetings, and Google classroom. The grades 9 -12 programs follow the NJDOE requirement that students take United States History 1, United States History 2, and World History. The curriculum includes project-based learning, emphasis on improving reading comprehension and writing skills, and common assessments. The high school program also offers eight AP courses, six Dual Enrollment courses, and seven social studies related electives. In grades K - 12, Financial Literacy, Social Justice, and LGBTQ learning opportunities were added to the curriculum. The teachers received training on these revisions through professional development and grade level I departmental meetings.
Educational Technology
The curriculum developed for K-12 educational technologies are aligned to the New Jersey Technology Standards (8.1 and 8.2). Students in K-5 are engaged in digital literacy skills lessons, exploring digital citizenship, and introduced to computer science and computational thinking. Students in grades 6-8 are engaged in digital literacy skills and also introduced to computer science more in depth using the Gateway Program with Project Lead the Way. At PHS and Passaic Academy for Science and Engineering, students can select the Computer Science pathway, where they engage in Project Lead the Way curriculum with: Computer Science Essentials, Computer Science Principles (AP), Java in Programming, Cybersecurity, and Computer Science A (AP).
Bilingual, English as a Second Language (ESL), and World Language Education
The Division of Bilingual/ESL and World Language Education continues to develop, build, and revise curriculum and programming to support language learning and acquisition across grade levels. The district ongoing updates of all content area curriculum units include support for teachers of students identified as English Language Learners (ELLs). In addition, when adopting a new curriculum or revising a current curriculum, specific attention is given to the content, materials, and assessments necessary to provide access to the content learning for ELLs.
14

CAFR for the 2019-20 School Year Januaty 29, 2021
The division works across grade levels and content areas to identify additional learning opportunities for students to support language acquisition. In addition to summer programs traditionally offered for at-risk students, opportunities for English language development, remediation, and emichment were offered to all ELLs during after school and summer school programs.
Professional development was provided across the district to support language acquisition. Teachers of ELLs received professional development and coaching on Teaching for Biliteracy; reading and writing workshop for ELLs; Sheltered English Instruction; oral development, reading, and writing strategies for all language learners.
A Dual Language program was implemented in eight kindergarten classrooms at four schools as one of our full-time bilingual programs to develop language proficiency and literacy in English and Spanish Languages. A Two-Way Dual language approach was implemented in one of the schools, integrating native English speakers and Spanish native speakers for academic content instruction through both English and Spanish. Through our Bilingual and Dual Language programs, we promote bilingualism and biliteracy, grade-level academic achievement and crosscultural competence in all students. Students maintain their native language while adding another language, and they develop pride in their own culture and identity.
Specific attention is given to identify programs that support and celebrate biliteracy. English Language Learners continued participating in Project Adelante, a Kean University pre-college program designed to reduce the high school dropout rate of Latino students, increase their academic skills and encourage young students to pursue higher education. In addition, students demonstrating academic proficiency are encouraged to participate in AP Spanish courses. In 2020, 116 students participated in the OPic (oral), WPT (writing), and STAMP language assessments and were identified as eligible to receive the Seal of Biliteracy. By continuing to produce Biliterate students and promoting that accomplishment, Passaic Public Schools sends a clear message that multilingualism and cultural diversity is an asset to society. Ultimately earning the Seal of Biliteracy affords graduating students an additional opportunity to earn college credits in post-secondary education.
Passaic Public Schools was identified as a Bilingual State Model Program for School years 2020-2022 for the second time as the first recognition period ended with the school year 2019-2020.
Special Education
Our Special Education programs and services adapt content, teaching methodology, and delivery of instruction to meet the appropriate needs of students who may have a disability due to physical, sensory, emotional, communication, cognitive, or social difficulties.
The Division of Special Education ensures a community of care and support for students by providing a coherent system of social support services, extracurricular activities, and accommodations to meet the range of learning needs.
15

CAFR for the 2019-20 School Year January 29,2021
The Division of Special Education utilizes a scaffolding and differentiation of instruction approach to assure all its students have access to the NJSLS across all content areas. The division continues to expand the use of READ 180, and System 44 as primary interventions. In addition, the Division of Special Education has partnered with Children's Literacy Initiative (CLI) to provide curriculum development support, professional development, and coaching around the literacy block to support learning for the LLD MM Kindergarten through grade 5 students.
In addition, the Autistic and Intellectually Disabilities programs include instruction in transition skills offering students the opportunity to learn a variety of skills to transition to post-secondary experiences successfully. This instruction specifically addresses the needs of individual learners and encompasses the following: Community Based Instruction for general knowledge, social and recreational purposes, career exploration through Structured Learning Experiences, functional academics in the areas of reading, writing, math, daily living skills, social skills, health and safety, as well as decision making, and self-advocacy skills.
An Extended school year (ESY) program, beyond the regular school year, is provided to qualifying students with a disability in accordance with their IEP. Additional learning opportunities for remediation and enrichment are extended to students with disabilities during after school, Saturday and summer school programs.
Extended Learning Opportunities
In 2019-2020, Passaic Public Schools offered extended learning opportunities for students, which included before school homework support, after school academic support, Saturday learning enrichment and academic activities, and extensive summer programming.
Professional Development
In 2019-2020, Passaic Public Schools invested in significant professional development across grade levels and content areas. Professional development activities provided the following opportunities: walkthroughs, outside consultants with expertise in identified areas brought to the district curriculum committees, data-based instructional workshops, programmatic workshops, mentoring for novice teachers, workshops on instructional best-practices, and vertical and horizontal articulation meetings. The district continued its partnership with the Children's Literacy Initiative, an organization focused on supporting the instructional practice of teachers in primary grades. As noted above, the district has developed a comprehensive relationship with Math Solutions in order to provide coaching and other professional learning opportunities to teachers of math across the district. This district has increased its investment in the relationship with Math Solutions in order to support teacher learning as a means to improving student achievement in mathematics. Over 7,000 hours of independent online professional learning was completed utilizing our Passaic weLearn platform and workshops offered on the Educational Impact digital platform. Professional development such as Instructional Rounds and on-site workshops utilize experts from outside the district, while the district also invests in district personnel such as Teacher Coaches and Instructional Chairpersons to support teacher practice. After the transition to online teaching in March, the district focused significant time and energy on the effective use of digital resources. Teachers participated in hundreds of hours of
16

CAFR for the 2019-20 School Year January 29, 2021
professional learning focused on Google Suite applications as the district prepared for the potential of being in a remote learning environment for an extended period of time.
College Preparation, High School Pathways, Early College
The district is committed to building a college-going culture and expanding opportunities for students to work toward career certifications. Such preparation begins with the Advancement Via Individual Determination (AVID) program for students in grades 6-12. The AVID curriculum is designed to teach skills and behaviors to support academic success and is used across the middle and high school grades. School leaders and teachers attend annual training for the AVID program, and the district provides ongoing support for the curriculum implementation.
In 2017-2018, the district increased the number of Advanced Placement courses and dual-credit college courses offered at the high school. This has included a significant investment in training teachers to develop curriculum and improve instructional practices. It resulted in a significant change in the high school schedule, to allow for more students to have increased access to courses specifically designed to increase college attainment for Passaic High School students.
Over the last five years, the district has built pathways of study that include partnerships with colleges and universities, including Passaic County Community College, Bergen County College, Fairleigh Dickinson University, Kean University, Ramapo University, and William Paterson University. Through the partnerships, students are provided with opportunities to participate in dual enrollment courses eligible for college credit.
In 2018-2019, all three high schools utilized programs of study aligned to the "Twelve Career Ready Practices" defined by the NJDOE, as well as the Personal Financial Literacy Standards, Career Awareness, Exploration, and Preparation Standards, and the Standards for Career and Technical Education.
In 2019-2020, the curriculum has been aligned to provide pathways of study to direct students toward specific learning experiences, and NJDOE approved CTE coursework (noted below by the*). Further, the curriculum in all eleven CTE programs reflects industry needs and is aligned to post-secondary academic requirements.
Passaic High School offers ten pathways: Radio and Television*, Graphic Design*, National Academies Foundation Finance*, Computer Programming*, Automotive Technology, Building Trades, Criminal Justice, Education, NJROTC, and Sports Medicine.
Passaic Academy for Science and Engineering offers five pathways: Lab Sciences/Biotechnology*, Biomedical Science*, Aerospace Engineering*, Computer and Information Systems Security*, and Data Analytics.
Passaic Preparatory Academy offers seven pathways: Music Technology*, Drama & Dramatics/Theatre Arts*, Digital Art Animation*, Journalism, Piano Arts, Studio Arts, and Legal Studies.
17

CAFR for the 2019-20 School Year
Focus on Community
January 29, 2021
The Passaic Public Schools is determined and motivated to increase parental involvement district-wide. Various workshops and classes were strategically planned and conducted to help parents assist their children succeed academically and socially. There are lending libraries for parents to take out books for their enjoyment and to read to their children daily.
Parent Orientation meetings were held at the beginning of the school year introducing the administrative team and staff. Title I Workshops were held to inform parents of their right to be involved with their child's education. Curriculum learning workshops were held to inform parents of the curriculum for Pre-Kindergarten through Twelfth grade. A variety of workshops engaged parents' participation on the importance of student attendance, anti-bullying, drug prevention and awareness, health and wellness, parenting skills, and child development classes with an expert from each category establishing hands-on participation from the parents during the presentation. Basic and intermediate computer classes were offered to teach parents how to navigate technology to help their children.
An informational field trip was planned to visit Passaic County Community College to prepare parents in furthering their child's education. A Free Application for Federal Student Aid (F AFSA) workshop offered parents information on scholarships for their college bound child. District-wide Family Literacy Night event and Bilingual Education and English as a Second Language workshop were held informing parents in grades Kindergarten through Twelfth on an overview of the district's programs. The workshop began with an overview of the program and ended with grade level break-out sessions with hands-on strategies on how to help their children and what they are learning on a daily basis in school. Parents had the opportunity to participate in a Parent Book Club where they engaged in discussions on books their children have read throughout the school year. There was also a Saturday Parent Academy where the following classes were offered: ESL, Computer, Literacy workshop, and Math workshop.
Parents also participated in various commemorative events throughout the year such as: Hispanic Heritage Month, Honor Roll Assembly, Holiday Concert, Black History Month and Health Fairs where they would get a chance to meet and celebrate the accomplishments attained with other parents. An annual holiday event hosted by Passaic Lions Club was attended by many Passaic families. District-wide orientation meetings were held to introduce and inform all parents of the new academies that opened in September 2018. The Dominican Consulate Meritorious Award Event was held in New York City, to honor selected students and their families for outstanding student achievement.
18

CAFR for the 2019-20 School Year
Focus on Technology and Testing
January 29, 2021
In 2019-2020, the district continued to invest in its network infrastructure, security, and faculty and students devices. Some of the items procured and installed include a new core switch and firewall at the secondary datacenter at Prep/Science, over 1 00 teacher HP laptops, 220 Chromebooks and 36 Promethean interactive boards. In addition to providing access to online learning platforms, these devices facilitate online assessments, including the Measure of Academic Progress (MAP), STAR Reading Assessment, and the New Jersey Student Learning assessment, or NJSLA. By increasing the number of devices available to students, the district moves closer to its goal of achieving a one to one ratio and providing a state-of-the-art learning environment for our students.
Instructional Management System
The district's Instructional Management system is SchoolNet, which allows the user to sign-in through Power School. Through the PowerSchool integration, SchoolNet houses district assessments, standardized scores, classifications, resources, and historical data. Through this digital platform, teachers have access to immediate feedback on in-class student assessments, as well as results on state assessments.
Assessment
Across the district, assessment is used to provide formative and surnrnative data to support the development of a strong system of teaching and learning. District formative assessments provide feedback to both our teachers and students on the student's learning and developmental progress. District surnrnative assessments provide information for parents on their child's progress, and for teachers on students' instructional needs. The Passaic Public Schools' assessments are now online and students take their assessments in SchoolNet. The district conducts benchmarking and online benchmark assessments in Language Arts, Math, and Social Studies.
Data-driven decision making is being provided through Measures of Academic Progress (MAP) Reading and Math testing in grades K-2, MAP Science in grades 3-8, STAR Reading and Math in grades 3-12, Language Gains in grades 9-12, Collections, Everyday Mathematics, and benchmark assessments.
In addition, through a partnership with the Center for Education Policy Research Strategic Data Pro]ect at Harvard University, the district has invested in identifying how to build and analyze data critical to understanding student progress and success. During the 2019-2020 school year, the district used the findings to implement a graduation planner that will allow building leaders and students to track the amount and type of credits completed and what requirements are still needed in order to graduate.
19

CAFR for the 2019-20 School Year
Facility Operations
Positive, Accountable, Conscientious and Efficient Operations
January 29, 2021
High standards for Facility and Operations require the dedication and motivation of all team members. We operate under a system called P.A.C.E., summarizing our Facilities Department's ethos: Positive, Accountable, Conscientious, and Efficient. Our motto as a department is to "do it right the first time." Training, dedication, a passion for service, and supportive management are all key elements to maintaining the high quality of services for our students, team members, and community-at-large.
Facilities Capital and Maintenance Improvements
Well-managed facilities help to create optimal conditions for our children to achieve academic excellence. To help attain our vision to become one of the best school systems in New Jersey, we focus our efforts on providing a safe, secure, clean and positive learning environment for all of our school community. Timely maintenance, accountability systems, a high level of customer support and service combined with a carefully planned reinvestment into our facilities, equipment, and systems, help to ensure that the primary focus of our instructional team is on teaching and learning. The long-term reinvestment in our facilities, along. with the construction of new school buildings, help to provide all of Passaic's students with the most modern, technologically advanced learning environment available.
Current Conditions Require Clean, Safe, and Healthy Facilities
Like all of the districts around the nation, we have been faced with the challenge of operating our buildings to the highest standards of cleanliness, and safety. Equipment and supplies that ensure the proper cleaning and sanitary conditions necessary for our district to operate in a class, or hybrid environment are essential. Increased ventilation, scheduled changing and cleaning of filters, air purifiers, continual updating of HVAC systems is the standard protocol. Equipment, PPE, supplies and process to maintain clean sanitary conditions require the continued commitment and focus of everyone on our team.
Long Range Facilities Planning
Passaic Public Schools is actively focused on our district's Long Range Facilities Plan (LRFP) which is to be updated 2020-2021. Systems and planning reports like our Comprehensive Maintenance Plan (CMP) help to address our comprehensive long range approach to managing facilities.
The district continues to grow:
• Construction at the new Sonia Sotomayor School 21, was completed during the 2018-2019 school year and opened early in July 2019.
• Four (4) new schools presently under construction at Dayton Avenue will be opening by September 2022.
20

CAFR for the 2019-20 School Year January 29, 2021
During the 2019-2020 school year, the following projects, improvements and repairs were completed by the district, either by team members or our contracted vendors:
School]
The installation of a new recreational playspace and parking space project is undertaken, with completion slated by end of2020. New stairwell door system installed on all floors. Fire panel replacement, windows refurbished on third floor, roof repairs, playground repairs, and sidewalk repaus.
School3
Gym lighting, ceiling and painting, LED lighting upgrade, tree removal, roof repairs, and exterior lighting improvements.
SchoolS
Painted cafeteria, HVAC- replaced compressor, classroom window repairs, front door replacement, upgrades to vestibule lighting, and replacement of auditorium floor.
School SA
Gutter repair and replacement, HV AC repair work conducted in the gym, classroom and cafeteria, painted cafeteria.
School6
Power washed exterior, painted cafeteria, painted auditorium, painted hallways, HVAC repairs, installed lockers, teachers lounge improvements.
School7
Roof repair, paint cafeteria, LED lighting in multi-purpose room, HVAC repairs, painted hallways, repair boilers, security entrance door upgrade and landscaping improvements.
SchoolS
Gym ceiling, LED lighting and painting done. HV AC repairs conducted in the cafeteria. Painted interior spaces, repaired windows, and fence. Upgraded fire panel, intercom system and upgraded exhaust fans in kitchen.
School SA
Upgraded heating ventilation system, stairwell had resistant treads installed, bathroom repairs undertaken and cafeteria area modification made for use.
21

CAFR for the 2019-20 School Year
School9
January 29, 2021
New roof installed. Hallway lighting upgrades made. Sewer repairs and upgrades made. Painted hallways, bathrooms, and cafeteria. Upgraded art room lighting and ceiling tiles. Work conducted in the gym teachers' office and storage area in addition to landscaping and arbor care.
School9A
Repairs ceilings in kitchen, painted hallways, replaced side panels in front entrance, upgraded lighting, and fire panel repairs. Storage area in the kitchen improved.
SchoollO
Remodeling of Auditorium, including new HV AC, lighting, and sound. Improvements to interior and exterior of the cafeteria/gym annex building include kitchen and cafeteria flooring, gym flooring, and painting. Exterior wall and gutter replacement, landscaping and arbor care. Resealed entrance to boiler room.
School lOA
Replaced the HV AC System, repainted the gym and repaired the roof.
Schoolll
Replaced the floor in 1 0 classrooms, ceiling work done in both gyms, roof repaired, new fire panel system installed, refinished both gym floors, HV AC improvements in main office, auditorium wall repair, upgraded auditorium lighting. Drain cleaning and repairs.
PHS
Gym lighting upgrade in main gym, Yard work- Landscaping and drain cleaning,Fencing and security gate, Guidance suite HV AC, Painted GS and Drop Ceilings, Security door enhancement, Boiler Repairs, HV AC repairs, Upgrade exterior lighting on Paulison and replace fencing.
School15
Playground repair, sidewalk replacement and ramp replacements. Door replacement in the front osf school. Multi-purpose room on the second floor received new VCT tiles. HV AC repairs, elevator repairs, window repairs. Carpet areas in classrooms removed and replaced with VCT.
SchoollSA
Drain Repair, upgraded lighting in the gym, roof repair, new office space, intercom system upgrade, and office electrical upgrade.
22

CAFR for the 2019-20 School Year
School16
January 29, 2021
Classroom ceilings, painting, glasswork, gutter replacement, bathroom repairs, powerwash exterior.
School19
Gym sanding and refinishing of floor, cafeteria floor and painting. Cleaning of ceiling acoustical panels. Fire panel repairs, hallway painting, security booth lighting, front entrance lighting, garage door replacement, drain maintenance, wall repairs, landscaping, and playground repair.
School20
Constructed a music room. Gym flooring, wall panels on third floor, upgraded ballast in gym, upgraded stage lighting, window replacement, door work, conversion of small instruction spaces to larger classroom.
School21
HV AC control improvements, drain work, elevator repairs, lock replacements, and fence repairs.
Passaic Academy for Science and Engineering
Creation of new Art Studio. Construction of new Biogen Lab. Completion of Makerspace Lab. Additional classroom and improvements. Roof replacement. Library work, with ceiling tiles and roof repairs. HV AC repairs.
Passaic Preparatory Academy
Improvements to all science labs, include electrical and plumbing work. HV AC repairs in cafeteria, elevators repairs, bathroom conversion, sidewalk replacement, painting, fence repairs, water remediation, window safety upgrades. Improvements to office ceilings, floors, lighting, and painting, Locker room improvements, railing and painting.
Stadium
Project to replace track, replace scoreboards, and other improvements is undertaken. HV AC Unit upgrades, tile work and toilet repair, changed all locks, landscaping and arbor care, as well as field turf maintenance. Drain cleaning, repairs. Concrete and painting.
Administration Building
Lock replacement, electrical work for installation of TV's and copy machines. Installed dispensers in bathrooms and made improvements to hot water tanks for kitchen sinks.
23

CAFR for the 2019-20 School Year
Randolph Street Warehouse
January 29, 2021
Increase in storage area. Overhead door repair, burglar alarm system improvements.
Leased Facilities
The district has a considerable shortage of classrooms that necessitates the ongoing rental of the following school facilities:
• School}Jo. 5 • School }Jo. 5 Annex • School }Jo. 8 Annex • School }Jo. 9 Annex (identified as School 2A through June 2019) • School }Jo. 10 Annex • School }Jo. 15 Annex • School}Jo. 16
The district also leases for storage, and facilities operation purposes the "Randolph Street Warehouse" which is the center for the Facilities Office operation.
*The district continued to utilize the following temporary classroom units (TCUs) Eleven (II) units at School No.1 and Four (4) units at School No. I 0 through 2019. 12 of the 15 TCUs were decommissioned at the end of the 2018-2019 school year. Two (2) of the TCU's are located at the Randolph Street property for storage and office purposes. The district conducted demolition of those TCUs in July 2019, and is now developing those two sites to expand parking and outdoor play-space for the school district.
ECONOMIC CONDITIONS AND OUTLOOK
State Aid Revenues
The district receives 91% of its general fund operating revenues from the State of }Jew Jersey. This support comes primarily from the School Funding Reform Act of 2008 (SFRA) formula aid. SFRA is driven by enrollment that is reported in the annual Application for State School Aid (ASSA) and pupil transportation as reported annually in the District Report of Transported Students Report (DRTRS).
Local Revenues
The second-largest source of the school district operating revenues is local revenues, with the property tax levy being the primary local revenue source. The City of Passaic maintained the same level of property tax levy (general fund) in fiscal year 2019-20 as in fiscal year 2018-19.
Other components of the local revenues are interest income, tuition, prior year refunds, and other miscellaneous revenues.
24

CAFR for the 2019-20 School Year
E-rate Reimbursements
January 29, 2021
The district continues to seek increases in its revenue through E-rate reimbursements. The Schools and Libraries Program ofthe Universal Service Fund, commonly known as "E-Rate," is administered by the Universal Service Administrative Company (USAC) under the direction of the Federal Communications Commission (FCC) and provides discounts to assist most schools and libraries in the United States to obtain affordable telecommunications and Internet access.
Special Education Medicaid Initiative
The district maximizes its effort in generating revenue from the federally sponsored Special Education Medicaid Initiative (SEMI). SEMI provides reimbursement to the district for services provided to students who are receiving qualified special education services and who are also Medicaid eligible.
Federal Revenues
Federal revenues to support the budget are identified in the Special Revenue Funds. These Special Revenue Funds consist of grant resources that are restricted for the purpose of the granting institution. Every Student Succeeds Act (ESSA) grant is the largest federally funded special revenue grant available to the Passaic Public Schools.
The second-largest federally funded grant is the Individuals with Disabilities Education Act (IDEA). The district uses these IDEA funds to supplement its general fund special education programs. The Board of Education has attempted to maximize these funds in its ongoing effort to efficiently educate its student constituency.
Economic Development in the City of Passaic
An investment in the community is required to improve the quality of life for the citizenry. Quality-of-life factors include an improved lifestyle, recreation, employment opportunities, commercial and industrial growth, and well-planned full municipal services to address the needs of its constituency.
Strengths of Passaic include a diverse population, an abundant and eager workforce, and an accessible highway system. The Passaic Public Schools has positioned itself to provide a marketable well-trained workforce with the necessary skills and opportunities to compete in a global market while meeting current workforce demands.
Portions of the City of Passaic are part of the Urban Enterprise Zone that carries a reduced New Jersey sales tax rate as an incentive to economic growth. These portions have a Sales Tax rate of 3.3125%, as compared to the full sales tax rate of 6.625%.
25

CAFR for the 2019-20 School Year
INTERNAL ACCOUNTING CONTROLS
January 29, 2021
Management of the Passaic Public Schools is responsible for establishing and maintaining an internal control structure designed to ensure that the assets of the district are protected from loss, theft, or misuse. District management is also responsible for ensuring that adequate accounting data is compiled to allow for the preparation of the Financial Statements in conformity with generally accepted accounting principles (GAAP). The internal control structure is designed to provide reasonable assurance that these objectives are met. The concept ofreasonable assurance recognizes that:
(1) the cost of a control should not exceed the benefits likely to be derived; and (2) the valuation of these costs and benefits requires estimates and judgments by
management.
As a recipient of federal and state awards, the district is also responsible for ensuring that an adequate internal control structure is in place to ensure compliance with applicable laws and regulations related to those programs. This internal control structure is also subject to periodic evaluation by the management of the school district.
BUDGETARY CONTROLS
In addition to internal accounting controls, the district maintains budgetary controls. The objective of these budgetary controls is to ensure compliance with legal provisions embodied in the annual appropriated budget approved by the voters of the City of Passaic. Annual appropriated budgets are adopted for the General Fund, the Special Revenue Fund, and the Debt Service Fund. Project-length budgets are approved for capital improvements accounted for in the Capital Projects Fund. The final budget amount, as amended for the fiscal year, is reflected in the Financial Section.
An encumbrance accounting system is used to record outstanding purchase commitments on a line-item basis. Open encumbrances at year-end are either canceled or are included as reappropriations of fund balance in a subsequent year. Those amounts to be re-appropriated are reported as reservations of fund balance on June 30,2019.
The New Jersey Department of Education has prescribed forms and formats for the presentation of the annual school budget. The Passaic Board of Education adheres to Department of Education requirements, guidelines, and directives for budget development, presentation, and adoption.
DEBT ADMINISTRATION
As of June 30, 2020, the district had no outstanding general obligation bonds included m outstanding debt.
CASH MANAGEMENT & INVESTMENTS
The investment policy of the district is guided in large part by state statute. The district follows the statute which requires it to deposit public funds in public depositories protected from loss under the provision of the Governmental Unit Deposit Protection Act ("GUDP A"). GUDP A was enacted in 1970 to protect Governmental Units from a loss of funds on deposit with failed banking institutions. The law requires governmental units to deposit public funds only in public depositories located in New Jersey where the funds are secured in accordance with the account.
26

CAFR for the 2019-20 School Year
RISK MANAGEMENT
January 29, 2021
The Passaic Board of Education carries various forms of insurance. In 2019-2020, the District awarded its property and casualty insurance to the Fairview Insurance Agency, Verona, New Jersey that includes coverages for: general liability, automobile liability and comprehensive/collision, hazard and theft insurance on property and contents, and fidelity bonds.
Fairview Insurance Agency was also awarded a contract as the broker of record for employee benefits insurances. The Passaic Board of Education provides employee insurances in accordance with collective bargaining agreements and individual contracts for medical, prescription drugs, dental, optical, and disability programs. The statistical section includes a schedule that outlines the types and amounts of coverage.
The Passaic Board of Education maintains a self-insured, reinsured workers compensation program with Bergen Risk Managers, Inc. serving as the third-party administrator.
OTHER INFORMATION
State statutes require an annual audit by independent certified public accountants or registered municipal accountants. The accounting firm of Lerch, Vinci & Higgins LLP, Fair Lawn, New Jersey was selected by the Passaic Board of Education to conduct the audit. In addition to meeting the requirements set forth in state statutes, the audit was designed to meet the requirements of the U.S. Uniform Guidance and New Jersey OMB Circular 15-08. The independent auditor's report on the financial statements and combining and individual fund statements and schedules is included in the Financial Section of this report. The independent auditor's reports, related specifically to the single audit, are included in the Single Audit Section of this report.
CONTACT INFORMATION
The website for the Passaic Public Schools is www.passaicschools.org. The email address for Pablo Muiioz, Superintendent of Schools, is [email protected]. The email address for R. Aaron Bowman, Interim School Business Administrator, is [email protected].
ACKNOWLEDGEMENTS
We would like to thank the members of the Passaic Board of Education for their concern in providing fiscal accountability to the citizens and taxpayers of the school district. The Passaic Board of Education has contributed its full support to the development and maintenance of its district financial operations.
Respectfully submitted,
Pa~ Superintendent of Schools
27
R. Aaron Bowman Interim School Business Administrator/Board Secretary

N 00
Passaic Public Schools Organization Chart
Board Attorney Superintendent of
Schools
Assistant SUperintendent of
CUrriculum and Instruction
Director of Human : Resources or Personnel :

Passaic Public Schools Office of the Assistant Superintendent of Curriculum and Instruction
- Organization Chart
r--·· ;;upervisors of Bilingua iEducation/English as a [Second Language (ESL)
~-- I
tLanguage Acquisition 1
1 Instructional Chairs · l
Director of Early Childhood Education
Assistant Superintendent of Curriculum and Instruction
Master Teachers Supervisor of Art and L ~~ --M-u-si_c __ _, Supervise:_:]
PIRTs Supervisor of English 1
(Languages Arts literacy) (PK-S)
Supervisor of English (Languages Arts literacy) (6-12)
Supervisor of Mathematics (PK-5)
Supervisor of Mathematics (6-12)
Supervisor of Social · Studies & CTE
Director of Special Education
r
!supervisors of Special Education
..----~----
SpEd Instructional Chairs
Director of Staff Development
Supervisor of Educational Technology

w 0
Passaic Public Schools Office of the Assistant Superintendent of Schools
Organization Chart
I
Director of Athletics
l ~uperviso~of Athletics
Teacher Coordinator
(Parents)
Assistant Superintendent ofi
Schools I L
Director of ,Student Advocacy '
Supervisor of Guidance
Supervisor of Health Services
Teacher Coordinator (Dropout
Prevention)
.. _ I __ _
Principals

Passaic Public Schools Office of the School Business Administrator/Board Secretary
Organization Chart
School Business Administrator/Board ,
Secretary
!:·!"'"!',~ ,·
•. ;:.·~,. . .
·-·~
Purchasing Manager

Passaic Public Schools Division of Human Resources Organization Chart
School Business Administrator/Board
Secretary
· Director of Human Resources
i
I
Coordinator of Human Resources
Benefits Manager

Passaic Public Schools Office of the Chief of Operations
Organization Chart
------------- L ___________ _ Director of · Information :
_ Techno!9gy __ _
Web master
Data Systems Manager
Help Desk Manager
Network Manager
Chief of Operations
I _______ _j_ ________ _
Director of Operations
Coordinator of Security
Coordinator of Food Services
Coordinator of Facilities
_ __________ _ !__ _______ _
! Director of
I · Construction ,
Food Service Manager
Transportation Manager
Custodial Manager

PASSAIC BOARD OF EDUCATION PASSAIC, NEW JERSEY
June 30, 2020
ROSTER OF OFFICIALS
MEMBERS OF THE BOARD OF EDUCATION
CHRISTINA SCHRATZ, PRESIDENT L. DANIEL RODRIGUEZ, VICE PRESIDENT MARYANN CAPURSI HORACIO "RAY" CARRERA CRAIG B. MILLER RONALD VAN RENSALIER JUDITH SANCHEZ ARTHUR G. SOTO KENIA FLORES
OTHER OFFICIALS
TERM EXPIRES
2023 2021 2022 2023 2022 2021 2021 2023 2022
Mr. Pablo Munoz, Superintendent of Schools
Erlinda R. Arellano, CPA, Board Secretary/School Business Administrator/ Purchasing Agent
Yaacov Erisman, Esq., Board Attorney
Garbarini & Company, P.C., Treasurer of School Moneys
R. Aaron Bowman, CPA, Comptroller
34

PASSAIC BOARD OF EDUCATION PASSAIC, NEW JERSEY
CONSULTANTS AND ADVISORS SCHOOL YEAR 2019-2020
ATTORNEY Y AACOV BRISMAN
ATTORNEY AT LAW
140 RIDGE A VENUE
PASSAIC, NEW JERSEY 07055
AUDIT FIRM LERCH, VINCI & HIGGINS
17-17 ROUTE 208 FAIRLAWN, NEW JERSEY 07 410
OFFICIAL DEPOSITORIES
VALLEY BANK
615 MAIN AVE BRANCH
PASSAIC, NJ 07055
CAPITAL ONE BANK
MAIN- PARK BRANCH
PASSAIC, NEW JERSEY 07055
THEPNCBANK
MAIN A VENUE BRANCH
PASSAIC, NEW JERSEY 07055
35

The Certificate of Excellence in Financial Reporting is presented to
Passaic Board of Education
for its Comprehensive Annual Financial Report (CAFR) for the Fiscal Year Ended June 30, 2019.
The CAFR meets the criteria established for
ASBO International's Certificate of Excellence.
Claire Hertz, SFO President
David J. Lewis
Executive Director


LERCH, VINCI & HIGGINS, LLP CERTIFIED PUBLIC ACCOUNTANTS REGISTERED MUNICIPAL ACCOUNTANTS
DIETER P. LERCH, CPA, RMA, PSA
GARY J. VINCI, CPA, RMA, PSA
GARY W. HIGGINS, CPA, RMA, PSA
JEFFREY C. BLISS, CPA, RMA, PSA
PAUL J. LERCH, CPA, RMA, P SA
JULIUS B. CONSONI, CPA, PSA
ANDREW D. PARENTE, CPA, RMA, PSA
Honorable President and Members · of the Board of Education Passaic Public Schools 663 Main A venue Passaic, New Jersey 07055
INDEPENDENT AUDITOR'S REPORT
Report on the Financial Statements
ELIZABETH A. SHICK, CPA, RMA, PSA
ROBERT W. HAAG, CPA, PSA
RALPH M. PICONE, Ill, CPA, RMA, PSA
DONNA L. JAPHET, CPA, PSA
DEBRA GOLLE, CPA
MARKSACO, CPA
ROBERT LERCH, CPA
CHRIS SOHN, CPA
CHRISTOPHERM. VINCI, CPA
We have audited the accompanying financial statements of the governmental activities, the business-type activities, each major fund, and the aggregate remaining fund information of the Passaic Public Schools, as of and for the fiscal year ended June 30, 2020 and the related notes to the financial statements, which collectively comprise the Board of Education's basic financial statements as listed in the table of contents.
Management's Responsibility for the Financial Statements
Management is responsible for the preparation and fair presentation of these financial statements in accordance with accounting principles generally accepted in the United States of America; this includes the design, implementation, and maintenance of internal control relevant to the preparation and fair presentation of financial statements that are free from material misstatement, whether due to fraud or error.
Auditor's Responsibility
Our responsibility is to express opinions on these financial statements based on our audit. We conducted our audit in accordance with auditing standards generally accepted in the United States of America, the standards applicable to financial audits contained in the Government Auditing Standards, issued by the Comptroller General of the United States and audit requirements as prescribed by the Office of School Finance, Department of Education, State of New Jersey. Those standards require that we plan and perform the audit to obtain reasonable assurance about whether the financial statements are free from material misstatement.
An audit involves performing procedures to obtain audit evidence about the amounts and disclosures in the financial statements. The procedures selected depend on the auditor's judgment, including the assessment of the risks of material misstatement of the financial statements, whether due to fraud or error .. In making those risk assessments, the auditor considers internal control relevant to the entity's preparation and fair presentation of the financial statements in order to design audit procedures that are appropriate in the circumstances, but not for the purpose of expressing an opinion on the effectiveness of the entity's internal control. Accordingly, we express no such opinion. An audit also includes evaluating the appropriateness of accounting policies used and the reasonableness of significant accounting estimates made by management, as well as evaluating the overall presentation of the financial statements.
We believe that the audit evidence we have obtained is sufficient and appropriate to provide a basis for our audit opinions.
17-17 ROUTE 208 • FAIR LAWN, NJ 07410 • TELW,HONE (201) 791-7100 ·FACSIMILE (201) 791-3035 WWW.LVHCPA.COM

Opinions
In our opinion, the financial statements referred to above present fairly, in all material respects, the respective financial position of the governmental activities, the business-type activities, each major fund, and the aggregate remaining fund information of the Passaic Public Schools as of June 30, 2020, and the respective changes in financial position and, where applicable, cash flows thereof for the fiscal year then ended in accordance with accounting principles generally accepted in the United States of America.
Other Matters
Required Supplementary Information
Accounting principles generally accepted in the United States of America require that the management's discussion and analysis, budgetary comparison information, pension information and other postemployrnent benefits information be presented to supplement the basic fmancial statements. Such information, although not a part of the basic financial statements, is required by the Governmental Accounting Standards Board who considers it to be an essential part of financial reporting for placing the basic financial statements in an appropriate operational, economic, or historical context. We have applied certain limited procedures to the required supplementary information in accordance with auditing standards generally accepted in the United States of America, which consisted of inquiries of management about the methods of preparing the information and comparing the information for consistency with management's responses to our inquiries, the basic financial statements, and other knowledge we obtained during our audit of the basic financial statements. We do not express an opinion or provide any assurance on the information because the limited procedures do not provide us with sufficient evidence to express an opinion or provide any assurance.
Other Information .
Our audit was conducted for the purpose of forming opinions. on the financial statements that collectively comprise the Passaic Public . Schools' basic financial statements. The introductory section, combining fund financial statements, financial schedules,. statistical section, schedule of expenditures of federal awards as required by Title 2 U.S. Code of Federal Regulations Part 200, Uniform Administrative Requirements, Cost Principles, and Audit Requirements for Federal Awards (Uniform Guidance) and schedule of expenditures of state financial assistance as required by New Jersey OMB Circular 15-08, Single Audit Policy for Recipients of Federal Grants, State Grants and State Aid, are presented for purposes of additional analysis and are not a required part of the basic fmancial statements of the Passaic Public Schools.
The combining fund financial statements, schedule of expenditures of federal awards and schedule of expenditures of state financial assistance are the responsibility of management and were derived from and relate directly to the underlying accounting and other records used to prepare the basic financial statements. Such information has been subjected to the auditing procedures applied in the audit of the basic financial statements and certain additional procedures, including comparing and reconciling such information directly to the underlying accounting and other records used to prepare the basic financial statements or to the basic financial statements themselves, and other additional procedures in accordance with auditing standards generally accepted in the United States of America. In our opinion, the combining fund fmancial statements, schedules of expenditures of federal awards and state fmancial assistance are fairly stated in all material respects in relation to the basic financial statements as a whole.
The introductory section, financial schedules and statistical section have not been subjected to the auditing procedures applied in the audit of the basic financial statements and, accordingly, we do not express an opinion or provide any assurance on them.
38

Other Reporting Required by Government Auditing Standards
In accordance with Government Auditing Standards, we have also issued our report dated January 29, 2021 on our consideration of the Passaic Public Schools' internal control over financial repmting and on our tests of its compliance with certain provisions of laws, regulations, contracts, and grant agreements and other matters. The purpose of that report is solely to describe the scope of our testing of internal control over fmancial reporting and compliance and the results of that testing, and not to provide an opinion on the effectiveness of the Passaic Public Schools' internal control over financial reporting or on compliance. That report is an integral part of an audit performed in accordance with Government Auditing Standards in considering the Passaic Public Schools' internal control over financial reporting and compliance.
Fair Lawn, New Jersey January 29, 2021
39
/:a;(/~- -.1/ffi;.o/L! LERCH, VJNCI & HIG6i:&S, LLP Certified Public Accountants Public School Accountants
Public School Accountant PSA Number CS00829

REQUIRED SUPPLEMENTAL INFORMATION
PART I

Passaic Public Schools
Management's Discussion and Analysis Fiscal Year Ended June 30, 2020
This section of Passaic Public Schools' Comprehensive Annual Financial Report presents our discussion and analysis of the District's financial performance during the fiscal year ending June 30, 2020. This Management's Discussion and Analysis (MD&A) is intended as a report on the overall status of the school District's financial health. Please read it in conjunction with the transmittal letter of Passaic Public Schools' Superintendent of Schools and the School Business Administrator, found at the front of this report, and the District's basic financial statements and notes, which immediately follow this section.
Certain comparative information between the current year (2019-20) and the prior year (2018-19) is required to be presented in the MD&A.
FINANCIAL HIGHLIGHTS
The Financial Highlights section of the MD&A reflects (1) significant improvements concerning 2019-20 operations and (2) key financial information.
Significant Improvement
Significant areas of improvement, indicating a healthy financial condition for the 2019-20 year, are listed herein:
• Net Position of the District's Governmental Activities increased by $65,802,369 from June 30, 2019 through June 30, 2020. Net position of the Governmental Activities was $354,113,097 as compared with the prior year adjusted balance of$288,310,728.
• The General Fund ended the 2019-20 fiscal year with an unassigned budgetary basis fund balance of$9,762,120.
• The District appropriated $34,678,194 of fund balance and reserves for budget support of the 2020-21 school year.
40

Passaic Public Schools
Management's Discussion and Analysis Fiscal Year Ended June 30, 2020
OVERVIEW OF THE FINANCIAL STATEMENTS
The financial section of the annual report consists of five parts: (1) Independent Auditor's Report, (2) Management's Discussion and Analysis (this section), (3) Financial Statements and Notes, (4) Budgetary Comparison Schedules, (5) Individual Fund Schedules.
The financial statements include two kinds of statements that present different views of the Passaic Public Schools. These statements are organized so the reader can understand the Passaic Board of Education as a financial whole, or as an entire reporting entity.
• The basic financial statements, Statement of Net Position and Statement of Activities, are district-wide financial statements that provide information on both short-term and long-term overall financial status, as well as the activities of the entire school district.
• The remaining statements are fund financial statements that focus on individual parts of the Passaic Public Schools, reporting the District's operation in more detail than the district-wide statements.
• The governmental funds statements tell how basic services, such as regular and special education, were financed in short term, as well as what remains for future spending.
• Proprietary funds statements offer short-term and long-term financial information about the activities the Passaic Public Schools operate like a business.
• Fiduciary funds statements provide information about the financial relationships in which the District's act solely as a trustee or agent for the benefit of others to whom the resources belong.
The financial statements also include notes that explain some of the information in the statements and provide more detailed data. The major features of the Passaic Public Schools' financial statements, including the portion of the District's activities they cover and the types of information they contain are summarized below. The remainder of this overview section of Management's Discussion and Analysis highlights the structure and contents of each of the statements.
41

Scope
Required Financial Statements
Accounting Basis and Measurement Focus Type of asset/deferred inflows/outflows of resources/Liability Information
-
Type ofinflow/Outflow Information
Passaic Public Schools
Management's Discussion and Analysis Fiscal Year Ended June 30, 2020
Major Features of the District-Wide and Fund Financial Statements
Fund Financial Statements
District-wide Statements Governmental Funds Proprietary Funds Fiduciary Funds
Entire District (except fiduciary The activities of the District that Activities the District Instances in which the funds) are not proprietary or fiduciary, operates similar to private District administers
such as Regular and Special businesses: Enterprise Fund resources held in trust, such Education Instruction and as Scholarship, Payroll, Building Maintenance Agency, and Student
Activity Statement ofNet Position Balance Sheet Statement of Net Position Statements of Fiduciary Statement of Activities Statement of Revenues, Statement of Revenues, Net Position, Statement of
Expenditures, and Changes in Expenses, and Changes in Changes in Fiduciary Net Fund Balance Net Position Position
Statement of Cash Flows
Accrual accounting and Modified accrual accouting and Accrual accounting and Accrual accounting and economic resource focus current financial focus economic resource focus economic resource focus All assets, deferred Generally assets and deferred All assets, deferred All assets, deferred inflows/outflows of resources, outflows of resources expected to inflows/outflows of inflows/outflows of and liabilities, both financial and be used up and liabilities and resources and liabilities, resources, and liabilities, capital, long-term and short-term deferred inflows of resources that both financial and capital, both short-term and long-
come due during the year or soon and short-term and long- term funds do not currently thereafter; no capital assets or term contain capital assets long-term liabilities included
All revenues and expenses Revenues for which cash is All revenues and expenses All additions and during year, regardless of when received during or soon after the during the year, regardless deductions during the year, cash is received or paid end of the year; expenditures of when cash is received or regardless of when cash is
when goods or services have paid received or paid. been received and the related liability is due and payable
42
Passaic Public Schools
Management's Discussion and Analysis Fiscal Year Ended June 30, 2020
District-wide Statements
The district-wide statements report information about the Passaic Public Schools as a whole using the accrual method of accounting similar to the accounting system used by most privatesector companies. The Statement of Net Position includes all of the District's assets, deferred inflows and outflows of resources, and liabilities. All ofthe current year's revenue and expenses are accounted for in the Statement of Activities, regardless of when cash is received or paid.
The two district-wide statements report the Passaic Public Schools' net position and how it has changed. Net position, the difference between the District's assets and deferred outflows of resources and liabilities and deferred inflows of resources, is one way to measure the District's financial health or position.
• Over time, increases or decreases in the District's net position is an indicator of whether its financial position is improving or deteriorating, respectively.
• To assess the overall health of the District, one needs to consider additional non-financial factors such as changes in the District's property tax base, educational mandates and the condition of school buildings and other facilities.
In the district-wide financial statements, the District's activities are shown as:
• Governmental activities- Most of the District's basic services are included here, such as regular and special education, transportation, building services, administration, and community education. Property taxes and state aids finance most of these activities.
• Business-type activities-The District charges fees to customers to help it cover the costs of certain services it provides. The District's Food Service Fund is included here.
Fund Financial Statements
The fund financial statements provide more detailed information about the District's funds -focusing on its most significant or "major" funds - not the District as a whole. Funds are accounting devices the District uses to keep track of specific sources of funding and spending on particular programs:
• Some funds are required by State law and by bond covenants.
• The District uses other funds, established in accordance with the State of New Jersey Uniform Chart of Accounts, to control and manage money for particular purposes (e.g. repaying its long-term debts) or to show that it is properly using certain revenues (e.g. federal funds).
43

Passaic Public Schools
Management's Discussion and Analysis Fiscal Year Ended June 30,2020
The District has three funds categories:
• Governmental funds- Most of the Passaic Public Schools' basic services are included in governmental funds, which generally focus on (1) cash and other financial assets that can readily be converted to cash flow (2) the balances left at year-end that are available for spending. These funds are reported using an accounting method called modified accrual accounting. Consequently, the governmental funds statements provide a detailed shortterm view that helps to determine whether there are more or fewer financial resources that can be spent in the near future to finance the District's programs. Because this information does not encompass the additional long-term focus of the district-wide statements, we provide additional information at the bottom of the governmental funds statements that reconcile the relationship (or differences) between them.
• Proprietary funds- Services for which the District charges a fee are generally reported in proprietary funds. Proprietary funds are reported in the same way as the district-wide statements.
• Fiduciary funds- The District is the trustee, or fiduciary, for assets that belong to others. The District is responsible for ensuring that the assets reported in these funds are used only for their intended purposes and by those to whom the assets belong. All of the District's fiduciary activities are reported in a separate Statement of Agency Fund Net Position. We exclude these activities from the district-wide financial statements because the District cannot use these assets to finance its operations.
FINANCIAL ANALYSIS OF THE PASSAIC PUBLIC SCHOOLS AS A WHOLE
Net Position
The District's net position for governmental activities was $354,113,097 at June 30, 2020 as compared with $288,310,728 on June 30, 2019 (as adjusted). Net position of the governmental activities increased by $65,802,369 from June 30, 2019 through June 30, 2020. Also noteworthy is the District's commitment of funds to restricted reserves: $20,628,814 in Maintenance Reserve, $13,458,144 for Capital Projects and $1,000,000 in Emergency Reserve Funds.
44

Passaic Public Schools
Management's Discussion and Analysis Fiscal Year Ended June 30,2020
The District's financial position is the product of these factors:
• Total revenues in 2019-2020 for Governmental Activities were $442,719,288 an increase of$13,855,590 (3.2%) when compared with 2018-19.
• Governmental activities expenditures in 2019-20 were $376,773,443, a decrease of $2,402,033 (-.6%) over 2018-19 governmental expenditures.
The following are comparative schedules of revenues and expenditures from governmental activities.
%
$Change Change
REVENUES June 30, 2020 June 30, 2019 {:l 2020
Program Revenues
Operating Grants and Contributions $ 120,431,397 $ 129,999,021 $ (9,567,624) -7.4%
Charges for Services 437,610 429,767 7,843 1.8%
Capital Grants and Contributions 70,242,083 51,218,490 19,023,593 37.1%
General Revenues
Property Taxes 16,818,577 16,818,577 0.0%
State and Federal Aid Formula Grants 232,993,119 228,303,830 4,689,289 2.1%
Other 1,796,502 2,094,013 (297,511) -14.2%
Total Revenues and Other Items 442,719,288 428,863,698 13,855,590 3.2%
45

Passaic Public Schools
.Management's Discussion and Analysis Fiscal Year Ended June 30,2020
Change in Net Position
For The Fiscal Years Ended June 30,2020 and 2019
EXPENDITURES June 30, 2020 June 30, 2019
Instruction
Regular 153,800,221 150,254,025
Special Education 62,205,979 60,092,306
Other Instruction 35,483,254 37,117,664
Support Services
Student and Instruction Related Services 59,432,658 64,372,016
General Administrative Services 2,848,080 2,926,799
School Administrative Services 19,115,617 19,159,768
Plant Operations and Maintenance 29,817,545 29,522,229
Pupil Transportation 7,230,882 7,965,299
Business and Other Support Services 6,606,085 7,362,012
Interest on Long-Term Debt 233,122 403,358
Total Expenditures 376,773,443 379,1752476
Changes in Net Position
$Change +/Change+/
B 2020
3,546,196 2.4%
2,113,673 3.5%
(1,634,410) -4.4%
(4,939,358) -7.7%
(78,719) -2.7%
(44,151) -0.2%
295,316 1.0%
(734,417) -9.2%
(755,927) -10.3%
{170,236) -42.2%
{2,402,033) -0.6%
A summary comparison of changes in net position-governmental activities for the 2019-20 and 2018-19 school years reflects net position of the Governmental Activities were $354,113,097 as compared with $288,310,728 in the prior year. This is an increase of$65,802,369 (22.8%) from June 30, 2019 through June 30, 2020. The increase is largely attributable to the acquisition of capital assets financed by the NJ Schools Development Authority.
Summary Change in Net Position-Governmental Activities For The Fiscal Years Ended June 30, 2019 and 2018
2019-20 2018-19 $Increase
Revenues $ 442,719,288 $ 428,863,698 $ 13,855,590 Expenses (Including Loss on Capital Assets) 376,916,919 379,175,476 (2,258,557)
Net Increase (Decrease) in Net Position 65,802,369 49,688,222 16,114,147 Net Position Beginning of Year, as adjusted 288,310,728 238,622,506 49,688,222
Net Position End of Year 354,113,097 288,310,728 65,802,369
46
+/- Change+/-
3.2% -0.6% 32.4% 20.8%
22.8%

Passaic Public Schools
Management's Discussion and Analysis Fiscal Year Ended June 30, 2020
FINANCIAL ANALYSIS OF THE DISTRICT'S FUNDS
GOVERNMENTAL FUNDS
The focus of the District's governmental funds is to provide information on the inflows, outflows, and balances of the District's spendable resources. In particular, unassigned fund balance may serve as a useful measure of the District's net resources available for spending at year-end.
GENERAL FUND
The General Fund includes the primary operations of the District in providing educational services to students from prekindergarten through grade 12, including instruction, instructional support, student support, administration, operations and maintenance, pupil transportation activities and capital outlay projects.
General Fund Revenues
In the 2019-20 school year the major source of general fund revenues comes from state sources (state aid) which accounted for 93.5% of total revenues. Federal sources accounted for .3% of total revenues. Local revenues accounted for 6.2% of general fund revenues. The District's local tax levy remained flat at $16,818,577. The revenue summary below reflects the dollar and percent increase from the prior year.
2019-20 2018-19
%of %of Amount of
June 30! 2020 Revenue June 30! 2019 Revenue Increase/(Decrease}
Local Sources
Property Tax Levy $ 16,818,577 5.4% $ 16,818,577 5.6% $
Interest 1,120,263 0.4% 1,186,711 0.4% (66,448)
Miscellaneous 1,113,849 0.4% 1,337,069 0.5% (223,220)
Total Local Sources 19,052,689 6.2% 19,342,357 6.5% (289,668)
State Sources 289,884,437 93.5% 281,641,087 93.2% 8,243,350
Federal Sources 1,076,742 0.3% 1,228,531 0.3% (151,789)
Total General Fund Revenues $ 310,013,868 jQQ QO& $ 302,211,975 lQQ.Q% $ 7,801,893
47

Passaic Public Schools
Management's Discussion and Analysis Fiscal Year Ended June 30, 2020
General Fund Expenditures
The following schedule presents a summary of General Fund expenditures. The summary reflects the dollar and percent increases from the prior year.
Total General Fund expenditures increased $7,560,161 or 2.5% from the previous year.
Summary of General Fund Expenditures
Increase
June 30, 2020 June 30,2019 (Decrease)
Instruction
Regular Instruction 114,483,174 108,073,195 6,409,979
Special Education Instruction 54,030,670 51,300,335 2,730,335
Other Instruction 31,873,136 31,776,937 96,199
Support Services
Student & Instruction Related Svcs 44,271,019 47,056,156 (2,785,137)
School Administrative Services 2,638,033 16,640,502 (14,002,469)
General Administrative Services 17,606,967 2,594,336 15,012,631
Plant Operations and Maintenance 29,135,691 27,908,420 1,227,271
Pupil Transportation 7,223,216 7,926,127 (702,911)
Business and Other Support Services 6,392,454 6,728,665 (336,211)
Debt Service 2,599,857 2,610,001 (10,144)
Capital Outlay 738,703 818,085 {79,382)
Total General Fund Expenditures 310,992,920 303,432,759 7,560,161
Instruction expenses include activities directly dealing with the teaching of pupils and the interaction between teacher and student.
Percent
Increase
5.9%
5.3%
0.3%
-5.9%
-84.1%
578.7%
4.4%
-8.9%
-5.0%
-0.4%
-9.7%
2.5%
Student and instruction related service expense include the activities involved with assisting staff with the content and process of teaching students, including curriculum, staff development, and guidance.
General and school administration and business services include expenses associated with administrative and financial supervision of the District.
Plant operations and maintenance involve keeping the school grounds, buildings, and equipment in good working condition.
48

Passaic Public Schools
Management's Discussion and Analysis Fiscal Year Ended June 30,2020
Pupil transportation includes activities involved with the conveyance of students to and from school activities.
Debt service involves transactions associated with payment of interest related to District debt.
Appropriated Fund Balance
The District completed the 2019-20 school year with an unassigned budgetary basis Fund Balance of $9,762,120. It is the intent of District administration to preserve these funds for use in the 2020-21 school year. Below is a recapitulation of the District's General Fund balance (budgetary basis) at June 30, 2020:
Summary of General Fund - Fund Balance at June 30, 2020 Restricted:
Capital Reserve Capital Reserve Designated for Subsequent Year's Budget Maintenance Reserve Maintenance Reserve Designated for Subsequent Year's Budget Emergency Reserve
Committed: Encumbrances
.Assigned: Designated in Subsequent Year's Budget Encumbrances
Unassigned
TOTAL
1,278,321
7,047,654 13,284,814
7,344,000 1,000,000
1,125,976
20,286,540 306,820
9,762,120
$ 61,436,245
The District appropriated $34,678,194 of fund balance to support 2020-21 operations.
Delayed State Payment
The New Jersey Department of Education advised the Board of Education that the final two state aid payments for all New Jetsey School Districts would be delayed until July following the close of the fiscal year. This was a result of a funding crisis and remedies enacted by the State Legislature. The District did not need to borrow monies to support its cash flows.
49

Passaic Public Schools
Management's Discussion and Analysis Fiscal Year Ended June 30, 2020
UNRESERVED -UNASSIGNED FUND BALANCE AS A PERCENTAGE OF EXPENDITURES
The following table shows the General Fund unreserved-undesignated fund balance as a percentage of expenditures. In June 2001, Districts were limited to reserve no more than a maximum of 2.0% of its general fund expenditures as unreserved-unassigned fund balance. Impacting the fund balance for the fiscal years ended June 30, 2020 and June 30, 2019 on a GAAP basis was delayed state aid payments for June. These payments are made by the State in July of the subsequent fiscal year.
On a GAAP basis, the unreserved-unassigned fund deficit is $21,525,274 (Exhibit B-1). On a budgetary basis, the unreserved-unassigned fund balance is $9,762,120 (Exhibit C-1).
2020 2019 2018 2017 2016 2015 2014
General Fund
Umeserved-Undesignated
Fund Balance $ (21,525,274) $ (21,306,523) $ (20,423,800) $ (20,088,682) $ (18,885,181) $ (19,028,317) $ (18,461 ,285)
% ofincrease/(Decrease) -1% -4% -2% -6% 1% -3% -3%
Expenditures 310,992,920 303,432,759 291,050,519 282,080,280 281,307,284 269,873,996 275,335,267
% Increase/(Decrease) 2.5% 4.3% 3.2% 0.3% 4.2% -2.0% -1.8%
The District values its fund balances as a vehicle for addressing unbudgeted and emergent needs that occur during school year.
50

Passaic Public Schools
Management's Discussion and Analysis Fiscal Year Ended June 30, 2020
SPECIAL REVENUE FUND
The Special Revenue Fund includes all restricted Federal, State and Local sources utilized in the operations of the District in providing services to students.
Special Revenue Fund (GAAP Basis) activities for the fiscal years ended June 30, 2020 and 2019 were as follows:
REVENUES State Sources
Federal Sources Miscellaneous
Total Revenues
EXPENDITURES Instruction
Support Services Capital Outlay
Total Expenditures
Excess of Revenues Over Expenditures
OTHER FINANCING SOURCES/(USES)
Transfers In Transfers Out
Total Other Financing Sources and Uses
Net Change in Fund Balance
Fund Balance Beginning ofYear
Fund Balance End of Year
CAPITAL PROJECTS FUND
$
June 30, 2020 June 30, 2019
28,556,140 $ 29,924,323 15,670,378 15,655,843
11,863 5,866
44,238,381 45,586,032
24,969,852 24,476,005 13,772,544 13,788,674
88,660 70 630
38,831,056 38,335,309
5,407,325 7,250,723
3,057,699 1,754,937 (8,465,024) (9,005,660)
{5,407,325) (7,250,723)
Increase %Increase (Decrease) (Decrease)
$ (1,368,183) -4.6% 14,535 0.1%
5,997 102.2%
(1,347,651) -3.0%
493,847 2.0% (16,130) -0.1% 18,030 25.5%
495,747 1.3%
(1,843,398) -25.4%
1,302,762 74.2% 540,636 -6.0%
1,843,398 -25.4%
The Capital Projects Fund expenditures totaled $74,925,183 for the fiscal year ended June 30, 2020. Expenditures were comprised of on-behalf payments by the New Jersey Schools Development Authority of $70,242,083 and District expenditures of $4,683,100. On-behalf payments by the New Jersey Schools Development Authority of $51,218,490 and District payments of $3,856,990 comprised the Fund's expenditures for the fiscal year ended June 30, 2019.
51

Passaic Public Schools
Management's Discussion and Analysis Fiscal Year Ended June 30,2020
OTHER MAJOR FUNDS
The Food Service Fund operations in 2019-20 resulted in an ending net position of $3,176,553. This compares with an ending balance of $3,263,166 at the end of the 2018-19 school year. The change in net position was a loss of$86,613.
CAPITALASSET AND DEBT ADMINISTRATION
Capital Assets
At June 30, 2020, the District recorded the investment of $430,514,030 in a broad range of capital assets, including school buildings, athletic facilities, computer and audio-visual equipment, and administrative offices. Included are capital assets that were not being depreciated: land $1,753,991 and construction in progress $267,091,787. (Capital AssetsGovernmental Activities schedule below.) More detailed information about capital assets can be found in Note 4 to the financial statements. Total depreciation expenses for the year were $9,645,576.
(Note #4 to the Basic Financial Statements--Capital Assets)
Balance, Balance,
June 30, 2020 June 30, 2019
$Increase
(Decrease)
%Increase/
(Decrease)
Land (Not Depreciated) $ 1,753,991 $ 1,753,991 $
Construction in Progress (Not Depreciated) 267,091,787 195,194,824 71,896,963
Buildings 265,052,628 261,953,367 3,099,261
Land Improvements 4,630,605 4,628,386 2,219
Machinery and Equipment 17,725,815 16,648,042 1,077,773
Subtotal 556,254,826 480,178,610 76,076,216
Less: Depreciation {125,740,796) {116,985,462) {8,755,334)
Net Value of Assets $ 430,514,030 $ 363,193,148 $ 67,320,882
Long-Term Liabilities
The District had $8,103,031 as a liability for compensated absences in the governmental funds. This liability represents the District's contractual obligation to compensate employees for accumulated unused sick leave entitlements upon retirement.
More detailed information about the District's long-term liabilities is presented in Note 4 to the financial statements.
52
0.00%
36.83%
1.18%
0.05%
6.47%
15.84%
7.48%
18.54%

Govemmental Activity
Net Pension Liability
Unfunded Pension Obligations
Claims and Judgements
Compensated Absences
TOTAL
Passaic Public Schools
Management's Discussion and Analysis Fiscal Year Ended June 30, 2020
Long Term Liabilities
for the Fiscal Years Ended June 30, 2020 and 2019
Balance, Balance,
June 30, 2020 June 30, 2019
78,463,692 87,260,444
2,493,221 4,817,794
2,100,663 2,491,721
8,103,031 6,103,493
$ 91,160,607 $ 100,673,452 $
FACTORS BEARING ON THE DISTRICT'S FUTURE
Total
Dollar
Change
(8,796,752)
(2,324,573)
(391,058)
1,999,538
(9,512,845)
The factors bearing on the fiscal future ofthe Passaic Public Schools are tied to:
1. The economic health of the State ofNew Jersey and Federal government. 2. Fiscal reform initiatives of the New Jersey State government. 3. School Funding Reform Act of2008 (SFRA)- Award of State Aid .
Total
Percent
Change
-10.1%
-48.2%
-15.7%
32.8%
-9.4%
4. Revenue generation-Use of grant funding and other opportunities to supplement programs, positions and services
5. Modification of programs and operations to adjust to changing financial conditions 6. Collective bargaining with employee unions 7. Spiraling special education costs 8. Capital improvements and maintenance 9. Compliance activities required by state and federal governments 10. Charter schools enrollment of District residents
CONTACTING THE DISTRICT'S FINANCIAL MANAGEMENT
This financial report is designed to provide our citizens, taxpayers, customers, and investors and creditors with a general overview of the District's finances and to demonstrate the District's accountability for the money it receives. If you have questions about this report or need additional financial information, contact the District's School Business Administrator, Passaic Public Schools, 663 Main Avenue, Passaic, New Jersey 07055.
Telephone: Fax:
973 859-1320 x5241 973 470-7694
53

BASIC FINANCIAL STATEMENTS

EXHIBIT A-1
PASSAIC PUBLIC SCHOOLS STATEMENT OF NET POSITION
AS OF JUNE 30, 2020
Governmental Business-Type Activities Activities Total
ASSETS Cash and Cash Equivalents $ 47,982,545 $ 1,124,300 $ 49,106,845 Receivables, net 7,924,677 3,821,731 11,746,408 Inventory 145,726 145,726 Internal Balances 523,235 (523,235) Other Assets 100,640 100,640 Capital Assets
Not Being Depreciated 268,845,778 268,845,778 Being Depreciated, net 161,668,252 673,925 162,342,177
Total Assets 487,045,127 5,242,447 492,287,574
DEFERRED OUTFLOWS OF RESOURCES Deferred Amounts on Net Pension Liability 11,112,126 11,112,126
Total Deferred Outflows of Resources 11,112,126 11,112,126
Total Assets and Deferred Outflows of Resources 498,157,253 5,242,447 503,399,700
LIABILITIES Accounts Payable and Other Current Liabilities 18,253,260 1,730,418 19,983,678 Accrued Salaries and Wages 734,403 178,380 912,783 Accrued Interest Payable 45,235 45,235 Unearned Revenue 887,305 887,305 Claims and Judgments Payable 1,375,109 1,375,109 Noncurrent Liabilities
Due Within One Year 2,881,221 2,881,221 Due Beyond One Year 88,279,386 86,007 88,365,393
Total Liabilities 112,455,919 1,994,805 114,450,724
DEFERRED INFLOWS OF RESOURCES Deferred Amounts on Net Pension Liability 31,588,237 31,588,237 Deferred Commodities Revenue 71,089 71,089
Total Deferred Inflows of Resources 31,588,237 71,089 31,659,326
Total Liabilities and Deferred Inflows of Resources 144,044,156 2,065,894 146,110,050
NET POSITION Net Investment in Capital Assets 430,514,030 673,925 431,187,955 Restricted for:
Capital Projects 13,458,144 13,458,144 Other Purposes 21,628,814 21,628,814
Unrestricted (111,487,891) 2,502,628 ( 108,985,263)
Total Net Position $ 354,113,097 $ 3,176,553 $ 357,289,650
The accompanying Notes to the Financial Statements are an integral part of this statement.
54

EXHIBIT A-2 PASSAIC PUBLIC SCHOOLS
STATEMENT OF ACTIVITIES FOR THE FISCAL YEAR ENDED JUNE 30, 2020
Net (Expense) Revenue and Program Revenues Changes in Net Position
Operating Capital Charges for Grants and Grants and Governmental Business-Type
Functions/Programs Expenses Services Contributions Contributions Activities Activities Total Governmental Activities:
Instruction: Regular $ 153,800,221 $ 216,057 $ 45,849,824 $ 69,885,572 $ (37,848,768) $ (37,848,768) Special Education 62,205,979 221,553 34,878,159 (27,106,267) (27' 1 06,267) Other Instruction 35,483,254 10,874,283 (24,608,971) (24,608,971)
Support Services: Student and Instruction Related Services 59,432,658 15,092,143 (44,340,515) (44,340,515) General Administration Services 2,848,080 354,868 (2,493,212) (2,493,212) School Administration Services 19,115,617 4,187,207 (14,928,410) (14,928,410) Plant Operations and Maintenance 29,817,545 6,971,094 356,511 (22,489,940) (22,489,940) Pupil Transportation 7,230,882 2,030,655 (5,200,227) (5,200,227) Business and Other Support Services 6,606,085 193,164 (6,412,921) (6,412,921)
Interest and Other Charges on Long-Term Debt 233,122 (233,122) (233,122)
Total Governmental Activities 376,773,443 437,610 120,431,397 70,242,083 (185,662,353) (185,662,353)
Business-Type Activities: Food Service 11,894,188 55,129 11,763,849 $ (75,210) (75,210)
CJl CJl
Total Business-Type Activities 11,894,188 55,129 11,763,849 (75,210) (75,210)
Total Primary Government $ 388,667,631 $ 492,739 $ 132,195,246 $ 70,242,083 (185,662,353) (75,210) (185,737,563)
General Revenues: Property Taxes
General Purposes 16,818,577 16,818,577 Federal and State Aid- Unrestricted 224,528,095 224,528,095 Federal and State Aid -Restricted 8,465,024 8,465,024 Investment Earnings 1,120,263 41,365 1,161,628 Miscellaneous Income 676,239 676,239
Special Items: Loss on Disposal of Capital Assets (143,476) (52,768) (196,244)
Total General Revenues and Special Items 251,464,722 (11,403) 251,453,319
Change in Net Position 65,802,369 (86,613) 65,715,756
Net Position, Beginning of Year 286,953,340 3,263,166 290,216,506
Prior Year Adjustment- Capital Assets 1,357,388 1,357,388
Net Position, End of Year $ 354,113,097 $ 3,176,553 $ 357,289,650
The accompanying Notes to the Financial Statements are an integral part of this statement.

FUND FINANCIAL STATEMENTS

EXHIBIT B-1 PASSAIC PUBLIC SCHOOLS
GOVERNMENTAL FUNDS
BALANCE SHEET AS OF JUNE 30, 2020
Special Capital General Revenue Projects
Fund Fund Fund Total
ASSETS Cash and Cash Equivalents $ 42,777,970 $ 5,204,575 $ 47,982,545 Receivables From Other Governments 1,247,647 $ 6,528,452 7,776,099 Other Receivables 145,964 145,964 Due From Other Funds 3,562,310 3,562,310 Other Assets 100,640 100,640
Total Assets $ 47,834,531 $ 6,528,452 $ 5,204,575 $ 59,567,558
LIABILITIES AND FUND BALANCES Liabilities Accounts Payable and Other Liabilities $ 15,581,199 $ 1,838,701 $ 72,406 $ 17,492,306 Accrued Salaries and Wages 729,372 5,031 734,403 Claims and Judgements Payable 1,375,109 1,375,109 Payable to State and Federal Government 760,954 760,954 Due to Other Funds 3,036,461 3,036,461 Unearned Revenue 887,305 887,305
Total Liabilities 17,685,680 6,528,452 72,406 24,286,538
Fund Balances Restricted
Capital Reserve 1,278,321 1,278,321
Capital Reserve - Designated for
Subsequent Years Budget 7,047,654 7,047,654
Maintenance Reserve 13,284,814 13,284,814
Maintenance Reserve - Designated for
Subsequent Years Budget 7,344,000 7,344,000
Emergency Reserve 1,000,000 1,000,000
Capital Projects 5,132,169 5,132,169 Committed
Encumbrances 1,125,976 1,125,976
Assigned Designated for Subsequent Years Budget 20,286,540 20,286,540 Encumbrances 306,820 306,820
Unassigned (21,525,274) (21,525,274)
Total Fund Balances 30,148,851 5,132,169 35,281,020
Total Liabilities and Fund Balances $ 47,834,531 $ 6,528,452 $ 5,204,575
Amounts reported for governmental activities in the statement of net position (A-1) are different because:
Capital assets used in governmental activities are not financial resources and therefore are not reported in the funds. The cost of the assets is $556,254,826 and the accumulated depreciation is $125,740,796. 430,514,030
The District has outstanding liabilities for unfunded pension obligations. The interest accrual at year end is : (45,235)
Long-term liabilities are not due and payable in the current period and therefore are not reported as liabilities in the funds. The detail ofthis can be found in Note 2 in the Notes to Financial Statements (111,636,718)
Net Position of Governmental Activities (Exhibit A-1) $ 354,113,097
The accompanying Notes to the Financial Statements are an integral part of this statement
56

EXHIBIT B-2 PASSAIC PUBLIC SCHOOLS
GOVERNMENTAL FUNDS STATEMENT OF REVENUES, EXPENDITURES, AND CHANGES IN FUND BALANCES
FOR THE FISCAL YEAR ENDED JUNE 30, 2020
Special Capital General Revenue Projects
Fund Fund Fund Total REVENUES Local Sources
Propetty Tax Levy $ 16,818,577 $ 16,818,577 Tuition 437,610 437,610 Interest 1,120,263 1,120,263 Rentals 2,775 2,775 Miscellaneous 673,464 $ 11,863 685,327
Total - Local Sources · 19,052,689 11,863 19,064,552
State Sources 289,884,437 28,556,140 $ 70,242,083 388,682,660 Federal Sources 1,076,742 15,670,3'78 16,747,120
Total Revenues 310,013,868 44,238,381 70,242,083 424,494,332
EXPENDITURES Current
Instruction Regular Instruction 114,483,174 20,647,841 135,131,015 Special Education Instruction 54,030,670 4,322,011 58,352,681 Other Instruction 31,873,136 31,873,136
Suppmt Services Student and Instruction Related Services 44,271,019 13,770,327 58,041,346 General Administrative Services 2,638,033 2,638,033 School Administrative Services 17,606,967 17,606,967 Plant Operations and Maintenance 29,135,691 29,135,691 Pupil Transportation 7,223,216 2,217 7,225,433 Business and Other Suppmt Services 6,392,454 6,392,454
Debt Service Principal 2,324,573 2,324,573 Interest and Other Charges 275,284 275,284
Capital Outlay 738,703 88,660 74,925,183 75,752,546
Total Expenditures 310,992,920 38,831,056 74,925,183 424,749,159
Excess (Deficiency) of Revenues Over
(Under) Expenditures (979,052) 5,407,325 ( 4,683,1 00) (254,827)
OTHER FINANCING SOURCES (USES) Transfers In 8,465,024 3,057,699 5,421,000 16,943,723 Transfers Out (8,478,699) (8,465,024) (16,943,723)
Total Other Financing Sources (Uses) (13,675) (5,407,325) 5,421,000
Net Change in Fund Balances (992,727) 737,900 (254,827)
Fund Balance, Beginning of Year 31,141,578 4,394,269 35,535,847
Fund Balance, End of Year $ 30,148,851 $ $ 5,132,169 $ 35,281,020
The accompanying Notes to the Financial Statements are an integrak ~art of this statement

PASSAIC PUBLIC SCHOOLS RECONCILIATION OF THE STATEMENT OF REVENUES, EXPENDITURES,
AND CHANGES IN FUND BALANCES OF GOVERNMENTAL FUNDS
TO THE STATEMENT OF ACTIVITIES FOR THE FISCAL YEAR ENDED JUNE 30, 2020
Total Net Change in Fund Balances - Governmental Funds (Exhibit B-2)
Amounts reported for governmental activities in the statement
of activities (A-2) are different because:
Capital outlays are reported in governmental funds as expenditures. However, in the statement of
activities, the cost of those assets is allocated over their estimated useful lives as depreciation expense.
This is the amount by which capital outlays exceeded depreciation in the period.
Capital Outlay Depreciation Expense
Loss on Disposal of Capital Assets
Repayment of debt is an expenditure in the governmental funds, but the repayment reduces
long-tern1 liabilities in the statement of net position and is not reported in the statement of activities.
Early Retirement Pension Obligation
In the statement of activities, interest on long-term debt in the statement of activities is" accrued,
regardless of when due. In the governmental funds, interest is reported when due.
In the statement of activities, certain operating expenses, e.g., compensated absences, claims adjustments
and net pension liabilities are measured by the amounts earned during the year. In the governmental funds,
however, expenditures for these items are reported in the amount of financial resources used (paid).
Compensated Absences
Claims and Judgements
Net Pension Liability Expense - Public Employees' Retirement System
Change in Net Position of Governmental Activities (Exhibit A-2)
The accompanying Notes to the Financial Statements are an integral ~i of this statement
$ 75,752,546 (9,645,576)
(1,999,538)
391,058 (664,553)
EXHIBITB-3
$ (254,827)
66,106,970
(143,476)
2,324,573
42,162
(2,273,033)
$ 65,802,369

ASSETS
Current Assets Cash and Cash Equivalents Intergovernmental Receivable
State Federal
Accounts Receivable Inventories
Total Current Assets
Capital Assets Equipment Less: Accumulated Depreciation
Total Capital Assets, Net
Total Assets
LIABILITIES
Current Liabilities Accounts Payable Accrued Salaries and Benefits Due to Other Funds
Total Current Liabilities
Noncurrent Liabilities Compensated Absences Payable
Total Liabilities
DEFERRED INFLOWS OF RESOURCES
Deferred Commodities Revenue
Total Deferred Inflows of Resources
PASSAIC PUBLIC SCHOOLS PROPRIETARY FUND
FOOD SERVICE ENTERPRISE FUND STATEMENT OF NET POSITION
AS OF JUNE 30, 2020
Total Liabilities and Deferred Inflows of Resources
NET POSITION
Investment in Capital Assets Unrestricted
Total Net Position
The accompanying Notes to the Financial Statements are an integral part of this statement
59
$
$
EXHIBIT B-4
1,124,300
24,996 3,796,735
145,726
5,091,757
1,957,705 (1,283,780)
673,925
5,765,682
1,730,418 178,380 523,235
2,432,033
86,007
2,518,040
71,089
71,089
2,589,129
673,925 2,502,628
3,176,553

PASSAIC PUBLIC SCHOOLS PROPRIETARY FUND
FOOD SERVICE ENTERPRISE FUND STATEMENT OF REVENUES, EXPENSES AND
CHANGES IN NET POSITION FOR THE FISCAL YEAR ENDED JUNE 30, 2020
OPERATING REVENUES Charges for Services
Daily Sales-Non-Reimbursable Programs Other
Total Operating Revenues
OPERATING EXPENSES Salaries and Wages Employee Benefits
Cost of Sales Supplies and Materials Cleaning, Repairs and Maintenance Travel Other Purchased Services Miscellaneous Depreciation
Total Operating Expenses
Operating (Loss)
NONOPERATING REVENUES (EXPENSES) State Sources
School Lunch Program Federal Sources
School Breakfast Program National School Lunch Program Food Distribution Program (USDA Commodities) After School Snack Program Summer Food Service Program Fresh Fruits and Vegetables Program (FFVP)
Loss on Disposal of Capital Assets Interest Revenue
Total Nonoperating Revenues
Change in Net Position
Net Position, Beginning of Year
Net Position, End of Year
Auditor's Note- Financial information regarding the District's Fixed Price Contract is detailed on Exhibit G-2.
The accompanying Notes to the Financial Statements are an integral part ofthis statement
. 60
EXHIBITB-5
$ 20,118 35,011
55,129
3,036,745 1,432,509
6,694,285 269,188 323,040
2,800 44,486
5,356 85,779
11,894,188
(11,839,059)
95,349
2,206,327 4,477,021
422,729 215,608
4,096,670 250,145 (52,768) 41,365
11,752,446
(86,613)
3,263,166
$ 3,176,553

PASSAIC PUBLIC SCHOOLS PROPRIETARY FUND
FOOD SERVICE ENTERPRISE FUND STATEMENT OF CASH FLOWS
FOR THE FISCAL YEAR ENDED JUNE 30, 2020
CASH FLOWS FROM OPERATING ACTIVITIES Cash Received from Customers Cash Payments for Employees' Salaries and Benefits Cash Payments to Suppliers for Goods and Services
Net Cash Provided by (Used for) Operating Activities
CASH FLOWS FROM NONCAPITAL FINANCING ACTIVITIES Cash Received (Payments) to Other Funds Cash Received from FFVP Grant Program Cash Received from After School Snack Program Cash Received from Summer Food Program Cash Received from State and Federal Subsidy Reimbursements
Net Cash Provided by Noncapital Financing Activities
CASH FLOWS FROM CAPITAL FINANCING ACTIVITIES Acquisition of Capital Assets
Net Cash (Used for) Capital Financing Activities
CASH FLOWS FROM INVESTING ACTIVITIES Interest on Investments
Net Cash Provided by Investing Activities
Net Change in Cash and Cash Equivalents
Cash and Cash Equivalents, Beginning of Year
Cash and Cash Equivalents, End of Year
RECONCILIATION OF OPERATING (LOSS) TO NET CASH PROVIDED (USED) FOR OPERATING ACTIVITIES Operating (Loss)
Adjustments to Reconcile Operating (Loss) to Net Cash Provided (Used) for Operating Activities Depreciation USDA Commodities Change in Assets, Liabilities and Deferred Inflows of Resources
lncrease/(Decrease) in Accounts Payable Increase /(Decrease) in Accrued Salaries and Benefits Increase/(Decrease) in Deferred Commodities Revenue Increase/(Decrease) in Compensated Absences (Increase)/Decrease in Accounts Receivable (Increase )/Decrease in Inventory
Total Adjustments
Net Cash Provided by (Used for) for Operating Activities
Non-Cash Financing Activities: Fair Value of Food Distribution Program Commodities Received
The accompanying Notes to the Financial Statements are an integral part of this statement
61
EXHIBIT B-6
$ 74,687 ( 4,612,409) (5,905,717)
(10,443,439)
39,530 237,799 282,240 358,807
8,915,254
9,833,630
(217,320)
(217,320)
41,365
41,365
(785,764)
1,910,064
$ 1,124,300
$ (11,839,059)
85,779 422,729
989,298 (165,320)
39,267 22,165 19,558
(17,856)
1,395,620
$ (10,443,439)
$ 461,996

ASSETS Cash and Cash Equivalents
Total Assets
LIABILITIES
PASSAIC PUBLIC SCHOOLS FIDUCIARY FUNDS
STATEMENT OF FIDUCIARY NET POSITION AS OF JUNE 30, 2020
Scholarship Fund
$ 23,060
23,060
Payroll Deductions and Withholdings Accrued Salaries Due to Student Groups Employee Deposits Payable Due to Other Funds
Total Liabilities
NET POSITION Reserved For Scholarships $ 23,060
The accompanying Notes to the Financial Statements are an integral part of this statement
62
EXHIBITB-7
Agency Fund
$ 2,205,955 ~
$ 2,205,955
$ 1,933,425 , 6,950 ,
218,211 , 44,755 ,
2,614 ,..
$ 2,205,955

PASSAIC PUBLIC SCHOOLS FIDUCIARY FUNDS
STATEMENT OF CHANGES IN FIDUCIARY NET POSITION FOR THE FISCAL YEAR ENDED JUNE 30, 2020
ADDITIONS Contributions/Donations Interest Income
Total Additions
DEDUCTIONS Scholarships Awarded
Total Deductions
Change in Net Position
Net Position, Beginning of Year
Net Position, End ofYear
The accompanying Notes to the Financial Statements are an integral part of this statement 63
EXHIBITB-8
Scholarship Fund
$ 17,350 285
17,635
17 615
17,615
20
23,040
$ 23,060

NOTES TO THE FINANCIAL STATEMENTS

PASSAIC PUBLIC SCHOOLS NOTES TO THE FINANCIAL STATEMENTS FOR THE FISCAL YEAR ENDED JUNE 30, 2020
NOTE 1 SUMMARY OF SIGNIFICANT ACCOUNTING POLICIES
A. Reporting Entity
The Passaic Public Schools (the "Board" or the "District") is an instrumentality of the State of New Jersey, established to function as an education institution. The Board consists of nine elected officials and is responsible for the fiscal control of the District. A Superintendent of Schools is appointed by the Board and is responsible for the administrative control of the District. A School Business Administrator/Board Secretary is also appointed by the Board and oversees the business functions of the District. Under existing statutes, the Board's duties and powers include, but are not limited to, the development· and adoption of a school program; the establishment, organization and operation of schools; and the acquisition, maintenance and disposition of school property. The Board currently operates a Pre-Kindergarten through grade twelve (12) school district.
The Board also has broad fmancial responsibilities, including the approval of the annual budget and the establishment of a system of accounting and budgetary controls. The Superintendent of Schools is the Chief Administrative Officer of the District who is responsible for general supervision of all schools, planning and operational functions of the District. The School Business Administrator/Board Secretary is the Chief Financial Officer and is responsible for budgeting, fmancial accounting and reporting and reports through the Superintendent to the Board.
The reporting entity is composed of the primary government, component units, and other organizations that are included to ensure that the financial statements of the District are not misleading. The primary government consists of all funds, departments, boards and agencies that are not legally separate from the District. For the Passaic Public Schools this includes general operations, food service and student related activities of the District. ·
Component units are legally separate organizations for which the District is fmancially accountable. The District is fmancially accountable for an organization if the District appoints a voting majority of the organization's governing board and (1) the District is able to significantly influence the programs or services performed or provided by the organization; or (2) the District is legally entitled to or can otherwise access the organization's resources; the District is legally obligated or has otherwise assumed the responsibility to fmance the deficits of, or provide fmancial support to, the organization; or the District is obligated for the debt of the organization. Component units may also include organizations that are fiscally dependent on the District in that the District approves the budget, the issuance of debt or the levying of taxes. Based on the foregoing criteria, the District has no component units. Furthermore, the District is not includable in any other reporting entity as a component unit.
B. New Accounting Standards
For fiscal year 2020, there were no GASB statements required to be adopted and implemented by the District.
Accounting standards that the District is currently reviewing for applicability and potential impact on the fmancial statements include:
• GASB No. 84, Fiducimy Activities, implementation postponed will be effective beginning with the fiscal year ending June 30, 2021. The objective of this Statement is to improve guidance regarding the identification of fiduciary activities for accounting and financial reporting purposes and how those activities should be reported. This Statement established criteria for identifying fiduciary activities of all state and local governments.
64

PASSAIC PUBLIC SCHOOLS NOTES TO THE FINANCIAL STATEMENTS FOR THE FISCAL YEAR ENDED JUNE 30, 2020
NOTE 1 SUMMARY OF SIGNIFICANT ACCOUNTING POLICIES (Continued)
B. New Accounting Standards (Continued)
• GASB No. 87, Leases, implementation postponed will be effective beginning with th13 fiscal year ending June 30, 2022. The objective of this Statement is to better meet the information needs of financial statement users by improving accounting and fmancial reporting for leases by governments. This Statement increases the usefulness of governments' financial statements by requiring recognition of certain lease assets and liabilities for leases that previously were classified as operating leases and recognized as inflows of resources or outflows of resources based on the payment provisions of the contract.
• GASB No. 89, AccoW1ting for Interest Costs Incurred Before the End of a Construction Period, implementation postponed will be effective beginning with the fiscal year ending June 30, 2022. The objectives of this Statement is to improve fmancial reporting by providing users of fmancial statements with more relevant information about capital assets and the cost of borrowing for a reporting period. The resulting information also will enhance the comparability of information about capital assets and the cost of borrowing for a reporting period for both governmental activities and business-type activities.
• GASB No. 92, Omnibus 2020, implementation postponed will be effective beginning with the fiscal year ending June 30, .2022 except requirements related to GASB No. 87 and Implementation Guide No. 2019-3 are effective upon issuance. The objective of this Statement is to enhance comparability in the application of accounting and fmancial reporting requirements and to improve the consistency of authoritative literature by addressing practice issues that have been identified during implementation and application of certain GASB Statements. This Statement addresses a variety of topics.
• GASB No. 96, Subscription- Based Information Technology Arrangements, will be effective beginning with the fiscal year ending June 30, 2023. The objective of this Statement will be to improve fmancial reporting by establishing a defmition for subscription-based information technology arrangements (SBITAs) and providing uniform guidance for accounting and fmancial reporting for transactions that meet that defmition. That defmition and uniform guidance will result in greater consistency in practice. Establishing the capitalization criteria for implementation costs also will reduce diversity and improve comparability in fmancial reporting by governments. This Statement also will enhance the relevance and reliability or a government's fmancial statements by requiring a government to report a subscription asset and subscription liability for a SBITA and to disclose essential information about the arrangement. The disclosures will allow users to understand the scale and important aspects of a government's SBITA activities and evaluate a government's obligations and assets resulting from SBITAs.
• GASB No. 97, Certain Component Unit Criteria, and Accounting and Financial Reporting for Internal Revenue Code Section 457 Deferred Compensation Plans -An Amendment of GASB Statements No. 14 and No.84, and a Supersession ofGASB Statement No. 32, the section that maybe applicable to the District will be effective beginning with the fiscal year ending June 30, 2022. The objective of this Statement is to provide more consistent fmancial reporting of defmed contribution pension plans, defmed contribution OPEB plans, and other employee benefit plans, while mitigating the costs associated with reporting those plans. The requirements also will enhance the relevance, consistency, and comparability of (1) the information related to Section 457 plans that meet the definition of a pension plan and the benefits provided through those plans and (2) investment information for all Section 457 plans.
65

PASSAIC PUBLIC SCHOOLS NOTES TO THE FINANCIAL STATEMENTS FOR THE FISCAL YEAR ENDED JUNE 30, 2020
NOTE 1 SUMMARY OF SIGNIFICANT ACCOUNTING POLICIES (Continued)
C. Basis of Presentation - Financial Statements
The fmancial statements include both district-wide fmancial statements (based on the District as a whole) and fund financial statements (based on specific District activities or objectives). Both the district-wide and fund fmancial statements categorize activities as either governmental activities or business-type activities. While separate district-wide and fund fmancial statements are presented, they are interrelated. In the district-wide fmancial statements, the governmental activities column incorporates data from governmental funds while business-type activities incorporate data from the District's enterprise funds. Fiduciary funds are excluded from the district-wide fmancial statements.
District-Wide Financial Statements
The district-wide fmancial statements (i.e., the statement of net position and the statement of activities) report information on all of the nonfiduciary activities of the Board of Education. All fiduciary activities are reported only in the fund fmancial statements. For the most part, the effect of interfund activity has been removed from these statements. Governmental activities, which normally are supported by property taxes and intergovernmental revenues, are reported separately from business-type activities, which rely to a significant extent on fees and charges for support. In the statement of net position, both the governmental and business-type activities columns (a) are presented on a consolidated basis by column, and (b) reflect on a full accrual economic resource basis, which incorporates long-term assets and receivables as well as long-term debt and obligations.
The statement of activities demonstrates the degree to which the direct expenses of a given function or segment are offset by program revenues. Direct expenses are those that ·are clearly identifiable with a specific function or segment. Program revenues include 1) charges to customers or other governmental entities, including other sch9ol districts, who purchase, use, or directly benefit from goods or services provided by a given function or segment and 2) grants and contributions that are restricted to meeting the operational or capital requirements of a particular function or segment. Property taxes, unrestricted state aid, federal and state grants for school-based budgeting and other items not properly included among program revenues are reported instead as general revenues.
As a general rule the effect of interfund activity has been eliminated from the district-wide financial statements. Exceptions to this general rule are charges between the Board's proprietary and fiduciary funds since elimination of these charges would distort the direct costs and program revenues reported for the various functions concerned.
Fund Financial Statements
Separate fund fmancial statements are provided for governmental, proprietary, and fiduciary activities, even though the latter are excluded from the district-wide financial statements. The emphasis of fund fmancial statements is on major individual governmental and enterprise funds, each reported as separate columns in the fund fmancial statements. All remaining governmental and enterprise funds are aggregated and reported as nonmajor funds. The District considers all of its governmental and enterprise funds to be major funds.
The District reports the following major governmental funds:
The general fund is the School District's primary operating fund. It accounts for all fmancial resources of the District, except those to be accounted for in another fund.
66

PASSAIC PUBLIC SCHOOLS NOTES TO THE FINANCIAL STATEMENTS FOR THE FISCAL YEAR ENDED JUNE 30, 2020
NOTE 1 SUMMARY OF SIGNIFICANT ACCOUNTING POLICIES (Continued)
C. Basis of Presentation- Financial Statements (Continued)
Fund Financial Statements (Continued)
The special revenue fund accounts for the proceeds of specific revenue sources legally restricted to expenditures for specified purposes. This fund accounts for federal, state and local financial programs, with the exception of grants for major capital projects and the child nutrition programs.
The capital projects fund accounts for the proceeds from the sale of bonds, lease purchases and other revenues used for the acquisition or construction of capital facilities and other capital assets, other than those financed by the proprietary funds.
The District reports the following major proprietary fund which is organized to be self-supporting through user charges:
The food service fund accounts for the activities of the school cafeteria, which provides food service to students as well as a la carte and catering services for administrators, teachers and special events.
Additionally, the District reports the following fund types:
The fiduciary trust funds are used to account for resources legally held in trust for private donations for scholarship awards. All resources of the funds, including any earnings on invested resources, may be used to support the intended purpose. There is no requirement that any portion of these resources be preserved as capital.
The fiduciary agency funds account for assets held by the District as an agent for student activities and for payroll deductions and withholdings. The funds for the student activities fund are solely for noninstructional student activities that are supported and controlled by student organizations and clubs for which school administration does not have management involvement. The payroll funds are held to remit employee withholdings to respective state, federal and other agencies.
Activity between funds that are representative of lending/borrowing arrangements outstanding at the end of the fiscal year are referred to as either "due to/from other funds" (i.e., the current portion of interfund loans) or "advances to/from other funds" (i.e., the non-current portion of interfund loans). All other outstanding balances between funds are reported as "due to/from other funds". Any residual balances outstanding between the governmental activities and business-type activities are reported in the district-wide fmancial statements as "internal balances".
Reclassifications
Certain amounts presented in the prior year data may have been reclassified in order to be consistent with the current year's presentation.
·D. Measurement Focus and Basis of Accounting
The accounting and financial reporting treatment is determined by the applicable measurement focus and basis of accounting. Measurement focus indicates the type of resources being measured such as current financial resources or economic resources. The basis of accounting indicates the timing of transactions or events for recognition in the financial statements.
67

PASSAIC PUBLIC SCHOOLS NOTES TO THE FINANCIAL STATEMENTS FOR THE FISCAL YEAR ENDED JUNE 30, 2020
NOTE 1 SUMMARY OF SIGNIFICANT ACCOUNTING POLICIES (Continued)
D. Measurement Focus and Basis of Accounting (Continued)
The district-wide fmancial statements are reported using the economic resources measurement focus and the accrual basis of accounting, as are the proprietary fund and fiduciary fund fmancial statements with the exception of the agency fund which does not have a measurement focus. All assets, all liabilities and all deferred outflows/inflows of resources associated with these operations (with the exception of the fiduciary funds) are included on the Statement ofNet Position. Revenues are recorded when earned and expenses are recorded at the time liabilities are incurred, regardless of the timing of related cash flows. Property taxes are recognized as revenues in the year for which they are levied. Grants and similar items are recognized as revenue as soon as all eligibility requirements imposed by the provider have been met.
Governmental fund fmancial statements are reported using the current fmancial resources measurement focus and the modified accrual basis of accounting. Revenues are recognized when susceptible to accrual (i.e. when they are both measurable and available). Revenues are considered to be available when they are collectible within the current period or soon enough thereafter to pay liabilities of the current period. For this purpose, the Board considers revenues to be available if they are collected within 60 days after year-end. Expenditures are recorded when a liability is incurred, as under accrual basis of accounting, with the exception of debt service expenditures as well as expenditures related to compensated absences and claims and judgments which are recorded only when payment is due. General capital asset acquisitions are reported as expenditures in governmental funds. Issuance of long-term debt and acquisitions under capital leases are reported as other fmancing sources.
Property taxes, tuition, unrestricted state aid, and interest associated with the current fiscal period are all considered to be susceptible to accrual and so have been recognized as revenues of the current fiscal period. Entitlements (formula-type grants and aid) are recorded as revenues when all eligibility requirements are met, including any time requirements, and the . amount is received during the period or within the availability period for this revenue source. Expenditure-driven grants and similar awards (reimbursement-type grants and awards) are recognized as revenue when the qualifying expenditures have been incurred and all other eligibility requirements imposed by the grantor or provider have been met, and the amount is received during the period or within the availability period for this revenue source. All other revenue items are considered to be measurable and available only when cash is received by the District.
When both restricted and unrestricted resources are available for use, it is the Board's policy to use restricted resources first, then unrestricted resources as they are needed.
E. Assets, Liabilities, Deferred Outflows/Inflows of Resources, and Net Position/Fund Balance
1. Cash, Cash Equivalents and Investments
Cash and cash equivalents are considered to be cash on hand, demand deposits, and short-tenn investments with original maturities of three months or less from the date of acquisition.
Investments are reported at fair value and are limited by N.J.S.A. 18A:20-37.
2. Receivables
All receivables are reported at their gross value, and where appropriate, are reduced by the estimated portion that is expected to be uncollectible.
3. Inventories
The cost of inventories of the governmental fund types are recorded as expenditures at the time individual inventory items are purchased.
Food Service Fund inventories, exclusive of the federal commodities, are valued at cost, using the first-in first-out (FIFO) method and consist of food and expendable supplies. The cost of such inventories is recorded as expenses when consumed rather than when purchased. The United States Department of Agriculture (USDA) commodity portion of the Food Service Fund inventory consists of food donated by the USDA. It is valued at estimated market prices by the USDA. The amount of unused commodities inventory at year-end is reported as deferred inflows of resources.
68

PASSAIC PUBLIC SCHOOLS NOTES TO THE FINANCIAL STATEMENTS FOR THE FISCAL YEAR ENDED JUNE 30, 2020
NOTE 1 SUMMARY OF SIGNIFICANT ACCOUNTING POLICIES (Continued)
E. Assets, Liabilities, Deferred Outflows/Inflows of Resources, and Net Position/Fund Balance (Continued)
4. Capital Assets
Capital assets, which include property, plant and equipment, are reported in the applicable governmental or business-type activities columns in the district-wide fmancial statements. Capital assets are defmed by the Board as assets with an initial, individual cost of $2,000 and an estimated useful life in excess of two years. The District was able to estimate the historical cost for the initial reporting of these capital assets through back trending. As the District constructs or acquires additional capital assets each period, they are capitalized and reported at historical cost. Donated capital assets are recorded at acquisition value at the date of donation. The costs of normal maintenance and repairs that do not add to the value of the asset or materially extend its useful life are not capitalized.
Major outlays for capital assets and improvements are capitalized as projects are constructed. Interest incurred during the construction phase of capital assets of business-type activities is included as part of the capitalized value of the assets constructed.
Land and construction in progress are not depreciated. The other property, plant, and equipment of the District is depreciated using the straight line method over the following estimated useful lives:
Land Improvements Buildings and Building Improvements Machinery and Equipment
5. Deferred Outflows/Inflows of Resources
20 20-40 5-20
In addition to assets, the statement of fmancial position will sometimes report a separate section for deferred outflows of resources. This separate fmancial statement element, deferred outflows of resources, represents a consumption of net position that applies to future periods and so will not be recognized as an outflow of resources (expense/expenditure) until then. The Board has one item which arises only under the accrual basis of accounting that qualifies for reporting in this category. The item that qualifies for reporting in this category is the deferred amounts on net pension liability. Deferred amounts on net pension liability are reported in the district-wide statement of net position and result from: (1) differences between expected and actual experience; (2) changes in assumptions; (3) net difference between projected and actual investment earnings on pension plan investments; (4) changes in proportion and differences between employer contributions and proportionate share of contributions; and (5) contributions made subsequent to the measurement date. These amounts are deferred and amortized over future years.
In addition to liabilities, the statement of financial position will sometimes report a separate section for deferred inflows of resources. This separate fmancial statement element, deferred inflows of resources, represents an acquisition of net position that applies to future periods and so will not be recognized as an inflow of resources (revenue) until that time. The Board has two types of items which arise only under the accrual basis of accounting that qualifY for reporting in this category. One item that qualifies for reporting in this category are the deferred amounts on net pension liability. Deferred amounts on net pension liability are reported in the district-wide statement of net position and result from: (1) differences between expected and actual experience; (2) changes in assumptions; (3) net difference between projected and actual investment earnings on pension plan investments; and (4) changes in proportion and differences between employer contributions and proportionate share of contributions. These amounts are deferred and amortized over future years. The other item is the deferred commodities revenue, reported in both the district-wide and the proprietary funds statements of net position. The deferred comn1odities revenue represents the estimated market value of the donated and unused Federal commodities inventory at year end. This amount is deferred and recognized as an inflow of resources in the period the commodities are consumed.
69

PASSAIC PUBLIC SCHOOLS NOTES TO THE FINANCIAL STATE:MENTS FOR THE FISCAL YEAR ENDED JUNE 30, 2020
NOTE 1 SUMMARY OF SIGNIFICANT ACCOUNTING POLICIES (Continued)
E. Assets, Liabilities, Deferred Outflows/Inflows of Resources, and Net Position/Fund Balance (Continued)
6. Compensated Absences
It is the District's policy to permit employees to accumulate (with certain restrictions) earned but unused personal and sick leave benefits. A long-term liability of accumulated personal, sick leave and salary related payments has been recorded in the governmental activities in the district-wide fmancial statements, representing the Board's commitment to fund such costs from future operations. Proprietary Funds accrue accumulated sick leave and salary related payments in the period that they are earned. A liability is reported in the governmental funds only to the amount actually due at year end as a result of employee resignations and retirements.
7. Pensions
In the district-wide fmancial statements and proprietary fund types in the fund fmancial statements, for purposes of measuring the net pension liability, deferred outflows of resources and deferred inflows of resources related to pensions, and pension expense, information about the fiduciary net position of the retirement systems sponsored and administered by the State of New Jersey and additions to/deductions from these retirement systems' fiduciary net position have been determined on the same basis as they are reported by the retirement systems. For this purpose, benefit payments (including refunds of employee contributions) are recognized when due and payable in accordance with the benefit terms. Investments are reported at fair value.
In the govemmental fund financial statements, net pension liabilities represent amounts normally expected to be liquidated with expendable available fmancial resources for required pension contributions that are due and payable at year end. Pension expenditures are recognized based on contractual pension contributions that are required to be made to the pension plan during the fiscal year.
8. Long-Term Obligations
In the district-wide fmancial statements, and proprietary fund types in the fund fmancial statements, long-term debt and other long-term obligations are reported as liabilities in the applicable governmental activities, business-type activities, or proprietary fund type statement of net position.
9. Net Position/Fund Balance
District-Wide Statements
In the district-wide statements, there are three classes of net position:
• Net Investment in Capital Assets - consists of net capital assets (cost less accumulated depreciation) reduced by outstanding balances of related debt obligations from the acquisition, construction or improvement Of those assets. Deferred outflows of resources and deferred inflows of resources attributable to the acquisition, construction or improvement of those assets or related debt also should be included.
• Restricted Net Position - reports net position when constraints placed on the residual amount of noncapital assets are either externally imposed by creditors (such as through debt covenants), grantors, contributors, or laws or regulations of other governments, or imposed by law through constitutional provisions or enabling legislation.
• Unrestricted Net Position - any portion of net position not already classified as either net investment in capital assets or net position- restricted is classified as net position- unrestricted.
Governmental Fund Statements
Fund balance categories are designed to make the nature and extent of the constraints placed on the District's fund balance more transparent. These categories are comprised of a hierarchy based primarily on the extent to which the District is bound to observe constraints imposed upon the use of the res'ources reported in governmental funds.
70

PASSAIC PUBLIC SCHOOLS NOTES TO THE FINANCIAL STATEMENTS FOR THE FISCAL YEAR ENDED JUNE 30, 2020
NOTE 1 SUMMARY OF SIGNIFICANT ACCOUNTING POLICIES (Continued)
E. Assets, Liabilities, Deferred Outflows/Inflows of Resources, and Net Position/Fund Balance (Continued)
9. Net Position/Fund Balance (Continued)
Governmental Fund Statements (Continued)
Restricted Fund Balance- Amounts constrained to specific purposes by their providers (such as grantors, bondholders, and higher levels of government), through constitutional provisions, or by enabling legislation.
Capital Reserve- This restriction was created by the District in accordance with NJAC 6A:23A-14.1 to fund future capital expenditures (See Note 3C).
Capital Reserve - Designated for Subsequent Year's Budget- This designation was created to dedicate the portion of capital reserve fund balance appropriated in the adopted 2020/2021 District budget certified for taxes.
Maintenance Reserve - This restriction was created by the Board in accordance with NJAC 6A:23A-14.2 to accumulate funds for the required maintenance of school facilities in accordance with the EFCA (NJSA 18A:7G-9) for a thorough and efficient education. (See Note 3D).
Maintenance Reserve - Designated for Subsequent Year's Budget- This designation was created to dedicate the portion of maintenance reserve fund balance appropriated in the adopted 2020/2021 District budget certified for taxes
Emergency Reserve- This restriction was created in accordance with NJAC 6A:23A-14.4(A)1 to accumulate funds in accordance with State statute to fmance unanticipated general fund expenditures required for a thorough and efficient education. (See Note 3E).
Capital Projects - Represents fund balance restricted specifically for capital acquisitions and improvements in the Capital Projects Fund.
Committed Fund Balance - Amounts constrained to specific purposes by a government itself, using its highest level of decision-making authority; to be reported as committed, amounts ca1111ot be used for any other purpose unless the government takes the same highest level action to remove or change the constraint.
Encumbrances- Represents outstanding purchase orders at year end for contracts awarded by formal action of the Board of Trustee's for specific purposes from available resources of the current year for which the goods and materials have not yet been received or the services have not yet been rendered at June 30.
Assigned Fund Balance - Amounts a government intends to use for a specific purpose; intent can be expressed by the governing body or by an official or body to which the governing body delegates the authority.
Encumbrances - Represent outstanding purchase orders for goods or services approved by management for specific purposes from available resources of the current year for which the goods and materials have not yet been received or the services have not yet been rendered at June 30.
Designated for Subsequent Year's Budget - This designation was created to dedicate the portion of fund balance appropriated in the adopted 2020/2021 District budget certified for taxes.
Unassigned Fund Balance - Represents fund balance that has not been restricted, committed or assigned to specific purposes within the governmental funds.
In the general operating fund and other governmental funds (capital projects fund types), it is the District's policy to consider restricted resources to have been spent first when an expenditure is incuiTed for purposes for which both restricted and unrestricted (i.e., committed, assigned or unassigned) fund balances are available, followed by committed and then assigned fund balances. Unassigned amounts are used only after the other resources have been used.
71

PASSAIC PUBLIC SCHOOLS NOTES TO THE FINANCIAL STATEMENTS FOR THE FISCAL YEAR ENDED JUNE 30, 2020
NOTE 1 SUMMARY OF SIGNIFICANT ACCOUNTING POLICIES (Continued)
E. Assets, Liabilities, Deferred Outflows/Inflows ofResonrces, and Net Position/Fund Balance (Continued)
10. Fund Balance Policies
Fund balance of governmental funds is reported in various categories based on the nature of any limitations requiring the use of resources for specific purposes. The district itself can establish limitations on the use of resources through either a commitment (committed fund balance) or an assignment (assigned fund balance).
The committed fund balance classification includes amounts that can be used only for the specific purposes determined by a formal action of the district's highest level of decision-making authority. The Board of Trustees is the highest level of decision-making authority for the district that can, by adoption of a resolution or formal Board action prior to the end of the fiscal year, commit fund balance. Once adopted, the limitation imposed by the resolution remains in place until a similar action is taken (the adoption of another resolution) to remove or revise the limitation.
Amounts in the assigned fund balance classification are intended to be used by the government for specific purposes but do not meet the criteria to be classified as committed. The Board has authorized the School Business Administrator/Board Secretary to assign fund balance. The Board may also assign fund balance as it does when appropriating fund balance to cover a gap between estimated revenue and appropriations in the subsequent year's appropriated budget. Unlike commitments, assignments generally only exist temporarily. In other words, an additional action does not normally have to be taken for the removal of an assignment. Conversely, as discussed above, an additional action is essential to either remove or revise a commitment.
F. Revenues and Expenditures/Expenses
1. Program Revenues
Amounts reported as program revenues in the district-wide statement of activities include 1) charges to customers or applicants for goods or services, provided, 2) operating grants and contributions, and 3) capital grants and contributions. Internally dedicated resources are reported as general revenues rather than as program revenues. Likewise, general revenues include all property taxes, unrestricted state aid, federal and state grants for school-based budgeting, investment earnings and miscellaneous revenues.
2. Property Taxes
Property taxes are levied pursuant to law and are collected by the City and are transferred to the District as requested. Property tax revenues are recognized in the year they are levied and become available. Property taxes collected in advance of the year-end for which they are levied and transferred to the District are reported as deferred inflows of resources. The tax bills are mailed annually in June by the city tax collector and are levied and due in four quarterly installments on August 1, November 1, February 1 and May 1 of the fiscal year. When unpaid, taxes or any other city lien, or part thereof, on real property, remains in arrears on April1 st in the year following the calendar year levy when the same became in arrears, the tax collector of the City shall, subject to the provisions ofNew Jersey Statute, enforce the lien by placing the property on a tax sale. The city may institute annual "in rem" tax foreclosure proceedings to enforce the tax collection or acquisition of title to the property.
3. Tuition Revenues and Expenditures
Tuition Revenues - Tuition charges were established by the Board of Education based on estimated costs. The charges are subject to adjustment when the final costs are determined and certified by the State Department of Education.
Tuition Expenditures- Tuition charges for the fiscal years 2018-2019 and 2019-2020 were based on rates established by the receiving district. These rates are subject to change when the actual costs have been certified by the State Department of Education.
72

PASSAIC PUBLIC SCHOOLS NOTES TO THE FINANCIAL STATEMENTS FOR THE FISCAL YEAR ENDED JUNE 30, 2020
NOTE 1 SUMMARY OF SIGNIFICANT ACCOUNTING POLICIES (Continued)
F. Revenues and Expenditures/Expenses (Continued)
4. Proprietary Funds, Operating and Nonoperating Revenues and Expenses
Proprietary funds distinguish operating revenues and expenses from nonoperating items. Operating revenues and expenses generally result from providing services and producing and delivering goods in connection with a proprietary fund's principal ongoing operations. The principal operating revenues of the food service enterprise fund are charges to customers for sales and services. Operating expenses for enterprise funds include the cost of sales and services, administrative expenses, and depreciation on capital assets. All revenues and expenses not meeting this definition are reported as nonoperating revenues and expenses. Federal and State subsidies for the food service operation are considered nonoperating revenues.
NOTE 2 RECONCILIATION OF DISTRICT-WIDE AND FUND FINANCIAL STATEMENTS
A. Explanation of certain differences between the governmental fund balance sheet and the district-wide statement of net position
The governmental fund balance sheet includes a reconciliation between fund balance - total governmental funds and net position- governmental activities as reported in the district-wide statement of net position. One element of that reconciliation explains that "long-term liabilities, are not due and payable in the current period and therefore are not reported in the funds." The details of this difference are as follows:
Early Retirement Pension Obligations Claims and Judgements · Compensated Absences Net Pension Liability Deferred Amounts on Net Pension Liability Deferred Outflows Deferred Inflows
Net Adjustment to Reduce Fund Balance -Total Governmental Funds to Arrive at Net Position- Governmental Activities
$ . 2,493,221 2,100,663 8,103,031
78,463,692
(11,112,126) 31,588,237
$ 111,636,718
NOTE 3 STEWARDSHIP, COMPLIANCE AND ACCOUNTABILITY
A. Budgetary Information
In accordance with the requirements of the New Jersey Department of Education ("the Department"), the District annually prepares its operating budget for the forthcoming year. The budget, except for the general fund and special revenue fund, which is more fully explained below and in the notes to the required supplementary information, is prepared in accordance with accounting principles generally accepted in the United States of America and serves as a formal plan for expenditures and the proposed means for fmancing them. Capital lease transactions are accounted for on the GAAP basis.
The ammal budget is adopted in the spring of the preceding year for the general and special revenue funds. The District is not required to adopt an annual budget for the capital projects fund. The budget is submitted to the county superintendent for review and approval prior to adoption. The annual budget is voted upon at the annual school election on the third Tuesday in April.
73

PASSAIC PUBLIC SCHOOLS NOTES TO THE FINANCIAL STATEMENTS FOR THE FISCAL YEAR ENDED JUNE 30, 2020
NOTE 3 STEWARDSHIP, COMPLIANCE AND ACCOUNTABILITY (Continued)
A. Budgetary Information (Continued)
Budget adoptions and amendments are recorded in the District's board minutes. The budget is amended by the Board of Trustees as needed throughout the year. The budget for revenues, other resources, other uses, and fund balances is prepared by fund source and amount. The budget for expenditures is prepared by fund, program, function, object and amount. The legal level of budgetary control is established at the line item account within each fund. Line item accounts are defined as the lowest (most specific) level of detail as established pursuant to the minimum chart of accounts referenced in N.J.A.C. 6:20-2A.2(m)l. The Board approved several budget transfers during 2019/2020. Also, during 2019/2020 the Board increased the original budget of its General Fund by $1,895,021 and its Special Revenue Fund by $13,102,628. The increases were funded by the reappropriation of prior year encumbrances and additional grant awards.
Formal budgetary integration into the accounting system is employed as a management control device during the year. For governmental funds there are no substantial differences between the budgetary basis of accounting and accounting principles generally accepted in the United States of America, with the exception of the legally mandated revenue recognition of certain state aid payments for budgetary purposes only and the treatment of encumbrances in the special revenue fund as described in the Notes to Required Supplementary Information (RSI). Encumbrance accounting is also employed as an extension of formal budgetary integration in the governmental fund types. Unencumbered appropriations lapse at fiscal year end.
Encumbrance accounting is employed in the governmental funds. Under encumbrance accounting, purchase orders, contracts and other commitments for the expenditure of resources are recorded to reserve a portion of the applicable appropriation. Open encumbrances in governmental funds other than the special revenue fund are reported as committed and/or assigned fund balances at fiscal year end as they do not constitute expenditures or liabilities but rather commitments related to unperformed contracts for goods and services which are reappropriated and honored during the subsequent fiscal year.
B. Deficit Fund Equity
The District has an unassigned fund deficit of $21,525,274 in the General Fund as of June 30, 2020 as reported in the fund financial statements (modified accrual basis). NJSA 18A:22-44.2 provides that in the event a state school aid payment is not made until the following school budget year, districts must record these delayed state aid payments as revenue, for budget purposes only, in the cmTent school budget year. The statute provides legal authority for school districts to recognize this revenue in the current budget year. GASB Statement No. 33, "Accounting and Financial Reporting for Nonexchange Transactions", requires that intergovernmental transactions (revenue, expenditure, asset, liability) should be recognized in symmetry (i.e., if one government recognizes an asset, the other government recognizes a liability). Since the State of New Jersey is recording certain 2019/2020 budgeted state aid payments in the subsequent fiscal year, the school district cannot recognize such payments on the GAAP (fund) financial statements until the year the State records the payable. Due to the timing difference of recording these delayed state aid payments, the General Fund deficit does not alone indicate that the District is facing fmancial difficulties; however, unless the State of New Jersey budgets the delayed payments in future years, the District may also report fund deficits in the futme.
Pursuant to NJSA 18A:22-44.2, any negative unreserved, undesignated (i.e., unassigned) general fund balance that is reported as a direct result of a delay in the payment of state aid until the following fiscal year, is not considered as a violation of New Jersey Statute or regulation and is not considered an item in need of corrective action. The deficit in the GAAP (fund) financial statements is less than the delayed state aid payments at June 30, 2020.
74

PASSAIC PUBLIC SCHOOLS NOTES TO THE FINANCIAL STATEMENTS FOR THE FISCAL YEAR ENDED JUNE 30, 2020
NOTE 3 STEWARDSHIP, COMPLIANCE AND ACCOUNTABILITY (Continued)
C. Capital Reserve
A capital reserve account was established by the District. The accumulation of funds will be used for capital outlay expenditures in subsequent fiscal years. The capital reserve is maintained in the general fund and its activity is included in the general fund annual budget.
Funds placed in the capital reserve are restricted to capital projects in the district's approved Long Range Facilities Plan (LRFP). Upon submission of the LRFP to the Department, a district may increase the balance in the capital reserve by appropriating funds in the annual general fund budget certified for taxes or by transfer by board resolution at year end of any unanticipated revenue or unexpended line-item appropriation amounts or both. A district may also appropriate additional amounts when the express approval of the voters has been obtained either by a separate proposal at budget time or by a special question atone of the four special elections authorized pursuant to N.J.S.A. 19:60-2. Pursuant to N.J.A.C. 6:23A-14.1 (g), the balance in the reserve cannot at any time exceed the local support costs of uncompleted capital projects in its approved LRFP.
The activity of the capital reserve for the fiscal year ended June 30, 2020 is as follows:
Balance, July 1, 2019
Increased by:
Interest Income
Deposits Approved by Board Resolution
Decreased by: Withdrawal in District Budget
Balance, June 30,2020
Analysis of Balance
$ 129,377
1,148,944
Capital Reserve Designated for Subsequent Years' Budget Capital Reserve
$ 12,468,654
1,278,321
13,746,975
5,421,000
$ 8,325,975
$ 7,047,654 1,278,321
$ 8,325,975
The withdrawals from the capital reserve were for use in a department approved facilities project, consistent with the district's Long Range Facilities Plan.
75

PASSAIC PUBLIC SCHOOLS NOTES TO THE FINANCIAL STATEMENTS FOR THE FISCAL YEAR ENDED JUNE 30, 2020
NOTE 3 STEWARDSHIP, COMPLIANCE AND ACCOUNTABILITY (Continued)
D. Maintenance Reserve
A maintenance reserve account was established by the District. The accumulation of funds will be used for required maintenance of school facilities expenditures in subsequent fiscal years. The maintenance reserve is maintained in the General Fund and its activity is included in the General Fund annual budget.
Funds placed in the maintenance reserve are restricted to required maintenance activities for a school facility as reported in the comprehensive maintenance plan. A District may appropriate funds into the maintenance reserve in the a1mual General Fund budget certified for taxes or by transfer by board resolution at year end of any unanticipated revenue or unexpended line item appropriation amounts or both. Pursuant to N.J.A.C. 6A:23A-14.2(g), the balance in the reserve cannot at any time exceed four percent of the replacement cost of the school district's school facilities for the current year.
The activity of the maintenance reserve for the fiscal year ended June 30, 2020 is as follows:
Balance, July 1, 2019
fucreased by:
futerest fucome
Unexpended Funds Returned to Reserve
Deposits Approved by Board Resolution
Decreased by: Withdrawal in District Budget
Balance, June 30, 2020
Analysis of Balance
$ 271,435
1,751,210
7,500,000
Maintenance Reserve Designated for Subsequent Years' Budget Maintenance Reserve
$ 18,306,169
9,522,645
27,828,814
7,200,000
$ 20,628,814
$ 7,344,000 13,284,814
$ 20,628,814
The withdrawals from the maintenance reserve were for use in required maintenance activities for school facilities.
E. Emergency Reserve
An emergency reserve account was established by the District. The accumulation of funds will be used to fmance unanticipated General Fund current expenditures required for a thorough and efficient education in subsequent fiscal years.
Funds placed in the emergency reserve are restricted to fmance reasonably unforeseeable costs and shall not include additional costs due to poor planning. A District may appropriate funds into the emergency reserve in the annual General Fund budget certified for taxes or by transfer by board resolution at year end of any unanticipated revenue or unexpended line item appropriation amounts or both. Withdrawals from the reserve require the approval of the Commissioner unless the withdrawal is necessary to meet an increase in total health care costs in excess of four percent or the withdrawal is included in the original budget certified for taxes to finance school security improvements to school facilities pursuant to 18A:7G-6(c)l. Pursuant to NJAC 6A:23A-14.4(A), the balance in the reserve cannot at any time exceed the greater of $250,000 or one percent of the school district's General Fund budget as certified for taxes up to a maximum of$1,000,000.
76

PASSAIC PUBLIC SCHOOLS NOTES TO. THE FINANCIAL STATEMENTS FOR THE FISCAL YEAR ENDED JUNE 30, 2020
NOTE 3 STEWARDSHIP, COMPLIANCE AND ACCOUNTABILITY (Continued)
E. Emergency Reserve (Continued)
The activity of the emergency reserve for the fiscal year ended June 30,2020 is as follows:
Balance, July 1, 2019 $ 995,657
Increased by: Interest Income 4,343
Balance, June 30, 2020 $ 1,000,000
NOTE 4 DETAILED NOTES ON ALL FUNDS
A. Cash Deposits and Investments
Cash Deposits
The Board's deposits are insured through either the Federal Deposit Insurance Corporation (FDIC), National Credit Union Share Insurance Fund (NCUSIF), Securities Investor Protection Corporation (SIPC) or New Jersey's Governmental Unit Deposit Protection Act (GUDPA). The Board is required to deposit their funds in a depository which is protecting such funds pursuant to GUDPA. The New Jersey Governmental Unit Deposit Protection Act requires all banks doing business in the State ofNew Jersey to pledge collateral equal to at least 5% of the average amount of its public deposits and 100% of the average amount of its public funds in excess of the lesser of 75% of its capital funds or $200 million for all deposits not covered by the FDIC and NCUSIF.
Bank balances are insured up to $250,000 in the aggregate by the FDIC for each bank. NCUSIF insures credit union accounts up to $250,000 in the aggregate for each financial institution. SIPC replaces cash claims up to a maximum of $250,000 for each failed brokerage firm. At June 30, 2020, the book value of the Board's deposits were $51,335,860 and bank and brokerage firm balances of the Board's deposits amounted to $57,835,883. The Board's deposits which are displayed on the various fund balance sheets as "cash and cash equivalents" are categorized as:
Depositorv Account
Insured $
Bank Balance
57,835,883
Custodial Credit Risk - Deposits - Custodial credit risk is the risk that in the event of a bank failure, the government's deposits may not be returned to it. The Board does not have a policy for custodial credit risk. As of June 30, 2020 none of the Board's bank balances were exposed to custodial credit risk.
77

PASSAIC PUBLIC SCHOOLS NOTES TO THE FINANCIAL STATEMENTS FOR THE FISCAL YEAR ENDED JUNE 30, 2020
NOTE 4 DETAILED NOTES ON ALL FUNDS (Continued)
A. Cash Deposits and Investments (Continued)
Investments
The Board is permitted to invest public funds in accordance with the types of securities authorized by N.J.S.A. 18A:20-37. Examples of the allowable investments are bonds or other obligations of the United States or obligations guaranteed by the United States of America; Government Money Market Mutual Funds; any obligation that a federal agency or a federal instrumentality has issued in accordance with an act of Congress, which security has a maturity date not greater than 397 days from the date of purchase, provided that such obligations bear a fixed rate of interest not dependent on any index or other external factor; bonds or other obligations of the school district or bonds or other obligations of the local unit or units within which the school district is located; Bonds or other obligations, having a maturity date of not more than 397 days from the date of purchase, issued by New Jersey school districts, municipalities, counties, and entities subject to the "Local Authorities Fiscal Control Law," (C.40A:5A-1 et seq.); Other bonds or obligations having a maturity date not more than 397 days from the date of purchase may be approved by the Division of Investment in the Department of the Treasury for investment by school districts; Local Government investment pools; deposits with the State of New Jersey Cash Management Fund established pursuant to section 1 ofP.L. 1977, c.281 (C.52:18A-90.4); and agreements for the repurchase of fully collateralized securities, if transacted in accordance with the above statute.
As of June 30, 2020, the Board had no outstanding investments.
B. Receivables
Receivables as ofJune 30, 2020 for the district's individual major funds in the aggregate, including the applicable allowances for uncollectible accounts, are as follows:
Receivables: Intergovernmental Federal State Local
Other Accounts Receivable
Gross Receivables Less: Allowance for
Uncollectibles
Net Total Receivables
Special Food General Revenue Service
$ 79,100 $ 6,217,022 $ 3,796,735 $ 10,092,857 1,059,608 311,430 24,996 1,396,034
108,939 108,939 145,964 145,964
1,393,611 6,528,452 3,821,731 11,743,794
$ 1,393,611 $ 6,528,452 $ 3,821,731 $ 11,743,794
78

PASSAIC PUBLIC SCHOOLS NOTES TO THE FINANCIAL STATEMENTS FOR THE FISCAL YEAR ENDED JUNE 30, 2020
NOTE 4 DETAILED NOTES ON ALL FUNDS (Continued)
C. Unearned Revenue
Governmental funds report unearned revenue in connection with resources that have been received, but not yet earned. At the end of the current fiscal year, the various components of unearned revenue reported in the governmental funds were as follows:
Special Revenue Fund Unencumbered Grant Draw Downs Grant Draw Downs Year End Encumbrances
Total Unearned Revenue for Governmental Funds
D. Capital Assets
Capital asset activity for the fiscal year ended June 30, 2020 was as follows:
Balance, Prior Period
July 1, 2019 Adjustment
Governmental Activities:
Capital Assets, Not Being Depreciated:
Land $ 1,753,991
Construction In Progress 195,194,824 $ 609,268 $
Total Capital Assets, Not Being Depreciated 196,948,815 609,268
Capital Assets, Being Depreciated:
Buildings and Improvements 261,953,367
Land Improvements 4,628,386 2,219
Machinery And Equipment 16,648,042 250,410
Total Capital Assets Being Depreciated 283,229,795 252,629
Less Accumulated Depreciation For:
Buildings and Improvements (101,563,469) 495,491
Land Improvements (2,834,382)
Machinery And Equipment {12,587,611)
Total Accumulated Depreciation {I 16,985,462) 495,491
Total Capital Assets, Being Depreciated, Net 166,244,333 748,120
Governmental Activities Capital Assets, Net $ 363,193,148 $ 1,357,388 $
79
$
$
522,381 364,924
887,305
Increases
74,925,183 $
74,925,183
3,637,488
827,363
4,464,851
(8,412,401)
(194,740)
(1,038,435)
{9,645,576)
(5,180,725)
69,744,458 $
Decreases
(3,637,488)
(3,637,488)
(538,227)
(538,227)
394,751
394,751
{143,476)
(3,780,964)
Balance,
June 30, 2020
$ 1,753,991
267,091,787
268,845,778
265,052,628
4,630,605
17,725,815
287,409,048
(109,085,628)
(3,029,122)
(13,626,046)
{125,740,796)
161,668,252
$ 430,514,030
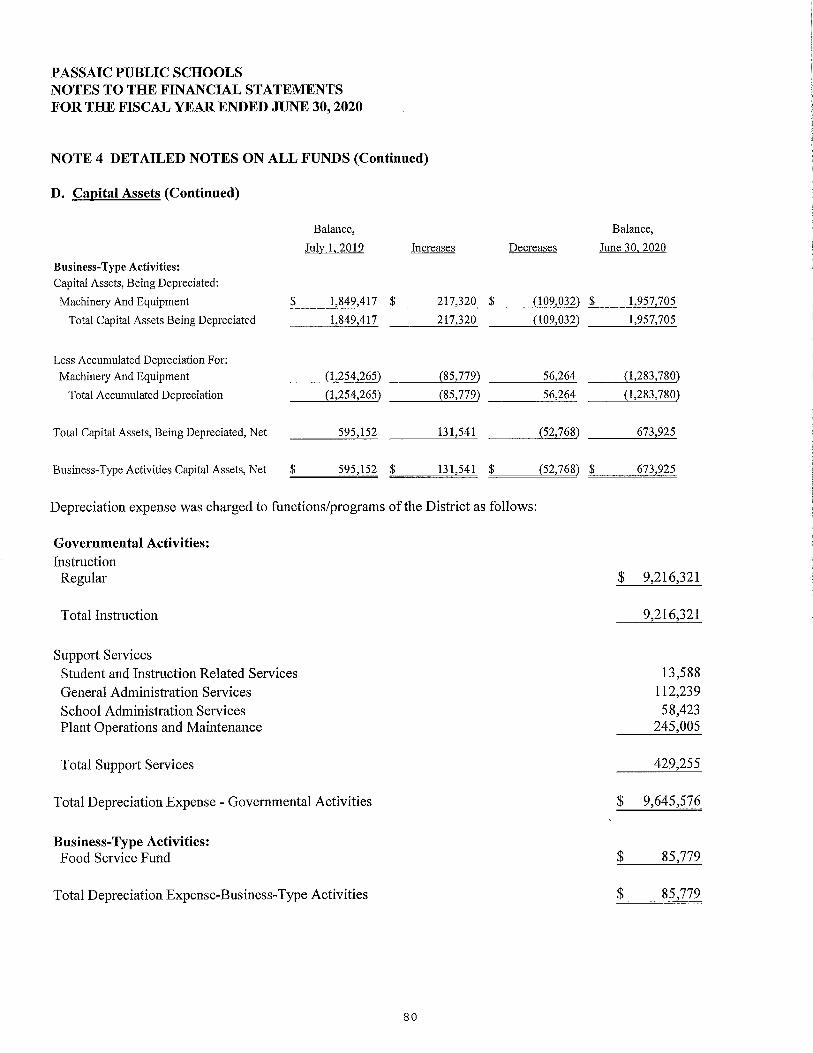
PASSAIC PUBLIC SCHOOLS NOTES TO THE FINANCIAL STATEMENTS FOR THE FISCAL YEAR ENDED JUNE 30, 2020
NOTE 4 DETAILED NOTES ON ALL FUNDS (Continued)
D. Capital Assets (Continued)
Balance,
July 1, 2019 Increases
Business-Type Activities:
Capital Assets, Being Depreciated:
Machinery And Equipment $ 1,849,417 $ 217,320
Total Capital Assets Being Depreciated 1,849,417 217,320
Less Accumulated Depreciation For:
Machinery And Equipment (1,254,265) (85,779)
Total Accumulated Depreciation (1,254,265) (85,779)
Total Capital Assets, Being Depreciated, Net 595,152 131,541
Business-Type Activities Capital Assets, Net $ 595,152 $ 131,541
Decreases
$ (109,032)
(109,032)
56,264
56,264
(52,768)
$ (52,768)
Depreciation expense was charged to functions/programs of the District as follows:
Governmental Activities: Instruction
Regular
Total Instruction
Suppmi Services Student and Instruction Related Services General Administration Services School Administration Services Plant Operations and Maintenance
Total Support Services
Total Depreciation Expense- Governmental Activities
Business-Type Activities: Food Service Fund
Total Depreciation Expense-Business-Type Activities
so
Balance,
June 30, 2020
$ 1,957,705
1,957,705
{1,283, 780)
(1,283,780)
673,925
$ 673,925
$ 9,216,321
9,216,321
13,588 112,239 58,423
245,005
429,255
$ 9,645,576
$ 85,779
$ 85,779

PASSAIC PUBLIC SCHOOLS NOTES TO THE FINANCIAL STATEMENTS FOR THE FISCAL YEAR ENDED JUNE 30, 2020
NOTE 4 DETAILED NOTES ON ALL FUNDS (Continued)
D. Capital Assets (Continued)
Construction and Other Significant Commitments
The District has the following active construction projects as of June 30, 2020:
Remaining Project Spent to Date Commitment
Track Replacement and Drainage Temporary Classroom Unit (TCU) Removal
E. Interfund Receivables, Payables, and Transfers
The composition of interfund balances as of June 3 0, 2020, is as follows:
Due To/From Other Funds
Receivable Fund Payable Fund
Special Revenue Fund
$
$
General Fund General Fund General Fund
Food Service Enterprise Fund Payroll Agency Trust Fund
Total
774,185 $ 271,437
1,045,622 $
1,143,669 1,178,573
2,322,242
Amolint
$ 3,036,461 523,235
2,614
$ 3,562,310
The above balances are the result of revenues earned or other financing sources received in one fund which are due to another fund and/or expenditures paid by one fund on behalf of another fund and/or to cover cash balances which were in an overdraft position.
The District expects all interfund balances to be liquidated within one year.
Interfund Transfers Transfer In:
Special Capital General Revenue Projects Total
Transfer Out: General Fund $ 3,057,699 $ 5,421,000 $ 8,478,699 Special Revenue Fund $ 8,465,024 8,465,024
Total Transfers Out $ 8,465,024 $ 3,057,699 $ 5,421,000 $ 16,943,723
The above transfers are the result of revenues earned and/or other financing sources received in one fund to finance expenditures in another fund.
81

PASSAIC PUBLIC SCHOOLS NOTES TO THE FINANCIAL STATEMENTS FOR THE FISCAL YEAR ENDED JUNE 30, 2020
NOTE 4 DETAILED NOTES ON ALL FUNDS (Continued)
F. Leases
Operating Leases
The District has entered into lease agreements for school building and/or annexes. The future minimum lease payments for these operating leases are as follows:
June 30,
G. Long-Term Debt
Statutory Borrowing Power
2021 2022 2023 2024 2025
Amount
$ 4,382,429 4,440,925 4,548,048 4,605,623 2,943,222
The Board's remaining borrowing power under N.J. S. 18A:24-19, as amended, atJune 3 0, 2020 was as follows:
4% ofEqualized Valuation Basis (Municipal) · Less: Net Debt
Remaining Borrowing Power
82
$ 149,959,892
$ 149,959,892

PASSAIC PUBLIC SCHOOLS NOTES TO THE FINANCIAL STATEMENTS FOR THE FISCAL YEAR ENDED JUNE 30, 2020
NOTE 4 DETAILED NOTES ON ALL FUNDS (Continued)
H. Other Long-Term Liabilities
Early Retirement Pension Liability
The District elected to participate in the State Division of Pensions "Early Retirement Incentive Program " ("ERIP") for both the Teacher Pensions and Annuity Fund and Public Employees' Retirement System. The total pension liability under these plans amounted to $21,409,721 for TPAF and $1,623,087 for PERS. The Board elected to pay-off this liability over 14 years. The following is a schedule of the future minimum pension contributions under the ERIP plans as of June 30, 2020.
Fiscal Year Ended
June 30,
2021
Total Minimum ERIP Pension Contributions
Less: Amount Representing Interest
Present Value of Net Minimum ERIP Pension Contributions
Changes in Long-Term Liabilities
General Governmental
Activities
$ 2,610,411
2,610,411
117,190
$ 2,493,221
Long-term liability activity for the fiscal year ended June 30, 2020, was as follows:
Balance, July 1, 2019 Additions Reductions
Governmental Activities: Net Pension Liability $ 87,260,444 $ 664,553 $ 9,461,305 Early Retirement Pension Obligations 4,817,794 2,324,573 Accrued Liability for Insurance Claims 2,491,721 10,501,163 10,892,221 Compensated Absences Payable 6,103,493 2,018,438 18,900
Governmental Activity Long-Term Liabilities $ 100,673,452 $ 13,184,154 $ 22,696,999
Business-Type Activities: Compensated Absences $ 63,842 $ 22,165 $
Business-Type Activity Long-Tenn Liabilities $ 63,842 $ 22,165 $
Due Balance, Within
June 30, 2020 One Year
$ 78,463,692 2,493,221 $ 2,493,221 2,100,663 163,000 8,103,031 225,000
$ 91,160,607 $ 2,881,221
$ 86,007 $
$ 86,007 $
For the governmental activities, the liabilities for compensated absences, claims and judgements, net pension liability and early retirement pension obligations are generally liquidated by the general fund.
83

PASSAIC PUBLIC SCHOOLS NOTES TO THE FINANCIAL STATEMENTS FOR THE FISCAL YEAR ENDED JUNE 30, 2020
NOTE 5 OTHER INFORMATION
A. Risk Management
The District is exposed to various risks of loss related to property, general liability, automobile coverage, theft of, damage to and destruction of assets; errors and omissions; injuries to employees; student accident; termination of employees and natural disasters. The Board has obtained commercial insurance coverage to guard against these events to minimize the exposure to the District should they occur. A complete schedule of insurance coverage can be found in the statistic.al section of this Comprehensive Annual Financial Report.
The District has established a worker's compensation plan for its employees. Transactions related to the plan are accounted for in the General Fund. The District funds the entire cost of the plan. Claims are paid directly by the plan up to a maximum of $1,000,000 for any one accident or occmTence, with any excess benefit being reimbursed through aReInsurance Agreement with State National Insurance Company. A contingent liability exists with respect to reinsurance, which would become an actual liability in the event the reinsuring company may not be able to meet their obligations to the District under existing reinsurance agreements.
Estimates of claims payable and of claims incurred, but not reported (IBNR) at June 30, 2020, are reported as claims and judgments payable and accrued liability for insurance claims, respectively. These estimates were determined based on claim information supplied by the claims administrator and actuary. The unpaid claims liability of $3,246,656 reported at June 30, 2020 is based on the requirements of the Governmental Accounting Standards Board, which requires that a liability for claims be reported if information prior to the issuance of the financial statements indicates that it is probable that a liability has been incurred at the date of the financial statements and the amount of the loss can be reasonably estimated.
Changes in the balances of claims liabilities for the worker's compensation plan for the fiscal years ended June 30, 2020 and 2019 are as follows:
Governmental Activities:
Unpaid Claims, Beginning ofFiscal Year Incurred Claims (including IBNR) Claim Payments
Unpaid Claims, End ofFiscal Year
General Fund: Claims and Judgements Payable
Long-Term Liabilities: Accrued Liability for Insurance Claims
84
Fiscal Year Ended June 30, 2020 June 30, 2019
$ 3,648,100 973,890
(1,375,334)
$. 3,246,656
$ 1,375,109
1,871,547
$ 3,246,656
$ 3,481,077 2,203,049
(2,036,026)
$ 3,648,100
$ 1,375,109
2,272,991
$ 3,648,100

PASSAIC PUBLIC SCHOOLS NOTES TO THE FINANCIAL STATEMENTS FOR THE FISCAL YEAR ENDED JUNE 30, 2020
NOTE 5 OTHER INFORMATION (Continued)
A. Risk Management (Continued)
The District has also established a prescription drug plan for its employees. Transactions related to the plan are accounted for in the General Fund. The District funds the entire cost of the plan. Claims are paid directly by the plan up to a maximum of $10,775,517 for calendar year 2019 and $10,619,844 for calendar year 2020, with any excess benefit being reimbursed through a Re-Insurance Agreement with American National Insurance Company. A contingent liability exists with respect to reinsurance, which would become an actual liability in the event the reinsuring company may not be able to meet their obligations to the District under existing reinsurance agreements.
Estimates of claims payable and of claims incuned, but not reported (IBNR) at June 30, 2020, are reported as accrued liability for insurance claims. These estimates were determined based on claim information supplied by the actuary. The unpaid claims liability of $229,116 reported at June 30, 2020 is based on the requirements of the Governmental Accounting Standards Board, which requires that a liability for claims be reported if information prior to the issuance of the financial statements indicates that it is probable that a liability has been incuned at the date of the financial statements and the amount of the loss can be reasonably estimated.
Changes in the balances of claims liabilities for the prescription drug plan for the fiscal years ended June 30, 2019 and 2018 are as follows:
Governmental Activities: Fiscal Year Ended June 30, 2020 June 30, 2019
Unpaid Claims, Beginning ofYear $ 218,730 $ 307,535 Incuned Claims 9,527,273 8,941,967 Claim Payments (9,516,887) (9,030, 772)
Unpaid Claims, End ofYear $ 229,116 $ 218,730
There has been no significant reduction in insurance coverage from the previous year nor have there been any settlements in excess of insurance coverage's in any of the prior three years.
B. Contingent Liabilities
The District is a party defendant in some lawsuits, none of a kind unusual for a school district of its size and scope of operation. In the opinion of the Board's Attorney the potential claims against the District not covered by insurance policies would not materially affect the financial condition of the District.
Federal and State Awards- The Board participates in a number of federal and state programs that are fully or partially funded by grants received from other governmental units. Expenditures financed by grants are subject to audit by the appropriate grantor government. If expenditures are disallowed due to noncompliance with grant program regulations, the Board may be required to reimburse the grantor government. As of June 30, 2020, significant amounts of grant expenditures have not been audited by the various grantor agencies but the Board believes that disallowed expenditures, if any, based on subsequent audits will not have a material effect on any of the individual governmental funds or the overall financial position of the District.
85

PASSAIC PUBLIC SCHOOLS NOTES TO THE FINANCIAL STATEMENTS FOR THE FISCAL YEAR ENDED JUNE 30, 2020
NOTE 5 OTHER INFORMATION (Continued)
C. Employee Retirement Systems and Pension Plans
Plan Descriptions and Benefits Provided
The State of New Jersey sponsors and administers the following contributory defmed benefit public employee retirement systems (retirement systems) covering substantially all Board employees who are eligible for pension coverage:
Public Employees' Retirement System (PERS)- Established in January 1955, under the provisions ofN.J.S.A. 43:15A to provide coverage, to substantially all full time employees of the State or any county, municipality, school district, or public agency provided the employee is not a member of another State-administered retirement system. Membership is mandatory for such employees. PERS is a cost sharing multiple employer defmed benefit pension plan. For additional information about PERS, please refer to the State Division of Pension and Benefits (Division's) Comprehensive Annual Financial Report (CAFR) which can be found at www.state.nj .us/treasury/pensions.
The vesting and benefit provisions are set by N.J.S .A. 43: 15A. PERS provides retirement, death, and disability benefits. All benefits vest after ten years of service, except for medical benefits, which vest after 25 years of service or under the disability provisions ofPERS.
The following represents the membership tiers for PERS:
Tier Definition
1 Members who were enrolled prior to July 1, 2007 2 Members who were eligible to enroll on or after July 1, 2007 and prior to November 2, 2008 3 Members who were eligible to enroll on or after November 2, 2008 and prior to May 22, 2010 4 Members who were eligible to enroll on or after May 22, 2010 and prior to June 28, 2011 5 Members who were eligible to enroll on or after June 28, 2011
Service retirement benefits of 1/55th of final average salary for each year of service credit is available to tier 1 and 2 members upon reaching age 60 and to tier 3 members upon reaching age 62. Service retirement benefits of 1/60th of fmal average salary for each year of service credit is available to tier 4 members upon reached age 62 and tier 5 members upon reaching age 65. Early retirement benefits are available to tier 1 and 2 members before reaching age 60, tier 3 and 4 members with 25 or more years of service credit before age 62, and tier 5 members with 30 or more years of service credit before age 65. Benefits are reduced by a fraction of a percent for each month that a member retires prior to the age at which a member can receive full early retirement benefits in accordance with their respective tier. Tier 1 members can receive an unreduced benefit from age 55 to age 60 if they have at least 25 years of service. Deferred retirement is available to members who have at least ten years of service credit and have not reached the service retirement age for the respective tier.
Teachers' Pension and Annuity Fund (TPAF) -Established in January 1955, under the provisions ofN.J.S.A. 18A:66 to provide coverage to substantially all full time certified teachers or professional staff of the public school systems in the State. Membership is mandatory for such employees. TP AF is a cost sharing multiple- employer defmed benefit pension plan with a special funding situation, which the State is responsible to fund 100% of local employer contributions, excluding any local employer early retirement incentive (ERI) contributions. For additional information about TPAF, please refer to the State Division of Pension and Benefits (Division's) Comprehensive Annual Financial Report (CAFR) which can be found at www.state.nj.us/treasury/pensions.
The vesting and benefit provisions are set by N.J. S.A. 18A:66. TP AF provides retirement, death, and disability benefits. All benefits vest after ten years of service, except for medical benefits, which vest after 25 years of service or under the disability provisions of TPAF. Members are always fully vested for their own contributions and, after three years of service credit, become vested for 2% of related interest earned on the contributions. In the case of death before retirement, members' beneficiaries are entitled to full interest credited to the members' accounts.
86

PASSAIC PUBLIC SCHOOLS NOTES TO THE FINANCIAL STATEMENTS FOR THE FISCAL YEAR ENDED JUNE 30, 2020
NOTE 5 OTHER INFORMATION (Continued)
C. Employee Retirement Systems and Pension Plans (Continued)
Teachers' Pension and Annuity Fund (TP AF) (Continued)
The following represent the membership tiers for TP AF:
Tier Definition
1 Members who were enrolled prior to July 1, 2007 2 Members who were eligible to enroll on or after July 1, 2007 and prior to November 2, 2008 3 Members who were eligible to enroll on or after November 2, 2008 and prior to May 22, 2010 4 Members who were eligible to enroll on or after May 22, 2010 and prior to June 28, 2011 5 Members who were eligible to enroll on or after June 28, 2011
Service retirement benefits of 1/55th offmal average salary for each year of service credit is available to tier 1 and 2 members upon reaching age 60 and to tier 3 members upon reaching age 62. Service retirement benefits of 1/60th of fmal average salary for each year of service credit is available to tier 4 members upon reached age 62 and tier 5 members upon reaching age 65. Early retirement benefits are available to tier 1 and 2 members before reaching age 60, tier 3 and 4 members with 25 or more years of service credit before age 62, and tier 5 members with 30 or more years of service credit before age 65. Benefits are reduced by a fraction of a percent for each month that a member retires prior to the retirement for his/her respective tier. Deferred retirement is available to members who have at least ten years of service credit and have not reached the service retirement age for the respective tier.
The State of New Jersey sponsors and administers the following defined contribution public employee retirement program covering certain state and local government employees which include those Board employees who are eligible for pension coverage.
Defined Contribution Retirement Program (DCRP)- established under the provisions of Chapter 92, P.L. 2007 and Chapter 103, P.L. 2008 to provide coverage to elected and certain appointed officials, effective July 1, 2007 and employees enrolled in PERS on or after July 1, 2007 who earn in excess of established mmual maximum compensation limits (equivalent to annual maximum wage for social security deductions). This provision was extended by Chapter 1, P.L. 2010, effective May 21, 2010, to new employees (Tier 2) of the PFRS and new employees who would otherwise be eligible to participate in PERS and do not earn the miniinum salary required or do not work the minimum required hours but earn a base salary of at least $5,000 are eligible for participation in the DCRP. Membership is mandatory for such individuals with vesting occurring after one (1) year of membership. DCRP is a defined contribution pension plan.
Other Pension Funds
The State established and administers a Supplemental Annuity Collective Trust Fund (SACT) which is available to active members of the State-administered retirement systems to purchase mmuities to supplement the guaranteed benefits provided by their retirement system. The state or local government employers do not appropriate funds to SACT.
The cost of living increase for PERS and TPAF, are funded directly by each of the respective systems but are currently suspended as a result of reform legislation.
According to state law, all obligations of each retirement system will be assumed by the State of New Jersey should m1y retirement system be terminated.
The State of New Jersey, Depmtment of the Treasury, Division of Pensions and Benefits ("Division"), issues publicly available fmancial reports that include the financial statements and required supplementary information of each of the above systems. The fmancial reports may be accessed via the New Jersey, Division of Pensions and Benefits, website at www.state.nj .us/treasury/pensions.
87

PASSAIC PUBLIC SCHOOLS NOTES TO THE FINANCIAL STATEMENTS FOR THE FISCAL YEAR ENDED JUNE 30, 2020
NOTE 5 OTHER INFORMATION (Continued)
C. Employee Retirement Systems and Pension Plans (Continued)
Plan Amendments
The authority to amend the provisions of the above plans rests with new legislation passed by the State of New Jersey. Pension reforms enacted pursuant to Chapter 78, P.L. 2011 included provisions creating special Pension Plan Design Committees for TP AF and PERS, once a Target Funded Ratio {TFR) is met. The Pension Plan Design Committees will have the discretionary authority to modify certain plan design features, including member contribution rate; formula for calculation of final compensation of fmal salary; fraction used to calculate a retirement allowance; age at which a member may be eligible and the benefits for service or early retirement; and benefits provided for disability retirement. The committees will also have the authority to reactivate the cost of living adjustment (COLA) on pensions. However, modifications can only be made to the extent that the resulting impact does not cause the funded ratio to drop below the TFR in any one year of a 30-year projection period.
Measurement Focus and Basis of Accounting I
The fmancial statements of the retirement systems are prepared in accordance with U.S. generally accepted accounting principles as applicable to governmental organizations. In doing so, the Division adheres to reporting requirements established by the Governmental Accounting Standards Board (GASB).
The accrual basis of accounting is used for measuring fmancial position and changes in net position of the pension trust funds. Under this method, contributions are recorded in the accounting period in which they are legally due from the employer or plan member, and deductions are recorded at the time the liabilities are due and payable in accordance with the terms of each plan. The accounts of the Division are organized and operated on the basis of funds. All funds are accounted for using an economic resources measurement focus.
Investment Valuation
The Division ofhwestment, Department of the Treasury, State ofNew Jersey (Division of Investment) manages and invests certain assets of the retirement systems. Prudential retirement is the third-party administrator for the DCRP and provides record keeping, administrative services and investment options. Investment transactions are accounted for on a trade or investment date basis. Interest and dividend income is recorded on the accrual basis, with dividends accruing on the exdividend date. The net increase or decrease in the fair value of investments includes the net realized and unrealized gains or losses on investments.
The State ofNew Jersey, Department of the Treasury, Division of Investment issues publicly available fmancial reports that include the fmancial statements of the State ofNew Jersey Cash Management Fund. The fmancial reports may be obtained in writing to the State of New Jersey, Department of the Treasury, Division of Investment, P.O. Box 290, Trenton, New Jersey 08625-0290 or at www.state.nj.us/treasury/doinvest. '
88

PASSAIC PUBLIC SCHOOLS NOTES TO THE FINANCIAL STATEMENTS FOR THE FISCAL YEAR ENDED JUNE 30, 2020
NOTE 5 OTHER INFORMATION (Continued)
C. Employee Retirement Systems and Pension Plans (Continued)
Collective Net Pension Liability
The collective net pension liability of the participating employers for local PERS at June 30, 2019 is $18.1 billion and the plan fiduciary net position as a percentage of the total pension liability is 56.27%. The collective net pension liability of the State funded TPAF at June 30, 2019 is $61.5 billion and the plan fiduciary net position as a percentage of total pension liability is 26.95%.
The total pension liabilities were determined based on actuarial valuations as of July 1, 2018 which were rolled forward to June 30, 2019.
Actuarial Methods and Assumptions
In the July 1, 2018 PERS and TP AF actuarial valuation, the actuarial assumptions and methods used in these valuations were described in the Actuarial Assumptions and Methods section of the Actuary's report and are included here in this note to the fmancial statements. The pension systems selected economic and demographic assumptions and prescribed them for use for purposes of compliance with GASB Statement No. 68. The Actuary provided guidance with respect to these assumptions, and it is their beliefthat the assumptions represent reasonable expectations of anticipated plan experience.
Employer and Employee Pension Contributions
The contribution policy is set by laws of the State of New Jersey and contributions are required by active members and participating employers. Plan members and employer contributions may be amended by State ofNew Jersey legislation with the amount of contributions by the State of New Jersey contingent upon the Annual Appropriations Act. As defmed, the retirement systems require employee contributions based on 7.50% for PERS, 7.50% for TPAF and 5.50% for DCRP of the employee's armual compensation for fiscal year 2020.
PERS employers' and TPAF State's nonemployer contributions are based on actuarially determined amounts, which include the normal cost and unfunded accrued liability. For the fiscal year ended June 30, 2020 for TP AF, which is a cost sharing multiple employer defined benefit pension plan with a special funding situation, the State's armual pension contribution was less than the actuarial determined amount. For PERS, which is a cost sharing multiple employer defined benefit pension plan, the armual pension contributions were equal to the actuarial determined amounts. TP AF nonemployer contributions are made armually by the State of New Jersey to the pension system on behalf of the Board. PERS employer contributions are made armually by the Board to the pension system in accordance with Chapter 114, P.L. 1997. In the DCRP, which is a defmed contribution plan, member contributions are matched by a 3% employer contribution. All PERS and DCRP contributions made by the Board for fiscal years 2020, 2019 and 2018 were equal to the required contributions.
During the fiscal years ended June 30, 2020, 2019 and 2018 the Board was required to contribute for PERS and DCRP and the State of New Jersey, as a nonemployer contributing entity, contributed for TPAF, respectively for normal cost pension and unfunded accrued liability contributions (including non-contributory group life insurance (NCGI)) the following amounts:
Fiscal Year Ended On-Behalf
June 30, PERS TPAF DCRP
2020 $ 4,235,786 $ 22,114,672 $ 26,903 2019 4,408,235 20,750,448 44,962 2018 4,191,959 16,001,000 30,962
89

PASSAIC PUBLIC SCHOOLS NOTES TO THE FINANCIAL STATEMENTS FOR THE FISCAL YEAR ENDED JUNE 30, 2020
NOTE 5 OTHER INFORMATION (Continued)
C. Employee Retirement Systems and Pension Plans (Continued)
Employer and Employee Pension Contributions (Continued)
In addition for fiscal years 2020, 2019 and 2018 the District contributed $23,265, $27,620 and $89,158, respectively for PERS and the State contributed $16,569, $20,292 and $24,304, respectively for TPAF for Long Term Disability Insurance Premium (LTDI).
The PERS contributions are recognized in the governmental fund fmancial statements (modified accrual basis) as an expenditure. The on-behalf TP AF contributions are recognized in the governmental fund financial statements (modified accrual basis) as both a revenue and expenditure in accordance with GASB Statement No. 85, Omnibus 2017 (GASB No. 85). The DCRP contributions are recognized in the governmental fund fmancial statements (modified accrual basis) as an expenditure, as well as, the district-wide financial statements (accrual basis) as an expense.
,,
Also, in accordance with N.J.S.A. 18A:66-66 the State of New Jersey reimbursed the Board $8,301,798 during the fiscal year ended June 30, 2020 for the employer's share of social security contributions for TPAF members as calculated on their base salaries. This amount has been recognized in the district-wide fmancial statements (accrual basis) and the governmental fund fmancial statements (modified accrual basis) as both a revenue and expense/expenditure in accordance with GASB No. 85.
Pension Liabilities, Pension Expense, and Deferred Outflows of Resources and Deferred Inflows of Resources Related to Pensions
Public Employees Retirement System (PERS)
GASB Statement No. 68, Accounting and Financial Reporting for Pensions, (GASB No. 68) requires participating employers in PERS to recognize their proportionate share of the collective net pension liability, collective deferred outflows of resources, collective deferred inflows of resources and collective pension expense. The employer allocation percentages presented are based on the ratio of the contributions as an individual employer to total contributions to the PERS during the measurement period July 1, 2018 through June 30, 2019. Employer allocation percentages have been rounded for presentation purposes.
Although the NJ Division of Pensions and Benefits ("Division") administers one cost-sharing multiple employer defmed benefit pension plan, separate (sub) actuarial valuations are prepared to determine the actuarial determined contribution rate by group. Following this method, the measurement of the collective net pension liability, deferred outflows of resources, deferred inflows of resources and pension expense are determined separately for each individual employer of the State and local groups of the plan.
To facilitate the separate (sub) actuarial valuations, the Division maintains separate accounts to identifY additions, deductions, and fiduciary net position applicable to each group. The allocation percentages are presented for each group. The allocation percentages for each group as of June 30, 2019 are based on the ratio of each employer's contribution to total employer contributions of the group for the fiscal year ended June 30, 2019.
At June 30, 2020, the District reported in the statement of net position (accrual basis) a liability of $78,463,692 for its proportionate share of the PERS net pension liability. The net pension liability was measured as of June 30, 2019 and was determined by an actuarial valuation as of July I, 2018. The District's proportionate share of the net pension liability was based on the ratio of the District's share of contributions to the pension plan relative to the total contributions of all participating governmental entities, for the year ended June 30, 2019. At June 30, 2019, the District's proportionate share was .43546 percent, which was a decrease of .00772 percent from its proportionate share measured as of June 30, 2018 of .44 318 percent.
90

PASSAIC PUBLIC SCHOOLS NOTES TO THE FINANCIAL STATEMENTS FOR THE FISCAL YEAR ENDED JUNE 30, 2020
NOTE 5 OTHER INFORMATION (Continued)
C. Employee Retirement Systems and Pension Plans (Continued)
Pension Liabilities, Pension Expense, and Deferred Outflows of Resources and Deferred Inflows of Resources Related to Pensions (Continued)
Public Employees Retirement System (PERS) (Continued)
For the fiscal year ended June 30, 2020, the District recognized in the district-wide statement of activities (accrual basis) pension expense $4,900,339 for PERS. The pension contribution made by the District during the current 2019/2020 fiscal year is the contribution that is applied to the net pension liability reported at the end of the current fiscal year of June 30, 2020 with a measurement date of the prior fiscal year end of June 30, 2019. Since the State of New Jersey applies the current year pension contribution towards the calculation of the net pension liability reported at the end of the current fiscal year, which has a measurement date ofthe preceding fiscal year end, there is no deferred outflows of resources reported as of June 30, 2020 for contributions made subsequent to the measurement date. At June 30, 2020, the District reported deferred outflows of resources and deferred inflows of resources related toPERS pension from the following sources:
Deferred Deferred Outflows Inflows
of Resources of Resources
Difference Between Expected and Actual Experience $ 1,408,321 $ 346,618
Changes of Assumptions 7,834,888 27,234,499 Net Difference Between Projected and Actual
Earnings on Pension Plan Investments 1,238,580 Changes in Proportion and Differences Between
District Contributions and Proportionate Share of Contributions 1,868,917 2,768,540
Total $ 11,112,126 $ 31,588,237
At June 30, 2020, the amounts reported as deferred outflows of resources and deferred inflows of resources related to PERS pension will be recognized in pension expense/(benefit) as follows:
Year Ending June 30, Total
2021 $ (1,449,630) 2022 (7,682,267) 2023 (7,335,457) 2024 (3,633,037) 2025 (375,720)
Thereafter
$ (20,476,111)
. 91

PASSAIC PUBLIC SCHOOLS NOTES TO THE FINANCIAL STATEMENTS FOR THE FISCAL YEAR ENDED JUNE 30, 2020
NOTE 5 OTHER INFORMATION (Continued)
C. Employee Retirement Systems and Pension Plans (Continued)
Pension Liabilities, Pension Expense, and Deferred Outflows of Resources and Deferred Inflows of Resources Related to Pensions (Continued)
Public Employees Retirement System (PERS) (Continued)
Actuarial Assumptions
The District's total pension liability for the June 30, 2019 measurement date was detennined by an actuarial valuation as of July 1, 2018, which was rolled forward to June 30, 2019. This actuarial valuation used the following actuarial assumptions, applied to all periods in the measurement.
Inflation Rate: Price Wage
Salary Increases:
Through 2026
Thereafter
Investment Rate of Return
Mortality Rate Table
2.75% 3.25%
2.00-6.00% Based on Years
of Service
3.00%-7.00%
Based on Years of Service
7.00%
Pub-2010
Assumptions for mortality improvements are based on Society of Actuaries Scale MP-2019.
The actuarial assumptions used in the July 1, 2018 valuation were based on the results of an actuarial experience study for the period July 1, 2014 to June 30, 2018.
92

PASSAIC PUBLIC SCHOOLS NOTES TO THE FINANCIAL STATEMENTS FOR THE FISCAL YEAR ENDED JUNE 30, 2020
NOTE 5 OTHER INFORMATION (Continued)
C. Employee Retirement Systems and Pension Plans (Continued)
Pension Liabilities, Pension Expense, and Deferred Outflows of Resources and Deferred Inflows of Resources Related to Pensions (Continued)
Public Employees Retirement System (PERS) (Continued)
Long-Term Expected Rate of Return
fu accordance with State statute, the long-term expected rate of return on plan investments (7% at June 30, 2019) is determined by the State Treasurer, after consultation with the Directors of the Division of fuvestment and Division of Pensions and Benefits, the board of trustees and actuaries. The long-term expected rate of return on pension plan investments was determined using a building-block method in which best-estimate ranges of expected future real rates of return (expected returns, net of pension plans investment expense and inflation) are developed for each major asset class. These ranges are combined to produce the long-tenn expected rate of return by weighting the expected future real rates of return by the target asset allocation percentage and by adding expected inflation. Best estimates of arithmetic real rates of return for each major asset class included in the PERS's target asset allocation as of June 30, 2019 are summarized in the following table:
Asset Class
Risk Mitigation Strategies Cash Equivalents U.S. Treasuries fuvestment Grade Credit US Equity Non-US Developed Markets Equity Emerging Markets Equity High Yield Real Assets Private Credit Real Estate Private Equity
Discount Rate
Long-Term Target Expected Real
Allocation Rate of Return
3.00% 4.67% 5.00% 2.00% 5.00% 2.68% 10.00% 4.25% 28.00% 8.26% 12.50% 9.00% 6.50% 11.37% 2.00% 5.37% 2.50% 9.31% 6.00% 7.92% 7.50% 8.33% 12.00% 10.85%
The discount rate used to measure the total pension liabilities of the PERS plan was as follows:
Fiscal Year Measurement Date Discount Rate
2020 June 30, 2019 6.28% 2019 June 30, 2018 5.66%
93

PASSAIC PUBLIC SCHOOLS NOTES TO THE FINANCIAL STATEMENTS FOR THE FISCAL YEAR ENDED JUNE 30, 2020
NOTE 5 OTHER INFORMATION (Continued)
C. Employee Retirement Systems and Pension Plans (Continued)
Pension Liabilities, Pension Expense, and Deferred Outflows of Resources and Deferred Inflows of Resources Related to Pensions (Continued)
Public Employees Retirement System (PERS) (Continued)
Discount Rate (Continued)
The following table represents the crossover period, if applicable, for the PERS defined benefit plan:
Period of Projected Benefit Payments for which the Following Rates were Applied: Long-Term Expected Rate of Return
Municipal Bond Rate *
Through June 30, 2057
From July 1, 2057 and Thereafter
*The municipal bond return rate used is 3.50% as of the measurement date of June 30, 2019. The source is the Bond Buyer Go 20-Bond Municipal Bond Index, which includes tax-exempt general obligation municipal bonds with an average rating of AA/Aa or higher.
Sensitivity of Net Pension Liability
The following presents the District's proportionate share of the PERS net pension liability calculated using the discount rate of 6.28%, as well as what the District's proportionate share of the PERS net pension liability would be if it were calculated using a discount rate that is 1-percentage-point lower (5.28 percent) or !-percentage-point higher (7.28 percent) than the current rate:
1% Current 1% Decrease Discount Rate Increase
5.28% 6.28% 7.28%
District's Proportionate Share of the PERS Net Pension Liability $ 99,112,393 $ 78,463,692 $ 61,064,236
The sensitivity analysis was based on the proportionate share of the District's net pension liability as of the measurement date of June 30, 2019. A sensitivity analysis specific to the District's net pension liability at June 30, 2019 was not provided by the pension system.
Pension Plan Fiduciary Net Position
Detailed information about the PERS pension plan's fiduciary net position is available in the separately issued fmancial report from the State of New Jersey, Department of the Treasury, Division of Pension and Benefits. The fmancial report may be accessed via the New Jersey, Division of Pensions and Benefits, website at www.state.ni.us/treasmy/pensions.
94

PASSAIC PUBLIC SCHOOLS NOTES TO THE FINANCIAL STATEMENTS FOR THE FISCAL YEAR ENDED JUNE 30, 2020
NOTE 5 OTHER INFORMATION (Continued)
C. Employee Retirement Systems and Pension Plans (Continued)
Pension Liabilities, Pension Expense, and Deferred Outflows of Resources and Deferred Inflows of Resources Related to Pensions (Continued)
Teachers Pension and Annuity Fund (TP AF)
GASB No. 68, requires participating employers in TP AF to recognize their proportionate share of the collective net pension liability, collective deferred outflows of resources, collective deferred inflows of resources and collective pension expense. The non-employer allocation percentages presented are based on the ratio of the State's contributions made as an employee and non-employer adjusted for unpaid early retirement incentives to total contributions to TP AF during the measurement period July 1, 2018 through June 30, 2019. Non-employer allocation percentages have been rounded for presentation purposes.
The contribution policy for TP AF is set by N.J. S.A. 18A: 66 and requires contributions by active members and non-employer contributions by the State. State legislation has modified the amount that is contributed by the State. The State's pension contribution is based on an actuarially determined amount, which includes the employer portion of the normal cost and an amortization of the unfunded accrued liability. For the fiscal year ended June 30, 2019, the State's pension contribution was less than the actuarial determined amount.
In accordance with GASB No. 68, the District is not required to recognize a net pension liability for TPAF. The State of New Jersey, as a nonemployer contributing entity, is the only entity that has a legal obligation to make employer contributions to TP AF on behalf of the District. Accordingly, the District's proportionate share percentage determined under Statement No. 68 is zero percent and the State's proportionate share is 100% of the net pension liability attributable to the District for TPAF. Therefore, in addition, the District does not recognize any portion of the TPAF collective deferred outflows of resources and deferred inflows of resources.
For the fiscal year ended June 30, 2020, the District recognized in the district-wide statement of activities (accrual basis) pension expense of $37,408,192 for TPAF. This amount has been included in the district-wide statement of activities (accrual basis) as both a revenue and expense in accordance with GASB No. 85.
At June 30, 2020 the State's proportionate share of the net pension liability attributable to the District is $634,223,406. The nonemployer allocation percentages are based on the ratio of the State's contributions made as a nonemployer attributable to the District adjusted for unpaid early retirement incentives relative to total contributions to TP AF during the year ended June 30, 2019. At June 30, 2019, the State's share of the net pension liability attributable to the District was 1.0334 percent, which was a decrease of .0274 percent from its proportionate share measured as ofJune 30,2018 of 1.0608 percent.
95

PASSAIC PUBLIC SCHOOLS NOTES TO THE FINANCIAL STATEMENTS FOR THE FISCAL YEAR ENDED JUNE 30, 2020
NOTE 5 OTHER INFORMATION (Continued)
C. Employee Retirement Systems and Pension Plans (Continued)
Pension Liabilities, Pension Expense, and Deferred Outflows of Resources and Deferred Inflows of Resources Related to Pensions (Continued)
Teachers Pension and Annuity Fund (TP AF) (Continued)
Actuarial Assumptions
The total pension liability for the June 30, 2019 measurement date was determined by an actuarial valuation as of July 1, 2018, which was rolled forward to June 30, 2019. This actuarial valuation used the following actuarial assumptions, applied to all periods in the measurement.
Inflation Rate: Price Wage
Salary fucreases:
Through 2026
Thereafter
Investment Rate of Return
Mortality Rate Table
2.75% 3.25%
1.55-4.55% Based on Years
of Service
2.75%-5.65% Based on Years
of Service
7.00%
Pub-2010
Assumptions for mortality improvements are based on Society of Actuaries Scale MP-2019.
The actuarial assumptions used in the July 1, 2018 valuation were based on the results of an actuarial experience study for the period July 1, 2015 to June 30, 2018.
96

PASSAIC PUBLIC SCHOOLS NOTES TO THE FINANCIAL STATEMENTS FOR THE FISCAL YEAR ENDED JUNE 30, 2020
NOTE 5 OTHER INFORMATION (Continued)
C. Employee Retirement Systems and Pension Plans (Continued)
Pension Liabilities, Pension Expense, and Deferred Outflows of Resources and Deferred Inflows of Resources Related to Pensions (Continued)
Teachers Pension and Annuity Fund (TP AF) (Continued)
Long-Term Expected Rate of Return
In accordance with State statute, the long-term expected rate of return on plan investments (7% at June 30, 2019) is determined by the State Treasurer, after consultation with the Directors of the Division of Investment and Division of Pensions and Benefits, the board of trustees and actuaries. The long-term expected rate of return on pension plan investments was determined using a building-block method in which best-estimate ranges of expected future real rate of return (expected returns, net of pension plans investment expense and inflation) are developed for each major asset class. These ranges are combined to produce the long-term expected rate of return by weighting the expected future real rates of return by the target asset allocation percentage and by adding expected inflation. Best estimates of arithmetic real rates of return for each major asset class included in the TPAF's target asset allocation as of June 30, 2019 are summarized in the following table:
Long-Term Target Expected Real
Asset Class Allocation Rate of Return
Risk Mitigation Strategies 3.00% 4.67% Cash Equivalents 5.00% 2.00% U.S. Treasuries 5.00% 2.68% Investment Grade Credit 10.00% 4.25% US Equity 28.00% 8.26%
Non-US Developed Markets Equity 12.50% 9.00% Emerging Markets Equity 6.50% 11.37% High Yield 2.00% 5.37%
Real Assets 2.50% 9.31% Private Credit 6.00% 7.92% Real Estate 7.50% 8.33%
Private Equity 12.00% 10.85%
97
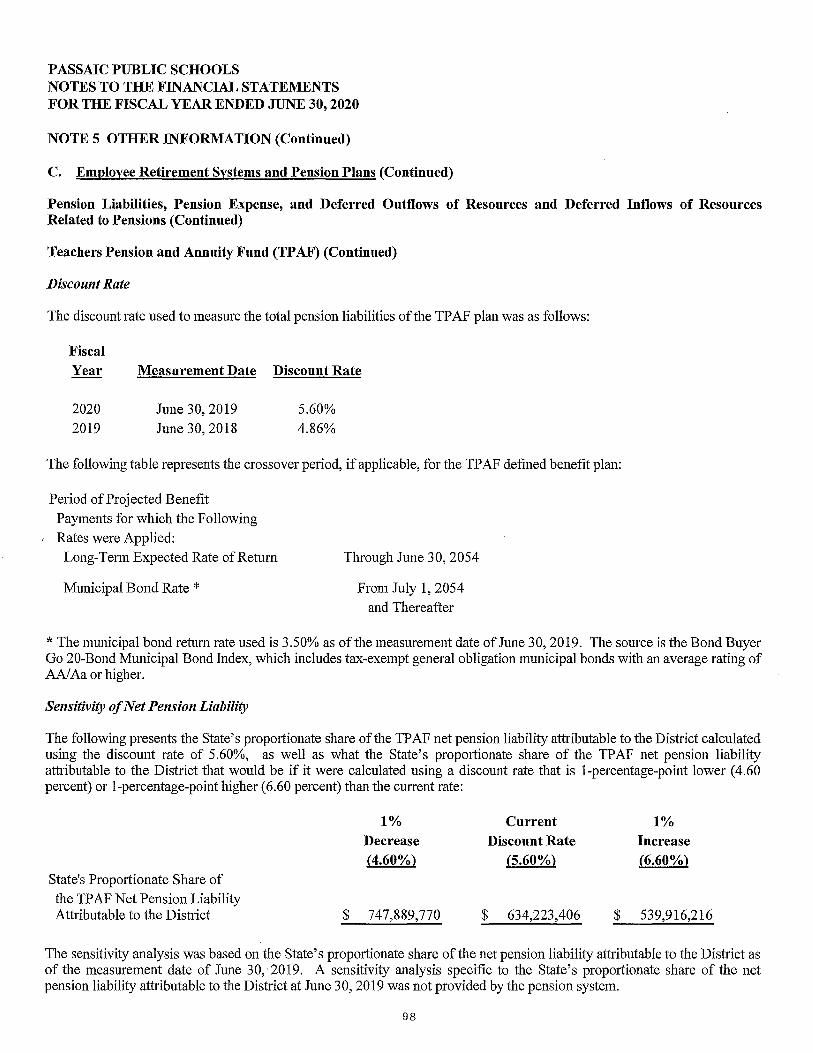
PASSAIC PUBLIC SCHOOLS NOTES TO THE FINANCIAL STATEMENTS FOR THE FISCAL YEAR ENDED J1JNE 30, 2020
NOTE 5 OTHER INFORMATION (Continued)
C. Employee Retirement Systems and Pension Plans (Continued)
Pension Liabilities, Pension Expense, and Deferred Outflows of Resources and Deferred Inflows of Resources Related to Pensions (Continued)
Teachers Pension and Annuity Fund (TP AF) (Continued)
Discount Rate
The discount rate used to measure the total pension liabilities of the TP AF plan was as follows:
Fiscal Year Measurement Date Discount Rate
2020 June 30, 2019 5.60% 2019 June 30, 2018 4.86%
The following table represents the crossover period, if applicable, for the TP AF defined benefit plan:
Period of Projected Benefit Payments for which the Following Rates were Applied:
Long-Term Expected Rate ofRetum
Municipal Bond Rate *
Through June 30,2054
From July 1, 2054 and Thereafter
*The municipal bond return rate used is 3.50% as of the measurement date of June 30, 2019. The source is the Bond Buyer Go 20-Bond Municipal Bond Index, which includes tax-exempt general obligation municipal bonds with an average rating of AA/Aa or higher.
Sensitivity of Net Pension Liability
The following presents the State's proportionate share ofthe TPAF net pension liability attributable to the District calculated using the discount rate of 5.60%, as well as what the State's proportionate share of the TPAF net pension liability attributable to the District that would be if it were calculated using a discount rate that is 1-percentage-point lower ( 4.60 percent) or 1-percentage-point higher ( 6.60 percent) than the current rate:
1% Current 1% Decrease Discount Rate Increase (4.60%) (5.60%) (6.60%}
State's Proportionate Share of the TP AF Net Pension Liability Attributable to the District $ 747,889,770 $ 634,223,406 $ 539,916,216
The sensitivity analysis was based on the State's proportionate share of the net pension liability attributable to the District as of the measurement date of June 30; 2019. A sensitivity analysis specific to the State's proportionate share of the net pension liability attributable to the District at June 30, 2019 was not provided by the pension system.
98

PASSAIC PUBLIC SCHOOLS NOTES TO THE FINANCIAL STATEMENTS FOR THE FISCAL YEAR ENDED JUNE 30, 2020
NOTE 5 OTHER INFORMATION (Continued)
C. Employee Retirement Systems and Pension Plans (Continued)
Pension Liabilities, Pension Expense, and Deferred Outflows of Resources and Deferred Inflows of Resources Related to Pensions (Continued)
Teachers Pension and Annuity Fund (TP AF) (Continued)
Pension Plan Fiduciary Net Position
Detailed information about the TPAF pension plan's fiduciary net position is available in the separately issued fmancial report from the State of New Jersey, Department of the Treasury, Division of Pension and Benefits. The fmancial report may be accessed via the New Jersey, Division of Pensions and Benefits, website at www.state.nj.us/treasury/pensions.
D. Post-Retirement Medical Benefits
The State of New Jersey sponsors and administers the post-retirement health benefit program plan for school districts.
As a result of implementing GASB Statement No. 74, Financial Reporting for Postemployment Benefit Plans Other than Pension Plans, the post-retirement health benefit program plan is reported in an Agency Fund in the New Jersey Comprehensive Annual Financial Report for the fiscal year ended June 30, 2019. Therefore, the plan has no assets accumulated in a trust. In accordance with GASB Statement No. 75, Accounting and Financial Reporting for Postemployment Benefits Other than Pension (GASB No. 75), the plan is classified as a single employer defmed benefit OPEB plan with a special funding situation that is not administered through a trust that meets the criteria in paragraph 4 of GASBNo. 75.
Plan Description and Benefits Provided
The State ofNew Jersey sponsors and administers the following post-retirement health benefit program plan covering certain local school district employees, including those Board employees and retirees eligible for coverage.
State Health Benefit Program Fund -Local Education Retired Employees Plan (including Prescription Drug Program Fund) - N.J.S.A. 52: 14-17.32f provides medical coverage, prescription drug benefits and Medicare Part B reimbursement to qualified retired education employees and their covered dependents. The State of New Jersey provides employer-paid coverage to members of the TP AF who retire from a board of education or county college with 25 years of service or on a disability retirement. Under the provisions of Chapter 126, P.L. 1992, the State also provides employer-paid coverage to members of the PERS and Alternate Benefits Program (ABP) who retire from a board of education or county college with 25 years of service or on a disability retirement if the member's employer does not provide this coverage. Certain local participating employers also provide post-retirement medical coverage to their employees. Retirees who are not eligible for employer paid health coverage at retirement can continue in the program if their employer participates in this program or if they are participating in the health benefits plan of their former employer and are enrolled in Medicare Parts A and B by paying the cost of the insurance for themselves and their covered dependents.
Pursuant to Chapter 78, P.L. 2011, future retirees eligible for postretirement medical coverage who have less than 20 years of creditable service on June 28, 2011 will be required to pay a percentage of the cost of their health care coverage in retirement provided they retire with 25 or more years of pension service credit. The percentage of the premium for which the retiree will be responsible will be determined based on the retiree's annual retirement benefit and level of coverage.
99

PASSAIC PUBLIC SCHOOLS NOTES TO THE FINANCIAL STATEMENTS FOR THE FISCAL YEAR ENDED JUNE 30, 2020
NOTE 5 OTHER INFORMATION (Continued)
D. Post-Retirement Medical Benefits (Continued)
The State of New Jersey, Department of the Treasury, Division of Pensions and Benefits, issues publicly available financial reports that include the financial statements and required supplementary information of the above Fund. The frnancial reports may be accessed via the State ofNew Jersey, Department of the Treasury, Division ofPensions and Benefits, website at www.state.nj. us/treasury/pensions.
Plan Membership
Membership ofthe defined benefit OPEB plan consisted of the following at June 30,2018:
Active Plan Members Inactive Plan Members or Beneficiaries Currently Receiving Benefits Inactive Plan Members Entitled to but not yet Receiving Benefits
Total
Measurement Focus and Basis of Accounting
216,892 148,051
364.943
The financial statements of the post-employment health benefit plans are prepared in accordance with U.S. generally accepted accounting principles as applicable to governmental organizations. In doing so, the Division adheres to reporting
·requirements established by the Governmental Accounting Standards Board (GASB).
The accrual basis of accounting is used for measuring frnancial position and changes in net position of the post-employment health benefit plans. Under this method, contributions are recorded in the accounting period in which they are legally due from the employer or plan member, and deductions are recorded at the time the liabilities are due and payable in accordance with the tenns of each plan. The accounts of the Division are organized and operated on the basis of funds. All funds are accounted for using an economic resources measurement focus.
Investment Valuation
Investments are reported at fair value. Investments that do not have an established market are reported at estimated fair value. Fair value is the amount at which a frnancial instrument could be exchanged in a current transaction between willing parties, other than in a forced or liquidation sale.
Collective Net OPEB Liability
The collective net OPEB liability of the State, as.the non-employer contributing entity, of the plan at June 30, 2019 is $41.7 billion, and the plan fiduciary net position as a percentage ofthe total OPEB liability is zero percent.
The total OPEB liabilities were determined based on actuarial valuations as of June 30, 2018 which were rolled forward to June 30, 2019.
100

PASSAIC PUBLIC SCHOOLS NOTES TO THE FINANCIAL STATEMENTS FOR THE FISCAL YEAR ENDED JUNE 30, 2020
NOTE 5 OTHER INFORMATION (Continued)
D. Post-Retirement Medical Benefits (Continued)
Actuarial Methods and Assumptions
In the June 30, 2018 OPEB actuarial valuation, the actuarial assumptions and methods used in these valuations were described in the Actuarial Assumptions and Methods section of the Actuary's report and are included here in this note to the fmancial statements. The Plan selected economic and demographic assumptions and prescribed them for use for purposes of compliai1ce with GASB Statement No. 75. The Actuary provided guidance with respect to these assumptions, and it is their belief that the assumptions represent reasonable expectations of anticipated plan experience.
Post-Retirement Medical Benefits Contributions
The funding policy of the OPEB plan is pay as you go basis; therefore, there is no prefunding of the liability. Contributions to pay for the health benefit premiums of participating employees in the OPEB plan are made by the State, as a nonemployer contributing entity, under a special funding situation in accordance with State statutes as previously disclosed. The State as a non-employer contributing entity made contributions of $1.28 billion to the OPEB plan in fiscal year 2019.
The State sets the contribution rate based on a pay as you go basis rather than the actuarial determined contribution an amount actuarially determined in accordance with the parameters of GASB Statement 75. The actuarial determined contribution represents a level of funding that, if paid on an ongoing basis, is projected to cover normal cost each year and any unfunded actuarial liabilities (or funding excess) of the plan using a systematic and rational method over a closed period equal to the average of the expected remaining service lives of all employees that are provided with OPEB through the Plan.
over a period not to exceed thirty years. The State's contributions, as a nonemployer contributing entity, to the State Health Benefits Program Fund- Local Education Retired Employees Plan for retirees' post-retirement benefits on behalf of the School District for the fiscal years ended June 30, 2020, 2019 and 2018 were $8,204,140, $9,412,370 and $10,334,706, respectively, which equaled the required contributions for each year. The State's contributions to the State Health Benefits Program Fund - Local Education Retired Employees Plan for PERS retirees' post-retirement benefits on behalf of the School District was not determined or made available by the State of New Jersey. The on-behalf OPEB contributions are recognized in the governmental fund fmancial statements (modified accrual basis) as both a revenue and expenditure in accordance with GASB No. 85.
OPEB Liabilities, OPEB Expenses and Deferred Outflows of Resources and Deferred Inflows of Resources Related toOPEB
GASB Statement No. 75 requires participating employers in the State Health Benefit Program Fund- Local Education Retired Employees Plan to recognize their proportionate share of the collective OPEB liability, collective deferred outflows of resources, collective deferred inflows of resources and collective OPEB expense. The nonemployer allocation percentages presented are based on the ratio of the State's contributions made as a nonemployer toward the actuarially determined contribution amount to total contributions to the plan during the measurement period July 1, 2018 through June 30,2019. Nonemployer allocation percentages have been rounded for presentation purposes.
In accordance with GASB No. 75, the District is not required to recognize an OPEB liability for the post-employment health benefit plan. The State of New Jersey, as a nonemployer contributing entity, is the only entity that has a legal obligation to make employer contributions to the plan on behalf of the District. Accordingly, the District's proportionate share percentage determined under Statement No. 75 is zero percent and the State's proportionate share is 100% of the OPEB liability attributable to the District. Therefore, in addition, the District does not recognize any portion of the collective deferred outflows of resources and deferred inflows·ofresources related to the plan.
For the fiscal year ended June 30, 2020, the District recognized in the district-wide statement of activities (accrual basis) OPEB expense of $11,135,576. This amount has been included in the district-wide statement of activities (accrual basis) as both a revenue and expense in accordance with GASB No. 85.
At June 30, 2020 the State's proportionate share of the OPEB liability attributable to the District is $359,698,653. The nonemployer allocation percentages are based on the ratio of the State's proportionate share of the OPEB liability attributable to the District at June 30, 2019 to the total OPEB liability of the State Health Benefit Program Fund- Local Education Retired Employees Plan at June 30, 2019. At June 30,2019, the state's share of the OPEB liability attributable to the District was .86 percent, which was an increase of .01 percent from its proportionate share measured as of June 30, 2018 of .85 percent.
101

PASSAIC PUBLIC SCHOOLS NOTES TO THE FINANCIAL STATEMENTS FOR THE FISCAL YEAR ENDED JUNE 30, 2020
NOTE 5 OTHER INFORMATION (Continued)
D. Post-Retirement Medical Benefits (Continued)
OPEB Liabilities, OPEB Expenses and Deferred Outflows of Resources and Deferred Inflows of Resources Related to OPEB (Continued)
Actuarial Assumptions
The OPEB liability for the June 30, 2019 measurement date was determined by an actuarial valuation as of June 30, 2018, which was rolled forward to June 30, 2019. This actuarial valuation used the following actuarial assumptions, applied to all periods in the measurement.
Inflation Rate
Salary Increases* PERS:
Initial Fiscal Year Applied Through Rate Rate Thereafter
TPAF:
2.50%
2026 2.00% to 6.00% 3.00% to 7.00%
Initial Fiscal Year Applied Through 2026 Rate 1.55% to 3.05% Rate Thereafter 1.55% to 3.05%
Mortality: PERS Pre-retirement and Post-retirement based on Pub-2010
Healthy "General" classification headcount-weighted mortality table with fully generational mortality improvement projections from the central year using Scale MP-2019.
TPAF
Long-Term Rate ofReturn
Pre-retirement and Post-retirement based on Pub-2010 "Teachers" and "General" classifications respectively, headcount-weighted mortality tables with fully generational mortality improvement projections from the central year using Scale MP-2019.
2.00%
*Salary increases are based on the defined benefit pension plan that the member is enrolled in and the members years of service.
For the June 30, 2019 measurement date healthcare cost trend rates for pre-Medicare medical benefits, the trend is initially 5.7% and decreases to a 4.5% long-term trend rate after eight years. For post-65 medical benefits, the actual fully-insured Medicare Advantage trend rates for fiscal year 20?0 are reflected. The assumed post-65 medical trend is 4.5% for all future years. For prescription drug benefits, the initial trend rate is 7.5% and decreases to a 4.5% long-term trend rate after eight years. For the Medicare Part B reimbursement, the trend rate is 5.0%.
102

PASSAIC PUBLIC SCHOOLS NOTES TO THE FINANCIAL STATEMENTS FOR THE FISCAL YEAR ENDED JUNE 30, 2020
NOTE 5 OTHER INFORMATION (Continued)
D. Post-Retirement Medical Benefits (Continued)
OPEB Liabilities, OPEB Expenses and Deferred Outflows of Resources and Deferred Inflows of Resources Related to OPEB (Continued)
Actuarial Assumptions (Continued)
The actuarial assumptions used in the June 30, 2018 valuation were based on the results of the TPAF and PERS actuarial experience studies for the period July 1, 2015 to June 30,2018 and July 1, 2014 to June 30,2018, respectively.
100% of active members are considered to participate in the plan upon retirement.
Long-Term Expected Rate of Return
As the OPEB plan only invests in the State ofNew Jersey Cash Management Fund, the long-term expected rate of return on OPEB investments was based off the best-estimate ranges of future real rates of return (expected returns, net of OPEB plan investment expense and inflation) for cash equivalents, which is 2.00% as of June 30, 2019.
Discount Rate
The discount rate used to measure the total OPEB liabilities of the plan was as follows:
Fiscal Year
2020 2019
Measurement Date
June 30, 2019 June 30,2018
Discount Rate
3.50% 3.87%
The discount rate represents the municipal bond return rate as chosen by the Division. The source is the Bond Buyer Go 20-Bond Municipal Bond Index, which includes tax-exempt general obligation municipal bonds with an average rating of AA/Aa or higher. As the long-term rate of return is less than the municipal bond rate, it is not considered in the calculation of the discount rate, rather the discount rate is set at the municipal bond rate.
103

PASSAIC PUBLIC SCHOOLS NOTES TO THE FINANCIAL STATE:MENTS FOR THE FISCAL YEAR ENDED JUNE 30, 2020
NOTE 5 OTHER INFORMATION (Continued)
D. Post-Retirement Medical Benefits (Continued)
OPEB Liabilities, OPEB Expenses and Deferred Outflows of Resources and Deferred Inflows of Resources Related to OPEB (Continued)
Changes in the Total OPEB Liability
The change in the State's proportionate share of the OPEB liability attributable to the District for the fiscal year ended June 30,2020 (measurement date June 30, 2019) is as follows:
Balance, June 3 0, 2018 Measurement Date
Changes Recognized for the Fiscal Year: Service Cost Interest on the Total OPEB Liability Differences Between Expected and Actual Experience Changes of Assumptions Gross Benefit Payments · Contributions from the Member
Net Changes
Balance, June 30, 2019 Measurement Date
Total OPEB Liability
(State Share 1 00%)
$ 392,887,002
$
16,299,448 15,630,161
(59,766,724) 5,363,136
(11,041,676) 327,306
(33,188,349)
359,698,653
Changes of assumptions and other inputs reflect a change in the discount rate from 3.87% percent in 2018 to 3.50% percent in2019.
The change in the total OPEB liability was based on the State's proportionate share of the OPEB liability attributable to the District at June 30, 2019.
104

PASSAIC PUBLIC SCHOOLS NOTES TO THE FINANCIAL STATEMENTS FOR THE FISCAL YEAR ENDED JUNE 30, 2020
NOTE 5 OTHER INFORMATION (Continued)
D. Post-Retirement Medical Benefits (Continued)
OPEB Liabilities, OPEB Expenses and Deferred Outflows of Resources and Deferred Inflows of Resources Related to OPEB (Continued)
Sensitivity of OPEB Liability
Sensitivity of the total OPEB liability to changes in the discount rate. The following presents the State's proportionate share of the OPEB liability attributable to the District calculated using the discount rate of 3.50%, as well as what the State's proportionate share of the OPEB liability attributable to the District that would be if it were calculated using a discount rate that is !-percentage-point lower (2.50 percent) or !-percentage-point higher ( 4.50 percent) than the current rate:
1% Current 1% Decrease Discount Rate Increase (2.50%) (3.50%) (4.50%)
State's Proportionate Share of the OPEB Liability Attributable to the District $ 424,946,252 $ 359,698,653 $ 307,869,537
Sensitivity of the total OPEB liability to changes in the healthcare cost trend rates. The following presents the State's proportionate share of the OPEB liability attributable to the District calculated using healthcare cost trend rates that are !percentage-point lower or !-percentage-point higher than the current health care cost trend rates:
Total OPEB Liability (School Retirees)
1% Decrease
$ 296,375,657
Health care Cost Trend
Rates
$. 359,698,653
1% Increase
$ 443,525,297
The sensitivity analyses were based on the State's proportionate share of the OPEB liability attributable to the District at June 30, 2019. Sensitivity analyses specific to the State's proportionate share of the OPEB liability attributable to the District at June 30, 2019 were not provided by the pension system.
E. Subsequent Events
On August 31, 2020 the Board approved the appropriation of $3,633,544 of prior year extraordinary aid.
105

PASSAIC PUBLIC SCHOOLS NOTES TO THE FINANCIAL STATEMENTS FOR THE FISCAL YEAR ENDED JUNE 30, 2020
NOTE 5 OTHER INFORMATION (Continued)
F. Tax Abatements
As defined by the Governmental Accounting Standards Board (GASB), a tax abatement is an agreement between a govenunent and an individual or entity in which the government promises to forgo tax revenues and the individual or entity promises to subsequently take a specific action that contributes to economic development or otherwise benefits the government or its citizens. School districts are not authorized by New Jersey statute to enter into tax abatement agreements. However, the county or municipality in which the school district is situated may have entered into tax abatement agreements, and that potential school tax revenue must be disclosed in these financial statements. If the county or municipality entered into tax abatement agreements, those agreements will not directly affect the school district's local tax revenue because N.J.S.A. 54:4-75 and N.J.S.A. 54:4-76 require that amounts so forgiven must effectively be recouped from other taxpayers and remitted to the school district.
For the year ended December 31, 2019, the City provided property tax abatements through certain programs authorized under State statutes. These programs include the Long Term Tax Exemption Law (the "LTTE Law") and the Five-Year Exemption and Abatement Law (the "FYEA). ·
• The Long Term Tax Exemption Law (NJSA 40A:20 et. seq.) is focused on broad areas of redevelopment. It allows for a longer abatement term to carry out a larger development plan through declaring an area as being "in need of redevelopment". These long-tern1 property abatements may last up to 30 years from completion of a project or 35 years from execution of the financial agreement. The process is initiated when the municipality passes a resolution calling for the municipal planning board to study the need for designating an area "in need of redevelopment". Upon adopting the planning board's recommendations and formalizing the redevelopment area designation, a municipality adopts a redevelopment plan, engages redevelopment entities to carry out the plan, and may authorize long-term tax abatements in the process. Developers submit abatement applications to the governing body for review. The financial agreement is approved through adoption of a local ordinance. The agreement exempts a project from taxation, but requires a payment in lieu of taxes (PILOTs) to the municipality in an amount based generally on a percentage of project costs or revenue generated by the project, depending on the type of project. For the year ended December 31, 2019 the City abated property taxes totaling $2,506,159 under the LTTE program. The District's share of abated taxes resulting from this has not been determined.
• The Five-Year Exemption and Abatement Law (NJSA 40:21et.seq.) generally concerns rehabilitation of particular buildings and structures, with an abatement period that lasts no more than five years. These "short-tenn" property tax abatements can be structured as reduced property tax bills that exclude all or part of improvement value or as payments in lieu of taxes (PILOTs) to the municipality. Procedurally, a municipality must first adopt an ordinance invoking its five-year abatement authority and setting forth application procedures. This ordinance, referred to as the general ordinance, defines the eligibility criteria, which may include types of structures, types of permissible in1provements, as well as qualifYing geographic zones or similar designations. An applicant must satisfY all of the criteria stipulated in the statute and general ordinance to be entitled to approval. Applications for individual short-term abatements are presented to the local governing body and must include a general description of the project, plans demonstrating the structure of the project, a statement of reasons for seeking the abatement, claimed benefits to be realized by the applicant if the application is approved, and a statement of taxes currently being assessed and taxes to be paid during the period of the abatement. The application is approved by an ordinance authorizing execution of a tax agreement. If during any tax year prior to the termination of the tax agreement, the property owner ceases to operate or disposes of the property, or fails to meet the conditions for qualifYing, then the property tax which would have otherwise been payable for each year shall become due and payable from the property owner as jfno exemption and abatement had been granted. For the year ended December 31, 2019 the City abated property taxes totaling $170,150 under the FYEA program. The District's share of abated taxes resulting from this has not been determined.
106

PASSAIC PUBLIC SCHOOLS NOTES TO THE FINANCIAL STATEMENTS FOR THE FISCAL YEAR ENDED JUNE 30, 2020
NOTE 6 INFECTIOUS DISEASE OUTBREAK- COVID-19 PANDEMIC
The outbreak of COVID-19, a respiratory disease caused by a new strain of coronavirus, has been characterized as a pandemic (the "Pandemic") by the World Health Organization and is currently affecting many parts of the world, including the United States and the State ofNew Jersey. On January 31,2020, the Secretary ofthe United States Health and Human Services Department declared a public health emergency for the United States and on March 13, 2020, the President of the United States declared the outbreak of COVID-19 in the United States a national emergency. Subsequently, the President's Coronavirus Guidelines for America and the United States Centers for Disease Control and Prevention called upon Americans to take actions to slow the spread of COVID-19 in the United States.
New Jersey Governor Phil Murphy has issued multiple Executive Orders since March 16, 2020 including but not limited to aggressive social distancing measures, restrictions on local elections, restrictions on foreclosure and evictions, suspension of all elective surgeries, closing of all schools and child care centers, the commandeering of property such as medical supplies, the cessation of all non-essential construction projects, extending insurance premium grace periods, the temporary reprieve to certain at-risk inmates and the extension of the permitted statutory grace period :from May 11, 2020 to June 1, 2020 for quarterly property taxes due May 1, 2020. The Board expects ongoing actions will be taken by State, federal and local governments and private entities to mitigate the spread and impacts of COVID-19. The Pandemic has negatively affected travel, commerce, and financial markets globally, and is widely expected to continue negatively affecting economic growth and financial markets worldwide. These negative impacts may reduce or negatively affect property values within the School District. The declaration of a public health emergency remains in effect as of the date of audit. As part of a planned multistage approach to restart the State's economy, Governor Murphy has signed a series of Executive Orders permitting the resumption of certain activities.
Because of the evolving nature of the outbreak and federal, state and local responses thereto, the Board cannot predict how the outbreak will impact the fmancial condition or operations of the School District, or if there will be any impact on the assessed values of property within the School District or deferral of tax payments to municipalities. The Board cannot predict costs associated with this or any other potential infectious disease outbreak, including whether there will be any reduction in State funding or an increase in operational costs incurred to clean, sanitize and maintain it facilities either before or after an outbreak of an infectious disease.
107

REQUIRED SUPPLEMENTARY INFORMATION -PART IT

BUDGETARY COMPARISON SCHEDULES

REVENUES Local Sources Property Taxes Tuition Interest Earned on Maintenance Reserve Interest Earned on Capital Reserve Interest Rentals Miscellaneous
Total Local Sources
State Sources Equalization Aid Education Adequacy Aid Transportation Aid Special Education Aid Security Aid Extraordinary Aid Family Crisis Transportation Aid TP AF Pension Contributions (Non-Budget)
Non-Contributory Group Insurance Nonnal Costs Long Term Disability Insurance Post Retirement
TP AF Social Security Contributions (Non-Budget)
Total State Sources
Federal Sources Medicaid Reimbursement- Administrative (MAC) Medicaid Reimbursement
Total Federal Sources
Total Revenues
EXPENDITURES CURRENT EXPENDITURES Instruction - Regular Programs
Salaries of Teachers Kindergarten Grades 1-5 Grades 6-8 Grades 9-12
Regular Programs - Home Instruction Salaries of Teachers Purchased Professional/Educational Services
Regular Programs- Undistributed Instruction Other Salaries for Instruction Purchased Professional/Educational Services Other Purchased Services General Supplies Textbooks Other Objects
Total Regular Programs
PASSAIC PUBLIC SCHOOLS GENERAL FUND
BUDGETARY COMPARISON SCHEDULE FOR THE FISCAL YEAR ENDED JUNE 30, 2020
Original Budget Adjustments
$ 16,818,577 150,000
1,000 1,000
10,000 1,200,000
18,180,577
205,013,015 19,998,279
1,978,076 12,147,460 6,745,057 2,700,000
248,581,887
990,533
990,533
267,752,997
1,798,894 $ 887,363 16,097,546 (171,486) 12,161,156 764,835 16,824,969 231,582
200,000 190,000 239,000 35,000
1,790,127 326,506 52,958 28,025
3,557,572 618,105 3,456,820 695,785
326,820 (9,470) 145,780 1,374
56,651,642 3,597,619
108
EXHIBIT C-1
Variance Final Final Budget To
Budget Actual Actual
$ 16,818,577 $ 16,818,577 150,000 437,610 $ 287,610
1,000 271,435- 270,435 1,000 129,377 ..... 128,377
719,451 719,451 10,000 2,775 (7,225)
1,200,000 673,464 {526,536)
18,180,577 19,052,689 872,112
205,013,015 205,013,015 19,998,279 19,998,279
1,978,076 1,978,076 12,147,460 12,147,460 6,745,057 6,745,057 2,700,000 6,967,944 4,267,944
46,789 46,789
389,401 389,401 21,725,271 21,725,271
16,569 16,569 8,204,140 8,204,140 8,301,798 8,301,798
248,581,887 291,533,799 42,951,912
279,188 279,188 990,533 797,554 {192,979)
990,533 1,076,742 86,209
267,752,997 311,663,230 43,910,233
2,686,257 2,483,689 202,568 15,926,060 15,396,915 529,145 12,925,991 12,515,768 410,223 17,056,551 16,216,381 840,170
390,000 364,225 25,775 274,000 100,717 173,283
2,116,633 1,938,366 178,267 80,983 27,514 53,469
4,175,677 3,601,835 573,842 4,152,605 3,313,087 839,518
317,350 301,862 15,488 147,154 53,557 93,597
60,249,261 56,313,916 3,935,345
Continued

EXPENDITURES CURRENT EXPENDITURES Special Education Cognitive Impaired - Mild Salaries of Teachers Other Salaries for Instruction General Supplies Textbooks Other Objects
Total Cognitive Impaired- Mild
Learning and/or Language Disabilities Salaries of Teachers Other Salaries for Instruction Other Purchased Services General Supplies Textbooks Other Objects
Total Learning and/or Language Disabilities
Behavioral Disabilities Salaries of Teachers Other Salaries for Instruction General Supplies Textbooks Other Objects
Total Behavioral Disabilities
Multiple Disabilities Salaries General Supplies Textbooks Other Objects
Total Multiple Disabilities
Resource Room/Resource Center Salaries of Teachers General Supplies Textbooks Other Objects
Total Resource Room/Resource Center
Autism Salaries of Teachers Other Salaries for Instruction General Supplies Textbooks Other Objects
Total Autism
PASSAIC PUBLIC SCHOOLS GENERAL FUND
BUDGETARY COMPARISON SCHEDULE FOR THE FISCAL YEAR ENDED JUNE 30, 2020
Original Budget Adjustments
$ 345,018 $ (119,673) 31,945
7,200 900 (360) 450
353,568 (88,088)
5,848,622 421,917 863,395 32,208
1,000 155,680 (26,871)
14,460 (2,833) 7,230
6,890,387 424,421
127,291 (64,423) 134,364
5,760 (5,000) 720 360
134,!31 64,941
59,774 1,440
180 90
61,484
11,423,725 (575,496) 188,560 (37,823) 25,645 (10,712) 15,404 {2,298)
11,653,334 {626,329)
1,277,311 (16,586) 165,381 274,797 88,302 (18,481) 3,240 (360) 1,620
1,535,854 239,370
109
EXHffiiTC-1
Variance Final Final Budget To
Budget Actual Actual
$ 225,345 $ 165,335 $ 60,010 31,945 31,945
7,200 7,200 540 540 450 450
265,480 165,335 100,145
6,270,539 6,045,693 224,846 895,603 724,347 171,256
1,000 1,000 128,809 35,500 93,309
11,627 4,541 7,086 7,230 7,230
7,314,808 6,810,081 504,727
62,868 59,550 3,318 !34,364 122,554 11,810
760 411 349 720 720 360 360
199,072 182,515 16,557
59,774 29,575 30,199 1,440 1,440
180 180 90 90
61,484 29 575 31,909
10,848,229 10,542,324 305,905 150,737 97,092 53,645
14,933 5,677 9,256 13,106 221 12,885
11,027,005 10,645,314 381,691
1,260,725 1,258,325 2,400 440,178 402,927 37,251
69,821 38,635 31,186 2,880 2,880 1,620 1,620
1,775,224 1,699,887 75,337
Continued

EXPENDITURES CURRENT EXPENDITURES Special Education Preschool Disabilities - Full Time Salaries of Teachers Other Salaries for Instruction General Supplies
Total Preschool Disabilities- Full Time
Total Special Education
Bilingual Education Salaries of Teachers General Supplies Textbooks Other Objects
Total Bilingual Education
School Sponsored Co/Extra Curricular Activities Salaries
Total School Sponsored Co/Extra Curricular Activities
School Sponsored Athletics Salaries Purchased Services Supplies and Materials Other Objects
Total School Sponsored Athletics
Other Instructional Programs - Instruction Salaries
Total Other Instructional Programs- Instruction
Before/ After School Programs - Instruction Salaries of Teachers Supplies and Materials
Total Before/After School Programs- Instruction
Before/ After School Programs - Support Salaries
Total Before/ After School Programs- Support
Total Before/ After School Programs
Summer School- Instruction Salaries of Teachers Other Salaries for Instruction Other Purchased Services General Supplies
Total Summer School- Instruction J
PASSAIC PUBLIC SCHOOLS GENERAL FUND
BUDGETARY COMPARISON SCHEDULE FOR THE FISCAL YEAR ENDED JUNE 30, 2020
Original Budget Adjustments
$ 441,955 304,984
1,000
747,939
21,376,697 $ 14,315
16,244,760 (740,540) 698,880 (166,101) 105,255 (31,742) 55,064 {7,088)
17,103,959 (945,471)
268,500 7,500
268,500 7,500
1,176,457 60,000
210,000 11,000 50,000 (5,712)
1,496,457 5,288
69,000 5,565
69,000 5,565
1,910,751 79,908 10,000 8,000
1,920,751 87,908
357,000 74,620
357,000 74,620
2,277,751 162,528
1,297,553 (2,732) 41,500 (16,500) 35,000 24,500 {3,343)
1,398,553 {22,575)
110
EXHIBIT C-1
Variance Final Final Budget To
Budget Actual Actual
$ 441,955 $ 372,528 $ 69,427 304,984 285,595 19,389
1,000 815 185
747,939 658,938 89,001
21,391,012 20,191,645 1,199,367
15,504,220 15,055,888 448,332 532,779 421,945 110,834
73,513 64,899 8,614 47,976 5,681 42,295
16,158,488 15,548,413 610,075
276,000 232,312 43 688
276,000 232,312 43,688
1,176,457 1,051,731 124,726 60,000 30,000 30,000
221,000 216,238 4,762 44,288 29,966 14,322
1,501,745 1,327,935 173,810
74,565 32,483 42,082
74,565 32,483 42 082
1,990,659 869,456 1,121,203 18 000 12,459 5 541
2,008,659 881,915 1,126 744
431,620 153,662 277,958
431,620 153,662 277,958
2,440,279 1,035,577 1,404 702
1,294,821 1,268,393 26,428 25,000 7,352 17,648 35,000 33,750 1,250 21,157 20,926 231
1,375,978 1,330,421 45,557
Continued

EXPENDITURES CURRENT EXPENDITURES
Summer School -Support
Salaries Purchased Professional and Technical Services
Total Summer School- Support
Total Summer School
Total Instruction
Undistributed Expenditures Instruction Tuition to Other LEAs w/i State - Regular Tuition to Other LEAs w/i State- Special Tuition to CVSD - Regular Tuition to CVSD- Special Tuition Co. Spec. Svc. School Districts and Regional Day Tuition to PSD Within the State Tuition to PSD and Other LEAs - Special - Out of State Tuition - State Facilities Tuition - Other
Total Undistributed Expenditures- Instruction
Attendance and Social Work Salaries Salaries of Drop-Out Prevention Officer/Coordinator Salaries of Family Support Teams Salaries of Family Liaisons/Comm. Parent Inv. Spec. Other Purchased Services
Total Attendance and Social Work
Health Services Salaries Salaries of Social Service Coordinators Purchased Professional and Technical Services Other Purchased Services Supplies and Materials
Total Health Services
Other Support Serv. Students- Speech, OT, PT Salaries Purchased Professional - Educational Services
Total Other Supp.Serv. Student- Speech, OT, PT
Other Support Serv. Students -Extra Serv. Salaries
Total Other Support Serv. Students- Extra Serv.
Guidance Salaries of Other Professional Staff Other Salaries
Total Guidance
PASSAIC PUBLIC SCHOOLS GENERAL FUND
BUDGETARY COMPARISON SCHEDULE FOR THE FISCAL YEAR ENDED JUNE 30, 2020
Original Budget Adjustments
$ 151,000 $ 55,187 55,000 (8,000)
206,000 47,187
1,604,553 24,612
I 00,848,559 2,871,956
2,693,999
752,342 (200,000) 6,587,960
222,761 (48,732) 2,326,311 322,491
17,581,396 (946,452) 974,130 388,732 325,750
68,500 (68,500)
31,533,149 (552,461)
143,418 604,670 45,502 499,834 163,415 899,856 25,410 10,000
2,157,778 234,327
2,659,608 87,801 155,339 2,911 245,000 712
33,000 43,500 13,040
3,136,447 104,464
253,714 8,708,100 399,939
8,961,814 399,939
5,466,271
5,466,271
2,815,848 175,435 142,082
2,957,930 175,435
111
EXHIBIT C-1
Variance Final Final Budget To
Budget Actual Actual'
$ 206,187 $ 197,334 $ 8,853 47,000 33,489 13,511
253,187 230,823 22,364
1,629,165 1,561,244 67,921
103,720,515 96,243 525 7,476,990
2,693,999 2,413,009 280,990
552,342 472,414 79,928 6,587,960 6,274,981 312,979
174,029 164,029 10,000 2,648,802 2,463,691 185,111
16,634,944 15,685,464 949,480 1,362,862 1,199,881 162,981
325,750 325,750
30,980,688 28,999,219 1,981469
143,418 135,058 8,360 650,172 574,085 76,087 663,249 536,074 127,175 925,266 879,273 45,993
10,000 5,400 4,600
2,392 105 2,129,890 262,215
2,747,409 2,591,229 156,180 158,250 158,250 245,712 168,921 76,791
33,000 29,975 3,025 56,540 44,538 12,002
3,240 911 2,992,913 247,998
253,714 193,072 60,642 9,108,039 7,867,764 1,240,275
9,361,753 8,060,836 1,300,917
5,466,271 5,257,580 208 691
5,466,271 5,257,580 208,691
2,991,283 2,799,997 191,286 142,082 142,081 I
3,133,365 2,942,078 191,287
Continued

EXPENDITURES CURRENT EXPENDITURES
Undistributed Expenditures (Continued) Child Study Team Salaries of Other Professional Staff Salaries of Secretarial and Clerical Assistants Other Purchased Services Supplies and Materials
Total Child Study Team
Improvement oflnstruction Services Salaries of Supervisors oflnstruction Salaries of Other Professional Staff Salaries of Secretarial and Clerical Assistants Salaries of Facilitators, Math and Literacy Coaches Purchased Professional- Educational Services Other Purchased Services Supplies and Materials
Total Improvement oflnstruction Services
Educational Media/School Library Salaries Salaries of Technology Coordinators Other Purchased Services Supplies and Materials
Total Educational Media/School Library
Instructional Staff Training Services Salaries of Supervisors oflnstruction Salaries of Secretarial and Clerical Assist Purchased Professional- Educational Services Other Purchased Services Supplies and Materials Other Objects
Total Instructional Staff Training Services
Support Services General Administration
Salaries Legal Services Audit Fees Other Purchased Professional Services Purchased Technical Services Communicationsffelephone BOE Other Purchased Services Miscellaneous Purchased Services General Supplies BOE In-House Training/Meeting Supplies Judgements Against the School District Miscellaneous Expenditures BOE Membership Dues and Fees
Total Support Services General Administration
PASSAIC PUBLIC SCHOOLS GENERAL FUND
BUDGETARY COMPARISON SCHEDULE FOR THE FISCAL YEAR ENDED JUNE 30, 2020
Original Budget Adjustments
$ 5,697,363 $ 39,000 66,969 1,357
128,000 296,279 10,000 70
5,902,332 336,706
1,494,667 (3,889) 64,000 (742)
349,556 (174,478) 996,138 (251) 154,000 (21,000)
134,700 (29,667) 17,500 (6,501)
3,210,561 (236,528)
266,524 (94,301)
1,280,658 349,494 2,000 (2,000)
38,500 (11,111)
1,587,682 242,082
127,271 52,880 485
1,497,000 480,458 190,000 65,309
5,000 16,000 2,900 6,290
1,875,051 568,542
867,818 255,000 1,365
75,000 35,000
7,000 (3,000) 470,000 (47,000)
24,500 (2,205) 606,000
36,000 (4,367) 350
500,000 (25,000)
31,189 (2,248) 29,000
2,936,857 (82,455)
112
EXHIDITC-1
Variance Final Final Budget To
Budget Actual Actual
$ 5,736,363 $ 5,239,742 $ 496,621 68,326 68,182 144
424,279 359,055 65,224 10 070 7,965 2,105
6,239,038 5,674,944 564,094
1,490,778 1,339,661 151,117 63,258 21,894 41,364
175,078 109,649 65,429 995,887 872,355 123,532 133,000 133,000
105,033 72,920 32,113 10,999 10,276 723
2,974,033 2,426 755 547,278
172,223 135,064 37,159
1,630,152 1,535,514 94,638
27,389 16 835 10,554
1,829,764 1,687,413 142,351
127,271 127,271 53,365 53,365
1,977,458 1,493,284 484,174 255,309 192,763 62,546
21,000 20,794 206 9,190 8,890 300
2,443,593 1,896,367 547 226
867,818 803,561 64,257 256,365 225,117 31,248
75,000 68,598 6,402 35,000 4,200 30,800
4,000 4,000 423,000 355,889 67,111
22,295 7,547 14,748 606,000 535,424 70,576
31,633 6,898 24,735 350 350
475,000 93,450 381,550
28,941 11,483 17,458 29,000 26,663 2,337
2,854,402 2,138,830 715 572
Continued

EXPENDITURES CURRENT EXPENDITURES
Undistributed Expenditures (Continued) Support Services School Administration Salaries of Principals/Asst. Principals Salaries of Other Professional Staff Salaries of Secretarial and Clerical Assistants Other Purchased Services Supplies and Materials Other Objects
Total Support Services School Administration
Central Services Salaries Purchased Professional Services Purchased Technical Services Miscellaneous Purchased Services Supplies and Materials Miscellaneous Expenditures
Total Central Services
Admin. Info. Technology Salaries Purchased Technical Services Other Purchased Services Supplies and Materials
Total Admin. Info. Technology
Required Maintenance for School Facilities Salaries Cleaning, Repair and Maintenance Services General Supplies
Total Required Maintenance for School Facilities
Custodial Services Salaries Purchased Professional and Technical Services Cleaning, Repair and Maintenance Services Rental of Land and Bldgs Other Than Lease Purchase Other Purchased Property Services Insurance Miscellaneous Purchased Services General Supplies Energy (Natural Gas) Energy (Electricity) Energy (Gasoline) Other Objects
Total Custodial Services
Security Salaries Purchased Professional and Technical Services General Supplies
Total Security
PASSAIC PUBLIC SCHOOLS GENERAL FUND
BUDGETARY COMPARISON SCHEDULE FOR THE FISCAL YEAR ENDED JUNE 30, 2020
Original Budget Adjustments
$ 7,370,207 $ (97,470) 620,672 (73,266)
2,943,107 226,061 206,570 230,895 114,500 21,759
200
11,255,256 307,979
2,922,254 4,889 211,000 135,000 5,000 309,300 168,648
55,580 13,078 15,500 776
3,648,634 192,391
1,439,541 40,000 115,000 (67,104)
32,000 75,706 15,000 638
1,601,541 49,240
2,041,240 4,508,760 70,258
650,000 26,258
7,200,000 96,516
6,108,050 417,000
850,000 751,069 265,000 (115,494)
2,950,000 20,000
650,000 1,000
85,000 2,500 350,000 345,296
997,620 (30,000) 3,023,263 (414,940)
7,000 10,000 10,000
15,315,933 966,431
2,435,237 96,260 3,516,672 (85,000)
30,000 94,490
5,981,909 105,750
113
EXHIBIT C-1
Variance Final Final Budget To
Budget Actual Actual
$ 7,272,737 $ 7,132,725 $ 140,012 547,406 547,406
3,169,168 3,020,871 148,297 437,465 382,094 55,371 136,259 95,154 41,105
200 170 30
11,563,235 11,178,420 384,815
2,927,143 2,702,463 224,680 211,000 130,785 80,215 140,000 89,930 50,070 477,948 105,998 371,950
68,658 63,992 4,666 16,276 11,292 4,984
3,841,025 3,104,460 736,565
1,479,541 1,305,696 173,845 47,896 44,692 3,204
107,706 74,144 33,562 15,638 15,638
1,650,781 1,440,170 210,611
2,041,240 1,782,890 258,350 4,579,018 2,556,022 2,022,996
676,258 478,080 198,178
7,296 516 4,816,992 2,479 524
6,525,050 6,331,774 193,276
1,601,069 747,822 853,247 149,506 9,378 140,128
2,950,000 2,843,263 106,737 20,000 20,000
651,000 649,710 1,290
87,500 75,327 12,173 695,296 610,761 84,535 967,620 343,971 623,649
2,608,323 2,071,671 536,652 17,000 6,654 10,346 10,000 3,596 6,404
16,282,364 13,693,927 2,588,437
2,531,497 2,384,843 146,654 3,431,672 3,400,000 31,672
124,490 113,884 10,606
6,087,659 5,898,727 188,932
Continued

EXHIBIT C-1 PASSAIC PUBLIC SCHOOLS
GENERAL FUND BUDGETARY COMPARISON SCHEDULE
FOR THE FISCAL YEAR ENDED JUNE 30, 2020
Variance Original Final Final Budget To Budget Adjustments Budget Actual Actual
EXPENDITURES CURRENT EXPENDITURES
Undistributed Expenditures (Continued) Student Transportation Services Sal. For Pupil Trans (Bet Home & School) - Reg. $ 171,874 $ 171,874 $ 153,967 $ 17,907 Management Fee - ESCs and CTSA . 30,000 $ 30,000 60,000 49,976 10,024 Other Purchased Professional and Technical Serv 7,000 6,150 13,150 8,150 5,000 Contracted Services-Aid in Lieu Payments-Non Public School 31,385 31,385 20,113 11,272 Contracted Services (Between Home and School)- Vendors 800,000 (800,000)
Contracted Services - AIL -Charter Schools 75,000 22,465 97,465 96,070 1,395 Contracted Services (Other Than Between Home and School) - Vendors 717,568 97,076 814,644 348,688 465,956
Contracted Services (Btw Home and School) -Joint Agreements 1,000 1,000 2,000 1,334 666
Contracted Services (Special Ed. Students) -Vendors 5,075,000 (211,173) 4,863,827 4,816,584 47,243 Contracted Services (Special Ed. Students)-Joint Agreements 2,000 2,000 2,000
Contracted Services- (Regular Students)-ESCs and CTSA 15,000 15,000 15,000
Contracted Services - (Special Ed. Students) -ESCs and CTSA 930,000 920,173 1,850,173 1,657,761 192,412
General Supplies 2,000 (200) 1,800 1,069 731 Other Objects 200 200 200
Total Student Transportation Services 7,826,442 97,076 7,923,518 7,153,912 769,606
Unallocated Benefits Social Security Contributions 3,328,809 (12,564) 3,316,245 2,496,242 820,003 TP AF Contributions - ERIP 2,535,750 2,535,750 2,427,239 108,511 Other Retirement Contributions - PERS 4,905,661 (431,992) 4,473,669 4,458,572 15,097 Other Retirement Contributions - ERIP 69,263 69,263 29,799 39,464
Other Retirement Contributions -Regular 2,529,944 195,620 2,725,564 2,087,130 638,434 Unemployment Compensation 396,207 76,428 472,635 464,491 8,144
Workers Compensation 1,510,000 169,065 1,679,065 1,387,446 291,619 Health Benefits 42,846,944 (4,735,727) 38,111,217 33,275,510 4,835,707
Tuition Reimbursements 425,000 (10,840) 414,160 414,114 46 Other Employee Benefits 1,226,500 10,200 1,236,700 429,634 807,066
Total Unallocated Benefits 59,774,078 (4,739,810) 55,034,268 47,470,177 7,564,091
Reimbursed TP AF Pension Contributions (NonBudgeted) Non-Contributory Group Insurance 389,401 (389,401) Normal Costs and Accrued Liability 21,725,271 (21,725,271) Long Term Disability Insurance 16,569 (16,569) Post Retirement 8,204,140 (8,204,140)
Reimbursed TP AF Social Security Contributions (Non-Budgeted) 8,301,798 {8,301,798)
Total TPAF On-Behalf 38,637,179 {38,637, 179)
Interest Earned on Maintenance Reservce 1,000 1,000 1,000
Total Undistributed Expenditures 182,330,665 {I ,734,376) 180,596 289 197,600,789 {17,004,500)
Total Current Expenditures 283,179,224 1,137,580 284,316,804 293,844,314 (9,527,510)
114 Continued

EXHIBIT C-1 PASSAIC PUBLIC SCHOOLS
GENERAL FUND BUDGETARY COMPARiSON SCHEDULE
FOR THE FISCAL YEAR ENDED JUNE 30, 2020
Variance Original Final Final Budget To Budget Adjustments Budget Actual Actual
EXPENDITURES CAPITAL OUTLAY Equipment Instruction
Kindergarten $ 5,095 $ 5,095 $ 5,095 Grades 1-5 $ 50,000 169,514 219,514 178,200 $ 41,314 Grades 6-8 2,545 2,545 2,450 95 Grades 9-12 20,000 20,921 40,921 20,531 20,390
Undistributed Expenditures Support Services- Instructional Staff 2,508 2,508 2,508 General Administration 13,498 13,498 13,498
School Administration 13,316 13,316 13,316 Central SerVIces 20,000 20,000 14,227 5,773 Admin. Info. Tech. 300,000 98,163 398,163 377,666 20,497 Required Maintenance for School Facilities 113,930 113 930 111,212 2,718
Total Equipment 390,000 439,490 829 490 738,703 90,787
Interest Deposit to Capital Reserve 1,000 1000 1,000
Total Capital Outlay 391,000 439,490 830,490 738,703 91,787
Transfer to Charter Schools 16,225,748 317,951 16,543,699 16,409,903 133,796
Total General Fund 299,795,972 1,895,021 301,690,993 310,992,920 (9,301,927)
Excess (Deficiency) of Revenues Over/(Under) Expenditures (32,042,975) (1,895,021) (33,937,996) 670,310 34,608,306
Other Financing Sources (Uses) Transfer In - School Based Budgets - General Fund 142,481,330 51,121 142,532,451 131,737,216 (10,795,235) Transfer In- School Based Budgets- Special Revenue Fund 7,600,674 1,517,400 9,118,074 8,465,024 (653,050) Transfer Out- Special Revenue Fund- Preschool (3,057,699) (3,057,699) (3,057,699) Transfer Out- Capital Reserve to Capital Projects Fund (5,421,000) (5,421,000) (5,421,000) Transfer Out - School Based Budgets (142,481,330) (51,121) (142,532,451) (131,737,216) 10,795,235
Total Other Financing Sources (Uses) (878,025) 1,517,400 639,375 (13,675) (653,050)
Excess (Deficiency) of Revenues and Other Financing Sources Over/(Under) Expenditures and Other Financing Sources (Uses) (32,921 ,000) (377,621) (33,298,621) 656,635 33,955,256
Fund Balance, Beginning of Year 60,779,610 60,779 610 60,779,610
Fund Balance, End of Year $ 27,858,610 $ (377,621) $ 27,480,989 $ 61,436,245 $ 33,955,256
Recapitulation of Fund Balance Restricted
Capital Reserve $ 1,278,321
Capital Reserve - Designated for Subsequent Years Budget 7,047,654
Maintenance Reserve 13,284,814
Maintenance Reserve - Designated for Subsequent Years Budget 7,344,000
Emergency Reserve 1,000,000
Committed Encumbrances 1,125,976
Assigned Designated for Subsequent Years Budget 20,286,540
Encumbrances 306,820 Unassigned 9,762,120
61,436,245
Reconciliation to Governmental Fund Statements (GAAP) Less: State Aid Payments Not Recognized on GAAP Basis (31,287,394)
Fund Balance Per Governmental Funds (Exhibit B-1) $ 30,148,851
115

EXHIBIT C-Ia PASSAIC PUBLIC SCHOOLS
GENERAL FUND BUDGETARY COMPARISON SCHEDULE
FOR THE FISCAL YEAR ENDED JUNE 30, 2020
Original Budget Adjustments Final Budoet Actual Blended Total Blended Total Blended Total Blended Total
Operating Resource General Operating Resource General Operating Resource General Operating Resource General Fund Fund Fund Fund Fund Fund Fund Fund Fund Fund Fund Fund
REVENUES Local Sources
Property Ta.xes 16,818,577 16,818,577 16,818,577 16,818,577 16,818,577 16,818,577 Tuition 150,000 150,000 150,000 I50,000 437,610 437,610 Interest Earned on Maintenance Reserve 1,000 1,000 1,000 1,000 271,435 271,435 Interest Earned on Capital Reserve 1,000 1,000 1,000 1,000 129,377 129,377 Interest 719,451 719,451 Rentals 10,000 10,000 10,000 10,000 2,775 2,775 Miscellaneous 1,200 000 I 200,000 1,200,000 I 200 000 673 464 673 464
Total Local Sources 18,180,577 18,180,577 18,180 577 18 180 577 19 052,689 19052689
State Sources Equalization Aid 205,013,015 205,013,015 205,013,015 205,013,015 205,013,015 205,013,015 Education Adequacy Aid 19,998,279 19,998,279 19,998,279 19,998,279 19,998,279 19,998,279 Transportation Aid 1,978,076 1,978,076 1,978,076 1,978,076 1,978,076 1,978,076 Special Education Aid 12,147,460 12,147,460 12,147,460 12,147,460 12,147,460 12,147,460 Security Aid 6,745,057 6,745,057 6,745,057 6,745,057 6,745,057 6,745,057 Extraordinary Aid 2, 700,000 2,700,000 2,700,000 2,700,000 6,967,944 6,967,944 Family Crisis Transportation Aid 46,789 46,789 TPAF Pension Contributions (Non-Budget)
Non-Contributory Group Insurance 389,401 389,401 Normal Costs 21,725,271 21,725,271 Long Term Disability Insurance 16,569 16,569 Post Retirement 8,204,140 8,204,140
TPAF Social Security Contributions (Non-Budget) 8 301 798 8 301 798
.....
..... Total State Sources 248,581,887 248,581,887 248,581,887 248,581,887 291 533 799 291,533,799 en
Federal Sources Medicaid Reimbursement - Administrative (MAC) 279,188 279,188 Medicaid Reimbursement 990,533 990,533 990 533 990 533 797,554 797 554
Total Federal Sources 990 533 990,533 990,533 990 533 1,076 742 I 076 742
Total Revenues 267 752 997 267 752,997 267 752,997 267 752,997 3l!,663,230 311,663 230
EXPENDITURES CURRENT EXPENDITURES
Instruction- Regular Programs Salaries ofTeachers
Kindergarten 302,000 1,496,894 1,798,894 200,000 687,363 887,363 502,000 2,184,257 2,686,257 399,603 2,084,086 2,483,689 Grades 1-5 957,000 15,140,546 16,097,546 9,202 (180,688) (171,486) 966,202 14,959,858 15,926,060 825,241 14,571,674 15,396,915 Grades 6-8 550,300 11,610,856 12,161,156 (186,378) 951,213 764,835 363,922 12,562,069 12,925,991 336,086 12,179,682 12,515,768 Grades 9-12 672,000 16,152,969 16,824,969 231,582 231,582 672,000 16,384,551 17,056,551 497,281 15,719,100 16,216,381
Regular Programs - Home Instruction Salaries of Teachers 200,000 200,000 190,000 190,000 390,000 390,000 364,225 364,225
Purchased Professional/Educational Services 239,000 239,000 35,000 35,000 274,000 274,000 100,717 100,717
Regular Programs - Undistributed Instruction Other Salaries for Instruction 1,790,127 1,790,127 326,506 326,506 2,116,633 2,116,633 1,938,366 1,938,366
Purchased Professional/Educational Services 52,958 52,958 28,025 28,025 80,983 80,983 27,514 27,514
Other Purchased Services 2,5l!,OOO 1,046,572 3,557,572 70,168 547,937 618,105 2,581,168 1,594,509 4,175,677 2,323,533 1,278,302 3,601,835
General Supplies 829,500 2,627,320 3,456,820 197,379 498,406 695,785 1,026,879 3,125, 726 4,152,605 522,029 2,791,058 3,313,087 Textbooks 326,820 326,820 (9,470) (9,470) 317,350 317,350 301,862 301,862
Other Objects 145 780 145 780 787 587 1374 787 146,367 147154 617 52 940 53 557
Total Regular Programs 6 260 800 50 390,842 56,651 642 516158 3,081,461 3,597,619 6 776 958 53 472,303 60,249,261 5 369,332 50 944 584 56 313 916
Continued

EXHIBIT C-Ia PASSAIC PUBLIC SCHOOLS
GENERAL FUND BUDGETARY COMPARISON SCHEDULE
FOR THE FISCAL YEAR ENDED JUNE 30, 2020
Original Budget Adjustments Final Budget Actual Blended Total Blended Total Blended Total Blended Total
Operating Resource General Operating Resource General Operating Resource General Operating Resource General Fund Fund Fund Elm.!! Fund Fund Fund Fund Fund Fund Fund Fund
EXPENDITURES
CURRENT EXPENDITURES
Special Education Cognitive Impaired ~ Mild
Salaries ofTeachers 345,018 345,018 (119,673) (119,673) 225,345 225,345 165,335 $ 165,335
Other Salaries for Instruction 31,945 31,945 31,945 31,945 General Supplies 7,200 7,200 7,200 7,200
Tex.tbooks 900 900 (360) (360) 540 540
Other Objects 450 450 450 450
Total Cognitive Impaired~ Mild 353,568 353,568 (88,088) (88,088) 265 480 265 480 165 335 165 335
Learning and/or Language Disabilities Salaries of Teachers 5,000 5,843,622 5,848,622 3,700 418,217 421,917 8,700 6,261,839 6,270,539 3,037 6,042,656 6,045,693 Other Salaries for Instruction 3,200 860,195 863,395 32,208 32,208 3,200 892,403 895,603 480 723,867 724,347 Other Purchased Services 1,000 1,000 1,000 1,000 General Supplies 50,000 105,680 155,680 329 (27,200) (26,871) 50,329 78,480 128,809 16,912 18,588 35,500 Te:...ibooks 14,460 14,460 (2,833) (2,833) 11,627 11,627 4,541 4,541 Other Objects 7 230 7 230 7,230 7 230
Total Learning and/or Language Disabilities 59 200 6831187 6 890 387 4029 420,392 424421 63229 7 251 579 7 314 808 20429 6 789 652 6,810 081
Behavioral Disabilities Salaries of Teachers 127,291 127,291 (64,423) (64,423) 62,868 62,868 59,550 59,550
...... Other Salaries for Instruction 134,364 134,364 134,364 134,364 122,554 122,554
...... General Supplies 5,760 5,760 (5,000) (5,000) 760 760 411 411 -1 Textbooks 720 720 720 720
Other Objects 360 360 360 360
Total Behavioral Disabilities 134131 134131 64,941 64941 199 072 199 072 182,5!5 182 515
Multiple Disabilities Salaries 59,774 59,774 59,774 59,774 29,575 29,575
General Supplies 1,440 1,440 1,440 1,440 Te;o..:tbooks 180 180 180 180
Other Objects 90 90 90 90
Total Multiple Disabilities 61.484 61484 61484 61484 29 575 29 575
Resource RoomJResource Center Salaries ofTeachers 11,423,725 11,423,725 (575,496) (575,496) 10,848,229 10,848,229 10,542,324 10,542,324 General Supplies 188,560 188,560 (37,823) (37,823) 150,737 150,737 97,092 97,092 Textbooks 25,645 25,645 (10,712) (10,712) 14,933 14,933 5,677 5,677 Other Objects 15 404 15 404 (2,298) (2,298) 13 106 13,106 221 221
Total Resource Room/Resource Center II 653 334 11,653 334 (626,329) (626,329) II 027 005 11,027 005 10,645 314 10,645,314
Autism Salaries ofTeachers 1,277,311 1,277,311 (16,586) (16,586) 1,260,725 1,260,725 1,258,325 1,258,325 Other Salaries for Instruction 165,381 165,381 274,797 274,797 440,178 440,178 402,927 402,927
General Supplies 88,302 88,302 (18,481) (18,481) 69,821 69,821 38,635 38,635
Textbooks 3,240 3,240 (360) (360) 2,880 2,880 Other Objects 1620 1620 1.620 1,620
Total Autism 1,535 854 I 535 854 239 370 239 370 I 775 224 I 775 224 I 699 887 I 699 887
Continued

EXHIBIT C-la PASSAIC PUBLIC SCHOOLS
GENERAL FUND BUDGETARY COMPARISON SCHEDULE
FOR THE FISCAL YEAR ENDED JUNE 30, 2020
Original Budget Adjustments Final Budget Actual Blended Total Blended Total Blended Total Blended Total
Operating Resource General Operating Resource General Operating Resource General Operating Resource General Fund Fund Fund Fund Fund Fund Fund Fund Fund Fund Fund Fund
EXPENDITURES CURRENT EXPENDITURES Special Education
Preschool Disabilities ~ Full Time Salaries of Teachers 441,955 441,955 441,955 441,955 372,528 372,528 Other Salaries for Instruction 304,984 304,984 304,984 304,984 285,595 285,595 General Supplies I 000 I 000 I 000 1,000 815 815
Total Preschool Disabilities~ Full Time 747 939 747 939 747,939 747,939 658,938 658 938
Total Special Education 807 139 20 569,558 21,376 697 4 029 10 286 14,315 811,168 20,579 844 21,391,012 679 367 19,512,278 20 191 645
Bilingual Education Salaries ofTeachers 16,244,760 16,244,760 (740,540) (740,540) 15,504,220 15,504,220 15,055,888 15,055,888 General Supplies 698,880 698,880 (166,101) (166,101) 532,779 532,779 421,945 421,945 Tex1books 105,255 105,255 (31,742) (31,742) 73,513 73,513 64,899 64,899 Other Objects 55 064 55 064 (7,088) (7,088) 47976 47,976 5 681 5 681
Total Bilingual Education 17,103,959 17 103,959 (945,471) (945,471) 16 !58 488 16 158 488 15,548 413 15 548 413
School Sponsored Co/Ex1ra Curricular Activities Salaries 268,500 268,500 7,500 7,500 276,000 276,000 232,312 232,312 Supplies and Materials
Total School Sponsored Co/Extra Curricular Activities 268 500 268 500 7 500 7,500 276 000 276 000 232 312 232 312
..... School Sponsored Athletics ..... Salaries 1,176,457 1,176,457 1,176,457 1,176,457 1,051,731 1,051,731 00 Purchased Services 60,000 60,000 60,000 60,000 30,000 30,000
Supplies and Materials 210,000 210,000 11,000 11,000 221,000 221,000 216,238 216,238 Other Objects 50 000 50 000 (5,712) (5,712) 44,288 44 288 29,966 29 966
Total School Sponsored Athletics 1,496 457 I 496 457 5 288 5 288 I 501 745 I SOl 745 I 327,935 1,327 935
Other Instructional Programs - Instruction Salaries 50,000 19,000 69 000 5,565 5,565 50,000 24 565 74565 14,333 18 ISO 32483
Total Other Instructional Programs- Instruction 50 000 19000 69,000 5,565 5 565 50 000 24 565 74 565 14 333 18 150 32 483
Before/ After School Programs - Instruction Salaries ofTeachers 162,288 1,748,463 1,910,751 8,956 70,952 79,908 171,244 1,819,415 1,990,659 58,195 811,261 869,456 Supplies and Materials 10 000 10 000 8 000 8 000 18,000 18,000 12 459 12459
Total Before/After School Programs- Instruction 172 288 I 748 463 1,920 751 16 956 70 952 87 908 189,244 I 819 415 2 008 659 70 654 811,261 881 915
Before/After School Programs- Support
Salaries 80,000 277,000 357,000 74,620 74,620 80,000 351,620 431,620 18,870 134,792 153,662 Purchased Professional and Technical Services
Total Before/After School Programs- Support 80 000 277 000 357 000 74,620 74 620 80 000 351 620 431,620 18 870 134,792 153 662
Total Before/After School Programs 252,288 2 025 463 2,277 751 16 956 145 572 162 528 269,244 2,171 035 2440,279 89 524 946 053 1,035 577
Sununer School- Instruction Salaries of Teachers 922,553 375,000 1,297,553 (111,000) 108,268 (2,732) 811,553 483,268 1,294,821 788,357 480,036 1,268,393 Other Salaries for Instruction 40,000 1,500 41,500 (15,000) (1,500) (16,500) 25,000 25,000 7,352 7,352 Other Purchased Services 35,000 35,000 35,000 35,000 33,750 33,750 General Supplies 20 000 4500 24 500 I 157 (4,500) (3,343) 21,157 21 157 20 926 20926
Total Summer School- Instruction 982 553 416,000 I 398 553 (124,843) 102 268 (22,575) 857 710 518 268 I 375 978 816 635 513 786 1,330 421
Continued

EXHIBIT C-la PASSAIC PUBLIC SCHOOLS
GENERAL FUND BUDGETARY COMPARISON SCHEDULE
FOR THE FISCAL YEAR ENDED JUNE 30, 2020
Original Budget Ad justrnents Final Budget Actual Blended Total Blended Total Blended Total Blended Total
Operating Resource General Operating Resource General Operating Resource General Operating Resource General Fund Fund Fund Fund Fund Fund Fund Fund Fund Fund Fund Fund
EXPENDITURES CURRENT EXPENDITURES
Surruner School -Support
Salaries 80,000 71,000 151,000 49,000 6,187 55,187 129,000 17,187 206,187 120,666 76,668 197,334 Purchased Professional and Technical Services 55 000 55 000 (8,000) (8,000) 47 000 47,000 33 489 33 489
Total Summer School- Support 135,000 71,000 206,000 41 000 6 187 47 187 176 000 17 187 253,187 154,155 76 668 230 823
Total Summer School 1 117 553 487 000 1,604 553 (83,843) 108,455 24612 1,033 710 595 455 1 629 165 970,790 590 454 1 561 244
Total Instruction 9 984,237 90 864 322 100,848 559 458 588 2,413 368 2 871 956 10,442 825 93 217 690 103 720 515 8 451 281 87,792 244 96,243,525
Undistributed Expenditures Instruction
Tuition to Other LEAs w/i State - Regular 2,693,999 2,693,999 2,693,999 2,693,999 2,413,009 2,413,009
Tuition to Other LEAs w/i State- Special 752,342 752,342 (200,000) (200,000) 552,342 552,342 472,414 472,414 Tuition to CVSD - Regular 6,587,960 6,587,960 6,587,960 6,587,960 6,274,981 6,274,981 Tuition to CVSD - Special 222,761 222,761 (48,732) (48,732) 174,029 174,029 164,029 164,029 Tuition Co. Spec. Svc. School Districts and Regional Day 2,326,311 2,326,311 322,491 322,491 2,648,802 2,648,802 2,463,691 2,463,691 Tuition to PSD Within the State 17,581,396 17,581,396 (946,452) (946,452) 16,634,944 16,634,944 15,685,464 15,685,464 Tuition to PSD and Other LEAs- Special- Out of State 974,130 974,130 388,732 388,732 1,362,862 1,362,862 1,199,881 1,199,881 Tuition- State Facilities 325,750 325,750 325,750 325,750 325,750 325,750 Tuition- Other 68 500 68 500 (68,500) (68,500)
...... Total Undistributed Expenditures- Instruction 31 533 149 31 533 149 (552,461) (552,461) 30,980 688 30 980 688 28 999,219 28,999,219
...... (0 Attendance and Social Work
Salaries 143,418 143,418 143,418 143,418 135,058 135,058 Salaries of Drop-Out Prevention Officer/Coordinator 10,000 594,670 604,670 45,502 45,502 10,000 640,172 650,172 574,085 574,085 Salaries of Family Support Teams 499,834 499,834 163,415 163,415 663,249 663,249 536,074 536,074 Salaries of Family Liaisons/Comm. Parent Inv. Spec. 2,000 897,856 899,856 25,410 25,410 2,000 923,266 925,266 879,273 879,273 Other Purchased Services 10,000 10 000 10,000 10 000 5 400 5 400
Total Attendance and Social Work 165 418 1 992 360 2,157 778 234 327 234 327 165 418 2 226 687 2 392,105 140 458 1,989 432 2,129 890
Health Services
Salaries 82,921 2,576,687 2,659,608 (1) 87,802 87,801 82,920 2,664,489 2,747,409 17,913 2,573,316 2,591,229
Salaries of Social Service Coordinators 155,339 155,339 2,911 2,911 158,250 158,250 158,250 158,250
Purchased Professional and Teclmical Services 245,000 245,000 712 712 245,712 245,712 168,921 168,921
Other Purchased Services 33,000 33,000 33,000 33,000 29,975 29,975
Supplies and Materials 10,000 33,500 43,500 6,938 6,102 13,040 16,938 39,602 56,540 15,501 29,037 44,538
Other Objects
Total Health Services 526 260 2 610 187 3 136 447 10 560 93 904 104 464 536,820 2 704 091 3,240 911 390,560 2 602,353 2,992 913
Other Support Serv. Students- Speech, OT, PT Salaries 253,714 253,714 253,714 253,714 193,072 193,072
Purchased Professional - Educational Services 8 708 100 8,708 100 399 939 399 939 9,108 039 9 108 039 7 867 764 7,867 764
Total Other Supp.Serv. Student- Speech, OT. PT 8 961 814 8,961 814 399 939 399 939 9,361,753 9 361,753 8 060 836 8 060 836
Other Support Serv. Students- Extra Serv.
Salaries 5 466 271 5 466,271 5 466,271 5 466 271 5 257 580 5,257 580
Total Other Support Serv. Students- Extra Serv. 5 466 271 5,466 271 5 466 271 5 466 271 5 257 580 5 257 580
Continued

EXHIBIT C-Ia PASSAIC PUBLIC SCHOOLS
GENERAL FUND BUDGETABY COMPARISON SCHEDULE
FOR THE FISCAL YEAR ENDED JUNE 30, 2020
Orig;inal Budget Adjustments Final Budget Actual Blended Total Blended Total Blended Total Blended Total
Operating Resource General Operating Resource General Operating Resource General Operating Resource General Fund Fund Fund !!!lli! Fund Fund f!!!!!! Fund Fund Fund Fund Fund
EXPENDITURES CURRENT EXPENDITURES
Undistributed Expenditures (Continued)
Guidance Salaries of Other Professional Staff 2,815,848 2,815,848 175,435 175,435 2,991,283 2,991,283 2,799,997 2,799,997
Other Salaries 142,082 142 082 142 082 142 082 142081 142081
Total Guidance 142 082 2 815 848 2,957 930 175 435 175 435 142,082 2 991 283 3,133 365 142081 2 799,997 2 942,078
Child Study Team
Salaries of Other Professional Staff 5,697,363 5,697,363 39,000 39,000 5,736,363 5,736,363 5,239,742 5,239,742
Salaries of Secretarial and Clerical Assistants 66,969 66,969 1,357 1,357 68,326 68,326 68,182 68,182
Purchased Professional~Educational Services Other Purchased Services 128,000 128,000 296,279 296,279 424,279 424,279 359,055 359,055
Supplies and Materials 10 000 10 000 70 70 10 070 10 070 7 965 7 965
Total Child Study Team 5,902 332 5 902 332 336 706 336 706 6 239 038 6 239,038 5 674,944 5,674 944
Improvement of Instruction Services Salaries of Supervisors of Instruction 1,494,667 1,494,667 (3,889) (3,889) 1,490,778 1,490,778 1,339,661 1,339,661 Salaries of Other Professional Staff 24,000 40,000 64,000 (15,000) 14,258 (742) 9,000 54,258 63,258 3,854 18,040 21,894 Salaries of Secretarial and Clerical Assistants 349,556 349,556 (174,478) (174,478) 175,078 175,078 109,649 109,649 Salaries of Facilitators. Math and Literacy Coaches 87,869 908,269 996,138 (2,559) 2,308 (251) 85,310 910,577 995,887 85,310 787,045 872,355 Purchased Professional ~ Educational Services 154,000 154,000 (21,000) (21,000) 133,000 133,000
...... Other Purchased Services 134,700 134,700 (29,667) (29,667) 105,033 105,033 72,920 72,920
N Supplies and Materials 17,500 17,500 (6,501) (6,501) 10,999 10,999 10,276 10,276 0 Other Objects
Total Improvement of Instruction Services 2,262,292 948,269 3 210 561 (253,094) 16 566 (236,528) 2,009,198 964,835 2 974 033 1.621 670 805,085 2.426 755
Educational Media/School Library Salaries 266,524 266,524 (94,301) (94,301) 172,223 172,223 135,064 135,064
Salaries ofTechnology Coordinators 1,280,658 1,280,658 349,494 349,494 1,630,152 1,630,152 1,535,514 1,535,514
Other Purchased Services 2,000 2,000 (2,000) (2,000)
Supplies and Materials 16,500 22 000 38 500 (11,111) (11,111) 5 389 22 000 27 389 5 389 11.446 16 835
Total Educational Media/School Library 16 500 I 571,182 1,587 682 (11,111) 253 193 242 082 5 389 I 824 375 I 829 764 5 389 1,682,024 1.687 413
Instructional Staff Training Services Salaries of Supervisors of Instruction 127,271 127,271 127,271 127,271 127,271 127,271
Salaries of Secretarial and Clerical Assist 52,880 52,880 485 485 53,365 53,365 53,365 53,365
Purchased Professional- Educational Services 40,000 1,457,000 1,497,000 (7,435) 487,893 480,458 32,565 1,944,893 1,977,458 30,650 1,462,634 1,493,284
Other Purchased Services 150,000 40,000 190,000 10,962 54,347 65,309 160,962 94,347 255,309 145,794 46,969 192,763
Supplies and Materials 2,000 3,000 5,000 4,000 12,000 16,000 6,000 15,000 21,000 5,979 14,815 20,794
Other Objects 2,900 2 900 6 290 6 290 9 190 9190 8 890 8 890
Total Instructional Staff Training Services 375,051 I 500 000 I 875,051 14302 554 240 568 542 389 353 2,054,240 2 443,593 371,949 I 524418 I 896 367
Continued

EXPENDITURES CURRENT EXPENDITURES
Undistributed Expenditures (Continued) Support Services General Administration
Salaries Legal Services Audit Fees Other Purchased Professional Services Purchased Technical Services Communicationsffelephone BOE Other Purchased Services Miscellaneous Purchased Services General Supplies BOE In-House Training/Meeting Supplies Judgements Against the School District
Miscellaneous Expenditures BOE Membership Dues and Fees
Total Support Services General Administration
Support Services School Administration Salaries of Principals/ Asst Principals Salaries of Other Professional Staff
Salaries of Secretarial and Clerical Assistants Purchased Professional and Technical Services Other Purchased Services Supplies and Materials Other Objects
Total Support Services School Administration
Central Services Salaries Purchased Professional Services Purchased Teclmical Services Miscellaneous Purchased Services Supplies and Materials
Miscellaneous Expenditures
Total Central Services
Admin. Info. Technology
Salaries Purchased Teclmical Services Other Purchased Services Supplies and Materials Other Objects
Total Admin. Info. Technology
Required Maintenance for School Facilities Salaries Cleaning, Repair and Maintenance Services General Supplies
Total Required Maintenance for School Facilities
Operating Fund
867,818 255,000
75,000 35,000
7,000 470,000
24,500 606,000
36,000 350
500,000
31,189 29 000
2,936.857
1,693,058
466,628
200
2,159,886
2,922,254
211,000
135,000
309,300
55,580
15 500
3,648,634
1,439,541 115,000
32,000 15,000
1,601541
2,041,240
4,508,760 650 000
7,200,000
Original Budget Blended Resource
Fund
5,677,149
620,672
2,476,479
206,570
114,500
9 095,370
Total General
Fund
867,818 255,000
75,000 35,000
7,000 470,000
24,500 606,000
36,000
350 500,000
31,189 29,000
2 936 857
7,370,207
620,672
2,943,107
206,570
114,500
200
II 255,256
2,922,254
211,000
135,000
309,300
55,580
15,500
3,648 634
1,439,541 115,000
32,000 15,000
1,601 541
2,041,240
4,508,760 650,000
7 200 000
PASSAIC PUBLIC SCHOOLS GENERAL FUND
BUDGETARY COMPARISON SCHEDULE FOR THE FISCAL YEAR ENDED JUNE 30, 2020
Operating Fund
1,365
(3,000) (47,000)
(2,205)
(4,367)
(25,000)
(2,248)
(82,455)
(8,182)
202,440
194 258
4,889
5,000
168,648
13,078
776
192 391
40,000 (67,104)
75,706 638
49240
70,258 26 258
96 516
Adjustments Blended Resource
Fund
(89,288)
(73,266)
23,621
230,895
21,759
113,721
$
Total General
Fund
1,365
(3,000) (47,000)
(2,205)
(4,367)
(25,000)
(2,248)
(82,455)
(97,470)
(73,266)
226,061
230,895
21,759
307 979
4,889
5,000
168,648
13,078
776
192 391
40,000 (67,104)
75,706 638
49240
70,258 26 258
96 516
Operating Fund
867,818 256,365
75,000 35,000
4,000 423,000
22,295 606,000
31,633
350 475,000
28,941 29000
2,854,402
1,684,876
669,068
200
2 354,144
2,927,143
211,000
140,000
477,948
68,658
16 276
3,841,025
1,479,541 47,896
107,706 15,638
I 650,781
2,041,240
4,579,018 676,258
7296516
Final Budaet Blended Resource
Fund
5,587,861
547,406
2,500,100
437,465
136,259
9 209 091
Total General
Fund
867,818 256,365
75,000 35,000
4,000 423,000
22,295 606,000
31,633 350
475,000
28,941 29,000
2 854 402
7,272,737
547,406
3,169,168
437,465
136,259
200
11,563,235
2,927,143
211,000
140,000
477,948
68,658
16276
3,841,025
1,479,541 47,896
107,706 15,638
1,650 781
2,041,240
4,579,018 676 258
7,296 516
Operating Fund
803,561 225,117
68,598 4,200
355,889
7,547 535,424
6,898
93,450
11,483 26 663
2,138,830
1,604,661
623,559
170
2 228 390
2,702,463
130,785
89,930
105,998
63,992
11292
3 104,460
1,305,696 44,692
74,144 15,638
1,440,170
1,782,890
2,556,022 478 080
4 8!6 992
Actual Blended
Resource Fund
5,528,064
547,406
2,397,312
382,094
95,154
8,950,030
EXHIBIT C-la
Total General
Fund
803,561 225,117
68,598 4,200
355,889
7,547 535,424
6,898
93,450
11,483 26 663
2,138,830
7,132,725
547,406
3,020,871
382,094
95,154
170
II 178 420
2,702,463
130,785
89,930
105,998
63,992
11,292
3 104 460
1,305,696 44,692
74,144 15,638
1,440 170
1,782,890
2,556,022 478 080
4 816 992
Continued

EXHIBIT C-Ia PASSAIC PUBLIC SCHOOLS
GENERAL FUND BUDGETARY COMPARISON SCHEDULE
FOR THE FISCAL YEAR ENDED JUNE 30, 2020
Original Budget Adjustments Final Budget Actual Blended Total Blended Total Blended Total Blended Total
Operating Resource General Operating Resource General Operating Resource General Operating Resource General
E!!!ll! Fund Fund .E!!.w! Fund Fund Fund Fund Fund Fund Fund Fund
EXPENDITURES CURRENT EXPENDITURES
Undistributed Expenditures (Continued)
Custodial Services Salaries 6,108,050 6,!08,050 417,000 417,000 6,525,050 6,525,050 6,331,774 6,33!,774
Purchased Professional and Technical Services 850,000 850,000 751,069 751,069 1,601,069 1,601,069 747,822 747,822 Cleaning, Repair and Maintenance Services 265,000 265,000 (115,494) (115,494) 149,506 149,506 9,378 9,378
Rental of Land and Bldgs Other Than Lease Purchase 2,950,000 2,950,000 2,950,000 2,950,000 2,843,263 2,843,263 Other Purchased Property Services 20,000 20,000 20,000 20,000 Insurance 650,000 650,000 1,000 1,000 651,000 65!,000 649,710 649,710
Miscellaneous Purchased Services 85,000 85,000 2,500 2,500 87,500 87,500 75,327 75,327 General Supplies 350,000 350,000 345,296 345,296 695,296 695,296 610,761 610,761 Energy (Natural Gas) 997,620 997,620 (30,000) (30,000) 967,620 967,620 343,971 343,971 Energy (Electricity) 3,023,263 3,023,263 (414,940) (414,940) 2,608,323 2,608,323 2,071,671 2,071,671 Energy (Gasoline) 7,000 7,000 10,000 10,000 17,000 17,000 6,654 6,654 Other Objects 10,000 10 000 10 000 10,000 3 596 3 596
Total Custodial Services 15,315,933 15 315,933 966 431 966,431 16 282 364 I6,282 364 13 693 927 13 693 927
Security
Salaries 310,869 2,124,368 2,435,237 2,224 94,036 96,260 313,093 2,218,404 2,531,497 253,089 2,131,754 2,384,843
Purchased Professional and Technical Services 3,516,672 3,516,672 (85,000) (85,000) 3,431,672 3,431,672 3,400,000 3,400,000 General Supplies 30,000 30,000 94,390 100 94,490 124,390 100 124,490 I 13,784 100 113,884 ..... Other Objects [>,:,
[>,:,
Total Security 3,857 54! 2 124,368 5,981 909 11 614 94136 105,750 3 869 !55 2 218 504 6,087,659 3 766 873 2,13! 854 5 898 727
Student Transportation Services Sal. For Pupil Trans (Bet Home & School)- Reg. 171,874 171,874 171,874 171,874 153,967 153,967 Management Fee- ESCs and CTSA 30,000 30,000 30,000 30,000 60,000 60,000 49,976 49,976
Other Purchased Professional and Technical Serv 7,000 7,000 6,150 6,150 !3,150 13,!50 8,150 8,150
Contracted Services-Aid in Lieu Payments-Non Public School 31,385 31,385 31,385 31,385 20,113 20,113
Contracted Services (Between Home and School)- Vendors 800,000 800,000 (800,000) (800,000)
Contracted Services - AIL -Charter Schools 75,000 75,000 22,465 22,465 97,465 97,465 96,070 96,070 Contracted Services (Other Than Between
Home and School) -Vendors 238,000 479,568 717,568 1,450 95,626 97,076 239,450 575,194 814,644 210,308 138,380 348,688
Contracted Services (Btw Home and School) -Joint Agreements 1,000 1,000 1,000 1,000 2,000 2,000 1,334 1,334
Contracted Services (Special Ed. Students) -Vendors 5,075,000 5,075,000 (211,173) (211,173) 4,863,827 4,863,827 4,816,584 4,816,584
Contracted Services (Special Ed. Students)-Joint Agreements 2,000 2,000 2,000 2,000
Contracted Services- (Regular Students)-ESCs and CTSA 15,000 15,000 15,000 15,000
Contracted Services- (Special Ed. Students)-ESCs and CTSA 930,000 930,000 920,173 920,173 1,850,!73 1,850,!73 1,657,761 1,657,761
Misceilaneous Purchased Services- Transportation Travel- All Other
General Supplies 2,000 2,000 (200) (200) 1,800 1,800 1,069 1,069 Other Objects 200 200 200 200 200 200
Total Student Transportation Services 7,346 874 479 568 7,826,442 1450 95 626 97 076 7 348 324 575 194 7923518 7 015 532 138 380 7 153 912
Continued

EXHIBIT C-la PASSAIC PUBLIC SCHOOLS
GENERAL FUND BUDGETARY COMPARISON SCHEDULE
FOR THE FISCAL YEAR ENDED JUNE 30, 2020
Original Budget Adjustments Final Budget Actual Blended Total Blended Total Blended Total Blended Total
Operating Resource General Operating Resource General Operating Resource General Operating Resource General Fund Fund Fund Fund Fund Fund Fund Fund Fund Fund Fund Fund
EXPENDITURES CURRENT EXPENDITURES
Undistnbuted Expenditures lContmued) Unallocated Benefits Social Security Contributions $ 1,786,406 1,542,403 $ 3,328,809 - $ (12,564) (12,564) 1,786,406 1,529,839 $ 3,316,245 1,375,297 1,120,945 $ 2,496,242 TP AF Contributions - ERIP 2,535,750 2,535,750 2,535,750 2,535,750 2,427,239 2,427,239 Other Retirement Contributions - PERS 4,905,661 4,905,661 (431,992) (431,992) 4,473,669 4,473,669 4,458,572 4,458,572 Other Retirement Contributions - ERIP 69,263 69,263 69,263 69,263 29,799 29,799 Other Retirement Contributions - Regular 2,529,944 2,529,944 195,620 195,620 2,725,564 2,725,564 2,087,130 2,087,130 Unemployment Compensation 103,033 293,174 396,207 '20,374 56,054 76,428 123,407 349,228 472,635 123,404 341,087 464,491 Workers Compensation 392,674 1,117,326 1,510,000 169,065 169,065 561,739 1,117,326 1,679,065 494,911 892,535 1,387,446 Health Benefits 12,319,261 30,527,683 42,846,944 (1,822,547) (2,913,180) (4,735,727) 10,496,714 27,614,503 38,111,217 8,137,060 25,138,450 33,275,510 Tuition Reimbursements 425,000 425,000 (10,840) (10,840) 414,160 414,160 414,114 414,114 Other Employee Benefits 1,226,500 1 226 500 10 200 10,200 I 236 700 1,236 700 429,634 429 634
Total Unallocated Benefits 23 763 548 36 010 530 59 774 078 (2,065,740) (2,674,070) (4,739,810) 21 697 808 33 336 460 55 034 268 17 890,030 29 580 147 47 470 177
Reimbursed TPAF Pension Contributions (NonBudgeted) Non-Contributory Group Insurance 389,401 389,401 Normal Costs and Accrued Liability 21,725,271 21,725,271 Long Tenn Disability Insurance 16,569 16,569 Post Retirement 8,204,140 8,204,140
Reimbursed TP AF Social Security Contributions (Non-Budgeted) 8,301 798 8 301 798
Total TPAF On-Behalf 38 637,179 38 637179 ...... ~ Interest Earned on Maintenance Reservce I 000 I 000 1 000 1,000 w
Total Undistributed Expenditures 123,182,983 59 147 682 182,330,665 (691,454) (1,042,922) (1,734,376) 122.491,529 58 104 760 180 596 289 145 397 069 52 203,720 197 600 789
Total Current Expenditures 133 167 220 150,012,004 283 179 224 (232,866) 1,370 446 1,137 580 132 934,354 151,382 450 284 316,804 153 848 350 139 995 964 293,844 314
CAPITAL OUTLAY
Equipment
Instruction Kindergarten 5,095 5,095 5,095 5,095 5,095 5,095
Grades 1-5 50,000 50,000 169,514 169,514 219,514 219,514 178,200 178,200
Grades 6-8 2,545 2,545 2,545 2,545 2,450 2,450
Grades 9-12 20,000 20,000 20,921 20,921 40,921 40,921 20,531 20,531
School Sponsored and Other Instructional Program Undistributed Expenditures
Support Services - Instructional Staff 2,508 2,508 2,508 2,508 2,508 2,508
General Administration 13,498 13,498 13,498 13,498 13,498 13,498
School Administration 13,316 13,316 13,316 13,316 13,316 13,316
Central Services 20,000 20,000 20,000 20,000 14,227 14,227
Admin. Info. Tech. 300,000 300,000 98,163 98,163 398,163 398,163 377,666 377,666 Required Maintenance for School Facilities 113 930 l!3,930 113 930 II3 930 1l!212 Ill 212
Total Equipment 320,000 70 000 390 000 241415 198 075 439490 561415 268,075 829,490 532427 206 276 738 703
Interest Deposit to Capital Reserve I 000 I 000 1 000 I 000
Total Capital Outlay 321 000 70 000 391 000 241415 198 075 439 490 562,415 268 075 830 490 532 427 206,276 738 703
Transfer to Charter Schools 16 225 748 16 225 748 317 951 317 951 16,543 699 16 543 699 16 409 903 16 409 903
Total General Fund 149 713,968 150,082 004 299,795,972 326 500 1 568,521 1 895 021 150,040.468 151,650,525 301 690 993 170,790 680 140 202,240 310 992 920
Continued

Excess (Deficiency) of Revenues Over/(Under) Expenditures
Other Financing Sources (Uses) Transfer In - School Based Budgets - General Fund Transfer In - School Based Budgets - Special Revenue
Fund Transfer Out- Special Revenue Fund- Preschool Transfer Out - Capital Reserve to Capital Projects Fund Transfer Out - School Based Budgets
Total Other Financing Sources (Uses)
Excess (Deficiency) of Revenues and Other Financing Sources Over/(Under) E.,.penditures and Other Financing Sources (Uses)
Fund Balance. Beginning ofYear
Fund Balance, End ofYear
Operating Fund
118,039,029
(3,057,699)
(5,421,000) (142,481,330)
(150,960,029)
(32,921,000)
60 779,610
27,858,610
Original Budget Blended Total
Resource General Fund Fund
$ (150,082,004) (32,042,975)
142,481,330 142,481,330
7,600,674 7,600,674
(3,057,699)
(5,421,000) (142,481,330)
150,082,004 (878,025)
(32,921,000)
60,779 610
27 858,610
PASSAIC PUBLIC SCHOOLS GENERAL FUND
BUDGETARY COMPARISON SCHEDULE FOR THE FISCAL YEAR ENDED .JUNE 30, 2020
Adjustments Blended Total
Operating Resource General Fund Fund Fund
$ (326,500) (1,568,521) (1,895,021) $
51,121 51,121
1,517,400 1,517,400
(51,121) (51,121)
(51,121) 1,568 521 1,517 400
(377,621) (377,621)
(377,621) (377,621)
EXHIBIT C-Ia
Final Budget Actual Blended Total Blended Total
Operating Resource -General Operating Resource General Fund Fund Fund Fund Fund Fund
117 712 529 $ (!51 ,650,525) (33,937,996) $ 140,872,550 $ (140,202,240) $ 670 310
142,532,451 142,532,451 131,737,216 131,737,216
9,118,074 9,118,074 8,465,024 8,465,024
(3,057,699) (3,057,699) (3,057,699) (3,057,699)
(5,421,000) (5,421,000) (5,421,000) (5,421,000) (142,532,451) (142,532,451) (131,737,216) (131,737,216)
(151,011,150) 151,650,525 639 375 (140,215,915) 140,202 240 (13,675)
(33,298,621) (33,298,621) 656,635 656,635
60,779 610 60 779 610 60 779 610 60 779 610
27,480,989 $ 27,480,989 61,436,245 $ 61,436,245

EXHIBIT C-2
PASSAIC PUBLIC SCHOOLS
SPECIAL REVENUE FUND
BUDGETARY COMPARISON SCHEDULE
FOR THE FISCAL YEAR ENDED JUNE 30, 2020
Variance
Original Final Final Budget to
Budget Adjustments Budget Actual Actual
REVENUES
Intergovernmental
State $ 30,378,607 $ 1,326,309 $ 31,704,916 $ 28,753,450 $ (2,951,466)
Federal 12,493,642 11,756,523 24,250,165 15,761,330 (8,488,835) Local Sources
Miscellaneous 19,796 19,796 13,063 (6, 733)
Total Revenues 42,872,249 13,102,628 55,974,877 44,527,843 (11,447,034)
EXPENDITURES
Instruction
Salaries of Teachers 9,714,521 (253,348) 9,461,173 9,376,332 84,841
Other Salaries for Instruction 5,034,204 923,700 5,957,904 5,161,490 796,414
Purchased Professional/Educational Services 1,744,430 498,197 2,242,627 1,387,891 854,736
Other Purchased Services 2,183,911 2,354,185 4,538,096 2,683,241 1,854,855
General Supplies 726,125 4,070,016 4,796,141 1,368,901 3,427,240
Textbooks 157,958 32,485 190,443 183,339 7,104 Other Objects 28,000 28,000 2,810 25,190
Total Instruction 19,589,149 7,625,235 27,214,384 20,164,004 7,050,380
Support Services
Salaries of Supervisors oflnstruction 155,823 46,307 202,130 196,597 5,533
Salaries of Principals/ Assistants/Prgm Dir 714,541 (63,895) 650,646 589,491 61,155 Salaries of Other Professional Staff 1,098,053 314,868 1,412,921 1,303,509 109,412 Salaries of Secretarial and Clerical Asst. 418,579 (3,875) 414,704 395,809 18,895 Other Salaries 397,816 552,091 949,907 747,816 202,091 Salaries of Community Parent Involvement 124,039 124,039 118,583 5,456 Salaries of Master Teachers 575,447 2,850 578,297 578,297
Purchased Professional/Educational Services 1,147,393 617,285 1,764,678 1,022,419 742,259
Purchased Educ. Svcs. - Contracted Pre-K 3,907,693 3,907,693 3,840,663 67,030
Purchased Educ. Svcs. -Head Start 1,405,208 1,405,208 1,405,208 Other Purchased Professional Services 12,000 12,000 12,000 Cleaning, Repairs, and Maintenance 15,650 14,139 29,789 22,784 7,005
Rentals 1,810,194 1,810,194 1,480,915 329,279 Travel 3,000 20,215 23,215 5,987 17,228
Other Purchased Services 1,142,544 1,142,544 421,266 721,278 Supplies and Materials 86,059 684,064 770,123 195,691 574,432
Total Support Services 11,871,495 3,326,593 15,198,088 12,325,035 2,873,053
Transportation
Contracted Services 18,342 5,308 23,650 2,217 21,433
Unallocated Benefits
Employee Benefits 6,850,288 461,919 7,312,207 6,488,249 823,958
125 Continued

EXPENDITURES (Continued)
Facilities Acquisition and Construction Building Improvements Instructional Equipment Noninstructional Equipment
Total Facilities Acq. & Construction
Total Expenditures
Excess (Deficiency) of Revenues and Other Financing Sources Over/(Under) Expenditures
Other Financing Sources (Uses) Transfer In
Transfer Out
Total Other Financing Sources (Uses)
Excess (Deficiency) of Revenues and Other
Financing Sources Over/(Under) Expenditures
And Other Financing Sources (Uses)
Fund Balance, Beginning of Year
Fund Balance, End of Year
PASSAIC PUBLIC SCHOOLS
SPECIAL REVENUE FUND
BUDGETARY COMPARISON SCHEDULE
FOR THE FISCAL YEAR ENDED JUNE 30, 2020
Original
Budget
38,329,274
4,542,975
3,057,699
(7,600,674)
(4,542,975)
$
Adjustments
19,620 100,412 46,141
166,173
11,585,228
1,517,400
(1,517,400)
(1,5 I 7,400)
126
$
Final
Budget
19,620 100,412 46,141
166,173
49,914,502
6,060,375
3,057,699 (9, 118,074)
(6,060,375)
$ 19,620 75,252 $ 46,141
141,013
39,120,518
5,407,325
3,057,699
EXHIBIT C-2
Variance
Final Budget to
Actual
25,160
25,160
10,793,984
(653,050)
(8,465,024) ____ 6_5'--'3,_05_0
(5,407,325) 653,050
$

PASSAIC PUBLIC SCHOOLS BUDGETARY COMPARISON SCHEDULE
NOTE TO REQUIRED SUPPLEMENTARY INFORMATION- PART II FOR THE FISCAL YEAR ENDED JUNE 30, 2020
Formal budgetary integration into the accounting system is employed as a management control device during the year. For governmental funds there are no substantial differences between the budgetary basis of accounting and accounting principles generally accepted in the United States of America, with the exception of the legally mandated revenue recognition of certain state aid payments for budgetary purposes only and the treatment of encumbrances in the special revenue fund as described below. Encumbrance accounting is also employed as an extension of formal budgetary integration of the governmental fund types. Unencumbered appropriations lapse at fiscal year end.
The accounting records of the Special Revenue Fund are maintained on the grant accounting budgetary basis. The grant accounting budgetary basis differs from GAAP in that the grant accounting budgetary basis recognizes encumbrances as expenditures and also recognizes the related revenues, whereas the GAAP basis does not. Sufficient supplemental records are maintained to allow for the presentation of GAAP basis financial reports.
The following presents a reconciliation ofthe General and Special Revenue Funds from the budgetary basis of accounting as presented in the Budgetary Comparison Schedule- General Fund and Special Revenue Fund to the GAAP basis of accounting as presented in the Statement of Revenues, Expenditures and Changes in Fund Balance- Governmental Funds.
Sources/Inflows of Resources
General Fund
EXHIBITC-3
Special Revenue
Fund
Actual Revenues (budgetary basis) (Exhibits C-1, C-2) $ 311,663,230 $ 44,527,843
Difference- budget to GAAP: State Aid payments recognized for budgetary purposes, not recognized for
GAAP statements (2019-2020) State Aid payments recognized for GAAP statements, not recognized for budgetary purposes (2018-20I9)
Grant accounting budgetary basis differs from GAAP in that encumbrances are recognized as expenditures, and the related revenue is recognized.
Encumbrances, June 30, 2020 Encumbrances, June 30, 20I9
Total Revenues as Reported on the Statement of Revenues, Expenditures and Changes in Fund Balances- Governmental Funds (Exhibit B-2)
Uses/Outflows of Resources Actual expenditures (budgetary basis) (Exhibits C-I, C-2)
Differences - budget to GAAP Encumbrances for supplies and equipment ordered but
not received are reported in the year the order is placed for budgetary purposes, but in the year the supplies are received for financial reporting purposes.
Encumbrances, June 30, 2020
Encumbrances, June 30, 20I9
Total Expenditures as Reported on the Statement of Revenues, Expenditures, and Changes in Fund Balances- Governmental Funds (Exhibit B-2)
127
$
$
$
(3I,287,394)
29,638,032
(570,980) 28I,5I8
3IO,OI3,868 $ 44,238,38I
3 I 0,992,920 $ 39,120,5 I 8
(570,980)
281,518
3I0,992,920 $ 38,83I,056

REQUIRED SUPPLEMENTARY INFORMATION- PART III
PENSION AND OTHER POST-EMPLOYMENT BENEFITS INFORMATION

,_. ~ 00
PASSAIC PUBLIC SCHOOLS REQUIRED SUPPLEMENTARY INFORMATION
SCHEDULE OF THE DISTRICT'S PROPORTIONATE SHARE OF THE NET PENSION LIABILITY
PUBLIC EMPLOYEES' RETIREMENT SYSTEM Last Seven Fiscal Years *
2020 2019 2018 2017
District's Proportion of the Net Position Liability (Asset) 0.43546% 0.44318% 0.45250% 0.45159%
District's Proportionate Share of the Net Pension Liability (Asset) $ 78,463,692 $ 87,260,444 $ 105,335,515 $133,747,337
District's Covered Payroll $ 30,939,910 $ 30,666,428 $ 31,001,676 $ 30,673,738
District's Proportionate Share of the Net Pension Liability (Asset) as a Percentage of its Covered Payroll 253.60% 284.55% 339.77% 436.03%
Plan Fiduciary Net Position as a Percentage of the Total Pension Liability 56.27% 53.60% 48.10% 40.14%
*The amounts presented for each fiscal year were determined as of the previous fiscal year end.
This schedule is presented to illustrate the requirement to show information for 10 years in accordance with GASB Statement No. 68. However, until a full10-year trend is compiled, the District will only present information for those years for which information is available.
EXHIBITL-1
2016 2015 2014
0.43249% 0.41578% 0.39247%
$ 97,084,527 $ 77,846,311 $ 75,008,148
$ 29,677,356 $ 29,192,826 $ 28,073,282
327.13% 266.66% 267.19%
47.93% 52.08% 48.72%

PASSAIC PUBLIC SCHOOLS REQUIRED SUPPLEMENTARY INFORMATION
SCHEDULE OF THE DISTRICT'S CONTRIBUTIONS PUBLIC EMPLOYEES' RETIREMENT SYSTEM
Contractually Required Contribution
Contributions in Relation to the Contractually Required Contributions
Contribution Deficiency (Excess)
District's Covered Payroll
Contributions as a Percentage of Covered Payroll
$
$
$
2020
4,235,786 $
4,235,786
- $
33,456,749 $
12.66%
Last Seven Fiscal Years
2019 2018
4,408,235 $ 4,191,959
4,408,235 4,191,959
- $ -
30,939,910 $ 30,666,428
14.25% 13.67%
This schedule is presented to illustrate the requirement to show information for 10 years in accordance with GASB Statement No. 68. However, until a fulllO-year trend is compiled, the District will only present information for those years for which information is available.
2017
$ 4,011,841
4,011,841
$ -
$ 31,001,676
12.94%
EXHIBIT L-2
2016 2015 2014
$ 3,718,223 $ 3,408,190 $ 2,957,155
3,718,223 3,408,190 2,957,155
$ - $ - $
$ 30,673,738 $ 29,677,356 $ 29,192,826
12.12% 11.48% 10.13%

I-'
w 0
PASSAIC PUBLIC SCHOOLS REQUIRED SUPPLEMENTARY INFORMATION
SCHEDULE OF THE DISTRICT'S PROPORTIONATE SHARE OF THE NET PENSION LIABILITY
TEACHERS' PENSION AND ANNUITY FUND Last Seven Fiscal Years *
2020 2019 2018 2017
District's Proportion of the Net Position Liability (Asset) 0.00% 0.00% 0.00% 0.00%
District's Proportionate Share of the Net Pension Liability (Asset) 0 0 0 $0
State's Proportionate Share ofthe Net Pension Liability (Asset) Associated With the District $ 634,223,406 $ 674,860,552 $ 724,329,223 $ 877,040,958
Total $ 634,223,406 $ 674,860,552 $ 724,329,223 $ 877,040,958
District's Covered Payroll $ 103,803,197 $ 106,153,988 $ 109,474,452 $ 108,154,903
District's Proportionate Share of the Net Pension Liability (Asset) as a Percentage of its Covered Payroll 0% 0% 0% 0%
Plan Fiduciary Net Position as a Percentage of the Total Pension Liability 26.95% 26.49% 25.41% 22.33%
*The amounts presented for each fiscal year were determined as of the previous fiscal year end.
This schedule is presented to illustrate the requirement to show information for 10 years in accordance with GASB Statement No. 68. However, until a fulllO-year trend is compiled, the District will only present information for those years for which information is available.
EXHIBITL-3
2016 2015 2014
0.00% 0.00% 0.00%
$0 $0 $0
$ 679,442,110 $ 547,187,994 $ 507,333,228
$ 679,442,110 $ 547,187,994 $ 507,333,228
$ 108,558,160 $ 110,950,811 $ 105,969,979
0% 0% 0%
28.71% 33.64% 33.76%

PASSAIC PUBLIC SCHOOLS REQUIRED SUPPLEMENTARY INFORMATION
EXHIBITL-4
SCHEDULE OF DISTRICT'S PROPORTIONATE SHARE OF NET PENSION LIABILITY AND SCHEDULE OF DISTRICT CONTRIBUTIONS
NOTES TO REQUIRED SUPPLEMENTARY INFORMATION
Change of Benefit Terms:
Change of Assumptions:
FOR THE FISCAL YEAR ENDED JUNE 30, 2020
None.
Assumptions used in calculating the net pension liability and statutorily required employer contribution are presented in Note SC.
L31

PASSAIC PUBLIC SCHOOLS REQUIRED SUPPLEMENTARY INFORMATION
SCHEDULE OF CHANGES IN THE DISTRICT'S PROPORTIONATE SHARE OF TOTAL OTHER POST EMPLOYMENT BENEFIT LIABILITY
Postemployment Health Benefit Plan
Last Three Fiscal Years*
2020 2019 2018
Service Cost $ 16,299,448 $ 19,052,439 $ 23,071,953
Interest on Total OPEB Liability 15,630,161 16,772,574 14,373,885
Differences Between Expected and Actual Experience (59,766,724) (42,191,592)
Changes of Assumptions 5,363,136 ( 45,085, 750) (60,043,634)
Gross Benefit Payments (11,041,676) (1 0,505,658) (12,522,899)
Member Contributions 327,306 363,092 461 125
Net Change in Total OPEB Liability (33,188,349) (61,594,895) (34,659,570)
Total OPEB Liability- Beginning ofYear 392,887,002 454,481,897 489,141,467
Total OPEB Liability- End ofYear $ 359,698,653 $ 392,887,002 $ 454,481,897
District's Proportionate Share ofOPEB Liability
State's Proportionate Share of OPEB Liability $ 359,698,653 $ 392,887,002 $ 454,481 897
Total OPEB Liability -Ending $ 359,698,653 $ 392,887,002 $ 454,481 897
District's Covered Payroll $ 134,743,107 $ 136,820,416 $ 140,476,128
District's Proportionate Share of the
Total OPEB Liability as a Percentage of its
Covered Payroll Q% Q% Q%
Note: No assets are accumulated in a trust that meets the criteria in paragraph 4 ofGASB 75.
*The amounts presented for each fiscal year were determined as of the previous fiscal year end.
This schedule is presented to illustrate the requirement to show information for 10 years in accordance with GASB Statement No. 75. However, until a fulllO-year trend is compiled, the District will only present information for those years for which information is available.
132
EXHIBIT L-5

PASSAIC PUBLIC SCHOOLS REQUIRED SUPPLEMENTARY INFORMATION
EXHIBITL-6
SCHEDULE OF CHANGES IN THE DISTRICT'S PROPORTIONATE SHARE OF THE OPEB LIABILITY AND SCHEDULE OF DISTRICT PROPORTIONATE SHARE OF THE OPEB LIABILITY
NOTES TO REQUIRED SUPPLEMENTARY INFORMATION
Changes in Benefit Terms:
Changes of Assumptions
FOR THE FISCAL YEAR ENDED JUNE 30, 2020
None.
Assumptions used in calculating the OPEB liability are presented in Note 5D.
133

SCHOOL LEVEL SCHEDULES
(General Fund)

EXHIBITD-1
PASSAIC PUBLIC SCHOOLS GENERAL FUND
COMBINING BALANCE SHEET AS OF JUNE 30, 2020
Blended Total Operating Resource General
Fund Fund Fund
ASSETS
Cash and Cash Equivalents $ 36,666,319 $ 6,111,651 $ 42,777,970 Receivables from Other Governments 1,247,647 1,247,647 Other Receivables 145,964 145,964 Due From Other Funds 3,562,310 3,562,310 Other Assets 100,640 100,640
Total Assets $ 41,722,880 $ 6,111,651 $ 47,834,531
LIABILITIES AND FUND BALANCES
Liabilities Accounts Payable and Other Current Liabilities $ 9,791,946 $ 5,789,253 $ 15,581,199 Accrued Salaries and Wages 445,594 283,778 729,372 Claims and Judgments Payable 1,375,109 1,375,109
Total Liabilities 11,612,649 6,073,031 17,685,680
Fund Balances Restricted
Capital Reserve 1,278,321 1,278,321 Capital Reserve Designated for Subsequent Year's Budget 7,047,654 7,047,654 Maintenance Reserve 13,284,814 13,284,814 Maintenance Reserve Designated for Subsequent Year's Budget 7,344,000 7,344,000 Emergency Reserve 1,000,000 1,000,000
Committed Encumbrances 1,125,976 1,125,976
Assigned
Designated for Subsequent Year's Budget 20,286,540 20,286,540
Encumbrances 268,200 38,620 306,820 Unassigned (21,525,274) (21,525,274)
Total Fund Balances 30,110,231 38,620 30,148,851
Total Liabilities and Fund Balances $ 41,722,880 $ 6,111,651 $ 47,834,531
134

PASSAIC PUBLIC SCHOOLS BLENDED RESOURCE FUND 15
SCHEDULE OF EXPENDITURES ALLOCATED BY RESOURCE TYPE-ACTUAL FOR THE FISCAL YEAR ENDED JUNE 30, 2020
District-Wide District-
Wide Total
Resource Blended Expenditures
Amount %of Total %of Total
(Final Budget) Resources Resources
Resources
General Fund Contribution $ 142,481,330 $ 131,686,095 General Fund Encumbrances at June 30,2019 51,121 51,121
Total General Fund Contribution $ 142,532,451 93.99% $ 131,737,216
Restricted Federal Resources
Title I, Part A ofESEA: Improving Basic Programs 8,480,293 5.59% 7,869,611
Title I Reallocated 222,919 0.15% 207,048
Title III ofESEA: Grants for English Language 414,862 0.27% 388,365
Total Restricted Federal Resources 9,ll8,074 6.01% 8,465,024
Totals $ 151,650,525 100.00% $ 140,202,240
135
EXHIBITD-2
Total/Surplus
Caraover
$ 10,795,235
$ 10,795,235
610,682
15,871
26,497
653,050
$ 11,448,285
Continued

PASSAIC PUBLIC SCHOOLS BLENDED RESOURCE FUND 15
SCHEDULE OF EXPENDITURES ALLOCATED BY RESOURCE TYPE-ACTUAL FOR THE FISCAL YEAR ENDED JUNE 30, 2020
Schooll - Thomas Jefferson District-
Wide Total
Resource Blended Expenditures
Amount %of Total %of Total
(Final Budget) Resources Resources
Resources
General Fund Contribution $ 6,359,366 $ 5,952,906 General Fund Encumbrances at June 30, 2019
Total General Fund Contribution 6,359,366 92.13% 5,952,906
Restricted Federal Resources
Title I, Part A ofESEA: Improving Basic Programs 437,282 6.34% 409,333
Title I Reallocated 13,682 0.20% 12,808
Title III of ESEA: Grants for English Language 91,909 1.33% 86,035
Total Restricted Federal Resource~ 542,873 7.87% 508,175
Totals $ 6,902,239 100.00% $ 6,461,081
136
EXHIBIT D-2A
Total/Surplus
Carryover
$ 406,460
406,460
27,949
874
5,874
34,698
$ 441,158
Continued

PASSAIC PUBLIC SCHOOLS BLENDED RESOURCE FUND 15
SCHEDULE OF EXPENDITURES ALLOCATED BY RESOURCE TYPE-ACTUAL FOR THE FISCAL YEAR ENDED JUNE 30, 2020
School3 - Mario J. Drago District-
Wide Total
Resource Blended Expenditures
Amount %of Total %of Total
{Final Budget) Resources Resources
Resources
General Fund Contribution $ 9,280,819 $ 8,773,264 General Fund Encumbrances at June 30, 2019 162 162
Total General Fund Contribution 9,280,981 93.11% 8,773,426
Restricted Federal Resources
Title I, Part A ofESEA: Improving Basic Programs 435,294 4.37% 411,489
Title I Reallocated 16,443 0.16% 15,544
Title III ofESEA: Grants for English Language 234,598 2.35% 221,768
Total Restricted Federal Resources 686,335 6.89% 648,801
Totals $ 9,967,316 100.00% $ 9,422,227
137
EXHIBIT D-2C
Total/Surplus
Carryover
$ 507,555
507,555
23,805
899
12,830
37,534
$ 545,089
Continued

PASSAIC PUBLIC SCHOOLS BLENDED RESOURCE FUND 15
SCHEDULE OF EXPENDITURES ALLOCATED BY RESOURCE TYPE-ACTUAL FOR THE FISCAL YEAR ENDED JUNE 30, 2020
SchoolS District-
Wide Total
Resource Blended Expenditures
Amount %of Total %of Total
(Final Budget) Resources Resources
Resources
General Fund Contribution $ 6,499,062 $ 5,953,920 General Fund Encumbrances at June 30, 2019
Total General Fund Contribution 6,499,062 94.72% 5,953,920
Restricted Federal Resources
Title I, Part A ofESEA: Improving Basic Programs 349,825 5.10% 320,482
Title I Reallocated 4,081 0.06% 3,739
Title III ofESEA: Grants for English Language 8,162 0.12% 7,477
Total Restricted Federal Resources 362,068 5.28% 331,698
Totals $ 6,861,130 100.00% $ 6,285,618
138
EXHIBIT D-2C
Total/Surplus
Carr~over
$ 545,142
545,142
29,343
342
685
30,370
$ 575,512
Continued

PASSAIC PUBLIC SCHOOLS BLENDED RESOURCE FUND 15
SCHEDULE OF EXPENDITURES ALLOCATED BY RESOURCE TYPE-ACTUAL
FOR THE FISCAL YEAR ENDED JUNE 30, 2020
School 6- Martin L. King Jr. District-
Wide Total
Resource Blended Expenditures
Amount %of Total %of Total
(Final Budget} Resources Resources
Resources
General Fund Contribution $ 12,270,693 $ 11,209,854 General Fund Encumbrances at June 30, 2019
Total General Fund Contribution 12,270,693 92.41% 11,209,854
Restricted Federal Resources
Title I, Part A ofESEA: Improving Basic Programs 932,208 7.02% 851,616
Title I Reallocated 22,264 0.17% 20,339
Title III ofESEA: Grants for English Language 53,180 0.40% 48,582
Total Restricted Federal Resources 1,007,652 7.59% 920,537
Totals $ 13,278,345 100.00% $ 12,130,391
139
EXHIBIT D-2D
Total/Surplus
Carryover
$ 1,060,839
1,060,839
80,592
1,925
4,598
87,115
$ 1,147,954
Continued

PASSAIC PUBLIC SCHOOLS BLENDED RESOURCE FUND 15
SCHEDULE OF EXPENDITURES ALLOCATED BY RESOURCE TYPE-ACTUAL FOR THE FISCAL YEAR ENDED JUNE 30, 2020
School 7 - Ulysses S. Grant District-
Wide Total
Resource Blended Expenditures
Amount % ofTotal % ofTotal
(Final Budget) Resources Resources
Resources
General Fund Contribution $ 944,659 $ 933,652 General Fund Encumbrances at June 30, 2019
Total General Fund Contribution 944,659 77.30% 933,652
Restricted Federal Resources
Title I, Part A ofESEA: Improving Basic Programs 269,326 22.04% 266,188
Title I Reallocated 7,341 0.60% 7,255
Title III ofESEA: Grants for English Language 680 0.06% 672
Total Restricted Federal Resources 277,347 22.70% 274,115
Totals $ 1,222,006 100.00% $ 1,207,767
140
EXHIBIT D-2E
Total/Surplus
Carryover
$ 11,007
11,007
3,138
86
8
3,232
$ 14,239
Continued

PASSAIC PUBLIC SCHOOLS
BLENDED RESOURCE FUND 15
SCHEDULE OF EXPENDITURES ALLOCATED BY RESOURCE TYPE-ACTUAL
FOR THE FISCAL YEAR ENDED JUNE 30, 2020
School 8 - Casimir Pulaski District-
Wide Total
Resource Blended Expenditures
Amount %of Total %of Total
(Final Budget) Resources Resources
Resources
General Fund Contribution $ 6,273,249 $ 5,761,348 General Fund Encumbrances at June 30, 2019 98 98
Total General Fund Contribution 6,273,347 93.33% 5,761,446
Restricted Federal Resources
Title I, Part A ofESEA: Improving Basic Programs 437,282 6.51% 401,600
Title I Reallocated 10,122 0.15% 9,296
Title III ofESEA: Grants for English Language 680 0.01% 625
Total Restricted Federal Resources 448,084 6.67% 411,521
Totals $ 6,721,431 100.00% $ 6,172,967
141
EXHIBIT D-2F
Total/Surplus
Carryover
$ 511,901
511,901
35,682
826
55
36,563
$ 548,464
Continued

PASSAIC PUBLIC SCHOOLS BLENDED RESOURCE FUND 15
SCHEDULE OF EXPENDITURES ALLOCATED BY RESOURCE TYPE-ACTUAL FOR THE FISCAL YEAR ENDED JUNE 30, 2020
School 9 - Etta Gero District-
Wide Total
Resource Blended Expenditures
Amount %of Total %of Total (Final Budget) Resources Resources
Resources
General Fund Contribution $ 10,944,627 $ 10,385,489 General Fund Encumbrances at June 30, 2019
Total General Fund Contribution 10,944,627 95.12% 10,385,489
Restricted Federal Resources
Title I, Part A ofESEA: Improving Basic Programs 547,597 4.76% 519,621
Title I Reallocated 12,842 0.11% 12,186
Title III ofESEA: Grants for English Language 680 0.01% 645
Total Restricted Federal Resources 561,119 4'.88% 532,453
Totals $ 11,505,746 100.00% $ 10,917,942
142
EXHIBIT D-2G
Total/Surplus
Carryover
$ 559,138
559,138
27,976
656
35
28,666
$ 587,804
Continued

PASSAIC PUBLIC SCHOOLS BLENDED RESOURCE FUND 15
SCHEDULE OF EXPENDITURES ALLOCATED BY RESOURCE TYPE-ACTUAL FOR THE FISCAL YEAR ENDED JUNE 30, 2020
School tO- Theodore Roosevelt District-
Wide Total
Resource Blended Expenditures
Amount % ofTotal %of Total
(Final Budget) Resources Resources
Resources
General Fund Contribution $ 8,573,822 $ 7,926,823 General Fund Encumbrances at June 30, 2019
Total General Fund Contribution 8,573,822 92.86% 7,926,823
Restricted Federal Resources
Title I, Part A ofESEA: Improving Basic Programs 644,992 6.99% 596,320
Title I Reallocated 13,942 0.15% 12,890
Title III ofESEA: Grants for English Language 680 0.01% 629
Total Restricted Federal Resources 659,614 7.14% 609,838
Totals $ 9,233,436 100.00% $ 8,536,661
143
EXHIBIT D-2H
Total/Surplus
Carr:iover
$ 646,999
646,999
48,672
1,052
51
49,776
$ 696,775
Continued

PASSAIC PUBLIC SCHOOLS BLENDED RESOURCE FUND 15
SCHEDULE OF EXPENDITURES ALLOCATED BY RESOURCE TYPE-ACTUAL FOR THE FISCAL YEAR ENDED JUNE 30, 2020
Schoolll - William B. Cruise Veterans Memorial District-
Wide Total
Resource Blended Expenditures
Amount %of Total %of Total
(Final Budget) Resources Resources
Resources
General Fund Contribution $ 11,568,266 $ 10,678,765 General Fund Encumbrances at June 30, 2019
Total General Fund Contribution 11,568,266 93.23% 10,678,765
Restricted Federal Resources
Title I, Part A ofESEA: Improving Basic Programs 815,928 6.58% 753,190
Title I Reallocated 23,084 0.19% 21,309
Title III ofESEA: Grants for English Language 680 0.01% 628
Total Restricted Federal Resources 839,692 6.77% 775,127
Totals $ 12,407,958 100.00% $ 11,453,892
144
EXHIBIT D-21
Total/Surplus
Carryover
$ 889,501
889,501
62,738
1,775
52
64,565
$ 954,066
Continued

PASSAIC PUBLIC SCHOOLS BLENDED RESOURCE FUND 15
SCHEDULE OF EXPENDITURES ALLOCATED BY RESOURCE TYPE-ACTUAL FOR THE FISCAL YEAR ENDED JUNE 30, 2020
School12 - Passaic High School District-
Wide Total Resource Blended Expenditures Amount %of Total %of Total
(Final Budget) Resources Resources Resources
General Fund Contribution $ 26,991,308 $ 25,243,596 General Fund Encumbrances at June 30, 2019
Total General Fund Contribution 26,991,308 91.48% 25,243,596
Restricted Federal Resources
Title I, PaJi A ofESEA: Improving Basic Programs 2,446,792 8.29% 2,288,360
Title I Reallocated 67,673 0.23% 63,291
Title III of ESEA: Grants for English Language 680 0.00% 636
Total Restricted Federal Resources 2,515,145 8.52% 2,352,287
Totals $ 29,506,453 100.00% $ 27,595,883
145
EXHIBIT D-2J
Total/Surplus
Carryover
$ 1,747,712
1,747,712
158,432
4,382
44
162,858
$ 1,910,570
Continued

PASSAIC PUBLIC SCHOOLS
BLENDED RESOURCE FUND 15
SCHEDULE OF EXPENDITURES ALLOCATED BY RESOURCE TYPE-ACTUAL
FOR THE FISCAL YEAR ENDED JUNE 30, 2020
School15 -Vincent Cauuana District-
Wide Total
Resource Blended Expenditures
Amount %of Total %of Total
(Final Budget} Resources Resources
Resources
General Fund Contribution $ 711,076 $ 640,552 General Fund Encumbrances at June 30, 2019
Total General Fund Contribution 711,076 100.00% 640,552
Restricted Federal Resources
Title I, Pmt A ofESEA: Improving Basic Programs
Total Restricted Federal Resources
Totals $ 711,076 100.00% $ 640,552
146
EXHIBIT D-2K
Total/Surplus
Carryover
$ 70,524
70,524
$ 70,524
Continued

PASSAIC PUBLIC SCHOOLS BLENDED RESOURCE FUND 15
SCHEDULE OF EXPENDITURES ALLOCATED BY RESOURCE TYPE-ACTUAL FOR THE FISCAL YEAR ENDED JUNE 30, 2020
School 19 - Daniel F. R1:an District-
·Wide Total
Resource Blended Expenditures
Amount %of Total %of Total
(Final Budget) Resources Resources
Resources
General Fund Contribution $ 9,225,041 $ 8,485,413 General Fund Encumbrances at June 30, 2019
Total General Fund Contribution 9,225,041 94.21% 8,485,413
Restricted Federal Resources
Title I, Part A ofESEA: Improving Basic Programs 543,621 5.55% 500,036
Title I Reallocated 14,122 0.14% 12,990
Title III ofESEA: Grants for English Language 8,874 0.09% 8,163
Total Restricted Federal Resources 566,617 5.79% 521,188
Totals $ 9,791,658 100.00% $ 9,006,601
147
EXHIBIT D-2L
Total/Surplus
Carryover
$ 739,628
739,628
43,585
1,132
711
45,429
$ 785,057

PASSAIC PUBLIC SCHOOLS BLENDED RESOURCE FUND 15
SCHEDULE OF EXPENDITURES ALLOCATED BY RESOURCE TYPE-ACTUAL FOR THE FISCAL YEAR ENDED JUNE 30, 2020
School 20 - Passaic Gifted and Talented Academy District-Wide Total
Resource Blended Expenditures Amount %of Total %of Total
(Final Budget) Resources Resources Resources
General Fund Contribution $ 7,587,579 $ 6,745,997 General Fund Encumbrances at June 30, 2019 1,662 1,662
Total General Fund Contribution 7,589,241 92.10% 6,747,659
Restricted Federal Resources
Title I, Part A of ESEA: Improving Basic Programs 620,146 7.53% 551,377
Title I Reallocated 17,323 0.21% 15,402
Title Ill ofESEA: Grants for English Language 13,379 0.16% 11,895
Total Restricted Federal Resources 650,848 7.90% 578,675
Totals $ 8,240,089 100.00% $ 7,326,334
148
EXHIBIT D-2M
Total/Surplus
Carr:yover
$ 841,582
841,582
68,769
1,921
1,484
72,173
$ 913,755

PASSAIC PUBLIC SCHOOLS BLENDED RESOURCE FUND 15
SCHEDULE OF EXPENDITURES ALLOCATED BY RESOURCE TYPE-ACTUAL FOR THE FISCAL YEAR ENDED JUNE 30, 2020
School 21 -Sonia Sotomayor District-
Wide Total
Resource Blended Expenditures
Amount %of Total %of Total
(Final Budget) Resources Resources
Resources
General Fund Contribution $ 8,449,062 $ 7,576,553 General Fund Encumbrances at June 30, 2019
Total General Fund Contribution 8,449,062 99.99% 7,576,553
Restricted Federal Resources
Title I, Part A ofESEA: Improving Basic Programs
Title I Reallocated
Title III ofESEA: Grants for English Language 680 0.01% 610
Total Restricted Federal Resources 680 0.01% 610
Totals $ 8,449,742 100.00% $ 7,577,163
149
EXHIBIT D-2N
Total/Surplus
Carryover
$ 872,509
872,509
70
70
$ 872,579

PASSAIC PUBLIC SCHOOLS
BLENDED RESOURCE FU:ND 15
SCHEDULE OF EXPENDITURES ALLOCATED BY RESOURCE TYPE-ACTUAL
FOR THE FISCAL YEAR ENDED JUNE 30, 2020
School27- Passaic Pre12 Academy District-
Wide Total
Resource Blended Expenditures
Amount %of Total % ofTotal
(Final Budget) Resources Resources
Resources
General Fund Contribution $ 8,298,353 $ 7,550,392 General Fund Encumbrances at June 30, 2019 12,904 12,904
Total General Fund Contribution 8,311,257 100.00% 7,563,296
Restricted Federal Resources
Title I, Part A ofESEA: Improving Basic Programs
Title I Reallocated
Title III ofESEA: Grants for English Language
Total Restricted Federal Resources
Totals $ 8,311,257 100.00% $ 7,563,296
150
EXHIBIT D-20
Total/Surplus
Carryover
$ 747,961
747,961
$ 747,961
Continued

PASSAIC PUBLIC SCHOOLS BLENDED RESOURCE FUND 15
SCHEDULE OF EXPENDITURES ALLOCATED BY RESOURCE TYPE-ACTUAL FOR THE FISCAL YEAR ENDED JUNE 30, 2020
School 30 - Passaic Academy for Science and Engineering District-
Wide Total
Resource Blended Expenditures
Amount %of Total %of Total
(Final Budget) Resources Resources
Resources
General Fund Contribution $ 8,504,348 $ 7,867,570 General Fund Encumbrances at June 30, 2019 36,295 36,295
Total General Fund Contribution 8,540,643 100.00% 7,903,865
Restricted Federal Resources
Title I, Part A ofESEA: Improving Basic Programs
Title I Reallocated
Title III ofESEA: Grants for English Language
Total Restricted Federal Resources
Totals $ 8,540,643 100.00% $ 7,903,865
151
EXHIBIT D-2P
Total/Surplus
Carryover
$ 636,778
636,778
$ 636,778

EXHIBITD-3
PASSAIC PUBLIC SCHOOLS BLENDED RESOURCE FUND 15
SCHEDULE OF BLENDED EXPENDITURES-BUDGET AND ACTUAL FOR THE FISCAL YEAR ENDED JUNE 30, 2020
District-Wide variance
Final Budget to
Original Budget Adjustments Final Budget Actual Actual
Regular Programs-Instruction
Kindergarten-Salaries of Teachers $ 1,496,894 $ 687,363 $ 2,184,257 $ 2,084,086 $ 100,171 Grades 1-5 Salaries of Teachers 15,140,546 (180,688) 14,959,858 14,571,674 388,184 Grades 6-8 Salaries of Teachers 11,610,856 951,213 12,562,069 12,179,682 382,387 Grades 9-12 Salaries ofTeachers 16,152,969 231,582 16,384,551 15,719,100 665,451
Regular Programs-Undistributed Instruction Other Salaries for Instruction 1,790,127 326,506 2,116,633 1,938,366 178,267 Purchased Professional-Educational Services 52,958 28,025 80,983 27,514 53,469 Other Purchased Services 1,046,572 547,937 1,594,509 1,278,302 316,207 General Supplies 2,627,320 498,406 3,125,726 2,791,058 334,668 Textbooks 326,820 (9,470) 317,350 301,862 15,488 Other Objects 145,780 587 146,367 52,940 93,427
Total Regular Programs-Instruction 50,390,842 3,081,461 53,472,303 50,944,584 2,527,719
Special Education-Instruction Cognitive Impaired-Mild
Salaries of Teachers 345,018 (119,673) 225,345 165,335 60,010 Other Salaries for Instruction 31,945 31,945 31,945 General Supplies 7,200 7,200 7,200 Textbooks 900 (360) 540 540 Other Objects 450 450 450
Total Cognitive Impaired- Mild 353,568 (88,088) 265,480 165,335 100,145
Learning and/or Language Disabilities Salaries of Teachers 5,843,622 418,217 6,261,839 6,042,656 219,183 Other Salaries for Instruction 860,195 32,208 892,403 723,867 168,536 General Supplies 105,680 (27,200) 78,480 18,588 59,892 Textbooks 14,460 (2,833) 11,627 4,541 7,086 Other Objects 7,230 7,230 7,230
Total Learning/Language Disabilities 6,831,187 420,392 7,251,579 6,789,652 461,927
Behavioral Disabilities Salaries of Teachers 127,291 (64,423) 62,868 59,550 3,318 Other Salaries for Instruction 134,364 134,364 122,554 11,810 General Supplies 5,760 (5,000) 760 411 349 Textbooks 720 720 720 Other Objects 360 360 360
Total Behavioral Disabilities 134,131 64,941 199,072 182,515 16,557
Multiple Disabilities Salaries ofTeachers 59,774 59,774 29,575 30,199 General Supplies 1,440 1,440 1,440 Textbooks 180 180 180 Other Objects 90 90 90
Total Multiple Disabilities 61,484 61,484 29,575 31,909
Resource Room/Resource Center Salaries of Teachers 11,423,725 (575,496) 10,848,229 10,542,324 305,905 General Supplies 188,560 (37,823) 150,737 97,092 53,645 Textbooks 25,645 (10,712) 14,933 5,677 9,256 Other Objects 15,404 (2,298) 13,106 221 12,885
Total Resource Room/Resource Center 11,653,334 (626,329) 11,027,005 10,645,314 381,691
Autism Salaries of Teachers 1,277,311 (16,586) 1,260,725 1,258,325 2,400 Other Salaries for Instruction 165,381 274,797 440,178 402,927 37,251
General Supplies 88,302 (18,481) 69,821 38,635 31,186
Textbooks 3,240 (360) 2,880 2,880 Other Objects 1,620 1,620 1,620
Total Autism 1,535,854 239,370 1,775,224 1,699,887 75,337
Total Special Education-Instruction 20,569,558 10,286 20,579,844 19,512,278 1,067,566
152 Continued

EXHIBITD-3
PASSAIC PUBLIC SCHOOLS BLENDED RESOURCE FUND 15
SCHEDULE OF BLENDED EXPENDITURES-BUDGET AND ACTUAL FOR THE FISCAL YEAR ENDED JUNE 30, 2020
District-Wide Variance
Final Budget to
Original Budget Adjustments Final Budget Actual Actual
Bilingual Education-Instruction Salaries of Teachers $ 16,244,760 $ (740,540) $ 15,504,220 $ 15,055,888 $ 448,332 General Supplies 698,880 (166,101) 532,779 421,945 110,834 Textbooks 105,255 (31,742) 73,513 64,899 8,614 Other Objects 55,064 {7,088) 47,976 5,681 42,295
Total Bilingual Education 17,103,959 (945,471) 16,158,488 15,548,413 610,075
School-Spon. Co-Curricular Activities· lust Salaries 268,500 7,500 276,000 232,312 43,688
Total Schooi-Spou Co-Curricular Activities lust. 268,500 7,500 276,000 232,312 43,688
Other School Programs - Instruction Salaries 19,000 5,565 24,565 18,150 6,415
Total Other School Programs - Instruction 19,000 5,565 24,565 18,150 6,415
Before/After School Programs- Instruction Salaries of Teachers 1,748,463 70,952 1,819,415 811,261 1,008,154
Total Before/After School Programs- Instruction 1,748,463 70,952 1,819,415 811,261 1,008,154
Before/After School Programs- Support Salaries 277,000 74,620 351,620 134,792 216,828
Total Before/After School Programs- Support 277,000 74,620 351,620 134,792 216,828 Total Before/After School Programs 2,025,463 145,572 2,171,035 946,053 1,224,982
Summer School-Instruction Salaries 375,000 108,268 483,268 480,036 3,232 Other Salaries for Instruction 1,500 (1,500) Other Purchase Services 35,000 35,000 33,750 1,250 General Supplies 4,500 {4,500)
Total Summer School-Instruction 416,000 102,268 518,268 513,786 4,482
Summer School - Support Services Salaries 71,000 6,187 77,187 76,668 519
Total Summer School - Support Services 71,000 6,187 77,187 76,668 519 Total Summer School 487,000 108,455 595,455 590,454 5,001
Total Instruction 90,864,322 2,413,368 93,277,690 87,792,244 5,485,446
Undistributed Expenditures Attend. and Social Work
Salaries of Drop Out Prev. Officer/Coordinator 594,670 45,502 640,172 574,085 66,087 Salaries of Family Support Teams 499,834 163,415 663,249 536,074 127,175 Sal. ofFam. Liaison and Corum. Parent Involv. Spec. 897,856 25,410 923,266 879,273 43,993
Total Attendance and Social Work Services 1,992,360 234,327 2,226,687 1,989,432 237,255
Health Services Salaries 2,576,687 87,802 2,664,489 2,573,316 91,173 Supplies and Materials 33,500 6,102 39,602 29,037 10,565
Total Health Services 2,610,187 93,904 2,704,091 2,602,353 101,738
Guidance Salaries of Other Professional Staff 2,815,848 175,435 2,991,283 2,799,997 191,286
Total Guidance 2,815,848 175,435 2,991,283 2,799,997 191,286
Improvement of Instructional Services Salaries of Other Professional Staff 40,000 14,258 54,258 18,040 36,218 Salaries of Facilitators, Math and Literacy Coaches 908,269 2,308 910,577 787,045 123,532
Total Improvement oflnstructional Services 948,269 16,566 964,835 805,085 159,750
153 Continue~

EXHIBITD-3
PASSAIC PUBLIC SCHOOLS BLENDEDRESOURCEFUND15
SCHEDULE OF BLENDED EXPENDITURES-BUDGET AND ACTUAL FOR THE FISCAL YEAR ENDED JUNE 30, 2020
District-Wide variance
Final Budget to
Original Budget Adjustments Final Budget Actual Actual
Edu. Media Serv./Sch. Library Salaries $ 266,524 $ (94,301) $ 172,223 $ 135,064 $ 37,159 Salaries of Technology Coordinators 1,280,658 349,494 1,630,152 1,535,514 94,638 Other Purchased Services 2,000 (2,000) Supplies and Materials 22,000 22,000 11,446 10,554
Total Edu. Media Servc/Sch. Library 1,571,182 253,193 1,824,375 1,682,024 142,351
Instructional Staff Training Serv. Purchased Professional-Educational Services 1,457,000 487,893 1,944,893 1,462,634 482,259 Other Purchased Services 40,000 54,347 94,347 46,969 47,378 Supplies and Materials 3,000 12,000 15,000 14,815 185
Total Instructional Staff Training Serv. 1,500,000 554,240 2,054,240 1,524,418 529,822
Supp. Serv.-School Admin. Salaries ofPrincipals/Asst Principals 5,677,149 (89,288) 5,587,861 5,528,064 59,797 Salaries of Other Professional Staff 620,672 (73,266) 547,406 547,406 Salaries of Secretarial and Clerical Assistants 2,476,479 23,621 2,500,100 2,397,312 102,788 Other Purchased Services 206,570 230,895 437,465 382,094 55,371 Supplies and Materials 114,500 21,759 136,259 95,154 41,105
Total Supp. Serv.-School Admin. 9,095,370 113,721 9,209,091 8,950,030 259,061
Security Salaries 2,124,368 94,036 2,218,404 2,131,754 86,650 Supplies and Materials 100 100 100
Total Security 2,124,368 94,136 2,218,504 2,131,854 86,650
Student Transportation Services Contracted Svc (Other Than Betw. Home & School) 479,568 95,626 575,194 138,380 436,814
Total Student Transportation Services 479,568 95,626 575,194 138,380 436,814
Unallocated Benefits Social Security Contributions 1,542,403 (12,564) 1,529,839 1,120,945 408,894 Other Retirement Contributions - Regular 2,529,944 195,620 2,725,564 2,087,130 638,434 Unemployment Compensation 293,174 56,054 349,228 341,087 8,141 Workers Compensation 1,117,326 1,117,326 892,535 224,791 Health Benefits 30,527,683 {2,913,180) 27,614,503 25,138,450 2,476,053
Total Unallocated Benefits 36,010,530 {2,674,070) 33,336,460 29,580,147 3,756,313
Total Undistributed Expenditures 59,147,682 {1,042,922) 58,104,760 52,203,720 5,901,040
Total School Based Budget Current 150,012,004 1,370,446 151,382,450 139,995,964 11,386,486
CAPITAL OUTLAY Equipment Instruction
Kindergarten 5,095 5,095 5,095 Grades 1-5 50,000 169,514 219,514 178,200 41,314
Grades 6-8 2,545 2,545 2,450 95 Grades 9-12 20,000 20,921 40,921 20,531 20,390
Total Equipment 70,000 198,075 268,075 206,276 61,799
Total Capital Outlay 70,000 198,075 268,075 206,276 61,799
Total School Based Expenditures $ 150,082,004 $ 1,568,521 $ 151,650,525 $ 140,202,240 $ 11,448,285
154 Continued

EXHIBIT D-3A
PASSAIC PUBLIC SCHOOLS BLENDED RESOURCE FUND 15
SCHEDULE OF BLENDED EXPENDITURES-BUDGET AND ACTUAL FOR THE FISCAL YEAR ENDED JUNE 30, 2020
School I - Thomas Jefferson Variance
Final Budget to
Original Budget Adjustments Final Budget Actual Actual
Regular Programs-Instruction Kindergarten-Salaries of Teachers $ 312,173 $ (312,173) Grades 1-5 Salaries of Teachers 1,152,098 (9,735) $ 1,142,363 $ 1,134,221 $ 8,142
Grades 6-8 Salaries of Teachers 700,091 100,872 800,963 777,208 23,755 Regular Programs-Undistributed Instruction
Other Salaries for Instruction 176,308 (88,759) 87,549 87,549 Purchased Professional-Educational Services 1,815 (400) 1,415 1,415
Other Purchased Services 13,017 4,749 17,766 15,943 1,823
General Supplies 92,640 19,644 112,284 106,157 6,127
Textbooks 7,950 (7,950) Other Objects 5,790 5,790 15 5,775
Total Regular Programs-Instruction 2,461,882 (293,752) 2,168,130 2,121,093 47,037
Special Education-Instruction Learning and/or Language Disabilities
Salaries of Teachers 194,357 24,752 219,109 214,249 4,860
Other Salaries for Instruction 62,380 (20,942) 41,438 20,718 20,720
General Supplies 7,680 7,680 1,629 6,051
Textbooks 960 (960) Other Objects 480 480 480
Total Learning/Language Disabilities 265,857 2,850 268,707 236,596 32,111
Resource Room/Resource Center Salaries of Teachers 859,001 (61,236) 797,765 744,489 53,276 General Supplies 7,440 7,440 7,440
Textbooks 930 (930) Other Objects 465 465 465
Total Resource Room/Resource Center 867,836 (62,166) 805,670 744,489 61,181
Total Special Education-Instruction 1,133,693 (59,316) 1,074,377 981,085 93,292
Bilingual Education-Instruction Salaries of Teachers 793,531 170,818 964,349 937,617 26,732 General Supplies 27,440 (533) 26,907 26,167 740
Textbooks 4,680 (4,680) Other Objects 2,340 2,340 2,340
Total Bilingual Education 827,991 165,605 993,596 963,784 29,812
School-Spon. Co-Curricular Activities Inst Salaries 1,500 1,125 2,625 1,050 1,575
Total School-Spon Co-Curricular Activities Inst. 1,500 1,125 2,625 1,050 1,575
Before/After School Programs- Instruction Salaries of Teachers 85,086 2,000 87,086 32,957 54,129
Total Before/After School Programs- Instruction 85,086 2,000 87,086 32,957 54,129
Before/After School Programs- Support
Salaries 12,500 875 13,375 3,654 9,721
Total Before/After School Programs- Support 12,500 875 13,375 3,654 9,721
Total Before/After School Programs 97,586 2,875 100,461 36,611 63,850
Total Instruction 4,522,652 (183,463) 4,339,189 4,103,623 235,566
155 Continued

EXHIBIT D-JA
PASSAIC PUBLIC SCHOOLS BLENDED RESOURCE FUND 15
SCHEDULE OF BLENDED EXPENDITURES-BUDGET AND ACTUAL FOR THE FISCAL YEAR ENDED JUNE 30, 2020
School! -Thomas Jefferson Variance
Final Budget to
Original Budget Adjustments Final Budget Actual Actual
Undistributed Expenditures Attend. and Social Work
Salaries of Drop Out Prev. Officer/Coordinator $ 65,864 $ (2,474) $ 63,390 $ 63,390 Salaries of Family Support Teams 117,464 (4,209) 113,255 111,755 $ 1,500 Sal. of Fam. Liaison and Comm. Parent Involv. Spec. 58,483 1,449 59,932 59,932
Total Attendance and Social Work Services 241,811 (5,234) 236,577 235,077 1,500
Health Services Salaries 126,690 (4,276) 122,414 120,405 2,009 Supplies and Materials 1,500 533 2,033 1,799 234
Total Health Services 128,190 (3,743) 124,447 122,204 2,243
Guidance Salaries of Other Professional Staff 74,045 12,510 86,555 86,345 210
Total Guidance 74,045 12,510 86,555 86,345 210
Improvement oflnst. Serv. Salaries of Other Professional Staff 4,000 6,242 10,242 10,242
Total Improvement of Inst. Serv. 4,000 6,242 10,242 10,242
Edu. Media Serv./Sch. Library Salaries ofTechnology Coordinators 58,749 58,749 58,599 150
Total Edu. Media Servc/Sch. Library 58,749 58,749 58,599 150
Instructional Staff Training Serv. Purchased Professional-Educational Services 95,000 41,105 136,105 122,589 13,516 Other Purch Services 1,075 1,075 1,075 Supplies and Materials 1,000 1,000 1,000
Total Instructional Staff Training Serv. 95,000 43,180 138,180 124,664 13,516
Supp. Serv.-School Admin. Salaries ofPrincipals/Asst Principals 271,210 (1) 271,209 271,209 Salaries of Other Professional Staff Salaries of Secretarial and Clerical Assistants 121,102 (1,999) 119,103 118,093 1,010 Other Purchased Services 8,813 4,691 13,504 12,276 1,228 Supplies and Materials 6,000 (1,000) 5,000 4,174 826
Total Supp. Serv.-School Admin. 407,125 1,691 408,816 405,752 3,064
Security Salaries 108,123 42,443 150,566 146,993 3,573
Total Security 108,123 42,443 150,566 146,993 3,573
Student Transportation Services Contracted Svc (Other Than Betw. Home & School) 15,334 15,334 15,334
Total Student Transportation Services 15,334 15,334 15,334
Unallocated Benefits Social Security Contributions 73,034 73,034 44,718 28,316 Other Retirement Contributions - Regular 85,669 46,082 131,751 131,751 Unemployment Compensation 10,485 2,043 12,528 12,217 311 Workers Compensation 39,960 39,960 30,450 9,510 Health Benefits 1,149,696 (73,385) 1,076,311 948,446 127,865
Total Unallocated Benefits 1,358,844 (25,260) 1,333,584 1,167,582 166,002
Total Undistributed Expenditures 2,432,472 130,578 2,563,050 2,357,458 205,592
156 Continued

School I -Thomas Jefferson
Total School Based Budget Current
Total School Based Expenditures
PASSAIC PUBLIC SCHOOLS BLENDED RESOURCE FUND IS
SCHEDULE OF BLENDED EXPENDITURES-BUDGET AND ACTUAL FOR THE FISCAL YEAR ENDED JUNE 30, 2020
Original Budget Adjustments Final Budget
$ 6,955,124 $ (52,885) $ 6,902,239
$ 6,955,124 $ (52,885) $ 6,902,239
157
EXHIBIT D-3A
Variance
Final Budget to
Actual Actual
$ 6,461,081 $ 441,158
$ 6,461,081 $ 441,158
Continued

EXHIBIT D-3B
PASSAIC PUBLIC SCHOOLS BLENDED RESOURCE FUND 15
SCHEDULE OF BLENDED EXPENDITURES-BUDGET AND ACTUAL FOR THE FISCAL YEAR ENDED JUNE 30, 2020
School 3 - Mario J. Drago Variance
Final Budget to
Original Budget Adjustments Final Budget Actual Actual
Regular Programs-Instruction Kindergarten-Salaries of Teachers $ 179,322 $ (179) $ 179,143 $ 179,143 Grades 1-5 Salaries of Teachers 1,272,420 222,665 1,495,085 1,487,036 $ 8,049 Grades 6-8 Salaries of Teachers 492,378 228,792 721,170 717,340 3,830
Regular Programs-Undistributed Instruction Other Salaries for Instruction 197,612 9,440 207,052 207,052 Purchased Professional-Educational Services 2,055 922 2,977 1,000 1,977 Other Purchased Services 20,174 2,891 23,065 21,693 1,372 General Supplies 90,000 20,937 110,937 106,040 4,897 Textbooks 8,130 8,130 8,096 34 Other Objects 5,625 (5,610) 15 15
Total Regular Programs-Instruction 2,267,716 479,858 2,747,574 2,727,415 20,159
Special Education-Instruction Resource Room/Resource Center:
Salaries of Teachers 1,117,476 (240,239) 877,237 877,237 General Supplies 11,760 11,760 3,730 8,030 Textbooks 1,470 (841) 629 404 225 Other Objects 735 735 735
Total Resource Room/Resource Center 1,131,441 (241,080) 890,361 881,371 8,990
Autism
Salaries of Teachers 1,079,853 (89,718) 990,135 990,135 Other Salaries for Instruction 165,381 191,795 357,176 357,176 General Supplies 23,040 (2,059) 20,981 3,720 17,261 Textbooks 2,880 2,880 2,880 Other Objects 1,440 1,440 1,440
Total Autism 1,272,594 100,018 1,372,612 1,351,031 21,581
Total Special Education-Instruction 2,404,035 (141,062) 2,262,973 2,232,402 30,571
Bilingual Education-Instruction Salaries of Teachers 1,164,297 (6,481) 1,157,816 1,157,816 General Supplies 29,600 (17,096) 12,504 11,060 1,444 Textbooks 4,950 4,950 4,950 Other Objects 2,475 2,475 2,475
Total Bilingual Education 1,201,322 (23,577) . 1,177,745 1,168,876 8,869
School-Spon. Co-Curricular Activities lost Salaries 4,000 4,000 2,500 1,500
Total School-Spon Co-Curricular Activities Inst. 4,000 4,000 2,500 1,500
Before/After School Programs- Instruction
Salaries of Teachers 76,577 4,000 80,577 34,494 46,083 Total Before/After School Programs- Instruction 76,577 4,000 80,577 34,494 46,083
Before/After School Programs- Support
Salaries 12,500 2,000 14,500 3,164 11,336 Total Before/After School Programs- Support 12,500 2,000 14,500 3,164 11,336 Total Before/After School Programs 89,077 6,000 95,077 37,658 57,419
Total Instruction 5,966,150 321,219 6,287,369 6,168,851 118,518
158 Continued

EXHIBIT D-3B
PASSAIC PUBLIC SCHOOLS BLENDED RESOURCE FUND 15
SCHEDULE OF BLENDED EXPENDITURES-BUDGET AND ACTUAL FOR THE FISCAL YEAR ENDED JUNE 30, 2020
School 3 - Mario J. Drago Variance
Final Budget to
Original Budget Adjustments Final Budget Actual Actual
Undistributed Expenditures
Attend. and Social Work Salaries of Family Support Teams $ 65,533 $ (2,378) $ 63,155 $ 63,155 Sal. ofFam. Liaison and Comm. Parent Involv 56,636 1,354 57,990 57,990
Total Attendance and Social Work Services 122,169 (1,024) 121,145 121,145
Health Services Salaries 188,925 6,265 195,190 195,190
Supplies and Materials 2,000 492 2,492 1,780 $ 712 Total Health Services 190,925 6,757 197,682 196,970 712
Guidance Salaries of Other Professional Staff 67,880 21,770 89,650 87,205 2,445
Total Guidance 67,880 21,770 89,650 87,205 2,445
Improvement of Inst. Serv. Salaries of Other Professional Staff 4,000 4,000 4,000
Total Improvement of Inst. Serv. 4,000 4,000 4,000
Edu. Media Serv.!Sch. Library Salaries of Technology Coordinators 80,540 40,004 120,544 114,611 5,933
Total Edu. Media Servc/Sch. Library 80 540 40,004 120,544 114,611 5,933
Instructional Staff Training Serv. Purchased Professional-Educational Services 95,000 71,643 166,643 150,357 16,286 Other Purchased Services 12,800 12,800 2,800 10,000
Total Instructional Staff Training Serv. 95,000 84,443 179,443 153,157 26,286
Supp. Serv.-School Admin. Salaries ofPrincipals/Asst Principals 455,683 (4,237) 451,446 451,446 Salaries of Secretarial and Clerical Assistants l17,032 (7,715) 109,317 109,317 Other Purchased Services 7,826 13,773 21,599 21,253 346 Supplies and Materials 6,000 (1,000) 5,000 4,154 846
Total Supp. Serv.-Schoo1 Admin. 586,541 821 587,362 586,170 1,192
Security Salaries 137,014 (29,902) 107,112 104,944 2,168
Total Security 137,014 (29,902) 107,112 104,944 2,168
Student Transportation Services Contracted Svc (Other Than Betw. Home & School) 15,574 15,574 15,574
Total Student Transportation Services 15,574 15,574 15,574
Unallocated Benefits Social Security Contributions 98,644 98,644 69,835 28,809 Other Retirement Contributions - Regular 170,370 170,370 158,939 11,431 Unemployment Compensation 20,621 4,020 24,641 24,029 612 Workers Compensation 78,588 78,588 61,616 16,972 Health Benefits 2,185,997 (316,900) 1,869,097 1,559,469 309,628
Total Unallocated Benefits 2,554,220 (312,880) 2,241,340 1,873,888 367,452
Total Undistributed Expenditures 3,853,863 (190,011) 3,663,852 3,238,090 425,762
Total School Based Budget Current 9,820,013 131,208 9,951,221 9,406,941 544,280
159 Continued

School 3 - Mario J. Drago
Capital Outlay Equipment
Instruction Kindergarten Grades 1-5
Total Equipment
Total Capital Outlay
Total School Based Expenditures
PASSAIC PUBLIC SCHOOLS BLENDED RESOURCE FUND 15
SCHEDULE OF BLENDED EXPENDITURES-BUDGET AND ACTUAL FOR THE FISCAL YEAR ENDED JUNE 30, 2020
Original Budget Adjustments Final Budget
$ 5,095 $ 5,095 11,000 11,000
16,095 16,095
16,095 16,095
$ 9,820,013 $ 147,303 $ 9,967,316
160
EXHIBIT D-3B
Variance
Final Budget to
Actual Actual
$ 5,095 10,191 $ 809
15,286 809
15,286 809
$ 9,422,227 $ 545,089
Continued

EXHIBIT D-3C
PASSAIC PUBLIC SCHOOLS BLENDED RESOURCE FUND 15
SCHEDULE OF BLENDED EXPENDITURES-BUDGET AND ACTUAL FOR THE FISCAL YEAR ENDED JUNE 30, 2020
SchoolS Variance
Final Budget to
Original Budget Adjustments Final Budget Actual Actual
Regular Programs-Instruction Kindergarten-Salaries of Teachers $ 60,000 $ 60,000 $ 53,950 $ 6,050 Grades 1-5 Salaries of Teachers $ 1,141,113 (442,535) 698,578 694,187 4,391 Grades 6-8 Salaries of Teachers 532,700 123,176 655,876 650,791 5,085
Regular Programs-Undistributed Instruction Other Salaries for Instruction 73,451 45,000 118,451 112,323 6,128 Purchased Professional-Educational Services 4,506 4,506 4,506 Other Purchased Services 13,573 4,321 17,894 7,321 10,573 General Supplies 57,040 67,269 124,309 109,!25 15,184 Textbooks 2,220 (1,288) 932 932 Other Objects 2,940 2,940 2,940
Total Regular Programs-Instruction 1,827,543 (144,057) 1,683,486 1,628,629 54,857
Special Education-Instruction Resource Room/Resource Center:
Salaries of Teachers 977,942 11,807 989,749 985,089 4,660 General Supplies 14,640 78 14,718 14,717 I Textbooks 1,830 (1,830) Other Objects 915 (78) 837 837
Total Resource Room/Resource Center 995,327 9,977 1,005,304 999,806 5,498
Total Special Education-Instruction 995,327 9,977 1,005,304 999,806 5,498
Bilingual Education-Instruction Salaries of Teachers 1,100,494 136,967 1,237,461 1,227,785 9,676 General Supplies 48,800 (3,695) 45,105 41,356 3,749 Textbooks 7,350 (7,350) Other Objects 3,675 3,675 3,675
Total Bilingual Education 1,160,319 125,922 1,286,241 1,269,141 17,100
School-Spon. Co-Curricular Activities Inst Salaries 3,000 3,000 3,000
Total School-Spon Co-Curricular Activities Inst. 3,000 3,000 3,000
Before/After School Programs- Instruction Salaries 51,051 4,000 55,051 30,824 24,227
Total Before/After School Programs- Instruction 51,051 4,000 55,051 30,824 24,227
Before/After School Programs- Support Salaries 12,500 2,000 14,500 3,576 10,924
Total Before/After School Programs- Support 12,500 2,000 14,500 3,576 10,924 Total Before/After School Programs 63,551 6,000 69,551 34,400 35,151
Total Instruction 4,049,740 (2,158) 4,047,582 3,931,976 115,606
Undistributed Expenditures Attend. and Social Work
Salaries of Family Support Teams 183,210 (5,000) 178,210 163,311 14,899 Sal. ofF am. Liaison and Comm. Parent Involv. Spec. 61,592 61,592 59,371 2,221
Total Attendance and Social Work Services 244,802 (5,000) 239,802 222,682 17,120
Health Services Salaries 226,595 226,595 215,549 11,046 Supplies and Materials 1,500 1,500 1,257 243
Total Health Services 228,095 228,095 216,806 11,289
161 Continued

EXHIBIT D-3C
PASSAIC PUBLIC SCHOOLS BLENDED RESOURCE FUND 15
SCHEDULE OF BLENDED EXPENDITURES-BUDGET AND ACTUAL FOR THE FISCAL YEAR ENDED JUNE 30, 2020
SchoolS Variance
Final Budget to
Original Budget Adjustments Final Budget Actual Actual
Improvement of lust. Serv. Salaries of Other Professional Staff $ 4,000 - $ 4,000 - $ 4,000
Total Improvement oflnst. Serv. 4,000 4,000 4,000
Edu. Media Serv./Sch. Library Salaries of Technology Coordinators 127,266 $ (10,000) 117,266 $ 111,401 5,865
Total Edu. Media Servc/Sch. Library 127,266 (10,000) 117,266 111,401 5,865
Instructional Staff Training Serv. Purchased Professional-Educational Services 95,000 14,081 109,081 48,930 60,151 Other Purchase Services 10,000 10,000 10,000
Total Instructional Staff Training Serv. 95,000 24,081 119,081 48,930 70,151
Supp. Serv.-School Admin. Salaries ofPrincipals/Asst Principals 273,462 14,499 287,961 287,961 Salaries of Secretarial and Clerical Assistants 140,207 1,971 142,178 137,275 4,903 Other Purchased Services 9,445 9,700 19,145 16,003 3,142 Supplies and Materials 7,500 15,000 22,500 15,406 7,094
Total Supp. Serv.-School Admin. 430,614 41,170 471,784 456,645 15,139
Security
Salaries 147,220 (66,885) 80,335 78,624 1,711 Total Security 147,220 (66,885) 80,335 78,624 1,711
Student Transportation Services Contracted Svc (Other Than Betw. Home & School) 9,070 9,070 9,070
Total Student Transportation Services 9,070 9,070 9,070
Unallocated Benefits Social Security Contributions 67,255 67,255 47,756 19,499 Other Retirement Contributions - Regular 126,277 126,277 85,070 41,207 Unemployment Compensation 13,747. 2,684 16,431 16,021 410 Workers Compensation 52,392 52,392 39,680 12,712 Health Benefits 1,399,829 (121,764) 1,278,065 1,026,332 251,733
Total Unallocated Benefits 1,659,500 (119,080) 1,540,420 1,214,859 325,561
Total Undistributed Expenditures 2,945,567 (135,714) 2,809,853 2,349,947 459,906
Total School Based Budget Current 6,995,307 (137,872) 6,857,435 6,281,923 575,512
Capital Outlay Equipment Instruction
Grades 1-5 3,695 3,695 3,695
Total Equipment 3,695 3,695 3,695
Total Capital Outlay 3,695 3,695 3,695
Total School Based Expenditures $ 6,995,307 $ (134,177) $ 6,861,130 $ 6,285,618 $ 575,512
162 Continued

EXHIBIT D-3D
PASSAIC PUBLIC SCHOOLS BLENDED RESOURCE FUND 15
SCHEDULE OF BLENDED EXPENDITURES-BUDGET AND ACTUAL FOR THE FISCAL YEAR ENDED JUNE 30, 2020
School 6- Martin L. King Jr. Variance
Final Budget to
Original Budget Adjustments Final Budget Actual Actual
Regular Programs-Instruction Kindergarten-Salaries of Teachers $ 124,784 $ 124,784 $ 64,150 $ 60,634 Grades 1-5 Salaries of Teachers 1,828,725 $ (16,988) 1,811,737 1,665,825 145,912 Grades 6-8 Salaries of Teachers 1,044,915 39,280 1,084,195 1,070,565 13,630
Regular Programs-Undistributed Instruction Other Salaries for Instruction 166,034 166,034 164,017 2,017 Purchased Professional-Educational Services 9,000 9,000 5,794 3,206 Other Purchased Services 12,885 25,722 38,607 33,381 5,226 General Supplies 110,000 26,829 136,829 123,766 13,063 Textbooks 6,360 6,360 5,939 421 Other Objects 6,030 6,030 6,030
Total Regular Programs-Instruction 3,308,733 74,843 3,383,576 3,133,437 250,139
Special Education-Instruction Learning and/or Language Disabilities
Salaries of Teachers 1,107,910 (161,018) 946,892 768,062 178,830 Other Salaries for Instruction 373,882 (198,650) 175,232 167,398 7,834 General Supplies 20,720 20,720 16,959 3,761 Textbooks 3,840 3,840 3,840 Other Objects 1,920 1,920 1,920
Total Learning/Language Disabilities 1,508,272 (359,668) 1,148,604 952,419 196,185
Multiple Disabilities Salaries of Teachers 59,774 59,774 29,575 30,199 General Supplies 1,440 1,440 1,440 Textbooks 180 180 180 Other Objects 90 90 90
Total Multiple Disabilities 61,484 61,484 29,575 31,909
Resource Room/Resource Center Salaries of Teachers 1,163,604 109,602 1,273,206 1,201,296 71,910 General Supplies 19,680 19,680 19,675 5 Textbooks 2,460 2,460 2,460 Other Objects 1,230 1,230 1,230
Total Resource Room/Resource Center 1,186,974 109,602 1,296,576 1,220,971 75,605
Total Special Education-Instruction 2,756,730 (250,066) 2,506,664 2,202,965 303,699
Bilingual Education-Instruction Salaries of Teachers 1,725,343 (65,000) 1,660,343 1,591,925 68,418 General Supplies 73,200 73,200 69,464 3,736 Textbooks 9,150 (7,212) 1,938 1,938 Other Objects 4,575 4,575 4,575
Total Bilingual Education 1,812,268 (72,212) 1,740,056 1,661,389 78,667
Schooi-Spon. Co-Curricular Activities lust Salaries 6,000 6,000 5,650 350
Total School-Spon Co-Curricular Activities lust. 6,000 6,000 5,650 350
Before/After School Programs- Instruction
Salaries of Teachers 182,595 8,000 190,595 71,941 118,654 Total Before/After School Programs- Instruction 182,595 8,000 190,595 71,941 118,654
163 Continued

EXHIBIT D-3D
PASSAIC PUBLIC SCHOOLS BLENDED RESOURCE FUND 15
SCHEDULE OF BLENDED EXPENDITURES-BUDGET AND ACTUAL FOR THE FISCAL YEAR ENDED JUNE 30, 2020
School 6- Martin L. King Jr. Variance
Final Budget to
Original Budget Adjustments Final Budget Actual Actual
Before/After School Programs- Support Salaries $ 17,SOO $ 19,000 $ 36,SOO $ 8,769 $ 27,731
Total Before/After School Programs- Support 17,SOO 19,000 36,SOO 8,769 27,731 Total Before/After School Programs 200,09S 27,000 227,09S 80,710 146,38S
Total Instruction 8,083,826 (220,43S) 7,863,391 7,084,1Sl 779,240
Undistributed Expenditures
Attend. and Social Work Salaries of Drop Out Prev. Officer/Coordinator 6S,S67 (SOO) 6S,067 63,104 1,963 Sal. ofF am. Liaison and Comm. Parent Involv. Spec. 63,792 (1,800) 61,992 47,6SS 14,337
Total Attendance and Social Work Services 129,3S9 (2,300) 127,0S9 110,7S9 16,300
Health Services Salaries 180,6S1 (1 0,000) 170,6S1 123,967 46,684 Supplies and Materials 2,000 3S1 2,3S1 2,1S4 197
Total Health Services 182,6S1 (9,649) 173,002 126,121 46,881
Guidance
Salaries of Other Professional Staff 193,84S 71,094 264,939 263,439 I,SOO Total Guidance 193,84S 71,094 264,939 263,439 1,SOO
Improvement of Inst. Serv.
Salaries of Other Professional Staff 4,000 4,000 4,000 Sal. of Facilitators, Math and Literacy Coaches 26S,167 26S,167 2S4,08S 11,082
Total Improvement of Inst. Serv. 269,167 269,167 2S4,08S 1S,082
Edu. Media Se•·v./Sch. Library Salaries of Technology Coordinators 112,771 33,S63 146,334 146,184 ISO
Total Edu. Media Servc/Sch. Library 112,771 33,S63 146,334 146,184 ISO
Instructional Staff Training Serv. Purchased Professional-Educational Services 9S,OOO 114,791 209,791 193,062 16,729 Other Purchased Services 3,800 3,800 3,300 soo Supplies and Materials 1,000 1,000 827 173
Total Instructional Staff Training Serv. 9S,OOO 119,S91 214,S91 197,189 17,402
Supp. Serv.-School Admin. Salaries of Principals/ Asst Principals S91,146 (29,616) S61,S30 S60,2S4 1,276 Salaries of Other Professional Staff 107,161 (70,747) 36,414 36,414 Salaries of Secretarial and Clerical Assistants 173,44S 9,848 183,293 183,293 Other Purchased Services IS,309 8,277 23,S86 23,S86 Supplies and Materials 6,000 (2,3SO) 3,6SO 3,6SO
Total Supp. Serv.-School Admin. 893,061 (84,S88) 808,473 803,S47 4,926
Security Salaries 137,793 3,273 141,066 134,299 6,767
Total Security 137,793 3,273 141,066 134,299 6,767
Student Transportation Services Contracted Svc (Other Than Betw. Home & School) 28,3SO 28,3SO 4,126 24,224
Total Student Transportation Services 28,3SO 28,3SO 4,126 24,224
164 Continued

EXHIBIT D-3D
PASSAIC PUBLIC SCHOOLS BLENDED RESOURCE FUND 15
SCHEDULE OF BLENDED EXPENDITURES-BUDGET AND ACTUAL FOR THE FISCAL YEAR ENDED JUNE 30, 2020
School 6- Martin L. King Jr. Variance
Final Budget to
Original Budget Adjustments Final Budget Actual Actual
Unallocated Benefits Social Security Contributions $ 146,234 $ 229 $ 146,463 $ 105,360 $ 41,103 Other Retirement Contributions - Regular 236,675 236,675 215,281 21,394 Unemployment Compensation 26,504 5,142 31,646 30,872 774 Workers Compensation 101,010 101,010 82,003 19,007 Health Benefits 2,679,087 24,580 2,703,667 2,551,831 151,836
Total Unallocated Benefits 3,189,510 29,951 3,219,461 2,985,347 234,114
Total Undistributed Expenditures 5,231,507 160,935 5,392,442 5,025,096 367,346
Total School Based Budget Current 13,315,333 (59,500) 13,255,833 12,109,247 1,146,586
Capital Outlay Equipment Instruction
Grades 1-5 22,512 22,512 21,144 1,368
Total Equipment 22,512 22,512 21,144 1,368
Total Capital Outlay 22,512 22,512 21,144 1,368
Total School Based Expenditures $ 13,315,333 $ (36,988) $ 13,278,345 $ 12,130,391 $ 1,147,954
165 Continued

PASSAIC PUBLIC SCHOOLS BLENDED RESOURCE FUND 15
SCHEDULE OF BLENDED EXPENDITURES-BUDGET AND ACTUAL FOR THE FISCAL YEAR ENDED JUNE 30, 2020
School 7- Ulysses S. Grant
Original Budget Adjustments Final Budget
Regular Programs-Instruction Kindergarten-Salaries of Teachers $ 355,153 $ 355,153 Grades 1-5 Salaries of Teachers 1,000 1,000
Regular Programs~Undistributed Instruction Other Salaries for Instruction 211,018 211,018 Other Purchased Services 8,854 8,854 General Supplies 40,717 40,717 Other Objects 706 706
Total Regular Programs-Instruction 617,448 617,448
Special Education-Instruction Resource Room/Resource Center:
Salaries of Teachers 75,795 75,795
Total Resource Room/Resource Center 75,795 75,795
Total Special Education-Instruction 75,795 75,795
Bilingual Education-Instruction Salaries of Teachers 136,603 136,603
Total Bilingual Education 136,603 136,603
Schooi-Spon. Co-Curricular Activities Inst Salaries 1,050 1,050
Total School-Spon Co-Curricular Activities lust. 1,050 1,050
Before/After School Programs- Instruction
Salaries of Teachers 7,756 7,756
Total Before/After School Programs- Instruction 7,756 7,756
Before/After School Programs- Support
Salaries 5,481 5,481
Total Before/After School Programs- Support 5,481 5,481
Total Before/After School Programs 13,237 13,237
Total Instruction 844,133 844,133
Undistributed Expenditures Attend. and Social Work
Sal. ofFam. Liaison and Comm. Parent Involv. Spec. 17,815 17,815 Total Attendance and Social Work Services 17,815 17,815
Health Services Salaries 58,000 58,000 Supplies and Materials 2,020 2,020
Total Health Services 60,020 60,020
Improvement of lust. Serv. Salaries of Other Professional Staff 8,016 8,016
Total Improvement of Inst. Serv. 8,016 8,016
Edu. Media Serv./Sch. Library Salaries of Technology Coordinators 22,000 22,000
Total Edu. Media Servc/Sch. Library 22,000 22,000
166
EXHIBIT D-3E
Variance
Final Budget to
Actual Actual
$ 355,024 $ 129 891 109
211,018 8,854
39,626 1,091 706
615,413 2,035
75,795 75,795
75,795
136,603
136,603
1,050 1,050
7,756
7,756
5,481 5,481
13,237
842,098 2,035
17,815
17,815
57,650 350 2,008 12
59,658 362
7,798 218 7,798 218
21,892 108 21,892 108
Continued

EXHIBIT D-3E
PASSAIC PUBLIC SCHOOLS BLENDED RESOURCE FUND 15
SCHEDULE OF BLENDED EXPENDITURES-BUDGET AND ACTUAL FOR THE FISCAL YEAR ENDED JUNE 30, 2020
School 7 - Ulysses S. Grant Variance
Final Budget to
Original Budget Adjustments Final Budget Actual Actual
Instructional Staff Training Serv. Purchased Professional-Educational Services - $ 16,000 $ 16,000 $ 11,000 $ 5,000
Total Instructional Staff Training Serv. 16,000 16,000 11,000 5,000
Supp. Serv.-School Admin. Salaries ofPrincipals/Asst Principals 19,104 19,104 15,440 3,664 Salaries of Secretarial and Clerical Assistants 3,500 3,500 3,188 312 Other Purchased Services 7,026 7,026 7,026 Supplies and Materials 2,384 2,384 2,334 50
Total Supp. Serv.-School Admin. 32,014 32,014 27,988 4,026
Security Salaries 37,000 37,000 36,204 796
Total Security 37,000 37,000 36,204 796
Unallocated Benefits Social Security Contributions 31,393 31,393 31,393 Other Retirement Contributions - Regular 57,206 57,206 57,206 Health Benefits 94,715 94,715 94,715
Total Unallocated Benefits 183,314 183,314 183,314
Total Undistributed Expenditures 376,179 376,179 365,669 10,510
Total School Based Budget Current 1,220,312 1,220,312 1,207,767 12,545
Capital Outlay Equipment Instruction
Grades 1-5 1,694 1,694 1,694
Total Equipment 1,694 1,694 1,694
Total Capital Outlay 1,694 1,694 1,694
Total School Based Expenditures $ - $ 1,222,006 $ 1,222,006 $ 1,207,767 $ 14,239
167 Continued

School 8 - Casimir Pulaski
Regula•· Programs-Instruction Kindergarten-Salaries ofTeachers Grades 1-5 Salaries of Teachers Grades 6-8 Salaries of Teachers
Regular Programs-Undistributed Instruction Other Salaries for Instruction Purchased Professional-Educational Services Other Purchased Services General Supplies Textbooks Other Objects
Total Regular Programs-Instruction
Special Education-Instruction Resource Room/Resource Center:
Salaries of Teachers General Supplies Textbooks Other Objects
Total Resource Room/Resource Center
Total Special Education-Instruction
Bilingual Education-Instruction Salaries of Teachers General Supplies Textbooks Other Objects
Total Bilingual Education
School-Spon. Co-Curricular Activities Inst Salaries
Total School-Spon Co-Curricular Activities Inst.
Before/After School Programs- Instruction Salaries of Teachers
Total Before/After School Programs- Instruction
Before/After School Programs- Support Salaries
Total Before/After School Programs- Support Total Before/After School Programs
Total Instruction
Undistributed Expenditures Attend. and Social Work
Salaries of Family Support Teams
PASSAIC PUBLIC SCHOOLS BLENDED RESOURCE FUND 15
SCHEDULE OF BLENDED EXPENDITURES-BUDGET AND ACTUAL FOR THE FISCAL YEAR ENDED JUNE 30, 2020
Original Budget Adjustments Final Budget
$ 58,921 716,764 605,946
124,944 1,656
15,674 90,000
4,410 3,825
1,622,140
1,198,281 15,360
1,920 960
1,216,521
1,216,521
1,411,998 45,920
6,990 3,495
1,468,403
4,000 4,000
59,561 59,561
12,500 12,500 72,061
4,383,125
$ 59,679 201,464 (34,455)
61,588
4,216 24,022
316,514
(323,952) {4,810) {1,920)
(960) (331,642)
(331,642)
(315,562)
(6,113) (2,231)
(323,906)
4000 4,000
2,000 2,000 6,000
(333,034)
$ 118,600 918,228 571,491
186,532 1,656
19,890 114,022
4,410 3,825
1,938,654
874,329 10,550
884,879
884 879
1,096,436 45,920
877 1,264
1,144,497
4,000
4,000
63,561 63,561
14,500 14,500 78,061
4,050,091
63,650 Sal. ofFarn. Liaison and Conun. Parent Involv. Spec. 49,332
63,650 4641 53,973
Total Attendance and Social Work Services
Health Services Salaries Supplies and Materials
Total Health Services
Guidance Salaries of Other Professional Staff
Total Guidance
Improvement of Inst. Serv. Salaries of Other Professional Staff
Total Improvement of Inst. Serv.
49,332
271,323 1,500
272,823
218,433 218,433
4,000 4,000
168
68,291 117,623
2,977 274,300 1500
2,977 275 800
(69,636) 148,797 (69,636) 148,797
4000
4,000
EXHIBIT D-3F
Variance
Final Budget to
Aetna! Aetna!
$ 106,325 $ 12,275 895,564 22,664 549,233 22,258
186,532 1,500 156
18,013 1,877 109,125 4,897
4,410 400 3,425
1,866,692 71,962
874,329 10,547 3
884,876 3
884,876 3
1,096,436 45,229 691
796 81 1,264
1,142,461 2,036
525 3,475 525 3,475
33,402 30,159 33,402 30,159
4,077 10,423
4,077 10,423 37,479 40,582
3,932,033 118,058
22,277 41,373 53,973 76,250 41,373
274,300 1,451 49
275,751 49
132,940 15,857 132,940 15,857
4,000
4,000
Continued

EXHIBIT D-3F
PASSAIC PUBLIC SCHOOLS BLENDED RESOURCE FUND 15
SCHEDULE OF BLENDED EXPENDITURES-BUDGET AND ACTUAL FOR THE FISCAL YEAR ENDED JUNE 30, 2020
School 8- Casimir Pulaski
Variance
Final Budget to
Original Budget Adjustments Final Budget Actual Actual
Edu. Media Serv./Sch. Library Salaries of Technology Coordinators $ 69,778 $ 9407 $ 79,185 $ 72,110 $ 7,075
Total Edu. Media Servc/Sch. Library 69,778 9,407 79 185 72,110 7,075
Instructional Staff Training Serv. Purchased Professional-Educational Services 95,000 18,122 113 122 101,862 11,260
Total Instructional Staff Training Serv. 95,000 18,122 113 122 101,862 11,260
Supp. Serv.-School Admin. Salaries of Principals/ Ass! Principals 282,487 282,487 282,487 Salaries of Secretarial and Clerical Assistants 124,230 966 125,196 125,196 Other Purchased Services 20,883 10,003 30,886 20,393 10,493 Supplies and Materials 6,000 98 6,098 1,764 4,334
Total Supp. Serv.-School Admin. 433,600 11,067 444,667 429,840 14,827
Security
Salaries 108,859 32,207 141,066 132,535 8,531
Total Security 108,859 32,207 141,066 132,535 8,531
Student Transportation Services Contracted Svc (Other Than Betw. Home & School) 15,080 15,080 130 14,950
Total Student Transportation Services 15,080 15,080 130 14,950
Unallocated Benefits Social Security Contributions 68,531 68,531 50,822 17,709 Other Retirement Contributions - Regular 133,483 133,483 104,137 29,346 Unemployment Compensation 14,446 2,819 17,265 16,835 430 Workers Compensation 55,056 55,056 49,430 5,626 Health Benefits 1,284,700 (227,035) 1,057,665 798,292 259,373
Total Unallocated Benefits 1,556,216 (224,2 16) 1,332,000 1,019,516 312,484
Total Undistributed Expenditures 2,823,121 (151,781) 2,671,340 2,240,934 430,406
Total School Based Budget Current 7,206,246 (484,815) 6,721,431 6,172,967 548,464
Total School Based Expenditures $ 7,206,246 $ (484,815) $ 6,721,431 $ 6,172,967 $ 548,464
169 Continued

EXHIBIT D-3G
PASSAIC PUBLIC SCHOOLS BLENDED RESOURCE FUND 15
SCHEDULE OF BLENDED EXPENDITURES-BUDGET AND ACTUAL FOR THE FISCAL YEAR ENDED JUNE 30, 2020
School 9 - Etta Gero Variance
Final Budget to
Original Budget Adjustments Final Budget Actual Actual
Regular Programs-Instruction Kindergarten-Salaries ofTeachers $ 179,243 $ 91,368 $ 270,611 $ 270,611 Grades 1-5 Salaries of Teachers 1,352,572.00 1,500.00 1,354,072.00 1,343,330.00 $ 10,742 Grades 6-8 Salaries of Teachers 961,420.00 (36,243.00) 925,177.00 885,059.00 40,118
Regular Programs-Undistributed Instruction Other Salaries for Instruction 197,660 72,421 270,081 211,619 58,462 Purchased Professional-Educational Services 2,658 19,112 21,770 6,670 15,100 Other Purchased Services 22,482 9,806 32,288 13,629 18,659 General Supplies 100,000 30,580 130,580 128,123 2,457 Textbooks 4,530 (1,612) 2,918 2,918 Other Objects 4,575 5,000 9,575 1,238 8,337
Total Regular Programs-Instruction 2,825,140 191,932 3,017,072 2,860,279 156,793
Special Education-Instruction Learning and/or Language Disabilities:
Salaries of Teachers 461,872 139,496 601,368 601,368 Other Salaries for Instruction 137,252 (6,263) 130,989 127,035 3,954 General Supplies 19,200 (19,200) Textbooks 2,400 (853) 1,547 1,547 Other Objects 1,200 1,200 1,200
Total Learning/Language Disabilities 621,924 113,180 735,104 728,403 6,701
Behavioral Disabilities
Salaries of Teachers 127,291 (64,423) 62,868 59,550 3,318 Other Salaries for Instruction 134,364 134,364 122,554 11,810 General Supplies 5,760 (5,000) 760 411 349 Textbooks 720 720 720 Other Objects 360 360 360
Total Behavioral Disabilities 134,131 64,941 199,072 182,515 16,557
Resource Room/Resource Center: Salaries of Teachers 1,179,601 (79,928) 1,099,673 1,099,672 I General Supplies 16,080 (6,132) 9,948 6,267 3,681 Textbooks 2,010 (2,010) Other Objects 1,005 (1,005)
Total Resource Room/Resource Center 1,198,696 (89,075) 1,109,621 1,105,939 3,682
Total Special Education-Instruction 1,954,751 89,046 2,043,797 2,016,857 26,940
Bilingual Education-Instruction Salaries of Teachers 1,759,515 (184,978) 1,574,537 1,553,128 21,409 General Supplies 88,400 (26,416) 61,984 61,984 Textbooks 12,300 (11,547) 753 753 Other Objects 6,150 6,150 2,460 3,690
Total Bilingual Education 1,866,365 (222,941) 1,643,424 1,617,572 25,852
Schooi-Spon. Co-Curricular Activities lust Salaries 5,000 1,000 6,000 5,650 350
Total Schooi-Spon Co-Curricular Activities Inst. 5,000 1,000 6,000 5,650 350
170 Continued

EXHIBIT D-3G
PASSAIC PUBLIC SCHOOLS BLENDED RESOURCE FUND 15
SCHEDULE OF BLENDED EXPENDITURES-BUDGET AND ACTUAL FOR THE FISCAL YEAR ENDED JUNE 30, 2020
School 9 - Etta Gero Variance
Final Budget to
Original Budget Adjustments Final Budget Actual Actual
Before/After School Programs- Instruction Salaries of Teachers $ 155,707 $ (44,850) $ 110,857 $ 46,019 $ 64,838
Total Before/After School Programs- Instruction 155,707 (44,850) 110,857 46,019 64,838
Before/After School Programs- Support
Salaries 17,500 (1,000) 16,500 7,160 9,340
Total Before/After School Programs- Support 17,500 (1,000) 16,500 7,160 9,340
Total Before/After School Programs 173,207 (45,850) 127,357 53,179 74,178
Total Instruction 6,824,463 13,187 6,837,650 6,553,537 284, I 13
Undistributed Expenditures Attend. and Social Work
Salaries of Drop Out Prev. Officer/Coordinator 66,150 (6,874) 59,276 55,231 4,045 Sal. ofF am. Liaison and Comm. Parent Involv. Spec. 55,125 55,125 51,433 3,692
Total Attendance and Social Work Services 121,275 (6,874) 114,401 106,664 7,737
Health Services Salaries 222,909 16,618 239,527 239,527 Supplies and Materials 2,000 2,000 4,000 2,114 1,886
Total Health Services 224,909 18,618 243,527 241,641 1,886
Guidance Salaries of Other Professional Staff 230,699 (7,285) 223,414 223,414
Total Guidance 230,699 (7,285) 223,414 223,414
Improvement oflnst. Serv.
Salaries of Other Professional Staff 4,000 4,000 4,000
Sal. of Facilitators, Math and Literacy Coaches 276,804 7,805 284,609 233,762 50,847
Total Improvement of Inst. Serv. 280,804 7,805 288,609 233,762 54,847
Edu. Media Serv./Sch. Library Salaries 128,418 (128,418) Salaries of Technology Coordinators 113,575 6,874 120,449 88,842 31,607
Total Edu. Media Servc/Sch. Library 241,993 (121,544) 120,449 88,842 31,607
Instructional Staff Training Serv. Purchased Professional-Educational Services 192,000 (158) 191,842 186,500 5,342 Other Purch Services 1,000 1,000 1,000
Total Instructional Staff Training Serv. 192,000 842 192,842 187,500 5,342
Supp. Serv.-School Admin. Salaries of Principals/ Asst Principals 399,855 (21,867) 377,988 374,522 3,466 Salaries of Other Professional Staff 109,089 1 109,090 109,090 Salaries of Secretarial and Clerical Assistants 179,221 10,000 189,221 166,920 22,301 Other Purchased Services 10,925 29,200 40,125 34,916 5,209 Supplies and Materials 6,000 2,499 8,499 6,527 1,972
Total Supp. Serv.-School Admin. 705,090 19,833 724,923 691,975 32,948
Security
Salaries 134,678 6,263 140,941 140,941 General Supplies 100 100 100
Total Security 134,678 6,363 141,041 141,041
171 Continued

EXHIBIT D-3G
PASSAIC PUBLIC SCHOOLS BLENDED RESOURCE FUND 15
SCHEDULE OF BLENDED EXPENDITURES-BUDGET AND ACTUAL FOR THE FISCAL YEAR ENDED JUNE 30, 2020
School 9 - Etta Gero Variance
Final Budget to
Original Budget Adjustments Final Budget Actual Actual
Student Transportation Services Contracted Svc (Other Than Betw. Home & School) $ 20,670 - $ 20,670 $ 4,395 $ 16,275
Total Student Transportation Services 20,670 20,670 4,395 16,275
Unallocated Benefits Social Security Contributions 121,728 121,728 92,423 29,305 Other Retirement Contributions -Regular 208,794 208,794 186,086 22,708 Unemployment Compensation 22,951 $ 4,480 27,431 26,747 684 Workers Compensation 87,468 87,468 70,889 16,579 Health Benefits 2,349,414 (211,615) 2,137,799 2,069,026 68,773
Total Unallocated Benefits 2,790,355 (207,135) 2,583,220 2,445,171 138,049
Total Undistributed Expenditures 4,942,473 (289,377) 4,653,096 4,364,405 288,691
Total School Based Budget Current 11,766,936 (276,190) 11,490,746 10,917,942 572,804
Capital Outlay Equipment
Instruction Grades 1-5 15,000 15,000 15,000
Total Equipment 15,000 15,000 15,000
Total Capital Outlay 15,000 15,000 15,000
Total School Based Expenditures $ 11,766,936 $ (261,190) $ 11,505,746 $ 10,917,942 $ 587,804
172 Continued

EXHIBIT D-3H
PASSAIC PUBLIC SCHOOLS BLENDED RESOURCE FUND 15
SCHEDULE OF BLENDED EXPENDITURES-BUDGET AND ACTUAL FOR THE FISCAL YEAR ENDED JUNE 30, 2020
School 10 - Theodore Roosevelt Variance
Final Budget to
Original Budget Adjustments Final Budget Actual Actual
Regular Programs-Instruction Kindergarten-Salaries ofTeachers $ 159,087 $ 159,087 $ 158,750 $ 337 Grades 1-5 Salaries of Teachers 1,220,335 $ 6,724 1,227,059 1,218,571 8,488 Grades 6-8 Salaries of Teachers 704,168 194,413 898,581 856,621 41,960
Regular Programs-Undistributed Instruction Other Salaries for Instruction 207,006 207,006 204,102 $ 2,904 Purchased Professional-Educational Services 2,289 1,150 3,439 2,200 1,239 Other Purchased Services 14,753 2,946 17,699 9,182 8,517 General Supplies 107,040 2,825 109,865 109,218 647 Textbooks 5,340 2,700 8,040 8,038 2 Other Objects 4,755 4,755 890 3,865
Total Regular Programs-Instruction 2,424,773 210,758 2,635,531 2,567,572 67,959
Special Education-Instruction Resource Room/Resource Center:
Salaries of Teachers 1,060,859 (5,280) 1,055,579 1,055,579 General Supplies 12,960 12,960 9,365 3,595 Textbooks 1,000 (!) 999 995 4 Other Objects 810 810 810
Total Resource Room/Resource Center 1,075,629 (5,281) 1,070,348 1,065,939 4,409
Total Special Education-Instruction 1,075,629 (5,281) 1,070,348 1,065,939 4,409
Bilingual Education-Instruction Salaries of Teachers 1,839,149 (218,681) 1,620,468 1,576,091 44,377 General Supplies 50,000 50,000 38,653 11,347 Textbooks 6,645 6,645 6,645 Other Objects 5,759 (4,768) 991 991
Total Bilingual.Education 1,901,553 (223,449) 1,678,104 1,621,389 56,715
Schoo1-Spon, Co-Curricular Activities Inst Salaries 4,500 4,500 4,200 300
Total School-Spon Co-Curricular Activities Inst. 4,500 4,500 4,200 300
Before/After School Programs- Instruction
Salaries of Teachers 106,357 63,220 169,577 61,249 108,328 Total Before/After School Programs- Instruction 106,357 63,220 169,577 61,249 108,328
Before/After School Programs- Support Salaries 12,500 5,000 17,500 5,344 12,156
Total Before/After School Programs- Support 12,500 5,000 17,500 5,344 12,156 Total Before/After School Programs 118,857 68,220 187,077 66,593 120,484
Total Instruction 5,525,312 50,248 5,575,560 5,325,693 249,867
Undistributed Expenditures Attend. and Social Work
Sal. ofFam. Liaison and Comm. Parent Involv. Spec. 47,578 1,325 48,903 48,903 Total Attendance and Social Work Services 47,578 1,325 48,903 48,903
Health Services Salaries 209,406 14,501 223,907 223,907 Supplies and Materials 2,000 2,000 2,000
Total Health Services 211,406 14,501 225,907 223,907 2,000
173 Continued

EXHIBIT D-3H
PASSAIC PUBLIC SCHOOLS BLENDED RESOURCE FUND 15
SCHEDULE OF BLENDED EXPENDITURES-BUDGET AND ACTUAL FOR THE FISCAL YEAR ENDED JUNE 30, 2020
SchoollO- Theodore Roosevelt Variance
Final Budget to
Original Budget Adjustments Final Budget Actual Actual
Guidance Salaries of Other Professional Staff $ 125,314 $ 61,208 $ 186,522 $ 185,908 $ 614
Total Guidance 125,314 61,208 186,522 185,908 614
Improvement oflnst. Serv. Salaries of Other Professional Staff 4,000 4,000 4,000 Sal. of Facilitators, Math and Literacy Coaches 92,806 21,149 113,955 113,955
Total Improvement of Inst. Serv. 96,806 21,149 117,955 113,955 4,000
Edu. Media Serv./Sch. Library Salaries of Technology Coordinators 56,788 78,162 134,950 134,950
Total Edu. Media Servc/Sch. Library 56,788 78,162 134,950 134,950
Instructional Staff Training Serv. Purchased Professional-Educational Services 95,000 21,942 116,942 84,576 32,366 Other Purchase Services 10,000 10,000 10,000
Total Instructional Staff Training Serv. 95,000 31,942 126,942 84,576 42,366
Supp. Serv.-School Admin. Salaries of Principals/Ass! Principals 418,444 418,444 414,273 4,171 Salaries of Secretarial and Clerical Assistants 179,952 3,987 183,939 183,939 Other Purchased Services 19,482 14,700 34,182 21,622 12,560 Supplies and Materials 6,000 316 6,316 6,252 64
Total Supp. Serv.-School Admin. 623,878 19,003 642,881 626,086 16,795
Security
Salaries 140,128 40,142 180,270 156,628 23,642
Total Security 140,128 40,142 180,270 156,628 23,642
Student Transportation Services Contracted Svc (Other Than Betw. Home & School) 22,140 (2,700) 19,440 500 18,940
Total Student Transportation Services 22,140 (2,700) 19,440 500 18,940
Unallocated Benefits Social Security Contributions 91,844 91,844 63,148 28,696 Other Retirement Contributions -Regular 163,237 163,237 155,239 7,998 Unemployment Compensation 17,359 3,393 20,752 20,233 519 Workers Compensation 66,156 66,156 53,584 12,572 Health Benefits 1,785,363 (203,402) 1,581,961 1,306,748 275,213
Total Unallocated Benefits 2,123,959 (200,009) 1,923,950 1,598,952 324,998
Total Undistributed Expenditures 3,542,997 64,723 3,607,720 3,174,365 433,355
Total School Based Budget Current 9,068,309 114,971 9,183,280 8,500,058 683,222
Capital Outlay Equipment Instruction
Grades 1-5 50,156 50,156 36,603 13,553
Total Equipment 50,156 50,156 36,603 13,553
Total Capital Outlay 50,156 50,156 36,603 13,553
Total School Based Expenditures $ 9,068,309 $ 165,127 $ 9,233,436 $ 8,536,661 $ 696,775
174 Continued

EXHIBIT D-31 PASSAIC PUBLIC SCHOOLS
BLENDED RESOURCE FUND IS SCHEDULE OF BLENDED EXPENDITURES-BUDGET AND ACTUAL
FOR THE FISCAL YEAR ENDED JUNE 30, 2020
School 11 -William B. Cruise Veterans Memorial Variance
Final Budget to
Original Budget Adjustments Final Budget Actual Actual
Regular Programs-Instruction Kindergarten-Salaries of Teachers $ 365,310 $ 365,310 $ 345,780 $ 19,530 Grades 1-5 Salaries of Teachers 1,853,278 $ (118,359) 1,734,919 1,731,942 2,977 Grades 6-8 Salaries of Teachers 649,014 331,435 980,449 970,946 9,503
Regular Programs-Undistributed Instruction Other Salaries for lnstmction 298,960 32,311 331,271 306,163 25,108 Purchased Professional-Educational Services 3,570 3,570 3,570 Other Purchased Services 16,932 8,153 25,085 14,438 10,647 General Supplies 167,040 32,328 199,368 174,638 24,730 Textbooks 9,090 9,090 4,643 4,447 Other Objects 7,410 7,410 255 7,155
Total Regular Programs-Instruction 3,370,604 285,868 3,656,472 3,548,805 107,667
Special Education-Instruction Learning and/or Language Disabilities:
Salaries of Teachers 1,086,139 (500,000) 586,139 582,744 3,395 Other Salaries for lnstmction 254,691 254,691 222,212 32,479 General Supplies 46,080 46,080 46,080 Textbooks 5,760 5,760 4,541 1,219 Other Objects 2,880 2,880 2,880
Total Learning/Language Disabilities 1,395,550 (500,000) 895,550 809,497 86,053
Resource Room/Resource Center: Salaries of Teachers 1,009,463 (178,393) 831,070 804,116 26,954 General Supplies 17,280 17,280 17,280 Textbooks 2,160 2,160 2,160 Other Objects 1,080 1,080 1,080
Total Resource Room/Resource Center 1,029,983 (178,393) 851,590 806,276 45,314
Total Special Education-Instruction 2,425,533 (678,393) 1,747,140 1,615,773 131,367
Bilingual Education-Instruction Salaries of Teachers 1,720,342 (158,960) 1,561,382 1,538,613 22,769 General Supplies 93,680 (25,094) 68,586 2,613 65,973 Textbooks 12,960 12,960 12,960 Other Objects 6,480 6,480 100 6,380
Total Bilingual Education 1,833,462 (184,054) 1,649,408 1,554,286 95,122
School-Spon. Co-Curricular Activities lust Salaries 3,000 3,000 2,100 900
Total School-Spon Co-Curricular Activities Inst. 3 000 3,000 2,100 900
Before/After School Programs- Instruction
Salaries 191,103 (51,220) 139,883 55,227 84,656
Total Before/After School Programs- Instruction 191,103 (51,220) 139,883 55,227 84,656
Before/ After School Programs - Support
Salaries 17,500 13,000 30,500 11,921 18,579
Total Before/After School Programs- Support 17,500 13,000 30,500 11,921 18,579 Total Before/After School Programs 208,603 (38,220) 170,383 67,148 103,235
Total Instruction 7,841 202 (614,799) 7,226,403 6,788,112 438,291
Undistributed Expenditures Attend. and Social Work
Salaries of Drop Out Prev. Officer/Coordinator 126,349 (99,537) 26,812 26,812 Salaries of Family Support Teams 65,747 (463) 65,284 54,103 11,181 Sal. ofF am. Liaison and Cmrnn. Parent lnvolv. Spec. 117,260 183 117,443 117,443
Total Attendance and Social Work Services 309,356 (99,817) 209,539 198,358 11,181
175 Continued

EXHIBIT D-31 PASSAIC PUBLIC SCHOOLS
BLENDED RESOURCE FUND 15 SCHEDULE OF BLENDED EXPENDITURES-BUDGET AND ACTUAL
FOR THE FISCAL YEAR ENDED JUNE 30, 2020
School!!- William B. Cruise Veterans Memorial Variance
Final Budget to
Ol'iginal Budget Adjustments Final Budget Actual Actual
Health Services Salaries $ 201,844 $ 12,793 $ 214,637 $ 214,637 Supplies and Materials 2,000 2,000 1,875 $ 125
Total Health Services 203,844 12,793 216,637 216,512 125
Guidance Salaries of Other Professional Staff 195,871 (37,175) 158,696 146,820 11,876
Total Guidance 195,871 (37,175) 158,696 146,820 11,876
Improvement of lnst. Serv.
Salaries of Other Professional Staff 4,000 4,000 4,000
Sal. of Facilitators, Math and Literacy Coaches 201,346 201,346 173,390 27,956
Total Improvement of Inst. Serv. 205,346 205,346 173,390 31,956
Edu. Media Serv./Sch. Lib•·ary Salaries ofTeclmology Coordinators 66,173 64,652 130,825 130,825
Total Edu. Media Servc/Sch. Library 66,173 64,652 130,825 130,825
Instructional Staff Training Serv. Purchased Professional-Educational Services 120,000 26,084 146,084 115,825 30,259 Other Purchased Services 2,000 2,000 2,000
Total Instructional Staff Training Serv. 120,000 28,084 148,084 117,825 30,259
Supp. Serv.-School Admin. Salaries of Principals/ Asst Principals 528,232 (42,243) 485,989 473,763 12,226 Salaries of Secretarial and Clerical Assistants 170,905 {12,976) 157,929 154,858 3,071 Other Purchased Services 8,439 11,700 20,139 19,369 770 Supplies and Materials 6,000 6,000 139 5,861
Total Supp. Serv.-School Admin. 713,576 (43,519) 670,057 648,129 21,928
Security Salaries 139,414 4,202 143,616 139,297 4,319
Total Security 139,414 4,202 143,616 139,297 4,319
Student Transportation Services Contracted Svc (Other Than Betw. Home & School) 35,820 35,820 35,820
Total Student Transportation Services 35,820 35,820 35,820
Unallocated Benefits Social Security Contributions 148,428 148,428 110,022 38,406 Other Retirement Contributions - Regular 223,323 223,323 179,017 44,306 Unemployment Compensation 27,494 5,369 32,863 32,042 821 Workers Compensation 104,784 104,784 88,411 16,373 Health Benefits 2,983,009 (254,566) 2,728,443 2,460,038 268,405
Total Unallocated Benefits 3,487,038 (249,197) 3,237,841 2,869,530 368,311
Total Undistributed Expenditures 5,476,438 (319,977) 5,156,461 4,640,686 515,775
Total School Based Budget Current 13,317,640 (934,776) 12,382,864 11,428,798 954,066
Capital Outlay Equipment Instruction
Grades 1-5 25,094 25,094 25,094
Total Equipment 25,094 25,094 25,094
Total Capital Outlay 25,094 25,094 25,094
Total School Based Expenditures $ 13,317,640 $ (909,682) $ 12,407,958 $ 11,453,892 $ 954,066
176 Continued

EXHIBIT D-3J
PASSAIC PUBLIC SCHOOLS BLENDED RESOURCE FUND 15
SCHEDULE OF BLENDED EXPENDITURES-BUDGET AND ACTUAL FOR THE FISCAL YEAR ENDED JUNE 30, 2020
School 12 - Passaic High School Variance
Final Budget to
Original Budget Adjustments Final Budget Actual Actual
Regular Programs-Instruction Grades 9-12 Salaries ofTeachers $ 11,184,993 $ 269,257 $ 11,454,250 $ 10,972,455 $ 481,795
Regular Programs-Undistributed Instruction Purchased Professional-Educational Services 6,900 6,900 1,500 5,400 Other Purchased Services 680,000 427,746 1,107,746 896,046 211,700 General Supplies 506,560 (13,404) 493,156 458,891 34,265 Textbooks 140,000 (12,845) 127,155 124,136 3,019 Other Objects 54,160 (7,000) 47,160 22,531 24,629
Total Regular Programs-Instruction 12,572,613 663,754 13,236,367 12,475,559 760,808
Special Education-Instruction Cognitive Impaired-Mild
Salaries of Teachers 72,008 23,587 95,595 95,595 Other Salaries for Instruction 31,945 31,945 31,945 General Supplies 2,880 2,880 2,880 Textbooks 360 (360) Other Objects 180 180 180
Total Cognitive Impaired- Mild 75,428 55,172 130,600 95,595 35,005
Learning and/or Language Disabilities: Salaries of Teachers 2,919,299 60,802 2,980,101 2,948,003 32,098 Other Salaries for Instruction 31,945 31,945 31,945 General Supplies 8,160 (8,000) 160 160 Textbooks 1,020 (1,020) Other Objects 510 510 510
Total Learning/Language Disabilities 2,928,989 83,727 3,012,716 2,948,003 64,713
Resource Room/Resource Center: Salaries of Teachers 422,296 (314,941) 107,355 107,355 General Supplies 28,000 (27,000) 1,000 94 906 Textbooks 6,195 6,195 6,195 Other Objects 5,369 5,369 5,369
Total Resource Room/Resource Center 461,860 (341,941) 119,919 107,449 12,470
Autism Salaries of Teachers 197,458 73,132 270,590 268,190 2,400 Other Salaries for Instruction 83,002 83,002 45,751 37,251 General Supplies 2,880 2,880 2,880 Textbooks 360 (360) Other Objects 180 180 180
Total Autism 200,878 155,774 356,652 313,941 42,711
Total Special Education-Instruction 3,667,155 (47,268) 3,619,887 3,464,988 154,899
Bilingual Education-Instruction . Salaries of Teachers 733,827 352,592 1,086,419 895,471 190,948
General Supplies 51,520 (38,260) 13,260 4,845 8,415 Textbooks 8,940 20,000 28,940 28,048 892 Other Objects 4,470 4,470 4,470
Total Bilingual Education 798,757 334,332 1,133,089 928,364 204,725
Schooi-Spon, Co-Curricular Activities Inst Salaries 110,000 110,000 87,685 22,315
Total Schooi-Spon Co-Curricular Activities Inst. 110,000 110,000 87,685 22,315
177 Continued

EXHIBIT D-3J
PASSAIC PUBLIC SCHOOLS BLENDED RESOURCE FUND 15
SCHEDULE OF BLENDED EXPENDITURES-BUDGET AND ACTUAL FOR THE FISCAL YEAR ENDED JUNE 30, 2020
School 12 - Passaic High School Variance
Final Budget to
Original Budget Adjustments Final Budget Actual Actual
Other Instructional Programs - Instruction
Salaries $ 17,000 $ 5,650 $ 22,650 $ 18,150 $ 4,500
Total Other Instructional Programs - Instruction 17,000 5,650 22,650 18,150 4,500
Before/After School Programs- Instruction
Salaries of Teachers 240,000 8,400 248,400 88,013 160,387
Total Before/After School Programs- Instruction 240,000 8,400 248,400 88,013 160,387
Before/After School Programs- Support
Salaries 40,000 2,600 42,600 23,945 18,655
Total Before/After School Programs- Support 40,000 2,600 42,600 23,945 18,655
Total Before/After School Programs 280,000 11,000 291,000 111,958 179,042
Summer School-Instruction Salaries 305,000 18,513 323,513 320,285 3,228 Other Salaries for Instruction 1,500 (1,500) Purchased Services 35,000 35,000 33,750 1,250 Supplies 4,500 (4,500)
Total Summer School-Instruction 346,000 12,513 358,513 354,035 4,478
Summer School - Suppo•·t Services
Salaries 37,000 5,500 42,500 42,154 346
Total Summer School - Support Services 37,000 5,500 42,500 42,154 346 Total Summer School 383,000 18,013 401,013 396,189 4,824
Total Instruction 17,828,525 985,481 18,814,006 17,482,893 1,331,113
Undistributed Expenditures Attend. and Social Work
Salaries of Drop Out Prev. Officer/Coordinator 220,789 90,095 310,884 283,054 27,830 Sal. ofFam. Liaison and Comm. Parent Involv. Spec. 95,865 10,423 106,288 106,288
Total Attendance and Social Work Services 316,654 100,518 417,172 389,342 27,830
Health Services Salaries 380,481 ' 4,259 384,740 384,368 372 Supplies and Materials 2,500 576 3,076 2,507 569
Total Health Services 382,981 4,835 387,816 386,875 941
Guidance Salaries of Other Professional Staff 837,560 4,496 842,056 793,933 48,123
Total Guidance 837,560 4,496 842,056 793,933 48,123
Improvement of Inst. Serv.
Salaries of Other Prof Staff 4,000 4,000 4,000 Total Improvement of lnst. Serv. 4,000 4,000 4,000
Edu. Media Serv./Sch. Li(:)rary Salaries 32,980 29,571 62,551 44,105 18,446 Salaries of Technology Coordinators 124,747 (6, 164) 118,583 118,583 Supplies and Materials 8,000 8,000 8,000
Total Edu. Media Servc/Sch. Library 165,727 23,407 189,134 162,688 26,446
178 Continued

EXHIBIT D-3J
PASSAIC PUBLIC SCHOOLS BLENDED RESOURCE FUND 15
SCHEDULE OF BLENDED EXPENDITURES-BUDGET AND ACTUAL FOR THE FISCAL YEAR ENDED JUNE 30, 2020
Schooll2- Passaic High School Variance
Final Budget to
Original Budget Adjustments Final Budget Actual Actual
Instructional Staff Training Serv. Purchased Professional-Educational Services $ 195,000 $ 138,949 $ 333,949 $ 182,550 $ 151,399 Other Purchased Services 40,000 1,872 41,872 34,994 6,878 Supplies and Materials 3,000 10,000 13,000 12,988 12
Total Instructional Staff Training Serv. 238,000 150,821 388,821 230,532 158,289
Supp. Serv.-School Admin. Salaries ofPrincipals/Asst Principals 655,903 2,713 658,616 658,616 Salaries of Other Professional Staff 404,422 (2,520) 401,902 401,902 Salaries of Secretarial and Clerical Assistants 519,269 (28,179) 491,090 480,429 10,661 Other Purchased Services 39,989 57,000 96,989 84,584 12,405 Supplies and Materials 22,000 (2,000) 20,000 9,795 10,205
Total Supp. Serv.-School Admin. 1,641,583 27,014 1,668,597 1,635,326 33,271
Security Salaries 521,882 (26,966) 494,916 494,916
Total Security 521,882 (26,966) 494,916 494,916
Student Transportation Services Contracted Svc (Other Than Betw. Home & School) 211,736 76,948 288,684 88,774 199,910
Total Student Transportation Services 211,736 76,948 288,684 88,774 199,910
Unallocated Benefits Social Security Contributions 298,547 (69,420) 229,127 207,497 21,630 Other Retirement Contributions - Regular 467,542 69,420 536,962 536,962 Unemployment Compensation 52,425 10,048 62,473 61,003 1,470 Workers Compensation 199,800 199,800 162,643 37,157 Health Benefits 5,444,198 (481,699) 4,962,499 4,962,499
Total Unallocated Benefits 6,462,512 (471,651) 5,990,861 5,930,604 60,257
Total Undistributed Expenditures 10,782,635 (110,578) 10,672,057 10,112,990 559,067
Total School Based Budget Current 28,611,160 874,903 29,486,063 27,595,883 1,890,180
Capital Outlay Equipment Instruction
Grades 9-12 20,000 390 20,390 20,390
Total Equipment 20,000 390 20,390 20,390
Total Capital Outlay 20,000 390 20,390 20,390
Total School Based Expenditures $ 28,631,160 $ 875,293 $ 29,506,453 $ 27,595,883 $ 1,910,570
179 Continued

EXHIBIT D-3K
PASSAIC PUBLIC SCHOOLS BLENDED RESOURCE FUND 15
SCHEDULE OF BLENDED EXPENDITURES-BUDGET AND ACTUAL FOR THE FISCAL YEAR ENDED JUNE 30, 2020
School IS -Vincent Capuana Variance
Final Budget to
Original Budget Adjustments Final Budget Actual Actual
Regular Programs-Instruction Preschool/Kindergarten-Salaries of Teachers $ 328,714 $ 328,714 $ 327,948 $ 766 Grades 1-5 Salaries ofTeachers 500 500 500
Regular Programs-Undistributed Instruction Other Salaries for Instruction 129,017 129,017 129,017 Purchased Professional-Educational Services 10,000 10,000 10,000 Other Purchased Services 6,700 6,700 5,610 1,090
·General Supplies 28,000 28,000 25,905 2,095 Other Objects 5,000 5,000 5,000
Total Regular Programs-Instruction 507,931 507,931 488,480 19,451
Special Education-Instruction Resource Room/Resource Center:
Salaries of Teachers 59,676 59,676 50,518 9,158
Total Resource Room/Resource Center 59,676 59,676 50,518 9,158
Total Special Education-Instruction 59,676 59,676 50,518 9,158
Before/After School Programs- Instruction Salaries of Teachers 17,070 17,070 10,474 6,596
Total Before/After School Programs- Instruction 17,070 17,070 I 0,474 6,596
Before/After School Programs- Support Salaries 10,000 10,000 2,746 7,254
Total Before/After School Programs- Support 10,000 10,000 2,746 7,254
Total Before/After School Programs 27,070 27,070 13,220 13,850
Total Instruction 594,677 594,677 552,218 42,459
Undistributed Expenditures Edu. Media Serv./Sch. Library
Salaries of Technology Coordinators 22,000 22,000 21,892 108 Total Edu. Media Servc/Sch. Library 22,000 22,000 21,892 108
Supp. Serv.-School Admin. Other Purchased Services 3,000 3,000 3,000 Supplies and Materials 10,900 10,900 10,855 45
Total Supp. Serv.-School Admin. 13,900 13,900 13,855 45
Student Transportation Services Contracted Svc (Other Than Betw. Home & School) 5,000 5,000 5,000
Total Student Transportation Services 5,000 5,000 5,000
Unallocated Benefits Social Security Contributions 25,234 25,234 25,234 Other Retirement Contributions- Regular 22,912 22,912 22,912 Health Benefits 27,353 27,353 27,353
Total Unallocated Benefits 75,499 75,499 52,587 22,912
Total Undistributed Expenditures 116,399 116,399 88,334 28,065
Total School Based Budget Current 711,076 $ 711,076 $ 640,552 70,524
Total School Based Expenditures $ - $ 711,076 $ 711,076 $ 640,552 $ 70,524
180

EXHIBIT D-3L
PASSAIC PUBLIC SCHOOLS BLENDED RESOURCE FUND 15
SCHEDULE OF BLENDED EXPENDITURES-BUDGET AND ACTUAL FOR THE FISCAL YEAR ENDED JUNE 30, 2020
Schooll9- Daniel F. Ryan Variance
Final Budget to
Original Budget Adjustments Final Budget Actual Actual
Regular Programs-Instruction Preschool/Kindergarten-Salaries of Teachers $ 60,840 $ (60,840) Grades 1-5 Salaries of Teachers 1,587,268 (82,151) $ 1,505,117 $ 1,505,089 $ 28 Grades 6-8 Salaries of Teachers 1,079,360 62,660 1,142,020 1,023,549 118,471
Regular Programs-Undistributed Instruction Other Salaries for Instruction 217,329 (210,338) 6,991 234 6,757 Purchased Professional-Educational Services 7,700' 7,700 5,200 2,500 Other Purchased Services 18,395 9,179 27,574 13,490 14,084 General Supplies 86,000 34,574 120,574 88,782 31,792 Textbooks 5,670 (5,670) Other Objects 6,000 6,000 553 5,447
Total Regular Programs-Instruction 3,068,562 (252,586) 2,815,976 2,636,897 179,079
Special Education-Instruction Cognitive Impaired-Mild
Salaries of Teachers 126,800 126,800 69,740 57,060 Total Cognitive Impaired- Mild 126,800 126,800 69,740 57,060
Learning and/or Language Disabilities Salaries of Teachers 683,980 683,980 683,980 Other Salaries for Instruction 170,500 170,500 133,940 36,560
Total Learning/Language Disabilities 854,480 854,480 817,920 36,560
Resource Room/Resource Center Salaries of Teachers 1,061,716 121,964 I, 183,680 1,148,372 35,308 General Supplies 23,520 23,520 22,445 1,075 Textbooks 2,940 (2,940) Other Objects 1,470 1,470 1,470
Total Resource Room/Resource Center 1,089,646 119,024 1,208,670 1,170,817 37,853
Autism
General Supplies 62,382 (16,422) 45,960 34,915 11,045 Total Autism 62,382 (16,422) 45,960 34,915 11,045
Total Special Education-Instruction 1,152,028 1,083,882 2,235,910 2,093,392 142,518
Bilingual Education-Instruction Salaries of Teachers 1,681,681 (703,266) 978,415 965,401 13,014 General Supplies 79,040 (10,768) 68,272 55,162 13,110 Textbooks 11,130 (11,130) Other Objects 5,565 5,565 5,565
Total Bilingual Education 1,777,416 (725,164) 1,052,252 1,020,563 31,689
School-Spon. Co-Curricular Activities lust Salaries 4,500 750 5,250 5,250
Total Schooi-Spon Co-Curricular Activities Inst. 4,500 750 5,250 5,250
Before/After School Programs- Instruction
Salaries of Teachers 89,340 9,250 98,590 52,838 45,752 Total Before/After School Programs- Instruction 89,340 9,250 98,590 52,838 45,752
Before/After School Programs- Support
Salaries 12,500 7,000 19,500 5,286 14,214 Total Before/After School Programs- Support 12,500 7,000 19,500 5,286 14,214 Total Before/After School Programs 101,840 16,250 118,090 58,124 59,966
181

EXHIBIT D-3L
PASSAIC PUBLIC SCHOOLS BLENDED RESOURCE FUND 15
SCHEDULE OF BLENDED EXPENDITURES-BUDGET AND ACTUAL FOR THE FISCAL YEAR ENDED JUNE 30, 2020
School 19 - Daniel F. Ryan Variance
Final Budget to
Original Budget Adjustments Final Budget Actual Actual
Summer School - Support Services
Salaries - $ 4,600 $ 4,600 $ 4,456 $ 144
Total Summer School - Support Services 4,600 4,600 4,456 144
Total Summer School 4,600 4,600 4,456 144
Total Instruction $ 6,104,346 127,732 6,232,078 5,818,682 413,396
Undistributed Expenditures Attend. and Social Work
Salaries of Drop Out Prev. Officer/Coordinator 49,951 868 50,819 18,570 32,249 Sal. ofFam. Liaison and Comm. Parent Involv. Spec. 50,596 (40) 50,556 34,534 16,022
Total Attendance and Social Work Services 100,547 828 101,375 53,104 48,271
Health Services Salaries 197,577 19,237 216,814 216,814 Supplies and Materials 2,000 (632) 1,368 1,368
Total Health Services 199,577 18,605 218,182 216,814 1,368
Guidance Salaries of Other Professional Staff 195,978 195,978 193,177 2,801
Total Guidance 195,978 195,978 193,177 2,801
Improvement oflnst. Serv. Salaries of Other Professional Staff 4,000 4,000 4,000
Total Improvement of Inst. Serv. 4,000 4,000 4,000
Edu. Media Serv./Sch. Library
Salaries 72,146 (72,146) Salaries of Technology Coordinators 86,406 3,532 89,938 88,887 1,051 Supplies and Materials 2,000 2,000 2,000
Total Edu. Media Servc/Sch. Library 160,552 (68,614) 91,938 88,887 3,051
Instructional Staff Training Serv. Purchased Professional-Educational Services 95,000 24,122 119,122 75,939 43,183
Total Instructional Staff Training Serv. 95,000 24,122 119,122 75,939 43,183
Supp. Serv.-School Admin. Salaries of Principals/ Asst Principals 389,386 (5,648) 383,738 383,738 Salaries of Secretarial and Clerical Assistants 209,082 (2,605) 206,477 166,437 40,040 Other Purchased Services 7,985 11,000 18,985 18,985 Supplies and Materials 6,000 879 6,879 5,158 1,721
Total Supp. Serv.-School Admin. 612,453 3,626 616,079 574,318 41,761
Security
Salaries 106,102 9,785 115,887 113,637 2,250 Total Security 106,102 9,785 115,887 113,637 2,250
Student Transportation Services Contracted Svc (Other Than Betw. Home & School) 19,858 (879) 18,979 559 18,420
Total Student Transportation Services 19,858 (879) 18,979 559 18,420
182

EXHIBIT D-3L
PASSAIC PUBLIC SCHOOLS BLENDED RESOURCE FUND 15
SCHEDULE OF BLENDED EXPENDITURES-BUDGET AND ACTUAL FOR THE FISCAL YEAR ENDED JUNE 30, 2020
School19- Daniel F. Ryan Variance
Final Budget to
Original Budget Adjustments Final Budget Actual Actual
Unallocated Benefits Social Security Contributions $ 98,693 - $ 98,693 $ 64,955 $ 33,738 Other Retirement Contributions - Regular 178,805 178,805 132,729 46,076 Unemployment Compensation 20,038 $ 3,897 23,935 23,345 590 Workers Compensation 76,368 76,368 60,545 15,823 Health Benefits 2,092,953 (433,077) 1,659,876 1,549,547 110,329
Total Unallocated Benefits 2,466,857 (429,180) 2,037,677 1,831,121 206,556
Total Undistributed Expenditures 3,960,924 (441,707) 3,519,217 3,147,556 371,661
Total School Based Budget Current 10,065,270 (313,975) 9,751,295 8,966,238 785,057
Capital Outlay Equipment Instmction
Grades 1-5 40,363 40,363 40,363
Total Equipment 40,363 40,363 40,363
Total Capital Outlay 40,363 40,363 40,363
Total School Based Expenditures $ 10,065,270 $ (273,612) $ 9,791,658 $ 9,006,601 $ 785,057
183

EXHIBIT D-3M
PASSAIC PUBLIC SCHOOLS BLENDED RESOURCE FUND 15
SCHEDULE OF BLENDED EXPENDITURES-BUDGET AND ACTUAL FOR THE FISCAL YEAR ENDED JUNE 30, 2020
School 20 Passaic Gifted and Talented Academy Variance
Final Budget to
Original Budget Adjustments Final Budget Actual Actual
Regular Programs-Instruction Grades 1-5 Salaries of Teachers $ 2,152,197 - $ 2,152,197 $ 2,101,410 $ 50,787 Grades 6-8 Salaries of Teachers 1,468,243 $ (47,289) 1,420,954 1,393,282 27,672
Regular Programs-Undistributed Instruction Other Salaries for Instruction 446 446 446 Purchased Professional-Educational Services 3,009 (1,909) 1,100 1,100 Other Purchased Services 29,187 2,541 31,728 23,071 8,657 General Supplies 180,000 39,569 219,569 196,853 22,716 Textbooks 13,020 (13,020) Other Objects 17,160 (3,102) 14,058 9,356 4,702
Total Regular Programs-Instruction 3,862,816 {22,764) 3,840,052 3,725,518 114,534
Special Education-Instruction Resource Room/Resource Center:
Salaries of Teachers 266,272 (63,116) 203,156 156,705 46,451 General Supplies 2,880 360 3,240 2,836 404 Textbooks 360 (360) Other Objects 180 180 121 59
Total Resource Room/Resource Center 269,692 {63,116) 206,576 159,662 46,914
Total Special Education-Instruction 269,692 {63,116) 206,576 159,662 46,914
Bilingual Education-Instruction Salaries of Teachers 434,067 100,404 534,471 483,483 50,988 General Supplies 18,080 3,510 21,590 20,734 856 Textbooks 3,510 (3,510) Other Objects 1,755. 1,755 1,755
Total Bilingual Education 457,412 100,404 557,816 505,972 51,844
School-Spon. Co-Curricular Activities Inst Salaries 15,000 15,000 8,187 6,813
Total School-Spon Co-Curricular Activities Inst. 15,000 15,000 8,187 6,813
Before/After School Programs- Instruction Salaries of Teachers 116,000 4,000 120,000 64,389 55,611
Total Before/After School Programs- Instruction 116,000 4,000 120,000 64,389 55,611
Before/After School Programs- Support Salaries 30,000 2,000 32,000 8,332 23,668
Total Before/After School Programs- Support 30,000 2,000 32,000 8,332 23,668
Total Before/After School PJ"Ograms 146,000 6,000 152,000 72,721 79,279
Total Instruction 4,750,920 20,524 4,771,444 4,472,060 299,384
Undistributed Expenditures Attend. and Social Work
Salaries of Family Support Teams 67,880 1,054 68,934 39,680 29,254 Sal. ofF am. Liaison and Comm. Parent Involv. Spec. 64,232 64,232 62,175 2,057
Total Attendance and Social Work Services 132,112 1,054 133,166 101,855 31,311
Health Services Salaries 184,917 (82,103) 102,814 79,077 23,737 Supplies and Materials 2,000 739 2,739 2,739
Total Health Services 186,917 (81,364) 105,553 81,816 23,737
184

EXHIBIT D-3M
PASSAIC PUBLIC SCHOOLS BLENDED RESOURCE FUND 15
SCHEDULE OF BLENDED EXPENDITURES-BUDGET AND ACTUAL FOR THE FISCAL YEAR ENDED JUNE 30, 2020
School20 Passaic Gifted and Talented Academy Variance
Final Budget to
Original Budget Adjustments Final Budget Actual Actual
Guidance Salaries of Other Professional Staff $ 86,106 $ 27,222 $ 113,328 $ 111,509 $ 1,819
Total Guidance 86,106 27,222 113,328 111,509 1,819
Edu. Media Serv./Sch. Library Salaries 33,701 33,701 24,770 8,931 Salaries of Technology Coordinators 242,953 (24,769) 218,184 177,407 40,777 Other Purchased Services 2,000 (2,000) Supplies and Materials 2,000 2,000 1,736 264
Total Edu. Media Servc/Sch. Library 246,953 6,932 253,885 203,913 49,972
Instructional Staff Training Serv.
Purchased Professional-Educational Services 95,000 21,800 116,800 87,084 29,716 Other Purchase Services 11,800 11,800 1,800 10,000
Total Instructional Staff Training Serv. 95,000 33,600 128,600 88,884 39,716
Supp. Serv.-School Admin. Salaries of Principals/ Asst Principals 371,428 11,062 382,490 382,490 Salaries of Secretarial and Clerical Assistants 118,535 3,781 122,316 118,055 4,261 Other Purchased Services 15,965 14,200 30,165 27,976 2,189 Supplies and Materials 6,000 {967) 5,033 5,019 14
Total Supp. Serv.-School Admin. 511,928 28,076 540,004 533,540 6,464
Security
Salaries 101,009 44,107 145,116 139,882 5,234
Total Security 101,009 44,107 145,116 139,882 5,234
Student Transportation Services Contracted Svc (Other Than Betw. Home & School) 26,078 7,909 33,987 15,535 18,452
Total Student Transportation Services 26,078 7,909 33,987 15,535 18,452
Unallocated Benefits Social Security Contributions 69,520 69,520 50,300 19,220 Other Retirement Contributions - Regular 146,647 146,647 144,713 1,934 Unemployment Compensation 17,009 3,306 20,315 19,815 500 Workers Compensation 64,824 64,824 48,909 15,915 Health Benefits 1,705,188 5,967 1,711,155 1,311,153 400,002
Total Unallocated Benefits 2,003,188 9,273 2,012,461 1,574,890 437,571
Total Undistributed Expenditures 3,389,291 76,809 3,466,100 2,851,824 614,276
Total School Based Budget Current 8,140,211 97,333 8,237,544 7,323,884 913,660
Capital Outlay Equipment
Instruction Grades 6-8 2,545 2,545 2,450 95
Total Equipment 2,545 2,545 2,450 95
Total Capital Outlay 2,545 2,545 2,450 95
Total School Based Expenditures $ 8,140,211 $ 99,878 $ 8,240,089 $ 7,326,334 $ 913,755
185

EXHIBIT D-3N
PASSAIC PUBLIC SCHOOLS BLENDED RESOURCE FUND 15
SCHEDULE OF BLENDED EXPENDITURES-BUDGET AND ACTUAL FOR THE FISCAL YEAR ENDED JUNE 30, 2020
School 21 -Sonia Sotomayor Variance
Final Budget to
Original Budget Adjustments Final Budget Actual Actual
Regular Programs-Instruction Preschool/Kindergarten-Salaries of Teachers $ 57,214 $ 165,641 $ 222,855 $ 222,405 $ 450 Grades 1-5 Salaries ofTeachers 863,776 55,227 919,003 793,608 125,395 Grades 6-8 Salaries of Teachers 630,509 (88,750) 541,759 541,759
Regular Programs-Undistributed Instruction Other Salaries for Instruction 130,823 64,362 195,185 118,294 76,891 Purchased Professional-Educational Services 2,500 2,500 2,500 Other Purchased Services 14,500 14,500 11,224 3,276 General Supplies 575,000 (22,939) 552,061 405,573 146,488
Textbooks 5,100 5,592 10,692 10,692 Other Objects 4,290 4,290 1,522 2,768
Total Regular Programs-Instruction 2,283,712 179,133 2,462,845 2,105,077 357,768
Special Education-Instruction Cognitive Impaired-Mild
Salaries of Teachers 273,010 (270,060) 2,950 2,950 General Supplies 4,320 4,320 4,320 Textbooks 540 540 540 Other Objects 270 270 270
Total Cognitive Impaired- Mild 278,140 (270,060) 8,080 8,080
Learning and/or Language Disabilities Salaries of Teachers 74,045 170,205 244,250 244,250 Other Salaries for Instruction 31,990 55,618 87,608 52,564 35,044 General Supplies 3,840 3,840 3,840 Textbooks 480 480 480 Other Objects 240 240 240
Total Learning/Language Disabilities 110,595 225,823 336,418 296,814 39,604
Resource Room/Resource Center Salaries of Teachers 882,411 (953) 881,458 823,271 58,187 General Supplies 11,040 11,040 11,040 Textbooks 1,380 1,380 1,008 372 Other Objects 690 690 690
Total Resource Room/Resource Center 895,521 (953) 894,568 824,279 70,289
Total Special Education-Instruction 1,284,256 (45,190) 1,239,066 1,121,093 117,973
Bilingual Education-Instruction Salaries of Teachers 1,559,988 (119,667) 1,440,321 1,440,320 General Supplies 66,400 (48,549) 17,851 17,851 Textbooks 10,800 10,800 10,800 Other Objects 5,400 5,400 5,400
Total Bilingual Education 1,642,588 (168,216) 1,474,372 1,468,971 5,401
School-Spon. Co-Curricular Activities lnst Salaries 4,000 75 4,075 4,075
Total School-Spon Co-Curricular Activities lnst. 4,000 75 4,075 4,075
Before/After School Programs- Instruction Salaries ofTeachers 85,086 41,990 127,076 58,293 68,783
Total Before/After School Programs- Instruction 85,086 41,990 127,076 58,293 68,783
186

EXHIBIT D-3N
PASSAIC PUBLIC SCHOOLS BLENDED RESOURCE FUND 15
SCHEDULE OF BLENDED EXPENDITURES-BUDGET AND ACTUAL FOR THE FISCAL YEAR ENDED JUNE 30, 2020
School 21 - Sonia Sotomayor Variance
Final Budget to
Original Budget Adjustments Final Budget Actual Actual
Before/After School Programs- Support
Salaries $ 12,500 $ 5,000 $ 17,500 $ 8,149 $ 9,351
Total Before/After School Programs- Support 12,500 5,000 17,500 8,149 9,351
Total Before/After School Programs 97,586 46,990 144,576 66,442 78,134
Total Instruction 5,312,142 12,792 5,324,934 4,765,658 559,276
Undistributed Expenditures Attend. and Social Work
Salaries of Family Support Teams 110,761 110,761 81,793 28,968 Sal. ofFam. Liaison and Corum. Parent Involv. Spec. 56,260 56,260 50,598 5,662
Total Attendance and Social Work Services 56,260 110,761 167,021 132,391 34,630
Health Services Salaries 59,347 48,008 107,355 107,355 Supplies and Materials 8,500 8,500 5,433 3,067
Total Health Services 67,847 48,008 115,855 112,788 3,067
Guidance Salaries of Other Professional Staff 135,205 135,205 122,047 13,158
Total Guidance 135,205 135,205 122,047 13,158
Edu. Media Serv./Sch. Library Salaries 33,699 33,699 25,751 7,948 Salaries of Technology Coordinators 84,806 35,794 120,600 118,786 1,814 Supplies and Materials 5,000 5,000 4,710 290
Total Edu. Media Servc/Sch. Library 89,806 69,493 159,299 149,247 10,052
Supp. Serv.-School Admin. Salaries ofPrincipals/Asst Principals 253,424 (19,000) 234,424 233,135 1,289 Salaries of Secretarial and Clerical Assistants 93,206 29,500 122,706 109,491 13,215 Other Purchased Services 21,509 21,509 19,352 2,157 Supplies and Materials 15,000 15,000 11,011 3,989
Total Supp. Serv.-School Admin. 383,139 10,500 393,639 372,989 20,650
Security
Salaries 137,793 137,793 111,362 26,431
Total Security 137,793 137,793 111,362 26,431
Student Transportation Services Contracted Svc (Other Than Betw. Home & School) 19,858 12,000 31,858 294 31,564
Total Student Transportation Services 19,858 12,000 31,858 294 31,564
Unallocated Benefits Social Security Contributions 74,531 74,531 61,508 13,023 Other Retirement Contributions - Regular 135,719 135,719 135,719 Unemployment Compensation 16,776 3,282 20,058 19,554 504 Workers Compensation 63,936 63,936 48,321 15,615 Health Benefits 1,851,700 (211,806) 1,639,894 1,639,894
Total Unallocated Benefits 2,142,662 (208,524) 1,934,138 1,769,277 164,861
Total Undistributed Expenditures 3,032,570 42,238 3,074,808 2,770,395 304,413
Total School Based Budget Current 8,344,712 55,030 8,399,742 7,536,053 863,689
187

School21 -Sonia Sotomayor
Capital Outlay Equipment Instruction
Grades 1-5
Total Equipment
Total Capital Outlay
Total School Based Expenditures
PASSAIC PUBLIC SCHOOLS BLENDED RESOURCE FUND 15
SCHEDULE OF BLENDED EXPENDITURES-BUDGET AND ACTUAL FOR THE FISCAL YEAR ENDED JUNE 30, 2020
EXHIBIT D-JN
Variance
Final Budget to
Original Budget __ A~dJ,_·u_s_tm_e_n_ts ___ F_in_a_l B_u_d-"g,_e_t ____ A_ct_u_al ____ A_c....:t.;..ua'-'1 __
$ 50,000 - $ 50,000 $ 41,110 $ 8,890
50,000 50,000 41,110 8,890
50,000 50,000 41,110 8,890
$ 8,394,712 $ 55,030 $ 8,449,742 $ 7,577,163 $ 872,579
188

EXHIBIT D-30
PASSAIC PUBLIC SCHOOLS BLENDED RESOURCE FUND 15
SCHEDULE OF BLENDED EXPENDITURES-BUDGET AND ACTUAL FOR THE FISCAL YEAR ENDED JUNE 30, 2020
School 27 -Passaic Pre[! Academy Variance
Final Budget to
Original Budget Adjustments Final Budget Actual Actual
Regular Programs-Instruction Grades 6-8 Salaries of Teachers $ 1,484,403 $ (195,719) $ 1,288,684 $ 1,288,684 Grades 9-12 Salaries of Teachers 2,423,284 98,252 2,521,536 2,400,647 $ 120,889
Regular Programs-Undistributed Instruction Other Salaries for Instruction Purchased Professional-Educational Services 2,650 (850) 1,800 1,800 Other Purchased Services 75,000 15,669 90,669 81,793 8,876 General Supplies 230,000 65,745 295,745 276,761 18,984 Textbooks 50,000 23,355 73,355 73,355 Other Objects 11,430 5,496 16,926 9,559 7,367
Total Regular Programs-Instruction 4,276,767 11,948 4,288,715 4,132,599 156,116
Special Education-Instruction Resource Room/Resource Center:
Salaries of Teachers 112,508 191,031 303,539 303,539 General Supplies 4,080 (157) 3,923 3,923 Textbooks 510 (42) 468 468 Other Objects 255 (255)
Total Resource Room/Resource Center 117,353 190,577 307,930 307,930
Total Special Education-Instt·uction 117,353 190,577 307,930 307,930
Bilingual Education-Instruction Salaries of Teachers 185,973 29,104 215,077 215,077 General Supplies 13,280 800 14,080 14,076 4 Textbooks 2,910 (200) 2,710 2,710 Other Objects 1,455 (89) 1,366 1,366
Total Bilingual Education 203,618 29,615 233,233 233,229 4
School-Spon. Co-Curricular Activities Inst Salaries 49,000 1,500 50,500 47,675 2,825
Total School-Spon Co-Curricular Activities Inst. 49,000 1,500 50,500 47,675 2,825
Other Instructional Programs - Instruction
Salaries 1,000 (85) 915 915 Total Other Instructional Programs - Instruction 1,000 (85) 915 915
Before/After School Programs- Instruction
Salaries of Teachers 150,000 150,000 62,298 87,702 Total Before/After School Programs- Instruction 150,000 150,000 62,298 87,702
Before/After School Programs- Support
Salaries 33,500 33,500 11,133 22,367 Total Before/After School Programs- Support 33,500 33,500 11,133 22,367 Total Before/After School Programs 183,500 183,500 73,431 110,069
Summer School-Instruction Salaries 35,000 32,561 67,561 67,557 4
Total Summer School-Instruction 35,000 32,561 67,561 67,557 4
Summer School - Support Services Salaries 6,000 6,000 5,971 29
189

EXHIBIT D-30
PASSAIC PUBLIC SCHOOLS BLENDED RESOURCE FUND 15
SCHEDULE OF BLENDED EXPENDITURES-BUDGET AND ACTUAL FOR THE FISCAL YEAR ENDED JUNE 30, 2020
School 27 - Passaic Pre11 Academy Variance
Final Budget to
Original Budget Adjustments Final Budget Actual Actual
Total Summer School - Support Services $ 6,000 - $ 6,000 $ 5,971 $ 29
Total Summer School 41,000 $ 32,561 73,561 73,528 33
Total Instruction 4,872,238 266,116 5,138,354 4,868,392 269,962
Undistributed Expenditures Attend. and Social Work
Sal. ofFam. Liaison and Corum. Parent Involv. Spec. 55,993 (7,939) 48,054 48,053
Total Attendance and Social Work Services 55,993 (7,939) 48,054 48,053
Health Services Salaries 56,148 (22,198) 33,950 26,975 6,975 Supplies and Materials 2,000 23 2,023 2,023
Total Health Services 58,148 (22,175) 35,973 28,998 6,975
Guidance Salaries of Other Professional Staff 228,832 17,521 246,353 205,152 41,201
Total Guidance 228,832 17,521 246,353 205,152 41,201
Improvement of Inst. Serv. Sal. of Facilitators, Math and Literacy Coaches 72,146 (26,646) 45,500 11,853 33,647
Total Improvement of lnst. Serv. 72,146 (26,646) 45,500 ll,853 33,647
Edu. Media Serv./Sch. Library Salaries 16,490 4,646 21,136 20,084 1,052 Salaries of Technology Coordinators 56,148 11,647 67,795 67,795 Supplies and Materials 5,000 5,000 5,000
Total Edu. Media Servc/Sch. Library 77,638 16,293 93,931 92,879 1,052
Instructional Staff Training Serv. Purchased Professional-Educational Services 95,000 (20,588) 74,412 40,930 33,482
Total Instructional Staff Training Serv. 95,000 (20,588) 74,412 40,930 33,482
Supp. Serv.-School Admin. Salaries ofPrincipals/Asst Principals 383,210 (2,732) 380,478 380,477 Salaries of Secretarial and Clerical Assistants 169,705 15,542 185,247 185,246 Other Purchased Services 10,000 11,125 21,125 19,832 1,293 Supplies and Materials 8,000 (1,500) 6,500 6,500
Total Supp. Serv.-School Admin. 570,915 22,435 593,350 592,055 1,295
Security Salaries 102,566 4,246 106,812 106,812
Total Security 102,566 4,246 106,812 106,812
Student Transportation Services Contracted Svc (Other Than Betw. Home & School) 20,000 (4,771) 15,229 5,968 9,261
Total Student Transportation Services 20,000 (4,771) 15,229 5,968 9,261
190

EXHIBIT D-30
PASSAIC PUBLIC SCHOOLS BLENDED RESOURCE FUND 15
SCHEDULE OF BLENDED EXPENDITURES-BUDGET AND ACTUAL FOR THE FISCAL YEAR ENDED JUNE 30, 2020
School 27 - Passaic PreQ Academy Variance
Final Budget to
Original Budget Adjustments Final Budget Actual Actual
Unallocated Benefits Social Security Contributions $ 91,936 - $ 91,936 $ 50,744 $ 41,192 Other Retirement Contributions -Regular 129,797 129,797 129,797 Unemployment Compensation 16,951 $ 2,913 19,864 19,569 295 Workers Compensation 64,602 64,602 48,762 15,840 Health Benefits 1,841,591 (247,867) 1,593,724 1,429,763 163,961
Total Unallocated Benefits 2,144,877 (244,954) 1,899,923 1,548,838 351,085
Total Undistributed Expenditures 3,426,115 (266,578) 3,159,537 2,681,538 477,999
Total School Based Budget Current 8,298,353 (462) 8,297,891 7,549,930 747,961
Capital Outlay Equipment Instruction
Grades 9-12 13,366 13,366 13,366
Total Equipment 13,366 13,366 13,366
Total Capital Outlay 13,366 13,366 13,366
Total School Based Expenditures $ 8,298,353 $ 12,904 $ 8,311,257 $ 7,563,296 $ 747,961
191

EXHIBIT D-3P
PASSAIC PUBLIC SCHOOLS BLENDED RESOURCE FUND 15
SCHEDULE OF BLENDED EXPENDITURES-BUDGET AND ACTUAL FOR THE FISCAL YEAR ENDED JUNE 30, 2020
Passaic Academy for Science and Engineering Variance
Final Budget to
Original Budget Adjustments Final Budget Actual Actual
Regular Programs-Instruction Grades 6-8 Salaries of Teachers $ 1,257,709 $ 273,041 $ 1,530,750 $ 1,454,645 $ 76,105 Grades 9-12 Salaries ofTeachers 2,544,692 (135,927) 2,408,765 2,345,998 62,767
Regular Programs-Undistributed Instruction Purchased Professional-Educational Services 2,650 2,650 750 1,900 Other Purchased Services 100,000 14,444 114,444 104,614 9,830 General Supplies 236,000 101,710 337,710 332,475 5,235 Textbooks 65,000 1,268 66,268 66,031 237 Other Objects 11,790 97 11,887 6,606 5,281
Total Regulu Programs-Instruction 4,217,841 254,633 4,472,474 4,311,119 161,355
Special Education-Instruction Resource Room/Resource Center:
Salaries of Teachers 112,295 122,667 234,962 234,962 General Supplies 3,840 (162) 3,678 3,493 185 Textbooks 480 162 642 642 Other Objects 240 240 100 140
Total Resource Room/Resource Center 116,855 122,667 239,522 239,197 325
Total Special Education-Instruction 116,855 122,667 239,522 239,197 325
Bilingual Education-Instruction Salaries of Teachers 134,555 105,567 240,122 240,122 General Supplies 13,520 13,520 12,751 769 Textbooks 2,940 2,940 2,940 Other Objects 1,470 1,470 1,470
Total Bilingual Education 152,485 105,567 258,052 255,813 2,239
School-Spon. Co-Curricular Activities Inst Salaries 55,000 2,000 57,000 56,715 285
Total Schooi-Spon Co-Curricular Activities Inst. 55,000 2,000 57,000 56,715 285
Other Instructional Programs - Instruction
Salaries 1,000 1,000 1,000 Total Other Instructional Programs - Instruction 1,000 1,000 1,000
Before/After School Programs- Instruction
Salaries of Teachers 160,000 (6,664) 153,336 101,087 52,249 Total Before/After School Programs- Instruction 160,000 (6,664) 153,336 101,087 52,249
Before/After School Programs- Support
Salaries 33,500 (336) 33,164 22,055 11,109 Total Before/After School Programs- Support 33,500 (336) 33,164 22,055 11,109 Total Before/After School Programs 193,500 (7,000) 186,500 123,142 63,358
Summer School-Instruction Salaries 35,000 57,194 92,194 92,194
Total Summer School-Instruction 35,000 57,194 92,194 92,194
192

EXHIBIT D-3P
PASSAIC PUBLIC SCHOOLS BLENDED RESOURCE FUND IS
SCHEDULE OF BLENDED EXPENDITURES-BUDGET AND ACTUAL FOR THE FISCAL YEAR ENDED JUNE 30, 2020
Passaic Academy for Science and Engineering Variance
Final Budget to
Original Budget Adjustments Final Budget Actual Actual
Summer School- Support Services
Salaries $ 28,000 $ (3,913) $ 24,087 $ 24,087
Total Summer School- Support Services 28,000 (3,913) 24,087 24,087
Total Summer School 63,000 53,281 116,281 116,281
Total Instruction 4,799,681 531,148 5,330,829 5,102,267 $ 228,562
Undistributed Expenditures Attend. and Social Work
Salaries of Drop Out Prev. Officer/Coordinator 63,924 63,924 63,924 Sal. ofFam. Liaison and Comm. Parent Involv. Spec. 65,112 (2,001) 63,111 63,110
Total Attendance and Social Work Services 65,112 61,923 127,035 127,034
Health Services Salaries 69,874 23,721 93,595 93,595 Supplies and Materials 2,000 2,000 1,897 103
Total Health Services 71,874 23,721 95,595 95,492 103
Guidance Salaries of Other Professional Staff 226,080 73,710 299,790 248,108 51,682
Total Guidance 226,080 73,710 299,790 248,108 51,682
Edu. Media Serv./Sch. Library Salaries 16,490 4,646 21,136 20,354 782 Salaries of Technology Coordinators 58,707 4,043 62,750 62,750
Total Edu. Media Servc/Sch. Library 75,197 8,689 83,886 83,104 782
Instructional Staff Training Serv. Purchased Prof Serv 95,000 95,000 61,430 33,570
Total Instructional Staff Training Serv. 95,000 95,000 61,430 33,570
Supp. Serv.-School Admin. Salaries of Principals/ Asst Principals 403,279 (11,322) 391,957 358,253 33,704 Salaries of Secretarial and Clerical Assistants 160,588 (2,000) 158,588 155,575 3,013 Other Purchased Services 10,000 25,500 35,500 31,921 3,579 Supplies and Materials 8,000 (1,500) 6,500 6,066 434
Total Supp. Serv.-School Admin. 581,867 10,678 592,545 551,815 40,730
Security
Salaries 101,787 (5,879) 95,908 94,680 1,228 Total Security 101,787 (5,879) 95,908 94,680 1,228
Student Transportation Services Contracted Svc (Other Than Betw. Home & School) 20,000 2,119 22,119 18,099 4,020
Total Student Transportation Services 20,000 2,119 22,119 18,099 4,020
193

EXHIBIT D-3P
PASSAIC PUBLIC SCHOOLS BLENDED RESOURCE FUND 15
SCHEDULE OF BLENDED EXPENDITURES-BUDGET AND ACTUAL FOR THE FISCAL YEAR ENDED JUNE 30, 2020
Passaic Academy for Science and Engineering Variance
Final Budget to
Original Budget Adjustments Final Budget Actual Actual
Unallocated Benefits Social Security Contributions $ 93,478 - $ 93,478 $ 45,230 $ 48,248 Other Retirement Contributions - Regular 123,606 123,606 123,606 Unemployment Compensation 16,368 $ 2,658 19,026 18,805 221 Workers Compensation 62,382 62,382 47,292 15,090 Health Benefits 1,774,958 (282,679) 1,492,279 1,403,344 88,935
Total Unallocated Benefits 2,070,792 (280,021) 1,790,771 1,514,671 276,100
Total Undistributed Expenditures 3,307,709 (105,060) 3,202,649 2,794,433 408,216
Total School Based Budget Current 8,107,390 426,088 8,533,478 7,896,700 636,778
Capital Outlay Equipment Instruction
Grades 9-12 7,165 7,165 7,165
Total Equipment 7,165 7,165 7,165
Total Capital Outlay 7,165 7,165 7,165
Total School Based Expenditures $ 8,107,390 $ 433,253 $ 8,540,643 $ 7,903,865 $ 636,778
194

SPECIAL REVENUE FUND

EXHIBIT E-1
PASSAIC PUBLIC SCHOOLS
SPECIAL REVENUE FUND
COMBINING SCHEDULE OF REVENUES AND EXPENDITURES- BUDGETARY BASIS
FOR THE FISCAL YEAR ENDED JUNE 30, 2020
EXHIBIT EXHIBIT EXHIBIT EXHIBIT EXHIBIT
E-lA E-lB E-lC E-lD E-lE Total
REVENUES
Intergovenunentai
State $ 79,388 $ 26,143,599 $ 1,167,824 $ 1,288,279 $ 74,360 $ 28,753,450
Federal 10,609,912 634,355 4,214,449 302,614 15,761,330 Local 13,063 13,063
Total Revenues $ 10,689,300 $ 26,777,954 $ 5,382,273 $ 1,288,279 $ 390,037 $ 44,527,843
EXPENDITURES
Instruction
Salaries of Teachers $ 44,955 $ 9,269,985 $ 61,392 $ 9,376,332
Other Salaries for Instruction 542,959 3,683,702 $ 911,327 23,502 5,161,490
Purchased Professional/Educational Services 203,906 79,045 $ 1,104,940 1,387,891
Other Purchased Services 117,404 27,460 2,538,377 2,683,241
General Supplies 758,068 129,013 387,576 94,244 1,368,901
Textbooks 183,339 183,339 Other Objects 2,810 2,810
Totallnstmction I,667,292 13,192,015 3,837,280 1,288,279 179,138 20,164,004
Support Services
Salaries of Supervisors oflnstmction 155,447 41,150 196,597
Salaries of Principals/Assistants/Program Dir 589,491 589,491 Salaries of Other Professional Staff 1,293,100 10,409 1,303,509 Salaries of Secretarial aud Clerical Asst. 382,213 13,596 395,809
Other Salaries 74,743 632,223 2,660 38,190 747,816
Salaries of Community Parent Involvement 118,583 118,583
Salaries of Master Teachers 578,297 578,297 Personal Services-Employee Benefits 175,525 6,018,107 267,536 27,081 6,488,249 Purchased Educ. Svcs. - Contracted Pre-K 3,840,663 3,840,663 Purchased Educ. Svcs. -Head Start 1,405,208 1,405,208
Purchased Professional/Educational Services 117,845 14,950 868,938 20,686 1,022,419
Other Purchased Professional Services Cleaning, Repairs and Maintenance 22,784 22,784 Rentals 1,480,915 1,480,915
Contracted Services-Transportation 2,217 2,217 Travel 2,474 796 2,717 5,987
Other Purchased Services 37,636 31,244 303,876 48,510 421,266 Supplies and Materials 133,943 50,471 11,277 195,691
Total Support Services 542,166 16,616,709 1,445,727 210,899 18,815,50 I
Facilities Acquisition and Constmction
Building Improvements 19,620 19,620
lnstmctional Equipment 14,818 26,929 33,505 75,252 Noninstmctional Equipment 46,141 46,141
Total Facilities Acq. and Construction 14,818 26,929 99,266 141,013
Contribution to School Based Budgets 8,465,024 8,465,024
Total Expenditures 10,689,300 29,835,653 5,382,273 1,288,279 390,037 47,585,542
Excess (Deficiency) of Revenues and Other
Financing Sources Over/(Under) Expenditures (3,057,699) (3,057,699)
Other Financing Sources Transfer In -General Fund $ $ 3,057,699 $ $ $ $ 3,057,699
195

EXHIBIT E-lA PASSAIC PUBLIC SCHOOLS SPECIAL REVENUE FUND
COMBINING SCHEDULE OF PROGRAM REVENUES AND EXPENDITURES- BUDGETARY BASIS FOR THE FISCAL YEAR ENDED JUNE 30,2020
ESEA
Title Ill Capacity for CARES Emergency Title I Title I Reallocated Title Ill Immigrant Career Pathway Relief Aid Total
REVENUES Intergovernmental State $ 79,388 $ 79,388 Federal 9,033,582 $ 425,067 $ 638,342 $ 24,731 $ 488,190 10,609,912
Total Revenues $ 9,033,582 $ 425,067 $ 638,342 $ 24,731 $ 79,388 $ 488,190 $ 10,689,300
EXPENDITURES
Instruction Salaries ofTeachers $ 44,955 $ 44,955 Other Salaries for Instruction $ 301,874 $ 172,735 57,752 $ 10,598 542,959 Purchased Professional/Educational Services 203,906 203,906 Other Purchased Services 96,006 19,900 $ 1,498 117,404 General Supplies 311,349 15,417 4,427 10,241 46,847 369,787 758,068 Textbooks Other Objects
T otallnstruction 913,135 188,152 127,034 20,839 48,345 369,787 1,667,292
,_. Support Services
co Salaries ofPrincipals/Ass't Principals C'l Salaries of Other Professional Staff
Salaries of Secretaries and Clerical Asst. Other Salaries 51,418 14,348 8,977 74,743 Personal Services~Employee Benefits 122,473 14,432 37,093 806 721 175,525 Purchased ProfessionaVEducational Services 31,995 85,850 117,845 Contracted Services-Transportation Rentals Travel 2,474 2,474
Other Purchased Services 32,376 5,260 37,636 Supplies and Materials 10,100 1,087 3,086 1,267 118,403 133,943
Total Support Services 250,836 29,867 122,943 3,892 16,225 l18,403 542,166
Facilities Acquisition and Construction
Instructional Equipment 14,818 14,818
Noninstructional Equipment
Total Facilities Acq. and Construction 14,818 14,818
Contribution to School Based Budgets 7,869,611 207,048 388,365 8,465,024
Total Expenditures 9,033,582 425,067 638,342 24,731 79,388 488,190 10,689,300
Excess (Deficiency) of Revenues and Other
Financing Sources Over/(Under) Expenditures
Other Financing Sources Transfer In - General Fund $ $ $ $ $ $
Continued

REVENUES Intergovernmental
State Federal
Total Revenues
EXPENDITURES Instruction
Salaries of Teachers Other Salaries for Instruction Purchased Professional/Educational Services Other Purchased Services General Supplies Textbooks Other Objects
Total Instruction
Support Services Salaries of Supervisors ofinstruction Salaries of Principals/ Ass't Principals/Program Directors Salaries of Other Professional Staff Salaries of Secretarial and Clerical Asst. Other Salaries Salaries of Community Parent Involvement Salaries of Master Teachers Personal Services~Employee Benefits Purchased Educ. Svcs.- Contracted Pre-K Purchased Educ. Svcs. - Head Start Purchased Professional/Educational Services Other Purchased Professional Services Cleaning, Repairs and Maintenance Rentals Contracted Services- Transportation (Field Trips) Travel Other Purchased Services Supplies and Materials
Total Support Services
Facilities Acquisition and Construction Instructional Equipment Noninstructional Equipment
Total Facilities Acq. and Construction
Contribution to School Based Budgets
Total Expenditures
Excess (Deficiency) of Revenues and Other Financing Sources Over/(Under) Expenditures
Other Financing Sources Transfer ln- General Fund
PASSAIC PUBLIC SCHOOLS SPECIAL REVENUE FUND
COMBINING SCHEDULE OF PROGRAM REVENUES AND EXPENDITURES- BUDGETARY BASIS FOR THE FISCAL YEAR ENDED JUNE 30,2020
Temporary Emergency 21st Century 21st Century 21st Century Carl D. Impact Aid for Community Learning Community Learning Community Learning Perkins Disolaced Children Center (Supplemental) Center (Summer) Center
91,366 56,813 7,137 20,347 458,692
91,366 56,813 7,137 20,347 458,692
1,337 33,090 $ 1,248 $ 2,406 $ 98,742
79,045
1,115 4,500
31,663 1,820 48,908
34,115 34,910 1,248 2,406 231,195
1,924 5,398 11,240 151,989
19,979 491 6,701 55,775
14,950
407
26,868 4,376 8,252
35,120 21,903 5,889 17,941 227,497
22,131
22,131
9!366 56,813 7,137 20,347 458,692
EXHIBIT E-18
Preschool Education Aid Total
26,143,599 26,143,599 634,355
26,143,599 $ 26,777,954
9,268,648 9,269,985 3,548,216 3,683,702
79,045 21,845 27,460 46,622 129,Q13
2,810 2,810
12,888,141 13,192,015
155,447 155,447 589,491 589,491
1,293,100 1,293,100
382,213 382,213 461,672 632,223
118,583 118,583 578,297 578,297
5,935,161 6,018,107
3,840,663 3,840,663
1,405,208 1,405,208
14,950
22,784 22,784 1,480,915 1,480,915
2,217 2,217 389 796
31,244 42,219 50,471
16,308,359 16,6!6,709
4,798 26,929
4,798 26,929
29,201,298 29,835,653
(3 057 6991 (3 057 699)
3,057,699 $ 3,057,699

REVENUES Intergovernmental
State Federal
Total Revenues
EXPENDITURES
Instruction Salaries ofTeachers Other Salaries for Instruction Purchased Professional/Educational Services Other Purchased Services Travel General Supplies Textbooks Other Objects
Total Instruction
Support Services
...... Salaries of Supervisors of Instruction co Salaries of Principals/ Ass't Principals 00 Salaries of Other Professional Staff
Salaries of Secretarial and Clerical Assistants Other Salaries Personal Services-Employee Benefits Purchased Professional/Educational Services Rentals Contracted Services ~ Transportation Travel Other Purchased Services Supplies and Materials Other Objects
Total Support Services
Facilities Acq. and Construction Building Improvements Instructional Equipment
Non-instructional Equipment
Total Facilities Acquisition and Construction
Contribution to School Based Budgets
Total Expenditures
Excess (Deficiency) of Revenues and Other Financing Sources Over/(Under) Expenditure~
Other Financing Sources Transfer In - General Fund $
PASSAIC PUBLIC SCHOOLS SPECIAL REVENUE FUND
COMBINING SCHEDULE OF PROGRAM REVENUES AND EXPENDITURES- BUDGETARY BASIS FOR THE FISCAL YEAR ENDED JUNE 30,2020
IDEA County Vocational County Vocational School District School District Non public
Basic Preschool PartnershiQ Gr;:~nt Partnershin Qrant Security
$_ 88,311 40,010 548,899 4,080 086 134 363
4,080,086 134,363 88,311 40,010 548,899
906,597 4,730
2,409,407 126,297 2,673
2,608 5,686 44,100 8,387 205,161
3,318612 131983 46 773 13 117 205,161
1,018 1,642 266,977 72 487 493,867 12,000
2,118 599 630 2,380 24,165 276,701
761,474 2,380 15,208 26,893 276,701
19,620 6,710 20,896
46,141
26,330 67,037
4,080 086 134,363 88,311 40,010 548,899
EXHIBIT E-IC
Non public Nonpublic Technology Nursin<r Total
127,533 363,071 1,167,824 4,214,449
127,533 363,071 5,382,273
911,327
2,538,377
121,634 387,576
121,634 3,837,280
2,660 267,536
363,071 868,938
2,717 303,876
363,071 1,445,727
19,620 5,899 33,505
46,141
5,899 99,266
127,533 363,071 5,382,273

EXHIBIT E-lD PASSAIC PUBLIC SCHOOLS
SPECIAL REVENUE FUND
COMBINING SCHEDULE OF PROGRAM REVENUES AND EXPENDITURES- BUDGETARY BASIS FOR THE FISCAL YEAR ENDED JUNE 30, 2020
Non Public Ch. 192 ~AuxiliarY. Services Non Public Ch. 193- Handica12ned Services
English as
Comp. a Second Home Supplemental Examination & Corrective Nonpublic
Education Language Instruction Instruction Classification Speech Textbool<s Total
REVENUES Intergovernmental
State 467,413 11,084 22,004 167,000 240,873 196,566 183,339 1,288,279 Federal
Total Revenues 467,413 11,084 22,004 167,000 240,873 196,566 183,339 1,288,279
EXPENDITURES Instruction
Salaries of Teachers
Other Salaries for Instruction
Purchased Professional/ Educational Services 467,413 $ 11,084 $ 22,004 $ 167,000 $ 240,873 $ 196,566 $ 1,104,940 Other Purchased Services
General Supplies
Textbooks 183,339 183,339 Other Objects
Total Instruction 467,413 11,084 22,004 167,000 240,873 196,566 183,339 1,288,279
...... Support Services CD Salaries of Supervisors of Instruction CD
Salaries ofPrincipals/Ass1t. Principals Salaries of Other Professional Staff Salaries of Secretarial and Clerical Asst.
Other Salaries Personal Services -Employee Benefits
Purchased Professional/Educational Services Contracted Services-Transportation
Rentals Travel
Other Purchased Services
Supplies and Materials
Total Support Services
Facilities Acq. and Construction
Instructional Equipment
Non-Instructional Equipment
Total Facilities Acquisition and Construction
Contribution to School Based Budgets
Total Expenditures 467,413 11,084 22,004 167,000 240,873 196,566 183,339 1,288,279
Excess (Deficiency) of Revenues and Other Financing Sources Over/(Under) Expenditure
Other Financing Sources Transfer In - General Fund $

N 0 0
REVENUES Intergovernmental
State Federal Local
Total Revenues
EXPENDITURES Instruction Salaries ofTeachers Other Salaries for Instruction Purchased Professional/Educational Services Other Purchased Services Travel General Supplies Textbooks Other Objects
Total Instruction
Support Services Salaries of Supervisors of Instruction Salaries ofPrincipals/Ass't Principals Salaries of Other Professional Staff Salaries of Secretarial and Clerical Assistants Other Salaries Personal Services-Employee Benefits Purchased Professional/ Educational Services Travel Other Purchased Services Supplies and Materials Other Objects
Total Support Services
Facilities Acq. and Construction Instructional Equipment Noninstructional Equipment
Total Facilities Acquisition and Construction
Contribution to School Based Budgets
Total Expenditures
Excess (Deficiency) of Revenues and Other Financing Sources Over/(Under) Expenditure
Other Financing Sources Transfer In- General Fund
$
$
$
PASSAIC PUBLIC SCHOOLS SPECIAL REVENUE FUND
COMBINING SCHEDULE OF PROGRAM REVENUES AND EXPENDITURES- BUDGETARY BASIS FOR THE FISCAL YEAR ENDED JUNE 30, 2020
Wrap Around Grant
74,360
74,360 $
74,360
74,360
$
74,360
NJ Sarety Grant
5,428
5,428
4,060
1,368
5,428
5,428
Project Lead The Way
$
7,635
7,635
5,685
5 685
1,950
1,950
7,635
$
Building Effective
!BEST)
I 16,265
116,265 $
7,130 $
4,246
11,376
38,190
14,290
42,500
9,909
104,889
I 16,265
Stop School Violence
26,486
26,486
5,388
5,388
412 20,686
21,098
26,486
Adult Basic
Education
$ 159,863
159,863
61,392
10,984
9,953
82 329
41,150
10,409
13,596
12,379
77,534
159,863
$
$
$
EXHIBIT E-1E
Total
74,360
302,614 13,063
390,037
61,392 23,502
94,244
179,138
41,150
10,409
13,596
38,190
27,081
20,686
48,510
11,277
210,899
390,037

EXHIBITE-2
PASSAIC PUBLIC SCHOOLS SPECIAL REVENUE FUND
PRESCHOOL EDUCATION AID SCHEDULE OF EXPENDITURES BUDGETARY BASIS
FOR THE FISCAL YEAR ENDED JUNE 30, 2020
Variance Original Final Final Budget to
Summary Budget Adjustment Budget Actual Actual
Instruction Salaries of Teachers $ 9,506,659 $ (217,057) $ 9,289,602 $ 9,268,648 $ 20,954 Other Salaries for Instruction 3,959,904 (89,400) 3,870,504 3,548,216 322,288 Other Purchased Services 21,845 394 22,239 21,845 394 General Supplies 94,608 (10,000) 84,608 46,622 37,986 Other Objects 28,000 28,000 2,810 25,190
Total Instruction 13,611,016 (316,063) 13,294,953 12,888,141 406,812
Support Services Salaries of Supervisors ofinstruction 155,823 155,823 155,447 376
Salaries of Program Directors 714,541 (63,895) 650,646 589,491 61,155
Salaries of Other Professional Staff 1,098,053 301,000 1,399,053 1,293,100 105,953
Salaries of Secretaries and Clerical Assistants 418,579 (18,729) 399,850 382,213 17,637
Other Salaries 397,816 66,503 464,319 461,672 2,647
Salaries of Community Parent Involvement 124,039 124,039 118,583 5,456
Salaries of Master Teachers 575,447 2,850 578,297 578,297
Personal Services - Employee Benefits 6,611,755 6,611,755 5,935,161 676,594
Purchased Educ. Svcs. - Contracted Pre-K 3,907,693 3,907,693 3,840,663 67,030
Purchased Educ. Svcs. - Head Start 1,405,208 1,405,208 1,405,208
Other Purchased Professional - Ed. Services 5,000 5,000 5,000
Other Purchased Professional Services 12,000 12,000 12,000
Cleaning, Repairs and Maintenance 15,650 14,139 29,789 22,784 7,005
Rentals 1,810,194 1,810,194 1,480,915 329,279
Contracted Services- Transportation (Field Trips) 18,342 5,308 23,650 2,217 21,433
Travel 3,000 5,000 8,000 389 7,611
Other Purchased Services 5,000 5,000 5,000 Supplies and Materials 86,059 (5,911) 80,148 42,219 37,929
Total Support Services 17,359,199 311,265 17,670,464 16,308,359 1,362,105
Facilities Acquisition and Construction
Instructional Equipment 4,798 4,798 4,798
Total Facilities Acquisition and Construction 4,798 4,798 4,798
Total Expenditures $ 30,970,215 $ $ 30,970,215 $ 29,201,298 $ 1,768,917
Total-All Schools
Total2019-2020 Preschool Education Aid Allocation $ 24,612,529
Actual Preschool/ECPA Carryover (June 30, 2019) 4,366,690 Budgeted Transfer from General Fund 3,057,699
Total Funds Available for 2019-2020 Budget 32,036,918 Less: 2019-2020 Budgeted Preschool Education Aid (Including Prior Year
Budgeted Carryover) 30,970,215
Available & Unbudgeted Preschool Funds as of June 30, 2020 1,066,703
Add: 2019-2020 Unexpended Preschool Education Aid 1,768,917
2019-2020 Actual Carryover- Preschool Education Aid $ 2,835,620
2019-2020 Preschool Education Aid Carryover Budgeted in 2020-2021 $ 1,066,675
201

CAPITAL PROJECTS FUND

Issue/Project Title
Administrative Offices - 663 Main
Various Capital Improvements
Various Capital Improvements
Various Capital Improvements
Various Capital Improvements
On-Behalf Payments
PASSAIC PUBLIC SCHOOLS CAPITAL PROJECTS FUND
SUMMARY SCHEDULE OF PROJECT EXPENDITURES FOR THE FISCAL YEAR ENDED JUNE 30, 2020
EXHIBITF-1
Modified Appropriation*
Expenditures to Date Prior Years* Current Year Balance
$ 4,392,955 $ 4,292,955 $ I 00,000
1,070,303 837,592 232,711
6,083,391 4,033,414 $ 1,393,283 656,694
1,068,872 10,600 691,990 366,282
6,374,309 2,597,827 3,776,482
$ 18,989,830 $ 9,174,561 4,683,100 ;;;,$ ==,;;5,;,;, 1;,;;32;;:1,•;;16;,;;,9
Economic Development Authority
Various Improvements
Total Expenditures
* Modified budget and prior year expenditures - not available for Economic Development Authority On-Behalf Projects
70,242,083
$ 74,925,183
202

PASSAIC PUBLIC SCHOOLS CAPITAL PROJECTS FUND
EXHIBITF-2
SUMMARY SCHEDULE OF REVENUES, EXPENDITURES AND CHANGES IN FUND BALANCE FOR THE FISCAL YEAR ENDED JUNE 30, 2020
REVENUES AND OTHER FINANCING SOURCES Revenues
Transfer from Capital Reserve State Sources- On-Behalf SCC Contributions
Total Revenues and Other Financing Sources
EXPENDITURES AND OTHER FINANCING USES Expenditures Professional Services Facilities Acquisition and Construction Services On-BehalfSCC Construction Services
Total Expenditures and Other Financing Uses
Excess of Revenues and Other Financing Sources Over Expenditures and Other Financing Uses
Fund Balance, Beginning of Year
Fund Balance, End of Year
Analysis of Restricted for Capital Projects Encumbrances Available for Capital Projects
203
$
$
$
5,421,000 70,242,083
75,663,083
76,753 4,606,347
70,242,083
74,925,183
737,900
4,394,269
5,132,169
2,441,543 2,690,626
$ 5,132,169

PASSAIC PUBLIC SCHOOLS CAPITAL PROJECTS FUND
SCHEDULE OF PROJECT REVENUES, EXPENDITURES, PROJECT BALANCE AND PROJECT STATUS- BUDGETARY BASIS
ADMINISTRATIVE OFFICES- 663 MAIN A VENUE FROM INCEPTION THROUGH THE FISCAL YEAR ENDED JUNE 30, 2020
Prior Periods Current Year Totals
REVENUES AND OTHER FINANCING SOURCES Transfer from Capital Reserve $ 4,000,000 $ 4,000,000 Transfer from Capital Outlay 1,152,745 1,152,745 Transfers to/from Other Capital Projects (535,000) $ (224,790) (759,790)
Total Revenues 4,617,745 (224,790) 4,392,955
EXPENDITURES AND OTHER FINANCING USES
Professional Services 28,242 28,242
Facilities Acquisition and Construction Services 4,264,713 4,264,713
Total Expenditures 4,292,955 4,292,955
Excess of Revenue Over Expenditures $ 324,790 $ (224,790) $ 100,000
Additional Project Information: Project Numbers N/A Original Authorized Cost $ 3,152,745 Revised Authorized Cost $ 4,392,955
Percentage Decrease Over Original Authorized Cost 0.00%
Percentage Completion 100.00% Original Target Completion Date December 31, 2017 Revised Target Completion Date December 31, 201 7
204
SCHEDULE F-2a
Revised Authorized
Cost
$ 4,000,000 1,152,745 (759,790)
. 4,392,955
28,242
4,364,713
4,392,955
$

PASSAIC PUBLIC SCHOOLS CAPITAL PROJECTS FUND
SCHEDULE OF PROJECT REVENUES, EXPENDITURES, PROJECT BALANCE AND PROJECT STATUS- BUDGETARY BASIS
V ARlO US CAPITAL IMPROVEMENTS FROM INCEPTION THROUGH THE FISCAL YEAR ENDED JUNE 30, 2020
REVENUES AND OTHER FINANCING SOURCES Transfer from Capital Reserve Transfers to/from Other Capital Projects
Total Revenues
EXPENDITURES AND OTHER FINANCING USES
Professional Services
Facilities Acquisition and Construction Services
Total Expenditures
Excess of Revenue Over Expenditures
Additional Project Information: Project Numbers Original Authorized Cost Revised Authorized Cost Percentage Decrease Over Original Authorized Cost
Percentage Completion Original Target Completion Date Revised Target Completion Date
Prior Periods Current Year
$ 1,478,422 $ (320,246) $ (87,873)
1,158,176 (87,873)
71,258
766,334
837,592
$ 320,584 $ {87,873) $
1601, 1602, 1603, 1604, 1605, 1606, 1607 $ 2,600,000 $ 1,070,303
-43.14% 100.00%
June 30,2017 June 30, 2019
205
Totals
1,478,422 (408,119)
1,070,303
71,258
766,334
837,592
232,711
SCHEDULE F-2b
Revised Authorized
Cost
$ 1,478,422 (408,119)
1,070,303
190,549
879,754
1,070,303
$

PASSAIC PUBLIC SCHOOLS CAPITAL PROJECTS FUND
SCHEDULE OF PROJECT REVENUES, EXPENDITURES, PROJECT BALANCE AND PROJECT STATUS- BUDGETARY BASIS
V ARlO US CAPITAL IMPROVEMENTS FROM INCEPTION THROUGH THE FISCAL YEAR ENDED JUNE 30, 2020
Prior Periods Current Year Totals
REVENUES AND OTHER FINANCING SOURCES Transfer fi-om Capital Outlay $ 492,250 $ 492,250 Transfer from Capital Reserve 4,925,413 4,925,413 Transfers to/from Other Capital Projects 820,246 $ (154,518) 665,728
Total Revenues 6,237,909 (154,518) 6,083,391
EXPENDITURES AND OTHER FINANCING USES
Professional Services 95,002 49,839 144,841
Facilities Acquisition and Construction Services 3,938,412 1,343,444 5,281,856
Total Expenditures 4,033,414 1,393,283 5,426,697
Excess of Revenue Over Expenditures $ 2,204,495 $ (I ,54 7,801) $ 656,694
Additional Project Information: Project Numbers N/A Original Authorized Cost $ 2,917,663 Revised Authorized Cost $ 6,083,391 ...
Percentage Decrease Over Original Authorized Cost 28.11%
Percentage Completion 89.21% Original Target Completion Date June 30,2018 Revised Target Completion Date June 30, 2021
206
SCHEDULE F-2c
Revised Authorized
Cost
$ 492,250 4,925,413
665,728
6,083,391
144,841
5,938,550
6,083,391
$

PASSAIC PUBLIC SCHOOLS CAPITAL PROJECTS FUND
SCHEDULE OF PROJECT REVENUES, EXPENDITURES, PROJECT BALANCE AND PROJECT STATUS -BUDGETARY BASIS
V ARlO US CAPITAL IMPROVEMENTS FROM INCEPTION THROUGH THE FISCAL YEAR ENDED JUNE 30, 2020
Prior Periods Current Year Totals
REVENUES AND OTHER FINANCING SOURCES Transfer from Capital Reserve $ 1,520,000 $ 1,520,000 Transfers to/from Other Capital Projects 35,000 $ (486,128) (451,128)
Total Revenues 1,555,000 (486, 128) 1,068,872
EXPENDITURES AND OTHER FINANCING USES
Professional Services 10,600 26,914 37,514
Facilities Acquisition and Construction Services 665,076 665,076
Total Expenditures 10,600 691,990 702,590
Excess of Revenue Over Expenditures $ 1,544,400 $ (1,178,118) $ 366,282
Additional Project Information: Project Numbers N/A Original Authorized Cost $ 1,555,000 Revised Authorized Cost $ 1,068,872
Percentage Decrease Over Original Authorized Cost 0.00%
Percentage Completion 65.73% Original Target Completion Date June 30,2019 Revised Target Completion Date June 30, 2021
207
SCHEDULE F-2d
Revised Authorized
Cost
$ 1,520,000 (451,128)
1,068,872
37,514
1,031,358
1,068,872
$

PASSAIC PUBLIC SCHOOLS CAPITAL PROJECTS FUND
SCHEDULE OF PROJECT REVENUES, EXPENDITURES, PROJECT BALANCE AND PROJECT STATUS- BUDGETARY BASIS
VARIOUS CAPITAL IMPROVEMENTS FROM INCEPTION THROUGH THE FISCAL YEAR ENDED JUNE 30, 2020
Prior Periods Current Year Totals
REVENUES AND OTHER FINANCING SOURCES Transfer fi·om Capital Reserve $ 5,421,000 $ 5,421,000 Transfers to/from Other Capital Projects 953,309 953,309
Total Revenues 6,374,309 6,374,309
EXPENDITURES AND OTHER FINANCING USES
Professional Services
Facilities Acquisition and Construction Services 2,597,827 2,597,827
Total Expenditures 2,597,827 2,597,827
Excess of Revenue Over Expenditures $ $ 3,776,482 $ 3,776,482
Additional Project Information: Project Numbers N/A Original Authorized Cost $ 5,421,000 Revised Authorized Cost $ 6,374,309
Percentage Decrease Over Original Authorized Cost 0.00%
Percentage Completion 40.75% Original Target Completion Date June 30, 2020 Revised Target Completion Date June 30, 2021
208
SCHEDULE F-2e
Revised Authorized
Cost
$ 5,421,000 953,309
6,374,309
6,374,309
6,374,309
$

PROPRIETARY FUNDS

PASSAIC PUBLIC SCHOOLS PROPRIETARY FUND
STATEMENT OF NET POSITION AS OF JUNE 30, 2020
THIS STATEMENT IS NOT APPLICABLE
FINANCIAL STATEMENTS ARE PRESENTED ON EXHIBIT B-4
209
EXHIBIT G-1

EXHIBIT G-2
PASSAIC PUBLIC SCHOOLS PROPRIETARY FUND
STATEMENT OF REVENUES, EXPENSES AND CHANGES IN NET POSITION
FOR THE FISCAL YEAR ENDED JUNE 30, 2020
Fresh Frutis and
School Summer Vegetable Program Total
Nutrition Food (FFVP) Food Service
OPERATING REVENUES Charges for Services
Daily Sales-Non-Reimbursable Programs $ 20,118 $ 20,118 Other 35,011 35,0 II
Total Operating Revenues 55,129 55,129
OPERATING EXPENSES Salaries and Wages 2,713,438 $ 323,307 3,036,745
Employee Benefits 1,432,509 1,432,509
Cost of Sales 2,670,777 3,773,363 $ 250,145 6,694,285
Supplies and Materials 269,188 269,188
Cleaning, Repairs and Maintenance 323,040 323,040
Travel 2,800 2,800 Other Purchased Services 44,486 44,486
Miscellaneous 5,356 5,356 Depreciation 85,779 85,779
Total Operating Expenses 7,547,373 4,096,670 250,145 11,894,188
Operating (Loss) (7 ,492,244) ( 4,096,670) (250,145) (11 ,839,059)
NONOPERATING REVENUES State Sources
School Lunch Program 95,349 95,349
Federal Sources
School Breakfast Program 2,206,327 2,206,327
National School Lunch Program 4,477,021 4,477,021 Food Distribution Program (USDA Commodities) 422,729 422,729 After School Snack Program 215,608 215,608 Summer Food Service Program 4,096,670 4,096,670 Fresh Fruits and Vegetables Program (FFVP) 250,145 250,145
Loss on Disposal of Capital Assets (52,768) (52,768) Interest Revenue 41,365 41,365
Total Nonoperating Revenues 7,405,631 4,096,670 250,145 11,752,446
Change in Net Position (86,613) (86,613)
Net Position, Beginning ofYear 3,263,166 3,263,166
Net Position, End of Year $ 3,176,553 $ $ $ 3,176,553
210

PASSAIC PUBLIC SCHOOLS PROPRIETARY FUND
STATEMENT OF CASH FLOWS FOR THE FISCAL YEAR ENDED JUNE 30, 2020
THIS STATEMENT IS NOT APPLICABLE FINANCIAL STATEMENTS ARE PRESENTED ON EXHIBIT B-6
211
EXHIBIT G-3

FIDUCIARY FUNDS

PASSAIC PUBLIC SCHOOLS FIDUCIARY FUNDS
COMBINING STATEMENT OF AGENCY ASSETS AND LIABILITIES AS OF JUNE 30, 2020
Student Activity Payroll
ASSETS
Cash $ 218,211 $ 1,987,744
Total Assets $ 218,211 $ 1,987,744
LIABILITIES
Payroll Deductions and Withholdings $ 1,933,425 Accrued Salaries 6,950 Employee Deposits Payable 44,755 Due to Other Funds 2,614 Due to Student Groups $ 218,211
Total Liabilities $ 218,211 $ 1,987,744
FIDUCIARY FUNDS COMBINING STATEMENT OF CHANGES IN FIDUCIARY NET POSITION
FOR THE FISCAL YEAR ENDED JUNE 30, 2020
NOT APPLICABLE
212
EXHIBIT H-1
Total Agency Funds
$ 2,205,955
$ 2,205,955
$ 1,933,425 6,950
44,755 2,614
218,211
$ 2,205,955
EXHIBITH-2

Elementary Schools High School
High School Athletic
PASSAIC PUBLIC SCHOOLS FIDUCIARY FUNDS
STUDENT ACTIVITY AGENCY FUND SCHEDULE OF RECEIPTS AND DISBURSEMENTS
FOR THE FISCAL YEAR ENDED JUNE 30, 2020
Balance July 1, 2019
Cash Receipts
Cash Disbursements
$ 112,307 $ 107,044 $
84,682 33,667
825 30,715
$ 197,814 $ 171,426 $
FIDUCIARY FUNDS -~ AYROLL AGENCY FUND
SCHEDULE OF RECEIPTS AND DISBURSEMENTS FOR THE FISCAL YEAR ENDED JUNE 30, 2020
Balance, July 1, 2019 Additions
94,077
27,519
29,433
151,029
Deletions
Payroll Deductions and Withholdings $ 1,375,552 $ 95,107,895 $ 94,550,022
Accrued Salaries and Wages 114 97,973,957 97,967,121
Employee Deposits Payable 66,355 9,882,880 9,904,480 Due to Other Funds 4,568 57,676 59,630
Total Liabilities $ 1,446,589 $ 203,022,408 $ 202,481,253
213
$
$
$
$
EXHIBITH-3
Balance, June 30, 2020
125,274
90,830
2,107
218,21 I
EXHIBIT H-4
Balance, June 30,
2020
1,933,425
6,950
44,755 2,614
1,987,744

LONG-TERM DEBT

PASSAIC PUBLIC SCHOOLS LONG-TERM DEBT
SCHEDULE OF SERIAL BONDS FOR THE FISCAL YEAR ENDED JUNE 30, 2020
This schedule is not applicable
LONG-TERM DEBT
SCHEDULE OF CAPITAL LEASES PAYABLE
FOR THE FISCAL YEAR ENDED JUNE 30, 2020
This schedule is not applicable
DEBT SERVICE FUND BUDGETARY COMPARISON SCHEDULE
FOR THE FISCAL YEAR ENDED JUNE 30, 2020
This schedule is not applicable
214
EXHIBIT 1-1
EXHIBIT 1-2
EXHIBIT 1-3

~TATI~TICAJL ~JECJTII(Q)N

STATISTICAL SECTION
This part of the Passaic Public Schools' comprehensive annual financial report presents detailed information as a context for understanding what the information in the financial statements, note disclosures, and required supplementary information says about the government's overall financial health.
Contents
Financial Trends
These schedules contain trend information to help the reader understand how the government's financial performance and well-being have changed over time.
Revenue Capacity
These schedules contain information to help the reader assess the government's most significant local revenue source, the property tax.
Debt Capacity
These schedules present information to help the reader assess the affordability of the government's current levels of outstanding debt and the government's ability to issue additional debt in the future.
Demographic and Economic Information
These schedules offer demographic and economic indicators to help the reader understand the environment within which the government's financial activities take place.
Operating Information
These schedules contain service and infrastructure data to help the reader understand how the information in the government's financial report relates to the services the government provides and the activities it performs.
Sources: Unless otherwise noted, the information in these schedules is derived from the comprehensive annual financial reports for the relevant year.
Exhibits
J-1 to J-5
J-6 to J-9
J-1 0 to J-13
J-14 and J-15
J-16 to J-20

EXHIBIT J-1 PASSAIC PUBLIC SCHOOLS
NET POSITION BY COMPONENT LAST TEN FISCAL YEARS
(Unaudited) (accrual basis of accounting)
Fiscal Year Ended June 30, 2011 2012 2013 2014 2015 2016 2017 2018 2019 2020
Governmental Activities Net Investment in Capital Assets 230,331,241 $ 236,285,923 $ 254,920,869 269,443,724 $287,736,801 294,629,811 $ 301,791,164 315,730,205 363,193,148 430,514,030 Restricted 12,518,428 12,534,682 16,960,563 20,069,187 16,519,284 22,038,835 26,093,082 32,349,905 35,169,092 35,086,958 Unrestricted (28,279,709) 9,355,748 (9,767,077) (18,641,489) (82,687,659) (94,103,593) (106,019,292) (110,814,992) (111,408,900) (111,487,891)
Total Governmental Activities Net Position 214,569,960 $ 258,176,353 262,114,355 270,871,422 $221,568,426 222,565,053 $ 221,864,954 $ 237,265,118 286,953,340 354,113,097
Business-Type Activities Net Investment in Capital Assets 269,909 404,545 370,760 345,741 227,086 405,609 386,215 465,418 595,152 673,925 Restricted Unrestricted 125,636 523,935 1,298,787 2,191,492 3,478,317 3,158,379 3,095,158 3,207,100 2,668,014 2,502,628
Total Business-Type Activities Net Position 395,545 928,480 1,669,547 2,537,233 3,705,403 3,563,988 3,481,373 3,672,518 3,263,166 3,176,553
District-Wide Net Investment in Capital Assets 230,601,150 $ 236,690,468 $ 255,291,629 269,789,465 $ 287,963,887 295,035,420 $ 302,177,379 316,195,623 363,788,300 431,187,955 Restricted 12,518,428 12,534,682 16,960,563 20,069,187 16,519,284 22,038,835 26,093,082 32,349,905 35,169,092 35,086,958 Unrestricted (28, 154,073) 9,879,683 (8,468,290) (16,449,997) (79,209,342) (90,945,214) (102,924,134) (107,607,892) (108,740,886) (108,985,263)
Total District Net Position 214,965,505 $ 259,104,833 $ 263,783,902 273,408,655 $ 225,273,829 226,129,041 $ 225,346,327 240,937,636 290,216,506 357,289,650

EXHIBITJ-2 PASSAIC PUBLIC SCHOOLS CHANGES IN NET POSITION
LAST TEN FISCAL YEARS (Unaudited)
(accrual basis of accouming)
Fiscal Year Ended June 30,
2011 2012 2013 2014 2015 2016 2017 2018 2019 2020
Expenses
Governmental Activities Instruction
Regular 103,965,035 114,299,726 131,460,014 129,354,547 148,230,497 144,021,933 152,944,145 153,382,956 150,254,025 153,800,221 Special Education 49,439,889 53,483,594 53,749,369 52,372,204 54,140,688 55,002,593 59,628,242 60,016,388 60,092,306 62,205,979 Other Instruction 9,712,388 11,928,054 15,644,250 17,251,067 16,562,102 35,480,724 43,444,917 41,697,370 37,117,664 35,483,254 Community Services 159,696 667,874 501,400
Support Services: Student and Instruction Related Services 44,021,292 48,558,512 54,840,623 58,967,452 57,264,036 60,869,854 67,014,371 65,268,398 64,372,016 59,432,658 General Administration 2,172,042 2,764,742 2,201,912 2,582,254 2,917,494 2,777,596 2,966,401 3,082,789 2,926,799 2,848,080 School Administrative Services 10,218,538 11,666,750 12,191,793 12,279,263 16,141,668 19,385,907 20,862,151 21,630,254 19,159,768 19,115,617 Plant Operations And Maintenance 19,283,228 21,103,286 22,439,194 27,567,381 23,504,389 25,562,625 26,727,740 29,122,073 29,522,229 29,817,545 Pupil Transportation 6,384,142 6,628,340 6,867,461 6,893,217 6,959,612 7,060,917 7,163,723 7,917,999 7,965,299 7,230,882 Business and Other Support Services 4,203,889 4,736,813 5,018,658 5,491,473 5,451,127 6,369,943 7,751,812 8,709,956 7,362,012 6,606,085
Interest and Other Charges On Long~ Term Debt 1,466,523 1,352,252 1,200,779 1,075,511 962,127 841,150 711,399 553,031 403,358 233,122
Total Governmental Activities Expenses 250,866,966 276,522,069 305,773,749 314,502,243 332,133,740 357,373,242 389,716,303 391,381,214 379,175,476 376,773,443
Business· Type Activities: Food Service 6,454,223 7,135,295 8,281,210 8,541,225 9,787,984 11,548,205 10,694,669 10,777,811 11,909,323 11,894,188
~ Total Business~ Type Activities Expense 6,454,223 7,135,295 8,281,210 8,541,225 9,787,984 11,548,205 10,694,669 10,777,811 11,909,323 11,894,188
......
"' Total District Expenses 257,321,189 283,657,364 314,054,959 323,043,468 341,921,724 368,921,447 400,410,972 402,159,025 391,084,799 $ 388,667,631
Program Revenues Governmental Activities:
Operating Grants And Contributions 64,231,013 80,305,444 74,561,111 76,505,943 102,234,044 116,717,260 136,346,391 144,858,897 129,999,021 $ 120,431,397 Charges for Services 180,613 139,111 176,830 284,260 55,217 22,449 156,439 551,373 429,767 437,610 Capital Grants And Contributions 8,193,884 2,923,546 I, 734,011 II, 116,897 19,756,380 7,314,469 10,874,125 19,663,458 51,218,490 70,242,083
Total Governmental Activities Program Revenues 72,605,510 83,368,101 76,471,952 87,907,100 122,045,641 124,054,178 147,376,955 165,073,728 181,647,278 191,111,090
Business-Type Activities: Charges For Services
Food Service 372,449 333,604 364,019 330,869 78,642 108,829 104,682 123,674 122,053 55,129 Capital Grants and Contributions 16,751 53,785 Operating Grants And Contributions 6,300,571 7,140,096 8,656,234 9,033,740 10,940,792 11,060,059 10,506,517 10,833,765 11,343,0!3 II, 763,849
Total Business Type Activities Program Revenues 6,689,771 7,473,700 9,020,253 9,364,609 11,019,434 11,222,673 10,611,199 10,957,439 11,465,066 11,818,978
Total District Program Revenues 79,295,281 90,841,801 85,492,205 97,271,709 133,065,075 135,276,851 157,988,154 176,031,167 193,112,344 202,930,068
Net {Expense)/Revenue Governmental Activities $ (178,261,456) (193,153,968) (229,301,797) (226,595, 143) $ (210,088,099) $ (233,319,064) $ (242,339,348) $ (226,307,486) $ (197,528, 198) (185,662,353) Business-Type Activities 235,548 338,405 739,043 823,384 1,231,450 (325,532) (83,470) 179,628 (444,257) (75,210)
Total District-Wide Net Expense (I 78,025,908) (192,815,563) $ (228,562,754) $ (225,771,759) $ (208,856,649) $ (233,644,596) $ (242,422,818) $ (226, 127,858) $ (197,972,455) (185,737,563)

EXHIBIT J-2 PASSAIC PUBLIC SCHOOLS CHANGES IN NET POSITION
LAST TEN FISCAL YEARS (Unaudited)
(accrual basis of accounting)
Fiscal Year Ended June 30, 2011 2012 2013 2014 2015 2016 2017 2018 2019 2020
General Revenues And Other Changes In Net Position Governmental Activities:
Property Taxes Levied For General Purposes 16,818,577 16,818,577 16,818,577 16,818,577 16,818,577 16,818,577 16,818,577 16,818,577 $ 16,818,577 16,818,577 Property Taxes Levied For Debt Service 321,834 311,829 179,920 177,869 Federal And State Aid- Unrestricted 167,720,332 206,784,671 209,572,328 212,063,921 212,734,050 212,700,915 213,407,322 214,810,717 219,298,170 224,528,095 Federal And State Aid -Restricted 4,856,127 4,886,923 4,824,216 2,565,503 5,472,894 4,104,726 7,726,810 8,941,605 9,005,660 8,465,024 State Aid Restricted For Debt Service 483,054 468,041 270,050 266,969 Investment Earnings 157,680 250,516 407,115 295,537 203,164 219,127 241,640 400,522 1,186,711 I, 120,263 Miscellaneous Income 1,058,685 1,559,600 1,238,852 2,697,578 796,187 911,557 3,496,351 736,229 907,302 676,239 Loss on Disposal of Capital Assets (48,838) (361,706) (143,476)
Total Governmental Activities 191,416,289 231,080,157 233,311,058 234,837,116 235,663,166 234,754,902 241,690,700 241,707,650 247,216,420 251,464,722
Business-Type Activities: Investment Earnings 750 1,959 2,024 6,032 5,493 9,395 7,702 11,517 34,905 41,365 Loss on Disposal of Capital Assets (68,773) (6,847) (52,768)
Total Business-Type Activities 750 1,959 2,024 6,032 (63,280) 9,395 855 11,517 34,905 (11,403)
Total District-Wide 191,417,039 231,082,116 233,313,082 234,843,148 235,599,886 $ 234,764,297 241,691,555 241,719,167 $ 247,251,325 251,453,319
Change In Net Position Governmental Activities 13,154,833 37,926,189 '4,009,261 8,241,973 25,575,067 1,435,838 (648,648) 15,400,164 49,688,222 65,802,369
"" Business-Type Activities 236,298 340,364 741,067 829,416 1,168,170 (316,137) (82,615) 191,145 (409,352) (86,613) ...... -.1
Total District 13,391,131 38,266,553 4,750,328 9,071,389 26,743,237 1,119,701 (731,263) 15,591,309 49,278,870 65,715,756

EXHIBIT J-3 PASSAIC PUBLIC SCHOOLS
FUND BALANCES- GOVERNMENTAL FUNDS LAST TEN FISCAL YEARS
(Unaudited) (modified accmal basis of accounting)
Fiscal Year Ended June 30, 2011 2012 2013 2014 2015 20 16 2017 2018 2019 2020
General Fund Nonspendable 121,828 316,250 316,250 20,150 Restricted 15,591,684 $ 14,026,309 18,684,094 $ 23,236,046 $ 17,474,079 21,921,070 26,403,729 29,114,303 $ 31,770,480 29,954,789 Committed 261,363 860,412 10,091,429 683,483 7,169,388 643,390 103,544 1,125,976 Assigned 7,861,829 51,043,778 19,839,380 19,800, 127 24,919,711 22,510,239 21,939,630 20,420,986 20,574,077 20,593,360 Unassigned (14,239,250) (19,323,252) (17,957,879) (18,461,285) (19,028,317) (18,885,181) (20,088,682) (20,423,800) (21,306,523) (21,525,274)
Total General Fund 9,475,626 46,607,247 30,778,852 25,258,371 30,534,861 $ 26,505,768 28,570,927 $ 29,131,639 31,141,578 30,148,851
All Other Governmental Funds Restricted $ 103,631 $ 572,077 $ 124,406 40,862 $ 1,113,422 $ 685,010 $ 4,231,259 4,394,269 $ 5,132,169 -Unassigned (1,091,593) (1,330,419) (486,932)
Total All Other Governmental Funds 103,631 (519,516) (1,206,013) (446,070) 1,113,422 $ 685,010 4,231,259 4,394,269 5,132,169

EXHIBIT J-4 PASSAIC PUBLIC SCHOOLS
CHANGES IN FUND BALANCES- GOVERNMENTAL FUNDS LAST TEN FISCAL YEARS
(Unaudited) (modified accrual basis of accounting)
Fiscal Year Ended June 30, 2011 2012 2013 2014 2015 2016 2017 2018 2019 2020
Revenues Tax Levy $17,140,411 $ 17,130,406 $ 16,998,497 $ 16,996,446 $ 16,818,577 $ 16,818,577 $ 16,818,577 $ 16,818,577 $ 16,818,577 $ 16,818,577 Tuition Charges 180,613 139,811 144,681 284,260 55,217 22,449 156,439 551,373 429,767 437,610 Interest Earuings 157,680 250,516 407,115 295,537 203,164 219,126 241,640 400,522 1,186,711 1,120,263 Miscellaneous 1,061,733 1,562,283 1,272,367 2,706,083 798,102 915,161 3,515,759 738,890 913,168 688,102 State Sources 224,812,751 269,701,836 276,696,831 286,148,993 300,479,559 291,901,587 298,141,702 316,669,093 362,783,900 388,682,660 Federal Sources 20,668,611 25,663,406 14,263,519 16,361,735 16,083,854 16,372,339 16,379,831 16,608,812 16,884,374 16,747,120
Total Revenues 264,021,799 314,448,258 309,783,010 322,793,054 334,438,4 73 326,249,239 335,253,948 351,787,267 399,016,497 424,494,332
Expenditures Instruction
Regular Instruction 103,754,954 113,501,773 126,482,948 122,952,740 126,913,851 119,559,708 118,421,907 121,638,746 129,063,590 135,131,015 Special Education Instruction 49,426,450 53,367,496 53,773,739 52,228,921 49,628,753 48,683,549 49,701,910 50,859,148 54,785,945 58,352,681 Other Instruction 9,709,593 11,882,759 15,657,744 17,179,389 14,299,577 28,936,373 32,007,117 31,682,600 31,776,937 31,873,136 Connnuuity Services 159,696 667,874 501,400
Support Services Student and Inst. Related Services 43,983,667 48,445,644 54,880,284 58,801,918 56,244,743 57,897,746 59,165,779 58,075,894 60,830,789 58,041,346 General Adruiuistration 2,157,318 2,758,834 2,218,848 2,320,718 2,698,662 2,415,197 2,501,526 2,575,804 2,594,336 2,638,033 School Adruiuistrative Services 10,157,885 11,513,504 12,141,383 12,189,885 14,370,620 16,389,823 15,732,994 16,831,425 16,640,502 17,606,967 Plant Operations And Maintenance 15,580,543 16,933,257 22,293,218 27,146,389 23,241,856 24,121,090 24,004,993 26,230,820 27,908,420 29,135,691 Pupil Transportation 6,384,142 6,627,507 6,867,834 6,891,696 6,954,458 7,043,568 7,115,122 7,879,224 7,940,168 7,225,433
N Business and Other Support Services 4,200,875 4,724,400 4,988,015 5,416,190 5,504,429 5,921,848 6,599,988 7,442,517 6,728,665 6,392,454 1-'
co Capital Outlay 9,252,129 4,211,064 23,581,644 20,139,862 25,915,479 15,120,326 15,234,853 21,853,717 55,964,195 75,752,546 Debt Service
Principal 1,980,484 2,068,037 1,852,696 1,964,762 1,637,780 1,756,601 1,884,042 2,020,729 2,167,333 2,324,573 Interest And Other Charges 1,498,562 1,385,993 1,232,872 1,109,688 991,832 873,011 745,570 589,682 442,668 275,284
Total Expenditures 258,086,602 277,420,268 326,130,921 329,010,032 328,402,040 328,718,840 333,617,201 347,680,306 396,843,548 424,749,159
Excess (Deficiency) OfRevenues Over (Under) Expenditures 5,935,197 37,027,990 (16,347,911) (6,216,978) 6,036,433 (2,469,601) 1,636,747 4,106,961 2,172,949 (254,827)
Other Financing Sources (Uses) Transfers In 6,289,845 5,778,442 12,487,846 5,363,435 9,453,508 11,960,838 15,943,743 15,628,700 14,780,597 16,943,723 Transfers Out ( 6,289,845) (5,778,442) (12,487,846) (5,363,435) (9,453,508) (11,960,838) (15,943,743) (15,628,700) (14,780,597) (16,943,723)
Total Other Financing Sources (Uses)
Net Change In Fund Balances $ 5,935,197 $ 37,027,990 $(16,347,911) $ (6,216,978) $ 6,036,433 $ (2,469,601) $ 1,636,747 $ 4,106,961 $ 2,172,949 $ (254,827)
Debt Service As A Percentage Of Noncapital Expenditures 1.40% 1.26% 1.02% 1.00% 0.87% 0.84% 0.83% 0.80% 0.77% 0.74%
* Noncapital expenditures are total expenditures less capital outlay.

EXIDBITJ-5
PASSAIC PUBLIC SCHOOLS GENERAL FUND OTHER LOCAL REVENUE BY SOURCE
LAST TEN YEARS (Unaudited)
Cancellation Fiscal Year of Prior Year
Ended Interest Tuition/ Accrued Refunds/ June 30, Earned Transl!ortation Salaries Payable Rentals Reimbursements E-Rate Miscellaneous Total
2011 $ 157,680 $ 180,613 $ 424,951 $ 10,133 $ 338,304 $ 277,561 $ 7,736 $ 1,396,978
2012 250,516 139,111 96,418 12,783 269,122 749,735 431,542 1,949,227
2013 407,115 176,830 14,213 252,130 354,206 618,303 1,822,797
2014 295,537 284,260 343,427 16,455 778,749 1,499,500 59,447 3,277,375
2015 203,164 55,217 10,349 556,841 206,737 22,260 1,054,568
2016 219,126 22,449 10,608 622,881 201,321 76,748 1,153,133
2017 241,640 156,439 14,915 2,552,075 829,409 99,952 3,894,430
~ ~ 2018 400,522 551,373 14,582 473,318 162,400 85,929 1,688,124 0
2019 1,186,711 429,767 537,443 20,046 141,416 118,448 89,949 2,523,780
2020 1,120,263 437,610 2,775 256,488 ; 332,817 84,159 2,234,112

Fiscal Year
Ended June 30, Vacant Land Residential
2011 $ 7,722,300 $ 824,134,200 2012 7,146,100 821,957,000 2013 7,621,900 820,217,600 2014 6,302,500 821,496,500 2015 6,160,500 811,919,700 2016 8,263,400 1,737,285,000 2017 8,071,200 1,731,041,600 2018 10,254,700 1,725,157,500 2019 10,417,700 1,723,245,900
N 2020 12,383,100 1,728,211,400 N ,.....
Source: County Abstract ofRatables
• Tax rates are per $100
PASSAIC PUBLIC SCHOOLS ASSESSED VALUATION AND ACTUAL VALUE OF TAXABLE PROPERTY
LAST TEN YEARS (Unaudited)
Total Assessed Commercial Industrial Apartment Valuation
$ 284,417,900 $ 80,960,300 $ 145,151,700 $ 1,342,386,400 287,151,000 78,141,500 143,351,200 1,337,746,800 282,929, 1 00 76,070,600 143,165,800 1,330,005,000 279,511,900 74,599,800 143,488,700 1,325,399,400 285,190,900 75,519,800 144,027,600 1,322,818,500 720,351,700 194,841,300 389,068,500 3,049,809,900 702,718,900 185,574,200 383,458,000 3,010,863,900 694,155,900 173,167,000 380,967,100 2,983,702,200 661,025,100 170,898,200 378,986,100 2,944,573,000 649,051,900 169,828,000 385,426,900 2,944,901,300
EXHIBIT J-6
Estimated Actual Total
(County Direct
Net Valuation Equalized) School Tax
Public Utilities Taxable Valuation Rate a
$ 5,814,500 $ 1,348,200,900 $ 3,547,156,667 $ 1.271 5,814,500 1,343,561,300 3,360,831,040 1.270 5,814,500 1,335,819,500 3,266,831,739 1.272 5,814,500 1,331,213,900 3,248,963,982 1.270 5,814,500 1,328,633,000 3,089,652,409 1.266
15,203,200 3,065,013,100 3,334,909,672 0.549 15,203,200 3,026,067,100 3,430,959,275 0.556 15,203,200 2,998,905,400 3,582,302,080 0.561 15,213,200 2,959,786,200 3,852,023,124 0.569 11,429,766 2,956,331,066 4,032,338,424 0.569

EXHIBIT J-7
PASSAIC PUBLIC SCHOOLS DIRECT AND OVERLAPPING PROPERTY TAX RATES
LAST TEN YEARS (Unaudited)
(rate per $100 of assessed value)
Calendar Overla22ing Rates
Year School County (a)
2011 $ 1.271 $ 1.480 2012 1.270 1.562 2013 1.272 1.653 2014 1.270 1.715 2015 1.266 1.738 2016 0.549 0.775 2017 0.556 0.826 2018 0.561 0.875 2019 0.569 0.904 2020 0.569 0.912
Source: Explanation ofComputed Tax Rates for Passaic City (a) Includes County Open Space Tax (b) Includes Municipal Library Tax
222
$
City (b)
4.140 4.275 4.387 4.449 4.569 2.044 2.105 2.162 2.204 2.250
Overlapping
Tax Rate
$ 6.891 7.107 7.313 7.434 7.573 3.368 3.487 3.598 3.677 3.731

Taxpayer
Prime Healthcare Services Lester Robbins, Trustee
ISLIP U SLIP, LLC/Home Depot
Passaic Industrial Properties
Barry Gardens Owns Corp.
PASSAIC PUBLIC SCHOOLS PRINCIPAL PROPERTY TAXPAYERS
CURRENT YEAR AND NINE YEARS AGO
(Unaudited)
2020
Taxable Assessed Value
$ 29,201,500 25,058,200 17,475,000
18,542,600 16,089,000
Chestnut Hill C/0 1st American Cap 11,753,700
River Drive Realty, Inc Howard Whse, Inc
Kranbro Realty LLC & Et. Als.
RJS Corp.
Net Valuation Taxable-- 2020
Passaic Industrial Center Home Depot Barry Gardens Owns Corp. Cahn Estates Passaic Plaza Associates, LLC D M Realty LLC Robbins Lester Trustee Verizon- New Jersey Chestnut Hill c/o Greystone Serv. Co. Kranbro Realty LLC
Net Valuation Taxable-- 2011
Source: Municipal Tax Assessor
14,697,000 13,326,100
11,662,900
12,500,000 $ 170,306,000
$ 2,956,331,066
2011
Taxable Assessed Value
$ 9,000,000 8,247,900 6,896,100 6,797,600 6,500,000 6,246,000 6,082,300 5,814,500 5,626,600 5,206,000
$ 66,417,000
$ 1,348,200,900
223
EXHIBIT J-8
%of Total District Net
Assessed Value
0.99% 0.85%
0.59%
0.63%
0.54%
0.40%
0.50% 0.45%
0.39%
0.42% 5.76%
%of Total District Net
Assessed Value
0.67% 0.61% 0.51% 0.50% 0.48% 0.46% 0.45% 0.43% 0.42% 0.39% 4.93%

Fiscal Year
Ended June 30,
2011 2012 2013 2014 2015 2016 2017 2018 2019 2020
PASSAIC PUBLIC SCHOOLS PROPERTY TAX LEVIES AND COLLECTIONS
LAST TEN FISCAL YEARS (Unaudited)
Collected within the Fiscal Year of the Levy
Taxes Levied for Percentage the Fiscal Year Amount of Levy
$ 17,140,411 $ 17,140,411 100.00% 17,130,406 17,130,406 100.00% 16,998,497 16,998,497 100.00% 16,996,446 16,996,446 100.00% 16,818,577 16,818,577 100.00% 16,818,577 16,818,577 100.00% 16,818,577 16,818,577 100.00% 16,818,577 16,818,577 100.00% 16,818,577 16,818,577 100.00% 16,818,577 16,818,577 100.00%
224
EXHIBIT J-9

Fiscal Year
Ended June 30,
2011 2012 2013 2014 2015 2016 2017 2018 2019 2020
$
General Obligation
Bonds
320,000
Source: District records
E- Estimate
PASSAIC PUBLIC SCHOOLS RATIOS OF OUTSTANDING DEBT BY TYPE
LAST TEN FISCAL YEARS (Unaudited)
Governmental Activities
$
Loans
1,287,391 866,757 437,766
Capital Leases
$
Total District
1,607,391 866,757 437,766
None None None None None None None
Population
70,145 69,977 70,098 70,267 70,228 70,086 70,020 69,948 69,703 69,703 E
EXHIBIT J-10
Per Capita
$ 23 12 6

Fiscal Year
Ended June 30,
2011 $ 2012 2013 2014 2015 2016 2017 2018 2019 2020
PASSAIC PUBLIC SCHOOLS RATIOS OF NET GENERAL BONDED DEBT OUTSTANDING
LAST TEN FISCAL YEARS (Unaudited)
General Bonded Debt Outstanding
Percentage of General Net General Actual Taxable
Obligation Bonded Debt Value of Bonds Deductions Outstanding Property
320,000 $ 320,000 0.02%
Source: District records
226
EXHIBIT J-11
Per Capita
$ 5

PASSAIC PUBLIC SCHOOLS DIRECT AND OVERLAPPING GOVERNMENTAL ACTIVITIES DEBT
AS OF DECEMBER 31, 2019 (Unaudited)
Municipal Debt: (1) Passaic Public Schools City ofpassaic
Overlapping Debt Apportioned to the Municipality: Passaic County: County of Passaic (2) Passaic County Utilities Authority (2)
North Jersey District Water Supply Commission (3)
Passaic Valley Sewerage Commission (3)
Passaic Valley Water Commission (4)
Total Direct and Overlapping Debt
Source: ( 1) City of Passaic's December 31, 2019 Annual Debt Statement (2) Based on Equalized Value of Municipality to County Total (3) Based on Usage (4) Based upon ownership
$
$
227
Gross Debt
21,767,628
21,767,628
Deductions
$ 1,320,651
$ 1,320,651
EXHIBIT J-12
Net Debt
$ 20,446,977
20,446,977
37,753,332 3,394,133
1,618,536
7,201,055
28,886,200
78,853,256
$ 99,300,233

N N 00
IQl! 2012
Debt Limit $ 146,644,052 $ 139,911,809 $
Total Net Debt Applicable to Limit 1,607,391 866,757
Legal Debt Margin $ 145,036,661 $ 139,045,052 $
Total Net Debt Applicable to the Limit as a Percentage of Debt Limit 1.10% 0.62%
Source: Equalized valuation bases were obtained from the Annual Report of the State of New Jersey, Department ofTreasul)', Division ofTaxation
PASSAIC PUBLIC SCHOOLS LEGAL DEBT MARGIN INFORMATION
LAST TEN FISCAL YEARS
2013 2014
132,733,265 $ 128,826,417
437,766
132,295,499 $ 128,826,417
0.33% 0.00%
Fiscal Year Ended June 30, 2015 2016 2017
$ 125,293,997 $ 128,759,952 $ 131,298,727
$ 125,293,997 $ 128,759,952 $ 131,298,727
0.00% 0.00% 0.00%
Legal Debt Margin Calculation for Fiscal Year 2020
Equalized Valuation Basis 2017 2018 2019
Average Equalized Valuation ofTaxable Property
Debt Limit (4% of Average Equalization Value) Total Net Debt Applicable to Limit Legal Debt Margin
2018 2019
$ 137,722,362 $ 142,670,013
$ 137,722,362 $ 142,670,013
0.00% 0.00%
EXHIBIT J-13
2020
$ 149,959,892
$ 149,959,892
0.00%
$ 3,498,157,198 3,832,137,426 3,916,697,260
$11,246,991,884
$ 3,748,997,295
$ 149,959,892
$ 149,959,892

Year
2010 2011 2012 2013 2014 2015 2016 2017 2018 2019
PASSAIC PUBLIC SCHOOLS DEMOGRAPHIC AND ECONOMIC STATISTICS
LAST TEN FISCAL YEARS (Unaudited)
County Per Capita Personal
Population Income
69,864 $ 40,555 70,145 41,980 69,977 42,585 70,098 43,037 70,267 45,251 70,228 46,625 70,086 47,142 70,020 48,152 69,948 50,570 69,703 N/A
Source: New Jersey State Department of Education
N/A- Not Available
229
EXHIBIT J-14
Unemployment Rate
12.60% 12.40% 13.20% 11.40% 9.40% 8.00% 7.20% 6.70% 5.80% 4.80%

PASSAIC PUBLIC SCHOOLS PRINCIPAL EMPLOYERS
CURRENT YEAR AND NINE YEARS AGO (Unaudited)
INFORMATION NOT AVAILABLE
230
EXHIBIT J-15

EXHIBIT J-16 PASSAIC PUBLIC SCHOOLS
FULL-TIME EQUIVALENT DISTRICT EMPLOYEES BY FUNCTION/PROGRAM
LAST TEN FISCAL YEARS
(Unaudited)
2010-11 2011-12 2012-13 2013-14 2014-15 2015-16 2016-17 2017-18 2018-19 2019-20
Function/Program
Instruction
Regular 940 974 1,022 1,087 1,050 1,033 1,010 997 930 821 Special Education 317 317 343 355 349 238 250 284 257 249
Other Instruction 38 5 12 48 81 23 4 4 2 2
Support Services:
Student & Instruction Related Services 307 310 374 322 276 422 425 472 424 412 General Administration 8 7 7 9 9 6 6 6 6 5 School Administrative Services 84 84 87 85 96 107 109 112 103 186 Central Services 42 40 50 50 52 57 61 60 56 68
N Plant Operations and Maintenance 102 102 117 124 141 176 185 202 215 191 w 1-'
Total 1,838 1,839 2,012 2,080 2,054 2,062 2,050 2,137 1,993 1,934
Source: Business Office Annual Budget Personnel Control Records

N w N
Fiscal Year Enrollment
2011 12,562 2012 12,705 2013 13,154 2014 13,414 2015 13,674 2016 13,826 2017 13,910 2018 14,037 2019 13,898 2020 13,595
ADEAverage Daily
Enrollment
Sch#1 479.67
Sch#3 823.93
Science 867.07
Prep 783.77
Sch#5 429.09
Sch#6 1040.02
Sch#7 313.78
Sch#8 651.52
Sch#9 797.22
Sch #10 786.44
Sch#ll 1024.97
PHS 2348.19
Sch #15 276.05
Sch #16 493.95
Sch#19 833.22
Sch#20 922.68
Sch#21 718.50
Total 13590.07
Operating
Expenditures
$ 245,355,427 269,755,174 299,463,709 305,795,720 299,856,949 310,968,902 315,752,736 323,216,178 338,269,352 346,396,756
ADA Average
Daily Attendance
450.71
781.90
796.25
708.86
385.77
943.76
295.53
606.73
755.06
734.65
951.36
1999.38
258.91
457.01
797.01
865.70
655.85
12444.44
Cost Per
Pupil
$ 19,531 21,233 22,766 22,797 21,929 22,492 22,700 23,026 24,339 25,480
ADA Rate
94.0%
94.9%
91.8%
90.4%
89.9%
90.7% 94.2%
93.1%
94.7%
93.4%
92.8%
85.1%
93.8%
92.5%
95.7%
93.8%
91.3%
91.6%
Percentage
Change
-4.21% 8.71% 7.22% 0.14%
-3.81% 2.57% 0.93% 1.44% 5.70% 4.68%
Note: Enrollment based on annual October ASSA District count.
Sources: District records
N/A- Not Available
PASSAIC PUBLIC SCHOOLS OPERATING STATISTICS LAST TEN FISCAL YEARS
(Unaudited)
Pupilffeacher Ratio
Elementary Teaching
Staff
(PreK through High School Average Daily Grade 8) (Grades 9-12) Enrollment (ADE)
1,295 n/a nla 13,387.4 1,070 nla n/a 12,725.3 1,040 nla nla 13,578.8 1,070 n!a n/a 13,850.9 1,075 n/a n!a 13,810.8 1,086 n/a nla 13,291.1 1,184 nla n!a 14,051.8 1,198 nla n!a 13,822.0 1,170 nla nla 13,622.0 1,172 n/a nla 13,590.1
Average Daily
Attendance
(ADA)
12,462.1 11,770.4 12,799.2 13,102.2 12,726.3 12,567.5 13,162.1 12,859.0 12,622.0 12,444.4
EXHIBIT J-17
%Change in
Average Daily Student Attendance
Enrollment Percentage
1.86% 93.09% -4.95% 92.50% 6.71% 94.26% 2.00% 94.59% -0.29% 92.15% -3.76% 94.56% 5.72% 93.67% -1.64% 93.03% -1.45% 92.66% -0.23% 91.57%

EXHIBIT J-18
PASSAIC PUBLIC SCHOOLS SCHOOL BUILDING INFORMATION
LAST TEN FISCAL YEARS (Unaudited)
2010-11 2011-12 2012-13 2013-14 2014-15 2015-16 2016-17 2017-18 2018-19 2019-20
School #I Square Feet 81,316 81,316 81,316 81,316 81,316 81,316 81,316 81,316 81,316 81,316 Capacity (students) 633 633 633 633 633 633 633 633 633 633 Students on Roll 794 768 768 807 794 699 661 668 782 468
School #2 Square Feet 14,288 14,288 14,288 14,288 14,288 14,288 14,288 14,288 14,288 Capacity (students) 250 250 250 250 250 250 250 250 250 Students on Roll 216 217 225 231 203 180 163 188 198
School #3 Square Feet 120,270 120,270 120,270 120,270 120,270 120,270 120,270 120,270 120,270 120,270 Capacity (students) 911 911 911 911 911 911 911 911 911 911 Students on Roll 1,013 949 956 985 955 851 788 794 843 804
LMS Square Feet 233,080 233,080 233,080 233,080 233,080 233,080 233,080 233,080 Capacity (students) 1,429 1,429 1,429 1,429 1,429 1,429 1,429 1,429 Students on Roll 1,740 1,783 1,783 1,863 1,925 1,675 1,717 1,781
Science Academy Square Feet 116,540 116,540 Capacity (students) 715 715 Students on Roll 715 893
Preparatory Academy Square Feet 116,540 116,540 Capacity (students) 715 715 Students on Roll 709 789
School #5 Square Feet 18,312 18,312 18,312 18,312 41,715 41,715 41,715 41,715 41,715 41,715 Capacity (students) 250 250 250 250 460 460 460 460 460 460 Students on Roll 331 337 297 297 381 349 345 442 461 417
School #6 Square Feet 124,600 124,600 124,600 124,600 124,600 124,600 124,600 124,600 124,600 124,600 Capacity (students) 973 973 973 973 973 973 973 973 973 973 Students on Roll 1,178 1,147 1,272 1,272 1,146 1,125 1,110 1,129 1,095 1,025
School #7 Square Feet 45,400 45,400 45,400 45,400 45,400 45,400 45,400 45,400 45,400 45,400 Capacity (students) 203 203 203 203 203 203 203 203 203 203 Students on Roll 291 289 321 321 395 391 379 371 393 313
School #8 Square Feet 45,645 45,645 45,645 45,645 45,645 45,645 45,645 45,645 45,645 45,645 Capacity (students) 381 381 381 381 381 381 381 381 381 381 Students on Roll 565 541 572 572 445 421 407 347 578 660
School#9 Square Feet 75,900 75,900 75,900 75,900 75,900 75,900 75,900 75,900 75,900 90,!88 Capacity (students) 491 491 491 491 491 491 491 491 491 741 Students on Roll 655 723 784 784 728 647 644 680 681 812
School #10 Square Feet 69,040 69,040 69,040 69,040 69,040 69,040 86,617 86,617 86,617 86,617 Capacity (students) 513 513 513 513 513 513 513 513 513 513 Students on Roll 750 762 804 804 795 738 776 858 905 775
School #II Square Feet 135,220 135,220 135,220 135,220 135,220 135,220 135,220 135,220 135,220 135,220 Capacity (students) 881 881 881 881 881 881 881 881 881 881 Students on Roll 1,306 1,340 1,391 1,391 1,267 1,194 1,138 1,063 1,192 1,003
PHS Square Feet 307,365 307,365 307,365 307,365 307,365 307,365 307,365 307,365 307,365 307,365 Capacity (students) 2,099 2,099 2,099 2,099 2,099 2,099 2,099 2,099 2,099 2,099 Students on Roll 2,788 2,580 2,713 2,713 2,896 3,062 3,115 3,223 2,625 2,365
233

EXHIBIT J-18
PASSAIC PUBLIC SCHOOLS SCHOOL BUILDING INFORMATION
LAST TEN FISCAL YEARS (Unaudited)
2010-11 2011-12 2012-13 2013-14 2014-15 2015-16 2016-17 2017-18 2018-19 2019-20
LC Square Feet 10,075 10,075 Capacity (students) 150 150 Students on Roll 117 NIA
School #14 Square Feet 8,700 8,700 Capacity (students) 176 176 Students on Roll 194 NIA
School #15 Square Feet 30,866 30,866 30,866 30,866 30,866 55,063 55,063 55,063 55,063 55,063 Capacity (students) 195 195 195 195 195 354 354 354 354 354 Students on Roll 227 238 208 205 205 178 243 267 268 274
School #16 Square Feet 63,600 63,600 63,600 63,600 63,600 63,600 63,600 63,600 63,600 63,600 Capacity (students) 471 471 471 471 471 471 471 471 471 471 Students on Roll 525 492 505 467 467 610 558 544 461 488
School#17 Square Feet 36,960 36,960 36,960 36,960 36,960 36,960 36,960 36,960 Capacity (students) 330 330 330 330 330 330 330 330 Students on Roll 400 395 382 401 401 621 554 552
School #18 Square Feet 12,737 12,737 Capacity (students) 135 135 Students on Roll 102 NIA
School #19 Square Feet 149,855 149,855 149,855 149,855 149,855 149,855 149,855 149,855 149,855 149,855 Capacity (students) N/A NIA NIA NIA N/A N/A N/A 672 672 672 Students on Roll NIA 752 703 735 735 730 653 654 878 81 I
School #20 Square Feet 121,625 121,625 121,625 121,625 Capacity (students) 717 717 717 717 Students on Roll 780 870 974 940
School #21 Square Feet 109,100 Capacity (students) 698 Students on Roll 733
Stadium Square Feet 17,500 17,500 17,500 17,500 17,500 17,500 17,500 17,500 17,500 17,500 Capacity (students) NIA NIA N!A NIA NIA N/A N/A N/A N/A N/A Students on Roll N/A N!A N/A NIA N/A N/A N/A N/A N/A N/A
Randolph Street Square Feet 12,500 12,500 12,500 12,500 Capacity (students) N/A N/A N/A N/A Students on Roll N/A N/A N/A N/A
Administration Building Square Feet 12,500 12,500 12,500 12,500 12,500 12,500 12,500 12,500 12,500 12,500 Capacity (students) N/A N/A N/A N/A N/A N/A N/A N/A N/A N/A Students on Roll N/A NIA N/A N/A N/A N/A N/A NIA N/A N/A
Main Ave Admin Building Square Feet 46,000 46,000 Capacity (students) N/A N/A Students on Roll N/A NIA
Number of Schools at June 30, 2020 Elementary 14 14 14 14 14 14 15 15 14 14 Middle School 1 I 0 0 High School I Total Schools 16 16 16 16 16 16 17 17 17 17
Note: Enrollment is based on the annual October district count.
234

EXHIBIT J-19 PASSAIC PUBLIC SCHOOLS
GENERAL FUND SCHEDULE OF REQUIRED MAINTENANCE FOR SCHOOL FACILITIES
LAST TEN FISCAL YEARS (Unaudited)
School Facilities School# SQ Footage 2011 2012 2013 2014 2015 2016 2017 2018 2019 2020
Number 1 Thomas Jefferson 80 81,316 $ 100,405 $ 105,535 $ 371,133 $ 1,010,598 $ 210,341 $ 167,994 $ 205,864 $ 240,434 $ 607,081 $ 277,350 Number 2 George Washington 85 14,288 15,525 19,682 61,009 125,592 40,191 42,872 37,191 42,246 44,819 Number 3 Mario J Drago 90 120,270 137,513 175,533 326,871 390,592 313,266 188,796 304,355 355,614 220,425 356,734 Number 4 Lincoln Middle 95 233,080 372,822 440,563 1,023,043 1,085,592 685,756 748,136 571,479 689,169 Science Academy 301 116,540 257,331 287,718 Preparatory Academy 302 116,540 414,380 308,718 Number 5 Benito Juarez 97 41,715 18,528 26,948 49,953 1,131,984 158,148 87,837 107,145 123,343 105,376 195,096 Number 6 Martin L King Jr 100 124,600 151,358 185,023 515,037 979,092 428,032 390,816 143,864 368,417 328,122 249,557 Number 7 Grant 110 45,400 58,855 75,140 160,051 795,092 146,545 70,734 115,967 134,239 180,169 129,052 Number 8 Pulaski 120 75,900 77,792 87,833 217,203 280,592 123,047 205,777 116,219 134,963 253,913 378,066 Number 9 Etta Gero 125 75,900 91,980 149,065 252,436 320,592 229,192 127,353 193,235 224,420 185,890 293,281 Number 10 Roosevelt 130 86,617 128,258 127,722 239,966 511,184 230,189 181,692 192,080 256,108 161,682 357,479 Number 11 Wm B Crnise Memorial 140 135,220 148,715 177,501 520,132 792,592 356,658 350,248 326,216 399,817 352,639 316,838 Number 14 160 Number 15 Vincent Capuana 170 55,063 40,056 46,013 151,562 276,184 82,658 102,122 141,152 162,809 113,428 150,046 Number 16 Sallie D. Gamble 180 63,600 7,797 8,549 35,394 175,592 13,594 102,880 161,781 86,607 145,152 122,527 School#l7 185 42,072 61,081 344,592 686,192 123,660 78,826 101,032 Number 19 Daniel F. Ryan 200 149,855 159,112 38,447 76,202 263,592 139,936 281,151 376,303 443,090 401,083 232,519 Number 20 Passaic Gifted & Talented Academy 300 121,625 184,957 305,833 359,620 419,702 211,556 Number 21 Sonia Sotomayor 303 109,100 206,923
t--:l Passaic Alternate School 55 w CJl Passaic High School 50 307,365 382,966 450,923 1,121,511 698,092 840,549 559,430 678,447 908,812 665,359 553,331
Randolph Street 12,500 20,895 31,683 17,021 22,603 20,809 School Stadium 0 17,500 43,935 206,193 48,016 108,608 85,429 29,846 44,864 26,208 46,838 77,533 !58 Passaic Street 0 663 Main Ave Admin Bid. 0 46,000 15,660 128,282 91,859 Admin Bid. 0 12,500 29,881 21,684 119,744 180,336 23,394 70,579 32,643 27,720
Total School Facilities 2,162,494 2,007,570 2,403,435 5,633,855 9,812,098 4,230,585 3,992,941 4,187,353 5,016,317 5,054,274 4,816,992
Source: District Records

PASSAIC PUBLIC SCHOOLS
INSURANCE SCHEDULE
JUNE 30, 2020 (Unaudited)
New Jersey Schools Comprehensive General Liability Insurance Group
Combined Single Limit Each Occurrence
New Jersey Schools
Automobile Liability Insurance Group
Combined Single Limit Medical Payments Personal Injury Uninsured Motorist Auto Physical Damage--Collision Auto Physical Damage--Other than Collision
Crime Coverage/ Employee Dishonest New Jersey School Boards Association (Including Faithful Performance Insurance Group Forgery and Alteration
Money & Securities Money Orders/ Counterfeit
Computers Fraud
Property Insurance New Jersey Schools Insurance Group
Buildings/ Personal Property
EDP Equipment Valuable Papers
Boiler & Machinery Included New Jersey Schools Insurance Group
Equipment Breakdown Business Income Extra Expense
School Leaders Errors and Omissions Greenwich- Western World Each Occurrence Aggregate
Employment Practices
School Leaders Excess Aggregate RSUI Indemnity Co.
236
Coverage
16,000,000
16,000,000
*5,000 250,000
** 1,000,000 ACV ACV
1,000,000 500,000 100,000 100,000 500,000
466,533,800
25,000
10,000,000
100,000,000
5,000,000 50,000,000
5,000,000 5,000,000
5,000,000
5,000,000
EXHIBIT J-20
$
Deductible
N/A
N/A
1,000 1,000
1,000 1,000 1,000 1,000 1,000
10,000
1,000 10,000
25,000 25,000 25,000
25,000
35,000
N/A

Public Employees' Faithful Performance Bonds
Board Secretary
Comptroller
Treasurer of School Moneys
Excess Workers Compensation Employers Liab. SelfRetention $600,000
Student Accident Athletic Section Disability Section
Source: District Records
PASSAIC PUBLIC SCHOOLS
INSURANCE SCHEDULE
JUNE 30, 2020 (Unaudited)
Selective Insurance Company of America
State National Insurance Company
Catlin Specialty Ins. Co./US Fire Ins.
237
EXHIBIT J-20
Coverage Deductible
88,000
150,000
1,000,000
Statutory 1,000,000
25,000/5,000,000 N/A 1,000,000

~TIN(G} ILJE AUJJD) TIT ~JEcrTI(Q)N

LERCH, VINCI & HIGGINS, LLP
DIETER P. LERCH, CPA, RMA, PSA
GARY J. VINCI, CPA, RMA, PSA
GARY W. IDGGINS, CPA, RMA, PSA
. JEFFREY C. BLISS, CPA, RMA, PSA
PAUL J. LERCH, ·cPA, RMA, PSA
JULIUS B. CONSONI, CPA, PSA
ANDREW D. PARENTE, CPA, RMA,PSA
CERTIFIED PUBLIC ACCOUNTANTS REGISTERED MUNICIPAL ACCOUNTANTS
EX.HIBITK-1
ELIZABETH A SIDCK, QPA, RMA, PSA
ROBERT W. HAAG, CPA, PSA
RALPH M. PICONE, III, CPA, RMA, PSA
DONNAL. JAPHET, CPA, PSA
DEBRA GOLLE, CPA
MARK SACO, CPA
ROBERT LERCH, CPA
CHRIS SOHN, CPA
CHRISTOPHERM. VINCI, CPA
REPORT ON INTERNAL CONTROL OVER FINANCIAL REPORTING AND ON COMPLIANCE AND OTHER MATTERS
BASED ON AN AUDIT OF FINANCIAL STATEMENTS PERFORMED IN ACCORDANCE WITH GOVERNMENT AUDITING STANDARDS
Honorable President and Members of the Board ofEducation
Passaic Public Schools 663 Main A venue Passaic, New Jersey 07055
INDEPENDENT AUDITOR'S REPORT
We have audited, in accordance with the auditing standards generally accepted in the United States of America; the standards applicable to financial audits contained in Government Auditing Standards issued by the Comptroller General of the United States and audit requirements prescribed by the Office of School Finance, Department of Education, State of New Jersey, the fmancial statements of the governmental activities, the business-type activities, each major fund, and the aggregate remaining fund information of the Passaic Public Schools as of and for the fiscal year ended June 30, 2020 and the related notes to the financial statements, which collectively comprise the Passaic Public Schools' basic financial statements and have issued our report thereon dated January 29, 2021.
Internal Control Over Financial Reporting
In planning and performing our audit of the fmancial statements, we considered the Passaic Public Schools' internal control over financial reporting (internal control) to determine the audit procedures that are appropriate in the circumstances for the purpose of expressing our opinions on the financial statements but not for the purpose of expressing an opinion on the effectiveness of the Passaic Public Schools' internal control. Accordingly, we do not express an opinion on the effectivenes~ of the Passaic Public Schools' internal control.
A deficiency in internal control exists when the design or operation of a control does not allow management or employees, in the normal course of performing their assigned functions, to prevent, or detect and correct, misstatements on a timely basis. A material weakness is a deficiency, or a combination of deficiencies, in internal control, such that there is a reasonable possibility that a material misstate.ment of the entity's financial statements will not be prevented, or detected and conected on a timely basis. A significant deficiency is a deficiency, or a combination of deficiencies, in internal control that is less severe than a material weakness, yet impotiant enough to merit attention by those charged with governance.
' .. 238 17-17 ROUTE 208 · FAIR LAWN, NJ 07410 • TELmffiNE.(201) 791-7100· FACSIMILE (201) 791-3035
WWW.LVHCPA.COM

Our consideration of internal control was for the limited purpose described in the first paragraph of this section and was not designed to identify all deficiencies in internal control that might be material weaknesses or significant deficiencies. Given these limitations, during our audit we did not identify any deficiencies in internal control that we consider to be material weaknesses. However, material weaknesses may exist that have not been identified.
Compliance and Other Matters
As part of obtaining reasonable assurance about whether the Passaic Public Schools' financial statements are free from material misstatement, we performed tests of its compliance with certain provisions of laws, regulations, contracts, and grant agreements, noncompliance with which could have a direct and material effect on the determination of financial statement amounts. However, providing an opinion on compliance with those provisions was not an objective of our audit, and accordingly, we do not express such an opinion. The results of our tests disclosed no instances of noncompliance or other matters that are required to be reported under Government Auditing Standards 'and audit requirements as prescribed by the Office of School Finance, Department of Education, State of New Jersey.
However, we noted certain matters that m·e not required to be reported under Govenunent Auditing Standards that we reported to management of the Passaic Public Schools in a separate report entitled, "Auditor's Management Report on Administrative Findings -Financial, Compliance and Performance" dated January 29, 2021.
Purpose of this Report
The purpose of this report is solely to describe the scope of our testing of internal control and complim1ce and the results of that testing, and not to provide an opinion on the effectiveness of the Passaic Public Schools' internal control or on compliance. This report is an integral part of an audit performed in accordance with Govenunent Auditing Standards in considering the Passaic Public Schools' internal control and compliance. Accordingly, this communication is not suitable
for any other purpose. ~.t«JJJ ~. ,/i ;, . ,t£1 LERCH,V~CI&~,LLP Certified Public Accountants Public School Accountants
Fair Lawn, New Jersey January 29, 2021
239
Public School Accountant PSA Number CS00829

LERCH, VINCI & HIGGINS, LLP
DIETERP. LERCH, CPA, RMA, PSA
GARY J . VINCI, CPA, RMA, PSA
GARYW. HIGGINS, CPA, RMA, PSA
JEFFREY C. BLISS, CPA, RMA, PSA
PAULJ. LERCH, CPA, RMA, PSA
JULIUS B. CONSONI, CPA, PSA
ANDREW D. PARENTE, CPA, RMA, PSA
CERTIFIED PUBLIC ACCOUNTANTS REGISTERED MUNICIPAL ACCOUNTANTS EXIDBIT K-2
ELIZABETH A SIDCK, OPA, RMA, PSA
ROBERT W. HAAG, CPA, PSA
RALPH M. PICONE, ITI, CPA, RMA, PSA
DONNAL. JAPHET, CPA, PSA
DEBRA GOLLE, CPA
MARKSACO, CPA
ROBERT LERCH, CPA
CHRIS SOHN, CPA
CHRISTOPHERM. VINCI, CPA
REPORT ON COMPLIANCE FOR EACH MAJOR FEDERAL AND STATE PROGRAM; REPORT ON INTERNAL CONTROL OVER COMPLIANCE; AND REPORT
ON THE SCHEDULE OF EXPENDITURES OF FEDERAL AWARDS REQUIRED BY THE U.S. UNIFORM GUIDANCE AND SCHEDULE OF EXPENDITURES OF STATE FINANCIAL ASSISTANCE AS
REQUIRED BY NEW JERSEY OMB CIRCULAR 15-08
Honorable President and Members of the Board of Education
Passaic Public Schools 663 Main A venue Passaic, New Jersey 07055
INDEPENDENT AUDITOR'S REPORT
Report on Compliance for Each Major Federal and State Program
We have audited the Passaic Public Schools' compliance with the types of compliance requirements described in the U.S. Office of Management and Budget COMB) Compliance Supplement and the New Jersey OMB Circular 15-08 State Aid/Grant Compliance Supplement that could have a direct and material effect on each of the Passaic Public Schools' major federal and state programs for the fiscal year ended June 30, 2020. The Passaic Public Schools' major federal and· state programs are identified in the summary of auditor's results section of the accompanying schedule of findings and questioned costs.
Management's Responsibility
Management is responsible for compliance with federal and state statutes, regulations, and the terms and conditions of its federal awards and state financial assistance applicable to its federal and state programs.
Auditor's Responsibility
Our responsibility is to express an opinion on compliance for each of the Passaic Public Schools' major federal and state programs based on our audit of the types of compliance requirements referred to above . . We conducted our audit of compliance in accordance with auditing standards generally accepted in the United States of America; the standards applicable to financial audits contained in Govemment Auditing Standards, issued by the Comptroller General of the United States; audit requirements as prescribed by the Office of School Finance, Department of Education, State of New Jersey; Title 2 U.S. Code of Federal Regulations Part 200, Uniform Administrative Requirements, Cost Principles, and Audit Requirements for Federal Awards (Uniform Guidance) and New Jersey OMB Circular 15-08, Single Audit Policy for Recipients of Federal Grants, State Grants ' and State Aid. Those standards, U.S . Unifmm Guidance and New Jersey Circular require that we plan and perform the audit to obtain reasonable assurance about whether noncompliance with the types of compliance requirements referred to above that could have a direct and material effect on a major federal or state program occuned. An audit includes examining, on a test basis, evidence about the Passaic Public Schools' compliance with those requirements and performing such other procedures as we considered necessaty in the circumstances.
17-17 ROUTE 208 ·FAIRLAWN, NJ 07410 • TELm~NE.(201) 791-7100·FACSIMILE (201) 791-3035 WWW.LVHCPACOM

We believe that our audit provides a reasonable basis for our opinion on compliance for each major federal and state program. However, our audit does not provide a legal determination of the Passaic Public Schools' compliance.
Opinion on Each Major Federal and State Program
In our opinion, the Passaic Public Schools complied, in all material respects, with the types of compliance requirements referred to above that could have a direct and material effect on each of its major federal and state programs for the fiscal year ended June 30, 2020.
Report on Internal Control Over Compliance
Management of the Passaic Public Schools is responsible for establishing and maintaining effective internal control over compliance with the types of compliance requirements referred to above. In planning and pe1forming our audit of compliance, we considered the Passaic Public Schools' internal control over compliance with the types of requirements that could have a direct and material effect on each major federal and state program to determine the auditing procedures that are appropriate in the circumstances for the purpose of expressing an opinion on compliance for each major federal and state program and to test and report on internal control over compliance in accordance with the U.S. Uniform Guidance and New Jersey OMB Circular 15-08, but not for the purpose of expressing an opinion on the effectiveness of internal control over compliance. Accordingly, we do not express an opinion on the effectiveness of the Passaic Public Schools' internal control over compliance.
A deficiency in internal control over compliance exists when the design or operation of a control over compliance does not allow management or employees, in the normal course o:f perforn1ing their assigned functions, to prevent, or detect and correct, noncompliance with a type of compliance requirement of a federal or state program on a timely basis. A material weakness in internal control over compliance is a deficiency, or combination of deficiencies, in internal control over compliance, such that there is a reasonable possibility that material noncompliance with a type of compliance requirem~nt of a federal or state program will not be prevented, or detected and corrected, on a timely basis. A significant deficiency in internal control over compliance is a deficiency, or a combination of deficiencies, in internal control over compliance with a type of compliance requirement of a federal or state program that is less severe than a material weakness in internal control over compliance, yet important enough to merit attention by those charged with governance.
Our consideration of internal control over compliance was for the limited purpose described in the first paragraph of this section and was not designed to identify all deficiencies in internal control over compliance that might be material weaknesses or significant deficiencies. We did not identify any deficiencies in internal control over compliance that we consider to be material weaknesses. However, material weaknesses may exist that have not been identified.
The purpose of this report on internal control over compliance is solely to describe the scope of our testing of internal control over compliance and the results of that testing based on the requirements of the U.S. Uniform Guidance and New Jersey OMB Circular 15-08. Accordingly, this report is not suitable for any other purpose.
241

Report on Schedule of Expenditures of Federal Awards Required by the U.S. Uniform Guidance and Schedule of Expenditures of State Financial Assistance Required by New Jersey OMB Circular 15-08
We have audited the fmancial statements of the governmental activities, the business-type activities, each major fund, and the aggregate remaining fund information of the Passaic Public Schools, as of and for the fiscal year ended June 30, 2020, and the related notes to the fmancial statements, which collectively comprise the Board of Education's basic fmancial statements. We have issued our report thereon dated January 29, 2021, which contained unmodified opinions on those fmancial statements. Our audit was conducted for the purpose of forming opinions on the fmancial statements that collectively comprise the basic fmancial statements. The accompanying schedule of expenditures of federal awards as required by the U.S. Uniform Guidance and schedule of expenditures of state fmancial assistance as required by New Jersey OJ\.ffi Circular 15-08 are presented for purposes of additional analysis and are not a required part of the basic fmancial statements. Such information is the responsibility of management and was derived from and relates directly to the underlying · accounting and other records used to prepare the basic fmancial statements. The infmmation has been subjected to the auditing procedures applied in the audit of the fmancial statements and certain additional procedures, including comparing and reconciling such information directly to the underlying accounting and other records used to prepare the basic fmancial statements or to the basic fmancial statements themselves, and other additional procedures in accordance with auditing standards generally accepted in the United States of America. In our opinion, the schedule of expenditures of federal awards m1d schedule of expenditures of state fmancial assistm1ce are fairly stated in all material respects in relation to the basic
financial statements as a whole. ( ~ 1
~· ..,//;~:. ,t£1'
u4~, VINCI & m3~LP
Fair Lawn, New Jersey January 29, 2021
242
Certified Public Accountants Public School Accountants
Public School Accountant PSA Number CS00829

FederaVGrantor/Pass-Through Grantor/ CFDA FAIN
Number
U.S. Department of Agriculture
Pa~sed-through State Department
of Education
NSLP -Non-Cash Assistance
NSLP -Non-Cash Assistance
NSLP - Cash Assistance NSLP - Cash Assistance
School Breakfast Program School Breakfast Program
Aller School Snack Program After School Snack Program Summer Food Service Program
Total Child Nutrition
Fresh Fruit and Vcget.nbleProgram Fresh Fruit and Vcgct.nble Program
Total U.S. Department of Agriculture
10.555 20!NJ304NJ099
10.555 191NJ304NI099
10.555 20 I NJ304N 1099 10.555 191NJ304Nl099
10.553 201NJ304NI099
10.553
10.555 10.555 10.559
10.582 10.582
191NJ304NI099
201NJ304NI099
191NJ304N2020 20 I NJ304N I 099
201NJ304N\099 191 NJ304Ll603
U.S. Department of Education passed-through
State Department of Education
Special Re\'enue Fund
Title!
Title! Title! Title I Reallocated Title I Reallocated
Title!
College and Career Readiness
Title I, School Improvem~o:nt - Pmt A Title I Arts Integration
Total Title!
Title III Tille III Title III Title Ill Immigrant Title III Immigrant
Total Title III
Cares Emergency Relief Grant
Total Cares
I.D.E.A. Part B
Basic Regular
Basic Regular
Preschool Preschool
Total I.D.E.A.
Blended Early Learning Innovation Blended Early Learning Innovation
Total Bknded Early teaming Innovation
84.0lOA SOIOA170030 84.0 lOA SO I OA 180030
84.01 OA SO I OA 190030 84.010A SOIOAI80030 84.010A SOIOAI90030
84.010A NIA
84.0 I OA SO I OA 160030
84.010A NIA 84.010A SOIOA160030
84.365
84.365
84.365
84.365 84.365
84.4250
84.027A
84.027A
84.173A 84.173A
84.412 84.412
S365AI80030
S365Al90030 S365A200030
SOIIAI90030 S365A200030
$425000027
H027AI80100
H027AI90100
HI73AI80114 Hi73Al90114
S412AI30049 S412AI30049
Grant or Shttc
Project Num~r
NIA
NIA
NIA
NIA
NIA
NIA
NIA
NIA NIA
NIA NIA
ESEA397018
ESEA397019
ESEA397020 ESEA397019
ESEA397020
NCL8397012
17EOOI22
NCLB397012 17EOOI41
ESEA397018
ESEA397019
ESEA397020
ESEA397019 ESEA397020
FT-3970-19
FT-3970-20
PS-3970-19 PS-3970-20
!6E00050 17E00050
Grant
Period
711119-6/30120
711118-6130/19
7/1119-6/30/20 7/!/!8-6/30/19
7/1/19-6130120
711118-6/30119
711119-6130/20
711118-6130119 711119-6/30/20
7/1119-6130120 711118-6130/19
7/!/!7-6130/18 711/18-6130/19
711119-9/30120
211119-9130119
711119-9/30/20
9/1111-8131112
911116-8/31117
911111-8131112 111117-7131117
711117-6/30/18
711/18-6/30/19
711/19-9/30/20
711118-6130119 711119-9/30120
3/13/20-9/30122
711118-6/30119
711119-9/30120
711118-6/30/19 7/l/19-9130120
9/1/15-8131116 9/1116-8/31117
PASSAIC PUBLIC SCHOOLS
SCHEDULE OF EXPENDITURES OF FEDERAL AWARDS
FOR THE FISCAL YEAR ENDED JUNE 30,2020
Award
Amount
461,996
515,380
4,477,021 6,642,247
2,206,327
3,057,741
215,608
319,513 4,096,670
250.145
Balance
Juh· I, 2019
31,822
{1,422,902)
(713,722)
(66,632)
228,158 ~
9,!56,753 5,257
Carryover
Amount
9,409,084 (357,084) (1,199,128)
9,050,459 1,199,128
387 ,I 04 (81,670)
231,959 7,490,698 947
250,000 (928)
324 71,533 ___ 17_7
746,861
662,290
635,762
78,438 41,065
(84,097)
(22,058)
(95,890)
95,890 (41,065)
~
6,099.002 ---- ----
Cash
Reeeh•ed
461,996
4,477,021 1,422,902
2,206,327
713,722 215,608
66,632 358 807
9,923,015
191,273 46526
10,160 814
360,380
5,047,996 298,186 130,398
5,836,960
84,110
361,528
22,058 4,270
471,966
Budgetary
390,907
31,822
4,477,021
2,206,327
215,608
4,096,670
11,418,355
250,145
11,668,500
1,199,128
9,033,582 {1,199,128)
214,037 211,030
9,458.649 ----
638,342
24,731
663,073
95,890
(95,890)
41,065
~
488,190 ----
Prior Year
488,190 ---- ----
4,120,225
4,154,801
139,581 142,160
(601.243)
(52,264)
75.000 752 75,000 ------..illQ)
(720,713)
720,713
(3,948)
~
601,243
3,105,882
52,264 94,779
3,854,168
4,080,086
720,713
(720,713)
3,948 134.363~
4.214,449
The Notes to lhc Schedules of Federal Awards and State Financial Assistance are an Integral Part of this Statement
Repayment or _____ J,u~n~o 3:.!0~, 2~0:!:20,_ ___ _
Prior Yean' (Accounts Unearned Due to
Balnnel!ll Recei"ablcl Re"enue Grantor
947
324 ___ 17_7
752
71,089
(3,737,863) ___ .:..__
(3.737,863) ---'7_,1."'08"-9
(58,872)
(3,796,735) __ .!.7_,1.,;08"'-9
(5,201,591)
(101,561)
(928)
3,296
1,216,005 2,479
20,929
5,257
(5,304,080) 1,242,709 _____21fL
(370,124)
13
93,310
---'-'(7-"7'"'86""0) ---"5-"7'"-'39"-9
(447,984) 150.722 ___ 4
(6,099,002) 5,610,812 ---
(6.099,002) 5,610,812 ---
(1,769,632) 795,428
(51,329) 11,745
(1,820.961) --'8"'0"'7 ""'17ce.3
---'Q~8~6) ---~
---'("'78""6) ----
EXHIBIT K-3
MEMO
GAAP
(58,872)
(58,872)
(3,881,433)
(79,229)
(928)
(3,961,590)
(273,483)
(20,058)
(293,541)
(483,306)
(483,306)
(973,863)
(39,584)
(1,013,447)
(786)
(786)
Continued

Federal/Grantor/Pass-Through Grantor/ CFDA
21st Century Commwllty Learning Center 21st Centwy Commwllty Learning Center 21st Century Community Learning Center 21st Centwy Community Learning Center
84.287 84.287
84.287 84.287
Total 21st Century CommwlltyLearrung Center
Adult Education Bt~sic Slcills Grant Progrnm 84.002A
Adult Education Basic Slcills Grant Program 84.002A Adult Education Basic Slcills Grant Program 84.002A
Total Adult Education Basic Slcills Grunt Program
McKinney Vento (Passed Through Bergen County)
Total McKinney Vento
Temporary Emergency Impact Aid
Total Temporary Emergcnccy Impact Aid
Building Effective Sup (BEST)
Carl D. Perkins Vocational and Applied Technology Initiative Technology Initiative
84.!96A
84.938C
84.048A 84.048A
Total Carl D. Perkins Voct~tional and Applied
FAIN
Number
S287C180030
S287C180030
S287C190030 S287Cl60030
NIA
NIA NIA
S196A!5003!
S938C20005
V048Al90030 V048AI80030
Total U.S. Department ofEducation- Special Revenue Fund
U.S. Department of Justice Programs Stop School Violence 16.839
Total U.S. Department of Justice- Special Revenue Fund
Total- Special Revenue Fund
General Fund Medicaid Assistance Prgm (SEMI)
Medicaid Reimbursement (MAC}
Total Medicaid Assistance
Tou.J a- cancelled payable
93.778
93.778
2005NJ5MAP 2005NJ5MAP
Grant or State
Project Number
!9E00016
19E00042
20E00086 17E00032
15-3970
20-3970 19-3970
NIA
NIA
PERK397020 PERK397019
Grant
Period
91!118-8/31119
911118-8131/19
7/1/19-9/30/20 9/1116-6130117
911114-8131/15
911/19-8131120 9/1/!8-8/31119
111/16-6/15/16
711119-6/30120
711/19-6/30/20 711118-6130119
2018-YS-BX-0150 10/1/18-9/30121
NIA
NIA
7/1/19-6/30120
711119-6130/20
PASSAIC PUBLIC SCHOOLS
SCHEDULE OF EXPENDITURES OF FEDERAL AWARDS
FOR THE FISCAL YEAR ENDED JUNE 30,2020
Award Amount
Balance Julv 1. 2019
575,000 $ (161,124)
35,000 (9,906)
535,000 500,000 __2,i2Q_
230,000 129
184,000 189,000 ~
1,165 ____ 8
____ 8
56,813
500,000
93,018 62,134 ~
Carryover Amount
236,!40 ~ -----
Cash Received
181.471
17,Q43
273,567
472,081
44,757 112,456
157,213
56,813
56,813
56,383 1,511
57,894
10.907,095
Budgetary
20,347
7,137
458,692
486,176
159,863
159,863
Prior Year
----~5~6~81~3 -------- -------
56,813
116,265
116,265 ---- ----
91,366
91,366
15,734,844
----~2~6.~48~6 ------- -------
26.486
Repayment of June 30,2020
Prior Years' (Accounts Unearned Due to
~
(261.433) 76,308
(261.433) ----"7"'6.0030"'8 ~
129
(115,106)
----~(~16~7) ------~
___ 1_2_9 (115,273) ---~ ---
____ 8
____ 8
(500.000) -~3""83"',7"'35,_
(500,000) -~3"'83,.,7"'3"-5
(34,983) !OJ
----~~~4.~98~3) ______ !~0~1
(14,584.502) 8,271,560 ~
(66,799)
(66,799)
10,907.095 15,761,330 ---- ---- ___.bill_ (14,65!,301) 8,271,560 ~
797,554
279,188
761,033 236,609
997,642
797,554
----~27~9~,1~88~ -------- -------
1,076,742 ---- ----
(36,521)
(42,579)
(79.100)
MEMQ
GAAP
(156.482)
(156.482)
(115,106) (167)
(115,273)
(116,265)
(116,265)
(31,960)
(31.960)
(6.172.650)
(44,372)
(44,372)
(6,217.022)
(36,521)
(42,579)
(79,100)
$ (3J30.46~ _s _____ -_ 22,065,551 28,506.572 _$ _______ $___ ~ $ (18,527,!36) 8.342,649 ~ $ (10,092.857)
The Notes to the Schedules of Federal Awards and State Financial Assistance are an Integral Part of this Statement

State Grantor/Program Title
Stnte Deportment of Education
Grantor State
Project Number
Grant
Period
A word
Amount
20-495..034~5120..078 7/1/1945/30/20 s 205,013,015
July1,2019
Unearned
Rcvenuc/(Accts
Receivnhlel
Due to
~
PASSAIC PUBLIC SCHOOlS
SCHEDULE OF STATE FINANCIAL ASSISTANCE
FOR THE FISCAL YEAR ENDED JUNE 30, 2020
Cash
Received
Budgetary
Expenditures
lnterfund
Transfer
Genenl Fund
Eqwlization Aid
Eqwlization Aid
Education Adcqwcy Aid
Education Adcqwcy Aid
Security Aid
19-495-034~5120-078 711118-6/30/19 199,821,280 $ (19,791,274)
$ 184,735,784 $ 205,013,015
19,791,274
Security Aid
Special Education Aid Special Education Aid
Totnl State Aid Public
T.P AF.- Pension Contribution
Non..Contributory Insurance
Pension Contribution
Long Term Disability Jnsumncc
Post Retirement
Totnl T.P A.F. Pension
Transportation Aid
Transportation Aid Fmni1y Crisis Transportation Aid
Total Transportntion
&..1mordinruy Aid
Extraordinary Aid
T.P.A.F. ~Social Security T.P.A.F. ~Social Security
Totn1Genera1Fund
Special Revenue
Preschool Education Aid
Preschool Education Aid
New Jersey Nonpublic Aid
Textbook Aid
Textbook Aid
Nursing Services
Teclmology
Technology
Security
Security
Auxi1iaryServiccs:
Compensatory Education
Compensntory Education
English as a Second Language
English as a Second Language
Home Instruction
Home Instruction
Handicapped Services:
20-495-034~5120..083 711119-6/30/20
19-495-034~512().083 7/l/18-6/30/19
20-495-034~5120-084 7/1/19-6/30120
19-495-034~5120-084 7/1/18-6/30/19
20-495..034·5120-089 711119-6/30120 19-495-034~5120..089 7/1118-6/30/19
20-495-034-5094-{)04 7/1119-6130/20
20-495-034-5094-002 7/1119--6/30120
20-495-{)34~5094-004
20-495-034~5094-001
7/1/19--6/30120 7/1/19-6/30/20
20-495-034-5120-014 7/1/17--6/30/18
19-495-034~5120-014
20-495-034·5120-100 7/1/18-6/30/19 711/19-6/30120
20-100..034·5120-044 7/II19.Q/30/20
19-100-034~5120-044 7/1118...6/30/19
20-495-034~5095-003 7/1/19-6130/20 19-495-034-5094-003 7/1/18-6/30/19
20-495-034~5120..086 7/1119-6/30120
19-495-034-5120..086 7/1/18-6/30/19
20-10()-{)34-512().064 7/1/19-6/30/20
19-100..034~512().064 7/1118-6/30/19
20-100...034~5120..070 7/1/19-6/30120
20-100-034~5120~373 7/1119...6/30/20
19-100...034-5120~373 7/1/18-6/30/19
20~100-034-5120-509 7/111945/30/20
19-100-034~5120~509 7/1/l8.Q/30/19
20-100..034~512Q..067 7/1119-6/30/20
19~100..034-5120-067 7/1/18...6/30/19
20~100-034~5120..067 7/1/19-6/30120
19-100-034-5120-067 7/1/18-6/30/19
20·10Q..034~5120-066 7/1/19-6/30/20
19·100-034~5120..066 7/1/18-6/30/19
Exnmination and Classification 20-100..034~5120..066 7/1119-6/30!20
EXlllllination nnd Classification 19~100-034~512()-{)66 7/I/18-6/30II 9
Corrective Speech 20-100..034-5120..066 7/1/19-6/30120
Corrective Speech 19~100-034-5120..066 7/1/18...()/30119
Supplemental Instruction 20~100..034~5120-066 7/l/19-6/30/20
Supplementallnslruction 19~100-034~5120-066 7/1118-6/30/19
19,998,279
19,998,279
6,745,057
6,745,057
12.147,460 12,147,460
389,401
21,725,271
16,569 8,204,140
1,978,076
1.978,076 46,789
6,967,944
5,798,905
8,301,798
7,365,405
24,612,529
24,955,152
190,443
185,833
363,071
130,068
125,280
561,450
537.900
634,351
678,516
14,890
21,742
22,004
4,940
512,150
403,680
300,762
307,123
348,886
349,695
(1,980,727)
(668,064)
(1,203144) ----- ----'--
(23,643,209) ---- ----=--
(195,918)
(195.918) ----- ___ ___.:._
(5,798,905)
(727,092) ----
(30.365,124) ----
1,871,175
5,687
4,408
1,870
72,611
2,415
(4,940)
58,943
89,486
178,407
4,366,690
(4,366,690)
The Notes to the Schedules ofFedeml. Awards and State Financial Assistance nrc an Integral Part of !he Stntemenl
18,020,309
1,980,727
6,077,923
668,064
19,998,279
6,745,057
10,945,991 12.147,460
1203144 ---- ----
243 423.216 243.903,811
389,401
21,725,271
389,401
21,725,271
16,569 16,569
8,204140~
30335381~
1,782,430
195,918
1,978,076
1978.348 ~
5,798,905
7,505,036 727,092
6,967,944
8,301,798
289 767 978 291.533,799
22,151,275
2,495,515
190,443
363,071
130,068
561,450
564,676
13,692
4,940
394,729
286,294
332,104
29,201,298 $ 3,057,699
183,339
363,071
127,533
548,899
467,413
11,084
22,004
240,873
!96,566
167,000
Repayment of
Prior Years'
Balances
(Accounts
Receivable)
(20,277,231)
(1,977,970)
(667,134)
(1,201,469)
June30 2020
Unearned
(24.123,804) -----"-
(195,646)
----"(4"'6,"'78"-'9) -----"-
Due to
Grantor
GAAP
ExhibitK~
Memo
Cumulative
Total
E:menditures
19,998,279
6,745,057
12,147,460
38890796
389,401
21,725,271
16,569 8204140
------ ----- -----"30,,3"'35"'3"'8'-1
1,978,076
-----·~
---~- ---~(~24~2~43=5) -----"- ----- "' ~ ____ 1"',9"-7"'80'-'7"-6
5,687
4,408
1,870
72,611
2,415
58,943
89,486
178,407
{6,967,944) 6,967,944
(796,762) * s (796,762} 8,301,798
----=- ------=- --- --- -----'-
(32,130,945) ____ _.:_ ----- • ~ ___ __2:86e,:.4!!7~39;,z9:<.5
(2,461,254) $ 2,835,620
7,104
2,535
12,551
(69,675) 166,938
(1,198) 3,806
(22,004)
(117,421) 271,277
(14,468} 104,196
(16,782) 181,886
(69,675)
(1,198)
(22,004)
(117,421)
(14,468)
(16,782)
29,201,298
183,339
363,071
127,533
548,899
467,413
11,084
22,004
240,873
196,566
167,000
Continued

N ,p.
State Grantor!Progrnm Title
State Depnrtlnent of Education
Special Revenue Fund (Continued)
County Vocational School District
Partnership Grant (Passed Through
Passaic County V001tional School)
A"'o
Computer Science Futures
Career Pathways
Career Pathways
Career Pathways
WrapAround
Anti Bullying Positive Behavior {PBSIS)
Total Special Revenue Fund
Capital Projects Fund
Economic Development Authority On~ Behalf Payments
Total Capital Projects Fund
Grnnt or Stutc
Project Number
17-VE03-G06
IS-VE04-G06
18E00001
19£00001
20£00002
NIA N/A
N/A
Gnnt
Period
6/15117-6/30120
311/18-8/31/21
411/17-2/28/18
4/1/18-2128/19
4/l/19-2128120
9/1/11-6/30/12
7/1/19-6/30120
O':l Enterprise Fund
National School Lunch Program National School Lunch Progrrun
Total Enterprise Fund
20-100-034-5120-122 7/lll%/30120
19~100-034-5120-122 7/llls..tl/30/19
Total State Financial Assistnnce Subject to Single Audit Determination
Less: Amounts Not Subject to Stale Single Audit Dcte.nnination
T.P AF.- Pension Contribution
Non...Conuibutory Insurance
Pension Contribution
Long Term Disability Insurance
Post Retirement
Economic Development Authority On-Behalf Payments
Total State Financial Assistance for Major Program Detenninnlion
Award
Amount
278.,612
486,852
100,000
100,000
100,000
204,820
530 15,200
70,242,083
95,349
109,609
July 1, 2019
Uneurncd
Rcvcnud(Accts
Receivable)
$ (76,149)
(99,451)
(113)
(192)
530
291
1691151
Due to
Grnntor
----~
----
----
PASSAIC PUBLIC SCHOOlS
SCHEDULE OF STATE FINANCIAL ASSISTANCE
FOR THE FISCAL YEAR ENDED JUNE 30, 2020
Carryover
Amount
75,249
125,813
75,221
204,820
27969.360
70,242,083
70,242,083
70,353
Budgetary
Expenditures
s 88,311
40,010
130
79,258
74,360
----
~
~
70,242.083
95,349
Intcrfund
----s 3.057,699
----
----
--~(2~4,9~2~9) ----- ---~- --~~~ 24 929 ---- ----95.282 ----~(2~4·~~~9) -------- -----~- ----2~~
388,074.703 $ (28,698.902) ~ ___ ___;, -===
~
393,682,380
389,401
21,725,271
16,569
8,204,140
----
~
The Notes to the Schedules ofFedernl Awards and State Financial Assistnnce are an Integral Part of the Statement
Repayment of
PriorYcnrs'
Bnlances
413 827
413,827
June 30, 2020
(Accounts
Receivable)
(89,211)
(13,648)
(113)
(100,000) $
(4,229)
(2,910.003)
(24,996)
{24.996)
~35,065,944) $
Unearned
99,870
130,460
530
291
3066771
3,066,771
ExhibitK-4
Memo
Due to
Grnntor
---
GAAP
• $ (63,762) 5
(1,648)
(113)
(130)
(4,229)
----$ 750,293*~
--- ----
--- ----
(24,996)
--- ----
-----·~
~·~s
Cumulative
Total
Expenditures
88,311
40,010
130
79,258
74,360
31811149
70,242083
70,242083
95,349
95 349
188,622,576

PASSAIC PUBLIC SCHOOLS NOTESTOTHESCHEDULESOFEXPENDITURESOF FEDERAL AWARDS AND STATE FINANCIAL ASSISTANCE FOR THE FISCAL YEAR ENDED JlJNE 30, 2020
NOTE 1 GENERAL
EXHIBITK-5
The accompanying schedules present the activity of all federal and state fmancial assistance programs of the Passaic Public Schools. The Board of Education is defined in Note 1(A) to the Board's fmancial statements. All federal financial assistance received directly from federal agencies, as well as federal awards and state fmancial assistance passed through other government agencies is included on the schedule of expenditures of federal awards and state fmancial assistance.
NOTE 2 BASIS OF ACCOUNTING
The accompanying schedules are prepared and presented using the budgetary basis of accounting with the exception of programs recorded in the food service fund, which are presented using the accrual basis of accom1ting. These basis of accounting are described in Notes 1(C) to the Board's fmancial statements. The information in these schedules is presented in accordance with the requirements of Title 2 U.S. Code of Federal Regulations Part 200, Uniform Administrative Requirements, Cost Principles, and Audit Requirements for Federal Awards (U.S. Uniform Guidance) and New Jersey OMB Circular 15-08, "Single Audit Policy for Recipients of Federal Grants, State Grants, and State Aid". Therefore, some amounts presented in these schedules may differ from the amounts presented in, or used in the preparation of, the financial statements.
NOTE 3 RELATIONSHIP TO FINANCIAL STATEMENTS
The financial statements present the general fund and special revenue fund on a GAAP basis. Budgetmy comparison statements or schedules (RSI) are presented for the general fund and special revenue fund to demonstrate fmance-related legal compliance in which certain revenue is permitted by law or grant agreement to be recognized in the audit year, whereas for GAAP reporting, revenue is not recognized m1til the subsequent year or when expenditures have been made.
The general fund is presented in the accompanying schedules on a modified accrual basis with the exception of the revenue recognition of the delayed state aid payments in the current budget year, which is mandated pursuant to N.J.S.A. 18A:22-44.2. For GAAP purposes, those payments are not recognized until the subsequent year due to the state deferral and recording of certain state aid payments in the subsequent year. The special revenue fund is presented in the accompanying schedules on the grant accounting budgetary basis which recognizes encumbrances as expenditures and also recognizes the related revenues, which may include the delayed state aid payments, whereas the GAAP basis does not. The special revenue fund also recognizes the delayed state aid payments in the current budget year, consistent with N.J.S.A. 18A:22-44.2.
The net adjustment to reconcile from the budgetary basis to the GAAP basis is a decrease of $1,649,362 for the general fund and a decrease of $289,462 for the special revenue fund. See the Notes to Required Supplementary Information for a reconciliation of the budgetary basis to the modified accrual basis of accounting for the general and special revenue funds. Awards and fmancial assistance revenues are reported in the Board's fmancial statements on a GAAP basis as presented as follows:
Federal State Total
General Fund $ 1,076,742 $ 289,884,437 $ 290,961,179 Special Revenue Fund 15,670,378 28,556,140 44,226,518 Capital Projects Fund 70,242,083 70,242,083 Food Service Fund 11,668,500 95,349 11,763,849
Total Financial Assistance $ 28,415,620 $ 388,778,009 $ 417,193,629
247

PASSAIC PUBLIC SCHOOLS NOTES TO THE SCHEDULES OF EXPENDITURES OF FEDERAL AWARDS AND STATE FINANCIAL ASSISTANCE FOR THE FISCAL YEAR ENDED JUNE 30, 2020
NOTE 4 RELATIONSHIP TO FEDERAL AND STATE FINANCIAL REPORTS
EXHIBIT K-5
Amounts reported in the accompanying schedules may not necessarily agree with the amounts reported in the related federal and state financial reports due to timing differences between the District's fiscal year and grant program years.
NOTE 5 OTHER INFORMATION
Revenues and expenditures reported under the Food Distribution Program as non-cash assistance represent current year value received and current year distributions, respectively. TPAF Social Security contributions in the amount of$8,301,798 represents the amount reimbursed by the State for the employer's share of social security contributions for TP AF members for the fiscal year ended June 30, 2020. The amount reported as TPAF Pension System Contributions in the amount of $22,114,672, TPAF Post-Retirement Medical Benefits Contributions in the amount of $8,204,140 and TPAF Long-Term Disability Insurance in the amount of $16,569 represents the amount paid by the State on behalf of the District for the fiscal year ended June 30, 2020. The School Development Authority's ("SDA'') Educational Facilities Construction and Financing Act on-behalf payments totaling $70,242,083 represent the amounts paid by SDA on behalf of the District for the facility project expenditures of the District for the fiscal year ended June 30, 2020.
NOTE 6 ON-BEHALF PROGRAMS NOT SUBJECT TO STATE SINGLE AUDIT
On-behalf State Programs for TPAF Pension,_ Post-Retirement Medical Benefits and Long-Term Disability Insurance Contributions as well as on-behalf School Development Authority Educational Facility Construction and Financing Act Program payments are not subject to a State single audit and, therefore, are excluded from major program determination. The Schedule of State Financial Assistance provides a reconciliation of State fmancial assistance reported in the District's fmancial statements and the amount subject to State single audit and major program determination.
NOTE 7 SCHOOL WIDE PROGRAM FUNDS
Schoolwide programs are not separate federal programs as defmed in U.S. Unifonn Guidance; amounts used in schoolwide programs (i.e., school based budgets) are included in the total expenditures of the program contributing the funds in the Schedule of Expenditure of Federal Awards. The following funds by program are included in schoolwide programs in the District.
Federal Program
Title I, Part A: Grants to Local Educational Agencies Title ill, Part A: English Language Acquisition State Grants
Total
NOTE 8 DE l\!J1NIMIS INDIRECT COST RATE
Amount
$8,076,659 388,365
$8.465.024
The District has not elected to use the 10 percent de minimis indirect cost rate allowed under the Uniform Guidance.
248

EXHIBITK-6 PASSAIC PUBLIC SCHOOLS
SCHEDULE OF FINDINGS AND QUESTIONED COSTS FOR THE FISCAL YEAR ENDED JUNE 30, 2020
Part I- Summary of Auditor's Results
Financial Statement
Type of auditors' report issued:
Internal control over financial reporting:
1) Material weakness identified?
2) Significant deficiencies identified?
Noncompliance material to basic financial
statements noted?
Federal Awards
Internal control over compliance:
1) Material weakness identified?
2) Significant deficiencies identified?
Type of auditor's report issued on compliance for
major programs:
Any audit findings disclosed that are required to be reported
in accordance with 2 CFR 200 section .516 (a) of Uniform Guidance?
Identification of major federal programs:
CFDA Number(s)
84.027
84.173
10.553
10.555
10.555
10.559
84.010
93.778
Dollar threshold used to distinguish between
Type A and Type B programs:
Auditee qualified as low-risk auditee?
FAINNumber(s)
H027Al80100
H173A180114
201NJ304N1099
201NJ304Nl099
201NJ304Nl099
201NJ304N1099
S011A190030
2005NJ5MAP
249
Unmodified
____ yes
____ yes
____ yes
____ yes
____ yes
Unmodified
____ yes
X no ----__ X __ none reported
X no ----
X no ----
X nonereported _ __..;;..;;....__
X no ----
Name of Federal Program or Cluster
IDEA Basic
IDEA Preschool
School Breakfast Program
National School Lunch Program
After School Snack Program
Summer Food Service Program
Title I
Medical Assistance Program (SEMI)
$ 855,197
__ X __ yes no ----

PASSAIC PUBLIC SCHOOLS SCHEDULE OF FINDINGS AND QUESTIONED COSTS
FOR THE FISCAL YEAR ENDED JUNE 30, 2020
Part I- Summary of Auditor's Results
State Awards
Dollar threshold used to distinguish between
Type A and Type B programs:
Auditee qualified as low-risk auditee?
Internal Control over major programs:
$ 3,000,000
__ X __ yes
EXHIBIT K-6
no ----
1) Material weakness(es) identified? ____ yes _ _;:.;X __ no
2) Significant deficiencies identified that
are not considered to be material weaknesses?
Type of auditors' report issued on compliance for major programs:
Any audit findings disclosed that are required to be reported
in accordance with N.J. OMB Circular Letter 15-08?
Identification of major state programs:
State Grant/Project Number(s)
495-034-5120-078
495-034-5120-083
495-034-5120-089
495-034-5120-084
495-034-5094-003
495-034-5120-044
495-034-5120-086
250
____ yes none reported ----X
Unmodified
____ yes none ----X
Name of State Program
Equalization Aid
Education Adequacy Aid
Special Education Aid
Security Aid
TP AF Social Security Tax
Extraordinary Aid
Preschool Education Aid

PASSAIC PUBLIC SCHOOLS SCHEDULE OF FINDINGS .AND QUESTIONED COSTS
FOR THE FISCAL YEAR ENDED JUNE 30, 2020
Part 2 - Schedule of Financial Statement Findings
EXIDBITK-7
This section identifies the significant deficiencies, material weaknesses, fraud, illegal ads, violations of provisions of contracts and grant agreements and abuse related to the financial statements for which Govemment Auditing Standards.
There are none.
251

PASSAIC PUBLIC SCHOOLS SCHEDULE OF FINDINGS AND QUESTIONED COSTS
FOR THE FISCAL YEAR ENDED JUNE 30, 2020
EXHIBITK-7
Part 3- Schedule of Federal Award and State Assistance Findings and Questioned Costs
This section identifies the significant deficiencies, material weaknesses and instances of noncompliance, including questioned costs, related to the audit of major federal and state programs, as required by U.S. Uniform Guidance and New Jersey OMB Circular 15-08.
CURRENT YEAR FEDERAL AWARDS
There are none.
CURRENTYEARSTATEAWARDS
There are none.
252

PASSAIC PUBLIC SCHOOLS SUMMARY SCHEDULE OF PRIOR AUDIT FINDINGS
FOR THE FISCAL YEAR ENDED JUNE 30, 2020
EXHIBITK-8
This section identifies the status of prior-year findings related to the basic financial statements and federal and state awards that are required to be reported in accordance with Chapter 6.12 of Government Auditing Standards, U.S. Uniform Guidance and NJ OMB Circular 15-08.
STATUS OF PRIOR YEAR FINDINGS
There were none.
253