

James W. Brody, Esq. Chairman of Mortgage Banking Group ...
56
James W. Brody, Esq. Chairman of Mortgage Banking Group Johnston | Thomas, Attorneys at Law, P.C. T: 415/246-3995 E: [email protected] Thursday, May 10, 2018 10:30 a.m. PST/1:30 p.m. EST
-
Upload
khangminh22 -
Category
Documents
-
view
2 -
download
0
Transcript of James W. Brody, Esq. Chairman of Mortgage Banking Group ...

James W. Brody, Esq.Chairman of Mortgage Banking Group
Johnston | Thomas, Attorneys at Law, P.C.T: 415/246-3995
Thursday, May 10, 201810:30 a.m. PST/1:30 p.m. EST
Important Notice(s): Johnston Thomas, Attorneys at Law, P.C. (“JohnstonThomas”) makes available the information ("Information") in this presentation(“Presentation”) for general informational purposes only. The Information isnot intended to constitute, and does not constitute, legal advice or a solicitationfor the formation of an attorney-client relationship. No attorney-clientrelationship is created through your use of or your receipt of the Informationcontained within the Presentation. Johnston Thomas accepts clients only inaccordance with certain formal procedures, and renders legal advice only afterthe completion of those procedures, and/or completion and execution of anappropriate retainer agreement.
Any and all statements made by the moderator and the presenters, as part ofthis webinar program, reflect his or her own viewpoint and not necessarily thatof the program host, Johnston Thomas.
2
Johnston Thomas is a full suite boutique law firm, which amongst other practices such as real estate andcommercial litigation, has a nationally recognized Mortgage Banking Practice Group. With an experiencedteam of mortgage banking lawyers (including senior litigation attorneys, former in-house General Counseland in-house Compliance Counsel from a well-known bank and mortgage company, etc.), certified fraudexaminer(s) and forensic underwriter(s), and an extremely competent support staff, all of whom arededicated to aggressively and competently serving the needs of our valued clientele, Johnston Thomas’Mortgage Banking Practice Group is known all across the country for the experience and results that it bringsto the areas of regulatory compliance, mortgage banking litigation, and a broad range of mitigation services.
Amongst the many legal services Johnston Thomas offers the mortgage banking industry (e.g., brokers, lenders, servicers, vendors and more), such include, but are in no way limited to, as follows:
Mortgage Repurchase and Make-Whole Indemnification Litigation and Mitigation (e.g., Secondary Market Investors, Agencies, etc.)
Mortgage Industry Litigation (e.g., Servicer and Sub-Servicer Disputes, 3rd Party Fraud Recovery, CPL and Title Policy Actions, Appraiser E&O Claims, Loan Officer Actions, etc.
Mortgage Repurchase and Make-Whole Alternative Dispute Resolution (e.g., Arbitration, Mediation, etc.)
Regulatory Compliance, Administrative and Business Services (e.g., Mock Audits, LO Compensation, MSAs, Licensing, CA Dep’t of Business Oversight, HUD Review Board, etc.)
Transactional Matters (e.g., Drafting and Negotiating Broker and Correspondent Loan Purchase Agreements, Mergers & Acquisitions, etc.)
3
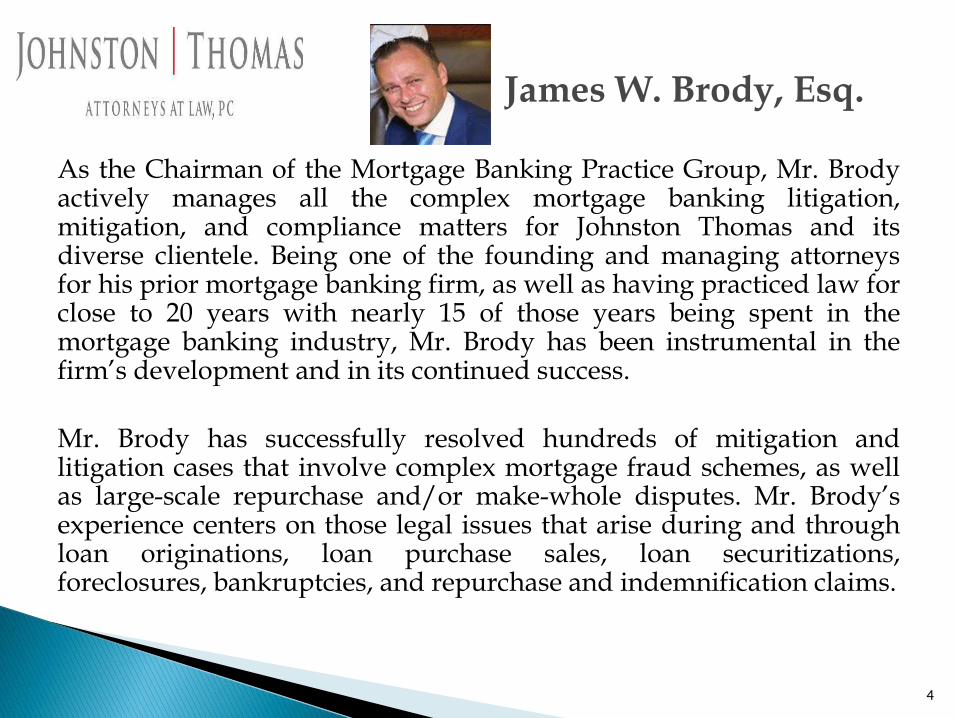
As the Chairman of the Mortgage Banking Practice Group, Mr. Brodyactively manages all the complex mortgage banking litigation,mitigation, and compliance matters for Johnston Thomas and itsdiverse clientele. Being one of the founding and managing attorneysfor his prior mortgage banking firm, as well as having practiced law forclose to 20 years with nearly 15 of those years being spent in themortgage banking industry, Mr. Brody has been instrumental in thefirm’s development and in its continued success.
Mr. Brody has successfully resolved hundreds of mitigation andlitigation cases that involve complex mortgage fraud schemes, as wellas large-scale repurchase and/or make-whole disputes. Mr. Brody’sexperience centers on those legal issues that arise during and throughloan originations, loan purchase sales, loan securitizations,foreclosures, bankruptcies, and repurchase and indemnification claims.
James W. Brody, Esq.
4
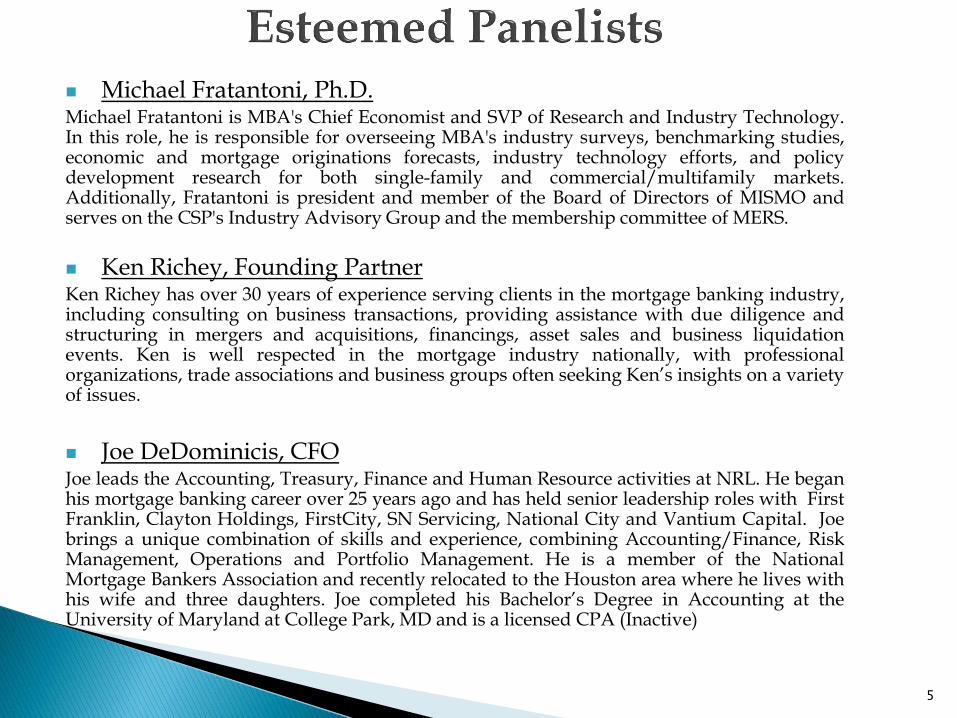
◼ Michael Fratantoni, Ph.D.Michael Fratantoni is MBA's Chief Economist and SVP of Research and Industry Technology.In this role, he is responsible for overseeing MBA's industry surveys, benchmarking studies,economic and mortgage originations forecasts, industry technology efforts, and policydevelopment research for both single-family and commercial/multifamily markets.Additionally, Fratantoni is president and member of the Board of Directors of MISMO andserves on the CSP's Industry Advisory Group and the membership committee of MERS.
◼ Ken Richey, Founding PartnerKen Richey has over 30 years of experience serving clients in the mortgage banking industry,including consulting on business transactions, providing assistance with due diligence andstructuring in mergers and acquisitions, financings, asset sales and business liquidationevents. Ken is well respected in the mortgage industry nationally, with professionalorganizations, trade associations and business groups often seeking Ken’s insights on a varietyof issues.
◼ Joe DeDominicis, CFOJoe leads the Accounting, Treasury, Finance and Human Resource activities at NRL. He beganhis mortgage banking career over 25 years ago and has held senior leadership roles with FirstFranklin, Clayton Holdings, FirstCity, SN Servicing, National City and Vantium Capital. Joebrings a unique combination of skills and experience, combining Accounting/Finance, RiskManagement, Operations and Portfolio Management. He is a member of the NationalMortgage Bankers Association and recently relocated to the Houston area where he lives withhis wife and three daughters. Joe completed his Bachelor’s Degree in Accounting at theUniversity of Maryland at College Park, MD and is a licensed CPA (Inactive)
5
8
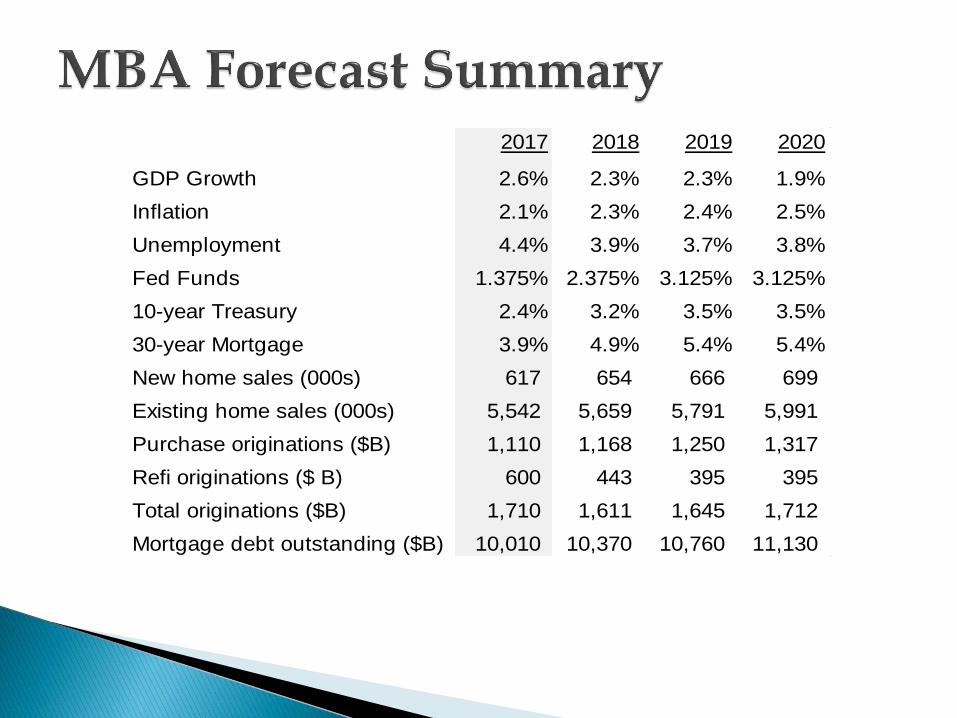
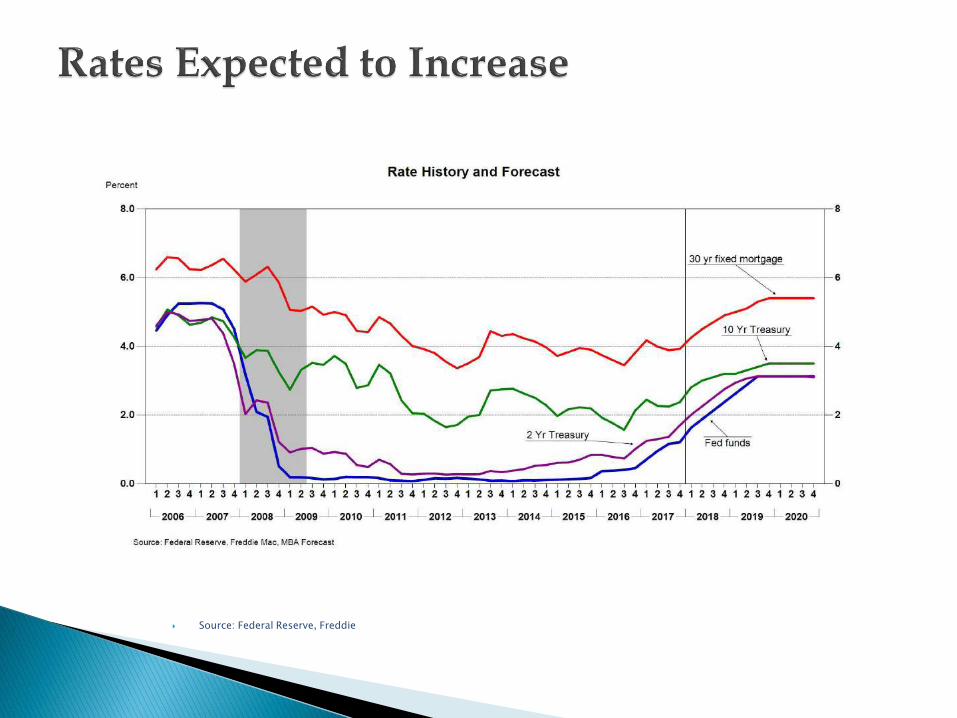
Source: MBA Forecast
2017 2018 2019 2020
GDP Growth 2.6% 2.3% 2.3% 1.9%
Inflation 2.1% 2.3% 2.4% 2.5%
Unemployment 4.4% 3.9% 3.7% 3.8%
Fed Funds 1.375% 2.375% 3.125% 3.125%
10-year Treasury 2.4% 3.2% 3.5% 3.5%
30-year Mortgage 3.9% 4.9% 5.4% 5.4%
New home sales (000s) 617 654 666 699
Existing home sales (000s) 5,542 5,659 5,791 5,991
Purchase originations ($B) 1,110 1,168 1,250 1,317
Refi originations ($ B) 600 443 395 395
Total originations ($B) 1,710 1,611 1,645 1,712
Mortgage debt outstanding ($B) 10,010 10,370 10,760 11,130

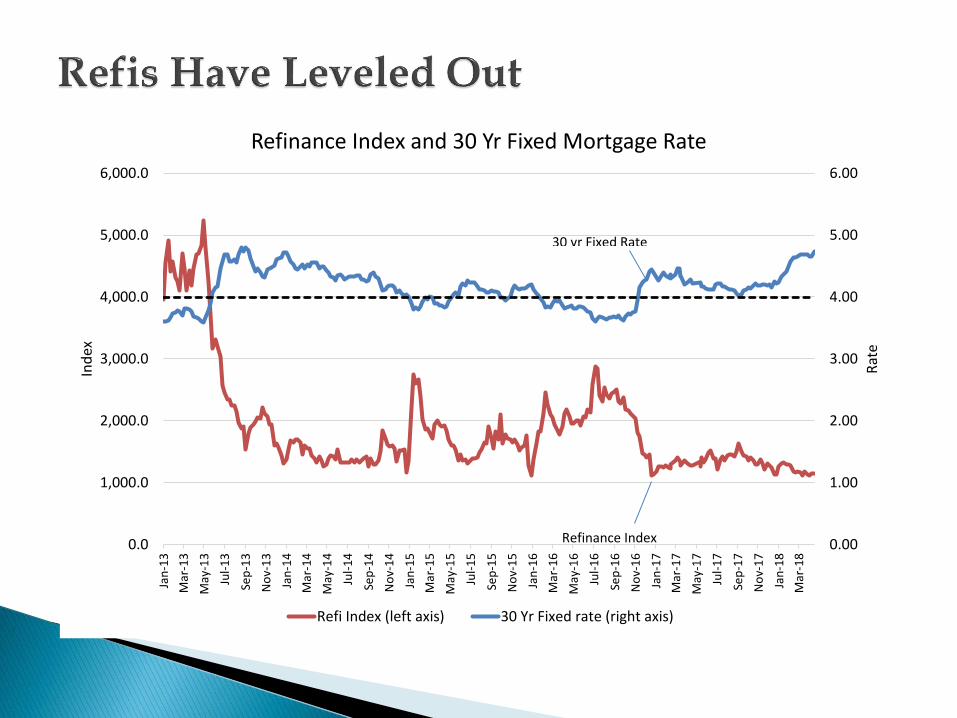
Source: MBA Weekly Applications Survey
8
0
50
100
150
200
250
300
350
1 3 5 7 9 11 13 15 17 19 21 23 25 27 29 31 33 35 37 39 41 43 45 47 49 51
Week of the Year
Purchase Mortgage Applications Index(by week of the year, NSA)
2014 2015 2016 2017 2018
Source: MBA Weekly Applications Survey
9
0.00
1.00
2.00
3.00
4.00
5.00
6.00
0.0
1,000.0
2,000.0
3,000.0
4,000.0
5,000.0
6,000.0Ja
n-1
3
Mar
-13
May
-13
Jul-
13
Sep
-13
No
v-1
3
Jan
-14
Mar
-14
May
-14
Jul-
14
Sep
-14
No
v-1
4
Jan
-15
Mar
-15
May
-15
Jul-
15
Sep
-15
No
v-1
5
Jan
-16
Mar
-16
May
-16
Jul-
16
Sep
-16
No
v-1
6
Jan
-17
Mar
-17
May
-17
Jul-
17
Sep
-17
No
v-1
7
Jan
-18
Mar
-18
Rat
e
Ind
ex
Refinance Index and 30 Yr Fixed Mortgage Rate
Refi Index (left axis) 30 Yr Fixed rate (right axis)
30 yr Fixed Rate
Refinance Index
Source: MBA Forecast
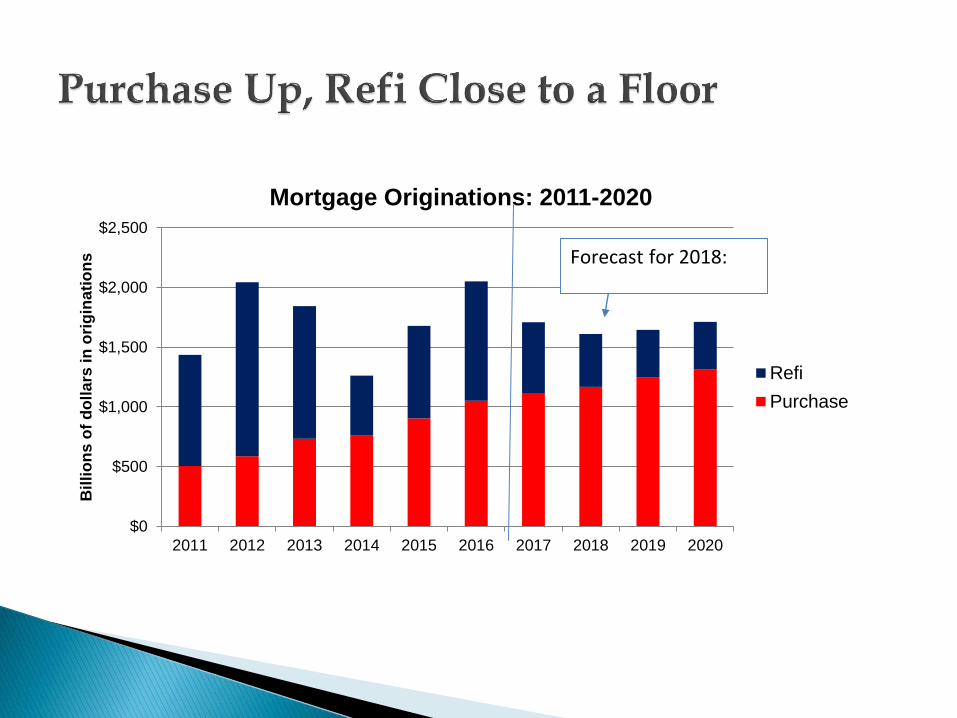
$0
$500
$1,000
$1,500
$2,000
$2,500
2011 2012 2013 2014 2015 2016 2017 2018 2019 2020
Bil
lio
ns
of
do
lla
rs in
ori
gin
ati
on
s
Mortgage Originations: 2011-2020
Refi
Purchase
Forecast for 2018:
Source: Federal Reserve, Freddie Mac, MBA
11

Source: NAR, MBA
12
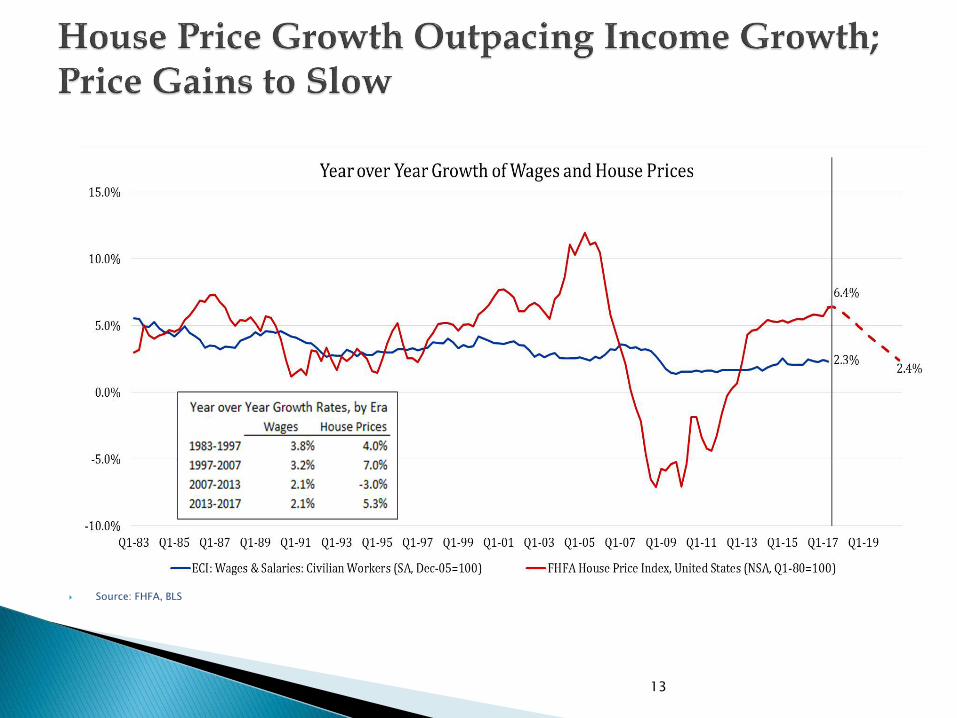
Source: FHFA, BLS
13
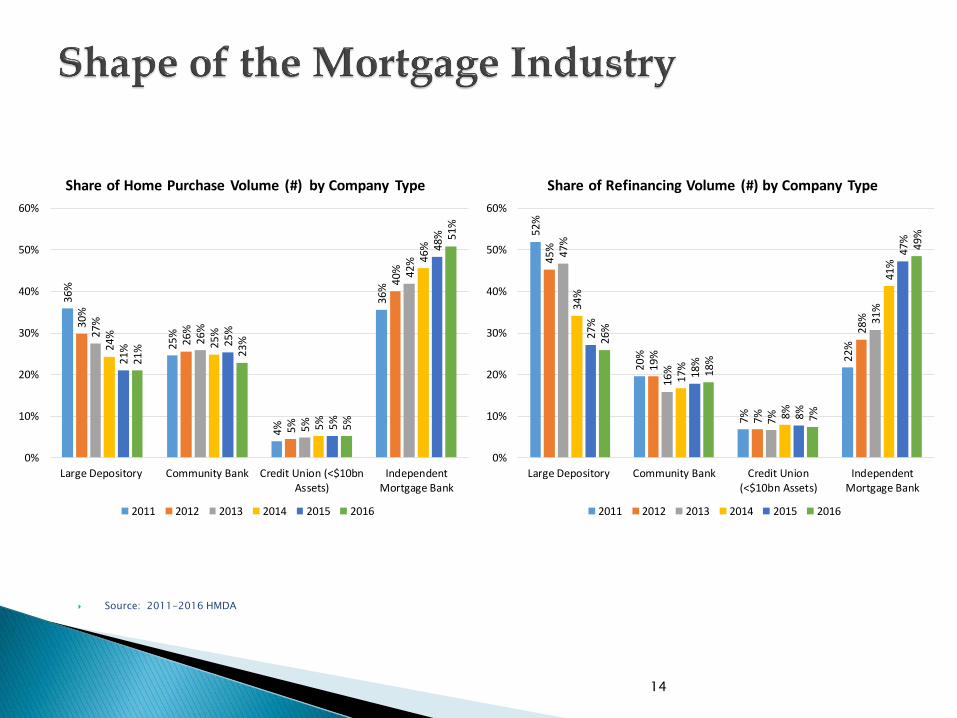
Source: 2011-2016 HMDA
14
36%
25
%
4%
36%
30%
26%
5%
40
%
27
%
26
%
5%
42%
24%
25
%
5%
46%
21
%
25
%
5%
48%
21% 23
%
5%
51
%0%
10%
20%
30%
40%
50%
60%
Large Depository Community Bank Credit Union (<$10bnAssets)
IndependentMortgage Bank
Share of Home Purchase Volume (#) by Company Type
2011 2012 2013 2014 2015 2016
52%
20
%
7%
22
%
45
%
19
%
7%
28
%
47
%
16%
7%
31
%34%
17%
8%
41%
27%
18%
8%
47%
26%
18%
7%
49
%
0%
10%
20%
30%
40%
50%
60%
Large Depository Community Bank Credit Union(<$10bn Assets)
IndependentMortgage Bank
Share of Refinancing Volume (#) by Company Type
2011 2012 2013 2014 2015 2016
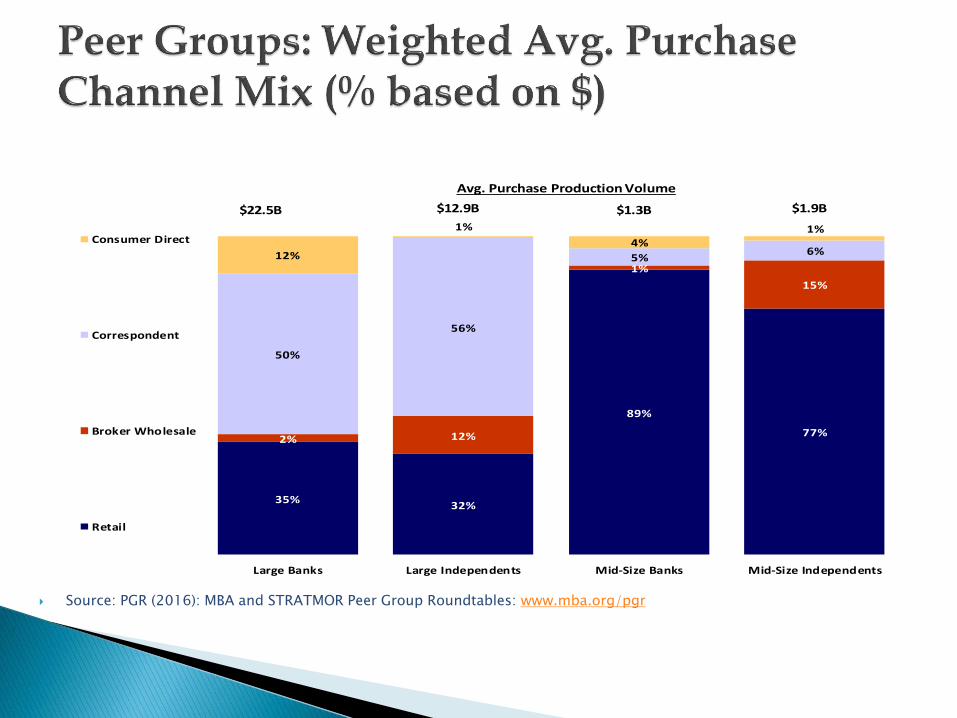
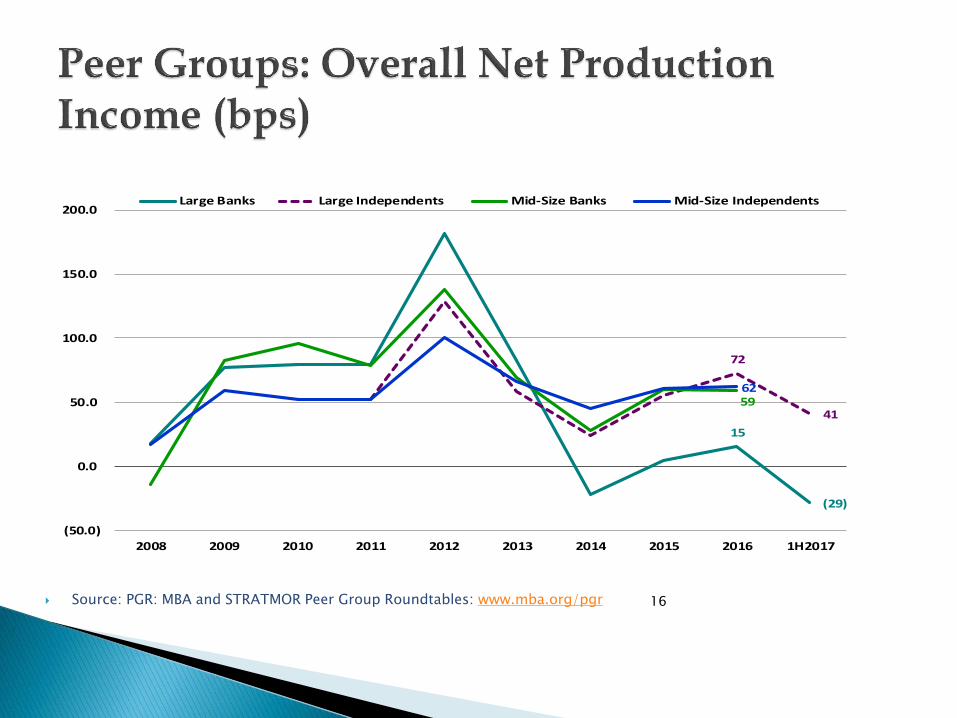
Source: PGR (2016): MBA and STRATMOR Peer Group Roundtables: www.mba.org/pgr 15
35%32%
89%
77%2% 12%
1%
15%
50%
56%
5%6%12%
1%
4%1%
Large Banks Large Independents Mid-Size Banks Mid-Size Independents
Consumer Direct
Correspondent
Broker Wholesale
Retail
Avg. Purchase Production Volume
$22.5B $12.9B $1.3B $1.9B
Source: PGR: MBA and STRATMOR Peer Group Roundtables: www.mba.org/pgr
15
(29)
72
415962
(50.0)
0.0
50.0
100.0
150.0
200.0
2008 2009 2010 2011 2012 2013 2014 2015 2016 1H2017
Large Banks Large Independents Mid-Size Banks Mid-Size Independents
16

17
107.4
86.5
74.6
38.2
8.7
(8.3)
45.7 42.1
32.1
60.4
67.3
55.3
21.6
33.2
72.6 73.7
24.0
10.4
45.7 40.5
9.3
$0
$100
$200
$300
$400
$500
$600
$700
$800
$900
Q412
Q113
Q213
Q313
Q413
Q114
Q214
Q314
Q414
Q115
Q215
Q315
Q415
Q116
Q216
Q316
Q416
Q117
Q217
Q317
Q417
Net Production Income (bps)
Avg. Production Volume ($M)
IMB Net Production Income (basis points)
Source: MBA’s Quarterly Mortgage Bankers Performance Report,
www.mba.org/performancereport
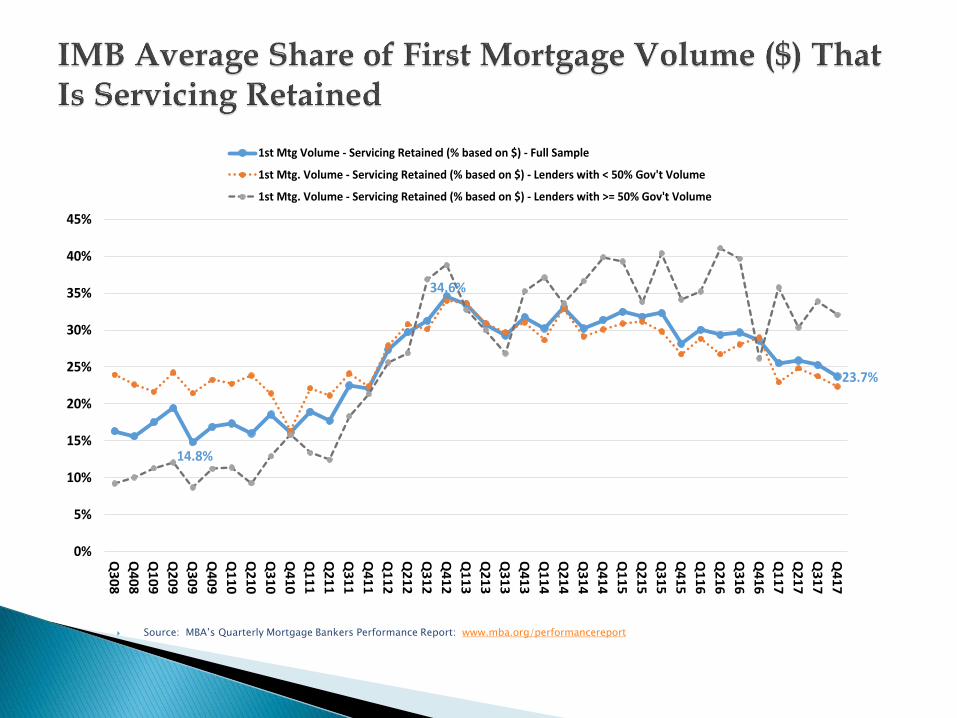
14.8%
34.6%
23.7%
0%
5%
10%
15%
20%
25%
30%
35%
40%
45%
Q3
08
Q4
08
Q1
09
Q2
09
Q3
09
Q4
09
Q1
10
Q2
10
Q3
10
Q4
10
Q1
11
Q2
11
Q3
11
Q4
11
Q1
12
Q2
12
Q3
12
Q4
12
Q1
13
Q2
13
Q3
13
Q4
13
Q1
14
Q2
14
Q3
14
Q4
14
Q1
15
Q2
15
Q3
15
Q4
15
Q1
16
Q2
16
Q3
16
Q4
16
Q1
17
Q2
17
Q3
17
Q4
17
1st Mtg Volume - Servicing Retained (% based on $) - Full Sample
1st Mtg. Volume - Servicing Retained (% based on $) - Lenders with < 50% Gov't Volume
1st Mtg. Volume - Servicing Retained (% based on $) - Lenders with >= 50% Gov't Volume
Source: MBA’s Quarterly Mortgage Bankers Performance Report: www.mba.org/performancereport

216
43 41
523
268 278
($250)
($150)
($50)
$50
$150
$250
$350
$450
$550
$650
Net Financial Income Net Operating Income
Source: MBA’s Servicing Operations Study and Forum (Prime Servicers): www.mba.org/sosf; PGR 1H2017
20
Tricia Migliazzo
Vice President, Member Engagement
https://www.mba.org/
202-557-2858
https://www.mba.org/members/member-resources/member-benefits
8
Ken RicheyFounding Partner
Business Advisory Partner, has over 30 years of experienceserving clients in the mortgage banking industry, includingconsulting on business transactions, providing assistance withdue diligence and structuring in mergers and acquisitions,financings, asset sales and business liquidation events. Ken iswell respected in the mortgage industry nationally, withprofessional organizations, trade associations and businessgroups often seeking Ken’s insights on a variety of issues.
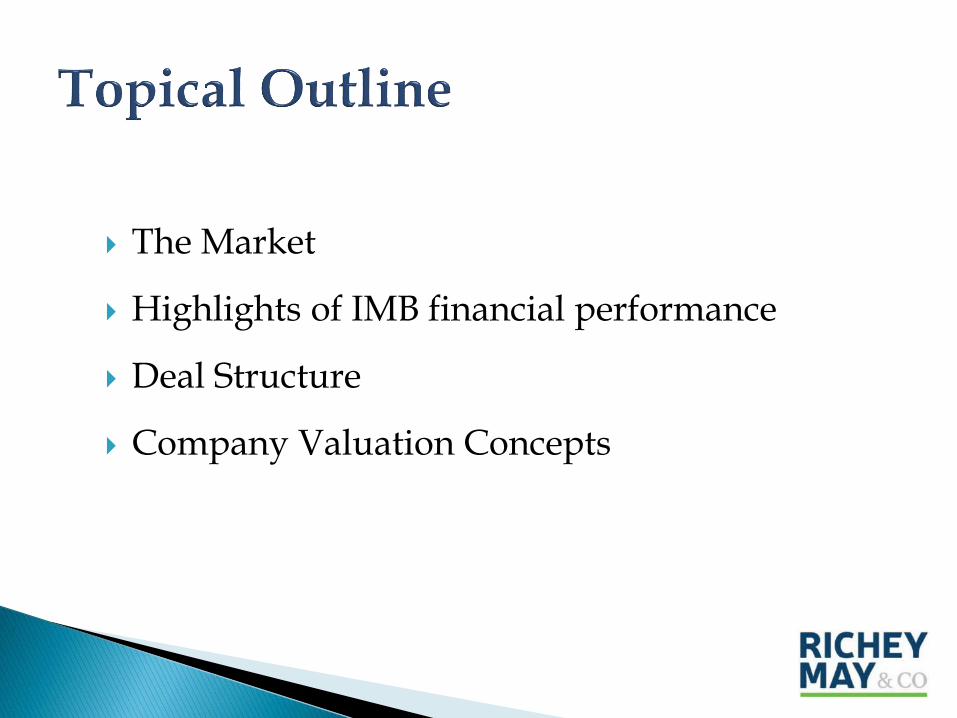
The Market
Highlights of IMB financial performance
Deal Structure
Company Valuation Concepts

What factors are driving the current M&A environment?
Is consolidation picking up or slowing down?
Is it still a seller’s market?
For how long?
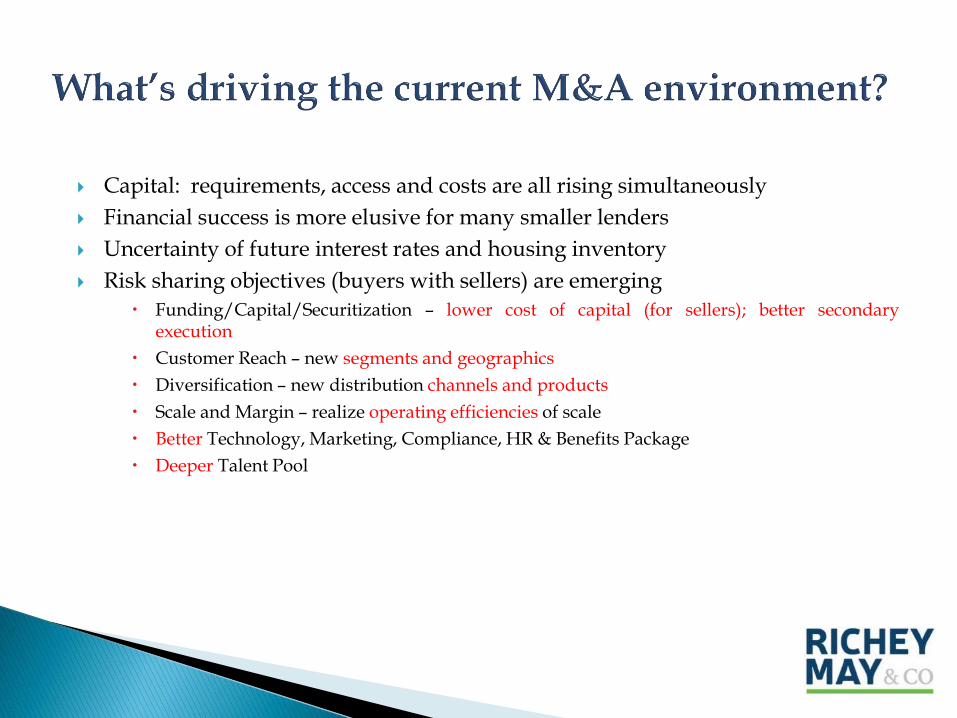
Capital: requirements, access and costs are all rising simultaneously
Financial success is more elusive for many smaller lenders
Uncertainty of future interest rates and housing inventory
Risk sharing objectives (buyers with sellers) are emerging
Funding/Capital/Securitization – lower cost of capital (for sellers); better secondaryexecution
Customer Reach – new segments and geographics
Diversification – new distribution channels and products
Scale and Margin – realize operating efficiencies of scale
Better Technology, Marketing, Compliance, HR & Benefits Package
Deeper Talent Pool
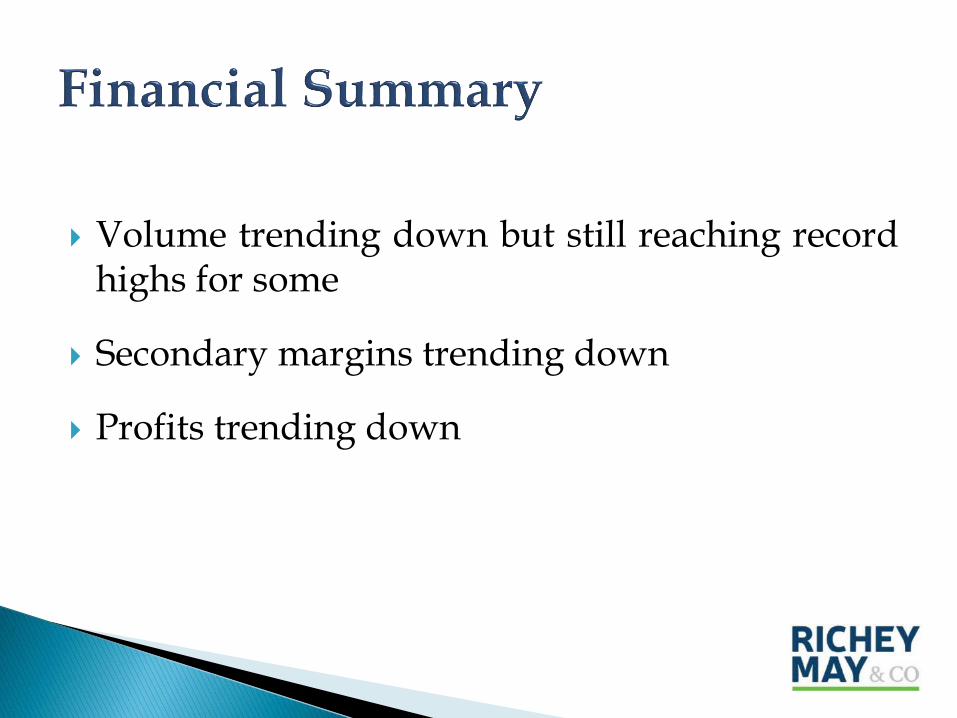
Volume trending down but still reaching recordhighs for some
Secondary margins trending down
Profits trending down
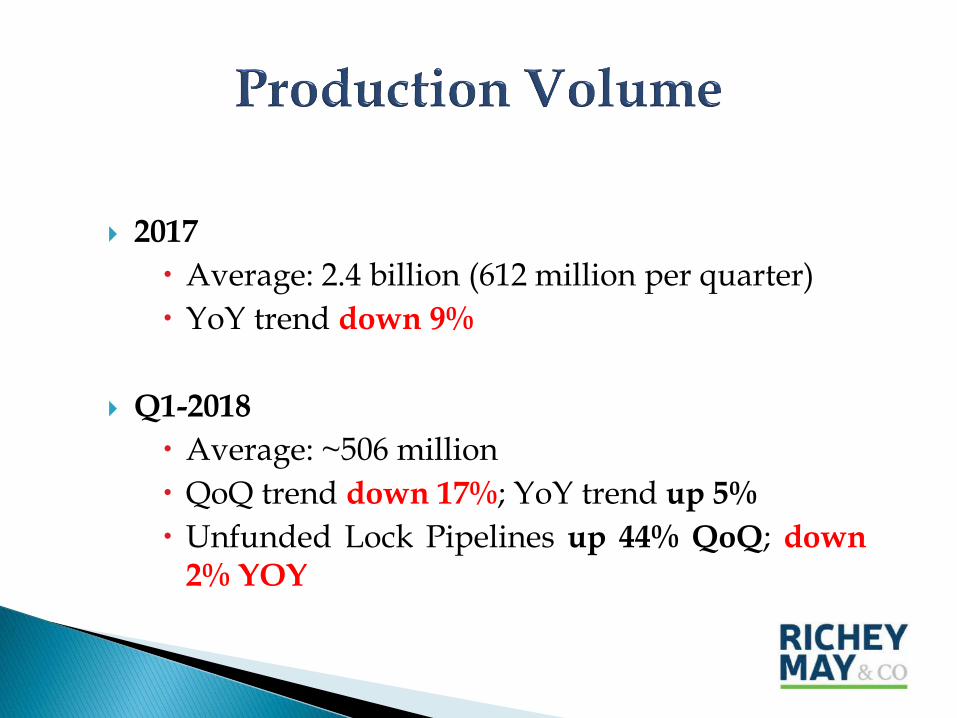
2017
Average: 2.4 billion (612 million per quarter)
YoY trend down 9%
Q1-2018
Average: ~506 million
QoQ trend down 17%; YoY trend up 5%
Unfunded Lock Pipelines up 44% QoQ; down2% YOY
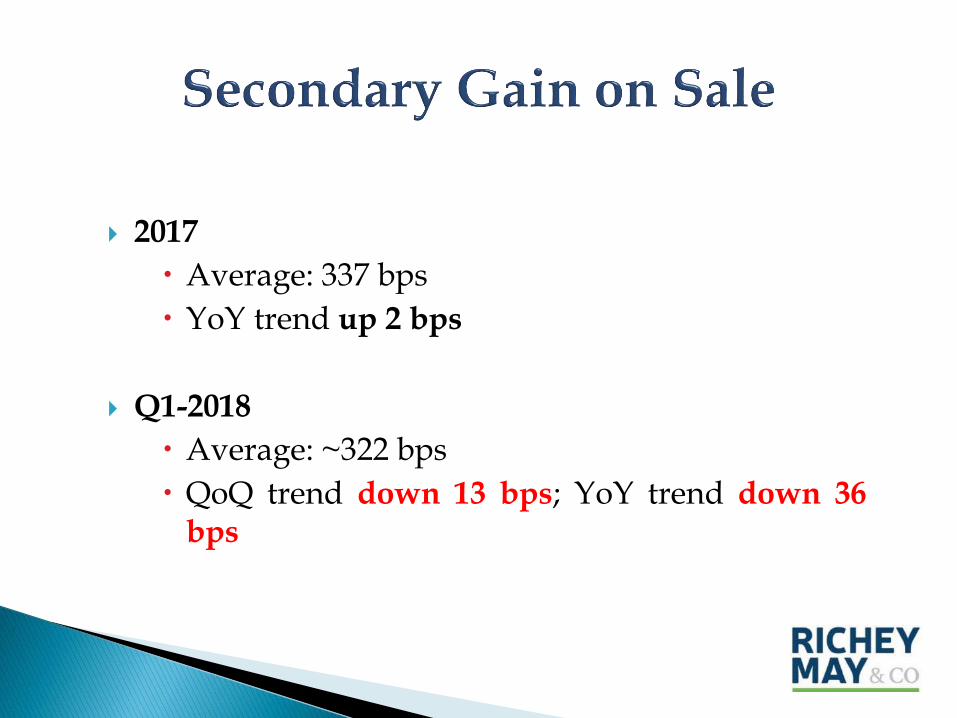
2017
Average: 337 bps
YoY trend up 2 bps
Q1-2018
Average: ~322 bps
QoQ trend down 13 bps; YoY trend down 36bps

2017
Average: $8,214 per loan
YoY trend up $728 per loan
Q1-2018
Average: ~$8,993 per loan
QoQ trend up $695; YoY trend up $172
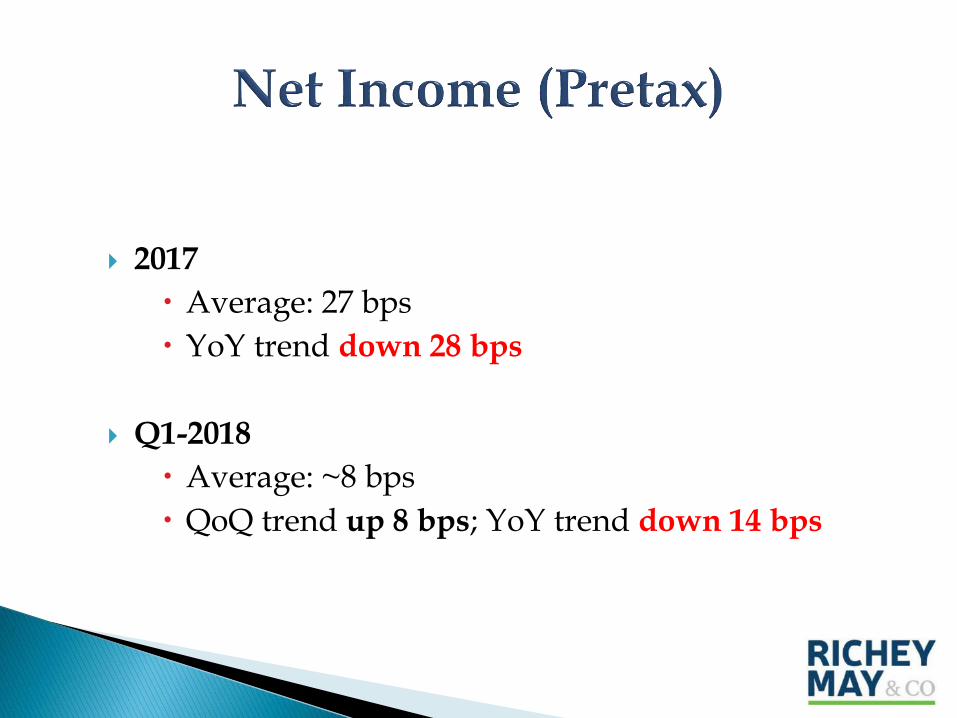
2017
Average: 27 bps
YoY trend down 28 bps
Q1-2018
Average: ~8 bps
QoQ trend up 8 bps; YoY trend down 14 bps
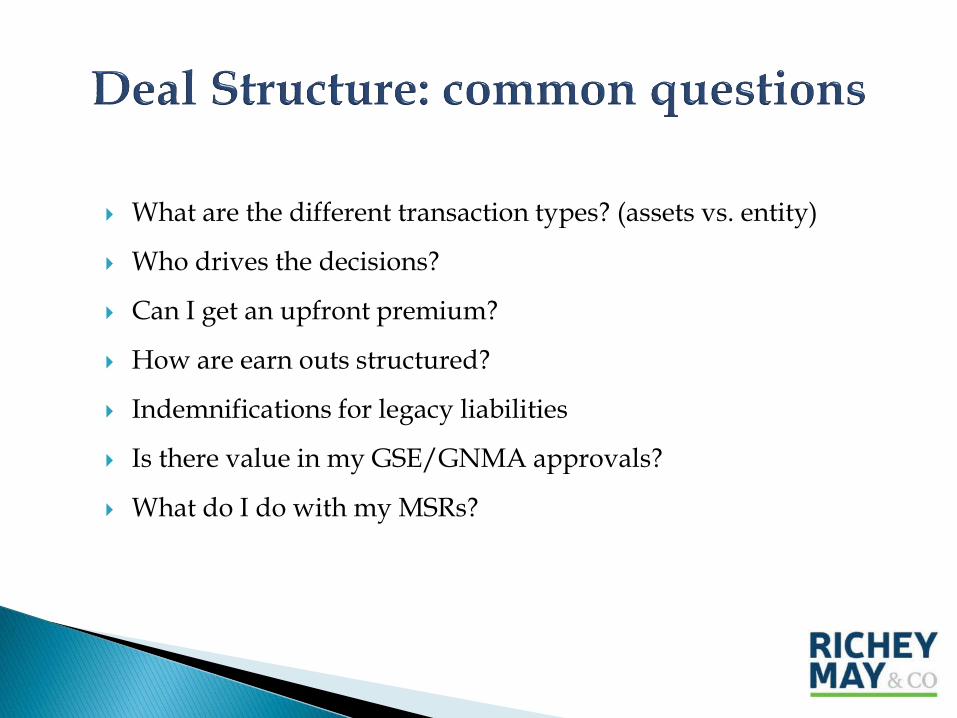
What are the different transaction types? (assets vs. entity)
Who drives the decisions?
Can I get an upfront premium?
How are earn outs structured?
Indemnifications for legacy liabilities
Is there value in my GSE/GNMA approvals?
What do I do with my MSRs?
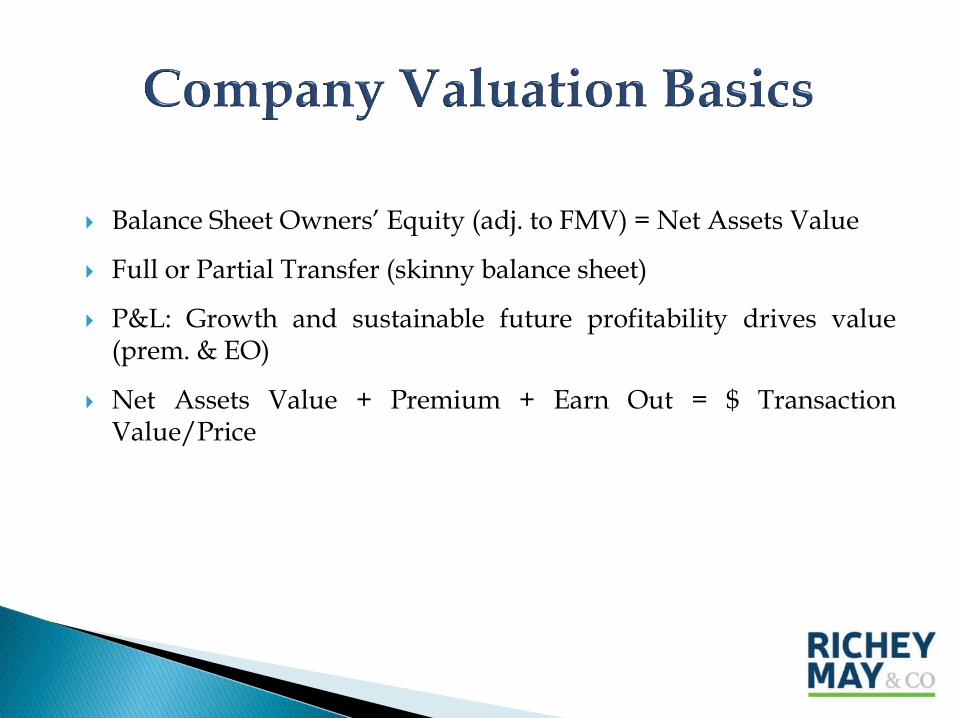
Balance Sheet Owners’ Equity (adj. to FMV) = Net Assets Value
Full or Partial Transfer (skinny balance sheet)
P&L: Growth and sustainable future profitability drives value(prem. & EO)
Net Assets Value + Premium + Earn Out = $ TransactionValue/Price

• Valuation is based on after tax cash flows
◦ – Investors consider corporate and personal taxes
◦ – TCJA lowers taxes
◦ – Valuations, generally, are expected to increase
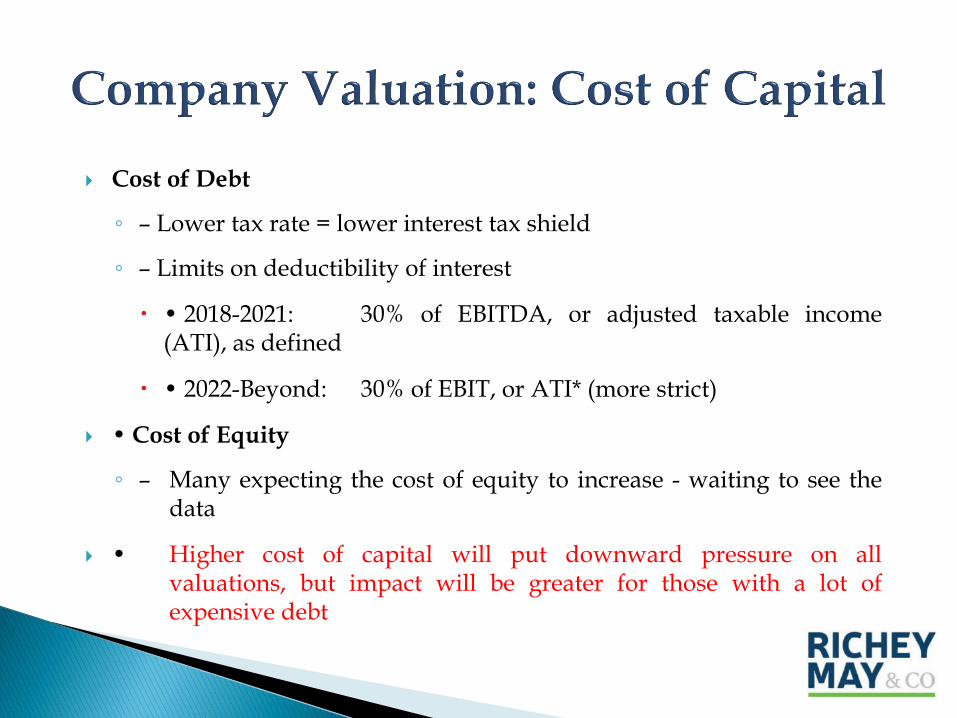
Cost of Debt
◦ – Lower tax rate = lower interest tax shield
◦ – Limits on deductibility of interest
• 2018-2021: 30% of EBITDA, or adjusted taxable income(ATI), as defined
• 2022-Beyond: 30% of EBIT, or ATI* (more strict)
• Cost of Equity
◦ – Many expecting the cost of equity to increase - waiting to see thedata
• Higher cost of capital will put downward pressure on allvaluations, but impact will be greater for those with a lot ofexpensive debt

First-time, or less experienced buyers with strong equity and liquidity
Mature, repeat buyers are getting more astute and skilled at transaction execution and integration
Very anxious to buy retail, purchase production especially where significant synergies & profitability enhancement opportunities exist
Wider discrepancies in buyers’ financial performance compared to peers potentially yielding greater discrepancies between buyers’ bid prices and terms
Some buyers willing to pay bps x production as portion of earn out (less seller risk)
Earn outs based on forward pretax income under new platform is most common (1 to 3x+)
Slightly longer earn out periods
Some very aggressive closing premiums where appropriate attributes & value is present
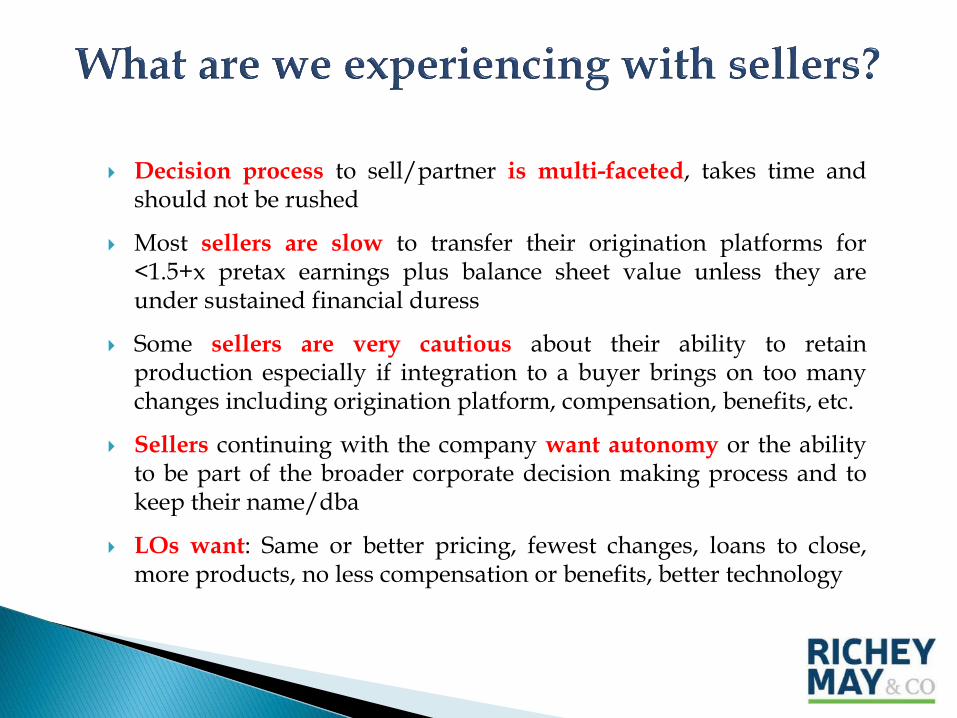
Decision process to sell/partner is multi-faceted, takes time andshould not be rushed
Most sellers are slow to transfer their origination platforms for<1.5+x pretax earnings plus balance sheet value unless they areunder sustained financial duress
Some sellers are very cautious about their ability to retainproduction especially if integration to a buyer brings on too manychanges including origination platform, compensation, benefits, etc.
Sellers continuing with the company want autonomy or the abilityto be part of the broader corporate decision making process and tokeep their name/dba
LOs want: Same or better pricing, fewest changes, loans to close,more products, no less compensation or benefits, better technology
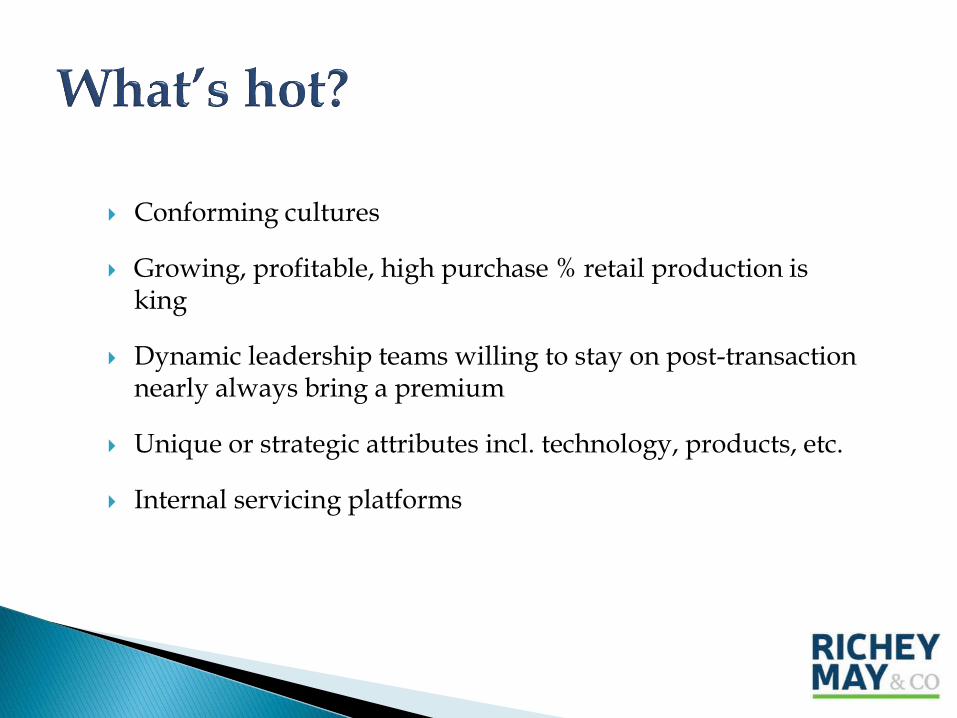
Conforming cultures
Growing, profitable, high purchase % retail production is king
Dynamic leadership teams willing to stay on post-transaction nearly always bring a premium
Unique or strategic attributes incl. technology, products, etc.
Internal servicing platforms
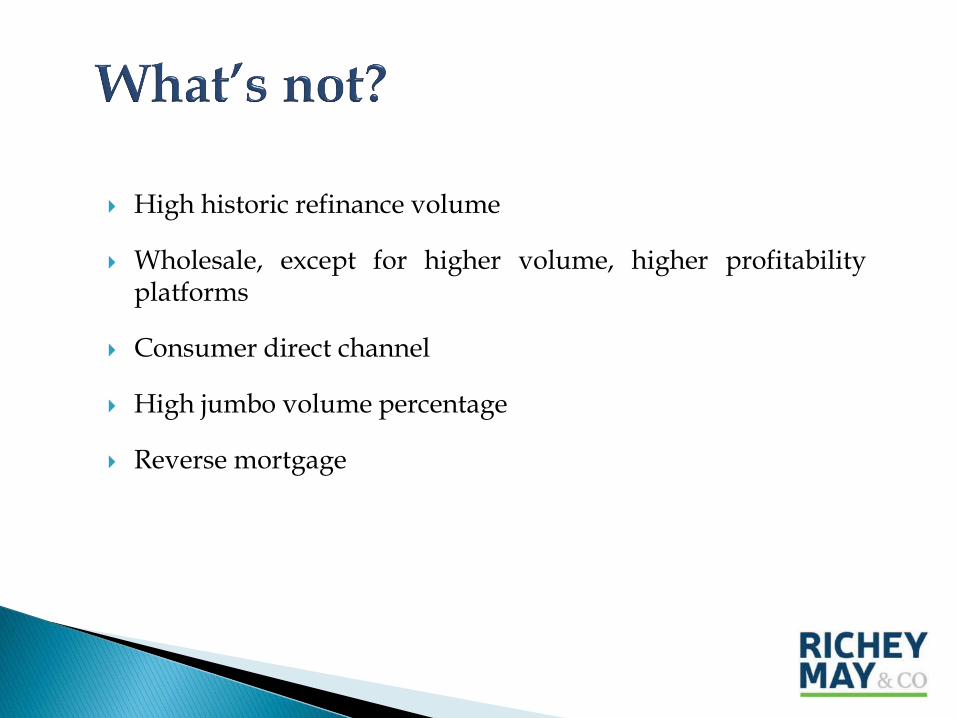
High historic refinance volume
Wholesale, except for higher volume, higher profitabilityplatforms
Consumer direct channel
High jumbo volume percentage
Reverse mortgage
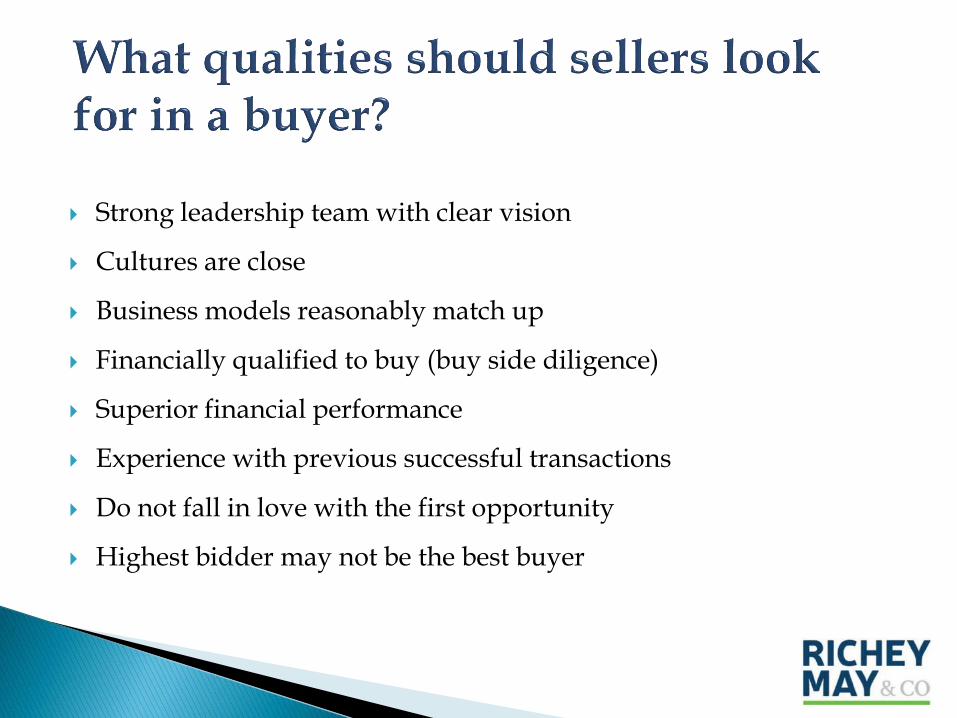
Strong leadership team with clear vision
Cultures are close
Business models reasonably match up
Financially qualified to buy (buy side diligence)
Superior financial performance
Experience with previous successful transactions
Do not fall in love with the first opportunity
Highest bidder may not be the best buyer
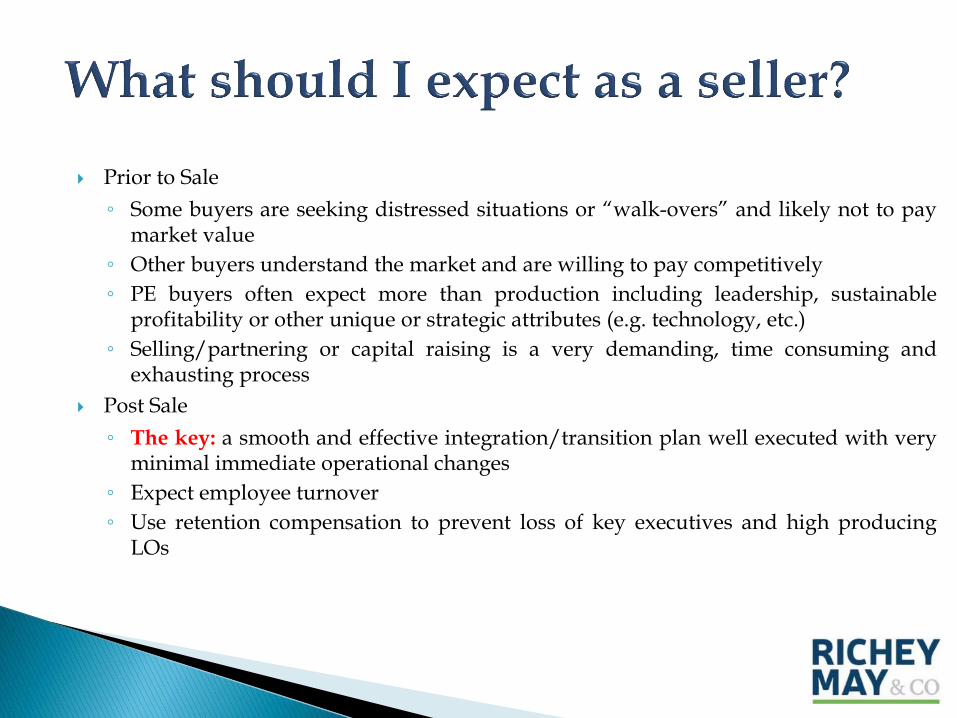
Prior to Sale
◦ Some buyers are seeking distressed situations or “walk-overs” and likely not to paymarket value
◦ Other buyers understand the market and are willing to pay competitively
◦ PE buyers often expect more than production including leadership, sustainableprofitability or other unique or strategic attributes (e.g. technology, etc.)
◦ Selling/partnering or capital raising is a very demanding, time consuming andexhausting process
Post Sale
◦ The key: a smooth and effective integration/transition plan well executed with veryminimal immediate operational changes
◦ Expect employee turnover
◦ Use retention compensation to prevent loss of key executives and high producingLOs

WWW.SLIDEFOREST.COM
43
NRL MORTGAGENRLMORTGAGE.COM
Presented By: Joe DeDominicis
WWW.SLIDEFOREST.COM
44
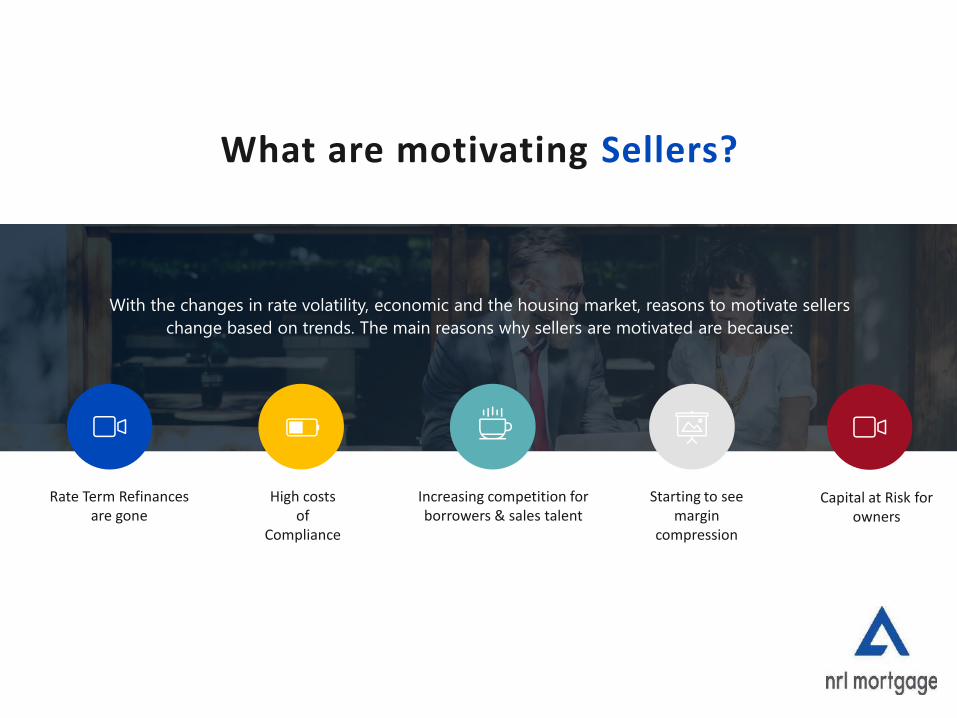
Starting to see margin
compression
Rate Term Refinances are gone
High costs of
Compliance
Increasing competition for borrowers & sales talent
With the changes in rate volatility, economic and the housing market, reasons to motivate sellers
change based on trends. The main reasons why sellers are motivated are because:
What are motivating Sellers?
Capital at Risk for owners
WWW.SLIDEFOREST.COM
45
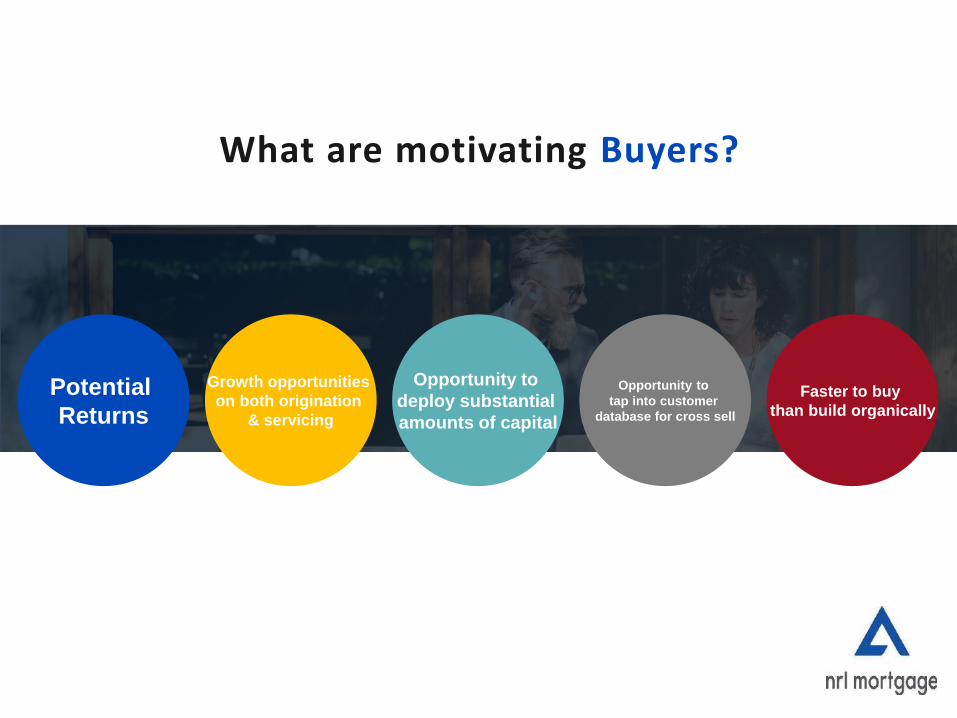
Opportunity to
deploy substantial
amounts of capital
Opportunity to
tap into customer
database for cross sell
Potential
Returns
Growth opportunities
on both origination
& servicing
What are motivating Buyers?
Faster to buy
than build organically

WWW.SLIDEFOREST.COM
46
Small to Medium Sized Banks
PE Firms
Medium to Large IMB’s
Who are the Buyers?
WWW.SLIDEFOREST.COM
47
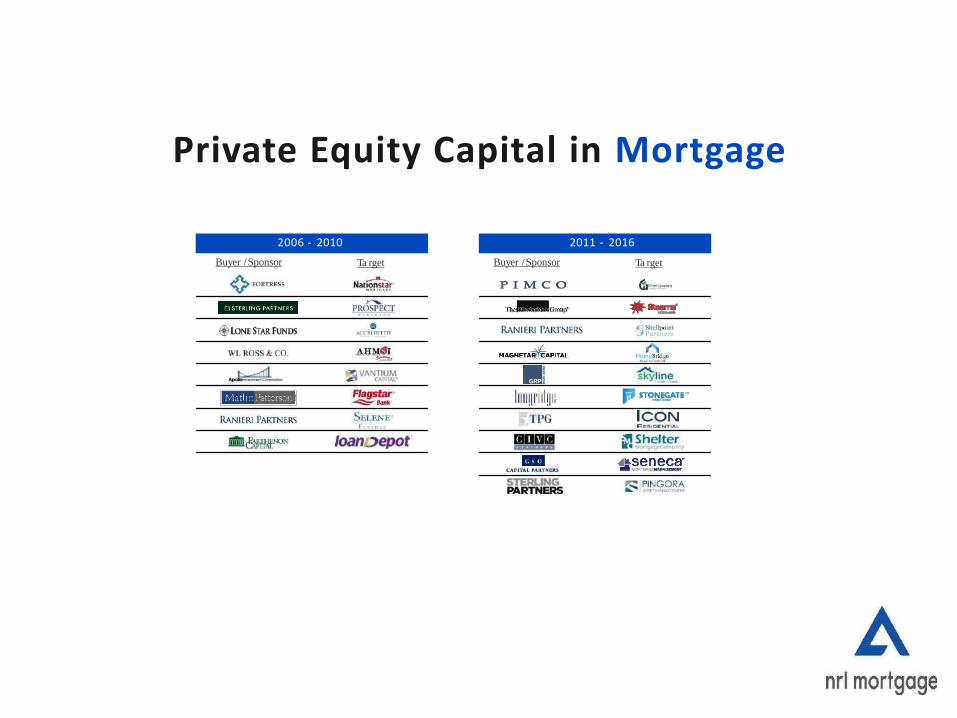
Buyer /Sponsor Buyer /SponsorTa rget Ta rget
6
2011 - 20162006 - 2010
Private Equity Capital in Mortgage
WWW.SLIDEFOREST.COM
48
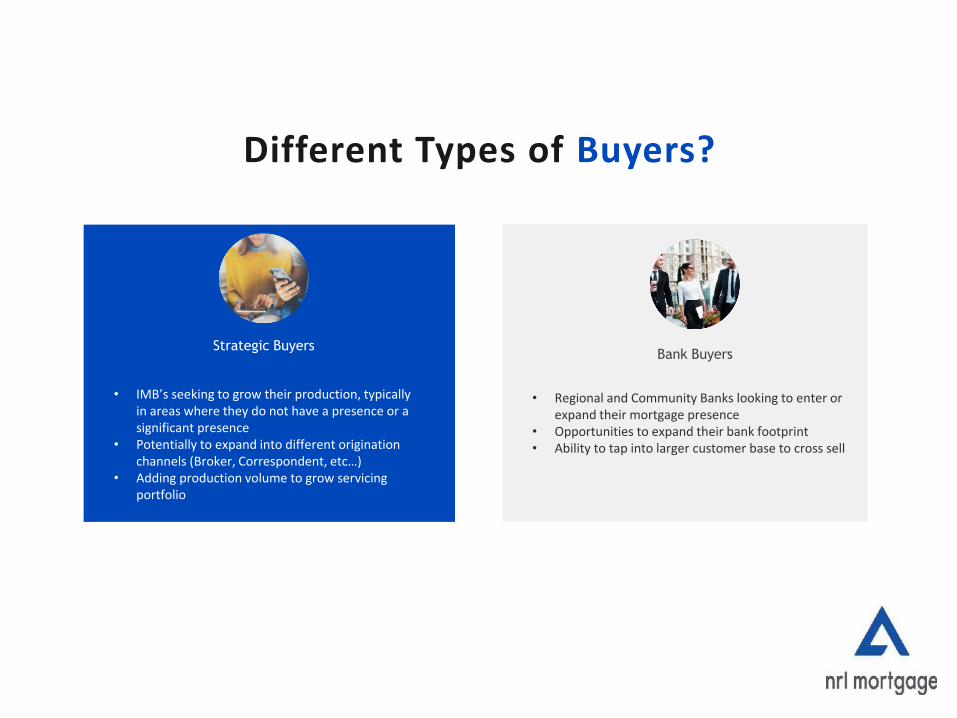
• Regional and Community Banks looking to enter or expand their mortgage presence
• Opportunities to expand their bank footprint• Ability to tap into larger customer base to cross sell
Bank Buyers
• IMB’s seeking to grow their production, typically in areas where they do not have a presence or a significant presence
• Potentially to expand into different origination channels (Broker, Correspondent, etc…)
• Adding production volume to grow servicing portfolio
Strategic Buyers
Different Types of Buyers?
WWW.SLIDEFOREST.COM
49
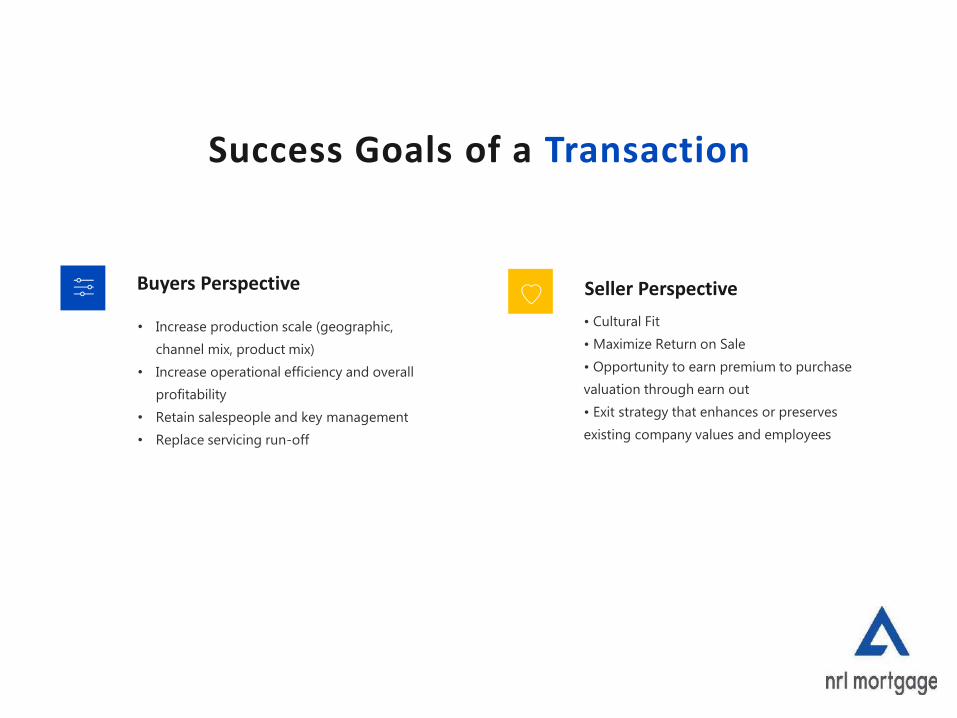
Seller Perspective
• Cultural Fit
• Maximize Return on Sale
• Opportunity to earn premium to purchase
valuation through earn out
• Exit strategy that enhances or preserves
existing company values and employees
Buyers Perspective
• Increase production scale (geographic,
channel mix, product mix)
• Increase operational efficiency and overall
profitability
• Retain salespeople and key management
• Replace servicing run-off
Success Goals of a Transaction
WWW.SLIDEFOREST.COM
50
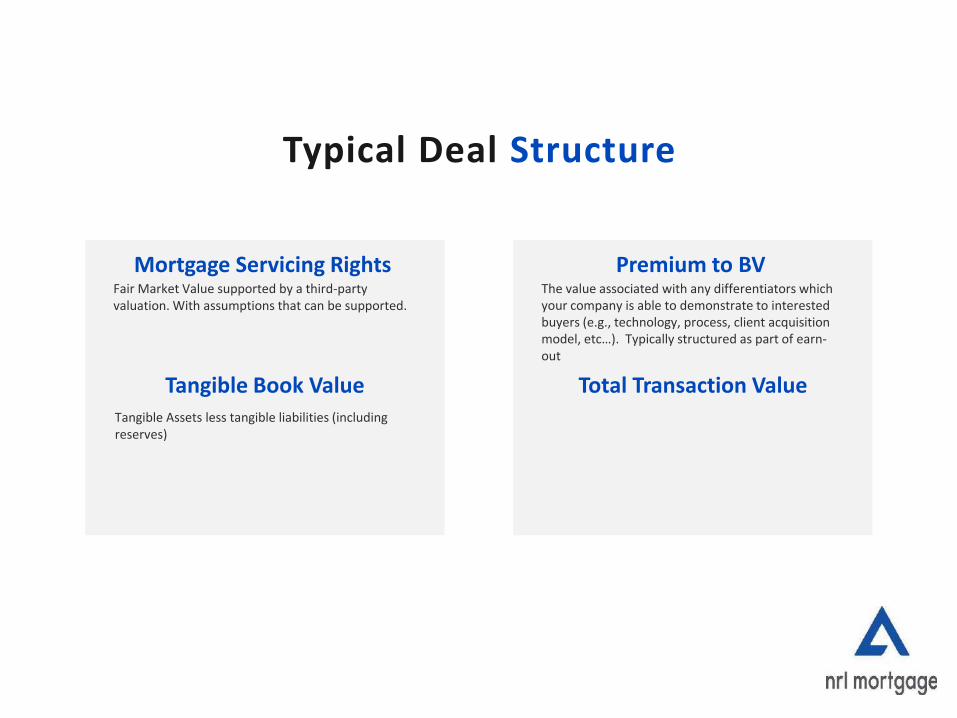
Mortgage Servicing RightsFair Market Value supported by a third-party valuation. With assumptions that can be supported.
Typical Deal Structure
Tangible Book ValueTangible Assets less tangible liabilities (including reserves)
Premium to BVThe value associated with any differentiators which your company is able to demonstrate to interested buyers (e.g., technology, process, client acquisition model, etc…). Typically structured as part of earn-out
Total Transaction Value
WWW.SLIDEFOREST.COM
51
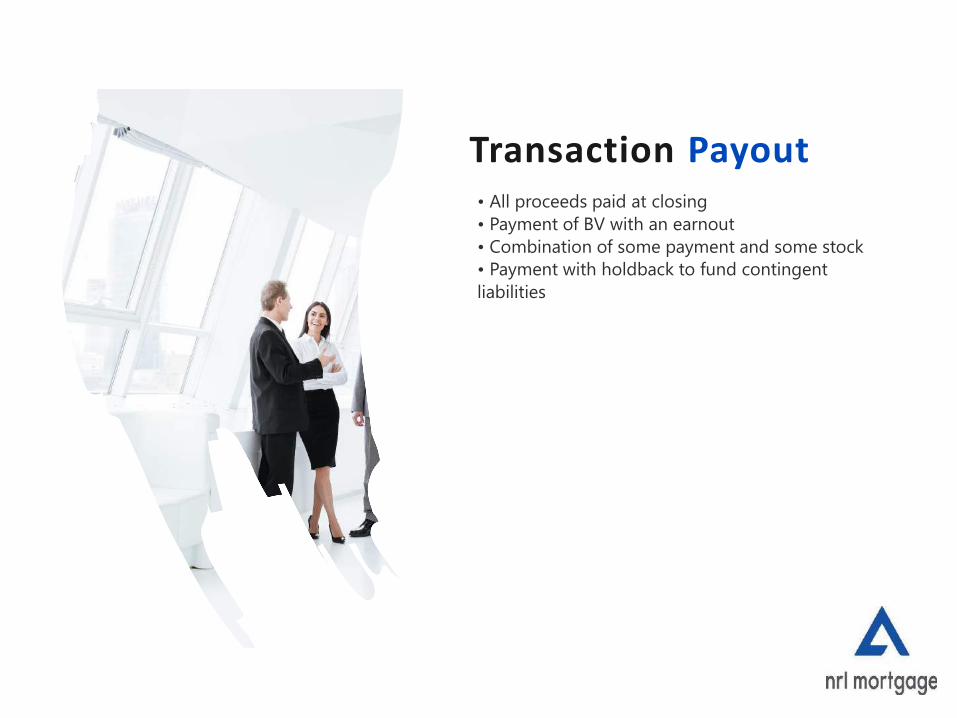
Transaction Payout• All proceeds paid at closing
• Payment of BV with an earnout
• Combination of some payment and some stock
• Payment with holdback to fund contingent
liabilities

WWW.SLIDEFOREST.COM
52
• Easier in terms of governmental approvals and third-party consents
• Allows for seamless business continuation, day after closing, with the opportunity to take time to integrate the two companies
• Requires buyer to take on potential contingent liabilities of seller
• Can lead to acquisition of bad vendor contract, leases, etc…
Stock Sale
WWW.SLIDEFOREST.COM
53
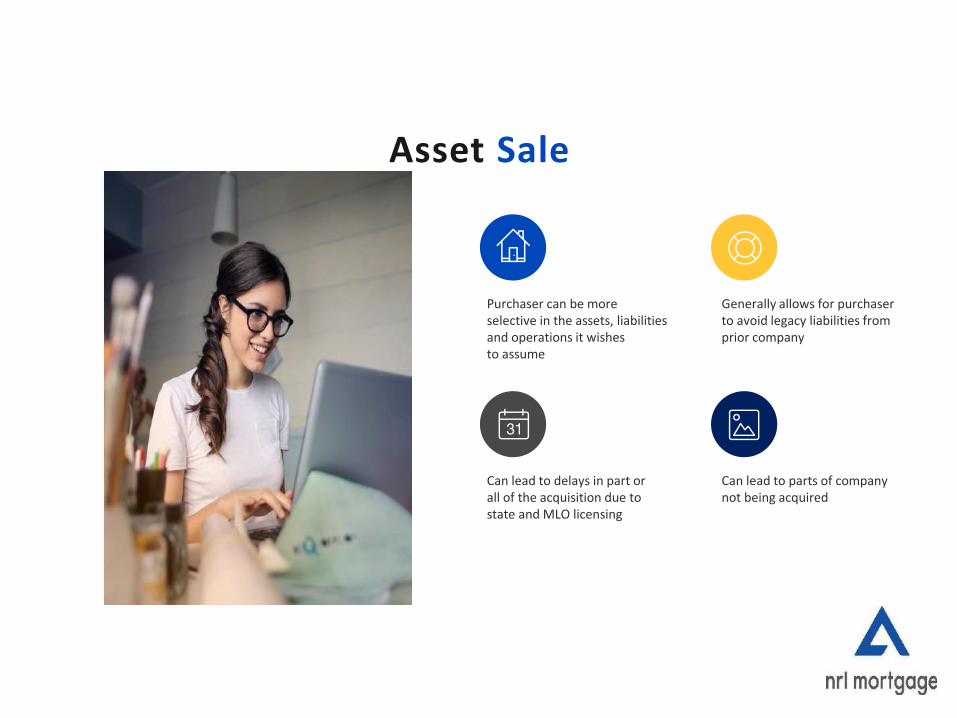
Purchaser can be more selective in the assets, liabilities and operations it wishes to assume
Generally allows for purchaser to avoid legacy liabilities from prior company
Can lead to delays in part or all of the acquisition due to state and MLO licensing
Can lead to parts of company not being acquired
Asset Sale

WWW.SLIDEFOREST.COM
54
• Agreement on true FMV of key assets (i.e., MSR’s)• Conversion of key branches and/or LO’s• Quantification of contingent liabilities• Audit and/or compliance issues• Underwriting quality
DEAL HURDLES

WWW.SLIDEFOREST.COM
55
KEYS TO A SUCCESSFUL DUE DILLIGENCE
Provide believable revenue and net income forecasts
Emphasize key differentiators & be able to tell the story
Assist in conversion of key branches and loan officers
Make sure everything is organized& be realistic with expectations

THANK YOU!
56