Iterative Elastic 3D-to-2D Alignment Method Using Normal Modes for Studying Structural Dynamics of...
11
Structure Resource Iterative Elastic 3D-to-2D Alignment Method Using Normal Modes for Studying Structural Dynamics of Large Macromolecular Complexes Qiyu Jin, 1,6 Carlos Oscar S. Sorzano, 2 Jose ´ Miguel de la Rosa-Trevı´n, 2 Jose ´ Roma ´ n Bilbao-Castro, 3 Rafael Nu ´n ˜ez-Ramı´rez, 4,7 Oscar Llorca, 4 Florence Tama, 5 and Slavica Joni c 1, * 1 IMPMC, Sorbonne Universite ´ s–CNRS UMR 7590, UPMC Paris 6, MNHN, IRD UMR 206, 4 Place Jussieu, 75005 Paris, France 2 Biocomputing Unit, Centro Nacional de Biotecnologı´a–CSIC, Madrid 28049, Spain 3 Departamento de Informa ´ tica, Universidad de Almerı ´a, Almerı ´a 04120, Spain 4 Centro de Investigaciones Biolo ´ gicas, CSIC, Madrid 28040, Spain 5 RIKEN, Advanced Institute for Computational Sciences, Kobe, Hyogo 650-0047, Japan 6 Present address: Institute of Image Processing and Pattern Recognition, Shanghai Jiao Tong University, Shanghai 200240, China 7 Present address: Instituto de Estructura de la Materia, CSIC, Madrid 28006, Spain *Correspondence: [email protected] http://dx.doi.org/10.1016/j.str.2014.01.004 SUMMARY This article presents a method to study large-scale conformational changes by combining electron microscopy (EM) single-particle image analysis and normal mode analysis (NMA). It is referred to as HEMNMA, which stands for hybrid electron micro- scopy normal mode analysis. NMA of a reference structure (atomic-resolution structure or EM volume) is used to predict possible motions that are then confronted with EM images within an automatic iter- ative elastic 3D-to-2D alignment procedure to iden- tify actual motions in the imaged samples. HEMNMA can be used to extensively analyze the conforma- tional changes and may be used in combination with classic discrete procedures. The identified con- formations allow modeling of deformation pathways compatible with the experimental data. HEMNMA was tested with synthetic and experimental data sets of E. coli 70S ribosome, DNA polymerase Pol a and B subunit complex of the eukaryotic primosome, and tomato bushy stunt virus. INTRODUCTION Normal mode analysis (NMA) of structures relies on modeling complex dynamics by a linear combination of harmonic oscilla- tions around an equilibrium structural conformation. NMA was extensively used in electron microscopy (EM), for predicting functional motions from non-atomic-resolution EM structures (Chaco ´ n et al., 2003; Ming et al., 2002; Tama et al., 2002) and for flexible fitting (Suhre et al., 2006; Tama et al., 2004a, 2004b) of atomic-resolution structures (e.g., from X-ray crystal- lography) into EM structures (EM density volumes). Normal modes of EM density volumes were shown to provide a good approximation of atomic-resolution normal modes in the low- frequency range that generally contains the modes reflecting experimentally observed large-scale conformational changes (Tama et al., 2002). They are thus useful for predicting conforma- tional dynamics of complexes whose structure at atomic resolu- tion is unavailable, but an intermediate-resolution structure can be obtained by EM (Chaco ´ n et al., 2003; Ming et al., 2002; Tama et al., 2002). Single-particle analysis (SPA) EM techniques have been traditionally used in determining structures of large macromolec- ular complexes (diameter, 10–30 nm) from samples prepared biochemically to ideally contain all complexes in the same steady conformation. The high homogeneity of conformations is required for a high resolution of the structure reconstructed from images. As the homogeneous population is sometimes difficult to obtain, even with the most improved biochemical procedures, image-processing methods have been developed to separate images into a few classes and determine the ones corresponding to the steady conformations that are being stud- ied (Elad et al., 2008; Grob et al., 2006; Penczek et al., 2006; Scheres et al., 2007; Simonetti et al., 2008). The goal of these standard approaches is thus to identify the most homogeneous classes of images in terms of conformations and compute the average structure from the classes. More accurate classification methods combined with the biochemical sample preparation to reduce the number of possible conformations should result in a higher homogeneity of classes and a higher resolution of computed structures. As the expected number of conformations is small in such cases, the standard methods are generally used with a small number of classes defined by the user initially. The standard methods thus allow the study of only a few discrete conformations of the complex, and new developments are needed for studying a large range of conformations with many intermediate conformations. This problem arises when studying a full dynamics of the complex that can freely change the confor- mation or when the biochemical stabilization of the complex in a few steady conformations is impossible. In such cases, the stan- dard methods provide the dynamics information biased by the mentioned initial discretization into a small number of classes (the reconstructed structures are not necessarily discrete sam- ples of the conformational change, but they may result from mix- ing different conformations into the selected number of classes). 496 Structure 22, 496–506, March 4, 2014 ª2014 Elsevier Ltd All rights reserved
-
Upload
sorbonne-fr -
Category
Documents
-
view
0 -
download
0
Transcript of Iterative Elastic 3D-to-2D Alignment Method Using Normal Modes for Studying Structural Dynamics of...
Structure
Resource
Iterative Elastic 3D-to-2D Alignment MethodUsing Normal Modes for Studying StructuralDynamics of Large Macromolecular ComplexesQiyu Jin,1,6 Carlos Oscar S. Sorzano,2 Jose Miguel de la Rosa-Trevın,2 Jose Roman Bilbao-Castro,3
Rafael Nunez-Ramırez,4,7 Oscar Llorca,4 Florence Tama,5 and Slavica Joni�c1,*1IMPMC, Sorbonne Universites–CNRS UMR 7590, UPMC Paris 6, MNHN, IRD UMR 206, 4 Place Jussieu, 75005 Paris, France2Biocomputing Unit, Centro Nacional de Biotecnologıa–CSIC, Madrid 28049, Spain3Departamento de Informatica, Universidad de Almerıa, Almerıa 04120, Spain4Centro de Investigaciones Biologicas, CSIC, Madrid 28040, Spain5RIKEN, Advanced Institute for Computational Sciences, Kobe, Hyogo 650-0047, Japan6Present address: Institute of Image Processing and Pattern Recognition, Shanghai Jiao Tong University, Shanghai 200240, China7Present address: Instituto de Estructura de la Materia, CSIC, Madrid 28006, Spain
*Correspondence: [email protected]
http://dx.doi.org/10.1016/j.str.2014.01.004
SUMMARY
This article presents a method to study large-scaleconformational changes by combining electronmicroscopy (EM) single-particle image analysis andnormal mode analysis (NMA). It is referred to asHEMNMA, which stands for hybrid electron micro-scopy normal mode analysis. NMA of a referencestructure (atomic-resolution structure or EM volume)is used to predict possible motions that are thenconfronted with EM images within an automatic iter-ative elastic 3D-to-2D alignment procedure to iden-tify actual motions in the imaged samples. HEMNMAcan be used to extensively analyze the conforma-tional changes and may be used in combinationwith classic discrete procedures. The identified con-formations allow modeling of deformation pathwayscompatible with the experimental data. HEMNMAwas tested with synthetic and experimental datasets of E. coli 70S ribosome, DNA polymerase Pol aand B subunit complex of the eukaryotic primosome,and tomato bushy stunt virus.
INTRODUCTION
Normal mode analysis (NMA) of structures relies on modeling
complex dynamics by a linear combination of harmonic oscilla-
tions around an equilibrium structural conformation. NMA was
extensively used in electron microscopy (EM), for predicting
functional motions from non-atomic-resolution EM structures
(Chacon et al., 2003; Ming et al., 2002; Tama et al., 2002) and
for flexible fitting (Suhre et al., 2006; Tama et al., 2004a,
2004b) of atomic-resolution structures (e.g., from X-ray crystal-
lography) into EM structures (EM density volumes). Normal
modes of EM density volumes were shown to provide a good
approximation of atomic-resolution normal modes in the low-
frequency range that generally contains the modes reflecting
496 Structure 22, 496–506, March 4, 2014 ª2014 Elsevier Ltd All righ
experimentally observed large-scale conformational changes
(Tama et al., 2002). They are thus useful for predicting conforma-
tional dynamics of complexes whose structure at atomic resolu-
tion is unavailable, but an intermediate-resolution structure can
be obtained by EM (Chacon et al., 2003; Ming et al., 2002;
Tama et al., 2002).
Single-particle analysis (SPA) EM techniques have been
traditionally used in determining structures of largemacromolec-
ular complexes (diameter, 10–30 nm) from samples prepared
biochemically to ideally contain all complexes in the same steady
conformation. The high homogeneity of conformations is
required for a high resolution of the structure reconstructed
from images. As the homogeneous population is sometimes
difficult to obtain, even with the most improved biochemical
procedures, image-processing methods have been developed
to separate images into a few classes and determine the ones
corresponding to the steady conformations that are being stud-
ied (Elad et al., 2008; Grob et al., 2006; Penczek et al., 2006;
Scheres et al., 2007; Simonetti et al., 2008). The goal of these
standard approaches is thus to identify the most homogeneous
classes of images in terms of conformations and compute the
average structure from the classes. More accurate classification
methods combined with the biochemical sample preparation to
reduce the number of possible conformations should result in a
higher homogeneity of classes and a higher resolution of
computed structures. As the expected number of conformations
is small in such cases, the standard methods are generally used
with a small number of classes defined by the user initially. The
standard methods thus allow the study of only a few discrete
conformations of the complex, and new developments are
needed for studying a large range of conformations with many
intermediate conformations. This problem arises when studying
a full dynamics of the complex that can freely change the confor-
mation or when the biochemical stabilization of the complex in a
few steady conformations is impossible. In such cases, the stan-
dard methods provide the dynamics information biased by the
mentioned initial discretization into a small number of classes
(the reconstructed structures are not necessarily discrete sam-
ples of the conformational change, but they may result frommix-
ing different conformations into the selected number of classes).
ts reserved

Figure 1. HEMNMA
Flowchart of the method for studying macromolecular dynamics (A) using a 3D-to-2D normal-mode-based alignment of atomic or pseudo-atomic structures with
single-particle images (B).
Structure
Iterative Elastic 3D-to-2D Alignment
In this article, we propose a method that was specifically
designed for studying a large range of conformations with
many intermediate conformations. It allows the analysis of highly
heterogeneous populations of complexes with slow and contin-
uous conformational changes (gradual conformational changes
where a discrete number of states cannot fully describe the
continuum of conformations). Given a reference structure (an
atomic-resolution structure or a reduced representation of an
EM structure), a set of normal modes of the structure, and a
set of images, projection-matching-based elastic alignment of
each single-particle image with the reference structure provides
an overall view of the conformational distribution. A potential of
combining NMA with EM image analysis was demonstrated by
Brink et al. (2004), who compared several different conforma-
tions observed in images with the conformational changes
predicted by NMA, through a visual evaluation of their consis-
tency. Here, we describe an automatic method to determine
conformations from images using normal modes. The proposed
method is based on a procedure for iterative elastic projection
matching. This procedure allows the processing of a high
number of images to determine all actual confirmations and
evaluate their pertinence, which is impossible to achieve with
other EM methods or X-ray crystallography. The proposed
method has the following four main features: (1) the conforma-
tional modeling is performed by displacing the reference struc-
ture along combinations of normal modes, and the amplitudes
of the displacement are computed through the elastic image
alignment; (2) each single-particle imagemay represent a unique
conformation; (3) classification and 3D reconstruction are not
mandatory; and (4) classic discrete EM methods may be used
to compute the reference structure when it is unavailable at
atomic resolution and/or to identify a subset of images to
analyze. Thanks to these features, this method allows modeling
of deformation pathways compatible with the experimental data
and analyzing the conformational changesmore extensively than
Structure 22,
using the classic discrete EM methods. The proposed method-
ology is referred to as hybrid EM NMA (HEMNMA). It was tested
here using several synthetic and experimental data sets:
synthetic and EM images of E. coli 70S ribosome (70S), EM
images of DNA polymerase Pol a and B subunit complex (Pol
a-B) of the eukaryotic primosome, and EM images of tomato
bushy stunt virus (TBSV).
RESULTS
HEMNMA DesignThe workflow (Figure 1A) comprises the following four steps: (1)
NMA of a reference structure at atomic or pseudoatomic resolu-
tion (see Experimental Procedures for the volume-to-pseudoa-
toms conversion and NMA methods used here); (2) selection
of normal modes; (3) iterative elastic 3D-to-2D alignment of
single-particle images with the reference structure; and (4) visu-
alization of computed conformations. The preprocessing block
in Figure 1A may include any preprocessing of single-particle
images (e.g., correction of the effects of the electron-micro-
scope contrast transfer function [CTF]).
Selection of Normal Modes
The computation of normal modes takes negligible time with
respect to the analysis of a long series of images using normal
modes (e.g., 10,000 single-particle images). To reduce image
analysis time while focusing on the most biologically relevant
conformational changes, normal modes can be selected on the
basis of some a priori knowledge about the conformational
change (e.g., two known motions of 70S, ratchet-like and L1-
stalk motions, were used in experiments 1 and 2). If no a priori
knowledge is available, lowest frequency modes with the collec-
tivity degree above a threshold can be selected, as highly collec-
tive low-frequency modes have been shown to be relevant to
functional conformational changes (Delarue and Dumas, 2004;
Suhre et al., 2006; Tama and Brooks, 2006; Tama et al.,
496–506, March 4, 2014 ª2014 Elsevier Ltd All rights reserved 497

Structure
Iterative Elastic 3D-to-2D Alignment
2004a; Tama and Sanejouand, 2001; Wang et al., 2004). For
instance, the overlap between experimentally observed confor-
mational changes (difference between two atomic conforma-
tions of the same complex) and the modes computed for one
of the conformations of the complex has showed that 1–3 low-
frequency modes with the highest overlap are highly collective
and usually capture 60% to 70% of the conformational change
(Tama and Sanejouand, 2001; Tama et al., 2002). The most rele-
vant modes are generally among the 20 lowest frequencymodes
for low-symmetry structures (Tama and Sanejouand, 2001;
Tama et al., 2002). They move to higher frequencies (due to de-
generacy) for symmetric structures but remain among the 100
lowest frequency modes, even for highly symmetric structures
such as icosahedral viruses (Tama and Brooks, 2005). The
number of lowest frequency modes to compute can thus gener-
ally be fixed to 100. The collectivity degree is computed to count
the number of (pseudo-)atoms that are significantly affected by
the mode (Bruschweiler, 1995). Given the number of (pseudo-)
atoms N, the collectivity degree is normalized between 1/N
and 1. The collectivity degree approaches 1 formaximally collec-
tive movements, whereas for localized motions (few atoms
move), it approaches 0. The most collective modes capturing
functional conformational changes can generally be selected
by setting the collectivity threshold to 0.5 (experiment 3). Higher
values of the threshold should be chosen to select a reduced
number of modes for highly symmetric structures (experiment
4). For instance, in the case of ‘‘swelling’’ icosahedral-symmetry
viruses, many modes have collectivities above 0.5 (experiment
4). However, a few of them are usually enough to describe func-
tional conformational changes (e.g., the mode describing best
the experimentally observed conformational changes is related
to a radially symmetric expansion of the capsid) (Tama and
Brooks, 2005) and can be selected using the collectivity
threshold of 0.75 (experiment 4).
Iterative Elastic 3D-to-2D Alignment Method
The amplitudes of the reference-structure displacement (defor-
mation) along normal modes and the orientation and the position
of the deformed structure are refined until a projection of the
deformed-reference density volume is found that is the most
similar to the analyzed single-particle image. The method is
based on a local-search Powell’s UOBYQA optimization (Powell,
2002) that uses quadratic approximation for building a local
model of the objective function. It consists of repeating the
following three steps iteratively until the change in elastic param-
eters (deformation amplitudes) and rigid-body parameters
(orientation and position of the deformed structure) between
two successive iterations becomes insignificant or a specified
number of iterations is reached (Figure 1B):
Step 1: Find the minimum of the current local model of the
objective function and move the current point (current vector
of deformation amplitudes) to this minimum.
Step 2: Evaluate the objective function at the new vector of
deformation amplitudes (new point). The structure is first
deformed with the new deformation amplitudes, and the
modified atomic or pseudoatomic coordinates are converted
into a volume. The computation of volumes from pseudoa-
tomic coordinates is based on the volume representation
by a sum of Gaussian functions (Nogales-Cadenas et al.,
498 Structure 22, 496–506, March 4, 2014 ª2014 Elsevier Ltd All righ
2013). The computation of volumes from atomic coordinates
uses electronic-form atomic factors (Peng et al., 1996). The
volume is subsequently aligned (rigid-body) with the single-
particle image using a rough alignment based on a discrete
library of reference projections of the volume (Sorzano
et al., 2004a) and a continuous refinement using a gradient-
based approach (Joni�c et al., 2005). The alignment quality
determined by a measure of similarity between the single-
particle image and the corresponding best matching volume
projection is considered as the new evaluation of the objec-
tive function for the optimization.
Step 3: Reconstruct the local model of the objective function
around the new point with the new evaluation. Go back to
Step 1.
The source code of the method is available in the open-source
software Xmipp (Sorzano et al., 2004b), starting from the version
Xmipp 3.0.1. The current implementation takes, on average,
around 2, 4, and 6 min to analyze an image of size 128 3 128
pixels using one, two, and three normal modes, respectively,
on a core of a Dual Intel Xeon X5472 processor (3.00GHz).
Note that the execution time was measured with one to three
modes, but the program allows the use of any number of modes.
An MPI-parallelized version of the method allows an efficient
analysis of a large number of images (xmipp_mpi_nma_align-
ment whose tutorial is at http://xmipp.cnb.csic.es/twiki/bin/
view/Xmipp/Nma_alignment_v3), which was tested on stan-
dard-size clusters and supercomputer centers.
Visualization of Computed Conformations
The computed conformations can be visualized by displacing
the reference atomic or pseudoatomic structure along normal
modes using the amplitudes of the displacement computed
through the elastic image alignment (direct visualization). Also,
the animated volumes can be obtained by converting displaced
atoms or pseudoatoms into volumes, as in Step 2 of the elastic
3D-to-2D alignment method. Optionally, 3D reconstruction
from images can be obtained by separating images into classes
with similar conformations (similar values of the computed
displacement amplitudes). However, for highly heterogeneous
samples, the underlying dynamics can only be partially eluci-
dated by analyzing these reconstructed structures due to a
discretization of the conformational distribution (discrete number
of classes) and averaging during the reconstruction. A direct
visualization shall be a preferred choice in such cases, as we
show with Pol a-B (experiment 3). For more details on the visual-
izationmethods, see the corresponding section of Supplemental
Experimental Procedures S1 available online.
Experiment 1: Synthetic Continuous-typeConformational ChangeIn this experiment, we show robustness of HEMNMA to noise
and to the CTF effects remaining after the phase inversion that
is usually used for CTF correction. A variety of conformations
were sampled from a synthetic continuous-type conformational
change determined by deforming an atomic-resolution E. coli
70S structure (Figure S1A) referred to as 3I1OP (without ligands,
in the conformation in which the 30S subunit is nonrotated with
respect to the 50S subunit) (Zhang et al., 2009). Synthetic images
[size, 1282 pixels; pixel size, (3 A)2] were computed as 300
ts reserved

Structure
Iterative Elastic 3D-to-2D Alignment
random projections of the atomic structure displaced with
random displacement amplitudes along two of its normal modes
while preserving a constant ratio between the two displacement
amplitudes (for details on the random image generation with a
linear relationship between the contributions of the two modes,
see Supplemental Experimental Procedures S2). The used
modes were mode 11 as it describes the ratchet-like motion
(rotation of 30S with respect to 50S visible in Movie S1) and
mode 12 as it describes the L1-stalk motion. The modes respon-
sible for these two motions have already been characterized
computationally (Tama et al., 2003; Wang et al., 2004), and
they were chosen here as the combined motion was already
observed experimentally (Fu et al., 2011; Valle et al., 2003).
The overall characteristics of the modes used in this article are
similar to those reported previously, although themode numbers
are not the same because of different structures and methods
used for calculations.
The amount of noise before and after CTF was adjusted for
each tested defocus value (0.5 mm, 1 mm, and 2 mm) so that
the images were obtained with the signal-to-noise ratio (SNR)
of 0.3 or 0.1. The different image sets (one without noise and
six for different defocus and SNR values; Figure S1D) were
analyzed using only the mode capturing ratchet-like motion to
see whether the proposedmethod can recover both synthesized
motions: ratchet-like and L1-stalkmotions. The elastic alignment
of images was performed with respect to the given atomic struc-
ture and the pseudoatomic structure obtained from a synthetic
volume of the atomic structure (Figure S1C). Movie S2 shows
the animated pseudoatomic mode 13 (ratchet-like mode) used
in image analysis. Details of the pseudoatomic structure and
normal modes computations can be found in Supplemental
Experimental Procedures S2.
The image alignment with a pseudoatomic structure is more
challenging than the alignment with an atomic structure, as
pseudoatomic and atomic normal modes have different resolu-
tions and the same movement often appears at a different
frequency in the two sets of modes (Tama et al., 2002). Here, a
more difficult alignment in the pseudoatomic case was expected
also because different structures were used to generate images
(atomic structure) and to analyze them (pseudoatomic structure),
while the same structure was used to generate and analyze
images in the atomic case. However, such a difficulty is ex-
pected in practice, as the resolution of experimental images is
usually higher than the resolution of the reference structure
when using EM structures. The exploration of only one move-
ment instead of two that are present in images is also challenging
but close to realistic as, in practice, images are expected to be
analyzed using only a few normal modes (sometimes, only one
as in experiment 2). Interestingly enough, although the used
mode was selected on the basis of previously observed 70S
motions instead of using the modes collectivity criterion, this
mode is actually the most collective one for each of the used
70S structures in experiments 1 and 2.
The results in the atomic and pseudoatomic cases show that
the accuracy of estimation of rigid-body and elastic parameters
decreases as SNR decreases and the defocus increases.
Although the maximum value (over seven image sets) of the
relative deformation-amplitude error doubled in the pseudoa-
tomic case compared to the atomic case (8.9% for pseudoa-
Structure 22,
toms with respect to 4.2% for atoms; Table S1A), the accuracy
is globally good, with the absolute angular and shift errors that
are similar in the two cases (below 0.6� and 0.15 pixels for
pseudoatoms; below 0.5� and 0.15 pixels for atoms; Table
S1B). In the most difficult case (SNR = 0.1, defocus = 2 mm),
the root-mean-square deviation between the structures with
computed and ground-truth deformation amplitudes along the
mode describing the ratchet-like motion is about 0.46 A for
pseudoatoms and 0.22 A for atoms, which is far below the
commonly achievable resolution in EM. Table S1C summarizes
how the key parameters of the volume-to-pseudoatoms con-
version and NMA methods and the resulting alignment error
depend on the volume approximation error (for more details on
the influence of these parameters, see Supplemental Experi-
mental Procedures S2).
Experiment 2: Mixed EM Images of E. coli 70S Ribosomewith and without EF-GIn this experiment, HEMNMA was used to analyze cryo-EM
images of a mixture of E. coli 70S ribosome with and without
Elongation Factor G (EF-G) bound. These images were used in
previous EM studies where ratchet-like and L1-stalk motions
were observed on the reconstructions corresponding to the
ribosome with and without EF-G (Elad et al., 2008; Scheres
et al., 2007). Here, the images were analyzed with the ratchet-
like mode and separated into the classes with and without
EF-G using the computed deformation amplitudes along the
mode. Indeed, our tests with synthetic data (generated using
EM structures of three different 70S conformations) showed
that this mode alone can be used to classify images of the
ribosome at distinct states of the conformational change
combining ratchet-like and L1-stalk motions and to reconstruct
the structure at distinct states of the conformational change
(for details of these tests, see Supplemental Experimental Proce-
dures S3; Figure S2).
The data set contained 10,000 cryo-EM images [size, 1302
pixels; pixel size, (2.82 A)2] and a result of a supervised image
classification into two subsets, with or without EF-G (5,000 im-
ages per subset). Ribosomes without EF-G contain three tRNAs
in the classical A/A, P/P, and E/E positions and are in the normal
(unratcheted) conformation. Ribosomes with EF-G contain a
single tRNA in the hybrid P/E position and are ratcheted. The
unratcheted-conformation EM structure EMD-5262 (Fu et al.,
2011) was used to compute the pseudoatomic structure and
its normal modes. Details of the computations are given in Sup-
plemental Experimental Procedures, S3, as the same structure
and normal modes were used there with synthetic images
capturing ratchet-like and L1-stalk motions from authentic EM
structures. Image analysis was conducted using the pseudoa-
tomic structure and its mode 9 that describes ratchet-like motion
(Supplemental Experimental Procedures S3; Movie S3).
The histogram of the computed amplitudes along the pseu-
doatomic mode 9 (green, in Figure 2A) may be interpreted as a
mixture of at least two Gaussian-type distributions, as two peaks
can be noticed. Figure 2A also shows the histogram portions
corresponding to the image separation by supervised classifica-
tion (with EF-G, red; without EF-G, blue). The bins containing one
third of the images with the smallest amplitudes (mean ampli-
tude, �401) are indicated by red asterisks, while the bins
496–506, March 4, 2014 ª2014 Elsevier Ltd All rights reserved 499
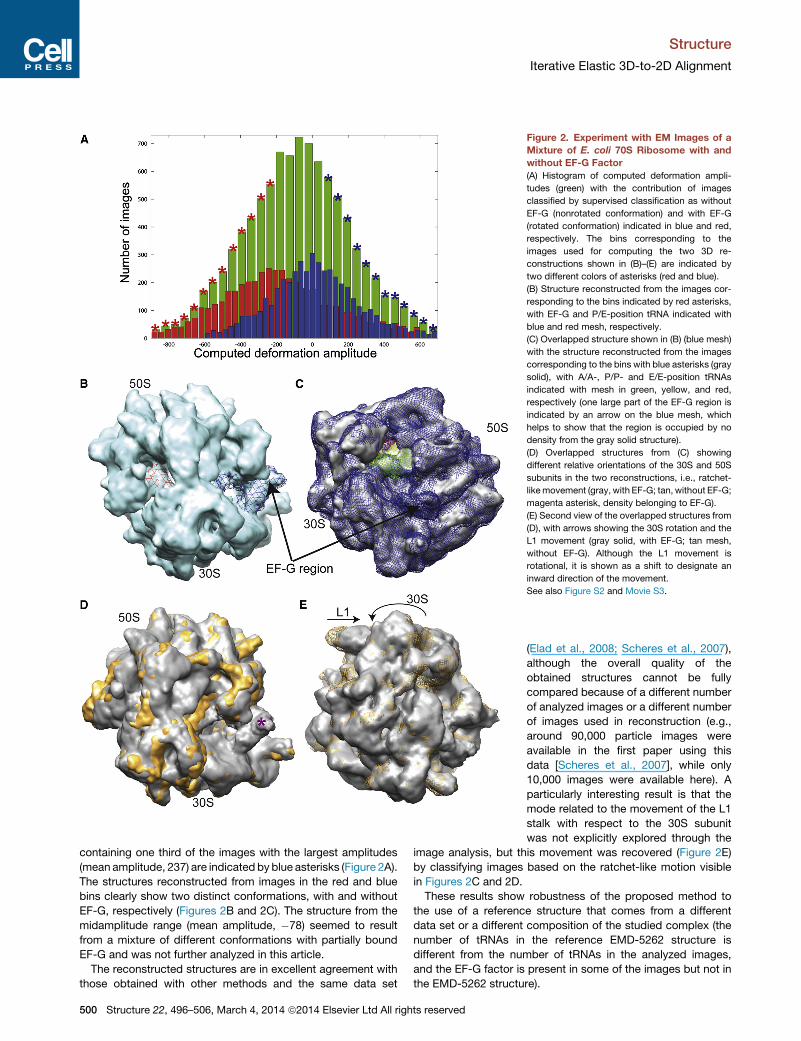
Figure 2. Experiment with EM Images of a
Mixture of E. coli 70S Ribosome with and
without EF-G Factor
(A) Histogram of computed deformation ampli-
tudes (green) with the contribution of images
classified by supervised classification as without
EF-G (nonrotated conformation) and with EF-G
(rotated conformation) indicated in blue and red,
respectively. The bins corresponding to the
images used for computing the two 3D re-
constructions shown in (B)–(E) are indicated by
two different colors of asterisks (red and blue).
(B) Structure reconstructed from the images cor-
responding to the bins indicated by red asterisks,
with EF-G and P/E-position tRNA indicated with
blue and red mesh, respectively.
(C) Overlapped structure shown in (B) (blue mesh)
with the structure reconstructed from the images
corresponding to the bins with blue asterisks (gray
solid), with A/A-, P/P- and E/E-position tRNAs
indicated with mesh in green, yellow, and red,
respectively (one large part of the EF-G region is
indicated by an arrow on the blue mesh, which
helps to show that the region is occupied by no
density from the gray solid structure).
(D) Overlapped structures from (C) showing
different relative orientations of the 30S and 50S
subunits in the two reconstructions, i.e., ratchet-
likemovement (gray, with EF-G; tan, without EF-G;
magenta asterisk, density belonging to EF-G).
(E) Second view of the overlapped structures from
(D), with arrows showing the 30S rotation and the
L1 movement (gray solid, with EF-G; tan mesh,
without EF-G). Although the L1 movement is
rotational, it is shown as a shift to designate an
inward direction of the movement.
See also Figure S2 and Movie S3.
Structure
Iterative Elastic 3D-to-2D Alignment
containing one third of the images with the largest amplitudes
(mean amplitude, 237) are indicated by blue asterisks (Figure 2A).
The structures reconstructed from images in the red and blue
bins clearly show two distinct conformations, with and without
EF-G, respectively (Figures 2B and 2C). The structure from the
midamplitude range (mean amplitude, �78) seemed to result
from a mixture of different conformations with partially bound
EF-G and was not further analyzed in this article.
The reconstructed structures are in excellent agreement with
those obtained with other methods and the same data set
500 Structure 22, 496–506, March 4, 2014 ª2014 Elsevier Ltd All rights reserved
(Elad et al., 2008; Scheres et al., 2007),
although the overall quality of the
obtained structures cannot be fully
compared because of a different number
of analyzed images or a different number
of images used in reconstruction (e.g.,
around 90,000 particle images were
available in the first paper using this
data [Scheres et al., 2007], while only
10,000 images were available here). A
particularly interesting result is that the
mode related to the movement of the L1
stalk with respect to the 30S subunit
was not explicitly explored through the
image analysis, but this movement was recovered (Figure 2E)
by classifying images based on the ratchet-like motion visible
in Figures 2C and 2D.
These results show robustness of the proposed method to
the use of a reference structure that comes from a different
data set or a different composition of the studied complex (the
number of tRNAs in the reference EMD-5262 structure is
different from the number of tRNAs in the analyzed images,
and the EF-G factor is present in some of the images but not in
the EMD-5262 structure).

Structure
Iterative Elastic 3D-to-2D Alignment
Experiment 3: EM Images of Pol a-BIn the absence of a structure at atomic resolution, Pol a-B
was previously studied using ML3D, an EM method based on
3D maximum likelihood (Scheres et al., 2007). Negative-stain
single-particle images of the complex were analyzed, which
yielded a structure composed of two lobes connected by a flex-
ible linker where the larger and smaller lobes roughly correspond
to the Pol a and B subunits, respectively (Klinge et al., 2009).
More precisely, ML3D revealed three different classes of images
that contained 42%,30%, and28%of the total number of images
and yielded to the reconstructions at 22.9 A, 24.5 A, and 25.5 A
resolutions, respectively, each corresponding to a different de-
gree of flexion of the linker (Klinge et al., 2009). The same images
(12,000 single particles) were analyzed here using HEMNMA.
The structure obtained by ML3D from the largest class of
images was converted into a pseudoatomic structure that was
used as the reference structure to analyze images. The volume
and image sizes were 643 voxels [voxel size, (3.8 A)3] and 642
pixels [pixel size, (3.8 A)2], respectively. A view of the reference
conformation is shown in Figures 3A–3C (a structure with 968
pseudoatoms was obtained for the EM volume approximation
error of 5%, and the SD of Gaussian functions s = 3.8).
From100computed normalmodes,we selected six lowest fre-
quency non-rigid-body modes, as their collectivity degree was
above 0.5 (Figure 3D). These six modes were used for the image
analysis with the proposed method. The computed deformation
amplitudes along the modes were then analyzed by principal-
component analysis (PCA) to reduce the complexity from six to
three dimensions. To visualize how the conformation changes
along a mode or a principal axis (PA), a volumetric form of the
pseudoatomic structure (obtained by pseudoatoms-to-volume
conversion) was displaced in positive and negative directions
of each of six normal modes and six PAs (Figure S3). As the
PAs are linear combinations of normal modes, a contribution of
different normal modes to the PAs can be observed in Figures
S3G–S3L. For example, themost important PA (PA1; Figure S3G)
ismainly contributed bymode 7 (Figure S3A) (a similarmovement
of the upper lobe is visible in Figure S3G and Figure S3A),
although some other modes contribute as well (e.g., the linker
is moving in Figure S3G but not in Figure S3A). Similarly, the sec-
ond most important PA (PA2; Figure S3H) is mostly contributed
by mode 8 (Figure S3B). The remaining PAs are more difficult to
interpret visually, and their quantitative analysis showed that
they were more ‘‘mixed’’ than PA1 and PA2 (i.e., a normal
mode has a similar contribution to a PA as the other modes).
The computed deformation amplitudes are shown in Figure 3E
as projections on to PA1–PA3 (each image is represented by a
point), together with linear regression lines through three identi-
fied clusters of points (Figures 3E and 3I). Displacements of the
volumetric form of the pseudoatomic structure along each of
the three lines (Figures 3F–3H) show a movement similar to
that along PA2 (Figure S3H). The main difference between the
displacements along the three lines is related to the degree of
an additional movement similar to that along PA1 (Figure S3G).
Movies S4 and S5 show the displacement of the pseudoatomic
structure and its volumetric form along the red (central) line as
the highest number of images was distributed along this line.
These results clearly show a high conformational hetero-
geneity of the complex, which suggests that any structure ob-
Structure 22,
tained by 3D reconstruction from these images would be of
low resolution and partially inaccurate, as the actual flexibility
would be limited by averaging of different conformations. Here,
we present some reconstructed structures to show these
effects. A structure was computed from each of the three clus-
ters of images (Figures 3I and 3K). The overlapped structures
(Figure 3K) show a movement similar to that along PA1 (Fig-
ure S3G). An overlap between the structures reconstructed
along any of the three regression lines (Figure 3E) shows a
movement similar to that along PA2 (Figure S3H). For example,
Figure 3L shows an overlap of the structures reconstructed
from three subsets (Figure 3J) of the yellow (central) cluster in
Figure 3I. These reconstructed structures (Figure 3L) are similar
to those shown for the displaced pseudoatomic structure
(Figure 3G) along the corresponding central regression line in
Figure 3E, but their resolution is low due to a variability of the
incorporated conformations in the reconstruction.
As the reconstructed structures show movements similar
to those along two most important PAs and these axes are
mostly contributed by modes 7 and 8, we can conclude that
these two modes are the most dominant modes for this data
set. Interestingly enough, it has been shown that one to three
modes can be sufficient to globally describe experimentally
observed conformational changes (Tama et al., 2004b; Tama
and Sanejouand, 2001). Our method, thus, can help to find the
most dominant modes, which may be particularly useful when
they are not among a few lowest frequency modes (e.g., exper-
iment 4).
Regarding the reconstructions in Figure 3K, a similar move-
ment was observed previously (Klinge et al., 2009), but with a
smaller amplitude. To check if the smaller amplitude was due
to an incorporation of different conformations into the same
reconstructed structure, we designed a test involving three
more reconstructions. We split the central cluster in Figure 3I
into three subsets of images according to their coordinate on
PA1 (each subset contained around 30% of images). Two struc-
tures were computed from two artificially mixed sets (each con-
taining a side cluster and its neighboring central-cluster subset).
The third structure was computed from the remaining central-
cluster subset. Interestingly enough, these last three structures
overlap quite well with the conformations obtained previously
(Klinge et al., 2009) (similar movements with similar amplitudes
can be observed in Figure 3M). The smaller amplitude of the
movement observed previously can thus be explained by a het-
erogeneity of conformations incorporated in the reconstructed
average structures (the flexibility could not be fully explored
with ML3D using a small number of classes, and the full explora-
tion would require a much larger number of classes and images;
Klinge et al., 2009). HEMNMA described more extensively the
conformational heterogeneity that was detected by ML3D using
the same data set. For example, it offered the possibility to addi-
tionally visualize the changes of the linker length coupledwith the
changes of the relative distance between the lobes (movements
reflecting mainly displacements along PA2 (Figures 3G and 3L;
Figure S3H).
Experiment 4: EM Images of TBSVSwelling of many icosahedral plant viruses has been observed
upon changes of pH and EDTA chelation of divalent cations on
496–506, March 4, 2014 ª2014 Elsevier Ltd All rights reserved 501

Figure 3. Experiment with EM Images of Pol a-B
(A) EM volume obtained by ML3D (from the largest class of images).
(B) Pseudoatomic structure (spheres) from the volume in (A) overlapped with the volume (mesh).
(C) Approximation of the volume shown in (A) by the pseudoatomic structure shown in (B).
(D) Collectivity degree of normal modes computed for the pseudoatomic structure (the first six modes related to rigid-body movements are not shown; for better
visibility, only 40 modes are shown; the asterisks denote the modes with the collectivity degree above 0.5).
(E) Computed deformation amplitudes projected on to the three most important PAs (the points denote single-particle images and PA1, the most important PA),
and linear regression lines (yellow, red, and green) through three clusters; see also (I).
(F–H) Volumetric form of the pseudoatomic structure displaced along the lines shown in (E) [(F), (G), and (H) for the yellow, red, and green lines, respectively], with
the overlapped structures from two endpoints of the line (blue mesh and red mesh) and the midpoint (yellow solid).
(I) Clusters of images denoted by cylinders.
(J) Three equal-sized subsets of the yellow (central) cluster in (I).
(legend continued on next page)
Structure
Iterative Elastic 3D-to-2D Alignment
502 Structure 22, 496–506, March 4, 2014 ª2014 Elsevier Ltd All rights reserved

Structure
Iterative Elastic 3D-to-2D Alignment
the interface between subunits (Ca2+ or Mg2+ that appear to play
a critical role in virion stability), but the swelling mechanism is still
not well understood (Witz and Brown, 2001). In a previous EM
study of the TBSV swelling, a structure of the native (compact)
TBSV form was obtained at 13 A resolution, and a continuous
particle size variation was found onmicrographs of the virus after
its dialysis in Tris-EDTA buffer (Aramayo et al., 2005). Also, a
structure of the most swollen form was obtained at 19 A resolu-
tion by an iterative procedure whose each iteration comprised
image alignment, sorting of the largest particles (based on a
threshold cross-correlation with the last reference structure),
and 3D reconstruction to compute a new reference structure
for the next iteration (Aramayo et al., 2005). HEMNMA was
used here to analyze a set of 7,000 TBSV images.
The EM structure and image sizes were reduced to 1283
voxels and 1282 pixels, respectively [pixel size, (3.2 A)2]. The
pseudoatomic structure for NMA was obtained from the struc-
ture of the compact form (6,096 pseudoatoms for the volume
approximation error of 5%, and for the SD of Gaussian functions
s = 3.2) (Figure 4A). From 100 computed normal modes, image
analysis was conducted using four lowest frequency non-rigid-
body modes whose collectivity degree was above 0.75 (modes
13, 24, 40, and 77,marked by asterisks in Figure 4B). No informa-
tionwas used about the potential symmetry of the conformations
during the image analysis, and the used modes allowed for
asymmetric geometrical transformations. In fact, only one of
the usedmodes deforms the structure while perfectly preserving
its symmetry (mode 24, which is related to the radially symmetric
expansion). The other three modes result in asymmetric
changes. The deformation amplitudes computed through image
analysis for each of the four modes were then mapped on to the
3D PCA space (Figure 4C). The data were fitted with a linear
regression line in the PCA space, and the reference structure
was displaced along this line (blue asterisks in Figure 4C; Movie
S6). Also, the data were split into four classes according to the
data coordinate on PA1 (four equal segments of the axis), and
3D reconstruction was conducted from the images in each class
(Figure 4D). The colors red, magenta, green, and yellow in Fig-
ures 4C and 4D correspond to the four classes with 21%,
25%, 24%, and 30% of all images, respectively. Although the
image analysis was conducted with no a priori information about
the conformational symmetry, the reconstructed structures were
icosahedrally symmetrized to reduce noise, as it was done in the
previous study (Aramayo et al., 2005). The difference between
the diameter of the structure from the most swollen particles
(yellow in Figure 4D) and that of the compact-form structure
(gray in Figure 4D) is about 4 nm, which is consistent with the
previously reported differences (Aramayo et al., 2005; Kruse
et al., 1982). The difference in the diameter of the structure
from the most and least swollen particles (yellow and red in Fig-
ure 4D, respectively) is about 3.2 nm. This indicates that the
diameter of the least swollen particles in the analyzed images
(K) Structures reconstructed from the clusters in (I) (the color of the structure is t
(L) Structures reconstructed from the subsets in (J), with the same coloring as th
(M) Structures from mixed subsets (blue mesh, see the text for more details) over
denotes an absence of the complete mass in the linker region obtained byML3D,
to compute this structure. Arrows show movements.
See also Figure S3 and Movies S4 and S5.
Structure 22,
is larger than that of the compact-form particle and that the par-
ticles were all more or less swollen in the analyzed samples.
The conformational change can be mainly described as a
combination of an increase in the radius of the particle (increase
in the negative direction of PA1), a rotation of the subunits around
the 5-fold symmetry axis, and an increase in the size of the
intersubunit space at the subunits quasi-trimer (central part of
the capsid in Figure 4D and Movie S6). These results are consis-
tent with the models of the TBSV conformational change pro-
posed in the literature (Aramayo et al., 2005; Kruse et al., 1982;
Robinson and Harrison, 1982). Most important, the visualization
of the full conformational distribution revealed many intermedi-
ate states of the change, which describes more extensively the
conformational heterogeneity that was detected previously (Ara-
mayo et al., 2005).
DISCUSSION
This article describes the method HEMNMA that allows analysis
of the dynamics of large macromolecular complexes by experi-
mental EM image analysis of possible conformational-change
directions predicted by NMA. HEMNMA is particularly useful in
the cases in which the reference structure at atomic resolution
is unavailable but a structure can be obtained by EM.
Full Dynamics Can Be StudiedHEMNMA is ideally suited to study full dynamics, as it does not
use classification during the image analysis. The classification
of the computed deformation amplitudes can be performed at
the last step to compute structures with similar conformations.
We showed that the conformational transition conveyed by the
reconstructed structures is consistent with the one conveyed
by the reference structure displaced along the trajectories fitted
through the computed deformation amplitudes. However, the full
conformational distribution conveys additional information that
is not contained in the reconstructions obtained from the clas-
ses. Therefore, when flexibility is described by a large range of
conformations, a clear advantage of our method is in looking
for a full range of conformations, contrary to the standard
methods that only look for discrete and limited number of confor-
mational states.
HEMNMA RobustnessIn the ribosome experiments (experiments 1 and 2), we analyzed
images with the proposed method using only the mode related
to ratchet-like motion to see whether we could recover both
ratchet-like and L1-stalk motions. The motions were success-
fully recovered, and robustness of the method was shown to
different realistic factors (e.g., different SNRs, different CTFs,
different resolutions and compositions of the reference structure
with respect to those of the imaged complexes).
hat of the cluster).
at used in (K).
lapped with the structures obtained with ML3D (orange solid). The red asterisk
which is an evidence of the conformational heterogeneity of the image set used
496–506, March 4, 2014 ª2014 Elsevier Ltd All rights reserved 503

Figure 4. Experiment with EM Images of TBSV(A) Pseudoatomic structure (spheres) computed using a compact-form TBSV structure from a previous EM study (the EM structure [Aramayo et al., 2005] is
shown in transparent gray).
(B) Collectivity degree of the pseudoatomic normal modes. The first six modes related to rigid-body movements are not shown; the horizontal line corresponds to
the collectivity of 0.75; the asterisks denote the modes with the collectivity degree above 0.75.
(C) Computed deformation amplitudes projected on to the three most important PAs (the points denote single-particle images and PA1, the most important PA),
the linear regression line (blue), and four groups of images (red, magenta, green, and yellow) determined by splitting the full range of the data coordinates on the
first PA into four equal-length intervals.
(D) Overlapped structures reconstructed from the four groups of images shown in (C). The volumes are indicated with the color of the corresponding group in (C).
See also Movie S6.
Structure
Iterative Elastic 3D-to-2D Alignment
Complexes of Different Composition Can Be StudiedThe experiment with EM images of 70S ribosome (experiment 2)
was principally used to show that the method can work with
different compositions of complexes in the same sample (with
EF-G, without EF-G, and with partially bound EF-G) that, at the
same time, produce different conformations of the complexes.
We refer to this kind of conformational variability to as
‘‘discrete-type conformational changes,’’ because the sample
is prepared so that a small number of conformational classes
are expected and the problem can be solved by classical
(‘‘discrete’’) methods. This experiment shows that, in the case
504 Structure 22, 496–506, March 4, 2014 ª2014 Elsevier Ltd All righ
of such ‘‘discrete-type’’ problems, our method can reproduce
the results obtained using classical methods and the same
data (Elad et al., 2008; Scheres et al., 2007). The functional
significance of these results was reported in the first paper in
which this data set was analyzed (Scheres et al., 2007).
Functional Significance of Observed MotionsThe experiments with Pol a-B and TBSV highlight the main
characteristics of the methodology, showing that it can be
used to explore truly continuous-type conformational changes
where the complex cannot be stabilized in one or a few particular
ts reserved

Structure
Iterative Elastic 3D-to-2D Alignment
conformations. They also showed how the method works when
no a priori knowledge about the conformational change is used
for the selection of normal modes. Themethod can find contribu-
tions of the used modes to the PAs as well as their contributions
to the principal trajectories that determine the most dominant
motions. Moreover, the methodology is particularly useful in
identifying the most dominant modes when they are not among
a few lowest frequency modes (e.g., as in the TBSV case). These
experiments are also interesting as they show that the method
allows studying conformational pathways that may actually exist
but may be difficult to solve by X-ray crystallography or classical
EM methods that rely on a predefined initial number of classes.
Pol a-B is arranged as an elongated structure organized in two
lobes connected by a flexible linker. This quaternary organization
has been observed for other eukaryotic replicative polymerases
such as DNA polymerase ε (Asturias et al., 2006) and DNA poly-
merase d (Jain et al., 2009), which are responsible for the replica-
tion of the leading and lagging strands, respectively. In all these
replicative complexes, the flexibility between the different lobes
has been identified as a functional characteristic that allows the
accommodation of different conformations of DNA during its
replication and facilitates the interactions of these complexes
with other components of the replication machinery. An EM
analysis of the structure of the complete eukaryotic primosome,
consisting of Pol a, the B subunit, and the two components of the
primase (PriL and PriS) revealed a very flexible connection
between the two lobes and that this complex was capable of
adopting a large range of different conformations (Nunez-Ram-
ırez et al., 2011). This flexibility was postulated as a mechanism
for the transfer of the DNA substrate from the primase catalytic
site placed in one of the lobes to the DNA polymerase catalytic
site located in the other lobe. It is surprising that ML3D image
classification of Pol a-B, a subcomplex, comprising only two of
the components of the primosome, revealed a limited flexibility
between the catalytic core of Pol a (the big lobe) and the
B-CTD platform (the small lobe) (Klinge et al., 2009). The distinct
behavior of the full primosome complex and the Pol a-B sub-
complex was difficult to rationalize. Now, the analysis of the
same data set with HEMNMA has revealed that the high degree
of flexibility showed in the full complex is also present in the Pol
a-B subcomplex. Intermediate conformations of the Pol a-B
subcomplex were undetected by ML3D, probably because of
the difficulty in assigning a large range of conformations to a
discrete number of solutions. In addition, the classical refine-
ment-based methods use an initial template and typically
discard images that poorly correlate with the average 3D model
obtained during the template refinement. Thus, if a dominant
conformation was used to build the initial reference, we suspect
that the particles corresponding to distant conformations
would be removed during the refinement by classical methods.
HEMNMA has provided amore precise description of the contin-
uous range of conformations of Pol a-B complexes, allowing a
better understanding of their structure-function relationship.
The visualization of the full conformational distribution of the
TBSV helped to reveal many intermediate conformations that
were previously hypothesized but impossible to visualize (Ara-
mayo et al., 2005). Indeed, many intermediate conformations
might explain a difficult crystallization of such swelling viruses
(e.g., crystallography produced a swollen TBSV structure at res-
Structure 22,
olution of only 8 A; Robinson and Harrison, 1982). The Ca2+ ions
are known to be present between the subunits forming the TBSV
capsid in order to strengthen the links between them. Many
different intermediate conformations may be explained by an
incomplete removal of these ions by EDTA (sample preparation
is described by Aramayo et al., 2005) that could lead to a partial
opening of the viruses, partially held by remaining Ca2+ ions.
Similar conformations may exist as mechanical intermediate
states permitting the release of the viral RNA within the host
cell. The genome of the TBSV consists of a single RNA filament
shifting toward the capsid in an environment depleted of Ca2+
ions, and such intermediate conformations could be enough
for the release of the single RNA filament in vivo.
Thus, HEMNMA seems highly suitable for macromolecular
complexes displaying a continuous range of conformations.
This may be the case of a large number of complexes in biology.
In these conditions, HEMNMA seems significantly more power-
ful than the methods with a predefined initial number of classes,
which would require larger data sets and larger computing times
to evaluate the presence of a large number of possible con-
formers. However, the classification-based methods can be
combined with HEMNMA to better analyze overall heterogeneity
(e.g., by providing one or several reference structures as in the
Pol a-B case).
EXPERIMENTAL PROCEDURES
Pseudoatomic Structures from EM Volumes
To obtain a reduced EMdensity representation, our recently publishedmethod
for volume-to-pseudoatoms conversion (Nogales-Cadenas et al., 2013) was
used as it allows controlling the volume approximation error and, thus, control-
ling quality of the projections for the elastic projection-matching-based image
alignment. The used conversionmethod represents a volume by a collection of
Gaussian functions whose number, positions, and amplitudes are adjusted for
a given volume approximation error and a given Gaussian standard deviation.
The Gaussian functions are referred to as pseudo-atoms although their posi-
tions do not generally coincide with the atomic positions, and the structure
with pseudo-atoms is referred to as pseudo-atomic structure (Nogales-Cade-
nas et al., 2013).
NMA
To compute normal modes, a simplified elastic network representation of the
potential energy function (Tirion, 1996) was used, as implemented on the
ElNemo web server (Suhre and Sanejouand, 2004) for atomic structures and
the 3DEM Loupe web server (Nogales-Cadenas et al., 2013) for EM structures.
Before computing normal modes, 3DEM Loupe converts the input EM volume
into a pseudoatomic structure that can be directly used as the reference struc-
ture for the method proposed here. The coordinates of the normal mode
vectors are computed in angstroms, while the deformation amplitudes have
no units. Six lowest frequency modes (modes 1–6) are not used as they are
related to rigid-body movements.
SUPPLEMENTAL INFORMATION
Supplemental Information includes Supplemental Experimental Procedures,
three figures, one table, and sixmovies and can be foundwith this article online
at http://dx.doi.org/10.1016/j.str.2014.01.004.
ACKNOWLEDGMENTS
This work was supported by the French National Center for Scientific Research
and the Spanish National Research Council (CSIC2009FR0015 and PICS 2011
to S.J. and C.O.S.S.); the Spanish Ministry of Economy and Competitiveness
(ACI2009-10220, ACI2010-1088, and BIO2010-16566 to J.M. Carazo and
496–506, March 4, 2014 ª2014 Elsevier Ltd All rights reserved 505

Structure
Iterative Elastic 3D-to-2D Alignment
SAF2011-22988 to O.L.); the European Social Fund and the Ministerio de Edu-
cacion y Ciencia (‘‘Ramon y Cajal’’ fellowship to C.O.S.S. and J.R.B.-C.); the
European Commission (DECI-6 to C.O.S.S. and S.J.); and the French National
ResearchAgency (ANR-11-BSV8-010-04 toS.J.).We thank theGENCI-CINES/
IDRIS for computing resources (2011-x2010072174 and 2012-x2010072174 to
S.J.), J. FrankandH.Gao (ColumbiaUniversity) fordepositing the70S/EF-G im-
ages on the EMDataBank web site, L. Pellegrini and S. Klinge (Cambridge Uni-
versity) for providing the Pol a-B samples, E. Larquet and R. Aramayo (IMPMC)
for providing the TBSV data, and I. Callebaut (IMPMC) and J.M. Carazo (Centro
Nacional de Biotecnologıa) for stimulating discussions.
Received: August 28, 2013
Revised: December 28, 2013
Accepted: January 2, 2014
Published: February 6, 2014
REFERENCES
Aramayo,R.,Merigoux,C., Larquet,E.,Bron,P.,Perez, J.,Dumas,C., Vachette,
P., and Boisset, N. (2005). Divalent ion-dependent swelling of tomato bushy
stunt virus: a multi-approach study. Biochim. Biophys. Acta 1724, 345–354.
Asturias, F.J., Cheung, I.K., Sabouri, N., Chilkova, O., Wepplo, D., and
Johansson, E. (2006). Structure of Saccharomyces cerevisiae DNA polymer-
ase epsilon by cryo-electron microscopy. Nat. Struct. Mol. Biol. 13, 35–43.
Brink, J., Ludtke, S.J., Kong, Y., Wakil, S.J., Ma, J., and Chiu, W. (2004).
Experimental verification of conformational variation of human fatty acid
synthase as predicted by normal mode analysis. Structure 12, 185–191.
Bruschweiler, R. (1995). Collective protein dynamics and nuclear spin relaxa-
tion. J. Chem. Phys. 102, 3396–3403.
Chacon, P., Tama, F., and Wriggers, W. (2003). Mega-Dalton biomolecular
motion captured from electron microscopy reconstructions. J. Mol. Biol.
326, 485–492.
Delarue, M., and Dumas, P. (2004). On the use of low-frequency normal modes
to enforce collective movements in refiningmacromolecular structural models.
Proc. Natl. Acad. Sci. USA 101, 6957–6962.
Elad, N., Clare, D.K., Saibil, H.R., and Orlova, E.V. (2008). Detection and
separation of heterogeneity in molecular complexes by statistical analysis of
their two-dimensional projections. J. Struct. Biol. 162, 108–120.
Fu, J., Munro, J.B., Blanchard, S.C., and Frank, J. (2011). Cryoelectron micro-
scopy structures of the ribosome complex in intermediate states during tRNA
translocation. Proc. Natl. Acad. Sci. USA 108, 4817–4821.
Grob,P.,Cruse,M.J., Inouye,C., Peris,M., Penczek,P.A., Tjian,R., andNogales,
E. (2006). Cryo-electron microscopy studies of human TFIID: conformational
breathing in the integration of gene regulatory cues. Structure 14, 511–520.
Jain, R., Hammel, M., Johnson, R.E., Prakash, L., Prakash, S., and Aggarwal,
A.K. (2009). Structural insights into yeast DNA polymerase delta by small angle
X-ray scattering. J. Mol. Biol. 394, 377–382.
Joni�c, S., Sorzano, C.O.S., Thevenaz, P., El-Bez, C., De Carlo, S., and Unser,
M. (2005). Spline-based image-to-volume registration for three-dimensional
electron microscopy. Ultramicroscopy 103, 303–317.
Klinge, S., Nunez-Ramırez, R., Llorca, O., and Pellegrini, L. (2009). 3D architec-
ture of DNA Pol alpha reveals the functional core of multi-subunit replicative
polymerases. EMBO J. 28, 1978–1987.
Kruse, J., Kruse, K.M., Witz, J., Chauvin, C., Jacrot, B., and Tardieu, A. (1982).
Divalent ion-dependent reversible swelling of tomato bushy stunt virus and
organization of the expanded virion. J. Mol. Biol. 162, 393–414.
Ming, D., Kong, Y., Lambert, M.A., Huang, Z., and Ma, J. (2002). How to
describe protein motion without amino acid sequence and atomic coordi-
nates. Proc. Natl. Acad. Sci. USA 99, 8620–8625.
Nogales-Cadenas, R., Jonic, S., Tama, F., Arteni, A.A., Tabas-Madrid, D.,
Vazquez, M., Pascual-Montano, A., and Sorzano, C.O.S. (2013). 3DEM
Loupe: analysis of macromolecular dynamics using structures from electron
microscopy. Nucleic Acids Res. 41, W363–W367.
Nunez-Ramırez, R., Klinge, S., Sauguet, L., Melero, R., Recuero-Checa, M.A.,
Kilkenny, M., Perera, R.L., Garcıa-Alvarez, B., Hall, R.J., Nogales, E., et al.
506 Structure 22, 496–506, March 4, 2014 ª2014 Elsevier Ltd All righ
(2011). Flexible tethering of primase and DNA Pol a in the eukaryotic primo-
some. Nucleic Acids Res. 39, 8187–8199.
Penczek, P.A., Frank, J., and Spahn, C.M. (2006). A method of focused clas-
sification, based on the bootstrap 3D variance analysis, and its application
to EF-G-dependent translocation. J. Struct. Biol. 154, 184–194.
Peng, L.M., Ren, G., Dudarev, S.L., and Whelan, M.J. (1996). Robust parame-
terization of elastic and absorptive electron atomic scattering factors. Acta
Crystallogr. A52, 257–276.
Powell, M.J.D. (2002). UOBYQA: unconstrained optimization by quadratic
approximation. Math. Program. 92, 555–582.
Robinson, I.K., and Harrison, S.C. (1982). Structure of the expanded state of
tomato bushy stunt virus. Nature 297, 563–568.
Scheres, S.H., Gao, H., Valle, M., Herman, G.T., Eggermont, P.P., Frank, J.,
and Carazo, J.M. (2007). Disentangling conformational states of macromole-
cules in 3D-EM through likelihood optimization. Nat. Methods 4, 27–29.
Simonetti, A., Marzi, S., Myasnikov, A.G., Fabbretti, A., Yusupov, M., Gualerzi,
C.O., and Klaholz, B.P. (2008). Structure of the 30S translation initiation
complex. Nature 455, 416–420.
Sorzano, C.O.S., Joni�c, S., El-Bez, C., Carazo, J.M., DeCarlo, S., Thevenaz, P.,
and Unser, M. (2004a). Amultiresolution approach to orientation assignment in
3D electron microscopy of single particles. J. Struct. Biol. 146, 381–392.
Sorzano, C.O.S., Marabini, R., Velazquez-Muriel, J., Bilbao-Castro, J.R.,
Scheres, S.H., Carazo, J.M., and Pascual-Montano, A. (2004b). XMIPP: a
new generation of an open-source image processing package for electron
microscopy. J. Struct. Biol. 148, 194–204.
Suhre, K., and Sanejouand, Y.H. (2004). ElNemo: a normal mode web server
for protein movement analysis and the generation of templates for molecular
replacement. Nucleic Acids Res. 32 (Web Server issue), W610–W614.
Suhre, K., Navaza, J., and Sanejouand, Y.H. (2006). NORMA: a tool for flexible
fitting of high-resolution protein structures into low-resolution electron-micro-
scopy-derived density maps. Acta Crystallogr. D Biol. Crystallogr. 62, 1098–
1100.
Tama, F., and Sanejouand, Y.H. (2001). Conformational change of proteins
arising from normal mode calculations. Protein Eng. 14, 1–6.
Tama, F., and Brooks, C.L., 3rd. (2005). Diversity and identity of mechanical
properties of icosahedral viral capsids studied with elastic network normal
mode analysis. J. Mol. Biol. 345, 299–314.
Tama, F., and Brooks, C.L. (2006). Symmetry, form, and shape: guiding prin-
ciples for robustness in macromolecular machines. Annu. Rev. Biophys.
Biomol. Struct. 35, 115–133.
Tama, F., Wriggers, W., and Brooks, C.L., 3rd. (2002). Exploring global distor-
tions of biological macromolecules and assemblies from low-resolution struc-
tural information and elastic network theory. J. Mol. Biol. 321, 297–305.
Tama, F., Valle, M., Frank, J., and Brooks, C.L., 3rd. (2003). Dynamic reorga-
nization of the functionally active ribosome explored by normal mode analysis
and cryo-electron microscopy. Proc. Natl. Acad. Sci. USA 100, 9319–9323.
Tama, F., Miyashita, O., and Brooks, C.L., 3rd. (2004a). Flexible multi-scale
fitting of atomic structures into low-resolution electron density maps with
elastic network normal mode analysis. J. Mol. Biol. 337, 985–999.
Tama, F., Miyashita, O., and Brooks, C.L., 3rd. (2004b). Normal mode based
flexible fitting of high-resolution structure into low-resolution experimental
data from cryo-EM. J. Struct. Biol. 147, 315–326.
Tirion, M.M. (1996). Large amplitude elastic motions in proteins from a single-
parameter, atomic analysis. Phys. Rev. Lett. 77, 1905–1908.
Valle, M., Zavialov, A., Sengupta, J., Rawat, U., Ehrenberg, M., and Frank, J.
(2003). Locking and unlocking of ribosomal motions. Cell 114, 123–134.
Wang, Y., Rader, A.J., Bahar, I., and Jernigan, R.L. (2004). Global ribosome
motions revealed with elastic network model. J. Struct. Biol. 147, 302–314.
Witz, J., and Brown, F. (2001). Structural dynamics, an intrinsic property of viral
capsids. Arch. Virol. 146, 2263–2274.
Zhang, W., Dunkle, J.A., and Cate, J.H. (2009). Structures of the ribosome in
intermediate states of ratcheting. Science 325, 1014–1017.
ts reserved