Italian organisations within the European nanotechnology network: presence, dynamics and effects
19
241 DIE ERDE · Vol. 145 · 4/2014 Zusammenfassung Die Nanotechnologie stellt ein aufstrebendes interdisziplinäres Gebiet dar, das laut der Europäischen Kom- mission eine der neuen technologischen Forschungsfronten der Welt bildet. Nanowissenschaften und Nano- technologien spielen eine Schlüsselrolle innerhalb der Forschungspolitik der Europäischen Union und sind beide Teil der „sieben vorrangigen Themenbereiche” des Sechsten Rahmenprogramms und der „neun The- men“ des Kooperationsprogramms des Siebten Rahmenprogramms. Das Ziel dieser Arbeit ist es, die Bedeu- tung italienischer Organisationen im bestehenden europäischen Netzwerk zur Nanotechnologieforschung zu erfassen und verschiedene Aspekte der relationalen und räumlichen Dynamik sowie der wissenschaftlichen und wirtschaftlichen Auswirkungen dieser Partnerschaften in Italien zu beleuchten. Unter Verwendung eines amtlichen Dokuments der Europäischen Kommission mit dem Titel ”Mapping Portal for Nanotechnology Re- search” und unter Einsatz von Techniken der sozialen Netzwerkanalyse sowie von Statistik und qualitativen Interviews wird festgestellt, dass Italien eine zentrale Rolle innerhalb des europäischen Nanotechnologie- netzwerkes spielt, dass italienische Organisationen tendenziell bereits zuvor bestehende zufriedenstellende Kooperationen wiederholt genutzt haben, dass für den Aufbau von Forschungsgruppen und bei der Projekt- entwicklung andere Faktoren wichtiger waren als die bloße geographische Nähe und dass auf nationaler Ebene die wissenschaftlichen Effekte beträchtlich größer waren als die ökonomischen Effekte. Keywords Geography of knowledge, EU research policy, nanotechnology, Italy Italian organisations within the European nanotechnology network: presence, dynamics and effects Giuseppe Calignano 1 1 Department of History, Society and Human Studies, University of Salento, Via V.M. Stampacchia, 73100 Lecce, Italy, [email protected] Manuscript submitted: 26 December 2013 / Accepted for publication: 6 October 2014 / Published online: 11 December 2014 Abstract Nanotechnology is an emerging interdisciplinary field that, according to the European Commission, represents one of the world’s new technological frontiers. Nanoscience and nanotechnology play a key role in European Union research policies; they have been included among the “seven priority thematic areas” of the Sixth Framework Programme and the “nine the- mes” of the Cooperation Programme of the Seventh Framework Programme. The purpose of this study is to assess the role of Italian organisations in the existing European nanotechnology innovation network and to illuminate several aspects of re- lational and geographical dynamics as well as the scientific and economic effects of these partnerships in Italy. Using an of- ficial document issued by the European Commission entitled “Mapping Portal for Nanotechnology Research” and adopting social network analysis techniques, statistics and qualitative interviews, it is determined that Italy plays a central role in the European nanotechnology network, that Italian organisations have tended to replicate satisfactory prior collaborations, that other factors have been more significant than geographical proximity in creating research groups and developing pro- jects, and, finally, that scientific effects have been substantially more significant than economic effects at the national level. Calignano, Giuseppe 2014: Italian organisations within the european nanotechnology network: presence, dynamics and effects. – DIE ERDE 145 (4): 241-259 DOI: 10.12854/erde-145-21 Vol. 145, No. 4 · Research article DIE ERDE Journal of the Geographical Society of Berlin
Transcript of Italian organisations within the European nanotechnology network: presence, dynamics and effects

241DIE ERDE · Vol. 145 · 4/2014
ZusammenfassungDie Nanotechnologie stellt ein aufstrebendes interdisziplinäres Gebiet dar, das laut der Europäischen Kom-mission eine der neuen technologischen Forschungsfronten der Welt bildet. Nanowissenschaften und Nano-technologien spielen eine Schlüsselrolle innerhalb der Forschungspolitik der Europäischen Union und sind beide Teil der „sieben vorrangigen Themenbereiche” des Sechsten Rahmenprogramms und der „neun The-men“ des Kooperationsprogramms des Siebten Rahmenprogramms. Das Ziel dieser Arbeit ist es, die Bedeu-tung italienischer Organisationen im bestehenden europäischen Netzwerk zur Nanotechnologieforschung zu erfassen und verschiedene Aspekte der relationalen und räumlichen Dynamik sowie der wissenschaftlichen und wirtschaftlichen Auswirkungen dieser Partnerschaften in Italien zu beleuchten. Unter Verwendung eines amtlichen Dokuments der Europäischen Kommission mit dem Titel ”Mapping Portal for Nanotechnology Re-search” und unter Einsatz von Techniken der sozialen Netzwerkanalyse sowie von Statistik und qualitativen Interviews wird festgestellt, dass Italien eine zentrale Rolle innerhalb des europäischen Nanotechnologie-netzwerkes spielt, dass italienische Organisationen tendenziell bereits zuvor bestehende zufriedenstellende Kooperationen wiederholt genutzt haben, dass für den Aufbau von Forschungsgruppen und bei der Projekt-entwicklung andere Faktoren wichtiger waren als die bloße geographische Nähe und dass auf nationaler Ebene die wissenschaftlichen Effekte beträchtlich größer waren als die ökonomischen Effekte.
Keywords Geography of knowledge, EU research policy, nanotechnology, Italy
Italian organisations within the European nanotechnology network: presence, dynamics and effects
Giuseppe Calignano1
1Department of History, Society and Human Studies, University of Salento, Via V.M. Stampacchia, 73100 Lecce, Italy, [email protected]
Manuscript submitted: 26 December 2013 / Accepted for publication: 6 October 2014 / Published online: 11 December 2014
AbstractNanotechnology is an emerging interdisciplinary field that, according to the European Commission, represents one of the world’s new technological frontiers. Nanoscience and nanotechnology play a key role in European Union research policies; they have been included among the “seven priority thematic areas” of the Sixth Framework Programme and the “nine the-mes” of the Cooperation Programme of the Seventh Framework Programme. The purpose of this study is to assess the role of Italian organisations in the existing European nanotechnology innovation network and to illuminate several aspects of re-lational and geographical dynamics as well as the scientific and economic effects of these partnerships in Italy. Using an of-ficial document issued by the European Commission entitled “Mapping Portal for Nanotechnology Research” and adopting social network analysis techniques, statistics and qualitative interviews, it is determined that Italy plays a central role in the European nanotechnology network, that Italian organisations have tended to replicate satisfactory prior collaborations, that other factors have been more significant than geographical proximity in creating research groups and developing pro-jects, and, finally, that scientific effects have been substantially more significant than economic effects at the national level.
Calignano, Giuseppe 2014: Italian organisations within the european nanotechnology network: presence, dynamics and effects. – DIE ERDE 145 (4): 241-259
DOI: 10.12854/erde-145-21
Vol. 145, No. 4 · Research article
D I E E R D EJournal of the
Geographical Society of Berlin

242 DIE ERDE · Vol. 145 · 4/2014
1. Introduction
The goal of the Lisbon Strategy (2000) was to make the European Union (EU) “the most competitive and dynamic knowledge-based economy in the world” over a ten-year period (European Council 2000). However, in the last decade, many EU countries have experienced a decline in growth. In addition, the 2008 global economic and financial crisis affected the EU more severely than other mature economies. In fact, a number of major nations have suffered pe-riods of economic recession (i.e., France and Spain) or dangerous economic downturns (i.e., Italy). The current economic phase is characterised not only by the outsourcing of labour-intensive activities to developing countries but in particular by the relent-less growth of emerging (or already emerged) econo-mies, including the area of high technology.
In this unprecedented and complex scenario, the EU research and innovation policy initiatives play a crucial role. The Sixth Framework Programme (FP 6) and the Seventh Framework Programme (FP 7) are the most direct measures derived from the Lisbon Strategy and the most important in-struments used by the EU for research funding in Europe (European Commission 2007a).
As reported in ‘Europe 2020’ (European Commission 2010), nanotechnologies are considered to be one of the five key technologies for development and innova-tion in Europe over the coming years and will play a key role in five major economic and social challenges in the near future (“grand challenges”): the progres-sively ageing population, climate change, the opti-misation of resource use (e.g., energy, water, food), digital technologies and global communication, and the development of efficient and sustainable produc-tion systems (Airi Nanotec 2011b; Di Bello 2013). This makes EU research funding and the interaction of Eu-ropean researchers involved in it an important arena for social, economic and also spatial investigation.
This article aims to i) identify the characteristics of the nanotechnology network within the FP 6 and FP 7, ii) assess Italy’s major partners, iii) evaluate the role played by Italian organisations (e.g., univer-sities, research centres, companies) at the country level within the nanotechnology network, iv) de-scribe the characteristics of the Italian organisa-tions in terms of presence and concentration, and v) assess the geographic and relational dynamics as
well as the scientific and economic effects that de-rive from the presence of Italian organisations with-in this specific transnational innovation network.
The empirical aspect of the study is based on data in-cluded in an official document issued by the EC enti-tled “Mapping Portal for Nanotechnology Research” (European Commission 2013a), which contains a list of more than two hundred transnational nano-technology projects funded under FP 6 and FP 7. In addition, six qualitative interviews with Italian na-notechnology experts are used and social network analysis (SNA), descriptive statistical techniques and a qualitative approach have been adopted.
The paper is organised as follows: In the next section, the main theoretical and procedural principles of the two most recent FPs are outlined with a focus on nano-technologies; Section 3 addresses the innovation level in Italy, with particular reference to nanotechnologies; in Section 4 (divided into 4 paragraphs), the entire network of all of the organisations (from 44 countries) involved in FP 6 and FP 7 is mapped and the differences between the main countries in the network are outlined; in Sec-tion 5 (divided into 3 paragraphs), the quality of Italian organisations, the geographic and relational dynamics and the national scientific and economic effects gener-ated by the ties created within the two latest FPs are assessed; finally, Section 6 discusses the primary re-sults of the study and presents conclusions.
2. The nanotechnology network in FP 6 and FP 7: theoretical framework and primary characteristics
Today, university-industry-government cooperation is more crucial than ever for regional and national growth and development (Etzkowitz and Leydesdorff 2000; Etzkowitz et al. 2007). In the current socio-economic context, the advent of the knowledge-based society and the simultaneous valorisation of intangi-ble resources in advanced economies have reinvigor-ated this relationship. In fact, in the last 20 years, this relationship has grown progressively stronger while becoming a priority in university policies and in the agenda of national and supranational organisations (i.e., the EU). Convergence and integration between university, industry and government resulted in the ‘triple helix model’ of innovation (Etzkowitz 1997; Etzkowitz and Leydesdorff 2000), which is a socio-logical metaphor that has fostered several models of evolutionary economics, such as innovation clusters
Italian organisations within the European nanotechnology network: presence, dynamics and effects

243DIE ERDE · Vol. 145 · 4/2014
Italian organisations within the European nanotechnology network: presence, dynamics and effects
(Porter 2000; Borrás and Tsagdis 2008; Asheim et al. 2006) and regional and national innovation systems (Cooke et al. 1997, 1998; Uyarra 2010).
Innovation is a social and relational construction (Trigilia 2008); accordingly, actors are not isolated but are involved in innovation networks (Uotila et al. 2006). In this regard, Autant-Bernard et al. (2007) emphasised the importance of network effects and demonstrated how social distance appears to matter more than geographical distance. This finding sup-ports the assumption that geographic prox imity – in the sense of the permanent co-localisation of indi-viduals and organisations – is no longer an essen-tial attribute of innovation dynamics, as Boschma (2005) and Torre (2008) have suggested.
However, most scholars in the field of geography and regional sciences have analysed the innovation net-works from both a national (Freeman 1991; Lund-vall 1992; Nelson 1993) and a regional perspective (Cooke et al. 1997, 1998; Braczyk et al. 1998; Asheim et al. 2006), often neglecting the increasing impor-tance of international innovation networks. Accord-ing to Binz and Truffer (2011), only recently – that is, in the last two decades – have scholars started to focus on the importance of multi-scalar innova-tion networks or transnational innovation concepts. The same authors emphasise how the advent of glo-balisation and the fast rise of emerging countries have had a substantial impact on how innovation is generated, diffused and employed (Binz and Truffer 2011). That is, the importance of international in-novation networks is increasing swiftly, and many studies have demonstrated how interactions among actors within these international networks have grown stronger over the past two decades and how long-distance collaborations and partnerships have increased over time (Amin 2002; Frenken 2000; Wagner and Leydesdorff 2005; Autant-Bernard et al. 2007; Maggioni and Uberti 2011; Frenken et al. 2009).
Several of these theoretical considerations appear to have inspired the EU innovation policies; in fact, FP 6 and FP 7 were open to all public and private insti-tutions (triple helix model) and adopted a transna-tional collaborative perspective (i.e., long-term and long-distance collaborations). Moreover, a primary objective of all of the FPs was to promote the com-petitiveness of European industry by “bringing to-gether actors with the most advanced resources and capabilities” (Roediger-Schluga and Barber 2007: 5).
Since the introduction of the FPs (1984-1988), thou-sands of projects funded by the EU have contributed to creating transnational innovation networks of al-liances among the different actors (e.g., researchers, managers, investors) variously involved in several highly innovative sectors. Currently, these networks consist of different types of actors (e.g., universities, companies, research centres, governmental institu-tions, venture capitalists) and represent the ideal en-vironment for creating and disseminating research re-sults and knowledge (European Commission 2007b).
Using these concepts as a starting point, this article concentrates on the transnational collaborations created within FP 6 and FP 7. In sectorial terms, the paper focuses on nanotechnology because na-noscale research is nearly unanimously considered to be an emerging and potentially irruptive field because of its highly interdisciplinary nature (Roco 2003; Porter and Youtie 2009) and its potentially extensive industrial applications in several fields, i.e., biotechnology, information and communication technology (ICT) and new technologies based on cognitive science (Roco and Bainbridge 2005).
Nanoscience and nanotechnology play a key role in EU research policies: both are included among the “seven priority thematic areas” of FP 6 (2002-2006) and the “nine themes” of the Cooperation Programme of FP 7 (2007-2013). Over the last ten years, the EU’s financial investment in nanoscale research and applications has been substantial and has increased over time. During the course of FP 6 (2002-2006), EU member countries allocated 1.3 billion euros to the thematic area of nano technology research, and this amount increased to approximately 3.5 billion euros in FP 7 (2007-2013) (European Commission 2007c). These investments are undoubtedly a sign of the EU’s sub-stantial interest in this area of science and technology.
Several scholars have analysed the network of rela-tionships established among organisations or coun-tries in the FPs; some of these studies have discussed the basic characteristics of the relational and multi-scalar spatial framework of technological innovation systems (Binz and Truffer 2011), demonstrated the existence of network and spatial effects alongside other microeconomic determinants of cooperation (Autant-Bernard et al. 2007) or analysed how the vari-ation of cross-regional industrial and public research networks is affected by geography (Scherngell and Barber 2010). Various factors determine the decision

244 DIE ERDE · Vol. 145 · 4/2014
Italian organisations within the European nanotechnology network: presence, dynamics and effects
of researchers and organisations to participate in FPs; among these, intellectual motivations, possibilities for interdisciplinary collaboration, the complementarity of resources and skills (Nokkala 2007) and funding opportunities (Pohoryles 2002; Hakala et al. 2002) are considered to be crucial by the individuals involved. In addition, many other studies have observed recur-rent collaborations between the same organisations within FPs and that factors such as the previously noted complementarity of resources and mutual trust encourage organisations to repeat collaborations with previous partners (Roediger-Schluga and Barber 2006; Nokkala 2007). In fact, in many cases these col-laborations within FP-funded projects have resulted in more durable links between collaboration partners (Georghiou 1999; Caloghirou et al. 2001; Pohoryles 2002; Barber et al. 2006; Nokkala 2007).
Compared with prior studies, the primary contribu-tion of this article is to determine Italy’s role in the specific and highly innovative field of nanotechnol-ogy. Accordingly, this paper is a first and necessary step toward revealing the interesting and little-known dynamics of the relationships and the roles played by Italian organisations within this innova-tion network. In addition, the empirical analysis aims to establish a basis for more in-depth research on the obscure economic, geographic and relational dynamics of nanotechnology in Italy.
3. Innovation and nanotechnologies in Italy
Despite occasionally significant differences at the re-gional level, many recent studies have demonstrated that the degree of innovation in Italy in general re-mains extremely weak (Istat 2013; Wired and Cotec 2009). Differentiating this overall observation, in fact, with respect to economic performance, the northeast-ern, northwestern and – to a lesser extent – central ar-eas of the country have historically been substantially more dynamic than the nation’s southern areas.
However, according to Italian National Statistical Institute (Istat) surveys, overall, Italy lags consider-ably behind the major European countries in terms of research results and patenting (Istat 2013). Several factors disrupt the innovation performance of Italy, including the limited number of large companies that operate in knowledge-intensive sectors, the concen-tration of small and micro firms in traditional manu-facturing, the relatively limited role of businesses in
R&D, the scarce use of the results obtained by public research on technology and industrial applications (despite many excellent scientific achievements). All of these factors considerably hinder Italy’s innovation performance (Wired and Cotec 2009).
Regarding nanotechnology, Italian investments are scarce. Italy invests approximately 100 million euros (approximately 135 million dollars, including Italian and European funds) annually in nanotechnologies, which is substantially less than the expenses of the leading countries in the field, such as the United States (2-3 billion plus 4-5 billion dollars of private invest-ment), Japan (1 billion dollars) and Germany (the Eu-ropean leader with 800 million dollars) (Airi Nanotec 2011a). However, in Italy the interest in nanotechnol-ogy has increased in recent years: The number of pri-vate companies directly engaged in nanotechnology nearly quadrupled – from 20 to 85 – between 2004 and 2010. Moreover, in 2010, there were 190 nano-technology research centres in Italy (55 % were public bodies; 45 % were located within private companies). In addition, the Third Italian Nanotechnology Census (Airi Nanotec 2011b) observed that nanotechnology is a growing industry in Italy characterised by niche ex-pertise as well as overall excellent scientific expertise and the increasing engagement of the industrial sys-tem. However, many problems persist, primarily as a result of structural weaknesses in Italy’s research and high technology sectors. Specifically, the two main weaknesses of the Italian nanotechnology system are fragmentation (in public research and industry) and limited private venture funding. Two of the main challenges that have been identified are strengthen-ing public support and defining a shared direction/strategy in the field (Airi Nanotec 2011b). Despite several weak – albeit encouraging – signs of change, these figures reveal Italy’s marginality in terms of in-novation in high technology and knowledge-intensive areas (such as nanotechnology). Thus, it is important to study the ability of Italian organisations to success-fully participate in projects related to nanotechnolo-gies and nanosciences funded under FP 6 and FP 7.
According to EU statistics, there were 4,764 appli-cations in FP 7’s “Nanosciences, nanotechnologies, materials and new production technologies” (NMP) category. The overall proposal success rate was 11.8 %. Among these applications, there were a high number of Italian coordinators (in second place be-hind Germany); however, an unsatisfactory success rate (9.3 %) placed Italy in third position in the win-

245DIE ERDE · Vol. 145 · 4/2014
ning coordinators ranking. Considering only Italian winning coordinators, Italian research centres ac-counted for 44.3 %, with an overall favourable suc-cess rate (11.5 %, i.e., the same as the EU average). Funds allocated to Italian organisations within FP 7 amounted to approximately 254 million Euros (10.5 %, Fig. 1); this figure places Italy second in this rank-ing behind only Germany (nearly 21.5 %) (Mini stero dell’Istruzione dell’Università e della Ricerca 2012). In FP 6, the percentage of funds allocated to Italy was nearly the same (10.6 %); however, Italy moved from fourth to second position in the transition between the two latest FPs because of the percentage decrease of funds allocated to the United Kingdom (-1 %) and France (-2.3 %). In sum, the FP 6 and FP 7 allocation figures demonstrate that overall Italy is one of the countries that have profited most from EU research funds allocated under the two latest FPs.
Participation in FPs research projects is also open to researchers from the so-called associate countries that have signed a bilateral cooperation agreement with the EU (European Commission 2011), and global cooperation is encouraged by the EU as well (Europe-an Commission 2013b). This explains the presence of Switzerland in Figure 1 and the participation of other non-EU member countries in the dataset used for this study (see next tables and figures).
According to Frenken (2000), the recombination of national competencies in transnational networks provides countries with a wide range of possible in-novations. Although for a different socio-economic context, Fitjar and Rodríguez-Pose (2011) also demon-strated how companies located in peripheral innova-tion areas that have a number of international part-ners in innovation processes are significantly more likely to develop new products and to generate radi-cal innovations. The same authors emphasised how regional hubs in peripheral areas with sound con-nections to international collaborative networks can successfully produce innovation and, consequently, economic development. Finally, a strong presence in international networks can generate beneficial net-work effects (Autant-Bernard et al. 2007). That is, the topology of the innovation space is changing, and the last few decades have been characterised by signifi-cant changes in the production and diffusion of tech-nological knowledge (Scherngell and Barber 2010). In particular, this shift has involved the increasing importance of collaborative network arrangements in the process of knowledge creation and diffusion (Castells 1996, 2004). Additionally, the importance of transnational collaborative networks has increased, often pushed by the new technology media, above all the Internet (Cairncross 1997). As a result, strong ties with the most dynamic organisations located in other
Italian organisations within the European nanotechnology network: presence, dynamics and effects
Fig. 1 EC nanotechnologies and nanosciences allocations in FP 6 and FP 7: shares of the 11 leading countries in per cent of allocated funds (top 11 countries in FP7). Data basis: KMU Forschung Austria and Oxford Research (2010); MIUR (2012). – DE: Germany, IT: Italy, UK: United Kingdom, ES: Spain, FR: France, NL: The Netherlands, CH: Switzerland, BE: Belgium, SE: Sweden, FI: Finland, DK: Denmark

246 DIE ERDE · Vol. 145 · 4/2014
countries could represent a substantial opportunity for an under-innovative country such as Italy.
4. Mapping the nanotechnology network
Mapping Portal for Nanotechnology Research (MPNR) is a 367-page on-line document issued by the EC in 2013 that lists 228 nanotechnology projects funded under FP 6 and FP 7. The document includes informa-tion about each project, including i) the name, ii) a one-line description, and iii) an abstract. In addition, all the organisations that have participated in each project are listed. However, in twenty-two cases, the project pages provide the abstract but no other information regarding the participating organisations and their locations. Overall, the document surveys 1056 organi-sations (e.g., universities, research centres, compa-nies, venture capital and private equity associations) from 44 European and extra-European countries. Only those organisations that confirmed their participation when the document was issued were considered.
As Autant-Bernard et al. (2007) noted with respect to a different dataset, determining the number of enti-ties involved in these projects is complicated inasmuch as two entities may have the same name, or the same organisation may be identified in different ways for different projects. However, in the MPNR document, a unique acronym was assigned to each institution, which is useful for distinguishing between two poten-tially similar organisations. Therefore, to accurately calculate the number of organisations involved, those organisations with the same acronym that participat-ed in more than one project were excluded. The same method facilitated the assessment of the overall pres-ence of each organisation in the projects. MPNR groups all the projects into seven clusters based on the pri-mary area of their research application: nanomedicine; energy and the environment; electronics, information and ICT; agro-food; industrial applications; nanomate-rials; textiles; and security. This classification was not considered to be relevant for the purposes of the pre-sent study and was ignored. Starting from this dataset, a case-by-case matrix was constructed, and various
SNA and statistical indices were applied to reconstruct the network of relations for the Italian organisations.
4.1 Density and centrality measures (degree, closeness, betweenness, eigenvector)
In the first phase of this case study, several SNA tech-niques were applied to define the activity level and the centrality of each country involved in the nano-technology network within the projects funded under FP 6 and FP 7. For this purpose, a case-by-case matrix was constructed in which the rows and the columns represent the cases, i.e., the countries that partici-pated in the projects. This matrix emphasises the cur-rent relationships among the organisations, and each cell indicates whether particular pairs of individuals are related by a common affiliation. In this case study, an affiliation consists of a partnership within the na-notechnology projects funded under FP 6 and FP 7. Therefore, this case-by-case matrix shows the actual relations or links that were established between the actors that constitute the network (Scott 1991; Cor-bisiero 2014). That is, in our study, we have considered two different countries connected to one another if two organisations from two different countries par-ticipated in at least one project among those included in the MPNR document.
According to the case-by-case matrix data analysis, the network’s overall density was 0.517 (Table 1); i.e., slightly more than half of the countries involved in the network were connected. Thus, we can argue that the nanotechnology network within the FP 6 and FP 7 was moderately dense inasmuch as the interconnection among nodes was between 1/3 and 2/3 (that is, 30 % to 60 %; Corbisiero 2014). The degree is a measure of centrality that corresponds to the number of direct connections established by each node (Freeman 1979; Scott 1991) and measures the centrality of an actor; that is, the most important players are those who have more ties with other actors within the network (Scott 1991; Corbisiero 2014). However, in this specific case study, we used the degree to provide a first measure of the importance of actors and to detect the activity
Italian organisations within the European nanotechnology network: presence, dynamics and effects
Number of countries Density Number of ties Average degree
44 0.517 1,024 22.75
Table 1 The European nanotechnology network – density, number of ties and average degree. Data basis: UCINET (Borgatti et al. 2002) elaboration from MPNR dataset (2013)

247DIE ERDE · Vol. 145 · 4/2014
level of Italy in the nanotechnology network (Knoke and Yang 2008). Figure 2 shows the network of rela-tionships established by the countries involved in the projects from a graphical viewpoint.
The size of the labels corresponds to each country de-gree, and countries are divided into statistical classes (the larger the size of the label, the higher the degree of the statistical class the country belongs to). The av-erage degree of the entire network is 22.576, and the countries with a higher degree (between 40 and 36) are Germany (40 links), Italy (39), France (39), the Unit-ed Kingdom (38), the Netherlands (38) and Spain (38). Therefore, if the analysis were limited to the degree, Italy would be one of the most prestigious and central countries, on the same level as Germany and other pre-viously noted more central members of the network.
The other centrality measures used to determine the level of activity and the relevance of Italy within the network were closeness, betweenness and the eigen-vector (Appendix A). All of the centrality measures confirmed Italy’s central role and high activity level (with several, albeit negligible, differences; Table 2).
Nevertheless, the simple use of centrality measures, such as degree, closeness, betweenness and the eigen-vector, does not suffice to determine the primary part-ners and, broadly speaking, the role of a specific coun-try in the network. In fact, these measures may provide guidance on the activity level and the centrality of each actor, but in the absence of further specifications, they do not enable the measurement of the intensity of the ties between the network’s different members.
If anything, in the absence of other relational data, the analysis of the case-by-case matrix reveals only the exist-ence of the network and provides only poor indications of the intensity of ties without clarifying which ties are the strongest between each pair of countries. For instance, the relationship between Belgian and German organisa-tions (190 ties) is substantially more intense than that between Russian and Danish organisations (only 1 tie). However, this feature cannot emerge if only the previ-ously adopted centrality measures are used. Thus, the centrality measures applied to determine the activity level and the role of Italy in the nanotechnology network require further, more in-depth analysis combined with the use of SNA and descriptive statistical techniques.
Italian organisations within the European nanotechnology network: presence, dynamics and effects
Fig. 2 The nanotechnology network (FP 6/FP7). Data basis: NetDraw elaboration from MPNR dataset (2013)
Country Degree Rank Closeness Rank Betweenness Rank Eigenvector Rank
Italy 39.0 2 89.796 2 47.807 2 0.207 3
Table 2 Italy’s role in the European nanotechnology network: centrality measures. Data basis: UCINET (Borgatti et al. 2002) elaboration from MPNR dataset (2013)

248 DIE ERDE · Vol. 145 · 4/2014
4.2 Identification of the nanotechnology network core
Table 3 shows i) the total number of organisations (e.g., universities, research centres, businesses) in-
volved per country, ii) the total number of projects in which these organisations were involved, and iii) the average participation of each country’s organi-sations in the projects. The table reveals how the
Italian organisations within the European nanotechnology network: presence, dynamics and effects
Rank Country Number of organisations Overall presence Average presence/project
1 Germany 197 391 2 2 United Kingdom 127 241 1.9 3 France 97 200 2.1 4 Italy 99 180 1.8 5 Spain 63 122 1.9 6 The Netherlands 46 115 2.5 7 Sweden 34 96 2.8 8 Belgium 33 89 2.7 9 Switzerland 36 82 2.3
10 Denmark 24 64 2.7 11 Finland 28 54 1.9 12 Ireland 17 51 3 13 Austria 29 46 1.6 14 Israel 17 44 1.4 15 Poland 27 37 1.8 16 Czech Republic 19 33 1.7 17 Greece 14 25 1.8 18 Portugal 14 25 1.8 19 Russia 19 20 1.1 20 Hungary 16 18 1.1 21 Slovenia 9 16 1.8 22 Norway 10 16 1.6 23 Romania 13 15 1.2 24 Turkey 7 10 1.4 25 Slovakia 10 10 1 26 USA 9 10 0.9 27 China 8 8 1 28 Estonia 3 7 2.3 29 Bulgaria 5 7 1.4 30 Latvia 3 5 1.7 31 Lithuania 4 5 1.3 32 Mexico 3 3 1 - Other countries 15 16 1.1
Table 3 Numbers and presence of organisations in the European nanotechnology network by countries. Data basis: MPNR 2013
249DIE ERDE · Vol. 145 · 4/2014
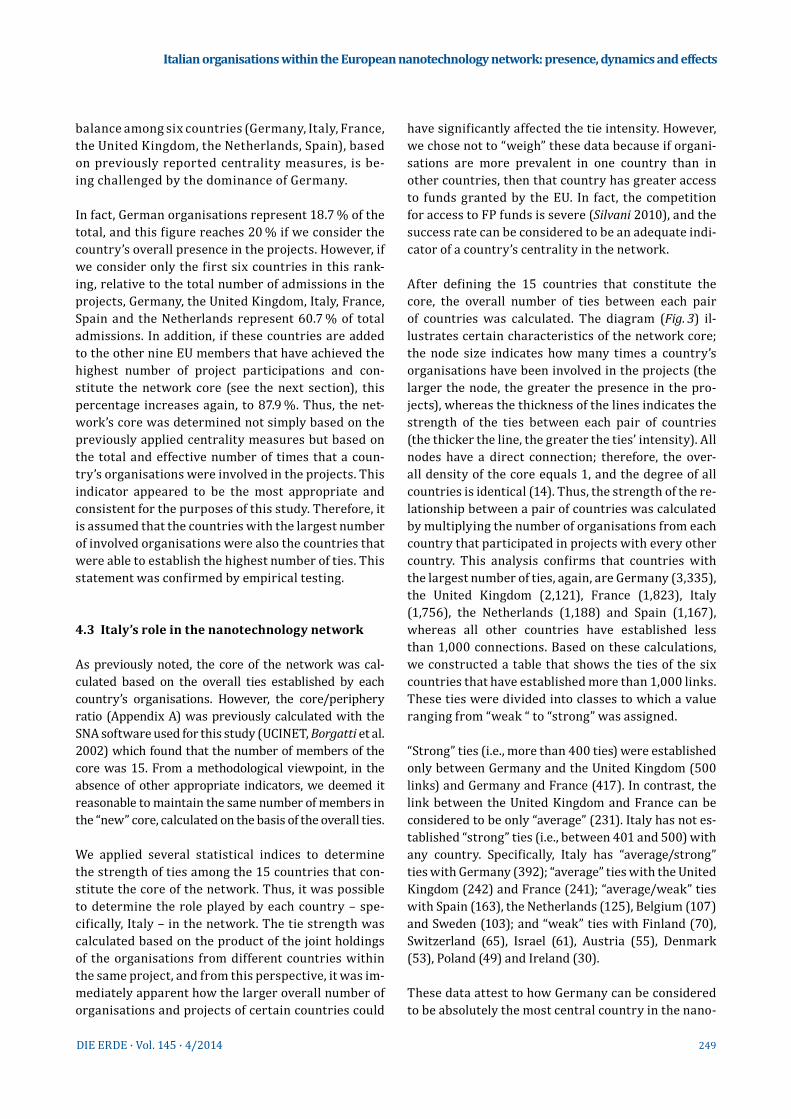
balance among six countries (Germany, Italy, France, the United Kingdom, the Netherlands, Spain), based on previously reported centrality measures, is be-ing challenged by the dominance of Germany.
In fact, German organisations represent 18.7 % of the total, and this figure reaches 20 % if we consider the country’s overall presence in the projects. However, if we consider only the first six countries in this rank-ing, relative to the total number of admissions in the projects, Germany, the United Kingdom, Italy, France, Spain and the Netherlands represent 60.7 % of total admissions. In addition, if these countries are added to the other nine EU members that have achieved the highest number of project participations and con-stitute the network core (see the next section), this percentage increases again, to 87.9 %. Thus, the net-work’s core was determined not simply based on the previously applied centrality measures but based on the total and effective number of times that a coun-try’s organisations were involved in the projects. This indicator appeared to be the most appropriate and consistent for the purposes of this study. Therefore, it is assumed that the countries with the largest number of involved organisations were also the countries that were able to establish the highest number of ties. This statement was confirmed by empirical testing.
4.3 Italy’s role in the nanotechnology network
As previously noted, the core of the network was cal-culated based on the overall ties established by each country’s organisations. However, the core/periphery ratio (Appendix A) was previously calculated with the SNA software used for this study (UCINET, Borgatti et al. 2002) which found that the number of members of the core was 15. From a methodological viewpoint, in the absence of other appropriate indicators, we deemed it reasonable to maintain the same number of members in the “new” core, calculated on the basis of the overall ties.
We applied several statistical indices to determine the strength of ties among the 15 countries that con-stitute the core of the network. Thus, it was possible to determine the role played by each country – spe-cifically, Italy – in the network. The tie strength was calculated based on the product of the joint holdings of the organisations from different countries within the same project, and from this perspective, it was im-mediately apparent how the larger overall number of organisations and projects of certain countries could
have significantly affected the tie intensity. However, we chose not to “weigh” these data because if organi-sations are more prevalent in one country than in other countries, then that country has greater access to funds granted by the EU. In fact, the competition for access to FP funds is severe (Silvani 2010), and the success rate can be considered to be an adequate indi-cator of a country’s centrality in the network.
After defining the 15 countries that constitute the core, the overall number of ties between each pair of countries was calculated. The diagram (Fig. 3) il-lustrates certain characteristics of the network core; the node size indicates how many times a country’s organisations have been involved in the projects (the larger the node, the greater the presence in the pro-jects), whereas the thickness of the lines indicates the strength of the ties between each pair of countries (the thicker the line, the greater the ties’ intensity). All nodes have a direct connection; therefore, the over-all density of the core equals 1, and the degree of all countries is identical (14). Thus, the strength of the re-lationship between a pair of countries was calculated by multiplying the number of organisations from each country that participated in projects with every other country. This analysis confirms that countries with the largest number of ties, again, are Germany (3,335), the United Kingdom (2,121), France (1,823), Italy (1,756), the Netherlands (1,188) and Spain (1,167), whereas all other countries have established less than 1,000 connections. Based on these calculations, we constructed a table that shows the ties of the six countries that have established more than 1,000 links. These ties were divided into classes to which a value ranging from “weak “ to “strong” was assigned.
“Strong” ties (i.e., more than 400 ties) were established only between Germany and the United Kingdom (500 links) and Germany and France (417). In contrast, the link between the United Kingdom and France can be considered to be only “average” (231). Italy has not es-tablished “strong” ties (i.e., between 401 and 500) with any country. Specifically, Italy has “average/strong” ties with Germany (392); “average” ties with the United Kingdom (242) and France (241); “average/weak” ties with Spain (163), the Netherlands (125), Belgium (107) and Sweden (103); and “weak” ties with Finland (70), Switzerland (65), Israel (61), Austria (55), Denmark (53), Poland (49) and Ireland (30).
These data attest to how Germany can be considered to be absolutely the most central country in the nano-
Italian organisations within the European nanotechnology network: presence, dynamics and effects

250 DIE ERDE · Vol. 145 · 4/2014
Italian organisations within the European nanotechnology network: presence, dynamics and effects
Fig. 3 The core of the European nanotechnology network (FP 6/FP 7). Data basis: NetDraw elaboration from MPNR dataset
Germany United Kingdom France Italy The
Netherlands Spain
Weak (0-100)
Israel, Poland
Austria, Denmark, Finland, Ireland, Israel, Poland
Austria, Poland, Denmark, Finland, Ireland, Israel, Poland, Sweden,
Austria, Denmark, Finland, Ireland, Israel, Poland, Switzerland
Austria, Belgium, Denmark, Finland, Ireland, Israel, Poland, Spain, Sweden, Switzerland
Austria, Belgium, Denmark, Finland, Ireland, Israel, Poland, Sweden, Switzerland, The Netherlands
Weak-Average (101-200)
Austria, Belgium, Denmark, Finland, Ireland
Belgium, Spain, Sweden, Switzerland, The Netherlands
Spain, Switzerland, The Netherlands
Belgium, Spain, Sweden, The Netherlands
France, Italy France, Italy, United Kingdom
Average (201-300)
Spain, Sweden, Switzerland, The Netherlands
France Italy, United Kingdom
France, United Kingdom
Germany Germany
Average-Strong (301-400)
Italy - - Germany - -
Strong (401-500)
France, United Kingdom
Germany Germany - - -
Table 4 Intensity of ties (countries with more than 1,000 connections). Data basis: MPNR dataset (2013)
technology network with respect to the EU projects funded under FP 6 and FP 7. For its part, Italy plays an important role in the network core and is placed in the
first position with regard to the strength of relation-ships among the top 15 countries that have the largest number of total participations in the projects. In sum,

251DIE ERDE · Vol. 145 · 4/2014
based on our analysis, Italy is nearly on the same level as the United Kingdom and France. It should also be noted how Germany, the United Kingdom, France and Italy performed best with respect to overall presence and tie intensity. In addition, based on Table 4, it is im-mediately clear how “average/strong” and “strong” ties concern only these four countries; this means that these countries represent an elite and are the most ac-tive and central nodes within the network.
4.4 The primary characteristics of the Italian organisations
Having assessed the role of Italy in the network compared with other countries, we found it inter-esting to briefly analyse the individual organisa-tions involved in the projects.
As previously noted, represented by 99 organisations (with 180 participations), Italy is one of the most ac-
tive and central countries in the network. Overall, the participation of private and public organisations is well balanced (both 50 %), whereas the geographi-cal locations of the Italian organisations that par-ticipated in the network were predominantly in the north (60 %) and the centre (approximately 29 %) of the country. This outcome may be explained by the previously emphasised regional socio-economic and productive differences that exist in Italy (Istat 2013).
Table 5 ranks the top 20 organisations according to the number of projects in which they have participated. In particular, one Italian organisation, the Consiglio Nazio-nale delle Ricerche (National Research Council, CNR), has the largest number of participations in nanotech-nology projects funded by the EU (33 participations). The CNR is followed by the Centre National de la Re-cherche Scientifique (France), Fraunhofer (Germany), the Commissariat à l’Energie Atomique (France) and the Max Planck Society (Germany); all of these organi-sations have been involved in more than 20 projects.
Italian organisations within the European nanotechnology network: presence, dynamics and effects
Rank Organisation Country Number of projects 1 Consiglio Nazionale delle Ricerche Italy 33 2 Centre National de la Recherche Scientifique France 28 3 Fraunhofer-Gesellschaft Germany 26 4 Commissariat à l'Énergie Atomique France 25 5 Max-Planck-Gesellschaft Germany 23
6 Agencia Estatal Consejo Superior de Investigaciones Cientificas Spain 19
7 Danmarks Tekniske Universitet Denmark 18 8 Lunds Universitet Sweden 18 9 École Polytechnique Fédérale de Lausanne Switzerland 16
10 Jrc Joint Research Centre European Commission Belgium 14 11 University College Cork Ireland 13 12 Technische Universiteit Eindhoven The Netherlands 13 13 Universiteit Twente The Netherlands 13
14 Eidgenössische Materialprüfungs- und Forschungsanstalt Switzerland 12
15 Tel Aviv University Israel 11 16 Chalmers Tekniska Höegskola Sweden 11 17 Philips The Netherlands 11 18 Katholieke Universiteit Leuven Belgium 10
19 Ludwig-Maximilians-Universität München Karlsruher Institut für Technologie
Germany Germany 10
20 Technische Universität München Cambridge University
Germany United Kingdom 9
Table 5 European nanotechnology network: Top 20 organisations (FP 6/FP 7). Data basis: MPNR dataset (2013)

252 DIE ERDE · Vol. 145 · 4/2014
Overall, in the top 20 ranking, there are five Ger-man organisations; three Dutch organisations; two French, Belgian, Swedish and Swiss organisations, respectively; and one Spanish, Danish, Israeli, Irish and British organisation, respectively. Accordingly, although the CNR was the organisation with the greatest number of admissions in absolute terms, Italy appears on the list with only one organisation.
Based on the distribution of the organisations from different countries in the nanotechnology network, various measures of dispersion were applied to un-derstand how the data were scattered around the in-dex of central tendency. Therefore, a small number of statistical indices, such as the range of variation and the standard deviation, were applied.
Table 6 shows that the United Kingdom is the most balanced country in terms of organisations present within projects; in fact, all of the dispersion indices applied to the United Kingdom are lower than those employed for the other members considered (which have established more than 1.000 tie). The first Brit-ish organisation on the list is the University of Cam-bridge (20th position, 9 participations). Other British organisations had fewer participations, although the numbers are not radically dissimilar, e.g., Institute of Occupational Medicine, University of Southampton, University of Birmingham, University of Liverpool, University of Oxford (7 participations); NPL Manage-ment, University of Nottingham (6 participations).
The considerations regarding Italy differ substantial-ly: After the CNR, which as previously noted occupies the first position, the next Italian organisation on the list appears in the 29th position. This organisation is
the University of Bologna, which scores only 1 partici-pation less than the first organisation from the United Kingdom (i.e., the University of Cambridge).
The data reported in Table 2 demonstrate how the presence of two countries in particular, Italy and France, is characterised by a large dispersion and a lack of balance with respect to the presence of their or-ganisations in the nanotechnology network. As noted, in France, the Centre National de la Recherche Scien-tifique and the Commissariat à l’Energie Atomique are the two leading organisations, whereas regarding Italy, the data related to the presence of the CNR indicate the leading role that it plays among the Italian nanotech-nology organisations involved in FP 6 and FP 7. In fact, the CNR alone accounts for 18.3 % of the total presence of Italian organisations within the projects (Fig. 4).
The CNR is a public organisation created to support scien-tific research and technology transfer. Its headquarters are located in Rome, but there are several branches else-where in Italy. Regarding nanotechnologies, two institu-tions within the CNR were specifically created to sup-port this area: the Istituto di Fotonica e Nanotecnologie (Photonics and Nanotechnologies Institute, IFN) and the Istituto Nanoscienze (Nanosciences Institute, IN). IFN is based in Milan, with other units in Rome, Bari, Padua and Trento; IN is a new CNR institute devoted to cutting-edge research in nanoscience and nanotechnology and was established in 2010 as the result of the merger of three former laboratories of the Istituto Nazionale per la Fi-sica della Materia (National Institute for the Physics of Matter): NEST-Pisa, NNL-Lecce and S3-Modena.
In addition to the CNR (33 participations) and the Uni-versity of Bologna (8 participations), the ranking of the
Italian organisations within the European nanotechnology network: presence, dynamics and effects
Country Organisations Projects Mean Range of variation Variance Standard
deviation
Germany 197 391 2 25 7.47 2.73
United Kingdom 127 241 1.9 8 2.8 1.67
France 97 200 2.1 27 14.22 3.79
Italy 99 180 1.8 32 11.08 3.35
Spain 63 122 1.9 18 5.84 2.42
The Netherlands 46 115 2.5 12 8.97 2.99
Table 6 Indices of dispersion – countries with more than 1,000 connections. Data basis: MPNR dataset (2013)

253DIE ERDE · Vol. 145 · 4/2014
Consiglio Nazionale delle Ricerche
Alma Mater Studiorum – Università di Bologna
Università degli Studi di Genova
Centro Ricerche Fiat
STMicroelectronics
Consorzio Interuniversitario Nationale per la Scienza e Technologia dei Materiali
Scuola Superiore di Studi Universitari e di Perfezionamento Sant’Anna
Politecnico di Milano
Laviosa Chimica Mineraria Spa
Università di Pisa
Colorobbia Italia
Università degli Studi di Milano
Università degli Studi di Trento
Other organisations (2 participations)
Other organisations (1 participation)
Italian organisations includes the University of Genova (5 participations); Centro Ricerche Fiat (Fiat Research Centre), STMicroelectronics, Consorzio Interuniversi-tario Nazionale per la Scienza e Tecnologia dei Materiali (Interuniversity Consortium for Materials Science and Technology), Scuola Superiore di Studi Universitari e di Perfezionamento Sant’Anna (The Sant’Anna School of Advanced Studies of Pisa) (4 participations); the Poly-technic University of Milan, Laviosa Chimica Minerara-ria, the University of Milan, Colorobbia, the University of Trento (3 participations); and 12 organisations with 2 participations. Finally, nearly 72 % of the Italian or-ganisations only participated in one project.
5. Presence, collaboration dynamics and scientific and economic effects: a qualitative analysis
To investigate several aspects that have emerged from SNA and the statistical analyses, six qualitative inter-views with researchers and professors from different public organisations (such as the CNR, the Sapienza University of Rome and the University of Salento) were performed. The six interviewed experts were selected on the basis of their willingness to cooperate from a shortlist of experts who have participated in projects funded under FP 6 and FP 7. The interviews were concluded when saturation was reached, i.e., when no new answers were provided by the respond-ents and consequently no new significant information emerged in addition to that stated by the previous
interviewees (for a substantial review on saturation, see Baker and Edwards 2012). The saturation point was reached after the fourth interview.
Specifically, these experts responded to questions re-garding the role played by the Italian organisations and researchers in the projects; relational and geographi-cal mechanisms as well as the dynamics that resulted in the establishment and development of research col-laborations; the prospective project follow-up and the scientific and economic effects of the projects funded under the two latest FPs at the national level.
5.1 The role of the CNR and other Italian organisations
Based on the qualitative interviews, the CNR, which is the organisation that has most frequently participat-ed in projects funded under FP 6 and FP 7, and other Italian organisations often co-ordinated the projects in which they were involved. In addition, researchers from Italian organisations are highly valued and are often invited by foreign institutions to participate in FP research projects. This information confirms the centrality of Italian organisations, which was previ-ously established from a quantitative viewpoint, and reflects the quality of their contributions.
According to the experts, this centrality is primarily the result of a small number of particularly intuitive
Italian organisations within the European nanotechnology network: presence, dynamics and effects
Fig. 4 Italian organisations involved in the nanotechnology network (FP 6/FP 7). Data basis: MPNR (2013)

254 DIE ERDE · Vol. 145 · 4/2014
Italian researchers being among the first scholars to become interested in nanotechnology at the interna-tional level; these renowned researchers were subse-quently regarded as the most important authorities on nanotechnology in Italy and abroad. This precocious interest in nanotechnology resulted in the establish-ment of high-level institutions and the subsequent training of researchers and highly trained specialists in Italy. That is, these factors could counterbalance the lack of public sector investment in nanotechnolo-gy. In a nutshell, the personal initiative, expertise and knowledge of individual researchers compensated for the scarce public investment in Italy. According to the respondents, the strong presence of Italian organisa-tions in projects funded under FP 6 and FP 7 can be explained by the high number of Italian research ap-plications. As previously noted, this high number re-sults from the lack of funding for R&D activities at the national and regional levels. Specifically, all the experts interviewed complained about the difficulties caused by this lack, particularly regarding the funds required to purchase the advanced equipment needed to perform their research. In Italy, there are only a small number of public (national or regional) funding provisions each year, and most are highly complicated because of excessive bureaucracy and highly restrict-ed expenditure. Consequently, Italian researchers and organisations consider EU funds to be one of the most important sources of research financing because of the high availability of grants and financial resources and the greater freedom of action (e.g., on-going re-vision and the possibility to re-balance expenditures and to allocate a certain sum to alternative projects). This aspect is considered to be crucial by researchers not only in Italy but also in several other countries, such as the United Kingdom, France and Finland (Po-horyles 2002; Hakala et al. 2002).
The predominance of the CNR can be explained in several ways. First, the CNR is a national organisation that, compared with other individual universities or research centres in Italy, has several research centres located throughout Italy and a greater number of re-searchers (accounting for 21 % of national research institutions and 29 % of research personnel in Italy; Airi Nanotec 2011b). However, there are similar or-ganisations in other major countries (i.e., Fraunhofer and the Max-Planck-Gesellschaft in Germany), and therefore, this characteristic is not sufficient to ex-plain the data that attest to how the distribution of Italian organisations in the nanotechnology network is substantially more concentrated than in the other
major European countries (except for France, where the concentration and lack of balance are even higher than in Italy). Consequently, there are other elements to consider when analysing the prevalence of the CNR. Among these, it should be noted that the CNR (and most of its members) focuses exclusively on research and has no training and teaching obligations. Accord-ing to the interviewees, this difference is perceived as an advantage in terms of level of participation and subsequent success in projects funded under FP 6 and FP 7. In addition, several researchers are affiliated both with the CNR and a public university. However, these researchers often prefer to apply for FP compe-titions with the CNR because of its simpler adminis-trative procedures for application submissions and research group construction.
5.2 Relationships and prospective project follow-ups within the EU nanotechnology network
Italian researchers have always tried to engage pres-tigious and high-profile foreign organisations in the creation of groups and coordinated projects within FP 6 and FP 7. The prestige and reputation of foreign partners is viewed as a crucial factor for the success of proposals and has a strong relevance in the building of research groups. Therefore, the research experience of the scientific partners is significant, and they are perceived as important factors to success. Research groups have also been created through considering needs in terms of particular researcher skills and equipment owned by a specific organisation; conse-quently, the complementarity of skills and equipment is considered to be another important element in net-work building, as previously noted by Nokkala (2007).
Additionally, prior relations between parties are similarly significant in research group building dy-namics. If a previous collaboration was satisfactory, Italian researchers tended to repeat it in projects funded under FP 6 and FP 7. For example, several collaborations within FP 6 and FP 7 arose from pre-vious joint experiments that produced a first result (i.e., a scientific paper). Later, this fruitful collabora-tion encouraged a more elaborate project.
When the resources (financial and intellectual) available to the initial partners were considered to be no longer sufficient, the partners determined to increase the number of researchers involved to apply for projects funded under FPs. In addition, collabora-
Italian organisations within the European nanotechnology network: presence, dynamics and effects

255DIE ERDE · Vol. 145 · 4/2014
tions that have arisen or continued during FP 6 and FP 7 have subsequently resulted in further collabo-ration in the form of co-publications, the develop-ment of prototypes or devices and informal contacts. The introduction of new researchers into durable research groups was explained by the need to find specific skills and expertise that were not yet pre-sent in the prior research groups, and it has primar-ily fostered a broader relational network.
Geographical distance is never viewed as a limitation. In fact, other factors, such as other types of proxim-ity (particularly, social proximity), sharing a common language and mutual trust based on the scientific quality of partners were considered to be more im-portant in research collaboration and relationships created or continued within the two latest FPs. All of the Italian experts interviewed emphasised that videoconferencing, frequent email exchanges and the use of data-processing systems and information soft-ware and tools did not necessarily require personal meetings to, e.g., perform simulations, process or ex-change data or provide updates regarding the evolu-tion of the research. However, the respondents em-phasised that direct contacts at academic or informal events, conferences and meetings already planned by the FPs were important, particularly to strengthen personal relationships. In addition, the respondents highlighted that a periodic common research loca-tion (typically, every six months) was considered to be helpful with respect to thoroughly discussing pro-jects and their evolution. Visits to the laboratories of scientific partners have also enabled Italian re-searchers to better assess the contribution that each foreign research partner can offer to projects.
5.3 Scientific and economic effects of the projects
The economic effects at the national level stemming from the strong presence of Italian organisations in the European nanotechnology network are highly limited. According to the respondents, first, this is a result of the characteristics of the FP calls for propos-als. In fact, these calls were primarily oriented toward basic research and less oriented toward applied re-search and, in most cases, the aim of the projects was the creation of prototypes that did not have an imme-diate industrial application. In addition to the charac-teristics of the FP calls, one of the main problems that Italian experts emphasised is the difficulty experi-enced by Italian firms in developing prototypes for in-
dustrial applications. Several experts noted that this problem primarily derives from the Italian economic system, which is chiefly based on traditional manu-facturing and small and medium enterprises (SMEs), and from the minimal interest of Italian companies in R&D investment. The same lack of interest was also found in technology companies and large companies; in fact, the R&D investments of the latter are low and often focus on short-term projects. Therefore, accord-ing to our respondents, large Italian companies do not have an overall, long-term R&D strategy. Italian indus-try’s lack of interest in scientific results and develop-ing prototypes from FP-funded projects results from doubts regarding the economic benefits that might ensue from these projects, R&D underinvestment, the absence of programming, a lack of interaction between researchers within and outside enterprises, a shortage of researchers employed in companies and an inability to develop a solid business plan and strong synergies with universities and research cen-tres (i.e., knowledge and technology transfer). Sever-al experts used the term “cultural heritage” to define the lack of interest of Italian industry in R&D.
One respondent also noted that in certain cases the response of private enterprises to FP calls for pro-posals is required. However, the respondent empha-sised how difficult it was to find private Italian com-panies interested in participating in FP applications and how their researchers usually contributed less than the academic partners. The same researcher observed that large companies were not particularly interested in FP projects because they considered the research issues to be uninteresting and the cost models not particularly advantageous. Moreover, typically, such businesses possessed scarce knowl-edge of the aims and scope of FP projects. By con-trast, two other experts emphasised that despite the previously mentioned problems, interaction with SMEs had generally been positive inasmuch as SMEs perceived opportunities to obtain access to econom-ic resources useful to recruiting new employees and opportunities to pursue interest in patents or pro-totypes with prospects for industrial development.
The considerations regarding the impact of FP- funded projects in terms of research quality are sub-stantially different. In fact, all of the Italian experts expressed a highly positive opinion regarding the experience of Italian organisations in the European projects in which they participated. Specifically, the presence of Italian organisations in the FP-funded
Italian organisations within the European nanotechnology network: presence, dynamics and effects

256 DIE ERDE · Vol. 145 · 4/2014
projects resulted, e.g., in the opening of new scien-tific or technical fields, in opportunities especially for small and medium-sized Italian universities and research centres to become more known and appre-ciated abroad and, more generally, in the creation and strengthening of significant and promising transna-tional relational networks for Italian researchers.
6. Discussion and conclusions
Starting from considerations on the increasing im-portance of international and transnational innova-tion networks (e.g., Amin 2002; Frenken 2002; Wag-ner and Leydesdorff 2005; Autant-Bernard et al. 2007; Frenken et al. 2009; Binz and Truffer 2011) and the significance for Italy, a particularly fragile country in terms of innovation, of connecting to internationally important nodes (Frenken 2000; Fitjar and Rodríguez-Pose 2011), the nanotechnology network created within FP 6 and FP 7 was reconstructed. Surprisingly, the success rate of the Italian proposals in this high-ly competitive European context was clearly higher than could be assumed from a harsh analysis of the state of the country’s scientific system (Silvani 2010).
One goal of this study was to define the role played by Italy in the European nanotechnology network, and several results were achieved. First, it can be confidently asserted that Italy plays a central role in the network. In fact, Italy belongs to the network core with respect to the number of organisations, the number of times that these organisations have partici-pated in projects and the number of links established with organisations in other countries. In addition, an analysis of the intensity of ties confirmed the signifi-cance and centrality of Italy. Additionally, statistical indices, such as the applied measures of dispersion, demonstrate that the presence of Italian organisations in the network is highly unbalanced, with only one dominant organisation (CNR) ranking among the top twenty positions. The predominance of the CNR can be explained primarily by the peculiarity of its research-ers – most of them are exclusively engaged in research activities – and the organisational structure of the in-stitution (i.e., simpler administrative procedures).
To elucidate the factors surrounding the presence of the Italian organisations, six Italian nanotechnol-ogy experts were interviewed. All experts confirmed the relevance of Italian organisations and research-ers in the European nanotechnology network from
Italian organisations within the European nanotechnology network: presence, dynamics and effects
a qualitative perspective and illuminated several little-known aspects regarding the geographical and relational dynamics of research projects created or continued within FP 6 and FP 7, the follow-up on prospective projects and the scientific and economic effects at the national level generated by the ties cre-ated within the two latest FPs. Regarding this last aspect, the economic effects of these transnational relationships have been limited primarily because of the characteristics of the system of economic pro-duction in Italy, in which large corporations, technol-ogy companies and a large variety of SMEs – often but not always belonging to the traditional manu-facturing sector – appear to be uninterested in or incapable of investment in R&D or do not possess a global strategy in this respect (with some significant exceptions, as several respondents noted). By con-trast, all experts stressed how scientific effects were highly satisfactory and often led to more durable links between collaboration partners (on this latter topic, see Georghiou 1999; Caloghirou et al. 2001; Po-horyles 2002; Barber et al. 2006; Nokkala 2007).
In this framework, a common language and trust based on the scientific quality of the partners are considered to be more important than geographical proximity by the Italian experts, which substantially confirms the findings of Autant-Bernard et al. (2007). This means that other types of proximity (particu-larly social proximity) and temporary and direct con-tacts (temporary physical proximity) can substitute for permanent co-localisation and that short-term visits are considered to be sufficient for the informa-tion exchange that partners require for satisfactory cooperation (Boschma 2005; Torre 2008)
In conclusion, this paper has presented a case study on the structure and dynamics of collaboration as well as the scientific and economic effects at the national level of the strong presence of Italian organisations in the nanotechnology networks created within FP 6 and FP 7. This empirical research has been embedded in a broader theoretical framework regarding network building, motivations and the relevance of different forms of proximity in transnational collaboration net-works. This article aspires to be considered the first concrete effort to assess nanotechnology activities in Italy from a geographical and relational perspective. We hope that other studies will build on our findings to help reveal additional interesting and little-known dynamics in Italy regarding the emerging and irrup-tive interdisciplinary field of nanotechnology.

257DIE ERDE · Vol. 145 · 4/2014
Italian organisations within the European nanotechnology network: presence, dynamics and effects
Acknowledgements
I am grateful to the editors and two anonymous review-ers for their helpful comments and suggestions. I thank the Italian nanotechnology experts whom I interviewed for their kind and valuable collaboration.
References
Airi Nanotec 2011a: Comunicato Stampa. Airi: micro e nano-tecnologie al centro della giornata Airi per l’innovazione industriale. – Roma. – Online available at: http://www.barabino.it/upload/documenti/COS_AIRI_10.05.pdf, 03/08/2014
Airi Nanotec 2011b: Third Italian nanotechnology census. – Roma
Amin, A. 2002: Spatialities of globalisation. – Environment and Planning A 34 (3): 385-399
Asheim, B.T., P. Cooke and R. Martin (eds.) 2006: Clusters and regional development; critical reflections and explora-tions. – London
Autant-Bernard, C., P. Billand, D. Frachisse and N. Massard 2007: Social distance versus spatial distance in R&D co-operation: empirical evidence from European collabora-tion choices in micro and nanotechnologies. – Papers in Regional Science 86 (3): 495-519
Baker, S.E. and R. Edwards (eds.) 2012: How many qualita-tive interviews is enough? Expert voices and early ca-reer reflections on sampling and cases in qualitative research. – National Centre for Research Methods Re-view Paper. – Online Available at: http://eprints.ncrm.ac.uk/2273/4/how_many_interviews.pdf, 31/07/2014
Barber, M.J., A. Krueger, T. Krueger and T. Roediger-Schluga 2006: The network of EU-funded collaborative R&D pro-jects. – Physical Review E 73: 036132
Binz, C. and B. Truffer 2011: Technological innovation systems in multi-scalar space. Analyzing an emerging water recycling industry with social network analysis. – Geographica Helvetica 66 (4): 254-260
Borgatti, S.P., M.G. Everett and L.C. Freeman 2002: Ucinet for Windows: Software for social network analysis. – Harvard, MA
Borrás, S. and D. Tsagdis 2008: Cluster policies in Europe: firms, institutions, and governance. – Cheltenham
Boschma, R. 2005: Proximity and innovation: a critical as-sessment. – Regional Studies 39 (1): 61-74
Braczyk, H.-J., P. Cooke and M. Heidenreich (eds.) 1998: Re-gional innovation systems; the role of governances in a globalized world. – London
Cairncross, F. 1997: The death of distance: how the commu-nications revolution will change our lives. – Cambridge
Caloghirou, Y., A. Tsakanikas and N.S. Vonortas 2001: Univer-sity-industry cooperation in the context of the European Framework Programmes. – The Journal of Technology Transfer 26 (1-2): 153-161
Castells, M. 1996: The rise of the network society. – Oxford et al.Castells, M. 2004: An introduction to the information age. –
In: Webster F., R. Blom, E. Karvonen, H. Melin, K. Norden-streng and E. Puoskari (eds.): The information society reader. – London et al.: 138-149
Cooke, P., M. Gomez Uranga and G. Etxebarria 1997: Regional innovation systems: institutional and organisational di-mensions. – Research Policy 26: 475-491
Cooke, P., M. Gomez Uranga and G. Etxebarria 1998: Regional systems of innovation: an evolutionary perspective. – Environment and Planning A 30 (9): 1563-1584
Corbisiero, F. 2014: Analisi delle reti sociali. – Dipartimen-to di Scienze Sociali, Università degli Studi di Napoli Fede rico II. – Online available at: https://www.docenti.unina.it/downloadPub.do?tipoFile=md&id=383461, 03/08/2014
Di Bello, G. 2013: Industrial competitiveness in Horizon 2020: Towards an integrated planning framework for key enabling technologies. – APRE – Agency for the Promo-tion of European Research. – Online available at: https:// community.oecd.org/servlet/JiveServlet/preview-Body/50271-102-1-94171/Di%20Bello_Report_%20In-dustrial%20Leadership_H2020.pdf, 22/12/2013
Etzkowitz, H. 1997: The triple helix: academy-industry- government relations and the growth of neo-corporatist industrial policy in the U.S. – In: Campodall’Orto, S. (ed.): Managing technological knowledge transfer: Proceedings from COST A3 Workshop in Milan, Italy, February 1-2, 1996. – EC Social Sciences COST A3, Vol. 4. – Luxembourg: 1-20
Etzkowitz, H. and L. Leydesdorff 2000: The dynamics of innovation: from national systems and “mode 2” to a tri-ple helix of university-industry-government relations. – Research Policy 29 (2): 109-123
Etzkowitz, H., J. Dzisah, M. Ranga and C. Zhou 2007: The triple helix model of innovation. University-industry- government interaction. – Asia Pacific Tech Monitor 24 (1): 14-23
European Commission 2007a: FP 7 in brief. How to get involved in the EU 7th Framework Programme for Research. – Luxembourg. – Online available at: http://ec.europa.eu/research/FP 7/pdf/FP 7-inbrief_en.pdf, 22/12/2013
European Commission 2007b: Improving knowledge trans-fer between research institutions and industry across Europe. – Luxembourg. – Online available at: http://ec.europa.eu/invest-in-research/pdf/download_en/knowledge_transfe_07.pdf, 22/12/2013
European Commission 2007c: FP 7 hands-on guide. – Bel-gium. – Online available at: http://ec.europa.eu/research/sme-techweb/pdf/sme_handson_en.pdf, 22/12/2013

258 DIE ERDE · Vol. 145 · 4/2014
European Commission 2010: Europe 2020. – Luxembourg. – Online available at: http://ec.europa.eu/europe2020/index_en.htm, 22/12/2013
European Commission 2011: FP 7 Third country agree-ments. International instruments associating third countries to FP 7. – Luxembourg. – Online available at: ftp://ftp.cordis.europa.eu/pub/FP 7/docs/third_coun-try_agreements_en.pdf, 22/12/2013
European Commission 2013a: Mapping portal for nanotech-nology research FP 6/7 Projects. – Luxembourg. – Online available at: http://ec.europa.eu/research/industrial_ technologies/pdf/ec-nanotechnology-research-map-ping_en.pdf, 22/12/2013
European Commission 2013b: Fact sheet: International Participation in Horizon 2020. – Luxembourg. – On-line available at: http://ec.europa.eu/research/hori-zon2020/pdf/press/fact_sheet_on_international_par-ticipation_in_horizon_2020.pdf, 22/12/2013
European Council 2000: Presidency conclusions, Lisbon Eu-ropean Council, 23 and 24 March 2000. – Online available at: http://www.consilium.europa.eu/uedocs/cms_data/docs/pressdata/en/ec/00100-r1.en0.htm, 22/12/2013
Fitjar, R.D. and A. Rodríguez-Pose 2011: Innovating in the periphery: firms, values, and innovation in southwest Norway. – European Planning Studies 19 (4): 555-574
Freeman, C. 1991: Network of innovators: a synthesis of research issues. – Research Policy 20 (5): 499-514
Freeman, L.C. 1979: Centrality in social networks. Concep-tual clarification. – Social Networks 1 (3): 215-239
Frenken, K. 2000: A complexity approach to innovation net-works. The case of the aircraft industry (1909-1997). – Research Policy 29 (2): 257-272
Frenken, K. 2002: A new indicator of European integra-tion and an application to collaboration in scientific re-search. – Economic Systems Research 14 (4): 345-361
Frenken, K., S. Hardeman and J. Hoekman 2009: Spatial scientometrics: towards a cumulative research pro-gram. – Journal of Informetrics 3 (3): 222-232
Georghiou, L. 1999: Socio-economic effects of collabora-tive R&D – European experiences. – The Journal of Technology Transfer 24 (1): 69-79
Granovetter, M. 1985: Economic action and social structure: the problem of embeddedness. – American Journal of Sociology 91 (3): 481-510
Hakala, J., P. Kutinlahti and E. Kaukonen 2002: Becoming in-ternational, becoming European: EU research collabora-tion at Finnish universities. – Innovation: The European Journal of Social Science Research 15 (4): 357-379
Istat 2013: Ricerca e Innovazione. – In: Istat: Bes 2013. Il benessere equo e sostenibile in Italia. – Rome: 229-249
KMU Forschung Austria and Oxford Research 2010: Ex-post evaluation of NMP (FP 6) strategic level. Strategic
impact, no revolution. Final Report. – Kristiansand. – Online available at: http://ec.europa.eu/research/in-dustrial_technologies/pdf/nmp-FP 6-ex-post-evalua-tion_en.pdf, 30/07/2014
Knoke, D. and S. Yang 2008: Social network analysis. – LondonLeydesdorff, L. and H. Etzkowitz 1998: The triple helix as a
model for innovation studies. – Science & Public Policy 25 (3): 195-203
Lundvall, B.-Å. (ed.) 1992: National systems of innovation: towards a theory of innovation and interactive learn-ing. – London
Maggioni, M.A. and T.E. Uberti 2011: Networks and geo-graphy in the economics of knowledge flows. – Quality and Quantity 45 (5):1031-1051
Nelson, R.R. (ed.) 1993: National innovation systems: a com-parative analysis. – New York et al.
Ministero dell’Istruzione, dell’Università e della Ricerca MIUR 2012: 7⁰ programma quadro di ricerca e sviluppo dell’unione europea. Dati della partecipazione italiana. – Rome. – Online available at: http://www.ricercainter-nazionale.miur.it/media/9122/settimo_programma_quadro_dati_partecipazione_italiana.pdf , 01/08/2014
Nokkala, T. 2007: Network building, motivation and learn-ing in inter-organisational R&D collaboration projects. Theoretical considerations. – NEMO Working Paper 4. – Guildford. – Online available at: http://epubs.surrey.ac.uk/1571/1/fulltext.pdf, 30/07/2014
Pohoryles, R.J. 2002: The making of the European research area – a view from research networks. – Innovation: The European Journal of Social Science Research 15 (4): 325-340
Porter, M.E. 2000: Location, competition and economic de-velopment: local clusters in a global economy. – Economic Development Quarterly 14 (1): 15-34
Porter, A.L. and J. Youtie 2009: How interdisciplinary is nanotechnology? – Journal of Nanoparticle Research 11 (5): 1023-1041
Roco, M.C. 2003: Nanotechnology: convergence with mod-ern biology and medicine. – Current Opinion in Biotech-nology 14 (3): 337-346
Roco, M.C. and W.S. Bainbridge 2005: Societal implications of nanoscience and nanotechnology: Maximizing human benefit. – Journal of Nanoparticle Research 7 (1): 1-13
Roediger-Schluga, T. and M.J. Barber 2006: The structure of R&D collaboration networks in the European Frame-work Programmes. – UNU-MERIT Working Paper 2006-36. – Maastricht. – Online available at: http://arno.uni-maas.nl/show.cgi?fid=6621, 30/07/2014
Roediger-Schluga, T. and M.J. Barber 2007: R&D collabora-tion networks in the European Framework Programmes: Data processing, network construction and selected re-sults. – UNU-MERIT Working Paper 2007-032. – Maas-
Italian organisations within the European nanotechnology network: presence, dynamics and effects

259DIE ERDE · Vol. 145 · 4/2014
tricht. – Online available at: http://www.merit.unu.edu/publications/wppdf/2007/wp2007-032.pdf, 30/07/2014
Scherngell, T. and M.J. Barber 2010: Distinct spatial charac-teristics of industrial and public research collaborations: evidence from the fifth EU Framework Programme. – The Annals of Regional Science 46 (2): 247-266
Scott, J. 1991: Social network analysis. A handbook. – London
Silvani, A. 2010: La ricerca europea ed il Programma Quadro. – In: Sirilli, G. (ed.): La produzione e la diffu-sione della conoscenza. Ricerca, innovazione e risorse umane. – Roma
Torre, A. 2008: On the role played by temporary geographi-cal proximity in knowledge transmission. – Regional Studies 42 (6): 869-889
Trigilia, C. 2008: La costruzione sociale dell’innovazione. – Firenze
Uotila, T., V. Harmaakorpi and H. Melkas 2006: A method for assessing absorptive capacity of a regional innovation system. – Fennia 184 (1): 49-58
Uyarra, E. 2010: What is evolutionary about ‘regional sys-tems of innovation’? Implications for regional policy. – Journal of Evolutionary Economics 20 (1): 115-137
Uzzi, B. 1997: Social structure and competition in interfirm networks: the paradox of embeddedness. – Administra-tive Science Quarterly 42 (1): 35-67
Wasserman, S. and K. Faust 1994: Social network analysis: methods and application. – Structural analysis in the so-cial sciences 8. – Cambridge
Wagner, C. and L. Leydesdorff 2005: Network structure, self-organization, and the growth of international collabora-tion in science. – Research Policy 34 (10): 1608-1618
Wired and Cotec 2009: La cultura dell’innovazione in Italia. Rapporto 2009. – Milano
Appendix A: Social network analysis concepts: definitions
Density is the sum of the values of all ties divided by the number of possible ties.
Degree measures the centrality of an actor using the degree (i.e., the number of ties). That is, the most “important” actors are those with the highest number of ties with the other actors in the network.
Closeness is based on the inverse distance of each actor to any other actor in the network. The most prestigious actor is the one who can most easily reach all other actors in the network. That is, he/she or it is “less far”.
Betweenness counts the number of the shortest paths between i and k that actor j resides on. In this case, the importance of an actor depends on the probabilities that he/she or it must be along all of the possible paths connecting the actors of the network.
Eigenvector measures the influence of a node within a network. Eigenvector centrality is calculated to assess how well connected an actor is to the different parts of the network with the greatest connectivity.
Core/periphery consists of a group of actors that cannot be subdivided into exclusive cohesive subgroups or factions, although some nodes (e.g., in the core) could be much better mutually connected than others.
Italian organisations within the European nanotechnology network: presence, dynamics and effects