Stability of anterior open-bite extraction and nonextraction treatment in the permanent dentition
Upload
independentCategory
view
1download
0
It is all in the head: morphological basis fordifferences in bite force among colour morphs of theDalmatian wall lizard
KATLEEN HUYGHE1*, ANTHONY HERREL1,2, DOMINIQUE ADRIAENS3,ZORAN TADIC4 and RAOUL VAN DAMME1
1Laboratory for Functional Morphology, Department of Biology, University of Antwerp,Universiteitsplein 1, B-2610 Wilrijk, Belgium2Department of Organismic and Evolutionary Biology, Harvard University, 26 Oxford Street,Cambridge, MA 02138, USA3Evolutionary Morphology of Vertebrates, Ghent University, K.L. Ledeganckstraat 35, B-9000 Gent,Belgium4Department of Animal Physiology, University of Zagreb, Rooseveltov trg 6, 10000 Zagreb, Croatia
Received 31 December 2007; accepted for publication 21 April 2008
Males of the lizard Podarcis melisellensis occur in three distinct colours that differ in bite performance, with orangemales biting harder than white or yellow ones. Differences in bite force among colour morphs are best explainedby differences in head height, suggesting underlying variation in cranial shape and/or the size of the jaw adductors.To explore this issue further, we examined variation in cranial shape, using geometric morphometric techniques.Additionally, we quantified differences in jaw adductor muscle mass. No significant differences in size correctedhead shape were found, although some shape trends could be detected between the colour morphs. Orange maleshave relatively larger jaw adductors than yellow males. Not only the mass of the external jaw adductors, but alsothat of the internal jaw adductors was greater for the orange morph. Data for other cranial muscles not relatedto biting suggest that this is not the consequence of an overall increase in robustness in orange individuals. Theseresults suggest that differences in bite performance among morphs are caused specifically by an increase in themass of the jaw adductor, which may be induced by differences in circulating hormone levels. © 2009 The LinneanSociety of London, Biological Journal of the Linnean Society, 2009, 96, 13–22.
ADDITIONAL KEYWORDS: geometric morphometrics – muscle mass – performance – Podarcis – shape.
INTRODUCTION
The coexistence of alternative phenotypes (polymor-phism) in a population has been described in manytaxa, with morphs primarily differing in externalmorphology, colour, and/or behaviour. Polymorphismimplies a selective balance between the morphs,resulting in similar fitness advantages for each. Themechanisms underlying the origin and maintenanceof polymorphisms can be two-fold. Divergent selectioncan cause a differentiation in habitat use (Hyla:
Wente & Phillips, 2003), foraging mode (cichlids:Hori, 1993), diet (Tyto alba, Roulin), or thermal niche(salamanders: Petruzzi, Niewiarowski & Moore,2006). Sexual selection, on the other hand, not onlypromotes sexual dimorphisms (differences betweenmales and females), but can also give rise to sex-limited divergence. In damselflies, female limitedmorphs may represent different strategies of matingbehaviour (Forbes, 1991). Alternative reproductivebehaviours are, however, more typical in male limitedmorphs, often resulting in one dominant and onesatellite or sneaker strategy. For example, in thelek-breeding ruff (Philomachus pugnax), plumage*Corresponding author. E-mail: [email protected]
Biological Journal of the Linnean Society, 2009, 96, 13–22. With 6 figures
© 2009 The Linnean Society of London, Biological Journal of the Linnean Society, 2009, 96, 13–22 13

colour polymorphism is associated with dominancebehaviour, with males of both the dominant and sat-ellite strategy having an equal lifetime reproductivesuccess but differing in plumage colour (Widemo,1998). Similarly, in the side-blotched lizard (Utastansburiana), males exhibit one of three alterna-tive colour morphs, reflecting one of three matingstrategies (Sinervo & Lively, 1996): one morph isultra dominant, defending large territories; a seconddefends a small territory, but also mate guards; and athird morph comprises the sneaker males, which donot defend territories. The continued existence ofpolymorphism in a population is guaranteed throughfrequency-dependent selection, providing a greaterfitness pay-off for the rarer morph, thus preventingone morph from out-competing the other(s) (Sinervo& Lively, 1996).
Not only can variation in phenotype (e.g. colour,size of sexual structures, etc.) be associated withreproductive fitness, but also variation in perfor-mance. Surprisingly, few studies have addressed thequestion of whether morphs that differ in theirappearance and lifestyle also differ in performancetraits, which can play a significant role in behavioursassociated with reproduction, and thus fitness. Maleswordtails (Xiphophorus nigrensis) occur in threediscrete morphs, which differ in body size and inendurance capacity (Ryan, 1988). Another studyshowed that blue, territorial male pupfish (Cyprin-odon pecosensis) can swim longer and at higherspeeds than pale, nonterritorial males (Kodric-Brown& Nicoletto, 1993). By contrast, in the colour poly-morphic lizard Urosaurus ornatus, males of the dif-ferent morphs do not differ in residual bite force orsprint speed capacity (Meyers et al., 2006). However,in the side blotched lizard (Uta stansburiana), colourmorphs do differ in endurance capacity (Sinervo et al.,2000). In a population of the medium ground finch(Geospiza fortis), beak size distribution is bimodal,with large beak males producing songs of differentfrequencies compared to small beak males (Huber &Podos, 2006). This appears to be a consequence ofecological selection for bigger beaks and sexual selec-tion on vocal mating signals. Bigger, more robustbeaks are limited in opening and closing rates, theyare slower, and, consequently, produce songs withlower trill rates and narrower frequency band widthsthan birds with smaller, more gracile beaks (Podos,2001). This latter example aside, the underlyingfunctional causes for the differences in performancebetween morphs often remain unclear. In somecases, sexual performance dimorphisms have beenexplained through dimorphisms in body shape andmuscle mass allocation (e.g. male Anolis carolinensislizards differ from females in bite force as a conse-quence of differences in skull shape and jaw adductor
mass; Herrel, McBrayer & Larson, 2007). Thesesexual dimorphisms in muscle mass can be inducedby androgen hormones (Regnier & Herrera, 1993;Eason et al., 2000). The mechanistic reasons for per-formance polymorphisms (i.e. differences in perfor-mance capacity among morphs of the same sex),however, are generally not known.
In the lizard Podarcis melisellensis, males occur inthree different colours. Orange males have largerheads and bite harder than white ones. White malesbite harder than yellow ones (Huyghe, Vanhooydonck& Tadic Van Damme, 2007). The present study aimedto investigate the underlying functional morphologi-cal basis for the differences in bite force betweenmorphs. First, we compared external head measuresand bite force in one set of lizards to determinewhether, and how, these external measurement(s)determine the observed variation in bite force.Second, we tested the hypothesis that differences inbite performance are related to differences in headshape, excluding size effects, using geometric morpho-metric techniques. Finally, we compared jaw musclemasses to investigate whether differences in musclemass and/or allocation between morphs exist.
MATERIAL AND METHODSHEAD SIZE AND BITE PERFORMANCE
A first set of adult male lizards (N = 42) was caughtby noose on the island Lastovo (Croatia) and trans-ported to the laboratory in Belgium. Only males witha body size greater than 55 mm were kept, to ensurethat each individual was sexually mature (K. Huyghe,pers. observ.). They were housed individually in glassvivaria (30 ¥ 30 ¥ 50 cm), and provided with food(crickets, dusted with calcium powder) and water adlibitum. Using digital calipers (Mitutuyo, with a pre-cision of 0.01 mm), the following measurements weretaken: head length (from tip of the snout to theposterior edge of the parietal bone), head width (atthe widest part of the head), head height (at thehighest part of the head just posterior to the orbit),lower jaw length, distance from quadrate to the tip ofthe jaw (jaw out-lever), and the distance from thecoronoid to the tip of the lower jaw. The in-lever forjaw closing was estimated by subtracting the latterdistance from the jaw out-lever length.
Bite forces were recorded by inducing lizards to biteonto two metal plates connected to an isometric forcetransducer (type 9203; Kistler Inc.), mounted on apurpose-built holder and connected to a charge ampli-fier (type 5995A; for a more detailed description of theset-up, see Herrel et al., 1999). Lizards were allowedto thermoregulate to obtain their preferred bodytemperature (32 ± 1 °C) before and inbetween trials.Recordings were repeated five times, and only the
14 K. HUYGHE ET AL.
© 2009 The Linnean Society of London, Biological Journal of the Linnean Society, 2009, 96, 13–22

highest bite force was retained, and was considered tobe the maximal bite performance for each individual.
HEAD SHAPE ANALYSIS
Dorsal and lateral head shape was quantified usinglandmark-based geometric morphometric methods(Rohlf, 1993, 1995; Rohlf & Marcus, 1993), standard-izing for size by performing generalized procrustesanalysis. Two high resolution photos of all individualswere taken with a digital camera (Nikon D70), one indorsal and one in tlateral view. Photos were madewith a grid as a background for scaling, and lizardswere held such that the anterior–posterior body axiswas identically oriented for all individuals. From eachimage, landmarks were recorded using TpsDig (Rohlf,
2001a; available at: http://life.bio.sunysb.edu/morph/):16 in the dorsal and 12 in the lateral view (Fig. 1).Landmarks were chosen based on their reliability ofidentification in all specimens in addition to theircoverage of regions that could be functionally relatedto biting. Moreover, these landmarks were testedin previous studies on Podarcis lizards (Bruner &Constantini, 2007; Kaliantzopoulou, Carretero &Llorente, 2007). The thin plate spline approach wasused and the distribution of shape configurationsinto the Euclidean tangent space was checked usingtpsSmall (Rohlf, 1998). TpsRelw (Rohlf, 2001b) wasused to calculate the consensus configuration of eachof the colour morphs (lateral and dorsal view), andto perform a principal component analysis on theweight matrix (including scores of both uniform and
A
B
Figure 1. Landmarks used in the geometric morphometric analyses in the dorsal (A) and lateral (B) view.
MORPHOLOGICAL BASIS FOR BITE FORCE DIFFERENCES 15
© 2009 The Linnean Society of London, Biological Journal of the Linnean Society, 2009, 96, 13–22

non-uniform partial warps). The centroid size of allspecimens was calculated, and used for regressingshape variables versus size using tpsRegr (Rohlf,2000).
MUSCLE MASSES
A second set of 11 lizards (Nwhite = 4; Nyellow = 3;Norange = 4) was used for quantifying muscle masses.These were road-killed specimens, with intact heads,of the same population of lizards used for the morpho-metric and performance measures. Specimens usedfor dissection were chosen on the basis of their headlengths, such that the difference in head lengthbetween the smallest and biggest individual is mini-mized (i.e. no more than 1.10 mm). Specimens werepreserved in 10% aquaeous formaldehyde solutionfor 24 h, rinsed, and transferred to a 70% aquaeousethanol solution. All jaw closers (i.e. adductor exter-nus, adductor internus and adductor posterior groupssensu Lakjer, 1926) and jaw openers (musculus cervi-comandibularis and musculus depressor mandibulae)were removed on one side in each individual. Muscleswere blotted dry and weighed using a Mettler MT5microbalance (with a precision of 0.01 mg).
STATISTICAL ANALYSIS
All data were log10-transformed to fulfill assumptionsof normality. A principal component analysis wasused to reduce the number of external head mea-sures. Subsequently, an analysis of covariance(ANCOVA) was used to determine differences in biteforce capacity between colour morphs, using thenewly-generated principal component as covariate.Nonsignificant interaction effects (P > 0.05) are notreported. A model incuding all six head measures asindependents and bite force as dependent variablewas tested in a multiple regression analysis.
To examine variation in head shape (geometricmorphometrics), a canonical variate analysis was per-formed on the weight matrix to test for differencesbetween colour morphs using STATISTICA, version6.0 (Statsoft Inc.). Additionally, to exclude nonsignifi-cance levels due to non-normality and heterogeneityof variance, a nonparametric multivariate analysis ofvariance was performed (Bonferroni corrected) usingEuclidean distance measures (with 10 000 permuta-tions) with PAST (Ryan, Harper & Whalley, 1995).For both centroid size and the canonical root scores,the Goodall test for goodness of fit was performed,combined with a permutation test of a 1000 replicas.Differences in shape between the consensus of eachmorph were visualized by deformation grids gener-ated by tpsSpline (Rohlf, 2002).
Univariate ANCOVAs and post-hoc pairwise com-parisons were used (with head length as covariate) tocompare muscle masses between colour morphs.
RESULTSHEAD SIZE AND BITE PERFORMANCE
A principal component analysis on all six externalhead measurements yielded one principal component,with positive factor loadings for all included vari-ables, and describing 72.25% of the variation (eigen-value 4.34). This new variable was called overallhead size.
Morphs differed in bite force capacity in absoluteterms (F2,39 = 7.51, P = 0.002). Furthermore, when cor-recting for head size, morphs still differed in bite forcecapacity (ANCOVA, covariate = overall head size,interaction effect colour X head size nonsignificant,F2,38 = 3.89, P = 0.029; Fig. 2). Keeping overall headsize equal, orange males can bite relatively harderthan white males, and white males can bite relativelyharder than yellow males. This means that the varia-tion in bite force capacity between morphs cannot befully explained by differences in overall head size. Toinvestigate which of these six external dimensionsindividually best predicted bite force, we performed amultiple regression analysis with bite force as thedependent variable and all the external head mea-surements as independents. This model was signifi-cant (F6,35 = 2.67, P = 0.031) and showed that headheight was the best predictor for bite performance(b = 0.53). When keeping all other measures equal,lizards having higher heads can bite harder.
HEAD SHAPE ANALYSIS
Both the dorsal and lateral datasets indicated thatvery little of the shape variation for the combineddataset of all three colour morphs could be explainedby size-related allometry (5.4% for the dorsal dataset,P = 0.05; 2.3% for the lateral dataset, P < 0.05). Therewas no significant difference in shape between thecolour morphs for both the dorsal and lateral datasets(for results of the canonical variate analysis, seeTable 1). However, a plot of canonical root 1 versusroot 2 shows a different pattern for the two datasets:(1) for the dorsal view, the yellow morphs are sepa-rated from the orange ones along root 2, with thewhite morph being separated along root 1 and takingan intermediate position along root 2 (Fig. 3A) and (2)in lateral view, the yellow morph is separated fromthe other two groups by root 1, but taking an inter-mediate position along root 2 (Fig. 3B). In the plot ofthe canonical scores based on the dorsal view, thespecimens of all three groups lie well clustered and
16 K. HUYGHE ET AL.
© 2009 The Linnean Society of London, Biological Journal of the Linnean Society, 2009, 96, 13–22
morphs are separated. However, between-group dif-ferences are not significant.
When exploring the subtle shape differencesbetween morphs, some interesting patterns wereobserved. First, the amount of shape variance thatcan be explained by the regression with root 2 (dorsal)and 1 (lateral) versus shape (partial warp scores)is quite low (3.9% and 6.5%, respectively) (Fig. 4).
Second, this subtle between-group variance is notcorrelated to centroid size (R2 < 0.2; Fig. 4), indicatingthat there is a fair amount of within-morph variance.However, when visualizing the aspect of shape varia-tion that is largest (i.e. between the yellow and theorange morph), the most distinctive feature appearsto be situated in the temporal region (Fig. 4). For thedorsal view, this corresponds to a subtle increase inthe width of the orbito-temporal region, whereas, forthe lateral view, it mainly involves a shorter temporalscale for the orange morphs.
MUSCLE MASSES
For a given head length, there is a tendency for morphsto differ in total adductor muscle mass (ANCOVA:F2,7 = 3.78, P = 0.094). When looking at the graph(Fig. 5), it appears that orange males have a relativelygreater muscle mass than yellow males. The whitemorph can be considered average, having adductormuscle masses in between those of the orange andyellow males. Post-hoc pairwise comparisons showindeed that only the yellow and orange morphsdiffer significantly from each other (F1,7 = 6.68,P = 0.036). White do not differ from yellow morphs(F1,7 = 1.50, P = 0.26), nor from orange morphs(F1,7 = 2.04, P = 0.20).
When comparing the jaw adductor muscle groupsseparately, the same trend can be seen for the exter-nus (Fig. 6A) and internus (Fig. 6B) muscle groups:orange individuals tend to have higher muscle massesthan yellow ones and white morphs show average
Overall head size
-3 -2 -1 0 1 2 3
Bite
fo
rce
ca
pa
city (
N)
12
14
16
18
20
22
24
26
28
Figure 2. Scatter plot showing the regression of the newly-generated head size variable in the x-axis versus bite forcecapacity (N) in the y-axis. White symbols, white males; grey symbols, yellow males; black symbols, orange males. Notethat the residuals of bite force capacity still differ between morphs.
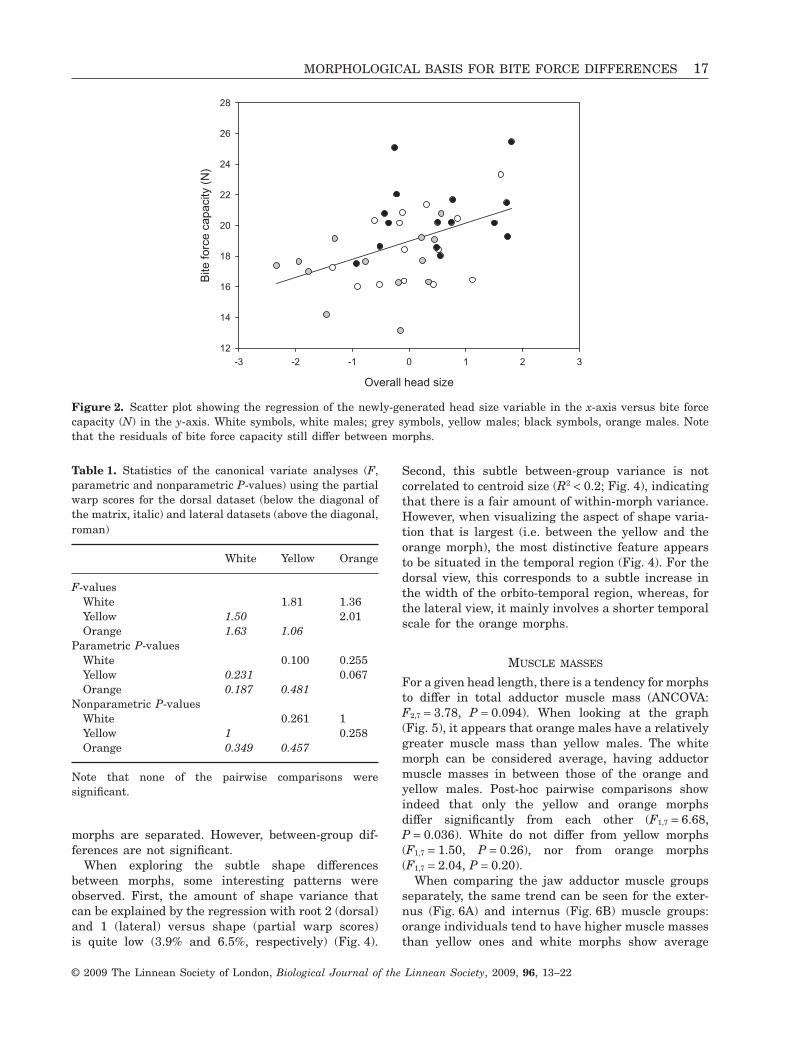
Table 1. Statistics of the canonical variate analyses (F,parametric and nonparametric P-values) using the partialwarp scores for the dorsal dataset (below the diagonal ofthe matrix, italic) and lateral datasets (above the diagonal,roman)
White Yellow Orange
F-valuesWhite 1.81 1.36Yellow 1.50 2.01Orange 1.63 1.06
Parametric P-valuesWhite 0.100 0.255Yellow 0.231 0.067Orange 0.187 0.481
Nonparametric P-valuesWhite 0.261 1Yellow 1 0.258Orange 0.349 0.457
Note that none of the pairwise comparisons weresignificant.
MORPHOLOGICAL BASIS FOR BITE FORCE DIFFERENCES 17
© 2009 The Linnean Society of London, Biological Journal of the Linnean Society, 2009, 96, 13–22

values. For the adductor posterior group (Fig. 6C), allthree morphs have similar muscle masses.
The total mass of the jaw opener muscles did notdiffer between morphs (ANCOVA: F2,7 = 1.06, P = 0.40).
DISCUSSION
In accordance with previous studies (Huyghe et al.,2007) colour morphs of P. melisellensis differ in biteforce capacity in both absolute and relative terms:orange males bite harder than white and yellow ones,
and white males bite harder than yellow ones. Theincrease in bite force is larger than would be pre-dicted by the differences in external head dimensionsbetween the morphs. When correcting for head size,males of the orange morphs still have greater biteforces than yellow males, indicating differences ininternal head morphology and musculature. Theresults obtained in the present study also showedthat head height predicted bite force best of all theexternal head measurements. An increase in headheight may increase the available space for jaw
-4
-3
-2
-1
0
1
2
3
4
5
-5 -4 -3 -2 -1 0 1 2 3 4
CV
2 (3
7.7
%)
CV1 (62.3%)
white
orange
yellow
A
-4
-3
-2
-1
0
1
2
3
4
-6 -5 -4 -3 -2 -1 0 1 2 3
CV
2 (3
8.7
%)
CV1 (61.3%)
white
orange
yellow
B
Figure 3. Scatter plot of canonical variate analysis scores based on data from dorsal view (A) and lateral view (B)(percentages given are the amount of between-group variance explained by each root in the morphospace defined by root1 and 2).
18 K. HUYGHE ET AL.
© 2009 The Linnean Society of London, Biological Journal of the Linnean Society, 2009, 96, 13–22

adductor muscles resulting in a higher physiologicalcross-section, and thus bite force (Herrel et al., 1999;Herrel, Grauw & Lemos-Espinal, 2001). Alternatively,a taller head may allow for a more vertical orienta-tion of the jaw adductors, providing them with
an increased moment arm around the quadrato-mandibular joint (Herrel, Aerts & Vree, 1998).However, because we were restricted to using roadkilled animals for the dissections, we do not havemuscle mass and bite force data available from the
Figure 4. Colour morphs with deformation grids, showing the shape differences between the mean shape of each morph.Each grid represents pairwise shape difference, by deforming a rectangular grid fitting one morph until it fits anothermorph (shape differences magnified three times).
Head length (mm)
14.2 14.4 14.6 14.8 15.0 15.2 15.4 15.6
To
tal a
dd
ucto
r m
ass (
mg
)
44
46
48
50
52
54
56
58
60
62
64
Figure 5. Scatterplot illustrating that orange coloured males (black symbols) have a greater residual jaw adductormuscle mass than do yellow males (grey symbols). White males are the average (white symbols).
MORPHOLOGICAL BASIS FOR BITE FORCE DIFFERENCES 19
© 2009 The Linnean Society of London, Biological Journal of the Linnean Society, 2009, 96, 13–22

same individuals. Consequently, we have to assumethat a positive correlation exists between jaw musclemasse and bite force on the individual level. Previousdata comparing in vivo bite forces to bite forces cal-culated based on the morphological properties of themuscles and the jaw system in bats suggest that thisis a reasonable assumption (Herrel et al., 2008).
Interestingly, although geometric morphometricanalyses did not reveal any significant head shapedifferences between morphs, we did find a subtletrend that could be related to differences in mass ofthe jaw adductor muscles: the width of the orbito-temporal region is slightly larger in orange individu-als than in yellow individuals. Moreover, orangemales have a higher relative muscle mass than yellowmales despite the near-identical head size (no morethan 1 mm difference). The observed subtle buthigher relative width of the orbito-temporal region inorange males may thus provide a slightly expandedspace for the jaw muscles. Yet, additional space formuscles still can be available (e.g. orange males mayhave a medially enlarged adductor chamber). As we
were restricted to using non-invasive techniques, noskulls were available for geometric morphometricanalyses to test this hypothesis. Alternatively, highermuscle mass could also be achieved by a higherdegree of pennation, allowing for a more optimalpacking of muscle fibres and thus a higher mass andforce output (Gans & De Vree, 1987). A differentorientation of the muscles themselves might alsoallow for more optimal packing and thus a highermuscle mass. In short, differences in muscle architec-ture between yellow and orange males may exist thatcould explain the observed difference in adductormuscle mass without changes in external head shape.Additionally, even though landmark-based geometricsare considered to efficiently grasp subtle changes inshape, a suitable selection of landmarks is no guar-antee that all relevant shape variation are included.
Proximate mechanisms possibly explaining this dif-ference in muscle masses between morphs involvetestosterone levels. Skeletal muscle is a major site oftestosterone action (Bardin & Catterall, 1981) notonly early in development through permanent orga-
Resid
ual M
AM
exte
rnus m
ass
-0.03
-0.02
-0.01
0.00
0.01
0.02
0.03
0.04A
White Yellow Orange
White Yellow Orange
White Yellow Orange
Resid
ual M
AM
inte
rnu
s m
ass
-0.03
-0.02
-0.01
0.00
0.01
0.02
0.03B
Re
sid
ua
l M
AM
po
ste
rio
r m
ass
-0.15
-0.10
-0.05
0.00
0.05
0.10
0.15C
Figure 6. Means ± SE of the residuals of the different jaw closer muscle groups for the three morphs (white symbols,white; grey symbols, yellow; black symbols, orange). A, musculus adductor mandibularis externus. B, musculus adductormandibularis internus. C, musculus adductor mandibularis posterior. MAM, musculus adductor mandibularis.
20 K. HUYGHE ET AL.
© 2009 The Linnean Society of London, Biological Journal of the Linnean Society, 2009, 96, 13–22

nizational effects on cells and tissues, but also pastsexual maturity (Emerson, 2000). An increase in tes-tosterone can activate the recruitment of quiescentsatellite cells in muscles and, consequently, causemuscle fibre hypertrophy in males (Joubert & Tobin,1995). This anabolic effect in males versus femalesalso occurs within males: the cross-sectional areas ofa frog’s forelimb muscles enlarge after testosteronetreatment (Dorlöchter, Astrow & Herrera, 2004). In aprevious study, we found that morphs of P. melisel-lensis differ in circulating testosterone levels: orangemales have higher levels than yellow ones (K.Huyghe, J.F. Husak & A. Herrel, unpubl. data). More-over, testosterone levels appeared to be positivelycorrelated with bite force capacity on the individuallevel. Combining these results with what thoseobtained in the present study, testosterone might be aprobable proximate factor causing differences inmuscle masses between the morphs. Testosteroneimplant or castration experiments are needed toconfirm this hypothesis.
The finding that only the external and internal jawadductor muscle groups differed between morphs, andnot the posterior group or the jaw openers, meansthat there is no overall increase in muscle mass. Onlythe first two functional muscle groups (external andinternal) contribute significantly to the generation offorce through biting, whereas the adductor posteriorgroup is attached to the quadrate and lower jaw andhas predominantly a joint stabilizing function duringthe biting process (Herrel et al., 1999). This resultindicates that selection for biting harder is occurring,resulting in muscle hypertrophy in the orange morph,and that the presumed action of circulating testoster-one is very site specific. Selection on bite force couldbe ecological, resulting in dietary divergence betweenmorphs, with orange males being able to handle andcrush harder prey items. Indeed, orange males had alarger proportion of hard prey items in their stomachsthan the other two morphs (Huyghe et al., 2007).However, the hardness of food items available doesnot appear to restrain any of the morphs from eatingall potential food items: all maximal bite forces arehigher than the force needed to crush the hardest fooditem found on the study site. The divergence in diet isthus not limited by performance, but is at least partlyrelated to differential foraging behaviour.
Alternatively, a second type of selection might beoccurring. Greater bite forces may be favored throughsexual selection either directly or indirectly throughselection on some other trait (e.g. aggression). Bitingopponents in male–male competitive interaction orterritorial defense is common in lizards (Lailvauxet al., 2004; Huyghe et al., 2005; Lappin & Husak,2005), and males with higher maximal bite forces havea higher probability of dominating such encounters.
Biting is clearly associated with aggressive behaviour.Within a polymorphic species, where morphs havedifferential bite force capacities, one might expectmorphs representing different strategies in male–maleinteractions, with the most aggressive morph bitinghardest. In general, in P. melisellensis, males werefrequently observed attacking each other using fastchases and biting. In particular, the orange malesclearly behave more aggressively than the othermorphs (K. Huyghe, B. Vanhooydonck & A. Herrel,unpubl. data), suggesting that their higher bite forcesare a reflection of this behaviour. The other morphsmight be using other behavioral strategies, resultingin an equal net lifetime reproductive success. Mateguarding after copulation, defending small or no ter-ritories, or displaying a sneaker strategy are a fewpossibilities, but further intensive behavioral observa-tions should shed light on this issue. In conclusion, wefind that selection can have an effect on performance(bite force), either directly or indirectly, through under-lying lower-level mechanisms, such as morphology(head size), muscle mass and architecture, andpossibly hormone levels (testosterone). Ultimately,behaviour (competitive ability, aggression, feedingbehaviour) might be the target of selection, and per-formance, morphology, muscles and hormone levels areconsequently affected.
ACKNOWLEDGEMENTS
The authors would like to thank the Croatian Minis-try of Culture for providing permits to collect thesedata (permit no. 532-08-01-01/3-07-02). We also thankPatricija Okovic, Duje Lisicica, and Bieke Vanhooy-donck for their impressive field assistance and lizardcatching skills. Lateral and dorsal images for shapeanalyses were made by Filip van Boven.
REFERENCES
Bardin CW, Catterall JF. 1981. Testosterone: a major deter-minant of extragenital sexual dimorphism. Science 211:1285–1294.
Bruner E, Constantini D. 2007. Head morphological varia-tion in Podarcis muralis and Podarcis sicula: a landmark-based approach. Amphibia-Reptilia 28: 566–573.
Dorlöchter M, Astrow SH, Herrera AA. 2004. Effects oftestosterone on a sexually dimorphic frog muscle: repeatedin vivo observations and androgen receptor distribution.Journal of Neurobiology 25: 897–916.
Eason JM, Schwartz GA, Pavlath GK, English AW. 2000.Sexually dimorphic expression of myosin heavy chains inthe adult mouse masseter. Journal of Applied Physiology89: 251–258.
Emerson SB. 2000. Vertebrate secondary sexual character-istics – physiological mechanisms and evolutionary pat-terns. American Naturalist 156: 84–91.
Forbes MR. 1991. Female morphs of the damselfly
MORPHOLOGICAL BASIS FOR BITE FORCE DIFFERENCES 21
© 2009 The Linnean Society of London, Biological Journal of the Linnean Society, 2009, 96, 13–22

Enallagma boreale Selys (Odonata: Coenagrionidae): abenefit for androchromatypes. Canadian Journal of Zoology69: 1969–1970.
Gans C, De Vree F. 1987. Functional bases of fiber length andangulation in muscle. Journal of Morphology 192: 63–85.
Herrel A, Aerts P, De Vree F. 1998. Ecomorphology of thelizard feeding apparatus: a modelling approach. Nether-lands Journal of Zoology 48: 1–25.
Herrel A, De Grauw E, Lemos-Espinal JA. 2001. Headshape and bite performance in xenosaurid lizards. Journalof Experimental Zoology 290: 101–107.
Herrel A, De Smet A, Aguirre LF, Aerts P. 2008. Morpho-logical and mechanical determinants of bite force in bats: domuscles matter? Journal of Experimental Biology 211: 86–91.
Herrel A, McBrayer LD, Larson PM. 2007. Functionalbasis for intersexual differences in bite force in the lizardAnolis carolinensis. Biological Journal of the LinneanSociety 91: 111–119.
Herrel A, Spithoven L, Van Damme R, De Vree F. 1999.Sexual dimorphism of head size in Gallotia galloti: testingthe niche divergence hypothesis by functional analyses.Functional Ecology 13: 289–297.
Hori M. 1993. Frequency-dependent natural selection in thehandedness of scale-eating cichlid fish. Science 5105: 216–219.
Huber SK, Podos J. 2006. Beak morphology and song fea-tures covary in a population of Darwin’s finches (Geospizafortis). Biological Journal of the Linnean Society 88: 489–498.
Huyghe K, Vanhooydonck B, Herrel A, Tadic Z, VanDamme R. 2007. Morphology, performance, behavior andecology of three color morphs in males of the lizard Podarcismelisellensis. Integrative and Comparative Biology 47: 211–220.
Huyghe K, Vanhooydonck B, Scheers H, Molina-BorjaM, Van Damme R. 2005. Morphology, performance andfighting capacity in male lizards, Gallotia galloti. Func-tional Ecology 19: 800–807.
Joubert Y, Tobin C. 1995. Testosterone treatment results inquiescent satellite cells being activated and recruited intocell cycle in rat levator ani muscle. Developmental Biology169: 236–294.
Kaliantzopoulou A, Carretero MA, Llorente GA. 2007.Multivariate and geometric morphometrics in the analysisof sexual diorphism variation in Podarcis lizards. Journal ofMorphology 268: 152–165.
Kodric-Brown A, Nicoletto PF. 1993. The relationshipbetween physical condition and social status in pupfishCyprinodon pecosensis. Animal Behaviour 46: 1234–1236.
Lailvaux SP, Herrel A, Vanhooydonck B, Meyers JJ,Irschick DJ. 2004. Performance capacity, fighting tacticsand the evolution of life-stage male morphs in the green anolelizard (Anolis carolinensis). Proceedings of the Royal Societyof London Series B, Biological Sciences 271: 2501–2508.
Lakjer T. 1926. Studien über die Trigeminus-versorgteKaumuskulatur der Sauropsiden. Carlsbergstiftung. Copen-hagen: CA Rietzel.
Lappin AK, Husak JF. 2005. Weapon performance, not size,determines mating success and potential reproductive
output in the collared lizard (Crotaphytus collaris). Ameri-can Naturalist 166: 426–436.
Meyers JJ, Irschick DJ, Vanhooydonck B, Herrel A.2006. Divergent roles for multiple sexual signals in apolygynous lizard. Functional Ecology 20: 709–716.
Petruzzi EE, Niewiarowski PH, Moore FB-G. 2006. Therole of thermal niche selection in maintenance of a colourpolymorphism in redback salamanders (Plethodon cinereus).Frontiers in Zoology 5: 3–10.
Podos J. 2001. Correlated evolution of morphology and vocalsignal structure in Darwin’s finches. Nature 409: 185–188.
Regnier M, Herrera AA. 1993. Changes in contractile prop-erties by androgen hormones in sexually dimorphic musclesof male frogs (Xenopus laevis). Journal of Physiology 461:565–581.
Rohlf FJ. 1993. Relative warp analysis and an example of itsapplication to mosquito wings. In: Marcus LF, Bello E,García-Valdecasas A, eds. Contributions to morphometrics.Madrid: CSIC, 131–159.
Rohlf FJ. 1995. Multivariate analysis of shape using partial-warp scores. In: Mardia KV, Gill CA, eds. Proceedings incurrent issues in statistical shape analysis. Leeds: Univer-sity of Leeds, 154–158.
Rohlf FJ. 1998. tpsSmall: thin plate spline small variationanalysis, Version 1.20. Stony Brook, NY: State University ofNew York at Stony Brook.
Rohlf FJ. 2000. tpsRegr: thin plate spline shape regression,Version 1.31. Stony Brook, NY: State University of NewYork at Stony Brook.
Rohlf FJ. 2001a. tpsDig: thin plate spline digitise, Version1.40. Stony Brook, NY: State University of New York atStony Brook.
Rohlf FJ. 2001b. Tpsrelw: thin plate spline relative warpanalysis, Version 1.42. Stony Brook, NY: State University ofNew York at Stony Brook.
Rohlf FJ. 2002. tpsSpline: thin plate spline, Version 1.20.Stony Brook, NY: State University of New York at StonyBrook.
Rohlf FJ, Marcus LF. 1993. A revolution in morphometrics.Trends in Ecology and Evolution 8: 129–132.
Ryan MJ. 1988. Coevolution of sender and receiver: effect onlocal mate preferences in cricket frogs. Science 240: 1786.
Ryan PD, Harper DAT, Whalley JS. 1995. PALSTAT, sta-tistics for palaeontologists. London: Chapman & Hall.
Sinervo B, Lively CM. 1996. The rock-paper-scissors gameand the evolution of alternative male strategies. Nature380: 240–243.
Sinervo B, Miles DB, Frankino WA, Klukowski M,DeNardo DF. 2000. Testosterone, endurance, and Darwin-ian fitness: natural and sexual selection on the physiologicalbases of alternative male behaviors in side-blotched lizards.Hormones and Behavior 38: 222–233.
Wente W, Phillips JB. 2003. Fixed green and brown colormorphs and a novel color-changing morph of the Pacific treefrog Hyla regilla. American Naturalist 162: 461–473.
Widemo F. 1998. Alternative reproductive strategies in theruff, Philomachus pugnax: a mixed ESS? Animal Behaviour56: 329–336.
22 K. HUYGHE ET AL.
© 2009 The Linnean Society of London, Biological Journal of the Linnean Society, 2009, 96, 13–22
Copyright © 2022 FDOKUMEN