ISS2019 - Fırat Akademi
207
ISS2019 4th INTERNATIONAL SCIENCE SYMPOSIUM New Horizons in Science PROCEEDING BOOK Editor: NWSA Academic Journals Kiev Yunus Emre Turkish Culture Center Kiev/Ukraine - 2019
-
Upload
khangminh22 -
Category
Documents
-
view
0 -
download
0
Transcript of ISS2019 - Fırat Akademi

ISS2019
4th INTERNATIONAL SCIENCE SYMPOSIUM
New Horizons in Science
PROCEEDING BOOK
Editor: NWSA Academic Journals
Kiev Yunus Emre Turkish Culture Center
Kiev/Ukraine - 2019

Yayın Adı
BİLDİRİLER KİTABI (Proceedings Book)
Yazar NWSA Akademik Dergiler Editörlüğü
© Bu kitabın bütün hakları kısa adı Fırat Akademi A.Ş. (Fırat Akademi Yay.Eğt.İnş. San. ve Tic. A.Ş).’ye aittir. Yayıncının yazılı izni olmaksızın, kitabın tümünün veya bir kısmının elektronik,
mekanik ya da fotokopi yoluyla basımı, yayımı, çoğaltılması ve dağıtımı yapılamaz.
BU KİTAP PARA İLE SATILMAZ.
ISBN
978-605-666789-5-0
Yayın No
2019.2
Sertifika
34290
Sayfa Tasarımı Belkıs Elyiğit
Fırat Akademi A.Ş. NWSA Yayın Sekreterliği
Kapak Tasarımı Cevdet Emin Ekinci
Baskı ve Cilt
Fırat Akademi A.Ş.
Fırat Teknokent TGB ArGe-2 Binası No:63/18 Elazığ-Türkiye Tel:0090424.241 32 33

Dr. Cevdet Emin EKİNCİ
ISS2019 Düzenleme Kurulu Başkanı
NWSA Akademik Dergiler Genel Yayın Yönetmeni
Fırat Üniversitesi Öğretim Üyesi
Sempozyumlar uzman kişilerin bilimi ve toplumu yakından
ilgilendiren temel konu, sorun ya da olaylar hakkındaki araştırmaların
yer aldığı akademik buluşma platformlarıdır. Bu platformların temel
amacı bilgiyi ve bilimi paylaşarak yaygınlaştırmaktır. Bu bağlamda,
NWSA Akademik Dergiler olarak dördüncüsünü düzenlenen Bilim Şenliği:
Bilimde Yeni Ufuklar sempozyumunda 8 farklı ülkeden 48 farklı
yükseköğretim kurumlarının yanı sıra mesleki kurum ve kuruluşlarla
birlikte olmanın gururunu yaşadık. Farklı bilim dallarında üretilen,
geliştirilen çalışmaların evrensel bilimle paylaşma sorumluluğu ve
gururu içerisindeyiz. Bu vesile ile ISS2019 Bilim Festivali: Bilimde
Yeni Ufuklar’a tebliğ ve poster bildiri sunan bütün taraflara sonsuz
şükranlarımı sunarım.
NWSA Ailesi bilimi sevgi yumağı olarak görmektedir. Sevginin
paylaşıldıkça çoğalması-büyümesi gibi, biliminde paylaşıldıkça daha da
gelişeceğine inanmaktadır. Farklı bilim dallarını bir araya getirerek,
bilim dalları arasında, ortak projeler, ortak araştırma alanları
oluşturmak, tanışmak, fikir ve görüş birliğine sahip olmaktır.
ISS2019 Bilim Şenliği’ne yaklaşık 205 akademik çalışma başvurusu
yapılmıştır. Düzenleme ve Bilim Kurulunun incelemesi sonucu bu
çalışmalardan 147 tanesinin sözlü sunum olarak yer alması uygun
görülmüştür. Bu sempozyum kapsamında sunulan çalışmaların bir kısmı
“ISS2019 Abstract Book”ta, bir kısmı “ISS2019 Prceeding Book”ta, bir
kısmı da NWSA Akademik Dergilerde yayınlanması planlanmıştır. Bu
kitapta 28 makalenin tam metinleri yer almakta olup makaleler bilim
kurulu incelemesinden geçirilmiştir.
Sempozyumun gerçekleştirilmesinde her türlü özveriyi gösteren
Düzenleme Kurulu, Bilim Kurulu üyelerine ve Yunus Emre Enstitüsü’ne
teşekkürlerimi sunuyorum. ISS2019 Bilim Sempozyumu Bildiriler
Kitabının (Proceeding Book) evrensel bilime yararlı olmasını
diliyorum.
5. Bilim Şenliğinde tekrar görüşmek ve bildiklerimizi ilgili
taraflarla paylaşmak dileğiyle…

i
ISS2019
4th International Science Symposium
“New Horizons in Science”
ISS2019 Organizing Committee
Dr. Aydın Durmuş Ondokuz Mayıs University
Dr. Cevdet Emin Ekinci Fırat University
Dr. Cihad Demirli Istanbul Commerce University
Dr. Ebru Temiz Niğde Ömer Halisdemir University
Dr. Zeka Pehlevan Mersin University
Dr. Hafize Öztürk Can Ege University
Dr. Hakan Arslan Mersin University
Dr. Harun Tuncel Bilecik Seyh Edebali University
Dr. Mustafa Akdağ Erciyes University
Dr. Nihal Yayla Pamukkale University
Dr. Nuri Başusta Fırat University
Dr. Ş. Kerem Özel Istanbul Medeniyet University
Dr. Melda Özdemir Gazi University
Dr. Uğur Çalıgülü Fırat University
Dr. Zafer Gonülalan Erciyes University
Composing
Belkıs Elyiğit
Editor and Publisher
Fırat Akademi Co. / NWSA Academic Journals
Notice
Responsibility for the articles in the book belong to the authors.

ii
Dr. Cevdet Emin EKİNCİ
ISS2019 Düzenleme Kurulu Başkanı
NWSA Akademik Dergiler Genel Yayın Yönetmeni
Fırat Üniversitesi Öğretim Üyesi
Sempozyumlar uzman kişilerin bilimi ve toplumu yakından
ilgilendiren temel konu, sorun ya da olaylar hakkındaki araştırmaların
yer aldığı akademik buluşma platformlarıdır. Bu platformların temel
amacı bilgiyi ve bilimi paylaşarak yaygınlaştırmaktır. Bu bağlamda,
NWSA Akademik Dergiler olarak dördüncüsünü düzenlenen Bilim Şenliği:
Bilimde Yeni Ufuklar sempozyumunda 8 farklı ülkeden 48 farklı
yükseköğretim kurumlarının yanı sıra mesleki kurum ve kuruluşlarla
birlikte olmanın gururunu yaşadık. Farklı bilim dallarında üretilen,
geliştirilen çalışmaların evrensel bilimle paylaşma sorumluluğu ve
gururu içerisindeyiz. Bu vesile ile ISS2019 Bilim Festivali: Bilimde
Yeni Ufuklar’a tebliğ ve poster bildiri sunan bütün taraflara sonsuz
şükranlarımı sunarım.
NWSA Ailesi bilimi sevgi yumağı olarak görmektedir. Sevginin
paylaşıldıkça çoğalması-büyümesi gibi, biliminde paylaşıldıkça daha da
gelişeceğine inanmaktadır. Farklı bilim dallarını bir araya getirerek,
bilim dalları arasında, ortak projeler, ortak araştırma alanları
oluşturmak, tanışmak, fikir ve görüş birliğine sahip olmaktır.
ISS2019 Bilim Şenliği’ne yaklaşık 205 akademik çalışma başvurusu
yapılmıştır. Düzenleme ve Bilim Kurulunun incelemesi sonucu bu
çalışmalardan 147 tanesinin sözlü sunum olarak yer alması uygun
görülmüştür. Bu sempozyum kapsamında sunulan çalışmaların bir kısmı
“ISS2019 Abstract Book”ta, bir kısmı “ISS2019 Prceeding Book”ta, bir
kısmı da NWSA Akademik Dergilerde yayınlanması planlanmıştır. Bu
kitapta 28 makalenin tam metinleri yer almakta olup makaleler bilim
kurulu incelemesinden geçirilmiştir.
Sempozyumun gerçekleştirilmesinde her türlü özveriyi gösteren
Düzenleme Kurulu, Bilim Kurulu üyelerine ve Yunus Emre Enstitüsü’ne
teşekkürlerimi sunuyorum. ISS2019 Bilim Sempozyumu Bildiriler
Kitabının (Proceeding Book) evrensel bilime yararlı olmasını
diliyorum.
5. Bilim Şenliğinde tekrar görüşmek ve bildiklerimizi ilgili
taraflarla paylaşmak dileğiyle…

iii
ISS2019 Scientific Committee
Dr. Ali JAMSHIDI Hokkaido University
Dr. Ali Reza AFSHARI Islamic Azad University
Dr. Anna ANDONOVA Technical University of Sofia
Dr. Apostolos E. PAPALIOS Experimental Research Center of ELPEN S.A.
Dr. Atdhe HYKOLLI Prizren University
Dr. Aydın DURMUŞ Ondokuz Mayıs University
Dr. Behxhet BRAJSHORI University of Prizren
Dr. Cevdet Emin EKİNCİ Fırat University
Dr. Cihad DEMİRLİ Istanbul Commerce University
Dr. Daniela DASHEVA National Sports Academy Vasil Levski
Dr. Debra BICK King’s Collage London
Dr. Elizabeth G. TUNKA BENGIL Girne American University
Dr. Ebru TEMİZ Ömer Halisdemir University
Dr. Eda VULA University of Prishtina
Dr. Erdoğan TEZCİ Balıkesir University
Dr. Esad KUREJSEPI Prizren University
Dr. Eteri JAKELİ Batumi State University
Dr. Fatih PERÇİN Ege University
Dr. Fatlume BERISHA University of Prishtina
Dr. Hafize ÖZTÜRK CAN Ege University
Dr. Hakan ULUKAN Ankara University
Dr. Hans W. GIESSEN University Saarlandes
Dr. Harun TUNCEL Bilecik Seyh Edebali University
Dr. Hiregoudar YERRENNAGOUDARU Visvesvaraya Technological University
Dr. Ismet TEMAJ Prizren University
Dr. Kastriot BUZA University of Prishtina
Dr. Kostiantyn MYKHALENKOV Igor Sikorsky Kyiv Polytechnic Institute
Dr. Lale GUREMEN Amasya University
Dr. Leo D'ACQUISTO Central Washington University
Dr. Levent BAT Sinop University
Dr. Marijana LAZAREVSKA Ss. Cyril and Methodius University
Dr. Maryam JALALI Azat İslamic Parand University
Dr. Melda ÖZDEMİR Gazi University
Dr. Metin ARSLAN Mersin University
Dr. Mustafa AKDAĞ Erciyes University
Dr. Müzeyyen ELDENİZ ÇETİN Abant İzzet Baysal University
Dr. Nazan TUNA ORAN Ege University
Dr. Nihal YAYLA Pamukkale University
Dr. Nuri BAŞUSTA Fırat University
Dr. Ş. Kerem ÖZEL İstanbul Medeniyet University
Dr. Simin GHAVIFEKR University of Malaya
Dr. Tomasz MALEC International University of Sarajevo
Dr. Uğur ÇALIGÜLÜ Fırat University
Dr. Ummahan YÜCEL Ege University
Dr. Valbona BERISHA University of Prishtina
Dr. Yaroslav ZAULYCHNYY Igor Sikorsky Kyiv Polytechnic Institute
Dr. Zafer GONULALAN Erciyes University
Dr. Zahadin SHEMSIDINI Prizren University
Dr. Zaur M. GAMISHIDZE Batumi Shota Rustaveli State University
Dr. Zeka PEHLEVAN Mersin University

iv
University and Institutions Represented in ISS2019
No University or Institutions Country
1 Ankara University Turkey
2 Antalya M. Municipality Marine Biology Museum Turkey
3 Atatürk University Turkey
4 Batman University Turkey
5 Batumi Shota Rustaveli State University Georgia
6 Batumi State University Georgia
7 Bingöl University Turkey
8 Biotechnical Center Naklo Slovenia
9 Bitlis Eren University Turkey
10 Boğaziçi University Turkey
11 Buca Gynecology and Pediatrics Hospital Turkey
12 Çankırı Karatekin University Turkey
13 Dokuz Eylül University Turkey
14 Düzce Borsa İstanbul VT Anadolu High School Turkey
15 Düzce University Turkey
16 Ege University Turkey
17 Erciyes University Turkey
18 Fırat Universirty Turkey
19 Fibrobeton Const. Element Ind. and Con. Co. Turkey
20 Gebze Teknik University Turkey
21 Girne American University RT North Cyprus
22 Hamidiye Health Vocational High School Turkey
23 Harran University Turkey
24 Islamic Azad University Iran
25 İskenderun Teknik University Turkey
26 İstanbul International Community School Turkey
27 İstanbul Özyeğin University Turkey
28 İzmir Private Çakabey Schools Turkey
29 Karabük University Turkey
30 Kastamonu University Turkey
31 Keşan Tic. ve San. Odası Anadolu High School Turkey
32 Kosovo Pedagogical Instıtute Kosovo
33 Kryviy Rih National University Ukraine
34 Maarif Shool of Kosovo Kosovo
35 Manisa Celal Bayar University Turkey
36 Mediterranean Conservation Association Turkey
37 Ministry of Health Sakarya Uni. T&R Hospital Turkey
38 Muğla Sıtkı Koçman University Turkey
39 Munzur University Turkey
40 Ondokuz Mayıs University Turkey
41 Pamukkale University Turkey
42 International University Of Sarajevo Bosnia and Herzegovina
43 Sakarya University Turkey
44 Selçuk University Turkey
45 Sinop University Turkey
46 Trabzon University Kosovo
47 Ulus Private Musevi Schools Turkey
48 YEE Pristina Turkish Culture Center Kosovo

v
Countries with active participation in the symposium
(Alphabetical)
No Country
1 Bosnia and Herzegovina
2 Georgia
3 Iran
4 Kosovo
5 Slovenia
6 Turkey
7 Turkish Republic of Northern Cyprus
8 Ukraine
CONTENT
ISS2019 ORGANIZING COMMITTEE/ISS2019 ORGANİZASYON KOMİTESİ I
PREFACE/ÖNSÖZ II
ISS2019 SCIENTIFIC COMMITTEE/ISS2019 BİLİMSEL KOMİTE III
UNIVERSITY AND INSTITUTIONS REPRESENTED IN ISS2019/
ISS2019’DA TEMSİL EDİLEN ÜNİVERSİTE VE KURUMLAR IV
CONTENT/İÇİNDEKİLER V
ID ARTICLE TITLE AND AUTHOR(S)
1A4PB CONCRETE ARMORING TECHNIQUES
Cevdet Emin Ekinci 1-18
1A5PB
INVESTIGATION OF MICROSTRUCTURAL PROPERTIES OF 5140 STEEL
WITH 316 STAINLESS STEEL JOINED BY FRICTION STUD METHOD
İhsan Kırık
19-24
1A6PB
LEACHING OF METALS IN PRESENCE OF AMMONIA SOLUTION FROM
PRIMARY LEACHING RESIDUE WITH COPPER OXALATE
Zeynel Abidin Sarı, M. Deniz Turan, Hasan Nizamoğlu,
Aslıhan Demiraslan
25-29
1A9PB
RECOVERY OF ZINC BY ELECTROLYSIS IN ZINC SULFATE SOLUTION
Hasan Nizamoğlu, M. Deniz Turan, Aslıhan Demiraslan,
Zeynel Abidin Sarı
30-36
1A15PB
İNŞAAT PROJELERİNDE MALİYET, SÜRE VE RİSKİN BİRLİKTE ELE
ALINDIĞI SİMÜLASYONA DAYALI BİR RİSK YÖNETİM MODELİ
Latif Onur Uğur, Yıldız Sarar, Molham Fataloun
37-45
1A16PB
ANALİTİK HİYERARŞİ PROSESİ (AHP) İLE ULUSLARARASI YAPIM İŞİ
YAPAN BİR FİRMA İÇİN HUKUK MÜŞAVİRİ FİRMA SEÇİMİ
Latif Onur Uğur, Yıldız Sarar, Yılmaz Ölper
46-55
1A17PB
SERVİS YÖNELİMLİ MİMARİLERDE GÜVENLİK PROBLEMLERİ İÇİN BİR
MİMARİ ÖNERİSİ
Deniz Balta, Musa Balta
56-63
1A18PB
NEW APPROACHES TO THE EVALUATION OF POMEGRANATE PEEL: A WASTE
RICH IN BIOACTIVE COMPONENTS
Fatma Işık, Ünkan Urgancı
64-73
1A19PB CORROSION IN SEAWATER
Semra Bilgiç 74-80
1A20PB
SEZGİSEL BULANIK AHP İLE NÖROLOJİ YOĞUN BAKIM ÜNİTESİNE KABUL
TRİYAJ KARARLARININ DEĞERLENDİRİLMESİ
Merve İkikat
81-87
1B1PB POSTPARTUM DÖNEMDE ANNE RUH SAĞLIĞINA YAKLAŞIM
Ummahan Yücel, Zehra Baykal Akmeşe 88-93
1B2PB
THE EFFECT OF VITAMIN B12, PHYSICAL AND COGNITIVE ACTIVITY ON
IDIOPATHIC FORGETFULNESS
Selcuk Mıstık, Emine Ağadayı, Emel Köseoğlu
94-103
1B3PB
EBELİK ÖĞRENCİLERİNİN KİŞİSEL GELİŞİM YÖNELİMLERİ VE SOSYAL
DESTEK ALGILARININ İNCELENMESİ
Ummahan Yücel, Pelin Tintaş
104-109
1B4PB GÜÇLÜ EBELİK VE GÜÇLÜ HEMŞİRELİK: DÜNYA SAĞLIK ÖRGÜTÜ’NÜN
TAAHHÜDÜ VE KÜRESEL STRATEJİK HEDEFLER 110-114

vi
Ummahan Yücel
2A2PB
THE PRODUCTION OF TIC-REINFORCED NICKEL-BRONZE MATRIX
COMPOSITES BY HOT PRESSING METHOD
Ihsan Kırık
115-120
2A3PB
INVESTIGATING CORROSION RESISTANCE OF 304 AND 316L AUSTENITIC
STAINLESS STEEL SURFACES COATED WITH Al2O3 POWDERS USING
PLASMA SPRAY METHOD
Uğur Çalıgülü, Mustafa Türkmen, Serkan Islak, Zeliha Aydeniz
121-127
2A4PB
THE WELDABILITY OF AA6063 ALUMINUM-BRASS ALLOYS USING
FRICTION WELDING
Halil Dikbaş, Mustafa Türkmen, Uğur Çalıgülü,
M. Görkem Dardağan
128-137
3C1PB ARTIFICIAL INTELLIGENCE-AI USAGE IN AQUACULTURE
Özlem Armağan, Fatih Perçin
138-141
5A1PB
THE FIRST DATA ON AGE AND GROWTH OF THE GIANT DEVIL RAY
(Mobula mobular (Bonnaterre, 1788)) FROM THE MEDITERRANEAN
SEA
Nuri Başusta, Asiye Başusta, Elif Özgür Özbek
142-145
5A2PB
HEALTH AND SAFETY OBSERVATIONS IN WORKING ENVIRONMENT OF
FISHING PORTS
Fatih Perçin
146-149
5A3PB
OCCURRENCE OF the cuckoo wrasse, Labrus mixtus Linnaeus, 1758
(Osteichthyes: Labridae), FROM THE NORTHERN AEGEAN SEA,
TURKEY
Fatih Perçin, Okan Akyol
150-153
5A4PB
MATURITY, REPRODUCTIVE CYCLE AND CONDITION FACTOR OF THE
LESSER SPOTTED DOGFISH, SCYLIORHINUS CANICULA (Linnaeus,
1758) FROM NORTHEASTERN MEDITERRANEAN
Ebru İfakat Özcan, Nuri Başusta
154-161
5A5PB
RESPONSE OF HUMP-HEAD CICHLID (Cytocara moorii)
TO 2-PHENOXYETHANOL AND CLOVE OIL AS ANESTHETIC
Müge Aliye Hekimoğlu, Fatih Perçin, Kürşat Fırat, Şahin Saka,
Cüneyt Süzer, Osman Özden
162-164
5A7PB
PRODUCTION OF CURLY LETTUCE (Lactuca sativa) WITH NILE
TILAPIA (Oreochromis niloticus) IN AQUAPONIC SYSYEMS
Harun Aydın, Kürşat Fırat, Fatih Güleç, Müge Aliye Hekimoğlu,
Fatih Perçin, Cüneyt Süzer, Şahin Saka, Osman Özden,
Serhat Engin
165-169
5A8PB
OPTIMIZATION OF Arthrospira sp. (Spirulina) GROWTH: FROM
LABORATORY SCALE TO PİLOT OUTDOOR CULTURE
Edis Koru, Fatih Perçin
170-177
5A9PB SAFETY MANAGEMENT AND FOOD IN AQUACULTURE INDUSTRY
Fatih Perçin 178-182
5A10PB
METALS LEVELS IN EDIBLE FISH SPECIES OF THE BLACK SEA:
EVALUATION OF POTENTIAL HEALTH RISKS TO CONSUMERS
Levent Bat
183-188
5A11PB HEALTH AND SAFETY IN LARGE SCALE FISHING BOATS
Ramazan Açıkgöz, Celal Ateş, Fatih Perçin 189-192
1A21PB
FARKLI FORMÜLASYONDA TATLI MAKARNA ÜRETİMİ VE BAZI
KARAKTERİSTİK ÖZELLİKLERİNİN BELİRLENMESİ
İlyas Çelik, Merve Özer
193-199

4th International Science Symposium Status: Proceeding Book
ISS2019 (September 4-6, 2019) ID : 2019.1A4PB
Cevdet Emin Ekinci
Fırat University, [email protected], Elazığ-Turkey
BETON ZIRHLAMA TEKNİKLERİ
ÖZ
Bu çalışmada beton zırh teknikleri incelenmiştir. Betonda
zırhlama, genel olarak, betonun kimyasal, biyolojik, radyolojik ve
manyetik zararlı etkileri absorbe etmek veya geri yansıtmak amacıyla
gerçekleştirilir. Beton zırhlamada farklı yöntem ve teknikler vardır.
Bunlar kaplamalı zırhlama, bariyerli zırhlama ve yoğun kesit elemanlı
zırhlamadır. En etkili, ekonomik ve sürdürülebilir zırhlama yoğun
kesit elemanlı zırhlamadır. Yoğun kesit elemanlı zırhlama da
genellikle yoğun beton tercih edilmektedir. Ayrıca bu teknik
genellikle sağlık, eğitim, yönetim, ticaret, savunma ve sığınma
binalarında uygulanır. Bu çalışmada literatür taraması yapılmıştır.
Mevcut bilgi ve bulgular değerlendirilmiş, etkili ve verimli zırhlama
için rasyonel öneriler sunulmuştur.
Anahtar Kelimeler: Beton, Zırhlama, Yoğun ve Ağır Beton,
Radyasyon, Beton Zırhlama Teknikleri
CONCRETE ARMORING TECHNIQUES
ABSTRACT
In this study, concrete armoring techniques were investigated.
Armoring in concrete is generally carried out to absorb or reflect
back chemical, biological, radiological and magnetic detrimental
effects of concrete. There are different methods and techniques in
concrete armor. These are coated armor, barrier armor and armor with
dense section elements. The most effective, economical and sustainable
armor is armor with dense section elements. Dense concrete is
generally preferred in armor with dense section elements. In addition,
this technique is generally applied in health, education,
administration, trade, defense and asylum buildings. In this study, a
literature review has been made. The available information and
findings have been evaluated, and rational recommendations for
effective and efficient armoring have been presented.
Keywords: Concrete, Armoring, Dense and Heavy Concrete,
Radiation, Concrete Armoring Techniques

2
4th International Science Symposium (September 04-06, 2019),
Kiev-Ukraine (ISS2019), 1A4PB; pp:1-18.
1. GİRİŞ (INTRODUCTION)
Canlı hayatına değişik düzey ve şekillerde olumsuz etkileri olan
Kimyasal, Biyolojik, Radyolojik ve Nükleer (KBRN) olumsuz etkileri
azaltmak, absorbe etmek, geri yansıtmak, bertaraf etmek veya başka
ortamlara geçişini engellemek amacıyla binanın kabuk yapı
elemanlarında yapılan koruyucu uygulamalara zırhlaması denilmektedir.
Gerçek beton zırhlaması ise beton kesitin yoğunluğunu artırıcı
uygulamalara beton zırhlaması denir. Ayrıca kesit üzerinde yapılan
kaplama ve bariyer uygulamaları da beton zırhlamadır. Zırhlamada temel
amaç KBRN etkilerini kaynağında absorde etmek, şiddetini düşürmek,
yayılmasını engellemek ve/veya geri yansıtmak amacıyla yapılmaktadır.
Hiç şüphesiz en etkili, ekonomik ve sürdürülebilir zırhlama tehdidin
canlıya ulaşmadan kaynağında engellenmesidir. Zırhlama denildiğinde
genelde canlı hayatını tehdit eden radyasyonun zararlı etkilerine
karşı alınan önlemler dizisi olarak algılanmaktadır. Oysa canlılar
Kimyasal, Biyolojik, Radyolojik ve Nükleer (KBRN) tehditlerle sürekli
karşı karşıyadır. Bu nedenle bir mekanın veya ortamın sadece
radyasyona karşı zırhlanması yeterli olmayabilir. Tombakoğlu’na göre
(2015), kanser tedavisinde kullanılan radyolojik tekniklerin gelişmesi
ve cihazların değişimi ve yüksek enerjili radyasyon demetlerinin
tedavi amaçlı kullanımı, bu tesislerin zırhlanmasında ve bu
tesislerden kaynaklı çalışanlar ile halkın alacağı dozun kabul
edilinilebilir seviyede sınırlandırılmasında düzenlemeler yapılmasını
gerektirmektedir [1]. Beton; çimento, agrega, su ve gerektiğinde katkı
maddelerinin belirli oranlarda homojen olarak karıştırılması ile elde
edilen, kompozit bir yapı malzemesidir. Yapılar, hizmet ettiği süre
boyunca içten ve dıştan birçok etkiye maruz kalmaktadır. Beton da
servis ömrü boyunca dış ve iç etkiler karşısında, fiziksel etkiler
(aşınma, erozyon, kavitasyon, donma-çözülme, yüksek sıcaklık gibi),
kimyasal etkiler (sülfat, asit, alkali, karbonat, gibi) ve biyolojik
etkilere maruz kalmakta ve bozulmakta hatta deformasyona
uğrayabilmektedir [2 ve 3]. Bu tür etkilere karşı en ideal beton türü
yüksek yoğun veya ağır beton olarak görünmektedir. Yüksek yoğunluklu
betonların özellikleri Tablo 1’de, normal betonların dayanım sınıfları
Tablo 2’de verilmiştir.
Tablo 1. Yüksek yoğunluklu betonun özellikleri [4]
(Table 1. Properties of high density concrete)
Agrega Tipi
Ağırlığa
Göre
Sabit Su
Yüzdesi*
Agrega
Özgül
Ağırlığı
Birim Hacim
Ağırlığı
kg/m3 (pct)
Betonun Yoğunluğu
kg/m3 (pct)
Goethit (Fe2O3H2O) 10-11 3.4-3.7 2080-2240(130-140) 2880-3200(180-200)
Limonit (Fe2O3)** 8-9 3.4-4.0 2080-2400(130-150) 2880-3360(180-210)
Barit (BaSO4) 0 4.0-4.6 2320-2560(145-160) 3360-3680(210-230)
İlmenit (FeTiO3) ↑ 4.3-4.8 2560-2700(160-170) 3520-3850(220-240)
Hematit (Fe2O3) ↑ 4.9-5.3 2880-3200(180-200) 3850-4170(240-260)
Magnetit (Fe3O4) ↑ 4.2-5.2 2400-3040(150-190) 3360-4170(210-260)
Ferrofosfor
(Fe2O3-P2O3) 0 5.8-6.8 3200-4160(200-260) 4080-5290(255-330)
Demir ve Kurşun
Parçacıkları(Fe) 0 6.2-7.8 3860-4650(230-290) 4650-6090(290-380)
Not
* Su tutulmuş veya agrega içinde kimyasal olarak bağlanmış.
** Test verileri mevcut değil.
↑ Agregalar %0.5-%5 sabit su içeriğiyle limonitlerle birleştirilebilir.

3
4th International Science Symposium (September 04-06, 2019),
Kiev-Ukraine (ISS2019), 1A4PB; pp:1-18.
Tablo 2. Beton dayanım sınıfları [5 ve 8]
(Table 1. Concrete strength classes
Beton Dayanım Sınıfları Karakteristik Basınç
Dayanımı (fck)
Hedef (Tasarım-Ortalama)
Basınç Dayanım (fcm)
TS500 TS802
Kullanım
Amacına
Göre Türü
Silindir
Basınç
Dayanımı
(15x30cm)
Eşdeğer
Küp
Basınç
Dayanımı
(15x15cm)
Standart
Sapma
Biliniyorsa
Standart
Sapma
Bilinmiyorsa
Silindir Küp
C14/16
Düşük
Mukavemetli
Beton
14
fcm= fck+1.48σ
18 20
C16 C16/20 Genel
Amaçlı
Betonlar
16 20 20 24
C18 C18/22 18 22 22 26
C20 C20/25 20 25 26 31
C25 C25/30 25 30 31 36
C30 C30/37 Normal
Mukavemetli
Betonlar
30 37 36 43
C35 C35/45 35 45 43 53
C40 C40/50 40 50 48 58
C45 C45/55 45 55 53 63
C50 C50/60 Yüksek
Mukavemetli
Betonlar
50 60 58 68
C55/67 55 67 63 75
C60/75 60 75 68 83
C70/85 70 85 78 93
C80/95 Çok Yüksek
Mukavemetli
Betonlar
80 95 88 103
C90/105 90 105 98 113
C100/115 100 115 108 123
Diğer taraftan, savunma ve sığınma yapılarında kullanılacak
betonların durabilite teknik özellikleri oldukça önemlidir. Bu
yapılardaki yapı malzemelerinin ve yapıların işlevlerini servis
ömürleri boyunca bozulmadan yerine getirmeleri beklenilir. Bu özelliğe
durabilite; yani dayanıklılık veya kalıcılık özelliği denilmektedir.
Bu nedenle, ciddi ve tutarlı yaklaşımlarla projelendirilmiş,
üretilmiş, geçirimsiz, yalıtımlı ve korunmuş yapılar için bu kavram
vazgeçilmez bir özelliktedir. Durabilite, özetle; betonun hizmet ömrü
boyunca fiziksel ve kimyasal etkilere karşı koyması, dayanması
anlamına gelmektedir.
Betonarme yapıların kalıcılığını etkileyen kimyasal ve fiziksel
işlemlerin hemen hepsinde ana faktör, su ve beton bünyesindeki
boşluklar ile çatlaklar içindeki taşınımdır. Gazların, suyun ve
zararlı maddelerin beton içine taşınımı ve bunların beton ile
etkileşimi, bozulma sürecinin gelişimi açısından çok önemlidir.
Taşınımın boyutu, hızı ve etkisi büyük ölçüde beton bünyesindeki
boşluk ve çatlakların çapı ve dağılımına ayrıca beton yüzeyindeki
“mikroiklime” bağlıdır.
Agrega, beton içinde çimento hamuru ile kaplanmış olduğundan ve
normalde az boşluk içermesi nedeniyle, betonun geçirimliliği büyük
ölçüde çimento hamurunun ve agrega-hamur arayüzeyinin geçirimliliğine
bağlıdır. Çimento hamuru ve betondaki çatlak ve boşluklar; çoğunlukla
beton teknolojisi kurallarına uyulmaması sonucu, yetersiz sıkıştırma,
yetersiz kür, kimyasal reaksiyona girmeyen fazla suyun terleme,
buharlaşma olayları veya hava sürükleyici katkı maddeleri eklenmesi
gibi nedenlerle oluşur. Çimento hamurundaki ve betondaki boşluklar
mikro, kapiler ve makro olarak gruplandırılabilir. Kalıcılığı büyük
ölçüde etkileyenler kılcal (kapiler) ve makro boyutta olanlardır [7].
Betonun geçirimlilik (permabilite) özelliği ise çimento hamuru
ile agrega yüzeyindeki mikro çatlaklar ve beton yüzeyinde bulunan
kılcal boşluklardan kaynaklanmaktadır. Geçirimli betonların içerisine
sızan sular ve bu sulardaki yabancı maddeler, betonda kimyasal ve

4
4th International Science Symposium (September 04-06, 2019),
Kiev-Ukraine (ISS2019), 1A4PB; pp:1-18.
fiziksel olaylara yol açmaktadır. Beton süneklilik özelliği gösteren
bir malzeme olduğundan bu olay betonda çatlamalara hatta çökerek
parçalanmalara (deformasyona) neden olmaktadır [8].
Ortamdaki α ve β parçacıkları ile γ ve x ışınları ve nötronlar
canlı dokular üzerinde zararlı etkilere neden olabilirler. Bu nedenle,
radyasyon dozlarını olabildiğince azaltabilmek amacıyla zırh veya
kalkan denilen tabakalar yapılır. Radyoaktif ışın ve parçacıkların
ortam dışına çıkışını engellemek amacıyla kullanılan kurşun
tabakaların nötronları yakalama kapasiteleri zayıftır. Nötron
hareketini hidrojen atomu zengin olan ortamlar durdurabildiğinden
hidrojen içeriği açısından yoğun olan betonlar bu açıdan en yararlı
malzeme olarak karşımıza çıkmaktadır [9].
Betonların birim ağırlıkları arttıkça radyasyona karşı koruyucu
etkileri de o ölçüde artmaktadır. Bu nedendendir ki birim ağırlığı
2400kg/m3 civarında olan geleneksel betonlar radyasyona karşı koruyucu
kalkan-perde yapıldığında kalınlıklarının daha büyük olması gerektiği
bilinmektedir.
Yoğun, yani ağır betonlar, üretim prosesleri olarak normal
betonlarla pek farklılık göstermez. Ağır beton üretiminde yararlanılan
özel agregalar genellikle barit, magnetit, limonit gibi demir
cevherleri olan agregalar ya da sanayi atıkları olan demir ve kurşun
parçacıkları gibi yapay agregalar olabilmektedir. Ağır betonlar,
özellikle nükleer reaktörlerde, röntgen odalarında, onkoloji
hastanelerinde ve savunma amaçlı sığınaklarda radyoaktif ışınlara
karşı kullanılır [9].
Biyolojik korumada iki tip radyasyon etkisi önemlidir. Yüksek
enerji ve frekanslı elektromanyetik dalgalar olan x ve γ ışınları
yüksek nüfuz etme yetenekleri nedeniyle ancak birim kütlesi yüksek
olan malzeme tarafından durdurulabilinmektedir. Elektrik yükü taşıyan
ve atom çekirdeğinin ağır parçacığı olan yüksek hızlardaki nötronlar
demir yüksek atom ağırlıklı malzemeler ile elastik olmayan çarpışma
sonunda yavaşlatılır. Hidrojen gibi hafif elemanlar orta hızdaki
nötronlar ile elastik çarpışma yaparak daha da yavaşlamalarına neden
olurlar. Yavaş hareket eden nötronlar ise yine hidrojen atomu ya da
bor minerali tarafından tamamen emilerek yok edilirler. Bu nedenle
beton dayanımına olumsuz etkisi olmaması için suda çözünmeyen boron
kullanılmaktadır. Nötron ve γ ışınlarını yavaşlatabilme karakterinin
yanında yeterli mekanik özelliklere sahip ve ilk mukavemeti ve bakım
masrafları düşük olan beton bu amaç için en ideal malzeme olarak
görülmektedir. Karma suyun bünyesindeki hidrojen ve oksijen gibi hafif
atomlu cisimlerin yanında içerdiği yüksek özgül ağırlıklı agregalar ve
parçacıklar ile ağır beton yüksek enerjili γ ışınlarını ve nötronları
pratik koşullar altında durdurmaya yeterli olmaktadır [10 ve 11].
Normal betonlarda nötronların durdurulması için gerekli hidrojen
miktarı karma suyunun yaklaşık %4’üne karşılık gelir. Bu su, çimento
hamurunun hidrate elemanlarında serbest olarak ya da kristal suyu
olarak çimento hamurunda ve agregada bulunur. Ağır beton üretiminde
kullanılan agregaların özgül ağırlıkları genellikle 4000kg/m3’ün
üzerinde olur. Bu nedenle ağır beton üretiminde en çok tercih edilen
agrega barittir [9]. Yüksek birim ağırlıklı agregalarla radyoaktif
geçirimsizliği sağlamak için üretilen ağır betonun kullanılması sonucu
gerekli olan normal beton kalınlığını 1.5 ile 2.5 kat azaltmak
mümkündür.
Yoğun beton, etüv kurusu birim ağırlığı en az 2600kg/m3 olan
betonlardır. Yoğun beton aynı zamanda ağır beton olarak da bilinir.
Yüksek yoğunluklu beton ise 6000 kg/m3’den daha büyük olan betonlardır.
Bu özellikteki betonlar, genelde yüksek radyasyondan korunma amacıyla
kullanılırlar. Yüksek yoğunluklu beton daha iyi bir koruma özelliğine
sahiptir. Böylece X ışınları, gama ışınları ve nötronlar gibi zararlı

5
4th International Science Symposium (September 04-06, 2019),
Kiev-Ukraine (ISS2019), 1A4PB; pp:1-18.
radyasyonları koruyabilir. Ağır betonu elde etmek için yüksek
yoğunluklu agregalar kullanılır. Yüksek yoğunluklu agregaların
bazıları, barit, ferrofosfor, limonit, hematit, manyetit, goethit ve
ilmenit’tir. Hatırlanması gereken nokta, bu tür betonu elde etmek için
yüksek sabit su içeriğinin gerekli olduğudur.
Nükleer santrallerde atom çekirdeklerinin kontrollü bir şekilde
parçalandıkları yerlerde α, β, γ, x ve nötron adı verilen ışın ve
parçacıklar açığa çıkar. Bu parçacıkların insanlara zararını en aza
indirgemek için bu tür tesislerde zırh denilen tabakalar oluşturulur.
Bu zırhı oluşturmak için en uygun malzeme ağır betonlardır. Atomun
parçalanmasından sonra açığa çıkan nötron ışınları hafif elementler
tarafından α, β, γ, x ışınları ise ağır elementler tarafından tutulma
özelliğine sahiptir. Ağır betonlarda karma suyu bünyesinde bulunan H
ve O nötron ışınlarının yutulmasında veya yavaşlatılmasında, ağır
agrega ise α, β, γ, x ışınlarının tutulmasında katkıda bulunurlar
[12].
Öktem’e göre, kararsız çekirdekler enerji vererek kararlı hale
geçerler. Parçacık veya elektromanyetik dalga olarak yayınlanan bu
enerjiye radyasyon denir. Kararsız durumdaki atom veya çekirdeklerin
fazla enerjilerini parçacık veya elektromanyetik dalga olarak
yayınlayarak gidermeleri olayına radyoaktivite, bu çekirdeklere ise
radyoaktif çekirdekler denir [13].
Yukarıda belirtilen agregaların seçimi esas olarak kütle
yoğunluğu, özgül ağırlık ve malzemelerin fiziksel özelliklerine
bağlıdır. İşlenebilirliği sağlamak için yüksek yoğunluklu agregalar
kir, yağ veya yağ lekeleri ve diğer yabancı maddelerden arındırılmış
olmalıdır. Veya hidrasyon işlemini ve partiküllerin etkili
bağlanmasını geciktirir. Kolemanit, borokalsit gibi bor ilavelerinin
bazıları, betonun hazırlanmasında, koruyucu özelliklerini geliştirmek
için kullanılır. Bu ilaveler betonun sertleşme süresini etkileyebilir,
bu nedenle deneme karışımları uygunluğa bağlı olarak yapılmalı ve test
edilmelidir [14].
Diğer bir tanımlamaya göre de radyasyon; bir ortamdan geçen
enerji transferi, elektromanyetik dalgaların yayınımı veya radyoaktif
parçacıkların yayınlandığı parçacık akımıdır [14]. AFAD KBRN
sözlüğüne göre (2019), radyasyon kaynağı ile kişiler, çalışma
alanı veya radyasyona hassas cihazlar arasına soğurucu
malzemeden yapılmış bir kalkan konulmasıyla radyasyon şiddetinin
azaltılmasıdır [15]. Enerjisi frekans ile doğru; dalga boyu ile ters
orantılıdır [16]. Betonda zırhlama denildiğinde genelde, gama ışınları
ve nötronlarına karşı alınan tedbirler dizisi olarak algılanmaktadır.
Yeryüzündeki tüm canlılar ve cansızlar havada, suda toprakta ve hatta
kendi vücutları içerisindeki doğal radyasyon kaynakları ve bunlara ek
olarak insanlar tarafından üretilen yapay radyasyon kaynaklarının her
an ışınımına maruz kalmaktadırlar [17]. Radyasyondan tamamen
arındırılmış savunma ve sığınma amaçlı bir ortamda yaşamamız ve ondan
tümüyle korunmamız şimdilik mümkün gözükmemektedir. Ancak, bazı
önlemler alarak maruz kalabileceğimiz radyasyon miktarını en aza
indirgenmesi mümkün görünmektedir. Radyasyon bir enerji olup, uzaydan,
soluduğumuz havadan, yediğimiz yiyeceklerden, evlerimizin yapı
malzemelerinden radyasyona maruz kalırız. Bu nedenle, radyasyon
yaşadığımız çevrenin bir parçasıdır ve zamanın başlangıcından itibaren
vardır [18].
2. ÇALIŞMANIN ÖNEMİ (RESEARCH SIGNIFICANCE)
Son yıllarda KBRM zararlı etkileri giderek artmaya başlamıştır.
Bu nedenle bu zararlı etkilerin en ekonomik ve etkili şekilde
çözümleme zaruriyeti ortaya çıkmıştır. En ekonomik ve etkili çözüm

6
4th International Science Symposium (September 04-06, 2019),
Kiev-Ukraine (ISS2019), 1A4PB; pp:1-18.
olarak betonun zırhlanarak kullanılmasıdır. Canlı hayatını tehdit eden
KBRN’nin zararlı etkilerini azaltmak, absorbe etmek, bertaraf etmek
veya geri yansıtmak amacıyla betonun önüne ve içine konulan
malzemelere zırh malzemesi denir. Bu çalışmada betonun zırhlanmasının
önemi, teknikleri, zırhlamada kullanılan malzemeler ve zırhlama
kazanımları ele alınmıştır. Çalışmada bir betimleme çalışması olup;
ele alınan konunun çok geniş ve halen teknik ve tıbbi tartışmalara
açık olması nedeniyle öncelikle bir derleme çalışmasının yapılması ve
bu derlemenin de tümevarım yöntemiyle hedefe ulaşılması düşünülmüştür.
Böylece, çalışmada ele alınan konu ve içerik bu konuda yapılacak yeni
çalışmalara ışık tutması ve ilgili taraflara nicel veri ve bilgiler
sunması amaçlanmıştır [19].
3. YAPIDA ZIRHLAMANIN ÖNEMİ (IMPORTANCE OF ARMORING IN BUILDING)
Radyasyon, dalga, parçacık veya foton olarak adlandırılan enerji
paketleri ile yayılan enerjidir. Radyasyondan korunmanın üç temel
unsuru zaman, mesafe ve zırhlama kuralıdır. Radyasyon kaynağı ile bu
kaynağın sebep olduğu dozdan etkilenme olasılığı olan kişiler arasına
kurşun, tuğla, beton, gibi malzemeden duvar konulmasına zırhlama ve
kullanılan malzemeye de zırh malzemesi denir. Zırh malzemelerinin
yoğunluğu ne kadar fazla ise X ve γ ışınlarını zırhlama etkinliği o
kadar artar. Radyasyon kaynağı ile insan arasına zırhlama malzemesi
konulmasıyla maruz kalınacak doz azaltılır. X ve γ ışınlarının
zırhlanması, genel olarak zırh malzemesinin yoğunluğuna bağlıdır. Bu
zırhları gerçekleştirmede ağır agregalı betonlar en elverişli malzeme
olmaktadır. Ağır betonlar; kayma ve devrilmeye karşı emniyette olmayan
yapılarda ağırlığından dolayı kullanılmakla beraber, radyoaktif
maddelerin yaydığı nükleer ışınlardan özellikle cisimlerin içine
girebilen öldürücü nötron ve γ ışınlarına karşı korunmak için
gerçekleştirilen yapılarda kullanılır. X ve γ ışınları madde içinde
başlıca üç çeşit etkileşme ile enerji kaybederler. Bunlar;
Atomun iç yörünge elektronları ile etkilenerek oluşan “Foto
Elektrik Olayı”,
Atomun dış yörünge elektronları ile oluşan “Compton Olayı”,
Atomun çekirdeğine yakın bir yerde bir pozitron ve bir elektron
meydana getirmesi ile oluşan “Çift Oluşumu Olayı”dır [20 ve 21].
Radyasyonun şiddetini zayıflatmak için önüne konan veya onu
çevreleyen malzemeye zırh denilmektedir. Radyasyon kaynağı ile kişi
arasına engel konmasına da zırhlama denilmektedir. Zırhlama, alınan
dozu en aza indirmeye yardımcı olur. Radyasyon tipine göre zırhlama
gereksinimleri farklılık göstermektedir. Şekil 1’de görüleceği üzere,
alfa (α) kaynağını zırhlamada bir kağıt parçası yeterli olurken, beta
(β) kaynakları için alüminyum, gama (γ) ve x-ışınları için kurşun
tabaka ve nötronlar için yoğun ve/veya yüksek yoğun beton kullanılır
[22].
Şekil 1. Değişik radyasyon türüne göre zırhlama örnekleri [23]
(Figure 1. Examples of different types of radiation armoring)
Kağıt Tahta Beton
Alfa
Beta
Gamma
X-Işınları
Nötronlar
Alüminyum Kurşun Beton
α
β
γ

7
4th International Science Symposium (September 04-06, 2019),
Kiev-Ukraine (ISS2019), 1A4PB; pp:1-18.
İnsanlar bugün iyonlaştırıcı ve iyonlaştırıcı olmayan
radyasyonlara maruz kalmaktadır. İyonlaştırıcı radyasyon olarak alfa
ışınları (α), beta ışınları (β), X ve gama ışınları (gamma)(γ) ile
nötronlar (n) dır. Bu radyasyonlar, X-ışınları hariç, atom
çekirdeğinden çıkmakta ve bundan dolayı bunlara nükleer radyasyonlar
denilmektedir. Şekil 2’de gösterilen ışınların temel özellikleri
aşağıdaki gibidir.
Alfa Işınları: Ağır kütleli olup oldukça yavaş hareket ederler.
Giricilikleri çok küçüktür ve enerjisine bağlı olarak havanın
bir kaç cm’si, cildin ölü tabakası veya bir kağıt tarafından
durdurulabilir.
Beta Işınları: Alfa ışınlarına göre daha hafif kütleli, hızlı ve
giricilikleri daha yüksek olmasına rağmen enerji is ne bağlı
olarak bir kaç metre hava, oldukça ince bir plastik veya
alüminyum tabaka tarafından durdurulabilir. İnsan vücuduna ancak
1-2 cm girebilirler.
X ve Gamma Işınları: Giricilikleri çok yüksek olup insan
vücudundan kolayca geçerler. X ve gamma ışınları enerjilerine
bağlı olarak oldukça kalın beton duvarlarla veya kurşun gibi
ağır metallerden yapılmış kalkan, bariyer veya yoğun kesitli
beton tabakalı zırhlarla durdurulabilir.
Nötronlar: Giricilikleri çok yüksek olup nükleer reaktörlerde
meydana getirilir. X ve gamma ışınlarının aksine su ve hidrojen
ağırlıklı diğer bazı hafif elementler nötronların
durdurulmasında çok etkindir [13].
Diğer taraftan, radyasyon olma ihtimali olan tüm mekanlarda
kolimatörler ve uyarıcı sistemler kullanılmalıdır. Radyasyona maruz
kalan hücre ölebilir veya zamanla doku tarafından onarılarak
kurtulabilir. Eğer kurtulan hücre, kromozomlarındaki kırılmalar
nedeniyle fiziksel ve kimyasal yapısı değişerek mutasyona uğrarsa,
bunun sonucunda hücre normal işlevini yapamaz ve ileride kişinin
kendisinde (somatik) veya gelecek nesillerde (genetik) zararlar
meydana getirebilir. Kısa bir süre içinde ve bir defada yüksek dozlara
maruz kalınması durumundan hemen sonra meydana gelecek hasarlara erken
etkiler (akut ışınlanma etkileri), kanser, ömür kısalması ve genetik
bozukluklar gibi sonradan çıkacak hasarlara da gecikmiş etkiler
(kronik ışınlanma etkileri) denir [24].
Radyasyon kaynağının enerjisi, kaynağın bulunduğu yer ve komşu
mekanlar ile olan ilişkisi, meşguliyet biçimleri ve bu mekanlarda
insanların bulunma sıklıkları ile bu kişilerin radyasyon ilişki
dereceleri, zırh malzemesinin radyasyon soğurma katsayısı ve
yoğunluğu, birincil veya ikincil zırh gibi parametreler zırh kalınlığı
seçimini ve kullanılacak zırh malzemesi özelliklerini belirler. Bu
parametrelerden birinin değişmesi ya da yanlış tespit edilmesi,
radyasyon korunması için yapılan zırhlamanın yetersiz kalmasına sebep
olur [25].
Tombakoğlu’na göre (2015), nötron yutulması sonucu açığa çıkan
γ-ışınları betonda yaklaşık 3.6 MeV enerjiye sahiptirler ve bu ışınlar
saçılma sonucu oluşan fotonlara göre daha fazla zırhlama
gerektirdiğinden ve foto-nötronlar için gerekli zırhlama da dikkate
alındığında saçılma sonucu oluşan düşük enerjili fotonlar önemini
yitirmekte ve zırhlama γ-ışınları için yapılmaktadır [1]. Radyasyondan
korunmanın hedefi, radyasyona maruz kalmaya neden olabilecek faydalı
uygulamaları aksatmadan, kişilerin ve toplum üyelerinin maruz kalacağı
radyasyon dozunu mümkün olabildiği kadar düşük düzeye indirerek
kişilerin ve toplumun korunmasını sağlamaktır. Bu amaç ve hedefe
erişebilmek için radyasyon korunması International Commission of
Radiation Protection (ICRP) tarafından yayınlanan 26 No'lu raporda bir

8
4th International Science Symposium (September 04-06, 2019),
Kiev-Ukraine (ISS2019), 1A4PB; pp:1-18.
doz sınırlama sistemi önerilmiştir [64]. Radyasyondan korunma
yöntemleri, dış radyasyondan korunma ve iç radyasyondan korunmak
şeklindedir.
Dış Radyasyondan Korunma: Dış radyasyon tehlikelerine karşı
korunma yöntemlerinde, vücut dışında bulunan radyasyon
kaynaklarından alınan radyasyon dozlarının, temel radyasyon
korunması standartlar standartlarıyla öngörülen sınırlar içinde
tutulmaları için uzaklık, zaman ve zırhlama olmak üzere üç
fiziksel korunma yönteminden yararlanılır.
o Mesafe: Radyoaktif madde veya radyasyon üreten cihazlarla
çalışırken mümkün olduğunca uzakta durmak gerekmektedir.
o Zaman: Radyoaktif madde veya radyasyon üreten cihazların
yanında, çalışma esnasında gerekenden fazla sürede kalmamak.
o Zırhlama: Radyoaktif madde veya radyasyon yayınlayan cihazlar
ile çalışırken radyasyon kaynağı ile çalışılacak yer arasına
radyasyonu tamamen durdurabilecek veya şiddetini azaltacak
nitelikte bir engelin konmasıdır.
İç Radyasyondan Korunma: İç ışınlanma, radyoaktif partiküllerin
gıda yolu ile solunum, yara ve kesiklerden vücut içerisindeki
belirli doku ve organlara yerleşerek etrafına ışıma yapmasıdır.
İç ışınlanmanın oluşumunu engellemek için açık radyoaktif
radyoaktif maddelerle çalışılırken uyulması gereken kurallara
titizlikle dikkat etmek gerekmektedir.
o Laboratuvarda çalışan personel dozimetre kullanmalı,
o Çeker ocaklarda çalışılmalı ve eldiven kullanılmalı,
o Laboratuvarın sürekli havalandırılması sağlanmalıdır [13].
4. ZIRHLAMA TEKNİKLERİ (ARMORING TECHNIQUES)
Beton zırhlamada farklı teknikler söz konusudur. Kullanılacak ve
seçilecek teknik KBRN tehditlerinin tamamını içermelidir. Bu aşamada
mekanı çevreleyen kabuğun nitelik ve nicelik durumu oldukça önemlidir.
Bu nedenle zırhlama yapılmadan önce mekanın kullanım amacı, KBRN türü,
düzeyi, şiddeti, etki şekli, kabuk elamanın nitelik ve niceliği ortaya
konulmalıdır. Beton zırhlama tekniği olarak aşağıdaki yöntemler ileri
sürülebilir. Uygulanacak teknik KBRN ve uygulama yapılacak malzeme
türü ve yerine göre değişiklik arz etmektedir.
Zırhlama işlemi çeşitli parametrelerin bir araya gelmesi ile
hesaplanan değerler sonucunda gerçekleştirilebilmektedir. Zırhlamada;
kaynak özellikleri, kaynağın bulunduğu mekanın özelikleri kullanım
özellikleri, kullanılacak zırh malzemelerinin özellikleri ve
uygulanacak zırh tipi özellikleri büyük önem taşır. Bu nedenle KBRN
etkilerine karşı uygulanacak zırhlama tekniği tipinin seçimindeki
önemli hususlar şunlardır;
Mekanın fiziki özellikleri,
Komşu mekanların işlevleri,
Kaynağın doğrultusu ve yönü,
Kaynağın teknik özellikleri,
Kaynağın bulunduğu yer ve konumu,
Komşu mekanlar ile olan ilişkisi,
Mekanın kullanım amacı, işlevi ve fonksiyonu,
Mekan kullanıcıların KBRN ile olan ilişki dereceleri,
Mekanın inşaasında kullanılan malzemelerin özellikleri,
Zırhlamada tercih edilen malzemenin nitelik ve niceliği,
Mekanlarda insanların ve diğer canlıların bulunma sıklığıdır.
Bu hususlardan birinin değişmesi ya da yanlış tespit edilmesi,
radyasyon koruması için yapılan zırhlamanın yetersiz kalmasına sebep
olabilir [25].

9
4th International Science Symposium (September 04-06, 2019),
Kiev-Ukraine (ISS2019), 1A4PB; pp:1-18.
Uygulama şekline göre bir radyasyon kaynağının söz konusu olduğu
bir mekan için zırhlama teknikleri şunlardır;
Kalkan Zırhlama,
Bariyerli Zırhlama,
Yoğun Kesit Elemanlı Zırhlamadır.
Bu yöntemlerden hangisinin daha elverişli olduğunu söylemek zor
olsa da en ekonomik ve verimli olanının beton kesitinde yapılan
uygulamadır. Ayrıca zırhlamanın yapının servis ömrü boyunca
işlevselliğini koruyabilmesi, maruz kalacağı yıpratıcı etkilerin
türünün ve şiddetinin tasarım aşamasında belirlenmesi ve gerekli
önlemlerin alınmasıyla mümkündür. Tekniğin seçiminde, yapının birden
fazla etkiye aynı anda ve tekrarlı olarak maruz kalmasının olası
olduğu ve tüm bu etkilerin bir arada değerlendirilmesinin gerektiği
gözden kaçırılmamalıdır.
A B
C
A: Kalkanlı, B: Bariyerli, C: Yoğun Kesit Elemanlı
Şekil 2. Beton zırhlama tekniği örnekleri
(A: Shield, B: Barrier, C: Dense Cross Section)
(Figure 2. Examples of concrete armoring techniques)
4.1. Kalkanlı Zırhlama (Shielded Armoring)
Beton yoğunluğunun düşük olması durumunda tercih edilir. Bu
zırhlama tekniğinde zırh malzemeleri yüzeyin iç veya dış tarafından
sürme, yapıştırma veya ankrajlama şeklinde yapılmaktadır. Kalkan
korumanın kalınlığı, türü ve miktarı radyasyonun nitelik ve niceliğine
bağlı olarak hesapla bulunur. Örneğin; radyoloji cihazları için
zorunlu olmamakla birlikte yerleşiminden önce projenin uygunluğuna
ilişkin TAEK’den proje zırhlama raporu alınabilir. Zırhlama
hesaplamaları Radyasyondan Korunma ve Radyasyon Ölçümleri Ulusal
Konseyi’nin (NCRP) X-ışını üniteleri ile ilgili 49 ve 147 nolu
raporlarında belirtilen hesaplama teknikleri kullanılarak yapılır.
Hesaplamada kullanılan parametreler şunlardır;

10
4th International Science Symposium (September 04-06, 2019),
Kiev-Ukraine (ISS2019), 1A4PB; pp:1-18.
Mesafe (d),
İş yükü (W),
Tasarım dozu,
Kullanım faktörü (U),
Meşguliyet faktörü (T),
Birinci ve ikincil engel,
Yarı kalınlık değeri (HVL),
Onda bir kalınlık değeri (TVL) dir.
Burada TVL, radyasyon demeti şiddetini onda bir değerine düşüren
zırhlama malzemesine özgü kalınlığıdır. HVL ise radyasyon demeti
şiddetini yarı değerine düşüren zırhlama malzemesine özgü kalınlığıdır
(–1HVL ≈ 0.3TVL) [26]. Genellikle yapının zırhlama gerekliliği
sonradan gündeme gelmesi durumunda yapılmaktadır. Bu teknikte yüzeyin
fiziki durumu ve KBRN özelliğine göre uygun levha, plaka veya sürme
esaslı malzemeler kullanılmaktadır. Kalkan zırhlama tekniği örneği
Şekil 2.A’da verilmiştir. Foto-nötronların zırhlanması için 32mm BPE
ve fotonlar için ise 1.5mm kurşun kalkan gerekmektedir [1]. Zırhlamada
kullanılan betonun yoğunluğu en az 2600kg/m3, kurşunun yoğunluğu ise
11.3g/cm3 (en az %99 saflıkta) olmalıdır [27]. Kalkan zırhlamasında
Tablo 2’de verilen Normal, Yüksek veya Çok Yüksek Mukavemetli beton
türü tercih edilmelidir.
4.2. Bariyerli Zırhlama (Barrier Armoring)
Beton yoğunluğunun düşük olması durumunda tercih edilir.
Bariyerli zırhlama tekniğinde, öncelikle zırhlama yapılacak elemanın
nitelik ve niceliği ile KBRN tehditin nicelik ve niteliği hakkında
veriler elde edilmelidir. Genelde hastanelerin röntren, MR, onkoloji,
nükleer tıp gibi birimlerinde tercih edilmektedir. Yani, tedavi odası
ve kontrol odası gibi girişlerin sınırlandırıldığı ve radyasyondan
korunma görevlisinin kontrolü altında çalışanların izlendiği yerler
ile kontrollü alan harici tüm yerler ise denetimli olmayan alan ya da
SRS-47 raporundaki tanım ile gözetlenen alanlarıdır. Bariyerli
zırhlama tekniği örneği Şekil 2b’de verilmiştir. Bu zırhlamasında
tekniğinde Tablo 2’de verilen Normal, Yüksek veya Çok Yüksek
Mukavemetli beton türü tercih edilmelidir. Şekil 2.B’deki birincil
bariyer, genellikle tedavi amaçlı kullanılan ışın demetinin
zırhlanmasında kullanılmaktadır. İkincil bariyer ise hastadan saçılan
ve tedavi cihazından sızan radyasyonun zırhlanmasında
kullanılmaktadır.
Resim 1. Kurşun plaka üretimi ve kalkanlı zırhlama uygulama örneği[65]
(Picture 1. Lead plate production and shielded armor application
example)
Kurşun malzemesiyle yapılan kalkan veya bariyerli zırhlama
işlemi, Türkiye Atom Enerjisi Kurumu’nun (TAEK) kurşun zırhlama
yapılması gerektiği şartnamesini koyduğu her alanda, saf kurşun

11
4th International Science Symposium (September 04-06, 2019),
Kiev-Ukraine (ISS2019), 1A4PB; pp:1-18.
levhalar kullanılarak, kurşuna herhangi bir zarar vermeden yapılan
işlemdir. Kalkanlı ve bariyerli zırhlamada kullanılabilecek malzemeler
şunlardır;
Kurşun Levhalar: En az %99 saflıkta olmalıdır. Kalınlığı oluşan
radyasyon tip ve miktarına göre hesaplanmalıdır. TS EN 12588
kalite belgesine sahip olmalıdır. Kullanılacak kuşun
malzemesinin teknik özellikleri Tablo 3’de verilmiştir [63].
Kurşun Cam: Röntgen ve bilgisayarlı tomografi (CT) odaları için
gözlem ve yalıtım camı olarak kullanılır. Yüksek yoğunluğu (5.05
gr/cm3 ve kalınlığı 8 mm) sayesinde ince bir kalınlıkla yüksek
radyasyon emme kapasitesine sahiptir. 100-300kV aralığındaki
ekipmanlardan yayılan radyasyona karşı koruma sağlar. İçinde
yüksek baryum ve kuşun ihtiva eder.
Tungsten-Polimer Kompozitler: Yeni bir malzeme olup, tungsten
(W) etilen vinil asetat (EVA) veya tungsten karbür (WC) etilen
vinil asetat (EVA) içeren gama ışını zırhlama kompozit
materyaldir. Bu malzeme, kurşuna kıyasla daha hafif, daha esnek
olmasına rağmen en az kurşun kadar etkili zırlama sağlayan,
toksik olmayan ve şekil alabilir γ ışını zırhlama kompozit
materyalidir. Bu malzemenin yenilikçi yönleri ve avantajları
şunlardır:
o İyonize radyasyonun zararlı etkilerinden korur.
o Hafif olması nedeniyle kişisel zırhlamada kullanım kolaylığı
sağlar.
o Aynı ebattaki kurşun disklere göre yaklaşık %70 oranında daha
hafiftir.
o Şekil alabilir olması nedeniyle uygulama alanları geniştir.
o Toksik etkisi olmaması nedeniyle insan sağlığına ve çevreye
zararsızdır.
o Teknikte sık olarak kullanılan kurşun bazlı zırhlara göre
daha etkin gama zırhlama özelliği gösterir.
Kurşun Tuğla: Bu tuğlalar sıcak oda (nükleer tıp, radyoaktif ve
radyofarmasotik çalışma) alanlarında kullanılan ve hücresel hale
getirilebilen radyo korunum özelliğine sahip TS8030 standardında
uygun üründür [62].
Resim 2. Kurşun tuğla örneği [62]
(Picture 2. Lead brick example)
Resim 3. Parafin levha örneği [66]
(Picture 3. Paraffin sheet sample)
Parafin (Nötron Tutucu Parafin): Petrol, neft, katran gibi
maddelerden çıkarılan, beyaz renkli, katı ve yarı saydam, buharı
parlak bir alevle yanan bir hidrokarbondur. Radyoterapi ünitesi
ve Linac odaları nötron tutucu özelliğe sahiptir.
Kalkanlı ve bariyerli zırhlanmada dikkat edilecek hususlar
şunlardır;
Komşu alanların kullanımı apartman boşluğu, depo, bahçe ve park
yeri olsa bile zırhlanması gerekebilir. Ancak komşu alanın
toprak dolgu ve üst kattaki laboratuvarlar için en az 10m boşluk
(açıklık) olması durumunda duvara herhangi bir zırh yapılması
gerekmez.

12
4th International Science Symposium (September 04-06, 2019),
Kiev-Ukraine (ISS2019), 1A4PB; pp:1-18.
Kurşun levhalar 2m yüksekliğinde arada boşluk olmayacak şekilde
kaplanmalıdır.
Kurşun levhalar birleşme yerlerinde en az 1mm üst üste
binmelidir.
Odanın pencereleri pervazları dahil olmak üzer duvar zırhı kadar
kurşunla kaplanmalıdır.
Zırhlama amacıyla kapılara yerleştirilen kurşun plakalar nedeni
ile kapının sarkması önlenmelidir.
Açıkta kalan kurşun bırakılmamalı, uygun malzeme ile (tercihen
alçıpan (fireboard)) kaplanmalıdır.
Tablo 3. Radyoaktif kaynak türüne göre bazı zırh malzeme seçimi ve
ölçüleri [28]
(Table 3. Selection of some armor materials by radioactive source type
and dimensions)
Zırh
Malzemesi
Türü
Radyoaktif Kaynak Türü
Co-60 Ir-192 Cs-137
HVL THL HVL THL HVL THL
Kurşun (cm) 1.24 4.11 0.48 1.62 0.63 2.13
Beton (cm) 6.50 21.84 4.82 15.74 5.33 18.03
4.2. Yoğun Kesit Elemanlı Zırhlama (Intensive Section Armouring)
Beton, gama ve nötron koruması için kullanılan ana malzemelerden
biridir. Gama ışınları durumunda, yoğunluğun artması genellikle
yeterince verimli olsa da, nötronlara karşı koruma daha karmaşıktır
[29].
Bu yöntem genelde sağlık, eğitim, yönetim, ticaret, savunma ve
sığınma yapıları başta olmak üzere KBRN etkilerinin söz konusu olduğu
yerlerde tercih edilmektedir. En ekonomik ve güvenli zırhlama tekniği
olup, uygulama örneği Şekil 2.C’de verilmiştir. Bu nedenle kabuk
elemanın kesitinde yapılacak zırhlamada en çok tercih edilen hiç
şüphesiz yüksek yoğun beton malzemesi tercih edilmektedir. Alınacak
önlemler yıpratıcı etkinin türüne ve şiddetine göre farklılık
gösterebilir. Örneğin; sülfat etkisinde kalacak bir yapı için çimento
seçiminin önemi büyüktür.
Yoğun kesit elemanlı zırhlamada en yaygın şekilde yoğun yani
ağır beton tercih edilmelidir. Betonların zırhlanmasında kullanılacak
malzeme uygulama tekniğine göre değişiklikler göstermektedir. Örneğin;
kabuk elemanın dış yüzeyine yapılacak uygulama genelde levha, plaka
veya sürme esaslı malzemeler olurken; kabuğun kesitinde tane yoğunluğu
yüksek agrega ve kendiliğinden özelikle radyasyon sünümleme, emme veya
geri yansıtma niteliğindeki malzemeler kullanılmaktadır. Tablo 2’de
ağır ve radyasyondan koruma amaçlı bazı beton agregaları ve tane
yoğunlukları verilmiştir. Ayrıca betonların radyasyondan korunma
etkisi Tablo 5’de ve ağır ve radyasyondan korunma amaçlı beton
agregaları Tablo 4’de verilmiştir. Beton yoğunluğunun artması, iyonize
(girici) elektromanyetik radyasyonun tutulmasında etken rol oynar.
Ancak, genel olarak, betonun veya betonarmenin dayanıklılığının
sağlanmasında temel felsefe, kaliteli ve geçirimsiz beton
kullanılmasıdır. Bu nedenle yıpratıcı etkinin kaynağı her ne olursa
olsun, yüksek durabiteli ve zırhlı beton için alınması gerekli genel
önlemleri şu şekilde özetlenebilir:
Çevresel etkinin şiddeti dikkate alınarak uygun beton sınıfı
seçilmeli (Tablo 2’de verilen yüksek ve çok yüksek türdeki
betonlar),
Yapısal dizayn açısından ihtiyaç olmasa bile gereğinde beton
kalitesi arttırılmalı (Min. C50/60),
Ağır agrega türü seçilmeli,

13
4th International Science Symposium (September 04-06, 2019),
Kiev-Ukraine (ISS2019), 1A4PB; pp:1-18.
Ayrışma ihtimaline karşı beton elyaf kullanılmalı,
Çimento dozajı 400kg/m3’ün üstünde olmalı,
Reaktif silisli agrega kullanılmamalı,
Agreganın Dmax değeri büyük seçilmeli,
Su/Çimento oranı en fazla 0.40 olmalı,
Yüksek oranda C3S içerikli ve yüksek incelikte öğütülmüş
çimentolar tercih edilmeli (CEM-I),
Beton elyafıyla güçlendirilmeli,
Dolu/boşluksuz agrega taneleri tercih edilmeli,
Uygun bir işlenebilirlik ve yüksek bir beton yoğunluğu için tane
dağılımı, mümkün olduğunca A/B gradasyon eğrileri arasındaki
bölgede seçilmeli,
İnşaat derzlerinden (soğuk derz) mümkün olabildiğince
kaçınılmalı,
Betonlar ilk 14 gün nemli olmalı,
Nötron yakalama olasılığı daha yüksek katkı maddeleri
kullanılmalı,
Beton kalınlığı (çekirdek çap) en az 30cm olmalı,
Paspayı, toprak veya su ile temas durumunda 5cm, açık havayla
temas durumunda da en az 2cm alınmalı,
Beton yüzeyine nitelikli su ve ısı yalıtımı uygulanmalı,
Çelik donatı sınıfı BÇ-III olmalı,
Taze betonların hızlı su kaybetmeleri engellenmeli,
Beton yüzeyler parafinle kür edilmeli,
Tercihen bor maddesinin saflaştırılmasıyla elde edilen bor
türevli madde sodyum pentaboratlı betonların kullanılmalı,
Betonun kompasitesi yüksek, porozitesi ise düşük olmalıdır [10,
20, 21, 25, 30, 31, 32, 33, 34, 35, 36, 37, 38, 39, 40, 41, 42,
43, 44, 46, 47, 48, 49, 50, 51, 52, 53, 54 ve 55].
Tablo 4. Betonların radyasyondan korunma etkisi [52]
(Table 4. Radiation protection effect of concretes)
Koruyucu
Radyasyon
Radyasyon Kaynakları
(Örnekler)
Radyasyondan Korunma Betonlarında
Nitel Gereksinimler
Röntgen
Işınları
Röntgen Cihazları,
Lineer Hızlandırıcı
Geleneksel normal beton ile beton
yoğunluğu;
ρR=2.40kg/dm3 ve yaklaşık 300 mm
kalınlıklar olmalı
α-Radyasyon
β-Radyasyon Radyonüklidler
Yeterli aralıktaki beton kalınlığı
(Min. 30cm)
γ-Radyasyon
Nükleer/Atom
Reaktörleri,
Radyonüklidler,
Nükleer Patlamalar
Yüksek yoğunluklu ve/veya büyük
kalınlık
Nötron
Radyasyonu
Nükleer/Atom
Reaktörleri,
Radyonüklidler,
Nükleer Patlamalar
Yüksek oranda kimyasal bağlı su içeriği
Bor, Kadmiyum veya hafniyum ilavesi
Yüksek yoğunluk ve büyük kalınlık

14
4th International Science Symposium (September 04-06, 2019),
Kiev-Ukraine (ISS2019), 1A4PB; pp:1-18.
Tablo 5. Ağır ve radyasyondan korunma amaçlı beton agregaları [45, 52
ve 56]
(Table 5. Heavy and radiation protection concrete aggregates)
Agrega Türü Açıklama Tane Yoğunluğu
(kg/dm3)
Normal Agregalar
(Normal Agrega Taneleri)
Çakıl 2.6-2.7
Kalker 2.6-2.8
Granit 2.6-2.8
Bazalt 2.9-3.1
Doğal Ağır Agregalar
(Doğal Ağır Taş Taneleri)
Baryt (Barit) 4.0-4.3
Ilmenit (Titanyum Demir Taşı) 4.6-4.7
Magnetit (Manyetik Demir Taşı) 4.6-4.8
Hematit (Kırmızı Demir Taşı) 4.7-4.9
Yapay Ağır Agregalar
(Endüstriyel Olarak
Üretilen, Ağır Taş
Taneleri)
Ağır Metal Cürufları 3.5-3.8
Ferrosilisyum 5.8-6.2
Ferrofosfor 6.0-6.2
Çelik Granüller (<8mm.) 6.8-7.5
Çelik Kum (0,2 ... 3mm) 7.5-7.6
Kristalleşme Suyu
Yükseltilmiş Agregalar
(Taş Taneleri)
Limonit (4 ... 16mm) 3.6-3.8
Serpantin 2.5-2.6
Bor İçeren Malzemeler
Borokalsit, Kolemanit 2.3-2.4
Borfrit 2.4-2.6
Bor karbid ≥2.4
Cam Malzemeler Katot Işın Tüpü Camı
(Cathode Ray Tube (CRT)) 2.4-2.8
5. SONUÇ VE ÖNERİLER (CONCLUSIONS AND RECOMMENDATIONS)
Son yıllardaki potansiyel tehlike, dünya çapında genel
krizlerden ziyade hemen her yerde patlayabilecek bölgesel
anlaşmazlıklardan kaynaklanacak tehdit senaryolarında görülmektedir.
Günümüzde böyle bir yerel veya bölgesel çıkar ve anlaşmazlıklarda, gün
geçtikçe etkinliği artan konvansiyonel silahların yanı sıra kimyasal
ve biyolojik silahlar da kullanılacağı, kuvvetle muhtemeldir. Her
halükarda en modern, hedefi şaşmayan silahlarla sadece askeri
tesislerin vurulması durumunda dahi doğru-düzgün savunma ve sığınma
yapılarına sahip olunmadığı takdirde yine siviller, modern savaşın
gerçek kurbanları ve kaybeden tarafı olabileceklerdir [57].
Betonların zırhlanması kalkanlı, bariyerli veya yoğun kesit
elemanlı betonların kullanımı şeklinde olmaktadır. En etkili, ekonomik
ve sürdürülebilir zırhlama, zırhlama yapılacak yerin kabuğunda yoğun
kesit elemanlı beton kullanımı ile olmaktadır. Ayrıca zırhlamanın bina
üretim-yapım aşamasında yapılması önemlidir.
Ülkemizde ağır betonların üretim ve kullanımları çok sınırlı
durumdadır. Ağır beton üretiminde barit, limonit, hematit, viterit,
geotit gibi doğal agregalar ile demir saçmaları, kurşun parçacıkları,
ferrosilikon ve ferrofosfor gibi yapay agregalarla olumlu sonuçlar
almak mümkündür. Ayrıca bor minerali de bu amaç için kullanılabilir.
En yaygın olarak kullanılan baryum sülfat esaslı barit minerali stabil
olması nedeniyle betona zarar vermez ve betonun birim ağırlığı
3600kg/m3’e kadar çıkabilmektedir. Magnetit ve limonit ile üretilen
betonların birim ağırlıkları da 3400-3600kg/m3 arasında olabilmektedir.
Demir parçacıkları tek başlarına ya da diğer ağır agregalar ile
kullanıldıklarında betonların birim ağırlıkları 5500-6500kg/m3 değerine
yükselmektedir [10].
Radyoaktif ışın absorpsiyonu ile beton sıcaklığı güçlü bir
şekilde artabilir. Betonun 100°C-250°C arasındaki sıcaklıklarda
ısınmadan dolayı kurumasına (su kaybına) ek olarak, beton, %20-25
oranında mukavemet kaybına neden olur.

15
4th International Science Symposium (September 04-06, 2019),
Kiev-Ukraine (ISS2019), 1A4PB; pp:1-18.
Mevcut bilgilere göre, 1019 nötron/cm2 den fazla giricilik
derecesine sahip nötron radyasyonu veya 2·1014J/g‘ın üstünde bir dozda
γ radyasyonu, betonun mekanik özelliklerinde (mukavemet, elastikiyet
modülü, termal genişleme katsayısı) bozulmaya neden olabilir. Bu tür
radyasyon şiddetine reaktör basınçlı kaplarında maruz kalınır. Binanın
hesaplanması veya yapısal tasarımında bu faktörlerin dikkate
alınmasına ek olarak, özellikle radyasyona dayanıklı agregalar (taş
taneleri) seçilmelidir [58].
Yoğun betonda barit kullanımında dikkat edilmesi gereken
hususlar şunlardır;
Basınç dayanımı kaybını azaltmak için kireçtaşı iskeleti
korunmalıdır.
Barit kullanımı, %20 civarında bir esneklik modülünün azalmasına
neden olur.
Kumun barit ile değiştirilmesi, betonun çekme dayanımını yarıya
indirir.
Barit tozu, betonun şişmesini etkilemez ancak büzülmeyi azaltır
[59].
Sonuç olarak, günümüzde, insan sağlığını tehdit eden başta
radyasyon yayan cihazların kullanımı, teknolojideki gelişmelerle
birlikte yaygınlaşmıştır [60]. Yüksek yoğunluklu betonlar nötronlara
ve γ ışınlarına karşı iyi koruma özellikleri, iç su içeriği ve
sırasıyla nispeten yüksek yoğunluğu nedeniyle radyasyon koruma için de
en yaygın kullanılan malzemedir [61]. Kalkan ve bariyerli zırhlı
betonlar, KBRN kaynaklarının şiddetini ve zararlı etkilerini
zayıflatmak için önüne konan veya onu çevreleyen engeldir. Kurşun,
beton ve su radyasyona karşı oldukça iyi koruma ve şiddette azalmayı
sağlamaktadır. Zırhlamada kullanılacak malzemelerin yüksek yoğunluklu
malzemelerden seçilmiş olması özellikle X ve γ ışınlarına karşı etkili
sonuçların alınmasına neden olacaktır. Bu nedenle savunma ve sığınma
amaçlı yapılarda ağır agregaların ve hammaddesi polipropilen olan
beton elyaflarının kullanımı oldukça önemlidir. Bu liflerin saha
betonlarında kullanılması durumunda 19 mm, şap betonlarında 12 mm ve
sıva işlerinde de 6 mm boyutunda olması yeterlidir. Beton elyaf
kullanımı sonucunda betonlarda önemli mukavemeti artışı hem de betonda
mikro çatlak önlenerek dolaylı bir zırhlama elde edilmiş olacaktır. Bu
bağlamda en etkinli ve verimli beton zırhlamanın; ağır agrega
kullanımlı, yüksek kompasiteli, tercihen bor mineral katkılı, S/Ç
oranı düşük, soğuk derzsiz, en az 60 cm çekirdek çaplı ve en az
400kg/m3 çimento dozlu betonlarda yapılması uygun olacaktır.
KAYNAKLAR (REFERENCES)
[1] Tombakoğlu, M., (2015). Radyasyon Zırhlama. XV. Medikal Fizik
Kongresi (Tebliğ). 16-19 Mayıs 2015, Trabzon.
[2] Baradan, B., Yazıcı, H. ve Ün, H., (2010). Beton ve Betonarme
Yapılarda Kalıcılık (Durabilite). İstanbul: THBB Yayınları.
[3] Cilason, N. ve Aksoy, N., (2000). Beton Yapı Hasarları Onarım ve
Korunması ve Sıcak İklimlerde Beton,
http://www.academia.edu/1534146/Beton_Yapi_Hasarlari_
Onarim_ve_Korunmasi_ve_ Sicak_Iklimlerde_Beton.
[4] URL-1, (2019). The Construction Civil. High Density Concrete.
https://www.theconstructioncivil.org/high-density-concrete/
(Erişim: 07.08.2019).
[5] TS500, (2000). Betonarme Yapıların Tasarım ve Yapım Kuralları.
Ankara: Türk Standartları Enstitüsü.
[6] TS802, (2016). Beton Karışım Tasarımı Hesap Esasları. Ankara:
Türk Standartları Enstitüsü.

16
4th International Science Symposium (September 04-06, 2019),
Kiev-Ukraine (ISS2019), 1A4PB; pp:1-18.
[7] Ünal, O., İçağa, Y. ve Çoşkun, A., (2016). Barit Agregalı
Betonların Radyasyon Soğurma Özelliklerinin Araştırılması. AKÜ
FEMÜBİD 16 (2016) 015602 (125‐131) [8] Salgın, B., (2007). Brüt Beton, Brütalizm ve Türkiye Örnekleri,
(Yüksek Lisans Tezi). Kayseri: Erciyes Üniversitesi, Fen
Bilimleri Enstitüsü
[9] Neville, A.M., (1981). Properties of Concrete, Longman
Scientific and Technical, 3rd Edition.
[10] Özturan, T., (2013). Özel Betonlar. Hazır Beton Dergisi. Sayı: 2013 Temmuz-Ağustos, ss:70-83.
[11] Bentur, A. ve Mindess, S., (1990). Fiber Reinforced Cementitious Composites, Elsevier Applied Science, London.
[12] Baradan, B., Yazıcı, H. ve Aydın, S., (2015). Beton (2.Baskı). İzmir: Dokuz Eylül Üniversitesi Mühendislik Fakültesi Yayınları.
[13] URL-2, (2019). Öktem, Y., Hızlandırıcılarda Radyasyon Güvenliği. https://indico.tarla.org.tr/event/19/contributions/12/attachment
s/757/253/Yesim_Oktem.pdf (Erişim: 08.08.2019)
[14] Johns, H.E. ve Cunningham, J.R., (1983). The Physicis of Radiology, C. Thomas Publishers.
[15] URL-3, (2019). AFAD KBRN Sözlüğü. https://www.afad.gov.tr/tr/23793/KBRN-
Sozlugu?kelime=Z%C4%B1rhlama (Erişim: 06.08.2019).
[16] Gökharman, F.D., Aydın, S. ve Koşar, P.N., (2016). Radyasyon Güvenliğinde Mesleki Olarak Bilmemiz Gerekenler. SDÜ Sağlık
Bilimleri Enstitüsü Dergisi, 7(2):35-40.
[17] TAEK. (1999). Nükleer Enerji, Çekmece Nükleer Araştırma ve Eğitim Merkezi. Bilgiler-Haberler, Sayı: 57.
[18] Hızarcı, S., (2019). Radyasyon Kaynakları ve Radyasyondan Korunma. http://www.cygm.gov.tr/CYGM/Files/
Guncelbelgeler/Radyasyon_olcum_sunum.pdf
[19] Ekinci, C.E., (2018). Fen ve Mühendislik Bilimleri İçin Bilimsel Araştırma Yöntemleri (3.Baskı). Ankara: Data Yayınları
[20] Kılınçarslan, Ş., (2004). Barit Agregalı Ağır Betonların Radyasyon Zırhlamasındaki Özellikleri ve Optimal Karışımlarının
Araştırılması (Doktora Tezi). Isparta: Süleyman Demirel
Üniversitesi Fen Bilimleri Enstitüsü.
[21] Kılınçarslan, Ş., Başyiğit, C. ve İskender Akkurt, İ., (2007). Barit Agregalı Ağır Betonların Radyasyon Zırhlama Amacıyla
Kullanımının Araştırılması. Gazi Üniv. Müh. Mim. Fak. Der. Cilt:
22, No: 2, ss:393-399.
[22] AFAD, (2019). İçsel ve Dışsal Radyasyondan Korunma. https://www.afad.gov.tr/tr/23729/Icsel-ve-Dissal-Radyasyondan-
Korunma Ait Tehdit Değerlendirmesinde Risk Analizi ve Yönetimi.
Güvenlik Bilimleri Dergisi, Kasım 2012, 1(1), 79-94.
[23] URL-4, (2019). Toksik Endüstriyel Kimyasallar. https://www.afad.gov.tr/tr/23671/Toksik-Endustriyel-Kimyasallar
[24] Mülayim, S. ve Diğ. (2019). Aktif Ol Radyoaktif Olma! tip.kocaeli.edu.tr/docs/todup/todup16-
17/C4aktifolradyoaktifolma.pptx
[25] Kaçar, A., (2006). Yapılarda Radyasyon Kalkanı Olarak Kullanılan Barit Agregalı Ağır Beton Elemanların Zırh Kalınlık
Hesaplarının Belirlenmesi (Yüksek Lisans Tezi). Isparta: SDÜ,
Fen Bilimleri Enstitüsü.
[26] Bulakbaşı, N., (2015). Radyolojide Zırhlama (Ders Notları: https://neu.edu.tr/wp-content/uploads/2015/11/Radyolojide-
Z%C4%B1rhlama-Nail-Bulakba%C5%9F%C4%B1.pdf). Yakın Doğu
Üniversitesi.
[27] URL-5, (2019). Tıbbi Radyoloji Laboratuvarlarının Tasarımında Dikkat Edilecek Hususlar ve Zırhlama Koşulları.

17
4th International Science Symposium (September 04-06, 2019),
Kiev-Ukraine (ISS2019), 1A4PB; pp:1-18.
https://docplayer.biz.tr/17227834-Tibbi-radyoloji-
laboratuvarlarinin-tasariminda-dikkat-edilecek-hususlar-ve-
zirhlama-kosullari-1-radyoloji-odasi-seciminde-dikkat-edilecek-
hususlar.html. (Erişim: 06.08.2019).
[28] Demirci, S., (2012). Nükleer Terörizm ve Tehdit Boyutlarına Yönelik Çıkarımlar. Ege Stratejik Araştırmalar Dergisi. Cilt: 3,
Sayı: 1, ss: 59-84.
[29] Piotrowski, T., Tefelski, D.B, Polański, A. ve Skubalski, J., (2012). Monte Carlo Simulations for Optimization of Neutron
Shielding Concrete. Central European Journal of Engineering.
2(2): 296-303. DOI: 10.2478/s13531-011-0063-0
[30] Yarar, Y., (1994). Kolemanitli Betonların Nötron Zırhlama Etkinliğinin ve Aktivitesinin İncelenmesi (Yüksek Lisans Tezi).
İstanbul: İstanbul Teknik Üniversitesi Nükleer Enerji Enstitüsü.
[31] Onur, S., (2002). Gama Radyasyonu Zırhlaması Amacıyla Farklı Betonların Değerlendirilmesi (Yüksek Lisans Tezi). İstanbul:
İstanbul Teknik Üniversitesi Nükleer Enerji Enstitüsü.
[32] Kan, Y-C., Pei, K-C. ve Chien, C-L., (2004). Strength and Fracture Toughness of Heavy Concrete with Various Iron Aggregate
Inclusions, Nuclear Engineering and Design, V.228, pp. 119-127.
[33] Sakr, K. ve El-Hakim, E., (2005). Effect of High Temperature or Fire on Heavyweight Concrete Properties, Cement and Concrete
Research, V.35, pp.590-596.
[34] Ekinci, C.E., (2019). Savunma ve Sığınma Yapılarında KBRN Tehditlerine Karşı Betonların Zırhlanması, Engineering Sciences
(NWSAENS), 14(3):119-153, DOI:10.12739/NWSA.2019.14.3.1A0437.
[35] Akkurt, İ., Başyiğit, C., Mavi, B., Günoğlu, K., Kılınçarslan, Ş., ve Akkaş, A., (2011). Ağır Agregaların Radyasyon Zırhlama
Özellikleri. e-Journal of New World Sciences Academy, Volume: 6,
Number: 4, Article Number: 1A0254.
[36] Kılınçarslan, Ş., Sancar, S. ve Uzun, İ., (2011). Barit Agregalı Ağır Betonların Betonarmede Kullanılabilirliği. 6th International
Advanced Technologies Symposium (IATS’11), 16-18 May 2011
[37] Binici, H., Küçükönder, A., Sevinç, A.H., Eken, M. ve Kara, M., (2013). Hafif ve Ağır Malzemelerin Isı, Ses ve Radyasyon Yalıtım
Özelliklerinin Araştırılması. Çukurova Üniversitesi Mühendislik
Mimarlık Fakültesi Dergisi, 28(2), 113-123.
[38] Yaltay, N., (2015). Kolemanit Katkılı Çimento İle Üretilen Pomza Agregalı Hafif Betonun Fiziksel Özelliklerinin Araştırılması
(Doktora Tezi). Elazığ: Fırat Üniversitesi Fen Bilimleri
Enstitüsü.
[39] Ünal, O., (1994). Isıl İşlem Uygulamasının Lifli Beton Özelliklerine Etkisi (Doktora Tezi), İstanbul: Teknik
Üniversitesi, Fen Bilimleri Enstitüsü, İstanbul.
[40] Küçük, B., (2000). Betonun Dayanım ve Durabilitesini Sağlayan Parametreler. Pamukkale Üni. Mühendislik Bilimleri Dergisi, 6
(1), 79-85.
[41] Erdoğan, T.Y., (1995). Betonu Oluşturan Malzemeler, Karışım ve Bakım Suları, Agregalar, Çimentolar. Ankara: ODTÜ
[42] Ekinci, C.E., (2016). Yapı. Ankara: Data Yayınları. [43] Oymael, S., (2018). Beton. İstanbul: Birsen Yayınevi. [44] Baradan, B., Yazıcı, H. ve Ün, H., (2010). Beton ve Betonarme
Yapılarda Kalıcılık (Durabilite). İstanbul: THBB Yayınları.
[45] Cilason, N. ve Aksoy, N., (2000). Beton Yapı Hasarları Onarım ve Korunması ve Sıcak İklimlerde Beton,
http://www.academia.edu/1534146/Beton_Yapi_Hasarlari_
Onarim_ve_Korunmasi_ve_ Sicak_Iklimlerde_Beton.

18
4th International Science Symposium (September 04-06, 2019),
Kiev-Ukraine (ISS2019), 1A4PB; pp:1-18.
[46] Baradan, B. ve Aydın, S., (2013). Betonun Durabilitesi (Dayanıklılık, Kalıcılık). Hazır Beton Dergisi, Sayı: 54 (Kasım-
Aralık), ss:54-68.
[47] Burhan, K., (2013). Betonda Durabilite (Lisans Tezi). Kırklareli: Kırklareli Üniversitesi Teknik Eğitim Fakültesi.
[48] Neville, A.M., (1981). Properties of Concrete, Longman Scientific and Technical, 3rd Edition.
[49] Çoşkun, A., (2010). Ağır Betonlarda Barit Agregasının Kullanımı ve Beton Özelliklerinin Araştırılması (Yüksek Lisans Tezi).
Afyonkarahisar: Afyonkocatepe Üniversitesi Fen Bilimleri
Enstitüsü.
[50] Kozak, M., (2013). Çelik Lifli Betonlar ve Kullanım Alanlarının Araştırılması. SDU Teknik Bilimler Dergisi, 3 (5), 26-35.
[51] Baradan, B., Yazıcı, H. ve Aydın, S., (2015). Beton (2.Baskı). İzmir: Dokuz Eylül Üniversitesi Mühendislik Fakültesi Yayınları.
[52] Akgün, Y., Durmuş, A. ve Durmuş, A., (?). Barit Agregasıyla Üretilen Ağır Bir Betonun Özelikleri.
http://www.imo.org.tr/resimler/ekutuphane/pdf/3173.pdf
[53] Alam, M.N., Mahi, M.M.H., Chowdhury, M.I., Kanal, M. ve Rahman, R., (2001). Attenuation Coefficients of Soils and Some Building
Materials in Energy Range 276-1332keV, Applied Radiation and
Isotopes, Vol. 54, pp.973-976.
[54] Akkurt, I., Başyiğit, C., Kılınçarslan, S. ve Mavi, B., (2003). The Shielding of γ-rays by Concretes Produced with Barite,
Progress in Nuclear Energy, Vol.46, pp.1-11.
[55] Topçu, İ.B., (2006). Beton Teknolojisi, Eskişehir: Eskişehir
Osmangazi Üniversitesi, Müh.‐Mim. Fak. [56] Tian, Y.L. et al., (2016). Recycled CRT Funnel Glass as Coarse
Aggregate and Fine Aggregate in the Radiation Protection
Concrete, Materials Science Forum, (847):437-444.
[57] Erkekoğlu, P. ve Koçer-Gümüşel, B., (2018). Kimyasal Savaş Ajanları: Tarihçeleri, Toksisiteleri, Saptanmaları ve Hazırlıklı
Olma. Hacettepe University Journal of the Faculty of Pharmacy,
Review Article, Volume: 38, Number: 1,pp: 24-38.
[58] İçemer, Ç., (2018). Radyasyona Karşı Ağır Beton. Hazır Beton Dergisi, Sayı: Eylül-Ekim, ss: 71-78.
[59] Saidani, K., Ajam, L. ve Ouezdou, M.B., (2015). Barite Powder as Sand Substitution in Concrete: Effect on Some Mechanical
Properties. Construction and Building Materials. 95(1):287-295.
https://doi.org/10.1016/j.conbuildmat.2015.07.140
[60] Özen, S., Sengül, C., Erenoğlu, T., Çolak, Ü., Reyhancan, İ.A. ve Taşdemir, M.A., (2015). Properties of Heavyweight Concrete
for Structural and Radiation Shielding Purposes. Arab J Sci Eng.
DOI 10.1007/s13369-015-1868-6.
[61] Pomaro, B., (2016). A Review on Radiation Damage in Concrete for Nuclear Facilities: From Experiments to Modeling. Modelling and
Simulation in Engineering, Volume: 2016, Article ID 4165746,
http://dx.doi.org/10.1155/2016/4165746.
[62] TS8030, (1990). TS 8030 İyonlayıcı Radyasyona Karşı Koruyucu
Zırhlar- 50 mm ve 100 mm Kalınlıktaki Duvar Yapımında Kullanılan
Kurşun Zırhlama Birimleri. Ankara: Türk Standartları Enstitüsü.
[63] TS12588, (2015). Kurşun ve Kurşun Alaşımları - İnşaat Amaçlı Haddelenmiş Kurşun Levha. Ankara: Türk Standartları Enstitüsü.
[64] URL-6, ICRP (2019). https://www.icrp.org. (Erişim, 14.08.2019) [65] URL-7, (2019). Tesla Grup. Kurşun Levha Üretimi.
http://kursunplaka.com/ (Erişim, 14.08.2019)
[66] URL-8, (2019). Parafin. www.adasumakine.com/css/ Parafin_urun_83.aspx (Erişim, 14.08.2019)

4th International Science Symposium Status: Proceeding Book
ISS2019 (September 4-6, 2019) ID : 2019.1A5PB
İhsan Kırık
Bingöl University, [email protected], Bingöl-Turkey
Edip Çetkin
Batman University, [email protected], Batman-Turkey
Musa Kılıç
Batman University, [email protected], Batman-Turkey
Zülküf Balalan
Bingöl University, [email protected], Bingöl-Turkey
INVESTIGATION OF MICROSTRUCTURAL PROPERTIES OF 5140 STEEL WITH 316
STAINLESS STEEL JOINED BY FRICTION STUD METHOD
ABSRACT
This study investigated the joinability of AISI 5140 heat treatable
steel and AISI 316 austenitic stainless steel joined by friction stud
welding. These steels have completely different properties, which is
widely used in industrial applications. Weldings was applied on steels
with the parameters of 1000, 1500 and 2000 rev/min turning speed and 8
and 10 sec friction time by milling machine. After the welding process,
hardness testing applied to determine hardness strength of welded
samples. Additionally, in order to determine the microstructural
features, research using the optical microscope, scanning electron
microscope (SEM) with Energy-dispersive Xray spectroscopy (EDS) analysis
tests were done. It was in the evaluation of information derived from
the results, AISI 316 and AISI 5140 steels which was joined by friction
stud without any problem.
Keywords: FSW, Hardness, Microstructure, AISI 5140, AISI 316
1. INTRODUCTION
Austenitic steels are non-magnetic stainless steels that contain
high levels of chromium and nickel and low levels of carbon. They are
the most widely used grade of stainless steel in many industries because
of their features such as formability, weldability, resistance to
corrosion and their good mechanical properties. Type 316 steel is an
austenitic Cr-Ni stainless steel that contains between two and three
percent Mo. the molybdenum content increases corrosion-resistance,
improves resistance to pitting in chloride ion solutions, and increases
strength at high temperatures. Common uses for type 316 stainless steel
include in the construction of exhaust manifolds, furnace parts, heat
exchangers, jet engine parts, pharmaceutical and photographic equipment,
valve and pump parts, chemical processing equipment, tanks, and
evaporators [1]. The weldability of austenitic stainless steel has been
considered to weld able but when welded they are subjected to a number
of problems such as liquation cracking, weld solidification and more
other problem may occur if some proper precaution not taken [2]. Despite
the good corrosion resistant of austenitic stainless steel, the localized
form of corrosion may occur in the heat affected zone and around the
weld zone when dissimilar materials have been welded by fusion welds
[3]. On the over hand, the solid-state welding techniques, such as
friction stud welding(FSW)process a weld between work piece and stud
under compressive force and plastically displaces material from faying
surfaces. The principle of this technique is transformation of mechanical
energy into heat energy, and besides HAZ is small and no defect of slag
inclusion [4] FSW should be applied to acquire the sound joints of the

20
4th International Science Symposium (September 04-06, 2019),
Kiev-Ukraine (ISS2019), 1A4PB; pp:19-24.
dissimilar metals in which there are non-consumable requirement, low
shrinkage, low distortion and excellent mechanical properties [5 and 6].
2. RESEARCH SIGNIFICANCE
The joining of AISI 5140 heat treatable steel and AISI 316
austenitic stainless steel is of very interest, because result of join
different but favorable properties of each component, namely, the high
corrosion resistant and strength at high temperature of AISI316, and the
wear resistant and high toughness of AISI 5140.
3. MATERIALS AND METHOD
3.1. Materials
For this study two materials were selected with different
properties, and besides AISI 316 stainless steel plate (10x50x50mm) studs
and AISI 5140 steel rod (20mm) were joined with the friction stud welding
method. Composition of materials used in this study were given in Table
1.
Table 1. Chemical compositions of the materials used in this study
Material Elements of Composition
%C %Cr %Si %Mn %P %S %Mo %Ni %Fe
AISI 316 0.008 16-18 1.0 2.0 0.045 0.03 2-3 10-14 Balance
AISI 5140 0.41 0.8 0.22 0.8 0.035 0.04 - - Balance
3.2. Friction Stud Welding
The samples of the test were machined for FSW as seen in figure 1
and surface of the samples cleaned and welding was carried out in a
milling machine using the process parameters given in Table 2. During
the welding, upset pressure kept constant 50MPa and while rotation speed
was 1750rpm and 2000rpm.
3.3. Microstructure Examination
The microstructures of friction stud welded interfaces were
analyzed by scanning electron microscopy (SEM) and Energy Dispersive
Spectrometry (EDS). For SEM inspections, cross-sectional interface of
AISI 316/AISI 5140 friction stud welded joints was grounded with using
adhesive SiC paper. For examine the microstructural changes in the weld
region, traditional cleaning and polishing method was utilized.
3.4. Microhardness Examination
The microhardness measurements of the friction stud welded of AISI
316/AISI 5140 couple, were performed from the base metal to the weld
center with intervals of 0.5mm and using the HV hardness scale under a
load of 100g.
4. RESULTS AND DISCUSSION
4.1. Macrostructure Examination
Macro images of FSW joints are illustrated in figure 1. It can be
seen that qualified and smooth joints is obtained. Moreover, depend on
increasing of the rotation speed, the AISI 5140 steel increasingly
flanges into the AISI 316 stainless steel surface and AISI 5140 gets
shorter.

21
4th International Science Symposium (September 04-06, 2019),
Kiev-Ukraine (ISS2019), 1A4PB; pp:19-24.
Figure 1. Macrograph of friction stud welded joints
4.2. Microstructure Results
Figure 2 illustrates micro appearance of friction stud welded joint
of specimen S2. As it is seen, the flash increases with rotation speed.
When, the friction stud welding of dissimilar materials the axial
shorting of materials and the degree of flash were depending on
mechanical properties of two used materials. Between the two parts there
is a region surrounding the partial joining region which cannot be
ejected. When rotation speed increase post-welding axial shortening
increases. Figure 3 and 4 are showed typical microstructure of joined
across the interface. The zones of across the interface could be
identified as parent materials (PM), deformed zone (DZ), fully
plasticized deformed zone (FPDZ) [10, 11 and 21]. During the friction
stud welding process, the temperature at the interface was measured
using an Extech VIR50 dual laser detector and the temperature values at
the interface of the joints are 1245-1350oC.
Flange Material
The Region Between two part (A+B)
B
A
Figure 2. Micro-photo of sample used for microstructure examinations

22
4th International Science Symposium (September 04-06, 2019),
Kiev-Ukraine (ISS2019), 1A4PB; pp:19-24.
Ful
ly P
last
iciz
ed D
efo
rmed
Zo
ne
Def
orm
ed Z
one
Def
orm
ed Z
one
AIS
I 31
6
AIS
I 51
40
Ful
ly P
last
iciz
ed D
efo
rmed
Zo
ne
Def
orm
ed Z
one
Def
orm
ed Z
one
AIS
I 31
6
AIS
I 51
40
Figure 3. SEM micrograph taken from the welding interface of specimen
S1 and S3, respectively
4.3. Hardness Test Results
In this study, the microhardness distribution of friction stud
welded joints varies in three regions in accordance with the literature.
These regions are called deformed regions, fully deformed regions and
base materials. The hardness distribution increases in DZ and FDZ close
to the source interface, and then decreases to the original metal
hardness value. The presence of a band showing deformation hardening due
to thermo-mechanical effect on the AISI 316 austenitic stainless-steel
side of was determined in the interface microstructure analysis of these
welded joints. Similarly, the region adjacent to the junction interface
on both side, which hardened as a result of thermo-mechanical effect
that was determined in the SEM analysis photographs. The obtained
hardness values are in parallel with the structural changes occurring
at the joint interface of welded joints. The highest microhardness value
was recorded as 535 Hv in the fully deformed region. As is evident from
the results, an increase in stiffness at the joint interface was recorded
due to increase of rotation speed. When a comparison is made between the
hardness values obtained from all these samples, it is seen that the
speed has a significant effect on the hardness values reached at the
interface. It was also observed that the hardness increased in the
interface of FSW. The main reason for this can be attributed to the fact
that the AISI5140 steel ability to deform plastic becomes less viscous
as required to remove material from the interface.
Figure 4. The results of hardness
-6 -4 -2 0 2 4 6
150
200
250
300
350
400
450
500
Distance from weld center (mm)
Mic
rohard
ness (
HV
)
FPDZ
S1
S2
S3
S4

23
4th International Science Symposium (September 04-06, 2019),
Kiev-Ukraine (ISS2019), 1A4PB; pp:19-24.
4.4. EDX Analysis
In order to detection of phases hot occur during friction stud
welding process SEM and EDX analysis were done. Table 2 were presented
element and elemental concentration of joint zone. From the EDX analysis
Fe, Cr, W, C and Ni elements were identified in the interface of the
joint interface as seen EDS point in Figure 2. Changes in the
concentration of these elements indicate that diffusion and thermo-
mechanical stir are main reason of this phenomenon. Moreover, existence
of C, W and Cr elements will cause formation of carbides such as WC, CrC
and Cr7C3 and this is due to the increase in hardness.
Table 2. EDX analysis point results from SEM microstructure
Elt. Line Intensity (c/s) Error 2-sig Conc Units 1
B Ka 0.00 1.649 0.000 wt.%
C Ka 127.31 8.120 23.038 wt.%
Ne Ka 14.66 4.130 1.780 wt.%
S Ka 33.72 6.402 0.867 wt.%
Cr Ka 408.00 13.539 12.680 wt.%
Fe Ka 1,090.87 21.211 53.997 wt.%
Ni Ka 95.72 7.090 6.847 wt.%
W La 1.79 3.058 0.791 wt.%
100.000 wt.% Total
Elt. Line Intensity (c/s) Error 2-sig Conc Units 2
B Ka 0.00 1.496 0.000 wt.%
C Ka 5.36 3.222 1.569 wt.%
Ne Ka 16.09 4.014 2.931 wt.%
S Ka 29.43 5.953 1.078 wt.%
Cr Ka 387.59 13.073 15.945 wt.%
Fe Ka 1,029.09 20.642 67.843 wt.%
Ni Ka 95.04 6.888 9.164 wt.%
W La 2.49 2.904 1.470 wt.%
100.000 wt.% Total
Elt. Line Intensity (c/s) Error 2-sig Conc Units 3
B Ka 0.00 1.720 0.000 wt.%
C Ka 98.33 7.197 22.524 wt.%
Ne Ka 0.00 2.993 0.000 wt.%
S Ka 2.09 4.457 0.070 wt.%
Cr Ka 36.74 5.197 1.051 wt.%
Fe Ka 1,177.79 21.980 74.173 wt.%
Ni Ka 4.35 3.108 0.407 wt.%
W La 3.11 2.491 1.775 wt.%
100.000 wt.% Total
5. CONCLUSIONS
In this research, Austenitic stainless steel and alloy steel has
been joined using friction stud welding. Below results was concluded:
The macrostructure study showed one-sided symmetrical flange
formation of joint and with increases in rotation speed flange
Austenitic stainless steel and alloy steel was seamlessly joined
using FSW without any defects.
Three different zone identified in microstructure examination of
friction stud welding namely parent material, deformed zone, fully
plasticized deformed zone.
The highest microhardness value was recorded as 535 Hv in the fully
deformed region due to dynamic recrystallization of the joint
interface.

24
4th International Science Symposium (September 04-06, 2019),
Kiev-Ukraine (ISS2019), 1A4PB; pp:19-24.
REFERENCES
[1] https://www.thebalance.com/metal-profile-austenitic-stainless
2340126.
[2] Brooks, J.A. and Lippold J.C., (1993). Selection of Wrought
Austenitic Stainless Steels, ASM Metal Handbooks Vol:6,
Materials Park, Ohio, USA (1993), pp:456-469.
[3] Lippold, J.C. and Kotechi, D.J., (2005). Welding Metallurgy and
Weldability of Stainless Steels, Wiley-Interscience, USA.
[4] Hynes, N.R.J. Nagaraj, P., and Sujana, J.A.J., (2014).
Ultrasonic Evaluation of Friction Stud Welded AA 6063/AISI 1030
Steel Joints. Materials & Design, Volume:62, pp:118-123.
[5] Wilson, J., (1978). The development of Welding Techniques for
British Fighting Vehicles. In: The Welding inst. proc. Trends in
Steels and Consumables for Welding Int. conf., p:473–9.
[6] Çelik, S. and Ersözlü, I., (2009). Investigation of the
Mechanical Properties and Microstructure of Friction Welded
Joints Between AISI 4140 and 1050 Steals. Mater Des; 30:970–6.
[7] Batı, S., Kılıç, M., and Kırık, İ., (2016). Friction Welding of
Dissimilar AISI 304 and AISI 8640 Steels, Vol:6, Number:2,
European Journal of Technic,79-86.
[8] Kırık, I. and Ozdemir N., (2005). Weldability and Joining
Characteristics of AISI 420/AISI 1020 Steels Using Friction
Welding Mater. Lett. 59, 2504–2509. DOI:10.1016/j. matlet.,034.
[9] Kırık, I. Özdemir, N., and Teker T., (2012). International Iron
& Steel Symposium, Vol:2, Karabuk, Turkey, 826–831.
[10] Ishibashi, A., Ezoe, S., and Tanaka, S., (1983). Bulletin of the JSME, 26(216):1080. DOI:10.1299/jsme1958.26.1080.
[11] Hynes, N.R.J., Nagaraj, P.A., and Sujana, J.A.J., (2014). Ultrasonic Evaluation of Friction Stud Welded AA 6063/AISI 1030
Steel Joints, Materials & Design, 62:118-123.
[12] Hynes, N.R.J., (2017). Joining of Hybrid AA6063-6SiCp-3Grp Composite and AISI 1030 Steel by Friction Welding, Defense
Technology, 13:338-345.
[13] Hynes, N.R.J. and Velu, P.S., (2018). Effect of rotational speed on Ti-6Al-4V-AA 6061 friction welded joints, Journal of
Manufacturing Processes 32, 2018, 288-297.

4th International Science Symposium Status: Proceeding Book
ISS2019 (September 4-6, 2019) ID : 2019.1A6PB
Zeynel Abidin Sarı
Iskenderun Technical University, [email protected],
Hatay-Turkey
M. Deniz Turan
Hasan Nizamoğlu
Aslıhan Demiraslan
Fırat University, Elazığ-Turkey
LEACHING OF METALS IN PRESENCE OF AMMONIA SOLUTION FROM PRIMARY
LEACHING RESIDUE WITH COPPER OXALATE
ABSTRACT
In this study, selective copper recovery from thermal
decomposed leach residue was investigated in presence of ammonia
solution. The leach residue was obtained that oxalated structure
exhibits by leaching the chalcopyrite concentrate in the presence of
oxalic acid and hydrogen peroxide. Optimum leaching conditions were found
to be as follows: Decomposition temperature: 400ºC; Ammonia
concentration: 9M; Leaching temperature: 45ºC; Leaching time: 120
min; Liquid/solid ratio: 25mL/g; Stirring speed: 400rpm. Under these
conditions, it was determined that the copper extraction value was 90%
and iron did not pass into the solution at all.
Keywords: Copper Oxalate, Ammonia Solution, Leaching,
Thermal Decomposition
1. INTRODUCTION
Hydrometallurgical processing of chalcopyrite to produce copper
remains challenging because of its inertness in aqueous systems,
particularly at room temperature and atmospheric pressure (Tanta et al.,
2019:118). Due to this inertness and its global abundance, chalcopyrite
is one of the most extensively investigated copper minerals (Watling,
2013:163). In order to accelerate the dissolution of chalcopyrite,
various leaching methods have been proposed from laboratory studies. The
leaching of chalcopyrite has been studied using nitric acid, sulfuric
acid, ferric chloride, ferric sulfate, oxygen, ozone, hydrogen peroxide
cyanide and ammonia (Sanchez and Lapidus., 2017:192). Among the less
toxic oxidants, hydrogen peroxide has received the most attention. Since
it satisfies the oxidation potential criterion (E°=1.77) and has been
successful in the oxidation of other refractory sulfides, such
as sphalerite (ZnS) and pyrite (FeS2)( Antonijević et al., 2004:329).
However, hydrogen peroxide is an unstable compound, whose decomposition
can be catalyzed by certain factors such as the presence of an acid,
base, mineral surface or soluble ion. The authors aimed to find
alternative chemicals suitable for copper leaching from chalcopyrite.
Oxalic acid was used as a chemical lixiviant to investigate the
efficiency of copper extraction from chalcopyrite. Due to chealitng
feature of oxalic acid, it hinders to iron precipitation by composing
soluble complex anions in range wide of pH. Oxalic acid is a common
organic acid and it dissolves easily in warm water. It is also widely
used as metal precipitant (Sun and Qiu., 2012:1575). Oxalate ion, which
has bidentate ligand, can react with metal ions such as Cu(II) and Zn(II)

26
4th International Science Symposium (September 04-06, 2019),
Kiev-Ukraine (ISS2019), 1A4PB; pp:25-329.
ions to form a square planar four coordinate complex as follows. Reaction
of aqueous oxalic acid with copper ion results in the formation of
aqueous copper oxalate (Cu(C2O4)22-) and then copper oxalate (CuC2O4)
precipitates. Leaching process of copper containing samples with the
aqueous solution of oxalic acid results low copper dissolution.
Because, the complex is scarcely soluble in water (Humar et al.,
2004:463). In this study, selective removal of iron from chalcopyrite
concentrate and selective copper recovery in presence of ammonia
solution from thermal decomposed leach residue was investigated.
2. MATERIAL AND METHODS
Leach residue was used in this study to investigate the selective
recovery of copper by thermal activation in the presence of ammonia
solution. The leach residue was obtained that oxalated structure
exhibits by leaching the chalcopyrite concentrate in the presence of
oxalic acid and hydrogen peroxide. Chemical analyses of leach residue
were carried out by ICP OES in clear supernatant that was obtained by
the microwave assisted dissolution technique. Results of the chemical
analyses are shown in Table 1. Mineralogical analysis of the leach
residue was performed using an X-ray diffraction system. Mineralogical
characteristics showed that the leach residue is mainly composed of
copper oxalate (C2CuO4) and chalcopyrite (CuFeS2) (Figure 1). Thermal
decomposition process of copper oxalate was carried out in the ash
furnace. The sample was weighed 8g and placed in the oven with a porcelain
crucible. Then thermal activation was performed. At the end of the
thermal decomposition time the sample was taken to the desiccator and
cooled to room temperature. After that, structure obtained by thermal
decomposition of leach residue was leached in presence ammonia solution.
Leaching experiments were carried out in 0.3 L flasks with a condenser,
placed on a magnetic multi stirrer equipped with a circulatory water
bath. At the end of the leaching process, the clear and pregnant
solutions were analyzed for copper and iron by a atomic absorption
spectrophotometer (AAS).
Table 1. Chemical constitute of leach residue
Element Cu Fe S Zn Mg Ca Al
% 29.3 9.7 13.29 0.08 0.22 0.02 0.16
Figure 1. XRD pattern of chalcopyrite concentrate(1) and leach
residue(2)

27
4th International Science Symposium (September 04-06, 2019),
Kiev-Ukraine (ISS2019), 1A4PB; pp:25-329.
3. RESULTS AND DISCUSSION
Thermal decomposition of metal oxalates has been the subject of
many researchers for more than a century. According to earlier reports
the thermal decomposition of copper oxalate is taking place through
various pathways, of which the three main competing reactions are (Sarada
et al., 2016):
CuC2O4(s):
a→ Cu(s)+2CO2(g)
b→ (½)Cu2O(s)+(½)CO(g)+½CO2(g)
c→ CuO(s)+CO(g)+CO2(g)
Decomposition of copper oxalate results in the formation of
metallic copper or copper oxide (CuO/Cu2O) by evolution of CO2/CO at the
end of the thermal decomposition process. But, in this study due to
elemental sulfur was observed formation of copper sulphate at the end
of thermal activation. In this study, firstly, the effect of thermal
decomposition temperature and the effect of ammonia concentration on the
result were examined. As shown in Figure 2, with increasing thermal
decomposition temperature increases in the amount of copper extracted.
In the leaching experiments performed as a result of thermal activation
at 200°C, it is understood that the amount of copper extracted does not
exceed 2% despite the increased ammonia amount.
In leaching of the samples obtained as a result of thermal
decomposition temperature of 300°C, it is seen that the amount of copper
transferred to the solution is around 65%. In leaching experiments
performed with 1 M NH3 concentration in thermal activation at 400°C, 30%
of copper was extracted. On the other hand, in leaching experiments
performed with 9 M NH3 concentration, it was understood that copper
extraction value increased up to 90%. As shown in Figure 3, the effect
of thermal decomposition time at 400°C on the result is seen.
Accordingly, it is seen that metal extraction value increases with
increasing decomposition time and after 60 min decomposition time,
extraction values do not change much. On the other hand, as expected in
all of this group of studies, it is seen that iron does not pass into
the solution at all. It is thought that the iron ions precipitate in the
form of hydroxide and/or oxide due to the high final pH (pH>10) of the
ammonia solution used in leaching studies. Whereas, copper ions are
transferred to the solution with the formation of various amine complexes

28
4th International Science Symposium (September 04-06, 2019),
Kiev-Ukraine (ISS2019), 1A4PB; pp:25-329.
(a) (b)
(c)
Figure 2. The effect of different ammonia concentration on the
extraction of metals by thermal decomposition at different
temperatures of leach residue, a) 200ºC, b) 300ºC, c) 400ºC (Thermal
decomposition time: 60 min; NH3 concentration: 1-9M; Leaching
temperature: 45ºC; Leaching time: 120 min; Liquid/solid ratio: 25mL/g;
Stirring speed: 400rpm)
Figure 3. The effect of different thermal decomposition time on the
extraction of metals from leach residue (Decomposition temperature:
400ºC; NH3 concentration: 9M; Leaching temperature: 45ºC; Leaching
time: 120 min; Liquid/solid ratio: 25mL/g; Stirring speed: 400rpm)

29
4th International Science Symposium (September 04-06, 2019),
Kiev-Ukraine (ISS2019), 1A4PB; pp:25-329.
4. CONCLUSION
In this study, selective copper recovery from thermal
decomposed leach residue was investigated in presence of ammonia
solution. The leach residue was obtained that oxalated structure
exhibits by leaching the chalcopyrite concentrate in the presence of
oxalic acid and hydrogen peroxide. Leach residue were characterized. The
effects of various leaching variables on metal extraction were studied.
Optimum leaching conditions were found to be as follows: Decomposition
temperature: 400ºC; Ammonia concentration: 9M; Leaching temperature:
45ºC; Leaching time: 120 min; Liquid/solid ratio: 25mL/g; Stirring
speed: 400rpm. Under these conditions, it was determined that the copper
extraction value was 90% and iron did not pass into the solution at all.
ACKNOWLEDGMENTS
The authors would like to acknowledge the TÜBİTAK (The Scientific
and Technological Research Council of Turkey) under project no 315M006,
and Research Foundation of Fırat University under project no FUBAP-
MF.15.25 for supporting the study.
REFERENCES
[1] Antonijević, M.M., Janković, Z.D., and Dimitrijević, M.D.,
(2004). Kinetics of Chalcopyrite Dissolution by Hydrogen
Peroxide in Sulphuric Acid, Hydrometallurgy. 71(3):329-334.
[2] Humar, M., Pohleven, F., and Sentjurc, M., (2004). Effect of
Oxalic, Acedic And Ammonia on Leaching of Cr and Cu from
Preserved Wood. Wood Sci Technol. 37, 463-473.
[3] Sanchez, A.R. and Lapidus, G.T., (2017). Study of Chalcopyrite
Leaching from a Copper Concentrate with Hydrogen Peroxide in
Aqueous Ethylene Glycol Media. Hydrometallurgy. 169, 192-200.
[4] Sarada, K., Vijisha, K.R., and Muraleedharan, K., (2016).
Exploration of the Thermal Decomposition of Oxalates of Copper
and Silver by Experimental and Computational Methods. Journal of
Analytical and Applied Pyrolysis. 120, 207–214.
[5] Sun, L. and Qiu, K., (2012). Organic Oxalate as Leachant and
Precipitant for the Recovery of Valuable Metals from Spent
Lithium-Ion Batteries. Waste Management. 32, 1575–1582.
[6] Tanda, B.C., Eksteen, J.J., Orabya, E.A., and O'Connor, G.M.,
(2019). The Kinetics of Chalcopyrite Leaching in Alkaline
Glycine/glycinate Solutions. Minerals Engineering. 135, 118–128.
[7] Watling, H.R., (2013). Chalcopyrite Hydrometallurgy at
Atmospheric Pressure: 1. Review of acidic sulfate, sulfate-
chloride and sulfate-nitrate process options. Hydrometallurgy.
140, 163–180.

4th International Science Symposium Status: Proceeding Book
ISS2019 (September 4-6, 2019) ID : 2019.1A9PB
Hasan Nizamoğlu
M. Deniz Turan
Aslıhan Demiraslan
Fırat University, Elazığ-Turkey
Z. Abidin Sarı
Iskenderun Technical University, [email protected],
Hatay-Turkey
RECOVERY OF ZINC BY ELECTROLYSIS IN ZINC SULFATE SOLUTION
ABSTRACT
In this study, the recovery of metallic zinc by electrolysis
from the zinc sulphate solution obtained by leaching of simitsonite
ore in the presence of sulfuric acid was investigated. According to
the results obtained at the end of leaching process, zinc and iron
extractions which are transferred to solution are given 92.83 % and 3.83
% respectively. The aim of this study was to investigate the effects of
electrolysis conditions such as temperature, time on metallic zinc
production. Under optimum conditions, it was determined that the metallic
zinc coating efficiency on the cathode surface was determined as 97%.
Xrd analysis of cathode metal indicated that pure zinc metal was
obtained.
Keywords: Zinc, Electrowinning, Zinc Sulfate, Leaching
1. INTRODUCTION
Zinc is one of the most important metallic elements in the world
and is mainly used on the surface of other metals to prevent oxidation;
it is also used to make zinc compounds and brass. Due to its low cost
and abundance, zinc is widely used in the production of galvanized steel,
sacrifice anodes and primary and secondary batteries. Currently, zinc
is the fourth most widely consumed metal, after iron, aluminum and copper
(Abkhoshk, 2014:153; Ma, 2011:134).
Pyrometallurgical and hydrometallurgical routes or their
combination can be employed for treating secondary materials. The
hydrometallurgical processes are regarded as eco-friendlier for treating
such materials having a low zinc content (Turan, 2004:169; Jha, 2001:1).
Approximately 90% of the world's zinc production utilizes
hydrometallurgical processing methods, which provide important technical
and economic advantages. Electrolytic recovery of zinc is one of the
oldest industrial processes, whose importance lies in the great worldwide
demand for this metal that currently reaches an overall production of 9
million tonnes per year. However, even though the electrolytic
processing of zinc has been in practice for many years, there still
exist current efficiency problems in the cathodic process. These low
efficiencies (88–93%) have a serious impact on the costs associated with
energy consumption (Rec endiz, 2007:6880). Due to the nature of the
electrochemical reactions, Zn electrowinning is an energy-intensive
process that consumes a large amount of energy, hence increasing current
efficiency and reducing energy consumption become one of the most
important objectives of the operation. In this study, the recovery of
metallic zinc by electrolysis from the zinc sulphate solution

32
4th International Science Symposium (September 04-06, 2019),
Kiev-Ukraine (ISS2019), 1A9PB; pp:30-36.
obtained by leaching of simitsonite ore in the presence of sulfuric
acid was investigated. In for this purpose, optimum electrowinning
conditions for metallic zinc recovery were determined.
2. RESEARCH SIGNIFICANCE
Zinc is one of the most important metallic elements in the world
and is mainly used on the surface of other metals to prevent oxidation;
it is also used to make zinc compounds and brass. Due to its low cost and abundance, zinc is widely used in the production of galvanized steel,
sacrifice anodes and primary and secondary batteries. Currently, zinc
is the fourth most widely consumed metal, after iron, aluminum and copper
(Abkhoshk, 2014:153; Ma, 2011:134). Pyrometallurgical and
hydrometallurgical routes or their combination can be employed for
treating secondary materials. The hydrometallurgical processes are
regarded as more eco-friendly for treating such materials having a low
zinc content (Turan, 2004:169; Jha, 2001:1). Approximately 90% of the
world's zinc production utilizes hydrometallurgical processing methods,
which provide important technical and economic advantages.
3. MATERIAL AND METHODS
Zinc sulphate solution was used in this study to investigate the
production metallic zinc by using electrolysis method. Zinc sulfate
solution was obtained by leaching simitsonite (ZnCO3) ore in sulfuric
acid medium. Simitsonite ore was provided Elazığ, Turkey. After leaching,
impurities in solution such as iron, arsenic and antimony was
precipitated through neutralization of lime water. Metallic zinc was
produced by electrowinning of zinc sulphate solution after adjusting the
pH value 4. Chemical analyses of simitsonite ore were carried out by
ICP-OES. Results of the chemical analyses are shown in Table 2.
Mineralogical analysis of the metallic zinc obtained by electrowinning
was performed using an X-ray diffraction system. Metallic zinc recovery
was investigated using a moving anode-cathode in a vertical plane in a
bench electroplated zinc electrolytic cell. As anode and cathode plate
for electrowinning were used lead and aluminum, respectively.
Electrolysis experiments were carried out in 0.4 L flasks with a
condenser, placed on a magnetic multi stirrer equipped with a circulatory
water bath. Metal analysis of initial and final leaching solution was
performed by an atomic absorption spectrophotometer(AAS). In all
electrowinning experiments, temperature and time were conducted. The
amount of zinc present in the first and last solution is shown below
(Table 1).
Table 1. Zinc values in different circumstances
Process steps %Value Amount of Zinc
Initial Zinc Content 100% 50.18 g/L zinc
Zinc Extract Obtained İn Leaching Process 92.83% 46.58 g/L zinc
Amount of Zinc Recovered After Electrolysis 97% 1.40 g/L zinc
Table 2. Chemical composition of simitsonite ore
Element Zn Pb Fe Mg Ti Ca Al
% 25.09 13.93 0.40 3.31 0.001 6.84 0.08
Table 3 shows the parameters that are kept constant during the
electrolysis process.

33
4th International Science Symposium (September 04-06, 2019),
Kiev-Ukraine (ISS2019), 1A9PB; pp:30-36.
Table 3. Electrolysis conditions
Conditions Values
Anode Surface Area (Lead)cm2 22.5
Cathode Surface Area (Aluminum)cm2 15
Anode-Cathode Distance (mm) 50
Voltage(V) 5-5.5
Current (A) 1-1.2
Stirring Rate (rpm) 600
4. RESULTS AND DISCUSSION
Zinc is one of the most commonly used metals. In our country, there
is no facility in the current situation regarding the production of
zinc. A number of researchers have conducted studies on zinc production.
Reactions that occur in the recovery of metallic zinc using electrolysis
method in zinc sulfate solution are given below. Several important
electrode reactions are involved in the Zn electrowinning process,
including the reduction of Zn ions and the side reaction of hydrogen
evolution on the cathode as well as the decomposition of water at the
anode
Anode
(SO4)2- + H+(OH)- → H2SO4 + 1/2O2 + 2e- -1.229 V (1)
Cathode
Zn2+ + 2e- → Zn°-0.763 V (2)
Cell Reaction
ZnSO4 + H2O →H2SO4 + 1/2O2 + Zn° -1.992 V (3)
In this study, firstly, the effect of electrolysis temperature and
time on the result was investigated. As shown in Figure 1, amount of
zinc coating increased on the cathode surface with increasing of
electrolysis time. After 7 hours of electrolysis time, it was observed
that by 97% efficiency zinc coated on the cathode surface. In the normal
electrolysis conditions, temperature is very effective parameter.
Nevertheless, in this study, it was determined that coating efficiency
decreased after 5 hours’ electrolysis at all temperatures (35-55°C). As
shown in Figure 2-4, zinc coating increased on the cathode surface with
increased electrolysis temperature until 55°C. At the end of 5 hours at
temperature range of 35-55°C, the amount of zinc coated on the cathode
surface was seen to be 94-96% approximately. However, it was observed
that coating production decreased with increased electrolysis time. This
decreasing of zinc coating can be attributed to stirring of electrolysis
solution, so that coated zinc particles on the cathode dissolute to
leaching solution with effect of high temperature. The effect of other
parameters is kept constant which they will be examined in the scope of
the study. Mineralogical analysis of the metallic zinc obtained by
electrowinning was performed using an X-ray diffraction system.
Mineralogical characteristics showed that the cathode product obtained
by electrowinning is mainly metallic zinc (Figure 5).

34
4th International Science Symposium (September 04-06, 2019),
Kiev-Ukraine (ISS2019), 1A9PB; pp:30-36.
Figure 1. The effect of electrolysis time on the production of
metallic zinc from zinc sulfate solution (Solution temperature:25ºC)
Figure 2. The effect of electrolysis time on the production of
metallic zinc from zinc sulfate solution (Solution temperature:35ºC)
Figure 3. The effect of electrolysis time on the production of
metallic zinc from zinc sulfate solution (Solution temperature:45ºC)
0
20
40
60
80
100
0 1 2 3 4 5 6 7 8
Electrolysis efficiency
(%)
Time (h)
0
20
40
60
80
100
0 1 2 3 4 5 6 7 8Electrolysis efficiency
(%)
Time (h)
0
20
40
60
80
100
0 1 2 3 4 5 6 7 8
Electrolysis efficiency
(%)
Time (h)

35
4th International Science Symposium (September 04-06, 2019),
Kiev-Ukraine (ISS2019), 1A9PB; pp:30-36.
Figure 4. The effect of electrolysis time on the production of
metallic zinc from zinc sulfate solution (Solution temperature:55ºC)
Figure 5. XRD pattern of metallic zinc
5. CONCLUSION
In this study, the recovery of metallic zinc by electrolysis
from the zinc sulphate solution obtained by leaching of simitsonite
ore in the presence of sulfuric acid was investigated. the effects of
electrolysis conditions on metallic zinc production were studied.
optimum electrolysis conditions were found to be as follows:
electrolysis temperature: 25℃; electrolysis time: 7 h; stirring
speed: 600 rpm, anode surface area: 22.5cm2; cathode surface area 15cm2;
voltage: 5-5.5V; current: 1-1.2A and anode-cathode distance: 50mm. Under
these conditions, metallic zinc recovery efficiency from leaching
solution was determined as 97%.
REFERENCES
[1] Abkhoshk, E., Jorjani, E., Al-Harahsheh, M.S., Rashchi, F., and
Naazeri, M., (2014). Review of the Hydrometallurgical Processing
of Non-Sulfide Zinc Ores. Hydrometallurgy, 149:153-167.
[2] Jha, M.K., Kumar, V., and Singh, R.J., (2001). Review of the
Hydro-Metallurgical Recovery of Zinc from Industrial Wastes,
Resources, Concervation and Recycling, 33(1):1–22.
0
20
40
60
80
100
0 1 2 3 4 5 6 7 8Electrolysis efficiency
(%)
Time (h)

36
4th International Science Symposium (September 04-06, 2019),
Kiev-Ukraine (ISS2019), 1A9PB; pp:30-36.
[3] Ma, H.W., Matsubae, K., Nakajima, K., Tsai, M.S., Shao K.H.,
Chen, P.C., Lee, C.H., and Nagasaka, T., (2011). Substance Flow
Analysis of Zinc Cycle and Current Status of Electric Arc
Furnace Dust Management for Zinc Recovery in Taiwan. Resources,
Concervation and Recycling, 56(1):134-140.
[4] Recendiz, A., Gonzalez, I., and Nava, J., (2007). Current
Efficiency Studies of the Zinc Electrowinning Process on
Aluminum Rotating Cylinder Electrode (RCE) in Sulfuric Acid
Medium: Influence of Different Additives. Electrochimica Acta,
52:6880–6887.
[5] Turan, M.D., Altundog an, H.S., and Tümen, F., (2004). Recovery
of Zinc and Lead from Zinc Plant Residue, Hydrometallurgy, 75:169–
176.

International Science Symposiumth 4 Status: Proceeding Book
ISS2019 (September 4-6, 2019) ID : 2019.1A15PB
Latif Onur Uğur
Düzce University, [email protected], Düzce-Turkey
Yıldız Sarar
Fibrobeton Building Elements San. and Construction Inc.,
[email protected], Düzce-Turkey
Molham Fataloun
Düzce University, Düzce-Turkey
İNŞAAT PROJELERİNDE MALİYET, SÜRE VE RİSKİN BİRLİKTE ELE ALINDIĞI
SİMÜLASYONA DAYALI BİR RİSK YÖNETİM MODELİ
ÖZ
Bu çalışmada inşaat projelerinde ana kaynak ve verimlilik
unsurlarından olan süre, maliyet ve kalitenin, risk yönetimi ile
optimizasyonu için bir model oluşturulmuştur. Bu model, Monte Carlo
Benzetimi ile bir üstyapı projesinin kaba inşaatına uygulanmıştır.
Modelin kurulumu, analizi ve risk kayıtları; bir ticari yazılım ile
sağlanmıştır. Çalışma sonucunda edinilen bulguların bazıları şöyledir;
Riskler dâhil edilmeden hesaplanan proje maliyeti 309.941,61TL, yapılan
benzetim sonucu %80 güven aralığında risklerin dâhil edilmesi ile
342.800,73 TL olmuş, tepki uygulandığında bu rakam 336.285,70 TL’ye
düşmüştür. Riskler dâhil edilmeden hesaplanan proje süresi 92 gün iken,
risklerin dâhil edilmesi ile 140 gün olmuş, risklere karşı tepki
uygulanması ile 115 güne düşmüştür. Sonuç olarak risklerin hesaba
katıldığı ve önlem alınmadığı durumda planlanan değerlere kıyasla, proje
maliyeti ve proje tamamlanma süresi artmıştır. Risklerin yönetilmesi ile
tepki planlarının projeye uygulanması halinde ise risklerin maliyete
olan etkisinin %49, süreye olan etkisi ise %44 azaldığı görülmüştür.
Anahtar Kelimeler: Risk Yönetimi, Üstyapı Projesi,
Monte Carlo Benzetimi, Verimlilik
A RISK MANAGEMENT MODEL BASED ON SIMULATION WITH COST, DURATION AND
RISK IN CONSTRUCTION PROJECTS
ABSTRACT
In this study, a model is developed for risk management and
optimization of time, cost and quality, which are the main source and
efficiency elements in construction projects. This model was applied to
the rough construction of a superstructure project with the Monte Carlo
Simulation. Model setup, analysis and risk records; provided with a
commercial software. Some of the findings obtained from the study are
as follows; The project cost is calculated as TL 309.942.- without the
inclusion of risks, and as a result of the simulation, the inclusion of
risks in the 80% confidence interval was TL 342.801.- and when the
response was applied, this figure decreased to TL 336.286.- While the
project duration calculated without the inclusion of risks was 92 days,
it was 140 days with the inclusion of risks and decreased to 115 days
with the response to risks. As a result, when the risks are taken into
account and no measures are taken, project cost and project completion
time have increased compared to the planned values. When the risks were
managed and the response plans were applied to the project, the impact
of risks on costs decreased by 49% and the impact on time decreased by
44%.
Keywords: Risk management, Superstructure Project,
Monte Carlo Simulation, Productivity

38
), 2019, 60-International Science Symposium (September 04 th4
Kiev-Ukraine (ISS2019), 1A15PB; pp:37-45.
1. GİRİŞ (INTRODUCTION)
İnşaat projelerinde verimlilik, iyi bir proje yönetimi ile mümkün
olur ve proje yönetimi, süre ve maliyet gibi kaynakları proje
gereksinimlerine göre en uygun şekilde ve miktarda kullanmayı hedefler.
İnşaat proje yönetiminin ana görevi projenin süre, maliyet ve kalite
şartlarını sağlamaktır. Bu unsurlar da bazı dış ve iç faktörler etkisi
altındadır. Bu etkiler proje yönetiminin bir bileşeni olan risk yönetimi
ile yönetilir. Risk yönetimi, proje süresince kaynaklara etki edebilecek
etkilerin belirlenmesinde ve etkilerinin en aza indirilmesi veya yok
edilmesi ile ilgilenir. Risk yönetimi, proje yönetiminin kritik bir
bileşenidir. Günümüzde artık yönetilmeyen riskler proje başarısızlığının
ana sebeplerinden biri olarak gösterilmektedir [1]. Bu çalışmada
betonarme bir villanın metraj bilgileri kullanılarak birim fiyat
analizleri ile kaynak kullanımları belirlenmiş ve buna göre bir planlama
yapılmıştır. Yapılan planlamada, projenin maruz kalabileceği maliyet,
süre, kalite riskleri, risk tepki planları ve bunların maliyetleri
yansıtılmıştır. Risklerin yönetildiği ve tepkisiz kalındığı durumlar
karşılaştırılmış, risklerin yönetildiği durumda ne kadarlık bir ilk
yatırım maliyetine karşılık kaynaklardan ne kadar tasarruf
yapılabileceği belirlenmiştir.
Risk yönetimi, günümüz literatüründe 4 bileşenden oluştuğu genel
olarak kabul edilmiştir. Bu bileşenler; riskin tanımlanması, risk
analizi, risk tepki planlaması, risk gözetimi ve kontrolüdür [2].
Risklerin tanımlanması, analizi ve kabul edilebilirlik kriterinin
hesaplanması aşamaları ISO standart tanımlarında risklerin
değerlendirilmesi (risk assessment) adı altında gruplanır [3]. Risklerin
değerlendirilmesi üzerine, Kangari ve Riggs (1989) bulanık küme
teorisini geliştirmiş, ardından 90’lı yıllarda risk yönetim modelleri
araştırmacıların ilgisini çekmiştir [4 ve 5]. Bilgisayarların
kapasitelerinin de artması önceden mümkün olmayan birçok olanağı
beraberinde getirmiş ve bunun sonucunda da çeşitli çalışmalar
yapılmıştır. Bu çalışmalar genel olarak olasılık ve bulanık küme teorisi
üzerine yapılmıştır. Örnek olarak Hull (1990) Monte Carlo benzetimi ve
PERT tekniklerini temel alan modeller geliştirmiştir [6]. Yeo (1990),
aralık yaklaşımı metodu ile PERT tekniğini birlikte kullanan
“beklenmeyen olay mühendisliği” metodunu geliştirmiştir [7]. Arıkan
(2005), uluslararası inşaat projeleriiçin teklif hazırlama aşamasında
kullanılmak üzere bir risk yönetim karar destek sistemi, Integrated Risk
Management System (IRMS), geliştirmiştir.
Hiyerarşik risk yapılanması kullanılarak risklerin tespit
edilmesi, Monte Carlo benzetimi kullanılarak risk analizi yapılması,
risk derecelendirilmesi ile risklerin değerlendirilmesi, risk yönetim
stratejilerinin geliştirilmesi, kurumsal bellek kullanımı ve risk
görüntüleme işlemi IRMS’in içerdiği başlıca özellikler olarak
vurgulanabilir [8]. Anaç (2007), risk değerlendirme aşamasını, proje
öncesi, proje uygulanma sırasında ve proje sonrası durumlarında ele
alarak, proje sonrası risk değerlendirilmesini destekleyen bir program
geliştirmiştir [9]. Bu çalışma ile Anaç (2007), verilerin verimli
kullanılması ile firmalar için ileriki projelerde daha isabetli bir risk
yönetimi uygulanmasına imkân sağlayan, sürdürülebilir bir risk yönetim
anlayışı kazandırmıştır. Nasser Abdollahi (2010), Marmaray Projesi ele
alarak avrupa yakası kazı işlemleri için detaylı bir risk yönetimi
uygulanmış, sonuç olarak toplam proje süresinden (1316 gün) 555 gün,
toplam proje maliyetinden (25.125.121.00$) 6.675.128.00$ tasarruf
sağlanmıştır [10]. Bu çalışmada risk yönetimi ile tasarruf edilebilecek
süre ve maliyetin bu kadar yüksek çıkması, projenin büyük ölçekte olması
ve beklenilmeyen koşulların çok fazla olmasından kaynaklanmaktadır. Bu
da sektöre, inşaat altyapı projelerinde risk yönetimi uygulamanın ne
kadar önemli olduğunu vurgulayan bir çalışma olmuştur.

39
), 2019, 60-International Science Symposium (September 04 th4
Kiev-Ukraine (ISS2019), 1A15PB; pp:37-45.
2. ÇALIŞMANIN ÖNEMİ (RESEARCH SIGNIFICANCE)
Yapılan çalışmada, plana risklerin analizi ve yorumlanması için
Monte Carlo metodu kullanılmıştır. Bunun ana sebebi, veri açısından
risklerin çok fazla belirsizlik içermesi ve inşaat projelerinin aynı
koşulları tekrar edemeyecek kadar karmaşık oluşudur. Monte Carlo
benzetiminin amacı birbirinden bağımsız rastgele değişkenler ile kurulan
modeli test etmek ve yorumlanmasına araç olmaktır.
3. ANALİTİK ÇALIŞMA (ANALYTICAL STUDY)
Süre ve maliyet risk unsurlarının, müştereken etki ettirilmesinin
süre ve maliyet etkisinin incelendiği bu çalışmada, ele alınan yapıya
ait metraj bilgileri ilgili bir firmadan edinilmiştir. Seçilen yapı,
kare tipi bir plana sahip, bir bodrum, bir zemin ve bir adet normal kat
bulunan betonarme bir villadır. Yapının mimari planı Şekil 1’de
gösterilmiştir. Binanın kaba inşaatının planlanması, risk kayıtlarının
oluşturulması, risk tepki planlarının oluşturulması, simülasyonun
uygulanması, karşılaştırma analizlerinin yapılması için ticari bir
yazılım olan Primavera Risk Analysis programı kullanılmıştır. Program
Oracle firmasının geliştirmiş olduğu bir programdır ve Pertmaster olarak
da bilinir. Sadece Pertmaster yazılımı ile bir plan yapılabilir, kaynak
kullanımları oluşturulabilir, her türlü kaynak kullanımına ait
istatistiksel bir dağılım verisi atanabilir ve birbirleri arasında
istenilen bir oranda ilişkilendirilebilir, proje riskleri detaylı bir
şekilde kayıt edilebilir, Monte Carlo simülasyonu uygulanabilir, birden
fazla durum birbirleri ile kıyaslanabilir.
Şekil 1. Mimari normal kat planı
(Figure 1. Architectural normal floor plan)

40
), 2019, 60-International Science Symposium (September 04 th4
Kiev-Ukraine (ISS2019), 1A15PB; pp:37-45.
Bu çalışmada uygulama için seçilen yapıya ait planlamanın
yapılabilmesi için gereken veriler bazı kabuller doğrultusunda elde
edilmiştir. Bu kabuller şunlardır;
Proje plan takvimi günlük 10 saat ve haftanın 5 günü çalışılacak
şekilde ayarlanmıştır.
Birim imalat girdi miktarları, bir diğer deyiş ile faaliyetlerin
kullandığı kaynak çeşitleri ve miktarları, birim fiyat
analizlerindeki değerler kabul edilerek hesaplanmıştır. Hesaplanan
değerlerde sadece doğrudan giderler ele alınmıştır.
Müteahhit karı dâhil edilmemiş ve dolaylı giderler farklı bir
kalemde ele alınmıştır.
Metodun sağlıklı uygulanabilmesi için bilgisayar ve bir yazılımın
kullanılması gerekmektedir. Çalışma 5 ana aşamadan oluşmaktadır;
Verilerin toplanması ve programa girilebilir hale getirilmesi
Verilerin programa girilmesi ve proje planlamasının yapılması
Projeye ait risklerin belirlenerek plana yansıtılması ve benzetim
uygulanması
Risklere karşı önlem planlarının plana yansıtılması ve benzetim
uygulanması
Çıktıların yorumlanması
Çalışmanın detaylı akış şeması ise Şekil 2’de gösterilmiştir.
Şekil 2. Akış şeması
(Figure 2. Flow chart)

41
), 2019, 60-International Science Symposium (September 04 th4
Kiev-Ukraine (ISS2019), 1A15PB; pp:37-45.
3.1. Risklerin Projeye Yansıtılması ve Risk Yönetim Modelinin
Oluşturulması (Projecting Risks to the Project and Forming a
Risk Management Model)
Primavera Risk Analysis programı ile planlamanın yapılmasının
ardından risklerin projeye dâhil edilmesi işlemi gelmektedir. Risklerin
projeye yansıtılması süreci şu alt süreçlerden oluşmuştur;
Risk skoru yöntemi ve matrisinin hazırlanması
Proje risklerinin “risk register” modülü ile programa tanıtılması
Risk tepkilerinin belirlenmesi ve özellikleri programa tanıtılması
Risklerin plana dâhil edilmesi
Risk skoru, bir riskin etkilerinin, olasılığının,
yönetilebilirliğinin hesaba katılarak hesaplandığı değerdir. Bu
çalışmada risk skoru hesabı; riskin maliyete, süreye ve kaliteye etkisi,
yönetilebilirlik seviyesi, gerçekleşme olasılığı parametreleri
değerlendirilerek yapılmıştır. Riskin maliyete, süreye ve kaliteye
etkisi beş skala değeri ile değerlendirilmiştir (Tablo 1).
Tablo 1. Risk etki skalaları
(Table 1. Risk impact scales)
Etki Tipi Çok Düşük Düşük Orta Yüksek Çok Yüksek
Süre <=2 Sa <=2 Sa -1 gün 1-5 Gün 5-20 Gün >20 Gün
Maliyet(TL) <=2 bin 2-5 bin 5-20 Bin 20-50 Bin >50 Bin
Kalite
Bir Az
Önemli
Şartname
Maddesi
İhlali
Birden Fazla
Az
Önemli
Şartname
İhlali
Bir
Önemli
Şartname
Maddesi
İhlali
Birden
Fazla
Önemli
Şartname
Maddesi
İhlali
Kabul
Edilemez
Bu tabloya göre örneğin eğer bir risk için süre ve maliyet etkisine
yüksek ise, risk gerçekleştiği takdirde, plan 5 ile 20 gün arasında
uniform dağılan rastgele bir sayıda gün gecikmeye uğrayacak demektir.
Buradaki dağılım isteğe bağlı değiştirilebilir. Aynı şekilde maliyet
için yüksek ise proje, 20 bin ile 50 bin arası rastgele bir değer proje
maliyetine eklenir. Aynı durum kalite için geçerli değildir. Kaliteden
kasıt burada işin şartnameye ne kadar uygun yapılıp yapılmadığıdır.
Burada kalite direkt olarak plana dâhil değildir. Fakat eğer bir risk,
birden fazla önemli şartname maddesi ihlal ediyor ise, bu o riskin
skorunu artırır ve risk, kalitenin dâhil olmadığı durumda göz ardı
edilebilir iken risk skorunun artması ile artık önemli hale gelebilir.
Bu şekilde kalite riskleri plana dolaylı şekilde etki ettirilmiştir.
Riskin meydana gelme olasılığı aynı şekilde beş skala değeri ile ifade
edilmiştir (Tablo 2).
Tablo 2. Risk olasılık skalası
(Table 2. Risk probability scale)
Değer Olasılık
Çok Yüksek %70 İle %100 Arası
Yüksek %50 İle %70 Arası
Orta %30 İle %50 Arası
Düşük %10 İle %30 Arası
Çok Düşük %0 İle %10 Arası
Riskin yönetilebilirlik derecesi ise bir riskin ne kadar kolay
veya zor yönetilebilir olduğunu belirtir. Risk skoruna etkisi ise; ilgili
skala değeri ile riskin skorunu çarpar ve bu sayede risk skorunu artırır
veya azaltır. Çalışmada kullanılan risk yönetilebilirlik skalası Tablo
3’de belirtilmiştir.

42
), 2019, 60-International Science Symposium (September 04 th4
Kiev-Ukraine (ISS2019), 1A15PB; pp:37-45.
Tablo 3. Riskin yönetilebilirlik skalası
(Table 3. Risk manageability mcale)
Skala Değeri Katsayı Açıklama
Yüksek 0.9 Proje Yönetim Ekibinin Kontrolü Altındadır
Olasılığı ve/veya Etkileri Kontrol Edilebilir
Normal 1 Proje Yönetim Ekibinin Etkisi Altındadır
Olasılığı ve/veya Etkileri Etkilenebilir
Düşük 1.1 Proje Yönetim Ekibinin Etkisi Dışındadır
Sadece Etkileri Etkilenebilir
Risk skorunun hesaplanmasında riskin olasılığı, etkileri ve
yönetilebilirlik değeri hesaba katılır. Modelde 3 farklı risk etki tipi
olduğundan risk skoru şu şekilde hesaplanır; maliyet için ayrı, süre
için ayrı ve kalite için ayrı skala değerleri, riskin olasılık skalası
ile matriste kesiştiği skor matristen alınır. Ardından bu üç skor
değerinin ortalaması alınır. Daha sonra ilgili yönetilebilirlik
katsayısı ile çarpılır ve risk skoru belirlenmiş olur. Örneğin; bir
riskin gerçekleşme olasılığı yüksek, maliyete etkisi yüksek, süreye
etkisi düşük, kaliteye etkisi yüksek ve yönetilebilirlik derecesi yüksek
ise risk skoru hesaplanır. Risk skorunun derecelendirilmesi üç ayrı
tolerans skalasına ayrılmıştır. Bu durumda risk skoru-derecesi ilişkisi
Tablo 4’de gösterilmiştir.
Tablo 4. Risk tolerans skalası
(Table 4. Risk tolerance scale)
Risk Skoru Risk Derecesi Renk
<=5 Düşük Yeşil
>5 Orta Sarı
>23 Yüksek Kırmızı
Risk parametrelerinin ifade edilebileceği ve nitelenebileceği
arayüz oluşturulduktan sonra sonra riskler, programa “risk register”
isimli modül ile tanıtılır. Bu çalışma için yapılan araştırma ile bir
bina inşaatının sıklıkla maruz kalabileceği 11 adet risk belirlenmiştir.
Bu riskler Tablo 5’da gösterilmiştir.
Tablo 5. Belirlenen proje riskleri
(Table 5. Identified project risks)
RİSK ID Tanım Risk Türü
1 Şantiyenin Hafta Sonları Kapatılması Çevresel
2 İnsan Düşmesi İnşaat
3 Malzeme Fiyatlarında Ani Artış Finansal
4 Göçük Sebebiyle İşçi Ölümü İnşaat
5 Yanlış/Eksik Tasarım Yapılması Tasarım
6 Yanlış İmalat Yapılması İnşaat
7 Ödemelerin Zamanında Yapılmaması Sözleşme
8 Aşırı Hava Koşullarından Dolayı İşlerin Durması Çevresel
9 Beklenmeyen Zemin Koşulları İnşaat
10 Deprem, Sel, Yangın Meydana Gelmesi Çevresel
11 Eksik/Yanlış Sözleşme Maddeleri Sözleşme
Belirlenen risklerin skala değerleri ve skorları ise Tablo 6’de
gösterilmiştir.

43
), 2019, 60-International Science Symposium (September 04 th4
Kiev-Ukraine (ISS2019), 1A15PB; pp:37-45.
Tablo 6. Risk parametrelerine ait skala değerleri ve derecelendirilmesi
(Table 6. Scale values and rating of risk parameters)
Risk ID Olasılık Süre Maliyet Kalite Yönet. Skor Derece
1 Orta Çok Yüksek İhmal İhmal Düşük 14 Orta
2 Yüksek Orta Çok Yüksek Orta Normal 28 Yüksek
3 Orta İhmal Çok Yüksek İhmal Normal 13 Orta
4 Düşük Orta Çok Yüksek İhmal Yüksek 9 Orta
5 Orta Yüksek Orta Çok yüksek Yüksek 20 Orta
6 Orta Düşük Yüksek Yüksek Yüksek 13 Orta
7 Orta Yüksek Düşük İhmal Normal 8 Orta
8 Yüksek Düşük Çok Düşük İhmal Düşük 4 Düşük
9 Orta Orta Düşük Düşük Düşük 7 Orta
10 Çok Düşük Orta Yüksek Orta Normal 3 Düşük
11 Yüksek Yüksek Yüksek Yüksek Normal 28 Yüksek
Primavera Risk Analysis programı belirlenen riskleri birer
faaliyet olarak plana işlemektedir. Atandığı faaliyet ile ardıl
aktivitesi arasında hayali bir aktivite oluşturur ve ilgili değerleri
bu faaliyet ile yansıtır. Eğer risk simülasyon sırasında gerçekleşirse
bu faaliyet oluşur ve gecikme değerince bir süre değeri, hasar değerince
de bir maliyet değeri kullanır. Risk gerçekleşmediği takdirde bu faaliyet
hiç ortaya çıkmaz ve faaliyet ardıl faaliyeti ile devam eder. Model
kurulduktan ve proje planına dâhil edildikten sonra Monte Carlo analizi
uygulanmıştır. Analiz için 1000 adet iterasyon kullanılmıştır.
4. BULGULAR (FINDINGS)
Çalışmaya konu olan binanın kaba inşaatına ilişkin oluşturulan
risk modelinin analizi için 1 durum birbirleriyle kıyaslanmıştır.
Yapının kaba inşaatının risklerin hesaba katılmadığı, planlanan duruma
ilişkin maliyeti 309941.61TL’dir. Planlanan proje süresi ise 92 gündür.
4.1. Risklerin Üstlenildiği ve Tepkisiz Kalındığı Durum
(Situation in Which Risks are Undertaken and Unresponsive)
Yapılan simülasyon sonucu, risklerin üstlenildiği ve tepkisiz
kalındığı durum için proje tamamlanma süresi 123 gün ile 155 gün arasında
değerler alarak ortalama olarak 140 gün değer almıştır. Projenin %50
ihtimal ile tamamlanma süresi 137 gün olurken %80 ihtimal ile tamamlanma
süresi 140 gün olmuştur (Şekil 3). Projenin planlanan tamamlanma süresi
olan 123 günde tamamlanma ihtimali ise %1’in altında olmuştur. Proje
maliyeti ise 318.883 TL ile 361.703 TL arası değerler alarak ortalama
olarak 342.800 TL değer almıştır. Proje maliyeti %50 ihtimal ile 334.896
TL olurken %80 ihtimal ile 342.790 TL olmuştur (Şekil 6). Projenin
planlanan durumdaki maliyeti olan 318.883 TL değerinde tamamlanma
ihtimali ise yine %1’in altında olmuştur.

44
), 2019, 60-International Science Symposium (September 04 th4
Kiev-Ukraine (ISS2019), 1A15PB; pp:37-45.
Şekil 3. Risklerin üstlenildiği ve tepkisiz kalındığı durumda
tamamlanma süresinin dağılımı
(Figure 3. Distribution of completion time if risks undertake and
unresponsive)
Şekil 6. Risklerin üstlenildiği ve tepkisiz kalındığı durumda proje
maliyetinin dağılımı
(Figure 6. Distribution of project costs when risks undertake and
unresponsive)

45
), 2019, 60-International Science Symposium (September 04 th4
Kiev-Ukraine (ISS2019), 1A15PB; pp:37-45.
5. SONUÇ (CONCLUSION)
Bu çalışmada bir üst yapı inşaat projesinin kaba inşaatının mevcut
risk değerlendirme teknikleri ile risk yönetimi uygulandığı takdirde
maliyet ve süre değerleri incelenmiştir. Proje riskleri, toplam proje
maliyetini ve süresini ciddi anlamda artırmıştır. Risklerin yönetildiği
durumda, tepki planları için belirli bir ön yatırım yapılmasına rağmen
maliyet ve süre açısından daha avantajlı olunduğu görülmüştür. Risk
etkileri, yönetilerek neredeyse yarı yarıya indirilmiştir.
NOT (NOTICE)
Bu çalışma destek ve katkılarından dolayı Fibrobeton Yapı
Elemanları San. ve İnşaat A.Ş.’ne teşekkür ederiz.
KAYNAKLAR (REFERENCES)
[1] Royer, P., (2000). Risk Management: The Undiscovered Dimension
of Project Management. PM Network, C.14: ss.31-40.
[2] Vicknayson, T., (2004). Mawdesley MJ., Perception of Human Risk
Factors in Construction Projects. An Exploratory Study,
International Journal of Project Management; s:22, ss:131-137.
[3] ISO Guide 73, (2009). International Organization for
Standardization 2009; Tanım 3.4.1.
[4] Taroun, A., Yang, J.B., and Lowe, D., (2011). Construction Risk
Modelling and Assessment. Insights from a Literature Review, The
Built & Human Environment Review; 4:87-97.
[5] Kangari, R. and Riggs, L., (1989). Construction Risk Assessment
by Linguistics, IEEE Transaction on Engineering Management; 36:
126-131.
[6] Hull, J., (1990). Application of Risk Analysis Techniques in
Proposal Assessment, Internationa Journal of Project Management;
8:152–157.
[7] Yeo, K., (1990). Risks, Classification of Estimate and
Contingency Management. Journal of Management in Engineering;
6:458-470.
[8] Arıkan, A.E., (2005). Development of a Risk Management Decision
Support System Forinternational Construction Projects, MSc.
Thesis, Middle East Technical University, Graduate School of
Natural and Applied.
[9] Anaç, C., (2007). Development of a Risk Assessment Tool for
Post-project Appraisal, MSc. Thesis, Middle East Technical
University, Graduate School of Natural and Applied.
[10] Abdollahi, N., (2010). Bir İnşaat Altyapı Projesinde Süre-Maliyet İyileştirilmesi İçin Bir Risk Yönetimi Modeli. Yüksek
Lisans Tezi, İstanbul Üniversitesi, Fen Bilimleri Enstitüsü.

4th International Science Symposium Status: Proceeding Book
ISS2019 (September 4-6, 2019) ID : 2019.1A16PB
Latif Onur Uğur
Düzce University, [email protected], Düzce-Turkey
Yıldız Sarar
Fibrobeton Building Elements San. and Construction Inc.,
[email protected], Düzce-Turkey
Yılmaz Ölper
Düzce University, [email protected], Düzce-Turkey
ANALİTİK HİYERARŞİ PROSESİ (AHP) İLE ULUSLARARASI YAPIM İŞİ YAPAN BİR
FİRMA İÇİN HUKUK MÜŞAVİRİ FİRMA SEÇİMİ
ÖZ
Globalleşmeyle beraber uluslararası arenaya çıkan yapım firmaları, kendi
ülkelerinin dışında faaliyette bulunacakları ülkelerin hukuk kurallarını, ayrıca
evrensel hukuk kurallarını bilmek ve uyum sağlamak zorunluluğundadır.
Uluslararası arenada ilerleyen firmaların güvenli ve zararsız hareket etmeleri
için hukuk müşaviri firmalarına ihtiyacı zaruridir. Uluslararası mahiyette bir
inşaat projesi yüklenecek bir yapım firması için hukuk müşaviri seçimi çok önemli
bir karardır. Hukuk müşaviri firması seçilirken, mesleki yeterliliklerinin,
uluslararası hukukta yetkinliğinin, firma temsil kabiliyetinin, çözüm odaklı
olmasının ve ücret politikası gibi kıstaslarının dikkate alınması ve en uygun
firmanın seçilmesi gerekir. Çünkü bu noktalarda yapılacak hata uluslararası
arenada yapım işleri yapan firmanın zor durumda kalmasına, yaptırımlar
uygulanmasına neden olabilir. Böyle bir hukuk müşaviri firması seçiminde, çok
kriterli çözüm yöntemlerinden biri olan AHP (Analitik Hiyerarşi Prosesi)
yönteminin kullanılması tercih edilmiştir. AHP yöntemi kullanılması ile diğer
seçim yöntemlerine göre daha doğru ve hızlı bir şekilde seçimin yapılması
amaçlanmıştır. Çalışma sonucunda AHP yöntemi ile aralarında seçim yapılması
istenen alternatifler, hiyerarşik düzene getirilip kolay, hızlı ve güvenilir bir
şekilde çözüme ulaştırılmıştır. Bu yöntemin; inşaat firmalarının, hukuk müşaviri
seçiminde başarı ile kullanılabileceği anlaşılmıştır.
Anahtar Kelimler: Hukuk Müşaviri Firması, Analitik Hiyerarşi Prosesi,
Uluslararası İnşaat Projeleri
SELECTION OF LAW CONSULTANT FOR AN INTERNATIONAL COMPANY WITH ANALYTIC
HIERARCHY PROCESS (AHP) ABSTRACT
With the globalization, the construction companies that have emerged in
the international arena are obliged to know and comply with the legal rules of
the countries they will operate in as well as the universal legal rules. The
need of legal counsel firms for the safe and harmless action of the companies
advancing in the international arena is essential. The choice of legal counsel
for a construction company to be installed on an international construction
project is a very important decision. When selecting a legal consultant firm,
professional competencies, competence in international law, firm representation
capability, solution-oriented and criteria such as wage policy should be
considered and the most appropriate firm should be selected. Because the mistake
to be made at these points may cause the firm that makes construction works in
the international arena to remain in a difficult situation and to impose
sanctions. AHP (Analytical Hierarchy Process), which is one of the multi-criteria
solution methods, is preferred in the selection of such a legal consultant firm.
By using AHP method, it is aimed to make the selection more accurately and faster
than the other selection methods. As a result of the study, the alternatives
that were required to be selected by AHP method were brought to a hierarchical
order and solved easily, quickly and reliably. This method; It has been
understood that construction companies can be used successfully in the selection
of legal advisors.
Keywords: Legal Consultant, Analytic Hierarchy Process (AHP),
International construction Project

47
4th International Science Symposium (September 04-06, 2019),
Kiev-Ukraine (ISS2019), 1A16PB; pp:46-55.
1. GİRİŞ (INTRODUCTION)
Ekonomik değişimin ve gelişimin bir sonucu olarak ülkemizde olduğu
gibi yabancı ülkelerde de hukuk kuralları artmakta ve karmaşık bir hal
almaktadır. Yabancı ülkelerde de hayatın her alanını anlaşılması daha
zor hükümlerle düzenlemeye devam etmektedir. Nitekim, yurtdışında
yapılan anketler 2011 yılının üçüncü çeyreğinde, ekonomik krizin yabancı
şirketlerin işlerini azalttığını; ancak, hukuk müşavirliklerinin iş
yükünü, önemli oranda arttırdığını ortaya koymaktadır [1]. Ülkemizde de
birden fazla ülkede, birden fazla hukuk sistemine tabi olarak faaliyet
gösteren holdinglerin, şirketlerin sayısı gün geçtikte artmaktadır [2].
Dolayısıyla uluslararası arenada iş yapan yapım firmalarının zarar
görmeden faaliyetlerine devam edebilmeleri için faaliyette bulunacakları
ülkelerin hukuk kurallarını, ayrıca evrensel hukuk kurallarını bilmek
ve uyum sağlamak zorunluluğundadır. Uluslararası mahiyette bir inşaat
projesi yüklenecek bir yapım firması için hukuk müşaviri seçimi çok
önemli bir karardır. Hukuk müşaviri firması seçilirken, mesleki
yeterliliklerinin, uluslararası hukukta yetkinliğinin, firma temsil
kabiliyetinin, çözüm odaklı olmasının ve ücret politikası gibi
kıstaslarının dikkate alınması ve en uygun firmanın seçilmesi gerekir.
Çünkü bu noktalarda yapılacak hata uluslararası arenada yapım işleri
yapan firmanın zor durumda kalmasına, yaptırımlar uygulanmasına neden
olabilir. Bu çalışmada; bu alanda yetkin, tecrübeli ve ekonomik olarak
en uygun firmayı bulabilmek için kriterlerin ve alternatiflerin
kullanıldığı bir seçim yöntemi olan Analitik Hiyerarşi Prosesi (AHP)
kullanılabilir ve böyle karışık durumlarda kolaylıkla seçim yapılabilir.
2. ÇALIŞMANIN ÖNEMİ (RESEARCH SIGNIFICANCE)
Bu çalışma ile “Uluslararası bir yapım firması için hukuk
müşavirliği firma seçimi” ÇKKV probleminin çözümünde Analitik hiyerarşi
prosesi yönteminin kullanılabilirliği sorgulanmıştır. Böylelikle benzer
durumlarda da kolaylıkla seçim yapılabileceği görülmüştür.
3. ANALİTİK HİYERARŞİ PROSES YÖNTEMİ (AHP)
(ANALYTIC HIERARCHY PROCESS METHOD (AHP))
Thomas L. Saaty tarafından Analitik Hiyerarşi Prosesi (AHP)
geliştirilmiştir. Yaygın kullanılan bir ÇKKV yöntemidir. AHP yöntemi
karmaşık karar problemlerinde, alternatif ve kriterlere göreceli önem
değerleri verilerek oluşan modelleme ile çözüm sağlamaktadır. Bu
yöntemin en önemli özelliği hem objektif hem de sübjektif
değerlendirmelerin karar sürecine dâhil edilebilmesidir [4]. Ayrıca AHP
yöntemi problemi detaylı bir şekilde ele alınarak ayrıştırılmasını
sağlamaktadır [3]. Literatürde AHP yöntemi, en iyi alternatifin seçimi,
kaynak dağıtımı, değerlendirme, planlama ve geliştirme, sıralama, karar
verme, tahminleme gibi çeşitli amaçlar için kullanılmıştır [31]. Ayrıca,
stratejik planlama, depo yeri seçimi, stratejik yatırım analiz, kuruluş
yeri seçimi, yazılım seçimi, forvet oyuncularının değerlendirilmesi,
hedef pazarın belirlenmesi, tedarikçi seçimi, personel seçimi, proje
yönetimi gibi pek çok farklı alana uygulanmıştır [3 ve 5].
AHP dokuz adımdan oluşmaktadır.
Karar verme probleminin tanımlanması ve amacın belirlenmesi,
Amacı gerçekleştirmek için gerekli karar kriterlerinin
belirlenmesi,
Muhtemel karar alternatiflerinin belirlenmesi,
Karar probleminin hiyerarşik yapısının oluşturulması,
Hiyerarşinin her seviyesi içi ikili karşılaştırılması ve öz
vektörlerden yararlanılarak kriterlerin önem derecelerinin
belirlenmesi,
Kriterlere alternatiflerinin ikili karşılaştırılması ve

48
4th International Science Symposium (September 04-06, 2019),
Kiev-Ukraine (ISS2019), 1A16PB; pp:46-55.
önceliklerin hesaplanması,
Tutarsızlık oranının hesaplanması,
Öncelik değerlerine göre alternatiflerin sıralanması ve en iyi
alternatifin seçilmesi,
Duyarlılık analizinin yapılması [6].
3.1. AHP Yönteminin Çözüm Aşamaları (Solution Steps of AHP Method)
Hiyerarşik Yapının Oluşturulması: Tepeden aşağıya yapı
oluşturulur. En üstte amaç yazılır. Ortada kriterler ve alt kriterler
en altta ise alternatifler yer alır [10].
Şekil 1. AHP hiyerarşik yapısı [n]
(Figure 1. AHP hierarchical structure [n])
İkili Karşılaştırma Matrisleri (A) ve Üstünlüklerin Belirlenmesi:
Hiyerarşik yapı oluşturulduktan sonra karşılaştırma matrisi, Denklem (1)
ifadede gösterilen (nxn) ikili karşılaştırma matrisi oluşturulur [7].
A=
[
1 𝑎21 𝑎31 … 𝑎𝑛1
1𝑎21
⁄ 1 𝑎32 … 𝑎𝑛2
1𝑎31
⁄ 1𝑎32
⁄ 1 … 𝑎𝑛3
⋮ ⋮ ⋮ ⋱ ⋮1
𝑎𝑛1⁄ 1
𝑎𝑛2⁄ 1
𝑎𝑛3⁄ … 1 ]
(1)
Denklem (1) numaralı eşitlikte verilen her bir kriter önem
derecelerine göre puanlandırılır. Burada üstünlüklerin belirlenmesi için
Saaty tarafından geliştirilen ve Tablo 1’de verilen önem ölçeği
kullanılmalıdır [7].

49
4th International Science Symposium (September 04-06, 2019),
Kiev-Ukraine (ISS2019), 1A16PB; pp:46-55.
Tablo 1. İkili karşılaştırma önem ölçeği
(Table 1. Binary comparison significance scale)
Önem
Derecesi Tanım Açıklama
1 Eşit Derecede Önemli Her İki Faktör Aynı Öneme Sahiptir
3 Orta Derecede Önemli Tecrübe ve Yargılara Göre Bir Faktör
Diğerine Göre Biraz Daha Önemlidir
5 Kuvvetli Derecede Önemli Bir Faktör Diğerinden Kuvvetle Daha
Önemlidir
7 Çok Kuvvetli Derece De
Önemli
Bir Faktör Diğerine Göre Yüksek
Derecede Kuvvetle Daha Önemlidir
9 Mutlak Derecede Önemli Faktörlerden Biri Diğerine Göre Çok
Yüksek Derecede Önemlidir
2,4,6,8 Ara Değerleri Temsil
Etmektedir
İki Faktör Arasındaki Tercihte
Yukarıdaki Açıklamalarda Bulunan
Derecelerin Ara Değerleridir
Karşılıklı
Değerler
𝑖,j İle Karşılaştırılırken Bir Değer (x) Atanmış ise j, 𝑖 İle Karşılaştırılırken Atanacak Değer (1/x) Olacaktır
Öz vektörün (Göreli Önem Vektörünün) Belirlenmesi: İkili
karşılaştırma matrisleri oluşturulduktan sonra, matristeki her bir
değerin diğer değerlere önemini gösteren öz vektör hesaplanır [8].
Matrisin nx1 boyutunda öz vektörü (2) numaralı ifadede verilmiştir.
𝑖 =1,2,3…..,n ve j=1,2,3,….n olmak üzere
𝑏𝑖𝑗 =𝑎𝑖𝑗
∑ 𝑎𝑖𝑗𝑛𝑖=1
) ve 𝑤𝑖 =∑ 𝑏𝑖𝑗
𝑛𝑗=1
𝑛 (2)
W sütün vektörü, (2) numaralı eşitlikte belirtilen 𝑏𝑖𝑗 değerlerinin
meydana getirdiği matrisin satır elemanlarının aritmetik ortalamasından
elde edilir [8].
Öz vektörün Tutarlılığının Hesaplanması: Her ikili karşılaştırma
matrisi için Tutarsızlık oranı (CR) hesaplanır. Tutarsızlık oranı 0,10
değerinin altında olması gerekir. Bu değerinin üzerinde ise puanlandırma
yeniden yapılmalıdır Tutarsızlık oranının hesaplanması için A matrisinin
en büyük öz vektörü yani max hesaplanır (Eşitlik 3).
𝑖 =1,2,3…..,n ve j=1,2,3,….n olmak üzere
D=[𝑎𝑖𝑗] 𝑚𝑥𝑛 𝑥 [𝑤𝑖] 𝑛𝑥1 = [𝑑𝑖] 𝑛𝑥1
ʎmax=
∑𝑑𝑖𝑤𝑖
𝑛𝑖=1
𝑛
(3)
Tutarsızlık oranının hesaplanabilmesi için rastsallık endeksi (RI)
Tablo 2’ den alınır. Sabit sayılardan meydana gelen ve n değerine göre
belirlenen RI değerlerinin yer aldığı veriler Tablo 2’de verilmiştir
[6]. Bu bilgiler doğrultusunda CR değerinin hesaplanması Denklem (4)
numaralı eşitlikte verilmiştir. Tzeng ve Huang’ın çalışmasına göre
güvenilir bir sonuç elde edilmesi için CR Tutarsızlık oranının 0.1’i
aşmaması gerekmektedir [6].
CR=ʎ−𝑛
(𝑛−1).𝑅𝐼 (4)
RI değeri Tablo 2’de verilen Rastsallık Endeksi Verilerinden
alınır [6].

50
4th International Science Symposium (September 04-06, 2019),
Kiev-Ukraine (ISS2019), 1A16PB; pp:46-55.
Tablo 2. Rastsallık endeksi verileri
(Table 2. Rasticity index data)
n 1 2 3 4 5 6 7 8 9 10
RI 0 0 0.58 0.9 1.12 1.24 1.32 1.41 1.45 1.49
Öncelik değerlerinin elde edilmesi için ilk dört aşama, hiyerarşik
yapının tamamı için hesaplanır. Bu aşamada hiyerarşik yapıdaki n tane
kriterin her birinin meydana getirdiği mx1 boyutundaki üstünlük sütün
vektörleri bir araya getirilerek mxn boyutundaki DW karar matrisi denklem
(5) verilmiştir. Elde edilen matrisin ölçütler arası W üstünlük vektörü
ile çarpımı sonucunda R sonuç vektörüne denklem (6) ile ulaşılır [9].
𝑖 =1,2,3…..,n ve j=1,2,3,….n olmak üzere DW=[𝑤𝑖] 𝑚𝑥𝑛 (5)
R=DWxW (6)
4. UYGULAMA (APPLICATION)
AHP ile uluslararası yapım işi yapan bir firma için hukuk müşaviri
firma seçimi yukarıda anlatılan işlem basamaklarına uygun şekilde
yapılacaktır. Bunun için ilk olarak kriterler ve bu kriterlerin alt
kriterleri belirlenmiştir. Belirlenen Kriterler;
4.1. Amacın Belirlenmesi (Determination of Purpose)
“En iyi hukuk müşaviri firma secimi” amaç olarak belirlenmiştir.
4.2. Kriterlerin ve Alt Kriterlerin Belirlenmesi
(Determination of Criteria and Sub-Criteria)
ÇKKV probleminin çözümünde uzmanlarca aşağıdaki kriter ve alt
kriterler belirlenmiştir.
K1 Mesleki yeterlilikler: Gerekli bilgi birikimine sahip, dalında
uzmanlaşmış sürekli gelişebilen firmalar avantajlı olacaktır.
Firma temsil kabiliyeti: Firmanın temsil ettiği diğer firmalar,
kazandığı davalar göz önünde bulundurulacaktır.
Yeni kanunlara göre güncelleme kabiliyeti: Değişen kanunlara göre
kendini güncelleyebilen, takip eden firma avantajlı olacaktır.
Uluslararası sözleşme yetkinliği ve deneyimi: uluslararası
sözleşmelerdeki bilgi ve tecrübesi fazla olan avantajlı olacaktır.
Uluslararası ticaret hukuku alanında yetkinliği ve deneyimi:
Firmanın uluslararası ticaret hukuku alanında bilgi ve tecrübesi
fazla olan avantajlı olacaktır.
Uluslararası borçlar hukuku alanında yetkinliği ve deneyimi:
Firmanın uluslararası Borçlar hukuku alanında bilgi ve tecrübesi
fazla olan avantajlı olacaktır.
Uluslararası icra-iflas hukuku alanında yetkinliği ve deneyimi:
Firmanın uluslararası icra- iflas hukuku alanında bilgi ve
tecrübesi fazla olan avantajlı olacaktır.
Uluslararası iş hukuku alanında yetkinliği ve deneyimi Firmanın
uluslararası İş hukuku alanında bilgi ve tecrübesi fazla olan
avantajlı olacaktır.
Uluslararası ilişkiler alanında yetkinliği ve deneyimi Firmanın
uluslararası ilişkilerde bilgi ve tecrübesi fazla olan avantajlı
olacaktır.
K2 Firma çalışan yeterlilikleri: Bu kriterde firma çalışanların
eğitimleri ve yeterlilikleri göz önünde bulundurulacaktır.
Çalışanların diploma geçerliliği: Çalışanların diplomalarının
uluslararası geçerliliği olan firma avantajlı olacaktır.

51
4th International Science Symposium (September 04-06, 2019),
Kiev-Ukraine (ISS2019), 1A16PB; pp:46-55.
Uluslararası hukuk eğitimi alma durumları: Çalışanların
uluslararası eğitimi olan firma avantajlı olacaktır.
Mezun olunan üniversite ve eğitim kalitesi: Çalışanların mezun
olduğu üniversitenin kalitesi ve eğitim kalitesi yüksek olan firma
avantajlı olacaktır.
Deneyim süreleri: Yapım firmaları temsil deneyimi fazla olan firma
avantajlı olacaktır.
Geçerli dilleri bilme dereceleri: Uluslararası geçerli dilleri
bilen çalışanları olan firma avantajlı olacaktır.
Mesleki dilleri bilme dereceleri: Mesleki dil ile geçerli dil
farklı olabilmektedir. Çalışanların sözleşme için mesleki dil
bilmesi gerekmektedir. Mesleki dil hakimiyeti olan firma avantajlı
olacaktır.
Mesleki bilgisayar programları bilme dereceleri: Mesleki
bilgisayar programlarına hâkim çalışanların olduğu firma avantajlı
olacaktır.
İletişim ve ikna kabiliyetleri: Çalışanların iletişim ve ikna
kabiliyeti yüksek olan firma avantajlı olacaktır.
K3 Firma tecrübesi: Tecrübesi fazla olan firma avantajlı
olacaktır.
Çözüm odaklı olma: Problemlerin en kısa sürede çözümlenebilmesi
için alternatifler üretebilmesi, kısa ve ucuz net çözümlere
ulaşabilmesidir.
Referanslar: referansları güçlü olan firma avantajlı olacaktır.
Hizmet verilen firmalarla çalışma süresi: Firmalarla çalışma
süresi uzun olan firma avantajlı olacaktır.
Hizmet verilen firma sayısı: hizmet verilen firma sayısı fazla
olan avantajlı olacaktır.
Nitelikli Çalışan sayısı: Nitelikli çalışan sayısı fazla ola firma
avantajlı olacaktır.
K4 Maliyetler: Daha düşük maliyet avantaj olacaktır.
Talep edilen ücret: Talep edilen ücret düşük olan firma avantajlı
olacaktır.
Talep edilen ulaşım hizmetleri: ulaşım hizmetlerinde minumum olan
firma avantajlı olacaktır.
Talep edilen konaklama hizmetleri: konaklama hizmetlerinde minumum
talep avantajlı olacaktır.
Ödeme şartları: ödeme şartlarında daha uzun vade veren firma
avantajlı olacaktır.
4.3. Alternatiflerin Belirlenmesi (Determining Alternatives)
Firma 1, Firma 2 ve Firma 3 için belirlenen amaç kriter, alt kriter
ve alternatifler Super Decisions paket programına girilerek model
oluşturulur.

52
4th International Science Symposium (September 04-06, 2019),
Kiev-Ukraine (ISS2019), 1A16PB; pp:46-55.
Şekil 2. AHP modelinin oluşturulması
(Figure 2. Creating AHP model)
Şekil üzerinde görünen ok işaretleri amaç ile kriterlerin,
Kriterler ile o kriterin, Alt kriterlerin ilişkilendirildiğini ve her
alt kriterin alternatiflerle ilişkilendirildiğini göstermektedir. Bu
ilişkilendirme Şekil 3’de verilen karşılaştırma matrislerinin
oluşturulmasında en önemli etkendir.
4.4. Karşılaştırma Anketlerinin Değerlendirilmesi
(Evaluation of Comparison Surveys)
Oluşturulan model de ilişkilendirilen amaca göre Kriterlerin kendi
aralarında ikili karşılaştırmaları yapılmaktadır. Şekil 2’de verilen
önem derecelerine göre uzmanlar tarafından puanlandırılmış kriterler
Şekil 3’de verilmiştir.
Şekil 3. Amaca göre kriterlerin değerendirilmesi
(Figure 3. Evaluation of criteria according to purpose)
Şekil 3’de yapılan puanlamalar ve buna bağlı olarak tutarsızlık
oranı görünmektedir. İnconsistency (tutarsızlık oranı) 0.05787’ dir Bu
oranın 0.1 in altında olduğu için yapılan işlem tutarlıdır. Firma
tecrübesi %38, birinci sırayı almaktadır. Maliyetler ise %13 ile son
sırayı almaktadır. Öncelik değerleri toplamı 1’dir. Şekil 4’te Firma
tecrübesi kriterinin, alt kriterleriyle ikili karşılaştırmaları
yapılmaktadır. Şekil 2’de verilen önem derecelerine göre uzmanlar
tarafından puanlandırılmış alt kriterler Şekil 4’te verilmiştir.

53
4th International Science Symposium (September 04-06, 2019),
Kiev-Ukraine (ISS2019), 1A16PB; pp:46-55.
Şekil 4. Firma tecrübesi kriterinin alt kriterleri için
değerlendirilmesi
(Figure 4. Evaluation of firm experience criteria for sub-criteria)
Şekil 4’de yapılan puanlamalar ve buna bağlı olarak tutarsızlık
oranı görünmektedir. İnconsistency (tutarsızlık oranı) 0.05805’ dir Bu
oranın 0.1 in altında olduğu için yapılan işlem tutarlıdır. Çözüm odaklı
olma %40 ile birinci sırayı almaktadır. Çalışan sayısı ise %8 ile son
sırayı almaktadır. Öncelik değerleri toplamı 1’dir. Şekil 5’de
Uluslararası borçlar hukuku yetkinliği ve deneyimi alt kriterine göre
alternatiflerin ikili karşılaştırmaları yapılmaktadır. Tablo 2’de
verilen önem derecelerine göre uzmanlar tarafından puanlandırılmıştır.
Şekil 5. Uluslararası borçlar hukuku alanında yetkinliği ve deneyimi
alt kriterinin alternatifler için değerlendirilmesi
(Figure 5. Evaluation of the sub-criterion of competence and
experience in the field of international law of obligations for
alternatives)
Şekil 5’de yapılan puanlamalar ve buna bağlı olarak tutarsızlık
oranı görünmektedir. Inconsistency (tutarsızlık oranı) 0.05156’ dir Bu
oran 0.1 in altında olduğu için yapılan işlem tutarlıdır. Firma 1 %49
ile birinci sırayı almaktadır. Firma 2 ise %20 ile son sırayı
almaktadır. Öncelik değerleri toplamı 1’dir. Şekil 6’ de ikili
karşılaştırmalar sonucu bulunan ağırlık değerlerinin birleştirilmesi
gösterilmektedir. Bu matris bir başlangıç matrisidir. Alternatiflerin

54
4th International Science Symposium (September 04-06, 2019),
Kiev-Ukraine (ISS2019), 1A16PB; pp:46-55.
amaç doğrultusunda öncelik değerleri yer almaktadır. Burada yer alan
ağırlıkları Şekil 7’de yer alan öncelik değerleri tablosunda yer alan
Raw sütunu ile aynı olduğu görülmektedir.
Şekil 6. alternatiflerin amaç ve kriterleri için öncelik
değerlendirilmesi
(Figure 6. Priority assessment of alternatives' objectives and
criteria)
5. BULGULAR (FINDINGS)
Şekil 7’de Alternatiflerin öncelik değerleri yer almaktadır.
Normals sütunu normalize edilmiş öncelik değerlerini göstermektedir.
Buna göre firma bir %37 ile ilk sırada yer almaktadır. Firma 3 %35 ile
ikinci sırayı alırken Firma 2 %27 ile son sırada yer almaktadır.
Şekil 7. Alternatiflerin öncelik değerleri
(Figure 7. Priority values of alternatives)
6. SONUÇ VE ÖNERİLER (CONCLUSION AND RECOMMENDATIONS)
Bu çalışma ile Analitik Hiyerarşi Prosesi (AHP) ile Uluslararası
Yapım İşi Yapan Bir Firma İçin Hukuk Müşaviri Firma Seçimi yapılmıştır.
Çalışma sonucunda üç ayrı firma arasında yapılan karşılaştırmada; firma
bir %37 ile ilk sırada yer almaktadır. Firma 3 %35 ile ikinci sırayı
alırken Firma 2 %27 ile son sırada yer almaktadır. AHP yönteminin en
önemli özelliği karar vericinin objektif ve sübjektif düşüncelerinin
karar sürecine dahil edilebilmesidir Hiyerarşik yapısı ile problemi
detaylı bir şekilde incelenme olanağı sağlamaktadır. Bu çalışma
sonucunda AHP yöntemi ile aralarında seçim yapılması istenen
alternatifler, hiyerarşik düzene getirilip kolay, hızlı ve güvenilir bir
şekilde çözüme ulaşılmıştır. “Uluslararası Yapım İşi Yapan Bir Firma
İçin Hukuk Müşaviri Firma Seçimi” ÇKKV probleminin çözümünde Analitik
hiyerarşi Prosesinin kullanılabileceği görülmüştür.

55
4th International Science Symposium (September 04-06, 2019),
Kiev-Ukraine (ISS2019), 1A16PB; pp:46-55.
NOT (NOTICE)
Bu çalışmada destek ve katkılarından dolayı Fibrobeton Yapı
Elemanları San. ve İnşaat A.Ş.’ne teşekkür ederiz.
KAYNAKLAR (REFERENCES)
[1] Stock, R., (2011). When Your Company Grows. Toronto, Lexpert
Magazine, 12(10):20-21.
[2] Kaya, B., (2012). Günümüzün Büyük Kuruluşlarında Hukuk
Müşavirliğinin Yapılanması ve İşlevi. Ankara Barosu Dergileri,
2:217-238.
[3] Sarıçalı, G. ve Kundakcı, N., (2016). Ahp ve Copras Yöntemleri
İle Otel Alternatiflerinin Değerlendirilmesi, International
Review of Economics and Management, Sayı: 4 ss:45-66.
[4] Kuruüzüm, A. ve Atsan, N., (2001). Analitik Hiyerarşi Yöntemi ve
İşletmecilik Alanındaki Uygulamaları., Akdeniz İktisadi ve İdari
Bilimler Fakültesi Dergisi, 1:83–105.
[5] Al-Harbi, K.M.A.S., (2001). Application of the AHP in project
management.International Journal of Project Management,
19(1):19–27.
[6] Yıldırım, B.F. ve Önder, E., vd., (2015). Çok kriterli karar
verme yöntemleri, 1.Baskı, Bursa, Türkiye.
[7] Bayhan, M. ve Bildik, T., (2014). Çok Kriterli Karar Verme
Tekniklerinden Analitik Hiyerarşi Süreciyle Akıllı Telefon
Seçimi, Uluslararası Alanya İşletme Fakültesi Dergisi,
6(3):27–36.
[8] Çelik, C., Alkan, A. ve Aladağ, Z., (2016). Otomotiv Sektöründe
Faaliyet Gösteren Bir Firmada Tedariikçi Seçimi: AHP-Bulanik AHP
ve TOPSIS Uygulaması. Beykent Üniversitesi Fen ve Mühendislik
Bilimleri Dergisi, 9(1):43–83.
[9] Supçiller, A.A. ve Çapraz, O., (2011). İstanbul Üniversitesi
Ekonomi ve İstatistik Dergisi, 13:1–22.
[10] Saaty, T.L., (2008). Decision Making with The Analytic Hierarchy Process. International Journal of Services Sciences, 1(1):83.

4th International Science Symposium Status: Proceeding Book
ISS2019 (September 4-6, 2019) ID : 2019.1A17PB
Deniz Balta
Musa Balta
Sakarya University, Sakarya-Turkey
[email protected], [email protected]
SERVİS YÖNELİMLİ MİMARİLERDE GÜVENLİK PROBLEMLERİ İÇİN BİR MİMARİ
ÖNERİSİ
ÖZ
Servis yönelimli mimariler, oluşturulan standartlar ve web
servislerinin yaygın olarak kullanılmaya başlanmasıyla birlikte yazılım
dünyasında daha fazla yer tutmaya başlamıştır. Yeni nesil dağıtık
uygulamaların önemli bölümünü oluşturan web servisleri, servis yönelimli
mimariye geçişte en çok tercih edilen yöntemlerden bir tanesidir.
Günümüzde, servis yönelimli mimarinin doğası gereği birçok heterojen
sistemin birlikte çalışması sonucunda ortaya çıkan güvenlik sorunları,
üzerinde çalışılması gereken önemli bir konu haline gelmiştir. Yapılan
bu çalışmada, servis yönelimli mimarilerin çalışması sırasında ortaya
çıkabilecek güvenlik problemlerine (kimlik doğrulama, yetkilendirme,
hata yönetimi, vb.) çözüm getiren, her bir güvenlik konsepti için ayrı
web servislerinin tanımlandığı, esnek, ölçeklenebilir ve dağıtık mimari
temelli bir güvenlik altyapı modeli önerilmiştir. Önerilen bu mimaride,
GoF (Gang of Four) tasarım desenlerinden yapısal tasarım deseni olan
Facade model alınmıştır. Güvenlik adımlarının ayrı birer web servisi
olarak tanımlandığı bu mimari önerisinde, Facade katmanıyla eş göreve
sahip bir “Aracı Servis” oluşturularak, bu güvenlik servislerinin
birbirleri ve kullanıcıyla olan etkileşimleri oluşturulan bu servis
üzerinden dinamik olarak sağlanmaktadır.
Anahtar Kelimeler: Servis Yönelimli Mimari(SOA), Dağıtık Mimari,
Web Servisleri, Web Servis Güvenliği
AN ARCHITECTURAL PROPOSAL FOR SECURITY PROBLEMS IN SERVICE ORIENTED
ARCHITECTURES
ABSTRACT
Service oriented architectures has become more popular in the
software world with the established standards and the widespread use of
web services. Web services, which constitute an important part of the
new generation of distributed applications, are one of the most preferred
methods of transition to service oriented architecture. Today, due to
the nature of service-oriented architecture, the security problems that
arise as a result of the working of many heterogeneous systems have
become an important issue to be studied. In this study, by defining
separate web services for each security concepts, a flexible, scalable
and distributed architecture based security infrastructure model is
proposed which provides solutions for security problems (authentication,
authorization, error management, etc.) that may occur during the
operation of service-oriented architectures. This proposed architecture
is modeled according to Facade pattern that is one of the GoF (Gang of
Four) and structural design patterns. In this architectural proposal,
where security steps are defined as separate web services, an
“Intermediary Service” with the same task as the Facade layer is created
and the interaction of these security services with each other and the
user is provided dynamically through this service.
Keywords: Service Oriented Architecture (SOA), Web Services,
Distributed Architecture, Web Service Security

57
4th International Science Symposium (September 04-06, 2019),
Kiev-Ukraine (ISS2019), 1A17PB; pp:1-.
1. GİRİŞ (INTRODUCTION)
Servis yönelimli mimari (Service Oriented Architecture, SOA),
birçok uygulamanın kendi modüllerini veya fonksiyonlarını başka
uygulamalar tarafından kullanılacak şekilde tasarladığı, dağıtık
uygulamalar için ideal mimari bir kavramdır. Genellikle farklı güvenlik
yönetim sistemleri altında ve farklı koşullarda çalışan, farklı
organizasyon ve farklı platformlarda geliştirilen birden fazla web
servisinden oluşmaktadır [1]. SOA’da servislerin keşfedilebilir olması,
kendi tanımlanabilmesi, birlikte çalışabilirliği, düşük bağımlılığı ve
birleştirilebilir özelliklerde olması, kurumsal mimari tasarımı
yapılırken bu teknolojinin daha kolay kullanılabilmesine olanak tanır
[2 ve 3]. Pratikte, SOA uygulamalarının sayısındaki artışla birlikte,
geleneksel bilgi sistemi güvenlik durumlarını beraberinde getirmiştir.
Son zamanlarda, SOA’ nın web servis teknolojisini kullanarak
geliştiriliyor olması, web servis teknolojisinin birçok avantaj ve
dezavantajlarını devralıyor olması demektir. Uygulama düzeyindeki SOA
güvenliği çoğunlukla web servis güvenlik çözümleri tabanlıdır (SOAP, WS-
Security, WS-SecureConversation, WS-Policy, WS-Trust vb.) [3]. Bugün pek
çok web servis uygulaması aşırı bağımlı alt sistemlerden oluşmakta ve
bu bağımlılık, alt sistemlerden herhangi birinde yapılacak bir
değişikliğin uygulamanın tümünü olumsuz etkilemesine neden olmaktadır.
Bu kırılgan yapı, bakım maliyetlerinin yüksek olmasındaki birincil
sebeptir. Ayrıca değişen iş gereksinim ve kurallarının karşılanmasını
ve yapılması muhtemel modifikasyonları zorlaştırmaktadır [4, 5 ve 6].
Dağıtık yapıya sahip olan SOA’nın güvenli hale getirilmesi,
dağıtık sistemin süreçlerinin ve bu süreçlerin birbirleri ile iletişimi
için kullanılan yöntemlerin güvenli hale getirilmesi ile sağlanır. Bu
kapsamda yapılan çalışmada, web servislerinin kullanılabildiği, her
türlü uygulamaya adapte olabilecek şekilde bir altyapı tasarlanmış, bu
sayede, mesajların iletimi sırasında uçtan uca güvenlik, gizlilik ve
bütünlük sağlayan servis yönelimli bir yapı hedeflenmiştir. Bu
doğrultuda çalışmada, GOF (Ganf of Four) tasarım desenlerinden olan
Facade deseninin tasarım mantığı temel alınarak, sistem içerisinde yer
alan ve güvenlik için kullanılan servislerin birbirleri ile olan
bağlantıları bu desenin çalışma şekline dayandırılmıştır. Yani mimari
tasarlanırken, web servislerinde güvenliği sağlamak için kullanılan
kimlik belirleme, yetki belirleme ve hata yönetimi gibi temel olan birkaç
fonksiyonun birbirleri ile iletişimleri tamamen kesilerek ayrı web
servisleri şeklinde tasarlanmıştır. Bu servisler kullanıcı ve
uygulamalar arasına yerleştirilerek kullanıcıların geçmeleri gereken
güvenlik ölçütlerini aşamalı hale getirilmiştir.
2. ÇALIŞMANIN ÖNEMİ (RESEARCH SIGNIFICANCE)
Çalışmada web servis güvenliğinde temel olan fonksiyonlar katmanlı
şekilde ayrı ve birbirinden bağımsız birer web servisi şeklinde
tasarlanıp kullanılarak güvenilir bir alt yapı modeli oluşturulmuştur.
Web servislerinin kontrolü ve iletişimi modüler ve sisteme bağımlı
olmayan tek bir aracı servis üzerinden sağlanmıştır. Bu sayede modelin
yönetimi tek bir yere bağlanmış ve birbirinden habersiz servisler
sayesinde güvenlik arttırılmıştır. Ayrıca sistemin geliştirilmesi ve
uygulamalara entegresi kolaylaşmıştır. Tasarlanan modelin en önemli
özelliği farklı platformlarda geliştirilebilen servislerin birlikte
çalışabilmesi ve güvenlik ayarlamalarının kendi içlerinde
yapılabilmesidir. Bu özellik sistemi esnek, ölçeklenebilir ve kolay
yapılandırılabilir hale getirmektedir. Sonuç olarak, tasarlanan ve
uygulanan modelin, servis yönelimli mimariye geçiş aşamasında birçok
kurumu düşündüren güvenlik sorunlarına bir alt yapı oluşturması
hedeflenmiştir.

58
4th International Science Symposium (September 04-06, 2019),
Kiev-Ukraine (ISS2019), 1A17PB; pp:1-.
3. WEB SERVİSLERİ VE GÜVENLİĞİ (WEB SERVICES AND SECURITY)
Web servisleri, farklı programlama dilleri kullanılarak yazılmış,
farklı lokasyon ve platformlarda bulunan yazılım bileşenlerinin web
standartları kullanılarak geniş alan ağlarında yayınlanmasına izin veren
teknolojilerdir. Web servis teknolojisinin başarısının temelinde,
standart iletişim protokolü olan HTTP ve standart veri şablonu olan XML
yatmaktadır [7]. Kurumsal bütünlük ve yapının korunması, veri güvenliği
ve güvenirliği açısından web servislerinde güvenlik en çok üzerinde
durulması gereken konu haline gelmiştir. Bu nedenle, web servis
güvenliğinin anahtar konularından olan kimlik belirleme, yetkilendirme,
güvenilirlik ve bütünlük konuları derinlemesine ele alınmaya ve bunlarla
alakalı birçok fikir ortaya konmaya başlamıştır [8]. Web servis
teknolojisinin SOAP, WSDL, BPEL gibi temel bileşenlerinin tamamı XML
tabanlıdır. Dolayısıyla web servislerinde güvenlik denildiğinde XML
güvenliğiyle ilgilenilmektedir. W3C (World Wide Web Consortium)
tarafından 2002 yılında ortaya konmuş XML güvenlik standartlarının ana
parçaları ve genişletilmiş hali olan diler aşağıdaki gibidir [9, 10 ve
11].
XML İmzalama (XML-Signature): Düz XML dokümanlarına kriptografik
koruma kazandırır. Bu yapı ile bütünlük, kimlik doğrulama ve inkar
edememe sağlanmış olur
XML Şifreleme (XML-Encryption) : XML dokümanlarının şifrelenmesi
ve aynı güvenilirlikte gönderilmesi hakkında destek sağlar.
XKMS: XML-İmzalama ve XML-Şifreleme ile birlikte kullanılan genel
anahtarların (public keys) yönetimi için kullanılır.
XACML (Extensible Access Control Markup Language): Bir takım
kurallar belirterek, karmaşık yetkilendirme kararlarının
alınmasını sağlayan standart olarak tanımlanmaktadır.
Ancak güvenilir web servisleri sağlamak için yukarıda bahsedilen
güvenlik yöntemlerinden hiçbiri dağıtık web uygulamalarında tek başına
yeterli olamamaktadır. Bu durum göz önünde bulundurularak bu çalışmada
içerisinde bu güvenlik fonksiyonlarının birçoğunun beraber kullanıldığı
güvenilir bir mimari önerisinde bulunulmuştur.
4. ÖNERİLEN MİMARİ (RECOMMENDED ARCHITECTURE)
Önerilen mimaride servis yönelimli mimarilerin çalışması sırasında
ortaya çıkabilecek güvenlik sorunlarını çözmek adına, güvenlik
fonksiyonlarının web servisi olarak kullanıldığı kurumsal bir altyapı
teknoloji modeli sağlanarak web servislerinin güvenli hale getirilmesi
amaçlanmıştır. Bu kapsamda mimari tasarlanırken GoF (Gang of Four)
tasarım desenlerinden olan Facade tasarım deseninin çalışma mantığından
yararlanılmıştır.
4.1. Facade Tasarım Deseni (Facade Design Pattern)
Facade deseni alt sistemlerin üst sistemler tarafından uygulanması
sırasında yapılacak işlemlerin daha basit bir kullanımla ifade edilerek
tekrar yazılmasıdır. Yani alt sistemlerin karmaşıklığı içerisinde
kaybolmadan, sadece gerekli parametreleri baz alarak diğer sistemler
için ideal bir kullanım ortamı sağlamak bu desenin temel işlevidir.
Desenin kullanım amacı, istemcilerin sistemimizin alt parçaları olan
sınıflar, servisler veya metotlarla direkt olarak iletişime geçmelerini
engellemektir. Sistemimizin alt parçaları, istemcilerin doğrudan
kullanımına kapalıdır. İstemci ve alt sistemlerin ilişkisi başka bir
katman (facade) tarafından yönetilmektedir. Böylelikle sistem güvenliği
artırılmakla beraber, kullanım kolaylığı da artmaktadır. Sistem alt
parçaları, tamamen birbirinden bağımsız olduğundan dolayı, her bir parça
bu sistemden alınıp, başka sistemlere kolayca uygulanabilmektedir.
Facade, sistemde asıl işi yapan katman değil, asıl işi yapan katman ile

59
4th International Science Symposium (September 04-06, 2019),
Kiev-Ukraine (ISS2019), 1A17PB; pp:1-.
kullanıcı arasında çalışan bir ara katmandır. Her bir alt sistem, kendi
içerisinde başarıyla çalışmaktadır. Bu nedenle, facade katmanı sistemden
çıkarıldığında, alt sistemler çalışmaya devam edeceklerdir. İlaveten,
facade katmanı, alt sistemleri referans almasına rağmen, bunun tersi
kesinlikle yanlıştır. Eğer, alt sistemler, facade katmanını referans
alırlarsa, bu katmanının sistemdeki zorunluluğu artacaktır. Bu ise
Facade’ın kullanım mantığına aykırıdır [12]. Facade desenin UML
diyagramı ve bileşenleri Şekil1’de gösterildiği gibidir.
Şekil 1. Facade Deseni UML Diyagramı ve bileşen parça gösterimi [12]
(Figure 1. UML Diagram and component representation of Facade Pattern)
4.2. Önerilen Mimari (Recommended Architecture)
Web servis güvenliğinde kullanılan temel güvenlik standartlarının
ayrı birer web servisi olarak tasarlandığı önerilen modele ait prensipler
şu şekilde özetlenebilir.
Tasarlanan model, web servis güvenlik standartlarını
kullanmaktadır ve kolay yapılandırılabilmek ve dahil olan diğer
uygulamaların birbirine bağımlılığını düşürmek amacındadır.
Modelde güvenlik altyapı fonksiyonları web servisi olarak
tasarlanmış, web servislerinin gücünden yararlanarak uçtan uca ve
uygulama katmanında güvenliği sağlamaktadır.
Model, güvenlik servislerini tek noktadan yönetebilme özelliği
sayesinde her türlü uygulamaya kolayca entegre edilebilmektedir.
Şekil 2’de Facade deseni mantığıyla tasarlanan mimari
gösterilmektedir. Mimaride kullanılan bütün servisler Aracı Servis adı
verilen ve facade katmanıyla eş durumda olan web servisi ile
bağlantılıdırlar. Buradaki amaç kullanıcıların direk olarak Bölüm 1 ve
Bölüm 2’deki servis ve uygulamalarla iletişimi kesmek ve bu sayede daha
güvenilir bir altyapı oluşturmaktır.

60
4th International Science Symposium (September 04-06, 2019),
Kiev-Ukraine (ISS2019), 1A17PB; pp:1-.
Şekil 2. Tasarlanan mimari
(Figure 2. Proposed architecture of the system)
Tasarlanan mimarinin Bölüm 1 olarak adlandırılan kısmında; web
servislerinde güvenlik için kullanılan fonksiyonlar ayrı birer web
servisi şeklinde kullanılmış ve Kimlik Belirleme, Yetkilendirme ve Hata
Yönetimi adı verilen 3 adet web servisi oluşturularak sisteme dahil
edilmiştir. Bu servisler birbirlerinden tamamen bağımsız durumdadırlar
ve iletişimlerini Aracı Servis üzerinden yapmaktadırlar. Servislerin bu
şekilde kullanılmasının amacı, kullanıcıların belirli uygulamalara
erişirken aşması gereken güvenlik fonksiyonlarını aşamalı duruma
getirmektir. Böylelikle daha karmaşık hale gelen sistem, dinleme ya da
saldırı durumlarına karşı daha dirençli hale gelebilecektir. Bölüm 2
olarak adlandırılan kısımda; kullanıcıların direk erişmek istedikleri
uygulamalar, veri tabanları, servisler vb. bulunabilir. Bu tasarımda
temsilen Servis1 ve Servis2 olarak adlandırılan iki adet web servisi ve
bunların bağlı oldukları veri tabanları bulunmaktadır. Kullanıcının asıl
kullanmak istediği hizmetler bunlardır. Ancak öncelikle Bölüm 1 de
bulunan güvenlik kriterlerini aşmak zorundadırlar. Kullanıcılar sisteme
giriş yapmak istediklerinde bağlantı yapabildikleri tek servis Aracı
Servis’tir ve sistemdeki diğer servislerle doğrudan bağlantıları
bulunmamaktadır. Bu durum hem sistemin güvenliğini sağlamakta hem de
sisteme esneklik katmaktadır. Aracı Servis bütün servislerden referans
almaktadır. Ancak bu durumun tersi mümkün değildir. Böylece sistemdeki
servisler Aracı Servis’e bağımlı kalmamış olup, Aracı sistemden
kaldırıldığında sistemin işleyişinde bir aksaklık olmayacaktır. Aracı
Servis’in diğer servislerden referans alması sayesinde, sistemde
herhangi bir servis üzerinde yapılan değişiklik başka bir yerde
değişiklik yapmaya gerek kalmadan bütün sisteme uygulanabilecektir.
Modelde, yönetici ve genel kullanıcı olarak adlandırılan 2 tip kullanıcı
bulunacağı düşünülmüştür. Yönetici rolü, servis ekleme, silme, servis
yönetim ve bakımı gibi haklara sahiptir. Diğer kullanıcı ise belirli
rollere sahip genel kullanıcılardır ve yalnızca Bölüm 2’de bulunan
Service1 ve Service2 isimli web servislerini kullanarak yerel veya
internette bulunan veri tabanları ile veri alışverişi
yapabilmektedirler.
Sistemin kullanım senaryosu şu şekildedir;
Kullanıcı, Bölüm 2’de bulunan servis ve uygulamalara erişmek için
sisteme giriş yapmak zorundadır. Model, kullanıcının giriş istek

61
4th International Science Symposium (September 04-06, 2019),
Kiev-Ukraine (ISS2019), 1A17PB; pp:1-.
mesajı şifreleyerek Aracı Servis üzerinden Kimlik Belirleme
Servisine iletir.
Kimlik Belirleme Servisinde şifre çözülerek, kullanıcı kimlik
bilgilerine göre veri tabanından kontrol yapılır.
Buradan dönen olumlu/olumsuz cevap ile birlikte kullanıcı
bilgileri tekrar şifrelenir ve bu mesaj geriye (Aracı Servis)
gönderilir.
Aracı Servis bu mesajı aynen Yetkilendirme Servisi’ne iletir.
Gelen şifreli mesaj çözülür. Mesajın sonunda Kimlik Belirleme
Servisi’nden gelen olumsuz ifade bulunuyorsa mesaj hiç
değiştirilmeden şifreli halde geri Aracı Servis’e yollanır. Eğer
olumlu ifade eklenmişse, kullanıcı bilgilerine göre kullanıcının
hangi role ait ve nelere erişim hakkına sahip olduğu veri
tabanından belirlenir ve mesajın sonuna bu bilgiler eklenir.
Mesaj kullanıcı bilgileri ve olumlu/olumsuz cevapla birlikte
tekrar şifrelenir ve Aracı Servis’e gönderilir.
Yetkilendirme Servisi’nden gelen mesajı Aracı Servis aynen Hata
Yönetimi Servisi’ne aktarır. Burada mesajın şifresi çözülür.
Diğer 2 servis tarafından eklenen olumlu/olumsuz cevap ve rol/izin
bilgileri veri tabanına aktarılarak kayıt altına alınır.
Buralardan dönen cevaplara göre, kullanıcının istekte bulunduğu
servise erişebilip erişemediği bilgisi şifrelenerek Aracı Servis’e
gönderilir.
Aracı Servis’te gelen mesajın şifresi çözülür ve kullanıcının
Bölüm 2 ile olan bağlantısı gerçekleşir.
4.3. Mimari Tasarım Modelindeki Güvenlik Metotları
(Security Methods in Architectural Design Model)
Tasarlanan modelin güvenlik gereksinimleri ve karakteristikleri
göz önüne alındığında güvenli iletişim için kullanılması gereken bazı
özellikler bulunmaktadır. Kullanıcının Bölüm 2’de bulunan uygulamalar
ve servislere erişimi için, oluşturulan SOAP-İstek (SOAP-Request)
mesajına öncelikle kullanıcı bilgileri, geçerlilik süresi ve zaman
damgası eklenir. Geçerlilik süresini yitirmiş mesajlar işleme
alınmamaktadır, böylece sahte kimlik ile yapılan istek mesajlarının
önüne geçilebilir. Oluşturulan SOAP-İstek mesajı açık anahtar yöntemi
(PKI-Public Key Infrastructure) ile XML olarak şifrelenir [13]. Aynı
şekilde sistemdeki servisler üzerinde yapılan şifreleme ve deşifre
işlemleri de açık anahtar yönetimi ile elde edilen anahtar sayesinde
yapılmaktadır. Güvenliğin bir kat daha arttırılması için mesaja
sertifika (X509 Certificate) bilgisi de eklenebilir. Eğer SOAP mesajında
sertifika kullanıldıysa kimlik doğulama servisi bunu onayladıktan sonra
başka işlem yapmaya gerek görmeden, mesajı direk yetkilendirme servisine
iletilmek üzere Aracı Servis’e geri gönderir. SOAP-İstek mesajı ilk
gönderilirken rastgele olarak bir seçim yapılır mesaj ya Kullanıcı
Adı/Şifre (Username/Password) kullanılarak şifrelenir ya da mesaja X.509
sertifika bilgisi eklenir. Bu rastgele olan seçim kullanıcının bilgisi
dışında yapılacaktır ve böylece XML-Şifreleme ve XML-İmzalama
yöntemlerinin sağladığı güvenliğin yanında ek bir güvenlik sağlanmış
olacaktır.
Yetkilendirme işlemi sırasında kullanıcı-rol tanımlamalarının her
bir kullanıcı için manuel yapılacak olmasının kullanıcı sayısındaki
fazlalık göz önüne alındığında epey zor ve yetersiz olacağı
düşünülmüştür. Bunun aksine her bir role ait izinler ve yetkiler daha
önceden birer kural ile belirtilirse yetkilendirme işlemi dinamik olarak
yapılabilecektir. Bu nedenle Yetkilendirme Servisi’nde rol tanımlamaları
ve her bir role ait kurallar XACML kuralları olarak belirtilmiştir. Hata

62
4th International Science Symposium (September 04-06, 2019),
Kiev-Ukraine (ISS2019), 1A17PB; pp:1-.
Yönetimi Servisi, kimlik belirleme ve yetki kontrolü işlemleri sırasında
başarılı girişleri ve meydana gelen hataları tutup, onları veri tabanına
kaydetmektedir ve istendiğinde görüntülenmelerini sağlamaktadır. Ayrıca
sistemde bir kullanıcının Bölüm 2’ye erişip erişemeyeceği bu servisten
dönecek cevaba göre belirlenir. Çünkü Kimlik Belirleme ve Yetkilendirme
Servislerinden dönen bilgilerin (olumlu/olumsuz ve rol/izin) bileştiği
mesaj paketi en son buraya iletilecektir. Daha sonra Aracı Servis’e
gönderilerek kullanıcının erişimi sağlanacaktır.
5. SONUÇLAR (RESULTS)
Yapılan çalışmanın amacı, web servis güvenliğinde temel olan
fonksiyonları kullanarak, güvenilir bir alt yapı oluşturmaktır.
Tasarlanan mimaride Facade deseni mantığındaki gibi, kullanıcı ve
uygulama katmanları arasındaki ilişki tamamen kesilmiştir. Ayrıca
uygulama katmanı 2 kısma bölünerek kullanıcı erişimi 2 aşamalı hale
getirilmiştir. İlk kısım güvenlik fonksiyonları, 2. Kısım ise
kullanıcıların erişmek istedikleri uygulama ve servislerin bulunduğu
kısımdır. Güvenlik bölümünde bulunan fonksiyonlar, web servis
güvenliğinde temel fonksiyonlardan bazıları olan kimlik belirleme, yeki
belirleme ve hata yönetimidir. Bu fonksiyonların her biri ayrı birer web
servisi şeklinde tasarlanmıştır ve birbirleriyle olan iletişimleri
kesilerek Aracı Servis adı verilen servis üzerinden haberleşmektedirler.
Aracı Servis desendeki Facade katmanıyla eş göreve sahip bir servis
olarak düşünülmüştür. Aracı Servis bütün servislerden referans alarak
çalışmaktadır ancak bu servisin sistemden çıkarılması sistemin bütününde
herhangi bir aksaklığa sebep olmayacaktır. Çünkü diğer servislerin buna
bir bağımlılığı bulunmamaktadır. Bu şekilde sistemde güvenliğin
merkezileştirilmesi hedeflenmiştir. Böylece model üzerinde yapılacak
ayarlamalar ve modelin yönetimi kolaylaşmış, güvenlik tek bir yere
toplanmış, bağımsız ve birbirinden habersiz servisler oluşturarak
güvenliği arttırılmaya çalışılmıştır. Bu mantık sayesinde sistemin
geliştirilmesi ve uygulamalara entegresi kolaylaşmıştır. Sonuç olarak;
servislerin birbiriyle iletişiminin kesilmesi, her bir servisin güvenlik
ayarlarının kendi içinde yapılması, farklı platformlarda yazılmış
servislerin birlikte çalışabilmeleri ve yeni servislerin sisteme
eklenmesindeki kolaylık sayesinde oluşturulan sistem daha güvenilir,
genişletilebilir, esnek, kolay ayarlama yapılabilir, dağıtılabilir ve
servis yönelimli bir yapıya sahip olduğu düşünülmektedir. Ayrıca
oluşturulan modelin, servis yönelimli mimariye geçiş aşamasında birçok
kurumu düşündüren güvenlik sorunlarına bir alt yapı oluşturması
hedeflenmiştir.
KAYNAKLAR (REFERENCES)
[1] Warschofsky, R., Menzel, M., and Meinel, C. (2010).
Transformation and Aggregation of Web Service Security
Requirements. 2010 Eighth IEEE European Conference on Web
Services, pp:43–50.
[2] Ono, K., Nakamura, Y., Satoh, F., and Tateishi, T., (2007).
Verifying the Consistency of Security Policies by Abstracting
into Security Types. 2007 IEEE International Conference on Web
Services, pp:497–504.
[3] Geric, S., (2010). Security of Web Services based Service-
oriented Architectures. MIPRO 2010, Opatija, pp:1250-1255.
[4] Sathiaseelan, J.G.R., Rabara, A.S., and Martin, R.J., (2010).
Multi-Level Secure Architecture for Distributed Integrated Web
Services. Computer Science and Information Technology (ICCSIT)
3rd IEEE International Conference, pp:180–184.
[5] Challagulla, S., (2004). Design and Development of an
Authorization and Authentication Web Service. Master of Science

63
4th International Science Symposium (September 04-06, 2019),
Kiev-Ukraine (ISS2019), 1A17PB; pp:1-.
in Technology, Division of Computing Studies, Arizona State
University. 2004.
[6] Zhang, W., (2010). Integrated Security Framework for Secure Web
Services. Third International Symposium on Intelligent
Information Technology and Security Informatics, IEEE, pp:178-
183.
[7] Sun, L. and Li. Y., (2008). XML and Web Services Security.
Computer Supported Cooperative Work in Design, CSCWD 12th
International Conference, pp:765-770.
[8] Nordbotten, N.A., (2009). XML and Web Service Security
Standards, IEEE Communication Survey&Tutorials, 114-21.
[9] Rosenberg, J. and Remy, D., (2004). Securing Web Services with
WS-Security: Demystifying WS-Security, WS-Policy, SAML, XML
Signature, and XML Encryption. Sams Publishing; 1 Edition.
[10] Mirtalebi, A. and Khayyambashi, M.R., (2011). Enhancing Security of Web Service Against WSDL Threats. Emergency Management and
Management Sciences, ICEMMS 2nd IEEE International Conference,
pp:920-923.
[11] Simon, B., Goldschmidt, B. and Kondorosi, K., (2015). A Performance Model for the Web Service Protocol Stacks. IEEE
Transactions on Services Computing, 8(5):644-657,
DOI: 10.1109/TSC.2014.2338866.
[12] Gamma, E., Helm, R., Johnson, R., and Vlissides, J., (1994). Design Patterns: Elements of Reusable Object-Oriented Software.
Addison-Wesley.
[13] Alrawais, A., Alhothaily, A., Cheng, X., Hu, C., and Yu, J., (2018). SecureGuard: A Certificate Validation System in Public
Key Infrastructure. IEEE Transactions on Vehicular Technology,
67(6):5399-5408. DOI: 10.1109/TVT.2018.2805700.

4th International Science Symposium Status: Proceeding Book
ISS2019 (September 4-6, 2019) ID : 2019.1A18PB
Fatma Işık
Ünkan Urgancı
Pamukkale University, Denizli-Turkey
[email protected]; [email protected]
NEW APPROACHES TO THE EVALUATION OF POMEGRANATE PEEL: A BIOACTIVE
COMPONENT RICH WASTE
ABSTRACT
Turkey is one of the main pomegranate producing countries with
537.847 tons produced in 2018 alone. In addition to the pomegranate
being widely consumed fresh, it can be also found in processed forms,
including juice, wine, jam, sour sauce and etc. During the processing,
26–40% of the fruit is discarded as peels. Pomegranate peel contains a
wide variety of phenolic compounds which include mainly ellagitannins,
anthocyanins and proanthocyanidins and it has a high level of dietary
fibers. In recent years, utilization of pomegranate peel powder and
extract has been experienced in various foods such as breads, muffins,
biscuits, meat and meat products, ice cream, jellies and edible oils.
Various studies have showed that pomegranate peel supplementation in
foods resulted in nutritional enhancement of the products;
additionally it has provided storage stability that considered to be a
healthier additive for food preservation. In this study, the results
of studies which foods supplemented with pomegranate peel will be
discussed in detail.
Keywords: Pomegranate Peel, Phenolics, Antioxidant Activity,
Foods, Nutritional
1. INTRODUCTION In recent years, increases of food waste have become an
irrepressible problem in developed world. Food and Agriculture
Organization of the United Nations (FAO) has published a report says
1/3 (approximately 1.3 billion tons/year) of all food produced
globally is lost or goes to waste. It was estimated 54% of the wastes
are derived from the first stage of production (harvesting and
storage) and the rest are further stages (processing, packing and
transportation etc.). The same report argues that the annual waste
amount per person has been estimated to be between 95-115kg in high
and middle income countries such as European and Northern American
countries, on the other hand, it is 6-11kg for low income countries
such as Sub Saharan Africa and Southeast Asia countries (FAO 2013).
Pomegranate (Punica granatum L.) belongs to the family of Punicaceae
and is a widely grown horticulture crop in various tropical and
subtropical countries (Golukcu et al., 2005; Kurt and Sahin, 2013).
Over 1000 cultivars of P. granatum exist and are native to the Middle
East, and spread to the Mediterranean parts, eastward to China and
India, then onto Middle and South America (Gundogdu et al. 2015).
Turkey is one of the main pomegranate producing countries in the
World, with 537,847 tons produced in 2018 alone (Oztop, 2010; TUIK,
2019).
As a bioactive components rich fruit, a wide body of literature
exist regarding pomegranate’s composition, storage and utilization
were carried out. Previous studies show that pomegranate leaves,
seeds, membranes and peels include significant amounts of bioactive

65
4th International Science Symposium (September 04-06, 2019),
Kiev-Ukraine (ISS2019), 1A18PB; pp:64-73.
compounds (Golukcu, et al., 2005; Akbulut, et al., 2010; Ullah, et
al., 2012; Al-Rahawi, et al., 2013; Ismail, et al., 2014; Romelle, et
al., 2016). Pomegranate also includes Zn, Mn, Fe, P, Mg, Ca and K
minerals (Ullah, et al., 2012; Kushwaha, et al., 2013). Table 1
indicates some chemical properties of pomegranate peels (Urganci,
2019).
Table 1. Some chemical properties of pomegranate peels
Component Amount (%)*
Protein 2.63
Fat 3.48
Ash 4.12
Carbohydrates 45.28
Soluble Dietary Fiber 8.15
Insoluble Dietary Fiber 35.34
Total Dietary Fiber 43.49
*: in dry basis
a: carbohydrates except dietary fibers
In recent years, researchers have showed momentous interest to
non-edible parts of pomegranate. Mainly these studies have focused on
phenolic compounds and antioxidant activity of pomegranate peel and
its extraction methods (Hasnoui, et al., 2014). In addition to its
high level of antioxidant activity, pomegranate peel is also a great
source of dietary fiber with 72.68/100g (Viuda-Martos, et al., 2013;
Gullon, et al., 2015). Thanks to its high dietary fiber content,
pomegranate peel powder has a high level of water absorption capacity
(5.03g/g) and oil absorption capacity (6.60g/g) which can provide
technological benefits to processed foods (Viuda-Martos, et al., 2013;
Hasnaoui, et al., 2014).
2. RESEARCH SIGNIFICANCE
In addition to fresh consumption of pomegranate, it is also used
to produce into processed foods such as pomegranate juice, wine and
sauce etc. (Golukcu, et al., 2005). During the pomegranate processing,
50% of the fruit is discarded as waste which are seeds, internal
membranes and peels (Topkaya and Isik, 2019). This waste is used as
fertilizer, or in the best case, as animal feed with no significant
added value. However, these composed nonedible parts, especially the
peels of the pomegranate are considered one of the most valuable by-
products of the food industry. In this study, the results of
researches on foods supplemented with this valuable by-product
pomegranate peel will be discussed in detail.
3. ANTIOXIDANTS Antioxidants are defined as molecules that fight against
oxidation or inhibit peroxide reactions. These molecules are used to
extend shelf life in food systems. As the biological approach,
antioxidants are substances that can prevent or slow damage to living
cells caused by free radicals and unstable molecules such as
carbohydrates, lipids, proteins and DNA that can be oxidized by
atmospheric oxygen. The sources of antioxidants can be natural or
artificial. In food industry, antioxidants are utilized widely,
including reduces the effects of lipid oxidation and dietary
antioxidants (Oztan, 2006; Kasapcopur, Ozel, and Birdane, 2014).
Antioxidants show preservative characteristic by inactivating
free radicals that are the by-products of cell metabolism. Free
radicals and their producers are defined as oxidants or prooxidants

66
4th International Science Symposium (September 04-06, 2019),
Kiev-Ukraine (ISS2019), 1A18PB; pp:64-73.
(Oztan, 2006). Free radicals are also defined as uncharged molecules
having an unpaired valence electron (Meral, et al., 2012).
Antioxidants terminate the free radical chain reaction by donating its
hydrogen or electrons to free radicals thus converting them to more
stable products (Nanditha and Prabhasankar, 2009).
Initiation: ROO* + AH → ROOH + A*
Propagation: ROO* + A. → ROOA
Termination: A* + A* → A-A
Primary antioxidants delay or inhibit the initiation step of
oxidation by reacting with a fat free radical (R*) or inhibit the
propagation step by reacting with the peroxy (ROO*) or alkoxy (RO*)
radicals (Apaydin 2008; Nanditha and Prabhasankar 2009). Moreover,
antioxidants prevent DNA mutation, lipid peroxidation and protein
crosslinking (Oztan, 2006; Meral, et al., 2012). The high level of
antioxidant activity of pomegranate peel was proven in many studies
(Guo, et al., 2003; Apaydin, 2008; Topkaya and Isik, 2019).
Pomegranate peel is rich in phenolic compounds that show antioxidant
activity, especially flavonoids (anthocyanins, catechin and other
complex flavonoids) and tannins (punicalin, punicalagin, gallic acid
and ellagic acid) (Ismail, et al. 2012).
According to Li, et al., (2006), pomegranate peel extract
(249.40mg/g) has phenolic compounds 10 times more than pomegranate
pulp extracts (24.40mg/g). Guo et al. (2003) reported the antioxidant
activities of pomegranate pulp, seed and peel as 3.10, 0.72 and
82.11mmol/100g respectively. In the same study, the researches have
investigated the antioxidant activities of 28 individual fruit pulps,
seeds and peels. The results have showed that pomegranate peel has
fairly higher antioxidant activity compared with the rest. Pomegranate
peel were followed by hawthorn peel (29.25mmol/100g), red grape peel
(11.02mmol/100g) and mango peel (10.13mmol/100g). Red grape seed is
considered to be an antioxidant rich waste, but it has showed lower
antioxidant activity (55.54mmol/100g) than pomegranate peel.
It was reported that phenolics in pomegranate peel also show
antimicrobial activity by inhibiting enzymes and changing the
substrate formation in addition to its antioxidant activity (Topkaya
and Isik, 2019). Previous studies proved that pomegranate peel is
effective on numerous microorganisms such as Aspergillus niger,
Staphylococcus aureus, Pseodomonas stutzeri, Bacillus subtilis and B.
brevis, Escherichia coli, Candida albicans (Ibrahim, 2010; Teixeira da
Silva, et al., 2013; Zoral and Turgay, 2014). Mainly as a result of
its high antioxidant activity, numerous studies have been conducted to
use pomegranate peels in food systems such as bakery, dairy and meat
products.
4. THE USE OF POMEGRANATE PEEL IN FOODS 4.1. Pomegranate Peels in Bakery Products
Bakery products are the most consumed food group in the World
with various kinds such as breads, cakes, biscuits, etc (Karabudak, et
al., 2013). The use of pomegranate peel powder in bakery products is
more suitable than other foods, due to its taste and physical
properties. Bakery products were determined to be suitable to contain
high levels of pomegranate peel powder supplementation (Topkaya and
Isik, 2019). Pomegranate peel is used to add bioactive function, as
well as to delay the oxidation and to increase the shelf life of
bakery products. The peels were used in as powder form or as its
extracts in various studies.
Topkaya and Isik, (2019) conducted a study on chemical and
physical properties along with consumer acceptance of muffins enriched
with pomegranate peel powder in different ratios. The muffins were

67
4th International Science Symposium (September 04-06, 2019),
Kiev-Ukraine (ISS2019), 1A18PB; pp:64-73.
compared with regards to moisture, crude protein, fat, ash, dietary
fiber, mineral content, antioxidant activity, total phenolic
compounds, textural and appearance features. The researchers found the
muffin samples were acceptable up to 15% by the consumers. The main
changes occurred in phenolic content, antioxidant activity and dietary
fiber content of the muffins. The phenolic compound of muffins with
5%, 10% and 15% pomegranate peel powder were found 3.1, 4.8 and 7.0
times higher than control cakes respectively. In the same way,
antioxidant activities were higher 10.3, 22.2 and 28.5 times
respectively. The total dietary fiber of control sample was 2.36%
while 15% pomegranate peel powdered cake’s was 6.48%. The researchers
suggested that pomegranate peel can be used to enrich muffins in terms
of dietary fiber. There were also significant increases in K, Ca and
Mg contents of cakes with the addition of pomegranate peel.
Ismail et al. (2014) investigated the bioactive potential of
using 1.5, 3, 4.5, 6 and 7.5% of pomegranate peels in cookies. They
determined the changes in chemical and sensory properties as well as
shelf life of cookies prepared with pomegranate peel powder. They
found that pomegranate peel addition increased significantly the
dietary fiber (0.32-1.96%) and phenolic compounds (90.70–161.90
mgGAE/100g) of the cookies. Moreover, pomegranate peel addition
delayed the oxidation of the cookies in 4 months of storage.
Prithwa and Sauryya (2015) added 2.5, 5, 7.5 and 10% pomegranate
peel powder in cookies and determined the antioxidant profile and
consumer acceptance of the samples. The control cookies had 35.00 GAE
μmol/g antioxidant activity and 100.29 GAE μmol/g phenolic content
while 10% pomegranate peel powdered cookies had 102.00 GAE μmol/g
antioxidant activity and 207.05 GAE μmol/g phenolic content. They
reported that pomegranate peel powder can be used to enrich cookies
with not changing rheological and sensory features of the cookies.
Omar and Mehder (2013) prepared flat bread with 1, 2 and 5% of
pomegranate peel powder addition and investigated the changes in
chemical composition of the bread samples. The researchers found the
dietary fiber content of control bread was 1.32% while it was 4.82%
for breads with 5% of pomegranate peel powder. On the other hand,
pomegranate peel addition increased the fermentation time of the
bread. Bread samples with 1% of pomegranate peel powder addition
received the closest score to control breads in sensory analysis.
Altunkaya, et al., (2013) conducted a study on effects of
pomegranate peel powder addition in bread making. They added
pomegranate peel powder in various ratios (0-10g/100g) in bread
formulation and observed the changes in bread for 5 days. The
researchers found antioxidant activity values of the breads between
1.8 and 6.8 TE/g, and they did not find any significant change in
antioxidants during 5 days of storage. Moreover, they reported that
using pomegranate peel powder delayed the oxidation in breads. In
sensory analysis, they found that breads were acceptable up to 2.5% of
pomegranate peel substitution.
4.2. Pomegranate Peels in Dairy Products
Dairy products are one of the most promising foods considering
their antioxidant potential and diversity of antioxidant molecules.
Natural antioxidants supplementation in dairy products manufacturing
is progressively applied to improve nutritional and therapeutic
properties. Pomegranate peel extract is one of the natural
antioxidants that was researched to use in various dairy products.
El-Said, et al., (2014) investigated the radical scavenging
activity, total phenolic content, total flavonoids content, as well as
sensory and viscosity properties of stirred yoghurt fortified with 5,

68
4th International Science Symposium (September 04-06, 2019),
Kiev-Ukraine (ISS2019), 1A18PB; pp:64-73.
10, 15, 20, 25, 30 and 35% aqueous extracts (1.67%) of pomegranate
peel. The researchers reported that increasing the ratio of the added
pomegranate peel extract significantly increased the antioxidant
activities of stirred yoghurt of up to 25%, and further increase of
the extracts led to no significant effect. Furthermore, they did not
find significant difference in yoghurts with extracts on sensory
attributes compared to control samples. Contrary to this, the addition
of aqueous extracts led to a decrease in viscosity in yoghurt samples.
Kennas, et al., (2018) conducted a study on fortifying yoghurt
powder with pomegranate peel powder (0-10%) with honey (0-5%) to
determine some chemical, physical and sensory properties of the
samples. They found that fortifying pomegranate peel powder provided
stability in yoghurt powder with increasing the glass transition
temperature value (T8). Furthermore, fortified yoghurt powders showed
higher phenolic content and consequently higher level of antioxidant
activity compared to control samples. The researchers concluded that
physical and physicochemical properties of yoghurt with pomegranate
peel powder and honey was acceptable, moreover this addition can
improve its shelf life.
Cam, et al., (2013) prepared ice creams with addition of 0.1%
and 0.4% of pomegranate peel powder and realized some chemical,
physical and sensory analyses. Researchers found significant changes
in the pH, total acidity and color properties of the ice cream
samples, but most importantly, they determined improvements in
phenolic content, antioxidant activity and antidiabetic properties of
the ice creams. In addition, both ice cream samples with pomegranate
peel enrichment were found acceptable by consumers. Researchers
suggested that ice cream enriched with pomegranate can be introduced
to markets as a functional food with its health benefits.
Singh and Immanuel (2014) fortified Paneer cheese of India with
1, 2 and 3% of pomegranate, lemon and orange peel aqueous extracts
(10%) and investigated extract’s effect on peroxide values of the
cheese samples. As expected, researchers found the highest antioxidant
activity in pomegranate peel powder extracts. They found the lowest
peroxide value in the cheese fortified with 3% of pomegranate peel
extract. In sensory analysis, cheeses with pomegranate peel extracts
of up to 2% were acceptable according to the panelists. The researches
submitted pomegranate peel extracts can be used to prevent rancidity
and increase the shelf life.
Sandhya, et al., (2018) conducted a study to evaluate the
functional properties and storage stability of pomegranate peel
extract powder in curd. For this aim, the researches prepared curds
with 3 different concentrations (0.5, 1, and 1.5%) of pomegranate peel
extract powder and realized some chemical, microbiological and sensory
tests. They determined that antioxidant activity and total phenolic
content of the curd samples increased with increasing of extract in
the formulation. However, the sensory attributes decreased in higher
extract concentrations. Thus, the researchers recommended to use of
pomegranate peel extract powder up to 1%. In addition to its
antioxidant benefits, pomegranate peel extract powder added curd had
longer shelf life compared to control samples in 6 days of storage.
4.3. Pomegranate Peels in Meat Products
Meat and meat products are highly consumed worldwide and
produced through various kinds that is considered as a great source of
high biological value protein, iron, zinc and vitamins. Fresh meat is
under constant oxidizing conditions that causes spoilage and quality
loses in the product. Muscle food is mostly stored in freezing
conditions or processed in further goods such as sausages, hams,

69
4th International Science Symposium (September 04-06, 2019),
Kiev-Ukraine (ISS2019), 1A18PB; pp:64-73.
bacons and salami etc. in order to preserve meat for a longer shelf
life. It was reported in previous studies that present applications to
preserve meat might be insufficient. In recent years, researches,
researches have been investigating the use of natural antioxidants
including pomegranate peel extracts in meat and meat products to
improve the oxidative stability (Pal, 2014; Jay, et al., 2005; Pal and
Devrani, 2018).
Turgut, et al., (2017) investigated the effect of pomegranate
peel extract on to retard lipid and protein oxidation in frozen
meatballs during storage at -18oC. The researchers used 0.5 and 1.0%
aqueous extracts of pomegranate peels in meatballs and compared the
results with control meatballs as well as samples with 0.01% butylated
hydroxytoluene (BHT). After 6 months of storage, they detected that
peroxide, malondialdehyde and carbonyl formation, and loss of total
protein solubility were lower in meatball samples with high level of
pomegranate peel extracts. Moreover, using pomegranate peel extract
was effective to prevent rancid odour formation and meatballs with
pomegranate peel extract received higher sensory scores. Also, Morsy,
et al., (2018) investigated the antioxidant and antimicrobial effect
of pomegranate peels in different concentrations (1 and 1.5%) and
compared with 0.01% BHT. Similarly, with the previous study, meatballs
with high level of pomegranate peel extract inhibited the increase of
peroxide, thiobarbituric acid reactive substances and total volatile
base nitrogen values compared to the other samples. Furthermore, the
researchers reported that using pomegranate peel extract decreased the
microbial load in meatballs and did not affect the sensory properties
of the samples. In both studies, the researchers determined that
pomegranate peel extract was effective to increase the shelf life of
meatballs by retarding the lipid and protein oxidation.
Naveena, et al., (2008) evaluated the antioxidant effect of
pomegranate peel powder extract on chicken patties and compared the
results with patties with vitamin C during refrigerated storage. Thus,
chicken patties were prepared with 5, 10, 15 and 20mg/100g of
pomegranate peel powder extract and 50mg/100g of vitamin C. Chicken
patties with pomegranate peel extract showed significantly higher
reducing power and DPPH radical scavenging activity. In addition,
samples with 20mg of pomegranate peel extract had 50% more phenolic
content (tannic acid equivalent) compared to control samples. The
researchers reported that chicken patties with pomegranate peel powder
extract addition exhibited significantly lower lipid oxidation
compared to samples with vitamin C. Additionally, pomegranate peel
extract supplementation did not affect the sensory attributes of
chicken patties.
Devatkal, et al., (2010) investigated the antioxidant effect of
natural extracts derived from pomegranate peel powder, pomegranate
seed powder and kinnow peel powder in goat meat patties. 10ml aqueous
(10%) extracts from each fruit by-products were added to 2kg of minced
goat meat and cooked in the oven. In the results, goat meat patties
with pomegranate peel powder extract had higher
antioxidant activity and total phenolic content compared to other
patties with extracts and control patties. Consequently, goat meat
patties enriched with pomegranate peel powder reduced lipid oxidation
more than the other samples. It was concluded the natural antioxidant
extracts, especially extracts of pomegranate peel powder, can be
replaced with synthetic antioxidants.
Fang, et al., (2013) studied the use of pomegranate peel extract
at different concentrations (0, 7.5 and 15g/L) on the melanosis
formation and quality changes of white shrimps during ice storage. The
researchers determined that melanosis formation was inhibited

70
4th International Science Symposium (September 04-06, 2019),
Kiev-Ukraine (ISS2019), 1A18PB; pp:64-73.
significantly while sensory properties were improved in shrimps with
pomegranate peel extract. Similarly, the increase of pH and total
volatile basic nitrogen were significantly inhibited in shrimps with
pomegranate extract compared to control samples. In another study,
Yuan, et al., (2016) investigated the quality changes and
microbiological aspects of frozen white shrimp coated with chitosan
combined with pomegranate peel powder during storage. 1.5% of
pomegranate peel extract and 1% chitosan solution were used separately
and combined together for coating shrimps as 1:2 (w/v)
shrimp/solution. As result, the increase in total aerobic plate
counts, pH and total volatile basic nitrogen values were inhibited in
shrimps coated with chitosan + pomegranate peel powder extract,
compared with control and other samples coated with pomegranate peel
extract or chitosan only. The researchers suggested that there is a
synergistic effect between chitosan and pomegranate peel powder
extract.
5. CONCLUSION The addition of pomegranate peels in bakery, dairy and meat
products has met acceptance for the retardation of oxidation and
development of bioactive components in foods. Additionally,
pomegranate peels are used to prolong the shelf life of the products
with no side effects contrarily to synthetic antioxidants. Future
studies are needed to determine the usage of pomegranate peel in
different kind of food products.
REFERENCES
[1] Akbulut, G., Yildiz, A. ve Yalinca, R., (2010). Nar: Bileşimi ve
Potansiyel Sağlık Etkileri. Kafkas Üniversitesi Fen Bilimleri
Enstitüsü Dergisi. 3(2):53-64.
[2] Altunkaya, A., Hedegaard, R.V., Brimer, L., Gokmen, V., and
Skibsted, L.H., (2013). Antioxidant Capacity Versus Chemical
Safety of Wheat Bread Enriched with Pomegranate Peel Powder.
Food Function. 4:722-727.
[3] Al-Rawahi, A.S., Rahman, M.S., Guizani, N., and Essa, M.M.,
(2013). Chemical Composition, Water Sorption Isotherm, and
Phenolic Contents in Fresh and Dried Pomegranate Peels. Drying
Technology, 31:257-263.
[4] Apaydin, E., (2008). Nar Suyu Konsantresi Üretim ve Depolama
Sürecinde Antioksidan Aktivitedeki Değişimler. Ankara
Üniversitesi Fen Bilimleri Enstitüsü Yüksek Lisans Tezi. Ankara.
[5] Cam, M., Erdogan, F., Aslan, D., and Dinc, M., (2013).
Enrichment of Functional Peoperties of Ice Cream with
Pomegranate By-Products. Journal of Food Science. 78(10):1543-
1550.
[6] Devatkal, S.K., Narsaiah, K., and Borah, A., (2010). Anti-
oxidant effect of extracts of Kinnow Rind, Pomegranate Rind and
Seed Powders in Cooked Goat Meat Patties. Meat Science. 85:155-
159.
[7] El-Said, M., Haggag, H.F., El-Din, H.M.F., Gad, A.S., and
Farahat, A.M., (2014). Antioxidant Activities and Physical
Properties of Stirred Yoghurt Fortified with Pomegranate Peel
Extracts. Annals of Agriculture Science. 59(2):207-212.
[8] Fang, X., Sun, H., Huang, B., and Yuan, G., (2013). Effect of
Pomegranate Peel Extract on the Melanosis of Pacific White
Shrimp (Litopenaeus vannamei) During Iced Storage. Journal of
Food, Agriculture & Environment. 11(1):105-109.
[9] FAO, I, WFP, (2013). The State of Food Insecurity in the World
2013.

71
4th International Science Symposium (September 04-06, 2019),
Kiev-Ukraine (ISS2019), 1A18PB; pp:64-73.
[10] Golukcu, M., Tokgoz, H. ve Celikyurt, M.A., (2005). Nar Çekirdeğinin Bazı Özellikleri Ve Nar Çekirdeği Yağının Yağ Asiti
Bileşimi. Derim. 2:33-40.
[11] Gullon, B., Pintado, M.E., Fernandez-Lopez, J., Perez-Alvarez, J.A., and Viuda-Martos, M., (2015). In Vitro Gastrointestinal
Digestion of Pomegranate Peel (Punica granatum) Flour Obtained
from Co-Producs: Changes in the Antioxidant Potential and
Bioactive Compounds Stability. Journal of Functional Foods.
19:617-628.
[12] Guo, C., Yang, J., Wei, J., Yunfeng, L., Xu, J., and Jiang, Y., (2003). Antioxidant Activities of Peel, Pulp and Seed Fractions
of Common Fruits as Determined by FRAP Assay. Nutrition
Research. 23:1719-1726.
[13] Gundogdu, M., Yilmaz, H. ve Canan, İ., (2015). Nar (Punica granatum L.) Çeşit ve Genotiplerin Fizikokimyasal
Karakterizasyonu. Uluslararası Tarım ve Yaban Hayatı Bilimleri
Dergisi. 1(2):57-65.
[14] Hasnaoui, N., Wathelet, B., and Jimenez-Araujo, A., (2014). Valorization of Pomegranate Peel from 12 Cultivars: Dietary
Fibre Composition, Antioxidant Capacity and Functional
Properties. Food Chemistry. 160:196-203.
[15] Ibrahim, M.I., (2010). Efficiency of Pomegranate Peel Extract as Antimicrobial, Antioxidant and Protective Agents. World Journal
of Agricultural Sciences. 6(4):338-344.
[16] Ismail T., Akhtar, S., Riaz, M., and Ismail, A., (2014). Effect of Pomegranate Peel Supplementation on Nutritional, Organoleptic
and Stability Properties of Cookies. International Journal of
Food Sciences and Nutrition, 65(6):661-666.
[17] Ismail, T., Sestili, P., and Akhtar, S., (2012). Pomegranate Peel and Fruit Extracts: A Review of Potential Anti-Inflammatory
and Anti-Infective Effects. Journal of Ethnopharmacology.
143:397-405.
[18] Jay, J.M., Loessner, M.J., and Golden, D.A., (2005). Modern Food Microbiology. 7th Ed., Springer Science and Business Media. NY.
pp:63-101.
[19] Karabudak, E., Basoglu, S., Turnagol, H., Bedir Ozbay, G. ve Turkozu, D., (2013). Pastacılık Ürünlerinin Enerji ve Besin
Değerleri İle Diyet Değişim Listelerindeki Karşılıklarının
Değerlendirilmesi. Gıda Dergisi. 38(4):231-238.
[20] Kasapçopur Özel, G.S. ve Birdane, Y.O., (2014). Antioksidanlar. Kocatepe Vet. J. 7(2):41-52.
[21] Kennas, A., Amellal-Chibane, H., Kessal, F., and Halladj, F., (2018). Effect of Pomegranate Peel and Honey Fortification on
Physicochemical, Physical, Microbiological and Antioxidant
Properties of Yoghurt Powder. Journal of the Saudi Society of
Agricultural Sciences. DOI: 10.1016/j.jssas.2018.07.001
[22] Kurt, H. ve Sahin, G., (2013). Bir ziraat çalışması: Türkiye’de nar (Punica granatum L.) tarımı. Marmara Coğrafya Dergisi.
27:551-574.
[23] Kushwaha, S.C., Bera, M.B., and Kumar, P., (2013). Nutritional Composition of Detanninated and Fresh Pomegranate Peel Powder.
IOSR Journal of Environmental Science, Toxicology and Food
Technology. 7(1):38-42.
[24] Li, Y., Guo, C., Yang, J., Wei, J., Xu, J., and Cheng, S., (2006). Evaluation of Antioxidant Properties of Pomegranate Peel
Extract in Comparison with Pomegranate Pulp Extract. Food
Chemistry. 96:254-260.

72
4th International Science Symposium (September 04-06, 2019),
Kiev-Ukraine (ISS2019), 1A18PB; pp:64-73.
[25] Meral, R., Dogan, İ.S. ve Kanberoglu, G.S., (2012). Fonksiyonel Gıda Bileşeni Olarak Antioksidanlar. Iğdır Üniversitesi Fen
Bilimleri Enstitüsü Dergisi. 2(2):45-50.
[26] Morsy, M.K., Mekawi, E., and Elsabagh, R., (2018). Impact of Pomegranate Peel Nanoparticles on Quality Attributes of
Meatballs During Refrigerated Storage. LWT–Food Science and
Technology. 89:489-495.
[27] Nanditha, B. and Prabhasankar, P., (2009). Antioxidants in Bakery Products: A Review. Critical Reviews in Food Science and
Nutrition. 49:1-27.
[28] Naveena, B.M., Sen, A.R., Kingsly, R.P., Singh, D.B., and Kondaiah, N., (2008). Antioxidant Activity of Pomegranate Rind
Powder Extract in Cooked Chicken Patties. International Journal
of Food Science and Technology. 43:1807-1812.
[29] Omar, A. and Mehder, A., (2013). Pomegranate Peels Effectiveness in Improving the Nutritional, Physical and Characteristics of
Pan Bread. Current Science International. 2(2):8-14.
[30] Oztan, T., (2006). Mor Havuç, Konsantresi, Şalgam Suyu, Nar Suyu ve Nar Ekşisi Ürünlerinde Antioksidan Aktivitesi Tayini ve
Fenolik Madde Profilinin Belirlenmesi. İstanbul Teknik
Üniversitesi Fen Bilimleri Enstitüsü Yüksek Lisans Tezi.
İstanbul.
[31] Oztop, A., Kececi, M. ve Kivradim, M., (2010). Antalya Ilinde Nar Zararlıları Üzerine Araştırmalar. Batı Akdeniz Tarımsal
Araştırma Enstitüsü Derim Dergisi. 27(1):12-17.
[32] Pal, M. and Devrani M., (2018). Application of Various Techniques for Meat Preservation. J. Exp. Chem. 4(1):134.
[33] Pal, M., (2014). Preservation of various foods. Addis Ababa University College of Veterinary Medicine and Agriculture Ph.D.
Lecture Note. Debre Zeit, Ethiopia. Pp.1-11.
[34] Prithwa, P. ve Sauryya, B., (2015). Antioxidant Profile and Sensory Evaluation of Cookies Fortified with Juice and Peel
Powder of Fresh Pomegranate (Punica granatum). International
Journal of Agricultural and Food Science. 5(3):85-91.
[35] Romelle, F.D., Rani P., A., and Manohar, R.S., (2016). Chemical Composition of Some Selected Fruit Peels. European Journal of
Food Science and Technology. 4(2):12-21.
[36] Sandhya, S., Khamrui, K., Prasad, W., and Kumar, M.C.T., (2018). Preparation of Pomegranate Peel Extract Powder and Evaluation of
Its Effect on Functional Properties and Shelf Life of Curd. LWT–
Food Science and Technology. 92:416-421.
[37] Singh, S. and Immanuel, G., (2014). Extraction of Antioxidants from Fruit Peels and Its Utilization in Paneer. J. Food Process
Technol. 5(7):349.
[38] Teixeira da Silva, J.A., Rana, T.S., Narzary, D., Verma, N., Meshram, D.T., and Ranade, S.A., (2013). Pomegranate Biology and
Biotechnology: A Review. Scientia Horticulturae. 160:85-107.
[39] Topkaya, C. ve Isik, F., (2019). Effects of Pomegranate Peel Supplementation on Chemical, Physical and Nutritional Properties
of Muffin Cakes. Journal of Food Processing and Preservation.
doi: 10.1111/jfpp.13868.
[40] TUIK, (2019). Türkiye İstatistik Kurumu bitkisel üretim istatistikleri. http://www.tuik.gov.tr/PreTablo.do?alt_id=1001
[41] Turgut, S.S., Isikci, F., and Soyer, A., (2017). Antioxidant Activity of Pomegranate Peel Extract on Lipid and Protein
Oxidation in Beef Meatballs During Frozen Storage. Meat Science.
129:111-119.
[42] Ullah, N., Ali, J., Khan F.A., Khurram, M., Hussain, A., Rahman, I., and Rahman, Z., (2012). Proximate Composition, Minerals

73
4th International Science Symposium (September 04-06, 2019),
Kiev-Ukraine (ISS2019), 1A18PB; pp:64-73.
Content, Antibacterial and Antifungal Activity Evaluation of
Pomegranate (Punica granatum L.) Peels Powder. Middle East
Journal of Scientific Research. 11(3):396-401.
[43] Urganci, U., (2019). Modifiye Atmosferde Paketlenmiş Nar Kabuğu Ilaveli Bisküvilerin Kalite Özelliklerinin Belirlenmesi.
Pamukkale Üniversitesi Fen Bilimleri Enstitüsü Yüksek Lisans
Tezi. Denizli.
[44] Viuda-Martos, M., Perez-Alvarez, J.A., Sendra, E., and Fernandez-Lopez, F., (2013). In Vitro Antioxidant Properties of
Pomegranate (Punica granatum) Peel Powder Extract Obtained as
Coproduct in the Juice Extraction Process. Journal of Food
Processing and Preservation. 37:772-776.
[45] Yuan, G., Lv, H., Tang, W., Zhang, X., and Sun, H., (2016). Effect of Chitosan Coating Combined with Pomegranate Peel
Extract on the Quality of Pacific White Shrimp During Iced
Storage. Food Control. 59:818-823.
[46] Zoral, F.B. ve Turgay, O., (2014). Çeşitli Gida Atiklarinin Toplam Fenolik Madde Içeriğinin, Antioksidan ve Antimikrobiyel
Aktivitelerinin Araştirilmasi. KSÜ Doğa Bilimleri Dergisi.
17(2):24-33.

4th International Science Symposium Status: Proceeding Book
ISS2019 (September 4-6, 2019) ID : 2019.1A19PB
Semra Bilgiç
Ankara University, [email protected], Ankara-Turkey
CORROSION IN SEAWATER
ABSTRACT
Corrosion is defined as the degradation of metals and alloys as
a result of their interaction with their environment. Corrosion is an
undesirable phenomenon that causes production losses and numerous
accidents. Corrosion of metals and alloys is primarily caused by water
and aqueous environments, acidic and basic solutions used in chemical
manufacturing facilities and atmospheric air. Water, and particularly
seawater, is an influential environment causing corrosion. Ship boats,
bridges, and prier stand installed on the sea oil exploration and
production facilities, sea pipelines and other facilities where
seawater is used as coolant are the structures affected by seawater
corrosion. Corrosion in seawater leads to major devastating accidents,
leakage of toxic substances, environmental pollution, and hazards to
human health. Seawater, which covers two-thirds of the world, is an
electrolyte containing almost all salts in nature, especially sodium
chloride (approximately 3.5%). Salinity is the most critical factor of
corrosion in seawater. In addition to salinity; water depth,
conductivity, dissolved oxygen, pH, water flow rate and temperature
also play a proponent role in seawater corrosion.
Keywords: Corrosion, Harmful Effects, Seawater,
Salinity, Microorganisms
1. INTRODUCTION
The term of corrosion can be defined as the interaction of
metals and alloys with surrounding environments. Corrosion is an
electrochemical process it involves the transfer of electrons between
a metal surface and aqueous electrolyte solution [1 and 2]. Formation
of rust on iron and steel and other corrosion products, darkness on
silver, the formation of green patina on copper and brass, cracks in
aircraft, automobiles, boats, gutters, ships can be given as a few
examples. The problem of corrosion is common and dangerous phenomenon
in various sectors, such as chemical industry, petrochemical,
shipbuilding construction, automotive, aviation, railway, maritime and
others. Corrosion wastes the sources and products, stops production
and causes various accidents. Corrosion causes important economical
losses. Corrosion is a major factor in the investment and production of the industry. According to some estimations, the cost of corrosion
to a national reaches to 3.5–5.5% of the gross national products [1
and 2]. It is predicted that twenty percent of iron produced is lost by corrosion every year.
corrosion in seawater; water and particularly seawater, is an
influential environment causing corrosion. Ship boats, bridges, and
pier stand installed on the sea, oil exploration and production
facilities, sea pipelines and other facilities where seawater is used
as coolant are the structures affected by seawater corrosion [2 and
7].

75
4th International Science Symposium (September 04-06, 2019),
Kiev-Ukraine (ISS2019), 1A19PB; pp:74-80.
Figure 1. Corrosion
2. RESEARCH SIGNIFICANCE
Corrosion in seawater leads to major devastating accidents,
leakage of toxic substances, environmental pollution, and hazards to
human health [3 and 4].
Figure 2. Corrosion in seawater
3. ANALYTICAL STUDY
Seawater, which is an electrolyte that contains almost all salts
found in nature especially sodium chloride (NaCl), covers two third of
the world [2 and 3]. Ocean water contains 3.5% electrolyte equivalent
to sodium chloride. However, its composition is quite complicated, as
it contains several of components. The concentration of salts in any

76
4th International Science Symposium (September 04-06, 2019),
Kiev-Ukraine (ISS2019), 1A19PB; pp:74-80.
seawater is given with reference to the amount of chloride. If
seawater is titrated with silver nitrate (AgNO3), it precipitates as
bromide (Br–), iodide (I–) and chloride (Cl–) [2].
4. FINDINGS AND DISCUSSIONS
4.1. Chlorinity
All halogen concentrations are taken into account in terms of
chloride for determination of chlorinity [1]. Chlorinity is the
quantity of silver in grams to precipitate the total amount of halogen
present in one kilogramme of seawater multiplied by 0.328533.
4.2. Salinity
Salinity is the most important factor for seawater corrosion.
The term salinity specifies the total amount of dissolved salts in
seawater. Salinity can not be determined directly, and can only be
determined in terms of chlorinity using the following equation [1].
Salinity=[0.03+(1.803×chlorinity)]
Both chlorinity and salinity are given in amounts per thousand.
Salinity in oceans does not change much, the value concentrating
between 33–37 per thousand where 35 salinities per thousand is
equivalent to 19.4 chlorinity per thousand. These values are accepted
as overage values for offshore seawater. However, local conditions
change these values. For example, in closed seas like the
Mediterranean, Black Sea and Red Sea evaporation rates are high
leading to salinity levels around 40 per thousand, whereas this value
is found to be very low in the Baltic Sea [1, 8, and 10].
Table 1. The components of seawater, chlorinity 19 per thousand
ρ=1.0243, t=20oC
Chloride (Cl–) 18.9799
Sulphate (SO42–) 2.6486
Bicarbonate (HCO3–) 0.1397
Bromide (Br–) 0.0646
Floride (F–) 0.0013
Boric acid (H3BO
3) 0.0260
Sodium (Na+) 10.5561
Magnesium (Mg2+) 1.2720
Calcium (Ca2+) 0.4001
Potassium (K+) 0.3800
Strontium (Sr2+) 0.0133
pH: Seawater is well buffered a pH value between 8.1–8.3
4.3. Potentials of Metals in Seawater
The electrical potential of the metal is an important factor in
determining the corrosion of a metal in seawater [11]. Open–circuit
potentials of most materials in seawater are not constant. These
values vary with the amount of oxygen, flow rate of water,
temperature, metallurgical and surface conditions of the metal. For
example, in stagnant and deaerated seawater, the potential of iron or
steel is almost constant, approaching –0.75V (versus saturated calomel
electrode) whereas at high flow rates and under aerated conditions
this value is approximately –0.61V [1].
4.4. Effect of Depth
The effect of depth on corrosion rate was less studied. The
following table shows the corrosion rates of the metals placed at
various regions in the Pasific Ocean at different times [2].

77
4th International Science Symposium (September 04-06, 2019),
Kiev-Ukraine (ISS2019), 1A19PB; pp:74-80.
Corrosion rate of steel, mpy
0 5
Corrosion
of steel
10 15 20
Sea atmosphere
inpact zone of water
increase in water level
decrease in water level
stagnant sea
mud line
Graphic 1. The variation of corrosion rate with flow rate with depth
Table 2. Effect of depth on corrosion rates of some metals and alloys
Materials Corrosion Rates in Different Depths (mm/y) Type of
Corrosion 0 m 704 m 1600 m 1700 m 2050 m
Zinc 0.015 0.058 0.068 0.091 0.150 General
Mild Steel 0.127 0.058 0.068 0.091 0.150 General
Al–4 Mg alloy – – – >0.576 – Pitting
Cu–10 Ni 0.008 0.005 0.008 0.018 0.018 General
Cu – 30 Ni 0.008 0.020 0.018 0.015 0.015 General
Stainless Steel
(Type 410) – 1.270 1.270 1.270 1.270 Pitting
Incoloy 825 – few few 0 few Pitting
Stainless Steel
(Type 316 L) – 0 0.025 0 few Pitting
Monel 400 – 0.033 >0.035 0.038 >0.092 Pitting
Conditions
Temperature (oC) 5–30 7.2 2.5 2.3 2.7
4.5. Effect of Time
Corrosion rates are almost constant when ferrous materials such
as steel are immersed in seawater [1].
Table 3. The effect of time on the corrosion rates of mild steel,
copper and aluminium.
Time (Month) Average Corrosion Rate (mm/y)
Steel Copper Aluminium
1 0.33 – –
2 0.25 – –
3 0.19 – –
6 0.15 – –
12 0.13 0.034 0.0043
24 0.11 0.019 0.0021
48 0.11 0.018 0.0017
4.6. Organisms in Seawater
There are various organisms such as mussels and algae in
seawater.

78
4th International Science Symposium (September 04-06, 2019),
Kiev-Ukraine (ISS2019), 1A19PB; pp:74-80.
Figure 3. Mussel Figure 4. Mussel
Figure 5. Foam algae Figure 6. Green algae
4.7. Effect of Flow Rate
Observations show that flow rate of water greatly affects
corrosion in seawater. Low flow rate prevents localization of
corrosion. As the flow rate increases, the clogged area between the
metal and the medium gradually becomes thinner. Thus, the oxygen
reaches the metal surface more quickly and the corrosion rate
increases continuously.
Graphic 2. The variation of corrosion rate with flow rate of steel
Oxygen–rich water causes a high rate of corrosion in the impact
zone. Therefore, marine structures are often damaged by condensation
just above the water level. These animals and plants attach to a solid
surface during their growth. The accumulation of these organisms
causes corrosion of the metal surfaces and, more importantly, these
surfaces may deteriorate, and fouling could occur [2 and 11]. Due to
the accumulation of mussels and other organisms under the ships, the
mobility of the ship may be impaired. As a result, the ship needs more
energy (more than 30%) to stay on course. The accumulation of
microorganisms in water depends in no small extent on environmental
conditions. Due to the lack of a suitable surface to hold
microorganisms in deep waters, the problems caused by microorganisms
arise mainly in shallow waters [2]. Climatic conditions also have a
significant effect on the growth of microorganisms. As the feeding
season is long in warm areas, breeding is fast for marine creatures
Corr
osi
on
rate
, m
dd
Flow rate, m/s
0 1 2 3 4 5 6
0
55
110
165
220

79
4th International Science Symposium (September 04-06, 2019),
Kiev-Ukraine (ISS2019), 1A19PB; pp:74-80.
such as mussels. For example, in the North Sea, fouling occurs only in
summer, while in the southern tropical waters this process is almost
continuous. Moreover, relatively small amounts of organisms accumulate
in fast boats; and the actual accumulation occurs while waiting for
the boat on the dock. If seawater is flowing rapidly, fouling
decreases, slow flow or accumulation of water occurs when the
operation is interrupted. Besides, the nature of the surface also
affects the attachment of microorganisms. A flat and hard surface
provides excellent adhesion, while the rough and flake–forming surface
prevents adhesion. Fouling caused by organisms can be prevented by
using antifouling dyes. These dyes generally contain toxic components
such as copper derivatives. These compounds cause the slow release of
copper ions into the marine environment. These ions have a toxic
effect on mussels and other aquatic organisms. Similar techniques are
also applied in closed systems. Various toxic substances and chlorine–
containing compounds are added to the system for this purpose.
5. CONCLUSION AND RECOMMENDATIONS
As a result, we can say that the corrosion in seawater is
dangerous for marine vehicles, and various marine structures,
especially in pier legs and that must be tackled. Cathodic protection
is the most effective way to prevent corrosion in seawater [12 and
13].
REFERENCES
[1] Üneri, S., (2011). Korozyon ve Önlenmesi, 2nd Edition, Ankara.
[2] Doruk, M., (2014). Metalik Malzemeler ve Korozyon, 1st Edition,
Ankara.
[3] LaQue, F.L., (1948). Corrosion by Sea Water, Corrosion Handbook
ed. By H.H. Uhlig, John Wiley & Sons, New York, 391.
[4] Wang, Y., Wharton, J.A., and Shenoi, R.A., (2014). Ultimate
Strength Analysis of Aged Steel–Plated Structures Exposed to
Marine Corrosion Damage: A Review Corros. Sci., 86:42–60.
[5] Obyagi, M., (1987). Statistical Survey on Wear of Ship's
Structural Members, NK Technical Bulletin, Tokyo.
[6] Shargawy, M.H., (2013). New Correlations for Seawater and Pure
Water Thermal Conductivity at Different Temperatures and
Salinities. Desalination, 313:97–104.
[7] Kirk, W.W. and Pikul, S.J., (1990). Seawater Corrosivity around
the World Results from Three Years of Testin In: C.H. Baloun
(Ed). Corrosion in Natural Waters, Philadelphia: American
Society for Testing and Materials, 2–36.
[8] Zakowski, K., Narrozny, M., Szocinski, M., and K. Darowicki, K.,
(2014). Influence of Water Salinity on Corrosion Risk – the case
of the Southern Baltic Sea coast, Environ. Monit Assess,
186:4871–4879.
[9] Millera, F.F., (2000). Effects of Changes in the Composition of
Seawater on the Density Salinity Relationship. Deep–Sea Research
Part 1: Oceanographic Research Papers, 47:1583.
[10] Millera, F.J., Feistel, R., Wright, D.G., and McDougall, T.J., (2008). The composition of Standart Seawater and the definition
of the Reference Composition Salinity Scale. Deep–Sea Research
Part 1: Oceanographic Research Papers, 55:50–72.
[11] Kharchenko, U.V., et al., (2011). Estimation of Aggressiveness of Seawater Corrosion using Indicators of Microbiological
Activity of Fouling Communities Formed on Metals. Protec. Met.
Phys. Chem. Surf. 47:907.

80
4th International Science Symposium (September 04-06, 2019),
Kiev-Ukraine (ISS2019), 1A19PB; pp:74-80.
[12] Shehadeh, M. and Hassan, I., (2011). Study of Sacrificial Cathodic Protection on Marine Structures in Sea and Fresh Water
in Relation to Flow Conditions. Ships and Offshore Structures,
8:1.
[13] Heselmans, J., Buijs, N.W., Isaac, I., (2011). Sacrificial Anodes for Protection of Seawater Pump Caissons against Galvanic
Corrosion. Corrosion, NACE, Conference & Expo, Paper No: 11056.

4th International Science Symposium Status: Proceeding Book
ISS2019 (September 4-6, 2019) ID : 2019.1A20PB
Merve İkikat
Barış Özkan
Ondokuz Mayıs Üniversity, [email protected], Samsun-Turkey
SEZGİSEL BULANIK ANALİTİK HİYERARŞİ PROSESİ İLE NÖROLOJİ YOĞUN BAKIM
ÜNİTESİNE KABUL TRİYAJ KARARLARININ DEĞERLENDİRİLMESİ
ÖZ
Nöroloji yoğun bakım ünitesi nöroloji hastalarına
özel, yoğun bakımın yapıldığı alanlardır. Bu ünitelerde nörolojik
hastalıkları olan hastaların izlenimi, uygun pozisyon verilmesi ve
değerlendirilmesi yapılmaktadır. Hastaların nöroloji yoğun bakım
ünitesine kabul triyaj kararı verilirken ünitenin yoğunluğuna göre
hastaların önceliklendirilmesi gerekebilmektedir. Karar esnasında göz
önünde bulundurulması gereken çeşitli kriterler bulunmaktadır. Bu
çalışmada öncelikle uzman görüşlerinden faydalanılarak şuuru gerilemiş
ve yakın takip gereken hastalar, nörolojik girişim (trombektomi,
trombolitik tedavi), çoklu organ yetmezliği, epileptik ve konversif
nöbet, solunum yetmezliği, izole edilmesi gereken hastalar olmak üzere
altı durum belirlenmiş. Daha sonra Sezgisel Bulanık Analitik Hiyerarşi
Prosesi yaklaşımı ile bu durumlar önceliklendirilmiştir. Sonuç olarak,
en önemli kriter “şuur durumu” olup, en az öneme sahip kriter ise
“solunum yetmezliği” olarak belirlenmiştir.
Anahtar Kelimeler: Sezgisel ulanık AHP, Triyaj Kararı,
Nöroloji Yoğun Bakım Ünitesi, Nöroloji,
Çok Kriterli Karar Verme
EVALUATION OF ACCEPTANCE TRIAGE DECISIONS TO NEUROLOGY INTENSIVE CARE
UNIT WITH INTUITIONISTIC FUZZY AHP
ABSTRACT
Neurology intensive care unit is the area where intensive care
is provided for neurology patients. In these units, the patients with
neurological diseases are monitored, given the appropriate position
and evaluated. Patients may need to be prioritized according to the
intensity of the unit when making a triage decision for admission to
the neurology intensive care unit. There are various criteria to be
considered during the decision. In this study, firstly, six cases were
identified as patients with reduced consciousness and close follow-up,
neurological intervention (thrombectomy, thrombolytic therapy),
multiple organ failure, epileptic and conversive attack, shortness of
breath, patients who need to be isolated utilizing expert opinions.
Then, these situations were prioritized with the Intuitionistic Fuzzy
Analytic Hierarchy Process approach. As a result, the most important
criterion was “consciousness condition” and the least important
criterion was “shortness of breath”.
Keywords: Intuitionistic Fuzzy AHP, Triage Decision,
Neurology Intensive Care Unit, Neurology,
Multi Criteria Decision Making

82
4th International Science Symposium (September 04-06, 2019),
Kiev-Ukraine (ISS2019), 1A20PB; pp:81-87.
1. GİRİŞ (INTRODUCTION)
Ülkemizde ve gelişmekte olan diğer ülkelerde, Nöroloji yoğun
bakım ünitesi yaygınlaşmakta olup bu konudaki talep de giderek
artmaktadır. Nöroloji yoğun bakım ünitesi, sinir sisteminin hayatı
tehdit eden hastalıklarını ele alan, genel yoğun bakım disiplerinin
nörolojik hastalıklara uygulanmasını hedefleyen bir prensiptir.
Nöroloji yoğun bakım ünitesinin rolü, nöroloji hastalarının etkin bir
şekilde yönetilmesini sağlamak amacıyla ortak kurallar oluşturmak ve
tüm hastalara bu kuralların uygulanabilirliğini sağlamaktır [3].
Nöroloji yoğun bakım ünitesinde yakın takibe ihtiyacı olan nörolojik
hastalıklara sahip hastalar yer almaktadır. Hastaların izlem ve
tedavilerinin yapıldığı bu üniteye hasta alımı, kısıtlı kaynakların
doğru yer ve zamanda kullanılmasını sağlayan triyaj kararları ile
verilmektedir. Triyaj kararları hastaların bulunduğu duruma göre
ciddiyetlerini değerlendirip, önceliklerini belirleyen, sıraya koyan
bir süreçtir. Çok kriterli karar verme (ÇKKV) yöntemleri birden fazla
kriter ve alternatifin yer aldığı bu tür problemlerin çözümünde
sıklıkla kullanılmaktadır. Bu çalışmada nöroloji yoğun bakım ünitesine
kabul triyaj kararları verilirken göz önünde bulundurulması gereken
kriterler belirlenerek değerlendirilmiştir. Çalışmanın amacı, uzman
görüşlerinden yararlanarak belirlenen kriterlerin Sezgisel Bulanık
Analitik Hiyerarşi Prosesi (SBAHP) yaklaşımı ile
önceliklendirilmesidir. Bu çalışmada, nöroloji yoğun bakım ünitesinde
çalışan üç farklı uzman sağlık personelinin görüşü alınarak triyaj
kararı verilirken değerlendirilecek altı kriter belirlenmiştir.
Belirlenen bu kriterlerin önceliklendirilmesinde yine üç farklı uzman
sağlık personelinden destek alınmıştır.
2. ÇALIŞMANIN ÖNEMİ (RESEARCH SIGNIFICANCE)
ÇKKV yöntemleri birden fazla çelişkili kriter ile karşılaşılan
karmaşık durumlarda, alternatifler arasından en uygun alternatifin
seçilmesine yardımcı olan etken bir yöntemdir. Günlük hayatta
belirsizliğin ön plana çıktığı durumlarda geleneksel ÇKKV modelleri
yetersiz kalıp bulanık mantığa başvurulmaktadır. Bulanık mantık ile
insana ait bilgi ve tecrübeler, sözel ifadeler matematiksel bir dile
dönüştürülür. Sezgisel bulanık mantık ise belirsizliğin daha fazla
çözüme katıldığı, mevcut bilginin bulanık mantık ile açıklanmasının
yetersiz olduğu durumlarda tercih edilen bir yaklaşımdır [7]. ÇKKV
teknikleri sağlık ve sağlık hizmetleri alanında etkin bir araç olarak
kullanılmaktadır. Sipahi ve Timor (2010) sağlık alanında en çok tercih
edilen alanların maliyet/fayda analizi, hastane yeri seçimi, beslenme,
risk değerlendirmesi ve rehabilitasyon problemleri olduğunu ifade
etmişlerdir [9]. Ameryoun ve diğerleri (2014) inceledikleri
çalışmaların birçoğunda problemin hastane ve depo yer seçimi olduğu
görülürken hizmet kalitesi ve hastanelerin sıralanması gibi konulara
da yer verildiği görülmüştür [1 ve 10]. Triyaj kararlarının
değerlendirilmesinde SBAHP yöntemi ile karar verme sağlık alanında
uygulanan ilk çalışma olarak yer almaktadır.
3. DENEYSEL ÇALIŞMA (EXPERIMENTAL METHOD-PROCESS)
Bu bölümde nöroloji yoğun bakım ünitesine kabul triyaj
kararlarının değerlendirilmesinde kullanılan Sezgisel Bulanık Analitik
Hiyerarşi Prosesi (SBAHP) yöntemi ayrıntıları ile açıklanmıştır.
Sezgisel bulanık mantık teorisi 1986 yılında Atanassov tarafından
bulanık küme teorisinin genellemesi olarak tanımlanmıştır. Sezgisel
bulanık küme, geleneksel bulanık küme vasıtasıyla belirsiz bir
kavramın tanımlanması için mevcut bilginin yetersiz olduğu durumlarda,
bir bulanık kümeyi tanımlamak için alternatif bir yaklaşımdır [7].
Sezgisel bulanık küme teorisinde bir elemanın bir kümeye üye olma

83
4th International Science Symposium (September 04-06, 2019),
Kiev-Ukraine (ISS2019), 1A20PB; pp:81-87.
derecesi, üye olmama derecesi ve tereddütlük derecesi ile belirtilir
[2]. SBAHP yöntemi, tedarik zinciri yönetimi [4], insan kaynakları
yönetimi [6], sağlık alanı [5] vb. konulara sahip ÇKKV problemlerinin
çözümünde kullanılmıştır. Literatürde SBAHP yönteminin kullanıldığı
çeşitli çalışmalar yer almaktadır. Sadiq ve Tefamariam (2007) sondaj
çalışmaları için en uygun çevresel delme işlemi seçimi yapmışlardır
[11]. Zhang vd. (2011) Han Park vd. (2011) klima sistemi seçimi
yapmışlardır Dammak vd. (2015) Sezgisel bulanık küme teorisini
kullanarak beşeri sermaye göstergeleri seçimi, Fahmi vd. (2015) insan
kaynakları yönetiminde belirli bir pozisyon için başvuran kişiler
arasından sezgisel bulanık AHP ile seçim yapmışlardır [11, 12 ve 13].
Deepika vd. (2016) sezgisel bulanık AHP ile global tedarikçi seçimi
yapmışlardır [14]. Xu ve Liao (2014) klasik AHP yönteminin sezgisel
bulanık küme ile sezgisel bulanık AHP’ye genişletilmesini ele
almışlardır [4 ve 8].
İkili karşılaştırmalar yapılırken birden fazla uzman görüşünün
yer aldığı durumlarda tüm uzman görüşlerinin ortak bir grup görüşü
haline indirgenmesi gerekmektedir. Bu çalışmada uzman görüşleri
sezgisel bulanık sayılar ile ifade edildiğinden Xu (2007) tarafından
onerilen sezgisel bulanık ağırlıklı ortalama operatörü (IFWA)
kullanılmıştır [8]. Bu çalışmada uygulanan SBAHP yönteminin adımları
aşağıda verilmiştir [8].
Adım 1: Problemin kriter ve alternatiflerden oluşan hiyerarşik
yapısı oluşturulur.
Adım 2: Alt kriter ve alternatifler arasında ikili
karşılaştırmalar yapılarak sezgisel tercih ilişki matrislerinin
oluşturulur. İkili karşılaştırmalar yapılırken Tablo 1’de yer
alan ikili karşılaştırma ölçeği kullanılmıştır [6].
Tablo 1. İlişki matrislerinin oluşturulmasında kullanılan dil ölçeği
(Table 1. Language scale used to construct relationship matrices)
Dilsel Değişkenler Sezgisel Bulanık Sayılar
Very High(VH) (0.95,0.05,0.00)
High(H) (0.75,0.15,0.10)
Medium(M) (0.50,0.40,0.10)
Equal(E) (0.50,0.50,0.00)
Low(L) (0.25,0.65,0.10)
Very low(VL) (0.05,0.95,0.00
Adım 3: Tüm sezgisel tercih ilişki matrislerinin tutarlılığı
kontrol edilir. Bu amaçla mukemmel carpımsal tutarlı sezgisel
tercih iliskisini ��=(��𝑖𝑘)𝑛×𝑛 kurmak icin Algoritma 1 uygulanır.
Algoritma 1
𝑘 > 𝑖 + 1 için ��𝑖𝑘 =(��𝑖𝑘 , ��𝑖𝑘) (1)
��𝑖𝑘 =√𝛱𝑡=𝑖+1
𝑘−1𝑘−𝑖−1𝜇𝑖𝑡𝜇𝑡𝑘
√𝛱𝑡=𝑖+1𝑘−1 µ𝑖𝑡µ𝑡𝑘
𝑘−𝑖−1+ √𝛱𝑡=𝑖+1
𝑘−1 (1−𝜇𝑖𝑡)(1−𝜇𝑡𝑘)𝑘−𝑖−1
(2)
��𝑖𝑘 =√𝛱𝑡=𝑖+1
𝑘−1𝑘−𝑖−1𝑣𝑖𝑡𝑣𝑡𝑘
√𝛱𝑡=𝑖+1𝑘−1 𝑣𝑖𝑡𝑣𝑡𝑘
𝑘−𝑖−1+ √𝛱𝑡=𝑖+1
𝑘−1 (1−𝑣𝑖𝑡)(1−𝑣𝑡𝑘)𝑘−𝑖−1
(3)
𝑘 > 𝑖 + 1 için ��𝑖𝑘 = 𝑟𝑖𝑘 (4)
𝑘 < 𝑖 + 1 için ��𝑖𝑘 = (��𝑘𝑖, ��𝑘𝑖) (5)
Adım 4: Sezgisel tercih ilişki matrislerinin tutarlıkları
Eşitlik (6) kullanılarak kontrol edilir. Matrislerin tümü
tutarlı ise Adım 6’ya, tutarlı değilse kabul edilebilir
tutarlılığa getirilmek üzere Adım 5’e geçilir.
𝑑(𝑅(𝑃), ��) =1
2(𝑛−1)(𝑛−2)∑ ∑ (|��𝑖𝑘 − 𝜇𝑖𝑘
(𝑝)|𝑛
𝑘=1𝑛𝑖=1 + |��𝑖𝑘 − 𝑣𝑖𝑘
(𝑝)| + |��𝑖𝑘− 𝜋𝑖𝑘
(𝑝)|) (6)

84
4th International Science Symposium (September 04-06, 2019),
Kiev-Ukraine (ISS2019), 1A20PB; pp:81-87.
τ=0.1 olmak üzere;
𝑑(𝑅(𝑃), ��) < 𝜏 ise denklemin çıktısı R’dir. Matris tutarlıdır.
Adım 5: 𝑑(𝑅(𝑃), ��) > 𝜏 olduğu durumlarda Algoritma 2’nin uygulanır.
σ karar verici tarafından belirlenen bir kontrol parametresidir. Algoritma 2
��𝑖𝑘 =(𝜇𝑖𝑘
(𝑝))1−𝜎(��𝑖𝑘)𝜎
(𝜇𝑖𝑘(𝑝)
)1−𝜎(��𝑖𝑘)𝜎+(1−𝜇𝑖𝑘(𝑝)
)1−𝜎(1−��𝑖𝑘)𝜎 , i=1,2…n (7)
��𝑖𝑘 =(𝑣𝑖𝑘
(𝑝))1−𝜎(��𝑖𝑘)𝜎
(𝑣𝑖𝑘(𝑝)
)1−𝜎(��𝑖𝑘)𝜎+(1−𝑣𝑖𝑘(𝑝)
)1−𝜎(1−��𝑖𝑘)𝜎 , i=1,2…n (8)
Adım 6: Her bir sezgisel tercih ilişki matrisi için sezgisel
bulanık öncelik ağırlıkları (𝜔) Eşitlik (9) kullanılarak
hesaplanır.
𝜔𝑖 = (∑ 𝜇𝑖𝑘
𝑛𝑘=1
∑ ∑ (1−𝑣𝑖𝑘)𝑛𝑘=1
𝑛𝑖=1
, 1 −∑ (1−𝑣𝑖𝑘)𝑛
𝑘=1
∑ ∑ 𝜇𝑖𝑘𝑛𝑘=1
𝑛𝑖=1
), i=1,2…n (9)
Adım 7: 𝜔 sezgisel bulanık sayısı için kriter skorları Eşitlik
(10) kullanılarak hesaplanır (Xu ve Yager, 2006).
𝑆(𝜔) = 𝜇𝜔 − 𝑣𝜔, 𝑆(𝜔) ∈ [−1,1] (10)
Adım 8: Kriterler skorlarına göre sıralanır.
4. BULGULAR VE TARTIŞMA (FINDINGS AND DISCUSSIONS)
Çalışmada öncelikle nöroloji yoğun bakım ünitesinde çalışan üç
farklı uzman sağlık personelinden oluşan bir uzman ekip
oluşturulmuştur. Uzman ekibin tecrübeleri doğrultusunda triyaj kararı
verilirken değerlendirilmesi gereken şuur bilinci (K1), nörolojik
girişim (K2), çoklu organ yetmezliği (K3), epileptik ve konversif
nöbet (K4), solunum yetmezliği (K5), izole edilmesi gereken hastalar
(K6) olmak üzere altı kriter belirlenmiştir. Belirlenen kriterlerin
ikili karşılaştırmaları yapılırken uzman ekibin görüşleri ayrı ayrı
alınmıştır. Her bir uzmana ait ikili karşılaştırma matrisleri sırası
Tablo 1, Tablo 2 ve Tablo 3’ de yer almaktadır.
Tablo 2. Uzman1 için kriterlerin tercih ilişki matrisi
(Table 2. Preference relation of criteria for expert 1) K1 K2 K3 K4 K5 K6
μ V π μ V π μ V π μ V π μ V π μ V π
K1 0.5 0.5 0 0.95 0.05 0 0.75 0.15 0.1 0.95 0.05 0 0.75 0.15 0.1 0.95 0.05 0
K2 0.05 0.95 0 0.5 0.5 0 0.75 0.15 0.1 0.5 0.4 0.1 0.5 0.5 0 0.5 0.4 0.1
K3 0.15 0.75 0.1 0.15 0.75 0.1 0.5 0.5 0 0.25 0.65 0.1 0.95 0.05 0 0.05 0.95 0
K4 0.05 0.95 0 0.4 0.5 0.1 0.65 0.25 0.1 0.5 0.5 0 0.5 0.4 0.1 0.5 0.4 0.1
K5 0.15 0.75 0.1 0.5 0.5 0 0.05 0.95 0 0.4 0.5 0.1 0.5 0.5 0 0.75 0.15 0.1
K6 0.05 0.95 0 0.4 0.5 0.1 0.95 0.5 0 0.4 0.5 0.1 0.15 0.75 0.1 0.5 0.5 0
Tablo 3. Uzman2 için kriterlerin tercih ilişki matrisi
(Table 3. Preference relation of criteria for expert 2) K1 K2 K3 K4 K5 K6
μ V π μ V π μ V π μ V π μ V π μ V π
K1 0.5 0.5 0 0.95 0.5 0 0.75 0.15 0.1 0.75 0.15 0.1 0.5 0.4 0.1 0.95 0.5 0
K2 0.5 0.95 0 0.5 0.5 0 0.5 0.4 0.1 0.95 0.05 0 0.75 0.15 0.1 0.05 0.95 0
K3 0.15 0.75 0.1 0.4 0.5 0.1 0.5 0.5 0 0.5 0.4 0.1 0.95 0.05 0 0.05 0.95 0
K4 0.15 0.75 0.1 0.05 0.95 0 0.4 0.5 0.1 0.5 0.5 0 0.95 0.05 0 0.5 0.4 0.1
K5 0.4 0.5 0.1 0.15 0.75 0.1 0.05 0.95 0 0.05 95 0 0.5 0.5 0 0.25 0.65 0.1
K6 0.5 0.95 0 0.95 0.05 0 0.95 0.05 0 0.4 0.5 0.1 0.65 0.25 0.1 0.5 0.5 0
Tablo 4. Uzman3 için kriterlerin tercih ilişki matrisi
(Table 4. Preference relation of criteria for expert 3) K1 K2 K3 K4 K5 K6
μ V π μ V π μ V π μ V π μ V π μ V π
K1 0.5 0.5 0 0.95 0.05 0 0.5 0.4 0.1 0.25 0.65 0.1 0.75 0.15 0.1 0.95 0.05 0
K2 0.05 0.95 0 0.5 0.5 0 0.5 0.4 0.1 0.25 0.65 0.1 0.75 0.15 0.1 0.5 0.5 0
K3 0.4 0.5 0.1 0.4 0.5 0.1 0.5 0.5 0 0.05 0.95 0 0.95 0.05 0 0.75 0.15 0.1
K4 0.65 0.25 0.1 0.65 0.25 0.1 0.95 0.05 0 0.5 0.5 0 0.5 0.4 0.1 0.75 0.15 0.1
K5 0.15 0.75 0.1 0.15 0.75 0.1 0.05 0.95 0 0.4 0.5 0.1 0.5 0.5 0 0.5 0.4 0.1
K6 0.05 0.95 0 0.5 0.5 0 0.15 0.75 0.1 0.15 0.75 0.1 0.4 0.5 0.1 0.5 0.5 0

85
4th International Science Symposium (September 04-06, 2019),
Kiev-Ukraine (ISS2019), 1A20PB; pp:81-87.
SBAHP yönteminin sonraki adımları oldukça uzun olduğu için
uygulama adımları sadece Uzman1’in tercih ilişki matrisi üzerinden
açıklanmıştır. Tablo 2’de yer alan Uzman1’e ait tercih ilişki matrisi
Eşitlik (1-5) kullanılarak mukemmel carpımsal tutarlı sezgisel
tercih iliskisi matrisi oluşturulmuştur (Tablo 5).
Tablo 5. Uzman1 için kriterlerin dönüştürülmüş tercih ilişki matrisi
(Table 5. Transformed preference relation of criteria for expert 1) K1 K2 K3 K4 K5 K6
μ V π μ V π μ V π μ V π μ V π μ V π
K1 0.500 0.500 0.000 0.400 0.500 0.100 0.983 0.009 0.008 0.813 0.097 0.090 0.965 0.025 0.010 0.826 0.096 0.077
K2 0.500 0.400 0.100 0.500 0.500 0.000 0.400 0.500 0.100 0.500 0.247 0.253 0.883 0.060 0.057 0.438 0.390 0.171
K3 0.009 0.983 0.008 0.500 0.400 0.100 0.500 0.500 0.000 0.500 0.400 0.100 0.250 0.553 0.197 0.813 0.097 0.090
K4 0.097 0.813 0.090 0.247 0.500 0.253 0.400 0.500 0.100 0.500 0.500 0.000 0.750 0.150 0.100 0.750 0.105 0.145
K5 0.025 0.965 0.010 0.060 0.883 0.057 0.553 0.250 0.197 0.150 0.750 0.100 0.500 0.500 0.000 0.750 0.150 0.100
K6 0.096 0.826 0.077 0.390 0.438 0.171 0.097 0.813 0.090 0.105 0.750 0.145 0.150 0.750 0.100 0.500 0.500 0.000
Örneğin Tablo 5’de yer alan K2 ve K6 kriterlerinin �� ve ��
değerleri sırası ile Eşitlik(2)ve Eşitlik(3) kullanılarak aşağıdaki
gibi hesaplanmıştır.
��26 =√𝛱𝑡=3
63𝜇23𝜇36𝜇24𝜇46𝜇25𝜇56
√𝛱𝑡=36 µ23µ36𝜇24𝜇46𝜇25𝜇56
3+ √𝛱𝑡=3
6 (1 − 𝜇23)(1 − 𝜇36)(1 − 𝜇24)(1 − 𝜇46)(1 − 𝜇25)(1 − 𝜇56)3
=√(0.75𝑥0.05𝑥0.5𝑥0.5𝑥0.5𝑥0.75)3
√(0.75𝑥0.05𝑥0.5𝑥0.05𝑥0.5𝑥0.75)+ √(1−0.75)(1−0.05)(1−0.5)(1−0.05)(1−0.5)(1−0.75)33=0.438
��26 =√𝛱𝑡=3
53𝑣23𝑣36𝑣24𝑣46𝑣25𝑣56
√𝛱𝑡=35 𝑣23𝑣35𝑣24𝑣45𝑣25𝑣56
3+ √𝛱𝑡=3
5 (1 − 𝑣23)(1 − 𝑣36)(1 − 𝑣24)(1 − 𝑣46)(1 − 𝑣25)(1 − 𝑣56)3
=√(3 0.15𝑥0.4𝑥0.5𝑥0.95𝑥0.4𝑥0.15)
√(0.15𝑥0.4𝑥0.5𝑥0.95𝑥0.4𝑥0.15)+ √(1−0.15)(1−0.4)(1−0.5)(1−0.05)(1−0,4)(1−0.15)33=0.390
Tercih ilişki matrislerinin oluşturulmasından sonra Eşitlik (6)
kullanılarak matrislerin tutarlılığı kontrol edilir. Eğer matris
tutarsız ise Adım 6’ ye geçilerek denklem onarılır. Örneğin Tablo 5’
de yer alan matris 𝑑(𝑅(𝑃), ��) = 0.2436 > 0.1 sonucuna göre tutarsız bulunmuş
ve Algoritma 2 kullanılarak denklem onarılmıştır (Tablo 6). Algoritma
2’de uygulanırken kontrol parametresi(𝜎) 0.8 ve yineleme sayısı (𝜌) 1 olarak kabul edilmiştir [6].
Tablo 6. Uzman1 için Algoritma2 ile oluşturulan ilişki matrisi
(Table 6. Relationship matrix created with Algorithm2 for Expert1) K1 K2 K3 K4 K5 K6
μ V π μ V π μ V π μ V π μ V π μ V π
K1 0.500 0.500 0.000 0.400 0.500 0.100 0.969 0.016 0.014 0.854 0.085 0.061 0.946 0.037 0.017 0.863 0.085 0.053
K2 0.500 0.400 0.100 0.500 0.500 0.000 0.400 0.500 0.100 0.500 0.274 0.226 0.834 0.100 0.065 0.450 0.392 0.157
K3 0.016 0.969 0.014 0.500 0.400 0.100 0.500 0.500 0.000 0.500 0.400 0.100 0.428 0.397 0.175 0.643 0.232 0.125
K4 0.085 0.854 0.061 0.274 0.500 0.226 0.400 0.500 0.100 0.500 0.500 0.000 0.750 0.150 0.100 0.707 0.143 0.151
K5 0.037 0.946 0.017 0.100 0.834 0.065 0.397 0.428 0.175 0.150 0.750 0.100 0.500 0.500 0.000 0.750 0.150 0.100
K6 0.085 0.863 0.053 0.392 0.450 0.157 0.232 0.643 0.125 0.143 0.707 0.151 0.150 0.750 0.100 0.500 0.500 0.000
Algoritma 2 ile oluşturulan tercih ilişki matrisinin tutarlılığı
Eşitlik (6) kullanılarak yeniden hesaplanmıştır. Örneğin Tablo 6’ de
yer alan matris 𝑑(𝑅(𝑃), ��) = 0.054 < 0.1 olarak hesaplanmış ve tutarlı hale getirilmiştir. Tüm tercih ilişki matrislerinin tutarlı hale
getirilmesinden sonra IFWA operatörü kullanılarak her bir uzmanın
görüşü grup kararı haline indirgenmiştir (Tablo 7).

86
4th International Science Symposium (September 04-06, 2019),
Kiev-Ukraine (ISS2019), 1A20PB; pp:81-87.
Tablo 7. IFWA operatörü kullanılarak oluşturulan birleştirilmiş matris
(Table 7. Unified matrix created using the IFWA operatör) K1 K2 K3 K4 K5 K6
μ V π μ V π μ V π μ V π μ V π μ V π
K1 0.646 0.500 0.146 0.798 0.165 0.037 0.947 0.065 0.012 0.857 0.136 0.007 0.939 0.048 0.013 0.783 0.174 0.043
K2 0.285 0.634 0.081 0.500 0.500 0.000 0.327 0.587 0.086 0.481 0.344 0.175 0.906 0.062 0.033 0.478 0.362 0.160
K3 0.153 0.941 0.094 0.719 0.238 0.043 0.500 0.500 0.000 0.779 0.169 0.052 0.731 0.206 0.063 0.614 0.265 0.122
K4 0.235 0.705 0.060 0.543 0.335 0.122 0.240 0.677 0.084 0.500 0.500 0.000 0.543 0.339 0.118 0.722 0.160 0.118
K5 0.051 0.928 0.021 0.090 0.851 0.059 0.467 0.432 0.101 0.454 0.436 0.109 0.500 0.500 0.000 0.563 0.320 0.116
K6 0.323 0.733 0.056 0.399 0.454 0.148 0.271 0.608 0.121 0.171 0.699 0.130 0.429 0.461 0.110 0.500 0.500 0.000
Birleştirilmiş matrisin oluşturulmasından sonra Eşitlik (9)
kullanılarak kriterlerin sezgisel bulanık öncelik ağırlıkları
𝜔1=(0.2427,3.138), 𝜔2=(0.1481,-1.762), 𝜔3=(0.1858,-2.221), 𝜔4=(0.1096,-
0.963), 𝜔5=(0.0898,-0.694), 𝜔6=(0.0661,-0.735) hesaplanmıştır. Sonuç
olarak triyaj kararı verilirken göz önünde bulundurulması gereken
kriterler önem seviyelerine göre sıralandığında şuur bilinci, çoklu
organ yetmezliği, nörolojik girişim, epileptik ve konversif nöbet,
izole edilmesi gereken hastalar ve solunum yetmezliği olarak ortaya
çıkmıştır.
Tablo 8. Kriterlerin skorlarının hesaplanması
(Table 8. Calculation of criteria scores)
Kriter Skor Değeri
S(𝜔1) 3.3808
S(𝜔2) 1.9101
S(𝜔3) 2.4068
S(𝜔4) 1.0724
S(𝜔5) 0.7836
S(𝜔6) 0.8012
5. SONUÇ VE ÖNERİLER (CONCLUSION AND RECOMMENDATIONS)
Nüfustaki ciddi artışlar göz önüne alındığında, yoğun bakım
yataklarına olan talep giderek artmaktadır. Yoğun bakımda uygulanan
tedavilerin pahalı ve yatak sayısının kısıtlı olması, nöroloji yoğun
bakım ünitesine yatıştan fayda görecek hastaların özenli seçilmesini,
sınıflandırılmasını gerektirmektedir. Literatürde SBAHP yöntemi
kullanılarak yapılan çalışmalar sınırlı sayıdadır. Bu çalışmada
nöroloji yoğun bakım ünitesine triyaj kararı verilirken
değerlendirilmesi gereken kriterler belirlenerek, SBAHP yöntemi ile
kriterler önem seviyelerine göre sıralanmıştır. Uygulama sonucunda
triyaj kararında en önemli kriter 3.3808 değeri ile şuur durumu ve en
düşük önem seviyesindeki kriter 0.7836 değeri ile solunum yetmezliği
kriteri olarak ortaya çıkmıştır.
KAYNAKLAR (REFERENCES)
[1] Ağaç, G. ve Birdoğan, B., (2016). Sağlık Alanında Çok Kriterli
Karar Verme Teknikleri kullanımı: Literatür İncelemesi.
Hacettepe Sağlık İdaresi Dergisi, 19(3):343-344.
[2] Atanassov, K.T., (1986). Intuitionistic Fuzzy Sets. Fuzzy Sets
and Sytems. 87-96.
[3] Bajrami, A., (2017). Nöroloji Yoğun Bakım Ünitesinde Yatan Akut
İnme Hastalarında Glasgow ve Four Skalaların Karşılaştırılması.
Nöroloji Kliniği Uzmanlık Tezi. İstanbul İli (Bakırköy) Kamu
Hastaneleri Birliği Genel Sekreterliği Bakırköy Dr. Sadi Konuk
Eğitim Ve Araştırma Hastanesi, 3-6.
[4] Çınar, A. ve Uygun, Ö., (2019). Sezgisel Bulanık AHP Yöntemiyle
Yeşil Tedarikçi Seçimi. Zeki Sistemler Teori ve Uygulamaları
Dergisi 2(2):24-31.

87
4th International Science Symposium (September 04-06, 2019),
Kiev-Ukraine (ISS2019), 1A20PB; pp:81-87.
[5] De, S.K., Biswas, R., and Roy, A.R., (2001). An Application of
Intuitionistic Fuzzy Sets in Medical Diagnosis. Fuzzy Sets and
Systems, 117(2):209–213. doi:10.1016/s0165-0114(98)00235-8
[6] Efe, B. and Efe, Ö.F., (2018). Intuitionistic Fuzzy Number Based
Group Decision Making Approach for Personnel Selection. Uludağ
University Journal of The Faculty of Engineering, 23(3):14-21.
DOI: 10.17482/uumfd.338406.
[7] Kumar, M. and Yadav, S.P., (2012). A Novel Approach for
Analyzing Fuzzy System Reliability Using Different Types of
Intuitionistic Fuzzy Failure Rates of Components. ISA
Transactions, 51:288-297.
[8] Xu, Z.S. and Yager, R.R., (2006). Some Geometric Aggregation
Operators Based on Intuitionistic Fuzzy Sets. International
Journal of General Systems, 35:417-433.
[9] Sipahi, S. and Timor M., (2010). The Analytic Hierarchy Process
and Analytic Network Process: An Overview of Applications.
Management Decision, 48(5-6):775-808.
[10] Ameryoun, A., Zaboli, R., Haghdoost, A.A., Mirzaei, T., and Tofighi, S., (2014). Applying Fuzzy Analytic Hierarchy Process
(FAHP) in Healthcare System. International Journal of Medical
Research and Review, 2(6):610-617.
[11] Sadiq, R. and Tesfamariam, S., (2009). Environmental Decision-Making Under Uncertainty Using Intuitionistic Fuzzy Analytic
Hierarchy Process (IF-AHP). Stochastic Environmental Research
and Risk Assessment, 23(1):75–91.
[12] Park, J.H., Park, I.Y., Kwun, Y.C., and Tan, X., (2011). Extension of the TOPSIS Method for Decision Making Problems
Under Interval-Valued Intuitionistic Fuzzy Environment. Applied
Mathematical Modelling, 35(5):2544-2556.
[13] Dammak, F., Baccour, L., and Alimi, A.M., (2015). A Comparative Analysis for Multi-Attribute Decision Making Methods: TOPSIS,
AHP, VIKOR Using Intuitionistic Fuzzy Sets. 2015 IEEE
International Conference on Fuzzy Systems. Bildiriler Kitabı,
ss:1-5.
[14] Deepika, M. and Kannan, A.S., (2016). Global Supplier Selection using Intuitionistic Fuzzy Analytic Hierarchy Process.
International Conference on Electrical, Electronics, and
Optimization Techniques(ICEEOT)–2016, Sivakasi, Tamilnadu,
India.

4th International Science Symposium Status: Proceeding Book
ISS2019 (September 4-6, 2019) ID : 2019.1B1PB
Ummahan Yücel
Zehra Baykal Akmeşe
Ege University, [email protected], İzmir-Turkey
POSTPARTUM DÖNEMDE ANNE RUH SAĞLIĞINA YAKLAŞIM VE EBENİN ROLÜ
ÖZ
Postpartum dönemde görülen ruhsal bozukluklar postpartum hüzün,
depresyon ve psikoz olarak sınıflandırılmaktadır. Doğum sonu dönemde
kadınların yaklaşık olarak %85’i, postpartum dönemde ortaya çıkan
ruhsal bozukluklardan birini hafif ya da kısa süreli olarak
deneyimlemekte, bu oranın %10-15’i kadarı ise depresyon, anksiyete
bozuklukları gibi ciddi bozukluklara dönüşebilmektedir. Görülme
sıklığı yüksek olan postpartum dönem ruhsal hastalıklardan korunma,
tanı, tedavi ve rehabilitasyon gibi tüm aşamalarında yoğun bakım,
takip ve izlem gerekmektedir. Özellikle postpartum dönem maternal ruh
sağlığını geliştirmede önemli rolleri olan ebelerin, risk altında olan
kadını tanılama da ki sahip olduğu fırsatları değerlendirmesi, mümkün
olan en kısa zamanda kadını ve ailesini ruhsal hastalıkların
getireceği yükten koruması açısından çok önemlidir. Bu derlemede
postpartum dönemde görülen ruhsal bozukluklar ve ebenin rolleri
tartışılacaktır.
Anahtar Kelime: Postpartum, Ruh Sağlığı, Ebelik, Anne, Depresyon
APPROACH TO MATERNAL MENTAL HEALTH IN POSTPARTUM PERIOD AND ROLE OF
THE MIDWIVES
ABSTRACT
Postpartum mental disorders have been classified as postpartum
blues, depression and psychosis. During the postpartum period, about
85% of women experience some type of mood disturbance. For most the
symptoms are mild and short-lived; however, 10 to 15% of women develop
more significant symptoms of depression or anxiety. The incidence rate
for any type of postpartum mental disorders is high. So it required at
intensive and follow up care all stages of prevention, diagnosis,
treatment and rehabilitation. Especially midwives have a unique
opportunity to identify women who are at risk of, or are suffering
from, perinatal mental illness, and to ensure that these women and
their families get the care they need at the earliest opportunity. The
wider role of all midwives in improving maternal mental health. In
this article common psychiatric disorders during pregnancy and the
roles of midwives in the postpartum period are being discussed.
Keywords: Postpartum, Mental Health, Midwifery,
Mother, Depression

89
4th International Science Symposium (September 04-06, 2019),
Kiev-Ukraine (ISS2019), 1B1PB; pp:88-93.
1. GİRİŞ (INTRODUCTION)
Dünya Sağlık Örgütü 2019 yılı verilerine göre, tüm dünyada gebe
kadınların %10’unun ve doğum yapan kadınların ise %13’ünün herhangi
bir ruhsal bozukluk deneyimlediği görülmektedir. Kadınların en sık
deneyimlediği ruhsal bozukluk ise depresyon olarak bildirilmektedir.
Gelişmekte olan ülkelerde gebelik sürecinde depresyon görülme oranı
%15.6 iken, doğum sonrası dönemde %19.8’dir [1]. Türkiye’de ise doğum
sonrası dönemde ruhsal bozukluk görülme sıklığını belirten toplum
tabanlı bir araştırma sonucuna ulaşılamazken, 2018 yılında Karaçam ve
ark.’nın yapmış olduğu geniş sistematik derlemede doğum sonrası en sık
görülen ruhsal bozukluk %24 oranında depresyon olarak belirtilmiştir
[2]. Doğum sonrası dönemde ruhsal bozuklukların ortaya çıkmasında
çeşitli genetik, biyolojik, hormonal ve çevresel koşulların ve bu
koşulların etkileşiminin sorumlu olduğu biliniyor. Bu nedenle ülkemiz
için kadın ruh sağlığını korumaya yönelik ruhsal ihtiyaçlar arasında
ruhsal bozuklukların belirtilerinin erken tanılanması, kadının ruh
sağlığını korumaya ve geliştirmeye yönelik toplum tabanlı eğitim
programlarının düzenlenmesi, herkesin ulaşabileceği yaygın ve
nitelikli ruh sağlığı hizmetlerinin sağlanması kadar, kadının sağlıklı
bir gebelik ve doğum sonu dönem geçirmesini sağlayacak sürdürülebilir
hizmet ve bakım alması da gerekli ve önemlidir [3]. Doğumla birlikte
ortaya çıkan fizyolojik, psikolojik ve sosyal değişimlere uyum
sağlanamama durumunda çeşitli düzeylerde duygusal sorunlar
gelişebilmektedir. Postpartum dönemde kadınların %50-85’inde ruhsal
belirti ve bozukluk görülebildiği bilinmekle birlikte [4 ve 7], bu
dönemde gelişen duygusal sorunların sınırları çok net
belirlenmemiştir. Konu ile ilgili literatürlerde postpartum duygusal
sorunlar özelliklerine, tedavi ve prognozlarına göre ayrılarak annelik
hüznü, postpartum depresyon ve postpartum psikoz olmak üzere üç grupta
toplanmaktadır [6, 8 ve 9].
2. ÇALIŞMANIN ÖNEMİ (RESEARCH SIGNIFICANCE)
Maternal ruhsal bozukluklar sonucunda kadının yaşamsal
fonksiyonlarında birçok zarar meydana gelirken, kadının intihar
etmesine neden olabilmektedir. Yine ruhsal bozukluğu olan bir gebenin
fetüsü ya da bir annenin çocuğu da büyüme ve gelişme sürecinde
biyolojik ve fiziksel olarak birçok olumsuz etki ile karşı karşıyadır.
Sağlık hizmet sunucularının etkili ve yerinde müdahale yöntemleri ile
maternal ruhsal bozukluklar tedavi edilebilmektedir Özellikle ebelerin
doğum sonu dönemde ruhsal bozuklukların belirtilerinin erken
tanılanmasında önemli rolleri vardır [1]. Bu derleme doğum sonu
dönemde sık görülen ruhsal bozuklukları ve bu bozukluklara yaklaşımda
ebenin rollerine vurgu yapılması açısından önemlidir.
3. BULGULAR VE TARTIŞMA (FINDINGS AND DISCUSSION)
3.1. Doğum Sonrası Hüzün (Sadness After Birth)
Genellikle doğum sonrası erken dönemde görülen, geçici ve kendi
kendini sınırlayan bir tablodur. Literatürde postpartum ilk üç-beş
günde çok yoğun olarak yaşanan hüznün tipik olarak on gün ile iki
hafta içinde sonlandığı ya da sakinleştiği, hatta birkaç haftaya kadar
devam edebildiği belirtilmektedir [10 ve 11]. En sık görülen
belirtileri, duygu durum dalgalanması, ağlama, anksiyete, uykusuzluk,
irritabilite, baş ağrısı, yorgunluk ve aşırı duyarlılıktır. Görülme
sıklığının yüzde 26–85 olduğu belirtilmekte ve nedenlerinin hormonal
faktörler, sosyo demografik özellikler, stresli yaşam olayları ve
doğum ile ilgili faktörler olduğu düşünülmektedir [12].
Ebelik Rolleri: Destekleyici psikoterapötik yaklaşım dışında
özel bir tedaviye gerek yoktur. Ebeler kadınların hissettikleri
hakkında konuşma olanağı sağlamalı ve fiziksel rahatsızlığı

90
4th International Science Symposium (September 04-06, 2019),
Kiev-Ukraine (ISS2019), 1B1PB; pp:88-93.
gidermelidir. Bu durum genelde meme ve emzirme problemleri ile
birlikte seyreder. Meme ve emzirme problemlerinin yaşanmaması
için gerekli önlemler alınmalı, bakım verilmelidir. Kadına
dinlenmesi için yardım edilmeli ve mümkünse ekstra destek
sunulmalıdır. Uzun süren ve daha derin yaşanan durumlarda ebe
psikiyatri hekimine yönlendirme yapmalıdır [13 ve 15].
3.2. Doğum Sonrası Depresyon (Postpartum Depression)
Doğum sonrası depresyon; çocuk doğurduktan sonraki bir yıl
içerisinde görülen psikotik olmayan depresif bozukluktur. Doğumdan
sonraki ilk beş hafta ise en riskli dönemdir [16]. Doğum sonrası
depresyon hem kadın hem de ailesi açısından kalıcı sonuçlara yol
açabilir. Bazı kadınlar zaman içerisinde kendiliğinden iyileşebilse de
çoğu kadında kronikleşebilir. Doğumdan sonraki bir yıl veya daha uzun
bir sürece yayılabilir. Bu kronik hastalık özellikle de düşük
sosyoekonomik statüye sahip kadınlarda belirgindir. Uzun süreli tedavi
edilmeyen depresif bozukluk sadece anne için değil onun eşi ve çocuğu
için de stres yaratıcıdır. Evlilikte sorunlara yol açabilir veya
mevcut problemleri kötüleştirebilir, ayrıca çocuğun entellektüel ve
duygusal gelişimini olumsuz etkileyebilir. Erken tanı ile zamanında
uygun tedavinin yapılması aile sağlığı açısından da önemlidir [17].
Doğum sonrası depresyonun erken belirtileri ağlama hali,
umutsuzluk, yetersizlik hissi, başa çıkmada eksiklik, anksiyete,
düşünceli ve dalgın olma, özellikle bebek bakımına ilişkin yetersiz
hissetme, bebeğine iyi bir anne olamadığı düşüncesi, uyku problemleri,
özellikle bebek bakımına ilişkin gece sık uyanma, uyuyamama, gün boyu
yorgun hissetme durumları sayılabilir [18 ve 19]. Duygu durumda derin
ve tutarlı bir değişiklik, depresif düşünceler, psikomotor
fonksiyonların yavaşlaması ve sabah erkenden uyanma gibi biyolojik
belirtiler ise ciddi depresyon bulgularıdır. Psikolojik faktörler
arasında kadının ebeveynleri ile önceki ilişkisi, kişilik gelişimi,
cinselliğinin kabul edilmesi sayılabilir. Kişiliğinde anksiyöz veya
obsesif davranışlar gösteren kadınlar veya aşırı kontrollü görünen
kadınlar daha fazla doğum sonrası depresyon riskine sahiptir. Kadının
önceki psikiyatrik öyküsü (ve ailesinin) birçok vakada önemli bir risk
faktörüdür. Epidemiyolojik çalışmalar ile major etiyolojik faktörlerin
psikososyal yapı olduğu öne sürülmüştür. Stresli hayat olaylarının
oluşması ve aile, eş veya arkadaşlardan kişisel desteğin bulunmaması
doğum sonrası depresyon riskini artırır [17 ve 20].
Ebelik Rolleri: Ebenin rolü temelde doğum sonrası depresyonu
önlemeye yönelik olmalıdır. Hastalık bulguları varsa, erken tanı
ve tedavi gereklidir. Kadınların doğum sonrası yaşayacakları
duygusal dalgalanmalara yönelik yeterince hazırlanmaları
gerekir. Doğum öncesi hazırlık eğitim programları ile kadınlar
ve eşleri ebeveynliğin gereklerini yerine getirmek üzere
hazırlanmalıdır. Programlar, tüm kadınların ihtiyaçlarını
karşılamaya yönelik olmalı, kadınlara kendilerini farklı
hissettirmeksizin sosyal koşulları ne olursa olsun eğitim
programlarına katılabilecekleri anlatılmalıdır. Kadınlar doğum
eylemi için gerçekçi bir şekilde hazırlanmalı, sonuç ne olursa
olsun, bilgilendirilecekleri ve kontrol altında olacakları
vurgulanmalıdır. Normal vajinal doğum gerçekleşmez ise, bu sonuç
kadının başarısızlığı olarak değerlendirilmemelidir. Aksine
kadının karar vermede ki etkin rolü, kadının kendini ve süreci
kontrol edebilme gücü ve karşılıklı olumlu ve duyarlı etkileşim
gibi çıktılar başarılı sonuç olarak değerlendirilmelidir.
Ebelerin, doğum sonrası depresyon gelişme riski yüksek olan
kadınları belirleme ve depresyon belirtilerini erken fark etmede
önemli rolü vardır. Ebe, doğum sonrası bakım sırasında, kadının

91
4th International Science Symposium (September 04-06, 2019),
Kiev-Ukraine (ISS2019), 1B1PB; pp:88-93.
duygu durumunu dikkatle incelemeli, kadını sadece bebeği değil,
kendi ile ilgili duygu ve kaygılarını da anlatması için teşvik
etmelidir [13 ve 15].
3.3. Doğum Sonrası Psikoz (Postpartum Psychosis)
Psikoz doğum sonu dönemde görülen ve sanrılar, halüsinasyonlar
ve gerçeği algılama bozukluğu ile karakterize bir grup hastalık olarak
ifade edilir. Doğum sonrası psikozların çoğu manik veya depresif
durumlar olmakla birlikte az bir kısmı şizofreni benzeri durumlardır.
Doğum sonrası psikoz insidansı 1000 canlı doğumda 2-3’tür. Kısmi bir
iyilik hali periyodu sonrası iki haftada ani bir hastalık başlangıcı
sıklıkla görülür [12]. Aşırı irritabilite, gerçek dışı düşünceler,
engellenmeye çalışıldığı durumlarda şiddet davranışları, fiziksel
olarak kötü görünüm, kafa karışıklığı, bulanıklık, korku, sıkıntı,
uykusuzluk, gece uyuyamama, yer ve zamana uyum sağlayamama psikoz
belirtileri arasında en sık görülenleridir. Bu belirtilerin dışında
çok hızlı konuşma, bazen normal çoğu zaman ise delüzyonel ve anlamsız
cümleler kurma, kadının ruhsal durumundaki ani değişiklikler,
sanrılar, halüsinasyonlar, davranış bozuklukları, bebeğe ve doğum
eylemine saplanma, odaklanma, bebeğinin öleceği ya da başka birinin
öldüreceği sanrıları yer alır. Doğum sonrası dönemde psikozun
görülmesinin en önemli nedenleri arasında ailede veya özgeçmişte
affektif psikoz hikayesi bulunmasıdır. Bu nedenle gebeliğin erken
döneminde alınan öykü ile bu durum sorgulanmalıdır [21 ve 22]. Bu
neden dışında bu süreçte özellikle de östrojendeki azalma olmak üzere
steroid hormon düzeylerinde yaşanan değişikliklerin psikoz
yaşanmasında önemli rolü vardır. Diğer bir teori de doğumdan sonra
meydana gelen progesteron düşüşü ile ilişkili olduğudur. Psikososyal
ve obstetrik faktörlerin de rolü olduğu düşünülmektedir. Ancak
sezaryen de dahil major obstetrik problemleri olan primiparların,
yüksek sosyoekonomik gruptan olanların, ilk çocuklarını doğurma
sırasında ortalamaya göre daha yaşlı olanların, çocuk doğurmadan hemen
önce veya hemen sonra büyük bir hayat olayı yaşayanların doğum sonrası
psikoz ile ilişkili yüksek risk taşıdıkları düşünülmektedir [23].
Ebelik Rolleri: Öncelikli yaklaşım tanılama, uygun sevk, kadına
ve ailesine destek olmaktır. Ebe bu durumda görülen davranışsal
değişiklikleri saptayan kişi olarak risk altında olan kadını
acil değerlendirme ve tedavi için uzmana sevk etmelidir. Bu
kadınlar duygusal olarak derin bir etkilenme içerisinde
olduklarından mümkün ise bebekleri ile birlikte hastaneye
yatırılmaları gerekir. Gelecekteki gebelikler için uygun bir
planlama yapabilmek için, özellikle de semptomların ilk
başlangıcının kaydedilmesi önemlidir. Doğum sonrası psikoz olan
kadınların yaklaşık yarısında bir sonraki çocuklarını
doğurduktan sonra ruhsal hastalık gelişme riski vardır. Bu dönem
kadının emzirdiği bir süreç olduğundan, ilaçların sadece anne
için etkili değil, aynı zamanda bebek için de güvenli olduğundan
emin olmak gerekir. Emzirmenin devam etmesi anne için önemlidir
ve teşvik edilmelidir. Kendine güven iyileşmeye yardım eder ve
annenin bebek ile olan ilişkisini güçlendirir. Emzirmenin
kesilmesi daha sonra annede suçluluk duygusuna yol açar [13, 14,
18 ve 22].
4. SONUÇ VE ÖNERİLER (CONCLUSION AND RECOMMENDATIONS)
Postpartum dönemde risk grubunda olan, stresli duruma sahip
kadınların erkenden fark edilmesi, uygun tedavisi ve destek
kaynaklarının bulunması açısından tüm sağlık profesyonellerinin
farkındalığının artması gerekmektedir [18]. Ebelerin ciddi ruhsal
hastalık öyküsü olan ve tekrarı açısından risk altında olan kadınlara

92
4th International Science Symposium (September 04-06, 2019),
Kiev-Ukraine (ISS2019), 1B1PB; pp:88-93.
yaklaşım protokollerini iyi bilmesi ve tüm güvenli annelik
hizmetlerinde kullanabilmesi gerekir. Önceki psikiyatrik hastalıklar,
şiddeti, verilen hizmet ve klinik uygulamaya dair anamnezin sistematik
ve titiz bir şekilde rutin olarak yapılması önemlidir. Önceden ciddi
bir psikiyatrik hastalık öyküsü olan kadınlar doğum sonrası dönemde
olsunlar veya olmasınlar gebelik döneminde bir psikiyatrist tarafından
değerlendirilmeli ve doğum sonrası yüksek tekrarlama riski nedeni ile
bir tedavi planı oluşturulmalıdır. Ebe değerlendirme ve yönlendirme
konusunda duyarlı ve takipte olmalıdır. Doğum sonrasında veya başka
bir zamanda ciddi ruhsal hastalık geçiren kadınlar, sonraki
gebeliklerinde bunun tekrarlayabileceğine dair ebe tarafından
bilgilendirilmelidirler.
KAYNAKLAR (REFERENCES)
[1] WHO Maternal Mental Health. Erişim adresi:
https://www.who.int/mental_health/maternal-
child/maternal_mental_health/en/ Erişim tarihi: 29.09.2019
[2] Karaçam, Z., Çoban, A., Akbaş, B., and Karabulut, E., (2018).
Status of Postpartum Depression in Turkey: A Meta-Analysis.
Health Care for Women International, 39(7):821-841.
[3] Ulusal Hastalık Yükü Çalışması 2017 Sonuçları ve Çözüm Önerileri
Erişim adresi:
http://www.tip.hacettepe.edu.tr/ekler/pdf/ulusal_program.pdf
Erişim tarihi: 29.09.2019
[4] Miller, L.J., (2002). Postpartum Depression. Jama, 287(6):762-
765.
[5] Beck, C.T., (2003). Postpartum Depression Predictors Inventory—
Revised. Advances in Neonatal Care, 3(1):47-48.
[6] Parry, B.L., Sorenson, D.L., Meliska, C.J., Basavaraj, N.,
Zirpoli, G.G., Gamst, A., and Hauger, R., (2003). Hormonal Basis
of Mood and Postpartum Disorders. Current Women's Health
Reports, 3(3):230-235.
[7] Dermott, K., (2006). Clinical Guidelines and Evidence Review for
Post Natal Care: Routine Post Natal Care of Recently Delivered
Women and Their Babies. NICE.
[8] Kısa, C. ve Yıldırım, S.G., (2004). Gebelik Postpartum Dönem ve
Ruhsal Bozukluklar. Psikiyatri Psikoloji Psikofarmakoloji (3P)
Dergisi, 12(4):3-6.
[9] Karaçam, Z., Öz, F. ve Taşkın, L., (2004). Postpartum Depresyon:
Önleme, Erken Tanı ve Hemşirelik Bakımı. Sağlık ve Toplum
Dergisi, 3, 14-24.
[10] Lowdermilk, D.L., Perry, S.E., and Bobak, I.M., (200). Maternity and Women’s Health Care. 7. Baskı. St. Louis, MosbyCompany, 639-
640, 940-963.
[11] Munoz, C., Agruss, J., Haeger, A., and Sivertsen, L., (2006). Postpartum Depression: Detection and Treatment in the Primary
Care Setting. The Journal for Nurse Practitioners, 2(4):247-253.
[12] Doyurgan, K., (2009). Gebelik ve Gebelik Sonrası Dönemdeki Kadınların Uyum Düzeyleri. Ondokuzmayıs Üniversitesi Sosyal
Bilimler Enstitüsü, Eğitim Bilimleri Anabilim Dalı Yüksek Lisans
Tezi. Samsun (Danışman: Yrd. Doç. Dr. ME Sardoğan).
[13] Maternal Mental Health Alliance, NSPCC, Royal College of Midwives., (2014). Specialist Mental Health Midwives–What they
do and whythey matter. Erişim adresi:
http://www.nspcc.org.uk/Inform/resourcesforprofessionals/underon
es/mental-health-midwivespdf_wdf99836.pdf. Erişim tarihi:
29.09.2019
[14] Mivsek, A.P. and Zaksek, T., (2012). Mood Disorders in the Puerperium and the Role of the Midwife: Study on Improvement of

93
4th International Science Symposium (September 04-06, 2019),
Kiev-Ukraine (ISS2019), 1B1PB; pp:88-93.
Midwives’ Knowledge about Post-Natal Depression After an
Educational Intervention. Clinical, Research and Treatment
Approaches to Affective Disorders: 284–323. Erişim adresi:
https://www.researchgate.net/publication/280007276_Mood_disorder
s_in_the_postpartum_and_the_role_of_the_midwife Erişim tarihi:
29.09.2019
[15] McCauley, K., Elsom, S., MUIR‐COCHRANE, E., and Lyneham, J., (2011). Midwives and Assessment of Perinatal Mental Health.
Journal of Psychiatric and Mental Health Nursing, 18(9):786-795.
[16] Koyun, A., Taşkın, L. ve Terzioğlu, F., (2011). Yaşam Dönemlerine Göre Kadın Sağlığı ve Ruhsal İşlevler: Hemşirelik
Yaklaşımlarının Değerlendirilmesi. Psikiyatride Güncel
Yaklaşımlar, 3(1):67-99.
[17] Clatworthy, J., (2012). The Effectiveness of Antenatal Interventions to Prevent Postnatal Depression in High-Risk
Women. Journal of Affective Disorders, 137(1-3):25-34.
[18] Royal College of Midwives., (2015). Caring for Women with Mental Health Problems: Standards and Competency Framework for
Specialist Maternal Mental Health Midwives.
[19] Alici-Evcimen, Y. and Sudak, D.M., (2003). Postpartum Depression. Primary care update for OB/GYNS, 10(5):210-216.
[20] Dennis, C.L. and Dowswell, T., (2013). Psychosocial and Psychological Interventions for Preventing Postpartum
Depression. Cochrane database of systematic reviews, (2).
[21] Henderson, C. and MacDonald, S., (Eds.)(2004). Mayes' Midwifery: A Textbook for Midwives. Bailliere Tindall Limited.
[22] Kadınların Yaşamı ve Kadın Ruh Sağlığı, TPD Yayınları, Çalışma Birimleri Dizisi, Editörler: Yüksel Ş, Gülseren L, Başterzi AD,
Ankara, 2013:752.
[23] Erdem, Ö., (2014). Doğum Sonrası Psikoz. Konuralp Tıp Dergisi, 6(1), 74-77.

4th International Science Symposium Status: Proceeding Book
ISS2019 (September 4-6, 2019) ID : 2019.1B2PB
Selçuk Mistik
Emine Ağadayı
Emel Köseoğlu
Erciyes University, [email protected], Kayseri-Turkey
VİTAMİN B12 KULLANIMI, ZİHİNSEL VE FİZİKSEL EGZERSİZLERİN İDİYOPATİK
UNUTKANLIK ÜZERİNE ETKİSİ
ÖZ
Bu çalışmada demans tanısı almamış ancak subjektif unutkanlık
şikayetleri olan orta yaştaki bireylerde fiziksel aktivite, B vitamini
takviyesi ve zihinsel aktivitenin bilişsel fonksiyonlar üzerine etkisini
değerlendirmek amaçlandı. Çalışmaya Mayıs 2017–2018 tarihleri arasında
Erciyes Üniversitesi Tıp Fakültesi Aile Hekimliği ve Nöroloji Anabilim
Dalı polikliniklerine subjektif unutkanlık şikayeti ile başvuran 40-65 yaş
arasındaki 82 kişi değerlendirildi. Katılımcılara genel fizik muayene
yapıldı. B12 vitamini, folik asit düzeyi ve tiroid fonksiyonlarını da
içeren bazal kan tetkikleri yapıldı. Sosyodemografik anketin dışında
çalışma başında ve sonunda Beck Anksiyete ve Beck Depresyon Ölçeği,
Montreal Bilişsel Değerlendirme Testi, Görsel ve Sözel Bellek Süreçleri
Testleri uygulandı. Çalışmaya uygun 68 kişi kognitif aktivite, fiziksel
aktivite ve vitamin takviyesi olmak üzere 3 gruba randomize olarak
dağıtıldı. Fiziksel aktivite grubu günlük minimum yarım saat tempolu
yürüyüş yaptı. Kognitif aktivite grubundan günde bir adet çengel bulmaca
çözmesi istendi. Vitamin takviyesi grubu günlük B vitamin kompleksi
kullandı. Üçüncü ayın sonunda kognitif testler ve B12 kan düzeyi testi
tekrarlandı. Bilişsel fonksiyonlardaki düzelme yürüyüş grubunda anlamlı
bulunurken; uzun süreli görsel bellek ve sözel bellek alt test skorları
açısından tüm gruplarda anlamlı düzelme görüldü.
Anahtar Kelimeler: Demans, Kognitif Aktivite, Fiziksel Aktivite,
B Vitamini
THE EFFECT OF VITAMIN B12, PHYSICAL AND COGNITIVE ACTIVITY ON IDIOPATHIC
FORGETFULNESS
ABSTRACT
In this study, we aimed to evaluate the effect of physical activity,
vitamin B supplementation and mental activity on cognitive functions in
middle-aged individuals with subjective forgetfulness. We included 82
people between 40-65 years of age who were admitted to Erciyes University
Faculty of Medicine Family Medicine and Neurology Departments polyclinics
with the complaint of subjective forgetfulness between May 2017 and May
2018. General physical examination, blood tests including B12, folic acid
level and thyroid function were performed. In addition to the socio-
demographic questionnaire, Beck Anxiety and Beck Depression Scale,
Montreal Cognitive Assessment Test, Visual and Verbal Memory Tests were
performed. Sixty-eight subjects were randomly allocated to 3 groups as
cognitive activity, physical activity and vitamin B supplementation. The
physical activity group made a minimum of half-hour brisk walk daily. The
cognitive activity group was asked to solve a hooked puzzle every day.
Vitamin supplement group used daily vitamin B complex. At the end of the
third month, cognitive tests and B12 blood level test were repeated. This
study has been supported by Erciyes University Scientific Research Unit,
ERUBAP Project no TTU-2017-7456. Improvement in cognitive functions was
found only in the walking group. Long-term visual memory and verbal memory
sub-test scores improved significantly in all groups.
Keywords: Dementia, Cognitive Activity, Physical Activity,
Vitamin B

95
4th International Science Symposium (September 04-06, 2019),
Kiev-Ukraine (ISS2019), 1B2PB; pp:94-103.
1. GİRİŞ (INTRODUCTION)
Tıp ve diğer bilimsel alanlardaki gelişmelerin sayesinde insan
ömrü uzamaktadır. Yaşlı nüfusun getirdiği yeni sorunlar ile insanoğlu
yüzleşmek durumunda kalmıştır. Yaşlanmanın insan bedeninde meydana
getirdiği değişiklikler ve tedavisi güç hastalıklar sadece yaşlı
bireyleri değil ailesi, çevresi hatta tüm toplumu etkileyecek
boyutlara ulaşmıştır. Ülkeler sağlık yönetimi, kaynak kullanımı ve
gelecek maliyet projeksiyonları gibi birçok konuda yaşlı nüfusu
dikkate almak zorunda kalmaktadır. İlerleyen yaş ile birlikte insan
vücudunda yıkım onarım ve yenilenme dengesi yıkım lehine
bozulmaktadır. Bunun sonucu olarak fiziksel kapasitede gerileme ve
zihinsel fonksiyonlarda yavaşlama ortaya çıkmaktadır. Bu gerileme
süreçlerinin bir sonucu da demanstır. Demans tanım olarak kişinin
sosyal ve mesleki yaşamını eskisine göre olumsuz yönde etkileyecek
derecede bilişsel fonksiyonlarda (hafıza, lisan, dikkat..) ilerleyici
bozulmadır. Kişinin sosyal hayattan soyutlanmasına, günlük
ihtiyaçlarını karşılayamamasına ve ilerleyen aşamalarda ölümüne yol
açabilecek derecede ciddi bir sağlık sorunudur. Yaşlı nüfustaki artış
demans sıklığını da dramatik şekilde arttırmaktadır. Artan demans
sıklığı hasta bireyler üzerindeki yıkıcı etkilerinin yanında ortaya
çıkan yeni ihtiyaçlarla ailelerini, sosyal çevrelerini ve sağlık
hizmetlerini de olumsuz şekilde etkilemektedir. Demansın ilerlemesini
durdurmaya yönelik çeşitli farmakolojik ajanlar hali hazırda bulunsa
da bunlar hastalığın kontrol altına alınmasında sınırlı etkiye
sahiptirler. Hastalığın tamamen iyileştirilmesinde ise henüz yeterli
başarı sağlanamamıştır. Bu nedenle alternatif önlemler son yıllarda
çalışmaların konusu olmuştur. Diyet rejimleri, mikro besin
takviyeleri, egzersiz, sistemik hastalıkların (diyabet, hipertansiyon,
hiperkolesterolemi) kontrolü temelinde demans gelişimini önlemek veya
bu süreci yavaşlatmaya yönelik çok sayıda çalışma yapılmıştır. Demans
geniş pencereden bakıldığında aslında bir halk sağlığı problemi olarak
önümüzde durmaktadır.
2. ÇALIŞMANIN ÖNEMİ (RESEARCH SIGNIFICANCE)
Bu çalışmada demans tanısı almamış ancak subjektif unutkanlık
şikayetleri olan orta yaştaki bireylerde egzersiz, B vitaminleri ve
zihinsel aktivitelerin bilişsel fonksiyonlar üzerine etkisini
değerlendirmek amaçlanmıştır. Çalışma sonuçlarının temel sağlık
hizmetleri sunumunda demans için risk faktörleri barındıran kişilere
basit, uygulanabilir ve ucuz öneriler geliştirilmesinde faydalı
veriler sağlayacağını düşünmekteyiz.
Günümüzde kullanılan farmakolojik ajanların hastalık seyri
üzerine olumlu etkileri görülmekle birlikte bu ilaçlar kognitif
fonksiyonlardaki gerilemeyi tamamen durdurmamakta ve kaybı geri
döndürememektedir. HKB olan kişilerde kolinesteraz inhibitörlerinin
plasebo ile karşılaştırıldığı çalışmaları içeren bir meta analizde
(n=5149) bu ilaçların kognitif bozukluğun demansa ilerleme riskini
azaltmakta ve kognitif skorlarda iyileşmede düşük düzeyde etkisi
saptanmıştır. Bununla birlikte hastalarda gastrointestinal başta olmak
üzere hayati olmayan sık yan etki profili gözlenmiştir [1]. İlaç
tedavisi çeşitli yan etkiler ve demanslı hastalar için kullanım
güçlükleri barındırmaktadır. Bu nedenle demansın erken işaretlerinin
önceden tespiti ve risk taşıyan kişilerde buna yönelik önleyici
stratejiler geliştirmek öncelikli hedef haline gelmiştir. Bu konuda
yapılan çalışmalarda sistemik hastalıklara bağlı risk faktörlerinin
kontrolü, egzersiz, diyet, bilgisayar programları veya çeşitli zeka
oyunları içeren kognitif aktiviteler, mikro besin takviyeleri gibi
yaşam değişiklikleri ile kognitif fonksiyonlarda gerilemenin durması
ya da düzelmesi amaçlanmıştır.

96
4th International Science Symposium (September 04-06, 2019),
Kiev-Ukraine (ISS2019), 1B2PB; pp:94-103.
3. GEREÇ VE YÖNTEM (MATERIALS AND METHODS)
Bu çalışmaya Erciyes Üniversitesi Etik Kurulu’nun 21.04.2017
tarihli ve 2017-216 sayılı onayı ve Bilimsel Araştırma Projesi (BAP)
kurulunun TTU-2017-7456 proje numarası onayı ile başlandı. Çalışma
Erciyes Üniversitesi Tıp Fakültesi Gevher Nesibe Hastanesi Aile
Hekimliği Anabilim Dalı polikliniğinde prospektif olarak
gerçekleştirildi. Bütün hastalara çalışmanın amaç ve prosedürü
anlatılarak; çalışma Helsinki deklarasyonu prensiplerine uygun olarak
yürütüldü. Ayrıca hastalardan aydınlatılmış onam formu alındı.
Çalışmaya Mayıs 2017–2018 tarihleri arasında Erciyes Üniversitesi Tıp
Fakültesi Aile Hekimliği ve Nöroloji Anabilim Dalı polikliniklerine
subjektif unutkanlık şikayeti ile başvuran 40-65 yaş arasındaki 82
kişi dahil edilmiştir. Tüm hastaların doğum tarihi, doğum yeri,
yaşadığı yer, meslek bilgileri ve sistemik hastalıklar yönünden
öyküleri kaydedildi. Hastalara genel fizik muayene yapıldı. Ayrıca 8
saat açlık sonrası hemogram, B12 vitamin düzeyi (0-3. ay), folik asit
düzeyi, açlık kan şekeri, total kolesterol, yüksek dansiteli
lipoprotein (HDL), düşük dansiteli lipoprotein (LDL), kalsiyum, kan
üre azotu (BUN), kreatinin, aspartat aminotransferaz (AST), alanin
aminotransferaz (ALT), trigliserid, total kolesterol, T3, T4, tiroid
uyarıcı hormon (TSH) düzeyi, eritrosit sedimentasyon hızını (ESR)
içeren kan testleri yapıldı. Sosyodemografik anketin dışında çalışma
başında ve üçüncü ayın sonunda Beck Anksiyete ve Beck Depresyon
Ölçeği, MBDT, WMS (Weschler Memory Scale) Görsel Üretim Alt Testi ve
Öktem Sözel Bellek Süreçleri Testi uygulandı.
Çalışma başında ve sonunda kognitif testleri etkileyebilecek
depresyon ve anksiyete bozukluğu açısından katılımcılara Beck
Anksiyete Testi ve Beck Depresyon Testi yapıldı. Buna göre hafif
depresyon düzeyi üzerindeki (16<puan) kişiler çalışma dışında tutuldu.
MBDT ile dikkat ve konsantrasyon, yürütücü işlevler, bellek, lisan,
görsel yapılandırma becerileri, soyut düşünce, hesaplama ve yönelim
olmak üzere 8 farklı bilişsel işlev değerlendirilmektedir. Test
bireylere uygulandıktan sonra puanlar toplanır. Testten alınabilecek
en yüksek puan 30’dur. 21 puan ve üstünde alınan puan normal olarak
değerlendirilir. Ön değerlendirme sonunda depresyonu olan, tanısı
konulmuş demansı (AH, vasküler demans) olan, hipotiroidi olan,
testlere ve çalışma gruplarına uyumu zorlaştıracak düzeyde işitme,
görme veya fiziksel hastalıkları bulunanlar, psikiyatrik hastalığı
bulunan, B12 vitamin 200pg/ml altında olan hastalar çalışma dışında
tutuldu. Katılımcılardan 14 kişi çalışma kriterleri doğrultusunda
çalışma dışı bırakıldı. Çalışmaya uygun olan 68 kişi kognitif aktivite
(n=23), fiziksel aktivite (n=23) ve vitamin takviyesi (n=22) olmak
üzere 3 gruba randomize olarak dağıtıldı. Fiziksel aktivite grubundan
günlük minimum yarım saat olmak üzere tempolu yürüyüş yapması istendi.
Hastaların motivasyonunu ve uyumunu arttırmak için verilen adım sayar
ile bu yürüyüşleri kaydetmeleri istendi. Kognitif aktivite grubundan
verilen kaynaktan günde bir adet çengel bulmaca çözmesi ve çalışma
sonunda bulmacaları beraberinde getirmeleri istendi. Vitamin takviyesi
grubundan günde 1 adet B vitamin kompleksi (Benexol® B1/B6/B12
250/250/1mg, ağızdan) kullanması istendi. Katılımcılarla aylık olarak
telefon görüşmeleri ile yan etki profili ve çalışma uyumu açısından
iletişim kuruldu. 3. ayın sonunda testler ve B12 kan düzeyi testi
tekrarlandı. Çalışmaya alınan hastalardan 14 kişi çeşitli nedenlerle
çalışmayı yarıda bıraktı. Fiziksel aktivite grubundan 19 kişi, bulmaca
grubundan 17 kişi, vitamin grubundan 18 kişi olmak üzere çalışmayı 54
kişi tamamladı.

97
4th International Science Symposium (September 04-06, 2019),
Kiev-Ukraine (ISS2019), 1B2PB; pp:94-103.
4. İSTATİSTİKSEL ANALİZ (STATISTICAL ANALYSIS)
Verilerin istatistiksel analizi SPSS for Windows programında
(SPSS for Windows software, version 20.0, SPSS Inc, Chicago, IL)
yapıldı. Verilerin dağılımı Saphiro Wilk test istatistiği ile
değerlendirildi. Bağımsız ikiden fazla grup verilerin
karşılaştırılmasında non parametrik verilerin incelenmesinde
kullanılan Kruskal Wallis test istatistiği kullanıldı. Bağımlı iki
grubun verilerinin incelenmesinde Wilcoxon Test istatistiği
kullanıldı. p≤0.05 düzeyi istatistiksel olarak anlamlı kabul edildi.
5. BULGULAR (RESULTS)
Çalışmayı tamamlayan 54 kişinin (Erkek=12, Kadın=42) yaş
ortalaması 49.7 olarak bulundu. Çalışma grupları arasında yaş
açısından anlamlı fark saptanmadı (p=0.864). Çalışmaya katılanların
büyük oranda kadın olduğu ve tüm gruplarda bu durumun izlendiği
görülmektedir. Hastaların eğitim durumu iki kişi dışında ilköğretim
veya sonrası düzeyindedir. 10 kişi lisans mezunudur. Eğitim durumları
açısından gruplar arasında farklılık izlenmedi. Meslek grupları
açısından bakıldığında katılımcıların büyük çoğunluğunun ev hanımı
olduğu dikkat çekmektedir.
Tablo 1. Çalışma grupları ve cinsiyet, eğitim durumu, meslek ilişkisi
(Table 1. Working groups and gender, educational status, professional
relationship)
Grup
Egzersiz Vitamin Bulmaca
Cinsiyet Erkek 3 3 6
Kadın 16 14 12
Eğitim
Düzeyi
Okur Yazar Değil 1 1 0
İlköğretim 11 13 11
Ortaöğretim 3 1 3
Lisans 4 2 4
Meslek
İşçi 4 3 7
Ev Hanımı 10 12 7
Memur 5 2 4
Katılımcılara çalışma başında bakılan açlık kan şekeri, tiroid
fonksiyon testleri, AST, ALT, ALT, BUN, kreatinin, hemoglobin,
kalsiyum düzeyleri ve ESR açısından gruplar arasında anlamlı fark
saptanmadı (Tablo 2). Çalışma başında folik asit düzeyleri açısından
fark saptanmazken; B12 düzeyleri vitamin takviyesi grubunda anlamlı
düzeyde düşük bulundu (p=0.024). Çalışma sonunda tekrar edilen B12
vitamin düzeyleri açısından gruplar arası fark izlenmedi (p=0.106).
Tablo 2. Çalışma grupları yaş ve kan testi değerleri
(Table 2. Age and blood test values of the study groups)
Grup
P Egzersiz Vitamin Bulmaca
Median(%25-%75) Median(%25-%75) Median(%25-%75)
Yaş 47(46-55) 49(45-52) 51(42-56) 0.864
AKŞ(mg/dl) 99.00(87-103) 91.00(89-97) 91.00(83-96) 0.224
Hbg(g/dl) 13.40(12.8-14.7) 14.00(13.30-14.90) 14,45(13,80-15,10) 0.128
TSH(µIU/ml) 1.66(1.36-2.60) 1.64(1.24-2.29) 1.60(1.06-2,66) 0.943
T4(ng/dl) 1.12(1.03-1.30) 1.20(1.10-1.33) 1.20(1.09-1,27) 0.709
Folik
asit(ng/ml) 8.10(6.50-10.00) 9,00(6,20-10,30) 7,05(5.60-10.70) 0.977
B12 ilk(pg/ml) 311.00(276-341) 250.00(215-289) 342.00(205-423) 0.024
B12 son(pg/ml) 280.00(270-377) 372.00(287-519) 322.85(261-379) 0.106

98
4th International Science Symposium (September 04-06, 2019),
Kiev-Ukraine (ISS2019), 1B2PB; pp:94-103.
Çalışma başında ve sonunda yapılan kognitif fonksiyonları
etkileyebilecek depresyon ve anksiyete ölçekleri açısından gruplar
arasında istatistiksel açıdan anlamlı fark saptanmadı (Tablo 3).
Tablo 3. Çalışma grupları ve Beck Depresyon/Beck Anksiyete Ölçekleri
ilişkisi
(Table 3. The relationship between the study groups and Beck
Depression / Beck Anxiety Scales)
Grup
P Egzersiz Vitamin Bulmaca
Median(%25-%75) Median(%25-%75) Median(%25-%75)
BECKD İlk 8(4-11) 10(7-13) 9(5-11) 0.334
BECKD Son 6(3-9) 7(5-10) 7(4-11) 0.340
BECKA İlk 8(6-11) 10(9-13) 10(6-19) 0.196
BECKA Son 6(3-10) 11(8-19) 11(3-21) 0.164
Çalışma başlangıcında MBDT testi total skoru açısından gruplar
arasında anlamlı fark saptandı (p=0.029). Bu fark ikili analizler
sonucu bulmaca ve vitamin grupları arasında (vitamin grubu daha düşük)
istatistiksel olarak anlamlı bulundu (p=0.028). MBDT total skorlarının
çalışma sonunda tüm gruplarda bir miktar arttığı görüldü. Bu artış
sadece yürüyüş grubunda anlamlı olarak saptandı (p=0.049). Çalışma
başında izlenen vitamin ve bulmaca grupları arasındaki anlamlı
derecede fark çalışma sonunda da devam etmekteydi (p=0.008).
Tablo 4. MBDT total skorları açısından gruplar arasındaki farklılık ve
değişim tablosu
(Table 4. Table of differences and changes between the groups in terms
of MBDT total scores)
İlk Son
P Median(%25-%75) Median(%25-%75)
Grup
Egzersiz 21(16-25)ᵃᵇ 23(17-25)ᵉᵈ 0.049
Vitamin 18(16-23)ᵃ 19(17-24)ᵉ 0.390
Bulmaca 24(22-27)ᵇ 26(23-28)ᵈ 0.229
P 0.029 0.011
* ᵃ ᵇ ᵉ ᵈ Sütunlardaki farklı üst karakterler gruplar arasındaki istatistiksel
farkı göstermektedir
Anlık görsel bellek test skorları açısından çalışma başında ve
sonunda gruplar arası anlamlı fark izlenmedi (p>0.05). Çalışma sonunda
grupların hiç birinde anlamlı değişiklik izlenmedi (Tablo 5).
Tablo 5. Anlık görsel bellek testi açısından gruplar arasındaki
farklılık ve değişim tablosu
(Table 5. Table of differences and changes between groups in terms of
instant visual memory test)
İlk Son
P Median(%25-%75) Median(%25-%75)
Grup
Egzersiz 11(7-12) 11(7-13) 0.326
Vitamin 9(8-12) 10(6-13) 0.266
Bulmaca 13(8-13) 13(12-14) 0.103
P 0.160 0.054
Uzun süreli görsel bellek test skorları açısından çalışma
başında ve sonunda gruplar arası anlamlı fark izlenmezken; çalışma
sonunda tüm gruplarda anlamlı şekilde artış izlendi (Tablo 6).

99
4th International Science Symposium (September 04-06, 2019),
Kiev-Ukraine (ISS2019), 1B2PB; pp:94-103.
Tablo 6. Uzun görsel bellek testi açısından gruplar arasındaki
farklılık ve değişim tablosu
(Table 6. Table of differences and changes between groups in terms of
long visual memory test)
İlk Son
P Median(%25-%75) Median(%25-%75)
Grup
Egzersiz 9(5-10) 10(6-13) 0.030
Vitamin 8(3-10) 9(5-10) 0.016
Bulmaca 11(7-12) 12(10-14) 0.042
P 0.052 0.062
Çalışmanın başında anlık sözel bellek skorları açısından gruplar
arasında fark saptanmadı. Çalışma sonu ikili karşılaştırma
analizlerinde vitamin grubu egzersiz grubuna göre istatistiksel olarak
düşük bulundu (p=0.042). Anlık sözel bellek test skorları çalışma
sonunda tüm gruplarda anlamlı düzeyde artmıştır (Tablo 7).
Tablo 7. Anlık sözel bellek testi açısından gruplar arasındaki
farklılık ve değişim tablosu
(Table 7. Table of differences and changes between groups in terms of
instant verbal memory test)
İlk Son
P Median(%25-%75) Median(%25-%75)
Grup
Egzersiz 5(3-6) 8(6-10)ᵃ <0.001
Vitamin 5(4-5) 6(5-7)ᵇ 0.004
Bulmaca 5(4-5) 6(6-8)ᵃᵇ <0.001
p 0.883 0.043
* ᵃ ᵇ Sütunlardaki farklı üst karakterler gruplar arasındaki istatistiksel
farkı göstermektedir
Çalışma başında sözel bellek öğrenme testi açısından gruplar
arasında anlamlı fark saptandı (p=0.049). Sözel bellek öğrenme test
skorları çalışma başında vitamin grubunda diğer gruplardan düşük
izlendi. Sözel bellek öğrenme test skorları çalışma sonunda tüm
gruplarda anlamlı şekilde artmıştır (Tablo 8).
Tablo 8. Sözel bellek öğrenme testi açısından gruplar arasındaki
farklılık ve değişim tablosu
(Table 8. Differences and changes between groups in terms of verbal
memory learning test)
İlk Son
P Median(%25-%75) Median(%25-%75)
Grup
Egzersiz 99(91-111) 113(106-127) <0.001
Vitamin 90(87-96) 100(88-115) 0.001
Bulmaca 99(91-109) 112(104-121) <0.001
p 0.049 0.064
Tablo 9. Sözel bellek hatırlama testi açısından gruplar arasındaki
farklılık ve değişim tablosu
(Table 9. Differences and changes between groups in terms of verbal
memory recall test)
İlk Son
P Median(%25-%75) Median(%25-%75)
Grup
Egzersiz 12(11-13) 13(12-14) 0.018
Vitamin 11(8-13) 11(10-13) 0.014
Bulmaca 12(10-13) 14(13-14) 0.016
p 0.189 0.047

100
4th International Science Symposium (September 04-06, 2019),
Kiev-Ukraine (ISS2019), 1B2PB; pp:94-103.
Tablo 10. Çalışma sonunda test skorlarındaki değişim tablosu
(Table 10. Table of changes in test scores at the end of the study) Test Egzersiz Vitamin Bulmaca
MBDT ↑ ↔ ↔
GBANLIK ↔ ↔ ↔
GBUZUN ↑ ↑ ↑
SBÖĞRENME ↑ ↑ ↑
SBANLIK ↑ ↑ ↑
SBHATIRLAMA ↑ ↑ ↑
Çalışma öncesi sözel bellek hatırlama skorları açısından gruplar
arasında fark saptanmadı. Çalışma sonunda vitamin grubu diğer gruplara
göre düşük bulundu. Sözel bellek hatırlama test skorları çalışma
sonunda tüm gruplarda anlamlı şekilde artmıştır (Tablo 9).
Çalışma süresince katılımcıların hiçbirinde sağlıklarını veya
çalışmaya uyumlarını etkileyecek yan etki gözlenmedi.
6. TARTIŞMA (DISCUSSION)
Gelişen sağlık teknolojileri ve tıp alanındaki ilerlemeler insan
ömrünün uzamasını sağlamıştır. İleri yaştaki nüfusun tüm dünyada
artması; yaşlılığa bağlı sağlık sorunlarını sadece bu alanda çalışan
kişi ve kurumların sorunu olmaktan çıkarmıştır. Ülkelerin sağlık
harcamalarında bu küresel problem önemli bir yer teşkil etmeye
başlamıştır. Buna ilave olarak yaşlı nüfus bireysel ihtiyaçlarının
karşılanması ve rehabilitasyon süreçleri ile sosyal çevrelerinin yaşam
kalitesi üzerinde etkilere sahiptir. Yaşlanmanın doğal bir sonucu
olarak beyinde metabolik ve yapısal değişiklikler ortaya çıkmaktadır.
Bu doğal bir gerileme süreci olarak görülse de bazı hastalıklar veya
sağlıksız yaşam biçimleri bu olumsuz süreci hızlandırmaktadır. Demans
bu değişikliklerin sonucunda ortaya çıkan ilerleyici nöron kaybı ile
seyreden bir hastalıktır. Kısa ve uzun süreli bellek bozuklukları,
yönetici işlevlerde bozulmalar, dil becerisinde gerileme gibi
semptomlar kişinin sağlıklılık halini etkilediği aşamada artık
hastalık olarak kabul edilmektedir. Demans nedenine veya kişinin
kognitif rezervine bağlı olarak bu süreç daha erken ortaya çıkabilir
ve farklı hızlarda ilerleyebilir. Demans tablosu ağırlaştıkça kişi
sosyal çevresinden soyutlanır. Özbakım sorunları yaşar ve son evrede
konuşma, beslenme gibi en temel ihtiyaçlarını dahi karşılayamaz.
Demans ileri yaşta önde gelen ölüm nedenleri arasında yer almaktadır.
Yaşlı nüfusa bağlı artan bakım ve sağlık maliyetleri ülke
yönetimlerinde buna yönelik tedbirler alınmasını gerekli kılmıştır.
Demans ve en sık nedeni olan AH'ye yönelik farkındalığı arttırmak
amacıyla ulusal ve uluslararası çok sayıda organizasyon mevcuttur.
2013 yılında G8 ülkeleri demansla küresel çapta mücadeleye öncülük
etmek amacıyla Dünya Demans Konseyi'ni kurmuştur. Öncelikli hedef
olarak küratif bir tedavi geliştirilene kadar demans için potansiyel
risk faktörleri ile mücadele kararı alınmıştır. Bunun dışında 21 Eylül
günü Dünya Alzheimer Günü olarak kabul edilmektedir.
Günümüzde kullanılan farmakolojik ajanların hastalık seyri
üzerine olumlu etkileri görülmekle birlikte bu ilaçlar kognitif
fonksiyonlardaki gerilemeyi tamamen durdurmamakta ve kaybı geri
döndürememektedir. HKB olan kişilerde kolinesteraz inhibitörlerinin
plasebo ile karşılaştırıldığı çalışmaları içeren bir meta analizde
(n=5149) bu ilaçların kognitif bozukluğun demansa ilerleme riskini
azaltmakta ve kognitif skorlarda iyileşmede düşük düzeyde etkisi
saptanmıştır. Bununla birlikte hastalarda gastrointestinal başta olmak
üzere hayati olmayan sık yan etki profili gözlenmiştir [1]. İlaç
tedavisi çeşitli yan etkiler ve demanslı hastalar için kullanım
güçlükleri barındırmaktadır. Bu nedenle demansın erken işaretlerinin

101
4th International Science Symposium (September 04-06, 2019),
Kiev-Ukraine (ISS2019), 1B2PB; pp:94-103.
önceden tespiti ve risk taşıyan kişilerde buna yönelik önleyici
stratejiler geliştirmek öncelikli hedef haline gelmiştir. Bu konuda
yapılan çalışmalarda sistemik hastalıklara bağlı risk faktörlerinin
kontrolü, egzersiz, diyet, bilgisayar programları veya çeşitli zeka
oyunları içeren kognitif aktiviteler, mikro besin takviyeleri gibi
yaşam değişiklikleri ile kognitif fonksiyonlarda gerilemenin durması
ya da düzelmesi amaçlanmıştır.
Çalışmamıza başlama amacımız unutkanlık şikayetleri olan orta
yaşlı kişilerde hafıza ve kognitif fonksiyonlardaki gerileme üzerine
olumlu etkisi olacak basit, ucuz ve etkili öneriler geliştirmektir.
Bunların arasında öne çıkan fiziksel egzersiz, zihinsel aktivite ve
vitamin takviyelerinin kognitif fonksiyonlar üzerine etkisi
çalışmamıza temel alınmıştır. Yaşam değişikliklerinin kognitif
fonksiyonlar üzerine olumlu etkileri çeşitli nedenlerle kesin fayda
düzeyine ulaşamamıştır. Bu kısıtlılıkların ilki çalışmaya alınan
kişiler arasındaki demografik farklılıklar nedeniyledir. Çalışmamıza
dahil olan kişiler demans tanısı almamış ve kognitif sorunları günlük
hayatlarını etkilemeyen sadece subjektif unutkanlık şikayetleri olan
kişilerdir. Katılımcılar arasında tüm gruplarda kadınların fazla
olduğu dikkat çekmektedir. Çalışmada uygulanan testlerin uzun sürmesi,
ikinci kere çağırılma ihtiyacı ve mesai saatlerinin uymaması
erkeklerin katılımını azaltmıştır. Eğitim düzeyleri açısından gruplar
arasında farklılık yoktu. Meslek çeşitleri açısından katılımcılar
arasında ev hanımlarının sıklığı dikkat çekmektedir. Çalışma başında
ve sonunda kognitif testleri etkileyebilecek depresyon ve anksiyete
bozukluğu açısından katılımcılara Beck Anksiyete Testi ve Beck
Depresyon Testi yapıldı. Gulpers ve ark. yaptığı sistematik bir
derlemede anksiyetenin kognitif gerileme ve demans için risk faktörü
olduğu ortaya konulmuştur [2]. Çalışmaya dahil edilen gruplar arasında
bu iki test puanları açısından farklılık saptanmadı. Katılımcılara
yapılan bazal kan tetkikleri, tiroid fonksiyon testleri, folik asit
düzeyleri açısından fark saptanmadı. Sadece vitamin takviyesi alan
grupta çalışma öncesi ölçülen B12 vitamin düzeyleri diğer gruplardan
düşük olarak saptandı. Çalışma sonunda bu farkın ortadan kalktığı
görüldü. B12 düşüklüğü ile kognitif fonksiyonlardaki gerileme ilişkisi
uzun süredir bilinmektedir. Ancak bu ilişkinin tam olarak hangi
mekanizmalar üzerinden gerçekleştiği kesinleşmemiştir. B12 homosistein
ve metil malonik asitin metilasyonunda kofaktör olarak görev
yapmaktadır. Öne sürülen mekanizmalardan biri düşük B12 vitamini
düzeyi sonucunda homosisteinin yetersiz metilasyonu ve homosistein
düzeylerinde yükselme üzerindendir. Yüksek homosistein düzeylerine
bağlı olarak serebral damar ağında hasar, beyin atrofisi ve beyaz
cevher hasarı gerçekleşmektedir [3]. Bu mekanizmayı destekleyici
biçimde yüksek homosistein düzeyleri ile kognitif fonksiyonlarda
gerileme arasındaki ilişki birçok çalışmada gösterilmiştir [4 ve 5].
Haan ve arkadaşlarının çalışmasında serum homosistein düzeyinin demans
ve demans dışı kognitif bozukluk için bağımsız bir risk faktörü olduğu
belirtilmiştir. Aynı çalışmada yüksek B12 düzeyleri homosistein
ilişkili demans riski açısından koruyucu bulunmuştur [6]. HKB ve AH
ile sağlıklı kontrol grubunun karşılaştırıldığı bir çalışmada ise
düşük serum B12 ve folat düzeyleri, yüksek homosistein düzeyleri HKB
ve AH ile ilişkili bulunmuştur [7].
Çalışmamızda bilişsel fonksiyonların değerlendirilmesinde MBDT
kullanıldı. Kognitif fonksiyonların değerlendirildiği MBDT açısından
gruplar arasında çalışma başında ve sonunda fark izlendi (p=0.029,
0.011). Her iki değerlendirmede vitamin grubu total skorları bulmaca
grubuna göre anlamlı derecede düşük bulundu. Vitamin grubunun MBDT
skorlarındaki düşüklük B12 seviyesindeki düşüklük ile ilişkili
olabilir. B vitamini kompleksi kullanımı sonunda 3. ayda diğer gruplar

102
4th International Science Symposium (September 04-06, 2019),
Kiev-Ukraine (ISS2019), 1B2PB; pp:94-103.
gibi vitamin grubunda da bilişsel fonksiyonlarda iyileşme izlendi.
Moore ve arkadaşlarının yaptığı derlemede günlük 1mg B12 vitamini
kullanımı ile biyokimyasal eksiklik düzelmiş kognitif fonksiyonlarda
düzelme sadece daha önce B12 eksikliği (<150pmol/L) olan kişilerde
izlenmiştir. Çalışmamızda tedavi öncesi B12 düzeyi ortalama 189
pmol/L(255pg/ml) olarak bulunmuştur. Çalışma sonunda B12 seviyeleri
açısından gruplar arasında fark olmamasına rağmen bilişsel fonksiyon
test skorları açısından vitamin grubu anlamlı şekilde düşük bulundu.
Bu farklılık kısa çalışma süresi nedeniyle biyokimyasal düzelmenin
kognitif fonksiyonlara yansımaması veya etkisinin sınırlı olması
şeklinde yorumlanabilir.
Çalışmamızda hafıza fonksiyonlarındaki değişiklikler WMS-Görsel
Bellek Alt Testi ve Öktem Sözel Bellek Süreçleri Testi ile
değerlendirildi. Görsel bellek testinde anlık bellek skorları
açısından çalışma başında ve sonunda gruplar arasında fark yoktu. 3
aylık süre sonunda çalışma gruplarında çalışma başlangıcına göre
düzelme saptanmadı. Uzun süreli görsel bellek testi açısından çalışma
başında ve sonunda gruplar arasında anlamlı fark saptanmadı. Uzun
süreli görsel bellek skorları açısından vitamin, fiziksel ve kognitif
aktivite gruplarının tümünde bu sürede anlamlı artış izlendi. Her üç
yaşam değişikliğinin görsel hafızanın bazı bileşenleri açısından
olumlu etkiye sahip olabileceği şeklinde yorumlandı. Sözel bellek
süreçleri testi alt değerlendirme puanları açısından gruplar
karşılaştırıldı. Sözel bellek anlık bellek, hatırlama, öğrenme
skorları değerlendirildi. Çalışma sonunda sözel bellek alt test
gruplarının tümünde anlamlı artış saptandı. Anlık sözel bellek ve
sözel bellek hatırlama skorları açısından çalışma başında fark
izlenmezken; çalışma sonunda vitamin grubunun diğer gruplardan anlamlı
şekilde düşük olduğu görüldü. Bir çalışmada HKB olan kişilerde B12
vitamini düzeyi düşük seviyede (normal sınır aralığında) olanlarda
öğrenme kapasitesi ve tanıma performanslarının yüksek düzeydekilere
göre yaş, eğitim, homosistein ve folat düzeylerinden bağımsız olarak
daha kötü olduğu bulunmuştur. Aynı çalışmada düşük olan grupta
hipokampus yapısal bütünlüğünün daha kötü olduğu gösterilmiştir [8].
Üçüncü ayın sonunda anlık sözel bellek ve sözel bellek hatırlama
skorlarında tüm gruplarda anlamlı artış izlenmiştir.
Çalışmamızdaki bulgular ışığında çeşitli yaşam değişiklikleri 3
ay gibi kısa sürede basit unutkanlık şikayeti olan kişilerde bilişsel
fonksiyonlar ve bellek açısından olumlu etkilere sahip görünmektedir.
Fiziksel engeli veya güçlük oluşturacak hastalığı olmayan kişiler için
yürüyüş veya basit fiziksel aktivite föyleri kognitif fonksiyonların
korunmasında yararlı bir öneri olabilir. Sadece aerobik egzersizlerin
değil evde yapılabilecek çeşitli denge ve güçlendirme egzersizlerinin
de uygun kişiler için alternatif olabileceğini gösteren kanıtlar
mevcuttur. Literatür ışığında bu öneriler her yaştan ve kognitif
fonksiyon düzeyindeki kişiye yapılabilir. Egzersizin sadece kognitif
sağlık açısından faydası değil fiziksel ve ruhsal kazanımları da
akılda tutulmalıdır.
Bulmaca ve B vitamini kompleksi kullanımının total kognitif
skorda anlamlı düzelme olmasa bile bellek testleri üzerine olumlu
etkileri görüldü. Kognitif fonksiyonların alt testlerindeki
değişiklikler çalışmamızda ele alınmamıştır. Alternatif bir test
seçimi ya da alt fonksiyon skorlarının ele alınması durumunda bu iki
yaşam değişikliğinin etkileri daha net şekilde gösterilebilir. Bunun
neticesinde fiziksel güçlüğü olan ve demans riski taşıyan kişilerde bu
alternatif öneriler gündeme gelebilir. Hafıza fonksiyonları açısından
bazı alt gruplarda farklılık olmakla birlikte her üç yaşam
değişikliğinin olumlu etkilerini gözlemledik. Unutkanlık şikayetleri
olan veya demans açısından risk faktörleri taşıyan kişilerde her üç

103
4th International Science Symposium (September 04-06, 2019),
Kiev-Ukraine (ISS2019), 1B2PB; pp:94-103.
yöntem basit ve faydalı gibi durmaktadır. Bu noktada B vitamini
kullanımının B12 düzeyleri normal kişilerde psikososyal nedenlerden
dolayı dirençle karşılaşılması muhtemeldir. Sağlık açısından ek
kazanımları ve kognitif fonksiyonlardaki anlamlı etkisi göz önünde
bulundurularak fiziksel aktivite öncelikli seçenek olarak sunulabilir.
Çalışmamızda kombine grup olmasa da bu konuda yapılmış kontrollü
çalışmalar (FINGER, MAX Çalışmaları vb.) ve düşük yan etki profili göz
önünde bulundurulduğunda; kognitif rezervin korunmasında bu yaşam
değişikliklerinin tamamlayıcı etkilerinin olabileceği akılda
tutulmalıdır.
Bilişsel fonksiyonlardaki düzelme yürüyüş grubunda anlamlı
bulunurken; uzun görsel bellek ve sözel bellek alt skorları açısından
tüm gruplarda anlamlı düzelme görüldü. Bellek alt test skorları
açısından gruplar arasında bazı farklılıklar izlendi. Çalışmanın
etkilerini ve gruplar arası farklılık nedenlerini daha net ortaya
koyabilmek adına katılımcı sayısının arttırılması, çift kör çalışma
modelinin benimsenmesi, hastaların çalışma süresince daha kontrollü
şartlarda bu aktivitelere ve takviye kullanımına uyumunun sağlanması
gerekmektedir. Çalışmamızda kontrol grubu bulunmaması bir eksiklik
gibi durmakla birlikte literatürde hafif kognitif bozukluğu olan
kişilerle yapılmış çalışmaların olumlu etkileri mevcutken bunun etik
olmayacağı kanaatindeyiz. Çalışmamızda katılımcıların kognitif ve
bellek fonksiyonları çalışma başında ve üçüncü ayın sonunda
değerlendirilmiştir. Uygulanan yaşam değişikliklerinin nörometabolik
ve fonksiyonel etkilerinin devamlılığının tespiti açısından
tekrarlayan değerlendirmelerin faydalı olacağı kanısındayız.
KAYNAKLAR (REFERENCES)
[1] Russ, T.C. and Morling, J.R., (2012). Cholinesterase Inhibitors
for Mild Cognitive Impairment. Cochrane Database Syst Rev.
2012(9):CD009132.
[2] Gulpers, B., Ramakers, I., Hamel, R., Kohler, S., Oude Voshaar,
R., and Verhey, F., (2016). Anxiety as a Predictor for Cognitive
Decline and Dementia: A Systematic Review and Meta-Analysis. Am
J Geriatr Psychiatry. 24(10):823-42.
[3] Smith, A.D., (2008). The Worldwide Challenge of the Dementias: a
Role for B Vitamins and Homocysteine? Food Nutr Bull.
29(2Suppl):S143-72.
[4] Ravaglia, G., Forti, P., Maioli, F., Muscari, A., Sacchetti, L.,
Arnone, G., et al., (2003). Homocysteine and Cognitive Function
in Healthy Elderly Community Dwellers in Italy. Am J Clin Nutr.
77(3):668-73.
[5] Wald, D.S., Kasturiratne, A., and Simmonds, M., (2011). Serum
Homocysteine and Dementia: Meta-Analysis of Eight Cohort Studies
Including 8669 Participants. Alzheimers Dement. 7(4):412-7.
[6] Haan, M.N., Miller, J.W., Aiello, A.E., Whitmer, R.A., Jagust,
W.J., Mungas, D.M.,o Dementia and Cognitive Impairment: Results
from the Sacramento Area Latino Study on Aging. Am J Clin Nutr.
85(2):511-7. PMCID: 1892349.
[7] Ma, F., Wu, T., Zhao, J., Ji, L., Song, A., Zhang, M., et al.,
(2017). Plasma Homocysteine and Serum Folate and Vitamin B12
Levels in Mild Cognitive Impairment and Alzheimer's Disease: A
Case-Control Study. Nutrients. 9(7). PMCID: 5537839.
[8] Kobe, T., Witte, A.V., Schnelle, A., Grittner, U., Tesky, V.A.,
Pantel, J., et al., (2016). Vitamin B-12 Concentration, Memory
Performance, and Hippocampal Structure in Patients with Mild
Cognitive Impairment. Am J Clin Nutr. 103(4):1045-54.

4th International Science Symposium Status: Proceeding Book
ISS2019 (September 4-6, 2019) ID : 2019.1B3PB
Ummahan Yücel
Pelin Tintaş
Ege University, [email protected], İzmir-Turkey
EBELİK ÖĞRENCİLERİNİN KİŞİSEL GELİŞİM YÖNELİMLERİ VE SOSYAL DESTEK
ALGILARININ İNCELENMESİ
ÖZ
Ebelik öğrencilerinin kişisel gelişim yönelimleri ve sosyal destek
algılarını değerlendirmek amacı ile yapılan kesitsel analitik tipteki bu
araştırmaya, Ege Üniversitesi Sağlık Bilimleri Fakültesi Ebelik Bölümünde,
2019 yılında okuyan 360 öğrenci katılmıştır. Veriler öğrencilerin
sosyodemografik özelliklerini içeren anket formu, ‘Kişisel Gelişim
Yönelimi Ölçeği-II’ (KGYÖ-II) ve ‘Çok Boyutlu Algılanan Sosyal Destek
Algısı Ölçeği (ÇBASDÖ)’ ile toplanmıştır. Verilerin değerlendirilmesinde
sayı, yüzde, ortalama alınmış ve bağımsız gruplarda t testi analizi
kullanılmıştır. ÇBASDÖ’den alınabilecek en düşük puan 12, en yüksek puan
84’dür. KGYÖ-II’den alınabilecek puanlar 0-80 arasında değişmektedir
ÇBASDÖ’den elde edilen puanın yüksek olması algılanan sosyal desteğin,.
KGYÖ-II’den alınan puanın yüksek olması bireylerin kişisel gelişim
yönelimlerinin yüksek olduğunu göstermektedir. Araştırmaya katılan
öğrencilerin yaş ortalaması 20.78±1.9’dur (min:18-max:37). Öğrencilerin
KGYÖ-II puan ortalaması 14.88±2.5 (min:6.25-max:20.0), ÇBASDÖ puan
ortalaması 68.40±13.9’dur (min:17-max:84). Sonuç olarak, araştırma
grubunun sosyal destek algılarının yüksek olduğu ve kişisel gelişim
yönelimlerinin bazı özelliklerine göre farklılık gösterdiği saptanmıştır.
Anahtar Kelimeler: Ebelik Öğrencisi, Kişisel Gelişim,
Sosyal Destek Algısı, Sağlık
THE REVIEW OF MIDWIFE STUDENTS PERSONAL DEVELOPMENT TRENDS AND SOCIAL
SUPPORT PERCEPTION
ABSTRACT
360 midwife students who studied in 2019 in the Faculty of Health
Sciences at Ege University attended to this cross-sectional analytical
research which was made to evaluate the review of midwife students
personal development trends and social support perception.The data has
been gathered with a survey form which includes students sociodemographic
features, ‘Personal development trend scale’ (PGIS-II) and ‘Multi
Dimensional Social Support Perception Scale’ (MSPSS). Number, percentage
and avarage have been taken into consideration when the data was evaluated
and the t-test analysis was used in independent groups.The min. point
which can be obtained from ‘Multi Dimensional Social Support Perception
Scale’ (MSPSS) is 12 while the maximum point is 84. PGIS-II points can
vary between 0-80. The high point obtained from MSPSS shows individual’s
social support perception is high.On the other hand,the high point
obtained from PGIS shows individual’s personal development trends are
high.The avarage age of the students who attended the research is
20.78±1.9 (min:18-max:37). The students avarage PGIS point is 14.88±2.5
(min:6.25-max:20.0), while the avarage MSPSS point is 68.40±13.9 (min:17-
max:84). As a result,it has been understood that research groups social
support perception is high and their personal development trends may
change according to some of their features.
Keywords: Personal Development, Social Support Perception,
Midwife Student, Health

105
4th International Science Symposium (September 04-06, 2019),
Kiev-Ukraine (ISS2019), 1B3PB; pp:104-109.
1. GİRİŞ (INTRODUCTION)
Bireylere duygusal, maddi ve bilişsel yardım sağlayan
kişilerarası ilişkiler sosyal destek sistemleri olarak kabul edilir
[1]. Yeterli sosyal destek kişilerin temel sosyal gereksinimleri olan
sevgi, şefkat, benlik saygısı gibi ihtiyaçlarını karşılayarak
insanların fiziksel, ruhsal ve sosyal iyilik halinde olmalarına katkı
sağlar [1 ve 2]. Sosyal destek çok hızlı değişimlerin ve
duygulanımların yaşandığı, bağımsızlığın kazanıldığı, sosyal
becerilerin geliştirildiği gençlik döneminde oldukça önemlidir.
Üniversite eğitimine başlayarak yeni bir meslek kazanma yolunda olan
gençler bu süreçte farklı bir yaşam ve sosyal çevre içine girer ve
çoğu ailelerinden uzakta bir yaşama başlarlar [1]. Üniversite
öğrencileri ile yapılan çalışmalarda sosyal destek algısı artıkça
sosyal yeterlik düzeyinin [3] ve psikolojik dayanıklılığın arttığı
[4], yalnızlık düzeylerinin azaldığı [2] gösterilmiştir.
Kişisel gelişim bir değişim sürecidir. Bu değişim kişilerin
eksik olduğunu düşündüğü durumdan, daha iyi olacağını düşündüğü duruma
doğru, sürekli devam eden ve pozitif yöndeki gelişimlerdir [5].
Kişinin değişim sürecine geçebilmesi kendisini eğitme ve geliştirme
sorumluluğunu üstlenmesi ile mümkün olur [5]. İbili’nin aktardığı
üzere Tat, kişisel gelişimi “insanın içindeki gücü fark etmesi ile
ortaya çıkan ve bu gücün içindeki bileşenleri ve karakterinin ana
hatlarını belirlemesi ile davranışlarına, hedeflerine, güzel ve etkili
konuşma becerilerine yöne veren bir süreçtir” olarak tanımlamıştır
[5]. Üniversite eğitiminin amaçlarından biri kişisel gelişimdir.
Mesleki eğitimin yanı sıra, kendi kendine öğrenme ve bireysel
tercihler yükseköğretimde önem taşır [6]. Ülkemizde yapılan
araştırmalar üniversite öğrencilerinin yaşam boyu öğrenme
eğilimlerinin ve kişisel gelişim faaliyetlerine katılımlarının istenen
düzeyde olmadığını göstermektedir [6 ve 7]. Kişisel gelişim, meslek
yaşantısına hazır olma, nitelikli hizmet sunma, iş ve kariyer ile
unsurlarda da belirleyici olabilmektedir. Bu araştırma toplum sağlığı
ve özellikle anne ve çocuk sağlığı hizmetlerinde önemli rol ve
sorumlulukları olan ebelik mesleğine aday ebe öğrencilerinin kişisel
gelişim yönelimlerinin ve algıladıkları sosyal desteklerinin
belirlenmesi amacı ile yapılmıştır.
2. ÇALIŞMANIN ÖNEMİ (RESEARCH SIGNIFICANCE)
Ebelik mesleği ağırlıklı olarak ana-çocuk sağlığına yönelik
sağlık hizmeti yürüten ve doğum yaptırma yetkisine sahip en eski ve
evrensel mesleklerden biridir. Ebelik eğitimi kapsamında verilen
teorik ve uygulamalı eğitim ile ebe yetiştirilmektedir. Nitelikli
ebelik hizmeti sunmak için alınan eğitimin niteliği önemlidir. Bununla
birlikte nitelikli ebelik hizmetinin meslek üyesi ebelerin kişisel
özellikleri ile de yakından ilişkili olduğu belirtilmektedir. Barwise,
her ebenin kendine has algı ve deneyime sahip olduğundan kişilik
özelliklerinin göz ardı edilemeyeceğini öne sürmektedir. Ebelerde öne
çıkan ve beklenen kişisel özellikler arasında sakin ve kendinden emin;
savunucu; cana yakın; nazik; yardımsever; iyi bir iletişimci;
merhametli; iyiliksever; hevesli; ileri görüşlü; motivasyonlu;
enerjik; dost; uyumlu; esnek; destekleyici gibi pek çok özellik
vardır. Bu kişisel özelliklerin nitelikli ve hizmet alan kişileri
memnun edici bir hizmet sunumu ile ilişkisi yapılan çalışmalarda
gösterilmiştir [8]. Bu nedenle üniversite eğitimi alan öğrencilerin
aldıkları eğitimin niteliği yanı sıra üniversite döneminde kendi
gelişimlerine yönelik faaliyetler içinde olmaları beklenir. Ebelik
öğrencilerinin kişisel gelişimleri yönündeki çabalarının ebelik
hizmetlerine de olumlu yansıyacağı düşünülmektedir. Öğrencilerin
algıladıkları sosyal destek ve kişisel gelişim yönelimini inceleyen bu

106
4th International Science Symposium (September 04-06, 2019),
Kiev-Ukraine (ISS2019), 1B3PB; pp:104-109.
çalışma bulguları öğrencilerin sosyal destek algıları ve kişisel
gelişim yönelimlerine yönelik yapılacak çalışmalarda yararlı
olacaktır.
3. MATERYAL VE METOD (MATERIAL AND METHODS)
Araştırma tanımlayıcı tipte bir araştırmadır. Araştırmanın
evrenini Ege Üniversitesi Sağlık Bilimleri Fakültesi Ebelik bölümünde
2019 yılında öğrenim gören birinci (n=113) , ikinci (n=101) , üçüncü
(n= 104) ve dördüncü (n=96) sınıf olmak üzere toplam 414 öğrenci
oluşturmuştur. Evrenin tümünün örnekleme alınması planlanmış,
çalışmaya katılmayı kabul eden 360 (katılım oranı %87) öğrenci
araştırmya dahil edilmiştir. Araştırmaya başlamadan önce, e-mail
yoluyla ölçeklerin kullanım izinleri, Ege Üniversitesi Sağlık
Bilimleri Bilimsel Araştırma ve Yayın Etiği Kurulu tarafından etik
kurul onayı (Sayı:69586843-050.06.04 ) ve araştırmanın yürütülmesi
için kurumdan yazılı izin alınmıştır. Araştırma verileri öğrencilerin
sosyo-demografik özelliklerini (12 soru) içeren anket formu, Kişisel
Gelişim Yönelim Ölçeği (16 soru) ve Çok Boyutlu Algılanan Sosyal
Destek Ölçeği (12 soru) aracılığı ile toplanmıştır.
3.1. Çok Boyutlu Algılanan Sosyal Destek Ölçeği (ÇBASDÖ)
(Multidimensional Perceived Social Support Scale)
Bireylerin algıladıkları sosyal destek unsurlarını belirlemek
amacı ile geliştirilmiş ölçeğin Türkçe geçerlilik çalışması Eker ve
Arkar tarafından 1995 yılında yapılmıştır. ÇBASDÖ, ‘kesinlikle evet’
(7 puan), ‘kesinlikle hayır’ (1 puan) arasında değerlendirilmiş yedili
Likert tipi ve 12 maddeden oluşan bir ölçektir. Ölçek her biri dört
maddeden oluşan desteğin kaynağına ilişkin üç alt ölçeği içerir. Bu
alt ölçekler: Aile (3., 4., 8., 11. maddeler), arkadaşlar (6., 7., 9.,
12. maddeler) ve özel bir insandır (1., 2., 5., 10. maddeler). Her alt
ölçekteki dört maddenin puanlarının toplanması ile alt ölçek puanı
elde edilmekte ve bütün alt ölçek puanlarının toplamı ölçeğin toplam
puanını vermektedir. Alt ölçeklerden alınacak en düşük puan 4, en
yüksek puan 28’dir ve ölçek toplamından alınacak en düşük puan 12, en
yüksek 84’dür. Elde edilen puanın yüksek olması algılanan sosyal
desteğin yüksek olduğunu ifade etmektedir [9, 10 ve 11].
3.2. Kişisel Gelişim Yönelim Ölçeği-II (KGYÖ-II)
(Personal Development Orientation Scale-II)
Kişisel Gelişim Yönelimi Ölçeği İlhan Yalçın ve Asude Malkoç
tarafından 2013 yılında Türkçeye uyarlanmıştır. Bireyin kişisel
gelişim sürecine ilişkin daha ayrıntılı değerlendirme yapmasını
sağlamak amacıyla geliştirilmiş, 16 maddeden oluşan ölçek 6’lı Likert
tipi bir ölçektir. Ölçek, 0 (hiç katılmıyorum) ile 5 (tamamen
katılıyorum) arasında derecelendirilmiştir. Planlı olma (1,3,5,10,13.
maddeler), değişime hazır olma (2., 8., 11., 16. maddeler), kaynakları
kullanma (6., 12., 14. maddeler) ve amaçlı davranış (4., 7., 9., 15.
maddeler) olmak üzere ölçeğin dört alt boyutu vardır. Toplam puan dört
alt ölçek puanlarının toplanıp, elde edilen toplam puanın dörde
bölünmesiyle hesaplanmaktadır. Ölçekten alınan puan 0 ile 80 arasında
değişmektedir. Alınan toplam puanın yüksek olması bireylerin kişisel
gelişim yönelimlerinin yüksek olduğunu ifade etmektedir [12].
Verilerin analizi SPSS (Statistical Package for Social Science) 16.0
paket programında ortalama, t testi ve varyans testleri ile analiz
edilmiştir. Kabul edilen anlamlılık düzeyi p<0.05’dir.

107
4th International Science Symposium (September 04-06, 2019),
Kiev-Ukraine (ISS2019), 1B3PB; pp:104-109.
4. BULGULAR (RESULTS)
Öğrencilerin yaş ortalaması 20.78±1.9 (min:18-max:37) olup
%26.4’ü dördüncü sınıf, %73.1’i Anadolu-Fen Lisesi, %10’u Sağlık
Meslek Lisesi mezunudur.
Tablo 1. Öğrencilere ait bazı özellikler
(Table 1. Some characteristics of the students)
Değişkenler Sayı(n) Yüzde(%)
Sınıf
1. Sınıf 92 25.6
2. Sınıf 92 25.6
3. Sınıf 81 22.5
4. Sınıf 95 26.4
Mezun olunan lise
Genel-Düz Lise 26 7.2
Anadolu-Fen Lisesi 263 73.1
Sağlık Meslek Lisesi 36 10.0
Diğer 35 9.7
Annenin Eğitim Durumu
Okur-Yazar Değil 11 3.1
Okur-Yazar İlkokul Mezunu Değil 30 8.3
İlkokul 176 48.9
Ortaokul 57 15.8
Lise 66 18.3
Üniversite 20 5.6
Babanın Eğitim Durumu
Okur-Yazar Değil 2 0.6
Okur-Yazar İlkokul Mezunu Değil 15 4.2
İlkokul 125 34.7
Ortaokul 76 21.1
Lise 97 26.9
Üniversite 45 12.5
Ailenin Gelir Durumu
Kötü 11 3.1
Orta 311 86.4
İyi 38 10.6
Toplam 360 100.0
Katılımcıların %48.9’unun annesi, %34.7’sinin babası ilkokul
mezunudur (Tablo 1). Öğrencilerin %51.7’sinin sağlık mensubu bir
yakını vardır ve öğrencilerin %78.3’ü ebelik bölümünde isteyerek
okumaktadır. Öğrencilerin mesleği seçme nedenleri ve ebelik eğitimine
başlamadan önce mesleğe uygun hissetme ve eğitime başladıktan sonra
mesleğe uygun hissetme durumları incelendiğinde, %50.3’ünün kendi
isteğiyle, %29.2’sinin ise iş bulma kolaylığı nedeniyle ebelik
bölümünü tercih ettikleri görülmüştür. Ebelik mesleğine eğitime
başlamadan önce kendileri için uygun olduğunu ifade eden öğrencilerin
oranı %51.1, ebelik eğitimine başladıktan sonra kendilerini mesleğe
uygun olduğunu ifade eden öğrencilerin oranı %86.7’dir (Tablo 2).

108
4th International Science Symposium (September 04-06, 2019),
Kiev-Ukraine (ISS2019), 1B3PB; pp:104-109.
Tablo 2. Öğrencilerin bölümle ilgili görüşlerine ait bazı özellikler
(Table 2. Some features of students opinions about the department)
Değişkenler Sayı(n) Yüzde(%)
Sınıf
1. Sınıf 92 25.6
2. Sınıf 92 25.6
3. Sınıf 81 22.5
4. Sınıf 95 26.4
Mezun olunan lise
Genel-Düz Lise 26 7.2
Anadolu-Fen Lisesi 263 73.1
Sağlık Meslek Lisesi 36 10.0
Diğer 35 9.7
Annenin Eğitim Durumu
Okur-Yazar Değil 11 3.1
Okur-Yazar İlkokul Mezunu Değil 30 8.3
İlkokul 176 48.9
Ortaokul 57 15.8
Lise 66 18.3
Üniversite 20 5.6
Babanın Eğitim Durumu
Okur-Yazar Değil 2 0.6
Okur-Yazar İlkokul Mezunu Değil 15 4.2
İlkokul 125 34.7
Ortaokul 76 21.1
Lise 97 26.9
Üniversite 45 12.5
Ailenin Gelir Durumu
Kötü 11 3.1
Orta 311 86.4
İyi 38 10.6
Toplam 360 100.0
Tablo 3. Çok boyutlu algılanan sosyal destek algısı ve kişisel gelişim
yönelimi ölçeği-ıı‘den elde edilen puanların ortalamaları (Ort±ss) ve
minimum-maksimum (Min-Mak) Değerleri (n=360)
(Table 3. Means of multi-dimensional perceived social support
perception and personal development orientation scale)
Ölçekler Ort±ss Min-Mak
ÇBASDÖ Toplam Puanı 68.4±13.88 17-84
Özel İnsan Toplam Puan 20.77±7.08 4-28
Aile Toplam Puanı 23.93±5.28 4-28
Arkadaş Toplam Puanı 23.64±5.26 4-28
KGYÖ-II Toplam Puanı 14.88±2.50 6.25-20
Planlı Olma Toplam Puanı 3.74±0.73 1.60-5
Değişime Hazır Olma Toplam Puanı 3.77±0.73 1.25-5
Kaynakları Kullanma Toplam Puanı 3.56±0.74 1.33-5
Amaçlı Davranış Toplam Puanı 3.74±0.69 1.50-5
KAYNAKLAR (REFERENCES)
[1] Kahriman, İ. ve Yeşilçiçek, K., (2007). Karadeniz Teknik
Üniversitesi Trabzon Sağlık Yüksekokulu Öğrencilerinin Aile ve
Arkadaşlarından Algıladıkları Sosyal Destek Düzeylerinin Bazı
Değişkenler Açısından İncelenmesi. Atatürk Üniversitesi
Hemşirelik Yüksekokulu Dergisi, 10(1):10-21.

109
4th International Science Symposium (September 04-06, 2019),
Kiev-Ukraine (ISS2019), 1B3PB; pp:104-109.
[2] Yılmaz, E., Yılmaz, E. ve Karaca, F., (2008). Üniversite
Öğrencilerinin Sosyal Destek Ve Yalnızlık Düzeylerinin
İncelenmesi. Genel Tip Dergisi, 18(2).
[3] Bakioğlu, F., (2019). Üniversite Öğrencilerinde Sosyal
Yeterliğin Algılanan Sosyal Destek Açısından İncelenmesi. OPUS
Uluslararası Toplum Araştırmaları Dergisi, 11(18):1858-1875.
[4] Terzi, Ş., (2008). Üniversite Öğrencilerinin Psikolojik
Dayanıklılıkları ve Algıladıkları Sosyal Destek Arasındaki
İlişki. Türk Psikolojik Danışma ve Rehberlik Derg., 3(29):1-11.
[5] İbili, E. ve Uyanık, H., (2018). Öğrencilerin Yurt Memnuniyet
Düzeyleri ile Kişisel Gelişim Yönelimleri Arasındaki İlişkinin
İncelenmesi. Yükseköğretim Dergisi, 8(3):293-300.
[6] Coşkun, Y.D. ve Demirel, M., (2012). Üniversite Öğrencilerinin
Yaşam Boyu Öğrenme Eğilimleri. Hacettepe Üniversitesi Eğitim
Fakültesi Dergisi, 42(42):108-120.
[7] Dikmen, Y., Denat, Y., Filiz, N.Y. ve Başaran, H., (2016).
Hemşirelik Öğrencilerinde Yaşam Boyu Öğrenme Eğilimleri. Journal
of Human Rhythm, 2(1).
[8] Downe, S., Byrom, S., and Simpson, L., (2011). Essential
Midwifery Practise: Leadership, Expertise and Collaborative
Working Chapter 6- Expertise in Intrapartum Midwifery Practise.
[9] Eker, D.H. ve Yaldız, H., (2001). Çok Boyutlu Algılanan Sosyal
Destek Ölçeğinin Gözden Geçirilmiş Formunun Faktör Yapısı,
Geçerlik Ve Güvenirliği. Türk Psikiyatri Dergisi, 12, 17-25.
[10] Eker, D. ve Akar, H., (1995). Çok Boyutlu Algılanan Sosyal Destek Ölçeğinin Faktör Yapısı, Geçerlilik Ve Güvenirliği. Türk
psikoloji dergisi 10:45-55.
[11] Yılmaz, E., Yılmaz, E. ve Karaca, F., (2008). Üniversite Öğrencilerinin Sosyal Destek Ve Yalnızlık Düzeylerinin
İncelenmesi. Genel Tıp Dergisi, 18(2).
[12] Yalçın, İ. ve Malkoç, A., (2013). Kişisel Gelişim Yönelimi Ölçeği II’nin Türkçeye Uyarlanması ve Psikometrik Özellikleriin
İncelenmesi. Düşünen Adam, 26, 258-266.

4th International Science Symposium Status: Proceeding Book
ISS2019 (September 4-6, 2019) ID : 2019.1B4PB
Ummahan Yücel
Ege University, [email protected], İzmir-Turkey
GÜÇLÜ EBELİK VE GÜÇLÜ HEMŞİRELİK: DÜNYA SAĞLIK ÖRGÜTÜ’NÜN TAAHHÜDÜ VE
KÜRESEL STRATEJİK HEDEFLER
ÖZ
Ebeler ve hemşireler pek çok ülkede sağlık işgücünün %50’sinden
fazlasını oluşturmaktadır. Dünya genelinde 43.5 milyon sağlık
çalışanının 20.7 milyonu ebe ve hemşiredir. Ebe ve hemşireler temel
sağlık hizmetlerinin sunumunda ve sağlık sisteminin güçlendirmede
kritik öneme sahiptir. Sürdürülebilir kalkınma ve herkes için sağlık
hedeflerine ulaşmaya yardımcı olması için Dünya Sağlık Örgütü’nün her
iki mesleği de güçlendirme taahhüdü vardır. 2000’li yıllardan itibaren
ebelik ve hemşirelik mesleklerini güçlendirmek üzere küresel stratejik
hedefler belirlenmekte ve gelişmeler takip edilmektedir. 2000 yılında
54. Dünya Sağlık Asemblesi WHA54.12 kararıyla ilk stratejik hedefler
2002 yılında geliştirmiş ve 2011 yılında güncellenmiştir. Sağlık için
İnsan Kaynakları Stratejisi: 2030 İşgücü, Hemşireliği ve Ebeliği
Güçlendirmek için Küresel Stratejik Hedefler 2016-2020, Dünyada Ebelik
Durum Raporları, Ebelikte LANCET serisi, Ebelik ve Hemşirelik İlerleme
Raporları (2008-2012 ve 2013-2015) bu kapsamda oluşturulan
uluslararası belge ve raporlardır. Bu derleme çalışmasında ebelik ve
hemşirelik mesleğini güçlendirmek için belirlenen küresel stratejik
hedefler ve bu hedeflerin kavramsal çerçevesi incelenmiştir.
Anahtar Kelime: Ebelik, Hemşirelik, Güçlendirme, Strateji
STRENGTHENED MIDWIFERY AND STRENGTHENED NURSING: WORLD HEALTH
ORGANIZATION'S COMMITMENT AND GLOBAL STRATEGIC DİRECTİONS
ABSTRACT
Midwives and nurses constitute more than 50% of the health
sector employees in many countries. Of the 43.5 million health
professionals worldwide, 20.7 million are midwives and nurses.
Midwives and nurses are critical in the provision of primary health
care and in strengthening the health system. In order to help achieve
sustainable development and health goals for all, the World Health
Organization has a commitment to strengthen both professions. Since
the 2000s, global strategic targets have been determined and
developments are followed to strengthen midwifery and nursing
professions. In 2000, with the decision of the 54th World Health
Assembly WHA54.12, the first strategic goals were developed in 2002
and updated in 2011. “The Global Strategy on Human Resources for
Health: Workforce 2030”, “Global Strategic Directions for
Strengthening Nursing and Midwifery 2016-2020”, “The State of the
World’s Midwifery Reports”, “The Lancet Series on Midwifery”,
Midwifery and Nursing Progress Reports (2008- 2012 and 2013-2015) are
international documents and reports created in this context. In this
review, the global strategic goals and the conceptual framework of
these goals have been examined to strengthen the midwifery and nursing
profession.
Keywords: Midwifery, Nursing, Strengthening, Directions

111
4th International Science Symposium (September 04-06, 2019),
Kiev-Ukraine (ISS2019), 1B4PB; pp:110-114.
1. GİRİŞ (INTRODUCTION)
Ebeler ve hemşireler birçok ülkede sağlık sağlık işgücünün
%50'sinden fazlasını oluşturmaktadır. Günümüzde 43.5 milyon sağlık
çalışanın, 20.7 milyonunun hemşire ve ebeler oluşturmaktadır [1].
Türkiye’de 2017 yılı için hekim sayısı 149.997, hemşire sayısı
166.142, ebe sayısı 53.741’dir [2]. Sağlıksız yaşam tarzı ve yaşlı
nüfustaki artış ile yaygınlaşan bulaşıcı olmayan hastalıklar ve
bulaşıcı hastalıklar toplum sağlığını tehdit etmeye devam etmektedir.
Aynı şekilde anne ve çocuk sağlığı sorunları ve sağlıkta eşitsizlikler
önemli sağlık sorunlarıdır. Bu nedenle ebelik ve hemşirelik
hizmetlerinin niteliği, erişilebilirliği ve bu mesleklerin
güçlendirilmesi uluslararası düzeyde öncelikli sağlık ve politik
konulardır [1, 3, 4, 5, 6, 7, 8 ve 9]. Herkes için sağlık hedefine
ulaşabilme ve toplum sağlığını geliştirmede ebelik ve hemşirelik
mesleklerini güçlendirmek önemli bir zorunluluktur [1]. Pek çok ülkede
ebeler ve hemşireler toplum sağlığı korunma ve geliştirme
kapasitelerini tam olarak kullanamamakta ve bağımsız rollerini yerine
getirememektedir. Dünya Sağlık Örgütü tarafından yapılan bir çalışmada
ebelerin ve hemşirelerin tam olarak rollerini yerine getirme ve tüm
potansiyelleri ile çalışmalarının karşısındaki engeller
tanımlanmıştır. Grafik 1’de verilen bu engeller; tedavi ağırlıklı
sağlık hizmetleri, yetersiz mali kaynak ve ebelerin ve hemşirelerin
profesyonel rollerinin net olarak belirlenmemiş olmasıdır [5].
Şekil 1. Hemşirelerin ve ebelerin tam potansiyelleri ile
çalışmalarının önündeki engeller [5]
(Graph 1. Obstacles for nurses and midwives to work to their full
potential)
2. ÇALIŞMANIN ÖNEMİ (RESEARCH SIGNIFICANCE)
Ebelik uygulama alanları üreme, anne ve yenidoğan sağlığı için
gerekli bakım gereksiniminin %87’sini karşılama potansiyeline sahiptir
[6]. Ebe ve ebelik için ulusal ve uluslararası başarı, üreme
hedefleri, anne yenidoğan ve çocuk sağlığı açısından büyük önem taşır
[7 ve 8]. Ebelik ve hemşirelik hizmetlerinin ulusal ve uluslararası
düzeyde güçlendirilmesi ile hizmetin niteliğini ve kapsayıcılığı
artıracaktır. Uluslararası düzeyde ebelik ve hemşirelik mesleklerini
güçlendirme doğrultusunda stratejik hedeflerin ve planlamaların takip
edilmesi, gelişmelerin izlenmesi ulusal düzeyde politika oluşturma ve
meslekleri güçlendirme çalışmalarında yol gösterici olacaktır.
Tedavi ağırlıklı sağlık
hizmetleri
Yetersiz mali kaynak
Profesyonel
hemşirelik/ebelik
rollerini tanımlama
problemleri
Diğer

112
4th International Science Symposium (September 04-06, 2019),
Kiev-Ukraine (ISS2019), 1B4PB; pp:110-114.
3. BULGULAR VE TARTIŞMA (FINDINGS AND DISCUSSION)
Dünya Sağlık Örgütü’nün ebelik ve hemşirelik mesleklerini
güçlendirme taahhüdü vardır ve bu taahhüt devam etmektedir. Bu taahhüt
ve küresel sağlık gereksinimlerinin doğrultusunda ebelik ve hemşirelik
hizmetlerini güçlendirmek için ilk stratejik hedefler 2002-2008
yılları için belirlenmiştir. Daha sonra 2008-2012 ve 2013-2015 DSÖ
hemşirelik ve ebelik ilerleme raporları ve Sağlık için İnsan
Kaynakları Küresel Stratejisi: İşgücü 2030 raporları ile süreç devam
etmiştir. Zaman içinde elde edilen başarıları gösteren ilerleme
raporlarındaki kazanımlar DSÖ’nün Hemşirelik ve Ebeliği Güçlendirmek
için 2016-2020 Küresel Stratejik Hedefler raporuna Tablo 1’de
gösterildiği şekilde özetlenmiştir [1].
Tablo 1. Hemşirelik ve ebelik gelişiminde elde edilen başarılar [1]
(Table 1. Achievements in nursing and midwifery development)
Alan Başarılar
Birinci basamak
sağlık
hizmetleri ve
insan merkezli
bakım
Hemşirelerin ve ebelerin (toplum/aile) gibi öncülük
ettiği bir temel sağlık hizmetleri modelleri; kadın
merkezli bakım ve ebelik bakım modeli
Palyatif bakıma muhtaç olanlar dahil engelli
insanların, kronik rahatsızlığı ve bulaşıcı olmayan
hastalıkları olan kişilerin ihtiyaçlarının karşılanması
Birinci basamak sağlık hizmetlerinde temel
yetkinliklerin değerlendirilmesi
Acil durum ve afet müdahaleleri, enfeksiyon kontrolü,
ruh sağlığı ve madde bağımlılığı alanlarında kapasite
geliştirme
Toplum sağlığı hizmetlerine katılımın artırılması
Hemşire liderliğinde çok disiplinli ve çok profesyonel
ekip büyümesi
İşgücü
politikası ve
uygulaması
Hemşirelik ve ebelik için ulusal stratejik planlar
Düzenleme, mevzuat ve akreditasyonların oluşması
Düzenleme, eğitim ve uygulama standartları
Güvenilir hemşirelik ve ebelik veri tabanlarının
kurulmasına daha fazla önem verilmesi.
Eğitim
Hizmet öncesi, sürekli eğitim ve öğretim kadrosunda
yetkinlik temelli eğitimin benimsenmesi
İleri hemşirelik ve ebelik uygulamalarının
geliştirilmesi
Kariyer Gelişimi Liderlik, beceri geliştirme ve liderlik pozisyonlarında
bulunma
İşgücü yönetimi
Küresel hedefleri desteklemeye yönelik işe alım, işte
tutma, motivasyon ve katılımı artırmaya yönelik
anlaşmaların yapılması
Hemşirelik ve ebelik işgücü için kapasite geliştirme ve
iyi ve en iyi uygulamaların yayılması için daha iyi
teknoloji ve iletişim platformların uygulanması
Taraflarla
İşbirliği
Sorunları çözmek için sivil toplum kuruluşları ile
işbirliğinin güçlendirilmesi
DSÖ'nün işbirliği yaptığı merkezler arasında hemşirelik
ve ebelik gelişimi ve Uluslararası Hemşireler Konseyi
ve Uluslararası Ebeler Konseyi gibi paydaşlar arasında
daha fazla sinerjinin oluşması
Ebelik hizmetlerinde son yıllarda kanıt temelli bilgi üretimi ve
anne çocuk sağlığının korunması ve geliştirilmesinde ebelerin önemi
kanıtlayan önemli belgelerden biri de 2014 yılında yayınlanan Lancet
dergisinin ebeliğe özel çıkardı özel sayısıdır. Lancet ebelik
serisindeki çalışmalar anne ve çocuk sağlığı ve yaşamı ile ilgili
sistematik değerlendirme analizleri, vaka çalışma analizi, ölüm
modellemesi kullanılarak elde edilen kanıtlar doğrultusunda

113
4th International Science Symposium (September 04-06, 2019),
Kiev-Ukraine (ISS2019), 1B4PB; pp:110-114.
oluşturulmuştur. Gebeler ve yenidoğan bebekler için güvenli, saygın ve
nitelikli bir doğum hizmeti bakış açısıyla hazırlanmıştır.
Çalışmalarda ortaya konan sonuçlar politika yapıcılar, karar
vericiler, eğitimciler, sağlık sistemi planlayıcıların da incelmesine
sunulmuştur [7 ve 8]. Bu yayında araştırmacılar ebelere yatırım
yapmanın ve ebeleri güçlendirmenin anne ölümlerini azaltmak için
etkili bir strateji olduğunu göstermişlerdir. Renfrew ve arkadaşları
kaliteli bir anne ve yenidoğan bakımınının kadınlar ve bebeklerin
ihtiyaçlarının farkında olan ebelerin de içinde yer aldığı işgücü
tarafından sağlanabileceğini belirtmiştir.
Lancetin bu sayısındaki makalelerde daha başarılı anne ve çocuk
sağlığı sonuçlarının alınabilmesi için anne ve yenidoğan bakım
kalitesinin evrensel düzeyde artırılması gerektiği bildirilmiştir.
Ebelerin ve ebelik hizmetlerinin kalitesinin artırılması için üç ana
ortaya konmuştur: eğitim, yönetmelik, yasa. Bu derleme çalışmasında
uluslararası platformda üretilmiş, gündemini koruyan raporlar ve
çalışmalar (The Global Strategy on Human Resources for Health:
Workforce 2030; the Global strategic directions for strengthening
nursing and midwifery 2016–2020; the State of the world’s midwifery
report; the Lancet series on midwifery; the Global Strategy for
Women’s, Children’s and Adolescents’ Health 2016–2030) doğrultusunda
ebelik ve hemşirelik mesleğinin güçlendirilmesine yönelik
faaliyetlerin ve gelişmelerin kavramsal çerçevesini sunmaktadır [1, 3
ve 9]. Elli Dördücü Dünya Sağlık Asemblesi’nde (WHA54.12 kararı)
ebeliğin ve hemşireliğin güçlendirilmesi için bir eylem planı
oluşturulması kararlaştırılmıştır. Alınan karar sonrasında ilk küresel
stratejiler 2002 yılında geliştirilmiş ve 2011 yılında bu stratejiler
güncellenmiştir. 2011 yılındaki 64. Dünya Sağlık Asemblesi’nde
(WHA64.7 nolu) kararı) ebelik ve hemşirelik hizmetlerini güçlendirmek
için çeşitli kararlar alınmıştır [1]. Alınan kararların kavramsal
çerçevesi Şekil 1’de sunulmuştur [1]. Bu kavram çerçeve vizyon,
temalar ve ilkeler şeklindedir.
VİZYON Evrensel sağlık kapsayıcılığı ve sürdürülebilir kalkınma hedeflerini
desteklemede ve toplum gereksinimlerine dayalı herkes için mevcut,
erişilebilir, kabul edilir, kaliteli, maliyet etkin
hemşirelik ve ebelik hizmetleri
TEMALAR
Farklı kurumlarda
ve tüm basamaklara
etkili ve duyarlı
sağlık
sistemlerinde
eğitimli, yetkin
ve motive hemşire
ve ebe işgücü
temini
Politika
geliştirme,
etkili
liderlik ve
yönetim ve
yönetişimi
en üst
düzeye
çıkarma
Meslek içi ve
meslekler arası
işbirliği, eğitim
ve sürekli
profesyonel
gelişim ile
hemşirelerin ve
ebelerin
potansiyellerini
ve kapasitelerini
en üst düzeye
çıkarmak için
birlikte çalışma
Etkili kanıta
dayalı
hemşirelik ve
ebelik işgücü
gelişimi
oluşturmaya
yatırım
yapmak için
siyasi
iradeyi
harekete
geçirme
Ülkeler
Bölgeler
Küresel
Ortaklıklar
İLKELER
Etik
Uygulama
Uygunluk
İşbirliği
Kalite
Şekil 1. Dünya sağlık örgütü hemşirelik ve ebeliğin güçlendirilmesi
için küresel stratejik yönelimlerin kavramsal çerçevesi
(Figure 1. WHO Global strategic directions for directions for
strenghthening nursing and midwifery conceptual framework)

114
4th International Science Symposium (September 04-06, 2019),
Kiev-Ukraine (ISS2019), 1B4PB; pp:110-114.
4. SONUÇ VE ÖNERİLER (CONCLUSION AND RECOMMENDATIONS)
Toplum sağlığında ebelik ve hemşirelik hizmetlerinde kanıta
dayalı kılavuzlar geliştirilerek bu mesleklerin hizmet etkinliklerinin
ve müdahalelerinin etkinliği saptanmalı. Bu incelemede ana hatları ile
özetlenmeye çalışılan raporlar ve çalışmalarda gösterilen kanıta
dayalı sonuçlar doğrultusunda ulusal politikalar oluşturulmalı ve
hayata geçirilmelidir. Meslekleri güçlendirme çalışmalarında ilgili
raporlar ve gelişmeler sürekli takip edilmeli gündemde tutulmalıdır.
Meslek üyelerinin ve meslek örgütlerinin sağlık politikalarının
oluşturulmasında ve uygulanmasında karar mekanizmasına katılımın
sağlanmalıdır. Ebelik ve hemşirelik mesleki eğitimleri toplum odaklı
olmalı, eğitim müfredatlarında sağlığa sosyo-kültürel bakış açısı
geliştirme becerisi ve bilgisi kazandıran dersler bulunmalıdır.
Üniversite eğitimi de içinde olmak üzere sürekli mesleki gelişim için
olanaklar sağlanmalıdır. Ebe ve hemşirelerin halk sağlığı, sağlığın
geliştirilmesi ve toplum kalkınmasındaki rolleri vurgulanmalı, bu
rolleri iş gücü planlaması başta olmak üzere politika oluşturmada
dikkate alınmalıdır.
KAYNAKLAR (REFERENCES)
[1] Global Strategic Directions for Strengthening Nursing and
Midwifery 2016-2020.
[2] Başara, B.B., Çağlar, İ.S., Aygun, A., ve Özdemir, T.A., (2018).
T.C. Sağlık Bakanlığı.
[3] Sağlık İstatistikleri Yıllığı (2017). Ankara.
[4] WHO Strategic Directions for Strengthening Nursing and Midwifery
Services 2002–2008. Global Network of WHO Collaborating Centres
for Nursing and Midwifery Development; 2002.
[5] WHO Strategic Directions for Strengthening Nursing And Midwifery
Services 2011–2015. Geneva: Health Professions Networks, Nursing
and Midwifery Office, Department of Human Resources for Health,
World Health Organization; 2010.
[6] Büscher, A., Sivertsen, B., and White, J., (2009). Nurses and
Midwives: A force for health Survey on the situation of nursing
and midwifery in the Member States of the European Region of the
World Health Organization
http://www.bnemid.byethost14.com/RULE%20OF%20MIDWIFERY%203.pdf?i
=. Ulaşım Tarihi: 25.09.2019.
[7] World Health Organization (2016). Global Strategy on Human
Resources for Health: Workforce 2030.
[8] Hoope-Bender, P., Luc de, B., Campbell, J., Downe, S., Fauveau,
V., Fogstad, H., Homer, C., Powell Kennedy, H., Matthews, Z.,
McFadden, A., Renfrew, M.J., Lemberghe, W.V., (2014).
Improvement of maternal and newborn health through midwifery,
THE LANCET, 384(9949):1226-1235.
[9] Midwifery. The Lancet series, 2014.
http://www.thelancet.com/series/midwifery.
[10] The State of the World’s Midwifery (2014). A Universal Pathway, a Woman’s Right To Health. UNFPA, International Confederation of
Midwives, and WHO; 2014.
https://apps.who.int/iris/bitstream/handle/10665/250368/97892415
11131-eng.pdf. Ulaşım Tarihi: 25.09.2019.

4th International Science Symposium Status: Proceeding Book
ISS2019 (September 4-6, 2019) ID : 2019.2A2PB
Musa Kılıç, Edip Çetkin
Batman University, Batman-Turkey
[email protected]; [email protected]
İhsan Kırık, Zülküf Balalan
Bingöl University, Bingol-Turkey
[email protected]; [email protected]
THE PRODUCTION OF TIC-REINFORCED NICKEL-BRONZE MATRIX COMPOSITES BY
HOT PRESSING METHOD
ABSTRACT
The aim of this study is to produce Ni-Co-Bronze composite by
adding TiC particles which has four different rates through the hot-
pressing method. The impact of reinforcement ratio (3, 7, 10 and 15 wt
%) on the microstructures of the TiC/Ni-Bronze composites were
investigated. In order to determine microstructural formation in
internal region Optical Microscope (OM), the Scanning Electron
Microscope (SEM), Electron Dispersive Spectrometer (EDS), and X-Ray
Analysis (XRD) were performed. Furthermore, micro-hardness test was
conducted for estimate mechanical behavior. Experiment results were
illustrated that TiC ratio has important effect on the Nickel-Bronze
composite. As a result, microstructure investigations were shoved that
there was a serious interaction between reinforcement and matrix; in
addition, the binding was present.
Keywords: TiC, Hot Pressing, Bronze, Nickel
1. INTRODUCTION
The use of traditional engineering materials was restricted for
some features like weightiness, density, strength, hardness etc.
However, composite materials have advantage to utilize reinforcing
materials in definite volume fractions. Metal matrix composites (MMC)
are the materials that have perform physical and mechanical properties
in a wide range of engineering applications [1]. Matrix properties,
reinforcement and interaction of these two basic elements, are the
primarily basic factor of increasing properties of metal matrix
composites [3]. Metal matrix composites have many different production
methods such as metal spraying, In-situ composites, powder metallurgy,
hot pressing etc., Powder metallurgy which is widely used in these
methods. The method PM, on account of its simplicity, is applied commonly
for the production of composite materials with magnesium alloys matrix
[4], aluminum alloys matrix [5], and copper matrices. One of the
production methods of PM is Hot Pressing (HP) which provides advantages
like full densification capabilities, short processing times, uniform
dispersion of the reinforcing element and near net shape production
together [6 and 8]. Bronze has two basic production methods, the first
of which is cast on to the steel and the other is powder metallurgy (PM)
to produce a bimetal strip [2]. Nickel is added to the normal bronze as
an alloying element and copper in separate alloys. When nickel bronze
is applied, it dilutes the tissue, increases the mechanical properties
and facilitates cold rolling. In addition, 50% nickel bronze is not
oxidized, does not change and has good resistance to rapid steam flows.

116
4th International Science Symposium (September 04-06, 2019),
Kiev-Ukraine (ISS2019), 2A2PB; pp:115-120.
2. RESEARCH SIGNIFICANCE
As a result, when the literature researches are [1 and 11]
examine, it is stated that the mechanical properties are improved with
the addition nickel to bronze, also the mechanical properties of the
metal matrix composites are improved with the addition of TiC
reinforcement. Therefore, the aim of this study was to add nickel and
TiC together to study the effects on bronze.
3. EXPERIMENTAL METHODS
In this study commercially available TiC, Ni and Bronze powders
used and TiC reinforced Ni-Bronze matrix composites were produced with
the hot press technique. Before HIP the powders were prepared in groups
at the rates (see in Table 1) and mixed in stainless steel cylindrical
box with steel ball for 24 hours. The mixtures of powders were poured
into a graphite die (5x10x25mm) and produced at the temperature of 800oC
under a pressure of 16 MPa for 15 min. XRD, SEM, and EDS analysis were
carried out for detection status of phase contents and microstructure,
moreover microhardness was applied according to the indentation method
with the load of 10N, which was applied on the polished surface with
an interval of 0.5mm.
Table 1. Quantities of powder used in the experiment
Material TiC (%) Ni(g) Co(g) Bronze(g) (CuSn90/10) Total(g)
Sample 1 0 5 5 5 15
Sample 2 3 4.1 5 4.1 15
Sample 3 7 2.9 5 2.9 15
Sample 4 10 2 5 2 15
Sample 5 15 0.5 5 0.5 15
4. RESULTS and DISCUSSION
Figure 1 shows the macro structure image of samples produced by
adding TiC and Ni in different ratios to the bronze. It is seen that the
color produced from the sample is different from the other samples
because it is only Ni additive and there appears to be an integrity in
all samples. Figure 2a and b illustrate optic microstructure of S1 and
S5.
Figure 1. Macro image of samples
Figure 3-5 show SEM images of S1, S2, and S3 samples produced with
Co added by hot pressing technique and the EDS points taken from these
samples. When the image of S1 was examined, it was seen that preferably
agglomerated regions with completely irregular and different sizes.
However, the EDS results from different regions show us that when Co is

117
4th International Science Symposium (September 04-06, 2019),
Kiev-Ukraine (ISS2019), 2A2PB; pp:115-120.
added to the Ni-bronze, there are two regions that do not dissolve in
each other, and preferably unite in different ways. One of them is Co-
based (region A) and the other is Ni-based (region B). Although these
regions are seen as different formations, the boundaries of these two
regions are clearly visible in the picture.
Figure 2a and Figure 2b. Optic images of S1 and S5, respectively
Figure 3. Shows SEM images and EDS zones of S1
a b

118
4th International Science Symposium (September 04-06, 2019),
Kiev-Ukraine (ISS2019), 2A2PB; pp:115-120.
Figure 4 illustrates SEM images of S3 sample which prudeced with
3% TiC addition at Ni 4.1g, CuSn90/10g and EDS regions taken from this
sample. As it is seen titanium carbides are observed to accumulate
outside the bronze and Ni-containing regions. Neither TiC nor Co is
almost never seen inside grains. It was observed that they were
accumulated more in the boundaries of grains. When the SEM image of the
sample produced by adding 7% TiC is examined (Figure 5). With the
increasing trade rate, Co-based region is expanding and more regular.
The more we increase the rate of TiC ratio, the TiC particles into the
internal structure of nickel hardly be seen from the SEM images (Figure
5).
Microhardness measurements of the TiC-Ni-Co-bronze composites for
specimens S1 and S5 are given in Figure 6. As can be seen in this result,
a significantly deferent trend was observed in the microhardness profiles
of S1 and S5 specimens. It was observed that the hardness increased with
the addition of TiC and this increase was almost twice the sample without
TiC supplementation.
Figure 4. SEM image and EDS regions of S2

119
4th International Science Symposium (September 04-06, 2019),
Kiev-Ukraine (ISS2019), 2A2PB; pp:115-120.
Figure 5. SEM image and EDS regions of S3
Figure 6. Microhardness results of S1 and S5 specimens
5. CONCLUSION
TiC-reinforced Co-Ni-bronze matrix composites were successfully
produced with hot pressing method. Results of this research can be summed
as follows:
From the SEM microstructure photo of TiC-Ni-Co-Bronze composite,
there was not a cavity and defect in the interface of TİC added
Ni-Co-Bronze composites of all produced samples.
When the image of S1 was examined, it was seen that preferably
agglomerated regions with completely irregular and different
sizes. However, the EDS results from different regions show us
0
100
200
300
400
500
600
1 2 3 4 5 6 7 8 9 10
Distance(mm)
Mic
roh
ard
ness (
Hv)
S5
S1

120
4th International Science Symposium (September 04-06, 2019),
Kiev-Ukraine (ISS2019), 2A2PB; pp:115-120.
that when Co is added to the Ni-bronze, there are two regions that
do not dissolve in each other, and preferably unite in different
ways.
These results showed that the hardness increased with the addition
of TiC and this increase was almost twice the sample without TiC
supplementation
REFERENCES
[1] Azizieh, H., Kehler, R., and Bode, H., (2017). Hadden horst
Partikel verstärkte Leicht metalle Metall, 49(1995):191-195,
[2] Iranparast, D., Dezfuli, M.A.G., Balak, Z., and Kim, H.S.,
(2017). Fabrication of Al/Al2Cu in Situ Nanocomposite Via
Friction Stir Processing [J]. Transactions of Nonferrous Metals
Society of China, 27:779−788.
[3] Tallafuss, P. and Janette, J., (2018). Defects, Causes and
Prevention Controls in the Continuous Bronze/Steel Bimetal Strip
Sintering Process. Engineering Failure Analysis 92, 32–43.
[4] Barmouz, M. and Givi, M.K.B., (2011). Fabrication of in Situ
Cu/SiC Composites Using Multi-Pass Friction Stir Processing:
Evaluation of Microstructural, Porosity Mechanical and
Electrical Behavior. Compos. Part A-Appl. S. 42, 1445.
[5] Kehler, H., Bode, R., and Haddenhorst, H., (1995).
Partikelverstärkte Leicht Metalle Metall, 49:191-195.
[6] Han, B.Q. and Chan, K.C., (1996). Super Plastic Deformation
Mechanisms of Particulate Reinforced Aluminum Alloy Matrix
Composites Mater. Sci. Eng., 212, pp. 256-264
[7] Kaczmar, J.W., (1989). Effect of Production Engineering
Parameters on Structure and Properties of Cu–W Composite Powders
Powder Metall. 32:171-175.
[8] Kathari, N.C., (1984). Sintering Behavior of Copper Containing
Titania Modern Develop. Powder Metall., 16:361-376.
[9] Warrier, K.G.K. and Rohatgi, P.K., (1984). Copper–Titania
Electrical Contacts Powder Metall., 29:65-69.
[10] Fogagnolo, J.B., Robert, M.H., Ruiz-Navas, E.M., and Torralba, J.M., (2004). 6061 Al Reinforced with Zirconium Diboride
Particles Processed by Conventional Powder Metallurgy and
Mechanical Alloying, J. Mater Sci. 39:127e132.
[11] Özçatalbaş, Y., Bahçeci, E., and Turker, M., (2007). Effect of Cutting Tool Materials on Surface Roughness and Cutting Forces
in Machining of Al-Si3N4 Composite Produced by Powder
Metallurgy, Mater Sci. Forum 534e536:869e872.
[12] Huda, M.D., Hashmi, M.S.J., and El-Baradie, M.A., (1995). MMCs: Materials, Manufacturing and Mechanical Properties, Key Eng.
Mat. 104e10:37e64.

4th International Science Symposium Status: Proceeding Book
ISS2019 (September 4-6, 2019) ID : 2019.2A3PB
Uğur Çalıgülü
Fırat University, [email protected], Elazığ-Turkey
Mustafa Türkmen
Gebze Technical University, [email protected], Kocaeli-Turkey
Serkan Islak
Kastamonu University, [email protected], Kastamonu-Turkey
Zeliha Aydeniz
Fırat University, [email protected], Elazığ-Turkey
INVESTIGATING CORROSION RESISTANCE OF 304 AND 316L AUSTENITIC
STAINLESS STEEL SURFACES COATED WITH Al2O3 POWDERS USING PLASMA SPRAY
METHOD
ABSTRACT
The aim of this study was to improve the surface properties of
the AISI 304 and AISI 316L austenitic stainless steels by coating with
the Al2O3-TiO2 powders in the thickness of 0-100µm, 100-200µm and 200-
300µm by using the plasma spray method, one of thermal spray methods.
Corrosion resistance of the samples was investigated after the coating
process. As a result of the corrosion tests performed with the
reference 3000 Potentiostat/Galvanostat/ZRA corrosion system, the
results obtained were examined and it was observed that the corrosion
resistance increased with the coating thickness treatment in both Al2O3
coated materials and AISI 316L stainless steel had higher corrosion
resistance than AISI 304 stainless steel.
Keywords: AISI 304, AISI 316L, Al2O3, Thermal Spray Coating,
Corrosion Resistance
1. INTRODUCTION
When metals are separated from the basic state (metal ore), they
absorb some energy in their structures. By releasing this absorbed
energy with corrosion reactions, they go back to their basic state.
Since the corrosion reactions are exothermic, they can take place even
at room temperature. The amount of free energy increasing during the
metallization processes varies from metal to metal. The greater the
free energy in absolute value, the higher the tendency of metal to
corrode. Therefore, magnesium and iron are exposed to much faster
corrosion than gold and platinum [1]. Economic losses caused directly
or indirectly by the corrosion cause high costs. In a sense, the
economic losses of corrosion include corrosion-resistant materials,
surface coatings, additions to aggressive environments in order to
reduce the effectiveness of the environment and replacement of the
deformed parts that cannot perform their duties with new ones. The
studies have showed that non-metallic materials are similarly affected
by environmental factors. For example, the methods used to describe
the deformation of metal and its alloys as a result of stress
corrosion can be applied successfully to glass, ceramic materials,
polymers and compound materials. For this reason, the term corrosion
is used in a way to cover the deformation of all materials having the
quality of construction material due to the environmental effect [2].
Nickel is the second most important alloying element of
stainless steels. The oxide layer on the surface of stainless steel
forming in the environment with oxygen regains its old feature by
fixing itself when it is deformed. Nickel improves the re-formation of

122
4th International Science Symposium (September 04-06, 2019),
Kiev-Ukraine (ISS2019), 2A3PB; pp:121-127.
the oxide layer, especially in environments that have an effect of
degrading the oxide layer; however, if the nickel rate exceeds 8-10%,
the stress corrosion resistance of the steel deteriorates. As the
nickel ratio increases to around 30%, the stressed corrosion
resistance improves again. Nickel improves the stainless steel’s yield
point, toughness and resistance to acids degrading oxide layer [3 and
4]. Coatings are an engineering solution for improving the material
surfaces against wear, corrosion, degradation and other surface
events. Since coatings are applied in many fields, there are many
coating materials and coating methods. The main distinguishing
properties between these coating methods are based on the thickness of
the coating obtained in the process and the temperature differences
forming on the coated material. These properties are the determining
parameters for choosing the coating method by considering the
properties of the coating material and the material to be coated.
Thermal spray coatings are the most popular and most preferred method
among these coating methods since they are versatile due to their wide
coating thicknesses and substrate temperatures and have good
mechanical properties [5].
Thermal spray is the general name of a group of processes in
which metallic or non-metallic surface coating materials are molten or
semi- molten by a heat source and applied to form a coating on a
previously prepared surface. The surface coating material may be in
powder, wire or rod form. The thermal spray gun produces the required
heat with a flammable gas or electric arc. When heated, the coating
materials become semi- molten, accelerated with the help of the gases
used in the process and moved towards the surface of the base
material. The particles flatten by hitting the surface, form thin
plates and stick to the rough surface and to each other. When the
particles sprayed hit to the surface of the base material, they cool,
solidify and form a lamella structure which forms the coating. The
adhesion of each particle takes place with mechanical bonding or
metallurgical bonding or diffusion in some cases. Increasing speed of
the particles provides a better adhesion strength and higher density.
In order to ensure a good bonding between the base material and the
coating, it is extremely important to roughen the surface of the base
material by sandblasting and to remove and clean the oil completely
before coating [6].
Allowing to obtain high heat with plasma makes it possible to
use ceramic and metal-based alloy powders with high melting point in
coating applications. The ceramics are an important coating material
with the advantage of their properties such as high wear and hardness
properties, the availability and cheapness of their raw material,
corrosion, oxidation and low thermal conductivity and high number of
thermal cycles. However, due to their high melting points, their
applicability/melting capability in coating applications are only
possible at very high temperatures. Plasma spray coating technology
depending on the use of plasma energy allows the processability
(coatability) of materials with high melting temperature as coating
material [7 and 8]. Figure 1.1 shows a schematic view of the Plasma
Spray method.
Plasma spraying technique is the general definition for
different metallic or non-metallic coating application group in the
molten or semi-molten state on a substrate prepared for spray
accumulation. Molten or semi-molten particles are rapidly directed to
the previously prepared surface with the gases and atomized jets used.
A mechanical bonding occurs at the interface with the hitting of
molten or semi-molten particles to the surface. A coating structure
forms with repeating hits and bonding of the directed particles. These

123
4th International Science Symposium (September 04-06, 2019),
Kiev-Ukraine (ISS2019), 2A3PB; pp:121-127.
finely adherent particles suddenly solidify on the surface of the
substrate by showing a very rapid cooling regime. Thus, the spraying
process is completed [10].
Figure 1. Plasma spray system [9]
In the study by Aslan, (2015), biocompatible coatings comprised
of mono and double-layered hydroxyapatite (HAP) and TiO2 powders were
produced with plasma spray coating method on the surfaces of AISI 316L
stainless steel materials used as implant material. They observed that
the corrosion resistance of AISI 316 L stainless steels coated with
HAP improved [11]. In their study, Islak, et al., (2019) investigated
the microstructure, wear and corrosion properties of Ti3SiC2 MAX phase
coating produced on AISI 304 stainless steel by plasma spray
method. The wear properties of the coating and substrate were
determined using the scratch test. The friction coefficient of the
coating layer was found to be low compared to the substrate. The
corrosion properties of the substrate and coating were determined by
conducting potentiodynamic measurements in 3.5% NaCl solution. They
observed from the corrosion results that the coating layer had a
corrosion resistance of 3.5 times compared to the substrate [12].
İrşat, (2016) obtained the coating material by accumulating mechanical
alloyed composite powder Al-12Si with 100mm spray distance and Al-
12Si/SiO2 with 150mm spray distance on surface of Al matrix with
plasma spray method on the base material and they observed that the
alumina formation increased as coating distance increased [13].
2. RESEARCH SIGNIFICANCE
AISI 304 and AISI 316L austenitic stainless steels are used in
the flue gases in the casting industry. In this study, was to improve
the surface properties of the AISI 304 and AISI 316L austenitic
stainless steels by coating with the Al2O3-TiO2 powders in the
thickness of 0-100µm, 100-200µm and 200-300µm by using the plasma
spray method, one of thermal spray methods. The results obtained were
examined and it was observed that the corrosion resistance increased
with the coating thickness treatment in both Al2O3 coated materials and
AISI 316L stainless steel had higher corrosion resistance than AISI
304 stainless steel.
3. MATERIAL AND METHOD
After the AISI 304 and AISI 316L Austenitic Stainless Steel
plates were cut, their surfaces were coated with Al2O3 powders, whose
properties were shown in Table 1, to have different coating
thicknesses by using a Plasma Spray coating device setup in a private
company in Figure 1, Table 2 shows the samples used in the

124
4th International Science Symposium (September 04-06, 2019),
Kiev-Ukraine (ISS2019), 2A3PB; pp:121-127.
experimental study. SEM micrographs and X-ray diffraction patterns of
Al2O3/13wt.%TiO2 powder are shown in Figure 2. Powders are in different
grain sizes, irregular and sharp-edged. As was evident from the XRD
data, Al2O3/13wt.%TiO2 powder consists of a dense α-Al2O3 and rutile-
(TiO2) phases.
Table 1. Properties of powders used in experimental studies
Oxide Powders Powder
Grain Size
Powder
Morphology
Chemical
Composition
Aluminum Oxide Al2O3 Amdry 6220 -22+5µm Angular Al2O3 13TiO2
Table 2. Samples used in the experimental study
Material 0-100µm 100-200µm 200-300µm
AISI 304 N1 N2 N3
AISI 316L N4 N5 N6
Figure 1. Plasma spray coating setup used for coating
20 30 40 50 60 70 80 90
0
50
100
150
200
250
300
350
400
450
Inte
nsity (
Counts
)
2 Theta (degree)
:Rutile (TiO2)
:-Al2O
3
Figure 2. XRD diffraction patterns and SEM imagines of Al2O3 –13% TiO2
The coated samples were sanded with coarse grained and fine
sandpaper for corrosion tests and cleaned in an ultrasonic bath. The
corrosion measurements were performed using the Reference 3000
Potentiostat/Galvanostat/ZRA corrosion system given in Figure 2.
Corrosion tests were conducted after keeping the samples at room
temperature (25°C) in a NaCI solution of 3.5 wt.% (pH 3) for 1 hour. A
conventional three-electrode cell was used for all electrochemical
measurements. Ag/AgCl electrode was used as the reference electrode
and a carbon graphite was used as the counter electrode.
Potentiodynamic sweep was performed with a sweep of 1mV/s sweep rate
in the range of ±0.25V potential range according to Eocp. Anodic and
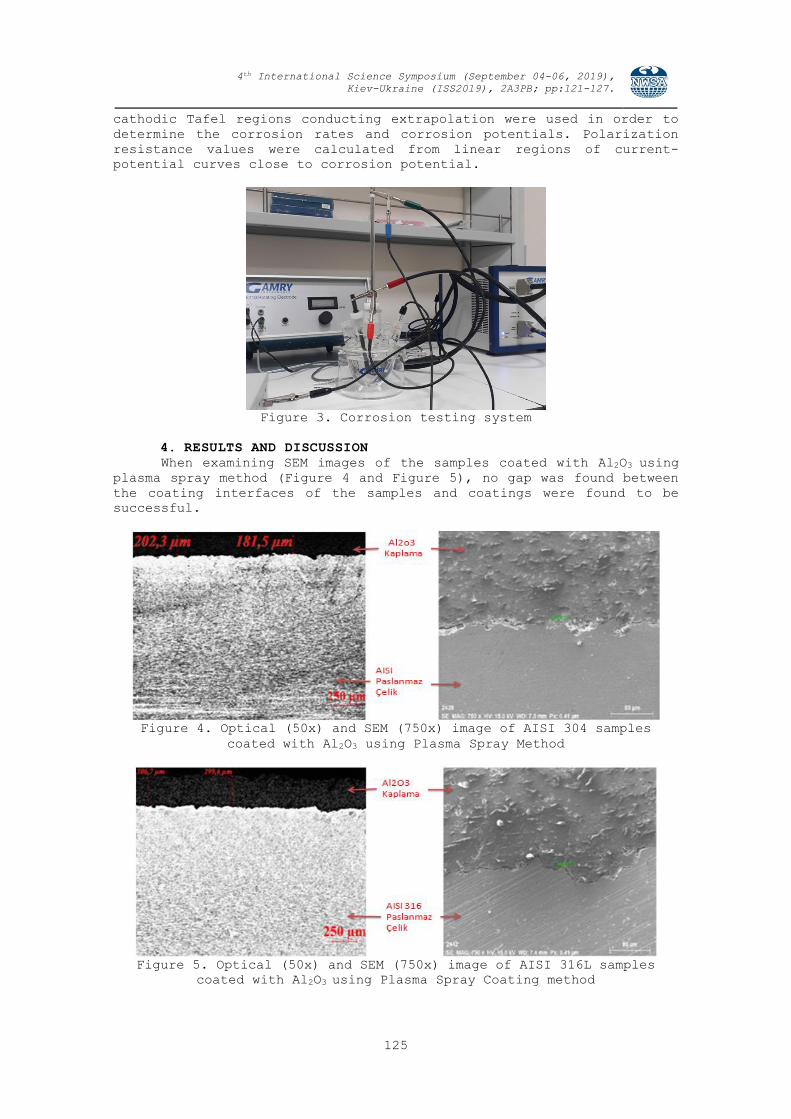
125
4th International Science Symposium (September 04-06, 2019),
Kiev-Ukraine (ISS2019), 2A3PB; pp:121-127.
cathodic Tafel regions conducting extrapolation were used in order to
determine the corrosion rates and corrosion potentials. Polarization
resistance values were calculated from linear regions of current-
potential curves close to corrosion potential.
Figure 3. Corrosion testing system
4. RESULTS AND DISCUSSION
When examining SEM images of the samples coated with Al2O3 using
plasma spray method (Figure 4 and Figure 5), no gap was found between
the coating interfaces of the samples and coatings were found to be
successful.
Figure 4. Optical (50x) and SEM (750x) image of AISI 304 samples
coated with Al2O3 using Plasma Spray Method
Figure 5. Optical (50x) and SEM (750x) image of AISI 316L samples
coated with Al2O3 using Plasma Spray Coating method

126
4th International Science Symposium (September 04-06, 2019),
Kiev-Ukraine (ISS2019), 2A3PB; pp:121-127.
Figure 6 shows potential change polarization curves of the
samples determined in 3.5% NaCI corrosive medium. The results of
potentiodynamic polarization measurements are summarized in Table 3
Corrosion potential (Ekor), anodic and cathodic Tafel curves (βa and
βc), corrosion resistance (Rp), corrosion rate and corrosion current
(Ikor) were found from Tafel curves. Corrosion resistance was
calculated by the Stern and Geary equation given below [14].
Figure 6. Tafel Polarization Curve
(1)
Corrosion rates in coatings generally depend on the amount of
porosity and microcracks that occur in the characteristics of the
coatings. Porosities and microcracks significantly reduce the
corrosion resistance of coatings [15].
Table 3. Electrochemical results of AL2O3 coating samples
Samples
Ecor (mV)
Icor
(µAcm-2)
βa(mV)
βc(mV)
Corrosion
Rate (mpy)
Corrosion
Resistance
(kΩ.cm2)
AISI 304-100 micron -366 9.34 309 177.3 10.35 5.2375
AISI 304-200 micron -408 13.8 237.4 238.2 15.51 3.7412
AISI 304-300 micron -427 28.6 178.8 289.5 31.71 1.6782
AISI 316-100 micron -221 3.07 431.7 81.1 3.4 9.6566
AISI 316-200 micron -281 3.05 292.7 61.4 3.42 7.2256
AISI 316-300 micron -255 4.72 907.9 82.4 5.5 6.9496
It was determined from the results of corrosion test that
corrosion resistance of AISI 316 L austenitic stainless steel was
higher than AISI 304 austenitic stainless steel in coated steels. In
addition, it was observed that the highest corrosion resistance (0-
100µm) belongs to the Al2O3 coated sample. Results of the corrosion
test conducted in NaCI solution revealed that although the environment
was not too aggressive, the rate of corrosion losses is quite
different. Weight losses in corrosion test are maximum 200-300µm for
AISI 304 and minimum 0-100µm for AISI 316L depending on corrosion
resistances. It was observed that the grain size was also effective in
corrosion resistance.

127
4th International Science Symposium (September 04-06, 2019),
Kiev-Ukraine (ISS2019), 2A3PB; pp:121-127.
5. CONCLUSION
It was determined as a result of the conducted tests and
investigations that AISI 304 and AISI 316L austenitic stainless steel
surfaces were successfully coated with Plasma Spray method using Al2O3
powders. It was determined that the corrosion resistance increased as
the coating thickness increased. In addition, it was concluded that
AISI 316L austenitic stainless steels had higher corrosion resistance
than AISI 304 austenitic stainless steel after coating.
ACKNOWLEDGEMENT
The study was supported by the Firat University Research Project
Committee (Project No: TEKF.18.11).
REFERENCES
[1] Boles, M.A., (1994). Thermodynamics, An Engineering Approach.
Second Edition. McGraw Hill Press, New York, USA.
[2] Doruk, M., (1982). Corrosion and Its Prevention, METU
Publications, 20-29, Ankara.
[3] Can, A.Ç., (2006). Material Science, Birsen Publishing House,
Istanbul.
[4] Aran, A. and Temel, M.A., (2004). Production, Use and Standards
of Stainless Steels, Sarıtaş Technical Publication, Istanbul.
[5] Kambur, K., (2018). The Effect of Different Substrate
Temperatures on Coating Properties in Coating of Ti6Al4V Alloy
with HA. Master's thesis, Manisa Celal Bayar University, Turkey.
[6] AWS Committee, (1997). Thermal Spraying: Practice, Theory, and
Application, American Welding Society Inc, 12-15.
[7] Lugscheider, E. and Jokiel, P., (1993). Plasmaspritzen-
Verfahren, Anwendungen, Enteicklungen, Metal Heft 3, 230-235.
[8] Esschnauer, H. and Lugscheider, E., (1985). Fortschritte Beim
Thermisvhen Spritzen, Metal Heft 3, 218-224.
[9] Smolka, K., Thermisches Spritzen, (2002). DVS-Verlag, 50-57.
[10] Sert, Y., (2007). Examining Wear Properties of Textile Piece Coated with Plasma Spray Technique, Master's thesis, Sakarya
University Institute of Science, Sakarya.
[11] Aslan, O., (2015). Examining Corrosion Behaviors of Single and Double layered AISI 316L Stainless Steel Coated by Plasma Spray
Coating, Afyon Kocatepe University, Afyon.
[12] Islak, S., Özorak, C., and Eski, Ö., (2019). Characterization of Coating with Ti3SiC2 MAX Phase produced on AISI 304 Stainless
Steel by using Plasma Spray Method, Kastamonu University,
Mechanical Engineering, Kastamonu, 206-213s.
[13] İrşat, C., (2016). Determining Corrosion Behavior of Al-12Si Plasma Spray Composite Coatings Reinforced with In-Situ AL2O3
Phases, Master's thesis, Atatürk University Institute of
Science.
[14] Stern, M., and Geary, A.L., (1957). Electro Chemical Polarization I. A Theoretical Analysis of the Shape of
Polarization Curves. Journal of the Electro Chemical Society 104
56-63.
[15] Zhang, D. and Kong, D., (2018). Microstructures and Immersion Corrosion behavior of Laser Thermal Sprayed Amorphous Al-
Nicoatings in 3.5% NaCl Solution. Journal of Alloys and
Compounds, 735, 1-12.
[16] Kırık, I., Özdemir, N., and Sarsılmaz, F., (2012). Microstructure and Mechanical Behaviour of Friction Welded AISI
2205/AISI 1040 Steel Joints. MP Material Testing, 54(10):683-
688.

4th International Science Symposium Status: Proceeding Book
ISS2019 (September 4-6, 2019) ID : 2019.2A4PB
Halil Dikbaş
Fırat University, Elazığ-Turkey
Mustafa Türkmen
Gebze Technical University, [email protected], Kocaeli-Turkey
Ugur Çalıgülü, Görkem Dardağan
Fırat University, [email protected], Elazığ-Turkey
THE WELDABILITY OF AA6063 ALUMINUM-BRASS ALLOYS USING FRICTION WELDING
ABSTRACT
In this study, the weldability of AA6063 aluminum and Brass alloys
using friction welding was investigated. AA6063 aluminum and Brass alloys
each of which had a 12mm diameter were used to fabricate the joints. The
friction welding tests were performed by using a direct-drive type
friction welding machine. After friction welding, interface regions of
the welded specimens were examined by OM, SEM, EDS and X-Ray analysis
to determine the microstructure changes. Microhardness and tensile tests
were conducted to determine mechanical properties of the welded
specimens. The experimental results indicated that AA6063 aluminum and
CuZn30 brass alloys using the friction welding technique for achieving
a weld with sufficient strength. Tensile strength values also confirmed
this result and intermetallic phases did not occur at the interface.
Keywords: AA6063, CuZn30, Friction Welding,
Microstructure, Tensile Strength
1. INTRODUCTION
Aluminum metal has numerous application areas today due to the
fact that it is light weight and easy to machine. Aluminum is used in
many areas such as defense, construction components, furniture, solar
and wind energy, electricity, electronics, and decoration [1, 2 and 3].
Brass is one of materials that can be used in the production of many
parts because of its unique joining properties. When good strength and
ductility are combined with very good corrosion and machinability, this
makes it indispensable [4, 5 and 6]. Friction welding is a solid-state
welding technique in which the surfaces of parts are welded utilizing
heat generated as a result of conversion of mechanical energy into
thermal energy through friction. Friction welding is a kind of pressure
welding in which materials are welded through plastic deformation with
friction heat without melting them. In general sense, friction welding
machines resemble metal working machines such as lathe and drilling
machine and consist of main body, fasteners, rotating and upsetting
mechanisms, brake system, power unit, control units and control panel.
As is known, main functions of friction welding are connection and
compression of parts, rotation and friction under pressure, braking,
upsetting, and precise adjustment of necessary periods [7, 8, 9, 10, 11
and 12]. Çakır, et al., joined aluminum and copper materials by using
the friction stir welding method and investigated the mechanical
properties of welded joints [13]. Ozbekmez examined the effect of welding
parameters on mechanical properties in welding of CuZn30 alloys by using
FSW method [14]. Barlas observed that temperature change in both the
base material and the weld center varied depending on the rotational
speed [15]. Küçükömeroğlu, et al., joined AA5754H22 and CuZn30 alloys
by using solid-state welding method and observed that different loads

129
4th International Science Symposium (September 04-06, 2019),
Kiev-Ukraine (ISS2019), 2A4PB; pp:128-137.
alongside different rotational speeds of the tool affected significantly
strength of weld seam [16].
2. RESEARCH SIGNIFICANCE
As is known, the use of materials with different structural
properties may be required in many application areas. It is limited and
very problematic to weld aluminum and brass alloys using fusion welding
methods. Therefore, this study investigated weldability of (AA6063)
aluminum and brass (CuZn30) alloys using friction stir welding technique,
one of solid-state welding methods.
3. EXPERIMENTAL METHODS
AA6063 aluminum and Brass alloys 12mm diameter and 70mm in length
were used to fabricate the joints in this study. Table 2 illustrates the
chemical compositions of the base metals. The friction welding tests
were carried out using a direct-drive type friction-welding machine.
Table 3 present mechanical properties of AA6063 and Brass alloys. Table
4 illustrates the experimental conditions. Friction time, and upsetting
time from the friction welding parameters were kept constant during the
welding and the welding was performed so that rotational speed 1600 and
1700Rpm, the friction pressure was 20MPa, 30MPa, and 40MPa and upsetting
pressure was 40MPa, 60MPa, and 80MPa.
Figure 1. Experimental set-up [17]
Table 2. Chemical compositions of AA6063 aluminum and Brass alloys
Materials Elements (% wt)
Fe Zn Cu Ni Mn Si Ti Mg Al Pb Sn
AA6063 0.7 0.10 0.10 0.2 0.5 0.3-0.7 0.20 0.4-0.9 Kalan - -
CuZn30 0.05 Kalan 69.0-71.0 0.30 - - - - 0.02 0.05 0.10
Table 3. Mechanical properties of AA6063 aluminum and Brass alloys
Materials Tensile Strength
(MPa)
Yield Strength
(MPa)
Elasticity Module
(GPa)
Hardness
(HV)
AA6063 235 140 70 70
CuZn30 350 170 33 95
Table 4. The process parameters used in the friction welding
Specimens
Welding Parameters
Rotating
Speed (rpm)
Friction
Pressure(MPa)
Friction
Time(S)
Upsetting
Pressure(MPa)
Upsetting
Time(s)
N1 1600 20 6 40 4
N2 1600 30 6 60 4
N3 1600 40 6 80 4
N4 1700 20 6 40 4
N5 1700 30 6 60 4
N6 1700 40 6 80 4

130
4th International Science Symposium (September 04-06, 2019),
Kiev-Ukraine (ISS2019), 2A4PB; pp:128-137.
After the welding, the specimens were cut with water-cooled discs
as perpendicular to the joint area in order to examine the structural
changes occurring in the joint area. The surfaces of the specimens cut
in the perpendicular direction were cleaned with 400, 600, 800, 1000,
and 1200 mesh abrasive respectively to make metallographic
investigations on the specimens. The cleaned surfaces were polished by
using a 3-μm diamond paste. After the polishing operation, AA6063
aluminum side of the welded specimens was etched with the solution with
a mixture of modified Keller solution (95ml distilled water, 1ml HF, 1ml
HCI, 3ml HNO3) and CuZn30 brass side of the welded specimens was etched
with the solution containing a mixture of 100ml distilled water, 4ml
saturated sodium chloric, 2g potassium dichromate, and 5ml sulfuric acid
and they were made ready for metallographic examinations. The
microstructures of the joints were observed by using Optical Microscopy
(OM), the Energy Dispersive Spectroscopy (EDS), and X-Ray Diffraction
(XRD). Micro-hardness measurements were taken under a load of 500g.
Tensile tests were conducted at room temperature with 0.5mm s-1 cross-
head rate.
4. RESULTS AND DISCUSSION
4.1. Evaluation of Microstructures
The macro-view of specimens S1, S2, S3, S4, S5 and S6 welded under
different welding conditions is shown in Figure 2. Visual examination
of the welded specimens showed uniform weld joints. When Figure 2 was
examined, it was observed that the flange amount increased directly
proportional to the increase in the rotation speed, friction pressure,
and upsetting pressure. The formation of flange in joining materials
having different properties with friction welding method depends on the
mechanical properties of two main materials.
Figure 2. Overview of friction welded AA6063 aluminum and CuZn30 brass
alloys
The flash obtained was symmetric, which indicated plastic
deformation on both the rotating and upsetting (reciprocating) side. The
integrity of the joints was evaluated for the friction-welded joints.
The friction processed joints were sectioned perpendicular to the bond
line and observed through an OM microscope. It can be clearly seen that,
there were no crack and voids at the weld interface. According to the
microstructural observations, the microstructures formed interface zone
during or after FW processes, and there were three distinct zones across
the specimens as unaffected zone (UZ), deformed zone (DZ) and transformed
and recrystallized fully plastic deformed zone (FPDZ). There were no

131
4th International Science Symposium (September 04-06, 2019),
Kiev-Ukraine (ISS2019), 2A4PB; pp:128-137.
blanks, cracks or porosities in the weld zone (Figure 3). As a result
of the microstructural examinations, it was observed that the rotation
speed had an important effect on geometry and width of the weld zone.
It was observed that the DZ zone contracted with the increase of the
friction pressure and the upsetting pressure. This can be attributed to
increased ejection of the material which became viscose at the joining
interface along with the increased friction pressure. When the FPDZs
were examined, it was observed that the elongation of the grain
structures occurred due to the increase in friction pressure and
upsetting pressure.
N1
N2
N3
N4
N5
N6
Figure 3. Optical micrograph taken from the welding interface of the
specimens N1, N2, N3, N4, N5 and N6 respectively
4.2. Tensile Test Results
Shape and measurements of the tensile specimens are present in
Figure 4. The results of tensile tests are present in Figure 5 and Figure

132
4th International Science Symposium (September 04-06, 2019),
Kiev-Ukraine (ISS2019), 2A4PB; pp:128-137.
6, respectively. As can be seen in Figure 5, the friction welded
specimens were fractured in the weld zone. When the fracture surfaces
of the specimens as a result of tensile test were examined, it was
observed that these welded joints showed brittle fracture mechanism.
When examining the results of the tensile test in Figure 6, it was
observed that maximum tensile strength of the specimen S1 was 103.21MPa,
the maximum tensile strength of the specimen S2 was 109.19MPa, maximum
tensile strength of the specimen S3 was 115.88MPa, the maximum tensile
strength of the specimen S4 was 119.57MPa, the maximum tensile strength
of the specimen S5 was 124.28MPa, and the maximum tensile strength of
the specimen S6 was 130.69MPa. As can be seen from the results of the
tensile test, the increase in the maximum tensile strength of the welded
joints, namely the strength of welded joints, was observed depending on
the increase in the friction pressure and upsetting pressure.
Consequently, the welding parameters preferred were successful for
joining these two base materials.
Figure 4. Shape and measurement of the tensile test specimens
(TSE 138)
Figure 5. Optical image of the specimens S1, S2, S3, S4, S5 and S6
after tensile test
6

133
4th International Science Symposium (September 04-06, 2019),
Kiev-Ukraine (ISS2019), 2A4PB; pp:128-137.
Figure 6. Tensile test results of friction-welded joints
4.3. Fractography
Figure 7 shows the images of the fracture surfaces caused by the
tensile test for the friction-welded specimen S4. In the EDS analyses
(Table 4) taken from the 100-μm area of the fracture surface occurring
as a result of the tensile test of the specimen S4, 58.63% Cu, 23.17%
Zn, 16.28% Al, 0.99% Pb 0.31% Fe, 0.19% Ti, 0.16% Mg, 0.10% P, 0.09% Mn
and 0.07% Sn were determined. When the fractured surface and SEM images
of the material were examined in friction welded specimen S4, the brittle
fracture mechanism was observed to occur (Figure 7).
Figure 7. Micrograph of the tensile fracture surfaces of S4 specimens
observed by SEM
Table 4. EDS analyses taken from the fracture surfaces of S4 specimen
EDS
Point
Alloying Elements (wt%)
Cu Zn Al Pb Fe Ti Mg P Mn Sn
1 58.63 23.17 16.28 0.99 0.31 0.19 0.16 0.10 0.09 0.07
4.4. Microhardness
Figure 8 shows microhardness measurements in the direction
perpendicular to the weld interface of the friction-welded joints for
the specimens S1-S6. When examining microhardness graphs of the welded
samples in Figure 8, it was observed that as AA6063 aluminum moved from
the base material towards weld zone, the hardness values of the weld
zone changed parallel with hardness values of the aluminum. This increase
in hardness values in weld zone was thought to be caused by the copper-
rich structures within the weld zone. As transferring from the weld zone
to the CuZn30 brass base material, it was observed that its hardness
values changed in parallel those of the base material as in the AA6063
aluminum side.
A
S4
A

134
4th International Science Symposium (September 04-06, 2019),
Kiev-Ukraine (ISS2019), 2A4PB; pp:128-137.
Figure 8. Microhardness distribution across the welding interface of
friction-welded specimens
4.5. X-Ray Diffraction
Figure 9 shows X-Ray diffraction across the interface of the
specimen N4. In the X-Ray analysis, Al9Si, Al0.0983Cr0.017 and Al10Mn3
phase and Al were determined (Figure 9).
Figure 9. The result of XRD analyses N4 specimen
4.6. EDS Analysis
The results of EDS analysis taken from 3 points on the welding
interface of N6 specimen in a distance of 100 μm were seen (in Table 5
and Figure 9, Figure 10, Figure 11, Figure 12). When Table 5 and Figure
9, Figure 10, Figure 11, Figure 12 were examined;
98.09% Al, 0.55% Mg, 0.49% Si, 0.13% Mn and 0.39% Fe elements were
detected in AA6063 aluminum side (EDS point no.1),
56.69% Al, 0.63% Mg, 22.01% Cu, 0.28% Si, 0.52% Mn, 7.07% Zn, 1.20%
Ni, 0.18% Cr, 10.24%Pb, 0.85% Ti and 0.33% Sn elements were
detected in the weld zone (EDS point no.2),
59.69% Cu, 0.41% Mn, 32.92% Zn, 0.62 %Fe, 6.03% Pb and 0.33% Sn
elements were detected in CuZn30 brass side (EDS point no.3),
however, any formation of intermetallic phase was not observed.

135
4th International Science Symposium (September 04-06, 2019),
Kiev-Ukraine (ISS2019), 2A4PB; pp:128-137.
Table 5. Quantity of concentration taken from EDS analysis across the
welding interface of N6 specimen
EDS
Point
Alloying elements (wt%)
Al Mg Cu Si Mn Zn Fe Ni Cr Pb Ti Sn
1 98.09 0.55 - 0.49 0.13 - 0.39 - - - - -
2 56.69 0.63 22.01 0.28 0.52 7.07 - 1.20 0.18 10.24 0.85 0.33
3 - - 59.69 - 0.41 32.92 0.62 - - 6.03 - 0.33
Figure 9. EDS Point 1
Figure 10. EDS Point 2
Figure 11. EDS Point 3

136
4th International Science Symposium (September 04-06, 2019),
Kiev-Ukraine (ISS2019), 2A4PB; pp:128-137.
Figure 12. EDS analyses across the welding interface of the friction-
welded specimen N6
5. CONCLUSION
AA6063 aluminum and CuZn30 brass alloys were joined by friction
technique using different process parameters. Below are conclusions
drawn based on the results of microstructure analysis, hardness and
tensile tests;
This study revealed that the rotation speed (1500 and 1600 rt./min)
selected to join AA6063 aluminum and CuZn30 brass alloys was
successful in joining these two base materials
When friction welded joints were examined, no crack and unconnected
regions were encountered at macro and micro levels.
When friction welded specimens were examined from microstructure
aspect, there was a contraction in the deformed region depending
on the increase in friction pressure and upsetting pressure.
When examining from microstructure aspect, an increase was
observed in hardness as it progressed from the base material to
the weld zone. As the welding parameters increased, the hardness
of welded joints increased. The highest microhardness value was
measured as 96.3HV in specimen S6.
When the results of the tensile test were examined, all of the
specimens (S1, S2, S3, S4, S5 and S6) were observed to fracture
from the weld zone.
The increase occurred in the strength of welded joints as the
welding parameters (Rotating speed, friction pressure, and
upsetting pressure) increased. The highest tensile value (1700rpm)
was measured approximately as 130.69Mpa in the specimen N6 welded
with the friction pressure of 40Mpa and the upsetting pressure of
80Mpa.
In XRD analysis, Al9Si, Al0.0983Cr0.017 and Al10Mn3 phase was
detected.
When Al, Mg, Cu, Si, Mn, Zn, Fe, Ni, Cr, Pb, Ti and Sn elements
were detected in the EDS analysis, no intermetallic phase formation
was observed.
REFERENCES
[1] Kevorkijan, V., (2012). Density-based Prediction of Aluminium
Content in Pressed Skulls of Aluminum Dross- Development of an
Industrial Measurement Procedure. Int. Journal For Industry,
Research an Application, (88):60-65.
AA6063 CuZn30
1 3 2

137
4th International Science Symposium (September 04-06, 2019),
Kiev-Ukraine (ISS2019), 2A4PB; pp:128-137.
[2] Awad, S.H., (2012). Study on Coloring of Aluminum Alloys by
Microplasma Oxidation (MPO) technique. Journal of Babylon
University, (20):293-300.
[3] Özlü, H., Çakar, S., and Çeper, İ., (2013). Aluminium Profile of
AA6063 Alloy is Coating Anodized in H2SO4 Solution.
Gaziosmanpaşa Journal of Scientific Research 6:41-45.
[4] Sentürk, B.S., (2007). Manufacturing Defects Taking Place During
The Extrusion of Brass Alloys: Reasons and Solutions. Master's
thesis, İTÜ Institute of Science.
[5] Kesici, T., (2006). The effect of the Annealing Parameters on
Deep drawing of the %70 Cu-%30 Zn Brass Alloys. Master’s Thesis,
Kırıkkale Universty, Institute of Science.
[6] Yalcin, M., (2014). Study of Size Effect in Micro-Extrusion
Process of CuZn30 brass. Master’s Thesis, Sakarya Universty,
Institute of Science.
[7] Karabulut, A. and Tasgetiren, S., (2004). Design and
Manufacturing of Continuous Drive Friction Welding Machine,
Electronic Journal of Machine Technologies. pp:38-50.
[8] Anik, S., (1991). Friction Welding, Publication of Gedik
Holding, İstanbul, pp:134-137.
[9] Dabak, S., (1995). Manufacturing of Friction Welding Lathe,
Welding of SAE 8620-1040 Materials and Their Mechanical and
Metallographic Examination, Balıkesir University, Institute of
Science Master's thesis.
[10] Coşkun, O., (1992). A Simulation for Controlling of Continuous Drive Friction Welding by Computer, Erciyes University,
Institute of Science Department of Electronics Doctoral
Dissertation.
[11] Paylaşan, U., (2000). Examination of Joining of Bronze and Low Carbon Steel by Friction Welding and Its Parameters. Kocatepe
University, Institute of Science Master's thesis.
[12] Meriç, C., Köksal, N.S., Erdoğan, M.T., and Okur, A., (2008). Investigation of The Welding Region of The Different Materials
Welded By Friction Welding, C.B.U. Journal of Science, pp:135–
144.
[13] Çakır, R. and Çelik, S., (2015). The Effect of Tool Position for Aluminum and Copper at High Rotational Friction Stir Welding.
Pamukkale University Journal of Engineering Sciences, 21(8):352-
357.
[14] Özbekmez, R., (2006). Joining of CuZn30 Alloy Plates by Friction Stir Welding and Inventigation of Mechanical Properties.
Master’s thesis, Sakarya Universty, Institute of Science.
[15] Barlas, Z., (2009). Mechanical and Microstructural Properties of the Joined Dissimilar Cu ile CuZn37 Plates by Friction Stir
Welding. Doctoral Thesis, Sakarya Universty, Institute of
Science.
[16] Küçükömeroğlu, T., Akyüz, H., and Çalışkan, H., (2010). The Effects of Certain Friction Stir Spot Welding Parameters on the
AA5754 and CuZn30 Alloys. 13th International Materials Symposium
(IMSP’2010) 13-15th October, Pamukkale University, Denizli-
Turkey
[17] Kırık, İ., Özdemir, N., and Çalıgülü, U., (2013). Effect of Particle Size and Volume Fraction of the Reinforcement on the
Microstructure and Mechanical Properties of Friction Welded MMC
to AA 6061 Aluminium Alloy. Kovove Materials, 51(4):221-227.

4th International Science Symposium Status: Proceeding Book
ISS2019 (September 4-6, 2019) ID : 2019.3C1PB
Özlem Armağan
Özyeğin University, İstanbul-Turkey
Fatih Perçin,
Ege University, [email protected], İzmir-Turkey
ARTIFICIAL INTELLIGANCE-AI USAGE IN AQUAQULTURE
ABSTRACT
In accordance with the increased demand for fish has put a bustle
on resources and sustainable practices among fisheries, requiring the
innovative use of existing and new technologies. In addition to that via
using artificial intelligence (AI) there is great potential to produce
this protein source sustainably. AI usage may be seen on many ways,
computer controlled intensive cultivation a future trend of open-sea
aquaculture, automatic remote monitoring or environmental pollution
monitoring etc. Moreover, the management of modern aquaculture, the
monitoring of water quality plays an important role. Developed real-
time, accurate and fast monitoring systems with low power consumption
and low cost which performs role, as eye and hands in fish farm workers
that is used in Artificial Intelligence Implementations. In the study,
it could be indicated new developments via using AI on aquaculture from
the aspect of international, EU and Turkish Law especially on obligations
and insurance law
Keywords: Artificial Intelligence, Aquaculture, Monitoring, Law
1. INTRODUCTION
At the beginning we have to state that AI usage may be seen on
many ways, such as computer controlled intensive cultivation a future
trend of open- sea aquaculture or automatic remote monitoring. In
addition to that the management of modern aquaculture, the monitoring
of water quality plays an important role. This paper mainly aims to
explain using AI on aquaculture from the aspect of international, EU and
Turkish Law especially on obligations and insurance law.
Technology provides the means for modifying the natural
environment for human purposes [1]. On the other hand aquaculture has a
tradition of about 4000 years. C. F. Hickling the English aquaculture
author, citing S.Y. Lin a noted Chinese aquaculturist, considered the
earliest beginnings of aquaculture as during the period 2000–1000 B.C.
[2]. It began in China, possibly due to the desires of an emperor to
have a constant supply of fish. It is speculated that the techniques for
keeping fish in ponds originated in China with fishermen who kept their
surplus catch alive temporarily in baskets submerged in rivers or small
bodies of water created by damming one side of a river bed. Another is
that aquaculture developed from ancient practices for trapping fish,
with the operations steadily improving from trapping-holding to
trapping-holding-growing, and finally into complete husbandry practices
[3].
At recent times remotely operated and autonomous vehicles such as
drones is used for reduced costs. From the technological side; Paley
wants autonomous underwater vehicles to have the same capabilities as
fish [4]. These developments especially examined by obligations law,
data security, security law and insurance law.

139
4th International Science Symposium (September 04-06, 2019),
Kiev-Ukraine (ISS2019), 3C1PB; pp:138-141.
2. RESEARCH SIGNIFICANCE
Fisheries and aquaculture research are important the last few
decades. Thus, especially underwater area and their monitoring is show
some aspects such as behavior of fish population in wild life or cultured
conditions, feeding and reproduction behavior of fish in wild or under
controlled systems in cages, growing fishes in cultured area,
environmental pollution or exposures, shifting of cages in sea
conditions, etc. From the aspect of law the main important points for
consideration are rights and liability [5].
Observe Technologies aims to convert aquaculture processes from
an art to a science by using Artificial Intelligence and data processing
to identify measurable patterns in feeding activities and strategies to
present to farmers. The system is built to be adaptable and empowering
for farmers by seamlessly tapping into the existing sensors, feed systems
and cameras on site [6]. By monitoring continuous presence may be
realized and not influenced by weather or other seagoing conditions; in
addition to that this method is efficient and accurate data gathering
potential to incorporate catch weights and risk based monitoring is also
high quality evidence for operational efficiency savings added value
[7].
3. EXPERIMENTHAL METHOD-PROCESS
Liability regimes arranged in the international arena with global
limitation conventions such as the 1976 Convention on Limitation of
Liability for Maritime Claims and the 1996 International Convention on
Liability and Compensation for Damage in Connection with the Carriage
of Hazardous and Noxious Substances by Sea. According to technological
developments underwater robotics the problems caused by the conflict
between global limitations arrangements and governmental liability
regimes (Article 13) may be solved [8]. On the other hand importance on
monitoring is defined via FAO documents;
define the powers, duties and obligations of States and regional
fisheries bodies to manage fisheries resources;
establish rules to be observed by those harvesting fishery
resources, including prohibiting certain activities, requiring
that other activities be undertaken only with the authority of a
license, and prescribing the manner in which fishing and related
activities must be conducted;
grant enforcement powers to officials (e.g. to arrest, detain and
seize);
protect the interests of fishers, particularly in relation to
confidential information;
establish both the judicial process for penalizing those who
violate fisheries rules and the procedures that govern the judicial
process. It is critical to understand the distinction between
international law and domestic (national) law, as well as the
relationship between those two spheres of law.
As explained more fully in the following section, international
law primarily regulates the relationship among States (and between States
and international organizations). Domestic law regulates the
relationships between persons (including legal persons such as
companies) within a particular state [9]. In parallel to that regulation
Turkish obligations law states obligations for fisheries especially from
the contract law. Contracts, which are prepared by one of the parties
within the scope of freedom of contract and submitted for counter party’s
signature without giving permission for any amendment or discussion on
contract provisions, are valid in principle if the counter party agrees
on the provisions and there is no pressure to sign the contract [10].

140
4th International Science Symposium (September 04-06, 2019),
Kiev-Ukraine (ISS2019), 3C1PB; pp:138-141.
Via monitoring and using AI effective contracts may be prepared for
insurance law. The term “aquaculture insurance” describes all the various
types of insurance that would normally be used to protect an aquaculture
business operation [11].
For a reasonably large aquaculture company, this would include
insurance protection for buildings and equipment, employees, stock,
livestock, liabilities, motor vehicles, vessels and divers, goods in
transit, and other insurable interests. Every insurance policy broadly
addresses key issues such as:
what is insured
where it is insured
what risks it is insured against
how it is valued
what the policy-holder should do if a claim occurs
what general conditions apply [12].
On the other hand, aquaculture has its own industry-specific
supply-side insurance challenges in four areas:
the insurance of offshore operations
some aspects of employer’s liability, particularly for offshore
workers, and employers' liability for divers
insurance of the end product, especially product recall and
products liability
insurance of livestock (the aquatic animals and plants).
In addition to that for examining insurance market there are some
necessities such as; Needs assessment Risk proposal and assessment Risk
management (Risk management surveys; biological surveys; Survey costs)
Claim handling procedures (Immediate reporting of and responding to
problems; Expertise of farm management) Eligibility for insurance. At
the end results for aim usage in aquaculture from the aspect of law has
many advantages, aquaculture process control and artificial intelligence
systems are:
increased process efficiency;
reduced energy and water losses;
reduced labor costs;
reduced stress and disease;
improved accounting; and
improved understanding of the process.
Solution for liability and insurance problems.
4. RESULTS
Under the consideration of legal arrangements liability and
insurance issues on aim usage may be used for periodical examination of
aquaculture so that the problems from the aspect of obligation and
insurance law may be solved. According to insurance law Art. 13 of the
Insurance Code 5684 is about public social welfare [13]. Compulsory
insurance; This the main pillar of our offer is ARTICLE 13 (1) that is
“The Council of Ministers may impose compulsory insurances where it deems
necessary for public interest. Insurance companies, without prejudice
to the provisions of Article 20, paragraph two subparagraph (b) and
paragraph three of this Law, shall not refrain from providing those
compulsory insurances which are within their fields of operation”. The
termination of public welfare may be explained mainly for the fisheries
and also consumers of the marine products so that it is about
aquaculture. From the aspect of sustainable environment and natural
resources; basic arrangements such as European Union’s regional
arrangements may be a solution for legal problems which are in parallel

141
4th International Science Symposium (September 04-06, 2019),
Kiev-Ukraine (ISS2019), 3C1PB; pp:138-141.
to international conventions and governmental laws [14 and 15]. According
to the term Public interest which is stated on Art. 13 new legislation
may be stated on goods insurance law; because the liability may
investigate via underwater robotics.
5. CONCLUSION
According to that observations (made by ai) new arrangements on
insurance code for goods may be realized. In relation to new insurance
system insurance security and obligations problems may be solved.
REFERENCES
[1] Antonelli, G., Fossen, T.F., and Yoerger, D.R., (2016). Modelling and Control of Underwater Robots. In: Siciliano B.,
Khatib, O. (eds) Springer Handbook of Robotics. Springer
Handbooks, Springer, Cham.
[2] Hickling, C.F., (1974). Recommendations for, Constructions and Management of Brackishwater Aquacuiture Ponds in Areas with Acid
Sulfate Soils. FAO, Fisheries Circular. No:658, pp:243-260.
[3] Antonelli, G., (2014). Underwater Robots. Motion and Force Control of Vehicle-Manuplator Systems, Springer Tracts in
Advanced Robotics. 3rd Edition. Springer, Berlin, Heidelberg.
[4] Lin, S.Y., (1968). J.C.R.R. Fisheries Series: Number 6, 4. http://www.fao.org/3/ag158e/AG158E02.htm (Erişim 30.9.2019).
[5] Elliot, D., (2004). Energy Efficiency and Renewables. Energy & Environment, 15:6.1099-1105.
[6] Yokuş Sevük, H., (2017). Çevre Hukuku (Environmental Law), 2. Baskı, Avrupa İnsan Hakları Mahkemesi Kararları. Ankara, Adalet
Yayınevi.
[7] Anonymous. Robotics. https://spectrum.ieee.org/robotics/robotics-software/inspiredby-
nature-autonomous-underwater-robotics
http://assets.wwf.org.uk/downloads/fisheriesmanagement2.pdf(30.3
.2019)
[8] Anonymous.Underwaterrobotics. https://www.researchgate.net/public
ation/227168671_Underwater_Robotics Anonymous. Food Farming
Fisheries. https://ec.europa.eu/info/food-farming-fisheries_en
(Erişim 30.9.2019).
[9] FAO Report http://www.fao.org/3/y3427e/y3427e03.htm (Erişim
30.9.2019).
[10] Oğuzman, M.K. ve Öz, T., (2015). Borçlar Hukuku Genel Hükümler Cilt 1. 13. Baskı, s.80.
[11] Anonymous. FAO Report. http://www.fao.org/3/a1455e/a1455e02.pdf (Erişim 30.9.2019)
[12] Topaloğlu, M. ve Dinç, M. (2018), Sigorta Davaları, Seçkin Yay., s:52-63.
[13] Armağan, Ö. and Perçin, F., (2018). Legal Situation of the Usage of Underwater Robots. ISS2018. 3rd International Science
Symposium. Science Festival: New Horizons in Science. Eds: NWSA
Academic Journals. 05-08 September 2018. Pristine-Kosovo,
Proceeding Book. pp:313-316.
[14] Perçin, F., Akyol, O., Davas, A., and Saygı, H., (2012). Occupational health of Turkish Aegean Small-Scale Fishermen.
Occupational Medicine, 62:148-151.
[15] Perçin, F., (2017). Accidents and Diseases of Fishermen in İzmir Province. In: Fisheries of İzmir Province. Kınacigil, T.,
Tosunoğlu, Z., Çaklı, Ş., Bey, E., Öztürk, H., Eds., pp:179-187.
(ISBN: 978-975-18-0222-4) İzmir Büyükşehir Belediyesi Konak
İzmir (in Turkish).

4th International Science Symposium Status: Proceeding Book
ISS2019 (September 4-6, 2019) ID : 2019.5A1PB
Nuri Başusta
Asiye Başusta,
Fırat University, Elazığ-Turkey
[email protected]; [email protected]
Elif Özgür Özbek
Turkish Marine Research Foundation (TUDAV), Istanbul-Turkey
THE FIRST DATA ON AGE AND GROWTH OF THE GIANT DEVIL RAY
(Mobula mobular (Bonnaterre, 1788)) FROM THE MEDITERRANEAN SEA
ABSTRACT
Herein, we report the first data estimated age and back-
calculation growth at age from sectioned vertebrae readings of a giant
devil ray, Mobula mobular, from the Antalya Bay within the
Mediterranean Sea. The single male specimen measured 335cm in total
length (TL), 272cm in disc with (DW) and 105kg in weight, and was aged
to 9 years old. Age estimated from vertebral band counts resulted in
an Index of Average Percent Error (IAPE) of 2.31%, suggesting that
this method represents an accurate approach to the age assessment of
M. mobular. The von Bertalanffy growth parameters were estimated as
L∞=587.24cm, k=0.058 year-1 for this species.
Keywords: Giant devil ray, Mobula mobular, Age,
Back Calculation, Northeastern Mediterranean
1. INTRODUCTION Age information is one of the most important variables for
estimating a population’s status and assessing the risks associated
with its exploitation as it forms the basis for the calculations of
growth rate, mortality rate and productivity (Cailliet and Goldman,
2004). Unfortunately, age determination and growth characteristics are
lacking for most cartilaginous species within the Eastern
Mediterranean Sea. Giant devil ray, Mobula mobular (Bonnaterre, 1788)
is very large semipelagic fish that often swims near the surface but
also descends to the substrate. They feed on zooplankton with help of
two cephalic flaps that extent anteriorly and resembles horns. M.
mobular is distributed Eastern Atlantic from England to Senegal,
including the Mediterranean [2]. There is no more biological data for
M. mobular except a few records [3 and 4] from the Northeastern
Mediterranean.
2. RESEARCH SIGNIFICANCE This study report the first data estimated age and back-
calculation growth at age from sectioned vertebrae readings of a giant
devil ray, Mobula mobular, from Antalya Bay, Mediterranean.
3. MATERIALS AND METHODS A total of thirty M. mobular specimens were captured
accidentally by a commercial purse seiner at a depth of approximately
25m off the Beşadalar, Antalya, Bay) Turkish coast of Mediterranean on
10 March 2017 (Figure 1) and one of them was transported on ice to
the laboratory, Faculty of Fisheries, Fırat University. Male specimen
was measured total length and disc width to the nearest 1cm, body mass
(W) was weighted to the nearest 1kg and the sex was determined by
presence of the claspers.

143
4th International Science Symposium (September 04-06, 2019),
Kiev-Ukraine (ISS2019), 5A1PB; pp:142-145.
Figure 1. Fishing area, Antalya Bay (The open circle), Coast of
Turkish Mediterranean
A block of 15 centra were taken from end of the tail. Sagittal
sections (0.6mm thick) were taken using a Ray Tech gam saw for centra
[5]. Sections were mounted on microscope slides using Crystal bond
adhesive. All centra were examined and measured under a Leica S8APO
brand microscope using Leica Application Suit software (Version 4.8)
(Figure 2).
Figure 2. Longitudinal cross-section of vertebral centrum from a
male Mobula mobular (Disc width=272.0cm) which was estimated to be 9
years old
In male Disc Width (DW) at previous ages were back calculated
from centra measurements using the linear-modified Dahl-Lea method:
DWi=DWc[(a + bCRi)/(a + bCRc)]
Where ‘a’ and ‘b’ are the linear fit parameter estimates, DWi is
the length at ring, DWc is length at capture, CRc=centrum radius at
capture and CRi=centrum radius at ring ‘i’ [6].
The von Bertalanffy [7] growth model (VBGM) is described as:
DW=DW∞ * (1 - exp(-K*(t-t0)))
Where, DWt is the expected length at age t years, DW is the
asymptotic average maximum length, K is the growth coefficient, and t0
is the theoretical age at zero length.
The Index of Average Percent Error (IAPE) which is described by
Beamish and Fournier [8] was used for the count reproducibility.

144
4th International Science Symposium (September 04-06, 2019),
Kiev-Ukraine (ISS2019), 5A1PB; pp:142-145.
4. RESULTS AND DISCUSSION The single male specimen was measured 335cm in total length
(TL), 272cm in disc width (DW) and weighed 105kg, and estimated age to
9 years old. The ranges of DW and W for this species reported in a
recent investigation in Gaza (Palestinian waters) were 173–320cm and
25-295kg [4]. Measured disc width values were given in Table 1.
Table 1. Back calculation disc width values
1 2 3 4 5 6 7 8 9 10 11 12 13 14 15 Mean
DW(cm)
272.00
272.00
272.00
272.00
272.00
272.00
272.00
272.00
272.00
272.00
272.00
272.00
272.00
272.00
272.00
S0 0.50 0.50 0.50 0.50 0.50 0.50 0.50 0.50 0.50 0.50 0.50 0.50 0.50 0.50 0.50 53.83
S1 0.91 0.91 0.91 0.91 0.91 0.91 0.91 0.91 0.91 0.91 0.91 0.91 0.91 0.91 0.91 98.06
S2 1.09 1.09 1.09 1.09 1.09 1.09 1.09 1.09 1.09 1.09 1.09 1.09 1.09 1.09 1.09 17.43
S3 1.27 1.27 1.27 1.27 1.27 1.27 1.27 1.27 1.27 1.27 1.27 1.27 1.27 1.27 1.27 136.80
S4 1.49 1.49 1.49 1.49 1.49 1.49 1.49 1.49 1.49 1.49 1.49 1.49 1.49 1.49 1.49 159.84
S5 1.69 1.69 1.69 1.69 1.69 1.69 1.69 1.69 1.69 1.69 1.69 1.69 1.69 1.69 1.69 181.58
S6 1.90 1.90 1.90 1.90 1.90 1.90 1.90 1.90 1.90 1.90 1.90 1.90 1.90 1.90 1.90 204.61
S7 2.10 2.10 2.10 2.10 2.10 2.10 2.10 2.10 2.10 2.10 2.10 2.10 2.10 2.10 2.10 226.14
S8 2.30 2.30 2.30 2.30 2.30 2.30 2.30 2.30 2.30 2.30 2.30 2.30 2.30 2.30 2.30 247.67
S9 2.54 2.54 2.54 2.48 2.54 2.54 2.54 2.54 2.50 2.49 2.54 2.54 2.54 2.54 2.54 272.00
Figure 3. Age-disc width growth curves for male Mobula mobular from
Antalya Bay
Age estimated from vertebral band counts resulted in an Index of
Average Percent Error (IAPE) of 2.31%, suggesting that this method
represents an accurate approach to the age assessment of M. mobular.
The von Bertalanffy growth parameters were estimated as DW∞=587.24cm,
K=0.058 year-1 for this species and age-disc width growth curves were
showed in Figure 3. Research on M. mobular is very scarce and more
studies should be done to understand their biology, abundance,
distribution, and also reproduction and nursery areas should be
identified throughout the Mediterranean Sea.
REFERENCES
[1] Cailliet, G.M. and Goldman, K.J., (2004). Age Determination and Validation in Chondrichthyan Fishes. In “The Biology of Sharks
and Their Relatives”. (Eds J. Carrier, J.A. Musick and M.
Heithaus.) pp:399–447. (CRC Press: Boca Raton, FL, USA).
0
50
100
150
200
250
300
0 2 4 6 8 10
Disc Width
(cm)
Age (years)

145
4th International Science Symposium (September 04-06, 2019),
Kiev-Ukraine (ISS2019), 5A1PB; pp:142-145.
[2] Golani, D., Öztürk, B., and Başusta, N., (2006). Fishes of the Eastern Mediterranean. Turkish Marine Research Foundation.
Publication number 24. 266 pp.
[3] Başusta, N. and Özbek, E.Ö., (2017). New Record of Giant Devil Ray, Mobula mobular (Bonnaterre, 1788) from the Gulf of Antalya
(Eastern Mediterranean Sea). J. Black Sea/Mediterranean
Environment, 23(2):162-169.
[4] Abudaya, M.A., Ulman, A., Salah, J., Fernando, D., Wor, C., and Notarbartolo di Sciara, G., (2017). Speak of the Devil Ray
(Mobula mobular) Fishery in Gaza. Rev Fish Biol Fisheries, 1-11.
[5] Başusta, N. and Sulikowski, J.A., (2012). The Oldest Estimated Age for Roughtail Stingray (Dasyatis centroura; Mitchill, 1815)
from the Mediterranean Sea. Journal of Applied Ichthyology,
28:641-642. doi:10.1111/j.1439-0426.2012.01940.x
[6] Sulikowski, J.A., Irvine, S.B., De Valerio, K.C., and Carlson, J.K. (2009). Age Growth and Maturity of the Roundel Skate, Raja
Texana, from the Gulf of Mexico, USA. Marine and Freshwater
Research 58, 41–53.
[7] Von Bertalanffy, L., (1938) A Quantitative Theory of Organic Growth (Inquiries on Growth Laws II). Human Biology, 10, 181–
213.
[8] Beamish, R.J. and Fournier, D.A., (1981). A Method for Comparing the Precision of a set of Age Determinations. Canadian Journal
of Fisheries and Aquatic Sciences, 38, 982–983.
https://doi.org/10.1139/f81-132

4th International Science Symposium Status: Proceeding Book
ISS2019 (September 4-6, 2019) ID : 2019.5A2PB
Fatih Perçin
Ege University, [email protected], İzmir-Turkey
HEALTH AND SAFETY OBSERVATIONS IN WORKING ENVIRONMENT OF FISHING PORTS
ABSTRACT
Working area and working environment in fishing ports is risky
area for occupational health and safety studies in fisheries. Especially
different fish boats, vehicles, yachts, and vessels are anchorage so
that, some dangerous factors are arising, and sometimes serious accidents
can be made in fishing ports. In the study, three different fishing
ports are examined in İzmir and Aydın City. According to the occupational
safety rules, principle dangerous areas and movements of employee could
be observed and recorded. Hence, main important risks are indicated as
follows: Risks of indoor working areas, ergonomic risk factors for
employee, working at height altitude and their risks, dust and leakage
risks due to load or environmental conditions, environmental pollutions
caused by different vessels, health condition and awareness of hygiene,
noise and exhaust fumes, deficiency of using personal protective
equipment, flammable and explosive materials, fire and lacks of
extinguishing systems. Thus, protective solutions and recommendations
for prevention against hazards and accidents areas could be given
Keywords Fishing Port, Risk, Observation, Health, Safety
1. INTRODUCTION
Fisheries activity in Turkey is an important and risky area for
occupational health and safety like and other developing countries [1,
2, and 3]. In addition, fishing activity, and working on board, and
fisheries vessels are dangerous areas which have environmental risks
from the natural and heavy air and extreme region, sea conditions,
hardworking, night shift, and working day and night, humidity [4, 5, and
6]. Thus, fishing vessels need a sheltering harbour and necessity port
protected against bad weather conditions. Moreover, they are also need
for land logistics and repairmen on fishing boats [4 and 6]. Thus, the
areas of fishing ports are given many opportunity and help to fishermen.
On the other hand, these harbours are an economic zone for fishing
wholesale and etc. Generally, different vessels have anchorage in fishing
ports such as purse-seine, trawl, small-scale fishing boats, and yachts
[3, 7, 8, and 9]. By the way, for technic, industrial, mechanic, machine
and other operations, fishing ports are the main important place.
However, there is a need for infrastructure and redevelop in fishing
ports and protection measures should be focussed. For example,
environmental pollution, fire extinguishing system and waste water
facilities, machinery and equipment storage areas etc. [7, 9, 10, 11,
and 12]. Hence, in Turkey, it needs start to examine and observation in
fishing ports for working environment, dangerous activity or wrong using
machines and areas by fishermen.
2. RESEARCH SIGNIFICANCE
In this study, it could be observed and determined fishing ports
for working environment, occupational safety, health style, dangerous
and unsafety places, wrong using movements and activity, hygienic and
cleanse rules. Limited research is finding on safety working in fishing

147
4th International Science Symposium (September 04-06, 2019),
Kiev-Ukraine (ISS2019), 5A2PB; pp:146-149.
ports, in Turkey. Thus, the study is important for future research and
may constitute a basic knowledge’s.
3. EXPERIMENTAL METHODS
Industrial fishing ports were observed and prepared a survey in
the study. In addition, three different ports located in İzmir and Aydın
province were observed and determined primarily in the field. In the
research, two fishing ports were selected from İzmir region and one
fishing port was selected from Aydın region and the places shown in
Figure 1 [13].
Figure 1. Working areas of fishing ports in İzmir and Aydın province
In the observations made at the fishing port area, hazards in the
study area, dangerous or wrong activities, environmental order and
cleanliness were examined. Afterwards, frequent dangerous movements,
faults, irregularities and cleaning conditions are classified and made
a surveyed. According to the preliminary information, observations were
made twice a month in fishing ports in a period of six months. During
the observation, principle dangerous areas and activities of employee
were recorded. After that, all data obtained coded and converted into
numerical data. Then, statistical evaluations, Excel 17.0 statistic
program, were made on numerical data. All results are given as frequently
higher statistics to lower.
4. RESULTS
According to the results on occupational safety and health, the
main dangerous areas and movements of employee in three fishing ports
could be observed and recorded in surveyed as follows;
Risks of indoor working areas,
Ergonomic risk factors for employee,
Working at height altitude and their risks,
Dust and leakage risks due to load or environmental conditions,
Environmental pollutions caused by different vessels,
Health condition and awareness of hygiene,

148
4th International Science Symposium (September 04-06, 2019),
Kiev-Ukraine (ISS2019), 5A2PB; pp:146-149.
Noise and exhaust fumes,
Deficiency of using personal protective equipment (PPE),
Flammable and explosive materials,
Fire and lacks of extinguishing systems
In fishing ports, it could be determined these risk factors and
the problems identified as priority and high incidence as a result of
observations and survey studies are classified below (Table 1).
Table 1. Main important problems and risk factors in three fishing
ports classified as a frequency (%)
Frequency Problems Incidence (%)
1 Environmental Pollution 91.66
2 Health awareness and hygiene 91.66
3 Deficiency of using PPE 83.33
4 Ergonomic risk factors 83.33
5 Fire, lacks of extinguishing systems 75.00
6 Flammable, explosive materials 75.00
7 Working at height altitude 66.6
8 Indoor Working area 58.33
9 Dust and leakage risks 58.33
10 Noise and exhaust fume 50.00
In the research, as a result of Elmeri working environment
surveillance observations and surveys, the highest frequency of the
problems in three fishing ports are environmental pollution effects and
health awareness and hygiene of employee such as fishermen. The following
problems are deficiency of Personal Protective Equipment and ergonomic
risk factors. The lowest frequency of risks is indoor working area, dust
and leakage risks, noise and exhaust fumes. Some of the researchers
indicated that many of the fishing ports can affect from pollution,
hygienic areas, health awareness and protection of employees, ergonomic
risk factors, chemical flammable or toxicological substances, lack of
infrastructure such as fire and extinguishing systems. On the other
hand, other visitors, such as yachts in fishing ports, are also sometimes
problematic because of anchorage [2, 4, 5, 9, and 11].
5. CONCLUSION
In this study, important occupational health and safety problems
and risk factors in fishing ports have been put forward. In addition,
working conditions, risky behaviors and dangerous environments of
fishermen working in fishing ports were studied. As a result, in addition
to officials and authorities at fishing ports, stakeholders and fishermen
who use these areas should be informed, training should be provided and
awareness and maturation should be established in the field of
occupational health and safety [14, 15, and 16].
REFERENCES
[1] Mert, B. ve Ercan, P., (2014). Su Ürünleri Sektöründe İş Sağlığı ve Güvenliği Uygulamalarının Değerlendirilmesi. Türk Bilim
Araştırma Vakfı, 7(4):16-27 (in Turkish).
[2] Perçin, F., (2018a). Working Environmental Risks in a Fishing Port: An İzmir City Sample. Ziraat Mühendisliği, 366:28-38. DOI:
10.33724/zm.505580.
[3] ILO, (2003). Global Strategy on Occupational Safety and Health, Conclusions Adopted by the International Labour Conference at
Its 91st, Session, pp:3-4.

149
4th International Science Symposium (September 04-06, 2019),
Kiev-Ukraine (ISS2019), 5A2PB; pp:146-149.
[4] Perçin, F., Akyol, O., Davas, A., and Saygı, H., (2012). Occupational Health of Turkish Aegean Small Scale Fishermen.
Occupational Medicine, 62:148-151. doi: 10.1093/occmed/kqr181.
[5] EL-Saadawy, M.E., Soliman, N.E., El-Tayeb, I.M., and Hammouda, M.A., (2014). Some Occupational Health Hazards among Fishermen
in Alexandria City. Gaziantep Medical Journal, 20(1):71-78. DOI:
10.5455/GMJ-30-44689.
[6] Ulukan, U., (2016). Balıklar, Tekneler ve Tayfalar: Türkiye’de Balıkçılık Sektöründe Çalışma Ve Yaşam Koşulları. Çalışma ve
Toplum Dergisi, 2016(1):115-141 (in Turkish).
[7] Tokaç, A., Ünal, V., Tosunoğlu, Z., Akyol, O., Özbilgin, H., and Gökçe, G., (2010). Ege Denizi Balıkçılığı. IMEAK Deniz Ticaret
Odası İzmir Şubesi Yayınları, İzmir 138-143s (in Turkish).
[8] Moreau, D.T.R. and Neis, B., (2009). Occupational Health and Safety Hazards in Atlantic Canadian Aquaculture: Laying the
Groundwork for Prevention. Marine Policy, 33(2):401-411.
[9] Perçin, F., (2017). Accidents and Diseases of Fishermen in İzmir Province. In: Fisheries of İzmir Province. Kınacigil, T.,
Tosunoğlu, Z., Çaklı, Ş., Bey, E., Öztürk, H., Eds., pp:179-187.
(ISBN: 978-975-18-0222-4) İzmir Büyükşehir Belediyesi Konakİzmir
(in Turkish).
[10] Akyol, O., Ceyhan, T., and İçlik, M.A., (2016). A Preliminary Study on Occupational Health and Accidents in İzmir Fish Market
Workers (in Turkish with English abstract). Ege Journal of
Fisheries and Aquatic Sciences, 33(2):109-112.
doi: 10.12714/egejfas.2016.33.2.03 (in Turkish).
[11] Köken, S., Ceyhan, T., and Tosunoğlu, Z., (2019). Evaluation of the Lagoon Fishery on Occupational Health and Safety. Ege
Journal of Fisheries and Aquatic Sciences, 36(2):171-179.
DOI: 10.12714/egejfas.2019.36.2.09 (in Turkish).
[12] Myers, M.L. and Durborow, R.M., (2012). Aquacultural Safety and Health. In Health and Environment in Aquaculture. InTech.
pp:385-400.
[13] Myers, M.L., (2010). Review of Occupational Hazards Associated with Aquaculture. Journal of Agromedicine. Vol:15, pp:412-426.
[14] Map of Aegean Sea. https:// commons.wikimedia.org/wiki/file: Aegean Sea map bathymetry (06.10.2019).
[15] Perçin, F. and Haydan, E., (2017). Maturation Pyramid of Occupational Health and Safety. Engineering Sciences, 12(4):262-
270. DOI: 10.12739/NWSA.2017.12.4.1A0393.
[16] Perçin, F., (2018b). Job Safety and Accidents in Marine Fish Farms (Sea Bream/Sea Bass) in İzmir/ Turkey. Qualitative
Studies, 13:30-32. DOI: 10.12739/ NWSA.2018.13.4.E0038.

4th International Science Symposium Status: Proceeding Book
ISS2019 (September 4-6, 2019) ID : 2019.5A3PB
Fatih Perçin
Okan Akyol
Ege University, İzmir-Turkey
[email protected]; [email protected]
OCCURRENCE OF THE CUCKOO WRASSE, Labrus mixtus Linnaeus, 1758
(Osteichthyes: Labridae), FROM THE NORTHERN AEGEAN SEA, TURKEY
ABSTRACT
Two specimens of the cuckoo wrasse, Labrus mixtus was caught by
hand line from the coast of Çanakkale at a depth of 15m on 25 April
2010. Moreover, these specimens were both large-sized adults, and a
male and a female. Since then, we never have seen the species again.
These captures confirm the occurrence of the species in the area
although locally it is considered to be very rare. This ichthyologic
note presents a new occurrence of rare L. mixtus on the ichthyofaunal
richness of the Turkish Aegean Sea.
Keywords: Rare Species, Measurement, Çanakkale, Aegean Sea,
Labrus mixtus Linnaeus
1. INTRODUCTION
Labridae is the most diverse family with more than 500 species
in all tropical and temperate regions, and Golani, et al., (2006),
indicated that, 23 in the Mediterranean and 10 of them in the eastern
basin, of which one is a Lessepsian migrant, Pteragogus pelycus [1].
Labrus mixtus inhabits littoral rocky habitats down to mainly 40-80m
(depth range 2-200m). It feeds on invertebrates, crustaceans, small
fish and worms. It lives in territory, solitary or in pairs often with
several young. Maximal size is to 40cm SL (usually 25-30cm). Very
pronounced sexual dimorphism and probably protogeny hermaphrodite. In
the spawning season build a nest of seaweed and algae. Females lay
about 1000 eggs in a nest of algae; the nest is guarded by the male.
Reproduction in western Mediterranean is between March and June.
Distribution is Atlanto-Mediterranean from Norway to Senegal, Azores
and Madeira. Common in Cyprus caught in trammel nets. Absent from
Israel and the southeast Levant [1, 2, and 3]. Although, L. mixtus
distributes in the Sea of Marmara, Aegean Sea and Turkish
Mediterranean Sea by the Bilecenoğlu et al., (2002), it is a rare fish
[4 and 5]. Moreover, Fricke et al. (2007) reported that the L.
mixtus, significant decline was endangered fish in Turkey and it was
sensitive to human activities [5].
2. RESEARCH SIGNIFICANCE
In this paper, it could report on the occurrence of uncommon
Labrus mixtus as an incidental catch from hand line fishery in
shoreline of Çanakkale, northern Aegean Sea of Turkey.
3. EXPERIMENTAL METHODS
On 25 April 2010, a 268mm SL male and a 257mm SL female
specimens of L. mixtus (Figure 1) were captured by a hand line from
the coast of Çanakkale (3950’N-2608’E; Figure 2) at a depth of 15m.
The specimen was fixed in 4% formaldehyde solution and deposited in

151
4th International Science Symposium (September 04-06, 2019),
Kiev-Ukraine (ISS2019), 5A3PB; pp:150-153.
the fish collection of Ege University, Fisheries Faculty (ESFM-
PIS/2010-002).
Figure 1. Labrus mixtus, caught from coast of northern Aegean Sea,
257mm SL in female (upper), 268mm SL in male (below) (Photo: O. Akyol)
Figure 2. The sampling location of Labrus mixtus
4. RESULT
Morphometric measurements, ratios and meristic counts of Labrus
mixtus were indicated in Table 1. All measurements, counts, and color
patterns determined are in accordance with description of Quignard and
Pras (1986), Golani et al. (2006) and Froese and Pauly (2019) [1, 2,
and 3].

152
4th International Science Symposium (September 04-06, 2019),
Kiev-Ukraine (ISS2019), 5A3PB; pp:150-153.
Table 1. Morphometric measurements, ratios and meristic counts of
Labrus mixtus, captured from Çanakkale, Aegean Sea
Specimens Male Female
Measurements Size(mm) Proportion %TL Size(mm) Proportion %TL
Total Length (TL) 307 290
Standard Length (SL) 268 87.3 257 88.6
Pre-dorsal Fin Length 94 9.4 94 32.4
Pre-anal Fin Length 169 55.0 163 56.2
Inter Orbitary Length 23 7.5 22 7.6
Maximum Body Depth 70 22.8 64 22.1
Head Length (HL) 68 22.1 64 22.1
Eye Diameter 15 4.9 15 5.2
Iris Diameter 8 2.6 8 2.8
Preorbitary Length 35 11.4 38 13.1
Meristic Counts
Dorsal Fin Rays XVII+14 XVII+14
Anal Fin Rays III+11 III+11
Pectoral Fin Rays 15 15
Ventral Fin Rays I+5 I+5
In the Aegean Sea, Geldiay (1969) mentioned the L. mixtus (as L.
bimaculatus) in İzmir Bay, NE Aegean Sea only by name, but no solid
details [6]. Afterwards, Ulutük (1987) recorded first time from the
Gökçeada Island. Karakulak et al. (2006) also reported a specimen of
L. mixtus (266mm TL) from Gökçeada Island, northern Aegean Sea [7 and
8]. Recently, Rafrafı-Nouira et al. (2012) recorded two specimens of
L. mixtus from off the coast of Ras Jebel, a city located in northern
Tunisia [9]. Matić-Skoko et al. (2013) collected many of L. mixtus,
caught with hand line and trammel net in the eastern central Adriatic,
Vis Archipelago from 30 to 65 m depths [10].
5. CONCLUSION
In conclusion, the occurrence of L. mixtus in Çanakkale coasts
is not unexpected due to the previous records of the species from the
Gökçeada Islands, northern Aegean Sea. However, these records reveal
the rarity of L. mixtus in both the Aegean Sea and the Mediterranean.
REFERENCES
[1] Golani, D., Öztürk, B., and Başusta, N., (2006). Fishes of the
Eastern Mediterranean. Turkish Marine Research Foundation.
Publication No:24, Istanbul, Turkey, 259p.
[2] Quignard, J.P. and Pras, A., (1986). Labridae. In: Fishes of the
North-eastern Atlantic and the Mediterranean. P.J.P. Whitehead
et al., (Eds). Vol III., Paris, UNESCO, pp:919-942.
[3] Froese, R. and Pauly, D., (2019). Fishbase. Worldwide Web
Electronic Publication, Version (04/2019). Available at
www.fishbase.org. (Accessed date: 01.08.2019).
[4] Bilecenoglu, M., Taskavak, E., Mater, S., and Kaya, M., (2002).
Checklist of the Marine Fishes of Turkey. Zootaxa, 113:1-194.
[5] Fricke, R., Bilecenoglu, M., and Sarı, H.M., (200)7. Annotated
Checklist of Fish and Lamprey Species (Gnathostomata and
Petromyzontomorphi) of Turkey, Including a Red List of
Threatened and Declining Species. Stuttgarter Beitr. Naturk.
Serie A (Biologie), Nr. 706, Stuttgart, 10.IV., 169 p.
[6] Geldiay, R., (1969). Important Fishes Found in the Bay of Izmir
and Their Possible Invasions. Monogr. Fac. Sci., Ege Univ., 11,
1-135 [in Turkish].
[7] Ulutürk, T., (1987). Fish Fauna, Back-gound Radioactivity of the
Gökçeada Marine Enviroment. Istanbul University Journal of
Fisheries and Aquatic Sciences, 1(1):95-119. [in Turkish].

153
4th International Science Symposium (September 04-06, 2019),
Kiev-Ukraine (ISS2019), 5A3PB; pp:150-153.
[8] Karakulak, F.S., Erk, H., and Bilgin, B., (2006). Length–weight
Relationships for 47 Coastal Fish Species from the Northern
Aegean Sea, Turkey. J. Appl. Ichthyol. 22:274–278.
[9] Rafrafi-Nouira, S., Boumaïza, M., Reynaud, C., and Capapé, C.,
(2012). Confirmed occurrence of Cuckoo wrasse Labrus mixtus
(Osteichthyes: Labridae) in Tunisian Waters (Central
Mediterranean). ANNALES · Ser. hist. nat. 22(2):115-120.
[10] Matić-Skoko, S., Bojanić Varezić, D., Šiljić, J., Tutman, P., and Pallaoro, A., (2013). The cuckoo wrasse, Labrus mixtus
(Pisces: Labridae): Biological Indices For Life History and
Conservation. Scientia Marina, 77(4):595-605.

4th International Science Symposium Status: Proceeding Book
ISS2019 (September 4-6, 2019) ID : 2019.5A4PB
Ebru Ifakat Ozcan
Munzur University, [email protected], Tunceli, Turkey
Nuri Başusta
Firat University, [email protected], Elazığ, Turkey
MATURITY LENGTH AND AGE, REPRODUCTIVE CYCLE, HEPATOSOMATIC INDEX,
GONADOSOMATIC INDEX AND CONDITION FACTOR OF THE LESSER SPOTTED
DOGFISH, Scyliorhinus canicula (Linnaeus, 1758) FROM NORTHEASTERN
MEDITERRANEAN
ABSTRACT
In this study, maturity length and age, reproductive cycle,
hepatosomatic index, gonadosomatic index and condition factor of
Scyliorhinus canicula was determined the Northeastern Mediterranean.
Sexual maturity length (L50) and age of S. canicula was found to be
36.48cm for females and 36.90cm for males and 4 age group for both sexes.
The highest hepatosomatic index values for S. canicula were calculated
in July (9.463), whereas lowest in April (0.1161). The average
gonadosomatic index of S. canicula determined that lives in the
Northeastern Mediterranean reached maximum in November (8.906) for both
sexes. The highest average condition factor values were calculated in
June (0.43517), whereas lowest in March (0.28394).
Keywords: Maturity Length, Reproductive Cycle, Condition Factor,
Scyliorhinus canicula, Northeastern Mediterranean
1. INTRODUCTION
Sharks have become one of the basic components of sea life with
their evolutionary history of at least 400 million years and succeeded
to adapt into various ecological factors. Being the predator of their
habitats in general; sharks play an utterly important role in the
structure of the marine ecosystem. Scyliorhinus canicula is known with
slim body shape, blunted head, round and long nose and small dorsal
fins. The teeth are aligned on a few lines and they are numerous. The
nose is smaller than the width of the mouth. Nostrils are attached to
the mouth via canals. There are five pairs of gill slits. Both of the
dorsal fins are very small. The second dorsal fin is smaller than the
first dorsal fin. The body is light brown and is covered with many light
and dark colored spots. There are no ventral spots. It has a rough skin
that resembles a sandpaper [1]. The most important prey groups for S.
canicula were crustaceans and fishes in the Northeastern Mediterranean
[2]. Cihangir, et al., [3] studied distribution and some biological
aspects of S. canicula from the northern Aegean Sea. Ozcan and Başusta
[4] studied on the occurence of juveniles and egg capsules of S. canicula
from the Northeastern Mediterranean Sea. In addition, growth parameters
related to this species were made in the Northeastern Mediterranean [5].
S. canicula is almost never consumed in the domestic market, it has not
been hunted until recently. However, it has become commercially valuable
due to the increasing demand in foreign market in recent years. It is
very important to know the biological features of these living creatures
that are placed at the top of the food chain and have an ecological
importance for preserving and managing the stocks. In this study, it is
aimed to determine the parameters of maturity length and age,
reproductive cycle, hepatosomatic index, gonadosomatic index and

155
4th International Science Symposium (September 04-06, 2019),
Kiev-Ukraine (ISS2019), 5A4PB; pp:154-161.
condition factor of lesser spotted dogfish, S. canicula in the
Northeastern Mediterranean Sea for the first time.
2. RESEARCH SIGNIFICANCE
The International Wildlife Protection Agency reports that almost
one-third of shark species on the high seas are in danger of extinction
[6]. Experts indicate that the breed of S. canicula is at greater risk
than sharks, and that if the protection measures are not taken, the
species may disappear one day. The absence of these fishes, one of the
largest predators at the top of the marine ecosystem, can have a serious
impact on the ecosystem [7]. This study is to describe the firstly
maturity length and age, reproductive cycle, hepatosomatic index,
gonadosomatic index and condition factor of S. canicula in the North-
eastern Mediterranean.
3. MATERIALS AND METHODS
Specimens of S. canicula were collected by commercial trawl between
March 2012-May 2014 in the Northeastern Mediterranean Sea (Figure 1).
Fish samples were transported to the laboratory of Fisheries Faculty at
the Firat University. For each fish the total length (TL) was measured
0.1cm, weight was measured 0.1g and the sex was determined. The
differentation of species was made according to Golani et al. [1]. Sexual
maturity length, sexual maturity age and monthly recruitment (%) were
analyzed using FISAT II [8]. The recruitment pattern was obtained by
projecting the length-frequency data backwards on the time axis using
growth parameters [9]. Normal distribution of the recruitment pattern
was determined by NORMSEP [10] in FISAT.
Figure 1. The study area, Northeastern Mediterranean Sea
Hepatosomatic index value provides us information about the
healthy condition of fish because higher HSI value means fishes are
growing rapidly. HSI %=(Weight of the liver/Weight of the body)x100
[11].
Gonadosomatic index was determined by formula GSI %=(Weight of the
gonad/Weight of the body)x100 [12].
Condition factor was calculated with the formula CF
%=(Weight/Total lengthb)x100, b is the coefficient of allometric
of relationship [13].

156
4th International Science Symposium (September 04-06, 2019),
Kiev-Ukraine (ISS2019), 5A4PB; pp:154-161.
4. RESULTS AND DISCUSSION
Sexual maturity lengths (L50) of S. canicula calculated by the
FISAT II were 36.48cm for females and 36.90cm for males (Figure 2).
According to the sexual maturity length acquired from the FISAT II, the
sexual maturity age was determined as 4 for both sexes. Ford [14]
determined the maturity lengths of female and male as 57-60cm in the
South of Great Britain. Leloup and Olivereau [15] determined the maturity
lengths of female and male respectively as 52-60cm in the Atlantic and
38-44cm in the Mediterranean. Capape [16] stated that female reached
sexual maturity at 40-45cm and male at 40cm on the Tunisian coasts; and
both egg production and reproduction continued the all year. Capape et
al. [17] stated that female reached sexual maturity at 41-47cm and male
at 44 cm on the Mediterranean coasts in France; and males were generally
bigger than females. Henderson and Casey [18] determined that female
reached sexual maturity at 58.1cm and male at 57.5cm. Capape et al. [19]
stated that female reached sexual maturity at 36.4-47.1cm and male at
40-47.8cm in Tunisia.
Figure 2. Sexual maturity length for females (a) and males (b) of S.
canicula obtained by using FISAT II from the Northeastern
Mediterranean Sea
According to the percentage (%) values of S. canicula inhabiting
the Northeastern Mediterranean; it is estimated that recruitment into
a
b

157
4th International Science Symposium (September 04-06, 2019),
Kiev-Ukraine (ISS2019), 5A4PB; pp:154-161.
the population generally occurs in two periods annually; the first is
in April-May-June, the second one is in January-March (Table 1).
Table 1. Monthly Recruitment (%) for S. canicula obtained by using
FISAT II, from Northeastern Mediterranean Sea
Months Recruitment (%)
March-12 5.13
April-12 13.33
May-12 11.28
June-12 13.75
July-12 9.93
September-12 6.46
October-12 10.78
November-12 1.66
December-12 3.92
January-13 8.97
March-13 14.80
The highest average hepatosomatic index values for S. canicula
were calculated in July (9.463), whereas lowest in April (0.1161) (Table
2). Among the limited number of studies on hepatosomatic index values;
Jardas [20] found that 2.53-2.67, Ellis and Shackley [21] 2.72-14.09,
Türker Çakır et al. [22] 1.493-10.726 and Yarmaz [23] 1.492-10.726.
Torcu Koç and Erdoğan [24] determined that HSI values of males and
females as 4.6±0.06 and 4.0±0.03 from Bandırma Bay (The Sea of Marmara,
Turkey).
Table 2. Hepatosomatic index values by months for S. canicula (635
samples) from Northeastern Mediterranean Sea (N:sample size,
SD:standard deviation)
Months N Min Max Average SD
March-12 3 3.059 4.994 4.250 0.601
April-12 1 - - 0.1161 -
May-12 27 2.368 9.538 5.769 0.365
June-12 101 2.523 10.077 5.519 0.149
July-12 2 9.457 9.469 9.463 0.006
September-12 36 3.210 20.932 6.309 0.467
October-12 7 4.239 9.140 6.542 0.564
November-12 4 4.184 8.457 5.885 0.916
December-12 19 4.289 9.547 6.263 0.398
January-13 35 2.907 10.760 5.331 0.303
March-13 84 1.419 10.843 4.902 0.158
April-13 4 5.889 6.973 6.402 0.223
May-13 34 3.009 10.060 5.445 0.291
June-13 229 2.572 22.453 5.758 0.135
July-13 5 4.653 7.679 5.568 0.541
August-13 5 4.694 9.149 5.861 0.840
January-14 4 4.103 10.703 6.740 1.530
February-14 34 2.278 8.787 5.609 0.311
March-14 1 - - 5.618 -
The average gonadosomatic index of S. canicula determined that
lives in the Northeastern Mediterranean reached maximum in November
(8.906) (Table 3) (Figure 3). Capape et al. [17] suggest that egg
production of the same species is synchronised and reproduction activity
continues throughout the year; reaching maximum in December, January and
July. As seen in our study, S. canicula in the Mediterranean grows less
and reaches sexual maturity at a shorter length.

158
4th International Science Symposium (September 04-06, 2019),
Kiev-Ukraine (ISS2019), 5A4PB; pp:154-161.
Table 3. Gonadosomatic index values by months for S. canicula (860
samples) from Northeastern Mediterranean Sea
(N:sample size, SD:standard deviation)
Months N Min Max Average SD
March-12 3 2.306 4.230 3.046 0.598
April-12 1 - - 2.388 -
May-12 27 0.933 8.882 4.036 0.537
June-12 116 0.080 8.971 3.419 0.273
July-12 33 0.357 11.570 6.450 1.035
September-12 36 1.325 11.760 4.866 0.531
October-12 16 1.312 9.7920 5.104 0.740
November-12 19 1.375 13.954 8.906 4.520
December-12 59 0.208 11.790 5.383 0.393
January-13 90 0.568 11.110 4.858 0.254
March-13 84 0.216 14.120 4.383 0.395
April-13 65 1.204 13.510 5.571 0.389
May-13 34 2.659 13.729 6.102 7.269
June-13 229 0.188 12.788 3.465 0.168
July-13 5 3.701 10.500 6.192 1.298
August-13 5 3.602 5.561 7.101 0.449
January-14 4 5.051 7.500 5.818 0.566
February-14 34 0.059 7.476 2.670 0.441
Figure 3. Monthly GSI value for S. canicula from Northeastern
Mediterranean Sea
The highest average condition factor values for S. canicula were
calculated in June (0.43517), whereas lowest in March (0.28394) (Table
4). Yarmaz [23] found that min-max average condition factor as 0.0003-
0.000765. The condition factor (CF) of a fish reflects physical and
biological circumstances and fluctuations by interaction among feeding
conditions and physiological factors [25]. The fact that the condition
factor is high shows that the environmental conditions are quite suitable
for population dynamics studies [26]. It can be said that the
environmental conditions are not suitable for S. canicula in this region
since the condition factor value is less than 1.
0
1
2
3
4
5
6
7
8
9
10
Mar.
Apr.
May.
Jun.
Jul.
Sept.
Oct.
Nov.
Dec.
Jan.
Gonadosomatic indeks (%)
Months

159
4th International Science Symposium (September 04-06, 2019),
Kiev-Ukraine (ISS2019), 5A4PB; pp:154-161.
Table 4. Condition factor values by months for S. canicula (1150
samples) from Northeastern Mediterranean Sea (N:sample size,
SD:standard deviation)
Months N Min Max Average SD
March-12 3 0.27940 0.28237 0.28394 0.0014
April-12 3 0.25160 0.29651 0.30051 0.0248
May-12 29 0.24287 0.29038 0.33598 0.0050
June-12 124 0.22136 0.28677 0.43517 0.0028
July-12 36 0.15483 0.23135 0.34393 0.0074
September-12 37 0.22086 0.27636 0.34505 0.0047
October-12 18 0.25617 0.29430 0.34066 0.0059
November-12 21 0.24758 0.29883 0.34196 0.0053
December-12 63 0.21875 0.30795 0.41481 0.0042
January-13 94 0.25124 0.30514 0.35955 0.0025
March-13 104 0.23896 0.30073 0.36222 0.0028
April-13 70 0.19279 0.30248 0.36436 0.0030
May-13 37 0.22478 0.31721 0.38522 0.0050
June-13 372 0.19158 0.28723 0.39998 0.0010
July-13 6 0.28320 0.31480 0.36577 0.0120
August-13 8 0.29324 0.32595 0.38261 0.0100
January-14 4 0.31743 0.33349 0.34747 0.0060
February-14 87 0.21660 0.27262 0.39309 0.0030
March-14 2 0.33743 0.35042 0.36341 0.0120
May-14 32 0.21496 0.28736 0.36495 0.0060
5. CONCLUSION
As a consequence; since S. canicula grows later and has a longer
reproduction period, it is required to prevent possible negativities in
the stock. Sustainable hunting of this species could be provided with
the help of selective hunting, which would decrease the ratio of hunting
them as off-target.
ACKNOWLEDGEMENT
Meltem Manaşırlı and Salih Ilhan for helping to prepare FISAT-II
programme. A part of this work was supported by Scientific Research
Projects Coordination Unit of Firat University. (Project Number: FUBAP
SUF.12.02).
REFERENCES
[1] Golani, D., Öztürk, B., and Başusta, N., (2006). Fishes of the
Eastern Mediterranean. Turkish Marine Research Foundation.
Publication Number 24. 266 pp.
[2] Ozcan, E.I. and Başusta, N., (2015). Stomach Contents of the
Lesser Spotted Dogfish, (Scyliorhinus canicula (Linnaeus, 1758))
Inhabiting Northeastern Mediterranean. Ege Journal of Fish
Aquatic Science, 32(4):193-195.
[3] Cihangir, B., Unluoglu, A., and Tiraşin, E.M., (1997).
Distribution and Some Biological Aspects of the Lesser Spotted
Dogfish (Chondrichthyes, Scyliorhinus canicula, Linnaeus, 1758)
from the Northern Aegean Sea. Mediterranean Fisheries Congress,
9-11 Nisan İzmir, Turkey, pp. 585-603.
[4] Ozcan, E.I. and Başusta, N., (2016). On the Occurence of
Juveniles and Egg Capsules of Scyliorhinus Canicula from the
Northeastern Mediterranean Sea. Ecological Life Sciences
11(4):28-32.
[5] Ozcan, E.I. and Başusta, N., (2018). Some Population Parameters
of Scyliorhinus canicula (Linnaeus, 1758) from the Northeastern
Mediterranean Sea. J. Black Sea/Mediterranean Environment,
24(1):51-64.

160
4th International Science Symposium (September 04-06, 2019),
Kiev-Ukraine (ISS2019), 5A4PB; pp:154-161.
[6] IUCN., (2010). IUCN, Red List of Threaneted Species. Version
2010. 2.
[7] IUCN., (2014). http://www.cepecevre.com/?p=1. Köpekbalıkları
Tükenme Tehlikesi Altında.
[8] Gayanilo, F.C., Sparre, P., and Pauly, D., (1996). The FAO-
ICLARM Stock Assessment Tools (FiSAT) Users Guide. FAO
Computerized Information Series (Fisheries). FAO, Rome. 126 pp.
[9] Moreau, J. and Cuende, F.X., (1991). On Improving the Resolution
of the Recruitment Patterns of Fishes. ICLARM Fishbyte 9, 45–46.
[10] Pauly, D. and Caddy, J.F., (1985). A Modification of Bhattacharya’s Method for the Analysis of Mixtures of Normal
Distributions. FAO, Rome, FAO Fish. Cir. 781, 16.
[11] Nunes, D.M. and Hartz, M.S., (2001). Feeding Dynamics and Ecomorphology of Oligosarcus jenynsii (Gunther, 1864) and
Oligosarcus robustus (Menezes, 1969) in the Lagoa Fortaleza.”,
Southern Brazil, Programa de Pós-Graduação em Ecologia,
Universidade Federal do Rio Grande do Sul, Brasil, Brazilian
Journal of Biology, 1-13.
[12] Lagler, K.F., (1966). Freshwater Fishery Biology. W.M.C. Brown Company, Iowa, 421 pp.
[13] Bagenal, T.B. and Tesch, F.W., (1978). Age and Growth. –In: Bagenal, T.B. (ed.) Methods of assessment of fish production in
fresh waters. Oxford Blackwell Scientific Publication, 101-136.
[14] Ford, E., (1921). A Contribution to Our Knowledge of the Life-Histories of the Dogfishes Landed at Plymouth. Journal of Marine
Biological Association of the United Kingdom, 12:468-450.
[15] Leloup, J. and Olivereau, M., (1951). Données Biométrique Comparatives sur la roussette (Scyllium canicula L.) de la
Manche et de la Méditerranée. Vie et Milieu, 2:182-209.
[16] Capape, C., (1977). Contribution à la Biologie des Scyliorhinidae des Côtes Tunisiennes I.S. canicula (Linné,
1758): Répartition Géographique et Bathymétrique, Sexualité,
Reproduction, Fécondité. Bull. Off. Natn. Pech. Tunisie, 1: 83–
101.
[17] Capape, C., Tomasini, J.A., and Bouchereau, J.L., (1991). Observations Sur la Biologie de Reproduction de la Petite
Roussette, Scyliorhinus Canicula (Linnaeus, 1758)(Pisces,
Scyliorhinidae du golfe du Lion (France
Méridionale).Ichtyophysiologica Acta, 13: 87-109.
[18] Henderson, A.C. and Casey, A., (2001). Reproduction and Growth in the Lesser-spotted Dogfish Scyliorhinus Canicula
(Elasmobranchii; Scyliorhinidae), from the West Coast of
Ireland. Cahiers de Biologie Marine, 42:397-405.
[19] Capape, C., Mnasri-Sioudi, N.O., El Kamel-Moutalibi, M., Boumaïza, M., Ben Amor, M., and Reynaud, C., (2014). Production,
Maturity, Reproductive Cycle and Fecundity of Small-spotted
catshark, Scyliorhinus canicula (Chondrichthyes:
Scyliorhinidae) from the Northern Coast of Tunisia (Central
Mediterranean). Journal of Ichthyology, January, 54(1):111-126.
[20] Jardas, I., (1979). Morphological, Biological and Ecological Characteristic of the Lesser Spotted Dogfish, Scyliorhinus
canicula ( L., 1758), population in the Adriatic Sea. Report,
IV(2-3 SPLIT): pp:104.
[21] Ellis, J.R. and Shackley, S.E., (1995). Ontogenic Changes and Sexual Dimorphisim in The Head, Mouth and Teeth of the Lesser
Spotted Dogfish. J. Fish Biol. , 47:155-164.
[22] Türker Çakır, D., Torcu Koç, H., and Erdoğan, Z., (2006). Some Biological Aspects of the Lesser Spotted Dogfish Scyliorhinus
canicula (Linnaeus, 1758) in Edremit Bay (the Northern Aegean

161
4th International Science Symposium (September 04-06, 2019),
Kiev-Ukraine (ISS2019), 5A4PB; pp:154-161.
Sea) Turkey. Turkey. Proceedings of the International Workshop
on Mediterranean Cartilaginous Fish with Emphasis on Southern
East of Mediterranean, 14-16 Oct. 06, Istanbul-Turkey: 17-27.
[23] Yarmaz, A., (2009). Some Biological Properties of Cartilaginous Fish Living in Edremit Bay and Their Vicinity. Balıkesir
University, Institute of Science, Department of Biology. Master
Thesis. (In Turkish)
[24] Torcu Koç, H. and Erdoğan, Z., (2018). Length-Weight Relationships, Reproduction, Hepatosomatic Index of The Lesser
Spotted Catshark, Scyliorhinus canicula [L.] The Sea of Marmara,
Turkey. J. BAUN Inst. Sci. Technol., 20(2):98-108
[25] Le Cren, E.D., (1951). The Length-weight Relationships and Seasonal Cycle in Gonad Weight and Condition in the Perch (Perca
fluviatilis). Journal of Animal Ecology. 20:201–219.
[26] Blackwell, B.G., Brown, M.L., and Willis, D.W., (2000). Relative Weight (Wr) Status and Current Use in Fisheries Assessment and
Management. Reviews in Fisheries Science, 28:1-44.
DOI: 10.1080/10641260091129161.

4th International Science Symposium Status: Proceeding Book
ISS2019 (September 4-6, 2019) ID : 2019.5A5PB
Müge Aliye Hekimoğlu
Fatih Perçin*
Kürşat Fırat
Fatih Güleç
Cüneyt Süzer
Şahin Saka
Osman Özden
*Ege University, [email protected], İzmir-Turkey
RESPONSE OF Humphead cichlid (Cyrtocara moorii) TO 2-Phenoxyethanol
AND CLOVE OIL AS ANESTHETIC
ABSTRACT
Cichlid species in the aquarium industry are a fish of high
commercial value, especially humphead. Anesthetics are widely used to
capture, transport, measure, weight, vaccinate, photograph, mark, and
surgical procedures and to reduce stress and possible deaths
associated with these applications. In this study, two anesthetic
agents used in aquaculture studies were selected. Trial fish were
6.77±2.5g. The doses used were 0.5, 1, 1.5ml/l for phenoxyethanol. For
clove oil 20, 30, 40ml/l doses were used. During the administration of
both anesthetics, as the dose increased during the transition to
fainting phase, the fainting time was shortened. In the sobering
phase, the opposite situation occurred; the higher the dose, the
shorter the awakening time.
Keywords: Humphead cichlid, clove oil, 2-phenoxyethanol,
Anesthetic
1. INTRODUCTION
Among the hobby types, there is an important interest in
aquarium fish. The cichlid family is one of the most interesting and
traded fish in the aquarium fish sector. Many members of this family
re able to produce in all around the world. Their colorful appearance,
the many different species available, their behavior and their
breeding are just some of the reasons the Cichlids are one of the most
popular aquarium fish. The humphead cichlid, on the males develops a
distinctive large hump on its head, particularly. Due to their
aggressive behavior, anesthetic agent is reducing stress and possible
deaths during some procedures such as capture, milking, marking,
measurement, weighing, taking photos, transporting, killing, surgical
applications of fish. Keeping the fish calm during aquaculture of
aquarium fish is a matter to be considered in terms of their health
and price. Especially, the stress caused when the transportation of
caring tanks, during its production processes the anesthesia agents
should be used in order to prevent the negative pre-emerged.
Anesthesia provides the absence of sensory functions in fish. Fish
become unable to respond to external stimuli. This depends on the
anesthesia concentration and duration of administration. After calm,
loss of mobility, balance, loss of consciousness and pain, and finally
loss of reflex movements. There are many anesthetics’ available for
aquatic animals, including MS-222, benzocaine, quinaldine, 2-
phenoxyethanol. 2-phenoxyethanol is an anesthetic agent that used
commonly in Aquaculture. Clove oil is used a natural anesthetic agent
in dentistry. In recent years, the work of calming fish with clove oil

163
4th International Science Symposium (September 04-06, 2019),
Kiev-Ukraine (ISS2019), 5A5PB; pp:162-164.
has increased. This can be due to the fact that it is a natural
substance, as well as being readily available and cheap [1, 2, and 3].
2. RESEARCH SIGNIFICANCE
In this study, two anesthetic agents used in aquaculture
research are selected and used for humphead chichlid. During the
treatment, both anesthetics, phenoxyethanol and clove oil, applicated
on humphead chichlid, and fainting phase and sobering phase, and also
fainting time and awakening time are determined.
3. EXPERIMENTAL METHODS
120 fish (6.77±2.5g) were used in trail. Before the experiment,
the fish were observed and fed in clean aquariums with daily
maintenance for 15 days. Fish were starved the day before the
experiment. The doses used were 0.5, 1, 1.5ml/ for 2-phenoxyethanol.
For clove oil 20, 30, 40ml/l doses were used. Water temperature was
measured as 22±1 C. It was used for observation Ross et al., (2008)
definition on which induction (deep anesthesia=Non-moving tilting over
one side, opercular movement is little or nothing) and recovery
(Awake=Reaching to balance except for very strong stimuli) [1].
Statistical analysis; for each treatment fishes were compared by one-
way analysis of variance (ANOVA). Induction and recovery time means
were compared with Paired sample test. The α level for statistical
analyses was set at 0.05. Statistics were performed using the SPSS 15
statistical Package.
4. RESULTS
At the end of the study, all three doses of 2-phenoxethanol
administration fainted the fish under 3 minutes. In this context, the
differences between the groups were found to be significant. In the
sobering phase, all the fish were awaked under 5 minutes. However, 5
fish died at the highest dose of 1.5ml/l (Table 1).
Table 1. Different doses of 2-phenoxiethanol effect in induction and
recovery phases of cichlid as mean time±SD
Induction (p≤0.05) Recovery (p≤0.05)
Doze(ml/l) N Mean (min.sc) Std. Dev(SD) N Mean(min.sc) Std. Dev(SD)
0.5 15 2.83 2.29 15 1.31 .86
1 15 .55 .35 15 1.71 1.47
1.5 15 .33 .16 10 4.46 1.71
In the application of clove oil, 30 and 40 ppm provided the
transition to the desired fainting stage in less than 3 minutes.
However, the difference between the groups was not significant. All
groups woke up in less than 5 minutes (Table 2). Differences between
groups were found to be statistically significant during the awakening
phase.
Table 2. Different doses of clove oil effect in induction and recovery
phases of cichlid as mean time±SD
Induction (p≤0.05) Recovery (p≤0.05)
Doze(ml/l) N Mean (min.sc) Std. Dev(SD) N Mean(min.sc) Std. Dev(SD)
20 15 4.93 5.13 15 1.25 .60
30 15 2.66 1.47 15 2.46 1.24
40 15 1.93 1.30 14 3.25 1.98
While Kaiser et al., (1998) anesthetized Goldfish (Carasius
auratus) with 4 ml/l 2-Phenoxethanol., the expected result in cichlid
was 1 ml in the lower dose [2]. According Grush et al., (2004), mean

164
4th International Science Symposium (September 04-06, 2019),
Kiev-Ukraine (ISS2019), 5A5PB; pp:162-164.
weight 0.62+0.01g Zebrafish (Danio rerio) trial resulted the best
doses were 60-100 ppm clove oil [3]. Common carp with 32.6+8.2 g has
entered the stage of deep anesthesia with 50ppm clove oil [4]. In this
study, although the cichlid fish were heavier than zebra fish, they
switched to the fainting phase at a lower clove oil dose and faster
than accepted times. Another family member Pangasius pangasius with
mean weight 9.5+2.7g showed best result at 5-10ppm clove oil. When the
fish species studied are considered, it is seen that these fishes
react differently in terms of duration and dose during the fainting
and sobering phases because they come from different families.
5. CONCLUSION
This is the first report to the knowledge regarding the use of
clove oil and 2-phenoxiethanol for Cyrtocara moorii. Even 2-
phenoxiethanol affected all doses under 5 minutes’ induction and
recovery, we suggest clove oil. It is rapidly absorbed and metabolized
after oral administration, and it is almost completely excreted in the
urine within 24 h with no apparent ill effects in fish. Because Clove
oil, containing the active ingredient eugenol, has been reported to be
an inexpensive, organic, safe and effective fish anesthetic. The
objective of the presently reported study was to establish the lowest
effective concentration of 30 ppm clove oil for the cichlid species.
REFERENCES
[1] Ross, L.G. and Ross, B., (1999). Anesthetic and Sedative
Techniques for Aquatic Animals, vol. 58, Institute of
Aquaculture, University of Stirling.
[2] Kaiser, H. and Vine, N., (1998). The effect of 2-phenoxyethanol
and transport packing density on the post-transport survival
rate and metabolic activity in the goldfsh, Carassius auratus.
Aquarium Sciences and Conservation, 2, 1-7.
[3] Grush, J., Noakes, D.L., and Moccia, R.D., (2004). The efficacy
of clove oil as an anesthetic for the zebrafish, Danio rerio
(Hamilton). Zebrafish. 1(1):46-53.
Doi:10.1089/154585404774101671.
[4] Hajek, G.J., Klyszejko, B., and Dziaman, R., (2006). The
Anesthetic Effects of Clove Oil on Common Carp, Cyprinus carpio
L. Acta Ichthyologica et Piscatoria, 36(2):93-97.

4th International Science Symposium Status: Proceeding Book
ISS2019 (September 4-6, 2019) ID : 2019.5A7PB
Harun Aydın
Kürşat Fırat
Fatih Güleç
Müge Aliye Hekimoğlu
Fatih Perçin*
Cüneyt Suzer
Şahin Saka
Osman Özden
Serhat Engin
*Ege University, [email protected], İzmir-Turkey
PRODUCTION Curly Lettuce (Lactuca sativa) WITH NILE TILAPIA
(Oreochromis niloticus) IN AQUAPONIC SYSTEMS
ABSTRACT
This study was conducted to compare two different aquaponic
systems which for used curly lettuce (Lactuca sativa) cultivation from
Nile tilapia (Oreochromis niloticus) discharged water. In this
context, gravel and raft systems were compared. At the end of the
experiment, the development of curly lettuce produced in the sale
system was relatively higher than the gravel system. As a result, it
has been determined that curly lettuce cultivation can be used easily
in closed circuit fish culture in both systems. These systems, which
are used without setting up a biological filter, have not a negative
effect on fish development and fish health. Besides, it is seen that
additional product can be obtained by providing plant growth. It is
concluded that quality of the seedlings should be paid attention to
the production of the plants and the weather conditions should be
compatible with the development conditions of the plant.
Keywords: Aquaphonic, Curly lettuce, Lattuca sativa,
Nile Tilapia, Oreochromis niloticus
1. INTRODUCTION
The pace of world population growth is increasingly important
for sustainable food production using less water and energy. Although
aquaculture is the fastest growing food production sector, intensive
production can cause significant environmental problems if not planned
properly. Closed circuit systems use 90-95% less water than
conventional breeding; however, it leaves unwanted nutrients such as
nitrogen to the environment [1]. Aquaponic production can reduce this
problem [1 and 2]. Aquaponic production; by using water efficiently,
it allows the same water to return to the plants and then to the fish.
As water is re-used, less water is drawn off from the surface or
underground for production, so areas with water scarcity can benefit
from aquaponic production to produce food [2].
2. RESEARCH SIGNIFICANCE
In the study, two different systems, gravel system and raft
system which is using in aquaculture research are determined, and the
effects of aquaponic experiments on the mentioned fish and plant were
investigated.

166
4th International Science Symposium (September 04-06, 2019),
Kiev-Ukraine (ISS2019), 5A7PB; pp:165-169.
3. EXPERIMENTAL METHODS
A total of 6 glass aquariums, a water volume of 48lt, were used
for aquaculture. In the hydroponics section, 6 foam boxes, each having
a size of 45x30x15cm and a water volume of 20 lt were used for the
plant bed. Lava stone was used as substrate in the raft and gravel
system. In closed circuit system, water circulation was with using 12
watts 6 l/min revving water engines. Led lamps (28 watt) were used for
lighting in the system. The fish were used in the experiment were
selected randomly from the Nile tilapias (48 fish; 90.5±3.90g and
17.5±0.1cm). Curly lettuce seedlings were obtained from a commercial
company. There were 8 fish in each aquarium. Fishes were placed in
aquariums with an average of 15kg/m3. The study was carried out with
three repetitions. Hydroponics part; 10 pieces of lettuce seedlings
were placed in each foam box. 1cm thick styrofoam was placed on the
water to float the pots where the plants will be placed in the raft
technique. Seedlings were placed in boxes at intervals of 10cm.
Seedlings were applied for 6 hours dark/18 hours light. The length of
the plants' root-eye (cm), number of leaves (n) and total weights (g)
were measured at the beginning and end of the experiment. At the end
of the trial, the yield per square meter was calculated in terms of
weight and also the Specific Growth Rate (SBO) was calculated. For
statistical analysis were used SPSS 15.0 (SPSS, Chicago, IL)
statistical software.
4. RESULTS
The aquarium measured daily water temperature, pH, O2, NH3, NO2,
NO3 and PO4-3 and Mg were given in Table 1. They showed no difference
between and in group (p>0.05).
Table 1. Water parameters and amount of phosphate and magnesium
detected in experimental groups (X ± sx) System (oC) pH O2(mg/lt) NH3(mg/lt) NO2(mg/lt) NO3(mg/lt) PO4−3(mg/lt) Mg(mg/lt)
Gravel 26.6±1a 8.2±0.1a 7.4±0.2a 0.6±0.4a 3.9±1.9a 22.3±19.5a 3.5±1.1a 17.8±0.4a
Raft 26.8±1a 8.2±0.1a 6.9±0.4a 0.1±0.2a 2.9±1.2a 24.7±22.8a 4.1±1.2a 17.9±0.6a
*Different letters indicate the difference between groups (p0.05
The characteristics of lettuce development during the trial are
given in Table 2.
Table 2. Developmental properties of lettuce in experimental groups
(�� ± 𝑠��) Group Characteristic Start of Trial End of Trial
Gravel
Root (cm) 4.4±0.13 10.4±1.44a
Body (cm) 4.5±0.13 22.1±0.75a
Total Weight (gr) 2.6±0.17 7.4±0.60a
Number of Sheets (n) - 21.4±0.87a
Yield (gr/m2) 203.84 573.33a
SGR - 6.42a
Raft
Root (cm) 4.4±0.16 7.9±0.90ab
Body (cm) 4.5±0.13 20.6±2.13ab
Total Weight (gr) 2.6±0.17 13.3±0.08ab
Number of Sheets (n) - 26.5±3.02a
Yield (gr/m2) 203.84 799.23ab
SGR - 6.70a
*Different letters indicate the difference between groups (p0.05
When the total weight of the lettuce was examined at the end of
the experiment, the difference between the two groups was found
significant and it was determined that the lettuce in the raft group
showed better development than the lettuce in the gravel system

167
4th International Science Symposium (September 04-06, 2019),
Kiev-Ukraine (ISS2019), 5A7PB; pp:165-169.
(p<0.05). Aquaponic aquaculture is one of the few techniques that can
dissolve low density dissolved nitrogen and phosphate [3]. Therefore
it is a promising solution for the adverse environmental impacts
associated with dense fish and crop production [4]. Organic compounds
such as inorganic nutrients and humic substances such as nitrate,
phosphate and potassium accumulate in the process water of closed
circuit systems in fish production [5 and 6]. The main source for
these systems consists of transforming fish metabolites into biofilter
directly through microbial separation or indirectly by different
chemical compounds containing fish feed [7]. Many of these chemical
compounds are suitable for plant growth and may be affected by system
reuse and use of different treatment units. However, some compounds,
such as ammonia, nitrite and nitrate that accumulate in large
quantities, should be kept at a critical threshold to prevent adverse
effects. In such cases, a certain amount of water change is
particularly important in terms of fish health and development. In
this context, in case of exceeding the limits of fish production, a
certain amount of water exchange was applied by interfering with the
system. During the study, the amount of water change was less than the
anticipated 10%, which did not reveal a negative situation for fish
and plants.
It controls the accumulation of waste nutrients from the
hydroponic fish culture and thus can reduce water consumption. The
first researchers have shown that waste nutrients from fish culture
waters can be decomposed by plants grown in hydroponics. The choice of
the hydroponic cultivation system under an aquaponic system can be
based on the different advantages provided by the hydroponic component
in question. For example; sand/gravel systems can eliminate the need
for a separate biofilter. These systems also act as a substrate for
nitrification bacteria and therefore replace conventional biofilter
[8]. Similarly, the gravel/sand substrate may also function as a solid
filtration medium. On the other hand, proponents of floating or raft
hydroponic components are claimed to be extremely heavy on sand or
gravel substrates and can easily clog water drainage, inefficient
biofiltration and negative nutrition for plants. In the study carried
out in the form of closed circuit system, biological filter is not
needed and there is no risk for fish health. However, during the study
it was determined that the plants in the raft group had relatively
better development. Although this results in similar results in
different plants, it is also stated that there is better plant growth
in the gravel group [2 and 9].
The presence of nitrogen in the ambient water increases the
biomass of the lettuce. Nitrogen concentration increased with
experimental duration in relation to fish density and feed dose. In
addition, nitrate produced from fish waste comes from protein content
in feed [10]. The nitrate values were lower in the raft group,
although they were not significant. This situation suggested that the
production in the raft would be more efficient. Magnesium
concentration is significantly associated with days and fish density.
This element has a nitrogen-like tendency. For this reason, the feeds
given to the fish must contain optimum amounts of magnesium for
improved growth and lettuce development. In our study, the amount of
magnesium required for the plant was found in the water environment.
Ambient temperature varies between 4 and 27ºC in traditional
methods (soil) lettuce cultivation [11]. In hydroponic systems,
cultivated lettuce in winter (average 22ºC) and summer (average 30ºC)
and recorded higher productivity in cold season (3.5kg/m2) than in cold
season (1.7kg/m2) [12].

168
4th International Science Symposium (September 04-06, 2019),
Kiev-Ukraine (ISS2019), 5A7PB; pp:165-169.
In the study, the ambient temperature (>31ºC) was effective in
lettuce development. It was observed that the rising temperature
increased the tendency of lettuce to go to seed. Similarly to other
researchers, this has probably affected their growth potential. This
finding supported the idea that the combination of high air
temperature and light intensity led to early flowering in lettuce
(bolting) to reduce lettuce quality and marketability [13]. When the
subject is evaluated in terms of yield, it can be seen that production
increased less than [14 and 15].
5. CONCLUSION
As a result, it has been determined that curly lettuce
cultivation can be used easily in closed circuit fish culture in both
systems. It was found that these systems used without establishing a
biological filter had not a negative effect on fish development and
fish health, the fish had a good performance in feed consumption and
additional crops could be obtained by plant growth. At the same time,
it is concluded that in the plants to be produced, attention should be
paid to the supply of quality seedlings and the weather conditions
should be compatible with the development conditions of the plant.
REFERENCES
[1] Badiola, M., Mendiola, D., and Bostock, J., (2012).
Recirculating Aquaculture Systems Analysis: Main Issues on
Management and Future Challenges. Aquacultural Engineering, 51:
26-35.
[2] Rakocy, J.E., (2012). Aquaponics-Integrating Fish and Plant
Culture. Aquaculture Production Systems. First Edition. Chapter
14; Edited by James Tidwell. John Wiley & Sons. Inc.
[3] Buzby, K.M. and Lin, L.S., (2014). Scaling Aquaponic Systems:
Balancing Plant Uptake with Fish Output. Aquacultural
Engineering, 63:39–44.
[4] Maucieri, C., Nicoletto, C., Junge, R., Schmautz, Z., Sambo, P.
and Borin, M., (2017). Hydroponic System Sand Water Management
in Aquaponics: A Review. Italian Journal of Agronomy,
[5] Hambly, A.C., Arvin, E., Pedersen, L.F., Pedersen, P.B.,
Seredynska-Sobecka, B., and Stedmon, C.A., (2015).
Characterising Organic Matter in Recirculating Aquaculture
Systems with Fluorescence EEM Spectroscopy. Water Res.,
83:112e120. Kloas, W., Groß, R., Baganz, D., Graupner, J.,
Monsees, H.,
[6] Yamin, G., Borisover, M., Cohen, E., and Van Rijn, J., (2017).
Accumulation of Humic-like and Proteinaceous Dissolved Organic
Matter in Zero-Discharge Aquaculture Systems as Revealed By
Fluorescence EEM spectroscopy. Water Res., 108:412-421.
[7] Van Rijn, J., (2013). Waste Treatment in Recirculating
Aquaculture Systems. Aquacultural Engineering, 53:49‐56. [8] Dontje, J.H. and Clanton, C.J., (1999). Nutrient Fate in
Aquaculture Systems for Waste Treatment. Trans. Am. Soc. Agric.
Eng., 42(4):1073–1085.
[9] Lennard, W.A. and Leonard, B.V., (2006). A Comparison of Three
Different Hydroponic Sub-Systems (Gravel Bed. Floating and
Nutrient Film Technique) in an Aquaponic Test System.
Aquaculture Int., 14:539–550.
[10] Rincon, S.L., Perez, C.A., Pellicer, B., Saez, S.J., and Abadıa, S.A., (2002). Influencia de la Fertilizacion Nitrogenada en la
Absorcion de Nitrogeno y Acumulacion de Nitratos en la Lechuga
Iceberg. Invest. Agr. Prod. Prot. Veg. 17(2).

169
4th International Science Symposium (September 04-06, 2019),
Kiev-Ukraine (ISS2019), 5A7PB; pp:165-169.
[11] Puiatti, M. and Finger, F.L., (2005). Fatores climáticos. In: Fontes, P.C.R. (ed.) Olericultura Teoria e Prática. Suprema, Rio
Branco, Brasil. P:17-38.
[12] Fallovo, C., Rouphael, Y., Cardarelli, M., Rea, E., Battistelli, A., and Colla, G., (2009). Yield and Quality of Leafy Lettuce in
Response to Nutrient Solution Composition and Growing Season.
Journal of Food, Agriculture and Environment, 7(2):456-462.
[13] Zhao, X. and Carey, E., (2009). Summer Production of Lettuce, and Microclimate in High Tunnel and Open Field Plots in Kansas.
HortTechnology, 19(1):113-119.
[14] Palm, H.W., Seidemann, R., Wehofsky, S., and Knaus, U., (2014). Significant Factors Affecting The Economic Sustainability of
Closed Aquaponic Systems. Part I: System Design, Chemo-Physical
Parameters and General Aspects. Aquaculture, Aquarium,
Conservation & Legislation. International Journal of the Bioflux
Society, 7(1):20-32.
[15] Rakocy, J.E., Bailey, D.S., Shultz, K.A., and Cole, W.M., (1997). Evaluation of a Commercial-Scale Aquaponics Unit for the
Production of Tilapia and Lettuce. Pages 357–372 in K.
Fitzsimmons. Editor. Tilapia aquaculture: Proceedings of the
Fourth International Symposium on Tilapia in Aquaculture at
Orlando. Florida. Northeast Regional Agricultural Engineering
Service. Ithaca. New York. USA.

4th International Science Symposium Status: Proceeding Book
ISS2019 (September 4-6, 2019) ID : 2019.5A8PB
Edis Koru
Fatih Perçin
Ege University, İzmir-Turkey
[email protected] [email protected]
OPTIMIZATION OF Arthrospira sp. (Spirulina) GROWTH: FROM LABORATORY
SCALE TO PILOT OUTDOOR CULTURE
ABSTRACT
In this study, the culture of Arthrospira sp. isolated from Çamaltı
saltern ecosystem was studied. Arthrospira sp. biomass productivity was
investigated through medium choice. Type MZ modified Zarrouk’s medium
was selected as it gave higher final dry weights and longer sustained
growth than Zarrouk’s culture media. Then, in order to reduce Spirulina
species production cost, modified Zarrouk’s medium was rationalized by
testing different compond. It was found that modified Zarrouk’s medium
could be diluted up to twice times without impacting the growth rates
in a 20-21 days batch cultivation. Higher dry weights were even observed
after 21 days of batch cultivation (1.26±3g/L for 50%- MZ in comparison
to 0.90±3 g/L for Zarrouk’s medium). Photosynthetically Photon Flux
Density (PPFD) from 1800 lux. to 2000 lux. At 2000 lux. light intensity,
photoinhibition was not observed and the specific growth rate was maximum
(0.13±1/day). Finally, a 21-day cultivation experiment was conducted in
a 2000mL culture erlenmayer flaks giving a maximum daily volume
productivity of 70±2mg/L/day. A techno-economic analysis according to
Turkish economicall terms gave production cost two to 20 times higher
for culture medium MZ (from 20 to 80€/kg) than for open ponds (from 6
to 12-15€/kg) depending on Spirulina productivity.
Keywords: Arthrospira, Biomass, Culture, Çamaltı Saltern, İzmir
1. INTRODUCTION
Çamaltı saltworks is the biggest coastal solar saltern located on
the Aegean coast of Turkey (Figure 1).
Figure 1. Çamaltı Saltworks
Gulf of
İzmir
Çamaltı Saltern

171
4th International Science Symposium (September 04-06, 2019),
Kiev-Ukraine (ISS2019), 5A8PB; pp:170-177.
Figure 2. Çamaltı saltern ponds
The saltern of Çamaltı is man-made systems for the extraction of
salt from seawater, by means of solar and wind evaporation. The Çamaltı
saltpans manufacture sodium chloride continuously throughout the year,
but others lie fallow during winters and produce salt only during the
summer seasons. Continuously operated saltworks maintain a salinity
gradient throughout their ponds during the entire year; they produce
salt uninterruptedly (although decreased amounts may be harvested in the
autumn and winter); and their crystallizers maintain a layer of salt
(the salt floor) above which the harvestable crop is deposited [1].
These installations are found in dry climates with low annual rainfall.
The saltworks of Çamaltı is also coastal aquatic ecosystem of great
ecological importance, as they are characterized by considerable habitat
heterogeneity [8]. It combines a spectrum of aquatic environmental types
along salinity gradient (seawater salinity – 300 ppt).
It is a multipond system that consists of 176-180 ponds covering
approximately 58-60km². Seawater from the Aegean Sea flows into these
shallow ponds [9] (Figure 2). The strain Arthrospira sp. is an aquatic,
filamentous cyanobacterium which is often classified as a blue-green
microalga. The general name of its commercialized biomass is ‘Spirulina’
(the name used in this paper) which production makes this microorganism
to be the most cultivated in the whole world [6 and 12]. Spirulina
cultivation medium has a great impact on the productivity of biomass and
other compounds of advantage [4]. For example, nitrogen concentration
in the medium [7] (optimum at 2.5g/L) and also nitrogen source (urea
better than ammonium or nitrate) (Soletto, 2005) has a great effect on
Spirulina productivity. Furthermore a phosphate concentration of 250mg/L
in the form of K2HPO4 was found to optimize biomass production.
2. RESEARCH SIGNIFICANCE
We can explain the research significance under three headings.
First; Common Saltworks Ecosystem. Second; The common salt production
system on salt fields. Çamaltı saltpans like the solar saltworks
manufacture sodium chloride continuously throughout the year, but others
lie fallow during winters and produce salt only during the summer
seasons. The solar evaporation of sea water to produce especially salt
and other components of sea water is not only a physical process but
there is also an organic contribution from the biological communities
with in the saltern ecosystem [2] (Figure 2).

172
4th International Science Symposium (September 04-06, 2019),
Kiev-Ukraine (ISS2019), 5A8PB; pp:170-177.
1. Sea Water 35-37 ppt
2. Reservotion 40-50 ppt
3. Evaporation 50-80 ppt
4. Evaporation 80-150 ppt
5. Evaporation 160-250 ppt
6. Crystallizer
Figure 2. Common salt system steps
Thirdly; In an aquatic ecosystem, related algae (seaweeds and
phytoplankton), small animals, and microscopic organisms naturally
develop a biological system composed of planktonic and benthic
communities in the ponds of every solar saltworks. The plants, algae,
and bacteria with photosynthetic pigments use sunlight energy and
inorganic nutrients (e.g., sectional nitrogen and phosphate) to output
organic matter, but the total group of organisms consumes and oxidizes
these matters. As the wind and sun evaporate the brine, it flows through
a sequence of ponds of increasing salinity. In this discontinuous
salinity gradient, the salt concentration in each pond is approximately
constant over time. When the saturation is reached, at approximately 8-
9 times the salt content of the original sea water, crystallization
begins [9]. Therefore, multipond solar salterns have a range of
salinities, from seawater to saturation, that are model habitats for
studying biological communities in hypersaline environments
(Silinabacter sp, Hallobacillus sp, Arthrospira sp., Dunaliella sp,
Artemia sp, Chironomus sp, Phoenicopterus sp, Aphanius fasciatus,
various water birds, etc) [3] (Figure 3).
Figure 3. Some creatures of saltern habitat
3. EXPERIMENTAL METHODS
The samples for this study were collected in situ of Çamaltı
saltworks and investigated as per conventional methods in laboratory.
The production monthly time from typical saltworks of season in Çamaltı
salterns is from April to November. The active salt production operation
in the saltworks is seasonal, the production period is from April to
November. The water samples were taken from the evaporators of the
saltworks, hydrographical factors such as studies samples were taken
with the help of a 38-40°C temperature, salinity, dissolved oxygen, pH,
and total mesh plankton net. All samples were preserved total 5% formalin
and the organisms were identified by solids, nutrients (nitrite, nitrate,
phosphate, ammonia using published papers and monographs) and primary

173
4th International Science Symposium (September 04-06, 2019),
Kiev-Ukraine (ISS2019), 5A8PB; pp:170-177.
productivity, were studied along with plankton communities. Water
temperature was recorded with a digital thermometer, salinity by using
a salinometer, and pH measurement with a pH meter. Standard methods of
seawater parameters at analysis were followed for the estimation of
other parameters. Samples for phytoplankton analysis were collected by
filtering 5 liter of water through a plankton net having a mesh size of
40µm.
3.1. Microorganism and Culture Medium
Arthrospira sp. (Çamaltı Saltworks Strain: ÇSWS) was isolated from
Çamaltı saltern ecosystem on reservoir water ponds (Figure 4). The
cyanobacterium Spirulina sp. strain ÇSWS used in the present study was
obtained from the Aquaculture Department of Plankton Laboratory, Ege
University of Fisheries Faculty. Modified versions of two media designed
for Spirulina growth were used in this study: Zarrouk’s Medium (ZM) [12]
and Modified Zarrouk’s Medium (MZ) (Table 1). The strain was maintained
in 500mL sterilized Erlenmeyer flasks containing 100mL (ZM) medium and
(MZ)at 28±1 C, pH 9 with continuous illumination using cool white
fluorescent tubes (2000 Lux) and twice daily shaking by hand.
Figure 4. Spirulina sp. ÇSW strain and culture
Table 1. Zarrouk’s Medium (ZM) and Modified Zarrouk’s Medium (MZ)
Chemicals
Zarrouk
Medium
(gr/Lt)
Modified
Zarrouk Medium
(gr/Lt)
Chemicals
Zarrouk
Medium
(gr/Lt)
Modified
Zarrouk Medium
(gr/Lt)
NaHCO3 16.8 10 K2HPO4 0.5 1.0
NaCl 1.0 15 MgSO4・7H2O 0.2 0.2
NaNO3 2.5 2.0 CaCl2 0.04 0.5
KNO3 --- 1.0 FeSO4・7H2O 0.01 0.1
K2SO4 1.0 0.5 EDTA-Na 0.08 0.1
Solution A5 1 mL --- Solution B6 1 mL ---
Solution A5: (g/L): H3BO3, 2.86; MnCl2.4H2O, 1.81; ZnSO4.7H2O, 0.222; Na2MoO4.2H2O,
0.390; CuSO2.5H2O, 0.079.
Solution B6: (mg/L): NH4VO3: 22.86; KCr(SO4)2. 12 H2O: 192; NiSO4. 6H2O: 44.8;
Na2WO4. 2H2O: 17.94; TiOSO4. 8H2O: 61.1; CO(NO3)2. 6H2O: 43.98.
3.2. Culture Conditions
Spirulina sp. ÇSWS was grown in a 2L (net volume 1.5 L) Erlenmeyer
glass flask at 28°±1°C with a 24h continuous illumination photoperiod.
The 2000 Lux illuminance was provided by daylight-type fluorescent lamps
(40W). Aeration was carried out by filtered air with CO2 through an
aquarium pomp (Eheim Universal 1250; 1200 L/H).
15 µm

174
4th International Science Symposium (September 04-06, 2019),
Kiev-Ukraine (ISS2019), 5A8PB; pp:170-177.
3.3. Growth Data
The dry weight was measured after desiccation on pre-weighed
filters with a porosity of 0.45µm: 10mL of Spirulina cultures were
filtered and rinsed twice with the same volume of ultrapure water. The
prefilters were maintained at 80°C microwave oven. Optical density was
measured at 880nm (OD:880) in order to reduce the influence of the
pigments absorption (mainly chlorophylls and phycocyanin) with a
Spectrophotometer. Productivities and nutrient consumption rates were
calculated using the following formula, with t being the time and at
being the dry weight or the nutrient concentration: Rate of At1―t2=At2-
At1/t2-t1.
4. RESULTS
4.1. Physico-chemical Parameters
Table 1. Meteorological data (TMS, 2019) [11]
İzmir/Time
(Monthly)
January
February
March
April
May
June
July
August
September
October
November
December
Time Average Values in Years (1950-2018)
Average
Temperature(°C) 8.9 9.5 11.7 15.9 20.8 25.6 28.0 27.7 23.7 18.8 14.0 10.6
Average Max.
Temperature(°C) 12.5 13.5 16.3 20.9 26.0 30.7 33.2 32.9 29.1 23.9 18.5 14.1
Average Min.
Temperature(°C) 5.9 6.2 7.8 11.3 15.5 20.0 22.6 22.5 18.7 14.7 10.7 7.7
Average Sunny
Time (hours) 4.2 5.1 6.2 7.5 9.5 11.3 12.1 11.5 10.1 7.3 5.3 4.1
Average Number
of Rainy Days 11.9 10.8 9.2 8.2 5.4 2.1 0.5 0.5 2.0 5.6 8.9 12.5
Monthly Total
Rainfall
Average (kg/m²)
125.1 101.9 75.6 46.4 30.9 9.8 1.8 2.6 15.0 45.3 94.8 141.1
Figure 5. Some chemical, physical and biological data of earth ponds
4.2. Culture Media Comparison
Media conventionally used in lab-scale experiments and by
Spirulina producers were compared in two culture medium, i.e., Zarrouk
medium [12] and modified ZM. Pre-cultures were done in each medium for
acclimation. Growth curves are shown in Figure 5.
Dis
solv
ed O
xyg
en (
DO
: m
g/l
)
Tem
per
atu
re (
°C)
Temperature (°C)

175
4th International Science Symposium (September 04-06, 2019),
Kiev-Ukraine (ISS2019), 5A8PB; pp:170-177.
Figure 5. OD880 of Spirulina sp. for two different media: Original
Zarrouk´s Medium and modified Zarrouk´s Medium
For 7 days, ZM and modified ZM showed similar growth curves. But
seven days later, the Spirulina sp., culture using MZ medium had a higher
density. This difference could be a consequence of the higher sodium
chloride concentrations in media comparison to modified ZM (less sodium
chloride in MZ). After 10 days, growth continued for modified ZM but not
for ZM. The higher N, P, S and NaCl content in modified ZM could explain
this more sustained growth. Modified ZM also showed a higher biomass
productivity (70±2mg/L/day from day 0 to day 21) than ZM
(50.3±2mg/L/day). Modified ZM was then selected for the cultivation
experiments.
4.3. Influence of the Initial Biomass Concentration on
Spirulina Growth Using Modified Zarrouk’s Medium
The influence of the initial biomass concentration was tested with
modified ZM (no replicate). As shown in Figure 6, there is no significant
difference in the final OD880 for all experiments. All growth curves
reached their stationary phase after 21 days with similar OD880. This
was possibly due to higher growth rates measured for culture experiment
started at lower initial concentration as this could imply more light
availability per cell leading to higher growth rates. In a similar study
it was found that higher initial biomass concentrations led to lower
growth rates due to the shadowing effect [4 and 5].
Figure 6. OD880 measurements of Spirulina for four different
preliminary dry weights in modified Zarrouk´s Medium: 0.70g/L and
Zarrouk´s Medium 0.5g/L
0
0,5
1
1,5
2
2,5
3
1 2 3 4 5 6 7 8 9 10 11 12 13 14
Optic Densitite OD:880
Time (Days)
0
0,2
0,4
0,6
0,8
1
1,2
1,4
1,6
1 2 3 4 5 6 7 8 9 10 11 12 13 14 15 16 17 18 19 20 21
Modified Zarrouk medium 0.7 g/L
Zarrouk
Medium
Modified
Zarrouk Medium
Zarrouk medium 0.5 g/L
OD 880 nm

176
4th International Science Symposium (September 04-06, 2019),
Kiev-Ukraine (ISS2019), 5A8PB; pp:170-177.
5. CONCLUSION
In this study, Cost optimization of modified Zarrouk’s medium
compound was tested. Modified Zarrouk's medium have better growth than
the Zarrouk´s media. Zarrouk medium tested but it contains higher amounts
of various chemicals leading to significant increased costs. The nitrogen
content of modified ZM can theoretically lead to a maximal biomass
concentration of 4-4.5g/L for Spirulina sp. (if nitrogen was the only
limiting element) [4 and 12]. This would be chloride, sodium nitrate,
potassium nitrate, phosphorus, sulfur, and calcium, respectively.
Therefore, dilution of modified ZM was investigated in order to reduce
the cost of the cultivation. Arthrospira ÇSWS strain cultivation can be
advanced though three criteria: productivity, quality, and cost.
Spirulina ÇSWS biomass productivity can be significantly improved by
using the special medium. Finally, in this study, while isolating to
Spirulina sp. the most appropriate nutrient medium for Spirulina sp. was
also determined by tested medium for culture. Actually, in this study,
modified ZM was found to provide higher biomass productivity than the
Zarrouk media tested.
REFERENCES
[1] Davis, J.S., (2000). Structure, Function, And Management of the
Biological System for Seasonal Solar Saltworks, Global Nest: The
International Journal, 2, 217-226.
[2] Davis, J.S., (2006). Biological and Physical Management
İnformation for Commercial Solar Saltworks, In: Ecological
Importance of Solar Saltworks, Lekkas T.D. and Korovessis N.A.
(eds.), Proceedings of the 1st International Conference on the
Ecological Importance of Solar Saltworks (CEISSA 06), Santorini
Island, Greece, 20-22 October 2006, GlobalNEST, Athens.
[3] Dolapsakis, N., Tafas T., Abatzopoulos T., Ziller S., and
Economou-Amilli A., (2005). Abundance and Growth response of
Microalgae at Megalon Embolon Solar Saltworks in northern
Greece: An Aquaculture Prospect, Journal of Applied Phycology,
17, 39-49.doi: 10.1007/s10811-005-5553-0.
[4] Delrue, F., Alaux, E., Moudjaoui, L., Gaignard, C., Fleury, G.,
Perilhou, A., Richaud, P., Petitjean, M., and Sassi, F.J.,
(2017). Optimization of Arthrospira platensis (Spirulina)
Growth: From Laboratory Scale to Pilot Scale, Fermentation, 3,
59; doi:10.3390/fermentation3040059
[5] Gitelson, A., Qiuang, H., and Richmond, A., (1996). Photic
Volume in Photobioreactors Supporting Ultrahigh Population
Densities of the photoautotroph Spirulina platensis, Appl.
Environ. Microbiology, 62, 1570–1573.
[6] Henrikson, R., (2009). Earth Food Spirulina How This Remarkable
Blue-Green Algae can Transform Your Health and Our Planet,
Library of Congress Catalog Card Number: 89-091683 ISBN 0-
9623111-0-3, 6th. Printed, USA.
[7] Çelekli, A., and Yavuzatmaca, M., (2009). Predictive Modeling of
Biomass Production by Spirulina platensis as Function of Nitrate
and NaCl Concentrations. Bioresour. Technol. 100, 1847–1851.
[8] Koru, E. ve Deniz, M., (2017). Çamaltı Tuzlasının (Sasalı/İzmir)
alg florası ve mevsimsel değişimleri, Su Ürünleri Dergisi,
Cilt.34, ss.431-442, DOI: 10.12714/egejfas.2017.34.4.10 (in
Turkish).
[9] Koru, E. and Perçin, F., (2018). Characteristics of Biological
Systems in Çamaltı Solar Saltworks (İzmir/Turkey), Qualitative
Studies (NWSAQS), 13(3):15-25,
DOI: 10.12739/NWSA.2018.13.3.E0036.

177
4th International Science Symposium (September 04-06, 2019),
Kiev-Ukraine (ISS2019), 5A8PB; pp:170-177.
[10] Soletto, D., Binaghi, L., Lodi, A., Carvalho, J.C.M., and Converti, A., (2005). Batch and Fed-batch Cultivations of
Spirulina platensis Using Ammonium Sulphate and Urea as Nitrogen
Sources. Aquaculture, 243, 217–224.
[11] TMS (2019). Turkish State Meteorological Service, https://mgm.gov.tr/eng/forecast-cities.aspx
[12] Vonshak, A., (1997). Spirulina platensis (Arthrospira): Physiology, Cell-biology and Biotechnology, ISBN 0-203-79220-3
Taylor & Francis Ltd, 1 Gunpowder Square, London EC4A 3DE

4th International Science Symposium Status: Proceeding Book
ISS2019 (September 4-6, 2019) ID : 2019.5A9PB
Fatih Perçin
Ege University, [email protected], İzmir-Turkey
SAFETY MANAGEMENT AND FOOD IN AQUACULTURE INDUSTRY
ABSTRACT
In Turkey, aquaculture production is made under cultivate
condition by professionals. Cultured fish species are grown in
freshwater, brackish and sea water, and aquarium areas. Recently, it has
been working on some different aquatic species for growing such as
cephalopods culture such as octopus and squids, bivalve culture such as
mussels, blue crab, lobster, and shrimp culture, and molluscs for example
sea cucumber or leech. Aquatic plant culture such as algae and seaweed
is improving. Recently, aqua phonic culture and applications are
increasing. During the cultured process, it can be need some safety
applications, and comply with health conditions and hygiene. In the
study, it can be work on safety culture technics and applications, and
also quality standards-accreditations on management system, information
security, “El Meri” health environment surveillance requirements,
occupational health and safety, environmental waste management system.
It could be give some information on safety food standard and global
gap, international agriculture standards and British retailing
standards.
Keywords Aquaculture, Safety, Health, Product, Food
1. INTRODUCTION
Generally aquatic farm with aquatic plants and animals (fish,
molluscs, bivalves, crustaceans and aquatic plants) in the environment
is called aquaculture. Aquaculture systems and productions are rapidly
increasing demand for aquaculture. It is one of the main sector within
the agricultural area in terms of food necessity, healthy nutrition,
against reducing hunting pressure on natural fish stocks, contributing
to rural development. In addition, sector of aquaculture is providing
employment and foreign exchange input, and carrying the aims of fishery
of water resources [1, 2, 3, 4, and 5]. Today, fish is cheap protein and
energy source which the body contains 17-20% valuable protein. For this
reason, the importance of aquaculture production in sea, brackish water,
inland and inland waters are increasing. Thus, the account of worldwide
aquaculture is almost 40% of total fishery production. According to TUİK
data in 2015, the total aquaculture production for 2015 is almost 672,000
tons and approximately 240,300 tons of this is obtained from aquaculture
[1, 4, 5, and 6]. In addition, fish production in aquaculture is
gradually improve with the development of net cages, production in soil
ponds and concrete ponds, mooring systems in open sea and freshwater
area, barge platforms, automatic feeding systems, improvement of
logistics, automatic protection and environmental monitoring and
tracking systems, artificial intelligence, and hatcheries. Thus, Turkey
is the main important supplier of cultured fish export to EU and other
countries such as sea bream, sea bass, rainbow trout and bluefin tuna.
Moreover, it could be research on culture and production technics of
cephalopods, bivalves, crustacean, mollusc, and aquarium species,
besides different fish culture. And also aquatic plants and aqua phonic
systems are recently using with fish culture [1, 3, 4, 5, and 7]. Hence,
during the production or processing period, safety management, safety

179
4th International Science Symposium (September 04-06, 2019),
Kiev-Ukraine (ISS2019), 5A9PB; pp:178-182.
culture and awareness, and culture of safe fish and fish products such
as mullet or carp caviar are priority studying area [5, 8, and 9].
Therefore, some of the international standards in Turkey because of
seafood export, are remarkably significant substances in the last two
decade as; International Organization for Standardization ISO,
Occupational Health and Safety, Global GAP, British Retailing Systems
etc.
2. RESEARCH SIGNIFICANCE
It is important to safety food and labelling standards for
import/export products in aquaculture industry, Turkey. Because, the
only one agricultural product, cultured fish species and seafood, have
been export regularly and gradually increase from Turkey to European
Union, and USA, and other developed countries. Thus, it can be an
important to comply with newly introduced and progressive developing
culture standards.
3. EXPERIMENTAL METHODS
In the study, it could be give some information and knowledge on
safety food system and labelling in Aquaculture and some authorities and
security culture standards such as ISO 9000, and 14000, and 18000,
Occupational health and Safety (OHS) and El-Meri observations of working
environment, and also Global Gap, and British retailing standards. In
addition, the study provides information and classified about the rules
and standards to be made and complied with in aquaculture, hatchery, and
other fish production facilities and possible risks.
4. RESULTS
Safety production activities and practices in aquaculture
facilities are primarily seen in export-oriented aquaculture facilities.
These species are sea bream and sea bass production farms especially in
marine fish and tuna fish fattened farms which have gained importance
in recent years. Inland waters and fresh waters are the trout farms that
produce the highest amount of water in dams, lakes, ponds and spring
waters. In addition, salmon fish production is relatively low in the
Black Sea [5]. From this point of view, safety production activities in
fish farms emerge as a priority. Production models, feeding systems,
environmental factors, fish diseases and control, post-production
packaging transport and export system are important issues starting from
the installation stage in fish farms and hatchery production facilities
[1, 3, 5, and 10].
Project Designing and site selection;
Priority criteria for site selection should not be close to the
primary and secondary settlements of the production area, tourism,
cottage and military facilities
There should be no sources of pollution close to the selected
location, and there should be no discharge streams from the river
bed
Water sources are suitable and single-entry and waste water should
not be mixed into the pool entrances
The current should be within the appropriate limits and the
pollution factors should be sufficient to remove the region
There should be no risk of environmental microbiological
contamination to areas where facilities such as hatcheries are
located
Areas where contamination risk is minimized should be selected in
the production of soil pools or dams and ponds. Water inlets should

180
4th International Science Symposium (September 04-06, 2019),
Kiev-Ukraine (ISS2019), 5A9PB; pp:178-182.
be sieved. Soil ponds should be disinfected before and after
production
Physicochemical parameters;
Temperature
Oxygen
Salinity
pH level
Flow rate
Lighting
Nitrite and Nitrate levels
Production modeling and filtration;
Brood eggs from broodstock
PreLarval–Post larval growth
Surveying
Puppy feeding
Fingerlink fish
Portion fish
Broodstock fish care
Algae culture unit
Artemia Rotifer unit
Mechanisation unit
Filtration unit.
Feeding and automation systems;
Feed raw materials, additives and commercial fish feeds should not
contain disease, microbiological, parasitic, pesticide, chemical
contaminants, residues, residues and mycotoxins and should be
checked regularly
Fish feeds should comply with the codex application guidelines of
good feeds Feed and fresh stocks should be used before shelf life
expires
Produced feeds and other substances should be labeled correctly
and information such as production date, place, content,
expiration should be given [10].
Disease factors
Use of fish stocks that do not contain specific pathogens as
rootstocks in production (aquatic animal disease control guide
Healthy eggs and larvae should be obtained
Antibiotics and disinfectants used should not leave residues [5
and 11].
Environmental factors and pollution
Water supply sources (marine, artesian, spring water, dams, lakes,
ponds, rivers)
Heavy metal problem, iron, bromide, arsenic, etc. (deformities,
internal organ and structural disorders)
Pollution factors (environmental waste, garbage, factory waste
textile, paint, food processing factories -cheese and milk
processing factories, fruit juice factories- wood industry,
leather processing and industrial plants) (disease, deformity,
residue) [11].
Logistics systems and facilities;
Work areas, workshops, shelter, packaging, loading and unloading
areas

181
4th International Science Symposium (September 04-06, 2019),
Kiev-Ukraine (ISS2019), 5A9PB; pp:178-182.
Materials and equipment used, net and reinforcement materials
(buoyancy, dipper)
Wastes from machine parts used in the repair of materials and
equipment, chemicals (protective chemicals used in networks) [11].
Transport and export
Labeling should be on the manufactured products. The type,
production place, date of production, conditions of production
(such as concrete soil pool, net cage), last consumption date,
content information should be given here.
Management systems in safe production;
ISO 9001 quality management
ISO 14001 environmental management
ISO 18001 OHS (45001 conversion)
Occupational Health and Safety Law No.6331
El Meri Observation of working environment
ISO 27001 Information security
ISO 22000 Food safety management system
Global GAP (global agricultural standard ---) use their own work
in certification
ASC (Aquaculture Stewardship Council) sgs
BRC British retailers' association [4, 5, 8, 11, and 12].
5. CONCLUSION
In this study, the concepts which are important in the production
of safe fish and aquaculture in fish farms and hatchery systems which
are main export products in aquaculture in our country Turkey are
emphasized. In addition to this, information about production procedures
required for sales abroad, and international standards and structures
of these standards are given.
REFERENCES
[1] Özden, O., Suzer, C., and Korkut, A.Y., (2017). Aquaculture in İzmir. In: Fisheries of İzmir Province. Kınacigil, T.,
Tosunoğlu, Z., Çaklı, Ş., Bey, E., Öztürk, H., Eds., pp:197-209.
(ISBN: 978-975-18-0222-4) İzmir Büyükşehir Belediyesi,
Konak/İzmir (in Turkish).
[2] Mert, B. ve Ercan, P., (2014). Su Ürünleri Sektöründe İş Sağlığı ve Güvenliği Uygulamalarının Değerlendirilmesi. Türk Bilim
Araştırma Vakfı, 7(4):16-27 (in Turkish).
[3] Suzer, C., Korkut, A.Y., and Özden, O., (2017). Why should we Consume Cultured Fish? In: Fisheries of İzmir Province.
Kınacigil, T., Tosunoğlu, Z., Çaklı, Ş., Bey, E., Öztürk, H.,
Eds., pp:197-209. (ISBN: 978-975-18-0222-4) İzmir Büyükşehir
Belediyesi, Konak/İzmir (in Turkish).
[4] Perçin, F., (2018a). Job Safety and Accidents in Marine Fish Farms (Sea Bream / Sea Bass) in İzmir/ Turkey. Qualitative
Studies, 13, 30-32. DOI: 10.12739/ NWSA.2018.13.4.E0038
A. Reilly, A., Lima DosSantos, C., and Phillips, M., (1997). Food
Safety and Products from Aquaculture. /FAO/NACA/WHO Study Group
on Food Safety Issues; 22nd-26th August 1997 In Bangkok, Thailand.
[5] TÜİK, (2015). Su Ürünleri İstatistikleri. http://www.tüik.gov.tr [6] Armağan, Ö. and Perçin, F., (2018). Legal Situation of the Usage
of Underwater Robots. ISS2018. 3rd International Science
Symposium. Science Festival: New Horizons in Science. Eds: NWSA
Academic Journals. 05-08 September 2018. Pristine-Kosovo,
Proceeding Book. pp. 313-316.

182
4th International Science Symposium (September 04-06, 2019),
Kiev-Ukraine (ISS2019), 5A9PB; pp:178-182.
[7] Perçin, F. and Haydan, E., (2017). Maturation Pyramid of Occupational Health and Safety. Engineering Sciences, 12(4),
262-270. DOI: 10.12739/NWSA.2017.12.4.1A0393
[8] Perçin, F., (2018b). Effects of Disinfectants Used in Fish Production Facilities on Employees. Ziraat Mühendisliği, 365,
13-21 (in Turkish).
[9] Demir, O., (2008). General Perspective of Aquaculture and
Feeding Sector in Turkey. Journal of Fisheries Sciences,
(2)5:704-710.
[10] Myers, M.L. and Durborow, R.M., (2012). Aquacultural Safety and Health. In Health and Environment in Aquaculture. InTech.pp.385-
400.
[11] Myers, M.L., (2010). Review of Occupational Hazards Associated with Aquaculture. Journal of Agromedicine. Vol:15, pp:412-426
[12] Moreau, D.T.R. and Neis, B., (2009). Occupational Health and Safety Hazards in Atlantic Canadian Aquaculture: Laying the
Groundwork for Prevention. Marine Policy. 33(2):401-411.

4th International Science Symposium Status: Proceeding Book
ISS2019 (September 4-6, 2019) ID : 2019.5A10PB
Levent Bat
Sinop University, [email protected], Sinop-Turkey
METALS LEVELS IN EDIBLE FISH SPECIES OF THE BLACK SEA: EVALUATION OF
POTENTIAL HEALTH RISKS TO CONSUMERS
ABSTRACT
The aim of this study to conduct a health risk assessment of six
heavy metals attributed to consumption of Diplodus puntazzo (Walbaum,
1792) and Diplodus annularis (Linnaeus, 1758) available for consumers.
Results of the present study showed that Fe and Zn were the most
abundant among edible tissues of these species followed by Cu. The
order of accumulation in both D. puntazzo and D. annularis is
Fe>Zn>Cu>Pb>Hg>Cd. The levels of Cd, Hg, Pb, Cu, Zn and Fe in D.
puntazzo were 0.018±0.002, 0.035±0.005, 0.09±0.008, 0.28±0.04, 8.5±1.5
and 14.5±2.8 mg kg-1 wet wt., respectively. However, the levels of Cd,
Hg, Pb, Cu, Zn and Fe in D. annularis were 0.015±0.0015, 0.028±0.003,
0.12±0.03, 0.17±0.035, 10.2±2.2 and 19.3±4.2 mg kg-1 wet wt.,
respectively. The values of heavy metals in muscles of fish in this
study were below the permissible limits. Moreover, the probable health
risks of these six metals to people via consumption of these fish were
assessed by estimating daily intake and target heath quotient. Risk
values for the measured six metals do not pose unacceptable risks at
mean ingestion rate for edible tissues. It can be concluded that Hg,
Cd, Pb, Cu, Zn and Fe in edible parts of sharp-snout seabream and
annular seabream have no health problems for consumers.
Keywords: Diplodus puntazzo, Diplodus annularis, Black Sea,
Daily Intake, Target Hazard Quotient
1. INTRODUCTION
The importance of heavy metals in seafood has been intensively
investigated during few decades. Fish is one of the most important
protein sources in the Black Sea coasts, its contamination with heavy
metal can be risky to public health. The raised urbanisation,
industrial development and population increment contributed to
pollution growth in the Black Sea. The different kinds of contaminants
at the Black Sea coasts have affect the marine ecosystem (Bat et al.,
2018). Because of their persistence and bio accumulative nature, the
discharge of contaminants especially heavy metals into the coastal
environment can degrade the biodiversity of marine ecosystems. Heavy
metals have the tendency to accumulate in fish, which in turn may
include into the human metabolism via consumption causing toxic
effects. In the Black Sea a lot of studies have been done on heavy
metal levels in fishes (see reviews Bat, 2014: Bat, 2017a, b: Bat and
Arıcı, 2018). Moreover, heavy metals contamination in fish has become
a significant issue worldwide concern, not only because of the hazard
to fish, but also due to the health threats via fish consumption. In
recent reviews, Bat (2017a) and Bat (2017b) point out that there is no
possible health risk below the current consumption rate of consumers,
but such studies are essential. Therefore, this study was undertaken
to determine the concentrations of heavy metals in commercially
important fish species and health risks to people. Two species of
pelagic fish available in Sinop coasts of the Black Sea were collected
directly from professional fishermen in fishing season of 2015-2016.

184
4th International Science Symposium (September 04-06, 2019),
Kiev-Ukraine (ISS2019), 5A10PB; pp:183-188.
These species were Diplodus puntazzo (Walbaum, 1792) and Diplodus
annularis (Linnaeus, 1758).
2. RESEARCH SIGNIFICANCE
Fishes are good bio-indicator species for the long-term
monitoring of metal accumulation in the marine ecosystem. Since fish
constitute a considerable part of people diet, it is not astonishing
that the quality and safety aspects of fish are of exclusive interest.
Over the past few decades, the heavy metal amounts in several fish
species have been broadly studied in various places in the world. The
consumption is the major course of human exposure to heavy metals. The
targets of the present study were to determine Cd, Hg, Pb, Cu, Zn and
Fe in edible parts of sharp-snout seabream and annular seabream in
Sinop coasts of the Black Sea, and to assess their potential risks to
people health.
3. EXPERIMENTAL METHODS
D. puntazzo and D. annularis were taken from fishermen in
fishing season of 2016-2017 from Sinop coasts (Figure 1). The edible
tissues were removed with plastic knives, homogenised and weighed. The
samples of fish muscles were taken for the heavy metal analysis. Metal
levels in the samples were measured by an inductively coupled plasma
mass spectrometry (ICP-MS). Precision and accuracy of the method were
controlled by analysing at least three replicates of the reference
material TORT-3 lobster hepatopancreas.
Figure 1. Sampling area
3.1. Health - Risk Assessment of Fish Consumption
The daily intakes of six metals from the consumption of edible
tissues of D. puntazzo and D. annularis were also estimated for
adults, and target hazard quotient (THQ) in fish samples were
calculated to determine the health risks due to the consumption of
contaminated fish. The EDI of metals was calculated using the
following equation (Bat et al., 2019a):
EDI =Cmetal x W
BW (1)
where: C metal is the concentration of metals in fish; W
represents the daily mean consumption of fish for adults; BW is the
body weight of 70kg for adults.
The health risks from consumptions of these fish species by
people were assessed based on the target hazard quotient (THQ). The
method of estimating risk using THQ was provided in the US Environment
Protection Agency region risk based concentration table and it is
described by the following equation:
THQ =EF x ED x FI x MC
RfD x BW x AT (2)

185
4th International Science Symposium (September 04-06, 2019),
Kiev-Ukraine (ISS2019), 5A10PB; pp:183-188.
where, THQ refers to target hazard quotient; EF is the exposure
frequency (365 days/year); ED is the exposure duration (70 years in
adults); FI is the mean ingestion rate, 27.4 g/person/day in Sinop
(Bat, 2017a); MC is the metal concentration in fish muscles (g/kg, on
wet wt.); RfD is the oral reference dose for Fe, Zn, Cu, Cd and Hg
0.7, 0.3, 0.04, 0.001 and 0.0003mg/kg/day, respectively. RfD of Pb is
not available on the U.S. Department of Health and Human Services
Public Health Service (U.S. EPA, 2018). However, the RfD value for Pb
in this study was used as 0.0035mg/kg/day (Bat et al., 2019b); BW is
the average body weight (70kg); and AT is the averaging time (equal to
EF×ED). The total THQ (TTHQ) of metals for individual species is the
sum of the following equation:
TTHQsp. = THQFe + THQZn + THQCu + THQPb + THQHg + THQCd (3)
THQ value is above 1 means that THQ is higher than the RfD, and
thus toxic effects may occur.
3.2. Statistical Analysis
All samples were collected and analysed in three replicates. The
mean results were used to represent the data. Minitab 17 for Windows
was used to test one-way (ANOVA) to compare the heavy metals
concentrations between different species in edible tissues
(significant values, P<0.05). Other calculations were performed by
Microsoft Excel 2010.
4. RESULTS
The recovery of the heavy metals ranged from 96% to 102%.
Precision expressed as relative standard deviation was lower than 6%
for all the measured metals. This shows that the results are reliable.
Concentrations of heavy metals in muscles of D. puntazzo and D.
annularis from Sinop coasts of the Black Sea are shown in Figures 2.
No statistically significant differences were found between the toxic
metal (Hg, Cd and Pb) values detected in the muscles of the fish
(p>0.05). However, Cu was found high in D. puntazzo, Zn and Fe were
high in D. Annularis (p<0.05). The order of accumulation in both
sharp-snout seabream and annular seabream sharp-snout seabream and
annular seabream is Fe>Zn>Cu>Pb>Hg>Cd. The levels of Cd, Hg, Pb, Cu,
Zn and Fe in D. puntazzo were 0.018±0.002, 0.035±0.005, 0.09±0.008,
0.28±0.04, 8.5±1.5 and 14.5±2.8mg kg-1 wet wt., respectively. However,
the levels of Cd, Hg, Pb, Cu, Zn and Fe in D. annularis were
0.015±0.0015, 0.028±0.003, 0.12±0.03, 0.17±0.035, 10.2±2.2 and
19.3±4.2 mg kg-1 wet wt., respectively.
Figure 2. The concentrations of heavy metals (mg kg-1 wet wt.) in
muscles of D. puntazzo and D. annularis from Sinop coasts of the Black
Sea. a, b, c, d, e, f, g and h=The same letters beside the vertical
bars indicate the values are not significantly different (p>0.05)

186
4th International Science Symposium (September 04-06, 2019),
Kiev-Ukraine (ISS2019), 5A10PB; pp:183-188.
The EDI of metals for adults in Sinop coasts of the Black Sea
via consumptions of fish are presented in Table 1.
Table 1. EDIs of metals via consumptions of fish muscles in Sinop
coasts of the Black Sea
Species Estimated Daily Intakes (µg/kg/day)
Cd Hg Pb Cu Zn Fe
D. puntazzo 0.0071 0.0137 0.0352 0.1096 3.3271 5.6757
D. annularis 0.0059 0.0109 0.0469 0.0665 3.9926 7.5428
Table 2 shows the health risks from consumptions of fish by
people from Sinop coasts of the Black Sea by calculating THQs and
TTHQs.
Table 2. THQs and TTHQs for heavy metals by consumptions of D.
puntazzo and D. annularis muscles from Sinop coasts of the Black Sea
Species THQs
TTHQ Cd Hg Pb Cu Zn Fe
D. puntazzo 0.00704 0.04566 0.01006 0.00274 0.01109 0.00812 0.08472
D. annularis 0.00587 0.03653 0.01342 0.00166 0.01331 0.01077 0.08157
THQs and TTHQs were below 1, indicate exposure levels lower than
the reference dose and absence of risk for people health.
5. DISCUSSION
The values of Cd, Hg and Pb in muscles of fish in this study
were below the maximum limits set by Commission Regulation (EC) No
1881/2006. There are no maximum limits for essential metals in
Commission Regulation (2006) and Turkish Food Codex (2008). Cu and Zn
did not exceed the maximum limits set by other international
regulations (MAFF, 1995). Detected mean heavy metal amounts in edible
tissues of D. puntazzo and D. annularis in decreasing order were:
Fe>Zn>Cu>Pb>Hg>Cd. Heavy metal levels in the analysed these fish
species were lower than the acceptable limits. The results obtained in
the present study were compared with the few available data. Heavy
metal accumulation studies with Diplodus spp. have been rarely
encountered (see review Bat and Arıcı, 2018). Cd is well known to be a
very toxic non-essential heavy metal and has no essential role in
biological process in biota. Pb is also a non-essential metal and a
toxic element which can affect fish in high levels lead to a decrease
in survival, growth rates, development and metabolism and to the
increased mucus formation (Soliman and Nasr, 2015). Data of this study
for Cd and Pb levels are quite lower than those in reported literature
where values in the range of 0.16-4 and 1.4-6.99mg/kg wet wt.,
respectively were recorded for D. annularis from the Aegean Sea (Uysal
et al., 1989: Kuçuksezgin et al., 2000). Cu and Fe are essential
metals and play important role for biota. Cu levels in the present
data are also lower than those in D. annularis muscles (1.27mg/kg wet
wt.) from the Aegean Sea (Uysal et al., 1989). Fe concentrations in
the present data were generally in similar ranges with the literature,
where it has been reported as 13.52mg/kg wet wt. for D. annularis
muscles from the Aegean Sea (Uysal et al., 1989.
EDI values for D. puntazzo and D. annularis muscles were below
the recommended values (FAO/WHO, 1989 and 2011; U.S. EPA, 2000 and
2005; U.S. Department of Health and Human Services Public Health
Service, 2007), indicating that health risk associated with the intake
of studied heavy metals through the consumption of examined fish
samples was absent. The HQ values of these heavy metals were all less
than 1.

187
4th International Science Symposium (September 04-06, 2019),
Kiev-Ukraine (ISS2019), 5A10PB; pp:183-188.
THQ values for Fe, Zn, Cu, Pb, Hg and Cd for consumers are not
likely to cause any hazard effects during lifetime in any population.
People health risk assessment, thus, showed that the heavy metal
exposure through consumption of sharp-snout seabream and annular
seabream from Sinop coasts of the Black Sea are safe.
6. CONCLUSION
EDI values for adults consuming D. puntazzo and D. annularis
were lower than published RfD values. As all THQ and TTHQ values were
lower than 1, it could be concluded that the consumption of D.
puntazzo and D. annularis caught in Sinop costs of the Black Sea, did
not pose any risk for the health of adult people as Cd, Hg, Pb, Cu, Zn
and Fe concentrations were concerned. A major task in evaluating
related hazards to people health from potentially damaging heavy
metals in fish is the data of the dietary intake of such contaminants
which must remain within determined safety allowances. Therefore, the
continuity of this kind of monitoring studies is extremely essential.
ACKNOWLEDGEMENT
This work was carried out at the Department of Hydrobiology,
Fisheries Faculty, University of Sinop.
REFERENCES
[1] Kevorkijan, V., (2012). Density-based Prediction of Aluminium
Content in Pressed Skulls of Aluminum Dross- Development of an
Industrial Measurement Procedure. Int. Journal For Industry,
Research an Application, (88):60-65.
[2] Bat, L., (2014). Heavy Metal Pollution in the Black Sea. In:
Düzgüneş, E., Öztürk, B., and Zengin, M., (Eds.). Turkish
Fisheries in the Black Sea. Published by Turkish Marine Research
Foundation (TUDAV), Istanbul, TURKEY.40, pp:71-107.
[3] Bat, L., (2017a). Pollution and Fishing. In: Black Sea and
Fishing Workshop Book. 13-14 October 2016, Sinop, In: Sezgin,
M., Şahin, F., and Özsandıkçı, U., (Eds.) University of Sinop
13. Bilimsel Yayın. Şimal Ajans; 21439, pp:17-54. (in Turkish).
[4] Bat, L., (2017b). The Contamination Status of Heavy Metals in
Fish from The Black Sea, Turkey and Potential Risks to Human
Health. In: Sezgin, M., Bat, L., Ürkmez, D., Arıcı, E., and
Öztürk, B., (Eds.). Black Sea Marine Environment: The Turkish
Shelf. Turkish Marine Research Foundation (TUDAV), Publication
No: 46, Istanbul, TURKEY, pp:322-418.
[5] Bat, L, and Arıcı, E., (2018). Chapter 5. Heavy Metal Levels in
fish, Molluscs, And Crustacea from Turkish Seas and Potential
Risk of Human Health. In: Holban, A.M., and Grumezescu, A.M.,
(Eds.) Handbook of Food Bioengineering, Food Quality: Balancing
Health and Disease. Elsevier, Academic Press, 13, pp:159-196.
[6] Bat, L., Öztekin, A., Şahin, F., Arıcı, E., and Özsandıkçı, U.,
(2018). An Overview of the Black Sea Pollution in Turkey.
MedFAR., 1(2):67-86.
[7] Bat, L., Şahin, F., and Öztekin, A., (2019a). Heavy Metal
Contamination of Pleuronectiformes Species from Sinop Coasts of
the Black Sea. Sustainability, Agri, Food and Environmental
Research 7(2):150-162.
[8] Bat, L., Şahin, F., Öztekin, A., Arıcı, E., and Yardım, O.,
(2019b). Assessment of Cd, Hg, Pb, Cu and Zn Amounts in Muscles
of Cyprinus carpio from Karasu Stream, Sinop. Curr Agri Res,
7(2), Available from: https://bit.ly/2XhjKVI.
[9] Commission Regulation (EC), (2006). Setting Maximum Levels for
Certain Contaminants in Food Stuffs. Commission Regulation (EC)

188
4th International Science Symposium (September 04-06, 2019),
Kiev-Ukraine (ISS2019), 5A10PB; pp:183-188.
No 1881/2006; Official Journal of the European Union, 364, pp:5-
24.
[10] FAO/WHO, (1989). Evaluation of Certain Food Additives and the Contaminants Mercury, Lead and Cadmium, WHO Technical Report.
No, 505.
[11] FAO/WHO, (2011). Joint FAO/WHO Food Standards Programme Codex Committee on Contaminants in Foods, Fifth Session, Working
Document for Information and Use in Discussions related to
Contaminants and Toxins in the GSCTFF, The Hague, The
Netherlands.
[12] Kucuksezgin, F., (2000). İzmir Körfezi’nde Tüketilen Balıklarda Iz Element Seviyeleri (Hg, Cd, Pb,Cr) ve Balık Boylarının Metal
Içeriğine Etkisi (in Turkish). Dokuz Eylul Universitesi Deniz
Bilimleri ve Teknolojisi Enstitusu, Piri Reis Rotasinda 25. Yıl
Sempozyumu, 22–24, Kasim 2000(in Turkish).
[13] MAFF (The Ministry of Agriculture, Forestry and Fisheries), (1995). Monitoring and Surveillance of Non-radioactive
Contaminants in the Aquatic Environment and Activities
Regulating the Disposal Wastes at Sea. Directorate of Fisheries
research, Lowestoft, Aquatic Environment Monitoring Report no,
44.
[14] Soliman, N.F. and Nasr, S.M., (2015). Metal Contents in Common Edible Fish Species And Evaluation of Potential Health Risks to
Consumers. Journal of Coastal Life Medicine, 3(12):956-961.
[15] Turkish Food Codex (FC), (2008). Communiqué on Maximum Limits of Contaminants in Foodstuffs. Published in the Official Gazette:
(in Turkish). Notification No: 2008/26, Issue: 26879.
[16] U.S. EPA (Environmental Protection Agency)., (2000). Supplementary Guidance for Conducting Health Risk Assessment of
Chemical Mixtures. National Center for Environmental Assessment,
Washington, DC, EPA/630/R00/002.
[17] U.S. Environmental Protection Agency IRIS, (2005). Lead. U.S. Environmental Protection Agency. Washington, DC: Integrated Risk
Information System. Available from: http://www.epa.gov/iris/.
[18] U.S. Department of Health and Human Services Public Health Service, (2007). Agency for Toxic Substances and Disease
Registry. Toxicological profile for lead. Atlanta, Georgia.
Available from: https://www.atsdr.cdc.gov/toxprofiles/tp13.pdf
(accessed 11.07.2019).
[19] U.S. Environmental Protection Agency (U.S. EPA), (2018). Integrated Risk Information System. Available from:
https://www.epa.gov/risk/regional-screening-levels-rsls-generic-
tables (accessed 11.07.2019).
[20] Uysal, H., Yaramaz, O., Tuncer, S., and Parlak, H., (1989). Ege Denizi Kıyılarında Pollüsyon Durumu, Organizma ve Ekosistem
Üzerindeki Etkileriyle Ilgili Araştırmalar. E.U. Su Ürünleri
Dergisi, 6, 144–159.

4th International Science Symposium Status: Proceeding Book
ISS2019 (September 4-6, 2019) ID : 2019.5A11PB
Ramazan Açıkgöz
University of Health Sciences, İstanbul-Turkey
Celal Ateş
Sıtkı Koçman University, Muğla-Turkey
Fatih Perçin,
Ege University, [email protected], İzmir-Turkey
HEALTH AND SAFETY IN LARGE SCALE FISHING BOATS
ABSTRACT
Marine fishing boats in Turkey consist of two parts; one of them
is small scale fisheries, 12m length, other is industrial fishing
vehicles called trawl and purse seine. Fishing activity is difficult
working area. Unsafety behaviors and positions arise many dangerous
and risky events. These situations lead to accidents and disease. For
sustainable fisheries, workers should be under safety and health
umbrella. According to Turkish statistics in 2018, 1569 large scale
fishing boat are being and 30878 employees are work in fishing area.
In the study, the survey was conducted face-to-face with a total of
356 fishermen at 105 boats. The questions of survey consist of:
Occupational health and safety education, occupational accidents,
occupational disease factors, and disease controls, awareness of
hazards and risks in workplace. Data are obtained simple randomly
sampling method. Hence, according to 6331 act in Turkey, it could be
determined whether safety materials, and machines in fishing boat, and
using personal protective equipment
Keywords: Fishing Boat, Health, Safety, Occupation
1. INTRODUCTION
Fishing is a vital activity not only providing animal protein
but also reducing human being hunger and poverty in the world.
Fisheries who are working on board fishing vessels are put at
environmental risks from the nature elements such as rolling and
pitching of vessel, heavy weather conditions, humidity, sea water and
extreme climate conditions [1, 2, 3, and 4]. Countries reports and
international organizations such as ILO and FAO show that fishing is
probably one of the most dangerous jobs in the world. The
International Labor Organization(ILO) and Food and Agriculture
Organization (FAO) estimate that 7% of all worker fatalities worldwide
occur in the fishing industry [4, 5, 6, 7, and 8]. Turkey as a
peninsula, due to surrounded by four seas named Black, Mediterranean,
Aegean and Marmara with a coastline over 8000km (approximately 5.000
sea miles) in length, fishing activity and industry are also important
for Turkey. Fishing is necessary, but also in term of sustainable
fishing, health and safety, social protection and insurance and
security are necessary for fisheries in Turkish fishing industry [2,
3, 5, 8, 9, and 10]. Last statistics data’s of TUİK (2018), and
various researchers from Turkey, indicated that are 13783 fishing
vessels as small scale below 12m and 1569 fishing vessels as large
scale 12m and over in length for sea catching. There are totally 15352
fishing vessel for sea water catching. Besides, there are 2656 fishing
vessel for inland water catching. According to the statistical
information available in Turkey, totally of 30878 people are employed
in the fishing vessels. 40% of the total employees are working on

190
4th International Science Symposium (September 04-06, 2019),
Kiev-Ukraine (ISS2019), 5A11PB; pp:189-192.
industrial fishing vessels in this study area [2, 3, 5, 8, and 10].
Research was carried out among fishermen on industrial fishing vessels
12m and over. In fact, occupational diseases, injuries and mortality
are existing among fisheries who are working on industrial fishing
vessels 12m and over in fishing industry. The research revealed that
employees are not aware of health and safety and facing various safety
risks.
2. RESEARCH SIGNIFICANCE
In the study, it will be determined occupational diseases,
injuries and mortality of fishery workers in fishing vessels 12m and
over. The limited research is available in Turkey about fisheries
health and safety. This research will be reference study about health
and safety of fisheries for designated sea areas.
3. EXPERIMENTAL METHODS
Industrial fishing vessels start to visit between April 2018 and
September 2019 in fishing ports in West Black Sea and Sea of Marmara.
The questionnaire survey is a very well-known and widely-used research
technique for quickly and efficiently gathering and analyzing data
from a population under this kind of study. A questionnaire prepared
for getting information’s about accidents, risks, awareness for health
and safety, social security etc. among fishermen who are working
industrial fishing vessels. Study carried out face to face interview
with fishermen. Demographic, socio-economic, maritime working
conditions and health surveys and variables were included in this
study. Face to face interviews carried out with fishermen by simple
random sampling method in study area. The data obtained from the
questionnaire were classified and analyzed with licensed SPSS 25
(Statistical Package for Social Sciences) software.
4. RESULTS
According to the statistical information available in Turkey,
totally of 30 878 people are employed in the fishing vessels. 40% of
the total employees are working on industrial fishing vessels in this
study area (Figure 1).
Figure 1. Survey Area of larga scale fishing boat in İstanbul

191
4th International Science Symposium (September 04-06, 2019),
Kiev-Ukraine (ISS2019), 5A11PB; pp:189-192.
All seafarer nationalities who are working flying Turkish Flag
were Turkish citizen. The ages of seafarer between 36 and 55 were
58.4% which is over half of all seafarer population on this study.
Ratios were 76.8% married, 88.8% of smoking and or alcohol habits,
84.8% of all fishermen educated in primary basic school. 98.4% of all
fishermen did not receive any vocational or site training. 94.4% of
all fishermen had an occupational disease which are not designated by
hospital. 56.8% percent of seafarer did not any coverage for social
protection and security.
4.1. Results of Survey Data
98.4 percent of fishermen indicate that health and safety policy
is not existing on board commercial vessels although mandatory
regulations are in force.
77.6 percent of fishermen do not know how to conduct risk
awareness, identification, assessment and control on board
fishing vessels (Figure 2).
100 percent of fishermen agree on importance of HSE on board
fishing vessels.
88 percent of fishermen are also agreeing that working
atmosphere at work place is very dangerous job.
Figure 2. Awareness to HSE (Health and Safety Environment)
5. CONCLUSION
“Health, Safety and Environment” in commercial fish catching
industry in which carry out activities by large scale fishing vessels
must have a HSE policy and follow rules, regulation, procedure and
recommendation which are in force [5, 7, 10, 11, and 12]. Fishermen
who are working on fishing vessels should be awareness of permit to
work, risk assessments, risk control, risk identifications. Some key
finding come out during this survey that 65 percent of fishermen in
round number were injured and fatalities while working on board
fishing vessels which are not reported [3, 11, 13, 14, 15, and 16].
Occupational health problem and injuries met during survey due to not
implementing HSE measures.
6. RECOMMENDATIONS
From survey those following recommendations are given decision
makers and fishing industry.
Fishing industry and owner of the fishing vessels should follow
and implement HSE legislation which is in force.
Permit to work system should be established as soon as possible.
Training needs of fishermen should be designated as required.
Awareness to HSE?
1,00 2,00 3,00

192
4th International Science Symposium (September 04-06, 2019),
Kiev-Ukraine (ISS2019), 5A11PB; pp:189-192.
Occupational injury and fatality reporting system should be
developed.
A special medical agency should be establishing for fishermen
and seafarer to follow occupational diseases.
REFERENCES
[1] EL-Saadawy, M.E., Soliman, N.E., El-Tayeb, I.M., and Hammouda,
M.A., (2014). Some Occupational Health Hazards Among Fishermen
in Alexandria City. Gaziantep Medical Journal, 20(1):71-78. DOI:
10.5455/GMJ-30-44689.
[2] Mert, B. ve Ercan, P., (2014). Su Ürünleri Sektöründe Iş Sağlığı
Ve Güvenliği Uygulamalarının Değerlendirilmesi. Türk Bilim
Araştırma Vakfı, 7(4):16-27.
[3] Perçin, F., Akyol, O., Davas, A., and Saygı, H., (2012).
Occupational Health of Turkish Aegean Small Scale Fishermen.
Occupational Medicine, 62:148-151. DOI:10.1093/occmed/kqr181
[4] Moreau, D.T.R. and Neis, B., (2009). Occupational Health and
Safety Hazards in Atlantic Canadian Aquaculture: Laying the
Groundwork for Prevention. Marine Policy. 33(2):401-411.
[5] Perçin, F., (2017). Accidents and Diseases of Fishermen in İzmir
Province. In: Fisheries of İzmir Province. Kınacigil, T.,
Tosunoğlu, Z., Çaklı, Ş., Bey, E., Öztürk, H., Eds., pp:179-187.
(ISBN: 978-975-18-0222-4) İzmir Büyükşehir Belediyesi Konak
İzmir (in Turkish).
[6] ILO, (2003). Global Strategy on Occupational Safety and Health,
Conclusions Adopted by the International Labour Conference at
Its 91st, Session, pp:3-4.
[7] Antonsen, S., (2009). Safety Culture: Theory, Method and
Improvement, Ashgate Publishing Limited, England.
[8] Fleming, M., (2001). Safety Culture Maturation Model HSE Books,
pp:3-6.
[9] TÜİK, (2018). Fishery Statistics 2013. Türkiye İstatistik
Kurumu, Ankara, Eylül 2014, 61 s.
[10] Akyol, O., Ceyhan, T., and İçlik, M.A., (2016). A Preliminary Study on Occupational Health and Accidents in İzmir Fish Market
Workers (in Turkish with English Abstract). Ege Journal of
Fisheries and Aquatic Sciences, 33(2):109-112. doi:
10.12714/egejfas.2016.33.2.03.
[11] Tokaç, A., Ünal, V., Tosunoğlu, Z., Akyol, O., Özbilgin, H. ve Gökçe, G., (2010). Ege Denizi Balıkçılığı. IMEAK Deniz Ticaret
Odası İzmir Şubesi Yayınları, İzmir 138-143s.
[12] Ulukan, U., (2016). Balıklar, Tekneler ve Tayfalar: Türkiye’de Balıkçılık Sektöründe Çalışma ve Yaşam Koşulları. Çalışma ve
Toplum Dergisi, 2016(1):115-141.
[13] Myers, M.L. and Durborow, R.M., (2012). Aquacultural Safety and Health. In Health and Environment in Aquaculture. InTech.pp.385-
400.
[14] Myers, M.L., (2010). Review of Occupational Hazards Associated with Aquaculture. Journal of Agromedicine. Vol:15, pp:412-426.
[15] Perçin, F., (2018a). Job Safety and Accidents in Marine Fish Farms (Sea Bream/Sea Bass) in İzmir/Turkey. Qualitative Studies,
13(4):30-32. DOI: 10.12739/NWSA.2018.13.4.E0038.
[16] Perçin, F., (2018b). Bir Balıkçı Barınağı Çalışma Alanı Risk Faktörleri: İzmir İli Örneği. Ziraat Mühendisliği, 366, 28-38.
DOI: 10.33724/zm.505580.

4th International Science Symposium Status: Proceeding Book
ISS2019 (September 4-6, 2019) ID : 2019.1A21PB
İlyas Çelik
Merve Özer
Pamukkale Üniversitesi, [email protected], Denizli-Turkey
FARKLI FORMÜLASYONDA TATLI MAKARNA ÜRETİMİ VE BAZI KARAKTERİSTİK
ÖZELLİKLERİN BELİRLENMESİ
ÖZ
Bu çalışmada, farklı formülasyonlarda üretilen tatlı makarnalarda
bazı tekstür, fiziksel, kimyasal ve duyusal
özellikleri belirlenmiştir. Kakaolu makarnalarda su absorpsiyonu,
kabarma oranı, renk L değeri, kül değerleri diğer makarnalara göre
yüksek sonuçlar bulunmuştur. Hacim artışı ve duyusal analiz sonucunda
örnekler arasında fark bulunmamıştır. Tekstür özelliği açısından
kakaolu ve tahin ilaveli makarnalarda yapışkanlık, yayılma ve
çiğnebilirlik özeliklerinde, kakolu makarnalarda ise sadece sertlik ve
sakızımsılık değerlerinde diğer uygulama makarnalara göre daha yüksek
değerler elde edilmiştir. Duyusal analizde panalistler
tarafından hindistan cevizli makarna tekstür yapısı dışında diğer
özellikler yakın bir değerlendirme yapılmış ve elde edilen sonuçlar
ortalama değerlerin üzerinde kalmıştır.
Anahtar Kelimeler: Makarna, Tekstür, Hindistan Cevizi,
Kakao, Ceviz
PRODUCTION OF SWEET PASTA IN DIFFERENT FORMATION AND DETERMINATION OF
SOME CHARACTERISTIC PROPERTIES
ABSTRACT
In this study, some textures, physical, chemical and sensory
properties of sweet pastas produced in different formulations were
determined. Water absorption, swelling rate, color L value, ash values
of cocoa pasta were higher than other pasta. No difference was found
between the samples as a result of volume increase and sensory analysis.
In terms of texture properties, higher values were obtained in the
stickiness, spread and chewability properties of cocoa and tahini added
pasta and in hardness and guminess values of cocoa pasta compared to
other application pasta. In sensory analysis, other features except for
coconut pasta texture texture were made close by the panalists and the
results were above the average values.
Keywords: Pasta, Texture, Coconut, Cocoa, Walnut

194
4th International Science Symposium (September 04-06, 2019),
Kiev-Ukraine (ISS2019), 1A21PB; pp:193-199.
1. GİRİŞ (INTRODUCTION)
M.Ö. 1700 yıllarında Çin'de kullanıldığı tahmin edilen makarnanın
1292 yılında Marco Polo tarafından, bugün makarnanın anavatanı sayılan
İtalya'ya getirildiği sanılmaktadır. İtalya da hızla gelişen makarna
üretimi kısa zamanda diğer Avrupa ülkelerine yayılmıştır. A.B.D'ye göç
eden İtalyanlar (1789), beraberinde makarnayı da götürmüşler, böylece
A.B.D’de makarna ile tanışmıştır [1, 2 ve 3].
Gıda Kodeksinde makarna; Triticum durum buğdayından üretilen
irmiğe su katılıp tekniğine uygun yoğrularak hazırlanan hamurun
şekillendirilip kurutulmasıyla elde edilen bir ürün olup; sade, tam
buğday, çeşnili, zenginleştirilmiş ve güçlendirilmiş olarak
adlandırılmaktadır [4]. Aynı zamanda un yumurta ve su karışımından elde
edilebilen makarnalar kuru ve taze olmak üzere ikiye ayrılmaktadır.
Makarna çeşitleri; sade makarna, tam buğday makarnası, çeşnili makarna,
güçlendirilmiş makarna ve Triticum durum buğday irmiğinden tekniğine
uygun olarak üretilen makarna hamuruna, tiamin, riboflavin, niasin,
folik asit, demir karışımı ve/veya vitamin D ve/veya kalsiyum katılarak
şekillendirilip, kurutulmasıyla elde edilen zenginleştirilmiş makarna
bulunmaktadır [5].
Makarna, düşük yağ, sodyum ve kolestrol değerlerine sahip olduğu
ve yapısında bulunan kompleks karbonhidratların hızlı bir şekilde
parçalanıp enerjiye dönüşmesi nedeniyle önemli bir enerji kaynağıdır[6].
Ayrıca Makarna düşük glisemik indeksine sahip olduğu için kan şekerinin
yükselmesine neden olmamaktadır [7].
Makarna pişirilirken besin kaybının az olması, enerji verici
olması ve kolay hazırlanabilen bir besin olması, annelerin çocuklarının
beslenmesi için makarnayı seçmesine sebep olmaktadır.
Makarna çocukların günlük enerji ihtiyacının karşılanması için
uygun bir karbonhidrattır. Çocuk yaştaki bireylerin gün içinde ihtiyaç
olan enerjiyi düşünecek olursak makarna çocuklar için tatlı makarna güzel
bir lezzet olacak ve kaybolan enerjiyi çocuklara geri verecektir [8].
Çocukta enerji alımı, normal büyüme ve gelişmeyi sağlayacak düzeyde
tüketime eşit olmalıdır. Bu dengenin kurulması çocuğun fiziksel ve ruhsal
sağlığı açısından çok önemlidir. Yeterli ve dengeli enerji alan
çocuklarda ağırlık ve boy uygun seviyelerde ilerlemektedir. Okul çağı
çocuğunun beslenmesinde karbonhidrat alımı arttırılmalıdır[18].
Yakın zamanda makarna üzerinde zenginleştirme üzerine çalışmalar
yoğunlaşmış, öne çıkan bazı çalışmalar; Soğan tozunun makarnada işleme
etkisi incelenmiş [9], beyaz fasulye, nohut ve sarı mercimek ile
zenginleştirilmiş makarna ürünlerinin bazı özellikleri değerlendirilmiş
[10], acı bakla ve bezelye unlarının protein kalitesinin işleme etkisini
incelenmiş[11],yüksek aleuronca zengin bir un makarna üretiminde
kullanılmış ve makarna kalitesine etkisi araştırılmıştır [12].
2. ÇALIŞMANIN ÖNEMİ (RESEARCH SIGNIFICANCE)
Çocukların şeker, tatlı, pasta, çikolata gibi yiyeceklere olan
ilgilerinden yola çıkarak, onların hem seveceği hem de günlük enerji
ihtiyacını karşılayabilecek, ilgilerini çekecek bir makarna çeşidini
geliştirmektir.
Çocuklar şekerleme, çikolata gibi kolay kolay vazgeçemediği bu
ürünleri sık tüketimi sonucu diş sağlığında sıkıntı ve obezite potensiyel
olma durumu ile karşı karşıya kalma durumları artmaktadır. Tatlı makarna
ürünü ile böyle bir sorunu da sınırlandıracaktır. Ayrıca üretilen tatlı
makarnanın; fiziksel, tekstür ve duyusal özelliklerinin saptanması ile
makarnaya farklı bir boyut katarak, tatlı makarnanın makarnacılık
sektörüne kazandırılması ile bu sektörde mevcut piyasa hareketliliği
olumlu yönde etkileyecektir.

195
4th International Science Symposium (September 04-06, 2019),
Kiev-Ukraine (ISS2019), 1A21PB; pp:193-199.
3. DENEYSEL ÇALIŞMA (EXPERIMENTAL STUDY)
Materyal: Tatlı makarna üretiminde un, yumurta, pudra şekeri,
kakao, tahin, hindistan cevizi ve ceviz kullanılmıştır. Kullanılan
Triticum durum irmiği 125-400μ granülasyon iriliğinde olup
Pastavilla İşletmesinden (Bornova/İzmir) temin edilmiştir.
Yumurta, tahin, pudra şekeri, tarçın, kakao, hindistan cevizi ve
ceviz içi yerel marketlerden temin edilmiştir.
Metod: Araştırmada Tablo 1'de gösterilen dört farklı
formülasyonlar (kakao, tahin, hindistan cevizi ve ceviz içi)
kullanılmış ve üretim iki tekerrürlü olarak yürütülmüştür.
Tablo 1. Farklı tatlı makarna formülasyoları
(Table 1. Different sweet pasta formulations)
Bileşeneler
(%)
Kakaolu Tatlı
Makarna
Tahinli Tatlı
Makarna
Hindistan
Cevizli Tatlı
Makarna
Cevizli Tatlı
Makarna
İrmik 58.16 58.16 58.16 58.16
Pudra Şekeri 14.54 14.54 14.54 14.54
Yumurta 21.81 21.81 21.81 21.81
Tarçın 0.04 0.04 0.04 0.04
Kakao 5.45 - - -
Tahin - 5.45 - -
Hindistan Ceviz - - 5.45 -
Ceviz içi - - - 5.45
Tatlı makarna hamurlarının hazırlanmasında; malzemeler yoğurucunun
(KithcenAid, Belçika) düşük devirde 2 dakika karışması sağlanmış,
ardından yüksek devirde sert bir hamur elde edilinceye kadar 15 dakika
yoğrulmuştur. Elde edilen hamur 50g‘lık bezeler halin e getirildikten
sonra şekil verici makinede (Atlas-Deluxe) önce 6mm'ye kadar inceltilmiş
sonra düz kesim yapılarak hamurun şekil alması sağlanmıştır [13]. Şeklini
alan taze makarnalar oda koşullarında 1 gün kurumaya bırakılmıştır. Tatlı
makarna örnekler analizlerde kullanılmak üzere polietilen torbalarda oda
koşullarında muhafaza edilmiştir.
Fiziksel ve Kimyasal Analizler: Tatlı makarnalarda % kül tayini,
su tayini, renk analizi AOAC (1990)’a göre gerçekleştirilmiş kül
sonuçlar kuru madde üzerinden verilmiştir. Makarna kalitesini
belirlemede, pişirme süresi 6 dakikada yapılmıştır. Daha sonra
pişen makarnada hacim artışı ve su absorpsiyon değerleri
belirlenmiştir [14].
Kabarma Oranı ve Su Yüzdesi: Kabarma oranını hesaplamak için;
makarna hamurları 5x8cm olacak şekilde kesilip kurutulmuştur.
Kurutulan makarnalar dijital kumpas (Mitutoyo) ile en, boy ve
kalınlık değerler mm cinsinden ölçülmüştür. Ölçülen makarnalar
kaynayan suda 6 dakika pişirilip, tekrar kumpas cihazı ile
ölçülmüştür. Bulunan değerin kuru ve yaş olmak üzere alanları
bulunmuştur. Bu değerler oranlanıp, sonuç hesaplanmıştır. Aynı
işlem kesilip kurutulan makarnalar kuru tartılmış, pişirildikten
sonra tekrar tartılmış ve bulunan sonuçlar oranlanarak su yüzdesi
hesaplanmıştır.
Tekstür TPA Analizleri: Tekstür TPA analizinde; Brookfield CT3
(Brookfield Engineering Laboratories Inc., ABD) cihazında TA43
başlığı, Target 3.0mm, Trigger load 50.0g ve test hızı 1.00mm/sn
şartlarında pişmiş makarna hamurlarının; sertlik, yapışkanlık,
yayılma, sakızımsılık ve çiğnenebilirlik değerleri ölçülmüştür
[15].
Duyusal Analizler: Gıda mühendisliği bölümü akademisyen ve
öğrencilerden oluşan 40 katılımcı belirlenmiştir. Hazırlanan tatlı
makarna üzerinde tat, koku, renk, yapı, çiğnenebilirlik ve genel

196
4th International Science Symposium (September 04-06, 2019),
Kiev-Ukraine (ISS2019), 1A21PB; pp:193-199.
beğeni gibi özellikleri üzerinde durum hedonik skala testi 0 (en
az beğenilen) ile 7 (en çok beğenilen) arasında puan vererek
değerlendirilmiştir [16].
Veri Analizi: Analiz sonrası elde edilen veriler SPSS programı
kullanılarak analiz edilmiştir. Farklı olan ortalamaların
belirlenmesinde α=0.05 seviyesi alınarak Duncan testi
kullanılmıştır [17].
4. BULGULAR VE TARTIŞMA (RESULTS AND DISCUSSION)
4.1. Analitik Sonuçlar (Analytical Results)
Gerçekleştirilen fiziksel analiz sonuçlarında; su yüzdesi olarak
kakaolu makarnanın diğer makarnalara göre daha düşük değer almıştır
(p<0.05). Diğer makarnalarda yüksek çıkmasında yağ oranının kakaoluya
göre daha yüksek olması etkili olmuştur (Tablo 2). Hacim artışı olarak
makarnalar arasında deskriptif olarak fark gözükürken istatistiksel
olarak fark görülmemiştir (p>0.05).
Tablo 2. Tatlı makarnada fiziksel analiz sonuçları
(Table 2. Physical analysis results in sweet pasta)
Makarna
Çeşitleri Su(%)
Hacim
Artışı(%)
Su
Absorpsiyonu(%)
Kabarma
Oranı(%) Kül(%)
Kakaolu
Tatlı
Makarna
10±0.2b 100±57 90±4a 51±13a 1.294±0.146a
Tahinli
Tatlı
Makarna
11±0.2a 120±7 90±6a 45±6ab 1.102±0.008ab
Hindistan
Cevizli
Tatlı
Makarna
11±0.2a 88±18 69±1b 17±1c 0.956±0.023b
Cevizli
Tatlı
Makarna
12±0.2a 95±7 69±8b 26±10bc 0.945±0.140b
Analizde; su absorpsiyonu olarak ceviz ve hindistan cevizli
makarnalar daha düşük değer vermiştir (p<0.05). Buna neden olarak diğer
makarnalara oranla fazla yağ içerdikleri, az miktarda kuru madde içermesi
ve parçacık halinde oldukları için su absorplanmalarının daha az
oluşmasında etkili olduğu söylenebilir. Kabarma oranında ise; kakao en
yüksek değeri almıştır (p<0.05). Kakaonun kuru madde oranı yüksek olması
etkili olmuştur. Kül analizinde; kakaolu tatlı makarna en yüksek değeri
almıştır (p<0.05). Kakao da diğer ürünlere göre mineral madde oranı daha
fazla olduğu için yüksek değer alınmıştır.
4.2. Tatlı Makarnada Renk Değerleri Sonuçları
(Color Values Results in Sweet Pasta)
Tatlı makarna hamurlarında yapılan renk analizinde; kakaolu tatlı
makarna hamuru en düşük değeri almıştır (p<0.05). Bunun nedeni ise
kakaonun koyu bir renkte olmasıyla oluşan hamur üzerinde de etkili olmuş
ve L değerini düşürmüştür (Tablo 3). Kakaolu tatlı makarna hamuru ve
tahinli tatlı makarna hamurunda a değerleri diğerlerine göre belirgin
olarak (p<0.05) daha yüksek renk almıştır. Bunun neden ise kakao ve
tahinde kırmızı renk pigmentli bileşiklerin daha fazla bulunmasıdır.
Kakaolu tatlı makarna hamurunun b değeri diğerlerine göre belirgin olarak
daha düşüktür (p<0.05). Kakaolu tatlı makarna hamurunda kakao
kullanıldığı için irmiğin verdiği o sarı rengin ortadan kalkıp koyu bir
renk almasından dolayı b değerinin düşük çıktığı düşünülmektedir.

197
4th International Science Symposium (September 04-06, 2019),
Kiev-Ukraine (ISS2019), 1A21PB; pp:193-199.
Tablo 3. Tatlı makarna hamurunda renk değerleri sonuçları
(Table 3. Results of color values in sweet pasta dough)
Makarna Çeşitleri L a b
Kakaolu Tatlı Makarna 15.71±2.18b 4.50±0.11a 3.97±0.59c
Tahinli Tatlı Makarna 40.10±0.09a 4.32±0.14a 17.06±0.18ab
Hindistan Cevizli Tatlı Makarna 43.40±0.06a 3.61±0.09b 17.62±0.21a
Cevizli Tatlı Makarna 40.93±0.86a 3.57±0.29b 16.26±0.13b
4.3. Tekstür TPA Analiz Sonuçları (Results of Texture TPA Analysis)
Yapılan sertlik analizinde; kakaolu tatlı makarna diğerlerine göre
en yüksek değeri alınırken en düşük serlik değeri cevizli tatlı makarna
vermiştir (p<0.05) Yapışkanlık ve yayılma değerlerinde hindistan cevizli
tatlı makarna ve cevizli tatlı makarnanın yapışkanlığı diğerlerine göre
düşük değer almıştırlar (p<0.05). Hindistan cevizli tatlı makarna ve
cevizli tatlı makarnanın yapısında parçacıklar bulunmasından dolayı
makarnanın iç bağ gücünün düşük olmasından kaynaklanmıştır.
Sakızımsılık analizinde; Kakaolu tatlı makarna diğerlerine göre en
yüksek puan almıştır (p<0.05) (Tablo 4). Kakaolu tatlı makarnanın kuru
madde oranı fazla olması, çok miktarda su emmesinden dolayı diğer
makarnalara göre daha ser ve elastiki yapı düşük olup yüksek değer
alınmıştır.
Çiğnemenebilirliğinde ise hindistan cevizli tatlı makarna ve
cevizli tatlı makarnanın çiğneme enerjisi diğerlerine göre düşük puan
alınmıştır (p<0.05). Hindistan cevizli tatlı makarna ve cevizli tatlı
makarnanın yapısı biraz daha yumuşak ve elastikiyeti az olmasından dolayı
çiğnemede enerji değeri düşük çıkmasında etkili olmuştur.
Tablo 4. Tatlı makarnada tekstür TPA analiz sonuçları
(Table 4. Texture thrust analysis results in sweet pasta)
4.4. Duyusal Analiz Sonuçları (Result of Sensory Analysis)
Gerçekleştirilen duyusal analizde; renk özelliği dikkate
alındığında renk puanları (4,55 - 5,10 ) belirlendi. Tatlı makarnalarda
renk, koku, çiğneme, lezzet ve genel beğeni olarak belirgin bir farklılık
görülmemiştir (p>0.05). Ancak tekstür özelliği açısından panelistler
cevizli tatlı makarnayı en az puanlama ile değerlendirmişlerdir (P<0.05)
(Tablo 5). Bunun nedeni ceviz ve hindistan cevizinin içinde parçacık
olmasıyla ilişkili olabileceği düşünülmüştür.
Tablo 5. Duyusal analiz sonuçları
(Table 5. Result of sensory analysis)
Makarna Çeşitleri Renk
(0-7 P)
Tekstür
(0-7 P)
Koku
(0-7 P)
Çiğneme
(0-7 P)
Lezzet
(0-7 P)
Genel Beğeni
(0-7 P)
Kakaolu Tatlı Makarna 5.0±0.1 5.1±0.1a 4.9±0.2 5.0±0.1 4.4±0.2 4.6±0.1
Tahinli Tatlı Makarna 5.1±0.3 5.1±0.1a 4.8±0.2 4.9±0.2 4.2±0.3 4.4±0.1
Hindistan Cevizli
Tatlı Makarna 4.9±0.1 5.1±0.1ab 4.7±0.3 4.9±0.1 4.6±0.2 4.7±0.1
Cevizli Tatlı Makarna 4.5±0.6 4.8±0.1b 4.8±0.4 4.8±0.4 4.4±0.4 4.45±0.3
Makarna Çeşitleri
Tekstür TPA Analizleri
Sertlik
(g)
Yapışkanlık
(g)
Yayılma
(mm)
Sakızımsılık
(g)
Çiğnenebil
irlik (mj)
Kakaolu Tatlı Makarna 198±2 a 0.8±0.02 a 2.5±0.1 a 157±5 a 3.7±0.3 a
Tahinli Tatlı Makarna 155±18 ab 0.8±0.05 a 2.3±0.2 a 118±21 b 3.0±1.0 a
Hindistan Cevizli
Tatlı Makarna 190±6 ab 0.2±0.02 b 1.6±0.2 b 34±4 c 0.6±0.1 b
Cevizli Tatlı Makarna 153±24 b 0.2±0.01 b 1.8±0.1 b 34±5 c 0.6±0.1 b

198
4th International Science Symposium (September 04-06, 2019),
Kiev-Ukraine (ISS2019), 1A21PB; pp:193-199.
5. SONUÇ VE ÖNERİLER (CONCLUSIONS AND RECOMMENDATIONS)
Yapılan fiziksel analizlerde su yüzdesi değeri; kakaolu tatlı
makarnada düşük, tahinli, hindistan cevizli ve cevizli tatlı
makarnalarda yüksek olduğu belirlenmiştir. Kül analizinde; kakaolu tatlı
makarnan en yüksek değeri almıştır.
Renk analizleri sonucunda; L değerleri incelendiğinde kakaolu
tatlı makarnanın diğer tatlı makarnalara göre daha yüksek değer elde
edilmesi beklenen bir durum olup kakaolu tatlı makarna hamuru ile tahinli
tatlı makarna hamurunun a değerleri diğerlerine göre en yüksek değer
almıştır. Kakaolu tatlı makarna hamurunun b değeri en düşük değeri
almıştır.
Gerçekleştirilen tekstür TPA analizinde sertlik değeri; kakaolu
tatlı makarnanın diğerlerine göre en yüksek değeri vermiş yapısal olarak
daha sert bir yapıda hamur vermiştir.
Yapışkanlık değerleri hindistan cevizli tatlı makarna ve cevizli
tatlı makarnanın yapışkanlığı diğerlerine göre en düşük puanı alması bu
tip makarna üretiminde işleme safhasında zorluklar yaşanmasınada sebep
olmuştur hindistan cevizli tatlı makarna ve cevizli tatlı makarnanın
çiğneme enerjisi diğerlerine göre en düşük çıkmıştır.
Tatlı makarnalarda duyusal özelliklerinde panalistlerin
değerlendirmesi ortalamaların üzerinde kalırken renk, koku, çiğneme,
lezzet ve genel beğeni olarak istatiksel açıdan belirgin bir fark
görülmemiştir. Ancak tekstür özelliği açısından panelistler cevizli
tatlı makarnayı en az puanlama ile değerlendirmişlerdir.
Yapılan çalışma sonucunda kakaolu ve tahinli tatlı makarna
üretilmesinin diğer uygulamalara göre daha yüksek potansiyele sahip
olduğu sonucuna varılmıştır.
KAYNAKLAR (REFERENCES)
[1] Alexander, D., (2000). The Professional Geographer. The
Geography of Italian Pasta. 52(3):553–566.
[2] McClatchey, C., (2011). “How Pasta Became the World’s Favourite
Food”. BBC News Magazine Retrieved 23 March 2012,
http://www.bbc.com/news/magazine-13760559.
[3] Anonim, (2010a). Türkiye Makarna Sektörü Raporu, Türkiye Makarna
Sanayiciler Derneği, S:4-6, Ankara.
[4] Anonim, (2002). Türk Gıda Kodeksi Makarna Tebliğ, Tebliğ
No:2002/20, Tebliğ Sayısı: 24686.
[5] Usta, H., (2002). İstanbul Ticaret Odası. Makarna Sektörü Profil
Araştırması, S:4,İstanbul.
[6] Gallegos-Infante, J.A., Rocha-Guzman, N.E., Gonzalez-Laredo,
R.F., Ochoa-Martínez, L.A., Corzo, N., Bello-Perez, L.A.,
Medina-Torres, L., and Peralta-Alvarez, L.E., (2010). Quality of
Spaghetti Pasta Containing Mexican Common Bean Flour (Phaseolus
vulgaris L.). Food Chemistry 119(4):1544–1549.
[7] Barkeling, B., Granfelt, Y., Björck, I., and Rössner, S.,
(1995). Effects of Carbohydrates in the Form of Pasta and Bread
on Food Intake and Satıety in Man. 15(4):467-476.
[8] Anonim, (2014). Türkiye Halk Sağlığı Kurumu-Obezite, Diyabet ve
Metabolik Hastalıklar Daire Başkanlığı, Ankara.
[9] Rajeswari, G., Susana, S., Prabhasankar, P., and Venkateswara,
G., (2013). Influence of Onion Powder and Its Hydrocolloid
Blends on Pasta Dough, Pasting, Microstructure, Cooking and
Sensory Characteristics-Food Bioscience. 4:13-20.
[10] Wójtowicz, A. and Mościcki, L., (2014). Influence of Legume Type and Addition Level on Quality Characteristics, Texture and
Microstructure of Enriched Precooked Pasta-Food Science and
Technology 59(2):11175–1185.

199
4th International Science Symposium (September 04-06, 2019),
Kiev-Ukraine (ISS2019), 1A21PB; pp:193-199.
[11] Martı´nez-Villaluenga, C., Torres, A, Frias, J., and Vidal-Valverde, C., (2010). Semolina Supplementation with Processed
Lupin and Pigeon pea Flours Improveprotein Quality of Pasta.
Food Science and Technology 43:617–622
[12] Bagdi, A., Szabó, F., Gere, A., Kókai, Z., Sipos, L. ve Tömösközi, S., (2014). Effect of Aleurone-rich Flour on
Composition, Cooking, Textural, and Sensory Properties of Pasta.
LWT-Food Science and Technology 59(2):996-1002
[13] Anonim, (2015). Pasta. http://www.recipetips.com. [14] Elgün, A., Certel, M., Ertugay, Z. ve Kotancılar, H.G., (2011).
Tahıl ve Ürünlerinde Analitik Kalite Kontrolü ve Laboratuvar
Uygulama Klavuzu, Atatürk Üniversitesi Ziraat Fakültesi
Yayınları No: 335, Erzurum, 48, 49, 230, 238, 231. 232s.
[15] Tudorica, C.M., Kuri, V., and Brennan, C.S., (2002). Nutritonal and Physicochemical of Dieatary Fiber an Riched Pasta. Jurnal of
Agricultural and Food Chemistry 50: 347-356.
[16] Onoğur A.T, Elmacı Y., (2011). Gıdalarda Duyusal Değerlendirme Ege Üniversitesi Mühendislik Fakültesi Gıda Mühendisliği Bölümü
35100 Bornava-İzmir. Yayın No:010-1B 66s.
[17] Anonim, (2010b). SPSS for Windows 11,5 http://www.spss-for-windows.software. informer.com/ 11.5
[18] Karaağaoğlu, N., (2008). İlköğretim Çocukları İçin Sağlıklı Beslenme Sağlık Bakanlığı Yayın No: 726.