Elucidation and in planta reconstitution of the parthenolide biosynthetic pathway

Seediscussions,stats,andauthorprofilesforthispublicationat:http://www.researchgate.net/publication/280870037
Isolation,Characterization,CrystalStructureElucidationofTwoFlavanonesandSimultaneousRP-HPLCDeterminationofFiveMajorCompoundsfromSyzygiumcampanulatumKorth
ARTICLEinMOLECULES·AUGUST2015
ImpactFactor:2.42·DOI:10.3390/molecules200814212·Source:PubMed
8AUTHORS,INCLUDING:
AbdulHakeemMemon
UniversityofScienceMalaysia
3PUBLICATIONS2CITATIONS
SEEPROFILE
ZhariIsmail
UniversityofScienceMalaysia
145PUBLICATIONS807CITATIONS
SEEPROFILE
FouadSaleihAl-Suede
UniversityofScienceMalaysia
18PUBLICATIONS43CITATIONS
SEEPROFILE
AminMalikShahAbdulMajid
UniversityofScienceMalaysia
157PUBLICATIONS421CITATIONS
SEEPROFILE
Availablefrom:FouadSaleihAl-Suede
Retrievedon:26August2015
Molecules 2015, 20, 14212-14233; doi:10.3390/molecules200814212
molecules ISSN 1420-3049
www.mdpi.com/Journal/molecules
Article
Isolation, Characterization, Crystal Structure Elucidation of Two Flavanones and Simultaneous RP-HPLC Determination of Five Major Compounds from Syzygium campanulatum Korth
Abdul Hakeem Memon 1, Zhari Ismail 1,*, Fouad Saleih Resq Al-Suede 2, Abdalrahim F. A. Aisha 1,
Mohammad Shahrul Ridzuan Hamil 1, Mohammed Ali Ahmed Saeed 1, Madeeha Laghari 3
and Amin Malik Shah Abdul Majid 2
1 Department of Pharmaceutical Chemistry, School of Pharmaceutical Sciences,
Universiti Sains Malaysia, 11800-Minden, Penang, Malaysia;
E-Mails: [email protected] (A.H.M.); [email protected] (A.F.A.A.);
[email protected] (M.S.R.H.); [email protected] (M.A.A.S.) 2 EMAN Research and Testing Laboratory, School of Pharmaceutical Sciences,
Universiti Sains Malaysia, 11800-Minden, Penang, Malaysia;
E-Mails: [email protected] (F.S.R.A.-S.); [email protected] (A.M.S.A.M.) 3 Department of Pharmaceutical Technology, School of Pharmaceutical Sciences,
Universiti Sains Malaysia, 11800-Minden, Penang, Malaysia; E-Mail: [email protected]
* Author to whom correspondence should be addressed; E-Mail: [email protected];
Tel.: +60-46577-888 (ext. 2242); Fax: +60-46570-017.
Academic Editor: Isabel C. F. R. Ferreira
Received: 24 May 2015 / Accepted: 6 July 2015 / Published: 4 August 2015
Abstract: Two flavanones named (2S)-7-Hydroxy-5-methoxy-6,8-dimethyl flavanone (1),
(S)-5,7-dihydroxy-6,8-dimethyl-flavanone (2), along with known chalcone, namely, (E)-2ʹ,4ʹ-
dihydroxy-6ʹ-methoxy-3ʹ,5ʹ-dimethylchalcone (3) and two triterpenoids, namely, betulinic
and ursolic acids (4 and 5), were isolated from the leaves of Syzygium campanulatum Korth
(Myrtaceae). The structures of compounds (1 and 2) were determined on the basis of
UV-visible, FTIR, NMR spectroscopies and LC-EIMS analytical techniques. Furthermore,
new, simple, precise, selective, accurate, highly sensitive, efficient and reproducible RP-HPLC
method was developed and validated for the quantitative analysis of the compounds (1–5)
from S. campanulatum plants of five different age. RP-HPLC method was validated in terms
of specificity, linearity (r2 ≤ 0.999), precision (2.0% RSD), and recoveries (94.4%–105%).
The LOD and LOQ of these compounds ranged from 0.13–0.38 and 0.10–2.23 µg·mL−1,
OPEN ACCESS

Molecules 2015, 20 14213
respectively. Anti-proliferative activity of isolated flavanones (1 and 2) and standardized
extract of S. campanulatum was evaluated on human colon cancer (HCT 116) cell line.
Compounds (1 and 2) and extract revealed potent and dose-dependent activity with IC50
67.6, 132.9 and 93.4 µg·mL−1, respectively. To the best of our knowledge, this is the first study
on isolation, characterization, X-ray crystallographic analysis of compounds (1 and 2) and
simultaneous RP-HPLC determination of five major compounds (1–5) from different age of
S. campanulatum plants.
Keywords: Syzygium campanulatum Korth; secondary metabolites; X-ray crystallography;
RP-HPLC
1. Introduction
The Syzygium genus (Myrtaceae) comprises about 1200 species, and has high levels of diversity.
It is widely distributed from Malaysia to north-eastern Australia [1]. It is reported that the genus
Syzygium is rich in secondary metabolites such as terpenoids [2,3], phenylpropanoids [4], chalcones [5],
flavonoids [6], lignans [7], alkyl phloroglucinols [8], hydrolysable tannins and chromone derivatives [9].
Therapeutically, Syzygium genus is used in the treatment of rheumatism [10], haemorrhage, GIT
disorders [11], diabetes [12], inflammation, allergy [13,14], convulsion [15], hypertension [16] and
bacterial infections [17]. Despite its wide distribution, scientific research about S. campanulatum is
scarce. Memon et al., 2014 reported isolation, characterization, crystal structure elucidation, and
anticancer effect of dimethyl cardamonin isolated from Syzygium campanulatum Korth [5]. Aisha et al.,
2013 reported anti-angiogenesis and antitumor effects of Syzygium campanulatum extracts [18].
Furthermore, previous work conducted by our research group indicated Syzygium aromaticum extracts
as a good source of betulinic acid with potential anti-breast cancer effect [3]. The present study was
conducted in order to further analyze the phytochemical profile of S. campanulatum including: isolation
and characterization of new compounds from leaves extracts and development of reverse phase high
performance liquid chromatography (RP-HPLC) method for the quantitative determination of the
major secondary metabolites in S. campanulatum extracts. It was reported that the environmental
conditions affect the formation of secondary metabolites which are found mostly in young and actively
growing tissues [19]. Therefore, this study also aimed to investigate the effect of age of S. campanulatum
shrub on the concentration of its active ingredients. The isolated compounds were characterized by
HPLC, LCMS, X-ray crystallography and NMR. A new, rapid, accurate, precise, robust and reproducible
RP-HPLC method has been developed and validated for simultaneous determination of five major
compounds in S. campanulatum extracts. The developed HPLC method was applied in studying the
effect of plant’s age on the concentration of its major compounds.

Molecules 2015, 20 14214
2. Results and Discussion
The crude extract n-hexane:methanol (1:1) of dried green leaves of S. campanulatum was extracted
using soxhletion. The crude extract was subjected to flash column chromatography using increasing
concentration of ethyl acetate in n-hexane starting with 100% n-hexane. Nineteen fractions were
obtained: the white, yellow, yellow orange and white solid appeared in fractions 16–17, 6, 7–8 and 12–14
(obtained in n-hexane:ethyl acetate 60:40, 92:8, 85:15, and 60:40), respectively. All solid compounds
were re-crystallized using a mixture of acetone, methanol: n-hexane and methanol. White, yellow,
yellow orange and white needle type crystals of compounds (1–4), respectively were obtained.
The UV-Vis spectra of compounds (1–5) showed absorption at λmax 330 and 210 nm (Figure 1).
Figure 1. UV-spectra of compounds: (2S)-7-Hydroxy-5-methoxy-6,8-dimethyl flavanone
(1), (S)-5,7-dihydroxy-6,8-dimethyl flavanone (2), (E)-2ʹ,4ʹ-dihydroxy-6ʹ-methoxy-3ʹ,5ʹ-
dimethylchalcone (3), Betulinic acid (4) Ursolic acid (5) and (E)-2ʹ,4ʹ-dihydroxy-6ʹ-
methoxy chalcone (6).
FTIR spectrum of compound (1 and 2) showed a strong and sharp vibrational band at 3260–3263 cm−1
that indicated the presence of (O-H stretching) [20], 1640–1631 cm−1 (C=O), 1580–1605 cm−1 (C6H5).
The presence of alkyl groups was assigned by 2860, 2918 cm−1 two vibrational bands in compound (1)
and 2865 cm−1 in compound (2) [21]. A doublet was found at 2360 and 2340 cm−1 in compound (1)
may be due to presence of small amount of CO2 in sample chamber when data was collected [22].
Furthermore, the presence of methoxy group was assigned by 2849 cm−1 in compound (1) [23]. These
prominent characteristic functional groups indicated the presence of flavanone, based upon a 15-carbon
skeleton consisting of two benzene rings (A and B) linked via a heterocyclic pyran ring (C) [24] Figure 2.

Molecules 2015, 20 14215
Figure 2. FTIR-spectra of compounds: (2S)-7-Hydroxy-5-methoxy-6,8-dimethyl flavanone
(A) and (S)-5,7-dihydroxy-6,8-dimethyl flavanone (B).
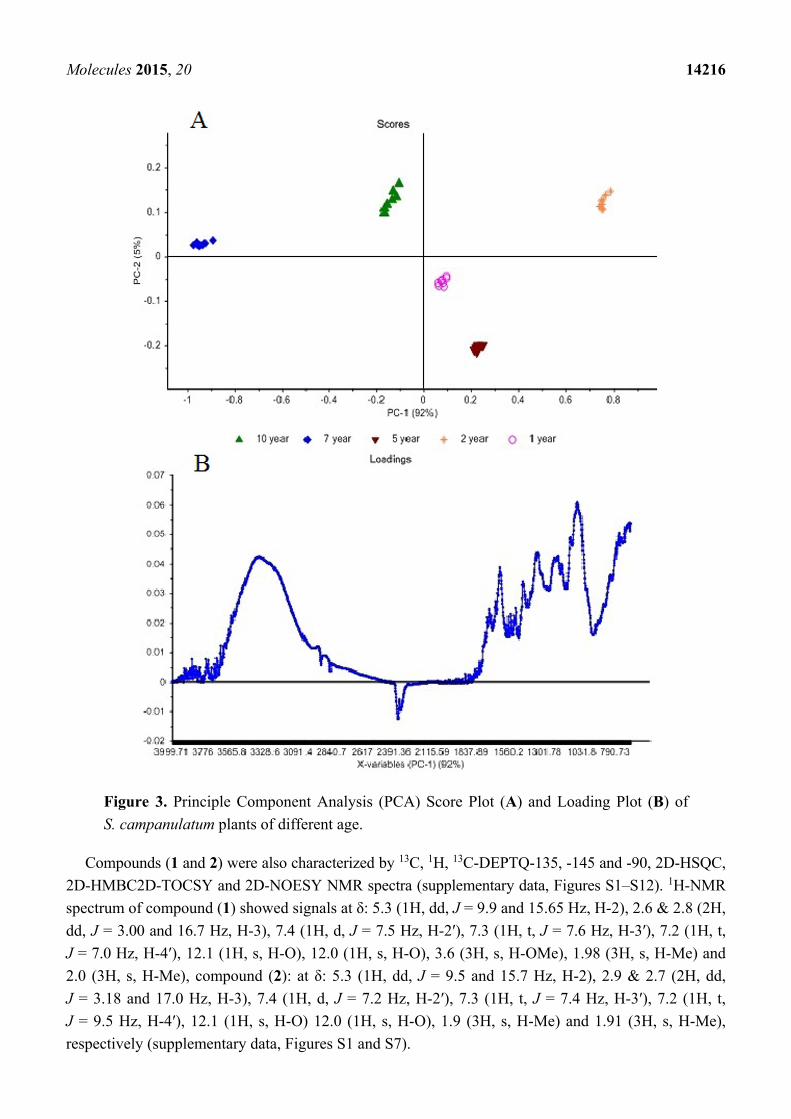
Principle component analysis (PCA) of five different age plants (A–C) has shown that all extracts
have different region of absorption because of the different concentration of compounds (1–5) Figure 3.
PCA data can be used to differentiate age of plant with maximum concentration of all compounds (1–5).
LC-EIMS analysis of compound (1 and 2) indicated molecular formulae C18H18O4 (m/z 298.10 calc.
[M]+ 299.10), and C17H16O4 (m/z 284.10 calc. [M]+ 285.10), respectively. The molecular weights
of compounds (1 and 2) were determined by liquid chromatography-mass spectroscopy (LC-MS).
Compound (2) showed proposed retrocyclization cleavage of molecule [25]. The fragmented molecular
ion peaks were observed at 195 and 181 as daughter ions and the main fragmentation peaks at 299 and
285 for compounds (1 and 2), respectively (Figure 4).
Molecules 2015, 20 14216
Figure 3. Principle Component Analysis (PCA) Score Plot (A) and Loading Plot (B) of
S. campanulatum plants of different age.
Compounds (1 and 2) were also characterized by 13C, 1H, 13C-DEPTQ-135, -145 and -90, 2D-HSQC,
2D-HMBC2D-TOCSY and 2D-NOESY NMR spectra (supplementary data, Figures S1–S12). 1H-NMR
spectrum of compound (1) showed signals at δ: 5.3 (1H, dd, J = 9.9 and 15.65 Hz, H-2), 2.6 & 2.8 (2H,
dd, J = 3.00 and 16.7 Hz, H-3), 7.4 (1H, d, J = 7.5 Hz, H-2ʹ), 7.3 (1H, t, J = 7.6 Hz, H-3′), 7.2 (1H, t,
J = 7.0 Hz, H-4′), 12.1 (1H, s, H-O), 12.0 (1H, s, H-O), 3.6 (3H, s, H-OMe), 1.98 (3H, s, H-Me) and
2.0 (3H, s, H-Me), compound (2): at δ: 5.3 (1H, dd, J = 9.5 and 15.7 Hz, H-2), 2.9 & 2.7 (2H, dd,
J = 3.18 and 17.0 Hz, H-3), 7.4 (1H, d, J = 7.2 Hz, H-2′), 7.3 (1H, t, J = 7.4 Hz, H-3′), 7.2 (1H, t,
J = 9.5 Hz, H-4′), 12.1 (1H, s, H-O) 12.0 (1H, s, H-O), 1.9 (3H, s, H-Me) and 1.91 (3H, s, H-Me),
respectively (supplementary data, Figures S1 and S7).

Molecules 2015, 20 14217
Figure 4. LC-EIMS-spectra of compounds: (2S)-7-Hydroxy-5-methoxy-6,8-dimethyl
flavanone (A) and (S)-5,7-dihydroxy-6,8-dimethyl flavanone (B).
13C-NMR spectrum: 13C-NMR spectrum of compound (1) showed signals at δ: C-2 (78.8), C-3 (45.0),
C-4 (190.94), C-4a (107.76), C-5 (161.74), C-5-O-CH3 (60.0), C-6 (107.82), C-7 (160.0), C-8 (112.23),
C-8a (157.2), C-1′ (139.5), C-2′ & C6′ (128.29), C-3′ & C-5′ (125.7), C-4′ (128), C-6-CH3 (7.09) and
C-8-CH3 (7.27) Figure 5A.

Molecules 2015, 20 14218
Figure 5. 13C-NMR-spectra of compounds: (2S)-7-Hydroxy-5-methoxy-6,8-dimethyl
flavanone (A) and (S)-5,7-dihydroxy-6,8-dimethyl flavanone (B).
13C-NMR spectrum: 13C-NMR spectrum of compound (2) showed signals at δ: C-2 (78.6), C-3
(42.82), C-4 (196.6), C-4a (103.54), C-5 (163.0), C-6 (102.76), C-7 (162.8), C-8 (101.87), C-8a (158.9),
C-1′ (139.4), C-2′ & C6′ (128.29), C-3′ & C-5′ (125.77), C-4′ (128.0), C-6-CH3 (6.75) and C-8-CH3
(6.0) Figure 5B.
It was observed that the 13C-DEPT-135 shows positive CH3 and CH2 and negative CH2 signals and
vice versa in -90 NMR spectra recorded in MeOD at 125.75 MHz at 25 °C for both compounds (1 and 2).
2D-HSQC and HMBC-NMR spectra of compounds (1 and 2) demonstrate that C-2 has correlation
with C-3, C-4 and C-1′. 2D-TOCSY and 2D-COSY NMR spectra illustrate the characteristic diagonal
component and cross peaks of compounds (1 and 2) found in respective spectra (Refer to the
supplementary data, Figures S2–S12).
Molecules 2015, 20 14219
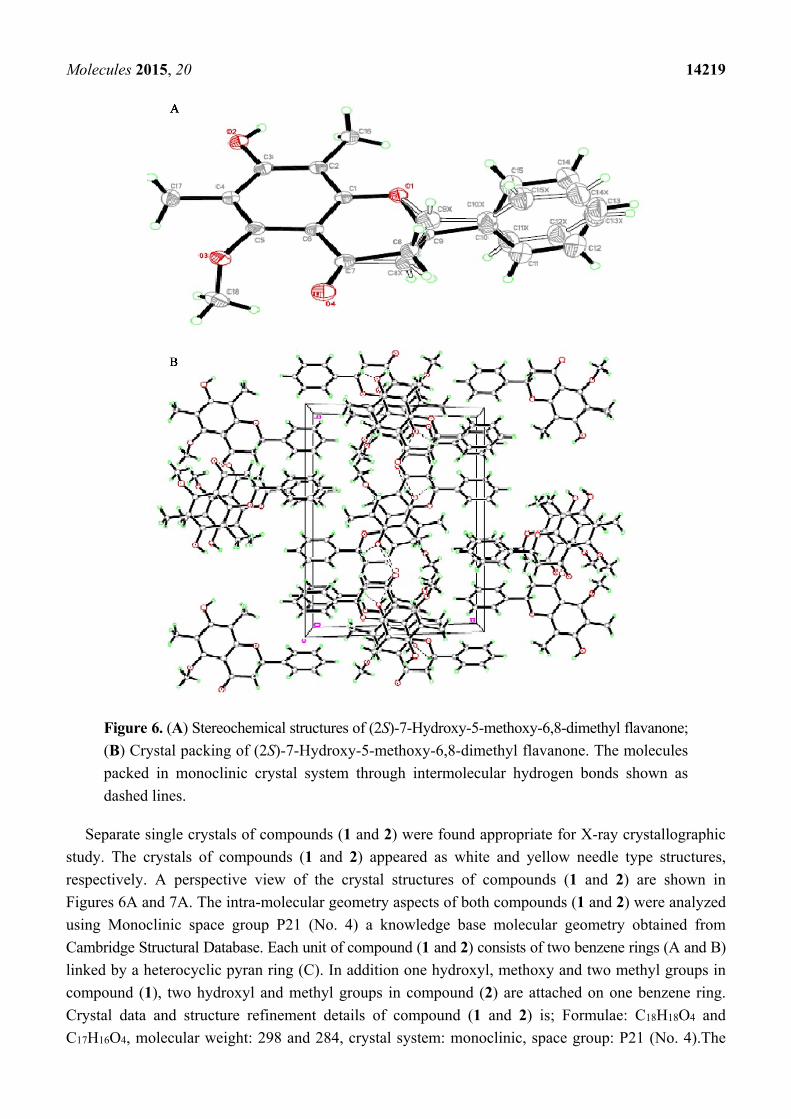
Figure 6. (A) Stereochemical structures of (2S)-7-Hydroxy-5-methoxy-6,8-dimethyl flavanone;
(B) Crystal packing of (2S)-7-Hydroxy-5-methoxy-6,8-dimethyl flavanone. The molecules
packed in monoclinic crystal system through intermolecular hydrogen bonds shown as
dashed lines.
Separate single crystals of compounds (1 and 2) were found appropriate for X-ray crystallographic
study. The crystals of compounds (1 and 2) appeared as white and yellow needle type structures,
respectively. A perspective view of the crystal structures of compounds (1 and 2) are shown in
Figures 6A and 7A. The intra-molecular geometry aspects of both compounds (1 and 2) were analyzed
using Monoclinic space group P21 (No. 4) a knowledge base molecular geometry obtained from
Cambridge Structural Database. Each unit of compound (1 and 2) consists of two benzene rings (A and B)
linked by a heterocyclic pyran ring (C). In addition one hydroxyl, methoxy and two methyl groups in
compound (1), two hydroxyl and methyl groups in compound (2) are attached on one benzene ring.
Crystal data and structure refinement details of compound (1 and 2) is; Formulae: C18H18O4 and
C17H16O4, molecular weight: 298 and 284, crystal system: monoclinic, space group: P21 (No. 4).The

Molecules 2015, 20 14220
crystals refinement data of compounds (1 and 2) are shown in Table 1, whereas the selected bond
lengths and angles of both compounds (1 and 2) crystallographically are shown in Figures 6 and 7 and
are also listed in (Supplementary data, Tables S1–S18).
Figure 7. (A) Stereochemical structures of (S)-5,7-dihydroxy-6,8-dimethyl flavanone; (B)
Crystal packing of (S)-5,7-dihydroxy-6,8-dimethyl flavanone. The molecules packed in
monoclinic crystal system through intermolecular hydrogen bonds shown as dashed lines.
Table 1. Crystal data and structure refinement details for (2S)-7-hydroxy-5-methoxy-6,8-
dimethyl flavanone and (S)-6,8-dihydroxy-5,7-dimethyl flavanone.
Parameters Crystal Data
Compound 1 Compound 2
Formula C18H18O4 C17H16O4 Formula Weight 298.32 284.30 Crystal System Monoclinic Monoclinic
Space group P21/c (No. 14) P21/c (No. 14)

Molecules 2015, 20 14221
Table 1. Cont.
Parameters Crystal Data
Compound 1 Compound 2
Alpha (°) 90 90 Beta (°) 105.966 (3) 100.1616 (17)
Gamma (°) 90 90 Unit cell dimensions a (A°) 12.7683 (14) 4.8133 (1)
b (A°) 17.2730 (15) 24.5685 (6) c (A°) 7.2728 (7) 12.7303 (4)
V (A°3) 1542.1 (3) 1481.82 (7) Z 4 4
Density (calcd) (gm/cm3) 1.285 1.274 Mu(CuKa) [/mm] 0.090 0.744
F(000) 632 600 Crystal Size (mm) 0.479 × 0.167 × 0.122 0.03 × 0.09 × 0.32 Temperature (K) 294 294 Radiation (A°) MoK\a CuKa 1.54178 θ Min, max (°) 1.659, 27.499 4.0, 70.2
Dataset −16:16; −22:22; −8: 9 −5:5; −28:29; −15:14 Tot., Uniq. Data 15,650, 3514 26,315, 2751
R (int) 0.0416 0.037 Observed data [I > 2.0 sigma(I)] 2558 2104
Nref, Npar 3514, 240 2751, 240 R, wR2, S 0.0775, 0.2521, 0.975 0.056, 0.1714, 1.10
S = Goodness of fit, in general value of S should be close to 1. wR2 = Weighted Residual Factor is the most
closely related to the refinement against squared structure factors. The weighting factor w is individually
derived from the standard uncertainties of the measured reflections and expresses the confidence we have in
every single reflection. This factor should be minimum during refinement. R = Un-weighted residual factor.
This factor should also be minimum during refinement. Nref = Number of independent reflections.
Npar = the number of refined parameters. R (int) = merging residual value, reflects the summations involve
all the input reflections for which more than one symmetry equivalent are averaged.
The crystal packing of both compounds (1 and 2) shows that the compounds (1 and 2) molecules
are connected via intermolecular hydrogen bonding interactions in which C7 of aromatic ring (A)
as donor for H-bond via C4-O of pyran ring (C) in the neighboring molecules at –x + 1, −y, −z + 1 to
produce a three-dimensional network (Figures 6B and 7B). The compounds (1 and 2) showed statistical
conformational disorders, with three conformations having two orientations of alkyl group attached on
C-6 of aromatic ring (A) of compound (1) and three orientations of the phenyl ring (B) and two
orientations of the fused heterocyclic pyran ring (C) of compounds (1 and 2). The crystal stability of
compounds (1 and 2) is assumed to be improved by weak intermolecular interactions. Furthermore, π-π
interactions are present between the aromatic rings of neighboring chroman-4-one groups with the
same conformation at (−x + 1, −y, −z + 1). The isomerization equilibrium between the flavanone and
chalcone forms can be correlated with this conformational disorder [26]. This conformational behavior
has major impact on the diverse biological activities of this class of compounds [27]. Crystal data and
structure refinement details of compounds (1 and 2) are shown in Table 1. Some selected bond angles

Molecules 2015, 20 14222
of compounds (1 and 2) are shown in Table 2 and complete data is given in supplementary data
(Tables S1–S18). Crystallography data of compound (1) is reported which was obtained from aqueous
ethanolic extract of the leaves of C. guianensis, using dichloromethane extraction and a silica-gel
chromatographic column. Single crystals were obtained by evaporation from a chloroform solution [26].
Table 2. Selected bond angles (°) of (2S)-7-Hydroxy-5-methoxy-6,8-dimethyl flavanone
and (S)-6,8-dihydroxy-5,7-dimethyl flavanone.
Compound-1 Compound-2
Atoms Bond Angles (°) Atoms Bond Angles (°)
C1-O1-C9 115.76(16) C9-O1-C1-C2 154.0(3) C2-C3-C4 123.12(16) C1-O1-C9-C8 52.9(4)
C3-C4-C17 120.72(17) C1-O1-C9-C10 172.7(3) C4-C5-C6 122.19(16) O1-C1-C2-C16 1.5(3) C5-C4-C3 117.90(16) C6-C1-C2-C3 2.1(3) C1-C6-C5 116.81(15) C1-C2-C3-O2 179.14(18)
C3-C2-C16 122.27(15) C16-C2-C3-C4 178.51(19) O2-C3-C2 121.25(16) O2-C3-C4-C5 178.59(18) C3-C4-C17 120.72(17) C2-C3-C4-C17 179.1(2) C3-C4-C5 117.90(16) C3-C4-C5-C6 2.6(3)
C17-C4-C5 121.38(17) C17-C4-C5-O3 1.8(3) O3-C5-C6 120.01(15) O3-C5-C6-C1 178.83(18)
O2--H1, O2--C3 0.88(3), 1.359(2) O2--H1, O2--O4 0.87(3),1.91(4) O3--C5, O3--C18 1.376(2), 1.425(3) O3--H1, O3--O4 0.92(3),1.73(3)
C16--H16A 0.9600 C16--H16A--O1 0.9600, 2.3400 C17--H17A 0.9600 C17--H17A--O3 0.9600, 2.3500
In the current study, however, compound (1) is reported, which was obtained from n-hexane
methanolic extract of the leaves of S. campanulatum, using n-hexane:ethyl acetate extraction and a
silica-gel chromatographic column. Single crystals were obtained by evaporation from a methanol
solution. It was observed that it shows different bond angles due to use of different solvates. The
incorporation of solvents resulted in changes of the crystal symmetry, intermolecular arrangements,
stoichiometry and hydrogen bonding interactions [28].
In the present study, HPLC method has been developed and validated for simultaneous determination
of flavanones, chalcone and triterpenoids. Complete separation of the compounds (1–5) was
accomplished in less than 20 min and the method was successfully applicable to perform simultaneous
determination of all five compounds from standard solutions and different age plant extracts. Initially
the mixture of compounds (1–5) was analyzed using a mobile phase consisting of 0.1% o-phosphoric
acid:methanol (40:60 v/v) at flow rate 1 mL·min−1. Under these conditions, the separation and peak
symmetries were not satisfactory, so the mobile phase was changed to 0.1% o-phosphoric acid:acetonitrile
(40:60 v/v) with a flow rate of 1 mL·min−1 at 210 nm. It was observed that using these conditions,
peaks were separated and resolved with good symmetry and sharpness. Therefore mobile phase
containing 0.1% o-phosphoric acid:acetonitrile (40:60 v/v) was chosen for the present study. The
retention times for compounds (1–5) were 5.1, 7.3, 10.0, 15.0 and 16.0 min, respectively (Figure 8A).

Molecules 2015, 20 14223
Figure 8. Representative HPLC chromatograms of; (A) of standards mixture; (B) With internal
standards. (2S)-7-Hydroxy-5-methoxy-6,8-dimethyl flavanone (1), (S)-5,7-dihydroxy-6,8-
dimethyl flavanone (2), (E)-2ʹ,4ʹ-dihydroxy-6ʹ-methoxy-3ʹ,5ʹ-dimethylchalcone (3), Betulinic
acid (4) Ursolic acid (5) and (E)-2ʹ,4ʹ-dihydroxy-6ʹ-methoxy chalcone (6).
The concentration of each compound (1–5) in the extracts of different age plants was calculated
from the experimental peak areas by interpolation to standard calibration curves (Table 3).
Table 3. Amount found of compounds (1–5) in different plants.
Plant Compound 1 (%) Compound 2 (%) Compound 3 (%) Compound 4 (%) Compound 5 (%) Total (%)
A 0.12 0.34 0.09 49.33 5.27 55.16
B 1.39 0.34 5.03 60.49 5.70 72.97
C 2.99 0.52 8.97 34.54 2.85 49.89
D 2.04 1.00 9.37 7.355 2.46 22.24
E 0.30 0.20 0.19 52.23 4.01 56.94
Plant A (one year old), Plant B (two years old), Plant C (five years old), Plant D (seven years old), Plant E
(ten years old).

Molecules 2015, 20 14224
The calibration curves were linear over the concentration range of 0.78–200, 12.5–200 and
3.1–200 µg·mL−1 for compounds (1–3), (4) and (5), respectively. The regression equations representing
the calibration curves and their correlation coefficients are summarized in Table 4. The % RSD in
precision studies was found to be 0.14%–0.29% (Intra-day) and 0.59%–0.76% (Inter-day). The LOQ
was found to be 0.7346 µg·mL−1 and the LOD was found to be 0.2423 µg·mL−1 (Table 4). The % RSD
in accuracy studies (Table 4) and robustness was found to be less than 2%, indicating that the method is
precise, accurate and robust (Supplementary data, Tables S19 and S20). Reproducibility of developed
method was analyzed and performed by another person measuring the intra-day and inter-day precisions
of method on different instrument in another laboratory. It was observed that the difference in terms of
% RSD is not more than 2. There were no significant differences between % RSD values for intra-day
and inter-day precision, which indicates the method is reproducible.
Table 4. Validation parameters for compounds (1–5).
Parameters 1 2 3 4 5
Retention time (min) 5.1 7.3 10.0 15.1 16.0 Linearity range (µg·mL−1) 0.78–200 0.78–200 0.78–200 12.5–200 3.1–200
Slope 47.90 54.57 54.66 1.208 5.182 Intercept 31.89 −73.75 −81.22 −1.25 −11.60
Correlation coefficient 0.999 0.999 0.999 0.999 0.999 LOD (µg·mL−1) 0.13 0.03 0.05 0.73 0.38 LOQ (µg·mL−1) 0.40 0.10 0.14 2.23 1.17 Accuracy (%) 95–92 99–91 101–98 96–92 94–92
The % RSD of robustness was not more than 1 and no significant changes were observed. The results
are shown in supplementary data (Table S19). Accuracy of developed method was determined at three
concentration levels of compounds (1–5) i.e., 250, 125 and 62.5 µg·mL−1 (n = 3), and the percentage
recoveries were calculated and summarized in (Table 4).
It was observed that cardamonin used as internal standard did not interfere with the chromatograms
of compounds (1–5). However, a sharp, well-shaped separated peak indicates the specificity of the
developed method. The result for specificity is shown in Figure 8B. In this developed method, there
was no interference from cardamonin structurally related to chalcone and flavanone. So this RP-HPLC
method can be used in the quality control department of herbal drugs.
The representative chromatograms (Figure 9) and data on flavanones, chalcone and triterpenoids in
S. campanulatum plants of five different age is presented in Table 3. It was revealed from data that
compounds (1–5) ranged from 22.24% to 72.97% in five different age plants (A–E). It was observed
that the age of the S. campanulatum plant generally has a very prominent impact on production of high
valued secondary metabolites. Developed HPLC method is suitable for quantification of compounds
(1–5) in standard mixtures and in plant extracts. Therefore, it can be concluded that use of developed
method can save time, money and it can be used for routine analysis of compounds (1–5) in herbal
laboratories with high accuracy and reproducibility.

Molecules 2015, 20 14225
Figure 9. Representative HPLC chromatograms of different age S. campanulatum plants;
(A) One year old; (B) Two years old; (C) Five years old; (D) Seven years old and (E) Ten
years old.
Inhibition of Human Colorectal Carcinoma (HCT 116) cells proliferation by ethanolic extract of
S. campanulatum and compounds (1 and 2) was performed. In correspondence to Figure 10, ethanolic
extract of S. campanulatum and compounds (1 and 2) inhibited the proliferation on HCT 116 in
dose-dependent manner. The median inhibitory concentrations (IC50s) for ethanolic extract of
S. campanulatum and compounds (1 and 2) were then calculated with the accurate precision from the
dose response curves. These were found to be anti-proliferative on the human colon cancer (HCT 116)
cell line with IC50 93.4, 67.6 and 132.9 µg·mL−1, respectively.

Molecules 2015, 20 14226
Figure 10. Dose dependent anti-proliferative effect of (2S)-7-Hydroxy-5-methoxy-6,8-
dimethyl flavanone (compound-1), (S)-5,7-dihydroxy-6,8-dimethyl flavanone (compound-2)
and S. campanulatum ethanolic extract on HCT 116 cell lines was assessed by MTT-assay.
3. Experimental Section
3.1. Plant Material
The green leaves of S. campanulatum shrub of five different ages (1, 2, 5, 7 and 10 years old) were
collected in June 2014, from the main campus of University Sains Malaysia (USM), Penang, Malaysia.
The age of the shrub was determined based on the records of date of plantation by the Herbarium of
School of Biological Sciences. The plant was authenticated by the Herbarium of School of Biological
Sciences, USM, where a voucher specimen was deposited (Ref. No. 11047). The samples were labeled
as Plant-A (One year old), Plant-B (2 years old), Plant-C (5 years old), Plant-D (7 years old) and
Plant-E (10 years old).

Molecules 2015, 20 14227
3.2. Chemicals and Reagents
All solvents were used of HPLC-grade and analytical grade reagents, MTT (3-(4,5-dimethylthiazol-
2-yl)-2,5 diphenyl tetrazolium bromide), 5-Fluorouracil 99% HPLC grade, phosphate-buffered
saline (PBS), DMSO (dimethyl sulfoxide) were purchased from Sigma-Aldrich, Munich, Germany.
Penicillin/streptomycin, fetal bovine serum and trypsin were purchased from Gibco, Life technology,
Grand Island, NY, USA.
3.3. Cell Culture and Cell Lines
Human colorectal carcinoma (HCT 116), obtained from American Type Culture Collection
(ATCC), Rockville, MD, USA. Cells were cultured in RPMI-1640 (Invitrogen, Gibco, Waltham, MA,
USA) medium containing L-glutamine at 5% CO2-humidifed atmosphere at 37 °C growth medium
supplemented with 10% heat-inactivated fetal bovine serum (HIFBS) and 1% penicillin/streptomycin (PS).
3.4. Extraction
The green leaves of S. campanulatum (A–E) were washed under tap water and dried at 45 °C in
oven for 2–3 days and ground to fine powder using electric grinder (Retsch, Deutschland, Germany).
The powdered leaves (250 g) were separately extracted by Soxhlet with a mixture of n-hexane:methanol
(1:1) for 48 h. The extracts were filtered using Whatmann filter paper No. 1 and the filtrates were
evaporated to dryness at 40 °C by using rotary evaporator (Buchi, New Castle, PA, USA). The crude
extracts were further kept for 12 h at 45 °C in oven to ensure complete dryness. Crude extract of plant
C (5 years old) was selected on the basis of high contents of compounds (1, 2 and 3) for isolation and
the other four plant samples were used for quantitative analysis of the marker compounds.
3.5. Isolation of Compounds (1–4)
The crude n-hexane:methanol (1:1) extract (20 g) was ground into fine powder using a mortar and
pestle. Subsequently, the powdered material was subjected to flash column chromatography under
vacuum as the following: column dimensions were 10 × 7 cm, the stationary consisted of silica gel
(0.063–0.200 mm, 230–400 mesh). Elution was started with n-hexane, and continued with a mixture of
n-hexane:ethyl acetate with decreasing ratio of n-hexane (92.5%, 60%, 30%, 15% and 0%). The
volume of the eluent in each cycle was 250 mL, and a total of 19-fractions were obtained. The solvent
was evaporated at room temperature in fume hood for 3–4 days. Compound (1) was obtained (200 mg)
as a light green solid. Compounds 2 (100 mg) and 3 (400 mg) were obtained a yellow solid (100 mg).
Compound 4 was obtained as a white solid (600 mg). All isolated compounds were studied further.
3.6. Crystallization
Compound (1) was dissolved in 2 mL acetone, compound (2) in 2 mL n-hexane, compound (3) in
2 mL n-hexane and 0.2 mL methanol, and compound (4) was dissolved in 2 mL methanol, filtered
through a 0.45-μm filter and allowed to evaporate at room temperature. Compound (1) produced needle
type white crystals and compound (2) produced yellow crystals. Purity of crystals of compounds (1 and 2)

Molecules 2015, 20 14228
was confirmed by HPLC, UV, FTIR, NMR and X-ray crystallography. Compound (3) produced needle
type yellow crystals and compound (4) produced white crystals, while the purity of crystals of
compounds (3 and 4) were analyzed as discussed [3,5].
3.7. Characterization of Compounds
3.7.1. UV-Visible Spectroscopy
All compounds (1–5) were dissolved in methanol and scanned from 500–200 nm for maximum
absorbance using Double beam UV/Visible spectrometer (Lambda 25, Perkin-Elmer, Waltham, MA,
USA) with dual silica 1 cm cuvettes controlled by UVWinLab 25 software (Waltham, MA, USA).
3.7.2. FTIR Spectroscopy
The crystals of compounds (1–4) and compound (5) as powder were characterized by FTIR
spectrophotometer (Perkin Elmer Spectrum one FTIR spectrometer, USA) using potassium bromide
(KBr) disc method. The IR spectrum was scanned at infrared region of 400–4000 cm−1. Furthermore,
n-hexane:methanol (1:1) crude extracts were prepared from S. campanulatum at five different ages
(A–E) and scanned using FTIR spectroscopy.
3.7.3. NMR Spectroscopy
Compounds (1 and 2) were analyzed by 2D-NMR spectra (FT-NMR spectrometer, Bruker
500 MHz) in deuterated methanol (MeOD). The NMR peaks were labeled as singlet (s), doublet (d),
triplet (t) and multiplet (m) chemical shifts were referenced with respect to solvent signals.
3.7.4. X-ray Crystallography
The single crystal of compounds (1 and 2) obtained were analyzed by Bruker SMART APEX2 CCD
area detector diffractometer. The molecular graphics were constructed by Mercury 3.1 Development
(Build RC5) software (Cambridge, UK).
3.7.5. LC-EIMS Analysis
Mass spectra (n = 5) of compounds (1 and 2) were determined using a Micro QTof ESI Mass
Spectrometer (Waters) coupled with LCMS Xevo G2 QTof, USA. The compounds (1 and 2) were
prepared separately in MS grade methanol and 2 µL of each compound was injected through UPLC into
ESI probe. The MS conditions: column; ACQUITY UPLC BEH C18, 1.7 µ (Waters, Europe/Dublin,
Ireland), column dimension 2.1 × 50 mm, part number: 186002350, mobile phase; double distilled
deionized water and acetonitrile both with 0.1% formic acid (100 µL·100 mL−1) at a flow rate
0.3 mL·min−1 positive ion mode; gas (N2); temperature, 350 °C; flow rate, 10 L·min−1, nebulizer pressure,
15 psi; sample infusion flow rate 20 µL·min−1, HV voltage, 4.0 kV; octopole RF amplitude, 150 Vpp;
skim 1 voltage, −38.8 V; skim 2 voltage, −6.0 V; cap (KV) 3 V; sampling cone 40, extraction cone 4,
and scan range, m/z 100–1000 units. Acquired mass spectra represented the average of n = 5 spectra.

Molecules 2015, 20 14229
3.7.6. Preparation of Stock Solutions for HPLC Analysis
Stock solutions of all compounds (1–5) and extracts of S. campanulatum plant (A–E) were prepared
at the concentration of 1 mg·mL−1 in methanol, filtered using 0.45 µm filter and stored at 25 °C.
The stock solution of compounds (1–5) was further diluted to the concentration range 250–0.24 µg·mL−1.
3.8. HPLC Method Validation
The developed method was validated for the following parameters: linearity, precision, accuracy,
selectivity, robustness, limit of quantification (LOQ), limit of detection (LOD) and system
suitability [29,30].
3.8.1. Selection of Detection Wavelength
The UV spectrum of diluted solutions of compounds (1–5) was recorded using UV
spectrophotometer. It was observed that compounds (1–3) have shown absorbance at 330 nm but no
absorbance was shown by (4 and 5). So, λmax 210 nm was selected as best for all compounds (1–5).
3.8.2. Linearity
Linearity was studied in the range 250–0.24 μg·mL−1 of the standard compounds (1–5).Ten
microliter of each solution was injected into the HPLC system, and the linearity for each compound (1–5)
was calculated by plotting peak area versus concentration. The calibration curves of compounds (1–5)
were linear with relatively wide range of concentrations 0.78–200 µg·mL−1 for (1–3), 12.5–200 (4) and
3.1–200 µg·mL−1 for (5). All compounds (1–5) showed good linear regressions with high correlation
coefficient values (r2 ≤ 0.999) between peak area (y) and concentrations of each compound (x, µg·mL−1).
3.8.3. Accuracy
Accuracy of developed method was determined at three concentration levels: 250, 125 and
62.5 μg·mL−1 (n = 3), and the percentage recovery was calculated. Peak areas of the compounds (1–5)
in plant (A–C) extracts (W), reference compounds (Z) and their combinations (X) were recorded.
Percentage recovery was calculated using the formula: % Recovery = (X − W)/Z × 100 [30] and the
results are presented as mean ± SD (n = 3).
3.8.4. Precision
The intra-day and inter-day precisions of developed method were evaluated at four concentrations:
250, 125, 62.5 and 31.25 µg·mL−1 (n = 3). The result was calculated as % RSD. The LOQ and LOD
were determined based on the standard deviation of the response and the slope of the constructed
calibration curves (n = 3) as described [29,30].

Molecules 2015, 20 14230
3.8.5. Robustness
The robustness of the developed method was performed by introducing small changes in the
optimized HPLC conditions such as wavelength (±5 nm), percentage of acetonitrile in the mobile
phase (±10%), flow rate (±0.1 mL·min−1) and column temperature (±5 °C).
3.8.6. Specificity
The specificity of developed method was evaluated by observing interference of chemically related
compound, cardamonin (compound 6). The test result was compared with that obtained for standard
compounds (1–5).
3.8.7. Reproducibility
The reproducibility of developed method was investigated by determining precision by another
analyst on a different instrument and laboratory.
3.9. Quantification of Compounds (1–5) in Mixture and Extracts
HPLC analysis was performed using Agilent HPLC 1260 system, on ZORBAX Eclipse Plus Phenyl
Hexyl column (4.6 × 250 mm, 5 µ). The mobile phase consisted of acetonitrile: 0.1% o-phosphoric
acid. The elution program was isocratic at 60:40 for 20 min, at 1 mL·min−1. A sample of 10 µL
(250–0.24 µg·mL−1) was injected at λmax 210 nm. The purity of compounds (1–5) was assured from
chromatograms, and the plant extracts were analyzed for the presence of all compounds (1–5). Linear
regression equations of the calibration curves were applied to calculate the concentration of the marker
compounds in S. campanulatum extracts. The results were calculated as % w/w using the formula:
(Calculated concentration/Loaded concentration) × 100% [3].
3.10. Cells Proliferation Assay Using MTT
The assay was carried out using the method described by [31] with minor modification. Cells were
seeded at density of 1–1.5 × 10⁵ mL−1 in 96 wells flat-bottomed plates, after 24 h the extracts or
positive control were added to each well within 100 µL media at different concentration and free
culture media used as a blank. DMSO was used as a negative control and 5-FU as a positive control.
All tested samples were performed in six serial concentrations as follow; 200, 100, 50, 25, 12.5 and
6.125 µg·mL−1. The plates were incubated at 37 °C incubator under 5% CO2. After 48 h incubation,
20 µL of MTT reagent solution (5 mg·mL−1 in PBS) was added to each well as an indicator of cell
viability. The reading of the colorimetric assay was taken using micro plate reader Infinit pro200
(Tecan, Männedorf, Switzerland) at a wavelength of 570 and 620 nm. The percentage of inhibition was
calculated according to the equation: Cell inhibition % = (1 − (A Sample − A Blank)/(A Control − A
Blank)) × 100.

Molecules 2015, 20 14231
4. Conclusions
It is concluded from the present study that 1–5 year old plants produced high amount of compounds
(1–5) as secondary metabolites in selected five differently aged plants of the same specie. Newly
developed HPLC method is accurate, precise, reproducible, and specific. In the present study, the isolation
of compounds (1 and 2) from dried leaves of S. campanulatum with their purification, detailed chemical
structural characterization and anti-proliferative activity is reported. It has been observed that both
compounds (1 and 2) and extract of S. campanulatum possess strong anti-proliferative activity against
Human colorectal carcinoma (HCT 116) cells.
Supplementary Materials
Compounds (1 and 2) X-ray crystallographic data of the structures have been deposited with the
Cambridge Crystallographic Data Center, CCDC1026578 and 1007509, respectively. This data of both
compounds can be obtained free of charge from CCDC via www.ccdc.cam.ac.uk/data_request/cif.
Supplementary materials can be accessed at: http://www.mdpi.com/1420-3049/20/08/14212/s1.
Acknowledgments
The authors are thankful to Universiti Sains Malaysia for providing a financial support.
Author Contributions
Zhari Ismail participated in research design. Abdul Hakeem Memon, Fouad Saleih Resq Al-Suede,
Abdalrahim F. A. Aisha, Mohammad Shahrul Ridzuan Hamil, Mohammed Ali Ahmed Saeed,
Madeeha Laghari, and Amin Malik Shah Abdul Majid conducted experiments and performed data
analysis. Zhari Ismail and Abdul Hakeem Memon wrote or contributed to the writing of the manuscript.
Conflicts of Interest
The authors declare no conflict of interest.
References
1. Tuiwawa, S.H.; Craven, L.A.; Sam, C.; Crisp, M.D. The genus Syzygium (Myrtaceae) in Vanuatu.
Blumea 2013, 58, 53–67.
2. Chang, C.W.; Wu, T.S.; Hsieh, Y.S.; Kuo,S.C.; Chao, P.D. Terpenoids of Syzygium formosanum.
J. Nat. Prod. 1999, 62, 327–328.
3. Abdalrahim, F.A.A.; Khalid, M.A.; Salman, A.A.; Mohammad, J.S.; Zhari, I.; Amin, M.S.A.M.
Syzygium aromaticum extracts as good source of betulinic acid and potential anti-breast cancer.
Braz. J. Pharmacog. 2012, 22, 335–343.
4. Miyazawa, M.; Hisama, M. Antimutagenic activity of phenylpropanoids from clove
(Syzygium aromaticum). J. Agric. Food Chem. 2003, 51, 6413–6422.

Molecules 2015, 20 14232
5. Memon, A.H.; Ismail, Z.; Aisha, A.F.A.; Al-Suede, F.S.R.; Hamil, M.S.R.; Hashim, S.;
Saeed, M.A.A.; Laghari, M.; Abdul Majid, A.M.S. Isolation, Characterization, Crystal Structure
Elucidation, and Anticancer Study of Dimethyl Cardamonin, Isolated from Syzygium campanulatum
Korth. Evid. Based Complement. Altern. Med. 2014, 2014, doi:10.1155/2014/470179.
6. Samy, M.N.; Sugimoto, S.; Matsunami, K.; Otsuka, H.; Kamel, M.S. One new flavonoid xyloside
and one new natural triterpene rhamnoside from the leaves of Syzygium grande. Phytochem. Lett.
2014, 10, 86–90.
7. Mir, Q.Y.; Ali, M.; Alam, P. Lignan derivatives from the stem bark of Syzygium cumini (L.) Skeels.
Nat. Prod. Res. 2009, 23, 422–430.
8. Zou, J.; Mi, Y.; Chen, W.; Liu, Q.; Wang, J.; Lou, L.; Zhao, W. Alkyl phloroglucinol derivatives from
Syzygium levinei and their differentiation-inducing activity. Planta Med. 2006, 72, 533–538.
9. Tanaka, T.; Orii,Y.; Nonaka, G.I.; Nishioka, I.; Kouno, I. Syzyginin-A and Syzyginin-B, 2
Ellagitannins from Syzygium-aromaticum. Phytochemistry 1996, 43, 1345–1348.
10. Qing-Hua, H.; Dong-Mei, W.; Zhong-Bin, C.; Xue, Y.; Xin-Jun, X.; Jun, W.; Sheng, Y. Chemical
constituents from the leaves and twigs of Syzygium tetragonum Wall. Biochem. Syst. Ecol. 2012,
41, 3–5.
11. Wilma, P.R.; Leonardo, L.B.; Nilda, M.A.; Pedro, H.F.; José, R.P. Chemical variability in the
essential oils from leaves of Syzygium Jambos. Braz. J. Pharmacog. 2013, 22, 433–440.
12. Stanely, M.P.; Menon, V.P.; Pari, L. Hypoglycaemic activity of Syzigium cumini seeds: Effect on
lipid peroxidation in alloxan diabetic rats. J. Ethnopharmacol. 1998, 61, 1–7.
13. Muruganandan, S.; Srivastava, K.; Chandra, S.; Tandan, S.K.; Lal, J.; Raviprakash, V.
Anti-inflammatory activity of Syzygium cumini bark. Fitoterapia 2001, 72, 369–375.
14. Kim, H.M.; Lee, E.H.; Hong, S.H.; Song, H.J.; Shin, M.K.; Kim, S.H.; Shin, T.Y. Effect of
Syzygium aromaticum extract on immediate hypersensitivity in rats. J. Ethnopharmacol. 1998, 60,
125–131.
15. De Lima, T.C.M.; Klüeger, P.A.; Pereira, P.A.; Macedo-Neto, W.P.; Morato, G.S.; Farias, M.R.
Behavioral effects of crude and semi-purified extracts of Syzygium cuminii linn. skeels.
Phytother. Res. 1998, 12, 488–493.
16. Arai, Y.; Watanabe, S.; Kimira, M.; Shimoi, K.; Mochizuki, R.; Kinae, N. Dietary intakes of
flavonols, flavones and isoflavones by Japanese women and the inverse correlation between
quercetin intake and plasma LDL cholesterol concentration. J. Nutr. 2000, 130, 2243–2250.
17. Djipa, C.D.; Delmée, M.; Quetin-Leclercq, J. Antimicrobial activity of bark extracts of
Syzygium Jambos (L.) Alston (Myrtaceae). J. Ethnopharmacol. 2000, 71, 307–313.
18. Abdalrahim, F.A.A.; Zhari, I.; Khalid, M.A.; Jamshed, M.S.; Gheniya, G.; Amin, M.S.A.M.
Syzygium campanulatum korth methanolic extract inhibits angiogenesis and tumor growth in nude
mice. BMC. Complement. Altern. Med. 2013, 13, 168–179.
19. Waller, G.R.; Nowacki, E.K. Alkaloid Biology and Metabolism in Plants; Plenum Press:
New York, NY, USA, 1978.
20. Starlin, T.; Arul, R.C.; Ragavendran, P.; Gopalakrishnan, V.K. Phytochemical screening, Functional
Groups and Element Analysis of Tylophora Pauciflora Wight and Arn. Int. Res. J. Pharm. 2012,
3, 180–183.

Molecules 2015, 20 14233
21. Iqbal, M.A.; Haque, R.A.; Ahamed, M.B.K.; Abdul, M.A.M.S.; Al-Rawi, S. Synthesis and
anticancer activity of para-xylyl linked bis-benzimidazolium salts and respective Ag(I)
N-heterocyclic carbene complexes. Med. Chem. Res. 2013, 22, 2455–2466.
22. Terry, M.I.; James, C.R.; Christian, C.M.; Mathew, J.S.; Mark, D.B.; Robert, J.O.T. Instrumental
Data for Drug Analysis; CRC Press, Taylor & Frances Group: Boca Raton, FL, USA; London, UK;
New York, NY, USA, 2006; Volume 1, p. 4688.
23. Coates, J. Interpretation of infrared spectra, a practical approach. In Encyclopedia of Analytical
Chemistry; Meyers, R.A., Ed.; John Wiley & Sons Ltd: Chichester, UK, 2000; pp. 10815–10837.
24. Shashank, K.; Abhay, K.P. Chemistry and Biological Activities of Flavonoids: An Overview.
Sci. World J. 2013, 2013, doi:10.1155/2013/162750.
25. Nicolas, F.; Isabelle, R.; Edmond, D.H.; Joe¨lle, Q.L. Determination of Flavone, Flavonol, and
Flavanone Aglycones by Negative Ion Liquid Chromatography Electrospray Ion Trap Mass
Spectrometry. J. Am. Soc. Mass Spectrom. 2001, 12, 701–715.
26. Bruno, D.M.; Ana, M.; Ramon, J.E. 7-Hydroxy-5-methoxy-6,8-dimethylflavanone: A natural
flavonoid. Acta Crystallogr. 2008, C64, 353–356.
27. Safavi, M.; Esmati, N.; Ardestani, S.K.; Emami, S.; Ajdari, S.; Davoodi, J.; Shafiee, A.;
Foroumadi, A. Halogenated flavanones as potential apoptosis-inducing agents: Synthesis and
biological activity evaluation. Eur. J. Med. Chem. 2012, 58, 573–580.
28. Xiaoying, W.; Ningbo, G.; Shiying, Y.; Guanhua, D.; Yang, L. Studies on Solvatomorphism of
Betulinic Acid. J. Pharm. Sci. 2014, 103, 2696–2703.
29. ICH Q2 (R1). Validation of Analytical Procedures:Text and Methodology. In Proceedings of
International Conference on Harmonization, Geneva, Switzerland, 2005.
30. Nursyazura, K.; Abdalrahim, F.A.A.; Zhari, I. Reverse Phase High Performance Liquid
Chromatography for the Quantification of Eurycomanone in Eurycoma longifolia Jack
(Simaroubaceae) Extracts and their Commercial Products. Trop. J. Pharm. Res. 2014, 13,
801–807.
31. Al-Suede, F.S.R.; Elham, F.; Mohamed, B.; Ismail, Z.; Majid, A.S.A.; Abdul Majid, A.M.S.
Marked antitumor activity of cat’s whiskers tea (Orthosiphon stamineus) extract in orthotopic
model of human colon tumor in nude mice. J. Biochem. Technol. 2012, 3, 170–176.
Sample Availability: Samples of the compounds (2S)-7-Hydroxy-5-methoxy-6,8-dimethyl flavanone,
(S)-5,7-dihydroxy-6,8-dimethyl flavanone, (E)-2ʹ,4ʹ-dihydroxy-6ʹ-methoxy-3ʹ,5ʹ-dimethylchalcone,
and Betulinic acid are available from the authors.
© 2015 by the authors; licensee MDPI, Basel, Switzerland. This article is an open access article
distributed under the terms and conditions of the Creative Commons Attribution license
(http://creativecommons.org/licenses/by/4.0/).
Copyright © 2022 FDOKUMEN


![Analysis of [FeFe]hydrogenase genes for the elucidation of a ...](https://static.fdokumen.com/doc/165x107/6324e1b9051fac18490cfd07/analysis-of-fefehydrogenase-genes-for-the-elucidation-of-a-.jpg)