Is the Renewable Portfolio Standard in China Effective ... - MDPI
18
Citation: Wang, S.; Zhao, W.; Fan, S.; Xue, L.; Huang, Z.; Liu, Z. Is the Renewable Portfolio Standard in China Effective? Research on RPS Allocation Efficiency in Chinese Provinces Based on the Zero-Sum DEA Model. Energies 2022, 15, 3949. https://doi.org/10.3390/en15113949 Academic Editor: Surender Reddy Salkuti Received: 25 April 2022 Accepted: 24 May 2022 Published: 27 May 2022 Publisher’s Note: MDPI stays neutral with regard to jurisdictional claims in published maps and institutional affil- iations. Copyright: © 2022 by the authors. Licensee MDPI, Basel, Switzerland. This article is an open access article distributed under the terms and conditions of the Creative Commons Attribution (CC BY) license (https:// creativecommons.org/licenses/by/ 4.0/). energies Article Is the Renewable Portfolio Standard in China Effective? Research on RPS Allocation Efficiency in Chinese Provinces Based on the Zero-Sum DEA Model Shangjia Wang 1, * , Wenhui Zhao 1 , Shuwen Fan 1 , Lei Xue 2 , Zijuan Huang 3 and Zhigang Liu 4 1 College of Economics and Management, Shanghai University of Electric Power, Shanghai 200090, China; [email protected] (W.Z.); [email protected] (S.F.) 2 State Grid Shanxi Economic Research Institute, Taiyuan 030021, China; [email protected] 3 Shanghai Envision Digital Technology Co., Ltd., Shanghai 200011, China; [email protected] 4 Beijing Bojin Hengxin Technology Consulting Company, Beijing 100080, China; [email protected] * Correspondence: [email protected] Abstract: As one of the countries with the most rapid development of new energy, China has been committed to exploring countermeasures to the challenges of new energy consumption. After more than ten years of consideration and consultation, the “renewable portfolio standard“(RPS) for “renewable energy power consumption responsibility weighting” has landed in China. However, in the official affirmation issued by the National Energy Administration, theoretical support for the basis of the initial quota allocation is still lacking. In this study, we examine the efficiency of the weight allocation scheme for renewable energy power consumption responsibilities, which was announced by the National Energy Administration in 2018 and which is based on the BCC-DEA efficiency model. The results indicate that most provinces have low allocation efficiency under this allocation scheme. Therefore, we propose an optimal allocation scheme for a renewable energy consumption quota, based on the ZSG-DEA model. With the achievement of its target, this study’s allocation scheme would ensure 100% efficiency in all provinces, improve provincial economic efficiency, and simultaneously bring economic growth. After analyzing the fairness before and after adjustment of the RPS, our findings suggest that the adjusted RPS allocation scheme can promote equity in per capita renewable electricity consumption. Keywords: renewable portfolio standards; China’s renewable energy consumption; zero-sum DEA Model; ZSG-DEA model 1. Introduction Energy and environmental issues are becoming subjects of the world’s focus; reducing greenhouse gas emissions is critical to mitigating the effects of climate change [1]. For many countries today, increasing the share of renewable energy in power production is the leading solution. For example, the European Commission plans to increase the share of renewable energy in power production to 27% by 2030 [2,3]. Several studies have shown that reducing energy intensity can effectively stimulate economic progress in emerging economies [4]. Therefore, further reductions in energy intensity and emissions are significantly important for developing countries’ economies and sustainable development. As the world’s largest developing country, China is experiencing rapid growth in energy consumption and significant greenhouse gas emissions [5]. In 2019, China’s primary energy consumption was 2650.2394 Mt (4.8% higher than in 2018), accounting for 24.3% of total global primary energy consumption; CO 2 emissions were 10.17 billion tons, accounting for 28% of world CO 2 emissions [6,7]. Environmental pollution has attracted the attention of the Chinese government, which is actively promoting the development of renewable energy and the reduction of greenhouse gases [8]. In the United Nations General Assembly Energies 2022, 15, 3949. https://doi.org/10.3390/en15113949 https://www.mdpi.com/journal/energies
-
Upload
khangminh22 -
Category
Documents
-
view
1 -
download
0
Transcript of Is the Renewable Portfolio Standard in China Effective ... - MDPI

Citation: Wang, S.; Zhao, W.; Fan, S.;
Xue, L.; Huang, Z.; Liu, Z. Is the
Renewable Portfolio Standard in
China Effective? Research on RPS
Allocation Efficiency in Chinese
Provinces Based on the Zero-Sum
DEA Model. Energies 2022, 15, 3949.
https://doi.org/10.3390/en15113949
Academic Editor: Surender
Reddy Salkuti
Received: 25 April 2022
Accepted: 24 May 2022
Published: 27 May 2022
Publisher’s Note: MDPI stays neutral
with regard to jurisdictional claims in
published maps and institutional affil-
iations.
Copyright: © 2022 by the authors.
Licensee MDPI, Basel, Switzerland.
This article is an open access article
distributed under the terms and
conditions of the Creative Commons
Attribution (CC BY) license (https://
creativecommons.org/licenses/by/
4.0/).
energies
Article
Is the Renewable Portfolio Standard in China Effective?Research on RPS Allocation Efficiency in Chinese ProvincesBased on the Zero-Sum DEA ModelShangjia Wang 1,* , Wenhui Zhao 1, Shuwen Fan 1, Lei Xue 2, Zijuan Huang 3 and Zhigang Liu 4
1 College of Economics and Management, Shanghai University of Electric Power, Shanghai 200090, China;[email protected] (W.Z.); [email protected] (S.F.)
2 State Grid Shanxi Economic Research Institute, Taiyuan 030021, China; [email protected] Shanghai Envision Digital Technology Co., Ltd., Shanghai 200011, China; [email protected] Beijing Bojin Hengxin Technology Consulting Company, Beijing 100080, China; [email protected]* Correspondence: [email protected]
Abstract: As one of the countries with the most rapid development of new energy, China has beencommitted to exploring countermeasures to the challenges of new energy consumption. Aftermore than ten years of consideration and consultation, the “renewable portfolio standard“(RPS) for“renewable energy power consumption responsibility weighting” has landed in China. However, inthe official affirmation issued by the National Energy Administration, theoretical support for the basisof the initial quota allocation is still lacking. In this study, we examine the efficiency of the weightallocation scheme for renewable energy power consumption responsibilities, which was announcedby the National Energy Administration in 2018 and which is based on the BCC-DEA efficiencymodel. The results indicate that most provinces have low allocation efficiency under this allocationscheme. Therefore, we propose an optimal allocation scheme for a renewable energy consumptionquota, based on the ZSG-DEA model. With the achievement of its target, this study’s allocationscheme would ensure 100% efficiency in all provinces, improve provincial economic efficiency, andsimultaneously bring economic growth. After analyzing the fairness before and after adjustment ofthe RPS, our findings suggest that the adjusted RPS allocation scheme can promote equity in percapita renewable electricity consumption.
Keywords: renewable portfolio standards; China’s renewable energy consumption; zero-sum DEAModel; ZSG-DEA model
1. Introduction
Energy and environmental issues are becoming subjects of the world’s focus; reducinggreenhouse gas emissions is critical to mitigating the effects of climate change [1]. For manycountries today, increasing the share of renewable energy in power production is the leadingsolution. For example, the European Commission plans to increase the share of renewableenergy in power production to 27% by 2030 [2,3]. Several studies have shown that reducingenergy intensity can effectively stimulate economic progress in emerging economies [4].Therefore, further reductions in energy intensity and emissions are significantly importantfor developing countries’ economies and sustainable development.
As the world’s largest developing country, China is experiencing rapid growth inenergy consumption and significant greenhouse gas emissions [5]. In 2019, China’s primaryenergy consumption was 2650.2394 Mt (4.8% higher than in 2018), accounting for 24.3% oftotal global primary energy consumption; CO2 emissions were 10.17 billion tons, accountingfor 28% of world CO2 emissions [6,7]. Environmental pollution has attracted the attentionof the Chinese government, which is actively promoting the development of renewableenergy and the reduction of greenhouse gases [8]. In the United Nations General Assembly
Energies 2022, 15, 3949. https://doi.org/10.3390/en15113949 https://www.mdpi.com/journal/energies

Energies 2022, 15, 3949 2 of 18
in September 2020, President Xi Jinping proposed achieving carbon peaking by 2030 andcarbon neutrality by 2060. As a major coal power producer, the power sector plays animportant role in China’s renewable energy development and carbon reduction process.Therefore, increasing the share of renewable energy in the power sector is an essentialpathway for China in achieving energy transition [9,10].
In recent years, China has developed many incentives to promote the developmentof renewable energy [11,12]. Since the introduction of the Feed-in Tariff (FIT) in 2005,applicable law has ensured the entry of renewable electricity to the grid, resulting in veryrapid development and continued optimization of China’s power supply structure.
As shown in Figures 1 and 2, in addition to technically mature hydroelectric powergeneration, non-hydraulic renewable energy sources (NHRES), such as wind power andphotovoltaics, have grown substantially; the power production share of renewable energysources (RES) reached an installed capacity exceeding 35% by 2019 [13]. However, China’soriginal institutional model of power planning, operations, and mechanisms have becomeincreasingly incompatible with its development, and many deep-seated contradictionshave emerged [14]. On the technical level, the systemic and guiding role of power plan-ning is weak. The development scale of wind power and photovoltaic power generationproposed in the original institutional model is lower than the actual development scaleand potential. This scale deviation exacerbates the difficulties and contradictions thatarise due to consumption [15]. On the mechanism and system levels, due to the lack of aprevious renewable energy consumption guarantee mechanism and unclear local consump-tion responsibilities, it is difficult to effectively implement the renewable energy powerconsumption target, so the phenomenon of abandoned wind, light, and water sourcesoccurs in many places [16,17]. The average wind abandonment rate in China has graduallyincreased, reaching as high as 21% in the first half of 2016. Since 2015, China’s averagewind abandonment rate has remained high, at around 12% [18]. Moreover, the growingcapital subsidy gap under the feed-in tariff (FIT) subsidy mechanism has made the financialburden increasingly heavy, with the renewable electricity subsidy gap reaching 120 billionyuan in the first half of 2018 [19].
Energies 2022, 15, x FOR PEER REVIEW 2 of 19
accounting for 28% of world CO2 emissions [6,7]. Environmental pollution has attracted the attention of the Chinese government, which is actively promoting the development of renewable energy and the reduction of greenhouse gases [8]. In the United Nations Gen-eral Assembly in September 2020, President Xi Jinping proposed achieving carbon peak-ing by 2030 and carbon neutrality by 2060. As a major coal power producer, the power sector plays an important role in China’s renewable energy development and carbon re-duction process. Therefore, increasing the share of renewable energy in the power sector is an essential pathway for China in achieving energy transition [9,10].
In recent years, China has developed many incentives to promote the development of renewable energy [11,12]. Since the introduction of the Feed-in Tariff (FIT) in 2005, ap-plicable law has ensured the entry of renewable electricity to the grid, resulting in very rapid development and continued optimization of China’s power supply structure.
As shown in Figures 1 and 2, in addition to technically mature hydroelectric power generation, non-hydraulic renewable energy sources (NHRES), such as wind power and photovoltaics, have grown substantially; the power production share of renewable energy sources (RES) reached an installed capacity exceeding 35% by 2019 [13]. However, China’s original institutional model of power planning, operations, and mechanisms have become increasingly incompatible with its development, and many deep-seated contradictions have emerged [14]. On the technical level, the systemic and guiding role of power plan-ning is weak. The development scale of wind power and photovoltaic power generation proposed in the original institutional model is lower than the actual development scale and potential. This scale deviation exacerbates the difficulties and contradictions that arise due to consumption [15]. On the mechanism and system levels, due to the lack of a previ-ous renewable energy consumption guarantee mechanism and unclear local consumption responsibilities, it is difficult to effectively implement the renewable energy power con-sumption target, so the phenomenon of abandoned wind, light, and water sources occurs in many places [16,17]. The average wind abandonment rate in China has gradually in-creased, reaching as high as 21% in the first half of 2016. Since 2015, China’s average wind abandonment rate has remained high, at around 12% [18]. Moreover, the growing capital subsidy gap under the feed-in tariff (FIT) subsidy mechanism has made the financial bur-den increasingly heavy, with the renewable electricity subsidy gap reaching 120 billion yuan in the first half of 2018 [19].
Figure 1. Total installed capacity and renewable energy capacity in China, and their respective shares. Figure 1. Total installed capacity and renewable energy capacity in China, and their respective shares.
How can we solve the above problems in renewable energy consumption in China,economically and effectively? According to the experience of some countries, a renewableenergy quota system is an effective way [20]. However, different countries’ power systems,grid structures, and economic systems differ significantly, so it is not easy to transfer theexisting international quota system directly to China. After more than a decade of consid-eration and three solicitations, on 10 May 2019, China’s National Energy Administrationofficially released its Notice on Establishing a Sound Renewable Energy Consumption

Energies 2022, 15, 3949 3 of 18
Mechanism (thereafter referred to as the “Notice”) [21,22]. The quota system was imple-mented in the form of “renewable power responsibility weighting.” After one year ofsimulation, complete monitoring and evaluation were carried out from 2020 onwards.Representative documents and differences in the development process of the policy areshown in Table 1.
Energies 2022, 15, x FOR PEER REVIEW 3 of 19
Figure 2. Total power generation, RES, and NHRES power generation and their respective shares.
How can we solve the above problems in renewable energy consumption in China, economically and effectively? According to the experience of some countries, a renewable energy quota system is an effective way [20]. However, different countries’ power sys-tems, grid structures, and economic systems differ significantly, so it is not easy to transfer the existing international quota system directly to China. After more than a decade of consideration and three solicitations, on 10 May 2019, China’s National Energy Admin-istration officially released its Notice on Establishing a Sound Renewable Energy Con-sumption Mechanism (thereafter referred to as the “Notice”) [21,22]. The quota system was implemented in the form of “renewable power responsibility weighting.” After one year of simulation, complete monitoring and evaluation were carried out from 2020 on-wards. Representative documents and differences in the development process of the pol-icy are shown in Table 1.
Table 1. Typical documents and differences in the process of renewable energy policy formulation.
Date Name Sectors Quota Subjects Allocation Principles and Plans Differences from the Last Policy
Febru-ary 2012
Renewable Energy Power Quota Man-agement Measures (Discussion Draft)
New Energy Department, National En-ergy Admin-istration
1. Large power producer companies produce green power and generate quotas.
2. Grid companies at all levels ac-quire quotas.
3. Provincial governments consume quotas.
The more abundant the renewable energy power resources, the more quotas will be assumed as the prin-ciple, and there is no specific allo-cation scheme.
Febru-ary 2016
Guidance on the Establishment of a Target Guidance System for Renew-able Energy Devel-opment and Utili-zation
National En-ergy Admin-istration
1. All power supply entities (includ-ing power sales enterprises and di-rect power generation enterprises) to produce green electricity and generate quotas.
2. Collect quotas from grid compa-nies at all levels for acquisition.
3. All social consumption quotas.
Allocate the task of renewable elec-tricity quota by province and re-gion.
1. The responsible body has changed.
2. The target of the pro-portion of non-water renewable energy power consumption is listed separately. It is suggested that a green certificate trading mechanism be estab-lished for renewable energy power.
Figure 2. Total power generation, RES, and NHRES power generation and their respective shares.
Table 1. Typical documents and differences in the process of renewable energy policy formulation.
Date Name Sectors Quota Subjects Allocation Principlesand Plans Differences from the Last Policy
February2012
Renewable EnergyPower QuotaManagement Measures(Discussion Draft)
New EnergyDepartment, NationalEnergyAdministration
1. Large power producercompanies producegreen power andgenerate quotas.
2. Grid companies at alllevels acquire quotas.
3. Provincial governmentsconsume quotas.
The more abundant therenewable energypower resources, themore quotas will beassumed as theprinciple, and there isno specific allocationscheme.
February2016
Guidance on theEstablishment of aTarget Guidance Systemfor Renewable EnergyDevelopment andUtilization
National EnergyAdministration
1. All power supplyentities (includingpower sales enterprisesand direct powergeneration enterprises)to produce greenelectricity and generatequotas.
2. Collect quotas from gridcompanies at all levelsfor acquisition.
3. All social consumptionquotas.
Allocate the task ofrenewable electricityquota by province andregion.
1. The responsible body haschanged.
2. The target of theproportion of non-waterrenewable energy powerconsumption is listedseparately. It is suggestedthat a green certificatetrading mechanism beestablished for renewableenergy power.
February2017
Notice on the TrialImplementation ofRenewable EnergyGreen Power CertificateIssuance and VoluntarySubscription TradingSystem
NationalDevelopment andReform Commission,Ministry of Finance,National EnergyAdministration
No change compared to 2016. No change compared to2016.
1. Proposal to establish avoluntary subscriptionsystem for renewableenergy green powercertificates; suggestion ofthe trial issuance ofrenewable energy greenpower certificates.
2. Assign the task ofcompleting renewableenergy power quotas toprovinces and regions.

Energies 2022, 15, 3949 4 of 18
Table 1. Cont.
Date Name Sectors Quota Subjects Allocation Principlesand Plans Differences from the Last Policy
March2018
Renewable EnergyPower Quota andAssessment Measures(Draft for Comments)
National EnergyAdministrationIntegrated Division
The provincial powercompanies, local power gridenterprises, other types ofelectricity distributionenterprises, industrialenterprises with self-providedpower plants, direct purchaseof electricity users involved inpower market transactions andother market entities to changeto bear the obligations ofrenewable energy power quotasubject.
Allocation principlesadd consideration offactors such ascross-provincial andcross-regionaltransmission channelcapacity and localpower supply anddemand.The allocation methoduses the means ofmandatoryamortization.
1. There is no longer a quotaproduction responsibilitysubject; the main body ofresponsibility forconsumption has changed.
2. Market-based tradingsupporting the measuresof consumption isproposed.
3. the subject of theassessment changed togreen certificates.
4. Beijing, Tianjin, and Hebeiquota tasks are no longerconsistent.
September2018
Renewable EnergyPower Quota andAssessment Measures(Second Draft forComments)
NationalDevelopment andReform Commission
Provincial power companies,local power grid enterprises;distribution and salescompanies; independentpower sales companies; powerusers involved in direct powertrading; enterprises withself-provided power plants.
Allocation principlesand provincial quotaallocation method;nuclear tasks withoutmajor changes
The way to meet the assessmentneeds by selling “alternativecertificates” to the gridcompanies. Once again, it is clearthat the “green certificate” is thesubject of the quota assessment.
November2018
Notice on theImplementation ofRenewable EnergyPower Quota System
NationalDevelopment andReform Commission,National EnergyAdministration
Unchanged
On the basis of theprevious “draftopinion”, thedevelopment of theallocation indicatorstook into account theproposed indicators ofrenewable energypower quotas submittedby the provincialadministrative regionsthemselves.
The allocation principle has beenchanged to take into account theproposed renewable energypower quota targets submitted bythe provincial administrativeregions themselves.
May 2019
Notice on Establishing aSound GuaranteeMechanism forRenewable EnergyPower Consumption(NDRC Energy [2019]No. 807)
NationalDevelopment andReform Commission,National EnergyAdministration
The first category is all types ofgrid companies thatsupply/sell electricity directlyto power consumers,independent power salescompanies, and power salescompanies that have the rightto operate distribution grids;the second category is powerconsumers that purchaseelectricity through thewholesale power market andcompanies that ownself-provided power plants.
Allocation principles,allocation methods andallocation schemesremain unchanged.
1. Quota subject haschanged.
2. Change the quota torenewable energyconsumptionresponsibility weighting,according to the provincialadministrative regions toallocate the proportion ofrenewable energyconsumption.
Based on the above-mentioned policy development process, the focus for more thanten years was on who should be the main body in implementing the quota; however, thefinal formulation of China’s renewable energy consumption policy provides the allocationprinciples and the allocation scheme. Nevertheless, the government has not provided aclear allocation method, a calculation model, or even a specific indicator system; ultimately,each provincial administrative region tends to achieve the result by referring to historicalenergy consumption data. Although this initial allocation scheme can accomplish theachievement of China’s renewable electricity consumption target, its allocation efficiency isworthy of consideration.
In summary, few studies have questioned the allocation scheme in the current quotasystem in China. The purpose of this study is to analyze the rationality of this allocationscheme. On this basis, the study designed a quota system allocation method that is moresuitable for the development of renewable energy in China. The remainder of this paperis structured as follows: In Section 2, a literature review is conducted to identify otherresearch results and their shortcomings, and to provide the innovation points of this study.In Section 3, the efficiency of the existing quota allocation is analyzed using the DEA-BCCmodel. Then, a zero-sum DEA model is constructed to achieve quota reallocation. Section 4develops an empirical analysis of 30 provinces and regions in China. Section 5 summarizes

Energies 2022, 15, 3949 5 of 18
the research process and the conclusions of the article, and presents the study’s limitationsand directions for future research.
2. Literature Review
The renewable portfolio standard (RPS) was first applied in the United States [23]and has since been implemented in many countries, including the United Kingdom, Bel-gium, Japan, China, and South Korea [24,25]. Many scholars have carried out comparativestudies of the two surge policies, the RPS and the FIT, at their initial stages, with differentconclusions due to policy differences among the countries and different perspectives inareas of research [26,27]. In terms of installed capacity, Sun and Nie argues that the FITpolicy is more advantageous than the RPS policy, while the RPS has more cost advan-tages [28]. In fact, the RPS and the FIT are not completely independent of each other andcan be implemented as complementary policies [29]. Dong and Shi studied China’s RPSpolicy and argued that the current RPS policy is essentially a combination of RPS and FITimplementation. The effectiveness of the RPS policy is limited by the contribution of theFIT to renewable energy development [30]. That study also confirmed the rationality of theidea of a policy mix, as proposed by some scholars [31,32]. Sun and Kim analyzed the profitmaximization of power producers under the RPS, and the carbon emissions trading policyin light of the current situation of renewable energy development in Korea. Their studyconcluded that setting different RPS ratios for different regions or different generatorswould be more conducive to achieving RPS goals than a uniform RPS ratio [33].
Regarding the evaluation of the effects of policy implementation, countries such as theUnited States, Japan, and Korea, as well as the European Union, have evaluated the benefitsof the RPS at the national level, building various optimization, gaming, and combinationmodels to confirm the applicability of policy implementation from multiple perspectives,such as cost-benefit, technological innovation, and market risk [34,35]. However, thesestudies focused on the effects of implementing different RPS policies in different countries,and they did not find the best way to achieve RPS goals [36].
Unlike other countries, China has set provincial RPS targets and established a mini-mum percentage of renewable energy generation as part of its total annual energy consump-tion. Subject to a final political assessment, provincial allocation targets are set to provide aguarantee to achieve the overall target [37]. In addition, all provincial governments, gridcompanies, electricity marketing companies, and electricity consumers have respectiveobligations to meet the RPS targets [38]. Nonetheless, Abbas, Wang, Bashir, Iqbal, andUllah [39] pointed out some barriers and obstacles in the implementation of RPS policiesin China, especially in the initial construction phase of the RPS. Since the distributionof renewable energy in China is uneven and economic development varies greatly fromone place to another, an unreasonable quota allocation will lead to an intensification ofthe conflict between economic development and environmental considerations in eachprovince [40]. Therefore, establishing reasonable quota obligations for each province isa complex task [41]. Furthermore, China differs from many countries, such as Australia,South Korea, and India, in that it has only an overall nationally based RPS target without asub-level allocation policy [42]. While China is the only country that has set clear provincialRPS targets, there is limited research on the achievement of provincial RPS targets. Thetheoretical basis for the allocation of quotas has not been clearly explained, either in aca-demic studies or in official documents issued by the National Energy Administration, andresponsible provincial authorities are skeptical about the fairness and effectiveness of thecurrently prescribed quotas [43].
Navarro-Chávez [44] and others concluded that DEA can be an effective assessmenttool for the analysis of energy efficiency issues in the future, through a comprehensiveanalysis. Not only can DEA evaluate the overall energy efficiency of a country and a region,but it can also evaluate the energy efficiency of individual units and provide guidance forimproving energy efficiency [45]. Previously, many scholars in China and abroad have usedDEA models to measure the efficiency of carbon emission rights allocation, and further

Energies 2022, 15, 3949 6 of 18
studied the efficiency of carbon emission rights allocation using zero-sum DEA models,thereby proposing a fair and effective way to allocate carbon emission rights and promotingthe development of low-carbon economies [46,47]. In view of the research results of DEAmodels in other fields, a DEA model approach is innovatively used in this paper to optimizethe allocation efficiency of the RPS. Compared with other DEA models, this model canprovide the optimal DEA allocation scheme in multiple iterations. Some major DEA modelsand their advantages and disadvantages are shown in Table 2.
Table 2. Major DEA models and their advantages and disadvantages.
Models Advantages Disadvantages
CCR-DEA The model can calculate the efficiency of resourceallocation with constant return of scale.
Cannot be applied in case of change inreturn of scale.
BCC-DEA The model can calculate the efficiency of resourceallocation in the case of a change in the return of scale.
The model can only give the relativeefficiency of the initial state and cannotperform the integration of inputs oroutputs to help it achieve DEA effective.
ZSG-DEA
The model can adjust the allocation scheme fornon-desired outputs based on the DEA efficiencyvalues of the decision units and gives DEA efficientallocation schemes by iteration.
The model requires multiple iterationsand is computationally complex.
Currently, the global economy has been affected by the impact of the novel coronavirusoutbreak, which has caused significant economic losses and a high degree of uncertaintyabout the short-term growth of the global economy [48]. According to data released by theNational Bureau of Statistics of China, China’s GDP growth fell by 6.8% in the first quarterof 2020 [49]. Under this unpromising economic environment, although the development ofrenewable energy is strategically important to reduce carbon emissions and to cope withthe finiteness of fossil energy, studying the economics and effectiveness of quota allocationis of more practical importance at present in achieving China’s consumption target. Thispaper addresses these issues and makes the following contributions.
1. In terms of the research content, we study the efficiency of renewable energy responsi-bility weight allocation in China, which is a new issue in the development processof renewable energy in China [50]. This is a problem that has not yet been focusedon by scholars from the perspectives of theory or practice. Therefore, the researchperspective and the methodology provided in this paper can fill some gaps.
2. In terms of research methodology, we adopt a zero-sum DEA model, which is suitablefor the study of allocation strategies in keeping the total amount of allocations constant,and through which the allocation efficiency of the current allocation scheme in Chinacan be improved. From the perspective of efficiency, the DEA-BCC model is appliedto analyze the validity of the minimum consumption responsibility weights issued bythe National Energy Administration; according to the output, the original scheme isreallocated using the ZSG-DEA model to achieve the Pareto optimum.
3. In terms of impact and sensitivity analysis, we compare the optimized scheme withthe original scheme, analyze the impact of the change in allocation efficiency on GDP,and the impact on equity. We propose corresponding policy recommendations basedon the analysis results.
In summary, there is a gap in the present research on the efficiency of the current RPSquota allocation in China. In this study, a zero-sum DEA model is innovatively used toreallocate the original scheme to achieve optimal efficiency. This study also addresses theimpact of allocation efficiency on GDP and fairness, and finally provides policy recommen-dations to promote fair quota allocation and renewable energy development
Energies 2022, 15, 3949 7 of 18
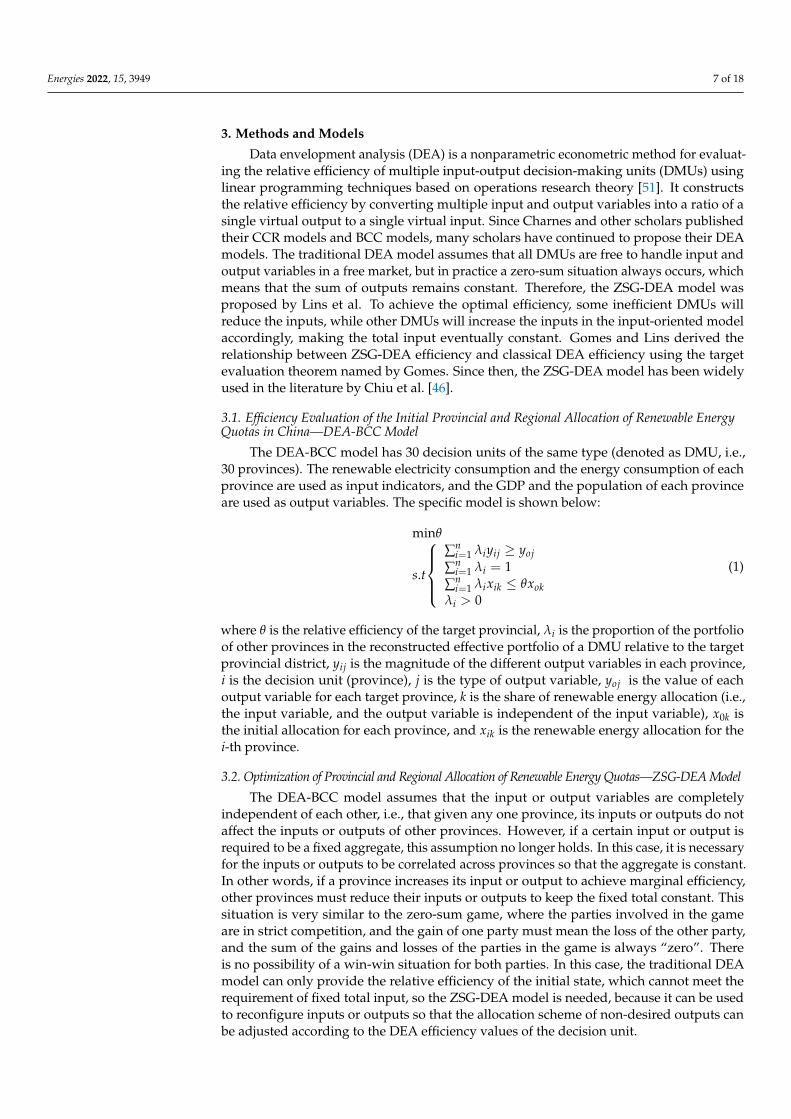
3. Methods and Models
Data envelopment analysis (DEA) is a nonparametric econometric method for evaluat-ing the relative efficiency of multiple input-output decision-making units (DMUs) usinglinear programming techniques based on operations research theory [51]. It constructsthe relative efficiency by converting multiple input and output variables into a ratio of asingle virtual output to a single virtual input. Since Charnes and other scholars publishedtheir CCR models and BCC models, many scholars have continued to propose their DEAmodels. The traditional DEA model assumes that all DMUs are free to handle input andoutput variables in a free market, but in practice a zero-sum situation always occurs, whichmeans that the sum of outputs remains constant. Therefore, the ZSG-DEA model wasproposed by Lins et al. To achieve the optimal efficiency, some inefficient DMUs willreduce the inputs, while other DMUs will increase the inputs in the input-oriented modelaccordingly, making the total input eventually constant. Gomes and Lins derived therelationship between ZSG-DEA efficiency and classical DEA efficiency using the targetevaluation theorem named by Gomes. Since then, the ZSG-DEA model has been widelyused in the literature by Chiu et al. [46].
3.1. Efficiency Evaluation of the Initial Provincial and Regional Allocation of Renewable EnergyQuotas in China—DEA-BCC Model
The DEA-BCC model has 30 decision units of the same type (denoted as DMU, i.e.,30 provinces). The renewable electricity consumption and the energy consumption of eachprovince are used as input indicators, and the GDP and the population of each provinceare used as output variables. The specific model is shown below:
minθ
s.t
∑n
i=1 λiyij ≥ yoj∑n
i=1 λi = 1∑n
i=1 λixik ≤ θxokλi > 0
(1)
where θ is the relative efficiency of the target provincial, λi is the proportion of the portfolioof other provinces in the reconstructed effective portfolio of a DMU relative to the targetprovincial district, yij is the magnitude of the different output variables in each province,i is the decision unit (province), j is the type of output variable, yoj is the value of eachoutput variable for each target province, k is the share of renewable energy allocation (i.e.,the input variable, and the output variable is independent of the input variable), x0k isthe initial allocation for each province, and xik is the renewable energy allocation for thei-th province.
3.2. Optimization of Provincial and Regional Allocation of Renewable Energy Quotas—ZSG-DEA Model
The DEA-BCC model assumes that the input or output variables are completelyindependent of each other, i.e., that given any one province, its inputs or outputs do notaffect the inputs or outputs of other provinces. However, if a certain input or output isrequired to be a fixed aggregate, this assumption no longer holds. In this case, it is necessaryfor the inputs or outputs to be correlated across provinces so that the aggregate is constant.In other words, if a province increases its input or output to achieve marginal efficiency,other provinces must reduce their inputs or outputs to keep the fixed total constant. Thissituation is very similar to the zero-sum game, where the parties involved in the gameare in strict competition, and the gain of one party must mean the loss of the other party,and the sum of the gains and losses of the parties in the game is always “zero”. Thereis no possibility of a win-win situation for both parties. In this case, the traditional DEAmodel can only provide the relative efficiency of the initial state, which cannot meet therequirement of fixed total input, so the ZSG-DEA model is needed, because it can be usedto reconfigure inputs or outputs so that the allocation scheme of non-desired outputs canbe adjusted according to the DEA efficiency values of the decision unit.

Energies 2022, 15, 3949 8 of 18
In the input-oriented zero-sum benefit DEA model, let the target province be a non-DEA efficient decision unit that must reduce the use of inputs (renewable energy allocations)in order to achieve DEA efficiency. Then, the amount of quota used by the target provinceto distribute to other provinces is as follows:
v = x0 − δx0 (2)
where x0 is the initial renewable energy allocation of DMU0, v is the amount of renewableenergy quota reduction, and δ is the zero-sum gain DEA allocation efficiency value. Theallocation reduction v will be allocated to the other 29 provinces in certain proportions.
The quota v used for distribution to other provinces in the target province needs tofollow a certain ratio, which is the percentage of the quota of the i-th province in the totalquota. The renewable energy quota that the i-th province (DMUi) will receive from thetarget province (DMU0) is:
xi
∑i 6=0 xi·x0(1− δ) (3)
Since each province and region is making proportional reductions in inputs, the finalinput volume reallocation to the decision unit, DMUi, is the difference between the sum ofthe new allocations that the i-th province receives from each of the other provinces and itsown quota allocated to the other provinces. The redistribution of the final input (renewableenergy quota) to the decision unit (province i) is:
x′i = ∑i 6=0
[xi
∑i 6=0 xi·x0(1− δ)
]− xi(1− δi) (4)
In summary, by substituting x′i into Equation (1), the final ZSG-DEA model can beobtained as follows.
minδ
s.t
∑ni=1 λiyij ≥ yoj
∑ni=1 λixik ≤ xok∑n
i=1 λi = 1
∑ni=1 λixi
[1 + x0(1−δ)
∑i 6=0 xi
]≤ δx0
λi > 0
(5)
In this study, the ZSG-DEA model is solved by an iterative method. Through multipleiterations, the input variables can be reallocated several times and, eventually, all DMUswill reach the effective boundary, i.e., 100% effectiveness. At this point, the input allocationresult is the one that provides the best efficiency.
In summary, the symbols used in the model and their meanings are summarized inTable 3.
Table 3. Summary table.
Symbols Implication
DMU Decision making unitsθ Relative efficiency of the target provinciali The decision unit (province)j The type of output variable.k The share of renewable energy allocation
λiThe proportion of the portfolio of other provinces in the reconstructed effective portfolio of a DMU
relative to the target provincial districtn 30 decision units (i.e., 30 provinces)yij The magnitude of the different output variables in each provinceyoj The value of each output variable for each target provincexik The renewable energy allocation for the i-th province

Energies 2022, 15, 3949 9 of 18
Table 3. Cont.
Symbols Implication
x0k The initial allocation for each provincex0 The initial renewable energy allocation of DMU0v The amount of renewable energy quota reductionδ The zero-sum gain DEA allocation efficiency value
x′i The redistribution of the final input (renewable energy quota) to the decision unit (province i)
3.3. Indicator Selection and Data Description
The study of environmental efficiency can use the labor force (or population) andenergy consumption as input variables, and the GDP and the renewable energy quota asoutput variables, where the GDP is the expected output and the renewable energy quotais the undesired output. We focus on the efficiency of renewable energy quota allocationin Chinese provinces, so we use the renewable energy quota as the non-expected output.In the efficiency evaluation model of DEA, there are various ways to deal with the non-expected output. However, in this paper, the non-expected output is considered as input;according to Lins, Gomes, Mello, and Mello [52], less input and more expected outputwill lead to higher efficiency. The electricity consumption and the energy consumption ofrenewable energy in each province, calculated in 2018, are used as input indicators, whilethe GDP and the population of each province are used as output variables. When theelectricity consumption of renewable energy and the energy consumption are the same andthe decision-making unit has a higher GDP and population, the allocation is more efficient.
There are two main dimensions of the consumption responsibility weighting index.:The first dimension is the total consumption responsibility weighting and non-hydropower consumption responsibility weighting. The second dimension is the minimum con-sumption responsibility weight and the incentive consumption responsibility weight. Theminimum consumption responsibility weight indicator is the minimum share of renewableenergy electricity consumption that each province should achieve, while the incentiveconsumption responsibility weight does not specify how to incentivize, because the itempolicy promotion itself will cause the crowding out of traditional thermal power in mostprovinces and raise the economic cost caused by the rising energy cost; accordingly, thispaper is only based on the dimension of minimum consumption responsibility weight forresearch. The Notice assigns the consumption responsibility weights for each year from2018 to 2020. The 2018 dissipation responsibility weight is used as the reference value forself-verification of each provincial administrative region. Therefore, this paper multipliesthe minimum consumption responsibility weight of 2018 by the total electricity consump-tion of the corresponding provinces to obtain the electricity consumption of renewableenergy. The energy consumption of each province is calculated based on the product ofenergy consumption per unit GDP and the GDP of each province; the energy consumptionper unit GDP, GDP, and population data are taken from the National Bureau of Statistics ofthe People’s Republic of China.
4. Empirical Analysis4.1. Allocation Efficiency of the Renewable Energy Quota
According to the above-proposed allocation scheme, the original DEA efficiency issolved by Matlab. The calculated initial efficiency values of the renewable energy quotafor each province and region in China are shown in Table 4. In Table 4, we can seethat the average value of initial efficiency is only 0.5718, which indicates that the overallefficiency of renewable energy distribution in China is not high and needs to be improved.In the initial allocation scheme, Guangdong Province, Yunnan Province, and SichuanProvince have a larger amount of renewable energy consumption. However, differentprovinces have different reasons, according to their characteristics. Guangdong Provincehas a developed economy, a large population base, and is dominated by light industry,

Energies 2022, 15, 3949 10 of 18
so electricity consumption is high and more renewable energy consumption should beapplied. Yunnan and Sichuan provinces, on the other hand, account for more than half ofthe hydroelectric power generation because of the abundance of their hydro resources.
Table 4. Efficiency of Quota Distribution by Provinces in China.
Province/Municipality
RenewableEnergy
Consumption/100 Million kwh
Population/Ten Thousand
GDP/100 Million Yuan
EnergyConsumption/ton
DEA-BCCComprehensiveEfficiency Value
Beijing 133.62 2171 303,20 177,760,000 1Tianjin 99.384 1557 188,09.64 103,453,020 0.8873Hebei 414.655 7520 360,10.3 198,056,650 0.8089Shanxi 271.347 3702 16,818.11 924,996,05 0.5717
Inner Mongolia 481.925 2529 17,300 951,500,00 0.2277Liaoning 250.551 4369 25,315.4 139,234,700 0.7577
Jilin 146.96 2717 15,074.62 829,104,10 0.7762Heilongjiang 198.237 3789 16,361.6 899,888,00 0.8019
Shanghai 490.38 2418 32,679.87 179,739,285 0.358Jiangsu 807.932 8029 92,595.4 509,274,700 1
Zhejiang 735.87 5657 56,197 309,083,500 0.4598Anhui 267.455 6255 30,006.8 165,037,400 1Fujian 471.6 3911 35,804.04 196,922,220 0.4397Jiangxi 314.678 4622 21,984.8 120,916,400 0.6216
Shandong 469.017 10,006 76,469.7 420,583,350 1Henan 451.339 9559 48,055.86 264,307,780 0.9859Hubei 705.2 5902 39,366.55 216,516,025 0.3793Hunan 801.856 6860 36,425.78 200,341,790 0.3741
Guangdong 1654.95 11,169 97,149.56 534,322,580 1Guangxi 680 4885 20,352.51 111,938,805 0.3047Hainan 33.005 926 4832.05 265,762,75 1
Chongqing 416.25 3075 20,363.19 111,997,545 0.3229Sichuan 1680.8 8302 40,678.13 223,729,715 0.2246Guizhou 391.23 3580 14,806.45 814,354,75 0.3828Yunnan 1128.8 4801 17,881.12 983,461,60 0.1803Shaanxi 241.546 3835 24,438.32 134,410,760 0.6973Gansu 509.07 2626 8246.1 453,535,50 0.2118
Qinghai 433.202 598 2865.23 157,587,65 0.0762Ningxia 215.541 682 3705.18 203,784,90 0.1531Xinjiang 664.692 2445 12,199.08 670,949,40 0.1506
Table 4 shows that the efficiency of each province and region varies greatly, with16 provinces accounting for a larger share than the average efficiency level. Among the30 provinces counted, only Beijing, Jiangsu, Anhui, Shandong, Guangdong, and Hainanreach 100% of the initial allocation efficiency. These provinces are followed by HenanProvince, Tianjin City, and Heilongjiang Province, which all exceeded 80%. The lowestdistribution efficiency is in Qinghai Province. In some provinces with significant economicvolume and energy consumption, such as Shanghai and Zhejiang, the efficiency is notsatisfactory, or even below average. This means that the renewable energy quotas in mostprovinces still need to be adjusted.
Under the original DEA model, the provinces that need to adjust the quota amountshould target the provinces that reach the effective allocation. If we ask each province toadjust with the target province, according to the efficiency value and the slack variables ofthe original DEA model, although we will obtain the most economical renewable energyallocation scheme, this adjustment does not take into account the actual situation of eachprovince comprehensively and may be hindered by some policies. For such phenomenaand problems, the feasible solution is to implement total control; i.e., the overall renewableenergy consumption of the country as a whole would remain unchanged as a hard con-
Energies 2022, 15, 3949 11 of 18
straint, while each province could choose different ways to fulfill the renewable energyconsumption obligations according to its development. Obviously, this is a zero-sum allo-cation problem, so energy consumption can be redistributed with the help of the ZSG-DEAmodel, and then the optimization of the renewable energy quota could be carried outaccording to the efficiency value and the slack variables under the ZSG-DEA model.
4.2. Optimizing Allocation Efficiency of Renewable Energy Quotas
A fair allocation of renewable energy consumption should be such that the allocationis efficient in all provinces, either under the original DEA model or under the ZSG-DEAmodel. However, under the ZSG-DEA model, each province only adjusts its target valueaccording to its wishes. When all provinces only adjust their targets, there may be anunbalanced result, i.e., some provinces may wish to reduce the renewable energy allocation,while others may wish to increase the renewable energy allocation. The result may bethat it is difficult for each province to reach an agreement. Therefore, a multiple iterationapproach is used in this paper.
According to the results of the ZSG-DEA model, under renewable energy quota al-location, the adjusted renewable energy quota allocation result of each province can beobtained. According to the results of ZSG-DEA model, under renewable energy quotaallocation, the adjusted renewable energy quota allocation results of each province can beobtained. Compared with the initial allocation announced by the National Energy Admin-istration, 15 provinces, including Inner Mongolia, Shanghai, Zhejiang, and Fujian, needto reduce electricity consumption from renewable energy sources, with a total reductionof 451,226.3 million kWh. The remaining 15 provinces, including Beijing, Tianjin, Hebei,and Shanxi, need to obtain electricity consumption from these renewable sources, with atotal increase of 451,226.3 million kWh. The total amount of this increase is equal to thetotal amount of its decrease because the total amount of renewable energy consumption isguaranteed to be constant.
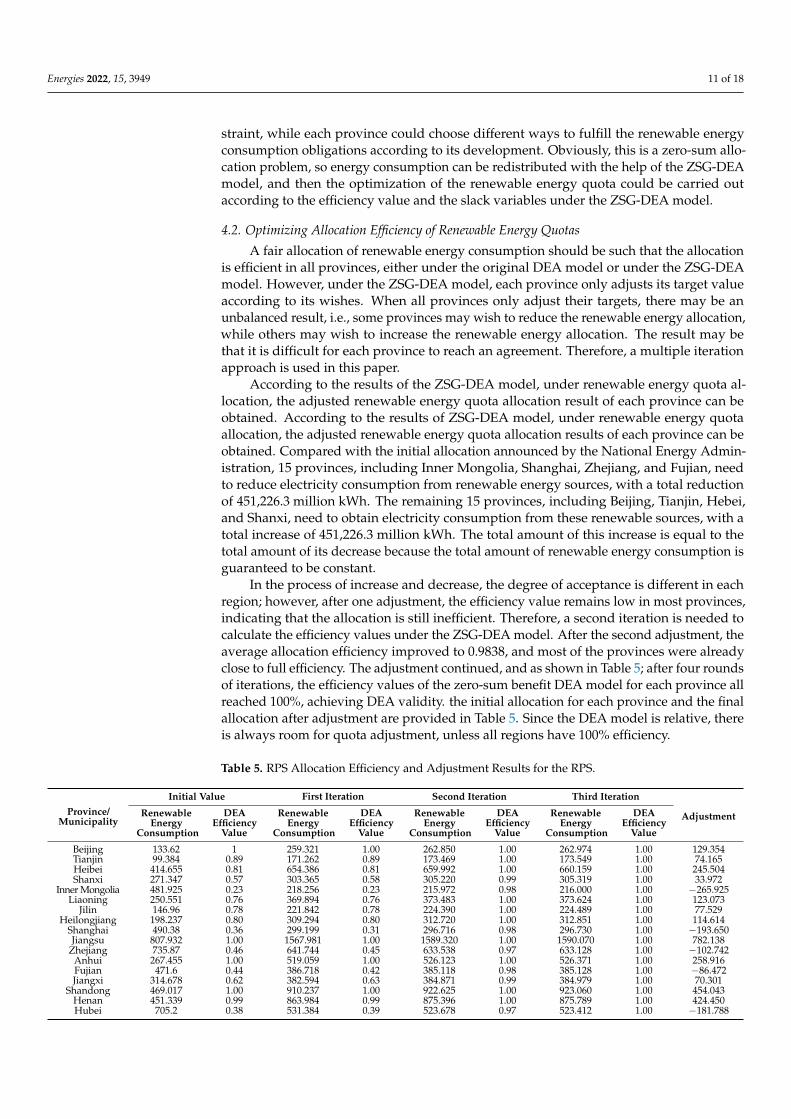
In the process of increase and decrease, the degree of acceptance is different in eachregion; however, after one adjustment, the efficiency value remains low in most provinces,indicating that the allocation is still inefficient. Therefore, a second iteration is needed tocalculate the efficiency values under the ZSG-DEA model. After the second adjustment, theaverage allocation efficiency improved to 0.9838, and most of the provinces were alreadyclose to full efficiency. The adjustment continued, and as shown in Table 5; after four roundsof iterations, the efficiency values of the zero-sum benefit DEA model for each province allreached 100%, achieving DEA validity. the initial allocation for each province and the finalallocation after adjustment are provided in Table 5. Since the DEA model is relative, thereis always room for quota adjustment, unless all regions have 100% efficiency.
Table 5. RPS Allocation Efficiency and Adjustment Results for the RPS.
Province/Municipality
Initial Value First Iteration Second Iteration Third Iteration
AdjustmentRenewableEnergy
Consumption
DEAEfficiency
Value
RenewableEnergy
Consumption
DEAEfficiency
Value
RenewableEnergy
Consumption
DEAEfficiency
Value
RenewableEnergy
Consumption
DEAEfficiency
Value
Beijing 133.62 1 259.321 1.00 262.850 1.00 262.974 1.00 129.354Tianjin 99.384 0.89 171.262 0.89 173.469 1.00 173.549 1.00 74.165Heibei 414.655 0.81 654.386 0.81 659.992 1.00 660.159 1.00 245.504Shanxi 271.347 0.57 303.365 0.58 305.220 0.99 305.319 1.00 33.972
Inner Mongolia 481.925 0.23 218.256 0.23 215.972 0.98 216.000 1.00 −265.925Liaoning 250.551 0.76 369.894 0.76 373.483 1.00 373.624 1.00 123.073
Jilin 146.96 0.78 221.842 0.78 224.390 1.00 224.489 1.00 77.529Heilongjiang 198.237 0.80 309.294 0.80 312.720 1.00 312.851 1.00 114.614
Shanghai 490.38 0.36 299.199 0.31 296.716 0.98 296.730 1.00 −193.650Jiangsu 807.932 1.00 1567.981 1.00 1589.320 1.00 1590.070 1.00 782.138
Zhejiang 735.87 0.46 641.744 0.45 633.538 0.97 633.128 1.00 −102.742Anhui 267.455 1.00 519.059 1.00 526.123 1.00 526.371 1.00 258.916Fujian 471.6 0.44 386.718 0.42 385.118 0.98 385.128 1.00 −86.472Jiangxi 314.678 0.62 382.594 0.63 384.871 0.99 384.979 1.00 70.301
Shandong 469.017 1.00 910.237 1.00 922.625 1.00 923.060 1.00 454.043Henan 451.339 0.99 863.984 0.99 875.396 1.00 875.789 1.00 424.450Hubei 705.2 0.38 531.384 0.39 523.678 0.97 523.412 1.00 −181.788

Energies 2022, 15, 3949 12 of 18
Table 5. Cont.
Province/Municipality
Initial Value First Iteration Second Iteration Third Iteration
AdjustmentRenewableEnergy
Consumption
DEAEfficiency
Value
RenewableEnergy
Consumption
DEAEfficiency
Value
RenewableEnergy
Consumption
DEAEfficiency
Value
RenewableEnergy
Consumption
DEAEfficiency
Value
Hunan 801.856 0.37 601.949 0.39 590.856 0.97 590.384 1.00 −211.472Guangdong 1654.95 1.00 3211.818 1.00 3255.529 1.00 3257.064 1.00 1602.114
Guangxi 680 0.30 414.860 0.31 407.900 0.97 407.758 1.00 −272.242Hainan 33.005 1.00 64.054 1.00 64.926 1.00 64.956 1.00 31.951
Chongqing 416.25 0.32 265.666 0.33 264.445 0.98 264.487 1.00 −151.763Sichuan 1680.8 0.22 801.318 0.25 745.963 0.92 743.026 1.00 −937.774Guizhou 391.23 0.38 295.287 0.39 294.705 0.98 294.756 1.00 −96.474Yunnan 1128.8 0.18 420.232 0.19 400.956 0.94 400.493 1.00 −728.307Shaanxi 241.546 0.70 328.458 0.70 331.381 1.00 331.504 1.00 89.958Gansu 509.07 0.21 214.782 0.22 212.129 0.97 212.153 1.00 −296.917
Qinghai 433.202 0.08 65.748 0.08 64.933 0.97 64.959 1.00 −368.243Ningxia 215.541 0.15 64.816 0.15 64.929 0.99 64.959 1.00 −150.582Xinjiang 664.692 0.15 201.584 0.16 196.960 0.96 196.959 1.00 −467.733
Mean 0.57 0.57 0.98 1.00Total 15,561.092 15,561.092 15,561.092 15,561.092
The empirical results show that there is a significant difference between the initialallocation scheme published by the NEA and the Pareto optimal allocation scheme underthe ZSG-DEA model, as shown in Figure 3.
Energies 2022, 15, x FOR PEER REVIEW 13 of 19
Shaanxi 241.546 0.70 328.458 0.70 331.381 1.00 331.504 1.00 89.958 Gansu 509.07 0.21 214.782 0.22 212.129 0.97 212.153 1.00 −296.917
Qinghai 433.202 0.08 65.748 0.08 64.933 0.97 64.959 1.00 −368.243 Ningxia 215.541 0.15 64.816 0.15 64.929 0.99 64.959 1.00 −150.582 Xinjiang 664.692 0.15 201.584 0.16 196.960 0.96 196.959 1.00 −467.733
Mean 0.57 0.57 0.98 1.00 Total 15,561.092 15,561.092 15,561.092 15,561.092
The empirical results show that there is a significant difference between the initial allocation scheme published by the NEA and the Pareto optimal allocation scheme under the ZSG-DEA model, as shown in Figure 3.
Figure 3. Comparison of the 2018 Pareto Efficiency RPS Allocation Scheme (left) with the RPS Allo-cation Scheme (right) published by the NEA.
The initial efficiency varies greatly, and the regions should have different quotas be-cause of the variability in their economies, resources, and policies. From the perspective of national policymakers, the regions with high quota allocation efficiency should be allo-cated more quotas, while the regions with low efficiency should have fewer quotas. From a national perspective, redistribution of renewable energy quotas is necessary, because the redistribution leads to national efficiency gains and increases in total output by ad-justing the quotas in the provinces.
4.3. The Economic Impact of Pareto Efficiency From the perspective of efficiency change, the first change in efficiency is from no
quota to allocated quota, while the second change in efficiency is from reallocation of the quota. The change of efficiency will directly promote the consumption of renewable en-ergy and the improvement of resource allocation, and GDP is one of the output variables when calculating the efficiency value using the above model; the model principle shows that when the efficiency value is improved, it will have an impact on the output variable GDP.The specific results are shown in Table 6.
Figure 3. Comparison of the 2018 Pareto Efficiency RPS Allocation Scheme (left) with the RPSAllocation Scheme (right) published by the NEA.
The initial efficiency varies greatly, and the regions should have different quotasbecause of the variability in their economies, resources, and policies. From the perspectiveof national policymakers, the regions with high quota allocation efficiency should beallocated more quotas, while the regions with low efficiency should have fewer quotas.From a national perspective, redistribution of renewable energy quotas is necessary, becausethe redistribution leads to national efficiency gains and increases in total output by adjustingthe quotas in the provinces.
4.3. The Economic Impact of Pareto Efficiency
From the perspective of efficiency change, the first change in efficiency is from noquota to allocated quota, while the second change in efficiency is from reallocation ofthe quota. The change of efficiency will directly promote the consumption of renewableenergy and the improvement of resource allocation, and GDP is one of the output variableswhen calculating the efficiency value using the above model; the model principle showsthat when the efficiency value is improved, it will have an impact on the output variableGDP.The specific results are shown in Table 6.

Energies 2022, 15, 3949 13 of 18
Table 6. Impact of RPS Allocation Efficiency Change on GDP.
Province/Municipality Renewable EnergyConsumption Changes/100 Million kWh GDP Changes/100 Million Yuan
Beijing 129.359 248.5Tianjin 74.168 196.3Hebei 245.510 206.7Shanxi 33.977 178.6
Inner Mongolia −265.921 187.3Liaoning 123.080 196.5
Jilin 77.533 154.3Heilongjiang 114.620 134.2
Shanghai −193.647 239.5Jiangsu 782.168 432.1
Zhejiang −102.760 267.9Anhui 258.926 231.7Fujian −86.469 125.8Jiangxi 70.306 78.6
Shandong 454.060 297.5Henan 424.465 290.6Hubei −181.796 219.5Hunan −211.490 234.6
Guangdong 1602.175 432.1Guangxi −272.243 87.3Hainan 31.953 −57.9
Chongqing −151.759 100.6Sichuan −937.925 156.9Guizhou −96.470 −45.6Yunnan −728.316 −112.5Shaanxi 89.964 113.6Gansu −296.914 −123.5
Qinghai −368.241 −159Ningxia −150.580 −90.8Xinjiang −467.730 −154.6
Total - 4066.8
Table 6 and Figure 4 show that the net output of China can be increased by406.68 (billion yuan) by reallocating the quota while keeping the total amount of renew-able energy consumption unchanged. There is significant scope for Pareto improvement.Beijing, Jiangsu, Shandong, and Tianjin benefited from the increased quota, while Shang-hai, Zhejiang, Fujian, and Hunan benefited from the reduced quota. A small number ofprovinces, such as Qinghai, Ningxia, Gansu, and Xinjiang, showed a decreasing trend ofGDP, which was also related to the local economic development. Of course, the results ofthis paper are rough, because other control variables of economic development were notconsidered; rather, only the perspective of resource allocation efficiency was considered inmaking an evaluation. However, even if there is a discrepancy between the estimated andaccurate values, the general direction proves the necessity of reallocating renewable energyconsumption quotas to achieve Pareto improvement.
4.4. Analysis of Fairness before and after the Adjustment of the RPS
The Lorenz curves before and after the adjustment of the quota target scheme areshown in Figure 5 by arranging, in order, the provinces’ renewable energy consumptionas a percentage of the country’s, using the cumulative percentage of these indices as thevertical coordinate and the cumulative percentage of the population as the horizontalcoordinate, respectively.

Energies 2022, 15, 3949 14 of 18Energies 2022, 15, x FOR PEER REVIEW 15 of 19
Figure 4. RPS Allocation Efficiency and Adjustment Results for the RPS.
4.4. Analysis of Fairness before and after the Adjustment of the RPS The Lorenz curves before and after the adjustment of the quota target scheme are
shown in Figure 5 by arranging, in order, the provinces’ renewable energy consumption as a percentage of the country’s, using the cumulative percentage of these indices as the vertical coordinate and the cumulative percentage of the population as the horizontal co-ordinate, respectively.
Figure 5. Loren Curve of Per Capita Renewable Energy Electricity Consumption in 2018.
The Gini coefficient of per capita renewable electricity consumption is 0.3796 when the allocation is made according to the RPS allocation scheme announced by the National Energy Administration in 2018, and 0.3428 when the allocation is made according to the adjusted Pareto optimal RPS allocation scheme. The Gini coefficient of per capita
BeijingTianjinHebeiShanxiInner
LiaoningJilin
HeilongjiangShanghaiJiangsuZhejiangAnhuiFujianJiangxi
ShandongHenanHubeiHunan
GuangdongGuangxiHainan
ChongqingSichuanGuizhouYunnanShaanxiGansu
QinghaiNingxiaXinjiang
-1000 0 1000 2000
Renewable Energy Consumption Changes/GDP Changes
Province/M
unicipality
GDP Changes/100 million yuan Renewable Energy Consumption Changes/100 million kWh
Figure 4. RPS Allocation Efficiency and Adjustment Results for the RPS.
Energies 2022, 15, x FOR PEER REVIEW 15 of 19
Figure 4. RPS Allocation Efficiency and Adjustment Results for the RPS.
4.4. Analysis of Fairness before and after the Adjustment of the RPS The Lorenz curves before and after the adjustment of the quota target scheme are
shown in Figure 5 by arranging, in order, the provinces’ renewable energy consumption as a percentage of the country’s, using the cumulative percentage of these indices as the vertical coordinate and the cumulative percentage of the population as the horizontal co-ordinate, respectively.
Figure 5. Loren Curve of Per Capita Renewable Energy Electricity Consumption in 2018.
The Gini coefficient of per capita renewable electricity consumption is 0.3796 when the allocation is made according to the RPS allocation scheme announced by the National Energy Administration in 2018, and 0.3428 when the allocation is made according to the adjusted Pareto optimal RPS allocation scheme. The Gini coefficient of per capita
BeijingTianjinHebeiShanxiInner
LiaoningJilin
HeilongjiangShanghaiJiangsuZhejiangAnhuiFujianJiangxi
ShandongHenanHubeiHunan
GuangdongGuangxiHainan
ChongqingSichuanGuizhouYunnanShaanxiGansu
QinghaiNingxiaXinjiang
-1000 0 1000 2000
Renewable Energy Consumption Changes/GDP Changes
Province/M
unicipality
GDP Changes/100 million yuan Renewable Energy Consumption Changes/100 million kWh
Figure 5. Loren Curve of Per Capita Renewable Energy Electricity Consumption in 2018.
The Gini coefficient of per capita renewable electricity consumption is 0.3796 whenthe allocation is made according to the RPS allocation scheme announced by the NationalEnergy Administration in 2018, and 0.3428 when the allocation is made according to theadjusted Pareto optimal RPS allocation scheme. The Gini coefficient of per capita renewableelectricity consumption decreases after the adjustment of the scheme, which shows thatthe curvature is smaller and the area enclosed by the diagonal is smaller when the Paretooptimal RPS allocation scheme is adjusted. This suggests that adjusting the RPS allocationscheme promotes equity in per capita renewable electricity consumption.

Energies 2022, 15, 3949 15 of 18
5. Conclusions and Policy Implications5.1. Conclusions
Renewable energy consumption is not only an environmental concept, but also in-volves the fairness and efficiency of distribution among provinces. At present, the quotasystem plays a key role in controlling carbon emissions as a policy and as an instrument topromote the consumption of renewable energy. However, the allocation of quotas involvespolitical, equitable, environmental, and historical factors. Therefore, the current allocationsystem is relatively inefficient. The efficiency can be improved through rational allocationto achieve Pareto optimality. The principle of this paper is the maximization of efficiency toensure that all provinces achieve 100% efficiency after redistribution. This principle wouldnot only greatly improve overall efficiency, but also provide economic gains through theimprovement of Pareto optimality.
The ZSG-DEA model outperforms the traditional DEA model, due to the presenceof a quota system. Therefore, this paper applies the output-driven ZSG-DEA model andits solution method to explore the efficiency changes that result from quota adjustment.In addition, the specific values of quota adjustment for different provinces are provided,where the number of provinces requiring a quota increase or a quota decrease are both15. The adjusted allocation scheme is more efficient than the current one, and this paper isbased on maximizing the efficiency of the whole country, while each province is focused onlocal economic and environmental objectives.
5.2. Policy Implications
Based on our conclusions, we believe that one-time measurements and adjustments donot allow the policy options that are needed to improve more quickly in the right direction;therefore, we build on the foundation with the following recommendations regarding thedesign of the renewable energy responsibility weighting scheme for each province.
1. The total renewable energy target needs to adapt to the national strategy and makea dynamic adjustment. The planning of the total renewable energy target shouldbe subordinated to the national macro strategy and the laws of economic and socialdevelopment. China has proposed the “30.60” peak carbon neutral target [53], whichshould be used to dynamically adjust the share of renewable electricity.
2. The total renewable energy target needs to guarantee China’s power security. Thedevelopment of the total renewable energy target needs to consider China’s gridplanning, especially the construction of the grid’s long-distance transmission capacity.The short financing of the Shanxi spot market in 2021 under extreme weather andthe waiver of wind power capacity in Texas, USA, are good examples of the needfor renewable energy development to be paired with flexibility backup to guaranteeregional electricity security.
3. The design of the renewable energy responsibility weight distribution scheme shouldconsider the differences in various aspects, such as renewable energy resource con-ditions, the original energy structure, and the transmission capacity in each region.This not only ensures that the renewable energy in each province can be fully andeffectively developed, but also ensures the fairness of the development in each re-gion, so that people in the whole society can share the dividends that result from thedevelopment.
4. Timely post-evaluation of the effect of renewable energy responsibility weight al-location can help make adjustments. There is uncertainty in improving efficiencyonly by trading quotas among provinces, and mistakes in inter-provincial decisionmaking is likely to result in lower efficiency. In addition, the implementation planof each provincial government often deviates from the optimized plan, so timelypost-evaluation of the allocation effect and the exploration of more adjustment toolsand measures will be considered in future research. The process of adjustment shouldbe long-term and continuous.

Energies 2022, 15, 3949 16 of 18
5. Focusing on the secondary distribution of renewable energy quotas has an importantimpact on the cost and efficiency of achieving the target. Although the actual situationvaries from place to place and there are differences between programs, the fairnessand reasonableness of the programs must be fully justified. Once the demonstrationis approved, strict assessment and reward and punishment mechanisms are neededin the implementation.
5.3. Limitations and Future Work
Although this paper draws some interesting conclusions from the study of RPS quotaallocation in China, the study has the following limitations.
1. While the study revolves around the quota allocation method of the RPS in Chinaand proposes the allocation method with optimal allocation efficiency, it is based onsome assumptions. Since China’s RPS quotas are divided into hydropower quotasand non-hydro renewable energy quotas, the two are assessed separately in thetotal quota assessment process. In contrast, this study only analyzes the minimumconsumption responsibility weights, and has not yet given separate considerationto the hydropower quotas and the non-hydro renewables quotas. Therefore, futureresearch will study different kinds of quota assessment methods separately, to suggestmore detailed optimal allocation schemes.
2. In this study, the quota allocation was carried out on a provincial and regional basis,which is tantamount to tacitly assuming that the responsible entity for the quota isthe provincial grid company. However, China’s RPS assessment includes both powersales companies and large power consumers. Most power sales companies are notonly responsible for power sales in their own province, but their businesses spanacross multiple provinces and regions. Therefore, changing the target of the quotareallocation study to different power sales companies will be more relevant to theactual situation in China, and this is one of the directions of future research.
Author Contributions: Conceptualization, S.W. and W.Z.; methodology, S.F.; software, Z.H.; vali-dation, L.X., Z.L., and Z.H.; formal analysis, S.W.; investigation, S.W.; writing—review and editing,S.W.; visualization, S.F. All authors have read and agreed to the published version of the manuscript.
Funding: This research was funded by the National Social Science Foundation of China, grantnumber 20BJL036 and by the Humanities and Social Science Fund of Ministry of Education of China,grant number 18YJAZH138.
Institutional Review Board Statement: Not applicable.
Informed Consent Statement: Not applicable.
Data Availability Statement: Data available in a publicly accessible repository that does not issueDOIs. Publicly available datasets were analyzed in this study. This data can be found here: [http://www.stats.gov.cn/].
Conflicts of Interest: The authors declare no conflict of interest.
References1. Zhao, W.; Zhang, J.; Li, R.; Zha, R. A transaction case analysis of the development of generation rights trading and existing
shortages in China. Energy Policy 2021, 149, 112045. [CrossRef]2. Xin-Gang, Z.; Pei-Ling, L.; Ying, Z. Which policy can promote renewable energy to achieve grid parity? Feed-in tariff vs.
renewable portfolio standards. Renew. Energy 2020, 162, 322–333. [CrossRef]3. Wu, D.; Zheng, X.; Xu, Y.; Olsen, D.; Xia, B.; Singh, C.; Xie, L. An open-source extendable model and corrective measure
assessment of the 2021 texas power outage. Adv. Appl. Energy 2021, 4, 100056. [CrossRef]4. Hosan, S.; Karmaker, S.C.; Rahman, M.M.; Chapman, A.J.; Saha, B.B. Dynamic links among the demographic dividend,
digitalization, energy intensity and sustainable economic growth: Empirical evidence from emerging economies. J. Clean. Prod.2022, 330, 129858. [CrossRef]
5. Ying, Z.; Xin-Gang, Z.; Zhen, W. Demand side incentive under renewable portfolio standards: A system dynamics analysis.Energy Policy 2020, 144, 111652. [CrossRef]

Energies 2022, 15, 3949 17 of 18
6. Zhou, C.; Zhou, L.; Liu, F.; Chen, W.; Wang, Q.; Liang, K.; Guo, W.; Zhou, L. A Novel Stacking Heterogeneous Ensemble Modelwith Hybrid Wrapper-Based Feature Selection for Reservoir Productivity Predictions. Complexity 2021, 2021, 12. [CrossRef]
7. Fang, D.; Zhao, C.; Kleit, A.N. The impact of the under enforcement of RPS in China: An evolutionary approach. Energy Policy2019, 135, 111021. [CrossRef]
8. Liu, D.; Liu, M.; Xu, E.; Pang, B.; Guo, X.; Xiao, B.; Niu, D. Comprehensive effectiveness assessment of renewable energygeneration policy: A partial equilibrium analysis in China. Energy Policy 2018, 115, 330–341. [CrossRef]
9. Khanna, N.; Fridley, D.; Zhou, N.; Karali, N.; Zhang, J.; Feng, W. Energy and CO2 implications of decarbonization strategies forChina beyond efficiency: Modeling 2050 maximum renewable resources and accelerated electrification impacts. Appl. Energy2019, 242, 12–26. [CrossRef]
10. Zhou, N.; Price, L.; Yande, D.; Creyts, J.; Khanna, N.; Fridley, D.; Lu, H.; Feng, W.; Liu, X.; Hasanbeigi, A. A roadmap for China topeak carbon dioxide emissions and achieve a 20% share of non-fossil fuels in primary energy by 2030. Appl. Energy 2019, 239,793–819. [CrossRef]
11. Zhao, Z.-Y.; Chen, Y.-L.; Chang, R.-D. How to stimulate renewable energy power generation effectively?—China’s incentiveapproaches and lessons. Renew. Energy 2016, 92, 147–156. [CrossRef]
12. Fan, J.; Wang, J.; Wei, S.; Zhang, X. The Development of China’s Renewable Energy Policy and Implications to Africa. IOP Conf.Ser. Mater. Sci. Eng. 2018, 394, 042034. [CrossRef]
13. China Statistical Yearbook. 2019. Available online: http://www.stats.gov.cn/tjsj/ndsj/ (accessed on 30 January 2022).14. Cai, Y.; Aoyama, Y. Fragmented authorities, institutional misalignments, and challenges to renewable energy transition: A case
study of wind power curtailment in China. Energy Res. Soc. Sci. 2018, 41, 71–79. [CrossRef]15. Xin-Gang, Z.; Ling, W.; Ying, Z. How to achieve incentive regulation under renewable portfolio standards and carbon tax policy?
A China’s power market perspective. Energy Policy 2020, 143, 111576. [CrossRef]16. Li, C.; Shi, H.; Cao, Y.; Wang, J.; Kuang, Y.; Tan, Y.; Wei, J. Comprehensive review of renewable energy curtailment and avoidance:
A specific example in China. Renew. Sustain. Energy Rev. 2015, 41, 1067–1079. [CrossRef]17. Fan, J.-L.; Wang, J.-X.; Hu, J.-W.; Wang, Y.; Zhang, X. Optimization of China’s provincial renewable energy installation plan for
the 13th five-year plan based on renewable portfolio standards. Appl. Energy 2019, 254, 113757. [CrossRef]18. Zhou, Q.; Wang, N.-B.; Shen, C.-Y.; Zhao, L.; Wang, D.-M.; Zhang, J.-M. Analysis the reasons and prospect for the abandonment
of new energy power in China. In Proceedings of the 2016 5th International Conference on Energy and Environmental Protection(ICEEP 2016), Sanya, China, 21–23 November 2016; pp. 613–617. [CrossRef]
19. Zhang, L.; Long, R.; Chen, H.; Huang, X. Performance changes analysis of industrial enterprises under energy constraints. Resour.Conserv. Recycl. 2018, 136, 248–256. [CrossRef]
20. Xin-Gang, Z.; Yu-Qiao, Z. Analysis of the effectiveness of Renewable Portfolio Standards: A perspective of shared mental model.J. Clean. Prod. 2021, 278, 124276. [CrossRef]
21. Chen, F.; Zhao, T.; Xia, H.; Cui, X.; Li, Z. Allocation of carbon emission quotas in Chinese provinces based on Super-SBM modeland ZSG-DEA model. Clean Technol. Environ. Policy 2021, 23, 2285–2301. [CrossRef]
22. Yu, S.; Hu, X.; Li, L.; Chen, H. Does the development of renewable energy promote carbon reduction? Evidence from Chineseprovinces. J. Environ. Manag. 2020, 268, 110634. [CrossRef]
23. Johnson, E.P. The cost of carbon dioxide abatement from state renewable portfolio standards. Resour. Energy Econ. 2014, 36,332–350. [CrossRef]
24. Bolkesjø, T.F.; Eltvig, P.T.; Nygaard, E. An Econometric Analysis of Support Scheme Effects on Renewable Energy Investments inEurope. Energy Procedia 2014, 58, 2–8. [CrossRef]
25. Kim, J.; Park, J.; Kim, H.; Heo, E. Assessment of Korean customers’ willingness to pay with RPS. Renew. Sustain. Energy Rev. 2012,16, 695–703. [CrossRef]
26. Choi, G.; Huh, S.-Y.; Heo, E.; Lee, C.-Y. Prices versus quantities: Comparing economic efficiency of feed-in tariff and renewableportfolio standard in promoting renewable electricity generation. Energy Policy 2018, 113, 239–248. [CrossRef]
27. Zhou, W.; Qian, X.; Nakagami, K.I. Opportunities for Renewable Energy Introduction Through Feed-in Tariff (FIT) Scheme. EastAsian Low-Carbon Community 2021, 389–406. [CrossRef]
28. Sun, P.; Nie, P.-Y. A comparative study of feed-in tariff and renewable portfolio standard policy in renewable energy industry.Renew. Energy 2015, 74, 255–262. [CrossRef]
29. Zhang, Y.; Zhao, X.; Zuo, Y.; Ren, L.; Wang, L. The development of the renewable energy power industry under feed-in tariff andrenewable portfolio standard: A case study of China’s photovoltaic power industry. Sustainability 2017, 9, 532. [CrossRef]
30. Dong, F.; Shi, L.; Ding, X.; Li, Y.; Shi, Y. Study on China’s Renewable Energy Policy Reform and Improved Design of RenewablePortfolio Standard. Energies 2019, 12, 2147. [CrossRef]
31. Zhang, Q.; Wang, G.; Li, Y.; Li, H.; Mclellan, B.; Chen, S. Substitution effect of renewable portfolio standards and renewableenergy certificate trading for feed-in tariff. Appl. Energy 2018, 227, 426–435. [CrossRef]
32. Xin-Gang, Z.; Yu-Zhuo, Z.; Ling-Zhi, R.; Yi, Z.; Zhi-Gong, W. The policy effects of feed-in tariff and renewable portfolio standard:A case study of China’s waste incineration power industry. Waste Manag. 2017, 68, 711–723. [CrossRef]
33. Son, D.; Kim, J.; Jeong, B. Optimal Operational Strategy for Power Producers in Korea Considering Renewable Portfolio Standardsand Emissions Trading Schemes. Energies 2019, 12, 1667. [CrossRef]

Energies 2022, 15, 3949 18 of 18
34. Oliver, A.; Khanna, M. The spatial distribution of welfare costs of Renewable Portfolio Standards in the United States electricitysector. Lett. Spat. Resour. Sci. 2018, 11, 269–287. [CrossRef]
35. Ying, Z.; Xin-Gang, Z.; Xue-Feng, J.; Zhen, W. Can the Renewable Portfolio Standards improve social welfare in China’s electricitymarket? Energy Policy 2021, 152, 112242. [CrossRef]
36. Özdemir, Ö.; Hobbs, B.F.; Van Hout, M.; Koutstaal, P.R. Capacity vs energy subsidies for promoting renewable investment:Benefits and costs for the EU power market. Energy Policy 2020, 137, 111166. [CrossRef]
37. Wang, J.; Zhang, S.; Zhang, Q. The relationship of renewable energy consumption to financial development and economic growthin China. Renew. Energy 2021, 170, 897–904. [CrossRef]
38. Shang, B.; Huang, T.; Du, X. Impact of government regulation of RPS on China’s power market under carbon abatementconstraints. J. Intell. Fuzzy Syst. 2020, 39, 2947–2975. [CrossRef]
39. Abbas, M.G.; Wang, Z.; Bashir, S.; Iqbal, W.; Ullah, H. Nexus between energy policy and environmental performance in China:The moderating role of green finance adopted firms. Environ. Sci. Pollut. Res. 2021, 28, 63263–63277. [CrossRef]
40. Pang, J.; Timilsina, G. How would an emissions trading scheme affect provincial economies in China: Insights from a computablegeneral equilibrium model. Renew. Sustain. Energy Rev. 2021, 145, 111034. [CrossRef]
41. Zhou, D.; Hu, F.; Zhu, Q.; Wang, Q. Regional allocation of renewable energy quota in China under the policy of renewableportfolio standards. Resour. Conserv. Recycl. 2022, 176, 105904. [CrossRef]
42. Mamkhezri, J.; Malczynski, L.A.; Chermak, J.M. Assessing the Economic and Environmental Impacts of Alternative RenewablePortfolio Standards: Winners and Losers. Energies 2021, 14, 3319. [CrossRef]
43. Xu, J.; Lv, T.; Hou, X.; Deng, X.; Liu, F. Provincial allocation of renewable portfolio standard in China based on efficiency andfairness principles. Renew. Energy 2021, 179, 1233–1245. [CrossRef]
44. Navarro-Chávez, C.L.; Delfín-Ortega, O.V.; Díaz-Pulido, A. Efficiency of the electricity sector in Mexico 2008-2015: An applicationof the DEA network model. Int. J. Energy Sect. Manag. 2020, 14, 683–706. [CrossRef]
45. Zhao, Y.; Kong, G.; Chong, C.H.; Ma, L.; Li, Z.; Ni, W. How to Effectively Control Energy Consumption Growth in China’s29 Provinces: A Paradigm of Multi-Regional Analysis Based on EAALMDI Method. Sustainability 2021, 13, 1093. [CrossRef]
46. Chiu, Y.H.; Lin, J.C.; Su, W.N.; Liu, J.K. An Efficiency Evaluation of the EU’s Allocation of Carbon Emission Allowances. EnergySources Part B Econ. Plan. Policy 2014, 10, 192–200. [CrossRef]
47. Xin-Gang, Z.; Zhen, W. The technical efficiency of China’s wind power list enterprises: An estimation based on DEA method andmicro-data. Renew. Energy 2019, 133, 470–479. [CrossRef]
48. Chen, Z. Symposium on the Economic Impact of the COVID-19 Pandemic: An Introduction. Front. Econ. China 2020, 15, 475–477.[CrossRef]
49. Zhang, J.; Gao, R.; Xu, N.; Xie, C. How Can China Achieve Its Non-fossil Energy Target? An Effective Allocation of China’sRenewable Electricity Consumption Obligation. Front. Energy Res. 2020, 8, 103. [CrossRef]
50. Liu, L.; Xiao, H.; Shen, L. The Status Quo of Renewable Energy Development and Utilization and the Prospects of IndustrialDevelopment. IOP Conf. Ser. Earth Environ. Sci. 2021, 766, 012001. [CrossRef]
51. Bouzidis, T.; Karagiannis, G. A note on the zero-sum gains data envelopment analysis model. Oper. Res. 2021. [CrossRef]52. Lins, M.P.E.; Gomes, E.G.; de Mello, J.C.C.S.; de Mello, A.J.R.S. Olympic ranking based on a zero sum gains DEA model. Eur. J.
Oper. Res. 2003, 148, 312–322. [CrossRef]53. Liu, Y.; Tan, Q.; Han, J.; Guo, M. Energy-Water-Carbon Nexus Optimization for the Path of Achieving Carbon Emission Peak in
China Considering Multiple Uncertainties: A Case Study in Inner Mongolia. Energies 2021, 14, 1067. [CrossRef]