Is rural migration a threat to environmental sustainability in Southern Burkina Faso
14
IS RURAL MIGRATION A THREAT TO ENVIRONMENTAL SUSTAINABILITY IN SOUTHERN BURKINA FASO? I. OUEDRAOGO 1 * , P. SAVADOGO 1,2 , M. TIGABU 1 , R. COLE 3 , P. C. ODE ´ N 1 AND J.-M. OUADBA 2 1 Southern Swedish Forest Research Center, Tropical Silviculture and Seed Laboratory, Swedish, University of Agricultural Sciences (SLU), PO Box 49 SE-230 53 Alnarp, Sweden 2 De ´partement Productions Forestie `res, Institut de l’Environnement et de Recherches Agricoles, Centre National de la Recherche Scientifique et Technologique, 03 BP 7047, Ouagadougou 03, Burkina Faso 3 Geography and Planning Department, Grand Valley State University, 1154 Au Sable Hall, Allendale, Michigan (MI) 49410-9403, USA Received 8 September 2008; Revised 5 January 2009; Accepted 6 January 2009 ABSTRACT There is growing evidence that population pressure on the land has become the most intractable problem in the developing countries where demand for food exceeds the food production capacity of the land. Southern Burkina Faso has experienced rapid population growth, mostly driven by immigration of farmers. This study was carried out in Sissili Province and used satellite images acquired over 31-year period, census and survey data to capture migration patterns and its impacts on land use change. Results showed that migrant population which accounted for only 3 per cent in the study area in 1976 shifted to 57 per cent in 2007. Migrant people were using improved technology to progressively convert forest land to cropland. Cropland increased at an annualized rate of 046 per cent to the detriment of the dense forest and woodland which decreased at 057 per cent per annum. Population growth was highly correlated with increasing area of cropland (r 2 ¼ 095, p ¼ 0014) and declining dense forest (r 2 ¼ 078) and woodland (r 2 ¼ 095) covers. It can be concluded that rural migration, driven by the relatively good soil and rainfall conditions in the recipient area, is accounted for deforestation in the study area. If rural migration is not checked, it will seriously degrade the environment. Copyright # 2009 John Wiley & Sons, Ltd. key words: Burkina Faso; migration; land use change; population growth; wood cutting; fuel wood INTRODUCTION Thoughts on population–environment interactions have many historical antecedents, but neo-Malthusian and Boserupian notions are pre-eminent (Perz et al., 2005; Perz et al., 2006). Malthus (1798) argued that population growth leads to agricultural expansion and ultimately to land degradation and famine. This statement was later supported by Ehrlich (1968), Hardin (1968) and Meadows et al. (1972). Alternative approaches have emerged since Boseru ¨p (1965) and Simon (1980) showed that population growth leads to sustainable land use via intensification due to technological improvement. More recently, Bilsborrow (2002) articulated the third possibility of a demographic-economic response via migration from crowded or degraded environments to frontier zones. New thoughts also emerge that the effect of population on environment depends on many things, including a gamut of cultural and political factors as well as the scale of observation (Gibson et al., 2000; Wood, 2002; Perz et al., 2005). In the tropics, rapid population growth constitutes the main force of change in land use (Ramankutty and Foley, 1999). Population growth in developing countries is generally associated with increased demand for food and fuelwood and also increased rural migration, which lead to high rates of forest losses (Lambin et al., 2003). Migration, in its various forms, is known to be the most important demographic factor causing land use change at time scale (Geist and Lambin, 2001; Lambin et al., 2003), operating as a significant driver with other non-demographic factors such as policies, consumption patterns, economic dynamics and globalization (Fearnside, 1997). land degradation & development Land Degrad. Develop. 20: 217–230 (2009) Published online 2 March 2009 in Wiley InterScience (www.interscience.wiley.com) DOI: 10.1002/ldr.910 *Correspondence to: I. Ouedraogo, Southern Swedish Forest Research Center, Tropical Silviculture and Seed Laboratory, Swedish University of Agricultural Sciences (SLU), PO Box 49 SE-230 53 Alnarp, Sweden. E-mail: [email protected] Copyright # 2009 John Wiley & Sons, Ltd.
Transcript of Is rural migration a threat to environmental sustainability in Southern Burkina Faso

land degradation & development
Land Degrad. Develop. 20: 217–230 (2009)
Published online 2 March 2009 in Wiley InterScience (www.interscience.wiley.com) DOI: 10.1002/ldr.910
IS RURAL MIGRATION A THREAT TO ENVIRONMENTALSUSTAINABILITY IN SOUTHERN BURKINA FASO?
I. OUEDRAOGO1*, P. SAVADOGO1,2, M. TIGABU1, R. COLE3, P. C. ODEN1 AND J.-M. OUADBA2
1Southern Swedish Forest Research Center, Tropical Silviculture and Seed Laboratory, Swedish, University of Agricultural Sciences (SLU), POBox 49 SE-230 53 Alnarp, Sweden
2Departement Productions Forestieres, Institut de l’Environnement et de Recherches Agricoles, Centre National de la Recherche Scientifiqueet Technologique, 03 BP 7047, Ouagadougou 03, Burkina Faso
3Geography and Planning Department, Grand Valley State University, 1154 Au Sable Hall, Allendale, Michigan (MI) 49410-9403, USA
Received 8 September 2008; Revised 5 January 2009; Accepted 6 January 2009
ABSTRACT
There is growing evidence that population pressure on the land has become the most intractable problem in the developingcountries where demand for food exceeds the food production capacity of the land. Southern Burkina Faso has experienced rapidpopulation growth, mostly driven by immigration of farmers. This study was carried out in Sissili Province and used satelliteimages acquired over 31-year period, census and survey data to capture migration patterns and its impacts on land use change.Results showed that migrant population which accounted for only 3 per cent in the study area in 1976 shifted to 57 per cent in2007. Migrant people were using improved technology to progressively convert forest land to cropland. Cropland increased at anannualized rate of 0�46 per cent to the detriment of the dense forest and woodland which decreased at 0�57 per cent per annum.Population growth was highly correlated with increasing area of cropland (r2¼ 0�95, p¼ 0�014) and declining dense forest(r2¼ 0�78) and woodland (r2¼ 0�95) covers. It can be concluded that rural migration, driven by the relatively good soil andrainfall conditions in the recipient area, is accounted for deforestation in the study area. If rural migration is not checked, it willseriously degrade the environment. Copyright # 2009 John Wiley & Sons, Ltd.
key words: Burkina Faso; migration; land use change; population growth; wood cutting; fuel wood
INTRODUCTION
Thoughts on population–environment interactions have many historical antecedents, but neo-Malthusian and
Boserupian notions are pre-eminent (Perz et al., 2005; Perz et al., 2006). Malthus (1798) argued that population
growth leads to agricultural expansion and ultimately to land degradation and famine. This statement was later
supported by Ehrlich (1968), Hardin (1968) and Meadows et al. (1972). Alternative approaches have emerged since
Boserup (1965) and Simon (1980) showed that population growth leads to sustainable land use via intensification
due to technological improvement. More recently, Bilsborrow (2002) articulated the third possibility of a
demographic-economic response via migration from crowded or degraded environments to frontier zones. New
thoughts also emerge that the effect of population on environment depends on many things, including a gamut of
cultural and political factors as well as the scale of observation (Gibson et al., 2000; Wood, 2002; Perz et al., 2005).
In the tropics, rapid population growth constitutes the main force of change in land use (Ramankutty and
Foley, 1999). Population growth in developing countries is generally associated with increased demand for food and
fuelwood and also increased rural migration, which lead to high rates of forest losses (Lambin et al., 2003). Migration,
in its various forms, is known to be the most important demographic factor causing land use change at time scale (Geist
and Lambin, 2001; Lambin et al., 2003), operating as a significant driver with other non-demographic factors such as
policies, consumption patterns, economic dynamics and globalization (Fearnside, 1997).
* Correspondence to: I. Ouedraogo, Southern Swedish Forest Research Center, Tropical Silviculture and Seed Laboratory, Swedish University ofAgricultural Sciences (SLU), PO Box 49 SE-230 53 Alnarp, Sweden.E-mail: [email protected]
Copyright # 2009 John Wiley & Sons, Ltd.

218 I. OUEDRAOGO ET AL.
In Burkina Faso, the total population shifted from 5�6 million inhabitants in 1975 to 13�7 million inhabitants in
2006 (INSD, 2007); out of this, 90 per cent practice rain-fed subsistence agriculture (Kramer, 2002). Under such
rapid growing population, demand for arable land to produce food may exceed the capacity of the country to
provide land. The country is phytogeographically divided into four zones, namely the north-Sahelian, south-
Sahelian, north-Sudanian and south-Sudanian zones. In the Sahelian zones, soils are generally poor with an
unreliable distribution of the rainfall in space and time (400–600 mm y�1 within 2–3 months y�1). It is mainly in the
Sudanian zones that are located in the southern, south-western and south-eastern parts of the country, where soils
are fairly fertile and rainfall relatively abundant that agriculture is expanding due to an amplified rural–rural
migration in search of available non-degraded land (Reenberg and Lund, 1998; Gray, 2005).
During the last few decades, southern Burkina Faso has experienced a rapid population growth driven by high
growth rate, declining mortality and mainly immigration, which was believed to have boosted the rapid growth of the
population in this area (Howorth and O’Keefe, 1999; Henry et al., 2003). Migration to southern Burkina Faso started
in the 1980s when the severe drought affected the northern and central regions of the country, inflicting significant
losses in terms of crops and livestock to farmers (Reenberg and Lund, 1998; Gray, 2005; Ouedraogo, 2006a; Pare
et al., 2008). From that period onwards, migrating to less drought affected areas (south, east and west of the country)
has become per se an important livelihood diversification strategy. It allows to supplement subsistence economy and
to have access to money, therefore, migrants can support their families’ education, health and building activities. In
southern Burkina Faso, the size of cropland increased at an annualized rate higher than 1 per cent during 1986–2002
and believed to be driven by migrant population size and distribution (Ouedraogo, 2006a,b; Pare et al., 2008). Given
the unquestionable contribution of increase population to environmental degradation in southern Burkina Faso,
research that examines demographic drivers and particularly the impact of rural migration on land use change at
spatial and temporal scales is of utmost importance to unravelling detail features of land use change.
The main objective of the paper was to analyse to what extent land use patterns can be described by a rural–rural
migration. To this end, a multi-scale, -spatial and -temporal analysis of land use patterns in Neboun village,
including demographic and socio-economic activities was performed. The specific objectives of the study were to
(i) estimate the trend in human population (both migrant and indigenous people) at different periods from 1976 to
2006, (ii) identify socio-economic activities, production tools, acreage and motives of migration and (iii) quantify
land use change in time series as a result of migration.
MATERIALS AND METHODS
Study Area Description
The study was carried out in the surroundings of Neboun village, located in Sissili Province (108570N to 118550Nand�28480W to�18240W), southern Burkina Faso (Figure 1). This study site was chosen for a variety of reasons. In
particular, the site is flat, removing undesired topographic influences in the remotely sensed response and it is
located in a junction of two main roads, thus providing better accessibility to migrant people. Improvement of road
networks in a rural area amplifies rural migration and land use change (Verburg et al., 2004; Ningal et al., 2008). It
covers about 95 km2 and is characterized by a low relief with an average altitude of 300 m a.s.l. The unimodal rainy
season lasts for about 6 months, from May to October. Based on data collected from the in situ mini-weather station
at the province city (Leo) located at 30 km from the study site, the mean annual rainfall during the study period
(1975–2007) was 883� 147 mm. Mean daily minimum and maximum temperatures ranged from 16 to 328C in
January (the coldest month) and from 26 to 408C in April (the hottest month). According to the FAO soil
classification system (Driessen et al., 2001), most frequently encountered soil type is Lixisol (tropical ferruginous
soils), which is poorly to fully leached, overlying sandy, clayey-sandy and sandy-clayey material.
Phyto-geographically, the area belongs to the south-Sudanian zone (Fontes and Guinko, 1995). The natural
vegetation comprises of a cluster of mostly dry forest and tree savannas. The flora is dominated by perennial grass
species such as Andropogon gayanus Kunth, A. ascinodis C. B. Clarke and Schizachiryum sanguineum (Retz.)
Alston (Fontes and Guinko, 1995). The ligneous species are represented mostly by Afzelia africana Sm., Khaya
Copyright # 2009 John Wiley & Sons, Ltd. LAND DEGRADATION & DEVELOPMENT, 20: 217–230 (2009)
DOI: 10.1002/ldr

Figure 1. Location of the study area.
Copyright # 2009 John Wiley & Sons, Ltd. LAND DEGRADATION & DEVELOPMENT, 20: 217–230 (2009)
DOI: 10.1002/ldr
ENVIRONMENTAL SUSTAINABILITY IN SOUTHERN BURKINA FASO 219
220 I. OUEDRAOGO ET AL.
senegalensis A. Juss. and Pterocarpus erinaceus Lam. The occurrence of scattered trees on croplands, such as
Vitellaria paradoxa C. F. Gaertn, Parkia biglobosa (Jacq.) R. Br. ex G. Don and Tamarindus indica L., is also a
common feature in the study area. The different types of forest encountered in the study area included: State forest
reserve (Sissili protected forest) edging the southern part of the village, unprotected forests and forests managed by
cooperatives (Forest Management Units). The dominant farming system in the study area is traditional subsistence
cultivation of cereals (such as sorghum, millet and maize) and tubers (yam and sweet potatoes) and animal
husbandry. Since a decade ago, there has been a high competition between the traditional farming system and the
lucrative productive system; involving extraction of fuelwood and non-wood forest products, cultivation of cash
crops (with cotton and fruit-tree plantation) and ranching (Pare et al., 2008). Croplands are mainly located around
human settlements.
The population of Neboun was estimated at 1926 inhabitants in 2007. It is composed of four main ethnic groups:
Nuni, Mossi, Fulani and Wala. Nuni and Wala are assumed indigenous people of the village because they have been
living in the area for centuries. Mossi (originating from the central plateau in Burkina Faso) and Fulani (herders
from the northern region of the country) are called migrants because they were attracted to Sissili Province during
the 1980s in search of arable land and green pasture, respectively (Howorth and O’Keefe, 1999). Land tenure
system in the village is being controlled by customary law arrangements managed by land-chiefs of the indigenous
populations (Howorth and O’Keefe, 1999; Ouedraogo, 2006a). The principal roles of the land-chiefs are to oversee
and supervise everything that has to do with the land, including the bush, the farms and wildlife.
Study Method
Demographic and socio-economic survey
In Burkina Faso, like in most of the developing countries, reports from the national population censuses do not
provide data at the village level. Furthermore, data related to internal population mobility among ethnic groups are
not reported (INSD, 1998, 2007). To estimate current data on the population and migration in the village, we
conducted a complete population census in August 2007. Information recorded in the census included name of the
household head, sex, birth date, profession, ethnic group, province of origin, date of arrival and residence status
(migrant or indigenous). The same information was recorded from all members of the households. Data collected
from the census were processed with MapInfo 7�51. Structured Query Language (SQL) module of MapInfo was
used to distribute all population recorded into residence status, ethnic groups, ages, provinces of origin and date of
arrival for all time series.
To estimate the historical data of the population (1976, 1986, 1992 and 2000), we first computed the population
data of each of these time series based on cohorts of the recorded population living in the village at the census date.
These data do not take into account people who passed away or migrated out of the village during these periods.
Secondly, we adjusted the data taking the deaths into consideration, by using the following equation:
P ¼ Pn þ PnDrt
where P is the population number taking into account the deaths, Pn the population on cohorts, Dr the mean death
rate at the national census date and t the number of years after the census date.
We could not unfortunately include the out-migration (Om) in the final estimation of the population because Om
rate was missing as stated above. But during the interviews, people argued that Om concerned very few people who
seasonally go to Ghana or Cote d’Ivoire in seek of cash money. This information is in line with Henry et al. (2003).
A household survey was also done from February to March 2008 using semi-structured questionnaire. A total of
175 household heads, corresponding to 56 per cent of the total count, were randomly selected for the survey. From
the respondents, 50 per cent were migrants and 23 per cent were educated from primary to secondary school. All
respondents were supposed to be at least 30 years old and to have been living in the village since the 1980s. The
assumption was that people who satisfied these conditions were qualified enough to provide accurate information
related to the purpose of the study. The following information was recorded for each respondent: income generating
activities from forest exploitation or agriculture including livestock husbandry, farming technology (tools and
practices), production acreage and reason for migrating to the study area if the respondent was a migrant. To avoid
Copyright # 2009 John Wiley & Sons, Ltd. LAND DEGRADATION & DEVELOPMENT, 20: 217–230 (2009)
DOI: 10.1002/ldr

Table I. References and date of acquisition of Landsat and ASTER images used in the present study
Scene references Date of acquisition Satellite
p210r52_2m19760330 30 March 1976 Landsat MSSSp195r52_5t861118 18 November 1986 Landsat MSSSL4_1992101819450 18 October 1992 Landsat TML71195052_05220001031 31 October 2000 Landsat ETMþAST_L1B_00311172006104325 17 November 2007 ASTER
ENVIRONMENTAL SUSTAINABILITY IN SOUTHERN BURKINA FASO 221
bias on the production acreage estimation, we usually go to the respondent croplands for measuring with GPS.
Some key issues were also discussed with the respondents during the interviews; especially farming techniques at
the home provinces and also grazing practices in Neboun Village.
Detection of land use change
Four Landsat images and one ASTER (Advanced Spaceborne Thermal Emission and Reflection Radiometer)
image of the study area acquired over a period of 31 years (1976–2007) were used to detect land use change
(Table I). Each image was geo-rectified to UTM WGS 84 Zone 30 North coordinates using ground control points
(Focardi et al., 2008). A first-order affine transformation was applied to all data, resulting in a root mean square
error below 15 m for the Landsat images (Braimoh, 2004). The visible and the near-infra-red bands (1–3) of
the ASTER image were resized to a resolution of 30� 30 m2 to fit the Landsat scenes. Land-cover classification for
the images was carried out based on training sites, available topographic maps and in situ observations. The
procedure first involved radiometric rectification of the 1976, 1986, 1992 and 2002 images to the 2007 image (Hall
et al., 1991), followed by a tasselled cap orthogonal transformation of the original six bands in each image into three
new dimensional spaces, corresponding to soil brightness, green vegetation and moisture indices. Apart from
yielding relevant training data for land use classification, the transformation also improved visual discrimination of
land use types. Classification was carried out on three bands of the tasselled cap transformation using the maximum
likelihood algorithm. The accuracy of the classification ranged from 86 to 94 per cent for all images, which is
considered to be much acceptable according to Jansen et al. (2008). Six classification schemes (cropland, dense
forest, woodland, shrubland, plantation and settlement) were used to assign pixels to land use classes (Table II). All
image processing was done using ENVI (ENVI Version 4�2, Copyright 2005, Research Systems, Inc. 4990 Pearl
East Circle)1 and the vectorized data were processed with MapInfo 7�5 (MapInfo Professional Version 7�5, Release
Build 23, Copyright 1985–2003 MapInfo Corporation)1.
Data Analyses
Repeated measurement ANOVA was performed to determine the statistical significance of the inter-annual
variability of both land use types and migrant and indigenous population. The magnitude of the variation was
Table II. Land use classification schemes
Land use class Description
Cropland Farmland, harvested agricultural land, pastures and young fallow with signs of human induceddisturbances, such as felled tree trunks or stumps.
Shrubland Land covered by shrubs, bushes, grass and young broadleaf plantlets (<50 trees ha�1).Woodland Open woodland with an upper stratum of deciduous trees of small to medium size, with their crowns
more or less touching above a sparse woody stratum. The ground layer consists of undergrowth of shrubsand grasses (75–150 trees ha�1).
Dense forest Forests and closed woody vegetation, gallery forest and close lowland woody vegetation.Plantation Land covered with planted trees such as cashew, mango, orange, banana and Ecalyptus trees.Settlement Built up area, roads and bare surfaces.
Adapted from Lamprecht (1989).
Copyright # 2009 John Wiley & Sons, Ltd. LAND DEGRADATION & DEVELOPMENT, 20: 217–230 (2009)
DOI: 10.1002/ldr
222 I. OUEDRAOGO ET AL.
determined by a statistic called partial eta squared (h2p), and was considered as small, moderate or large if the value
of this statistic was 0�01, 0�06 or 0�14, respectively (Cohen, 1988). Data collected from the household survey were
grouped into four main categories: income generating activities, dynamics of farm size, the evolution of production
tools with regards to residence status and finally the reasons for migrating to the study area and further subject to
descriptive statistics. Changes in land use types were first determined by computing the difference in land use
statistics over two consecutive periods. Second, overall change during the entire study period (1976–2007) from
one land use type to another was determined by pixel-to-pixel comparison resulting in land use change matrix in
which each element was the proportion of total land area of its class in 1976 that was changed to the other class in
2007. To investigate whether the change in land use types was related with the population, Pearson’s product-
moment correlation coefficient was computed.
RESULTS
Population Dynamics and Socio-Economic Patterns
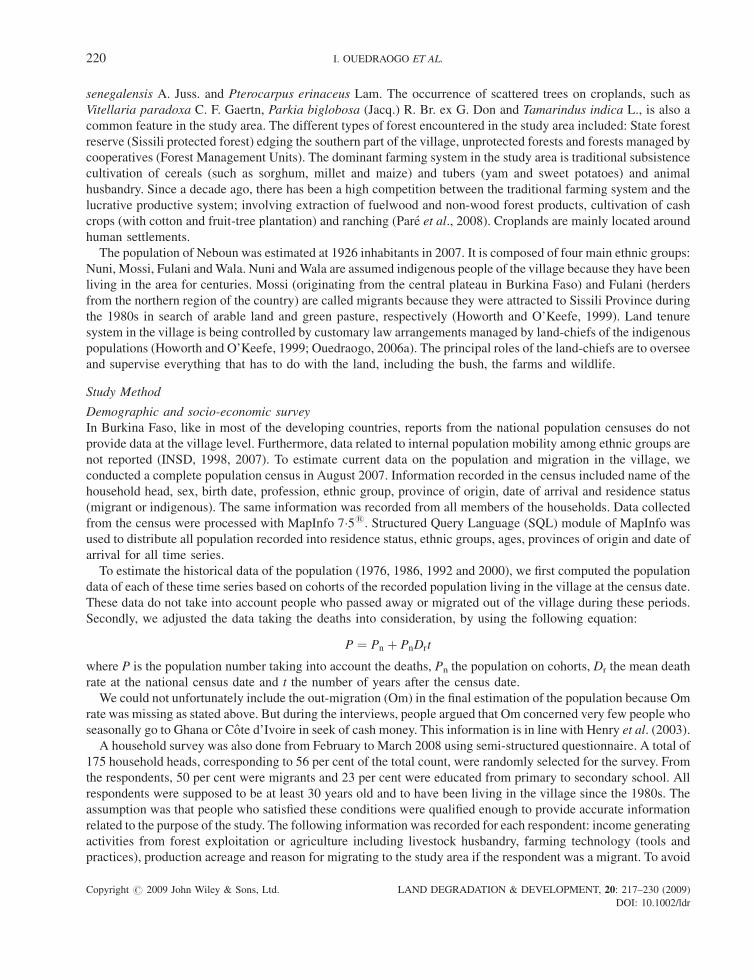
There was a significant inter-annual variation in both migrant and indigenous populations (F1,1¼ 239�7, p¼ 0�04),
and the magnitude of the change was large (h2p ¼ 0�99). From 1976 to 2007, the population increased tenfold
(Table III). In 1976, the Nuni people accounted for nearly 88 per cent of the population of the village; but this
proportion decreased progressively through the years and finally dropped to 39 per cent in 2007. Conversely, the
Mossi people who represented 2 per cent of the total population in 1976 increased rapidly and reached 46 per cent of
the population in 2007. The annual rate of increase of the Mossi people from 1976 to 2007 was about 5 per cent
while for the Nuni, Wala and Fulani People, the rates were similar (3 per cent). The Lele and Kassena people were
minority and they started coming into the village in the late 2000s. The migrant population which accounted for
only 3 per cent of the total population in 1976 became the dominating group (57 per cent) at the end of the study
period.
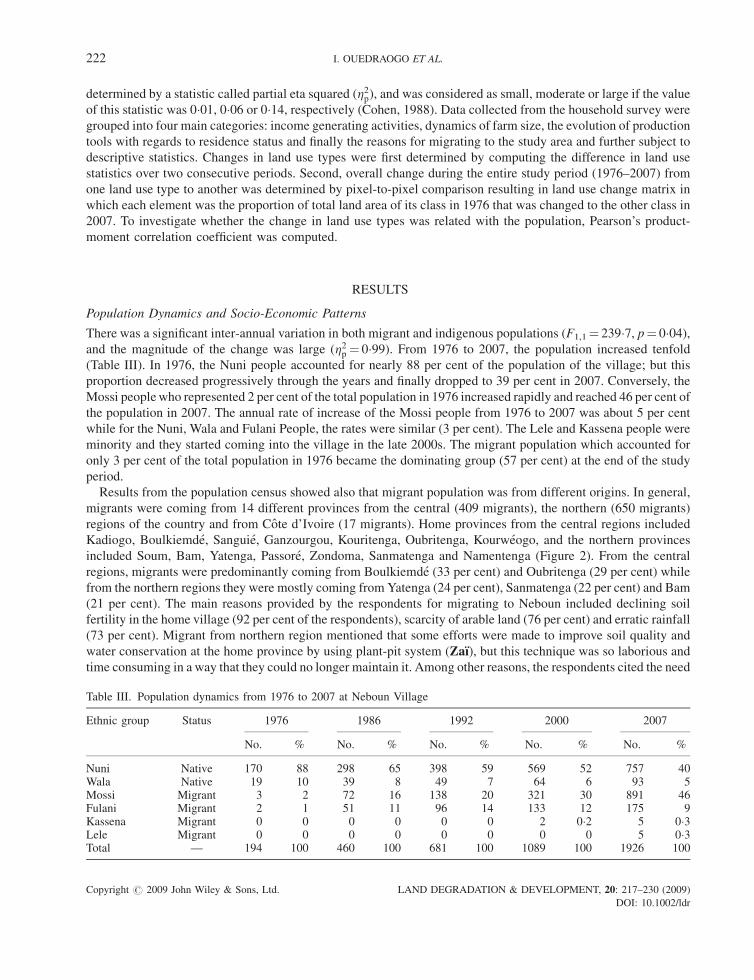
Results from the population census showed also that migrant population was from different origins. In general,
migrants were coming from 14 different provinces from the central (409 migrants), the northern (650 migrants)
regions of the country and from Cote d’Ivoire (17 migrants). Home provinces from the central regions included
Kadiogo, Boulkiemde, Sanguie, Ganzourgou, Kouritenga, Oubritenga, Kourweogo, and the northern provinces
included Soum, Bam, Yatenga, Passore, Zondoma, Sanmatenga and Namentenga (Figure 2). From the central
regions, migrants were predominantly coming from Boulkiemde (33 per cent) and Oubritenga (29 per cent) while
from the northern regions they were mostly coming from Yatenga (24 per cent), Sanmatenga (22 per cent) and Bam
(21 per cent). The main reasons provided by the respondents for migrating to Neboun included declining soil
fertility in the home village (92 per cent of the respondents), scarcity of arable land (76 per cent) and erratic rainfall
(73 per cent). Migrant from northern region mentioned that some efforts were made to improve soil quality and
water conservation at the home province by using plant-pit system (Zaı), but this technique was so laborious and
time consuming in a way that they could no longer maintain it. Among other reasons, the respondents cited the need
Table III. Population dynamics from 1976 to 2007 at Neboun Village
Ethnic group Status 1976 1986 1992 2000 2007
No. % No. % No. % No. % No. %
Nuni Native 170 88 298 65 398 59 569 52 757 40Wala Native 19 10 39 8 49 7 64 6 93 5Mossi Migrant 3 2 72 16 138 20 321 30 891 46Fulani Migrant 2 1 51 11 96 14 133 12 175 9Kassena Migrant 0 0 0 0 0 0 2 0�2 5 0�3Lele Migrant 0 0 0 0 0 0 0 0 5 0�3Total — 194 100 460 100 681 100 1089 100 1926 100
Copyright # 2009 John Wiley & Sons, Ltd. LAND DEGRADATION & DEVELOPMENT, 20: 217–230 (2009)
DOI: 10.1002/ldr
Figure 2. Migration routes from central and northern regions to Neboun village in southern Burkina Faso.
ENVIRONMENTAL SUSTAINABILITY IN SOUTHERN BURKINA FASO 223
to produce more food to help parents left at home, need to make income, seek for pasture to graze their cattle and the
politico-economic unrest in the neighbouring Cote d’Ivoire started in 2000, which caused the return of Burkinabe
from the coffee, cocoa and banana plantation areas. All respondents mentioned that grazing was practiced
everywhere in the village territory apart from the Sissili protected forest and, during the dry seasons, some tree
species were cut to feed cattle.
The household survey revealed four main sources of income generation in the study area, namely crop production
(63 per cent), livestock husbandry (27 per cent), non-timber forest products (6 per cent) and wood/charcoal
production (4 per cent). The mean farm size of the migrants changed from 3�0 to 3�7 ha during the period from 1986
to 2007 for a mean household size of 6� 2 persons. During the same period, the farm size of the indigenous
population, with the same household size, changed from 2�0 to 3�1 ha. The main agricultural tools in use
were ‘Daba’ (local traditional tool based on human force) and plough (based on animal force). In the 1980s, about
95 per cent of the respondents were using ‘Daba’, but they shifted progressively to the use of plough. The change
was more pronounced among migrants; more than 83 per cent of the migrants were using the plough in 2007 while
this figure was only 59 per cent among indigenous people.
Land Use Change
Results from the image processing revealed an important change in the spatial distribution of land use types in the
study area from 1976 to 2007 (Figures 3). In 1976, croplands formed a continuum around the settlement, but were
Copyright # 2009 John Wiley & Sons, Ltd. LAND DEGRADATION & DEVELOPMENT, 20: 217–230 (2009)
DOI: 10.1002/ldr
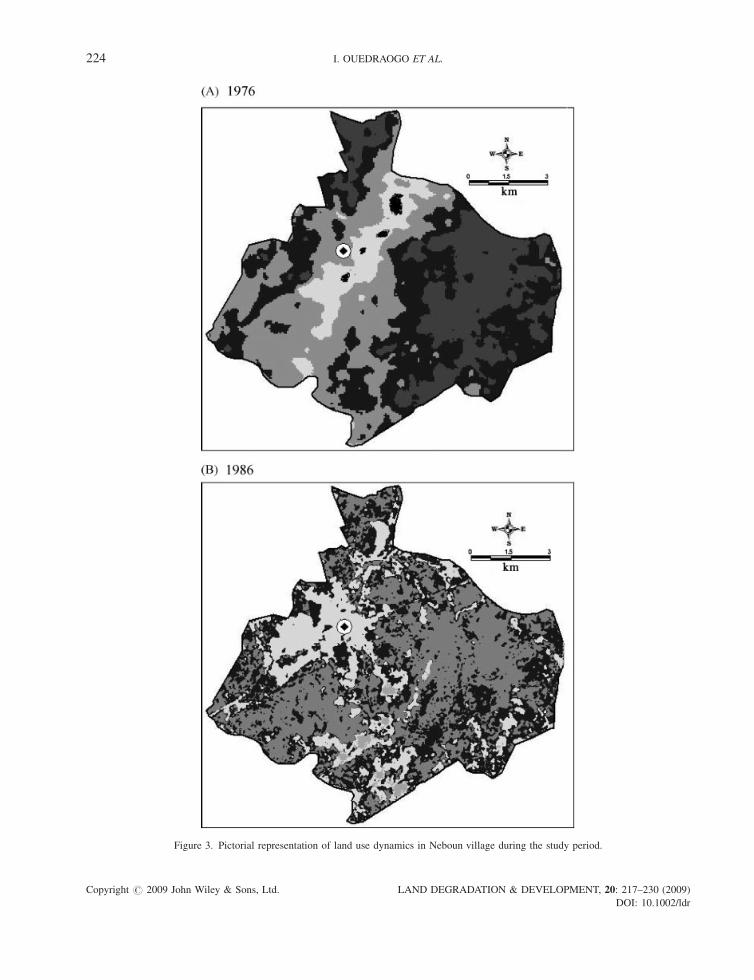
Figure 3. Pictorial representation of land use dynamics in Neboun village during the study period.
Copyright # 2009 John Wiley & Sons, Ltd. LAND DEGRADATION & DEVELOPMENT, 20: 217–230 (2009)
DOI: 10.1002/ldr
224 I. OUEDRAOGO ET AL.
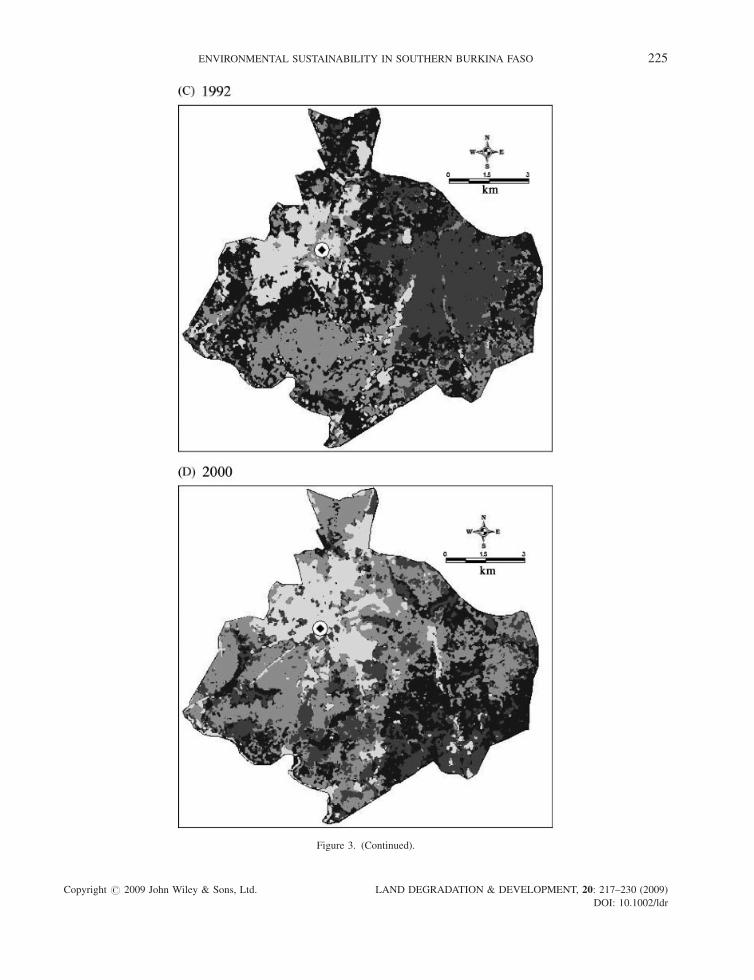
Figure 3. (Continued).
Copyright # 2009 John Wiley & Sons, Ltd. LAND DEGRADATION & DEVELOPMENT, 20: 217–230 (2009)
DOI: 10.1002/ldr
ENVIRONMENTAL SUSTAINABILITY IN SOUTHERN BURKINA FASO 225
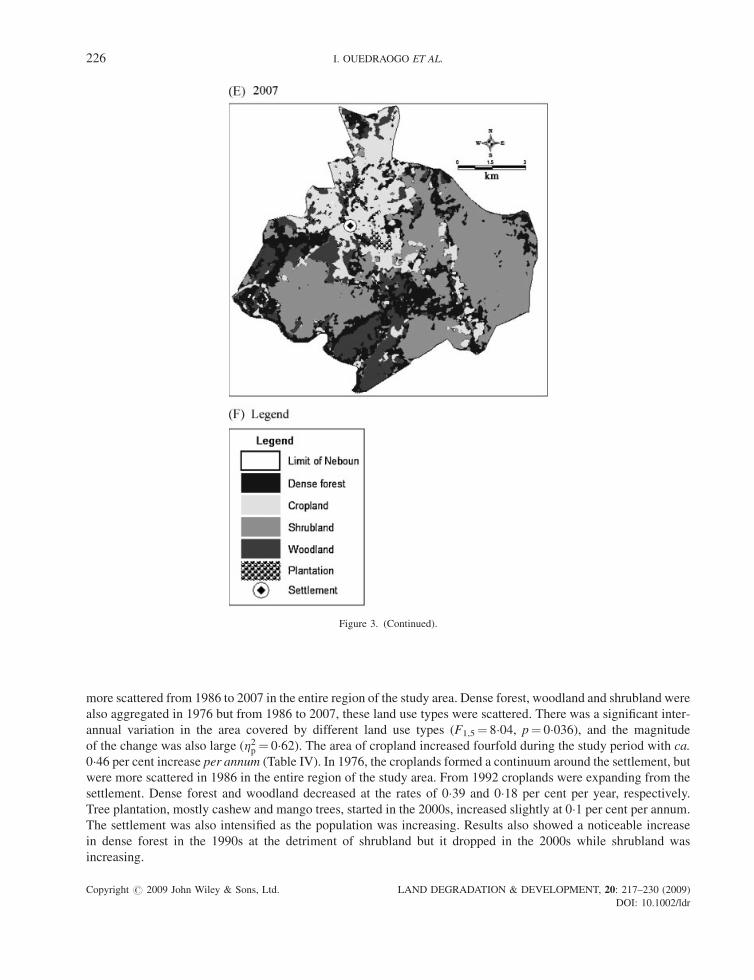
Figure 3. (Continued).
226 I. OUEDRAOGO ET AL.
more scattered from 1986 to 2007 in the entire region of the study area. Dense forest, woodland and shrubland were
also aggregated in 1976 but from 1986 to 2007, these land use types were scattered. There was a significant inter-
annual variation in the area covered by different land use types (F1,5 ¼ 8�04, p¼ 0�036), and the magnitude
of the change was also large (h2p ¼ 0�62). The area of cropland increased fourfold during the study period with ca.
0�46 per cent increase per annum (Table IV). In 1976, the croplands formed a continuum around the settlement, but
were more scattered in 1986 in the entire region of the study area. From 1992 croplands were expanding from the
settlement. Dense forest and woodland decreased at the rates of 0�39 and 0�18 per cent per year, respectively.
Tree plantation, mostly cashew and mango trees, started in the 2000s, increased slightly at 0�1 per cent per annum.
The settlement was also intensified as the population was increasing. Results also showed a noticeable increase
in dense forest in the 1990s at the detriment of shrubland but it dropped in the 2000s while shrubland was
increasing.
Copyright # 2009 John Wiley & Sons, Ltd. LAND DEGRADATION & DEVELOPMENT, 20: 217–230 (2009)
DOI: 10.1002/ldr
Table V. Pearson’s correlations between land use types and population
Scale Correlation Native pop. Migrant pop. Total pop.
1. Cropland Pearson correlation 0�988 0�914 0�949p-value 0�002 0�030 0�014
2. Dense forest Pearson correlation �0�789 �0�777 �0�788p-value 0�113 0�122 0�114
3. Woodland Pearson correlation �0�984 �0�927 �0�955p-value 0�003 0�024 0�011
4. Shrubland Pearson correlation 0�317 0�353 0�343p-value 0�604 0�560 0�572
5. Plantation Pearson correlation 0�907 0�979 0�961p-value 0�033 0�004 0�009
6. Settlement Pearson correlation 0�981 0�986 0�992p-value 0�003 0�002 0�001
Table IV. Change in land use types (both in size and proportion) from 1976 to 2007 in Neboun village of Sissili Province,Southern Burkina Faso
Land use types Change from1976 to 1992
Change from 1992to 2007
Change from 1976to 2007
Annual change
Ha % Ha % Ha % Ha %
Cropland 653 7 625 7 1278 14 41 1Dense forest 388 4 �1477 �16 �1089 �12 �35 �1Woodland �275 �3 �219 �3 �494 �6 �16 <1Shrubland �777 �9 908 10 131 2 4 <1Plantation <1 <1 139 2 139 2 5 <1Settlement 13 <1 24 <1 36 1 1 <1
ENVIRONMENTAL SUSTAINABILITY IN SOUTHERN BURKINA FASO 227
Relationship Between Land Use Change and Population
There was a strong correlation between land use types and population changes (Table V). The change in size of
cropland was strongly and positively correlated with both migrant population and indigenous population
( p< 0�05). Dense forest was strongly and negatively correlated with population but the correlation was not
significant ( p> 0�05). Woodland was also strongly and negatively correlated with population ( p< 0�05). Plantation
and settlement were positively and strongly correlated with population while shrubland was weakly correlated with
population.
DISCUSSION
Results from the present study showed that the population in the study area increased tenfold and indicated that the
increase was amplified by rural migration estimated at 5 per cent per annum. This figure is fairly higher than the one
found at the province level which was 3�7 per cent (Ouedraogo et al., unpublished data). This difference could be
explained by the variation of the spatial scale of the study. Previous studies indicated that migration differed
significantly among districts in Sissili Province (Ouedraogo et al., unpublished data). Farmers’ migration to
southern Burkina Faso and its environmental effects have been studied previously. Howorth and O’Keefe (1999)
reported earlier that migrants and indigenous population in Sissili Province had a peaceful coexistence and
practiced an environmentally friendly agriculture. In their recent studies, Henry et al. (2003), Ouedraogo (2003),
Copyright # 2009 John Wiley & Sons, Ltd. LAND DEGRADATION & DEVELOPMENT, 20: 217–230 (2009)
DOI: 10.1002/ldr

228 I. OUEDRAOGO ET AL.
Ouedraogo (2006a) and Pare et al. (2008) showed however that if the migration flow continues unabated, the area
will ran out of forest reserve in the near future due to agricultural expansion, which in turn could lead to inter-ethnic
conflicts over the control of land.
Results from the image processing revealed that in 1976, land use types in the region around the village were
aggregated while from 1986 to 2007, they were scattered. Explanation to this could be the increasing population in
the study area, resulting in the increase and the diversification of the activities. With the increasing migration, land
around settlements could no longer meet the need of the farmers in terms of arable land, thus forcing farmers to go
beyond settlements in search of more suitable lands. Firewood extraction, charcoal production and grazing could
also justify the patchy distribution and the reduction in size of the dense forest and the woodland in the village.
The case of Neboun where migrant population shifted from 3 per cent in 1976 to 57 per cent of the total
population in 2007 illustrated the pessimistic view of environment and human population relationships (Maltus,
1798; Hardin, 1968; Meadows et al., 1972). Population growth highly correlated with the area of cropland during
the study period. Obviously, the annual increase in area of cropland (0�46 per cent) in the village was below the
recent estimations at the district and provincial levels (Ouedraogo, 2006a; Pare et al., 2008). However, if the
population growth and the production system (extensive production) remain unchanged, the rate of increase in area
of cropland could reach 1 per cent in the near future. Population growth was also coupled with the decrease in area
of dense forest and woodland (strong negative correlation). This may signify the important role played by the
population in the deforestation process. Besides agriculture, farmers were producing charcoal and extracting
fuelwood from the forest and also grazed their livestock in the forest. Fuelwood extraction and charcoal production
in the village were, on one hand practiced at a large scale (personal communication) to meet the energy requirement
of the capital city of the country (Ouagadougou) where wood contributes for more than 90 per cent to the domestic
energy (Kramer, 2002). On the other hand, grazing was practiced everywhere in the village apart from the Sissili
protected forest and the croplands (during the cropping season). During the dry season, when feed became
increasingly scarce, livestock relies on straws and foliage of wood species such as A. africana, P. erinaceus,
K. senegalensis and Adansonia digitata L. (Ouedraogo, 2006a,b). The apparent increase of dense forest in 1990s at
the detriment of the shrubland could be the result of the environmental policy introduced during 1983–1987. A
strong interest in environmental protection led to the institution of three fights: fight against illegal cutting, fight
against bushfires and fight against free mobility of livestock (Yameogo, 2005). These rules were strongly observed
and could have contributed to the regrowth of shrubland to dense forest. Furthermore, enhancing food self-
sufficiency through agricultural intensification put most fallows (which constitute shrubland) back into production,
thereby accounting for reduced area of the shrubland. The decrease in dense forest area in 1990 could be explained
by the relax environmental protection and expansion of commercial agriculture such as cotton (Ouattara et al.,
2008) and thus contributing to reduction in previously gained forest area.
Migrant people in Neboun came mainly from the central Plateau and northern region of the Country. Explanation
to this could be that these two regions have specific demographic and ecological characteristics which push people
to migrate as pointed by migrant respondents. The central regions accounted for more than 46 per cent of the total
population of the country (INSD, 2007) from which more than 90 per cent were farmers (Breusers, 1998). This
region is nowadays crowded and the capacity of the lands to sustain agriculture and grazing under extensive
subsistence practices is almost exceeded (Gray, 1999, 2005; Reij et al., 2005). In such conditions, the easiest way is
to migrate towards new frontiers where land is still available (Boserup, 1972; Bilsborrow and Carr, 2001). In the
northern region, the rains are insufficient and unreliable resulting in an increasing aridity. The mean annual rainfall
ranges from 400 to 600 mm within a rainy season which does not exceed 4 months (Reenberg and Lund, 1998). To
face this environmental condition, farmers from this region developed secular techniques known as Zaı or Demi-
lunes (plant-pit system) (Slingerland and Stork, 2000; Sorgho et al., 2005), but their success was a function of the
spatial and temporal distribution of the rains. These techniques were seen as more and more laborious and
hazardous by some local farmers. Therefore, they see Om of one or more family members as a mean of earning cash
income and reducing risk (Youl et al., 2008). Unfortunately, during their first years of settlement in the attracted
area, the first activity they practice to make rapid income for survival is to cut wood for charcoal production. This
could impact the sustainability of forest in the village.
Copyright # 2009 John Wiley & Sons, Ltd. LAND DEGRADATION & DEVELOPMENT, 20: 217–230 (2009)
DOI: 10.1002/ldr
ENVIRONMENTAL SUSTAINABILITY IN SOUTHERN BURKINA FASO 229
The results indicated that migrants had relatively larger farmlands compared to indigenous. The justification for
this could be that the indigenous people have a strong and secular relationship with their ever-changing
environment developed over several years (Howorth and O’Keefe, 1999). Therefore, despite the recent introduction
of cash crop productions (cotton mainly), indigenous people have been inventive and adaptive in their resource use
patterns and survival strategies. In contrast, the migrant people who came to work in a new environment have two
main objectives. On the one hand, they had to secure their income and domestic food; on the other hand, they had to
produce more to meet also the food shortages and chronic food insecurity that their parents face in their home
villages. To do so, migrants use improved technology (ploughs), thus, cutting large forest areas to make space for
agriculture as compared to the indigenous. Our observation corroborates that of Howorth and O’Keefe (1999), who
found differences in farmland size between indigenous people and migrant population in the province.
CONCLUSIONS
The area under agriculture at Neboun village increased by fourfold while population almost increased by tenfold
between 1976 and 2007. Migrant people which accounted for 3 per cent in 1976 shifted to 57 per cent of the total
population of the village in 2007. Croplands were aggregated around settlement in the 1970s, but were scattered
alongside the village territory in the 2000s. The change in land use types correlated with change in population,
which in turn is driven by migration. In the absence of rural migration control, agricultural intensification and
alternative source of energy or plantation of rapidly growing tree species for energy use, the current trend of
increasing agricultural area as a result of human population growth is likely to continue. This eventually will
contribute to environmental degradation and spread of desertification.
acknowledgements
Funding for this study was provided by Swedish International Development Cooperation Agency (SIDA). We thank
Halidou Compaore, Dabre and Nignan for their contributions to the fieldworks. Our thanks are also due to the whole
population of Neboun for their kind cooperation during the data collection.
references
Bilsborrow RE. 2002. Migration, population change, and the rural environment. Environmental Change and Security Project Report 8: 69–94.Bilsborrow RE, Carr DL. 2001. Population, agricultural land use and the environment in Developing Countries. In Tradeoffs or Synergies?
Agricultural Intensification, Economic Development and the Environment, Lee D, Barrett C (eds). CAB International Wallingford: 35–55.Boserup E. 1965. The Conditions of Agricultural Growth. Allen and Unwin: London.Boserup E. 1972. Conditions of agricultural growth—Reply to Sheffer. American Antiquity 37: 447.Braimoh AK. 2004. Seasonal migration and land-use change in Ghana. Land Degradation & Development 15: 37–47.Breusers M. 1998. On the Move: Mobility, Land Use and Livelihood Practices on the Central Plateau in Burkina Faso, Thesis. Wageningen
Agricultural University: Wageningen.Cohen JW. 1988. Statistical Power Analysis for the Behavioral Sciences. Lawrence Erlbaum Associates: Hillsdale, NJ.Driessen P, Deckers J, Spaargaren O. 2001. Lectures Notes on the Major Soils of the World. FAO World Soil Resources, Report-94. Food and
Agriculture Organization of the United Nations: Rome.Ehrlich PR. 1968. The Population Bomb. Ballantine Books.Fearnside PM. 1997. Carbon emissions and sequestration by forests: Case studies of developing countries—Guest editorial. Climatic Change
35: 263.Focardi S, Loiselle SA, Mazzuoli S, Bracchini L, Dattilo AM, Rossi C. 2008. Satellite-based indices in the analysis of land cover for
municipalities in the province of Siena, Italy. Journal of Environmental Management 86: 383–389.Fontes J, Guinko S. 1995. Carte de vegetation et de l’occupation du sol du Burkina Faso. Projet Campus, UPS, ICIV Toulouse, France, 10.Geist HJ, Lambin EF. 2001. What Drives Tropical Deforestation? A Meta-Analysis of Proximate and Underlying Causes of Deforestation Based
on Subnational Case Study Evidence. LUCC International Project Office, University of Louvain: Louvain-la-Neuve, Belgium.Gibson C, Ostrom E, Ahn TK. 2000. The concept of scale and the human dimensions of global change: A survey. Ecological Economics 32: 217–
239.Gray LC. 1999. Is land being degraded? A multi-scale investigation of landscape change in southwestern Burkina Faso. Land Degradation &
Development 10: 329–343.Gray LC. 2005. What kind of intensification? Agricultural practice, soil fertility and socioeconomic differentiation in rural Burkina Faso.
Geographical Journal 171: 70–82.
Copyright # 2009 John Wiley & Sons, Ltd. LAND DEGRADATION & DEVELOPMENT, 20: 217–230 (2009)
DOI: 10.1002/ldr

230 I. OUEDRAOGO ET AL.
Hall FG, Strebel DE, Nickeson JE, Goetz SJ. 1991. Radiometric rectification—Toward a common radiometric response among multidate,multisensor images. Remote Sensing of Environment 35: 11–27.
Hardin G. 1968. The tragedy of the commons. Science New Series 162: 1243–1248.Henry S, Boyle P, Lambin EF. 2003. Modelling inter-provincial migration in Burkina Faso, West Africa: The role of socio-demographic and
environmental factors. Applied Geography 23: 115–136.Howorth C, O’Keefe P. 1999. Farmers do it better: Local management of change in southern Burkina Faso. Land Degradation & Development10: 93–109.
INSD. 1998. Recensement general de la population et de l’habitat du Burkina Faso: du 10 au 20 December 1996, Resultats definitifs. InstitutNational des Statistiques et de la Demographie (INSD), Direction de la Demographie: Ouagadougou, Burkina Faso.
INSD. 2007. Resultats preliminaires du recensement general de la population et de l’habitat de 2006. Institut National des Statistiques et de laDemographie (INSD), Direction de la Demographie: Ouagadougou, Burkina Faso.
Jansen LJM, Bagnoli M, Focacci M. 2008. Analysis of land-cover/use change dynamics in Manica Province in Mozambique in a period oftransition (1990–2004). Forest Ecology and Management 254: 308–326.
Kramer P. 2002. The Fuel Wood Crisis in Burkina Faso, Solar Cooker as an Alternative. Solar Cooker Archive: Ouagadougou, Burkina Faso.Lambin EF, Geist HJ, Lepers E. 2003. Dynamics of land use and land cover change in tropical regions. Annual Review of Environment and
Resources 28: 205–241.Lamprecht H. 1989. Silviculture in the Tropics: Tropical Forest Ecosystems and Their Tree Species, Possibilities and Methods for Their Long
Term Utilization. GTZ: Eschborn.Maltus TR. 1798. An Essay on the Principle of Population. J. Johnson: London.Meadows DH, Meadows Dennis L, Jorgen R, Behrens WW III. 1972. Limits to Growth. Universe Books: New York.Ningal T, Hartemink AE, Bregt AK. 2008. Land use change and population growth in the Morobe province of Papua New Guinea between 1975
and 2000. Journal of Environmental Management 87: 117–124.Ouattara K, Ouattara B, Nyberg G, Sedogo MP, Malmer A. 2008. Effects of ploughing frequency and compost on soil aggregate stability in a
cotton-maize (Gossypium hirsutum-Zea mays) rotation in Burkina Faso. Soil Use and Management 24: 19–28.Ouedraogo I. 2006a. Land use dynamics in Bieha district, Sissili Province; southern Burkina Faso, West Africa. Umoja: Bulletin of the African
and African American Studies 1: 18–34.Ouedraogo I. 2006b. Land Use Dynamics in Bieha, Sissili Province, southern Burkina Faso. Department of Geography and Tourism, University
of Cape Coast. MSc. Thesis, Cape Coast, Ghana, 145.Ouedraogo M. 2003. New Stakeholders and the Promotion of Agro-Silvo-Pastoral Activities in Southern Burkina Faso: False Start or
Inexperience. IIED report N- 118.Pare S, Soderberg U, Sandewall M, Ouadba JM. 2008. Land use analysis from spatial and field data capture in southern Burkina Faso, West
Africa. Agriculture, Ecosystems and Environment 127: 277–285.Perz SG, Aramburu C, Bremner J. 2005. Population, land use and deforestation in the Pan Amazon Basin: A comparison of Brazil, Bolivia,
Colombia, Ecuador, Peru and Venezuela. Environment Development and Sustainability 7: 23–49.Perz SG, Walker RT, Caldas MM. 2006. Beyond population and environment: Household demographic life cycles and land use allocation among
small farms in the Amazon. Human Ecology 34: 829–849.Ramankutty N, Foley JA. 1999. Estimating historical changes in global land cover: Croplands from 1700 to 1992. Global Biogeochemical Cycles13: 997–1027.
Reenberg A, Lund C. 1998. Land use and land right dynamics—Determinants for resource management options in Eastern Burkina Faso.Human Ecology 26: 599–620.
Reij C, Tappan G, Belemvire A. 2005. Changing land management practices and vegetation on the Central Plateau of Burkina Faso (1968–2002).Journal of Arid Environments 63: 642–659.
Simon J. 1980. Resources, population, environment. An oversupply of false bad news. Science New Series 208: 1431–1437.Slingerland MA, Stork VE. 2000. Determinants of the practice of Zai and mulching in North Burkina Faso. Journal of Sustainable Agriculture16: 53–76.
Sorgho MM, Sylvain K, Karim T. 2005. Burkina Faso: The Zai technique and enhanced agricultural productivity. IK Notes, No.80, 4.Verburg PH, Overmars KP, Witte N. 2004. Accessibility and land-use patterns at the forest fringe in the northeastern part of the Philippines. The
Geographical Journal 170: 238–255.Wood CH. 2002. Land use and deforestation: Introduction. In Deforestation and Land Use in the Amazon, Wood CH, Porro R (eds). University
of Florida Press: Gainesville; 1–38.Yameogo UG. 2005. Le feu, un outil d’ingenierie ecologique au ranch de gibier de Nazinga au Burkina Faso. These de doctorat, Universite
d’Orleans, France.Youl S, Barbier B, Moulin CH, Manlay RJ, Botoni E, Masse D, Hien V, Feller C. 2008. Modelisation empirique des principaux determinents
socio-economiques de la gestion des exploitations agricoles au sud-ouest du Burkina Faso. Biotechnologie Agronomie Societe EtEnvironnement 12: 9–21.
Copyright # 2009 John Wiley & Sons, Ltd. LAND DEGRADATION & DEVELOPMENT, 20: 217–230 (2009)
DOI: 10.1002/ldr


![Onchocerciasis Control Programme [OCP] - Burkina Faso](https://static.fdokumen.com/doc/165x107/63283ba86d480576770daa1c/onchocerciasis-control-programme-ocp-burkina-faso.jpg)