Mappinig land suitability at worldwide scale for fuelwood plantations
Is drought the main decline factor at the rear edge of Europe? The caseof southern Iberian pine plantations
Raúl Sánchez-Salguero a,b,⇑,1, Rafael M. Navarro-Cerrillo b,1, Thomas W. Swetnam c, Miguel A. Zavala a,d
aCIFOR–INIA. Ctra. de la Coruña, km. 7.5, 28040 Madrid, SpainbDepartamento Ingeniería Forestal, Laboratorio de Dendrocronología, DendrodatLab–ERSAF, Universidad de Córdoba, Campus de Rabanales, Ctra. IV, km. 396, 14071 Córdoba, Spainc Laboratory of Tree-Ring Research, 105 West Stadium, University of Arizona, Tucson, AZ 85721, United StatesdDepartamento de Ecología, Facultad de Ciencias, Universidad de Alcalá, 28871 Alcalá de Henares, Madrid, Spain
a r t i c l e i n f o
Article history:
Received 25 October 2011
Received in revised form 23 January 2012
Accepted 25 January 2012
Available online 9 March 2012
Keywords:
Mediterranean pines
Tree rings
Plantations
Forest decline
Crown defoliation
Rear edge
a b s t r a c t
Drought has been frequently discussed as a trigger for forest decline. Today, large-scale forest decline is
observed at the rear edge of Mediterranean forests, with drought identified as the most likely driver. The
vulnerability of Mediterranean mountain plantations to regional climatic variations; however, is poorly
understood. In this paper, we analyze the impact of biotic and abiotic factors on the growth and vigor
of two pine species in drought-prone areas. We assess the main factors influencing crown defoliation
and radial growth to develop a predictive model of forest decline risk for pine plantations at the dry edge
of the species range. Dendrochronological data were collected on 50 plots for Pinus nigra subsp. salzmanii
and 40 plots for Pinus sylvestris. We examined tree size, competition, site characteristics and climate vari-
ables related to decline of pine plantations. Correlation and principal component analysis (PCA) were
used to identify the correlates of decline with crown condition and growth, separately. Logistic regression
and generalized linear models were used to study the relationship between canopy defoliation and
growth, respectively, for P. nigra and P. sylvestris. Explanatory variables were introduced in a stepwise
selection. The PCA revealed three main axes, associated with climate, competition and physiographic
variables. Those three axes were associated with crown damage and basal area growth, respectively.
Probability of crown damage was associated with tree size, competition and climate conditions. P. sylves-
tris was more sensitive than P. nigra to summer potential evapotranspiration effects. Also, climate and
competition were the two main drivers affecting basal area growth. Unlike crown defoliation, physiogra-
phy had an important effect. Within each species, there was a divergence between healthy and damaged
trees, mainly related to competition factors. On the other hand, growth trends as an independent variable
were not included in the crown damage probability model in a stepwise selection. However, declining
growth found in trees at higher crown defoliation and drier sites may imply a greater vulnerability to
decline, suggesting an enhanced die-off risk. The sharp growth reduction and widespread defoliation
in declining pine plantations make their future persistence in xeric sites subject to frequent and severe
droughts unlikely under expected warmer and drier conditions in the future.
Ó 2012 Elsevier B.V. All rights reserved.
1. Introduction
Global climate change is expected to cause a progressively in-
creased frequency and severity of mortality rates and episodes of
forest dieback (Allen et al., 2010). As the Mediterranean Basin cli-
mate is becoming warmer and drier (IPCC, 2007), an increase in
drought-induced mortality of pine plantations is expected (Sarris
et al., 2010; Sánchez-Salguero et al., 2012). In addition, ‘‘rear edge’’
tree populations (i.e., populations at or near the species range lim-
its) are likely to be particularly sensitive to the effects of increasing
aridity and management release (Hampe and Petit, 2005). Rear
edge forest mortality and decline processes have been related to
stand density and lack of silvicultural practices (Linares et al.,
2009, 2010; Camarero et al., 2011). Denser stands normally result
in stronger plant competition (Gómez-Aparicio et al., 2011) and
‘‘natural’’ self-thinning processes (Chen et al., 2008), because of
the corresponding reduction in soil water availability per unit of
basal area (Sabaté et al., 2002). This scenario seems to be particu-
larly relevant in dense pine plantations in the Mediterranean Basin.
The Mediterranean Basin is one of the world regions with the
largest proportion of planted forests (e.g., Spain, FAO, 2006). Pines
were the tree species most commonly planted due to their fast
0378-1127/$ - see front matter Ó 2012 Elsevier B.V. All rights reserved.
doi:10.1016/j.foreco.2012.01.040
⇑ Corresponding author at: CIFOR–INIA. Ctra. de la Coruña, km. 7.5, 28040
Madrid, Spain.
E-mail addresses: [email protected] (R. Sánchez-Salguero), [email protected]
(R.M. Navarro-Cerrillo), [email protected] (T.W. Swetnam), zavala.miguel
@inia.es (M.A. Zavala).1 These authors have contributed equally to the work.
Forest Ecology and Management 271 (2012) 158–169
Contents lists available at SciVerse ScienceDirect
Forest Ecology and Management
journal homepage: www.elsevier .com/ locate/ foreco

growth rates in open, xeric conditions, promoting rapid canopy
closure and eventual facilitation of the establishment of late suc-
cessional hardwoods (Zavala and Zea, 2004). Lack of post-planta-
tion practices – due to their elevated costs and low timber
production – has often resulted in high-density pine stands with
limited dynamic succession (Gómez-Aparicio et al., 2011). More-
over, those plantations have shown a high risk of dying under
water stress (drought) conditions (Martínez-García, 1999; Galiano
et al., 2011).
Tree decline in Mediterranean stands is a complex process that
has been attributed to a wide range of potential causes, often
involving prior droughts that initiate a growth decline and a
lengthy chain of interacting events (Camarero et al., 2004; Das
et al., 2007; Galiano et al., 2010). A multi-factor, sequential decline
hypothesis has commonly been considered to describe and explain
this process (Manion, 1991): (1) ‘‘predisposing factors’’ expose
plants to long-term stress (e.g., poor soil conditions and/or high
stand density, Vilá-Cabrera et al., 2011); these predisposing factors
increase the susceptibility of trees to (2) severe short-term stresses,
known as ‘‘inciting factors’’ (e.g., an extreme drought); and (3)
eventually the ‘‘contributing factors’’ (e.g., parasites and/or addi-
tional climatic events) produce tree mortality events. Despite the
compelling theoretical background of this hypothesis, the empirical
support is relatively weak because the studies documenting
drought-induced decline rarely analyze the relative importance of
all the factors that are potentially involved (but see Galiano et al.,
2010). This is particularly the case in studies of decline in Mediter-
ranean forest plantations (Sánchez-Salguero et al., 2010, 2012).
Forest decline can be linked to two main processes: a progres-
sive growth reduction (radial, height, or volume, etc.) and a rapid
defoliation, both used as descriptive variables to study impact of
environmental factors on forest decline (Bréda et al., 2006; Droby-
shev et al., 2007; Carnicer et al., 2011). Defoliation is one of the
main factors used to indicate future mortality and forest health
and it integrates the effects of other factors such as relative water
and nutrient availability (Dobbertin and Brang, 2001; Dobbertin,
2005). In forest decline studies defoliation refers to reduction of
overall crown volume, and usually visually estimated via a visual
assessment and systematic rating system applied to individual
trees assessed their vigor using a semi-quantitative scale based
on the percentage of crown defoliation (Mueller and Stierlin,
1990). Several studies have suggested the existence of a relation-
ship between negative growth trend and crown defoliation in a
decline process (Dobbertin, 2005; Jump et al., 2006; Drobyshev
et al., 2007). A negative trend in a recent basal area may be a strong
indication of overall tree growth and physiological decline (Jump
et al., 2006). Several studies demonstrated that tree crown condi-
tions at the time of sampling was correlated with tree growth over
the preceding decade, and from this relationship it was possible to
predict the decline process with significant statistical precision
(i.e., about 90% variance explained in the models) by at least
5 years beforehand (Duchesne et al., 2003; Bigler and Bugmann,
2003; Drobyshev et al., 2007). There are few studies, however, that
have evaluated growth and crown dieback separately, while also
assessing the effects of environmental and competition factors,
and particularly in Mediterranean pine stands (Bravo-Oviedo
et al., 2006; Kantavichai et al., 2010).
In this study, the objectives are: (i) to identify the main abiotic
and biotic factors that may be causing pine plantation decline in
southern Spain. Pinus sylvestris L. and Pinus nigra Arnold. subsp.
salzmannii stands have undergone severe decline (i.e., extensive
tree dieback) in the southern limit of their natural distribution area
in the Iberian Peninsula (Navarro-Cerrillo et al., 2007; Galiano
et al., 2010; Sánchez-Salguero et al., 2012). (ii) to determine the
relationship of these factors to tree growth decline processes;,
(iii) to evaluate relationship between crown defoliation and
growth decline, and (iv) to assess interspecific differences in the re-
sponses to these two processes. A combination of growth trend,
crown condition and those environmental variables could improve
predictions of the tree decline process using statistical models.
2. Materials and methods
2.1. Study area and species
The study area is located in ‘‘Sierra de Los Filabres’’ (37° 220 N,
2° 500 W, 150.000 ha. between 300 and 2186 m.a.s.l) (hereafter
abbreviated as Filabres), which represents the southern natural
distribution limit of Pinus nigra (Fig. 1). Mean annual precipitation
is 320 mm and moderately mild temperatures (13.1 °C,
1000 m.a.s.l) were recorded for the 1940–2009 periods (Sánchez-
Salguero et al., 2010), with prolonged drought during the summer.
Dominant soils are regosols and topography is characterized by
steep slopes (>35%) (LUCDEME, 2004).
P. sylvestris and P. nigra subsp. salzmanii plantations were stud-
ied. In the study area, forests were planted in the 1970s using seeds
from South and Central Spain, and afterwards they were managed
through selective thinning that involved harvesting depressed
trees while retaining dominant trees for future natural seeding
(Rodríguez Gutiérrez, 2003; Serrada et al., 2008). Silvicultural fea-
tures of these stands are summarized on Tables 1 and 2.
2.2. Field procedures and tree ring analysis
A stratified sampling was made by species and crown damage
classes, live and dead trees (Dobbertin and Brang, 2001), and tree
size (dbh, height) following a stratified sampling according to the
altitudinal gradient of the study area; taking into account the sur-
face occupied by each pine species and its recent defoliation levels
(Table 1 and Fig. 1). We sampled at least one stand within each 1-
km2 grid in the study area. Sampled stands in those grids with mul-
tiple stands were randomly selected. For each tree measurements
and observations were made of physiographic variables (elevation,
slope and aspect), size (dbh, height and crown height), age (num-
ber of rings at 1.3 m) and crown damage (percentage of defolia-
tion) using a semi-quantitative scale based on the percentage of
crown defoliation (Mueller and Stierlin, 1990) (Table 2) and the
ICP (International Co-operative Programme on Assessment and
Monitoring of Air Pollution Effects on Forests) monitoring method-
ology (UN/ECE, 1994) since it has been used in similar decline stud-
ies in Europe (see for example Heikkilä et al., 2002). Percent crown
defoliation (as proxy indicator of damage) was assessed visually by
the first author because estimates of defoliation vary among
observers. Since these estimates may also vary among sites we
used as a reference a tree with the maximum amount of foliage
at each location (Dobbertin, 2005). In this study, a tree was re-
garded as declining if its crown showed a needle loss greater than
50%. Two defoliation classes were reclassified from the initial scale:
class 1 (H) (slightly damaged trees and trees without evident defo-
liation <50%) and 2 (D) (severely damaged trees or dead ones
P50%) (Drobyshev et al., 2007; Sánchez-Salguero et al., 2012).
In this study, damage levels were directly related to crown
defoliation (Table 1), which permitted one to accept that current
defoliation levels were linked to the severity of recent droughts
(Dobbertin, 2005). This assumption was supported by physiologi-
cal data since stomatal conductance and water potential were sig-
nificantly lower in defoliated than in non-defoliated trees in both
species (Hernandez-Clemente et al., 2011).
A wood section at 1.3 m from each tree was obtained, and two
radii located perpendicular to the maximum slope and in opposite
directions were selected for cross-dating and measuring. Wood
R. Sánchez-Salguero et al. / Forest Ecology and Management 271 (2012) 158–169 159

disks were dried and sanded with progressively finer grades of
sandpaper until the wood anatomical elements were visible in
transverse section and then scanned at 3200 dpi using an Epson
Perfection V750 Pro scannerÓ (Seiko Epson Corp., Nagano, Japan).
Tree-ring widths were measured to the nearest 0.01 mm along
the two radii of each section using WinDendroÓ (Regents
Instruments, Quebec, Canada). Tree-ring series were dated follow-
ing standard procedures (Stokes and Smiley, 1996). In order to de-
tect dating and measurement errors, ring-width series were
checked with COFECHA software (Holmes, 1983; Grissino-Mayer,
2001). We did not detrend chronologies to filter out eventual
decrease of increment with age (age trend) since this operation
could partly remove growth signal related to more short-term
changes in trees’ crown status. Instead, we analyzed raw ring-
width series and ring-width series transformed to basal area incre-
ments using standard methods for such transformations (Biondi
and Qaedan, 2008).
2.3. Environmental and biotic factors
Discrete climate data were obtained from the Spanish weather-
monitoring system (Spanish Meteorological Agency; http://
www.aemet.es) and CRU TS 3.0 dataset (Mitchell and Jones,
2005) (Table 2). Climatic and site characteristics datasets were
implemented in a Geographic Information System (GIS) environ-
ment. Spatial interpolation based on inverse distance weighting
and spline, were used to predict monthly and average annual
precipitation (Pan), as well as monthly and average annual temper-
ature (Tan) with a spatial resolution of 10 m. Potential evapotrans-
piration (PET) according to Thornthwaite, 1948 were calculated.
Site characteristics were represented by altitude (Alt), slope
(Slp), aspect (Asp), solar radiation (Rad), a Compound topographic
index (CTI) that provides information on the availability of soil
water (Gessler et al., 1995) and soil type according to FAO classifi-
cation (Soil) (Table 2).
Fig. 1. Study area and sampling. The upper inset maps show the distribution of both species and the location of the study area in SE Spain (Andalusia).
Table 1
Description of the selected trees to decline model in Filabres area for trees with low (H, healthy trees; defoliation < 50%) or high defoliation (D, declining trees; defoliation P 50%)
considering the two pine species (Ps, P. sylvestris; Pn, P. nigra). Values are means ± SE. Different letters indicate significant (P < 0.05) differences between defoliation classes within
areas (Mann–Whitney U test).
Species (code) No. of trees (No. of radii) Dbh (cm) Height (m) Defoliation (%)
H D H D H D H D
P. sylvestris (Ps) 25 (50) 15 (30) 17.7 ± 0.5a 15.2 ± 0.7b 8.2 ± 0.3 7.3 ± 0.3 16.3 ± 2.3a 68.0 ± 6.4b
P. nigra (Pn) 32 (64) 18 (36) 16.7 ± 0.5a 14.4 ± 0.5b 7.8 ± 0.3 7.1 ± 0.4 20.0 ± 1.5a 63.0 ± 4.4b
160 R. Sánchez-Salguero et al. / Forest Ecology and Management 271 (2012) 158–169

Diameter at breast height (dbh), total height (H), crown diame-
ter (Cd), crown height (Ch), stability index (H/dbh) and defoliation
classes were measured for all trees. Competition was characterized
by basal area (BA), quadratic mean diameter (Dg), ratio dbh/Dg,
ratio BA-basal area density (G), stand density (N) and Reineke’s
stand density index (SDI) (Yang et al., 2003; Shaw, 2006) (Table 2).
2.4. Statistical analysis
Normal distribution of all variables and tree-ring data were
tested with a Kolmogorov–Smirnov test. Then, biotic and abiotic
variables were studied by applying dimension reduction tech-
niques to avoid convergence problems during parameter estima-
tion. The shared variation between independent variables was
evaluated using a principal component analysis (PCA), calculated
from their correlation matrix and the influence of these variables
(Pearson r) in defoliation and growth, respectively.
2.5. Crown decline model
Based on crown defoliation, many studies have grouped trees
into vitality classes to test the differences between classes in die-
back models (Dobbertin, 2005). Discriminant Analysis, one-way
ANOVA analysis and dendrochronological statistics that refer to
the residual (MSx) and standard autocorrelation (AR1) series of
tree-ring width between healthy (H) and damaged-dead (D) per
each species were used to explain this reclassification (Drobyshev
et al., 2007).
A logistic model was parameterized by the probability of dam-
age level for each individual tree (H (defoliation < 50%) and D
(defoliationP 50%)), using logistic regression (Bigler et al., 2006;
Lines et al., 2010)
PrðY i;t ¼ 1jXi;tÞ ¼ 1=1þ expðXi;tbÞÿ1 ð1Þ
with Yi,t: status of tree i at time t (Y = 0 means the tree is health,
Y = 1 means the tree is damaged-dead). Pr (Yi,t = 1|Xi,t) crown dam-
age probability in the interval [0,1], and Xi,tb a linear combination of
the independent variables (X) and the regression coefficients (b).
To develop the logistic model, a two-stage stepwise variable
selection strategy was applied, and decline models were fitted by
maximum log-likelihood estimation using (LL) and the Akaike
Information Criterion (AIC) (Burnham and Anderson, 2002). The
significance level of deviance differences served as the criterion
for variable selection. The reduction of deviance in a stepwise pro-
cess can be assumed to be X2 distributed, even for ungrouped data
(McCullagh and Nelder, 1989). The starting point for each stepwise
regression was the Null model, where only the intercept with dbh
was included as an independent variable.
In a first stage of the analysis, the most significant variables
were determined using a stepwise selection process. At a second
stage, the best linear combination using the variables selected at
stage one was sought via another logistic regression model. The
resulting main model, which only included significant variables,
was used for all further analyses. The smallest values of LL and
AIC were observed in linear form and species-specific models, so
we decided to retain those models (Flewelling and Monserud,
2002).
Upon arriving at a final model, a multiple measure of goodness-
of-fit was calculated accepting that prediction accuracy is a useful
criterion for comparing logistic models of decline process
(Dobbertin and Brang, 2001; Bigler and Bugmann, 2003;
Table 2
Summary statistics for the data used in decline models for P. sylvestris (Ps) and P. nigra (Pn).
Variables Metadata Mean SD Minimum Maximum
Ps Pn Ps Pn Ps Pn Ps Pn
Biotic
Diameter at breast height (dbh) (cm) FWa 16.8 15.6 2.6 2.8 11.3 11.3 21.0 22
Tree height (H) (m) FW 7.9 7.4 1.4 1.8 5.8 4.3 11.6 11.3
Crown diameter (Cd) (m) FW 4.5 3.8 0.7 0.8 3.1 2.1 5.8 5.3
Crown height (Ch) (m) FW 5.8 5.8 1.4 1.5 3.4 2.7 10.2 9.4
Stability index (H/dbh) FW 47.3 47.7 5.6 9.7 37.6 31.8 59.2 79.3
Defoliation (Defo) (%)b FW 45.2 40.8 29.3 25.9 5 10 100 100
Basal area(BA) (m2haÿ1) FIc 155.7 128.5 99.9 52.0 73.9 67.9 611.3 353.0
Stand density (N) (trees haÿ1) FI 1050 925 418 353 100 100 1800 1600
Quadratic mean diameter (Dg) (cm) FI 13.7 12.6 3.4 2.3 9.7 9.3 27.9 21.2
Ratio Dbh/Dg FI 1.3 1.3 0.3 0.3 0.7 0.6 1.9 1.9
Basal area density (G) FI 12.5 12.2 5.5 5.7 3.5 2.6 28.9 27.4
Ratio Dbh/G FI 15.8 14.1 17.3 15.5 6.9 3.9 100.9 100.9
Reineke’s index (SDI) FI 386.4 302.2 186.9 130.4 76.7 68.9 894.5 557.9
Abiotic
Altitude (Alt) REDIAMd 1871 1786 129 156.8 1611 1380 2137 2111
Slope (Slp) REDIAM 25.0 27.1 13.5 10.9 1.8 4.0 48.1 55.4
Aspect (Asp) REDIAM 171.7 201.2 121.5 107.1 – – – –
Solar radiation (Rad) REDIAM 24 27 2.9 3.0 13.0 19 35.0 35
Compound topographic index (CTI) REDIAM 5.6 5.9 1.7 2.1 3.0 3.1 10.9 15.1
Soil REDIAM – – – – – – – –
Precipitation (P)e – 320 323 45 48 305 282 382 384
Temperature (T) – 10.4 10.8 1.7 1.7 7.3 7.4 12.9 13.6
Evapotranspiration (PET) – – – – – – – – –
a Fieldwork in winter 2006–2007.b Defoliation class – the level of decline is based on classes of damage in response to defoliation (%) of the tree (class = 0, healthy defoliation = 0–10%, class 1 = slight
damage, defoliation = 11–25%), class 2 = trees with damage moderate to intense defoliation = 26–60%; class 3 = severely damaged or dying trees, defoliation = 61–99%, class
4 = tree dead, defoliation = 100%). Based on Mueller and Stierlin (1990) and UN/ECE (1994).c Forest Inventory (2007). All the tree sampling was inside these plots (network 1 � 1 km).d REDIAM (Environmental Information Network of Andalusian Government, Spain, Consejería de Medio Ambiente, 2009).Topographic data are based on raster digital
elevation model with a resolution of 10 � 10 m. Soil is based in FAO soil type.e Precipitation, temperature and evapotranspiration were calculated monthly (numbers from January, 1 to December, 12) and for different seasons from 30 local mete-
orological stations (see Sánchez-Salguero et al., 2010, 2012), CRU TS 3.0 and REDIAM. This information was got for each plot in raster format.
R. Sánchez-Salguero et al. / Forest Ecology and Management 271 (2012) 158–169 161

Bravo-Oviedo et al., 2006). Comparing the observed stage with pre-
dicted one of each individual tree allowed us to develop a semi-
mechanistic understanding of dieback processes at an individual
scale. Evaluation was performed with independent plots not used
in the fitting process (10%). An ‘‘optimal’’ cut-off point was deter-
mined for each model. Three cut-off points or thresholds were
tested, as well as random numbers. First, the point at which sensi-
tivity and specificity curves crossed was considered; second, the
overall survival rate found for the species was used, and, third,
an arbitrary one was considered. Random numbers were run 10
times and the average classification rates were recorded (Hosmer
and Lemeschow, 1989; Bravo-Oviedo et al., 2006).
To verify if the decline model with an originally continuous
dependent variable grouped on two crown defoliation categories
was correct, when part of the extreme data removed a logistic
model was applied, and thus, only trees with crown defoliation
near to 50% were used to evaluate this model.
2.6. Growth model
Basal-area increment (BAI = p (R2t ÿ R2
tÿ1) where R is the radius
of the tree and t is the year of tree-ring formation) for each species
and damage class was obtained by averaging the annual values of
the 180 radii measured in 90 disks for the period 1990–2006, when
treeshave surpassed their earlyBAI releasephase (Sánchez-Salguero
et al., 2012). BAI of the two species was then quantified, considering
separately twodamageclasses (see supporting information;Fig. A1).
BAI distribution was skewed and log-transformed and used as
the response variable in all the following analyses. Mixed effects
models (maximum likelihood method) (Burnham and Anderson,
2002) were used to analyze the effect of the independent variables
on tree growth in both species with different crown damage status.
The general structure of the models can be summarized as
Yij ¼ lþ Xibi þ Zij þ Zici þ nij ð2Þ
where Yij is the vector containing the values of log(BAI) for tree i and
year j, l constant intercept. Xi corresponds to the matrix of fixed ef-
fects (e.g., dbh, height, topographic variable, etc.), bi is the vector of
parameters associated with the fixed effects, Zi is the design matrix
of randomeffects (e.g., year, tree), cj is thematrix containing the vec-
tors of parameters corresponding to the random effects (year, year-
tree, etc.), Zici is the random effects relationship damage-year and
nij is the vector of error terms for tree i and year j. The random effects
were assumed to follow a normal distribution with zero mean. The
selection of explanatory variables also responded to a compromise
with the availability of reliable data and considerations on the rele-
vant time frame in the context of the study. Residuals were studied
to validate the mixedmodels assumptions of normality and to verify
that no correlation existedwith the variables not included in the final
model. With the BAI predicted by the final model, a determination
coefficient (R2) was used to check significantly differences between
growths depending on damage level.
An information-theoretic approach to multi-model selection,
based on the Akaike Information Criterion (AIC) and BIC (Bayesian
Information Criterion) was used, and the model with the lowest
AIC and BIC selected (Burnham and Anderson, 2002). The dataset
was randomly split into 10 parts and 90% was used for initial mod-
el development and 10% was used for model validation. The final
model was developed using the entire dataset. Using the validation
dataset, the coefficients of the multilevel mixed model analysis
were used to predict growth. The residuals were calculated by sub-
tracting the predicted values from the observed values. Mean
Squared Error (MS Error), Mean bias (MB), Absolute Mean bias (A
Mean bias) and Mean Percent Error (Mean% Error) were used to
check model accuracy (Uzoh and Oliver, 2008). Analyses were con-
ducted with SAS v. 9.1.3 (SAS Corporation, Cary, NC, USA). Signifi-
cance for all statistical analyses was accepted at a = 0.05.
3. Results
3.1. Variables related to forest decline
The Manion (1991) model characterizing tree decline envisions
a sequential process of predisposing, inciting, and contributing
stressors. Within this framework, our statistical assessments point
to competition and climate (extreme drought events) as the most
likely and strongest predisposing and inciting (maybe contributing
too) factors, respectively (Fig. 3). The scatter plot of the principal
component analysis (PCA) loading coefficients displayed groups
of variables. P. nigra and P. sylvestris biotic variables (Fig. 3a and
b) were significant, representing PC1 (63–55%) and PC2 (17–24%)
of the total variance, respectively. The scatter plot (Fig. 3a and b)
represented the competition factors (e.g., SDI or Cd), as predispos-
ing factors in the decline process in both species. This PCA loaded
two groups: tree scale (PC1) and stands scale (PC2).
The abiotic PCA of both species with the significant variables
(Pearson analysis) showed similar loadings with the PC1 (Fig. 3c
and d). Climate variables had positive correlations with it, show-
ing that they shared a common variance. On the other hand, site
characteristic variables were scattered, covering nearly all the
range of the second axis values (e.g., soil, aspect, and radiation)
that explain the second axis (PC2) in both species. Fig. 3(e and f)
shows the evolution of the explained variance of all the signifi-
cant abiotic and biotic factors. Although the groups showed dif-
ferent loadings with the PC1 in both species, all climate variables
had positive correlations with it, showing that they shared a
common variance. In contrast, June (P6) and August precipita-
tions (P8) in P. nigra and P. sylvestris, respectively, were scattered
in other groups. The variance explained for this component rep-
resented the contributing climate factors in the third decline
stage (contributing factors).
Although thePC2 inFig. 3(e and f) showedsimilar loadings in sev-
eral site characteristic variables inboth species, andcompetition fac-
tors as a predisposing factor in P. nigra, but in P. sylvestris, they could
act as predisposing, and contributing factors too. These different
loadings with PC1 and PC2, were due to implicit species differences.
When PCA was computed with all the variables (biotic and abi-
otic factors) depending on species (P. nigra and P. sylvestris), the
first and second axes appeared significant (PC1 42% and 35.8%;
PC2 14.5% and 18%), respectively.
3.2. Crown decline model
A discriminant analysis of different crown damage classes with
the biotic and abiotic factors was conducted to test the decline
classification. This analysis showed the best results at two crown
damage levels–growth pattern 50% of defoliation (P = 0.01, Cor-
rectly classified 93% of original grouped cases (Significant
p < 0.05) (Fig. 2).
The best explanatory variables used to create a decline crown
model, obtained in a previous analysis, were roughly equivalent
between species and listed in Tables 3 and 4. A stepwise model
selection was used in both cases starting from the same initial
set of explanatory variables (Table 3). Only the final model selected
variables are shown (Table 4). Both decline models were mostly af-
fected by specific spring climate conditions (Pjune and Tjune) as
inciting (before decline stage) and contributing factors (in extreme
dry years); and stand competition (SDI, dbh and Cd) as a predispos-
ing factor, but P. sylvestris model was associated with one addi-
tional explanatory variable, summer evapotranspiration (PETsum)
162 R. Sánchez-Salguero et al. / Forest Ecology and Management 271 (2012) 158–169

as a contributing factor in the stage of decline (Table 4). At the
individual level, the stepwise model selection used to fit the de-
cline model removed the explanatory variables that were not sig-
nificant, including the growth variable (e.g., BAI) (Table 3). All
the variables tested in the final model were significantly associated
with level of damage (Table 4).
Increases in decline probability were associated with increase in
competition, lower crown diameter (Cd) (P. nigra), diameter breast
height (dbh) (P. sylvestris) and lower late spring precipitation
(Pjune) and higher late spring temperature (Tjune) in both species
(inciting and contributing factors, respectively). Also, in P. sylvestris
model, a higher PET for the summer months (June–August) in-
creased decline probability. Including an interaction term for these
variables did not improve the explanatory power of the model.
As regards the final model used for modeling decline probability
in each species, the results of parameter estimates are shown in ta-
ble 4; being statistically significant.
Assessments of model fit using validation data sets show the
models to be reasonably accurate representations of the relation-
ships. The healthy and damaged pines calibration model supplied
a reasonable fit to the health and damage validation data. A Hos-
mer–Lemeshow test and AIC revealed a good overall fit, and a val-
idation test showed an acceptable level of discrimination
(Table 4). We found the optimal cut-point for model classification
to be 0.50 (i.e., trees are classified as healthy or damaged when
P(m) < 0.50 and P(m)P 0.50, respectively). The P. nigra decline
model correctly predicted the status of 92% and the P. sylvestris
model predicted 90.6%.
3.3. Growth model
On the other hand, it is known that tree-growth reactions to
environmental stresses may serve as a vitality indicator, appearing
previous to crown damage (without insect damage). Crown dam-
age and growth can complement each other to predict forest de-
cline. For this reason, although the decline models did not
include a tree recent growth parameter (it was automatically re-
moved to the fit test by the model), growth models were calculated
to find out the sequence of decline process and if there were differ-
ences across species and dependent variables (defoliation and
growth) in their responses to predisposing, inciting and contribut-
ing decline factors.
The variables used to create a growth model, were obtained in
previous analyses and from decline model analyses. A stepwise
model selection was used in both cases starting from the same ini-
tial set of explanatory variables. Only the final model’s selected
variables are shown (Table 5).
The selected mixed models in P. nigra (Health, AIC(BIC) = ÿ7.5(-
5.8)); (Damage, AIC(BIC) = 7.3(8.9)) detected that the significant po-
sitive effects of tree size (dbh, Cd) exerted significant positive effects
on basal area increment (BAI), but on crown diameter only in dam-
aged trees (D) (Table 5). An increase in dbh and Cd is positively re-
lated to growth. Spring precipitation showed significant positive
effects on BAI in both levels of damage (Table 5). In addition, Spring
temperature (Tjune) and Reineke’s index exerted significant nega-
tive effects on BAI only in damaged trees (D) (Table 5). Aspect is re-
lated negatively and significantly to growth in both levels of
damage, but soil showed significant negative effects only in Healthy
trees (H). The best estimate for the time effect was positive, reflect-
ing that, on average, BAI growth increased over time (Table 5).
The final model to P. sylvestris (Health, AIC(BIC) = ÿ85.3(ÿ83.6);
Damage, AIC(BIC) = ÿ86.5(ÿ84.9) showed that dbh is correlated
significantly positively with BAI in both levels of damage (Table 5).
Competition variables (Reineke’s index) showed negative effects,
only significant in damaged trees (D) (Table 5). Slope showed neg-
ative effects only significant in healthy trees (H), but soil is corre-
lated negatively with growth in both levels of damage. As for the
climate variables, Spring precipitation (spring temperature, sum-
mer PET) exerted significant positive (negative) effects on BAI (Ta-
ble 5). As expected, climate variables showed greater effects in
damaged trees (D) than in healthy trees (H) (Table 5). Including
an interaction term for these variables did not improve the explan-
atory power of the model.
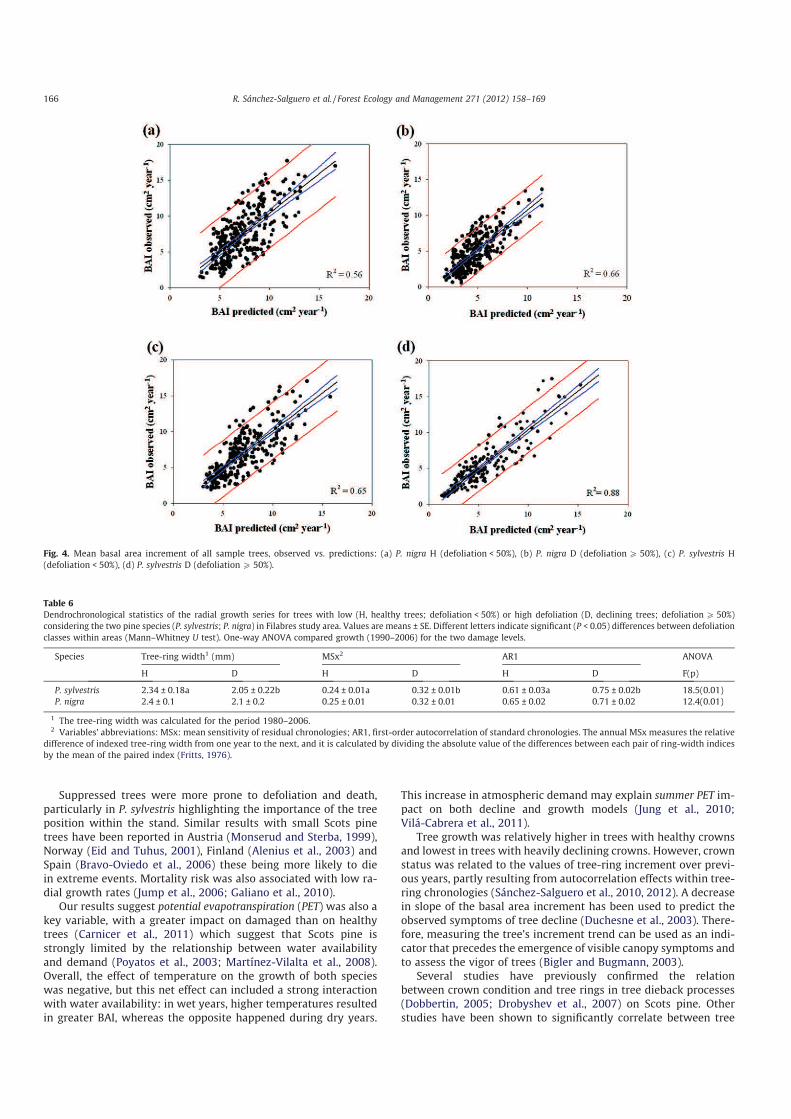
The average growth per level of damage and species is shown in
Fig. 4 (Supporting Information, Fig. A1). On this figure, the ob-
served means of basal area increment per species were plotted
against the predictions for the two selected damage classes. All
the models showed acceptable predictions. All residual statistics
presented in the tables and figures were based on transformed log-
arithmic values and the correction term was added into the inter-
cept in Supporting information, Table A1.
3.4. Growth-defoliation relationship
The range of radial growth rates in both species indicated differ-
ences between crown damage levels. The distribution of crown
damage (defoliation) in decline pine stands was bimodal, with
the majority of trees experiencing either mild or severe amounts
of crown damage (Fig. 2).
High probabilities of mortality were clearly associated with
high levels of crown damage (defoliation) and reduction in basal-
area increment. These species showed a significant relationship be-
tween crown damage and low growth rates (Table 6; Supporting
Information, Fig. A1). The dendrochronological statistics (first-or-
der autocorrelation, mean sensitivity) tended to be higher in dam-
Fig. 2. Crown defoliation for Pinus sylvestris and Pinus nigra in Filabres originally
sampled. Trees with 100% are dead. Crown defoliation was estimated for felled
trees.
R. Sánchez-Salguero et al. / Forest Ecology and Management 271 (2012) 158–169 163

aged-dead than in healthy trees, and these differences were signif-
icant in P. sylvestris but not in P. nigra (Table 6). Tree-ring incre-
ments were highest in trees with healthy crowns and lowest in
trees with heavily declining crowns (Table 6). Two damage levels
showed significant differences in annual growth as the results of
one-way ANOVA analysis of ring increments and crown defoliation
class, run for each year (1990–2006) (Table 6).
4. Discussion
We confirmed the expected association between forest
decline – defoliation and mortality –, climatic conditions – spring
and summer precipitation – and competition previously found in
Mediterranean forests. Our results provide additional support to
previous studies in forest decline showing a high vulnerability to
PC 1 (63%)
PC
2 (
17
%)
0.0
0.2
0.4
0.6
0.8
1.0
PC 1 (54.5%)
PC
2 (
15
%)
-0.2
0.0
0.2
0.4
0.6
0.8
1.0
(a)
(c)
PC 1 (42%)
PC
2 (
14
.5%
)
-0.2
0.0
0.2
0.4
0.6
0.8
1.0
(e)SDI
G BAN
ChPET 8
dbh
SoilCd
H
Asp
CTI
Rad2
Rad1Rad3
P6
PET 9
PET 6T6
Tmx spr
Tmx fall
Tmx sum
Rad1
Rad2 Rad3
Alt
Soil
Asp
CTI
PET9
PET8
PET6T6
P6
Tmx spr
Tmx fallTmx sum
N
SDIG
BA
Cd
HCh
dbh
PC 1 (55%)
PC
2 (
24
%)
0.0
0.2
0.4
0.6
0.8
1.0
PC 1 (47%)
PC
2 (
20
%)
-0.2
0.0
0.2
0.4
0.6
0.8
1.0
(b)
(d)
PC 1 (35.8%)
0.0 0.2 0.4 0.6 0.8 1.0
-0.2 0.0 0.2 0.4 0.6 0.8 1.0
-0.2 0.0 0.2 0.4 0.6 0.8 1.0 1.2
0.0 0.2 0.4 0.6 0.8 1.0
-0.2 0.0 0.2 0.4 0.6 0.8 1.0
-0.2 0.0 0.2 0.4 0.6 0.8 1.0 1.2
PC
2 (
18
%)
-0.2
0.0
0.2
0.4
0.6
0.8
1.0
(f)
SDI
G
BA
NCh
PET 8dbh
Soil
CdH
Asp
CTI
Rad2Rad1 Rad3
P6
PET 9
PET 6T6
Tmx spr
Tmx fall
Tmx sum
Rad1Rad2 Rad3
P8
Soil
AspCTI
PET9
PET8
PET6T6
P6Tmx spr
Tmx fall
Tmx sum
N
SDI GBA
Cd
H
Chdbh
P8
P. nigra P. sylvestris
Fig. 3. Scatter plot of principal component loadings obtained from a correlation matrix between independent variables (biotic (a and b), abiotic (c and d) and both (e and f))
for both species. The percentage of variance explained by the PC axes is shown. The letters codes for each variable are the same as in Table 2. Abbreviations of variables: N,
stand density; SDI, Reineke’s index; G, basal area density; BA, basal area; Ch, crown height; Cd, crown diameter; H, tree height; dbh, diameter at breast height; Rad, solar
radiation (1 – spring equinox, 2 – summer solstice, 3 – fall equinox); Alt, altitude; Asp, aspect; Soil, FAO soil type; CTI, compound topographic index; P, precipitation (from 1-
January to 12-December); PET, Potential evapotranspiration (from 1-January to 12-December); Tmx spr, mean maximum spring temperature; Tmx sum, mean maximum
summer temperature; Tmx fall, mean maximum fall temperature.
Table 3
Summary of the models based on Eqn (1) (see text).
Model Model likelihood (-2LL) AIC Hosmer–Lemesshow test (p-value) R2 Nagerkelke Correctly classified (%)
P. nigra
0: �dbh 46.315 48.315 0.002 0.240 74.4
1: �0 + Cd 44.838 48.838 0.642 0.280 76.9
2: �1 + SDI + N 44.838 52.838 0.642 0.280 77.0
3: �2 + Alt + Asp + Rad + Soil 32.569 48.569 0.577 0.565 79.5
4: �3 + P + T + PET 27.770 49.770 0.986 0.654 84.6
P. sylvestris
0: �dbh 32.941 34.941 0.196 0.282 76.7
1: �0 + Cd 32.373 36.373 0.364 0.281 77.0
2: �1 + SDI + N 30.791 38.791 0.320 0.342 77.6
3: �2 + Alt + Asp + Rad + Soil 27.774 43.774 0.294 0.440 79.2
4: �3 + P + T + PET 22.724 44.724 0.612 0.584 80.0
164 R. Sánchez-Salguero et al. / Forest Ecology and Management 271 (2012) 158–169

severe droughts near the climatic xeric tolerance limits under high
competition; e.g., unmanaged or high dense planted stands of
these two species: P. sylvestris (Martínez-Vilalta and Piñol, 2002;
Galiano et al., 2010, 2011; Carnicer et al., 2011; Vilá-Cabrera
et al., 2011) and P. nigra (Martínez-Vilalta and Piñol, 2002; Palahí
and Grau, 2003; Linares and Tíscar, 2010; Carnicer et al., 2011).
Our results suggest that the relationship among these variables
is complex and may involve a wide range of contributing causes
(Manion, 1991; Galiano et al., 2010). The decay process may be
seen as a result of a series of chain events with first drought events
(e.g., 1994–1995) operating as inciting factors; stand structure and
competition being a predisposing factor; and intense drought epi-
sode (e.g., 1999, 2005) acting as a contributing factor (e.g., Manion,
1991; Galiano et al., 2010; Sánchez-Salguero et al., 2012).
Drought events can trigger several effects on trees (Bréda and
Badeau, 2008) that lead to defoliation (Dobbertin, 2005; Drobyshev
et al., 2007). Defoliation (i.e., leaf-shedding) could initially occur as
an avoidance mechanism to maintain a favorable water balance by
reducing transpiring needle area (Bréda et al., 2006). Leaf-shedding
also signals the early stages of a sequence leading to tree death
(Dobbertin, 1999; Dobbertin and Brang, 2001; Galiano et al.,
2010; Carnicer et al., 2011; Sánchez-Salguero et al., 2012). It is
important to note that in this study we operated with the esti-
mates of crown conditions taken on only one occasion. However,
our study demonstrated that the condition of pine crowns in two
categories (healthy and damaged trees) at the dates of sampling
did reflect the trees ‘growth over the preceding decade, although
no growth term was included in the decline model.
Spring temperature and precipitation in conjunction with soil
type showed themselves to be the most important variables, be-
cause growth is sensitive to the length of growing season, re-
sources and water availability in soil (Galiano et al., 2010;
Carnicer et al., 2011). Precipitation and temperature during the
growing season have been considered as variables directly related
to competition for water during growth period (Dobbertin, 2005;
Bigler et al., 2006; Camarero et al., 2010), and, hence, they may
be surrogate variables of two-sided competition (Galiano et al.,
2010). Water availability in late spring and early summer during
the years of tree-ring formation is a major driver for wood forma-
tion, since the maximum cambial activity of the studied pines hap-
pens between April and June (Camarero et al., 2010).
In agreement with previous studies on drought-induced decline
after extreme climate events in Spain (e.g., Galiano et al., 2010;
Carnicer et al., 2011) our results confirm a correlation among the
decline process and both spring climatic conditions and summer
drought intensity. Accordingly, the subgroup of Damaged trees
was among the best adjustment level in both species according to
their defoliation and reduction in basal-area increment, which
agrees with the idea that water-deficit stress and high density is a
major factor driving the decline of species vulnerable to xylem
embolism in xeric sites (Galiano et al., 2011). This is also consistent
with their greater vulnerability to drought-induced xylem
embolism of P. sylvestris in comparison to the other pine species
(Martínez-Vilalta et al., 2004; Bréda et al., 2006). Scots pine re-
sponds to severe droughts by increasing the diameter of tracheids
while decreasing their number, which might lead to a sharp reduc-
tion in radial growth, and, thus, to an impairment ofwater transport
through the xylem (Eilmann et al., 2009). Scots pine, however, is an
introduced species in the studied location, and these plantations
maybe established well beyond the natural southern edge of the
species’ distribution area (Fernández-Cancio et al., 2011).
Our validation test values (Supporting information, Table A1)
were quite similar inmagnitude to comparable BAI-models of other
European tree species (Monserud and Sterba, 1996; Andreassen and
Tomter, 2003; Dobbertin, 2005). Similar trends have been reported
for other pine species (Kobe, 1996; Zavala et al., 2011) which sug-
gest that pines are very vulnerable to growth suppression.
Table 4
Best fit logistic regression models (model 5) predicting P. nigra and P. sylvestris decline.
Species Variable Estimated (SE) Wald test (Z) Odds ratio (exp (b)) Hosmer–Lemeshow test (p-value) MLa (Gb) AIC R2 Nagerkelke
P. nigra (b0) Constant ÿ47.561 (18.128)* 6.883 – 0.789 10.571 (<0.001) 0.805
(b1) Cd ÿ2.636 (1.122)* 5.520 0.072 18.517
(b2) Tjune 3.268 (1.170)* 7.803 26.272
(b3) SDI 0.023 (0.010)* 5.739 0.977
(b4) Pjune ÿ0.861 (0.383)* 5.046 2.366
P. sylvestris (b0) Constant 16.887(2.7185)* 0.369 – 0.665 21.493 (<0.001) 0.815
(b1) Dbh ÿ0.648(0.363)* 3.194 0.523 31.493
(b2) Tjune 0.028(0.646)* 0.002 1.029
(b3) PETsum 1.425(1.131)* 1.589 4.159
(b4) Pjune ÿ0.637(0.440)* 2.095 1.890
(b5) SDI 0.008(0.004)* 3.020 0.992
Note: Parameter estimates are presented with standard errors in parenthesis. b0, the constant; bi, model coefficients estimated from the data; Cd, Crown diameter; Tjune, June
temperature; SDI, Reineke’s stand density index; Pjune, June precipitation; Dbh, diameter breast height; PETsum, summer evapotranspiration.a Values for the maximum likelihood.b Values for the G statistic of the likelihood ratio test.
* Significant at 0.05 level.
Table 5
Statistical parameters of the fixed factors in the best mixed models for basal-area
increment in P. nigra and P. sylvestris based on Eq. (2) (see text). low (H, healthy trees;
defoliation < 50%) and high defoliation (D, declining trees; defoliation P 50%).
Fixed effects Estimate SE P
P. nigra H D H D H D
Intercept 0.9693 2.1950 0.3111 0.4152 0.0067 0.0001
Time 0.0229 0.0236 0.0093 0.0094 0.0070 0.0059
Dbh 0.0028 0.0025 0.0005 0.0005 <.0001 <.0001
Cd 0.0001 0.1218 0.0195 0.0195 0.9945 <.0001
Tjune ÿ0.0343 ÿ0.1227 0.0185 0.0275 0.0653 <.0001
SDI ÿ0.0001 ÿ0.0006 0.0001 0.0002 0.2712 0.0009
Pjune 0.0135 0.0226 0.0056 0.0059 0.0176 0.0002
Soil ÿ0.1268 ÿ0.0560 0.0404 0.0320 0.0019 0.0815
Aspect ÿ0.0009 ÿ0.0003 0.0001 0.0001 <.0001 0.0113
P. sylvestris H D H D H D
Intercept ÿ6.6148 7.1138 2.7561 1.5742 0.0289 0.0003
Time 0.0118 0.0305 0.0047 0.0110 0.0060 0.0028
Dbh 0.0467 0.0367 0.0095 0.0119 <.0001 0.0026
SDI ÿ0.00001 ÿ0.0006 0.00007 0.0003 0.8653 0.0372
Slp ÿ0.0001 ÿ0.0001 0.0003 0.0033 0.0010 0.9748
Soil ÿ0.3351 ÿ0.2931 0.1191 0.0877 0.0052 0.0010
Tjune ÿ1.7183 ÿ2.3416 0.2738 1.1439 <.0001 <.0001
Pjune 0.0142 0.3479 0.0055 0.1289 0.0115 0.0077
PETsum ÿ0.2851 ÿ0.3731 0.0474 0.1478 <.0001 <.0001
R. Sánchez-Salguero et al. / Forest Ecology and Management 271 (2012) 158–169 165
Suppressed trees were more prone to defoliation and death,
particularly in P. sylvestris highlighting the importance of the tree
position within the stand. Similar results with small Scots pine
trees have been reported in Austria (Monserud and Sterba, 1999),
Norway (Eid and Tuhus, 2001), Finland (Alenius et al., 2003) and
Spain (Bravo-Oviedo et al., 2006) these being more likely to die
in extreme events. Mortality risk was also associated with low ra-
dial growth rates (Jump et al., 2006; Galiano et al., 2010).
Our results suggest potential evapotranspiration (PET) was also a
key variable, with a greater impact on damaged than on healthy
trees (Carnicer et al., 2011) which suggest that Scots pine is
strongly limited by the relationship between water availability
and demand (Poyatos et al., 2003; Martínez-Vilalta et al., 2008).
Overall, the effect of temperature on the growth of both species
was negative, but this net effect can included a strong interaction
with water availability: in wet years, higher temperatures resulted
in greater BAI, whereas the opposite happened during dry years.
This increase in atmospheric demand may explain summer PET im-
pact on both decline and growth models (Jung et al., 2010;
Vilá-Cabrera et al., 2011).
Tree growth was relatively higher in trees with healthy crowns
and lowest in trees with heavily declining crowns. However, crown
status was related to the values of tree-ring increment over previ-
ous years, partly resulting from autocorrelation effects within tree-
ring chronologies (Sánchez-Salguero et al., 2010, 2012). A decrease
in slope of the basal area increment has been used to predict the
observed symptoms of tree decline (Duchesne et al., 2003). There-
fore, measuring the tree’s increment trend can be used as an indi-
cator that precedes the emergence of visible canopy symptoms and
to assess the vigor of trees (Bigler and Bugmann, 2003).
Several studies have previously confirmed the relation
between crown condition and tree rings in tree dieback processes
(Dobbertin, 2005; Drobyshev et al., 2007) on Scots pine. Other
studies have been shown to significantly correlate between tree
Fig. 4. Mean basal area increment of all sample trees, observed vs. predictions: (a) P. nigra H (defoliation < 50%), (b) P. nigra D (defoliationP 50%), (c) P. sylvestris H
(defoliation < 50%), (d) P. sylvestris D (defoliationP 50%).
Table 6
Dendrochronological statistics of the radial growth series for trees with low (H, healthy trees; defoliation < 50%) or high defoliation (D, declining trees; defoliation P 50%)
considering the two pine species (P. sylvestris; P. nigra) in Filabres study area. Values are means ± SE. Different letters indicate significant (P < 0.05) differences between defoliation
classes within areas (Mann–Whitney U test). One-way ANOVA compared growth (1990–2006) for the two damage levels.
Species Tree-ring width1 (mm) MSx2 AR1 ANOVA
H D H D H D F(p)
P. sylvestris 2.34 ± 0.18a 2.05 ± 0.22b 0.24 ± 0.01a 0.32 ± 0.01b 0.61 ± 0.03a 0.75 ± 0.02b 18.5(0.01)
P. nigra 2.4 ± 0.1 2.1 ± 0.2 0.25 ± 0.01 0.32 ± 0.01 0.65 ± 0.02 0.71 ± 0.02 12.4(0.01)
1 The tree-ring width was calculated for the period 1980–2006.2 Variables’ abbreviations: MSx: mean sensitivity of residual chronologies; AR1, first-order autocorrelation of standard chronologies. The annual MSx measures the relative
difference of indexed tree-ring width from one year to the next, and it is calculated by dividing the absolute value of the differences between each pair of ring-width indices
by the mean of the paired index (Fritts, 1976).
166 R. Sánchez-Salguero et al. / Forest Ecology and Management 271 (2012) 158–169

rings and the degree of crown defoliation in several species across
Europe (Juknys et al., 2003; Dobbertin, 2005).
Species and damage class differences in decline and growth
models during drought and high competition are probably due to
a diverse range of physiological and morphological adaptations
(Camarero et al., 2010). Constraints on balancing carbon gain and
water loss are also thought to impose a trade-off between compe-
tition and drought tolerance (Smith and Huston, 1989) in un-
managed plantations. The proposed trade-off is premised on the
assumption that competition tolerance is achieved by maximizing
low-light carbon gain (Smith and Huston, 1989; Caspersen and
Kobe, 2001), which increases stomatal conductance of both carbon
dioxide and water vapor; higher in P. sylvestris (Eurosiberian spe-
cie) than in P. nigra (Mediterranean specie). Thus, artificial stands
may face inevitable constraints on growth when crown height
and water are simultaneously limiting (Lines et al., 2012). A possi-
ble explanation for our results is that the ability to survive limita-
tion by one resource may be associated with a conservative
strategy that confers tolerance of multiple limiting resources,
which was different across the species studied (Camarero et al.,
2010). Indeed, there is a common set of traits that characterize
plants found in low resource environments, including low maxi-
mum rates of resource acquisition, photosynthesis, and growth
which allows plants to survive resource limitation (Chapin,
1991). These mechanisms are regulated by biotic and abiotic fac-
tors in artificial stands.
A significant part of the uncertainty associated with growth and
damage predictions is related to dieback-mortality process, so that
appropriate mortality and damage-dieback models are generally
vital for any analysis of large-scale forestry scenarios. Silvicultural
practices, such as intensive thinning operations carried out during
the early damage stage, can alter survival and damage patterns;
therefore, the monitoring of the defoliation process should be car-
ried out in stands under different conditions to allow prediction of
survival at any point in the life of a plantation.
5. Conclusions
Several research works in Europe have illustrated how tree
growth and defoliation can serve as a tree-vitality or stress indica-
tor depending on the type and extent of the stress factor (Dobbertin,
2005). In addition, dendrochronological data serve as a valuable
complement to visual inventories, providing the advantage of a ret-
rospective analysis of growth conditions with an annual and sea-
sonal resolution. Tree growth and crown defoliation may
complement each other to understand the forest decline process.
It is therefore important to also monitor the possible stress factors
and environmental conditions affecting tree growth and crown
defoliation, to identify the stage of the decline process (Manion,
1991).
The decline models developed for P. nigra and P. sylvestris reveal
that the damage probability of a tree is conditioned by the tree
size, competition (predisposing factors) and climate conditions
(inciting and contributing factors), but there was a remarkable dif-
ference in how competition affects the survival process in both
studied species. This result confirms the Mediterranean character
of P. nigra compared to P. sylvestris and the significance of below-
ground resource competition in the Mediterranean region.
Our results demonstrated that crown defoliation (assessed in
two 50% classes) is a useful parameter to predict decline stages.
Decline and growth models are a promising approach to achieve
this (Dobbertin, 2005). This is very useful from the point of view
of model fitting, since the crown damage of all trees is usually mea-
sured in traditional forest inventories. The models developed relat-
ing decline and growth processes to stands can represent a
valuable contribution to guidelines on forest management tech-
niques that will be required to meet changing objectives, specifi-
cally the early stages of transformation from even-aged to
irregular structure, and they should be incorporated into overall
forest guidance rather than used in isolation.
In conclusion, our study documents an episode of multifactor
forest decline in a forest under increasing drought without pests
or diseases (Navarro-Cerrillo et al., 2007). At that scale, defoliation
and mortality were mostly associated with the local water avail-
ability in Filabres. The high damage and low growth rates found
in this study, favor the decline process are increasing under current
conditions. This decline process observed at the local scale sup-
ports biogeographical approaches revealing that many rear-edge
populations of Scots pine and Black pine sheltered in the mountain
environments of the Iberian Peninsula could be at risk under future
climate scenarios (Galiano et al., 2010; Linares and Tiscar, 2010;
Vilá-Cabrera et al., 2011). At the same time, the relevance of forest
management as thinning treatments and sustainable harvest activ-
ities could potentially be used to mitigate the effects of climate
change on high-density artificial stands in the Mediterranean Basin
(Millar et al., 2007; Galiano et al., 2010; Gómez-Aparicio et al.,
2011).
Acknowledgments
We are grateful for support from the Spanish MEC projects
INTERBOS (CGL2008-04503-CO3-02), SUM-INIA (SUM2008-
00004-C03.01 (INIA)) and a FPU grant program (AP2007-04747)
(Ministerio de Educación, Spain) to the first author, and AEMET
(Agencia Estatal de Meteorologia) for providing meteorological
data. MAZ was supported by CEXTREME; FP7-ENV-2008-1-
226701. We thank J. Bautista and A. Herrero for their help in the
field and the support of Junta de Andalucía and EGMASA. The first
author thanks all the members of Laboratory of Tree-Ring Research
(University of Arizona), T. Kitzberger (Uni. Comahue) and P. Shepp-
ard for their generous comments. And we thank JJ Camarero (ARA-
ID-CSIC) and A. Fernández-Cancio (CIFOR-INIA) for their useful
advices. We also thank Dr. D. Binkley and two anonymous review-
ers for their constructive comments.
Appendix A. Supplementary data
Supplementary data associated with this article can be found, in
the online version, at doi:10.1016/j.foreco.2012.01.040.
References
Alenius, V., Hökkä, H., Salminen, H., Jutras, S., 2003. Evaluating Estimation Methodsfor Logistic Regression in Modeling Individual-Tree Mortality. In: Amaro, A.,Reed, D., Soares, P. (Eds.), Modelling Forest Systems. CABI Publishing,Wallingford, UK.
Allen, C.D., Macalady, A.K., Chenchouni, H., Bachelet, D., McDowell, N., Vennetier,M., Kitzberger, T., Rigling, A., Breshears, D.D., Hogg, E.H., Gonzalez, P., Fensham,R., Zhang, Z., Castro, J., Demidova, N., Lim, J.H., Allard, G., Running, S.W., Semerci,A., Cobb, N., 2010. A global overview of drought and heat-induced tree mortalityreveals emerging climate change risks for forests. For. Ecol. Manag. 259, 660–684.
Andreassen, K., Tomter, S.M., 2003. Basal area growth models for individual trees ofNorway spruce, Scots pine, birch and other broadleaves in Norway. For. Ecol.Manag. 180, 11–24.
Bigler, C., Bräker, O., Bugmann, H., Dobbertin, M., Rigling, A., 2006. Drought as aninciting mortality factor in scots pine stands of the Valais, Switzerland.Ecosystems 9, 330–343.
Bigler, C., Bugmann, H., 2003. Growth-dependent tree mortality models based ontree rings. Can. J. For. Res. 33, 210–221.
Biondi, F., Qaedan, F., 2008. A theory-driven approach to tree ring standardization:defining the biological trend from expected basal area increment. Tree-Ring Res.64, 81–96.
Bravo-Oviedo, A., Sterba, H., del Río, M., Bravo, F., 2006. Competition-inducedmortality for Mediterranean Pinus pinaster Ait. and P. sylvestris L.. For. Ecol.Manag. 222, 88–98.
R. Sánchez-Salguero et al. / Forest Ecology and Management 271 (2012) 158–169 167
Bréda, N., Badeau, V., 2008. Forest tree responses to extreme drought and somebiotic events: towards a selection according to hazard tolerance?.. C. R. Geosci.40, 651–662.
Burnham, K.P., Anderson, D.R., 2002. Model Selection and Multimodel Inference: aPractical Information–Theoretic Approach. Springer, Heidelberg, Germany, p.353.
Bréda, N., Huc, R., Granier, A., Dreyer, E., 2006. Temperate forest trees and standsunder severe drought: a review of ecophysiological responses, adaptationprocesses and long-term consequences. Ann. For. Sci. 63, 625–644.
Camarero, J.J., Corcuera, L., Peñuelas, J., Gil-Pelegrín, E., 2004. Cambio global ydecaimiento del bosque. In: Valladares, F. (Ed.), Ecología del BosqueMediterráneo en un Mundo Cambiante. Ministerio de Medio Ambiente,Madrid, pp. 397–423.
Camarero, J.J., Olano, J.M., Parras, A., 2010. Plastic bimodal xylogenesis in conifersfrom continental Mediterranean climates. New Phytol. 185, 471–480.
Camarero, J.J., Bigler, C.J., Linares, J.C., Gil-Peregrín, E., 2011. Synergistic effects ofpast historical logging and drought on the decline of Pyrenean silver fir forests.For. Ecol. Manag. 262, 759–769.
Carnicer, J., Coll, M., Ninyerola, M., Pons, X., Sanchez, G., Penuelas, J., 2011.Widespread crown condition decline, food web disruption, and amplified treemortality with increased climate change-type drought. Proc. Natl. Acad. Sci.USA 108, 1474–1478.
Caspersen, J.P., Kobe, R.K., 2001. Interspecific variation in sapling mortality inrelation to growth and soil moisture. Oikos 92, 160–168.
Chapin, S.F., 1991. Integrated responses of plants to stress. BioScience 41 (1), 29–36.Chen, H.Y.H., Fu, S., Monserud, R.A., Gillies, I.C., 2008. Relative size and stand age
determine Pinus banksiana mortality. For. Ecol. Manag. 255, 3980–3984.Consejería de Medio Ambiente, 2009. REDIAM, Red de Información Ambiental de
Andalucía. Datos Ambientales de Andalucía. (CD-rom). Consejería de MedioAmbiente. Junta de Andalucía. Sevilla, Spain.
Das, A.J.B., John, J., Stephenson, Nathan, L., van Mantgem, Phillip, J., 2007. Therelationship between tree growth patterns and likelihood of mortality: a studyof two tree species in the Sierra Nevada. Can. J. For. Res. 37, 580–597.
Dobbertin, M. 1999. Relating defoliation and its causes to premature tree mortality.In: Forster B, Knizek M, Grodzki W (eds) Methodology of forest insect anddisease survey in Central Europe. Proceedings of the Second Workshop of theIUFRO WP 7.03.10, April 20–23, 1999, Sion-Châateauneuf, Switzerland.Birmensdorf, Swiss Federal Institute for Forest, Snow and Landscape (WSL),pp. 215–220.
Dobbertin, M., 2005. Tree growth as indicator of tree vitality and of tree reaction toenvironmental stress: a review. Eur. J. For. Res. 124, 319–333.
Dobbertin, M., Brang, P., 2001. Crown defoliation improves tree mortality models.For. Ecol. Manag. 141, 271–284.
Drobyshev, I., Linderson, H., Sonesson, K., 2007. Relationship between crowncondition and tree diameter growth in southern Swedish oaks. Environ. Monit.Assess. 128, 61–73.
Duchesne, L., Ouimet, R., Morneau, C., 2003. Assessment of sugar maple healthbased on basal area growth pattern. Can. J. For. Res. 33 (11), 2074–2080.
Eid, T., Tuhus, E., 2001. Models for individual tree mortality in Norway. For. Ecol.Manag. 154, 69–84.
Eilmann, B., Zweifel, R., Buchmann, N., Fonti, P., Rigling, A., 2009. Drought-inducedadaptation of the xylem in Scots pine and pubescent oak. Tree Physiol. 29,1011–1020.
FAO. 2006. Global planted forests thematic study. Results and analysis, Food andAgriculture Organization of the United Nations. Rome, Italy.
Fernández-Cancio, A., Navarro-Cerrillo, R.M., Sánchez-Salguero, R., FernándezFernández, R., Manrique Menéndez, E., 2011. Phytoclimatic suitability of Scotspine plantations (Pinus sylvestris L.) at Sierra de los Filabres (Almería).Ecosistemas 20 (1), 124–144.
Fritts, H.C., 1976. Tree Rings and Climate. Academic Press, London, New York, SanFrancisco, p. 567.
Flewelling, J. W., Monserud, R. A. 2002. Comparing Methods for Modelling TreeMortality. USDA Forest Service Proceedings RMRS-P-25, 168–177.
Galiano, L., Martínez-Vilalta, J., Lloret, F., 2010. Drought-induced multifactor declineof scots pine in the pyrenees and potential vegetation change by the expansionof co-occurring oak species. Ecosystems 13, 978–991.
Galiano, L., Martínez-Vilalta, J., Lloret, F., 2011. Carbon reserves and canopydefoliation determine the recovery of Scots pine 4 year after a droughtepisode. New Phytol. 190 (3), 750–759.
Gessler, P.E., Moore, I.D., McKenzie, N.J., Ryan, P.J., 1995. Soil-landscape modellingand spatial prediction of soil attributes. Int. J. Geogr. Inf. Sci. 9 (4), 421–432.
Grissino-Mayer, H.D., 2001. Evaluating crossdating, accuracy: a manual and tutorialfor the computer program COFECHA. Tree-Ring Res. 57 (2), 205–221.
Gómez-Aparicio, L., García-Valdes, R., Ruiz-Benito, P., Zavala, M.A., 2011.Disentangling the relative importance of climate, size and competition ontree growth in Iberian forests: implications for management under globalchange. Glob. Change Biol. 17, 2400–2414.
Hampe, A., Petit, R.J., 2005. Conserving biodiversity under climate change: the rearedge matters. Eco. Lett. 8, 461–467.
Heikkilä, J., Nevalainen, S., Tokola, T., 2002. Estimating defoliation in borealconiferous forest by combining Landsat TM, aerial photographs and field data.For. Ecol. Manag. 158, 9–23.
Hernandez-Clemente, R., Navarro-Cerrillo, R.M., Suarez, L., Morales, F., Zarco-Tejada,P.J., 2011. Assessing structural effects on PRI for stress detection in coniferforests. Remote Sens. Environ. 115, 2360–2375.
Holmes, R.L., 1983. Computer-assisted quality control in tree-ring dating andmeasurement. Tree-Ring Bull. 43, 69–78.
Hosmer, D.W., Lemeshow, S., 1989. Applied Logistic Regression. Wiley Interscience,New York.
IPCC. 2007. Climate Change 2007: The Physical Science Basis. Cambridge UniversityPress, Cambridge, UK, p. 996.
Juknys, R., Vencloviene, J., Stravinskiene, V., Augustaitis, A., Bartkevicius, E., 2003.Scots pine (Pinus sylvestris L.) growth and condition in a polluted environment:from decline to recovery. Environ. Pollut. 125, 205–212.
Jump, A.S., Hunt, J.M., Peñuelas, J., 2006. Rapid climate change-related growth declineat the southern range edge of Fagus sylvatica. Glob. Change Biol. 12, 2163–2174.
Jung, M., Reichstein, M., Ciais, P., Seneviratne, S.I., Sheffield, J., Goulden, M.L., Bonan,G., Cescatti, A., Chen, J., de Jeu, R., Dolman, A.J., Eugster, W., Gerten, D., Gianelle,D., Gobron, N., Heinke, J., Kimball, J., Law, B.E., Montagnani, L., Mu, Q., Mueller,B., Oleson, K., Papale, D., Richardson, A.D., Roupsard, O., Running, S., Tomelleri,E., Viovy, N., Weber, U., Williams, C., Wood, E., Zaehle, S., Zhang, K., 2010. Recentdecline in the global land evapotranspiration trend due to limited moisturesupply. Nature 467, 951–954.
Kantavichai, R., Briggs, D., Turnblom, E., 2010. Modeling effects of soil, climate, andsilviculture on growth ring specific gravity of Douglas-fir on a drought-pronesite in Western Washington. For. Ecol. Manag. 259, 1085–1092.
Kobe, R.K., 1996. Intraspecific variation in sapling mortality and growth predictsgeographic variation in forest composition. Ecol. Monogr. 66, 181–201.
Linares, J.C., Camarero, J.J., Carreira, J.A., 2009. Interacting effects of changes inclimate and forest cover on mortality and growth of the southernmostEuropean fir forests. Glob. Ecol. Biogeogr. 18, 485–497.
Linares, J.C., Camarero, J.J., Carreira, J.A., 2010. Competition modulates theadaptation capacity of forests to climatic stress: insights from recent growthdecline and death in relict stands of the Mediterranean fir Abies pinsapo. J. Ecol.98, 592–603.
Linares, J.C., Tíscar, P.A., 2010. Climate change impacts and vulnerability of thesouthern populations of Pinus nigra subsp. salzmannii. Tree Physiol. 30 (7), 795–806.
Lines, E.R., Coomes, D.A., Purves, D.W., 2010. Influences of forest structure, climateand species composition on tree mortality across the Eastern US. PLoS ONE 5,e13212.
Lines, E.R., Zavala, M.A., Purves, D.W., Coomes, D.A., 2012. Predictable changes inaboveground allometry of trees along gradients of temperature, aridity andcompetition. Global Ecol. Biogeogr.. doi:10.1111/j.1466-8238.2011.00746.x.
LUCDEME. 2004. Ministerio de Medio Ambiente, Proyecto LUCDEME (Provincia deAlmería-Baza) 1986–2004. Memorias y mapas de suelos E. 1:50.000. Madrid,Spain. (<http://www.mma.es/portal/secciones/biodiversidad/desertificacion/lucha_desertificacion/lucdeme.htm>).
Manion, P.D., 1991. Tree Disease Concepts. Prentice Hall, Upper Saddle River (NJ), p.409.
Martínez-García, F. 1999. Los bosques de Pinus sylvestris L. del Sistema Centralespañol. Distribución, historia, composición florística y tipología. PhD thesis.Universidad Complutense de Madrid, Madrid, Spain.
Martínez-Vilalta, J., López, B.C., Adell, N., Badiella, L., Ninyerola, M., 2008. Twentiethcentury increase of Scots pine radial growth in NE Spain shows strong climateinteractions. Glob. Change Biol. 14, 2868–2881.
Martínez-Vilalta, J., Piñol, J., 2002. Drought-induced mortality and hydraulicarchitecture in pine populations of the NE Iberian Peninsula. For. Ecol. Manag.161, 247–256.
Martínez-Vilalta, J., Sala, A., Piñol, J., 2004. The hydraulic architecture of Pinaceae – areview. Plant Ecol. 171, 3–13.
McCullagh, P., Nelder, J.A., 1989. Generalized Linear Models. Chapman and Hall,London.
Millar, C.I., Stephenson, N.L., Stephens, S.L., 2007. Climate change and forests of thefuture: managing in the face of uncertainty. Ecol. Appl. 17, 2145–2151.
Mitchell, T.D., Jones, P.D., 2005. An improved method of constructing a database ofmonthly climate observations and associated high-resolution grids. Int. J.Climatol. 25, 693–712.
Monserud, R.A., Sterba, H., 1996. A basal area increment model for individual treesgrowing in even- and uneven-aged forest stands in Austria. For. Ecol. Manag. 80,57–80.
Monserud, R.A., Sterba, H., 1999. Modeling individual tree mortality for Austrianforest species. For. Ecol. Manag. 113, 109–123.
Mueller, E., Stierlin, H.R. (Eds.), 1990. Sanasilva Tree Crown Photos with Percentagesof Foliage Loss. Birmensdorf, Switzerland.
Navarro-Cerrillo, R.M., Varo, M.A., Lanjeri, S., Hernández Clemente, R., 2007.Cartografía de defoliación en los pinares de pino silvestre (Pinus sylvestris L.) ypino salgareño (Pinus nigra Arn.) en la Sierra de los Filabres. Ecosistemas 16,163–171.
Palahí, M., Grau, J.M., 2003. Preliminary site index model and individual tree-growth and mortality models for black pine (Pinus nigra Arn.) in Catalonia(Spain). Invest. Agrar. Sist. Recursos Fores. 12 (1), 137–148.
Poyatos, R., Latron, J.R.M., Llorens, P., 2003. Land use and land cover change afteragricultural abandonment. Mt. Res. Dev. 23, 362–368.
Rodríguez Gutiérrez, G.M. 2003. Caracterización de las Masas Forestales Artificialesde la Sierra de Los Filabres para la Optimización de los Tratamientos de Claros yClareos. Master Thesis, Univ. Córdoba, Córdoba, Spain.
Sabaté, S., Gracia, C.A., Sánchez, A., 2002. Likely effects of climate change on growthof Quercus ilex, Pinus halepensis, Pinus pinaster, Pinus sylvestris and Fagus sylvaticaforests in the Mediterranean Region. For. Ecol. Manag. 162 (1), 23–37.
168 R. Sánchez-Salguero et al. / Forest Ecology and Management 271 (2012) 158–169

Sánchez-Salguero, R., Navarro-Cerrillo, R.M., Camarero, J.J., Fernández-Cancio, A.,2010. Drought-induced growth decline of Aleppo and maritime pine forests insouth-eastern Spain. For. Syst. 19 (3), 458–469.
Sánchez-Salguero, R., Navarro-Cerrillo, R.M., Camarero, J.J., Fernández-Cancio, A.,2012. Selective drought-induced decline of pine species in southeastern Spain.Clim. Change. doi:10.1007/s10584-011-0372-6.
Sarris, D., Christodoulakis, D., Körner, Ch., 2010. Impact of recent climatic change ongrowth of low elevation eastern Mediterranean forest trees. Clim. Change 106(2), 203–223.
Serrada Hierro, R., Montero Gonzalez, G., Reque, J. (Eds.), 2008. Compendio deSelvicultura Aplicada en España. INIA-Fundación Conde del Valle de Salazar,Madrid, Spain, p. 178.
Shaw, J.D. 2006. Reineke’s Stand Density Index: Where are we and where do we gofrom here? Proceedings: Society of American Foresters 2005 NationalConvention. October 19–23, 2005, Ft. Worth, TX. [published on CD-ROM]:Society of American Foresters, Bethesda, MD.
Smith, T., Huston, M., 1989. A theory of the spatial and temporal dynamics of plantcommunities. Plant Ecol. 83, 49–69.
Stokes, M.A., Smiley, T.L., 1996. An Introduction to Tree-Ring Dating. University ofArizona Press, Tucson.
Thornthwaite, C.W., 1948. An approach toward a rational classification of climate.Geogr. Rev. 38, 55–94.
UN/ECE. 1994. Manual on Methods and Criteria for Harmonised Sampling,Assessment, Monitoring and Analysis of the Effects of Air Pollution on Forests.Third ed. Programme Co-ordinating Centres, Hamburg and Prague. <http://www.icp-forests.org/pdf/Chapt2_compl06.pdf>.
Uzoh, F.C.C., Oliver, W.W., 2008. Individual tree diameter increment model formanaged even-aged stands of ponderosa pine throughout the western UnitedStates using a multilevel linear mixed effects model. For. Ecol. Manag. 256, 438–445.
Vilá-Cabrera, A., Martínez-Vilalta, J., Vayreda, J., Retana, J., 2011. Structural andclimatic determinants of demographic rates of Scots pine forests across theIberian Peninsula. Ecol. Appl. 21 (4), 1662–1672.
Yang, Y., Titus, S.J., Huang, S., 2003. Modeling individual tree mortality for whitespruce in Alberta. Ecol. Modell. 163, 209–222.
Zavala, M., Zea, E., 2004. Mechanisms maintaining biodiversity in Mediterraneanpine-oak forests: insights from a spatial simulation model. Plant Ecol. 171, 197–207.
Zavala, M.A., Espelta, J.M., Caspersen, J., Retana, J., 2011. Interspecific differences insapling performance with respect to light and aridity gradients inMediterranean pine–oak forests: implications for species coexistence. Can. J.For. Res. 41, 1432–1444.
R. Sánchez-Salguero et al. / Forest Ecology and Management 271 (2012) 158–169 169
Copyright © 2022 FDOKUMEN