Ion microprobe evidence for the mechanisms of stable isotope retrogression in high-grade metamorphic...
14
Contrib Mineral Petrol (1995) 118:365-378 @, Springer-Verlag 1995 J.M. Eilcr - J.W. Valley C.M. Graham L.P. Baumgartner Ion microprobe evidence for the mechanisms of stable isotope retrogression in high-grade metamorphic rocks Received: 24 December 1993 / Accepted: 4 June 1994 Abstract Retrograde interdiffusion is widely proposed as the dominant factor in producing the stable isotopic fractionation among minerals in slowly cooled igneous and metamorphic rocks. Mineral zonation consistent with interdiffusion of stable isotopes has never been di- rectly observed, however, leaving doubt as to the mech- anism responsible for the bulk-mineral isotopic compo- sitions commonly measured. Ion microprobe analyses of oxygen isotope ratios in magnetite were combined with conventional bulk mineral analyses and diffusion modeling to document the relationship between mineral zonation and the mechanism of retrogression inferred from bulk mineral data. Two samples of magnetite- bearing, quartzo-feldspathic Lyon Mountain gneiss from the Adirondack mountains, N.Y were studied in detail. Conventional stable isotope analysis of both samples indicates that isotopic thermometers are dis- cordant and were reset by as much as 200 ~ C from the estimated peak temperature of 750 ~ C. The relative or- der of apparent temperatures recorded by various ther- mometers differs between the two samples, however, with Tqtz4g p >> Tmt_qtz and rmt.fsp in one sample and Tqt z. fsp.< T,,,)-qtz and T,~t_f~ p in the other. Diffusion modeling using the Fast Grain Boundary model shows that the former pattern of apparent temperatures is consistent with closed system interdiffusion during cooling, where- as the latter is not. The modeling predicts that 0.5 mm diameter magnetite grains common to this rock type will contain isotopic zonation of 1%o (rims lower in 81sO than cores), and that the cores of smaller (0.1 mm) grains will be similarly lower than to the cores of large (0.5 ram) grains. Ion microprobe analysis reveals that J.M. Eiler ([Y2]). J.W. Valley L.P. Baumgartner Department of Geology and Geophysics, University of Wisconsin, Madison, WI 53706, USA C.M. Graham Department of Geology and Geophysics, University of Edinburgh, Edinburgh EH9 3JW, Scotland, UK Editorial responsibility: I. S. E. Carmichael the zoning patterns of magnetite grains from the first sample contain clear core to rim zonation in multiple grains (Acore-rim = 1.1 ___ 0.4%o) and predicted grain-size vs core composition variations, consistent with diffu- sion-controlled resetting of bulk mineral fractionations. In contrast, the second sample shows irregular inter- and intra-granular variations over an 8%o range, consis- tent with open system alteration. These results provide direct documentation of the importance of interdiffu- sion in affecting stable isotope distributions in slowly cooled rocks. The correlations of bulk-mineral resetting with zonation show that bulk mineral data, when inter- preted with detailed modeling, can be used to determi- nate what processes controlling retrogression. Introduction The temperature-dependent fractionation of stable iso- topes between coexisting minerals is the basis of oxygen isotope geothermometry, and is important to their in- terpretation as petrogenetic markers in high-tempera- ture environments. However, the use of stable isotopic data in these applications have been complicated by the failure of minerals to preserve fractionations consistent with their known history and experimentally deter- mined fractionation factors. This paper describes the results of an integrated ion- microprobe and conventional stable isotope analysis study comparing the apparent mechanisms of retrogres- sion as seen by these techniques. Until recently, infor- mation on the internal zonation of individual minerals was virtually unavailable (but see Wada 1988). With the advent of laser-based analysis (Crowe et al. 1990; Sharp 1990) and ion-microprobe analysis of natural materials (Eldridge et al. 1987; Hervig etal. 1989; Giletti and Shimizu 1989; Zinner 1989; Lorin et al. 1990; Valley and Graham 1991), a number of studies have now docu- mented the existence of frequently complex intracrys- talline variations in oxygen isotope ratios (Valley and Graham 1991, 1993; Chamberlain and Conrad 1991;
Transcript of Ion microprobe evidence for the mechanisms of stable isotope retrogression in high-grade metamorphic...
Contrib Mineral Petrol (1995) 118:365-378 @, Springer-Verlag 1995
J.M. Eilcr - J.W. Valley �9 C.M. Graham L.P. Baumgartner
Ion microprobe evidence for the mechanisms of stable isotope retrogression in high-grade metamorphic rocks
Received: 24 December 1993 / Accepted: 4 June 1994
Abstract Retrograde interdiffusion is widely proposed as the dominant factor in producing the stable isotopic fractionation among minerals in slowly cooled igneous and metamorphic rocks. Mineral zonation consistent with interdiffusion of stable isotopes has never been di- rectly observed, however, leaving doubt as to the mech- anism responsible for the bulk-mineral isotopic compo- sitions commonly measured. Ion microprobe analyses of oxygen isotope ratios in magnetite were combined with conventional bulk mineral analyses and diffusion modeling to document the relationship between mineral zonation and the mechanism of retrogression inferred from bulk mineral data. Two samples of magnetite- bearing, quartzo-feldspathic Lyon Mountain gneiss from the Adirondack mountains, N.Y were studied in detail. Conventional stable isotope analysis of both samples indicates that isotopic thermometers are dis- cordant and were reset by as much as 200 ~ C from the estimated peak temperature of 750 ~ C. The relative or- der of apparent temperatures recorded by various ther- mometers differs between the two samples, however, with Tqtz4g p >> Tmt_qtz and rmt.fsp in one sample and Tqt z. fsp.< T,,,)-qtz and T,~t_f~ p in the other. Diffusion modeling using the Fast Grain Boundary model shows that the former pattern of apparent temperatures is consistent with closed system interdiffusion during cooling, where- as the latter is not. The modeling predicts that 0.5 mm diameter magnetite grains common to this rock type will contain isotopic zonation of 1%o (rims lower in 81sO than cores), and that the cores of smaller (0.1 mm) grains will be similarly lower than to the cores of large (0.5 ram) grains. Ion microprobe analysis reveals that
J.M. Eiler ([Y2]). J.W. Valley �9 L.P. Baumgartner Department of Geology and Geophysics, University of Wisconsin, Madison, WI 53706, USA
C.M. Graham Department of Geology and Geophysics, University of Edinburgh, Edinburgh EH9 3JW, Scotland, UK
Editorial responsibility: I. S. E. Carmichael
the zoning patterns of magnetite grains from the first sample contain clear core to rim zonation in multiple grains (Acore-rim = 1.1 ___ 0.4%o) and predicted grain-size vs core composition variations, consistent with diffu- sion-controlled resetting of bulk mineral fractionations. In contrast, the second sample shows irregular inter- and intra-granular variations over an 8%o range, consis- tent with open system alteration. These results provide direct documentation of the importance of interdiffu- sion in affecting stable isotope distributions in slowly cooled rocks. The correlations of bulk-mineral resetting with zonation show that bulk mineral data, when inter- preted with detailed modeling, can be used to determi- nate what processes controlling retrogression.
Introduction
The temperature-dependent fractionation of stable iso- topes between coexisting minerals is the basis of oxygen isotope geothermometry, and is important to their in- terpretation as petrogenetic markers in high-tempera- ture environments. However, the use of stable isotopic data in these applications have been complicated by the failure of minerals to preserve fractionations consistent with their known history and experimentally deter- mined fractionation factors.
This paper describes the results of an integrated ion- microprobe and conventional stable isotope analysis study comparing the apparent mechanisms of retrogres- sion as seen by these techniques. Until recently, infor- mation on the internal zonation of individual minerals was virtually unavailable (but see Wada 1988). With the advent of laser-based analysis (Crowe et al. 1990; Sharp 1990) and ion-microprobe analysis of natural materials (Eldridge et al. 1987; Hervig etal. 1989; Giletti and Shimizu 1989; Zinner 1989; Lorin et al. 1990; Valley and Graham 1991), a number of studies have now docu- mented the existence of frequently complex intracrys- talline variations in oxygen isotope ratios (Valley and Graham 1991, 1993; Chamberlain and Conrad 1991;

366
Kohn et al. 1993; Elsenheimer and Valley 1993). Ulti- anately, such information will greatly advance our un- derstanding of the fundamental mechanisms of isotopic exchange, and their relevance to the study of thermal and fluid history of igneous and metamorphic rocks. A major problem that has remained unresolved, however, is the relative importance of closed-system interdiffu- sion, recrystallization and fluid infiltration in con- trolling oxygen isotopic exchange during the retrogres- sion of slowly cooled rocks (Cole et al. 1983; Giletti 1985; Cole and Ohmoto 1986).
It is widely thought that the resetting of stable iso- tope thermometers in slowly cooled igneous and meta- morphic rocks results from diffusional reequilibration during cooling (Deines 1977; Javoy 1977; Giletti 1986; Cole and Ohmoto 1986; Valley 1986; Eiler et al. 1992, 1993). A large body of experimentally determined stable isotope diffusion coefficients has been measured over the last three decades, in part to address this problem. Several mathematical models have been proposed in or- der to retrieve quantitative geologic information about the retrograde history responsible for resetting (Dodson 1973; Giletti 1986; Eiler et al. 1992, 1993). A persistent problem in the usefulness of diffusion data and model- ing has been the lack of microanalytical data demon- strating that natural minerals are zoned with respect to stable isotopes in a way consistent with diffusional re- setting. Such models are based on the obvious but previ- ously untestable hypothesis that the analysis of bulk mineral separates reflects the integrated analysis of grains with internal diffusion profiles. The uncertainty introduced by this assumption can be appreciated if one considers the difficulties that would be encountered in applying cation-exchange thermometry without elec- tron microprobe data.
The only previous microanalytical studies of retro- gression of stable isotopes in slowly cooled rocks have found complex zonation controlled by episodic retro- grade fluid infiltration (Valley and Graham 1991, 1993). The questions asked in this study are: in rocks in which the expected effects of closed system interdiffusion are unambiguous, can we find simple diffusion-controlled zonation and, more importantly, correctly distinguish it from more complex zonation based only upon our com- monly available bulk mineral fractionations?
Samples Two lithologically similar samples (AF665 and AF667) were se- lected for detailed analysis in this study. Both come from the Lyon Mountain Gneiss, a massive, granular, magnetite-bearing quart- zo-feldspathic unit from the north-east Adirondack Highlands (Fig. 1). The mineralogy, petrography, and history of this unit make it well suited to the goals of this study. The fractionations of oxygen isotopes between magnetite and the quartz and feldspar that dominate this unit are large and sensitive to temperature (Chiba et al. 1989). The self-diffusion coefficient of oxygen in mag- netite under water present (Giletti and Hess 1988) or water-absent (Sharp 1991) conditions is rapid enough to allow substantial iso- topic mobility during cooling alter high-grade metamorphism.
44-
74 P
/ Z ; / _ _
,?:::,:+:- "i:i;i:i:i:!: - "" 4
i!iiiiiiiiiii ~ Meta-M onzonite/G ranite
I Gabbroic Gneiss
~ Meta-Anorthosite
~ Pyroxene Granitic Gneiss
N Metasediment '] Homblend and Fayalite
Granite Gneiss [ ] Leucogranitic Gneiss
(incl. Lyon Mountain Gneiss)
-44
Fig. 1 Generalized geologic map of the Adirondack Highlands (after McLelland et al. 1988). The location for the samples ana- lyzed in this study is indicated
This region experienced granulite facies conditions of 750_+ 50 ~ C and 7.5 + 1 kbar during the Grenville orogeny (Bohlen et al. 1985), at 1070-1050 Ma (McLelland and Chiarenzelli 1990), and meta- morphism was followed by slow, initially isobaric cooling of I 3~ m.y. (Mezger et al. 1990; Bohlen 1987; Lamb et al. 1991).
The premetamorphic history of the Lyon Mountain Gneiss is a subject of recent study. Much of this unit has an unusual chem- istry, with K20/Na20 ratios lower than 0.02 in albite gneisses such as the samples studied, but ranging to values as high as 10.0 in related microcline gneisses (Whitney and Olmstead 1988). Por- tions of the two samples analyzed in this study were analyzed by X-ray fluorescence (Whitney and Olmstead 1988). AF665 has a K20/Na20 ratio of 0.05, placing it within the "albite gneiss" suite of Whitney and Olmstead, while AF667 has a ratio of 0.15, placing it within their "transitional" suite. Whitney and Olmstead propose that the range and extremes in alkali ratios reflect a premetamor- phic alteration of volcanoclastic sediments. Recent geochronolog- ical study has shown, however, that zircons with apparently ig- neous morphologies from various members of this unit yield ages synchronous with granulite facies metamorphism (McLelland and Chiarenzelli 1991 ). McLelland and Chiarenzelli (1991 ) and Bohlen et al. (1992) interpret these ages as indicating that the Lyon Moun- tain Gneiss and its correlative units intruded the Highlands as leucogranitic magmas during the peak of granulite facies meta- morphism. Regardless of their premetamorphic origin, the intensi- ty and duration of the Grenville metamorphism was sufficient to equilibrate oxygen isotope ratios on the hand-sample scale in the rock-type being studied (based on grain sizes and estimates of volume diffusion coefficients in quartz, alkali feldspar, magnetite and diopside, referenced below).
Both samples are dominantly plagioclase (62~5 modal %), have substantial amounts of quartz (25-28%) and lesser non-ti- taniferous magnetite and clinopyroxene (3-6% of each). Both are massive and granular with average grain diameters of 1-1.4 mm for albite and 0.6 mm for other minerals (Fig. 2a, b). Tabulated modal abundances and grain sizes for these samples can be found in Eiler et al. (1993). Electron microprobe analysis of minerals from both samples shows that greater than 95% of feldspar is

367
1 0 -
8 -
0
<3 4 -
2 -
0
�9 Quartz-Feldspar �9 Quartz-Magnetite
L �9 Feldspar-Magnet te
A i
I I I I
% % % %0,
Fig. 3 Stablc isotopic fractionations recorded in conventional analysis of bulk mineral separates in samples AF665 and AF667 (left), and equilibrium values for the peak of granulite metamor- phism (750 ~ C) or predicted by the Fast Grain Boundary model to be produced by diffusional resetting ("diffusion modeling"). Both samples show 2-3%o resetting of magnetite-silicate fractionations. All three fractionations are within uncertainty of the diffusion modeling in AF665, but AF667 records a much larger value of Aqtz_fs ~ and too large of a difference between Aqt z mt and Af~ mt for diffusion modeling. See Eiler et al. (1993) for tabulated va~'ues
Fig. 2a, b Thin section photomicrographs of Lyon Mountain Gneiss in transmitted light (a: sample AF665, b. sample AF667). Field of view l cm wide. Opaque grains: magnetite, dark, translu- cent grains: clinopyroxene, clear, featureless grains: quartz, clear, faintly mottled grains: alkali feldspar (dominantly albite). The equigranular, medium grained texture makes this rock type well suited to modeling of diffusion controlled retrogression. The large central magnetite grains in each sample are grains of LP204-1 magnetite standard mounted in the rock with epoxy
homogeneous, near-endmember albite (Abgs4, An34, Oro_~). Mag- netite is nearly endmember Fe304(<~ 1% hercynite in AF665 and AF667; < 1% ulvospinel, in AF667). Exceptions to these general- ities, and their relationship to stable isotope analysis are discussed in the following sections.
Conventional stable isotope data and thermometry
Oxygen isotope ratios of magnetite, feldspar and quartz mineral separates as well as whole-rock powders for both samples have been measured by conventional fluo- rination techniques. Extraction of oxygen and conver- sion to CO2 was made following the method of Clayton and Mayeda (1963), and gases were analyzed for their isotopic ratios on a Finnigan-MAT 251 gas-source mass spectrometer. All samples were analyzed 2 4 times, with a mean standard deviation of +0.2%0. Tabulated values can be found in Eiler et al. (1993).
The results of conventional analysis (Fig. 3) reveal that both samples have undergone substantial isotopic reequilibration, but that the effects of retrogression on isotopic fractionations between coexisting minerals dif- fer in detail between the samples. Feldspar-magnetite fractionations are approximately 8%o in both samples, yielding apparent temperatures of approximately 550 ~ C, indicative of resetting from estimated peak metamorphic fractionations by almost 3%0. Quartz- magnetite fractionations are different in the two samples (8.8 in AF665 vs 10.2 in AF667), but yield apparent temperatures comparable to those recorded by feldspar- magnetite fractionations (570 and 510 ~ C, respectively). A more significant difference between the samples is seen in a comparison of their quartz-feldspar fractiona- tions. AF665 records a quartz-feldspar fractionation that is within error of that expected for peak metamor- phic conditions (0.6 vs 0.9%o), while AF667 records an unusually large quartz-feldspar fractionation of 2.6%o, corresponding to an apparent temperature of 325 ~ C. Given the average uncertainty of _+ 0,2%, in the conven- tional analyses, both the resetting of silicate-magnetite thermometers and the difference in quartz-feldspar frac- tionation between the samples are significant.
The significance of the resetting seen in the conven- tional data for both samples can be interpreted in terms of the expected results of purely diffusive reequilibra- tion, as calculated by the Fast Grain Boundary model of Eiler et al. (1992). The detailed results of this modeling are tabulated in Eiler et al. (1993). Sensitivity tests of these calculations indicate that predicted apparent tem- peratures for this system have uncertainties on the order of _+ 2 0 4 0 ~ C for the magnetite-silicate fractionations
0 CO
368
a Mechanisms of retrograde zonation in magnetite
Partial recrystallization
(9 Homogeneous reerystallizsiio n
=0 2 " = ' > ~r
Diffusion 0
initial bulk . . . . . . final bulk
-2 Core Distance Rim b o.o
b Magnetite closure profiles by size 6
~ 00 grn
50 gm
I n1~
9 2
i
0 I I I I I I I I I
0.0 0,2 0.4 0.6 0.8 1.0 C Radius (mm)
c Core to near-rim isotopic contrasts within magnetite grains
Hyd rot her ma . . . ,= / . ,_ . , , f " ' "
. / / " ~ grain sizes of y magnetite, this study
I I I I I I I I I
0,2 0.4 0.6 0.8 1.0 Grain radius (mm)
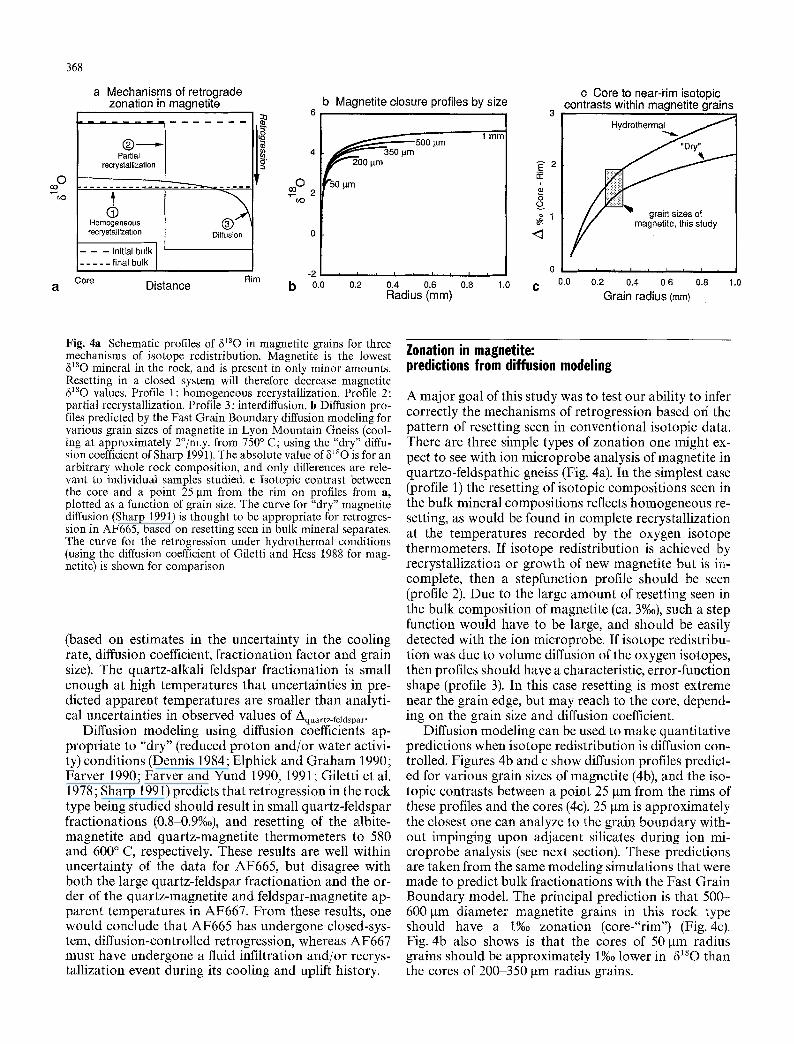
Fig. 4a Schematic profiles of 8~80 in magnetite grains for three mechanisms of isotope redistribution. Magnetite is the lowest 8180 mineral in the rock, and is present in only minor amounts. Resetting in a closed system will therefore decrease magnetite 8~80 values. Profile 1: homogeneous recrystallization. Profile 2: partial recrystallization. Profile 3: interdiffusion, b Diffusion pro- files predicted by the Fast Grain Boundary diffusion modeling for various grain sizes of magnetite in Lyon Mountain Gneiss (cool- ing at approximately 2~ from 750 ~ C; using the "dry" diffu- sion coefficient of Sharp 1991). The absolute value of 8180 is for an arbitrary whole rock composition, and only differences are rele- vant to individual samples studied, e Isotopic contrast between the core and a point 25 gm from the rim on profiles from a, plotted as a function of grain size. The curve for "dry" magnetite diffusion (Sharp 1991) is thought to be appropriate for retrogres- sion in AF665, based on resetting seen in bulk mineral separates. The curve for the retrogression under hydrothermal conditions (using the diffusion coefficient of Giletti and Hess 1988 for mag- netite) is shown for comparison
(based on estimates in the uncertainty in the cooling rate, diffusion coefficient, fractionation factor and grain size). The quartz-alkali feldspar fractionation is small enough at high temperatures that uncertainties in pre- dicted apparent temperatures are smaller than analyti- cal uncertainties in observed values of Aquartz_feldspar.
Diffusion modeling using diffusion coefficients ap- propriate to "dry" (reduced proton and/or water activi- ty) conditions (Dennis 1984; Elphick and Graham 1990; Farver 1990; Farver and Yund 1990, 1991; Giletti et al. 1978; Sharp 1991) predicts that retrogression in the rock type being studied should result in small quartz-feldspar fractionations (0.8q3.9%o), and resetting of the albite- magnetite and quartz-magnetite thermometers to 580 and 600 ~ C, respectively. These results are well within uncertainty of the data for AF665, but disagree with both the large quartz-feldspar fractionation and the or- der of the quartz-magnetite and feldspar-magnetite ap- parent temperatures in AF667. From these results, one would conclude that AF665 has undergone closed-sys- tem, diffusion-controlled retrogression, whereas AF667 must have undergone a fluid infiltration and/or recrys- tallization event during its cooling and uplift history.
Zonation in magnetite: predictions from diffusion modeling
A major goal of this study was to test our ability to infer correctly the mechanisms of retrogression based ori the pattern of resetting seen in conventional isotopic data. There are three simple types of zonation one might ex- pect to see with ion microprobe analysis of magnetite in quartzo-feldspathic gneiss (Fig. 4a). In the simplest case (profile 1) the resetting of isotopic compositions seen in the bulk mineral compositions reflects homogeneous re- setting, as would be found in complete recrystallization at the temperatures recorded by the oxygen isotope thermometers. If isotope redistribution is achieved by recrystallization or growth of new magnetite but is in- complete, then a stepfunction profile should be seen (profile 2). Due to the large amount of resetting seen in the bulk composition of magnetite (ca. 3%0), such a step function would have to be large, and should be easily detected with the ion microprobe. If isotope redistribu- tion was due to volume diffusion of the oxygen isotopes, then profiles should have a characteristic, error-function shape (profile 3). In this case resetting is most extreme near the grain edge, but may reach to the core, depend- ing on the grain size and diffusion coefficient.
Diffusion modeling can be used to make quantitative predictions when isotope redistribution is diffusion con- trolled. Figures 4b and c show diffusion profiles predict- ed for various grain sizes of magnetite (4b), and the iso- topic contrasts between a point 25 gm from the rims of these profiles and the cores (4c). 25 gm is approximately the closest one can analyze to the grain boundary with- out impinging upon adjacent silicates during ion mi- croprobe analysis (see next section). These predictions are taken from the same modeling simulations that were made to predict bulk fractionations with the Fast Grain Boundary model. The principal prediction is that 500- 600 pm diameter magnetite grains in this rock type should have a 1%o zonation (core-"rim") (Fig. 4c). Fig. 4b also shows is that the cores of 50 pm radius grains should be approximately 1%o lower in 8~so than the cores of 200 350 I~m radius grains.

369
Ion microprobe analysis Recent advances in ion microprobe analysis of stable isotope ra- tios provide the opportunity of testing for the presence of gradi- ents in minerals thought to have undergone diffusional reequili- bration. Laser-based microanalysis has been proven to have more than the required accuracy and precision (e.g., Sharp 1991; Kohn et al. 1993), but in-situ analysis remains problematic (Chamber- lain and Conrad 1991). Both in situ analysis and analysis of me- chanically micro-sampled specimens have spatial resolutions on the order of 500 gin, which is too large to describe intracrystalline diffusion profiles in most cases. Ion microprobe analyses in this study were made with a spatial resolution of 8 pro, but with a single-spot uncertainty (_+ 1.0%o, icy) larger than the isotopic con- trasts that are expected to be produced in many minerals by retro- grade diffusion alone. This problem is dealt with in this study by effectively improving counting statistics with systematic sets of sample analyses. Multiple analyses of the same portions of grains permit the average 5 1 8 0 of such portions to be known with a
(3" 0 precision of +1/~%o, where cy ts the standard deviation and n the
number of analyses. These methods allow quantitative tests of the expected zonation.
The conclusion reached from conventional data and diffusion modeling was tested by analyzing oxygen isotope ratios from indi- vidual magnetite grains in polished thin sections of the two sam- ples of Lyon Mountain gneiss with an ion microprobe. Ion mi- croprobe analysis of magnetites was made using the Cameca ims- 4f at the University of Edinburgh, following the technique de- scribed in detail in Valley and Graham (1991).
Tcchnique
Analyses were made with a defocused (30 Ixm) primary beam of 133Cs+ ions, at an accelerating voltage of 10 kV. The secondary beam of negative O ions was accelerated to 4.5 kV through a series of apertures reducing the analyzed domain to an 8 gm diameter spot. The sample chamber was maintained at a high-vacuum of 2 x 10 -9 torr or better. Total mass resolution was routinely 3000, allowing resolution of the hydride interferences. Ions were detect- ed using a new Balzers SEV217 electron multiplier. The deadtime of the electron multiplier and associated counting circuit was mea- sured to be 32_+1 ns by 12C/13C ratios. Each analysis of 8~80 is based on 200 cycles, with each cycle including 1 s counting 160 (approximately 500,000 cps) and 5 s counting 180 (approximately 1000 cps). Total counts of 1sO for each analysis was approximately 106, yielding an ideal precision of _+ 1%o (lcy), based on Gaussian counting statistics.
Previous studies using these techniques have reported poorer precision within 50 Ixm of an external grain boundary in spot mode, most likely due to polishing relief and/or imperfect charge compensation near the insulating minerals surrounding magnetite (Valley and Graham 1991, 1993). Thin sections of both samples in this study were prepared with a lead-lap polish, which removed this limitation. Analyses were reproducibly and routinely made within 25 Ixm of the edges of grains. Two possible reasons for the different results are (a) samples in this study were polished on a lead-lap minimizing sample relief, whereas earlier studies used a coarser polishing technique, and (b) the contrast in hardness be- tween feldspar and magnetite is smaller than between calcite and magnetite, both leading to reduced polishing relief.
Data
Analyses were collected in seven continuous sessions (multiple analyses made without major refocusing, realignment, sample change, or other interruptions) over five days. Each session in- cluded multiple analyses of both samples and standards (average of 11 standards and 9 samples in each session). The standard
analyzed was a grain of LP204-1 nontitaniferous magnetite mounted with epoxy into a hole in a thin section plug before the thin section was cut. LP204-1 is from a magnetite-rich marble described in detail in Valley and Graham (1991). This magnetite has a chemical composition very similar to the "unknown" mag- netite in both AF665 and AF667, and previous ion microprobe analysis has established that it is homogeneous in oxygen isotope ratios at the 1%o level at distances greater than 50 Ixm from grain edges (Valley and Graham 1991). The standards of each session were regressed (as a function of the order of analysis) in order to account for drift, and the unknowns then corrected by the differ- ence between the known (conventional) standard value and the ion microprobe value for the standard. Drift and average correc- tions were found to average 3.0%0 (0.15%o per analysis) and 10.1%, (0.6%0 per ainu), respectively (corrections are always positive, drift usually toward more fractionated numbers with time). Drift was approximately twice that found by Valley and Graham (1991), whereas the average fractionation was comparable. The cause of instrumental drift is thought to be progressive wear on the elec- tron multiplier (Valley and Graham 1991; this study). This hy- pothesis was supported in this study by thc observation that changing instrumental fractionation on the standard is correlated to changes in the electron-multiplier voltage. The electron multi- plier used in this study was somewhat newer than that used by Valley and Graham (1991), possibly accounting for the apparently greater rate of change in its performance, and hence the drift in standard analyses. Drift was found to be linear within error, and its effect was minimized by frequent restandardization and repeat- ed analysis of the same regions of unknowns both in different sessions and at different times in the same session. The accuracy of the correction procedure can be independently confirmed by com- parison of averages of ion microprobe data for unknowns with conventional analyses. This test for data in this study (see next section) confirms that the correction procedure is good to within a few tenths of a %o on average, therefore making the accuracy of a single analysis no worse than its ideal precision.
Data analyzed in this study are reported in 81sO . . . . . values, corrected for instrumental fractionation and drift in Table 1. Data describing the magnetite standard, LP-204-1, can be found in Val- ley and Graham (1991). Grain numbers for each analysis refer to Fig. 5a, b. Outliers (more than two standard deviations from the mean of a population of ten o r m o re analyses) are shown in italics. These data are not included in various statistical analyses in the text. Tables of raw data can be found in Eiler (1994).
Ion microprobe-conventional data comparisons
It is useful to compare the results of ion microprobe analyses with those of conventional analyses of magnetite, as these data repre- sent the first independent check of the internal accuracy of the analytical correction procedures used by Valley and Graham (1991, 1993), and in this study. Ion microprobe analysis of either stable isotope ratios or elemental concentrations requires a sub- stantial instrumental correction that is typically a function of the chemical composition of the sample or standard. However, be- cause the elemental composition of magnetite in both samples analyzed in this study is very similar to the magnetite standard (LP204-1 of Valley and Graham 1991), correction of the data rela- tive to that standard should result in averages equal to the con- ventional analysis of magnetite separates of the samples. The aver- ages of the ion microprobe data for the two samples (including large and small grains) is -0.84%o and 3.04%0, 818OsMow for AF665 and AF667, respectively. This arithmetic average should be within uncertainty of the bulk composition, as the overrepre- sentation of cores in large grains is balanced by the analyses of small grains that make up only a few percent of the volume of all magnetite. The conventional analyses for magnetite separates from these two samples (averages of 2 4 analyses) are -0.87 and 3.00. This obviously favorable comparison must actually be fortu- itously good, as the ideal uncertainties in the means of ion mi- croprobe data for even homogeneous populations are _+ 0.2%o for

370
Table 1 Ion microprobe analyses of magnetite from samples AF665 and AF667 with standards. Raw data are available in Eiler (1994)
Sample filSOasMow Distance Comments to grain boundary (~m) ~
9-Jul-92 (drift ~ = 6.6%o, A" = 3.3%o, standards ~ = • 0.86%0)
Lp-204 std 9.24 Lp-204 std 7.85 AF665-9 -0.07 238 grain 1 AF665-10 - 1.73 37 grain 1 Lp-204 std 9.65 AF665-12 1.86 231 grain 1 AF665-13 - 1.17 37 grain 1 Lp-204 std 8.69 Lp-204 std 9.32 AF665-16 0.53 203 grain 1 AF665-17 0.72 30 grain 1 Lp-204 std 10.07 Lp-204 std 7.55
10-Jul-92 (drift c = 3.5%0, A a = 3.5%0, standards e = __+ 0.78%0)
Lp-204 std 7.60 Lp-204 std 9.97 Lp-204 std 9.41 Lp-204 std 8.89 Lp-204 std 8.99 Lp-204 std 11.19 std. outlier Lp-204 std 7.51 Lp-204 std 9.63 Lp-204 std 9.08 AF665-4t --0.96 182 grain 2 AF665-42 0.05 28 grain 2 Lp-204 std 9.36 AF665-44 -0.87 196 grain 2 AF665-45 1.19 28 grain 2 Lp-204 std 9.40 Lp-204 std 8.05
11-Jul-92 (drift c = 1.0%o, A n = 8.3%0, standards ~ = • 0.88%0)
Lp-204 std 9.01 AF665-52 - 1.37 30 AF665-53 0.21 140 Lp-204 std 7.36 Lp-204 std 10.36 Lp-204 std 8.88 Lp-204 std 9.00 AF665-58 --3.I6 98 grain 2 AF665-59 - 1.81 23 grain 2 Lp-204 std 9.50 Lp-204 sld 8.19 AF665-62 0.07 154 grain 3 AF665-63 - 2.11 18 grain 3
11-Jul-92 (drift ~ = 5.5%0, A d = 10.6%o,
Lp-204 std 9.71 Lp-204 std 8.70 Lp-204 std 8.71 Lp-204 std 9.33 Lp-204 std 8.65 AF665-69 - 0.78 AF665-70 -- 2.23 Lp-204 std 9.20
standards ~ = _+ 0.58%0)
140 grain 3 16 grain 3
Table 1 (continued)
Sample 8180~SMOW Distance to grain boundary (~m) b
Comments
Lp-204 std 8.75 AF665-73 -0.50 154 grain 3 AF665-74 - 1.06 19 grain 3 Lp-204 std 8.73 AF665-76 -2.99 42 grain 4 AF665-77 -0.33 70 grain 5 Lp-204 std 7.45 Lp-204 std 8.78 AF665-80 - 3.35 42 grain 4 AF665-81 1.24 28 grain 5 Lp-204 std 8.74 AF665-83 - 1,96 42 grain 6 AF665-84 - 1.11 35 grain 6 Lp-204 std 9.15 Lp-204 std 9.90
11, 12-Jul-92 (drift~ = 0.7%oo, A d = 14.0%o, standards * = • 0.69%o)
Lp-204 std 10.03 Lp-204 std 8.49 AF667-3 6.92 147 grain 1 AF667-4 5.61 17 grain 1 AF667-5 5.53 189 grain 1 Lp-204 std 9.23 AF667-7 5.99 140 grain 1 AF667-8 5.00 21 grain 1 AF667-9 6.23 19 grain 1 Lp-204 std 8.41 AF667-11 6.19 84 grain 1 AF667-12 4.89 19 grain 1 Lp-204 std 9.50 Lp-204 std 8.66 AF667-15 1.30 133 grain 2 AF667-16 3.40 24 grain 2 Lp-204 std 7.83 Lp-204 std 8.43 Lp-204 std 9.09 Lp-204 std 9.43 AF667-21 3.87 126 grain 2 Lp-204 std 7.96 Lp-204 std 6.00 std. outlier Lp-204 std 6.09 std. outlier Lp-204 std 8.71 Lp-204 std 8.89 AF667-27 4.01 133 grain 2 Lp-204 std 8.42 AF667-29 2.00 126 grain 2 AF667-30 2.14 26 grain 2 Lp-204 std 10.40 Lp-204 std 8.35 Lp-204 std 9.6l AF667-34 2.09 35 grain 2 AF667-35 1.20 126 grain 2
12-Jul-92 (drift ~ = - 2.8%0, A d = 15.2%0, standards e = + 0.72%,)
AF667-36 1.86 35 grain 2 Lp-204 std 8.06 Lp-204 std 8.97 Lp-204 std 9.43 Lp-204 std 9.75 AF667-41 - 0.20 105 grain 3 Lp-204 std 9.11

371
Table 1 (continued) Table 2 Summary of population statistics
Population n ~ X d c~ ~ ~ / Outliers ~
AF665 Cores~; Lg. grains 9 -0.06 0 .84 0.28 1 Rimsb; Lg. grains 10 -1.19 0.88 0.28 Small grains 6 -1.42 1.57 0.64
AF667 Cores; Lg. grains 13 3.18 2.02 0.54 Rims; Lg. grains 13 3.43 1.73 0.48 Small grains 4 1.82 0.91 0.46
Sample g~SO~sMow Distance Comments to grain boundary (I.tm) b
AF667-43 3.24 84 grain 3 Lp-204 std 8.89 AF667-45 0.33 56 grain 3 Lp-204 std 7.96 AF667-47 0.44 14 grain 3 AF667-48 5.37 std. outlier Lp-204 std 7.65 Lp-204 std 9.30 Lp-204 std 8.19 AF667-52 2.14 15 grain 3 Ep-204 std 10.15 Lp-204 std 9.34 Lp-204 std 9.00 Lp-204 std 10.00 Lp-204 std 8.34 AF667-58 3.27 21 grain 3 Lp-204 std 8.05 Lp-204 std 8.96 AF667-61 2.82 42 grain 4 AF667-62 1.63 35 grain 4 AF667-63 1.22 112 grain 7
12-Jul-92 (drift ~= -1.2%o, A d= 15.8%o, standards ~= -+ 1.19%o) Lp-204 std 8.36 Lp-204 std 8.86 AF667-66 2.54 105 grain 7 Lp-204 std 9.28 AF667-68 2.01 182 grain 7 AF667-69 3.84 77 grain 7 Lp-204 std 9.86 AF667-71 2.17 17 grain 7 AF667-72 5.41 35 grain 7 AF667-73 4.90 175 grain 7 Lp-204 std 7.36 AF667-75 0.43 35 grain 9 AF667-76 2.41 28 grain 9 Lp-204 std 10.98 Lp-204 std 7.56
Corrected for drift and instrumental mass fractionation (see text) b Distances to grain boundaries are measured in thin-section
"drift" is the total difference ends of the regressed line of stan- dards a "A" is the average instrumental fractionation, relative to an ac- cepted value for LP 204 magnetite standard of + 8.9%0 ~The internal standard deviation (1-sigma) is given for the stan- dards of each block (gross outliers are shown in italics, and have not been included in the standard deviation)
samplings of 25 to 34 analyses. The average standard deviation of the conventional data is similarly +0.2%0. Therefore one should not expect an agreement much better than several tenths of a %0 for ion microprobe data sets of the size gathered in this study. Nevertheless, the correction procedure introduces no more uncer- tainty than that from counting statistics. It remains to be learned if improved internal precision (e.g., from longer count times or higher count-rates) will further improve accuracy of a given anal- ysis, or whether there are other analytical factors that will ulti- mately limit accuracy.
a Cores are more than 100 gm from the grain edge b Rims are within 50 pm of the grain edge
n=the number of analyses in a population d X = the mean value of the population, in permil vs SMOW
cy = the standard deviation about the mean f ~ = the standard deviation of the mean (~,/]/n) g = Outliers are defined as more than 2a from the mean. The one analysis to fit this definition is not included in the statistics
Results
Grain maps
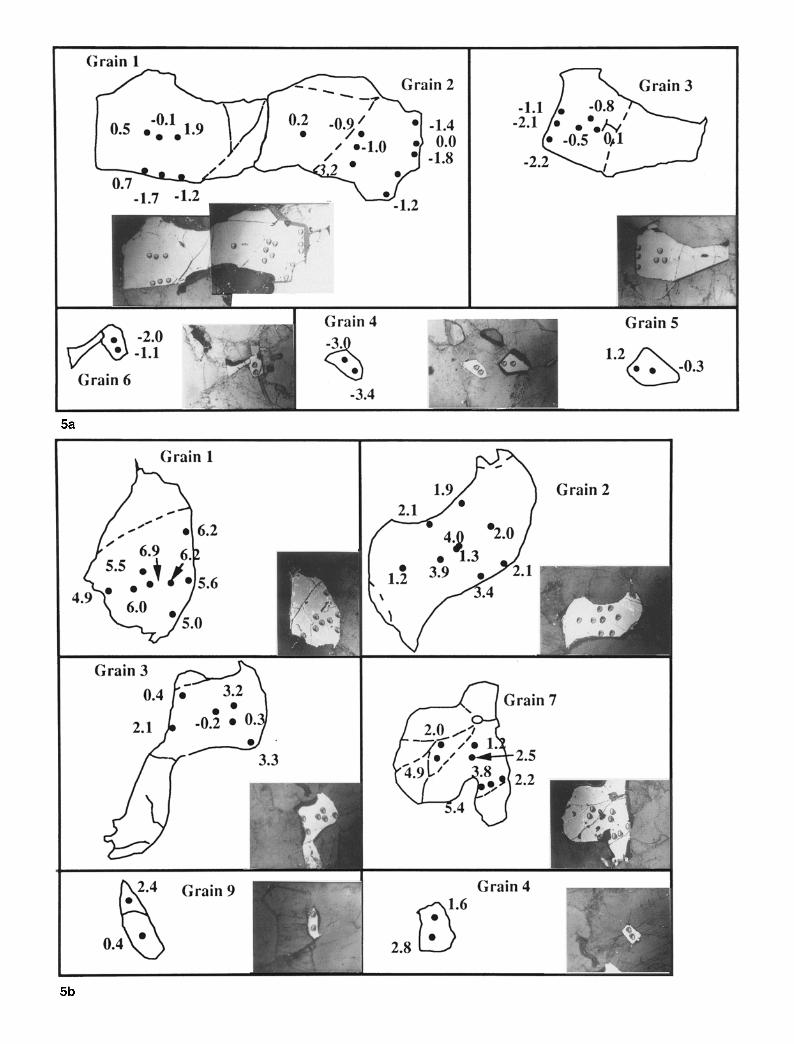
The ion microprobe data are illustrated in the grain- maps in Fig. 5a, b. The data for sample AF665 (Fig. 5a) show several systematic features. The cores of the three large grains (grains 1, 2 and 3) average -0.06_+0.84%0 ( 1 ~ = 0.28%0, where ~ is the uncertainty in the mean; see Table 2 for a summary of the popula t ion statistics discussed in this section). There are no substantial dif- ferences between different grains (grain 1 = 0.8%0, grain 2 = - 0 . 5 8 % 0 , and grain 3 = - 0 . 4 0 % 0 ; three analyses of each). The rims of these same grains, in contrast, aver- age - 1.19 _+ 0.88%0 ( 1 ~ = 0.28%0) but also have no sub- stantial grain-to-grain differences (grain 1 = - 0 . 7 % o , grain 2 = - 1.1%o, and grain 3 = - 1.8%o; three or four analyses of each). These averages combine to indicate a core-rim zonat ion in large grains of 1.13 + 0.40%0 (un- certainty in the difference between the means). There is one analysis of grain 2 that is a clear outlier f rom both populat ions at - 3.2%o, and is rejected in further discus- sion. Given a data set of this size (26 analyses in this sample) and an ideal one point uncertainty of _+ 1.0%o, at least one significant outlier is expected, but should not be included in the local averages, due to distort ion it will give to any local popula t ion of 3-4 analyses.
Six analyses of small grains (grains 4, 5 and 6) aver- age abou t 1.4%o lower in g lso than the cores of large grains, at - 1.42%o. This group of analyses is relatively heterogeneous, but clearly indicates a depletion of small grains with respect to cores of large grains, by approxi- mately the same amoun t as are rims of large grains. In addition, at least part of the internal variat ion of this popula t ion is size dependent, with the smallest grain (grain 4) having the lowest value of S~aO.
The da ta for sample AF667 (Fig. 5b), in contrast, show complex intra- and inter-granular variations. The cores of the four large grains in this sample average 3.18 _+ 2.02%0 in 6180 (1 ~ = 0.54%o), with the large stan- dard deviat ion being caused in large par t by grain-to-
5a
5b
373
4-
2-
(3~80~ -2
-4
AF665 (large grains)
-6 300
Rim Core
a
Rims= -1 .19 _+o.88 (c~g=0.28)
100 200 distance (gm)
C o r e - Rim = 1.13_+0.4 (predicted: 1.25_+0,47)
Cores= -0.06 _+0.84 ((~g=0.28)
Predicted -- --Conventional Analysis O Grain 1 [ ] Grain 2 �9 Grain 3
A F 6 6 7 (large grains) 8
Cores = 3 .18 _+2.02 ~g= 0.54
Predicted - -- Conventional analysis
�9 Grain 1 O Grain 2 [ ] Grain 3 �9 Grain 7
0 100 200 Rim distance (urn) Core
Core - Rim = -0.25 _+0.72 predicted = 1.0_+0.37
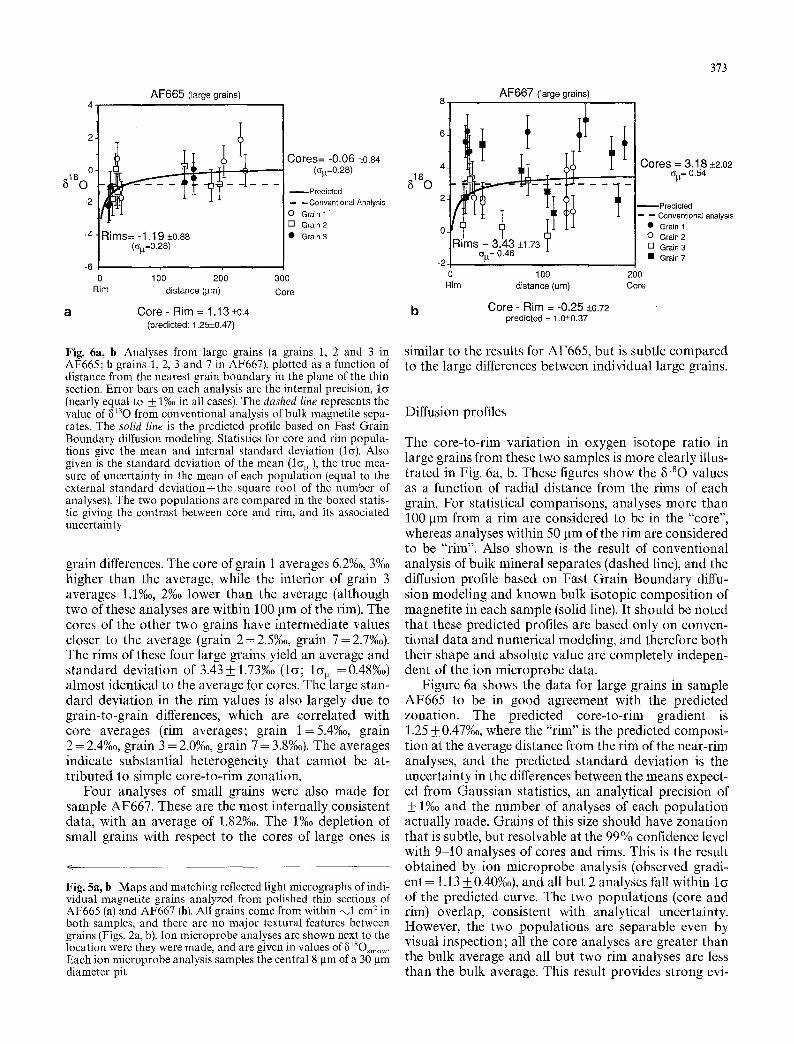
Fig. 6a, b Analyses from large grains (a grains l, 2 and 3 in AF665; b grains 1, 2, 3 and 7 in AF667), plotted as a function of distance from the nearest grain boundary in the plane of the thin section. Error bars on each analysis are the internal precision, l~ (nearly equal to _+ 1%o in all cases). The dashed line represents the value of ~lsO from conventional analysis of bulk magnetite sepa- rates. The solid line is the predicted profile based on Fast Grain Boundary diffusion modeling. Statistics for core and rim popula- tions give the mean and internal standard deviation (lc~). Also given is the standard deviation of the mean (lc~), the true mea- sure of uncertainty in the mean of each population (equal to the external standard deviation-the square root of the number of analyses). The two populations are compared in the boxed statis- tic giving the contrast between core and rim, and its associated uncertainty
grain differences. The core of grain 1 averages 6.2%0, 3%0 higher than the average, while the interior of grain 3 averages 1.1%o, 2%0 lower than the average (although two of these analyses are within 100 gm of the rim). The cores of the other two grains have intermediate values closer to the average (grain 2= 2.5%o, grain 7 =2.7%0). The rims of these four large grains yield an average and standard deviation of 3.43 __ 1.73%o (1~; 1 ~ = 0.48%o) almost identical to the average for cores. The large stan- dard deviation in the rim values is also largely due to grain-to-grain differences, which are correlated with core averages (rim averages; grain 1=5.4%o, grain 2 = 2.4%0, grain 3 = 2.0%0, grain 7 = 3.8%0). The averages indicate substantial heterogeneity that cannot be at- tributed to simple core-to-rim zonation,
Four analyses of small grains were also made for sample AF667. These are the most internally consistent data, with an average of 1.82%o. The 1%o depletion of small grains with respect to the cores of large ones is
Fig. 5a, b Maps and matching reflected light micrographs of indi- vidual magnetite grains analyzed from polished thin sections of AF665 (a) and AF667 (b). All grains come from within ~1 cm a in both samples, and there are no major textural features between grains (Figs. 2a, b). Ion microprobe analyses are shown next to the location were they were made, and are given in values of ~1~O .. . . . - Each ion microprobe analysis samples the central 8 gm of a 30 gm diameter pit
similar to the results for AF665, but is subtle compared to the large differences between individual large grains.
Diffusion profiles
The core-to-rim variation in oxygen isotope ratio in large grains from these two samples is more clearly illus- trated in Fig. 6a, b. These figures show the ~lsO values as a function of radial distance from the rims of each grain. For statistical comparisons, analyses more than 100 I~m from a rim are considered to be in the "core", whereas analyses within 50 gm of the rim are considered to be "rim". Also shown is the result of conventional analysis of bulk mineral separates (dashed line), and the diffusion profile based on Fast Grain Boundary diffu- sion modeling and known bulk isotopic composition of magnetite in each sample (solid line). It should be noted that these predicted profiles are based only on conven- tional data and numerical modeling, and therefore both their shape and absolute value are completely indepen- dent of the ion microprobe data.
Figure 6a shows the data for large grains in sample AF665 to be in good agreement with the predicted zonation. The predicted core-to-rim gradient is 1.25 + 0.47%o, where the "rim" is the predicted composi- tion at the average distance from the rim of the near-rim analyses, and the predicted standard deviation is the uncertainty in the differences between the means expect- ed from Gaussian statistics, an analytical precision of + 1%0 and the number of analyses of each population actually made. Grains of this size should have zonation that is subtle, but resolvable at the 99% confidence level with %10 analyses of cores and rims. This is the result obtained by ion microprobe analysis (observed gradi- ent = I. 13 +_ 0.40%o), and all but 2 analyses fall within let of the predicted curve. The two populations (core and rim) overlap, consistent with analytical uncertainty. However, the two populations are separable even by visual inspection; all the core analyses are greater than the bulk average and all but two rim analyses are less than the bulk average. This result provides strong evi-
374
dence that the intra-granular isotopic variations in AF665 were produced by closed system, diffusion con- trolled retrogression, as was indicated by the diffusion modeling of bulk-mineral fractionations.
The same plot and statistical analysis of core-to-rim zonation in large grains from sample AF667 (Fig. 6b) contrasts with the results for AF665. Resetting in AF667 has caused variability that is not consistent with closed system retrogression. The predicted gradient for this sample is 1.0 + 0.37%0. The observed lack of core to rim zonation, with a scatter of the data over an 8%0 range (17 out of 30 analyses are more than 1(~ from the predicted curve) is in obvious disagreement with these predictions. This disagreement provides evidence that AF667 could not have been reset by closed system inter- diffusion alone, and must have also experienced an al- teration and/or recrystallization event in its uplift histo- ry. This is the same result suggested by the bulk mineral data described above.
The precision of individual ion microprobe analyses (__ 1.0%o) is such that the intracrystalline zonation ob- served contains little information about the exact shape of lsO/a60 distribution. Of particular significance is the fact that the curvature of core-to-rim gradients in large magnetite grains from sample AF665 is not well defined. In the absence of additional constraints this would leave the mechanism of isotope redistribution uncertain. However, there are four other lines of evidence indicat- ing that these gradients are diffusion profiles, as op- posed to reaction rims.
(1) The observed gradients are in the same direction, magnitude and over the same scale as that predicted by Fast Grain Boundary (FGB) modeling using an inde- pendent determination of the self-diffusion coefficient of oxygen in magnetite. (2) The absolute 61sO values of magnetite (including the cores of large grains) have been strongly reset by the process of isotope redistribution, as predicted by FGB diffusion modeling (Figs. 3, 6a). (3) The 6asO values of the interiors of small grains (par- ticularly grains 4 and 6) are lower than those in large grains at a comparable distance from the grain edges. This is a specific prediction of diffusion modeling (Fig. 4a) that would not be seen if zonation were caused by low 61sO reaction rims or overgrowths. (4) The simple, subtle zonation pattern in AF665 con- trasts sharply with that seen in samples containing tex- tural evidence for retrograde alteration/reactions (see discussion of this study, and Valley and Graham 1993).
Grain size/composition relationships
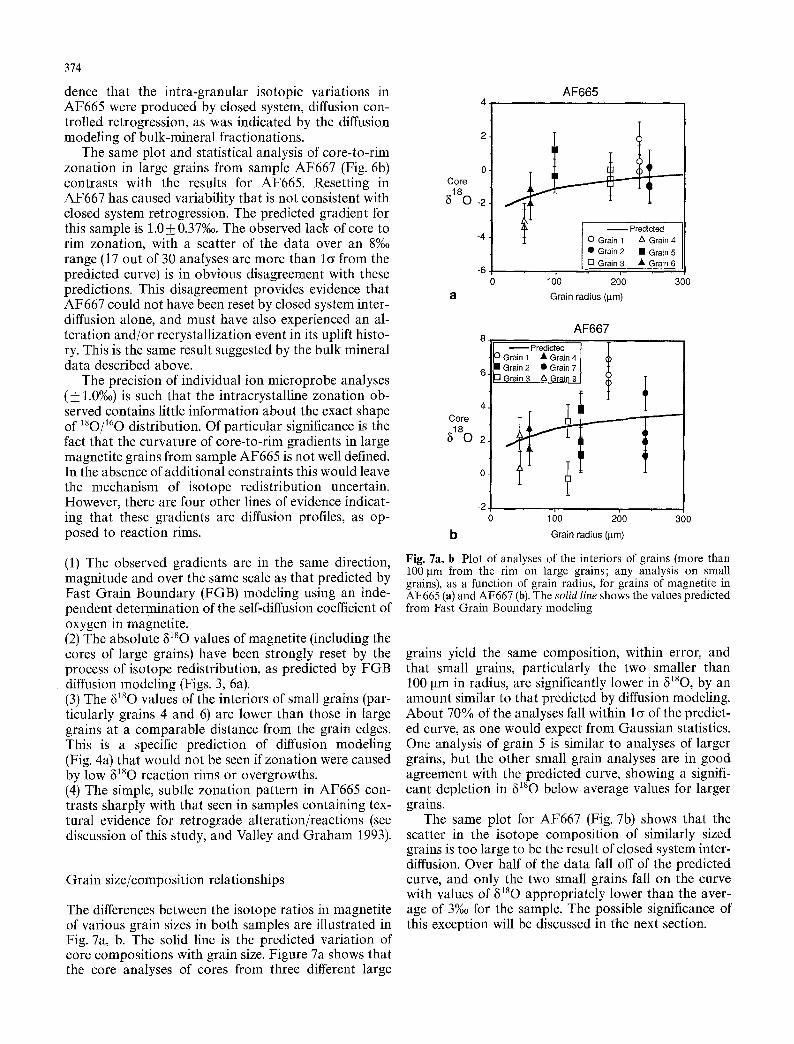
The differences between the isotope ratios in magnetite of various grain sizes in both samples are illustrated in Fig. 7a, b. The solid line is the predicted variation of core compositions with grain size. Figure 7a shows that the core analyses of cores from three different large
4-
2-
0- Core
8180 -2
-6
AF665
t ] O Grain 1 A Grain 4 | �9 Grain 2 �9 Grain 5 L r-i Grain 3 �9 Grain 6
100 200 300
Grain radius (Bm)
Core
5 1 8 0 2
0
-2
AF667 8
[ Predicted ~OGrain 1 �9 Grain [111 Grain 2 �9 Grain
6 IF 1Grain3 AGrain
42 < Tt
16o 260 300 b Grain radius (~tm)
Fig. 7a, b Plot of analyses of the interiors of grains (more than 100 Bm from the rim on large grains; any analysis on small grains), as a function of grain radius, for grains of magnetite in AF665 (a) and AF667 (b). The solid line shows the values predicted from Fast Grain Boundary modeling
grains yield the same composition, within error, and that small grains, particularly the two smaller than 100 pm in radius, are significantly lower in 61sO, by an amount similar to that predicted by diffusion modeling. About 70% of the analyses fall within l a of the predict- ed curve, as one would expect from Gaussian statistics. One analysis of grain 5 is similar to analyses of larger grains, but the other small grain analyses are in good agreement with the predicted curve, showing a signifi- cant depletion in ~1~O below average values for larger grains.
The same plot for AF667 (Fig. 7b) shows that the scatter in the isotope composition of similarly sized grains is too large to be the result of closed system inter- diffusion. Over half of the data fall off of the predicted curve, and only the two small grains fall on the curve with values of 61sO appropriately lower than the aver- age of 3%0 for the sample. The possible significance of this exception will be discussed in the next section.
375
Discussion
The results of ion microprobe analysis demonstrate the predicted correlation between bulk mineral fractiona- tions and zonation. Where bulk mineral fractionations are in agreement with the predictions of Fast Grain Boundary modeling, inter- and intra-crystalline compo- sitional differences are in good agreement with the same diffusion modeling. Where bulk fractionations are clear- ly in disagreement with modeling, magnetite zonation is pronounced and erratic. We interpret this as direct evi- dence that some minerals are zoned with respect to sta- ble isotopes in a way consistent with closed system in- terdiffusion during retrogression, and that the presence of such zonation is predictable based on detailed analy- sis of mineral-mineral fractionations. The questions re- main: (a) what additional processes have affected AF667, and (b) what, if any, relationship is there be- tween retrogression and the complex, open system ex- change revealed by previous ion microprobe studies of other Adirondack magnetites?
Petrographic evidence of alteration
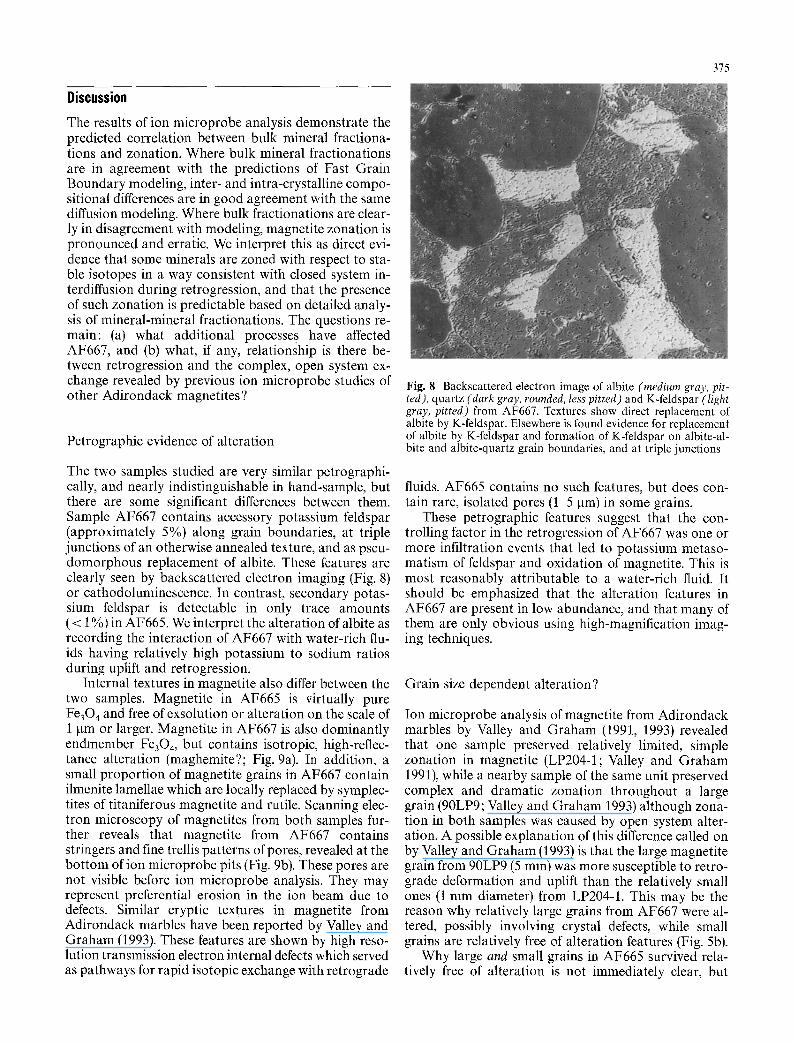
The two samples studied are very similar petrographi- cally, and nearly indistinguishable in hand-sample, but there are some significant differences between them. Sample AF667 contains accessory potassium feldspar (approximately 5%) along grain boundaries, at triple junctions of an otherwise annealed texture, and as pseu- domorphous replacement of albite. These features are clearly seen by backscattered electron imaging (Fig. 8) or cathodoluminescence. In contrast, secondary potas- sium feldspar is detectable in only trace amounts ( < 1%) in AF665. We interpret the alteration of albite as recording the interaction of AF667 with water-rich flu- ids having relatively high potassium to sodium ratios during uplift and retrogression.
Internal textures in magnetite also differ between the two samples. Magnetite in AF665 is virtually pure Fe304 and free of exsolution or alteration on the scale of 1 pm or larger. Magnetite in AF667 is also dominantly endmember Fe30~, but contains isotropic, high-reflec- tance alteration (maghemite?; Fig. 9a). In addition, a small proportion of magnetite grains in AF667 contain ilmenite lamellae which are locally replaced by symplec- tites of titaniferous magnetite and rutile. Scanning elec- tron microscopy of magnetites from both samples fur- ther reveals that magnetite from AF667 contains stringers and fine trellis patterns of pores, revealed at the bottom of ion microprobe pits (Fig. 9b). These pores are not visible before ion microprobe analysis. They may represent preferential erosion in the ion beam due to defects. Similar cryptic textures in magnetite from Adirondack marbles have been reported by Valley and Graham (1993). These features are shown by high reso- lution transmission electron internal defects which served as pathways for rapid isotopic exchange with retrograde
Fig. 8 Backscattered electron image of albite (medium gray, pit- ted), quartz (dark gray, rounded, less pitted) and K-feldspar (light gray, pitted) from AF667. Textures show direct replacement of albite by K-feldspar. Elsewhere is found evidence for replacement of albite by K-feldspar and formation of K-feldspar on albite-al- bite and albite-quartz grain boundaries, and at triple junctions
fluids. AF665 contains no such features, but does con- tain rare, isolated pores (1 5 gm) in some grains.
These petrographic features suggest that the con- trolling factor in the retrogression of AF667 was one or more infiltration events that led to potassium metaso- matism of feldspar and oxidation of magnetite. This is most reasonably attributable to a water-rich fluid. It should be emphasized that the alteration features in AF667 are present in low abundance, and that many of them are only obvious using high-magnification imag- ing techniques.
Grain size dependent alteration?
Ion microprobe analysis of magnetite from Adirondack marbles by Valley and Graham (1991, 1993) revealed that one sample preserved relatively limited, simple zonation in magnetite (LP204-1; Valley and Graham 1991), while a nearby sample of the same unit preserved complex and dramatic zonation throughout a large grain (90LP9; Valley and Graham 1993) although zona- tion in both samples was caused by open system alter- ation. A possible explanation of this difference called on by Valley and Graham (1993) is that the large magnetite grain from 90LP9 (5 mm) was more susceptible to retro- grade deformation and uplift than the relatively small ones (1 mm diameter) from LP204-1. This may be the reason why relatively large grains from AF667 were al- tered, possibly involving crystal defects, while small grains are relatively free of alteration features (Fig. 5b).
Why large and small grains in AF665 survived rela- tively free of alteration is not immediately clear, but

376
8.
6-
4. 8180
AF667 range as a function of average
- !
O /
/ i
/ /
ZX. ~
[] O
2- [] ~ / t /
] / ~ " I FI Grain 3
1 2 3 4 5 6 18
Oavg
Fig. 10 Plo t o f all analyses from large magne t i t e grains in AF667, plotted as a function of the average for that grain. The range seen in the highest ~5~sO grain (grain 1) is half that of the lower g~80 grains, perhaps reflecting a greater degree of equilibration with altering fluids. This hypothesis is supported by the observation that the lowest values of 6~80 seen in this sample fall within the range of most analysis from the relatively pristine sample, AF665
Fig. 9a Reflected light micrograph of grain 2, AF667, showing high-reflectance alteration (maghemite?). b scanning electron mi- crograph of magnetite from AF667 (grain 3), showing strings of blebs where the sample has been ablated by the ion microprobe primary beam during analysis (field of view 150 gin). These fea- tures are similar to those described by Valley and Graham (1993), and are thought to represent crystal defects that enhanced retro- grade exchange with infiltrating fluid during retrogression
could perhaps be attributed to the absence of retrograde fluids (as supported by the success of "dry" diffusion modeling). There is no major difference in the structural setting of the two samples that could be called on the explain this difference. The selective alteration suggests that fluids were channeled on the outcrop to hand-sam- ple scale due to more localized factors. This is not sur- prising given that fluid-hosted alteration in sample AF667 was heterogeneous down to a scale of microns (Fig. 5b). More definite statements of the source and mobility of retrograde fluids in this unit requires an ex- tensive survey of retrograde metasomatism in the Lyon Mountain gneiss, and is beyond the scope of this study.
Conditions of alteration
There is evidence that infiltrating fluids were abundant enough to change appreciably the bulk isotopic compo-
sition of the minerals in AF667. In a plot of the range of 6~so as a function of the average for each large grain in AF667 (Fig. 10), one can see that as the average 5~so increases, the grains become more homogeneous. The most homogeneous grain (grain 1) also has as much or more visible evidence of oxidation and healed cracks~as any of the grains (Fig. 5b). This is consistent with alter- ing fluid(s) elevating the 81so of minerals, with more complete mineral-fluid exchange leading to higher 6~sO values (consistent with the difference in whole rock 61sO for these samples: AF665 = 7.2, AF667 = 11.3). The tem- perature of this alteration event is difficult to estimate, but is indicated by the replacement of rare ilmenite lamellae by futile and magnetite. The upper stability limit of rutile + magnetite is not well known, but experi- mental determination puts it at or below 500-400 ~ C (Lindsley and Lindh 1974; Lindsley 1976, 1991), and it is only common in nature as an oxidation of ilmenite at greenschist or subgreenschist conditions, or rarely as a prograde assemblage in greenschist facies rocks (South- wick 1968; Mielke and Schreyer 1972; Rumble 1976). As it is unlikely that mineral-fluid equilibrium was fully attained during retrogression, and the temperature can only be estimated, we can make only an approximate estimation of the 6~aO of the infiltrating fluid. If the fluid was water-rich, the minimum estimate is 9%0 (assuming equilibrium with feldspar at the maximum temperature estimate of 500 ~ C), and the maximum estimate is 14%o (assuming equilibrium with the highest 6~sO magnetite at the lower end of the temperatures estimated for alter- ation in the Adirondacks of 300 ~ C) (O'Neil et al. 1969; Chiba et al. 1989; O'Neil and Taylor 1967; Becket 197l; Valley and Graham 1991; Morrison and Valley 1988). This estimate is comparable to values estimated for wa- ter-hosted alteration elsewhere in the Adirondacks (7-
11%o; Valley and Graham 1991, 1993; Morrison and Valley 1988, 1991). The results of this study are also similar to those found in a stable isotopic study of the Diana syenites of the western Adirondacks, where quartzo-feldspathic gneisses were found to be elevated in their whole rock 8180 values during postmetamor- phic alteration (Cartwright et al. 1993).
377
controlled zonation and apparently diffusion-controlled bulk mineral fractionations suggests that the prospects for arriving at correct interpretations from bulk-mineral data are good. Important goals for future research will be testing the reliability of such interpretations, and as- sessing the true relative importance of open and closed system retrogression in igneous and metamorphic rocks.
Conclusions and summary
The data presented for AF665 provide the first direct evidence that closed system interdiffusion of stable iso- topes produces internal zonation in natural minerals. This result confirms the implied assumption in many previous studies that volume diffusion is the rate-limit- ing kinetic step in the retrogression of slowly cooled rocks. Of greater practical significance, the results of this study show that rocks in which interdiffusion controls mineral zonation can be identified based on bulk miner- al data and existing diffusion models. Caution is needed in interpreting resetting of bulk fractionations, as appar- ent temperatures recorded by any one mineral pair may be very similar even when arrived at by very different mechanisms. The fractionations recorded between mag- netite and coexisting silicates in both samples analyzed in this study were similar, and both could have readily been interpreted as being consistent with existing esti- mates of oxygen diffusion rates in magnetite. Only by considering the pattern of multiple fractionations in these two rocks were we able to predict the different mechanisms of retrogression seen through ion mi- croprobe analysis.
Comparison of the results of this study with those of Valley and Graham (1991, 1993) allow some generalities about resetting to be made, at least in the granulites of the Adirondack Highlands. Water-hosted retrogression is common (it has been found to be dominant in three of four Adirondack samples studied by ion microprobe to date), and is facilitated by complex internal alteration features within mineral grains, some of which have been only fortuitously discovered due to the "milling" of min- eral surfaces during ion microprobe analysis (Valley and Graham 1993; Sitzman et al. 1994; this study Fig. 9b). The visible alteration of samples described in these stud- ies is not volumetrically significant, but can have sub- stantial stable isotopic effects, most notably complex intracrystalline zonation and grain-to-grain hetero- geneities. Where rocks have not been infiltrated by and reacted with retrograde fluids, retrogression was rate limited by volume diffusion. Distinguishing between these two cases is the problem presented to routine studies of the stable isotopic characteristics of slowly cooled rocks; a task complicated by the recent discov- ery that closed system interdiffusion can produce effects very different from the predictions of simple "closure temperature" models in many rock types (Eiler et al. 1992, 1993). The success of this approach in the one sample shown to have both closed-system, diffusion-
Acknowledgements We gratefully acknowledge the financial sup- port of a National Science Foundation doctoral fellowship and a Wisconsin Alumni Research Foundation fellowship (J.M.E.), NSF grants EAR-9105709 (J.W.V.) EAR-9206090 (L.P.B.) DOE grant 93ER 14389 (J.W.V.), and research grants to J.M.E. from the Geo- logical Society of America, Sigma Xi and the University of Wis- consin. Thanks are due to Phil Whitney for supplying samples of Lyon Mountain Gneiss, to Mike Spicuzza for assistance with con- ventional stable isotope analysis, to Jill Banfield for enlightening discussions on oxide defects, and to an anonymous reviewer for suggestions that improved this manuscript. We especially thank John Craven for assistance, training and advice in the use of the ion microprobe. Thanks also are due to Stuart Kearns tbr techni- cal assistance with electron microprobe analysis at the University of Edinburgh, and to Rick Noll for assistance with the Scanning Electron Microscope at the University of Wisconsin.
References
Becker RH (1971) Carbon and oxygen isotope ratios in iron-for- mation and associated rocks from the Hamersley Range of Western Australia and their implications. PhD thesis, Chicago Univ
Bohlen SR (1987) Pressure-temperature-time paths and a tectonic model for the evolution of granulites. J Geol 95:61~632
Bohlen SR, Valley JW, Essene EJ (1985) Metamorphism in the Adirondacks. I. petrology, pressure and temperature. J Petrol 26:971-992
Bohlen SR, McLelland J, Valley J, Chiarenzelli J (1992) Petrology and geochronology of the Adirondack Mountains: a critical look at a classic granulite terrain and its associated anorthosite-mangerite-charnockite-granite (AMCG) suite. Field guide for IGCP-304
Cartwright I, Valley JW, Hazelwood A (1993) Resetting of oxy- barometers and oxygen isotope ratios in granulite facies or- thogneisses during cooling and shearing, Adirondack Moun- tains, New York. Contrib Mineral Petrol 113:208-225
Chamberlain CP, Conrad ME (1991) Oxygen isotope zoning in garnet. Science 254:403-406
Chiba H, Chacko T, Clayton RN, Goldsmith JR (1989) Oxygen isotope fractionations involving diopside, forsterite, magnetite and calcite: application to geothermometry. Geochim Cos- mochim Acta 53:2985 2995
Clayton RN, Mayeda TK (1963) The use of bromine pentafluo- ride in the extraction of oxygen fiom the oxides and silicates for isotopic analysis. Geochim Cosmochim Acta 27:43-52
Cole DR, Ohmoto H (1986) Kinetics of isotopic exchange at ele- vated temperatures and pressures. In: Valley JW, Taylor HP Jr, O'Neil JR (eds) Stable isotopes in high temperature geological processes (Reviews in Mineralogy vol. 16). Mineralogical Soci- ety of America, Washington DC, pp 41-87
Cole DR, Ohmoto H, Lasaga A (1983) Isotopic exchange in min- eral-fluid systems-I. Theoretical evaluation of oxygen isotope exchange accompanying surface reactions and diffusion. Geochim Cosmochim Acta 53:1681 1693
Crowe DE, Valley JW, Baker K (1990) Micro-analysis of sulfur- isotope ratios and zonation by laser microprobe. Geochim Cosmochim Acta 54:2075-2092

378
Deines P (1977) On the oxygen isotope distribution among miner- al triplets in igneous rocks. Geochim Cosmochim Acta 41 : 1709-1730
Dennis PF (1984) Oxygen self diffusion in quartz. Progress in Experimental Petrology, NERC Publ. D. 25:260-265
Dodson MH (1973) Closure temperature in cooling geochrono- logic and petrologic systems. Contrib Mineral Petrol 40:259- 274
Eiler JM (1994) Diffusion of stable isotopes in metamorphic rocks: theoretical and applied studies. PhD thesis, University of Wisconsin
Eiler JM, Baumgartner LP, Valley JW (1992) Interdiffusion of stable isotopes : a fast grain boundary model. Contrib Mineral Petrol 112: 543-557
Eiler JM, Valley JW, Baumgartner LP (1993) A new look at stable isotope thermometry. Geochim Cosmochim Acta 57:2571- 2583
Eldridge CS, Compston W, Williams IS, Walsh JL (1987) In situ microanalysis for 34S/32S ratios using the ion microprobe SHRIMP. Int J Mass Spectron Ion Process 76:65 83
Elphick SC, Graham CM (1990) Hydrothermal oxygen diffusion in diopside at 1 kb, 900-1200 ~ C, a comparison with oxygen diffusion in forsterite, and constraints on oxygen isotope dise- quilibrium in pcridotite nodules. Terra Abstracts 2:72
Elsenheimer D, Valley JW (1993) Submillimeter scale zonation of 81sO in quartz and feldspar, Isle of Skye, Scotland. Geochim Cosmochim Acta 57:3669-3676
Farver JR (1990) Oxygen self-diffusion in diopside with applica- tion to cooling rate determinations. Earth Planet Sci Lett 92:386-396
Farver JR, Yund RA (1990) The effect of hydrogen, oxygen and water fugacity on oxygen diffusion in alkali feldspar. Geochim Cosmochim Acta 54:2953 2964
Farver JR, Yund RA (1991) Oxygen diffusion in quartz: depen- dence on temperature and water fugacity. Chem Geol 90:55- 70
Giletti BJ (1985) The nature of oxygen transport within minerals in the presence of hydrothermal water and the role of diffusion. Chem Geol 53:197-206
Giletti BJ (1986) Diffusion effects on oxygen isotope temperatures of slowly cooled igneous and metamorphic rocks. Earth Planet Sci Lett 77:218 228
Giletti BJ, Hess KC (1988) Oxygen diffusion in magnetite. Earth Planet Sci Lett 89:115 122
Giletti B J, Shimizu N (1989) Use of the ion microprobe to measure natural abundances of oxygen isotopes in minerals. US Geol Surv Bull 1890:129-136
Giletti BJ, Semet MP, Yund RA (1978) Studies in diffusion III. Oxygen in feldspars, an ion microprobe determination. Geochim Cosmochim Acta 42:45-57
Hervig RL, Thomas RM, Williams P (1989) Charge neutralization and oxygen isotopic analysis of insulators with the ion mi- croprobe. US Geol Surv Bull 1890:137-143
Javoy M (1977) Stable isotopes and geothermometry. J Geol Soc Lond 133:609 636
Kohn M J, Valley JW, Elsenheimer D, Spicuzza M (1993) Oxygen isotope zoning in garnet and staurolite: evidence for closed system mineral growth during regional metamorphism. Am Mineral 78:988 1001
Lamb WM, Brown PE, Valley JW (1991) Fluid inclusions in Adirondack granulites: implications for the retrograde P-T path. Contrib Mineral Petrol 107:472 483
Lindsley DH (1976) Experimental studies of oxide minerals. In: Rumble DH III (ed) Oxide minerals (Reviews in Mineralogy vol. 3). Mineralogical Society of America, Washington DC, pp 61-88
Lindsley DH (1991) Experimental studies of oxide minerals. In: Lindsley DH (ed) Oxide minerals: petrologic and magnetic significance (Reviews in Mineralogy vol. 25). Mineralogical Society of America, Washington DC, pp 69-106
Lindsley DH, Lindh A (1974) A hydrothermal investigation of the system FeO-Fe203-TiO2: a discussion with new data. Lithos 7:65-68
Lorin JC, Slodzian G, Dennebouy R, Chaintreau M (1990) SIMS measurement of oxygen isotope-ratios in meteorites and prim- itive solar system matter. In: Benninghoven A, Evans CA, McKeegan KD, Storms HA, Werner HW (eds) Secondary ion mass spectrometry SIMS VI1. Wiley Chichester, pp 377-380
McLelland JM, Chiarenzelli J (1990) Isotopic constraints on em- placement age of anorthositic rocks of the Marcy Massif, Adirondack Mts NY. J Geol 98:19-41
McLelland JM, Chiarenzelli J (1991) Geochronological studies in the Adirondack Mountains and the implications of a middle Proterozoic tonalite suite. Geol Assoc Can Spec Pap 38:175- 194
McLelland JM, Chiarenzelli J, Whitney P, Isachsen Y (1988) U-Pb zircon geochronology of the Adirondack Mts. and implica- tions for their tectonic evolution. Geol 16:920-924
Mezger K, Rawns!ey C, Bohlen SR, Hanson GN (1990) U-Pb garnet, sphene, monazite, and rutile ages: implications for the duration of high-grade metamorphism and cooling histories, Adirondack Mts., New York. J Geol 99:415-428
Mielke H, Schreyer W (1972) Magnetite-rutile assemblages in metapelites of the Fichtelgebirge, Germany. Earth Planet Sci Lett 16:423~428
Morrison J, Valley JW (1988) Post-granulite facies fluid infiltra- tion in the Adirondack Mountains. Geol 16:513 516
Morrison J, Valley JW (1991) Retrograde fluids in granulites: sta- ble isotope evidence of fluid migration. J Geol 99 : 559--570
O'Neil J, Taylor HP Jr (1967) The oxygen isotope and cation exchange chemistry of feldspars. Am Mineral 52:1414-1437
O'Neil JR, Clayton RN, Mayeda TK (1969) Oxygen isotope frac- tionation in divalent metal carbonates. J Chem Phys 51 : 5547- 5558
Rumble DH III (1976) Oxide minerals inrnetamorphic rocks. In: Rumble DH III (ed) Oxide minerals (Reviews in Mineralogy vol. 3). Mineralogical Society of America, Washington DC, pp R 1-R24
Sharp ZD (1990) A laser based microanalytical method for the in situ determination of oxygen isotope ratios of silicates and oxides. Geochim Cosmochim Acta 54:1353-1357
Sharp ZD (1991) Determination of oxygen diffnsion rates in mag- netite from natural isotopic variations. Geology 19:653 656
Sitzman SD, Banfield JF, Valley JW (1994) Serpentine/Talc filled submicroscopic solution channels in metamorphic magnetic: an explanation for micron-scale oxygen heterogenity? Geol Soc Am abstr w pro 26:A279
Southwick DL (1968) Mineralogy of a rutile- and apatite-bearing ultra-mafic chlorite rock. US Geol Surv Prof Pap 600-C:C38 C44
Valley JW (1986) Stable isotope geochemistry of metamorphic rocks. In: Valley JW, Taylor HP Jr, O'Neil JR (eds) Stable isotopes in high temperature geologic processes (Reviews in Mineralogy vol. 16). Mineralogical Society of America, Wash- ington DC, pp 445490
Valley JW, Graham CM (1991) Ion microprobe analysis of oxygen isotope ratios in granulite facies magnetites: diffusive exchange as a guide to cooling history. Contrib Mineral Petrol 109:38 .... 52
Valley JW, Graham CM (1993) Cryptic grain-scale heterogeneity of oxygen isotope ratios in metamorphic magnetite. Science 259:1729-1733
Wada H (1988) Microscale isotopic zoning in calcite and graphite crystals in marble. Nature 331:61-63
Whitney P, Olmstead J (1988) Geochemistry and origin of albite gneisses, northeastern Adirondacks, N.Y. Contrib Mineral Petrol 99:476 484
Zinner E (1989) Isotopic measurements with the ion microprobe. US Geol Surv Bull 1890:145 162